
Celanese Q3 2013 Earnings Friday, October 18, 2013 Conference Call / Webcast Monday, October 21, 2013 10:00 a.m. EDT © Celanese Mark Rohr, Chairman and Chief Executive Officer Steven Sterin, Senior Vice President and Chief Financial Officer Exhibit 99.2

This presentation, and public statements made in connection with this presentation, may contain “forward-looking statements,” which include information concerning the company's plans, objectives, goals, strategies, future net sales or performance, capital expenditures, financing needs and other information that are not historical facts. All forward-looking statements are based upon current expectations and beliefs and various assumptions. There can be no assurance that the company will realize these expectations or that these beliefs will prove correct. There are a number of risks and uncertainties that could cause actual results to differ materially from the results expressed or implied in such forward- looking statements. These risks and uncertainties include, among other things: changes in general economic, business, political and regulatory conditions in the countries or regions in which we operate; the length and depth of product and industry business cycles, particularly in the automotive, electrical, textiles, electronics and construction industries; changes in the price and availability of raw materials, particularly changes in the demand for, supply of, and market prices of ethylene, methanol, natural gas, wood pulp and fuel oil and the prices for electricity and other energy sources; the ability to pass increases in raw material prices on to customers or otherwise improve margins through price increases; the ability to maintain plant utilization rates and to implement planned capacity additions and expansions; the ability to reduce or maintain their current levels of production costs and to improve productivity by implementing technological improvements to existing plants; increased price competition and the introduction of competing products by other companies; market acceptance of our technology; the ability to obtain governmental approvals and to construct facilities on terms and schedules acceptable to the company; changes in the degree of intellectual property and other legal protection afforded to our products or technologies, or the theft of such intellectual property; compliance and other costs and potential disruption or interruption of production or operations due to accidents, interruptions in sources of raw materials, cyber security incidents, terrorism or political unrest or other unforeseen events or delays in construction or operation of facilities, including as a result of geopolitical conditions, the occurrence of acts of war or terrorist incidents or as a result of weather or natural disasters; potential liability for remedial actions and increased costs under existing or future environmental regulations, including those relating to climate change; potential liability resulting from pending or future litigation, or from changes in the laws, regulations or policies of governments or other governmental activities in the countries in which we operate; changes in currency exchange rates and interest rates; our level of indebtedness, which could diminish our ability to raise additional capital to fund operations or limit our ability to react to changes in the economy or the chemicals industry; and various other factors discussed from time to time in the company's periodic reports with the Securities and Exchange Commission. Any forward-looking statement speaks only as of the date on which it is made, and the company undertakes no obligation to update any forward-looking statements to reflect events or circumstances after the date on which it is made or to reflect the occurrence of anticipated or unanticipated events or circumstances. Results Unaudited The results in this presentation, together with the adjustments made to present the results on a comparable basis, have not been audited and are based on internal financial data furnished to management. Quarterly results should not be taken as an indication of the results of operations to be reported for any subsequent period or for the full fiscal year. Non-GAAP Financial Measures and Change in Accounting Policy This presentation, and statements made in connection with this presentation, contain references to non-GAAP financial measures. For more information on the non-GAAP financial measures used by the company and referenced in this presentation, including definitions and reconciliations with comparable GAAP financial measures, as well as prior period information, please refer to Investor Relations/Financial Information/Non-GAAP Financial Measures on our website, www.celanese.com. The website materials also describe a change in accounting policy regarding pension and other postretirement benefits effective January 1, 2013. © Celanese Celanese Corporation 2 Forward-Looking Statements

Mark Rohr Chairman and Chief Executive Officer © Celanese Celanese Corporation 3
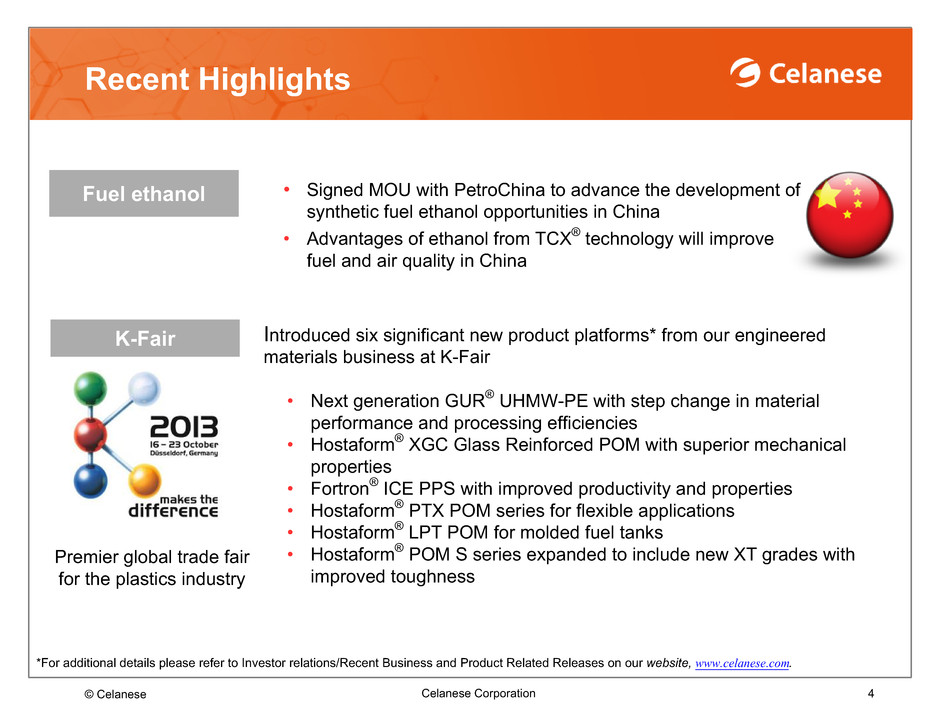
Recent Highlights © Celanese Celanese Corporation 4 • Signed MOU with PetroChina to advance the development of synthetic fuel ethanol opportunities in China • Advantages of ethanol from TCX® technology will improve fuel and air quality in China Fuel ethanol K-Fair Introduced six significant new product platforms* from our engineered materials business at K-Fair • Next generation GUR® UHMW-PE with step change in material performance and processing efficiencies • Hostaform® XGC Glass Reinforced POM with superior mechanical properties • Fortron® ICE PPS with improved productivity and properties • Hostaform® PTX POM series for flexible applications • Hostaform® LPT POM for molded fuel tanks • Hostaform® POM S series expanded to include new XT grades with improved toughness Premier global trade fair for the plastics industry *For additional details please refer to Investor relations/Recent Business and Product Related Releases on our website, www.celanese.com.
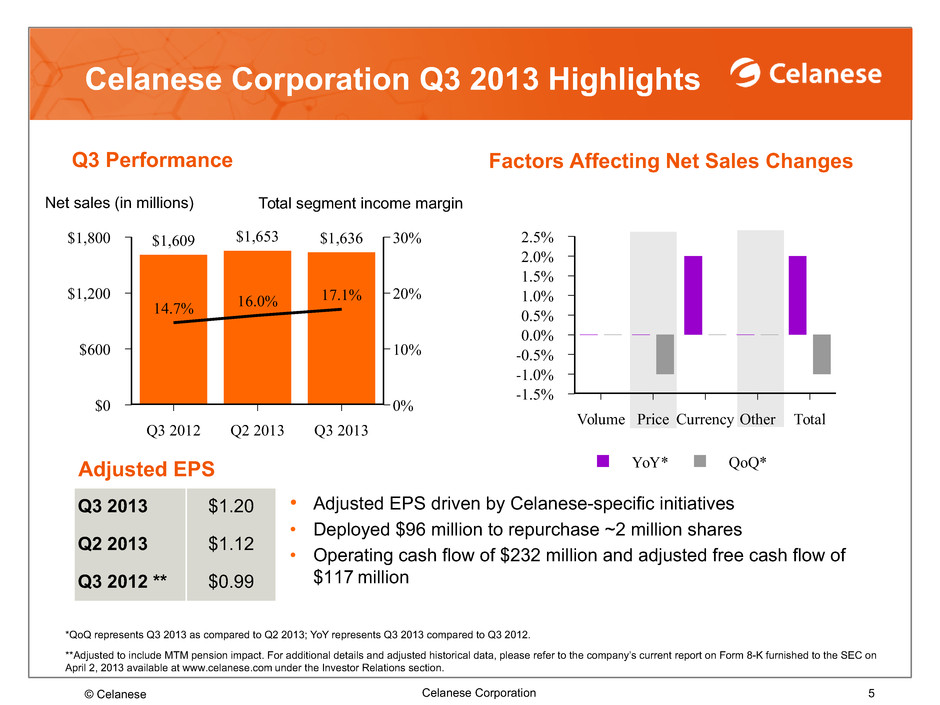
YoY* QoQ* 2.5% 2.0% 1.5% 1.0% 0.5% 0.0% -0.5% -1.0% -1.5% Volume Price Currency Other Total $1,800 $1,200 $600 $0 30% 20% 10% 0% Q3 2012 Q2 2013 Q3 2013 14.7% 16.0% 17.1% $1,609 $1,653 $1,636 Celanese Corporation Q3 2013 Highlights Q3 Performance Factors Affecting Net Sales Changes © Celanese Celanese Corporation • Adjusted EPS driven by Celanese-specific initiatives • Deployed $96 million to repurchase ~2 million shares • Operating cash flow of $232 million and adjusted free cash flow of $117 million *QoQ represents Q3 2013 as compared to Q2 2013; YoY represents Q3 2013 compared to Q3 2012. **Adjusted to include MTM pension impact. For additional details and adjusted historical data, please refer to the company’s current report on Form 8-K furnished to the SEC on April 2, 2013 available at www.celanese.com under the Investor Relations section. Adjusted EPS Q3 2013 $1.20 Q2 2013 $1.12 Q3 2012 ** $0.99 Net sales (in millions) Total segment income margin 5

YoY Segment income highlights • Higher volumes in Americas from autos and in Asia from targeted growth programs • Price decline due to product and geographic mix and higher energy costs partially offset by lower raw material costs • $15 million lower affiliate earnings primarily due to turnaround at Middle East affiliate QoQ Segment income highlights • $15 million lower affiliate earnings primarily due to turnaround at Middle East affiliate • Continued success in auto despite lower QoQ auto builds in Europe (-13%) and US (-9%) • Improved mix of medical, lower raw material costs, and savings from focused spending initiatives Net sales (in millions) Advanced Engineered Materials Q3 Performance Factors Affecting Net Sales Changes © Celanese Celanese Corporation 6 $400 $300 $200 $100 $0 40% 30% 20% 10% 0% Q3 2012 Q2 2013 Q3 2013 25.2% 24.4% 23.4% $322 $352 $346 Total segment income margin YoY QoQ 10% 8% 6% 4% 2% 0% -2% -4% Volume Price Currency Other Total

Consumer Specialties Q3 Performance Factors Affecting Net Sales Changes © Celanese Celanese Corporation YoY Segment income highlights • Lower volumes due to cessation of production at Spondon; energy and operating cost savings • Higher acetate tow pricing more than offset higher raw material costs in cellulose derivatives • Timing of dividends from cellulose derivatives ventures changed from annual to quarterly QoQ Segment income highlights • Continued healthy demand for tow resulted in consistent volume and pricing • Initial commercial success with Qorus™; more than 50 customer trials globally Net sales (in millions) Total segment income margin $400 $300 $200 $100 $0 60% 40% 20% 0% Q3 2012 Q2 2013 Q3 2013 25.2% 34.7% 34.8% $314 $314 $310 YoY QoQ 8% 6% 4% 2% 0% -2% -4% -6% -8% -10% Volume Price Currency Other Total 7
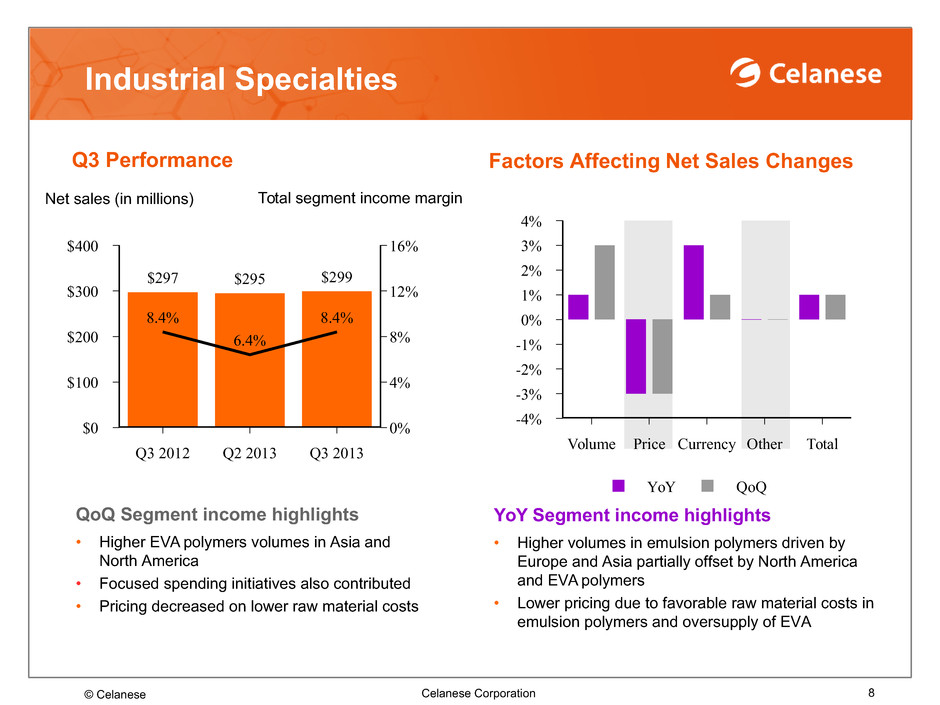
Industrial Specialties Q3 Performance Factors Affecting Net Sales Changes © Celanese Celanese Corporation 8 YoY Segment income highlights • Higher volumes in emulsion polymers driven by Europe and Asia partially offset by North America and EVA polymers • Lower pricing due to favorable raw material costs in emulsion polymers and oversupply of EVA QoQ Segment income highlights • Higher EVA polymers volumes in Asia and North America • Focused spending initiatives also contributed • Pricing decreased on lower raw material costs Net sales (in millions) Total segment income margin $400 $300 $200 $100 $0 16% 12% 8% 4% 0% Q3 2012 Q2 2013 Q3 2013 8.4% 6.4% 8.4% $297 $295 $299 YoY QoQ 4% 3% 2% 1% 0% -1% -2% -3% -4% Volume Price Currency Other Total
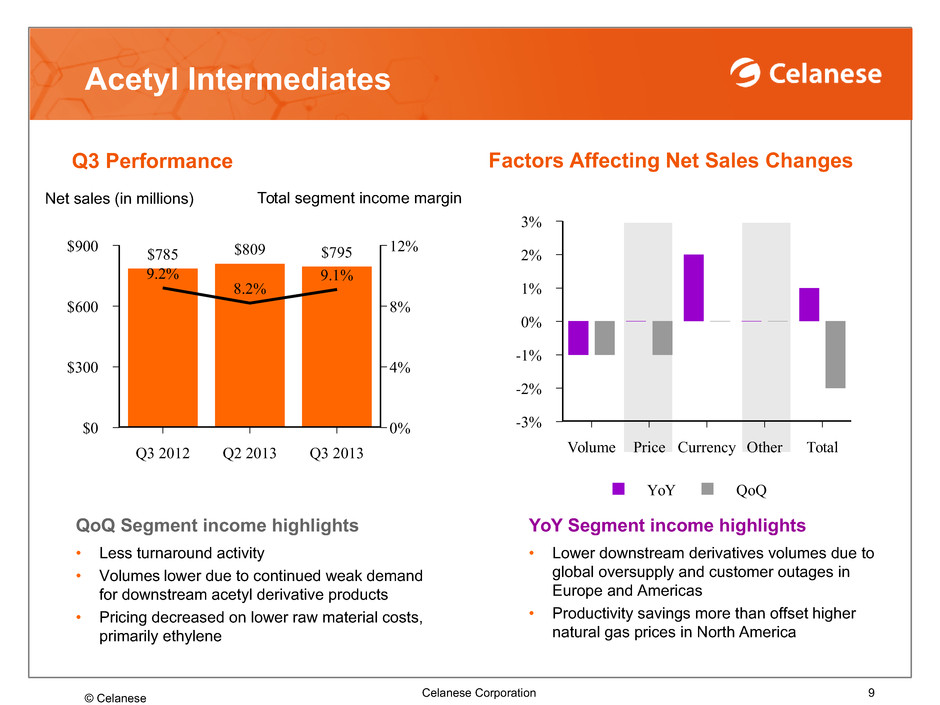
Acetyl Intermediates Q3 Performance Factors Affecting Net Sales Changes © Celanese Celanese Corporation 9 YoY Segment income highlights • Lower downstream derivatives volumes due to global oversupply and customer outages in Europe and Americas • Productivity savings more than offset higher natural gas prices in North America QoQ Segment income highlights • Less turnaround activity • Volumes lower due to continued weak demand for downstream acetyl derivative products • Pricing decreased on lower raw material costs, primarily ethylene Net sales (in millions) Total segment income margin $900 $600 $300 $0 12% 8% 4% 0% Q3 2012 Q2 2013 Q3 2013 9.2% 8.2% 9.1% $785 $809 $795 YoY QoQ 3% 2% 1% 0% -1% -2% -3% Volume Price Currency Other Total
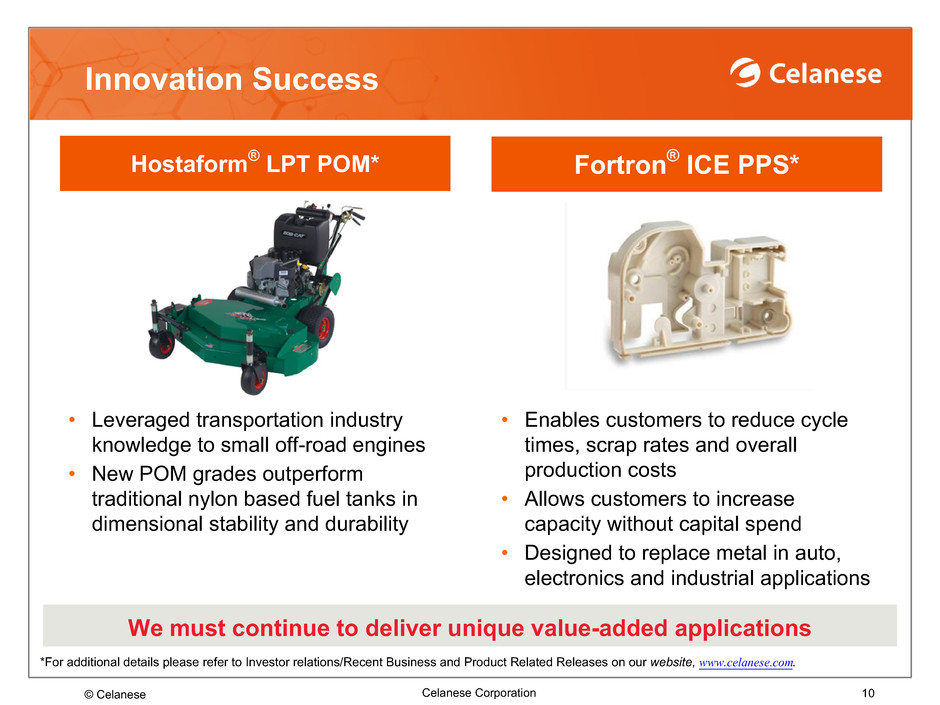
Innovation Success © Celanese Celanese Corporation 10 • Leveraged transportation industry knowledge to small off-road engines • New POM grades outperform traditional nylon based fuel tanks in dimensional stability and durability • Enables customers to reduce cycle times, scrap rates and overall production costs • Allows customers to increase capacity without capital spend • Designed to replace metal in auto, electronics and industrial applications We must continue to deliver unique value-added applications Hostaform® LPT POM* Fortron® ICE PPS* *For additional details please refer to Investor relations/Recent Business and Product Related Releases on our website, www.celanese.com.
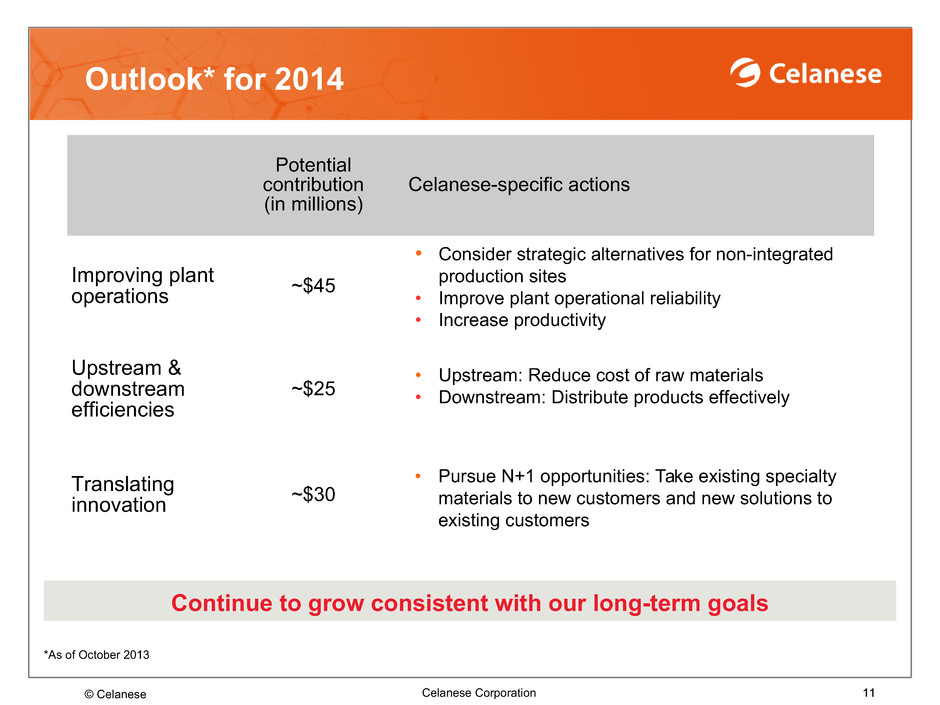
Outlook* for 2014 © Celanese Celanese Corporation 11 Continue to grow consistent with our long-term goals Potential contribution (in millions) Celanese-specific actions Improving plant operations ~$45 Upstream & downstream efficiencies ~$25 Translating innovation ~$30 • Consider strategic alternatives for non-integrated production sites • Improve plant operational reliability • Increase productivity • Upstream: Reduce cost of raw materials • Downstream: Distribute products effectively • Pursue N+1 opportunities: Take existing specialty materials to new customers and new solutions to existing customers *As of October 2013

Steven Sterin Senior Vice President and Chief Financial Officer © Celanese Celanese Corporation 12

Adjusted Free Cash Flow Strong Cash Flow Generation © Celanese Celanese Corporation 13 • Operating cash flow primarily driven by strong earnings performance • Re-priced $970 million term loan facility at 0.75% lower interest rate • Capex and investments in other productive assets of $115 million in Q3 2013 • Continue to expect capex of $375-400 million for 2013 and $400-500 million for 2014 with construction of Clear Lake methanol and conversion of coal to gas boilers in Narrows • Net debt <$2 billion as of September 30, 2013 • On pace to deliver annual free cash flow in 2013 in excess of 2012 Continue to focus on a balanced capital deployment strategy (in millions) Q3 2013 YTD Q3 2013 Cash flow from operations 608 232 Adjusted free cash flow 335 117 Adjusted FCF as % net sales 6.8% 7.2%
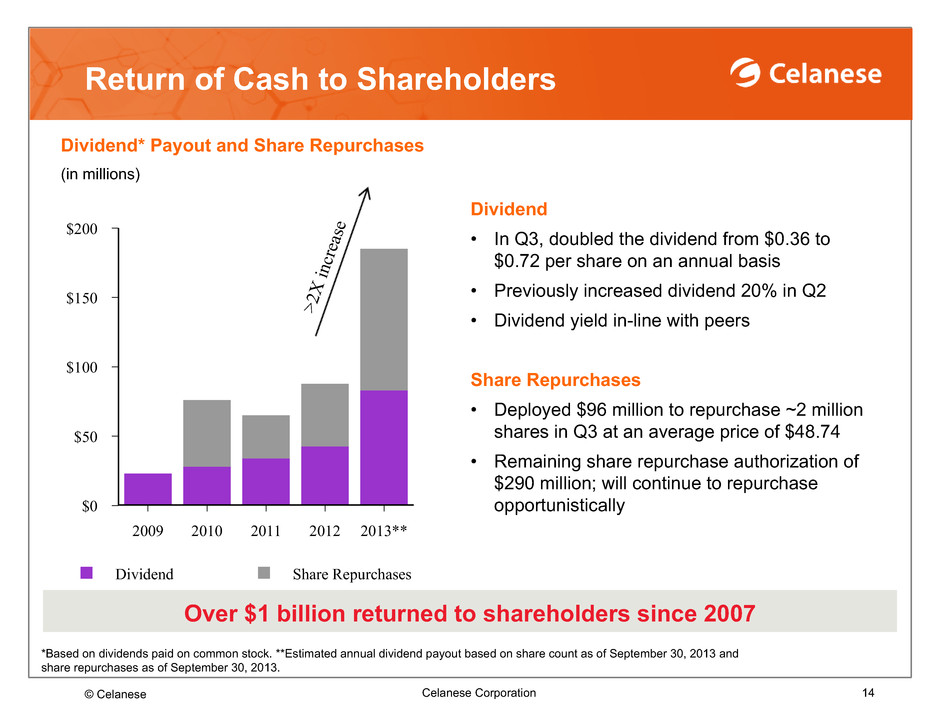
Dividend Share Repurchases $200 $150 $100 $50 $0 2009 2010 2011 2012 2013** Return of Cash to Shareholders Dividend • In Q3, doubled the dividend from $0.36 to $0.72 per share on an annual basis • Previously increased dividend 20% in Q2 • Dividend yield in-line with peers Share Repurchases • Deployed $96 million to repurchase ~2 million shares in Q3 at an average price of $48.74 • Remaining share repurchase authorization of $290 million; will continue to repurchase opportunistically Over $1 billion returned to shareholders since 2007 © Celanese Celanese Corporation 14 *Based on dividends paid on common stock. **Estimated annual dividend payout based on share count as of September 30, 2013 and share repurchases as of September 30, 2013. Dividend* Payout and Share Repurchases (in millions) >2 X increas e


