
Celanese and Blackstone to Form Joint Venture in Acetate Tow J U N E 1 8 , 2 0 1 7 Combines complementary tow portfolios to drive innovation and enhance cost competitiveness Proceeds from transaction to be deployed in high-growth businesses at Celanese

2A C E T A T E T O W J V – J U N E 2 0 1 7 Disclosures Forward-Looking Statements This presentation contains “forward-looking statements,” which include information concerning the Company’s plans, objectives, goals, strategies, future revenues, synergies, or performance, financing needs and other information that is not historical information. All forward-looking statements are based upon current expectations and beliefs and various assumptions, including the announced joint venture transaction. There can be no assurance that the Company will realize these expectations or that these beliefs will prove correct. There are a number of risks and uncertainties that could cause actual results to differ materially from the results expressed or implied in the forward-looking statements contained in this presentation, including with respect to the joint venture. These risks and uncertainties include, among other things: changes in general economic, business, political and regulatory conditions in the countries or regions in which we operate; the length and depth of product and industry business cycles, particularly in the automotive, electrical, textiles, electronics and construction industries; changes in the price and availability of raw materials, particularly changes in the demand for, supply of, and market prices of ethylene, methanol, natural gas, wood pulp and fuel oil and the prices for electricity and other energy sources; the ability to pass increases in raw material prices on to customers or otherwise improve margins through price increases; the ability to maintain plant utilization rates and to implement planned capacity additions and expansions; the ability to reduce or maintain current levels of production costs and to improve productivity by implementing technological improvements to existing plants; increased price competition and the introduction of competing products by other companies; changes in the degree of intellectual property and other legal protection afforded to our products or technologies, or the theft of such intellectual property; compliance and other costs and potential disruption or interruption of production or operations due to accidents, interruptions in sources of raw materials, cyber security incidents, terrorism or political unrest or other unforeseen events or delays in construction or operation of facilities, including as a result of geopolitical conditions, the occurrence of acts of war or terrorist incidents or as a result of weather or natural disasters; potential liability for remedial actions and increased costs under existing or future environmental regulations, including those relating to climate change; potential liability resulting from pending or future litigation, or from changes in the laws, regulations or policies of governments or other governmental activities in the countries in which we operate; changes in currency exchange rates and interest rates; our level of indebtedness, which could diminish our ability to raise additional capital to fund operations or limit our ability to react to changes in the economy or the chemicals industry; and various other factors discussed from time to time in the Company’s filings with the Securities and Exchange Commission. In addition to the risks and uncertainties identified above, the following risks and uncertainties, among others, could cause the Company’s actual results of operations regarding the joint venture to differ materially from the results expressed or implied in this presentation: the timing or ultimate completion of the transaction as the transaction is subject to closing conditions, including antitrust clearance; the benefits of the transaction may not materialize as expected; ability to successfully implement the integration strategy for the joint venture; and the ability to ensure continued performance or market growth of the combined tow businesses. Any forward-looking statement speaks only as of the date on which it is made, and the Company undertakes no obligation to update any forward-looking statements to reflect events or circumstances after the date on which it is made or to reflect the occurrence of anticipated or unanticipated events or circumstances. Results Unaudited The results in this document, together with the adjustments made to present the results on a comparable basis, have not been audited and are based on internal financial data furnished to management. Quarterly results should not be taken as an indication of the results of operations to be reported for any subsequent period or for the full fiscal year. Presentation This document presents the Company’s business segments in two subtotals, reflecting our two cores, the Acetyl Chain and Materials Solutions, based on similarities among customers, business models and technical processes. As described in the Company’s annual report on Form 10-K and quarterly reports on Form 10-Q, the Acetyl Chain includes the Company’s Acetyl Intermediates segment and the Industrial Specialties segment. Materials Solutions includes the Company’s Advanced Engineered Materials segment and the Consumer Specialties segment. The Consumer Specialties segment includes the Company’s Cellulose Derivatives business. Non-GAAP Financial Measures This presentation, and statements made in connection with this presentation, refer to non-GAAP financial measures. For more information on the non-GAAP financial measures used by the Company, including the most directly comparable GAAP financial measure for each non-GAAP financial measures used, including definitions and reconciliations of the differences between such non-GAAP financial measures and the comparable GAAP financial measures, please refer to the Non-US GAAP Financial Measures and Supplemental Information documents available on our website, www.celanese.com, under Investor Relations/Financial Information/Non-GAAP Financial Measures.

3A C E T A T E T O W J V – J U N E 2 0 1 7 Agenda > Value creation at Celanese > Tow transaction de-risks portfolio and unlocks tremendous value > Clear path to accelerate growth
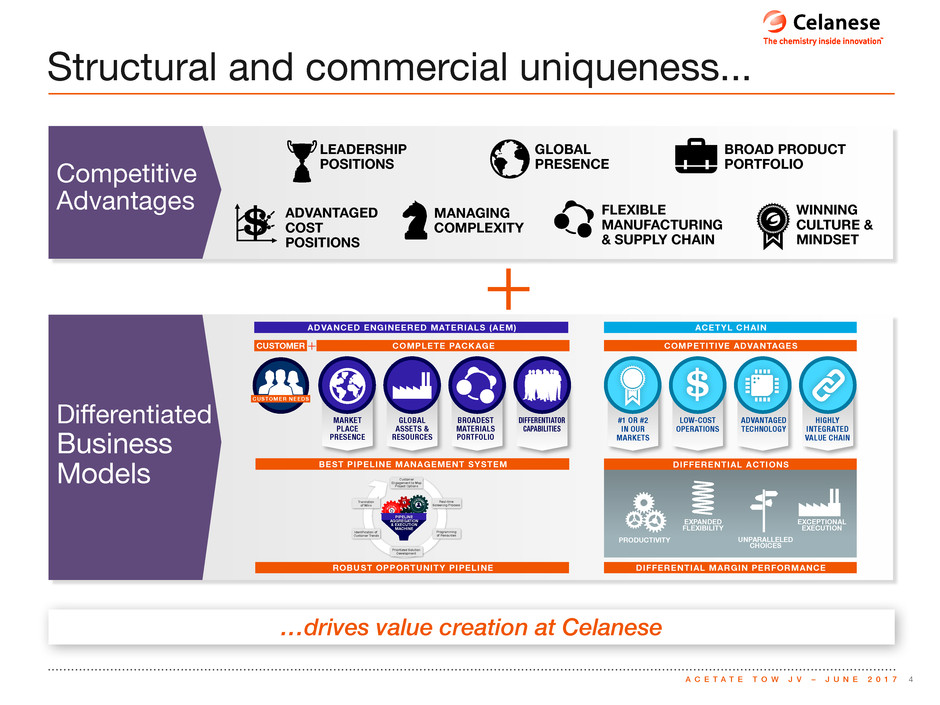
4A C E T A T E T O W J V – J U N E 2 0 1 7 …drives value creation at Celanese Structural and commercial uniqueness... Competitive Advantages Differentiated Business Models LEADERSHIP POSITIONS MANAGING COMPLEXITY GLOBAL PRESENCE BROAD PRODUCT PORTFOLIO FLEXIBLE MANUFACTURING & SUPPLY CHAIN ADVANTAGED COST POSITIONS WINNING CULTURE & MINDSET + MARKET PLACE PRESENCE GLOBAL ASSETS & RESOURCES BROADEST MATERIALS PORTFOLIO DIFFERENTIATOR CAPABILITIES PRODUCTIVITY UNPARALLELED CHOICES EXPANDED FLEXIBILITY EXCEPTIONAL EXECUTION COMPETITIVE ADVANTAGES DIFFERENTIAL ACTIONS DIFFERENTIAL MARGIN PERFORMANCE ACETYL CHAIN #1 OR #2 IN OUR MARKETS LOW-COST OPERATIONS ADVANTAGED TECHNOLOGY HIGHLY INTEGRATED VALUE CHAIN BEST PIPELINE MANAGEMENT SYSTEM COMPLETE PACKAGECUSTOMER ROBUST OPPORTUNITY PIPELINE ADVANCED ENGINEERED MATERIALS (AEM) + CUSTOMER NEEDS C US TOMER M ATERIAL PART PIPELINE AGGREGATION & EXECUTION MACHINE Customer Engagement to Map Project Options Translation of Wins Real-time Screening Process Programming of Resources Prioritized Solution Development Identification of Customer Trends

5A C E T A T E T O W J V – J U N E 2 0 1 71. 2015 free cash flow excludes payment of $177 million related to the termination of an existing supplier agreement 2. 2016 free cash flow excludes voluntary payment of $300 million for pension deleveraging …supported by strong commercial and operational fundamentals A track record of robust growth... 2012 2013 2014 2015 2016 2017F $4.07 $4.50 $5.67 $6.02 $6.61 ~8-11% GROWTH 2012 2013 2014 2015 2016 2017F $361 $392 $548 $7331 $9232 ~$850 13% CAGR 2012-16 26% CAGR 2012-16 2012 2013 2014 2015 2016 17.5% 16.2% 17.8% 18.6% 19.4% $88 $247 $394 $594 $701 18% 2012 2013 2014 2015 2016 CELANESE AVG. ADJUSTED ROIC 11% PEER MEAN ROIC China Eastman Celanese Daicel Solvay Other 2016 Acetate Tow Capacity ADJUSTED EPS FREE CASH FLOW I N M I L L I O N S
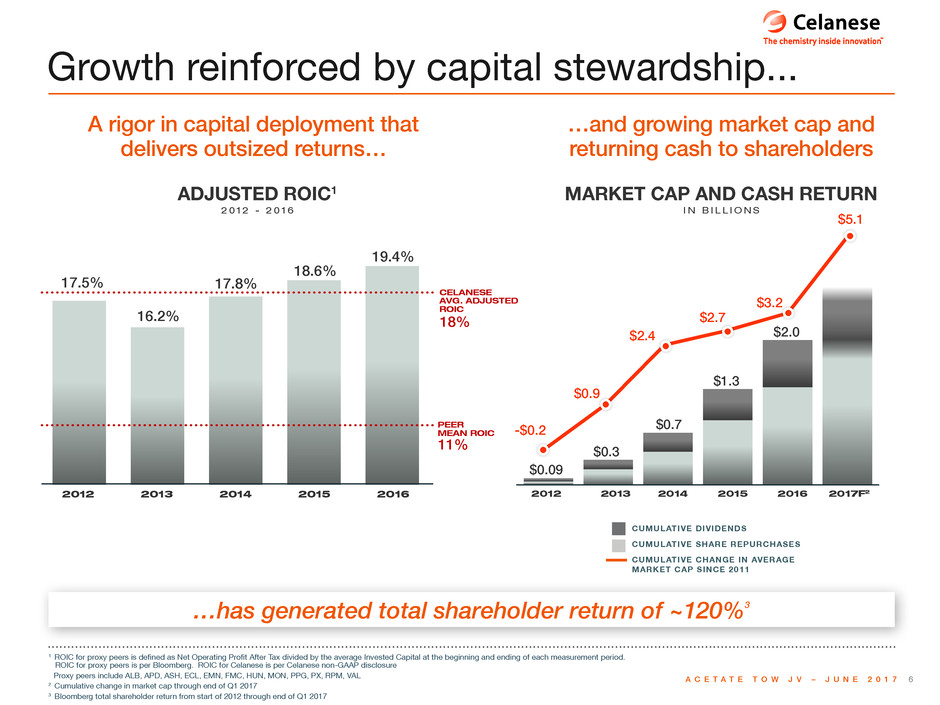
6A C E T A T E T O W J V – J U N E 2 0 1 7 Growth reinforced by capital stewardship... 1. ROIC for proxy peers is defined as Net Operating Profit After Tax divided by the average Invested Capital at the beginning and ending of each measurement period. ROIC for proxy peers is per Bloomberg. ROIC for Celanese is per Celanese non-GAAP disclosure Proxy peers include ALB, APD, ASH, ECL, EMN, FMC, HUN, MON, PPG, PX, RPM, VAL 2. Cumulative change in market cap through end of Q1 2017 3. Bloomberg total shareholder return from start of 2012 through end of Q1 2017 …has generated total shareholder return of ~120%3 2012 2013 2014 2015 2016 2017F $4.07 $4.50 $5.67 $6.02 $6.61 ~8-11% GROWTH 2012 2013 2014 2015 2016 2017F $361 $392 $548 $7331 $9232 ~$850 13% CAGR 2012-16 26% CAGR 2012-16 2012 2013 2014 2015 2016 17.5% 16.2% 17.8% 18.6% 19.4% $88 $247 $394 $594 $701 18% 2012 2013 2014 2015 2016 CELANESE AVG. ADJUSTED ROIC 11% PEER MEAN ROIC China Eastman Celanese Daicel Solvay Other 2016 Acetate Tow Capacity $0.09 $0.9 $2.4 $2.7 $3.2 $5.1 -$0.2 $0.3 $0.7 $1.3 $2.0 2012 2013 4 2015 2016 2017F2 ADJUSTED ROIC1 2 0 1 2 - 2 0 1 6 MARKET CAP AND CASH RETURN I N B I L L I O N S A rigor in capital deployment that delivers outsized returns… …and growing market cap and returning cash to shareholders CUMULATIVE CHANGE IN AVERAGE MARKET CAP SINCE 2011 CUMULATIVE DIVIDENDS CUMULATIVE SHARE REPURCHASES

7A C E T A T E T O W J V – J U N E 2 0 1 7 Numerous headwinds identified and addressed Taking steps to overcome the remaining headwind – tow > Currency > Industrial Ethanol > Methanol Contract Expiration > Decline in AEM Affiliate Earnings > Complexity in AEM > Weakness in Acetyl Chain Margins OFFSET OFFSET OFFSET OFFSET OFFSET OFFSET 2012-2017 HEADWINDS

8A C E T A T E T O W J V – J U N E 2 0 1 71. Celanese estimates 2. Rhodia Acetow assets recently acquired by Blackstone ...and has delivered high levels of cash and earnings growth Acetate tow is a high-value global business… > Capacity ~270 kT > Most production in JVs with China National Tobacco Corporation (CNTC) > Celanese JVs have the largest share of the Chinese market > Imports into China have dropped by 75% over recent years > Capacity ~540 kT > Four global players INSIDE CHINAOUTSIDE CHINA ACETATE TOW CAPACITY 2 0 1 6 2012 2013 2014 2015 2016 2017F $4.07 $4.50 $5.67 $6.02 $6.61 ~8-11% GROWTH 2012 2013 2014 2015 2016 2017F $361 $392 $548 $7331 $9232 ~$850 13% CAGR 2012-16 26% CAGR 2012-16 2012 2013 2014 2015 2016 17.5% 16.2% 17.8% 18.6% 19.4% $88 $247 $394 $594 $701 18% 2012 2013 2014 2015 2016 CELANESE AVG. ADJUSTED ROIC 11% PEER MEAN ROIC China Eastman Celanese Daicel Solvay Other 2016 Acetate Tow Capacity ~810 kT TOTAL GLOBAL CAPACITY1 CHINA EASTMANCELANESE DAICEL SOLVAY2 OTHER

9A C E T A T E T O W J V – J U N E 2 0 1 71. GAMA data, Euromonitor, Celanese estimates 2. Stick Equivalent Recent shifts in Chinese demand pattern… 2011-2014 2014-2020E CHINA CIGARETTES CHINA IMPORT VOLUME (KT)ROW CIGARETTES IMPORT % OF CHINESE TOW DEMAND CAGR CAGR -0.7% -1.5% 2012 2013 2014 2015 2016E 2017E 2018E 2019E 2020E 6.3 6.3 6.26.2 5.9 5.9 5.8 5.7 5.6 5.6 2011 2012 I M P O R T % I M P O R T V O L U M E ( K T ) 2013 2014 2015 2016E 2017E 2018E2011 200 160 120 80 40 0 50% 40% 30% 20% 10% 0% I M P O R T % I M P O R T V O L U M E ( K T ) 200 160 120 80 40 0 50% 40% 30% 20% 10% 0% 43% 43% 36% 32% 19% 15% 9% 5% 43% 43% 36% 32% 19% 15% 9% 5% 2012 2013 2014 2015 2016E 2017E 2018E 2019E 2020E 6.3 6.3 6.26.2 6.0 5.9 5.8 5.7 5.6 5.6 2011 2012 2013 2014 2015 2016E 2017E 2018E2011 CU M U L AT I V E CA SH GE NE R AT I O N 2011 2016 2017 2018 2019 2020 $x $x C U M U L A T I V E C A S H G E N E R A T I O N V A L U E S C A L E HIGHEST 2016 2017 2018 2019 2020 $6.0B $4.2B $2.5B C U M U L A T I V E C A S H G E N E R A T I O N 20161 2017F 2018F 2019F 2020F $6.2B $4.6B H I G H E S T V A L U E H I G H E S T V A L U E $1.8 $0.9 1 2016: $0.9 2017F: $1.8 2018F: Orange: $2.7; Silver: $1.6 2019F: Orange: $3.6; Silver: $1.6 2020F: Orange: $4.6; Silver: $1.6 $1.6 $4.2B I M P O R T % I M P O R T V O L U M E ( K T ) 200 160 120 80 40 0 50% 40% 30% 20% 10% 0% 43% 43% 36% 32% 19% 15% 9% 5% 2012 2013 2014 2015 2016E 2017E 2018E2011 120 80 40 0 43% 43% 36% 32% 19% 15% 9% 5% 2012 2013 2014 2015 2016E 2017E 2018E2011 ...have lowered industry tow utilization rates GLOBAL CIGARETTE DEMAND1 T R I L L I O N S E 2 CHINA TOW IMPORTS Demand for cigarettes in China hit an inflection point in 2015 China’s shift to self-sufficiency resulted in sharp decline in tow imports
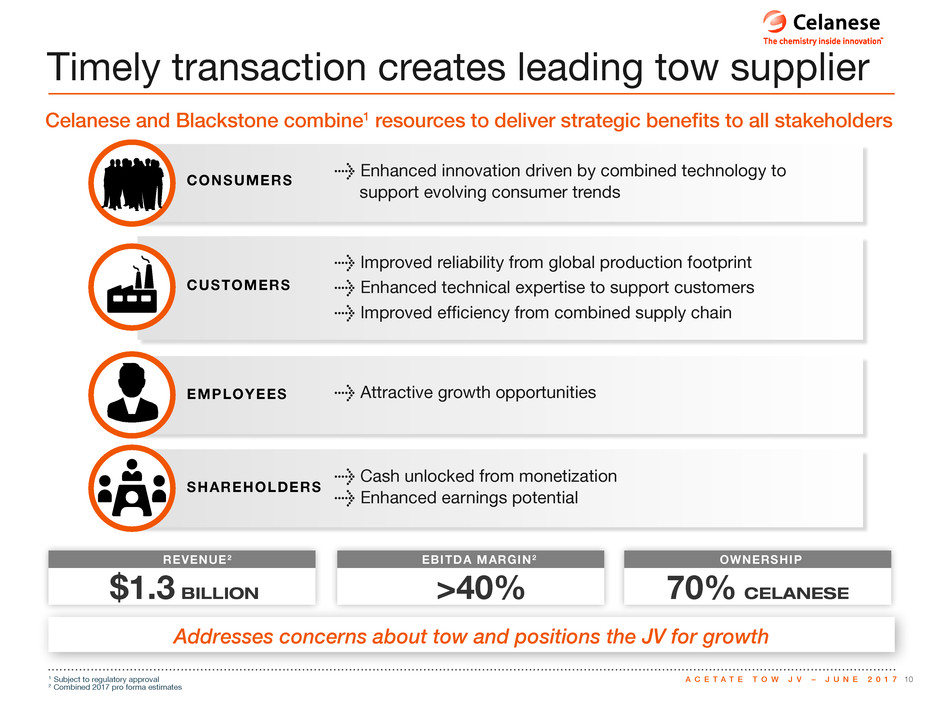
10A C E T A T E T O W J V – J U N E 2 0 1 71. Subject to regulatory approval 2. Combined 2017 pro forma estimates Addresses concerns about tow and positions the JV for growth Timely transaction creates leading tow supplier REVENUE2 EBITDA MARGIN2 OWNERSHIP $1.3 BILLION >40% 70% CELANESE Celanese and Blackstone combine1 resources to deliver strategic benefits to all stakeholders > Enhanced innovation driven by combined technology to support evolving consumer trends > Improved reliability from global production footprint > Enhanced technical expertise to support customers > Improved efficiency from combined supply chain > Attractive growth opportunities > Cash unlocked from monetization > Enhanced earnings potential CONSUMERS CUSTOMERS EMPLOYEES SHAREHOLDERS

11A C E T A T E T O W J V – J U N E 2 0 1 7 Amsterdam, Netherlands (New Company HQ) Freiburg, Germany Lanaken, Belgium Celanese-CNTC JV Zhuhai, China (30%) Narrows, VA Santo Andre, Brazil Ocotlan, Mexico Celanese-CNTC JV Kunming, China (30%) Celanese-CNTC JV Nantong, China (31%) Serpukhov, Russia Roussillon, France Kingsport, TN 1. Combined 2016 pro forma revenue …enhances efficiency of the supply chain and reliability for customers Combined assets expand global footprint... CELANESE BLACKSTONE Americas ~16% Europe ~49% Asia ~31% NEW COMPANY PRO FORMA REVENUE MIX1 ROW ~4%

12A C E T A T E T O W J V – J U N E 2 0 1 7 Significant value creation for Celanese TOW JOINT VENTURE Immediately EPS neutral Full run-rate synergies will more than offset the cost of JV debt Expect $0.50 - $0.75 of adjusted EPS accretion in year 3 after close 1. Debt after paying down $0.6 billion of debt from Blackstone 2. Pro forma 2017 forecasted EBITDA including pro forma run-rate synergy estimates Cost Synergies > Combination of technology expertise > Optimization of supply chain networks > Procurement economies of scale > Tax synergies CELANESE Optimal Capital Structure > JV to take on $2.2 billion debt1 supported by strong cash flow generation > JV distributes $1.6 billion to Celanese as initial dividend > Debt largely non-recourse to parents > JV debt/EBITDA of ~3.5x2 $1.6 billion initial dividend > Proceeds to be deployed in organic growth, acquisitions, share repurchases, and debt reduction > Celanese committed to maintaining investment grade rating, $0.8 billion to be used to de-lever

13A C E T A T E T O W J V – J U N E 2 0 1 7 Tow transaction advances significant growth options for Celanese Multi-faceted successes > $1.6 billion initial monetization of Cellulose Derivatives > Opportunity to create value uplift through reallocation of capital to higher-growth businesses > Enhanced cost competitiveness > Improved value proposition > Enhanced long-term strategic options > End of tow earnings decline DE-RISK MONETIZE REALLOCATE

14A C E T A T E T O W J V – J U N E 2 0 1 7 ...supported by robust cash flow generation from acetyls and tow Clear set of growth opportunities at Celanese... Robust Cash Generation Acetate Tow JV > Tow JV will enable earnings enhancement > Initial monetization to unlock cash Acetyl Chain > Outsized share of industry growth > Engagement in activities that improve global landscape Explosive Growth AEM > Turbocharge the existing customer project pipeline engagement model > Bolt-on M&A > Larger transactions offer step change options DI SC IPL INE D CA PITAL EARNINGS AE M AEMD EP LO YME NT GROW TH A c e t y l C h a i n & To w J V CASH F LOW E X PANDING VALUE UPLIFT CYCLE

15A C E T A T E T O W J V – J U N E 2 0 1 71. Celanese estimates of industry utilization at 1Q of each year Differentiated performance overcomes weak industry dynamics Acetyl Chain model delivers strong results 12% 10% 10% 16% 14% 13% 64% 61% 63% 70% 65%64% Q1 2012 Q1 2013 Q1 2014 Q1 2015 Q1 2016 Q1 2017 8-10% OLD RANGE 12-16% NEW RANGE ADJUSTED EBIT MARGIN ACETIC ACID INDUSTRY UTILIZATION1 LTM ADJ. EBIT MARGIN PRODUCTIVITY UNPARALLELED CHOICES EXPANDED FLEXIBILITY EXCEPTIONAL EXECUTION COMPETITIVE ADVANTAGES DIFFERENTIAL ACTIONS DIFFERENTIAL MARGIN PERFORMANCE #1 OR #2 IN OUR MARKETS LOW-COST OPERATIONS ADVANTAGED TECHNOLOGY HIGHLY INTEGRATED VALUE CHAIN
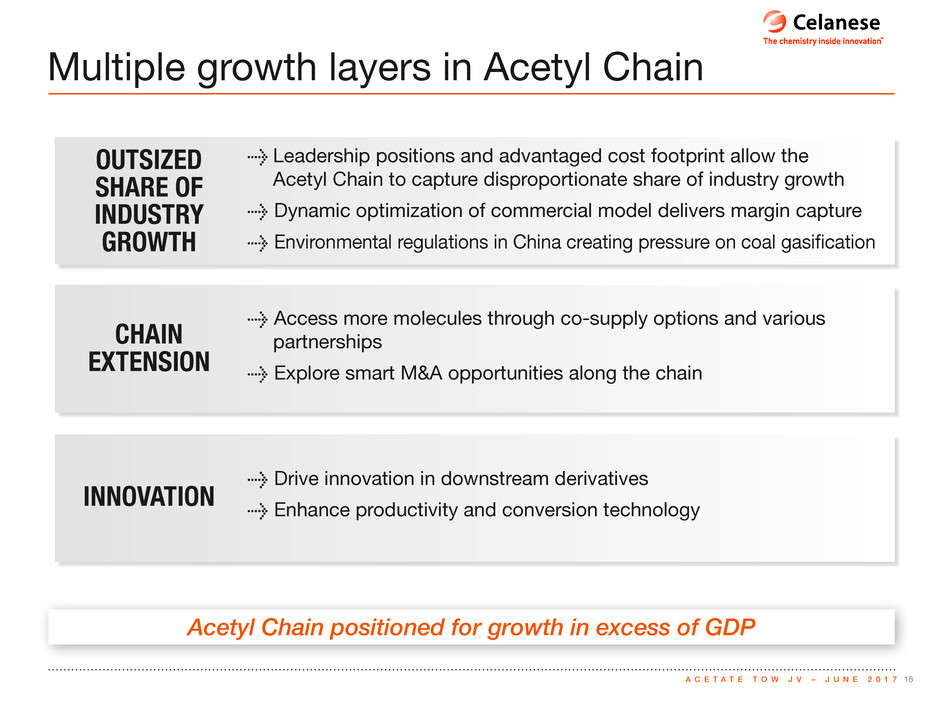
16A C E T A T E T O W J V – J U N E 2 0 1 7 Acetyl Chain positioned for growth in excess of GDP Multiple growth layers in Acetyl Chain > Leadership positions and advantaged cost footprint allow the Acetyl Chain to capture disproportionate share of industry growth > Dynamic optimization of commercial model delivers margin capture > Environmental regulations in China creating pressure on coal gasification > Access more molecules through co-supply options and various partnerships > Explore smart M&A opportunities along the chain > Drive innovation in downstream derivatives > Enhance productivity and conversion technology OUTSIZED SHARE OF INDUSTRY GROWTH CHAIN EXTENSION INNOVATION
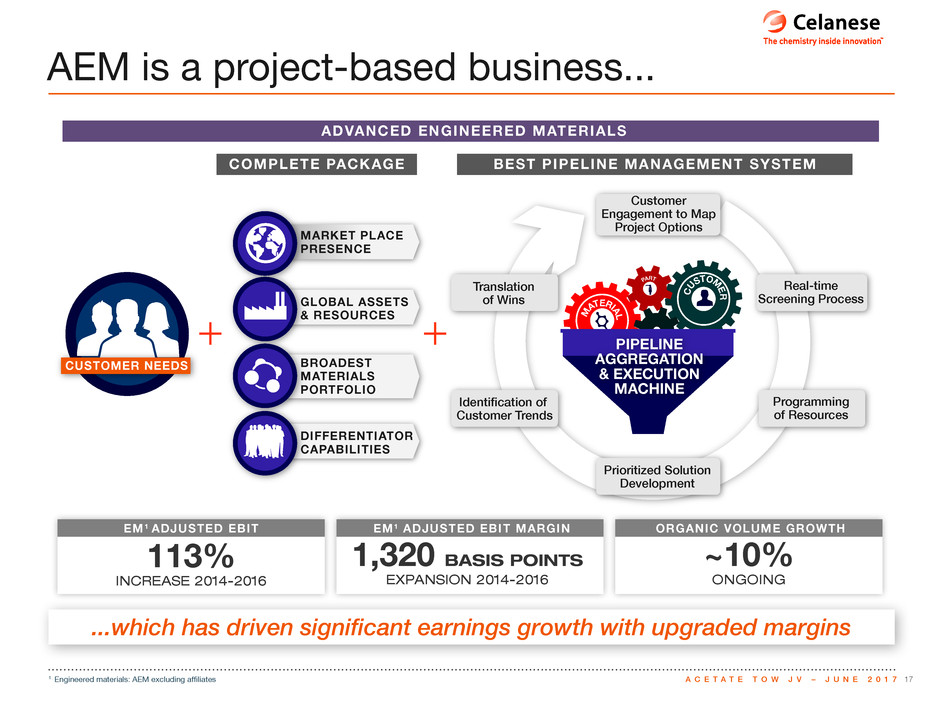
17A C E T A T E T O W J V – J U N E 2 0 1 71. Engineered materials: AEM excluding affiliates ...which has driven significant earnings growth with upgraded margins AEM is a project-based business... GLOBAL ASSETS & RESOURCES MARKET PLACE PRESENCE DIFFERENTIATOR CAPABILITIES BROADEST MATERIALS PORTFOLIO C US TOMER M ATERIAL PART PIPELINE AGGREGATION & EXECUTION MACHINE MILLION + + = SOLID EARNINGS GROWTH CUSTOMER NEEDS ~$175 Customer Engagement to Map Project Options Translation of Wins Real-time Screening Process Programming of Resources Prioritized Solution Development Identification of Customer Trends COMPLETE PACKAGE BEST PIPELINE MANAGEMENT S YSTEM EM1 AD JUSTED EBIT EM1 AD JUSTED EBIT MARGIN ORGANIC VOLUME GROWTH 113% INCREASE 2014-2016 1,320 BASIS POINTS EXPANSION 2014-2016 ~10% ONGOING ADVANCED ENGINEERED MATERIALS
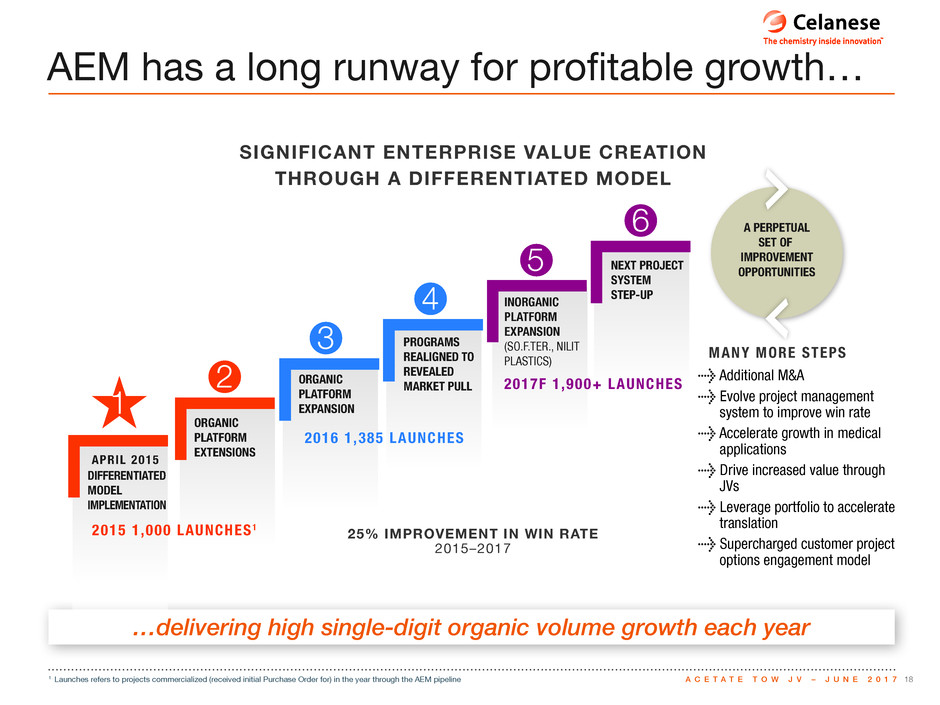
18A C E T A T E T O W J V – J U N E 2 0 1 71. Launches refers to projects commercialized (received initial Purchase Order for) in the year through the AEM pipeline …delivering high single-digit organic volume growth each year AEM has a long runway for profitable growth… NEXT PROJECT SYSTEM STEP-UPINORGANIC PLATFORM EXPANSION (SO.F.TER., NILIT PLASTICS) PROGRAMS REALIGNED TO REVEALED MARKET PULLORGANIC PLATFORM EXPANSION ORGANIC PLATFORM EXTENSIONS > Additional M&A > Evolve project management system to improve win rate > Accelerate growth in medical applications > Drive increased value through JVs > Leverage portfolio to accelerate translation > Supercharged customer project options engagement model 2015 1 ,000 LAUNCHES 1 DIFFERENTIATED MODEL IMPLEMENTATION APRIL 2015 2016 1 ,385 LAUNCHES 2017F 1 ,900+ LAUNCHES MANY MORE STEPS 6 5 4 3 2 1 A PERPETUAL SET OF IMPROVEMENT OPPORTUNITIES SIGNIFICANT ENTERPRISE VALUE CREATION THROUGH A DIFFERENTIATED MODEL 25% IMPROVEMENT IN WIN RATE 2015–2017
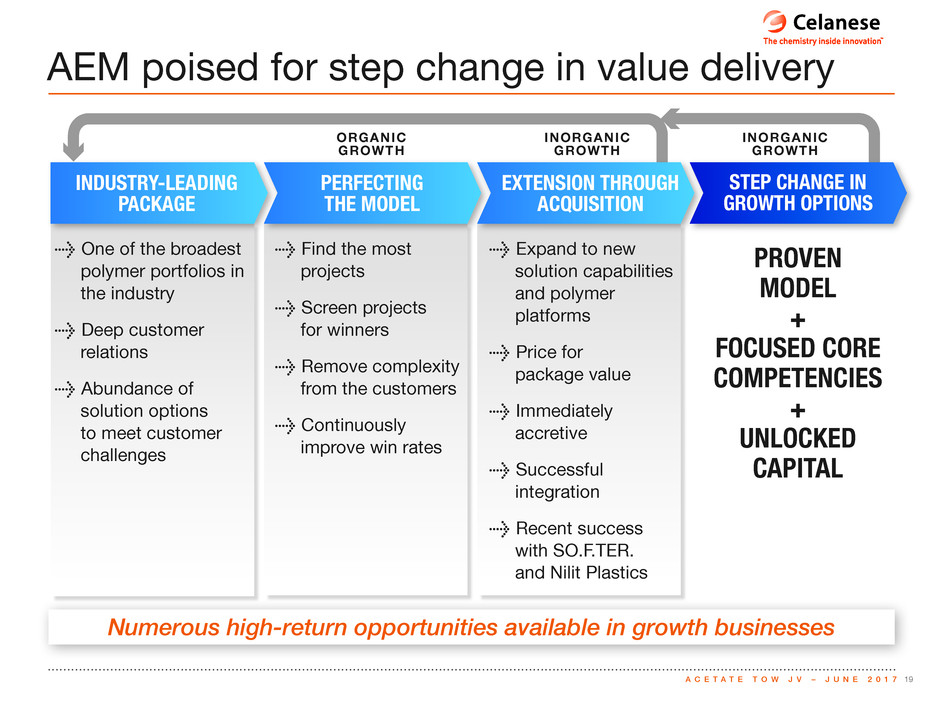
19A C E T A T E T O W J V – J U N E 2 0 1 7 AEM poised for step change in value delivery > Find the most projects > Screen projects for winners > Remove complexity from the customers > Continuously improve win rates > One of the broadest polymer portfolios in the industry > Deep customer relations > Abundance of solution options to meet customer challenges > Expand to new solution capabilities and polymer platforms > Price for package value > Immediately accretive > Successful integration > Recent success with SO.F.TER. and Nilit Plastics ORGANIC GROWTH INORGANIC GROWTH INORGANIC GROWTH PROVEN MODEL + FOCUSED CORE COMPETENCIES + UNLOCKED CAPITAL Numerous high-return opportunities available in growth businesses INDUSTRY-LEADING PACKAGE PERFECTING THE MODEL EXTENSION THROUGH ACQUISITION STEP CHANGE IN GROWTH OPTIONS

20A C E T A T E T O W J V – J U N E 2 0 1 7 C U M U L A T I V E C A S H G E N E R A T I O N 20161 2017F 2018F 2019F 2020F $6.2B $4.6B H I G H E S T V A L U E $2.5B 1. 2016 free cash flow excludes voluntary payment of $300 million for pension deleveraging 2. Including estimated ongoing cash flow available to CE from new acetate tow JV 3. Includes voluntary payment of $300 million in 2016 for pension deleveraging. Excludes any deleveraging at the new acetate tow JV $6.2B of cash generation to be deployed to enhance growth Value uplift via thoughtful capital allocation HIGH ROIC PROJECTS RETURNING CASH TO SHAREHOLDERS ANTICIPATED $1.6B INITIAL DIVIDEND FROM NEW ACETATE TOW JV COMMITMENT TO MAINTAIN INVESTMENT GRADECELANESE CASH GENERATION FROM OPERATIONS2 SOURCES OF CASH 2 0 1 6 - 2 0 2 0 I N B I L L I O N S USES OF CASH 2 0 1 6 - 2 0 2 0 I N B I L L I O N S ~$1.3 ~$2.0 ~$1.8 ~$1.13 DELEVERAGING ORGANIC GROWTH AND M&A DIVIDENDS SHARE REPURCHASES NO EXCESS CASH ON BALANCE SHEET


