EXHIBIT 99.1
EXETER RESOURCE CORPORATION | |
THE CASPICHE PROJECT ATACAMA REGION, CHILE | |
 Effective Date: April 30, 2014 Amendment and Restated Date – 19 December 2014 | |
Prepared By: Alquimia Conceptos S.A NCL Ingeniería y Construcción Spa (NCL) Carlos Guzmán, Mining Eng., FAusIMM. Leticia Conca, Mining Eng., SMEMember of Chilean Mining Commission Rick Adams, BSc, MAIG. | Prepared For: Exeter Resource Corporation. |
CERTIFICATE OF QUALIFIED PERSON
Carlos Guzmán
General del Canto 235
Providencia, Santiago, Chile
Telephone: (56 2) 2651-0800
Fax: (56 2) 2651-0890
cguzman@ncl.cl
I, Carlos Guzmán do hereby certify that:
| 1. | I am Principal and Project Director with the firm NCL Ingeniería y Construcción SpA., Santiago, Chile. My address is General del Canto 235, Providencia, Santiago Chile. |
| 2. | This certificate applies to the Technical Report titled "Amended NI 43-101 Technical Report on the Caspiche Project, Atacama Region, Chile", Date effective April 30, 2014, prepared for Exeter Resource Corporation. (the "Technical Report"). |
| 3. | I am a Graduate of the Universidad de Chile and hold a Mining Engineer title (1995). |
| 4. | I am a practicing Mining Engineer and a Fellow Member of the Australasian Institute of Mining and Metallurgy (FAusIMM, N° 229036); and a Registered Member of the Chilean Mining Commission (0119). |
| 5. | I have worked as a mining engineer for a total of 19 years. My relevant experience for the purpose of the Technical Report is: |
| · | Review and report as a consultant on numerous exploration, mining operation and projects around the world for due diligence and regulatory requirements. |
| · | I have extensive experience in mining engineering. I have worked on mining engineering assignments. |
| 6. | I have read the definition of “qualified person” set out in National Instrument 43-101 – Standards of Disclosure for Mineral Projects (“NI 43-101”) and confirm that by reason of my education, affiliation with a professional association (as defined in NI 43-101) and past relevant work experience, I fulfill the requirements to be a “qualified person” for the purposes of NI 43-101. |
| 7. | I am responsible for the preparation of Items 15 and 16 and portions of items 1, 21, 22, 24, 25 and 26 that are directly relevant to those items of the “Amended NI 43-101 Technical Report on the Caspiche Project, Atacama Region, Chile", Date effective April 30, 2014. |
| 8. | I am independent of Exeter Resource Corporation. |
| 9. | I have had prior involvement with the Caspiche Project. I have been fully responsible for the Technical Report (NI 43-101) of the Prefeasibility Study for the Caspiche Project, Region III, Chile, for Exeter Resource Corporation, effective January 16th, 2012. |
| 10. | On April 12th, 2011, I completed a personal inspection of the Caspiche Project. |
| 11. | I have read NI 43-101 and the Technical Report has been prepared in compliance with NI 43-101. |
| 12. | As of the effective date of the Technical Report, to the best of my knowledge, information and belief, the Technical Report contains all scientific and technical information that is required to be disclosed to make the Technical Report not misleading. |
Dated this December 19, 2014.
Carlos Guzmán
_____________________________________
Carlos Guzmán
Mining Engineer, FAusIMM (229036)
Registered Member of the Chilean Mining Commission (0119)
CERTIFICATE OF QUALIFIED PERSON
Alonso de Córdova 5710, Office 404, Las Condes,
Santiago, Chile
Telephone: +56 (2) 2351 7700
Fax: +56 (2) 2351 7702
lconca@alquim.cl
I, Leticia Conca do hereby certify that:
| 1. | I am General Manager of Alquimia Conceptos S.A., a minerals processing consultant and engineering company, of Santiago, Chile. My address is Alonso de Córdova 5710, Office 404, Las Condes, Santiago, Chile. |
| 2. | This certificate applies to the Technical Report titled "Amended NI 43-101 Technical Report on the Caspiche Project, Atacama Region, Chile", Date effective April 30, 2014", prepared for Exeter Resource Corporation. (the "Technical Report"). |
| 3. | I graduated with a Bachelor of Science degree in Civil Mining Engineering from the Universidad de Chile, Santiago, Chile, in 1976 and a Civil Mining Engineer degree in 1993. |
| 4. | I am a practicing Mining Engineer and a Registered Member of the Chilean Mining Commission. |
| 5. | I have worked as a mining engineer for a total of 38 years. My relevant experience for the purposes of the Technical Report is: |
| · | Review and report as a consultant on numerous mining operation and projects around the world for due diligence and regulatory requirements. |
| · | Pre-feasibility and Feasibility Study work on several copper porphyry projects. |
| 6. | I have read the definition of “qualified person” set out in National Instrument 43-101 – Standards of Disclosure for Mineral Projects (“NI 43-101”) and confirm that by reason of my education, affiliation with a professional association (as defined in NI 43-101) and past relevant work experience, I fulfill the requirements to be a “qualified person” for the purposes of NI 43-101. |
| 7. | I am responsible for the preparation of Items 2, 3, 13, 17, 18, 19, 20, 22 and 27, and portions of Items 1, 21, 24, 25 and 26 of the “Amended NI 43-101 Technical Report on the Caspiche Project, Atacama Region, Chile", Date effective April 30, 2014. I am responsible for the compilation of information and preparation of the overall Report. Significant contributions were also received from Cube and NCL. |
| 8. | I am independent of Exeter Resource Corporation. |
| 9. | I have had no prior involvement with the Caspiche Project. |
| 10. | On October 23rd, 2013, I completed a personal inspection of the Caspiche Project. |
| 11. | I have read NI 43-101 and the Technical Report has been prepared in compliance with NI 43-101. |
| 12. | As of the effective date of the Technical Report, to the best of my knowledge, information and belief, the Technical Report contains all scientific and technical information that is required to be disclosed to make the Technical Report not misleading. |
Dated this December 19, 2014.
Leticia Conca
_____________________________________
Leticia Conca
Civil Mining Engineer
Chilean Mining Commission.
CERTIFICATE OF QUALIFIED PERSON
Level 4, 1111 Hay Street. West Perth, Western Australia 6005
PO BOX 877. West Perth, Western Australia 6872
Phone: +61 (0) 8 9442 2111
Fax: +61 (0) 8 9442 2110
ricka@cubeconsulting.com
I, Patrick Adams do hereby certify that:
| 1. | I am Director and Consultant Geologist at Cube Consulting Pty Ltd., a mining consulting and IT consulting services and systems provider to the resource sector. My address is Level 4, 1111 Hay Street, West Perth, Western Australia 6005. |
| 2. | This certificate applies to the Technical Report titled "Amended NI 43-101 Technical Report on the Caspiche Project, Atacama Region, Chile", Date effective April 30, 2014", prepared for Exeter Resource Corporation. (the "Technical Report"). |
| 3. | I graduated with a Bachelor of Science degree in Computer Science/Geology degree from the University of New South Wales, Sydney, Australia, in 1982 and a Graduate Certificate Geostatistics from the Edith Cowan University, in 2011. |
| 4. | I am a member of the Australian Institute of Geoscientists (MAIG 765) and a member of the AusIMM (112739) with Chartered Professional (Geology) accreditation. |
| 5. | I have worked as a Geologist for a total 27 years. My relevant experience for the purposes of the Technical Report is: |
| · | Geological modelling and resource estimation of base and precious metal deposits located in Australia, Asia, Africa, Europe and South America. |
| · | Review and report as a consultant on numerous mining operation and projects around the world for due diligence and regulatory requirements. |
| · | I have been involved in 3D modelling of geology and mineralisation using traditional and advanced geostatistical methods with a particular interest in resource risk analysis. I have designed Mine grade control and undertaken reconciliation optimisation and MRE review and audit studies for a wide variety of styles of deposits, including copper and gold. |
| 6. | I have read the definition of “qualified person” set out in National Instrument 43-101 – Standards of Disclosure for Mineral Projects (“NI 43-101”) and confirm that by reason of my education, affiliation with a professional association (as defined in NI 43-101) and past relevant work experience, I fulfill the requirements to be a “qualified person” for the purposes of NI 43-101. |
| 7. | I am responsible for the preparation of Items 4 to 12, 14, 23 and 24, and portions of Items 1, 24, 25 and 26 of the “Amended NI 43-101 Technical Report on the Caspiche Project, Atacama Region, Chile", Date effective April 30, 2014. |
| 8. | I am independent of Exeter Resource Corporation. |
| 9. | I have had no prior involvement with the Caspiche Project. |
| 10. | From the 22nd to 24th October 2013, I completed a personal inspection of the Caspiche Project. |
| 11. | I have read NI 43-101 and the Technical Report has been prepared in compliance with NI 43-101. |
| 12. | As of the effective date of the Technical Report, to the best of my knowledge, information and belief, the Technical Report contains all scientific and technical information that is required to be disclosed to make the Technical Report not misleading. |
Dated this December 19, 2014.
Patrick John Adams
_____________________________________
Patrick John Adams
Geologist
Member of the Australian Institute of Geoscientists.
Member of AusIMM (CP Geo).
 |  |
Table of Contents
| 1. | SUMMARY | 1 |
| 1.1 | Introduction | 1 |
| 1.2 | Caution Regarding Forward-Looking Information | 2 |
| 1.3 | Project Location | 3 |
| 1.4 | Property Ownership | 4 |
| 1.5 | Property Description | 12 |
| 1.6 | Geology and Mineralization | 14 |
| 1.7 | Drilling | 17 |
| 1.8 | Mineral Processing and Metallurgical Testing | 18 |
| 1.8.1 | Oxide Mineralization | 18 |
| 1.8.2 | Sulphide Mineralization | 18 |
| 1.9 | Mineral Resource Estimate | 19 |
| 1.10 | Mineral Reserves Estimate | 21 |
| 1.11 | Mining Methods | 21 |
| 112 | Process Design and Recovery | 23 |
| 1.12.1 | Process Plant Description | 24 |
| 1.13 | Project Infrastructure | 24 |
| 1.13.1 | Power Supply | 25 |
| 1.13.2 | Tailings Handling | 25 |
| 1.14 | Marketing Studies | 26 |
| 1.14.1 | Refined Copper Market Review | 26 |
| 1.14.2 | Outlook for the Copper Price | 26 |
| 1.14.3 | Copper Concentrates 10 – 15 year Outlook | 27 |
| 1.14.4 | Treatment and Refining Charges and other Commercial Terms | 27 |
| 1.14.5 | Caspiche Concentrates Marketability | 29 |
| 1.14.6 | Doré Metal Market | 29 |
| 1.15 | Capital Cost Estimate | 30 |
| 1.16 | Operating Costs Estimate | 31 |
| 1.17 | Economic Analysis | 32 |
| 1.17.1 | Production and Revenue | 33 |
| 1.17.2 | Economic Evaluation Results | 34 |
| 1.18 | Conclusions and Recommendations | 34 |
| 2. | INTRODUCTION | 37 |
| 2.1 | Purpose of the Technical Report | 37 |
| 2.2 | Frequently Used Acronyms, Abbreviations, Definitions, and Units of Measurement | 38 |
| 2.3 | PEA Effective Dates | 44 |
| 3. | RELIANCE ON OTHER EXPERTS | 45 |
| 3.1 | Other Independent Expert Persons | 45 |
| 4. | PROPERTY DESCRIPTION AND LOCATION | 46 |
| 4.1 | Location | 46 |
| 4.2 | Mineral Tenure and Agreements | 47 |
| 4.2.1 | Mineral Rights | 48 |
| 4.2.2 | Agreements and Royalties | 58 |
| 4.3 | Operational Permits and Jurisdictions | 59 |
| |
| 4.3.1 | Environmental Permits | 59 |
| 4.3.2 | Surface and Land Rights | 59 |
| 4.3.3. | Water Use Rights | 61 |
| 5. | ACCESSIBILITY, CLIMATE, LOCAL RESOURCES, INFRASTRUCTURE AND PHYSIOGRAPHY | 63 |
| 5.1 | Accessibility | 63 |
| 5.2 | Climate | 63 |
| 5.3 | Local Resources | 63 |
| 5.4 | Current Infrastructure | 66 |
| 5.4.1 | Physiography | 66 |
| 6. | HISTORY | 68 |
| 7. | GEOLOGICAL SETTING AND MINERALIZATION | 70 |
| 7.1 | Regional Geology | 70 |
| 7.2 | Local & Property Geology | 73 |
| 7.2.1 | Volcano-sedimentary Units | 76 |
| 7.2.2 | Intrusive Rocks | 77 |
| 7.2.3 | Structure | 78 |
| 7.2.4 | Alteration | 79 |
| 7.2.5 | Mineralization | 81 |
| 8. | DEPOSIT TYPES | 83 |
| 9. | EXPLORATION | 85 |
| 9.1 | Exeter (2005 – 2013) | 85 |
| 9.2 | Newcrest (1996 – 1998) | 90 |
| 9.3 | Anglo (1986 – 1990) | 91 |
| 10. | DRILLING | 92 |
| 10.1 | Caspiche Porphyry | 93 |
| 10.2 | Caspiche Epithermals | 96 |
| 10.3 | Exploration Drilling | 96 |
| 10.4 | Drilling Procedures and Conditions | 99 |
| 10.4.1 | Exeter | 99 |
| 10.4.2 | Newcrest | 99 |
| 10.5 | Logging | 99 |
| 10.6 | Surveys | 100 |
| 10.7 | Drilling Results | 100 |
| 10.8 | True Thickness of Mineralization | 105 |
| 10.9 | Orientation of Mineralization | 105 |
| 11. | SAMPLE PREPARATION, ANALYSIS AND SECURITY | 106 |
| 11.1 | Sample Procedures and Protocols | 106 |
| 11.1.1 | Surface Sampling | 106 |
| 11.1.2 | Drill Sampling | 106 |
| 11.2 | Sample Preparation and Analysis | 108 |
| 11.2.1 | Surface Samples | 108 |
| 11.2.2 | Drill Samples | 108 |
| |
| 12. | DATA VERIFICATION | 127 |
| 12.1 | Mineral Resource Database Audits | 127 |
| 12.1.1 | AMEC | 127 |
| 12.1.2 | Cube Consulting | 128 |
| 12.2 | Drill Hole Locations | 128 |
| 12.3 | Independent Sampling | 129 |
| 12.3.1 | AMEC Core Sampling | 129 |
| 12.3.2 | Cube Core Sampling | 130 |
| 12.3.3 | Rio Tinto Metallurgical Sampling | 131 |
| 12.4 | Exeter QA/QC | 132 |
| 12.4.1 | Geochemical Standards | 132 |
| 12.5 | Twinned Holes | 132 |
| 12.6 | Check Assaying of Samples Greater Than 1 Au ppm | 133 |
| 12.7 | Cube Consulting Statement | 134 |
| 13. | MINERAL PROCESSING AND METALLURGICAL RECOVERY | 135 |
| 13.1 | Oxide Mineralization | 135 |
| 13.1.1 | Historical Testing | 135 |
| 13.1.2 | Leach Cycle Definition | 140 |
| 13.2 | Sulphide Mineralization | 141 |
| 13.2.1 | Historical Testing | 141 |
| 13.2.2 | Exeter 2008-2010 Metallurgical Testing | 142 |
| 13.2.3 | Exeter 2010-2011 Metallurgical Testing | 143 |
| 13.2.4 | Exeter 2012-2013 Metallurgical Testing | 145 |
| 13.2.5 | Metallurgical results and discussion | 148 |
| 14. | MINERAL RESOURCE ESTIMATION | 159 |
| 14.1 | Drilling database | 159 |
| 14.2 | Topography | 161 |
| 14.3 | Lithological model and definition of domains | 161 |
| 14.4 | Composites | 167 |
| 14.5 | Exploratory data analysis | 168 |
| 14.5.1 | Domain boundary analysis | 168 |
| 14.5.2 | Summary Statistics and Assay Capping | 172 |
| 14.6 | Variography | 182 |
| 14.7 | Block Model Definition | 186 |
| 14.7.1 | Estimation Plan | 187 |
| 14.8 | Model Bulk Density | 190 |
| 14.9 | Block Model Validation | 191 |
| 14.9.1 | Statistical Comparison | 191 |
| 14.9.2 | Swath Plots | 191 |
| 14.9.3 | Visual Validation | 193 |
| 14.9.4 | Theoretical Grade-Tonnage Curve Comparisons | 196 |
| 14.10 | Resource Classification and Tabulation | 197 |
| 14.10.1 | Gold Equivalent (AuEq) | 201 |
| 14.10.2 | Mineral Resource Statement | 202 |
| 14.10.3 | Qualified Persons Statement | 204 |
| 14.10.4 | Sensitivity Grade Tonnage Graphs and Tabulation | 205 |
| 15. | MINERAL RESERVES ESTIMATES | 209 |
| 16. | MINING METHODS | 210 |
| |
| 16.2 | Conceptual Open Pit Design | 211 |
| 16.2.1 | Parameters for Mine Design | 212 |
| 16.2.2 | Pit Optimization Results | 214 |
| 16.2.3 | Option 1: Pit and Preliminary Mining Phases Design | 219 |
| 16.2.4 | Options 2&3: Pit and Preliminary Mining Phases Design | 224 |
| 16.2.5 | Waste and Stockpile Storage Areas | 230 |
| 16.3 | Conceptual Underground Design | 232 |
| 16.3.1 | General | 232 |
| 16.3.2 | Mining Methods | 233 |
| 16.3.3 | Preliminary Design Criteria | 237 |
| 16.3.4 | Cut-off Grade Estimate | 239 |
| 16.3.5 | Dilution | 240 |
| 16.3.6 | Underground Mining Inventory | 240 |
| 16.3.7 | Conceptual Underground Mine Design | 241 |
| 16.4 | Mine Production Schedules | 244 |
| 16.4.1 | Option 1 | 245 |
| 16.4.2 | Option 2 | 247 |
| 16.4.3 | Option 3 | 252 |
| 16.5 | Alternative Options | 257 |
| 16.5.1 | Option 4 | 258 |
| 16.5.2 | Option 5 | 258 |
| 16.6 | Hauling Distances | 261 |
| 16.7 | Equipment Requirement | 263 |
| 16.8 | Estimated Labor Requirement | 265 |
| 16.9 | Geotechnical Studies | 267 |
| 16.9.1 | General | 267 |
| 16.9.2 | Preliminary Pit Geotechnical Analysis | 269 |
| 16.9.3 | Underground Geotechnical Analysis | 269 |
| 17. | RECOVERY METHODS | 270 |
| 17.1 | Oxide Plant | 270 |
| 17.1.1 | Process Design Basis and Design Criteria Summary | 272 |
| 17.1.2 | Crushing | 272 |
| 17.1.3 | Heap Leaching | 273 |
| 17.1.4 | ADR, EW and Smelting | 282 |
| 17.2 | Sulphide Plant | 286 |
| 17.2.1 | Process Design Basis and Design Criteria Summary | 290 |
| 18. | PROJECT INFRASTRUCTURE | 304 |
| 18.1 | Power Supply | 309 |
| 18.1.1 | Site Generation | 309 |
| 18.1.2 | Power Line from Cardones Substation | 309 |
| 18.1.3 | Power Line from Maricunga Substation | 310 |
| 18.1.4 | Power Supply by Option | 310 |
| 18.2 | Tailings Handling | 311 |
| 18.2.1 | Filtered Tailings | 311 |
| 18.2.2 | Thickened Tailings | 312 |
| 18.2.3 | Tailings Handling by Option | 312 |
| 18.3 | Roads | 313 |
| 18.3.1 | Access Road | 313 |
| 18.3.2 | On-site Roads | 314 |
| 18.4 | Fresh Water Supply | 315 |
| 18.5 | Port Facilities |
| |
| 18.6 | Operations Camp | 315 |
| 1.8.7 | Ancillary Site Buildings and Facilities | 316 |
| 19. | MARKET STUDIES AND CONTRACTS | 317 |
| 19.1 | Introduction and Scope | 317 |
| 19.2 | Refined Copper Market Review | 318 |
| 19.3 | Outlook for the Copper Price | 320 |
| 19.4 | Copper Concentrates 10 – 15 year Outlook | 321 |
| 19.5 | Concentrate Production Outpaces Smelter Capacity Growth | 322 |
| 19.6 | Treatment and Refining Charges and other Commercial Terms | 323 |
| 19.7 | Caspiche Concentrates Marketability | 326 |
| 19.8 | Logistics Load Port Options | 330 |
| 19.9 | Ocean Freight | 332 |
| 19.10 | Doré Metal Market | 335 |
| 20. | ENVIRONMENTAL STUDIES, PERMITTING SOCIAL OR COMMUNITY IMPACT | 337 |
| 20.1 | Principal Environmental Baseline Findings | 339 |
| 20.1.1 | Physical Environment: Climatic Characterization | 339 |
| 20.1.2 | Physical Environment: Main Geomorphological Units | 339 |
| 20.1.3 | Physical Environment Soil, characterizations and applications | 339 |
| 20.1.4 | Physical Environment: Hydrology | 340 |
| 20.1.5 | Biotic Environment: Flora and Vegetation | 340 |
| 20.1.6 | Biotic Environment: Fauna | 340 |
| 20.1.7 | Description of Socioeconomics-Cultural Environment: Demography | 341 |
| 20.1.8 | Historical and Archaeological Heritage | 342 |
| 20.1.9 | Anthropology | 342 |
| 20.2 | Summary of Main Environmental and Social Issues for the Project | 343 |
| 20.3 | Socio-economic Potential Impacts | 344 |
| 20.4 | Closure and Abandonment Stage | 345 |
| 20.4.1 | Closure Plan | 345 |
| 20.4.2 | Post-closing Stage or Abandonment | 348 |
| 21. | CAPITAL AND OPERATING COSTS | 349 |
| 21.1 | Introduction | 349 |
| 21.2 | Capital Cost Estimate | 349 |
| 21.2.1 | Mine Capital Costs | 357 |
| 21.2.2 | Indirect Costs | 361 |
| 21.2.3 | Owners Cost | 362 |
| 21.2.4 | Contingency | 362 |
| 21.2.5 | Accuracy | 362 |
| 21.2.6 | Estimate Exclusions | 363 |
| 21.2.7 | Deferred and Sustainable Capital Cost | 363 |
| 2 1.3 | Operating Cost Estimates | 363 |
| 21.3.1 | Mining Operating Cost | 364 |
| 21.3.2 | Process Plant Operating Cost | 366 |
| 21.4 | Cash Cost Indicators | 369 |
| 21.4.1 | All-In Sustaining Cost (AISC) per Ounce of Gold Equivalent | 372 |
| 21.4.2 | C1 Cash Cost per Pound of Copper Equivalent | |
| 374 | ||
| 22. | ECONOMIC ANALYSIS | |
| 374 | ||
| 22.1 | Caution Regarding Forward-Looking Information |
| |
| 22.2 | Introduction | 374 |
| 22.3 | Methodology Used | 375 |
| 22.4 | Financial Model Parameters | 375 |
| 22.5 | Taxes and Royalties | 377 |
| 22.5.1 | Income Tax | 377 |
| 22.5.2 | Mining Royalty Tax | 379 |
| 22.5.3 | Production and Revenue | 380 |
| 22.5.4 | PEA Economic Evaluation Results | 386 |
| 22.5.5 | Sensitivity Analysis | 392 |
| 22.6 | After Income Tax Analysis | 402 |
| 22.7 | Conclusion from the Preliminary Economic Analysis | 403 |
| 23. | ADJACENT PROPERTIES | 405 |
| 24. | OTHER RELEVANT INFORMATION | 406 |
| 24.1 | Drilling Data | 406 |
| 25. | INTERPRETATIONS AND CONCLUSIONS | 407 |
| 25.1 | Strengths, Weaknesses, Opportunities and Threats | 407 |
| 25.1.1 | General | 408 |
| 25.1.2 | Geology | 408 |
| 25.1.3 | Mine | 409 |
| 25.1.4 | Recovery | 410 |
| 25.1.5 | Infrastructure | 411 |
| 25.1.6 | Marketing | 412 |
| 25.1.7 | Environmental | 412 |
| 25.2 | Conclusions | 413 |
| 26. | RECOMMENDATIONS | 418 |
| 26.1 | General Project Recommendations | 418 |
| 26.2 | Mining Recommendations | 418 |
| 26.3 | Process Recommendations | 419 |
| 26.4 | Estimated Budget to next phase | 419 |
| 27. | REFERENCES | 420 |
| |
List of Figures
| Figure 1-1: Caspiche Location Map (Source: Exeter, 2013) | 4 |
| Figure 1-2: Property Map Showing All Exploration and Exploitation Concessions Controlled by Exeter (Source: Exeter, 2014) | 6 |
| Figure 1-3: “Caspiche” Concessions Map Showing All Exploration and Exploitation Concessions Controlled by Exeter (Source: Exeter, 2013) | 7 |
| Figure 1-4: “Reineta” Concessions Map Showing All Exploration and Exploitation Concessions Controlled by Exeter (Source: Exeter, 2013) | 8 |
| Figure 1-5: “Gloria” Concessions Map Showing All Exploration and Exploitation Concessions Controlled by Exeter (Source: Exeter, 2013) | 9 |
| Figure 1-6: “Flamingo” Concessions Map Showing All Exploration and Exploitation Concessions Controlled by Exeter (Source: Exeter, 2013) | 10 |
| Figure 1-7: “Albacora” Concessions Map Showing All Exploration and Exploitation Concessions Controlled by Exeter (Source: Exeter, 2013) | 11 |
| Figure 1-8: Caspiche Location Map (Source: Exeter, 2013) | 13 |
| Figure 1-9: Metallogenic Belts of Northern Chile and Argentina (Source: Vila and Sillitoe, 1991) | 15 |
| Figure 1-10: Regional Geology of the Maricunga Metallogenic Belt (Source: Vila and Sillitoe, 1991) | 16 |
| Figure 1-11: Global Refined Copper Market Balance (Source: Alfonso Gonzalez 2013 ©) | 27 |
| Figure 4-1: Caspiche Location Map (Source: Exeter, 2013) | 46 |
| Figure 4-2: Property Map Showing All Exploration and Exploitation Concessions Controlled by Exeter (Source: Exeter, 2014) | 49 |
| Figure 4-3: “Caspiche” Concessions Map Showing All Exploration and Exploitation Concessions Controlled by Exeter (Source: Exeter, 2013) | 50 |
| Figure 4-4: “Reineta” Concessions Map Showing All Exploration and Exploitation Concessions Controlled by Exeter (Source: Exeter, 2013) | 51 |
| Figure 4-5: “Gloria” Concessions Map Showing All Exploration and Exploitation Concessions Controlled by Exeter (Source: Exeter, 2013) | 52 |
| Figure 4-6: “Flamingo” Concessions Map Showing All Exploration and Exploitation Concessions Controlled by Exeter (Source: Exeter, 2013) | 53 |
| Figure 4-7: “Albacora” Concessions Map Showing All Exploration and Exploitation Concessions Controlled by Exeter (Source: Exeter, 2013) | 54 |
| Figure 4-8: Extended Surface Rights Caspiche Project (Exeter 2013) | 61 |
| Figure 5-1: Caspiche Location Map (Source: Exeter, 2013) | 65 |
| Figure 5-2: Photograph of Caspiche Property Looking West (Source: Exeter, 2013) | 67 |
| |
| Figure 7-1: Metallogenic Belts of Northern Chile and Argentina (Source: Vila and Sillitoe, 1991) | 71 |
| Figure 7-2: Regional Geology of the Maricunga Metallogenic Belt (Source: Vila and Sillitoe, 1991) | 72 |
| Figure 7-3: Bedrock Geology of the Caspiche Property (Source: Exeter, 2013) | 73 |
| Figure 7-4: Gold Grade Histogram in Red, Copper Grade Histogram in Purple (Source: Exeter, 2013) | 74 |
| Figure 8-1: Generalized Porphyry Model (Source: Vila and Sillitoe, 1991) | 84 |
| Figure 10-1: Drill Hole Location Map for the Caspiche Porphyry Prospect Area (Source: Exeter, 2013) | 96 |
| Figure 10-2: Regional Drill Hole Location Map Showing Location of Exploration Drill Holes (2009-2011) (Source: Exeter, 2013) | 98 |
| Figure 11-1: SRM Control Chart OM00 (2010-2011) - Gold (Source: Cube Consulting, 2013) | 116 |
| Figure 11-2: SRM Control Chart OM00 (2010-2011) - Copper (Source: Cube Consulting, 2013) | 116 |
| Figure 11-3: SRM Control Chart OM00 (2010-2011) - Silver (Source: Cube Consulting, 2013) | 117 |
| Figure 11-4: SRM Control Chart OM10 (2010-2011) - Gold (Source: Cube Consulting, 2013) | 117 |
| Figure 11-5: SRM Control Chart OM10 (2010-2011) - Copper (Source: Cube Consulting, 2013) | 118 |
| Figure 11-6: SRM Control Chart OM10 (2010-2011) - Silver (Source: Cube Consulting, 2013) | 118 |
| Figure 11-7: SRM Control Chart OM100 (2010-2011) - Gold (Source: Cube Consulting, 2013) | 119 |
| Figure 11-8: SRM Control Chart OM100 (2010-2011) - Copper (Source: Cube Consulting, 2013) | 119 |
| Figure 11-9: SRM Control Chart OM100 (2010-2011) - Silver (Source: Cube Consulting, 2013) | 120 |
| Figure 11-10: SRM Control Chart OM110 (2010-2011) - Gold (Source: Cube Consulting, 2013) | 120 |
| Figure 11-11: SRM Control Chart OM110 (2010-2011) -Copper (Source: Cube Consulting, 2013) | 121 |
| Figure 11-12: SRM Control Chart OM110 (2010-2011) - Silver (Source: Cube Consulting, 2013) | 121 |
| Figure 11-13: SRM Control Chart OM200 (2010-2011) - Gold (Source: Cube Consulting, 2013) | 122 |
| Figure 11-14: SRM Control Chart OM200 (2010-2011) -Copper (Source: Cube Consulting, 2013) | 122 |
| Figure 11-15: SRM Control Chart OM200 (2010-2011) - Silver (Source: Cube Consulting, 2013) | 123 |
| Figure 11-16: SRM Control Chart OM210 (2010-2011) - Gold (Source: Cube Consulting, 2013) | 123 |
| Figure 11-17: SRM Control Chart OM210 (2010-2011) -Copper (Source: Cube Consulting, 2013) | 124 |
| Figure 11-18: SRM Control Chart OM210 (2010-2011) - Silver (Source: Cube Consulting, 2013) | 124 |
| Figure 11-19: SRM Control Chart OM300 (2010-2011) - Gold (Source: Cube Consulting, 2013) | 125 |
| Figure 11-20: SRM Control Chart OM300 (2010-2011) -Copper (Source: Cube Consulting, 2013) | 125 |
| |
| Figure 11-21: SRM Control Chart OM300 (2010-2011) - Silver (Source: Cube Consulting, 2013) | 126 |
| Figure 12-1: Re-Assays of Samples >1 Au ppm | 134 |
| Figure 13-1: Gold Leach Rate Profile – 25 mm | 139 |
| Figure 13-2: Gold Leach Rate Profile – 50 mm | 140 |
| Figure 13-3: Granulometric Curve for Heap Leach Feed | 141 |
| Figure 13-4: Cu recovery in rougher flotation vs. primary P80 – DP and QDP1 samples | 150 |
| Figure 13-5: Cu recovery in rougher flotation vs. primary P80 – Other samples | 150 |
| Figure 13-6: Au recovery in rougher flotation vs. primary P80 – DP and QDP1 samples | 151 |
| Figure 13-7: Au recovery in rougher flotation vs. primary P80 – Other samples | 151 |
| Figure 13-8: Batch rougher flotation results at coarse grind | 152 |
| Figure 14-1: Caspiche topography and drill hole locations – Caspiche Porphyry Project (Source: Cube Consulting, April 11 2012) | 161 |
| Figure 14-2: Caspiche Stratigraphic Model Section - Looking Northwest (Source: Cube Consulting, 2012) | 163 |
| Figure 14-3: Caspiche Stratigraphic Model - Plan (Source: Cube Consulting, 2012) | 164 |
| Figure 14-4: Caspiche Stratigraphic Model – Looking North (Source: Cube Consulting, 2012) | 165 |
| Figure 14-5: Caspiche Stratigraphic and Alteration Model – Looking North (Source: Cube Consulting, 2012) | 166 |
| Figure 14-6: Boundary Contact Analysis – DP v QDP1, VOLCBX and CFB | 170 |
| Figure 14-7: Boundary Contact Analysis – OXIDE v SULPHIDE | 171 |
| Figure 14-8: Caspiche 8 m Composites by Stratigraphy – Log-Prob Plot - Au ppm | 174 |
| Figure 14-9: Caspiche 8 m Composites by Stratigraphy – Log-Prob Plot - Ag ppm | 175 |
| Figure 14-10: Caspiche 8 m Composites by Stratigraphy – Log-Prob Plot - Cu % | 175 |
| Figure 14-11: Caspiche 8 m Composites by Alteration – Log-Prob Plot - Au ppm | 176 |
| Figure 14-12: Caspiche 8 m Composites by Alteration – Log-Prob Plot - Ag ppm | 176 |
| Figure 14-13: Caspiche 8 m Composites by Alteration – Log-Prob Plot - Cu % | 177 |
| Figure 14-14: Caspiche 8 m Composites by Weathering – Log-Prob Plot - Au ppm | 177 |
| Figure 14-15: Caspiche 8 m Composites by Weathering – Log-Prob Plot - Ag ppm | 178 |
| Figure 14-16: Caspiche 8 m Composites by Weathering – Log-Prob Plot - Cu % | 178 |
| Figure 14-17: Caspiche Variogram Model – DP+QDP1+VOLCBX+CFB - Gold | 183 |
| |
| Figure 14-18: Caspiche Variogram Model – DP+QDP1+VOLCBX+CFB – Copper | 184 |
| Figure 14-19: Caspiche Swath Plots by 100 m Elevation - Gold | 192 |
| Figure 14-20: Caspiche Swath Plots by 100 m Elevation – Copper | 193 |
| Figure 14-21: Vertical Section 6937400mN (looking north) - Composite and Model Grades - Au ppm (Source: Cube Consulting, 2012) | 194 |
| Figure 14-22: Plan Section 4000mRL - Composite and Model Grades - Au ppm (Source: Cube Consulting, 2012) | 194 |
| Figure 14-23: Vertical Section 6937400mN (looking north) - Composite and Model Grades - Cu % (Source: Cube Consulting, 2012) | 195 |
| Figure 14-24: Plan Section 4000mRL - Composite and Model Grades - Cu % (Source: Cube Consulting, 2012) | 195 |
| Figure 14-25: Caspiche Global Grade-Tonnage Curve – OK vs DGM – Gold | 197 |
| Figure 14-26: Caspiche Global Grade-Tonnage Curve – OK vs DGM – Copper | 197 |
| Figure 14-27: Vertical Section (looking northwest) - Resource Classification (Source: Cube Consulting, 2012) | 200 |
| Figure 14-28: Plan Section 4000mRL - Resource Classification (Source: Cube Consulting, 2012) | 200 |
| Figure 14-29: Grade Tonnage Curve Estimated Blocks of oxide Material (Measured and Indicated) | 206 |
| Figure 14-30: Grade Tonnage Curve Estimated Blocks of non-oxidized (including Transitional) Material (Measured and Indicated) | 207 |
| Figure 14-31: Vertical Section at 6937000mN (looking north) – non-oxidized M+I (Source: Cube Consulting, 2012) | 208 |
| Figure 14-32: Vertical Section at 6937400mN (looking north) – non-oxidized M+I (Source: Cube Consulting, 2012) | 208 |
| Figure 16-1: Pit Optimization Results – Option 1 | 216 |
| Figure 16-2: Pit Optimization Results – Options 2&3 | 218 |
| Figure 16-3: Final Pit – Option 1 | 221 |
| Figure 16-4: Mining Phases – Option 1 | 223 |
| Figure 16-5: Final Pit – Options 2&3 | 225 |
| Figure 16-6: Mining Phases – Options 2&3 | 226 |
| Figure 16-7: General Layout – Option 1 | 231 |
| Figure 16-8: General Layout – Options 2 | 232 |
| Figure 16-9: Sulphide Resources Grades Distribution | 234 |
| |
| Figure 16-10: Basic Blast hole Stoping Method | 235 |
| Figure 16-11: Mining Horizons | 238 |
| Figure 16-12: Main Infrastructure | 241 |
| Figure 16-13: Plant Feed Handling | 242 |
| Figure 16-14: Schematic of Paste Fill Distribution | 243 |
| Figure 16-15: Schematic of the Ventilation System | 244 |
| Figure 16-16: Sulphide Plant Feed Schedule | 256 |
| Figure 17-1: Conceptual Process Plant Flowsheet | 271 |
| Figure 17-2: Crushing Flow Diagram | 273 |
| Figure 17-3: Leaching Flow Diagram | 274 |
| Figure 17-4: Cell Configuration | 275 |
| Figure 17-5: Module Configuration | 276 |
| Figure 17-6: Drainage and Collection System (Plan view) | 277 |
| Figure 17-7: Design Summary Sketch (Typical Cell – General Plant) | 278 |
| Figure 17-8: Base Liner System | 280 |
| Figure 17-9: Leach Pad Construction – 10%, 50% and 100% | 281 |
| Figure 17-10: ADR Plant Flow Diagram | 283 |
| Figure 17-11: Conceptual General Arrangement | 284 |
| Figure 17-12: Conceptual General Arrangement – Process Plant | 285 |
| Figure 17-13: Conceptual Process Plant Simplified Sketch | 289 |
| Figure 17-14: Primary Crushing Flow Diagram | 291 |
| Figure 17-15: Conceptual Grinding Flow Diagram | 292 |
| Figure 17-16: Conceptual Flotation Flow Diagram | 293 |
| Figure 17-17: Conceptual Concentrate Handling Flow Diagram | 295 |
| Figure 17-18: Conceptual final Cu-Au Concentrate Treatment Flow Diagram | 297 |
| Figure 17-19: Conceptual filtered Tailings Handling Flow Diagram | 299 |
| Figure 17-20: Thickened Handling Flow Diagram | 299 |
| |
| Figure 17-21: Conceptual Gold Recovery Plant Flow Diagram | 301 |
| Figure 18-1: Map Plant Area | 305 |
| Figure 18-2: Project Plot Plan – Option 1 | 306 |
| Figure 18-3: Project Plot Plan – Option 2 | 307 |
| Figure 18-4: Project Plot Plan – Option 3 | 308 |
| Figure 18-5: Project Plot Plan – Option 4 | 308 |
| Figure 18-6: Project Plot Plan – Option 5 | 309 |
| Figure 18-7: Cardones Power Line | 310 |
| Figure 18-8: Filtered Tailings Handling Facilities | 312 |
| Figure 18-9: Access Road | 313 |
| Figure 18-10: Fresh Water Pipeline | 315 |
| Figure 19-1: Global Refined Copper Market Balance (Source: Alfonso Gonzalez ©, 2013) | 318 |
| Figure 19-2: Increase in Mine Copper Production at World level (Source: Alfonso Gonzalez ©) | 322 |
| Figure 19-3: Copper Concentrates Top Importers (Source: Alfonso Gonzalez ©) | 325 |
| Figure 19-4: Port Options | 331 |
| Figure 19-5: Average Spot Ocean freight rates for concentrates (2002 -2013) | 332 |
| Figure 19-6: Baltic Dry Index (2009 -2014) | 334 |
| Figure 21-1: Option 1: AISC per Ounce of Gold Equivalent | 369 |
| Figure 21-2: Option 2: AISC per Ounce of Gold Equivalent373 | 370 |
| Figure 21-3: Option 3: AISC per Ounce of Gold Equivalent373 | 370 |
| Figure 21-4: Option 4: AISC per Ounce of Gold Equivalent387 | 371 |
| Figure 21-5: Option 5: AISC per Ounce of Gold Equivalent | 371 |
| Figure 21-6: Option 2: C1 Cash Cost per Pound of Copper Equivalent | 372 |
| Figure 21-7: Option 3: C1 Cash Cost per Pound of Copper Equivalent | 372 |
| Figure 21-8: Option 3: C1 Cash Cost per Pound of Copper Equivalent | 373 |
| Figure 21-9: Option 3: C1 Cash Cost per Pound of Copper Equivalent | 373 |
| |
| Figure 22-2: Cash Flow – Option 2 | 387 |
| Figure 22-3: Cash Flow – Option 3 | 388 |
| Figure 22-4: Cash Flow – Option 4 | 388 |
| Figure 22-5: Cash Flow – Option 5 | 389 |
| Figure 22-6: NPV Sensitivity – Option 1 | 394 |
| Figure 22-7: NPV Sensitivity – Option 2 | 396 |
| Figure 22-8: NPV Sensitivity – Option 3 | 398 |
| Figure 22-9: NPV Sensitivity – Option 4 | 400 |
| Figure 22-10: NPV Sensitivity – Option 5 | 402 |
| |
List of Tables
| Table 1-1: Options Summary | 2 |
| Table 1-2: Exeter Exploration Concessions - Granted | 12 |
| Table 1-3: Summary of Drilling on the Caspiche and Adjacent Properties | 17 |
| Table 1-4: Recoveries for the production plan | 18 |
| Table 1-5: Caspiche Mineral Resource Statement April 2012 | 19 |
| Table 1-6: Caspiche – Transitional Measured and Indicated Mineral Resources - April 2013 above 0.75 g/t AuEq cut off | 20 |
| Table 1-7: Caspiche – Sulphide Project Measured and Indicated Mineral Resources - April 2013 above 0.75 g/t AuEq6 cut off | 21 |
| Table 1-8: Mining Schedule and Mine Life by Option (source: NCL, May, 2014) | 23 |
| Table 1-9: Metal Production | 23 |
| Table 1-10: TC/RC’s Benchmark Terms | 28 |
| Table 1-11: TC/RC’s Spot Terms | 28 |
| Table 1-12: Outlook for Annual Contract Concentrates TC/RC’s | 28 |
| Table 1-13: Concentrates – Commercial Terms Assumptions | 28 |
| Table 1-14: Caspiche Concentrates Expected Annual Production | 29 |
| Table 1-15: Analysts’ Consensus for Gold Price 2013 – 2017 and Long Term (Source: Scotiabank) | 30 |
| Table 1-16: Capital Costs Summary | 31 |
| Table 1-17: Summary of Operating Costs | 32 |
| Table 1-18: Main Economic Parameters | 33 |
| Table 1-19: Production and Revenues Summary | 33 |
| Table 1-20: Summary of Pre-Tax Economic Evaluation Results | 34 |
| Table 1-21: Summary of Post-Tax Economic Evaluation Results (20% income tax rate) | 34 |
| Table 2-1: Options Summary | 38 |
| Table 2-2: Technical Terms and Abbreviations | 39 |
| Table 2-3: Units of Measurement | 43 |
| Table 4-1: Exeter Caspiche Mining Exploitation Concessions - Granted | 55 |
| |
| Table 4-2: Exeter Caspiche Exploitation Concessions - In Application | 56 |
| Table 4-3: Exeter Exploration Concessions - Granted | 57 |
| Table 4-4: Summary of Ground Covered by Exeter Mineral Properties and Details of Exeter Concessions which Overlap Caspiche and Third Party Concessions | 58 |
| Table 4-5: Minimum Expenditures and Drilling Requirements under Exeter’s ORA with Anglo | 59 |
| Table 9-1: Summary of Exeter Exploration Programs on the Caspiche Property | 88 |
| Table 9-2: Summary of Exeter Exploration Programs on the Caspiche Property (continuation) | 89 |
| Table 9-3: Summary of Newcrest Exploration Programs on the Caspiche Property | 90 |
| Table 9-4: Summary of Anglo Exploration Programs on the Caspiche Property | 91 |
| Table 10-1: Summary of Drilling on the Caspiche and Adjacent Properties | 92 |
| Table 10-2: Summary of Drilling Campaigns at Caspiche Porphyry | 93 |
| Table 10-3: Significant Intercepts for the Caspiche Porphyry Prospect Area | 101 |
| Table 11-1: RC Sample Preparation Procedure for 2007-2008 Exeter Drill Samples | 110 |
| Table 11-2: Refined DD Sample Preparation Procedure for Exeter Drill Samples | 110 |
| Table 11-3: Further Refined DD Sample Preparation Procedure for Exeter Drill Samples | 111 |
| Table 12-1: Caspiche Drill Hole Collar Checks | 129 |
| Table 12-2: Summary of AMEC Check Sampling of Caspiche Core | 130 |
| Table 12-3: Summary of Cube Check Sampling of Caspiche Core | 131 |
| Table 12-4: Summary of Rio Tinto Metallurgical Sampling of Caspiche Core | 131 |
| Table 13-1: MLI Leach Program Main Results | 137 |
| Table 13-2: Results of Optimization Program | 138 |
| Table 13-3: Summary of MLI Program Results | 139 |
| Table 13-4: Grindability tests results | 149 |
| Table 13-5: LCT results for cone crusher prepared samples | 153 |
| Table 13-6: Flotation test results for DP and QDP1 samples | 154 |
| Table 13-7: Flotation test results other (Non DP) samples | 155 |
| Table 13-8: Flotation test results other (Non DP) samples | 156 |
| Table 13-9: CIL test results | 157 |
| |
| Table 13-10: SART tests results | 157 |
| Table 13-11: Recoveries for the production plan | 158 |
| Table 14-1: Summary of Drill Data on the Caspiche and Adjacent Properties as at April 11, 2013. | 160 |
| Table 14-2: Stratigraphy Description | 162 |
| Table 14-3: Alteration Description | 162 |
| Table 14-4: Oxidation Description | 163 |
| Table 14-5: Estimation Domains and Data Combinations – Gold, Silver and Arsenic | 172 |
| Table 14-6: Estimation Domains and Data Combinations – Copper, Sulphur and Molybdenum | 172 |
| Table 14-7: Estimation Domains and Data Combinations – Iron | 172 |
| Table 14-8: Caspiche Assay Capping – 8 m Composites | 174 |
| Table 14-9: Caspiche 8 m Composites by Stratigraphy – Summary Statistics | 179 |
| Table 14-10: Caspiche 8 m Composites by Alteration – Summary Statistics | 180 |
| Table 14-11: Caspiche 8 m Composites by Alteration – Summary Statistics | 181 |
| Table 14-12: Caspiche 8 m Composites by Weathering – Summary Statistics | 182 |
| Table 14-13: Caspiche – Variogram Parameters – Overburden | 184 |
| Table 14-14: Caspiche – Variogram Parameters – DP, QDP1, VOLCBX and CFB | 185 |
| Table 14-15: Caspiche – Variogram Parameters – QDP2 | 185 |
| Table 14-16: Caspiche – Variogram Parameters – MacNeill | 185 |
| Table 14-17: Caspiche – Variogram Parameters – DTB2 | 186 |
| Table 14-18: Caspiche – Variogram Parameters – Iron | 186 |
| Table 14-19: Caspiche 3D Block Model Definition | 186 |
| Table 14-20: Caspiche Block Model Attribute Names | 187 |
| Table 14-21: Caspiche – Estimation Parameters – Overburden (Cu, S, Mo and Fe OX) | 188 |
| Table 14-22: Caspiche – Estimation Parameters – DP, QDP1, QDP2, VOLCBX, CFB and K-Ca Alt | 188 |
| Table 14-23: Caspiche – Estimation Parameters – DTB2 Alt | 189 |
| Table 14-24: Caspiche – Estimation Parameters – MacNeill | 189 |
| Table 14-25: Caspiche – Estimation Parameters – Iron (SU) | 189 |
| |
| Table 14-26: Bulk Density – Sulphide | 190 |
| Table 14-27: Bulk Density - Oxide | 190 |
| Table 14-28: Comparison between Composite, OK and NN – Gold & Copper | 191 |
| Table 14-29: Caspiche Confidence Intervals – Gold | 199 |
| Table 14-30: Caspiche Confidence Intervals – Copper | 199 |
| Table 14-31: Marginal Cut-off Calculation Parameters and Results (Jan 2012 PFS) | 201 |
| Table 14-32: Caspiche Recovery Factors (NCL Nov 2013) | 202 |
| Table 14-33: Marginal Cut-off Calculation Parameters and Results Oxide and Non-oxide (Exeter Jan 16 2012) | 202 |
| Table 14-34: Caspiche Mineral Resource Statement April 2012* | 203 |
| Table 14-35: Caspiche – PEA Measured and Indicated Mineral Resources oxide portion - April 2013 above 0.18 g/t AuEq6 cut off* | 204 |
| Table 14-36: Caspiche – PEA Measured and Indicated Mineral Resources mixed oxide portion - April 2013 above 0.75 g/t AuEq6 cut off* | 204 |
| Table 14-37: Caspiche – PEA Measured and Indicated Mineral Resources non-oxide (sulphide) portion- April 2013 above 0.75 g/t AuEq6 cut off* | 204 |
| Table 14-38: Sensitivity – Oxide Material (Measured + Indicated) - April 2013 by AuEq6 cut off | 205 |
| Table 14-39: Sensitivity – Transitional and Sulphide Material (Measured + Indicated) April 2013 by AuEq6 cut off | 207 |
| Table 16-1: Options Summary | 211 |
| Table 16-2: Lerch-Grossman Optimization Parameters | 213 |
| Table 16-3: Pit Optimization Results – Option 1 | 215 |
| Table 16-4: Option 1 – Pit Shell 36 by Resource Category | 216 |
| Table 16-5: Pit Optimization Results – Options 2&3 | 217 |
| Table 16-6: Options 2&3 – Pit Shell 25 by Resource Category | 218 |
| Table 16-7: Selected Pit Shell Details – Options 2&3 | 219 |
| Table 16-8: Pit Design Parameters | 220 |
| Table 16-9: Mineral Resources Contained in Final Pit at Various Cut-Off Grades – Option 1 | 224 |
| Table 16-10: Resources Contained in Final (Oxide Push-Backs) – Options 2&3 | 228 |
| Table 16-11: Resources Contained in Final (Sulphide Push-Backs) – Options 2 | 229 |
| |
| Table 16-12: Technical and Economic Parameters used for COG Estimate | 239 |
| Table 16-13: Sulphide Mining Inventory | 240 |
| Table 16-14: Sulphide Mining Inventory by Category | 241 |
| Table 16-15: Mine Schedule and Plant Feed – Option 1 | 246 |
| Table 16-16: Option 1 – Plant Feed by Resource Category | 248 |
| Table 16-17: Mine Schedule – Option 2 | 249 |
| Table 16-18: Plant Feed – Option 2 | 250 |
| Table 16-19: Option 2 - Plant Feed by Resource Category | 251 |
| Table 16-20: Mine Schedule and Plant Feed – Option 3 | 252 |
| Table 16-21: Option 3 – Oxides Plant Feed by Resource Category | 252 |
| Table 16-22: Mine Production Schedule – Option 3 | 254 |
| Table 16-23: Underground Sulphides Plant Feed Schedule – Option 3 | 255 |
| Table 16-24: Underground Sulphides Plant Feed Schedule by Category – Option 3 | 257 |
| Table 16-25: Plant Feed – Option 4 | 258 |
| Table 16-26: Sulphides Plant Feed Schedule – Option 5 | 259 |
| Table 16-27: Underground Sulphides Plant Feed Schedule by Category – Option 5 | 260 |
| Table 16-28: Hauling Distances – Option1 | 262 |
| Table 16-29: Hauling Distances – Option 2 | 262 |
| Table 16-30: Hauling Distances – Option 3 | 262 |
| Table 16-31: Hauling Distances – Option 4 | 262 |
| Table 16-32: Equipment Selection – Option 1 | 263 |
| Table 16-33: Main Equipment Requirement – Option 1 | 264 |
| Table 16-34: Equipment Selection – Option 2&3 | 264 |
| Table 16-35: Main Equipment Requirement – Option 2&3 | 264 |
| Table 16-36: Main Equipment Requirement – Option 4 | 265 |
| Table 16-37: Underground Main Equipment Requirement – Options 3&5 | 265 |
| Table 16-38: Labor Requirement | 266 |
| |
| Table 16-39: Geomechanical Properties (Source: AKL, December, 2013) | 268 |
| Table 17-1: Summary of Key Process Design Criteria | 272 |
| Table 17-2: Oxide Process Plant Main Equipment | 286 |
| Table 17-3: Summary of Key Process Design Criteria | 290 |
| Table 17-4: Sulphide Process Plant Main Equipment | 303 |
| Table 18-1: Options Summary | 304 |
| Table 18-2: On-Site Roads | 314 |
| Table 18-3: Fresh Water Requirements | 315 |
| Table 19-1: Analysts’ Consensus for Copper Price 2012 – 2017 and Long Term (Source: Scotiabank) | 320 |
| Table 19-2: TC/RC’s Benchmark Terms | 324 |
| Table 19-3: TC/RC’s Spot Terms | 324 |
| Table 19-4: Outlook for Annual Contract Concentrates TC/RC’s | 325 |
| Table 19-5: Concentrates – Commercial Terms Assumptions | 326 |
| Table 19-6: Caspiche Concentrates Expected Annual Production | 327 |
| Table 19-7: Analysts’ Consensus for Gold Price 2013 – 2017 and Long Term (Source: Scotiabank) | 336 |
| Table 20-1: Required Environmental Studies | 338 |
| Table 21-1: Options Summary | 350 |
| Table 21-2: Capital Costs Summary– Option 1 | 351 |
| Table 21-3: Capital Costs Summary – Option 2 | 352 |
| Table 21-4: Capital Costs Summary – Option 3 | 353 |
| Table 21-5: Capital Costs Summary – Option 4 | 354 |
| Table 21-6: Capital Costs Summary – Option 5 | 355 |
| Table 21-7: Main Unitary Construction Costs | 356 |
| Table 21-8: Chilean High Altitude Pay Scale | 356 |
| Table 21-9: Equipment Prices (USD) | 358 |
| Table 21-10: Road Construction by Option | 359 |
| Table 21-11: Open Pit Pre-Production Operation Expenses by Option | 359 |
| |
| Table 21-12: Open Pit Initial and Sustaining Capital Cost – Option 1 | 359 |
| Table 21-13: Open Pit Initial and Sustaining Capital Cost – Option 2 | 360 |
| Table 21-14: Open Pit Initial and Sustaining Capital Cost – Option 3 | 360 |
| Table 21-15: Open Pit Initial and Sustaining Capital Cost – Option 4 | 360 |
| Table 21-16: Underground Equipment Prices | 361 |
| Table 21-17: Underground Mine Initial and Sustaining Capital Costs | 361 |
| Table 21-18: Owners Costs | 362 |
| Table 21-19: Summary of Operating Costs | 36 |
| Table 21-20: Open Pit Mine Costs | 364 |
| Table 21-21: Open Pit Mine Costs - Option 4 | 365 |
| Table 21-22: Underground Mine Unit Costs - Options 3 and 5 | 366 |
| Table 21-23: Main Reagents and Consumables Unit Prices | 367 |
| Table 21-24: Summary of Process Plant Operating Cost | 368 |
| Table 21-25: Cash Cost Indicators | 369 |
| Table 22-1: Main Economic Parameters | 376 |
| Table 22-2: Mining Royalty Tax Scale for Mining Exploitation under 50,000 t of Equivalent Copper | 380 |
| Table 22-3: Mining Royalty Tax Scale for Mining Exploitation over 50,000 t of Equivalent Copper | 380 |
| Table 22-4: Options Summary | 381 |
| Table 22-5: Production Summary | 381 |
| Table 22-6: Annual Production – Option 1 | 382 |
| Table 22-7: Annual Production – Option 2 | 382 |
| Table 22-8: Annual Production – Option 3 | 383 |
| Table 22-9: Annual Production – Option 4 | 384 |
| Table 22-10: Annual Production – Option 5 | 385 |
| Table 22-11: Summary of Pre-Tax Preliminary Economic Evaluation Results | 386 |
| Table 22-12: Annual and Accumulated Cash Flow Pre-tax | 390 |
| Table 22-13: Annual and Accumulated Cash Flow After-tax | 391 |
| |
| Table 22-14: Gold Price Sensitivity – Option 1 | 393 |
| Table 22-15: Discount Rate Sensitivity – Option 1 | 394 |
| Table 22-16: Gold Price Sensitivity – Option 2 | 395 |
| Table 22-17: Copper Price Sensitivity – Option 2 | 395 |
| Table 22-18: Discount Rate Sensitivity – Option 2 | 396 |
| Table 22-19: Gold Price Sensitivity – Option 3 | 397 |
| Table 22-20: Copper Price Sensitivity – Option 3 | 397 |
| Table 22-21: Discount Rate Sensitivity – Option 3 | 398 |
| Table 22-22: Gold Price Sensitivity – Option 4 | 399 |
| Table 22-23: Copper Price Sensitivity – Option 4 | 399 |
| Table 22-24: Discount Rate Sensitivity – Option 4 | 400 |
| Table 22-25: Gold Price Sensitivity – Option 5 | 401 |
| Table 22-26: Copper Price Sensitivity – Option 5 | 401 |
| Table 22-27: Discount Rate Sensitivity – Option 5 | 402 |
| Table 22-28: Summary of Post-Tax Economic Evaluation Results | 403 |
| Table 25-1: Options Summary | 414 |
| Table 25-2: Metal Production | 415 |
| Table 25-3: Capital Costs Estimate | 416 |
| Table 25-4: Operating Costs Estimate | 416 |
| Table 25-5: Economic Evaluation Summary | 417 |
| Table 26-1: Estimated Budget | 419 |
| |
| 1 | SUMMARY |
| 1.1 | Introduction |
Exeter Resource Corporation (Exeter) commissioned Alquimia to prepare a Technical Report for the Caspiche Project to the standards required by National Instrument 43-101 for Preliminary Economic Assessment (PEA).
Introductory Cautionary Statement
This Technical Report analyses the new options as detailed below, to a PEA level as alternatives to the Super Pit Option that had been analysed to a Pre-feasibility level in the 2012 Pre-feasibility Study (PFS). The Super Pit mine development plan in the PFS is no longer considered by Exeter to be the preferred option for developing the Caspiche project. This PEA reviews alternative, lower capital, staged development options for Caspiche. Exeter considers the PFS and mineral reserves resulting from the PFS no longer to be current.
The options considered in this PEA have been developed to AACE International recommendations for a class 5 study. The PEA operating and capital costs were developed to an accuracy of ± 35%.
The scope of the work defined was to evaluate the economic potential of developing three projects, as follows:
| ● | Option 1: 30 ktpd open pit mine for gold and silver oxide mineralization treated by heap leaching | |
| ● | Option 2: 60 ktpd open pit mine for gold and silver oxide mineralization treated by heap leaching and a 27 ktpd open pit mine for gold and copper sulphide mineralization treated in a conventional concentrator plant | |
| ● | Option 3: 60 ktpd open pit mine for gold and silver oxide mineralization treated by heap leaching and a 27 ktpd underground mine for gold and copper sulphide mineralization treated in a conventional concentrator plant. |
In addition, 2 further secondary options were also considered; these being
| ● | Option 4: 60 ktpd open pit mine for gold and silver oxide mineralization treated by heap leaching and 12 ktpd open pit mine for gold and copper sulphide mineralization treated in a conventional concentrator plant | |
| ● | Option 5: 27 ktpd underground mine for gold and copper sulphide mineralization treated in a conventional concentrator plant. |
1
| |
In tabular format, this is illustrated as follows:
Table 1-1: Options Summary

The inclusion of these options into the study shows that there is further optionality in the Caspiche deposit which can be considered.
The economic analysis contained in the PEA is considered preliminary in nature. No inferred mineral resources form part of the PEA studies and no mineral reserves for the PEA have been established. Mineral resources are not mineral reserves and have no demonstrated economic viability. There is no certainty that economic forecasts outlined in the PEA will be realized. The PEA and the Cube 2012 Mineral Resource (as defined herein) may be materially affected by environmental, permitting, legal, title, taxation, socio-political, marketing or other relevant factors.
| 1.2 | Caution Regarding Forward-Looking Information |
Certain information and statements contained in this report are “forward-looking” in nature. Forward-looking statements include, but are not limited to, statements with respect to the economic and feasibility parameters of the Caspiche Project; the cost and timing of the development of the project; the proposed mine plan and mining method, stripping ratio, processing method and rates and production rates; grades; projected metallurgical recovery rates; infrastructure, capital, operating and sustaining costs; the projected life of mine and other expected attributes of the Caspiche Project; the net present value (NPV) and internal rate of return (IRR) and payback period of capital; cash costs and all-in sustaining costs; the success and continuation of exploration activities; estimates of mineral Resources; the future price of copper, gold and silver; the timing of environmental assessment process; government regulations and permitting timelines; estimates of reclamation obligations that may be assumed; requirements for additional capital; environmental risks; and general business and economic conditions.
Forward-looking information statements involve known and unknown risks, uncertainties and other factors which may cause the actual results, performance or achievements to be materially different from any of the future results, performance or achievements expressed or implied by forward-looking statements.
2
| |
These risks, uncertainties and other factors include, but are not limited to, the assumptions underlying the Preliminary Economic Assessment and economic parameters discussed herein not being realized; decrease in future gold and copper prices; cost of labour, supplies, fuel and equipment rising; actual results of current exploration; adverse changes in project parameters; discrepancies between actual and estimated production, Mineral Resources and recoveries; exchange rate fluctuations; delays in costs inherent in consulting and accommodating rights of indigenous groups; title risks; regulatory risks and political or economic developments in Chile; changes to tax rates; risks and uncertainties with respect to obtaining necessary surface rights and permits or delays in obtaining same, risks associated with maintaining and renewing permits and complying with permitting requirements; and other risks involved in the exploration and development industry; as well as those risk factors discussed elsewhere in this report.
| 1.3 | Project Location |
The Caspiche property is located 120 km ESE of Copiapó in the Atacama region of Chile (See Figure 1-1). The property is situated at the southern end of the Maricunga metallogenic belt, between the undeveloped Cerro Casale gold-copper project 12 km to the south, and the operating Maricunga Gold Mine, 15 km to the north.
3
| |
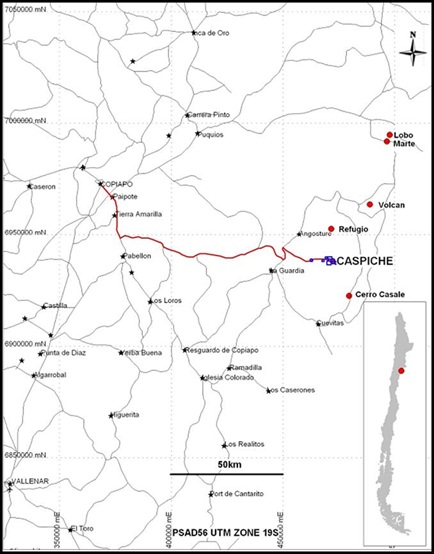
Figure 1-1: Caspiche Location Map (Source: Exeter, 2013)
The geographic centre of the property is located at approximately 27° 41’ south latitude and 69° 18’ west longitude (UTM Zone 19J, Geodesic system). Coordinates using datum PSAD56 are 471,000 m east and 6,937,000 m north (UTM Zone 19S, Cartesian system). Known mineralization on the Caspiche property is located in two areas: Caspiche Porphyry and Caspiche Epithermals. Caspiche Porphyry has been referred to as Caspiche Central in previous Technical Reports. The Caspiche Epithermals has been referred to as Caspiche III in previous Technical Reports.
| 1.4 | Property Ownership |
The Caspiche property is 100% owned by Exeter Resource Corporation. Anglo American Norte S.A. (Anglo), formerly Minera Anglo American Chile Limitada and its affiliate Empresa Minera Mantos Blancos S.A. (EMABLOS) retains a 3% Net Smelter Royalty (NSR) on production from
4
| |
the project under the terms of the Purchase and Sale of Mining Claims agreement executed upon the exercise of an option to acquire the properties from Anglo. Anglo retains the right to repurchase the mineral properties for the agreed expenditures that Exeter has incurred on the property in the event that commercial production has not commenced by March 31, 2026. In addition to the EMABLOS NSR, a private Chilean company holds a 0.08% NSR on the property.
The Caspiche exploitation concessions do not have expiration dates, and are in good standing as of the effective date of this report. Exeter paid the annual license fee for the Caspiche concessions for the period 2013 to 2014 and expects to make all payments required to maintain the properties in good standing in the future.
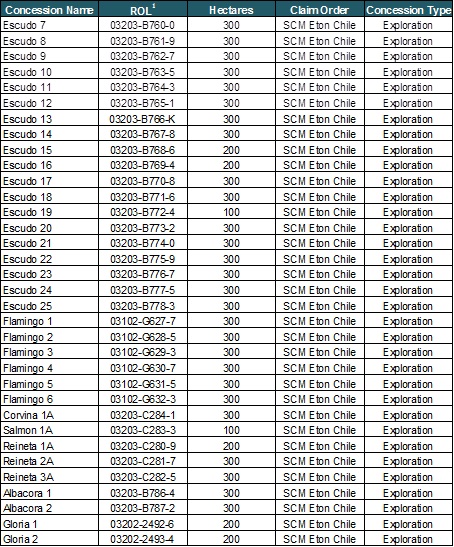
At the effective date of this report, the Caspiche property consists of twenty eight mining exploitation concessions totalling 4,467 ha and 34 mining exploration concessions over the original concessions, vacant ground and those of third parties, totalling 9,300 ha. In addition there are further seven Mining Exploitation Concessions in the process of being granted, totalling 1,357 ha. The Mining Exploration Concessions are valid under Chilean law, but are considered junior to the Caspiche and third party concessions where they overlap. The concessions that overlap the Caspiche concessions were established by Exeter as a safeguard only. The Panorama and Bonanza series of concessions were established to allow for various infrastructure location scenarios. All granted mining exploration concessions are free of encumbrances and they are not affected by the payment of royalties or other obligations in favour of third parties. The total granted Exeter mining exploration concessions are shown in Figure 1-2 and in detail in Figures 1-3 to 1-7.
5
| |

Figure 1-2: Property Map Showing All Exploration and Exploitation Concessions Controlled by Exeter (Source: Exeter, 2014)
6
| |

Figure 1-3: “Caspiche” Concessions Map Showing All Exploration and Exploitation Concessions Controlled by Exeter (Source: Exeter, 2013)
7
| |

Figure 1-4: “Reineta” Concessions Map Showing All Exploration and Exploitation Concessions Controlled by Exeter (Source: Exeter, 2013)
8
| |
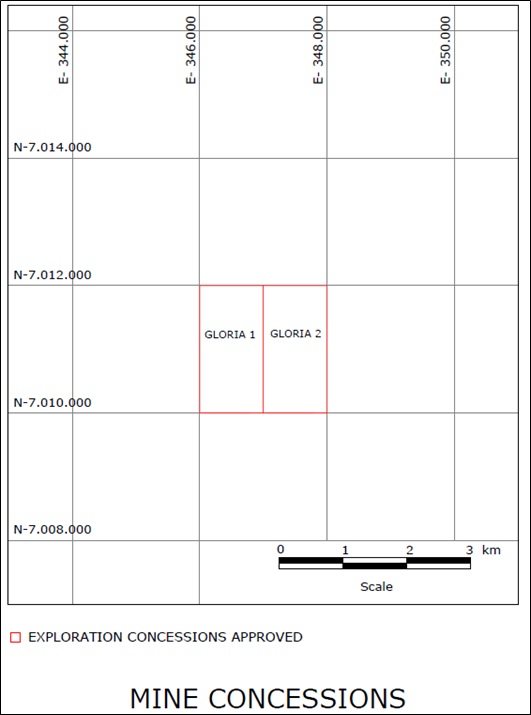
Figure 1-5: “Gloria” Concessions Map Showing All Exploration and Exploitation Concessions Controlled by Exeter (Source: Exeter, 2013)
9
| |
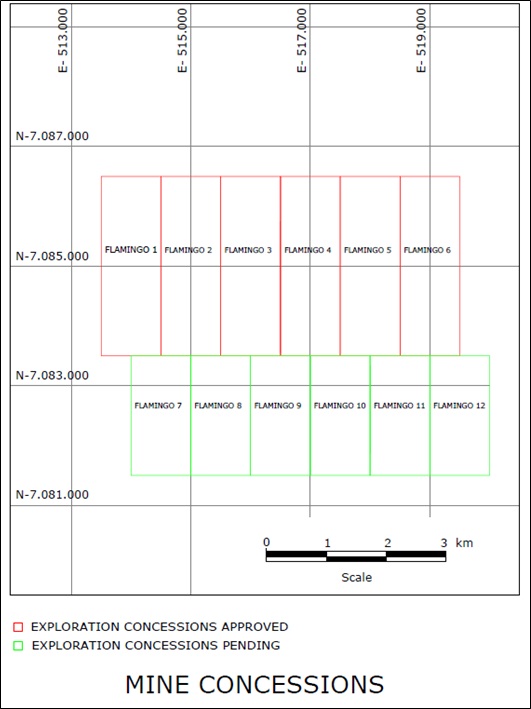
Figure 1-6: “Flamingo” Concessions Map Showing All Exploration and Exploitation Concessions Controlled by Exeter (Source: Exeter, 2013)
10
| |

Figure 1-7: “Albacora” Concessions Map Showing All Exploration and Exploitation Concessions Controlled by Exeter (Source: Exeter, 2013)
11
| |
Table 1-2: Exeter Exploration Concessions - Granted
| 1.5 | Property Description |
Access to the project is by 183 km of paved and gravel road from Copiapó. The initial 22 km running south from Copiapó through the town of Tierra Amarilla is paved highway which connects to a 161 km treated gravel road that runs east-southeast to the project site (Ruta C-459). The main gravel road serves as a regional transportation route to Argentina and is gradually being upgraded. From this road, which is the main access to Kinross Gold’s Maricunga Mine, several access alternatives exist to the project and other additional access options have been identified if required and are illustrated in Figure 1-8.
12
| |
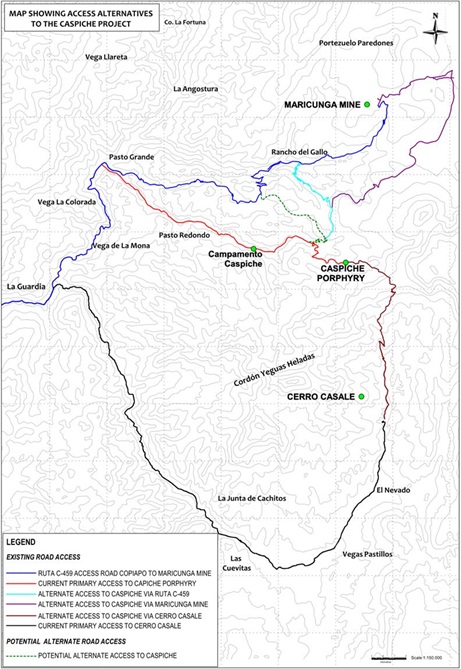
Figure 1-8: Caspiche Location Map (Source: Exeter, 2013)
The climate at Caspiche is typical for the central Andean Cordillera: windy, cold at night with limited precipitation, usually in the form of snow. Day-time temperatures in summer months approach 23 °C, with night-time lows of 5 °C. Day-time temperatures in winter are around freezing, with night-time temperatures dropping to -15 °C. Exploration field seasons generally run from late October through mid-May. Operating mines in the area, such as the nearby
13
| |
Maricunga Gold Mine, are operated year-round at elevations similar to Caspiche at 4,200 to 4,500 m.a.s.l. Upon development, it is expected that the mine would be operated year-round.
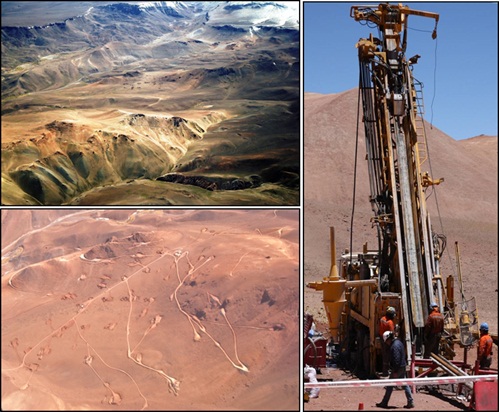
The Caspiche property is located high in the central Chilean Andes within the region commonly described as the Atacama Desert. The topography within the property is almost entirely volcanic in nature and consists of broad open areas of moderate relief and prominent ridges with limited cliff zones of exposed bedrock.
Elevation within the property ranges from 4,200 to 4,700 m.a.s.l. Vegetation is limited to grasses and small thorny bushes and small marsh areas at the junction of creeks. Wildlife includes guanaco, vicuña, foxes, rabbits, ground squirrels, hawks, condors and small reptiles.
There are no significant population centres in the immediate vicinity of the Caspiche project. There are a number of local communities who raise crops and livestock in areas of the vegas that drain the region.
The Copiapó River and its tributaries are the main source of drinking and industrial/agricultural water for the Region and its resources are currently fully exploited. New and developing mining projects are either planning to exploit high altitude Andean endorheic basins with no hydraulic connection to the Copiapó River, or raw or desalinated seawater.
| 1.6 | Geology and Mineralization |
The Caspiche property is located in the Maricunga metallogenic belt, a north-northeast trending, linear zone containing at least 14 occurrences of gold and/or silver mineralization between latitudes 26° and 28° S in the Andean Cordillera of northern Chile1.
The Maricunga belt is composed of a series of volcanoes of andesitic to dacitic composition; this is presented in Figure 1-9. Two main structural trends are important in the Maricunga belt. North-south to north-northeast trending high-angle reverse faults form a series of horsts and graben blocks, and it is these graben structures that host significant mineralization. West-northwest to north-northwest trending structures occur as normal trans-tensional faults, dykes, veins and linear alteration zones, and are associated with alteration and mineralization in late Oligocene to early Miocene age volcanic centres. Figure 1-9 illustrates this phenomenon.
1 Vila and Sillitoe, 1991; Figure 7-1: Metallogenic Belts of Northern Chile and Argentina (Source: Vila and Sillitoe, 1991)
14
| |

Figure 1-9: Metallogenic Belts of Northern Chile and Argentina (Source: Vila and Sillitoe, 1991)
The Maricunga belt hosts numerous significant mines and advanced projects. The deposits are typically of the porphyry gold-copper style or high sulphidation epithermal gold-silver. Examples of porphyry deposits in the Maricunga belt are the Maricunga mine, Cerro Casale, and Lobo Marte. High sulphidation examples include La Coipa and La Pepa and are illustrated in Figure
15
| |
1-10. A strong northwest-southeast structural control to the mineralization is typical of many of the deposits. Some Maricunga deposits have epithermal alteration textures superimposed or telescoped onto porphyry alteration textures.

Figure 1-10: Regional Geology of the Maricunga Metallogenic Belt (Source: Vila and Sillitoe, 1991)
16
| |
Stockwork-hosted, gold-copper porphyry, high-sulphidation epithermal gold mineralization and intermediate-sulphidation gold mineralization styles have been recognized on the Caspiche property. Mineralization at Caspiche Porphyry is interpreted to be a high-sulphidation epithermal gold deposit above a gold-rich, gold-copper porphyry deposit. The MacNeill zone, confined beneath the underside of the eastward-flared, late-mineral diatreme contact, is assigned an intermediate-sulphidation epithermal origin. It appears to be the product of the final mineralizing event in the Caspiche system, post-dating all alteration and partially overlapping Caspiche mineralization.
| 1.7 | Drilling |
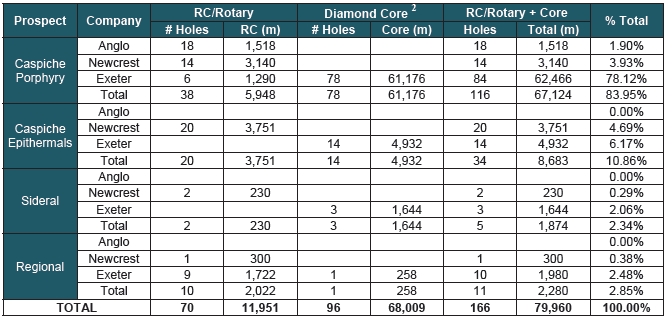
A total of 79,960 m of drilling in 166 drill holes have been completed on the Caspiche property and adjacent areas by Exeter, Newcrest, and Anglo from 1988 to April, 2012. Drilling is concentrated in two main areas of the Caspiche property: Caspiche Porphyry and Caspiche Epithermals.
Of the drill total, 116 holes totalling 67,124 m have been drilled at the Caspiche Porphyry prospect and 34 holes totalling 8,683 m have been drilled at the Caspiche Epithermals prospect.
Table 1-3: Summary of Drilling on the Caspiche and Adjacent Properties
2 RC pre-collar drill lengths are included in the core drilling totals. Drill totals for Exeter campaigns are current as of the effective date of the Resource Estimate.
17
| |
| 1.8 | Mineral Processing and Metallurgical Testing |
The Caspiche project oxide and sulphide mineralization has been subject to several physical characterization and metallurgical test programs to determine possible process routes and expected recoveries.
| 1.8.1 | Oxide Mineralization |
Alquimia carried out an extensive analysis of all column tests, in order to define the expected recoveries and leach irrigating cycle. Based on the information presented the recoveries to be used in this PEA are 80% for gold and 40% for silver.
The total irrigation cycle time, to obtain these recoveries, is estimated at 130 days for an irrigation rate of 10 l/m2/h, a lift height of 10 m and a bulk density for the mineral placed on the pad of 1.6 m3/t.
To accomplish this leach cycle time without generating excess solution or gold grade dilution, an intermediate leach solution (ILS) cycle and pond are considered, thus the irrigation cycle of 130 days is divided in 65 using ILS and 65 days using barren solution.
| 1.8.2 | Sulphide Mineralization |
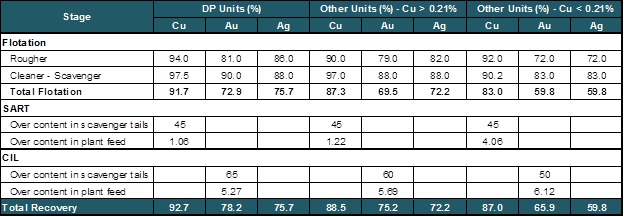
Alquimia conducted an extensive analysis of all test programs carried out for the sulphide mineralization, in order to define expected recoveries and predict metallurgical behavior. Table 1-4 summarizes the main recoveries used in this PEA.
Table 1-4: Recoveries for the production plan
18
| |
| 1.9 | Mineral Resource Estimate |
The Mineral Resource Estimate (MRE) reported below for the Caspiche Project with an effective date of April 11, 2012 (the “Cube 2012 Mineral Resource”) was prepared by Mr. Ted Coupland, MAusIMM(CP), at the time, Director and Principal Geostatistician of Cube Consulting Pty Ltd (“Cube”). The Cube 2012 Mineral Resource, was classified in accordance with the CIM Definition Standards for Mineral Resources and Mineral Reserves (Nov 2010). Mr. Patrick Adams MAusIMM(CP), Director and Principal Geologist of Cube has reviewed and validated the Cube 2012 Mineral Resource.
The Cube 2012 Mineral Resource reported from within the 'reasonable prospects' resource shell is summarized in Table 1-5 below. The Cube 2012 Mineral Resource may be affected by further infill and exploration drilling that may result in increases or decreases in subsequent resource estimates. The MRE may also be affected by subsequent assessments of mining, environmental, processing, permitting, taxation, socio-economic, and other as yet identified factors. The Cube 2012 Mineral Resource is reported above a gold equivalent (AuEq) cut-off. Oxide material was reported above 0.18 g/t AuEq cut-off and sulphide material was reported above 0.30 g/t AuEq4 cut-off. Note that the PEA does not include or use the inferred mineral resources.
Table 1-5: Caspiche Mineral Resource Statement April 20123
| Material | Class | Tonnes | Au (g/t) | Cu (%) | Ag (g/t) | AuEq4 (g/t) | Au Eq5 |
| (Mt) | (Moz) | ||||||
| Oxide | Measured | 66 | 0.46 | 1.55 | 0.46 | 1.0 | |
| Oxide | Indicated | 56 | 0.39 | 1.63 | 0.40 | 0.7 | |
| Total Oxide | Meas + Ind | 122 | 0.43 | 1.58 | 0.43 | 1.7 | |
| Sulphide | Measured | 554 | 0.58 | 0.23 | 1.16 | 1.02 | 18.3 |
| Sulphide | Indicated | 727.9 | 0.48 | 0.18 | 1.17 | 0.84 | 19.6 |
| Total Sulphide | Meas + Ind | 1,282.1 | 0.52 | 0.20 | 1.17 | 0.92 | 37.9 |
| Total Meas+Ind | 1,403.6 | 0.51 | 0.19 | 1.2 | 0.88 | 39.6 | |
| Material | Class | Tonnes | Au (g/t) | Cu (%) | Ag (g/t) | AuEq4 (g/t) | Au Eq5 |
| (Mt) | (Moz) | ||||||
| Oxide | Inferred | 2.5 | 0.23 | 0 | 1.18 | 0.23 | 0 |
| Sulphide | Inferred | 195.6 | 0.29 | 0.12 | 0.91 | 0.52 | 3.3 |
| Total | Inferred | 198.1 | 0.29 | 0.12 | 0.91 | 0.52 | 3.3 |
3 Cautionary Note: Mineral resources that are not mineral reserves do not have demonstrated economic viability
4 The following formula was used in calculating AuEq values in each block of the model:

where Au and Cu are the block kriged Au and Cu grades, PAu and PCu are the Au and Cu prices (US$1,150/oz and US$2.50/lb, respectively), and RAu and RCu are the Au and Cu projected metallurgical recoveries, 65% and 85%, respectively for sulphide material and 78% for Au and 11% for Cu in the oxide zone.
Au Eq (Moz) = resource tonnes * AuEq4
19
| |
Both the oxide and sulphide AuEq cut-off grades were selected as appropriate for the reporting of resources intended for open pit exploitation. Cu% grades shown in the oxide portions of the Cube 2012 Mineral Resource are provided for information only. Copper is not considered an economically viable product in the oxide portions of the Cube 2012 Mineral Resource.
For the purposes of the PEA a sub set of the Cube 2012 Mineral Resource including only the sulphide portion of the Cube 2012 Mineral Resource are reported using an updated AuEq formula. The sulphide portions of the Cube 2012 Mineral Resource are reported in Table 1-6 and Table 1-7 above a cut off of 0.75 g/t AuEq6. This higher cut off was selected as appropriate for the reporting of mineral resources intended for underground exploitation based on preliminary economic cut off studies commissioned by Exeter during October 2013 (NCL 29/10/2013).
Table 1-6: Caspiche – Transitional Measured and Indicated Mineral Resources3 - April 2013 above 0.75 g/t AuEq6 cut off
| Material | Class | Tonnes (Mt) | Au (g/t) | Cu (%) | Ag (g/t) | AuEq6 (g/t) |
| Transitional | Measurd | 2.8 | 0.93 | 019 | 0.97 | 0.93 |
| Transitional | Indicated | 0.7 | 1.04 | 0.30 | 1.26 | 1.05 |
| Total Transitional | Meas + Ind | 3.5 | 0.95 | 0.21 | 1.02 | 0.95 |
Table 1-7 details the recovery factors for gold, silver and copper within the oxidized, and sulphide domains and the DP and Non-DP stratigraphic units using a sulphur threshold determined by and provided by Exeter.
6 The following formula was used in calculating AuEq values in each block of the model:
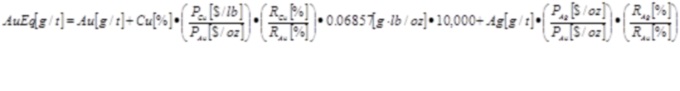
Where Au, Ag and Cu are the block kriged gold, silver and copper grades, PAu, PAg and PCu are the gold, silver and copper prices (1,250 US$/oz., 15US$/oz. and 2.75 US$/lb, respectively). RAu and RCu are the Au and Cu projected metallurgical recoveries based on a number of S % thresholds.
20
| |
Table 1-7: Caspiche – Sulphide Project Measured and Indicated Mineral Resources3 - April 2013 above 0.75 g/t AuEq6 cut off
| Material | Clss | Tonnes (Mt) | Au (g/t) | Cu (%) | Ag (g/t) | AuEq6 (g/t) |
| Sulphide | Measured | 378.6 | 0.71 | 0.30 | 1.30 | 1.28 |
| Sulphide | Indicated | 431.6 | 0.64 | 0.27 | 1.40 | 1.16 |
| Total Sulphide | Meas + Ind | 810.2 | 0.67 | 0.29 | 1.35 | 1.22 |
| 1.10 | Mineral Reserves Estimate |
The economic analysis contained in the PEA is considered preliminary in nature. No inferred mineral resources form part of the PEA studies and no mineral reserves for the PEA have been established. There is no certainty that economic forecasts outlined in the PEA will be realized. The PEA and the Cube 2012 Mineral Resource (as defined herein) may be materially affected by environmental, permitting, legal, title, taxation, socio-political, marketing or other relevant factors.
| 1.11 | Mining Methods |
NCL Ingeniería y Construcción SpA (NCL) was commissioned by Exeter Resource Corporation (Exeter) to provide mine planning services for the Caspiche Project.
NCL’s Scope of Work is summarized as follows:
| ● | Develop conceptual mine plans and mine production schedules for the potential life of mine (LOM), for five defined options: | ||
| º | Option 1: 30 ktpd open pit mine for gold and silver oxide mineralization treated by heap leaching | ||
| º | Option 2: 60 ktpd open pit mine for gold and silver oxide mineralization treated by heap leaching and 27 ktpd open pit mine for gold and copper sulphide mineralization treated in a conventional concentrator plant | ||
| º | Option 3: 60 ktpd open pit mine for gold and silver oxide mineralization treated by heap leaching and 27 ktpd underground mine for gold and copper sulphide mineralization treated in a conventional concentrator plant. | ||
| º | Option 4: 60 ktpd open pit mine for gold and silver oxide mineralization treated by heap leaching and 12 ktpd open pit mine for gold and copper sulphide mineralization treated in a conventional concentrator plant. | ||
21
| |
| º | Option 5: 27 ktpd underground mine for gold and copper sulphide mineralization treated in a conventional concentrator plant. | ||
| ● | Determine the mine equipment and labour requirements for the LOM of the three primary and two secondary options | ||
| ● | Estimate the mine initial and sustaining capital and operating costs for the LOM of the options. | ||
Different mining schedules, equipment and labour requirements were prepared and evaluated. Only Measured and Indicated resources were included in the schedules.
| ● | Option 1 proposes to extract an average of 30 ktpd of mineralized material over a potential project life of 10 years. Total materials movement from the mine does not exceed 15 Mt per year. | ||
| ● | Option 2 considers an extended open pit to extract oxide and sulphide material. Proposed production averages 57 ktpd of oxide material for 6 years. From the sixth year of operation, the pit production is up to 27 ktpd of sulphide material for 12 years. | ||
| ● | Option 3 combines a proposed open pit to extract oxide with an underground mine to extract sulphide material. Proposed produce from the pit averages 60 ktpd of oxide material for 5 years. Proposed underground mine production averages 25 ktpd of sulphide material for 38 years. | ||
| ● | Option 4 considers an extended open pit to extract oxide and sulphide material. Proposed production averages 60 ktpd of oxide material for 6 years. From the sixth year of operation, pit production is up to 12 ktpd of sulphide material for 12 years. | ||
| ● | Option 5 considers an underground mine producing an average of 25 ktpd of sulphide material for 38 years. | ||
The open pit options consider a full diesel fleet, 8 m for benches for option 1 and 16 m benches for all other options. The underground options include an underground sizer and conveyor belt.
Measured and Indicated mineral resources included in the mining schedules for all options are summarized in Table 1-8.
22
| |
Table 1-8: Mining Schedule and Mine Life by Option (source: NCL, May, 2014)

| 1.12 | Process Design and Recovery |
Total payable metal production of Cu, Au and Ag, saleable sub-products, such as, Cu2S and sulphuric acid in Table 1-8 by each Option was determined.
Table 1-9: Metal Production
| Category | Item | Unit | Option 1 | Option 2 | Option 3 | Option 4 | Option 5 |
| Measured | Measured | Mt | 57.9 | 156.5 | 250.0 | 116.8 | 188.3 |
| Au | g/t | 0.48 | 0.59 | 0.75 | 0.56 | 0.84 | |
| Ag | g/t | 1.52 | 1.32 | 1.43 | 1.36 | 1.39 | |
| Cu | % | 0.01 | 0.14 | 0.27 | 0.11 | 0.35 | |
| Indicated | Indicated | Mt | 49.2 | 97.6 | 210.1 | 73.4 | 162.3 |
| Au | g/t | 0.39 | 0.48 | 0.71 | 0.44 | 0.81 | |
| Ag | g/t | 1.65 | 1.46 | 1.57 | 1.56 | 1.53 | |
| Cu | % | 0.01 | 0.09 | 0.26 | 0.06 | 0.34 | |
| Measured + Indicated | M&I | Mt | 107.1 | 254.1 | 460.1 | 190.2 | 350.6 |
| Au | g/t | 0.44 | 0.55 | 0.73 | 0.51 | 0.83 | |
| Ag | g/t | 1.58 | 1.37 | 1.50 | 1.44 | 1.45 | |
| Cu | % | 0.01 | 0.12 | 0.27 | 0.09 | 0.35 | |
| Total Metals Production | Au | Moz | 1.24 | 3.5 | 8.3 | 2.43 | 7.13 |
| Ag | Moz | 2.21 | 5.8 | 14.4 | 4.3 | 12.1 | |
| Cu | Mlb | - | 575 | 2,380 | 313 | 2,380 | |
Cu2S | t | - | 3,700 | 15,100 | 3,500 | 15,100 | |
| Sulphuric Acid | Mt | - | 0.32 | 1.3 | 0.18 | 1.3 | |
Au Equivalent7 | Moz | 1.27 | 4.9 | 14.2 | 3.24 | 12.8 | |
Cu Equivalent8 | Mlb | - | 2,123 | 6,143 | 1,402 | 5,549 |
7 Gold equivalent oz (AuEq) value is based on gold, silver and copper revenues (prices and recoveries involved). AuEq (oz) = [Au Production (oz)] + [Ag Production (oz) * Ag Price (US$/oz) / Ag Price (US$/oz)] + [Cu Production (lb) * 2204 * Cu Price (US$/lb) / Au Price (US$/oz)]. Recoveries are adjusted based on metallurgical characteristic of the resource.
8 Copper equivalent lb (CuEq) value is based on gold, silver and copper revenues (prices and recoveries involved). CuEq lb = [Cu Production (lb)] + [Au Production (oz) * Au Price (US$/oz) / Cu Price (US$/lb)] + [Ag Production (oz) * Ag Price (US$/oz) / Cu Price (US$/lb)]. Recoveries are adjusted based on metallurgical characteristic of the resource.
23
| |
| 1.12.1 | Process Plant Description |
Oxide Plant
The plant would process feed from the oxide open pit and recovers gold and silver from the oxide mineralization, by means of a heap leach pad, fed with material crushed in two stages, irrigated with cyanide to obtain an Au/Ag rich solution that feeds an adsorption, desorption recovery (ADR) plant, electrowinning and smelting plant in order to produce a doré bar containing gold and silver.
Sulphide Plant
The plant would process sulphide mineralized material delivered from the underground mine or from the extended open pit. Copper concentrates with gold by-product would be produced and gold doré and copper sulphide would be produced from the cleaner tails. The proposed process includes crushing and grinding of the ROM material, rougher flotation, regrinding, cleaner and scavenger flotation, concentrate thickening and filtering. The concentrator is designed for a nominal throughput of 27,000 tpd with an average head grade of 0.45% Cu and 1.3 g/t Au.
The secondary options 4 and 5, consider a similar process route but in the case of the 60 ktpd oxide / 12 ktpd sulphide option the sulphide process plant was re-dimensioned for the lower sulphide throughput.
Due to the characteristics of the deposit mineralization, the Caspiche process incorporates a number of considerations to maximize production and to ensure a saleable product, such as:
| ● | Treatment of the copper concentrates to eliminate arsenic through a reduced atmosphere roasting process | |
| ● | Leaching of the cleaner flotation tails to recover additional gold | |
| ● | Use of a SART plant to recover copper contained in the gold rich leachate and to recycle cyanide. |
| 1.13 | Project Infrastructure |
The project site is accessible from Copiapó, following existing roads which lead to Minera Maricunga (Kinross Gold). An upgraded road of approximately 8 km must be constructed from the existing road to the project site, to allow construction and capital equipment and ongoing operations supplies to be safely delivered. This road would be 9 m wide and designed to meet Chilean regulations.
Potential water requirements are considered to be supplied from the Peñas Blancas area near Laguna Verde through a 140 km long pipeline where Exeter is currently exploring for water. The
24
| |
fresh water pumping system would consist of two pump stations each with one operating pump and one stand by.
A typical prefabricated modular structure camp, located 5 km from the concentrator plant is considered with capacity for third party contractors that, according to the experience of other projects, may add 30% to 40% more people to the owners direct hire personnel.
| 1.13.1 | Power Supply |
The proposed power supply considered for each option is as follows:
| ● | Option 1: On Site Power Generation | |
| ● | Option 2: Power line from Maricunga substation for the Oxide plant and power line from Cardones substation for the Sulphide plant | |
| ● | Option 3: Power line from Maricunga substation for the Oxide plant and power line from Cardones substation for the Sulphide plant | |
| ● | Option 4: Power line from Maricunga substation for the Oxide and Sulphide plant | |
| ● | Option 5: Power line from Cardones substation. |
| 1.13.2 | Tailings Handling |
The proposed tailings handling technology and specification for each option is as follows:
| ● | Option 1: No tailings | |
| ● | Option 2: Thickened tailings. Facility designed for 110 Mt of storage capacity. For the construction of the wall 34 Mm3 of waste material will be needed over the life of mine. The upstream and downstream faces are constructed with a 2:1 (H:V) slope | |
| ● | Option 3: Filtered tailings. Facility designed for 134 Mt of storage capacity. The starter wall will need 680,000 m3 of waste material | |
| ● | Option 4: Thickened tailings. Facility designed for 60 Mt of storage capacity. For the construction of the wall 20 Mm3 of waste material will be needed over life of mine. The upstream and downstream faces are constructed with a 2:1 (H:V) slope | |
| ● | Option 5: Filtered tailings. Facility designed for 134 Mt of storage capacity. The starter wall will need 680,000 m3 of waste material. |
25
| |
| 1.14 | Marketing Studies |
| 1.14.1 | Refined Copper Market Review |
Selmar International Services Ltda (Selmar) was contracted to complete a review of the market conditions for copper concentrates and doré to the levels required for the PEA. Global refined copper consumption at 20 million tonnes in 2012 is expected to increase to nearly 34 million tonnes by 2025.9 This would be equivalent to an average growth rate of 4.1% average per annum. In the longer run despite the current economic slowdown in most parts of the world, strong copper demand growth prospects are based on the expected resource intensive use in economies such as China, India and other developing countries, associated with investment in power distribution networks and other infrastructure development.
China today consumes about 41% of the world’s refined copper and it is expected to continue to grow and may rise to 52% by 2025 given the huge infrastructure development programs in China. Today there is some concern about the slowing down of China’s growth rate. Despite the economic uncertainty, which could well lead to some slowing of copper consumption growth in the short term, there are good reasons to believe that growth in copper consumption will continue to be positive.
| 1.14.2 | Outlook for the Copper Price |
Recent reviews of copper price forecasts indicate an expectation of a long-term price range from $2.50 to $3.50 per pound in constant 2013 dollars. Selmar suggests that assuming a range of $5,500 to $6,600 per tonne ($2.50 to $3.00 per pound) in constant 2013 dollars is reasonable for the longer term project price scenario. This longer term forecast may be conservative. Over the last few months, many analysts from banks and other institutions and organizations have decreased their near-term price forecasts, but, despite the current uncertainty, the majority view is for copper prices to remain in dollars of the day above this level for the next two or three years. The consensus opinion is shown in Figure 1-11.
26
| |

Figure 1-11: Global Refined Copper Market Balance (Source: Alfonso Gonzalez 2013 ©)
| 1.14.3 | Copper Concentrates 10 – 15 year Outlook |
Total World concentrate production is predicted to rise from about 13.3 million tonnes copper contained in 2012 to nearly 25.3 million tonnes in 2025 assuming all current projects develop on time. Concentrate supplies are expected to increase particularly between 2013-2018 as a result of new projects now in the advanced feasibility and development stage and announced expansions of operational mines.
It should be noted that approximately 90% of the expected increased mine production during the period 2013 – 2025 will be in the form of concentrates
| 1.14.4 | Treatment and Refining Charges and other Commercial Terms |
The copper concentrate market has seen significant structural imbalances between mine production and smelting capacities and by the middle years of this decade, if all new project and expansion plans are met, there will be a surplus of concentrates which could last for several years. Increasing treatment charges will also result from increased smelter costs and China is already moving towards achieving more economic smelter terms. Table 1-9 and Table 1-10 put into perspective the variation in treatment charges (“TC”) and copper refining charges (“RC”)
27
| |
terms over 2007 to 2013. Forecasts for benchmark TC/RC’s for the next 5 years are shown in Table 1-11.
Table 1-10: TC/RC’s Benchmark Terms
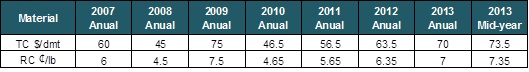
Table 1-11: TC/RC’s Spot Terms
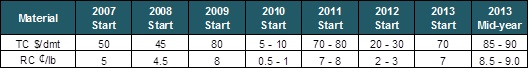
Table 1-12: Outlook for Annual Contract Concentrates TC/RC’s
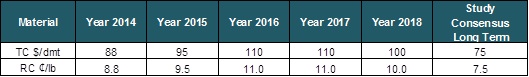
The study consensus long term takes into consideration historical trending over a longer period and the cyclic nature of refinery charges. The assumptions recommended for the PEA evaluation of Caspiche calcine concentrates are presented in Table 1-12.
Table 1-13: Concentrates – Commercial Terms Assumptions
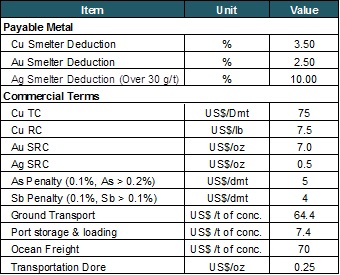
28
| |
| 1.14.5 | Caspiche Concentrates Marketability |
Alquimia has provided Selmar with details relative to the expected annual productions and concentrate assays for both the unroasted flotation copper concentrate and for the calcined concentrates after partial roasting as shown in Table 1-13.
Table 1-14: Caspiche Concentrates Expected Annual Production

Without any discussion with smelters to ascertain the quantity that can be taken and the cost thereof, in Selmar’s opinion, based on the calcine quality supplied by Exeter at about 29% copper, 54 g/t gold, 110 g/t silver, 25% sulphur, arsenic levels of less than 0.2% and antimony levels of 0.16%, it should be feasible to find a sustainable long-term market for such concentrates.
Selmar has also noted that there may be limited appetite for offtakers to take smaller quantities of Caspiche concentrate which has not been calcined. A penalty for arsenic and antimony would be applied. This has not been considered in the base case financial assessment.
| 1.14.6 | Doré Metal Market |
This market is very competitive and in many cases payable metals approaches 100% of the analytical contents and there is not a great deal of variance in terms between refineries. This situation is expected to continue in the foreseeable future.
Selmar suggests the following terms are used for purposes of doré metal evaluation:
| ● | Gold return rate | : | 99.7% of the analytical fine gold content | |
| ● | Silver return rate | : | 98.5% of the analytical fine silver content | |
| ● | Treatment charge | : | 0.50 US$ / oz gross weight received | |
| ● | Transport and insurance | : | $ 4,700 per shipment; basis consignments of 200 kg. |
29
| |
Above fees include: Transport from mine site to Santiago, customs clearance, international air freight, reception in Zurich’s airport, customs clearance, ground transportation to the refinery in Switzerland and 100% insurance coverage door to door.
The long term gold price consensus assumptions seen in the market recently for major projects are in the $ 1,200 to $ 1,500 per ounce range. Consensus opinion is illustrated
Table 1-15: Analysts’ Consensus for Gold Price 2013 – 2017 and Long Term (Source: Scotiabank)

| 1.15 | Capital Cost Estimate |
Capital cost estimates are composed of the following:
| ● | Direct cost of construction and assembly: Acquisitions of equipment supply, labour, auxiliary equipment for construction and building materials are considered | |
| ● | Indirect project costs: Transportation and equipment insurance, general spare parts, vendor’s representatives, detailed engineering, EPCM, start up and owner costs are considered | |
30
| |
| ● | Contingency estimation based on Direct Cost plus Indirect Cost | |
| ● | Sustaining capital is defined as that required to maintain operations and may include capital spent on expansion or new infrastructure items such as tailings dam | |
| ● | Deferred capital is that required to complete an expansion in the mine and process plant. |
Table 1-16 summarizes initial, deferred and sustaining capital cost, including contingencies, required for each option.
Table 1-16: Capital Costs Summary
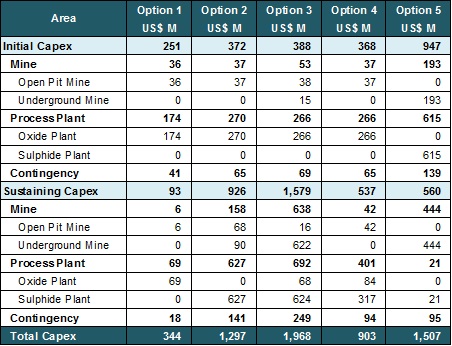
| 1.16 | Operating Costs Estimate |
The PEA operating costs have been estimated for the operating areas of Mining, Process Plant, Infrastructure and Administration. Costs were reported under subheadings related to the function of each of the areas identified.
Table 1-16 summarizes total operating cost by area, as well as average unit operating cost. Labor costs for mine and process plant consider only up to Superintendent Level. All superior positions are considered as administration costs.
The operating costs are considered to have accuracy of ± 30% with a 90% probability of occurrence, based on the assumptions listed in this section of the report. All unitary operating costs are expressed in processed tonnes.
31
| |
Table 1-16: Summary of Operating Costs
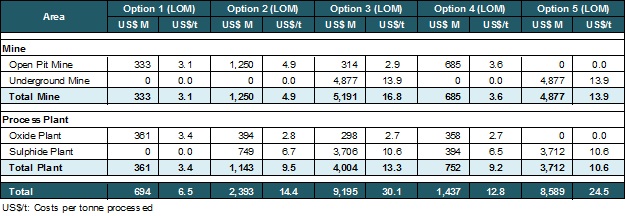
| 1.17 | Economic Analysis |
The economic analysis is based on the estimated CAPEX and OPEX and revenue calculated thereof. The CAPEX and OPEX were developed as noted in Section 21. Cash flow and economic analyses were performed from the effective date that equipment was on the project site.
The economic analysis is presented in a pre and post-tax format, and includes the Anglo American and third party royalty totalling 3.08% and the Chilean state royalty. A post-tax discussion is also included in this report but as Alquimia is not a financial advisor these figures should be confirmed with a recognised tax expert. Sensitivities based on commodity price, metals recovery, operating cost and capital expenditure variation were performed and discussed in Section 22.
Since the analysis is based on a cash flow estimate, it should be expected that actual economic results might vary from these results. The PEA has been completed to a level of accuracy of ± 35%. The PEA is not a preliminary feasibility study or feasibility study as defined by the NI 43-101 guidelines.
There are no mineral reserves defined by the PEA study, as the PEA is only a conceptual analysis of potential economic viability.
The economic analysis contained in the PEA is considered preliminary in nature. No inferred mineral resources form part of the PEA economic evaluation and no mineral reserves for the PEA have been established. Mineral resources are not mineral reserves and have not demonstrated economic viability. There is no certainty that economic forecasts outlined in the PEA will be realized. The PEA and the Cube 2012 Mineral Resource (as defined herein) may be materially affected by environmental, permitting, legal, title, taxation, socio-political, marketing or other relevant factors.
32
| |
This PEA is considered preliminary in nature and there is no certainty that the preliminary economic assessment will be realized.
Economic parameters used for the evaluation are shown in Table 1-17.
Table 1-17: Main Economic Parameters

| 1.17.1 | Production and Revenue |
Revenues by saleable product such as, doré bars, calcine and concentrate and sub-product, such as, Cu2S and sulphuric acid are summarized in Table 1-18.
Table 1-18: Production and Revenues Summary
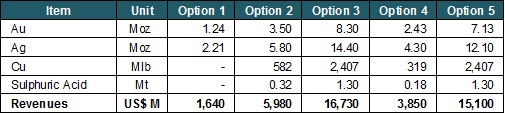
33
| |
| 1.17.2 | Economic Evaluation Results |
Based on the projections resulting from the financial model, the pre-tax NPV, IRR and payback periods are shown in Table 1-19.
Table 1-19: Summary of Pre-Tax Economic Evaluation Results
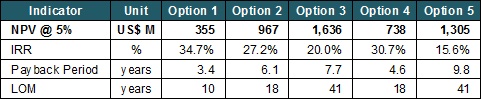
Table 1-20 shows post-tax main economic indicators, considering 20% and 35% income tax rates.
Table 1-20: Summary of Post-Tax Economic Evaluation Results (20% income tax rate)
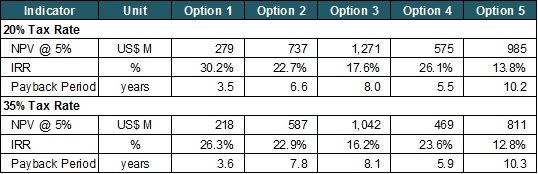
| 1.18 | Conclusions and Recommendations |
| ● | No fatal flaws were identified during the course of the Caspiche Project Preliminary Economic Assessment. The recommendations are largely based on normal metallurgical and other development test work which would be part of project development. | ||
| ● | The study involved the evaluation of the economic potential of developing three primary options and 2 secondary options, as follows: | ||
| º | Option 1: 30 ktpd open pit mine for gold and silver oxide mineralization treated by heap leaching | ||
| º | Option 2: 60 ktpd open pit mine for gold and silver oxide mineralization treated by heap leaching and 27 ktpd open pit mine for gold and copper sulphide mineralization treated in a conventional concentrator plant | ||
34
| |
| º | Option 3: 60 ktpd open pit mine for gold and silver oxide mineralization treated by heap leaching and 27 ktpd underground mine for gold and copper sulphide mineralization treated in a conventional concentrator plant. | ||
| º | Option 4: 60 ktpd open pit mine for gold and silver oxide mineralization treated by heap leaching and 12 ktpd open pit mine for gold and copper sulphide mineralization treated in a conventional concentrator plant | ||
| º | Option 5: 27 ktpd underground mine for gold and copper sulphide mineralization treated in a conventional concentrator plant. | ||
| ● | The conclusion of the pit optimization stage suggested design of a series of practical phases and pits for each option. | ||
| º | Option 1: The ultimate pit has been divided in 4 phases. This option contains 107 Mt of Measured and Indicated resource (M+I) at an average head grade of 0.44 g/t Au and 1.58 g/t Ag | ||
| º | Option 2: The ultimate pit has been divided in 4 phases for the initial oxide production and 3 phases for the extended pit including sulphide production. This option contains 143 Mt M+I resource at an average head grade of 0.38 g/t Au and 1.54 g/t Ag in the oxide mineralization and 207 Mt of M+I resource at an average head grade of 0.55 g/t Au, 1.12 g/t Ag and 0.20% Cu in the sulphide mineralization. | ||
| º | Option 3: The ultimate pit has been divided in 4 phases for the initial oxide production. Underground planning indicates 25 levels with stopes of 30 m x 40 m x 50 m. This option contains 110 Mt of M+I resource at an average head grade of 0.42 g/t Au, 1.62 g/t Ag in the oxide mineralization and 351 Mt of sulphide M+I resource at an average head grade of 0.83 g/t Au, 1.45 g/t Ag and 0.35% Cu. | ||
| º | Option 4: The ultimate pit has been divided in 4 phases for the initial oxide production and 1 phase for the extended pit including sulphide production. This option contains 131 Mt of M+I resource at an average head grade of 0.40 g/t Au and 1.55 g/t Ag in the oxide mineralization and 59 Mt of sulphide M+I resource at an average head grade of 0.76 g/t Au, 1.18 g/t Ag and 0.27% Cu. | ||
| mº | Option 5: Underground planning indicates 25 levels with stopes of 30 m x 40 m x 50 m. This option contains 351 Mt of sulphide M+I resource at an average head grade of 0.83 g/t Au, 1.45 g/t Ag and 0.35% Cu. | ||
| ● | Proposed mine plans are appropriate to the mineralization | ||
| ● | The mining inventory is based on Measured and Indicated resources only | ||
35
| |
| ● | Based on the current assumptions the financial analysis indicated that all alternatives for the project had a net positive cash flow and an internal rate of return that supports further study for the potential development of Caspiche. | ||
| ● | OPEX and CAPEX used for the project represents those expected for a project of this type exhibiting average characteristics of abrasiveness and hardness; grades and rock type characterizations as indicated in the geological section. Operating costs were generated from first principles and benchmarked against other operations, and capital costs were based on referential quotations, database information and were also benchmarked against similar operations | ||
| ● | The mine plan is appropriate to the mineralization and adequately reflects the deposit type, dimensions and host rock characterization | ||
| ● | Additional metallurgical studies at pilot plant level are needed to optimize recovery and equipment selection, on oxide and sulphide mineralization. The sulphide metallurgical studies should include: geometallurgical mapping of the deposit to link geological units with metallurgical performance; further studies on gold recovery from the flotation scavenger tailings and low grade copper recovery testwork as a minimum | ||
| ● | Should Exeter complete additional studies and determine that the project be advanced to a development decision, an approved environmental impact study will be required and additional baseline studies required to support the impact study should be initiated as soon as possible | ||
| ● | Additional geotechnical and hydrological studies are required particularly to model surface water flows into the vegas or seasonal creeks. | ||
36
| |
| 2 | INTRODUCTION |
| 2.1 | Purpose of the Technical Report |
Exeter Resource Corporation (herein Exeter) commissioned Alquimia to prepare a Technical Report for the Caspiche Project to the standards required by National Instrument 43-101 for Preliminary Economic Assessment (PEA). This is broadly in line with AACE International recommendations for a class 5 study. The Project operating and capital costs were developed to an accuracy of ± 35%.
This Technical Report analyses new options as detailed below, to a PEA level as alternatives to the Super Pit Option that had been analysed to a Pre-feasibility level in the 2012 Pre-feasibility Study (PFS). The Super Pit mine development plan in the PFS is no longer considered by Exeter to be the preferred option for developing the Caspiche project. This PEA reviews alternative, lower capital, staged development options for Caspiche. Exeter considers the PFS and mineral reserves resulting from the PFS no longer to be current.
The scope of the work defined was to evaluate the economic potential of developing three primary options and two secondary options, as follows:
| ● | Option 1: 30 ktpd open pit mine for gold and silver oxide mineralization treated by heap leaching | |
| ● | Option 2: 60 ktpd open pit mine for gold and silver oxide mineralization treated by heap leaching and 27 ktpd open pit mine for gold and copper sulphide mineralization treated in a conventional concentrator plant | |
| ● | Option 3: 60 ktpd open pit mine for gold and silver oxide mineralization treated by heap leaching and 27 ktpd underground mine for gold and copper sulphide mineralization treated in a conventional concentrator plant. |
The secondary options considered were:
| ● | Option 4: 60 ktpd open pit mine for gold and silver oxide mineralization treated by heap leaching and 12 ktpd open pit mine for gold and copper sulphide mineralization treated in a conventional concentrator plant | |
| ● | Option 5: 27 ktpd underground mine for gold and copper sulphide mineralization treated in a conventional concentrator plant. |
In tabular format this is illustrated as follows:
37
| |
Table 2-1: Options Summary
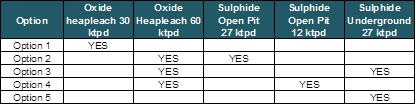
The economic analysis contained in the PEA is considered preliminary in nature. No inferred mineral resources form part of the PEA studies and no mineral reserves for the PEA have been established. Mineral resources are not mineral reserves and have no demonstrated economic viability. There is no certainty that economic forecasts outlined in the PEA will be realized. The PEA and the Cube 2012 Mineral Resource (as defined herein) may be materially affected by environmental, permitting, legal, title, taxation, socio-political, marketing or other relevant factors.
The 5 new options outlined within have been considered to PEA level only. The Caspiche gold / copper deposit is located in the Atacama Region of Chile and is wholly owned by Exeter Resource Corporation, a Canadian public company listed on the TSX and NYSE-MKT under the symbols XRC and XRA. This Technical Report has been prepared for Exeter by or under the supervision of Qualified Persons within the meaning of NI 43-101 in support of Exeter Resource’s disclosure of scientific and technical information for the Project. The principal consultants used in the preparation of this document are:
| ● | Alquimia Conceptos: | Engineering, infrastructure, costing and cash flow | |
| ● | Cube Consulting: | Geology, database, resource estimate and associated topics | |
| ● | NCL Ingeniería y Construcción: | Mine Design and Production Planning | |
| ● | AKL Ingeniería y Geomecánica: | Geotechnical revision | |
| ● | Arcadis: | Environmental base line studies. |
| 2.2 | Frequently Used Acronyms, Abbreviations, Definitions, and Units of Measurement |
All units in this report are based on the International System of Units (“SI”), except industry standard units, such as troy ounces for the mass of precious metals. All currency values are in United States Dollars (“USD” or “$”) unless otherwise stated.
38
| |
This report uses abbreviations and acronyms common within the minerals industry.
Table 2-2 and Table 2-3 respectively identify the terms, abbreviations and units of measurement used in this Report.
Table 2-2: Technical Terms and Abbreviations
39
| |
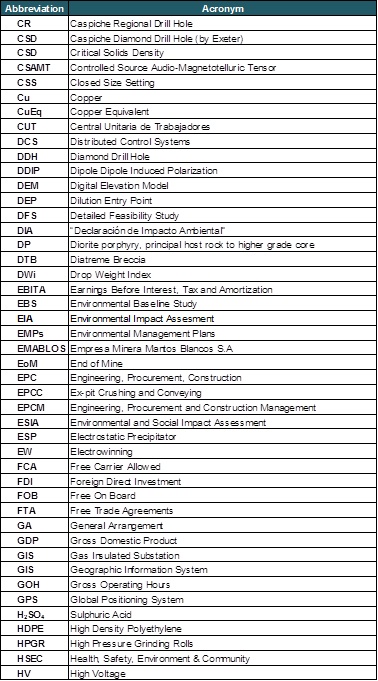
40
| |
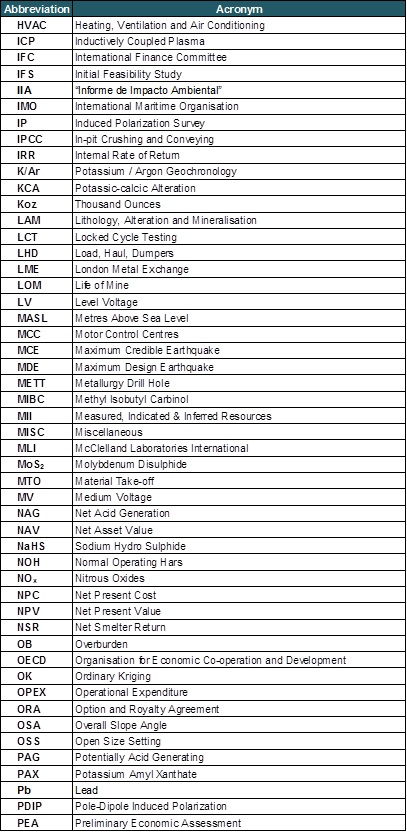
41
| |
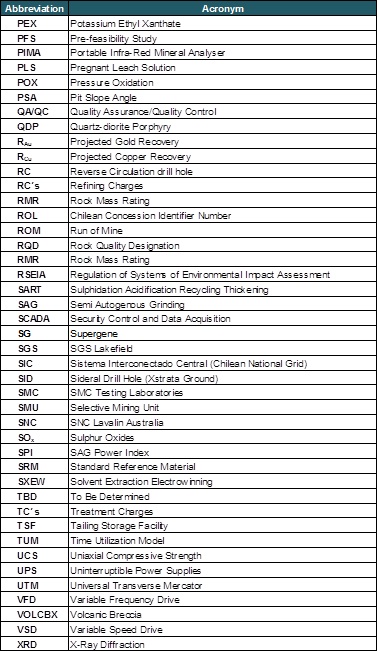
42
| |
Table 2-3: Units of Measurement
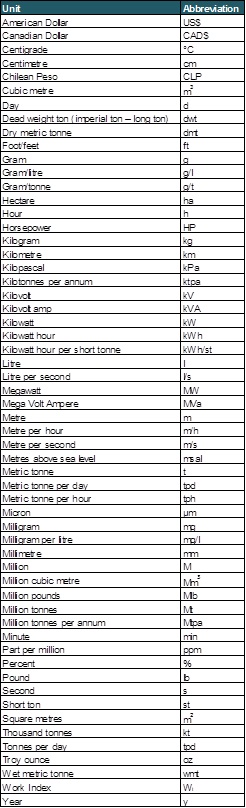
43
| |
2.3 | PEA Effective Dates |
The Effective Date of this report is taken to be the date of the completion of the financial model for the Project on April 30, 2014. The dates for critical information used in this report are:
| ● | The Mineral Resource Estimate and block model were completed on April 11, 2012. | |
| ● | The final PEA mine plans were issued on March 15, 2014. | |
| ● | PEA Mineral process engineering and capital cost estimate were completed on April 10, 2014. | |
| ● | The current personal inspection and site visit undertaken by all Qualified Persons was completed on April 12, 2011 and October 23, 2013. |
There were no material changes to the scientific and technical information of the Project between the Effective Date and signature date of the Report.
44
| |
| 3 | RELIANCE ON OTHER EXPERTS |
| 3.1 | Other Independent Expert Persons |
The reader is directed to the caution regarding forward information statement in Section 1.2 of this Technical Report.
The authors of this Technical Report are not qualified to provide extensive comment on legal issues associated with the Property. For portions of Section 4 dealing with the types and numbers of mineral tenures and licenses, the nature and extent of Exeter’s title and interest in the Property, the terms of any royalties, back-in rights, payments or other agreements and encumbrances to which the Project is subject, Alquimia relied on the legal opinion of Mr. Pablo Mir of Bofill Mir Abogados.
45
| |
| 4 | PROPERTY DESCRIPTION AND LOCATION |
This description of the property was modified from Van Kerkvoort et al. (2008).
| 4.1 | Location |
The Caspiche property is located 120 km ESE of Copiapó in the Atacama region of Chile (Figure 4-1). The property is situated at the southern end of the Maricunga metallogenic belt, between the undeveloped Cerro Casale gold-copper project 12 km to the south, and the operating Maricunga Gold Mine, 15 km to the north.

Figure 4-1: Caspiche Location Map (Source: Exeter, 2013)
46
| |
The geographic centre of the property is located at approximately 27° 41’ south latitude and 69° 18’ west longitude (UTM Zone 19J, Geodesic system). Coordinates using datum PSAD56 are 471,000 m east and 6,937,000 m north (UTM Zone 19S, Cartesian system). Known mineralization on the Caspiche property is located in two areas: Caspiche Porphyry and Caspiche Epithermals as shown in Figure 4-3. Caspiche Porphyry has been referred to as Caspiche Central in previous Technical Reports. The Caspiche Epithermals has been referred to as Caspiche III in previous Technical Reports.
The total concession areas controlled by Exeter are shown in Figure 4-2 and the specific concession areas are presented in Figure 4-3 to Figure 4-7.
All concessions shown in Figure 4-3 represent those where Exeter has the earliest dated concession and can exercise exclusive exploration and exploitation rights over the illustrated areas. The total concession area covered by mineral rights owned by Exeter is 15,124 ha.
| 4.2 | Mineral Tenure and Agreements |
Chile is a country with a stable mining industry with mature mining laws. There are two types of mining concessions in Chile, exploration concessions and exploitation concessions.
With exploration concessions, the titleholder has the right to carry out all types of exploration activities within the area of the concession. Exploration concessions can overlap, but only the titleholder with the earliest dated exploration concession over the area as indicated by their identification (ROL10) number, can exercise these rights. For each exploration concession, the titleholder must pay an annual fee per hectare to the Chilean Treasury. Exploration concessions have duration of two years. At the end of this period, the concession may be renewed for 2 more years, in which case at least 50% of the surface area must be renounced; or converted, in total or in part, into exploitation concessions.
With exploitation concessions, the titleholder has the right to explore and exploit the minerals located within the concession area and to take ownership of the extracted minerals. Exploitation concessions can overlap, but only the titleholder with the earliest dated exploitation concession over the area can exercise these rights.
The titleholder must pay an annual fee to the Chilean Treasury of approximately 5.80 USD/ha. Exploitation concessions are of indefinite duration.
Concession owners do not necessarily have surface rights to the underlying land; however, they do have the right to explore or exploit the concession.
47
| |
4.2.1 | Mineral Rights |
The Caspiche property is 100% owned by Exeter Resource Corporation. Anglo American Norte S.A. (Anglo), formerly Minera Anglo American Chile Limitada and its affiliate Empresa Minera Mantos Blancos S.A. (EMABLOS) retains a 3% Net Smelter Royalty (NSR) on production from the project under the terms of the Purchase and Sale of Mining Claims agreement and retains the right to repurchase the mineral properties for the agreed expenditures that Exeter has incurred on the property in the event that commercial production has not commenced by March 31, 2026. In addition to the EMBALOS NSR, a private Chilean company holds a 0.08% NSR from production from the project.
48
| |
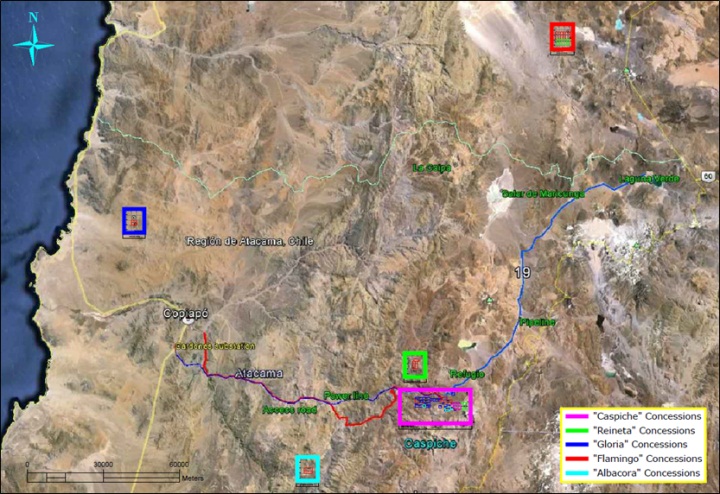
Figure 4-2: Property Map Showing All Exploration and Exploitation Concessions Controlled by Exeter (Source: Exeter, 2014)
49
| |
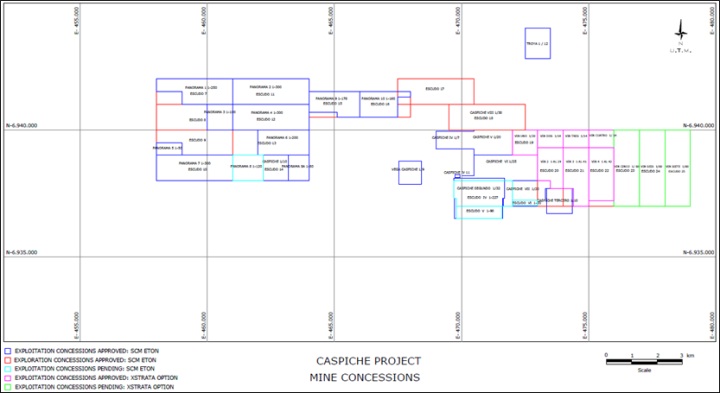
Figure 4-3: “Caspiche” Concessions Map Showing All Exploration and Exploitation Concessions Controlled by Exeter (Source: Exeter, 2013)
50
| |
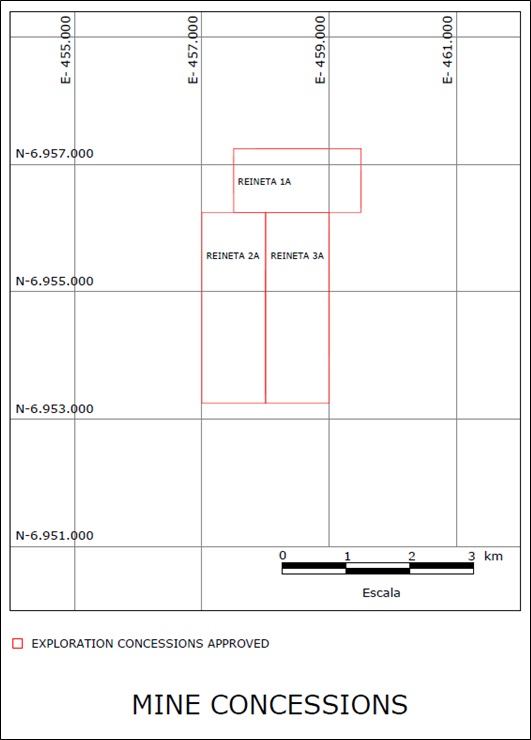
Figure 4-4: “Reineta” Concessions Map Showing All Exploration and Exploitation Concessions Controlled by Exeter (Source: Exeter, 2013)
51
| |

Figure 4-5: “Gloria” Concessions Map Showing All Exploration and Exploitation Concessions Controlled by Exeter (Source: Exeter, 2013)
52
| |

Figure 4-6: “Flamingo” Concessions Map Showing All Exploration and Exploitation Concessions Controlled by Exeter (Source: Exeter, 2013)
53
| |
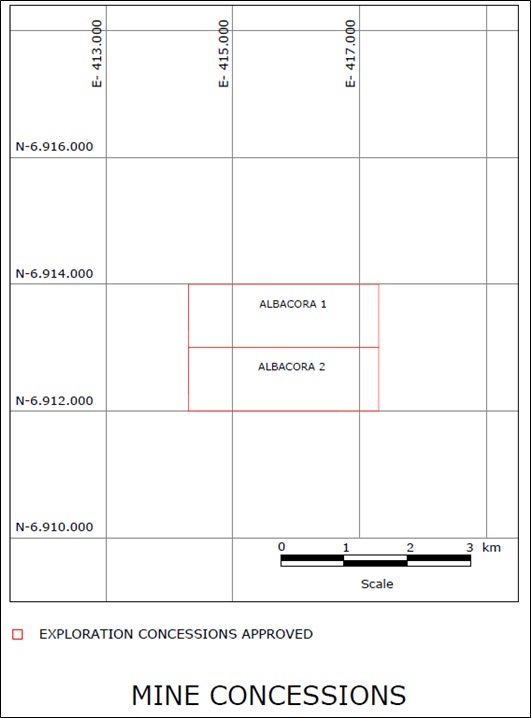
Figure 4-7: “Albacora” Concessions Map Showing All Exploration and Exploitation Concessions Controlled by Exeter (Source: Exeter, 2013)
At the effective date of this report, the Caspiche property consists of twenty eight mining exploitation concessions totalling 4,467 ha. The granted mining exploitation concessions are listed in Table 4-1 and those under application are listed in Table 4-2.
54
| |
Table 4-1: Exeter Caspiche Mining Exploitation Concessions - Granted
| Concession Name | ROL | Hectares | Claim Order | Concession Type |
| Caspiche 1 al 10 | 03203-1455-0 | 100 | SCM Eton Chile | Exploitation |
| Caspiche Segundo 1 al 32 | 03203-1494-1 | 312 | SCM Eton Chile | Exploitation |
| Vega de Caspiche 1 al 9 | 03203-1493-3 | 81 | SCM Eton Chile | Exploitation |
| Caspiche Tercero 1 al 10 | 03203-1495-k | 100 | SCM Eton Chile | Exploitation |
| Caspiche IV 1 al 7 | 03203-4659-2 | 70 | SCM Eton Chile | Exploitation |
| Caspiche V 1 al 20 | 03203-4660-6 | 185 | SCM Eton Chile | Exploitation |
| Caspiche VI 1 al 25 | 03203-4661-4 | 243 | SCM Eton Chile | Exploitation |
| Caspiche VII 1 al 20 | 03203-4662-2 | 169 | SCM Eton Chile | Exploitation |
| Caspiche VIII 1/30 | 03203-6117-6 | 300 | SCM Eton Chile | Exploitation |
| Caspiche IV 11 | 03203-4727-0 | 2 | SCM Eton Chile | Exploitation |
| Troya 1 al 12 | 03203-1856-4 | 120 | SCM Eton Chile | Exploitation |
| Panorama 1 1/250 | 03203-6292-K | 250 | SCM Eton Chile | Exploitation |
| Panorama 2 1/300 | 03203-6293-8 | 300 | SCM Eton Chile | Exploitation |
| Panorama 3 1/100 | 03203-6294-6 | 100 | SCM Eton Chile | Exploitation |
| Panorama 4 1/300 | 03203-6295-4 | 300 | SCM Eton Chile | Exploitation |
| Panorama 5 1/50 | 03203-6296-2 | 50 | SCM Eton Chile | Exploitation |
| Panorama 6 1/200 | 03203-6297-0 | 200 | SCM Eton Chile | Exploitation |
| Panorama 7 1/300 | 03203-6298-9 | 300 | SCM Eton Chile | Exploitation |
| Panorama 9 1/178 | 03203-6300-4 | 178 | SCM Eton Chile | Exploitation |
| Panorama 10 1/160 | 03203-6301-2 | 160 | SCM Eton Chile | Exploitation |
| Panorama 8A 1/80 | 03203-6302-0 | 80 | SCM Eton Chile | Exploitation |
| Vin Uno 1 al 20 | 03203-6259-8 | 100 | Xstrata | Exploitation |
| Vin Dos 1 al 14 | 03203-6260-1 | 70 | Xstrata | Exploitation |
| Vin Tres 1 al 14 | 03203-6261-K | 70 | Xstrata | Exploitation |
| Vin Cuatro 1 al 14 | 03203-6262-8 | 70 | Xstrata | Exploitation |
| Vin Dos 1 al 29 | 03203-5685-7 | 145 | Xstrata | Exploitation |
| Vin Tres 1 al 41 | 03203-5686-5 | 202 | Xstrata | Exploitation |
| Vin Cuatro 1 al 42 | 03203-5687-3 | 210 | Xstrata | Exploitation |
| TOTAL | 4,467 | |||
55
| |
Table 4-2: Exeter Caspiche Exploitation Concessions - In Application
| Concession Name | ROL1 | Hectares | Claim Order | Concession Type |
| Escudo IV 1/240 red. 1/227 | 03203-5923-6 | 227 | SCM Eton Chile | Exploitation in application |
| Escudo V 1/240 red. 1/90 | 03203-5924-4 | 90 | SCM Eton Chile | Exploitation in application |
| Escudo VI 1/100 red. 1/20 | 03203-5925-2 | 20 | SCM Eton Chile | Exploitation in application |
| Panorama 8 1/300 red. 1/120 | 03203-6299-7 | 120 | SCM Eton Chile | Exploitation in application |
| Vin Cinco 1 al 60 | 03203-6263-6 | 300 | Xstrata | Exploitation in application |
| Vin Seis 1 al 60 | 03203-6264-4 | 300 | Xstrata | Exploitation in application |
| Vin Siete 1 al 60 | 03203-6265-2 | 300 | Xstrata | Exploitation in application |
| TOTAL | 1,357 | |||
The Caspiche exploitation concessions do not have expiration dates, and are in good standing as of the effective date of this report. Exeter paid the annual license fee for the Caspiche concessions for the period 2013 to 2014 and Exeter expects to make payments required to maintain the properties in good standing for the foreseeable future. No encumbrances are registered on the concessions and they are subject only to the 3% Anglo NSR and an additional 0.08% NSR to a third party Chilean company.
At the effective date of this report Exeter had been granted 34 mining exploration concessions over the original concessions, vacant ground and those of third parties, totalling 9,300 ha. These concessions are valid under Chilean law, but are considered junior to the Caspiche and third party concessions where they overlap. The concessions that overlap the Caspiche concessions were established by Exeter as a safeguard only. The Panorama and Bonanza series of concessions were established to allow for various infrastructure location scenarios. All granted mining exploration concessions are free of encumbrances and they are not affected by the payment of royalties or other obligations in favour of third parties. The granted Exeter mining exploration concessions are shown in Figure 4-3 and listed in Table 4-3.
56
| |
Table 4-3: Exeter Exploration Concessions - Granted

On March 4, 2011, Exeter entered into an option agreement with Xstrata Norte Exploraciones for their VIN properties located immediately east of the Exeter Caspiche licenses. The properties cover 1,767 ha and are shown in Figure 4-3. The agreement with Xstrata provides for Exeter to acquire 100% of the VIN properties by meeting escalating annual drilling requirements, to a total of 15,000 m, within 4 years. After the 15,000 m of drilling is completed, Xstrata has a once only back in right to acquire a 60% interest in the property, provided the discovery of a deposit of greater than 100 Mt at >0.5 % copper has been made. Should Xstrata elect to back in, it must pay Exeter three times its expenditure on the property. In the event that Xstrata does not exercise its back in right, its interest will revert to a 2% NSR. Exeter has the right to purchase 50% of the NSR for USD 10 million.
57
| |
The VIN exploitation concessions do not have expiration dates, and are in good standing as of the effective date of this report. Exeter will make all payments required to maintain the properties in good standing in 2013 - 2014. No encumbrances are registered on the concessions and they are subject only to the agreement with Xstrata as detailed above.
Figure 4-3 shows those Exeter concessions (including the Caspiche concessions and those held under the option agreement with Xstrata) in which Exeter holds the earliest dated concessions and controls exclusive rights to the mineral rights.
Table 4-4 shows the area of all exploration and exploitation concessions applied for and / or controlled by Exeter.
Table 4-4: Summary of Ground Covered by Exeter Mineral Properties and Details of Exeter Concessions which Overlap Caspiche and Third Party Concessions
| Concession Block | Hectares | |
| 1 | Total Exeter Caspiche concessions (includes Caspiche VIII) | 1,562 |
| 2 | Exeter Troya concession | 120 |
| 3 | 6,038 | |
| 4 | Xstrata concessions subject to option agreement with Exeter (less areas where Exeter has priority*) | 1,767 |
| 5 | Total Area Controlled By Exeter (1+2+3+4) | 9,487 |
| 6 | Total Area Of Exeter Concessions That Overlie Pre-existing Concessions | 5,637 |
| 4.2.2 | Agreements and Royalties |
On October 11, 2005, Exeter entered into an option and royalty agreement (ORA) with Anglo American Chile Limitada and EMABLOS. The ORA is subject to Chilean Law and any dispute resulting from the agreement will be resolved through arbitration by the Centro de Arbitrajes de la Cámara de Comercio de Santiago A.G.
The ORA covered seven projects, including Caspiche. According to the terms of the ORA, Exeter had the option to acquire a 100% interest in the property by meeting certain expenditure and drill requirements, as set out in Table 4-5.
As of March 2011, Exeter had fulfilled the total expenditure and drilling requirements for the full term of the ORA and in April 2011 Minera Eton Chile S.A. (“Eton”), Exeter’s local subsidiary, entered into an agreement (the “Purchase Agreement”) to exercise the option and purchase the Caspiche project from Anglo. The Purchase Agreement dated April 13, 2011, superseded and replaced the ORA, added additional tenure to the Caspiche property package and provided additional definition and details on the transaction.
58
| |
Table 4-5: Minimum Expenditures and Drilling Requirements under Exeter’s ORA with Anglo
| Year | Minimum Expenditure (USD) | Drilling Requirements (m) |
| 1 | 250,000 (spent) | 1,500 (completed) |
| 2 | 300,000 (spent) | 2,000 (completed) |
| 3 | 400,000 (spent) | 3,000 (completed) |
| 4 | 600,000 (spent) | 4,000 (completed) |
| 5 | 1,000,000 (spent) | 5,000 (completed) |
| TOTAL | 2,550,000 (spent) | 15,500 (completed) |
According to the Purchase Agreement, Anglo holds a royalty equal to a 3% NSR from the commencement of the commercial production of the Caspiche Project. An advance royalty payment of USD 250,000 is payable annually for the first 10 years to March 2021 and then USD 1 million per year through March 2026. These payments terminate upon the commencement of commercial production at Caspiche and the NSR becomes payable. The NSR is not payable in months when the gold price is below 325 USD/oz. If production from the property has not commenced within 15 years of exercising the option, Anglo has a right to buy the property back by paying Exeter’s agreed historical expenditures.
Exeter has paid the annual license fees for all concessions for the period 2013 to 2014.
Exeter relied on the opinion of Mr. Pablo Mir of Bofill Mir Abogados regarding the validity of the option agreement and the title of the optioned lands (Mir, 2013).
The property has been legally surveyed.
| 4.3 | Operational Permits and Jurisdictions |
| 4.3.1 | Environmental Permits |
On March 6, 2009 Exeter’s DIA (Environmental Impact Declaration) was approved allowing the Company to undertake future exploration activities. All drilling activities at Caspiche have been permitted through the approved DIA. No additional permits are required for exploration activities at Caspiche. Additional permits will be required for the exploitation of the Caspiche orebody. There are no further environmental liabilities known for the project at this time.
| 4.3.2 | Surface and Land Rights |
In accordance with that set forth in the Chilean Mining Code any titleholder of a mining concession, whether for exploration or exploitation, shall have the right to establish an occupation easement over the surface land as required for the comfortable exploration or exploitation of its concession. In the event that the surface property owner is not agreeable to grant the easement voluntarily, the titleholder of the mining concession may request said easement before the Courts of Justice who shall grant it upon determination of the compensation for losses as deemed fit.
59
| |
On March 15, 2011, Exeter’s local subsidiary, Eton, was granted an occupation easement over an area of 1.77 ha where the project camp was located. The initial duration of this easement was three years with a further, once only, extension of three years. According to this contract, Exeter must pay a mutually agreed amount every three months.
On June 16, 2011, the Ministry of Public Property (Ministerio de Bienes Nacionales) granted Exeter a lease over an area of 1,313 ha in the area of the Caspiche project. The duration of the initial contract is five years from May 3, 2011 and is renewable thereafter. An annual rental payment is paid quarterly by Exeter.
On June 10, 2013, Exeter’s application for additional surface rights, referred to in Chile as a surface land use easement (“Easement”), was granted by the Ministry of Public Property (Ministerio de Bienes Nacionales). This extends the easement area to cover most of Exeter’s additional tenements as well as surface area that may be required for Caspiche development. This Easement secures the right to carry out work and install all of the infrastructure and surface modifications required for the potential development of a mining operation, including roads, excavations, stockpiles, buildings, pipelines, power lines, tailings storage facilities and the like. In consideration for securing the Easement, Exeter made an initial payment of US$1.5 million and is required to make annual payments through to 2022 to maintain the Easement which is valid for 25 years. The Easement excludes specific surface rights in areas owned by the indigenous community, the Comunidad Colla Rio Jorquera y sus afluentes (CCRJ). Exeter has an access agreement with CCRJ and expects to maintain a good relationship, including open communications with the CCRJ and other indigenous communities in the Maricunga area. The Easement is currently the subject a court claim challenging the Chilean Government’s grant of the Easement. The claim, filed before the Santiago Civil Court, was filed by a private Chilean mineral exploration company, Cerro del Medio. Under Chilean mining law there are provisions which provide for securing necessary surface access for the development of mineral deposits. Cerro del Medio’s claim, cites “non-compliance by the Chilean Government of certain legal formalities required to approve the easement” and “that the easement granted overlaps Cerro del Medio’s Santa Cecilia project mining properties”. A review of the claim by Eton Chile’s Chilean legal counsel has concluded that Cerro del Medio’s claim has no grounds under Chilean law and should be rejected.
Figure 4-8 shows a plan of the granted surface rights (Easement) for the Caspiche Project.
60
| |
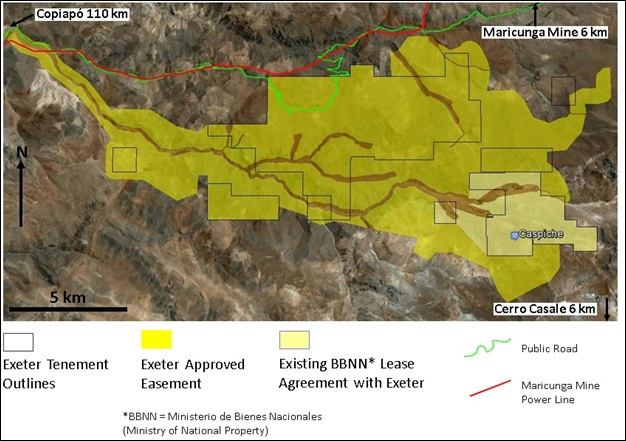
Figure 4-8: Extended Surface Rights Caspiche Project (Exeter 2013)
| 4.3.3 | Water Use Rights |
Cuenca One
In March 2013 Exeter announced that it had completed its first water exploration drill hole to test a potential aquifer located within the Cuenca One tenement. Water was encountered in drilling and preliminary air lift tests were conducted to establish the initial characteristics and significance of the water encountered.
A second exploration drill hole sited approximately 1,200 m northwest of the first drill hole, encountered similar lithologies and good quality water. Air lift tests completed on this hole returned water flows similar to the first drill hole. The water levels in each of the holes returned to original levels within minutes of the termination of the air lift tests, suggesting the potential for positive recharge within the aquifer.
Eton has applied for new water exploration rights to the area and is awaiting approval. Should the Company secure new water exploration rights, data will be evaluated to determine potential size, continuity and transmissivity of the aquifer ahead of a decision to conduct further drilling.
61
| |
Program for 2013/2014 Season
The objective of Exeter’s current water program is to identify, evaluate, and secure water sources to support a potential initial heap leach gold stage and a follow-on gold-copper sulphide stage of mining at Caspiche. Preliminary, internal studies relating to developing Caspiche as a smaller scale, staged mine indicate potential for a significantly lower water requirement.
On June 3, 2013 Exeter’s Chilean subsidiary, Eton, entered into a joint venture agreement (JV) with Minera Atacama Pacific Gold Limitada (“MAPG”), the Chilean subsidiary of Canadian company Atacama Pacific Gold Corporation (“Atacama”). The JV, which was subsequently amended on 27 February, 2014 covers the potential exploration for subsurface water associated with granted tenements, Cuenca Two and in the Peñas Blancas area near Laguna Verde. This agreement allows Eton to earn up to an aggregate 90% interest in the concessions by incurring 90% of all expenditures relating to the exploration and potential development of water supply from JV areas. In addition, upon discovery and approval of water rights by the General Directorate of Water Resources (DGA), Eton will to pay Hydro Exploraciones SpA (a related company to MAPG) US$ 15,000 per litre for 40% of any DGA approved water rights to a maximum of US$1.0 million.
62
| |
| 5 | ACCESSIBILITY, CLIMATE, LOCAL RESOURCES, INFRASTRUCTURE AND PHYSIOGRAPHY |
| 5.1 | Accessibility |
Access to the project is by 183 km of paved and gravel road from Copiapó. The initial 22 km running south from Copiapó through the town of Tierra Amarilla is paved highway which connects to a 161 km treated gravel road that runs east-southeast to the project site (Ruta C-459). Currently, total driving time from Copiapó to site is approximately 3 hours. The main gravel road serves as a regional transportation route to Argentina and is gradually being upgraded. This route also serves the nearby Maricunga Gold Mine (Kinross Gold Corp.) and Cerro Casale gold-copper project (Kinross Gold Corp. and Barrick Gold Corp.). From this road, several access alternatives exist to the project and other additional access options have been identified if required, this is presented in Figure 5-1.
Copiapó is the administrative capital of Chile’s Atacama Region and has a population of approximately 130,000 people. It has a long history as a mining centre with excellent mine support infrastructure and also has a significant agricultural industry based on fruit production. Copiapó is situated on national Ruta 5 which forms part of the continental Pan-American Highway. It is serviced by three Chilean airlines and has multiple daily services with Santiago and other regional centres.
| 5.2 | Climate |
The climate at Caspiche is typical for the central Andean Cordillera: windy, cold at night with limited precipitation, usually in the form of snow. Day-time temperatures in summer months approach 23 °C, with night-time lows of 5 °C. Day-time temperatures in winter are around freezing, with night-time temperatures dropping to -15 °C. Exploration field seasons generally run from late October through mid-May. Operating mines in the area, such as the nearby Maricunga Gold Mine, are operated year-round at elevations similar to Caspiche, at 4,200 to 4,500 m.a.s.l. Should Caspiche be developed, it is expected that the mine would be operated year-round. Exeter operates three automatic weather stations to monitor detailed climatic variations and this data is incorporated in environmental baseline studies.
| 5.3 | Local Resources |
There are no significant population centres in the immediate vicinity of the Caspiche project. There are a number of local communities who raise crops and livestock in areas of the valleys that drain the region. However there is a significant skilled and semi-skilled workforce in the Copiapó valley stretching from Tierra Amarilla to the north through Copiapó to Caldera on the coast and northwards to Antofagasta and beyond. Chile generally is an advanced country in terms of mining technology and infrastructure and supplies high quality mining professionals to other countries.
63
| |
The Copiapó River and its tributaries are the main source of drinking and industrial/agricultural water for the Region and its resources are currently fully exploited. New and developing mining projects are either planning to exploit high altitude Andean endorheic basins with no hydraulic connection to the Copiapó River, or raw or desalinated sea water.
All workforce transport is by private vehicles. Existing mines and exploration projects house their workers in fully serviced camps with workers travelling in and out on a roster system. Exeter will follow this procedure during construction and operation of Caspiche.
64
| |

Figure 5-1: Caspiche Location Map (Source: Exeter, 2013)
65
| |
| 5.4 | Current Infrastructure |
Caspiche is a green field site, and thus existing site infrastructure is limited to an exploration camp and roads.
The property is large enough to host an open pit or underground mining operation, although optimum locations for infrastructure may overlie third party mining claims. Concession owners have the right to establish an occupation easement over the surface as required for the comfortable exploration or exploitation of the concession.
On March 15, 2011, Exeter was granted an occupation easement over an area of 1.77 ha where the project camp was located. On June 16, 2011 the Ministry of Public Land of the Chilean government (Bienes Nacionales) granted Exeter a surface rights lease over an area of 1,313 ha in the area of the Caspiche project. The duration of the initial occupation easement and surface rights contract is three and five years respectively with both being renewable thereafter.
On June 10, 2013 the Chilean government granted approximately 9,600 ha surface land use easement to extend the area to cover future potential development of Caspiche. The easement specifically excludes surface rights in areas owned by the local indigenous communities. This easement is now also the subject of a court claim initiated by a local Chilean company challenging the Chilean governments granting of the easement.
Exeter is also completing production size drill holes at concessions in the Penas Blancas area where it has the option to acquire up to a 90% interest in any water discovered. It is anticipated that these initiatives could provide sufficient water for the proposed oxide development at Caspiche. In addition, initiatives are ongoing to outline additional sources of water.
Power for the existing projects in the Maricunga region is normally sourced from near Copiapó and carried to the mines by private power lines owned by the operating companies. Copiapó and the surrounding areas are serviced by an extensive power grid known as the Central Interconnected System, (SIC), which also services the main population centres around Santiago and further south. Plans are currently being implemented to considerably strengthen the power generation and distribution system in the region and are due to be completed in 2017. Exeter intends using on site power generation or extending the Maricunga line for the power supply for the heap leach power requirements and will then connect to the grid system should the sulphide project be developed.
| 5.4.1 | Physiography |
The Caspiche property is located high in the central Chilean Andes within the region commonly described as the Atacama Desert. The topography within the property is almost entirely volcanic in nature and consists of broad open areas of moderate relief and prominent ridges with limited cliff zones of exposed bedrock (Figure 5-2). The Caspiche property itself lies within the
66
| |
catchment of the Copiapó river tributary system, however a little further to the north-west an intermediate ridgeline and valley system closes the high Andean drainage resulting in a chain of endorheic saline lakes stretching considerable distances within the high Atacama region.
Elevation within the property ranges from 4,200 to 4,700 m.a.s.l. Vegetation is limited to grasses and small thorny bushes and small marsh areas at the junction of creeks. Wildlife includes guanaco, vicuña, foxes, rabbits, ground squirrels, hawks, condors and small reptiles.
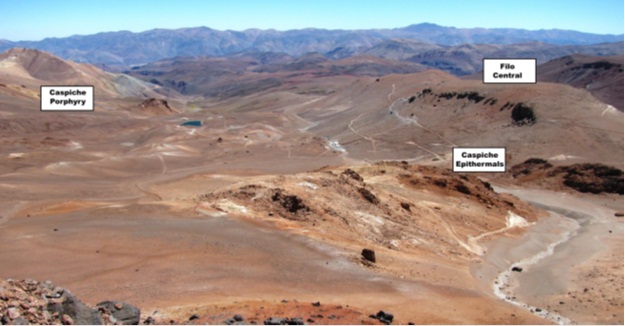
Figure 5-2: Photograph of Caspiche Property Looking West (Source: Exeter, 2013)
67
| |
| 6 | HISTORY |
The following project history was modified from Van Kerkvoort et al. (2008).
The southwest part of the property, which includes Caspiche Porphyry, was staked in 1986 by Anglo as part of a generative exploration program covering the entire Maricunga metallogenic belt. Newcrest held the project through an option agreement with Anglo from 1996 to 1998, during which time they discovered the Caspiche Epithermals mineralization and staked an additional 2,561 ha to cover it. Newcrest decided to abandon exploration in South America in 1998, and the ground held by Newcrest lapsed and became open. Anglo subsequently staked portions of this ground to form the current Caspiche property position.
Anglo was the first to explore the Caspiche area. Between 1986 and 1990, Anglo conducted three field campaigns on the property. The first campaign consisted of rock-chip and grid-soil geochemical surveys, where a total of 842 rock-chip samples and 431 soil samples were collected. These surveys identified a 650 m by 300 m zone of the Caspiche Porphyry area that was strongly anomalous at surface in gold, silver, copper, and arsenic. Eighty rock samples returned values greater than 1 g/t gold, with a high value of 5.45 g/t gold.
During the 1988 field season, Anglo drilled 568 m in 12 shallow air rotary holes in the Caspiche Porphyry sector. These drill holes targeted near-surface gold mineralization identified in hydrothermally altered volcanic rocks, and delineated by geochemical surveys. Drilling from this campaign intersected significant widths of mineralization in several holes, including 32 m grading 1.10 g/t gold in SHC-4 and 48 m grading 1.03 g/t gold in SHC-5.
During the 1990 season, Anglo drilled 950 m in six reverse circulation (RC) holes, exploring the Caspiche Porphyry gold system to greater depths. Results from this program yielded narrow intersections of gold mineralization, including 10 m grading 1.09 g/t gold in SPC-02 and 34 m grading 0.63 g/t gold in SPC-05.
During the first field season of the option in 1996-997, Newcrest conducted geological mapping, rock geochemical surveys, aeromagnetic and IP / resistivity geophysical surveys and drilled 3,298 m in 14 RC drill holes. Twelve holes were drilled at Caspiche Porphyry to follow-up disseminated mineralization discovered by Anglo and to test targets defined by the geochemical and geophysical surveys. Two holes were drilled in the Caspiche Epithermals area, targeting epithermal-style mineralization indicated by anomalous gold and mercury surface geochemistry.
During the 1997-1998 field season, Newcrest conducted soil geochemical surveys, geological investigations and drilled 4,123 m in 22 RC drill holes in the Caspiche Porphyry and Caspiche Epithermals prospect areas. Porphyry-style gold-copper mineralization was encountered in several of the drill holes at Caspiche Porphyry.
68
| |
Exeter optioned the property in October 2005. No significant exploration work was reportedly conducted on the property from the end of the Newcrest drill campaign until Exeter began work.
In 2006 and 2007, Exeter compiled historic exploration data into a geographic information system (GIS), reprocessed existing geophysical data, completed geological mapping of the property area, collected rock-chip samples and conducted controlled source audio-frequency magnetotellurics (CSAMT), pole-dipole induced polarization (PDIP), and natural source magnetotellurics geophysical surveys. In 2008 and 2009, Exeter completed property-scale geological mapping, a PIMATM (field portable, infrared spectrometer useful for mineral identification) study of drill core samples, a soil orientation survey over the Caspiche Porphyry area, a reinterpretation of the regional geophysical data and age dating work.
From 2006 through September 2011, Exeter completed over 66,000 m of drilling in 99 drill holes, mostly as deep diamond drill holes in the Caspiche Porphyry area. Other work conducted during this period included geological mapping of the surface of the property, geochemical and geophysical surveying to help guide exploration for additional intrusive centres, geotechnical logging and geomechanical testing of a significant number of oriented drill cores and metallurgical testwork to determine expected metallurgical recoveries and guide process design.
During the drill season between September 2011 to May 2012, Exeter completed 35 diamond holes for 8,666 m, including an extensive geotechnical program, metallurgical test holes and groundwater monitoring holes.
At the end of November 2012, a radiometrics and high resolution helicopter magnetic program was conducted at Panorama and over the Vin properties held under option from Xstrata by NewSense Geophysics Ltd.
69
| |
| 7 | GEOLOGICAL SETTING AND MINERALIZATION |
The following description of the regional geology was modified from Van Kerkvoort et al. (2008).
| 7.1 | Regional Geology |
The Caspiche property is located in the Maricunga metallogenic belt, a north-northeast trending linear zone containing at least 14 occurrences of gold and / or silver mineralization between latitudes 26° and 28° S in the Andean Cordillera of northern Chile (Vila and Sillitoe, 1991; Figure 7-1).
The Maricunga belt consists of a series of volcanoes of andesitic to dacitic composition as presented in Figure 7-2. These volcanoes are Oligocene to late Miocene in age and form part of the continental margin volcanic-plutonic arc. These volcanic rocks are generally restricted to north-south trending grabens, and Paleozoic to Triassic age basement rocks are exposed in intervening horst blocks. Volcanism occurred in four events grouped into two main episodes. The initial event began in late Oligocene and lasted until early Miocene age (26 to 20 Ma). The second occurred during the middle Miocene age (16 to 11 Ma). These events created numerous stratovolcanic complexes and dome fields over the length of the belt. The third and fourth episodes of dacitic volcanism occurred in the late Miocene age (11 to 7 Ma) and late Miocene to early Pliocene age (7 to 5 Ma), respectively, and included the formation of two pronounced volcanic edifices, Volcán Copiapó and Volcán Jotabeche shown in Figure 7-2.
Two main structural trends are important in the Maricunga belt. North-south to north-northeast trending high-angle reverse faults form a series of horsts and graben blocks. It is these graben structures that host significant west-northwest to north-northwest trending structures occurring as normal trans-tensional faults, dykes, veins and linear alteration zones, and are associated with alteration and mineralization in late Oligocene to early Miocene age volcanic centres.
The Maricunga belt hosts several significant mines and advanced projects. The deposits are typically of the porphyry gold-copper style or high sulphidation epithermal gold-silver. Examples of porphyry deposits in the Maricunga belt are the Maricunga mine, Cerro Casale, and Lobo Marte. High sulphidation examples include La Coipa and La Pepa. A strong northwest-southeast structural control to the mineralization is typical of many of the deposits. Some Maricunga deposits have epithermal alteration textures superimposed (telescoped) onto porphyry alteration textures. Figure 7-1 illustrates the regional geology of the Maricunga metallogenic belt.
70
| |
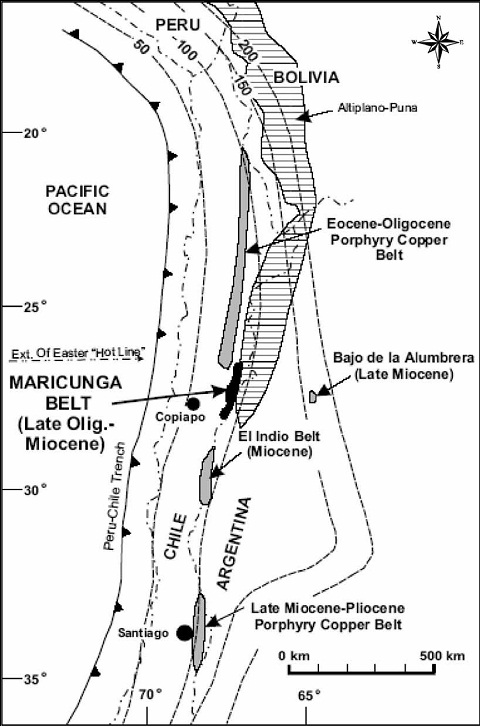
Figure 7-1: Metallogenic Belts of Northern Chile and Argentina (Source: Vila and Sillitoe, 1991)
71
| |

Figure 7-2: Regional Geology of the Maricunga Metallogenic Belt (Source: Vila and Sillitoe, 1991)
72
| |
| 7.2 | Local & Property Geology |
The following description of the property geology was modified from Tolman and Perkins (2010).
Figure 7-3, summarizes the bedrock geology of the Caspiche property, the black line indicates the outer boundary of the main property block. Figure 7-4 shows a representative geological cross-section of the Caspiche Porphyry deposit looking NNW.
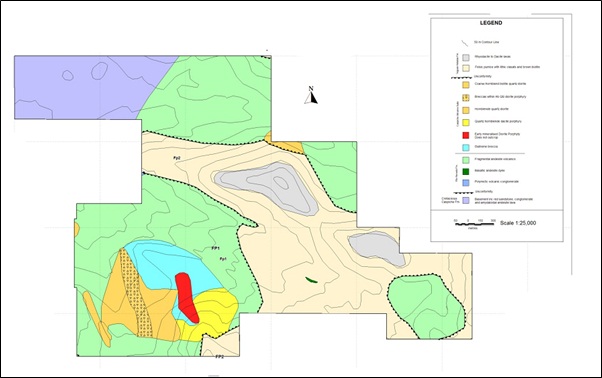
Figure 7-3: Bedrock Geology of the Caspiche Property (Source: Exeter, 2013)
73
| |
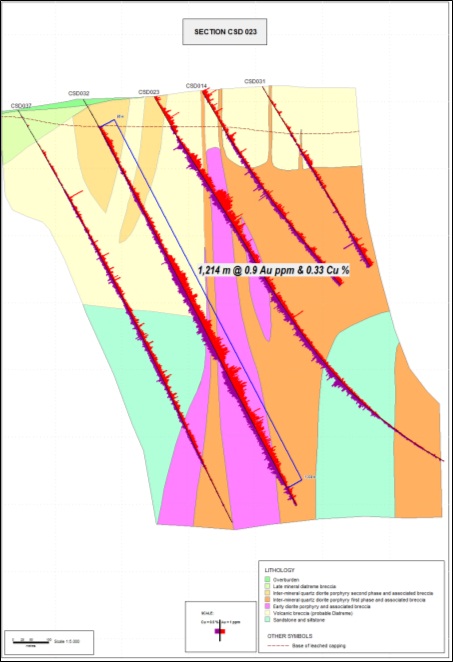
Figure 7-4: Gold Grade Histogram in Red, Copper Grade Histogram in Purple (Source: Exeter, 2013)
Drilling during the 2008-2009 and 2009-2010 campaigns led to an improved understanding of the alteration model at Caspiche Porphyry. The extent of late-stage advanced argillic alteration was confirmed, and the distribution of potassic alteration in the lower levels of the system was established. Supergene oxidation occurs dominantly as a flat lying blanket deepest in the central parts of the system. Vuggy quartz ledges intersected in the northern, eastern and southern part of Caspiche Porphyry are oxidized to depths of 150 to 200 m.
74
| |
Infill drilling during the 2010-2011 campaign has confirmed the veracity of the previously proposed Caspiche alteration and geological model and has provided an improved context for peripheral exploration. Interpretation of drill core by Exeter geologists and consultants, together with recent geological modelling and resource estimation has highlighted the following significant findings:
| · | The host rocks at depth surrounding the porphyritic intrusive rocks are flat lying, at least 700 m thick, and contain sedimentary breccia, andesitic volcanic rocks, and abundant sandstone and siltstone |
| · | The andesitic volcanic breccia is an important host to mineralization in the shallow parts of the Caspiche Porphyry deposit and is widely distributed in the immediate Caspiche area |
| · | Modelling of the porphyritic intrusives shows them to be a sigmoidal, Z-shaped body in which the early diorite porphyry phase is surrounded by a discontinuous shell of inter-mineral quartz diorite porphyry |
| · | The propylitic halo to the Caspiche Porphyry system has been intersected to the southwest about 600 m from the porphyry intrusive contact. Further definition of this halo at depth, below the overprinted advanced argillic zone, should effectively delimit the system |
| · | A potassic-calcic zone, defined by the presence of actinolite, K-feldspar and magnetite, occurs at depth in the centre of the system. It is sulphide deficient, and forms a base to the mineralised zone |
| · | An extensive zone of chlorite-sericite with and without albite alteration of siliciclastic sedimentary rocks appears to close off the system eastwards. However, a distal propylitic zone, like that defined previously to the west, has yet to be encountered |
| · | Deep drilling along the west side of the system demonstrated the existence of a 700 m thickness of monotonous, polymict breccia, thereby confirming that it must define a phreatomagmatic diatreme |
| · | The MacNeill gold-zinc zone, confined beneath the underside of the eastward-flared, late-mineral diatreme contact, is assigned an intermediate-sulphidation epithermal origin. It appears to be the product of the final mineralizing event in the Caspiche system, post-dating all alteration |
| · | The principal rock types defined at Caspiche are assigned to four broad units: pre-mineral sedimentary rocks, volcanic breccia of probable diatreme origin that also predates much of the mineralization, several porphyry intrusions, and a post-mineral diatreme breccia. |
75
| |
| 7.2.1 | Volcano-sedimentary Units |
The sedimentary rocks are separated by disconformities. These are informally divided into the pre-mineral Caspiche Formation of Jurassic to Cretaceous age; the pre to syn-mineral Rio Nevado Formation of Oligocene to Lower Miocene age; and the post-mineral Yeguas Heladas Formation of Middle to Upper Miocene age.
The Caspiche Formation is exposed at the western margin of the property and is shown in purple in Figure 7-3. It is composed of columnar jointed andesite lava flows. Approximately 1 km west of the property boundary, the lavas are viewed overlying a sedimentary sequence of rocks which range from volcanoclastic siltstones to sedimentary breccias.
The Rio Nevado Formation consists of undifferentiated felsic pyroclastic rocks. The sequence contains multiple volcanic events forming a volcanic pile that is a minimum of 200 m thick, shown in light green in Figure 7-3. At Caspiche Epithermals, to the east of the property, the formation is crudely stratified with shallow, west-dipping horizons several metres thick. The rocks range from fine tuffs to pyroclastic breccias. Locally, thinly laminated siltstone separates the pyroclastic horizons. On the northern flank of Caspiche Porphyry, the formation contains pumice-rich pyroclastic flows that are locally welded. The upper portion of the formation is composed of felsic, flow-banded, and auto-brecciated lava.
The Yeguas Heladas Formation consists of a series of stratified volcanic rocks that post-date alteration and mineralization, shown in tan and gray in Figure 7-3. This unit comprises a lower conglomerate horizon overlain by non-welded pyroclastic deposits that contain vuggy silica and massive silica-altered clasts of the Rio Nevado Formation. The youngest volcanic unit on the property is a glassy, porphyritic, flow-banded and auto-brecciated felsic lava.
Unconsolidated quaternary deposits cover over 90% of the Caspiche project area, and include debris flows, glacial moraines, colluvium, alluvium and “vegas” (local term for small wetlands that are common on valley floors in the Andes). Drilling indicates the quaternary cover can be up to 80 m thick. This not shown in Figure 7-3 in order to show the distribution of the bedrock units.
In the Caspiche Porphyry area, the sedimentary rocks surround the composite porphyry stockworks on all sides roughly 500 m to 750 m below the surface (3700 m to 3870 m elevation level). The rocks comprise a monotonous sequence of hornfelsed and highly-altered sandstones and siltstones that in places display no obvious textural variation over tens of metres; hence, their previous designation as microdiorite. Locally, however, relict bedding at high angles to the core axis is observed, confirming the sedimentary origin of the package, which exceeds 400 m in thickness. Minor bodies of probable andesite porphyry, characterized by centimetre-sized plagioclase phenocrysts in a black, fine-grained, and highly altered groundmass, cut the sedimentary rocks locally, particularly near their upper contact. The andesite porphyry bodies are clearly intrusive because of the presence of chilled margins, but it is uncertain if they represent sills, dykes, or both.
76
| |
The sedimentary rocks are overlain by 500 m to 750 m of volcanic breccia. The extent of this unit in the Caspiche Porphyry area is very extensive and has been noted over more than 1 km north-south and 3 km east-west. The breccia is polymictic and mainly composed of rounded to sub-angular clasts surrounded by a difficult to identify, highly altered, fine-grained, fragmental matrix. The clasts are typically between 1 cm and 3 cm in size, but locally up 10 cm. No evidence of bedding or size sorting has been observed. Intense alteration precludes certain identification of most clast lithologies, but the remnant textures and characteristic absence of magmatic quartz grains suggest that andesite, diorite and their porphyries predominate. Hornfelsed sedimentary rock and, very locally, andesite porphyry clasts are prominent in the breccia within a few metres of the contacts with these rock types. Although most clasts are internally homogeneous, recognition of veinlets confined in a minority of clasts is important, because it indicates hydrothermal activity occurred prior to breccia formation.
The origin of this volcanic breccia unit remains uncertain; however, it seems likely to be part of a large diatreme. The lack of bedding and size sorting over several hundred vertical metres would appear to preclude subaerial accumulation of the breccia. The presence of mineralized material in its clasts suggests that the diatreme was emplaced after the Caspiche porphyry system was initiated. It is unlikely that such material could have been transported from a distant volcano. Diatreme formation may even have aborted an early hydrothermal event at Caspiche. Previous interpretations centred the intrusive vent in the Caspiche Porphyry area, but the spacing of the drill pattern after the 2008-2009 drill programs effectively negated this possibility. Therefore, the vent is currently thought to lie beyond the core of the system, possibly to the north.
| 7.2.2 | Intrusive Rocks |
Exposed intrusive rocks at Caspiche are limited to a series of small felsic porphyritic stockworks located at Caspiche Porphyry that extend to the north and south. Locally, these exhibit chilled margins and flow banding. At depth at Caspiche Porphyry, two main porphyry intrusions constitute the well mineralized Caspiche stockwork, and a third porphyry intrusion abuts the Caspiche stockwork to the west and south. The two main porphyry intrusions are referred to as the Early Diorite Porphyry (DP) and the Early Inter-Mineral Porphyry (QDP1) and are interpreted to be early and early inter-mineral phases of the same intrusions. The third porphyry referred to as the Late Inter-Mineral Porphyry (QDP2) and is interpreted to be a late to inter-mineral phase.
The mineralized stockwork measures approximately 300 m by 400 m in plan, and does not vary appreciably in size over its defined 1200 m vertical extent. The DP appears to expand in size below the 3600 m elevation level, although it is intruded by a body of the Early Inter-Mineral Porphyry at this level. The bulk of the Early Inter-Mineral Porphyry lies east of the Early Diorite Porphyry, although a narrow, dyke-like body of Early Inter-Mineral Porphyry also follows the western side of the Early Diorite Porphyry. A fine-grained diorite porphyry occurs locally as a minor dyke within the mineralized stockworks, which it appears to post-date. The Late Inter-Mineral Porphyry is well-defined at shallow levels, where it constitutes a curved, body that wraps
77
| |
around and truncates the western and southern sides of the earlier intrusions. At depth, however, the Late Inter-Mineral Porphyry is appreciably smaller.
The Early Diorite Porphyry is considered dioritic in composition because of the lack of quartz phenocrysts. Plagioclase and biotite phenocrysts are abundant and accompanied by subordinate hornblende. The original texture of the Early Diorite Porphyry is partly obliterated by intense alteration and veining. Veining is dominated by an intense, multi-directional, A-type quartz-veinlet stockwork. Near the top of the intrusive body, this type of veining constitutes more than 50% of the rock mass. Magnetite-only and quartz-magnetite veinlets are also widely developed as part of the stockwork.
The inter-mineral phases are coarser-grained and texturally better preserved than the DP. The inter-mineral phases contain quartz phenocrysts, and thus are interpreted to be quartz diorite porphyries. The Late Inter-Mineral Porphyry is noticeably coarser-grained and contains larger quartz phenocrysts than the Early Inter-Mineral Porphyry. The Early Inter-Mineral Porphyry is cut by abundant, relatively narrow (<0.5 cm), A-type quartz veinlets, but truncates many of the quartz veinlets in the Early Diorite Porphyry, including all those with widths of 1-4 cm. Quartz veinlet xenoliths are commonplace in the Early Inter-Mineral Porphyry, especially near contacts with the Early Diorite Porphyry. In contrast, the Late Inter-Mineral Porphyry is only weakly veined and, in its western parts, displays low alteration intensity and preservation of magmatic biotite and magnetite.
| 7.2.3 | Structure |
Mapping of bedrock exposures indicates the main structural orientations at Caspiche to be northwest, east-northeast, and roughly north-south. These same orientations are observed as lineaments on Landsat satellite imagery and airborne magnetic imagery. Newcrest interpreted several of these lineaments to be major fault zones, including a west-northwest trending structure north of Caspiche Porphyry. Exeter found no clear evidence of this fault zone being a controlling feature in the field during geological mapping in 2009.
Several minor faults and breccia systems have been identified within the Caspiche prospect from drilling. Despite preliminary attempts, no compelling correlations have been drawn to map the existence of major late faults indicating significant offsets, with the exception of a single vertically dipping, structure orientated NW-SE on the north-eastern edge of the system beyond the mineralized envelope. Another significant zone of structural weaknesses lies on the western contact of the lower flange of the late diatreme where scouring from the diatreme has generated a zone of 3 to 4 m of finely ground rock with a sand size consistency.
The prior existence of major mantle tapping structures is evidenced by the emplacement of the cluster of westward younging porphyry intrusions. The emplacement of the porphyry bodies appears to have healed or closed the upper extremities of these structures and/or the potential
78
| |
trap site which halted the porphyry intrusions ascension towards the paleo surface at least in the area of the Caspiche prospect.
The broadly west younging porphyry association is attributed to progressive emplacement along the porphyry-sedimentary basement contact which would be the path of least lithostatic resistance to ascending magmas. Detailed checking of minor faults with consistent orientations between adjacent drillholes commonly shows different thicknesses, styles and fill mineralogy suggesting the correlation with consistent orientation may not imply connectivity. These can be interpreted to be related to secondary and tertiary fracturing of rock which remained unhealed during inter-mineral and late-mineral porphyry emplacement and brecciation.
| 7.2.4 | Alteration |
There are four end member alteration types noted on the Caspiche property:
| · | Porphyry style stockwork vein and associated alteration |
| · | Retrograde hydrothermal alteration |
| · | High sulphidation epithermal style alteration |
| · | Supergene leaching and oxidation. |
At Caspiche Porphyry, all four alteration styles are present. At Caspiche Epithermals no porphyry-style stockwork vein associated alteration has been observed, though it may be present at depth or laterally beneath cover.
Alteration is complex at Caspiche Porphyry. There are strong vertical controls, as well as proximal versus distal alteration mineralogy assemblages for the various styles. Pervasive overprinting by successive alteration events has frequently destroyed most primary textures, making identification of the original lithologies difficult. Porphyry stockwork style mineralization and associated alteration is not observed at surface, but has been intersected extensively in drill holes. The alteration comprises an inner potassic zone of potassium feldspar and biotite. These minerals are observed as independent zones and overlapping other alteration styles. Where unaffected by later alteration, magnetite as disseminations and hairline veinlets accompany the potassic alteration. Potassic alteration has a positive correlation with veining. Frequently potassium feldspar is observed as selvages on veins up to several centimetres wide which grades out into secondary biotite-dominated alteration. Biotite alteration is also developed in that portion of the Cretaceous Caspiche Formation basement that has undergone high temperature pro-grade hornfels contact metamorphism. In volcanic pendants immediately overlying the felsic stocks a strong patchy alteration is observed comprising irregular blebs of silica and clay. This has been described as a breccia, but can be traced laterally, where it grades into lithic tuffs. In some intrusive stockworks the upper cupola zone contains an intense “wormy” quartz texture. At deeper levels more typical A- and B-style porphyry stockwork veining is observed with late stage sulphidic D-veins cutting both the earlier quartz veining and extending into the overlying volcanic units.
79
| |
In some cases, propylitic alteration assemblages comprising epidote-chlorite-pyrite are observed in surface exposures within 1 km from the limits of potassic-altered zones, but generally propylitic alteration only occurs more distally. Propylitic-altered rocks have not been intersected to date on the western side of the system. The rocks between the potassic and propylitic alteration zones are variably clay-altered, but it is not certain if this is an argillic alteration halo related to the porphyry mineralizing event or if it is the result of the late-stage retrograde argillic-phyllic event.
A potassic-calcic zone, defined by the presence of actinolite, K-feldspar and magnetite, occurs at depth in the centre of the system, is sulphide deficient, and forms a base to the mineralised zone.
An intense retrograde argillic-phyllic (clay-sericite) alteration has affected the upper levels of the porphyry system, and locally extends deep within it. In the strongly-affected zones, the potassic alteration mineral assemblages have been completely overprinted with clay and philosilicate minerals, leaving zones of strong stockwork veining with a soft white “bleached” matrix. Potassium feldspar and biotite have been completely replaced. The contact between this zone and the underlying potassic alteration dips toward an apparent “draw-down” zone. The retrograde event has converted magnetite to specular hematite (martitization), but it does not appear to have affected the gold and copper distribution.
In some lithologies, and most notably in the lithic tuff unit, selective alteration of clasts to clay and matrix flooded with silica has produced patchy alteration giving the rock a brecciated appearance. A similar texture is observed proximal to intrusive contacts. This texture is thought to be the product of abundant xenoliths, or magma stopping.
The high-sulphidation epithermal zone is characterized by siliceous ridges which outcrop on the peripheries of the Caspiche Porphyry mineralization. The ridges comprise strongly silicified crystal-lithic tuff and quartz-feldspar porphyry. These units exhibit typical vuggy residual silica textures with rectangular cavities where feldspar phenocrysts have been totally leached from the rock and the matrix is replaced by silica. In the volcanic units, lithic clasts have been selectively dissolved or replaced by kaolin – alunite – quartz ± pyrophylite ± dickite assemblages. These zones are interpreted as high-level advanced argillic-altered silica cap zones. The silica caps contain structurally controlled tufasite breccia dykes with brecciated silica cap material hosted in a kaolin-silica-alunite matrix. These structural zones can be traced outward to adjacent argillic-altered areas where they are observed as linear zones of vuggy residual silica, or silica-ledges.
Oxidation and supergene effects are notable in the upper 100 m to 150 m and occasionally down to 200 m. The primary effect is the oxidation of pyrite, with the resultant acid conversion of minerals other than silica into kaolin. The contact between oxide and sulphide material is sharp.
80
| |
Minor chalcocite is observed on the oxide-sulphide contact, but there is no development of copper enrichment, presumably because copper-enriched solutions migrated laterally. Visually the contact is easy to pick and is geochemically sharp with a notable depletion in copper in the oxide zone to less than 0.03%.
Outcropping hydrothermal alteration at Caspiche Epithermals is developed entirely in felsic lithic tuffs of Rio Nevado Formation. Zoned alteration is observed with leached zones of residual silica restricted to narrow linear structures within more widespread silica flooding. At the eastern extent of the Caspiche Epithermals zone at the boundary of the property, the rocks are affected by low-temperature silica and argillic mineral assemblages that are characteristic of steam-heated alteration which forms above paleo-water tables in high-sulphidation-style alteration systems.
| 7.2.5 | Mineralization |
The following description of the mineralization was modified from Van Kerkvoort et al. (2008).
Mineralization has been encountered in two main areas of the Caspiche property. These two areas are called Caspiche Porphyry and Caspiche Epithermals.
All high-sulphidation epithermal, intermediate-sulphidation epithermal and porphyry-style mineralization occur at Caspiche Porphyry. High-sulphidation epithermal-style alteration outcrops at Caspiche Porphyry, and hosts disseminated gold in felsic volcanic rocks and dioritic to quartz dioritic quartz-feldspar porphyry intrusive rocks. Modelling of the mineralization indicates the presence of an upper gold-bearing oxide zone underlain by a lower gold-copper-bearing sulphide zone. Porphyry-style stockwork quartz veining, containing gold and copper mineralization, has been intersected over broad lengths in drill holes. Gold only mineralization from the MacNeill zone partially overprints and upgrades the western edge of porphyry style mineralization and is confined to the underside of the eastward-flared, late-mineral diatreme contact. No porphyry-style mineralization or intermediate-epithermal style mineralization has been observed at surface on the property. This is in part due to the extensive alluvium and colluvium which covers approximately 90% of the Caspiche property area.
Mineralization is hosted primarily by diorite porphyry and mineralized basement and andesitic volcanic rocks, covered by up to 60 m of alluvial waste. The upper 100 – 200 m below the surficial deposits is generally mineralized only in gold and low level silver, and the onset of copper mineralization generally coincides with the commencement of sulphide mineralization. No significant supergene oxide mineralization has been observed at Caspiche Porphyry. Mineralized intercepts in and around the diorite porphyry appear to have good continuity, and yield consistent intercepts of several hundred metres of porphyry-style, sulphide mineralization grading between 0.3 g/t and 1.0 g/t gold, and 0.1% and 0.4% copper. Near surface, oxide intercepts at Caspiche Porphyry generally range between 20 m and 200 m grading between 0.2 g/t and 1.2 g/t gold and <0.02% copper.
81
| |
At Caspiche Epithermals, only high-sulphidation epithermal style alteration and mineralization have been observed and intersected by drilling to date. Potential for porphyry-style mineralization at depth remains, because drilling to date at Caspiche Epithermals has mostly targeted near-surface high-sulphidation epithermal mineralization and thus reached only relatively shallow depths in most areas. One deeper drill hole completed in 2009 to the west of the system and an additional two deeper drillholes in the southern portion of the prospect failed to intersect intrusive rocks or proximal porphyry-style alteration and mineralization downgrading the potential for these areas.
82
| |
| 8 | DEPOSIT TYPES |
The following discussion of deposit types was modified from Van Kerkvoort et al. (2008).
Stockwork hosted, gold-copper porphyry, high-sulphidation epithermal gold mineralization and intermediate-sulphidation gold mineralization styles have been recognized on the Caspiche property. Mineralization at Caspiche Porphyry is interpreted as being a high-sulphidation epithermal gold deposit above a gold-rich, gold-copper porphyry deposit. The MacNeill zone, confined beneath the underside of the eastward-flared, late-mineral diatreme contact, is assigned an intermediate-sulphidation epithermal origin. This zone appears to be the product of the final mineralizing event in the Caspiche system, post-dating all alteration and partially overlapping Caspiche mineralization.
The Maricunga metallogenic belt contains significant gold-rich, gold-copper porphyry deposits, and high-sulphidation epithermal gold ± copper ± silver systems. In some cases the high-sulphidation epithermal systems are superimposed on the porphyry style mineralization. These deposit types are different from the copper-dominant, large porphyry copper deposits found further north in Chile.
Vila and Sillitoe (1991) described the style of mineralization in the Maricunga belt as follows:
Porphyry-type mineralization in the Maricunga belt was generated beneath andesitic-(dacitic) stratovolcanoes. Volcanic rocks were intruded by isolated, composite dioritic porphyry stocks. Weakly porphyritic microdiorite and associated intrusion breccia are prominent stock components.
Gold-copper mineralization is believed to have been introduced with K silicate alteration, which is well preserved only at the Amalia, Maricunga (Refugio), and Cerro Casale (Aldebarán) prospects. K silicate alteration is overprinted and commonly obliterated by sericite-clay-chlorite assemblages of intermediate argillic type. Much of the gold is present in quartz stockworks. Iron oxides, both early magnetite and late hematite, constitute 5 to 10 vol percent of mineralized zones. Sulphides are dominated completely by pyrite but include minor chalcopyrite and trace bornite and molybdenite. Supergene leaching of copper is developed to various degrees, but enrichment is developed only incipiently.
Several porphyry-type stockworks are overlain by pyrite and alunite-rich advanced argillic alteration, which carries barite, native sulphur, enargite, and at La Pepa, high-grade, vein-type gold mineralization of high sulphidation, epithermal type. The quartz stockworks and advanced argillic caps are telescoped at Marte, Valy, Santa Cecilia, and La Pepa but are separated by a chloritized zone transacted by a swarm of gold-poor, polymetallic veins with quartz-alunite selvages at Aldebarán.
83
| |
Marte and Lobo are rich in gold (1.43 and 1.6 ppm) and poor in copper (0.05 and 0.12%) and molybdenum (46 and ~10 ppm), and may be designated as porphyry gold deposits. However, gold contents are lower (0.6-1 ppm) and hypogene copper contents probably higher at Refugio and Aldebarán.
The depth of erosion of Maricunga porphyry-type systems is believed to decrease from the K silicate zones exposed at Maricunga (Refugio) and in the Casale Hill sector at Aldebarán, through Marte, Valy, Santa Cecilia, and La Pepa where remnants of advanced Argillic caps are present, to the highest, mercury-rich part of the Cathedral Peak sector at Aldebaran and zones higher than and west of Marte which comprise advanced argillic alteration rich in native sulphur.
Figure 8-1 presents a generalized porphyry model and the relationship between the porphyry and epithermal environments.
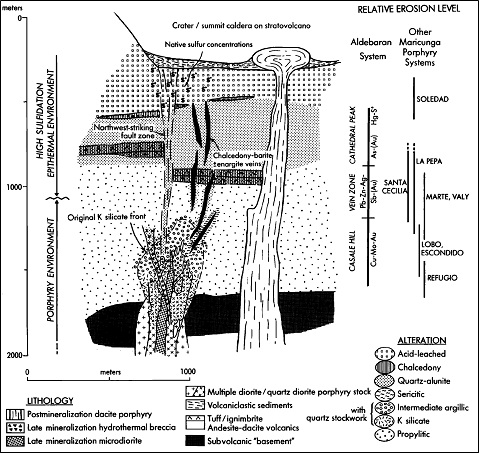
Figure 8-1: Generalized Porphyry Model (Source: Vila and Sillitoe, 1991)
84
| |
| 9 | EXPLORATION |
The Caspiche property has been explored by Anglo, Newcrest, and Exeter from 1986 to the effective date of this Technical Report. Exploration activities and results, organized by these companies, are presented in Table 9-1 through Table 9-4. Exploration work reported in previous Technical Reports is summarized in this Technical Report as is permitted under Instruction 1 of Form 43-101F1, for further detail see item 27, References.
Work covers all drilling and work on Caspiche. In the authors opinion the sampling methods used and sample quality are representative of the deposit and have no significant biases. For further detail see Item 11, Sample Preparation and Item 12, Data Verification of this report.
| 9.1 | Exeter (2005 – 2013) |
Exeter optioned the Caspiche property in October 2005, and has conducted geological mapping, geochemical sampling, geophysical surveying, and drilling programs through to the effective date of this report.
A total of 29,521 m from 43 drill holes were completed during the 2009-2010 season, and included drill holes CSD-041A to CSD-073 (excluding CSD-042, which was drilled during the 2008-2009 drill campaign), re-entry and deepening of CSD-016 and CSD-025, and RC holes CR-001 to CR-005. Exeter drilling during the 2009-2010 season was designed to raise the confidence of the existing mineral resource through infill drilling; continue to test the limits of mineralization, particularly to the southwest; and confirm the grade and thickness of near-surface legacy drill campaigns through twin drilling. The confirmation drill holes were drilled using PQ and HQ diameter core and were used to provide additional mineralized oxide material for metallurgical test work. All 2009-2010 drilling was completed in the Caspiche Porphyry area; no drilling was completed in the Caspiche Epithermals area. A summary of 2009-2010 drilling is presented in Item 10 of this report.
Other significant exploration work conducted during this period included refinement of the geological model from recent drilling, and an IP geophysical survey.
The interpretation of drill results from the 2009-2010 drill campaign by Exeter geologists, and geological work by consultant Dr. Dick Sillitoe in January 2010 resulted in a re-interpretation of some of the stratigraphic units that which led to a better understanding of the geological setting at Caspiche. Dr. Sillitoe conducted a complete review of the Caspiche Porphyry geological model and surrounding exploration potential. Dr. Sillitoe logged several of the 2009-2010 drill holes and updated several of his cross sections and level plans. All Exeter geologists participated in discussions and logging, to ensure consistency and robustness of the model.
A total of 11,353 m from 14 drill holes were completed during the 2010-2011 season, and included drill holes CSD-074 to CSD-081, METT01 to METT03 and SID01 to SID02.
85
| |
Approximately two-thirds of this program was dedicated to infill drilling at the Caspiche Porphyry designed to convert high-grade mineralization in the “Inferred” mineral resource category to “Indicated” or better (holes CSD074 to CSD079). Approximately 15% of this program was dedicated to metallurgical drilling at the Caspiche Porphyry for future testwork (holes METT01 to METT03) and the remainder was dedicated to “regional” drilling exploring for additional porphyry mineralization in the immediate vicinity of the Caspiche Epithermals and the Sideral prospect (CSD080, CSD082 and SID01 and SID02). A single regional exploration hole (CSD081) was drilled approximately 1 km north of the Caspiche Porphyry prospect. A summary of 2010-2011 drilling is presented in Item 10 of this report.
Additional work completed during the 2010-2011 campaign included extension of the Dipole Dipole Induced Polarization (DDIP) and Controlled Source Audio-Magnetotelluric Tensor (CSAMT) geophysical surveys to the east to cover the Sideral prospect. Some of the CSAMT data was later considered of poor quality and was rerun using a more powerful system in 2011. Geological, surficial and stratigraphic mapping to refine geological models was undertaken and recovery and size testing of a bulk sample of Caspiche oxide mineralization from three distinct pits where this material outcrops on the eastern edge of the oxide deposit was also collected.
All historical drilling and results from the 2009-2010 season and the majority of the 2010-2011 season was included in the estimation of resources for the Caspiche Porphyry project in August 2011 undertaken by AMEC International (Marinho, 2011).
Regional drilling failed to encounter mineralized intrusions or potentially economic porphyry style mineralization. Drilling in the Caspiche epithermals showed the presence of outer propylitic alteration below the advanced argillic blanket in the south of this prospect downgrading the exploration potential in this area. Some anomalous alteration and path finder minerals for epithermal systems were noted in the Sideral, this was followed up in 2011/2012 drilling one more hole in the northernmost part without significant results.
During the 2011-2012 drill season, a total of 35 diamond holes were drilled, this program had different purposes, the main being: to improve the category of the resources and for metallurgical and geotechnical data collection. All historical drilling and results, along with the majority of the 2011-2012 season was included in the estimation of an updated resource in April 2012 undertaken by Cube Consulting (Coupland, 2012).
The objective of the 6 holes drilled in the oxide zone (CSD083, CSD08, CSD086, CSD087, CSD088 and CSD089) was to provide drill core for metallurgical testing, and to determine the size of the rock fragmentation characteristics for mill feed purposes.
The CSD085 diamond hole was drilled in the sulphide zone to provide additional support to aid the conversion of Inferred Resources to indicate category and to test the depth of the mineralization.
86
| |
The holes CSD090, CSD091 and CSD092 were drilled to test for an extension of the McNeill mineralization zone to the north and to the south and to provide additional information to support the classification of the Resource to Indicated.
The remaining holes, CGT01 to CGT17 (including the extra CGT16A) correspond to the geotechnical program, METT04 to METT07 were for metallurgical testing and two more holes CSH02 and CSH03 (CSH01 wasn’t drilled) for groundwater monitoring.
A radiometric and high resolution helicopter magnetic program was carried out during November 2012 by NewSense Geophysics Ltd; this program covered the Panorama and Sideral tenements.
A summary of the exploration work completed by Exeter is provided in Table 9-1.
87
| |
Table 9-1: Summary of Exeter Exploration Programs on the Caspiche Property

88
| |
Table 9-2: Summary of Exeter Exploration Programs on the Caspiche Property (continuation)
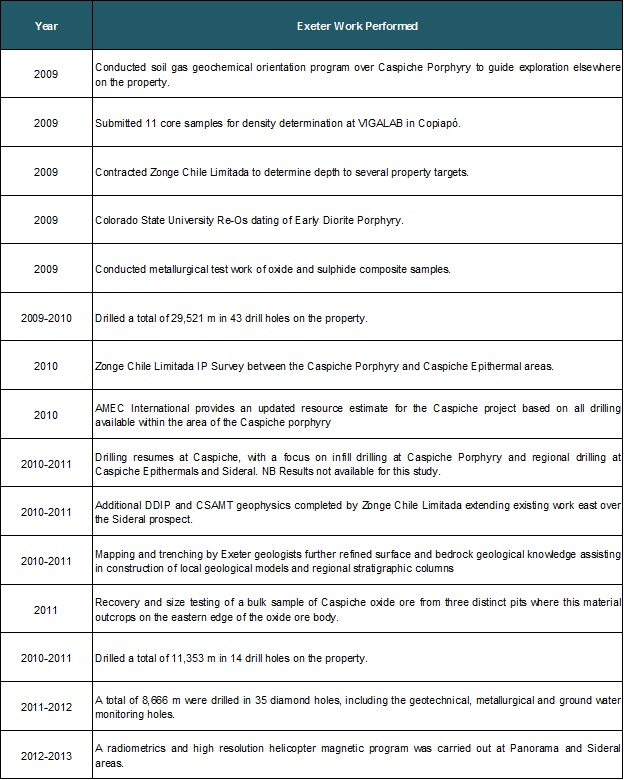
89
| |
| 9.2 | Newcrest (1996 – 1998) |
A summary of the exploration work completed by Newcrest is provided in Table 9-3.
Table 9-3: Summary of Newcrest Exploration Programs on the Caspiche Property
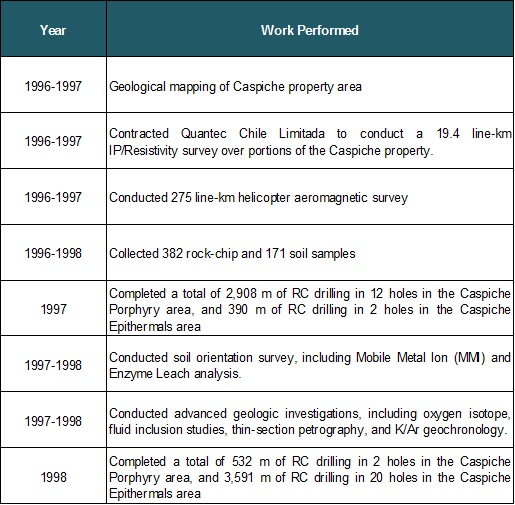
90
| |
| 9.3 | Anglo (1986 – 1990) |
A summary of the exploration work completed by Anglo is provided in Table 9-4.
Table 9-4: Summary of Anglo Exploration Programs on the Caspiche Property
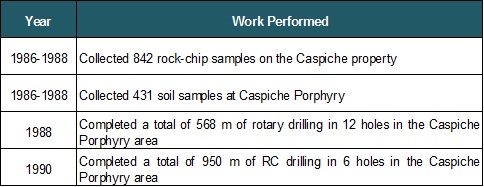
91
| |
| 10 | DRILLING |
A total of 79,960 m of drilling in 166 drill holes have been completed on the Caspiche property and adjacent areas by Exeter, Newcrest, and Anglo from 1988 to April 2012. Drilling is concentrated in two main areas of the Caspiche property: Caspiche Porphyry and Caspiche Epithermals.
Of the drill total, 116 holes totalling 67,124 m have been drilled at the Caspiche Porphyry prospect and 34 holes totalling 8,683 m have been drilled at the Caspiche Epithermals prospect. Table 10-1 summarises all Caspiche drilling by prospect, company and drilling type.
Table 10-1: Summary of Drilling on the Caspiche and Adjacent Properties
| Prospect | Company | RC/Rotary | Diamond Core12 | RC/Rotary + Core | % Total | |||
| # Holes | RC (m) | # Holes | Core (m) | Holes | Total (m) | |||
| Caspiche Porphyry | Anglo | 18 | 1,518 | 18 | 1,518 | 1.90% | ||
| Newcrest | 14 | 3,140 | 14 | 3,140 | 3.93% | |||
| Exeter | 6 | 1,290 | 78 | 61,176 | 84 | 62,466 | 78.12% | |
| Total | 38 | 5,948 | 78 | 61,176 | 116 | 67,124 | 83.95% | |
| Caspiche Epithermals | Anglo | 0.00% | ||||||
| Newcrest | 20 | 3,751 | 20 | 3,751 | 4.69% | |||
| Exeter | 14 | 4,932 | 14 | 4,932 | 6.17% | |||
| Total | 20 | 3,751 | 14 | 4,932 | 34 | 8,683 | 10.86% | |
| Sideral | Anglo | 0.00% | ||||||
| Newcrest | 2 | 230 | 2 | 230 | 0.29% | |||
| Exeter | 3 | 1,644 | 3 | 1,644 | 2.06% | |||
| Total | 2 | 230 | 3 | 1,644 | 5 | 1,874 | 2.34% | |
| Regional | Anglo | 0.00% | ||||||
| Newcrest | 1 | 300 | 1 | 300 | 0.38% | |||
| Exeter | 9 | 1,722 | 1 | 258 | 10 | 1,980 | 2.48% | |
| Total | 10 | 2,022 | 1 | 258 | 11 | 2,280 | 2.85% | |
| TOTAL | 70 | 11,951 | 96 | 68,009 | 166 | 79,960 | 100.00% | |
Operators have employed air-rotary, reverse circulation (RC), and diamond drilling (DD) methods on the property. Drilling at Caspiche Porphyry has been predominantly by diamond drilling methods, whereas drilling at Caspiche Epithermals has been predominantly by RC drilling methods.
92
| |
| 10.1 | Caspiche Porphyry |
A total of 67,124 m of drilling in 116 drill holes have been completed at Caspiche Porphyry (both oxide and sulphide sections). A summary of the drilling campaigns carried out at Caspiche Porphyry as of the effective date of this report are shown in Table 10-2.
Table 10-2: Summary of Drilling Campaigns at Caspiche Porphyry
| Campaign | Timeframe | Rotary Drill Holes | Rotary Drill Total (m) | RC Drill Holes | RC Drill Total (m) | Core Drill Holes | Core Drill13 Total (m) |
| Anglo | 1988 - 1990 | 12 | 568 | 6 | 950 | ||
| Newcrest | 1997 - 1998 | 14 | 3,140 | ||||
| Exeter | 2006 - 2011 | 6 | 1,290 | 67 | 56,843 | ||
| Exeter | 2011 - 2012 | 11 | 10,280 | ||||
| TOTAL | 12 | 568 | 26 | 5,380 | 78 | 67,124 | |
Figure 10-1 shows the spatial distribution of the drill holes from the different drill campaigns. Newcrest’s drill hole CDH-11 is located off Figure 10-1 about 1 km to the south-west and is considered as a regional exploration hole.
Anglo focused its drilling at Caspiche Porphyry on testing areas of surface high-sulphidation epithermal gold mineralization. In 1988, Anglo drilled a series of shallow, 50 m rotary drill holes around the prominent silica-altered hill on the north side of the property.
In 1990, Anglo drilled six RC holes with total depths between 150 m and 200 m to test the high-sulphidation epithermal system at depth, illustrated in Figure 10-1. Drill holes were mostly inclined between -60° and -70° and oriented to the northeast and southwest. Anglo intersected several zones of significant oxide mineralization, including 32 m grading 1.10 g/t gold and 4.3 g/t silver in drill hole SHC-4, and 48 m grading 1.03 g/t gold and 6.1 g/t silver in drill hole SHC-5.
Confirmation twin drilling of Anglo drilling, with two drill holes for 334 m, by Exeter in 2009-2010 revealed a slight high-bias, on average, in the Anglo gold assays; however, the thickness of the intercepts are approximately equal. Anglo copper assays are, on average, unbiased when compared to Exeter confirmation drilling intercepts. AMEC reviewed the results from the twinned holes and concluded that the Exeter drilling confirms the gold and copper grades and thickness of the Anglo near-surface drill intercepts, and the Anglo assay data are acceptable for use in mineral resource estimation (Wakefield and Marinho, 2010).
13 RC pre-collar drill lengths are included in the core drilling totals. Drill totals for Exeter campaigns are current as of the effective date of this report.
93
| |
Cube concurs with AMEC’s finding and supports the inclusion of the Anglo drilling in the current resource estimate.
Newcrest followed-up Anglo’s success at the prominent silica-altered hill with 12 drill holes in the 1996-1997 exploration season and two drill holes in the 1997-1998 season shown in Figure 10-1. Newcrest drill holes were mostly inclined between -60° and -80° and oriented to the northeast and south. Drill hole depth ranged between 80 m and 332 m and averaged 230 m also shown in Figure 10-1. In addition to confirming the presence of near-surface, oxide gold mineralization, Newcrest intersected several zones of sulphide, porphyry-style, gold-copper mineralization, including 120 m grading 0.51 g/t gold and 0.27% copper in drill hole CDH-2b, and 154 m grading 0.63 g/t gold and 0.24% copper in drill hole CDH-3.
Exeter drilled two confirmation twin holes of Newcrest drilling in 2009-2010. This drilling plus two twinned confirmation drill holes drilled during previous Exeter campaigns, show that no significant bias exists, on average, in the Newcrest gold assays, and that the thickness of the intercepts are approximately equal. Newcrest copper and silver assays are, on average, unbiased when compared to Exeter confirmation drilling intercepts. AMEC reviewed the results from the twinned holes and concluded that the Exeter drilling confirms the gold, copper, and silver grades and thickness of the Newcrest drill intercepts, and that these data are acceptable for unrestricted use in mineral resource estimation (Wakefield and Marinho, 2010). Cube concurs with AMEC’s finding and supports the inclusion of the Newcrest drilling in the current resource estimate.
Exeter first drilled the Caspiche Porphyry area with the last RC drill hole of the 2006-2007 season, CSR-13. Exeter drilling during the 2007-2008 season was aimed at following up the previous season’s intercept and drilling during the 2008-2009 season was designed to define the limits of the mineralized system. Exeter drilling during the 2009-2010 season was designed to raise the confidence of the existing mineral resource through infill drilling; continue to test the limits of mineralization, particularly to the south and west and confirm the grade and thickness of near-surface legacy drill campaigns through twin drilling. Four RC drill holes were completed on the property outside the Caspiche Porphyry and Caspiche Epithermals areas in an effort to identify vectors towards additional buried intrusive centres.
Exeter drilling during the 2010-2011 season was designed whereby approximately two-thirds of this program was dedicated to infill drilling at the Caspiche Porphyry designed to convert high-grade mineralization in the “Inferred” mineral resource category to “Indicated” or better. Approximately 15% of this program was dedicated to metallurgical drilling at the Caspiche Porphyry for future testwork and the remainder was dedicated to “regional” drilling exploring for additional porphyry mineralization in the immediate vicinity of the Caspiche Epithermals and the Sideral prospect.
94
| |
Exeter drill holes are generally inclined between -60° and -80° and oriented predominantly to the northeast and southwest. The last drill hole of the 2006-2007 drill campaign, drill hole CSR-013, intersected 304 m grading 0.90 g/t gold and 0.10% copper from a downhole depth of 40 m.
Significant intercepts returned from the 2007-2008 and 2008-2009 drill campaigns include drill hole CSD-016, which intersected 92 m of oxide mineralization grading 0.41 g/t gold, and 792 m of sulphide mineralization grading 0.96 g/t gold and 0.40% copper, drill hole CSD-028, which intersected 862 m of sulphide mineralization grading 0.54 g/t gold and 0.29% copper, and drill hole CSD-032, which intersected 1,214 m of sulphide mineralization grading 0.90 g/t gold and 0.33% copper.
Significant intercepts returned from the 2009-2010 drill campaign include drill hole CSD-043, which intersected 90 m of oxide mineralization grading 0.38 g/t gold, and 954 m of sulphide mineralization grading 0.65 g/t gold and 0.27% copper, and drill hole CSD-048, which intersected 94 m of oxide mineralization grading 0.49 g/t gold, and 830 m of sulphide mineralization grading 0.60 g/t gold and 0.24% copper.
Significant intercepts returned from the 2010-2011 drill campaign include CSD-074, which intersected 908 m grading 0.60 g/t gold and 0.22% copper, drill hole CSD-075, which intersected 572 m grading 0.78 g/t gold and 0.31% copper with the hole ending in sulphide mineralization, drill hole CSD-076, which intersected 1,146 m grading 0.38 g/t gold and 0.31% copper and drill hole CSD-078 which intersected 376 m grading 1.25 g/t gold and 0.40% copper.
Significant intercepts returned from the 2011-2012 drill campaign include CSD-084, which intersected 232 m grading 0.70 g/t gold but insignificant grades of copper, drill hole CSD-086, which intersected 120 m grading 0.62 g/t gold and 0.06% copper, drill hole CSD-088, which intersected 12 m grading 1.46 g/t with no copper, and 159 m grading 0.50 g/t gold with and 0.04% copper, finally drill hole CSD-089 which intersected 102 m grading 0.58 g/t gold and 0.13% copper.
95
| |
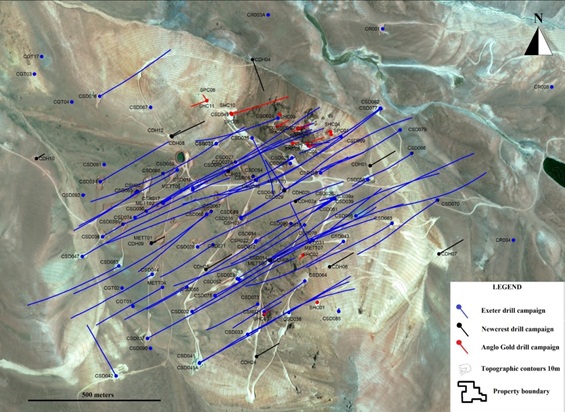
Figure 10-1: Drill Hole Location Map for the Caspiche Porphyry Prospect Area (Source: Exeter, 2013)
| 10.2 | Caspiche Epithermals |
A total of 8,683 m of RC and diamond drilling in 34 drill holes have been completed at Caspiche Epithermals. Drill results from mineralization at Caspiche Epithermals are not included in the Caspiche mineral resource estimate in this report.
| 10.3 | Exploration Drilling |
Exeter completed four RC exploration drill holes during the 2009-2010 drill program. These four holes were drilled to the northeast of the Caspiche Porphyry area and on the Vega de Caspiche 1/9 concession to the northwest of Caspiche Porphyry, and were aimed at discovering subtle geochemical and / or alteration vectors towards additional mineralized porphyry centres. No significant gold or copper mineralization was encountered in this drilling.
Exeter completed five regional DD exploration holes during the 2010-2011 drill programs. The aim of this drilling was to explore for additional porphyry mineralization in the immediate vicinity of the Caspiche Epithermals and Sideral prospects, these are identified as the SID series in Figure 10-2, and approximately 1 km north of the Caspiche Porphyry prospect. Regional drilling failed to encounter mineralized intrusions or potentially economic porphyry style mineralization. Drilling in the Caspiche Epithermals showed the presence of outer propylitic alteration below the
96
| |
advanced argillic blanket in the south of this prospect downgrading the exploration potential in this area. Some anomalous alteration and path finder minerals for epithermal systems were noted in the Sideral holes. This was followed up in 2011/2012 by drilling one more hole in the northernmost part without significant results.
Figure 10-2 shows the location of the exploration drill holes.
97
| |
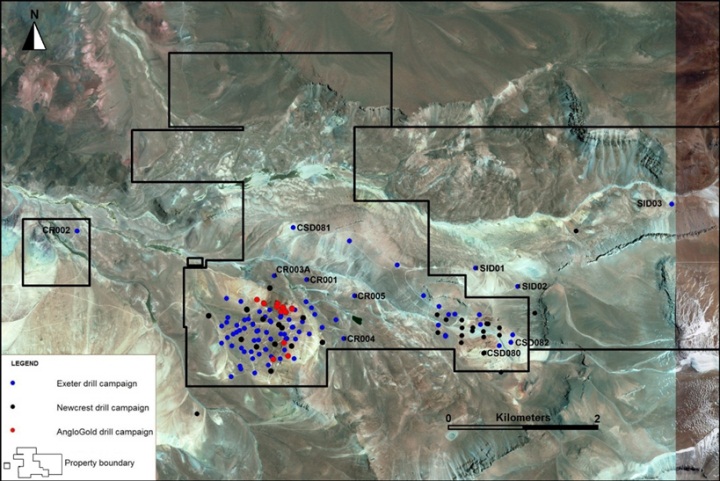
Figure 10-2: Regional Drill Hole Location Map Showing Location of Exploration Drill Holes (2009-2011) (Source: Exeter, 2013)
98
| |
| 10.4 | Drilling Procedures and Conditions |
| 10.4.1 | Exeter |
Exeter employs industry-standard RC and diamond drilling procedures. During the 2007-2008 Exeter drill campaign, diamond drilling was performed by Major Drilling Chile (Major) from La Serena, Chile. Drilling was supervised by experienced drilling supervisors, and used skid-mounted diamond drill rigs: a Major 50 and a Boyles 20. All core drilling employed triple tube, HQ3 (6.11 cm) diameter tools, reducing to NQ3 (4.50 cm) diameter when the rig reached the depth capacity of the HQ3 equipment. The majority of core holes were drilled using the Ballmark orientation equipment to provide accurate core orientations. RC drilling was performed by Soletanche Bachy Chile (Bachy) from Santiago, Chile, using an Ingersoll Rand TH75 E drill rig with an additional compressor and 5.125 in. tricone bits.
During the 2008-2009 drill campaign, diamond drilling was performed by Major using a Major 50 diamond drill rig and UDR1000 and UDR200 RC rigs. Diamond drilling was performed using HQ (6.35 cm) and NQ (4.76 cm) diameter tools.
Drilling during the 2009-2010 and 2010-2011 drill campaigns continued with Major and Boart Longyear drill rigs using HQ and NQ diameter tools.
During the last drill season 2011-2012, only Boart Longyear continued to complete the drill program ending May, NQ, HQ, and PQ (8.50 cm) diameters were used. The metallurgical drill holes used PQ and HQ diameter tools to provide larger diameter core for metallurgical testwork.
| 10.4.2 | Newcrest |
Newcrest RC drilling was performed by Bachy S.A. in 1997 and Ausdrill Chile Ltda. in 1998. Both drill programs used 5.5 in diameter down-the-hole hammer bits. Information available to Exeter regarding the drilling procedures employed by Newcrest is incomplete. AMEC (Wakefield and Marinho, 2010) considered it reasonable to believe that Newcrest used industry-standard RC drilling procedures during its drill campaigns at Caspiche.
Confirmation drilling by Exeter has confirmed the accuracy of the Newcrest mineralized intercepts, allowing them to be used in mineral resource estimation.
| 10.5 | Logging |
Exeter exploration staff log drill core at Exeter’s facility in Copiapó. Logging includes: lithology, pervasive and vein selvage alteration, veining description, classification and frequency measurements, oxidation and sulphide content. Detailed geotechnical logging is also performed and includes logging of core recovery, rock quality designation (RQD), fracture frequency, and rock mass rating (RMR) data. Point load testing is also carried out and calibrated against
99
| |
uniaxial compressive strength (UCS) measurements from external laboratories. The data are captured in palm-top computers using direct manual entry into Microsoft Excel spreadsheets.
RC drill cuttings are logged at the drill site in 1 m intervals. The paper logging sheet includes similar fields to those used for core logging, but also includes a column for sample moisture content. A spoonful of the washed chips is placed in the chip tray as a record of the logged interval.
Geological logs from Anglo drill holes are not available to Exeter.
| 10.6 | Surveys |
Exeter drill-collar locations are first estimated by Exeter personnel using a hand-held GPS, together with the distance from the nearest surveyed drill hole. Collar locations are then surveyed with a Leica TC 600 Total Station instrument by Mr. Luis Jorquera Galaz from Copiapó, Chile, a professional surveyor. Mr. Galaz has surveyed all drill hole collars on the property.
Downhole surveys for diamond drill holes are conducted by the drill contractor every 50 m down-hole using a Reflex EZ Shot digital down-hole camera. RC drill holes are surveyed down-hole within the drill steel by Exeter to determine the dip deviation. Azimuth data from the RC surveys are discarded.
In Cube’s opinion, the accuracy of the collar and down-hole surveys is adequate to support mineral resource estimation procedures.
| 10.7 | Drilling Results |
Drilling for the last three campaigns has been completed on a grid with an approximate drill collar spacing in the Caspiche Porphyry area based on a 200 m by 200 m staggered grid with a central drill hole, meaning at any point in the grid a collar should be located within 100 m of its neighbour. In practice, hole spacing is approximately 100 m between drill lines with closed fences of holes approximately 200 m apart. Dip and azimuth can vary between different sections. The average depth of drilling at Caspiche Porphyry is 586 m below surface. This average includes early Anglo drilling that averaged 84 m in total depth, and Newcrest drilling that averaged 229 m in total depth. Average depth of drilling by Exeter at Caspiche Porphyry is 748 m, and the deepest hole on the Property is 1,497 m.
A list of significant intercepts for the Caspiche Porphyry areas is provided in Table 10-3. Intercepts are cut at the oxide / sulphide contact and reported separately to show the relative thickness and mineralization within these two distinct zones.
100
| |
Table 10-3: Significant Intercepts for the Caspiche Porphyry Prospect Area
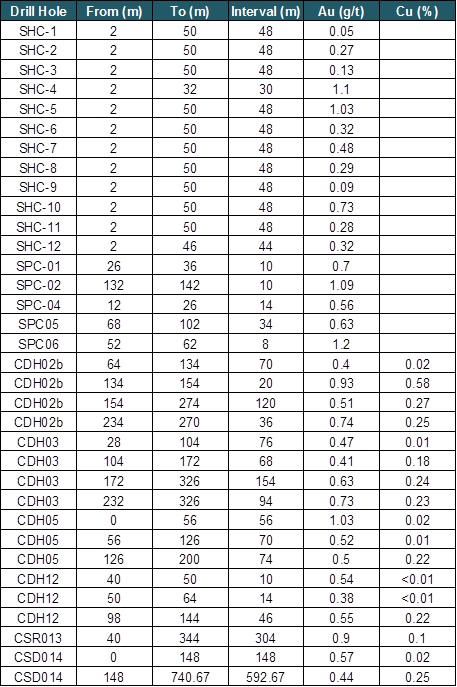
101
| |
Table 10-3: Significant Intercepts for the Caspiche Porphyry Prospect Area (continuation)

102
| |
Table 10-3: Significant Intercepts for the Caspiche Porphyry Prospect Area (continuation)

103
| |
Table 10-3: Significant Intercepts for the Caspiche Porphyry Prospect Area (continuation)

104
| |
Table 10-3: Significant Intercepts for the Caspiche Porphyry Prospect Area (continuation)

| 10.8 | True Thickness of Mineralization |
Mineralized zones at Caspiche are irregular in shape and orientation and true thickness is variable. Geological modeling and mineral resource estimation procedures take into account the intercept angles of drilling versus the geometry of mineralization.
| 10.9 | Orientation of Mineralization |
Mineralization at Caspiche Porphyry generally trends northwest-southeast and is most continuous vertically. Mineralization at Caspiche Epithermals generally trends east-west. Mineralization at the MacNeill zone adjacent to the Caspiche Porphyry is controlled by the flared edge of the late diatreme breccias and is strongest directly under this control at angles of 30 degrees or less where fluids are interpreted to have ponded and been trapped when they were unable rise due to the impermeable cap rock.
105
| |
| 11 | SAMPLE PREPARATION, ANALYSIS AND SECURITY |
| 11.1 | Sample Procedures and Protocols |
The following description of the sampling methodology was modified from Van Kerkvoort et al. (2008). Surface sampling and drill sampling methodology through the 2007-2008 field season was described in detail in Van Kerkvoort et al. (2008) and is only summarized in this report.
| 11.1.1 | Surface Sampling |
No description of the sampling protocols for Anglo and Newcrest surface sampling are available to Exeter. Anglo conducted an extensive rock-chip sampling campaign along road cuts and at bedrock exposures throughout the property area and collected soil samples on a grid in the Caspiche Porphyry area. Newcrest also collected rock-chip and soil samples during its tenure with the Caspiche property.
Exeter collected rock-chip samples during the 2005-2006 field season to confirm previously reported values and to gain a better understanding of the geological and mineralization environment. Outcrop, channel, and character samples were collected as part of this program. A soil orientation program was conducted by Exeter during the 2008-2009 field season.
The results from these surface sampling programs are not used in the Mineral Resource Estimate.
| 11.1.2 | Drill Sampling |
Exeter
Reverse Circulation Sampling
Reverse Circulation (RC) sampling by Exeter has been consistently applied throughout the Exeter drill campaigns. Exeter has documented their RC sampling procedure in a document, written in Spanish, which is used to train drill sampling staff.
RC drill cuttings are sampled using a tricone or hammer bit via a cyclone at 1 m intervals. Sample material is collected at the drill rig in a large plastic bag, weighed, labelled and then transported to the Caspiche camp, located about 8 km from Caspiche Porphyry. At Caspiche camp, the entire sample is manually split to one-eighth and seven-eighth fractions using a single pass through a triple stage riffle splitter. The one-eighth split is then weighed and set aside for compositing, while the seven-eighth reject sample is bagged. The one-eighth splits from each consecutive 1 m samples are combined to form the 2 m field composite for assaying.
106
| |
The drill-bit diameter is recorded for each drill hole, which together with the sample weight, assists in the calculation of RC sample recovery. Average recovery from the 2007-2008 RC drilling campaign was 84.3%. RC drilling during the 2008-2009 and 2009-2010 drill campaigns has been limited to core pre-collar drilling through post-mineral cover rocks and non-mineralized bedrock.
Diamond Drilling Sampling
Core sampling has also been consistently applied throughout the Exeter drill campaigns. Exeter has documented their diamond-drill sampling procedure in a document, written in Spanish, which is used to train drill sampling staff.
Diamond drilling by Exeter at Caspiche has employed HQ (6.35 cm), HQ3 (6.11 cm), NQ (4.76 cm), and NQ3 (4.50 cm) diameter core tools. PQ (8.50 cm) diameter core was employed during the confirmation / metallurgical drill program of the 2009-2010 drill campaign.
HQ3 and NQ3 triple-tube core tools are used with oriented core. The triple-tube splits are removed from the core barrel and rolled into a spare split, where Exeter’s trained field technicians fit the core together, measure the length of the recovered sample and continue the oriented line. The angle between the pin and ball mark is transferred to the core from the ring using specifically-designed protractors and marked as a red pencil line. The oriented core is then placed in a wooden core tray, where the end of the run is marked with a core block marked with hole depth. There is always a trained field technician at the rig to perform core orientation and to record the preliminary core run recovery.
Exeter personnel transport the drill core from the drill site to Exeter’s offices in Copiapó where the core is logged and photographed by digital camera. To maintain the integrity of the core, the boxes are packed and fastened with belts in the back of the trucks.
Following logging and photographing, core is sawn in half in uniform 2 m intervals using a diamond saw. One half of the core interval is bagged for assay, and the other half is stored for future reference. Core samples for assay are placed in marked plastic bags, sealed and transported to the assay laboratory by Exeter personnel.
PQ diameter core from the confirmation / metallurgical drill program in 2009-2010 was split differently than the core from the routine drilling programs. To preserve as much of the core as possible for metallurgical testing, the core was divided so that the portion retained for assaying was approximately one-quarter NQ core. In practice, a 1.7 cm split of the 8.5 cm core was used for assaying, and the remainder was retained in the core box for use in later metallurgical testwork.
Average core recovery for the 2007-2008, 2008-2009, 2009-2010 and 2010-2011 drill programs was approximately 98%.
107
| |
Newcrest
All Newcrest drilling at Caspiche was completed using RC drilling methods. All samples were collected in 2 m intervals. Exeter obtained Newcrest project reports in 2009 that discuss drill procedures and sample recovery for the 1996-1997 Newcrest drilling campaign. Newcrest reports that reasonable sampling procedures and good sample recoveries were obtained from the drill contractor. Newcrest used industry-standard practices regarding drill-sampling procedures.
Anglo
Anglo drilling was conducted using air-rotary and RC methods. All samples were collected in 2 m intervals. Details of drilling practices employed by Anglo are not available to Exeter. It is reasonable to assume that Anglo used industry-standard practices regarding drill-sampling procedures. Air-rotary drilling is typically only used for reconnaissance exploration drilling, because the sampling method is susceptible to down-hole contamination from mineralized intercepts and was not used in resource estimate calculations.
| 11.2 | Sample Preparation and Analysis |
| 11.2.1 | Surface Samples |
Newcrest rock samples were analyzed by ALS Geolab in Copiapó, Chile. Gold was assayed using standard 50 g fire assay with an atomic absorption finish; other elements were determined by acid digestion and inductively coupled plasma (ICP) finish. The Exeter rock samples were analyzed at ALS Chemex in La Serena, Chile for gold by standard fire assay of a 50 g sub-sample and atomic absorption finish; with additional elements by ICP. ALS Chemex is an independent ISO 9001:2000 registered assay laboratory. External quality control samples were not inserted consistently in surface sample batches. Surface samples are not included in the Caspiche mineral resource database and were not used for mineral resource estimation purposes.
| 11.2.2 | Drill Samples |
Exeter
2006–2007 Drill Campaign
All samples from the 2006-2007 Exeter drill campaign were assayed by ACME Laboratories (ACME) in Santiago, Chile. ACME is an independent ISO 9001:2000 registered assay laboratory. Samples were transported from the project site to Santiago using Estafeta, a contract transport group, and no sample loss was recorded. At ACME, samples were prepared by crushing 1 kg to 70% passing 2 mm (10 mesh ASTM-E11), splitting 250 g and pulverizing it to 95% passing 0.106 mm (150 mesh Tyler) (ACME code R150). Gold was determined by fire
108
| |
assay on a 50 g charge and atomic absorption finish (ACME code AuG6). Silver was determined by aqua regia digestion and atomic absorption finish (ACME code ICP-1D). Assays returning greater than 300 ppm silver were re-assayed by fire assay and gravimetric finish. Check assays of select intervals were completed at ALS Chemex in La Serena, Chile.
External Standard Reference Materials (SRMs), coarse blanks, pulp duplicates, and check assays were used to control assay quality. A total of 160 quality control samples were inserted into the total sample stream of 1,784 samples submitted to ACME, for an insertion rate of 8.3%.
Exeter used four SRMs from Geostats Pty. Ltd. (Geostats), of Perth, Australia, to control assay accuracy. The recommended values for these SRMs range between 0.82 g/t and 2.14 g/t gold and acceptably match the expected range of gold concentrations at Caspiche. SRM results for the 2006-2007 drill campaign were reviewed and found that the assay accuracy for ACME gold assays is acceptable; consistent with the conclusions of AMEC in the Technical Report authored by Wakefield and Marinho, issued in March, 2010. The SRMs were not certified for copper and thus the copper values were not monitored for assay accuracy.
Of 80 blanks assayed during the campaign, only 3 returned values greater than 0.03 g/t gold; six times the lower detection limit for gold, the maximum value was 0.07 g/t gold.
A total of 53 samples were assayed in duplicate by ACME. Pulp duplicate sample results have been reviewed and the ACME assay precision for gold is acceptable; consistent with the conclusions of AMEC in the previous NI 43-101 report from Wakefield and Marinho, March 2010. Ninety percent of the pulp duplicate pairs have absolute relative differences less than 30%.
A total of 54 samples were assayed at ACME and ALS Chemex. No significant bias exists between the ACME and ALS Chemex results for gold.
The ACME gold assays from the 2006-2007 drill campaign are adequately accurate and precise and are acceptable for purposes of mineral resource estimation; consistent with the conclusions of AMEC in the previous NI 43-101 report from Wakefield and Marinho, in March 2010.
2007-2008 Drill Campaign
All samples from the 2007-2008 drilling program were prepared and assayed by ALS Chemex, an independent ISO 9002 certified laboratory, in La Serena, Chile. RC samples were prepared as shown in Table 11-1.
109
| |
Table 11-1: RC Sample Preparation Procedure for 2007-2008 Exeter Drill Samples
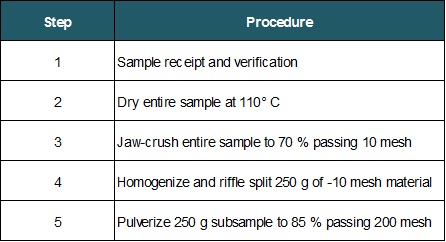
The core sample preparation procedure was refined several times during the drilling program to provide coarse material for metallurgical samples. The first 676 m of core hole CSD-014 was prepared and assayed with the same procedures as used for RC samples. However, the procedure was changed for the last 65 m of CSD-014 from 676 to 741 m (total depth), and for holes CSD-015, and CSD-016, to that shown in Table 11-2.
Table 11-2: Refined DD Sample Preparation Procedure for Exeter Drill Samples

110
| |
The sample preparation procedure was refined again for drill holes CSD-018 through CSD-026 as shown in Table 11-3.
Table 11-3: Further Refined DD Sample Preparation Procedure for Exeter Drill Samples
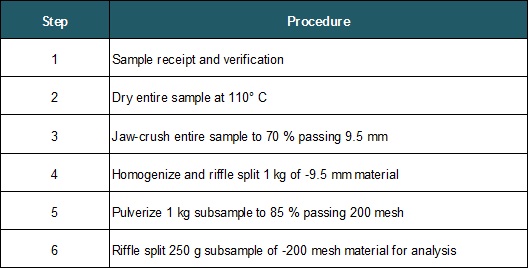
All RC and core samples were assayed for gold by fire assay of a 50 g sub-sample and an atomic absorption finish (ALS Chemex code Au-AA24). Samples reporting greater than 1 g/t gold were re-assayed to provide a check on the original assay. Copper and silver were assayed by four acid (total) digestion and atomic absorption finish (ALS Chemex codes Cu-AA62 and Ag-AA62). Fifty one additional elements, including copper and molybdenum, were determined on all samples using aqua regia digestion and ICP-MS (ALS Chemex code ME-MS41).
SRMs, coarse blanks, and duplicates were used to control assay quality. SRMs, blanks, and coarse duplicates were inserted at a rate of 1 in 20 for core samples, and 1 in 30 for RC samples.
Exeter used SRMs from Geostats to control assay accuracy. The recommended values for these SRMs range between 0.6 g/t and 0.8 g/t gold and acceptably match the expected range of gold concentrations at Caspiche. SRM results from the 2007-2008 drill campaign show accuracy for gold to be acceptable. Of 65 SRMs assayed, 86% were within acceptable limits, and there was no significant bias in the results.
A review of pulp duplicate assays found that ALS Chemex precision for gold is acceptable. Of 40 pairs of pulp duplicates assayed, greater than 97.5% were within 10% absolute relative difference.
Of 66 blanks assayed, all returned gold values less than three times the lower detection limit of 0.005 g/t.
111
| |
Results from the ALS Chemex gold assays from the 2007-2008 drill campaign are adequately accurate and precise and are acceptable for use in mineral resource estimation.
2008-2009 Drill Campaign
Sample preparation and assaying for the 2008-2009 drill campaign remained much the same as it was at the end of the 2007-2008 drill campaign. Sample preparation was performed as shown in Table 11-3. Assaying for gold was by fire assay of a 50 g sub-sample and an atomic absorption finish (ALS Chemex code Au-AA24). Copper was assayed by four acid (total) digestion and atomic absorption finish (ALS Chemex codes Cu-AA62). Fifty one additional elements, including copper and molybdenum, were assayed on all samples using aqua regia digestion and ICP-MS (ALS Chemex code ME-MS41). Silver was not assayed by total digestion during this campaign, but it is included in the ME-MS41 multi-element aqua regia package. Samples reporting greater than 2 g/t gold, instead of 1 g/t in 2007-2008, were re-assayed to provide a check on the original assay.
SRMs, coarse blanks, duplicates, and check assays were used to control assay quality and were inserted at a rate of 1 in 40 samples.
A review of the 115 SRM results from ALS Chemex during the 2008-2009 drill campaign found the assay accuracy for gold to be acceptable. Recommended values for the Geostats SRMs ranged between 0.24 g/t and 1.48 g/t gold and are appropriate for the range of gold values expected at Caspiche. Several SRMs returned unacceptably low values during the campaign, but the affected batches were re-assayed with acceptable results and the assays replaced in the Exeter database. Copper and silver SRMs were not included in the 2008-2009 drill program but were acquired by Exeter for use in the 2009-2010 drill program.
A total of 51 coarse reject samples from drill holes completed between November 2008 and February 2009 were submitted by Exeter to Geoanalitica in Copiapó, Chile, for check assay. Geoanalitica is an independent ISO 9001:2000 registered assay laboratory. Gold and copper results from the 51 check assay samples were reviewed and found no significant bias exists between the ALS Chemex and Geoanalitica results for gold and copper. Control samples submitted with the check assay samples showed that assay accuracy for gold and copper at Geoanalitica is acceptable.
A total of 91 pulps from sample intervals from the 2008-2009 drill campaign were submitted by Exeter to ACME for analysis of gold, copper, and silver as an extra check on the accuracy of the ALS assays. Two blanks and two gold SRMs were included with the batch and reported acceptable accuracy for gold, and no significant carry-over contamination. Copper and silver SRMs were not included with the check assay batch. The check assay results show that the ALS gold assays are biased low. This finding is in agreement with the findings from the SRM results. The results of the copper and silver checks show that the ALS copper and silver assays are acceptably accurate.
112
| |
All 64 blank samples reported gold concentrations below two times the lower detection limit of 0.01 g/t gold, and thus there is no evidence of significant carry-over contamination in the ALS Chemex gold assays. All blank samples reported copper values were below 0.01%, and silver values below 0.3 g/t, and thus there is no evidence of significant carry-over contamination in the ALS Chemex copper and silver assays.
A total of 68 pulp samples were resubmitted to ALS Chemex for duplicate analysis at the end of the 2008-2009 drill program. Duplicate data was reviewed and the precision for gold, copper, and silver was found to be acceptable.
The ALS Chemex gold and copper assays from the 2008-2009 drill campaign are within normal industry standards for accuracy and precision, and are acceptable for use in mineral resource estimation.
2009-2010 Drill Campaign
Drill hole samples collected during the 2009-2010 drill campaign were submitted to ACME Analytical Laboratories (Chile) S.A. in Santiago, Chile, for assay. At ACME, samples were prepared by crushing 500 g to 70% passing 2 mm (10 mesh ASTM-E11), splitting 250 g and pulverizing it to 95% passing 0.075 mm (200 mesh Tyler) (ACME code R200-500). Gold was determined by fire assay on a 30 g charge and atomic absorption finish (ACME code AuG6). Copper and silver plus an additional 31 elements were determined by aqua regia digestion and an ICP finish (ACME code ICP-1D). Samples returning greater than 0.2% copper were re-digested using a total, four-acid digestion and atomic absorption finish (ACME code 8TD). Samples returning greater than 300 g/t silver were re-assayed by fire assay and gravimetric finish.
SRMs, coarse blanks, duplicates, and check assays are used to control assay quality and are inserted at a nominal rate of 1 in 25 samples.
Exeter submitted a total of 404 gold SRMs and 28 copper and silver SRMs, a 3.0% insertion rate, with the project samples to control assay accuracy. Recommended values for the Geostats gold SRMs ranged between 0.2 g/t and 2.0 g/t gold and are appropriate for the range of gold values expected at Caspiche. No significant bias was observed in the SRM results for gold. Over 96% of the gold and base metal standards returned results within two standard deviations.
Copper and silver SRMs were acquired for this campaign, but were not inserted into assay batches during the early part of the program. Beginning in February 2010, assay batches included a mixture of silver and copper SRMs, together with the gold SRMs. SRMs employed by Exeter range between 1.3 g/t and 26.8 g/t silver and 0.15% and 0.24% copper, and are appropriate for the range of silver and copper values expected at Caspiche. Gold SRMs, while not certified for silver, have historically returned reasonably precise results in an appropriate grade range between 0.3 g/t to 6.0 g/t for silver grades expected at Caspiche. Exeter has produced a number of SRMs from Caspiche project material to control accuracy in future drill campaigns.
113
| |
Exeter selected 338 representative samples from mineralized intercepts from the 2009/2010 drill campaign and submitted them to ALS La Serena Laboratory, with appropriate blanks and standards, for check assay. Results showed no significant problems with precision or sample integrity.
Blanks were submitted at the start of each batch to test for cross-batch contamination and also after suspect high-grade zones such as auriferous ledges or massive sulphide veins. Of 154 blanks submitted, a 1.1% insertion rate, over 98% of the assays for gold were less than two times the lower detection limit value for the method. Copper assays for blank samples were all below 20 ppm (0.002%), except for one value of 60 ppm (0.006%). Results show there is no significant contamination of gold, silver, or copper assays due to sample preparation at ACME.
Coarse reject material from 386 intervals from the 2009-2010 drill campaign were selected and re-assayed at ACME to determine assay precision for gold, copper, and silver. Results for gold show that, 95% of the samples have related percent difference (RPD) levels below 20%. Results for copper and silver show that 90% and 99% of duplicates respectively have RPD levels below 20%. General industry practice considers coarse duplicates having RPD less than 20% to be acceptable.
Exeter reviews quality control results of each batch before loading the assay into the mineral resource database. Additionally, Exeter reviews long-range trends of control sample results and modifies the QA/QC protocol as necessary. In 2011, AMEC reviewed the 2009-2010 control results with Exeter prior to calculation of the updated resource estimate and agreed that Exeter’s control of data quality and evaluation of the results to be effective and the data was acceptable for use in mineral resource estimation.
2010-2011 Drill Campaign
Sample preparation and analysis was the same as for the 2009-2010 drill campaign. Drill hole samples collected during the 2009-2010 drill campaign were submitted to ACME Analytical Laboratories (Chile) S.A. in Santiago, Chile, for assay. At ACME, samples were prepared by crushing 500 g to 70% passing 2 mm (10 mesh ASTM-E11), splitting 250 g and pulverizing it to 95% passing 0.075 mm (200 mesh Tyler) (ACME code R200-500). Gold was determined by fire assay on a 30 g charge and atomic absorption finish (ACME code AuG6). Copper and silver plus an additional 31 elements were determined by aqua regia digestion and an ICP finish (ACME code ICP-1D). Samples returning greater than 0.2% copper were re-digested using a total, four-acid digestion and atomic absorption finish (ACME code 8TD). Samples returning greater than 300 g/t silver were re-assayed by fire assay and gravimetric finish.
114
| |
SRMs, coarse blanks, duplicates, and check assays are used to control assay quality and are inserted at a nominal rate of 1 in 25 samples.
All SRMs submitted during the 2010-2011 drill campaign have been produced and characterized from representative Caspiche mineralized material. All SRMs produced from Caspiche mineralized materials have been characterized for gold, copper and silver.
Exeter submitted a total of 142 gold SRMs and 142 copper and silver SRMs, a 3.0% insertion rate, with the project samples to control assay accuracy. Recommended values for the Caspiche gold, copper and silver SRMs ranged between 0.28 g/t and 0.69 g/t gold, between 90 ppm (0.009%) and 2252 ppm (0.2252%) copper and 0.70 g/t and 1.00 g/t silver. These values and are appropriate for the range of gold, copper and silver values expected at Caspiche. No significant bias was observed in the SRM results for gold. Approximately 96% of the gold SRMs and 91% of copper SRMs returned results within two standard deviations of the expected values. Greater than 99% of silver SRMs returned results within two standard deviations of the expected values however the majority of results indicated a slight low bias.
Blanks were submitted at the start of each batch to test for cross-batch contamination and also after suspect high-grade zones such as auriferous ledges or massive sulphide veins. Of 63 blanks submitted, a 1.4% insertion rate, over 98.4% of the assays for gold returned values less than 0.02 g/t gold and a maximum value of 0.05 g/t gold. All copper assays for blank samples returned values less than 20 ppm (0.002%). Results show there is no significant contamination of gold, silver, or copper assays due to sample preparation at ACME.
Exeter reviews quality control results of each batch before loading the assay into the mineral resource database. Additionally, Exeter review long-range trends of control sample results and modify the QA/QC protocol as necessary. In 2011, AMEC reviewed the 2010-2011 control results with Exeter prior to calculation of the updated resource estimate and agreed that Exeter’s control of data quality and evaluation of the results was effective and the data was acceptable for use in mineral resource estimation. Cube Consulting undertook an independent review of SRM control charts for all Exeter data and believed that the 2011 database provided an accurate and robust representation of the Caspiche project and was appropriate for use in mineral resource estimation. Cube Consulting is an independent Australian based consulting firm specializing in mining and mineral resource services.
All SRM control charts for the 2010-2011 drilling campaign for gold, copper and are shown in Figure 11-1 to Figure 11-21. The amount of additional QA/QC data from 2011/2012 is relatively small and unlikely to materially affect the overall quality statistics detailed here. Continuous field monitoring of the QA/QC data was maintained throughout the 2011/12 season by Exeter.
115
| |
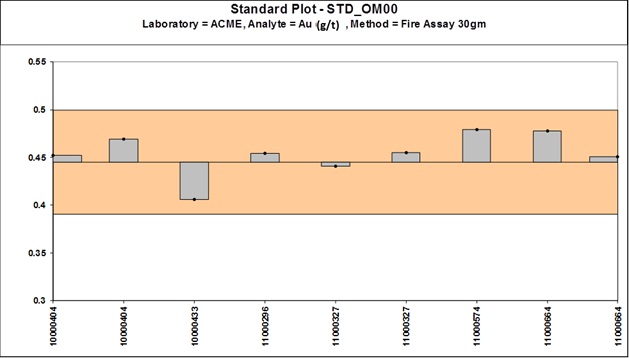
Figure 11-1: SRM Control Chart OM00 (2010-2011) - Gold (Source: Cube Consulting, 2013)
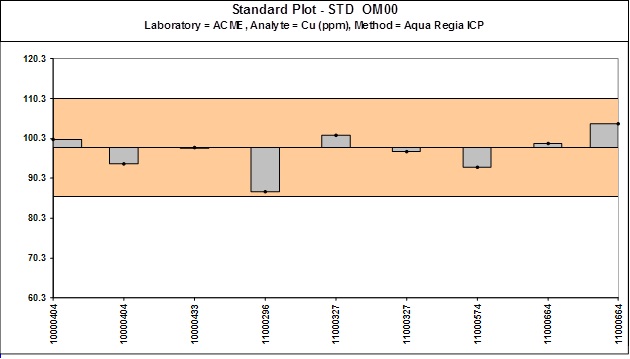
Figure 11-2: SRM Control Chart OM00 (2010-2011) - Copper (Source: Cube Consulting, 2013)
116
| |
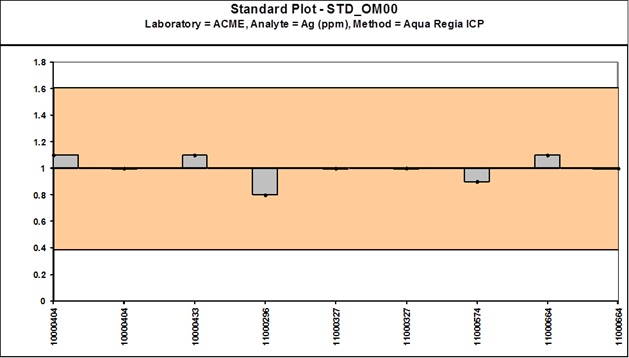
Figure 11-3: SRM Control Chart OM00 (2010-2011) - Silver (Source: Cube Consulting, 2013)
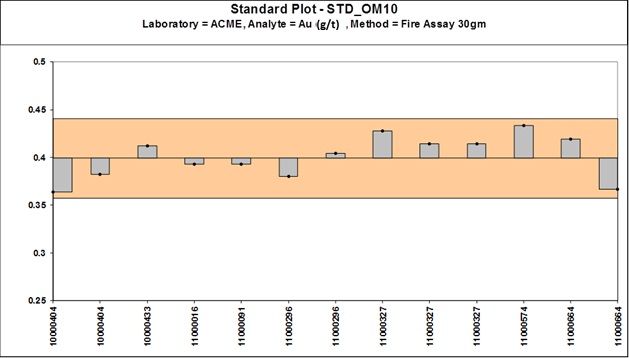
Figure 11-4: SRM Control Chart OM10 (2010-2011) - Gold (Source: Cube Consulting, 2013)
117
| |
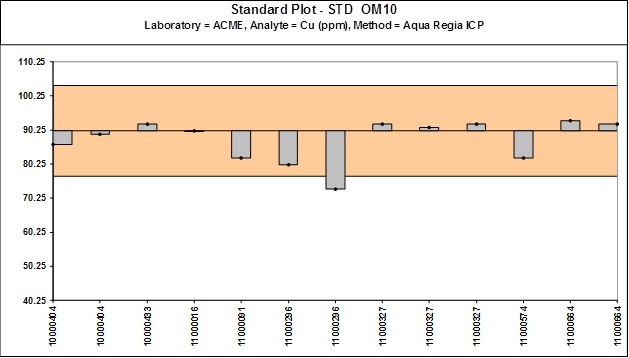
Figure 11-5: SRM Control Chart OM10 (2010-2011) - Copper (Source: Cube Consulting, 2013)
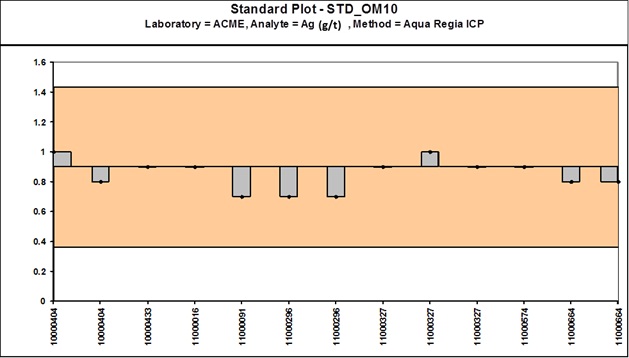
Figure 11-6: SRM Control Chart OM10 (2010-2011) - Silver (Source: Cube Consulting, 2013)
118
| |
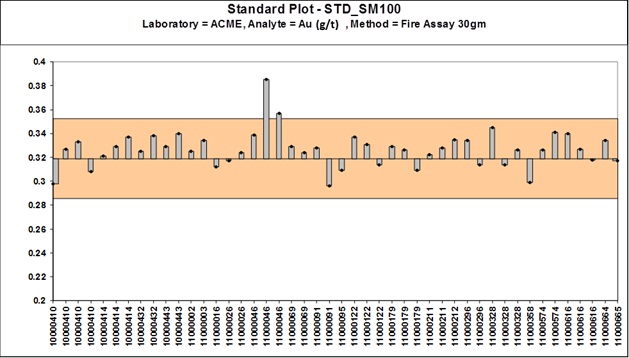
Figure 11-7: SRM Control Chart OM100 (2010-2011) - Gold (Source: Cube Consulting, 2013)
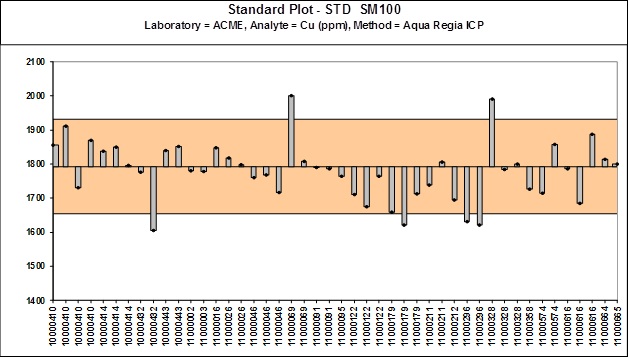
Figure 11-8: SRM Control Chart OM100 (2010-2011) - Copper (Source: Cube Consulting, 2013)
119
| |

Figure 11-9: SRM Control Chart OM100 (2010-2011) - Silver (Source: Cube Consulting, 2013)
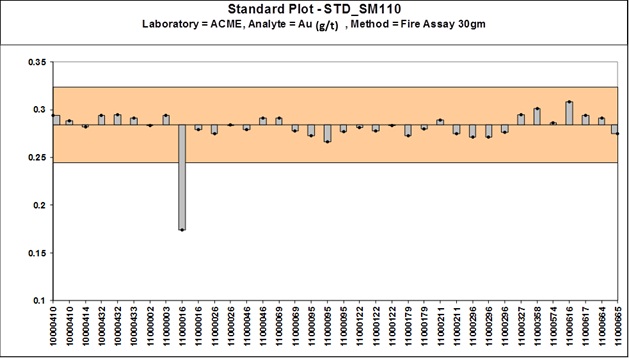
Figure 11-10: SRM Control Chart OM110 (2010-2011) - Gold (Source: Cube Consulting, 2013)
120
| |
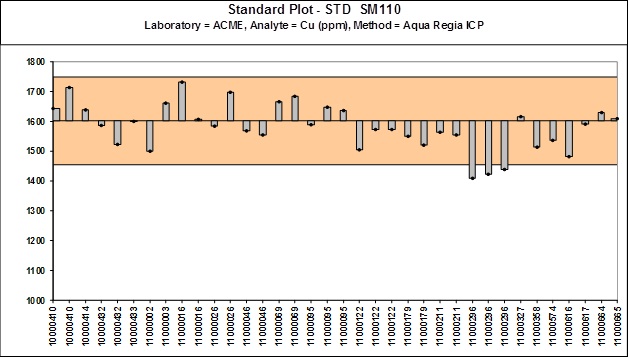
Figure 11-11: SRM Control Chart OM110 (2010-2011) -Copper (Source: Cube Consulting, 2013)

Figure 11-12: SRM Control Chart OM110 (2010-2011) - Silver (Source: Cube Consulting, 2013)
121
| |
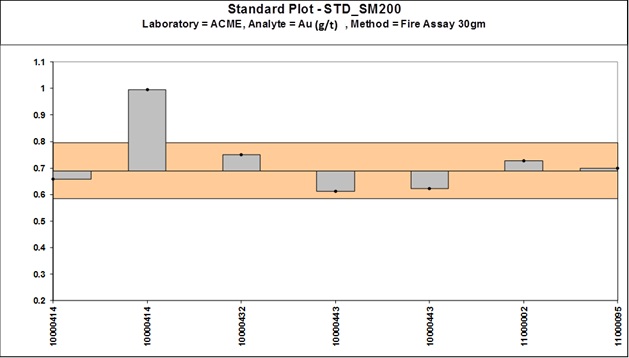
Figure 11-13: SRM Control Chart OM200 (2010-2011) - Gold (Source: Cube Consulting, 2013)
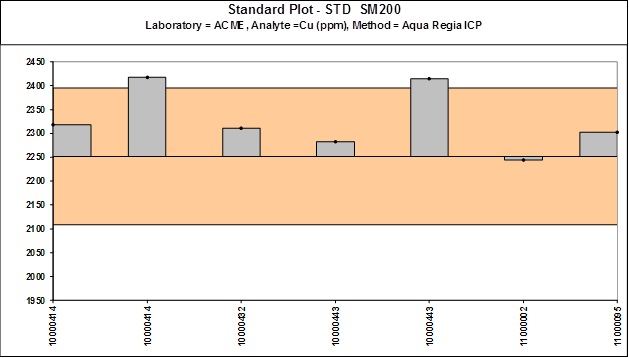
Figure 11-14: SRM Control Chart OM200 (2010-2011) -Copper (Source: Cube Consulting, 2013)
122
| |

Figure 11-15: SRM Control Chart OM200 (2010-2011) - Silver (Source: Cube Consulting, 2013)
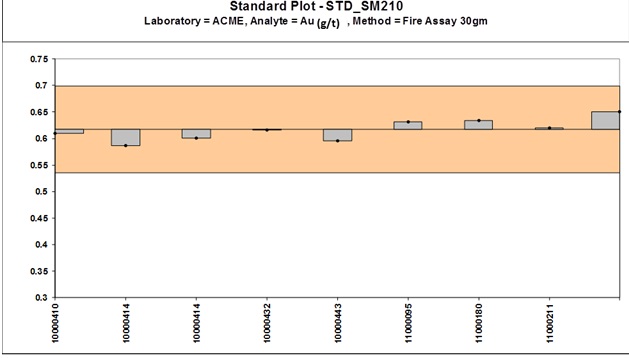
Figure 11-16: SRM Control Chart OM210 (2010-2011) - Gold (Source: Cube Consulting, 2013)
123
| |
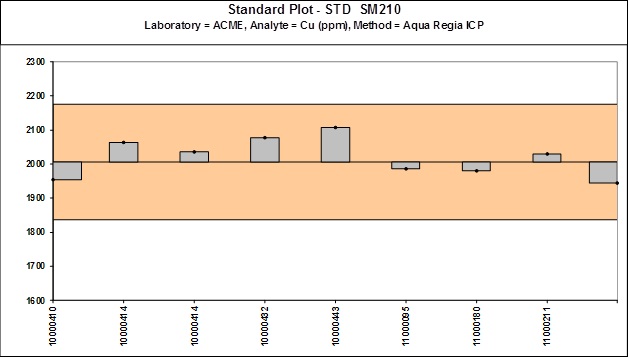
Figure 11-17: SRM Control Chart OM210 (2010-2011) -Copper (Source: Cube Consulting, 2013)
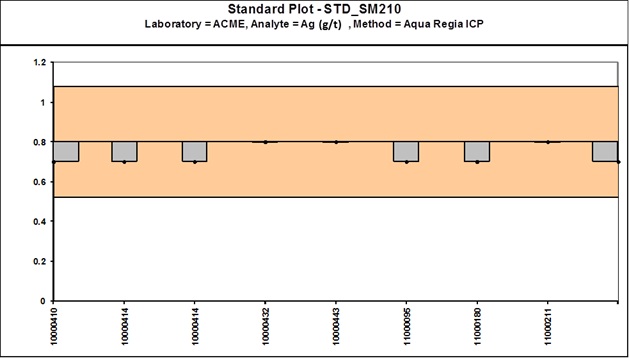
Figure 11-18: SRM Control Chart OM210 (2010-2011) - Silver (Source: Cube Consulting, 2013)
124
| |

Figure 11-19: SRM Control Chart OM300 (2010-2011) - Gold (Source: Cube Consulting, 2013)
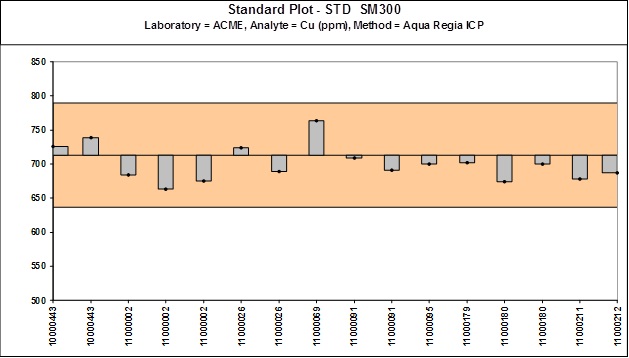
Figure 11-20: SRM Control Chart OM300 (2010-2011) -Copper (Source: Cube Consulting, 2013)
125
| |

Figure 11-21: SRM Control Chart OM300 (2010-2011) - Silver (Source: Cube Consulting, 2013)
Newcrest
Drill samples were assayed for gold, silver, and copper at ALS Geolab in Copiapó, Chile. The quality control program consisted of external standards and blanks sent to ALS Geolab, with check assays sent to ACME Laboratories and SGS Laboratories in Santiago, Chile. ACME and SGS are ISO 9001 registered assay laboratories. The ACME checks reportedly produced systematically higher (bias not quantified) gold values than those from ALS Geolab (Van Kerkvoort et al., 2008). This indicates that the Newcrest gold assays may be biased low and thus may underestimate the true gold grade of the Newcrest intercepts.
Anglo
Specific details regarding the sample preparation and assay methodology for the Anglo drill samples are not available to Exeter. Drill samples were assayed for gold, silver, and copper at ALS Geolab in Copiapó, Chile. ALS Geolab assay certificates show the laboratory performed duplicate assays every five samples and included standards in each batch. Anglo reports did not mention any significant issues with assay quality (Van Kerkvoort et al., 2008).
126
| |
| 12 | DATA VERIFICATION |
The various steps taken by Exeter to ensure the integrity of analytical data are consistent with standard industry practice. The sampling procedures are appropriate for the style of mineralization and structural controls for the Caspiche Project. Cube’s examination of drill cores, particularly in regard to the recognition of mineralized intervals, verified the soundness of the core sampling procedure.
Cube most recently undertook a site visit to the Caspiche Project on the 22nd, 23rd, and 24th of October 2013. Cube’s site visit included a field inspection, confirmation of drill hole locations, review of the geological and structural setting and inspection of representative mineralization in diamond drill core. Cube undertook independent sampling and assaying of select drill core intervals during this site visit.
Exeter conducts comprehensive internal and external validation of its databases, both in hard copy and electronic format. Drill collars are professionally surveyed and independent audits are encouraged. All laboratory results are checked by a qualified geologist before loading into the database and again at regular intervals for long term trends.
Comprehensive external database audits have been conducted several times during the period October 2008 to September 2011. AMEC audited the Exeter Caspiche mineral resource database on four occasions during January 2009, August 2009, January 2010 and August 2010. The AMEC database audits included checking of collar, survey, lithology, stratigraphic unit, alteration, oxidation and assay data against original log sheets and assay records. In addition to database auditing, AMEC checked the location of drill holes in the field, and sampled and assayed select drill core intervals during their site visit in October 2008.
Details of previous data validation can be found in NI 43-101 reports on Caspiche (Wakefield and Marinho 2009a, 2009b, 2010, Tolman and Perkins 2010 and Holmes et al, 2012). All five of these documents have been previously lodged with the Canadian Securities Administrators and are available for viewing on SEDAR at http://www.sedar.com. For completeness, some of the sections from the previous reports are repeated below, either in full or part.
| 12.1 | Mineral Resource Database Audits |
| 12.1.1 | AMEC |
AMEC performed four audits of the Caspiche mineral resource database during the period October 2008 to August 2010 and found that it was adequately free of data entry errors and determined that it was acceptable for use in mineral resource estimation (Wakefield and Marinho, 2009a, 2009b, 2010, and Tolman and Perkins, 2010).
At the end of the 2010 drill season, Exeter performed an internal database audit on all hard copy and electronic data and determined that no significant data entry problems existed.
127
| |
In August 2010, AMEC performed an audit of Caspiche drilling data received since the effective date of the MRE (AMEC 2011) for the Property. No significant errors were found in the mineral resource database in collar, survey, lithology, stratigraphic unit, alteration or oxidation in data entry from original logs. A selection of assay records in the database were checked against the original assay certificates and no errors were found.
| 12.1.2 | Cube Consulting |
In September 2012 Cube undertook an extensive verification of the drill holes database whilst in Exeter’s Copiapó office in Chile. Database verification included:
| · | A detailed overview of the database structure with Exeter's database manager |
| · | A detailed check of 1 in 10 of all drill holes drilled by Exeter between January 2007 and September 2012 including: |
| ° | Cross-validation of sample numbers from sample cutting sheet, Exeter dispatch number, laboratory job number and database - no errors detected |
| ° | Cross-validation of standard reference material numbers between sample dispatch sheet and database - no errors detected |
| ° | Cross-validation of official ALS and ACME lab assay reports (obtained directly from the laboratories) against the database. Approximately 20% of all database assay records were checked - no errors detected |
| ° | Check of downhole survey between original Reflex EZ Shot records and database - no errors detected |
| ° | Check of database drill hole collar coordinates against original paper drill hole record - no errors detected. |
| 12.2 | Drill Hole Locations |
Exeter routinely uses a professional surveyor to determine the exact position of drill hole locations. Drill hole collar locations are surveyed using a Leica TC 600 total station unit with centimetre accuracy using the Instituto Geográfico Militar 26° to 36° transform.
Drill hole locations were verified during an October 2008 site visit to the property by AMEC who collected handheld GPS location readings for seven drill hole locations in the Caspiche Porphyry area to verify the accuracy of the drill hole coordinates in the mineral resource database. An additional three holes were surveyed by Cube in September 2011 with a hand held Garman 76Cx GPS unit. A comparison between Exeter surveyed drill hole locations and GPS location readings are shown in Table 12-1.
128
| |
Significant differences were noted between the Exeter surveyed drill hole locations and GPS collar coordinates. Handheld GPS coordinates were collected using the PSAD56 datum, which is a general transform that can vary up to 50 m from the more precise Instituto Geográfico Militar 26° to 36° transform used by Exeter (Galaz, 2008). AMEC compared Exeter surveyed collar locations with drill pads on geo-referenced digital images, and found the collar locations to be acceptably accurate (Wakefield and Marinho, 2010).
Table 12-1: Caspiche Drill Hole Collar Checks
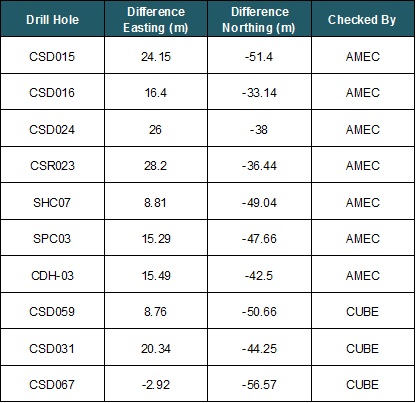
| 12.3 | Independent Sampling |
| 12.3.1 | AMEC Core Sampling |
AMEC, during their October 2008 site visit, selected six Exeter drill hole intervals for check assaying to confirm the presence of gold and copper in the Caspiche drill core (Wakefield and Marinho, 2009a). Mineralized intervals at various depths were selected from the three most relevant drill holes available at the time (CSD014, CSD015, and CSD016). Exeter split (sawn quarter-core), sampled, and bagged the core under AMEC supervision and AMEC submitted the samples to ACME Laboratories in Santiago, Chile, for assaying. ACME assayed gold by standard 30 g fire assay and atomic absorption finish (ACME code G6), and copper by four-acid total digestion and atomic absorption (ACME code 8TD).
129
| |
Table 12-2 summarises the ACME check sampling of Caspiche drill core, and shows the assay results from the original Exeter half-core sampling and the AMEC quarter-core sampling. A single SRM submitted with the check samples reported good assay accuracy for gold and copper.
Table 12-2: Summary of AMEC Check Sampling of Caspiche Core
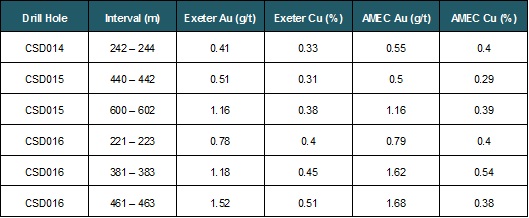
The assay results shown in Table 12-2 confirm the presence of gold and copper in Exeter Caspiche drill core. AMEC assay results also agree reasonably well with Exeter assay results.
| 12.3.2 | Cube Core Sampling |
Cube, during their October 2013 site visit, selected two Exeter drill hole intervals for check assaying to confirm the presence of gold and copper in the Caspiche drill core. Mineralized intervals at various depths were selected from recent drill holes CSD075 and CSD078. Exeter split (sawn quarter-core), sampled, and bagged the core under Cube supervision and Cube transported and submitted the core samples to ACME Laboratories, an independent ISO 9000 certified laboratory, in Santiago, Chile, for sample preparation. The pulps were then shipped to Cube’s Perth Office in Australia. Cube submitted the pulps to Intertek (Genalysis) Laboratory Services, an independent ISO 9000 certified laboratory, in Maddington, Western Australia for assaying.
Table 12-3 summarises the Cube check sampling of Caspiche drill core, and shows the assay results from the original Exeter half-core sampling and the Cube quarter-core sampling. A single SRM submitted with the check samples reported reasonable assay accuracy for gold and copper. Intertek were requested to undertake 25 g fire assay and AAS finish for gold and 4 acid digest with ICP finish for 33 elements including copper.
130
| |
Table 12-3: Summary of Cube Check Sampling of Caspiche Core
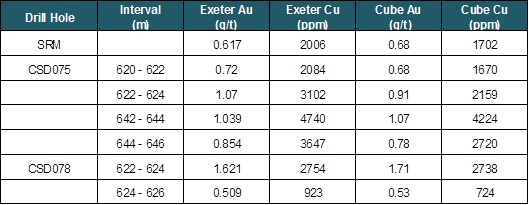
The assay results shown in Table 12-3 confirm the presence of gold and copper in Exeter Caspiche drill core. The Cube assay results (Au and Cu) agree reasonably well with Exeter assay results.
| 12.3.3 | Rio Tinto Metallurgical Sampling |
Rio Tinto undertook a review of the Caspiche project in October 2008. As part of this review, Rio Tinto took six samples of drill core coarse reject material for metallurgical testwork. The samples were selected to be representative of a variety of alteration styles occurring at Caspiche. A comparison of drill hole intercept grades and metallurgical testwork head grades are presented in Table 12-4. In general, there is very good agreement between the metallurgical testwork head grades and the drill hole assay grades as recorded in the drill hole database.
Table 12-4: Summary of Rio Tinto Metallurgical Sampling of Caspiche Core
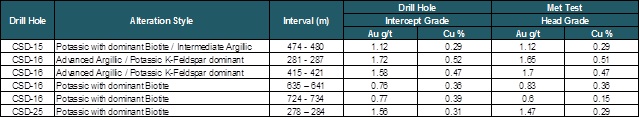
131
| |
| 12.4 | Exeter QA/QC |
| 12.4.1 | Geochemical Standards |
Geochemical Standard Reference Material (SRM’s) has been used by Exeter in all drilling programmes at Caspiche. During the period January 2008 to May 2012, SRM’s and blanks were inserted at rates varying between 1 in 25 to 1 in 40 samples. The majority of SRM’s are provided by Geostats Pty. Ltd. (“Geostats”) of Australia. Exeter has also produced and characterised some SRM’s based on representative Caspiche mineralized material. To date, a total of 928 gold SRM’s have been submitted from 28 different standards with recommended assay values varying from 0.24 to 2.14 Au ppm. In addition, a total of 169 copper SRM’s have been submitted from 7 different standards with recommended assay values varying from 90 to 2,252 Cu ppm
Cube undertook a review of all SRM results for the period between January 2007 and September 2011. During this period, the majority of gold and copper SRM's performed within the expected limits with 93% and 92% being within two standard deviations of the expected value respectively. Cube made selected random checks of the database for SRM values that were outside two standard deviations of the expected value and noted that in all cases Exeter had highlighted these for follow-up.
In general, blanks showed acceptable performance with only 11 values exceeding 0.03 Au ppm and only 1 value exceeding 0.09 Au ppm.
Cube is of the opinion that Exeter has implemented and continues to maintain a well-managed and robust QA/QC program and there does not appear to be evidence of systematic error or material bias.
| 12.5 | Twinned Holes |
Exeter conducted selected confirmation drilling of Anglo drilling (two holes) and Newcrest drilling (four holes).
Exeter confirmation drilling of Anglo drilling revealed a slight high-bias, on average, in the Anglo gold assays, however the thickness of the intercepts are approximately equal. Anglo copper assays are, on average, unbiased when compared to Exeter confirmation drilling intercepts. Exeter confirmation drilling of Newcrest drilling showed that no significant bias exists, on average, in the Newcrest gold assays, and that the thicknesses of the intercepts are approximately equal. Newcrest copper and silver assays are, on average, unbiased when compared to Exeter confirmation drilling intercepts.
AMEC reviewed the results from all six twinned holes and concluded that the Exeter drilling confirms gold, copper, and silver grades (Newcrest only for silver) and thicknesses of both the Anglo and Newcrest drill intercepts. AMEC concluded that Anglo and Newcrest drill hole are
132
| |
acceptable for use in mineral resource estimation (Wakefield and Marinho, 2010). Cube briefly reviewed the twin data and concurred with the AMEC conclusion.
Metallurgical drilling at the Caspiche Porphyry deposit in 2011 - 2012 resulted in two extra opportunities for twin-hole comparison. Metallurgical holes METT05 and METT06 were drilled during the 2011 – 2012 campaign. These holes are not direct or intentional twins and therefore are only in proximity to the original Exeter holes CSD015 and CSD014. Assayed data points on hole METT05 are located in space between 1.5 and 90 metres from data on hole CSD015; Assayed data points on hole METT06 are located in space between 8 and 70 metres from data on hole CSD014. Cube has compared the assay results for gold, copper, arsenic and sulphur in these holes using 10 m bench composites. The comparisons of all elements show only moderate correlation and a wide dispersion. This being said, the data compared are within the defined mineralization and interval averages show reasonable correlation and confirm the overall mineralised interval grades. There is no evidence of systematic bias between the two pairs of drill data. From an estimation of mineralization perspective the differences in the data are not considered to be material by Cube, due to the overall mode of occurrence of the mineralization as a bulk domain. Within the mineralization variations in the grades of gold copper and silver of the magnitudes demonstrated are expected to occur and will not materially impact the estimate.
| 12.6 | Check Assaying of Samples Greater Than 1 Au ppm |
As part of the assaying procedure, samples that return significant gold values greater than 1-2 Au ppm, are routinely re-assayed with a second fire assay using the same method as the original assay. Figure 12-1 shows a scatter plot of the original assay versus the re-assay of all gold samples with an original grade of greater than 1 Au ppm, a total of 560 pairs, with one outlier removed. This comparison shows reasonable correlation indicating relatively low variability within the pulp sample. This re-assaying procedure also includes the geochemical standards.
133
| |

Figure 12-1: Re-Assays of Samples >1 Au ppm
| 12.7 | Cube Consulting Statement |
Cube Consulting has undertaken reasonable endeavours to assess the veracity of drilling data for the Caspiche project. It can be concluded that all logging, sampling and data QA/QC procedures between January 2007 and May 2012 have been carried out to a high industry standard and record keeping and database management is excellent.
Cube believes that the current database provides an accurate and robust representation of the Caspiche project and is appropriate for use in mineral resource estimation.
134
| |
| 13 | MINERAL PROCESSING AND METALLURGICAL RECOVERY |
| 13.1 | Oxide Mineralization |
The Caspiche project oxide mineralization has been subject to several physical characterization and metallurgical test programs to determine possible process routes and expected recoveries.
This chapter summarizes all metallurgical test work undertaken at the time of preparing this 43-101 Technical Report, it discusses the nature, extent and analytical procedures of the tests and provides a summary of the most relevant results.
| 13.1.1 | Historical Testing |
Newcrest 1997 and Exeter 2007 Metallurgical Testing
Prior to 2008, the only metallurgical test work carried out on Caspiche mineralization was leaching test work of a scouting nature on oxide samples. Exeter carried out bottle roll tests on reverse circulation (RC) drill chips from the discovery hole CSD 013 at SGS Santiago. Ten years earlier Newcrest also carried out similar level scouting work on six intercepts at SGS Santiago. There were no records of any metallurgical work being carried out by Anglo. The test details of all these early metallurgical programs were reported in the first Exeter NI 43-101 Technical Report issued in 2008.14
McClelland Laboratories 2008 Bottle Roll Tests
In August 2008, Exeter selected drill-hole intervals from the Caspiche oxide mineralized intercepts for metallurgical test work. Six oxide intervals were selected and the stored coarse crushed material was appropriately assembled and sent to McClelland Laboratories International (MLI) in Sparks, Nevada.
Caspiche oxide mineralization is present in the deposit as a relatively thick horizontal blanket with little to no copper content; the average copper grade was less than 0.01% Cu, or below the detection limit of the laboratory analyses. The objective of the test program was to confirm that this material would be amenable to heap leaching as flotation of any gold values into a concentrate was thought to be challenging.
MLI carried out bottle roll tests on each of the six oxide intercepts at the as received size and at a finer crush size of 1.7 mm. The intercepts were then combined to form two composites classified as ‘Andesite’ and ‘Porphyry’ which provided sufficient material for a column leach test
14 “Technical Report & Proposed Exploration for Caspiche Project, Region III, Chile”, prepared for Exeter Resource Corporation, dated on 26 April 2008, by Van Kerkvoort, G., Delendatti, G.L.A., and Perkins, J. http://www.sedar.com.
135
| |
on both. Gold dissolutions of approximately 77% and 84% were achieved within 30 days of leaching with moderate reagent consumptions. Exeter considered these results to be sufficiently encouraging confirmation of the potential to heap leach the oxide blanket. The program was reported in detail in the independent AMEC NI 43-101 Technical Report of 2009.15
There was very little additional oxide mineralization encountered in the 2009 drill program, so a specific drilling program was completed in the 2009 – 2010 field season to obtain further appropriate oxide samples.
McClelland Laboratories 2010 Column and Bottle Roll Tests
Following the encouraging results of the initial 2008 column leaching tests, a comprehensive column leach program was implemented. The objective was to examine leaching characteristics at a range of oxide crush sizes in order to select the most appropriate size for gold recovery by heap leaching, and perhaps to give an indication of whether run-of-mine (ROM) leaching might be feasible. Seven large diameter PQ core (85 mm diameter) drill holes were completed to characterize the oxide zone, with several of them “twinning” RC holes drilled by earlier explorers. The oxide mineralization encountered in these PQ holes was considered by Exeter geologists to be broadly representative of the overall oxide resource in terms of depth and area.
The mineralization intersected in these holes was split into 11 composites based on rock type, depth or location. The composites ranged in length from 22 metres to 116 metres of continuous sample. The intention was to complete a column leach test each on each composite at nominal P80 sizes of 50 mm, 25 mm and 12.5 mm where sufficient weight was available, as well as completing bottle roll leach tests and physical crushing and abrasion test work.
The program was carried out at MLI in 2010 in 10’ high columns with diameters of up to 12”, selected to suit the material top size. The weight requirements for the larger columns meant that only 8 of the 11 composites were tested at all 3 P80 sizes. One of these composites, Composite 8, was a transition sample, included to evaluate what might happen if leaching of oxide was extended into the transition zone. Composite 1 was a sample of mineralized transported material from 0 to 22 m depth and there was only sufficient material for it to be tested at 12.5 mm. Composite 3 (86 m to 146 m) and Composite 11 (120 m to 150 m) were tested at P80 of 25 mm and 12.5 mm.
“Caspiche Property, Region III, Chile, NI 43-101 Technical Report, Prepared for Exeter Resource Corporation” dated 14 September 2009 by Wakefield, T. W., and Marinho, R. Available for viewing on SEDAR at http://www.sedar.com.
136
| |
The whole PQ core was hand-crushed at MLI in order that the largest size range would be as coarse as possible. The average size distribution of the 8 composites tested at the coarser size was approximately 65% passing (P65) 50 mm rather than the nominal 80% passing size. This coarser than nominal size should be considered when reviewing the results. Head grades of all the oxide composites ranged from 0.39 to 0.67 g/t Au and 50 to 230 ppm Cu. The transition composite, Composite 8, contained 0.07% Cu and 0.83% sulphide sulphur.
The seven oxide composites that were tested at all three feed sizes reported average gold recoveries of 79.3%, 80.4% and 81.7% for 50 mm, 25 mm and 12.5 mm respectively shows the results for the seven composites tested at all three sizes. Leach kinetics are presented in more detail in Table 13-3 and Figure 13-1 and Figure 13-2, as well as in Section 13.1.2.
The 50mm samples leached substantially slower than the finer samples, however gold recovery was expected to approach those recoveries obtained from the finer samples with a longer leaching cycle. Composite 11 (120 m to 130 m) gave the lowest gold recoveries of the oxide samples at just over 70% for the 25 mm size material.
Table 13-1: MLI Leach Program Main Results

Gold recoveries obtained from transition Composite 8 at -50 mm, -25 mm and -12.5 mm were 54.2%, 68.8% and 68.9% respectively. The leach kinetics were slower than those for the oxide samples. The higher copper content in the sample resulted in cyanide consumptions which were significantly higher than those in the oxide samples. The results suggest that transition material could be treated by heap leaching if required. However it is probable that copper might need to be removed and cyanide recovered in a SART facility. The expected gold recoveries may also be lower and leach cycle times substantially longer. Due to copper in solution, transition material should not be leached or mixed with oxide material.
Bottle roll test results at P80 -1.7 mm feed sizes were reasonably predictive of column test gold recoveries and were effectively used to estimate column test lime requirements. This suggests
137
| |
that in production, such tests might be used for performance prediction if carried out on blast hole cuttings.
Cyanide consumptions for the oxide composites were high, but, based on comparative test work data base results and actual production results of similar operations, should be significantly lower in commercial production. Lime requirements were moderate; generally pH control during leaching was not difficult. Load/permeability tests on the column residues indicated that the oxide mineral would display adequate permeability under expected heap stack height compressive loadings.
Sufficient material was left from two composites to carry out additional column leach tests at 25 mm using lower cyanide concentrations, namely addition rates of 1.00, 0.50 and 0.25 kg/t NaCN. The results of this optimization program are summarized in Table 13-2.
Table 13-2: Results of Optimization Program
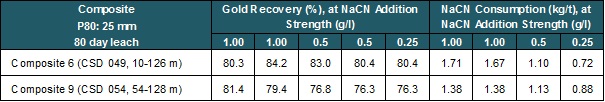
The program confirmed the expected downward trend in cyanide consumption together with a small reduction in gold recovery associated with the weaker cyanide solution.
Detailed results of this work are presented in MLI 3423 “Report on Cyanide Optimization Column Leach Testing – Caspiche Drill Core Composites” dated 21 September, 2011. The results from this program were considered as comprehensive confirmation of the technical application of heap leaching for oxide mineral by MLI, Exeter and 3rd party consultants.
Table 13-3 summarises the column tests for oxide mineral, whilst Figure 13-1 and Figure 13-2 show the kinetic curves for all oxide composites as a function of the leaching days.
138
| |
Table 13-3: Summary of MLI Program Results
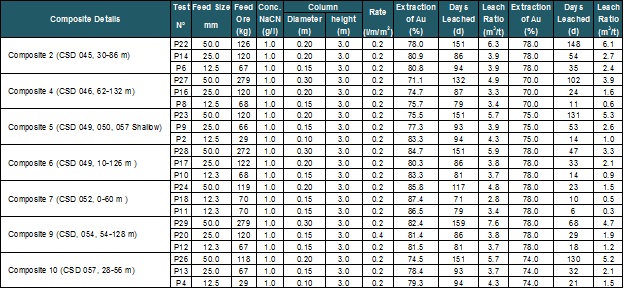
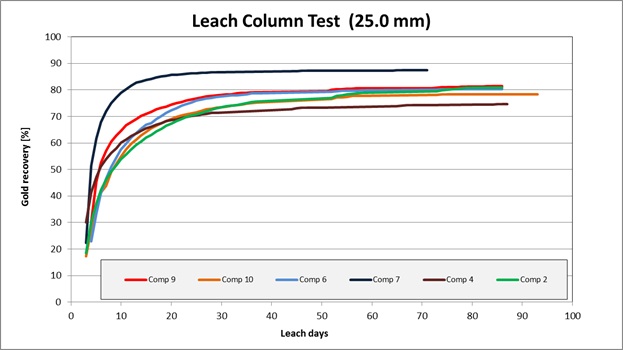
Figure 13-1: Gold Leach Rate Profile – 25 mm
139
| |
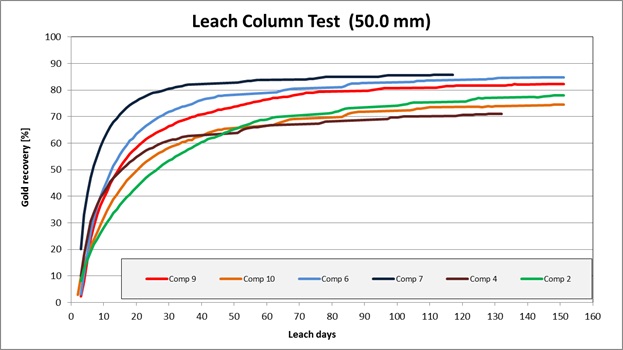
Figure 13-2: Gold Leach Rate Profile – 50 mm
In January 2011, two truckloads of mineralized oxide material was excavated from 3 trenches located next to drill holes 14, 23 and 64 and sent to SGS Santiago for sizing. This data was used to estimate screening requirements ahead of the jaw crusher and assist in crusher dimensioning. The samples were selected and composited to reflect actual Caspiche oxide mineral composition as much as practically possible given the limited outcrop and depth penetration. All overburden or “transported” material was carefully excluded from the samples.
| 13.1.2 | Leach Cycle Definition |
Alquimia carried out an extensive analysis of all column tests, in order to define the expected recoveries and leach irrigation cycle. Based on the information presented, the Au and Ag recovery used in this PEA is 80% and 40% respectively. Considering that the granulometric curve expected for the heap leach feed should be between the curves for -50 mm and -25 mm per Figure 13-3, a leach ratio of 2 m3/t is assumed to obtain these metals recoveries.
● A granulometric curve for the heap leach feed obtained from simulations for commercial crushing and screening equipment is presented in Figure 13-3. The curves for -50 mm and -25 mm for test composites 2 and 4 are also shown here.
● A leach ratio of 2 m3 of solution per tonne of material stacked
140
| |
The total irrigation time is estimated at 130 days for an irrigation rate of 10 l/m2/h, a lift height of 10 m and a bulk density for the mineral on the pad of 1.6 m3/t. To accomplish this leach cycle time without generating excess solution or gold grade dilution, Alquimia considered an intermediate leach solution (ILS) cycle and ILS pond. The irrigation cycle of 130 days is divided into 2 periods, 65 days using ILS and 65 days using barren solution.
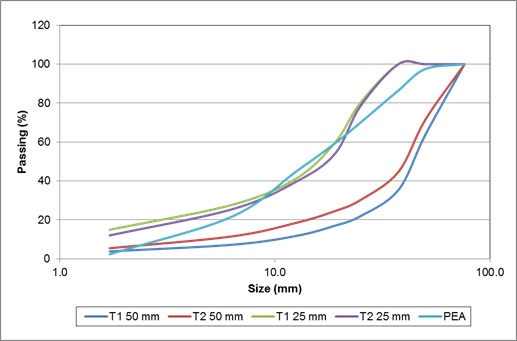
Figure 13-3: Granulometric Curve for Heap Leach Feed
| 13.2 | Sulphide Mineralization |
The Caspiche project sulphide mineralization has been subject to several physical characterization and metallurgical test programs to determine possible process routes and expected recoveries.
This chapter summarizes all metallurgical testwork undertaken at the time of preparing this Technical Report, it discusses the nature, extent and analytical procedures of the tests and provides summary of the most relevant results.
| 13.2.1 | Historical Testing |
The first Exeter test program was carried out on reverse circulation (RC) chips because of the timing of CSD 013 at the end of the first field drilling season in 2007. From this point on it was decided that all future work would be carried out on diamond drill core with the exception of a small number of shallow RC precollars.
141
| |
Following an examination of early assay statistics, Exeter’s geologists and metallurgists decided it would be prudent to make a preliminary split of coarse crushed, nominally 70% passing 10 mm, half-drill core and store this material for future metallurgical test regimes. If future statistics indicated a nugget effect requiring finer crushing of all the half-core, this procedure would be reviewed.
In August 2008, Exeter selected drill-hole intervals from the Caspiche oxide and sulphide mineralized intercepts for metallurgical test work. Six oxide and six sulphide intervals were selected and the stored coarse crushed material was appropriately assembled and sent to two laboratories.
| 13.2.2 | Exeter 2008-2010 Metallurgical Testing |
In August 2008, the first six sulphide intercepts were sent to G&T Metallurgical Laboratories. Preliminary testwork examined a wide range of rocks and alteration types for liberation and flotation characteristics, prior to composite preparation. All six samples were subjected to modal analysis and mineralogical investigation, rougher flotation tests were carried out using standard reagents. Subsequently, regrinding and cleaner flotation were carried out, with the objective of producing a 25% Cu grade concentrate.
In July 2009, 14 new sulphide intervals were added to those already assembled and a new characterization and flotation testwork program was conducted on all 20 samples. Variable results were obtained, with wide ranges of recoveries and concentrate grades. Enargite produced a high arsenic (As) content in the final copper concentrate, which is a penalty element for smelting operations. Centrifugal gravity testwork was also completed, which revealed some potential to enhance overall gold recoveries by gravity methods.
An important conclusion obtained from the 2009 program was that flotation performance is more sensitive to changes in sulphur grades than the mineralization per se, and hence it was decided to form composites based on sulphur and arsenic content. In 2010 G&T carried out a flotation program comprising of rougher and locked cycle tests (LCT). Rougher test results indicated a primary grind P80 of 130 µm and a concentrate regrind P80 of about 20 – 25 µm was required. LCT confirmed that low sulphur composites performed better, with 87% Cu and 73% Au recovered into a concentrate with 27% Cu grade.
A number of gravity tests were conducted on the composites, but with rather poor results. Attempts were made to improve the results in the high sulphur samples, but similar results were obtained.
142
| |
The results from these programs were reported in more detail in the September 2009 Technical Report authored by AMEC16 and in the September 2010 Technical Report authored by Tolman and Perkins.17
Concentrate Treatment
Due to the high arsenic content in the Caspiche copper concentrates, SNC Lavalin Australia conducted a study to define the best treatment alternatives for arsenic removal, based on the mineral characteristics and flotation tests results. Roasting and pressure oxidation were recommended and testwork programs were developed to confirm these approaches.
| 13.2.3 | Exeter 2010-2011 Metallurgical Testing |
Metallurgical testwork on mineralized sulphide material continued through a number of programs in the period 2010-2011. The results generated by these programs are summarized in more detail in the independent 2012 PFS by Aker Solutions NI 43-101 Technical Report. The principal results for this report were extracted from the SGS report, ‘Project 12403-003, Final Report’ dated 28 February 2011.
November 2010 Pilot Plant
A pilot plant test program was conducted with a blended sample from 84 intercepts that were considered to be representative of the Caspiche sulphide mineralization. The prime objective of the program was to generate enough concentrate to conduct preliminary roasting and pressure oxidation tests but several further studies were also completed.
Prior to starting the pilot plant tests, several physical and preliminary flotation tests were carried out. Physical tests included solids SG, Bond ball mill work index, SMC testing and gravity recoverable gold testing. Preliminary flotation included batch rougher and cleaner tests, together with locked cycle tests, with the main objective being the selection of optimum conditions to perform the flotation tests. Additional pyrite flotation tests were performed on cleaner scavenger tails.
Physical test results indicated that the Caspiche samples straddled the average of the laboratory database. The best pilot plant result produced a final concentrate of 31% Cu at 75% copper and 59% gold recoveries, from an initial head grade of 0.25% Cu and 0.49 g/t Au. On average, a final concentrate grading 23.5% Cu was produced at 77% copper and
16 Wakefield, T. W., and Marinho, R., 2009, Caspiche Property, Region III, Chile, NI 43-101Technical Report, Prepared for Exeter Resource Corporation, 14 September 2009.
17 Tolman, J.T. and Perkins, J., 2010, Caspiche Property, Region III, Chile NI 43-101 Technical Report, Prepared for Exeter Resource Corporation, 13 September 2010
18 “Caspiche Project, Copiapó, Chile, NI 43-101 Technical Report on Pre-feasibility Study”, prepared for Exeter Resource Corporation, dated 16 January, 2012, summited by Holmes, G., Duggan, A., Guzmán, C., Coupland, D., Wells, J. and Nguyen, L . Available for viewing on SEDAR at http://www.sedar.com.
52% gold recoveries. Gold and copper losses to first cleaner scavenger tails were considerable, this as expected for mineral with low copper head grade containing significant quantities of pyrite.
Mineral characterization of the final concentrate and the cleaner scavenger tails indicated that 55% of the copper was present as chalcopyrite and 30% as enargite in both products. The high enargite content produced high concentrations of arsenic (2.27%) and antimony (0.41%) in the concentrate.
Product characterisation tests
Solid liquid separation tests were performed on rougher tails, cleaner scavenger tails and final concentrate. All three principal products settled well with a non-ionic flocculant, and clear supernatants were obtained. Rheology tests were conducted on the thickened material in order to determine critical solids density. Final concentrate showed a fast settling behaviour, which should be further examined. Vacuum filtration tests were completed on the final concentrate and cake moistures in the range of 9% – 11% were obtained.
A rougher tails sample was treated for almost 40 weeks in a humidity cell to determine the acid generation potential of the mineral. The discharge solutions from this testwork appear stable and at the time of writing this report no parameters have been reported as being outside Chilean environmental limits.
Gold recovery
Samples of the cleaner scavenger tails and of the pyrite flotation concentrate were tested for gold dissolution in cyanide leaching tests. Sample pulps at 40% solids were leached for 48 hours in 0.1% NaCN solution. Gold dissolution ranged from 60.2% to 67.6% while silver dissolution ranged from 32.2% to 50.7%.
Three solutions obtained from the cyanidation tests were subsequently subject to sulphidization, acidification, recycling and thickening (SART) testwork. Copper recoveries from this testwork ranged from 98% to 100%, but cyanide recoveries were lower, between 74% and 80% because some cyanide was consumed as thiocyanate, CNS, which is not recoverable by SART.
Concentrate treatment
Both pressure oxidation tests (POX) and roasting tests were conducted on final concentrate samples obtained from the pilot plant.
POX tests were developed in SGS laboratories, and were carried out in a 2 liter titanium autoclave. Copper extraction was greater than 90%, with faster kinetics obtained at higher temperatures. The arsenic content in the final solution was low, with an average concentration of
144
| |
200 mg/l, while virtually all antimony remained in the residue. The final solution contained 20 – 23 g/l Cu and 40 – 50 g/l H2SO4. POX residues were bottle-roll leached at 25% solids, with 1 g/l NaCN for 24 – 48 hours. Gold dissolution ranged from 95 to 99%, silver recoveries were low, at 7% to 29%.
Roasting testwork was completed by two roasting technology suppliers. Outotec carried out roasting tests in a rotatory kiln and in a SO2 fluid bed reactor. Calcine residues of less than 0.2% As were achieved, while almost 70% of the antimony was removed. Technip technology was also investigated; tests were conducted at Hazen Research in a stainless steel fluidized bed reactor, using sand as an inert fluidizing medium. A calcine of 0.2% As was obtained with 26% – 27% sulphur content.
| 13.2.4 | Exeter 2012-2013 Metallurgical Testing |
Further testwork was developed by Exeter, with the primary objective of optimizing flotation conditions and defining the crushing technology that suits the Caspiche mineralization.67
Exeter 2013 Reagent Optimization Program
A reagent optimization program was developed by SGS using the remaining feed from the pilot plant test carried out in 2010. The key objective of the program was to investigate, and where possible, improve copper and gold metallurgy by means of optimizing flotation conditions.
A total of 33 rougher flotation tests were conducted, evaluating effects of pH, pulp density, primary grind, collector and depressant type and dosage, pulp mixing intensity and viability of flash flotation. Three rougher conditions were selected which met the test targets of mass pull of ~8% by weight and rougher recoveries of 90% Cu and 80% Au. These conditions were used in subsequent batch cleaner runs.
Eight batch cleaner tests were completed to determine the best conditions to be used in the locked cycle tests (LCT). The effect of guar gum, collector type and dosage and pH were evaluated. The highest copper recovery was 81.5% and six of the eight samples reached the target Cu concentrate grade of 25%.
Additional pyrite flotation tests were conducted on primary cleaner scavenger tails, to evaluate if the gold associated with pyrite could be efficiently recovered. Results indicate that pyrite gold recovery could be achieved.
19 “Optimization testwork on pilot plant feed from Caspiche Deposit”, the project update report “Project #12403-005: Variability – 13 March flotation update”, the July 2012 technical report “The grindability characteristics of samples from Caspiche Project” (March, 2013)
145
| |
Finally, four LCT’s were completed using a standard circuit with three cleaner stages. The best test achieved a concentrate grade of 29.9% Cu with recoveries of 81.7% Cu and 58.3% Au. These results are comparable, if not better, than previous programs. A duplicate run at a finer primary grind showed no improvement in rougher and overall gold recoveries.
Additional test work was completed to characterize rougher and primary cleaner tails and to improve recoveries. These tests included: gold diagnostic leach tests, magnetic separation test and gravity amenability test (GAT) and the use of a proprietary contact flotation technology.
Variability Assessment
Variability flotation tests were completed on 20 mainly lower-grade copper samples from the Caspiche property. The objective of the program was to understand the effect of lower head grade and mineralogy on the metallurgical response of the deposit.
Mineralogical analysis was performed on each of the 20 samples. Chalcopyrite was the dominant copper mineral in 13 of the samples and present in all. Enargite was also present in all 20 samples and was the dominant or equal-dominant copper mineral in seven of them. Bornite was also detected in all samples as a minor copper phase, but at levels of up to 20% of the copper minerals in one or two samples.
Covelite, which tends to slime during grinding operations was present in 7 samples. Chalcocite was the dominant copper mineral in one deeper sample, but was generally detected only at levels of 1% to 2%. Twelve samples showed elevated pyrite content of over 2%. Clay and clay minerals were present in all samples. Clay and clay minerals create metallurgical challenges, since these materials usually require special flotation conditions..
A total of 33 rougher flotation kinetic tests were completed using the variability samples. The test conditions were the same as those used in the pilot plant operation. After six minutes of flotation, thirteen of the samples yielded Cu recovery in the 80-90% range, and four in the 74-80% range, these four samples had low pyrite values and were high in chalcocite. Six samples that recovered 80-90% Cu yielded gold recovery over 70%, no common mineralogical or chemical properties were seen as being present amongst these samples.
When the rougher tests were completed, 33 batch cleaner flotation and 9 LCT tests were completed on the variability samples. Six of the nine LCT’s achieved a Cu concentrate grade above 25%, with global copper recoveries ranging from 39.8% to 88.7% and gold recovery ranging from 42.4% to 65.8%.
HPGR and Physical Characteristics
The key objective of this study, developed in 2012-2013, was to compare mill grindability and flotation response between Caspiche samples prepared by HPGR and by conventional cone crushing. Two whole HQ drill cores of well-mineralized material were available for the work
146
| |
which allowed relatively coarse material to be generated for HPGR testwork in the SGS HPGR pilot plant. The samples were selected on a down-hole basis so that differences in properties with depth as well as rock type could be assessed. Sub-samples were subjected to detailed head assay and mineralogical analysis using QEMSCAN techniques, to allow their characterization in terms of the rest of the mineralization.
Initially eleven samples were submitted for a grindability characterization study. This included head assays, SMC and SPI test, Bond ball mill and Bond abrasion tests, UCS tests and HPGR batch tests. In order to have sufficient weight, six composites were prepared for locked cycle HPGR tests. Bond ball mill tests on the locked cycle tests products were completed on the six composites.
The optimised conditions obtained in the batch HPGR tests were replicated for the locked cycle tests. The series of batch HPGR tests produced similar behaviour for the eleven samples; the main parameters did not vary significantly from one sample to another. The Bond ball mill test performed on the HPGR products indicated a reduction in work index varying between 7% to 20% when comparing HPGR and conventionally crushed materials. The additional fines created by the HPGR – ball mill combination may generate an overall reduction between 17% and 31% in grinding power requirement.
Rougher flotation tests were conducted on both HPGR and cone crusher product for all six composites. Conditions for the tests were taken from the previous optimization testwork program.
An initial series of tests with a primary product of P80 ~115 µm was completed with the aim of determining the effect of HPGR product on “finer” grind sizes. In general, the HPGR products showed slightly better copper and gold recoveries at the same mass pull than the conventional crusher products. Improvements in recoveries were better for samples taken from deeper in the deposit which were harder and hence more amenable to HPGR grinding. These composites were also low in sulphur and arsenic and contained less clay material.
A second series of comparative rougher flotation tests were completed at a target P80 of ~130 µm in order to determine the effect of HPGR grinding at “coarse” grind size. Two samples showed better copper recoveries for HPGR prepared products, while the additional four showed comparable recoveries. Gold recoveries at a coarser grind also showed comparable results for HPGR prepared products.
A third and final series of rougher flotation tests were completed to determine the effect of lower pulp density on those composites from shallower zones with high clay content. Results showed improvements in copper recovery for one conventional crusher product, but not for the HPGR products. No improvements were recorded in gold recovery.
147
| |
One batch cleaner flotation test was completed for each of the two grind products of the six composites to establish cleaning conditions before the locked cycle test. Batch cleaner flotation tests showed no difference in the grade-recovery relationship between the two material types on four of the six composites.
Finally, locked cycle tests were completed on the six composites; an initial twelve tests on the two grind products from the six composites plus seven additional tests to attempt to improve metallurgical results.
In the initial twelve tests, HPGR products yielded better copper recovery and grade for two of the composites, while similar results were obtained for both products in the remaining four composites. Trends were similar for gold recovery. More studies are required in order to define the implementation of HPGR in the crushing circuit.
| 13.2.5 | Metallurgical results and discussion |
Grindability characterization
Table 13-4 presents a summary of the results obtained in the grindability characterization study carried out in 2012 (Comp. 1 – 3 and Comp A – H). The results of the physical tests completed on the pilot plant feed sample are also shown (Exeter #1 and #2, duplicated test).
148
| |
Table 13-4: Grindability tests results
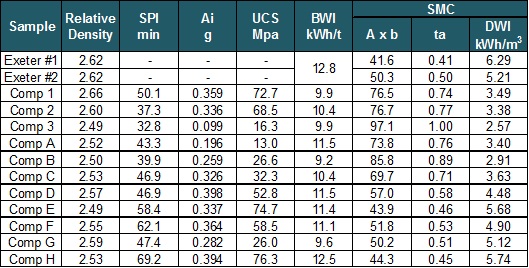
The eleven composites were classified as soft to medium in terms of resistance to impact breakage (Axb) and SPI test, and soft to moderate soft in terms of the BWI test. The samples were also medium to moderately abrasive, whereas for the unconfined compressive strength test they covered the soft to hard range of hardness’s. The pilot plant test sample is medium to moderate hard in terms of Axb.
Flotation programs
Rougher flotation
Figure 13-4 to Figure 13-7 plot the results obtained in all rougher flotation tests completed to date on different Caspiche samples. The results are separately analyzed for those mineral samples identified as diorite porphyry (DP), in order to investigate its general behavior flotation.
149
| |
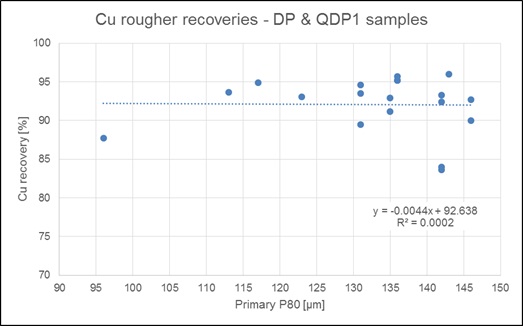
Figure 13-4: Cu recovery in rougher flotation vs. primary P80 – DP and QDP1 samples
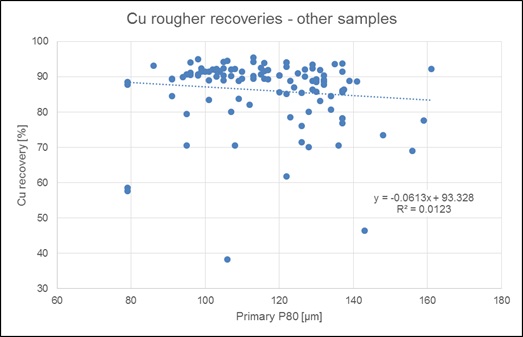
Figure 13-5: Cu recovery in rougher flotation vs. primary P80 – Other samples
150
| |
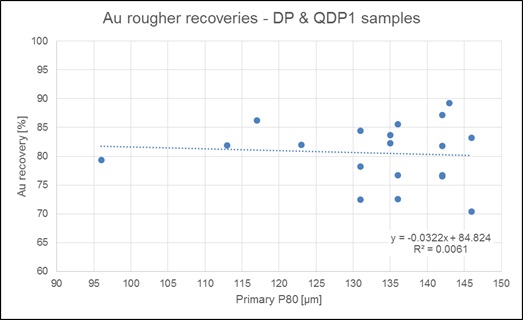
Figure 13-6: Au recovery in rougher flotation vs. primary P80 – DP and QDP1 samples
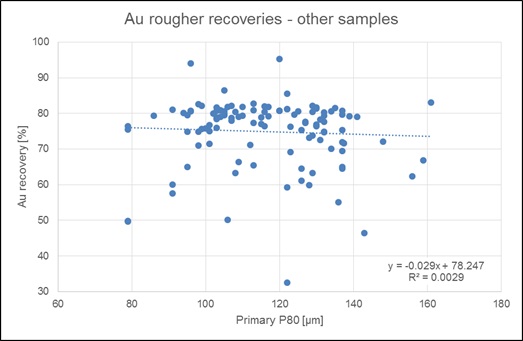
Figure 13-7: Au recovery in rougher flotation vs. primary P80 – Other samples
The figures show that for both types of samples, copper behavior in rougher flotation is not affected by the primary feed P80. However the figures do include all of the data and don’t discriminate between poor tests that were part of an optimisation series and confirmatory tests. Alquimia notes that both the laboratories involved, G&T and SGS, as well as Exeter staff, have
151
| |
formed opinions from the work that finer grinds improve both gold and copper rougher recoveries, especially for the more complex and finer grained mineralization. A coarser grind in the 130 micron range is optimal for the “easier” mineralization styles such as DP. Copper recovery is in the 90% – 95% range for DP and QDP1 samples and in the 85% – 95% range for “other” samples.
Similar results are obtained for gold. Recovery in rougher flotation is not affected by feed P80, for DP, QDP1 and “others”. Gold recovery is between 70% and 90% for DP and QDP1 samples and is generally in the 75% – 85% range for “others”.
This analysis supports the selected grind P80 of 130 µm for the plant design. No detrimental impact is expected in the recovery of both Cu and Au with this grind size.
Regarding the grinding technology, Figure 13-8 compares the results obtained in rougher flotation for both HPGR and conventional crushing products, for a target size of ~130 microns.

Figure 13-8: Batch rougher flotation results at coarse grind
As indicated previously, two samples show better copper recovery for HPGR product, while the remaining four show comparable results. Most samples show comparable results for both types of grinding product. The alternative of including HPGR in the circuit may warrant further analysis.
152
| |
Locked cycle tests (LCT)
Table 13-5 shows the results obtained in the LCT’s in the last program for those samples ground using conventional crushing.
Table 13-5: LCT results for cone crusher prepared samples
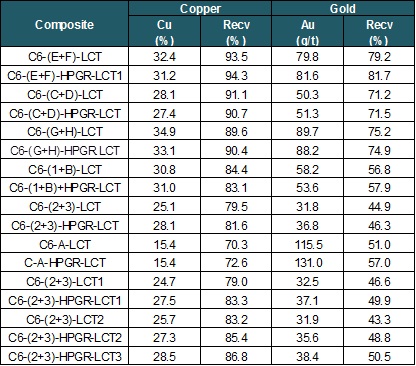
The best copper concentrate grade was 34.9% for a global recovery of 89.6% Cu and 75.2% Au. All samples achieved copper concentrate grades above 24.7%, with the exception of composite A, which was very low-grade, near-surface and exhibited poor metallurgical behaviour. Copper concentrate grades for the rest of the tests averaged 28.8% (without considering composite A), supporting the copper concentrate grade of 26% used for plant design.
Table 13-6 to Table 13-8 show the results obtained for DP&QDP1 samples and “others”, arranged according to the type of test: rougher, locked cycle test and cleaner test. The information presents the best definition of both rougher and cleaner recoveries and hence global recoveries, to be used in the production plan of the project.
Initially the tests were ranked in order to reflect the head grades reported in the mining plan, specifically copper and sulphur grades. All tests performed on samples with copper head grade below the average copper grade of 0.2% Cu reported in the mining plan were removed. All tests with sulphur head grades above the average in the mining plan of 2.3% were also removed. Once the test were ranked according to their head grades, all tests conducted on HPGR product
153
| |
samples were removed, in order to reflect the conventional crushing technology selected for the project.
Table 13-6: Flotation test results for DP and QDP1 samples
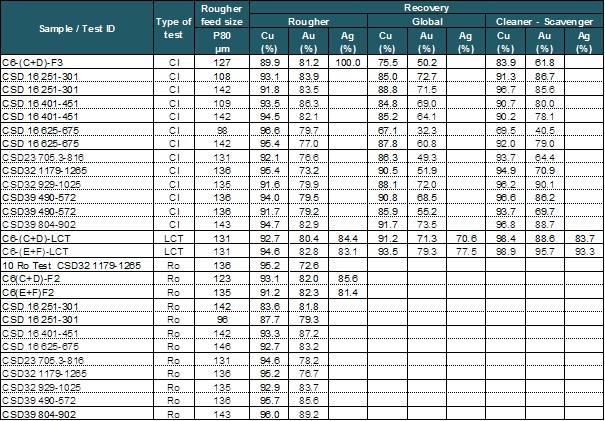
154
| |
Table 13-7: Flotation test results other (Non DP) samples
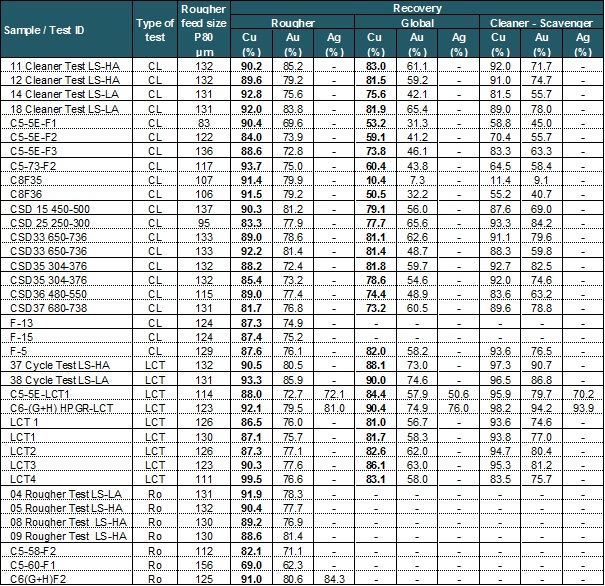
155
| |
Table 13-8: Flotation test results other (Non DP) samples
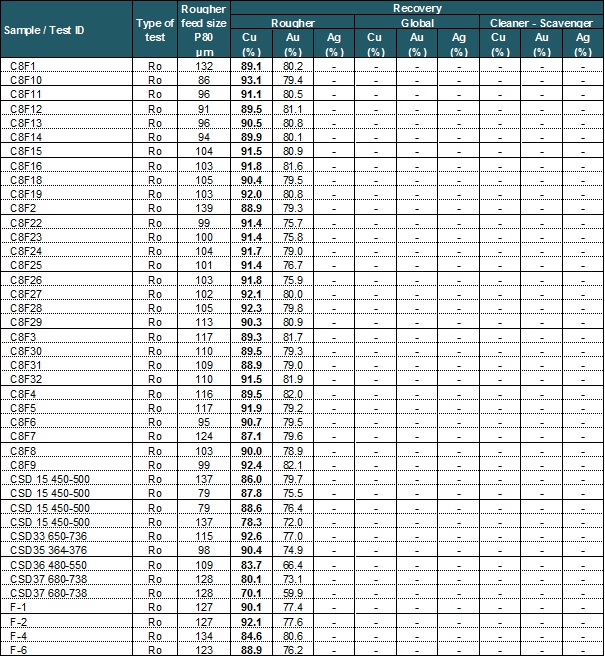
156
| |
Carbon in leach (CIL) tests
Table 13-9 shows the results obtained from all CIL tests completed on cleaner scavenger tails.
Table 13-9: CIL test results
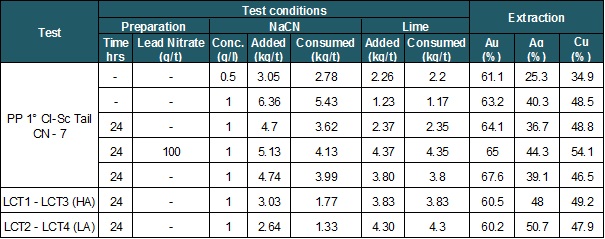
According to the results shown inTable 13-9, Au recovery in CIL ranged from 60.2% to 67.6%.
The production plan considers a gold recovery in CIL of 65% for DP and QDP1 samples and 60% for “others”. Further evaluation of the gold recovery route selected for the process may be warranted with counter current decantation being a potential alternative.
Sulphidization, acidification, recycling and thickening tests (SART)
Table 13-10 shows the results obtained in the SART tests, completed on solutions produced from the CIL tests carried out with cleaner scavenger tails.
Table 13-10: SART tests results
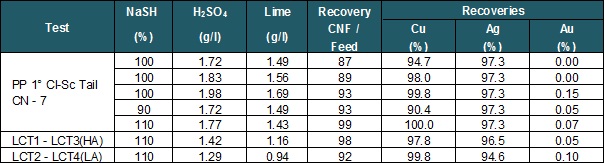
The production plan considers a copper recovery in SART of 95% for all samples and 90% for cyanide.
157
| |
From the test programs and results obtained a matrix of recoveries was generated based on material characteristics, these are presented in Table 1-4. As part of future development studies, further testwork should be evaluated to confirm these results and if warranted a more detailed recovery algorithm generated which would incorporate geometallurgical results with metallurgical recovery which could then be assigned to the geological units in the deposit.
Table 13-11: Recoveries for the production plan
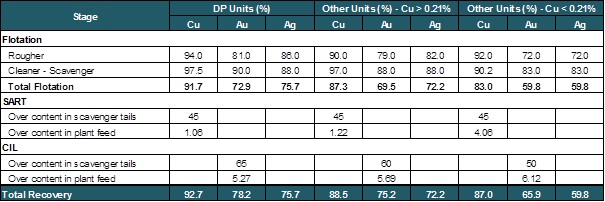
158
| |
| 14 | MINERAL RESOURCE ESTIMATION |
The Caspiche Porphyry Mineral Resource Estimate (MRE) (the ‘Cube 2012 MRE’) was prepared by Mr. Ted Coupland, MAusIMM (CP), former Director and Principal Geostatistician of Cube Consulting Pty Ltd (Cube). The MRE was prepared in accordance with the CIM Estimation of Mineral Resources and Mineral Reserves Best Practice Guidelines (2003). The effective date of this MRE is April 11, 2012.
The Cube 2012 MRE was reviewed and verified by Mr. Patrick Adams, MAusIMM (CP), Director and Principal Geologist at Cube. It is the opinion of Mr. Adams that the Cube 2012 MRE is suitable for use in this PEA study. Cube Consulting Pty Ltd is an independent Australian firm specializing in mining and mineral resource consulting services.
The oxidized portion of the Cube 2012 MRE is reported above an AuEq cut off of 0.18 g/t AuEq3. The non-oxidized portion is reported above 0.30 g/t AuEq3 cut-off these selected marginal cut-offs are considered appropriate for open pit exploitation methods. Details of the derivation of these cut-offs are summarized in Section 14.10.1, Table 14-1.
A sub set of the non-oxidized portion of the MRE is re-reported above an AuEq cut off of 0.75 g/t AuEq4 for use in the PEA study. The higher cut off (0.75 g/t AuEq4) used to report the non-oxidized portion is considered appropriate as a lower limit for reporting mineralization to be considered for underground exploitation methods. The selection of this cut-off is based on information provided in the January 16, 2012 PFS and subsequent information provided by NCL. Key assumptions and parameters used to select the underground cut-off are provided in Table 14-33, Section 14.10.1 below.
| 14.1 | Drilling database |
Exeter provided Cube with an MS Access drilling database for the Caspiche property updated to 11 April, 2012. The drilling database was suitable for direct connectivity to Surpac mining software, a commercial mining software program. Surpac validation routines were used to check for overlapping intervals, missing intervals, and inconsistent drill hole lengths between tables; no errors were reported.
The database contains data for 166 drill holes, and totals 79,950 m of drilling.
Table 14-1 is a tabulation of the drill holes that were used in the Cube 2012 MRE. The database includes an additional 12 diamond holes for 4,797 m completed by Exeter since the previous MRE (AMEC, 2011). Of the 12 new diamond holes 11 targeted Caspiche porphyry prospect. This most recent drilling program was focused on increasing resource confidence and providing additional metallurgical samples within the Caspiche porphyry prospect.
Subsequent to the Cube 2012 MRE, Exeter received the final assay results for three additional drill holes. The QP has reviewed the results for these three holes in the context of the Cube
159
| |
2012 MRE and concluded that the extra information is not sufficiently material to the MRE to warrant a re-estimation at this time.
Table 14-1: Summary of Drill Data on the Caspiche and Adjacent Properties as at April 11, 2013.
| Prospect | Company | RC/Rotary | Diamond Core21 | RC/Rotary + Core | % Total | |||
| # Holes | RC (m) | # Holes | Core (m) | Holes | Total (m) | |||
| Caspiche Porphyry | Anglo | 18 | 1,520 | 18 | 1,520 | 1.90% | ||
| Newcrest | 14 | 3,140 | 14 | 3,140 | 3.93% | |||
| Exeter | 6 | 1,290 | 78 | 61,170 | 84 | 62,460 | 78.12% | |
| Total | 38 | 5,950 | 78 | 61,170 | 116 | 67,120 | 83.95% | |
| Caspiche Epithermals | Anglo | 0.00% | ||||||
| Newcrest | 20 | 3,750 | 20 | 3,750 | 4.69% | |||
| Exeter | 14 | 4,930 | 14 | 4,930 | 6.17% | |||
| Total | 20 | 3,750 | 14 | 4,930 | 34 | 8,680 | 10.86% | |
| Sideral | Anglo | 0.00% | ||||||
| Newcrest | 2 | 230 | 2 | 230 | 0.29% | |||
| Exeter | 3 | 1,640 | 3 | 1,640 | 2.06% | |||
| Total | 2 | 230 | 3 | 1,640 | 5 | 1,870 | 2.34% | |
| Regional | Anglo | 0.00% | ||||||
| Newcrest | 1 | 300 | 1 | 300 | 0.38% | |||
| Exeter | 9 | 1,720 | 1 | 260 | 10 | 1,980 | 2.48% | |
| Total | 10 | 2,020 | 1 | 260 | 11 | 2,280 | 2.85% | |
| TOTAL | 70 | 11,950 | 96 | 68,000 | 166 | 79,950 | 100.00% | |
21 RC pre-collar drill lengths are included in the core drillling totals. Drill totals for Exeter campaigns are current as of the effective date of the Mineral Resources.
160
| |
| 14.2 | Topography |
The topographic model of the Caspiche Project was based on 0.5 m resolution DEM modelling from high definition stereo satellite photos. Isolated portions of the topographic surface were then adjusted using surveyed drill hole collar elevations, to create a final topographic surface for use in resource estimation. Figure 14-1 shows detailed topography and drill hole locations over the Caspiche Porphyry project.
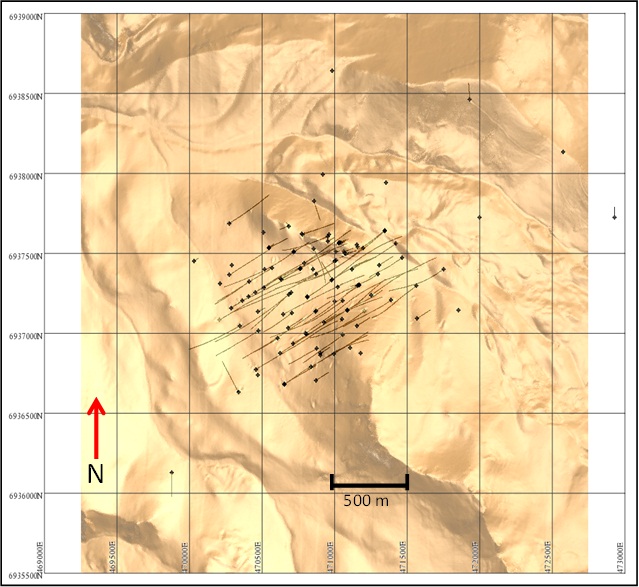
Figure 14-1: Caspiche topography and drill hole locations – Caspiche Porphyry Project (Source: Cube Consulting, April 11 2012)
| 14.3 | Lithological model and definition of domains |
Exeter provided triangulated solid models representing the Caspiche lithological and alteration units. The alteration model consists of potassic and argillic units and a calcite-potassic zone at the bottom of the system. Table 14-2 and Table 14-3 summarise the stratigraphic and alteration units used for the modelling. Examples of the lithological and alteration wireframes are shown in Figure 14-2 to Figure 14-5.
161
| |
The lithological solids provide the main support for the estimation domains. Gold, copper and silver grades are clearly higher in the DP (diorite porphyry) as this intrusion is thought to be the main source of mineralizing solutions. The mineralizing solutions were disseminated outwards from the DP into the surrounding stratigraphic units during the mineralization event thus resulting in lower tenor grade values away from the DP.
An alteration model, consisting of potassic and argillic units and a calcite-potassic zone at the base of the system was also constructed.
Table 14-2: Stratigraphy Description
| Stratigraphic Unit | Model Code | Description | |
| OB | 100 | Overburden | |
| CFB (Basement) | 200 | Earliest cretaceous host rock | |
| DTB2 | 300 | Diatreme breccia | |
| DP | 400 | Diorite porphyry (Early - main host rock for mineralization) | |
| QDP1 | 500 | Quartz-diorite porphyry (first phase) | |
| QDP2 | 600 | Quartz-diorite porphyry (second phase - lower grade) | |
| VOLCBX | 700 | Volcanic breccias | |
| MAC | 800 | MacNeill Zone |
Table 14-3: Alteration Description
| Alteration Style | Model Code | Description | |
| AA | 1000 | Advanced Argillic (Quartz - dominant Kaolinite) | |
| K-CA | 2000 | Potassic-Calcic (Actinolite-diopside-albite) | |
| IA | 3000 | Intermediate Argillic (Illite - smectite) |
The limit of oxidation surface was constructed from logging information (mainly sulphide descriptions). Cube checked the oxide and sulphide solids against the drill holes database coding and found them to be appropriate. Sulphur values are significantly depleted in the oxide zone due to the destruction of sulphide minerals and low or absent sulphur values provide an excellent proxy for defining the base of the oxide surface. The base of oxidation appears to be a reasonably sharp contact. A mixed oxide-sulphide (Transitional) zone was arbitrarily created by lowering the base of oxidation surface by 30 m. Table 14-4 summarizes the oxidation codes used for the modelling.
162
| |
Table 14-4: Oxidation Description
| Oxidation State | Model Code | Description |
| Oxide (OX) | 10 | >90% oxidized |
| Mixed Oxide - SulphideMXSU) | 20 | 10 to 90% oxidized |
| Sulphide (SU) | 30 | <10% oxidized |
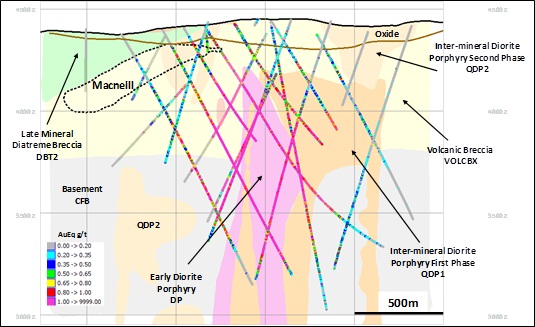
Figure 14-2: Caspiche Stratigraphic Model Section - Looking Northwest (Source: Cube Consulting, 2012)
163
| |
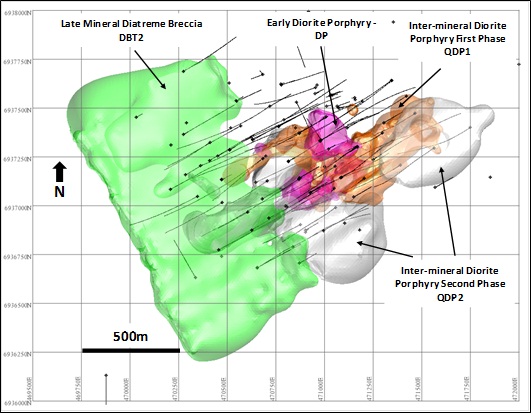
Figure 14-3: Caspiche Stratigraphic Model - Plan (Source: Cube Consulting, 2012)
164
| |

Figure 14-4: Caspiche Stratigraphic Model – Looking North (Source: Cube Consulting, 2012)
165
| |
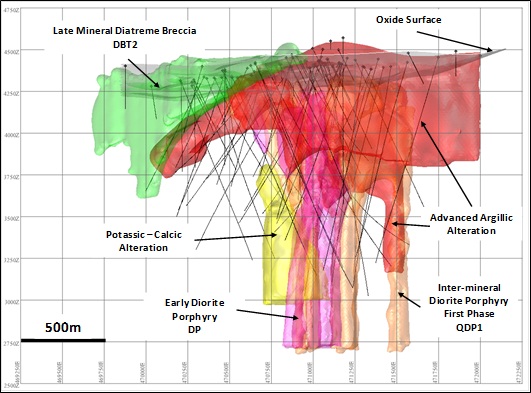
Figure 14-5: Caspiche Stratigraphic and Alteration Model – Looking North (Source: Cube Consulting, 2012)
166
| |
| 14.4 | Composites |
Drill holes within the database were assigned a unique stratigraphic and oxidation code based on the numbering system outlined in Table 14-4 and Table 14-2. An additional code was created representing a combination of weathering and stratigraphy. The unique database coding was used to control the compositing process.
Downhole compositing was carried out independently for each stratigraphic zone (stratdom), weathering domain (weathering) and combined weathering/stratigraphic zone (strat_weath) whereby the database coding was used to control compositing. A downhole composite length of 8 m was used for all zones. The downhole compositing process uses a ‘best fit’ approach whereby the composite length is optimised over the coded interval to eliminate the problem of residuals.
The resulting composite files were further flagged within the main alteration wireframes.
167
| |
| 14.5 | Exploratory data analysis |
| 14.5.1 | Domain boundary analysis |
As mentioned in Section 14.3, the stratigraphic solids provide the main support for the estimation domains. It is important, however, to characterise the grade behaviour at the stratigraphic or weathering contacts to determine the relationship between grades on either side of the contact. The outcome of these boundary tests are a key factor in determining the extent to which, if any, samples should be shared between domains during estimation.
Cube undertook extensive boundary testing for gold and copper and determined that two types of boundary conditions are necessary to achieve robust grade estimation at Caspiche:
Hard Boundaries: No sample sharing between adjacent stratigraphic units or weathering domains;
Soft Boundaries: Unlimited sample sharing between adjacent stratigraphic units or weathering domains
Cube adopted a boundary analysis method whereby composite grades are grouped and compared in distance 'bands' on either side of the domain boundary. The Cube method involves computing the sample distances relative to the interpreted wireframe surface. A list of the boundary tests undertaken for gold and copper are as follows:
DP v QDP1
DP v VOLCBX
DP v CFB
DP v Combined CFB and VOLCBX
QDP1 v VOLCBX
QDP1 v CFB
QDP1 v Combined CFB and VOLCBX
DTB v CFB
QDP1 OX v QDP1 SU
DTB OX v VOLCBX SU
QDP2 OX v QDP2 SU
168
| |
DTB2 v Combined CFB and VOLCBX
QDP2 v Combined CFB and VOLCBX
Figure 14-6 and Figure 14-7 show examples of the boundary analysis output - the contact position is located on the X-Axis at distance zero. Figure 14-6 shows the change in grade profile for gold and copper when moving from inside the DP unit into the QDP1, VOLCBX and CFB units. It is clearly demonstrates that tenor of gold and copper grade in the adjacent stratigraphy gradually reduces with increasing distance from the DP contact. This somewhat 'diffuse' behaviour away from the DP contact is consistent with the concept of mineralizing solutions being disseminated outwards from the DP into the surrounding stratigraphic units. It was decided to use only DP composites for estimating the DP volume to ensure that the DP grade distribution is not 'diluted' by lower grade adjacent units. In this sense, the DP contact is treated as a 'hard' boundary for the purposes of estimating the DP itself. The DP contact is treated as 'soft' (i.e., samples are shared from the DP) for estimating all other adjacent units (QDP1, VOLCBX and CFB).
Figure 14-7 shows some examples of gold and copper grade behaviour between the sulphide (SU) and oxide (OX) zone. It can be clearly seen that weathering has a relatively minor influence on gold grade whereas copper is substantially depleted in the oxide zone. It was decided to treat the oxide surface as a 'soft' boundary for the estimation of gold and as a 'hard' boundary for the estimation of copper.
169
| |
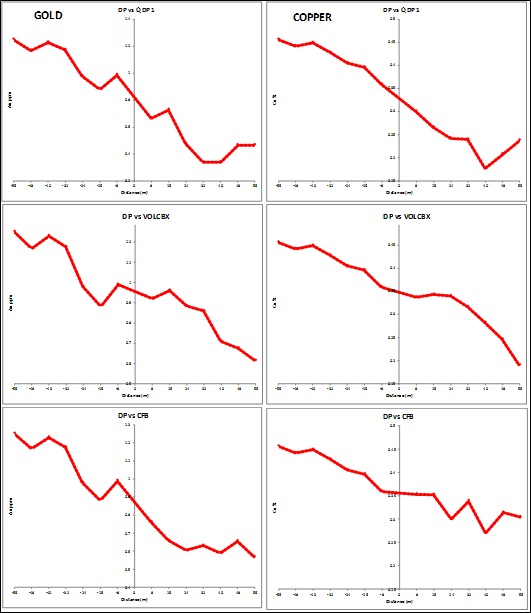
Figure 14-6: Boundary Contact Analysis – DP v QDP1, VOLCBX and CFB
170
| |
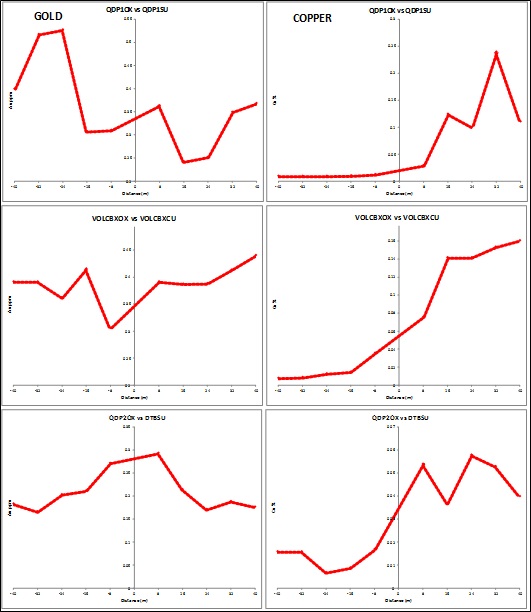
Figure 14-7: Boundary Contact Analysis – OXIDE v SULPHIDE
A full summary of estimation domains and sample combinations are shown in Table 14-5 to Table 14-7. Oxide and sulphide samples were combined for the estimation of gold, silver and arsenic whereas oxide and sulphide domains were separated for the estimation of copper, sulphur and molybdenum. Oxide material was combined with overburden for the purposes of the copper, sulphur and molybdenum estimation. The MacNeill zone was estimated with available surrounding data however the grades within the MacNeill zone were not permitted to influence the estimates outside of this zone. Iron was estimated separately for oxide and sulphide material with no additional stratigraphic domaining.
171
| |
Table 14-5: Estimation Domains and Data Combinations – Gold, Silver and Arsenic
| Estimation Domain | Sample Combinations (Au, Ag, As) | Boundary Type |
| OB | OB | Hard |
| CFB | QDP1 + DP + VOLCBX + CFB (OX+SU) | Soft |
| DTB2 | DTB2 (OX+SU) | Hard |
| DP | DP (OX+SU) | Hard |
| QDP1 | QDP1 + DP + VOLCBX + CFB (OX+SU) | Soft |
| QDP2 | QDP2 (OX+SU) | Hard |
| VOLCBX | QDP1 + DP + VOLCBX + CFB (OX+SU) | Soft |
| MAC | MAC + QDP1 + QDP2 + DP + VOLCBX +CFB (OX+SU) | Soft |
| K-CA Alteration | K-CA Alt | Hard |
Table 14-6: Estimation Domains and Data Combinations – Copper, Sulphur and Molybdenum
| Estimation Domain | Sample Combinations (Cu, S, Mo) | Boundary Type |
| OB/OX | Combined OB + All OX | Hard |
| CFB | QDP1 + DP + VOLCBX + CFB (SU Only) | Soft |
| DTB2 | DTB2 (SU Only) | Hard |
| DP | DP (SU Only) | Hard |
| QDP1 | QDP1 + DP + VOLCBX + CFB (SU Only) | Soft |
| QDP2 | QDP2 (SU Only) | Hard |
| VOLCBX | QDP1 + DP + VOLCBX + CFB (SU Only) | Soft |
| MAC | MAC + QDP1 + QDP2 + DP + VOLCBX +CFB (SU Only) | Soft |
| K-CA Alteration | K-CA Alt | Hard |
Table 14-7: Estimation Domains and Data Combinations – Iron
| Estimation Domain | Sample Combinations (Fe) | Boundary Type |
| OB/OX | Combined OB + All OX | Hard |
| SU | All SU | Hard |
| 14.5.2 | Summary Statistics and Assay Capping |
A statistical analysis based on 8 m composites for gold, copper, silver, sulphur, iron, molybdenum and arsenic was undertaken. The main elements of economic interest are gold, copper and silver. Figure 14-8 to Figure 14-16 show log-probability plots for gold, silver and copper 8 m downhole composites for the Caspiche porphyry project classified by stratigraphy, alteration and weathering.
172
| |
Table 14-8 to Table 14-12 summarise basic statistics for all estimated elements classified by stratigraphy, alteration and weathering.
As expected, statistical analysis confirms that the diorite porphyry (DP) is preferentially mineralized having the highest mean gold, copper and silver (excepting OB) grade and the lowest statistical variability of all the mineralized units. The tenor of gold and silver grade is similar for the basement (CFB), volcanic breccia (VOLCBX) and second phase quartz-diorite porphyry (QDP2).
All mineralized units demonstrate relatively low variability with respect to gold and copper grades as manifested by low to moderate coefficient of variation (CoV) values. The overburden (OB), diatreme breccia (DTB2) and second phase quartz-diorite porphyry (QDP2) demonstrate the highest degree of variability of all the mineralized units.
Arsenic grades broadly correlate with intensity of argillic alteration with the highest grades associated with advance argillic (AA) alteration. Isolated “pods” of higher grade arsenic can locally occur at depth in the central portions of the system.
The spatial distribution of gold, copper and silver is similar within the sulphide zone; however, copper is significantly depleted within the oxide zone. Sulphur grades are also significantly depleted in the oxide zone.
Whilst silver grades appear to be somewhat elevated within the DP and OB units, the silver grade distributions are remarkably consistent for most stratigraphic units.
Molybdenum grades are higher in VOLCBX, MacNeill (MAC) and basement rocks (CFB). Molybdenum is thought to be of magmatic provenance whereby the distribution of molybdenum forms a “halo” around the central intrusions as a function of temperature.
High grade assay capping was applied to the 8 m composite data where obvious statistical outliers were evident or where it was determined that individual composite grades posed an unacceptable risk to the estimate. A statistical and spatial analysis was undertaken to quantify the potential influence of outlier values and to determine an appropriate assay capping strategy. The aim of this analysis was to quantify the potential metal influence associated with individual composites in conjunction with declustering weights. Only a small number of individual composites were targeted by assay capping which was generally applied above the 99th percentile of the respective grade distribution.
173
| |
Table 14-8 summarizes the assay capping values applied to 8 m composites.
Table 14-8: Caspiche Assay Capping – 8 m Composites
| Stratigraphic Unit | Au (ppm) | Cu % Su (Ox) | Ag (ppm) | As (ppm) | S % Su (Ox) | Mo ppm Su (Ox) | Fe % Su (Ox) |
| OB | 0.9 | 0.08 | 8 | 600 | 2.5 | 300 | 6 |
| CFB | 2.5 | 0.8 (0.08) | 15 | 1500 | 8 (2.5) | 600 (300) | 10 (6) |
| DTB2 | 0.4 | 0.8 (0.08) | 4 | 300 | 8 (2.5) | 600 (300) | 10 (6) |
| DP | 2.5 | 0.8 | 15 | 1500 | 8 | 600 | 10 |
| QDP1 | 2.5 | 0.8 (0.08) | 15 | 1500 | 8 (2.5) | 600 (300) | 10 (6) |
| QDP2 | 1.5 | 0.8 (0.08) | 8 | 600 | 8 (2.5) | 600 (300) | 10 (6) |
| VOLCBX | 2.5 | 0.8 (0.08) | 15 | 1500 | 8 (2.5) | 600 (300) | 10 (6) |
| MAC | 2.5 | 0.8 | 15 | 1500 | 8 | 600 | 10 |
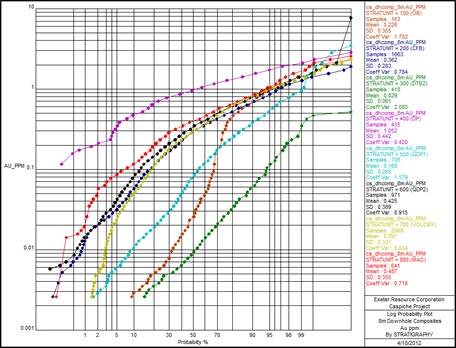
Figure 14-8: Caspiche 8 m Composites by Stratigraphy – Log-Prob Plot - Au ppm
174
| |
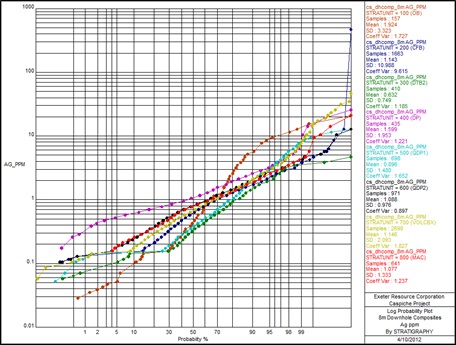
Figure 14-9: Caspiche 8 m Composites by Stratigraphy – Log-Prob Plot - Ag ppm
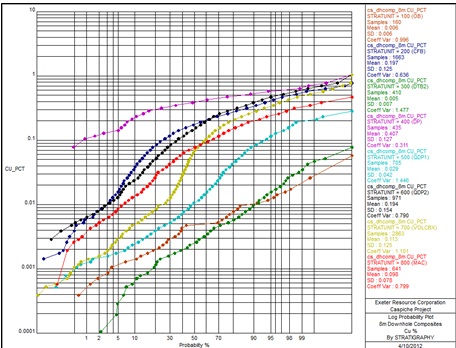
Figure 14-10: Caspiche 8 m Composites by Stratigraphy – Log-Prob Plot - Cu %
175
| |

Figure 14-11: Caspiche 8 m Composites by Alteration – Log-Prob Plot - Au ppm
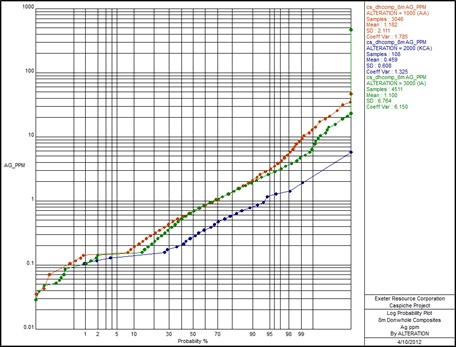
Figure 14-12: Caspiche 8 m Composites by Alteration – Log-Prob Plot - Ag ppm
176
| |

Figure 14-13: Caspiche 8 m Composites by Alteration – Log-Prob Plot - Cu %
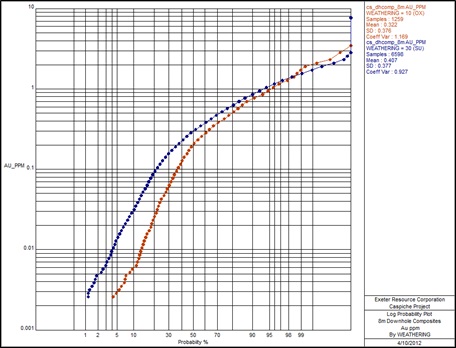
Figure 14-14: Caspiche 8 m Composites by Weathering – Log-Prob Plot - Au ppm
177
| |

Figure 14-15: Caspiche 8 m Composites by Weathering – Log-Prob Plot - Ag ppm
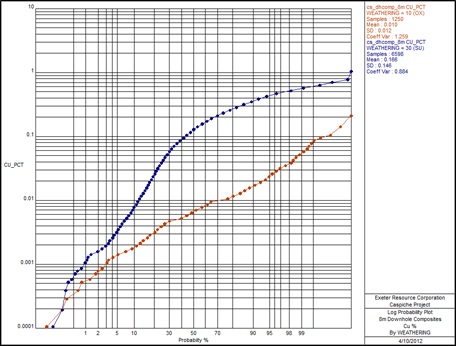
Figure 14-16: Caspiche 8 m Composites by Weathering – Log-Prob Plot - Cu %
178
| |
Table 14-9: Caspiche 8 m Composites by Stratigraphy – Summary Statistics
| Stratunit | 100 (OB) | 200 (CFB) | 300 (DTB2) | 400 (DP) | 500 (QDP1) | 600 (QDP2) | 700 (VOLCBX) | 800 (MAC) |
| Gold (Au ppm) | ||||||||
| Number | 163 | 1663 | 410 | 435 | 705 | 971 | 2869 | 641 |
| Minimum | 0.00 | 0.00 | 0.00 | 0.12 | 0.00 | 0.01 | 0.00 | 0.00 |
| Maximum | 2.36 | 1.90 | 0.51 | 2.96 | 3.36 | 7.71 | 2.43 | 2.68 |
| Mean | 0.23 | 0.36 | 0.03 | 1.05 | 0.17 | 0.43 | 0.40 | 0.49 |
| Std Dev | 0.39 | 0.28 | 0.06 | 0.44 | 0.27 | 0.39 | 0.33 | 0.35 |
| Coeff Var | 1.70 | 0.78 | 2.08 | 0.42 | 1.58 | 0.92 | 0.83 | 0.72 |
| Copper (Cu %) | ||||||||
| Number | 160 | 1663 | 410 | 435 | 705 | 971 | 2863 | 641 |
| Minimum | 0.00 | 0.00 | 0.00 | 0.08 | 0.00 | 0.00 | 0.00 | 0.00 |
| Maximum | 0.06 | 0.79 | 0.07 | 1.00 | 0.29 | 1.01 | 1.09 | 0.46 |
| Mean | 0.01 | 0.20 | 0.01 | 0.41 | 0.03 | 0.19 | 0.11 | 0.10 |
| Std Dev | 0.01 | 0.13 | 0.01 | 0.13 | 0.04 | 0.15 | 0.13 | 0.08 |
| Coeff Var | 1.00 | 0.64 | 1.48 | 0.31 | 1.45 | 0.79 | 1.10 | 0.80 |
| Silver (Ag ppm) | ||||||||
| Number | 157 | 1663 | 410 | 435 | 698 | 971 | 2690 | 641 |
| Minimum | 0.03 | 0.10 | 0.06 | 0.18 | 0.05 | 0.10 | 0.06 | 0.15 |
| Maximum | 20.20 | 447.63 | 4.69 | 24.62 | 12.17 | 12.88 | 48.68 | 21.28 |
| Mean | 1.92 | 1.14 | 0.63 | 1.60 | 0.90 | 1.09 | 1.15 | 1.08 |
| Std Dev | 3.32 | 10.99 | 0.75 | 1.95 | 1.48 | 0.98 | 2.09 | 1.33 |
| Coeff Var | 1.73 | 9.62 | 1.19 | 1.22 | 1.65 | 0.90 | 1.83 | 1.24 |
| Arsenic (As ppm) | ||||||||
| Number | 154 | 1663 | 369 | 435 | 665 | 959 | 2446 | 615 |
| Minimum | 1.78 | 1.00 | 3.48 | 1.99 | 5.00 | 1.99 | 2.00 | 2.39 |
| Maximum | 1837.40 | 6784.76 | 2805.88 | 1418.70 | 950.44 | 2840.02 | 5420.30 | 1183.84 |
| Mean | 131.75 | 190.21 | 53.28 | 424.13 | 92.18 | 344.44 | 280.90 | 185.01 |
| Std Dev | 201.93 | 478.61 | 194.27 | 320.23 | 99.70 | 349.93 | 307.08 | 184.54 |
| Coeff Var | 1.53 | 2.52 | 3.65 | 0.76 | 1.08 | 1.02 | 1.09 | 1.00 |
| Sulphur (S %) | ||||||||
| Number | 149 | 1663 | 369 | 435 | 665 | 959 | 2408 | 615 |
| Minimum | 0.01 | 0.03 | 0.01 | 0.18 | 0.01 | 0.04 | 0.01 | 0.03 |
| Maximum | 1.15 | 8.86 | 5.73 | 6.95 | 5.10 | 19.70 | 11.33 | 6.35 |
| Mean | 0.14 | 2.29 | 1.25 | 1.51 | 1.44 | 2.51 | 2.07 | 2.02 |
| Std Dev | 0.18 | 1.82 | 1.31 | 1.08 | 1.37 | 2.14 | 1.75 | 1.47 |
| Coeff Var | 1.28 | 0.79 | 1.05 | 0.72 | 0.95 | 0.85 | 0.85 | 0.73 |
| Molybdenum (Mo ppm) | ||||||||
| Number | 154 | 1663 | 369 | 435 | 665 | 959 | 2446 | 615 |
| Minimum | 0.27 | 0.85 | 0.50 | 2.73 | 0.50 | 1.77 | 0.32 | 0.50 |
| Maximum | 267.02 | 2893.62 | 48.51 | 306.84 | 269.66 | 812.63 | 938.01 | 461.19 |
| Mean | 12.83 | 63.70 | 2.76 | 41.57 | 19.04 | 41.85 | 83.66 | 75.34 |
| Std Dev | 34.12 | 94.68 | 5.29 | 44.10 | 35.65 | 54.14 | 87.56 | 59.31 |
| Coeff Var | 2.66 | 1.49 | 1.92 | 1.06 | 1.87 | 1.29 | 1.05 | 0.79 |
| Iron (Fe %) | ||||||||
| Number | 154 | 1663 | 369 | 435 | 665 | 959 | 2446 | 615 |
| Minimum | 1.20 | 0.98 | 1.13 | 0.91 | 0.68 | 0.72 | 0.24 | 0.56 |
| Maximum | 13.82 | 15.07 | 8.86 | 7.78 | 6.78 | 22.86 | 10.83 | 6.16 |
| Maximum | 13.82 | 15.07 | 8.86 | 7.78 | 6.78 | 22.86 | 10.83 | 6.16 |
| Mean | 2.74 | 3.95 | 3.03 | 3.45 | 2.82 | 3.93 | 3.38 | 3.09 |
| Std Dev | 1.20 | 1.20 | 0.75 | 1.21 | 0.87 | 1.85 | 1.29 | 0.81 |
| Coeff Var | 0.44 | 0.30 | 0.25 | 0.35 | 0.31 | 0.47 | 0.38 | 0.26 |
179
| |
Table 14-10: Caspiche 8 m Composites by Alteration – Summary Statistics
| Alteration | 1000 (AA) | 2000 (K-CA) | 3000 (IA) |
| Gold (Au ppm) | |||
| Number | 3184 | 108 | 4565 |
| Minimum | 0.00 | 0.00 | 0.00 |
| Maximum | 7.71 | 0.52 | 2.68 |
| Mean | 0.41 | 0.08 | 0.39 |
| Std Dev | 0.41 | 0.11 | 0.36 |
| Coeff Var | 0.99 | 1.32 | 0.92 |
| Copper (Cu %) | |||
| Number | 3176 | 108 | 4564 |
| Minimum | 0.00 | 0.00 | 0.00 |
| Maximum | 1.09 | 0.51 | 1.01 |
| Mean | 0.11 | 0.04 | 0.16 |
| Std Dev | 0.14 | 0.06 | 0.15 |
| Coeff Var | 1.27 | 1.62 | 0.89 |
| Silver (Ag ppm) | |||
| Number | 3046 | 108 | 4511 |
| Minimum | 0.04 | 0.10 | 0.03 |
| Maximum | 48.68 | 5.67 | 447.63 |
| Mean | 1.18 | 0.46 | 1.10 |
| Std Dev | 2.11 | 0.61 | 6.76 |
| Coeff Var | 1.79 | 1.33 | 6.15 |
| Arsenic (As ppm) | |||
| Number | 2888 | 108 | 4310 |
| Minimum | 1.65 | 2.11 | 1.00 |
| Maximum | 3145.48 | 289.86 | 6784.76 |
| Mean | 277.90 | 31.38 | 215.15 |
| Std Dev | 300.23 | 47.90 | 377.24 |
| Coeff Var | 1.08 | 1.53 | 1.75 |
| Sulphur (S %) | |||
| Number | 2845 | 108 | 4310 |
| Minimum | 0.01 | 0.03 | 0.01 |
| Maximum | 19.70 | 1.37 | 8.88 |
| Mean | 2.58 | 0.35 | 1.67 |
| Std Dev | 1.84 | 0.26 | 1.60 |
| Coeff Var | 0.72 | 0.72 | 0.96 |
| Molybdenum (Mo ppm) | |||
| Number | 2888 | 108 | 4310 |
| Minimum | 0.27 | 1.40 | 0.32 |
| Maximum | 930.87 | 24.67 | 2893.62 |
| Mean | 65.10 | 3.99 | 56.22 |
| Std Dev | 76.99 | 3.12 | 79.99 |
| Coeff Var | 1.18 | 0.78 | 1.42 |
| Iron (Fe %) | |||
| Number | 2888 | 108 | 4310 |
| Minimum | 0.24 | 2.59 | 0.56 |
| Maximum | 22.86 | 7.14 | 15.07 |
| Mean | 3.10 | 4.10 | 3.72 |
| Std Dev | 1.32 | 1.11 | 1.27 |
| Coeff Var | 0.43 | 0.27 | 0.34 |
180
| |
Table 14-11: Caspiche 8 m Composites by Alteration – Summary Statistics
| Alteration | 1000 (AA) | 2000 (K-CA) | 3000 (IA) |
| Gold (Au ppm) | |||
| Number | 3184 | 108 | 4565 |
| Minimum | 0.00 | 0.00 | 0.00 |
| Maximum | 7.71 | 0.52 | 2.68 |
| Mean | 0.41 | 0.08 | 0.39 |
| Std Dev | 0.41 | 0.11 | 0.36 |
| Coeff Var | 0.99 | 1.32 | 0.92 |
| Copper (Cu %) | |||
| Number | 3176 | 108 | 4564 |
| Minimum | 0.00 | 0.00 | 0.00 |
| Maximum | 1.09 | 0.51 | 1.01 |
| Mean | 0.11 | 0.04 | 0.16 |
| Std Dev | 0.14 | 0.06 | 0.15 |
| Coeff Var | 1.27 | 1.62 | 0.89 |
| Silver (Ag ppm) | |||
| Number | 3046 | 108 | 4511 |
| Minimum | 0.04 | 0.10 | 0.03 |
| Maximum | 48.68 | 5.67 | 447.63 |
| Mean | 1.18 | 0.46 | 1.10 |
| Std Dev | 2.11 | 0.61 | 6.76 |
| Coeff Var | 1.79 | 1.33 | 6.15 |
| Arsenic (As ppm) | |||
| Number | 2888 | 108 | 4310 |
| Minimum | 1.65 | 2.11 | 1.00 |
| Maximum | 3145.48 | 289.86 | 6784.76 |
| Mean | 277.90 | 31.38 | 215.15 |
| Std Dev | 300.23 | 47.90 | 377.24 |
| Coeff Var | 1.08 | 1.53 | 1.75 |
| Sulphur (S %) | |||
| Number | 2845 | 108 | 4310 |
| Minimum | 0.01 | 0.03 | 0.01 |
| Maximum | 19.70 | 1.37 | 8.88 |
| Mean | 2.58 | 0.35 | 1.67 |
| Std Dev | 1.84 | 0.26 | 1.60 |
| Coeff Var | 0.72 | 0.72 | 0.96 |
| Molybdenum (Mo ppm) | |||
| Number | 2888 | 108 | 4310 |
| Minimum | 0.27 | 1.40 | 0.32 |
| Maximum | 930.87 | 24.67 | 2893.62 |
| Mean | 65.10 | 3.99 | 56.22 |
| Std Dev | 76.99 | 3.12 | 79.99 |
| Coeff Var | 1.18 | 0.78 | 1.42 |
| Iron (Fe %) | |||
| Number | 2888 | 108 | 4310 |
| Minimum | 0.24 | 2.59 | 0.56 |
| Maximum | 22.86 | 7.14 | 15.07 |
| Mean | 3.10 | 4.10 | 3.72 |
| Std Dev | 1.32 | 1.11 | 1.27 |
| Coeff Var | 0.43 | 0.27 | 0.34 |
181
| |
Table 14-12: Caspiche 8 m Composites by Weathering – Summary Statistics
| Weathering | 10 (OX | 30 (SU) |
| Gold (Au ppm) | ||
| Number | 1259 | 6598 |
| Minimum | 0.00 | 0.00 |
| Maximum | 3.36 | 7.71 |
| Mean | 0.32 | 0.41 |
| Std Dev | 0.38 | 0.38 |
| Coeff Var | 1.17 | 0.93 |
| Copper (Cu %) | ||
| Number | 1250 | 6598 |
| Minimum | 0.00 | 0.00 |
| Maximum | 0.20 | 1.09 |
| Mean | 0.01 | 0.17 |
| Std Dev | 0.01 | 0.15 |
| Coeff Var | 1.26 | 0.88 |
| Silver (Ag ppm) | ||
| Number | 1087 | 6578 |
| Minimum | 0.03 | 0.10 |
| Maximum | 48.68 | 447.63 |
| Mean | 1.53 | 1.06 |
| Std Dev | 2.85 | 5.66 |
| Coeff Var | 1.86 | 5.36 |
| Arsenic (As ppm) | ||
| Number | 957 | 6349 |
| Minimum | 1.78 | 1.00 |
| Maximum | 3145.48 | 6784.76 |
| Mean | 182.09 | 245.55 |
| Std Dev | 247.93 | 360.07 |
| Coeff Var | 1.36 | 1.47 |
| Sulphur (S %) | ||
| Number | 932 | 6331 |
| Minimum | 0.01 | 0.03 |
| Maximum | 3.88 | 19.70 |
| Mean | 0.38 | 2.24 |
| Std Dev | 0.44 | 1.75 |
| Coeff Var | 1.17 | 0.78 |
| Molybdenum (Mo ppm) | ||
| Number | 957 | 6349 |
| Minimum | 0.27 | 0.32 |
| Maximum | 404.99 | 2893.62 |
| Mean | 49.24 | 60.43 |
| Std Dev | 68.29 | 79.96 |
| Coeff Var | 1.39 | 1.32 |
| Iron (Fe %) | ||
| Number | 957 | 6349 |
| Minimum | 0.24 | 0.56 |
| Maximum | 13.82 | 22.86 |
| Mean | 2.40 | 3.64 |
| Std Dev | 1.00 | 1.29 |
| Coeff Var | 0.42 | 0.35 |
| 14.6 | Variography |
Variography was carried out using the same data combinations as defined in Table 14-5 to Table 14-7. The combined DP+QDP1+VOLCBX+CFB data resulted in a low relative nugget value with long and very well structured variogram ranges in a vertical plunge direction for gold and copper. Figure 14-17 and Figure 14-18 show variogram models with maximum ranges of 850 m and 700 m in the vertical plunge direction for gold and copper respectively. The variogram
182
| |
models shown in Figure 14-17 and Figure 14-18 were used to estimate gold and copper for the DP, QDP1, VOLCBX and CFB domains.
In general, all elements resulted in low to moderate nugget effects with well-structured spatial continuity. Silver appears to exhibit the greatest variability and is typically manifested by a higher nugget effect. A tabulation of all variogram parameters is shown in Table 14-13 to Table 14-18.
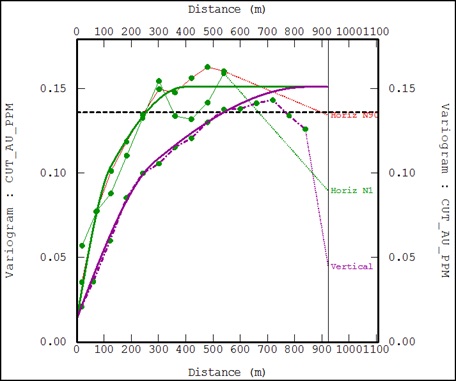
Figure 14-17: Caspiche Variogram Model – DP+QDP1+VOLCBX+CFB - Gold
183
| |
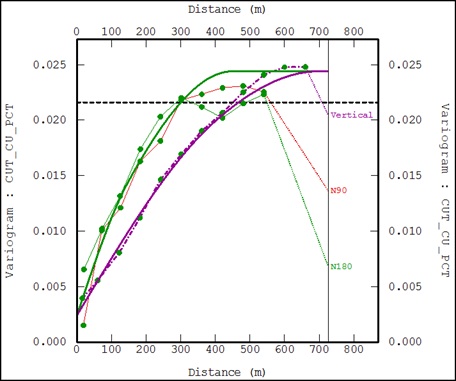
Figure 14-18: Caspiche Variogram Model – DP+QDP1+VOLCBX+CFB – Copper
Table 14-13: Caspiche – Variogram Parameters – Overburden
| Element | Structure 1 | Structure 2 | Rotations | |||||||||
Nugget (%) | Sill 1 (%) | Ranges 1 | Sill 2 (%) | Ranges 2 | Azim | Plunge | dip | |||||
| (u) | (v) | (w) | (u) | (v) | (w) | 0 | 0 | 0 | ||||
| Au ppm | 0.23 | 0.25 | 125 | 125 | 90 | 0.52 | 300 | 300 | 200 |  | ||
| Cu % (OB+OX) | 0.23 | 0.39 | 125 | 125 | 285 | 0.39 | 400 | 400 | 850 | |||
| Ag ppm | 0.52 | 0.31 | 120 | 120 | 85 | 0.17 | 30 | 300 | 200 | |||
| Su % (OB+OX) | 0.29 | 0.61 | 125 | 125 | 90 | 0.10 | 460 | 460 | 310 | |||
| As ppm | 0.39 | 0.48 | 125 | 125 | 90 | 0.14 | 300 | 300 | 200 | |||
| Mo ppm (OB+OX) | 0.05 | 0.37 | 105 | 105 | 75 | 0.57 | 250 | 250 | 165 | |||
184
| |
Table 14-14: Caspiche – Variogram Parameters – DP, QDP1, VOLCBX and CFB
| Element | Structure 1 | Structure 2 | Rotations | |||||||||
Nugget (%) | Sill 1 (%) | Ranges 1 | Sill 2 (%) | Ranges 2 | Azim | Plunge | dip | |||||
| (u) | (v) | (w) | (u) | (v) | (w) | 0 | 0 | 0 | ||||
| Au ppm | 0.23 | 0.39 | 125 | 125 | 285 | 0.38 | 400 | 400 | 850 |  | ||
| Cu % (OB+OX) | 0.10 | 0.78 | 150 | 150 | 400 | 0.12 | 450 | 450 | 700 | |||
| Ag ppm | 0.43 | 0.28 | 180 | 180 | 320 | 0.28 | 300 | 300 | 800 | |||
| Su % (OB+OX) | 0.14 | 0.15 | 180 | 180 | 180 | 0.71 | 600 | 600 | 800 | |||
| As ppm | 0.23 | 0.27 | 110 | 110 | 110 | 0.51 | 500 | 500 | 350 | |||
| Mo ppm (OB+OX) | 0.28 | 0.21 | 150 | 150 | 180 | 0.52 | 250 | 250 | 525 | |||
Table 14-15: Caspiche – Variogram Parameters – QDP2
| Element | Structure 1 | Structure 2 | Rotations | |||||||||
Nugget (%) | Sill 1 (%) | Ranges 1 | Sill 2 (%) | Ranges 2 | Azim | Plunge | dip | |||||
| (u) | (v) | (w) | (u) | (v) | (w) | 0 | 0 | 0 | ||||
| Au ppm | 0.15 | 0.12 | 100 | 100 | 230 | 0.72 | 300 | 300 | 730 | 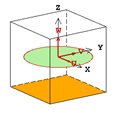 | ||
| Cu % (OB+OX) | 0.11 | 0.01 | 125 | 125 | 300 | 0.88 | 300 | 300 | 650 | |||
| Ag ppm | 0.53 | 0.11 | 90 | 90 | 210 | 0.36 | 260 | 260 | 800 | |||
| Su % (OB+OX) | 0.12 | 0.28 | 250 | 250 | 300 | 0.60 | 700 | 700 | 950 | |||
| As ppm | 0.19 | 0.18 | 655 | 65 | 65 | 0.62 | 365 | 365 | 300 | |||
| Mo ppm (OB+OX) | 0.26 | 0.17 | 100 | 100 | 120 | 0.57 | 400 | 400 | 500 | |||
Table 14-16: Caspiche – Variogram Parameters – MacNeill
| Element | Structure 1 | Structure 2 | Rotations | |||||||||
Nugget (%) | Sill 1 (%) | Ranges 1 | Sill 2 (%) | Ranges 2 | Azim | Plunge | dip | |||||
| (u) | (v) | (w) | (u) | (v) | (w) | 0 | 0 | 0 | ||||
| Au ppm | 0.14 | 0.29 | 28 | 28 | 24 | 0.58 | 265 | 265 | 145 |  | ||
| Cu % (OB+OX) | 0.36 | 0.33 | 45 | 45 | 40 | 0.32 | 105 | 105 | 60 | |||
| Ag ppm | 0.14 | 0.42 | 42 | 42 | 36 | 0.44 | 250 | 250 | 135 | |||
| Su % (OB+OX) | 0.08 | 0.47 | 45 | 45 | 40 | 0.44 | 260 | 260 | 150 | |||
| As ppm | 0.18 | 0.20 | 35 | 35 | 30 | 0.61 | 345 | 345 | 190 | |||
| Mo ppm (OB+OX) | 0.17 | 0.33 | 20 | 20 | 20 | 0.50 | 145 | 145 | 80 | |||
185
| |
Table 14-17: Caspiche – Variogram Parameters – DTB2
| Element | Structure 1 | Structure 2 | Rotations | |||||||||
Nugget (%) | Sill 1 (%) | Ranges 1 | Sill 2 (%) | Ranges 2 | Azim | Plunge | dip | |||||
| (u) | (v) | (w) | (u) | (v) | (w) | 0 | 0 | 0 | ||||
| Au ppm | 0.14 | 0.29 | 28 | 28 | 24 | 0.58 | 265 | 265 | 145 |  | ||
| Cu % (OB+OX) | 0.36 | 0.33 | 45 | 45 | 40 | 0.32 | 205 | 105 | 60 | |||
| Ag ppm | 0.14 | 0.42 | 42 | 42 | 36 | 0.44 | 250 | 250 | 135 | |||
| Su % (OB+OX) | 0.09 | 0.47 | 45 | 45 | 40 | 0.44 | 260 | 260 | 150 | |||
| As ppm | 0.19 | 0.20 | 35 | 35 | 30 | 0.61 | 345 | 345 | 190 | |||
| Mo ppm (OB+OX) | 0.17 | 0.33 | 20 | 20 | 30 | 0.50 | 145 | 145 | 80 | |||
Table 14-18: Caspiche – Variogram Parameters – Iron
| Element | Structure 1 | Structure 2 | ||||||||||
Nugget (%) | Sill 1 (%) | Ranges 1 | Sill 2 (%) | Ranges 2 | Rotations | |||||||
| (u) | (v) | (w) | (u) | (v) | (w) | Azim | Plunge | dip | ||||
| Fe % (OB+OX) | 0.29 | 0.51 | 100 | 100 | 50 | 0.20 | 500 | 500 | 150 | 0 | 0 | 0 |
| Fe % (SU) | 0.21 | 0.23 | 150 | 150 | 150 | 0.56 | 500 | 500 | 325 | 0 | 0 | 0 |
| 14.7 | Block Model Definition |
A 3D block model with regular blocks of Y=10 m x X=10 m x Z=8 m was defined to cover the Caspiche porphyry project area. The Caspiche block model definition is shown in Table 14-19 and a list of field names and descriptions is shown in Table 14-20.
Table 14-19: Caspiche 3D Block Model Definition
| Origin | Minimum | Model Extent | |
| Y | 6,935,500 | 3,500 | |
| X | 469,250 | 3,500 | |
| Z | 2,560 | 2,552 | |
| Parent Cell Y | 10m | Min Sub-Cell Y m | 10m |
| Parent Cell X | 10m | Min Sub-Cell X m | 10m |
| Parent Cell Z | 8 m | Min Sub-Cell Z m | 8 m |
186
| |
Table 14-20: Caspiche Block Model Attribute Names
| Field Name | Description |
| x | X Block Centroid |
| y | Y Block Centroid |
| z | Z Block Centroid |
| au | Gold Grade (ppm) - Ordinary Kriging |
| cu | Copper Grade (% )- Ordinary Kriging |
| ag | Silver Grade (ppm) - Ordinary Kriging |
| aueq | Calculated gold equivalent (ppm) |
| as | Arsenic Grade (ppm) - Ordinary Kriging |
| s | Sulphur Grade (%) - Ordinary Kriging |
| Mo | Molybdenum Grade (ppm) - Ordinary Kriging |
| Fe | Iron Grade (%) - Ordinary Kriging |
| class | Resource Classification 1=Measured 2=Indicated 3=Inferred |
| density | Density g/cm3 |
| ads_ag | Average Distance to Sample - Silver |
| ads_au | Average Distance to Sample - Gold |
| ads_cu | Average Distance to Sample - Copper |
| ksdev_ag | Kriging Standard Deviation - Silver |
| ksdev_au | Kriging Standard Deviation - Gold |
| ksdev_cu | Kriging Standard Deviation - Copper |
| nbs_ag | Number of Samples - Silver |
| nbs_au | Number of Samples - Gold |
| nbs_cu | Number of Samples - Copper |
| slpreg_ag | Kriging Slope of Regression - Silver |
| slpreg_au | Kriging Slope of Regression - Gold |
| slpreg_cu | Kriging Slope of Regression - Copper |
| alteration | Alteration (1000=AA, 2000=K-Ca, 3000=IA) |
| strat_weat_alter | Combined Alteration+Strat+weathering Eg.1430 = AA + DP + Sulphide |
| stratunit | Stratunit (100=OB, 200=CFB, 300=DTB2, 400=DP, 500=QDP1, 600=QDP2, 700=VOLVBX, 800=MAC) |
| weathering | Weathering (10=Oxidized, 20=Mixed 30=Sulphide) |
| 14.7.1 | Estimation Plan |
Grade estimation for all elements (gold, silver, copper, arsenic, iron, sulphur and molybdenum) was undertaken by Ordinary Kriging (OK) in Y=10 m x X=10 m x Z=8 m parent blocks. Each stratigraphic domain was estimated separately using the sample combinations defined in Table 14-5 to Table 14-7. A single search pass was used and some kriging quality parameters such as kriging standard deviation and kriging slope of regression were captured for later guidance in determining appropriate resource classification categories.
Quantitative Kriging Neighbourhood Analysis (QKNA) was undertaken to assist in optimizing the search parameters for estimation. The procedure of search optimization involves selecting
187
| |
several individual blocks representing varying data configurations. OK allows a theoretical comparison to be made of actual block estimates and a theoretically unbiased block estimate as a qualitative way of assessing the robustness of a kriged block estimate. This comparison is expressed in terms of slope of regression between estimated blocks z*(v) and theoretical true blocks z (v) and can be monitored in conjunction with a various search routines to minimise conditional bias. The aim of search optimization is to produce conditionally unbiased block estimates with a slope of regression as close as possible to 1. The resulting slope of regression can be used a guide for resource classification as it provides an objective and robust way of comparing the relative quality of block estimates.
The estimation parameters for all elements are summarized in Table 14-21 to Table 14-25.
Table 14-21: Caspiche – Estimation Parameters – Overburden (Cu, S, Mo and Fe OX)
| Rotations | ||||
| Azim | Plunge | dip | ||
| Parameter | Au, Ag, Cu, As, S, Mo, Fe | 0 | 0 | 0 |
| Minimum number of Comps | 4 |  | ||
| Maximum number of Comps | 24 | |||
| Search Distance (u) | 500 | |||
| Search Distance (v) | 500 | |||
| Search Distance (w) | 200 | |||
| Block Discretization | 5 x 5 x 2 | |||
Table 14-22: Caspiche – Estimation Parameters – DP, QDP1, QDP2, VOLCBX, CFB and K-Ca Alt
| Rotations | ||||
| Azim | Plunge | dip | ||
| Parameter | Au, Ag, Cu, As, S, Mo | 0 | 0 | 0 |
| Minimum number of Comps | 4 |  | ||
| Maximum number of Comps | 24 | |||
| Search Distance (u) | 400 | |||
| Search Distance (v) | 400 | |||
| Search Distance (w) | 850 | |||
| Block Discretization | 5 x 5 x 2 | |||
188
| |
Table 14-23: Caspiche – Estimation Parameters – DTB2 Alt
| Rotations | ||||
| Azim | Plunge | dip | ||
| Parameter | Au, Ag, Cu, As, S, Mo | 33 | -15 | 0 |
| Minimum number of Comps | 4 | 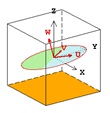 | ||
| Maximum number of Comps | 24 | |||
| Search Distance (u) | 600 | |||
| Search Distance (v) | 600 | |||
| Search Distance (w) | 300 | |||
| Block Discretization | 5 x 5 x 2 | |||
Table 14-24: Caspiche – Estimation Parameters – MacNeill
| Rotations | ||||
| Azim | Plunge | dip | ||
| Parameter | Au, Ag, Cu, As, S, Mo | 33 | -35 | 0 |
| Minimum number of Comps | 4 | 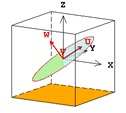 | ||
| Maximum number of Comps | 24 | |||
| Search Distance (u) | 400 | |||
| Search Distance (v) | 400 | |||
| Search Distance (w) | 250 | |||
| Block Discretization | 5 x 5 x 2 | |||
Table 14-25: Caspiche – Estimation Parameters – Iron (SU)
| Rotations | ||||
| Azim | Plunge | dip | ||
| Parameter | Fe (SU) | 0 | 0 | 0 |
| Minimum number of Comps | 4 |  | ||
| Maximum number of Comps | 24 | |||
| Search Distance (u) | 600 | |||
| Search Distance (v) | 600 | |||
| Search Distance (w) | 600 | |||
| Block Discretization | 5 x 5 x 2 | |||
189
| |
| 14.8 | Model Bulk Density |
Bulk density was assigned on the basis of stratigraphy, alteration and oxidation. Statistical averages for bulk density were determined based on 1,079 measurements. Table 14-26 and Table 14-27 list the assigned bulk densities for sulphide and oxide material respectively.
Table 14-26: Bulk Density – Sulphide
| Stratigraphic Unit | Stratunit Model Code | Alteration Model Code | Determinations | Density(g/cm3) |
| CFB | 200 | AA (1000) | 6 | 2.48 |
| DTB2 | 300 | AA (1000) | Assumed | 2.41 |
| DP | 400 | AA (1000) | 35 | 2.42 |
| QDP1 | 500 | AA (1000) | 85 | 2.47 |
| QDP2 | 600 | AA (1000) | 32 | 2.41 |
| VOLCBX | 700 | AA (1000) | 139 | 2.44 |
| MAC | 800 | AA (1000) | 27 | 2.36 |
| CFB | 200 | IA(3000) | 271 | 2.54 |
| DTB2 | 300 | IA(3000) | 42 | 2.41 |
| DP | 400 | IA(3000) | 35 | 2.54 |
| QDP1 | 500 | IA(3000) | 58 | 2.51 |
| QDP2 | 600 | IA(3000) | 24 | 2.44 |
| VOLCBX | 700 | IA(3000) | 140 | 2.37 |
| MAC | 800 | IA(3000) | 70 | 2.48 |
| K_Ca Alt | K-Ca (2000) | 18 | 2.64 |
Table 14-27: Bulk Density - Oxide
| Stratigraphic Unit | Stratunit Model Code | Weathering Model Code | Determinations | Density(g/cm3) |
| OB | 100 | 10 | 9 | 2.2 |
| CFB | 200 | 10 | (2.25) Assumed | |
| DTB2 | 300 | 10 | 11 | 2.24 |
| DP | 400 | 10 | (2.25) Assumed | |
| QDP1 | 500 | 10 | 3 | (2.25) Assumed |
| QDP2 | 600 | 10 | 20 | 2.23 |
| VOLCBX | 700 | 10 | 54 | 2.29 |
| MAC | 800 | 10 | (2.25) Assumed |
190
| |
| 14.9 | Block Model Validation |
Cube undertook a variety of validation checks on the final estimated block model outcome. The validation checks included statistical comparisons, swath plots, nearest neighbour (NN), theoretical grade-tonnage curves and visual inspection.
| 14.9.1 | Statistical Comparison |
Cube compared 8 m composites (declustered) to blocks estimates by OK and NN for gold and copper as presented in Table 14-28. The OK estimates for gold and copper are generally within 5% of the NN grades and are considered by Cube to be acceptable. The composite grades have been declustered using a cell declustering process based on Y=100 m x X=100 m x Z=24 m cells. In general, the input composite grades are somewhat higher grade than either the OK or NN model outcomes. It is, however, difficult to obtain a stable statistical composite average using cell-declustering due to the generally elongated geometry of the domains relative to the drilling configuration. The NN estimate provides a significantly more robust method of statistical comparison as it takes account of the domain geometry more effectively than cell declustering. For this reason, less emphasis is placed on the cell declustering results for the purpose of model validation.
Table 14-28: Comparison between Composite, OK and NN – Gold & Copper
| Domain | Gold | Copper | ||||||
Au (ppm) Comp | Au (ppm) OK | Au (ppm) NN | Au OK/ Au NN | Cu (%) Comp | Cu (%) OK | Cu (%) NN | Cu OK/ Cu NN | |
| OB | 0.21 | 0.18 | 0.16 | 113% | 0.01 | 0.007 | 0.006 | 117% |
| CFB | 0.35 | 0.24 | 0.23 | 103% | 0.20 | 0.15 | 0.14 | 101% |
| DTB2 | 0.03 | 0.03 | 0.03 | 100% | 0.005 | 0.005 | 0.005 | 100% |
| DP | 1.03 | 0.88 | 0.84 | 105% | 0.4 | 0.36 | 0.37 | 99% |
| QDP1 | 0.42 | 0.41 | 0.40 | 102% | 0.19 | 0.19 | 0.18 | 102% |
| QDP2 | 0.16 | 0.11 | 0.11 | 99% | 0.03 | 0.03 | 0.03 | 104% |
| VOLCBX | 0.39 | 0.26 | 0.26 | 101% | 0.12 | 0.09 | 0.09 | 102% |
| MAC | 0.49 | 0.44 | 0.44 | 99% | 0.10 | 0.08 | 0.08 | 101% |
| 14.9.2 | Swath Plots |
Swath plots for 100 m vertical (elevation) slices were used to detect any obvious spatial biases between the OK estimates and the informing composites. The OK estimates were compared to both raw 8 m composites and nearest neighbour (NN) estimates. As expected, swath plots for gold and copper (Figure 14-19 and Figure 14-20) confirm a very close comparison between the OK and NN estimations indicating little, if any, evidence of obvious spatial bias. Some minor local discrepancies exist for gold in the upper and lower extremities of the comparison however
191
| |
these difference are likely to be influenced by the low number of informing composites and small volumes involved.
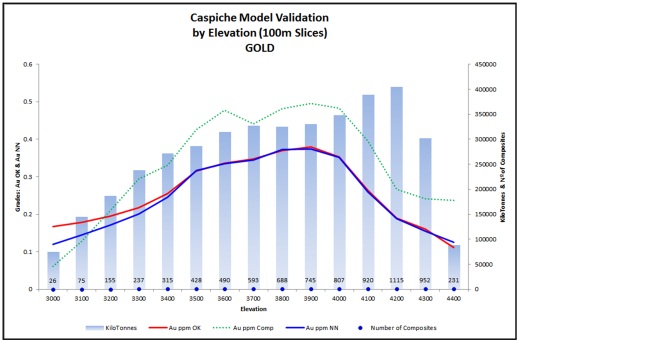
Figure 14-19: Caspiche Swath Plots by 100 m Elevation - Gold
192
| |
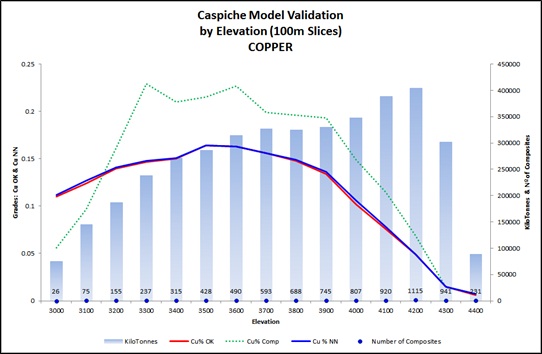
Figure 14-20: Caspiche Swath Plots by 100 m Elevation – Copper
| 14.9.3 | Visual Validation |
Cube undertook a comprehensive visual validation of composite grades and estimated model outcomes for all elements. Cube concluded that the grade estimation process adequately reflects the input data. Figure 14-21 to Figure 14-24 show example vertical and plan view section comparing raw sample grades and estimated block grades for gold and copper.
193
| |
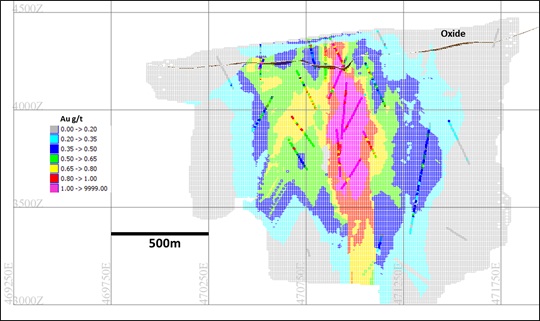
Figure 14-21: Vertical Section 6937400mN (looking north) - Composite and Model Grades - Au ppm (Source: Cube Consulting, 2012)
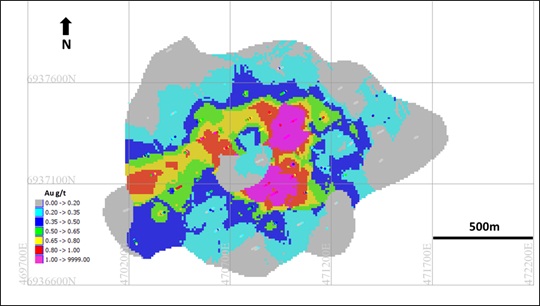
Figure 14-22: Plan Section 4000mRL - Composite and Model Grades - Au ppm (Source: Cube Consulting, 2012)
194
| |
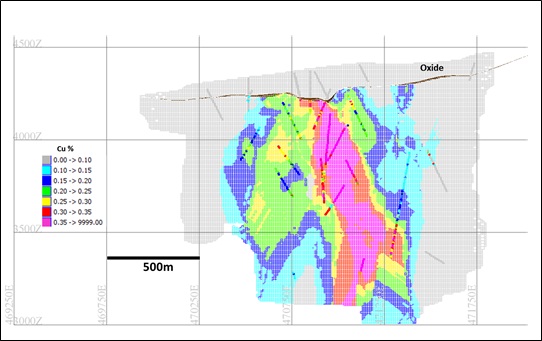
Figure 14-23: Vertical Section 6937400mN (looking north) - Composite and Model Grades - Cu % (Source: Cube Consulting, 2012)
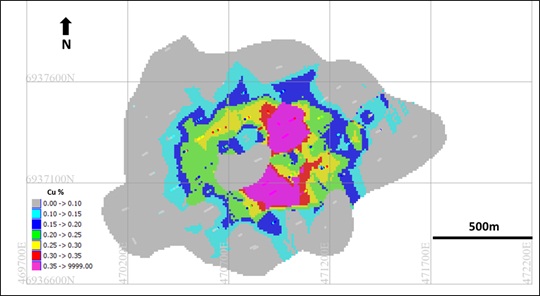
Figure 14-24: Plan Section 4000mRL - Composite and Model Grades - Cu % (Source: Cube Consulting, 2012)
195
| |
| 14.9.4 | Theoretical Grade-Tonnage Curve Comparisons |
Ordinary Kriging (OK) is often used to estimate mineral resources above various cut-off grades. OK can however, predict misleading tonnage and metal quantities once cut-offs above zero are applied. This is often the case when OK is used to estimate large blocks compared to somewhat greater selectivity during actual mining. OK will tend to produce a grade-tonnage distribution which is over-smoothed relative to that achieved from selective mining. The degree of smoothing produced from OK depends largely on the spatial continuity and variability of the input data as characterised by the variogram model, in particular, the nugget effect and variogram ranges. Often it is necessary to adopt a non-linear estimation method with a change of support to better predict the grade-tonnage distribution achievable from selective mining.
At Caspiche, a Selective Mining Unit (SMU) of 10 m x 10 m x 8 m is considered appropriate given the scale of mining under consideration. The key consideration from an estimation perspective is whether OK can directly predict an appropriate grade-tonnage distribution of SMU's given the relatively wide drill spacing. There are various methods to test this assumption based on theoretical change of support models.
Cube performed a global change of support on the 8 m composite data using the Discrete Gaussian Model (DGM). The DGM allows a change of support and subsequent computation of theoretical grade-tonnage for any SMU and cut-off assumption. The first step towards producing a global grade-tonnage curve for a given SMU using the DGM is to define a Gaussian transformation function for the grade variable at composite support. A series of Hermite Polynomials are fitted to the transformed composite data. The resulting fitted Hermite Polynomial function describes the properties of composite scale support, also referred to as 'point support'. The Discrete Gaussian change of support model relies upon calculating change of support coefficients derived by a mathematical relationship between the Hermite Polynomial 'Point Support' function and the variogram model. A new 'Block Support' function representing the support at SMU scale is subsequently derived and is used to compute the recoverable metal, tonnage and grade at various grade cut-offs, assuming that SMU sized blocks are freely selected during mining. The DGM change of support is particularly applicable and robust for 'diffuse' styles of mineralization such as that found at Caspiche. Figure 14-25 and Figure 14-26 show comparison grade-tonnage curves for SMUs of 10 m x 10 m x 8 m as predicted by the DGM method and blocks estimated directly by OK for gold and copper respectively. This comparison was restricted to areas classified as Measured and Indicated Mineral Resource. It can be seen that there is very good correspondence between the DGM and OK grade-tonnage prediction across all cut-off grades for gold and copper. Cube concluded that OK is an appropriate method of direct estimation at the scale of mining selectivity under consideration.
196
| |
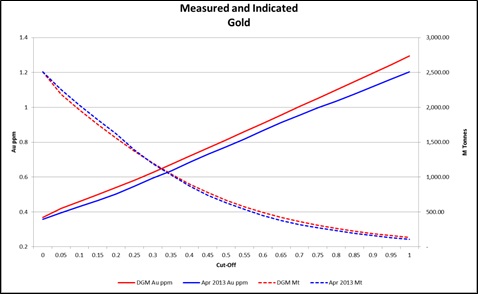
Figure 14-25: Caspiche Global Grade-Tonnage Curve – OK vs DGM – Gold
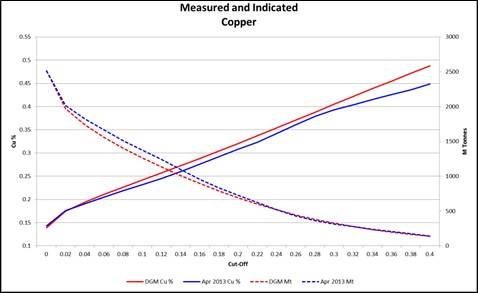
Figure 14-26: Caspiche Global Grade-Tonnage Curve – OK vs DGM – Copper
| 14.10 | Resource Classification and Tabulation |
Cube considered a range of criteria in determining an appropriate mineral resource classification for the Caspiche resource estimate including:
| · | Sample representivity, quality and positional accuracy; |
| · | Geological continuity and veracity of the interpreted mineralized model; |
197
| |
| · | Geostatistical spatial continuity and estimation quality; and |
| · | Scale of mining and associated level of risk. |
Kriging slope of regression can be used a guide for resource classification as it provides an objective and robust way of comparing the relative quality of block estimates whereby, high quality block estimates will approach a value of 1. It was determined that areas where the slope of regression value was consistently 0.9 or greater could be used as a guide for defining Measured material and values between 0.7 to 0.9 could be used to define Indicated material. Slope of regression values below 0.25 were generally regarded as being of insufficient quality for classification to be applied. It should be noted that resource classification boundaries were determined manually using slope of regression as a guide. Whilst somewhat more time consuming, this approach avoids a 'spotted dog' outcome and allows the Qualified Person to consider other important factors such as geological and volume continuity.
Measured areas were generally confined to areas where drilling density is closer than 75 m x 75 m and Indicated areas were defined by drilling of 100 m x 100 m or closer. Inferred areas were defined where drilling is generally between 100 m x 100 m to 200 m x 200 m. The average slope of regression and drill hole spacing for the final classified Mineral Resource is as follows:
| · | Measured: Average Slope of Regression ~0.95, Average drill hole spacing ~70 m |
]
| · | Indicated: Average Slope of Regression ~0.82, Average drill hole spacing ~106 m |
| · | Inferred: Average Slope of Regression ~0.60, Average drill hole spacing ~162 m |
An additional high level geostatistical study was carried out to determine the suitability of the proposed classification strategy with respect to the scale of likely mining production. In particular, to broadly quantify the likely uncertainty associated with drill spacing over specified mining production periods. Cube applied a simple geostatistical technique where confidence intervals can be calculated using 'Global Estimation Variance'.
This method involves the use of an extension variance applied to an approximately regular grid of data points, to derive a global estimation variance. The calculation of the global estimation variance requires as input the number of samples for a given grid spacing that are required to sample a specific volume. This volume may be equivalent to quarterly or annual mining production, or some other period over which the confidence interval is required
The global estimation variance can be converted into confidence intervals assuming that the error distribution is symmetrical and normally distributed. By using reference tables of the probabilities of the standard normal distribution one can calculate confidence intervals at different levels of uncertainty. Confidence intervals at a 90% level of certainty were calculated at various drilling spacing for quarterly and annual production periods assuming daily mine production of 25,000 tpd.
198
| |
It is increasingly common to define Measured Resource material as being with ±10% at a 90% level of confidence for Quarterly production volumes and Indicated Resource material being within ±15% at a 90% level of confidence for annual production volumes.
Table 14-29 and Table 14-30 show calculated confidence intervals at various drill hole spacing for gold and copper respectively. The resource classifications as defined by Cube are well within the expected confidence interval calculated using the global estimation variance method. It should be noted that the global estimation method provides a 'global' insight into the uncertainty associated with the resource estimate. The method is not suitable for detailed localised risk analysis such as associating a risk with a particular mining schedule. More sophisticated geostatistical methods such as Conditional Simulation are more applicable for detailed risk analysis.
Table 14-29: Caspiche Confidence Intervals – Gold
| Drilling Grid (m) | Quarterly 90% CI (±%) | Annual 90% CI (±%) | ||
| X | y | z | ||
| 50 | 50 | 8 | 10.4% | 5.2% |
| 75 | 75 | 8 | 17.2% | 8.7% |
| 100 | 100 | 8 | 25.0% | 12.6% |
Table 14-30: Caspiche Confidence Intervals – Copper
| Drilling Grid (m) | Quarterly 90% CI (±%) | Annual 90% CI (±%) | ||
| x | y | z | ||
| 50 | 50 | 8 | 10.3% | 5.2% |
| 75 | 75 | 8 | 16.6% | 8.3% |
| 100 | 100 | 8 | 23.4% | 11.8% |
199
| |
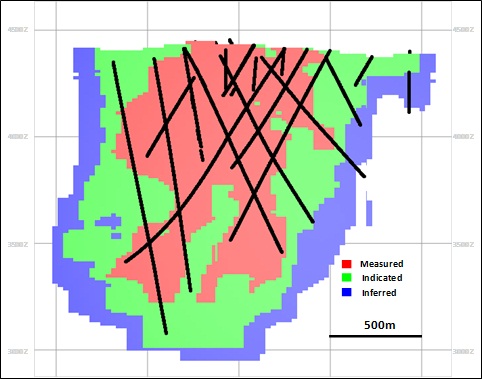
Figure 14-27: Vertical Section (looking northwest) - Resource Classification (Source: Cube Consulting, 2012)
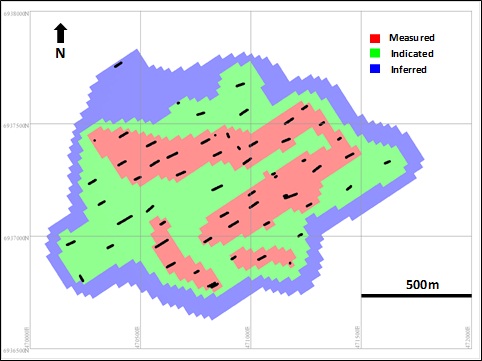
Figure 14-28: Plan Section 4000mRL - Resource Classification (Source: Cube Consulting, 2012)
200
| |
| 14.10.1 | Gold Equivalent (AuEq) |
The April 2012 MRE (Cube 2012) used the following formula in calculating AuEq4 values in each block of the model:
| 1. | AuEq4: |

where Au and Cu are the block kriged Au and Cu grades, PAu and PCu are the Au and Cu prices (US$1,150/oz and US$2.50/lb, respectively), and RAu and RCu are the Au and Cu projected metallurgical recoveries, 65% and 85%, respectively for sulphide material and 78% for Au and 11% for Cu in the oxide zone.
The MRE is reported using an approximation of marginal cut-off values defined in terms of AuEq4. The key assumptions and parameters for the oxide and non-oxide portions of the MRE are shown in Table 14-31. These assumptions and parameters are appropriate for open pit exploitation only.
Table 14-31: Marginal Cut-off Calculation Parameters and Results (Jan 2012 PFS)
| Parameters | Oxide | No Oxide |
| Processing (US$/t) Cost | 3.4 | 7.04 |
| Recovery (%) | 78 | 65 |
| Gold Price (US$/oz.) | 1,150 | 1,150 |
| Copper Price (US$/lb) | NA | 2.5 |
| Refining Cost (US$/oz.) | 6 | 6 |
| Cut-off AuEq (g/t) | 0.119 | 0.294 |
In 2013 Cube reported a sub set of the non-oxidized portion of the Cube 2012 Mineral Resource, using a cut off of 0.75 g/t AuEq6, which was selected as an appropriate cut-off for the reporting of mineralization intended for underground exploitation. This calculated AuEq6 value is based on Au, Cu and Ag revenues (using both prices and recoveries) and uses the following formula to calculate AuEq6 values in each estimated block of the model:
| 2. | AuEq6: |
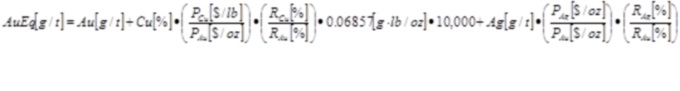
201
| |
Where Au, Ag and Cu are the block kriged gold, silver and copper grades, PAu, PAg and PCu are the gold, silver and copper prices (1,250 US$/oz., 15US$/oz. and 2.75 US$/lb, respectively). RAu and RCu are the Au and Cu projected metallurgical recoveries based on a number of S % thresholds. Table 14-32 details the recovery factors for gold, silver and copper within the oxidized, and non-oxidized portions of the MRE and the DP and Non-DP stratigraphic units using a sulphur threshold determined by and provided by Exeter.
Table 14-32: Caspiche Recovery Factors (NCL Nov 2013)
| Oxides/Sulphides | Stratigraphic Unit (Domain) | S% Threshold | RAu | RCu | RAg |
| Oxide | OB (100) | No threshold | 0.75 | 0.00 | 0.34 |
| Oxide | All Others | No threshold | 0.78 | 0.00 | 0.34 |
| Sulphide | DP (400) | Less than or equal to 2.0 | 0.75 | 0.92 | 0.40 |
| Sulphide | DP (400) | Greater than 2.0 & less than or equal to 2.5 | 0.725 | 0.90 | 0.40 |
| Sulphide | DP (400) | Greater than 2.5 | 0.68 | 0.86 | 0.40 |
| Sulphide | Non-DP | Less than or equal to 2.5 | 0.70 | 0.88 | 0.40 |
| Sulphide | Non-DP | Greater than 2.5 | 0.68 | 0.86 | 0.40 |
Table 14-33 shows the key parameters and assumptions used for the determination of the marginal cut-off values and results for reporting of oxide and the non-oxide portion of the MRE intended for underground exploitation. The cut-off for reporting the oxide portion of the MRE was selected at 0.18 g/t AuEq6 for the oxide zone based on work prepared by Aker Solutions (Jan, 2012). The marginal cut-off selected for reporting of the portion of non-oxidized MRE intended for underground exploitation was selected at 0.75 g/t AuEq6.
Table 14-33: Marginal Cut-off Calculation Parameters and Results Oxide and Non-oxide (Exeter Jan 16 2012)
| Parameters | Oxide | Non Oxide |
| Processing (US$/t) Cost | 3.4 | 7.8 |
| Recovery (%) | 78 | 72 |
| Gold Price (US$/oz.) | 1,150 | 1,400 |
| Copper Price (US$/lb) | NA | 2.5 |
| Refining Cost (US$/oz.) | 6 | 6 |
| Cut-off AuEq (g/t) | 0.119 | 1.00 |
| 14.10.2 | Mineral Resource Statement |
The Cube 2012 MRE has been classified as Indicated and Inferred within the meaning of the CIM Definition Standards for Mineral Resources and Mineral Reserves (Nov 2010) and is reported above AuEq cut-offs in Table 14-34. The Cube 2012 MRE a total of 166 holes (79,960 metres) drilled at Caspiche. The AuEq block values have been calculated using the AuEq4
202
| |
formulae detailed Section 14.10.1 above. The cut-offs selected are considered appropriate for exploitation by open pit methods. The MRE may be affected by further infill and exploration drilling that may result in increases or decreases in subsequent resource estimates. The MRE may also be affected by subsequent assessments of mining, environmental, processing, permitting, taxation, socio-economic, and other as yet identified factors.
The Cube 2012 MRE reported from within the 'reasonable prospects' resource shell are summarized in Table 14-34 below. The oxide portion of this MRE is reported above 0.18 g/t AuEq4 cut-off and the sulphide (non-oxidized) portion is reported above 0.30 g/t AuEq4 cut-off. Note that the PEA does not include Inferred Mineral Resources.
Table 14-34: Caspiche Mineral Resource Statement April 2012*
| Material | Class | Tonnes (Mt) | Au (g/t) | Cu (%) | Ag (g/t) | AuEq4 (g/t) | AuEq5 (Moz) |
| Oxide | Measured | 65.9 | 0.46 | 1.55 | 0.46 | 1.0 | |
| Oxide | Indicated | 55.6 | 0.39 | 1.63 | 0.40 | 0.7 | |
| Total Oxide | Meas + Ind | 121.5 | 0.43 | 1.58 | 0.43 | 1.7 | |
| Sulphide | Measured | 554.2 | 0.58 | 0.23 | 1.16 | 1.02 | 18.3 |
| Sulphide | Indicated | 727.9 | 0.48 | 0.18 | 1.17 | 0.84 | 19.6 |
| Total Sulphide | Meas + Ind | 1,282.1 | 0.52 | 0.20 | 1.17 | 0.92 | 37.9 |
| Total Meas+Ind | 1,403.6 | 0.51 | 0.19 | 1.20 | 0.88 | 39.6 |
| Material | Class | Tonnes (Mt) | Au (g/t) | Cu (%) | Ag (g/t) | AuEq4 (g/t) | AuEq5 (Moz) |
| Oxide | Inferred | 2.5 | 0.23 | 1.18 | 0.23 | 0.0 | |
| Sulphide | Inferred | 195.6 | 0.29 | 0.12 | 0.91 | 0.52 | 3.3 |
| Total Oxide | Inferred | 198.1 | 0.29 | 0.12 | 0.91 | 0.52 | 3.3 |
*Note: Mineral resources that are not mineral reserves do not have demonstrated economic viability
For the purposes of the PEA the MRE is re-reported in Table 14-35 to Table 14-37 in three parts, by oxidation state, using different AuEq6 cut-offs. The cut-off for oxide portion was set to 0.18 g/t AuEq4 based on results for the oxide zone prepared by Aker Solutions. A sub set of the Cube 2012 MRE comprising the sulphide portion of the MRE are reported above a cut off of 0.75 g/t AuEq6. This higher cut off was selected as appropriate for the reporting of mineral resources intended for underground exploitation based on preliminary economic cut off studies commissioned by Exeter during October 2013 (NCL 29/10/2013) as detailed in Section 14.10.1 above. The PEA subset resource tables (Table 14-35 - Table 14-37) have an effective date of April 2013 and have been classified as Indicated and Inferred within the meaning of the CIM Definition Standards for MRMR (Nov 2010). The MRE may be affected by further infill and exploration drilling that may result in increases or decreases in subsequent resource estimates. The MRE may also be affected by subsequent assessments of mining, environmental, processing, permitting, taxation, socio-economic, and other as yet identified factors.
203
| |
Table 14-35: Caspiche – PEA Measured and Indicated Mineral Resources oxide portion - April 2013 above 0.18 g/t AuEq6 cut off*
| Material | Class | Tonnes (Mt) | Au (g/t) | Ag (g/t) | AuEq6 (g/t) |
| Oxide | Measured | 67.4 | 0.45 | 1.56 | 0.46 |
| Oxide | Indicated | 56.4 | 0.39 | 1.63 | 0.40 |
| Total Oxide | Meas + Ind | 123.8 | 0.43 | 1.59 | 0.43 |
* Note: Mineral resources that are not mineral reserves do not have demonstrated economic viability
Table 14-36: Caspiche – PEA Measured and Indicated Mineral Resources mixed oxide portion - April 2013 above 0.75 g/t AuEq6 cut off*
| Material | Class | Tonnes (Mt) | Au (g/t) | Cu % | Ag (g/t) | AuEq6 (g/t) | |||||||||||||||
| Transitional | Measured | 2.8 | 0.93 | 019 | 0.97 | 0.93 | |||||||||||||||
| Transitional | Indicated | 0.7 | 1.04 | 0.30 | 1.26 | 1.05 | |||||||||||||||
| Total Transitional | Meas + Ind | 3.5 | 0.95 | 0.21 | 1.02 | 0.95 | |||||||||||||||
* Note: Mineral resources that are not mineral reserves do not have demonstrated economic viability
Table 14-37: Caspiche – PEA Measured and Indicated Mineral Resources non-oxide (sulphide) portion- April 2013 above 0.75 g/t AuEq6 cut off*
| Material | Class | Tonnes (Mt) | Au (g/t) | Cu % | Ag (g/t) | AuEq6 (g/t) |
| Sulphide | Measured | 378.6 | 0.71 | 0.30 | 1.30 | 1.28 |
| Sulphide | Indicated | 431.6 | 0.64 | 0.27 | 1.40 | 1.16 |
| Total Sulphide | Meas + Ind | 810.2 | 0.67 | 0.29 | 1.35 | 1.22 |
* Note: Mineral resources that are not mineral reserves do not have demonstrated economic viability
| 14.10.3 | Qualified Persons Statement |
The Cube 2012 Caspiche MRE was prepared by Mr. Ted Coupland, MAusIMM(CP), at the time, Director and Principal Geostatistician of Cube Consulting. This MRE was prepared in accordance with the CIM Estimation of Mineral Resources and Mineral Reserves Best Practice Guidelines (2003). The effective date of this MRE is April 11, 2012.
The MRE methodology been reviewed and validated by Mr Patrick Adams MAusIMM(CP), Director and Principal Geologist of Cube Consulting. Mr Adams has undertaken sufficient steps to enable him to assume QP responsibilities for the Cube 2012 MRE in place of Mr Coupland. These investigations include a site visit and independent sampling. Mr. Adams is ‘Independent’ and a ‘Qualified Person’ as defined by NI 43-101. Mr. Adams consents to be the ‘Qualified Person’ with respect to the MRE that is the subject of this report.
204
| |
Mr Adams has re-reported a sub-set portion of the Cube 2012 MRE for the purposes of the PEA. This sub-set portion includes all the oxidized portion of the Cube 2012 MRE and a sub-set of the non-oxidized. The oxidized portion of the MRE has been reported above a marginal cut-off determined to be appropriate for defining resources for open pit exploitation. The sub-set of the non-oxidized portion of the Cube 2012 MRE has been reported above a marginal cut-off determined to be appropriate for defining resources for underground exploitation.
Mr. Adams believes that the Cube 2012 MRE provides a robust quantification of the tonnage and metal content of the Caspiche project within the levels of uncertainty commensurate with the assigned Mineral Resource categories. The Cube 2012 MRE is appropriate and fit for purpose for the level of studies currently being undertaken.
| 14.10.4 | Sensitivity Grade Tonnage Graphs and Tabulation |
Cube have prepared two grade tonnage curve figures which show the estimated mineral inventory over a range of cut-offs, one for the estimated non-oxidized (including transitional) material (Figure 14-30) and the other for the estimated oxide material (Figure 14-29). These curves demonstrate the behaviour of grade and tonnes for the estimated blocks only, and cannot be interpreted as representing blocks with demonstrated economic feasibility.
Sensitivity tables are presented at a number of cut-offs to demonstrate the behaviour of the Cube 2012 MRE proximal to the selected marginal cut-offs. Table 14-38 details the estimated oxide material reported at regular AuEq cut-offs from 0.1 to 0.5 g/t AuEq6.
Table 14-38: Sensitivity – Oxide Material (Measured + Indicated) - April 2013 by AuEq6 cut off
| AuEq Cut-off | Mt | Au (g/t) | Ag (g/t) | AuEq6 (g/t) |
| 0.10 | 163.469 | 0.35 | 1.48 | 0.36 |
| 0.15 | 137.174 | 0.40 | 1.57 | 0.41 |
| 0.18 | 123.796 | 0.43 | 1.59 | 0.43 |
| 0.20 | 114.908 | 0.44 | 1.60 | 0.45 |
| 0.25 | 94.775 | 0.49 | 1.63 | 0.50 |
| 0.30 | 77.243 | 0.54 | 1.65 | 0.55 |
| 0.35 | 65.354 | 0.59 | 1.67 | 0.59 |
| 0.40 | 56.639 | 0.62 | 1.69 | 0.63 |
| 0.45 | 48.329 | 0.65 | 1.71 | 0.66 |
| 0.50 | 39.008 | 0.70 | 1.73 | 0.71 |
205
| |

Figure 14-29: Grade Tonnage Curve Estimated Blocks of oxide Material (Measured and Indicated)
Table 14-39 details the estimated transitional and sulphide material reported at regular AuEq cut-offs from 0.6 to 1.50 g/t AuEq6. The report item highlighted in yellow, above a 0.75 g/t AuEq6 includes the transitional estimated material and totals 813.7 Mt.
206
| |
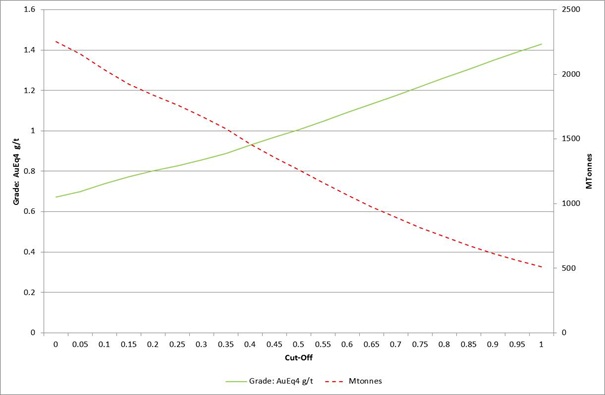
Figure 14-30: Grade Tonnage Curve Estimated Blocks of non-oxidized (including Transitional) Material (Measured and Indicated)
Table 14-39: Sensitivity – Transitional and Sulphide Material (Measured + Indicated) April 2013 by AuEq6 cut off
| AuEq Cut-off | Mt | Au (g/t) | Ag (g/t) | Cu (%) | AuEq6 (g/t) |
| 0.60 | 1,063.22 | 0.60 | 1.26 | 0.26 | 1.09 |
| 0.65 | 974.81 | 0.62 | 1.29 | 0.27 | 1.13 |
| 0.70 | 891.35 | 0.65 | 1.32 | 0.28 | 1.18 |
| 0.75 | 813.72 | 0.67 | 1.35 | 0.29 | 1.22 |
| 0.80 | 742.23 | 0.70 | 1.37 | 0.29 | 1.26 |
| 0.85 | 675.61 | 0.72 | 1.39 | 0.30 | 1.31 |
| 0.90 | 612.71 | 0.75 | 1.41 | 0.31 | 1.35 |
| 0.95 | 558.74 | 0.77 | 1.43 | 0.32 | 1.39 |
| 1.00 | 510.06 | 0.80 | 1.45 | 0.33 | 1.43 |
| 1.05 | 462.23 | 0.82 | 1.48 | 0.34 | 1.47 |
| 1.10 | 415.44 | 0.85 | 1.50 | 0.35 | 1.52 |
| 1.15 | 375.11 | 0.87 | 1.51 | 0.36 | 1.56 |
| 1.20 | 342.24 | 0.89 | 1.53 | 0.37 | 1.60 |
| 1.25 | 311.35 | 0.92 | 1.56 | 0.38 | 1.63 |
| 1.30 | 281.86 | 0.94 | 1.59 | 0.38 | 1.67 |
| 1.35 | 253.78 | 0.96 | 1.63 | 0.39 | 1.71 |
| 1.40 | 226.67 | 0.99 | 1.66 | 0.40 | 1.75 |
| 1.45 | 198.71 | 1.02 | 1.69 | 0.40 | 1.79 |
| 1.50 | 177.05 | 1.05 | 1.71 | 0.41 | 1.83 |
An illustration of the position of the non-oxidized portion of MRE reported at two AuEq6 cut-offs is provided in Figure 14-31 and Figure 14-32 below. Each Figure is a vertical northing slice through the non-oxidized portion of the MRE with blocks limited to Measured and Indicated
207
| |
classification. On the left hand side of each Figure the 0.3 g/t AuEq6 cut-off has been applied. On the right hand side of each Figure the 0.75 g/t AuEq6 cut-off has been applied. The two figures provide visual confirmation that the re-reporting of the 2012 MRE at the 0.75 g/t AuEq6 for the PEA is a sub-set of the reported 2012 MRE at the 0.3 g/t AuEq6 cut-off.

Figure 14-31: Vertical Section at 6937000mN (looking north) – non-oxidized M+I (Source: Cube Consulting, 2012)
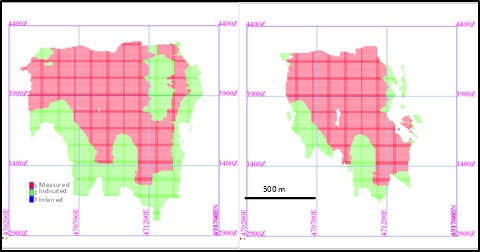
Figure 14-32: Vertical Section at 6937400mN (looking north) – non-oxidized M+I (Source: Cube Consulting, 2012)
208
| |
| 15 | MINERAL RESERVES ESTIMATES |
There are no mineral reserves defined by the PEA study, as the PEA is only a conceptual analysis of potential economic viability.
The results of the PEA are based on a mineral resource estimate and that mineral resources that are not mineral reserves do not have demonstrated economic viability.\
The economic analysis contained in the PEA is considered preliminary in nature. No inferred mineral resources form part of the PEA studies and no mineral reserves for the PEA have been established. There is no certainty that economic forecasts outlined in the PEA will be realized. The PEA and the Cube 2012 Mineral Resource (as defined herein) may be materially affected by environmental, permitting, legal, title, taxation, socio-political, marketing or other relevant factors.
209
| |
| 16 | MINING METHODS |
| 16.1 | Introduction and Summary |
NCL Ingeniería y Construcción SpA (NCL) was commissioned by Exeter Resource Corporation (Exeter) to provide mine planning services for the Caspiche Gold/Copper Project in the Atacama Region of Chile. This work was undertaken to support a Preliminary Economic Assessment (PEA) authored by Alquimia Conceptos (Alquimia).
NCL’s Scope of Work is summarized as follows:
| · | Develop a mine plan and mine production schedule for the life of mine (LOM), for five defined options: |
| ° | Option 1: 30 ktpd open pit mine for gold and silver oxide mineralization treated by heap leaching |
| ° | Option 2: 60 ktpd open pit mine for gold and silver oxide mineralization treated by heap leaching and 27 ktpd open pit mine for gold and copper sulphide mineralization treated in a conventional concentrator plant |
| ° | Option 3: 60 ktpd open pit mine for gold and silver oxide mineralization treated by heap leaching and 27 ktpd underground mine for gold and copper sulphide mineralization treated in a conventional concentrator plant. |
| ° | Option 4: 60 ktpd open pit mine for gold and silver oxide mineralization treated by heap leaching and 12 ktpd open pit mine for gold and copper sulphide mineralization treated in a conventional concentrator plant |
| ° | Option 5: 27 ktpd underground mine for gold and copper sulphide mineralization treated in a conventional concentrator plant. |
In tabular format this is illustrated as follows:
210
| |
Table 16-1: Options Summary
| Option | Oxide heap leach 30 ktpd | Oxide Heapleach 60 ktpd | Sulphide Open Pit 27 ktpd | Sulphide Open Pit 2 ktpd | Sulphide Underground 27 ktpd |
| Option 1 | YES | ||||
| Option 2 | YES | YES | |||
| Option 3 | YES | YES | |||
| Option 4 | YES | YES | |||
| Option 5 | YES |
NCL’s scope included:
| · | Determine the mine equipment and labor requirements for the LOM of the five options |
| · | Estimate the mine initial and sustaining capital and operating costs for the LOM of the five options. |
The PEA report work was started in the third quarter 2013 and completed in Q1 2014. NCL prepared the Mining Study under the direct supervision of Mr Carlos Guzmán BSc Mining Engineering, RM Chilean Mining Commission 119, FAusIMM 229036, Director of NCL and Qualified Person as defined in the CIM Guidelines.
The economic analysis contained in the PEA is considered preliminary in nature. No inferred mineral resources form part of the PEA studies and no mineral reserves for the PEA have been established. Mineral resources are not mineral reserves and have no demonstrated economic viability. There is no certainty that economic forecasts outlined in the PEA will be realized. The PEA and the April 2012 Mineral Resource (as defined herein) may be materially affected by environmental, permitting, legal, title, taxation, socio-political, marketing or other relevant factors.
| 16.2 | Conceptual Open Pit Design |
Oxides Standalone at 30ktpd
A mine plan was developed for the Caspiche Oxide project to process approximately 30,000 tonnes per day (tpd) with a peak total material movement rate of 15 Mt per year. The mine is scheduled to work seven days per week and 360 days per year, 5 days downtime was assumed for weather delays. Each day will consist of two 12 hour shifts. Four mining crews will cover the operation.
This option is based on operating the open pit mine in 8 m benches with a leased fleet of front-end-loaders of 18 cubic metre capacity and trucks with a capacity of 137 tonnes. This type of equipment will develop the required productivity to achieve an annual total material movement
211
| |
of 15 Mt. The selection of front-end-loaders also provides good mining selectivity as defined by grade control activities.
Oxides at 60ktpd / Sulphides at 27ktpd
Mine plans were developed to process 60,000 tonnes per day (tpd) of oxides and 27,000 tpd of sulphides in the combined option with a peak total material movement rate of 50 Mt per year. The mine is scheduled to work seven days per week and 360 days per year, 5 days downtime was assumed for weather delays. Each day will consist of two 12 hour shifts. Four mining crews will cover the operation.
This option is based on operating the open pit mine in 16 m benches with a leased fleet of front-end-loaders of 19 cubic metre capacity, hydraulic excavators of 22 cubic metre capacity and trucks with a capacity of 185 tonnes. The selection of hydraulic excavators for this option provides the required productivities.
NCL performed pit optimization and mine planning according to the conclusions of the resource estimate, without introducing any additional factors to account for dilution. The resulting block model is considered to be a fully diluted resource model.
NCL considered 100% mining recovery due to the disseminated characteristics of the mineralized material. Metallurgical recoveries in the heap leach are important so significant efforts on grade control will be required during mining to minimize misclassification of material.
| 16.2.1 | Parameters for Mine Design |
Table 16-2 summarizes the economic parameters used for Lerch-Grossman economic shell analyses and mine design.
The mining cost unitary breakdown is based on studies developed by NCL during 2011, as part of the previous Pre-feasibility study for a larger production open pit. The estimated average life of project mining cost was separated into various components such as fuel, explosives, tires, parts, salaries etc. according to similar current operations in Chile. Each component was updated for 1st Quarter 2014 prices and exchange rate from Chilean Peso to US dollars. This resulted in the mining cost estimate of approximately US$2.4/t plant feed mined, as shown in Table 16-2.
The metal prices, processing costs, refining costs, and processing recoveries were provided to NCL by Exeter and Alquimia.
212
| |
Table 16-2: Lerch-Grossman Optimization Parameters
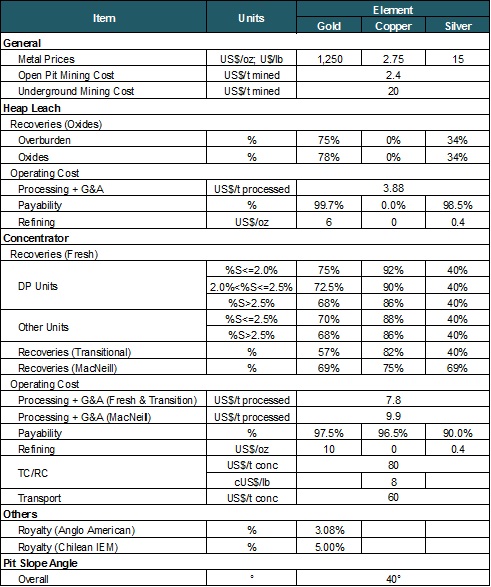
NCL calculated a gold equivalent (AuEq) value based on gold copper and silver revenues (prices and recoveries involved). The following formula was used to calculate AuEq values in each block of the model:

where Au, Cu and Ag are gold, copper and silver grades, PAu, PCu and PAg are the Au, Cu and Ag prices (1,250 US$/oz, 2.75 US$/lb and 15 US$/oz, respectively), and RAu, RCu and RAg are the Au, Cu and Ag projected metallurgical recoveries as per Table 16-2 for the different materials.
213
| |
| 16.2.2 | Pit Optimization Results |
Option 1: Oxides Standalone at 30ktpd
Table 16-3 shows the results of the optimization run for the oxides standalone option where sulphide material is considered as waste. Nested pit shells were generated for several revenue factors1 applied to the base case values. Measured and Indicated Mineral Resources were used for the pit evaluation and mine planning. Inferred Resources were treated as waste. The results are also shown graphically in Figure 16-1.
22 Revenue Factor: is a number which escalates up and down (generally varying from 0.3 to 1.5) the revenue generated by all the elements to create the pit shells; revenue factor 1 identifies the mineral which makes breakeven point for a set of selected economic criteria used for the mining and processing scenario
214
| |
Table 16-3: Pit Optimization Results – Option 1
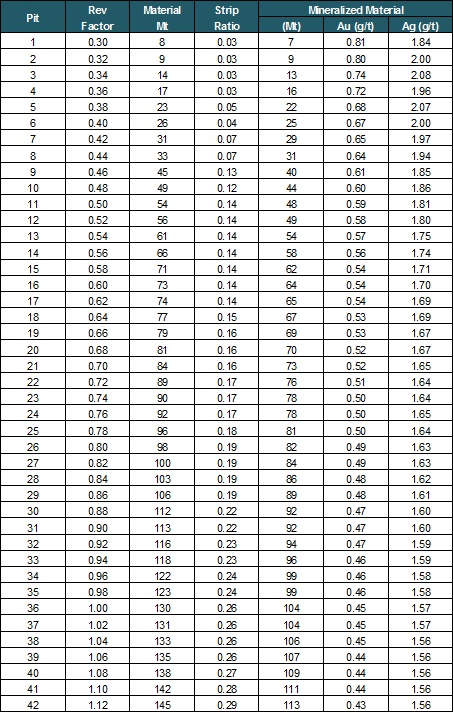
215
| |
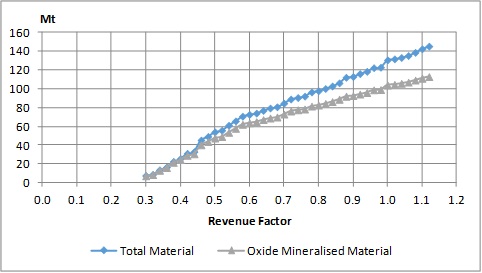
Figure 16-1: Pit Optimization Results – Option 1
Revenue Factor 1 pit shell (pit 36) was selected as the guide for final pit design for option 1. Table 16-4 shows selected pit shell 36 by resource category
Table 16-4: Option 1 – Pit Shell 36 by Resource Category

Options 2 & 3: Oxides at 60ktpd / Sulphides at 27ktpd
Table 16-5 shows the results of the optimization run of the combined option: oxides to heap leach and sulphides to concentrator.
The pit optimization for the combined option was developed assigning value to the oxide material to the heap leach and only the fresh sulphides to the concentrator. Additionally, for the fresh sulphides a minimum grade of 1.1 g/t AuEq was considered.
Transition and MacNeill material were considered as waste during the pit optimization, but thereafter reported within the pit shells.
216
| |
Measured and Indicated Mineral Resources were used for the pit evaluation and mine planning. Inferred Resources were treated as waste.
The results are also shown graphically in Figure 16-2.
Table 16-5: Pit Optimization Results – Options 2&3
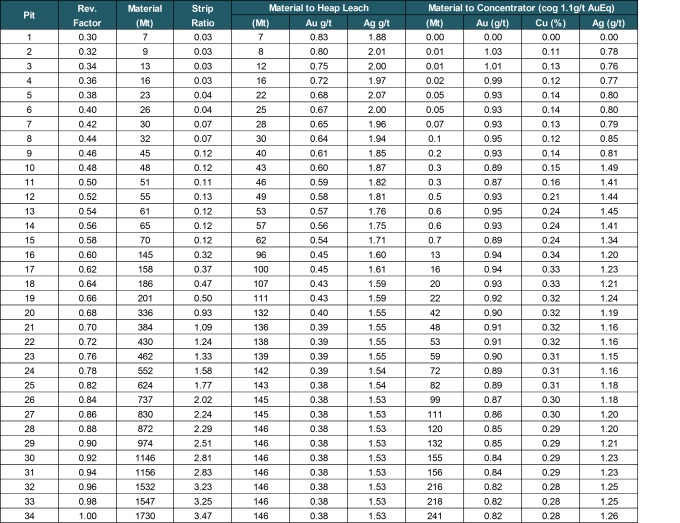
217
| |

Figure 16-2: Pit Optimization Results – Options 2&3
Revenue Factor 0.82 pit shell (pit 25) was selected as the guide for final pit design for this combined option.
Table 16-6: Options 2&3 – Pit Shell 25 by Resource Category

218
| |
Table 16-7 details the selected pit shell for additional cut-offs applied to the feed material to the concentrator.
Table 16-7: Selected Pit Shell Details – Options 2&3

| 16.2.3 | Option 1: Pit and Preliminary Mining Phases Design |
The final pit design was based on the economic shells obtained at revenue factor 1, with constant overall slope angles defined by geotechnical recommendations of 37° for overburden 43° for strong alteration breccia and 50° for fresh rock. Table 16-8 shows the key open pit design parameters.
NCL engaged AKL to carry out a geotechnical evaluation of the designs of the pits. AKL collated and analyzed all geological, geotechnical and hydrological data collected during exploration operations at Caspiche.
The current mine plan is designed with 8 m benches stacked to 16 m, i.e. double benching for the fresh rock material. Mining costs for this report are based on blasting 8 m benches for the waste and mineralized zones.
Geotechnical recommendations were also considered in the design of additional 40 m wide safety berms when the slope height exceeds 160 m.
219
| |
Road width of 24 m was considered to accommodate the selected 137 t trucks. NCL used a 10% road gradient which is common in the industry for this type of trucks.
Table 16-8: Pit Design Parameters
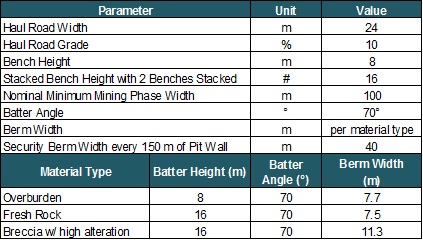
Figure 16-3 shows the final oxide pit design. The pit has two exits on the west side to provide access to the primary crusher and to the waste dump. On the east side there is another exit to access the main waste storage area. The final pit is 1,100 m long in the north-south direction and 890 m wide in the east-west direction. The pit bottom is at the 4,216 m elevation. The highest wall is about 216 m on the south side. The total area disturbed by the pit is about 71.2 hectares.
220
| |
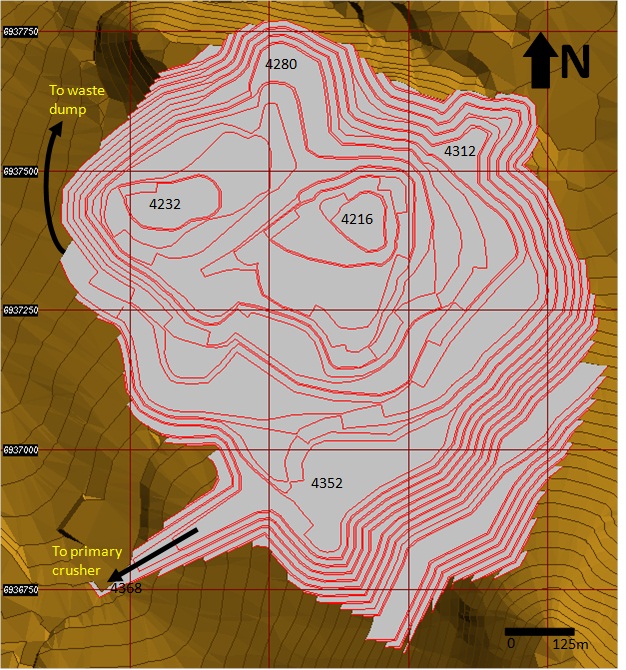
Figure 16-3: Final Pit – Option 1
NCL designed a set of four mining phases for this option, shown in plan view in Figure 16-4.
221
| |
Phase 1 targets the mineralized material with the highest grade and lowest strip ratio in the northern area, this is exploited to 4,264 m.a.s.l in two pit bottoms. Phases 2 and 3 are expansions to the south and west, exploited to 4,216 m.a.s.l and 4,232 m.a.s.l respectively. Phase 4 is the final expansion to the south-east.
222
| |
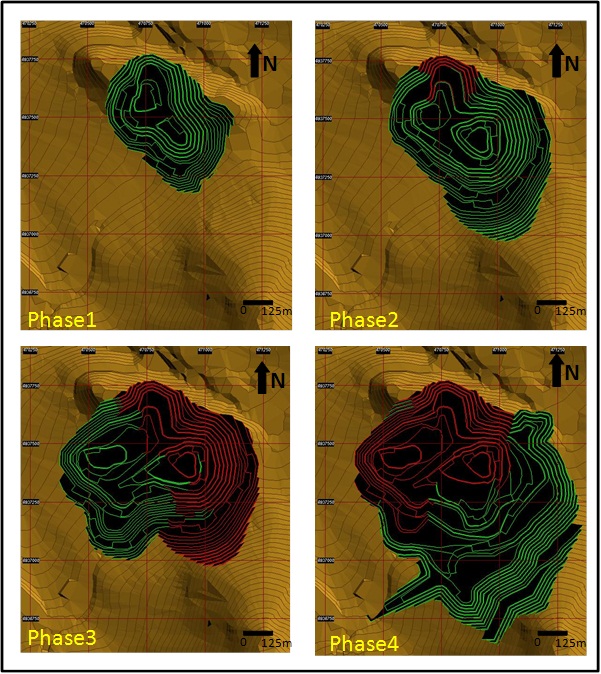
Figure 16-4: Mining Phases – Option 1
Table 16-9 summarizes the pit contained resources for the final design pit at several different gold cut-off grades (Au g/t). The tables include only Measured and Indicated Resources using the updated April 2013 block model. Inferred Resources are considered to be waste material.
223
| |
At the marginal cut-off grade of 0.14 g/t gold for the mineralized overburden material and 0.13 g/t gold for the rest of the oxides, calculated from the economical and metallurgical parameters detailed in Table 16-2, the final pit contains 107.3 Mt of mineralized material at 0.44 g/t gold and 29.1 Mt of waste material with a 0.27 to 1 strip ratio.
Table 16-9: Mineral Resources Contained in Final Pit at Various Cut-Off Grades – Option 1

| 16.2.4 | Options 2&3: Pit and Preliminary Mining Phases Design |
The final pit design for options 2 and 3 is based on the economic shell obtained at a revenue factor of 0.82 (pit shell 25) with constant overall slope angle of 40 degrees. This shell was smoothed and narrow bottoms eliminated to obtain a non-operative final pit.
Figure 16-5 shows the final pit design. There is a planned exit on the west of the pit which gives access to the ROM pad area and oxides primary crusher. Another exit was planned on the north of the pit to access the waste dumps, sulphides primary crusher and sulphides stockpiles. The first 400 metres of the pit have accesses generated from existing topography.
The final pit is 1,610 m long in the north-south direction and 1,150 m wide in the east-west direction. The pit bottom is at the 3,920 m elevation. The highest wall is about 780 m on the south side. The total area disturbed by the pit is about 143 hectares.
224
| |
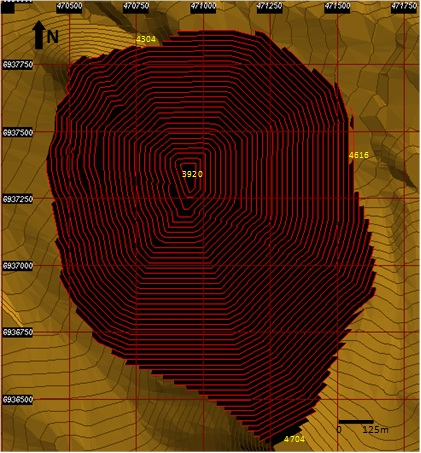
Figure 16-5: Final Pit – Options 2&3
NCL designed a set of seven mining phases for the Caspiche oxides/sulphides options. Figure 16-6 shows a plan-view of the seven phases.
Phases 1 to 4 are focused on oxides material; following the same general sequence of the previously described oxides standalone option. Phases 5 to 7 are focused on sulphide material, expanding to the east, south and north respectively.
225
| |

Figure 16-6: Mining Phases – Options 2&3
Table 16-10 summarizes the pit contained resources for the final design pit and mining phases. The tables include only Measured and Indicated Resources using the updated April 2013 block model. Inferred Resources are considered to be waste material.
226
| |
According to the economic and metallurgical parameters, the cut-off grades for the different materials and processes are as follows:
| · | Oxides: 0.13-0.14 g/t AuEq (overburden - rest of oxides; to heap leach) |
| · | Fresh: 0.36 g/t AuEq (to concentrator) |
| · | Transition: 0.42 g/t AuEq (to concentrator) |
| · | MacNeill: 0.43 g/t AuEq (to concentrator) |
The total contained oxide material amounts to 143 Mt at 0.38 g/t Au and 1.54 g/t Ag. The total contained resources of sulphides material (fresh and transition) amounts to 192 Mt at grades of 0.56 g/t Au, 0.20% Cu and 1.12 g/t Ag. The total contained resources of MacNeil material amounts to 15 Mt at grades of 0.47 g/t Au, 0.13% Cu and 1.21 g/t Ag. The total amount of waste corresponds to 256 Mt.
227
| |
Table 16-10: Resources Contained in Final (Oxide Push-Backs) – Options 2&3

228
| |
Table 16-11: Resources Contained in Final (Sulphide Push-Backs) – Options 2
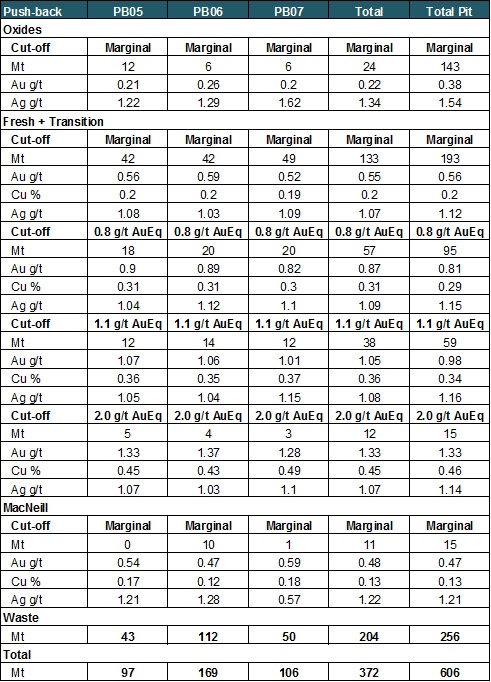
229
| |
16.2.5 | Waste and Stockpile Storage Areas |
The waste storage areas were designed in 15 m lifts. Each lift is constructed at an approximate angle of repose of 37°. A 35 m set-back between three lifts maintains the overall angle at 26° to facilitate reclamation and long term stability.
During the pre-production period, the oxides ROM pad area will be constructed close to the primary crusher for later re-handling. The ROM pad was designed as a single lift 25 m high.
Low grade oxide material will be mined and hauled to a stockpile located close to the primary crusher. This material will be re-handled and will become part of the plant feed in later years. The total low grade oxides stockpile capacity amounts to 30 Mt The low grade stockpile was designed in 10 m lifts with a 24 m wide ramp at 10% slope and with a 12 m set-back every 50 m. The resulting angle of the stockpile is 26°.
Option 1: Oxides Standalone at 30ktpd
One waste rock storage area to the north of the pit was designed for this option with a design capacity of 36 M tonnes. The final configuration is shown in Figure 16-7.
Options 2 & 3: Oxides at 60ktpd / Sulphides at 27ktpd
Two waste rock storage areas to the north / north east of the pit were designed for these options, up to elevations of 4,400 m.a.s.l and 4,575 m.a.s.l respectively. The designed capacity is 70 M tonnes for the north dump and 130 M tonnes for the north-east dump.
Sulphide material will be mined and hauled to a stockpile located to the west of the north dump. This material will be re-handled and will become part of the concentrator plant feed from year 6. The total sulphides stockpile capacity amounts to 25 Mt. The low grade stockpile was designed in 10 m lifts with a 24 m wide ramp at 10% slope and with a 12 m set-back every 50 m. The resulting angle of the stockpile is 26°.
The final configuration is shown in Figure 16-8.
230
| |
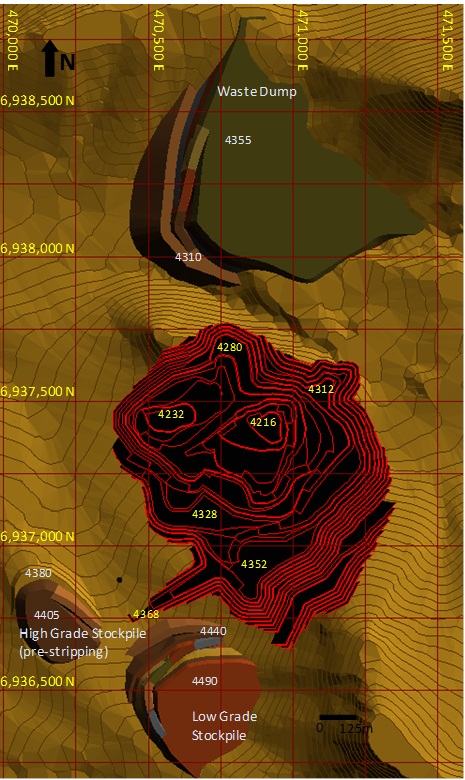
Figure 16-7: General Layout – Option 1
231
| |
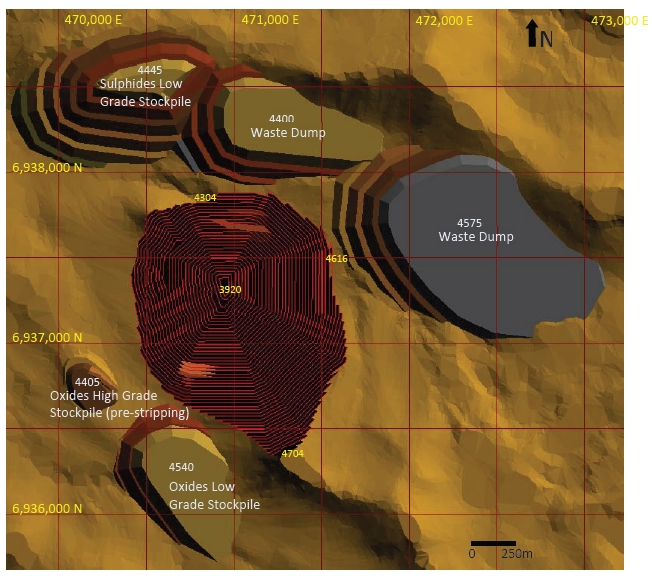
Figure 16-8: General Layout – Options 2
| 16.3 | Conceptual Underground Design |
| 16.3.1 | General |
Previous underground designs for the sulphide deposit have included massive mining methods such as block caving. More selective underground methods trying to recover the higher grade zones by sub level stoping were not considered in these previous analyses. The underground design for this Report now considers sub level stoping as a means to extract higher grade material from within the overall underground sulphide resource.
The scope of work completed included stope designs including cut-off grade (COG) estimates and estimation of mining inventory including dilution and recovery for the resource to be mined.
232
| |
This section incorporates the following activities:
| · | Mining methods |
| · | Underground mining inventory |
| · | Production sequencing |
| · | Mine scheduling |
| · | Equipment fleet |
| · | Mine personnel. |
| 16.3.2 | Mining Methods |
Examination of the sulphide underground resources indicates that there is a high grade (AuEq>2.0 g/t) area in the Diorite Porphyry (DP) surrounded by a medium grade (AuEq>1.5 g/t) zone. Lower grades are found outside of those areas. Figure 16-9 illustrates this in a plan view and as a section showing grade distribution.
233
| |
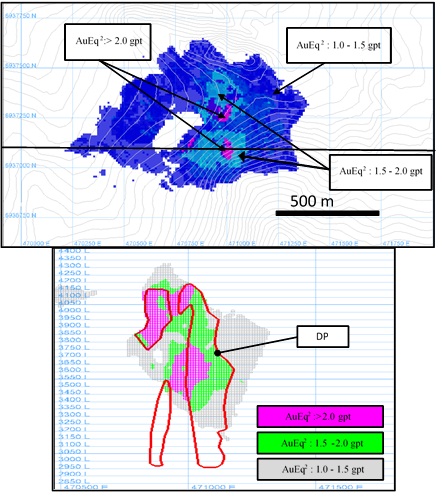
Figure 16-9: Sulphide Resources Grades Distribution2
DP in the above vertical cross section references the diorite porphyry unit at Caspiche, the main host rock of the higher grade core of the deposit.
23 AuEq2: The following formula was used in calculating AuEq values in each block of the model:

Where Au, Ag and Cu are the block kriged gold, silver and copper grades, PAu, PAg and PCu are the gold, silver and copper prices (1,250 US$/oz., 15US$/oz. and 2.75 US$/lb, respectively). RAu and RCu are the Au and Cu projected metallurgical recoveries based on a number of S % thresholds. Table 14-31 details the recovery factors for gold, silver and copper within the oxidized, and sulphide domains and the DP and Non-DP stratigraphic units using a sulphur threshold determined by and provided by Exeter.
234
| |
Open stoping has been considered as the underground mining method to be applied. Definitions of different horizons and mining phases, based on grades and productivities were determined.
Geotechnical input from NCL’s geotechnical consultants, AKL was used in the design of the mining method and AKL have approved the final layouts and sequencing used in this report.
Given the geometry of the deposit, an open blast hole stoping mining method including paste backfilling was used. An example of this mining method as it applies to the Caspiche deposit is illustrated in Figure 16-10.
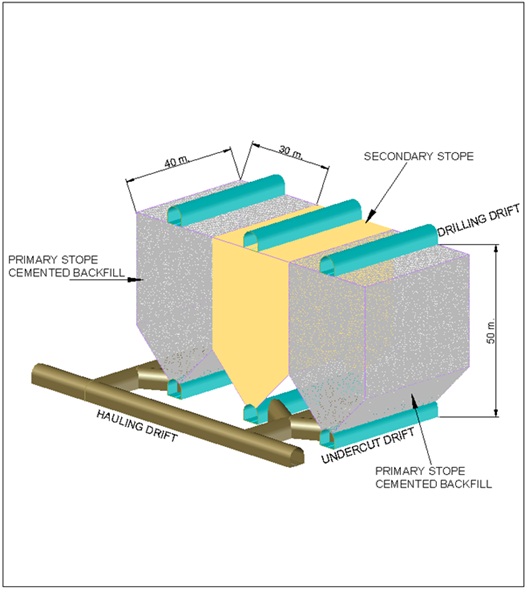
Figure 16-10: Basic Blast hole Stoping Method
235
| |
Each stope has the following dimensions:
| · | Length | : | 40 m |
| · | Width | : | 30 m |
| · | Height | : | 50 m |
The typical stope layout requires both an upper and lower sill drift. The upper sill drift serves as the drill platform, while the lower sill drift serves as the undercut level and connects to the drawpoint drifts. The unit operations or activities required to mine or “cycle” an open blast hole stope are listed below:
| · | Slot Development |
| · | Blast hole Drilling |
| · | Blasting |
| · | Mucking |
| · | Filling |
The mining sequence in a stope can be summarized as follows:
| · | A drilling drift (5 m x 5 m) at the top of the stope is developed |
| · | An undercut drift (5 m x 5 m) at the bottom of the stope is developed |
| · | Four drawpoint drifts (5 m x 5 m) are then developed in the undercut level connecting the hauling drift |
| · | A Vertical Crater Retreat (VCR) (3 m x 3 m) slot raise is constructed at the stope limit |
| · | The slot is slashed to the total stope width |
| · | Drill and blast the undercut and stope benches or rings |
| · | Mucking the stopes with LHD |
| · | Backfill the stopes. |
236
| |
| 16.3.3 | Preliminary Design Criteria |
The first stage of the mine design interrogated the geological block model and created the production entities for the selected mining method. Cut-off grades were estimated to define the boundaries.
According to the mine inventory equivalent gold distribution and considering the geotechnical information and recommendations, the higher grade zones located in the DP zones were the initial target. Medium grades, were the secondary target and finally low grades will be mined.
The second stage of the mine design involved laying out the declines, level drifts, access ramps, ventilation raises and accesses.
Five different horizontal areas and a crown pillar were defined, as shown in Figure 16-11. Each horizon is composed of three stope levels and is limited vertically by a 50 m high sill pillar. This sill pillar will be mined using the same stopes layout only after the lower and upper horizons have been fully filled.
237
| |
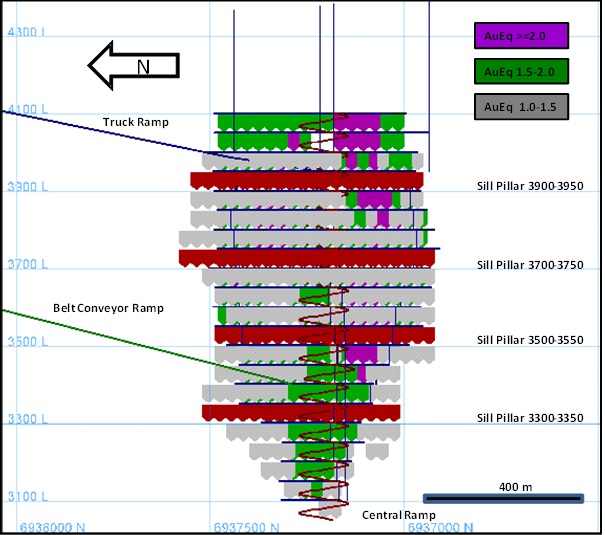
Figure 16-11: Mining Horizons24
AuEq: The following formula was used in calculating AuEq values in each block of the model:

Where Au, Ag and Cu are the block kriged gold, silver and copper grades, PAu, PAg and PCu are the gold, silver and copper prices (1,250 US$/oz., 15US$/oz. and 2.75 US$/lb, respectively). RAu and RCu are the Au and Cu projected metallurgical recoveries based on a number of S % thresholds. Table 14-31 details the recovery factors for gold, silver and copper within the oxidized, and sulphide domains and the DP and Non-DP stratigraphic units using a sulphur threshold determined by and provided by Exeter
16.3.4 | Cut-off Grade Estimate |
The break-even cut-off grade (COG) is one of the key parameters to be determined prior to stope and mine design. COG’s are used to identify whether material is classified as economic, at or above the COG, or waste, below the COG. The COG is a function of operating costs, metal prices, royalties and process recoveries.
The mine COG considers mining, processing and overhead operating costs.
| Break ven cut-off grade (g/t) = | (Mining Cost + Process Cost + G&A) x (1- Chilean Royalty) |
| (BECOG) | (Payable Au x Gold Recovery) x (Gold price - Gold Refining Cost - Copper Charges) x (1-Anglo Royalty) x (1-Chilean Royalty) |
Preliminary COG for a 27 ktpd production based on estimated operating costs, royalties and process recoveries rate was calculated for the purpose of generating mineable stopes.
Technical and economic parameters used in the COG estimates are included in Table 16-12.
Table 16-12: Technical and Economic Parameters used for COG Estimate
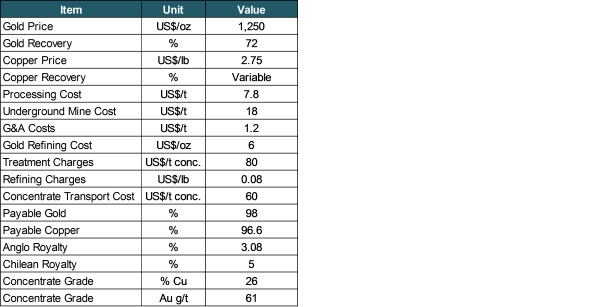
Cut-off grade value for the underground mine was calculated as 1.10 g/t AuEq.
239
| |
| 16.3.5 | Dilution |
The actual diluted tonnage for each stope and the concomitant loss for adjacent stopes are calculated for each stope. Dilution depends on the nature of each of the stope walls determined by consideration of the status of each side adjacent stope: Either it has not yet been stoped, therefore, rock dilution is at the grade of the adjacent stope, or it has been filled, and fill dilution is at a grade of zero.
A lateral over-excavation of 0.7 m on each side of the stope has been assumed. The dilution material for secondary stopes will be backfill from both sides. Using zero grade as diluting material, mined grades for secondary benching stopes will be diluted by 4%. Undercuts will not be affected by dilution in primary or secondary stopes.
| 16.3.6 | Underground Mining Inventory |
Mineable Shape Optimiser (MSO) was used to identify contiguous areas of mineralization above the COG within the sulphide region. The stope sizes selected for the analysis were 40 m long by 30 m wide x 50 m high.
The mining inventory for the underground sulphide has considered only Measured and Indicated Resources. Any Inferred Resources included in the mining units were considered as having zero grade.
The mining units used for this study have the same dimensions as the stope units described in Section 16.3.2. Mining units with a grade greater than the cut-off grade were included in the total inventory.
Table 16-13 presents the mining inventory split by grade quality.
Table 16-13: Sulphide Mining Inventory25
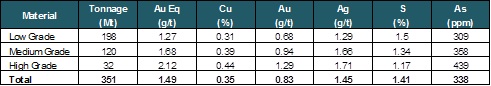
The breakdown by category is presented in Table 16-14.
The reader is cautioned that the mining study is part of a preliminary economic assessment that is preliminary in nature. There is no certainty that the preliminary economic assessment will be realized. No mineral reserves have been estimated.
240
| |
Table 16-14: Sulphide Mining Inventory by Category
| Material | Measured | Indicated | ||||||
Tonnage (Mt) | Cu (%) | Au (g/t) | Ag (g/t) | Tonnage (Mt) | Cu (%) | Au (g/t) | Ag (g/t) | |
| Low Grade | 103 | 0.31 | 0.68 | 1.28 | 96 | 0.31 | 0.69 | 1.30 |
| Medium Grade | 62 | 0.39 | 0.95 | 1.49 | 58 | 0.38 | 0.94 | 1.83 |
| High Grade | 24 | 0.45 | 1.28 | 1.58 | 8 | 0.42 | 1.30 | 2.07 |
| Total | 188 | 0.35 | 0.84 | 1.39 | 162 | 0.34 | 0.81 | 1.53 |
| 16.3.7 | Conceptual Underground Mine Design |
A typical mine layout has been assumed for the proposed blast hole stoping. During the initial years, mineralized material will be trucked to surface. After production year 3, an underground sizer will be installed and the mineralized material will be transported to surface by a belt conveyor and discharged at the primary crusher feed.
The main infrastructure is presented in Figure 16-12.
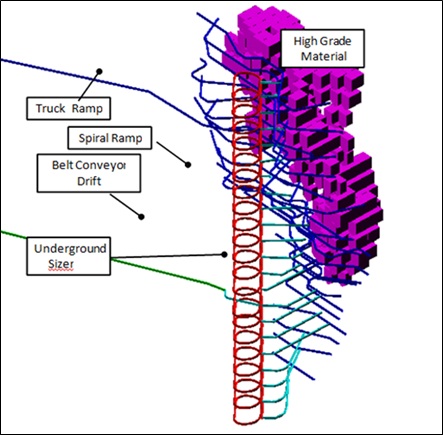
Figure 16-12: Main Infrastructure
241
| |
The general concept for plant feed handling when the underground sizer operates is as follows:
| · | Loading by LHD from stopes and dumping in a transfer station |
| · | Loading to 40 t trucks (type Volvo A40) |
| · | Hauling to an orepass |
| · | Crushing |
| · | Belt conveying to surface |
Figure 16-13 illustrates this concept.
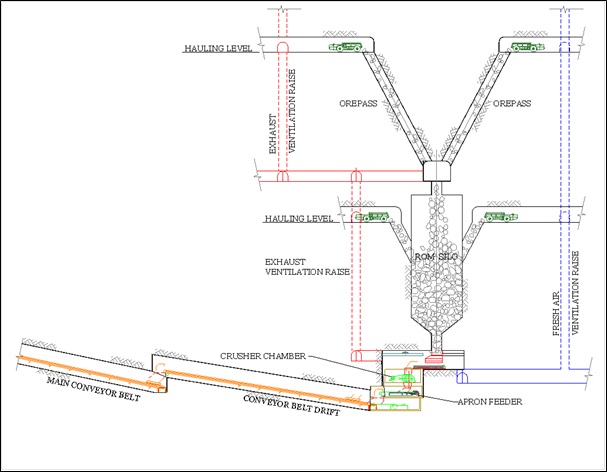
Figure 16-13: Plant Feed Handling
A conceptual design has been completed for paste backfill distribution where required. A pipeline 2,500 m long is designed to run on surface, the paste backfill will then be introduced to the mining area through the truck decline connecting to the 4,000 Level Backfill Transfer Station.
242
| |
From 4,000 Level, the paste fill will be delivered to the other levels through inclined sub-vertical holes, at an angle of 65° to 75°. The paste backfill distribution system concept is presented in Figure 16-14.

Figure 16-14: Schematic of Paste Fill Distribution
The ventilation system is composed of a number of fresh ventilation raises of 5 m diameter combined with exhaust air raises also of 5 m diameter. Declines are also used for exhaust air. Figure 16-15 presents the schematics for the main ventilation system.
An underground workshop was considered. This building will include heavy and light workshop facilities with adjacent warehouse, lubrication storage and waste oil tank and oil change area.
An external wash-down area will be provided for the vehicle workshops.
243
| |
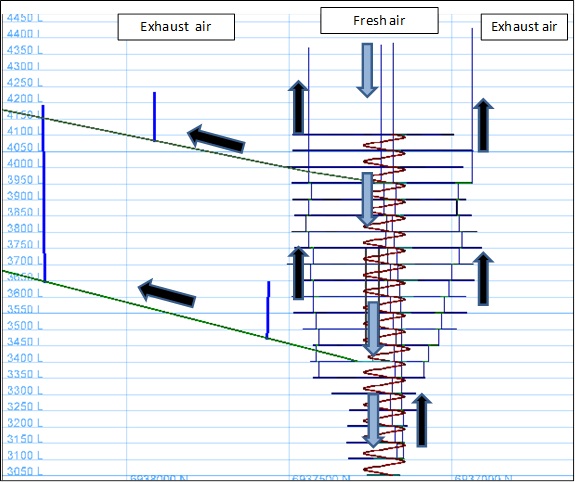
Figure 16-15: Schematic of the Ventilation System
| 16.4 | Mine Production Schedules |
Mine production schedules were developed to show the mineralized material tonnes and grades, tonnes of waste material and tonnes of total material by year for the life of the mine for the five defined options.
For the open pits, the distribution of mineralized material and waste contained in each of the mining phases was used to develop the schedule, ensuring that criteria such as continuous material exposure, mining accessibility, and consistent material movements were met.
NCL used an in-house developed system to evaluate several potential mine production schedules. Required annual throughput rate and user specified annual total material movements are provided to the algorithm, which then calculates the mine schedule. Several runs at various proposed total material movement schedules and different operating cut-off grades for the year were carried out to determine an efficient production schedule strategy. It is important to note
244
| |
that this program is not a simulation package, but a tool for calculation the mine schedule and haulage profiles for a given set of phases and constraints that must be set by the user.
The mine plans developed by NCL do not include any special provisions for dilution as the resource block model is considered to be already diluted.
NCL considered a 100% open pit mining recovery due to the low strip ratio. Nevertheless, careful grade control must be carried out during mining tminimize misplaced material.
Grade control efforts will need to take advantage of all the experience of selective mining to ensure the material classes are properly selected and processed. These efforts should include the following standard procedures:
| · | Implement an intense and systematic program of sampling, mapping, laboratory analyses, and reporting |
| · | Utilize specialized in-pit, bench sampling drills for sampling well ahead of production drilling and blasting |
| · | Maintain top laboratory staff, equipment, and procedures to provide accurate and timely assay reporting |
| · | Utilize trained geologists and technicians to work with excavator operators in identifying, marking, and selectively mining and dispatching crusher feed and waste. |
| 16.4.1 | Option 1 |
As noted previously, 0.13 - 0.14 g Au/t corresponds to the marginal cut-off that defines the separation between mineralized material and waste. NCL used an operational cut-off grade higher than the marginal cut-off grade as a strategy to improve the plant feed grade during the first three years of production. The material with grades between the marginal cut-off and the operational cut-off are stockpiled for later re-handling.
Table 16-15 shows the final production schedule and plant feed, specifying the high and low grade material for each mining year. The schedule is based on 11 Mt per year plant feed. The low grade material is defined as that between 0.13 - 0.14 g Au/t and the operating cut-off grade for the year. The table also shows the total material movement from the mine by year, which peaks at 15 Mt during commercial production. The number of benches it is possible to mine in a year in any single phase is the limit to production.
The preproduction period mines a total of 5 Mt in order to expose sufficient material to provide reliable crusher feed at the start of commercial production in Year 1 and rock for the construction of the leach pad base and ROM pad. The preproduction period is completed in approximately 12
245
| |
months. The mineralized material mined during preproduction will be stockpiled near the crusher to make up part of Year 1 plant feed.
The total mined waste considers two main destinations, the main waste storage area and the leach pad for construction:
| · | Waste requirements for leach pad construction were provided to NCL by Alquimia and amounts to 3 Mt |
| · | Mine waste storage corresponds to the difference between the total mined waste from the mine production schedule and the requirement for the leach pad construction. One waste rock storage area at the north of the pit was designed for this option. |
The mined mineralized material will be hauled to the primary crusher for direct tipping. Low grade material will be mined and hauled to a stockpile located close to the primary crusher. This material will be re-handled and will become part of the plant feed in later years. The total low grade material amounts to 8 Mt and the maximum size of the stockpile is 7 Mt.
The plant feed schedule is shown in Table 16-15. The table illustrates that Year 1 consists of material mined during preproduction and Year 1. Table 16-16 shows the plant feed by resource category
Table 16-15: Mine Schedule and Plant Feed – Option 1
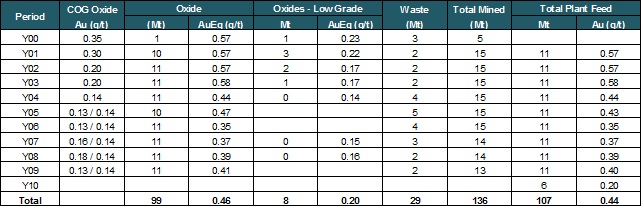
246
| |
Table 16-16: Option 1 – Plant Feed by Resource Category
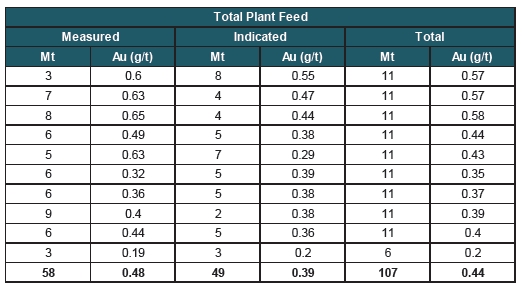
| 16.4.2 | Option 2 |
Table 16-17 shows the final production schedule on yearly basis. The schedule is based on 22 Mt per year plant feed for a heap leach operation of 60,000 tpd. According to the sulphides material distribution in depth and the established mining rate, it was only possible to obtain a reliable plant feed to the concentrator, based on 27,000 tpd from Year 6 of production.
The table also shows the total material movement from the mine by year, which peaking at 50 Mt during commercial production from Year 4. The number of benches it is possible to mine in a year in any single phase is the limit to production.
The preproduction period mines a total of 6 Mt in order to expose sufficient oxide material to provide reliable crusher feed at the start of commercial production in Year 1 and rock for the construction of the leach pad base and ROM pad. The preproduction period is completed in approximately 12 months. The mineralized material mined during preproduction will be stockpiled near the crusher to make up part of Year 1 plant feed.
The initial three years of production are focused only on the oxide phases to feed the heap leach operation. The sulphide material mined during this period is stockpiled to the north of the pit, close to the concentrator primary crusher.
Stripping for sulphides push-backs is developed during Years 4 and 5 (phases 5 and 6), with a total material movement of 23 Mt during these two years, feed commences to the concentrator in Year 6.
The total mined waste considers three main destinations, the main waste storage areas, the leach pad for construction and the tailings dam construction.
247
| |
| · | Waste requirements for leach pad construction were provided to NCL by Alquimia and amounts to 3 Mt |
| · | Waste requirement for tailings dam construction from Year 5, provided to NCL by Alquimia and amounts to 57 Mt, from Year 4 through Year 9 |
| · | Mine waste storage corresponds to the difference between the total mined waste from the mine production schedule and the requirement for construction of the leach pad and tailings dam. Two waste rock storage areas at the north and north-east of the pit were designed for this option. |
The oxide and sulphide mineralized material will be hauled to the primary crushers for direct tipping. Low grade materials will be mined and hauled to stockpiles located close to the primary crushers. This material will be re-handled and will become part of the plant feed in later years. The maximum size of the oxide stockpile is 14 Mt in Year 4 and the maximum size of the sulphide stockpile corresponds to 121 Mt in Year 14.
The plant feed schedule is shown on Table 16-17. The table illustrates that Year 1 consists of material mined during preproduction and Year 1. Table 16-19 shows the plant feed by resource category.
The heap leach is planned to operate at 60,000 tpd or 22 Mt per year, during the initial 5 year period. Due to lower quantities of oxide material within the sulphides push-backs in phases 5, 6 and 7, only 16 Mt of mineralized material is fed to the plant during Year 6. The oxide material is stockpiled from Year 7 through Year 11 and the total mined production of 17 Mt is fed to the plant during Year 11 as a single campaign. The remaining 0.3 Mt of oxide material mined during Year 12 was not sent to the plant.
The concentrator is planned to operate from Year 6 through Year 18 at a rate of 27,000 tpd. At the end Year 18 there are still 96 Mt of low grade sulphide material on the stockpile, which was not sent to the plant; there is potential to process this material if market conditions change.
248
| |
Table 16-17: Mine Schedule – Option 2
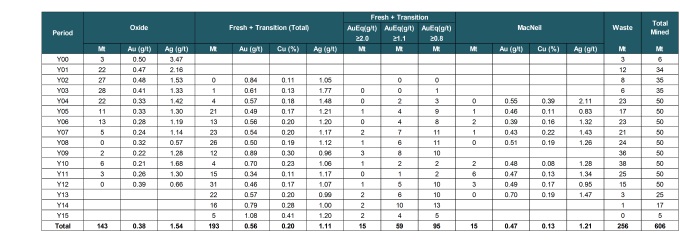
249
| |
Table 16-18: Plant Feed – Option 2
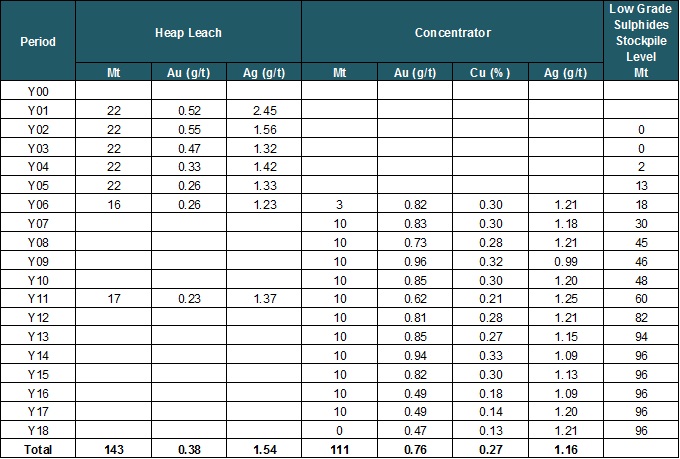
250
|
Table 16-19: Option 2 - Plant Feed by Resource Category
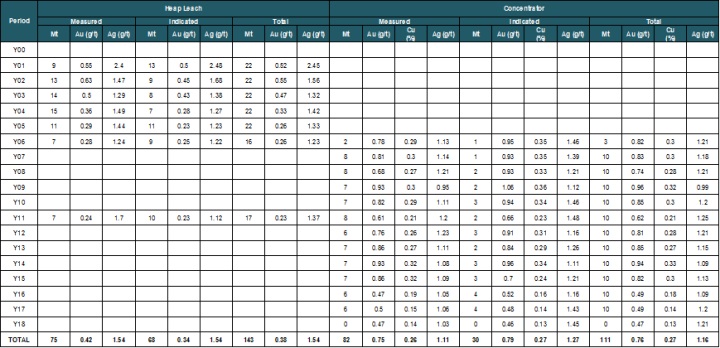
251
|
| 16.4.3 | Option 3 |
For a standalone oxides pit with a mining rate of 60,000 tpd feed to plant, the first four push-backs of Option 2 pit were considered. A mine schedule was developed on the same basis as Option 2.
Table 16-20 presents the final production schedule and plant feed, specifying the high and low grade material for each mining year. The schedule is based on 60 ktpd or 22 Mt per year plant feed. The low grade material is defined as that between 0.13 - 0.14 g Au/t and the operating cut-off grade for the year. The table also shows the total material movement from the mine by year, which peaks at 35 Mt during commercial production. The number of benches it is possible to mine in a year in any single phase is the limit to production.
Table 16-21 shows the oxides plant feed by resource category.
The preproduction period mines a total of 6 Mt in order to expose sufficient material to provide reliable crusher feed at the start of commercial production in Year 1 and rock for the construction of the leach pad base and ROM pad. The preproduction period is completed in approximately 12 months. The mineralized material mined during preproduction will be stockpiled near the crusher to make up part of Year 1 plant feed.
At the end of Year 5, 0.8 Mt of low grade oxides is left on the stockpile.
Table 16-20: Mine Schedule and Plant Feed – Option 3
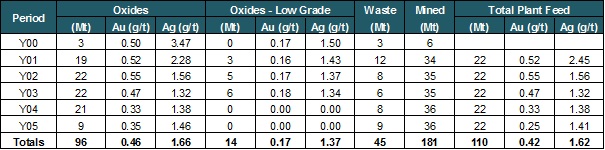
Table 16-21: Option 3 – Oxides Plant Feed by Resource Category
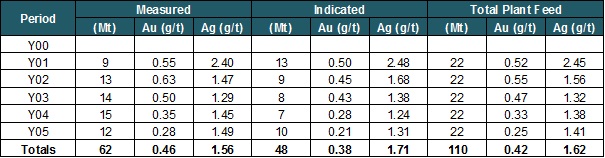
252
|
The underground mine schedule was created with the following goals in mind:
| · | Only Measured and Indicated Resources will be used for planning and reporting. Any Inferred Resource contained in the development and stopes will be treated as waste tonnage with 0.0 g/t Au grade |
| · | Initial production for open stoping would target material greater than 2.0 g/t AuEq COG in order to maximize production in the capital payback period. In later years COG’s is lowered to 1.5 g/t Au and finally to the breakeven COG in order to maintain mill throughput |
| · | The production plan is developed on a yearly basis for the mine life |
| · | The equipment requirements estimate consider that the mine will operate 360 d/y, with five days allowed for delays due to ramp maintenance, power interruptions, weather conditions and others |
| · | The plant is scheduled to operate 365 d/y. |
The following considerations have been incorporated into the mining sequence:
| · | A checker board mining sequence will be applied |
| · | The initial stope in a level has to be a primary stope |
| · | Secondary stopes are subsequently added in the sequence |
| · | Stopes of the following level in elevation will only be added in the sequence when stopes of the previous level have finished their cycle. |
Total mineralized material mine production per year is summarized in Table 16-22. It can be observed that higher mined grades are produced in the initial periods of the mine life.
253
|
Table 16-22: Mine Production Schedule – Option 3
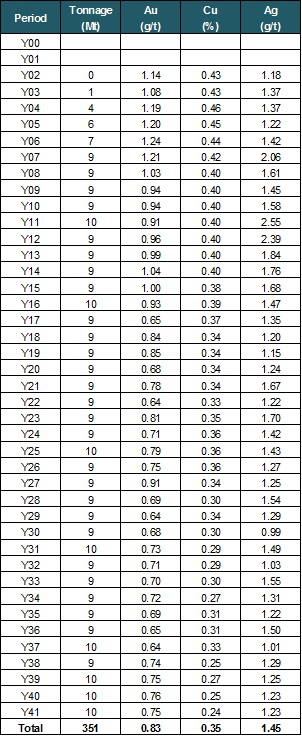
Mineralized material mined during Year 2 and Year 3 will be placed on a surface stockpile and then delivered to the process plant in Year 4 and combined with the mine production of that year. The plant feed schedule is presented in Table 16-23 and Figure 16-16.
254
|
Table 16-23: Underground Sulphides Plant Feed Schedule – Option 3
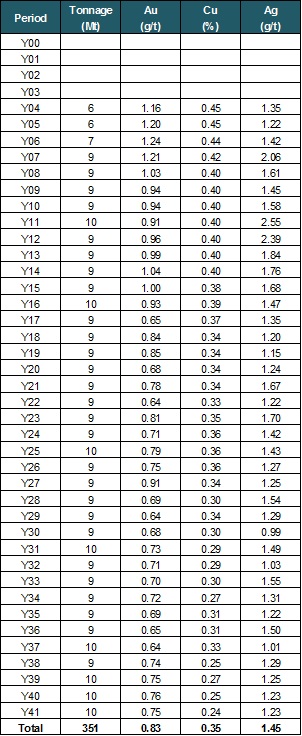
255
|
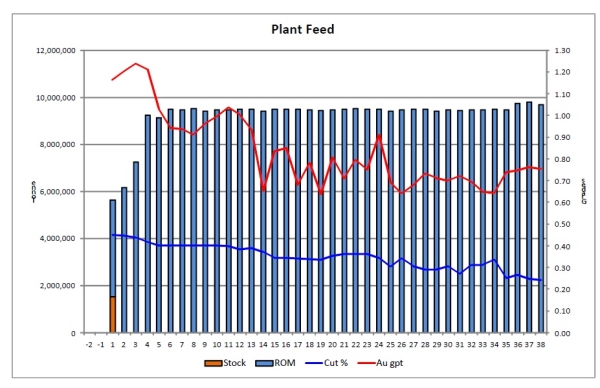
Figure 16-16: Sulphide Plant Feed Schedule
The plant feed breakdown by category is presented in Table 16-24.
256
|
Table 16-24: Underground Sulphides Plant Feed Schedule by Category – Option 3
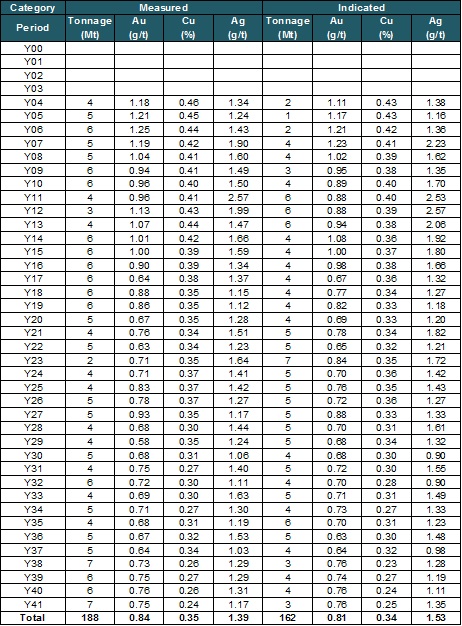
| 16.5 | Alternative Options |
Two additional options were also developed to a conceptual level:
| · | Option 4: Combined Open Pit for oxides at 60,000 tpd and sulphides at 12,000 tpd |
| · | Option 5: Underground Standalone for sulphides at 27,000 tpd. |
257
|
| 16.5.1 | Option 4 |
The same general process used for Option 2 was applied:
| · | Selection of a pit shell from the pit optimization. Pit shell 20 was selected as the final geometry for this option |
| · | Smoothing and elimination of narrow bottoms of the pit shells to obtain a non-operative final pit and mining phases |
| · | Use of same designed stockpiles and waste storage areas as Option 2 |
| · | Development of a mine schedule for 60,000 tpd of oxides and 12,000 tpd of sulphides |
| · | Pre-stripping is the same as Option 2 |
| · | Peak mining rate is 35 Mt per year. |
Table 16-25 summarizes the plant feed for Option 4.
Table 16-25: Plant Feed – Option 4
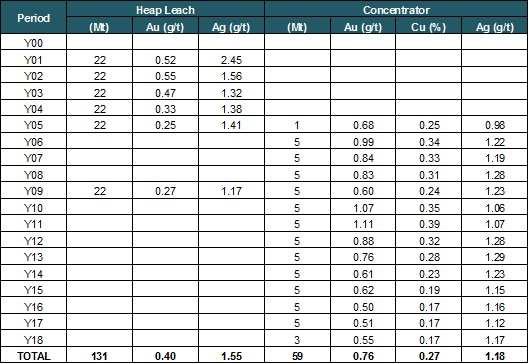
| 16.5.2 | Option 5 |
In this option, the underground portion of Option 3 was considered as a standalone option for sulphides feeding a concentrator.
258
|
Table 16-26 summarizes the plant feed for this option.
Table 16-26: Sulphides Plant Feed Schedule – Option 5

259
|
Plant feed by category is presented in Table 16-27.
Table 16-27: Underground Sulphides Plant Feed Schedule by Category – Option 5
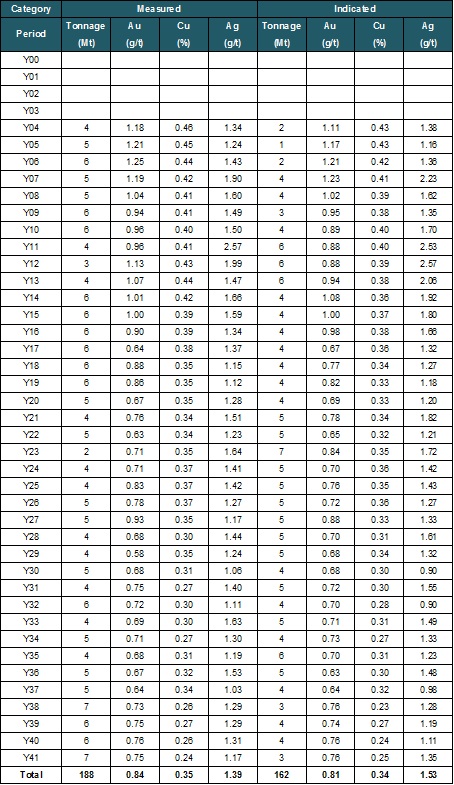
260
|
| 16.6 | Hauling Distances |
The haulage distances were calculated in the yearly plans of the pits, waste dump and stockpiles, for each mining phase and for mineralized materials and waste using NCL’s in-house developed system. The distances were divided between uphill, downhill (normally at 10% gradient) and horizontal transport as shown in Table 16-28 to Table 16-31.
261
|
Table 16-28: Hauling Distances – Option1
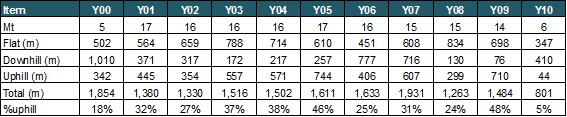
Table 16-29: Hauling Distances – Option 2
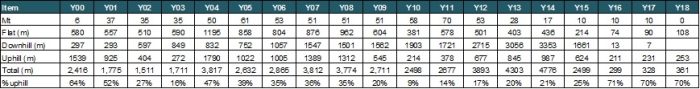
Table 16-30: Hauling Distances – Option 3
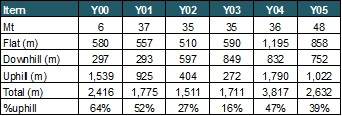
Table 16-31: Hauling Distances – Option 4
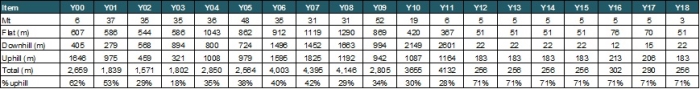
262
|
| 16.7 | Equipment Requirement |
The work schedule assumes production will operate 24 h/d, 7 d/wk, 365 d/a, it is assumed that a total of 5 days each year will be lost due to weather conditions. All personnel assigned to positions that form part of continuous operations will work a 1-week-in/1-week-out rotation. These operations and mining personnel will work two 12 hour shifts.
The entire mine fleet will be diesel operated. Equipment selected for the project is for a standard truck and front end loader mining operation using conventional drill, blast, load and haul with regular requirements for face and road maintenance.
Option 1
According to the bench height and materials movement required, equipment selected for this option is presented in Table 16-32.
Table 16-32: Equipment Selection – Option 1
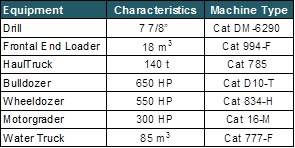
Supplier names and equipment types are provided for orientation purposes only.
To determine the number of units required for each major equipment activity, calculations were made based on estimated annual operating hours and mechanical availability. Annual operating hours varied by fleet due to associated availabilities.
Main equipment hours and number of units in the fleet were calculated using the estimated performance and the materials movement requirement per period.
Table 16-33 presents initial and the peak number of equipment units required.
263
|
Table 16-33: Main Equipment Requirement – Option 1

Option 2&3
The required total materials movement for Option 2 is 50 Mt and for Option 3 is 35 Mt, using 16 m benches for both options. Accordingly, the selected equipment is as per that presented in Table 16-34.
Table 16-34: Equipment Selection – Option 2&3

The initial and peak number of required units is presented in Table 16-35.
Table 16-35: Main Equipment Requirement – Option 2&3

264
|
Option 4
The full open pit producing 60 ktpd of oxides and 12 ktpd of sulphides utilizes similar equipment to Option 2&3. Equipment required is presented in Table 16-36.
Table 16-36: Main Equipment Requirement – Option 4
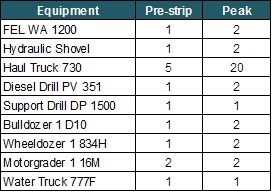
The fleet build-up required to sustain underground mining operations at the peak of development and production activities is presented in Table 16-37. It has been assumed that the main equipment fleet will be leased.
Table 16-37: Underground Main Equipment Requirement – Options 3&5

| 16.8 | Estimated Labor Requirement |
The organizational structure for the open pit will be composed by three areas reporting to the mine manager:
| · | Mine operations |
| · | Technical services |
| · | Mine maintenance |
265
|
Each of these areas will have three different personnel levels:
| · | Senior personnel and supervisors |
| · | Technicians |
| · | Operators |
In general, production manpower estimates are based on one person/shift/installed machine. Operators for haul trucks are estimated based upon operating trucks. Manpower for support and ancillary equipment are estimated based on the equipment and the use of multi-functional operators.
MARC maintenance was considered during the initial leasing period, thereafter owners’ maintenance was considered.
An allowance of 12% has been considered to cover vacations, sickness, absenteeism and training.
Under the direction of the mine operations superintendent, the underground mine operations department will be responsible for operator training and underground operation. Operations will include drilling, blasting, loading, and hauling of plant feed and waste, dump and haul ramps construction and maintenance and mine services. The number of operators is based on the annual equipment requirements and the crew’s schedule, ensuring that sufficient operators are available on each crew to operate the equipment. The number of maintenance personnel is based on the number of pieces of equipment.
Table 16-38 present initial and peak labor overhead and direct personnel for each option.
Table 16-38: Labor Requirement

266
|
| 16.9 | Geotechnical Studies |
| 16.9.1 | General |
NCL has engaged AKL to carry out a geotechnical evaluation of the designs of the pits and underground mining.
The basis for this study was the collation and analysis by AKL of the geological and geotechnical data collected during exploration operations at Caspiche.
The rock mass properties were estimated for all the geotechnical units. The results are illustrated in Table 16-39.
267
|
Table 16-39: Geomechanical Properties (Source: AKL, December, 2013)

268
|
| 16.9.2 | Preliminary Pit Geotechnical Analysis |
Pit geotechnical analysis was based in the technical report “Nota Geotécnica N°NCL 2011-01” and an updated report “Nota Geotécnica N°NCL 2013-02”.
Main conclusions of the geotechnical analysis were:
| · | Maximum slope height of 300 m |
| · | Maximum interramp height of 160 m with safety berms of 40 m |
| · | Maximum interramp slope angle of 51 degrees, except overburden material which considers 37 degrees and the B-F geotechnical unit which must use 43° |
| · | Maximum overall slope angle of 47 degrees |
| · | The bench height change from 15 to 8 m maintains the 70° face angle and the interramp slopes proposed originally. |
| 16.9.3 | Underground Geotechnical Analysis |
The underground geotechnical study focused on a stability analysis of stopes and tunnels including the stopes mining sequencing. This analysis was based in the technical report “Evaluación Geomecánica Explotación Subterránea SLS”, Noviembre 2013.
Main conclusions are:
| · | Using the Laubscher 2000 methodology, the hydraulic radius for a stope between 12 and 14 m satisfies stability conditions |
| · | For the analysis of the backfill behavior and stopes sequencing, AKL used the Phase2 software, indicating that the 300 m crown pillar is stable. However if the crown pillar is reduced to 100 m, stability may be risky |
| · | The designed 50 m sill pillars are stable |
| · | Examine3D was used to review the stopes stability. A minimum pillar of 30 m between open stopes should be established. Secondary stopes only can be mined once the primary stopes are backfilled |
| · | Stopes of the following level in elevation can only be added in the sequence, when stopes of the previous level have finished their filling cycle |
| · | Support recommendations for accesses and drifts correspond to preliminary assessment for that engineering level. |
269
|
| 17 | RECOVERY METHODS |
| 17.1 | Oxide Plant |
The process for the recovery of gold and silver from the oxide mineralized material of the Caspiche Project has been designed for two nominal throughputs, 30 ktpd and 60 ktpd, and includes the following unit operations or facilities:
| · | Crushing |
| ° | Primary classification and crushing |
| ° | Secondary classification and crushing |
| ° | Crushed material bin storage and transport from crusher section to a valley fill heap leach pad |
| · | Heap leaching |
| ° | Solution handling |
| · | Adsorption, Desorption and Recovery (ADR), electrowinning (EW) and smelting |
| ° | Adsorption |
| ° | Acid wash and Desorption |
| ° | Recovery (electrowinning and smelting) |
| ° | Carbon reactivation. |
The process route for the heap leach operation is as illustrated in Figure 17-1.
270
|
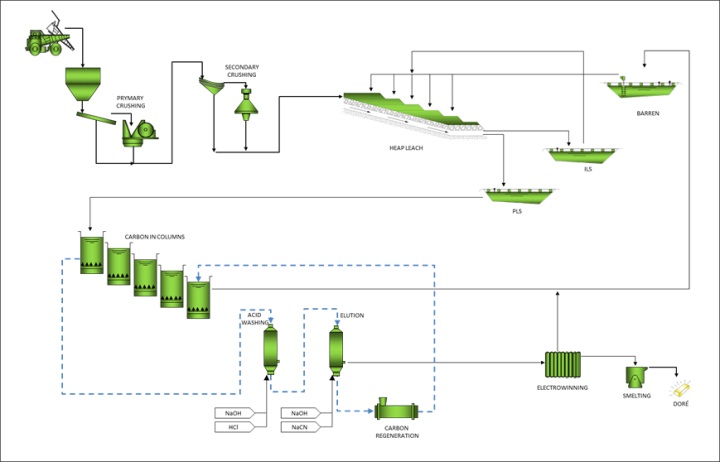
Figure 17-1: Conceptual Process Plant Flowsheet
271
|
| 17.1.1 | Process Design Basis and Design Criteria Summary |
The key process criteria used for plant design and operating costs calculations are provided in Table 17-1.
Table 17-1: Summary of Key Process Design Criteria
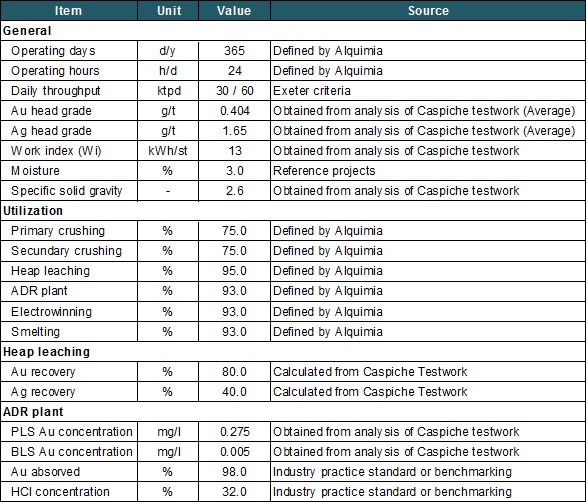
| 17.1.2 | Crushing |
Mine trucks, of 136 t of capacity for 30 ktpd option and 185 t capacity for the 60 ktpd option, discharge run of mine (ROM) material into the primary crusher dump pocket. Material is fed to the primary crusher by a vibrating grizzly feeder. This grizzly scalps off undersize material of less than 150 mm, which reports directly to the primary crusher discharge conveyor. The oversize feeds the primary jaw crusher. The primary crusher product and grizzly undersize are conveyed to a double deck banana screen. Both screens’ oversize material feed the secondary cone crusher, and the screen undersize, less than 51 mm, is conveyed with the secondary
272
|
crusher undersize to the heap leach load out bin where the material is transported by mine trucks to the heap leach pad. The crushing circuit flow diagram is as illustrated in Figure 17-2.

Figure 17-2: Crushing Flow Diagram
| 17.1.3 | Heap Leaching |
The material delivered by truck is levelled and arranged in modules of 10 m height x 90 m long and 40 m wide. The leach operation is conducted on a permanent valley fill pad. Gold and silver are recovered from the heap leach mineralization by use of a weak cyanide solution which irrigates the stacked material using drippers over a 130 day cycle. The leach process uses 2 stage leaching; fresh material is initially leached with intermediate leach solution (ILS) which contains a medium gold tenor. The fresh material is irrigated in this manner to maximize initial gold value in the pregnant solution. The ILS, once recovered from the irrigated, material reports to the pregnant leach solution (PLS) pond and from there is pumped to the carbon in column (CIC) circuit where gold is adsorbed onto activated carbon and the barren solution exiting the CIC is pumped to the barren solution tank. The barren solution is used to irrigate partially leached material and once collected from the heap leach pad it reports to the ILS pond. This circuit minimizes solution flow volumes downstream of the heap leach and also increases gold tenor in solution reporting to the CIC. The leach process flow is as illustrated in Figure 17-3.
273
|
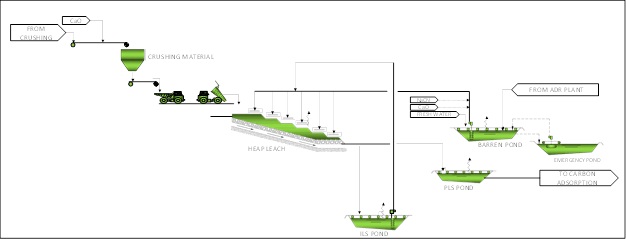
Figure 17-3: Leaching Flow Diagram
Heap Leach Pad
The heap leach pad is located 1 km west of the oxide pit at an elevation of 4,250 m.a.s.l. The mineralized material will be stacked using mine trucks of 150 t capacity. A conceptual design for the pad has been developed involving the irrigating and drainage systems as well as the liner system configuration.
Irrigation System
The irrigation system designed will evenly apply cyanide solution directly on the heap leach surface, to ensure leaching throughout the heap. For design purposes, an irrigation rate of 10 l/hr/m2 and 130 days irrigation cycle, 65 days with barren solution and 65 with intermediate solution, were considered.
The modules are arranged in cells of 90 m width. The length of each cell is defined by the geometry of each lift plan area, which also determines the number of modules per cell. The heap leach cell configuration is as presented in Figure 17-4.
274
|
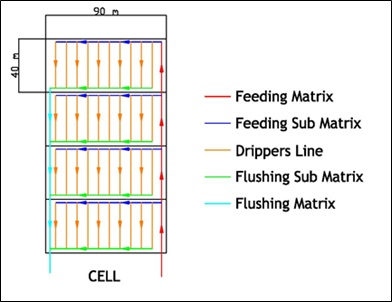
Figure 17-4: Cell Configuration
The irrigation system consists of several irrigation subsystems subdivided in modules of 90 m x 40 m. The main components of each module are:
| · | Drippers or emitters |
| · | Dripper lines |
| · | Feed sub matrix |
| · | Feed pipeline or matrix |
| · | Flushing sub matrix |
| · | Flushing pipeline or matrix. |
The spacing between the drippers and the dripper lines was calculated based on the irrigation rate set for the project and the basic criteria to ensure a uniform irrigation through the heap leach surface and depth.
For operational purposes, and based on the suppliers experience in similar projects, a square arrangement is recommended, resulting the following 0.7 m of separation between drippers and dripper lines. Figure 17-5 shows a schematic module configuration.
275
|
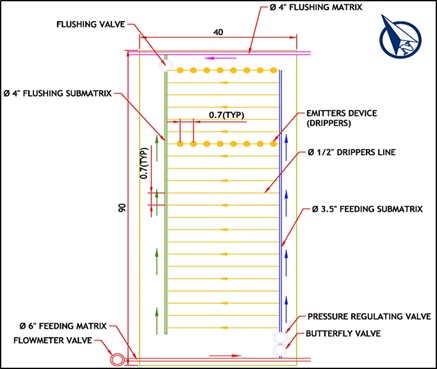
Figure 17-5: Module Configuration
Drainage System
The drainage system will consist of a network of perforated HDPE pipes, running from East to West towards the telescopic longitudinal collector pipelines placed at every 90 m. The longitudinal manifolds consist of perforated HDPE pipelines, running from northeast to southwest, transporting the flow into discharge chambers. Additionally, perimeter collector pipelines will be placed at the downstream end of each cell, and will also direct the solution flow into the discharge chambers. A plan view of the drainage system is presented in Figure 17-6.
The discharge chambers will collect the solutions from each cell. Transport of the collected solutions to the main collection pipelines will consider intermediate chambers that will work as drop boxes. The lowest chamber will have two discharge pipelines to discharge the solution, either to the PLS or the ILS main perimeter collector pipelines, located at the southwest side of the heap leach. The general cell configuration is as per Figure 17-7.
276
|
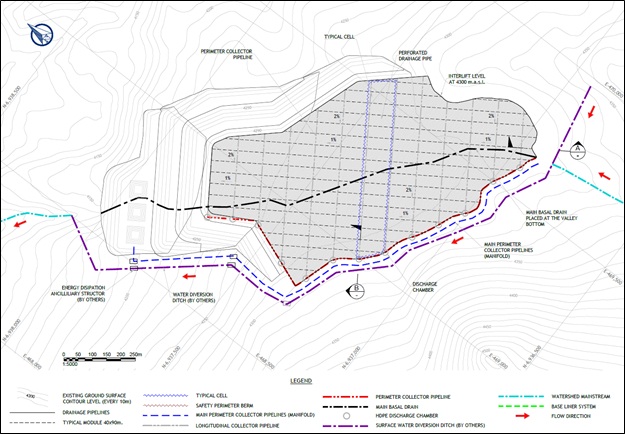
Figure 17-6: Drainage and Collection System (Plan view)
277
|
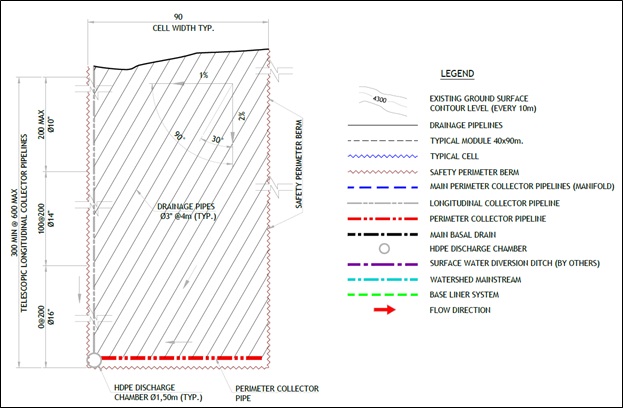
Figure 17-7: Design Summary Sketch (Typical Cell – General Plant)
Longitudinal Collector Pipelines
To optimize the drainage system design, the longitudinal collector pipelines were designed by sectors, every 200 m, from the northeast to southwest side of the heap leach, resulting in a telescopic pipeline arrangement.
A summary of the results is the following:
| · | Sector I: |
| ° | Nominal diameter | 10” (250 mm) |
| ° | Internal diameter | 234.6 mm |
| · | Sector II: |
| ° | Nominal diameter | 14” (355 mm) |
| ° | Internal diameter | 333.2 mm |
278
|
· | Sector III: |
| ° | Nominal diameter | 16” (400 mm) |
| ° | Internal diameter | 375.4 mm. |
Perimeter Collector Pipelines
Based on the geometry of the heap leach, there are some drainage pipes which cannot discharge their flows into the longitudinal collector pipelines, so, a perimeter collector pipeline per cell was considered, which collect these flows and transports them towards the discharge chambers.
Discharge Pipeline
The flows discharged to the lowest discharge chamber shall be directed to the main perimeter collector pipelines for ILS and PLS, which are located to the southwest side of the heap leach.
Liner System Configuration
Base Liner System
The leach pad base liner system, as the environmental barrier between the leach operations and existing ground, consists of the following components:
| · | 0.80 m thick overliner, consisting of granular material which provides protection to the LLDPE geomembrane liner, and simultaneously works as bedding for the drainage pipes |
| · | Primary barrier consisting of 2.0 mm thick LLDPE geomembrane liner |
| · | Secondary barrier consisting of an asphalt underliner |
| · | 0.5 m thick basal improvement. |
This is presented in Figure 17-8.
279
|
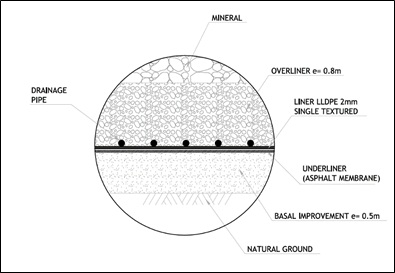
Figure 17-8: Base Liner System
Leach Pad Construction and Loading Plan
The leach pad loading plant considers that the material will be stacked from the lower to upper levels. Each platform is 10 m high and the maximum piezometric height is 100 m.
Figure 17-9 shows the construction of the leach pad at 10%, 50% and 100% fill stages. Requirement for base liner system is indicated in green. The figure also shows a section view of the leach pad arrangement.
280
|
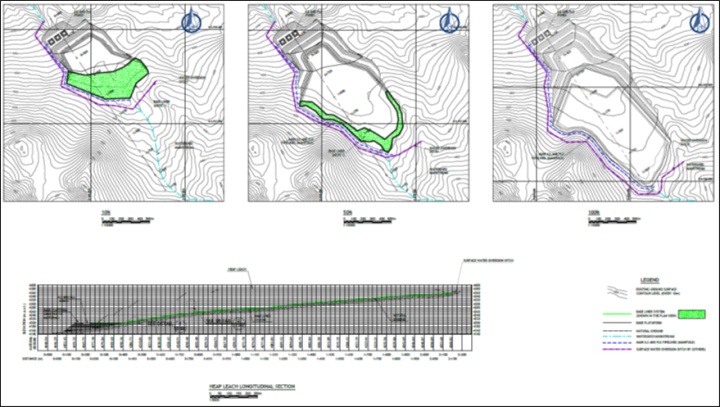
Figure 17-9: Leach Pad Construction – 10%, 50% and 100%
281
|
| 17.1.4 | ADR, EW and Smelting |
The adsorption plant consists of a counter current carbon in column (CIC) train of five columns. The carbon is pumped counter-current to the gold bearing solution and transferred to the elution area where gold and silver are removed from the carbon. The process flow diagram is illustrated in Figure 17-10.The barren solution is pumped from the last CIC column to the barren solution tank and conditioned with cyanide and lime prior to being reused as heap leach irrigation solution. The CIC circuit has a safety screen at the discharge end to ensure that no carbon is lost to the barren solution pond.
The loaded carbon is acid washed with weak, 3%, hydrochloric acid to remove fouling and other contaminants. This is completed in a glass fibre column. The acid wash solution is neutralized and pumped to the barren solution tank. Gold and silver are then removed or desorbed from carbon by elution, using a strong cyanide/caustic solution at temperatures of 135 – 140 °C in two carbon steel columns. The resultant gold and silver bearing solution is recirculated through two electrowinning cells in parallel where gold and silver precipitate out either as sludge at the bottom of the cell or on the cell cathodes. This doré sludge is filtered and then smelted producing a bullion doré as final product. The stripped strong cyanide/caustic solution is reused in the next elution to reduce reagents make up. As the solution becomes contaminated with other material part of it is purged into the barren solution tank and fresh water make up is added as required.
The stripped carbon generated from desorption is reactivated in a rotary kiln every four cycles and returned to the adsorption columns with additional fresh carbon make up as required.
General arrangements for the heap leach operation are illustrated in Figure 17-11 and Figure 17-12.
282
|

Figure 17-10: ADR Plant Flow Diagram
283
|
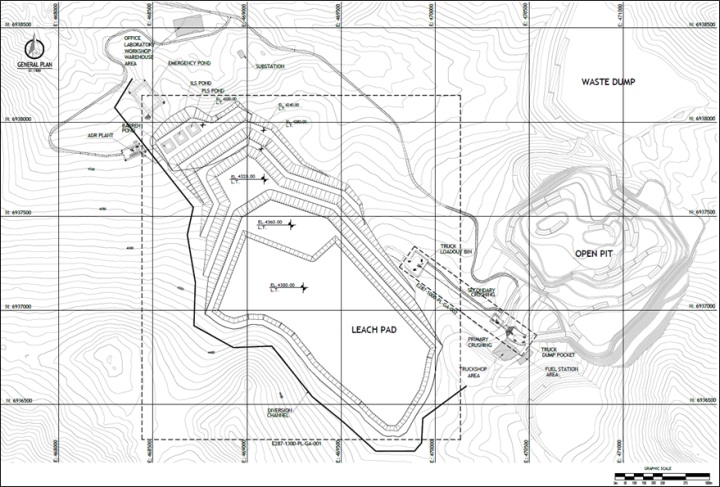
Figure 17-11: Conceptual General Arrangement
284
|
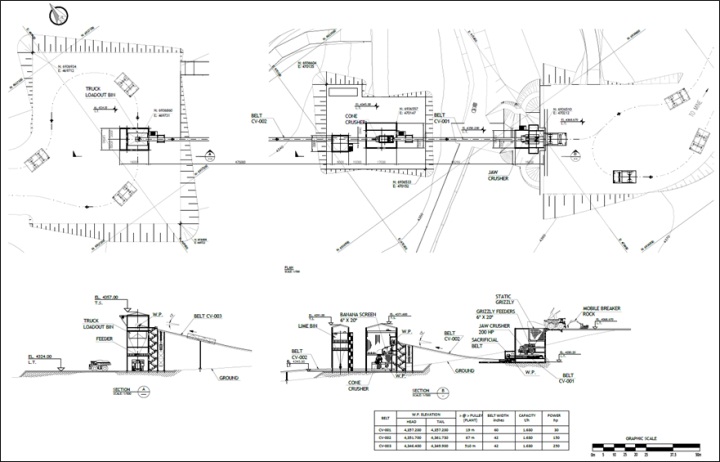
Figure 17-12: Conceptual General Arrangement – Process Plant
285
|
Table 17-2 shows the main equipment required for 30 ktpd and 60 ktpd heap leach options.
Table 17-2: Oxide Process Plant Main Equipment

| 17.2 | Sulphide Plant |
The concentrator process for treatment of the sulphide mineralised material of the Caspiche project has been designed for two nominal throughputs, 27 ktpd and 12 ktpd, considering an average head grade of 0.45% Cu and 1.3 g/t Au.
The process features the following unit operations or facilities:
| · | Crushing |
| ° | Primary crushing and coarse stock pile |
| · | Grinding |
| ° | SAG mill grinding |
| · | Flotation |
| ° | Rougher flotation |
286
|
° | Regrinding |
| ° | 1st cleaner flotation |
| ° | 2nd cleaner flotation |
| ° | 3rd cleaner flotation |
| ° | Cleaner / scavenger flotation |
| · | Concentrate handling |
| ° | Cu-Au concentrate thickening |
| ° | Cu-Au concentrate filtering |
| · | Concentrate treatment |
| · | Roasting plant – Only for 27 ktpd options |
| · | Tailings handling |
| ° | Tailings thickening |
| ° | Tailings filtering – Only for underground mining |
| ° | Backfill preparation – Only for underground mining |
| ° | Tailings Disposal |
| o | Filtered: Underground mining |
| o | Thickened: Open pit mining |
| · | Gold recovery plant |
| ° | Pyrite concentrate thickening |
| ° | CIL circuit |
| ° | Cold desorption, acid washing and hot desorption |
| ° | Electrowinning |
| ° | Smelting |
287
|
° | SART |
| ° | Carbon reactivation |
| ° | CIL tail thickening |
| ° | CIL tail filtering |
| ° | INCO. |
Figure 17-13 illustrates the general process diagram.
Due to the characteristics of the deposit mineralization, the Caspiche process incorporates a number of considerations to maximize production and to ensure a saleable product, such as:
| · | Treatment of the copper concentrates to eliminate arsenic through a reduced atmosphere roasting process |
| · | Leaching of the cleaner flotation tails to recover additional gold |
| · | Use of a SART plant to recover copper contained in the gold rich leachate and to recycle cyanide. |
288
|

Figure 17-13: Conceptual Process Plant Simplified Sketch
289
|
| 17.2.1 | Process Design Basis and Design Criteria Summary |
The key process criteria used for the plant design and operating costs calculations are provided in Table 17-3.
Table 17-3: Summary of Key Process Design Criteria
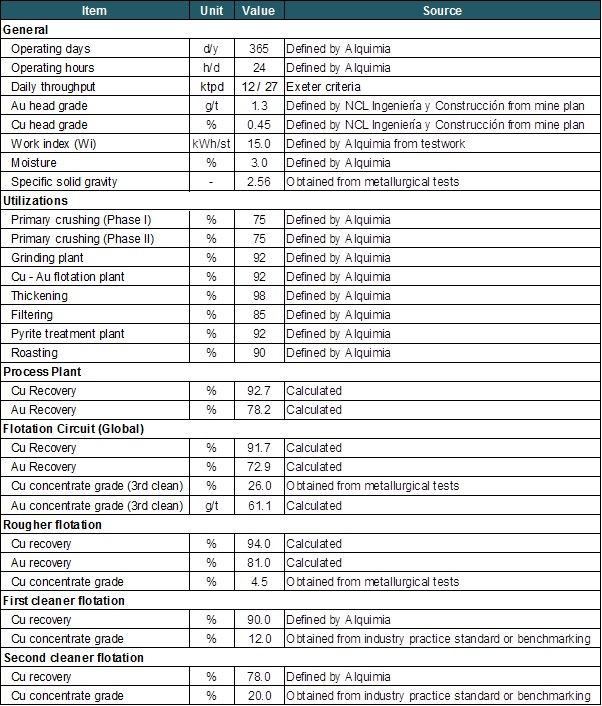
290
|
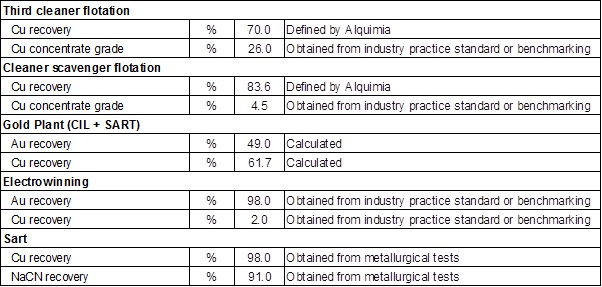
Primary Crushing
The mineralized material from the underground mine is rehandled at the mine portal and is transported from the portal to the primary crushing facility at the process plant by 150 t capacity mine trucks for the first three years. It is then discharged into the crusher dump pocket which feeds a jaw crusher. From year four to end of mine life, an in-mine sizer will partially crush mine feed which is then conveyed to the primary crusher by a conveyor running through 4,150 m long tunnel and then an overland conveyor which feeds the primary crusher in the plant area. This is illustrated in Figure 17-14. In the case of the open pit options, mineralized material is transported to the primary crusher by mine trucks.
The crusher discharges onto an apron feeder and the crushed material is then conveyed to the coarse material stockpile.

Figure 17-14: Primary Crushing Flow Diagram
291
|
Grinding
Metallurgical tests indicate a low to medium rock hardness for grinding purposes. According to these and other flotation tests, the grinding circuit is designed to deliver a P80 of 130 µm. A single SAG mill, SAC circuit, has been selected with a short trommel and a pebble screen at the discharge of the SAG mill.
The grinding circuit includes the coarse stockpile to the overflow of the cyclone cluster. The SAG mill is fed by a conveyor belt from the coarse material stockpile. The SAG mill discharge slurry passes through a vibrating double deck screen with a minimum aperture of 13 mm to remove pebbles. The screen undersize flows into a header tank which supplies the cyclone feed pump. The cyclone cluster overflow feeds the flotation circuit and the underflow returns to the SAG mill.
The vibrating screen pebbles oversize is conveyed to the pebble crusher plant and the crusher product then returned to the SAG mill. The pebble crushing plant assumes a nominal 20% pebble production rate with a maximum of 35% for design purposes. The grinding flow diagram is illustrated in Figure 17-15.

Figure 17-15: Conceptual Grinding Flow Diagram
292
|
Flotation
The flowsheet selected consists of rougher flotation, rougher concentrate regrind, three stages of cleaner flotation, and one stage of scavenger flotation and is presented in Figure 17-16. The rougher concentrate will be reground to a P80 of 30 μm to achieve adequate metal recovery. After regrinding, conventional flotation is used to enable the production of saleable grade concentrates.
The three outputs of this stage are:
| · | Cu-Au concentrate, as product of third cleaner flotation, which is sent to the concentrate handling section |
| · | Pyrite concentrate from scavenger cleaner tails, which is sent to the gold plant section and, |
| · | Tailings or rougher flotation tails, which are sent to the tailings handling section. |
The circuit has been designed in two phases, considering the quantity of equipment needed according to the mine feed to the plant. For the underground 27,000 tpd option, phase I operates from year 1 to 3 processing 20,000 tpd and Phase II operates from year 4 onward processing 27,000 tpd. For the 27,000 tpd and 12,000 tpd open pit options the plant is designed for throughput capacity from the outset.
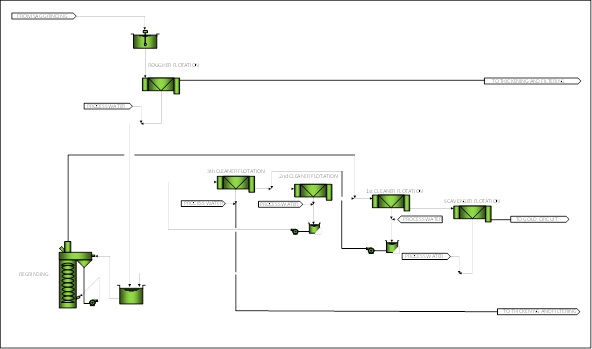
Figure 17-16: Conceptual Flotation Flow Diagram
293
|
Rougher Flotation
Rougher flotation for the 27 ktpd options are fed with pulp at 35% solids content and considers two lines of 3 conventional flotation cells each of 300 m3 for Phase I, increasing to four cells each line for Phase II. For the 12 ktpd option, rougher flotation is completed using two lines of four flotation cells of 160 m3. This provides 45 minutes residence time to maximize copper and gold recovery into the rougher concentrates. This residence time is required given the low grades of copper and gold in the feed pulp.
The rougher concentrate grade is estimated at 4.5% Cu. Copper recovery is expected to be 94% while gold recovery is expected to be 85%.
Regrind Circuit
Rougher and scavenger cleaner concentrate will report to the regrind cyclone feed pumpbox. The regrind cyclones will target a cut size P80 of 30 μm, which will be achieved with a cluster of cyclones operating in reverse closed circuit, with an estimated circulating load of 150%. The cyclone overflow will report to the first cleaner flotation, while the underflow will feed the vertical mill which discharges back to the regrind cyclone feed pumpbox.
First, Second and Third Cleaner Flotation
For the 27 ktpd option, the first cleaner stage is composed of three conventional flotation cells each of 40 m3 in Phase I, increasing to four in Phase II. The 12 ktpd option considers three flotation cells each of 30 m3. The cells are fed by the overflow from the regrind cyclone cluster and the tail of the second cleaner stage. This circuit will recover 90% of the copper resulting in a product containing 12% Cu. This product feeds the second cleaner, while the tail feeds the first scavenger stage.
For the 27 ktpd option, second and third flotation cleaning stages are arranged in-line, using four conventional flotation cells of 10 m3 and two of 5 m3 respectively for Phase I, increasing to five and three for Phase II. The 12 ktpd option uses a similar configuration using three 110 m3 and two of 5 m3 flotation cells. The first cleaner concentrate plus the third cleaner tailings feed the second cleaner stage. The second cleaner concentrate feeds countercurrent to the third cleaner flotation stage. Residence times are eight minutes for secondary cleaner and five minutes for tertiary cleaner. Secondary cleaner concentrate copper grade is estimated design criteria at 20% with 78% Cu recovery. Third cleaner concentrate - the final concentrate - contains approximately 26% Cu and 67 g/t Au.
Scavenger Cleaner Flotation
The first cleaner tailings report directly to scavenger cleaner flotation stage with three cells each of 70 m3 for Phase I, increasing to four for Phase II in the 27 ktpd option and three cells each of 50 m3 for the 12 ktpd option. In both options this provides 30 minutes retention time. The cleaner
294
|
scavenger concentrate reports to the regrind cyclone feed pumpbox, with an estimated design criteria grade of 4.5% copper. Copper recovery is estimated as 83.6%. The tails of this stage report to the gold recovery plant.
Final Cu-Au Concentrate Handling
The final Cu-Au concentrate with 19% solid and a characteristic size D80 of 30 µm, will be thickened to 60% solids in a High-Rate thickener for subsequent pumping to the filter plant. A typical thickening rate of 0.11 t/h/m2 is considered for thickener design.
Concentrates are pressure filtered and washed to obtain a solid with 8-9% moisture. A typical filtering rate of 300 kg/h/m2 was used to design the plate filter. The filtered concentrate with a design criteria copper grade of 26% and gold content of 67.4 g/t and overall recovery of 91.7% copper and 74.5% gold, is transported by trucks 140 km to the roasting plant located at a lower altitude where the concentrate is roasted in a reduced atmosphere roaster to reduce arsenic content to levels acceptable to commercial smelters.
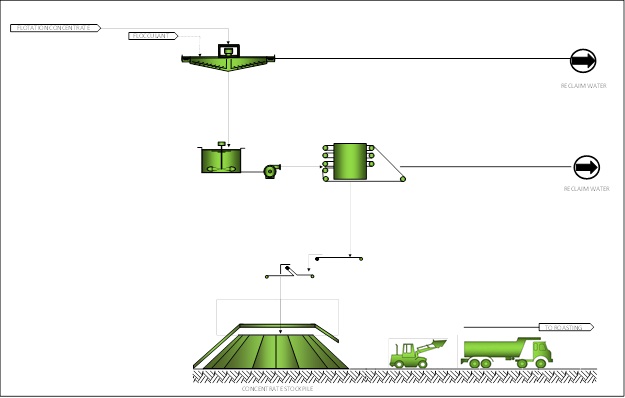
Figure 17-17: Conceptual Concentrate Handling Flow Diagram
295
|
Final Cu-Au Concentrate Treatment
The final concentrate is expected to contain an average arsenic grade of 2.5%. In order to produce commercially viable and sealable concentrate, arsenic content must be reduced to less than 0.2%. This is achieved through a partial atmosphere roaster plant, which will be located at Las Dunas, approximately 140 km from the Caspiche Project.
The roasting process is performed in a FluoSolids roaster, at around 700 °C and a controlled atmosphere to avoid the conversion of arsenic sulphides into arsenic oxides which would fix the arsenic to the copper compounds inside the roaster. Figure 17-18 illustrates the ferric arsenate precipitation process.
296
|
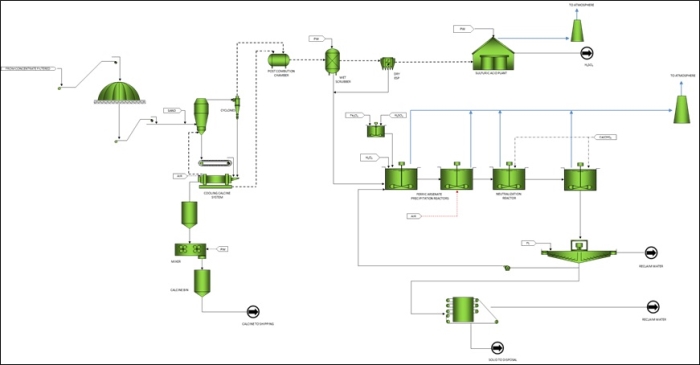
Figure 17-18: Conceptual final Cu-Au Concentrate Treatment Flow Diagram
297
|
The main product of the roasting process is a calcined copper concentrate (calcine), which in weight is approximately 90% of the original concentrate. The reduction in weight is mainly due to the elimination of the arsenic and part of the sulphur content. The calcine is then cooled down and rewetted to approximately 5%, then transported by trucks to the port.
The gases generated containing arsenic sulphides and SO2 are cooled to 370-400 °C and fed to an electrostatic precipitator (ESP). The clean gases leaving the ESP will be wet washed before reporting to the sulphuric acid plant. The arsenic trioxide generated will be precipitated and treated with lime and ferric ions to produce ferric arsenate. The ferric arsenate will be disposed of according to environmental regulations, in a lined impoundment area. The SO2 will be treated and converted to SO3 to produce 98% sulphuric acid.
Tailings Handling
The plant design considers two options for tailings handling and disposal depending on the mining method, as follows.
When the mining method is underground and thereafter paste backfill is needed tailings will be disposed filtered. When the mining method is open pit and thereafter there is no need of paste backfill the tailings will be disposed thickened.
Filtered Tailings
This tailings handling stage comprises thickening, filtering and underground mine paste backfill preparation.
The rougher flotation tailings are thickened to 55% in a High-Rate thickener, a typical thickening rate of 0.4 t/h/m2 has been considered. Tailings are pressure filtered to 20% moisture. A typical filtering rate of 350 kg/h/m2 was used to design the plate filters. After filtering, tailings can be either sent to tailings disposal or to backfill preparation. Figure 17-19 shows the filtered tailings process.
298
|

Figure 17-19: Conceptual filtered Tailings Handling Flow Diagram
Thickened Tailings
The rougher flotation tailings are thickened to around 60% in a High-Rate thickener, a typical thickening rate of 0.4 t/h/m2 has been considered, and then conducted to the tailings storage facility. Figure 17-21 shows the thickened tailings process.

Figure 17-20: Thickened Handling Flow Diagram
299
|
Gold Recovery Plant
In order to increase gold recovery, the pyrite concentrate or cleaner scavenger tail is treated in a gold recovery plant, comprised of the following stages: thickening and filtering, CIL, cold desorption, acid washing, hot desorption, electro-winning, smelting, SART and carbon reactivation, as illustrated in Figure 17-21.
300
|
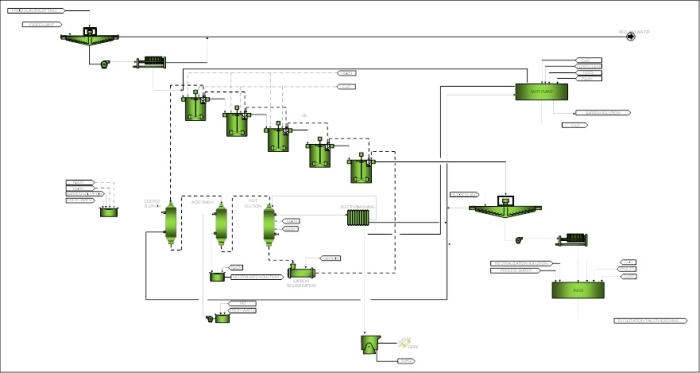
Figure 17-21: Conceptual Gold Recovery Plant Flow Diagram
301
|
Design gold recovery in the rougher concentrate has been estimated from metallurgical test work as approximately 80%. Final gold recovery will be approximately 60% of the gold head grade; this is because the rougher concentrate copper grade of around 4.5% requires a high concentration ratio in the cleaner stage to obtain a saleable final concentrate, resulting in gold being left in the cleaner scavenger tails.
Metallurgical tests indicate approximately half of the gold in the cleaner tails can be recovered by cyanide leaching; however the circuit consumes high levels of cyanide due to the copper content. A Sulphidation, Acidification, Recycling, Thickening (SART) process is included to recover the copper and regenerate the cyanide.
The SART feed solution mainly comprises of the overflow of the thickening and filtering circuit which treats the tailings of the CIL plant. This solution is mixed with sulphuric acid and sodium hydrosulphide and feeds a precipitation reactor. In this reactor, copper sulphide is precipitated at pH 5 and dissolved hydrogen cyanide is generated. The precipitation reactor discharges by gravity into the precipitation thickener. A fraction of underflow is recirculated to the precipitation reactor to increase the volume and handleability of the copper sulphide. Another fraction of underflow is neutralized with sodium hydroxide at pH 12 and is contained in a holding tank. Treated barren solution, rich in free cyanide, reports to the neutralization stage where milk of lime is added to raise the pH to approximately 10.5, the solution is then re-used in the CIL plant.
Neutralized barren solution flows by gravity to a second thickener. This thickener recirculates its underflow to thicken the gypsum contained in the solution to increase the size and handleability of the gypsum precipitate. The portion of underflow not recirculated is pumped to the filtration stage. The gypsum filter cake produced is repulped, adding fresh water in order to minimize the cyanide content, and is then pumped to a stand-alone tailing pond. The overflow from the gypsum thickener is the treated final solution, which is recycled to the carbon in leach process.
Table 17-4 shows the main equipment required for 27 ktpd and 12 ktpd options.
302
|
Table 17-4: Sulphide Process Plant Main Equipment

303
|
| 18 | PROJECT INFRASTRUCTURE |
The Caspiche project treats both gold rich oxide and copper and gold rich sulphide mineralization as described in Items 13 and 17. The oxide mineral will be treated by heap leaching and a CIC-ADR plant. The sulphides will be processed through a copper concentrator plant and roaster with a small CIL plant to recover gold from the scavenger flotation tailings.
Three primary options were developed for this Report, as follows:
| · | Option 1: 30 ktpd open pit mine for gold and silver oxide mineralization treated by heap leaching |
| · | Option 2: 60 ktpd open pit mine for gold and silver oxide mineralization treated by heap leaching and 27 ktpd open pit mine for gold and copper sulphide mineralization treated in a conventional concentrator plant |
| · | Option 3: 60 ktpd open pit mine for gold and silver oxide mineralization treated by heap leaching and 27 ktpd underground mine for gold and copper sulphide mineralization treated in a conventional concentrator plant. |
In addition 2 further secondary options were also considered; these being
| · | Option 4: 60 ktpd open pit mine for gold and silver oxide mineralization treated by heap leaching and 12 ktpd open pit mine for gold and copper sulphide mineralization treated in a conventional concentrator plant |
| · | Option 5: 27 ktpd underground mine for gold and copper sulphide mineralization treated in a conventional concentrator plant. |
In tabular format this is illustrated as follows:
Table 18-1: Options Summary
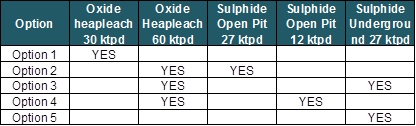
304
|
Overall project infrastructure is shown in Figure 18-1.
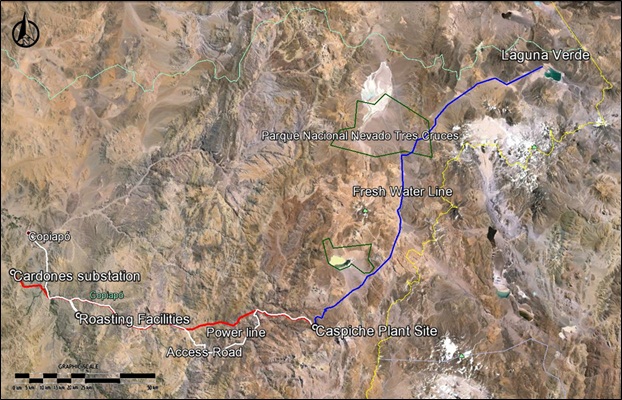
Figure 18-1: Map Plant Area
Overall layout for each option is shown in Figure 18-2 to Figure 18-6.
305
|

Figure 18-2: Project Plot Plan – Option 1
306
|
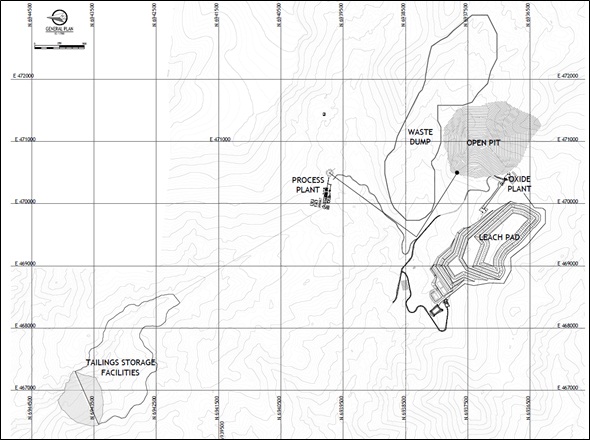
Figure 18-3: Project Plot Plan – Option 2
307
|
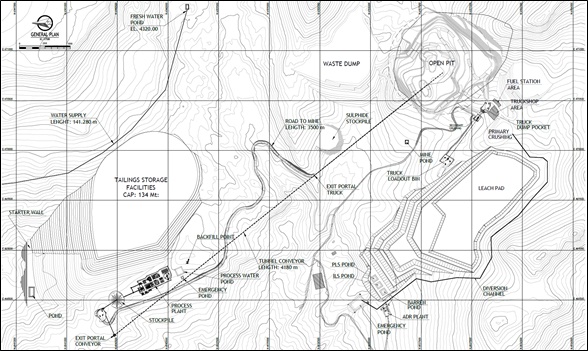
Figure 18-4: Project Plot Plan – Option 3

Figure 18-5: Project Plot Plan – Option 4
308
|
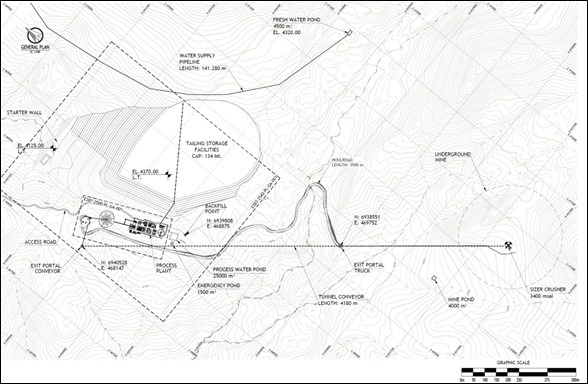
Figure 18-6: Project Plot Plan – Option 5
| 18.1 | Power Supply |
| 18.1.1 | Site Generation |
Where considered, the project will be powered by a diesel generation plant, located in the process plant, composed of four generators each of 2,000 kW.
Power will be distributed to the plant at 13.8 kV from the main substation via two transformers of 6,500 kW in 4.16/13.8 kV configuration and through overhead lines and duct banks to the secondary substations.
| 18.1.2 | Power Line from Cardones Substation |
For those options applicable, electrical power will be drawn from the national grid power (Sistema Interconectado Central, SIC) through a 110 kV overhead line from the Cardones electrical substation, located some 20 km south of Copiapó and 123 km from the Caspiche Project main substation. At kilometer 30, a 5 km spur line is considered to supply the roasting plant at Las Dunas.
309
|
Power will be distributed to the plant in medium voltage from the GIS 23 kV switchgear located in the project main substation through overhead lines and duct banks to the secondary substations. The substation electrical rooms will distribute energy to the plant equipment in medium voltage (4.16 kV) and low voltage (400 V).
Figure 18-7 illustrates the proposed power line route from the Cardones substation to the Project.
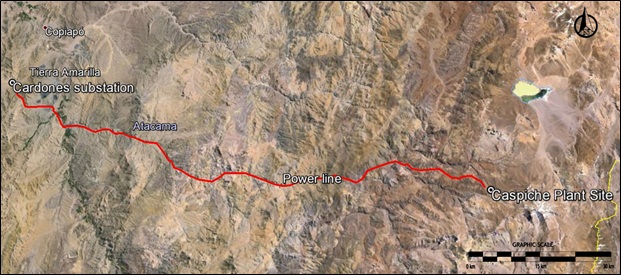
Figure 18-7: Cardones Power Line
| 18.1.3 | Power Line from Maricunga Substation |
Electrical power for those applicable options will be drawn from the national grid power (Sistema Interconectado Central, SIC) through a 110 kV overhead line from the Maricunga electrical substation, located some 13 km north of the Caspiche Project main substation.
Power will be distributed to the plant in medium voltage from the GIS 23 kV switchgear located in the project main substation through overhead lines and duct banks to the secondary substations. The substation electrical rooms will distribute energy to the plant equipment in medium voltage (4.16 kV) and low voltage (400 V).
| 18.1.4 | Power Supply by Option |
The power supply considered for each option is as follows:
| · | Option 1: On Site Power Generation |
| · | Option 2: Power line from Maricunga substation for the Oxide plant and power line from Cardones substation for the Sulphide plant |
310
|
| · | Option 3: Power line from Maricunga substation for the Oxide plant and power line from Cardones substation for the Sulphide plant |
| · | Option 4: Power line from Maricunga substation for the Oxide and Sulphide plant |
| · | Option 5: Power line from Cardones substation. |
| 18.2 | Tailings Handling |
| 18.2.1 | Filtered Tailings |
Tailings from the rougher and scavenger flotation report to a high-density thickener of 60 metre diameter, where tailings are thickened to 55% solids. Thickened tailings are pumped to two holding tanks which feed four plate filters of 992 m2 where tailings are further dewatered to produce a pulp with 80% solids.
After filtering, the tailings will be transported by a reversible belt conveyor, this conveyor can convey the filtered tailings either to the backfill plant, where it will be mixed with cement and water and then pumped underground, or to a transfer conveyor that feeds the tripper-stacking system of the tailings storage facility (TSF). Figure 18-8 illustrates the tailings handling facility layout.
The tailings storage facility is located adjacent to the process plant at 4,250 m.a.s.l. This location avoids areas of natural vegetation and where possible, areas recognised as belonging to the local indigenous Colla communities.
Filtered tailings will be conveyed by a tripper-stacking conveyor system, fed by a 150 metre long transfer conveyor.
The starter wall will be constructed with waste material from the oxide pit or from locally available rock.
311
|
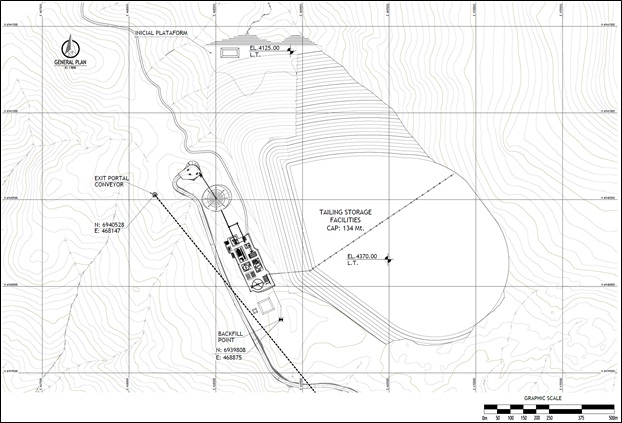
Figure 18-8: Filtered Tailings Handling Faclities
| 18.2.2 | Thickened Tailings |
Tailings from the rougher and scavenger flotation report to a high-density thickener of 60 metre diameter, where tailings are thickened to 60% solids and then conducted to the tailings storage facility (TSF).
TSF is located adjacent to the process plant at 4,250 m.a.s.l. This location avoids areas of natural vegetation and where possible, areas recognised as belonging to the local indigenous Colla communities.
The TSF wall will be constructed with waste material from the pit or from locally available rock.
| 18.2.3 | Tailings Handling by Option |
The tailings handling technology and specifications for each option are as follows:
| · | Option 1: No tailings |
312
| |
· | Option 2: Thickened tailings. Facility designed for 110 Mt of storage capacity. For the construction of the wall 34,000,000 m3 of waste material will be needed during the life of the project. The upstream and downstream faces are constructed with a 2:1 (H:V) slope |
| · | Option 3: Filtered tailings. Facility designed for 134 Mt of storage capacity. The starter wall will need 680,000 m3 of waste material |
| · | Option 4: Thickened tailings. Facility designed for 60 Mt of storage capacity. For the construction of the wall 20,000,000 m3 of waste material will be needed during the life of project. The upstream and downstream faces are constructed with a 2:1 (H:V) slope |
| · | Option 5: Filtered tailings. Facility designed for 134 Mt of storage capacity. The starter wall will need 680,000 m3 of waste material and locally available rock. |
| 18.3 | Roads |
| 18.3.1 | Access Road |
The project site is accessible from Copiapó, following existing roads which lead to Minera Maricunga. A new road of approximately 8 kilometers will be constructed from the existing road to the project site to allow construction and capital equipment and ongoing operations supplies to be safely delivered. This road will be 9 metres wide and designed to meet Chilean regulations.
Figure 18-9 illustrates the existing and proposed road extension to the Project.
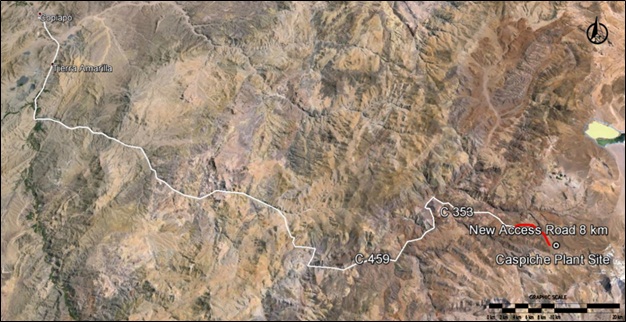
Figure 18-9: Access Road
313
|
| 18.3.2 | On-site Roads |
On-site roads for each Option are shown in Table 18-2.
Table 18-2: On-Site Roads
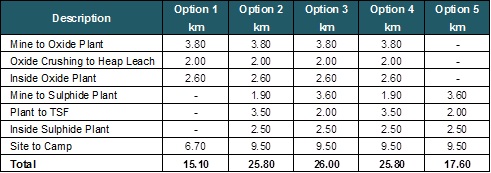
| 18.4 | Fresh Water Supply |
The required water make up will be supplied from Peñas Blancas in the Laguna Verde area through a 140 km long pipeline. Figure 18-10 presents the proposed pipeline route from Peñas Blancas to the Project.

Figure 18-10: Fresh Water Pipeline
314
|
The fresh water pumping system consists of two pump stations each with one operating pump and one stand by. Make up water requirements, material take off and pump characteristics for each option are shown in Table 18-3
Table 18-3: Fresh Water Requirements
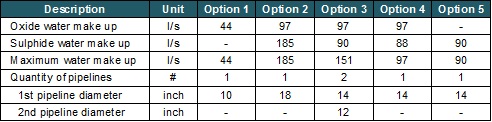
Electrical power for the water pump system will be generated with a diesel generation plant consisting of two generators each of 350 kW. In the case of the combined options, consideration has been made for additional pumping capacity by means of additional pumps and generators.
| 18.5 | Port Facilities |
For options 2, 3, 4 and 5, concentrate trucks will be loaded at the roasting facilities and then will deliver concentrate to the selected port location. Exeter is discussing alternatives with port operators in order to secure the best option for concentrate shipment.
| 18.6 | Operations Camp |
The camp will be a typical prefabricated modular structure, located 5 km from the concentrate plant. The size of the camp considers capacity for third party contractors that, according to xperience from other projects, may add 30% to 40% more people to the owners direct hire personnel. Operations camp will have the following capacities for each Project:
| · | Option 1: 210 people |
| · | Option 2: 600 people |
| · | Option 3: 770 People |
| · | Option 4: 560 people |
| · | Option 5: 700 people |
315
|
| 18.7 | Ancillary Site Buildings and Facilities |
Various ancillary facilities will be located near the process plant. The buildings and facilities include the following:
| · | Administration building |
| · | Assay and metallurgical laboratory facilities |
| · | First aid or clinic building |
| · | Gatehouse at the entrance to site |
| · | Concentrator warehouse and an attached workshop building |
| · | Potable water system |
| · | Sewage treatment plant. |
Mine ancillary facilities will be located near the primary crusher. These facilities include:
| · | Warehouse with offices |
| · | Heavy vehicle workshop |
| · | Tire shop |
| · | Maintenance and welding shop |
| · | Truck wash bay |
| · | Fuel storage depot |
| · | Effluent treatment facility |
| · | Mine explosives storage facility. |
All facilities and buildings have been sized and located for each project. Technical details will be developed during the next phases of project development.
316
|
| 19 | MARKET STUDIES AND CONTRACTS |
| 19.1 | Introduction and Scope |
Selmar International Services Ltda (“Selmar”) was commissioned by Alquimia Conceptos S.A. (“Alquimia”) on behalf of, Exeter Resource Corporation (“Exeter”) to provide input for marketing assumptions for a Preliminary Economic Assessment (“PEA”) of the Caspiche Project in northern Chile (“Project”).
In undertaking this commission, Selmar, based in Santiago, worked with its associate in Vancouver, Canada, Neil S. Seldon & Associates Ltd (“NSA”). Selmar and its associates around the world provide consulting advisory services and research focusing on the commercial aspects relative to mining and base and precious metal marketing, transportation and distribution, feasibility market studies, marketing audits, strategies, policy and price risk management.
In preparing this Report, Selmar has used the services of Alfonso Gonzalez of INCOMARE (International Copper Market Research), as a sub-consultant. Alfonso Gonzalez is based in Santiago, Chile and provides consulting services with respect to market statistics for the copper industry on a subscription basis to private clients. Where applicable in this Report, certain tables and charts are attributed to Alfonso Gonzalez.
For the marketing assessment for the Caspiche project, assumptions are based on metallurgical data and concentrates grades provided by Alquimia to Selmar with respect to the flotation copper concentrates, doré metal, copper cathodes and calcine copper concentrate characteristics from the proposed roasting facility. Selmar’s commentary and outlook on concentrate marketability and related smelter charges, including treatment, refining, penalty details, payment timing, metal accountability, and other contract terms, are based on Selmar’s market knowledge and use of data available in the public domain.
Selmar has not contacted any smelters specifically to discuss the marketability of the Caspiche calcine concentrates. As the project progresses through the next phase of the prefeasibility study, it is recommended that contact be made with smelters to discuss the acceptability of the proposed calcine concentrates from the Caspiche project and associated treatment and refining charges.
Given the time frame available the report focusses on “high level” key points and is intended as a general overall review and assessment and does not constitute a detailed market study. The marketing assumptions are at a level applicable for a PEA.
The Qualified Person responsible for the review of this Market Studies and Contracts has confirmed that the analyses and results in the Selmar Report support the assumptions of this Report.
317
|
19.2 | Refined Copper Market Review |
Any review of the current market for copper cathodes, needs to take into account not only the actual market for physical metal, but also the general market background for supply and demand of copper and price expectation. This decade began with the market moving from an extended period of relatively stable prices to a period where demand particularly from China resulted in prices moving sharply up. In any analysis of the commodity market and copper is no exception, changes in the macro economic and political situations have a major effect on long-term projections. Such factors often result in delays to projects which are not yet committed or even those in the probable development stage and in some extreme cases where early construction has already started.
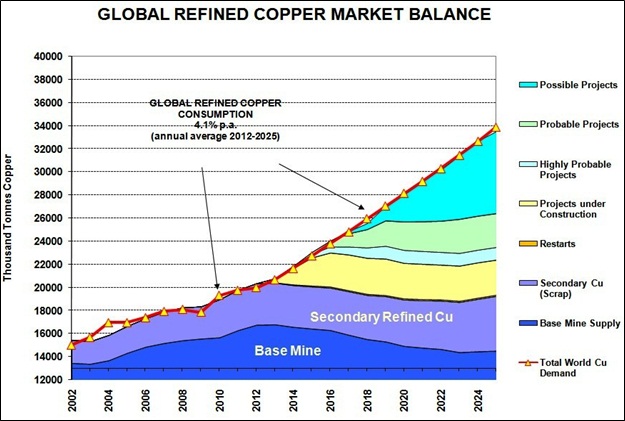
Figure 19-1: Global Refined Copper Market Balance (Source: Alfonso Gonzalez ©, 2013)
Figure 19-1 illustrates future market trend projections. The production of newly-mined copper is expected to increase from just over 17.0 million tonnes in 2013 to nearly 31.0 million tonnes by 202526 assuming all current projects in the pipeline advance on time together with additional
318
|
production expectation not currently in the pipeline. SX/EW electrowon copper cathode production of approximately 4 million tonnes in 2013 is expected to increase to around 4.7 million tonnes per year by 2019 and then remain relatively constant through 2025. Secondary refined copper (scrap and recycling) supply at approximately 3.7 million tonnes in 2013 will become more critical going forward in helping bridge the mine supply gap.
There has always been a delay between the discovery of an potentially viable deposit and production. Over the last 20 years this time horizon between discovery and production has extended. Understandably, more attention is taken of environmental and social economic issues and today is quite common for 8 to 10 years to elapse between discovery and production.
During 2013, several major projects were put on hold as a result of a number of factors including high capital costs, increasing operation costs to some extent linked to “Resource nationalism” and other social issues and the fall in the market capital value of many of the major mining houses. There has also been a dramatic fall in financing for the junior mining sector, which has been a key factor in the exploration success in many countries.
Global refined copper consumption at approximately 20 million tonnes in 2013 is expected to increase to nearly 34.0 million tonnes by 2025. This would be equivalent to an average growth rate of 4.1% per annum. In the longer run, despite the current economic slowdown in most parts of the world, strong copper demand growth prospects are based on the expected resource intensive use in economies such as China, India and other developing countries, associated with investment in power distribution networks and other infrastructure development.
Assuming that demand growth follows this trend, the projections imply that demand for copper, iron and aluminum could double or even treble over the next 25 years. A recent study by the Development Research Center under China’s State Council concluded that China’s industrialization stage will last into the 2020’s with potential GDP growth estimated to be in the 7 to 9 percent range.
China today consumes about 41% of the world’s refined copper and it is expected to continue to grow and may rise to 52% by 202527 given its huge infrastructure development programs. Today there is some concern about the slowdown of China’s growth rate. Despite the economic uncertainty, which could well lead to some slowing of copper consumption growth in the short term, there are good reasons to believe that growth in copper consumption will continue to be very positive.
27 Sourced from a variety of documents and copper industry Analyst reports
319
|
19.3 | Outlook for the Copper Price |
Recent reviews of copper price forecasts indicate an expectation of a long-term price range from $2.50 to $3.50 per pound in constant 2014 dollars. Over the last few months, many analysts from banks and other institutions and organizations have decreased their near-term price forecasts, but, despite the current uncertainty, the majority view is for copper prices to remain in dollars of the day around this level for the next two or three years.
In this respect, Table 19-1 presents a compilation of Research Analysts Metal Prices expectations for the copper price. This supports the Selmar view that the price in the near term will remain above longer term constant dollar forecasts with an average consensus price of $3.00 per pound.
Table 19-1: Analysts’ Consensus for Copper Price 2012 – 2017 and Long Term (Source: Scotiabank)

Putting all into perspective, it is difficult to forecast a single constant dollar price from today going forward. It is expected that over the next two years supply growth will cause prices to move down from current levels towards an expected long term level of $6,600 per tonne ($3.00 per pound) in constant dollars.
320
|
| 19.4 | Copper Concentrates 10 – 15 year Outlook |
Total World concentrate production is predicted to rise from about 13.3 million tonnes copper contained in 2012 to nearly 25.3 million tonnes in 202528 assuming all current projects develop on time. Concentrates supplies are expected to increase particularly between 2013-2018 as a result of new projects now in the advanced feasibility and development stage and announced expansions of operational mines. A striking feature of the growth in concentrates supply is that it will be narrowly based. The bulk of the prospective expansion over the next decade will come from just ten producers:
| · | Rio Tinto’s Oyu Tolgoi project in Mongolia (over 380 kt copper per year when Phase II expansion is completed in 2017) |
| · | Codelco Norte expansion in Chile including MMH(additional 240 ktpy) |
| · | Freeport’s Cerro Verde mine in Peru (over 250 ktpy extra production) |
| · | Xstrata/Anglo’s Collahuasi expansion (170 ktpy increase) |
| · | Grasberg expansion (over 180 ktpy extra production) |
| · | Xstrata’s Las Bambas project in Peru (340 ktpy) |
| · | Chinalco’s Toromocho project in Peru (over 290 ktpy) |
| · | Sentinel’s Trident project in Zambia (over 280 ktpy) |
| · | Konkkola Deep in Zambia (175 ktpy) and |
| · | Southern Copper’s Buena Vista (ex-Cananea) in México in 2016 (170 ktpy) |
Other important new producers are: PPC’s Caserones and KGHM’s Sierra Gorda in Chile; Vale’s Salobo expansion in Brazil; Nevsun’s Bisha mine in Eritrea; Lumina Copper’s Galeno and Anglo American’s Quellaveco projects both in Peru.
Figure 19-2 illustrates these significant annual increases in concentrate relative to overall mine production over the period to 2025 on a year-on-year basis.
321
|
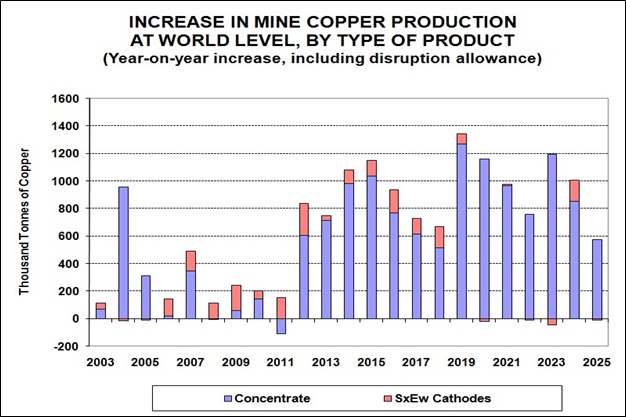
Figure 19-2: Increase in Mine Copper Production at World level (Source: Alfonso Gonzalez ©)
It should be noted that approximately 90% of the expected increased mine production during the period 2013 – 2025 will be in the form of concentrates.
| 19.5 | Concentrate Production Outpaces Smelter Capacity Growth |
A significant portion of World copper concentrates is processed by integrated smelters, captive plants which are vertically integrated with mines through ownership. However, an increasing annual volume of World copper concentrates is treated by custom smelters, which are generally not integrated, although there is in many cases, smelter investment ownership in mines. Custom smelters have increased their overall smelting market share from 30% in 1980 to about 50% today.
Over the last decade there has been a significant expansion of smelting and refining capacity, particularly in India and China. The Chinese smelting industry has increased imports as limited domestic mine capacity has not met demand and this trend has been a key determinant in world supply/demand concentrate balances.
Chinese copper concentrate smelting capacity at 3.6 million tonnes of contained copper in 2012 represented 26% of global smelting capacity with growth showing no sign of abating. In fact, more than fifty percent of global custom smelting capacity is expected to be in China by the early
322
|
part of next decade29. Chinese government policies, including tariffs on refined copper imports, preferential treatment for investments and VAT tax breaks for smelters and refineries are largely responsible for the private sector boom in smelter capacity. This dominant position in the custom smelting sector implies that in a well-supplied market the smelters will be able to secure higher Treatment and Refining charges (TC’s & RC’s). This is already apparent as recent negotiations have resulted in TC’s and RC’s increasing by up to 40% over those negotiated twelve months ago.
Imbalances between concentrate supply and demand are not unusual and are heavily influenced by different lead times to construct mines outside China and build smelters in China. The latter can be brought on line in three to four years, much sooner than mine development time. However, the development time-line for smelter construction in China will increase as planning and other regulations become more sophisticated.
The balance of the supply and demand of concentrates is set by the level of concentrate output of the mining industry and by the availability of processing capacity across the smelting industry. The availability of custom concentrates, relative to smelting capacity should, in theory, be the ultimate determinant of terms for custom treatment of concentrates.
It is relevant that the governments of many countries around the world are seeking to upgrade various mine products, including copper, in order to add value. Such countries include Indonesia, Zambia, DRC, and Saudi Arabia. Looking forward, this could have a material effect on further development of custom smelting capacity as well as supplies to existing custom smelters.
| 19.6 | Treatment and Refining Charges and other Commercial Terms |
The copper concentrate market has seen significant structural imbalances between mine production and smelting capacities and by the middle years of this decade, if all new project and expansion plans are met, there will be a surplus of concentrates which could last for several years. Increasing treatment charges will also result from increased smelter costs and China is already moving towards achieving more economic smelter terms.
Table 19-2 and Table 19-3 put into perspective the variation in treatment charges (“TC”) and copper refining charges (“RC”) terms over 2007 to 2013.
29 Various copper industry Analyst reports.
323
|
Table 19-2: TC/RC’s Benchmark TermS
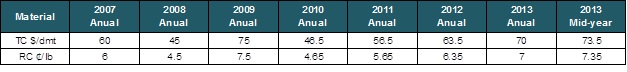
Annual benchmark terms are not published, but are reported in various publications and are not finite. They represent a consensus of the likely average base numbers negotiated by the major players in Asia. One should bear in mind the TC/RC (and historically price participation “PP”, not recently applicable, although may well apply again in the future) are the head-line terms, but other terms may well be negotiated and applied, affecting the TC/RC level.30
Table 19-3: TC/RC’s Spot Terms
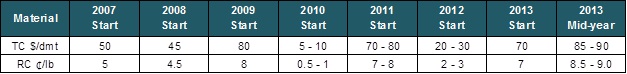
The spot terms in Table 19-3 generally represent the levels at which traders buy from mines as opposed to the sales by traders to smelters.
Current year-end negotiations for 2014 benchmarks are taking place in a high spot treatment charges environment. It is interesting that 2013 as a whole has been a year in which maintenance shutdowns of custom smelters around the world have been at a higher level than seen in recent years of reducing demand for concentrates. Benchmark charges are expected to rise from current 73 & 7.3 settlement negotiated by BHP Billiton for their mid-year annual negotiations, to 85-90 & 8.5-9.0 range in 2014, more likely towards the upper part of the range.
The general consensus is that increased concentrate production is going to move the level of treatment charges up over the next 2 to 3 years. In China, the government has announced closure of some older smelter capacity which may cause a capacity bottleneck short term.
In looking forward one must expect that treatment charges will need to move towards a level that is long-term economically viable for the smelting industry. There is no doubt that smelter costs are rising and this is very evident in China. Over the last decade the Chinese share of the traded custom concentrate market has increased dramatically and as such Chinese share of smelter capacity increases, it is inevitable that China will seek higher charges.
30 Selmar assumptions
324
|
Some market analysts believe that TC/RCs for the period 2015-2018 could reach around 110 & 11, and then dip a little as more smelting capacity comes on stream and then return to high levels by the end of the decade. Forecasts for benchmark TC/RC’s for the next 5 years are shown in Table 19-4.
Table 19-4: Outlook for Annual Contract Concentrates TC/RC’s
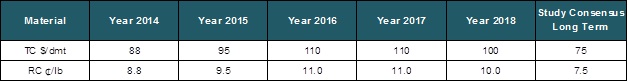
Assuming that most of the increase in future smelting capacity will be installed in China, by 2021 China will be importing more than 60% of the internationally traded copper concentrate, this projection is forecast in Figure 19-3. Under these conditions, Chinese smelting companies will be able to negotiate TC/RCs at the levels listed in Table 19-3, or higher.

Figure 19-3: Copper Concentrates Top Importers (Source: Alfonso Gonzalez ©)
In looking at levels of charges, as a general statement, where the grades of concentrates are somewhat similar but there is a significant difference in deleterious elements, one would expect that the overall difference in charges will be reflected in the penalty structure and payment terms.
325
|
Selmar suggests that without face-to-face discussions with smelters regarding the Caspiche calcine concentrate, a reasonable assumption is to utilize the long-term treatment and refining charges and to apply penalties at the lower end of the trigger points and the higher-end of the dollar penalty amounts used in applied.
The long-term commercial terms assumptions are recommended for the PEA evaluation of Caspiche calcine concentrates are presented in Table 19-5.
Table 19-5: Concentrates – Commercial Terms Assumptions
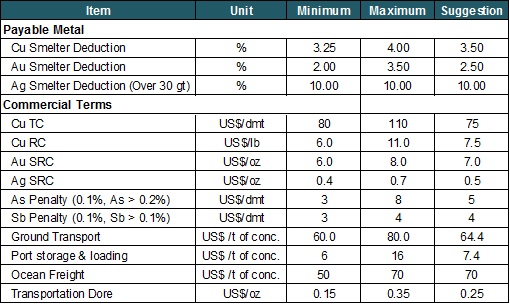
(*) It should be noted that delivery of concentrates is on the basis CIFFO (Cost, Insurance and Freight, Free Out) smelter ports. Therefore the mine must bear with the costs of delivering the concentrates to the receiving smelter's port, while the buyer is responsible for unloading the cargo and the cost thereof.
For purposes of calculating transportation costs, wet metric tonnes of concentrate were converted to dry metric tonnes assuming the concentrates contain 8% moisture.
| 19.7 | Caspiche Concentrates Marketability |
Alquimia has provided certain details relative to the expected annual productions and concentrate assays for both the unroasted flotation copper concentrate and for the calcined concentrates after partial roasting as shown in Table 19-6.
326
|
Table 19-6: Caspiche Concentrates Expected Annual Production

Selmar is of the opinion that the arsenic content in the flotation concentrate at 1.5% - 4.5% is at a level where very few smelters, if any, would be prepared to accept any substantial quantity.
Notwithstanding this comment, it is possible that smaller lots of uncalcined concentrate could be placed into the market with arsenic levels at 2-4% and sold. Selmar notes that while arsenic levels are a challenge in the concentrates, the gold content is attractive to certain smelters. Currently, Chinese smelters are not competitive for high gold concentrates given internal pricing considerations, although this is expected to change sometime in the future.
On the cost side, while the long term treatment charge assumptions herein still apply for this case, arsenic penalties will be higher. Penalty scales vary based on prevailing market terms, and it should be noted that arsenic penalties are moving towards a two tier structure. Today, it is not unusual to see arsenic penalties of $3 to $5 per 0.1% As over 0.1% As to 0.3% As with additional tiers of penalties being triggered at various points over 0.3% or 0.5% or 1% As of $5 to $10 per 0.1% As. There is no fixed formula and this will very much depend on the market demand at the time relative to the supply of competing concentrates. For evaluation, in order to simplify, it’s suggested using $3 per 0.1% As over 0.2% As and $7.5 per 0.1% As over 0.5% As.
Consideration was given to blending high arsenic flotation concentrates with clean sulphide concentrates to be placed as part of a blend shipment and likely markets.
Potential smelter destinations for high arsenic copper concentrates are Glencore Xstrata’s Altonorte smelter in northern Chile and the Horne smelter in Canada. However, this group has tended to use such arsenic treatment capacity more for its own internal requirements. The Namibia inland smelter is also a destination for high arsenic concentrates. Logistical costs are high and smelting capacity relatively limited and as a result is not expected to be a long-term home for any substantial quantity.
327
|
It is understood that Xstrata’s Altonorte smelter in Chile treats high arsenic bearing concentrates up to 1.5% arsenic, particularly from Collahuasi and imports from Antamina and other high arsenic Peruvian sources.
Blending high arsenic concentrates with clean concentrates does not appear to be a viable option due to the very significant volume of clean concentrates required to dilute a 2% plus arsenic content, as well as the sanctity of the blend and the relatively limited market.
Two suppliers of roaster technology, Outotec and Technip successfully completed test work on the Caspiche concentrates, reducing the arsenic content to less than 0.2% while retaining a sulphur content of 25%. There were no copper or gold losses noted during the roasting process. The resulting roaster calcine met a specification that should be acceptable to 3rd party custom smelters.
The use of roaster processes is becoming more common in the industry. Reduction roasting was selected for Codelco’s new Mina Ministro Hales (MMH) copper mine in northern Chile and is expected to come on stream during 2014. Selmar understands that MMH flotation concentrate prior to roasting would have an arsenic level similar or higher than that of Caspiche.
From a market perspective, significant additional tonnages of arsenic bearing concentrates from existing arsenic rich mine expansions and new projects are expected to enter the market in the next 5 to 8 years. The largest increase of arsenic in concentrates is expected between 2013 and 2019 coming from new arsenic rich projects and expansions of operational mines including Los Bronces, Mina Ministro Hales (MMH), Collahuasi, Escondida, Los Pelambres, Grasberg, BatuHijau, Oyu Tolgoi, Pascua Lama and Chelopech. Reportedly this could increase the global average arsenic content in copper concentrates from about 0.16% in 2012 to around 0.22% by 2020, a 37% increase, exacerbating custom smelters constraints6 and hence the need to adapt to this reality.
In simple terms the ability of smelters to process arsenic bearing concentrates has decreased over the last several years, due to a variety of factors including environmental and legislative controls as well as technical factors.
On the legislation side, a good example is the new environmental legislation from the Chilean Ministry of the Environment “Norma de Emisión para Fundiciones de Cobre y Fuentes Emisoras de Arsénico” which is expected to be enacted during 2014. This will not only set new and more stringent limits for smelters on sulphur capture, but also for arsenic and mercury capture requirements as a percentage of actual feed intake as well as total emissions. The new legislation fixes SO2 and arsenic capture for Chilean smelters at 95% minimum across the board
31 From Selmar contact with copper industry sources
328
|
not only to privately owned smelters such as Altonorte and Chagres, but to state owned Codelco and Enami smelters. As a result, Chilean producers of high arsenic bearing concentrates are being faced with additional challenges as local smelters have less tolerance for arsenic and therefore might be forced to limit such concentrate intake. A preliminary estimate of capital expenditures and operational adjustments by Chilean smelters to comply with this new legislation is $US 1.5 Billion7. The time frame proposed for full compliance is 5 years. Particular cost pressure is expected will be put on Enami’s Paipote smelter since Enami’s social mandate to process small and medium-sized miner’s deposits and concentrates historically has generated limited operational margins.
The key challenge when addressing the marketability of Caspiche sulphide concentrates is the availability of a sustainable long-term market for the calcined concentrates, given that product quality issues, especially arsenic and antimony impurities are a major concern for the custom smelters world-wide in the current and medium term scenarios. This is an industry issue.
After partial roasting, the residual arsenic contained in Caspiche calcine concentrates is likely to be at a level below 0.2% and antimony at 0.16%. Smelters generally target their feed blend at sub 0.1% arsenic, but accept higher levels if the overall feed can be blended. In the case of antimony, which is becoming more of a concern for the smelting refining process, blend targets for antimony are generally speaking at 0.1% and in the case of several major smelters as low as 0.05%.
The Caspiche calcine concentrate assaying 30% copper has an attractive grade for smelters today as there is a lot of low to medium copper grade concentrates (20% - 25% Cu) coming into the market. These lower grade concentrates however, do not have residual arsenic and antimony levels at or above the penalty trigger points. Given these penalty elements constraints and the somewhat lower than normal sulphur content at 25%, smelters will need to blend the calcine into their feed.
Most smelters look for a sulphur content in the low 30% range and, as a rule of thumb, a balanced concentrate with copper/sulphur/iron content at around 30% in order to provide the right heat blend. Residual sulphur levels in the Caspiche calcine at 25% should not be problematic for smelters, but will depend on the individual smelter plant blend mix. Given the fact that today many concentrates have higher sulphur levels, blending at this level may in fact have advantages to some buyers.
In order not to ship calcine with 0% moisture and incur potential losses and environmental problems due to dust generation, water will be added at the point of origin and there will be no need to pelletize. It should be noted that pelletized concentrates are not widely accepted by smelters and could pose feed issues to the reactors.
32 Sourced from press report in Diario Financiero, Chile (www.df.cl)
329
|
Given the chemical quality and assuming no other deleterious elements, Caspiche calcine should be of interest to smelters, but from the physical point of view there likely will be the need to get opinion as to the acceptability of such material. On the basis of preliminary contacts with smelters it would appear that the calcine, once moisture is added back, should be acceptable. Based on other partially roasted experiences, calcine once rewetted should behave in a manner similar to normal sulphide concentrates, provided this is done in a fashion that it prevents calcine from lumping. For reference, this was achieved some years ago at the El Indio roasters with a controlled addition of water in the discharge cooling screw conveyors. Target moisture was 7 to 9%.
Smelters may include provisions in sales contracts to ensure that concentrates are shipped and arrive with moisture levels above agreed minimum, often 6 or 7%, as well as meeting IMO regulations relative to maximum levels. This is to avoid handling problems including dust generation during discharge.
Without any discussion with smelters to ascertain the quantity that can be taken and the cost thereof, in Selmar’s opinion, based on the calcine quality supplied by Exeter at about 29% copper, 54 g/t gold, 110 g/t silver, 25% sulphur, arsenic levels of less than 0.2% and antimony levels of 0.16%, it should be feasible to find a sustainable long-term market for such concentrates. Nevertheless, securing long term smelter contracts for arsenic and antimony bearing concentrates is a challenge.
The likelihood is that a greater number of sales contracts will be required for Caspiche calcine than would be the case for cleaner sulphide copper concentrates. While some smelters with precious metals refinery circuits will favour high gold bearing concentrates, this is not true at present for all, particularly for most Chinese smelters.
Selmar recommends that once the PEA is complete, detailed project presentations should be made to smelters to ascertain and quantify potential interest.
| 19.8 | Logistics Load Port Options |
Four port options located in Chile’s Atacama and Coquimbo Region were identified with potential capabilities for loading Caspiche calcine concentrate shipments in bulk. These ports are indicated in Figure 19-4.
330
|
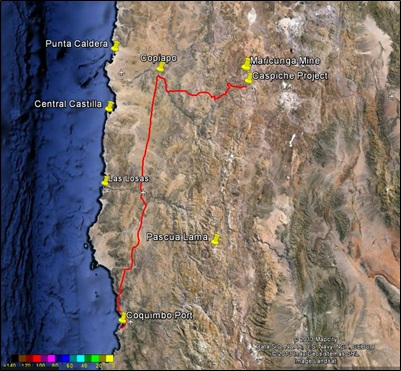
Figure 19-4: Port Options
It should be noted that currently Coquimbo Port, despite the distance from Caspiche Project (570kms), is the single nearest viable shipping option. Punta Caldera and Central Castilla which should be the logical ports for Caspiche are still on the drawing board. The Caserones Project which had initially planned to ship out of Caldera will now be shipping its copper concentrates production 500,000 tonnes per year through Coquimbo Port starting Q2-2014.
Last year, Chile's Supreme Court cited environmental questions in rejecting construction of Central Castilla, a $5 billion thermoelectric plant. The 2,100 megawatt plant is a joint venture of Germany's E.ON and Brazil's MPX Energía SA. Local communities and environmentalist groups have opposed strongly the Castilla Project. Most noticeable “Atacama sin Carbón” group.
Despite above opposition further revised EIA and feasibility studies are under way and the project might be resurrected. No timing has been set.
As the Caspiche Project progresses through the next phase of the feasibility study, Selmar recommends discussions should be held with the nearest ports identified to determine in the first instance potential interest, their viability and how it is intended to handle receipt, storage and loading of calcine concentrates to the vessel without concerns arising as to the integrity of other cargoes.
331
|
| 19.9 | Ocean Freight |
The assumption is that the calcine concentrates will be shipped overseas mainly to Asia in lot sizes of 10,000 tonnes each and for purposes of this study the most likely destinations are Japan, Korea, China and India. Currently, a substantial part of the concentrates from Chile and Peru to Asia are shipped in lots of about 10,000 tonnes and this is used as basis for this evaluation. However, ultimately market distribution and the quantities sold to various parties will determine the shipment size. Indeed it is likely that from the perspective of loading to vessels, larger parcels will be used but for two or more discharge ports.
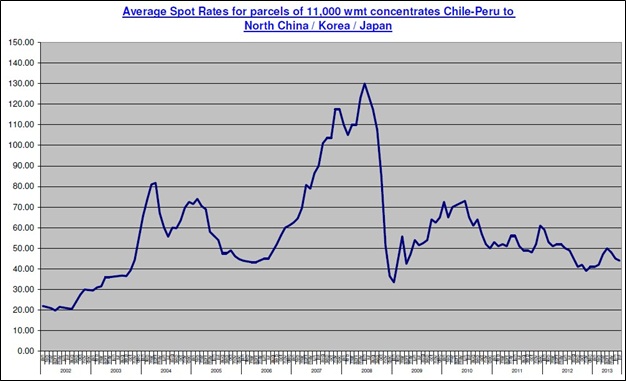
Figure 19-5: Average Spot Ocean freight rates for concentrates (2002 -2013)
Figure 19-5 illustrates annual spot ocean freight rates for the last 10 years. It is noticeable that over the last 12 years freight rates for concentrates from Chile and Peru to Asia destinations have fluctuated from $ 20 per wmt to an all-time record high level of $ 120 per wmt in 2007-2008. For guidance, up to until 2006, rates averaged $35 to $40 per wmt off the West Coast of South America (WCSA) to Japan and Korea for parcels of about 11,000 wmt. Today, spot rates of $45 to $50 are more the norm.
Selmar received the following comments from a major shipbroker serving the mining industry with branches in South America, including Peru and Chile, on current ocean freight rates from WCSA to the Far East:
332
|
“WCSA Spot Japan, Korea and North China parity is about:
PERU CHILE
| · | basis 20,000 wmt : US$ 41 – 47 US$ 43 - 49 |
| · | basis 15,000 wmt : US$ 42 – 48 US$ 44 - 50 |
| · | basis 10,000 wmt : US$ 43 – 49 US$ 45 - 51 |
| · | basis 5,000 wmt : US$ 50 – 56 US$ 52 - 58 |
Cargo discharged South China, but not south of Huangpu, would incur a lumpsum premium of about $70,000 per shipment and for cargo discharged South of China, but not south of Fangcheng, this would be a lumpsum of about $ 100,000 per shipment.”
Ocean freights have been discussed with several major ship-owners serving the mining industry to world-wide destinations. Consensus view is that freight rates will not return to the high levels experienced in 2007-2008 and the current level of rates could be sustained depending on the price of fuel oil. Supporting this view is the fact that currently the availability of Handysize and Handymax bulk carriers, typically used for concentrates shipments, significantly exceeds the demand. It is noticeable that during the mineral boom periods, shipping companies aggressively built vessels to transport growing volumes of dry bulk minerals in the expectation of a continued World growth trend.
333
|
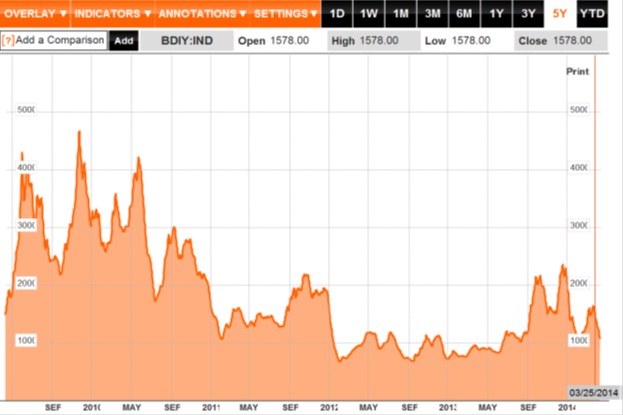
Figure 19-6: Baltic Dry Index (2009 -2014)
Figure 19-6 with latest five years Baltic freight indices sourced from Bloomberg33 reflects the general overall market trend in that ship hire costs have halved from the peak levels of 2009 and early 2010. Growing ship supply is set to cap dry bulk freight rate gains in the coming months, with economic uncertainty, a financing squeeze and a slowdown in China adding to headwinds.
Freight rates from West Coast South America (WCSA) routes show almost same pattern adjusted for regional incoming trade and considering that concentrates are typically shipped overseas in Handysize and Handymax bulk carriers.
In summary, for the purposes of the PEA evaluation and assuming that there will likely be more than one destination port in Asia for calcine concentrate shipments, an average long term ocean freight rate of $ 55 per wet metric tonne for parcels of 11,000 wmt in constant 2014 dollars is suggested.
33 Sourced from www.bloomberg.com and press report
334
|
| 19.10 | Doré Metal Market |
This market is very competitive and in many cases payable metals approaches 100% of the analytical contents and there is not a great deal of variance in terms between refineries. This situation is expected to continue in the foreseeable future.
Selmar suggests the following terms are used for purposes of doré metal evaluation:
| · | Gold return rate : 99.7% of the analytical fine gold content |
| · | Silver return rate : 98.5% of the analytical fine silver content |
| · | Treatment charge: $ 0.50 per oz gross weight received |
| · | Transport and insurance: $ 4,700 per shipment; basis consignments of 200 kilos. |
Above fees include: Transport from mine site to Santiago, customs clearance, international air freight, reception in Zurich’s airport, customs clearance, ground transportation to the refinery in Switzerland and 100% insurance coverage door to door.
The long term gold price consensus assumptions seen in the market recently for major projects are in the $ 1,200 to $ 1,500 per ounce range.
In this connection, Selmar was not asked to provide the detailed assessment of the expectation for gold prices, however Table 19-7 presents Research Analyst Metal Prices for the outlook for gold and is at the upper end of the various consensus prices assumptions referred to above.
335
|
Table 19-7: Analysts’ Consensus for Gold Price 2013 – 2017 and Long Term (Source: Scotiabank)
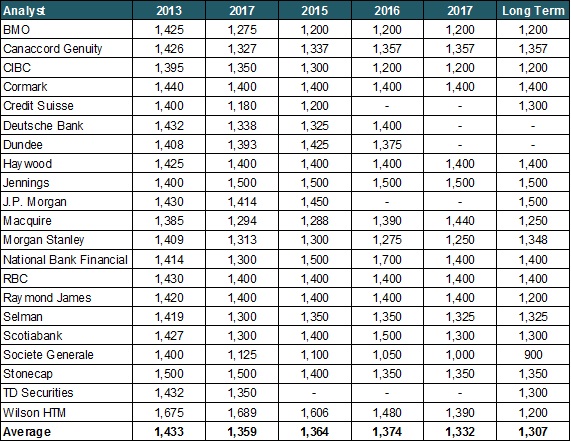
336
|
| 20 | ENVIRONMENTAL STUDIES, PERMITTING SOCIAL OR COMMUNITY IMPACT |
Exeter has completed a number of environmental campaigns to generate a suitable Environmental Baseline Study (EBS) to support a future project Environmental Impact Study (EIS) for the Caspiche Project. The main contractor used for the compilation of this EBS was IAL Ltda. (IAL) of Santiago, Chile. In July 2011, Exeter´s locally registered entity; SCM Eton contracted Arcadis Chile (Environmental Division) to carry out a gap analysis of the developed Caspiche EBS. The objective of this analysis was firstly to confirm all legally required elements had been included and secondly to expand the EBS to include the potential footprints of the project options. Arcadis Chile has extensive national and international experience in development and management Base Line Studies (BLS) and environmental impact studies (EIS) for mining projects, with special expertise in the Region of Atacama where the Caspiche project is situated.
The base line studies which have been completed to date were based on the project considered as part of the 2012 prefeasibility study34 which considered a large open pit and associated tailings dam and infrastructure to develop this mining and processing scenario. As such, on review of the base line study work completed, it is the opinion of the authors that this is still valid for the large operation considered in the 2012 PFS and also meets the needs of the project considered in this PEA.
In the context of the Preliminary Economic Assessment specific environmental studies have been identified which are required for each of the options under evaluation. Table 20-1 summarizes the list of studies which must be completed to complement the existing baseline as part of the Environmental Impact Assessment (EIA) before the document can be submitted for review and approval by the appropriate Chilean authorities. In addition to those items summarized, recent changes in legislation require community participation and public audiences to explain the project development. These must be completed for both indigenous and non-indigenous communities in the area of influence.
34 For further information see ‘Caspiche Project Copiapo, Chile: NI 43-101 Technical Report on Prefeasibility Study’ dated 16 January 2012, and submitted and prepared for Exeter Resource Corporation, by Holmes, G., Duggan, A., Guzmán, C., Coupland, D., Wells, J. and Nguyen, L (www.sedar.com )
337
|
Table 20-1: Required Environmental Studies
| Component | Activity Proposal |
| Hydrology | Continue monitoring of surface water, extending to the areas that have not been sampled, replacing points that have been dry during previous sampling periods, and adding, for the same purpose additional sampling points. |
| Hydrogeology | Develop further groundwater sampling, ideally in areas where potential recipients are located (eg. CCRJ summer encampments). The proposed sampling includes 5 points along the Aguas Blancas River valley. Detailed Hydrogeology is required for dewatering program. (pit areas) |
| Geology | In order to define potential future Acid Rock drainage (ARD), analysis of the waste rock by ABA and humidity cell techniques is recommended. |
| Jotabeche Glacier | Dust and other environmental modelling need to be completed to determine the impact of the project on the Jotabeche glacier. |
| Archaeology | Once location of project facilities has been defined an intensive archaeological baseline of the area to be affected must be completed. |
| Anthropology | Once location of project facilities has been defined, an analysis of Convention No. 169 of the ILO (Sept. 2009) must be undertaken, which aims to present the project to the indigenous communities. |
Biological Issues (Flora, Fauna and Limnology) | Once location of proect facilities has been defined an intensive flora and fauna baseline of the area to be affected must be completed. This will be completed in parallel with the water sample monitoring program. Two limnology campaigns are required during the next season. |
| Use of the Soil | Once location of project facilities has been defined an intensive soil characterization and use of soil programme for the areas to be affected must be implemented. |
Development of EIA | To present the EIA to the environmental assessment authorities, a document, completing a total of 9 chapters (within which is found the Environmental Baseline) must be prepared. Once the project facilities have been defined, the environmental studies required to complete the Environmental Baseline must be developed. |
The EBS was designed to meet relevant local and international legislation, and contains:
• Principal Environmental findings
• Environmental and social issues of the project
• Socio-economic potential impacts and closure, and
• Closure / abandonment stage.
The studies were completed over a continuous 12 month period between mid-2009 and mid-2010. A seasonal water monitoring campaign of the area continues as part of the ongoing surface water quality programme.
338
|
A series of methodological steps were completed to fulfill the objectives and achieve the correct characterization of the environmental elements.
| 20.1 | Principal Environmental Baseline Findings |
| 20.1.1 | Physical Environment: Climatic Characterization |
The mountain range of the Atacama Region, from a bioclimatic point of view is in a transition area between two regimes; the first with rainfall during summer months and the second with winter rainfall and summer droughts. The general trend in the area is a desert influence with snow precipitation and high evaporation.
Caspiche local conditions from the weather station installed at the camp, show an average temperature of 6.43 °C, with minimum average in July of -6.24 °C, and maximum average in March of 17.08 °C. Wind gusts average 3.85 m/s in a north-west direction, predominantly from the north. Maximum wind intensities were recorded in September/October, and minimum in the months of April, May, June and July.
Maximum annual rainfall recorded in this sector was 23.2 mm (registered in 2009). Approximately 50% of rainfall is concentrated between May, June and July; the remaining 50% in the months of January and February.
| 20.1.2 | Physical Environment: Main Geomorphological Units |
The Quebrada Aguas Blancas basin is located between the southern sections of the foothills of Domeyko formation associated with Nevado Jotabeche with an elevation of 5,802 m.a.s.l. and the confluence of the Aguas Blancas River with Quebrada Seca, a distance of approximately 25 kilometres downstream of the Nevado Jotabeche and at an approximate elevation of 3,100 m.a.s.l. The Quebrada Aguas Blancas basin has a number of landforms associated with glacial and fluvial processes.
| 20.1.3 | Physical Environment Soil, characterizations and applications |
There are clear limitations on conditions of soil formation processes in the area. One of the key factors corresponds to the climate variable, which severely limits the accumulation of organic matter generated by the soil, so most of the forming processes have a geological formation, either by weathering or gelifraction.
There are low and flat areas, where vegetation formations have been generated (meadows and wetlands), with azonal features that have allowed the development of some soils with organic characteristics.
Soil use at the regional level is characterized by low agricultural capacity, except for the cultivated valleys of the region. In terms of land use, the greatest potential of the region corresponds to mining.
339
|
| 20.1.4 | Physical Environment: Hydrology |
The Project is located in the Aguas Blancas River System, which is a tributary of the Figueroa River. This sub-basin has a runoff orientation of SE – NW and drains an area of approximately 20,402 ha. The area affected directly by the Project is located at the head of this sub-basin, specifically in a first order system called “Quebrada Yeguas Heladas.” Exeter has developed hydrochemical characterization and analysis of water quality in the project area on a seasonal basis from mid 2009, completing a total of 7 monitoring campaigns.
As it descends through the sub-basin, water quality progressively deteriorates. Elevated values of sulphates, total iron, total copper and pH were recorded in the middle and lower sections of the basin. These parameters substantially exceed the permitted limits for environmental standards, especially sulphates and total iron, which are characteristic of sites where projects and mining processes could be developed.
The majority of the water sampled has high turbidity values; a great deal of purification and other processes are required to meet the relevant standards for drinking water.
Analysis of pH identified two grades of waters. The first corresponds to those categories ranging from "4" to "6" (according to Nisbet and Verneaux 1970), the qualities of these varies from neutral to alkaline neutral. The second group exhibits the most extreme behaviour, either with a high acidity or alkalinity.
| 20.1.5 | Biotic Environment: Flora and Vegetation |
The area is inserted in a transition zone between the High Andean Steppe Region, Sub-region Mediterranean Andes, High Andean Steppe Formation of Doña Ana Mountain Range and the Desert Region, Sub-region Andean Desert, Formation of desert steppe of El Salvador (Gajardo, 1983 and 1994).
The highest proportion of vegetation within the study area corresponds to a tall thorny shrub of Adesmia hystrix which has a vertical structure and density that varies according to different physiographic positions; and an herbaceous perennial stratum of Stipa atacamensis and / or Cristaria andicola.
The study recorded 83 species of local flora, all of which are native. None of the species identified have known conservation problems. The sectors of water azonal vegetation, consisting of meadows and wetlands, must be considered because these ecosystems are relevant for local sustainability, wherein the biological diversity is quite restricted.
| 20.1.6 | Biotic Environment: Fauna |
In parallel with the Andean desert conditions, and low and sparse vegetation, the fauna present in the studied area is scarce. The current inventory of invertebrates and / or potentially present
340
|
invertebrates in the area comprises a total of 51 species, 50 native and one introduced. The native species include two endemic species. Of these, there are two species of reptile, 40 birds (25 passerines and 15 non-passerines) and nine species of mammals (three carnivores, one artiodactyl, five rodents and lagomorphs), 35 species were observed directly in the field during the four campaigns.
Birds are the most diverse group with 40 species, followed by mammals with nine taxa. Despite the existence of bodies of water, amphibians were not observed, they are recorded in lower areas of the basin but not in the high mountains. Almost all species are distributed in various regions of the country and there are only two species of reptiles endemic to the Atacama Region, Liolaemus juanortizi, and Liolaemus rosenmanni.
National regulations define two complementary means of defining protected species; the Regulations for Classification of Wildlife Species and the Hunting Law. None of the invertebrates recorded are cited by the Regulations for Classification of Wildlife; however according to the Hunting Law (SAG, 2008) the conservation status of species observed is as follows:
| · | Reptiles: Liolaemus rosenmanni (Vulnerable) y Liolaemus juanortizi (Critically Endangered); |
| · | Birds: Tinamotis pentlandii (Endangered), Chloephaga melanoptera (Endangered), Vultur gryphus (Endangered), Attagis gayi (Vulnerable); |
| · | Mammals: Puma concolor (Critically Endangered, SAG 2008; Near Threatened, DS 151/2006 MINSEGPRES), Pseudalopex culpaeus y Pseudalopex griseus (Near Threatened), Lama guanicoe (Critically Endangered) y Lagidium viscacia (Critically Endangered). |
Colonies of Ctenomys sp. are distributed over a wide area within the project area, including the sectors of exploration, access road, meadows, and Quebrada Yeguas Heladas, and are always associated with a low scrub thorn bush of Adesmia echinus and tussocky grass, Stipa atacamensis.
The project area is not mentioned in either the Red Book of Priority Sites for Conservation of Biodiversity in Chile, or among those highlighted by the National Biodiversity Strategy.
| 20.1.7 | Description of Socioeconomics-Cultural Environment: Demography |
The regional population concentration is largely urban, 83.9% of the population in the area live in cities or towns with Copiapó and Vallenar holding the largest demographic weight.
Due to the specialization in activities related to mining and agriculture, the population is predominantly male, with a M/F sex ratio higher than the national average 103.16 for the region, compared to 97.12 for the country; this situation is exacerbated in rural areas.
341
|
The district of Las Juntas, where the project is located has a population density of 0.091 inhabitants per square kilometre which demonstrates how sparsely inhabited the project area is. Despite the small size of the population, its presence is important, as it is associated with the indigenous Colla communities of the River Jorquera (CCRJ) who are dedicated to pastoral activities mainly through migration cycles.
In terms of productive activities, whilst at the regional level mining is the main contributor to regional GDP activity with 39%, in terms of labour demand it only accounts for 10%; agriculture, accounts for 19% employment, for a contribution to regional GDP of 10%.
| 20.1.8 | Historical and Archaeological Heritage |
Information sources confirm that the project area does not contain national monuments, zones of historic or special interest, national parks or other historical or archaeological heritage sites. However, the survey identified and recorded 41 archaeological items, 25 of them in the direct influence area of the project.
| 20.1.9 | Anthropology |
Since exploration activities of the Caspiche Project started, Exeter has developed a relationship with the neighbouring Colla Community at Jorquera River (CCRJ) and its tributaries. Exeter has also signed formal agreements with other indigenous communities such as the Paiote to the north of the project, who are outside the area of influence of the main project but who may be impacted by infrastructure items such as water pipeline.
Guidelines have been established which define the project objectives, and the principles of coexistence and respect for the heritage and Colla indigenous culture. Exeter and the community have fixed goals to work together via formal documents and agreements. Technical groups meet with the participation of the National Corporation of Indigenous Development (CONADI) and representatives of CCRJ to discuss issues such as the environment and others.
342
|
| 20.2 | Summary of Main Environmental and Social Issues for the Project |
From the Environmental Baseline Studies completed to date, it is possible to conclude that the points of sensitivity of the project area correspond to the following:
| · | The data obtained from geological components, water quality and climate and weather indicate the possible generation of acidic water. This is mainly due to strong presence of sulphur in the composition of rocks of volcanic origin, in the Basin of Aguas Blancas River |
| · | The results of the water analyses indicate a progressive deterioration of water quality as the water flows downstream to the sub-basin, highlighting elevated values of sulphates, total iron, total copper and pH. This is important as the project will be located in the upper basin |
| · | The existence of threatened fauna in the area of influence of the Project |
| · | Flora and vegetation, are relevant to the functioning of ecosystems, especially those relating to water azonal vegetation, the project execution plan must take measures to reduce the risks to these communities |
| · | As a landscape and scenic resource, the most important point is the current proposed Sendero de Chile route where mine activities may have an impact on the area’s current visual quality with a resource loss or significant alteration of the landscape and / or touristic values. Mitigation or compensation measures in the future must be considered |
| · | The eventual overload on the infrastructure systems of major urban centres is the most important issue with regard to equipment and infrastructure components |
| · | Archaeological sites identified are unique evidence of past activities and correspond to national monuments, it is necessary first to avoid development of any type of work that can generate partial or total destruction of the sites and make all efforts to ensure their preservation |
| · | The anthropological issue must take into account the existence of two villages that are used during the summer by some family groups of the CCRJ. Although they are not permanently inhabited structures these areas should be considered as significant to the Colla lifestyle and their nomadic character. The same consideration should be given to the meadows and slopes along the gully of the Aguas Blancas River that are used throughout the year by the community’s livestock. |
343
|
| 20.3 | Socio-economic Potential Impacts |
Socioeconomic impacts linked to the Project are expressed in the first instance by the location of the area, which houses 15.2% of the existing indigenous population in the Atacama Region. In the area of direct influence of the Project, the CCRJ located in the area of the Jorquera River and its tributaries are the main community impacted. This community has a native-like organization covered by law 19.253 and is a legitimate interlocutor as the project advances.
The Colla community is spread over a large area of foothills and mountainous uplands and also has a presence in the urban areas of the region. The communities in the rural areas have a low population density, but own an area of 10,000 ha granted adjacent to seasonal water courses. Due to their nomadic culture, employment in the area changes with the season, from lowlands to highlands, in a cycle determined by the presence and absence of snow, and the growth of vegetation.
Livestock farming is the main economic activity of the community, together with ancillary activities to support the local consumer base. This is reflected in each household that produces similar products for different purposes, in some cases there is a market for the product, while in the majority of cases the product is intended for family consumption.
There is no rural school for the CCRJ and other nearby communities, resulting in migration to urban areas. Health infrastructure is represented by a primary care clinic providing a monthly round of medical and dental care.
Possible local project impacts expected are:
| · | Impact on meadows and wetlands of the area and associated fauna, essential for economic and ancient-cultural development of the Colla people. This is due to the high pressure which mining projects such as Caspiche and others in the area would subject the territory to as they are developed and operated |
| · | Increase in atmospheric emissions of suspended material produced by the mining process and vehicular traffic. This may eventually affect people in the immediate area (primary standard of air quality) as well as flora and fauna (Huasco secondary reference standard). This negative impact may be mitigated through the implementation of measures to control emissions |
| · | Increase of traffic flow which could result in the death or injury of animals or members of the community. This can be mitigated by speed control and strict monitoring of internal driving rules of the company and national regulations in force |
| · | Impact on the quality and quantity of water resources. Sustainable exploitation of this resource is maintained through a secure water flow approved by the competent authority. The water source to be used ensures there is no significant impact on the current users |
344
|
| · | Impact on winter and summer grazing areas that feed the animals due to traffic of light and heavy vehicles, water use, and mining activities |
| · | Impact on archaeological sites that could eventually be given the status of ancestral occupation of the territory. These sites may be affected by mining activity. To ensure that the archaeological history of the area is not be impacted by future mining infrastructure, artefacts to be impacted should be rescued (Law 17.288; Ministry of Education, MINEDUC) |
| · | Impact on local economic activity. The loss of territory for migration and grazing of livestock and possible impact of meadows and wetlands used for summer pasture and winter activities that care for and feed livestock will have a negative impact. However, development of the Project will generate a significant positive impact on employment levels and the local economy |
| 20.4 | Closure and Abandonment Stage |
| 20.4.1 | Closure Plan |
An essential part of the Project is the development of a closure plan that outlines activities for decommissioning and mitigation of impacts during operation and closure. The preparation of a closure strategy prior to the development of the Project is an integral part of the closure design process. This approach to project planning recognizes that mining represents a temporary use of land and that appropriate closure of the operation is in line with the sustainable use of available resources.
The project closure plan will focus on safety, stabilization of the land surfaces, post mine utilization of facilities and structures and protection of the environment. Since the Project is located in an extreme arid, high altitude environment, re-vegetation is considered impractical and not conducive to the surrounding environment
In Chile, there are clear and precise rules regarding the closure of mining facilities (Regulation on Mine Safety No. 72. section 5), which indicate the activities required to carry out the closure of a mining project. The following is a summary of the objectives of the Regulation, as well as the activities listed.
| · | Ensure that the remaining facilities will not affect human health or degrade the environment |
| · | Ensure maintenance of physical stability and that the areas affected by mining activities are in stable condition at the closure of the project |
| · | Ensure the maintenance of stability associated with chemicals in the long term, in order to reduce effects on biological diversity and to avoid endangering public health and safety |
345
|
| · | Ensure environmental components, both surface and underground are not affected as a result of the closure. |
The following sections present a description of the proposed closure activities that will be developed for each project. To the extent possible, closure will be concurrent with the mining activities, with final closure occurring once mining ceases. Post closure monitoring will also take place to document and ensure proper reclamation of all impacted areas.
Oxide Project
| · | Open pit Closure Plan: Once the open pit has reached ultimate surface area, a safety berm and/or fencing will be installed to deter access |
| · | Waste dump Closure Plan: Physical and chemical stabilization of the waste rock materials and the rehabilitation of the habitat. Handling of runoff surface in order to avoid flushing of sedimentary material and infiltration control to prevent pollutants transport, such as acid drainage into groundwater. Slope stability measures implemented |
| · | Leach pad Closure Plan: Construction of interceptor dikes and rainwater run-off channel. Ensure slope stability of heap leach and waste deposit. Cover with waste and natural soil or other material. Compact and definition of surface slope. Heap leach pad is neutralized |
| · | Mineral Processing Facilities Closure Plan: Decommissioning and demolition of industrial structures related to the mine support and processing areas of the Project, such as: |
| ° | Electromechanical installations/equipment decommissioning and removal from the project site |
| ° | Dismantling of internal metallic structures |
| ° | Removal of insulation materials |
| ° | Disassembling of structural steel beams and joists |
| · | Mine Site Roads Closure Plan: After operations cease, the mine haul roads are to be decommissioned. All other site roads are to be left in place and used as access for facility monitoring during and after closure |
| · | Safety and Security: Site security during the early years of closure will be an important concern, with varying numbers of contractors and workers onsite, and fewer mine employees overseeing the Project. Security measures may include the use of lockable gates and signs, as well as regular security checks |
346
|
| · | Final Closure and Environmental Monitoring: Monitoring plan consists of several actions focussed on checking that environmental and safety conditions are within the limits set by current regulations and to check that the closure plan returns the area to environmental conditions similar to the baseline |
| · | Schedule: Development of a follow-up and monitoring programme of relevant variables associated with safety and the environment after closure and abandonment of the mining works |
| · | Closure Cost Estimate: A cost estimation of the proposed closure plan, according to law 20.551, Art. 13 has been included in the financial evaluation of the Project. |
Sulphide Project
| · | Underground Mine Closure Plan: Should consider the following aspects to the closure plan of the underground mine: |
| ° | Evaluate eventual generation of acidic waters and minimize their impact on water bodies. Minimize the infiltration of water |
| ° | Permanent closure of all access to the stopes or galleries. Warning signs |
| ° | Closure of all roads for non-public use leading to mine |
| ° | Partial or total backfill of the mined stopes and galleries. |
| · | Tailings Storage Facility Closure Plan: The following measures have been considered for closing of the tailings storage facility: |
| ° | Installation of a layer of granular material on the surface of the tailings, a geomembrane will be placed over this layer and, finally, a new layer of granular material will be placed |
| ° | Reparation and adaptation of freshwater diversion channels |
| ° | Repairing perimeter channel so that it will resist flash floods. |
| ° | Implementation of a canal over the tailings pond destined to carry the contributing waters in case the interception works or perimeter canal are insufficient for this purpose |
| ° | Construction of retaining walls via rock fills, installed at the foot of the slope to improve the stability. |
347
|
| · | Mineral Processing Facilities Closure Plan: Decommissioning and demolition of industrial structures related to the mine support and processing areas of the Project, such as: |
| ° | Completion of all electromechanical installations/equipment decommissioning and removal of such equipment from the project site |
| ° | Dismantling of internal metallic structures |
| ° | Removal of insulation materials |
| ° | Disassembling of structural steel beams and joists |
| 20.4.2 | Post-closing Stage or Abandonment |
After the closure, it is necessary to follow and monitor all environmental and physical variables, with the purpose of verifying the correct performance of the plan and if any contingent event were to happen, adopt the necessary corrective measures.
348
|
| 21 | CAPITAL AND OPERATING COSTS35 |
| 21.1 | Introduction |
The capital and operating cost estimates for the PEA were developed in Chilean Pesos (CLP) and United States Dollars (US$) according to source currency of costs. The exchange rate (CLP/US$) used is 540. All costs for the PEA are estimated as of the Effective Date of this Technical Report. All cost projections are presented on a nominal dollar basis.
The economic analysis contained in the PEA is considered preliminary in nature. No inferred mineral resources form part of the PEA studies and no mineral reserves for the PEA have been established. Mineral resources are not mineral reserves and have no demonstrated economic viability. There is no certainty that economic forecasts outlined in the PEA will be realized. The PEA and the Cube 2012 Mineral Resource (as defined herein) may be materially affected by environmental, permitting, legal, title, taxation, socio-political, marketing or other relevant factors.
| 21.2 | Capital Cost Estimate |
Capital cost estimates were completed for the three primary options and two secondary options as follows:
| · | Option 1: 30 ktpd open pit mine for gold and silver oxide mineralization treated by heap leaching |
| · | Option 2: 60 ktpd open pit mine for gold and silver oxide mineralization treated by heap leaching and 27 ktpd open pit mine for gold and copper sulphide mineralization treated in a conventional concentrator plant |
| · | Option 3: 60 ktpd open pit mine for gold and silver oxide mineralization treated by heap leaching and 27 ktpd underground mine for gold and copper sulphide mineralization treated in a conventional concentrator plant |
| · | Option 4: 60 ktpd open pit mine for gold and silver oxide mineralization treated by heap leaching and 12 ktpd open pit mine for gold and copper sulphide mineralization treated in a conventional concentrator plant |
35 For more information regarding cautionary forward looking statements the reader is directed to section 1.2 of this Technical Report
349
|
| · | Option 5: 27 ktpd underground mine for gold and copper sulphide mineralization treated in a conventional concentrator plant. |
In tabular format this is illustrated as follows:
Table 21-1: Options Summary

| Capital cost estimates are composed of the following: |
| · | Direct cost of construction and assembly: Acquisitions of equipment supply, labour, auxiliary equipment for construction and building materials are considered |
| · | Indirect project costs: Transportation and equipment insurance, general spare parts, vendor’s representatives, detailed engineering, EPCM, start up and owner costs are considered |
| · | Contingency estimation based on Direct Cost plus Indirect Cost |
| · | Sustaining capital is defined as that required to maintain operations and may include capital spent on expansion or new infrastructure items such as the tailings dam |
| · | Deferred capital is that required to complete an expansion in the mine and process plant. |
Table 21-2 to Table 21-4 summarize initial, deferred and sustaining capital cost requirements.
350
|
Table 21-2: Capital Costs Summary– Option 1
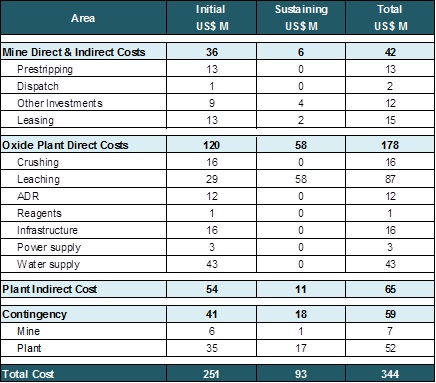
351
|
Table 21-3: Capital Costs Summary – Option 2
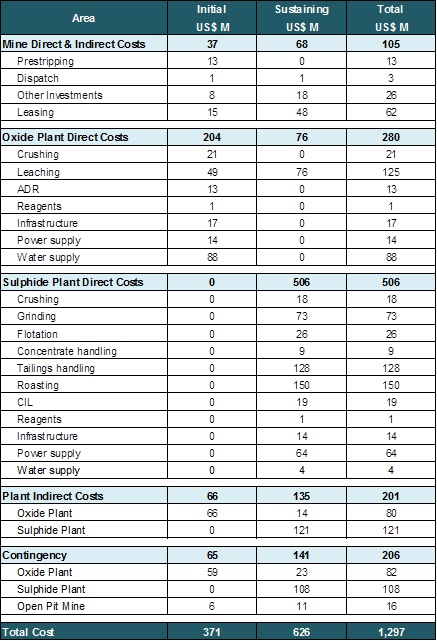
352
|
Table 21-4: Capital Costs Summary – Option 3

353
|
Table 21-5: Capital Costs Summary – Option 4
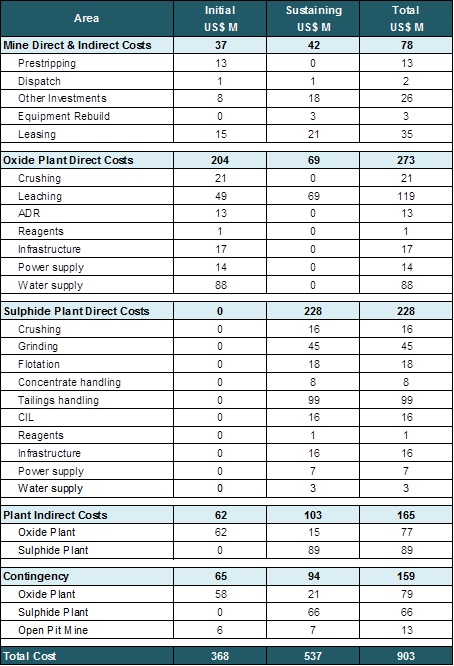
354
|
Table 21-6: Capital Costs Summary – Option 5

Direct costs were estimated using:
| · | Material take-offs (MTOs) based on preliminary layouts, process flow diagrams, and topographic information |
| · | Historical data |
| · | Allowances based on similar projects |
Table 21-7 shows unit construction costs considered. Table 21-8 shows Chilean high-altitudes mine pay scales.
355
|
Table 21-7: Main Unitary Construction Costs
| Item | Unit | Value US$ |
| Earthworks | ||
| Massive excavation - Gravel | m3 | 7.00 |
| Massive excavation - Soil | m3 | 5.00 |
| Excavation - Top soil | m3 | 4.00 |
| Basal improvement | m | 12.00 |
| Massive filling | m3 | 8.00 |
| Gravel layer | m3 | 25.00 |
| Earthwork - Cut | m3 | 10.00 |
| Earthwork - Fill | m3 | 10.00 |
| Covers | ||
| HDPE liner 40 mils (1 mm) | m2 | 5.50 |
| HDPE liner 60 mils (1,5 mm) | m2 | 8.00 |
| Geonet (5 mm) | m2 | 4.50 |
| Geotextile (400 gr/m²) | m2 | 4.50 |
| Granular coating | m3 | 20.00 |
| Drainage material | m3 | 15.00 |
| Steel | ||
| Carbon Steel | kg | 3.00 |
| Structural Steel | kg | 3.00 |
| Pipes | ||
| Carbon Steel - Pipes | kg | 6.00 |
| Concretes | ||
| Concrete Slab | m3 | 1,200 |
| Concrete foundations | m3 | 1,600 |
Table 21-8: Chilean High Altitude Pay Scale
| Position | Annual Wage |
| kUS$ | |
| Plant Superintendent | 185 |
| Metallurgical Planner | 120 |
| Metallurgical Engineer | 80 |
| Operation Supervisor | 102 |
| Maintenance Supervisor | 102 |
| Operator | 42 |
| Maintenance | 42 |
| Technician | 32 |
| Administrative | 23 |
356
|
| 21.2.1 | Mine Capital Costs |
The estimated open pit mine capital cost includes the following items:
| · | Shop tools |
| · | Initial spare parts |
| · | Engineering and geology equipment |
| · | Mine preproduction development expenses |
| · | Major and support equipment |
| · | Roads construction |
| · | Mining software and computers |
| · | Survey and geology equipment. |
The open pit mine capital costs estimate does not include the following mine physical structures:
| · | Fuel and lubricant storage facilities |
| · | The mine shop, offices, and warehouse |
| · | Explosive storage facilities. |
Underground mine capital cost includes:
| · | Services infrastructure |
| · | Main haulage |
| · | Belt conveyor and sizer excavations |
| · | Ventilation and dewatering system |
| · | Mining development |
| · | Main and support mine equipment |
| · | Electrical infrastructure and instrumentation. |
357
|
Open Pit
The equipment capital estimate is based on the equipment acquisition schedule shown in Section 16. Prices for all major pieces of equipment have been obtained from budgetary quotations, these prices are shown in the following table and include price ex-factory and total cost of the equipment on site and ready to work.
Table 21-9: Equipment Prices (USD)
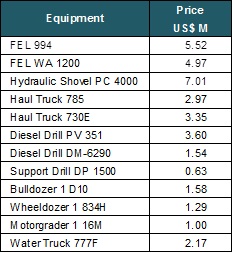
Main equipment is considered to be acquired via leasing agreements with 30% of the total equipment value, which is expected to be paid as an initial payment, included as initial capital cost.
Other minor costs such as the dispatch system, computers, software, spare parts, survey and geological equipment and light vehicles have also been included as capital costs.
The following activities would be developed before pit production starts and were also included in the cost estimate of the mining area:
| · | Accesses and prestripping of the pits |
| · | Production and placement of construction material. |
All the works for prestripping and production operations will be developed using owner’s equipment.
Unit costs for roads construction were estimated by Alquimia. Total expenses for road construction for the open pit by option are presented in Table 21-10.
358
|
Table 21-10: Road Construction by Option
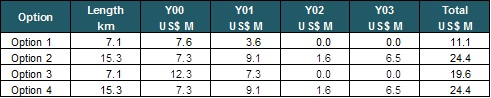
Total operating expenses for preproduction operations are presented in Table 21-11.
Table 21-11: Open Pit Pre-Production Operation Expenses by Option
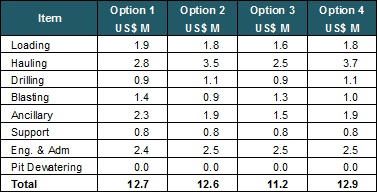
A summary of initial and sustaining capital for the open pit in the three options are presented in Table 21-12, Table 21-13 and Table 21-14.
Table 21-12: Open Pit Initial and Sustaining Capital Cost – Option 1
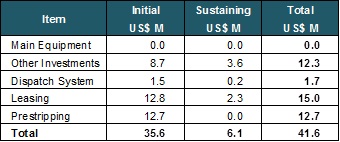
359
|
Table 21-13: Open Pit Initial and Sustaining Capital Cost – Option 2
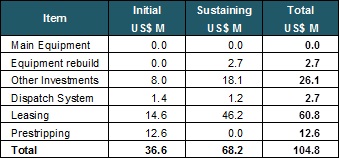
Table 21-14: Open Pit Initial and Sustaining Capital Cost – Option 3
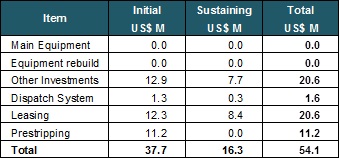
An additional open pit case was also estimated consisting of an open pit, initially producing 60ktpd oxide mineralization and thereafter 12ktpd sulphide mineralization. Results of the initial and sustaining capital mine costs are presented in Table 21-15.
Table 21-15: Open Pit Initial and Sustaining Capital Cost – Option 4
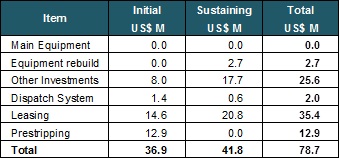
Underground Mine
Development works for the underground mine for Options 3 and 5 will be developed by owner’s personnel.
Extraction and support works will be developed with owner’s equipment, pricing costs from suppliers and from referential values for similar recent projects have been used in cost estimates.
360
|
Unit capital costs for underground equipment are presented in Table 21-16.
Table 21-16: Underground Equipment Prices
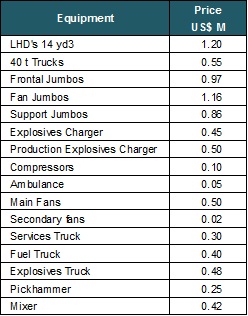
Leased equipment was used in the cost estimates.
A summary of initial and sustaining capital costs for the underground mine are presented in Table 21-17.
Table 21-17: Underground Mine Initial and Sustaining Capital Costs
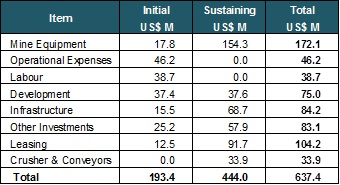
| 21.2.2 | Indirect Costs |
Lump sum allowances or factors have been used to calculate indirect costs as is typical for a PEA. At this level, many of the resourcing and contract strategies are not defined, so reasonable and customary assumptions have been made based on experience on similar projects.
361
|
| 21.2.3 | Owners Cost |
Owners cost is included in the capital estimate and was supplied by Exeter. The estimate for owners cost includes the following items, shown in Table 21-18.
Table 21-18: Owners Costs
| Item | Option 1 | Option 2 | Option 3 | Option 4 | Option 5 |
| US$ M | US$ M | US$ M | US$ M | US$ M | |
| Project Management On/Off Site | 3.5 | 6.0 | 6.0 | 6.0 | 4.2 |
| Legal and Permitting | 2.0 | 3.4 | 3.4 | 3.4 | 2.4 |
| Public Relations | 0.8 | 1.3 | 1.3 | 1.3 | 0.9 |
| Hydrology studies – pit, stockpiles, dams | 0.1 | 0.2 | 0.2 | 0.2 | 0.2 |
| Geotechnical studies – pit, stockpiles, dams | 0.1 | 0.2 | 0.2 | 0.2 | 0.2 |
| Environmental studies | 1.0 | 1.7 | 1.7 | 1.7 | 1.2 |
| Operations crew training | 0.5 | 0.9 | 0.9 | 0.9 | 0.6 |
| Condemnation drilling – all surface disturbance | 0.0 | 1.3 | 1.3 | 1.3 | 1.5 |
| Owners commissioning team | 0.8 | 1.3 | 1.3 | 1.3 | 0.9 |
| Community development contributions | 0.8 | 1.3 | 1.3 | 1.3 | 0.9 |
| General access road upgrade contribution | 0.0 | 1.0 | 1.0 | 1.0 | 1.2 |
| Water and land option conversions | 5.0 | 23.6 | 23.6 | 23.6 | 23.7 |
| Water supply development/permitting | 3.8 | 6.5 | 6.5 | 6.5 | 4.5 |
| Metallurgical testwork & Flotation/Roaster/POX pilot plant | 1.0 | 1.7 | 1.7 | 1.7 | 1.2 |
| Water treatment plant | 1.3 | 2.2 | 2.2 | 2.2 | 1.5 |
| Total | 20.5 | 52.6 | 52.6 | 52.6 | 45.0 |
| 21.2.4 | Contingency |
Contingency is an allowance to cover unforeseeable costs that may arise during project execution, which are within the scope-of-work, but cannot be explicitly defined or described at the time of the estimate due to lack of information. It is assumed that contingency will be spent.
Contingency does not cover scope changes or project exclusions.
| 21.2.5 | Accuracy |
The cost estimates have been developed to a level sufficient to assess/evaluate the project concept and verify its overall potential economic viability. The capital cost estimate is considered to have a level of accuracy of ± 30% with a 90% probability of occurrence. This is based on the level of contingency applied, the confidence levels of the authors in their respective estimates, and an assessment comparing this estimate to standard accuracy levels for PEA estimates.
362
|
The estimated costs are based on the following:
| · | Critical Equipment List |
| · | Equipment budgetary quotations |
| · | Material take-offs estimates |
| · | Alquimia’s historical and current data |
| · | Other costs information from Chilean contractors |
| 21.2.6 | Estimate Exclusions |
The following items are not included in the capital estimate:
| · | Costs incurred prior to commencement of any prefeasibility Study |
| · | All Owner’s taxes, including any financial transaction tax, withholding tax, or value-added tax (VAT) |
| · | Future foreign currency exchange rate fluctuations |
| · | Interest and financing costs |
| · | Escalation beyond first-quarter 2014 |
| · | Risk due to political upheaval, government policy changes, labor disputes, permitting delays, weather delays, or any other force major occurrences. |
| 21.2.7 | Deferred and Sustainable Capital Cost |
During the life of the project there will be a requirement for further capital expenditure. This may take the form of additional mining fleet, capital spares and equipment as required.
| 21.3 | Operating Cost Estimates |
Operating costs have been estimated for the operating areas of Mining, Process Plant, Infrastructure and Administration. Costs were reported under subheadings related to the function of each of the areas identified.
Table 21-19 summarizes total operating cost by area, as well as average unit operating cost. Labor costs for mine and process plant consider only up to Superintendent Level. All senior positions are considered as administration costs.
363
|
The operating costs are considered to have accuracy of ± 30% with a 90% probability of occurrence, based on the assumptions listed in this section of the Report. All unitary operating costs are expressed in processed tonnes.
Table 21-19: Summary of Operating Costs
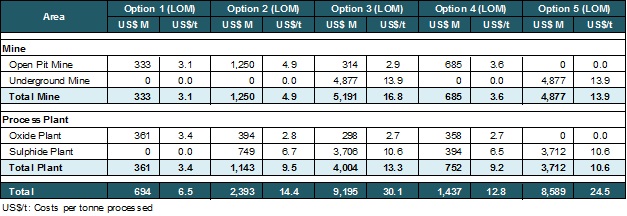
| 21.3.1 | Mining Operating Cost |
Open Pit
The open pit mine area direct costs include all mine operations required to feed the primary crusher. All costs associated with the operation and maintenance of the mine are also included. Blasting operations have been assumed to be by contractors and a full Maintenance and Repair Contract (MARC) is assumed for the first 3 years of operation.
Indirect costs such as training material and office supplies were estimated and are included in the mine operating costs. Food, catering, camp, transport, recreation, safety supplies and work clothes are included in General and Administration costs.
The average open pit mining costs are illustrated for each option in Table 21-20: Open Pit Mine Costs
364
|
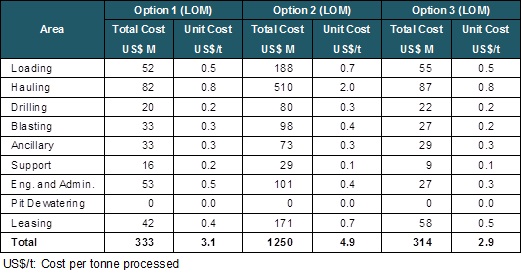
Open pit operating costs for Option 4 are summarized in Table 21-21.
Table 21-21: Open Pit Mine Costs - Option 4
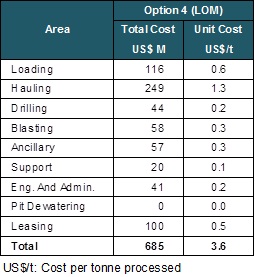
Underground Mine
Underground mine operating costs have been developed from first principles, in a bottom-up unit cost approach. The estimated costs include drilling, blasting, mucking, bolting, utilities and stope backfilling. Paste fill preparation cost has been estimated by Alquimia and is included in the relevant process plant costs.
All operations in the underground mine were estimated using owner equipment fleet and labor.
365
|
Underground operating costs are presented in Table 21-22
Table 21-22: Underground Mine Unit Costs - Options 3 and 5

| 21.3.2 | Process Plant Operating Cost |
Process plant operating costs incorporate labour, energy, maintenance, contracts and reagents and supplies. These operating costs were adjusted for local labor rates and supply costs, while tracking recent experience for projects with similar equipment.
Labor
Labor cost were estimated considering the organizational structure and total process plant labour requirements for the operation presented in Section 17 plus the Chilean high-altitudes mine pay scales presented in Table 21-8.
Energy
Energy costs are calculated considering the power consumption for each operation and energy price as follows.
| · | Contractor rate for site generation of 0.25 US$/kWh for Option 1 |
| · | Energy drawn from SIC at 0.10 US$/kWh for the first 8 years and 0.09 US$/kWh from year 9 to EoM for Options 2, 3, 4 and 5. |
366
|
Reagents and Consumables
Consumptions considered for the Project are based on estimated by Alquimia using testwork data discussed in Section 13. Unit prices are based on indications form manufacturers and suppliers and the database of Alquimia’s database and are shown in Table 21-23.
Table 21-23: Main Reagents and Consumables Unit Prices
| Item | Unit | Value |
| Energy - Site Generation | US$/kWh | 0.25 |
| Energy from SIC - Years 0 to 8 | US$/kWh | 0.10 |
| Energy from SIC - Long Term | US$/kWh | 0.09 |
| Diesel | US$/m3 | 900 |
| Lime | US$/t | 140 |
| NaCN | US$/kg | 2.48 |
| Carbon | US$/kg | 3.90 |
| Cement | US$/t | 140 |
| Steel Balls | US$/kg | 0.90 |
Spare Parts
Spare parts cost per year of 0.8% of the total cost of equipment is considered.
Support Services
This item includes contracts for services such as office and industrial cleaning, personnel safety protection, transport, camps, catering and other expenses necessary to maintain operations personnel.
General and Administration
G&A expenses consider the administrative costs of the process plant, laboratories and warehouse. Senior administration and project overhead cost are also included here.
Process Plant Operating Cost Summary
Table 21-24 summarizes the operating costs for the process plant by unit operation
367
|
Table 21-24: Summary of Process Plant Operating Cost
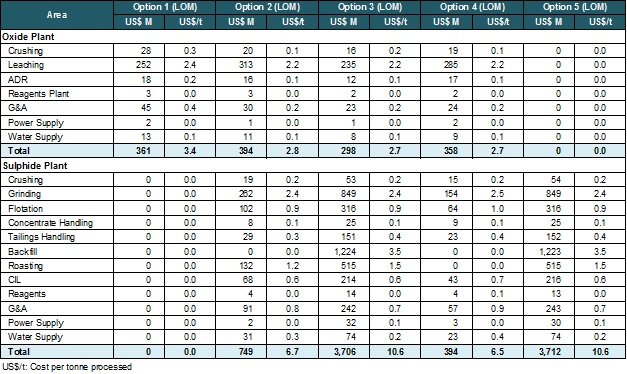
| 21.4 | Cash Cost Indicators |
Total cash costs include mine site operating costs (mining, processing, G&A, royalties and production taxes).
All-in sustaining costs – is the sum of total cash costs, sustaining capital expenditures, corporate general & administrative costs, capitalized and expensed exploration that is sustaining in nature and environmental reclamation/closure costs. There is no assumption for Corporate G&A accounted for at this time.
C1 Cash Cost represents the cash cost incurred at each processing stage, from mining through to recoverable metal delivered to market, less net by-product credits (sulphuric acid only). By product gold and silver are calculated on an equivalent basis (AuEq). C1 Cash Costs generally include: mining, freight and milling costs, purchase and freight costs from third parties in the case of custom smelters or mills, mine-site administration and general expenses, concentrate freight, smelting and smelter general and administrative costs, matte freight, refining and refinery general and administrative costs, marketing costs (freight and selling).
Table 21-25 shows cash cost indicators for each option.
368
|
Table 21-25: Cash Cost Indicators
| Indicator | Unit | Option 1 | Option 2 | Option 3 | Option 4 | Option 5 |
| Cash Cost - AuEq | US$/oz | 546 | 486 | 649 | 443 | 671 |
| Total Cash Cost - AuEq | US$/oz | 589 | 551 | 709 | 492 | 726 |
| All in Sustaining Cash cost AuEq | US$/oz | 676 | 752 | 828 | 671 | 848 |
| C1 Cash Cost - CuEq | US$/lb | NA | 1.31 | 1.77 | 2.51 | 1.83 |
Where:
| · | Gold Equivalent (AuEq) is calculated as follows: |
AuEq (oz) = [Au Production (oz)] + [Ag Production (oz) * Ag Price (US$/oz) / Ag Price (US$/oz)] + [Cu Production (lb) * 2204 * Cu Price (US$/lb) / Au Price (US$/oz)]
| · | Copper Equivalent (CuEq) is calculated as follows: |
CuEq lb = [Cu Production (lb)] + [Au Production (oz) * Au Price (US$/oz) / Cu Price (US$/lb)] + [Ag Production (oz) * Ag Price (US$/oz) / Cu Price (US$/lb)]
| 21.4.1 | All-In Sustaining Cost (AISC) per Ounce of Gold Equivalent |
Figure 21-1 to Figure 21-3 show All-In Sustaining Cost (AISC) per ounce of gold equivalent by year. Annual variations in each of the options are discussed where applicable after each figure.

Figure 21-1: Option 1: AISC per Ounce of Gold Equivalent
369
|
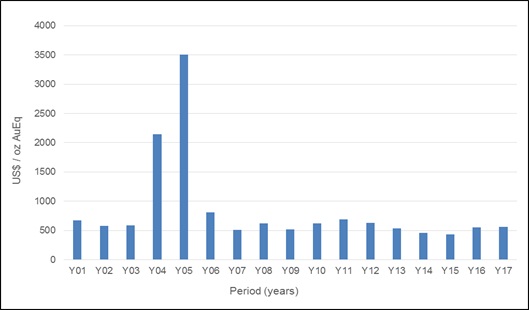
Figure 21-2: Option 2: AISC per Ounce of Gold Equivalent
The variation in costs in years 4 and 5 for option 2 is due to the construction of the sulphide plant. This is being considered as sustaining capital and as such increases the AISC cost per ounce reported for the investment period considered.
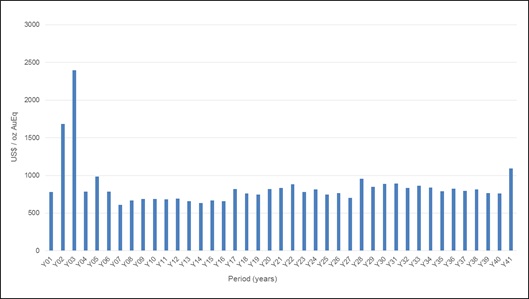
Figure 21-3: Option 3: AISC per Ounce of Gold Equivalent
The variation in costs in years 2 and 3 for option 3 is due to the construction of the sulphide plant. This is being considered as sustaining capital and as such increases the AISC cost per ounce reported for the investment period considered.
370
|
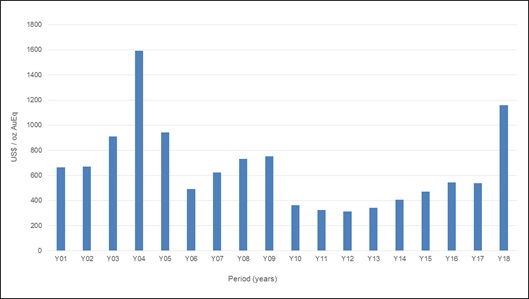
Figure 21-4: Option 4: AISC per Ounce of Gold Equivalent
The variation in costs in year 4 for option 4 is due to the construction of the sulphide plant. This is being considered as sustaining capital and as such increases the AISC cost per ounce reported for the investment period considered.

Figure 21-5: Option 5: AISC per Ounce of Gold Equivalent
371
|
| 21.4.2 | C1 Cash Cost per Pound of Copper Equivalent |
Figure 21-6 to Figure 21-9 show C1 Cash Cost per pound of copper equivalent by year. Annual variations for each option are largely due to operational changes such as strip ratios or sustaining capital investments.

Figure 21-6: Option 2: C1 Cash Cost per Pound of Copper Equivalent
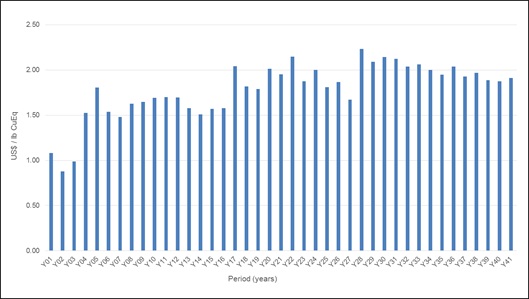
Figure 21-7: Option 3: C1 Cash Cost per Pound of Copper Equivalent
372
|
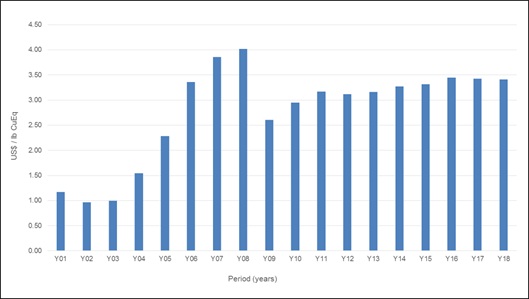
Figure 21-8: Option 3: C1 Cash Cost per Pound of Copper Equivalent
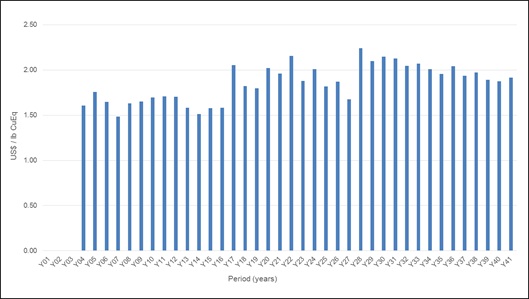
Figure 21-9: Option 3: C1 Cash Cost per Pound of Copper Equivalent
373
|
| 22 | ECONOMIC ANALYSIS |
| 22.1 | Caution Regarding Forward-Looking Information |
| 22.2 | Introduction |
The results of the PEA discussed in this section represent forward-looking information as defined under Canadian securities law. The results depend on inputs that are subject to a number of known and unknown risks, uncertainties and other factors that may cause actual results to differ materially from those presented here. Some of the information that is forward-looking includes, but is not limited to:
| · | Mineral Resource estimates |
| · | Assumed metal prices |
| · | The proposed mine and process production plan |
| · | Projected recovery rates |
| · | Infrastructure costs |
| · | Ability to obtain sufficient process water to support planned project activities |
| · | Ability to obtain sufficient electrical power to support planned project activities |
| · | Ability to permit the Project, in particular the assumption that an environmental permit allowing mine production will be approved by the appropriate Chilean authorities. |
The preliminary economic analysis is based on the estimated Capex and Opex and revenue calculated thereof. The Capex and Opex were developed as noted in Section 21. This section illustrates the projects revenues and associated preliminary economic analysis. Cash flow and preliminary economic analyses were performed from effective date that equipment was on the project site.
The preliminary economic analysis has been calculated pre and post taxes and includes the Anglo American and third party net smelter royalty totalling 3.08% and the Chilean state Royalty. The economic analysis also includes a post-tax discussion but as Alquimia is not a financial advisor these figures should be confirmed with a recognised tax expert. Sensitivities based on commodity price, metals recovery, operating cost and capital expenditure variation are highlighted in Figure 22-6 to Figure 22-8 and the results discussed in Section 22.7.
The economic analysis contained in the PEA is considered preliminary in nature. No inferred mineral resources form part of the PEA studies and no mineral reserves for the
374
|
PEA have been established. Mineral resources are not mineral reserves and have no demonstrated economic viability. There is no certainty that economic forecasts outlined in the PEA will be realized. The PEA and the Cube 2012 Mineral Resource (as defined herein) may be materially affected by environmental, permitting, legal, title, taxation, socio-political, marketing or other relevant factors.
| 22.3 | Methodology Used |
Alquimia has estimated the Project’s net present value based on a discounted cash flow model. Using the mine plan as input, the model calculates annual quantities of metal production and associated revenues, and the capital, operating and other costs to sustain production.
The model considers closure costs, committed as required by the Chilean legislative authorities11. Closure costs for each option considered have been calculated as 5% of the total initial direct capital cost assigned to process plant capital cost.
Chilean legislation allows that the estimated cost for closure can be guaranteed by:
| · | Cash lodged in a bank account |
| · | Bank guarantee or |
| · | Standby Letter of Credit issued by a Bank with a minimum of ‘A’ rating. |
The model has assumed that one of the latter 2 mechanisms will be used and has applied the estimated closure costs in the last year of operation and two years post closure.
| 22.4 | Financial Model Parameters |
The base-case discount rate is 5%. Chile is a politically stable country and the Caspiche Project has similar technical features as several other projects or operations in Chile. The major sources of financial uncertainties are metal price and cost escalation.
NPV has been calculated to the annual period prior to initial mining capital expenditure, considered as Period 1.
The exchange rate is not a direct input in the financial model since all the input costs are converted to US$. However, a significant part of the cost will actually be in Chilean pesos (CLP) and Alquimia applied an exchange rate of 540 pesos per US$ in the cost estimation.
36 Law 20.551, see http://www.leychile.cl/Navegar?idNorma=1032158
375
|
Since the analysis is based on a cash flow estimate, it should be expected that actual economic results might vary from these results. The PEA has been completed to a level of accuracy of ±35%. The PEA is not a preliminary feasibility study or feasibility study as defined by the NI 43-101 guidelines.
Economic parameters used for the evaluation are shown in Table 22-1.
Table 22-1: Main Economic Parameters

376
|
| 22.5 | Taxes and Royalties |
The financial results are presented on a pre-income tax basis throughout this document. However, the third party NSR has been deducted as well as the Mining Royalty Tax. An after-tax analysis of the financial results for the Project is presented in Section 22.6.
The Chilean tax code applicable to mining companies and mining operations is complicated. Consequently the following is not a comprehensive review of all potential Chilean income tax requirements and is only a general summarized description of the Chilean income tax code applicable to mining companies.
| 22.5.1 | Income Tax |
The corporate income tax legislation provides for a system divided as follows:
First Category Tax
First Category Tax is due on income derived from commercial, industrial and agricultural activities; mining, fishing and other extractive activities; investment; and real estate. At the date of this Technical Report the corporate tax rate is 20% and affects all taxpayers which carry out these activities.
Additional Tax (Impuesto Adicional)
This tax operates as a withholding tax and affects, amongst others, Chilean-source income withdrawn or remitted abroad to non-residents or non-domiciled individuals, companies or other entities organised abroad with or without a permanent establishment in Chile in the form of branches, offices, agencies or representatives. Dividends paid to the shareholders not domiciled or resident in Chile are subject to a withholding tax on distribution at a rate of 35%.
However, if the distributed amounts had been subject to First Category tax, a 20% credit is given against the additional tax such that the total effective tax rate on profits distributed is 35%. The additional tax must be withheld by the corporation. The same tax procedure is applicable on remittances of profit to partners or profit withdrawn by individuals not domiciled or resident in Chile. The new Chilean administration has presented a number of suggested changes to the tax regime which are currently under discussion, The bill proposes an increase in the first category income tax rate on corporate income over a four-year period, as follows: 21% in 2014, 22.5% in 2015, 24% in 2016 and 25% in 2017. These changes may or may not be implemented in the future and should they be approved the economic analyses presented in this Technical Report may need to be updated.
377
|
Depreciation
Depreciation on fixed assets, except for land, is tax deductible by the straight-line method based on the asset’s useful life in accordance with the guidelines of the Internal Revenue Service (SII), computed on the asset restated value. A shorter lifespan has been set by the Internal Revenue Service to apply to fixed assets purchased after 2003. However, the taxpayer may opt for accelerated depreciation for new assets when acquired locally, or new or used assets when imported, with useful lives of over five years. For this purpose, the assets will be assigned useful lives equivalent to one-third of the normal, eliminating fractions of months. Taxpayers may discontinue the use of the accelerated method at any time but may not return again to the accelerated method. Publically available documents published by the SII include the straight-line and accelerated depreciation schedules for different asset categories.
No allowance is made for amortization of intangible assets such as goodwill, patents, trademarks, etc. Depletion is not tax deductible.
Stock/Inventory
The costing of goods sold or production materials and supplies consumed are based on the first-in, first-out (FIFO) basis, although the ‘average’ method may be elected. The method adopted determines the basis for the valuation of the closing inventory. The valuation so determined is however, adjusted for the manner stipulated for the annual monetary correction procedures.
Dividends
Chilean companies receiving dividends from Chilean corporations are exempt from First Category tax. There is no distinction in Chile between personal dividends and inter-company dividends. A dividend in kind as such does not exist. Dividends are necessarily expressed in cash, notwithstanding the fact that the company may distribute certain assets corresponding in value to the dividend amount. Stock dividends in the form of bonus shares or increases in the par value of existing shares are not considered income for tax purposes.
Interest Deduction
Generally, interest accrued or paid in the financial year is a deductible expense, provided that it has been incurred in connection with loans related to the business. The interest accrued on this expense is not tax deductible. The draft bill submitted to Congress in April 2014 looks to modify thin capitalization rules. These thin capitalization rules impose a special tax on interest on debt that exceeds a debt-to-equity ratio of 3:1. The new provision would affect interest and any other expenses relevant to financing, such as commissions and remuneration. Although the 3:1 debt-to- equity ratio to determine the existence of excess indebtedness would be maintained, excess indebtedness also would be deemed to exist if financing expenses exceed 50% of the taxpayer’s net taxable income for the period, before such expenses are deducted. For these purposes, certain adjustments would need to be made to net taxable income. In addition, for purposes of
378
|
determining excess indebtedness, not only foreign debt, but also debt incurred with Chilean resident parties would be taken into account. The new rules would apply as from 1 January 2015.
Losses
Tax losses incurred can be applied against future profits or carried back without any time limit. It is not possible to group profitable and non-profitable affiliates for tax purposes.
Foreign Sourced Income
Non-domiciled or non-resident corporations are only subject to income taxes on their Chilean-sourced income. If the domestic corporation receives amounts in excess of the book value of an investment when a foreign subsidiary is liquidated, these monies are considered income subject to regular taxes. From 2012, the income received or accrued from derivatives such as forwards, futures, swaps and options, by persons or entities without domicile or residence in the country, is not affected by income tax, except those arising from derivatives that are settled by physical delivery of shares or rights in companies incorporated in Chile.
Interest payments to financial institutions not domiciled in Chile are subject to an additional withholding tax of 4%. There is no withholding tax on interest paid between Chilean companies but the loan has to be made at a commercial rate of interest
| 22.5.2 | Mining Royalty Tax |
All mining properties are subject to statutory obligations to the Chilean Government in the form of a Mining Royalty Tax or “Impuesto Específico a la Minería” in Spanish (IEM). This tax was introduced in 2006 and amended in 2010, and is applied against the collective operating (mining) profits of all the operating units. The tax rate is calculated on a step scale on the basis of fine copper equivalent sales:
| · | 0 to 12,000 t copper equivalent: No tax applied |
| · | 12,001 to 50,000 t copper equivalent: 0.5% to 4.5% of the Mining Operating Income according to the scale presented in Table 22- 2 |
| · | Greater than 50,000 t copper equivalent: A different scale applies that starts at 5% of the Mining Operating Income for Mining Operating Margins of less than 35% up to 34.5% for Mining Operating Margins in excess of 85%. This scale is shown in Table 22-3 |
379
|
Table 22-2: Mining Royalty Tax Scale for Mining Exploitation under 50,000 t of Equivalent Copper
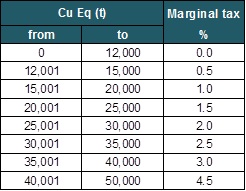
Table 22-3: Mining Royalty Tax Scale for Mining Exploitation over 50,000 t of Equivalent Copper

The Mining Operating Income on which this tax is applied is determined following certain specific rules. Certain expenses such as losses from past periods, accelerated depreciation of fixed assets, etc. are not allowed for this purpose.
The Mining Operating Margin is determined as a ratio of the Mining Operating Income to the mining operational revenues.
| 22.5.3 | Production and Revenue |
Total payable metal production of Cu, Au and Ag, saleable sub-products, such as Cu2S and sulphuric acid and revenues associated for all options studied are summarized in Table 22-5. The options considered in this study are:
| · | Option 1: 30 ktpd open pit mine for gold and silver oxide mineralization treated by heap leaching |
380
|
| · | Option 2: 60 ktpd open pit mine for gold and silver oxide mineralization treated by heap leaching and 27 ktpd open pit mine for gold and copper sulphide mineralization treated in a conventional concentrator plant |
| · | Option 3: 60 ktpd open pit mine for gold and silver oxide mineralization treated by heap leaching and 27 ktpd underground mine for gold and copper sulphide mineralization treated in a conventional concentrator plant |
| · | Option 4: 60 ktpd open pit mine for gold and silver oxide mineralization treated by heap leaching and 12 ktpd open pit mine for gold and copper sulphide mineralization treated in a conventional concentrator plant |
| · | Option 5: 27 ktpd underground mine for gold and copper sulphide mineralization treated in a conventional concentrator plant. |
In tabular form these options can be shown as follows:
Table 22-4: Options Summary
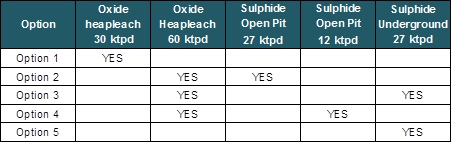
Table 22-5: Production Summary
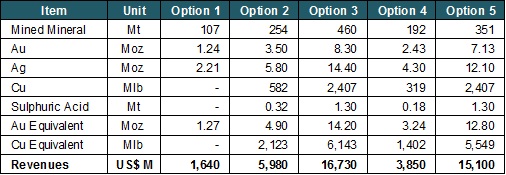
Table 22-5 presents summarised production of gold, copper, silver and sulphuric acid and revenue by option. Table 22-6 presents annual gold and silver production for Option 1, the stand alone heap leach, Table 22-7 to Table 22-9 present gold, silver, copper and sulphuric acid annual production for options 2 – 4 and Table 22-10 presents gold, copper and sulphuric acid annual production for Option 5.
381
|
Table 22-6: Annual Production – Option 1
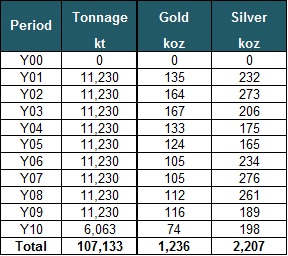
Table 22-7: Annual Production – Option 2

382
|
Table 22-8: Annual Production – Option 3
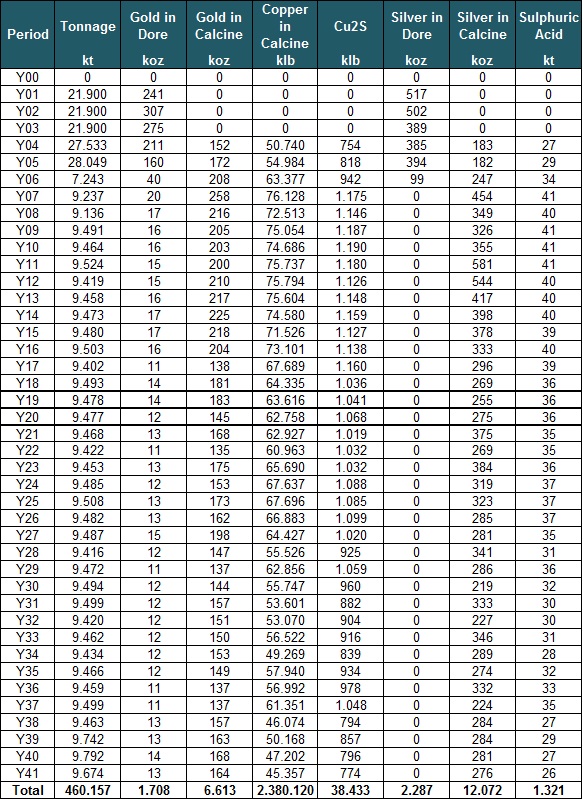
383
|
Table 22-9: Annual Production – Option 4
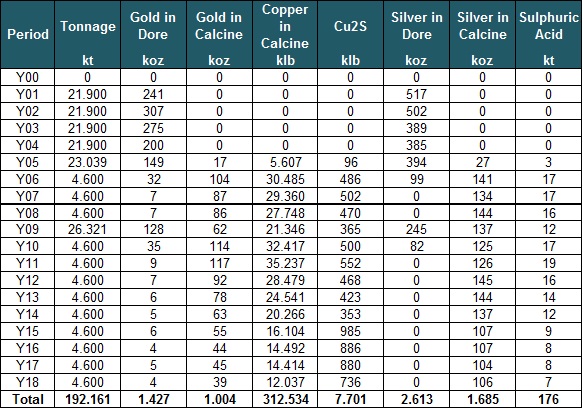
384
|
Table 22-10: Annual Production – Option 5
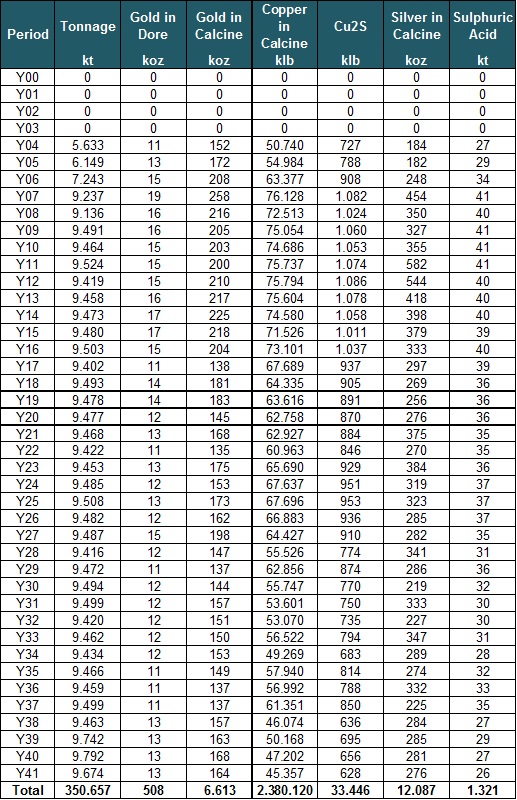
385
|
| 22.5.4 | PEA Economic Evaluation Results |
Based on the projections resulting from the financial model, the pre-tax NPV, IRR and payback periods are shown in Table 22-11.
Table 22-11: Summary of Pre-Tax Preliminary Economic Evaluation Results

The cumulative cash flows calculated for each option pre and post tax are presented in Figure 22-1 to Figure 22-5.
386
|
Table 22-13 present annual and accumulated cash flow Pre-tax and After-tax respectively

Figure 22-1: Cash Flow – Option 1
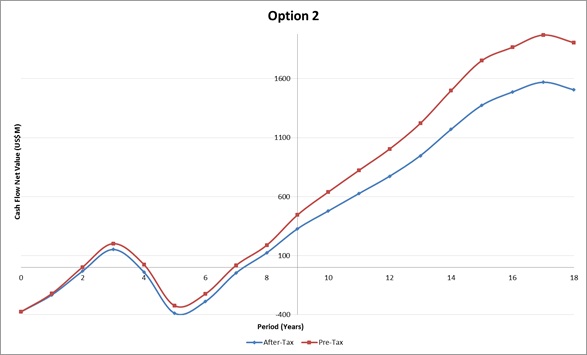
Figure 22-2: Cash Flow – Option 2
387
|
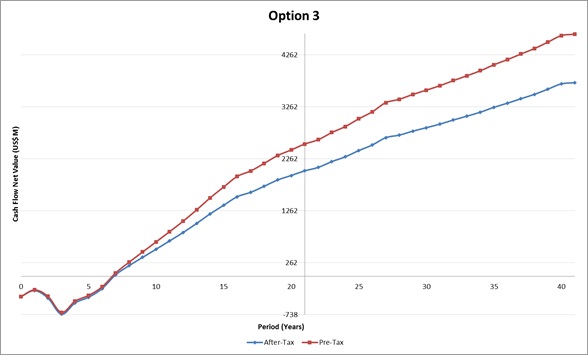
Figure 22-3: Cash Flow – Option 3
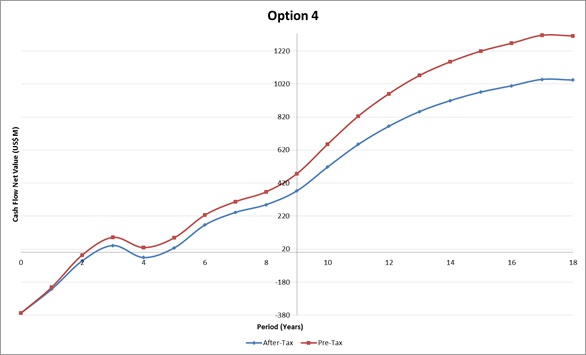
Figure 22-4: Cash Flow – Option 4
388
|
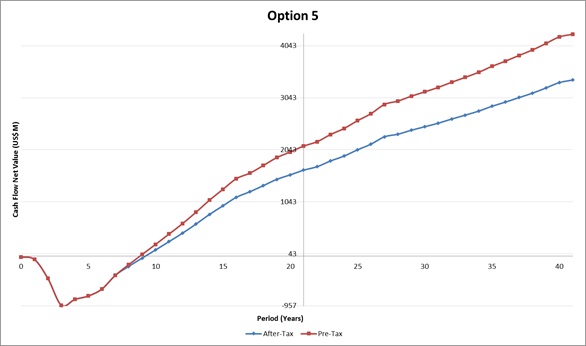
Figure 22-5: Cash Flow – Option 5
389
|
Table 22-12: Annual and Accumulated Cash Flow Pre-tax
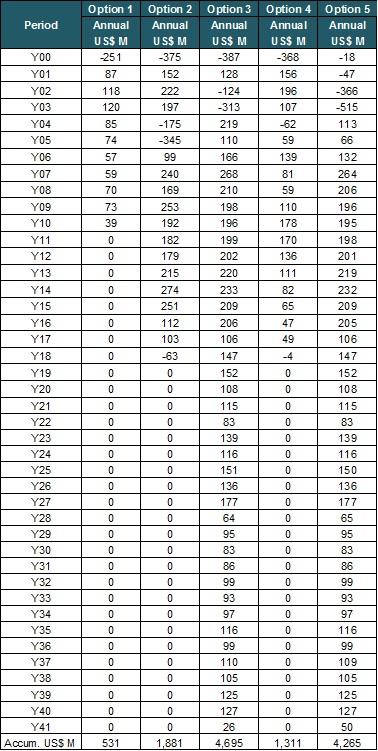
390
|
Table 22-13: Annual and Accumulated Cash Flow After-tax
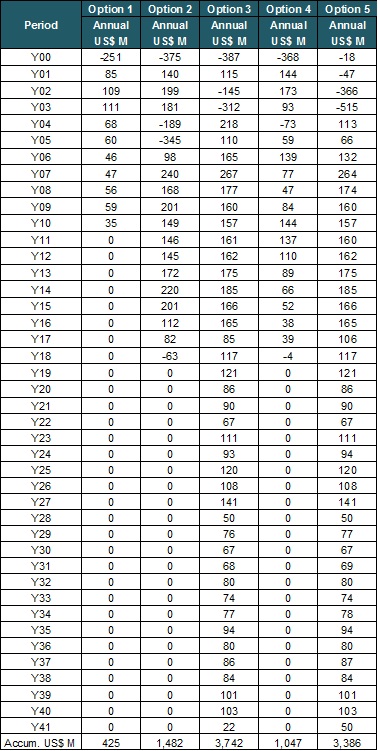
391
|
| 22.5.5 | Sensitivity Analysis |
NPV sensitivity analyses have been performed for changes in market price for copper and gold, changes in recovery rates for copper and gold, changes in capital and operating costs, and changes to discount rate. Sensitivity analyses were performed on base rate, 20%, taxation only.
Changes in metal prices are expressed in increments of 25 cUS/lb for copper and US$50 per ounce for gold. Operating and capital costs are expressed in 5% increments of negative and positive deviation from the Base Case values. For discount rate, sensitivity has been made by increments of 1% between 0% and 10%.
Option 1
For option 1, NPV is most sensitive to changes in discount rate and the gold price. For every US$25/oz change in the gold price NPV5 increases or decreases approximately US$22 million or 6%. The project is least sensitive to changes in capex.
Table 22-15 and Figure 22-6 show main economic indicators at various gold prices and discount rates.
392
|
Table 22-14: Gold Price Sensitivity – Option 1
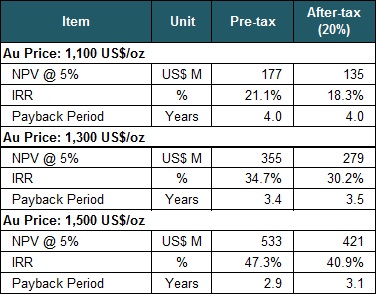
393
|
Table 22-15: Discount Rate Sensitivity – Option 1

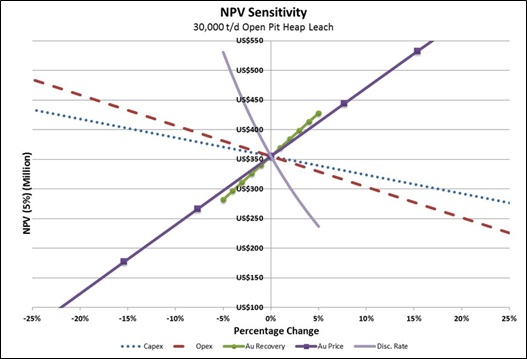
Figure 22-6: NPV Sensitivity – Option 1
Option 2
For Option 2, NPV is most sensitive to changes in discount rate, the gold price and the copper price. For every US$25/oz change in the gold price NPV5 increases or decreases approximately US$51 million or 5.3%. For every US$0.25/lb. change in the copper price NPV5 increases or decreases approximately US$74 million or 7.6%.
Table 22-16 to Table 22-18 and Figure 22-7 show main economic indicators at various gold prices, copper prices and discount rates.
394
|
Table 22-16: Gold Price Sensitivity – Option 2
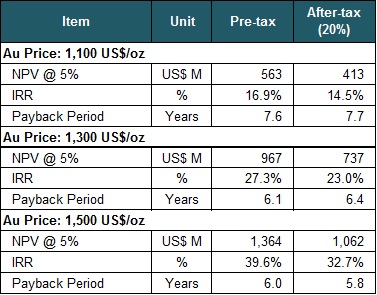
Table 22-17: Copper Price Sensitivity – Option 2

395
|
Table 22-18: Discount Rate Sensitivity – Option 2


Figure 22-7: NPV Sensitivity – Option 2
Option 3
For option 3, NPV is most sensitive to changes in discount rate, the gold price and the copper price. For every US$25/oz change in the gold price NPV5 increases or decreases approximately US$84 million or 5%. For every US$0.25/lb. change in the copper price NPV5 increases or decreases approximately US$206 million or 12.6%.
Table 22-19 to Table 22-21 and Figure 22-8 show main economic indicators at various gold prices, copper prices, and discount rates.
396
|
Table 22-19: Gold Price Sensitivity – Option 3
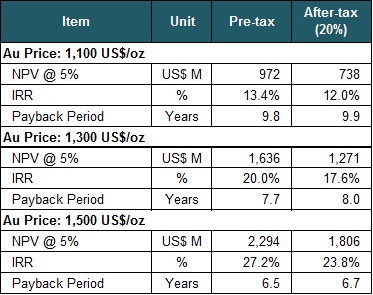
Table 22-20: Copper Price Sensitivity – Option 3
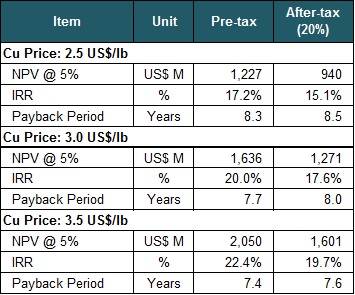
397
|
Table 22-21: Discount Rate Sensitivity – Option 3
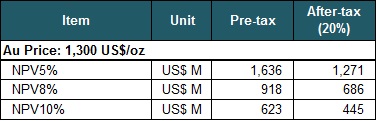
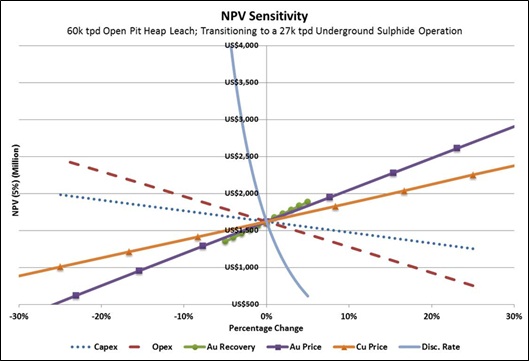
Figure 22-8: NPV Sensitivity – Option 3
Option 4
Sensitivity analysis for Option 4 indicates that NPV is most sensitive to changes in discount rate and the gold price. For every US$25/oz. change in the gold price NPV5 increases or decreases approximately US$38 million or 5.2%. For every US$0.25/lb. change in the copper price NPV5 increases or decreases approximately US$47 million or 6.4%.
Table 22-22 to Table 22-24 and Figure 22-9 show main economic indicators at various gold prices, copper prices and discount rates.
398
|
Table 22-22: Gold Price Sensitivity – Option 4
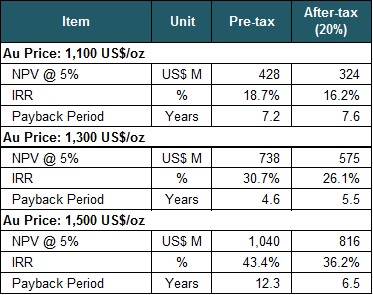
Table 22-23: Copper Price Sensitivity – Option 4

399
|
Table 22-24: Discount Rate Sensitivity – Option 4
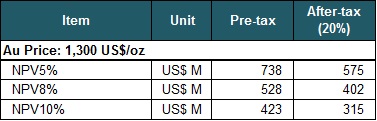

Figure 22-9: NPV Sensitivity – Option 4
Option 5
Sensitivity analysis for Option 5 indicates the NPV is most sensitive to changes in discount rate, the gold price and the copper price. For every $25/oz. change in the gold price NPV5 increases or decreases approximately US$61 million or 4.7%. For every $0.25/lb. change in the copper price NPV5 increases or decreases approximately US$202 million or 15.4%.
Table 22-25 to Table 22-27 and Figure 22-10 show main economic indicators at various gold prices, copper prices and discount rates.
400
|
Table 22-25: Gold Price Sensitivity – Option 5
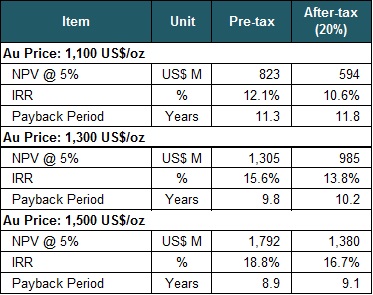
Table 22-26: Copper Price Sensitivity – Option 5
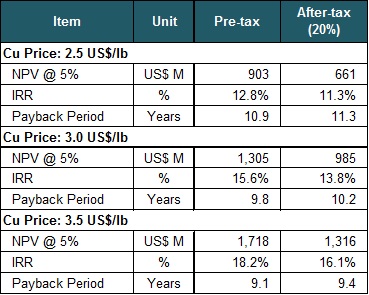
401
|
Table 22-27: Discount Rate Sensitivity – Option 5

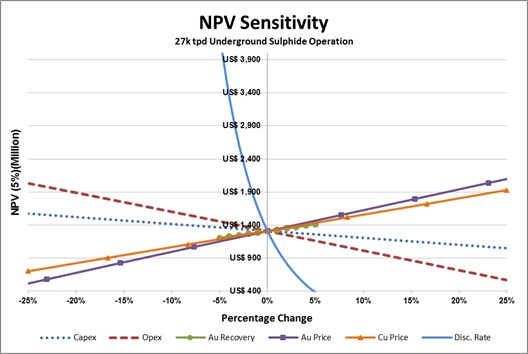
Figure 22-10: NPV Sensitivity – Option 5
| 22.6 | After Income Tax Analysis |
Alquimia is not a financial adviser, and these models are indicative only. Alquimia recommends that the Company and other readers of this Technical Report seek their own financial and tax advice before taking action in relation to the financial matters herein.
The preliminary financial models and results have been presented on a pre-income tax basis after deducting the Mining Royalty Tax. After-tax sensitivities have been prepared to illustrate on a pro-forma basis the potential impact of different taxation scenarios that may be applicable.
The preparation of a comprehensive after-tax model results from proper tax planning, modelled with the advice of taxation specialists, which rely on a number of material assumptions that cannot be defined at this point, but can be generally grouped into:
402
|
| · | The optimal capital structure (leverage) |
| · | The financial and commercial terms and conditions available in the markets at the time of preparing the actual comprehensive funding package for the Project |
| · | The availability and principal characteristics of multi-jurisdictional tax planning alternatives. |
These assumptions depend on multiple material variables including, but not limited to:
| · | The financial, operational and commercial strength and the country of origin of strategic partners, joint venture partners, or other sponsors that would be involved in the development and operation of the Project |
| · | The conditions prevailing in the multiple debt, equity and other financial markets relevant to the Project |
| · | The country of origin of the Project’s main equipment suppliers, and |
| · | The conditions prevailing in the main commercial markets relevant to the Project (off-take, EPCM, power supply, etc.). |
Table 1-20 shows post-tax main economic indicators, considering 20% and 35% income tax rates.
Table 22-28: Summary of Post-Tax Economic Evaluation Results
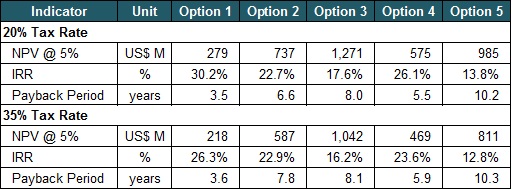
| 22.7 | Conclusion from the Preliminary Economic Analysis |
The NPV5, IRR and payback period indicate the following:
| · | All five options have positive NPV |
| · | Option 1 presents the best return (IRR) and shortest payback at low capital investment |
403
|
| · | Option 2 provides a potentially viable alternative at low CAPEX and OPEX |
| · | Option 3 provides the most favourable economic return in terms of NPV |
| · | Option 3 provides the highest revenue due to the largest resource exploitation of the options studied |
| · | Option 4 provides the second best IRR and payback period |
| · | Option 5 indicates that there is a potentially viable economic strategy for the development of an underground operation only, should it be required for corporate or other reasons. |
404
|
| 23 | ADJACENT PROPERTIES |
There are no properties immediately adjacent to the Caspiche project that is at the same state of development as the Caspiche Porphyry deposit.
405
|
| 24 | OTHER RELEVANT INFORMATION |
| 24.1 | Drilling Data |
Since the completion of the Mineral Resource Estimate in April 2012, the Cube 2012 MRE, Exeter has completed four metallurgical drill holes and received final assay data for the last two diamond holes of the 2012 campaign. The four metallurgical holes are sampled by 4 m composite lengths over a total down hole length of 2,088 m. The two diamond holes with final assay data are CSD090 (573 m) and CSD092 (537 m) both have been sampled on 2 m composite lengths. Cube has made investigations of these specific holes by comparing them to the estimation domain, block model outcomes and holes nearby to ensure they do not represent new data which has a material effect on the Cube 2012 MRE. It is Cube’s opinion that the new holes do not represent or cause material changes to the Cube 2012 MRE.
406
|
| 25 | INTERPRETATIONS AND CONCLUSIONS |
Certain information and statements contained in this Technical Report are “forward-looking” in nature. Forward-looking statements include, but are not limited to, statements with respect to the potential economic and feasibility parameters of the Caspiche Project; the cost and timing of the potential development of the project; the proposed mine plan and mining method, stripping ratio, processing method and rates and production rates; grades; projected metallurgical recovery rates; infrastructure, capital, operating and sustaining costs; the projected life of mine and other expected attributes of the Caspiche Project; the net present value (NPV) and internal rate of return (IRR) and payback period of capital; cash costs and all-in sustaining costs; the success and continuation of exploration activities; estimates of mineral Resources; the future price of copper, gold and silver; availability of power and water; the timing of environmental assessment process; government regulations and permitting timelines; estimates of reclamation obligations that may be assumed; requirements for additional capital; environmental risks; and general business and economic conditions.
Forward-looking information statements involve known and unknown risks, uncertainties and other factors which may cause the actual results, performance or achievements to be materially different from any of the future results, performance or achievements expressed or implied by forward-looking statements.
These risks, uncertainties and other factors include, but are not limited to, the assumptions underlying the PEA and economic parameters discussed herein not being realized; decrease in future gold, silver and copper prices; cost of labour, supplies, fuel and equipment rising; actual results of current exploration; location and availability of power and water; adverse changes in project parameters; discrepancies between actual and estimated production, Mineral Resources and recoveries; exchange rate fluctuations; delays in costs inherent in consulting and accommodating rights of indigenous groups; title risks; regulatory risks and political or economic developments in Chile; changes to tax rates; risks and uncertainties with respect to obtaining necessary surface rights and permits or delays in obtaining same, risks associated with maintaining and renewing permits and complying with permitting requirements; and other risks involved in the exploration and development industry; as well as those risk factors discussed elsewhere in this report.
| 25.1 | Strengths, Weaknesses, Opportunities and Threats |
As the Technical Report is at Preliminary Economic Assessment level it is difficult to define specific strengths, weaknesses, opportunities and threats (SWOT) to the individual options considered. The options are largely similar in mining method and process route and as such the SWOT analyses presented in the following sections can be applied to each option. Should the project be developed further then a more detailed analysis of the SWOT’s for the options selected can be completed with a greater degree of available information.
407
|
The SWOT’s presented in the following sections have been separated into distinct development areas where applicable.
| 25.1.1 | General |
Strengths
| · | Chile is an investment grade jurisdiction with Fitch rating of A+ and Moody´s Aa3 with stable outlook |
| · | Mining friendly culture |
| · | Defined transparent processes for permitting |
| · | Comprehensive mining support services within the country |
| · | Opportunity to develop the project in a staged manner |
| · | Project benefits from various options and scalability. |
Weaknesses
| · | Personnel availability, at all levels, as other projects start up |
| · | Agreements with local stakeholders are not yet in place. |
Opportunities
| · | Project will be designed to meet international and ISO standards |
| · | Access to new and emerging technologies and infrastructure |
| · | Sign up to International Cyanide Management Code: improved community perceptions of cyanide transport, handling and use. |
Threats
| · | Potential increases in corporate tax rates |
| · | Overall water supply in the region and country. |
| 25.1.2 | Geology |
Strengths
| · | Mineral Resources are well defined for conversion to reserves |
408
|
| · | Continuous mineralization with minimal grade variability |
| · | Relatively clean contact zone between oxide and sulphide mineralization. Minimal transitional material to be processed. |
Weaknesses
| · | Less geotechnical information available at depth in the pit and underground areas due to lower drill density. |
Opportunities
| · | Further exploration upside in areas surrounding Caspiche |
| · | Resource potential within the Caspiche Epithermals. |
Threats
| · | Availability of equipment and personnel to develop exploration plans in a timely manner. |
| 25.1.3 | Mine |
Weaknesses
| · | Further geotechnical studies need to be developed for the underground mine |
| · | Unforeseeable conditions could develop requiring adjustments to the mine plan that may impact the production profile |
| · | The location and design of waste and mineralised stockpiles needs to be further assessed |
| · | Further studies need to consider initial training period |
| · | Rheology and strengths tests need to be completed using Caspiche tailings to determine backfilling properties. |
Opportunities
| · | Review new mining technologies such as intensive blasting, which may reduce downstream processing costs |
| · | Mine fleet optimization studies and mine scheduling may be further developed in order to improve equipment matching and plant scheduling |
| · | Investigate the use of contractors for the open pit mining and the underground development |
409
|
| · | Investigate the MacNeill recoveries behaviour to include this material in the production plan |
| · | Investigate the transition-sulphides limit including recovery tests for the transition material |
| · | Mining recovery for underground options may be increased using remote control LHD´s avoiding drawpoints in the production levels. |
| 25.1.4 | Recovery |
Strengths
| · | Oxide mineralization has simple metallurgy and good recovery |
| · | In general oxidized and sulphide mineralization has comparatively low rock hardness and abrasiveness |
| · | Proven technologies exist for recovery of both oxide and sulphide mineralization |
| · | Good sedimentation properties for all products |
| · | Compact plant design footprint |
| · | Filtered tailings deposition increases stability and reduces potential for infiltration. |
Weaknesses
| · | Oxide mineralization ROM size distribution requires further evaluation as feed size to the plant may impact recovery and throughput |
| · | Arsenic treatment and disposal in the sulphide mineralization needs further test work |
| · | Geometallurgical studies are required to improve the understanding of mineral units within the sulphide zone |
| · | Wider grinding test variability is needed to clearly define optimum grind size for concentrator |
| · | Gold recovery from the sulphide mineralization scavenger tails needs to be evaluated further to determine the optimum recovery process |
| · | Recovery algorithms should be developed for optimization of sulphide mineralization recovery based on the findings of additional test work and completion of a more detailed geometallurgical model. |
410
|
Opportunities
| · | Further flotation test work with finer grinding product may improve overall gold and copper recoveries as a result of increasing liberation |
| · | Use of intensive blasting and mine to mill technologies may reduce capital and operating costs. |
Threats
| · | Assay composites completed to date may not accurately identify geological units and corresponding recovery rates; individual samples from each geological unit should be tested to improve this correlation. |
| 25.1.5 | Infrastructure |
Strengths
| · | Access; close to regional road system |
| · | Power availability; improvements in power supply and transmission network as part of ongoing national improvements to be completed in 2017. |
Weaknesses
| · | Port facilities; agreement should be reached with port operators as currently there are few public ports in the area. This may change as new port approvals are granted |
| · | Water catchment area exploration required to discover and confirm availability of sufficient water source |
Opportunities
| · | Lower power costs as additional generation capacity comes on stream in time for project development and implementation of new government policies designed to reduce energy cost |
| · | Infrastructure sharing with neighbouring operations |
| · | Improved access to support infrastructure for local stakeholders. |
Threats
| · | Potential restrictions on water supply and /or water extraction rights. |
411
|
| 25.1.6 | Marketing |
Strengths
| · | No penalties are expected on the sale of calcined concentrate |
| · | High precious metals content in concentrate could make the product more attractive to the market |
| · | Doré market competitive and without issues. |
Weaknesses
| · | Additional costs involved to remove arsenic and antimony from the concentrate. |
Opportunities
| · | Longer term market demand may drive prices higher than those used in the study evaluation |
| · | Potential to market smaller lots of uncalcined copper concentrate and pay a smelter penalty which may reduce capital and operating costs for the roaster plant. |
Threats
| · | Short term smelter capacity shortfalls |
| · | Potential for reduced smelter tolerance levels for penalty elements in concentrate. |
| 25.1.7 | Environmental |
Strengths
| · | Significant baseline data collected |
| · | No permanent settlements or residents in the immediate area. |
Weaknesses
| · | Increased traffic density within the area will require mitigation |
| · | Mitigation against potential changes in downstream water quality |
| · | Acid rock drainage for waste rock needs further characterization. |
412
|
Opportunities
| · | Build on good indigenous community relations and work with local community to develop a sustainable project and community relations plan |
| · | Incorporation of additional local infrastructure which will benefit the community |
| · | Increased community employment, training and education opportunities. |
Threats
| · | Perception of cyanide use and arsenic treatment. |
| 25.2 | Conclusions |
| · | The study involved the evaluation of the economic potential of developing three primary and two secondary options, as follows: |
| ° | Option 1: 30 ktpd open pit mine for gold and silver oxide mineralization treated by heap leaching |
| ° | Option 2: 60 ktpd open pit mine for gold and silver oxide mineralization treated by heap leaching and 27 ktpd open pit mine for gold and copper sulphide mineralization treated in a conventional concentrator plant |
| ° | Option 3: 60 ktpd open pit mine for gold and silver oxide mineralization treated by heap leaching and 27 ktpd underground mine for gold and copper sulphide mineralization treated in a conventional concentrator plant |
| ° | Option 4: 60 ktpd open pit mine for gold and silver oxide mineralization treated by heap leaching and 12 ktpd open pit mine for gold and copper sulphide mineralization treated in a conventional concentrator plant |
| ° | Option 5: 27 ktpd underground mine for gold and copper sulphide mineralization treated in a conventional concentrator plant. |
In tabular form these options can be shown as follows:
413
|
Table 25-1: Options Summary
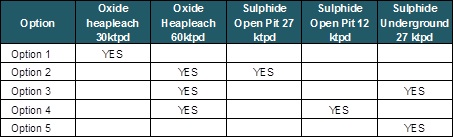
| · | No fatal flaws were identified during the course of the Caspiche Project Preliminary Economic assessment. The recommendations are largely based on normal metallurgical and other development test work which would be part of project development |
| · | The conclusion of the pit optimization stage suggested design of a series of practical phases and final pit for each option. |
| ° | Option 1: The ultimate pit has been divided in 4 phases. This option contains 107 Mt of mineralized material at an average head grade of 0.44 g/t Au and 1.58 g/t Ag |
| ° | Option 2: The ultimate pit has been divided in 4 phases for the initial oxide production and 3 phases for the extended pit including sulphide production. This option contains 143 Mt of mineralized oxide material at an average head grade of 0.38g/t Au and 1.54 g/t Ag and 207 Mt of mineralized sulphide material at an average head grade of 0.55 g/t Au, 1.12 g/t Ag and 0.20% Cu |
| ° | Option 3: The ultimate pit has been divided in 4 phases for the initial oxide production. Underground planning indicates 25 levels with stopes of 30 m x 40 m x 50 m. This option contains 110 Mt of mineralized oxide material at an average head grade of 0.42 g/t Au, 1.62 g/t Ag and 351 Mt of sulphide mineralized material at an average head grade of 0.83 g/t Au, 1.45 g/t Ag and 0.35% Cu. |
| ° | Option 4: The ultimate pit has been divided in 4 phases for the initial oxide production and 1 phase for the extended pit including sulphide production. This option contains 131 Mt of mineralized oxide material at an average head grade of 0.40 g/t Au and 1.55 g/t Ag and 59 Mt of mineralized sulphide material at an average head grade of 0.76 g/t Au, 1.18 g/t Ag and 0.27% Cu. |
| ° | Option 5: Underground planning indicates 25 levels with stopes of 30 m x 40 m x 50 m. This option contains 351 Mt of sulphide mineralized material at an average head grade of 0.83 g/t Au, 1.45 g/t Ag and 0.35% Cu. |
| · | The mine plan is appropriate to the mineralization and adequately reflects the deposit type, dimensions and host rock characterization |
414
|
| · | The mining inventory is based on Measured and Indicated resources however this is a preliminary economic assessment and no studies have been completed for the conceptual mining options and hence probable and possible mineral reserves cannot be classified under NI 43-101 guidelines. |
Table 25-2 summarizes metal production for the five options.
Table 25-2: Metal Production
| Item | Unit | Option 1 | Option 2 | Option 3 | Option 4 | Option 5 |
| Mined Mineral | Mt | 107 | 254 | 460 | 192 | 351 |
| Au | Moz | 1.24 | 3.50 | 8.30 | 2.43 | 7.13 |
| Ag | Moz | 2.21 | 5.80 | 14.40 | 4.30 | 12.10 |
| Cu | Mlb | - | 2,380 | 313 | 2,380 | |
Cu2S | t | - | 3,700 | 15,100 | 3,500 | 15,100 |
| Sulphuric Acid | Mt | - | 0.32 | 1.30 | 0.18 | 1.30 |
Au Equivalent37 | Moz | 1.27 | 4.90 | 14.20 | 3.24 | 12.80 |
Cu Equivalent38 | Mlb | - | 2,123 | 6,143 | 1,402 | 5,549 |
| Revenues | US$ M | 1,640 | 5,980 | 16,730 | 3,850 | 15,100 |
Summaries of the Capital and Operating Costs for the five options are presented in Table 25-3 and Table 25-4.
37 Gold equivalent oz (AuEq) value is based on gold, silver and copper revenues (prices and recoveries involved). AuEq (oz) = [Au Production (oz)] + [Ag Production (oz) * Ag Price (US$/oz) / Ag Price (US$/oz)] + [Cu Production (lb) * 2204 * Cu Price (US$/lb) / Au Price (US$/oz)]. Recoveries are adjusted based on metallurgical characteristic of the resource.
38 Copper equivalent lb (CuEq) value is based on gold, silver and copper revenues (prices and recoveries involved). CuEq lb = [Cu Production (lb)] + [Au Production (oz) * Au Price (US$/oz) / Cu Price (US$/lb)] + [Ag Production (oz) * Ag Price (US$/oz) / Cu Price (US$/lb)]. Recoveries are adjusted based on metallurgical characteristic of the resource.
415
|
Table 25-3: Capital Costs Estimate
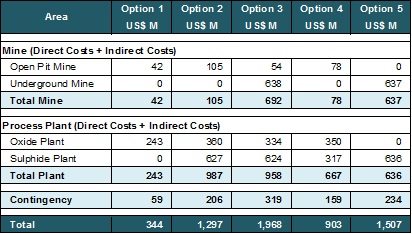
Table 25-4: Operating Costs Estimate
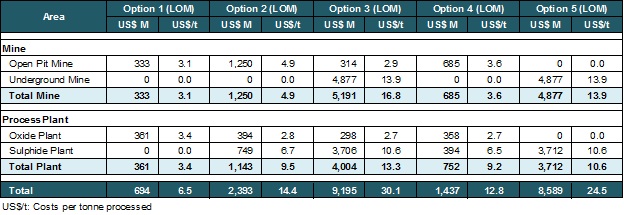
| · | The financial analysis indicated that all options for the project had a net positive cash flow and an acceptable internal rate of return and indicates the potential for developing Caspiche. Table 25-5 shows a summary of the economic indicators pre and after tax. |
416
|
Table 25-5: Economic Evaluation Summary
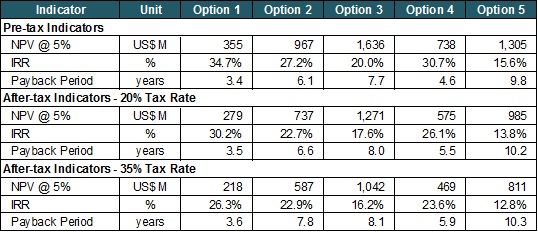
This PEA is preliminary in nature; there is no certainty that the preliminary economic assessment will be realized. Mineral resources that are not mineral reserves do not have demonstrated economic viability
| · | Opex and Capex determined for the project options represent those expected for a project of this type exhibiting average characteristics of abrasiveness and hardness; grades and rock type characterizations as indicated in the geological section. Operating costs were generated from first principles and benchmarked against other operations. Capital costs were based on referential quotations, database information and were also benchmarked against similar operations |
| · | Additional metallurgical studies at pilot plant level on oxide and sulphide mineralization are needed to optimize recovery and equipment selection |
| · | In the event that further studies conclude that the Caspiche project be advanced and a decision is made to advance to construction, Exeter will require an approved environmental impact study which will require additional baseline studies. Such additional base line studies required to support the impact study should be initiated as soon as possible |
| · | Additional geotechnical and hydrological studies are required particularly to model surface water flows into the Vegas or seasonal creeks. |
417
|
| 26 | RECOMMENDATIONS |
At this level of study the recommendations made are general as further evaluation needs to be made on the specific options as they are developed.
| 26.1 | General Project Recommendations |
| · | Trade-off studies should be completed on the PEA options prior to determining which option could be carried forward to Prefeasibility Study level. |
| · | Evaluate further options for transport to port and concentrate treatment to remove arsenic in trade-off studies prior to initiating further studies |
| · | Water supply studies and negotiations and land acquisition should be advanced. |
Recommendations pertaining to mine and process plant are noted below in more detail.
| 26.2 | Mining Recommendations |
Recommendations in the mine area are:
| · | Mine fleet optimization studies and mine scheduling may be further developed in order to improve equipment matching and plant scheduling |
| · | Main risks in the underground mine are related to geotechnical conditions that may be encountered during development and production. Further geotechnical studies should be advanced |
| · | The current conceptual study extraction sequence for the underground mine in the Sulphides Standalone Project (option 5) and the Combined Project (option 3), has not yet been evaluated for overall geotechnical stability. Unstable conditions could be encountered with the proposed mine plan hence requiring adjustments to the mine plan that may impact on the production profile |
| · | The location and design of waste and mineralized stockpiles needs to be further assessed |
| · | Investigate the use of contractors for the open pit mining and the underground developments |
| · | Further studies need to consider initial training period requirements |
| · | Investigate the recovery characteristics of the McNeill mineralization and determine its economic viability |
418
|
| · | Further Investigate metallurgical characteristics of the transition zone material and its physical limits |
| · | Rheology and strength tests need to be included using Caspiche tailings to determine backfilling properties |
| · | Mining recovery in the underground may be increased using remote control LHD´s avoiding drawpoints in the production levels. |
| 26.3 | Process Recommendations |
| · | Define, with new flotation tests, the optimum primary grinding and regrind sizes, by each type of mineral |
| · | Confirm grindability indices with representative samples |
| · | Improve upon the current metallurgical data with new tests, in order to generate a geo-metallurgical model, which takes into account recovery variability of different rock units |
| · | Further test work on the treatment of the cleaner scavenger tails (flotation, CIL, SART) is recommended |
| · | Perform standardized tests for process equipment design. |
| 26.4 | Estimated Budget to next phase |
In order to the develop the project to the next phase Alquimia estimate the following budget as presented in Table 26-1 is required. This budget is included within the owners’ costs used in the financial analyses of the options considered. This budget is general and will vary depending on the final option selected, i.e. there is no need for condemnation drilling if the oxide standalone option is selected.
Table 26-1: Estimated Budget
| Task | Estimated Budget $MUS |
| Condemnation drilling | 5 |
| Water rights and Exploration | 2 |
| Engineering Studies | 5 |
| Environmental Baseline and Permitting | 4 |
| Permits and concession payments | 2 |
| Head office costs | 3 |
| Total | 21 |
419
|
| 27 | REFERENCES |
Aker Solutions Prefeasibility Study for the Caspiche Project, Region III, Chile, Prepared for Exeter Resource Corporation, 16 January 2012.
CIM, Estimation of Mineral Resources and Mineral Reserves, Best Practice Guidelines, 23 November 2003.
CIM Definition Standards – For Mineral Resources and Mineral Reserves. Prepared for the CIM standing committee on Reserve Definitions. Adopted by the CIM Council 27 November, 2010.
G&T Metallurgical Services Ltd., 2009, Preliminary assessment of the Caspiche Deposit, Prepared for Exeter Resource Corporation, 20 March 2009.
G&T Metallurgical Services Ltd., 2009, Further process development of the Caspiche deposit, Prepared for Exeter Resource Corporation, 11 September 2009.
G&T Metallurgical Services Ltd., 2009, Further process development of the Caspiche deposit, Prepared for Exeter Resource Corporation, 03 December 2009.
G&T Metallurgical Services Ltd., 2010, Advanced metallurgical assessment of ore type composites from the Caspiche Project, Prepared for Exeter Resource Corporation, 04 June 2010.
G&T Metallurgical Services Ltd., 2010, Advanced process development to improve gold recoveries for the Caspiche Project, Prepared for Exeter Resource Corporation, 04 July 2010.
Holmes, G., Duggan, A., Guzmán, C., Coupland, D., Wells, J. and Nguyen, L., 2012, Caspiche Project, Copiapó, Chile: NI 43-101 Technical Report on Pre-feasibility Study, Prepared for Exeter Resource Corporation, 16 January 2012.
Inversiones IAL Ambiental Limitada, Environmental Considerations, EBS Caspiche Mining Project, June 2011.
Richard H. Sillitoe, Geology and Potential of the Caspiche Porphyry Copper-Gold Prospect, Northern Chile, June 2008.
Richard H. Sillitoe, Geological Model of the Caspiche Porphyry Copper-Gold Prospect, Northern Chile, February 2009.
Richard H. Sillitoe, Updated Geological Model of the Caspiche Porphyry Gold-Copper Prospect, Northern Chile, May 2009.
Richard H. Sillitoe, Some New Geological Features of the Caspiche Porphyry Gold-Copper Deposit, Northern Chile, July 2010.
SGS Minerals Services, 2011, A pilot plant test program on material from the Caspiche Project - Project 12403-003, Prepared for Exeter Resource Corporation, 28 February 2011.
420
|
SGS Minerals Services, 2010, Flotation evaluation of two test composites from the Caspiche Project - Project 12403-001 Final Report, Prepared for Exeter Resource Corporation, 05 July 2010.
SGS Minerals Services, 2011, Pruebas de flotación Rougher, Prepared for Exeter Resource Corporation, 10 November 2011.
SGS Minerals Services, 2012, The grindability characteristics of samples from the Caspiche Project, Prepared for Exeter Resource Corporation, 19 July 2012.
SGS Minerals Services, 2013, Optimization testwork on pilot plant feed from the Caspiche Deposit, Prepared for Exeter Resource Corporation, 21 March 2013.
SGS Minerals Services, 2013, An investigation into flotation response of HPGR samples versus cone crushed prepared samples, October, 2013.
Sillitoe, R.H., McKee, E.H., and Vila, T., 1991, Reconnaissance K-Ar geochronology of the Maricunga gold-silver belt, northern Chile: Economic Geology, v. 86, p. 1261– 1270.
Tolman, J.T. and Perkins, J., 2010, Caspiche Property, Region III, Chile NI 43-101 Technical Report, Prepared for Exeter Resource Corporation, 13 September 2010.
Tolman, J., Van Kerkvoort, G., and Perkins, J., 2008, Caspiche Project, February 9, 2009, Technical Report, Region III, Chile, Prepared for Exeter Resource Corporation, 9 February 2009.
Van Kerkvoort, G., Delendatti, G.L.A., and Perkins, J., 2008, Technical Report & Proposed Exploration for Caspiche Project, Region III, Chile, Prepared for Exeter Resource Corporation, 26 pril 2008.
Wakefield, T. W., and Marinho, R., 2009a, Caspiche Property, Region III, Chile, NI 43-101 Technical Report, Prepared for Exeter Resource Corporation, 27 March 2009.
Wakefield, T. W., and Marinho, R., 2009, Caspiche Property, Region III, Chile, NI 43-101Technical Report, Prepared for Exeter Resource Corporation, 14 September 2009.
Wakefield, T. W., and Marinho, R., 2009b, Caspiche Property, Region III, Chile, NI 43-101 Technical Report, Prepared for Exeter Resource Corporation, 14 September 2009, Revised Date: 19 October 2009.
Wakefield, T. W., and Marinho, R., 2010, Caspiche Property, Region III, Chile, NI 43-101 Technical Report, Prepared for Exeter Resource Corporation, 12 March 2010.
421