UNITED STATES
SECURITIES AND EXCHANGE COMMISSION
Washington, D.C. 20549
FORM N-CSR
CERTIFIED SHAREHOLDER REPORT OF REGISTERED
MANAGEMENT INVESTMENT COMPANIES
Investment Company Act File Number: 811-21668
Cohen & Steers Alternative Income Fund, Inc.
(Exact name of registrant as specified in charter)
280 Park Avenue, New York, NY 10017
(Address of principal executive offices) (Zip code)
Dana A. DeVivo
Cohen & Steers Capital Management, Inc.
280 Park Avenue
New York, New York 10017
(Name and address of agent for service)
Registrant’s telephone number, including area code: (212) 832-3232
Date of fiscal year end: October 31
Date of reporting period: October 31, 2020
Item 1. Reports to Stockholders.
COHEN & STEERS ALTERNATIVE INCOME FUND, INC.
To Our Shareholders:
We would like to share with you our report for the year ended October 31, 2020. The total returns for Cohen & Steers Alternative Income Fund, Inc. (the Fund) and its comparative benchmarks were:
| | | | | | | | |
| | | Six Months Ended
October 31, 2020 | | | Year Ended
October 31, 2020 | |
Cohen & Steers Alternative Income Fund: | | | | | | | | |
Class A | | | 3.90 | % | | | –14.74 | % |
Class C | | | 3.68 | % | | | –15.25 | % |
Class I | | | 4.18 | % | | | –14.41 | % |
Class R | | | 3.92 | % | | | –14.85 | % |
Class Z | | | 4.18 | % | | | –14.41 | % |
Blended Benchmarka | | | 2.29 | % | | | –10.02 | % |
S&P 500 Indexa | | | 13.29 | % | | | 9.71 | % |
The performance data quoted represent past performance. Past performance is no guarantee of future results. The investment return and the principal value of an investment will fluctuate and shares, if redeemed, may be worth more or less than their original cost. Current performance may be lower or higher than the performance data quoted. Current total returns of the Fund can be obtained by visiting our website at cohenandsteers.com. All share class returns assume the reinvestment of all dividends and distributions at net asset value (NAV). Fund performance figures reflect fee waivers and/or expense reimbursements, without which the performance would have been lower. Performance quoted does not reflect the deduction of the maximum 4.50% initial sales charge on Class A shares or the 1.00% maximum contingent deferred sales charge on Class C shares. The 1.00% maximum contingent deferred sales charge on Class C shares applies if redemption occurs on or before the one year anniversary date of their purchase. If such charges were included, returns would have been lower. Index performance does not reflect the deduction of any fees, taxes or expenses. An investor cannot invest directly in an index. Performance figures for periods shorter than one year are not annualized.
The Fund seeks to declare and pay dividends monthly at a level rate (the Policy). Distributions paid by the Fund are subject to recharacterization for tax purposes and are taxable up to the amount of the Fund’s investment company taxable income and net realized gains. As a result of the Policy, the Fund may pay distributions in excess of the Fund’s investment company taxable income and net realized gains. This excess would be a return of capital distributed from the Fund’s assets. Distributions of capital decrease the Fund’s total assets and, therefore, could have the effect of increasing the Fund’s expense ratio. In addition, in order to make these distributions, the Fund may have to sell portfolio securities at a less than opportune time.
| a | For benchmark descriptions, see page 8. |
1
COHEN & STEERS ALTERNATIVE INCOME FUND, INC.
Market Review
Real assets and alternative income classes had negative returns for the 12-month period ended October 31, 2020, except for preferred securities, which had a modest gain. Markets began the period on a positive note, but early 2020 saw the emergence of a global health catastrophe and an economic shutdown that brought about one of the fastest downturns in modern history.
The pandemic-driven recession that took effect in the first quarter led to sharp declines for nearly all asset classes, including real assets and preferred securities. As the coronavirus began to spread globally, equity and credit markets reacted powerfully to stay-at-home orders that forced many businesses to close. Mass layoffs led to unemployment levels not seen since the Great Depression nearly a century ago.
Governments and central banks around the world responded with unprecedented relief efforts to support affected businesses and households, with the U.S. providing paycheck protection and increased unemployment benefits, and injecting liquidity into financial markets to keep credit flowing and avoid large-scale bankruptcies. Anticipating that these measures would prevent a worst-case outcome, major stock and bond indexes rebounded sharply starting in mid-March. While the broad stock market more than recovered earlier losses by period end, the rally was dominated by technology and other growth-oriented companies. For the value-type stocks that comprise much of real assets, the rebound was relatively mild and these groups ended with declines for the 12 months.
Fund Performance
The Fund had a negative total return in the period and underperformed its blended benchmark.
Preferred Securities
The banking industry, which represents the largest issuer of preferreds, came under heavy pressure in March as investors feared the economic shutdown could precipitate a banking crisis. However, banks are in much better financial shape than they were in 2008 during the global financial crisis. Banks have exercised much stricter lending standards, and we do not see signs of broad-based lending on “bubble” assets, as occurred back then. Also, thanks to post-crisis regulatory changes, capital is far higher—approximately three times greater than a decade ago. Since 2008, banks have been required to maintain more capital protection for riskier assets (on top of dramatically increased absolute capital levels), which has changed business models, generally reducing capital market risks and making earnings more stable. As the economic outlook began to improve, preferreds more than recovered their initial declines by the end of the period.
Security selection in the banking and insurance sectors detracted from relative performance. These included overweight positions in certain euro-denominated European bank and insurance Tier 1 contingent capital securities (CoCos). An overweight allocation and security selection in the pipeline sector also hindered relative performance; the sector was impacted by a sharp selloff in crude oil, which led to concerns of reduced throughput volumes and of producers’ potential inability to meet their obligations to midstream companies. Contributors to relative performance consisted of overweight positions in certain high-quality, long-duration securities, as well as underweights in certain securities with low coupons and low reset spreads.
2
COHEN & STEERS ALTERNATIVE INCOME FUND, INC.
Global Real Estate
Global real estate stocks underperformed broad equities in the downturn—despite the relative stability of lease-based cash flows—because the shutdown directly impacted certain types of real estate, including hotels, retail and offices. This more than countered gains in sectors that were more resilient amid the pandemic, including data center and industrial companies, which were aided by a significant increase in demand for e-commerce–related services amid a surge in working and purchasing from home.
Overall stock selection in real estate was relatively favorable, led by stock selection in Australia, where we were overweight the self storage sector, which advanced, and did not own certain retail landlords that had sizable declines. Stock selection in the Netherlands and Singapore also helped performance.
Global Listed Infrastructure
Infrastructure began a sharp descent along with broader equities markets in late February and into March as the pandemic intensified. Although most infrastructure sectors, including utilities and cell towers, have relatively little direct exposure to the economic effects of the virus, roughly one-third of the infrastructure space consists of transportation-related subsectors and midstream energy, which were especially vulnerable to heavy travel restrictions and reduced economic transportation activity. Cell towers significantly outperformed, benefiting from secular demand growth and a shift to working from home by large sections of the global workforce.
Our average overweight in airports detracted from performance. The sector contended with flight cancellations and reduced landing fees from airlines, with still no clear picture of when air travel may return to normal levels. Stock selection in the midstream energy and water sectors also hindered performance, more than countering the outperformance of the Fund’s gas distribution and communications holdings
MLPs and Midstream Energy
Master limited partnerships (MLPs) and other midstream energy companies suffered historic declines as energy markets endured the twin shocks of an unprecedented collapse in demand and the emergence of an oil price war between Saudi Arabia and Russia. Oil gained back some of its declines as OPEC reversed course and recommitted to supply discipline and global economies began to reopen, helping oil prices to recover into the $40 per barrel range (compared with above $50 per barrel at the start of the period). Although crude oil prices are a key driver of sentiment and confidence for the industry, it is important to note that midstream energy derives about half of its revenues from natural gas-related activities, about a third coming from crude oil and refined products, and about 10% from natural gas liquids (NGLs). The Fund’s average overweight in gathering & processing companies, which tend to be more sensitive to moves in commodity prices, detracted from performance, as did stock selection in the diversified midstream sector.
Natural Resource Equities
Natural resource equities underperformed global equities as a group, although returns were mixed by sector. Agribusiness had only a modest decline, consistent with its focus on consumer staples. Metals
3
COHEN & STEERS ALTERNATIVE INCOME FUND, INC.
and mining companies split between industrial and precious metals producers. Steel companies faced reduced demand from the auto, aerospace and energy industries, while gold and precious metals producers benefited from investor demand for safe-haven assets. The energy sector reeled as global oil markets grappled with some of the greatest pressures in history, which only partly eased by period end.
Stock selection and an overweight in the integrated oil and gas sector detracted from relative performance amid the industrywide impact. The Fund’s underweight in gold producers also negatively impacted relative performance. Contributors to relative performance included beneficial positions in several fertilizer and chemical companies that outperformed.
Impact of Derivatives on Fund Performance
The Fund used derivatives in the form of forward foreign currency exchange contracts for managing currency risk on certain Fund positions denominated in foreign currencies. The currency exchange contracts did not have a material impact on the Fund’s total return during the 12 months ended October 31, 2020.
Sincerely,
| | |
 | |  |
| |
| JON CHEIGH | | VINCENT L. CHILDERS |
| Portfolio Manager | | Portfolio Manager |
| | |
 | |  |
| |
| BEN MORTON | | CHRISTOPHER RHINE |
| Portfolio Manager | | Portfolio Manager |
| | |
 | |  |
| |
| TYLER S. ROSENLICHT | | WILLIAM F. SCAPELL |
| Portfolio Manager | | Portfolio Manager |

ELAINE ZAHARIS-NIKAS
Portfolio Manager
4
COHEN & STEERS ALTERNATIVE INCOME FUND, INC.
The views and opinions in the preceding commentary are subject to change without notice and are as of the date of the report. There is no guarantee that any market forecast set forth in the commentary will be realized. This material represents an assessment of the market environment at a specific point in time, should not be relied upon as investment advice and is not intended to predict or depict performance of any investment.
Visit Cohen & Steers online at cohenandsteers.com
For more information about the Cohen & Steers family of mutual funds, visit cohenandsteers.com. Here you will find fund net asset values, fund fact sheets and portfolio highlights, as well as educational resources and timely market updates.
Our website also provides comprehensive information about Cohen & Steers, including our most recent press releases, profiles of our senior investment professionals and their investment approach to each asset class. The Cohen & Steers family of mutual funds invests in major real asset categories including real estate securities, listed infrastructure, commodities and natural resource equities, as well as preferred securities and other income solutions.
5
COHEN & STEERS ALTERNATIVE INCOME FUND, INC.
Performance Review (Unaudited)
| | |
Class A—Growth of a $10,000 Investment 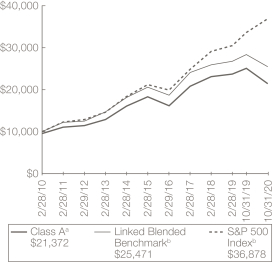
| | Class C—Growth of a $10,000 Investment 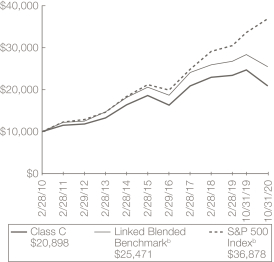
|
| | |
Class I—Growth of a $100,000 Investment 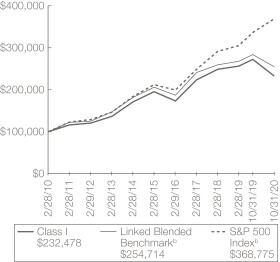
| | Class R—Growth of a $10,000 Investment 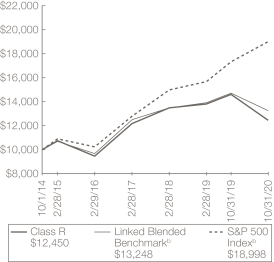
|
6
COHEN & STEERS ALTERNATIVE INCOME FUND, INC.
Performance Review (Unaudited)—(Continued)
Class Z—Growth of a $10,000 Investment
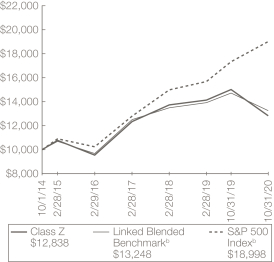
Average Annual Total Returns—For Periods Ended October 31, 2020
| | | | | | | | | | | | | | | | | | | | |
| | | Class A
Shares | | | Class C
Shares | | | Class I
Shares | | | Class R
Shares | | | Class Z
Shares | |
1 Year (with sales charge) | | | –18.58 | %a | | | –16.10 | %c | | | — | | | | — | | | | — | |
1 Year (without sales charge) | | | –14.74 | % | | | –15.25 | % | | | –14.41 | % | | | –14.85 | % | | | –14.41 | % |
5 Years (with sales charge) | | | 3.06 | %a | | | 3.36 | % | | | — | | | | — | | | | — | |
5 Years (without sales charge) | | | 4.02 | % | | | 3.36 | % | | | 4.40 | % | | | 3.86 | % | | | 4.39 | % |
10 Years (with sales charge) | | | 7.53 | %a | | | 7.33 | % | | | — | | | | — | | | | — | |
10 Years (without sales charge) | | | 8.03 | % | | | 7.33 | % | | | 8.42 | % | | | — | | | | — | |
Since Inceptiond (with sales charge) | | | 5.33 | %a | | | 4.97 | % | | | — | | | | — | | | | — | |
Since Inceptiond (without sales charge) | | | 5.65 | % | | | 4.97 | % | | | 6.02 | % | | | 3.67 | % | | | 4.19 | % |
The Fund changed its investment objectives and principal investment strategies on July 1, 2019. The performance above reflects returns achieved pursuant to different investment objectives and principal investment strategies than the investment objectives and strategies currently employed by the Fund. If the Fund’s current strategies had been in place prior to July 1, 2019, results shown would have been different.
The performance data quoted represent past performance. Past performance is no guarantee of future results. The investment return and principal value of an investment will fluctuate and shares, if redeemed, may be worth more or less than their original cost. Current performance may be lower or higher than the performance data quoted. Performance information current to the most recent month end can be obtained by visiting our website at cohenandsteers.com. All share class returns assume the reinvestment of all dividends and distributions at NAV. The performance graphs and table do not reflect
7
COHEN & STEERS ALTERNATIVE INCOME FUND, INC.
Performance Review (Unaudited)—(Continued)
the deduction of taxes that a shareholder would pay on Fund distributions or the redemption of Fund shares. During the periods presented above, the investment advisor waived fees and/or reimbursed expenses. Without this arrangement, performance would have been lower.
The annualized gross and net expense ratios, respectively, for each class of shares as disclosed in the March 1, 2020 prospectus were as follows: Class A—1.79% and 1.00%; Class C—2.44% and 1.65%; Class I—1.51% and 0.65%; Class R—1.94% and 1.15%; and Class Z—1.44% and 0.65%. Through June 30, 2022, the investment advisor has contractually agreed to waive its fee and/or reimburse expenses so that the Fund’s total annual operating expenses (excluding acquired fund fees and expenses, taxes and extraordinary expenses) do not exceed 1.00% for Class A shares, 1.65% for Class C shares, 0.65% for Class I shares, 1.15% for Class R shares and 0.65% for Class Z shares. This contractual agreement can only be amended or terminated by agreement of the Fund’s Board of Directors and the investment advisor and will terminate automatically in the event of termination of the investment advisory agreement between the investment advisor and the Fund.
| a | Reflects a 4.50% front-end sales charge. |
| b | The comparative indexes are not adjusted to reflect expenses or other fees that the U.S. Securities and Exchange Commission (SEC) requires to be reflected in the Fund’s performance. Index performance does not reflect the deduction of any fees, taxes or expenses. An investor cannot invest directly in an index. The Fund’s performance assumes the reinvestment of all dividends and distributions at NAV. For more information, including charges and expenses, please read the prospectus carefully before you invest. |
| c | Reflects a contingent deferred sales charge of 1.00%. |
| d | Inception date of August 31, 2005 for Class A, C and I shares and October 1, 2014 for Class R and Z shares. |
Benchmark Descriptions
The Fund changed its investment objectives and principal investment strategies on July 1, 2019. In connection with such change, the Fund’s benchmark also changed and the Fund’s Linked Blended Benchmark is now represented by the performance of the Russell 1000 Value Index through June 30, 2019 and the blended benchmark consisting of 15% FTSE EPRA Nareit Developed Real Estate Index (Net), 15% Alerian MLP Index, 15% Dow Jones Brookfield Global Infrastructure Index, 10% S&P Global Natural Resource Index (Net), and 45% Preferred Blended Benchmark (consists of 60% ICE BofA US IG Institutional Capital Securities Index, 20% ICE BofA Core Fixed Rate Preferred Securities Index and 20% Bloomberg Barclays Developed Market USD Contingent Capital Index) thereafter. The Russell 1000 Value Index measures the performance of the large-capitalization value segment of the U.S. equity universe in the Russell 1000 Index that have lower price-to-book ratios and lower expected growth values. The FTSE EPRA Nareit Developed Real Estate Index (Net) is an unmanaged market-capitalization-weighted total-return index, which consists of publicly traded equity REITs and listed property companies from developed markets and is net of dividend withholding taxes. The Alerian MLP Index (Total Return) is a capped, float-adjusted, capitalization-weighted index, whose constituents represent approximately 85% of total Master Limited Partnership (MLP) float-adjusted market
8
COHEN & STEERS ALTERNATIVE INCOME FUND, INC.
Performance Review (Unaudited)—(Continued)
Benchmark Descriptions—(Continued)
capitalization. The Dow Jones Brookfield Global Infrastructure Index is a float-adjusted market-capitalization-weighted index that measures performance of globally domiciled companies that derive more than 70% of their cash flows from infrastructure lines of business. The S&P Global Natural Resources Index (Net) includes the largest publicly-traded companies in natural resources and commodities businesses that meet specific investability requirements and is net of dividend withholding taxes. The ICE BofA US IG Institutional Capital Securities Index tracks the performance of US dollar denominated investment grade hybrid capital corporate and preferred securities publicly issued in the US domestic market. The ICE BofA Core Fixed Rate Preferred Securities Index tracks the performance of fixed-rate US dollar-denominated preferred securities issued in the US domestic market, excluding $1000 par securities. The Bloomberg Barclays Developed Market USD Contingent Capital Index includes hybrid capital securities in developed markets with explicit equity conversion or write down loss absorption mechanisms that are based on an issuer’s regulatory capital ratio or other explicit solvency-based triggers. The S&P 500 Index is an unmanaged index of 500 large-capitalization stocks that is frequently used as a general measure of U.S. stock market performance.
9
COHEN & STEERS ALTERNATIVE INCOME FUND, INC.
Expense Example (Unaudited)
As a shareholder of the Fund, you incur two types of costs: (1) transaction costs, including sales charges (loads) on purchase payments and (2) ongoing costs including investment advisory fees; distribution and/or service (12b-1) fees; and other Fund expenses. This example is intended to help you understand your ongoing costs (in dollars) of investing in the Fund and to compare these costs with the ongoing costs of investing in other mutual funds.
The example is based on an investment of $1,000 invested at the beginning of the period and held for the entire period May 1, 2020—October 31, 2020.
Actual Expenses
The first line of the following table provides information about actual account values and expenses. You may use the information in this line, together with the amount you invested, to estimate the expenses that you paid over the period. Simply divide your account value by $1,000 (for example, an $8,600 account value divided by $1,000 = 8.6), then multiply the result by the number in the first line under the heading entitled “Expenses Paid During Period” to estimate the expenses you paid on your account during this period.
Hypothetical Example for Comparison Purposes
The second line of the following table provides information about hypothetical account values and hypothetical expenses based on the Fund’s actual expense ratio and an assumed rate of return of 5% per year before expenses, which is not the Fund’s actual return. The hypothetical account values and expenses may not be used to estimate the actual ending account balance or expenses you paid for the period. You may use this information to compare the ongoing cost of investing in the Fund and other funds. To do so, compare this 5% hypothetical example with the 5% hypothetical examples that appear in the shareholder reports of other funds.
Please note that the expenses shown in the table are meant to highlight your ongoing costs only and do not reflect any transaction costs, such as sales charges (loads). Therefore, the second line of the table is useful in comparing ongoing costs only, and will not help you determine the relative total costs of owning different funds. In addition, if these transactional costs were included, your costs would have been higher.
10
COHEN & STEERS ALTERNATIVE INCOME FUND, INC.
Expense Example (Unaudited)—(Continued)
| | | | | | | | | | | | |
| | | Beginning
Account Value
May 1, 2020 | | | Ending
Account Value
October 31, 2020 | | | Expenses Paid
During Perioda
May 1, 2020—
October 31, 2020 | |
Class A | |
Actual (3.90% return) | | $ | 1,000.00 | | | $ | 1,039.00 | | | $ | 5.13 | |
Hypothetical (5% annual return before expenses) | | $ | 1,000.00 | | | $ | 1,020.11 | | | $ | 5.08 | |
|
Class C | |
Actual (3.68% return) | | $ | 1,000.00 | | | $ | 1,036.80 | | | $ | 8.45 | |
Hypothetical (5% annual return before expenses) | | $ | 1,000.00 | | | $ | 1,016.84 | | | $ | 8.36 | |
|
Class I | |
Actual (4.18% return) | | $ | 1,000.00 | | | $ | 1,041.80 | | | $ | 3.34 | |
Hypothetical (5% annual return before expenses) | | $ | 1,000.00 | | | $ | 1,021.87 | | | $ | 3.30 | |
|
Class R | |
Actual (3.92% return) | | $ | 1,000.00 | | | $ | 1,039.20 | | | $ | 5.89 | |
Hypothetical (5% annual return before expenses) | | $ | 1,000.00 | | | $ | 1,019.36 | | | $ | 5.84 | |
|
Class Z | |
Actual (4.18% return) | | $ | 1,000.00 | | | $ | 1,041.80 | | | $ | 3.34 | |
Hypothetical (5% annual return before expenses) | | $ | 1,000.00 | | | $ | 1,021.87 | | | $ | 3.30 | |
| a | Expenses are equal to the Fund’s Class A, Class C, Class I, Class R and Class Z annualized net expense ratios of 1.00%, 1.65%, 0.65%, 1.15% and 0.65%, respectively, multiplied by the average account value over the period, multiplied by 184/366 (to reflect the one-half year period). |
11
COHEN & STEERS ALTERNATIVE INCOME FUND, INC.
October 31, 2020 Top Ten Holdingsa (Unaudited)
| | | | | | | | |
Security | | Value | | | % of
Net
Assets | |
| | |
Enterprise Products Partners LP | | $ | 1,492,261 | | | | 2.1 | |
Magellan Midstream Partners LP | | | 1,426,860 | | | | 2.1 | |
MPLX LP | | | 1,352,792 | | | | 1.9 | |
Plains All American Pipeline LP | | | 1,205,250 | | | | 1.7 | |
Energy Transfer LP | | | 1,075,423 | | | | 1.5 | |
Emera, Inc., 6.75%, due 6/15/76, Series 16-A (Canada) | | | 1,014,959 | | | | 1.5 | |
Citigroup, Inc., 6.25%, Series T | | | 991,591 | | | | 1.4 | |
Assurant, Inc., 7.00%, due 3/27/48 | | | 817,660 | | | | 1.2 | |
MetLife, Inc., 10.75%, due 8/1/39 | | | 814,961 | | | | 1.2 | |
American Tower Corp. | | | 742,918 | | | | 1.1 | |
| a | Top ten holdings (excluding short-term investments and derivative instruments) are determined on the basis of the value of individual securities held. The Fund may also hold positions in other types of securities issued by the companies listed above. See the Schedule of Investments for additional details on such other positions. |
Strategy Breakdownb (Unaudited)

| b | The strategy breakdown is expressed as a percentage of the Fund’s total long-term investments and excludes derivative instruments. |
12
COHEN & STEERS ALTERNATIVE INCOME FUND, INC.
SCHEDULE OF INVESTMENTS
October 31, 2020
| | | | | | | | | | | | |
| | | | | | Shares | | | Value | |
| | | | | | | | | | | | |
COMMON STOCK | | | 40.2% | | | | | | | | | |
AIRPORTS—FOREIGN | | | 0.4% | | | | | | | | | |
Aena SME SA, 144A (Spain)a | | | | 705 | | | $ | 94,989 | |
Aeroports de Paris (France) | | | | 217 | | | | 21,235 | |
Airports of Thailand PCL (Thailand) | | | | 22,300 | | | | 36,974 | |
Auckland International Airport Ltd. (New Zealand) | | | | 25,105 | | | | 116,133 | |
| | | | | | | | | | | | |
| | | | | | | | | | | 269,331 | |
| | | | | | | | | | | | |
COMMUNICATIONS | | | 2.7% | | | | | | | | | |
TOWERS | | | 2.0% | | | | | | | | | |
American Tower Corp. | | | | 3,235 | | | | 742,918 | |
Crown Castle International Corp. | | | | 2,345 | | | | 366,289 | |
SBA Communications Corp. | | | | 1,101 | | | | 319,697 | |
| | | | | | | | | | | | |
| | | | | | | | | | | 1,428,904 | |
| | | | | | | | | | | | |
TOWERS—FOREIGN | | | 0.7% | | | | | | | | | |
Cellnex Telecom SA, 144A (Spain)a | | | | 7,132 | | | | 457,810 | |
| | | | | | | | | | | | |
TOTAL COMMUNICATIONS | | | | | | | | 1,886,714 | |
| | | | | | | | | | | | |
CONSUMER STAPLES | | | 0.7% | | | | | | | | | |
FOOD PRODUCTS | | | 0.5% | | | | | | | | | |
Darling Ingredients, Inc.b | | | | 8,356 | | | | 359,308 | |
| | | | | | | | | | | | |
FOOD PRODUCTS—FOREIGN | | | 0.2% | | | | | | | | | |
Wilmar International Ltd. (Singapore) | | | | 49,700 | | | | 147,139 | |
| | | | | | | | | | | | |
TOTAL CONSUMER STAPLES | | | | | | | | 506,447 | |
| | | | | | | | | | | | |
CONSUMER—NON-CYCLICAL | | | 2.0% | | | | | | | | | |
AGRICULTURE | | | 1.6% | | | | | | | | | |
AGCO Corp. | | | | 494 | | | | 38,053 | |
Archer-Daniels-Midland Co. | | | | 7,841 | | | | 362,568 | |
Bunge Ltd. | | | | 6,475 | | | | 367,327 | |
Corteva, Inc. | | | | 11,053 | | | | 364,528 | |
| | | | | | | | | |
| | | | | | | | | | | 1,132,476 | |
| | | | | | | | | | | | |
FOOD PRODUCTS—FOREIGN | | | 0.4% | | | | | | | | | |
Associated British Foods PLC (United Kingdom) | | | | 5,240 | | | | 115,237 | |
Mowi ASA (Norway) | | | | 9,985 | | | | 157,742 | |
| | | | | | | | | |
| | | | | | | | | | | 272,979 | |
| | | | | | | | | | | | |
TOTAL CONSUMER—NON-CYCLICAL | | | | | | | | 1,405,455 | |
| | | | | | | | | |
See accompanying notes to financial statements.
13
COHEN & STEERS ALTERNATIVE INCOME FUND, INC.
SCHEDULE OF INVESTMENTS—(Continued)
October 31, 2020
| | | | | | | | | | | | |
| | | | | | Shares | | | Value | |
| | | | | | | | | | | | |
ELECTRIC | | | 2.4% | | | | | | | | | |
Alliant Energy Corp. | | | | 3,503 | | | $ | 193,646 | |
CenterPoint Energy, Inc. | | | | 8,857 | | | | 187,149 | |
Evergy, Inc. | | | | 3,264 | | | | 180,173 | |
FirstEnergy Corp. | | | | 10,248 | | | | 304,571 | |
NextEra Energy Partners LP | | | | 920 | | | | 57,776 | |
NextEra Energy, Inc. | | | | 3,092 | | | | 226,365 | |
NorthWestern Corp. | | | | 3,395 | | | | 176,981 | |
Pinnacle West Capital Corp. | | | | 1,255 | | | | 102,370 | |
Public Service Enterprise Group, Inc. | | | | 3,429 | | | | 199,396 | |
| | | | | | | | | |
| | | | | | | | | | | 1,628,427 | |
| | | | | | | | | | | | |
ELECTRIC—FOREIGN | | | 0.9% | | | | | | | | | |
Elia Group SA/NV (Belgium) | | | | 928 | | | | 89,757 | |
Enel S.p.A. (Italy) | | | | 10,556 | | | | 83,925 | |
Hydro One Ltd., 144A (Canada)a | | | | 9,497 | | | | 207,504 | |
Iberdrola SA (Spain) | | | | 3,565 | | | | 42,094 | |
National Grid PLC (United Kingdom) | | | | 8,258 | | | | 98,233 | |
Orsted A/S, 144A (Denmark)a | | | | 553 | | | | 87,769 | |
| | | | | | | | | |
| | | | | | | | | | | 609,282 | |
| | | | | | | | | | | | |
ENERGY | | | 4.6% | | | | | | | | | |
GAS—DISTRIBUTION—FOREIGN | | | 0.7% | | | | | | | | | |
Enn Energy Holdings Ltd. (China) | | | | 12,500 | | | | 158,201 | |
Snam S.p.A. (Italy) | | | | 29,172 | | | | 142,245 | |
Towngas China Co., Ltd. (China) | | | | 364,000 | | | | 165,338 | |
| | | | | | | | | |
| | | | | | | | | | | 465,784 | |
| | | | | | | | | | | | |
OIL & GAS | | | 1.6% | | | | | | | | | |
Cabot Oil & Gas Corp. | | | | 9,666 | | | | 171,958 | |
Concho Resources, Inc. | | | | 5,702 | | | | 236,690 | |
ConocoPhillips | | | | 1,336 | | | | 38,236 | |
EOG Resources, Inc. | | | | 5,057 | | | | 173,152 | |
EQT Corp. | | | | 8,672 | | | | 131,294 | |
Renewable Energy Group, Inc.b | | | | 6,326 | | | | 356,787 | |
| | | | | | | | | |
| | | | | | | | | | | 1,108,117 | |
| | | | | | | | | | | | |
See accompanying notes to financial statements.
14
COHEN & STEERS ALTERNATIVE INCOME FUND, INC.
SCHEDULE OF INVESTMENTS—(Continued)
October 31, 2020
| | | | | | | | | | | | |
| | | | | | Shares | | | Value | |
| | | | | | | | | | | | |
OIL & GAS—FOREIGN | | | 2.0% | | | | | | | | | |
BP PLC (United Kingdom) | | | | 203,926 | | | $ | 520,151 | |
Lukoil PJSC, ADR (Russia) | | | | 4,606 | | | | 235,657 | |
Repsol SA (Spain) | | | | 74,713 | | | | 469,053 | |
Suncor Energy, Inc. (Canada) | | | | 10,957 | | | | 123,609 | |
Total SA (France) | | | | 1,315 | | | | 39,840 | |
| | | | | | | | | | | | |
| | | | | | | | | | | 1,388,310 | |
| | | | | | | | | | | | |
OIL & GAS SERVICES | | | 0.3% | | | | | | | | | |
Hess Midstream LP, Class A | | | | 14,852 | | | | 253,672 | |
| | | | | | | | | | | | |
TOTAL ENERGY | | | | | | | | 3,215,883 | |
| | | | | | | | | | | | |
INDUSTRIALS—MACHINERY | | | 0.9% | | | | | | | | | |
Deere & Co. | | | | 2,697 | | | | 609,279 | |
| | | | | | | | | | | | |
INFORMATION TECHNOLOGY—FOREIGN | | | 0.1% | | | | | | | | | |
NEXTDC Ltd. (Australia)b | | | | 10,743 | | | | 96,191 | |
| | | | | | | | | | | | |
MARINE PORTS—FOREIGN | | | 0.2% | | | | | | | | | |
Koninklijke Vopak NV (Netherlands) | | | | 2,163 | | | | 112,429 | |
| | | | | | | | | | | | |
MATERIALS | | | 5.1% | | | | | | | | | |
CHEMICALS | | | 0.4% | | | | | | | | | |
FMC Corp. | | | | 2,593 | | | | 266,405 | |
| | | | | | | | | | | | |
CHEMICALS—FOREIGN | | | 0.7% | | | | | | | | | |
Nutrien Ltd. (Canada) | | | | 6,773 | | | | 275,526 | |
Sociedad Quimica y Minera de Chile SA, ADR (Chile) | | | | 5,883 | | | | 217,730 | |
| | | | | | | | | | | | |
| | | | | | | | | | | 493,256 | |
| | | | | | | | | | | | |
METALS & MINING | | | 1.3% | | | | | | | | | |
Freeport-McMoRan, Inc. | | | | 8,097 | | | | 140,402 | |
Newmont Corp. | | | | 8,540 | | | | 536,653 | |
Nucor Corp. | | | | 4,360 | | | | 208,234 | |
| | | | | | | | | | | | |
| | | | | | | | | | | 885,289 | |
| | | | | | | | | | | | |
METALS & MINING—FOREIGN | | | 2.7% | | | | | | | | | |
Anglo American PLC (South Africa) | | | | 20,969 | | | | 491,999 | |
BHP Group PLC (Australia) | | | | 24,775 | | | | 479,950 | |
MMC Norilsk Nickel PJSC, ADR (Russia) | | | | 3,743 | | | | 89,212 | |
Rio Tinto Ltd. (Australia) | | | | 4,882 | | | | 317,593 | |
Sumitomo Metal Mining Co., Ltd. (Japan) | | | | 2,400 | | | | 74,601 | |
Wheaton Precious Metals Corp. (Canada) | | | | 10,029 | | | | 462,437 | |
| | | | | | | | | | | | |
| | | | | | | | | | | 1,915,792 | |
| | | | | | | | | | | | |
TOTAL MATERIALS | | | | | | | | 3,560,742 | |
| | | | | | | | | | | | |
See accompanying notes to financial statements.
15
COHEN & STEERS ALTERNATIVE INCOME FUND, INC.
SCHEDULE OF INVESTMENTS—(Continued)
October 31, 2020
| | | | | | | | | | | | |
| | | | | | Shares | | | Value | |
| | | | | | | | | | | | |
PIPELINES | | | 1.2% | | | | | | | | | |
Kinder Morgan, Inc. | | | | 14,080 | | | $ | 167,552 | |
ONEOK, Inc. | | | | 10,363 | | | | 300,527 | |
Targa Resources Corp. | | | | 2,813 | | | | 45,149 | |
Williams Cos., Inc./The | | | | 17,886 | | | | 343,232 | |
| | | | | | | | | | | | |
| | | | | | | | | | | 856,460 | |
| | | | | | | | | | | | |
PIPELINES—FOREIGN | | | 1.3% | | | | | |
Enbridge, Inc. (Canada) | | | | 20,801 | | | | 573,148 | |
Pembina Pipeline Corp. (Canada) | | | | 6,312 | | | | 132,134 | |
TC Energy Corp. (Canada) | | | | 4,636 | | | | 182,475 | |
| | | | | | | | | | | | |
| | | | | | | | | | | 887,757 | |
| | | | | | | | | | | | |
RAILWAYS | | | 0.4% | | | | | |
Norfolk Southern Corp. | | | | 1,319 | | | | 275,829 | |
| | | | | | | | | | | | |
REAL ESTATE | | | 15.1% | | | | | |
DATA CENTERS | | | 0.6% | | | | | |
CyrusOne, Inc. | | | | 1,177 | | | | 83,626 | |
Digital Realty Trust, Inc. | | | | 2,335 | | | | 336,940 | |
| | | | | | | | | | | | |
| | | | | | | | | | | 420,566 | |
| | | | | | | | | | | | |
DIVERSIFIED—FOREIGN | | | 3.6% | | | | | |
Activia Properties, Inc. (Japan) | | | | 49 | | | | 177,038 | |
Castellum AB (Sweden) | | | | 13,184 | | | | 274,500 | |
Charter Hall Group (Australia) | | | | 14,630 | | | | 126,850 | |
China Resources Land Ltd. (China) | | | | 16,000 | | | | 65,435 | |
City Developments Ltd. (Singapore) | | | | 8,000 | | | | 37,151 | |
Covivio (France) | | | | 666 | | | | 39,661 | |
ESR Cayman Ltd., 144A (China)a,b | | | | 18,000 | | | | 54,368 | |
Frasers Logistics & Commercial Trust (Singapore) | | | | 77,300 | | | | 69,704 | |
Hang Lung Properties Ltd. (Hong Kong) | | | | 45,000 | | | | 109,552 | |
ICADE (France) | | | | 1,528 | | | | 77,272 | |
Keppel DC REIT (Singapore) | | | | 45,473 | | | | 96,549 | |
Land Securities Group PLC (United Kingdom) | | | | 11,957 | | | | 78,892 | |
Mirvac Group (Australia) | | | | 78,759 | | | | 116,797 | |
Mitsubishi Estate Co., Ltd. (Japan) | | | | 10,900 | | | | 162,583 | |
Mitsui Fudosan Co., Ltd. (Japan) | | | | 15,500 | | | | 263,927 | |
See accompanying notes to financial statements.
16
COHEN & STEERS ALTERNATIVE INCOME FUND, INC.
SCHEDULE OF INVESTMENTS—(Continued)
October 31, 2020
| | | | | | | | | | | | |
| | | | | | Shares | | | Value | |
| | | | | | | | | | | | |
New World Development Co., Ltd. (Hong Kong) | | | | 37,750 | | | $ | 180,233 | |
NIPPON REIT Investment Corp. (Japan) | | | | 45 | | | | 144,487 | |
NSI NV (Netherlands) | | | | 3,272 | | | | 103,319 | |
Stockland (Australia) | | | | 24,196 | | | | 65,428 | |
Sun Hung Kai Properties Ltd. (Hong Kong) | | | | 11,000 | | | | 141,590 | |
United Urban Investment Corp. (Japan) | | | | 87 | | | | 92,887 | |
| | | | | | | | | | | | |
| | | | | | | | | | | 2,478,223 | |
| | | | | | | | | | | | |
HEALTH CARE | | | 1.4% | | | | | |
Healthcare Trust of America, Inc., Class A | | | | 6,324 | | | | 153,673 | |
Healthpeak Properties, Inc. | | | | 8,205 | | | | 221,289 | |
Medical Properties Trust, Inc. | | | | 9,124 | | | | 162,590 | |
Ventas, Inc. | | | | 6,058 | | | | 239,109 | |
Welltower, Inc. | | | | 3,797 | | | | 204,165 | |
| | | | | | | | | | | | |
| | | | | | | | | | | 980,826 | |
| | | | | | | | | | | | |
HEALTH CARE—FOREIGN | | | 0.3% | | | | | |
Assura PLC (United Kingdom) | | | | 87,957 | | | | 86,829 | |
Parkway Life Real Estate Investment Trust (Singapore) | | | | 33,126 | | | | 98,201 | |
| | | | | | | | | | | | |
| | | | | | | | | | | 185,030 | |
| | | | | | | | | | | | |
HOTEL | | | 0.1% | | | | | |
Host Hotels & Resorts, Inc. | | | | 10,374 | | | | 108,719 | |
| | | | | | | | | | | | |
INDUSTRIALS | | | 1.5% | | | | | |
Americold Realty Trust | | | | 2,967 | | | | 107,494 | |
Duke Realty Corp. | | | | 10,936 | | | | 415,459 | |
Prologis, Inc. | | | | 5,353 | | | | 531,018 | |
| | | | | | | | | | | | |
| | | | | | | | | | | 1,053,971 | |
| | | | | | | | | | | | |
INDUSTRIALS—FOREIGN | | | 0.6% | | | | | |
GLP J-REIT (Japan) | | | | 73 | | | | 112,540 | |
Goodman Group (Australia) | | | | 2,758 | | | | 35,697 | |
LondonMetric Property PLC (United Kingdom) | | | | 29,521 | | | | 82,539 | |
Segro PLC (United Kingdom) | | | | 9,071 | | | | 105,992 | |
Warehouses De Pauw SCA (Belgium) | | | | 1,574 | | | | 52,734 | |
| | | | | | | | | | | | |
| | | | | | | | | | | 389,502 | |
| | | | | | | | | | | | |
See accompanying notes to financial statements.
17
COHEN & STEERS ALTERNATIVE INCOME FUND, INC.
SCHEDULE OF INVESTMENTS—(Continued)
October 31, 2020
| | | | | | | | | | | | |
| | | | | | Shares | | | Value | |
| | | | | | | | | | | | |
NET LEASE | | | 1.1% | | | | | |
Agree Realty Corp. | | | | 1,881 | | | $ | 116,754 | |
Broadstone Net Lease, Inc., Class A | | | | 6,753 | | | | 111,425 | |
Spirit Realty Capital, Inc. | | | | 2,554 | | | | 76,748 | |
VEREIT, Inc. | | | | 16,432 | | | | 101,878 | |
VICI Properties, Inc. | | | | 15,652 | | | | 359,213 | |
| | | | | | | | | | | | |
| | | | | | | | | | | 766,018 | |
| | | | | | | | | | | | |
NET LEASE—FOREIGN | | | 0.1% | | | | | |
ARGAN SA (France) | | | | 487 | | | | 45,840 | |
| | | | | | | | | | | | |
OFFICE—FOREIGN | | | 0.4% | | | | | |
Alstria Office REIT-AG (Germany) | | | | 6,043 | | | | 76,925 | |
Cofinimmo SA (Belgium) | | | | 765 | | | | 103,969 | |
Entra ASA, 144A (Norway)a | | | | 3,691 | | | | 48,252 | |
Gecina SA (France) | | | | 341 | | | | 42,333 | |
Workspace Group PLC (United Kingdom) | | | | 4,009 | | | | 32,049 | |
| | | | | | | | | | | | |
| | | | | | | | | | | 303,528 | |
| | | | | | | | | | | | |
RESIDENTIAL | | | 2.4% | | | | | |
APARTMENT | | | 0.8% | | | | | |
Apartment Investment & Management Co., Class A | | | | 3,950 | | | | 126,005 | |
Essex Property Trust, Inc. | | | | 1,090 | | | | 223,003 | |
UDR, Inc. | | | | 6,518 | | | | 203,622 | |
| | | | | | | | | | | | |
| | | | | | | | | | | 552,630 | |
| | | | | | | | | | | | |
APARTMENT—FOREIGN | | | 1.0% | | | | | |
Aedifica SA (Belgium) | | | | 616 | | | | 62,080 | |
Daiwa House REIT Investment Corp. (Japan) | | | | 48 | | | | 111,036 | |
LEG Immobilien AG (Germany) | | | | 1,548 | | | | 209,217 | |
Vonovia SE (Germany) | | | | 4,982 | | | | 318,168 | |
| | | | | | | | | | | | |
| | | | | | | | | | | 700,501 | |
| | | | | | | | | | | | |
MANUFACTURED HOME | | | 0.3% | | | | | |
Sun Communities, Inc. | | | | 1,460 | | | | 200,940 | |
| | | | | | | | | | | | |
SINGLE FAMILY | | | 0.3% | | | | | |
Invitation Homes, Inc. | | | | 7,811 | | | | 212,928 | |
| | | | | | | | | | | | |
TOTAL RESIDENTIAL | | | | | | | | 1,666,999 | |
| | | | | | | | | | | | |
See accompanying notes to financial statements.
18
COHEN & STEERS ALTERNATIVE INCOME FUND, INC.
SCHEDULE OF INVESTMENTS—(Continued)
October 31, 2020
| | | | | | | | | | | | |
| | | | | | Shares | | | Value | |
| | | | | | | | | | | | |
RETAIL—FOREIGN | | | 1.0% | | | | | |
CapitaLand Mall Trust (Singapore) | | | | 55,296 | | | $ | 70,091 | |
Catena AB (Sweden) | | | | 1,893 | | | | 77,044 | |
Japan Retail Fund Investment Corp. (Japan) | | | | 131 | | | | 188,824 | |
Klepierre SA (France) | | | | 5,528 | | | | 70,040 | |
Link REIT (Hong Kong) | | | | 28,083 | | | | 214,325 | |
SmartCentres Real Estate Investment Trust (Canada) | | | | 4,884 | | | | 77,203 | |
| | | | | | | | | | | | |
| | | | | | | | | | | 697,527 | |
| | | | | | | | | | | | |
SELF STORAGE | | | 1.1% | | | | | |
CubeSmart | | | | 8,081 | | | | 274,189 | |
Public Storage | | | | 2,147 | | | | 491,813 | |
| | | | | | | | | | | | |
| | | | | | | | | | | 766,002 | |
| | | | | | | | | | | | |
SELF STORAGE—FOREIGN | | | 0.2% | | | | | |
National Storage REIT (Australia) | | | | 59,539 | | | | 75,563 | |
Safestore Holdings PLC (United Kingdom) | | | | 4,944 | | | | 51,467 | |
| | | | | | | | | | | | |
| | | | | | | | | | | 127,030 | |
| | | | | | | | | | | | |
SHOPPING CENTERS—REGIONAL MALL | | | 0.6% | | | | | |
Simon Property Group, Inc. | | | | 6,625 | | | | 416,116 | |
| | | | | | | | | | | | |
TIMBER | | | 0.1% | | | | | |
Weyerhaeuser Co. | | | | 1,877 | | | | 51,223 | |
| | | | | | | | | | | | |
TOTAL REAL ESTATE | | | | | | | | 10,457,120 | |
| | | | | | | | | | | | |
TOLL ROADS—FOREIGN | | | 1.2% | | | | | |
Atlantia S.p.A. (Italy)b | | | | 4,458 | | | | 68,433 | |
Transurban Group (Australia) | | | | 32,089 | | | | 303,872 | |
Vinci SA (France) | | | | 5,089 | | | | 401,955 | |
Zhejiang Expressway Co., Ltd. (China) | | | | 76,000 | | | | 51,884 | |
| | | | | | | | | | | | |
| | | | | | | | | | | 826,144 | |
| | | | | | | | | | | | |
WATER | | | 0.3% | | | | | |
American Water Works Co., Inc. | | | | 1,519 | | | | 228,625 | |
| | | | | | | | | | | | |
WATER—FOREIGN | | | 0.7% | | | | | |
Guangdong Investment Ltd. (China) | | | | 88,000 | | | | 130,514 | |
Pennon Group PLC (United Kingdom) | | | | 17,662 | | | | 227,301 | |
United Utilities Group PLC (United Kingdom) | | | | 10,864 | | | | 121,447 | |
| | | | | | | | | | | | |
| | | | | | | | | | | 479,262 | |
| | | | | | | | | | | | |
TOTAL COMMON STOCK
(Identified cost—$27,365,092) | | | | | | | | 27,911,377 | |
| | | | | | | | | | | | |
See accompanying notes to financial statements.
19
COHEN & STEERS ALTERNATIVE INCOME FUND, INC.
SCHEDULE OF INVESTMENTS—(Continued)
October 31, 2020
| | | | | | | | | | | | |
| | | | | | Shares | | | Value | |
| | | | | | | | | | | | |
MASTER LIMITED PARTNERSHIPSAND RELATED COMPANIES | | | 15.5% | | | | | |
CRUDE/REFINED PRODUCTS | | | 6.7% | | | | | |
BP Midstream Partners LP | | | | 24,367 | | | $ | 236,360 | |
Genesis Energy LP | | | | 64,972 | | | | 272,882 | |
Holly Energy Partners LP | | | | 15,402 | | | | 176,507 | |
Magellan Midstream Partners LP | | | | 40,148 | | | | 1,426,860 | |
NuStar Energy LP | | | | 49,249 | | | | 487,073 | |
Phillips 66 Partners LP | | | | 22,839 | | | | 536,031 | |
Plains All American Pipeline LP | | | | 192,840 | | | | 1,205,250 | |
Rattler Midstream LP | | | | 32,218 | | | | 189,120 | |
Shell Midstream Partners LP | | | | 12,895 | | | | 112,831 | |
| | | | | | | | | | | | |
| | | | | | | | | | | 4,642,914 | |
| | | | | | | | | | | | |
DIVERSIFIED MIDSTREAM | | | 5.6% | | | | | |
Energy Transfer LP | | | | 208,820 | | | | 1,075,423 | |
Enterprise Products Partners LP | | | | 90,058 | | | | 1,492,261 | |
MPLX LP | | | | 78,605 | | | | 1,352,792 | |
| | | | | | | | | | | | |
| | | | | | | | | | | 3,920,476 | |
| | | | | | | | | | | | |
GATHERING & PROCESSING | | | 1.8% | | | | | |
Crestwood Equity Partners LP | | | | 12,604 | | | | 188,808 | |
Enable Midstream Partners LP | | | | 75,118 | | | | 334,275 | |
EnLink Midstream LLC | | | | 35,003 | | | | 94,858 | |
Noble Midstream Partners LP | | | | 14,273 | | | | 113,756 | |
Western Midstream Partners LP | | | | 59,105 | | | | 481,706 | |
| | | | | | | | | | | | |
| | | | | | | | | | | 1,213,403 | |
| | | | | | | | | | | | |
NATURAL GAS PIPELINES | | | 1.3% | | | | | |
Cheniere Energy Partners LP | | | | 4,251 | | | | 153,249 | |
Equitrans Midstream Corp. | | | | 35,428 | | | | 257,207 | |
TC PipeLines LP | | | | 17,874 | | | | 503,153 | |
| | | | | | | | | | | | |
| | | | | | | | | | | 913,609 | |
| | | | | | | | | | | | |
PROPANE | | | 0.1% | | | | | |
Suburban Propane Partners LP | | | | 2,719 | | | | 44,700 | |
| | | | | | | | | | | | |
TOTAL MASTER LIMITED PARTNERSHIPSAND RELATED COMPANIES
(Identified cost—$13,173,951) | | | | | | | | 10,735,102 | |
| | | | | | | | | | | | |
PREFERRED SECURITIES—$25 PAR VALUE | | | 8.3% | | | | | |
BANKS | | | 1.7% | | | | | |
Bank of America Corp., 4.375%, Series NNc | | | | 3,200 | | | | 80,208 | |
See accompanying notes to financial statements.
20
COHEN & STEERS ALTERNATIVE INCOME FUND, INC.
SCHEDULE OF INVESTMENTS—(Continued)
October 31, 2020
| | | | | | | | | | | | |
| | | | | | Shares | | | Value | |
| | | | | | | | | | | | |
Dime Community Bancshares, Inc., 5.50%, Series Ac | | | | 5,287 | | | $ | 128,368 | |
Fulton Financial Corp., 5.125%, Series Ac | | | | 4,400 | | | | 111,826 | |
JPMorgan Chase & Co., 6.10%, Series AAc | | | | 7,619 | | | | 192,685 | |
Truist Financial Corp., 4.75%, Series Rc | | | | 5,204 | | | | 135,772 | |
Truist Financial Corp., 5.25%, Series Oc | | | | 2,750 | | | | 74,112 | |
Wells Fargo & Co., 4.75%, Series Zc | | | | 19,670 | | | | 491,357 | |
| | | | | | | | | | | | |
| | | | | | | | | | | 1,214,328 | |
| | | | | | | | | | | | |
ELECTRIC | | | 0.8% | | | | | |
SCE Trust V, 5.45% to 3/15/26, Series Kc,d | | | | 8,800 | | | | 199,760 | |
Southern Co./The, 4.20%, due 10/15/60, Series C | | | | 8,800 | | | | 223,080 | |
Southern Co./The, 4.95%, due 1/30/80, Series 2020 | | | | 5,785 | | | | 152,608 | |
| | | | | | | | | | | | |
| | | | | | | | | | | 575,448 | |
| | | | | | | | | | | | |
| | | | | | | | | | | | |
ELECTRIC—FOREIGN | | | 0.2% | | | | | |
Brookfield Infrastructure Partners LP, 5.125%, Series 13 (Canada)c | | | | 4,931 | | | | 126,875 | |
| | | | | | | | | | | | |
FINANCIAL | | | 0.3% | | | | | | | | | |
DIVERSIFIED FINANCIAL SERVICES | | | 0.2% | | | | | | | | | |
Synchrony Financial, 5.625%, Series Ac | | | | 5,800 | | | | 145,522 | |
| | | | | | | | | | | | |
INVESTMENT ADVISORY SERVICES | | | 0.1% | | | | | | | | | |
Affiliated Managers Group, Inc., 4.75%, due 9/30/60 | | | | 3,600 | | | | 93,528 | |
| | | | | | | | | | | | |
TOTAL FINANCIAL | | | | | | | | 239,050 | |
| | | | | | | | | | | | |
INSURANCE | | | 1.7% | | | | | | | | | |
LIFE/HEALTH INSURANCE | | | 0.4% | | | | | | | | | |
Athene Holding Ltd., 6.375% to 6/30/25, Series Cc,d | | | | 3,410 | | | | 91,729 | |
Unum Group, 6.25%, due 6/15/58 | | | | 5,747 | | | | 151,951 | |
| | | | | | | | | | | | |
| | | | | | | | | | | 243,680 | |
| | | | | | | | | | | | |
MULTI-LINE | | | 0.2% | | | | | | | | | |
American International Group, Inc., 5.85%, Series Ac | | | | 6,320 | | | | 171,272 | |
| | | | | | | | | | | | |
MULTI-LINE—FOREIGN | | | 0.1% | | | | | | | | | |
Aegon Funding Co. LLC, 5.10%, due 12/15/49 (Netherlands) | | | | 3,300 | | | | 85,998 | |
| | | | | | | | | | | | |
PROPERTY CASUALTY | | | 0.3% | | | | | | | | | |
Axis Capital Holdings Ltd., 5.50%, Series Ec | | | | 7,400 | | | | 188,552 | |
| | | | | | | | | | | | |
PROPERTY CASUALTY—FOREIGN | | | 0.4% | | | | | | | | | |
Enstar Group Ltd., 7.00% to 9/1/28, Series D (Bermuda)c,d | | | | 10,325 | | | | 274,851 | |
| | | | | | | | | | | | |
See accompanying notes to financial statements.
21
COHEN & STEERS ALTERNATIVE INCOME FUND, INC.
SCHEDULE OF INVESTMENTS—(Continued)
October 31, 2020
| | | | | | | | | | | | |
| | | | | | Shares | | | Value | |
| | | | | | | | | | | | |
REINSURANCE | | | 0.3% | | | | | | | | | |
Arch Capital Group Ltd., 5.45%, Series Fc | | | | 8,317 | | | $ | 217,074 | |
| | | | | | | | | | | | |
TOTAL INSURANCE | | | | | | | | 1,181,427 | |
| | | | | | | | | | | | |
INTEGRATED TELECOMMUNICATIONS SERVICES | | | 0.7% | | | | | | | | | |
AT&T, Inc., 4.75%, Series Cc | | | | 11,800 | | | | 298,422 | |
United States Cellular Corp., 6.25%, due 9/1/69 | | | | 7,200 | | | | 189,288 | |
| | | | | | | | | | | | |
| | | | | | | | | | | 487,710 | |
| | | | | | | | | | | | |
PIPELINES | | | 0.2% | | | | | | | | | |
Energy Transfer Operating LP, 7.60% to 5/15/24, Series Ec,d | | | | 7,482 | | | | 145,525 | |
| | | | | | | | | | | | |
REAL ESTATE | | | 2.0% | | | | | | | | | |
INDUSTRIALS | | | 0.7% | | | | | | | | | |
Monmouth Real Estate Investment Corp., 6.125%, Series Cc | | | | 13,700 | | | | 341,130 | |
| | | | | | | | | | | | |
Rexford Industrial Realty, Inc., 5.625%, Series Cc | | | | 6,200 | | | | 165,199 | |
| | | | | | | | | | | | |
| | | | | | | | | | | 506,329 | |
| | | | | | | | | | | | |
NET LEASE | | | 0.3% | | | | | | | | | |
Spirit Realty Capital, Inc., 6.00%, Series Ac | | | | 7,350 | | | | 190,512 | |
| | | | | | | | | | | | |
OFFICE | | | 0.3% | | | | | | | | | |
Brookfield Property Partners LP, 5.75%, Series Ac | | | | 8,446 | | | | 163,853 | |
| | | | | | | | | | | | |
RESIDENTIAL—SINGLE FAMILY | | | 0.7% | | | | | | | | | |
American Homes 4 Rent, 5.875%, Series Gc | | | | 9,364 | | | | 246,273 | |
American Homes 4 Rent, 6.25%, Series Hc | | | | 9,169 | | | | 247,838 | |
| | | | | | | | | | | | |
| | | | | | | | | | | 494,111 | |
| | | | | | | | | | | | |
TOTAL REAL ESTATE | | | | | | | | 1,354,805 | |
| | | | | | | | | | | | |
UTILITIES | | | 0.7% | | | | | | | | | |
ELECTRIC UTILITIES | | | 0.2% | | | | | | | | | |
NextEra Energy Capital Holdings, Inc., 5.65%, due 3/1/79, Series N | | | | 3,297 | | | | 92,415 | |
| | | | | | | | | | | | |
GAS UTILITIES | | | 0.5% | | | | | | | | | |
Sempra Energy, 5.75%, due 7/1/79 | | | | 6,987 | | | | 185,994 | |
South Jersey Industries, Inc., 5.625%, due 9/16/79 | | | | 7,175 | | | | 182,747 | |
| | | | | | | | | | | | |
| | | | | | | | | | | 368,741 | |
| | | | | | | | | | | | |
TOTAL UTILITIES | | | | | | | | 461,156 | |
| | | | | | | | | | | | |
TOTAL PREFERRED SECURITIES—$25 PAR VALUE
(Identified cost—$5,723,824) | | | | | | | | 5,786,324 | |
| | | | | | | | | | | | |
See accompanying notes to financial statements.
22
COHEN & STEERS ALTERNATIVE INCOME FUND, INC.
SCHEDULE OF INVESTMENTS—(Continued)
October 31, 2020
| | | | | | | | | | | | |
| | | | | | Principal
Amount | | | Value | |
| | | | | | | | | | | | |
PREFERRED SECURITIES—CAPITAL SECURITIES | | | 34.5% | | | | | | | | | |
BANKS | | | 6.6% | | | | | | | | | |
Bank of America Corp., 5.875% to 3/15/28, Series FFc,d | | | $ | 332,000 | | | $ | 357,623 | |
Bank of America Corp., 6.10% to 3/17/25, Series AAc,d | | | | 230,000 | | | | 254,059 | |
Bank of America Corp., 6.25% to 9/5/24, Series Xc,d | | | | 228,000 | | | | 248,035 | |
Bank of America Corp., 6.50% to 10/23/24, Series Zc,d | | | | 295,000 | | | | 329,928 | |
Bank of New York Mellon Corp./The, 3.70% to 3/20/26, Series Hc,d | | | | 150,000 | | | | 149,224 | |
Citigroup, Inc., 5.95% to 5/15/25, Series Pc,d | | | | 150,000 | | | | 157,506 | |
Citigroup, Inc., 6.25% to 8/15/26, Series Tc,d | | | | 887,000 | | | | 991,591 | |
Citigroup, Inc., 5.00% to 9/12/24, Series Uc,d | | | | 381,000 | | | | 382,773 | |
Citizens Financial Group, Inc., 5.65% to 10/6/25, Series Fc,d | | | | 65,000 | | | | 69,306 | |
Comerica, Inc., 5.625% to 7/1/25c,d | | | | 98,000 | | | | 104,860 | |
Dresdner Funding Trust I, 8.151%, due 6/30/31, 144Aa | | | | 200,000 | | | | 293,415 | |
Farm Credit Bank of Texas, 5.70% to 9/15/25, Series 4, 144Aa,c,d,e | | | | 125,000 | | | | 134,813 | |
Huntington Bancshares, Inc., 4.45% to 10/15/27, Series Gc,d | | | | 280,000 | | | | 279,300 | |
JPMorgan Chase & Co., 6.10% to 10/1/24, Series Xc,d | | | | 220,000 | | | | 231,567 | |
Regions Financial Corp., 5.75% to 6/15/25, Series Dc,d | | | | 50,000 | | | | 53,688 | |
Truist Financial Corp., 4.95% to 9/1/25, Series Pc,d | | | | 153,000 | | | | 162,563 | |
Truist Financial Corp., 5.10% to 3/1/30, Series Qc,d | | | | 245,000 | | | | 268,718 | |
Wells Fargo & Co., 7.50%, Series Lc | | | | 107 | † | | | 144,317 | |
| | | | | | | | | | | | |
| | | | | | | | | | | 4,613,286 | |
| | | | | | | | | | | | |
BANKS—FOREIGN | | | 11.3% | | | | | | | | | |
Banco Santander SA, 7.50% to 2/8/24 (Spain)c,d,f,g | | | | 200,000 | | | | 208,320 | |
Bank of Ireland Group PLC, 7.50% to 5/19/25 (Ireland)c,d,f,g | | | | 200,000 | | | | 246,032 | |
Bank of Nova Scotia/The, 4.90% to 6/4/25 (Canada)c,d | | | | 160,000 | | | | 167,408 | |
Barclays PLC, 7.875% to 3/15/22 (United Kingdom)c,d,f,g | | | | 400,000 | | | | 413,720 | |
BNP Paribas SA, 7.00% to 8/16/28, 144A (France)a,c,d,g | | | | 200,000 | | | | 230,037 | |
BNP Paribas SA, 7.375% to 8/19/25, 144A (France)a,c,d,g | | | | 200,000 | | | | 223,389 | |
Commerzbank AG, 6.125% to 10/9/25 (Germany)c,d,f,g | | | | 200,000 | | | | 227,999 | |
Credit Agricole SA, 6.875% to 9/23/24, 144A (France)a,c,d,g | | | | 200,000 | | | | 214,263 | |
Credit Agricole SA, 7.875% to 1/23/24, 144A (France)a,c,d,g | | | | 200,000 | | | | 221,032 | |
See accompanying notes to financial statements.
23
COHEN & STEERS ALTERNATIVE INCOME FUND, INC.
SCHEDULE OF INVESTMENTS—(Continued)
October 31, 2020
| | | | | | | | | | | | |
| | | | | | Principal
Amount | | | Value | |
| | | | | | | | | | | | |
Credit Agricole SA, 8.125% to 12/23/25, 144A (France)a,c,d,g | | | $ | 200,000 | | | $ | 235,340 | |
Credit Suisse Group AG, 5.25% to 2/11/27, 144A (Switzerland)a,c,d,g | | | | 200,000 | | | | 201,860 | |
Credit Suisse Group AG, 7.125% to 7/29/22 (Switzerland)c,d,f,g | | | | 200,000 | | | | 207,848 | |
Credit Suisse Group AG, 7.25% to 9/12/25, 144A (Switzerland)a,c,d,g | | | | 200,000 | | | | 216,881 | |
Credit Suisse Group AG, 7.50% to 7/17/23, 144A (Switzerland)a,c,d,g | | | | 400,000 | | | | 425,004 | |
HSBC Capital Funding Dollar 1 LP, 10.176% to 6/30/30, 144A (United Kingdom)a,c,d | | | | 200,000 | | | | 339,163 | |
HSBC Holdings PLC, 6.375% to 3/30/25 (United Kingdom)c,d,g | | | | 200,000 | | | | 208,330 | |
HSBC Holdings PLC, 6.50% to 3/23/28 (United Kingdom)c,d,g | | | | 200,000 | | | | 214,263 | |
ING Groep N.V., 4.875% to 5/16/29 (Netherlands)c,d,f,g | | | | 200,000 | | | | 193,250 | |
ING Groep N.V., 5.75% to 11/16/26 (Netherlands)c,d,g | | | | 200,000 | | | | 208,543 | |
Intesa Sanpaolo SpA, 7.70% to 9/17/25, 144A (Italy)a,c,d,g | | | | 200,000 | | | | 211,086 | |
Lloyds Banking Group PLC, 7.50% to 9/27/25 (United Kingdom)c,d,g | | | | 200,000 | | | | 215,671 | |
Nationwide Building Society, 5.75% to 6/20/27 (United Kingdom)c,d,f,g | | | | 200,000 | | | | 267,199 | |
Natwest Group PLC, 8.00% to 8/10/25 (United Kingdom)c,d,g | | | | 200,000 | | | | 224,320 | |
Natwest Group PLC, 8.625% to 8/15/21 (United Kingdom)c,d,g | | | | 200,000 | | | | 206,866 | |
Royal Bank of Canada, 4.50% to 10/24/25, due 11/24/80, Series 1 (Canada)d | | | | 200,000 | | | | 154,402 | |
Societe Generale SA, 6.75% to 4/6/28, 144A (France)a,c,d,g | | | | 400,000 | | | | 420,826 | |
Societe Generale SA, 7.375% to 9/13/21, 144A (France)a,c,d,g | | | | 200,000 | | | | 205,884 | |
Societe Generale SA, 7.875% to 12/18/23, 144A (France)a,c,d,g | | | | 400,000 | | | | 427,030 | |
Standard Chartered PLC, 7.75% to 4/2/23, 144A (United Kingdom)a,c,d,g | | | | 200,000 | | | | 212,848 | |
Stichting AK Rabobank Certificaten, 6.50% (Netherlands)c,f | | | | 175,000 | | | | 253,421 | |
See accompanying notes to financial statements.
24
COHEN & STEERS ALTERNATIVE INCOME FUND, INC.
SCHEDULE OF INVESTMENTS—(Continued)
October 31, 2020
| | | | | | | | | | | | |
| | | | | | Principal
Amount | | | Value | |
| | | | | | | | | | | | |
UBS Group AG, 6.875% to 8/7/25 (Switzerland)c,d,f,g | | | $ | 200,000 | | | $ | 221,310 | |
UBS Group AG, 7.00% to 1/31/24, 144A (Switzerland)a,c,d,g | | | | 200,000 | | | | 215,389 | |
| | | | | | | | | | | | |
| | | | | | | | | | | 7,838,934 | |
| | | | | | | | | | | | |
ELECTRIC | | | 1.1% | | | | | | | | | |
CMS Energy Corp., 4.75% to 3/1/30, due 6/1/50d | | | | 255,000 | | | | 273,004 | |
Sempra Energy, 4.875% to 10/15/25c,d | | | | 290,000 | | | | 302,325 | |
Southern Co./The, 4.00% to 10/15/25, due 1/15/51, Series Bd | | | | 165,000 | | | | 167,979 | |
| | | | | | | | | | | | |
| | | | | | | | | | | 743,308 | |
| | | | | | | | | | | | |
FINANCIAL | | | 0.6% | | | | | | | | | |
CREDIT CARD | | | 0.1% | | | | | | | | | |
Discover Financial Services, 6.125% to 6/23/25, Series Dc,d | | | | 40,000 | | | | 43,220 | |
| | | | | | | | | | | | |
DIVERSIFIED FINANCIAL SERVICES | | | 0.1% | | | | | | | | | |
General Motors Financial Co., Inc., 5.70% to 9/30/30, Series Cc,d | | | | 60,000 | | | | 62,250 | |
| | | | | | | | | | | | |
INVESTMENT BANKER/BROKER | | | 0.4% | | | | | | | | | |
Charles Schwab Corp./The, 5.375% to 6/1/25, Series Gc,d | | | | 256,000 | | | | 280,960 | |
| | | | | | | | | | | | |
TOTAL FINANCIAL | | | | | | | | 386,430 | |
| | | | | | | | | | | | |
INSURANCE | | | 8.8% | | | | | | | | | |
LIFE/HEALTH INSURANCE | | | 3.0% | | | | | | | | | |
Equitable Holdings, Inc., 4.95% to 9/15/25, Series Bc,d | | | | 240,000 | | | | 247,800 | |
MetLife, Inc., 3.85% to 9/15/25, Series Gc,d | | | | 200,000 | | | | 201,072 | |
MetLife, Inc., 6.40%, due 12/15/36 | | | | 275,000 | | | | 340,405 | |
MetLife, Inc., 10.75%, due 8/1/39 | | | | 500,000 | | | | 814,961 | |
SBL Holdings, Inc., 7.00% to 5/13/25, 144Aa,c,d | | | | 290,000 | | | | 241,062 | |
Voya Financial, Inc., 6.125% to 9/15/23, Series Ac,d | | | | 265,000 | | | | 272,472 | |
| | | | | | | | | | | | |
| | | | | | | | | | | 2,117,772 | |
| | | | | | | | | | | | |
LIFE/HEALTH INSURANCE—FOREIGN | | | 0.4% | | | | | | | | | |
Legal & General Group PLC, 5.625% to 3/24/31 (United Kingdom)c,d,f,g | | | | 200,000 | | | | 265,421 | |
| | | | | | | | | | | | |
MULTI-LINE | | | 0.6% | | | | | | | | | |
American International Group, Inc., 8.175% to 5/15/38, due 5/15/58d | | | | 325,000 | | | | 460,873 | |
| | | | | | | | | | | | |
See accompanying notes to financial statements.
25
COHEN & STEERS ALTERNATIVE INCOME FUND, INC.
SCHEDULE OF INVESTMENTS—(Continued)
October 31, 2020
| | | | | | | | | | | | |
| | | | | | Principal
Amount | | | Value | |
| | | | | | | | | | | | |
MULTI-LINE—FOREIGN | | | 0.9% | | | | | | | | | |
AXA SA, 6.379% to 12/14/36, 144A (France)a,c,d | | | $ | 300,000 | | | $ | 409,909 | |
Beazley Insurance DAC, 5.50%, due 9/10/29 (United Kingdom)f | | | | 200,000 | | | | 210,106 | |
| | | | | | | | | | | | |
| | | | | | | | | | | 620,015 | |
| | | | | | | | | | | | |
PROPERTY CASUALTY | | | 1.6% | | | | | | | | | |
Assurant, Inc., 7.00% to 3/27/28, due 3/27/48d | | | | 750,000 | | | | 817,660 | |
Enstar Finance LLC, 5.75% to 9/1/25, due 9/1/40d | | | | 90,000 | | | | 91,563 | |
Markel Corp., 6.00% to 6/1/25c,d | | | | 80,000 | | | | 85,100 | |
PartnerRe Finance B LLC, 4.50% to 4/1/30, due 10/1/50d | | | | 110,000 | | | | 110,249 | |
| | | | | | | | | | | | |
| | | | | | | | | | | 1,104,572 | |
| | | | | | | | | | | | |
PROPERTY CASUALTY—FOREIGN | | | 1.5% | | | | | | | | | |
QBE Insurance Group Ltd., 5.875% to 5/12/25, 144A (Australia)a,c,d | | | | 200,000 | | | | 214,000 | |
QBE Insurance Group Ltd., 5.875% to 6/17/26, due 6/17/46, Series EMTN (Australia)d,f | | | | 200,000 | | | | 219,227 | |
VIVAT NV, 6.25% to 11/16/22 (Netherlands)c,d,f | | | | 600,000 | | | | 609,315 | |
| | | | | | | | | | | | |
| | | | | | | | | | | 1,042,542 | |
| | | | | | | | | | | | |
REINSURANCE | | | 0.8% | | | | | | | | | |
AXIS Specialty Finance LLC, 4.90% to 1/15/30, due 1/15/40d | | | | 535,000 | | | | 542,148 | |
| | | | | | | | | | | | |
TOTAL INSURANCE | | | | | | | | 6,153,343 | |
| | | | | | | | | | | | |
INTEGRATED TELECOMMUNICATIONS SERVICES—FOREIGN | | | 0.8% | | | | | | | | | |
Vodafone Group PLC, 7.00% to 1/4/29, due 4/4/79 (United Kingdom)d | | | | 455,000 | | | | 540,355 | |
| | | | | | | | | | | | |
OIL & GAS—FOREIGN | | | 0.9% | | | | | |
BP Capital Markets PLC, 4.375% to 6/22/25 (United Kingdom)c,d | | | | 120,000 | | | | 124,200 | |
BP Capital Markets PLC, 4.875% to 3/22/30 (United Kingdom)c,d | | | | 495,000 | | | | 520,987 | |
| | | | | | | | | | | | |
| | | | | | | | 645,187 | |
| | | | | | | | | | | | |
PIPELINES | | | 0.0% | | | | | |
Energy Transfer Operating LP, 7.125% to 5/15/30, Series Gc,d | | | | 40,000 | | | | 32,744 | |
| | | | | | | | | | | | |
See accompanying notes to financial statements.
26
COHEN & STEERS ALTERNATIVE INCOME FUND, INC.
SCHEDULE OF INVESTMENTS—(Continued)
October 31, 2020
| | | | | | | | | | | | |
| | | | | | Principal
Amount | | | Value | |
| | | | | | | | | | | | |
PIPELINES—FOREIGN | | | 1.7% | | | | | |
Enbridge, Inc., 5.75% to 4/15/30, due 7/15/80, Series 20-A (Canada)d | | | $ | 315,000 | | | $ | 321,647 | |
Enbridge, Inc., 6.00% to 1/15/27, due 1/15/77, Series 16-A (Canada)d | | | | 350,000 | | | | 348,606 | |
Transcanada Trust, 5.50% to 9/15/29, due 9/15/79 (Canada)d | | | | 365,000 | | | | 374,482 | |
Transcanada Trust, 5.625% to 5/20/25, due 5/20/75 (Canada)d | | | | 115,000 | | | | 117,731 | |
| | | | | | | | | | | | |
| | | | | | | | 1,162,466 | |
| | | | | | | | | | | | |
REAL ESTATE—RETAIL—FOREIGN | | | 0.7% | | | | | |
Scentre Group Trust 2, 4.75% to 6/24/26, due 9/24/80, 144A (Australia)a,d | | | | 200,000 | | | | 196,750 | |
Scentre Group Trust 2, 5.125% to 6/24/30, due 9/24/80, 144A (Australia)a,d | | | | 300,000 | | | | 295,186 | |
| | | | | | | | | | | | |
| | | | | | | | 491,936 | |
| | | | | | | | | | | | |
UTILITIES | | | 2.0% | | | | | |
ELECTRIC UTILITIES | | | 0.5% | | | | | |
NextEra Energy Capital Holdings, Inc., 5.65% to 5/1/29, due 5/1/79d | | | | 325,000 | | | | 367,098 | |
| | | | | | | | | | | | |
ELECTRIC UTILITIES—FOREIGN | | | 1.5% | | | | | |
Emera, Inc., 6.75% to 6/15/26, due 6/15/76, Series 16-A (Canada)d | | | | 915,000 | | | | 1,014,959 | |
| | | | | | | | | | | | |
TOTAL UTILITIES | | | | | | | | 1,382,057 | |
| | | | | | | | | | | | |
TOTAL PREFERRED SECURITIES—CAPITAL SECURITIES
(Identified cost—$23,057,103) | | | | | | | | 23,990,046 | |
| | | | | | | | | | | | |
SHORT-TERM INVESTMENTS | | | 1.1% | | | | | |
MONEY MARKET FUNDS | | | | | | | | | | | | |
State Street Institutional Treasury Money Market Fund, Premier Class, 0.01%h | | | | 750,124 | | | | 750,124 | |
| | | | | | | | | | | | |
TOTAL SHORT-TERM INVESTMENTS
(Identified cost—$750,124) | | | | | | | | 750,124 | |
| | | | | | | | | | | | |
TOTAL INVESTMENTSIN SECURITIES
(Identified cost—$70,070,094) | | | 99.6% | | | | | | | | 69,172,973 | |
OTHER ASSETSIN EXCESSOF LIABILITIES | | | 0.4 | | | | | | | | 311,910 | |
| | | | | | | | | | | | |
NET ASSETS | | | 100.0% | | | | | | | $ | 69,484,883 | |
| | | | | | | | | | | | |
See accompanying notes to financial statements.
27
COHEN & STEERS ALTERNATIVE INCOME FUND, INC.
SCHEDULE OF INVESTMENTS—(Continued)
October 31, 2020
Forward Foreign Currency Exchange Contracts
| | | | | | | | | | | | | | | | | | | | |
| Counterparty | | Contracts to
Deliver | | | In Exchange
For | | | Settlement
Date | | | Unrealized
Appreciation
(Depreciation) | |
Brown Brothers Harriman | | CAD | | | 205,896 | | | USD | | | 154,549 | | | | 11/3/20 | | | $ | 7 | |
Brown Brothers Harriman | | EUR | | | 868,120 | | | USD | | | 1,018,235 | | | | 11/3/20 | | | | 7,179 | |
Brown Brothers Harriman | | EUR | | | 111,437 | | | USD | | | 131,969 | | | | 11/3/20 | | | | 2,184 | |
Brown Brothers Harriman | | GBP | | | 531,215 | | | USD | | | 686,282 | | | | 11/3/20 | | | | (1,907 | ) |
Brown Brothers Harriman | | USD | | | 154,405 | | | CAD | | | 205,896 | | | | 11/3/20 | | | | 137 | |
Brown Brothers Harriman | | USD | | | 275,531 | | | EUR | | | 233,171 | | | | 11/3/20 | | | | (3,968 | ) |
Brown Brothers Harriman | | USD | | | 127,847 | | | EUR | | | 109,656 | | | | 11/3/20 | | | | (136 | ) |
Brown Brothers Harriman | | USD | | | 741,771 | | | EUR | | | 636,730 | | | | 11/3/20 | | | | (204 | ) |
Brown Brothers Harriman | | USD | | | 149,793 | | | GBP | | | 116,121 | | | | 11/3/20 | | | | 642 | |
Brown Brothers Harriman | | USD | | | 536,770 | | | GBP | | | 415,094 | | | | 11/3/20 | | | | 984 | |
Brown Brothers Harriman | | CAD | | | 208,166 | | | USD | | | 156,110 | | | | 12/2/20 | | | | (151 | ) |
Brown Brothers Harriman | | EUR | | | 635,299 | | | USD | | | 740,520 | | | | 12/2/20 | | | | 147 | |
Brown Brothers Harriman | | GBP | | | 417,571 | | | USD | | | 540,030 | | | | 12/2/20 | | | | (1,030 | ) |
| | | $ | 3,884 | |
| |
Glossary of Portfolio Abbreviations
| | |
ADR | | American Depositary Receipt |
CAD | | Canadian Dollar |
EMTN | | Euro Medium Term Note |
EUR | | Euro Currency |
GBP | | Great British Pound |
REIT | | Real Estate Investment Trust |
USD | | United States Dollar |
Note: Percentages indicated are based on the net assets of the Fund.
| a | Securities exempt from registration under Rule 144A of the Securities Act of 1933. These securities may only be resold to qualified institutional buyers. Aggregate holdings amounted to $6,735,859 which represents 9.7% of the net assets of the Fund, of which 0.0% are illiquid. |
| b | Non-income producing security. |
| c | Perpetual security. Perpetual securities have no stated maturity date, but they may be called/redeemed by the issuer. |
See accompanying notes to financial statements.
28
COHEN & STEERS ALTERNATIVE INCOME FUND, INC.
SCHEDULE OF INVESTMENTS—(Continued)
October 31, 2020
| d | Security converts to floating rate after the indicated fixed-rate coupon period. |
| e | Security value is determined based on significant unobservable inputs (Level 3). |
| f | Securities exempt from registration under Regulation S of the Securities Act of 1933. These securities are subject to resale restrictions. Aggregate holdings amounted to $3,543,168 which represents 5.1% of the net assets of the Fund, of which 0.0% are illiquid. |
| g | Contingent Capital security (CoCo). CoCos are debt or preferred securities with loss absorption characteristics built into the terms of the security for the benefit of the issuer. Aggregate holdings amounted to $7,189,961 or 10.3% of the net assets of the Fund. |
| h | Rate quoted represents the annualized seven-day yield. |
| | | | |
Country Summary | | % of
Net Assets | |
United States | | | 59.4 | |
United Kingdom | | | 7.9 | |
Canada | | | 6.0 | |
France | | | 4.8 | |
Australia | | | 3.7 | |
Netherlands | | | 2.3 | |
Switzerland | | | 2.1 | |
Japan | | | 1.9 | |
Spain | | | 1.8 | |
Germany | | | 1.2 | |
Hong Kong | | | 0.9 | |
China | | | 1.1 | |
Italy | | | 0.7 | |
South Africa | | | 0.7 | |
Brazil | | | 0.7 | |
Singapore | | | 0.5 | |
Sweden | | | 0.5 | |
Russia | | | 0.5 | |
Other | | | 3.3 | |
| | | | |
| | | 100.0 | |
| | | | |
See accompanying notes to financial statements.
29
COHEN & STEERS ALTERNATIVE INCOME FUND, INC.
STATEMENT OF ASSETS AND LIABILITIES
October 31, 2020
| | | | |
ASSETS: | |
Investments in securities, at value (Identified cost—$70,070,094) | | $ | 69,172,973 | |
Foreign currency, at value (Identified cost—$31,074) | | | 31,102 | |
Receivable for: | | | | |
Dividends and interest | | | 530,182 | |
Investment securities sold | | | 279,114 | |
Fund shares sold | | | 167,105 | |
Due from investment advisor | | | 88,209 | |
Unrealized appreciation on forward foreign currency exchange contracts | | | 11,280 | |
Other assets | | | 270 | |
| | | | |
Total Assets | | | 70,280,235 | |
| | | | |
LIABILITIES: | |
Unrealized depreciation on forward foreign currency exchange contracts | | | 7,396 | |
Payable for: | | | | |
Investment securities purchased | | | 423,808 | |
Fund shares redeemed | | | 88,525 | |
Dividends declared | | | 36,259 | |
Shareholder servicing fees | | | 11,194 | |
Administration fees | | | 1,215 | |
Distribution fees | | | 684 | |
Directors’ fees | | | 278 | |
Other liabilities | | | 225,993 | |
| | | | |
Total Liabilities | | | 795,352 | |
| | | | |
NET ASSETS | | $ | 69,484,883 | |
| | | | |
NET ASSETS consist of: | |
Paid-in capital | | $ | 89,070,702 | |
Total distributable earnings/(accumulated loss) | | | (19,585,819 | ) |
| | | | |
| | $ | 69,484,883 | |
| | | | |
See accompanying notes to financial statements.
30
COHEN & STEERS ALTERNATIVE INCOME FUND, INC.
STATEMENT OF ASSETS AND LIABILITIES—(Continued)
October 31, 2020
| | | | |
CLASS A SHARES: | |
NET ASSETS | | $ | 16,199,795 | |
Shares issued and outstanding ($0.001 par value common stock outstanding) | | | 1,697,284 | |
| | | | |
Net asset value and redemption price per share | | $ | 9.54 | |
| | | | |
Maximum offering price per share ($9.54 ÷ 0.955)a | | $ | 9.99 | |
| | | | |
CLASS C SHARES: | |
NET ASSETS | | $ | 5,634,007 | |
Shares issued and outstanding ($0.001 par value common stock outstanding) | | | 594,869 | |
| | | | |
Net asset value and offering price per shareb | | $ | 9.47 | |
| | | | |
CLASS I SHARES: | |
NET ASSETS | | $ | 47,551,155 | |
Shares issued and outstanding ($0.001 par value common stock outstanding) | | | 4,968,965 | |
| | | | |
Net asset value, offering and redemption price per share | | $ | 9.57 | |
| | | | |
CLASS R SHARES: | |
NET ASSETS | | $ | 78,737 | |
Shares issued and outstanding ($0.001 par value common stock outstanding) | | | 8,235 | |
| | | | |
Net asset value, offering and redemption price per share | | $ | 9.56 | |
| | | | |
CLASS Z SHARES: | |
NET ASSETS | | $ | 21,189 | |
Shares issued and outstanding ($0.001 par value common stock outstanding) | | | 2,215 | |
| | | | |
Net asset value, offering and redemption price per share | | $ | 9.57 | |
| | | | |
| a | On investments of $100,000 or more, the offering price is reduced. |
| b | Redemption price per share is equal to the net asset value per share less any applicable contingent deferred sales charge of 1.00% on shares held for less than one year. |
See accompanying notes to financial statements.
31
COHEN & STEERS ALTERNATIVE INCOME FUND, INC.
STATEMENT OF OPERATIONS
For the Year Ended October 31, 2020
| | | | |
Investment Income: | | | | |
Dividend income (net of $61,399 of foreign withholding tax) | | $ | 1,620,930 | |
Interest income | | | 1,379,355 | |
| | | | |
Total Investment Income | | | 3,000,285 | |
| | | | |
Expenses: | |
Investment advisory fees | | | 546,208 | |
Professional fees | | | 146,203 | |
Registration and filing fees | | | 109,078 | |
Distribution fees—Class A | | | 44,785 | |
Distribution fees—Class C | | | 51,281 | |
Distribution fees—Class R | | | 410 | |
Shareholder reporting expenses | | | 76,148 | |
Shareholder servicing fees—Class A | | | 17,914 | |
Shareholder servicing fees—Class C | | | 17,094 | |
Shareholder servicing fees—Class I | | | 37,154 | |
Administration fees | | | 69,676 | |
Custodian fees and expenses | | | 46,671 | |
Transfer agent fees and expenses | | | 12,534 | |
Directors’ fees and expenses | | | 4,825 | |
Miscellaneous | | | 14,171 | |
| | | | |
Total Expenses | | | 1,194,152 | |
Reduction of Expenses (See Note 2) | | | (555,998 | ) |
| | | | |
Net Expenses | | | 638,154 | |
| | | | |
Net Investment Income (Loss) | | | 2,362,131 | |
| | | | |
Net Realized and Unrealized Gain (Loss): | |
Net realized gain (loss) on: | |
Investments in securities | | | (17,525,590 | ) |
Forward foreign currency exchange contracts | | | (52,698 | ) |
Foreign currency transactions | | | (5,592 | ) |
| | | | |
Net realized gain (loss) | | | (17,583,880 | ) |
| | | | |
Net change in unrealized appreciation (depreciation) on: | |
Investments in securities | | | (1,302,313 | ) |
Forward foreign currency exchange contracts | | | 31,556 | |
Foreign currency translations | | | (492 | ) |
| | | | |
Net change in unrealized appreciation (depreciation) | | | (1,271,249 | ) |
| | | | |
Net Realized and Unrealized Gain (Loss) | | | (18,855,129 | ) |
| | | | |
Net Increase (Decrease) in Net Assets Resulting from Operations | | $ | (16,492,998 | ) |
| | | | |
See accompanying notes to financial statements.
32
COHEN & STEERS ALTERNATIVE INCOME FUND, INC.
| | | | | | | | | | | | |
STATEMENT OF CHANGES IN NET ASSETS | |
| | | For the
Year Ended
October 31, 2020 | | | For the Period
March 1, 2019
through
October 31, 2019a | | | For the
Year Ended
February 28, 2019 | |
Change in Net Assets: | |
From Operations: | |
Net investment income (loss) | | $ | 2,362,131 | | | $ | 857,510 | | | $ | 1,140,338 | |
Net realized gain (loss) | | | (17,583,880 | ) | | | 7,664,423 | | | | 9,418,685 | |
Net change in unrealized appreciation (depreciation) | | | (1,271,249 | ) | | | (5,016,443 | ) | | | (8,880,724 | ) |
| | | | | | | | | | | | |
Net increase (decrease) in net assets resulting from operations | | | (16,492,998 | ) | | | 3,505,490 | | | | 1,678,299 | |
| | | | | | | | | | | | |
Distributions to Shareholders: | |
Class A | | | (665,907 | ) | | | (3,748,975 | ) | | | (2,867,895 | ) |
Class C | | | (208,239 | ) | | | (1,437,007 | ) | | | (2,114,731 | ) |
Class I | | | (2,166,161 | ) | | | (4,567,823 | ) | | | (8,344,335 | ) |
Class R | | | (2,920 | ) | | | (17,815 | ) | | | (12,699 | ) |
Class Z | | | (445 | ) | | | (1,376 | ) | | | (1,325 | ) |
Tax Return of Capital to Shareholders: | |
Class A | | | (343,141 | ) | | | — | | | | — | |
Class C | | | (132,477 | ) | | | — | | | | — | |
Class I | | | (1,020,539 | ) | | | — | | | | — | |
Class R | | | (1,573 | ) | | | — | | | | — | |
Class Z | | | (298 | ) | | | — | | | | — | |
| | | | | | | | | | | | |
Total distributions | | | (4,541,700 | ) | | | (9,772,996 | ) | | | (13,340,985 | ) |
| | | | | | | | | | | | |
Capital Stock Transactions: | |
Increase (decrease) in net assets from Fund share transactions | | | 22,488,403 | | | | 13,793,835 | | | | (22,275,280 | ) |
| | | | | | | | | | | | |
Total increase (decrease) in net assets | | | 1,453,705 | | | | 7,526,329 | | | | (33,937,966 | ) |
Net Assets: | |
Beginning of period | | | 68,031,178 | | | | 60,504,849 | | | | 94,442,815 | |
| | | | | | | | | | | | |
End of period | | $ | 69,484,883 | | | $ | 68,031,178 | | | $ | 60,504,849 | |
| | | | | | | | | | | | |
| a | The Fund has changed its fiscal year end from February 28 to October 31. |
See accompanying notes to financial statements.
33
COHEN & STEERS ALTERNATIVE INCOME FUND, INC.
FINANCIAL HIGHLIGHTS
The following tables include selected data for a share outstanding throughout each period and other performance information derived from the financial statements. They should be read in conjunction with the financial statements and notes thereto.
| | | | | | | | | | | | | | | | | | | | | | | | |
| | | Class A | |
| | | For the
Year Ended
October 31, 2020 | | | For the Period
March 1, 2019
through
October 31, 2019a | | | For the Year Ended February 28, | |
Per Share Operating Data: | | 2019 | | | 2018 | | | 2017 | | | 2016b | |
Net asset value, beginning of period | | | $11.85 | | | | $13.33 | | | | $15.16 | | | | $15.50 | | | | $13.30 | | | | $16.33 | |
| | | | | | | | | | | | | | | | | | | | | | | | |
Income (loss) from investment operations: | | | | | | | | | | | | | | | | | | | | | | | | |
| | | | | | |
Net investment income (loss)c | | | 0.29 | | | | 0.17 | | | | 0.17 | | | | 0.17 | | | | 0.18 | | | | 0.14 | |
Net realized and unrealized gain (loss) | | | (2.02 | ) | | | 0.59 | | | | 0.15 | | | | 1.42 | | | | 3.56 | | | | (1.92 | ) |
| | | | | | | | | | | | | | | | | | | | | | | | |
Total from investment operations | | | (1.73 | ) | | | 0.76 | | | | 0.32 | | | | 1.59 | | | | 3.74 | | | | (1.78 | ) |
| | | | | | | | | | | | | | | | | | | | | | | | |
Less dividends and distributions to shareholders from: | | | | | | | | | | | | | | | | | | | | | | | | |
| | | | | | |
Net investment income | | | (0.38 | ) | | | (0.23 | ) | | | (0.17 | ) | | | (0.17 | ) | | | (0.18 | ) | | | (0.14 | ) |
Net realized gain | | | — | | | | (2.01 | ) | | | (1.98 | ) | | | (1.76 | ) | | | (1.36 | ) | | | (1.11 | ) |
Tax return of capital | | | (0.20 | ) | | | — | | | | — | | | | — | | | | — | | | | — | |
| | | | | | | | | | | | | | | | | | | | | | | | |
Total dividends and distributions to shareholders | | | (0.58 | ) | | | (2.24 | ) | | | (2.15 | ) | | | (1.93 | ) | | | (1.54 | ) | | | (1.25 | ) |
| | | | | | | | | | | | | | | | | | | | | | | | |
Net increase (decrease) in net asset value | | | (2.31 | ) | | | (1.48 | ) | | | (1.83 | ) | | | (0.34 | ) | | | 2.20 | | | | (3.03 | ) |
| | | | | | | | | | | | | | | | | | | | | | | | |
Net asset value, end of period | | | $9.54 | | | | $11.85 | | | | $13.33 | | | | $15.16 | | | | $15.50 | | | | $13.30 | |
| | | | | | | | | | | | | | | | | | | | | | | | |
| | | | | | |
| | | | | | | | | | | | | | | | | | | | | | | | | |
Total returnd,e | | | -14.74 | % | | | 5.90 | %f | | | 2.59 | % | | | 10.81 | % | | | 28.76 | % | | | -11.63 | % |
| | | | | | | | | | | | | | | | | | | | | | | | |
| | | | | | |
| | | | | | | | | | | | | | | | | | | | | | | | | |
See accompanying notes to financial statements.
34
COHEN & STEERS ALTERNATIVE INCOME FUND, INC.
FINANCIAL HIGHLIGHTS—(Continued)
| | | | | | | | | | | | | | | | | | | | | | | | |
| | | Class A | |
| | | For the
Year Ended
October 31, 2020 | | | For the Period
March 1, 2019
through
October 31, 2019a | | | For the Year Ended February 28, | |
| | | 2019 | | | 2018 | | | 2017 | | | 2016b | |
Ratios/Supplemental Data: | | | | | | | | | | | | | | | | | | | | | | | | |
| | | | | | |
Net assets, end of period (in millions) | | | $16.2 | | | | $21.1 | | | | $19.8 | | | | $18.5 | | | | $19.6 | | | | $17.0 | |
| | | | | | | | | | | | | | | | | | | | | | | | |
Ratios to average daily net assets: | | | | | | | | | | | | | | | | | | | | | | | | |
| | | | | | |
Expenses (before expense reduction) | | | 1.67 | % | | | 1.79 | %g | | | 1.40 | % | | | 1.25 | % | | | 1.31 | % | | | 1.37 | % |
| | | | | | | | | | | | | | | | | | | | | | | | |
Expenses (net of expense reduction) | | | 1.00 | % | | | 1.00 | %g | | | 1.00 | % | | | 1.00 | % | | | 1.00 | % | | | 1.01 | % |
| | | | | | | | | | | | | | | | | | | | | | | | |
Net investment income (loss) (before expense reduction) | | | 2.15 | % | | | 1.27 | %g | | | 0.80 | % | | | 0.85 | % | | | 0.92 | % | | | 0.59 | % |
| | | | | | | | | | | | | | | | | | | | | | | | |
Net investment income (loss) (net of expense reduction) | | | 2.82 | % | | | 2.06 | %g | | | 1.20 | % | | | 1.10 | % | | | 1.23 | % | | | 0.95 | % |
| | | | | | | | | | | | | | | | | | | | | | | | |
Portfolio turnover rate | | | 143 | % | | | 178 | %f | | | 158 | % | | | 102 | % | | | 70 | % | | | 64 | % |
| | | | | | | | | | | | | | | | | | | | | | | | |
| a | The Fund has changed its fiscal year end from February 28 to October 31. |
| b | For the year ended February 29. |
| c | Calculation based on average shares outstanding. |
| d | Return assumes the reinvestment of all dividends and distributions at net asset value. |
| e | Does not reflect sales charges, which would reduce return. |
| g | Ratios for periods less than one year are annualized. Certain professional, shareholder reporting and non-recurring expenses incurred by the Fund are not annualized for periods less than one year. |
See accompanying notes to financial statements.
35
COHEN & STEERS ALTERNATIVE INCOME FUND, INC.
FINANCIAL HIGHLIGHTS—(Continued)
| | | | | | | | | | | | | | | | | | | | | | | | |
| | | Class C | |
| | | For the
Year Ended
October 31, 2020 | | | For the Period
March 1, 2019
through
October 31, 2019a | | | For the Year Ended February 28, | |
Per Share Operating Data: | | 2019 | | | 2018 | | | 2017 | | | 2016b | |
Net asset value, beginning of period | | | $11.76 | | | | $13.22 | | | | $15.04 | | | | $15.38 | | | | $13.20 | | | | $16.22 | |
| | | | | | | | | | | | | | | | | | | | | | | | |
Income (loss) from investment operations: | | | | | | | | | | | | | | | | | | | | | | | | |
| | | | | | |
Net investment income (loss)c | | | 0.23 | | | | 0.11 | | | | 0.07 | | | | 0.07 | | | | 0.09 | | | | 0.04 | |
Net realized and unrealized gain (loss) | | | (2.01 | ) | | | 0.59 | | | | 0.15 | | | | 1.41 | | | | 3.53 | | | | (1.91 | ) |
| | | | | | | | | | | | | | | | | | | | | | | | |
Total from investment operations | | | (1.78 | ) | | | 0.70 | | | | 0.22 | | | | 1.48 | | | | 3.62 | | | | (1.87 | ) |
| | | | | | | | | | | | | | | | | | | | | | | | |
Less dividends and distributions to shareholders from: | | | | | | | | | | | | | | | | | | | | | | | | |
| | | | | | |
Net investment income | | | (0.31 | ) | | | (0.15 | ) | | | (0.06 | ) | | | (0.06 | ) | | | (0.08 | ) | | | (0.04 | ) |
Net realized gain | | | — | | | | (2.01 | ) | | | (1.98 | ) | | | (1.76 | ) | | | (1.36 | ) | | | (1.11 | ) |
Tax return of capital | | | (0.20 | ) | | | — | | | | — | | | | — | | | | — | | | | — | |
| | | | | | | | | | | | | | | | | | | | | | | | |
Total dividends and distributions to shareholders | | | (0.51 | ) | | | (2.16 | ) | | | (2.04 | ) | | | (1.82 | ) | | | (1.44 | ) | | | (1.15 | ) |
| | | | | | | | | | | | | | | | | | | | | | | | |
Net increase (decrease) in net asset value | | | (2.29 | ) | | | (1.46 | ) | | | (1.82 | ) | | | (0.34 | ) | | | 2.18 | | | | (3.02 | ) |
| | | | | | | | | | | | | | | | | | | | | | | | |
Net asset value, end of period | | | $9.47 | | | | $11.76 | | | | $13.22 | | | | $15.04 | | | | $15.38 | | | | $13.20 | |
| | | | | | | | | | | | | | | | | | | | | | | | |
| | | | | | |
| | | | | | | | | | | | | | | | | | | | | | | | | |
Total returnd,e | | | -15.25 | % | | | 5.39 | %f | | | 1.95 | % | | | 10.11 | % | | | 27.97 | % | | | -12.25 | % |
| | | | | | | | | | | | | | | | | | | | | | | | |
| | | | | | |
| | | | | | | | | | | | | | | | | | | | | | | | | |
Ratios/Supplemental Data: | | | | | | | | | | | | | | | | | | | | | | | | |
| | | | | | |
Net assets, end of period (in millions) | | | $5.6 | | | | $6.6 | | | | $12.6 | | | | $18.1 | | | | $26.7 | | | | $25.7 | |
| | | | | | | | | | | | | | | | | | | | | | | | |
Ratios to average daily net assets: | | | | | | | | | | | | | | | | | | | | | | | | |
| | | | | | |
Expenses (before expense reduction) | | | 2.32 | % | | | 2.44 | %g | | | 2.05 | % | | | 1.90 | % | | | 1.96 | % | | | 2.02 | % |
| | | | | | | | | | | | | | | | | | | | | | | | |
Expenses (net of expense reduction) | | | 1.65 | % | | | 1.65 | %g | | | 1.65 | % | | | 1.65 | % | | | 1.65 | % | | | 1.66 | % |
| | | | | | | | | | | | | | | | | | | | | | | | |
Net investment income (loss) (before expense reduction) | | | 1.52 | % | | | 0.52 | %g | | | 0.13 | % | | | 0.18 | % | | | 0.27 | % | | | (0.06 | )% |
| | | | | | | | | | | | | | | | | | | | | | | | |
Net investment income (loss) (net of expense reduction) | | | 2.19 | % | | | 1.31 | %g | | | 0.53 | % | | | 0.43 | % | | | 0.58 | % | | | 0.30 | % |
| | | | | | | | | | | | | | | | | | | | | | | | |
Portfolio turnover rate | | | 143 | % | | | 178 | %f | | | 158 | % | | | 102 | % | | | 70 | % | | | 64 | % |
| | | | | | | | | | | | | | | | | | | | | | | | |
| a | The Fund has changed its fiscal year end from February 28 to October 31. |
| b | For the year ended February 29. |
| c | Calculation based on average shares outstanding. |
| d | Return assumes the reinvestment of all dividends and distributions at net asset value. |
| e | Does not reflect sales charges, which would reduce return. |
| g | Ratios for periods less than one year are annualized. Certain professional, shareholder reporting and non-recurring expenses incurred by the Fund are not annualized for periods less than one year. |
See accompanying notes to financial statements.
36
COHEN & STEERS ALTERNATIVE INCOME FUND, INC.
FINANCIAL HIGHLIGHTS—(Continued)
| | | | | | | | | | | | | | | | | | | | | | | | |
| | | Class I | |
| | | For the
Year Ended
October 31, 2020 | | | For the Period
March 1, 2019
through
October 31, 2019a | | | For the Year Ended February 28, | |
Per Share Operating Data: | | 2019 | | | 2018 | | | 2017 | | | 2016b | |
Net asset value, beginning of period | | | $11.88 | | | | $13.36 | | | | $15.19 | | | | $15.53 | | | | $13.32 | | | | $16.36 | |
| | | | | | | | | | | | | | | | | | | | | | | | |
Income (loss) from investment operations: | | | | | | | | | | | | | | | | | | | | | | | | |
| | | | | | |
Net investment income (loss)c | | | 0.33 | | | | 0.20 | | | | 0.22 | | | | 0.22 | | | | 0.23 | | | | 0.20 | |
Net realized and unrealized gain (loss) | | | (2.02 | ) | | | 0.60 | | | | 0.15 | | | | 1.42 | | | | 3.57 | | | | (1.94 | ) |
| | | | | | | | | | | | | | | | | | | | | | | | |
Total from investment operations | | | (1.69 | ) | | | 0.80 | | | | 0.37 | | | | 1.64 | | | | 3.80 | | | | (1.74 | ) |
| | | | | | | | | | | | | | | | | | | | | | | | |
Less dividends and distributions to shareholders from: | | | | | | | | | | | | | | | | | | | | | | | | |
| | | | | | |
Net investment income | | | (0.42 | ) | | | (0.27 | ) | | | (0.22 | ) | | | (0.22 | ) | | | (0.23 | ) | | | (0.19 | ) |
Net realized gain | | | — | | | | (2.01 | ) | | | (1.98 | ) | | | (1.76 | ) | | | (1.36 | ) | | | (1.11 | ) |
Tax return of capital | | | (0.20 | ) | | | — | | �� | | — | | | | — | | | | — | | | | — | |
| | | | | | | | | | | | | | | | | | | | | | | | |
Total dividends and distributions to shareholders | | | (0.62 | ) | | | (2.28 | ) | | | (2.20 | ) | | | (1.98 | ) | | | (1.59 | ) | | | (1.30 | ) |
| | | | | | | | | | | | | | | | | | | | | | | | |
Net increase (decrease) in net asset value | | | (2.31 | ) | | | (1.48 | ) | | | (1.83 | ) | | | (0.34 | ) | | | 2.21 | | | | (3.04 | ) |
| | | | | | | | | | | | | | | | | | | | | | | | |
Net asset value, end of period | | | $9.57 | | | | $11.88 | | | | $13.36 | | | | $15.19 | | | | $15.53 | | | | $13.32 | |
| | | | | | | | | | | | | | | | | | | | | | | | |
| | | | | | |
| | | | | | | | | | | | | | | | | | | | | | | | | |
Total returnd | | | –14.41 | % | | | 6.18 | %e | | | 2.96 | % | | | 11.18 | % | | | 29.24 | % | | | –11.35 | % |
| | | | | | | | | | | | | | | | | | | | | | | | |
|
| | |
Ratios/Supplemental Data: | | | | | | | | | | | | | | | | | | | | | | | | |
| | | | | | |
Net assets, end of period (in millions) | | | $47.6 | | | | $40.2 | | | | $28.0 | | | | $57.8 | | | | $143.5 | | | | $163.5 | |
| | | | | | | | | | | | | | | | | | | | | | | | |
Ratios to average daily net assets: | | | | | | | | | | | | | | | | | | | | | | | | |
| | | | | | |
Expenses (before expense reduction) | | | 1.38 | % | | | 1.51 | %f | | | 1.09 | % | | | 0.96 | % | | | 1.01 | % | | | 1.06 | % |
| | | | | | | | | | | | | | | | | | | | | | | | |
Expenses (net of expense reduction) | | | 0.65 | % | | | 0.65 | %f | | | 0.65 | % | | | 0.65 | % | | | 0.65 | % | | | 0.66 | % |
| | | | | | | | | | | | | | | | | | | | | | | | |
Net investment income (loss) (before expense reduction) | | | 2.47 | % | | | 1.64 | %f | | | 1.09 | % | | | 1.11 | % | | | 1.23 | % | | | 0.91 | % |
| | | | | | | | | | | | | | | | | | | | | | | | |
Net investment income (loss) (net of expense reduction) | | | 3.20 | % | | | 2.50 | %f | | | 1.53 | % | | | 1.42 | % | | | 1.59 | % | | | 1.31 | % |
| | | | | | | | | | | | | | | | | | | | | | | | |
Portfolio turnover rate | | | 143 | % | | | 178 | %e | | | 158 | % | | | 102 | % | | | 70 | % | | | 64 | % |
| | | | | | | | | | | | | | | | | | | | | | | | |
| a | The Fund has changed its fiscal year end from February 28 to October 31. |
| b | For the year ended February 29. |
| c | Calculation based on average shares outstanding. |
| d | Return assumes the reinvestment of all dividends and distributions at net asset value. |
| f | Ratios for periods less than one year are annualized. Certain professional, shareholder reporting and non-recurring expenses incurred by the Fund are not annualized for periods less than one year. |
See accompanying notes to financial statements.
37
COHEN & STEERS ALTERNATIVE INCOME FUND, INC.
FINANCIAL HIGHLIGHTS—(Continued)
| | | | | | | | | | | | | | | | | | | | | | | | |
| | | Class R | |
| | | For the
Year Ended
October 31, 2020 | | | For the Period
March 1, 2019
through
October 31, 2019a | | | For the Year Ended February 28, | |
Per Share Operating Data: | | 2019 | | | 2018 | | | 2017 | | | 2016b | |
Net asset value, beginning of period | | | $11.87 | | | | $13.34 | | | | $15.17 | | | | $15.51 | | | | $13.31 | | | | $16.35 | |
| | | | | | | | | | | | | | | | | | | | | | | | |
Income (loss) from investment operations: | | | | | | | | | | | | | | | | | | | | | | | | |
| | | | | | |
Net investment income (loss)c | | | 0.28 | | | | 0.16 | | | | 0.15 | | | | 0.15 | | | | 0.15 | | | | 0.12 | |
Net realized and unrealized gain (loss) | | | (2.02 | ) | | | 0.59 | | | | 0.14 | | | | 1.41 | | | | 3.57 | | | | (1.93 | ) |
| | | | | | | | | | | | | | | | | | | | | | | | |
Total from investment operations | | | (1.74 | ) | | | 0.75 | | | | 0.29 | | | | 1.56 | | | | 3.72 | | | | (1.81 | ) |
| | | | | | | | | | | | | | | | | | | | | | | | |
Less dividends and distributions to shareholders from: | | | | | | | | | | | | | | | | | | | | | | | | |
| | | | | | |
Net investment income | | | (0.37 | ) | | | (0.21 | ) | | | (0.14 | ) | | | (0.14 | ) | | | (0.16 | ) | | | (0.12 | ) |
Net realized gain | | | — | | | | (2.01 | ) | | | (1.98 | ) | | | (1.76 | ) | | | (1.36 | ) | | | (1.11 | ) |
Tax return of capital | | | (0.20 | ) | | | — | | | | — | | | | — | | | | — | | | | — | |
| | | | | | | | | | | | | | | | | | | | | | | | |
Total dividends and distributions to shareholders | | | (0.57 | ) | | | (2.22 | ) | | | (2.12 | ) | | | (1.90 | ) | | | (1.52 | ) | | | (1.23 | ) |
| | | | | | | | | | | | | | | | | | | | | | | | |
Net increase (decrease) in net asset value | | | (2.31 | ) | | | (1.47 | ) | | | (1.83 | ) | | | (0.34 | ) | | | 2.20 | | | | (3.04 | ) |
| | | | | | | | | | | | | | | | | | | | | | | | |
Net asset value, end of period | | | $9.56 | | | | $11.87 | | | | $13.34 | | | | $15.17 | | | | $15.51 | | | | $13.31 | |
| | | | | | | | | | | | | | | | | | | | | | | | |
|
| | |
Total returnd | | | –14.85 | % | | | 5.81 | %e | | | 2.43 | % | | | 10.63 | % | | | 28.61 | % | | | –11.81 | % |
| | | | | | | | | | | | | | | | | | | | | | | | |
|
| | |
Ratios/Supplemental Data: | | | | | | | | | | | | | | | | | | | | | | | | |
| | | | | | |
Net assets, end of period (in 000s) | | | $78.7 | | | | $82.9 | | | | $96.9 | | | | $90.4 | | | | $64.8 | | | | $8.0 | |
| | | | | | | | | | | | | | | | | | | | | | | | |
Ratios to average daily net assets: | | | | | | | | | | | | | | | | | | | | | | | | |
| | | | | | |
Expenses (before expense reduction) | | | 1.82 | % | | | 1.94 | %f | | | 1.55 | % | | | 1.40 | % | | | 1.46 | % | | | 1.52 | % |
| | | | | | | | | | | | | | | | | | | | | | | | |
Expenses (net of expense reduction) | | | 1.15 | % | | | 1.15 | %f | | | 1.15 | % | | | 1.15 | % | | | 1.15 | % | | | 1.16 | % |
| | | | | | | | | | | | | | | | | | | | | | | | |
Net investment income (loss) (before expense reduction) | | | 2.00 | % | | | 1.11 | %f | | | 0.67 | % | | | 0.70 | % | | | 0.71 | % | | | 0.45 | % |
| | | | | | | | | | | | | | | | | | | | | | | | |
Net investment income (loss) (net of expense reduction) | | | 2.67 | % | | | 1.90 | %f | | | 1.07 | % | | | 0.95 | % | | | 1.02 | % | | | 0.81 | % |
| | | | | | | | | | | | | | | | | | | | | | | | |
Portfolio turnover rate | | | 143 | % | | | 178 | %e | | | 158 | % | | | 102 | % | | | 70 | % | | | 64 | % |
| | | | | | | | | | | | | | | | | | | | | | | | |
| a | The Fund has changed its fiscal year end from February 28 to October 31. |
| b | For the year ended February 29. |
| c | Calculation based on average shares outstanding. |
| d | Return assumes the reinvestment of all dividends and distributions at net asset value. |
| f | Ratios for periods less than one year are annualized. Certain professional, shareholder reporting and non-recurring expenses incurred by the Fund are not annualized for periods less than one year. |
See accompanying notes to financial statements.
38
COHEN & STEERS ALTERNATIVE INCOME FUND, INC.
FINANCIAL HIGHLIGHTS—(Continued)
| | | | | | | | | | | | | | | | | | | | | | | | |
| | | Class Z | |
| | | For the
Year Ended
October 31, 2020 | | | For the Period
March 1, 2019
through
October 31, 2019a | | | For the Year Ended February 28, | |
Per Share Operating Data: | | 2019 | | | 2018 | | | 2017 | | | 2016b | |
Net asset value, beginning of period | | | $11.88 | | | | $13.36 | | | | $15.19 | | | | $15.53 | | | | $13.32 | | | | $16.36 | |
| | | | | | | | | | | | | | | | | | | | | | | | |
Income (loss) from investment operations: | | | | | | | | | | | | | | | | | | | | | | | | |
| | | | | | |
Net investment income (loss)c | | | 0.41 | | | | 0.20 | | | | 0.22 | | | | 0.22 | | | | 0.23 | | | | 0.20 | |
Net realized and unrealized gain (loss) | | | (2.10 | ) | | | 0.60 | | | | 0.15 | | | | 1.42 | | | | 3.57 | | | | (1.94 | ) |
| | | | | | | | | | | | | | | | | | | | | | | | |
Total from investment operations | | | (1.69 | ) | | | 0.80 | | | | 0.37 | | | | 1.64 | | | | 3.80 | | | | (1.74 | ) |
| | | | | | | | | | | | | | | | | | | | | | | | |
Less dividends and distributions to shareholders from: | | | | | | | | | | | | | | | | | | | | | | | | |
| | | | | | |
Net investment income | | | (0.42 | ) | | | (0.27 | ) | | | (0.22 | ) | | | (0.22 | ) | | | (0.23 | ) | | | (0.19 | ) |
Net realized gain | | | — | | | | (2.01 | ) | | | (1.98 | ) | | | (1.76 | ) | | | (1.36 | ) | | | (1.11 | ) |
Tax return of capital | | | (0.20 | ) | | | — | | | | — | | | | — | | | | — | | | | — | |
| | | | | | | | | | | | | | | | | | | | | | | | |
Total dividends and distributions to shareholders | | | (0.62 | ) | | | (2.28 | ) | | | (2.20 | ) | | | (1.98 | ) | | | (1.59 | ) | | | (1.30 | ) |
| | | | | | | | | | | | | | | | | | | | | | | | |
Net increase (decrease) in net asset value | | | (2.31 | ) | | | (1.48 | ) | | | (1.83 | ) | | | (0.34 | ) | | | 2.21 | | | | (3.04 | ) |
| | | | | | | | | | | | | | | | | | | | | | | | |
Net asset value, end of period | | | $9.57 | | | | $11.88 | | | | $13.36 | | | | $15.19 | | | | $15.53 | | | | $13.32 | |
| | | | | | | | | | | | | | | | | | | | | | | | |
|
| | |
Total returnd | | | –14.41 | % | | | 6.17 | %e | | | 2.96 | % | | | 11.18 | % | | | 29.24 | % | | | –11.35 | % |
| | | | | | | | | | | | | | | | | | | | | | | | |
|
| | |
Ratios/Supplemental Data: | | | | | | | | | | | | | | | | | | | | | | | | |
| | | | | | |
Net assets, end of period (in 000s) | | | $21.2 | | | | $7.2 | | | | $8.1 | | | | $9.2 | | | | $9.4 | | | | $8.0 | |
| | | | | | | | | | | | | | | | | | | | | | | | |
Ratios to average daily net assets: | | | | | | | | | | | | | | | | | | | | | | | | |
| | | | | | |
Expenses (before expense reduction) | | | 1.32 | % | | | 1.44 | %f | | | 1.05 | % | | | 0.90 | % | | | 0.96 | % | | | 1.02 | % |
| | | | | | | | | | | | | | | | | | | | | | | | |
Expenses (net of expense reduction) | | | 0.65 | % | | | 0.65 | %f | | | 0.65 | % | | | 0.65 | % | | | 0.65 | % | | | 0.66 | % |
| | | | | | | | | | | | | | | | | | | | | | | | |
Net investment income (loss) (before expense reduction) | | | 3.25 | % | | | 1.62 | %f | | | 1.14 | % | | | 1.18 | % | | | 1.27 | % | | | 0.95 | % |
| | | | | | | | | | | | | | | | | | | | | | | | |
Net investment income (loss) (net of expense reduction) | | | 3.92 | % | | | 2.41 | %f | | | 1.54 | % | | | 1.43 | % | | | 1.58 | % | | | 1.31 | % |
| | | | | | | | | | | | | | | | | | | | | | | | |
Portfolio turnover rate | | | 143 | % | | | 178 | %e | | | 158 | % | | | 102 | % | | | 70 | % | | | 64 | % |
| | | | | | | | | | | | | | | | | | | | | | | | |
| a | The Fund has changed its fiscal year end from February 28 to October 31. |
| b | For the year ended February 29. |
| c | Calculation based on average shares outstanding. |
| d | Return assumes the reinvestment of all dividends and distributions at net asset value. |
| f | Ratios for periods less than one year are annualized. Certain professional, shareholder reporting and non-recurring expenses incurred by the Fund are not annualized for periods less than one year. |
See accompanying notes to financial statements.
39
COHEN & STEERS ALTERNATIVE INCOME FUND, INC.
NOTES TO FINANCIAL STATEMENTS
Note 1. Organization and Significant Accounting Policies
Cohen & Steers Alternative Income Fund, Inc. (the Fund) was incorporated under the laws of the State of Maryland on November 8, 2004 and is registered under the Investment Company Act of 1940 (the 1940 Act) as a diversified, open-end management investment company. The investment objectives of the Fund are to seek a high level of current income and secondarily, capital appreciation. The authorized shares of the Fund are divided into six classes designated Class A, C, F, I, R and Z shares. Each of the Fund’s shares has equal dividend, liquidation and voting rights (except for matters relating to distribution and shareholder servicing of such shares). Class F shares are currently not available for purchase.
The following is a summary of significant accounting policies consistently followed by the Fund in the preparation of its financial statements. The Fund is an investment company and, accordingly, follows the investment company accounting and reporting guidance of the Financial Accounting Standards Board Accounting Standards Codification (ASC) Topic 946—Investment Companies. The accounting policies of the Fund are in conformity with accounting principles generally accepted in the United States of America (GAAP). The preparation of the financial statements in accordance with GAAP requires management to make estimates and assumptions that affect the reported amounts of assets and liabilities at the date of the financial statements and the reported amounts of income and expenses during the reporting period. Actual results could differ from those estimates.
Portfolio Valuation: Investments in securities that are listed on the New York Stock Exchange (NYSE) are valued, except as indicated below, at the last sale price reflected at the close of the NYSE on the business day as of which such value is being determined. If there has been no sale on such day, the securities are valued at the mean of the closing bid and ask prices on such day or, if no ask price is available, at the bid price. Forward foreign currency exchange contracts are valued daily at the prevailing forward exchange rate.
Securities not listed on the NYSE but listed on other domestic or foreign securities exchanges (including NASDAQ) are valued in a similar manner. Securities traded on more than one securities exchange are valued at the last sale price reflected at the close of the exchange representing the principal market for such securities on the business day as of which such value is being determined. If after the close of a foreign market, but prior to the close of business on the day the securities are being valued, market conditions change significantly, certain non-U.S. equity holdings may be fair valued pursuant to procedures established by the Board of Directors.
Readily marketable securities traded in the over-the-counter (OTC) market, including listed securities whose primary market is believed by Cohen & Steers Capital Management, Inc. (the investment advisor) to be OTC, are valued on the basis of prices provided by a third-party pricing service or third-party broker-dealers when such prices are believed by the investment advisor, pursuant to delegation by the Board of Directors, to reflect the fair value of such securities.
Fixed-income securities are valued on the basis of prices provided by a third-party pricing service or third-party broker-dealers when such prices are believed by the investment advisor, pursuant to delegation by the Board of Directors, to reflect the fair value of such securities. The pricing services or
40
COHEN & STEERS ALTERNATIVE INCOME FUND, INC.
NOTES TO FINANCIAL STATEMENTS—(Continued)
broker-dealers use multiple valuation techniques to determine fair value. In instances where sufficient market activity exists, the pricing services or broker-dealers may utilize a market-based approach through which quotes from market makers are used to determine fair value. In instances where sufficient market activity may not exist or is limited, the pricing services or broker-dealers also utilize proprietary valuation models which may consider market transactions in comparable securities and the various relationships between securities in determining fair value and/or characteristics such as benchmark yield curves, option-adjusted spreads, credit spreads, estimated default rates, coupon rates, anticipated timing of principal repayments, underlying collateral, and other unique security features which are then used to calculate the fair values.
Short-term debt securities with a maturity date of 60 days or less are valued at amortized cost, which approximates fair value. Investments in open-end mutual funds are valued at net asset value (NAV).
The policies and procedures approved by the Fund’s Board of Directors delegate authority to make fair value determinations to the investment advisor, subject to the oversight of the Board of Directors. The investment advisor has established a valuation committee (Valuation Committee) to administer, implement and oversee the fair valuation process according to the policies and procedures approved annually by the Board of Directors. Among other things, these procedures allow the Fund to utilize independent pricing services, quotations from securities and financial instrument dealers and other market sources to determine fair value.
Securities for which market prices are unavailable, or securities for which the investment advisor determines that the bid and/or ask price or a counterparty valuation does not reflect market value, will be valued at fair value, as determined in good faith by the Valuation Committee, pursuant to procedures approved by the Fund’s Board of Directors. Circumstances in which market prices may be unavailable include, but are not limited to, when trading in a security is suspended, the exchange on which the security is traded is subject to an unscheduled close or disruption or material events occur after the close of the exchange on which the security is principally traded. In these circumstances, the Fund determines fair value in a manner that fairly reflects the market value of the security on the valuation date based on consideration of any information or factors it deems appropriate. These may include, but are not limited to, recent transactions in comparable securities, information relating to the specific security and developments in the markets.
Foreign equity fair value pricing procedures utilized by the Fund may cause certain non-U.S. equity holdings to be fair valued on the basis of fair value factors provided by a pricing service to reflect any significant market movements between the time the Fund values such securities and the earlier closing of foreign markets.
The Fund’s use of fair value pricing may cause the NAV of Fund shares to differ from the NAV that would be calculated using market quotations. Fair value pricing involves subjective judgments and it is possible that the fair value determined for a security may be materially different than the value that could be realized upon the sale of that security.
41
COHEN & STEERS ALTERNATIVE INCOME FUND, INC.
NOTES TO FINANCIAL STATEMENTS—(Continued)
Fair value is defined as the price that the Fund would expect to receive upon the sale of an investment or expect to pay to transfer a liability in an orderly transaction with an independent buyer in the principal market or, in the absence of a principal market, the most advantageous market for the investment or liability. The hierarchy of inputs that are used in determining the fair value of the Fund’s investments is summarized below.
| | • | | Level 1—quoted prices in active markets for identical investments |
| | • | | Level 2—other significant observable inputs (including quoted prices for similar investments, interest rates, credit risk, etc.) |
| | • | | Level 3—significant unobservable inputs (including the Fund’s own assumptions in determining the fair value of investments) |
The inputs or methodology used for valuing investments may or may not be an indication of the risk associated with those investments. Changes in valuation techniques may result in transfers into or out of an assigned level within the disclosure hierarchy.
The following is a summary of the inputs used as of October 31, 2020 in valuing the Fund’s investments carried at value:
| | | | | | | | | | | | | | | | |
| | | Total | | | Quoted Prices
in Active
Markets for
Identical
Investments
(Level 1) | | | Other
Significant
Observable
Inputs
(Level 2) | | | Significant
Unobservable
Inputs
(Level 3) | |
Common Stock: | | | | | | | | | | | | | | | | |
Airports—Foreign | | $ | 269,331 | | | $ | — | | | $ | 269,331 | | | $ | — | |
Communications | | | 1,886,714 | | | | 1,428,904 | | | | 457,810 | | | | — | |
Consumer Staples | | | 506,447 | | | | 359,308 | | | | 147,139 | | | | — | |
Consumer—Non-Cyclical | | | 1,405,455 | | | | 1,132,476 | | | | 272,979 | | | | — | |
Electric—Foreign | | | 609,282 | | | | 295,273 | | | | 314,009 | | | | — | |
Energy | | | 3,215,883 | | | | 1,485,398 | | | | 1,730,485 | | | | — | |
Information Technology—Foreign | | | 96,191 | | | | — | | | | 96,191 | | | | — | |
Materials | | | 3,560,742 | | | | 2,107,387 | | | | 1,453,355 | | | | — | |
Real Estate | | | 10,457,120 | | | | 5,770,896 | | | | 4,686,224 | | | | — | |
Toll Roads—Foreign | | | 826,144 | | | | �� | | | | 826,144 | | | | — | |
Water—Foreign | | | 479,262 | | | | — | | | | 479,262 | | | | — | |
Other Industries | | | 4,598,806 | | | | 4,598,806 | | | | — | | | | — | |
Master Limited Partnerships and Related Companies | | | 10,735,102 | | | | 10,735,102 | | | | — | | | | — | |
Preferred Securities— | | | | | | | | | | | | | | | | |
$25 Par Value: | | | | | | | | | | | | | | | | |
Banks | | | 1,214,328 | | | | 1,022,294 | | | | 192,034 | | | | — | |
Other Industries | | | 4,571,996 | | | | 4,571,996 | | | | — | | | | — | |
42
COHEN & STEERS ALTERNATIVE INCOME FUND, INC.
NOTES TO FINANCIAL STATEMENTS—(Continued)
| | | | | | | | | | | | | | | | |
| | | Total | | | Quoted Prices
in Active
Markets for
Identical
Investments
(Level 1) | | | Other
Significant
Observable
Inputs
(Level 2) | | | Significant
Unobservable
Inputs
(Level 3) | |
Preferred Securities— | | | | | | | | | | | | | | | | |
Capital Securities: | | | | | | | | | | | | | | | | |
Banks | | $ | 4,613,286 | | | $ | 144,317 | | | $ | 4,334,156 | | | $ | 134,813 | b |
Other Industries | | | 19,376,760 | | | | — | | | | 19,376,760 | | | | — | |
Short-Term Investments | | | 750,124 | | | | — | | | | 750,124 | | | | — | |
| | | | | | | | | | | | | | | | |
Total Investments in Securitiesa | | $ | 69,172,973 | | | $ | 33,652,157 | | | $ | 35,386,003 | | | $ | 134,813 | |
| | | | | | | | | | | | | | | | |
Forward Foreign Currency Exchange Contracts | | $ | 11,280 | | | $ | — | | | $ | 11,280 | | | $ | — | |
| | | | | | | | | | | | | | | | |
Total Derivative Assetsa | | $ | 11,280 | | | $ | — | | | $ | 11,280 | | | $ | — | |
| | | | | | | | | | | | | | | | |
Forward Foreign Currency Exchange Contracts | | $ | (7,396 | ) | | $ | — | | | $ | (7,396 | ) | | $ | — | |
| | | | | | | | | | | | | | | | |
Total Derivative Liabilitiesa | | $ | (7,396 | ) | | $ | — | | | $ | (7,396 | ) | | $ | — | |
| | | | | | | | | | | | | | | | |
| a | Portfolio holdings are disclosed individually on the Schedule of Investments. |
| b | Level 3 investments are valued by a third-party pricing service. The inputs for these securities are not readily available or cannot be reasonably estimated. A change in the significant unobservable inputs could result in a significantly lower or higher value in such Level 3 investments. |
The following is a reconciliation of investments for which significant unobservable inputs (Level 3) were used in determining fair value:
| | | | |
| | | Preferred
Securities—Capital
Securities—Banks | |
Balance as of October 31, 2019 | | $ | — | |
Purchases | | | 125,000 | |
Change in unrealized appreciation (depreciation) | | | 9,813 | |
| | | | |
Balance as of October 31, 2020 | | $ | 134,813 | |
| | | | |
The change in unrealized appreciation (depreciation) attributable to securities owned on October 31, 2020 which were valued using significant unobservable inputs (Level 3) amounted to $9,813.
43
COHEN & STEERS ALTERNATIVE INCOME FUND, INC.
NOTES TO FINANCIAL STATEMENTS—(Continued)
Security Transactions: Investment Income and Expense Allocations: Security transactions are recorded on trade date. Realized gains and losses on investments sold are recorded on the basis of identified cost. Interest income, which includes the amortization of premiums and accretion of discounts, is recorded on the accrual basis. Dividend income is recorded on the ex-dividend date, except for certain dividends on foreign securities, which are recorded as soon as the Fund is informed after the ex-dividend date. Distributions from Real Estate Investment Trusts (REITs) are recorded as ordinary income, net realized capital gain or return of capital based on information reported by the REITs and management’s estimates of such amounts based on historical information. These estimates are adjusted when the actual source of distributions is disclosed by the REITs and actual amounts may differ from the estimated amounts. Distributions from Master Limited Partnerships (MLPs) are recorded as income and return of capital based on information reported by the MLPs and management’s estimates of such amounts based on historical information. These estimates are adjusted when the actual source of distributions is disclosed by the MLPs and actual amounts may differ from the estimated amounts. Income, expenses (other than expenses attributable to a specific class), and realized and unrealized gains or losses on investments are allocated to each class of shares based on its relative net assets.
Master Limited Partnerships: Entities commonly referred to as MLPs are generally organized under state law as limited partnerships or limited liability companies. The Fund invests in MLPs receiving partnership taxation treatment under the Internal Revenue Code of 1986, as amended (the Code), and whose interest or “units” are traded on securities exchanges like shares of corporate stock. To be treated as a partnership for U.S. federal income tax purposes, an MLP whose units are traded on a securities exchange must receive at least 90% of its income from qualifying sources such as interest, dividends, real property rents, gains on dispositions of real property, income and gains from mineral or natural resources activities, income and gains from the transportation or storage of certain fuels, and, in certain circumstances, income and gains from commodities or futures, forwards and options on commodities. Mineral or natural resources activities include exploration, development, production, processing, mining, refining, marketing and transportation (including pipelines) of oil and gas, minerals, geothermal energy, fertilizer, timber or industrial source carbon dioxide. An MLP consists of a general partner and limited partners (or in the case of MLPs organized as limited liability companies, a managing member and members). The general partner or managing member typically controls the operations and management of the MLP and has an ownership stake in the partnership or limited liability company. The limited partners or members, through their ownership of limited partner or member interests, provide capital to the entity, are intended to have no role in the operation and management of the entity and receive cash distributions. The Fund’s investments in MLPs consist only of limited partner or member interests ownership. The MLPs themselves generally do not pay U.S. federal income taxes and unlike investors in corporate securities, direct MLP investors are generally not subject to double taxation (i.e., corporate level tax and tax on corporate dividends). Currently, most MLPs operate in the energy and/or natural resources sector.
Foreign Currency Translation: The books and records of the Fund are maintained in U.S. dollars. Investment securities and other assets and liabilities denominated in foreign currencies are translated into U.S. dollars based upon prevailing exchange rates on the date of valuation. Purchases and sales of investment securities and income and expense items denominated in foreign currencies are translated into U.S. dollars based upon prevailing exchange rates on the respective dates of such transactions.
44
COHEN & STEERS ALTERNATIVE INCOME FUND, INC.
NOTES TO FINANCIAL STATEMENTS—(Continued)
The Fund does not isolate that portion of the results of operations resulting from fluctuations in foreign exchange rates on investments from the fluctuations arising from changes in market prices of securities held. Such fluctuations are included with the net realized and unrealized gain or loss on investments in securities.
Net realized foreign currency transaction gains or losses arise from sales of foreign currencies, (excluding gains and losses on forward foreign currency exchange contracts, which are presented separately, if any) currency gains or losses realized between the trade and settlement dates on securities transactions, and the difference between the amounts of dividends, interest, and foreign withholding taxes recorded on the Fund’s books and the U.S. dollar equivalent of the amounts actually received or paid. Net unrealized foreign currency translation gains and losses arise from changes in the values of assets and liabilities, other than investments in securities, on the date of valuation, resulting from changes in exchange rates. Pursuant to U.S. federal income tax regulations, certain foreign currency gain/loss included in realized and unrealized gains/losses are included in or are a reduction of ordinary income for federal income tax purposes.
Forward Foreign Currency Exchange Contracts: The Fund enters into forward foreign currency exchange contracts to hedge the currency exposure associated with certain of its non-U.S. dollar denominated securities. A forward foreign currency exchange contract is a commitment between two parties to purchase or sell foreign currency at a set price on a future date. The market value of a forward foreign currency exchange contract fluctuates with changes in foreign currency exchange rates. These contracts are marked to market daily and the change in value is recorded by the Fund as unrealized appreciation and/or depreciation on forward foreign currency exchange contracts. Realized gains or losses equal to the difference between the value of the contract at the time it was opened and the value at the time it was closed are included in net realized gain or loss on forward foreign currency exchange contracts. For federal income tax purposes, the Fund has made an election to treat gains and losses from forward foreign currency exchange contracts as capital gains and losses.
Forward foreign currency exchange contracts involve elements of market risk in excess of the amounts reflected on the Statement of Assets and Liabilities. The Fund bears the risk of an unfavorable change in the foreign exchange rate underlying the contract. Risks may also arise upon entering these contracts from the potential inability of the counterparties to meet the terms of their contracts. In connection with these contracts, securities may be identified as collateral in accordance with the terms of the respective contracts.
Dividends and Distributions to Shareholders: Dividends from net investment income and capital gain distributions are determined in accordance with U.S. federal income tax regulations, which may differ from GAAP. Dividends from net investment income, if any, are declared and paid monthly. Net realized capital gains, unless offset by any available capital loss carryforward, are typically distributed to shareholders at least annually. Dividends and distributions to shareholders are recorded on the ex-dividend date and are automatically reinvested in full and fractional shares of the Fund based on the NAV per share at the close of business on the payable date, unless the shareholder has elected to have them paid in cash.
45
COHEN & STEERS ALTERNATIVE INCOME FUND, INC.
NOTES TO FINANCIAL STATEMENTS—(Continued)
Dividends from net investment income are subject to recharacterization for tax purposes. Based upon the results of operations for the year ended October 31, 2020, a portion of the dividends have been reclassified to distributions from tax return of capital.
Income Taxes: It is the policy of the Fund to continue to qualify as a regulated investment company (RIC), if such qualification is in the best interest of the shareholders, by complying with the requirements of Subchapter M of the Internal Revenue Code applicable to RICs, and by distributing substantially all of its taxable earnings to its shareholders. Also, in order to avoid the payment of any federal excise taxes, the Fund will distribute substantially all of its net investment income and net realized gains on a calendar year basis. Accordingly, no provision for federal income or excise tax is necessary. Dividend and interest income from holdings in non-U.S. securities is recorded net of non-U.S. taxes paid. Management has analyzed the Fund’s tax positions taken on federal and applicable state income tax returns as well as its tax positions in non-U.S. jurisdictions in which it trades for all open tax years and has concluded that as of October 31, 2020, no additional provisions for income tax are required in the Fund’s financial statements. The Fund’s tax positions for the tax years for which the applicable statutes of limitations have not expired are subject to examination by the Internal Revenue Service, state departments of revenue and by foreign tax authorities.
Note 2. Investment Advisory Fees, Administration Fees and Other Transactions with Affiliates
Investment Advisory Fees: Cohen & Steers Capital Management, Inc. serves as the Fund’s investment advisor pursuant to an investment advisory agreement (the investment advisory agreement). Under the terms of the investment advisory agreement, the investment advisor provides the Fund with day-to-day investment decisions and generally manages the Fund’s investments in accordance with the stated policies of the Fund, subject to the supervision of the Board of Directors.
For the services provided to the Fund, the investment advisor receives a fee, accrued daily and paid monthly, at an annual rate of 0.70% of the average daily net assets of the Fund.
For the year ended October 31, 2020 and through June 30, 2022, the investment advisor has contractually agreed to waive its fee and/or reimburse expenses so that the Fund’s total annual operating expenses (excluding acquired fund fees and expenses, taxes and extraordinary expenses) do not exceed 1.00% for Class A shares, 1.65% for Class C shares, 0.65% for Class I shares, 1.15% for Class R shares and 0.65% for Class Z shares. This contractual agreement can be amended at any time by agreement of the Board of Directors of the Fund and the investment advisor and will terminate automatically in the event of termination of the investment advisory agreement between the Fund and the investment advisor. For the year ended October 31, 2020, fees waived and/or expenses reimbursed totaled $555,998.
Under subadvisory agreements between the investment advisor and each of Cohen & Steers Asia Limited and Cohen & Steers UK Limited (collectively, the subadvisors), affiliates of the investment advisor, the subadvisors are responsible for managing the Fund’s investments in certain non-U.S. holdings. For their services provided under the subadvisory agreements, the investment advisor (not the Fund) pays the subadvisors. The investment advisor allocates 50% of the investment advisory fee received from the Fund among itself and each subadvisor based on the portion of the Fund’s average daily net assets managed by the investment advisor and each subadvisor.
46
COHEN & STEERS ALTERNATIVE INCOME FUND, INC.
NOTES TO FINANCIAL STATEMENTS—(Continued)
Administration Fees: The Fund has entered into an administration agreement with the investment advisor under which the investment advisor performs certain administrative functions for the Fund and receives a fee, accrued daily and paid monthly, at the annual rate of 0.02% of the average daily net assets of the Fund. For the year ended October 31, 2020, the Fund incurred $15,606 in fees under this administration agreement. Additionally, the Fund pays State Street Bank and Trust Company as co-administrator under a fund accounting and administration agreement.
Distribution Fees: Shares of the Fund are distributed by Cohen & Steers Securities, LLC (the distributor), an affiliated entity of the investment advisor. The Fund has adopted an amended distribution and service plan (the plan) pursuant to Rule 12b-1 under the 1940 Act, which allows the Fund to pay distribution fees for the sale and distribution of its shares. The plan provides that the Fund will pay the distributor a fee, accrued daily and paid monthly, at an annual rate of up to 0.25% of the average daily net assets attributable to Class A shares, up to 0.75% of the average daily net assets attributable to Class C shares and up to 0.50% of the average daily net assets attributable to Class R shares. In addition, with respect to Class R shares, such amounts may also be used to pay for services to Fund shareholders or services related to the maintenance of shareholder accounts.
There is a maximum initial sales charge of 4.50% for Class A shares. There is a contingent deferred sales charge (CDSC) of 1.00% on purchases of $1 million or more of Class A shares, which applies if redemption occurs within one year from purchase. There is a CDSC of 1.00% on Class C shares, which applies if redemption occurs within one year from purchase. For the year ended October 31, 2020, the Fund has been advised that the distributor received $10,655, which represents a portion of the sales commissions paid by shareholders from the sale of Class A shares, and $150 and $1,185 of CDSC relating to redemptions of Class A and Class C shares, respectively. The distributor has advised the Fund that proceeds from the CDSC on these classes are used by the distributor to defray its expenses related to providing distribution-related services to the Fund in connection with the sale of these classes, including payments to dealers and other financial intermediaries for selling these classes. The payment of a CDSC may result in the distributor receiving amounts greater or less than the upfront commission paid by the distributor to the financial intermediary.
Shareholder Servicing Fees: For shareholder services, the Fund pays the distributor or its affiliates a fee, accrued daily, at an annual rate of up to 0.10% of the average daily net assets of the Fund’s Class A and Class I shares and up to 0.25% of the average daily net assets of the Fund’s Class C shares. The distributor is responsible for paying qualified financial institutions for shareholder services.
Directors’ and Officers’ Fees: Certain directors and officers of the Fund are also directors, officers and/or employees of the investment advisor. The Fund does not pay compensation to directors and officers affiliated with the investment advisor except for the Chief Compliance Officer, who received compensation from the investment advisor, which was reimbursed by the Fund, in the amount of $569 for the year ended October 31, 2020.
Other: As of October 31, 2020, the investment advisor and/or affiliated persons of the investment advisor owned 18% of the Fund’s outstanding shares. Investment activities of these shareholders could have a significant impact on the Fund. In addition, a person who beneficially owns, either directly or indirectly, more than 25% of the voting securities of the Fund may be presumed to control the Fund. A
47
COHEN & STEERS ALTERNATIVE INCOME FUND, INC.
NOTES TO FINANCIAL STATEMENTS—(Continued)
control person could potentially control the outcome of any proposal submitted to shareholders for approval, including changes to the Fund’s fundamental policies or terms of the investment advisory agreement with the investment advisor.
Note 3. Purchases and Sales of Securities
Purchases and sales of securities, excluding short-term investments, for the year ended October 31, 2020, totaled $130,519,069 and $107,849,897, respectively.
Note 4. Derivative Investments
The following tables present the value of derivatives held at October 31, 2020 and the effect of derivatives held during the year ended October 31, 2020, along with the respective location in the financial statements.
Statement of Assets and Liabilities
| | | | | | | | | | | | |
| | | Assets | | | Liabilities | |
Derivatives | | Location | | Fair Value | | | Location | | Fair Value | |
Foreign Exchange Risk: | | | | | | | | | | | | |
Forward Foreign Currency Exchange Contractsa | | Unrealized appreciation | | $ | 11,280 | | | Unrealized depreciation | | $ | 7,396 | |
| a | Forward foreign currency exchange contracts executed with Brown Brothers Harriman are not subject to a master netting arrangement or another similar agreement. |
Statement of Operations
| | | | | | | | | | |
Derivatives | | Location | | Realized
Gain (Loss) | | | Change in
Unrealized
Appreciation
(Depreciation) | |
Foreign Exchange Risk: | | | | | | | | | | |
Forward Foreign Currency Exchange Contracts | | Net Realized and Unrealized Gain (Loss) | | $ | (52,698 | ) | | $ | 31,556 | |
The following summarizes the volume of the Fund’s forward foreign currency exchange contracts activity for the year ended October 31, 2020:
| | | | |
| | | Forward
Foreign Currency
Exchange Contracts | |
Average Notional Amount | | $ | 1,962,176 | |
48
COHEN & STEERS ALTERNATIVE INCOME FUND, INC.
NOTES TO FINANCIAL STATEMENTS—(Continued)
Note 5. Income Tax Information
The tax character of dividends and distributions paid was as follows:
| | | | | | | | | | | | |
| | | For the
Year Ended
October 31, 2020 | | | For the Period
March 1, 2019
through
October 31, 2019a | | | For the
Year Ended
February 28, 2019 | |
Ordinary income | | $ | 3,043,672 | | | $ | 4,215,532 | | | $ | 4,234,579 | |
Long-term capital gain | | | — | | | | 5,557,464 | | | | 9,106,406 | |
Return of capital | | | 1,498,028 | | | | — | | | | — | |
| | | | | | | | | | | | |
Total dividends and distributions | | $ | 4,541,700 | | | $ | 9,772,996 | | | $ | 13,340,985 | |
| | | | | | | | | | | | |
| a | The Fund has changed its fiscal year end from February 28 to October 31. |
As of October 31, 2020, the tax-basis components of accumulated earnings, the federal tax cost and net unrealized appreciation (depreciation) in value of investments held were as follows:
| | | | |
Cost of investments in securities for federal income tax purposes | | $ | 79,908,249 | |
| | | | |
Gross unrealized appreciation on investments | | $ | 3,950,777 | |
Gross unrealized depreciation on investments | | | (14,684,827 | ) |
| | | | |
Net unrealized appreciation (depreciation) on investments | | $ | (10,734,050 | ) |
| | | | |
As of October 31, 2020, the Fund has a net capital loss carryforward of $8,815,510 which may be used to offset future capital gains. These losses are a short-term capital loss carryforward of $8,815,510, which under current federal income tax rules, may offset capital gains recognized in any future period.
As of October 31, 2020, the Fund had temporary book/tax differences primarily attributable to wash sales on portfolio securities, partnership investments and unrealized gains on passive foreign investment companies and permanent book/tax differences primarily attributable to certain fixed income securities. To reflect reclassifications arising from the permanent differences, paid-in capital was credited $59,261 and total distributable earnings/(accumulated loss) was charged $59,261. Net assets were not affected by this reclassification.
49
COHEN & STEERS ALTERNATIVE INCOME FUND, INC.
NOTES TO FINANCIAL STATEMENTS—(Continued)
Note 6. Capital Stock
The Fund is authorized to issue 400 million shares of capital stock, at a par value of $0.001 per share, classified in six classes as follows: 50 million of Class A capital stock, 50 million of Class C capital stock, 50 million of Class F capital stock, 150 million of Class I capital stock, 50 million of Class R capital stock and 50 million of Class Z capital stock. Class F shares are currently not available for purchase. The Fund’s Board of Directors may increase or decrease the aggregate number of shares of common stock that the Fund has authority to issue. With the exception of certain intermediaries, as noted in the Fund’s prospectus, effective September 15, 2020, Class C shares automatically convert to Class A shares on a monthly basis approximately eight years after the original date of purchase. Prior to that, Class C shares automatically converted to Class A shares on a monthly basis approximately ten years after the original date of purchase transactions in Fund shares were as follows:
| | | | | | | | | | | | | | | | | | | | | | | | |
| | | For the
Year Ended
October 31, 2020 | | | For the Period
March 1, 2019
through
October 31, 2019a | | | For the
Year Ended
February 28, 2019 | |
| | | Shares | | | Amount | | | Shares | | | Amount | | | Shares | | | Amount | |
Class A: | |
Sold | | | 647,469 | | | $ | 6,464,619 | | | | 967,474 | | | $ | 11,956,222 | | | | 605,243 | | | $ | 8,485,815 | |
Issued as reinvestment of dividends and distributions | | | 63,031 | | | | 640,452 | | | | 176,946 | | | | 2,116,562 | | | | 118,720 | | | | 1,591,572 | |
Redeemed | | | (796,204 | ) | | | (8,269,682 | ) | | | (849,980 | ) | | | (10,285,611 | ) | | | (453,157 | ) | | | (6,251,211 | ) |
| | | | | | | | | | | | | | | | | | | | | | | | |
Net increase (decrease) | | | (85,704 | ) | | $ | (1,164,611 | ) | | | 294,440 | | | $ | 3,787,173 | | | | 270,806 | | | $ | 3,826,176 | |
| | | | | | | | | | | | | | | | | | | | | | | | |
Class C: | |
Sold | | | 340,935 | | | $ | 3,831,420 | | | | 258,417 | | | $ | 3,037,155 | | | | 219,768 | | | $ | 2,946,636 | |
Issued as reinvestment of dividends and distributions | | | 28,858 | | | | 287,666 | | | | 42,942 | | | | 508,457 | | | | 82,741 | | | | 1,101,543 | |
Redeemed | | | (336,414 | ) | | | (3,396,101 | ) | | | (691,895 | ) | | | (8,555,781 | ) | | | (555,273 | ) | | | (7,664,709 | ) |
| | | | | | | | | | | | | | | | | | | | | | | | |
Net increase (decrease) | | | 33,379 | | | $ | 722,985 | | | | (390,536 | ) | | $ | (5,010,169 | ) | | | (252,764 | ) | | $ | (3,616,530 | ) |
| | | | | | | | | | | | | | | | | | | | | | | | |
Class I: | |
Sold | | | 4,494,724 | | | $ | 50,686,317 | | | | 1,675,316 | | | $ | 19,935,423 | | | | 258,127 | | | $ | 3,637,057 | |
Issued as reinvestment of dividends and distributions | | | 304,174 | | | | 3,084,515 | | | | 330,240 | | | | 3,959,082 | | | | 517,839 | | | | 6,959,658 | |
Redeemed | | | (3,214,858 | ) | | | (30,869,656 | ) | | | (714,602 | ) | | | (8,876,211 | ) | | | (991,440 | ) | | | (13,177,592 | ) |
Redemptions in-kindb | | | — | | | | — | | | | — | | | | — | | | | (1,492,294 | ) | | | (19,922,121 | ) |
| | | | | | | | | | | | | | | | | | | | | | | | |
Net increase (decrease) | | | 1,584,040 | | | $ | 22,901,176 | | | | 1,290,954 | | | $ | 15,018,294 | | | | (1,707,768 | ) | | $ | (22,502,998 | ) |
| | | | | | | | | | | | | | | | | | | | | | | | |
50
COHEN & STEERS ALTERNATIVE INCOME FUND, INC.
NOTES TO FINANCIAL STATEMENTS—(Continued)
| | | | | | | | | | | | | | | | | | | | | | | | |
| | | For the
Year Ended
October 31, 2020 | | | For the Period
March 1, 2019
through
October 31, 2019a | | | For the
Year Ended
February 28, 2019 | |
| | | Shares | | | Amount | | | Shares | | | Amount | | | Shares | | | Amount | |
Class R: | |
Sold | | | 843 | | | $ | 10,000 | | | | 752 | | | $ | 10,000 | | | | 1,933 | | | $ | 28,320 | |
Issued as reinvestments of dividends and distributions | | | 410 | | | | 4,151 | | | | 1,375 | | | | 16,471 | | | | 854 | | | | 11,418 | |
Redeemed | | | — | | | | — | | | | (2,411 | ) | | | (27,934 | ) | | | (1,480 | ) | | | (21,666 | ) |
| | | | | | | | | | | | | | | | | | | | | | | | |
Net increase (decrease) | | | 1,253 | | | $ | 14,151 | | | | (284 | ) | | $ | (1,463 | ) | | | 1,307 | | | $ | 18,072 | |
| | | | | | | | | | | | | | | | | | | | | | | | |
Class Z: | |
Sold | | | 23,616 | | | $ | 278,028 | | | | — | | | $ | — | | | | — | | | $ | — | |
Issued as reinvestment of dividends and distributions | | | 38 | | | | 370 | | | | — | | | | — | | | | — | | | | — | |
Redeemed | | | (22,043 | ) | | | (263,696 | ) | | | — | | | | — | | | | — | | | | — | |
| | | | | | | | | | | | | | | | | | | | | | | | |
Net increase (decrease) | | | 1,611 | | | $ | 14,702 | | | | — | | | $ | — | | | | — | | | $ | — | |
| | | | | | | | | | | | | | | | | | | | | | | | |
| a | The Fund has changed its fiscal year end from February 28 to October 31. |
| b | Certain shareholders of the Fund redeemed shares in-kind. |
Note 7. Redemptions In-Kind
The Fund may make payment for Fund shares redeemed wholly or in part by distributing portfolio securities to shareholders. For the year ended February 28, 2019, the Fund had redemptions in-kind with total proceeds in the amount of $19,922,121. The net realized gains on these redemptions in-kind for the year ended February 28, 2019, amounted to $2,852,428 which will not be realized for tax purposes. For the year ended October 31, 2020 and the eight months ended October 31, 2019, the Fund did not have any redemptions in-kind.
Note 8. Other Risks
Common Stock Risk: While common stocks have historically generated higher average returns than fixed-income securities over the long-term, common stocks have also experienced significantly more volatility in those returns, although under certain market conditions, fixed-income investments may have comparable or greater price volatility. The value of common stocks and other equity securities will fluctuate in response to developments concerning the company, political and regulatory circumstances, the stock market, and the economy. In the short term, stock prices can fluctuate dramatically in response to these developments. Different parts of the market and different types of equity securities can react differently to these developments. For example, stocks of large companies can react differently than stocks of smaller companies, and value stocks (stocks of companies that are undervalued by various measures and have potential for long-term capital appreciation), can react
51
COHEN & STEERS ALTERNATIVE INCOME FUND, INC.
NOTES TO FINANCIAL STATEMENTS—(Continued)
differently from growth stocks (stocks of companies with attractive cash flow returns on invested capital and earnings that are expected to grow). These developments can affect a single company, all companies within the same industry, economic sector or geographic region, or the stock market as a whole.
Preferred Securities Risk: Preferred securities are subject to credit risk, which is the risk that a security will decline in price, or the issuer of the security will fail to make dividend, interest or principal payments when due, because the issuer experiences a decline in its financial status. Preferred securities are also subject to interest rate risk and may decline in value because of changes in market interest rates. The Fund may be subject to a greater risk of rising interest rates than would normally be the case in an environment of low interest rates and the effect of potential government fiscal policy initiatives and resulting market reaction to those initiatives. In addition, an issuer may be permitted to defer or omit distributions. Preferred securities are also generally subordinated to bonds and other debt instruments in a company’s capital structure. During periods of declining interest rates, an issuer may be able to exercise an option to redeem (call) its issue at par earlier than scheduled, and the Fund may be forced to reinvest in lower yielding securities. Certain preferred securities may be substantially less liquid than many other securities, such as common stocks. Generally, preferred security holders have no voting rights with respect to the issuing company unless certain events occur. Certain preferred securities may give the issuers special redemption rights allowing the securities to be redeemed prior to a specified date if certain events occur, such as changes to tax or securities laws.
Contingent Capital Securities Risk: Contingent capital securities (sometimes referred to as “CoCos”) are debt or preferred securities with loss absorption characteristics built into the terms of the security, for example, a mandatory conversion into common stock of the issuer under certain circumstances, such as the issuer’s capital ratio falling below a certain level. Since the common stock of the issuer may not pay a dividend, investors in these instruments could experience a reduced income rate, potentially to zero, and conversion would deepen the subordination of the investor, hence worsening the investor’s standing in a bankruptcy. Some CoCos provide for a reduction in the value or principal amount of the security under such circumstances. In addition, most CoCos are considered to be high yield or “junk” securities and are therefore subject to the risks of investing in below investment-grade securities. Finally, CoCo issuers can, at their discretion, suspend dividend distributions on their CoCo securities and are more likely to do so in response to negative economic conditions and/or government regulation. Omitted distributions are typically non-cumulative and will not be paid on a future date. Any omitted distribution may negatively impact the returns or distribution rate of the Fund.
Below-Investment-Grade Securities Risk: Below investment grade securities generally involve greater volatility of price and risk of loss of income and principal, and may be more susceptible to real or perceived adverse economic and competitive industry conditions than higher grade securities. Such securities may face major ongoing uncertainties or exposure to adverse business, financial or economic conditions which could lead to inadequate capacity to meet timely interest and principal payments. It is reasonable to expect that any adverse economic condition could disrupt the market for below investment grade securities, have an adverse impact on the value of those securities and adversely affect the ability of the issuers of those securities to repay principal and interest on those securities.
52
COHEN & STEERS ALTERNATIVE INCOME FUND, INC.
NOTES TO FINANCIAL STATEMENTS—(Continued)
Liquidity Risk: Liquidity risk is the risk that particular investments of the Fund may become difficult to sell or purchase. The market for certain investments may become less liquid or illiquid due to adverse changes in the conditions of a particular issuer or due to adverse market or economic conditions. In addition, dealer inventories of certain securities, which provide an indication of the ability of dealers to engage in “market making,” are at, or near, historic lows in relation to market size, which has the potential to increase price volatility in the fixed income markets in which the Fund invests. Federal banking regulations may also cause certain dealers to reduce their inventories of certain securities, which may further decrease the Fund’s ability to buy or sell such securities. As a result of this decreased liquidity, the Fund may have to accept a lower price to sell a security, sell other securities to raise cash, or give up an investment opportunity, any of which could have a negative effect on performance. Further, transactions in less liquid or illiquid securities may entail transaction costs that are higher than those for transactions in liquid securities.
Liquidity risk also includes the risk that market conditions or large shareholder redemptions may impact the ability of the Fund to meet redemption requests within required time periods. In order to meet such redemption requests, the fund may be forced to sell securities at inopportune times or prices.
Foreign (Non-U.S.) and Emerging Market Securities Risk: The Fund directly purchases securities of foreign issuers. Risks of investing in foreign securities, which can be expected to be greater for investments in emerging markets, include currency risks, future political and economic developments and possible imposition of foreign withholding taxes on income or proceeds payable on the securities. In addition, there may be less publicly available information about a foreign issuer than about a domestic issuer, and foreign issuers may not be subject to the same accounting, auditing and financial recordkeeping standards and requirements as domestic issuers. Moreover, securities of many foreign issuers and their markets may be less liquid and their prices more volatile than securities of comparable U.S. issuers.
Foreign Currency Risk: Although the Fund will report its NAV and pay dividends in U.S. dollars, foreign securities often are purchased with and make any dividend and interest payments in foreign currencies.
Therefore, the Fund’s investments in foreign securities will be subject to foreign currency risk, which means that the Fund’s NAV could decline solely as a result of changes in the exchange rates between foreign currencies and the U.S. dollar. Certain foreign countries may impose restrictions on the ability of issuers of foreign securities to make payment of principal, dividends and interest to investors located outside the country, due to blockage of foreign currency exchanges or otherwise.
Derivatives and Hedging Transactions Risk: The Fund’s use of derivatives, including for the purpose of hedging interest rate or foreign currency risks, presents risks different from, and possibly greater than, the risks associated with investing directly in traditional securities. Among the risks presented are counterparty risk, financial leverage risk, liquidity risk, OTC trading risk and tracking risk. The use of derivatives can lead to losses because of adverse movements in the price or value of the underlying asset, index or rate, which may be magnified by certain features of the derivatives.
53
COHEN & STEERS ALTERNATIVE INCOME FUND, INC.
NOTES TO FINANCIAL STATEMENTS—(Continued)
REIT Risk: In addition to the risks of securities linked to the real estate industry, REITs are subject to certain other risks related to their structure and focus. REITs are dependent upon management skills and generally may not be diversified. REITs are also subject to heavy cash flow dependency, defaults by borrowers and self-liquidation. In addition, REITs could possibly fail to (i) qualify for pass-through of income under applicable tax law, or (ii) maintain their exemptions from registration under the 1940 Act. The above factors may also adversely affect a borrower’s or a lessee’s ability to meet its obligations to the REIT. In the event of a default by a borrower or lessee, the REIT may experience delays in enforcing its rights as a mortgagee or lessor and may incur substantial costs associated with protecting its investments.
Real Estate Market Risk: Since the Fund invests in companies engaged in the real estate industry, an investment in the Fund may be linked to the performance of the real estate markets. Risks of investing in real estate securities include falling property values due to increasing vacancies, declining rents resulting from economic, legal, tax, political or technological developments, lack of liquidity, limited diversification, and sensitivity to certain economic factors such as interest-rate changes and market recessions. Real estate company prices also may drop because of the failure of borrowers to pay their loans and poor management, and residential developers, in particular, could be negatively impacted by falling home prices, slower mortgage origination and rising construction costs. The risks of investing in REITs are similar to those associated with direct investments in real estate securities.
Small- and Medium-Sized Companies Risk: Real estate companies in the industry tend to be small- to medium-sized companies in relation to the equity markets as a whole. There may be less trading in a smaller company’s stock, which means that buy and sell transactions in that stock could have a larger impact on the stock’s price than is the case with larger company stocks. Smaller companies also may have fewer lines of business so that changes in any one line of business may have a greater impact on a smaller company’s stock price than is the case for a larger company. Further, smaller company stocks may perform differently in different cycles than larger company stocks. Accordingly, real estate company shares can, and at times will, perform differently than large company stocks.
MLP Investment Risk: An investment in MLPs involves risks that differ from a similar investment in equity securities, such as common stock, of a corporation. Holders of equity securities issued by MLPs have the rights typically afforded to limited partners in a limited partnership. As compared to common shareholders of a corporation, holders of such equity securities have more limited control and limited rights to vote on matters affecting the partnership. MLPs may have additional expenses, as some MLPs pay incentive distribution fees to their general partners. Additionally, conflicts of interest may exist among common unit holders, subordinated unit holders and the general partner or managing member of an MLP; for example, a conflict may arise as a result of incentive distribution payments.
MLPs may have comparatively smaller capitalizations relative to issuers whose securities are included in major benchmark indexes which presents unique investment risks. MLPs and other small capitalization companies often have limited product lines, markets, distribution channels or financial resources, and the management of such companies may be dependent upon one or a few key people. The market movements of equity securities issued by MLPs and other small capitalization companies may be more abrupt or erratic than the market movements of equity securities of larger, more
54
COHEN & STEERS ALTERNATIVE INCOME FUND, INC.
NOTES TO FINANCIAL STATEMENTS—(Continued)
established companies or the stock market in general. MLPs and other smaller capitalization companies have sometimes gone through extended periods when they did not perform as well as larger companies. In addition, equity securities of smaller capitalization companies generally are less liquid than those of larger companies. This means that the Fund could have greater difficulty selling such securities at the time and price that the Fund would like.
MLPs are subject to significant regulation and may be adversely affected by changes in the regulatory environment. The value of MLPs depends largely on the MLPs being treated as partnerships for U.S. federal income tax purposes. If MLPs were subject to U.S. federal income taxation as a corporation, the MLPs would be required to pay U.S. federal income tax on their taxable income which would have the effect of reducing the amount of cash available for distribution to the MLP unitholders. This would also cause any such distributions received by the Fund to be taxed as dividend income to the extent of the MLP’s current or accumulated earnings and profits. As a result, after-tax returns could be reduced, which could cause a decline in the value of MLPs.
Energy Sector Risk: The Fund is subject to more risks related to the energy sector than if the Fund were more broadly diversified over numerous sectors of the economy. A downturn in the energy sector of the economy could have a larger impact on the Fund than on an investment company that does not concentrate in the sector. In addition, there are several specific risks associated with investments in the energy sector, including the following: Commodity Price Risk, Depletion Risk, Supply and Demand Risk, Regulatory Risk, Acquisition Risk, Weather Risks, Exploration Risk, Catastrophic Event Risk, Interest Rate Transaction Risk, Affiliated Party Risk and Limited Partner Risk and Risks of Subordinated MLP Units. MLPs which invest in the energy industry may be highly volatile due to significant fluctuation in the prices of energy commodities as well as political and regulatory developments.
Interest Rate Risk to MLPs and Related Companies: Rising interest rates could increase the cost of capital thereby increasing operating costs and reducing the ability of MLPs and other entities operating in the energy sector to carry out acquisitions or expansions in a cost-effective manner. As a result, rising interest rates could negatively affect the financial performance of MLPs and other entities operating in the energy sector. Rising interest rates may also impact the price of the securities of MLPs and other entities operating in the energy sector as the yields on alternative investments increase. These risks may be greater in the current market environment because certain interest rates are at historically low levels.
Tax Risk: The Fund intends to qualify each year as a RIC for U.S. federal income tax purposes under Subchapter M of the Internal Revenue Code of 1986, as amended (the “Code”). For any year in which the Fund so qualifies, it will not be subject to U.S. federal income tax on income or gain that it timely distributes to shareholders as dividends. In order to qualify as a RIC, the Fund must meet certain asset diversification requirements, including that, at the close of each quarter of its taxable year, no more than 25% of its total assets will be invested in Qualified Publicly Traded Partnerships (QPTPs) as defined in the Code. The Fund expects that the MLPs that are treated as publicly traded partnerships for tax purposes in which the Fund invests will generally be QPTPs. The treatment of certain of the Fund’s investments for purposes of this test may be unclear, and it is possible that the Internal Revenue Service (IRS) or a court could recharacterize one or more such investments in a manner bearing adversely on the Fund’s ability to meet this 25% requirement. As of October 31, 2020, the Fund held 14.5% of its total assets in QPTPs.
55
COHEN & STEERS ALTERNATIVE INCOME FUND, INC.
NOTES TO FINANCIAL STATEMENTS—(Continued)
Infrastructure Companies Risk: Securities and instruments of infrastructure companies are more susceptible to adverse economic or regulatory occurrences affecting their industries. Infrastructure companies may be subject to a variety of factors that may adversely affect their business or operations, including high interest costs in connection with capital construction and improvement programs, high leverage, costs associated with environmental and other regulations, the effects of economic slowdown, surplus capacity, increased competition from other providers of services, uncertainties concerning the availability of fuel at reasonable prices, the effects of energy conservation policies and other factors. Infrastructure companies may also be affected by or subject to high interest costs in connection with capital construction and improvement programs; difficulty in raising capital in adequate amounts on reasonable terms in periods of high inflation and unsettled capital markets; inexperience with and potential losses resulting from a developing deregulatory environment; costs associated with compliance with and changes in environmental and other regulations; regulation by various government authorities; government regulation of rates charged to customers; service interruption due to environmental, operational or other mishaps; the imposition of special tariffs and changes in tax laws, regulatory policies and accounting standards; technological innovations that may render existing plants, equipment or products obsolete; and general changes in market sentiment towards infrastructure and utilities assets.
Natural Resources Risk: The Fund’s investments in securities of natural resource companies involve risks. The market value of securities of natural resource companies may be affected by numerous factors, including events occurring in nature, inflationary pressures and international politics. Because the Fund invests significantly in natural resource companies, there is the risk that the Fund will perform poorly during a downturn in the natural resource sector. For example, events occurring in nature (such as earthquakes or fires in prime natural resource areas) and political events (such as coups, military confrontations or acts of terrorism) can affect the overall supply of a natural resource and the value of companies involved in such natural resource. Political risks and the other risks to which foreign securities are subject may also affect domestic natural resource companies if they have significant operations or investments in foreign countries. Rising interest rates and general economic conditions may also affect the demand for natural resources.
Geopolitical Risk: Occurrence of global events similar to those in recent years, such as war, terrorist attacks, natural or environmental disasters, country instability, infectious disease epidemics, such as that caused by the COVID-19 virus, market instability, debt crises and downgrades, embargoes, tariffs, sanctions and other trade barriers and other governmental trade or market control programs, the potential exit of a country from its respective union and related geopolitical events, may result in market volatility and may have long-lasting impacts on both the U.S. and global financial markets. Additionally, those events, as well as other changes in foreign and domestic political and economic conditions, could adversely affect individual issuers or related groups of issuers, securities markets, interest rates, secondary trading, credit ratings, inflation, investor sentiment and other factors affecting the value of the Fund’s investments.
An outbreak of respiratory disease caused by a novel coronavirus designated as COVID-19 has resulted in, among other things, extreme volatility in the financial markets and severe losses, reduced liquidity of many instruments, significant travel restrictions, significant disruptions to business
56
COHEN & STEERS ALTERNATIVE INCOME FUND, INC.
NOTES TO FINANCIAL STATEMENTS—(Continued)
operations, supply chains and customer activity, lower consumer demand for goods and services, service and event cancellations, reductions and other changes, strained healthcare systems, as well as general concern and uncertainty. The impact of the COVID-19 outbreak has negatively affected the global economy, the economies of individual countries, and the financial performance of individual issuers, sectors, industries, asset classes, and markets in significant and unforeseen ways. Pandemics may also exacerbate other pre-existing political, social, economic, market and financial risks. The effects of the outbreak in developing or emerging market countries may be greater due to less established health care systems and supply chains. The COVID-19 pandemic and its effects may be short term or, particularly in the event of a “second wave” of infections, may result in a sustained economic downturn or a global recession, ongoing market volatility and/or decreased liquidity in the financial markets, exchange trading suspensions and closures, higher default rates, domestic and foreign political and social instability and damage to diplomatic and international trade relations. There are numerous potential vaccines in development, but the scalability and effectiveness of such vaccines are unknown. Even if an effective vaccine were to become readily available, the political, social, economic, market and financial risks of COVID-19 could persist for years to come. The foregoing could impair the Fund’s ability to maintain operational standards (such as with respect to satisfying redemption requests), disrupt the operations of the Fund’s service providers, adversely affect the value and liquidity of the Fund’s investments, and negatively impact the Fund’s performance and your investment in the Fund.
On January 31, 2020, the UK withdrew from the European Union (EU) (referred to as Brexit), commencing a transition period. During this period, the UK will no longer be considered a member state of the EU, but will remain subject to EU law, regulations and maintain access to the EU single market while the UK and EU negotiate and agree on the nature of their future relationship. The transition period is expected to end December 31, 2020, subject to extension. Brexit has resulted in volatility in European and global markets and could have negative long-term impacts on financial markets in the UK and throughout Europe. There is considerable uncertainty about the potential consequences of Brexit, how negotiations of trade agreements will proceed, and how the financial markets will react. As this process unfolds, markets may be further disrupted. Given the size and importance of the UK’s economy, uncertainty about its legal, political and economic relationship with the remaining member states of the EU may continue to be a source of instability. In addition, if the UK and the EU are unable to agree on trade and/or other agreements by the end of the transition period, or a related extension, the economic impact resulting from Brexit may be more negative.
Growing tensions, including trade disputes, between the United States and other nations, or among foreign powers, and possible diplomatic, trade or other sanctions could adversely impact the global economy, financial markets and the Fund. The strengthening or weakening of the U.S. dollar relative to other currencies may, among other things, adversely affect the Fund’s investments denominated in non-U.S. dollar currencies. It is difficult to predict when similar events affecting the U.S. or global financial markets may occur, the effects that such events may have, and the duration of those effects.
57
COHEN & STEERS ALTERNATIVE INCOME FUND, INC.
NOTES TO FINANCIAL STATEMENTS—(Continued)
Regulatory Risk: The U.S. government has proposed and adopted multiple regulations that could have a long-lasting impact on the Fund and on the mutual fund industry in general. The U.S. Securities and Exchange Commission’s (SEC)’s final rules, related requirements and amendments to modernize reporting and disclosure, along with other potential upcoming regulations, could, among other things, restrict the Fund’s ability to engage in transactions, impact flows into the Fund and/or increase overall expenses of the Fund. In addition, the SEC, Congress, various exchanges and regulatory and self-regulatory authorities, both domestic and foreign, have undertaken reviews of the use of derivatives by registered investment companies, which could affect the nature and extent of instruments used by the Fund. While the full extent of all of these regulations is still unclear, these regulations and actions may adversely affect both the Fund and the instruments in which the Fund invests and its ability to execute its investment strategy. Similarly, regulatory developments in other countries may have an unpredictable and adverse impact on the Fund.
The SEC has recently adopted a rule relating to a registered investment company’s use of derivatives and similar transactions that could potentially require the Fund to observe more stringent requirements than are currently imposed by the 1940 Act. The new rule will replace present SEC and SEC staff regulatory guidance related to limits on a registered investment company’s use of derivative instruments and certain other transactions, such as short sales and reverse repurchase agreements. The rule may substantially curtail the Fund’s ability to use derivative instruments as part of the Fund’s investment strategy and could ultimately prevent the Fund from being able to achieve its investment goals.
LIBOR Risk: Many financial instruments are tied to the London Interbank Offered Rate, or “LIBOR,” to determine payment obligations, financing terms, hedging strategies, or investment value. LIBOR is the offered rate for short-term Eurodollar deposits between major international banks. In 2017 the head of the UK Financial Conduct Authority announced a desire to phase out the use of LIBOR by the end of 2021.Alternatives to LIBOR are in development in many major financial markets. For example, the U.S. Federal Reserve has begun publishing a Secured Overnight Financing Rate (SOFR), a broad measure of secured overnight U.S. Treasury repo rates, as a possible replacement for U.S. dollar LIBOR. Bank working groups and regulators in other countries have suggested other alternatives for their markets, including the Sterling Overnight Interbank Average Rate (SONIA) in England. Other countries are introducing their own local-currency-denominated alternative reference rates for short-term lending and global consensus on alternative rates is lacking. It is likely that panel banks will cease reporting LIBOR as soon as they are able to, effectively phasing it out as of 2022; however, the LIBOR transition might be extended. The official sector appears resistant to adjusting deadlines but there may be more pressing demands on regulators and companies stemming from COVID-19. There remains uncertainty and risk regarding the willingness and ability of issuers and lenders to include enhanced provisions in new and existing contracts or instruments, the suitability of the proposed replacement rates, and the process for amending existing contracts and instruments remains unclear. As such, the transition away from LIBOR may lead to increased volatility and illiquidity in markets that are tied to LIBOR, reduced values of, inaccurate valuations of, and miscalculations of payment amounts for LIBOR-related investments or investments in issuers that utilize LIBOR, increased difficulty in borrowing or refinancing and reduced effectiveness of hedging strategies, adversely affecting the Fund’s performance or NAV. In addition, any
58
COHEN & STEERS ALTERNATIVE INCOME FUND, INC.
NOTES TO FINANCIAL STATEMENTS—(Continued)
alternative reference rate may be an ineffective substitute resulting in prolonged adverse market conditions for the Fund. Since the usefulness of LIBOR as a benchmark could deteriorate during the transition period, these effects could occur prior to the end of 2021 and could extend into 2022 or beyond.
Large Shareholder Risk: The Fund may have one or more large shareholders or a group of shareholders investing in Fund shares indirectly through an account, platform or program sponsored by a financial institution. Investment and asset allocation decisions by such financial institutions regarding the account, platform or program through which multiple shareholders invest may result in subscription and redemption decisions that have a significant impact on the assets, expenses and trading activities of the Fund. Such a decision may cause the Fund to sell assets (or invest cash) at disadvantageous times or prices, increase or accelerate taxable gains or transaction costs and may negatively affect the Fund’s NAV, performance, or ability to satisfy redemptions in a timely manner.
This is not a complete list of the risks of investing in the Fund. For additional information concerning the risks of investing in the Fund, please consult the Fund’s prospectus.
Note 9. Other
In the normal course of business, the Fund enters into contracts that provide general indemnifications. The Fund’s maximum exposure under these arrangements is dependent on claims that may be made against the Fund in the future and, therefore, cannot be estimated; however, based on experience, the risk of material loss from such claims is considered remote.
Note 10. Subsequent Events
Management has evaluated events and transactions occurring after October 31, 2020 through the date that the financial statements were issued, and has determined that no additional disclosure in the financial statements is required.
59
COHEN & STEERS ALTERNATIVE INCOME FUND, INC.
REPORT OF INDEPENDENT REGISTERED PUBLIC ACCOUNTING FIRM
To the Board of Directors and Shareholders of
Cohen & Steers Alternative Income Fund, Inc.
Opinion on the Financial Statements
We have audited the accompanying statement of assets and liabilities, including the schedule of investments, of Cohen & Steers Alternative Income Fund, Inc. (the “Fund”) as of October 31, 2020, the related statement of operations for the year ended October 31, 2020, the statement of changes in net assets for the year ended October 31, 2020, the period March 1, 2019 through October 31, 2019 and for the year ended February 28, 2019, including the related notes, and the financial highlights for the year ended October 31, 2020, the period March 1, 2019 through October 31, 2019 and each of the four years in the period ended February 28, 2019 (collectively referred to as the “financial statements”). In our opinion, the financial statements present fairly, in all material respects, the financial position of the Fund as of October 31, 2020, the results of its operations for the year then ended, the changes in its net assets for the year ended October 31, 2020, the period March 1, 2019 through October 31, 2019 and for the year ended February 28, 2019 and the financial highlights for the year ended October 31, 2020, the period March 1, 2019 through October 31, 2019 and each of the four years in the period ended February 28, 2019 in conformity with accounting principles generally accepted in the United States of America.
Basis for Opinion
These financial statements are the responsibility of the Fund’s management. Our responsibility is to express an opinion on the Fund’s financial statements based on our audits. We are a public accounting firm registered with the Public Company Accounting Oversight Board (United States) (PCAOB) and are required to be independent with respect to the Fund in accordance with the U.S. federal securities laws and the applicable rules and regulations of the Securities and Exchange Commission and the PCAOB.
We conducted our audits of these financial statements in accordance with the standards of the PCAOB. Those standards require that we plan and perform the audit to obtain reasonable assurance about whether the financial statements are free of material misstatement, whether due to error or fraud.
Our audits included performing procedures to assess the risks of material misstatement of the financial statements, whether due to error or fraud, and performing procedures that respond to those risks. Such procedures included examining, on a test basis, evidence regarding the amounts and disclosures in the financial statements. Our audits also included evaluating the accounting principles used and significant estimates made by management, as well as evaluating the overall presentation of the financial statements. Our procedures included confirmation of securities owned as of October 31, 2020 by correspondence with the custodian, transfer agent and brokers; when replies were not received from brokers, we performed other auditing procedures. We believe that our audits provide a reasonable basis for our opinion.
/s/PricewaterhouseCoopers LLP
New York, New York
December 22, 2020
We have served as the auditor of one or more investment companies in the Cohen & Steers family of mutual funds since 1991.
60
COHEN & STEERS ALTERNATIVE INCOME FUND, INC.
TAX INFORMATION—2020 (Unaudited)
For the calendar year ended October 31, 2020, for individual taxpayers, the Fund designates $1,986,103 as qualified dividend income eligible for reduced tax rates. In addition, for corporate taxpayers, 23.3% of the ordinary dividends paid qualified for the dividends received deduction (DRD).
OTHER INFORMATION
A description of the policies and procedures that the Fund uses to determine how to vote proxies relating to portfolio securities is available (i) without charge, upon request, by calling 800-330-7348, (ii) on our website at cohenandsteers.com or (iii) on the SEC’s website at http://www.sec.gov. In addition, the Fund’s proxy voting record for the most recent 12-month period ended June 30 is available by August 31 of each year (i) without charge, upon request, by calling 800-330-7348 or (ii) on the SEC’s website at http://www.sec.gov.
Disclosures of the Fund’s complete holdings are required to be made monthly on Form N-PORT, with every third month made available to the public by the SEC 60 days after the end of the Fund’s fiscal quarter. Previously, the Fund filed its complete schedule of portfolio holdings with the SEC for the first and third quarters of each fiscal year on Form N-Q, which has now been rescinded. Both the Fund’s Form N-Q and Form N-PORT are available (i) without charge, upon request, by calling 800-330-7348 or (ii) on the SEC’s website at http://www.sec.gov.
Please note that distributions paid by the Fund to shareholders are subject to recharacterization for tax purpose and are taxable up to the amount of the Fund’s investment company taxable income and net realized gains. Distributions in excess of the Fund’s investment company taxable income and net realized gains are a return of capital distributed from the Fund’s assets. To the extent this occurs, the Fund’s shareholders of record will be notified of the estimated amount of capital returned to shareholders for each such distribution and this information will also be available at cohenandsteers.com. The final tax treatment of all distribution is reported to shareholders on their 1099-DIV forms, which are mailed after the close of each calendar year. Distributions of capital decrease the Fund’s total assets and, therefore, could have the effect of increasing the Fund’s expense ratio. In addition, in order to make these distributions, the Fund may have to sell portfolio securities at a less than opportune time.
APPROVAL OF INVESTMENT ADVISORY AND SUBADVISORY AGREEMENTS
The Board of Directors of the Fund, including a majority of the directors who are not parties to the Fund’s investment advisory and subadvisory agreements (the Advisory Agreements), or interested persons of any such party (the Independent Directors), has the responsibility under the Investment Company Act of 1940 to approve the Fund’s Advisory Agreements for their initial two year terms and their continuation annually thereafter at a meeting of the Board of Directors called for the purpose of voting on the approval or continuation. The Advisory Agreements were discussed at a meeting of the Independent Directors, in their capacity as the Contract Review Committee, held on June 2, 2020 and at meetings of the full Board of Directors held on March 17, 2020 and June 9, 2020. The Independent Directors, in their capacity as the Contract Review Committee, also discussed the Advisory Agreement in executive session on June 8, 2020. At the meeting of the full Board of Directors on June 9, 2020, the Advisory Agreements were unanimously continued for a term ending June 30, 2021 by the Fund’s Board of Directors, including the Independent Directors. The Independent Directors were represented by independent counsel who assisted them in their deliberations during the meetings and executive sessions.
61
COHEN & STEERS ALTERNATIVE INCOME FUND, INC.
In considering whether to continue the Advisory Agreements, the Board of Directors reviewed materials provided by an independent data provider, which included, among other items, fee, expense and performance information compared to peer funds (the Peer Funds and, collectively with the Fund, the Peer Group) and performance comparisons to a larger category universe; summary information prepared by the Fund’s investment advisor (the Investment Advisor); and a memorandum from Fund counsel outlining the legal duties of the Board of Directors. The Board of Directors also considered a supplemental peer group compiled by the Investment Advisor when evaluating the Fund’s performance and fees and expenses; the Investment Advisor believes the supplemental peer group is more representative of the Fund’s investment strategy. The Board of Directors also spoke directly with representatives of the independent data provider and met with investment advisory personnel. In addition, the Board of Directors considered information provided from time to time by the Investment Advisor throughout the year at meetings of the Board of Directors, including presentations by portfolio managers relating to the investment performance of the Fund and the investment strategies used in pursuing the Fund’s objective. The Board of Directors also considered information provided in response to a request for information submitted by counsel to the Independent Directors, as well as information provided in response to a supplemental request. In addition, the Board of Directors considered the changes to the Fund’s investment strategy that it had recently approved, including the rationale for the changes. Additionally, the Independent Directors noted that in connection with their considerations, that they had received information from the Investment Advisor about, and discussed with the Investment Advisor, the operations of its business continuity plan and related matters and the operations of third party service providers during the COVID-19 pandemic. In particular, the Board of Directors considered the following:
(i) The nature, extent and quality of services to be provided by the Investment Advisor and the Subadvisors: The Board of Directors reviewed the services that the Investment Advisor and the sub-investment advisors (the Subadvisors) provide to the Fund, including, but not limited to, making the day-to-day investment decisions for the Fund, placing orders for the investment and reinvestment of the Fund’s assets, furnishing information to the Board of Directors of the Fund regarding the Fund’s portfolio, providing individuals to serve as Fund officers, and, for the Investment Advisor, generally managing the Fund’s investments in accordance with the stated policies of the Fund. The Board of Directors also discussed with officers and portfolio managers of the Fund the types of transactions conducted on behalf of the Fund. Additionally, the Board of Directors took into account the services provided by the Investment Advisor and the Subadvisors to other funds and accounts, including those that have investment objectives and strategies similar to those of the Fund. The Board of Directors also considered the education, background and experience of the Investment Advisor’s and Subadvisors’ personnel, particularly noting the potential benefit that the portfolio managers’ work experience and favorable reputation can have on the Fund. The Board of Directors further noted the Investment Advisor’s and Subadvisors’ ability to attract qualified and experienced personnel. The Board of Directors also considered the administrative services provided by the Investment Advisor, including compliance and accounting services. After consideration of the above factors, among others, the Board of Directors concluded that the nature, extent and quality of services provided by the Investment Advisor and the Subadvisors are satisfactory and appropriate.
(ii) Investment performance of the Fund and the Investment Advisor and the Subadvisors: The Board of Directors considered the investment performance of the Fund compared to Peer Funds and compared to a relevant benchmark. The Board of Directors noted that the Fund was repositioned as an
62
COHEN & STEERS ALTERNATIVE INCOME FUND, INC.
alternative income fund effective July 1, 2019, and any investment performance information relating to periods before July 1, 2019 were reflective of the Fund’s previous investment objectives and strategies. The Board of Directors noted that the Fund outperformed the Peer Group median for the five-year period ended March 31, 2020, ranking in the second quintile, was the only fund within its Peer Group with a 10-year period performance record, and underperformed the Peer Group medians for the one- and three-year periods ended March 31, 2020, ranking in the fifth and fourth quintiles, respectively. The Board of Directors considered that the Fund underperformed the linked blended benchmark for the one-, three- five- and ten-year periods ended March 31, 2020. The Board of Directors also considered the Fund’s performance compared to a supplemental peer group compiled by the Investment Advisor, and noted that the Fund underperformed the supplemental peer group median for the one-, three-, five- and ten-year periods ended March 31, 2020, ranking five out of six peers, five out of six peers, five out of six peers and four out of six peers, respectively. The Board of Directors engaged in discussions with the Investment Advisor regarding the contributors to and detractors from the Fund’s performance during the period, including the relevant implications of the continuing COVID-19 pandemic. The Board of Directors also considered supplemental information provided by the Investment Advisor, including a narrative summary of various factors affecting performance and the Investment Advisor’s performance in managing other funds that invest in similar securities. The Board of Directors determined that Fund performance, in light of all the considerations noted above, supported the continuation of the Advisory Agreements.
(iii) Cost of the services to be provided and profits to be realized by the Investment Advisor from the relationship with the Fund: The Board of Directors considered the contractual and actual management fees paid by the Fund as well as the Fund’s total expense ratio. As part of its analysis, the Board of Directors gave consideration to the fee and expense analyses provided by the independent data provider. The Board of Directors noted that the Fund’s actual management fee is the lowest in the Peer Group, ranking the Fund in the first quintile. The Fund’s total expense ratio is lower than the Peer Group median, ranking the Fund in the first quintile. Directors also considered the Fund’s fees and expenses versus the supplemental peer group compiled by the Investment Advisor, and noted that the Fund’s overall net expense ratio versus the supplemental peer group is higher than the supplemental peer group median, ranking four out of six peers. The Board of Directors noted that the Fund’s actual management fee is the lowest in the supplemental peer group, ranking the Fund in the first quintile. The Board of Directors considered that the Investment Advisor continues to waive a portion of its fees and/or reimburse expenses to limit overall operating expenses of the Fund. In light of the considerations above, the Board of Directors concluded that the Fund’s current expense structure was satisfactory.
The Board of Directors also reviewed information regarding the profitability to the Investment Advisor of its relationship with the Fund. The Board of Directors considered the level of the Investment Advisor’s profits and whether the profits were reasonable for the Investment Advisor. The Board of Directors noted that the Investment Advisor is currently waiving its fee and/or reimbursing expenses of the Fund. Since the Subadvisors are paid by the Investment Advisor (and not by the Fund) for investment services provided to the Fund and are affiliates of the Investment Advisor, the Board of Directors considered the profitability of the Investment Advisor as a whole and did not consider the Subadvisors’ separate profitability to be particularly relevant to their determination. The Board of Directors took into consideration other benefits to be derived by the Investment Advisor in connection with the Advisory Agreements, noting particularly the research and related services, within the meaning of Section 28(e) of the Securities Exchange Act of 1934, that the Investment Advisor receives by
63
COHEN & STEERS ALTERNATIVE INCOME FUND, INC.
allocating the Fund’s brokerage transactions. The Board of Directors further considered that the Investment Advisor continues to reinvest profits back in the business, including upgrading and/or implementing new trading, compliance and accounting systems, and by adding investment personnel to the portfolio management teams. The Board of Directors also considered the administrative services provided by the Investment Advisor and the associated administration fee paid to the Investment Advisor for such services under the Administration Agreement. The Board of Directors determined that the services received under the Administration Agreement are beneficial to the Fund. The Board of Directors noted that because of the Fund’s asset size, the operating expenses continue to be subsidized, and the Fund is not yet profitable.
(iv) The extent to which economies of scale would be realized as the Fund grows and whether fee levels would reflect such economies of scale: The Board of Directors considered the Fund’s asset size and determined that there were not at this time significant economies of scale that were not being shared with shareholders. In considering economies of scale, the Board of Directors also noted, as discussed above in (iii), that the Investment Advisor continues to reinvest profits back in the business.
(v) Comparison of services to be rendered and fees to be paid to those under other investment advisory contracts, such as contracts of the same and other investment advisors or other clients: As discussed above in (iii), the Board of Directors compared the fees paid under the Advisory Agreements to those under other investment advisory contracts of other investment advisors managing Peer Funds. The Board of Directors also compared the services rendered and fees paid under the Advisory Agreements to fees paid, including the ranges of such fees, under the Investment Advisor’s other fund advisory agreements and advisory contracts with institutional and other clients with similar investment mandates, noting that the Investment Advisor provides more services to the Fund than it does for institutional or subadvised accounts. The Board of Directors also considered the entrepreneurial risk and financial exposure assumed by the Investment Advisor in developing and managing the Fund that the Investment Advisor does not have with institutional and other clients and other differences in the management of registered investment companies and institutional accounts. The Board of Directors determined that on a comparative basis the fees under the Advisory Agreements were reasonable in relation to the services provided.
No single factor was cited as determinative to the decision of the Board of Directors, and each Director may have assigned different weights to the various factors. Rather, after weighing all of the considerations and conclusions discussed above, the Board of Directors, including the Independent Directors, unanimously approved the continuation of the Advisory Agreements.
LIQUIDITY RISK MANAGEMENT PROGRAM
Pursuant to Rule 22e-4 under the Investment Company Act of 1940 (the Liquidity Rule), the Fund has adopted and implemented a liquidity risk management program (the Program), effective June 1, 2019. The Liquidity Rule requires an open-end investment company to adopt a program that is reasonably designed to assess and manage its liquidity risk, which is the risk that an open-end fund investment company could not meet redemption requests without significant dilution of remaining investors’ interests in the open-end investment company. The Board has designated Cohen & Steers Capital Management, Inc. (the Investment Advisor) as the administrator of the Program. The Investment Advisor has delegated this responsibility to the Liquidity Risk Management Committee (the LRM Committee), which is comprised of representatives from various departments within the Investment
64
COHEN & STEERS ALTERNATIVE INCOME FUND, INC.
Advisor. The Program includes policies and procedures reasonably designed to: (1) assess, manage, and periodically review the Fund’s liquidity risk; (2) classify the Fund’s portfolio investments as highly liquid, moderately liquid, less liquid, or illiquid; (3) determine a highly liquid investment minimum (HLIM) for the Fund or determine that one is not required; (4) limit the Fund’s illiquid investments to no more than 15% of its net assets; and (5) establish how and when the Fund will engage in in-kind redemptions.
The Board met on June 9, 2020 (the Meeting) to review the Program. At the Meeting, the LRM Committee provided the Board with a report that addressed the operation of the Program, including its implementation and effectiveness in assessing and managing the Fund’s liquidity risk (the Report). The Report covered the period from June 1, 2019 through March 31, 2020 (the Reporting Period).
The Report described the LRM Committee’s role in administering the Program, which complied with the Liquidity Rule requirements for assessing, managing and reviewing the Fund’s liquidity risk through the LRM Committee’s daily monitoring and quarterly analysis of liquidity parameters which include historical net redemption activity and consideration of the Fund’s shareholder ownership concentration, as applicable. The Report noted that the Fund’s investments are categorized into one of four liquidity buckets: highly liquid, moderately liquid, less liquid and illiquid. Liquidity classifications take into account a variety of market, trading, and investment factors, including the Fund’s reasonably anticipated trade size. The Investment Advisor has engaged a third-party vendor to assist with the classification of portfolio investments. The Report also described the LRM Committee’s determination that the Fund is a primarily highly liquid fund under the Liquidity Rule and is not required to set a HLIM.
The Report noted that there were no liquidity events during the Reporting Period that materially impacted the Fund’s ability to timely meet redemptions without significantly diluting remaining shareholders’ interests. The Report concluded that the Program is operating as intended, effective in implementing the requirements of the Liquidity Rule and reasonably designed to assess and manage the Fund’s liquidity risk.
There can be no assurance that the Program will achieve its objectives in the future. Please refer to the Fund’s prospectus for more information regarding the Fund’s exposure to liquidity risk and other principal risks to which an investment in the Fund may be subject.
65
COHEN & STEERS ALTERNATIVE INCOME FUND, INC.
MANAGEMENT OF THE FUND
The business and affairs of the Fund are managed under the direction of the Board of Directors. The Board of Directors approves all significant agreements between the Fund and persons or companies furnishing services to it, including the Fund’s agreements with its investment advisor, administrator, co-administrator, custodian and transfer agent. The management of the Fund’s day-today operations is delegated to its officers, the investment advisor, administrator and co-administrator, subject always to the investment objective and policies of the Fund and to the general supervision of the Board of Directors.
The Board of Directors and officers of the Fund and their principal occupations during at least the past five years are set forth below. The statement of additional information (SAI) includes additional information about fund directors and is available, without charge, upon request by calling 800-330-7348.
| | | | | | | | | | | | |
Name, Address and Year of Birth1 | | Position(s) Held With Fund | | Term of Office2 | | Principal Occupation During At Least The Past 5 Years (Including Other Directorships Held) | | Number of Funds Within Fund Complex Overseen by Director (Including the Fund) | | | Length of Time Served3 |
| | | | | |
| Interested Directors4 | | | | | | | | | | | | |
| | | | | |
Robert H. Steers 1953 | | Director, Chairman | | Until Next Election of Directors | | Chief Executive Officer of Cohen & Steers Capital Management, Inc. (CSCM or the Advisor) and its parent, Cohen & Steers, Inc. (CNS) since 2014. Prior to that, Co- Chairman and Co-Chief Executive Officer of the Advisor since 2003 and CNS since 2004. Prior to that, Chairman of the Advisor; Vice President of Cohen & Steers Securities, LLC. | | | 21 | | | Since 1991 |
| | | | | |
Joseph M. Harvey 1963 | | Director | | Until Next Election of Directors | | President of the Advisor (since 2003) and President of CNS (since 2004). Chief Investment Officer of CSCM from 2003 to 2019. Prior to that, Senior Vice President and Director of Investment Research of CSCM. | | | 21 | | | Since 2014 |
(table continued on next page)
66
COHEN & STEERS ALTERNATIVE INCOME FUND, INC.
(table continued from previous page)
| | | | | | | | | | | | |
Name, Address and Year of Birth1 | | Position(s) Held With Fund | | Term of Office2 | | Principal Occupation During At Least The Past 5 Years (Including Other Directorships Held) | | Number of Funds Within Fund Complex Overseen by Director (Including the Fund) | | | Length of Time Served3 |
| | | | |
| Disinterested Directors | | | | | | | | | | |
| | | | | |
Michael G. Clark 1965 | | Director | | Until Next Election of Directors | | CPA and CFA; From 2006 to 2011, President and Chief Executive Officer of DWS Funds and Managing Director of Deutsche Asset Management. | | | 21 | | | Since 2011 |
| | | | | |
George Grossman 1953 | | Director | | Until Next Election of Directors | | Attorney-at-law. | | | 21 | | | Since 1993 |
| | | | | |
Dean A. Junkans 1959 | | Director | | Until Next Election of Directors | | CFA; Advisor to SigFig (a registered investment advisor) since July, 2018; Adjunct Professor and Executive–In–Residence, Bethel University since 2015; Chief Investment Officer at Wells Fargo Private Bank from 2004 to 2014 and Chief Investment Officer of the Wealth, Brokerage and Retirement group at Wells Fargo & Company from 2011 to 2014; former Member and Chair, Claritas Advisory Committee at the CFA Institute from 2013 to 2015; Board Member and Investment Committee member, Bethel University Foundation since 2010; formerly Corporate Executive Board Member of the National Chief Investment Officers Circle, 2010 to 2015; formerly, Member of the Board of Governors of the University of Wisconsin Foundation, River Falls, 1996 to 2004; U.S. Army Veteran, Gulf War. | | | 21 | | | Since 2015 |
(table continued on next page)
67
COHEN & STEERS ALTERNATIVE INCOME FUND, INC.
(table continued from previous page)
| | | | | | | | | | |
Name, Address and Year of Birth1 | | Position(s) Held With Fund | | Term of Office2 | | Principal Occupation During At Least The Past 5 Years (Including Other Directorships Held) | | Number of Funds Within Fund Complex Overseen by Director (Including the Fund) | | Length of Time Served3 |
| | | | | |
Gerald J. Maginnis 1955 | | Director | | Until Next Election of Directors | | Philadelphia Office Managing Partner, KPMG LLP from 2006 to 2015; Partner in Charge, KPMG Pennsylvania Audit Practice from 2002 to 2008; President, Pennsylvania Institute of Certified Public Accountants (PICPA) from 2014 to 2015; Member, PICPA Board of Directors from 2012 to 2016; Member, Council of the American Institute of Certified Public Accountants (AICPA) from 2013 to 2017; Member, Board of Trustees of AICPA Foundation from 2015 to 2020; Board member and Audit Committee Chairman of inTEST Corporation since 2020. | | 21 | | Since 2015 |
| | | | | |
Jane F. Magpiong 1960 | | Director | | Until Next Election of Directors | | President, Untap Potential since 2013; Senior Managing Director, TIAA-CREF, from 2011 to 2013; National Head of Wealth Management, TIAA- CREF, from 2008 to 2011; and prior to that, President, Bank of America Private Bank from 2005 to 2008. | | 21 | | Since 2015 |
(table continued on next page)
68
COHEN & STEERS ALTERNATIVE INCOME FUND, INC.
(table continued from previous page)
| | | | | | | | | | |
Name, Address and Year of Birth1 | | Position(s) Held With Fund | | Term of Office2 | | Principal Occupation During At Least The Past 5 Years (Including Other Directorships Held) | | Number of Funds Within Fund Complex Overseen by Director (Including the Fund) | | Length of Time Served3 |
| | | | | |
Daphne L. Richards 1966 | | Director | | Until Next Election of Directors | | Independent Director of Cartica Management, LLC since 2015; Investment Committee Member of the Berkshire Taconic Community Foundation since 2015 and Member of the Advisory Board of Northeast Dutchess Fund since 2016; President and CIO of Ledge Harbor Management since 2016; formerly, worked at Bessemer Trust Company from 1999 to 2014; prior thereto, held investment positions at Frank Russell Company from 1996 to 1999. Union Bank of Switzerland from 1993 to 1996; Credit Suisse from 1990 to 1993; and Hambros International Venture Capital Fund from 1988 to 1989. | | 21 | | Since 2017 |
| | | | | |
C. Edward Ward, Jr 1946 | | Director | | Until Next Election of Directors | | Member of The Board of Trustees of Manhattan College, Riverdale, New York from 2004 to 2014. Formerly, Director of closed-end fund management for the NYSE where he worked from 1979 to 2004. | | 21 | | Since 2004 |
| 1 | The address for each director is 280 Park Avenue, New York, NY 10017. |
| 2 | On March 12, 2008, the Board of Directors adopted a mandatory retirement policy stating a Director must retire from the Board on December 31st of the year in which he or she turns 75 years of age. |
| 3 | The length of time served represents the year in which the Director was first elected or appointed to any fund in the Cohen & Steers fund complex. |
| 4 | “Interested person” as defined in the 1940 Act, of the Fund because of affiliation with CSCM (Interested Directors). |
69
COHEN & STEERS ALTERNATIVE INCOME FUND, INC.
The officers of the Fund (other than Messrs. Steers and Harvey, whose biographies are provided above), their address, their year of birth and their principal occupations for at least the past five years are set forth below.
| | | | | | |
Name, Address and Year of Birth1 | | Position(s) Held With Fund | | Principal Occupation During At Least the Past 5 Years | | Length of Time Served2 |
| | | |
Adam M. Derechin 1964 | | President and Chief Executive Officer | | Chief Operating Officer of CSCM since 2003 and CNS since 2004. | | Since 2005 |
| | | |
James Giallanza 1966 | | Chief Financial Officer | | Executive Vice President of CSCM since 2014. Prior to that, Senior Vice President of CSCM since 2006. | | Since 2006 |
| | | |
Dana A. DeVivo 1981 | | Secretary and Chief Legal Officer | | Senior Vice President of CSCM since 2019. Prior to that, Vice President of CSCM since 2013. | | Since 2015 |
| | | |
Albert Laskaj 1977 | | Treasurer | | Senior Vice President of CSCM since 2019. Prior to that, Vice President of CSCM since 2015. Prior to that, Director of Legg Mason & Co. since 2013. | | Since 2015 |
| | | |
Stephen Murphy 1966 | | Chief Compliance Officer and Vice President | | Senior Vice President of CSCM since 2019. Prior to that, Managing Director at Mirae Asset Securities (USA) Inc. since 2017. Prior to that, VP & Chief Compliance Officer of Weiss Multi-Strategy Adviser LLC since 2011. | | Since 2019 |
| | | |
Jon Cheigh 1972 | | Vice President | | Chief Investment Officer of CSCM since October 2019 and Executive Vice President of CSCM since 2012. Prior to that, Senior Vice President of CSCM since 2007. | | Since 2006 |
| | | |
Vincent L. Childers 1976 | | Vice President | | Senior Vice President of CSCM since 2013. Prior to that, portfolio manager for real asset strategies at AllianceBernstein. | | Since 2013 |
| | | |
Tyler S. Rosenlicht 1985 | | Vice President | | Senior Vice President of CSCM since 2018. Prior to that, Vice President of CSCM since 2015. Prior to that, research associate at CSCM since 2012. | | Since 2015 |
| 1 | The address of each officer is 280 Park Avenue, New York, NY 10017. |
| 2 | Officers serve one-year terms. The length of time served represents the year in which the officer was first elected as an officer of any fund in the Cohen & Steers fund complex. All of the officers listed above are officers of one or more of the other funds in the complex. |
70
COHEN & STEERS ALTERNATIVE INCOME FUND, INC.
Cohen & Steers Privacy Policy
| | |
| | |
| Facts | | What Does Cohen & Steers Do With Your Personal Information? |
| |
| Why? | | Financial companies choose how they share your personal information. Federal law gives consumers the right to limit some but not all sharing. Federal law also requires us to tell you how we collect, share, and protect your personal information. Please read this notice carefully to understand what we do. |
| |
| What? | | The types of personal information we collect and share depend on the product or service you have with us. This information can include: • Social Security number and account balances • Transaction history and account transactions • Purchase history and wire transfer instructions |
| |
| How? | | All financial companies need to share customers’ personal information to run their everyday business. In the section below, we list the reasons financial companies can share their customers’ personal information; the reasons Cohen & Steers chooses to share; and whether you can limit this sharing. |
| | | | |
| Reasons we can share your personal information | | Does Cohen & Steers
share? | | Can you limit this
sharing? |
| | |
For our everyday business purposes— such as to process your transactions, maintain your account(s), respond to court orders and legal investigations, or reports to credit bureaus | | Yes | | No |
| | |
For our marketing purposes— to offer our products and services to you | | Yes | | No |
| | |
| For joint marketing with other financial companies— | | No | | We don’t share |
| | |
For our affiliates’ everyday business purposes— information about your transactions and experiences | | No | | We don’t share |
| | |
For our affiliates’ everyday business purposes— information about your creditworthiness | | No | | We don’t share |
| | |
| For our affiliates to market to you— | | No | | We don’t share |
| | |
| For non-affiliates to market to you— | | No | | We don’t share |
| | |
| | | | |
| | | |
| Questions? Call 800.330.7348 | | | | |
71
COHEN & STEERS ALTERNATIVE INCOME FUND, INC.
Cohen & Steers Privacy Policy—(Continued)
| | |
| | |
| Who we are | | |
| |
| Who is providing this notice? | | Cohen & Steers Capital Management, Inc., Cohen & Steers Asia Limited, Cohen & Steers Japan, LLC, Cohen & Steers UK Limited, Cohen & Steers Securities, LLC, Cohen & Steers Private Funds and Cohen & Steers Open and Closed-End Funds (collectively, Cohen & Steers). |
| |
| What we do | | |
| |
| How does Cohen & Steers protect my personal information? | | To protect your personal information from unauthorized access and use, we use security measures that comply with federal law. These measures include computer safeguards and secured files and buildings. We restrict access to your information to those employees who need it to perform their jobs, and also require companies that provide services on our behalf to protect your information. |
| |
| How does Cohen & Steers collect my personal information? | | We collect your personal information, for example, when you: • Open an account or buy securities from us • Provide account information or give us your contact information • Make deposits or withdrawals from your account We also collect your personal information from other companies. |
| |
| Why can’t I limit all sharing? | | Federal law gives you the right to limit only: • sharing for affiliates’ everyday business purposes—information about your creditworthiness • affiliates from using your information to market to you • sharing for non-affiliates to market to you State law and individual companies may give you additional rights to limit sharing. |
| |
| Definitions | | |
| |
| Affiliates | | Companies related by common ownership or control. They can be financial and nonfinancial companies. • Cohen & Steers does not share with affiliates. |
| |
| Non-affiliates | | Companies not related by common ownership or control. They can be financial and nonfinancial companies. • Cohen & Steers does not share with non-affiliates. |
| |
| Joint marketing | | A formal agreement between non-affiliated financial companies that together market financial products or services to you. • Cohen & Steers does not jointly market. |
72
COHEN & STEERS ALTERNATIVE INCOME FUND, INC.
Cohen & Steers Open-End Mutual Funds
COHEN & STEERS REALTY SHARES
| • | | Designed for investors seeking total return, investing primarily in U.S. real estate securities |
| • | | Symbols: CSJAX, CSJCX, CSJIX, CSRSX, CSJRX, CSJZX |
COHEN & STEERS REAL ESTATE SECURITIES FUND
| • | | Designed for investors seeking total return, investing primarily in U.S. real estate securities |
| • | | Symbols: CSEIX, CSCIX, CREFX, CSDIX, CIRRX, CSZIX |
COHEN & STEERS INSTITUTIONAL REALTY SHARES
| • | | Designed for institutional investors seeking total return, investing primarily in U.S. real estate securities |
COHEN & STEERS GLOBAL REALTY SHARES
| • | | Designed for investors seeking total return, investing primarily in global real estate equity securities |
| ��� | | Symbols: CSFAX, CSFCX, CSSPX, GRSRX, CSFZX |
COHEN & STEERS INTERNATIONAL REALTY FUND
| • | | Designed for investors seeking total return, investing primarily in international (non-U.S.) real estate securities |
| • | | Symbols: IRFAX, IRFCX, IRFIX, IRFRX, IRFZX |
COHEN & STEERS REAL ASSETS FUND
| • | | Designed for investors seeking total return and the maximization of real returns during inflationary environments by investing primarily in real assets |
| • | | Symbols: RAPAX, RAPCX, RAPIX, RAPRX, RAPZX |
COHEN & STEERS PREFERRED SECURITIES
AND INCOME FUND
| • | | Designed for investors seeking total return (high current income and capital appreciation), investing primarily in preferred and debt securities issued by U.S. and non-U.S. companies |
| • | | Symbols: CPXAX, CPXCX, CPXFX, CPXIX, CPRRX, CPXZX |
COHEN & STEERS LOW DURATION PREFERRED
AND INCOME FUND
| • | | Designed for investors seeking high current income and capital preservation by investing in low-duration preferred and other income securities issued by U.S. and non-U.S. companies |
| • | | Symbols: LPXAX, LPXCX, LPXFX, LPXIX, LPXRX, LPXZX |
COHEN & STEERS MLP & ENERGY OPPORTUNITY FUND
| • | | Designed for investors seeking total return, investing primarily in midstream energy master limited partnership (MLP) units and related stocks |
| • | | Symbols: MLOAX, MLOCX, MLOIX, MLORX, MLOZX |
COHEN & STEERS GLOBAL INFRASTRUCTURE FUND
| • | | Designed for investors seeking total return, investing primarily in global infrastructure securities |
| • | | Symbols: CSUAX, CSUCX, CSUIX, CSURX, CSUZX |
COHEN & STEERS ALTERNATIVE INCOME FUND
(FORMERLY COHEN & STEERS DIVIDEND VALUE FUND)
| • | | Designed for investors seeking high current income and capital appreciation, investing in equity, preferred and debt securities, focused on real assets and alternative income strategies |
| • | | Symbols: DVFAX, DVFCX, DVFIX, DVFRX, DVFZX |
Distributed by Cohen & Steers Securities, LLC.
Please consider the investment objectives, risks, charges and expenses of any Cohen & Steers U.S. registered open-end fund carefully before investing. A summary prospectus and prospectus containing this and other information can be obtained by calling 800-330-7348 or by visiting cohenandsteers.com. Please read the summary prospectus and prospectus carefully before investing.
73
COHEN & STEERS ALTERNATIVE INCOME FUND, INC.
OFFICERS AND DIRECTORS
Robert H. Steers
Director and Chairman
Joseph M. Harvey
Director and Vice President
Michael G. Clark
Director
George Grossman
Director
Dean A. Junkans
Director
Gerald J. Maginnis
Director
Jane F. Magpiong
Director
Daphne L. Richards
Director
C. Edward Ward, Jr.
Director
Adam M. Derechin
President and Chief Executive Officer
James Giallanza
Chief Financial Officer
Dana A. DeVivo
Secretary and Chief Legal Officer
Albert Laskaj
Treasurer
Stephen Murphy
Chief Compliance Officer
and Vice President
Jon Cheigh
Vice President
Vincent L. Childers
Vice President
Tyler Rosenlicht
Vice President
KEY INFORMATION
Investment Advisor and Administrator
Cohen & Steers Capital Management, Inc.
280 Park Avenue
New York, NY 10017
(212) 832-3232
Co-administrator and Custodian
State Street Bank and Trust Company
One Lincoln Street
Boston, MA 02111
Transfer Agent
DST Asset Manager Solutions, Inc.
P.O. Box 219953
Kansas City, MO 64121-9953
(800) 437-9912
Legal Counsel
Ropes & Gray LLP
1211 Avenue of the Americas
New York, NY 10036
Distributor
Cohen & Steers Securities, LLC
280 Park Avenue
New York, NY 10017
| | |
| NASDAQ Symbol: | | Class A—DVFAX |
| | Class C—DVFCX |
| | Class F—DVVFX* |
| | Class I—DVFIX |
| | Class R—DVFRX |
| | Class Z—DVFZX |
website: cohenandsteers.com
This report is authorized for delivery only to shareholders of Cohen & Steers Alternative Income Fund, Inc. unless accompanied or preceded by the delivery of a currently effective prospectus setting forth details of the Fund. Performance data quoted represent past performance which is no guarantee of future results and your investment may be worth more or less at the time you sell your shares.
| * | Class F shares are currently not available for purchase. |
74
eDelivery AVAILABLE
Stop traditional mail delivery;
receive your shareholder reports
and prospectus online.
Sign up at cohenandsteers.com

Cohen & Steers
Alternative
Income Fund
Annual Report October 31, 2020
Beginning on January 1, 2021, as permitted by regulations adopted by the U.S. Securities and Exchange Commission, paper copies of the Fund’s annual and semi-annual shareholder reports will no longer be sent by mail, unless you specifically request paper copies of the reports. Instead, the reports will be made available on the Fund’s website at www.cohenandsteers.com, and you will be notified by mail each time a report is posted and provided with a website link to access the report.
If you have already elected to receive shareholder reports electronically, you will not be affected by this change and you need not take any action. You may elect to receive shareholder reports and other communications from a Fund electronically anytime by contacting your financial intermediary or, if you are a direct investor, by signing up at www.cohenandsteers.com.
You may elect to receive all future reports in paper, free of charge, at any time. If you invest through a financial intermediary, you can contact your financial intermediary or, if you are a direct investor, you can call (800) 330-7348 to let the Fund know you wish to continue receiving paper copies of your shareholder reports. Your election to receive reports in paper will apply to all Funds held in your account if you invest through your financial intermediary or all Funds held within the fund complex if you invest directly with the Fund.
DVFAXAR
Item 2. Code of Ethics.
The Registrant has adopted an Amended and Restated Code of Ethics that applies to its Principal Executive Officer and Principal Financial Officer. The Code of Ethics was in effect during the reporting period. The Registrant has not amended the Code of Ethics as described in Form N-CSR during the reporting period. The Registrant has not granted any waiver, including an implicit waiver, from a provision of the Code of Ethics as described in Form N-CSR during the reporting period. A current copy of the Code of Ethics is available on the Registrant’s website at https://www.cohenandsteers.com/assets/content/uploads/Code_of_Ethics_for_Principal_Executive_and_Principal_Financial_Officers_of_the_Funds.pdf. Upon request, a copy of the Code of Ethics can be obtained free of charge by calling 800-330-7348 or writing to the Secretary of the Registrant, 280 Park Avenue, 10th floor, New York, NY 10017.
Item 3. Audit Committee Financial Expert.
The Registrant’s board has determined that Gerald J. Maginnis qualifies as an audit committee financial expert based on his years of experience in the public accounting profession. The registrant’s board has determined that Michael G. Clark qualifies as an audit committee financial expert based on his years of experience in the public accounting profession and the investment management and financial services industry. Each of Messrs. Clark and Maginnis is a member of the board’s audit committee, and each is independent as such term is defined in Form N-CSR.
Item 4. Principal Accountant Fees and Services.
(a) – (d) Aggregate fees billed to the registrant for the last two fiscal years ended October 31, 2020 and October 31, 2019 for professional services rendered by the registrant’s principal accountant were as follows:
| | | | | | | | |
| | | 2020 | | | 2019 | |
Audit Fees | | $ | 45,580 | | | $ | 45,580 | |
Audit-Related Fees | | $ | 0 | | | $ | 2,500 | |
Tax Fees | | $ | 6,800 | | | $ | 6,800 | |
All Other Fees | | $ | 0 | | | $ | 0 | |
Audit related fees were billed in connection with the Registrant’s independent auditor’s issuance of their consent related to a registration statement filing for the Registrant’s strategy change and related fiscal year-end change. Tax fees were billed in connection with tax compliance services, including the preparation and review of federal and state tax returns.
(e)(1) The audit committee is required to pre-approve audit and non-audit services performed for the registrant by the principal accountant. The audit committee also is required to pre-approve non-audit services performed by the registrant’s principal accountant for the registrant’s investment advisor and any sub-advisor (not including any sub-advisor whose role is primarily portfolio management and is subcontracted with or overseen by another investment advisor) and/or to any entity controlling, controlled by or under common control with the registrant’s investment advisor that provides ongoing services to the registrant, if the engagement for services relates directly to the operations and financial reporting of the registrant.
The audit committee may delegate pre-approval authority to one or more of its members who are independent members of the board of directors of the registrant. The member or members to whom such authority is delegated shall report any pre-approval decisions to the audit committee at its next scheduled meeting. The audit committee may not delegate its responsibility to pre-approve services to be performed by the registrant’s principal accountant to the investment advisor.
(e)(2) No services included in (b) – (d) above were approved by the audit committee pursuant to paragraphs (c)(7)(i)(C) of Rule 2-01 of Regulation S-X.
(f) Not applicable.
(g) For the fiscal years ended October 31, 2020 and October 31, 2019, the aggregate fees billed by the registrant’s principal accountant for non-audit services rendered to the registrant and for non-audit services rendered to the registrant’s investment advisor (not including any sub-advisor whose role is primarily portfolio management and is subcontracted with or overseen by another investment advisor) and/or to any entity controlling, controlled by or under common control with the registrant’s investment advisor that provides ongoing services to the registrant were:
| | | | | | | | |
| | | 2020 | | | 2019 | |
Registrant | | $ | 6,800 | | | $ | 6,800 | |
Investment Advisor | | $ | 0 | | | $ | 0 | |
(h) The registrant’s audit committee considered whether the provision of non-audit services that were rendered to the registrant’s investment advisor (not including any sub-advisor whose role is primarily portfolio management and is subcontracted with or overseen by another investment advisor) and/or to any entity controlling, controlled by or under common control with the registrant’s investment advisor that provides ongoing services to the registrant that were not required to be pre-approved pursuant to paragraph (c)(7)(ii) of Rule 2-01 of Regulation S-X was compatible with maintaining the principal accountant’s independence.
Item 5. Audit Committee of Listed Registrants.
Not applicable.
Item 6. Schedule of Investments.
Included in Item 1 above.
Item 7. Disclosure of Proxy Voting Policies and Procedures for Closed-End Management Investment Companies.
Not applicable.
Item 8. Portfolio Managers of Closed-End Investment Companies.
Not applicable.
Item 9. Purchases of Equity Securities by Closed-End Management Investment Company and Affiliated Purchasers.
Not applicable.
Item 10. Submission of Matters to a Vote of Security Holders.
None.
Item 11. Controls and Procedures.
(a) The registrant’s principal executive officer and principal financial officer have concluded that the registrant’s disclosure controls and procedures are reasonably designed to ensure that information required to be disclosed by the registrant in this Form N-CSR was recorded, processed, summarized and reported within the time periods specified in the Securities and Exchange Commission’s rules and forms, based upon such officers’ evaluation of these controls and procedures as of a date within 90 days of the filing date of this report.
(b) There were no changes in the registrant’s internal control over financial reporting that occurred during the period covered by this report that have materially affected, or are reasonably likely to materially affect, the registrant’s internal control over financial reporting.
Item 12. Disclosure of Securities Lending Activities for Closed-End Management Investment Companies.
Not applicable.
Item 13. Exhibits.
(a)(1) Not applicable.
(a)(2) Certifications of principal executive officer and principal financial officer as required by Rule 30a-2(a) under the Investment Company Act of 1940.
(a)(3) Not applicable.
(a)(4) Not applicable.
(b) Certifications of principal executive officer and principal financial officer as required by Rule 30a- 2(b) under the Investment Company Act of 1940.
SIGNATURES
Pursuant to the requirements of the Securities Exchange Act of 1934 and the Investment Company Act of 1940, the registrant has duly caused this report to be signed on its behalf by the undersigned, thereunto duly authorized.
COHEN & STEERS ALTERNATIVE INCOME FUND, INC.
| | | | |
| | By: | | /s/ Adam M. Derechin |
| | Name: | | Adam M. Derechin |
| | Title: | | Principal Executive Officer |
| | | | (President and Chief Executive Officer) |
| |
| | Date: December 30, 2020 |
Pursuant to the requirements of the Securities Exchange Act of 1934 and the Investment Company Act of 1940, this report has been signed below by the following persons on behalf of the registrant and in the capacities and on the dates indicated.
| | | | |
| | By: | | /s/ Adam M. Derechin |
| | Name: | | Adam M. Derechin |
| | Title: | | Principal Executive Officer |
| | | | (President and Chief Executive Officer) |
| | |
| | By: | | /s/ James Giallanza |
| | Name: | | James Giallanza |
| | Title: | | Principal Financial Officer |
| | | | (Chief Financial Officer) |
| |
| | Date: December 30, 2020 |