Washington, D.C. 20549
This fund is one of more than 40 offered by one of the nation’s largest mutual fund families, American Funds, from Capital Group. For more than 80 years, Capital has invested with a long-term focus based on thorough research and attention to risk.
Here are the average annual total returns on a $1,000 investment with all distributions reinvested for periods ended June 30, 2013:
For other share class results, visit americanfunds.com and americanfundsretirement.com.
The total annual fund operating expense ratio was 0.60% for Class A shares as of the prospectus dated March 1, 2013.
Investment results assume all distributions are reinvested and reflect applicable fees and expenses. When applicable, investment results reflect fee waivers, without which results would have been lower. Visit americanfunds.com for more information.
The return of principal for bond funds and for funds with significant underlying bond holdings is not guaranteed. Fund shares are subject to the same interest rate, inflation and credit risks associated with the underlying bond holdings. Bond ratings, which typically range from Aaa/AAA (highest) to D (lowest), are assigned by credit rating agencies such as Moody’s, Standard & Poor’s and/or Fitch as an indication of an issuer’s creditworthiness. High-yield bonds are subject to greater fluctuations in value and risk of loss of income and principal than investment-grade bonds. Investing in bonds issued outside the U.S. may be subject to additional risks. They include currency fluctuations, political and social instability, differing securities regulations and accounting standards, higher transaction costs, possible changes in taxation, illiquidity and price volatility. These risks may be heightened in connection with investments in developing countries. Refer to the fund prospectus and the Risk Factors section of this report for more information on these and other risks associated with investing in the fund.
After a prolonged, multiyear period of low interest rates, bond yields began rising during the first half of The Bond Fund of America’s current fiscal year. With the resulting decline in bond prices, the fund returned –2.66% for the six-month period.
By way of comparison, the unmanaged Barclays U.S. Aggregate Index returned –2.44% for the period. The fund’s peer group, as measured by the Lipper Intermediate Investment Grade Debt Funds Average, returned –2.56%.
The fund’s dividend income helped mitigate the decline in bond prices. During the six-month period, the fund paid dividends totaling just under 14 cents a share. This amounted to an income return of 1.07% (2.14% annualized) for the fund’s investors, whether they reinvested returns or took income in cash.
During the first half of the six-month period, bond yields remained relatively stable, but this changed in April as concerns about slowing economic growth drove yields to their lows for the calendar year.
Bond yields began their climb in May. This was prompted by stronger economic data, and signals from the Federal Reserve that it was considering reducing its bond purchases — known as quantitative easing — at some future point. While the timing of this reduction wasn’t specified, the bond markets reacted dramatically. The yield on the bellwether 10-year Treasury note rose nearly a full percentage point in less than two months.
In late June, a number of Federal Reserve officials sought to reassure the market that the Fed would not reduce bond purchases quickly, and not without evidence of further economic strengthening. While rates declined slightly immediately afterward, they resumed climbing modestly in early July, buoyed by strong gains in payrolls and other signs of economic growth.
The fund was previously positioned for a rise in rates prior to the start of the fiscal year, and the portfolio managers maintained this positioning throughout the six-month period to prepare for what they believed will be a long-term trend toward marginally higher rates. By buying shorter duration bonds now, the managers can reinvest the money into longer duration, higher yielding bonds when the short-duration bonds mature.
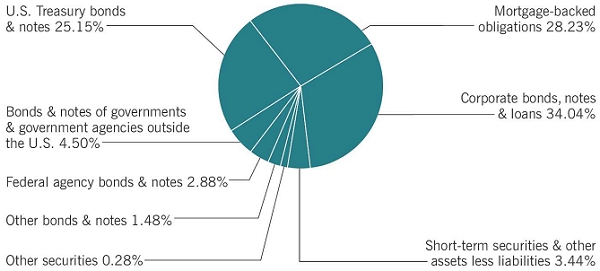
The fund’s holdings in U.S. Treasury and agency bonds increased slightly during the period, representing 28% of the portfolio at the end of the six-month period, compared to 25% of the portfolio at the beginning of the fiscal year. Mortgage-backed securities made up 28% of the portfolio, down from 34% at the start of the period, while corporate bonds climbed to 34% of the fund, up from 30%.
The fund slightly increased its holdings in high-yield corporate bonds, from 5.2% of the portfolio at the start of the fiscal year to 5.4% at the midpoint. High-yield continued to be a positive contributor to the fund during the period.
It is our belief that interest rates will continue to rise modestly through the remainder of the fund’s fiscal year and into calendar year 2014. This climb won’t be steep, and there may be periods in which bonds rally, but we feel confident that the bond market has begun a period of slowly rising rates.
Our investors often choose The Bond Fund of America to provide income, as well as a degree of capital preservation when compared with other assets they may own — especially as events such as college or retirement near. We remain confident that the fund can continue to serve our investors in these areas going forward. While rates rose sharply during the period, we believe future increases will be more moderate. In this environment, bonds can and do lose some value. However, when those bonds are sold or reach maturity, the proceeds can be reinvested in less expensive bonds that yield more, providing increased income and contributing to total return.
We take a long-term, research-driven approach to investing, and believe it is during periods like these that we as fixed-income portfolio managers can be most effective. We thank you for your continued interest and investment in the fund, and look forward to reporting to you again in six months.
John H. Smet
President
The following summary investment portfolio is designed to streamline the report and help investors better focus on the fund’s principal holdings. See the inside back cover for details on how to obtain a complete schedule of portfolio holdings.
“Other securities” includes all issues that are not disclosed separately in the summary investment portfolio. Some of these securities (with an aggregate value of $45,135,000, an aggregate cost of $81,170,000, and which represented .15% of the net assets of the fund) were acquired from 12/16/2008 to 2/15/2013 through private placement transactions exempt from registration under the Securities Act of 1933, which may subject them to legal or contractual restrictions on resale.
The fund has entered into forward currency contracts to purchase or sell currencies as shown in the following table. The open forward currency contracts shown are generally indicative of the level of activity over the prior 12-month period.
The fund has entered into interest rate swaps as shown in the following table. The interest rate swaps shown are generally indicative of the volume of activity over the prior 12-month period.
The following footnotes apply to either the individual securities noted or one or more of the securities aggregated and listed as a single line item.
*Additional information related to class-specific fees and expenses is included in the Notes to Financial Statements.
*Unaudited.
The Bond Fund of America (the “fund”) is registered under the Investment Company Act of 1940 as an open-end, diversified management investment company. The fund seeks as high a level of current income as is consistent with preservation of capital through a diversified portfolio of bonds and other fixed-income obligations.
The fund has 16 share classes consisting of five retail share classes (Classes A, B and C, as well as two F share classes, F-1 and F-2), five 529 college savings plan share classes (Classes 529-A, 529-B, 529-C, 529-E and 529-F-1) and six retirement plan share classes (Classes R-1, R-2, R-3, R-4, R-5 and R-6). The 529 college savings plan share classes can be used to save for college education. The retirement plan share classes are generally offered only through eligible employer-sponsored retirement plans. The fund’s share classes are further described below:
* Class B and 529-B shares of the fund are not available for purchase.
Holders of all share classes have equal pro rata rights to assets, dividends and liquidation proceeds. Each share class has identical voting rights, except for the exclusive right to vote on matters affecting only its class. Share classes have different fees and expenses (“class-specific fees and expenses”), primarily due to different arrangements for distribution, administrative and shareholder services. Differences in class-specific fees and expenses will result in differences in net investment income and, therefore, the payment of different per-share dividends by each share class.
The financial statements have been prepared to comply with accounting principles generally accepted in the United States of America. These principles require management to make estimates and assumptions that affect reported amounts and disclosures. Actual results could differ from those estimates. The fund follows the significant accounting policies described below, as well as the valuation policies described in the next section on valuation.
Capital Research and Management Company (“CRMC”), the fund’s investment adviser, values the fund’s investments at fair value as defined by accounting principles generally
accepted in the United States of America. The net asset value of each share class of the fund is generally determined as of approximately 4:00 p.m. New York time each day the New York Stock Exchange is open.
Equity securities are generally valued at the official closing price of, or the last reported sale price on, the exchange or market on which such securities are traded, as of the close of business on the day the securities are being valued or, lacking any sales, at the last available bid price. Prices for each security are taken from the principal exchange or market on which the security trades.
Fixed-income securities, including short-term securities purchased with more than 60 days left to maturity, are generally valued at prices obtained from one or more pricing vendors. Vendors value such securities based on one or more of the inputs described in the following table. The table provides examples of inputs that are commonly relevant for valuing particular classes of fixed-income securities in which the fund is authorized to invest. However, these classifications are not exclusive, and any of the inputs may be used to value any other class of fixed-income security.
When the fund’s investment adviser deems it appropriate to do so (such as when vendor prices are unavailable or not deemed to be representative), fixed-income securities will
be valued in good faith at the mean quoted bid and ask prices that are reasonably and timely available (or bid prices, if ask prices are not available) or at prices for securities of comparable maturity, quality and type.
Securities with both fixed-income and equity characteristics, or equity securities traded principally among fixed-income dealers, are generally valued in the manner described above for either equity or fixed-income securities, depending on which method is deemed most appropriate by the fund’s investment adviser. Short-term securities purchased within 60 days to maturity are valued at amortized cost, which approximates fair value. The value of short-term securities originally purchased with maturities greater than 60 days is determined based on an amortized value to par when they reach 60 days. Forward currency contracts are valued at the mean of representative quoted bid and ask prices, generally based on prices supplied by one or more pricing vendors. Interest rate swaps are generally valued by pricing vendors based on market inputs that include the index and term of index, reset frequency, payer/receiver, currency, and pay frequency.
Securities and other assets for which representative market quotations are not readily available or are considered unreliable by the fund’s investment adviser are fair valued as determined in good faith under fair valuation guidelines adopted by authority of the fund’s board of trustees as further described below. The investment adviser follows fair valuation guidelines, consistent with U.S. Securities and Exchange Commission rules and guidance, to consider relevant principles and factors when making fair value determinations. The investment adviser considers relevant indications of value that are reasonably and timely available to it in determining the fair value to be assigned to a particular security, such as the type and cost of the security; contractual or legal restrictions on resale of the security; relevant financial or business developments of the issuer; actively traded similar or related securities; conversion or exchange rights on the security; related corporate actions; significant events occurring after the close of trading in the security; and changes in overall market conditions. Fair valuations and valuations of investments that are not actively trading involve judgment and may differ materially from valuations that would have been used had greater market activity occurred.
fair value measurements from period to period and may, as deemed appropriate, update the fair valuation guidelines to better reflect the results of back testing and address new or evolving issues. The Fair Valuation Committee reports any changes to the fair valuation guidelines to the board of trustees with supplemental information to support the changes. The fund’s board and audit committee also regularly review reports that describe fair value determinations and methods.
The fund’s investment adviser has also established a Fixed-Income Pricing Review Group to administer and oversee the fixed-income valuation process, including the use of fixed-income pricing vendors. This group regularly reviews pricing vendor information and market data. Pricing decisions, processes and controls over security valuation are also subject to additional internal reviews, including an annual control self-evaluation program facilitated by the investment adviser’s compliance group.
Investing in the fund may involve certain risks including, but not limited to, those described below.
Bonds and other debt securities are subject to credit risk, which is the possibility that the credit strength of an issuer will weaken and/or an issuer of a debt security will fail to make timely payments of principal or interest and the security will go into default. Lower quality debt securities generally have higher rates of interest and may be subject to greater price fluctuations than higher quality debt securities. Credit risk is gauged, in part, by the credit ratings of the securities in which the fund invests. However, ratings are only the opinions of the rating agencies issuing them and are not guarantees as to credit quality or an evaluation of market risk. The fund’s investment adviser relies on its own credit analysts to research issuers and issues in seeking to mitigate the risks of an issuer defaulting on its obligations.
underlying the securities are prepaid more slowly than expected, the time in which the securities are expected to be paid off could be extended. This may reduce the fund’s cash for potential reinvestment in higher yielding securities.
On a daily basis, the fund’s investment adviser values forward currency contracts based on the applicable exchange rates and records unrealized appreciation or depreciation for open forward currency contracts in the fund’s statement of assets and liabilities. Realized gains or losses are recorded at the time the forward currency contract is closed or offset by another contract with the same broker for the same settlement date and currency.
On a daily basis, the fund’s investment adviser records interest accruals related to the exchange of future payments as a receivable and payable in the fund’s statement of assets and liabilities. Unrealized appreciation or depreciation as a result of market fluctuation is recorded as an asset or liability. Periodic payments received or made by the fund are recorded in the fund’s statement of operations as realized gains or losses, respectively. Gains or losses are realized upon early termination or expiration of the interest rate swap agreement.
The following tables present the financial statement impacts resulting from the fund’s use of forward currency contracts and interest rate swaps as of June 30, 2013 (dollars in thousands):
As of and during the period ended June 30, 2013, the fund did not have a liability for any unrecognized tax benefits. The fund recognizes interest and penalties, if any, related to unrecognized tax benefits as income tax expense in the statement of operations. During the period, the fund did not incur any interest or penalties.
The fund is not subject to examination by U.S. federal tax authorities for tax years before 2009 and by state tax authorities and tax authorities outside the U.S. for tax years before 2008.
The components of distributable earnings on a tax basis are reported as of the fund’s most recent year-end. As of December 31, 2012, the components of distributable earnings on a tax basis were as follows (dollars in thousands):
Under the Regulated Investment Company Modernization Act of 2010 (the “Act”), net capital losses recognized after December 31, 2010, may be carried forward indefinitely, and their character is retained as short-term and/or long-term losses. Previously, net capital losses were carried forward for eight years and treated as short-term losses. As a transition rule, the Act requires that post-enactment net capital losses be used before pre-enactment net capital losses.
As of June 30, 2013, the tax basis unrealized appreciation (depreciation) and cost of investment securities were as follows (dollars in thousands):
Tax-basis distributions paid or accrued to shareholders from ordinary income were as follows (dollars in thousands):
CRMC, the fund’s investment adviser, is the parent company of American Funds Distributors,® Inc. (“AFD”), the principal underwriter of the fund’s shares, and American Funds Service Company® (“AFS”), the fund’s transfer agent. CRMC, AFD and AFS are considered related parties to the fund.
agreement also provides for monthly fees, accrued daily, based on a series of decreasing rates beginning with 2.25% on the first $8,333,333 of the fund’s monthly gross income and decreasing to 1.75% on such income in excess of $41,666,667. For the six months ended June 30, 2013, the investment advisory services fee was $30,297,000, which was equivalent to an annualized rate of 0.187% of average daily net assets.
Capital share transactions in the fund were as follows (dollars and shares in thousands):
*Includes exchanges between share classes of the fund.
The fund made purchases and sales of investment securities, excluding short-term securities and U.S. government obligations, if any, of $54,582,808,000 and $56,275,262,000, respectively, during the six months ended June 30, 2013.
See page 35 for footnotes.
See page 35 for footnotes.
As a shareholder of the fund, you incur two types of costs: (1) transaction costs, such as initial sales charges on purchase payments and contingent deferred sales charges on redemptions (loads), and (2) ongoing costs, including management fees, distribution and service (12b-1) fees, and other expenses. This example is intended to help you understand your ongoing costs (in dollars) of investing in the fund so you can compare these costs with the ongoing costs of investing in other mutual funds. The example is based on an investment of $1,000 invested at the beginning of the period and held for the entire six-month period (January 1, 2013, through June 30, 2013).
The first line of each share class in the table on page 38 provides information about actual account values and actual expenses. You may use the information in this line, together with the amount you invested, to estimate the expenses that you paid over the period. Simply divide your account value by $1,000 (for example, an $8,600 account value divided by $1,000 = 8.6), then multiply the result by the number in the first line under the heading entitled “Expenses paid during period” to estimate the expenses you paid on your account during this period.
The second line of each share class in the table on page 38 provides information about hypothetical account values and hypothetical expenses based on the actual expense ratio for the share class and an assumed rate of return of 5.00% per year before expenses, which is not the actual return of the share class. The hypothetical account values and expenses may not be used to estimate the actual ending account balance or expenses you paid for the period. You may use this information to compare the ongoing costs of investing in the fund and other funds. To do so, compare this 5.00% hypothetical example with the 5.00% hypothetical examples that appear in the shareholder reports of the other funds.
There are some account fees that are charged to certain types of accounts, such as individual retirement accounts and 529 college savings plan accounts (generally, a $10 fee is charged to set up the account and an additional $10 fee is charged to the account annually), that would increase the amount of expenses paid on your account. In addition, retirement plan participants may be subject to certain fees charged by the plan sponsor, and Class F-1, F-2 and 529-F-1 shareholders may be subject to fees charged by financial intermediaries, typically ranging from 0.75% to 1.50% of assets annually depending
on services offered. You can estimate the impact of these fees by adding the amount of the fees to the total estimated expenses you paid on your account during the period as calculated on the previous page. In addition, your ending account value would be lower by the amount of these fees.
Note that the expenses shown in the table are meant to highlight your ongoing costs only and do not reflect any transactional costs, such as sales charges (loads). Therefore, the second line of each share class in the table is useful in comparing ongoing costs only and will not help you determine the relative total costs of owning different funds. In addition, if these transactional costs were included, your costs would have been higher.
The fund’s board has approved the fund’s Investment Advisory and Service Agreement (the “agreement”) with Capital Research and Management Company (“CRMC”) for an additional one-year term through March 31, 2014. The board approved the agreement following the recommendation of the fund’s Contracts Committee (the “committee”), which is composed of all of the fund’s independent board members. The board and the committee determined that the fund’s advisory fee structure was fair and reasonable in relation to the services provided and that approving the agreement was in the best interests of the fund and its shareholders.
In reaching this decision, the board and the committee took into account information furnished to them throughout the year, as well as information prepared specifically in connection with their review of the agreement and were advised by their independent counsel. They considered the factors discussed below, among others, but did not identify any single issue or particular piece of information that, in isolation, was the controlling factor, and each board and committee member did not necessarily attribute the same weight to each factor.
The board and the committee considered the depth and quality of CRMC’s investment management process, including its global research capabilities; the experience, capability and integrity of its senior management and other personnel; the low turnover rates of its key personnel; the overall financial strength and stability of its organization; and the ongoing evolution of CRMC’s organizational structure designed to maintain and strengthen these qualities. The board and the committee also considered the nature, extent and quality of administrative, compliance and shareholder services provided by CRMC to the fund under the agreement and other agreements, as well as the benefits to fund shareholders from investing in a fund that is part of a large family of funds. The board and the committee concluded that the nature, extent and quality of the services provided by CRMC have benefited and should continue to benefit the fund and its shareholders.
The board and the committee considered the investment results of the fund in light of its objective of providing as high a level of current income as is consistent with the preservation of capital. They compared the fund’s investment results with those of other relevant funds (including funds that form the basis of the Lipper index for the category in which the fund is included), and market data such as relevant market indexes, over various periods
through October 31, 2012. This report, including the letter to shareholders and related disclosures, contains certain information about the fund’s investment results. The board and the committee reviewed the fund’s investment results measured against the Lipper Intermediate Investment Grade Average (the Lipper category that includes the fund) and the Barclays U.S. Aggregate Index. They noted that the investment results of the fund generally compared favorably to the Barclays Index for all such periods other than the five-year period, and also generally compared favorably to the Lipper Average for the ten-year and lifetime periods. The board and the committee concluded that the fund’s investment results have been satisfactory and that CRMC’s record in managing the fund indicated that its continued management should benefit the fund and its shareholders.
The board and the committee compared the advisory fees and total expense levels of the fund to those of other relevant funds. They observed that the fund’s advisory fees were below that of the other funds in the Lipper Intermediate Investment Grade category and that although its total expenses were slightly higher than the median of such funds, such expenses less distribution expenses were significantly below the median. The board and the committee also noted the breakpoint discounts in the fund’s advisory fee structure that reduce the level of fees charged by CRMC to the fund as fund assets increase. In addition, they reviewed information regarding effective advisory fees charged to non-mutual fund clients by CRMC and its affiliates. They noted that, to the extent there were differences between the advisory fees paid by the fund and the advisory fees paid by those clients, the differences appropriately reflected the investment, operational and regulatory differences between advising the fund and the other clients. The board and the committee concluded that the fund’s cost structure was fair and reasonable in relation to the services provided, and that the fund’s shareholders receive reasonable value in return for the advisory fees and other amounts paid to CRMC by the fund.
The board and the committee considered a variety of other benefits that CRMC and its affiliates receive as a result of CRMC’s relationship with the fund and the other American Funds, including fees for administrative services provided to certain share classes; fees paid to CRMC’s affiliated transfer agent; sales charges and distribution fees received and retained by the fund’s principal underwriter, an affiliate of CRMC; and possible ancillary
benefits to CRMC’s institutional management affiliates. The board and the committee reviewed CRMC’s portfolio trading practices, noting that while CRMC receives the benefit of research provided by broker-dealers executing portfolio transactions on behalf of the fund, it does not obtain third-party research or other services in return for allocating brokerage to such broker-dealers. The board and the committee took these ancillary benefits into account in evaluating the reasonableness of the advisory fees and other amounts paid to CRMC by the fund.
The board and the committee reviewed information regarding CRMC’s costs of providing services to the American Funds, including personnel, systems and resources of investment, compliance, trading, accounting and other administrative operations. They considered CRMC’s costs and willingness to invest in technology, infrastructure and staff to maintain and expand services and capabilities, respond to industry and regulatory developments, and attract and retain qualified personnel. They noted information regarding the compensation structure for CRMC’s investment professionals. The board and the committee also compared CRMC’s profitability to the reported results of several large, publicly-held investment management companies. The board and the committee noted the competitiveness and cyclicality of both the mutual fund industry and the capital markets, and the importance in that environment of CRMC’s long-term profitability for maintaining its independence, company culture and management continuity. They further considered the breakpoint discounts in the fund’s advisory fee structure. The board and the committee concluded that the fund’s advisory fee structure reflected a reasonable sharing of benefits between CRMC and the fund’s shareholders.
This page intentionally left blank.
This page intentionally left blank.
This page intentionally left blank.
P.O. Box 6007
Indianapolis, IN 46206-6007
P.O. Box 2280
Norfolk, VA 23501-2280
American Funds Distributors, Inc.
333 South Hope Street
Los Angeles, CA 90071-1406
“American Funds Proxy Voting Procedures and Principles” — which describes how we vote proxies relating to portfolio securities — is available on the American Funds website or upon request by calling AFS. The fund files its proxy voting record with the U.S. Securities and Exchange Commission (SEC) for the 12 months ended June 30 by August 31. The proxy voting record is available free of charge on the SEC website at sec.gov and on the American Funds website.
A complete June 30, 2013, portfolio of The Bond Fund of America’s investments is available free of charge by calling AFS or visiting the SEC website (where it is part of Form N-CSR).
The Bond Fund of America files a complete list of its portfolio holdings with the SEC for the first and third quarters of each fiscal year on Form N-Q. This filing is available free of charge on the SEC website. You may also review or, for a fee, copy this filing at the SEC’s Public Reference Room in Washington, D.C. Additional information regarding the operation of the Public Reference Room may be obtained by calling the SEC’s Office of Investor Education and Advocacy at (800) SEC-0330. Additionally, the list of portfolio holdings is available by calling AFS.
This report is for the information of shareholders of The Bond Fund of America, but it also may be used as sales literature when preceded or accompanied by the current prospectus or summary prospectus, which gives details about charges, expenses, investment objectives and operating policies of the fund. If used as sales material after September 30, 2013, this report must be accompanied by an American Funds statistical update for the most recently completed calendar quarter.
Since 1931, American Funds, part of Capital Group, has helped investors pursue long-term investment success. Our consistent approach — in combination with The Capital SystemSM — has resulted in a superior long-term track record.
Not applicable for filing of semi-annual reports to shareholders.
Not applicable for filing of semi-annual reports to shareholders.
Not applicable for filing of semi-annual reports to shareholders.
Not applicable to this Registrant, insofar as the Registrant is not a listed issuer as defined in Rule 10A-3 under the Securities Exchange Act of 1934.
| Bonds, notes & other debt instruments 96.28% | | |
| Corporate bonds, notes & loans 34.04% | | |
| Financials 8.91% | Principal amount | Value |
| Diversified financials 3.00% | (000) | (000) |
| | | |
| Bank of America Corp., Series L, 3.625% 2016 | $ 9,700 | $10,138 |
| Bank of America Corp. 3.75% 2016 | 29,480 | 30,921 |
| Bank of America Corp. 2.00% 2018 | 18,000 | 17,447 |
| Merrill Lynch & Co., Inc. 4.625% 2018 | €4,330 | 5,938 |
| Bank of America Corp. 5.65% 2018 | $ 8,205 | 9,122 |
| Bank of America Corp. 7.625% 2019 | 8,205 | 9,869 |
| Bank of America Corp. 5.625% 2020 | 10,500 | 11,572 |
| Bank of America Corp. 5.00% 2021 | 5,000 | 5,337 |
| Bank of America Corp. 5.875% 2021 | 13,110 | 14,771 |
| Bank of America Corp. 3.30% 2023 | 61,700 | 58,398 |
| JPMorgan Chase & Co. 3.40% 2015 | 17,500 | 18,273 |
| JPMorgan Chase & Co. 1.625% 2018 | 91,730 | 88,007 |
| JPMorgan Chase & Co. 1.80% 2018 | 16,500 | 15,973 |
| JPMorgan Chase & Co. 4.35% 2021 | 2,195 | 2,289 |
| JPMorgan Chase & Co. 4.625% 2021 | 6,500 | 6,879 |
| JPMorgan Chase & Co. 3.20% 2023 | 21,665 | 20,596 |
| JPMorgan Chase & Co., Series Q, junior subordinated 5.15% (undated)1 | 3,575 | 3,423 |
| Goldman Sachs Group, Inc. 3.625% 2016 | 27,625 | 28,851 |
| Murray Street Investment Trust I 4.647% 2017 | 6,120 | 6,483 |
| Goldman Sachs Group, Inc. 1.476% 20181 | 17,415 | 17,274 |
| Goldman Sachs Group, Inc. 2.375% 2018 | 12,790 | 12,567 |
| Goldman Sachs Group, Inc. 7.50% 2019 | 4,045 | 4,807 |
| Goldman Sachs Group, Inc. 5.25% 2021 | 6,000 | 6,427 |
| Goldman Sachs Group, Inc. 5.75% 2022 | 5,000 | 5,522 |
| Goldman Sachs Group, Inc. 3.625% 2023 | 66,110 | 63,341 |
| Goldman Sachs Group, Inc. 6.25% 2041 | 7,470 | 8,486 |
| Morgan Stanley, Series F, 2.875% 2014 | 14,750 | 14,905 |
| Morgan Stanley 1.75% 2016 | 13,500 | 13,381 |
| Morgan Stanley 3.80% 2016 | 8,850 | 9,209 |
| Morgan Stanley 2.125% 2018 | 72,935 | 69,854 |
| Morgan Stanley, Series F, 5.625% 2019 | 30,875 | 33,215 |
| Morgan Stanley 3.75% 2023 | 3,600 | 3,447 |
| Morgan Stanley 6.375% 2042 | 900 | 1,009 |
| Citigroup Inc. 4.587% 2015 | 18,750 | 20,033 |
| Citigroup Inc. 4.75% 2015 | 21,500 | 22,746 |
| Citigroup Inc. 1.30% 2016 | 2,000 | 1,977 |
| Citigroup Inc. 3.953% 2016 | 8,300 | 8,754 |
| Citigroup Inc. 4.45% 2017 | 4,000 | 4,285 |
| Citigroup Inc. 6.125% 2017 | 7,000 | 7,961 |
| Citigroup Inc. 1.75% 2018 | 15,120 | 14,470 |
| Citigroup Inc. 8.50% 2019 | 10,695 | 13,487 |
| Citigroup Inc. 3.375% 2023 | 11,500 | 11,017 |
| American Express Credit Co. 1.75% 2015 | 14,500 | 14,702 |
| American Express Co. 6.15% 2017 | 150 | 174 |
| Bonds, notes & other debt instruments | | |
| | Principal amount | Value |
| Financials — Diversified financials (continued) | (000) | (000) |
| | | |
| American Express Co. 0.863% 20181 | $12,500 | $ 12,499 |
| American Express Co. 1.55% 2018 | 19,700 | 19,140 |
| UBS AG 2.25% 2014 | 14,500 | 14,641 |
| UBS AG 5.75% 2018 | 2,245 | 2,596 |
| UBS AG 4.875% 2020 | 16,067 | 17,760 |
| UBS AG 7.50% 2025 | 800 | 961 |
| Lazard Group LLC 7.125% 2015 | 16,500 | 17,923 |
| Bank of New York Mellon Corp., Series G, 2.50% 2016 | 16,000 | 16,560 |
| iStar Financial Inc., 3.875% 2016 | 2,300 | 2,214 |
| iStar Financial Inc., Term Loan B, 4.50% 20171,2,3 | 3,746 | 3,797 |
| iStar Financial Inc., Series B, 9.00% 2017 | 7,635 | 8,551 |
| iStar Financial Inc., 4.875% 2018 | 250 | 236 |
| Northern Trust Corp. 4.625% 2014 | 8,475 | 8,768 |
| Northern Trust Corp. 5.85% 2017 | 3,750 | 4,270 |
| International Lease Finance Corp. 4.875% 2015 | 9,515 | 9,705 |
| Springleaf Finance Corp., Term Loan B, 5.50% 20171,2,3 | 9,350 | 9,375 |
| Discover Financial Services 2.00% 2018 | 6,200 | 6,005 |
| Jefferies Group, Inc. 6.50% 2043 | 4,200 | 4,038 |
| Franklin Resources, Inc. 1.375% 2017 | 2,700 | 2,621 |
| Franklin Resources, Inc. 2.80% 2022 | 1,300 | 1,223 |
| NASDAQ OMX Group, Inc. 5.25% 2018 | 2,750 | 2,954 |
| | | 913,174 |
| | | |
| Real estate 2.65% | | |
| | | |
| Westfield Capital Corp. Ltd., WT Finance (Australia) Pty Ltd. and WEA Finance LLC 5.125% 20144 | 5,000 | 5,318 |
| Westfield Group 7.50% 20144 | 16,670 | 17,711 |
| Westfield Group 5.75% 20154 | 35,300 | 38,582 |
| Westfield Group 5.70% 20164 | 9,195 | 10,281 |
| Westfield Group 7.125% 20184 | 16,725 | 19,862 |
| Westfield Group 6.75% 20194 | 10,750 | 12,707 |
| Westfield Group 4.625% 20214 | 13,955 | 14,739 |
| Westfield Group 3.375% 20224 | 18,290 | 17,263 |
| Prologis, Inc. 5.75% 2016 | 9,300 | 10,215 |
| Prologis, Inc. 6.125% 2016 | 5,690 | 6,415 |
| Prologis, Inc. 6.25% 2017 | 6,115 | 6,836 |
| Prologis, Inc. 6.625% 2018 | 47,517 | 54,731 |
| Prologis, Inc. 6.625% 2019 | 3,740 | 4,314 |
| Prologis, Inc. 7.375% 2019 | 16,237 | 19,557 |
| Prologis, Inc. 6.875% 2020 | 26,860 | 31,196 |
| Hospitality Properties Trust 7.875% 2014 | 3,060 | 3,182 |
| Hospitality Properties Trust 5.125% 2015 | 9,925 | 10,280 |
| Hospitality Properties Trust 6.30% 2016 | 29,368 | 31,949 |
| Hospitality Properties Trust 5.625% 2017 | 1,195 | 1,291 |
| Hospitality Properties Trust 6.70% 2018 | 30,450 | 33,908 |
| Hospitality Properties Trust 5.00% 2022 | 5,375 | 5,371 |
| Hospitality Properties Trust 4.50% 2023 | 13,570 | 13,124 |
| Kimco Realty Corp., Series C, 4.82% 2014 | 17,200 | 17,797 |
| Kimco Realty Corp., Series C, 4.904% 2015 | 1,770 | 1,869 |
| Kimco Realty Corp., Series C, 5.783% 2016 | 14,000 | 15,473 |
| Kimco Realty Corp. 5.70% 2017 | 28,450 | 31,812 |
| Kimco Realty Corp. 4.30% 2018 | 13,935 | 14,985 |
| Kimco Realty Corp. 6.875% 2019 | 5,440 | 6,582 |
| Kimco Realty Corp. 3.125% 2023 | 1,750 | 1,621 |
| Bonds, notes & other debt instruments | | |
| | Principal amount | Value |
| Financials — Real estate (continued) | (000) | (000) |
| | | |
| Developers Diversified Realty Corp. 5.50% 2015 | $16,838 | $ 18,024 |
| Developers Diversified Realty Corp. 9.625% 2016 | 9,960 | 11,866 |
| Developers Diversified Realty Corp. 7.50% 2017 | 15,356 | 17,817 |
| Developers Diversified Realty Corp. 4.75% 2018 | 1,225 | 1,317 |
| Developers Diversified Realty Corp. 7.875% 2020 | 6,697 | 8,177 |
| Simon Property Group, LP 6.75% 2014 | 9,100 | 9,431 |
| Simon Property Group, LP 4.20% 2015 | 2,430 | 2,532 |
| Simon Property Group, LP 5.875% 2017 | 8,000 | 9,033 |
| Simon Property Group, LP 1.50% 20184 | 9,505 | 9,162 |
| Simon Property Group, LP 6.125% 2018 | 10,000 | 11,757 |
| Simon Property Group, LP 10.35% 2019 | 8,995 | 12,467 |
| Realogy Corp., Letter of Credit, 4.50% 20161,2,3 | 29 | 29 |
| Realogy Corp. 7.875% 20194 | 23,406 | 24,810 |
| Realogy Corp., Term Loan B, 4.50% 20201,2,3 | 9,245 | 9,297 |
| Realogy Corp. 9.00% 20204 | 12,515 | 14,017 |
| Goodman Funding Pty Ltd. 6.375% 20204 | 8,425 | 9,441 |
| Goodman Funding Pty Ltd. 6.00% 20224 | 25,785 | 28,575 |
| ERP Operating LP 6.584% 2015 | 10,000 | 10,982 |
| ERP Operating LP 7.125% 2017 | 5,595 | 6,492 |
| ERP Operating LP 4.625% 2021 | 9,480 | 10,054 |
| ERP Operating LP 3.00% 2023 | 11,025 | 10,147 |
| American Campus Communities, Inc. 3.75% 2023 | 19,110 | 18,364 |
| Alexandria Real Estate Equities, Inc. 3.90% 2023 | 15,395 | 14,719 |
| UDR, Inc., Series A, 5.25% 2015 | 12,780 | 13,489 |
| AvalonBay Communities, Inc. 2.85% 2023 | 11,985 | 10,921 |
| Corporate Office Properties Trust 3.60% 20234 | 10,674 | 9,866 |
| American Tower Corp. 4.625% 2015 | 7,000 | 7,400 |
| American Tower Corp. 5.90% 2021 | 2,000 | 2,228 |
| Mack-Cali Realty Corp. 2.50% 2017 | 1,045 | 1,028 |
| Mack-Cali Realty Corp. 3.15% 2023 | 7,540 | 6,741 |
| Weingarten Realty Investors, Series A, 4.857% 2014 | 6,080 | 6,197 |
| Essex Portfolio L.P. 3.25% 2023 | 6,185 | 5,706 |
| Crescent Resources 10.25% 20174 | 4,700 | 4,865 |
| Piedmont Operating Partnership LP 3.40% 20234 | 5,300 | 4,833 |
| Ryman Hospitality Properties, Inc. 5.00% 20214 | 3,025 | 2,949 |
| Brandywine Operating Partnership, LP 5.40% 2014 | 2,000 | 2,107 |
| Brandywine Operating Partnership, LP 5.70% 2017 | 25 | 27 |
| Brandywine Operating Partnership, LP 3.95% 2023 | 100 | 94 |
| FelCor Lodging Trust Inc. 5.625% 2023 | 915 | 892 |
| | | 806,824 |
| | | |
| Banks 2.04% | | |
| | | |
| HSBC Finance Corp. 0.705% 20161 | 8,679 | 8,611 |
| HSBC Bank PLC 1.50% 20184 | 29,225 | 28,186 |
| HSBC Holdings PLC 4.125% 20204 | 9,453 | 9,912 |
| HSBC Holdings PLC 4.875% 2020 | 20,125 | 21,582 |
| HSBC Holdings PLC 4.00% 2022 | 11,810 | 12,107 |
| PNC Funding Corp. 5.40% 2014 | 10,000 | 10,436 |
| PNC Financial Services Group, Inc. 2.854% 2022 | 43,639 | 39,864 |
| PNC Preferred Funding Trust I, junior subordinated 1.923% (undated)1,4 | 12,700 | 10,573 |
| BNP Paribas 3.60% 2016 | 14,000 | 14,674 |
| BNP Paribas 5.00% 2021 | 21,225 | 22,593 |
| BNP Paribas 3.25% 2023 | 18,535 | 17,063 |
| Bonds, notes & other debt instruments | | |
| | Principal amount | Value |
| Financials — Banks (continued) | (000) | (000) |
| | | |
| BNP Paribas, junior subordinated 7.195% (undated)1,4 | $ 3,000 | $ 2,918 |
| Standard Chartered PLC 3.85% 20154 | 19,327 | 20,170 |
| Standard Chartered PLC 3.20% 20164 | 26,136 | 27,360 |
| Standard Chartered Bank 3.95% 20234 | 6,820 | 6,353 |
| Wells Fargo & Co. 3.676% 2016 | 14,000 | 14,966 |
| Wells Fargo & Co. 0.906% 20181 | 11,100 | 11,056 |
| Wells Fargo & Co. 1.50% 2018 | 14,650 | 14,299 |
| Wells Fargo & Co., Series I, 3.50% 2022 | 5,200 | 5,266 |
| Royal Bank of Scotland PLC 3.40% 2013 | 12,325 | 12,366 |
| Royal Bank of Scotland PLC 3.95% 2015 | 15,000 | 15,673 |
| Royal Bank of Scotland Group PLC 4.375% 2016 | 7,500 | 7,943 |
| Royal Bank of Scotland PLC 5.625% 2020 | 8,435 | 9,158 |
| Nordea Bank, Series 2, 3.70% 20144 | 8,000 | 8,297 |
| Nordea Bank AB 3.125% 20174 | 12,500 | 12,871 |
| Nordea Bank AB 1.625% 20184 | 13,100 | 12,678 |
| Barclays Bank PLC 5.125% 2020 | 18,125 | 20,071 |
| Barclays Bank PLC 6.00% 2021 | €4,000 | 5,637 |
| Regions Financial Corp. 7.75% 2014 | $ 6,726 | 7,270 |
| Regions Financial Corp. 5.20% 2015 | 590 | 612 |
| Regions Financial Corp. 5.75% 2015 | 7,287 | 7,864 |
| Regions Financial Corp. 2.00% 2018 | 5,850 | 5,534 |
| CIT Group Inc., Series C, 4.75% 20154 | 9,250 | 9,423 |
| CIT Group Inc. 4.25% 2017 | 1,400 | 1,412 |
| CIT Group Inc. 5.00% 2017 | 9,750 | 10,006 |
| UniCredito Italiano SpA 6.00% 20174 | 19,483 | 19,891 |
| ANZ National (International) Ltd. 3.125% 20154 | 16,500 | 17,163 |
| Westpac Banking Corp. 3.00% 2015 | 14,400 | 15,075 |
| Sovereign Bancorp, Inc. 8.75% 2018 | 1,880 | 2,251 |
| Santander Issuances, SA Unipersonal 6.50% 20191,4 | 11,600 | 11,542 |
| US Bancorp., Series T, 1.65% 2017 | 13,000 | 12,968 |
| Svenska Handelsbanken AB 1.625% 2018 | 12,500 | 12,218 |
| Korea Development Bank 8.00% 2014 | 10,265 | 10,637 |
| VEB Finance Ltd. 6.902% 20204 | 9,100 | 10,021 |
| VEB Finance Ltd. 6.80% 20254 | 500 | 535 |
| Banco del Estado de Chile 4.125% 20204 | 10,000 | 10,033 |
| Royal Bank of Canada 1.50% 2018 | 8,830 | 8,633 |
| BBVA Bancomer SA 4.50% 20164 | 3,225 | 3,362 |
| BBVA Bancomer SA, junior subordinated 7.25% 20204 | 2,430 | 2,661 |
| BBVA Bancomer SA 6.50% 20214 | 2,355 | 2,484 |
| Banco de Crédito del Perú 5.375% 20204 | 7,000 | 7,227 |
| HSBK (Europe) BV 7.25% 20214 | 6,710 | 6,799 |
| Bank of India 3.625% 20184 | 5,000 | 4,803 |
| Intesa Sanpaolo SpA 6.50% 20214 | 4,500 | 4,537 |
| HBOS PLC 4.375% 20191 | €2,870 | 3,638 |
| Development Bank of Kazakhstan 5.50% 20154 | $ 2,735 | 2,872 |
| BB&T Corp., 2.05% 2018 | 2,350 | 2,318 |
| Eole Finance SPC, 2.341% 20242,4 | 2,155 | 2,150 |
| | | 618,622 |
| | | |
| Insurance 0.93% | | |
| | | |
| Berkshire Hathaway Inc. 2.20% 2016 | 14,000 | 14,464 |
| Berkshire Hathaway Finance Corp. 1.30% 2018 | 7,115 | 6,886 |
| Berkshire Hathaway Inc. 1.55% 2018 | 5,000 | 4,902 |
| Bonds, notes & other debt instruments | | |
| | Principal amount | Value |
| Financials — Insurance (continued) | (000) | (000) |
| | | |
| Berkshire Hathaway Inc. 3.00% 2022 | $13,175 | $ 12,764 |
| Berkshire Hathaway Inc. 3.00% 2023 | 2,500 | 2,411 |
| Berkshire Hathaway Inc. 4.40% 2042 | 3,000 | 2,783 |
| ACE INA Holdings Inc. 5.875% 2014 | 17,445 | 18,274 |
| ACE INA Holdings Inc. 2.60% 2015 | 19,990 | 20,756 |
| ACE INA Holdings Inc. 2.70% 2023 | 3,000 | 2,796 |
| American International Group, Inc. 4.875% 2016 | 5,000 | 5,480 |
| American International Group, Inc. 3.80% 2017 | 28,250 | 29,632 |
| American International Group, Inc. 4.875% 2022 | 5,000 | 5,336 |
| QBE Insurance Group Ltd. 2.40% 20184 | 21,565 | 21,157 |
| CNA Financial Corp. 5.85% 2014 | 4,500 | 4,788 |
| CNA Financial Corp. 6.50% 2016 | 8,000 | 9,068 |
| CNA Financial Corp. 7.35% 2019 | 2,770 | 3,357 |
| CNA Financial Corp. 5.875% 2020 | 1,250 | 1,416 |
| CNA Financial Corp. 7.25% 2023 | 2,000 | 2,389 |
| Prudential Financial, Inc. 4.50% 2021 | 3,000 | 3,164 |
| Prudential Holdings, LLC, Series C, 8.695% 20232,4 | 14,150 | 17,572 |
| Monumental Global Funding III 5.25% 20144 | 20,000 | 20,503 |
| MetLife Global Funding I 2.50% 20154 | 17,000 | 17,593 |
| RSA Insurance Group PLC 9.375% 20391 | £3,765 | 7,096 |
| RSA Insurance Group PLC 8.50% (undated)1 | 2,429 | 3,860 |
| AXA SA 8.60% 2030 | $4,615 | 5,596 |
| AXA SA, Series B, junior subordinated 6.379% (undated)1,4 | 5,065 | 4,951 |
| UnumProvident Finance Co. PLC 6.85% 20154 | 2,400 | 2,675 |
| Unum Group 7.125% 2016 | 6,500 | 7,522 |
| Liberty Mutual Group Inc. 6.70% 20164 | 6,250 | 7,113 |
| Liberty Mutual Group Inc. 4.25% 20234 | 1,705 | 1,650 |
| Allstate Corp. 3.15% 2023 | 5,775 | 5,615 |
| Allstate Corp. 4.50% 2043 | 3,000 | 2,973 |
| Assicurazioni Generali SpA 10.125% 2042 | €2,500 | 3,924 |
| GE Global Insurance Holding Corporation 6.45% 2019 | $ 1,000 | 1,183 |
| Loews Corp. 6.00% 2035 | 225 | 250 |
| | | 281,899 |
| | | |
| Automobiles & components 0.29% | | |
| | | |
| Ford Motor Credit Co. 1.70% 2016 | 10,500 | 10,334 |
| Ford Motor Credit Co. 2.50% 2016 | 13,250 | 13,372 |
| Ford Motor Credit Co. 2.375% 2018 | 38,450 | 37,048 |
| Toyota Motor Credit Corp. 1.375% 2013 | 16,500 | 16,520 |
| Toyota Motor Credit Corp. 0.875% 2015 | 11,000 | 11,043 |
| | | 88,317 |
| | | |
| Energy 4.61% | | |
| | | |
| Kinder Morgan Energy Partners, LP 5.125% 2014 | 14,410 | 15,228 |
| Kinder Morgan Energy Partners, LP 5.625% 2015 | 12,600 | 13,514 |
| Kinder Morgan Energy Partners, LP 3.50% 2016 | 1,700 | 1,792 |
| Kinder Morgan Energy Partners, LP 6.00% 2017 | 17,000 | 19,157 |
| Kinder Morgan Energy Partners, LP 9.00% 2019 | 4,395 | 5,619 |
| Kinder Morgan Energy Partners, LP 5.30% 2020 | 2,750 | 3,057 |
| Kinder Morgan Energy Partners, LP 6.85% 2020 | 21,335 | 25,425 |
| Kinder Morgan Energy Partners, LP 3.95% 2022 | 6,000 | 5,927 |
| Kinder Morgan Energy Partners, LP 4.15% 2022 | 5,000 | 5,032 |
| Kinder Morgan Energy Partners, LP 3.45% 2023 | 4,500 | 4,231 |
| Bonds, notes & other debt instruments | | |
| | Principal amount | Value |
| Energy (continued) | (000) | (000) |
| | | |
| Kinder Morgan Energy Partners, LP 3.50% 2023 | $20,060 | $18,827 |
| Kinder Morgan Energy Partners, LP 6.95% 2038 | 4,250 | 5,045 |
| Kinder Morgan Energy Partners, LP 6.55% 2040 | 2,000 | 2,274 |
| Kinder Morgan Energy Partners, LP 5.00% 2042 | 3,000 | 2,844 |
| StatoilHydro ASA 2.90% 2014 | 15,360 | 15,806 |
| Statoil ASA 3.125% 2017 | 26,500 | 27,980 |
| Statoil ASA 0.565% 20181 | 15,370 | 15,396 |
| StatoilHydro ASA 1.20% 2018 | 8,880 | 8,643 |
| Statoil ASA 3.15% 2022 | 19,950 | 19,757 |
| StatoilHydro ASA 2.45% 2023 | 10,950 | 10,159 |
| Enbridge Energy Partners, LP, Series B, 6.50% 2018 | 25,120 | 29,196 |
| Enbridge Energy Partners, LP 9.875% 2019 | 27,005 | 35,295 |
| Enbridge Energy Partners, LP 5.20% 2020 | 1,500 | 1,636 |
| Enbridge Energy Partners, LP 4.20% 2021 | 8,250 | 8,398 |
| Enbridge Energy Partners, LP, Series B, 7.50% 2038 | 7,450 | 9,041 |
| Enbridge Energy Partners, LP 5.50% 2040 | 3,500 | 3,392 |
| Enbridge Energy Partners, LP, junior subordinated 8.05% 20771 | 1,100 | 1,252 |
| Total Capital SA 3.00% 2015 | 17,000 | 17,771 |
| Total Capital International 1.55% 2017 | 13,140 | 13,031 |
| Total Capital Canada Ltd. 1.45% 2018 | 7,520 | 7,351 |
| Total Capital International 2.875% 2022 | 28,560 | 27,487 |
| Total Capital International 2.70% 2023 | 14,825 | 13,890 |
| Total Capital Canada Ltd. 2.75% 2023 | 4,745 | 4,443 |
| Transocean Inc. 5.05% 2016 | 19,250 | 20,946 |
| Transocean Inc. 2.50% 2017 | 10,880 | 10,759 |
| Transocean Inc. 6.375% 2021 | 25,995 | 29,251 |
| Transocean Inc. 3.80% 2022 | 16,370 | 15,614 |
| Chevron Corp. 1.104% 2017 | 1,900 | 1,858 |
| Chevron Corp. 1.718% 2018 | 9,610 | 9,529 |
| Chevron Corp. 2.355% 2022 | 26,090 | 24,572 |
| Chevron Corp. 3.191% 2023 | 35,190 | 35,072 |
| Anadarko Petroleum Corp. 5.95% 2016 | 21,205 | 23,799 |
| Anadarko Petroleum Corp. 6.375% 2017 | 21,750 | 25,028 |
| Anadarko Petroleum Corp. 8.70% 2019 | 8,745 | 11,266 |
| Anadarko Petroleum Corp. 6.20% 2040 | 1,750 | 1,972 |
| Devon Energy Corp. 1.875% 2017 | 6,405 | 6,322 |
| Devon Energy Corp. 3.25% 2022 | 52,575 | 50,990 |
| Devon Energy Corp. 4.75% 2042 | 1,000 | 938 |
| Shell International Finance BV 3.10% 2015 | 10,000 | 10,484 |
| Shell International Finance BV 1.125% 2017 | 34,650 | 33,918 |
| Shell International Finance BV 2.25% 2023 | 2,455 | 2,255 |
| Shell International Finance BV 3.625% 2042 | 10,880 | 9,658 |
| Gazprom OJSC 5.092% 2015 | 16,500 | 17,449 |
| Gazprom OJSC 5.092% 20154 | 6,125 | 6,477 |
| Gaz Capital SA, Series 7, 6.212% 2016 | 5,300 | 5,748 |
| Gazprom OJSC 3.85% 20204 | 3,750 | 3,590 |
| Gazprom OJSC 6.51% 20224 | 14,500 | 15,406 |
| Gazprom OJSC, Series 9, 6.51% 2022 | 5,000 | 5,313 |
| Enterprise Products Operating LLC 5.20% 2020 | 4,125 | 4,621 |
| Enterprise Products Operating LLC 4.05% 2022 | 8,300 | 8,493 |
| Enterprise Products Operating LLC 3.35% 2023 | 28,250 | 27,224 |
| Enterprise Products Operating LLC 4.85% 2042 | 7,500 | 7,103 |
| Enterprise Products Operating LLC 4.85% 2044 | 2,400 | 2,288 |
| Bonds, notes & other debt instruments | | |
| | Principal amount | Value |
| Energy (continued) | (000) | (000) |
| | | |
| Pemex Finance Ltd., Series 1999-2, Class A-3, 10.61% 20172 | $11,700 | $13,881 |
| Pemex Project Funding Master Trust 5.75% 2018 | 3,150 | 3,465 |
| Petróleos Mexicanos 5.50% 2021 | 4,075 | 4,360 |
| Petróleos Mexicanos 4.875% 2022 | 4,290 | 4,386 |
| Pemex Project Funding Master Trust, Series 13, 6.625% 2035 | 11,750 | 12,396 |
| Petróleos Mexicanos 6.50% 2041 | 4,150 | 4,306 |
| Petróleos Mexicanos 5.50% 20444 | 1,000 | 903 |
| BG Energy Capital PLC 2.50% 20154 | 7,200 | 7,441 |
| BG Energy Capital PLC 2.875% 20164 | 22,045 | 23,088 |
| BG Energy Capital PLC 4.00% 20214 | 9,930 | 10,334 |
| Petrobras Global Finance Co. 3.00% 2019 | 4,250 | 3,957 |
| Petrobras International Finance Co. 5.375% 2021 | 19,220 | 19,397 |
| Petrobras Global Finance Co. 4.375% 2023 | 6,540 | 6,061 |
| Petrobras International Finance Co. 6.875% 2040 | 6,970 | 7,112 |
| Petrobras International Finance Co. 6.75% 2041 | 500 | 502 |
| Petrobras Global Finance Co. 5.625% 2043 | 1,060 | 926 |
| Williams Partners L.P. and Williams Partners Finance Corp. 3.80% 2015 | 15,800 | 16,478 |
| Williams Partners L.P. and Williams Partners Finance Corp. 5.25% 2020 | 11,625 | 12,506 |
| Williams Partners L.P. 3.35% 2022 | 6,500 | 5,978 |
| Cenovus Energy Inc. 3.00% 2022 | 28,310 | 26,976 |
| Cenovus Energy Inc. 6.75% 2039 | 1,750 | 2,107 |
| QGOG Atlantic/Alaskan Rigs Ltd. 5.25% 20192,4 | 25,584 | 26,223 |
| Apache Corp. 2.625% 2023 | 19,845 | 18,324 |
| Apache Corp. 4.25% 2044 | 7,260 | 6,511 |
| Enbridge Inc. 5.80% 2014 | 1,200 | 1,260 |
| Enbridge Inc. 5.60% 2017 | 19,200 | 21,536 |
| Reliance Holdings Ltd. 4.50% 20204 | 6,350 | 6,252 |
| Reliance Holdings Ltd. 5.40% 20224 | 6,350 | 6,459 |
| Reliance Holdings Ltd. 6.25% 20404 | 10,000 | 10,005 |
| El Paso Pipeline Partners Operating Co., LLC 5.00% 2021 | 12,500 | 13,467 |
| El Paso Pipeline Partners Operating Co., LLC 4.70% 2042 | 8,500 | 7,580 |
| Energy Transfer Partners, L.P. 5.20% 2022 | 4,500 | 4,768 |
| Energy Transfer Partners, L.P. 3.60% 2023 | 11,255 | 10,548 |
| Energy Transfer Partners, L.P. 6.50% 2042 | 665 | 712 |
| Energy Transfer Partners, L.P. 5.15% 2043 | 5,250 | 4,794 |
| Ras Laffan Liquefied Natural Gas III 5.50% 2014 | 3,335 | 3,498 |
| Ras Laffan Liquefied Natural Gas III 5.50% 20144 | 330 | 346 |
| Ras Laffan Liquefied Natural Gas III 5.832% 20162 | 1,163 | 1,239 |
| Ras Laffan Liquefied Natural Gas II 5.298% 20202,4 | 11,895 | 12,847 |
| Ras Laffan Liquefied Natural Gas III 6.332% 20272 | 2,000 | 2,349 |
| Husky Energy Inc. 6.20% 2017 | 12,830 | 14,587 |
| Korea National Oil Corp. 4.00% 20164 | 6,850 | 7,277 |
| Harvest Operations Corp. 2.125% 20184 | 7,400 | 7,036 |
| Western Gas Partners LP 4.00% 2022 | 14,445 | 14,040 |
| NGPL PipeCo LLC 7.119% 20174 | 1,950 | 1,901 |
| NGPL PipeCo LLC 9.625% 20194 | 11,435 | 11,892 |
| TransCanada PipeLines Ltd. 6.50% 2018 | 7,500 | 9,018 |
| TransCanada PipeLines Ltd. 7.125% 2019 | 3,040 | 3,710 |
| TransCanada PipeLines Ltd., junior subordinated 6.35% 20671 | 1,000 | 1,043 |
| Alpha Natural Resources, Inc. 9.75% 2018 | 7,415 | 7,183 |
| Alpha Natural Resources, Inc. 6.00% 2019 | 3,140 | 2,567 |
| Alpha Natural Resources, Inc. 6.25% 2021 | 2,700 | 2,167 |
| Marathon Oil Corp. 0.90% 2015 | 11,000 | 10,944 |
| Bonds, notes & other debt instruments | | |
| | Principal amount | Value |
| Energy (continued) | (000) | (000) |
| | | |
| ConocoPhillips 1.05% 2017 | $11,000 | $ 10,623 |
| Peabody Energy Corp. 6.00% 2018 | 8,410 | 8,463 |
| Peabody Energy Corp. 6.25% 2021 | 1,675 | 1,625 |
| Woodside Finance Ltd. 4.60% 20214 | 9,565 | 10,073 |
| CONSOL Energy Inc. 8.00% 2017 | 1,945 | 2,057 |
| CONSOL Energy Inc. 8.25% 2020 | 7,430 | 7,820 |
| QGOG Constellation S.A. 6.25% 20194 | 9,800 | 9,629 |
| Spectra Energy Partners, LP 2.95% 2016 | 6,375 | 6,539 |
| Spectra Energy Partners 4.60% 2021 | 2,185 | 2,229 |
| Arch Coal, Inc. 7.00% 2019 | 3,245 | 2,718 |
| Arch Coal, Inc. 7.25% 2021 | 7,025 | 5,831 |
| Transportadora de Gas Peru SA 4.25% 20284 | 8,050 | 7,165 |
| Canadian Natural Resources Ltd. 3.45% 2021 | 6,185 | 6,189 |
| Sabine Pass Liquefaction, LLC 5.625% 20214 | 6,350 | 6,175 |
| CNOOC Finance (2013) Ltd. 3.00% 2023 | 6,800 | 6,152 |
| Regency Energy Partners LP and Regency Energy Finance Corp. 6.50% 2021 | 3,875 | 4,069 |
| Regency Energy Partners LP and Regency Energy Finance Corp. 5.50% 2023 | 2,050 | 2,030 |
| Odebrecht Drilling Norbe VIII/IX Ltd 6.35% 20212,4 | 5,562 | 5,646 |
| Teekay Corp. 8.50% 2020 | 5,125 | 5,599 |
| Energy Transfer Partners, L.P. 7.50% 2020 | 5,000 | 5,488 |
| PDC Energy Inc. 7.75% 20224 | 4,725 | 4,902 |
| Phillips 66 5.875% 2042 | 4,410 | 4,884 |
| Denbury Resources Inc. 4.625% 2023 | 2,725 | 2,517 |
| Laredo Petroleum, Inc. 9.50% 2019 | 1,950 | 2,155 |
| MarkWest Energy Partners, LP 5.50% 2023 | 2,050 | 2,030 |
| Access Midstream Partners, L.P. 4.875% 2023 | 2,150 | 2,005 |
| Transportadora de Gas Internacional 5.70% 20224 | 1,250 | 1,297 |
| Bonanza Creek Energy, Inc. 6.75% 20214 | 1,050 | 1,063 |
| Samson Investment Co., 2nd Lien Term Loan B, 6.00% 20181,2,3 | 300 | 300 |
| | | 1,401,755 |
| | | |
| Health care 3.53% | | |
| Pharmaceuticals, biotechnology & life sciences 1.92% | | |
| | | |
| AbbVie Inc. 1.75% 20174 | 34,440 | 33,765 |
| AbbVie Inc. 2.90% 20224 | 61,595 | 57,682 |
| AbbVie Inc. 4.40% 20424 | 29,475 | 27,518 |
| Amgen Inc. 2.50% 2016 | 27,200 | 28,122 |
| Amgen Inc. 2.125% 2017 | 22,567 | 22,675 |
| Amgen Inc. 3.625% 2022 | 7,330 | 7,338 |
| Amgen Inc. 5.15% 2041 | 1,500 | 1,501 |
| Amgen Inc. 5.375% 2043 | 9,055 | 9,410 |
| Gilead Sciences, Inc. 2.40% 2014 | 7,215 | 7,377 |
| Gilead Sciences, Inc. 3.05% 2016 | 14,765 | 15,617 |
| Gilead Sciences, Inc. 4.40% 2021 | 30,510 | 32,802 |
| Gilead Sciences, Inc. 5.65% 2041 | 8,905 | 9,951 |
| Roche Holdings, Inc. 6.00% 20194 | 33,270 | 39,903 |
| Roche Holdings, Inc. 7.00% 20394 | 15,560 | 21,148 |
| Schering-Plough Corp. 5.30% 20131 | 6,000 | 6,119 |
| Schering-Plough Corp. 6.00% 2017 | 5,300 | 6,190 |
| Merck & Co., Inc. 1.10% 2018 | 5,830 | 5,620 |
| Merck & Co., Inc. 2.80% 2023 | 24,590 | 23,300 |
| Merck & Co., Inc. 4.15% 2043 | 4,750 | 4,550 |
| GlaxoSmithKline Capital Inc. 1.50% 2017 | 10,500 | 10,435 |
| Bonds, notes & other debt instruments | | |
| | Principal amount | Value |
| Health care — Pharmaceuticals, biotechnology & life sciences (continued) | (000) | (000) |
| | | |
| GlaxoSmithKline Capital Inc. 5.65% 2018 | $15,000 | $ 17,409 |
| GlaxoSmithKline Capital Inc. 2.80% 2023 | 2,900 | 2,764 |
| GlaxoSmithKline Capital Inc. 6.375% 2038 | 5,600 | 6,868 |
| GlaxoSmithKline Capital Inc. 4.20% 2043 | 4,250 | 4,005 |
| inVentiv Health Inc. 9.00% 20184 | 12,725 | 13,329 |
| inVentiv Health Inc. 10.75% 20184 | 19,255 | 16,174 |
| inVentiv Health Inc. 11.00% 20184 | 7,655 | 6,430 |
| Novartis Capital Corp. 4.125% 2014 | 11,025 | 11,268 |
| Novartis Securities Investment Ltd. 5.125% 2019 | 11,280 | 12,993 |
| Novartis Capital Corp. 2.40% 2022 | 7,250 | 6,823 |
| VPI Escrow Corp. 6.375% 20204 | 10,455 | 10,390 |
| VPI Escrow Corp. 7.50% 20214 | 11,800 | 12,228 |
| Biogen Idec Inc. 6.875% 2018 | 17,000 | 20,231 |
| Quintiles, Term Loan B-2, 4.50% 20181,2,3 | 14,763 | 14,843 |
| Pfizer Inc. 6.20% 2019 | 10,000 | 12,068 |
| Teva Pharmaceutical Financial IV LLC, 2.25% 2020 | 2,390 | 2,289 |
| Teve Pharmaceutical Finance Company BV, 2.95% 2022 | 9,350 | 8,773 |
| Sanofi 0.586% 20141 | 10,000 | 10,022 |
| Patheon Inc., Term Loan B1, 7.25% 20181,2,3 | 9,542 | 9,637 |
| INC Research LLC 11.50% 20194 | 4,990 | 5,389 |
| Johnson & Johnson 0.365% 20141 | 5,000 | 5,007 |
| Grifols Inc. 8.25% 2018 | 3,350 | 3,618 |
| | | 583,581 |
| | | |
| Equipment & services 1.61% | | |
| | | |
| Express Scripts Inc. 2.75% 2014 | 15,500 | 15,845 |
| Medco Health Solutions, Inc. 2.75% 2015 | 10,310 | 10,605 |
| Express Scripts Inc. 3.125% 2016 | 18,427 | 19,172 |
| Express Scripts Inc. 3.50% 2016 | 3,000 | 3,187 |
| Express Scripts Inc. 2.65% 2017 | 29,335 | 29,888 |
| Express Scripts Inc. 4.75% 2021 | 13,500 | 14,461 |
| Express Scripts Inc. 3.90% 2022 | 37,060 | 37,572 |
| Express Scripts Inc. 6.125% 2041 | 3,000 | 3,481 |
| UnitedHealth Group Inc. 0.85% 2015 | 5,525 | 5,535 |
| UnitedHealth Group Inc. 1.40% 2017 | 6,095 | 5,988 |
| UnitedHealth Group Inc. 6.00% 2017 | 19,920 | 22,976 |
| UnitedHealth Group Inc. 1.625% 2019 | 7,800 | 7,546 |
| UnitedHealth Group Inc. 2.75% 2023 | 880 | 820 |
| UnitedHealth Group Inc. 2.875% 2023 | 15,985 | 15,042 |
| UnitedHealth Group Inc. 5.70% 2040 | 1,250 | 1,382 |
| UnitedHealth Group Inc. 3.95% 2042 | 315 | 272 |
| Baxter International Inc. 1.85% 2018 | 11,030 | 10,949 |
| Baxter International Inc. 2.40% 2022 | 2,600 | 2,405 |
| Baxter International Inc. 3.20% 2023 | 33,200 | 32,614 |
| Cardinal Health, Inc. 4.00% 2015 | 3,990 | 4,215 |
| Cardinal Health, Inc. 1.90% 2017 | 3,550 | 3,497 |
| Cardinal Health, Inc. 1.70% 2018 | 4,935 | 4,792 |
| Cardinal Health, Inc. 4.625% 2020 | 6,020 | 6,444 |
| Cardinal Health, Inc. 3.20% 2023 | 16,490 | 15,411 |
| Allegiance Corp. 7.00% 2026 | 7,635 | 9,478 |
| Coventry Health Care, Inc. 6.30% 2014 | 11,395 | 12,048 |
| Aetna Inc. 1.50% 2017 | 10,375 | 10,080 |
| Aetna Inc. 2.75% 2022 | 16,000 | 14,757 |
| Bonds, notes & other debt instruments | | |
| | Principal amount | Value |
| Health care — Equipment & services (continued) | (000) | (000) |
| | | |
| Kinetic Concepts, Inc. 10.50% 2018 | $20,950 | $ 22,626 |
| Kinetic Concepts, Inc. 12.50% 2019 | 9,300 | 9,672 |
| McKesson Corp. 0.95% 2015 | 2,255 | 2,250 |
| McKesson Corp. 3.25% 2016 | 1,580 | 1,667 |
| McKesson Corp. 1.40% 2018 | 8,770 | 8,471 |
| McKesson Corp. 2.70% 2022 | 1,640 | 1,531 |
| McKesson Corp. 2.85% 2023 | 2,925 | 2,758 |
| Catalent Pharma Solutions Inc., Term Loan, 6.50% 20171,2,3 | 3,350 | 3,338 |
| PTS Acquisition Corp. 9.75% 2017 | €8,775 | 11,879 |
| Humana Inc. 3.15% 2022 | $ 9,650 | 8,968 |
| Humana Inc. 4.625% 2042 | 5,350 | 4,818 |
| Boston Scientific Corp. 6.00% 2020 | 10,900 | 12,349 |
| VWR Funding, Inc. 7.25% 2017 | 10,440 | 10,858 |
| DENTSPLY International Inc. 1.775% 20131 | 5,000 | 5,007 |
| DENTSPLY International Inc. 2.75% 2016 | 5,620 | 5,773 |
| Symbion Inc. 8.00% 2016 | 10,050 | 10,502 |
| Select Medical Holdings Corp. 6.375% 20214 | 9,070 | 8,662 |
| Rotech Healthcare Inc. 10.50% 20185 | 12,400 | 6,448 |
| Centene Corp. 5.75% 2017 | 5,265 | 5,541 |
| HCA Inc. 6.50% 2020 | 4,745 | 5,145 |
| Surgical Care Affiliates, Inc. 8.875% 20154 | 3,927 | 3,947 |
| Surgical Care Affiliates, Inc. 10.00% 20174 | 925 | 957 |
| Bausch & Lomb Inc. 9.875% 2015 | 2,811 | 2,902 |
| Bausch & Lomb Inc., Bridge Loan, 6.25% 20181,2,3,6 | 1,400 | 1,402 |
| Dignity Health 3.125% 2022 | 4,100 | 3,783 |
| Apria Healthcare Group Inc., Term Loan B, 6.75% 20201,2,3 | 3,530 | 3,521 |
| Tenet Healthcare Corp. 4.375% 20214 | 480 | 441 |
| Tenet Healthcare Corp. 4.50% 20214 | 1,300 | 1,216 |
| HealthSouth Corp. 5.75% 2024 | 1,455 | 1,422 |
| Catholic Health Initiatives, Series 2012, 1.60% 2017 | 1,250 | 1,225 |
| Multiplan Inc. 9.875% 20184 | 980 | 1,071 |
| | | 490,612 |
| | | |
| Industrials 3.24% | | |
| Capital goods 1.88% | | |
| | | |
| General Electric Co. 0.85% 2015 | 13,000 | 12,993 |
| General Electric Capital Corp. 1.00% 2015 | 10,800 | 10,789 |
| General Electric Capital Corp., Series A, 2.25% 2015 | 19,500 | 19,991 |
| General Electric Capital Corp. 2.95% 2016 | 2,790 | 2,909 |
| General Electric Capital Corp. 1.60% 2017 | 11,000 | 10,746 |
| General Electric Capital Corp. 2.30% 2017 | 14,200 | 14,405 |
| General Electric Corp. 5.25% 2017 | 7,455 | 8,423 |
| General Electric Capital Corp. 0.994% 20181 | 7,818 | 7,860 |
| General Electric Capital Corp. 1.625% 2018 | 13,182 | 12,850 |
| General Electric Capital Corp. 2.10% 2019 | 4,225 | 4,116 |
| General Electric Capital Corp., Series A, 6.00% 2019 | 26,050 | 30,268 |
| General Electric Co. 2.70% 2022 | 18,900 | 17,912 |
| General Electric Capital Corp. 3.10% 2023 | 37,600 | 35,570 |
| General Electric Co. 4.125% 2042 | 4,000 | 3,742 |
| General Electric Capital Corp., Series C, junior subordinated 5.25% (undated)1 | 1,700 | 1,628 |
| Volvo Treasury AB 5.95% 20154 | 56,693 | 60,958 |
| United Technologies Corp. 1.80% 2017 | 4,660 | 4,680 |
| United Technologies Corp. 3.10% 2022 | 15,660 | 15,490 |
| Bonds, notes & other debt instruments | | |
| | Principal amount | Value |
| Industrials — Capital goods (continued) | (000) | (000) |
| | | |
| United Technologies Corp. 4.50% 2042 | $17,195 | $ 17,043 |
| JELD-WEN Escrow Corp. 12.25% 20174 | 25,000 | 28,625 |
| Associated Materials, LLC and AMH New Finance, Inc. 9.125% 2017 | 24,305 | 25,642 |
| Associated Materials, LLC 9.125% 20174 | 260 | 274 |
| Ply Gem Industries, Inc. 9.375% 2017 | 1,980 | 2,104 |
| Ply Gem Industries, Inc. 8.25% 2018 | 22,012 | 23,553 |
| European Aeronautic Defence and Space Company 2.70% 20234 | 22,400 | 21,048 |
| Nortek Inc. 10.00% 2018 | 8,000 | 8,720 |
| Nortek Inc. 8.50% 2021 | 10,645 | 11,443 |
| US Investigations Services, Inc., Term Loan B, 5.00% 20151,2,3 | 521 | 504 |
| US Investigations Services, Inc., Term Loan D, 7.75% 20151,2,3 | 4,929 | 4,892 |
| US Investigations Services, Inc. 10.50% 20154 | 7,200 | 6,516 |
| US Investigations Services, Inc. 11.75% 20164 | 6,610 | 5,321 |
| DAE Aviation Holdings, Inc. 11.25% 20154 | 12,558 | 12,621 |
| DAE Aviation Holdings, Inc. and Standard Aero Ltd., Term Loan B, 6.25% 20181,2,3 | 2,254 | 2,256 |
| DAE Aviation Holdings, Inc., Term Loan B2, 6.25% 20181,2,3 | 1,022 | 1,023 |
| Northrop Grumman Corp. 5.05% 2019 | 14,180 | 15,846 |
| ABB Finance (USA) Inc. 1.625% 2017 | 9,245 | 9,190 |
| ABB Finance (USA) Inc. 2.875% 2022 | 6,750 | 6,476 |
| BAE Systems Holdings Inc. 4.95% 20144 | 13,505 | 13,980 |
| Euramax International, Inc. 9.50% 2016 | 13,010 | 12,522 |
| HD Supply, Inc. 11.50% 2020 | 9,050 | 10,521 |
| Honeywell International Inc. 5.00% 2019 | 8,725 | 9,964 |
| Beechcraft Holdings, LLC., Term Loan, 5.75% 20201,2,3 | 8,585 | 8,601 |
| BE Aerospace, Inc. 5.25% 2022 | 6,135 | 6,135 |
| Builders Firstsource 7.625% 20214 | 5,100 | 4,947 |
| Raytheon Co. 6.75% 2018 | 4,030 | 4,827 |
| Esterline Technologies Corp. 7.00% 2020 | 3,475 | 3,744 |
| Silver II Borrower S.C.A./Silver II U.S. Holdings, LLC 7.75% 20204 | 3,650 | 3,687 |
| Odebrecht Finance Ltd 5.125% 20224 | 265 | 260 |
| Odebrecht Finance Ltd 7.125% 20424 | 3,000 | 2,925 |
| RBS Global, Inc. and Rexnord LLC 8.50% 2018 | 2,650 | 2,829 |
| TransDigm Inc. 5.50% 20204 | 2,700 | 2,565 |
| Safway Group Holding 7.00% 20184 | 2,000 | 1,965 |
| The Boeing Company 0.95% 2018 | 1,410 | 1,350 |
| Precision Castparts Corp. 1.25% 2018 | 1,300 | 1,265 |
| Hawker Beechcraft Acquisition Co., LLC, Letter of Credit, 2.051% 20141,2,3 | 1,637 | 893 |
| Hawker Beechcraft Acquisition Co., LLC 8.875% 20155,6 | 1,568 | 149 |
| | | 571,556 |
| | | |
| Transportation 1.28% | | |
| | | |
| Continental Airlines, Inc., Series 1997-1, Class A, 7.461% 20162 | 1,839 | 1,899 |
| Continental Airlines, Inc., Series 2001-1, Class B, 7.373% 20172 | 60 | 63 |
| Continental Airlines, Inc., Series 1998-1, Class B, 6.748% 20182 | 539 | 574 |
| Continental Airlines, Inc., Series 1997-4B, Class B, 6.90% 20182 | 69 | 72 |
| Continental Airlines, Inc., Series 1998-1, Class A, 6.648% 20192 | 9,903 | 10,416 |
| Continental Airlines, Inc., Series 1997-4, Class A, 6.90% 20192 | 14,869 | 15,868 |
| Continental Airlines, Inc., Series 2000-2, Class B, 8.307% 20192 | 210 | 218 |
| Continental Airlines, Inc., Series 1999-1, Class A, 6.545% 20202 | 7,438 | 8,089 |
| Continental Airlines, Inc., Series 1999-1, Class B, 6.795% 20202 | 4,388 | 4,542 |
| Continental Airlines, Inc., Series 1999-2, Class A-1, 7.256% 20212 | 239 | 267 |
| United Air Lines, Inc., Series 2007-1, Class B, 7.336% 20212,4 | 760 | 795 |
| Continental Airlines, Inc., Series 2001-1, Class A-1, 6.703% 20222 | 10,800 | 11,637 |
| Bonds, notes & other debt instruments | | |
| | Principal amount | Value |
| Industrials — Transportation (continued) | (000) | (000) |
| | | |
| Continental Airlines, Inc., Series 2007-1, Class B, 6.903% 20222 | $ 3,736 | $ 3,906 |
| Continental Airlines, Inc., Series 2000-2, Class A-1, 7.707% 20222 | 12,277 | 13,673 |
| Continental Airlines, Inc., Series 2000-1, Class A-1, 8.048% 20222 | 9,815 | 11,171 |
| Continental Airlines, Inc., Series 2000-1, Class B, 8.388% 20222 | 679 | 723 |
| Burlington Northern Santa Fe LLC 7.00% 2014 | 875 | 906 |
| Burlington Northern Santa Fe LLC 5.65% 2017 | 12,500 | 14,190 |
| Burlington Northern Santa Fe LLC 5.75% 2018 | 9,035 | 10,378 |
| Burlington Northern Santa Fe LLC 3.60% 2020 | 7,500 | 7,788 |
| Burlington Northern Santa Fe LLC 3.45% 2021 | 2,800 | 2,811 |
| Burlington Northern Santa Fe LLC 3.05% 2022 | 14,500 | 14,013 |
| Burlington Northern Santa Fe LLC 3.00% 2023 | 9,080 | 8,665 |
| Burlington Northern Santa Fe LLC 4.45% 2043 | 6,450 | 6,041 |
| Union Pacific Corp. 5.125% 2014 | 8,430 | 8,668 |
| Union Pacific Corp. 5.75% 2017 | 12,250 | 14,152 |
| Union Pacific Corp. 4.00% 2021 | 12,500 | 13,411 |
| Union Pacific Corp. 4.163% 2022 | 7,437 | 7,923 |
| Union Pacific Railroad Co. Pass Through Trust, Series 2001-1, 6.63% 20222 | 5,422 | 6,116 |
| Union Pacific Corp. 6.15% 2037 | 3,395 | 4,060 |
| Northwest Airlines, Inc., Term Loan B, 3.78% 20131,2,3 | 900 | 889 |
| Northwest Airlines, Inc., Term Loan A, 2.03% 20181,2,3 | 48,149 | 45,260 |
| Delta Air Lines, Inc., Series 2002-1, Class G-1, MBIA insured, 6.718% 20242 | 83 | 91 |
| Norfolk Southern Corp. 5.75% 2016 | 3,390 | 3,773 |
| Norfolk Southern Corp. 5.75% 2018 | 5,000 | 5,806 |
| Norfolk Southern Corp. 5.90% 2019 | 9,250 | 10,958 |
| Norfolk Southern Corp. 3.25% 2021 | 1,100 | 1,095 |
| Norfolk Southern Corp. 3.00% 2022 | 15,250 | 14,746 |
| Canadian National Railway Co. 1.45% 2016 | 6,090 | 6,144 |
| Canadian National Railway Co. 5.55% 2018 | 2,000 | 2,311 |
| Canadian National Railway Co. 2.85% 2021 | 10,000 | 9,786 |
| Navios Maritime Acquisition Corporation and Navios Acquisition Finance (US) Inc. 8.625% 2017 | 7,850 | 8,066 |
| Navios Maritime Holdings Inc. 8.875% 2017 | 1,460 | 1,518 |
| Navios Maritime Holdings Inc. and Navios Maritime Finance II (US) Inc. 8.125% 2019 | 6,290 | 5,991 |
| Navios Logistics Finance (US) Inc., 9.25% 2019 | 375 | 404 |
| United Parcel Service, Inc., 1.125% 2017 | 12,000 | 11,749 |
| American Airlines, Inc., Series 2011-2, Class A, 8.625% 20232 | 9,555 | 10,188 |
| Brunswick Rail Finance Ltd. 6.50% 20174 | 4,790 | 4,752 |
| Brunswick Rail Finance Ltd. 6.50% 2017 | 4,610 | 4,573 |
| CSX Corp. 7.375% 2019 | 7,500 | 9,258 |
| CEVA Group PLC 11.625% 20164 | 5,715 | 5,801 |
| CEVA Group PLC 8.375% 20174 | 209 | 206 |
| Red de Carreteras de Occidente 9.00% 2028 | MXN61,570 | 4,494 |
| Far East Capital Limited SA 8.00% 20184 | $1,415 | 1,313 |
| Far East Capital Limited SA 8.75% 20204 | 2,835 | 2,602 |
| Watco Companies 6.375% 20234 | 3,755 | 3,755 |
| ENA Norte Trust 4.95% 20282,4 | 3,428 | 3,485 |
| TRAC Intermodal 11.00% 20194 | 2,950 | 3,260 |
| Avianca Holdings SA, 8.375% 20204 | 1,925 | 2,007 |
| ERAC USA Finance Co. 5.625% 20424 | 1,000 | 1,008 |
| | | 388,324 |
| | | |
| Commercial & professional services 0.08% | | |
| | | |
| Republic Services, Inc. 3.80% 2018 | 2,000 | 2,114 |
| Republic Services, Inc. 5.00% 2020 | 5,000 | 5,479 |
| Bonds, notes & other debt instruments | | |
| | Principal amount | Value |
| Industrials — Commercial & professional services (continued) | (000) | (000) |
| | | |
| Republic Services, Inc. 3.55% 2022 | $ 500 | $ 487 |
| Republic Services, Inc. 5.70% 2041 | 2,000 | 2,192 |
| Waste Management, Inc. 2.60% 2016 | 3,330 | 3,441 |
| Waste Management, Inc. 4.60% 2021 | 5,455 | 5,863 |
| R.R. Donnelley & Sons Co. 7.25% 2018 | 4,075 | 4,238 |
| ADS Waste Escrow 8.25% 20204 | 650 | 666 |
| Nielsen Finance LLC and Nielsen Finance Co. 11.625% 2014 | 211 | 222 |
| | | 24,702 |
| | | |
| Consumer discretionary 3.14% | | |
| Media 1.72% | | |
| | | |
| NBCUniversal Media, LLC 2.10% 2014 | 12,000 | 12,147 |
| NBCUniversal Enterprise, Inc. 0.817% 20161,4 | 24,375 | 24,464 |
| NBCUniversal Media, LLC 2.875% 2016 | 17,000 | 17,778 |
| NBCUniversal Enterprise, Inc. 0.965% 20181,4 | 12,560 | 12,684 |
| NBCUniversal Enterprise, Inc. 1.¢974% 20194 | 10,685 | 10,409 |
| NBCUniversal Media, LLC 5.15% 2020 | 7,000 | 7,978 |
| NBCUniversal Media, LLC 4.375% 2021 | 5,500 | 5,940 |
| NBCUniversal Media, LLC 2.875% 2023 | 7,300 | 6,944 |
| NBCUniversal Media, LLC 4.45% 2043 | 3,200 | 3,003 |
| NBCUniversal Enterprise, Inc. 5.25% (undated)4 | 17,895 | 17,923 |
| Comcast Corp. 6.30% 2017 | 5,410 | 6,396 |
| Comcast Corp. 5.875% 2018 | 18,570 | 21,696 |
| Comcast Corp. 5.15% 2020 | 7,500 | 8,583 |
| Comcast Corp. 3.125% 2022 | 11,000 | 10,732 |
| Comcast Corp. 2.85% 2023 | 5,000 | 4,754 |
| Comcast Corp. 4.25% 2033 | 6,000 | 5,765 |
| Comcast Corp. 6.95% 2037 | 12,020 | 15,193 |
| Comcast Corp. 4.65% 2042 | 5,120 | 4,934 |
| Time Warner Inc. 5.875% 2016 | 19,170 | 21,896 |
| Time Warner Companies, Inc. 7.25% 2017 | 1,600 | 1,918 |
| Time Warner Inc. 4.75% 2021 | 11,090 | 11,944 |
| Time Warner Inc. 3.40% 2022 | 2,500 | 2,426 |
| Time Warner Companies, Inc. 7.57% 2024 | 12,340 | 15,428 |
| Time Warner Inc. 6.20% 2040 | 9,450 | 10,447 |
| Time Warner Inc. 6.25% 2041 | 7,300 | 8,091 |
| Time Warner Inc. 4.90% 2042 | 6,000 | 5,736 |
| Time Warner Cable Inc. 6.20% 2013 | 5,700 | 5,700 |
| Time Warner Cable Inc. 7.50% 2014 | 10,050 | 10,542 |
| Time Warner Cable Inc. 6.75% 2018 | 11,650 | 13,345 |
| Time Warner Cable Inc. 8.25% 2019 | 2,000 | 2,410 |
| Time Warner Cable Inc. 4.00% 2021 | 10,280 | 9,856 |
| Thomson Reuters Corp. 6.50% 2018 | 29,355 | 34,729 |
| News America Inc. 8.00% 2016 | 1,000 | 1,203 |
| News America Inc. 6.90% 2019 | 12,750 | 15,412 |
| News America Inc. 3.00% 2022 | 8,000 | 7,477 |
| News America Inc. 6.15% 2037 | 300 | 327 |
| News America Inc. 6.65% 2037 | 7,800 | 9,013 |
| Cox Communications, Inc. 5.45% 2014 | 3,437 | 3,668 |
| Cox Communications, Inc. 2.95% 20234 | 24,980 | 22,756 |
| Walt Disney Co. 0.875% 2014 | 10,500 | 10,561 |
| Walt Disney Co. 1.10% 2017 | 9,800 | 9,508 |
| DISH DBS Corp. 4.625% 2017 | 7,005 | 7,075 |
| Bonds, notes & other debt instruments | | |
| | Principal amount | Value |
| Consumer discretionary — Media (continued) | (000) | (000) |
| | | |
| DISH DBS Corp. 4.25% 20184 | $ 8,600 | $ 8,471 |
| DISH DBS Corp. 6.75% 2021 | 2,075 | 2,215 |
| WPP Finance 2010 4.75% 2021 | 15,840 | 16,404 |
| WPP Finance 2010 5.125% 2042 | 1,300 | 1,205 |
| Virgin Media Finance PLC 8.375% 20194 | 8,050 | 8,775 |
| UPC Germany GmbH 9.625% 2019 | €1,250 | 1,797 |
| Mediacom LLC and Mediacom Capital Corp. 9.125% 2019 | $9,000 | 9,720 |
| CBS Corp. 1.95% 2017 | 8,500 | 8,449 |
| Cequel Communications Holdings I, LLC and Cequel Capital Corp. 6.375% 20204 | 7,350 | 7,515 |
| Grupo Televisa, SAB 6.625% 2040 | 5,200 | 5,792 |
| Grupo Televisa, SAB 7.25% 2043 | MXN25,290 | 1,665 |
| Omnicom Group Inc. 3.625% 2022 | $ 6,500 | 6,277 |
| Quebecor Media Inc. 5.75% 2023 | 4,375 | 4,288 |
| Warner Music Group 6.00% 20214 | 2,520 | 2,577 |
| | | 523,941 |
| | | |
| Retailing 0.56% | | |
| | | |
| Dollar General Corp. 4.125% 2017 | 5,000 | 5,277 |
| Dollar General Corp. 1.875% 2018 | 21,600 | 20,856 |
| Dollar General Corp. 3.25% 2023 | 69,000 | 63,101 |
| Staples, Inc. 9.75% 2014 | 23,470 | 24,571 |
| Nordstrom, Inc. 6.75% 2014 | 18,975 | 19,986 |
| Toys “R” Us-Delaware, Inc., Term Loan B, 6.00% 20161,2,3 | 4,067 | 4,016 |
| Toys “R” Us Property Co. II, LLC 8.50% 2017 | 7,275 | 7,593 |
| Toys “R” Us Property Co. I, LLC 10.75% 2017 | 650 | 689 |
| Macy’s Retail Holdings, Inc. 7.875% 20151 | 9,891 | 11,219 |
| Home Depot, Inc. 4.40% 2021 | 7,500 | 8,242 |
| Target Corp. 0.447% 20141 | 2,000 | 2,004 |
| Lowe’s Companies, Inc. 3.12% 2022 | 1,500 | 1,478 |
| | | 169,032 |
| | | |
| Automobiles & components 0.47% | | |
| | | |
| DaimlerChrysler North America Holding Corp. 6.50% 2013 | 16,775 | 17,127 |
| DaimlerChrysler North America Holding Corp. 1.30% 20154 | 11,000 | 11,029 |
| DaimlerChrysler North America Holding Corp. 1.25% 20164 | 10,750 | 10,685 |
| DaimlerChrysler North America Holding Corp. 2.625% 20164 | 15,050 | 15,456 |
| Daimler Finance NA LLC 3.00% 20164 | 2,000 | 2,070 |
| DaimlerChrysler North America Holding Corp. 1.875% 20184 | 13,450 | 13,134 |
| DaimlerChrysler North America Holding Corp. 8.50% 2031 | 7,250 | 10,293 |
| RCI Banque 3.50% 20184 | 35,200 | 34,901 |
| Volkswagen International Finance NV 0.894% 20141,4 | 12,000 | 12,027 |
| Volkswagen International Finance NV 2.875% 20164 | 1,000 | 1,040 |
| Volkswagen International Finance NV 4.00% 20204 | 11,650 | 12,345 |
| Dynacast International LLC 9.25% 2019 | 2,825 | 3,093 |
| Ford Motor Co. 4.75% 2043 | 500 | 443 |
| | | 143,643 |
| | | |
| Consumer services 0.39% | | |
| | | |
| MGM Resorts International 5.875% 2014 | 28,345 | 29,124 |
| MGM Resorts International 6.625% 2015 | 2,600 | 2,785 |
| MGM Resorts International 6.625% 2021 | 1,650 | 1,704 |
| Caesars Entertainment Operating Co. 11.25% 2017 | 8,845 | 9,232 |
| Caesars Entertainment Operating Co. 9.00% 20204 | 4,025 | 3,854 |
| Bonds, notes & other debt instruments | | |
| | Principal amount | Value |
| Consumer discretionary — Consumer services (continued) | (000) | (000) |
| | | |
| Caesars Entertainment Operating Co. 9.00% 20204 | $ 3,255 | $ 3,125 |
| Caesars Entertainment Operating Co. 9.00% 20204 | 2,550 | 2,442 |
| Boyd Gaming Corp. 7.125% 2016 | 10,285 | 10,156 |
| Boyd Gaming Corp. 9.125% 2018 | 3,920 | 4,106 |
| Mohegan Tribal Gaming Authority 10.50% 20164 | 6,375 | 6,247 |
| Mohegan Tribal Gaming Authority 11.00% 20181,4,6 | 6,750 | 6,396 |
| Seminole Tribe of Florida 5.798% 20132,4 | 2,270 | 2,293 |
| Seminole Tribe of Florida 7.804% 20202,4 | 7,115 | 7,577 |
| CityCenter Holdings, LLC and CityCenter Finance Corp. 7.625% 2016 | 6,910 | 7,325 |
| Burger King Corp 0%/11.00% 20194,7 | 8,075 | 6,894 |
| NCL Corp. Ltd. 5.00% 20184 | 3,850 | 3,792 |
| Seneca Gaming Corp. 8.25% 20184 | 2,775 | 2,969 |
| Laureate Education, Inc. 9.25% 20194 | 2,100 | 2,258 |
| Marina District Finance Co., Inc. 9.50% 2015 | 2,000 | 2,090 |
| Royal Caribbean Cruises Ltd. 11.875% 2015 | 1,700 | 1,981 |
| Circus and Eldorado Joint Venture and Silver Legacy Resort Casino 10.00% 20181,6 | 1,449 | 1,182 |
| | | 117,532 |
| | | |
| Utilities 2.60% | | |
| | | |
| Consumers Energy Co., First Mortgage Bonds, 5.15% 2017 | 11,574 | 13,053 |
| Consumers Energy Co. 5.65% 2018 | 3,460 | 4,082 |
| Consumers Energy Co., First Mortgage Bonds, 6.125% 2019 | 27,704 | 33,258 |
| Consumers Energy Co., First Mortgage Bonds, 6.70% 2019 | 3,498 | 4,349 |
| Consumers Energy Co. 2.85% 2022 | 24,062 | 23,306 |
| CMS Energy Corp. 5.05% 2022 | 10,000 | 10,818 |
| National Rural Utilities Cooperative Finance Corp. 5.50% 2013 | 14,500 | 14,500 |
| National Rural Utilities Cooperative Finance Corp. 10.375% 2018 | 41,425 | 57,435 |
| Niagara Mohawk Power 3.553% 20144 | 14,850 | 15,356 |
| National Grid PLC 6.30% 2016 | 37,605 | 42,559 |
| MidAmerican Energy Co. 4.65% 2014 | 5,000 | 5,248 |
| MidAmerican Energy Holdings Co., Series D, 5.00% 2014 | 225 | 231 |
| MidAmerican Energy Holdings Co. 5.75% 2018 | 35,700 | 41,473 |
| PacifiCorp., First Mortgage Bonds, 2.95% 2023 | 11,300 | 10,912 |
| CenterPoint Energy Resources Corp. 4.50% 2021 | 41,336 | 45,166 |
| Ohio Edison Co. 6.40% 2016 | 6,260 | 7,151 |
| FirstEnergy Corp., Series A, 2.75% 2018 | 16,000 | 15,588 |
| Cleveland Electric Illuminating Co. 8.875% 2018 | 12,864 | 16,735 |
| Toledo Edison Co. 7.25% 2020 | 4,438 | 5,498 |
| Teco Finance, Inc. 6.75% 2015 | 15,546 | 16,960 |
| Teco Finance, Inc. 4.00% 2016 | 3,333 | 3,555 |
| Teco Finance, Inc. 6.572% 2017 | 4,539 | 5,293 |
| Teco Finance, Inc. 5.15% 2020 | 8,949 | 9,902 |
| Tampa Electric Co. 2.60% 2022 | 1,900 | 1,765 |
| Tampa Electric Co. 4.10% 2042 | 5,060 | 4,692 |
| Public Service Co. of Colorado 5.80% 2018 | 9,606 | 11,362 |
| Public Service Co. of Colorado 5.125% 2019 | 4,350 | 5,029 |
| Public Service Co. of Colorado 3.20% 2020 | 5,000 | 5,129 |
| Northern States Power Co., First Mortgage Bonds, 2.15% 2022 | 6,595 | 6,061 |
| Northern States Power Co., First Mortgage Bonds, 7.125% 2025 | 6,875 | 9,037 |
| Public Service Co. of Colorado 3.60% 2042 | 600 | 521 |
| Iberdrola Finance Ireland 3.80% 20144 | 13,099 | 13,440 |
| Scottish Power PLC 5.375% 2015 | 15,000 | 15,874 |
| Iberdrola Finance Ireland 5.00% 20194 | 2,000 | 2,105 |
| Bonds, notes & other debt instruments | | |
| | Principal amount | Value |
| Utilities (continued) | (000) | (000) |
| | | |
| PG&E Corp. 5.75% 2014 | $ 2,000 | $ 2,074 |
| Pacific Gas and Electric Co. 8.25% 2018 | 4,000 | 5,162 |
| Pacific Gas and Electric Co. 2.45% 2022 | 7,500 | 6,939 |
| Pacific Gas and Electric Co. 3.25% 2023 | 15,700 | 15,397 |
| Virginia Electric and Power Co., Series B, 5.95% 2017 | 10,000 | 11,629 |
| Virginia Electric and Power Co. 1.20% 2018 | 9,600 | 9,311 |
| Virginia Electric and Power Co. 2.95% 2022 | 8,000 | 7,904 |
| TXU, Term Loan, 4.693% 20171,2,3 | 29,373 | 20,650 |
| Texas Competitive Electric Holdings Co. LLC 11.50% 20204 | 9,860 | 7,420 |
| Ohio Power Co., Series H, 4.85% 2014 | 5,965 | 6,101 |
| American Electric Power Co. 1.65% 2017 | 10,195 | 9,918 |
| American Electric Power Co. 2.95% 2022 | 12,905 | 12,030 |
| Abu Dhabi National Energy Co. PJSC (TAQA) 6.165% 20174 | 12,000 | 13,470 |
| Abu Dhabi National Energy Co. PJSC (TAQA) 6.165% 2017 | 2,700 | 3,031 |
| Abu Dhabi National Energy Co. PJSC (TAQA) 5.875% 20214 | 3,055 | 3,406 |
| Abu Dhabi National Energy Co. PJSC (TAQA) 3.625% 20234 | 610 | 567 |
| Abu Dhabi National Energy Co. PJSC (TAQA) 6.50% 2036 | 1,500 | 1,673 |
| Abu Dhabi National Energy Co. PJSC (TAQA) 6.50% 20364 | 1,000 | 1,115 |
| Entergy Corp. 4.70% 2017 | 14,900 | 15,822 |
| Entergy Arkansas, INC 3.05% 2023 | 6,100 | 5,827 |
| E.ON International Finance BV 5.80% 20184 | 17,500 | 20,324 |
| Sierra Pacific Power Co., General and Refunding Mortgage Notes, Series Q, 5.45% 2013 | 4,275 | 4,309 |
| Nevada Power Co., General and Refunding Mortgage Notes, Series M, 5.95% 2016 | 1,000 | 1,114 |
| Nevada Power Co., General and Refunding Mortgage Notes, Series S, 6.50% 2018 | 10,165 | 12,226 |
| Nevada Power Co., General and Refunding Mortgage Notes, Series V, 7.125% 2019 | 2,050 | 2,541 |
| NV Energy, Inc 6.25% 2020 | 90 | 106 |
| Progress Energy, Inc. 6.05% 2014 | 2,100 | 2,178 |
| Progress Energy, Inc. 7.05% 2019 | 8,840 | 10,720 |
| Progress Energy, Inc. 7.00% 2031 | 750 | 913 |
| Progress Energy, Inc. 7.75% 2031 | 3,920 | 5,090 |
| AES Corp. 7.75% 2015 | 6,575 | 7,282 |
| AES Corp. 8.00% 2020 | 8,350 | 9,561 |
| Veolia Environnement 6.00% 2018 | 10,002 | 11,592 |
| CEZ, a s 4.25% 20224 | 8,480 | 8,457 |
| Empresa Nacional de Electricidad SA 8.35% 2013 | 5,000 | 5,024 |
| Empresa Nacional de Electricidad SA 8.625% 2015 | 3,000 | 3,378 |
| SP PowerAssets Ltd. 5.00% 20134 | 8,000 | 8,099 |
| Midwest Generation, LLC, Series B, 8.56% 20162,5 | 7,968 | 7,451 |
| Israel Electric Corp. Ltd. 8.10% 20964 | 6,250 | 6,246 |
| Consolidated Edison Company of New York, Inc. Series 2013-A, 3.95% 2043 | 6,470 | 5,885 |
| Colbun SA 6.00% 20204 | 5,400 | 5,776 |
| PSEG Power LLC 2.75% 2016 | 3,140 | 3,240 |
| Public Service Electric and Gas Co., Series E, 5.30% 2018 | 2,190 | 2,532 |
| Enel Finance International SA 3.875% 20144 | 3,235 | 3,313 |
| Electricité de France SA 5.50% 20144 | 3,000 | 3,078 |
| Wisconsin Electric Power Co. 2.95% 2021 | 3,000 | 3,009 |
| Tri-State Generation and Transmission Assn. Inc., Pass Through Trust, Series 2003-A, 6.04% 20182,4 | 1,553 | 1,655 |
| | | 791,988 |
| | | |
| Telecommunication services 2.56% | | |
| | | |
| Verizon Communications Inc. 5.55% 2014 | 82,729 | 84,944 |
| Verizon Communications Inc. 3.00% 2016 | 24,000 | 25,100 |
| Verizon Communications Inc. 8.50% 2018 | 8,000 | 10,398 |
| Bonds, notes & other debt instruments | | |
| | Principal amount | Value |
| Telecommunication services (continued) | (000) | (000) |
| | | |
| Verizon Communications Inc. 8.75% 2018 | $ 7,141 | $ 9,314 |
| Verizon Communications Inc. 2.45% 2022 | 10,858 | 9,859 |
| Telecom Italia Capital SA 6.999% 2018 | 16,771 | 18,514 |
| Telecom Italia Capital SA 7.175% 2019 | 24,991 | 27,926 |
| Telecom Italia Capital SA 7.20% 2036 | 3,179 | 3,149 |
| Telecom Italia Capital SA 7.721% 2038 | 11,255 | 11,487 |
| Deutsche Telekom International Finance BV 4.875% 2014 | 16,250 | 16,885 |
| Deutsche Telekom International Finance BV 3.125% 20164 | 15,300 | 15,970 |
| Deutsche Telekom International Finance BV 2.25% 20174 | 11,050 | 11,110 |
| Deutsche Telekom International Finance BV 9.25% 2032 | 8,744 | 13,106 |
| AT&T Inc. 0.90% 2016 | 10,000 | 9,930 |
| SBC Communications Inc. 5.625% 2016 | 22,575 | 25,270 |
| AT&T Inc. 1.40% 2017 | 12,015 | 11,689 |
| AT&T Inc. 2.625% 2022 | 8,000 | 7,333 |
| Wind Acquisition SA 11.75% 20174 | 27,212 | 28,437 |
| Wind Acquisition SA 11.75% 2017 | €12,100 | 16,419 |
| Wind Acquisition SA 7.25% 20184 | $ 7,025 | 7,113 |
| Leap Wireless International, Inc., Term Loan C, 4.75% 20201,2,3 | 19,300 | 19,159 |
| Cricket Communications, Inc. 7.75% 2020 | 29,800 | 28,757 |
| Telefónica Emisiones, SAU 3.992% 2016 | 14,500 | 14,988 |
| Telefónica Emisiones, SAU 3.192% 2018 | 31,805 | 30,829 |
| Koninklijke KPN NV 8.375% 2030 | 35,898 | 44,509 |
| Clearwire Communications and Clearwire Finance, Inc., Series B, 12.00% 20154 | 20,200 | 21,513 |
| Clearwire Communications and Clearwire Finance, Inc., Series A, 12.00% 20154 | 14,155 | 15,075 |
| Clearwire Communications and Clearwire Finance, Inc. 12.00% 20174 | 2,735 | 3,179 |
| Sprint Nextel Corp. 8.375% 2017 | 5,075 | 5,722 |
| Sprint Nextel Corp. 9.125% 2017 | 9,250 | 10,684 |
| Sprint Nextel Corp. 7.00% 2020 | 7,300 | 7,738 |
| Sprint Nextel Corp. 11.50% 2021 | 8,550 | 11,414 |
| Vodafone Group PLC, Term Loan B, 6.875% 20152,3,6 | 5,095 | 5,184 |
| Vodafone Group PLC 0.90% 2016 | 22,000 | 21,647 |
| Vodafone Group PLC, Term Loan B, 6.25% 20162,3,6 | 5,491 | 5,656 |
| Vodafone Group PLC 2.95% 2023 | 3,214 | 2,976 |
| Frontier Communications Corp. 8.125% 2018 | 1,500 | 1,654 |
| Frontier Communications Corp. 8.50% 2020 | 2,950 | 3,267 |
| Frontier Communications Corp. 9.25% 2021 | 2,450 | 2,811 |
| Frontier Communications Corp. 8.75% 2022 | 1,275 | 1,396 |
| Frontier Communications Corp. 7.125% 2023 | 4,575 | 4,569 |
| Frontier Communications Corp. 7.625% 2024 | 11,400 | 11,486 |
| NII Capital Corp. 7.875% 20194 | 4,075 | 3,881 |
| NII Capital Corp. 8.875% 2019 | 1,075 | 919 |
| NII Capital Corp. 11.375% 20194 | 8,700 | 9,353 |
| NII Capital Corp. 7.625% 2021 | 13,005 | 10,241 |
| France Télécom 4.375% 2014 | 11,440 | 11,785 |
| France Télécom 2.125% 2015 | 9,805 | 9,954 |
| France Télécom 4.125% 2021 | 2,525 | 2,554 |
| MetroPCS Wireless, Inc. 6.25% 20214 | 11,425 | 11,668 |
| MetroPCS Wireless, Inc. 6.625% 20234 | 11,450 | 11,693 |
| LightSquared, Term Loan B, 12.00% 20142,3,5,6 | 18,669 | 20,349 |
| Intelsat Jackson Holding Co. 6.625% 20224 | 15,905 | 15,507 |
| América Móvil, SAB de CV 2.375% 2016 | 3,000 | 3,054 |
| América Móvil, SAB de CV 5.00% 2020 | 6,700 | 7,222 |
| América Móvil, SAB de CV 8.46% 2036 | MXN27,000 | 2,075 |
| Bonds, notes & other debt instruments | | |
| | Principal amount | Value |
| Telecommunication services (continued) | (000) | (000) |
| | | |
| Digicel Group Ltd. 8.25% 20204 | $ 4,950 | $ 5,148 |
| Digicel Group Ltd. 6.00% 20214 | 4,100 | 3,885 |
| Trilogy International Partners, LLC 10.25% 20164 | 9,250 | 8,926 |
| Level 3 Communications, Inc. 11.875% 2019 | 1,000 | 1,138 |
| Syniverse Holdings, Inc. 9.125% 2019 | 500 | 536 |
| | | 778,054 |
| | | |
| Consumer staples 2.55% | | |
| Food, beverage & tobacco 2.13% | | |
| | | |
| Anheuser-Busch InBev NV 0.637% 20141 | 6,440 | 6,455 |
| Anheuser-Busch InBev NV 3.625% 2015 | 25,250 | 26,523 |
| Anheuser-Busch InBev NV 4.125% 2015 | 32,375 | 34,026 |
| Anheuser-Busch InBev NV 0.80% 2016 | 2,000 | 1,990 |
| Anheuser-Busch InBev NV 1.375% 2017 | 12,505 | 12,315 |
| Anheuser-Busch InBev NV 1.25% 2018 | 2,000 | 1,943 |
| Anheuser-Busch InBev NV 6.875% 2019 | 6,740 | 8,404 |
| Anheuser-Busch InBev NV 7.75% 2019 | 8,725 | 11,044 |
| Anheuser-Busch InBev NV 2.50% 2022 | 4,420 | 4,132 |
| Anheuser-Busch InBev NV 3.75% 2042 | 3,400 | 2,962 |
| SABMiller Holdings Inc. 1.85% 20154 | 2,000 | 2,030 |
| SABMiller Holdings Inc. 2.45% 20174 | 47,360 | 48,139 |
| SABMiller Holdings Inc. 3.75% 20224 | 26,680 | 27,187 |
| ConAgra Foods, Inc. 1.30% 2016 | 13,165 | 13,193 |
| ConAgra Foods, Inc. 1.90% 2018 | 16,355 | 16,090 |
| ConAgra Foods, Inc. 3.20% 2023 | 32,490 | 31,114 |
| ConAgra Foods, Inc. 4.65% 2043 | 7,075 | 6,586 |
| Altria Group, Inc. 9.25% 2019 | 4,392 | 5,821 |
| Altria Group, Inc. 4.75% 2021 | 7,350 | 7,881 |
| Altria Group, Inc. 2.85% 2022 | 6,800 | 6,297 |
| Altria Group, Inc. 2.95% 2023 | 10,000 | 9,276 |
| Altria Group, Inc. 9.95% 2038 | 6,350 | 9,433 |
| Altria Group, Inc. 10.20% 2039 | 4,000 | 6,043 |
| Altria Group, Inc. 4.25% 2042 | 3,000 | 2,573 |
| Altria Group, Inc. 4.50% 2043 | 13,000 | 11,619 |
| Kraft Foods Inc. 1.625% 2015 | 9,120 | 9,220 |
| Kraft Foods Inc. 2.25% 2017 | 8,050 | 8,111 |
| Kraft Foods Inc. 3.50% 2022 | 24,180 | 23,977 |
| Kraft Foods Inc. 6.50% 2040 | 2,000 | 2,397 |
| Kraft Foods Inc. 5.00% 2042 | 6,000 | 6,106 |
| Pernod Ricard SA 2.95% 20174 | 16,500 | 16,892 |
| Pernod Ricard SA 4.45% 20224 | 26,500 | 27,027 |
| Pernod Ricard SA 5.50% 20424 | 3,000 | 3,081 |
| British American Tobacco International Finance PLC 2.125% 20174 | 23,125 | 23,208 |
| British American Tobacco International Finance PLC 9.50% 20184 | 15,750 | 21,117 |
| Coca-Cola Co. 1.50% 2015 | 18,970 | 19,360 |
| Coca-Cola Co. 1.80% 2016 | 18,815 | 19,229 |
| Coca-Cola Co. 3.15% 2020 | 4,190 | 4,298 |
| Philip Morris International Inc. 1.125% 2017 | 4,000 | 3,890 |
| Philip Morris International Inc. 1.625% 2017 | 2,000 | 1,990 |
| Philip Morris International Inc. 2.90% 2021 | 9,200 | 8,945 |
| Philip Morris International Inc. 2.50% 2022 | 1,600 | 1,479 |
| Philip Morris International Inc. 2.625% 2023 | 15,500 | 14,370 |
| Reynolds American Inc. 3.25% 2022 | 25,260 | 23,514 |
| Bonds, notes & other debt instruments | | |
| | Principal amount | Value |
| Consumer staples — Food, beverage & tobacco (continued) | (000) | (000) |
| | | |
| Reynolds American Inc. 4.75% 2042 | $ 5,500 | $ 4,935 |
| PepsiCo, Inc. 3.10% 2015 | 17,000 | 17,641 |
| PepsiCo, Inc. 2.50% 2016 | 7,500 | 7,808 |
| Imperial Tobacco Finance PLC 2.05% 20184 | 16,000 | 15,739 |
| Imperial Tobacco Finance PLC 3.50% 20234 | 2,500 | 2,354 |
| Heineken NV 1.40% 20174 | 13,335 | 12,965 |
| Heineken NV 2.75% 20234 | 4,000 | 3,673 |
| Kraft Foods Inc. 6.125% 2018 | 6,000 | 6,939 |
| Kraft Foods Inc. 5.375% 2020 | 2,500 | 2,807 |
| Marfrig Holdings (Europe) BV 9.875% 20174 | 3,640 | 3,676 |
| Marfrig Holdings (Europe) BV 8.375% 2018 | 400 | 378 |
| Marfrig Overseas Ltd. 9.50% 20204 | 1,570 | 1,572 |
| Marfrig Overseas Ltd. 9.50% 2020 | 325 | 325 |
| Del Monte Corp. 7.625% 2019 | 4,000 | 4,130 |
| BFF International Ltd. 7.25% 20204 | 2,500 | 2,765 |
| Constellation Brands, Inc. 8.375% 2014 | 550 | 597 |
| Constellation Brands, Inc. 7.25% 2017 | 750 | 859 |
| Constellation Brands, Inc. 6.00% 2022 | 500 | 539 |
| Constellation Brands, Inc. 4.25% 2023 | 400 | 379 |
| Smithfield Foods, Inc. 7.75% 2017 | 750 | 831 |
| Smithfield Foods, Inc. 6.625% 2022 | 1,370 | 1,476 |
| Brown-Forman Corp. 2.25% 2023 | 1,900 | 1,747 |
| TreeHouse Foods, Inc. 7.75% 2018 | 1,200 | 1,274 |
| Cott Beverages Inc. 8.375% 2017 | 1,000 | 1,059 |
| Tyson Foods, Inc. 6.60% 20161 | 500 | 565 |
| | | 648,320 |
| | | |
| Food & staples retailing 0.42% | | |
| | | |
| Wal-Mart Stores, Inc. 2.875% 2015 | 11,550 | 12,021 |
| Wal-Mart Stores, Inc. 2.80% 2016 | 11,500 | 12,094 |
| Wal-Mart Stores, Inc. 5.80% 2018 | 11,095 | 13,006 |
| Wal-Mart Stores, Inc. 2.55% 2023 | 15,625 | 14,664 |
| Kroger Co. 7.50% 2014 | 6,500 | 6,741 |
| Kroger Co. 3.90% 2015 | 10,000 | 10,604 |
| Kroger Co. 6.40% 2017 | 13,000 | 15,012 |
| Delhaize Group 6.50% 2017 | 16,205 | 18,215 |
| Tesco PLC 5.50% 20174 | 12,459 | 14,018 |
| Wesfarmers Ltd. 1.874% 20184 | 5,250 | 5,162 |
| Safeway Inc. 3.95% 2020 | 4,000 | 3,927 |
| Rite Aid Corp. 10.25% 2019 | 40 | 45 |
| Rite Aid Corp. 8.00% 2020 | 2,075 | 2,309 |
| | | 127,818 |
| | | |
| Household & personal products 0.00% | | |
| | | |
| Procter & Gamble Co. 3.50% 2015 | 150 | 157 |
| | | |
| | | |
| Materials 1.85% | | |
| | | |
| Xstrata Canada Financial Corp. 2.05% 20151,4 | 2,000 | 2,001 |
| Glencore Xstrata LLC 1.70% 20164 | 17,680 | 17,154 |
| Xstrata Canada Financial Corp. 2.70% 20171,4 | 12,250 | 11,888 |
| Xstrata Canada Financial Corp. 3.60% 20174 | 9,750 | 9,832 |
| Glencore Xstrata LLC 1.574% 20191,4 | 19,275 | 18,159 |
| Bonds, notes & other debt instruments | | |
| | Principal amount | Value |
| Materials (continued) | (000) | (000) |
| | | |
| Glencore Xstrata LLC 2.50% 20194 | $12,500 | $11,318 |
| Xstrata Canada Financial Corp. 4.95% 20214 | 29,380 | 28,477 |
| Xstrata Canada Financial Corp. 4.25% 20221,4 | 3,600 | 3,273 |
| Glencore Xstrata LLC 4.125% 20234 | 30,590 | 27,321 |
| Rio Tinto Finance (USA) Ltd. 8.95% 2014 | 5,000 | 5,329 |
| Rio Tinto Finance (USA) Ltd. 1.375% 2016 | 3,000 | 2,984 |
| Rio Tinto Finance (USA) Ltd. 2.25% 2016 | 10,500 | 10,725 |
| Rio Tinto Finance (USA) Ltd. 2.50% 2016 | 14,650 | 15,071 |
| Rio Tinto Finance (USA) Ltd. 1.625% 2017 | 13,300 | 13,053 |
| Rio Tinto Finance (USA) Ltd. 2.25% 2018 | 15,005 | 14,594 |
| Rio Tinto Finance (USA) Ltd. 9.00% 2019 | 11,170 | 14,522 |
| Rio Tinto Finance (USA) Ltd. 2.875% 2022 | 22,380 | 20,549 |
| International Paper Co. 7.40% 2014 | 24,650 | 26,079 |
| International Paper Co. 7.95% 2018 | 5,700 | 6,984 |
| International Paper Co. 4.75% 2022 | 1,500 | 1,580 |
| Cliffs Natural Resources Inc. 3.95% 2018 | 8,000 | 7,648 |
| Cliffs Natural Resources Inc. 4.875% 2021 | 26,855 | 24,366 |
| Cliffs Natural Resources Inc. 6.25% 2040 | 1,725 | 1,432 |
| CEMEX Finance LLC 9.50% 2016 | 5,925 | 6,295 |
| CEMEX Finance LLC 9.50% 20164 | 5,200 | 5,525 |
| CEMEX SAB de CV 5.875% 20194 | 6,000 | 5,835 |
| CEMEX España, SA 9.25% 20204 | 1,126 | 1,194 |
| CEMEX Finance LLC 9.375% 20224 | 5,175 | 5,667 |
| Teck Resources Ltd. 4.75% 2022 | 10,320 | 10,276 |
| Teck Resources Ltd. 6.25% 2041 | 6,750 | 6,421 |
| Teck Resources Ltd. 5.20% 2042 | 2,500 | 2,130 |
| Teck Resources Ltd. 5.40% 2043 | 4,310 | 3,790 |
| FMG Resources 7.00% 20154 | 2,525 | 2,563 |
| FMG Resources 6.00% 20174 | 9,780 | 9,560 |
| FMG Resources 6.875% 20184 | 8,240 | 8,168 |
| FMG Resources 8.25% 20194 | 1,950 | 2,018 |
| Newcrest Finance Pty Ltd. 4.45% 20214 | 20,625 | 18,531 |
| ArcelorMittal 6.00% 20211 | 1,875 | 1,880 |
| ArcelorMittal 6.75% 20221 | 4,375 | 4,506 |
| ArcelorMittal 7.25% 20411 | 12,845 | 12,139 |
| Inmet Mining Corp. 8.75% 20204 | 11,480 | 11,796 |
| Inmet Mining Corp. 7.50% 20214 | 5,575 | 5,366 |
| Reynolds Group Inc. 9.875% 2019 | 1,480 | 1,591 |
| Reynolds Group Inc. 5.75% 2020 | 14,070 | 14,211 |
| Praxair, Inc. 4.625% 2015 | 500 | 534 |
| Praxair, Inc. 1.05% 2017 | 11,000 | 10,623 |
| Dow Chemical Co. 5.70% 2018 | 3,500 | 3,994 |
| Dow Chemical Co. 3.00% 2022 | 7,500 | 6,985 |
| E.I. du Pont de Nemours and Co. 5.25% 2016 | 500 | 567 |
| E.I. du Pont de Nemours and Co. 2.80% 2023 | 10,000 | 9,542 |
| Ecolab Inc. 3.00% 2016 | 7,320 | 7,642 |
| Ecolab Inc. 4.35% 2021 | 750 | 793 |
| Ecolab Inc. 5.50% 2041 | 1,250 | 1,372 |
| BHP Billiton Finance (USA) Ltd. 5.50% 2014 | 8,795 | 9,128 |
| MacDermid 9.50% 20174 | 6,870 | 7,092 |
| MacDermid Inc., 2nd Lien Term Loan B, 7.75% 20201,2,3 | 1,000 | 1,015 |
| JMC Steel Group Inc. 8.25% 20184 | 8,075 | 7,934 |
| Newpage Corp., Term Loan B, 7.75% 20181,2,3 | 6,445 | 6,536 |
| Bonds, notes & other debt instruments | | |
| | Principal amount | Value |
| Materials (continued) | (000) | (000) |
| | | |
| Ryerson Inc. 9.00% 20174 | $ 400 | $ 408 |
| Ryerson Inc. 11.25% 20184 | 5,675 | 5,746 |
| Taminco Global Chemical Corp. 9.75% 20204 | 4,500 | 5,034 |
| Gerdau SA 7.25% 20174 | 4,000 | 4,360 |
| Smurfit Capital Funding PLC 7.50% 2025 | 3,345 | 3,663 |
| Inversiones CMPC S.A. 4.375% 20234 | 3,800 | 3,644 |
| Georgia-Pacific Corp. 5.40% 20204 | 2,775 | 3,098 |
| U.S. Coatings Acquisition Inc. and Flash Dutch 2 BV, Term Loan B, 4.75% 20201,2,3 | 1,696 | 1,699 |
| U.S. Coatings Acquisition Inc. and Flash Dutch 2 BV 7.375% 20214 | 1,250 | 1,280 |
| Ball Corp. 5.75% 2021 | 1,850 | 1,956 |
| Ball Corp. 5.00% 2022 | 530 | 530 |
| Ball Corp. 4.00% 2023 | 475 | 441 |
| Yara International ASA 7.875% 20194 | 2,175 | 2,643 |
| Barrick Gold Corp. 3.85% 2022 | 3,000 | 2,527 |
| Airgas, Inc. 7.125% 2018 | 2,000 | 2,100 |
| OMNOVA Solutions Inc. 7.875% 2018 | 2,000 | 2,090 |
| Holcim Ltd. 6.00% 20194 | 1,607 | 1,796 |
| Caraustar, Term Loan, 7.50% 20191,2,3 | 1,450 | 1,462 |
| Packaging Dynamics Corp. 8.75% 20164 | 1,430 | 1,451 |
| PQ Corp. 8.75% 20184 | 1,375 | 1,416 |
| Potash Corp. of Saskatchewan Inc. 5.875% 2036 | 1,250 | 1,408 |
| Graphic Packaging International, Inc. 4.75% 2021 | 1,420 | 1,381 |
| Walter Energy, Inc. 9.875% 20204 | 1,525 | 1,334 |
| Georgia Gulf Corp. 4.625% 20214 | 250 | 241 |
| Georgia Gulf Corp. 4.875% 20234 | 1,065 | 1,016 |
| Crown Holdings, Inc. 4.50% 20234 | 950 | 900 |
| Consolidated Minerals Ltd. 8.875% 20164 | 825 | 804 |
| Ardagh Packaging Finance 4.875% 20224 | 600 | 563 |
| | | 562,549 |
| | | |
| Information technology 1.05% | | |
| Software & services 0.80% | | |
| | | |
| International Business Machines Corp. 0.75% 2015 | 16,510 | 16,567 |
| International Business Machines Corp. 1.95% 2016 | 12,105 | 12,415 |
| International Business Machines Corp. 2.00% 2016 | 28,500 | 29,250 |
| International Business Machines Corp. 1.25% 2018 | 10,000 | 9,743 |
| International Business Machines Corp. 1.625% 2020 | 32,250 | 30,224 |
| International Business Machines Corp. 4.00% 2042 | 3,252 | 3,068 |
| First Data Corp. 11.25% 2016 | 15,774 | 15,498 |
| First Data Corp., Term Loan 1L, 4.193% 20171,2,3 | 5,000 | 4,909 |
| First Data Corp. 6.75% 20204 | 1,050 | 1,074 |
| First Data Corp. 8.25% 20214 | 2,843 | 2,914 |
| First Data Corp. 11.75% 20214 | 26,780 | 24,236 |
| First Data Corp. 12.625% 2021 | 6,545 | 6,954 |
| First Data Corp. 8.75% 20221,4,6 | 10,627 | 10,972 |
| Microsoft Corp. 2.375% 2023 | 23,730 | 21,993 |
| Microsoft Corp. 3.75% 2043 | 7,630 | 6,887 |
| SRA International, Inc., Term Loan B, 6.50% 20181,2,3 | 12,787 | 12,734 |
| SRA International, Inc. 11.00% 2019 | 12,080 | 12,563 |
| SunGard Data Systems Inc. 7.375% 2018 | 3,915 | 4,150 |
| SunGard Data Systems Inc. 7.625% 2020 | 5,911 | 6,295 |
| Oracle Corp. 1.20% 2017 | 6,325 | 6,147 |
| eBay Inc. 1.35% 2017 | 2,300 | 2,262 |
| Bonds, notes & other debt instruments | | |
| | Principal amount | Value |
| Information technology — Software & services (continued) | (000) | (000) |
| | | |
| Compucom Systems Inc., 7.00% 20214 | $ 700 | $ 686 |
| | | 241,541 |
| | | |
| Technology hardware & equipment 0.14% | | |
| | | |
| Xerox Corp. 6.40% 2016 | 768 | 855 |
| Xerox Corp. 2.95% 2017 | 14,035 | 14,159 |
| Cisco Systems, Inc. 2.90% 2014 | 10,125 | 10,459 |
| Apple Inc. 2.40% 2023 | 10,000 | 9,289 |
| Jabil Circuit, Inc. 8.25% 2018 | 5,425 | 6,388 |
| Hewlett-Packard Co. 0.673% 20141 | 2,000 | 1,991 |
| Hughes Satellite Systems Corp. 7.625% 2021 | 575 | 614 |
| | | 43,755 |
| | | |
| Semiconductors & semiconductor equipment 0.11% | | |
| | | |
| Freescale Semiconductor, Inc. 9.25% 20184 | 5,000 | 5,413 |
| Freescale Semiconductor, Inc. 10.75% 2020 | 4,470 | 4,939 |
| Freescale Semiconductor, Inc. 5.00% 20214 | 7,345 | 6,996 |
| Samsung Electronics America, Inc. 1.75% 20174 | 8,900 | 8,821 |
| National Semiconductor Corp. 6.60% 2017 | 6,000 | 7,054 |
| | | 33,223 |
| | | |
| Total corporate bonds, notes & loans | | 10,350,919 |
| Mortgage-backed obligations 28.23% | | |
| Federal agency mortgage-backed obligations2 24.16% | | |
| | | |
| Fannie Mae 3.418% 20171 | 3,991 | 4,263 |
| Fannie Mae, Series 2002-15, Class PG, 6.00% 2017 | 1,440 | 1,521 |
| Fannie Mae 5.50% 2019 | 45 | 47 |
| Fannie Mae 5.50% 2020 | 4,189 | 4,480 |
| Fannie Mae 5.50% 2020 | 561 | 602 |
| Fannie Mae 11.064% 20201 | 45 | 51 |
| Fannie Mae, Series 2012-M5, Class A1, multifamily 1.787% 2022 | 3,516 | 3,510 |
| Fannie Mae 2.50% 2022 | 45,038 | 46,250 |
| Fannie Mae 2.50% 2022 | 28,027 | 28,779 |
| Fannie Mae 2.50% 2022 | 13,261 | 13,618 |
| Fannie Mae, Series 2013-M4, multifamily 2.608% 2022 | 4,325 | 4,202 |
| Fannie Mae, Series 2012-M2, Class A2, multifamily 2.717% 2022 | 8,400 | 8,259 |
| Fannie Mae, Series 2012-M3, Class 1-A2, multifamily 3.044% 2022 | 3,500 | 3,542 |
| Fannie Mae 2.50% 2023 | 28,741 | 29,517 |
| Fannie Mae 2.50% 2023 | 10,792 | 10,973 |
| Fannie Mae 5.00% 2023 | 2,730 | 2,914 |
| Fannie Mae 5.50% 2023 | 15,684 | 16,650 |
| Fannie Mae 5.50% 2023 | 15,221 | 16,180 |
| Fannie Mae 6.00% 2023 | 381 | 420 |
| Fannie Mae 4.50% 2024 | 8,494 | 9,020 |
| Fannie Mae 6.00% 2024 | 3,907 | 4,301 |
| Fannie Mae 3.50% 2025 | 16,776 | 17,524 |
| Fannie Mae 3.50% 2025 | 13,083 | 13,675 |
| Fannie Mae 3.50% 2025 | 11,631 | 12,152 |
| Fannie Mae 3.50% 2025 | 8,055 | 8,420 |
| Fannie Mae 3.50% 2025 | 7,453 | 7,789 |
| Fannie Mae 3.50% 2025 | 7,219 | 7,549 |
| Bonds, notes & other debt instruments | | |
| | Principal amount | Value |
| Mortgage-backed obligations — Federal agency mortgage-backed obligations2 (continued) | (000) | (000) |
| | | |
| Fannie Mae 3.50% 2025 | $ 5,035 | $ 5,263 |
| Fannie Mae 3.50% 2025 | 4,396 | 4,593 |
| Fannie Mae 3.50% 2025 | 3,063 | 3,203 |
| Fannie Mae 4.50% 2025 | 11,340 | 12,037 |
| Fannie Mae 4.50% 2025 | 7,312 | 7,766 |
| Fannie Mae 4.50% 2025 | 6,961 | 7,391 |
| Fannie Mae, Series 2001-4, Class GA, 9.556% 20251 | 152 | 176 |
| Fannie Mae, Series 2001-4, Class NA, 10.913% 20251 | 260 | 288 |
| Fannie Mae 2.478% 20261 | 279 | 293 |
| Fannie Mae 3.50% 2026 | 55,134 | 57,582 |
| Fannie Mae 3.50% 2026 | 36,656 | 38,282 |
| Fannie Mae 3.50% 2026 | 18,873 | 19,711 |
| Fannie Mae 3.50% 2026 | 5,588 | 5,839 |
| Fannie Mae 3.50% 2026 | 1,409 | 1,472 |
| Fannie Mae 3.50% 2026 | 1,283 | 1,340 |
| Fannie Mae 4.00% 2026 | 11,062 | 11,682 |
| Fannie Mae 6.00% 2026 | 9,896 | 10,906 |
| Fannie Mae 2.50% 2027 | 47,646 | 47,959 |
| Fannie Mae 2.50% 2027 | 29,242 | 29,434 |
| Fannie Mae 2.50% 2027 | 20,720 | 20,856 |
| Fannie Mae 2.50% 2027 | 14,792 | 14,890 |
| Fannie Mae 2.50% 2027 | 14,759 | 14,856 |
| Fannie Mae 2.50% 2027 | 14,673 | 14,770 |
| Fannie Mae 2.50% 2027 | 14,600 | 14,696 |
| Fannie Mae 2.50% 2027 | 12,839 | 12,918 |
| Fannie Mae 2.50% 2027 | 8,563 | 8,617 |
| Fannie Mae 2.50% 2027 | 5,894 | 5,930 |
| Fannie Mae 2.50% 2027 | 4,792 | 4,823 |
| Fannie Mae 2.50% 2027 | 3,403 | 3,423 |
| Fannie Mae 2.50% 2027 | 2,927 | 2,947 |
| Fannie Mae 2.50% 2027 | 2,522 | 2,538 |
| Fannie Mae 2.50% 2027 | 2,283 | 2,298 |
| Fannie Mae 2.50% 2027 | 1,965 | 1,977 |
| Fannie Mae 2.50% 2027 | 1,944 | 1,956 |
| Fannie Mae 2.50% 2027 | 1,735 | 1,747 |
| Fannie Mae 2.50% 2027 | 1,594 | 1,604 |
| Fannie Mae 2.50% 2027 | 942 | 948 |
| Fannie Mae 2.50% 2027 | 788 | 793 |
| Fannie Mae 2.50% 2027 | 766 | 771 |
| Fannie Mae 3.00% 2027 | 88,199 | 90,958 |
| Fannie Mae 3.00% 2027 | 50,205 | 51,711 |
| Fannie Mae 5.50% 2027 | 4,073 | 4,439 |
| Fannie Mae 2.00% 2028 | 23,750 | 23,093 |
| Fannie Mae 2.50% 2028 | 60,000 | 60,291 |
| Fannie Mae 2.50% 2028 | 27,527 | 27,699 |
| Fannie Mae 2.50% 2028 | 24,295 | 24,444 |
| Fannie Mae 2.50% 2028 | 14,613 | 14,709 |
| Fannie Mae 2.50% 2028 | 7,881 | 7,929 |
| Fannie Mae 2.50% 2028 | 5,794 | 5,830 |
| Fannie Mae 3.00% 2028 | 166,209 | 170,520 |
| Fannie Mae 3.00% 2028 | 22,350 | 22,979 |
| Fannie Mae 3.50% 2028 | 86,650 | 90,306 |
| Fannie Mae 6.00% 2028 | 2,509 | 2,764 |
| Fannie Mae 6.00% 2028 | 1,280 | 1,410 |
| Bonds, notes & other debt instruments | | |
| | Principal amount | Value |
| Mortgage-backed obligations — Federal agency mortgage-backed obligations2 (continued) | (000) | (000) |
| | | |
| Fannie Mae, Series 1998-W5, Class B3, 6.50% 2028 | $ 1,225 | $ 1,163 |
| Fannie Mae, Series 2002-W7, Class A-5, 7.50% 2029 | 273 | 312 |
| Fannie Mae, Series 2001-25, Class ZA, 6.50% 2031 | 2,512 | 2,792 |
| Fannie Mae, Series 2001-20, Class E, 9.575% 20311 | 30 | 34 |
| Fannie Mae 6.50% 2032 | 126 | 136 |
| Fannie Mae 4.50% 2034 | 40,264 | 42,743 |
| Fannie Mae 6.50% 2034 | 819 | 926 |
| Fannie Mae 5.00% 2035 | 60,008 | 64,910 |
| Fannie Mae, Series 2005-68, Class PG, 5.50% 2035 | 2,812 | 3,092 |
| Fannie Mae, Series 2006-51, Class PO, principal only, 0% 2036 | 4,101 | 3,900 |
| Fannie Mae, Series 2006-32, Class OA, principal only, 0% 2036 | 3,379 | 3,120 |
| Fannie Mae, Series 2006-96, Class OP, principal only, 0% 2036 | 910 | 803 |
| Fannie Mae, Series 2006-101, Class PC, 5.50% 2036 | 2,795 | 3,081 |
| Fannie Mae, Series 2006-106, Class HG, 6.00% 2036 | 10,237 | 11,295 |
| Fannie Mae, Series 2006-43, Class PX, 6.00% 2036 | 6,815 | 7,495 |
| Fannie Mae 6.00% 2036 | 6,137 | 6,686 |
| Fannie Mae 6.00% 2036 | 3,134 | 3,416 |
| Fannie Mae 6.00% 2036 | 1,535 | 1,675 |
| Fannie Mae 6.50% 2036 | 5,130 | 5,726 |
| Fannie Mae 6.50% 2036 | 3,235 | 3,577 |
| Fannie Mae 7.00% 2036 | 849 | 980 |
| Fannie Mae 7.00% 2036 | 688 | 792 |
| Fannie Mae 7.50% 2036 | 359 | 409 |
| Fannie Mae 7.50% 2036 | 112 | 128 |
| Fannie Mae 8.00% 2036 | 417 | 477 |
| Fannie Mae 2.068% 20371 | 3,126 | 3,263 |
| Fannie Mae 2.662% 20371 | 2,569 | 2,736 |
| Fannie Mae 2.861% 20371 | 5,050 | 5,412 |
| Fannie Mae 3.257% 20371 | 5,271 | 5,539 |
| Fannie Mae 5.00% 2037 | 2,087 | 2,254 |
| Fannie Mae, Series 2007-40, Class PT, 5.50% 2037 | 10,880 | 12,069 |
| Fannie Mae 6.00% 2037 | 27,314 | 29,671 |
| Fannie Mae 6.00% 2037 | 25,293 | 27,510 |
| Fannie Mae 6.00% 2037 | 15,928 | 17,326 |
| Fannie Mae 6.00% 2037 | 3,875 | 4,210 |
| Fannie Mae 6.00% 2037 | 3,701 | 4,020 |
| Fannie Mae 6.00% 2037 | 3,186 | 3,374 |
| Fannie Mae 6.00% 2037 | 1,348 | 1,428 |
| Fannie Mae 6.00% 2037 | 1,040 | 1,133 |
| Fannie Mae 6.00% 2037 | 669 | 730 |
| Fannie Mae 6.50% 2037 | 5,665 | 6,299 |
| Fannie Mae 6.50% 2037 | 3,850 | 4,257 |
| Fannie Mae 6.50% 2037 | 3,186 | 3,460 |
| Fannie Mae 6.50% 2037 | 759 | 842 |
| Fannie Mae 7.00% 2037 | 1,773 | 1,989 |
| Fannie Mae 7.00% 2037 | 1,588 | 1,781 |
| Fannie Mae 7.00% 2037 | 1,004 | 1,129 |
| Fannie Mae 7.00% 2037 | 405 | 454 |
| Fannie Mae 7.00% 2037 | 245 | 280 |
| Fannie Mae 7.00% 2037 | 122 | 135 |
| Fannie Mae 7.50% 2037 | 658 | 750 |
| Fannie Mae 7.50% 2037 | 484 | 551 |
| Fannie Mae 7.50% 2037 | 413 | 470 |
| Fannie Mae 7.50% 2037 | 410 | 467 |
| Bonds, notes & other debt instruments | | |
| | Principal amount | Value |
| Mortgage-backed obligations — Federal agency mortgage-backed obligations2 (continued) | (000) | (000) |
| | | |
| Fannie Mae 7.50% 2037 | $ 317 | $ 362 |
| Fannie Mae 7.50% 2037 | 307 | 350 |
| Fannie Mae 7.50% 2037 | 306 | 348 |
| Fannie Mae 7.50% 2037 | 305 | 347 |
| Fannie Mae 7.50% 2037 | 283 | 322 |
| Fannie Mae 7.50% 2037 | 246 | 280 |
| Fannie Mae 7.50% 2037 | 234 | 267 |
| Fannie Mae 7.50% 2037 | 189 | 215 |
| Fannie Mae 7.50% 2037 | 126 | 140 |
| Fannie Mae 7.50% 2037 | 67 | 76 |
| Fannie Mae 7.50% 2037 | 26 | 30 |
| Fannie Mae 8.00% 2037 | 177 | 203 |
| Fannie Mae 8.00% 2037 | 119 | 137 |
| Fannie Mae 8.00% 2037 | 101 | 115 |
| Fannie Mae 2.63% 20381 | 2,044 | 2,196 |
| Fannie Mae 3.956% 20381 | 4,897 | 5,220 |
| Fannie Mae 5.352% 20381 | 482 | 509 |
| Fannie Mae 5.50% 2038 | 79 | 86 |
| Fannie Mae 6.00% 2038 | 75,723 | 82,384 |
| Fannie Mae 6.00% 2038 | 63,671 | 69,167 |
| Fannie Mae 6.00% 2038 | 3,034 | 3,300 |
| Fannie Mae 6.00% 2038 | 2,670 | 2,901 |
| Fannie Mae 6.00% 2038 | 402 | 437 |
| Fannie Mae 6.50% 2038 | 76,726 | 87,977 |
| Fannie Mae 3.49% 20391 | 3,502 | 3,687 |
| Fannie Mae 3.578% 20391 | 2,083 | 2,192 |
| Fannie Mae 3.588% 20391 | 9,364 | 9,878 |
| Fannie Mae 3.71% 20391 | 464 | 492 |
| Fannie Mae 3.775% 20391 | 2,454 | 2,592 |
| Fannie Mae 3.795% 20391 | 1,125 | 1,192 |
| Fannie Mae 3.857% 20391 | 3,022 | 3,209 |
| Fannie Mae 3.914% 20391 | 1,130 | 1,198 |
| Fannie Mae 3.935% 20391 | 1,378 | 1,456 |
| Fannie Mae 3.935% 20391 | 1,046 | 1,108 |
| Fannie Mae 3.967% 20391 | 5,579 | 5,947 |
| Fannie Mae 4.50% 2039 | 23,610 | 24,978 |
| Fannie Mae 5.00% 2039 | 20,749 | 22,886 |
| Fannie Mae 5.50% 2039 | 17,414 | 18,929 |
| Fannie Mae 5.50% 2039 | 2,636 | 2,867 |
| Fannie Mae 6.00% 2039 | 35,605 | 38,678 |
| Fannie Mae 3.20% 20401 | 26,265 | 27,354 |
| Fannie Mae 3.603% 20401 | 4,542 | 4,803 |
| Fannie Mae 4.00% 2040 | 35,807 | 37,320 |
| Fannie Mae 4.189% 20401 | 1,406 | 1,494 |
| Fannie Mae 4.408% 20401 | 5,373 | 5,730 |
| Fannie Mae 4.50% 2040 | 53,510 | 56,703 |
| Fannie Mae 4.50% 2040 | 6,035 | 6,395 |
| Fannie Mae 4.50% 2040 | 3,940 | 4,176 |
| Fannie Mae 4.50% 2040 | 2,689 | 2,849 |
| Fannie Mae 4.50% 2040 | 399 | 426 |
| Fannie Mae 5.00% 2040 | 27,453 | 29,988 |
| Fannie Mae 5.00% 2040 | 13,901 | 15,090 |
| Fannie Mae 5.00% 2040 | 2,436 | 2,697 |
| Fannie Mae 5.00% 2040 | 2,304 | 2,516 |
| Bonds, notes & other debt instruments | | |
| | Principal amount | Value |
| Mortgage-backed obligations — Federal agency mortgage-backed obligations2 (continued) | (000) | (000) |
| | | |
| Fannie Mae 5.00% 2040 | $ 1,836 | $ 1,998 |
| Fannie Mae 5.50% 2040 | 12,171 | 13,387 |
| Fannie Mae 5.50% 2040 | 1,102 | 1,212 |
| Fannie Mae 6.00% 2040 | 6,758 | 7,342 |
| Fannie Mae 2.921% 20411 | 3,208 | 3,304 |
| Fannie Mae 3.525% 20411 | 1,732 | 1,808 |
| Fannie Mae 3.562% 20411 | 11,012 | 11,493 |
| Fannie Mae 3.777% 20411 | 5,306 | 5,645 |
| Fannie Mae 4.00% 2041 | 20,963 | 21,950 |
| Fannie Mae 4.00% 2041 | 6,734 | 7,019 |
| Fannie Mae 4.00% 2041 | 5,077 | 5,291 |
| Fannie Mae 4.50% 2041 | 27,608 | 29,513 |
| Fannie Mae 4.50% 2041 | 25,865 | 27,408 |
| Fannie Mae 4.50% 2041 | 20,917 | 22,182 |
| Fannie Mae 4.50% 2041 | 20,466 | 21,877 |
| Fannie Mae 4.50% 2041 | 19,110 | 20,265 |
| Fannie Mae 4.50% 2041 | 9,665 | 10,355 |
| Fannie Mae 4.50% 2041 | 8,412 | 9,033 |
| Fannie Mae 4.50% 2041 | 7,994 | 8,571 |
| Fannie Mae 4.50% 2041 | 5,678 | 6,021 |
| Fannie Mae 4.50% 2041 | 1,382 | 1,466 |
| Fannie Mae 4.50% 2041 | 1,164 | 1,243 |
| Fannie Mae 5.00% 2041 | 17,999 | 19,600 |
| Fannie Mae 5.00% 2041 | 16,774 | 18,371 |
| Fannie Mae 5.00% 2041 | 15,787 | 17,299 |
| Fannie Mae 5.00% 2041 | 14,884 | 16,241 |
| Fannie Mae 5.00% 2041 | 12,924 | 14,086 |
| Fannie Mae 5.00% 2041 | 12,194 | 13,415 |
| Fannie Mae 5.00% 2041 | 11,504 | 12,656 |
| Fannie Mae 5.00% 2041 | 7,194 | 7,988 |
| Fannie Mae 5.00% 2041 | 5,565 | 6,190 |
| Fannie Mae 5.00% 2041 | 5,475 | 5,977 |
| Fannie Mae 5.00% 2041 | 3,587 | 3,989 |
| Fannie Mae 5.00% 2041 | 2,451 | 2,726 |
| Fannie Mae 5.00% 2041 | 2,306 | 2,565 |
| Fannie Mae 5.00% 2041 | 1,897 | 2,110 |
| Fannie Mae, Series 2001-T10, Class A-1, 7.00% 2041 | 3,283 | 3,896 |
| Fannie Mae, Series 2001-50, Class BA, 7.00% 2041 | 905 | 1,024 |
| Fannie Mae, Series 2002-W3, Class A-5, 7.50% 2041 | 1,837 | 2,166 |
| Fannie Mae 3.50% 2042 | 88,616 | 90,107 |
| Fannie Mae 3.50% 2042 | 43,369 | 44,085 |
| Fannie Mae 3.50% 2042 | 38,765 | 39,432 |
| Fannie Mae 3.50% 2042 | 29,758 | 30,250 |
| Fannie Mae 3.50% 2042 | 23,442 | 23,847 |
| Fannie Mae 3.50% 2042 | 20,410 | 20,749 |
| Fannie Mae 3.50% 2042 | 15,018 | 15,278 |
| Fannie Mae 3.50% 2042 | 14,136 | 14,376 |
| Fannie Mae 3.50% 2042 | 13,284 | 13,514 |
| Fannie Mae 3.50% 2042 | 12,282 | 12,498 |
| Fannie Mae 3.50% 2042 | 6,934 | 7,082 |
| Fannie Mae 3.50% 2042 | 6,937 | 7,060 |
| Fannie Mae 3.50% 2042 | 6,901 | 7,049 |
| Fannie Mae 3.50% 2042 | 4,613 | 4,693 |
| Fannie Mae 3.50% 2042 | 4,600 | 4,678 |
| Bonds, notes & other debt instruments | | |
| | Principal amount | Value |
| Mortgage-backed obligations — Federal agency mortgage-backed obligations2 (continued) | (000) | (000) |
| | | |
| Fannie Mae 3.50% 2042 | $ 4,466 | $ 4,543 |
| Fannie Mae 3.50% 2042 | 2,021 | 2,056 |
| Fannie Mae 3.50% 2042 | 1,157 | 1,177 |
| Fannie Mae 4.00% 2042 | 73,426 | 76,751 |
| Fannie Mae 4.00% 2042 | 42,152 | 44,157 |
| Fannie Mae 4.00% 2042 | 5,274 | 5,513 |
| Fannie Mae 4.00% 2042 | 3,306 | 3,455 |
| Fannie Mae, Series 2002-W1, Class 2A, 6.767% 20421 | 2,588 | 3,094 |
| Fannie Mae 3.00% 2043 | 142,400 | 139,129 |
| Fannie Mae 3.50% 2043 | 926,378 | 940,274 |
| Fannie Mae 3.50% 20438 | 34,577 | 35,172 |
| Fannie Mae 3.50% 2043 | 30,832 | 31,376 |
| Fannie Mae 3.50% 2043 | 23,797 | 24,217 |
| Fannie Mae 3.50% 20438 | 10,915 | 11,099 |
| Fannie Mae 3.50% 2043 | 5,000 | 5,022 |
| Fannie Mae 4.00% 2043 | 632,489 | 658,876 |
| Fannie Mae 4.00% 2043 | 201,500 | 209,465 |
| Fannie Mae 4.00% 2043 | 70,000 | 72,592 |
| Fannie Mae 4.50% 2043 | 250 | 265 |
| Fannie Mae 5.50% 2043 | 34,648 | 37,635 |
| Fannie Mae 6.00% 2043 | 17,200 | 18,697 |
| Fannie Mae 6.00% 2047 | 366 | 391 |
| Fannie Mae 6.50% 2047 | 201 | 222 |
| Fannie Mae 6.50% 2047 | 119 | 132 |
| Fannie Mae 7.00% 2047 | 630 | 702 |
| Fannie Mae 7.00% 2047 | 45 | 50 |
| Government National Mortgage Assn. 10.00% 2021 | 279 | 305 |
| Government National Mortgage Assn. 2.50% 2027 | 3,265 | 3,297 |
| Government National Mortgage Assn. 2.50% 2027 | 3,231 | 3,263 |
| Government National Mortgage Assn. 3.00% 2027 | 8,642 | 8,940 |
| Government National Mortgage Assn. 2.50% 2028 | 91,316 | 92,283 |
| Government National Mortgage Assn. 2.50% 2028 | 34,701 | 35,069 |
| Government National Mortgage Assn. 2.50% 2028 | 20,621 | 20,795 |
| Government National Mortgage Assn. 2.50% 2028 | 20,500 | 20,717 |
| Government National Mortgage Assn. 2.50% 2028 | 20,500 | 20,703 |
| Government National Mortgage Assn. 2.50% 2028 | 7,029 | 7,099 |
| Government National Mortgage Assn. 2.50% 2028 | 6,277 | 6,435 |
| Government National Mortgage Assn. 2.50% 2028 | 6,133 | 6,194 |
| Government National Mortgage Assn. 5.00% 2035 | 2,319 | 2,531 |
| Government National Mortgage Assn. 6.00% 2038 | 20,555 | 22,604 |
| Government National Mortgage Assn. 6.50% 2038 | 470 | 532 |
| Government National Mortgage Assn. 3.50% 2039 | 9,507 | 9,769 |
| Government National Mortgage Assn. 5.00% 2039 | 3,430 | 3,716 |
| Government National Mortgage Assn. 3.50% 2040 | 8,285 | 8,526 |
| Government National Mortgage Assn. 4.00% 2040 | 84,522 | 89,313 |
| Government National Mortgage Assn. 4.50% 2040 | 5,522 | 5,955 |
| Government National Mortgage Assn. 5.50% 2040 | 18,840 | 21,032 |
| Government National Mortgage Assn. 3.50% 2041 | 1,039 | 1,068 |
| Government National Mortgage Assn. 4.00% 2041 | 4,567 | 4,795 |
| Government National Mortgage Assn. 4.50% 2041 | 33,915 | 36,185 |
| Government National Mortgage Assn. 4.50% 2041 | 15,335 | 16,421 |
| Government National Mortgage Assn. 4.50% 2041 | 3,415 | 3,663 |
| Government National Mortgage Assn. 4.50% 2041 | 2,845 | 3,050 |
| Government National Mortgage Assn. 4.50% 2041 | 2,357 | 2,516 |
| Bonds, notes & other debt instruments | | |
| | Principal amount | Value |
| Mortgage-backed obligations — Federal agency mortgage-backed obligations2 (continued) | (000) | (000) |
| | | |
| Government National Mortgage Assn. 5.00% 2041 | $ 18,944 | $ 20,523 |
| Government National Mortgage Assn. 3.00% 2042 | 15,766 | 15,617 |
| Government National Mortgage Assn. 3.50% 2042 | 1,611 | 1,633 |
| Government National Mortgage Assn. 3.50% 2043 | 420,777 | 432,483 |
| Government National Mortgage Assn. 3.50% 2043 | 115,290 | 118,280 |
| Government National Mortgage Assn. 3.50% 2043 | 7,345 | 7,549 |
| Government National Mortgage Assn. 4.00% 2043 | 107,026 | 112,327 |
| Freddie Mac, Series K501, Class A1, multifamily 1.337% 2016 | 3,881 | 3,913 |
| Freddie Mac, Series K702, Class A1, multifamily 2.084% 2017 | 1,994 | 2,040 |
| Freddie Mac, Series K705, Class A2, multifamily 2.303% 2018 | 3,092 | 3,132 |
| Freddie Mac, Series K706, Class A2, multifamily 2.323% 2018 | 3,225 | 3,269 |
| Freddie Mac, Series K704, Class A2, multifamily 2.412% 2018 | 3,100 | 3,159 |
| Freddie Mac, Series K702, Class A2, multifamily 3.154% 2018 | 15,455 | 16,322 |
| Freddie Mac, Series K711, Class A2, multifamily 1.73% 2019 | 4,325 | 4,241 |
| Freddie Mac, Series K712, Class A2, multifamily 1.869% 2019 | 3,365 | 3,269 |
| Freddie Mac, Series K710, Class A2, multifamily 1.883% 2019 | 2,330 | 2,274 |
| Freddie Mac, Series K709, Class A2, multifamily 2.086% 2019 | 1,870 | 1,853 |
| Freddie Mac, Series 2890, Class KT, 4.50% 2019 | 2,500 | 2,699 |
| Freddie Mac 5.50% 2019 | 2,200 | 2,361 |
| Freddie Mac, Series K015, Class A1, multifamily 2.257% 2020 | 3,341 | 3,431 |
| Freddie Mac, Series K009, Class A1, multifamily 2.757% 2020 | 3,569 | 3,737 |
| Freddie Mac, Series K014, Class A1, multifamily 2.788% 2020 | 3,577 | 3,725 |
| Freddie Mac, Series K013, Class A1, multifamily 2.902% 2020 | 3,801 | 3,977 |
| Freddie Mac, Series K010, Class A1, multifamily 3.32% 20201 | 3,378 | 3,581 |
| Freddie Mac, Series K019, Class A1, multifamily 1.459% 2021 | 2,130 | 2,092 |
| Freddie Mac, Series K017, Class A2, multifamily 2.873% 2021 | 4,200 | 4,152 |
| Freddie Mac, Series KS01, Class A1, multifamily 1.693% 2022 | 952 | 938 |
| Freddie Mac, Series K023, Class A2, multifamily 2.307% 2022 | 34,990 | 32,736 |
| Freddie Mac, Series K022, Class A2, multifamily 2.355% 2022 | 4,325 | 4,069 |
| Freddie Mac, Series K020, Class A2, multifamily 2.373% 2022 | 32,600 | 30,737 |
| Freddie Mac, Series K021, Class A2, multifamily 2.396% 2022 | 40,350 | 38,042 |
| Freddie Mac, Series K024, Class A2, multifamily 2.573% 2022 | 5,500 | 5,262 |
| Freddie Mac, Series KS01, Class A2, multifamily 2.522% 2023 | 6,735 | 6,460 |
| Freddie Mac, Series K028, Class A2, multifamily 3.111% 2023 | 4,200 | 4,154 |
| Freddie Mac, Series 2626, Class NG, 3.50% 2023 | 177 | 184 |
| Freddie Mac 5.00% 2023 | 2,968 | 3,139 |
| Freddie Mac 5.00% 2023 | 107 | 114 |
| Freddie Mac 5.00% 2023 | 16 | 17 |
| Freddie Mac, Series 1617, Class PM, 6.50% 2023 | 673 | 748 |
| Freddie Mac 5.00% 2024 | 7,014 | 7,511 |
| Freddie Mac 6.00% 2026 | 5,514 | 6,069 |
| Freddie Mac 6.00% 2026 | 4,825 | 5,313 |
| Freddie Mac 5.50% 2027 | 3,093 | 3,344 |
| Freddie Mac 6.00% 2027 | 34,513 | 37,999 |
| Freddie Mac 4.50% 2029 | 1,478 | 1,564 |
| Freddie Mac, Series 2153, Class GG, 6.00% 2029 | 1,123 | 1,235 |
| Freddie Mac, Series 2122, Class QM, 6.25% 2029 | 1,853 | 2,066 |
| Freddie Mac 4.50% 2030 | 3,336 | 3,530 |
| Freddie Mac 2.695% 20351 | 5,239 | 5,575 |
| Freddie Mac 4.50% 2035 | 725 | 764 |
| Freddie Mac, Series 3061, Class PN, 5.50% 2035 | 14,650 | 16,015 |
| Freddie Mac, Series 3136, Class OP, principal only, 0% 2036 | 2,910 | 2,744 |
| Freddie Mac, Series 3147, Class OD, principal only, 0% 2036 | 2,259 | 2,185 |
| Freddie Mac, Series 3149, Class MO, principal only, 0% 2036 | 2,315 | 2,156 |
| Bonds, notes & other debt instruments | | |
| | Principal amount | Value |
| Mortgage-backed obligations — Federal agency mortgage-backed obligations2 (continued) | (000) | (000) |
| | | |
| Freddie Mac, Series 3149, Class AO, principal only, 0% 2036 | $ 2,030 | $ 1,978 |
| Freddie Mac, Series 3156, Class PO, principal only, 0% 2036 | 39 | 36 |
| Freddie Mac 4.50% 2036 | 2,889 | 3,045 |
| Freddie Mac 4.50% 2036 | 1,521 | 1,600 |
| Freddie Mac, Series 3257, Class PA, 5.50% 2036 | 21,812 | 23,649 |
| Freddie Mac, Series 3233, Class PA, 6.00% 2036 | 16,894 | 18,607 |
| Freddie Mac, Series 3156, Class NG, 6.00% 2036 | 5,304 | 5,896 |
| Freddie Mac 1.87% 20371 | 2,181 | 2,283 |
| Freddie Mac 2.189% 20371 | 4,462 | 4,731 |
| Freddie Mac 4.50% 2037 | 13,878 | 14,629 |
| Freddie Mac 4.50% 2037 | 2,323 | 2,448 |
| Freddie Mac, Series 3286, Class JN, 5.50% 2037 | 21,044 | 22,861 |
| Freddie Mac, Series 3318, Class JT, 5.50% 2037 | 11,678 | 12,679 |
| Freddie Mac, Series 3312, Class PA, 5.50% 2037 | 11,213 | 12,181 |
| Freddie Mac 5.50% 2037 | 5,387 | 5,796 |
| Freddie Mac 5.50% 2037 | 206 | 222 |
| Freddie Mac 5.50% 2037 | 38 | 41 |
| Freddie Mac 5.74% 20371 | 2,229 | 2,402 |
| Freddie Mac, Series 3271, Class OA, 6.00% 2037 | 7,575 | 8,455 |
| Freddie Mac 7.00% 2037 | 163 | 182 |
| Freddie Mac 7.00% 2037 | 138 | 155 |
| Freddie Mac 7.50% 2037 | 1,401 | 1,571 |
| Freddie Mac 2.838% 20381 | 7,218 | 7,629 |
| Freddie Mac 4.50% 2038 | 2,751 | 2,904 |
| Freddie Mac 4.975% 20381 | 2,647 | 2,792 |
| Freddie Mac 5.137% 20381 | 4,911 | 5,237 |
| Freddie Mac 5.50% 2038 | 18,375 | 19,740 |
| Freddie Mac 5.50% 2038 | 5,149 | 5,545 |
| Freddie Mac 5.50% 2038 | 4,473 | 4,805 |
| Freddie Mac 5.50% 2038 | 4,134 | 4,441 |
| Freddie Mac 5.50% 2038 | 2,362 | 2,614 |
| Freddie Mac 5.50% 2038 | 2,162 | 2,323 |
| Freddie Mac 5.50% 2038 | 1,903 | 2,044 |
| Freddie Mac 5.50% 2038 | 1,389 | 1,492 |
| Freddie Mac 5.50% 2038 | 886 | 952 |
| Freddie Mac 5.50% 2038 | 524 | 563 |
| Freddie Mac 6.00% 2038 | 14,262 | 15,469 |
| Freddie Mac 3.722% 20391 | 3,419 | 3,674 |
| Freddie Mac 4.50% 2039 | 22,026 | 23,189 |
| Freddie Mac 4.50% 2039 | 12,937 | 13,621 |
| Freddie Mac 4.50% 2039 | 3,372 | 3,550 |
| Freddie Mac 4.50% 2039 | 2,842 | 2,990 |
| Freddie Mac 4.50% 2039 | 961 | 1,012 |
| Freddie Mac 4.50% 2039 | 263 | 277 |
| Freddie Mac 5.00% 2039 | 22,728 | 24,262 |
| Freddie Mac 5.50% 2039 | 24,358 | 26,262 |
| Freddie Mac 5.50% 2039 | 11,765 | 12,639 |
| Freddie Mac 4.50% 2040 | 56,262 | 59,334 |
| Freddie Mac 4.50% 2040 | 5,002 | 5,327 |
| Freddie Mac 4.50% 2040 | 2,844 | 2,997 |
| Freddie Mac 4.50% 2040 | 2,511 | 2,646 |
| Freddie Mac 4.50% 2040 | 2,005 | 2,113 |
| Freddie Mac 4.50% 2040 | 303 | 319 |
| Freddie Mac 5.50% 2040 | 490 | 527 |
| Bonds, notes & other debt instruments | | |
| | Principal amount | Value |
| Mortgage-backed obligations — Federal agency mortgage-backed obligations2 (continued) | (000) | (000) |
| | | |
| Freddie Mac 5.50% 2040 | $ 20 | $ 22 |
| Freddie Mac 4.50% 2041 | 18,335 | 19,604 |
| Freddie Mac 4.50% 2041 | 16,579 | 17,330 |
| Freddie Mac 4.50% 2041 | 10,133 | 10,839 |
| Freddie Mac 4.50% 2041 | 7,177 | 7,556 |
| Freddie Mac 4.50% 2041 | 7,088 | 7,462 |
| Freddie Mac 4.50% 2041 | 5,662 | 5,967 |
| Freddie Mac 4.50% 2041 | 3,331 | 3,517 |
| Freddie Mac 4.50% 2041 | 2,868 | 3,028 |
| Freddie Mac 4.50% 2041 | 2,391 | 2,525 |
| Freddie Mac 4.50% 2041 | 2,244 | 2,369 |
| Freddie Mac 4.50% 2041 | 1,556 | 1,642 |
| Freddie Mac 4.50% 2041 | 986 | 1,047 |
| Freddie Mac 4.50% 2041 | 750 | 791 |
| Freddie Mac 5.00% 2041 | 16,949 | 18,376 |
| Freddie Mac 5.00% 2041 | 11,432 | 12,415 |
| Freddie Mac 5.00% 2041 | 10,378 | 11,501 |
| Freddie Mac 5.00% 2041 | 7,700 | 8,359 |
| Freddie Mac 5.00% 2041 | 5,691 | 6,207 |
| Freddie Mac 5.50% 2041 | 16,031 | 17,222 |
| Freddie Mac 2.563% 20421 | 6,981 | 7,013 |
| Freddie Mac 2.586% 20421 | 3,308 | 3,372 |
| Freddie Mac 4.50% 2042 | 26,948 | 28,355 |
| Freddie Mac 2.355% 20431 | 13,799 | 13,634 |
| Freddie Mac 2.438% 20431 | 6,833 | 6,803 |
| Freddie Mac 3.50% 2043 | 19,750 | 20,000 |
| Freddie Mac 6.50% 2047 | 316 | 345 |
| Freddie Mac 7.00% 2047 | 277 | 309 |
| National Credit Union Administration, Series 2011-M1, Class A2, 1.40% 2015 | 1,368 | 1,390 |
| National Credit Union Administration, Series 2010-R2, Class 1A, 0.563% 20171 | 1,772 | 1,778 |
| National Credit Union Administration, Series 2011-R3, Class 1A, 0.593% 20201 | 1,794 | 1,801 |
| National Credit Union Administration, Series 2011-R1, Class 1A, 0.643% 20201 | 2,028 | 2,038 |
| FDIC Structured Sale Guaranteed Notes, Series 2010-S1, Class 1-A, 0.744% 20481,4 | 325 | 325 |
| | | 7,349,476 |
| | | |
| Commercial mortgage-backed securities2 3.32% | | |
| | | |
| J.P. Morgan Chase Commercial Mortgage Securities Corp., Series 2004-CBX, Class A-5, 4.654% 2037 | 1,841 | 1,858 |
| J.P. Morgan Chase Commercial Mortgage Securities Corp., Series 2005-CIBC12, Class A-3B, 5.462% 20371 | 10,531 | 10,813 |
| J.P. Morgan Chase Commercial Mortgage Securities Corp., Series 2005-LDP3, Class A-4A, 4.936% 20421 | 1,655 | 1,769 |
| J.P. Morgan Chase Commercial Mortgage Securities Corp., Series 2006-CB15, Class A-4, 5.814% 20431 | 11,600 | 12,768 |
| J.P. Morgan Chase Commercial Mortgage Securities Corp., Series 2005-LDP5, Class A-2, 5.198% 2044 | 4,728 | 4,750 |
| J.P. Morgan Chase Commercial Mortgage Securities Corp., Series 2006-LDP7, Class A-4, 6.056% 20451 | 47,285 | 52,300 |
| J.P. Morgan Chase Commercial Mortgage Securities Corp., Series 2011-C3A, Class A-2, 3.673% 20464 | 43,400 | 46,039 |
| J.P. Morgan Chase Commercial Mortgage Securities Corp., Series 2005-LDP1, Class A-2, 4.625% 2046 | 1,918 | 1,932 |
| J.P. Morgan Chase Commercial Mortgage Securities Corp., Series 2007-CB19, Class A-4, 5.901% 20491 | 37,697 | 42,445 |
| J.P. Morgan Chase Commercial Mortgage Securities Corp., Series 2007-C1, Class A-4, 5.716% 2051 | 15,660 | 17,567 |
| J.P. Morgan Chase Commercial Mortgage Securities Corp., Series 2007-LD12, Class A-M, 6.197% 20511 | 4,565 | 4,955 |
| Greenwich Capital Commercial Funding Corp., Series 2005-GG5, Class A-4-1, 5.243% 20371 | 15,000 | 14,975 |
| Greenwich Capital Commercial Funding Corp., Series 2006-GG7, Class A-4, 6.056% 20381 | 13,465 | 14,961 |
| Greenwich Capital Commercial Funding Corp., Series 2007-GG9, Class A-4, 5.444% 2039 | 43,820 | 48,615 |
| Greenwich Capital Commercial Funding Corp., Series 2007-GG11, Class A-M, 5.867% 20491 | 16,835 | 18,088 |
| CS First Boston Mortgage Securities Corp., Series 2004-C5, Class A-3, 4.499% 2037 | 6,007 | 6,181 |
| CS First Boston Mortgage Securities Corp., Series 2005-C3, Class A-AB, 4.614% 2037 | 6,916 | 7,072 |
| CS First Boston Mortgage Securities Corp., Series 2004-C1, Class E, 5.015% 20374 | 8,240 | 8,361 |
| Bonds, notes & other debt instruments | | |
| | Principal amount | Value |
| Mortgage-backed obligations — Commercial mortgage-backed securities2 (continued) | (000) | (000) |
| | | |
| CS First Boston Mortgage Securities Corp., Series 2005-C5, Class A-AB, 5.10% 20381 | $ 5,086 | $ 5,142 |
| CS First Boston Mortgage Securities Corp., Series 2006-C5, Class A-3, 5.311% 2039 | 25,026 | 27,571 |
| CS First Boston Mortgage Securities Corp., Series 2006-C5, Class A-M, 5.343% 2039 | 1,275 | 1,353 |
| CS First Boston Mortgage Securities Corp., Series 2006-C4, Class A-3, 5.467% 2039 | 481 | 531 |
| CS First Boston Mortgage Securities Corp., Series 2006-C1, Class A-3, 5.569% 20391 | 4,852 | 4,881 |
| CS First Boston Mortgage Securities Corp., Series 2007-C5, Class A4, 5.695% 20401 | 15,187 | 17,032 |
| CS First Boston Mortgage Securities Corp., Series 2007-C2, Class A-M, 5.615% 20491 | 12,473 | 13,287 |
| Wachovia Bank Commercial Mortgage Trust, Series 2005-C18, Class A-PB, 4.807% 2042 | 1,019 | 1,045 |
| Wachovia Bank Commercial Mortgage Trust, Series 2005-C20, Class A-7, 5.118% 20421 | 9,605 | 10,273 |
| Wachovia Bank Commercial Mortgage Trust, Series 2007-C30, Class A-5, 5.342% 2043 | 7,801 | 8,695 |
| Wachovia Bank Commercial Mortgage Trust, Series 2005-C22, Class A-PB, 5.47% 20441 | 4,417 | 4,549 |
| Wachovia Bank Commercial Mortgage Trust, Series 2006-C26, Class A-M, 6.187% 20451 | 1,155 | 1,269 |
| Wachovia Bank Commercial Mortgage Trust, Series 2007-C31, Class A-5, 5.50% 2047 | 4,900 | 5,511 |
| Wachovia Bank Commercial Mortgage Trust, Series 2007-C31, Class A-M, 5.591% 20471 | 22,270 | 23,668 |
| Wachovia Bank Commercial Mortgage Trust, Series 2007-C32, Class A-3, 5.937% 20491 | 15,250 | 17,127 |
| Wachovia Bank Commercial Mortgage Trust, Series 2007-C33, Class A-M, 6.122% 20511 | 1,500 | 1,631 |
| LB-UBS Commercial Mortgage Trust, Series 2005-C7, Class A-2, 5.103% 2030 | 84 | 84 |
| LB-UBS Commercial Mortgage Trust, Series 2005-C7, Class A-4, 5.197% 20301 | 4,000 | 4,295 |
| LB-UBS Commercial Mortgage Trust, Series 2007-C2, Class A-3, 5.43% 2040 | 6,100 | 6,714 |
| LB-UBS Commercial Mortgage Trust, Series 2007-C2, Class A-M, 5.493% 20401 | 2,500 | 2,568 |
| LB-UBS Commercial Mortgage Trust, Series 2007-C6, Class A-M, 6.114% 20401 | 35,467 | 38,662 |
| LB-UBS Commercial Mortgage Trust, Series 2007-C7, Class A-M, 6.425% 20451 | 8,680 | 9,775 |
| ML-CFC Commercial Mortgage Trust, Series 2006-4, Class A-3, 5.172% 20491 | 41,210 | 45,170 |
| ML-CFC Commercial Mortgage Trust, Series 2006-4, Class A-M 5.204% 20491 | 4,425 | 4,775 |
| ML-CFC Commercial Mortgage Trust, Series 2007-8, Class A-3, 6.093% 20491 | 8,660 | 9,836 |
| DBUBS Mortgage Trust, Series 2011-LC1A, Class A1, 3.742% 20464 | 53,993 | 57,147 |
| J.P. Morgan Chase Commercial Mortgage Securities Trust, Series 2006-LDP8, Class A-4, 5.399% 2045 | 7,500 | 8,264 |
| J.P. Morgan Chase Commercial Mortgage Securities Trust, Series 2006-LDP8, Class A-M, 5.44% 2045 | 2,626 | 2,874 |
| J.P. Morgan Chase Commercial Mortgage Securities Trust, Series 2006-LDP8, Class A-J, 5.48% 20451 | 5,200 | 5,254 |
| J.P. Morgan Chase Commercial Mortgage Securities Trust, Series 2006-LDP9, Class A-M, 5.372% 2047 | 33,885 | 35,846 |
| Citigroup-Deutsche Bank Commercial Mortgage Trust, Series 2005-CD1, Class A-4, 5.392% 20441 | 23,005 | 24,748 |
| Citigroup-Deutsche Bank Commercial Mortgage Trust, Series 2006-CD3, Class A-5, 5.617% 2048 | 22,711 | 25,048 |
| J.P. Morgan Chase Commercial Mortgage Securities Trust, Series 2006-LDP6, Class A-4, 5.475% 20431 | 40,860 | 44,806 |
| Merrill Lynch Mortgage Trust, Series 2005-CKI1, Class AM, 5.458% 20371 | 4,620 | 4,978 |
| Merrill Lynch Mortgage Trust, Series 2004-BPC1, Class A-5, 4.855% 20411 | 6,750 | 7,022 |
| Merrill Lynch Mortgage Trust, Series 2005-MCP1, Class AM, 4.805% 20431 | 6,300 | 6,547 |
| Merrill Lynch Mortgage Trust, Series 2006-C2, Class A-4, 5.742% 20431 | 10,250 | 11,397 |
| Merrill Lynch Mortgage Trust, Series 2007-C1, Class A-4, 6.038% 20501 | 12,509 | 14,101 |
| Morgan Stanley Capital I Trust, Series 2007-IQ13, Class A-M, 5.406% 2044 | 13,600 | 14,611 |
| Morgan Stanley Capital I Trust, Series 2007-IQ15, Class A-4, 6.09% 20491 | 25,038 | 28,275 |
| Banc of America Commercial Mortgage Inc., Series 2005-3, Class A-2, 4.501% 2043 | 136 | 140 |
| Banc of America Commercial Mortgage Inc., Series 2006-3, Class A-4, 5.889% 20441 | 11,014 | 12,248 |
| Banc of America Commercial Mortgage Inc., Series 2005-5, Class A-4, 5.115% 20451 | 2,500 | 2,686 |
| Banc of America Commercial Mortgage Inc., Series 2007-2, Class A-M, 5.803% 20491 | 4,083 | 4,502 |
| Banc of America Commercial Mortgage Inc., Series 2007-3, Class A-4, 5.857% 20491 | 3,615 | 4,064 |
| Banc of America Commercial Mortgage Inc., Series 2007-4, Class A-M, 6.002% 20511 | 8,145 | 8,838 |
| Banc of America Commercial Mortgage Inc., Series 2008-1, Class A-4, 6.395% 20511 | 6,220 | 7,161 |
| L.A. Arena Funding, LLC, Series 1, Class A, 7.656% 20264 | 32,973 | 37,105 |
| Crown Castle Towers LLC, Series 2010-1, Class C, 4.523% 20354 | 2,000 | 2,100 |
| Crown Castle Towers LLC, Series 2010-5, Class C, 4.174% 20374 | 20,000 | 21,151 |
| Crown Castle Towers LLC, Series 2010-2, Class C, 5.495% 20374 | 10,000 | 11,250 |
| Bear Stearns Commercial Mortgage Securities Trust, Series 2007-PW17, Class A-4, 5.694% 20501 | 7,791 | 8,859 |
| Citigroup Commercial Mortgage Trust, Series 2008-C7, Class A-M, 6.339% 20491 | 7,468 | 8,236 |
| Bear Stearns Commercial Mortgage Securities Trust, Series 2007-PW18, Class A-M, 6.084% 20501 | 5,730 | 6,396 |
| Bonds, notes & other debt instruments | | |
| | Principal amount | Value |
| Mortgage-backed obligations — Commercial mortgage-backed securities2 (continued) | (000) | (000) |
| | | |
| Greenwich Capital Commercial Funding Corp., Series 2005-GG5, Class A-M, 5.277% 20371 | $ 2,000 | $ 2,129 |
| GS Mortgage Securities Corp. II, Series 2007-GG10, Class A-4, 5.982% 20451 | 1,000 | 1,118 |
| | | 1,009,794 |
| | | |
| Other mortgage-backed securities2 0.63% | | |
| | | |
| Bank of Montreal 1.30% 20144 | 4,000 | 4,042 |
| Bank of Montreal 2.85% 20154 | 17,000 | 17,708 |
| Bank of Montreal 2.625% 20164 | 4,250 | 4,435 |
| Royal Bank of Canada 3.125% 20154 | 18,160 | 18,930 |
| Westpac Banking Corp. 1.375% 20154 | 4,325 | 4,378 |
| Westpac Banking Corp. 2.45% 20164 | 4,325 | 4,487 |
| Westpac Banking Corp. 1.25% 20174 | 4,425 | 4,311 |
| Westpac Banking Corp. 1.375% 20184 | 4,375 | 4,233 |
| Bank of Nova Scotia 1.25% 20144 | 4,000 | 4,040 |
| Bank of Nova Scotia 2.15% 20164 | 4,650 | 4,803 |
| Bank of Nova Scotia 1.75% 20174 | 4,150 | 4,225 |
| Swedbank AB 2.125% 20164 | 3,400 | 3,482 |
| Swedbank AB 2.95% 20164 | 3,000 | 3,141 |
| Swedbank AB 1.375% 20184 | 4,375 | 4,232 |
| DEPFA ACS Bank 5.125% 20374 | 10,405 | 9,045 |
| Australia & New Zealand Banking Group Ltd. 1.00% 20154 | 4,250 | 4,266 |
| Australia & New Zealand Banking Group Ltd. 2.40% 20164 | 4,250 | 4,401 |
| UBS AG 1.875% 20154 | 4,200 | 4,277 |
| UBS AG 0.75% 20164 | 4,375 | 4,345 |
| Commonwealth Bank of Australia 0.75% 20164 | 3,850 | 3,821 |
| Commonwealth Bank of Australia 2.25% 20174 | 4,150 | 4,235 |
| Sparebank 1 Boligkreditt AS 2.625% 20174 | 3,400 | 3,531 |
| Sparebank 1 Boligkreditt AS 1.25% 20194 | 4,000 | 3,817 |
| Compagnie de Financement Foncier 2.25% 20144 | 6,500 | 6,568 |
| National Australia Bank 2.00% 20174 | 3,500 | 3,551 |
| National Australia Bank 1.25% 20184 | 2,880 | 2,799 |
| Credit Suisse Group AG 2.60% 20164 | 4,300 | 4,478 |
| Toronto-Dominion Bank 1.625% 20164 | 4,400 | 4,472 |
| HSBC Bank PLC 1.625% 20144 | 4,400 | 4,442 |
| Canadian Imperial Bank of Commerce 2.75% 20164 | 4,150 | 4,342 |
| National Bank of Canada 2.20% 20164 | 4,175 | 4,315 |
| Credit Mutuel-CIC Home Loan SFH 1.50% 20174 | 4,400 | 4,281 |
| DnB NOR ASA 1.45% 20194 | 4,375 | 4,251 |
| Skandinaviska Enskilda 1.375% 20184 | 4,375 | 4,218 |
| Stadshypotek AB 1.875% 20194 | 4,275 | 4,092 |
| Nordea Eiendomskreditt AS 2.125% 20174 | 4,000 | 4,092 |
| Barclays Bank PLC 2.50% 20154 | 3,600 | 3,728 |
| Caisse Centrale Desjardins 1.60% 20174 | 3,375 | 3,403 |
| | | 191,217 |
| | | |
| Collateralized mortgage-backed obligations (privately originated)2 0.12% | | |
| | | |
| Residential Accredit Loans, Inc., Series 2005-QR1, Class A, 6.00% 2034 | 15,761 | 16,374 |
| TBW Mortgage-backed Trust, Series 2007-2, Class A-4-B, 0.613% 20371 | 15,822 | 12,634 |
| American General Mortgage Loan Trust, Series 2010-1A, Class A-1, 5.15% 20581,4 | 4,965 | 5,011 |
| CS First Boston Mortgage Securities Corp., Series 2002-30, Class I-A-1, 7.50% 2032 | 200 | 217 |
| CS First Boston Mortgage Securities Corp., Series 2002-34, Class I-A-1, 7.50% 2032 | 28 | 30 |
| CS First Boston Mortgage Securities Corp., Series 2003-21, Class V-A-1, 6.50% 2033 | 1,518 | 1,633 |
| | | |
| Bonds, notes & other debt instruments | | |
| | | |
| Mortgage-backed obligations — Collateralized mortgage-backed | Principal amount | Value |
| obligations (privately originated)2 (continued) | (000) | (000) |
| | | |
| CS First Boston Mortgage Securities Corp., Series 2003-29, Class V-A-1, 7.00% 2033 | $ 27 | $ 30 |
| | | 35,929 |
| | | 197,833 |
| Total mortgage-backed obligations | | 8,586,416 |
| U.S. Treasury bonds & notes 25.15% | | |
| U.S. Treasury 19.91% | | |
| | | |
| U.S. Treasury 0.125% 2013 | 2,635 | 2,635 |
| U.S. Treasury 3.125% 2013 | 78,030 | 78,425 |
| U.S. Treasury 2.25% 2014 | 70,000 | 71,318 |
| U.S. Treasury 2.625% 2014 | 149,260 | 153,172 |
| U.S. Treasury 0.25% 2015 | 209,200 | 208,821 |
| U.S. Treasury 0.25% 20159 | 50,000 | 49,917 |
| U.S. Treasury 1.875% 2015 | 40,055 | 41,257 |
| U.S. Treasury 4.00% 2015 | 97,300 | 103,141 |
| U.S. Treasury 0.25% 2016 | 14,000 | 13,863 |
| U.S. Treasury 0.50% 2016 | 75,000 | 74,669 |
| U.S. Treasury 1.00% 2016 | 211,010 | 212,386 |
| U.S. Treasury 1.50% 2016 | 156,675 | 160,427 |
| U.S. Treasury 1.75% 2016 | 25,000 | 25,780 |
| U.S. Treasury 2.00% 2016 | 95,000 | 98,634 |
| U.S. Treasury 2.375% 2016 | 100,000 | 104,876 |
| U.S. Treasury 2.625% 2016 | 55,640 | 58,677 |
| U.S. Treasury 4.625% 2016 | 26,800 | 30,202 |
| U.S. Treasury 5.125% 2016 | 36,625 | 41,309 |
| U.S. Treasury 7.50% 2016 | 69,875 | 85,422 |
| U.S. Treasury 0.75% 2017 | 50,290 | 49,665 |
| U.S. Treasury 0.875% 2017 | 503,500 | 501,063 |
| U.S. Treasury 1.00% 2017 | 616,656 | 617,063 |
| U.S. Treasury 2.75% 2017 | 54,850 | 58,493 |
| U.S. Treasury 3.25% 2017 | 93,480 | 101,353 |
| U.S. Treasury 4.625% 2017 | 77,550 | 87,813 |
| U.S. Treasury 8.75% 2017 | 25,000 | 32,394 |
| U.S. Treasury 0.625% 2018 | 215,676 | 208,447 |
| U.S. Treasury 0.75% 2018 | 44,200 | 43,002 |
| U.S. Treasury 0.75% 2018 | 40,000 | 39,024 |
| U.S. Treasury 1.00% 2018 | 119,225 | 117,115 |
| U.S. Treasury 1.375% 2018 | 31,270 | 31,269 |
| U.S. Treasury 2.375% 2018 | 20,000 | 20,972 |
| U.S. Treasury 3.50% 2018 | 96,700 | 106,383 |
| U.S. Treasury 1.00% 2019 | 100,000 | 95,561 |
| U.S. Treasury 1.125% 2019 | 125,000 | 121,247 |
| U.S. Treasury 1.25% 2019 | 36,000 | 35,229 |
| U.S. Treasury 8.125% 2019 | 25,000 | 34,456 |
| U.S. Treasury 1.125% 2020 | 64,600 | 61,504 |
| U.S. Treasury 1.375% 2020 | 199,020 | 191,919 |
| U.S. Treasury 8.75% 2020 | 11,530 | 16,821 |
| U.S. Treasury 2.00% 2021 | 2,195 | 2,155 |
| U.S. Treasury 8.00% 2021 | 40,000 | 57,964 |
| U.S. Treasury 1.625% 2022 | 370,335 | 345,341 |
| U.S. Treasury 1.75% 2023 | 110,478 | 103,359 |
| U.S. Treasury 7.125% 2023 | 50,000 | 70,553 |
| Bonds, notes & other debt instruments | | |
| | Principal amount | Value |
| U.S. Treasury bonds & notes — U.S. Treasury (continued) | (000) | (000) |
| | | |
| U.S. Treasury 6.875% 2025 | $ 77,500 | $ 110,892 |
| U.S. Treasury 6.00% 2026 | 35,075 | 47,061 |
| U.S. Treasury 6.50% 2026 | 27,800 | 39,077 |
| U.S. Treasury 6.375% 2027 | 4,500 | 6,296 |
| U.S. Treasury 5.25% 2028 | 64,000 | 81,310 |
| U.S. Treasury 5.50% 2028 | 155,000 | 201,609 |
| U.S. Treasury 6.25% 2030 | 11,435 | 16,193 |
| U.S. Treasury 5.375% 2031 | 12,250 | 15,953 |
| U.S. Treasury 4.50% 2036 | 69,707 | 83,033 |
| U.S. Treasury 3.50% 2039 | 10,000 | 10,166 |
| U.S. Treasury 4.375% 2039 | 23,000 | 26,975 |
| U.S. Treasury 3.875% 2040 | 39,610 | 42,828 |
| U.S. Treasury 3.75% 2041 | 110,066 | 116,240 |
| U.S. Treasury 3.00% 2042 | 9,451 | 8,617 |
| U.S. Treasury 3.125% 2042 | 89,800 | 84,117 |
| U.S. Treasury 2.875% 2043 | 296,535 | 262,549 |
| U.S. Treasury 3.125% 2043 | 145,495 | 135,844 |
| | | 6,053,856 |
| | | |
| U.S. Treasury inflation-protected securities10 5.24% | | |
| | | |
| U.S. Treasury Inflation-Protected Security 1.875% 2013 | 51,441 | 51,518 |
| U.S. Treasury Inflation-Protected Security 1.25% 2014 | 50,242 | 50,955 |
| U.S. Treasury Inflation-Protected Security 2.00% 2014 | 86,356 | 89,200 |
| U.S. Treasury Inflation-Protected Security 2.00% 2014 | 385,655 | 391,220 |
| U.S. Treasury Inflation-Protected Security 0.50% 2015 | 89,061 | 91,333 |
| U.S. Treasury Inflation-Protected Security 1.625% 2015 | 30,324 | 31,543 |
| U.S. Treasury Inflation-Protected Security 0.125% 2016 | 12,379 | 12,700 |
| U.S. Treasury Inflation-Protected Security 2.50% 2016 | 82,905 | 91,688 |
| U.S. Treasury Inflation-Protected Security 0.125% 2017 | 19,836 | 20,359 |
| U.S. Treasury Inflation-Protected Security 0.125% 2018 | 219,226 | 224,886 |
| U.S. Treasury Inflation-Protected Security 0.625% 2021 | 6,696 | 6,910 |
| U.S. Treasury Inflation-Protected Security 0.125% 2022 | 88,197 | 86,162 |
| U.S. Treasury Inflation-Protected Security 0.125% 2022 | 25,685 | 25,144 |
| U.S. Treasury Inflation-Protected Security 0.125% 2023 | 115,332 | 111,696 |
| U.S. Treasury Inflation-Protected Security 2.375% 2025 | 57,735 | 68,729 |
| U.S. Treasury Inflation-Protected Security 2.00% 2026 | 31,751 | 36,645 |
| U.S. Treasury Inflation-Protected Security 1.75% 2028 | 8,436 | 9,443 |
| U.S. Treasury Inflation-Protected Security 0.75% 2042 | 25,728 | 22,616 |
| U.S. Treasury Inflation-Protected Security 0.625% 2043 | 204,107 | 171,293 |
| | | 1,594,040 |
| Total U.S. Treasury bonds & notes | | 7,647,896 |
| Bonds & notes of governments & government agencies outside the U.S. 4.50% | | |
| | | |
| Polish Government 3.00% 201610 | PLN15,920 | 5,015 |
| Polish Government, Series 1017, 5.25% 2017 | 37,895 | 12,133 |
| Polish Government 6.375% 2019 | $36,085 | 42,177 |
| Polish Government 5.125% 2021 | 25,800 | 28,122 |
| Polish Government, Series 1021, 5.75% 2021 | PLN20,100 | 6,703 |
| Polish Government 5.00% 2022 | $12,700 | 13,684 |
| Polish Government 2.75% 202310 | PLN6,105 | 1,895 |
| Russian Federation 6.20% 2018 | RUB1,174,100 | 34,976 |
| Bonds, notes & other debt instruments | | |
| | Principal amount | Value |
| Bonds & notes of governments & government agencies outside the U.S. (continued) | (000) | (000) |
| | | |
| Russian Federation 7.50% 2018 | RUB403,000 | $12,680 |
| Russian Federation 5.00% 2020 | $23,900 | 25,645 |
| Russian Federation 7.50% 20302 | 27,423 | 32,175 |
| Russian Federation 7.50% 20302,4 | 108 | 127 |
| United Mexican States Government, Series M, 5.00% 2017 | MXN 47,500 | 3,680 |
| United Mexican States Government, Series M10, 7.75% 2017 | 80,000 | 6,823 |
| United Mexican States Government 3.50% 201710 | 121,328 | 10,117 |
| United Mexican States Government Global 5.95% 2019 | $5,170 | 5,943 |
| United Mexican States Government 4.00% 201910 | MXN148,565 | 12,752 |
| United Mexican States Government, Series M, 8.00% 2020 | 112,500 | 9,948 |
| United Mexican States Government, Series M, 6.50% 2021 | 172,500 | 14,104 |
| United Mexican States Government Global, Series A, 3.625% 2022 | $11,000 | 10,807 |
| United Mexican States Government, Series M20, 10.00% 2024 | MXN150,000 | 15,637 |
| United Mexican States Government 4.00% 204010 | 146,584 | 12,478 |
| Spanish Government 4.40% 2023 | €38,525 | 48,761 |
| Spanish Government 5.40% 2023 | 37,125 | 50,793 |
| Turkey (Republic of) 7.50% 2017 | $ 5,725 | 6,591 |
| Turkey (Republic of) 6.75% 2018 | 17,250 | 19,654 |
| Turkey (Republic of) 4.00% 202010 | TRY17,337 | 9,744 |
| Turkey (Republic of) 10.50% 2020 | 4,500 | 2,600 |
| Turkey (Republic of) 3.00% 202110 | 4,126 | 2,240 |
| Turkey (Republic of) 5.625% 2021 | $8,000 | 8,580 |
| Turkey (Republic of) 9.50% 2022 | TRY22,950 | 12,643 |
| Turkey (Republic of) 8.00% 2034 | $ 1,250 | 1,559 |
| Turkey (Republic of) 6.75% 2040 | 9,300 | 10,311 |
| Turkey (Republic of) 6.00% 2041 | 5,650 | 5,657 |
| Venezuela (Republic of) 8.50% 2014 | 245 | 244 |
| Venezuela (Republic of) 7.65% 2025 | 985 | 739 |
| Venezuela (Republic of) 9.25% 2027 | 42,690 | 36,287 |
| Venezuela (Republic of) 9.25% 2028 | 26,980 | 22,124 |
| Indonesia (Republic of) 5.875% 2020 | 6,800 | 7,395 |
| Indonesia (Republic of) 5.875% 20204 | 6,200 | 6,743 |
| Indonesia (Republic of) 3.75% 2022 | 10,150 | 9,566 |
| Indonesia (Republic of) 7.75% 2038 | 18,400 | 22,816 |
| Indonesia (Republic of) 5.25% 2042 | 6,900 | 6,624 |
| France Government Agency-Guaranteed, Société Finance 2.875% 20144 | 33,200 | 34,161 |
| France Government Agency-Guaranteed, Société Finance 3.375% 20144 | 10,000 | 10,247 |
| Australia Government Agency-Guaranteed, Commonwealth Bank of Australia 2.90% 20144 | 23,005 | 23,707 |
| Australia Government Agency-Guaranteed, Commonwealth Bank of Australia 3.625% 20144 | 20,000 | 20,626 |
| Japanese Government, Series 296, 1.50% 2018 | ¥2,468,700 | 26,389 |
| Japanese Government, Series 29, 2.40% 2038 | 1,342,250 | 15,227 |
| JPMorgan Chase & Co., Brazil (Federal Republic of), Credit Linked Notes 6.00% 20148,10 | BRL 4,358 | 2,086 |
| Brazil (Federal Republic of) 10.00% 2017 | 20,015 | 8,722 |
| Brazil (Federal Republic of) 6.00% 201710 | 49,009 | 22,951 |
| Brazil (Federal Republic of) 6.00% 201810 | 6,748 | 3,231 |
| Brazil (Federal Republic of) 6.00% 202210 | 5,848 | 2,855 |
| Philippines (Republic of) 5.50% 2026 | $ 9,750 | 11,164 |
| Philippines (Republic of) 6.375% 2034 | 15,500 | 18,639 |
| Philippines (Republic of) 6.25% 2036 | PHP326,000 | 8,037 |
| Israeli Government 5.125% 2019 | $500 | 562 |
| Israeli Government, Series 5903, 4.00% 202110 | ILS31,908 | 10,770 |
| Israeli Government 4.00% 2022 | $18,624 | 18,975 |
| Israeli Government 3.15% 2023 | 5,000 | 4,692 |
| Bonds, notes & other debt instruments | | |
| | Principal amount | Value |
| Bonds & notes of governments & government agencies outside the U.S. (continued) | (000) | (000) |
| | | |
| New Zealand Government Agency-Guaranteed, Westpac Securities Co. 3.45% 20144 | $33,320 | $34,360 |
| South Africa (Republic of) 5.50% 2020 | 10,750 | 11,382 |
| South Africa (Republic of), Series R-2023, 7.75% 2023 | ZAR 97,790 | 9,989 |
| South Africa (Republic of), Series R-214, 6.50% 2041 | 147,400 | 11,509 |
| Lithuania (Republic of) 7.375% 2020 | $20,000 | 23,850 |
| Lithuania (Republic of) 6.625% 2022 | 3,700 | 4,264 |
| Lithuania (Republic of) 6.625% 20224 | 3,400 | 3,919 |
| Slovenia (Republic of) 5.50% 20224 | 3,000 | 2,768 |
| Slovenia (Republic of) 5.50% 2022 | 1,000 | 923 |
| Slovenia (Republic of) 5.85% 20234 | 25,150 | 23,452 |
| Iraq (Republic of) 5.80% 20282 | 28,450 | 23,827 |
| Colombia (Republic of) Global 12.00% 2015 | COP5,330,000 | 3,196 |
| Colombia (Republic of) Global 4.375% 2021 | $2,400 | 2,506 |
| Colombia (Republic of) Global 7.75% 2021 | COP 7,505,000 | 4,418 |
| Colombia (Republic of), Series B, 7.00% 2022 | 4,192,300 | 2,202 |
| Colombia (Republic of) Global 9.85% 2027 | 16,071,000 | 11,049 |
| Chilean Government 3.875% 2020 | $3,000 | 3,154 |
| Chilean Government 5.50% 2020 | CLP2,899,000 | 5,792 |
| Chilean Government 6.00% 2020 | 415,000 | 848 |
| Chilean Government 3.00% 202010 | 685,580 | 1,405 |
| Chilean Government 6.00% 2021 | 2,370,000 | 4,871 |
| Chilean Government 6.00% 2022 | 800,000 | 1,649 |
| Chilean Government 3.00% 202210 | 696,574 | 1,448 |
| Chilean Government 3.00% 202210 | 594,169 | 1,233 |
| Chilean Government 6.00% 2023 | 325,000 | 668 |
| Chilean Government 3.00% 202310 | 971,385 | 2,035 |
| South Korean Government 5.75% 2014 | $21,100 | 21,875 |
| Peru (Republic of) 8.75% 2033 | 8,226 | 12,010 |
| Peru (Republic of) 6.55% 20372 | 7,500 | 8,888 |
| Morocco Government 4.25% 2022 | 5,400 | 4,768 |
| Morocco Government 4.25% 20224 | 2,700 | 2,384 |
| Morocco Government 5.50% 2042 | 12,700 | 10,701 |
| Morocco Government 5.50% 20424 | 2,300 | 1,938 |
| Netherlands Government 1.00% 2017 | 18,300 | 18,259 |
| Latvia (Republic of) 2.75% 2020 | 18,500 | 17,205 |
| Uruguay (Republic of) 4.375% 20282,10 | UYU238,842 | 13,723 |
| Uruguay (Republic of) 7.625% 20362 | $ 1,250 | 1,584 |
| Hungarian Government 6.25% 2020 | 6,700 | 7,035 |
| Hungarian Government 5.375% 2023 | 8,500 | 8,235 |
| European Investment Bank 1.00% 2015 | 9,100 | 9,175 |
| European Investment Bank 1.00% 2017 | 5,000 | 4,871 |
| Argentina (Republic of) 7.00% 2015 | 1,285 | 1,099 |
| Argentina (Republic of) 8.28% 20332,6 | 21,767 | 12,353 |
| Nigerian Government 16.39% 2022 | NGN1,910,000 | 13,209 |
| Republic of Belarus 8.75% 2015 | $8,195 | 8,256 |
| Republic of Belarus 8.95% 2018 | 4,605 | 4,617 |
| Croatian Government 6.75% 2019 | 7,985 | 8,563 |
| Croatian Government 6.75% 20194 | 2,865 | 3,072 |
| Croatian Government 5.50% 20234 | 1,085 | 1,058 |
| KfW 1.00% 2015 | 8,400 | 8,460 |
| KfW 2.00% 2022 | 4,325 | 4,050 |
| Bermudan Government 5.603% 20204 | 5,675 | 6,186 |
| Bermudan Government 5.603% 2020 | 3,940 | 4,295 |
| Bonds, notes & other debt instruments | | |
| | Principal amount | Value |
| Bonds & notes of governments & government agencies outside the U.S. (continued) | (000) | (000) |
| | | |
| Bermudan Government 4.138% 20234 | $ 1,700 | $ 1,683 |
| Bahrain Government 5.50% 2020 | 10,440 | 10,584 |
| Bahrain Government 5.50% 20204 | 510 | 517 |
| State of Qatar 3.125% 20174 | 3,750 | 3,895 |
| State of Qatar 5.25% 2020 | 5,000 | 5,613 |
| State of Qatar 4.50% 20224 | 500 | 539 |
| Dominican Republic 9.04% 20182,4 | 4,481 | 4,929 |
| Dominican Republic 7.50% 20212,4 | 3,500 | 3,789 |
| Dominican Republic 7.50% 20212 | 950 | 1,028 |
| Caisse d’Amortissement de la Dette Sociale 1.625% 20154 | 4,000 | 4,078 |
| Caisse d’Amortissement de la Dette Sociale 2.00% 20204 | 5,000 | 4,840 |
| United Kingdom Government Agency-Guaranteed, Network Rail Infrastructure Ltd 1.50% 20144 | 8,000 | 8,054 |
| Aries Vermögensverwaltungs GmbH, Series C, 9.60% 2014 | 7,000 | 7,830 |
| Kommunalbanken 1.00% 20144 | 2,924 | 2,941 |
| Kommunalbanken 0.406% 20161,4 | 4,250 | 4,249 |
| Gabonese Republic 8.20% 2017 | 5,300 | 6,016 |
| Greek Government 2.00%/4.30% 20237 | €500 | 353 |
| Greek Government 2.00%/4.30% 20247 | 500 | 330 |
| Greek Government 2.00%/4.30% 20257 | 500 | 316 |
| Greek Government 2.00%/4.30% 20267 | 500 | 303 |
| Greek Government 2.00%/4.30% 20277 | 500 | 297 |
| Greek Government 2.00%/4.30% 20287 | 500 | 293 |
| Greek Government 2.00%/4.30% 20297 | 500 | 288 |
| Greek Government 2.00%/4.30% 20307 | 500 | 284 |
| Greek Government 2.00%/4.30% 20317 | 500 | 281 |
| Greek Government 2.00%/4.30% 20327 | 500 | 279 |
| Greek Government 2.00%/4.30% 20337 | 500 | 280 |
| Greek Government 2.00%/4.30% 20347 | 500 | 281 |
| Greek Government 2.00%/4.30% 20357 | 500 | 278 |
| Greek Government 2.00%/4.30% 20367 | 500 | 277 |
| Greek Government 2.00%/4.30% 20377 | 500 | 278 |
| Greek Government 2.00%/4.30% 20387 | 500 | 273 |
| Greek Government 2.00%/4.30% 20397 | 500 | 275 |
| Greek Government 2.00%/4.30% 20407 | 500 | 273 |
| Greek Government 2.00%/4.30% 20417 | 500 | 276 |
| Greek Government 2.00%/4.30% 20427 | 500 | 274 |
| El Salvador (Republic of) 7.375% 2019 | $4,800 | 5,316 |
| Portuguese Government 6.40% 2016 | €3,850 | 5,212 |
| Municipality Finance PLC 1.125% 20184 | $ 4,900 | 4,756 |
| FMS Wertmanagement 1.00% 2017 | 4,400 | 4,295 |
| Sri Lanka (Republic of) 6.25% 20214 | 3,400 | 3,383 |
| Panama (Republic of) Global 7.125% 2026 | 300 | 369 |
| Panama (Republic of) Global 8.875% 2027 | 250 | 347 |
| Panama (Republic of) Global 9.375% 2029 | 340 | 495 |
| Panama (Republic of) Global 6.70% 2036 | 1,504 | 1,756 |
| | | 1,369,222 |
| | | |
| Federal agency bonds & notes 2.88% | | |
| | | |
| Federal Home Loan Bank, Series 2753, 0.28% 2013 | 100,000 | 100,010 |
| Federal Home Loan Bank 3.625% 2013 | 75,000 | 75,788 |
| Federal Home Loan Bank 2.50% 2014 | 25,000 | 25,526 |
| Federal Home Loan Bank, Series 2816, 1.00% 2017 | 31,025 | 30,657 |
| Federal Home Loan Bank 2.75% 2018 | 16,635 | 17,681 |
| Bonds, notes & other debt instruments | | |
| | Principal amount | Value |
| Federal agency bonds & notes (continued) | (000) | (000) |
| | | |
| Federal Home Loan Bank 5.50% 2036 | $ 2,600 | $ 3,242 |
| Freddie Mac 0.50% 2014 | 12,400 | 12,442 |
| Freddie Mac 4.50% 2014 | 7,400 | 7,572 |
| Freddie Mac 5.00% 2014 | 25,000 | 26,250 |
| Freddie Mac 1.75% 2015 | 37,350 | 38,369 |
| Freddie Mac 2.50% 2016 | 15,200 | 15,964 |
| Freddie Mac 5.50% 2016 | 17,980 | 20,527 |
| Freddie Mac 1.00% 2017 | 3,425 | 3,395 |
| Freddie Mac 5.00% 2017 | 11,500 | 13,176 |
| Freddie Mac 4.875% 2018 | 13,365 | 15,461 |
| Freddie Mac 1.25% 2019 | 96,640 | 91,908 |
| Fannie Mae 0.75% 2013 | 99,300 | 99,552 |
| Fannie Mae 4.625% 2013 | 34,800 | 35,259 |
| Fannie Mae 0.50% 2016 | 21,940 | 21,786 |
| Fannie Mae 5.375% 2016 | 10,420 | 11,870 |
| Fannie Mae 6.25% 2029 | 400 | 527 |
| Fannie Mae: 7.125% 2030 | 9,300 | 13,318 |
| Tennessee Valley Authority, Series A, 5.50% 2017 | 1,500 | 1,743 |
| Tennessee Valley Authority, Series A, 3.875% 2021 | 4,125 | 4,513 |
| Tennessee Valley Authority 1.875% 2022 | 23,750 | 22,366 |
| Tennessee Valley Authority 4.65% 2035 | 4,000 | 4,297 |
| Tennessee Valley Authority 5.25% 2039 | 21,250 | 24,332 |
| Tennessee Valley Authority, Series B, 3.50% 2042 | 17,113 | 14,505 |
| Tennessee Valley Authority, Series 2008, Class A, 4.875% 2048 | 3,200 | 3,488 |
| Tennessee Valley Authority, Series A, 4.625% 2060 | 1,100 | 1,066 |
| CoBank, ACB 7.875% 20184 | 23,615 | 29,089 |
| CoBank, ACB 0.873% 20221,4 | 33,865 | 30,700 |
| Federal Farm Credit Banks, Consolidated Systemwide Designated Bonds, 1.625% 2014 | 33,700 | 34,333 |
| Federal Farm Credit Banks, Consolidated Systemwide Designated Bonds, 3.00% 2014 | 10,000 | 10,339 |
| Federal Agricultural Mortgage Corp. 5.125% 20174 | 5,000 | 5,687 |
| United States Agency for International Development, Republic of Egypt 4.45% 2015 | 5,000 | 5,427 |
| Private Export Funding Corp., Series W, 5.00% 2016 | 3,400 | 3,779 |
| | | 875,944 |
| | | |
| Municipals 0.74% | | |
| | | |
| State of California, Various Purpose General Obligation Bonds, 7.50% 2034 | 4,240 | 5,543 |
| State of California, Various Purpose General Obligation Bonds, 7.30% 2039 | 2,290 | 2,984 |
| State of California, Various Purpose General Obligation Bonds, 7.35% 2039 | 1,335 | 1,750 |
| State of California, Various Purpose General Obligation Bonds, 7.55% 2039 | 11,680 | 15,684 |
| State of California, Various Purpose General Obligation Bonds, 7.60% 2040 | 26,935 | 36,481 |
| State of California, Various Purpose General Obligation Bonds, 7.625% 2040 | 6,830 | 9,198 |
| State of Florida, Hurricane Catastrophe Fund Finance Corp., Revenue Bonds, Series 2013-A, 2.107% 2018 | 8,000 | 7,789 |
| State of Florida, Hurricane Catastrophe Fund Finance Corp., Revenue Bonds, Series 2013-A, 2.995% 2020 | 50,740 | 47,397 |
| State of Illinois, General Obligation Bonds, Build America Bonds, Series 2010-3, 5.727% 2020 | 17,000 | 18,238 |
| State of New York, Long Island Power Authority, Electric System General Revenue Refunding Bonds, | | |
| Series 2009-A, 5.75% 2039 | 14,330 | 16,034 |
| State of Illinois, Regional Transportation Authority of Cook, DuPage, Kane, Lake, McHenry and Will Counties, | | |
| General Obligation Revenue Refunding Bonds, Series 2003-A, FGIC-National insured, 6.00% 2033 | 12,120 | 14,377 |
| State of New Jersey, Transportation Trust Fund Authority, Transportation System Revenue Refunding Bonds, | | |
| Series 2013-B, 1.758% 2018 | 10,500 | 10,091 |
| State of Minnesota, Housing Finance Agency, Residential Housing Finance Bonds, Series 2013-A, | | |
| Alternative Minimum Tax, 3.00% 2031 | 2,295 | 2,371 |
| State of Minnesota, Housing Finance Agency, Homeownership Finance Bonds (GNMA and FNMA | | |
| Pass-Through Program), Series 2012-B, 2.25% 20422 | 7,518 | 7,360 |
| Bonds, notes & other debt instruments | | |
| | Principal amount | Value |
| Municipals (continued) | (000) | (000) |
| | | |
| State of Washington, Energy Northwest, Columbia Generating Station Electric Revenue Bonds, | | |
| Series 2012-E, 2.197% 2019 | $ 8,000 | $ 7,826 |
| State of New York, Metropolitan Transportation Authority, Dedicated Tax Fund Bonds (Build America Bonds), | | |
| Series 2009-C, 7.336% 2039 | 5,500 | 7,497 |
| State of Texas, SA Energy Acquisition Public Facility Corp., Gas Supply Revenue Bonds, Series 2007, 5.50% 2023 | 6,000 | 6,608 |
| State of Kentucky, Housing Corp., Housing Revenue Bonds, Series 2013-D, 3.50% 2033 | 2,250 | 2,373 |
| State of Nebraska, Investment Finance Authority, Single-family Housing Revenue Bonds, | | |
| Series 2013-A, 3.00% 2043 | 1,950 | 2,030 |
| State of North Dakota, Housing Finance Agency, Housing Finance Program Bonds (Home Mortgage | | |
| Finance Program), Series 2012-A, 3.75% 2042 | 1,650 | 1,764 |
| State of Maryland, Montgomery County Housing Opportunities Commission, Single-family Housing | | |
| Revenue Bonds, Series 2013-A, 4.00% 2031 | 1,000 | 1,047 |
| State of Illinois, Housing Development Authority, Housing Revenue Bonds, Series 2013-A, 2.45% 20432 | 820 | 807 |
| State of Maryland, Howard Hughes Medical Institute, Taxable Bonds, 3.45% 2014 | 125 | 129 |
| | | 225,378 |
| | | |
| Asset-backed obligations2 0.74% | | |
| | | |
| Hertz Vehicle Financing LLC, Rental Car Asset-backed Notes, Series 2009-2A, Class A-2, 5.29% 20164 | 17,500 | 18,584 |
| Hertz Vehicle Financing LLC, Rental Car Asset-backed Notes, Series 2013-1A, Class A-1, 1.12% 20174 | 11,075 | 10,973 |
| Hertz Vehicle Financing LLC, Rental Car Asset-backed Notes, Series 2010-1A, Class A-2, 3.74% 20174 | 4,500 | 4,729 |
| Hertz Vehicle Financing LLC, Rental Car Asset-backed Notes, Series 2013-1A, Class A-2, 1.83% 20194 | 15,000 | 14,634 |
| Aesop Funding II LLC, Series 2010-2A, Class A, 3.63% 20144 | 4,133 | 4,145 |
| Aesop Funding II LLC, Series 2010-5A, Class A, 3.15% 20174 | 20,000 | 20,868 |
| Aesop Funding II LLC, Series 2013-1A, Class A, 1.92% 20194 | 5,225 | 5,097 |
| CWHEQ Revolving Home Equity Loan Trust, Series 2005-C, Class 2-A, FSA insured, 0.373% 20351 | 9,297 | 7,990 |
| CWHEQ Revolving Home Equity Loan Trust, Series 2006-I, Class 2-A, FSA insured, 0.333% 20371 | 10,416 | 8,609 |
| CWHEQ Revolving Home Equity Loan Trust, Series 2007-B, Class A, FSA insured, 0.343% 20371 | 15,726 | 13,218 |
| Vega ContainerVessel PLC, Series 2006-1, Class A, XLCA insured, 5.562% 20214,8 | 21,438 | 20,902 |
| AEP Texas Central Transitioning Funding II LLC, Secured Transition Bonds, Series A, Class A-3, 5.09% 2017 | 16,720 | 17,476 |
| Vanderbilt Mortgage and Finance, Inc., Series 2002-C, Class A-4, 6.57% 2024 | 3,029 | 3,134 |
| Vanderbilt Mortgage and Finance, Inc., Series 2000-C, Class A-5, 8.195% 2030 | 6,211 | 6,344 |
| Vanderbilt Mortgage and Finance, Inc., Series 2001-C, Class M-1, 6.76% 2032 | 438 | 444 |
| Vanderbilt Mortgage and Finance, Inc., Series 2002-C, Class M-1, 7.82% 2032 | 1,195 | 1,280 |
| Flagstar Home Equity Loan Trust, Series 2006-2A, Class A, FSA insured, 0.353% 20191,4 | 9,332 | 8,372 |
| Vanderbilt Acquisition Loan Trust, Series 2002-1, Class A-4, 6.57% 2027 | 4,081 | 4,272 |
| Vanderbilt Acquisition Loan Trust, Series 2002-1, Class A-5, 7.12% 2032 | 3,000 | 3,280 |
| IndyMac Home Equity Mortgage Loan Asset-backed Trust, Series 2007-H1, Class A-1, FSA insured, 0.353% 20371 | 8,150 | 6,913 |
| Lehman ABS Manufactured Housing Contract Trust, Series 2002-A, Class A, 0.643% 20331 | 2,519 | 2,437 |
| Lehman ABS Manufactured Housing Contract Trust, Series 2001-B, Class A-3, 4.35% 2040 | 1,129 | 1,184 |
| Lehman ABS Manufactured Housing Contract Trust, Series 2001-B, Class A-4, 5.27% 2040 | 579 | 620 |
| Lehman ABS Manufactured Housing Contract Trust, Series 2001-B, Class A-5, 5.873% 2040 | 1,901 | 2,064 |
| RAMP Trust, Series 2004-RS10, Class A-I-6, 4.55% 2034 | 6,110 | 6,182 |
| Home Equity Asset Trust, Series 2004-7, Class M-1, 1.123% 20351 | 6,500 | 5,996 |
| First Horizon ABS Trust, Series 2006-HE2, Class A, FSA insured, 0.323% 20261 | 335 | 289 |
| First Horizon ABS Trust, Series 2007-HE1, Class A, FSA insured, 0.323% 20291 | 5,777 | 5,310 |
| Conseco Finance Securitizations Corp., Series 2002-2, Class A-2, 6.03% 2033 | 3,169 | 3,270 |
| UCFC Manufactured Housing Contract, Series 1996-2, Class A, MBIA insured, 7.135% 2028 | 3,039 | 3,181 |
| Green Tree Financial Corp., Series 1997-6, Class A-7, 7.14% 2029 | 1,873 | 1,995 |
| Conseco Finance Home Equity Loan Trust, Series 2002-B, Class M-1, 1.943% 20331 | 808 | 783 |
| Origen Manufactured Housing Contract Trust, Series 2004-B, Class M-1, 5.73% 2035 | 1,327 | 1,402 |
| Origen Manufactured Housing Contract Trust, Series 2004-B, Class M-2, 6.51% 2035 | 1,063 | 1,158 |
| Ally Master Owner Trust, Series 2011-1, Class A2, 2.15% 2016 | 2,450 | 2,464 |
| SLM Student Loan Trust, Series 2003-10, Class A-4, 5.15% 20394 | £1,160 | 1,640 |
| Bonds, notes & other debt instruments | | |
| | Principal amount | Value |
| Asset-backed obligations2 (continued) | (000) | (000) |
| | | |
| World Omni Auto Receivables Trust, Series 2010-A, Class A-4, 2.21% 2015 | $1,150 | $ 1,156 |
| Residential Funding Mortgage Securities II, Inc., Series 2006-HSA3, Class A, FSA insured, 0.323% 20361 | 1,084 | 941 |
| Hyundai Auto Receivables Trust, Series 2011-A, Class A3, 1.16% 2015 | 874 | 876 |
| | | 224,212 |
| | | |
| Total bonds, notes & other debt instruments (cost: $28,861,362,000) | | 29,279,987 |
| Convertible securities 0.08% | | |
| | Shares or | |
| Industrials 0.04% | principal amount | |
| | | |
| CEVA Group PLC 3.273 % convertible notes 20231,4,6,8 | $9,268,397 | 11,242 |
| CEVA Group PLC, Series A-2, 2.268% convertible preferred8,11 | 2,576 | 2,337 |
| | | 13,579 |
| | | |
| Information technology 0.04% | | |
| | | |
| Linear Technology Corp., Series A, 3.00% convertible notes 2027 | $11,500,000 | 12,032 |
| Total convertible securities (cost: $23,915,000) | | 25,611 |
| Preferred securities 0.02% | | |
| | | Value |
| Financials 0.02% | Shares | (000) |
| | | |
| CoBank, ACB, Class E, noncumulative4 | 6,250 | 4,266 |
| Goldman Sachs Group, Inc., Series J, 5.50% depositary shares12 | 61,270 | 1,487 |
| | | 5,753 |
| | | |
| Total preferred securities (cost: $7,352,000) | | 5,753 |
| Common stocks 0.18% | | |
| | | |
| Industrials 0.12% | | |
| | | |
| Beech Holdings, LLC8,11,12 | 3,952,726 | 27,037 |
| CEVA Group PLC4,8,12 | 12,179 | 11,050 |
| Atrium Corp.4,8,12 | 985 | 1 |
| | | 38,088 |
| | | |
| Consumer discretionary 0.04% | | |
| | | |
| Revel AC Inc8,11,12 | 222,053 | 11,073 |
| American Media, Inc.4,8,12 | 453,779 | 1,261 |
| | | 12,334 |
| | | |
| Materials 0.02% | | |
| | | |
| NewPage Holdings Inc.8,11,12 | 45,840 | 4,688 |
| | | |
| Energy 0.00% | | |
| | | |
| General Maritime Corp.4,8,12 | 1,716 | 63 |
| Total common stocks (cost: $114,489,000) | | 55,173 |
| Warrants 0.00% | | |
| | | Value |
| Energy 0.00% | Shares | (000) |
| | | |
| General Maritime Corp., warrants, expire 20174,8,12 | 2,654 | $ 19 |
| Total warrants (cost: $671,000) | | 19 |
| | Principal amount | |
| Short-term securities 12.09% | (000) | |
| | | |
| Freddie Mac 0.085%–0.17% due 7/1/2013–5/13/2014 | $1,233,700 | 1,232,875 |
| Fannie Mae 0.06%–0.18% due 7/1/2013–4/21/2014 | 990,165 | 989,685 |
| Federal Home Loan Bank 0.05%–0.18% due 7/17/2013–6/19/2014 | 333,220 | 333,031 |
| U.S. Treasury Bills 0.10%–0.158% due 7/11–11/14/2013 | 176,000 | 175,976 |
| Federal Farm Credit Banks 0.13%–0.22% due 7/10–12/2/2013 | 120,000 | 119,976 |
| Private Export Funding Corp. 0.17%–0.245% due 7/18/2013–2/13/20144 | 115,200 | 115,099 |
| Procter & Gamble Co. 0.10%–0.14% due 8/13–11/5/20134 | 112,100 | 112,082 |
| Merck & Co. Inc. 0.08%–0.13% due 7/16–10/28/20134 | 109,000 | 108,986 |
| Abbott Laboratories 0.10%–0.13% due 7/9–8/19/20134 | 91,200 | 91,194 |
| National Rural Utilities Cooperative Finance Corp. 0.08%–0.10% due 7/3–7/15/2013 | 90,900 | 90,899 |
| Coca-Cola Co. 0.14%–0.15% due 7/12–10/23/20134 | 86,100 | 86,091 |
| Chariot Funding, LLC 0.28% due 7/15/20134 | 50,000 | 49,998 |
| Jupiter Securitization Co., LLC 0.25% due 10/4/20134 | 34,500 | 34,483 |
| Chevron Corp. 0.07% due 7/8/20134 | 50,000 | 49,999 |
| ExxonMobil Corp. 0.09% due 7/24/2013 | 50,000 | 49,997 |
| Wal-Mart Stores, Inc. 0.06% due 7/8/20134 | 24,100 | 24,100 |
| Regents of the University of California 0.13% due 8/1/2013 | 10,000 | 9,999 |
| Google Inc. 0.10% due 9/24/20134 | 2,100 | 2,099 |
| Total short-term securities (cost $3,676,675,000) | | 3,676,569 |
| Total investment securities (cost: $32,684,464,000) | | 33,043,112 |
| Other assets less liabilities | | (2,631,755) |
| Net assets | | $30,411,357 |
ITEM 7 – Disclosure of Proxy Voting Policies and Procedures for Closed-End Management Investment Companies
Not applicable to this Registrant, insofar as the Registrant is not a closed-end management investment company.
Not applicable to this Registrant, insofar as the Registrant is not a closed-end management investment company.
ITEM 9 – Purchases of Equity Securities by Closed-End Management Investment Company and Affiliated Purchasers
Not applicable to this Registrant, insofar as the Registrant is not a closed-end management investment company.
There have been no material changes to the procedures by which shareholders may recommend nominees to the Registrant’s board of trustees since the Registrant last submitted a proxy statement to its shareholders. The procedures are as follows. The Registrant has a nominating and governance committee comprised solely of persons who are not considered ‘‘interested persons’’ of the Registrant within the meaning of the Investment Company Act of 1940, as amended. The committee periodically reviews such issues as the board’s composition, responsibilities, committees, compensation and other relevant issues, and recommends any appropriate changes to the full board of trustees. While the committee normally is able to identify from its own resources an ample number of qualified candidates, it will consider shareholder suggestions of persons to be considered as nominees to fill future vacancies on the board. Such suggestions must be sent in writing to the nominating and governance committee of the Registrant, c/o the Registrant’s Secretary, and must be accompanied by complete biographical and occupational data on the prospective nominee, along with a written consent of the prospective nominee for consideration of his or her name by the nominating and governance committee.
Pursuant to the requirements of the Securities Exchange Act of 1934 and the Investment Company Act of 1940, the Registrant has duly caused this report to be signed on its behalf by the undersigned, thereunto duly authorized.
Pursuant to the requirements of the Securities Exchange Act of 1934 and the Investment Company Act of 1940, this report has been signed below by the following persons on behalf of the Registrant and in the capacities and on the dates indicated.