|
The Bond Fund
of America® Prospectus March 1, 2022 |  |
| |
| | | | | | | | | | | | |
| Class | A | C | T | F-1 | F-2 | F-3 | 529-A | 529-C | 529-E | 529-T | 529-F-1 |
| | ABNDX | BFACX | TBFFX | BFAFX | ABNFX | BFFAX | CFAAX | CFACX | CFAEX | TFBFX | CFAFX |
| Class | 529-F-2 | 529-F-3 | R-1 | R-2 | R-2E | R-3 | R-4 | R-5E | R-5 | R-6 | |
| | FFBOX | FBOFX | RBFAX | RBFBX | RBEBX | RBFCX | RBFEX | RBFHX | RBFFX | RBFGX | |
Table of contents
| |
| The U.S. Securities and Exchange Commission has not approved or disapproved of these securities. Further, it has not determined that this prospectus is accurate or complete. Any representation to the contrary is a criminal offense. |
Prospectus Supplement March 1, 2022 |  |
For the following funds with prospectuses dated
May 1, 2021 – March 1, 2022 (as supplemented to date)
AMCAP Fund® (AMCAP)
American Balanced Fund® (AMBAL) American Funds Developing World Growth and Income FundSM (DWGI)
American Funds Corporate Bond Fund®
(CBF)
American Funds Emerging Markets Bond Fund®(EMBF) American Funds Global Balanced FundSM (GBAL) American Funds Global Insight FundSM (GIF) American Funds Inflation Linked Bond Fund®
(ILBF)
American Funds International Vantage FundSM (IVE) American Funds Mortgage Fund® (AFMF)
American Funds Multi-Sector Income FundSM
(MSI)
American Funds Strategic Bond FundSM (SBF) American Funds U.S. Government Money Market FundSM (MMF) | | American High-Income Trust® (AHIT)
American Mutual Fund® (AMF) The Bond Fund of America® (BFA)
Capital Income Builder® (CIB)
Capital World Bond Fund® (WBF) Capital World Growth and Income Fund® (WGI) EuroPacific Growth Fund® (EUPAC)
Fundamental Investors® (FI) The Growth Fund of America® (GFA) The Income Fund of America® (IFA) Intermediate Bond Fund of America® (IBFA) International Growth and Income FundSM (IGI)
The Investment Company of America® (ICA) The New Economy Fund® (NEF) New Perspective Fund® (NPF) New World Fund® (NWF) Short-Term Bond Fund of America® (STBF) SMALLCAP World Fund® (SCWF) U.S. Government Securities Fund® (GVT) Washington Mutual Investors FundSM (WMIF) |
Changes apply to all funds unless otherwise noted below.
1. The following is added to the section titled “The Capital System” in the “Management and organization” section of the Capital Income Builder prospectus:
Charles E. Ellwein, Partner, Capital Research Global Investors, serves as an equity portfolio manager for the fund. Charles has 26 years of experience in total; 16 years with Capital Research and Management Company or affiliate. He has one year of experience in managing the fund (plus 9 years of prior experience as an investment analyst for the fund).
2. The following is added to the “Investment objective(s), strategies and risks” section of the prospectus for each of the funds listed above (other than AMBAL, BFA, EMBF, FI, ICA, MSI, SBF, WBF):
The investment adviser may consider environmental, social and governance (“ESG”) factors that, depending on the facts and circumstances, are material to the value of an issuer or instrument. ESG factors may include, but are not limited to, environmental-related events resulting from climate change or society’s response to environmental change, social conditions (e.g., labor relations, investment in human capital, accident prevention, changing customer behavior) or governance issues (e.g., board composition, significant breaches of international agreements, unsound business practices).
3. The information under “Northwestern Mutual Investment Services, LLC” in the “Appendix – Sales charge waivers” section of the prospectus is amended to read as follows:
Northwestern Mutual Investment Services, LLC
Rights of accumulation on SIMPLE IRAs held at Northwestern Mutual Investment Services, LLC
Effective March 31, 2022, for SIMPLE IRA plans where the plan is held on the Simple IRA platform at Northwestern Mutual Investment Services, LLC (NMIS) through its clearing firm, Pershing LLC, each linked participant account will be aggregated at either the plan level or the individual level for rights of accumulation (ROA), depending on which aggregation method results in a greater breakpoint discount on front-end sales charges for the participant.
Class A and C share purchases in owner-only 401(k) plans held at Northwestern Mutual Investment Services, LLC
For 401(k) plans held at NMIS through its clearing firm, Pershing LLC, that cover only owners and their spouses and are not subject to ERISA, participants may purchase Class A shares with the applicable front-end sales charge or Class C shares with the applicable contingent deferred sales charge, in accordance with NMIS’s share class policies applicable to such plans.
4. The information under “Robert W. Baird & Co. Incorporated (Baird)” in the “Appendix – Sales charge waivers” section of the prospectus is amended to read as follows:
Robert W. Baird & Co. Incorporated (Baird)
Shareholders purchasing fund shares through a Baird platform or account will only be eligible for the following sales charge waivers (front-end sales charge waivers and CDSC waivers) and discounts, which may differ from those disclosed elsewhere in this prospectus or the SAI.
Front-end sales charge waivers on Class A shares available at Baird
| · | Shares purchased through reinvestment of capital gains distributions and dividend reinvestment when purchasing shares of the same fund |
| · | Shares purchased by employees and registered representatives of Baird or its affiliate and their family members as designated by Baird |
| · | Shares purchased from the proceeds of redemptions from another fund, provided (1) the repurchase occurs within 90 days following the redemption, (2) the redemption and purchase occur in the same accounts, and (3) redeemed shares were subject to a front-end or deferred sales charge (known as rights of reinstatement) |
| · | A shareholder in the fund’s Class C shares will have their shares converted at net asset value to Class A shares of the fund if the shares are no longer subject to CDSC and the conversion is in line with the policies and procedures of Baird |
| · | Charitable accounts in a transactional brokerage account at Baird |
CDSC waivers on Class A and C shares available at Baird
| · | Shares sold due to death or disability of the shareholder |
| · | Shares sold as part of a systematic withdrawal plan as described in the fund’s prospectus |
| · | Shares bought due to returns of excess contributions from an IRA Account |
| · | Shares sold as part of a required minimum distribution for IRA and retirement accounts due to the shareholder reaching the qualified age based on applicable IRS regulations as described in the fund’s prospectus |
| · | Shares sold to pay Baird fees but only if the transaction is initiated by Baird |
| · | Shares acquired through a right of reinstatement |
Front-end sales charge discounts available at Baird: breakpoints and/or rights of accumulation
| · | Breakpoints as described in this prospectus |
| · | Rights of accumulation which entitles shareholders to breakpoint discounts will be automatically calculated based on the aggregated holding of fund family assets held by accounts within the purchaser’s household at Baird. Eligible fund family assets not held at Baird may be included in the rights of accumulation calculation only if the shareholder notifies his or her financial advisor about such assets |
| · | Letters of intent (LOI) allow for breakpoint discounts based on anticipated purchases of fund family assets through Baird, over a 13-month period of time
|
Keep this supplement with your prospectus.
Lit. No. MFGEBS-503-0322P CGD/AFD/10039-S88045
Investment objective The fund’s investment objective is to provide as high a level of current income as is consistent with the preservation of capital.
Fees and expenses of the fund This table describes the fees and expenses that you may pay if you buy, hold and sell shares of the fund. You may pay other fees, such as brokerage commissions and other fees to financial intermediaries, which are not reflected in the tables and examples below. For example, in addition to the fees and expenses described below, you may also be required to pay brokerage commissions on purchases and sales of Class F-2, F-3, 529-F-2 or 529-F-3 shares of the fund. You may qualify for sales charge discounts if you and your family invest, or agree to invest in the future, at least $100,000 in American Funds. More information about these and other discounts is available from your financial professional, in the “Sales charge reductions and waivers” sections on page 38 of the prospectus and on page 82 of the fund’s statement of additional information, and in the sales charge waiver appendix to this prospectus.
| | | | | | | | |
| Shareholder fees (fees paid directly from your investment) |
| Share class: | A | 529-A | C and
529-C | 529-E | T and
529-T | All F and 529-F share classes | All R
share
classes |
| Maximum sales charge (load) imposed on purchases (as a percentage of offering price) | 3.75% | 3.50% | none | none | 2.50% | none | none |
| Maximum deferred sales charge (load) (as a percentage of the amount redeemed) | 1.001 | 1.001 | 1.00% | none | none | none | none |
| Maximum sales charge (load) imposed on reinvested dividends | none | none | none | none | none | none | none |
| Redemption or exchange fees | none | none | none | none | none | none | none |
1 The Bond Fund of America / Prospectus
| | | | | | | | |
| Annual fund operating expenses (expenses that you pay each year as a percentage of the value of your investment) |
| Share class: | A | C | T | F-1 | F-2 | F-3 | 529-A |
| Management fees | 0.16% | 0.16% | 0.16% | 0.16% | 0.16% | 0.16% | 0.16% |
| Distribution and/or service (12b-1) fees | 0.25 | 1.00 | 0.25 | 0.25 | none | none | 0.24 |
| Other expenses | 0.14 | 0.14 | 0.17 | 0.18 | 0.15 | 0.04 | 0.19 |
| Total annual fund operating expenses | 0.55 | 1.30 | 0.58 | 0.59 | 0.31 | 0.20 | 0.59 |
| | | | | | | | |
| Share class: | 529-C | 529-E | 529-T | 529-F-1 | 529-F-2 | 529-F-3 | R-1 |
| Management fees | 0.16% | 0.16% | 0.16% | 0.16% | 0.16% | 0.16% | 0.16% |
| Distribution and/or service (12b-1) fees | 1.00 | 0.50 | 0.25 | 0.25 | none | none | 1.00 |
| Other expenses | 0.19 | 0.13 | 0.21 | 0.212 | 0.17 | 0.11 | 0.14 |
| Total annual fund operating expenses | 1.35 | 0.79 | 0.62 | 0.62 | 0.33 | 0.27 | 1.30 |
| Expense reimbursement | — | — | — | — | — | 0.023 | — |
| Total annual fund operating expenses after expense reimbursement | 1.35 | 0.79 | 0.62 | 0.62 | 0.33 | 0.25 | 1.30 |
| | | | | | | | |
| Share class: | R-2 | R-2E | R-3 | R-4 | R-5E | R-5 | R-6 |
| Management fees | 0.16% | 0.16% | 0.16% | 0.16% | 0.16% | 0.16% | 0.16% |
| Distribution and/or service (12b-1) fees | 0.75 | 0.60 | 0.50 | 0.25 | none | none | none |
| Other expenses | 0.39 | 0.24 | 0.19 | 0.14 | 0.18 | 0.09 | 0.04 |
| Total annual fund operating expenses | 1.30 | 1.00 | 0.85 | 0.55 | 0.34 | 0.25 | 0.20 |
1 A contingent deferred sales charge of 1.00% applies on certain redemptions made within 18 months following purchases of $1 million or more made without an initial sales charge. Contingent deferred sales charge is calculated based on the lesser of the offering price and market value of shares being sold.
2 Restated to reflect current fees.
3 The investment adviser is currently reimbursing a portion of the other expenses. This reimbursement will be in effect through at least March 1, 2023. The adviser may elect at its discretion to extend, modify or terminate the reimbursement at that time.
The Bond Fund of America / Prospectus 2
Example This example is intended to help you compare the cost of investing in the fund with the cost of investing in other mutual funds.
The example assumes that you invest $10,000 in the fund for the time periods indicated and then redeem all of your shares at the end of those periods. The example also assumes that your investment has a 5% return each year and that the fund’s operating expenses remain the same. The example reflects the expense reimbursement described above through the expiration date of such reimbursement and total annual fund operating expenses thereafter. You may be required to pay brokerage commissions on your purchases and sales of Class F-2, F-3, 529-F-2 or 529-F-3 shares of the fund, which are not reflected in the example. Although your actual costs may be higher or lower, based on these assumptions your costs would be:
| | | | | | | | | | | | | | | |
| Share class: | A | C | T | F-1 | F-2 | F-3 | 529-A | 529-C | 529-E | 529-T | 529-F-1 | 529-F-2 | 529-F-3 | R-1 |
| 1 year | $429 | $232 | $308 | $60 | $32 | $20 | $408 | $237 | $81 | $312 | $63 | $34 | $26 | $132 |
| 3 years | 545 | 412 | 431 | 189 | 100 | 64 | 532 | 428 | 252 | 444 | 199 | 106 | 85 | 412 |
| 5 years | 671 | 713 | 566 | 329 | 174 | 113 | 668 | 739 | 439 | 587 | 346 | 185 | 150 | 713 |
| 10 years | 1,038 | 1,361 | 958 | 738 | 393 | 255 | 1,062 | 1,133 | 978 | 1,005 | 774 | 418 | 341 | 1,568 |
| | | | | | | | | | | | |
| Share class: | R-2 | R-2E | R-3 | R-4 | R-5E | R-5 | R-6 | For the share classes listed to the right, you would pay the following if you did not redeem your shares: | Share class: | C | 529-C |
| 1 year | $132 | $102 | $87 | $56 | $35 | $26 | $20 | 1 year | $132 | $137 |
| 3 years | 412 | 318 | 271 | 176 | 109 | 80 | 64 | 3 years | 412 | 428 |
| 5 years | 713 | 552 | 471 | 307 | 191 | 141 | 113 | 5 years | 713 | 739 |
| 10 years | 1,568 | 1,225 | 1,049 | 689 | 431 | 318 | 255 | 10 years | 1,361 | 1,133 |
Portfolio turnover The fund pays transaction costs, such as commissions, when it buys and sells securities (or “turns over” its portfolio). A higher portfolio turnover rate may indicate higher transaction costs and may result in higher taxes when fund shares are held in a taxable account. These costs, which are not reflected in annual fund operating expenses or in the example, affect the fund’s investment results. During the most recent fiscal year, the fund’s portfolio turnover rate was 368% of the average value of its portfolio.
Principal investment strategies The fund seeks to maximize your level of current income and preserve your capital by investing primarily in bonds. Normally the fund invests at least 80% of its assets in bonds and other debt securities, which may be represented by derivatives. The fund invests at least 60% of its assets in debt securities (excluding derivatives) rated A3 or better or A- or better by Nationally Recognized Statistical Ratings Organizations designated by the fund’s investment adviser, or in debt securities that are unrated but determined to be of equivalent quality by the fund’s investment adviser, and in U.S. government securities, money market instruments, cash or cash equivalents.
The fund may invest in debt securities and mortgage-backed securities issued by government-sponsored entities and federal agencies and instrumentalities that are not backed by the full faith and credit of the U.S. government.
The fund may invest in inflation-linked bonds issued by U.S. and non-U.S. governments, their agencies or instrumentalities, and corporations. Inflation-linked bonds are structured to protect against inflation by linking the bond’s principal and interest payments to an inflation index, such as the Consumer Price Index for Urban Consumers, so that principal and interest adjust to reflect changes in the index.
3 The Bond Fund of America / Prospectus
The fund may invest in futures contracts and swaps, which are types of derivatives. A derivative is a financial contract, the value of which is based on the value of an underlying financial asset (such as a stock, bond or currency), a reference rate or a market index. The fund may invest in a derivative only if, in the opinion of the investment adviser, the expected risks and rewards of the proposed investment are consistent with the investment objective and strategies of the fund as disclosed in this prospectus and in the fund’s statement of additional information.
The fund may invest up to 10% of its assets in debt securities rated Ba1 or below and BB+ or below by Nationally Recognized Statistical Ratings Organizations designated by the fund’s investment adviser, or in debt securities that are unrated but determined to be of equivalent quality by the fund’s investment adviser. Securities rated Ba1 or below and BB+ or below are sometimes referred to as “junk bonds.”
The investment adviser uses a system of multiple portfolio managers in managing the fund’s assets. Under this approach, the portfolio of the fund is divided into segments managed by individual managers.
The fund relies on the professional judgment of its investment adviser to make decisions about the fund’s portfolio investments. The basic investment philosophy of the investment adviser is to seek to invest in attractively priced securities that, in its opinion, represent good, long-term investment opportunities. Securities may be sold when the investment adviser believes that they no longer represent relatively attractive investment opportunities.
Principal risks This section describes the principal risks associated with investing in the fund. You may lose money by investing in the fund. The likelihood of loss may be greater if you invest for a shorter period of time.
Market conditions — The prices of, and the income generated by, the securities held by the fund may decline – sometimes rapidly or unpredictably – due to various factors, including events or conditions affecting the general economy or particular industries; overall market changes; local, regional or global political, social or economic instability; governmental, governmental agency or central bank responses to economic conditions; and currency exchange rate, interest rate and commodity price fluctuations.
Economies and financial markets throughout the world are highly interconnected. Economic, financial or political events, trading and tariff arrangements, wars, terrorism, cybersecurity events, natural disasters, public health emergencies (such as the spread of infectious disease) and other circumstances in one country or region, including actions taken by governmental or quasi-governmental authorities in response to any of the foregoing, could have impacts on global economies or markets. As a result, whether or not the fund invests in securities of issuers located in or with significant exposure to the countries affected, the value and liquidity of the fund’s investments may be negatively affected by developments in other countries and regions.
Issuer risks — The prices of, and the income generated by, securities held by the fund may decline in response to various factors directly related to the issuers of such securities, including reduced demand for an issuer’s goods or services, poor management performance, major litigation, investigations or other controversies related to the issuer, changes in government regulations affecting the issuer or its competitive
The Bond Fund of America / Prospectus 4
environment and strategic initiatives such as mergers, acquisitions or dispositions and the market response to any such initiatives.
Investing in debt instruments — The prices of, and the income generated by, bonds and other debt securities held by the fund may be affected by factors such as the interest rates, maturities and credit ratings of these securities.
Rising interest rates will generally cause the prices of bonds and other debt securities to fall. A general rise in interest rates may cause investors to sell debt securities on a large scale, which could also adversely affect the price and liquidity of debt securities and could also result in increased redemptions from the fund. Falling interest rates may cause an issuer to redeem, call or refinance a debt security before its stated maturity, which may result in the fund failing to recoup the full amount of its initial investment and having to reinvest the proceeds in lower yielding securities. Longer maturity debt securities generally have greater sensitivity to changes in interest rates and may be subject to greater price fluctuations than shorter maturity debt securities.
Bonds and other debt securities are also subject to credit risk, which is the possibility that the credit strength of an issuer or guarantor will weaken or be perceived to be weaker, and/or an issuer of a debt security will fail to make timely payments of principal or interest and the security will go into default. A downgrade or default affecting any of the fund’s securities could cause the value of the fund’s shares to decrease. Lower quality debt securities generally have higher rates of interest and may be subject to greater price fluctuations than higher quality debt securities. Credit risk is gauged, in part, by the credit ratings of the debt securities in which the fund invests. However, ratings are only the opinions of the rating agencies issuing them and are not guarantees as to credit quality or an evaluation of market risk. The fund’s investment adviser relies on its own credit analysts to research issuers and issues in seeking to assess credit and default risks.
Investing in mortgage-related and other asset-backed securities — Mortgage-related securities, such as mortgage-backed securities, and other asset-backed securities, include debt obligations that represent interests in pools of mortgages or other income-bearing assets, such as consumer loans or receivables. While such securities are subject to the risks associated with investments in debt instruments generally (for example, credit, extension and interest rate risks), they are also subject to other and different risks. Mortgage-backed and other asset-backed securities are subject to changes in the payment patterns of borrowers of the underlying debt, potentially increasing the volatility of the securities and the fund’s net asset value. When interest rates fall, borrowers are more likely to refinance or prepay their debt before its stated maturity. This may result in the fund having to reinvest the proceeds in lower yielding securities, effectively reducing the fund’s income. Conversely, if interest rates rise and borrowers repay their debt more slowly than expected, the time in which the mortgage-backed and other asset-backed securities are paid off could be extended, reducing the fund’s cash available for reinvestment in higher yielding securities. Mortgage-backed securities are also subject to the risk that underlying borrowers will be unable to meet their obligations and the value of property that secures the mortgages may decline in value and be insufficient, upon foreclosure, to repay the associated loans. Investments in asset-backed securities are subject to similar risks.
Investing in securities backed by the U.S. government — Securities backed by the U.S. Treasury or the full faith and credit of the U.S. government are guaranteed only as to the
5 The Bond Fund of America / Prospectus
timely payment of interest and principal when held to maturity. Accordingly, the current market values for these securities will fluctuate with changes in interest rates and the credit rating of the U.S. government. Securities issued by U.S. government-sponsored entities and federal agencies and instrumentalities that are not backed by the full faith and credit of the U.S. government are neither issued nor guaranteed by the U.S. government.
Liquidity risk — Certain fund holdings may be or may become difficult or impossible to sell, particularly during times of market turmoil. Liquidity may be impacted by the lack of an active market for a holding, legal or contractual restrictions on resale, or the reduced number and capacity of market participants to make a market in such holding. Market prices for less liquid or illiquid holdings may be volatile, and reduced liquidity may have an adverse impact on the market price of such holdings. Additionally, the sale of less liquid or illiquid holdings may involve substantial delays (including delays in settlement) and additional costs and the fund may be unable to sell such holdings when necessary to meet its liquidity needs or may be forced to sell at a loss.
Investing outside the United States — Securities of issuers domiciled outside the United States, or with significant operations or revenues outside the United States, may lose value because of adverse political, social, economic or market developments (including social instability, regional conflicts, terrorism and war) in the countries or regions in which the issuers operate or generate revenue. These securities may also lose value due to changes in foreign currency exchange rates against the U.S. dollar and/or currencies of other countries. Issuers of these securities may be more susceptible to actions of foreign governments, such as nationalization, currency blockage or the imposition of price controls or punitive taxes, each of which could adversely impact the value of these securities. Securities markets in certain countries may be more volatile and/or less liquid than those in the United States. Investments outside the United States may also be subject to different accounting and auditing practices and standards and different regulatory, legal and reporting requirements, and may be more difficult to value, than those in the United States. In addition, the value of investments outside the United States may be reduced by foreign taxes, including foreign withholding taxes on interest and dividends. Further, there may be increased risks of delayed settlement of securities purchased or sold by the fund. The risks of investing outside the United States may be heightened in connection with investments in emerging markets.
Investing in future delivery contracts — The fund may enter into contracts, such as to-be-announced contracts and mortgage dollar rolls, that involve the fund selling mortgage-related securities and simultaneously contracting to repurchase similar securities for delivery at a future date at a predetermined price. This can increase the fund’s market exposure, and the market price of the securities that the fund contracts to repurchase could drop below their purchase price. While the fund can preserve and generate capital through the use of such contracts by, for example, realizing the difference between the sale price and the future purchase price, the income generated by the fund may be reduced by engaging in such transactions. In addition, these transactions increase the turnover rate of the fund.
Investing in inflation-linked bonds — The values of inflation-linked bonds generally fluctuate in response to changes in real interest rates — i.e., rates of interest after factoring in inflation. A rise in real interest rates may cause the prices of inflation-linked securities to fall, while a decline in real interest rates may cause the prices to increase.
The Bond Fund of America / Prospectus 6
Inflation-linked bonds may experience greater losses than other debt securities with similar durations when real interest rates rise faster than nominal interest rates. There can be no assurance that the value of an inflation-linked security will be directly correlated to changes in interest rates; for example, if interest rates rise for reasons other than inflation, the increase may not be reflected in the security’s inflation measure.
Investing in inflation-linked bonds may also reduce the fund’s distributable income during periods of deflation. If prices for goods and services decline throughout the economy, the principal and income on inflation-linked securities may decline and result in losses to the fund.
Investing in derivatives — The use of derivatives involves a variety of risks, which may be different from, or greater than, the risks associated with investing in traditional securities, such as stocks and bonds. Changes in the value of a derivative may not correlate perfectly with, and may be more sensitive to market events than, the underlying asset, rate or index, and a derivative instrument may expose the fund to losses in excess of its initial investment. Derivatives may be difficult to value, difficult for the fund to buy or sell at an opportune time or price and difficult, or even impossible, to terminate or otherwise offset. The fund’s use of derivatives may result in losses to the fund, and investing in derivatives may reduce the fund’s returns and increase the fund’s price volatility. The fund’s counterparty to a derivative transaction (including, if applicable, the fund’s clearing broker, the derivatives exchange or the clearinghouse) may be unable or unwilling to honor its financial obligations in respect of the transaction. In certain cases, the fund may be hindered or delayed in exercising remedies against or closing out derivative instruments with a counterparty, which may result in additional losses.
Management — The investment adviser to the fund actively manages the fund’s investments. Consequently, the fund is subject to the risk that the methods and analyses, including models, tools and data, employed by the investment adviser in this process may be flawed or incorrect and may not produce the desired results. This could cause the fund to lose value or its investment results to lag relevant benchmarks or other funds with similar objectives.
Your investment in the fund is not a bank deposit and is not insured or guaranteed by the Federal Deposit Insurance Corporation or any other governmental agency, entity or person. You should consider how this fund fits into your overall investment program.
7 The Bond Fund of America / Prospectus
Investment results The following bar chart shows how the fund’s investment results have varied from year to year, and the following table shows how the fund’s average annual total returns for various periods compare with a broad measure of securities market results and other applicable measures of market results. This information provides some indication of the risks of investing in the fund. The Lipper Core Bond Funds Average includes the fund and other funds that disclose investment objectives and/or strategies reasonably comparable to those of the fund. Past investment results (before and after taxes) are not predictive of future investment results. Prior to October 30, 2020, certain fees, such as 12b-1 fees, were not charged on Class 529-F-1 shares. If these expenses had been deducted, results would have been lower. Updated information on the fund’s investment results can be obtained by visiting capitalgroup.com.
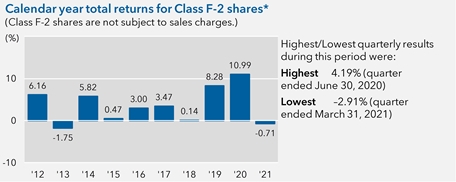
*We have elected to show Class F-2 shares because the share class has 10 years of history and has experienced substantial growth in net assets.
The Bond Fund of America / Prospectus 8
| | | | | | | |
| Average annual total returns For the periods ended December 31, 2021: | |
| Share class | Inception date | 1 year | 5 years | 10 years | Lifetime |
| F-2 − Before taxes | 8/4/2008 | -0.71% | 4.34% | 3.51% | 3.98% |
| − After taxes on distributions | | -1.52 | 3.05 | 2.36 | N/A |
| − After taxes on distributions and sale of fund shares | -0.33 | 2.82 | 2.22 | N/A |
| | | | | | |
| Share classes (before taxes) | Inception date | 1 year | 5 years | 10 years | Lifetime |
| A (with maximum sales charge) | 5/28/1974 | -4.68% | 3.28% | 2.86% | 7.19% |
| C | 3/15/2001 | -2.65 | 3.28 | 2.61 | 3.78 |
| F-1 | 3/15/2001 | -0.99 | 4.03 | 3.22 | 4.08 |
| F-3 | 1/27/2017 | -0.60 | N/A | N/A | 4.44 |
| 529-A (with maximum sales charge) | 2/15/2002 | -4.46 | 3.28 | 2.81 | 3.84 |
| 529-C | 2/19/2002 | -2.70 | 3.24 | 2.78 | 3.81 |
| 529-E | 3/7/2002 | -1.19 | 3.81 | 2.96 | 3.77 |
| 529-F-1 | 9/26/2002 | -0.82 | 4.24 | 3.41 | 4.30 |
| 529-F-2 | 10/30/2020 | -0.73 | N/A | N/A | 0.97 |
| 529-F-3 | 10/30/2020 | -0.69 | N/A | N/A | 1.02 |
| R-1 | 6/11/2002 | -1.69 | 3.29 | 2.48 | 3.28 |
| R-2 | 5/31/2002 | -1.69 | 3.30 | 2.49 | 3.26 |
| R-2E | 8/29/2014 | -1.40 | 3.61 | N/A | 2.84 |
| R-3 | 6/4/2002 | -1.25 | 3.77 | 2.94 | 3.71 |
| R-4 | 5/20/2002 | -0.94 | 4.08 | 3.26 | 4.07 |
| R-5E | 11/20/2015 | -0.75 | 4.29 | N/A | 3.94 |
| R-5 | 5/15/2002 | -0.65 | 4.39 | 3.57 | 4.39 |
| R-6 | 5/1/2009 | -0.60 | 4.44 | 3.62 | 4.98 |
| | | | | |
| Indexes | 1 year | 5 years | 10 years | Lifetime
(from Class F-2 inception) |
| Bloomberg U.S. Aggregate Index (reflects no deductions for sales charges, account fees, expenses or U.S. federal income taxes) | -1.54% | 3.57% | 2.90% | 3.98% |
| Lipper Core Bond Funds Average (reflects no deductions for sales charges, account fees or U.S. federal income taxes) | -1.26 | 3.65 | 3.10 | 4.07 |
Class F-2 annualized 30-day yield at December 31, 2021: 1.94%
(For current yield information, please call American Funds Service Company at (800) 421-4225 or visit capitalgroup.com.) |
After-tax returns are shown only for Class F-2 shares; after-tax returns for other share classes will vary. After-tax returns are calculated using the highest individual federal income tax rates in effect during each year of the periods shown and do not reflect the impact of state and local taxes. Your actual after-tax returns depend on your individual tax situation and likely will differ from the results shown above. In addition, after-tax returns are not relevant if you hold your fund shares through a tax-favored arrangement, such as a 401(k) plan, individual retirement account (IRA) or 529 college savings plan.
9 The Bond Fund of America / Prospectus
Management
Investment adviser Capital Research and Management CompanySM
Portfolio managers The individuals primarily responsible for the portfolio management of the fund are:
| | | |
Portfolio manager/
Fund title (if applicable) | Portfolio
manager
experience
in this fund | Primary title
with investment adviser |
| Pramod Atluri President | 6 years | Partner – Capital Fixed Income Investors |
| David J. Betanzos Senior Vice President | 6 years | Partner – Capital Fixed Income Investors |
| David A. Hoag Senior Vice President | 13 years | Partner – Capital Fixed Income Investors |
| Fergus N. MacDonald Senior Vice President | 7 years | Partner – Capital Fixed Income Investors |
| |
Purchase and sale of fund shares The minimum amount to establish an account for all share classes is normally $250 and the minimum to add to an account is $50. For a payroll deduction retirement plan account, payroll deduction savings plan account or employer-sponsored 529 account, the minimum is $25 to establish or add to an account. For accounts with Class F-3 shares held and serviced by the fund’s transfer agent, the minimum investment amount is $1 million.
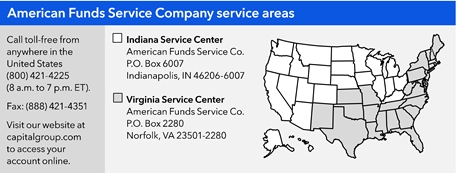
If you are a retail investor, you may sell (redeem) shares on any business day through your dealer or financial professional or by writing to American Funds Service Company® at P.O. Box 6007, Indianapolis, Indiana 46206-6007; telephoning American Funds Service Company at (800) 421-4225; faxing American Funds Service Company at (888) 421-4351; or accessing our website at capitalgroup.com. Please contact your plan administrator or recordkeeper to sell (redeem) shares from your retirement plan.
Tax information Dividends and capital gain distributions you receive from the fund are subject to federal income taxes and may also be subject to state and local taxes, unless you are tax-exempt or your account is tax-favored.
Payments to broker-dealers and other financial intermediaries If you purchase shares of the fund through a broker-dealer or other financial intermediary (such as a bank), the fund and the fund’s distributor or its affiliates may pay the intermediary for the sale of fund shares and related services. These payments may create a conflict of interest by influencing the broker-dealer or other intermediary and your individual financial professional to recommend the fund over another investment. Ask your individual financial professional or visit your financial intermediary’s website for more information.
The Bond Fund of America / Prospectus 10
Investment objective, strategies and risks The fund’s investment objective is to provide as high a level of current income as is consistent with the preservation of capital. While it has no present intention to do so, the fund’s board may change the fund’s investment objective without shareholder approval upon 60 days’ written notice to shareholders.
The fund seeks to maximize your level of current income and preserve your capital by investing primarily in bonds. Normally the fund invests at least 80% of its assets in bonds and other debt securities, which may be represented by derivatives. The fund invests at least 60% of its assets in debt securities (excluding derivatives) rated A3 or better or A- or better by Nationally Recognized Statistical Ratings Organizations designated by the fund’s investment adviser, or in debt securities that are unrated but determined to be of equivalent quality by the fund’s investment adviser, and in U.S. government securities, money market instruments, cash or cash equivalents.
The fund may invest in debt securities and mortgage-backed securities issued by government-sponsored entities and federal agencies and instrumentalities that are not backed by the full faith and credit of the U.S. government. The fund may invest in debt securities of any maturity or duration. Duration is a measure used to determine the sensitivity of a security’s price to changes in interest rates. The longer a security’s duration, the more sensitive it will be to changes in interest rates.
The fund may invest in inflation-linked bonds issued by U.S. and non-U.S. governments, their agencies or instrumentalities, and corporations. Inflation-linked bonds are structured to protect against inflation by linking the bond’s principal and interest payments to an inflation index, such as the Consumer Price Index for Urban Consumers, so that principal and interest adjust to reflect changes in the index.
The fund may invest in futures contracts and swaps, which are types of derivatives. A derivative is a financial contract, the value of which is based on the value of an underlying financial asset (such as a stock, bond or currency), a reference rate or a market index. The fund may invest in a derivative only if, in the opinion of the investment adviser, the expected risks and rewards of the proposed investment are consistent with the investment objective and strategies of the fund as disclosed in this prospectus and in the fund’s statement of additional information.
The fund may invest in futures contracts and interest rate swaps in order to seek to manage the fund’s sensitivity to interest rates, and in credit default swap indices, or CDSI, in order to assume exposure to a diversified portfolio of credits or to hedge against existing credit risks. A futures contract is a standardized exchange-traded agreement to buy or sell a specific quantity of an underlying asset, rate or index at an agreed-upon price at a stipulated future date. An interest rate swap is an agreement between two parties to exchange or swap payments based on changes in one or more interest rates, one of which is typically fixed and the other of which is typically a floating rate based on a designated short-term interest rate, such as the Secured Overnight Financing Rate, prime rate or other benchmark. A CDSI is based on a portfolio of credit default swaps with similar characteristics, such as credit default swaps on high-yield bonds. In a typical CDSI transaction, one party – the protection buyer – is obligated to pay the other party – the protection seller – a stream of periodic payments over the term of the contract, provided generally that no credit event on an underlying reference obligation has occurred. If such a credit event has occurred, the protection seller must pay the protection buyer the loss on those credits.
11 The Bond Fund of America / Prospectus
The fund may also enter into currency transactions to provide for the purchase or sale of a currency needed to purchase a security denominated in such currency. In addition, the fund may enter into forward currency contracts to protect against changes in currency exchange rates, to increase exposure to a particular foreign currency, to shift exposure to currency fluctuations from one currency to another or to seek to increase returns. A forward currency contract is an agreement to purchase or sell a specific currency at a future date at a fixed price.
The fund may invest up to 10% of its assets in debt securities rated Ba1 or below and BB+ or below by Nationally Recognized Statistical Ratings Organizations designated by the fund’s investment adviser, or in debt securities that are unrated but determined to be of equivalent quality by the fund’s investment adviser. Securities rated Ba1 or below and BB+ or below are sometimes referred to as “junk bonds.”
The fund may hold cash or cash equivalents, including commercial paper and short-term securities issued by the U.S. government, its agencies and instrumentalities. The percentage of the fund invested in such holdings varies and depends on various factors, including market conditions and purchases and redemptions of fund shares. The investment adviser may determine that it is appropriate to invest a substantial portion of the fund’s assets in such instruments in response to certain circumstances, such as periods of market turmoil. For temporary defensive purposes, the fund may invest without limitation in such instruments. A larger percentage of such holdings could moderate the fund’s investment results in a period of rising market prices. Alternatively, a larger percentage of such holdings could reduce the magnitude of the fund’s loss in a period of falling market prices and provide liquidity to make additional investments or to meet redemptions.
The fund may invest in other funds managed by the investment adviser or its affiliates (“Central Funds”) to more effectively invest in a diversified set of securities in a specific asset class such as money market instruments, bonds and other securities. Shares of Central Funds are only offered for purchase to the fund’s investment adviser and its affiliates and other funds, investment vehicles and accounts managed by the fund’s investment adviser and its affiliates. When investing in Central Funds, the fund bears its proportionate share of the expenses of the Central Funds in which it invests but does not bear additional management fees through its investment in such Central Funds. The investment results of the portions of the fund’s assets invested in the Central Funds will be based upon the investment results of the Central Funds.
The fund relies on the professional judgment of its investment adviser to make decisions about the fund’s portfolio investments. The basic investment philosophy of the investment adviser is to seek to invest in attractively priced securities that, in its opinion, represent good, long-term investment opportunities. The investment adviser believes that an important way to accomplish this is through fundamental research, which may include analysis of credit quality, general economic conditions and various quantitative measures and, in the case of corporate obligations, meeting with company executives and employees, suppliers, customers and competitors. Securities may be sold when the investment adviser believes that they no longer represent relatively attractive investment opportunities.
The investment adviser may consider environmental, social and governance (“ESG”) factors that, depending on the facts and circumstances, are material to the value of an
The Bond Fund of America / Prospectus 12
issuer or instrument. ESG factors may include, but are not limited to, environmental-related events resulting from climate change or society’s response to environmental change, social conditions (e.g., labor relations, investment in human capital, accident prevention, changing customer behavior) or governance issues (e.g., board composition, significant breaches of international agreements, unsound business practices).
The following are principal risks associated with investing in the fund.
Market conditions — The prices of, and the income generated by, the securities held by the fund may decline – sometimes rapidly or unpredictably – due to various factors, including events or conditions affecting the general economy or particular industries; overall market changes; local, regional or global political, social or economic instability; governmental, governmental agency or central bank responses to economic conditions; and currency exchange rate, interest rate and commodity price fluctuations.
Economies and financial markets throughout the world are highly interconnected. Economic, financial or political events, trading and tariff arrangements, wars, terrorism, cybersecurity events, natural disasters, public health emergencies (such as the spread of infectious disease) and other circumstances in one country or region, including actions taken by governmental or quasi-governmental authorities in response to any of the foregoing, could have impacts on global economies or markets. As a result, whether or not the fund invests in securities of issuers located in or with significant exposure to the countries affected, the value and liquidity of the fund’s investments may be negatively affected by developments in other countries and regions.
Issuer risks — The prices of, and the income generated by, securities held by the fund may decline in response to various factors directly related to the issuers of such securities, including reduced demand for an issuer’s goods or services, poor management performance, major litigation, investigations or other controversies related to the issuer, changes in government regulations affecting the issuer or its competitive environment and strategic initiatives such as mergers, acquisitions or dispositions and the market response to any such initiatives.
Investing in debt instruments — The prices of, and the income generated by, bonds and other debt securities held by the fund may be affected by factors such as the interest rates, maturities and credit ratings of these securities.
Rising interest rates will generally cause the prices of bonds and other debt securities to fall. A general rise in interest rates may cause investors to sell debt securities on a large scale, which could also adversely affect the price and liquidity of debt securities and could also result in increased redemptions from the fund. Falling interest rates may cause an issuer to redeem, call or refinance a debt security before its stated maturity, which may result in the fund failing to recoup the full amount of its initial investment and having to reinvest the proceeds in lower yielding securities. Longer maturity debt securities generally have greater sensitivity to changes in interest rates and may be subject to greater price fluctuations than shorter maturity debt securities.
Bonds and other debt securities are also subject to credit risk, which is the possibility that the credit strength of an issuer or guarantor will weaken or be perceived to be weaker, and/or an issuer of a debt security will fail to make timely payments of principal or interest and the security will go into default. A downgrade or default affecting any of the
13 The Bond Fund of America / Prospectus
fund’s securities could cause the value of the fund’s shares to decrease. Lower quality debt securities generally have higher rates of interest and may be subject to greater price fluctuations than higher quality debt securities. Credit risk is gauged, in part, by the credit ratings of the debt securities in which the fund invests. However, ratings are only the opinions of the rating agencies issuing them and are not guarantees as to credit quality or an evaluation of market risk. The fund’s investment adviser relies on its own credit analysts to research issuers and issues in seeking to assess credit and default risks.
Investing in mortgage-related and other asset-backed securities — Mortgage-related securities, such as mortgage-backed securities, and other asset-backed securities, include debt obligations that represent interests in pools of mortgages or other income-bearing assets, such as residential mortgage loans, home equity loans, mortgages on commercial buildings, consumer loans and equipment leases. While such securities are subject to the risks associated with investments in debt instruments generally (for example, credit, extension and interest rate risks), they are also subject to other and different risks. Mortgage-backed and other asset-backed securities are subject to changes in the payment patterns of borrowers of the underlying debt, potentially increasing the volatility of the securities and the fund’s net asset value. When interest rates fall, borrowers are more likely to refinance or prepay their debt before its stated maturity. This may result in the fund having to reinvest the proceeds in lower yielding securities, effectively reducing the fund’s income. Conversely, if interest rates rise and borrowers repay their debt more slowly than expected, the time in which the mortgage-backed and other asset-backed securities are paid off could be extended, reducing the fund’s cash available for reinvestment in higher yielding securities. Mortgage-backed securities are also subject to the risk that underlying borrowers will be unable to meet their obligations and the value of property that secures the mortgages may decline in value and be insufficient, upon foreclosure, to repay the associated loans. Investments in asset-backed securities are subject to similar risks, as well as additional risks associated with the assets underlying those securities.
Investing in securities backed by the U.S. government — Securities backed by the U.S. Treasury or the full faith and credit of the U.S. government are guaranteed only as to the timely payment of interest and principal when held to maturity. Accordingly, the current market values for these securities will fluctuate with changes in interest rates and the credit rating of the U.S. government. Securities issued by U.S. government-sponsored entities and federal agencies and instrumentalities that are not backed by the full faith and credit of the U.S. government are neither issued nor guaranteed by the U.S. government.
Liquidity risk — Certain fund holdings may be or may become difficult or impossible to sell, particularly during times of market turmoil. Liquidity may be impacted by the lack of an active market for a holding, legal or contractual restrictions on resale, or the reduced number and capacity of market participants to make a market in such holding. Market prices for less liquid or illiquid holdings may be volatile, and reduced liquidity may have an adverse impact on the market price of such holdings. Additionally, the sale of less liquid or illiquid holdings may involve substantial delays (including delays in settlement) and additional costs and the fund may be unable to sell such holdings when necessary to meet its liquidity needs or may be forced to sell at a loss.
Investing outside the United States — Securities of issuers domiciled outside the United States, or with significant operations or revenues outside the United States, may lose
The Bond Fund of America / Prospectus 14
value because of adverse political, social, economic or market developments (including social instability, regional conflicts, terrorism and war) in the countries or regions in which the issuers operate or generate revenue. These securities may also lose value due to changes in foreign currency exchange rates against the U.S. dollar and/or currencies of other countries. Issuers of these securities may be more susceptible to actions of foreign governments, such as nationalization, currency blockage or the imposition of price controls or punitive taxes, each of which could adversely impact the value of these securities. Securities markets in certain countries may be more volatile and/or less liquid than those in the United States. Investments outside the United States may also be subject to different accounting and auditing practices and standards and different regulatory, legal and reporting requirements, and may be more difficult to value, than those in the United States. In addition, the value of investments outside the United States may be reduced by foreign taxes, including foreign withholding taxes on interest and dividends. Further, there may be increased risks of delayed settlement of securities purchased or sold by the fund. The risks of investing outside the United States may be heightened in connection with investments in emerging markets.
Investing in future delivery contracts — The fund may enter into contracts, such as to-be-announced contracts and mortgage dollar rolls, that involve the fund selling mortgage-related securities and simultaneously contracting to repurchase similar securities for delivery at a future date at a predetermined price. This can increase the fund’s market exposure, and the market price of the securities that the fund contracts to repurchase could drop below their purchase price. While the fund can preserve and generate capital through the use of such contracts by, for example, realizing the difference between the sale price and the future purchase price, the income generated by the fund may be reduced by engaging in such transactions. In addition, these transactions increase the turnover rate of the fund.
Investing in inflation-linked bonds — The values of inflation-linked bonds generally fluctuate in response to changes in real interest rates — i.e., rates of interest after factoring in inflation. A rise in real interest rates may cause the prices of inflation-linked securities to fall, while a decline in real interest rates may cause the prices to increase. Inflation-linked bonds may experience greater losses than other debt securities with similar durations when real interest rates rise faster than nominal interest rates. There can be no assurance that the value of an inflation-linked security will be directly correlated to changes in interest rates; for example, if interest rates rise for reasons other than inflation, the increase may not be reflected in the security’s inflation measure.
Investing in inflation-linked bonds may also reduce the fund’s distributable income during periods of deflation. If prices for goods and services decline throughout the economy, the principal and income on inflation-linked securities may decline and result in losses to the fund.
Investing in derivatives — The use of derivatives involves a variety of risks, which may be different from, or greater than, the risks associated with investing in traditional securities, such as stocks and bonds. Changes in the value of a derivative may not correlate perfectly with, and may be more sensitive to market events than, the underlying asset, rate or index, and a derivative instrument may expose the fund to losses in excess of its initial investment. Derivatives may be difficult to value, difficult for the fund to buy or sell at an opportune time or price and difficult, or even impossible, to terminate or otherwise offset. The fund’s use of derivatives may result in losses to the fund, and investing in
15 The Bond Fund of America / Prospectus
derivatives may reduce the fund’s returns and increase the fund’s price volatility. The fund’s counterparty to a derivative transaction (including, if applicable, the fund’s clearing broker, the derivatives exchange or the clearinghouse) may be unable or unwilling to honor its financial obligations in respect of the transaction. In certain cases, the fund may be hindered or delayed in exercising remedies against or closing out derivative instruments with a counterparty, which may result in additional losses.
Management — The investment adviser to the fund actively manages the fund’s investments. Consequently, the fund is subject to the risk that the methods and analyses, including models, tools and data, employed by the investment adviser in this process may be flawed or incorrect and may not produce the desired results. This could cause the fund to lose value or its investment results to lag relevant benchmarks or other funds with similar objectives.
The following are additional risks associated with investing in the fund.
Interest rate risk — The values and liquidity of the securities held by the fund may be affected by changing interest rates. For example, the values of these securities may decline when interest rates rise and increase when interest rates fall. Longer maturity debt securities generally have greater sensitivity to changes in interest rates and may be subject to greater price fluctuations than shorter maturity debt securities. The fund may invest in variable and floating rate securities. When the fund holds variable or floating rate securities, a decrease in market interest rates will adversely affect the income received from such securities and the net asset value of the fund’s shares. Although the values of such securities are generally less sensitive to interest rate changes than those of other debt securities, the value of variable and floating rate securities may decline if their interest rates do not rise as quickly, or as much, as market interest rates. Conversely, floating rate securities will not generally increase in value if interest rates decline. During periods of extremely low short-term interest rates, the fund may not be able to maintain a positive yield and, given the current low interest rate environment, risks associated with rising rates are currently heightened.
Investing in futures contracts — In addition to the risks generally associated with investing in derivative instruments, futures contracts are subject to the creditworthiness of the clearing organizations, exchanges and futures commission merchants with which the fund transacts. Additionally, although futures require only a small initial investment in the form of a deposit of initial margin, the amount of a potential loss on a futures contract could greatly exceed the initial amount invested. While futures contracts are generally liquid instruments, under certain market conditions futures may be deemed to be illiquid. For example, the fund may be temporarily prohibited from closing out its position in a futures contract if intraday price change limits or limits on trading volume imposed by the applicable futures exchange are triggered. If the fund is unable to close out a position on a futures contract, the fund would remain subject to the risk of adverse price movements until the fund is able to close out the futures position. The ability of the fund to successfully utilize futures contracts may depend in part upon the ability of the fund’s investment adviser to accurately forecast interest rates and other economic factors and to assess and predict the impact of such economic factors on the futures in which the fund invests. If the investment adviser incorrectly forecasts economic developments or incorrectly predicts the impact of such developments on the futures in which it invests, the fund could be exposed to the risk of loss.
The Bond Fund of America / Prospectus 16
Investing in swaps — Swaps, including interest rate swaps and credit default swap indices, or CDSI, are subject to many of the risks generally associated with investing in derivative instruments. Additionally, although swaps require no or only a small initial investment in the form of a deposit of initial margin, the amount of a potential loss on a swap contract could greatly exceed the initial amount invested. The use of swaps involves the risk that the investment adviser will not accurately predict anticipated changes in interest rates or other economic factors, which may result in losses to the fund. If the fund enters into a bilaterally negotiated swap transaction, the counterparty may fail to perform in accordance with the terms of the swap agreement. If a counterparty defaults on its obligations under a swap agreement, the fund may lose any amount it expected to receive from the counterparty, potentially including amounts in excess of the fund’s initial investment. Certain swap transactions are subject to mandatory central clearing or may be eligible for voluntary central clearing. Although clearing interposes a central clearinghouse as the ultimate counterparty to each participant’s swap, central clearing will not eliminate (but may decrease) counterparty risk relative to uncleared bilateral swaps. Some swaps, such as CDSI, may be dependent on both the individual credit of the fund’s counterparty and on the credit of one or more issuers of any underlying assets. If the fund does not correctly evaluate the creditworthiness of its counterparty and, where applicable, of issuers of any underlying reference assets, the fund’s investment in a swap may result in losses to the fund.
Currency transactions — In addition to the risks generally associated with investing in derivative instruments, the use of forward currency contracts involves the risk that currency movements will not be accurately predicted by the investment adviser, which could result in losses to the fund. While entering into forward currency contracts could minimize the risk of loss due to a decline in the value of the hedged currency, it could also limit any potential gain that may result from an increase in the value of the currency. Additionally, the adviser may use forward currency contracts to increase exposure to a certain currency or to shift exposure to currency fluctuations from one country to another. Forward currency contracts may expose the fund to potential gains and losses in excess of the initial amount invested.
Portfolio turnover — The fund may engage in frequent and active trading of its portfolio securities. Higher portfolio turnover may involve correspondingly greater transaction costs in the form of dealer spreads, brokerage commissions and other transaction costs on the sale of securities and on reinvestment in other securities. The sale of portfolio securities may also result in the realization of net capital gains, which are taxable when distributed to shareholders, unless the shareholder is exempt from taxation or his or her account is tax-favored. These costs and tax effects may adversely affect the fund’s returns to shareholders. The fund’s portfolio turnover rate may vary from year to year, as well as within a year.
Exposure to country, region, industry or sector — Subject to the fund’s investment limitations, the fund may have significant exposure to a particular country, region, industry or sector. Such exposure may cause the fund to be more impacted by risks relating to and developments affecting the country, region, industry or sector, and thus its net asset value may be more volatile, than a fund without such levels of exposure. For example, if the fund has significant exposure in a particular country, then social, economic, regulatory or other issues that negatively affect that country may have a greater impact on the fund than on a fund that is more geographically diversified.
17 The Bond Fund of America / Prospectus
Cybersecurity breaches — The fund may be subject to operational and information security risks through breaches in cybersecurity. Cybersecurity breaches can result from deliberate attacks or unintentional events, including “ransomware” attacks, the injection of computer viruses or malicious software code, the use of vulnerabilities in code to gain unauthorized access to digital information systems, networks or devices, or external attacks such as denial-of-service attacks on the investment adviser’s or an affiliate’s website that could render the fund’s network services unavailable to intended end-users. These breaches may, among other things, lead to the unauthorized release of confidential information, misuse of the fund’s assets or sensitive information, the disruption of the fund’s operational capacity, the inability of fund shareholders to transact business, or the destruction of the fund’s physical infrastructure, equipment or operating systems. These events could cause the fund to violate applicable privacy and other laws and could subject the fund to reputational damage, additional costs associated with corrective measures and/or financial loss. The fund may also be subject to additional risks if its third-party service providers, such as the fund’s investment adviser, transfer agent, custodian, administrators and other financial intermediaries, experience similar cybersecurity breaches and potential outcomes. Cybersecurity risks may also impact issuers of securities in which the fund invests, which may cause the fund’s investments in such issuers to lose value.
In addition to the principal investment strategies described above, the fund has other investment practices that are described in the statement of additional information, which includes a description of other risks related to the fund’s principal investment strategies and other investment practices. The fund’s investment results will depend on the ability of the fund’s investment adviser to navigate the risks discussed above as well as those described in the statement of additional information.
Fund comparative indexes The investment results table in this prospectus shows how the fund’s average annual total returns compare with various broad measures of market results. The Bloomberg U.S. Aggregate Index represents the U.S. investment-grade fixed-rate bond market. This index is unmanaged, and its results include reinvested distributions but do not reflect the effect of sales charges, commissions, account fees, expenses or U.S. federal income taxes. The Lipper Core Bond Funds Average is composed of funds that invest at least 85% of their net assets in domestic investment-grade debt issues (rated in the top four grades) with any remaining investment in non-benchmark sectors such as high-yield, global and emerging market debt. These funds maintain dollar-weighted average maturities of five to ten years. The results of the underlying funds in the average include the reinvestment of dividends and capital gain distributions, as well as brokerage commissions paid by the funds for portfolio transactions and other fund expenses, but do not reflect the effect of sales charges, account fees or U.S. federal income taxes. Fund results All fund results in this prospectus reflect the reinvestment of dividends and capital gain distributions, if any. Unless otherwise noted, fund results reflect any fee waivers and/or expense reimbursements in effect during the periods presented.
Portfolio holdings Portfolio holdings information for the fund is available on our website at capitalgroup.com. A description of the fund’s policies and procedures regarding disclosure of information about its portfolio holdings is available in the statement of additional information.
The Bond Fund of America / Prospectus 18
Management and organization
Investment adviser Capital Research and Management Company, an experienced investment management organization founded in 1931, serves as the investment adviser to the fund and other funds, including the American Funds. Capital Research and Management Company is a wholly owned subsidiary of The Capital Group Companies, Inc. and is located at 333 South Hope Street, Los Angeles, California 90071. Capital Research and Management Company manages the investment portfolio and business affairs of the fund. The total management fee paid by the fund to its investment adviser for the most recent fiscal year, as a percentage of average net assets, appears in the Annual Fund Operating Expenses table under “Fees and expenses of the fund.” The management fee is based on the daily net assets of the fund and the fund’s monthly gross investment income. Please see the statement of additional information for further details. A discussion regarding the basis for approval of the fund’s Investment Advisory and Service Agreement by the fund’s board of trustees is contained in the fund’s semi-annual report to shareholders for the period ended June 30, 2021.
Capital Research and Management Company manages equity assets through three equity investment divisions and fixed income assets through its fixed income investment division, Capital Fixed Income Investors. The three equity investment divisions — Capital International Investors, Capital Research Global Investors and Capital World Investors — make investment decisions independently of one another.
The equity investment divisions may, in the future, be incorporated as wholly owned subsidiaries of Capital Research and Management Company. In that event, Capital Research and Management Company would continue to be the investment adviser, and day-to-day investment management of equity assets would continue to be carried out through one or more of these subsidiaries. Although not currently contemplated, Capital Research and Management Company could incorporate its fixed income investment division in the future and engage it to provide day-to-day investment management of fixed income assets. Capital Research and Management Company and each of the funds it advises have received an exemptive order from the U.S. Securities and Exchange Commission that allows Capital Research and Management Company to use, upon approval of the fund’s board, its management subsidiaries and affiliates to provide day-to-day investment management services to the fund, including making changes to the management subsidiaries and affiliates providing such services. The fund’s shareholders have approved this arrangement; however, there is no assurance that Capital Research and Management Company will incorporate its investment divisions or exercise any authority granted to it under the exemptive order.
The Capital SystemSM Capital Research and Management Company uses a system of multiple portfolio managers in managing mutual fund assets. Under this approach, the portfolio of a fund is divided into segments managed by individual managers. In addition, Capital Research and Management Company’s investment analysts may make investment decisions with respect to a portion of a fund’s portfolio. Investment decisions are subject to a fund’s objective(s), policies and restrictions and the oversight of the appropriate investment-related committees of Capital Research and Management Company and its investment divisions.
Certain senior members of Capital Fixed Income Investors, the investment adviser’s fixed income investment division, serve on the Portfolio Strategy Group. The group utilizes a research-driven process with input from the investment adviser’s analysts, portfolio
19 The Bond Fund of America / Prospectus
managers and economists to define investment themes on a range of macroeconomic factors, including duration, yield curve and sector allocation. The investment decisions made by the fund’s portfolio managers are informed by the investment themes discussed by the group.
The table below shows the investment experience and role in management of the fund for each of the fund’s primary portfolio managers.
| | | | |
| Portfolio manager | Investment
experience | Experience
in this fund | Role in
management
of the fund |
| Pramod Atluri | Investment professional for 24 years in total; 6 years with Capital Research and Management Company or affiliate | 6 years | Serves as a fixed income portfolio manager |
| David J. Betanzos | Investment professional for 22 years in total;
20 years with Capital Research and Management Company or affiliate | 6 years | Serves as a fixed income portfolio manager |
| David A. Hoag | Investment professional for
34 years in total;
31 years with Capital Research and Management Company or affiliate | 13 years | Serves as a fixed income portfolio manager |
| Fergus N. MacDonald | Investment professional for
29 years in total;
18 years with Capital Research and Management Company or affiliate | 7 years
(plus 11 years
of prior experience
as an
investment analyst
for the fund) | Serves as a fixed income portfolio manager |
| |
Information regarding the portfolio managers’ compensation, their ownership of securities in the fund and other accounts they manage is in the statement of additional information.
The Bond Fund of America / Prospectus 20
Certain privileges and/or services described on the following pages of this prospectus and in the statement of additional information may not be available to you, depending on your investment dealer or retirement plan recordkeeper. Please see your financial professional or retirement plan recordkeeper for more information.
Shareholder information
Shareholder services American Funds Service Company, the fund’s transfer agent, offers a wide range of services that you can use to alter your investment program should your needs or circumstances change. These services may be terminated or modified at any time upon 60 days’ written notice.
A more detailed description of policies and services is included in the fund’s statement of additional information and the owner’s guide sent to new American Funds shareholders entitled Welcome. Class 529 shareholders should also refer to the applicable program description for information on policies and services relating specifically to their account(s). These documents are available by writing to or calling American Funds Service Company.
21 The Bond Fund of America / Prospectus
Unless otherwise noted or unless the context requires otherwise, references on the following pages to (i) Class A, C, T or F shares also refer to the corresponding Class 529-A, 529-C, 529-T or 529-F shares, (ii) Class F shares refer to Class F-1, F-2 and F-3 shares and (iii) Class R shares refer to Class R-1, R-2, R-2E, R-3, R-4, R-5E, R-5 and R-6 shares.
Purchase, exchange and sale of shares The fund’s transfer agent, on behalf of the fund and American Funds Distributors,® the fund’s distributor, is required by law to obtain certain personal information from you or any other person(s) acting on your behalf in order to verify your or such person’s identity. If you do not provide the information, the transfer agent may not be able to open your account. If the transfer agent is unable to verify your identity or that of any other person(s) authorized to act on your behalf, or believes it has identified potentially criminal activity, the fund and American Funds Distributors reserve the right to close your account or take such other action they deem reasonable or required by law.
When purchasing shares, you should designate the fund or funds in which you wish to invest. Subject to the exception below, if no fund is designated, your money will be held uninvested (without liability to the transfer agent for loss of income or appreciation pending receipt of proper instructions) until investment instructions are received, but for no more than three business days. Your investment will be made at the net asset value (plus any applicable sales charge, in the case of Class A or Class T shares) next determined after investment instructions are received and accepted by the transfer agent. If investment instructions are not received, your money will be invested in Class A shares (or, if you are investing through a financial intermediary who offers only Class T shares, in Class T shares) of American Funds U.S. Government Money Market FundSM on the third business day after receipt of your investment.
If the amount of your cash investment is $10,000 or less, no fund is designated, and you made a cash investment (excluding exchanges) within the last 16 months, your money will be invested in the same proportion and in the same fund or funds and in the same class of shares in which your last cash investment was made. If you only have one open fund, the money will be invested into such fund on the day received if the investment is otherwise in good order.
Different procedures may apply to certain employer-sponsored arrangements, including, but not limited to, SEPs and SIMPLE IRAs.
Valuing shares The net asset value of each share class of the fund is the value of a single share of that class. The net asset value per share is calculated once daily as of the close of regular trading on the New York Stock Exchange, normally 4 p.m. New York time, each day the New York Stock Exchange is open. If the New York Stock Exchange makes a scheduled (e.g. the day after Thanksgiving) or an unscheduled close prior to 4 p.m. New York time, the net asset value of the fund will be determined at approximately the time the New York Stock Exchange closes on that day. If on such a day market quotations and prices from third-party pricing services are not based as of the time of the early close of the New York Stock Exchange but are as of a later time (up to approximately 4 p.m. New York time), for example because the market remains open after the close of the New York Stock Exchange, those later market quotations and prices will be used in determining the fund’s net asset value.
The Bond Fund of America / Prospectus 22
Equity securities are valued primarily on the basis of market quotations, and debt securities are valued primarily on the basis of prices from third-party pricing services. Futures contracts are valued primarily on the basis of settlement prices. The fund has adopted procedures for making fair value determinations if market quotations or prices from third-party pricing services, as applicable, are not readily available or are not considered reliable. For example, if events occur between the close of markets outside the United States and the close of regular trading on the New York Stock Exchange that, in the opinion of the investment adviser, materially affect the value of any of the fund’s equity securities that trade principally in those international markets, those securities will be valued in accordance with fair value procedures. Similarly, fair value procedures may be employed if an issuer defaults on its debt securities and there is no market for its securities. Use of these procedures is intended to result in more appropriate net asset values and, where applicable, to reduce potential arbitrage opportunities otherwise available to short-term investors.
Because the fund may hold securities that are listed primarily on foreign exchanges that trade on weekends or days when the fund does not price its shares, the values of securities held in the fund may change on days when you will not be able to purchase or redeem fund shares.
Your shares will be purchased at the net asset value (plus any applicable sales charge, in the case of Class A or Class T shares) or sold at the net asset value next determined after American Funds Service Company receives your request, provided that your request contains all information and legal documentation necessary to process the transaction. Orders in good order received after the New York Stock Exchange closes (scheduled or unscheduled) will be processed at the net asset value (plus any applicable sales charge) calculated on the following business day. A contingent deferred sales charge may apply at the time you sell certain Class A and C shares.
Purchase of Class A and C shares You may generally open an account and purchase Class A and C shares by contacting any financial professional (who may impose transaction charges in addition to those described in this prospectus) authorized to sell the fund’s shares. You may purchase additional shares in various ways, including through your financial professional and by mail, telephone, the Internet and bank wire.
Automatic conversion of Class C and Class 529-C shares Class C shares automatically convert to Class A shares in the month of the 8-year anniversary of the purchase date. Class 529-C shares automatically convert to Class 529-A shares, in the month of the 5-year anniversary of the purchase date. The Internal Revenue Service currently takes the position that such automatic conversions are not taxable. Should its position change, the automatic conversion feature may be suspended. If this were to happen, you would have the option of converting your Class C shares to Class A shares or your Class 529-C shares to Class 529-A shares at the anniversary date described above. This exchange would be based on the relative net asset values of the two classes in question, without the imposition of a sales charge or fee, but you might face certain tax consequences as a result.
Purchase of Class F shares You may generally open an account and purchase Class F shares only through fee-based programs of investment dealers that have special agreements with the fund’s distributor, through financial intermediaries that have been approved by, and that have special agreements with, the fund’s distributor to offer
23 The Bond Fund of America / Prospectus
Class F shares to self-directed investment brokerage accounts that may charge a transaction fee, through certain registered investment advisors and through other intermediaries approved by the fund’s distributor. These intermediaries typically charge ongoing fees for services they provide. Intermediary fees are not paid by the fund and normally range from .75% to 1.50% of assets annually, depending on the services offered.
Class F-2, F-3, 529-F-2 and 529-F-3 shares may also be available on brokerage platforms of firms that have agreements with the fund’s distributor to offer such shares solely when acting as an agent for the investor. An investor transacting in Class F-2, F-3, 529-F-2 or 529-F-3 shares in these programs may be required to pay a commission and/or other forms of compensation to the broker. Shares of the fund are available in other share classes that have different fees and expenses.
In addition, upon approval by an officer of the fund’s investment adviser, Class F-3 shares (but not Class 529-F-3 shares) are available to institutional investors, which include, but are not limited to, charitable organizations, governmental institutions and corporations. For accounts held and serviced by the fund’s transfer agent the minimum investment amount is $1 million.
Purchase of Class 529 shares Class 529 shares may be purchased only through an account established with a 529 college savings plan managed by Capital Research and Management Company. You may open this type of account and purchase Class 529 shares by contacting any financial professional (who may impose transaction charges in addition to those described in this prospectus) authorized to sell such an account. You may purchase additional shares in various ways, including through your financial professional and by mail, telephone, the Internet and bank wire.
Class 529-E shares may be purchased only by employees participating through an eligible employer plan.
Accounts holding Class 529 shares are subject to a $10 account setup fee and an annual $10 account maintenance fee. These fees are waived until further notice.
Investors residing in any state may purchase Class 529 shares through an account established with a 529 college savings plan managed by Capital Research and Management Company. Class 529-A, 529-C, 529-T and 529-F shares are structured similarly to the corresponding Class A, C, T and F shares.
Purchase of Class R shares Class R shares are generally available only to retirement plans established under Internal Revenue Code Sections 401(a), 403(b) or 457, and to nonqualified deferred compensation plans and certain voluntary employee benefit association and post-retirement benefit plans. Class R shares also are generally available only to retirement plans for which plan level or omnibus accounts are held on the books of the fund. Class R-5E, R-5 and R-6 shares are generally available only to fee-based programs or through retirement plan intermediaries. Class R-3 and Class R-5E shares are available through the American Funds SIMPLE IRA Plus Program and other similar programs. In addition, Class R-5 and R-6 shares are available for investment by other registered investment companies and collective investment trusts approved by the fund’s investment adviser or distributor. Except as otherwise provided in this prospectus, Class R shares are generally not available for purchase to retail nonretirement accounts; traditional and Roth individual retirement accounts (IRAs); Coverdell Education Savings
The Bond Fund of America / Prospectus 24
Accounts; SEPs, SARSEPs and SIMPLE IRAs held in brokerage accounts; and 529 college savings plans. Class R-6 shares are available to employer-sponsored SEPs, SARSEPs and SIMPLE IRAs held in fee-based programs that are serviced through retirement plan recordkeepers.
Purchases by employer-sponsored retirement plans Eligible retirement plans generally may open an account and purchase Class A or R shares by contacting any investment dealer (who may impose transaction charges in addition to those described in this prospectus) authorized to sell these classes of the fund’s shares. Some or all R share classes may not be available through certain investment dealers. Additional shares may be purchased through a plan’s administrator or recordkeeper.
Class A shares are generally not available for retirement plans using the PlanPremier® or Recordkeeper Direct® recordkeeping programs. These programs are proprietary recordkeeping solutions for small retirement plans.
Employer-sponsored retirement plans that are eligible to purchase Class R shares may instead purchase Class A shares and pay the applicable Class A sales charge, provided that their recordkeepers can properly apply a sales charge on plan investments. These plans are not eligible to make initial purchases of $1 million or more in Class A shares and thereby invest in Class A shares without a sales charge, nor are they eligible to establish a statement of intention that qualifies them to purchase Class A shares without a sales charge. More information about statements of intention can be found under “Sales charge reductions and waivers” in this prospectus. Plans investing in Class A shares with a sales charge may purchase additional Class A shares in accordance with the sales charge table in this prospectus.
Employer-sponsored retirement plans that invested in American Funds Class A shares without any sales charge before April 1, 2004, and that continue to meet the eligibility requirements in effect as of that date for purchasing Class A shares at net asset value, may continue to purchase American Funds Class A shares without any initial or contingent deferred sales charge.
A 403(b) plan may not invest in American Funds Class A or C shares unless it was invested in Class A or C shares before January 1, 2009.
25 The Bond Fund of America / Prospectus
Purchase minimums and maximums Purchase minimums described in this prospectus may be waived in certain cases. Minimums are currently waived for purchases of Class F-2 and F-3 shares held under fee-based programs. In addition, the fund reserves the right to redeem the shares of any shareholder for their then current net asset value per share if the shareholder’s aggregate investment in the fund falls below the fund’s minimum initial investment amount. See the statement of additional information for details.
For accounts established with an automatic investment plan, the initial purchase minimum of $250 may be waived if the purchases (including purchases through exchanges from another fund) made under the plan are sufficient to reach $250 within five months of account establishment.
The effective purchase maximums for Class 529-A, 529-C, 529-E, 529-T and 529-F shares will reflect the maximum applicable contribution limits under state law. See the applicable program description for more information.
The purchase maximum for Class C shares is $500,000 per transaction. In addition, if you have significant American Funds holdings, you may not be eligible to invest in Class C or 529-C shares. Specifically, you may not purchase Class C or 529-C shares if you are eligible to purchase Class A or 529-A shares at the $1 million or more sales charge discount rate (that is, at net asset value). See “Sales charge reductions and waivers” in this prospectus and the statement of additional information for more details regarding sales charge discounts.
The Bond Fund of America / Prospectus 26
Exchange Except for Class T shares or as otherwise described in this prospectus, you may exchange your shares for shares of the same class of other American Funds without a sales charge. Class A, C, T or F shares of any American Fund (other than American Funds U.S. Government Money Market Fund, as described below) may be exchanged for the corresponding 529 share class without a sales charge. Exchanges from Class A, C, T or F shares to the corresponding 529 share class, particularly in the case of Uniform Gifts to Minors Act or Uniform Transfers to Minors Act custodial accounts, may result in significant legal and tax consequences, as described in the applicable program description. Please consult your financial professional before making such an exchange.
Except as indicated above, Class T shares are not eligible for exchange privileges. Accordingly, an exchange of your Class T shares for Class T shares of any other American Funds will normally be subject to any applicable sales charges.
Exchanges of shares from American Funds U.S. Government Money Market Fund initially purchased without a sales charge to shares of other American Funds will be subject to the appropriate sales charge applicable to the other fund, unless the American Funds U.S. Government Money Market Fund shares were acquired by an exchange from a fund having a sales charge or by reinvestment or cross-reinvestment of dividends or capital gain distributions. For purposes of computing the contingent deferred sales charge on Class C shares, the length of time you have owned your shares will be measured from the first day of the month in which shares were purchased and will not be affected by any permitted exchange.
Exchanges have the same tax consequences as ordinary sales and purchases. For example, to the extent you exchange shares held in a taxable account that are worth more now than what you paid for them, the gain will be subject to taxation.
See “Transactions by telephone, fax or the Internet” in the section “How to sell shares” of this prospectus for information regarding electronic exchanges.
Please see the statement of additional information for details and limitations on moving investments in certain share classes to different share classes and on moving investments held in certain accounts to different accounts.
27 The Bond Fund of America / Prospectus
How to sell shares
You may sell (redeem) shares in any of the following ways:
Employer-sponsored retirement plans
Shares held in eligible retirement plans may be sold through the plan’s administrator or recordkeeper.
Through your dealer or financial advisor (certain charges may apply)
· Shares held for you in your dealer’s name must be sold through the dealer.
· Class F shares must be sold through intermediaries such as dealers or financial advisors.
Writing to American Funds Service Company
· Requests must be signed by the registered shareholder(s).
· A signature guarantee is required if the redemption is:
— more than $125,000;
— made payable to someone other than the registered shareholder(s); or
— sent to an address other than the address of record or to an address of record that has been changed within the previous 10 days.
· American Funds Service Company reserves the right to require signature guarantee(s) on any redemption.
· Additional documentation may be required for redemptions of shares held in corporate, partnership or fiduciary accounts.
Telephoning or faxing American Funds Service Company or using the Internet
· Redemptions by telephone, fax or the Internet (capitalgroup.com) are limited to $125,000 per American Funds shareholder each day.
· Checks must be made payable to the registered shareholder.
· Checks must be mailed to an address of record that has been used with the account for at least 10 days.
The fund typically expects to remit redemption proceeds one business day following receipt and acceptance of a redemption order, regardless of the method the fund uses to make such payment (e.g., check, wire or automated clearing house transfer). However, payment may take longer than one business day and may take up to seven days as generally permitted by the Investment Company Act of 1940, as amended (the “1940 Act”). Under the 1940 Act, the fund may be permitted to pay redemption proceeds beyond seven days under certain limited circumstances. In addition, if you recently purchased shares and subsequently request a redemption of those shares, the fund will pay the available redemption proceeds once a sufficient period of time has passed to reasonably ensure that checks or drafts, including certified or cashier’s checks, for the shares purchased have cleared (normally seven business days from the purchase date).
Under normal conditions, the fund typically expects to meet shareholder redemptions by monitoring the fund’s portfolio and redemption activities and by regularly holding a reserve of highly liquid assets, such as cash or cash equivalents. The fund may use additional methods to meet shareholder redemptions, if they become necessary. These methods may include, but are not limited to, the sale of portfolio assets, the use of overdraft protection afforded by the fund’s custodian bank, borrowing from a line of
The Bond Fund of America / Prospectus 28
credit or from other funds advised by the investment adviser or its affiliates, and making payment with fund securities or other fund assets rather than in cash (as further discussed in the following paragraph).
Although payment of redemptions normally will be in cash, the fund’s declaration of trust permits payment of the redemption price wholly or partly with portfolio securities or other fund assets under conditions and circumstances determined by the fund’s board of trustees. On the same redemption date, some shareholders may be paid in whole or in part in securities (which may differ among those shareholders), while other shareholders may be paid entirely in cash. In general, in-kind redemptions to affiliated shareholders will as closely as practicable represent the affiliated shareholder’s pro rata share of the fund’s securities, subject to certain exceptions. Securities distributed in-kind to unaffiliated shareholders will be selected by the investment adviser in a manner the investment adviser deems to be fair and reasonable to the fund’s shareholders. The disposal of the securities received in-kind may be subject to brokerage costs and, until sold, such securities remain subject to market risk and liquidity risk, including the risk that such securities are or become difficult to sell. If the fund pays your redemption with illiquid or less liquid securities, you will bear the risk of not being able to sell such securities.
29 The Bond Fund of America / Prospectus
Transactions by telephone, fax or the Internet Generally, you are automatically eligible to redeem or exchange shares by telephone, fax or the Internet, unless you notify us in writing that you do not want any or all of these services. You may reinstate these services at any time.
Unless you decide not to have telephone, fax or Internet services on your account(s), you agree to hold the fund, American Funds Service Company, any of its affiliates or mutual funds managed by such affiliates, and each of their respective directors, trustees, officers, employees and agents harmless from any losses, expenses, costs or liabilities (including attorney fees) that may be incurred in connection with the exercise of these privileges, provided that American Funds Service Company employs reasonable procedures to confirm that the instructions received from any person with appropriate account information are genuine. If reasonable procedures are not employed, American Funds Service Company and/or the fund may be liable for losses due to unauthorized or fraudulent instructions.
Frequent trading of fund shares The fund and American Funds Distributors reserve the right to reject any purchase order for any reason. The fund is not designed to serve as a vehicle for frequent trading. Frequent trading of fund shares may lead to increased costs to the fund and less efficient management of the fund’s portfolio, potentially resulting in dilution of the value of the shares held by long-term shareholders. Accordingly, purchases, including those that are part of exchange activity, that the fund or American Funds Distributors has determined could involve actual or potential harm to the fund may be rejected.
The fund, through its transfer agent, American Funds Service Company, maintains surveillance procedures that are designed to detect frequent trading in fund shares. Under these procedures, various analytics are used to evaluate factors that may be indicative of frequent trading. For example, transactions in fund shares that exceed certain monetary thresholds may be scrutinized. American Funds Service Company also may review transactions that occur close in time to other transactions in the same account or in multiple accounts under common ownership or influence. Trading activity that is identified through these procedures or as a result of any other information available to the fund will be evaluated to determine whether such activity might constitute frequent trading. These procedures may be modified from time to time as appropriate to improve the detection of frequent trading, to facilitate monitoring for frequent trading in particular retirement plans or other accounts and to comply with applicable laws.
Under the fund’s frequent trading policy, certain trading activity will not be treated as frequent trading, such as:
· transactions in Class 529 shares;
· purchases and redemptions by investment companies managed or sponsored by the fund’s investment adviser or its affiliates, including reallocations and transactions allowing the investment company to meet its redemptions and purchases;
· retirement plan contributions, loans and distributions (including hardship withdrawals) identified as such on the retirement plan recordkeeper’s system;
· purchase transactions involving in-kind transfers of shares of the fund, rollovers, Roth IRA conversions and IRA recharacterizations, if the entity maintaining the
The Bond Fund of America / Prospectus 30
shareholder account is able to identify the transaction as one of these types of transactions; and
· systematic redemptions and purchases, if the entity maintaining the shareholder account is able to identify the transaction as a systematic redemption or purchase.
Generally, purchases and redemptions will not be considered “systematic” unless the transaction is prescheduled for a specific date.
American Funds Service Company will work with certain intermediaries (such as investment dealers holding shareholder accounts in street name, retirement plan recordkeepers, insurance company separate accounts and bank trust companies) to apply their own procedures, provided that American Funds Service Company believes the intermediary’s procedures are reasonably designed to enforce the frequent trading policies of the fund. You should refer to disclosures provided by the intermediaries with which you have an account to determine the specific trading restrictions that apply to you.
If American Funds Service Company identifies any activity that may constitute frequent trading, it reserves the right to contact the intermediary and request that the intermediary either provide information regarding an account owner’s transactions or restrict the account owner’s trading. If American Funds Service Company is not satisfied that the intermediary has taken appropriate action, American Funds Service Company may terminate the intermediary’s ability to transact in fund shares.
There is no guarantee that all instances of frequent trading in fund shares will be prevented.
Notwithstanding the fund’s surveillance procedures described above, all transactions in fund shares remain subject to the right of the fund, American Funds Distributors and American Funds Service Company to restrict potentially abusive trading generally, including the types of transactions described above that will not be prevented. See the statement of additional information for more information about how American Funds Service Company may address other potentially abusive trading activity in American Funds.
31 The Bond Fund of America / Prospectus
Distributions and taxes
Dividends and distributions The fund declares daily dividends from net investment income and distributes the accrued dividends, which may fluctuate, to you each month. Generally, dividends begin accruing on the day payment for shares is received by the fund or American Funds Service Company. In the event the fund's distribution of net investment income exceeds its earnings and profits for tax purposes, a portion of such distribution may be classified as return of capital.
Capital gains, if any, are usually distributed in December and June. When a capital gain is distributed, the net asset value per share is reduced by the amount of the payment.
You may elect to reinvest dividends and/or capital gain distributions to purchase additional shares of this fund or other American Funds, or you may elect to receive them in cash. Dividends and capital gain distributions for 529 share classes and retirement plan shareholders will be reinvested automatically.
Taxes on dividends and distributions For federal tax purposes, dividends and distributions of short-term capital gains are taxable as ordinary income. If you are an individual and meet certain holding period requirements with respect to your fund shares, you may be eligible for reduced tax rates on “qualified dividend income,” if any, distributed by the fund to you. The fund’s distributions of net long-term capital gains are taxable as long-term capital gains. Returns of capital distributions decrease your cost basis and are not taxable until your cost basis has been reduced to zero. If your cost basis is zero, returns of capital distributions are treated as capital gains. Any dividends or capital gain distributions you receive from the fund will normally be taxable to you when made, regardless of whether you reinvest dividends or capital gain distributions or receive them in cash.
Dividends and capital gain distributions that are automatically reinvested in a tax-favored retirement or education savings account do not result in federal or state income tax at the time of reinvestment.
Taxes on transactions Your redemptions, including exchanges, may result in a capital gain or loss for federal tax purposes. A capital gain or loss on your investment is the difference between the cost of your shares, including any sales charges, and the amount you receive when you sell them.
Exchanges within a tax-favored retirement plan account will not result in a capital gain or loss for federal or state income tax purposes. With limited exceptions, distributions from a retirement plan account are taxable as ordinary income.
Shareholder fees Fees borne directly by the fund normally have the effect of reducing a shareholder’s taxable income on distributions.
Please see your tax advisor for more information. Holders of Class 529 shares should refer to the applicable program description for more information regarding the tax consequences of selling Class 529 shares.
The Bond Fund of America / Prospectus 32
Choosing a share class The fund offers different classes of shares through this prospectus. The services or share classes available to you may vary depending upon how you wish to purchase shares of the fund.
Each share class represents an investment in the same portfolio of securities, but each class has its own sales charge and expense structure, allowing you to choose the class that best fits your situation. For example, while Class F-1 shares are subject to 12b-1 fees and subtransfer agency fees payable to third-party service providers, Class F-2 shares are subject only to subtransfer agency fees payable to third-party service providers (and not 12b-1 fees) and Class F-3 shares are not subject to any such additional fees. The different fee structures allow the investor to choose how to pay for advisory platform expenses. Class R shares offer different levels of 12b-1 and recordkeeping fees so that a plan can choose the class that best meets the cost associated with obtaining investment related services and participant level recordkeeping for the plan. When you purchase shares of the fund for an individual-type account, you should choose a share class. If none is chosen, your investment will be made in Class A shares or, in the case of a 529 plan investment, Class 529-A shares (or, if you are investing through a financial intermediary who offers only Class T and 529-T shares, your investment will be made in Class T or Class 529-T shares, as applicable).
Factors you should consider when choosing a class of shares include:
· how long you expect to own the shares;
· how much you intend to invest;
· total expenses associated with owning shares of each class;
· whether you qualify for any reduction or waiver of sales charges (for example, Class A or 529-A or Class T or 529-T shares may be a less expensive option over time, particularly if you qualify for a sales charge reduction or waiver);
· whether you want or need the flexibility to effect exchanges among American Funds without the imposition of a sales charge (for example, while Class A shares offer such exchange privileges, Class T shares do not);
· whether you plan to take any distributions in the near future (for example, the contingent deferred sales charge will not be waived if you sell your Class 529-C shares to cover higher education expenses); and
· availability of share classes:
— Class C shares are not available to retirement plans that do not currently invest in such shares and that are eligible to invest in Class R shares, including retirement plans established under Internal Revenue Code Sections 401(a) (including 401(k) plans), 403(b) or 457;
— Class F and 529-F shares are available, as applicable, (i) to fee-based programs of investment dealers that have special agreements with the fund’s distributor, (ii) to financial intermediaries that have been approved by, and that have special agreements with, the fund’s distributor to offer Class F and 529-F shares to self-directed investment brokerage accounts that may charge a transaction fee, (iii) to certain registered investment advisors and (iv) to other intermediaries approved by the fund’s distributor;
— Class F-3 shares (but not Class 529-F-3 shares) are also available to institutional investors, which include, but are not limited to, charitable organizations,
33 The Bond Fund of America / Prospectus
governmental institutions and corporations. For accounts held and serviced by the fund’s transfer agent the minimum investment amount is $1 million; and
— Class R shares are available (i) to retirement plans established under Internal Revenue Code Sections 401(a) (including 401(k) plans), 403(b) or 457, (ii) to nonqualified deferred compensation plans and certain voluntary employee benefit association and post-retirement benefit plans, (iii) to certain institutional investors (including, but not limited to, certain charitable organizations), (iv) to certain registered investment companies approved by the fund’s investment adviser or distributor and (v) to other institutional-type accounts.
Each investor’s financial considerations are different. You should speak with your financial professional to help you decide which share class is best for you.
Sales charges
Class A and 529-A shares The initial sales charge you pay each time you buy Class A or 529-A shares differs depending upon the amount you invest and may be reduced or eliminated for larger purchases as indicated below. The “offering price,” the price you pay to buy shares, includes any applicable sales charge, which will be deducted directly from your investment. Shares acquired through reinvestment of dividends or capital gain distributions are not subject to an initial sales charge.
Class A shares
| | | | |
| | Sales charge as a percentage of: | |
| Investment | Offering price | Net amount
invested | Dealer commission
as a percentage
of offering price |
| Less than $100,000 | 3.75% | 3.90% | 3.00% |
| $100,000 but less than $250,000 | 3.50 | 3.63 | 2.75 |
| $250,000 but less than $500,000 | 2.50 | 2.56 | 2.00 |
| $500,000 but less than $750,000 | 2.00 | 2.04 | 1.60 |
| $750,000 but less than $1 million | 1.50 | 1.52 | 1.20 |
| $1 million or more and certain other investments described below | none | none | see below |
Class 529-A shares
| | | | |
| | Sales charge as a
percentage of: | |
| Investment | Offering price | Net amount
invested | Dealer commission
as a percentage
of offering price |
| Less than $250,000 | 3.50% | 3.63% | 2.75% |
| $250,000 but less than $500,000 | 2.50 | 2.56 | 2.00 |
| $500,000 but less than $750,000 | 2.00 | 2.04 | 1.60 |
| $750,000 but less than $1 million | 1.50 | 1.52 | 1.20 |
$1 million or more and certain other
investments described below | none | none | see below |
The sales charge, expressed as a percentage of the offering price or the net amount invested, may be higher or lower than the percentages described in the table above due
The Bond Fund of America / Prospectus 34
to rounding. This is because the dollar amount of the sales charge is determined by subtracting the net asset value of the shares purchased from the offering price, which is calculated to two decimal places using standard rounding criteria. The impact of rounding will vary with the size of the investment and the net asset value of the shares. Similarly, any contingent deferred sales charge paid by you on investments in Class A or 529-A shares may be higher or lower than the 1% charge described below due to rounding.
Except as provided below, investments in Class A shares of $1 million or more will be subject to a 1% contingent deferred sales charge if the shares are sold within 18 months of purchase. The contingent deferred sales charge is based on the original purchase cost or the current market value of the shares being sold, whichever is less.
Class A share purchases not subject to sales charges The following investments are not subject to any initial or contingent deferred sales charge if American Funds Service Company is properly notified of the nature of the investment:
· investments made by accounts that are part of qualified fee-based programs that purchased Class A shares before the discontinuation of the relevant investment dealer’s load-waived Class A share program with American Funds and that continue to be held through fee-based programs;
· rollover investments from retirement plans to IRAs that are described in the “Rollovers from retirement plans to IRAs” section of this prospectus; and
· investments made by accounts held at American Funds Service Company that are no longer associated with a financial professional may invest in Class A shares without a sales charge. This includes retirement plans investing in Class A shares, where the plan is no longer associated with a financial professional. SIMPLE IRAs and 403(b) custodial accounts that are aggregated at the plan level for Class A sales charge purposes are not eligible to invest without a sales charge under this policy.
The distributor may pay dealers a commission of up to 1% on investments made in Class A shares with no initial sales charge. The fund may reimburse the distributor for these payments through its plans of distribution (see “Plans of distribution” in this prospectus).
A transfer from the Virginia Prepaid Education ProgramSM or the Virginia Education Savings TrustSM to a CollegeAmerica account will be made with no sales charge. No commission will be paid to the dealer on such a transfer. Investment dealers will be compensated solely with an annual service fee that begins to accrue immediately.
If requested, American Funds Class A shares will be sold at net asset value to:
(1) currently registered representatives and assistants directly employed by such representatives, retired registered representatives with respect to accounts established while active, or full-time employees (collectively, “Eligible Persons”) (and their (a) spouses or equivalents if recognized under local law, (b) parents and children, including parents and children in step and adoptive relationships, sons-in-law and daughters-in-law, and (c) parents-in-law, if the Eligible Persons or the spouses, children or parents of the Eligible Persons are listed in the account registration with the parents-in-law) of dealers who have sales agreements with American Funds Distributors (or who clear transactions
35 The Bond Fund of America / Prospectus
through such dealers), plans for the dealers, and plans that include as participants only the Eligible Persons, their spouses, parents and/or children;
(2) the supervised persons of currently registered investment advisory firms (“RIAs”) and assistants directly employed by such RIAs, retired supervised persons of RIAs with respect to accounts established while a supervised person (collectively, “Eligible Persons”) (and their (a) spouses or equivalents if recognized under local law, (b) parents and children, including parents and children in step and adoptive relationships, sons-in-law and daughters-in-law and (c) parents-in-law, if the Eligible Persons or the spouses, children or parents of the Eligible Persons are listed in the account registration with the parents-in-law) of RIA firms that are authorized to sell shares of the funds, plans for the RIA firms, and plans that include as participants only the Eligible Persons, their spouses, parents and/or children;
(3) insurance company separate accounts;
(4) accounts managed by subsidiaries of The Capital Group Companies, Inc.;
(5) an individual or entity with a substantial business relationship with The Capital Group Companies, Inc. or its affiliates, or an individual or entity related or relating to such individual or entity;
(6) wholesalers and full-time employees directly supporting wholesalers involved in the distribution of insurance company separate accounts whose underlying investments are managed by any affiliate of The Capital Group Companies, Inc.;
(7) full-time employees of banks that have sales agreements with American Funds Distributors who are solely dedicated to directly supporting the sale of mutual funds; and
(8) current or former clients of Capital Group Private Client Services and their family members who purchase their shares through Capital Group Private Client Services or American Funds Service Company.
Shares are offered at net asset value to these persons and organizations due to anticipated economies in sales effort and expense. Once an account is established under this net asset value privilege, additional investments can be made at net asset value for the life of the account. Depending on the financial intermediary holding your account, these privileges may be unavailable. Investors should consult their financial intermediary for further information.
Certain other investors may qualify to purchase shares without a sales charge, such as employees of The Capital Group Companies, Inc. and its affiliates. Please see the statement of additional information for further details.
Class C shares Class C shares are sold without any initial sales charge. American Funds Distributors pays 1% of the amount invested to dealers who sell Class C shares. A contingent deferred sales charge of 1% applies if Class C shares are sold within one year of purchase. The contingent deferred sales charge is eliminated one year after purchase.
Any contingent deferred sales charge paid by you on sales of Class C shares, expressed as a percentage of the applicable redemption amount, may be higher or lower than the percentages described above due to rounding.
The Bond Fund of America / Prospectus 36
Class T shares The initial sales charge you pay each time you buy Class T shares differs depending upon the amount you invest and may be reduced for larger purchases as indicated below. The “offering price,” the price you pay to buy shares, includes any applicable sales charge, which will be deducted directly from your investment. Shares acquired through reinvestment of dividends or capital gain distributions are not subject to an initial sales charge.
| | | |
| | Sales charge as a
percentage of: |
| Investment | Offering price | Net amount
invested |
| Less than $250,000 | 2.50% | 2.56% |
| $250,000 but less than $500,000 | 2.00 | 2.04 |
| $500,000 but less than $1 million | 1.50 | 1.52 |
| $1 million or more | 1.00 | 1.01 |
The sales charge, expressed as a percentage of the offering price or the net amount invested, may be higher or lower than the percentages described in the table above due to rounding. This is because the dollar amount of the sales charge is determined by subtracting the net asset value of the shares purchased from the offering price, which is calculated to two decimal places using standard rounding criteria. The impact of rounding will vary with the size of the investment and the net asset value of the shares.
Class 529-E and Class F shares Class 529-E and Class F shares (including Class 529-F shares) are sold without any initial or contingent deferred sales charge.
Class R shares Class R shares are sold without any initial or contingent deferred sales charge. The distributor will pay dealers annually asset-based compensation of up to 1.00% for sales of Class R-1 shares, up to .75% for Class R-2 shares, up to .60% for Class R-2E shares, up to .50% for Class R-3 shares and up to .25% for Class R-4 shares. No dealer compensation is paid from fund assets on sales of Class R-5E, R-5 or R-6 shares. The fund may reimburse the distributor for these payments through its plans of distribution.
See “Plans of distribution” in this prospectus for ongoing compensation paid to your financial professional for all share classes.
Contingent deferred sales charges Shares acquired through reinvestment of dividends or capital gain distributions are not subject to a contingent deferred sales charge. In addition, the contingent deferred sales charge may be waived in certain circumstances. See “Contingent deferred sales charge waivers” in the “Sales charge reductions and waivers” section of this prospectus. For purposes of determining the contingent deferred sales charge, if you sell only some of your shares, shares that are not subject to any contingent deferred sales charge will be sold first, followed by shares that you have owned the longest.
37 The Bond Fund of America / Prospectus
Sales charge reductions and waivers To receive a reduction in your Class A initial sales charge, you must let your financial professional or American Funds Service Company know at the time you purchase shares that you qualify for such a reduction. If you do not let your financial professional or American Funds Service Company know that you are eligible for a reduction, you may not receive the sales charge discount to which you are otherwise entitled. In order to determine your eligibility to receive a sales charge discount, it may be necessary for you to provide your financial professional or American Funds Service Company with information and records (including account statements) of all relevant accounts invested in American Funds. You may need to invest directly through American Funds Service Company in order to receive the sales charge waivers described in this prospectus. Investors should consult their financial intermediary for further information. Certain financial intermediaries that distribute shares of American Funds may impose different sales charge waivers than those described in this prospectus. Such variations in sales charge waivers are described in an appendix to this prospectus titled “Sales charge waivers.” Note that such sales charge waivers and discounts offered through a particular intermediary, as set forth in the appendix to this prospectus, are implemented and administered solely by that intermediary. Please contact the applicable intermediary to ensure that you understand the steps you must take in order to qualify for any available waivers or discounts.
In addition to the information in this prospectus, you may obtain more information about share classes, sales charges and sales charge reductions and waivers through a link on the home page of our website at capitalgroup.com, from the statement of additional information or from your financial professional.
Reducing your Class A initial sales charge Consistent with the policies described in this prospectus, you and your “immediate family” (your spouse — or equivalent, if recognized under local law, your children under the age of 21 or disabled adult dependents covered by ABLE accounts) may combine all of your American Funds investments to reduce Class A sales charges. In addition, two or more retirement plans of an employer or an employer’s affiliates may combine all of their American Funds investments to reduce Class A sales charges. However, for this purpose, investments representing direct purchases of American Funds U.S. Government Money Market Fund Class A shares are excluded. Following are different ways that you may qualify for a reduced Class A sales charge:
Aggregating accounts To receive a reduced Class A sales charge, investments made by you and your immediate family (see above) may be aggregated if made for your own account(s) and/or certain other accounts, such as:
· individual-type employee benefit plans, such as an IRA, single-participant Keogh-type plan, or a participant account of a 403(b) plan that is treated as an individual-type plan for sales charge purposes (see “Purchases by certain 403(b) plans” under “Rollovers from retirement plans to IRAs” below);
· SEP plans and SIMPLE IRA plans established after November 15, 2004, by an employer adopting any plan document other than a prototype plan produced by American Funds Distributors;
· business accounts solely controlled by you or your immediate family (for example, you own the entire business);
The Bond Fund of America / Prospectus 38
· trust accounts established by you or your immediate family (for trusts with only one primary beneficiary, upon the trustor’s death the trust account may be aggregated with such beneficiary’s own accounts; for trusts with multiple primary beneficiaries, upon the trustor’s death the trustees of the trust may instruct American Funds Service Company to establish separate trust accounts for each primary beneficiary; each primary beneficiary’s separate trust account may then be aggregated with such beneficiary’s own accounts);
· endowments or foundations established and controlled by you or your immediate family; or
· 529 accounts, which will be aggregated at the account owner level (Class 529-E accounts may only be aggregated with an eligible employer plan).
Individual purchases by a trustee(s) or other fiduciary(ies) may also be aggregated if the investments are:
· for a single trust estate or fiduciary account, including employee benefit plans other than the individual-type employee benefit plans described above;
· made for two or more employee benefit plans of a single employer or of affiliated employers as defined in the 1940 Act, excluding the individual-type employee benefit plans described above;
· for a diversified common trust fund or other diversified pooled account not specifically formed for the purpose of accumulating fund shares;
· for nonprofit, charitable or educational organizations, or any endowments or foundations established and controlled by such organizations, or any employer-sponsored retirement plans established for the benefit of the employees of such organizations, their endowments, or their foundations;
· for participant accounts of a 403(b) plan that is treated as an employer-sponsored plan for sales charge purposes (see “Purchases by certain 403(b) plans” under “Rollovers from retirement plans to IRAs” below), or made for participant accounts of two or more such plans, in each case of a single employer or affiliated employers as defined in the 1940 Act; or
· for a SEP or SIMPLE IRA plan established after November 15, 2004, by an employer adopting a prototype plan produced by American Funds Distributors.
Purchases made for nominee or street name accounts (securities held in the name of an investment dealer or another nominee such as a bank trust department instead of the customer) may not be aggregated with those made for other accounts and may not be aggregated with other nominee or street name accounts unless otherwise qualified as described above.
Joint accounts may be aggregated with other accounts belonging to the primary owner and/or his or her immediate family. The primary owner of a joint account is the individual responsible for taxes on the account.
Investments made through employer-sponsored retirement plan accounts will not be aggregated with individual-type accounts.
Concurrent purchases You may reduce your Class A sales charge by combining simultaneous purchases (including, upon your request, purchases for gifts) of all classes of shares in American Funds. Shares of American Funds U.S. Government Money Market Fund purchased through an exchange, reinvestment or cross-
39 The Bond Fund of America / Prospectus
reinvestment from a fund having a sales charge also qualify. However, direct purchases of American Funds U.S. Government Money Market Fund Class A shares are excluded. If you currently have individual holdings in American Legacy variable annuity contracts or variable life insurance policies that were established on or before March 31, 2007, you may continue to combine purchases made under such contracts and policies to reduce your Class A sales charge.
Rights of accumulation Subject to the limitations described in the aggregation policy, you may take into account your accumulated holdings in all share classes of American Funds to determine your sales charge on investments in accounts eligible to be aggregated. Direct purchases of American Funds U.S. Government Money Market Fund Class A shares are excluded. Subject to your investment dealer’s or recordkeeper’s capabilities, your accumulated holdings will be calculated as the higher of (a) the current value of your existing holdings (the “market value”) as of the day prior to your American Funds investment or (b) the amount you invested (including reinvested dividends and capital gains, but excluding capital appreciation) less any withdrawals (the “cost value”). Depending on the entity on whose books your account is held, the value of your holdings in that account may not be eligible for calculation at cost value. For example, accounts held in nominee or street name may not be eligible for calculation at cost value and instead may be calculated at market value for purposes of rights of accumulation.
The value of all of your holdings in accounts established in calendar year 2005 or earlier will be assigned an initial cost value equal to the market value of those holdings as of the last business day of 2005. Thereafter, the cost value of such accounts will increase or decrease according to actual investments or withdrawals. You must contact your financial professional or American Funds Service Company if you have additional information that is relevant to the calculation of the value of your holdings.
When determining your American Funds Class A sales charge, if your investment is not in an employer-sponsored retirement plan, you may also continue to take into account the market value (as of the day prior to your American Funds investment) of your individual holdings in various American Legacy variable annuity contracts and variable life insurance policies that were established on or before March 31, 2007. An employer-sponsored retirement plan may also continue to take into account the market value of its investments in American Legacy Retirement Investment Plans that were established on or before March 31, 2007.
You may not purchase Class C or 529-C shares if such combined holdings cause you to be eligible to purchase Class A or 529-A shares at the $1 million or more sales charge discount rate (i.e., at net asset value).
If you make a gift of American Funds Class A shares, upon your request, you may purchase the shares at the sales charge discount allowed under rights of accumulation of all of your American Funds and applicable American Legacy accounts.
You should retain any records necessary to substantiate the historical amounts you have invested.
Statement of intention You may reduce your Class A sales charge by establishing a statement of intention. A statement of intention is a nonbinding commitment that allows you to combine all purchases of all American Funds share classes (excluding
The Bond Fund of America / Prospectus 40
American Funds U.S. Government Money Market Fund) that you intend to make over a 13-month period to determine the applicable sales charge; however, purchases made under a right of reinvestment, appreciation of your holdings, and reinvested dividends and capital gains do not count as purchases made during the statement period. Your accumulated holdings (as described and calculated under “Rights of accumulation” above) eligible to be aggregated as of the day immediately before the start of the statement period may be credited toward satisfying the statement. A portion of your account may be held in escrow to cover additional Class A sales charges that may be due if your total purchases over the statement period do not qualify you for the applicable sales charge reduction. Employer-sponsored retirement plans are restricted from establishing statements of intention. See the discussion regarding employer-sponsored retirement plans under “Purchase, exchange and sale of shares” in this prospectus for more information.
The statement of intention period starts on the date on which your first purchase made toward satisfying the statement of intention is processed. Your accumulated holdings (as described above under “Rights of accumulation”) eligible to be aggregated as of the day immediately before the start of the statement of intention period may be credited toward satisfying the statement of intention.
You may revise the commitment you have made in your statement of intention upward at any time during the statement of intention period. If your prior commitment has not been met by the time of the revision, the statement of intention period during which purchases must be made will remain unchanged. Purchases made from the date of the revision will receive the reduced sales charge, if any, resulting from the revised statement of intention. If your prior commitment has been met by the time of the revision, your original statement of intention will be considered met and a new statement of intention will be established.
The statement of intention will be considered completed if the shareholder dies within the 13-month statement of intention period. Commissions to dealers will not be adjusted or paid on the difference between the statement of intention amount and the amount actually invested before the shareholder’s death.
When a shareholder elects to use a statement of intention, shares equal to 5% of the dollar amount specified in the statement of intention may be held in escrow in the shareholder’s account out of the initial purchase (or subsequent purchases, if necessary) by American Funds Service Company. All dividends and any capital gain distributions on shares held in escrow will be credited to the shareholder’s account in shares (or paid in cash, if requested). If the intended investment is not completed within the specified statement of intention period the investments made during the statement period will be adjusted to reflect the difference between the sales charge actually paid and the sales charge which would have been paid if the total of such purchases had been made at a single time. Any dealers assigned to the shareholder’s account at the time a purchase was made during the statement period will receive a corresponding commission adjustment if appropriate.
In addition, if you currently have individual holdings in American Legacy variable annuity contracts or variable life insurance policies that were established on or before March 31, 2007, you may continue to apply purchases under such contracts and policies to a statement of intention.
41 The Bond Fund of America / Prospectus
Shareholders purchasing shares at a reduced sales charge under a statement of intention indicate their acceptance of these terms and those in the prospectus with their first purchase.
Reducing your Class T initial sales charge Consistent with the policies described in this prospectus, the initial sales charge you pay each time you buy Class T shares may differ depending upon the amount you invest and may be reduced for larger purchases. Additionally, Class T shares acquired through reinvestment of dividends or capital gain distributions are not subject to an initial sales charge. Sales charges on Class T shares are applied on a transaction-by-transaction basis, and, accordingly, Class T shares are not eligible for any other sales charge waivers or reductions, including through the aggregation of Class T shares concurrently purchased by other related accounts or in other American Funds. The sales charge applicable to Class T shares may not be reduced by establishing a statement of intention, and rights of accumulation are not available for Class T shares.
Right of reinvestment If you notify American Funds Service Company prior to the time of reinvestment, you may reinvest proceeds from a redemption, dividend payment or capital gain distribution without a sales charge in the same fund or other American Funds, provided that the reinvestment occurs within 90 days after the date of the redemption, dividend payment or distribution and is made into the same account from which you redeemed the shares or received the dividend payment or distribution. If the account has been closed, you may reinvest without a sales charge if the new receiving account has the same registration as the closed account and the reinvestment is made within 90 days after the date of redemption, dividend payment or distribution.
Proceeds from a redemption and all dividend payments and capital gain distributions will be reinvested in the same share class from which the original redemption, dividend payment or distribution was made. Any contingent deferred sales charge on Class A or C shares will be credited to your account. Redemption proceeds of Class A shares representing direct purchases in American Funds U.S. Government Money Market Fund that are reinvested in other American Funds will be subject to a sales charge.
Proceeds will be reinvested at the next calculated net asset value after your request is received by American Funds Service Company, provided that your request contains all information and legal documentation necessary to process the transaction. For purposes of this “right of reinvestment policy,” automatic transactions (including, for example, automatic purchases, withdrawals and payroll deductions) and ongoing retirement plan contributions are not eligible for investment without a sales charge. This paragraph does not apply to certain rollover investments as described under “Rollovers from retirement plans to IRAs” in this prospectus. Depending on the financial intermediary holding your account, your reinvestment privileges may be unavailable or differ from those described in this prospectus. Investors should consult their financial intermediary for further information.
Contingent deferred sales charge waivers The contingent deferred sales charge on Class A and C shares will be waived in the following cases:
· permitted exchanges of shares, except if shares acquired by exchange are then redeemed within the period during which a contingent deferred sales charge would apply to the initial shares purchased;
· tax-free returns of excess contributions to IRAs;
The Bond Fund of America / Prospectus 42
· redemptions due to death or postpurchase disability of the shareholder (this generally excludes accounts registered in the names of trusts and other entities);
· in the case of joint tenant accounts, if one joint tenant dies, a surviving joint tenant, at the time he or she notifies American Funds Service Company of the other joint tenant’s death and removes the decedent’s name from the account, may redeem shares from the account without incurring a contingent deferred sales charge; however, redemptions made after American Funds Service Company is notified of the death of a joint tenant will be subject to a contingent deferred sales charge;
· for 529 share classes only, redemptions due to a beneficiary’s death, postpurchase disability or receipt of a scholarship (to the extent of the scholarship award);
· redemptions due to the complete termination of a trust upon the death of the trustor/grantor or beneficiary, but only if such termination is specifically provided for in the trust document;
· shares redeemed at the discretion of American Funds Service Company for accounts that do not meet the fund’s minimum investment requirements, as described in this prospectus; and
· the following types of transactions, if they do not exceed 12% of the value of an account annually:
— required minimum distributions taken from retirement accounts in accordance with IRS regulations; and
— redemptions through an automatic withdrawal plan (“AWP”) (see “Automatic withdrawals” under “Shareholder account services and privileges” in the statement of additional information). For each AWP payment, assets that are not subject to a contingent deferred sales charge, such as shares acquired through reinvestment of dividends and/or capital gain distributions, will be redeemed first and will count toward the 12% limit. If there is an insufficient amount of assets not subject to a contingent deferred sales charge to cover a particular AWP payment, shares subject to the lowest contingent deferred sales charge will be redeemed next until the 12% limit is reached. Any dividends and/or capital gain distributions taken in cash by a shareholder who receives payments through an AWP will also count toward the 12% limit. In the case of an AWP, the 12% limit is calculated at the time an automatic redemption is first made, and is recalculated at the time each additional automatic redemption is made. Shareholders who establish an AWP should be aware that the amount of a payment not subject to a contingent deferred sales charge may vary over time depending on fluctuations in the value of their accounts. This privilege may be revised or terminated at any time.
For purposes of this paragraph, “account” means your investment in the applicable class of shares of the particular fund from which you are making the redemption.
The contingent deferred sales charge on American Funds Class A shares may be waived in cases where the fund’s transfer agent determines the benefit to the fund of collecting the contingent deferred sales charge would be outweighed by the cost of applying it.
Contingent deferred sales charge waivers are allowed only in the cases listed here and in the statement of additional information. For example, contingent deferred sales charge waivers will not be allowed on redemptions of Class 529-C shares due to termination of CollegeAmerica; a determination by the Internal Revenue Service that CollegeAmerica
43 The Bond Fund of America / Prospectus
does not qualify as a qualified tuition program under the Code; proposal or enactment of law that eliminates or limits the tax-favored status of CollegeAmerica; or elimination of the fund by Virginia529 as an option for additional investment within CollegeAmerica.
To have your Class A or C contingent deferred sales charge waived, you must inform your financial professional or American Funds Service Company at the time you redeem shares that you qualify for such a waiver.
Other sales charge waivers Purchases of Class A and 529-A shares through a self-clearing broker-dealer firm generally incur a sales charge. However, self-clearing broker-dealer firms may (i) offer 529-A shares purchased through a rollover from another 529 plan at net asset value (“529 rollover”), (ii) invest a recontribution of a refunded qualified education expense in 529-A shares without a sales charge (“refunded 529 expense”) or (iii) extend the 90 day right of reinvestment to allow reinvestment in Class A shares without a sales charge in cases where fund shareholders request reinvestment of a required minimum distribution from an Individual Retirement Account if such requirement is waived by regulation or legislation (“waived RMD reinvestment”), provided that the self-clearing broker-dealer firm has specific language in this prospectus to such effect. If a self-clearing firm does not have their own policies listed in the prospectus, 529 rollovers, refunded 529 expenses and waived RMD reinvestments are not available without a sales charge. Firm specific language is located in the Appendix to the prospectus. A self-clearing broker-dealer firm is a firm that holds some or all of the assets in your account, executes trades for the assets held on its platform internally rather than through the fund’s transfer agent or a third-party clearing firm and provides account statements and tax reporting to you. The largest broker-dealer firms are typically self-clearing. For all other broker-dealer firms, shares purchased through a 529 rollover, refunded 529 expense or a waived RMD reinvestment are available at net asset value.
For accounts held with the fund’s transfer agent, purchases of shares through 529 rollovers, refunded 529 expenses and waived RMD reinvestments are not subject to sales charges. If you have any questions, ask your financial professional whether Class A or 529-A shares purchased through these policies are available without a sales charge.
Recontributions or waived RMD investments distributed from Class 529-C or Class C shares will be reinvested in the same share class from which the distribution was made. In addition, any contingent deferred sales change paid on Class 529-A/Class A and Class 529-C/Class C share distributions under these policies will be credited to your account when reinvested.
Waivers of all or a portion of the contingent deferred sales charge on Class C and 529-C shares and the sales charge on Class A and 529-A shares will be granted for transactions requested by financial intermediaries as a result of (i) pending or anticipated regulatory matters that require investor accounts to be moved to a different share class or (ii) conversions of IRAs from brokerage to advisory accounts investing in Class F shares in cases where new investments in brokerage IRA accounts have been restricted by the intermediary.
The Bond Fund of America / Prospectus 44
Rollovers from retirement plans to IRAs Assets from retirement plans may be invested in Class A, C or F shares through an IRA rollover, subject to the other provisions of this prospectus. Class C shares are not available if the assets are being rolled over from investments held in American Funds Recordkeeper Direct and PlanPremier retirement plan recordkeeping programs.
Rollovers to IRAs from retirement plans that are rolled into Class A shares will be subject to applicable sales charges. The following rollovers to Class A shares will be made without a sales charge:
· rollovers to Capital Bank and Trust CompanySM IRAs if the assets were invested in any fund managed by the investment adviser or its affiliates at the time of distribution;
· rollovers to IRAs from 403(b) plans with Capital Bank and Trust Company as custodian; and
· rollovers to Capital Bank and Trust Company IRAs from investments held in American Funds Recordkeeper Direct and PlanPremier retirement plan recordkeeping programs.
IRA rollover assets that roll over without a sales charge as described above will not be subject to a contingent deferred sales charge, and investment dealers will be compensated solely with an annual service fee that begins to accrue immediately. All other rollovers invested in Class A shares, as well as future contributions to the IRA, will be subject to sales charges and to the terms and conditions generally applicable to Class A share investments as described in this prospectus and in the statement of additional information.
Purchases by SEP plans and SIMPLE IRA plans Participant accounts in a Simplified Employee Pension (SEP) plan or a Savings Incentive Match Plan for Employees of Small Employers IRA (SIMPLE IRA) will be aggregated at the plan level for Class A sales charge purposes if an employer adopts a prototype plan produced by American Funds Distributors or (a) the employer or plan sponsor submits all contributions for all participating employees in a single contribution transmittal or the contributions are identified as related to the same plan; (b) each transmittal is accompanied by checks or wire transfers and generally must be submitted through the transfer agent’s automated contribution system if held on the fund’s books; and (c) if the fund is expected to carry separate accounts in the name of each plan participant and (i) the employer or plan sponsor notifies the funds’ transfer agent or the intermediary holding the account that the separate accounts of all plan participants should be linked and (ii) all new participant accounts are established by submitting the appropriate documentation on behalf of each new participant. Participant accounts in a SEP or SIMPLE plan that are eligible to aggregate their assets at the plan level may not also aggregate the assets with their individual accounts.
Purchases by certain 403(b) plans A 403(b) plan may not invest in American Funds Class A or C shares unless such plan was invested in Class A or C shares before January 1, 2009.
Participant accounts of a 403(b) plan that invested in American Funds Class A or C shares and were treated as an individual-type plan for sales charge purposes before January 1, 2009, may continue to be treated as accounts of an individual-type plan for sales charge purposes. Participant accounts of a 403(b) plan that invested in American Funds Class A or C shares and were treated as an employer-sponsored plan for sales charge purposes before January 1, 2009, may continue to be treated as accounts of an employer-
45 The Bond Fund of America / Prospectus
sponsored plan for sales charge purposes. Participant accounts of a 403(b) plan that was established on or after January 1, 2009, are treated as accounts of an employer-sponsored plan for sales charge purposes.
Moving between accounts American Funds investments by certain account types may be moved to other account types without incurring additional Class A sales charges. These transactions include:
· redemption proceeds from a non-retirement account (for example, a joint tenant account) used to purchase fund shares in an IRA or other individual-type retirement account;
· required minimum distributions from an IRA or other individual-type retirement account used to purchase fund shares in a non-retirement account; and
· death distributions paid to a beneficiary’s account that are used by the beneficiary to purchase fund shares in a different account.
These privileges are generally available only if your account is held directly with the fund’s transfer agent or if the financial intermediary holding your account has the systems, policies and procedures to support providing the privileges on its systems. Investors should consult their financial intermediary for further information.
Plans of distribution The fund has plans of distribution, or “12b-1 plans,” for certain share classes under which it may finance activities intended primarily to sell shares, provided that the categories of expenses are approved in advance by the fund’s board of trustees. The plans provide for payments, based on annualized percentages of average daily net assets, of:
| | |
| Up to: | Share class(es) |
| 0.25% | Class A shares |
| 0.50% | Class T, F-1, 529-A, 529-T, 529-F-1 and R-4 shares |
| 0.75% | Class 529-E and R-3 shares |
| 0.85% | Class R-2E shares |
| 1.00% | Class C, 529-C, R-1 and R-2 shares |
For all share classes indicated above, up to .25% may be used to pay service fees to qualified dealers for providing certain shareholder services. The amount remaining for each share class, if any, may be used for distribution expenses.
The 12b-1 fees paid by each applicable share class of the fund, as a percentage of average net assets for the most recent fiscal year, are indicated in the Annual Fund Operating Expenses table under “Fees and expenses of the fund” in this prospectus. Since these fees are paid out of the fund’s assets on an ongoing basis, over time they may cost you more than paying other types of sales charges or service fees and reduce the return on your investment. The higher fees for Class C shares may cost you more over time than paying the initial sales charge for Class A or T shares.
The Bond Fund of America / Prospectus 46
Other compensation to dealers American Funds Distributors, at its expense, provides additional compensation to investment dealers. These payments may be made, at the discretion of American Funds Distributors, to no more than the top 60 dealers (or their affiliates) with which it has a substantive distribution relationship involving the sale of American Funds. The amount will be determined using a formula applied consistently to dealers based on their assets under management. The level of payments made to a qualifying firm under the formula will not exceed .035% of eligible American Funds assets attributable to that dealer. Eligible assets are all American Funds assets other than Class R shares, Class F-3 shares, Class F shares held in IRAs and shares held in certain retirement accounts. Dealers may direct American Funds Distributors to exclude additional assets. In addition to the asset-based payment, American Funds Distributors provides $5 million to certain firms based on their engagement with American Funds Distributors and the level of American Funds assets under management at each such firm to recognize the commitment each of those firms has made to collaborating with American Funds Distributors on achieving advisor training and education objectives. In 2020, American Funds Distributors paid this amount to the following firms:
| | |
| Edward Jones | Morgan Stanley Wealth Management |
| LPL Financial LLC | Raymond James Group |
| Merrill Lynch, Pierce, Fenner & Smith | Wells Fargo Advisors |
American Funds Distributors compensates the firms to support various efforts, including, among other things, to:
· help defray the costs incurred by qualifying dealers in connection with efforts to educate financial professionals about American Funds so that they can make recommendations and provide services that are suitable and meet shareholder needs;
· help defray the costs associated with the dealer firms’ provision of account related services and activities and support the dealer firms’ distribution activities; and
· support meetings, conferences or other training and educational events hosted by the firm, and obtain relevant data regarding financial professional activities to facilitate American Funds Distributors’ training and education activities.
American Funds Distributors will, on an annual basis, determine the advisability of continuing these payments. Firms receiving additional compensation payments must sign a letter acknowledging the purpose of the payment and generally requiring the firms to (1) perform the due diligence necessary to include American Funds on their platform, (2) not provide financial professionals, branch managers or associated persons with any financial incentives to promote the sales of one approved fund group over another approved group, (3) provide opportunities for their clients to obtain individualized advice, (4) provide American Funds Distributors broad access to their financial professionals and product platforms and work together on mutual business objectives, and (5) work with the fund’s transfer agent to promote operational efficiencies and to facilitate necessary communication between American Funds and the firm’s clients who own shares of American Funds.
Separately, American Funds Distributors has identified certain firms that provide a self-directed platform for the public as well as clearing, custody and recordkeeping services for certain other intermediaries. In lieu of the formula described above, these firms receive up to .018% of assets under administration (excluding assets where the firm acts
47 The Bond Fund of America / Prospectus
as a fiduciary and Class R shares). Firms may direct American Funds Distributors to exclude additional assets.
In addition to compensation through the formulas described above, American Funds Distributors provides compensation for, among other things, data (including fees to obtain information on financial professionals to better tailor training and education opportunities), account-related services, and operational improvements. American Funds Distributors estimates that in 2020 for the firms listed below, the compensation for such information and services was approximately:
| | |
| Cetera | $120,000 |
| Commonwealth Financial Network | $50,000 |
| Fidelity Investments | $6,700,000 |
| LPL Financial LLC | $1,800,000 |
| Morgan Stanley Wealth Management | $4,300,000 |
| Northwestern Mutual Investment Services LLC | $75,000 |
| OneAmerica | $35,000 |
| UBS Financial Services Inc. | $300,000 |
| Wells Fargo Advisors | $450,000 |
American Funds Distributors also pays expenses associated with meetings and other training and educational opportunities conducted by selling dealers, advisory platform providers and other intermediaries to facilitate educating financial professionals and shareholders about American Funds.
American Funds Distributors pays the recordkeepers listed below up to $1 million annually for product services, platform consideration, participation at recordkeeper-sponsored events and co-branding and other marketing services. The amount of the payment is based on the level of services and the access provided by the recordkeeper.
| | |
| |
| Empower (Great West Life & Annuity Insurance Company) | MML Investors Services |
| John Hancock | Transamerica |
| |
| |
If investment advisers, distributors or other affiliates of mutual funds pay additional compensation or other incentives to investment dealers in differing amounts, dealer firms and their financial professionals may have financial incentives for recommending a particular mutual fund over other mutual funds or investments, creating a potential conflict of interest. You should consult with your financial professional and review carefully any disclosure by your financial professional’s firm as to compensation received.
The Bond Fund of America / Prospectus 48
Fund expenses Note that, unless otherwise stated, references to Class A, C, T and F shares in this “Fund expenses” section do not include the corresponding Class 529 shares.
In periods of market volatility, assets of the fund may decline significantly, causing total annual fund operating expenses (as a percentage of the value of your investment) to become higher than the numbers shown in the Annual Fund Operating Expenses table under “Fees and expenses of the fund” in this prospectus.
For all share classes, “Other expenses” items in the Annual Fund Operating Expenses table in this prospectus include fees for administrative services provided by the fund’s investment adviser and its affiliates. Administrative services are provided by the investment adviser and its affiliates to help assist third parties providing non-distribution services to fund shareholders. These services include providing in-depth information on the fund and market developments that impact fund investments. Administrative services also include, but are not limited to, coordinating, monitoring and overseeing third parties that provide services to fund shareholders. The Administrative Services Agreement between the fund and the investment adviser provides the fund the ability to charge an administrative services fee of .05% for all share classes. The fund’s investment adviser receives an administrative services fee at the annual rate of .03% of the average daily net assets of the fund attributable to Class A, C, T, F, R and 529 shares (which could be increased as noted above) for its provision of administrative services.
The “Other expenses” items in the Annual Fund Operating Expenses table also include custodial, legal and transfer agent (and, if applicable, subtransfer agent/recordkeeping) payments and various other expenses applicable to all share classes.
49 The Bond Fund of America / Prospectus
Subtransfer agency and recordkeeping fees Subtransfer agent/recordkeeping payments may be made to third parties (including affiliates of the fund’s investment adviser) that provide subtransfer agent, recordkeeping and/or shareholder services with respect to certain shareholder accounts in lieu of the transfer agent providing such services. The amount paid for subtransfer agent/recordkeeping services varies depending on the share class and services provided, and typically ranges from $3 to $18 per account. Although Class F-3 and Class 529-F-3 shares are not subject to any subtransfer agency or recordkeeping fees, Class F-1 and F-2 shares (and the corresponding Class 529 shares) are subject to subtransfer agency fees of up to .12% of fund assets.
For employer-sponsored retirement plans, the amount paid for subtransfer agent/ recordkeeping services varies depending on the share class selected. The table below shows the maximum payments to entities providing these services to retirement plans.
| | |
| | Payments |
| Class A | 0.05% of assets or
$12 per participant position* |
| Class R-1 | 0.10% of assets |
| Class R-2 | 0.35% of assets |
| Class R-2E | 0.20% of assets |
| Class R-3 | 0.15% of assets |
| Class R-4 | 0.10% of assets |
| Class R-5E | 0.15% of assets |
| Class R-5 | 0.05% of assets |
| Class R-6 | none |
* Payment amount depends on the date services commenced.
Fee to Virginia529 For Class 529 shares, an expense of up to a maximum of .09% paid to a state or states for oversight and administrative services is included as an “Other expenses” item.
The Bond Fund of America / Prospectus 50
Financial highlights The Financial Highlights table is intended to help you understand the fund’s results for the past five fiscal years. Certain information reflects financial results for a single share of a particular class. The total returns in the table represent the rate that an investor would have earned or lost on an investment in the fund (assuming reinvestment of all dividends and capital gain distributions). Where indicated, figures in the table reflect the impact, if any, of certain reimbursements/waivers from Capital Research and Management Company. For more information about these waivers/reimbursements, see the fund’s statement of additional information and annual report. The information in the Financial Highlights table has been audited by Deloitte & Touche LLP, whose current report, along with the fund’s financial statements, is included in the statement of additional information, which is available upon request.
| | | | | | | | | | | | | | | | | | | | | | | | | | | |
| | | (Loss) income from
investment operations1 | Dividends and distributions | | | | | | |
| Period ended | Net asset
value,
beginning
of period | Net
investment
income | Net (losses)
gains on
securities
(both
realized and
unrealized) | Total from
investment
operations | Dividends
(from net
investment
income) | Distributions
(from capital
gains) | Total
dividends
and
distributions | Net asset
value,
end
of period | Total
return2, 3 | Net assets,
end of period
(in millions) | Ratio of
expenses to
average net
assets before
waivers/
reimbursements4 | Ratio of
expenses to
average net
assets after
waivers/
reimbursements3, 4 | Ratio of
net income
to average
net assets3 |
| Class A: | | | | | | | | | | | | | | | | | | | | | | | | | | |
| 12/31/2021 | $13.79 | | $.18 | | $(.31 | ) | $(.13 | ) | $(.19 | ) | $(.08 | ) | $(.27 | ) | $13.39 | | (.95 | )% | $30,201 | | .55 | % | .55 | % | 1.36 | % |
| 12/31/2020 | 13.09 | | .22 | | 1.18 | | 1.40 | | (.26 | ) | (.44 | ) | (.70 | ) | 13.79 | | 10.71 | | 29,570 | | .57 | | .57 | | 1.59 | |
| 12/31/2019 | 12.57 | | .31 | | .69 | | 1.00 | | (.30 | ) | (.18 | ) | (.48 | ) | 13.09 | | 8.02 | | 23,197 | | .60 | | .60 | | 2.35 | |
| 12/31/2018 | 12.89 | | .30 | | (.32 | ) | (.02 | ) | (.30 | ) | — | | (.30 | ) | 12.57 | | (.13 | ) | 19,352 | | .60 | | .60 | | 2.37 | |
| 12/31/2017 | 12.72 | | .25 | | .16 | | .41 | | (.24 | ) | — | | (.24 | ) | 12.89 | | 3.21 | | 19,939 | | .60 | | .60 | | 1.91 | |
| Class C: | | | | | | | | | | | | | | | | | | | | | | | | | | |
| 12/31/2021 | 13.79 | | .08 | | (.31 | ) | (.23 | ) | (.09 | ) | (.08 | ) | (.17 | ) | 13.39 | | (1.68 | ) | 717 | | 1.29 | | 1.29 | | .60 | |
| 12/31/2020 | 13.09 | | .11 | | 1.18 | | 1.29 | | (.15 | ) | (.44 | ) | (.59 | ) | 13.79 | | 9.90 | | 848 | | 1.31 | | 1.31 | | .87 | |
| 12/31/2019 | 12.57 | | .21 | | .69 | | .90 | | (.20 | ) | (.18 | ) | (.38 | ) | 13.09 | | 7.20 | | 786 | | 1.36 | | 1.36 | | 1.60 | |
| 12/31/2018 | 12.89 | | .20 | | (.32 | ) | (.12 | ) | (.20 | ) | — | | (.20 | ) | 12.57 | | (.91 | ) | 825 | | 1.39 | | 1.39 | | 1.58 | |
| 12/31/2017 | 12.72 | | .15 | | .16 | | .31 | | (.14 | ) | — | | (.14 | ) | 12.89 | | 2.40 | | 1,041 | | 1.40 | | 1.40 | | 1.11 | |
| Class T: | | | | | | | | | | | | | | | | | | | | | | | | | | |
| 12/31/2021 | 13.79 | | .21 | | (.31 | ) | (.10 | ) | (.22 | ) | (.08 | ) | (.30 | ) | 13.39 | | (.74 | )5 | — | 6 | .33 | 5 | .33 | 5 | 1.55 | 5 |
| 12/31/2020 | 13.09 | | .25 | | 1.18 | | 1.43 | | (.29 | ) | (.44 | ) | (.73 | ) | 13.79 | | 10.98 | 5 | — | 6 | .34 | 5 | .34 | 5 | 1.81 | 5 |
| 12/31/2019 | 12.57 | | .34 | | .69 | | 1.03 | | (.33 | ) | (.18 | ) | (.51 | ) | 13.09 | | 8.24 | 5 | — | 6 | .37 | 5 | .37 | 5 | 2.56 | 5 |
| 12/31/2018 | 12.89 | | .33 | | (.32 | ) | .01 | | (.33 | ) | — | | (.33 | ) | 12.57 | | .09 | 5 | — | 6 | .39 | 5 | .39 | 5 | 2.58 | 5 |
| 12/31/20177, 8 | 12.81 | | .20 | | .07 | | .27 | | (.19 | ) | — | | (.19 | ) | 12.89 | | 2.15 | 5, 9 | — | 6 | .38 | 5, 10 | .38 | 5, 10 | 2.15 | 5, 10 |
| |
| 51 The Bond Fund of America / Prospectus |
| | | | | | | | | | | | | | | | | | | | | | | | | | | |
| | | (Loss) income from
investment operations1 | Dividends and distributions | | | | | | |
| Period ended | Net asset
value,
beginning
of period | Net
investment
income | Net (losses)
gains on
securities
(both
realized and
unrealized) | Total from
investment
operations | Dividends
(from net
investment
income) | Distributions
(from capital
gains) | Total
dividends
and
distributions | Net asset
value,
end
of period | Total
return2, 3 | Net assets,
end of period
(in millions) | Ratio of
expenses to
average net
assets before
waivers/
reimbursements4 | Ratio of
expenses to
average net
assets after
waivers/
reimbursements3, 4 | Ratio of
net income
to average
net assets3 |
| Class F-1: | | | | | | | | | | | | | | | | | | | | | | | | | | |
| 12/31/2021 | $13.79 | | $.18 | | $(.31 | ) | $(.13 | ) | $(.19 | ) | $(.08 | ) | $(.27 | ) | $13.39 | | (.99 | )% | $1,011 | | .59 | % | .59 | % | 1.30 | % |
| 12/31/2020 | 13.09 | | .21 | | 1.18 | | 1.39 | | (.25 | ) | (.44 | ) | (.69 | ) | 13.79 | | 10.68 | | 1,315 | | .60 | | .60 | | 1.55 | |
| 12/31/2019 | 12.57 | | .31 | | .69 | | 1.00 | | (.30 | ) | (.18 | ) | (.48 | ) | 13.09 | | 7.97 | | 977 | | .64 | | .64 | | 2.31 | |
| 12/31/2018 | 12.89 | | .29 | | (.32 | ) | (.03 | ) | (.29 | ) | — | | (.29 | ) | 12.57 | | (.18 | ) | 745 | | .66 | | .66 | | 2.32 | |
| 12/31/2017 | 12.72 | | .24 | | .16 | | .40 | | (.23 | ) | — | | (.23 | ) | 12.89 | | 3.17 | | 801 | | .65 | | .65 | | 1.86 | |
| Class F-2: | | | | | | | | | | | | | | | | | | | | | | | | | | |
| 12/31/2021 | 13.79 | | .22 | | (.31 | ) | (.09 | ) | (.23 | ) | (.08 | ) | (.31 | ) | 13.39 | | (.71 | ) | 20,613 | | .31 | | .31 | | 1.60 | |
| 12/31/2020 | 13.09 | | .25 | | 1.18 | | 1.43 | | (.29 | ) | (.44 | ) | (.73 | ) | 13.79 | | 10.99 | | 16,494 | | .32 | | .32 | | 1.81 | |
| 12/31/2019 | 12.57 | | .35 | | .69 | | 1.04 | | (.34 | ) | (.18 | ) | (.52 | ) | 13.09 | | 8.28 | | 9,415 | | .35 | | .35 | | 2.59 | |
| 12/31/2018 | 12.89 | | .33 | | (.32 | ) | .01 | | (.33 | ) | — | | (.33 | ) | 12.57 | | .14 | | 5,728 | | .34 | | .34 | | 2.65 | |
| 12/31/2017 | 12.72 | | .28 | | .16 | | .44 | | (.27 | ) | — | | (.27 | ) | 12.89 | | 3.47 | | 4,067 | | .35 | | .35 | | 2.16 | |
| Class F-3: | | | | | | | | | | | | | | | | | | | | | | | | | | |
| 12/31/2021 | 13.79 | | .23 | | (.31 | ) | (.08 | ) | (.24 | ) | (.08 | ) | (.32 | ) | 13.39 | | (.60 | ) | 7,934 | | .20 | | .20 | | 1.72 | |
| 12/31/2020 | 13.09 | | .27 | | 1.18 | | 1.45 | | (.31 | ) | (.44 | ) | (.75 | ) | 13.79 | | 11.10 | | 4,465 | | .21 | | .21 | | 1.90 | |
| 12/31/2019 | 12.57 | | .36 | | .69 | | 1.05 | | (.35 | ) | (.18 | ) | (.53 | ) | 13.09 | | 8.40 | | 2,212 | | .25 | | .24 | | 2.70 | |
| 12/31/2018 | 12.89 | | .34 | | (.32 | ) | .02 | | (.34 | ) | — | | (.34 | ) | 12.57 | | .21 | | 1,483 | | .27 | | .27 | | 2.70 | |
| 12/31/20177, 11 | 12.74 | | .27 | | .14 | | .41 | | (.26 | ) | — | | (.26 | ) | 12.89 | | 3.25 | 9 | 2,061 | | .26 | 10 | .26 | 10 | 2.29 | 10 |
| Class 529-A: | | | | | | | | | | | | | | | | | | | | | | | | | | |
| 12/31/2021 | 13.79 | | .18 | | (.31 | ) | (.13 | ) | (.19 | ) | (.08 | ) | (.27 | ) | 13.39 | | (.99 | ) | 1,473 | | .59 | | .59 | | 1.31 | |
| 12/31/2020 | 13.09 | | .21 | | 1.18 | | 1.39 | | (.25 | ) | (.44 | ) | (.69 | ) | 13.79 | | 10.67 | | 1,526 | | .61 | | .61 | | 1.54 | |
| 12/31/2019 | 12.57 | | .30 | | .69 | | .99 | | (.29 | ) | (.18 | ) | (.47 | ) | 13.09 | | 7.95 | | 1,174 | | .66 | | .66 | | 2.29 | |
| 12/31/2018 | 12.89 | | .29 | | (.32 | ) | (.03 | ) | (.29 | ) | — | | (.29 | ) | 12.57 | | (.21 | ) | 1,003 | | .69 | | .69 | | 2.29 | |
| 12/31/2017 | 12.72 | | .24 | | .16 | | .40 | | (.23 | ) | — | | (.23 | ) | 12.89 | | 3.14 | | 1,022 | | .68 | | .68 | | 1.84 | |
| |
| The Bond Fund of America / Prospectus 52 |
| | | | | | | | | | | | | | | | | | | | | | | | | | | |
| | | (Loss) income from
investment operations1 | Dividends and distributions | | | | | | |
| Period ended | Net asset
value,
beginning
of period | Net
investment
income | Net (losses)
gains on
securities
(both
realized and
unrealized) | Total from
investment
operations | Dividends
(from net
investment
income) | Distributions
(from capital
gains) | Total
dividends
and
distributions | Net asset
value,
end
of period | Total
return2, 3 | Net assets,
end of period
(in millions) | Ratio of
expenses to
average net
assets before
waivers/
reimbursements4 | Ratio of
expenses to
average net
assets after
waivers/
reimbursements3, 4 | Ratio of
net income
to average
net assets3 |
| Class 529-C: | | | | | | | | | | | | | | | | | | | | | | | | | | |
| 12/31/2021 | $13.79 | | $.08 | | $(.31 | ) | $(.23 | ) | $(.09 | ) | $(.08 | ) | $(.17 | ) | $13.39 | | (1.73 | )% | $70 | | 1.34 | % | 1.34 | % | .56 | % |
| 12/31/2020 | 13.09 | | .11 | | 1.18 | | 1.29 | | (.15 | ) | (.44 | ) | (.59 | ) | 13.79 | | 9.85 | | 89 | | 1.36 | | 1.36 | | .90 | |
| 12/31/2019 | 12.57 | | .21 | | .69 | | .90 | | (.20 | ) | (.18 | ) | (.38 | ) | 13.09 | | 7.16 | | 180 | | 1.40 | | 1.40 | | 1.56 | |
| 12/31/2018 | 12.89 | | .20 | | (.32 | ) | (.12 | ) | (.20 | ) | — | | (.20 | ) | 12.57 | | (.94 | ) | 191 | | 1.43 | | 1.43 | | 1.55 | |
| 12/31/2017 | 12.72 | | .14 | | .16 | | .30 | | (.13 | ) | — | | (.13 | ) | 12.89 | | 2.35 | | 232 | | 1.44 | | 1.44 | | 1.07 | |
| Class 529-E: | | | | | | | | | | | | | | | | | | | | | | | | | | |
| 12/31/2021 | 13.79 | | .15 | | (.31 | ) | (.16 | ) | (.16 | ) | (.08 | ) | (.24 | ) | 13.39 | | (1.19 | ) | 46 | | .79 | | .79 | | 1.11 | |
| 12/31/2020 | 13.09 | | .18 | | 1.18 | | 1.36 | | (.22 | ) | (.44 | ) | (.66 | ) | 13.79 | | 10.46 | | 53 | | .80 | | .80 | | 1.37 | |
| 12/31/2019 | 12.57 | | .28 | | .69 | | .97 | | (.27 | ) | (.18 | ) | (.45 | ) | 13.09 | | 7.75 | | 46 | | .85 | | .85 | | 2.11 | |
| 12/31/2018 | 12.89 | | .27 | | (.32 | ) | (.05 | ) | (.27 | ) | — | | (.27 | ) | 12.57 | | (.40 | ) | 43 | | .88 | | .88 | | 2.10 | |
| 12/31/2017 | 12.72 | | .21 | | .16 | | .37 | | (.20 | ) | — | | (.20 | ) | 12.89 | | 2.93 | | 47 | | .88 | | .88 | | 1.63 | |
| Class 529-T: | | | | | | | | | | | | | | | | | | | | | | | | | | |
| 12/31/2021 | 13.79 | | .21 | | (.31 | ) | (.10 | ) | (.22 | ) | (.08 | ) | (.30 | ) | 13.39 | | (.78 | )5 | — | 6 | .37 | 5 | .37 | 5 | 1.52 | 5 |
| 12/31/2020 | 13.09 | | .24 | | 1.18 | | 1.42 | | (.28 | ) | (.44 | ) | (.72 | ) | 13.79 | | 10.91 | 5 | — | 6 | .39 | 5 | .39 | 5 | 1.77 | 5 |
| 12/31/2019 | 12.57 | | .33 | | .69 | | 1.02 | | (.32 | ) | (.18 | ) | (.50 | ) | 13.09 | | 8.20 | 5 | — | 6 | .42 | 5 | .42 | 5 | 2.51 | 5 |
| 12/31/2018 | 12.89 | | .32 | | (.32 | ) | — | 12 | (.32 | ) | — | | (.32 | ) | 12.57 | | .04 | 5 | — | 6 | .44 | 5 | .44 | 5 | 2.54 | 5 |
| 12/31/20177, 8 | 12.81 | | .20 | | .07 | | .27 | | (.19 | ) | — | | (.19 | ) | 12.89 | | 2.10 | 5, 9 | — | 6 | .45 | 5, 10 | .45 | 5, 10 | 2.08 | 5, 10 |
| Class 529-F-1: | | | | | | | | | | | | | | | | | | | | | | | | | | |
| 12/31/2021 | 13.79 | | .20 | | (.31 | ) | (.11 | ) | (.21 | ) | (.08 | ) | (.29 | ) | 13.39 | | (.82 | )5 | — | 6 | .41 | 5 | .41 | 5 | 1.48 | 5 |
| 12/31/2020 | 13.09 | | .24 | | 1.18 | | 1.42 | | (.28 | ) | (.44 | ) | (.72 | ) | 13.79 | | 10.92 | 5 | — | 6 | .38 | 5 | .38 | 5 | 1.87 | 5 |
| 12/31/2019 | 12.57 | | .34 | | .69 | | 1.03 | | (.33 | ) | (.18 | ) | (.51 | ) | 13.09 | | 8.20 | | 128 | | .42 | | .42 | | 2.53 | |
| 12/31/2018 | 12.89 | | .32 | | (.32 | ) | — | 12 | (.32 | ) | — | | (.32 | ) | 12.57 | | .03 | | 102 | | .44 | | .44 | | 2.54 | |
| 12/31/2017 | 12.72 | | .27 | | .16 | | .43 | | (.26 | ) | — | | (.26 | ) | 12.89 | | 3.37 | | 88 | | .45 | | .45 | | 2.06 | |
| Class 529-F-2: | | | | | | | | | | | | | | | | | | | | | | | | | | |
| 12/31/2021 | 13.79 | | .21 | | (.31 | ) | (.10 | ) | (.22 | ) | (.08 | ) | (.30 | ) | 13.39 | | (.73 | ) | 177 | | .33 | | .33 | | 1.58 | |
| 12/31/20207, 13 | 14.00 | | .03 | | .24 | | .27 | | (.04 | ) | (.44 | ) | (.48 | ) | 13.79 | | 1.88 | 9 | 166 | | .06 | 9 | .06 | 9 | .24 | 9 |
| |
| 53 The Bond Fund of America / Prospectus |
| | | | | | | | | | | | | | | | | | | | | | | | | | | |
| | | (Loss) income from
investment operations1 | Dividends and distributions | | | | | | |
| Period ended | Net asset
value,
beginning
of period | Net
investment
income | Net (losses)
gains on
securities
(both
realized and
unrealized) | Total from
investment
operations | Dividends
(from net
investment
income) | Distributions
(from capital
gains) | Total
dividends
and
distributions | Net asset
value,
end
of period | Total
return2, 3 | Net assets,
end of period
(in millions) | Ratio of
expenses to
average net
assets before
waivers/
reimbursements4 | Ratio of
expenses to
average net
assets after
waivers/
reimbursements3, 4 | Ratio of
net income
to average
net assets3 |
| Class 529-F-3: | | | | | | | | | | | | | | | | | | | | | | | | | | |
| 12/31/2021 | $13.79 | | $.22 | | $(.31 | ) | $(.09 | ) | $(.23 | ) | $(.08 | ) | $(.31 | ) | $13.39 | | (.69 | )% | $— | 6 | .27 | % | .27 | % | 1.62 | % |
| 12/31/20207, 13 | 14.00 | | .04 | | .23 | | .27 | | (.04 | ) | (.44 | ) | (.48 | ) | 13.79 | | 1.90 | 9 | — | 6 | .08 | 9 | .04 | 9 | .25 | 9 |
| Class R-1: | | | | | | | | | | | | | | | | | | | | | | | | | | |
| 12/31/2021 | 13.79 | | .08 | | (.31 | ) | (.23 | ) | (.09 | ) | (.08 | ) | (.17 | ) | 13.39 | | (1.69 | ) | 42 | | 1.29 | | 1.29 | | .62 | |
| 12/31/2020 | 13.09 | | .11 | | 1.18 | | 1.29 | | (.15 | ) | (.44 | ) | (.59 | ) | 13.79 | | 9.88 | | 39 | | 1.33 | | 1.33 | | .85 | |
| 12/31/2019 | 12.57 | | .21 | | .69 | | .90 | | (.20 | ) | (.18 | ) | (.38 | ) | 13.09 | | 7.21 | | 39 | | 1.35 | | 1.35 | | 1.61 | |
| 12/31/2018 | 12.89 | | .20 | | (.32 | ) | (.12 | ) | (.20 | ) | — | | (.20 | ) | 12.57 | | (.89 | ) | 30 | | 1.37 | | 1.37 | | 1.60 | |
| 12/31/2017 | 12.72 | | .15 | | .16 | | .31 | | (.14 | ) | — | | (.14 | ) | 12.89 | | 2.43 | | 34 | | 1.37 | | 1.37 | | 1.14 | |
| Class R-2: | | | | | | | | | | | | | | | | | | | | | | | | | | |
| 12/31/2021 | 13.79 | | .08 | | (.31 | ) | (.23 | ) | (.09 | ) | (.08 | ) | (.17 | ) | 13.39 | | (1.69 | ) | 409 | | 1.30 | | 1.30 | | .60 | |
| 12/31/2020 | 13.09 | | .12 | | 1.18 | | 1.30 | | (.16 | ) | (.44 | ) | (.60 | ) | 13.79 | | 9.91 | | 468 | | 1.30 | | 1.30 | | .87 | |
| 12/31/2019 | 12.57 | | .22 | | .69 | | .91 | | (.21 | ) | (.18 | ) | (.39 | ) | 13.09 | | 7.22 | | 410 | | 1.34 | | 1.34 | | 1.61 | |
| 12/31/2018 | 12.89 | | .20 | | (.32 | ) | (.12 | ) | (.20 | ) | — | | (.20 | ) | 12.57 | | (.88 | ) | 400 | | 1.36 | | 1.36 | | 1.61 | |
| 12/31/2017 | 12.72 | | .15 | | .16 | | .31 | | (.14 | ) | — | | (.14 | ) | 12.89 | | 2.44 | | 456 | | 1.36 | | 1.36 | | 1.15 | |
| Class R-2E: | | | | | | | | | | | | | | | | | | | | | | | | | | |
| 12/31/2021 | 13.79 | | .12 | | (.31 | ) | (.19 | ) | (.13 | ) | (.08 | ) | (.21 | ) | 13.39 | | (1.40 | ) | 44 | | 1.00 | | 1.00 | | .90 | |
| 12/31/2020 | 13.09 | | .16 | | 1.18 | | 1.34 | | (.20 | ) | (.44 | ) | (.64 | ) | 13.79 | | 10.22 | | 46 | | 1.02 | | 1.02 | | 1.14 | |
| 12/31/2019 | 12.57 | | .25 | | .69 | | .94 | | (.24 | ) | (.18 | ) | (.42 | ) | 13.09 | | 7.53 | | 33 | | 1.05 | | 1.05 | | 1.90 | |
| 12/31/2018 | 12.89 | | .24 | | (.32 | ) | (.08 | ) | (.24 | ) | — | | (.24 | ) | 12.57 | | (.59 | ) | 26 | | 1.07 | | 1.07 | | 1.92 | |
| 12/31/2017 | 12.72 | | .19 | | .16 | | .35 | | (.18 | ) | — | | (.18 | ) | 12.89 | | 2.75 | | 20 | | 1.06 | | 1.06 | | 1.48 | |
| Class R-3: | | | | | | | | | | | | | | | | | | | | | | | | | | |
| 12/31/2021 | 13.79 | | .14 | | (.31 | ) | (.17 | ) | (.15 | ) | (.08 | ) | (.23 | ) | 13.39 | | (1.25 | ) | 673 | | .85 | | .85 | | 1.05 | |
| 12/31/2020 | 13.09 | | .18 | | 1.18 | | 1.36 | | (.22 | ) | (.44 | ) | (.66 | ) | 13.79 | | 10.40 | | 743 | | .86 | | .86 | | 1.31 | |
| 12/31/2019 | 12.57 | | .27 | | .69 | | .96 | | (.26 | ) | (.18 | ) | (.44 | ) | 13.09 | | 7.70 | | 633 | | .89 | | .89 | | 2.06 | |
| 12/31/2018 | 12.89 | | .26 | | (.32 | ) | (.06 | ) | (.26 | ) | — | | (.26 | ) | 12.57 | | (.43 | ) | 582 | | .91 | | .91 | | 2.06 | |
| 12/31/2017 | 12.72 | | .21 | | .16 | | .37 | | (.20 | ) | — | | (.20 | ) | 12.89 | | 2.90 | | 622 | | .91 | | .91 | | 1.61 | |
| |
| The Bond Fund of America / Prospectus 54 |
| | | | | | | | | | | | | | | | | | | | | | | | | | | |
| | | (Loss) income from
investment operations1 | Dividends and distributions | | | | | | |
| Period ended | Net asset
value,
beginning
of period | Net
investment
income | Net (losses)
gains on
securities
(both
realized and
unrealized) | Total from
investment
operations | Dividends
(from net
investment
income) | Distributions
(from capital
gains) | Total
dividends
and
distributions | Net asset
value,
end
of period | Total
return2, 3 | Net assets,
end of period
(in millions) | Ratio of
expenses to
average net
assets before
waivers/
reimbursements4 | Ratio of
expenses to
average net
assets after
waivers/
reimbursements3, 4 | Ratio of
net income
to average
net assets3 |
| Class R-4: | | | | | | | | | | | | | | | | | | | | | | | | | | |
| 12/31/2021 | $13.79 | | $.18 | | $(.31 | ) | $(.13 | ) | $(.19 | ) | $(.08 | ) | $(.27 | ) | $13.39 | | (.94 | )% | $588 | | .54 | % | .54 | % | 1.35 | % |
| 12/31/2020 | 13.09 | | .22 | | 1.18 | | 1.40 | | (.26 | ) | (.44 | ) | (.70 | ) | 13.79 | | 10.73 | | 688 | | .55 | | .55 | | 1.61 | |
| 12/31/2019 | 12.57 | | .31 | | .69 | | 1.00 | | (.30 | ) | (.18 | ) | (.48 | ) | 13.09 | | 8.03 | | 567 | | .59 | | .59 | | 2.37 | |
| 12/31/2018 | 12.89 | | .30 | | (.32 | ) | (.02 | ) | (.30 | ) | — | | (.30 | ) | 12.57 | | (.13 | ) | 518 | | .61 | | .61 | | 2.37 | |
| 12/31/2017 | 12.72 | | .25 | | .16 | | .41 | | (.24 | ) | — | | (.24 | ) | 12.89 | | 3.22 | | 583 | | .60 | | .60 | | 1.91 | |
| Class R-5E: | | | | | | | | | | | | | | | | | | | | | | | | | | |
| 12/31/2021 | 13.79 | | .21 | | (.31 | ) | (.10 | ) | (.22 | ) | (.08 | ) | (.30 | ) | 13.39 | | (.75 | ) | 160 | | .34 | | .34 | | 1.60 | |
| 12/31/2020 | 13.09 | | .25 | | 1.18 | | 1.43 | | (.29 | ) | (.44 | ) | (.73 | ) | 13.79 | | 10.95 | | 88 | | .35 | | .35 | | 1.78 | |
| 12/31/2019 | 12.57 | | .34 | | .69 | | 1.03 | | (.33 | ) | (.18 | ) | (.51 | ) | 13.09 | | 8.25 | | 43 | | .37 | | .37 | | 2.53 | |
| 12/31/2018 | 12.89 | | .33 | | (.32 | ) | .01 | | (.33 | ) | — | | (.33 | ) | 12.57 | | .09 | | 8 | | .40 | | .40 | | 2.63 | |
| 12/31/2017 | 12.72 | | .27 | | .16 | | .43 | | (.26 | ) | — | | (.26 | ) | 12.89 | | 3.39 | | — | 6 | .42 | | .40 | | 2.11 | |
| Class R-5: | | | | | | | | | | | | | | | | | | | | | | | | | | |
| 12/31/2021 | 13.79 | | .22 | | (.31 | ) | (.09 | ) | (.23 | ) | (.08 | ) | (.31 | ) | 13.39 | | (.65 | ) | 373 | | .25 | | .25 | | 1.69 | |
| 12/31/2020 | 13.09 | | .26 | | 1.18 | | 1.44 | | (.30 | ) | (.44 | ) | (.74 | ) | 13.79 | | 11.06 | | 192 | | .26 | | .26 | | 1.91 | |
| 12/31/2019 | 12.57 | | .35 | | .69 | | 1.04 | | (.34 | ) | (.18 | ) | (.52 | ) | 13.09 | | 8.35 | | 173 | | .29 | | .29 | | 2.67 | |
| 12/31/2018 | 12.89 | | .34 | | (.32 | ) | .02 | | (.34 | ) | — | | (.34 | ) | 12.57 | | .17 | | 163 | | .31 | | .31 | | 2.67 | |
| 12/31/2017 | 12.72 | | .29 | | .16 | | .45 | | (.28 | ) | — | | (.28 | ) | 12.89 | | 3.52 | | 176 | | .30 | | .30 | | 2.21 | |
| Class R-6: | | | | | | | | | | | | | | | | | | | | | | | | | | |
| 12/31/2021 | 13.79 | | .23 | | (.31 | ) | (.08 | ) | (.24 | ) | (.08 | ) | (.32 | ) | 13.39 | | (.60 | ) | 15,035 | | .20 | | .20 | | 1.71 | |
| 12/31/2020 | 13.09 | | .27 | | 1.18 | | 1.45 | | (.31 | ) | (.44 | ) | (.75 | ) | 13.79 | | 11.11 | | 13,449 | | .21 | | .21 | | 1.95 | |
| 12/31/2019 | 12.57 | | .36 | | .69 | | 1.05 | | (.35 | ) | (.18 | ) | (.53 | ) | 13.09 | | 8.40 | | 10,434 | | .24 | | .24 | | 2.72 | |
| 12/31/2018 | 12.89 | | .34 | | (.32 | ) | .02 | | (.34 | ) | — | | (.34 | ) | 12.57 | | .22 | | 8,116 | | .26 | | .26 | | 2.73 | |
| 12/31/2017 | 12.72 | | .29 | | .16 | | .45 | | (.28 | ) | — | | (.28 | ) | 12.89 | | 3.58 | | 6,351 | | .25 | | .25 | | 2.27 | |
| |
| 55 The Bond Fund of America / Prospectus |
| | | | | | |
| | Year ended December 31, |
| Portfolio turnover rate for all share classes14 | 2021 | 2020 | 2019 | 2018 | 2017 |
| Excluding mortgage dollar roll transactions | 74% | 113% | 127% | 121% | 170% |
| Including mortgage dollar roll transactions | 368% | 535% | 286% | 356% | 379% |
1 Based on average shares outstanding.
2 Total returns exclude any applicable sales charges, including contingent deferred sales charges.
3 This column reflects the impact, if any, of certain waivers/reimbursements from American Funds Service Company and/or Capital Research and Management Company. During some of the periods shown, American Funds Service Company waived a portion of transfer agent services fees for Class F-3 shares. In addition, during some of the periods shown, Capital Research and Management Company reimbursed a portion of transfer agent services fees for certain share classes.
4 Ratios do not include expenses of any Central Funds. The fund indirectly bears its proportionate share of the expenses of any Central Funds.
5 All or a significant portion of assets in this class consisted of seed capital invested by Capital Research and Management Company and/or its affiliates. Fees for distribution services are not charged or accrued on these seed capital assets. If such fees were paid by the fund on seed capital assets, fund expenses would have been higher and net income and total return would have been lower.
6 Amount less than $1 million.
7 Based on operations for a period that is less than a full year.
8 Class T and 529-T shares began investment operations on April 7, 2017.
9 Not annualized.
10 Annualized.
11 Class F-3 shares began investment operations on January 27, 2017.
12 Amount less than $.01.
13 Class 529-F-2 and 529-F-3 shares began investment operations on October 30, 2020.
14 Rates do not include the fund’s portfolio activity with respect to any Central Funds.
| |
| The Bond Fund of America / Prospectus 56 |
Appendix
Sales charge waivers
The availability of certain sales charge waivers and discounts will depend on whether you purchase your shares directly from the fund or through a financial intermediary. Intermediaries may have different policies and procedures regarding the availability of front-end sales charge waivers or contingent deferred (back-end) sales charge (“CDSC”) waivers, which are discussed below. In all instances, it is the purchaser’s responsibility to notify the fund or the purchaser’s financial intermediary at the time of purchase of any relationship or other facts qualifying the purchaser for sales charge waivers or discounts. Please contact the applicable intermediary with any questions regarding how the intermediary applies the policies described below and to ensure that you understand what steps you must take to qualify for any available waivers or discounts. For waivers and discounts not available through a particular intermediary, shareholders will have to purchase fund shares directly from the fund or through another intermediary to receive these waivers or discounts. If you change intermediaries after you purchase fund shares, the policies and procedures of the new service provider (either your new intermediary or the fund’s transfer agent) will apply to your account. Those policies may be more or less favorable than those offered by the intermediary through which you purchased your fund shares. You should review any policy differences before changing intermediaries.
Class A shares front-end sales charge waivers available at Ameriprise Financial:
The following information applies to Class A shares purchases if you have an account with or otherwise purchase fund shares through Ameriprise Financial:
Effective May 24, 2021, shareholders purchasing fund shares through an Ameriprise Financial brokerage account are eligible for the following front-end sales charge waivers, which may differ from those disclosed elsewhere in this fund’s prospectus or SAI:
· Employer-sponsored retirement plans established prior to April 1, 2004 and that continue to meet the eligibility requirements in effect as of that date for purchasing Class A shares at net asset value (e.g., 401(k) plans, 457 plans, employer-sponsored 403(b) plans, profit sharing and money purchase pension plans and defined benefit plans). For purposes of this provision, employer-sponsored retirement plans do not include SEP IRAs, Simple IRAs or SAR-SEPs
· Shares purchased through reinvestment of capital gains distributions and dividend reinvestment when purchasing shares of the same fund (but not any other fund within the same fund family)
· Shares exchanged from Class C shares of the same fund in the month of or following the 7-year anniversary of the purchase date. To the extent that this prospectus elsewhere provides for a waiver with respect to exchanges of Class C shares or conversion of Class C shares following a shorter holding period, that waiver will apply
· Employees and registered representatives of Ameriprise Financial or its affiliates and their immediate family members
· Shares purchased by or through qualified accounts (including IRAs, Coverdell Education Savings Accounts, 401(k)s, 403(b) TSCAs subject to ERISA and defined benefit plans established prior to April 1, 2004 that continue to meet the eligibility requirements in effect as of that date for purchasing Class A shares at net asset value) that are held by a covered family member, defined as an Ameriprise financial advisor and/or the advisor’s spouse, advisor’s lineal ascendant (mother, father, grandmother, grandfather, great
57 The Bond Fund of America / Prospectus
grandmother, great grandfather), advisor’s lineal descendant (son, step-son, daughter, step-daughter, grandson, granddaughter, great grandson, great granddaughter) or any spouse of a covered family member who is a lineal descendant
· Shares purchased from the proceeds of redemptions within the same fund family, provided (1) the repurchase occurs within 90 days following the redemption, (2) the redemption and purchase occur in the same account, and (3) redeemed shares were subject to a front-end or deferred sales load (i.e. Rights of Reinstatement)
· Purchases of Class 529-A shares through a rollover from another 529 plan
· Purchases of Class 529 shares made for recontribution of refunded amounts
D.A. Davidson & Co.
Front-end sales charge waivers on Class A shares available at D.A. Davidson (effective January 1, 2020)
· Shares purchased within the same fund family through a systematic reinvestment of capital gains and dividend distributions
· Employees and registered representatives of D.A. Davidson or its affiliates and their family members as designated by D.A. Davidson
· Shares purchased from the proceeds of redemptions within the same fund family, provided (1) the repurchase occurs within 90 days following the redemption, (2) the redemption and purchase occur in the same account, and (3) redeemed shares were subject to a front-end or deferred sales charge (known as Rights of Reinstatement)
· A shareholder in the fund’s Class C shares will have their shares converted at net asset value to Class A shares (or the appropriate share class) of the fund if the shares are no longer subject to a CDSC and the conversion is consistent with D.A. Davidson’s policies and procedures
· D.A. Davidson has the authority to allow the purchase of Class A shares at net asset value for (1) rollovers to IRAs from investments held in American Funds Recordkeeper Direct and PlanPremier retirement plan recordkeeping programs (2) rollovers to IRAs from 403(b) plans with Capital Bank and Trust Company as custodian or (3) IRA purchases so long as the proceeds are from the sale of shares from an American Funds Recordkeeper Direct retirement plan, PlanPremier retirement plan or 403(b) plan with Capital Bank and Trust Company as custodian and are used to make a purchase within 60 days of the redemption, if the shares held are ineligible to be rolled over to an IRA.
CDSC Waivers on Classes A and C shares available at D.A. Davidson
• Death or disability of the shareholder
· Shares sold as part of a systematic withdrawal plan as described in the fund’s prospectus
· Return of excess contributions from an IRA Account
· Shares sold as part of a required minimum distribution for IRA and retirement accounts due to the shareholder reaching age 72 as described in the fund’s prospectus
· Shares acquired through a right of reinstatement
Front-end sales charge discounts available at D.A. Davidson: breakpoints, rights of accumulation and/or letters of intent
· Breakpoints as described in this prospectus
The Bond Fund of America / Prospectus 58
· Rights of accumulation which entitle shareholders to breakpoint discounts will be automatically calculated based on the aggregated holding of fund family assets held by accounts within the purchaser’s household at D.A. Davidson. Eligible fund family assets not held at D.A. Davidson may be included in the calculation of rights of accumulation only if the shareholder notifies his or her financial advisor about such assets
· Letters of intent which allow for breakpoint discounts based on anticipated purchases within a fund family, over a 13-month time period. Eligible fund family assets not held at D.A. Davidson may be included in the calculation of letters of intent only if the shareholder notifies his or her financial advisor about such assets
Edward D. Jones & Co., L.P. ("Edward Jones")
Policies Regarding Transactions Through Edward Jones
The following information has been provided by Edward Jones:
Effective on or after January 1, 2021, the following information supersedes prior information with respect to transactions and positions held in fund shares through an Edward Jones system. Clients of Edward Jones (also referred to as “shareholders”) purchasing fund shares on the Edward Jones commission and fee-based platforms are eligible only for the following sales charge discounts (also referred to as “breakpoints”) and waivers, which can differ from discounts and waivers described elsewhere in the mutual fund prospectus or statement of additional information ("SAI") or through another broker-dealer. In all instances, it is the shareholder's responsibility to inform Edward Jones at the time of purchase of any relationship, holdings of the American Funds, or other facts qualifying the purchaser for discounts or waivers. Edward Jones can ask for documentation of such circumstance. Shareholders should contact Edward Jones if they have questions regarding their eligibility for these discounts and waivers.
· Breakpoint pricing, otherwise known as volume pricing, at dollar thresholds as described in the prospectus
Rights of Accumulation ("ROA")
· The applicable sales charge on a purchase of Class A shares is determined by taking into account all share classes (except any direct purchase money market funds and assets held in group retirement plans) of the American Funds held by the shareholder or in an account grouped by Edward Jones with other accounts for the purpose of providing certain pricing considerations (“pricing groups”). If grouping assets as a shareholder, this includes all share classes held on the Edward Jones platform and/or held on another platform. The inclusion of eligible fund family assets in the ROA calculation is dependent on the shareholder notifying Edward Jones of such assets at the time of calculation
· The employer maintaining a SEP IRA plan and/or SIMPLE IRA plan may elect to establish or change ROA for the IRA accounts associated with the plan to a plan-level grouping as opposed to including all share classes at a shareholder or pricing group level
· ROA is determined by calculating the higher of cost minus redemptions or market value (current shares x NAV)
Letter of Intent ("LOI")
· Through a LOI, shareholders can receive the sales charge and breakpoint discounts for purchases shareholders intend to make over a 13-month period from the date Edward Jones receives the LOI. The LOI is determined by calculating the higher of cost or market
59 The Bond Fund of America / Prospectus
value of qualifying holdings at LOI initiation in combination with the value that the shareholder intends to buy over a 13-month period to calculate the front-end sales charge and any breakpoint discounts. Each purchase the shareholder makes during that 13-month period will receive the sales charge and breakpoint discount that applies to the total amount. The inclusion of eligible fund family assets in the LOI calculation is dependent on the shareholder notifying Edward Jones of such assets at the time of calculation. Purchases made before the LOI is received by Edward Jones are not adjusted under the LOI and will not reduce the sales charge previously paid. Sales charges will be adjusted if LOI is not met
· If the employer maintaining a SEP IRA plan and/or SIMPLE IRA plan has elected to establish or change ROA for the IRA accounts associated with the plan to a plan-level grouping, LOIs will also be at the plan-level and may only be established by the employer
Sales Charge Waivers
Sales charges are waived for the following shareholders and in the following situations:
· Associates of Edward Jones and its affiliates and their family members who are in the same pricing group (as determined by Edward Jones under its policies and procedures) as the associate. This waiver will continue for the remainder of the associate's life if the associate retires from Edward Jones in good-standing and remains in good standing pursuant to Edward Jones' policies and procedures
· Shares purchased in an Edward Jones fee-based program
· Shares purchased through reinvestment of capital gains distributions and dividend reinvestment
· Shares purchased from the proceeds of redeemed shares of the same fund family so long as the following conditions are met: 1) the proceeds are from the sale of shares within 60 days of the purchase, and 2) the sale and purchase are made in the same share class and the same account or the purchase is made in an individual retirement account with proceeds from liquidations in a non-retirement account
· Shares exchanged into Class A shares from another share class so long as the exchange is into the same fund and was initiated at the discretion of Edward Jones. Edward Jones is responsible for any remaining CDSC due to the fund company, if applicable. Any future purchases are subject to the applicable sales charge as disclosed in the prospectus
· Exchanges from Class C shares to Class A shares of the same fund, generally, in the 84th month following the anniversary of the purchase date or earlier at the discretion of Edward Jones
· Purchases of Class 529-A shares through a rollover from another 529 plan
· Purchases of Class 529 shares made for recontribution of refunded amounts
Contingent Deferred Sales Charge ("CDSC") Waivers
If the shareholder purchases shares that are subject to a CDSC and those shares are redeemed before the CDSC is expired, the shareholder is responsible to pay the CDSC except in the following conditions:
· The death or disability of the shareholder, or account beneficiary for Class 529 shares
· Systematic withdrawals with up to 10% per year of the account value
The Bond Fund of America / Prospectus 60
· Return of excess contributions from an Individual Retirement Account (IRA)
· Shares sold as part of a required minimum distribution for IRA and retirement accounts if the redemption is taken in or after the year the shareholder reaches qualified age based on applicable IRS regulations
· Shares sold to pay Edward Jones fees or costs in such cases where the transaction is initiated by Edward Jones
· Shares exchanged in an Edward Jones fee-based program
· Shares acquired through NAV reinstatement
· Shares redeemed at the discretion of Edward Jones for Minimum Balances, as described below
Other Important Information Regarding Transactions Through Edward Jones
Minimum Purchase Amounts
· Initial purchase minimum: $250
· Subsequent purchase minimum: none
Minimum Balances
· Edward Jones has the right to redeem at its discretion fund holdings with a balance of $250 or less. The following are examples of accounts that are not included in this policy:
— A fee-based account held on an Edward Jones platform
— A 529 account held on an Edward Jones platform
— An account with an active systematic investment plan or LOI
Exchanging Share Classes
· At any time it deems necessary, Edward Jones has the authority to exchange at NAV a shareholder's holdings in a fund to Class A shares, or Class R-4 shares for retirement plans with at least $1 million, so long as the shareholder is eligible to purchase the Class A or R-4 shares pursuant to the prospectus. Edward Jones is responsible for any remaining CDSC due to the fund company, if applicable. Any future purchases are subject to the applicable sale charge as disclosed in the prospectus
529 Plan Account Maintenance Fees
· For 529 Plan accounts held in omnibus by Edward Jones, the annual account maintenance fees are waived
Class A Sales Charge Waivers Available Through Farmers Financial Solutions
Farmers Financial Solutions has the authority to either (1) rollover shares from an employer sponsored retirement plan to Class A shares in an Individual Retirement Account (IRA) at net asset value or (2) allow the purchase of Class A shares at net asset value, so long as the proceeds are from the sale of shares from an employer sponsored retirement plan and are used to make a purchase within 60 days of the redemption, if the shares held are ineligible to be rolled over to an IRA.
Janney Montgomery Scott LLC
Effective May 1, 2020, if you purchase fund shares through a Janney Montgomery Scott LLC (“Janney”) brokerage account, you will be eligible for the following load waivers (front-end sales charge waivers and contingent deferred sales charge (“CDSC”), or back-end
61 The Bond Fund of America / Prospectus
sales charge, waivers) and discounts, which may differ from those disclosed elsewhere in this fund’s Prospectus or SAI.
Front-end sales charge* waivers on Class A shares available at Janney
· Shares purchased through reinvestment of capital gains distributions and dividend reinvestment when purchasing shares of the same fund (but not any other fund within the fund family)
· Shares purchased by employees and registered representatives of Janney or its affiliates and their family members as designated by Janney
· Shares purchased from the proceeds of redemptions within the same fund family, provided (1) the repurchase occurs within ninety (90) days following the redemption, (2) the redemption and purchase occur in the same account, and (3) redeemed shares were subject to a front-end or deferred sales load (i.e., right of reinstatement)
· Shares acquired through a right of reinstatement
· Class C shares that are no longer subject to a contingent deferred sales charge and are converted to Class A shares of the same fund pursuant to Janney’s policies and procedures
CDSC waivers on Class A and C shares available at Janney
· Shares sold upon the death or disability of the shareholder
· Shares sold as part of a systematic withdrawal plan as described in the fund’s Prospectus
· Shares purchased in connection with a return of excess contributions from an IRA Account
· Shares sold as part of a required minimum distribution for IRA and other retirement accounts due to the shareholder reaching the qualified age based on applicable IRS regulations as described in the fund’s Prospectus
· Shares sold to pay Janney fees but only if the transaction is initiated by Janney
· Shares acquired through a right of reinstatement
· Shares exchanged into the same share class of a different fund unless otherwise provided in the Prospectus
Front-end sales charge* discounts available at Janney: breakpoints, rights of accumulation, and/or letters of intent
· Breakpoints as described in the fund’s Prospectus
· Rights of accumulation (“ROA”), which entitle shareholders to breakpoint discounts, will be automatically calculated based on the aggregated holding of fund family assets held by accounts within the purchaser’s household at Janney. Eligible fund family assets not held at Janney may be included in the ROA calculation only if the shareholder notifies his or her financial advisor about such assets
· Letters of intent which allow for breakpoint discounts based on anticipated purchases within a fund family, over a 13-month time period. Eligible fund family assets not held at Janney Montgomery Scott may be included in the calculation of letters of intent only if the shareholder notifies his or her financial advisor about such assets
*Also referred to as an “initial sales charge.”
The Bond Fund of America / Prospectus 62
JP Morgan Securities LLC
Investors purchasing through JP Morgan Securities LLC may invest in Class 529-A shares at net asset value.
Merrill Lynch, Pierce, Fenner & Smith
Shareholders purchasing fund shares through a Merrill Lynch platform or account are eligible only for the following sales charge waivers (front-end sales charge waivers and contingent deferred, or back-end, sales charge waivers) and discounts, which may differ from those disclosed elsewhere in this fund’s prospectus or SAI.
Front-end sales charge waivers on Class A shares available at Merrill Lynch
· Employer-sponsored retirement, deferred compensation and employee benefit plans (including health savings accounts) and trusts used to fund those plans, provided that the shares are not held in a commission-based brokerage account and shares are held for the benefit of the plan. Except as provided below, Class A shares are not currently available to new plans described in this waiver. Plans that invested in Class A shares of any of the funds without any sales charge before April 1, 2004, and that continue to meet the eligibility requirements in effect as of that date for purchasing Class A shares at net asset value, may continue to purchase American Funds Class A shares without any initial or contingent deferred sales charge
· Shares purchased by or through a 529 Plan. Class A shares are not currently available to the plans described in this waiver
· Shares purchased through a Merrill Lynch affiliated investment advisory program. Class A shares are not currently available in the programs described in this waiver
· Shares purchased by third-party investment advisors on behalf of their advisory clients through Merrill Lynch’s platform. Class A shares are not currently available in the accounts described in this waiver
· Shares purchased through reinvestment of capital gains distributions and dividend reinvestment when purchasing shares of the same fund (but not any other fund within the fund family)
· Shares exchanged from Class C (i.e. level-load) shares of the same fund pursuant to Merrill Lynch’s policies relating to sales load discounts and waivers
· Employees and registered representatives of Merrill Lynch or its affiliates and their family members
· Directors or Trustees of the fund, and employees of the fund’s investment adviser or any of its affiliates, as described in this prospectus
· Eligible shares purchased from the proceeds of redemptions within the same fund family, provided (1) the repurchase occurs within 90 days following the redemption, (2) the redemption and purchase occur in the same account, and (3) redeemed shares were subject to a front-end or deferred sales charge (known as rights of reinstatement). Automated transactions (i.e. systematic purchases and withdrawals) and purchases made after shares are automatically sold to pay Merrill Lynch’s account maintenance fees are not eligible for reinstatement
CDSC waivers on Classes A and C shares available at Merrill Lynch
· Death or disability of the shareholder
63 The Bond Fund of America / Prospectus
· Shares sold as part of a systematic withdrawal plan as described in the fund’s prospectus
· Return of excess contributions from an IRA Account
· Shares sold as part of a required minimum distribution for IRA and retirement accounts pursuant to the Internal Revenue Code
· Shares sold to pay Merrill Lynch fees but only if the transaction is initiated by Merrill Lynch
· Shares acquired through a right of reinstatement
· Shares held in retirement brokerage accounts, that are exchanged for a lower cost share class due to transfer to certain fee based accounts or platforms (applicable to Class A and C shares only)
· Shares received through an exchange due to the holdings moving from a Merrill Lynch affiliated investment advisory program to a Merrill Lynch brokerage (non-advisory) account pursuant to Merrill Lynch’s policies relating to sales load discounts and waivers
Front-end sales charge discounts available at Merrill Lynch: breakpoints, rights of accumulation and letters of intent
· Breakpoints as described in this prospectus
· Rights of Accumulation (ROA) which entitle shareholders to breakpoint discounts as described in the fund’s prospectus will be automatically calculated based on the aggregated holding of fund family assets held by accounts (including 529 program holdings, where applicable) within the purchaser’s household at Merrill Lynch. Eligible fund family assets not held at Merrill Lynch may be included in the ROA calculation only if the shareholder notifies his or her financial advisor about such assets
· Letters of Intent which allow for breakpoint discounts based on anticipated purchases within a fund family, through Merrill Lynch, over a 13-month period of time (if applicable)
CollegeAmerica accounts
Accounts established through Merrill Lynch, Pierce, Fenner & Smith
If you establish or hold your CollegeAmerica account on the Merrill Lynch omnibus platform, the features and policies related to Class 529-A and Class 529-C sales charges (including contingent deferred sales charges), Class 529-A sales charge waiver eligibility, and Class 529-C conversion period will be different than referenced in this document.
Importantly, if you establish or hold your CollegeAmerica account on the Merrill Lynch omnibus platform, then you are eligible for Class 529-A shares at net asset value if your CollegeAmerica 529 plan assets with Merrill Lynch are $250,000 or more, you participate through an approved corporate 529 plan, or you qualify for Merrill Lynch Investment Advisory Relationship-Based Pricing (discussed below). If your 529 plan assets are less than $250,000 you are generally eligible to purchase Class 529-C shares. Among other things, Class 529-C shares generally will be automatically converted to Class 529-A shares (not subject to an initial sales charge) after four years from their respective dates of purchase.
Merrill Lynch Investment Advisory Relationship-Based Pricing
An account will be automatically eligible to purchase Class 529-A at net asset value regardless of the assets in the CollegeAmerica account if:
(1) at the time of purchase, the account is linked to a client household relationship in one or more of the Merrill Lynch investment advisory programs listed below; and
The Bond Fund of America / Prospectus 64
(2) at the time of purchase the client household relationship has combined assets held in any account through Merrill Lynch (excluding insurance, annuities, 401k assets, assets in defined benefit plan accounts and in BlackRock program accounts) that are equal to or greater than $250,000.
The following is a list of Merrill Lynch investment advisory programs that are included when determining eligibility: Merrill Lynch Investment Advisory Program, Managed Account Service (MAS), Strategic Portfolio Advisor Service (SPA), Merrill Guided Investment advisor programs (i.e., Merrill Guided Investing, Merrill Guided Investing with Advisor and Merrill Edge Advisory Account programs), Institutional Investment Consulting (IIC), and any future Merrill Lynch sponsored and managed investment advisory programs.
The $250,000 asset level is used to determine initial eligibility and is not a factor for continued participation in this relationship-based pricing program after the date of first qualifying. If a participant’s enrollment in any of the above investment advisory programs is terminated (whether by the participant or by Merrill Lynch), the account will no longer be eligible for this benefit.
Merrill Lynch reserves the right to terminate this relationship-based pricing program at any time with prior notice to participants.
Rollover assets from another 529 plan and refunded qualified higher education expenses may be invested in Class 529-A shares at net asset value. This policy applies to accounts on the Merrill Lynch platform and accounts held by the fund’s transfer agent.
Please contact your Merrill Lynch advisor with any questions.
Morgan Stanley Wealth Management
Morgan Stanley Wealth Management Class A share front-end sales charge waiver
Morgan Stanley Wealth Management clients purchasing or converting to Class A shares of the fund through Morgan Stanley transactional brokerage accounts are entitled to a waiver of the front-end load in the following additional circumstances:
· Morgan Stanley employee and employee-related accounts according to Morgan Stanley’s account linking rules
· Shares purchased through reinvestment of dividends and capital gains distributions when purchasing shares of the same fund
· Class C (level load) share positions that are no longer subject to a contingent deferred sales charge and are converted to a Class A share in the same fund pursuant to Morgan Stanley Wealth Management’s share class conversion program
· Effective June 1, 2020, Morgan Stanley, on your behalf, can convert Class F-1 shares to Class A shares without a sales charge if they were initially transferred to the transactional brokerage account or converted from Class C shares
· Shares purchased from the proceeds of redemptions within the same fund family under a Rights of Reinstatement provision, provided the repurchase occurs within 90 days following the redemption, the redemption and purchase occur in the same account, and redeemed shares were subject to a front-end or deferred sales load
Effective June 30, 2020, Morgan Stanley Wealth Management clients purchasing or converting to Class 529-A shares of the fund through Morgan Stanley transactional brokerage accounts are entitled to a waiver of the front-end load in the following additional circumstances:
65 The Bond Fund of America / Prospectus
· Shares purchased through a rollover from another 529 plan
· Recontribution(s) of a refunded qualified higher education expense
Unless specifically described above, no other front-end load waivers are available to mutual fund purchases by Morgan Stanley Wealth Management clients.
Morgan Stanley Wealth Management Class R-4 share employer-sponsored retirement plan eligibility
Employer-sponsored retirement plans (e.g., 401(k) plans, 457 plans, employer-sponsored 403(b) plans, profit sharing and money purchase pension plans and defined benefit plans). For purposes of this provision, employer-sponsored retirement plans do not include SEP IRAs, Simple IRAs, SAR-SEPs or Keogh plans.
Northwestern Mutual Investment Services, LLC
Class A and C share purchases in owner-only 401(k) plans held at Northwestern Mutual Investment Services, LLC (NMIS)
Effective November 5, 2021, for 401(k) plans held at NMIS through its clearing firm, Pershing LLC, that cover only owners and their spouses and are not subject to ERISA, participants may purchase Class A shares with the applicable front-end sales charge or Class C shares with the applicable contingent deferred sales charge, in accordance with NMIS’s share class policies applicable to such plans.
Oppenheimer & Co., Inc. (OPCO)
Effective June 1, 2020, shareholders purchasing fund shares through an OPCO platform or account are eligible only for the following load waivers (front-end sales charge waivers and contingent deferred, or back-end, sales charge waivers) and discounts, which may differ from those disclosed elsewhere in this fund’s prospectus or SAI.
Front-end sales load waivers on Class A shares available at OPCO
· Shares purchased through reinvestment of capital gains distributions and dividend reinvestment when purchasing shares of the same fund (but not any other fund within the fund family)
· Shares purchased from the proceeds of redemptions within the same fund family, provided (1) the repurchase occurs within 90 days following the redemption, (2) the redemption and purchase occur in the same account, and (3) redeemed shares were subject to a front-end or deferred sales load (known as Rights of Restatement)
· A shareholder in the fund’s Class C shares will have their shares converted at net asset value to Class A shares (or the appropriate share class) of the fund if the shares are no longer subject to a CDSC and the conversion is in line with the policies and procedures of OPCO
· Employees and registered representatives of OPCO or its affiliates and their family members
· Directors or trustees of the fund, and employees of the fund’s investment adviser or any of its affiliates, as described in this prospectus
CDSC waivers on Class A and C shares available at OPCO
· Death or disability of the shareholder
· Shares sold as part of a systematic withdrawal plan as described in the fund’s prospectus
The Bond Fund of America / Prospectus 66
· Return of excess contributions from an IRA Account
· Shares sold as part of a required minimum distribution for IRA and retirement accounts due to the shareholder reaching the qualified age based on applicable IRS regulations as described in the prospectus
· Shares sold to pay OPCO fees but only if the transaction is initiated by OPCO
· Shares acquired through a right of reinstatement
Front-end load discounts available at OPCO: breakpoints, rights of accumulation and letters of intent
· Breakpoints as described in this prospectus
· Rights of accumulation (ROA) which entitle shareholders to breakpoint discounts will be automatically calculated based on the aggregated holding of fund family assets held by accounts within the purchaser’s household at OPCO. Eligible fund family assets not held at OPCO may be included in the ROA calculation only if the shareholder notifies his or her financial advisor about such assets
Raymond James & Associates, Inc., Raymond James Financial Services, Inc., and each entity’s affiliates (“Raymond James”) Class A share front-end sales charge waiver
Effective March 1, 2019, shareholders purchasing fund shares through a Raymond James platform or account, or through an introducing broker-dealer or independent registered investment adviser for which Raymond James provides trade execution, clearance, and/or custody services, will be eligible only for the following sales charge waivers (front-end sales charge waivers and contingent deferred, or back-end, sales charge waivers) and discounts, which may differ from those disclosed elsewhere in this fund’s prospectus or SAI.
Front-end sales charge waivers on Class A shares available at Raymond James
· Shares purchased within the same fund family through a systematic reinvestment of capital gains and dividend distributions
· Employees and registered representatives of Raymond James or its affiliates and their family members as designated by Raymond James
· Shares purchased from the proceeds of redemptions within the same fund family, provided (1) the repurchase occurs within 90 days following the redemption, (2) the redemption and purchase occur in the same account, and (3) redeemed shares were subject to a front-end or deferred sales charge (known as Rights of Reinstatement)
· A shareholder in the Fund’s Class C shares will have their shares converted at net asset value to Class A shares (or the appropriate share class) of the Fund if the shares are no longer subject to a CDSC and the conversion is in line with the policies and procedures of Raymond James
CDSC waivers on Classes A and C shares available at Raymond James
· Death or disability of the shareholder
· Shares sold as part of a systematic withdrawal plan as described in the fund’s prospectus
· Return of excess contributions from an IRA Account
· Shares sold as part of a required minimum distribution for IRA and retirement accounts due to the shareholder reaching the qualified age based on applicable IRS regulations as described in the fund’s prospectus
67 The Bond Fund of America / Prospectus
· Shares sold to pay Raymond James fees but only if the transaction is initiated by Raymond James
· Shares acquired through a right of reinstatement
Front-end sales charge discounts available at Raymond James: breakpoints, rights of accumulation and/or letters of intent
· Breakpoints as described in this prospectus
· Rights of accumulation which entitle shareholders to breakpoint discounts will be automatically calculated based on the aggregated holding of fund family assets held by accounts within the purchaser’s household at Raymond James. Eligible fund family assets not held at Raymond James may be included in the calculation of rights of accumulation only if the shareholder notifies his or her financial advisor about such assets
· Letters of intent which allow for breakpoint discounts based on anticipated purchases within a fund family, over a 13-month time period. Eligible fund family assets not held at Raymond James may be included in the calculation of letters of intent only if the shareholder notifies his or her financial advisor about such assets
Robert W. Baird & Co. Incorporated (Baird)
Effective June 15, 2020, shareholders purchasing fund shares through a Baird platform or account will only be eligible for the following sales charge waivers (front-end sales charge waivers and CDSC waivers) and discounts, which may differ from those disclosed elsewhere in this prospectus or the SAI.
Front-end sales charge waivers on Class A shares available at Baird
· Shares purchased through reinvestment of capital gains distributions and dividend reinvestment when purchasing shares of the same fund
· Shares purchased by employees and registered representatives of Baird or its affiliate and their family members as designated by Baird
· Shares purchased from the proceeds of redemptions from another fund, provided (1) the repurchase occurs within 90 days following the redemption, (2) the redemption and purchase occur in the same accounts, and (3) redeemed shares were subject to a front-end or deferred sales charge (known as rights of reinstatement)
· A shareholder in the fund’s Class C shares will have their shares converted at net asset value to Class A shares of the fund if the shares are no longer subject to CDSC and the conversion is in line with the policies and procedures of Baird
CDSC waivers on Class A and C shares available at Baird
· Shares sold due to death or disability of the shareholder
· Shares sold as part of a systematic withdrawal plan as described in the fund’s prospectus
· Shares bought due to returns of excess contributions from an IRA Account
· Shares sold as part of a required minimum distribution for IRA and retirement accounts due to the shareholder reaching the qualified age based on applicable IRS regulations as described in the fund’s prospectus
· Shares sold to pay Baird fees but only if the transaction is initiated by Baird
· Shares acquired through a right of reinstatement
The Bond Fund of America / Prospectus 68
Front-end sales charge discounts available at Baird: breakpoints and/or rights of accumulation
· Breakpoints as described in this prospectus
· Rights of accumulation which entitles shareholders to breakpoint discounts will be automatically calculated based on the aggregated holding of fund family assets held by accounts within the purchaser’s household at Baird. Eligible fund family assets not held at Baird may be included in the rights of accumulation calculation only if the shareholder notifies his or her financial advisor about such assets
· Letters of intent (LOI) allow for breakpoint discounts based on anticipated purchases of fund family assets through Baird, over a 13-month period of time
Stifel, Nicolaus & Company, Incorporated ("Stifel")
Effective July 1, 2020, shareholders purchasing fund shares through a Stifel platform or account or who own shares for which Stifel or an affiliate is the broker-dealer of record are eligible for the following additional sales charge waiver
Front-end sales load waiver on Class A shares
· Class C shares that have been held for more than seven (7) years will be converted to Class A shares of the same fund pursuant to Stifel's policies and procedures
All other sales charge waivers and reductions described elsewhere in the fund’s prospectus or SAI still apply. For accounts held by the fund’s transfer agent, the fund’s standard C share conversion schedule of 8 years applies.
U.S. Bancorp Investments, Inc.
Class C to Class A share conversions at U.S. Bancorp Investments, Inc.
Effective November 30, 2020, a shareholder in the fund’s Class C shares will have their shares systematically converted at net asset value to Class A shares of the same fund in the month of the six-year anniversary of the purchase date, if the shares are no longer subject to a CDSC and the conversion is consistent with U.S. Bancorp Investments, Inc. share class exchange policy. This policy does not apply to accounts held with the fund’s transfer agent. Accounts held with the fund’s transfer agent will convert pursuant to the fund’s policy described in this prospectus.
69 The Bond Fund of America / Prospectus
Notes
The Bond Fund of America / Prospectus 70
| | | | |
| | | | |
| |
| | For shareholder services and 24-hour information | American Funds Service Company
(800) 421-4225
capitalgroup.com
For Class R share information, visit
AmericanFundsRetirement.com | |
| |
| | For retirement plan services | Call your employer or plan administrator | |
| | For 529 plans | American Funds Service Company
(800) 421-4225, ext. 529 | |
| |
| | Telephone calls you have with Capital Group may be monitored or recorded for quality assurance, verification and recordkeeping purposes. By speaking to Capital Group on the telephone, you consent to such monitoring and recording. | |
Multiple translations This prospectus may be translated into other languages. If there is any inconsistency or ambiguity as to the meaning of any word or phrase in a translation, the English text will prevail. Liability is not limited as a result of any material misstatement or omission introduced in the translation.
Annual/Semi-annual report to shareholders The shareholder reports contain additional information about the fund, including financial statements, investment results, portfolio holdings, a discussion of market conditions and the fund’s investment strategies, and the independent registered public accounting firm’s report (in the annual report).
Program description The CollegeAmerica® 529 program description contains additional information about the policies and services related to 529 plan accounts.
Statement of additional information (SAI) and codes of ethics The current SAI, as amended from time to time, contains more detailed information about the fund, including the fund’s financial statements, and is incorporated by reference into this prospectus. This means that the current SAI, for legal purposes, is part of this prospectus. The codes of ethics describe the personal investing policies adopted by the fund, the fund’s investment adviser and its affiliated companies.
The codes of ethics and current SAI are on file with the U.S. Securities and Exchange Commission (SEC). These and other related materials about the fund are available for review on the EDGAR database on the SEC’s website at sec.gov or, after payment of a duplicating fee, via email request to publicinfo@sec.gov. The codes of ethics, current SAI and shareholder reports are also available, free of charge, on our website, capitalgroup.com.
E-delivery and household mailings Each year you are automatically sent an updated summary prospectus and annual and semi-annual reports for the fund. You may also occasionally receive proxy statements for the fund. In order to reduce the volume of mail you receive, when possible, only one copy of these documents will be sent to shareholders who are part of the same family and share the same household address. You may elect to receive these documents electronically in lieu of paper form by enrolling in e-delivery on our website, capitalgroup.com.
If you would like to opt out of household-based mailings or receive a complimentary copy of the current SAI, codes of ethics, annual/semi-annual report to shareholders or applicable program description, please call American Funds Service Company at (800) 421-4225 or write to the secretary of the fund at 333 South Hope Street, Los Angeles, California 90071-1406.
Securities Investor Protection Corporation (SIPC) Shareholders may obtain information about SIPC® on its website at sipc.org or by calling (202) 371-8300.
| | |
| |
| |
 | MFGEPRX-008-0322P
Litho in USA CGD/ALD/8005
Investment Company File No. 811-02444 |
| |
| | |
| |
Private Client Services FundsSM Prospectus January 1, 2022 |  |
| |
| | |
| | Ticker |
| | |
| Capital Group Core Municipal FundSM | CCMPX |
| Capital Group Short-Term Municipal FundSM | CSTMX |
| Capital Group California Core Municipal FundSM | CCCMX |
| Capital Group California Short-Term Municipal FundSM | CCSTX |
| Capital Group Core Bond FundSM | CCBPX |
Table of contents
| | | |
Summaries: Capital Group Core Municipal Fund 1 Capital Group Short-Term Municipal Fund 4 Capital Group California Core Municipal Fund 7 Capital Group California Short-Term Municipal Fund 10 Capital Group Core Bond Fund 13 | | Investment objective, strategies and risks 16 Management and organization 23 Purchase, exchange and sale of shares 25 How to sell shares 26 Distributions and taxes 28 Fund expenses 28 Financial highlights 29 |
| |
| The U.S. Securities and Exchange Commission has not approved or disapproved of these securities. Further, it has not determined that this prospectus is accurate or complete. Any representation to the contrary is a criminal offense. |
 | Prospectus Supplement March 25, 2022 |

For the following funds with prospectuses dated January 1, 2022 (as supplemented to date):
Capital Group Private Client Services FundsSM Capital Group Core Municipal FundSM Capital Group Short-Term Municipal FundSM Capital Group Core Bond FundSM | |
The following is added to the “Principal investment strategies” section in the summary prospectus for each of the funds listed above and the “Principal investment strategies” section in the applicable summary portion of the prospectus for each of the funds listed above:
On March 11, 2022, the Board of Trustees of Capital Group Private Client Services Funds unanimously determined that participation in the reorganizations of Capital Group Core Bond Fund (“CAPCB”) with and into The Bond Fund of America (“BFA”), Capital Group Core Municipal Fund (“CAPCM”) with and into Limited Term Tax-Exempt Bond Fund of America (“LTEX”), and Capital Group Short-Term Municipal Fund (“CAPSTM”) with and into American Funds Short-Term Tax-Exempt Bond Fund (“STEX”) would be in the best interests of CAPCB, CAPCM and CAPSTM, as applicable, and that the interests of the existing shareholders of CAPCB, CAPCM and CAPSTM, as applicable, would not be diluted as a result of the reorganizations. On March 9, 2022, the board of the acquiring funds made similar determinations with respect to the acquiring funds participating in the reorganizations. If the reorganizations are consummated as proposed, shareholders of CAPCB, CAPCM and CAPSTM would become shareholders of BFA, LTEX and STEX, respectively. BFA seeks to provide a high level of current income as is consistent with the preservation of capital. Each of LTEX and STEX seeks to provide investors with current income exempt from regular federal income tax, consistent with the maturity and quality standards as described in each fund’s prospectus, and to preserve capital. It is anticipated that each proposed reorganization will qualify as a tax-free reorganization and that shareholders will not recognize any gain or loss for U.S. federal income tax purposes as a direct result of the proposed reorganizations.
The proposed reorganizations are subject to shareholder approval. Accordingly, shareholders of CAPCB, CAPCM and CAPSTM will receive a combined proxy statement and prospectus regarding the proposed reorganizations, as well as other related materials. These materials will provide further information regarding the acquiring funds and the proposed reorganizations and will request shareholder votes on the relevant reorganization. The proposed reorganizations are not contingent upon one another. If approved by shareholders, the proposed reorganizations are expected to take effect on or about October 31, 2022. No new purchases of shares of CAPCB, CAPCM or CAPSTM will be accepted within ten business days of the effective date of the proposed reorganizations. If the reorganizations are effected on October 31, 2022, as is currently planned, no new purchases of shares of CAPCB, CAPCM or CAPSTM will be accepted as of October 17, 2022.
Keep this supplement with your prospectus.
Lit. No. MFGEBS-513-0322P CGD/AFD/10039-S88132
Prospectus Supplement March 1, 2022 |  |

For the following funds with prospectuses dated January 1, 2022:
Capital Group Private Client Services FundsSM Capital Group Core Municipal FundSM Capital Group Short-Term Municipal FundSM Capital Group California Core Municipal FundSM
Capital Group California Short-Term Municipal FundSM Capital Group Core Bond FundSM | Capital Group U.S. Equity FundSM |
The following is added to the “Investment objectives, strategies and risks” section of the prospectus:
The investment adviser may consider environmental, social and governance (“ESG”) factors that, depending on the facts and circumstances, are material to the value of an issuer or instrument. ESG factors may include, but are not limited to, environmental-related events resulting from climate change or society’s response to environmental change, social conditions (e.g., labor relations, investment in human capital, accident prevention, changing customer behavior) or governance issues (e.g., board composition, significant breaches of international agreements, unsound business practices).
Keep this supplement with your prospectus.
Lit. No. MFGEBS-507-0322P CGD/AFD/10039-S88049
Capital Group Core Municipal Fund
Investment objective The fund seeks to provide current income exempt from federal income tax while preserving your investment.
Fees and expenses of the fund This table describes the fees and expenses that you may pay if you buy, hold and sell shares of the fund. You may pay other fees to financial intermediaries, which are not reflected in the tables and examples below.
| | |
Shareholder fees (fees paid directly from your investment) |
| Maximum sales charge (load) imposed on purchases (as a percentage of offering price) | none |
| Maximum deferred sales charge (load) (as a percentage of the amount redeemed) | none |
| Maximum sales charge (load) imposed on reinvested dividends | none |
| Redemption or exchange fees | none |
| | |
Annual fund operating expenses (expenses that you pay each year as a percentage of the value of your investment) |
| Management fees | 0.25% |
| Distribution and/or service (12b-1) fees | none |
| Other expenses | 0.03 |
| Total annual fund operating expenses | 0.28 |
Example This example is intended to help you compare the cost of investing in the fund with the cost of investing in other mutual funds.
The example assumes that you invest $10,000 in the fund for the time periods indicated and then redeem all of your shares at the end of those periods. The example also assumes that your investment has a 5% return each year and that the fund’s operating expenses remain the same. Although your actual costs may be higher or lower, based on these assumptions your costs would be:
| | | | |
| 1 year | 3 years | 5 years | 10 years |
| $29 | $90 | $157 | $356 |
Portfolio turnover The fund pays transaction costs, such as commissions, when it buys and sells securities (or “turns over” its portfolio). A higher portfolio turnover rate may indicate higher transaction costs and may result in higher taxes when fund shares are held in a taxable account. These costs, which are not reflected in annual fund operating expenses or in the example, affect the fund’s investment results. During the most recent fiscal year, the fund’s portfolio turnover rate was 48% of the average value of its portfolio.
Principal investment strategies The fund seeks to achieve its objective by investing primarily in municipal bonds.
The fund will invest at least 80% of its assets in bonds (for purposes of this limit, bonds include any debt instrument and cash equivalents, and may include certain preferred securities). Under normal circumstances, the fund will invest at least 80% of its assets in, or derive at least 80% of its income from, securities that are exempt from federal income tax. The fund will not invest in securities that subject you to the federal alternative minimum tax. The investment adviser will seek to manage the fund in order to minimize capital gain distributions.
The fund invests primarily in municipal bonds with quality ratings of A- or A3 or better by Nationally Recognized Statistical Rating Organizations (“NRSROs”) designated by the fund’s investment adviser or unrated but determined by the fund’s investment adviser to be of equivalent quality. The fund may also invest in municipal bonds in the rating categories of BBB or Baa by NRSROs designated by the fund’s investment adviser or unrated but determined by the fund’s investment adviser to be of equivalent quality. Under normal circumstances, the dollar-weighted average effective maturity of the fund’s portfolio will be between three and 10 years.
The fund may invest in municipal obligations of multiple issuers in the same state or backed by revenues of similar types of projects or industries. The fund may also invest more than 25% of its assets in industrial development bonds.
The investment adviser uses a system of multiple portfolio managers in managing the fund’s assets. Under this approach, the portfolio of the fund is divided into segments managed by individual managers.
The fund relies on the professional judgment of its investment adviser to make decisions about the fund’s portfolio investments. The basic investment philosophy of the investment adviser is to seek to invest in attractively priced securities that, in its opinion, represent good investment opportunities. Securities may be sold when the investment adviser believes that they no longer represent relatively attractive investment opportunities.
1 Capital Group Private Client Services Funds / Prospectus
Principal risks
This section describes the principal risks associated with investing in the fund. You may lose money by investing in the fund. The likelihood of loss may be greater if you invest for a shorter period of time.
Market conditions — The prices of, and the income generated by, the securities held by the fund may decline – sometimes rapidly or unpredictably – due to various factors, including events or conditions affecting the general economy or particular industries; overall market changes; local, regional or global political, social or economic instability; governmental, governmental agency or central bank responses to economic conditions; and currency exchange rate, interest rate and commodity price fluctuations.
Economies and financial markets throughout the world are highly interconnected. Economic, financial or political events, trading and tariff arrangements, wars, terrorism, cybersecurity events, natural disasters, public health emergencies (such as the spread of infectious disease) and other circumstances in one country or region, including actions taken by governmental or quasi-governmental authorities in response to any of the foregoing, could have impacts on global economies or markets. As a result, whether or not the fund invests in securities of issuers located in or with significant exposure to the countries affected, the value and liquidity of the fund’s investments may be negatively affected by developments in other countries and regions.
Issuer risks — The prices of, and the income generated by, securities held by the fund may decline in response to various factors directly related to the issuers of such securities, including reduced demand for an issuer’s goods or services, poor management performance, major litigation, investigations or other controversies related to the issuer, changes in government regulations affecting the issuer or its competitive environment and strategic initiatives such as mergers, acquisitions or dispositions and the market response to any such initiatives.
Investing in debt instruments — The prices of, and the income generated by, bonds and other debt securities held by the fund may be affected by factors such as the interest rates, maturities and credit ratings of these securities.
Rising interest rates will generally cause the prices of bonds and other debt securities to fall. A general rise in interest rates may cause investors to sell debt securities on a large scale, which could also adversely affect the price and liquidity of debt securities and could also result in increased redemptions from the fund. Falling interest rates may cause an issuer to redeem, call or refinance a debt security before its stated maturity, which may result in the fund failing to recoup the full amount of its initial investment and having to reinvest the proceeds in lower yielding securities. Longer maturity debt securities generally have greater sensitivity to changes in interest rates and may be subject to greater price fluctuations than shorter maturity debt securities.
Bonds and other debt securities are also subject to credit risk, which is the possibility that the credit strength of an issuer or guarantor will weaken or be perceived to be weaker, and/or an issuer of a debt security will fail to make timely payments of principal or interest and the security will go into default. A downgrade or default affecting any of the fund’s securities could cause the value of the fund’s shares to decrease. Credit risk is gauged, in part, by the credit ratings of the debt securities in which the fund invests. However, ratings are only the opinions of the rating agencies issuing them and are not guarantees as to credit quality or an evaluation of market risk. The fund’s investment adviser relies on its own credit analysts to research issuers and issues in seeking to assess credit and default risks.
Credit and liquidity support — Changes in the credit quality of banks and financial institutions providing credit and liquidity support features with respect to securities held by the fund could cause the values of these securities to decline.
Investing in lower rated debt instruments — Lower rated bonds and other lower rated debt securities generally have higher rates of interest and involve greater risk of default or price declines due to changes in the issuer’s creditworthiness than those of higher quality debt securities. The market prices of these securities may fluctuate more than the prices of higher quality debt securities and may decline significantly in periods of general economic difficulty.
Liquidity risk — Certain fund holdings may be or may become difficult or impossible to sell, particularly during times of market turmoil. Liquidity may be impacted by the lack of an active market for a holding, legal or contractual restrictions on resale, or the reduced number and capacity of market participants to make a market in such holding. Market prices for less liquid or illiquid holdings may be volatile, and reduced liquidity may have an adverse impact on the market price of such holdings. Additionally, the sale of less liquid or illiquid holdings may involve substantial delays (including delays in settlement) and additional costs and the fund may be unable to sell such holdings when necessary to meet its liquidity needs or may be forced to sell at a loss.
Investing in similar municipal bonds — Investing significantly in municipal obligations of multiple issuers in the same state or backed by revenues of similar types of projects or industries may make the fund more susceptible to certain economic, political or regulatory occurrences. As a result, the fund has greater risk of volatility, and greater risk of loss, from these investments.
Management — The investment adviser to the fund actively manages the fund’s investments. Consequently, the fund is subject to the risk that the methods and analyses, including models, tools and data, employed by the investment adviser in this process may be flawed or incorrect and may not produce the desired results. This could cause the fund to lose value or its investment results to lag relevant benchmarks or other funds with similar objectives.
Your investment in the fund is not a bank deposit and is not insured or guaranteed by the Federal Deposit Insurance Corporation or any other governmental agency, entity or person. You should consider how this fund fits into your overall investment program.
Capital Group Private Client Services Funds / Prospectus 2
Investment results The following bar chart shows how the fund’s investment results have varied from year to year, and the following table shows how the fund’s average annual total returns for various periods compare with a broad measure of securities market results and other applicable measures of market results. This information provides some indication of the risks of investing in the fund. The Lipper Short- Intermediate Municipal Debt Funds Average includes funds that disclose investment objectives and/or strategies reasonably comparable to those of the fund. Past investment results (before and after taxes) are not predictive of future investment results. Updated information on the fund’s investment results can be obtained by calling the fund’s transfer agent at (800) 421-4996.
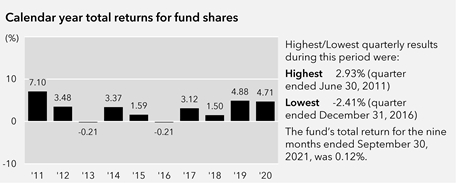
| | | | | | |
| Average annual total returns For the periods ended December 31, 2020: |
| | Inception date | 1 year | 5 years | 10 years | Lifetime |
| − Before taxes | 4/13/2010 | 4.71% | 2.78% | 2.91% | 2.83% |
| − After taxes on distributions | | 4.37 | 2.69 | 2.87 | 2.78 |
| − After taxes on distributions and sale of fund shares | 3.60 | 2.57 | 2.71 | 2.64 |
| | | | | |
| Indexes | 1 year | 5 years | 10 years | Lifetime |
| Bloomberg Municipal Short–Intermediate1–10 Years Index (reflects no deductions for account fees, expenses or U.S. federal income taxes) | 3.97% | 2.74% | 2.95% | 2.95% |
| Lipper Short-Intermediate Municipal Debt Funds Average (reflects no deductions for sales charges, account fees or U.S. federal income taxes) | 3.46 | 2.15 | 2.32 | 2.28 |
The fund’s annualized 30-day yield at October 31, 2021: 0.56%
(For current yield information, please call the fund’s transfer agent at (800) 421-4996.) |
After-tax returns are calculated using the highest individual federal income tax rates in effect during each year of the periods shown and do not reflect the impact of state and local taxes. Your actual after-tax returns depend on your individual tax situation and likely will differ from the results shown above. In addition, after-tax returns are not relevant if you hold your fund shares through a tax-favored arrangement, such as a 401(k) plan or individual retirement account (IRA).
Management
Investment adviser Capital Research and Management CompanySM
Portfolio managers The individuals primarily responsible for the portfolio management of the fund are:
| | | |
Portfolio manager/
Fund title (if applicable) | Portfolio manager
experience in this fund | Primary title
with investment adviser |
| Aaron Applebaum Senior Vice President | 5 years | Partner – Capital Fixed Income Investors |
| Mark Marinella Senior Vice President | 5 years | Partner – Capital Fixed Income Investors |
| |
Purchase and sale of fund shares The minimum amount required to establish an account is $25,000. You may sell (redeem) shares on any business day by contacting your Capital Group Private Client Services investment counselor or by calling (866) 421-2166.
Tax information Fund distributions of interest on municipal bonds are generally not subject to federal income tax. However, the fund may distribute taxable dividends, including distributions of short-term capital gains, which are subject to federal taxation as ordinary income. The fund’s distributions of net long-term capital gains are taxable as long-term capital gains for federal income tax purposes.
3 Capital Group Private Client Services Funds / Prospectus
Capital Group Short-Term Municipal Fund
Investment objectives The fund seeks to preserve your investment and secondarily to provide current income exempt from federal income tax.
Fees and expenses of the fund This table describes the fees and expenses that you may pay if you buy, hold and sell shares of the fund. You may pay other fees to financial intermediaries, which are not reflected in the tables and examples below.
| | |
Shareholder fees (fees paid directly from your investment) |
| Maximum sales charge (load) imposed on purchases (as a percentage of offering price) | none |
| Maximum deferred sales charge (load) (as a percentage of the amount redeemed) | none |
| Maximum sales charge (load) imposed on reinvested dividends | none |
| Redemption or exchange fees | none |
| | |
Annual fund operating expenses (expenses that you pay each year as a percentage of the value of your investment) |
| Management fees | 0.25% |
| Distribution and/or service (12b-1) fees | none |
| Other expenses | 0.06 |
| Total annual fund operating expenses | 0.31 |
| Expense reimbursement* | 0.01 |
| Total annual fund operating expenses after expense reimbursement | 0.30 |
* The investment adviser is currently reimbursing a portion of other expenses so that other expenses do not exceed .05%. This reimbursement will be in effect through at least January 1, 2023. The adviser may elect at its discretion to extend, modify or terminate the reimbursement at that time.
Example This example is intended to help you compare the cost of investing in the fund with the cost of investing in other mutual funds.
The example assumes that you invest $10,000 in the fund for the time periods indicated and then redeem all of your shares at the end of those periods. The example also assumes that your investment has a 5% return each year and that the fund’s operating expenses remain the same. The example reflects the expense reimbursement described above through the expiration date of such reimbursement and total annual fund operating expenses thereafter. Although your actual costs may be higher or lower, based on these assumptions your costs would be:
| | | | |
| 1 year | 3 years | 5 years | 10 years |
| $31 | $99 | $173 | $392 |
Portfolio turnover The fund pays transaction costs, such as commissions, when it buys and sells securities (or “turns over” its portfolio). A higher portfolio turnover rate may indicate higher transaction costs and may result in higher taxes when fund shares are held in a taxable account. These costs, which are not reflected in annual fund operating expenses or in the example, affect the fund’s investment results. During the most recent fiscal year, the fund’s portfolio turnover rate was 51% of the average value of its portfolio.
Principal investment strategies The fund seeks to achieve its objectives by investing primarily in municipal bonds.
The fund will invest at least 80% of its assets in bonds (for purposes of this limit, bonds include any debt instrument and cash equivalents, and may include certain preferred securities). Under normal circumstances, the fund will invest at least 80% of its assets in, or derive at least 80% of its income from, securities that are exempt from federal income tax. The fund will not invest in securities that subject you to the federal alternative minimum tax. The investment adviser will seek to manage the fund in order to minimize capital gain distributions.
The fund invests primarily in municipal bonds with quality ratings of AA- or Aa3 or better by Nationally Recognized Statistical Rating Organizations (“NRSROs”) designated by the fund’s investment adviser or unrated but determined by the fund’s investment adviser to be of equivalent quality. The fund may also invest in municipal bonds in the rating categories of A- or A3 by NRSROs designated by the fund’s investment adviser or unrated but determined by the fund’s investment adviser to be of equivalent quality. Under normal circumstances, the dollar-weighted average effective maturity of the fund’s portfolio will be no greater than three years.
The fund may invest in municipal obligations of multiple issuers in the same state or backed by revenues of similar types of projects or industries. The fund may also invest more than 25% of its assets in industrial development bonds.
The investment adviser uses a system of multiple portfolio managers in managing the fund’s assets. Under this approach, the portfolio of the fund is divided into segments managed by individual managers.
The fund relies on the professional judgment of its investment adviser to make decisions about the fund’s portfolio investments. The basic investment philosophy of the investment adviser is to seek to invest in attractively priced securities that, in its opinion, represent good investment opportunities. Securities may be sold when the investment adviser believes that they no longer represent relatively attractive investment opportunities.
Capital Group Private Client Services Funds / Prospectus 4
Principal risks
This section describes the principal risks associated with investing in the fund. You may lose money by investing in the fund. The likelihood of loss may be greater if you invest for a shorter period of time.
Market conditions — The prices of, and the income generated by, the securities held by the fund may decline – sometimes rapidly or unpredictably – due to various factors, including events or conditions affecting the general economy or particular industries; overall market changes; local, regional or global political, social or economic instability; governmental, governmental agency or central bank responses to economic conditions; and currency exchange rate, interest rate and commodity price fluctuations.
Economies and financial markets throughout the world are highly interconnected. Economic, financial or political events, trading and tariff arrangements, wars, terrorism, cybersecurity events, natural disasters, public health emergencies (such as the spread of infectious disease) and other circumstances in one country or region, including actions taken by governmental or quasi-governmental authorities in response to any of the foregoing, could have impacts on global economies or markets. As a result, whether or not the fund invests in securities of issuers located in or with significant exposure to the countries affected, the value and liquidity of the fund’s investments may be negatively affected by developments in other countries and regions.
Issuer risks — The prices of, and the income generated by, securities held by the fund may decline in response to various factors directly related to the issuers of such securities, including reduced demand for an issuer’s goods or services, poor management performance, major litigation, investigations or other controversies related to the issuer, changes in government regulations affecting the issuer or its competitive environment and strategic initiatives such as mergers, acquisitions or dispositions and the market response to any such initiatives.
Investing in debt instruments — The prices of, and the income generated by, bonds and other debt securities held by the fund may be affected by factors such as the interest rates, maturities and credit ratings of these securities.
Rising interest rates will generally cause the prices of bonds and other debt securities to fall. A general rise in interest rates may cause investors to sell debt securities on a large scale, which could also adversely affect the price and liquidity of debt securities and could also result in increased redemptions from the fund. Falling interest rates may cause an issuer to redeem, call or refinance a debt security before its stated maturity, which may result in the fund failing to recoup the full amount of its initial investment and having to reinvest the proceeds in lower yielding securities. Longer maturity debt securities generally have greater sensitivity to changes in interest rates and may be subject to greater price fluctuations than shorter maturity debt securities.
Bonds and other debt securities are also subject to credit risk, which is the possibility that the credit strength of an issuer or guarantor will weaken or be perceived to be weaker, and/or an issuer of a debt security will fail to make timely payments of principal or interest and the security will go into default. A downgrade or default affecting any of the fund’s securities could cause the value of the fund’s shares to decrease. Credit risk is gauged, in part, by the credit ratings of the debt securities in which the fund invests. However, ratings are only the opinions of the rating agencies issuing them and are not guarantees as to credit quality or an evaluation of market risk. The fund’s investment adviser relies on its own credit analysts to research issuers and issues in seeking to assess credit and default risks.
Credit and liquidity support — Changes in the credit quality of banks and financial institutions providing credit and liquidity support features with respect to securities held by the fund could cause the values of these securities to decline.
Liquidity risk — Certain fund holdings may be or may become difficult or impossible to sell, particularly during times of market turmoil. Liquidity may be impacted by the lack of an active market for a holding, legal or contractual restrictions on resale, or the reduced number and capacity of market participants to make a market in such holding. Market prices for less liquid or illiquid holdings may be volatile, and reduced liquidity may have an adverse impact on the market price of such holdings. Additionally, the sale of less liquid or illiquid holdings may involve substantial delays (including delays in settlement) and additional costs and the fund may be unable to sell such holdings when necessary to meet its liquidity needs or may be forced to sell at a loss.
Investing in similar municipal bonds — Investing significantly in municipal obligations of multiple issuers in the same state or backed by revenues of similar types of projects or industries may make the fund more susceptible to certain economic, political or regulatory occurrences. As a result, the fund has greater risk of volatility, and greater risk of loss, from these investments.
Management — The investment adviser to the fund actively manages the fund’s investments. Consequently, the fund is subject to the risk that the methods and analyses, including models, tools and data, employed by the investment adviser in this process may be flawed or incorrect and may not produce the desired results. This could cause the fund to lose value or its investment results to lag relevant benchmarks or other funds with similar objectives.
Your investment in the fund is not a bank deposit and is not insured or guaranteed by the Federal Deposit Insurance Corporation or any other governmental agency, entity or person. You should consider how this fund fits into your overall investment program.
5 Capital Group Private Client Services Funds / Prospectus
Investment results The following bar chart shows how the fund’s investment results have varied from year to year, and the following table shows how the fund’s average annual total returns for various periods compare with a broad measure of securities market results and other applicable measures of market results. This information provides some indication of the risks of investing in the fund. The Lipper Short Municipal Debt Funds Average includes funds that disclose investment objectives and/or strategies reasonably comparable to those of the fund. Past investment results (before and after taxes) are not predictive of future investment results. Updated information on the fund’s investment results can be obtained by calling the fund’s transfer agent at (800) 421-4996.
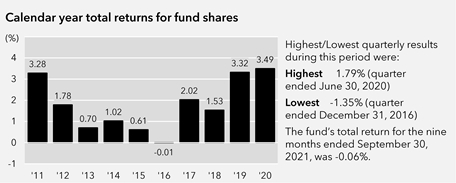
| | | | | | |
| Average annual total returns For the periods ended December 31, 2020: |
| | Inception date | 1 year | 5 years | 10 years | Lifetime |
| − Before taxes | 4/13/2010 | 3.49% | 2.06% | 1.77% | 1.75% |
| − After taxes on distributions | | 3.39 | 2.04 | 1.75 | 1.72 |
| − After taxes on distributions and sale of fund shares | 2.58 | 1.92 | 1.68 | 1.65 |
| | | | | |
| Indexes | 1 year | 5 years | 10 years | Lifetime |
| Bloomberg Municipal Short 1–5 Years Index (reflects no deductions for account fees, expenses or U.S. federal income taxes) | 2.83% | 1.98% | 1.87% | 1.88% |
| Lipper Short Municipal Debt Funds Average (reflects no deductions for account fees or U.S. federal income taxes) | 1.81 | 1.43 | 1.30 | 1.25 |
The fund’s annualized 30-day yield at October 31, 2021: 0.33%
(For current yield information, please call the fund’s transfer agent at (800) 421-4996.) |
After-tax returns are calculated using the highest individual federal income tax rates in effect during each year of the periods shown and do not reflect the impact of state and local taxes. Your actual after-tax returns depend on your individual tax situation and likely will differ from the results shown above. In addition, after-tax returns are not relevant if you hold your fund shares through a tax-favored arrangement, such as a 401(k) plan or individual retirement account (IRA).
Management
Investment adviser Capital Research and Management CompanySM
Portfolio managers The individuals primarily responsible for the portfolio management of the fund are:
| | | |
Portfolio manager/
Fund title (if applicable) | Portfolio manager
experience in this fund | Primary title
with investment adviser |
| Aaron Applebaum Senior Vice President | 5 years | Partner – Capital Fixed Income Investors |
| Mark Marinella Senior Vice President | 5 years | Partner – Capital Fixed Income Investors |
| |
Purchase and sale of fund shares The minimum amount required to establish an account is $25,000. You may sell (redeem) shares on any business day by contacting your Capital Group Private Client Services investment counselor or by calling (866) 421-2166.
Tax information Fund distributions of interest on municipal bonds are generally not subject to federal income tax. However, the fund may distribute taxable dividends, including distributions of short-term capital gains, which are subject to federal taxation as ordinary income. The fund’s distributions of net long-term capital gains are taxable as long-term capital gains.
Capital Group Private Client Services Funds / Prospectus 6
Capital Group California Core Municipal Fund
Investment objective The fund seeks to provide current income exempt from federal and California income taxes while preserving your investment.
Fees and expenses of the fund This table describes the fees and expenses that you may pay if you buy, hold and sell shares of the fund. You may pay other fees to financial intermediaries, which are not reflected in the tables and examples below.
| | |
Shareholder fees (fees paid directly from your investment) |
| Maximum sales charge (load) imposed on purchases (as a percentage of offering price) | none |
| Maximum deferred sales charge (load) (as a percentage of the amount redeemed) | none |
| Maximum sales charge (load) imposed on reinvested dividends | none |
| Redemption or exchange fees | none |
| | |
Annual fund operating expenses (expenses that you pay each year as a percentage of the value of your investment) |
| Management fees | 0.25% |
| Distribution and/or service (12b-1) fees | none |
| Other expenses | 0.02 |
| Total annual fund operating expenses | 0.27 |
Example This example is intended to help you compare the cost of investing in the fund with the cost of investing in other mutual funds.
The example assumes that you invest $10,000 in the fund for the time periods indicated and then redeem all of your shares at the end of those periods. The example also assumes that your investment has a 5% return each year and that the fund’s operating expenses remain the same. Although your actual costs may be higher or lower, based on these assumptions your costs would be:
| | | | |
| 1 year | 3 years | 5 years | 10 years |
| $28 | $87 | $152 | $343 |
Portfolio turnover The fund pays transaction costs, such as commissions, when it buys and sells securities (or “turns over” its portfolio). A higher portfolio turnover rate may indicate higher transaction costs and may result in higher taxes when fund shares are held in a taxable account. These costs, which are not reflected in annual fund operating expenses or in the example, affect the fund’s investment results. During the most recent fiscal year, the fund’s portfolio turnover rate was 38% of the average value of its portfolio.
Principal investment strategies The fund seeks to achieve its objective by primarily investing in municipal bonds issued by the state of California and its agencies and municipalities. Consistent with the fund’s objective, the fund may also invest in municipal securities that are issued by jurisdictions outside California.
The fund will invest at least 80% of its assets in bonds (for purposes of this limit, bonds include any debt instrument and cash equivalents, and may include certain preferred securities). Under normal circumstances, the fund will invest at least 80% of its assets in, or derive at least 80% of its income from, securities that are exempt from federal and California income taxes. The fund will not invest in securities that subject you to the federal alternative minimum tax. The investment adviser will seek to manage the fund in order to minimize capital gain distributions.
The fund invests primarily in municipal bonds with quality ratings of A- or A3 or better by Nationally Recognized Statistical Rating Organizations (“NRSROs”) designated by the fund’s investment adviser or unrated but determined by the fund’s investment adviser to be of equivalent quality. The fund may also invest in municipal bonds in the rating categories of BBB or Baa by NRSROs designated by the fund’s investment adviser or unrated but determined by the fund’s investment adviser to be of equivalent quality. Under normal circumstances, the dollar-weighted average effective maturity of the fund’s portfolio will be between three and 10 years.
The fund may invest in municipal obligations of multiple issuers in the same state or backed by revenues of similar types of projects or industries. The fund may also invest more than 25% of its assets in industrial development bonds.
The fund relies on the professional judgment of its investment adviser to make decisions about the fund’s portfolio investments. The basic investment philosophy of the investment adviser is to seek to invest in attractively priced securities that, in its opinion, represent good investment opportunities. Securities may be sold when the investment adviser believes that they no longer represent relatively attractive investment opportunities.
7 Capital Group Private Client Services Funds / Prospectus
Principal risks
This section describes the principal risks associated with investing in the fund. You may lose money by investing in the fund. The likelihood of loss may be greater if you invest for a shorter period of time.
Investing in municipal bonds of issuers within the state of California — Because the fund invests primarily in securities of issuers within the state of California, the fund is more susceptible to factors adversely affecting issuers of California securities than a comparable municipal bond mutual fund that does not concentrate its investments in a single state. For example, in the past, California voters have passed amendments to the state’s constitution and other measures that limit the taxing and spending authority of California governmental entities, and future voter initiatives may adversely affect California municipal bonds. More detailed information about the risks of investing in California municipal securities is contained in the statement of additional information.
Market conditions — The prices of, and the income generated by, the securities held by the fund may decline – sometimes rapidly or unpredictably – due to various factors, including events or conditions affecting the general economy or particular industries; overall market changes; local, regional or global political, social or economic instability; governmental, governmental agency or central bank responses to economic conditions; and currency exchange rate, interest rate and commodity price fluctuations.
Economies and financial markets throughout the world are highly interconnected. Economic, financial or political events, trading and tariff arrangements, wars, terrorism, cybersecurity events, natural disasters, public health emergencies (such as the spread of infectious disease) and other circumstances in one country or region, including actions taken by governmental or quasi-governmental authorities in response to any of the foregoing, could have impacts on global economies or markets. As a result, whether or not the fund invests in securities of issuers located in or with significant exposure to the countries affected, the value and liquidity of the fund’s investments may be negatively affected by developments in other countries and regions.
Issuer risks — The prices of, and the income generated by, securities held by the fund may decline in response to various factors directly related to the issuers of such securities, including reduced demand for an issuer’s goods or services, poor management performance, major litigation, investigations or other controversies related to the issuer, changes in government regulations affecting the issuer or its competitive environment and strategic initiatives such as mergers, acquisitions or dispositions and the market response to any such initiatives.
Investing in debt instruments — The prices of, and the income generated by, bonds and other debt securities held by the fund may be affected by factors such as the interest rates, maturities and credit ratings of these securities.
Rising interest rates will generally cause the prices of bonds and other debt securities to fall. A general rise in interest rates may cause investors to sell debt securities on a large scale, which could also adversely affect the price and liquidity of debt securities and could also result in increased redemptions from the fund. Falling interest rates may cause an issuer to redeem, call or refinance a debt security before its stated maturity, which may result in the fund failing to recoup the full amount of its initial investment and having to reinvest the proceeds in lower yielding securities. Longer maturity debt securities generally have greater sensitivity to changes in interest rates and may be subject to greater price fluctuations than shorter maturity debt securities.
Bonds and other debt securities are also subject to credit risk, which is the possibility that the credit strength of an issuer or guarantor will weaken or be perceived to be weaker, and/or an issuer of a debt security will fail to make timely payments of principal or interest and the security will go into default. A downgrade or default affecting any of the fund’s securities could cause the value of the fund’s shares to decrease. Credit risk is gauged, in part, by the credit ratings of the debt securities in which the fund invests. However, ratings are only the opinions of the rating agencies issuing them and are not guarantees as to credit quality or an evaluation of market risk. The fund’s investment adviser relies on its own credit analysts to research issuers and issues in seeking to assess credit and default risks.
Credit and liquidity support — Changes in the credit quality of banks and financial institutions providing credit and liquidity support features with respect to securities held by the fund could cause the values of these securities to decline.
Investing in lower rated debt instruments — Lower rated bonds and other lower rated debt securities generally have higher rates of interest and involve greater risk of default or price declines due to changes in the issuer’s creditworthiness than those of higher quality debt securities. The market prices of these securities may fluctuate more than the prices of higher quality debt securities and may decline significantly in periods of general economic difficulty.
Liquidity risk — Certain fund holdings may be or may become difficult or impossible to sell, particularly during times of market turmoil. Liquidity may be impacted by the lack of an active market for a holding, legal or contractual restrictions on resale, or the reduced number and capacity of market participants to make a market in such holding. Market prices for less liquid or illiquid holdings may be volatile, and reduced liquidity may have an adverse impact on the market price of such holdings. Additionally, the sale of less liquid or illiquid holdings may involve substantial delays (including delays in settlement) and additional costs and the fund may be unable to sell such holdings when necessary to meet its liquidity needs or may be forced to sell at a loss.
Investing in similar municipal bonds — Investing significantly in municipal obligations of multiple issuers in the same state or backed by revenues of similar types of projects or industries may make the fund more susceptible to certain economic, political or regulatory occurrences. As a result, the fund has greater risk of volatility, and greater risk of loss, from these investments.
Management — The investment adviser to the fund actively manages the fund’s investments. Consequently, the fund is subject to the risk that the methods and analyses, including models, tools and data, employed by the investment adviser in this process may be flawed or incorrect and may not produce the desired results. This could cause the fund to lose value or its investment results to lag relevant benchmarks or other funds with similar objectives.
Capital Group Private Client Services Funds / Prospectus 8
Your investment in the fund is not a bank deposit and is not insured or guaranteed by the Federal Deposit Insurance Corporation or any other governmental agency, entity or person. You should consider how this fund fits into your overall investment program.
Investment results The following bar chart shows how the fund’s investment results have varied from year to year, and the following table shows how the fund’s average annual total returns for various periods compare with a broad measure of securities market results and other applicable measures of market results. This information provides some indication of the risks of investing in the fund. The Lipper California Short-Intermediate Municipal Debt Funds Average includes funds that disclose investment objectives and/or strategies reasonably comparable to those of the fund. Past investment results (before and after taxes) are not predictive of future investment results. Updated information on the fund’s investment results can be obtained by calling the fund’s transfer agent at (800) 421-4996.

| | | | | | |
| Average annual total returns For the periods ended December 31, 2020: |
| | Inception date | 1 year | 5 years | 10 years | Lifetime |
| − Before taxes | 4/13/2010 | 3.81% | 2.59% | 2.99% | 2.82% |
| − After taxes on distributions | | 3.57 | 2.52 | 2.95 | 2.78 |
| − After taxes on distributions and sale of fund shares | 3.00 | 2.40 | 2.76 | 2.62 |
| | | | | |
| Indexes | 1 year | 5 years | 10 years | Lifetime |
| Bloomberg California Short-Intermediate Municipal Index (reflects no deductions for account fees, expenses or U.S. federal income taxes) | 3.82% | 2.53% | 3.00% | 3.00% |
| Lipper California Short-Intermediate Municipal Debt Funds Average (reflects no deductions for account fees or U.S. federal income taxes) | 2.32 | 1.85 | 2.12 | 1.99 |
The fund’s annualized 30-day yield at October 31, 2021: 0.42%
(For current yield information, please call the fund’s transfer agent at (800) 421-4996.) |
After-tax returns are calculated using the highest individual federal income tax rates in effect during each year of the periods shown and do not reflect the impact of state and local taxes. Your actual after-tax returns depend on your individual tax situation and likely will differ from the results shown above. In addition, after-tax returns are not relevant if you hold your fund shares through a tax-favored arrangement, such as a 401(k) plan or individual retirement account (IRA).
Management
Investment adviser Capital Research and Management CompanySM
Portfolio manager The individual primarily responsible for the portfolio management of the fund is:
| | | |
Portfolio manager/
Fund title (if applicable) | Portfolio manager
experience in this fund | Primary title
with investment adviser |
| Mark Marinella Senior Vice President | 5 years | Partner – Capital Fixed Income Investors |
| |
Purchase and sale of fund shares The minimum amount required to establish an account is $25,000. You may sell (redeem) shares on any business day by contacting your Capital Group Private Client Services investment counselor or by calling (866) 421-2166.
Tax information Fund distributions of interest on municipal bonds are generally not subject to federal income tax. However, the fund may distribute taxable dividends, including distributions of short-term capital gains, which are subject to federal taxation as ordinary income. The fund’s distributions of net long-term capital gains are taxable as long-term capital gains.
9 Capital Group Private Client Services Funds / Prospectus
Capital Group California Short-Term Municipal Fund
Investment objectives The fund seeks to preserve your investment and secondarily to provide current income exempt from federal and California income taxes.
Fees and expenses of the fund This table describes the fees and expenses that you may pay if you buy, hold and sell shares of the fund. You may pay other fees to financial intermediaries, which are not reflected in the tables and examples below.
| | |
Shareholder fees (fees paid directly from your investment) |
| Maximum sales charge (load) imposed on purchases (as a percentage of offering price) | none |
| Maximum deferred sales charge (load) (as a percentage of the amount redeemed) | none |
| Maximum sales charge (load) imposed on reinvested dividends | none |
| Redemption or exchange fees | none |
| | |
Annual fund operating expenses (expenses that you pay each year as a percentage of the value of your investment) |
| Management fees | 0.25% |
| Distribution and/or service (12b-1) fees | none |
| Other expenses | 0.04 |
| Total annual fund operating expenses | 0.29 |
Example This example is intended to help you compare the cost of investing in the fund with the cost of investing in other mutual funds.
The example assumes that you invest $10,000 in the fund for the time periods indicated and then redeem all of your shares at the end of those periods. The example also assumes that your investment has a 5% return each year and that the fund’s operating expenses remain the same. Although your actual costs may be higher or lower, based on these assumptions your costs would be:
| | | | |
| 1 year | 3 years | 5 years | 10 years |
| $30 | $93 | $163 | $368 |
Portfolio turnover The fund pays transaction costs, such as commissions, when it buys and sells securities (or “turns over” its portfolio). A higher portfolio turnover rate may indicate higher transaction costs and may result in higher taxes when fund shares are held in a taxable account. These costs, which are not reflected in annual fund operating expenses or in the example, affect the fund’s investment results. During the most recent fiscal year, the fund’s portfolio turnover rate was 43% of the average value of its portfolio.
Principal investment strategies The fund seeks to achieve its objectives by primarily investing in municipal bonds issued by the state of California and its agencies and municipalities. Consistent with the fund’s objectives, the fund may also invest in municipal securities that are issued by jurisdictions outside California.
The fund will invest at least 80% of its assets in bonds (for purposes of this limit, bonds include any debt instrument and cash equivalents, and may include certain preferred securities). Under normal circumstances, the fund will invest at least 80% of its assets in, or derive at least 80% of its income from, securities that are exempt from both federal and California income taxes. The fund will not invest in securities that subject you to the federal alternative minimum tax. The investment adviser will seek to manage the fund in order to minimize capital gain distributions.
The fund invests primarily in municipal bonds with quality ratings of A- or A3 or better by Nationally Recognized Statistical Rating Organizations (“NRSROs”) designated by the fund’s investment adviser or unrated but determined by the fund’s investment adviser to be of equivalent quality. The fund may also invest a portion of its assets in municipal bonds with quality ratings below A- or A3 by NRSROs designated by the fund’s investment adviser or unrated but determined by the fund’s investment adviser to be of equivalent quality. Under normal circumstances, the dollar-weighted average effective maturity of the fund’s portfolio will be no greater than three years.
The fund may invest in municipal obligations of multiple issuers in the same state or backed by revenues of similar types of projects or industries. The fund may also invest more than 25% of its assets in industrial development bonds.
The fund relies on the professional judgment of its investment adviser to make decisions about the fund’s portfolio investments. The basic investment philosophy of the investment adviser is to seek to invest in attractively priced securities that, in its opinion, represent good investment opportunities. Securities may be sold when the investment adviser believes that they no longer represent relatively attractive investment opportunities.
Capital Group Private Client Services Funds / Prospectus 10
Principal risks
This section describes the principal risks associated with investing in the fund. You may lose money by investing in the fund. The likelihood of loss may be greater if you invest for a shorter period of time.
Investing in municipal bonds of issuers within the state of California — Because the fund invests primarily in securities of issuers within the state of California, the fund is more susceptible to factors adversely affecting issuers of California securities than a comparable municipal bond mutual fund that does not concentrate its investments in a single state. For example, in the past, California voters have passed amendments to the state’s constitution and other measures that limit the taxing and spending authority of California governmental entities, and future voter initiatives may adversely affect California municipal bonds. More detailed information about the risks of investing in California municipal securities is contained in the statement of additional information.
Market conditions — The prices of, and the income generated by, the securities held by the fund may decline – sometimes rapidly or unpredictably – due to various factors, including events or conditions affecting the general economy or particular industries; overall market changes; local, regional or global political, social or economic instability; governmental, governmental agency or central bank responses to economic conditions; and currency exchange rate, interest rate and commodity price fluctuations.
Economies and financial markets throughout the world are highly interconnected. Economic, financial or political events, trading and tariff arrangements, wars, terrorism, cybersecurity events, natural disasters, public health emergencies (such as the spread of infectious disease) and other circumstances in one country or region, including actions taken by governmental or quasi-governmental authorities in response to any of the foregoing, could have impacts on global economies or markets. As a result, whether or not the fund invests in securities of issuers located in or with significant exposure to the countries affected, the value and liquidity of the fund’s investments may be negatively affected by developments in other countries and regions.
Issuer risks — The prices of, and the income generated by, securities held by the fund may decline in response to various factors directly related to the issuers of such securities, including reduced demand for an issuer’s goods or services, poor management performance, major litigation, investigations or other controversies related to the issuer, changes in government regulations affecting the issuer or its competitive environment and strategic initiatives such as mergers, acquisitions or dispositions and the market response to any such initiatives.
Investing in debt instruments — The prices of, and the income generated by, bonds and other debt securities held by the fund may be affected by factors such as the interest rates, maturities and credit ratings of these securities.
Rising interest rates will generally cause the prices of bonds and other debt securities to fall. A general rise in interest rates may cause investors to sell debt securities on a large scale, which could also adversely affect the price and liquidity of debt securities and could also result in increased redemptions from the fund. Falling interest rates may cause an issuer to redeem, call or refinance a debt security before its stated maturity, which may result in the fund failing to recoup the full amount of its initial investment and having to reinvest the proceeds in lower yielding securities. Longer maturity debt securities generally have greater sensitivity to changes in interest rates and may be subject to greater price fluctuations than shorter maturity debt securities.
Bonds and other debt securities are also subject to credit risk, which is the possibility that the credit strength of an issuer or guarantor will weaken or be perceived to be weaker, and/or an issuer of a debt security will fail to make timely payments of principal or interest and the security will go into default. A downgrade or default affecting any of the fund’s securities could cause the value of the fund’s shares to decrease. Credit risk is gauged, in part, by the credit ratings of the debt securities in which the fund invests. However, ratings are only the opinions of the rating agencies issuing them and are not guarantees as to credit quality or an evaluation of market risk. The fund’s investment adviser relies on its own credit analysts to research issuers and issues in seeking to assess credit and default risks.
Credit and liquidity support — Changes in the credit quality of banks and financial institutions providing credit and liquidity support features with respect to securities held by the fund could cause the values of these securities to decline.
Liquidity risk — Certain fund holdings may be or may become difficult or impossible to sell, particularly during times of market turmoil. Liquidity may be impacted by the lack of an active market for a holding, legal or contractual restrictions on resale, or the reduced number and capacity of market participants to make a market in such holding. Market prices for less liquid or illiquid holdings may be volatile, and reduced liquidity may have an adverse impact on the market price of such holdings. Additionally, the sale of less liquid or illiquid holdings may involve substantial delays (including delays in settlement) and additional costs and the fund may be unable to sell such holdings when necessary to meet its liquidity needs or may be forced to sell at a loss.
Investing in similar municipal bonds — Investing significantly in municipal obligations of multiple issuers in the same state or backed by revenues of similar types of projects or industries may make the fund more susceptible to certain economic, political or regulatory occurrences. As a result, the fund has greater risk of volatility, and greater risk of loss, from these investments.
Management — The investment adviser to the fund actively manages the fund’s investments. Consequently, the fund is subject to the risk that the methods and analyses, including models, tools and data, employed by the investment adviser in this process may be flawed or incorrect and may not produce the desired results. This could cause the fund to lose value or its investment results to lag relevant benchmarks or other funds with similar objectives.
Your investment in the fund is not a bank deposit and is not insured or guaranteed by the Federal Deposit Insurance Corporation or any other governmental agency, entity or person. You should consider how this fund fits into your overall investment program.
11 Capital Group Private Client Services Funds / Prospectus
Investment results The following bar chart shows how the fund’s investment results have varied from year to year, and the following table shows how the fund’s average annual total returns for various periods compare with a broad measure of securities market results and other applicable measures of market results. This information provides some indication of the risks of investing in the fund. The Lipper Short Municipal Debt Funds Average includes funds that disclose investment objectives and/or strategies reasonably comparable to those of the fund. Past investment results (before and after taxes) are not predictive of future investment results. Updated information on the fund’s investment results can be obtained by calling the fund’s transfer agent at (800) 421-4996.
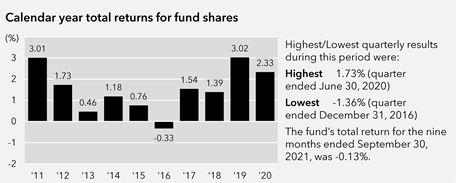
| | | | | | |
| Average annual total returns For the periods ended December 31, 2020: |
| | Inception date | 1 year | 5 years | 10 years | Lifetime |
| − Before taxes | 4/13/2010 | 2.33% | 1.59% | 1.50% | 1.45% |
| − After taxes on distributions | | 2.24 | 1.56 | 1.49 | 1.43 |
| − After taxes on distributions and sale of fund shares | 1.88 | 1.49 | 1.40 | 1.36 |
| | | | | |
| Indexes | 1 year | 5 years | 10 years | Lifetime |
| Bloomberg California Short Municipal Index (reflects no deductions for account fees, expenses or U.S. federal income taxes) | 2.65% | 1.77% | 1.82% | 1.83% |
| Lipper Short Municipal Debt Funds Average (reflects no deductions for account fees or U.S. federal income taxes) | 1.81 | 1.43 | 1.30 | 1.25 |
The fund’s annualized 30-day yield at October 31, 2021: 0.15%
(For current yield information, please call the fund’s transfer agent at (800) 421-4996.) |
After-tax returns are calculated using the highest individual federal income tax rates in effect during each year of the periods shown and do not reflect the impact of state and local taxes. Your actual after-tax returns depend on your individual tax situation and likely will differ from the results shown above. In addition, after-tax returns are not relevant if you hold your fund shares through a tax-favored arrangement, such as a 401(k) plan or individual retirement account (IRA).
Management
Investment adviser Capital Research and Management CompanySM
Portfolio manager The individual primarily responsible for the portfolio management of the fund is:
| | | |
Portfolio manager/
Fund title (if applicable) | Portfolio manager
experience in this fund | Primary title
with investment adviser |
| Mark Marinella Senior Vice President | 5 years | Partner – Capital Fixed Income Investors |
| |
Purchase and sale of fund shares The minimum amount required to establish an account is $25,000. You may sell (redeem) shares on any business day by contacting your Capital Group Private Client Services investment counselor or by calling (866) 421-2166.
Tax information Fund distributions of interest on municipal bonds are generally not subject to federal income tax. However, the fund may distribute taxable dividends, including distributions of short-term capital gains, which are subject to federal taxation as ordinary income. The fund’s distributions of net long-term capital gains are taxable as long-term capital gains.
Capital Group Private Client Services Funds / Prospectus 12
Capital Group Core Bond Fund
Investment objective The fund’s investment objective is to provide you with current income while preserving your investment.
Fees and expenses of the fund This table describes the fees and expenses that you may pay if you buy, hold and sell shares of the fund. You may pay other fees to financial intermediaries, which are not reflected in the tables and examples below.
| | |
Shareholder fees (fees paid directly from your investment) |
| Maximum sales charge (load) imposed on purchases (as a percentage of offering price) | none |
| Maximum deferred sales charge (load) (as a percentage of the amount redeemed) | none |
| Maximum sales charge (load) imposed on reinvested dividends | none |
| Redemption or exchange fees | none |
| | |
Annual fund operating expenses (expenses that you pay each year as a percentage of the value of your investment) |
| Management fees | 0.25% |
| Distribution and/or service (12b-1) fees | none |
| Other expenses | 0.03 |
| Total annual fund operating expenses | 0.28 |
Example This example is intended to help you compare the cost of investing in the fund with the cost of investing in other mutual funds.
The example assumes that you invest $10,000 in the fund for the time periods indicated and then redeem all of your shares at the end of those periods. The example also assumes that your investment has a 5% return each year and that the fund’s operating expenses remain the same. Although your actual costs may be higher or lower, based on these assumptions your costs would be:
| | | | |
| 1 year | 3 years | 5 years | 10 years |
| $29 | $90 | $157 | $356 |
Portfolio turnover The fund pays transaction costs, such as commissions, when it buys and sells securities (or “turns over” its portfolio). A higher portfolio turnover rate may indicate higher transaction costs and may result in higher taxes when fund shares are held in a taxable account. These costs, which are not reflected in annual fund operating expenses or in the example, affect the fund’s investment results. During the most recent fiscal year, the fund’s portfolio turnover rate was 217% of the average value of its portfolio.
Principal investment strategies The fund primarily invests in debt securities, including securities issued and guaranteed by the U.S. government and securities backed by mortgages or other assets. The fund may also invest in debt securities and mortgage-backed securities issued by federal agencies and instrumentalities that are not backed by the full faith and credit of the U.S. government. In addition, the fund may invest in asset-backed securities (securities backed by assets such as auto loans, credit card receivables or other providers of credit).
The fund will invest at least 80% of its assets in bonds (for purposes of this limit, bonds include any debt instrument and cash equivalents, and may include certain preferred securities), which may be represented by derivatives. The fund primarily invests in debt securities with quality ratings of A- or A3 or better by Nationally Recognized Statistical Rating Organizations (“NRSROs”) designated by the fund’s investment adviser or unrated but determined to be of equivalent quality by the fund’s investment adviser. The fund may invest up to 10% of its assets in debt securities rated in the BBB or Baa rating categories by NRSROs designated by the fund’s investment adviser or unrated but determined to be of equivalent quality by the fund’s investment adviser. Under normal circumstances, the dollar-weighted average effective maturity of the fund’s portfolio will be between three and 10 years.
The fund relies on the professional judgment of its investment adviser to make decisions about the fund’s portfolio investments. The basic investment philosophy of the investment adviser is to seek to invest in attractively priced securities that, in its opinion, represent good investment opportunities. Securities may be sold when the investment adviser believes that they no longer represent relatively attractive investment opportunities.
13 Capital Group Private Client Services Funds / Prospectus
Principal risks
This section describes the principal risks associated with investing in the fund. You may lose money by investing in the fund. The likelihood of loss may be greater if you invest for a shorter period of time.
Market conditions — The prices of, and the income generated by, the securities held by the fund may decline – sometimes rapidly or unpredictably – due to various factors, including events or conditions affecting the general economy or particular industries; overall market changes; local, regional or global political, social or economic instability; governmental, governmental agency or central bank responses to economic conditions; and currency exchange rate, interest rate and commodity price fluctuations.
Economies and financial markets throughout the world are highly interconnected. Economic, financial or political events, trading and tariff arrangements, wars, terrorism, cybersecurity events, natural disasters, public health emergencies (such as the spread of infectious disease) and other circumstances in one country or region, including actions taken by governmental or quasi-governmental authorities in response to any of the foregoing, could have impacts on global economies or markets. As a result, whether or not the fund invests in securities of issuers located in or with significant exposure to the countries affected, the value and liquidity of the fund’s investments may be negatively affected by developments in other countries and regions.
Issuer risks — The prices of, and the income generated by, securities held by the fund may decline in response to various factors directly related to the issuers of such securities, including reduced demand for an issuer’s goods or services, poor management performance, major litigation, investigations or other controversies related to the issuer, changes in government regulations affecting the issuer or its competitive environment and strategic initiatives such as mergers, acquisitions or dispositions and the market response to any such initiatives.
Investing in debt instruments — The prices of, and the income generated by, bonds and other debt securities held by the fund may be affected by factors such as the interest rates, maturities and credit ratings of these securities.
Rising interest rates will generally cause the prices of bonds and other debt securities to fall. A general rise in interest rates may cause investors to sell debt securities on a large scale, which could also adversely affect the price and liquidity of debt securities and could also result in increased redemptions from the fund. Falling interest rates may cause an issuer to redeem, call or refinance a debt security before its stated maturity, which may result in the fund failing to recoup the full amount of its initial investment and having to reinvest the proceeds in lower yielding securities. Longer maturity debt securities generally have greater sensitivity to changes in interest rates and may be subject to greater price fluctuations than shorter maturity debt securities.
Bonds and other debt securities are also subject to credit risk, which is the possibility that the credit strength of an issuer or guarantor will weaken or be perceived to be weaker, and/or an issuer of a debt security will fail to make timely payments of principal or interest and the security will go into default. A downgrade or default affecting any of the fund’s securities could cause the value of the fund’s shares to decrease. Credit risk is gauged, in part, by the credit ratings of the debt securities in which the fund invests. However, ratings are only the opinions of the rating agencies issuing them and are not guarantees as to credit quality or an evaluation of market risk. The fund’s investment adviser relies on its own credit analysts to research issuers and issues in seeking to assess credit and default risks.
Investing in lower rated debt instruments — Lower rated bonds and other lower rated debt securities generally have higher rates of interest and involve greater risk of default or price declines due to changes in the issuer’s creditworthiness than those of higher quality debt securities. The market prices of these securities may fluctuate more than the prices of higher quality debt securities and may decline significantly in periods of general economic difficulty.
Investing in mortgage-related and other asset-backed securities — Mortgage-related securities, such as mortgage-backed securities, and other asset-backed securities, include debt obligations that represent interests in pools of mortgages or other income-bearing assets, such as consumer loans or receivables. While such securities are subject to the risks associated with investments in debt instruments generally (for example, credit, extension and interest rate risks), they are also subject to other and different risks. Mortgage-backed and other asset-backed securities are subject to changes in the payment patterns of borrowers of the underlying debt, potentially increasing the volatility of the securities and the fund’s net asset value. When interest rates fall, borrowers are more likely to refinance or prepay their debt before its stated maturity. This may result in the fund having to reinvest the proceeds in lower yielding securities, effectively reducing the fund’s income. Conversely, if interest rates rise and borrowers repay their debt more slowly than expected, the time in which the mortgage-backed and other asset-backed securities are paid off could be extended, reducing the fund’s cash available for reinvestment in higher yielding securities. Mortgage-backed securities are also subject to the risk that underlying borrowers will be unable to meet their obligations and the value of property that secures the mortgages may decline in value and be insufficient, upon foreclosure, to repay the associated loans. Investments in asset-backed securities are subject to similar risks.
Investing in securities backed by the U.S. government — Securities backed by the U.S. Treasury or the full faith and credit of the U.S. government are guaranteed only as to the timely payment of interest and principal when held to maturity. Accordingly, the current market values for these securities will fluctuate with changes in interest rates and the credit rating of the U.S. government. Securities issued by U.S. government-sponsored entities and federal agencies and instrumentalities that are not backed by the full faith and credit of the U.S. government are neither issued nor guaranteed by the U.S. government.
Liquidity risk — Certain fund holdings may be or may become difficult or impossible to sell, particularly during times of market turmoil. Liquidity may be impacted by the lack of an active market for a holding, legal or contractual restrictions on resale, or the reduced number and capacity of market participants to make a market in such holding. Market prices for less liquid or illiquid holdings may be volatile, and reduced liquidity may have an adverse impact on the market price of such holdings. Additionally, the sale of less liquid or illiquid holdings may involve substantial delays (including delays in settlement) and additional costs and the fund may be unable to sell such holdings when necessary to meet its liquidity needs or may be forced to sell at a loss.
Capital Group Private Client Services Funds / Prospectus 14
Management — The investment adviser to the fund actively manages the fund’s investments. Consequently, the fund is subject to the risk that the methods and analyses, including models, tools and data, employed by the investment adviser in this process may be flawed or incorrect and may not produce the desired results. This could cause the fund to lose value or its investment results to lag relevant benchmarks or other funds with similar objectives.
Your investment in the fund is not a bank deposit and is not insured or guaranteed by the Federal Deposit Insurance Corporation or any other governmental agency, entity or person. You should consider how this fund fits into your overall investment program.
Investment results The following bar chart shows how the fund’s investment results have varied from year to year, and the following table shows how the fund’s average annual total returns for various periods compare with a broad measure of securities market results and other applicable measures of market results. This information provides some indication of the risks of investing in the fund. The Lipper Short-Intermediate Investment Grade Debt Funds Average includes funds that disclose investment objectives and/or strategies reasonably comparable to those of the fund. Past investment results (before and after taxes) are not predictive of future investment results. Updated information on the fund’s investment results can be obtained by calling the fund’s transfer agent at (800) 421-4996.
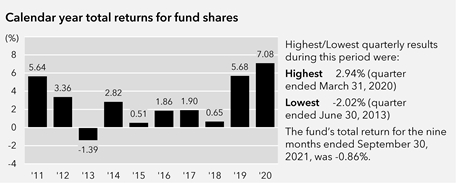
| | | | | | |
| Average annual total returns For the periods ended December 31, 2020: |
| | Inception date | 1 year | 5 years | 10 years | Lifetime |
| − Before taxes | 4/13/2010 | 7.08% | 3.40% | 2.78% | 2.90% |
| − After taxes on distributions | | 5.51 | 2.38 | 1.87 | 1.97 |
| − After taxes on distributions and sale of fund shares | 4.39 | 2.19 | 1.78 | 1.87 |
| | | | | |
| Indexes | 1 year | 5 years | 10 years | Lifetime |
| Bloomberg Intermediate A+ U.S. Government/Credit Index (reflects no deductions for account fees, expenses or U.S. federal income taxes) | 6.15% | 3.23% | 2.80% | 2.97% |
| Lipper Short-Intermediate Investment Grade Debt Funds Average (reflects no deductions for account fees or U.S. federal income taxes) | 5.11 | 2.97 | 2.54 | 2.70 |
The fund’s annualized 30-day yield at October 31, 2021: 0.66%
(For current yield information, please call the fund’s transfer agent at (800) 421-4996.) |
After-tax returns are calculated using the highest individual federal income tax rates in effect during each year of the periods shown and do not reflect the impact of state and local taxes. Your actual after-tax returns depend on your individual tax situation and likely will differ from the results shown above. In addition, after-tax returns are not relevant if you hold your fund shares through a tax-favored arrangement, such as a 401(k) plan or individual retirement account (IRA).
Management
Investment adviser Capital Research and Management CompanySM
Portfolio manager The individual primarily responsible for the portfolio management of the fund is:
| | | |
Portfolio manager/
Fund title (if applicable) | Portfolio manager
experience in this fund | Primary title
with investment adviser |
| John R. Queen Senior Vice President | 12 years | Partner – Capital Fixed Income Investors |
| |
Purchase and sale of fund shares The minimum amount required to establish an account is $25,000. You may sell (redeem) shares on any business day by contacting your Capital Group Private Client Services investment counselor or by calling (866) 421-2166.
Tax information Dividends and capital gain distributions you receive from the fund are subject to federal income taxes and may also be subject to state and local taxes, unless you are tax-exempt or your account is tax-favored.
15 Capital Group Private Client Services Funds / Prospectus
Investment objectives, strategies and risks Except where the context indicates otherwise, all references herein to the “fund” apply to each of the Capital Group Private Client Services Funds.
Capital Group Core Municipal Fund The fund seeks to provide current income exempt from federal income tax while preserving your investment. This investment objective may be changed by the fund’s board without shareholder approval upon 60 days’ written notice to shareholders. The fund seeks to achieve its objective by investing primarily in municipal bonds. Municipal bonds are debt obligations generally issued to obtain funds for various public purposes, including the construction of public facilities.
The fund will invest at least 80% of its assets in bonds (for purposes of this limit, bonds include any debt instrument and cash equivalents, and may include certain preferred securities). Under normal circumstances, the fund will invest at least 80% of its assets in, or derive at least 80% of its income from, securities that are exempt from federal income tax. The fund will not invest in securities that subject you to the federal alternative minimum tax. The investment adviser will seek to manage the fund in order to minimize capital gain distributions.
The fund invests primarily in municipal bonds with quality ratings of A- or A3 or better by Nationally Recognized Statistical Rating Organizations (“NRSROs”) designated by the fund’s investment adviser or unrated but determined by the fund’s investment adviser to be of equivalent quality. The fund may also invest in municipal bonds in the rating categories of BBB or Baa by NRSROs designated by the fund’s investment adviser or unrated but determined by the fund’s investment adviser to be of equivalent quality. Under normal circumstances, the dollar-weighted average effective maturity of the fund’s portfolio will be between three and 10 years.
The fund may invest in municipal obligations of multiple issuers in the same state or backed by revenues of similar types of projects or industries. The fund may also invest more than 25% of its assets in industrial development bonds.
The fund may also invest in futures contracts and swaps, which are types of derivatives. A derivative is a financial contract, the value of which is based on the value of an underlying financial asset (such as a stock, bond or currency), a reference rate or a market index. The fund may invest in a derivative only if, in the opinion of the investment adviser, the expected risks and rewards of the proposed investment are consistent with the investment objective and strategies of the fund as disclosed in this prospectus and in the fund’s statement of additional information.
Capital Group Short-Term Municipal Fund The fund seeks to preserve your investment and secondarily to provide current income exempt from federal income tax. These investment objectives may be changed by the fund’s board without shareholder approval upon 60 days’ written notice to shareholders. The fund seeks to achieve its objectives by investing primarily in municipal bonds. Municipal bonds are debt obligations generally issued to obtain funds for various public purposes, including the construction of public facilities.
The fund will invest at least 80% of its assets in bonds (for purposes of this limit, bonds include any debt instrument and cash equivalents, and may include certain preferred securities). Under normal circumstances, the fund will invest at least 80% of its assets in, or derive at least 80% of its income from, securities that are exempt from federal income tax. The fund will not invest in securities that subject you to the federal alternative minimum tax. The investment adviser will seek to manage the fund in order to minimize capital gain distributions.
The fund invests primarily in municipal bonds with quality ratings of AA- or Aa3 or better by NRSROs designated by the fund’s investment adviser or unrated but determined by the fund’s investment adviser to be of equivalent quality. The fund may also invest in municipal bonds in the rating categories of A- or A3 by NRSROs designated by the fund’s investment adviser or unrated but determined by the fund’s investment adviser to be of equivalent quality. Under normal circumstances, the dollar-weighted average effective maturity of the fund’s portfolio will be no greater than three years.
The fund may invest in municipal obligations of multiple issuers in the same state or backed by revenues of similar types of projects or industries. The fund may also invest more than 25% of its assets in industrial development bonds.
The fund may also invest in futures contracts and swaps, which are types of derivatives. A derivative is a financial contract, the value of which is based on the value of an underlying financial asset (such as a stock, bond or currency), a reference rate or a market index. The fund may invest in a derivative only if, in the opinion of the investment adviser, the expected risks and rewards of the proposed investment are consistent with the investment objective and strategies of the fund as disclosed in this prospectus and in the fund’s statement of additional information.
Capital Group Private Client Services Funds / Prospectus 16
Capital Group California Core Municipal Fund The fund seeks to provide current income exempt from federal and California income taxes while preserving your investment. This investment objective may be changed by the fund’s board without shareholder approval upon 60 days’ written notice to shareholders. The fund seeks to achieve its objective by primarily investing in municipal bonds issued by the state of California and its agencies and municipalities. Consistent with the fund’s objective, the fund may also invest in municipal securities that are issued by jurisdictions outside California. Municipal bonds are debt obligations generally issued to obtain funds for various public purposes, including the construction of public facilities.
The fund will invest at least 80% of its assets in bonds (for purposes of this limit, bonds include any debt instrument and cash equivalents, and may include certain preferred securities). Under normal circumstances, the fund will invest at least 80% of its assets in, or derive at least 80% of its income from, securities that are exempt from federal and California income taxes. The fund will not invest in securities that subject you to the federal alternative minimum tax. The investment adviser will seek to manage the fund in order to minimize capital gain distributions.
The fund invests primarily in municipal bonds with quality ratings of A- or A3 or better by NRSROs designated by the fund’s investment adviser or unrated but determined by the fund’s investment adviser to be of equivalent quality. The fund may also invest in municipal bonds in the rating categories of BBB or Baa by NRSROs designated by the fund’s investment adviser or unrated but determined by the fund’s investment adviser to be of equivalent quality. Under normal circumstances, the dollar-weighted average effective maturity of the fund’s portfolio will be between three and 10 years.
The fund may invest in municipal obligations of multiple issuers in the same state or backed by revenues of similar types of projects or industries. The fund may also invest more than 25% of its assets in industrial development bonds.
The fund may also invest in futures contracts and swaps, which are types of derivatives. A derivative is a financial contract, the value of which is based on the value of an underlying financial asset (such as a stock, bond or currency), a reference rate or a market index. The fund may invest in a derivative only if, in the opinion of the investment adviser, the expected risks and rewards of the proposed investment are consistent with the investment objective and strategies of the fund as disclosed in this prospectus and in the fund’s statement of additional information.
Capital Group California Short-Term Municipal Fund The fund seeks to preserve your investment and secondarily to provide current income exempt from federal and California income taxes. These investment objectives may be changed by the fund’s board without shareholder approval upon 60 days’ written notice to shareholders. The fund seeks to achieve its objectives by primarily investing in municipal bonds issued by the state of California and its agencies and municipalities. Consistent with the fund’s objectives, the fund may also invest in municipal securities that are issued by jurisdictions outside California. Municipal bonds are debt obligations generally issued to obtain funds for various public purposes, including the construction of public facilities.
The fund will invest at least 80% of its assets in bonds (for purposes of this limit, bonds include any debt instrument and cash equivalents, and may include certain preferred securities). Under normal circumstances, the fund will invest at least 80% of its assets in, or derive at least 80% of its income from, securities that are exempt from both federal and California income taxes. The fund will not invest in securities that subject you to the federal alternative minimum tax. The investment adviser will seek to manage the fund in order to minimize capital gain distributions.
The fund invests primarily in municipal bonds with quality ratings of A- or A3 or better by NRSROs designated by the fund’s investment adviser or unrated but determined by the fund’s investment adviser to be of equivalent quality. The fund may also invest a portion of its assets in municipal bonds with quality ratings below A- or A3 by NRSROs designated by the fund’s investment adviser or unrated but determined by the fund’s investment adviser to be of equivalent quality. Under normal circumstances, the dollar-weighted average effective maturity of the fund’s portfolio will be no greater than three years.
The fund may invest in municipal obligations of multiple issuers in the same state or backed by revenues of similar types of projects or industries. The fund may also invest more than 25% of its assets in industrial development bonds.
The fund may also invest in futures contracts and swaps, which are types of derivatives. A derivative is a financial contract, the value of which is based on the value of an underlying financial asset (such as a stock, bond or currency), a reference rate or a market index. The fund may invest in a derivative only if, in the opinion of the investment adviser, the expected risks and rewards of the proposed investment are consistent with the investment objective and strategies of the fund as disclosed in this prospectus and in the fund’s statement of additional information.
17 Capital Group Private Client Services Funds / Prospectus
Capital Group Core Bond Fund The fund’s investment objective is to provide you with current income while preserving your investment. This investment objective may be changed by the fund’s board without shareholder approval upon 60 days’ written notice to shareholders. The fund primarily invests in debt securities, including securities issued and guaranteed by the U.S. government and securities backed by mortgages or other assets. The fund may also invest in debt securities and mortgage-backed securities issued by federal agencies and instrumentalities that are not backed by the full faith and credit of the U.S. government. In addition, the fund may invest in asset-backed securities (securities backed by assets such as auto loans, credit card receivables or other providers of credit).
The fund may invest in inflation-linked bonds issued by U.S. and non-U.S. governments, their agencies or instrumentalities, and corporations. Inflation-linked bonds are structured to protect against inflation by linking the bond’s principal and interest payments to an inflation index, such as the Consumer Price Index for Urban Consumers, so that principal and interest adjust to reflect changes in the index.
The fund will invest at least 80% of its assets in bonds (for purposes of this limit, bonds include any debt instrument and cash equivalents, and may include certain preferred securities), which may be represented by other instruments, including derivatives. The fund primarily invests in debt securities with quality ratings of A- or A3 or better by NRSROs designated by the fund’s investment adviser or unrated but determined to be of equivalent quality by the fund’s investment adviser. The fund may invest up to 10% of its assets in debt securities rated in the BBB or Baa rating category by NRSROs designated by the fund’s investment adviser or unrated but determined to be of equivalent quality by the fund’s investment adviser. Under normal circumstances, the dollar-weighted average effective maturity of the fund’s portfolio will be between three and 10 years.
The fund may also invest in futures contracts and swaps, which are types of derivatives. A derivative is a financial contract, the value of which is based on the value of an underlying financial asset (such as a stock, bond or currency), a reference rate or a market index. The fund may invest in a derivative only if, in the opinion of the investment adviser, the expected risks and rewards of the proposed investment are consistent with the investment objective and strategies of the fund as disclosed in this prospectus and in the fund’s statement of additional information.
Capital Group Private Client Services Funds / Prospectus 18
Applicable to all funds Normally, no fund is required to dispose of a debt security if its rating is reduced below the rating allowed for the fund (or if unrated, when its quality falls below the equivalent rating).
The fund may also hold cash or cash equivalents, including commercial paper and short-term securities issued by the U.S. government, its agencies and instrumentalities. The percentage of the fund invested in such holdings varies and depends on various factors, including market conditions and purchases and redemptions of fund shares. The investment adviser may determine that it is appropriate to invest a substantial portion of the fund’s assets in such instruments in response to certain circumstances, such as periods of market turmoil. For temporary defensive purposes, the fund may invest without limitation in such instruments. A larger percentage of such holdings could moderate the fund’s investment results in a period of rising market prices. Alternatively, a larger percentage of such holdings could reduce the magnitude of the fund’s loss in a period of falling market prices and provide liquidity to make additional investments or to meet redemptions.
The fund may invest in other funds managed by the investment adviser or its affiliates to more effectively invest in a diversified set of securities in a specific asset class such as money market instruments, bonds and other securities (“Central Funds”). Shares of Central Funds are only offered for purchase to the fund’s investment adviser and its affiliates and other funds, investment vehicles and accounts managed by the fund’s investment adviser and its affiliates. When investing in Central Funds, the fund bears its proportionate share of the expenses of the Central Funds in which it invests but does not bear additional management fees through its investment in such Central Funds. The investment results of the portions of the fund’s assets invested in the Central Funds will be based upon the investment results of the Central Funds.
The fund relies on the professional judgment of its investment adviser to make decisions about the fund’s portfolio investments. The basic investment philosophy of the investment adviser is to seek to invest in attractively priced securities that, in its opinion, represent good investment opportunities. The investment adviser believes that an important way to accomplish this is by analyzing various factors, which may include the credit strength of the issuer, prices of similar securities issued by comparable issuers, anticipated changes in interest rates, general market conditions and other factors pertinent to the particular security being evaluated. Securities may be sold when the investment adviser believes that they no longer represent relatively attractive investment opportunities.
The following are principal risks associated with investing in the fund.
Market conditions — The prices of, and the income generated by, the securities held by the fund may decline – sometimes rapidly or unpredictably – due to various factors, including events or conditions affecting the general economy or particular industries; overall market changes; local, regional or global political, social or economic instability; governmental, governmental agency or central bank responses to economic conditions; and currency exchange rate, interest rate and commodity price fluctuations.
Economies and financial markets throughout the world are highly interconnected. Economic, financial or political events, trading and tariff arrangements, wars, terrorism, cybersecurity events, natural disasters, public health emergencies (such as the spread of infectious disease) and other circumstances in one country or region, including actions taken by governmental or quasi-governmental authorities in response to any of the foregoing, could have impacts on global economies or markets. As a result, whether or not the fund invests in securities of issuers located in or with significant exposure to the countries affected, the value and liquidity of the fund’s investments may be negatively affected by developments in other countries and regions.
Issuer risks — The prices of, and the income generated by, securities held by the fund may decline in response to various factors directly related to the issuers of such securities, including reduced demand for an issuer’s goods or services, poor management performance, major litigation, investigations or other controversies related to the issuer, changes in government regulations affecting the issuer or its competitive environment and strategic initiatives such as mergers, acquisitions or dispositions and the market response to any such initiatives.
Investing in debt instruments — The prices of, and the income generated by, bonds and other debt securities held by the fund may be affected by factors such as the interest rates, maturities and credit ratings of these securities.
Rising interest rates will generally cause the prices of bonds and other debt securities to fall. A general rise in interest rates may cause investors to sell debt securities on a large scale, which could also adversely affect the price and liquidity of debt securities and could also result in increased redemptions from the fund. Falling interest rates may cause an issuer to redeem, call or refinance a debt security before its stated maturity, which may result in the fund failing to recoup the full amount of its initial investment and having to reinvest the proceeds in lower yielding securities. Longer maturity debt securities generally have greater sensitivity to changes in interest rates and may be subject to greater price fluctuations than shorter maturity debt securities.
Bonds and other debt securities are also subject to credit risk, which is the possibility that the credit strength of an issuer or guarantor will weaken or be perceived to be weaker, and/or an issuer of a debt security will fail to make timely payments of principal or interest and the security will go into default. A downgrade or default affecting any of the fund’s securities could cause the value of the fund’s shares to decrease. Credit risk is gauged, in part, by the credit ratings of the debt securities in which the fund invests. However, ratings are only the opinions of the rating agencies issuing them and are not guarantees as to credit quality or an evaluation of market risk. The fund’s investment adviser relies on its own credit analysts to research issuers and issues in seeking to assess credit and default risks.
Liquidity risk — Certain fund holdings may be or may become difficult or impossible to sell, particularly during times of market turmoil. Liquidity may be impacted by the lack of an active market for a holding, legal or contractual restrictions on resale, or the reduced number and capacity of market participants to make a market in such holding. Market prices for less liquid or illiquid holdings may be volatile, and reduced liquidity may have an adverse impact on the market price of such holdings. Additionally, the sale of less liquid or illiquid holdings may involve substantial delays (including delays in settlement) and additional costs and the fund may be unable to sell such holdings when necessary to meet its liquidity needs or may be forced to sell at a loss.
19 Capital Group Private Client Services Funds / Prospectus
Management — The investment adviser to the fund actively manages the fund’s investments. Consequently, the fund is subject to the risk that the methods and analyses, including models, tools and data, employed by the investment adviser in this process may be flawed or incorrect and may not produce the desired results. This could cause the fund to lose value or its investment results to lag relevant benchmarks or other funds with similar objectives.
Capital Group Core Municipal Fund
Capital Group Short-Term Municipal Fund
Capital Group California Core Municipal Fund
Capital Group California Short-Term Municipal Fund
Investing in similar municipal bonds — Investing significantly in municipal obligations of multiple issuers in the same state or backed by revenues of similar types of projects or industries may make the fund more susceptible to certain economic, political or regulatory occurrences. As a result, the fund has greater risk of volatility, and greater risk of loss, from these investments.
Credit and liquidity support — Changes in the credit quality of banks and financial institutions providing credit and liquidity support features with respect to securities held by the fund could cause the values of these securities to decline.
Capital Group Core Municipal Fund
Capital Group California Core Municipal Fund
Capital Group Core Bond Fund
Investing in lower rated debt instruments — Lower rated bonds and other lower rated debt securities generally have higher rates of interest and involve greater risk of default or price declines due to changes in the issuer’s creditworthiness than those of higher quality debt securities. The market prices of these securities may fluctuate more than the prices of higher quality debt securities and may decline significantly in periods of general economic difficulty.
Capital Group California Core Municipal Fund
Capital Group California Short-Term Municipal Fund
Investing in municipal bonds of issuers within the state of California — Because the fund invests primarily in securities of issuers within the state of California, the fund is more susceptible to factors adversely affecting issuers of California securities than a comparable municipal bond mutual fund that does not concentrate its investments in a single state. For example, in the past, California voters have passed amendments to the state’s constitution and other measures that limit the taxing and spending authority of California governmental entities, and future voter initiatives may adversely affect California municipal bonds. More detailed information about the risks of investing in California municipal securities is contained in the statement of additional information.
Capital Group Core Bond Fund
Investing in mortgage-related and other asset-backed securities — Mortgage-related securities, such as mortgage-backed securities, and other asset-backed securities, include debt obligations that represent interests in pools of mortgages or other income-bearing assets, such as residential mortgage loans, home equity loans, mortgages on commercial buildings, consumer loans and equipment leases. While such securities are subject to the risks associated with investments in debt instruments generally (for example, credit, extension and interest rate risks), they are also subject to other and different risks. Mortgage-backed and other asset-backed securities are subject to changes in the payment patterns of borrowers of the underlying debt, potentially increasing the volatility of the securities and the fund’s net asset value. When interest rates fall, borrowers are more likely to refinance or prepay their debt before its stated maturity. This may result in the fund having to reinvest the proceeds in lower yielding securities, effectively reducing the fund’s income. Conversely, if interest rates rise and borrowers repay their debt more slowly than expected, the time in which the mortgage-backed and other asset-backed securities are paid off could be extended, reducing the fund’s cash available for reinvestment in higher yielding securities. Mortgage-backed securities are also subject to the risk that underlying borrowers will be unable to meet their obligations and the value of property that secures the mortgages may decline in value and be insufficient, upon foreclosure, to repay the associated loans. Investments in asset-backed securities are subject to similar risks, as well as additional risks associated with the assets underlying those securities.
Investing in securities backed by the U.S. government — Securities backed by the U.S. Treasury or the full faith and credit of the U.S. government are guaranteed only as to the timely payment of interest and principal when held to maturity. Accordingly, the current market values for these securities will fluctuate with changes in interest rates and the credit rating of the U.S. government. Securities issued by U.S. government-sponsored entities and federal agencies and instrumentalities that are not backed by the full faith and credit of the U.S. government are neither issued nor guaranteed by the U.S. government.
Capital Group Private Client Services Funds / Prospectus 20
The following are additional risks associated with investing in the funds.
Exposure to country, region, industry or sector — Subject to the fund’s investment limitations, the fund may have significant exposure to a particular country, region, industry or sector. Such exposure may cause the fund to be more impacted by risks relating to and developments affecting the country, region, industry or sector, and thus its net asset value may be more volatile, than a fund without such levels of exposure. For example, if the fund has significant exposure in a particular country, then social, economic, regulatory or other issues that negatively affect that country may have a greater impact on the fund than on a fund that is more geographically diversified.
Large shareholder transactions risk — The fund may experience adverse effects when large shareholders purchase or redeem large amounts of shares of the fund. Such large shareholder redemptions may cause the fund to sell portfolio securities at times when it would not otherwise do so, which may negatively impact the fund’s net asset value and liquidity. Similarly, large fund share purchases may adversely affect the fund’s performance to the extent that the fund is delayed in investing new cash and is required to maintain a larger cash position than it ordinarily would. These transactions may also accelerate the realization of taxable income to shareholders if such sales of investments resulted in gains, and may also increase transaction costs. In addition, a large redemption could result in the fund’s current expenses being allocated over a smaller asset base, leading to an increase in the fund’s expense ratio.
Investing in derivatives — The use of derivatives involves a variety of risks, which may be different from, or greater than, the risks associated with investing in traditional securities, such as stocks and bonds. Changes in the value of a derivative may not correlate perfectly with, and may be more sensitive to market events than, the underlying asset, rate or index, and a derivative instrument may expose the fund to losses in excess of its initial investment. Derivatives may be difficult to value, difficult for the fund to buy or sell at an opportune time or price and difficult, or even impossible, to terminate or otherwise offset. The fund’s use of derivatives may result in losses to the fund, and investing in derivatives may reduce the fund’s returns and increase the fund’s price volatility. The fund’s counterparty to a derivative transaction (including, if applicable, the fund’s clearing broker, the derivatives exchange or the clearinghouse) may be unable or unwilling to honor its financial obligations in respect of the transaction. In certain cases, the fund may be hindered or delayed in exercising remedies against or closing out derivative instruments with a counterparty, which may result in additional losses.
Capital Group Core Bond Fund
Investing in inflation-linked bonds — The values of inflation-linked bonds generally fluctuate in response to changes in real interest rates — i.e., rates of interest after factoring in inflation. A rise in real interest rates may cause the prices of inflation-linked securities to fall, while a decline in real interest rates may cause the prices to increase. Inflation-linked bonds may experience greater losses than other debt securities with similar durations when real interest rates rise faster than nominal interest rates. There can be no assurance that the value of an inflation-linked security will be directly correlated to changes in interest rates; for example, if interest rates rise for reasons other than inflation, the increase may not be reflected in the security’s inflation measure.
Investing in inflation-linked bonds may also reduce the fund’s distributable income during periods of deflation. If prices for goods and services decline throughout the economy, the principal and income on inflation-linked securities may decline and result in losses to the fund.
Investing outside the United States — Securities of issuers domiciled outside the United States, or with significant operations or revenues outside the United States, may lose value because of adverse political, social, economic or market developments (including social instability, regional conflicts, terrorism and war) in the countries or regions in which the issuers operate or generate revenue. These securities may also lose value due to changes in foreign currency exchange rates against the U.S. dollar and/or currencies of other countries. Issuers of these securities may be more susceptible to actions of foreign governments, such as nationalization, currency blockage or the imposition of price controls or punitive taxes, each of which could adversely impact the value of these securities. Securities markets in certain countries may be more volatile and/or less liquid than those in the United States. Investments outside the United States may also be subject to different accounting and auditing practices and standards and different regulatory, legal and reporting requirements, and may be more difficult to value, than those in the United States. In addition, the value of investments outside the United States may be reduced by foreign taxes, including foreign withholding taxes on interest and dividends. Further, there may be increased risks of delayed settlement of securities purchased or sold by the fund. The risks of investing outside the United States may be heightened in connection with investments in emerging markets.
21 Capital Group Private Client Services Funds / Prospectus
In addition to the principal investment strategies described above, the funds have other investment practices that are described in the statement of additional information, which includes a description of other risks related to the funds’ principal investment strategies and other investment practices. Each fund’s investment results will depend on the ability of the fund’s investment adviser to navigate the risks discussed above as well as those described in the statement of additional information.
Fund comparative indexes The investment results tables in this prospectus show how the fund’s average annual total returns compare with various broad measures of market results.
The Bloomberg Municipal Short-Intermediate 1-10 Years Index is a market-value-weighted index that includes investment grade tax-exempt bonds with maturities of one to 10 years. This index is unmanaged, and its results include reinvested distributions but do not reflect the effect of commissions, account fees, expenses or U.S. federal income taxes. The Lipper Short-Intermediate Municipal Debt Funds Average is composed of funds that invest in municipal debt issues with dollar-weighted average maturities of one to five years. The results of the underlying funds in the average include reinvestment of dividends and capital gain distributions, as well as brokerage commissions paid by the funds for portfolio transactions and other fund expenses, but do not reflect the effect of sales charges, account fees or U.S. federal income taxes.
The Bloomberg Municipal Short 1–5 Years Index is a market-value-weighted index that includes investment-grade tax-exempt bonds with maturities of one to five years. This index is unmanaged, and its results include reinvested distributions but do not reflect the effect of commissions, account fees, expenses or U.S. federal income taxes. The Lipper Short Municipal Debt Funds Average is composed of funds that invest in municipal debt issues with dollar-weighted average maturities of less than three years. The results of the underlying funds in the average include reinvestment of dividends and capital gain distributions, as well as brokerage commissions paid by the funds for portfolio transactions and other fund expenses, but do not reflect the effect of sales charges, account fees or U.S. federal income taxes.
The Bloomberg California Short-Intermediate Municipal Index is a market-value-weighted index that includes only investment-grade tax-exempt bonds that are issued from California with maturities of one to 10 years. This index is unmanaged, and its results include reinvested distributions but do not reflect the effect of commissions, account fees, expenses or U.S. federal income taxes. The Lipper California Short-Intermediate Municipal Debt Funds Average is composed of funds that limit their assets to those securities that provide income that is exempt from taxation in California, with dollar-weighted average maturities of one to five years. The results of the underlying funds in the average include reinvestment of dividends and capital gain distributions, as well as brokerage commissions paid by the funds for portfolio transactions and other fund expenses, but do not reflect the effect of sales charges, account fees or U.S. federal income taxes.
The Bloomberg California Short Municipal Index is a market value-weighted index that includes only investment-grade tax-exempt bonds that are issued from California and with maturities of one to five years. This index is unmanaged and its results include reinvested distributions but do not reflect the effect of commissions, account fees, expenses or U.S. federal income taxes. The Lipper Short Municipal Debt Funds Average is composed of funds that invest in municipal debt issues with dollar-weighted average maturities of less than three years. The results of the underlying funds in the average include reinvestment of dividends and capital gain distributions, as well as brokerage commissions paid by the funds for portfolio transactions and other fund expenses, but do not reflect the effect of sales charges, account fees or U.S. federal income taxes.
The Bloomberg Intermediate A+ U.S. Government/Credit Index is a market-value-weighted index that tracks the total return of fixed-rate, publicly placed, dollar denominated obligations issued by the U.S. Treasury, U.S. government agencies and quasi-federal corporations, corporate or foreign debt guaranteed by the U.S. government, and U.S. corporate and foreign debentures and secured notes that meet specified maturity, liquidity and quality requirements, with maturities of one to 10 years, excluding BBB-rated securities. This index is unmanaged and its results include reinvested distributions but do not reflect the effect of account fees, expenses or U.S. federal income taxes. The Lipper Short-Intermediate Investment Grade Debt Funds Average is composed of funds that invest primarily in investment-grade debt issues (rated in the top four grades) with dollar-weighted average maturities of one to five years. The results of the underlying funds in the average include the reinvestment of dividends and capital gain distributions, as well as brokerage commissions paid by the funds for portfolio transactions and other fund expenses, but do not reflect the effect of sales charges, account fees or U.S. federal income taxes.
Fund results All fund results in this prospectus reflect the reinvestment of dividends and capital gain distributions, if any. Unless otherwise noted, fund results reflect any fee waivers and/or expense reimbursements in effect during the periods presented.
Portfolio holdings Portfolio holdings information for each fund is available at capitalgrouppcsfunds.com. A description of the funds’ policies and procedures regarding disclosure of information about its portfolio holdings is available in the statement of additional information.
Capital Group Private Client Services Funds / Prospectus 22
Management and organization
Investment adviser On July 1, 2019, the investment adviser of the funds changed from Capital Guardian Trust Company (“CGTC”) to Capital Research and Management Company (“CRMC”), an affiliate of CGTC. Accordingly, CRMC has assumed CGTC’s duties and obligations as investment adviser. Importantly, there has not been a change in the actual control or management of the funds’ investment adviser, and this change did not require shareholder approval.
Capital Research and Management Company, an experienced investment management organization founded in 1931, serves as the investment adviser to the funds and other funds, including the American Funds. Capital Research and Management Company is a wholly owned subsidiary of The Capital Group Companies, Inc. and is located at 333 South Hope Street, Los Angeles, California 90071. Capital Research and Management Company manages the investment portfolio and business affairs of the funds.
The management fees for each fund are based on the daily net assets of the fund. The total management fee paid by each fund to its investment adviser for the most recent fiscal year, as a percentage of average net assets, appears in the Annual Fund Operating Expenses tables under “Fees and expenses of the fund.”
A more detailed description of the Investment Advisory and Service Agreement between the funds and the investment adviser is included in the funds’ statement of additional information, and a discussion regarding the basis for approval by the funds’ board of trustees is contained in the funds’ semi-annual report to shareholders for the period ended April 30, 2021.
Capital Research and Management Company manages equity assets through three equity investment divisions and fixed income assets through its fixed income investment division, Capital Fixed Income Investors. The three equity investment divisions — Capital International Investors, Capital Research Global Investors and Capital World Investors — make investment decisions independently of one another.
The equity investment divisions may, in the future, be incorporated as wholly owned subsidiaries of Capital Research and Management Company. In that event, Capital Research and Management Company would continue to be the investment adviser, and day-to-day investment management of equity assets would continue to be carried out through one or more of these subsidiaries. Although not currently contemplated, Capital Research and Management Company could incorporate its fixed income investment division in the future and engage it to provide day-to-day investment management of fixed income assets. Capital Research and Management Company and each of the funds it advises have received an exemptive order from the U.S. Securities and Exchange Commission that allows Capital Research and Management Company to use, upon approval of the fund’s board, its management subsidiaries and affiliates to provide day-to-day investment management services to the fund, including making changes to the management subsidiaries and affiliates providing such services. Each fund’s shareholders have approved this arrangement; however, there is no assurance that Capital Research and Management Company will incorporate its investment divisions or exercise any authority granted to it under the exemptive order.
23 Capital Group Private Client Services Funds / Prospectus
The Capital SystemSM Capital Research and Management Company uses a system of multiple portfolio managers in managing mutual fund assets. Under this approach, the portfolio of a fund is divided into segments managed by individual managers. In addition, Capital Research and Management Company's investment analysts may make investment decisions with respect to a portion of a fund's portfolio. Investment decisions are subject to a fund’s objective(s), policies and restrictions and the oversight of the appropriate investment-related committees of Capital Research and Management Company and its investment divisions. Notwithstanding the Capital System, certain of the funds are currently managed by one portfolio manager.
Certain senior members of Capital Fixed Income Investors, the investment adviser’s fixed income investment division, serve on the Portfolio Strategy Group. The group utilizes a research-driven process with input from the investment adviser’s analysts, portfolio managers and economists to define investment themes on a range of macroeconomic factors, including duration, yield curve and sector allocation. The investment decisions made by the portfolio managers of the funds are informed by the investment themes discussed by the group.
The table below shows the investment experience and role in management of the funds for each of the fund’s primary portfolio managers.
| | | | |
| Portfolio manager | Investment
experience | Experience
in this fund | Role in
management
of the funds |
| Aaron Applebaum | Investment professional for
21 years in total; 14 years with
Capital Research and Management Company or affiliate | | Serves as a fixed income portfolio manager |
| Capital Group Core Municipal Fund | 5 years |
| Capital Group Short-Term Municipal Fund | 5 years |
| Mark Marinella | Investment professional for
36 years in total; 9 years with
Capital Research and Management Company or affiliate | | Serves as a fixed income portfolio manager |
| Capital Group Core Municipal Fund | 5 years |
| Capital Group Short-Term Municipal Fund | 5 years |
Capital Group California Core
Municipal Fund | 5 years |
| Capital Group California Short-Term Municipal Fund | 5 years |
| John R. Queen | Investment professional for
32 years in total; 20 years with
Capital Research and Management Company or affiliate | | Serves as a fixed income portfolio manager |
| Capital Group Core Bond Fund | 12 years |
| |
Information regarding the portfolio managers’ compensation, their ownership of securities in the funds and other accounts they manage is in the statement of additional information.
Capital Group Private Client Services Funds / Prospectus 24
Purchase, exchange and sale of shares
Each of the municipal bond funds reserves the right not to make its shares available to tax-deferred retirement plans and accounts. Capital Group California Core Municipal Fund and Capital Group California Short-Term Municipal Fund are intended primarily for taxable residents of California and may not be appropriate for residents of other states and tax-exempt entities. Capital Group California Core Municipal Fund and Capital Group California Short-Term Municipal Fund are qualified for sale only in California and other jurisdictions that do not require qualification.
The fund’s transfer agent, on behalf of the fund and American Funds Distributors,® the fund’s distributor, is required by law to obtain certain personal information from you or any other person(s) acting on your behalf in order to verify your or such person’s identity. If you do not provide the information, the transfer agent may not be able to open your account. If the transfer agent is unable to verify your identity or that of any other person(s) authorized to act on your behalf, or believes it has identified potentially criminal activity, the applicable fund and American Funds Distributors reserve the right to close your account or take such other action they deem reasonable or required by law.
Valuing shares The net asset value of the fund is the value of a single share of the fund. The net asset value per share is calculated once daily as of the close of regular trading on the New York Stock Exchange, normally 4 p.m. New York time, each day the New York Stock Exchange is open. If the New York Stock Exchange makes a scheduled (e.g. the day after Thanksgiving) or an unscheduled close prior to 4 p.m. New York time, the net asset value of the fund will be determined at approximately the time the New York Stock Exchange closes on that day. If on such a day market quotations and prices from third-party pricing services are not based as of the time of the early close of the New York Stock Exchange but are as of a later time (up to approximately 4 p.m. New York time), for example because the market remains open after the close of the New York Stock Exchange, those later market quotations and prices will be used in determining the fund’s net asset value.
Equity securities are valued primarily on the basis of market quotations, and debt securities are valued primarily on the basis of prices from third-party pricing services. Futures contracts are valued primarily on the basis of settlement prices. The fund has adopted procedures for making fair value determinations if market quotations or prices from third-party pricing services, as applicable, are not readily available or are not considered reliable. For example, if events occur between the close of markets outside the United States and the close of regular trading on the New York Stock Exchange that, in the opinion of the investment adviser, materially affect the value of any of the fund’s equity securities that trade principally in those international markets, those securities will be valued in accordance with fair value procedures. Similarly, fair value procedures may be employed if an issuer defaults on its debt securities and there is no market for its securities. Use of these procedures is intended to result in more appropriate net asset values and, where applicable, to reduce potential arbitrage opportunities otherwise available to short-term investors.
Because the fund may hold securities that are listed primarily on foreign exchanges that trade on weekends or days when the fund does not price its shares, the values of securities held in the fund may change on days when you will not be able to purchase or redeem fund shares.
Your shares will be purchased at the net asset value or sold at the net asset value next determined after American Funds Service Company receives your request, provided that your request contains all information and legal documentation necessary to process the transaction. Orders in good order received after the New York Stock Exchange closes (scheduled or unscheduled) will be processed at the net asset value (plus any applicable sales charge) calculated on the following business day.
Purchase of shares Shares of the fund may generally be purchased only by investors who have entered into an Investment Management Agreement with Capital Group Private Client Services, Inc. (“CGPCS”). CGPCS receives an annual fee based on a percentage of a client’s investment in the fund under management by CGPCS pursuant to an investment management agreement. You should read carefully the disclosures provided to you by CGPCS regarding the fees. The disclosures include information about the fees charged to you and paid to CGPCS for the services it provides. Certain investors who are not clients of CGPCS may purchase the fund, as described in the statement of additional information. Investors who wish to purchase, exchange, or sell shares should contact their CGPCS investment counselor or call (866) 421-2166. Alternatively, you may contact the fund’s transfer agent at (800) 421-4996 to purchase shares.
Investors may be eligible to purchase shares of the fund with securities in which the fund is authorized to invest, subject to procedures approved by the board of trustees of the fund.
Purchase minimums and maximums The purchase minimums described in this prospectus may be waived in certain cases.
Exchange Generally, you may exchange your shares for shares of another fund in the Capital Group Private Client Services Funds or for shares of Capital Group U.S. Equity Fund. Investors who wish to exchange shares should contact their Capital Group Private Client Services investment counselor or call (866) 421-2166. Alternatively, you may contact the fund’s transfer agent at (800) 421-4996 to exchange shares.
Exchanges have the same tax consequences as ordinary sales and purchases. For example, to the extent you exchange shares held in a taxable account that are worth more now than what you paid for them, the gain will be subject to taxation.
25 Capital Group Private Client Services Funds / Prospectus
How to sell shares
Investors who wish to sell (redeem) shares should contact their Capital Group Private Client Services investment counselor or call (866) 421-2166. Alternatively, you may contact the fund’s transfer agent at (800) 421-4996 to sell (redeem) shares.
A signature guarantee is required if the redemption is:
· more than $125,000;
· made payable to someone other than the registered shareholder(s); or
· sent to an address other than the address of record or to an address of record that has been changed within the previous 10 days.
The signature guarantee requirement may be waived if Capital Group Private Client Services determines it is appropriate. In addition to the situations described above, Capital Group Private Client Services and/or the fund’s transfer agent reserve the right to require a signature guarantee(s) in other instances based on the circumstances relative to the particular situation. Additional documentation may be required for redemptions of shares held in corporate, partnership or fiduciary accounts.
For all accounts, checks must be made payable to the registered shareholder and must be mailed to an address of record that has been used with the account for at least 10 days, unless you obtain a signature guarantee for the redemption.
The fund typically expects to remit redemption proceeds one business day following receipt and acceptance of a redemption order, regardless of the method the fund uses to make such payment (e.g., check, wire or automated clearing house transfer). However, payment may take longer than one business day and may take up to seven days as generally permitted by the Investment Company Act of 1940, as amended (the “1940 Act”). Under the 1940 Act, the fund may be permitted to pay redemption proceeds beyond seven days under certain limited circumstances. In addition, if you recently purchased shares and subsequently request a redemption of those shares, the fund will pay the available redemption proceeds once a sufficient period of time has passed to reasonably ensure that checks or drafts, including certified or cashier’s checks, for the shares purchased have cleared (normally seven business days from the purchase date).
Under normal conditions, the fund typically expects to meet shareholder redemptions by monitoring fund portfolios and redemption activities and by regularly holding a reserve of highly liquid assets, such as cash or cash equivalents. The fund may use additional methods to meet shareholder redemptions, if they become necessary. These methods may include, but are not limited to, the sale of portfolio assets, the use of overdraft protection afforded by the fund’s custodian bank, borrowing from a line of credit or from other funds advised by the investment adviser or its affiliates, and making payment with fund securities or other fund assets rather than in cash (as further discussed in the following paragraph).
While payment of redemptions normally will be in cash, the fund’s agreement and declaration of trust permits payment of the redemption price wholly or partly with portfolio securities or other assets of the fund under conditions and circumstances determined by the fund’s board of trustees. On the same redemption date, some shareholders may be paid in whole or in part in securities (which may differ among those shareholders), while other shareholders may be paid entirely in cash. In general, in-kind redemptions to affiliated shareholders will as closely as practicable represent the affiliated shareholder’s pro rata share of the fund’s securities, subject to certain exceptions. Securities distributed in-kind to unaffiliated shareholders will be selected by the investment adviser in a manner the investment adviser deems to be fair and reasonable to the fund’s shareholders. The disposal of the securities received in-kind may be subject to brokerage costs and, until sold, such securities remain subject to market risk and liquidity risk, including the risk that such securities are or become difficult to sell. If the fund pays your redemption with illiquid or less liquid securities, you will bear the risk of not being able to sell such securities.
Transactions by telephone Generally, you are automatically eligible to redeem or exchange shares by telephone unless you notify Capital Group Private Client Services in writing that you do not want these services. You may reinstate these services at any time.
Unless you decide not to have telephone services on your account(s), you agree to hold each fund, American Funds Service Company, any of its affiliates or mutual funds managed by such affiliates, and each of their respective directors, trustees, officers, employees and agents harmless from any losses, expenses, costs or liabilities (including attorney fees) that may be incurred in connection with the exercise of these privileges, provided that American Funds Service Company employs reasonable procedures to confirm that the instructions received from any person with appropriate account information are genuine. If reasonable procedures are not employed, American Funds Service Company and/or the relevant fund may be liable for losses due to unauthorized or fraudulent instructions.
Capital Group Private Client Services Funds / Prospectus 26
Frequent trading of fund shares The fund and American Funds Distributors reserve the right to reject any purchase order for any reason. The fund is not designed to serve as a vehicle for frequent trading. Frequent trading of fund shares may lead to increased costs to the fund and less efficient management of the fund’s portfolio, potentially resulting in dilution of the value of the shares held by long-term shareholders. Accordingly, purchases, including those that are part of exchange activity, that the fund or American Funds Distributors have determined could involve actual or potential harm to the fund may be rejected.
The fund, through its transfer agent, American Funds Service Company, maintains surveillance procedures that are designed to detect frequent trading in fund shares. Under these procedures, various analytics are used to evaluate factors that may be indicative of frequent trading. For example, transactions in fund shares that exceed certain monetary thresholds may be scrutinized. American Funds Service Company also may review transactions that occur close in time to other transactions in the same account or in multiple accounts under common ownership or influence. Trading activity that is identified through these procedures or as a result of any other information available to the fund will be evaluated to determine whether such activity might constitute frequent trading. These procedures may be modified from time to time as appropriate to improve the detection of frequent trading, to facilitate monitoring for frequent trading in particular retirement plans or other accounts and to comply with applicable laws.
Under the fund’s frequent trading policy, certain trading activity will not be treated as frequent trading, such as:
· retirement plan contributions, loans and distributions (including hardship withdrawals) identified as such;
· purchase transactions involving in-kind transfers of shares of the fund, rollovers, Roth IRA conversions and IRA recharacterizations; and
· systematic redemptions and purchases.
Generally, purchases and redemptions will not be considered “systematic” unless the transaction is prescheduled for a specific date.
American Funds Service Company will work with certain intermediaries (such as investment dealers holding shareholder accounts in street name, retirement plan recordkeepers, insurance company separate accounts and bank trust companies) to apply their own procedures, provided that American Funds Service Company believes the intermediary’s procedures are reasonably designed to enforce the frequent trading policies of the fund. You should refer to disclosures provided by the intermediaries with which you have an account to determine the specific trading restrictions that apply to you.
If American Funds Service Company identifies any activity that may constitute frequent trading, it reserves the right to contact the intermediary and request that the intermediary either provide information regarding an account owner’s transactions or restrict the account owner’s trading. If American Funds Service Company is not satisfied that the intermediary has taken appropriate action, American Funds Service Company may terminate the intermediary’s ability to transact in fund shares.
There is no guarantee that all instances of frequent trading in fund shares will be prevented.
Notwithstanding the fund’s surveillance procedures described above, all transactions in fund shares remain subject to the right of the fund, American Funds Distributors and American Funds Service Company to restrict potentially abusive trading generally, including the types of transactions described above that will not be prevented. See the statement of additional information for more information about how American Funds Service Company may address other potentially abusive trading activity in the fund.
27 Capital Group Private Client Services Funds / Prospectus
Distributions and taxes
Dividends and distributions Each fund declares monthly dividends from net investment income and distribute the accrued dividends, which may fluctuate, to you each month.
Capital gains, if any, are usually distributed in December. When a capital gain is distributed, the net asset value per share is reduced by the amount of the payment.
You may elect to reinvest dividends and/or capital gain distributions to purchase additional shares of the fund or other Capital Group Private Client Services Funds, or you may elect to receive them in cash.
Taxes on dividends and distributions
Capital Group Core Municipal Fund
Capital Group Short-Term Municipal Fund
Capital Group California Core Municipal Fund
Capital Group California Short-Term Municipal Fund
Fund distributions of interest on municipal bonds are generally not subject to federal income tax. However, a fund may distribute taxable dividends, including distributions of short-term capital gains, which are subject to federal taxation as ordinary income. The fund’s distributions of net long-term capital gains are taxable as long-term capital gains.
Depending on their state of residence, shareholders of the fund may be able to exempt from state taxation some or all of the federally tax-exempt income dividends paid by the fund.
Capital Group California Core Municipal Fund and Capital Group California Short-Term Municipal Fund anticipate that the federally exempt interest dividends paid by the fund and derived from interest on bonds exempt from California income tax will also be exempt from California state income tax. To the extent a fund’s dividends are derived from interest on debt obligations that is not exempt from California income tax, however, such dividends will be subject to state income tax.
Moreover, any federally taxable dividends and capital gains distributions from the fund may also be subject to state tax.
Any taxable dividends or capital gain distributions you receive from the fund normally will be taxable to you when made, regardless of whether you reinvest dividends or capital gain distributions or receive them in cash.
Capital Group Core Bond Fund
For federal tax purposes, dividends and distributions of short-term capital gains are taxable as ordinary income. If you are an individual and meet certain holding period requirements with respect to your fund shares, you may be eligible for reduced tax rates on “qualified dividend income,” if any, distributed by the fund to you. The fund’s distributions of net long-term capital gains are taxable as long-term capital gains. Any dividends or capital gain distributions you receive from the fund will normally be taxable to you when made, regardless of whether you reinvest dividends or capital gain distributions or receive them in cash.
Dividends and capital gain distributions that are automatically reinvested in a tax-favored retirement account do not result in federal or state income tax at the time of reinvestment.
Applicable to all funds
Taxes on transactions Your redemptions, including exchanges, may result in a capital gain or loss for federal tax purposes. A capital gain or loss on your investment is the difference between the cost of your shares and the amount you receive when you sell them.
Exchanges within a tax-favored retirement plan account will not result in a capital gain or loss for federal or state income tax purposes. With limited exceptions, distributions from a retirement plan account are taxable as ordinary income.
Shareholder fees Fees borne directly by the fund normally have the effect of reducing a shareholder’s taxable income on distributions.
Please see your tax advisor for more information.
Fund expenses In periods of market volatility, assets of the fund may decline significantly, causing total annual fund operating expenses (as a percentage of the value of your investment) to become higher than the numbers shown in the Annual Fund Operating Expenses tables in this prospectus.
The “Other expenses” items in the Annual Fund Operating Expenses tables for the funds include custodial, legal, transfer agent and various other expenses.
Capital Group Private Client Services Funds / Prospectus 28
Financial highlights The Financial Highlights tables are intended to help you understand each fund’s results for the period shown. Certain information reflects financial results for a single share. The total returns in the tables represent the rate that an investor would have earned or lost on an investment in each fund (assuming reinvestment of all dividends and capital gain distributions). Where indicated, figures in the tables reflect the impact, if any, of certain reimbursements from the funds‘ investment adviser. For more information about these reimbursements, see the fund’s statement of additional information and annual report. The information in the Financial Highlights table for the fiscal years ended October 31, 2018, 2019, 2020 and 2021, has been audited by PricewaterhouseCoopers LLP, whose current report, along with each fund’s financial statements, is included in the statement of additional information, which is available upon request. The information in the Financial Highlights table for the fiscal year ended October 31, 2017, has been audited by other auditors.
| | | | | | | | | | | | | | | | | | | | | | | | | | | | | | | | | | | | | | | |
| | | Income (loss) from investment operations1 | Dividends and distributions | | | | | | |
| Year ended | Net asset
value,
beginning
of year | Net
investment
income | Net (losses)
gains on
securities (both
realized and
unrealized) | Total from
investment
operations | Dividends
(from net
investment
income) | Distributions
(from capital
gains) | Total
dividends
and
distributions | Net asset
value, end
of year | Total
return2 | Net assets,
end of year
(in millions) | Ratio of
expenses to
average net
assets before
reimburse-ments3 | Ratio of
expenses to
average net
assets after
reimburse-ments2,3 | Ratio of
net income
to average
net assets2 |
| Capital Group Core Municipal Fund |
| 10/31/2021 | $10.76 | | $.13 | | $(.02 | ) | $.11 | | $(.13 | ) | $(.12 | ) | $(.25 | ) | $10.62 | | .99 | % | $785 | | .28 | % | .28 | % | 1.20 | % |
| 10/31/2020 | 10.55 | | .18 | | .22 | | .40 | | (.18 | ) | (.01 | ) | (.19 | ) | 10.76 | | 3.87 | | 652 | | .28 | | .28 | | 1.70 | |
| 10/31/2019 | 10.15 | | .22 | | .40 | | .62 | | (.22 | ) | — | | (.22 | ) | 10.55 | | 6.15 | | 584 | | .28 | | .28 | | 2.11 | |
| 10/31/2018 | 10.41 | | .21 | | (.26 | ) | (.05 | ) | (.19 | ) | (.02 | ) | (.21 | ) | 10.15 | | (.32 | ) | 474 | | .27 | | .27 | | 2.04 | |
| 10/31/2017 | 10.48 | | .21 | | (.07 | ) | .14 | | (.21 | ) | — | 4 | (.21 | ) | 10.41 | | 1.39 | | 442 | | .35 | | .34 | | 2.02 | |
| Capital Group Short-Term Municipal Fund |
| 10/31/2021 | $10.33 | | $.09 | | $(.04 | ) | $.05 | | $(.09 | ) | $(.03 | ) | $(.12 | ) | $10.26 | | .43 | % | $203 | | .31 | % | .30 | % | .87 | % |
| 10/31/2020 | 10.15 | | .14 | | .18 | | .32 | | (.14 | ) | — | | (.14 | ) | 10.33 | | 3.16 | | 208 | | .32 | | .30 | | 1.36 | |
| 10/31/2019 | 9.93 | | .19 | | .22 | | .41 | | (.19 | ) | — | | (.19 | ) | 10.15 | | 4.19 | | 127 | | .35 | | .30 | | 1.92 | |
| 10/31/2018 | 10.09 | | .17 | | (.18 | ) | (.01 | ) | (.15 | ) | — | | (.15 | ) | 9.93 | | .05 | | 138 | | .32 | | .30 | | 1.67 | |
| 10/31/2017 | 10.11 | | .14 | | (.02 | ) | .12 | | (.14 | ) | — | 4 | (.14 | ) | 10.09 | | 1.26 | | 150 | | .41 | | .35 | | 1.42 | |
| Capital Group California Core Municipal Fund |
| 10/31/2021 | $10.90 | | $.13 | | $(.08 | ) | $.05 | | $(.11 | ) | $(.09 | ) | $(.20 | ) | $10.75 | | .53 | % | $664 | | .27 | % | .27 | % | 1.17 | % |
| 10/31/2020 | 10.73 | | .17 | | .18 | | .35 | | (.17 | ) | (.01 | ) | (.18 | ) | 10.90 | | 3.29 | | 627 | | .28 | | .28 | | 1.55 | |
| 10/31/2019 | 10.34 | | .20 | | .40 | | .60 | | (.20 | ) | (.01 | ) | (.21 | ) | 10.73 | | 5.84 | | 557 | | .28 | | .28 | | 1.89 | |
| 10/31/2018 | 10.57 | | .19 | | (.23 | ) | (.04 | ) | (.18 | ) | (.01 | ) | (.19 | ) | 10.34 | | (.27 | ) | 452 | | .27 | | .27 | | 1.85 | |
| 10/31/2017 | 10.69 | | .20 | | (.11 | ) | .09 | | (.20 | ) | (.01 | ) | (.21 | ) | 10.57 | | .84 | | 388 | | .35 | | .34 | | 1.88 | |
| Capital Group California Short-Term Municipal Fund |
| 10/31/2021 | $10.39 | | $.08 | | $(.07 | ) | $.01 | | $(.08 | ) | $(.03 | ) | $(.11 | ) | $10.29 | | .12 | % | $182 | | .29 | % | .29 | % | .76 | % |
| 10/31/2020 | 10.28 | | .12 | | .11 | | .23 | | (.12 | ) | — | | (.12 | ) | 10.39 | | 2.26 | | 199 | | .30 | | .30 | | 1.16 | |
| 10/31/2019 | 10.06 | | .15 | | .22 | | .37 | | (.15 | ) | — | | (.15 | ) | 10.28 | | 3.55 | | 164 | | .32 | | .30 | | 1.46 | |
| 10/31/2018 | 10.21 | | .13 | | (.15 | ) | (.02 | ) | (.12 | ) | (.01 | ) | (.13 | ) | 10.06 | | (.07 | ) | 129 | | .31 | | .30 | | 1.28 | |
| 10/31/2017 | 10.23 | | .11 | | (.02 | ) | .09 | | (.11 | ) | — | 4 | (.11 | ) | 10.21 | | .97 | | 120 | | .42 | | .35 | | 1.11 | |
| Capital Group Core Bond Fund |
| 10/31/2021 | $10.70 | | $.14 | | $(.20 | ) | $(.06 | ) | $(.15 | ) | $(.25 | ) | $(.40 | ) | $10.24 | | (.60 | )% | $640 | | .28 | % | .28 | % | 1.36 | % |
| 10/31/2020 | 10.31 | | .18 | | .46 | | .64 | | (.19 | ) | (.06 | ) | (.25 | ) | 10.70 | | 6.28 | | 564 | | .28 | | .28 | | 1.73 | |
| 10/31/2019 | 9.82 | | .23 | | .48 | | .71 | | (.22 | ) | — | | (.22 | ) | 10.31 | | 7.33 | | 477 | | .28 | | .28 | | 2.24 | |
| 10/31/2018 | 10.14 | | .21 | | (.34 | ) | (.13 | ) | (.19 | ) | — | | (.19 | ) | 9.82 | | (1.14 | ) | 446 | | .28 | | .28 | | 2.08 | |
| 10/31/2017 | 10.31 | | .16 | | (.12 | ) | .04 | | (.16 | ) | (.05 | ) | (.21 | ) | 10.14 | | .41 | | 416 | | .35 | | .34 | | 1.58 | |
29 Capital Group Private Client Services Funds / Prospectus
| | | | | | |
| | Year ended October 31, |
Portfolio turnover rate for all share classes,
excluding mortgage dollar roll transactions5 | 2021 | 2020 | 2019 | 2018 | 2017 |
| Capital Group Core Bond Fund | 48% | 80% | 114% | 41% | 52% |
| | | | | | |
| | Year ended October 31, |
Portfolio turnover rate for all share classes,
including mortgage dollar roll transactions5 | 2021 | 2020 | 2019 | 2018 | 2017 |
| Capital Group Core Municipal Fund | 48% | 62% | 38% | 55% | 47% |
| Capital Group Short-Term Municipal Fund | 51 | 58 | 50 | 70 | 42 |
| Capital Group California Core Municipal Fund | 38 | 37 | 22 | 69 | 27 |
| Capital Group California Short-Term Municipal Fund | 43 | 42 | 39 | 65 | 36 |
| Capital Group Core Bond Fund | 217 | 158 | 151 | 110 | 95 |
1 Based on average shares outstanding.
2 This column reflects the impact, if any, of miscellaneous fee reimbursements by Capital Research and Management Company.
3 Ratios do not include expenses of any Central Funds. The fund indirectly bears its proportionate share of the expenses of any Central Funds, if applicable.
4 Amount less than $.01.
5 Rates do not include the fund’s portfolio activity with respect to any Central Funds, if applicable.
Capital Group Private Client Services Funds / Prospectus 30
| | | | |
| | | | |
| | More information about the funds | |
| | For shareholder services | American Funds Service Company (800) 421-4996 | |
| | Telephone calls you have with shareholder services may be monitored or recorded for quality assurance, verification and recordkeeping purposes. By speaking to shareholder services on the telephone, you consent to such monitoring and recording. | |
Annual/Semi-annual report to shareholders The shareholder reports contain additional information about the fund, including financial statements, investment results, portfolio holdings, a discussion of market conditions and the fund’s investment strategies, and the independent registered public accounting firm’s reports (in the annual report).
Statement of additional information (SAI) and codes of ethics The current SAI, as amended from time to time, contains more detailed information about the fund, including the fund’s financial statements, and is incorporated by reference into this prospectus. This means that the current SAI, for legal purposes, is part of this prospectus. The codes of ethics describe the personal investing policies adopted by the fund, the fund’s investment adviser and its affiliated companies.
The codes of ethics and current SAI are on file with the U.S. Securities and Exchange Commission (SEC). These and other related materials about the fund are available for review on the EDGAR database on the SEC’s website at sec.gov or, after payment of a duplicating fee, via email request to publicinfo@sec.gov.
For a complimentary copy of the current SAI, codes of ethics or annual/semi-annual report, or to request other information about the fund or make shareholder inquiries, please visit capitalgrouppcsfunds.com, call (800) 421-4996 or write to the secretary of the fund at 6455 Irvine Center Drive, Irvine, California 92618.
Securities Investor Protection Corporation (SIPC) Shareholders may obtain information about SIPC® on its website at sipc.org or by calling (202) 371-8300.
| | |
| |
| |
| |
 | MFGEPRX-380-0122P Printed in USA CGD/AFD/10210
Litho in USA CGD/AFD/10210
Investment Company File No. 811-22349 |
| |
The Bond Fund of America®
Part B
Statement of Additional Information
March 1, 2022
This document is not a prospectus but should be read in conjunction with the current prospectus of The Bond Fund of America (the “fund”) dated March 1, 2022. You may obtain a prospectus from your financial professional, by calling American Funds Service Company® at (800) 421-4225 or by writing to the fund at the following address:
The Bond Fund of America
Attention: Secretary
333 South Hope Street
Los Angeles, California 90071
Certain privileges and/or services described below may not be available to all shareholders (including shareholders who purchase shares at net asset value through eligible retirement plans) depending on the shareholder’s investment dealer or retirement plan recordkeeper. Please see your financial professional, investment dealer, plan recordkeeper or employer for more information.
| | | | | | |
Class A | ABNDX | Class 529-A | CFAAX | Class R-1 | RBFAX |
Class C | BFACX | Class 529-C | CFACX | Class R-2 | RBFBX |
Class T | TBFFX | Class 529-E | CFAEX | Class R-2E | RBEBX |
Class F-1 | BFAFX | Class 529-T | TFBFX | Class R-3 | RBFCX |
Class F-2 | ABNFX | Class 529-F-1 | CFAFX | Class R-4 | RBFEX |
Class F-3 | BFFAX | Class 529-F-2 | FFBOX | Class R-5E | RBFHX |
| | | Class 529-F-3 | FBOFX | Class R-5 | RBFFX |
| | | | | Class R-6 | RBFGX |
Table of Contents
| | |
Certain investment limitations and guidelines | 2 |
Description of certain securities, investment techniques and risks | 3 |
Fund policies | 31 |
Management of the fund | 33 |
Execution of portfolio transactions | 62 |
Disclosure of portfolio holdings | 66 |
Price of shares | 68 |
Taxes and distributions | 71 |
Purchase and exchange of shares | 74 |
Sales charges | 79 |
Sales charge reductions and waivers | 82 |
Selling shares | 87 |
Shareholder account services and privileges | 88 |
General information | 91 |
Appendix | 101 |
Investment portfolio
Financial statements
The Bond Fund of America — Page 1
Certain investment limitations and guidelines
The following limitations and guidelines are considered at the time of purchase, under normal circumstances, and are based on a percentage of the fund’s net assets unless otherwise noted. This summary is not intended to reflect all of the fund’s investment limitations.
· The fund will invest at least 80% of its assets in bonds and other debt instruments, including cash equivalents and certain preferred securities. For purposes of this investment guideline, investments may be represented by derivative instruments, such as futures contracts and swap agreements.
· The fund will invest at least 60% of its assets in debt securities rated A3 or better or A- or better by Nationally Recognized Statistical Rating Organizations, or NRSROs, designated by the fund’s investment adviser or unrated but determined to be of equivalent quality by the fund’s investment adviser, and in U.S. government securities, money market instruments, cash or cash equivalents. The fund currently intends to look to the ratings from Moody’s Investors Service, Standard & Poor’s Ratings Services and Fitch Ratings. If rating agencies differ, securities will be considered to have received the highest of these ratings, consistent with the fund’s investment policies.
· The fund may invest up to 40% of its assets in debt securities rated below A3 and below A- by NRSROs designated by the fund’s investment adviser or unrated but determined to be of equivalent quality by the fund’s investment adviser.
· The fund may invest up to 10% of its assets in debt securities rated Ba1 or below and BB+ or below by NRSROs designated by the fund’s investment adviser or unrated but determined to be of equivalent quality by the fund’s investment adviser.
· While the fund may not make direct purchases of common stocks or warrants or rights to acquire common stocks, the fund may invest in debt securities that are issued together with common stock or other equity interests or in securities that have equity conversion, exchange or purchase rights. The fund may hold up to 5% of its assets in common stock, warrants and rights acquired after sales of the corresponding debt securities or received in exchange for debt securities.
· In determining the domicile of an issuer, the fund’s investment adviser will generally look to the domicile determination of a leading provider of global indexes, such as Morgan Stanley Capital International. However, the adviser in its discretion also may take into account such factors as where the issuer’s securities are listed and where the issuer is legally organized, maintains principal corporate offices, conducts its principal operations, generates revenues and/or has credit risk exposure.
* * * * * *
The fund may experience difficulty liquidating certain portfolio securities during significant market declines or periods of heavy redemptions.
The Bond Fund of America — Page 2
Description of certain securities, investment techniques and risks
The descriptions below are intended to supplement the material in the prospectus under “Investment objective, strategies and risks.”
Market conditions – The value of, and the income generated by, the securities in which the fund invests may decline, sometimes rapidly or unpredictably, due to factors affecting certain issuers, particular industries or sectors, or the overall markets. Rapid or unexpected changes in market conditions could cause the fund to liquidate its holdings at inopportune times or at a loss or depressed value. The value of a particular holding may decrease due to developments related to that issuer, but also due to general market conditions, including real or perceived economic developments such as changes in interest rates, credit quality, inflation, or currency rates, or generally adverse investor sentiment. The value of a holding may also decline due to factors that negatively affect a particular industry or sector, such as labor shortages, increased production costs, or competitive conditions.
Global economies and financial markets are highly interconnected, and conditions and events in one country, region or financial market may adversely impact issuers in a different country, region or financial market. Furthermore, local, regional and global events such as war, acts of terrorism, social unrest, natural disasters, the spread of infectious illness or other public health threats could also adversely impact issuers, markets and economies, including in ways that cannot necessarily be foreseen. The fund could be negatively impacted if the value of a portfolio holding were harmed by such conditions or events.
Significant market disruptions, such as those caused by pandemics, natural or environmental disasters, war, acts of terrorism, or other events, can adversely affect local and global markets and normal market operations. Market disruptions may exacerbate political, social, and economic risks. Additionally, market disruptions may result in increased market volatility; regulatory trading halts; closure of domestic or foreign exchanges, markets, or governments; or market participants operating pursuant to business continuity plans for indeterminate periods of time. Such events can be highly disruptive to economies and markets and significantly impact individual companies, sectors, industries, markets, currencies, interest and inflation rates, credit ratings, investor sentiment, and other factors affecting the value of the fund’s investments and operation of the fund. These events could disrupt businesses that are integral to the fund’s operations or impair the ability of employees of fund service providers to perform essential tasks on behalf of the fund.
Governmental and quasi-governmental authorities may take a number of actions designed to support local and global economies and the financial markets in response to economic disruptions. Such actions may include a variety of significant fiscal and monetary policy changes, including, for example, direct capital infusions into companies, new monetary programs and significantly lower interest rates. These actions may result in significant expansion of public debt and may result in greater market risk. Additionally, an unexpected or quick reversal of these policies, or the ineffectiveness of these policies, could negatively impact overall investor sentiment and further increase volatility in securities markets.
Debt instruments — Debt securities, also known as “fixed income securities,” are used by issuers to borrow money. Bonds, notes, debentures, asset-backed securities (including those backed by mortgages), and loan participations and assignments are common types of debt securities. Generally, issuers pay investors periodic interest and repay the amount borrowed either periodically during the life of the security and/or at maturity. Some debt securities, such as zero coupon bonds, do not pay current interest, but are purchased at a discount from their face values and their values accrete over time to face value at maturity. Some debt securities bear interest at rates that are not fixed, but that vary with changes in specified market rates or indices. The market prices of debt securities fluctuate depending on such factors as interest rates, credit quality and maturity. In general, market prices of debt securities decline when interest rates rise and increase when interest rates fall. These fluctuations
The Bond Fund of America — Page 3
will generally be greater for longer-term debt securities than for shorter-term debt securities. Prices of these securities can also be affected by financial contracts held by the issuer or third parties (such as derivatives) relating to the security or other assets or indices. Borrowers that are in bankruptcy or restructuring may never pay off their indebtedness, or they may pay only a small fraction of the amount owed. Direct indebtedness of countries, particularly developing countries, also involves a risk that the governmental entities responsible for the repayment of the debt may be unable, or unwilling, to pay interest and repay principal when due.
Lower rated debt securities, rated Ba1/BB+ or below by Nationally Recognized Statistical Rating Organizations, are described by the rating agencies as speculative and involve greater risk of default or price changes due to changes in the issuer’s creditworthiness than higher rated debt securities, or they may already be in default. Such securities are sometimes referred to as “junk bonds” or high yield bonds. The market prices of these securities may fluctuate more than higher quality securities and may decline significantly in periods of general economic difficulty. It may be more difficult to dispose of, and to determine the value of, lower rated debt securities. Investment grade bonds in the ratings categories A or Baa/BBB also may be more susceptible to changes in market or economic conditions than bonds rated in the highest rating categories.
Certain additional risk factors relating to debt securities are discussed below:
Sensitivity to interest rate and economic changes — Debt securities may be sensitive to economic changes, political and corporate developments, and interest rate changes. In addition, during an economic downturn or a period of rising interest rates, issuers that are highly leveraged may experience increased financial stress that could adversely affect their ability to meet projected business goals, to obtain additional financing and to service their principal and interest payment obligations. Periods of economic change and uncertainty also can be expected to result in increased volatility of market prices and yields of certain debt securities and derivative instruments. As discussed under “Market conditions” above in this statement of additional information, governments and quasi-governmental authorities may take actions to support local and global economies and financial markets during periods of economic crisis, including direct capital infusions into companies, new monetary programs and significantly lower interest rates. Such actions may expose fixed income markets to heightened volatility and may reduce liquidity for certain investments, which could cause the value of the fund’s portfolio to decline.
Payment expectations — Debt securities may contain redemption or call provisions. If an issuer exercises these provisions in a lower interest rate market, the fund may have to replace the security with a lower yielding security, resulting in decreased income to investors. If the issuer of a debt security defaults on its obligations to pay interest or principal or is the subject of bankruptcy proceedings, the fund may incur losses or expenses in seeking recovery of amounts owed to it.
Liquidity and valuation — There may be little trading in the secondary market for particular debt securities, which may affect adversely the fund’s ability to value accurately or dispose of such debt securities. Adverse publicity and investor perceptions, whether or not based on fundamental analysis, may decrease the value and/or liquidity of debt securities.
Credit ratings for debt securities provided by rating agencies reflect an evaluation of the safety of principal and interest payments, not market value risk. The rating of an issuer is a rating agency’s view of past and future potential developments related to the issuer and may not necessarily reflect actual outcomes. There can be a lag between the time of developments relating to an issuer and the time a rating is assigned and updated. The investment adviser considers these ratings of securities as one of many criteria in making its investment decisions.
The Bond Fund of America — Page 4
Bond rating agencies may assign modifiers (such as +/–) to ratings categories to signify the relative position of a credit within the rating category. Investment policies that are based on ratings categories should be read to include any security within that category, without giving consideration to the modifier except where otherwise provided. See the Appendix to this statement of additional information for more information about credit ratings.
Inflation-linked bonds — The fund may invest in inflation-linked bonds issued by governments, their agencies or instrumentalities and corporations.
The principal amount of an inflation-linked bond is adjusted in response to changes in the level of an inflation index, such as the Consumer Price Index for Urban Consumers (“CPURNSA”). If the index measuring inflation falls, the principal value or coupon of these securities will be adjusted downward. Consequently, the interest payable on these securities will be reduced. Also, if the principal value of these securities is adjusted according to the rate of inflation, the adjusted principal value repaid at maturity may be less than the original principal. In the case of U.S. Treasury Inflation-Protected Securities (“TIPS”), currently the only inflation-linked security that is issued by the U.S Treasury, the principal amounts are adjusted daily based upon changes in the rate of inflation (as currently represented by the non-seasonally adjusted CPURNSA, calculated with a three-month lag). TIPS may pay interest semi-annually, equal to a fixed percentage of the inflation-adjusted principal amount. The interest rate on these bonds is fixed at issuance, but over the life of the bond this interest may be paid on an increasing or decreasing principal amount that has been adjusted for inflation. The current market value of TIPS is not guaranteed and will fluctuate. However, the U.S. government guarantees that, at maturity, principal will be repaid at the higher of the original face value of the security (in the event of deflation) or the inflation adjusted value.
Other non-U.S. sovereign governments also issue inflation-linked securities that are tied to their own local consumer price indexes and that offer similar deflationary protection. In certain of these non-U.S. jurisdictions, the repayment of the original bond principal upon the maturity of an inflation-linked bond is not guaranteed, allowing for the amount of the bond repaid at maturity to be less than par. Corporations also periodically issue inflation-linked securities tied to CPURNSA or similar inflationary indexes. While TIPS and non-U.S. sovereign inflation-linked securities are currently the largest part of the inflation-linked market, the fund may invest in corporate inflation-linked securities.
The value of inflation-linked securities is expected to change in response to the changes in real interest rates. Real interest rates, in turn, are tied to the relationship between nominal interest rates and the rate of inflation. If inflation were to rise at a faster rate than nominal interest rates, real interest rates would decline, leading to an increase in value of the inflation-linked securities. In contrast, if nominal interest rates were to increase at a faster rate than inflation, real interest rates might rise, leading to a decrease in value of inflation-linked securities. There can be no assurance, however, that the value of inflation-linked securities will be directly correlated to the changes in interest rates. If interest rates rise due to reasons other than inflation, investors in these securities may not be protected to the extent that the increase is not reflected in the security’s inflation measure.
The interest rate for inflation-linked bonds is fixed at issuance as a percentage of this adjustable principal. Accordingly, the actual interest income may both rise and fall as the principal amount of the bonds adjusts in response to movements of the consumer price index. For example, typically interest income would rise during a period of inflation and fall during a period of deflation.
The market for inflation-linked securities may be less developed or liquid, and more volatile, than certain other securities markets. There is a limited number of inflation-linked securities currently available for the fund to purchase, making the market less liquid and more volatile than the U.S. Treasury and agency markets.
The Bond Fund of America — Page 5
Equity securities — Equity securities represent an ownership position in a company. Equity securities held by the fund typically consist of common stocks. The prices of equity securities fluctuate based on, among other things, events specific to their issuers and market, economic and other conditions. For example, prices of these securities can be affected by financial contracts held by the issuer or third parties (such as derivatives) relating to the security or other assets or indices. Holders of equity securities are not creditors of the issuer. If an issuer liquidates, holders of equity securities are entitled to their pro rata share of the issuer’s assets, if any, after creditors (including the holders of fixed income securities and senior equity securities) are paid.
There may be little trading in the secondary market for particular equity securities, which may adversely affect the fund’s ability to value accurately or dispose of such equity securities. Adverse publicity and investor perceptions, whether or not based on fundamental analysis, may decrease the value and/or liquidity of equity securities.
Securities with equity and debt characteristics — Certain securities have a combination of equity and debt characteristics. Such securities may at times behave more like equity than debt or vice versa.
Preferred stock — Preferred stock represents an equity interest in an issuer that generally entitles the holder to receive, in preference to common stockholders and the holders of certain other stocks, dividends and a fixed share of the proceeds resulting from a liquidation of the issuer. Preferred stocks may pay fixed or adjustable rates of return, and preferred stock dividends may be cumulative or non-cumulative and participating or non-participating. Cumulative dividend provisions require all or a portion of prior unpaid dividends to be paid before dividends can be paid to the issuer’s common stockholders, while prior unpaid dividends on non-cumulative preferred stock are forfeited. Participating preferred stock may be entitled to a dividend exceeding the issuer’s declared dividend in certain cases, while non-participating preferred stock is entitled only to the stipulated dividend. Preferred stock is subject to issuer-specific and market risks applicable generally to equity securities. As with debt securities, the prices and yields of preferred stocks often move with changes in interest rates and the issuer’s credit quality. Additionally, a company’s preferred stock typically pays dividends only after the company makes required payments to holders of its bonds and other debt. Accordingly, the price of preferred stock will usually react more strongly than bonds and other debt to actual or perceived changes in the issuing company’s financial condition or prospects. Preferred stock of smaller companies may be more vulnerable to adverse developments than preferred stock of larger companies.
Convertible securities — A convertible security is a debt obligation, preferred stock or other security that may be converted, within a specified period of time and at a stated conversion rate, into common stock or other equity securities of the same or a different issuer. The conversion may occur automatically upon the occurrence of a predetermined event or at the option of either the issuer or the security holder. Under certain circumstances, a convertible security may also be called for redemption or conversion by the issuer after a particular date and at predetermined price specified upon issue. If a convertible security held by the fund is called for redemption or conversion, the fund could be required to tender the security for redemption, convert it into the underlying common stock, or sell it to a third party.
The holder of a convertible security is generally entitled to participate in the capital appreciation resulting from a market price increase in the issuer’s common stock and to receive interest paid or accrued until the convertible security matures or is redeemed, converted or exchanged. Before conversion, convertible securities have characteristics similar to non-convertible debt or preferred securities, as applicable. Convertible securities rank senior to common stock in an issuer’s capital structure and, therefore, normally entail less risk than the issuer’s common stock. However, convertible securities may also be subordinate to any senior debt obligations of the issuer, and, therefore, an issuer’s convertible securities may
The Bond Fund of America — Page 6
entail more risk than such senior debt obligations. Convertible securities usually offer lower interest or dividend yields than non-convertible debt securities of similar credit quality because of the potential for capital appreciation. In addition, convertible securities are often lower-rated securities.
Because of the conversion feature, the price of a convertible security will normally fluctuate in some proportion to changes in the price of the underlying asset, and, accordingly, convertible securities are subject to risks relating to the activities of the issuer and/or general market and economic conditions. The income component of a convertible security may cushion the security against declines in the price of the underlying asset but may also cause the price of the security to fluctuate based upon changes in interest rates and the credit quality of the issuer. As with a straight fixed income security, the price of a convertible security tends to increase when interest rates decline and decrease when interest rates rise. Like the price of a common stock, the price of a convertible security also tends to increase as the price of the underlying stock rises and to decrease as the price of the underlying stock declines.
Hybrid securities — A hybrid security is a type of security that also has equity and debt characteristics. Like equities, which have no final maturity, a hybrid security may be perpetual. On the other hand, like debt securities, a hybrid security may be callable at the option of the issuer on a date specified at issue. Additionally, like common equities, which may stop paying dividends at virtually any time without violating any contractual terms or conditions, hybrids typically allow for issuers to withhold payment of interest until a later date or to suspend coupon payments entirely without triggering an event of default. Hybrid securities are normally at the bottom of an issuer’s debt capital structure because holders of an issuer’s hybrid securities are structurally subordinated to the issuer’s senior creditors. In bankruptcy, hybrid security holders should only get paid after all senior creditors of the issuer have been paid but before any disbursements are made to the issuer’s equity holders. Accordingly, hybrid securities may be more sensitive to economic changes than more senior debt securities. Such securities may also be viewed as more equity-like by the market when the issuer or its parent company experiences financial difficulties.
Contingent convertible securities, which are also known as contingent capital securities, are a form of hybrid security that are intended to either convert into equity or have their principal written down upon the occurrence of certain trigger events. One type of contingent convertible security has characteristics designed to absorb losses, by providing that the liquidation value of the security may be adjusted downward to below the original par value or written off entirely under certain circumstances. For instance, if losses have eroded the issuer’s capital level below a specified threshold, the liquidation value of the security may be reduced in whole or in part. The write-down of the security’s par value may occur automatically and would not entitle holders to institute bankruptcy proceedings against the issuer. In addition, an automatic write-down could result in a reduced income rate if the dividend or interest payment associated with the security is based on the security’s par value. Such securities may, but are not required to, provide for circumstances under which the liquidation value of the security may be adjusted back up to par, such as an improvement in capitalization or earnings. Another type of contingent convertible security provides for mandatory conversion of the security into common shares of the issuer under certain circumstances. The mandatory conversion might relate, for example, to the issuer’s failure to maintain a capital minimum. Since the common stock of the issuer may not pay a dividend, investors in such instruments could experience reduced yields (or no yields at all) and conversion would deepen the subordination of the investor, effectively worsening the investor’s standing in the case of the issuer’s insolvency. An automatic write-down or conversion event with respect to a contingent convertible security will typically be triggered by a reduction in the issuer’s capital level, but may also be triggered by regulatory actions, such as a change in regulatory capital requirements, or by other factors.
The Bond Fund of America — Page 7
Obligations backed by the “full faith and credit” of the U.S. government — U.S. government obligations include the following types of securities:
U.S. Treasury securities — U.S. Treasury securities include direct obligations of the U.S. Treasury, such as Treasury bills, notes and bonds. For these securities, the payment of principal and interest is unconditionally guaranteed by the U.S. government, and thus they are of high credit quality. Such securities are subject to variations in market value due to fluctuations in interest rates and in government policies, but, if held to maturity, are expected to be paid in full (either at maturity or thereafter).
Federal agency securities — The securities of certain U.S. government agencies and government-sponsored entities are guaranteed as to the timely payment of principal and interest by the full faith and credit of the U.S. government. Such agencies and entities include, but are not limited to, the Federal Financing Bank (“FFB”), the Government National Mortgage Association (“Ginnie Mae”), the U.S. Department of Veterans Affairs (“VA”), the Federal Housing Administration (“FHA”), the Export-Import Bank of the United States (“Exim Bank”), the U.S. International Development Finance Corporation (“DFC”), the Commodity Credit Corporation (“CCC”) and the U.S. Small Business Administration (“SBA”).
Other federal agency obligations — Additional federal agency securities are neither direct obligations of, nor guaranteed by, the U.S. government. These obligations include securities issued by certain U.S. government agencies and government-sponsored entities. However, they generally involve some form of federal sponsorship: some operate under a congressional charter; some are backed by collateral consisting of “full faith and credit” obligations as described above; some are supported by the issuer’s right to borrow from the Treasury; and others are supported only by the credit of the issuing government agency or entity. These agencies and entities include, but are not limited to: the Federal Home Loan Banks, the Federal Home Loan Mortgage Corporation (“Freddie Mac”), the Federal National Mortgage Association (“Fannie Mae”), the Tennessee Valley Authority and the Federal Farm Credit Bank System.
In 2008, Freddie Mac and Fannie Mae were placed into conservatorship by their new regulator, the Federal Housing Finance Agency (“FHFA”). Simultaneously, the U.S. Treasury made a commitment of indefinite duration to maintain the positive net worth of both firms. As conservator, the FHFA has the authority to repudiate any contract either firm has entered into prior to the FHFA’s appointment as conservator (or receiver should either firm go into default) if the FHFA, in its sole discretion determines that performance of the contract is burdensome and repudiation would promote the orderly administration of Fannie Mae’s or Freddie Mac’s affairs. While the FHFA has indicated that it does not intend to repudiate the guaranty obligations of either entity, doing so could adversely affect holders of their mortgage-backed securities. For example, if a contract were repudiated, the liability for any direct compensatory damages would accrue to the entity’s conservatorship estate and could only be satisfied to the extent the estate had available assets. As a result, if interest payments on Fannie Mae or Freddie Mac mortgage-backed securities held by the fund were reduced because underlying borrowers failed to make payments or such payments were not advanced by a loan servicer, the fund’s only recourse might be against the conservatorship estate, which might not have sufficient assets to offset any shortfalls.
The FHFA, in its capacity as conservator, has the power to transfer or sell any asset or liability of Fannie Mae or Freddie Mac. The FHFA has indicated it has no current intention to do this; however, should it do so a holder of a Fannie Mae or Freddie Mac mortgage-backed security would have to rely on another party for satisfaction of the guaranty obligations and would be exposed to the credit risk of that party.
The Bond Fund of America — Page 8
Certain rights provided to holders of mortgage-backed securities issued by Fannie Mae or Freddie Mac under their operative documents may not be enforceable against the FHFA, or enforcement may be delayed during the course of the conservatorship or any future receivership. For example, the operative documents may provide that upon the occurrence of an event of default by Fannie Mae or Freddie Mac, holders of a requisite percentage of the mortgage-backed security may replace the entity as trustee. However, under the Federal Housing Finance Regulatory Reform Act of 2008, holders may not enforce this right if the event of default arises solely because a conservator or receiver has been appointed.
Pass-through securities — The fund may invest in various debt obligations backed by pools of mortgages, corporate loans or other assets including, but not limited to, residential mortgage loans, home equity loans, mortgages on commercial buildings, consumer loans and equipment leases. Principal and interest payments made on the underlying asset pools backing these obligations are typically passed through to investors, net of any fees paid to any insurer or any guarantor of the securities. Pass-through securities may have either fixed or adjustable coupons. The risks of an investment in these obligations depend in part on the type of the collateral securing the obligations and the class of the instrument in which the fund invests. These securities include:
Mortgage-backed securities — These securities may be issued by U.S. government agencies and government-sponsored entities, such as Ginnie Mae, Fannie Mae and Freddie Mac, and by private entities. The payment of interest and principal on mortgage-backed obligations issued by U.S. government agencies may be guaranteed by the full faith and credit of the U.S. government (in the case of Ginnie Mae), or may be guaranteed by the issuer (in the case of Fannie Mae and Freddie Mac). However, these guarantees do not apply to the market prices and yields of these securities, which vary with changes in interest rates.
Mortgage-backed securities issued by private entities are structured similarly to those issued by U.S. government agencies. However, these securities and the underlying mortgages are not guaranteed by any government agencies and the underlying mortgages are not subject to the same underwriting requirements. These securities generally are structured with one or more types of credit enhancements such as insurance or letters of credit issued by private companies. Borrowers on the underlying mortgages are usually permitted to prepay their underlying mortgages. Prepayments can alter the effective maturity of these instruments. In addition, delinquencies, losses or defaults by borrowers can adversely affect the prices and volatility of these securities. Such delinquencies and losses can be exacerbated by declining or flattening housing and property values. This, along with other outside pressures, such as bankruptcies and financial difficulties experienced by mortgage loan originators, decreased investor demand for mortgage loans and mortgage-related securities and increased investor demand for yield, can adversely affect the value and liquidity of mortgage-backed securities.
Collateralized mortgage obligations (CMOs) — CMOs are also backed by a pool of mortgages or mortgage loans, which are divided into two or more separate bond issues. CMOs issued by U.S. government agencies are backed by agency mortgages, while privately issued CMOs may be backed by either government agency mortgages or private mortgages. Payments of principal and interest are passed through to each bond issue at varying schedules resulting in bonds with different coupons, effective maturities and sensitivities to interest rates. Some CMOs may be structured in a way that when interest rates change, the impact of changing prepayment rates on the effective maturities of certain issues of these securities is magnified. CMOs may be less liquid or may exhibit greater price volatility than other types of mortgage or asset-backed securities.
Commercial mortgage-backed securities — These securities are backed by mortgages on commercial property, such as hotels, office buildings, retail stores, hospitals and other commercial buildings. These securities may have a lower prepayment uncertainty than other
The Bond Fund of America — Page 9
mortgage-related securities because commercial mortgage loans generally prohibit or impose penalties on prepayments of principal. In addition, commercial mortgage-related securities often are structured with some form of credit enhancement to protect against potential losses on the underlying mortgage loans. Many of the risks of investing in commercial mortgage-backed securities reflect the risks of investing in the real estate securing the underlying mortgage loans, including the effects of local and other economic conditions on real estate markets, the ability of tenants to make rental payments and the ability of a property to attract and retain tenants. Commercial mortgage-backed securities may be less liquid or exhibit greater price volatility than other types of mortgage or asset-backed securities and may be more difficult to value.
Asset-backed securities — These securities are backed by other assets such as credit card, automobile or consumer loan receivables, retail installment loans or participations in pools of leases. Credit support for these securities may be based on the underlying assets and/or provided through credit enhancements by a third party. The values of these securities are sensitive to changes in the credit quality of the underlying collateral, the credit strength of the credit enhancement, changes in interest rates and at times the financial condition of the issuer. Obligors of the underlying assets also may make prepayments that can change effective maturities of the asset-backed securities. These securities may be less liquid and more difficult to value than other securities.
Collateralized bond obligations (CBOs) and collateralized loan obligations (CLOs) — A CBO is a trust typically backed by a diversified pool of fixed-income securities, which may include high risk, lower rated securities. A CLO is a trust typically collateralized by a pool of loans, which may include, among others, senior secured loans, senior unsecured loans, and subordinate corporate loans, including lower rated loans. CBOs and CLOs may charge management fees and administrative expenses.
For both CBOs and CLOs, the cash flows from the trust are split into two or more portions, called tranches, varying in risk and yield. The riskiest and highest yielding portion is the “equity” tranche which bears the bulk of any default by the bonds or loans in the trust and is constructed to protect the other, more senior tranches from default. Since they are partially protected from defaults, the more senior tranches typically have higher ratings and lower yields than the underlying securities in the trust and can be rated investment grade. Despite the protection from the equity tranche, the more senior tranches can still experience substantial losses due to actual defaults of the underlying assets, increased sensitivity to defaults due to impairment of the collateral or the more junior tranches, market anticipation of defaults, as well as potential general aversions to CBO or CLO securities as a class. Normally, these securities are privately offered and sold, and thus, are not registered under the securities laws. CBOs and CLOs may be less liquid, may exhibit greater price volatility and may be more difficult to value than other securities.
“IOs” and “POs” are issued in portions or tranches with varying maturities and characteristics. Some tranches may only receive the interest paid on the underlying mortgages (IOs) and others may only receive the principal payments (POs). The values of IOs and POs are extremely sensitive to interest rate fluctuations and prepayment rates, and IOs are also subject to the risk of early repayment of the underlying mortgages that will substantially reduce or eliminate interest payments.
Municipal bonds — Municipal bonds are debt obligations that are exempt from federal, state and/or local income taxes. Opinions relating to the validity of municipal bonds, exclusion of municipal bond interest from an investor’s gross income for federal income tax purposes and, where applicable, state and local income tax, are rendered by bond counsel to the issuing authorities at the time of issuance.
The Bond Fund of America — Page 10
The two principal classifications of municipal bonds are general obligation bonds and limited obligation or revenue bonds. General obligation bonds are secured by the issuer’s pledge of its full faith and credit including, if available, its taxing power for the payment of principal and interest. Issuers of general obligation bonds include states, counties, cities, towns and various regional or special districts. The proceeds of these obligations are used to fund a wide range of public facilities, such as the construction or improvement of schools, highways and roads, water and sewer systems and facilities for a variety of other public purposes. Lease revenue bonds or certificates of participation in leases are payable from annual lease rental payments from a state or locality. Annual rental payments are payable to the extent such rental payments are appropriated annually.
Typically, the only security for a limited obligation or revenue bond is the net revenue derived from a particular facility or class of facilities financed thereby or, in some cases, from the proceeds of a special tax or other special revenues. Revenue bonds have been issued to fund a wide variety of revenue-producing public capital projects including: electric, gas, water and sewer systems; highways, bridges and tunnels; port and airport facilities; colleges and universities; hospitals; and convention, recreational, tribal gaming and housing facilities. Although the security behind these bonds varies widely, many provide additional security in the form of a debt service reserve fund which may also be used to make principal and interest payments on the issuer's obligations. In addition, some revenue obligations (as well as general obligations) are insured by a bond insurance company or backed by a letter of credit issued by a banking institution.
Revenue bonds also include, for example, pollution control, health care and housing bonds, which, although nominally issued by municipal authorities, are generally not secured by the taxing power of the municipality but by the revenues of the authority derived from payments by the private entity which owns or operates the facility financed with the proceeds of the bonds. Obligations of housing finance authorities have a wide range of security features, including reserve funds and insured or subsidized mortgages, as well as the net revenues from housing or other public projects. Many of these bonds do not generally constitute the pledge of the credit of the issuer of such bonds. The credit quality of such revenue bonds is usually directly related to the credit standing of the user of the facility being financed or of an institution which provides a guarantee, letter of credit or other credit enhancement for the bond issue.
Insured municipal bonds — The fund may invest in municipal bonds that are insured generally as to the timely payment of interest and repayment of principal. The insurance for such bonds may be purchased by the bond issuer, the fund or any other party, and is usually purchased from private, non-governmental insurance companies. Insurance that covers a municipal bond is expected to protect the fund against losses caused by a bond issuer’s failure to make interest or principal payments. However, insurance does not guarantee the market value of the bond or the prices of the fund’s shares. Also, the investment adviser cannot be certain that the insurance company will make payments it guarantees. The market value of the bond could drop if a bond's insurer fails to fulfill its obligations. Market conditions or changes to ratings criteria could adversely impact the ratings of municipal bond insurers. When rating agencies lower or withdraw the credit rating of the insurer, the insurance may be providing little or no enhancement of credit or resale value to the municipal bond.
Investing outside the U.S. — Securities of issuers domiciled outside the United States, or with significant operations or revenues outside the United States, may lose value because of adverse political, social, economic or market developments (including social instability, regional conflicts, terrorism and war) in the countries or regions in which the issuers are domiciled, operate or generate revenue. These issuers may also be more susceptible to actions of foreign governments such as the imposition of price controls or punitive taxes that could adversely impact the value of these securities. To the extent the fund invests in securities that are denominated in currencies other than the U.S. dollar, these securities may also lose value due to changes in foreign currency exchange rates against the U.S. dollar and/or currencies of other countries. Securities markets in certain countries may be more volatile or less liquid than those in the United States. Investments outside the United States may also be subject to different
The Bond Fund of America — Page 11
accounting and auditing practices and standards and different regulatory, legal and reporting requirements, and may be more difficult to value, than those in the United States. In addition, the value of investments outside the United States may be reduced by foreign taxes, including foreign withholding taxes on interest and dividends. Further, there may be increased risks of delayed settlement of securities purchased or sold by the fund. The risks of investing outside the United States may be heightened in connection with investments in emerging markets.
Additional costs could be incurred in connection with the fund’s investment activities outside the United States. Brokerage commissions may be higher outside the United States, and the fund will bear certain expenses in connection with its currency transactions. Furthermore, increased custodian costs may be associated with maintaining assets in certain jurisdictions.
Investing in emerging markets — Investing in emerging markets may involve risks in addition to and greater than those generally associated with investing in the securities markets of developed countries. For instance, emerging market countries tend to have less developed political, economic and legal systems and accounting and auditing practices and standards than those in developed countries. Accordingly, the governments of these countries may be less stable and more likely to intervene in the market economy, for example, by imposing capital controls, nationalizing a company or industry, placing restrictions on foreign ownership and on withdrawing sale proceeds of securities from the country, and/or imposing punitive taxes that could adversely affect the prices of securities. Information regarding issuers in emerging markets may be limited, incomplete or inaccurate, and there may be fewer rights and remedies available to the fund and its shareholders. In addition, the economies of these countries may be dependent on relatively few industries, may have limited access to capital and may be more susceptible to changes in local and global trade conditions and downturns in the world economy. Securities markets in these countries can also be relatively small and have substantially lower trading volumes. As a result, securities issued in these countries may be more volatile and less liquid, and may be more difficult to value, than securities issued in countries with more developed economies and/or markets. Less certainty with respect to security valuations may lead to additional challenges and risks in calculating the fund’s net asset value. Additionally, emerging markets are more likely to experience problems with the clearing and settling of trades and the holding of securities by banks, agents and depositories that are less established than those in developed countries.
In countries where direct foreign investment is limited or prohibited, the fund may invest in operating companies based in such countries through an offshore intermediary entity that, based on contractual agreements, seeks to replicate the rights and obligations of direct equity ownership in such operating company. Because the contractual arrangements do not in fact bestow the fund with actual equity ownership in the operating company, these investment structures may limit the fund’s rights as an investor and create significant additional risks. For example, local government authorities may determine that such structures do not comply with applicable laws and regulations, including those relating to restrictions on foreign ownership. In such event, the intermediary entity and/or the operating company may be subject to penalties, revocation of business and operating licenses or forfeiture of foreign ownership interests, and the fund’s economic interests in the underlying operating company and its rights as an investor may not be recognized, resulting in a loss to the fund and its shareholders. In addition, exerting control through contractual arrangements may be less effective than direct equity ownership, and a company may incur substantial costs to enforce the terms of such arrangements, including those relating to the distribution of the funds among the entities. These special investment structures may also be disregarded for tax purposes by local tax authorities, resulting in increased tax liabilities, and the fund’s control over – and distributions due from – such structures may be jeopardized if the individuals who hold the equity interest in such structures breach the terms of the agreements. While these structures may be widely used to circumvent limits on foreign ownership in certain jurisdictions, there is no assurance that they will be upheld by local regulatory authorities or that disputes regarding the same will be resolved consistently.
The Bond Fund of America — Page 12
Although there is no universally accepted definition, the investment adviser generally considers an emerging market to be a market that is in the earlier stages of its industrialization cycle with a low per capita gross domestic product (“GDP”) and a low market capitalization to GDP ratio relative to those in the United States and the European Union, and would include markets commonly referred to as “frontier markets.”
Certain risk factors related to emerging markets
Currency fluctuations — Certain emerging markets’ currencies have experienced and in the future may experience significant declines against the U.S. dollar. For example, if the U.S. dollar appreciates against foreign currencies, the value of the fund’s emerging markets securities holdings would generally depreciate and vice versa. Further, the fund may lose money due to losses and other expenses incurred in converting various currencies to purchase and sell securities valued in currencies other than the U.S. dollar, as well as from currency restrictions, exchange control regulation and currency devaluations.
Government regulation — Certain developing countries lack uniform accounting, auditing and financial reporting and disclosure standards, have less governmental supervision of financial markets than in the United States, and may not honor legal rights or protections enjoyed by investors in the United States. Certain governments may be more unstable and present greater risks of nationalization or restrictions on foreign ownership of local companies. Repatriation of investment income, capital and the proceeds of sales by foreign investors may require governmental registration and/or approval in some developing countries. While the fund will only invest in markets where these restrictions are considered acceptable by the investment adviser, a country could impose new or additional repatriation restrictions after the fund’s investment. If this happened, the fund’s response might include, among other things, applying to the appropriate authorities for a waiver of the restrictions or engaging in transactions in other markets designed to offset the risks of decline in that country. Such restrictions will be considered in relation to the fund’s liquidity needs and other factors. Further, some attractive equity securities may not be available to the fund if foreign shareholders already hold the maximum amount legally permissible.
While government involvement in the private sector varies in degree among developing countries, such involvement may in some cases include government ownership of companies in certain sectors, wage and price controls or imposition of trade barriers and other protectionist measures. With respect to any developing country, there is no guarantee that some future economic or political crisis will not lead to price controls, forced mergers of companies, expropriation, or creation of government monopolies to the possible detriment of the fund’s investments.
Fluctuations in inflation rates — Rapid fluctuations in inflation rates may have negative impacts on the economies and securities markets of certain emerging market countries.
Less developed securities markets — Emerging markets may be less well-developed and regulated than other markets. These markets have lower trading volumes than the securities markets of more developed countries and may be unable to respond effectively to increases in trading volume. Consequently, these markets may be substantially less liquid than those of more developed countries, and the securities of issuers located in these markets may have limited marketability. These factors may make prompt liquidation of substantial portfolio holdings difficult or impossible at times.
Settlement risks — Settlement systems in developing countries are generally less well organized than those of developed markets. Supervisory authorities may also be unable to
The Bond Fund of America — Page 13
apply standards comparable to those in developed markets. Thus, there may be risks that settlement may be delayed and that cash or securities belonging to the fund may be in jeopardy because of failures of or defects in the systems. In particular, market practice may require that payment be made before receipt of the security being purchased or that delivery of a security be made before payment is received. In such cases, default by a broker or bank (the “counterparty”) through whom the transaction is effected might cause the fund to suffer a loss. The fund will seek, where possible, to use counterparties whose financial status is such that this risk is reduced. However, there can be no certainty that the fund will be successful in eliminating this risk, particularly as counterparties operating in developing countries frequently lack the standing or financial resources of those in developed countries. There may also be a danger that, because of uncertainties in the operation of settlement systems in individual markets, competing claims may arise with respect to securities held by or to be transferred to the fund.
Limited market information — The fund may encounter problems assessing investment opportunities in certain emerging markets in light of limitations on available information and different accounting, auditing and financial reporting standards. For example, due to jurisdictional limitations, the Public Company Accounting Oversight Board (“PCAOB”), which regulates auditors of U.S. reporting companies, may be unable to inspect the audit work and practices of PCAOB-registered auditing firms in certain developing countries. As a result, there is greater risk that financial records and information relating to an issuer’s operations in developing countries will be incomplete or misleading, which may negatively impact the fund’s investments in such company. When faced with limited market information, the fund’s investment adviser will seek alternative sources of information, and to the extent the investment adviser is not satisfied with the sufficiency or accuracy of the information obtained with respect to a particular market or security, the fund will not invest in such market or security.
Taxation — Taxation of dividends, interest and capital gains received by the fund varies among developing countries and, in some cases, is comparatively high. In addition, developing countries typically have less well-defined tax laws and procedures and such laws may permit retroactive taxation so that the fund could become subject in the future to local tax liability that it had not reasonably anticipated in conducting its investment activities or valuing its assets.
Fraudulent securities — Securities purchased by the fund may subsequently be found to be fraudulent or counterfeit, resulting in a loss to the fund.
Remedies — Developing countries may offer less protection to investors than U.S. markets and, in the event of investor harm, there may be substantially less recourse available to the fund and its shareholders. In addition, as a matter of law or practicality, the fund and its shareholders - as well as U.S. regulators - may encounter substantial difficulties in obtaining and enforcing judgments and other actions against non-U.S. individuals and companies.
Investing through Bond Connect — The fund may invest in onshore China bonds via Bond Connect, the opening up of China’s Interbank Bond Market (CIBM) to global investors through the China-Hong Kong mutual access program. The program allows foreign and mainland China investors the ability to trade in each other’s bond market through a connection between the mainland and Hong Kong based financial infrastructure institutions. Bond Connect aims to enhance the efficiency and flexibility of investing in the CIBM. This is accomplished by easing the access requirements to enter the market and using the Hong Kong trading infrastructure to connect to China Foreign Exchange Trading System (CFETS). Market volatility and potential lack of liquidity due to low trading volume of certain debt securities in CIBM may result in prices of certain debt securities traded on such market fluctuating significantly. The bid and offer spreads of the prices of such securities may be large, and the fund may therefore incur significant trading, settlement and realization costs and may face counterparty default,
The Bond Fund of America — Page 14
liquidity, and volatility risks, resulting in significant losses for the funds and their investors. Bond Connect is a novel concept and, as such, the current regulations are untested and there is no certainty as to how they will be applied. In addition, the current regulations are subject to change which may have potential retrospective effects and there can be no assurance that Bond Connect will not be abolished. New regulations may be issued from time to time by the regulators in the PRC and Hong Kong in connection with operations, legal enforcement and cross-border trades under Bond Connect. The fund may be adversely affected as a result of such changes.
Currency transactions — The fund may enter into currency transactions on a spot (i.e., cash) basis at the prevailing rate in the currency exchange market to provide for the purchase or sale of a currency needed to purchase a security denominated in such currency. In addition, the fund may enter into forward currency contracts to protect against changes in currency exchange rates, to increase exposure to a particular foreign currency, to shift exposure to currency fluctuations from one currency to another or to seek to increase returns. A forward currency contract is an obligation to purchase or sell a specific currency at a future date, which may be any fixed number of days from the date of the contract agreed upon by the parties, at a price set at the time of the contract. Some forward currency contracts, called non-deliverable forwards or NDFs, do not call for physical delivery of the currency and are instead settled through cash payments. Forward currency contracts are typically privately negotiated and traded in the interbank market between large commercial banks (or other currency traders) and their customers. Although forward contracts entered into by the fund will typically involve the purchase or sale of a currency against the U.S. dollar, the fund also may purchase or sell a non-U.S. currency against another non-U.S. currency.
Currency exchange rates generally are determined by forces of supply and demand in the foreign exchange markets and the relative merits of investment in different countries as viewed from an international perspective. Currency exchange rates, as well as foreign currency transactions, can also be affected unpredictably by intervention by U.S. or foreign governments or central banks or by currency controls or political developments in the United States or abroad. Such intervention or other events could prevent the fund from entering into foreign currency transactions, force the fund to exit such transactions at an unfavorable time or price or result in penalties to the fund, any of which may result in losses to the fund.
Generally, the fund will not attempt to protect against all potential changes in exchange rates and the use of forward contracts does not eliminate the risk of fluctuations in the prices of the underlying securities. If the value of the underlying securities declines or the amount of the fund’s commitment increases because of changes in exchange rates, the fund may need to provide additional cash or securities to satisfy its commitment under the forward contract. The fund is also subject to the risk that it may be delayed or prevented from obtaining payments owed to it under the forward contract as a result of the insolvency or bankruptcy of the counterparty with which it entered into the forward contract or the failure of the counterparty to comply with the terms of the contract.
The realization of gains or losses on foreign currency transactions will usually be a function of the investment adviser’s ability to accurately estimate currency market movements. Entering into forward currency transactions may change the fund’s exposure to currency exchange rates and could result in losses to the fund if currencies do not perform as expected by the fund’s investment adviser. For example, if the fund’s investment adviser increases the fund’s exposure to a foreign currency using forward contracts and that foreign currency’s value declines, the fund may incur a loss. In addition, while entering into forward currency transactions could minimize the risk of loss due to a decline in the value of the hedged currency, it could also limit any potential gain that may result from an increase in the value of the currency. See also the “Derivatives” section under "Description of certain securities, investment techniques and risks" for a general description of investment techniques and risks relating to derivatives, including certain currency forwards.
The Bond Fund of America — Page 15
Forward currency contracts may give rise to leverage, or exposure to potential gains and losses in excess of the initial amount invested. Leverage magnifies gains and losses and could cause the fund to be subject to more volatility than if it had not been leveraged, thereby resulting in a heightened risk of loss. Under current regulatory requirements, the fund will segregate liquid assets that will be marked to market daily to meet its forward contract commitments to the extent required by the U.S. Securities and Exchange Commission.
Forward currency transactions also may affect the character and timing of income, gain, or loss recognized by the fund for U.S. tax purposes. The use of forward currency contracts could result in the application of the mark-to-market provisions of the Internal Revenue Code of 1986 as amended (the "Code") and may cause an increase (or decrease) in the amount of taxable dividends paid by the fund.
Indirect exposure to cryptocurrencies – Cryptocurrencies are currencies which exist in a digital form and may act as a store of wealth, a medium of exchange or an investment asset. There are thousands of cryptocurrencies, such as bitcoin. Although the fund has no current intention of directly investing in cryptocurrencies, some issuers have begun to accept cryptocurrency for payment of services, use cryptocurrencies as reserve assets or invest in cryptocurrencies, and the fund may invest in securities of such issuers. The fund may also invest in securities of issuers which provide cryptocurrency-related services.
Cryptocurrencies are subject to fluctuations in value. Cryptocurrencies are not backed by any government, corporation or other identified body. Rather, the value of a cryptocurrency is determined by other factors, such as the perceived future prospects or the supply and demand for such cryptocurrency in the global market for the trading of cryptocurrency. Such trading markets are unregulated and may be more exposed to operational or technical issues as well as fraud or manipulation in comparison to established, regulated exchanges for securities, derivatives and traditional currencies. The value of a cryptocurrency may decline precipitously (including to zero) for a variety of reasons, including, but not limited to, regulatory changes, a loss of confidence in its network or a change in user preference to other cryptocurrencies. An issuer that owns cryptocurrencies may experience custody issues, and may lose its cryptocurrency holdings through theft, hacking, or technical glitches in the applicable blockchain. The fund may experience losses as a result of the decline in value of its securities of issuers that own cryptocurrencies or which provide cryptocurrency-related services. If an issuer that owns cryptocurrencies intends to pay a dividend using such holdings or to otherwise make a distribution of such holdings to its stockholders, such dividends or distributions may face regulatory, operational and technical issues.
Factors affecting the further development of cryptocurrency include, but are not limited to: continued worldwide growth of, or possible cessation of or reversal in, the adoption and use of cryptocurrencies and other digital assets; the developing regulatory environment relating to cryptocurrencies, including the characterization of cryptocurrencies as currencies, commodities, or securities, the tax treatment of cryptocurrencies, and government and quasi-government regulation or restrictions on, or regulation of access to and operation of, cryptocurrency networks and the exchanges on which cryptocurrencies trade, including anti-money laundering regulations and requirements; perceptions regarding the environmental impact of a cryptocurrency; changes in consumer demographics and public preferences; general economic conditions; maintenance and development of open-source software protocols; the availability and popularity of other forms or methods of buying and selling goods and services; the use of the networks supporting digital assets, such as those for developing smart contracts and distributed applications; and general risks tied to the use of information technologies, including cyber risks. A hack or failure of one cryptocurrency may lead to a loss in confidence in, and thus decreased usage and/or value of, other cryptocurrencies.
Real estate investment trusts — Real estate investment trusts ("REITs"), which primarily invest in real estate or real estate-related loans, may issue equity or debt securities. Equity REITs own real estate properties, while mortgage REITs hold construction, development and/or long-term mortgage loans.
The Bond Fund of America — Page 16
The values of REITs may be affected by changes in the value of the underlying property of the trusts, the creditworthiness of the issuer, property taxes, interest rates, tax laws and regulatory requirements, such as those relating to the environment. Both types of REITs are dependent upon management skill and the cash flows generated by their holdings, the real estate market in general and the possibility of failing to qualify for any applicable pass-through tax treatment or failing to maintain any applicable exemptive status afforded under relevant laws.
Forward commitment, when issued and delayed delivery transactions — The fund may enter into commitments to purchase or sell securities at a future date. When the fund agrees to purchase such securities, it assumes the risk of any decline in value of the security from the date of the agreement. If the other party to such a transaction fails to deliver or pay for the securities, the fund could miss a favorable price or yield opportunity, or could experience a loss.
The fund may enter into roll transactions, such as a mortgage dollar roll where the fund sells mortgage-backed securities for delivery in the current month and simultaneously contracts to repurchase substantially similar (same type, coupon, and maturity) securities on a specified future date, at a pre-determined price. During the period between the sale and repurchase (the “roll period”), the fund forgoes principal and interest paid on the mortgage-backed securities. The fund is compensated by the difference between the current sales price and the lower forward price for the future purchase (often referred to as the “drop”), if any, as well as by the interest earned on the cash proceeds of the initial sale. The fund could suffer a loss if the contracting party fails to perform the future transaction and the fund is therefore unable to buy back the mortgage-backed securities it initially sold. The fund also takes the risk that the mortgage-backed securities that it repurchases at a later date will have less favorable market characteristics than the securities originally sold (e.g., greater prepayment risk). These transactions are accounted for as purchase and sale transactions, which contribute to the fund’s portfolio turnover rate.
With to be announced (TBA) transactions, the particular securities (i.e., specified mortgage pools) to be delivered or received are not identified at the trade date, but are “to be announced” at a later settlement date. However, securities to be delivered must meet specified criteria, including face value, coupon rate and maturity, and be within industry-accepted “good delivery” standards.
The fund will not use these transactions for the purpose of leveraging and will segregate liquid assets that will be marked to market daily in an amount sufficient to meet its payment obligations in these transactions. Although these transactions will not be entered into for leveraging purposes, to the extent the fund’s aggregate commitments in connection with these transactions exceed its segregated assets, the fund temporarily could be in a leveraged position (because it may have an amount greater than its net assets subject to market risk). Should market values of the fund’s portfolio securities decline while the fund is in a leveraged position, greater depreciation of its net assets would likely occur than if it were not in such a position. The fund will not borrow money to settle these transactions and, therefore, will liquidate other portfolio securities in advance of settlement if necessary to generate additional cash to meet its obligations. After a transaction is entered into, the fund may still dispose of or renegotiate the transaction. Additionally, prior to receiving delivery of securities as part of a transaction, the fund may sell such securities.
Repurchase agreements — The fund may enter into repurchase agreements, or “repos”, under which the fund buys a security and obtains a simultaneous commitment from the seller to repurchase the security at a specified time and price. Because the security purchased constitutes collateral for the repurchase obligation, a repo may be considered a loan by the fund that is collateralized by the security purchased. Repos permit the fund to maintain liquidity and earn income over periods of time as short as overnight.
The Bond Fund of America — Page 17
The seller must maintain with a custodian collateral equal to at least the repurchase price, including accrued interest. In tri-party repos, a third party custodian, called a clearing bank, facilitates repo clearing and settlement, including by providing collateral management services. However, as an alternative to tri-party repos, the fund could enter into bilateral repos, where the parties themselves are responsible for settling transactions.
The fund will only enter into repos involving securities of the type in which it could otherwise invest. If the seller under the repo defaults, the fund may incur a loss if the value of the collateral securing the repo has declined and may incur disposition costs and delays in connection with liquidating the collateral. If bankruptcy proceedings are commenced with respect to the seller, realization of the collateral by the fund may be delayed or limited.
Cash and cash equivalents — The fund may hold cash or invest in cash equivalents. Cash equivalents include, but are not limited to: (a) shares of money market or similar funds managed by the investment adviser or its affiliates; (b) shares of other money market funds; (c) commercial paper; (d) short-term bank obligations (for example, certificates of deposit, bankers’ acceptances (time drafts on a commercial bank where the bank accepts an irrevocable obligation to pay at maturity)) or bank notes; (e) savings association and savings bank obligations (for example, bank notes and certificates of deposit issued by savings banks or savings associations); (f) securities of the U.S. government, its agencies or instrumentalities that mature, or that may be redeemed, in one year or less; and (g) higher quality corporate bonds and notes that mature, or that may be redeemed, in one year or less.
The Bond Fund of America — Page 18
Commercial paper — The fund may purchase commercial paper. Commercial paper refers to short-term promissory notes issued by a corporation to finance its current operations. Such securities normally have maturities of thirteen months or less and, though commercial paper is often unsecured, commercial paper may be supported by letters of credit, surety bonds or other forms of collateral. Maturing commercial paper issuances are usually repaid by the issuer from the proceeds of new commercial paper issuances. As a result, investment in commercial paper is subject to rollover risk, or the risk that the issuer cannot issue enough new commercial paper to satisfy its outstanding commercial paper. Like all fixed income securities, commercial paper prices are susceptible to fluctuations in interest rates. If interest rates rise, commercial paper prices will decline and vice versa. However, the short-term nature of a commercial paper investment makes it less susceptible to volatility than many other fixed income securities because interest rate risk typically increases as maturity lengths increase. Commercial paper tends to yield smaller returns than longer-term corporate debt because securities with shorter maturities typically have lower effective yields than those with longer maturities. As with all fixed income securities, there is a chance that the issuer will default on its commercial paper obligations and commercial paper may become illiquid or suffer from reduced liquidity in these or other situations.
Commercial paper in which the fund may invest includes commercial paper issued in reliance on the exemption from registration afforded by Section 4(a)(2) of the 1933 Act. Section 4(a)(2) commercial paper has substantially the same price and liquidity characteristics as commercial paper generally, except that the resale of Section 4(a)(2) commercial paper is limited to institutional investors who agree that they are purchasing the paper for investment purposes and not with a view to public distribution. Technically, such a restriction on resale renders Section 4(a)(2) commercial paper a restricted security under the 1933 Act. In practice, however, Section 4(a)(2) commercial paper typically can be resold as easily as any other unrestricted security held by the fund. Accordingly, Section 4(a)(2) commercial paper has been generally determined to be liquid under procedures adopted by the fund’s board of trustees.
Variable and floating rate obligations — The interest rates payable on certain securities and other instruments in which the fund may invest may not be fixed but may fluctuate based upon changes in market interest rates or credit ratings. Variable and floating rate obligations bear coupon rates that are adjusted at designated intervals, based on the then current market interest rates or credit ratings. The rate adjustment features tend to limit the extent to which the market value of the obligations will fluctuate. When the fund holds variable or floating rate securities, a decrease in market interest rates will adversely affect the income received from such securities and the net asset value of the fund’s shares.
The London Interbank Offered Rate (“LIBOR”) is one of the most widely used interest rate benchmarks and is intended to represent the rate at which contributing banks may obtain short-term borrowings from each other in the London interbank market. On July 27, 2017, the U.K. Financial Conduct Authority (“FCA”), which regulates LIBOR, announced that the FCA will no longer persuade or compel banks to submit rates for the calculation of LIBOR after 2021. On March 5, 2021, the FCA and ICE Benchmark Administration, Limited (IBA), the administrator of LIBOR, announced that the publication of the one-week and two-month USD LIBOR maturities and non-USD LIBOR maturities will cease immediately after December 31, 2021, with the remaining USD LIBOR maturities ceasing immediately after June 30, 2023. As a result, LIBOR may no longer be available or may no longer be deemed an appropriate reference rate upon which to determine the interest rate on certain loans, bonds, derivatives and other instruments in the fund’s portfolio.
Public and private sector industry initiatives have been underway to identify new or alternative reference rates to be used in place of LIBOR. In the US, the Alternative Reference Rates Committee (ARCC), a group of market participants convened to help ensure a successful transition away from USD LIBOR, has identified the Secured Overnight Financing Rate (“SOFR”), which is intended to be a broad measure of secured overnight U.S. Treasury repo rates, as its preferred alternative rate. Working
The Bond Fund of America — Page 19
groups and regulators in other countries have suggested other alternative rates for their markets. There is no assurance that the composition or characteristics of any such alternative reference rate will be similar to or produce the same value or economic equivalence as LIBOR or that instruments using an alternative rate will have the same volume or liquidity. This, in turn, may affect the value or return on certain of the fund’s investments, result in costs incurred in connection with closing out positions and entering into new trades and reduce the effectiveness of related fund transactions such as hedges. Relatedly, there are outstanding contracts governing bonds and other instruments which reference LIBOR that are due to mature beyond the LIBOR cessation date. These “legacy contracts” will need to be transitioned to an alternative reference rate, and a failure to do so may adversely impact the security (for example, under existing contract language the instrument could fall back to a fixed rate or have no fallback rate) and create contractual uncertainty, as well as market and litigation risk. Although there are ongoing efforts among certain government entities and other organizations to address these uncertainties, the ultimate effectiveness of such efforts is not yet known. These risks may also apply with respect to potential changes in connection with other interbank offering rates (e.g., Euribor) and other indices, rates and values that may be used as “benchmarks” and are the subject of recent regulatory reform.
Loan assignments and participations — The fund may invest in loans or other forms of indebtedness that represent interests in amounts owed by corporations or other borrowers (collectively “borrowers”). The investment adviser defines debt securities to include investments in loans, such as loan assignments and participations. Loans may be originated by the borrower in order to address its working capital needs, as a result of a reorganization of the borrower’s assets and liabilities (recapitalizations), to merge with or acquire another company (mergers and acquisitions), to take control of another company (leveraged buy-outs), to provide temporary financing (bridge loans), or for other corporate purposes. Most corporate loans are variable or floating rate obligations.
Some loans may be secured in whole or in part by assets or other collateral. In other cases, loans may be unsecured or may become undersecured by declines in the value of assets or other collateral securing such loan. The greater the value of the assets securing the loan the more the lender is protected against loss in the case of nonpayment of principal or interest. Loans made to highly leveraged borrowers may be especially vulnerable to adverse changes in economic or market conditions and may involve a greater risk of default.
Some loans may represent revolving credit facilities or delayed funding loans, in which a lender agrees to make loans up to a maximum amount upon demand by the borrower during a specified term. These commitments may have the effect of requiring the fund to increase its investment in a company at a time when it might not otherwise decide to do so (including at a time when the company’s financial condition makes it unlikely that such amounts will be repaid). To the extent that the fund is committed to advance additional funds, the fund will segregate assets determined to be liquid in an amount sufficient to meet such commitments.
Some loans may represent debtor-in-possession financings (commonly known as “DIP financings”). DIP financings are arranged when an entity seeks the protections of the bankruptcy court under Chapter 11 of the U.S. Bankruptcy Code. These financings allow the entity to continue its business operations while reorganizing under Chapter 11. Such financings constitute senior liens on unencumbered collateral (i.e., collateral not subject to other creditors’ claims). There is a risk that the entity will not emerge from Chapter 11 and will be forced to liquidate its assets under Chapter 7 of the U.S. Bankruptcy Code. In the event of liquidation, the fund’s only recourse will be against the collateral securing the DIP financing.
The investment adviser generally makes investment decisions based on publicly available information, but may rely on non-public information if necessary. Borrowers may offer to provide lenders with material, non-public information regarding a specific loan or the borrower in general. The investment adviser generally chooses not to receive this information. As a result, the investment adviser may be at
The Bond Fund of America — Page 20
a disadvantage compared to other investors that may receive such information. The investment adviser’s decision not to receive material, non-public information may impact the investment adviser’s ability to assess a borrower’s requests for amendments or waivers of provisions in the loan agreement. However, the investment adviser may on a case-by-case basis decide to receive such information when it deems prudent. In these situations the investment adviser may be restricted from trading the loan or buying or selling other debt and equity securities of the borrower while it is in possession of such material, non-public information, even if such loan or other security is declining in value.
The fund normally acquires loan obligations through an assignment from another lender, but also may acquire loan obligations by purchasing participation interests from lenders or other holders of the interests. When the fund purchases assignments, it acquires direct contractual rights against the borrower on the loan. The fund acquires the right to receive principal and interest payments directly from the borrower and to enforce its rights as a lender directly against the borrower. However, because assignments are arranged through private negotiations between potential assignees and potential assignors, the rights and obligations acquired by a fund as the purchaser of an assignment may differ from, and be more limited than, those held by the assigning lender. Loan assignments are often administered by a financial institution that acts as agent for the holders of the loan, and the fund may be required to receive approval from the agent and/or borrower prior to the purchase of a loan. Risks may also arise due to the inability of the agent to meet its obligations under the loan agreement.
Loan participations are loans or other direct debt instruments that are interests in amounts owed by the borrower to another party. They may represent amounts owed to lenders or lending syndicates, to suppliers of goods or services, or to other parties. The fund will have the right to receive payments of principal, interest and any fees to which it is entitled only from the lender selling the participation and only upon receipt by the lender of the payments from the borrower. In connection with purchasing participations, the fund generally will have no right to enforce compliance by the borrower with the terms of the loan agreement relating to the loan, nor any rights of set-off against the borrower. In addition, the fund may not directly benefit from any collateral supporting the loan in which it has purchased the participation and the fund will have to rely on the agent bank or other financial intermediary to apply appropriate credit remedies. As a result, the fund will be subject to the credit risk of both the borrower and the lender that is selling the participation. In the event of the insolvency of the lender selling a participation, a fund may be treated as a general creditor of the lender and may not benefit from any set-off between the lender and the borrower.
Loan assignments and participations are generally subject to legal or contractual restrictions on resale and are not currently listed on any securities exchange or automatic quotation system. Risks may arise due to delayed settlements of loan assignments and participations. The investment adviser expects that most loan assignments and participations purchased for the fund will trade on a secondary market. However, although secondary markets for investments in loans are growing among institutional investors, a limited number of investors may be interested in a specific loan. It is possible that loan participations, in particular, could be sold only to a limited number of institutional investors. If there is no active secondary market for a particular loan, it may be difficult for the investment adviser to sell the fund’s interest in such loan at a price that is acceptable to it and to obtain pricing information on such loan.
Investments in loan participations and assignments present the possibility that the fund could be held liable as a co-lender under emerging legal theories of lender liability. In addition, if the loan is foreclosed, the fund could be part owner of any collateral and could bear the costs and liabilities of owning and disposing of the collateral. In addition, some loan participations and assignments may not be rated by major rating agencies and may not be protected by securities laws.
The Bond Fund of America — Page 21
Inverse floating rate notes — The fund may invest in inverse floating rate notes (a type of derivative instrument). These notes have rates that move in the opposite direction of prevailing interest rates. A change in prevailing interest rates will often result in a greater change in these instruments’ interest rates. As a result, these instruments may have a greater degree of volatility than other types of interest-bearing securities.
Restricted or illiquid securities — The fund may purchase securities subject to restrictions on resale. Restricted securities may only be sold pursuant to an exemption from registration under the Securities Act of 1933, as amended (the “1933 Act”), or in a registered public offering. Restricted securities held by the fund are often eligible for resale under Rule 144A, an exemption under the 1933 Act allowing for resales to “Qualified Institutional Buyers.” Where registration is required, the holder of a registered security may be obligated to pay all or part of the registration expense and a considerable period may elapse between the time it decides to seek registration and the time it may be permitted to sell a security under an effective registration statement. Difficulty in selling such securities may result in a loss to the fund or cause it to incur additional administrative costs.
Some fund holdings (including some restricted securities) may be deemed illiquid if the fund expects that a reasonable portion of the holding cannot be sold in seven calendar days or less without the sale significantly changing the market value of the investment. The determination of whether a holding is considered illiquid is made by the fund’s adviser under a liquidity risk management program adopted by the fund’s board and administered by the fund’s adviser. The fund may incur significant additional costs in disposing of illiquid securities.
Maturity — There are no restrictions on the maturity composition of the portfolio. The fund invests in debt securities with a wide range of maturities. Under normal market conditions, longer term securities yield more than shorter term securities, but are subject to greater price fluctuations.
The Bond Fund of America — Page 22
Derivatives — In pursuing its investment objective, the fund may invest in derivative instruments. A derivative is a financial instrument, the value of which depends on, or is otherwise derived from, another underlying variable. Most often, the variable underlying a derivative is the price of a traded asset, such as a traditional cash security (e.g., a stock or bond), a currency or a commodity; however, the value of a derivative can be dependent on almost any variable, from the level of an index or a specified rate to the occurrence (or non-occurrence) of a credit event with respect to a specified reference asset. In addition to investing in forward currency contracts, as described above under “Currency transactions,” the fund may take positions in futures contracts and swaps, each of which is a derivative instrument described in greater detail below.
Derivative instruments may be distinguished by the manner in which they trade: some are standardized instruments that trade on an organized exchange while others are individually negotiated and traded in the over-the-counter (OTC) market. Derivatives also range broadly in complexity, from simple derivatives to more complex instruments. As a general matter, however, all derivatives — regardless of the manner in which they trade or their relative complexities — entail certain risks, some of which are different from, and potentially greater than, the risks associated with investing directly in traditional cash securities.
As is the case with traditional cash securities, derivative instruments are generally subject to counterparty credit risk; however, in some cases, derivatives may pose counterparty risks greater than those posed by cash securities. The use of derivatives involves the risk that a loss may be sustained by the fund as a result of the failure of the fund’s counterparty to make required payments or otherwise to comply with its contractual obligations. For some derivatives, though, the value of — and, in effect, the return on — the instrument may be dependent on both the individual credit of the fund’s counterparty and on the credit of one or more issuers of any underlying assets. If the fund does not correctly evaluate the creditworthiness of its counterparty and, where applicable, of issuers of any underlying reference assets, the fund’s investment in a derivative instrument may result in losses. Further, if a fund’s counterparty were to default on its obligations, the fund’s contractual remedies against such counterparty may be subject to applicable bankruptcy and insolvency laws, which could affect the fund’s rights as a creditor and delay or impede the fund’s ability to receive the net amount of payments that it is contractually entitled to receive.
The value of some derivative instruments in which the fund invests may be particularly sensitive to changes in prevailing interest rates, currency exchange rates or other market conditions. Like the fund’s other investments, the ability of the fund to successfully utilize such derivative instruments may depend in part upon the ability of the fund’s investment adviser to accurately forecast interest rates and other economic factors. The success of the fund’s derivative investment strategy will also depend on the investment adviser’s ability to assess and predict the impact of market or economic developments on the derivative instruments in which the fund invests, in some cases without having had the benefit of observing the performance of a derivative under all possible market conditions. If the investment adviser incorrectly forecasts such factors and has taken positions in derivative instruments contrary to prevailing market trends, or if the investment adviser incorrectly predicts the impact of developments on a derivative instrument, the fund could be exposed to the risk of loss.
Certain derivatives may also be subject to liquidity and valuation risks. The potential lack of a liquid secondary market for a derivative (and, particularly, for an OTC derivative) may cause difficulty in valuing or selling the instrument. If a derivative transaction is particularly large or if the relevant market is illiquid, as is often the case with many privately-negotiated OTC derivatives, the fund may not be able to initiate a transaction or to liquidate a position at an advantageous time or price. Particularly when there is no liquid secondary market for the fund’s derivative positions, the fund may encounter difficulty in valuing such illiquid positions. The value of a derivative instrument does not always correlate perfectly with its underlying asset, rate or index, and many derivatives, and OTC derivatives in particular, are complex and often valued subjectively. Improper valuations can result in increased cash payment requirements to counterparties or a loss of value to the fund.
The Bond Fund of America — Page 23
Because certain derivative instruments may obligate the fund to make one or more potential future payments, which could significantly exceed the value of the fund’s initial investments in such instruments, derivative instruments may also have a leveraging effect on the fund’s portfolio. Certain derivatives have the potential for unlimited loss, irrespective of the size of the fund’s investment in the instrument. When a fund leverages its portfolio, investments in that fund will tend to be more volatile, resulting in larger gains or losses in response to market changes. In accordance with currently applicable regulatory requirements, the fund will generally segregate or earmark liquid assets, or enter into offsetting financial positions, to cover its obligations under derivative instruments, effectively limiting the risk of leveraging the fund’s portfolio. Because the fund is legally required to maintain asset coverage or offsetting positions in connection with leveraging derivative instruments, the fund’s investments in such derivatives may also require the fund to buy or sell portfolio securities at disadvantageous times or prices in order to comply with applicable requirements.
In October 2020, the SEC adopted a new rule applicable to the fund’s use of derivatives. The new rule, among other things, generally requires a fund to adopt a derivatives risk management program, appoint a derivatives risk manager and comply with an outer limit on fund leverage risk based on value at risk, or “VaR”. However, subject to certain conditions, if a fund uses derivatives only in a limited manner, it may be deemed a limited derivatives user and would not be subject to the full requirements of the new rule. The SEC also eliminated the asset segregation and cover framework, described above, arising from prior SEC guidance for covering derivatives and certain financial instruments effective at the time that a fund complies with the new rule. Compliance with the new rule will be required beginning in August 2022. The implementation of these requirements may limit the ability of the fund to use derivatives as part of its investment strategy.
Futures — The fund may enter into futures contracts to seek to manage the fund’s interest rate sensitivity by increasing or decreasing the duration of the fund or a portion of the fund’s portfolio. A futures contract is an agreement to buy or sell a security or other financial instrument (the “reference asset”) for a set price on a future date. Futures contracts are standardized, exchange-traded contracts, and, when a futures contract is bought or sold, the fund will incur brokerage fees and will be required to maintain margin deposits.
Unlike when the fund purchases or sells a security, such as a stock or bond, no price is paid or received by the fund upon the purchase or sale of a futures contract. When the fund enters into a futures contract, the fund is required to deposit with its futures broker, known as a futures commission merchant (FCM), a specified amount of liquid assets in a segregated account in the name of the FCM at the applicable derivatives clearinghouse or exchange. This amount, known as initial margin, is set by the futures exchange on which the contract is traded and may be significantly modified during the term of the contract. The initial margin is in the nature of a performance bond or good faith deposit on the futures contract, which is returned to the fund upon termination of the contract, assuming all contractual obligations have been satisfied. Additionally, on a daily basis, the fund pays or receives cash, or variation margin, equal to the daily change in value of the futures contract. Variation margin does not represent a borrowing or loan by the fund but is instead a settlement between the fund and the FCM of the amount one party would owe the other if the futures contract expired. In computing daily net asset value, the fund will mark-to-market its open futures positions. In the event of the bankruptcy or insolvency of an FCM that holds margin on behalf of the fund, the fund may be entitled to return of margin owed to it only in proportion to the amount received by the FCM’s other customers, potentially resulting in losses to the fund. An event of bankruptcy or insolvency at a clearinghouse or exchange holding initial margin could also result in losses for the fund.
When the fund invests in futures contracts and deposits margin with an FCM, the fund becomes subject to so-called “fellow customer” risk – that is, the risk that one or more customers of the FCM will default on their obligations and that the resulting losses will be so
The Bond Fund of America — Page 24
great that the FCM will default on its obligations and margin posted by one customer, such as the fund, will be used to cover a loss caused by a different defaulting customer. Applicable rules generally prohibit the use of one customer’s funds to meet the obligations of another customer and limit the ability of an FCM to use margin posed by non-defaulting customers to satisfy losses caused by defaulting customers. As a general matter, an FCM is required to use its own funds to meet a defaulting customer’s obligations. While a customer’s loss would likely need to be substantial before non-defaulting customers would be exposed to loss on account of fellow customer risk, applicable rules nevertheless permit the commingling of margin and do not limit the mutualization of customer losses from investment losses, custodial failures, fraud or other causes. If the loss is so great that, notwithstanding the application of an FCM’s own funds, there is a shortfall in the amount of customer funds required to be held in segregation, the FCM could default and be placed into bankruptcy. Under these circumstances, bankruptcy law provides that non-defaulting customers will share pro rata in any shortfall. A shortfall in customer segregated funds may also make the transfer of the accounts of non-defaulting customers to another FCM more difficult.
Although certain futures contracts, by their terms, require actual future delivery of and payment for the reference asset, in practice, most futures contracts are usually closed out before the delivery date by offsetting purchases or sales of matching futures contracts. Closing out an open futures contract purchase or sale is effected by entering into an offsetting futures contract sale or purchase, respectively, for the same aggregate amount of the identical reference asset and the same delivery date with the same FCM. If the offsetting purchase price is less than the original sale price (in each case taking into account transaction costs, including brokerage fees), the fund realizes a gain; if it is more, the fund realizes a loss. Conversely, if the offsetting sale price is more than the original purchase price (in each case taking into account transaction costs, including brokerage fees), the fund realizes a gain; if it is less, the fund realizes a loss.
Under current regulations, the fund is generally required to segregate liquid assets equivalent to the fund’s outstanding obligations under each futures contract. With respect to long positions in futures contracts that are not legally required to cash settle, the fund will segregate or earmark liquid assets in an amount equal to the contract price the fund will be required to pay on settlement less the amount of margin deposited with an FCM. For short positions in futures contracts that are not legally required to cash settle, the fund will segregate or earmark liquid assets in an amount that, when added to the amounts deposited with an FCM as margin, equals the market value of the reference asset underlying the futures contract. With respect to futures contracts that are required to cash settle, however, the fund is permitted to segregate or earmark liquid assets in an amount that, when added to the amounts deposited with an FCM as margin, equals the fund’s daily marked-to-market (net) obligation under the contract (i.e., the daily market value of the contract itself), if any; in other words, the fund may set aside its daily net liability, if any, rather than the notional value of the futures contract. By segregating or earmarking assets equal only to its net obligation under cash-settled futures, the fund may be able to utilize these contracts to a greater extent than if the fund were required to segregate or earmark assets equal to the full contract price or current market value of the futures contract. Such segregation of assets is intended to ensure that the fund has assets available to satisfy its obligations with respect to futures contracts and to limit any potential leveraging of the fund’s portfolio. However, segregation of liquid assets will not limit the fund’s exposure to loss. To maintain a sufficient amount of segregated assets, the fund may also have to sell less liquid portfolio securities at disadvantageous prices, and the earmarking of liquid assets will have the effect of limiting the fund’s ability to otherwise invest those assets in other securities or instruments.
The value of a futures contract tends to increase and decrease in tandem with the value of its underlying reference asset. Purchasing futures contracts will, therefore, tend to increase the
The Bond Fund of America — Page 25
fund’s exposure to positive and negative price fluctuations in the reference asset, much as if the fund had purchased the reference asset directly. When the fund sells a futures contract, by contrast, the value of its futures position will tend to move in a direction contrary to the market for the reference asset. Accordingly, selling futures contracts will tend to offset both positive and negative market price changes, much as if the reference asset had been sold.
There is no assurance that a liquid market will exist for any particular futures contract at any particular time. Futures exchanges may establish daily price fluctuation limits for futures contracts and may halt trading if a contract’s price moves upward or downward more than the limit in a given day. On volatile trading days, when the price fluctuation limit is reached and a trading halt is imposed, it may be impossible to enter into new positions or close out existing positions. If the market for a futures contract is not liquid because of price fluctuation limits or other market conditions, the fund may be prevented from promptly liquidating unfavorable futures positions and the fund could be required to continue to hold a position until delivery or expiration regardless of changes in its value, potentially subjecting the fund to substantial losses. Additionally, the fund may not be able to take other actions or enter into other transactions to limit or reduce its exposure to the position. Under such circumstances, the fund would remain obligated to meet margin requirements until the position is cleared. As a result, the fund’s access to other assets held to cover its futures positions could also be impaired.
Although futures exchanges generally operate similarly in the United States and abroad, foreign futures exchanges may follow trading, settlement and margin procedures that are different than those followed by futures exchanges in the United States. Futures contracts traded outside the United States may not involve a clearing mechanism or related guarantees and may involve greater risk of loss than U.S.-traded contracts, including potentially greater risk of losses due to insolvency of a futures broker, exchange member, or other party that may owe initial or variation margin to the fund. Margin requirements on foreign futures exchanges may be different than those of futures exchanges in the United States, and, because initial and variation margin payments may be measured in foreign currency, a futures contract traded outside the United States may also involve the risk of foreign currency fluctuations.
Swaps — The fund may enter into swap agreements, which are two-party contracts entered into primarily by institutional investors for a specified time period. In a typical swap transaction, two parties agree to exchange the returns earned or realized from one or more underlying assets or rates of return.
Swap agreements can be traded on a swap execution facility (SEF) and cleared through a central clearinghouse (cleared), traded over-the-counter (OTC) and cleared, or traded bilaterally and not cleared. For example, standardized interest rate swaps and credit default swap indices are traded on SEFs and cleared. Other forms of swap agreements, such as total return swaps, are entered into on a bilateral basis. Because clearing interposes a central clearinghouse as the ultimate counterparty to each participant’s swap, and margin is required to be exchanged under the rules of the clearinghouse, central clearing is intended to decrease (but not eliminate) counterparty risk relative to uncleared bilateral swaps. To the extent the fund enters into bilaterally negotiated swap transactions, the fund will enter into swap agreements only with counterparties that meet certain credit standards and subject to agreed collateralization procedures; however, if the counterparty’s creditworthiness deteriorates rapidly and the counterparty defaults on its obligations under the swap agreement or declares bankruptcy, the fund may lose any amount it expected to receive from the counterparty. In addition, bilateral swaps are subject to certain regulatory margin requirements that mandate the posting and collection of minimum margin amounts, which may result in the fund and its counterparties posting higher margin amounts for bilateral swaps than would otherwise be the case.
The Bond Fund of America — Page 26
The term of a swap can be days, months or years and certain swaps may be less liquid than others. If a swap transaction is particularly large or if the relevant market is illiquid, it may not be possible to initiate a transaction or liquidate a position at an advantageous time or price, which may result in significant losses.
Swap agreements can take different forms. The fund may enter into the following types of swap agreements:
Interest rate swaps — The fund may enter into interest rate swaps to seek to manage the interest rate sensitivity of the fund by increasing or decreasing the duration of the fund or a portion of the fund’s portfolio. An interest rate swap is an agreement between two parties to exchange or swap payments based on changes in an interest rate or rates. Typically, one interest rate is fixed and the other is variable based on a designated short-term interest rate such as the Secured Overnight Financing Rate (SOFR), prime rate or other benchmark. In other types of interest rate swaps, known as basis swaps, the parties agree to swap variable interest rates based on different designated short-term interest rates. Interest rate swaps generally do not involve the delivery of securities or other principal amounts. Rather, cash payments are exchanged by the parties based on the application of the designated interest rates to a notional amount, which is the predetermined dollar principal of the trade upon which payment obligations are computed. Accordingly, the fund’s current obligation or right under the swap agreement is generally equal to the net amount to be paid or received under the swap agreement based on the relative value of the position held by each party. Under current regulations, the fund will generally segregate assets with a daily value at least equal to the excess, if any, of the fund’s accrued obligations under the swap agreement over the accrued amount the fund is entitled to receive under the agreement, less the value of any posted margin or collateral on deposit with respect to the position.
In addition to the risks of entering into swaps discussed above, the use of interest rate swaps involves the risk of losses if interest rates change.
Credit default swap indices — In order to assume exposure to a diversified portfolio of credits or to hedge against existing credit risks, the fund may invest in credit default swap indices, including CDX and iTraxx indices (collectively referred to as “CDSIs”). A CDSI is based on a portfolio of credit default swaps with similar characteristics, such as credit default swaps on high-yield bonds. In a typical CDSI transaction, one party — the protection buyer — is obligated to pay the other party — the protection seller — a stream of periodic payments over the term of the contract. If a credit event, such as a default or restructuring, occurs with respect to any of the underlying reference obligations, the protection seller must pay the protection buyer the loss on those credits. Also, if a restructuring credit event occurs in an iTraxx index, the fund as protection buyer may receive a single name credit default swap (CDS) contract representing the relevant constituent.
The fund may enter into a CDSI transaction as either protection buyer or protection seller. If the fund is a protection buyer, it would pay the counterparty a periodic stream of payments over the term of the contract and would not recover any of those payments if no credit events were to occur with respect to any of the underlying reference obligations. However, if a credit event did occur, the fund, as a protection buyer, would have the right to deliver the referenced debt obligations or a specified amount of cash, depending on the terms of the applicable agreement, and to receive the par value of such debt obligations from the counterparty protection seller. As a protection seller, the fund would receive fixed payments throughout the term of the
The Bond Fund of America — Page 27
contract if no credit events were to occur with respect to any of the underlying reference obligations. If a credit event were to occur, however, the value of any deliverable obligation received by the fund, coupled with the periodic payments previously received by the fund, may be less than the full notional value that the fund, as a protection seller, pays to the counterparty protection buyer, effectively resulting in a loss of value to the fund. Furthermore, as a protection seller, the fund would effectively add leverage to its portfolio because it would have investment exposure to the notional amount of the swap transaction.
The use of CDSI, like all other swap agreements, is subject to certain risks, including the risk that the fund’s counterparty will default on its obligations. If such a default were to occur, any contractual remedies that the fund might have may be subject to applicable bankruptcy laws, which could delay or limit the fund’s recovery. Thus, if the fund’s counterparty to a CDSI transaction defaults on its obligation to make payments thereunder, the fund may lose such payments altogether or collect only a portion thereof, which collection could involve substantial costs or delays.
Additionally, when the fund invests in a CDSI as a protection seller, the fund will be indirectly exposed to the creditworthiness of issuers of the underlying reference obligations in the index. If the investment adviser to the fund does not correctly evaluate the creditworthiness of issuers of the underlying instruments on which the CDSI is based, the investment could result in losses to the fund.
Pursuant to current regulations and published positions of the U.S. Securities and Exchange Commission, the fund’s obligations under a CDSI agreement will be accrued daily and, where applicable, offset against any amounts owing to the fund. In connection with CDSI transactions in which the fund acts as protection buyer, the fund will segregate liquid assets with a value at least equal to the fund’s exposure (i.e., any accrued but unpaid net amounts owed by the fund to any counterparty), on a marked-to-market basis, less the value of any posted margin. When the fund acts as protection seller, the fund will segregate liquid assets with a value at least equal to the full notional amount of the swap, less the value of any posted margin. Such segregation is intended to ensure that the fund has assets available to satisfy its obligations with respect to CDSI transactions and to limit any potential leveraging of the fund’s portfolio. However, segregation of liquid assets will not limit the fund’s exposure to loss. To maintain this required margin, the fund may also have to sell portfolio securities at disadvantageous prices, and the earmarking of liquid assets will have the effect of limiting the fund’s ability to otherwise invest those assets in other securities or instruments.
Cybersecurity risks — With the increased use of technologies such as the Internet to conduct business, the fund has become potentially more susceptible to operational and information security risks through breaches in cybersecurity. In general, a breach in cybersecurity can result from either a deliberate attack or an unintentional event. Cybersecurity breaches may involve, among other things, “ransomware” attacks, injection of computer viruses or malicious software code, or the use of vulnerabilities in code to gain unauthorized access to digital information systems, networks or devices that are used directly or indirectly by the fund or its service providers through “hacking” or other means. Cybersecurity risks also include the risk of losses of service resulting from external attacks that do not require unauthorized access to the fund’s systems, networks or devices. For example, denial-of-service attacks on the investment adviser’s or an affiliate’s website could effectively render the fund’s network services unavailable to fund shareholders and other intended end-users. Any such cybersecurity breaches or losses of service may, among other things, cause the fund to lose proprietary information, suffer data corruption or lose operational capacity, or may result in the misappropriation, unauthorized release or other misuse of the fund’s assets or sensitive information
The Bond Fund of America — Page 28
(including shareholder personal information or other confidential information), the inability of fund shareholders to transact business, or the destruction of the fund’s physical infrastructure, equipment or operating systems. These, in turn, could cause the fund to violate applicable privacy and other laws and incur or suffer regulatory penalties, reputational damage, additional costs (including compliance costs) associated with corrective measures and/or financial loss. While the fund and its investment adviser have established business continuity plans and risk management systems designed to prevent or reduce the impact of cybersecurity attacks, there are inherent limitations in such plans and systems due in part to the ever-changing nature of technology and cybersecurity attack tactics, and there is a possibility that certain risks have not been adequately identified or prepared for.
In addition, cybersecurity failures by or breaches of the fund’s third-party service providers (including, but not limited to, the fund’s investment adviser, transfer agent, custodian, administrators and other financial intermediaries) may disrupt the business operations of the service providers and of the fund, potentially resulting in financial losses, the inability of fund shareholders to transact business with the fund and of the fund to process transactions, the inability of the fund to calculate its net asset value, violations of applicable privacy and other laws, rules and regulations, regulatory fines, penalties, reputational damage, reimbursement or other compensatory costs and/or additional compliance costs associated with implementation of any corrective measures. The fund and its shareholders could be negatively impacted as a result of any such cybersecurity breaches, and there can be no assurance that the fund will not suffer losses relating to cybersecurity attacks or other informational security breaches affecting the fund’s third-party service providers in the future, particularly as the fund cannot control any cybersecurity plans or systems implemented by such service providers.
Cybersecurity risks may also impact issuers of securities in which the fund invests, which may cause the fund’s investments in such issuers to lose value.
Interfund borrowing and lending — Pursuant to an exemptive order issued by the U.S. Securities and Exchange Commission, the fund may lend money to, and borrow money from, other funds advised by Capital Research and Management Company or its affiliates. The fund will borrow through the program only when the costs are equal to or lower than the costs of bank loans. The fund will lend through the program only when the returns are higher than those available from an investment in repurchase agreements. Interfund loans and borrowings normally extend overnight, but can have a maximum duration of seven days. Loans may be called on one day's notice. The fund may have to borrow from a bank at a higher interest rate if an interfund loan is called or not renewed. Any delay in repayment to a lending fund could result in a lost investment opportunity or additional borrowing costs.
Affiliated investment companies — The fund may purchase shares of another investment company managed by the investment adviser or its affiliates. The risks of owning another investment company are similar to the risks of investing directly in the securities in which that investment company invests. When investing in another investment company managed by the investment adviser or its affiliates, the fund bears its proportionate share of the expenses of any such investment company in which it invests but will not bear additional management fees through its investment in such investment company. Investments in other investment companies could allow the fund to obtain the benefits of a more diversified portfolio than might otherwise be available through direct investments in a particular asset class, and will subject the fund to the risks associated with the particular asset class or asset classes in which an underlying fund invests. However, an investment company may not achieve its investment objective or execute its investment strategy effectively, which may adversely affect the fund’s performance. Any investment in another investment company will be consistent with the fund’s objective(s) and applicable regulatory limitations.
* * * * * *
The Bond Fund of America — Page 29
Portfolio turnover — Portfolio changes will be made without regard to the length of time particular investments may have been held. Short-term trading profits are not the fund’s objective, and changes in its investments are generally accomplished gradually, though short-term transactions may occasionally be made. Higher portfolio turnover may involve correspondingly greater transaction costs in the form of dealer spreads or brokerage commissions. It may also result in the realization of net capital gains, which are taxable when distributed to shareholders, unless the shareholder is exempt from taxation or his or her account is tax-favored.
Fixed income securities are generally traded on a net basis and usually neither brokerage commissions nor transfer taxes are involved. Transaction costs are usually reflected in the spread between the bid and asked price.
The fund’s portfolio turnover rates for the fiscal years ended December 31, 2021 and 2020 were 368% and 535%, respectively. The decrease in turnover was due to decreased trading activity during the period. The fund’s portfolio turnover rate excluding mortgage dollar roll transactions for the fiscal years ended December 31, 2021 and 2020 were 74% and 113%, respectively. See “Forward commitment, when issued and delayed delivery transactions” above for more information on mortgage dollar rolls. The portfolio turnover rate would equal 100% if each security in a fund’s portfolio were replaced once per year. See “Financial highlights” in the prospectus for the fund’s annual portfolio turnover rate for each of the last five fiscal years.
The Bond Fund of America — Page 30
Fund policies
All percentage limitations in the following fund policies are considered at the time securities are purchased and are based on the fund’s net assets unless otherwise indicated. None of the following policies involving a maximum percentage of assets will be considered violated unless the excess occurs immediately after, and is caused by, an acquisition by the fund. In managing the fund, the fund’s investment adviser may apply more restrictive policies than those listed below.
Fundamental policies — The fund has adopted the following policies, which may not be changed without approval by holders of a majority of its outstanding shares. Such majority is currently defined in the Investment Company Act of 1940, as amended (the “1940 Act”), as the vote of the lesser of (a) 67% or more of the voting securities present at a shareholder meeting, if the holders of more than 50% of the outstanding voting securities are present in person or by proxy, or (b) more than 50% of the outstanding voting securities.
1. Except as permitted by (i) the 1940 Act and the rules and regulations thereunder, or other successor law governing the regulation of registered investment companies, or interpretations or modifications thereof by the U.S. Securities and Exchange Commission (“SEC”), SEC staff or other authority of competent jurisdiction, or (ii) exemptive or other relief or permission from the SEC, SEC staff or other authority of competent jurisdiction, the fund may not:
a. Borrow money;
b. Issue senior securities;
c. Underwrite the securities of other issuers;
d. Purchase or sell real estate or commodities;
e. Make loans; or
f. Purchase the securities of any issuer if, as a result of such purchase, the fund’s investments would be concentrated in any particular industry.
2. The fund may not invest in companies for the purpose of exercising control or management.
Nonfundamental policies — The following policy may be changed without shareholder approval:
The fund may not acquire securities of open-end investment companies or unit investment trusts registered under the 1940 Act in reliance on Sections 12(d)(1)(F) or 12(d)(1)(G) of the 1940 Act.
The Bond Fund of America — Page 31
Additional information about the fund’s policies — The information below is not part of the fund’s fundamental or nonfundamental policies. This information is intended to provide a summary of what is currently required or permitted by the 1940 Act and the rules and regulations thereunder, or by the interpretive guidance thereof by the SEC or SEC staff, for particular fundamental policies of the fund. Information is also provided regarding the fund’s current intention with respect to certain investment practices permitted by the 1940 Act.
For purposes of fundamental policy 1a, the fund may borrow money in amounts of up to 33-1/3% of its total assets from banks for any purpose. Additionally, the fund may borrow up to 5% of its total assets from banks or other lenders for temporary purposes (a loan is presumed to be for temporary purposes if it is repaid within 60 days and is not extended or renewed). The percentage limitations in this policy are considered at the time of borrowing and thereafter.
For purposes of fundamental policies 1a and 1e, the fund may borrow money from, or loan money to, other funds managed by Capital Research and Management Company or its affiliates to the extent permitted by applicable law and an exemptive order issued by the SEC.
For purposes of fundamental policy 1b, a senior security does not include any promissory note or evidence of indebtedness if such loan is for temporary purposes only and in an amount not exceeding 5% of the value of the total assets of the fund at the time the loan is made (a loan is presumed to be for temporary purposes if it is repaid within 60 days and is not extended or renewed). Further, to the extent the fund covers its commitments under certain types of agreements and transactions, including derivatives, mortgage-dollar-roll transactions, sale-buybacks, when-issued, delayed-delivery, or forward commitment transactions, and other similar trading practices, by segregating or earmarking liquid assets equal in value to the amount of the fund’s commitment (in accordance with applicable SEC or SEC staff guidance), such agreement or transaction will not be considered a senior security by the fund.
For purposes of fundamental policy 1c, the policy will not apply to the fund to the extent the fund may be deemed an underwriter within the meaning of the 1933 Act in connection with the purchase and sale of fund portfolio securities in the ordinary course of pursuing its investment objectives and strategies.
For purposes of fundamental policy 1e, the fund may not lend more than 33-1/3% of its total assets, provided that this limitation shall not apply to the fund’s purchase of debt obligations.
For purposes of fundamental policy 1f, the fund may not invest more than 25% of its total assets in the securities of issuers in a particular industry. This policy does not apply to investments in securities of the U.S. government, its agencies or government sponsored enterprises or repurchase agreements with respect thereto.
The Bond Fund of America — Page 32
Management of the fund
Board of trustees and officers
Independent trustees1
The fund’s nominating and governance committee and board select independent trustees with a view toward constituting a board that, as a body, possesses the qualifications, skills, attributes and experience to appropriately oversee the actions of the fund’s service providers, decide upon matters of general policy and represent the long-term interests of fund shareholders. In doing so, they consider the qualifications, skills, attributes and experience of the current board members, with a view toward maintaining a board that is diverse in viewpoint, experience, education and skills.
The fund seeks independent trustees who have high ethical standards and the highest levels of integrity and commitment, who have inquiring and independent minds, mature judgment, good communication skills, and other complementary personal qualifications and skills that enable them to function effectively in the context of the fund’s board and committee structure and who have the ability and willingness to dedicate sufficient time to effectively fulfill their duties and responsibilities.
Each independent trustee has a significant record of accomplishments in governance, business, not-for-profit organizations, government service, academia, law, accounting or other professions. Although no single list could identify all experience upon which the fund’s independent trustees draw in connection with their service, the following table summarizes key experience for each independent trustee. These references to the qualifications, attributes and skills of the trustees are pursuant to the disclosure requirements of the SEC, and shall not be deemed to impose any greater responsibility or liability on any trustee or the board as a whole. Notwithstanding the accomplishments listed below, none of the independent trustees is considered an “expert” within the meaning of the federal securities laws with respect to information in the fund’s registration statement.
The Bond Fund of America — Page 33
| | | | | |
Name, year of birth and position with fund (year first elected as a trustee2) | Principal
occupation(s)
during the
past five years | Number of
portfolios
in fund
complex
overseen
by trustee | Other directorships3 held
by trustee during the past five years | Other relevant experience |
Francisco G. Cigarroa, MD, 1957
Trustee (2021) | Professor of Surgery, University of Texas Health San Antonio; Trustee, Ford Foundation; Clayton Research Scholar, Clayton Foundation for Biomedical Research | 86 | None | · Corporate board experience · Service on boards of community and nonprofit organizations · MD |
James G. Ellis, 1947
Trustee (2006) | Former Dean and Professor of Marketing, Marshall School of Business, University of Southern California | 99 | Advanced Merger Partners; EVe Mobility Acquisition Corp (acquisitions of companies in the electric vehicle market); J. G. Boswell (agricultural production); Mercury General Corporation | · Service as chief executive officer for multiple companies · Corporate board experience · Service on advisory and trustee boards for charitable, municipal and nonprofit organizations · MBA |
Nariman Farvardin, 1956
Trustee (2018) | President, Stevens Institute of Technology | 91 | None | · Senior management experience, educational institution · Corporate board experience · Professor, electrical and computer engineering · Service on advisory boards and councils for educational, nonprofit and governmental organizations · MS, PhD, electrical engineering |
The Bond Fund of America — Page 34
| | | | | |
Name, year of birth and position with fund (year first elected as a trustee2) | Principal
occupation(s)
during the
past five years | Number of
portfolios
in fund
complex
overseen
by trustee | Other directorships3 held
by trustee during the past five years | Other relevant experience |
Mary Davis Holt, 1950
Trustee (2015-2016; 2017) | Principal, Mary Davis Holt Enterprises, LLC (leadership development consulting); former Partner, Flynn Heath Holt Leadership, LLC (leadership consulting); former COO, Time Life Inc. (1993–2003) | 87 | None | · Service as chief operations officer, global media company · Senior corporate management experience · Corporate board experience · Service on advisory and trustee boards for educational, business and nonprofit organizations · MBA |
Merit E. Janow, 1958
Trustee (2010) | Former Dean and Professor of Practice, International Economic Law & International Affairs, Columbia University, School of International and Public Affairs | 93 | Aptiv (autonomous and green vehicle technology); Mastercard Incorporated Former director of Trimble Inc. (software, hardware and services technology) (until 2021) | · Service with Office of the U.S. Trade Representative and U.S. Department of Justice · Corporate board experience · Service on advisory and trustee boards for charitable, educational and nonprofit organizations · Experience as corporate lawyer · JD |
Margaret Spellings, 1957
Chair of the Board (Independent and Non-Executive) (2010) | President and CEO, Texas 2036; former President, Margaret Spellings & Company (public policy and strategic consulting); former President, The University of North Carolina; former President, George W. Bush Presidential Center | 91 | Former director of ClubCorp Holdings, Inc. (until 2017) | · Former U.S. Secretary of Education, U.S. Department of Education · Former Assistant to the President for Domestic Policy, The White House · Former senior advisor to the Governor of Texas · Service on advisory and trustee boards for charitable and nonprofit organizations |
The Bond Fund of America — Page 35
| | | | | |
Name, year of birth and position with fund (year first elected as a trustee2) | Principal
occupation(s)
during the
past five years | Number of
portfolios
in fund
complex
overseen
by trustee | Other directorships3 held
by trustee during the past five years | Other relevant experience |
Alexandra Trower, 1964
Trustee (2019) | Former Executive Vice President, Global Communications and Corporate Officer, The Estée Lauder Companies | 86 | None | · Service on trustee boards for charitable and nonprofit organizations · Senior corporate management experience · Branding |
Paul S. Williams, 1959
Trustee (2020) | Former Partner/Managing Director, Major, Lindsey & Africa (executive recruiting firm) | 86 | Air Transport Services Group, Inc. (aircraft leasing and air cargo transportation); Compass Minerals, Inc. (producer of salt and specialty fertilizers); Public Storage, Inc.; Romeo Power, Inc. (manufacturer of batteries for electric vehicles) Former director of Bob Evans Farms, Inc. (restaurant company) (until 2017); Essendant, Inc. (business products wholesaler) (until 2019) | · Senior corporate management experience · Corporate board experience · Corporate governance experience · Service on trustee boards for charitable and educational nonprofit organizations · Securities law expertise · JD |
The Bond Fund of America — Page 36
Interested trustee(s)4,5
Interested trustees have similar qualifications, skills and attributes as the independent trustees. Interested trustees are senior executive officers and/or directors of Capital Research and Management Company or its affiliates. Such management roles with the fund’s service providers also permit the interested trustees to make a significant contribution to the fund’s board.
| | | | |
Name, year of birth
and position with fund
(year first elected
as a trustee/officer2) | Principal occupation(s)
during the
past five years
and positions
held with affiliated
entities or the
Principal Underwriter
of the fund | Number of
portfolios
in fund
complex
overseen
by trustee | Other directorships3
held by trustee
during the
past five years |
Michael C. Gitlin, 1970
Trustee (2015) | Partner – Capital Fixed Income Investors, Capital Research and Management Company; Vice Chairman and Director, Capital Research and Management Company; Director, The Capital Group Companies, Inc.*; served as Head of Fixed Income at a large investment management firm prior to joining Capital Research and Management Company in 2015 | 86 | None |
Karl J. Zeile, 1966
Trustee (2019) | Partner – Capital Fixed Income Investors, Capital Research and Management Company | 21 | None |
The Bond Fund of America — Page 37
Other officers5
| | |
Name, year of birth
and position with fund
(year first elected
as an officer2) | Principal occupation(s) during the past five years
and positions held with affiliated entities
or the Principal Underwriter of the fund |
|
Pramod Atluri, 1976
President (2016) | Partner – Capital Fixed Income Investors, Capital Research and Management Company; Vice President – Capital Fixed Income Investors, Capital Bank and Trust Company*; Director, Capital Research and Management Company |
|
Kristine M. Nishiyama, 1970
Principal Executive Officer (2003) | Senior Vice President and Senior Counsel – Fund Business Management Group, Capital Research and Management Company; Chair, Senior Vice President, General Counsel and Director, Capital Bank and Trust Company* |
Michael W. Stockton, 1967
Executive Vice President (2021) | Senior Vice President – Fund Business Management Group, Capital Research and Management Company |
David J. Betanzos, 1974
Senior Vice President (2016) | Partner – Capital Fixed Income Investors, Capital Research and Management Company; Director, Capital Research and Management Company |
David A. Hoag, 1965
Senior Vice President (2015) | Partner – Capital Fixed Income Investors, Capital Research and Management Company; Partner – Capital Fixed Income Investors, Capital Bank and Trust Company* |
Fergus N. MacDonald, 1969
Senior Vice President (2015) | Partner – Capital Fixed Income Investors, Capital Research and Management Company; Director, The Capital Group Companies, Inc.* |
Steven I. Koszalka, 1964
Secretary (2010) | Vice President – Fund Business Management Group, Capital Research and Management Company |
Brian C. Janssen, 1972
Treasurer (2011) | Senior Vice President – Investment Operations, Capital Research and Management Company |
Jane Y. Chung, 1974
Assistant Secretary (2014) | Associate – Fund Business Management Group, Capital Research and Management Company |
Sandra Chuon, 1972
Assistant Treasurer (2019) | Assistant Vice President – Investment Operations, Capital Research and Management Company |
|
Becky L. Park, 1979
Assistant Treasurer (2021) | Vice President – Investment Operations, Capital Research and Management Company |
|
* Company affiliated with Capital Research and Management Company.
1 The term independent trustee refers to a trustee who is not an “interested person” of the fund within the meaning of the 1940 Act.
2 Trustees and officers of the fund serve until their resignation, removal or retirement.
3 This includes all directorships/trusteeships (other than those in the American Funds or other funds managed by Capital Research and Management Company or its affiliates) that are held by each trustee as a director/trustee of a public company or a registered investment company. Unless otherwise noted, all directorships/trusteeships are current.
4 The term interested trustee refers to a trustee who is an “interested person” of the fund within the meaning of the 1940 Act, on the basis of his or her affiliation with the fund’s investment adviser, Capital Research and Management Company, or affiliated entities (including the fund’s principal underwriter).
5 All of the trustees and/or officers listed are officers and/or directors/trustees of one or more of the other funds for which Capital Research and Management Company serves as investment adviser.
The address for all trustees and officers of the fund is 333 South Hope Street, 55th Floor, Los Angeles, California 90071, Attention: Secretary.
The Bond Fund of America — Page 38
Fund shares owned by trustees as of December 31, 2021:
| | | | | |
Name | Dollar range1,2
of fund
shares owned | Aggregate
dollar range1
of shares
owned in
all funds
overseen
by trustee
in same
family of
investment
companies
as the fund | Dollar
range1,2 of
independent
trustees
deferred compensation3 allocated
to fund | Aggregate
dollar
range1,2 of
independent
trustees
deferred
compensation3 allocated to
all funds
overseen
by trustee
in same
family of
investment
companies
as the fund |
Independent trustees |
Francisco G. Cigarroa | None | None | $10,001 – $50,000 | Over $100,000 |
James G. Ellis | $10,001 – $50,000 | Over $100,000 | N/A | N/A |
Nariman Farvardin | None | Over $100,000 | Over $100,000 | Over $100,000 |
Mary Davis Holt | None | Over $100,000 | N/A | N/A |
Merit E. Janow | $50,001 – $100,000 | Over $100,000 | N/A | $50,001 – $100,000 |
Margaret Spellings | Over $100,000 | Over $100,000 | N/A | Over $100,000 |
Alexandra Trower | Over $100,000 | Over $100,000 | Over $100,000 | Over $100,000 |
Paul S. Williams | $10,001 – $50,000 | Over $100,000 | N/A | Over $100,000 |
| | | |
Name | Dollar range1,2
of fund
shares owned | Aggregate
dollar range1
of shares
owned in
all funds overseen
by trustee
in same
family of investment
companies as the fund |
Interested trustees |
Michael C. Gitlin | Over $100,000 | Over $100,000 |
Karl J. Zeile | $50,001 – $100,000 | Over $100,000 |
1 Ownership disclosure is made using the following ranges: None; $1 – $10,000; $10,001 – $50,000; $50,001 – $100,000; and Over $100,000. The amounts listed for interested trustees include shares owned through The Capital Group Companies, Inc. retirement plan and 401(k) plan.
2 N/A indicates that the listed individual, as of December 31, 2021, was not a trustee of a particular fund, did not allocate deferred compensation to the fund or did not participate in the deferred compensation plan.
3 Eligible trustees may defer their compensation under a nonqualified deferred compensation plan. Amounts deferred by the trustee accumulate at an earnings rate determined by the total return of one or more American Funds as designated by the trustee.
The Bond Fund of America — Page 39
Trustee compensation — No compensation is paid by the fund to any officer or trustee who is a director, officer or employee of the investment adviser or its affiliates. Except for the independent trustees listed in the “Board of trustees and officers — Independent trustees” table under the “Management of the fund” section in this statement of additional information, all other officers and trustees of the fund are directors, officers or employees of the investment adviser or its affiliates. The boards of funds advised by the investment adviser typically meet either individually or jointly with the boards of one or more other such funds with substantially overlapping board membership (in each case referred to as a “board cluster”). The fund typically pays each independent trustee an annual retainer fee based primarily on the total number of board clusters on which that independent trustee serves.
In addition, the fund generally pays independent trustees attendance and other fees for meetings of the board and its committees. Board and committee chairs receive additional fees for their services.
Independent trustees also receive attendance fees for certain special joint meetings and information sessions with directors and trustees of other groupings of funds advised by the investment adviser. The fund and the other funds served by each independent trustee each pay a portion of these attendance fees.
No pension or retirement benefits are accrued as part of fund expenses. Independent trustees may elect, on a voluntary basis, to defer all or a portion of their fees through a deferred compensation plan in effect for the fund. The fund also reimburses certain expenses of the independent trustees.
The Bond Fund of America — Page 40
Trustee compensation earned during the fiscal year ended December 31, 2021:
| | | |
Name | Aggregate compensation
(including voluntarily
deferred compensation1)
from the fund | Total compensation (including
voluntarily deferred
compensation1)
from all funds managed by
Capital Research and
Management
Company or its affiliates |
Francisco G. Cigarroa2 (service began January 2, 2021) | $22,053 | $318,000 |
James G. Ellis | 17,095 | 502,000 |
Nariman Farvardin2 | 16,094 | 400,500 |
Mary Davis Holt | 16,800 | 375,000 |
R. Clark Hooper2 (retired December 31, 2021) | 14,206 | 418,676 |
Merit E. Janow2 | 13,443 | 443,476 |
Margaret Spellings2 | 18,386 | 513,476 |
Alexandra Trower2 | 22,037 | 318,000 |
Paul S. Williams2 | 22,088 | 318,500 |
1 Amounts may be deferred by eligible trustees under a nonqualified deferred compensation plan adopted by the fund in 1993. Deferred amounts accumulate at an earnings rate determined by the total return of one or more American Funds as designated by the trustees. Compensation shown in this table for the fiscal year ended December 31, 2021 does not include earnings on amounts deferred in previous fiscal years. See footnote 2 to this table for more information.
2 Since the deferred compensation plan’s adoption, the total amount of deferred compensation accrued by the fund (plus earnings thereon) through the end of the 2021 fiscal year for participating trustees is as follows: Francisco G. Cigarroa ($10,461), Nariman Farvardin ($109,321), R. Clark Hooper ($62,697), Merit E. Janow ($3,602), Margaret Spellings ($89,639), Alexandra Trower ($78,755) and Paul S. Williams ($17,380). Amounts deferred and accumulated earnings thereon are not funded and are general unsecured liabilities of the fund until paid to the trustees.
The Bond Fund of America — Page 41
Fund organization and the board of trustees — The fund, an open-end, diversified management investment company, was organized as a Maryland corporation on December 3, 1973, and reorganized as a Delaware statutory trust on March 1, 2011. All fund operations are supervised by the fund’s board of trustees which meets periodically and performs duties required by applicable state and federal laws.
Delaware law charges trustees with the duty of managing the business affairs of the trust. Trustees are considered to be fiduciaries of the trust and owe duties of care and loyalty to the trust and its shareholders.
Independent board members are paid certain fees for services rendered to the fund as described above. They may elect to defer all or a portion of these fees through a deferred compensation plan in effect for the fund.
The fund has several different classes of shares. Shares of each class represent an interest in the same investment portfolio. Each class has pro rata rights as to voting, redemption, dividends and liquidation, except that each class bears different distribution expenses and may bear different transfer agent fees and other expenses properly attributable to the particular class as approved by the board of trustees and set forth in the fund’s rule 18f-3 Plan. Each class’ shareholders have exclusive voting rights with respect to the respective class’ rule 12b-1 plans adopted in connection with the distribution of shares and on other matters in which the interests of one class are different from interests in another class. Shares of all classes of the fund vote together on matters that affect all classes in substantially the same manner. Each class votes as a class on matters that affect that class alone. Note that 529 college savings plan account owners invested in Class 529 shares are not shareholders of the fund and, accordingly, do not have the rights of a shareholder, such as the right to vote proxies relating to fund shares. As the legal owner of the fund’s Class 529 shares, Virginia College Savings PlanSM (Virginia529SM) will vote any proxies relating to the fund’s Class 529 shares. In addition, the trustees have the authority to establish new series and classes of shares, and to split or combine outstanding shares into a greater or lesser number, without shareholder approval.
The fund does not hold annual meetings of shareholders. However, significant matters that require shareholder approval, such as certain elections of board members or a change in a fundamental investment policy, will be presented to shareholders at a meeting called for such purpose. Shareholders have one vote per share owned.
The fund’s declaration of trust and by-laws, as well as separate indemnification agreements with independent trustees, provide in effect that, subject to certain conditions, the fund will indemnify its officers and trustees against liabilities or expenses actually and reasonably incurred by them relating to their service to the fund. However, trustees are not protected from liability by reason of their willful misfeasance, bad faith, gross negligence or reckless disregard of the duties involved in the conduct of their office.
Removal of trustees by shareholders — At any meeting of shareholders, duly called and at which a quorum is present, shareholders may, by the affirmative vote of the holders of two-thirds of the votes entitled to be cast, remove any trustee from office and may elect a successor or successors to fill any resulting vacancies for the unexpired terms of removed trustees. In addition, the trustees of the fund will promptly call a meeting of shareholders for the purpose of voting upon the removal of any trustees when requested in writing to do so by the record holders of at least 10% of the outstanding shares.
Leadership structure — The board’s chair is currently an independent trustee who is not an “interested person” of the fund within the meaning of the 1940 Act. The board has determined that an independent chair facilitates oversight and enhances the effectiveness of the board. The independent chair’s duties include, without limitation, generally presiding at meetings of the board, approving
The Bond Fund of America — Page 42
board meeting schedules and agendas, leading meetings of the independent trustees in executive session, facilitating communication with committee chairs, and serving as the principal independent trustee contact for fund management and counsel to the independent trustees and the fund.
Risk oversight — Day-to-day management of the fund, including risk management, is the responsibility of the fund’s contractual service providers, including the fund’s investment adviser, principal underwriter/distributor and transfer agent. Each of these entities is responsible for specific portions of the fund’s operations, including the processes and associated risks relating to the fund’s investments, integrity of cash movements, financial reporting, operations and compliance. The board of trustees oversees the service providers’ discharge of their responsibilities, including the processes they use to manage relevant risks. In that regard, the board receives reports regarding the operations of the fund’s service providers, including risks. For example, the board receives reports from investment professionals regarding risks related to the fund’s investments and trading. The board also receives compliance reports from the fund’s and the investment adviser’s chief compliance officers addressing certain areas of risk.
Committees of the fund’s board, which are comprised of independent board members, none of whom is an “interested person” of the fund within the meaning of the 1940 Act, as well as joint committees of independent board members of funds managed by Capital Research and Management Company, also explore risk management procedures in particular areas and then report back to the full board. For example, the fund’s audit committee oversees the processes and certain attendant risks relating to financial reporting, valuation of fund assets, and related controls. Similarly, a joint review and advisory committee oversees certain risk controls relating to the fund’s transfer agency services.
Not all risks that may affect the fund can be identified or processes and controls developed to eliminate or mitigate their effect. Moreover, it is necessary to bear certain risks (such as investment-related risks) to achieve the fund’s objectives. As a result of the foregoing and other factors, the ability of the fund’s service providers to eliminate or mitigate risks is subject to limitations.
Committees of the board of trustees — The fund has an audit committee comprised of Francisco G. Cigarroa, James G. Ellis and Paul S. Williams. The committee provides oversight regarding the fund’s accounting and financial reporting policies and practices, its internal controls and the internal controls of the fund’s principal service providers. The committee acts as a liaison between the fund’s independent registered public accounting firm and the full board of trustees. The audit committee held five meetings during the 2021 fiscal year.
The fund has a contracts committee comprised of all of its independent board members. The committee’s principal function is to request, review and consider the information deemed necessary to evaluate the terms of certain agreements between the fund and its investment adviser or the investment adviser’s affiliates, such as the Investment Advisory and Service Agreement, Principal Underwriting Agreement, Administrative Services Agreement and Plans of Distribution adopted pursuant to rule 12b-1 under the 1940 Act, that the fund may enter into, renew or continue, and to make its recommendations to the full board of trustees on these matters. The contracts committee held one meeting during the 2021 fiscal year.
The fund has a nominating and governance committee comprised of Nariman Farvardin, Mary Davis Holt, Merit E. Janow, Margaret Spellings and Alexandra Trower. The committee periodically reviews such issues as the board’s composition, responsibilities, committees, compensation and other relevant issues, and recommends any appropriate changes to the full board of trustees. The committee also coordinates annual self-assessments of the board and evaluates, selects and nominates independent trustee candidates to the full board of trustees. While the committee normally is able to identify from its own and other resources an ample number of qualified candidates, it will consider shareholder suggestions of persons to be considered as nominees to fill future vacancies on the board. Such
The Bond Fund of America — Page 43
suggestions must be sent in writing to the nominating and governance committee of the fund, addressed to the fund’s secretary, and must be accompanied by complete biographical and occupational data on the prospective nominee, along with a written consent of the prospective nominee for consideration of his or her name by the committee. The nominating and governance committee held two meetings during the 2021 fiscal year.
The independent board members of the fund have oversight responsibility for the fund and certain other funds managed by the investment adviser. As part of their oversight responsibility for these funds, each independent board member sits on one of three fund review committees comprised solely of independent board members. The three committees are divided by portfolio type. Each committee functions independently and is not a decision making body. The purpose of the committees is to assist the board of each fund in the oversight of the investment management services provided by the investment adviser. In addition to regularly monitoring and reviewing investment results, investment activities and strategies used to manage the fund’s assets, the committees also receive reports from the investment adviser’s Principal Investment Officers for the funds, portfolio managers and other investment personnel concerning efforts to achieve the fund’s investment objectives. Each committee reports to the full board of the fund.
Proxy voting procedures and principles — The fund’s investment adviser, in consultation with the fund’s board, has adopted Proxy Voting Procedures and Principles (the “Principles”) with respect to voting proxies of securities held by the fund, other American Funds and American Funds Insurance Series. The complete text of these principles is available at capitalgroup.com. Proxies are voted by a committee of the appropriate equity investment division of the investment adviser under authority delegated by the funds’ boards. The boards of American Funds have established a Joint Proxy Committee (“JPC”) composed of independent board members from each American Funds board. The JPC’s role is to facilitate appropriate oversight of the proxy voting process and provide valuable input on corporate governance and related matters.
The Principles, which have been in effect in substantially their current form for many years, provide an important framework for analysis and decision-making by all funds. However, they are not exhaustive and do not address all potential issues. The Principles provide a certain amount of flexibility so that all relevant facts and circumstances can be considered in connection with every vote. As a result, each proxy received is voted on a case-by-case basis considering the specific circumstances of each proposal. The voting process reflects the funds’ understanding of the company’s business, its management and its relationship with shareholders over time.
The investment adviser seeks to vote all U.S. proxies; however, in certain circumstances it may be impracticable or impossible to do so. Proxies for companies outside the U.S. also are voted, provided there is sufficient time and information available. Certain regulators have granted investment limit relief to the investment adviser and its affiliates, conditioned upon limiting its voting power to specific voting ceilings. To comply with these voting ceilings, the investment adviser will scale back its votes across all funds and clients on a pro-rata basis based on assets. After a proxy statement is received, the investment adviser prepares a summary of the proposals contained in the proxy statement. A notation of any potential conflicts of interest also is included in the summary (see below for a description of Capital Research and Management Company’s special review procedures).
For proxies of securities managed by a particular equity investment division of the investment adviser, the initial voting recommendation is made by one or more of the division’s investment analysts familiar with the company and industry. A second recommendation is made by a proxy coordinator (an investment analyst or other individual with experience in corporate governance and proxy voting matters) within the appropriate investment division, based on knowledge of these Principles and familiarity with proxy-related issues. The proxy summary and voting recommendations are made available to the appropriate proxy voting committee for a final voting decision. In cases where a fund is co-managed and a security is held by more than one of the investment adviser’s equity investment
The Bond Fund of America — Page 44
divisions, the divisions may develop different voting recommendations for individual ballot proposals. If this occurs, and if permitted by local market conventions, the fund’s position will generally be voted proportionally by divisional holding, according to their respective decisions. Otherwise, the outcome will be determined by the equity investment division or divisions with the larger position in the security as of the record date for the shareholder meeting.
In addition to its proprietary proxy voting, governance and executive compensation research, Capital Research and Management Company may utilize research provided by Institutional Shareholder Services, Glass-Lewis & Co. or other third-party advisory firms on a case-by-case basis. It does not, as a policy, follow the voting recommendations provided by these firms. It periodically assesses the information provided by the advisory firms and reports to the JPC, as appropriate.
From time to time the investment adviser may vote proxies issued by, or on proposals sponsored or publicly supported by (a) a client with substantial assets managed by the investment adviser or its affiliates, (b) an entity with a significant business relationship with Capital Group, or (c) a company with a director of an American Fund on its board (each referred to as an “Interested Party”). Other persons or entities may also be deemed an Interested Party if facts or circumstances appear to give rise to a potential conflict. The investment adviser analyzes these proxies and proposals on their merits and does not consider these relationships when casting its vote.
The investment adviser has developed procedures to identify and address instances where a vote could appear to be influenced by such a relationship. Under the procedures, prior to a final vote being cast by the investment adviser, the relevant proxy committees’ voting results for proxies issued by Interested Parties are reviewed by a Special Review Committee (“SRC”) of the investment division voting the proxy if the vote was in favor of the Interested Party.
If a potential conflict is identified according to the procedure above, the SRC will be provided with a summary of any relevant communications with the Interested Party, the rationale for the voting decision, information on the organization’s relationship with the party and any other pertinent information. The SRC will evaluate the information and determine whether the decision was in the best interest of fund shareholders. It will then accept or override the voting decision or determine alternative action. The SRC includes senior investment professionals and legal and compliance professionals.
Information regarding how the fund voted proxies relating to portfolio securities during the 12-month period ended June 30 of each year will be available on or about September 1 of such year (a) without charge, upon request by calling American Funds Service Company at (800) 421-4225, (b) on the Capital Group website and (c) on the SEC’s website at sec.gov.
The following summary sets forth the general positions of American Funds, American Funds Insurance Series and the investment adviser on various proposals. A copy of the full Principles is available upon request, free of charge, by calling American Funds Service Company or visiting the Capital Group website.
Director matters — The election of a company’s slate of nominees for director generally is supported. Votes may be withheld for some or all of the nominees if this is determined to be in the best interest of shareholders or if, in the opinion of the investment adviser, such nominee has not fulfilled his or her fiduciary duty. Separation of the chairman and CEO positions also may be supported.
Governance provisions — Typically, proposals to declassify a board (elect all directors annually) are supported based on the belief that this increases the directors’ sense of accountability to shareholders. Proposals for cumulative voting generally are supported in order to promote
The Bond Fund of America — Page 45
management and board accountability and an opportunity for leadership change. Proposals designed to make director elections more meaningful, either by requiring a majority vote or by requiring any director receiving more withhold votes than affirmative votes to tender his or her resignation, generally are supported.
Shareholder rights — Proposals to repeal an existing poison pill generally are supported. (There may be certain circumstances, however, when a proxy voting committee of a fund or an investment division of the investment adviser believes that a company needs to maintain anti-takeover protection.) Proposals to eliminate the right of shareholders to act by written consent or to take away a shareholder’s right to call a special meeting typically are not supported.
Compensation and benefit plans — Option plans are complicated, and many factors are considered in evaluating a plan. Each plan is evaluated based on protecting shareholder interests and a knowledge of the company and its management. Considerations include the pricing (or repricing) of options awarded under the plan and the impact of dilution on existing shareholders from past and future equity awards. Compensation packages should be structured to attract, motivate and retain existing employees and qualified directors; however, they should not be excessive.
Routine matters — The ratification of auditors, procedural matters relating to the annual meeting and changes to company name are examples of items considered routine. Such items generally are voted in favor of management’s recommendations unless circumstances indicate otherwise.
The Bond Fund of America — Page 46
Principal fund shareholders — The following table identifies those investors who own of record, or are known by the fund to own beneficially, 5% or more of any class of its shares as of the opening of business on February 1, 2022. Unless otherwise indicated, the ownership percentages below represent ownership of record rather than beneficial ownership.
| | | | |
NAME AND ADDRESS | OWNERSHIP | OWNERSHIP PERCENTAGE |
EDWARD D JONES & CO
FOR THE BENEFIT OF CUSTOMERS
OMNIBUS ACCOUNT
SAINT LOUIS MO | RECORD | CLASS A | 51.30% |
| | CLASS C | 7.92 |
| | CLASS F-3 | 44.41 |
| | CLASS 529-A | 22.87 |
| | CLASS 529-C | 16.68 |
| | | | |
PERSHING LLC
OMNIBUS ACCOUNT
JERSEY CITY NJ
| RECORD | CLASS A | 6.67 |
| | CLASS C | 11.92 |
| | CLASS F-1 | 6.68 |
| | CLASS F-2 | 12.43 |
| | CLASS F-3 | 5.19 |
| | CLASS 529-F-2 | 6.88 |
| | | | |
WELLS FARGO CLEARING SERVICES LLC
SPECIAL CUSTODY ACCT FOR THE
EXCLUSIVE BENEFIT OF CUSTOMER
SAINT LOUIS MO | RECORD | CLASS C | 9.17 |
| | CLASS F-2 | 22.50 |
| | CLASS 529-C | 6.29 |
| | | |
RAYMOND JAMES
OMNIBUS FOR MUTUAL FUNDS
HOUSE ACCOUNT
ST PETERSBURG FL | RECORD | CLASS C | 7.05 |
| | CLASS F-2 | 6.50 |
| | CLASS 529-C | 7.34 |
| | CLASS 529-F-2 | 5.80 |
| | | | |
LPL FINANCIAL
--OMNIBUS CUSTOMER ACCOUNT--
SAN DIEGO CA | RECORD | CLASS C | 5.56 |
| | CLASS F-2 | 23.77 |
| | | |
VOYA INSTITUTIONAL TRUST COMPANY
401K PLAN
WINDSOR CT | RECORD
BENEFICIAL | CLASS F-1 | 17.82 |
| | |
| | | |
CHARLES SCHWAB & CO INC
SPEC CUSTODY ACCT FBO
CUSTOMERS #1
SAN FRANCISCO CA | RECORD | CLASS F-1 | 14.62 |
| | | |
| | | |
| | | |
TD AMERITRADE INC FOR THE
EXCLUSIVE BENEFIT OF OUR CLIENTS
OMNIBUS ACCOUNT
OMAHA NE | RECORD | CLASS F-1 | 11.45 |
| | | |
| | | |
| | | |
NATIONAL FINANCIAL SERVICES LLC
FOR EXCLUSIVE BENEFIT OF OUR CUSTOMERS
OMNIBUS ACCOUNT
JERSEY CITY NJ | RECORD | CLASS F-1 | 11.38 |
| | CLASS F-2 | 14.53 |
| | CLASS F-3 | 10.30 |
| | | |
The Bond Fund of America — Page 47
| | | | |
NAME AND ADDRESS | OWNERSHIP | OWNERSHIP PERCENTAGE |
CHARLES SCHWAB & CO INC
OMNIBUS ACCOUNT #2
SAN FRANCISCO CA | RECORD | CLASS F-3 | 30.08 |
| | | |
| | | |
MORGAN STANLEY SMITH BARNEY LLC
FOR THE BENEFIT OF ITS CUSTOMERS
OMNIBUS ACCOUNT
NEW YORK NY | RECORD | CLASS 529-A | 6.48 |
| | CLASS 529-C | 9.73 |
| | CLASS 529-E | 5.08 |
| | | |
CAPITAL RESEARCH & MANAGEMENT COMPANY
CORPORATE ACCOUNT
LOS ANGELES CA | RECORD | CLASS 529-F-1 | 100.00 |
| | CLASS 529-F-3 | 100.00 |
| | | |
TALCOTT RESOLUTION LIFE INS CO
SEPARATE ACCOUNT DC 401K
HARTFORD CT | RECORD
BENEFICIAL | CLASS R-1 | 9.66 |
| | |
| | | |
BELLMORE-MERRICK CSHD (NY)
403B PLAN
DENVER CO | RECORD
BENEFICIAL | CLASS R-1 | 5.06 |
| | |
| | | |
LINCOLN LIFE INSURANCE COMPANY
ACCOUNT
FORT WAYNE IN | RECORD | CLASS R-4 | 5.30 |
| | | |
| | | |
NEW JERSEY TRANSIT PLANS
401K PLAN
GREENWOOD VILLAGE CO | RECORD
BENEFICIAL | CLASS R-5 | 35.83 |
| | |
| | | |
VOYA INSTITUTIONAL TRUST COMPANY
AS TRUSTEE OR CUSTODIAN FOR
CORE MARKET RETIREMENT PLANS
401K PLAN
BRAINTREE MA | RECORD
BENEFICIAL | CLASS R-5 | 14.91 |
| | |
| | | |
| | | |
| | | |
VRSCO
FBO AIGFSB CUSTODIAN TRUSTEE FBO
RET PLANS
401K PLAN
HOUSTON TX | RECORD
BENEFICIAL | CLASS R-5 | 6.40 |
| | |
| | | |
| | | |
| | | |
TRADER JOE'S COMPANY
401K PLAN
ENGLEWOOD CO | RECORD
BENEFICIAL | CLASS R-5E | 31.64 |
| | |
| | | |
MASSMUTUAL RP
401K PLAN
ATLANTA GA | RECORD
BENEFICIAL | CLASS R-5E | 6.41 |
| | |
| | | |
CHARLES SCHWAB & CO INC
SPECIAL CUSTODY ACCT FOR EXCLUSIVE
BENEFIT OF CUSTOMERS - REINVEST AC #3
SAN FRANCISCO CA | RECORD | CLASS R-5E | 5.48 |
| | | |
| | | |
| | | |
AMERICAN FUNDS 2025 TARGET DATE
RETIREMENT FUND
NORFOLK VA | RECORD | CLASS R-6 | 13.76 |
| | | |
| | | |
The Bond Fund of America — Page 48
| | | | |
NAME AND ADDRESS | OWNERSHIP | OWNERSHIP PERCENTAGE |
AMERICAN FUNDS 2020 TARGET DATE
RETIREMENT FUND
NORFOLK VA | RECORD | CLASS R-6 | 9.80 |
| | | |
| | | |
AMERICAN FUNDS BALANCED PORTFOLIO
OMNIBUS ACCOUNT
NORFOLK VA | RECORD | CLASS R-6 | 8.79 |
| | | |
| | | |
AMERICAN FUNDS INCOME PORTFOLIO
OMNIBUS ACCOUNT
NORFOLK VA | RECORD | CLASS R-6 | 7.82 |
| | | |
| | | |
AMERICAN FUNDS 2030 TARGET DATE
RETIREMENT FUND
NORFOLK VA | RECORD | CLASS R-6 | 5.68 |
| | | |
| | | |
Because Class T and Class 529-T shares are not currently offered to the public, Capital Research and Management Company, the fund’s investment adviser, owns 100% of the fund‘s outstanding Class T and Class 529-T shares.
As of February 1, 2022, the officers and trustees of the fund, as a group, owned beneficially or of record less than 1% of the outstanding shares of the fund.
Unless otherwise noted, references in this statement of additional information to Class F shares, Class R shares or Class 529 shares refer to all F share classes, all R share classes or all 529 share classes, respectively.
The Bond Fund of America — Page 49
Investment adviser — Capital Research and Management Company, the fund’s investment adviser, founded in 1931, maintains research facilities in the United States and abroad (Geneva, Hong Kong, London, Los Angeles, Mumbai, New York, San Francisco, Singapore, Tokyo, Toronto and Washington, D.C.). These facilities are staffed with experienced investment professionals. The investment adviser is located at 333 South Hope Street, Los Angeles, CA 90071. It is a wholly owned subsidiary of The Capital Group Companies, Inc., a holding company for several investment management subsidiaries. Capital Research and Management Company manages equity assets through three equity investment divisions and fixed income assets through its fixed income investment division, Capital Fixed Income Investors. The three equity investment divisions — Capital World Investors, Capital Research Global Investors and Capital International Investors — make investment decisions independently of one another. Portfolio managers in Capital International Investors rely on a research team that also provides investment services to institutional clients and other accounts advised by affiliates of Capital Research and Management Company. The investment adviser, which is deemed under the Commodity Exchange Act (the “CEA”) to be the operator of the fund, has claimed an exclusion from the definition of the term commodity pool operator under the CEA with respect to the fund and, therefore, is not subject to registration or regulation as such under the CEA with respect to the fund.
The investment adviser has adopted policies and procedures that address issues that may arise as a result of an investment professional’s management of the fund and other funds and accounts. Potential issues could involve allocation of investment opportunities and trades among funds and accounts, use of information regarding the timing of fund trades, investment professional compensation and voting relating to portfolio securities. The investment adviser believes that its policies and procedures are reasonably designed to address these issues.
Compensation of investment professionals — As described in the prospectus, the investment adviser uses a system of multiple portfolio managers in managing fund assets. In addition, Capital Research and Management Company’s investment analysts may make investment decisions with respect to a portion of a fund’s portfolio within their research coverage.
Portfolio managers and investment analysts are paid competitive salaries by Capital Research and Management Company. In addition, they may receive bonuses based on their individual portfolio results. Investment professionals also may participate in profit-sharing plans. The relative mix of compensation represented by bonuses, salary and profit-sharing plans will vary depending on the individual’s portfolio results, contributions to the organization and other factors.
To encourage a long-term focus, bonuses based on investment results are calculated by comparing pretax total investment returns to relevant benchmarks over the most recent one-, three-, five- and eight-year periods, with increasing weight placed on each succeeding measurement period. For portfolio managers, benchmarks may include measures of the marketplaces in which the fund invests and measures of the results of comparable mutual funds. For investment analysts, benchmarks may include relevant market measures and appropriate industry or sector indexes reflecting their areas of expertise. Capital Research and Management Company makes periodic subjective assessments of analysts’ contributions to the investment process and this is an element of their overall compensation. The investment results of each of the fund’s portfolio managers may be measured against one or more benchmarks, depending on his or her investment focus, such as Bloomberg U.S. Aggregate Index, Bloomberg U.S. Government/Mortgage-Backed Securities Index and a custom average consisting of funds that disclose investment objectives and strategies comparable to those of the fund. From time to time, Capital Research and Management Company may adjust or customize these benchmarks to better reflect the universe of comparably managed funds of competitive investment management firms.
Portfolio manager fund holdings and other managed accounts — As described below, portfolio managers may personally own shares of the fund. In addition, portfolio managers may manage
The Bond Fund of America — Page 50
portions of other mutual funds or accounts advised by Capital Research and Management Company or its affiliates.
The following table reflects information as of December 31, 2021:
| | | | | | | |
Portfolio
manager | Dollar range
of fund
shares
owned1 | Number
of other
registered
investment
companies (RICs)
for which
portfolio
manager
is a manager
(assets of RICs
in billions)2 | Number
of other
pooled
investment
vehicles (PIVs)
for which
portfolio
manager
is a manager
(assets of PIVs
in billions)2 | Number
of other
accounts
for which
portfolio
manager
is a manager
(assets of
other accounts
in billions)2,3 |
Pramod Atluri | Over $1,000,000 | 3 | $368.8 | 3 | $2.86 | None |
David J. Betanzos | $100,001 – $500,000 | 6 | $80.4 | 2 | $0.50 | None |
David A. Hoag | Over $1,000,000 | 8 | $405.4 | 5 | $9.79 | None |
Fergus N. MacDonald | Over $1,000,000 | 8 | $194.0 | 4 | $1.13 | None |
1 Ownership disclosure is made using the following ranges: None; $1 – $10,000; $10,001 – $50,000; $50,001 – $100,000; $100,001 – $500,000; $500,001 – $1,000,000; and Over $1,000,000. The amounts listed include shares owned through The Capital Group Companies, Inc. retirement plan and 401(k) plan.
2 Indicates other RIC(s), PIV(s) or other accounts managed by Capital Research and Management Company or its affiliates for which the portfolio manager also has significant day to day management responsibilities. Assets noted are the total net assets of the RIC(s), PIV(s) or other accounts and are not the total assets managed by the individual, which is a substantially lower amount. No RIC, PIV or other account has an advisory fee that is based on the performance of the RIC, PIV or other account, unless otherwise noted.
3 Personal brokerage accounts of portfolio managers and their families are not reflected.
The fund’s investment adviser has adopted policies and procedures to mitigate material conflicts of interest that may arise in connection with a portfolio manager’s management of the fund, on the one hand, and investments in the other pooled investment vehicles and other accounts, on the other hand, such as material conflicts relating to the allocation of investment opportunities that may be suitable for both the fund and such other accounts.
The Bond Fund of America — Page 51
Investment Advisory and Service Agreement — The Investment Advisory and Service Agreement (the “Agreement”) between the fund and the investment adviser will continue in effect until April 30, 2022, unless sooner terminated, and may be renewed from year to year thereafter, provided that any such renewal has been specifically approved at least annually by (a) the board of trustees, or by the vote of a majority (as defined in the 1940 Act) of the outstanding voting securities of the fund, and (b) the vote of a majority of trustees who are not parties to the Agreement or interested persons (as defined in the 1940 Act) of any such party, in accordance with applicable laws and regulations. The Agreement provides that the investment adviser has no liability to the fund for its acts or omissions in the performance of its obligations to the fund not involving willful misconduct, bad faith, gross negligence or reckless disregard of its obligations under the Agreement. The Agreement also provides that either party has the right to terminate it, without penalty, upon 60 days’ written notice to the other party, and that the Agreement automatically terminates in the event of its assignment (as defined in the 1940 Act). In addition, the Agreement provides that the investment adviser may delegate all, or a portion of, its investment management responsibilities to one or more subsidiary advisers approved by the fund’s board, pursuant to an agreement between the investment adviser and such subsidiary. Any such subsidiary adviser will be paid solely by the investment adviser out of its fees.
In addition to providing investment advisory services, the investment adviser furnishes the services and pays the compensation and travel expenses of persons to perform the fund’s executive, administrative, clerical and bookkeeping functions, and provides suitable office space, necessary small office equipment and utilities, general purpose accounting forms, supplies and postage used at the fund’s offices. The fund pays all expenses not assumed by the investment adviser, including, but not limited to: custodian, stock transfer and dividend disbursing fees and expenses; shareholder recordkeeping and administrative expenses; costs of the designing, printing and mailing of reports, prospectuses, proxy statements and notices to its shareholders; taxes; expenses of the issuance and redemption of fund shares (including stock certificates, registration and qualification fees and expenses); expenses pursuant to the fund’s plans of distribution (described below); legal and auditing expenses; compensation, fees and expenses paid to independent trustees; association dues; costs of stationery and forms prepared exclusively for the fund; and costs of assembling and storing shareholder account data.
The investment adviser is currently reimbursing a portion of the expenses of Class 529-F-3 shares of the fund. This reimbursement will be in effect through at least March 1, 2023. The adviser may elect at its discretion to extend, modify or terminate the reimbursement at that time. For each of the fiscal years ended December 31, 2021, 2020 and 2019, the total expenses reimbursed by the investment adviser were $4,000, $54,000 and $61,000, respectively.
The Bond Fund of America — Page 52
Under the Agreement, the investment adviser receives a management fee based on the following annualized rates and daily net asset levels:
| | | |
Rate | Net asset level |
In excess of | Up to |
0.30% | $ 0 | $ 60,000,000 |
0.21 | 60,000,000 | 1,000,000,000 |
0.18 | 1,000,000,000 | 3,000,000,000 |
0.16 | 3,000,000,000 | 6,000,000,000 |
0.15 | 6,000,000,000 | 10,000,000,000 |
0.14 | 10,000,000,000 | 16,000,000,000 |
0.13 | 16,000,000,000 | 20,000,000,000 |
0.12 | 20,000,000,000 | 28,000,000,000 |
0.115 | 28,000,000,000 | 36,000,000,000 |
0.11 | 36,000,000,000 | 52,000,000,000 |
0.107 | 52,000,000,000 | 76,000,000,000 |
0.105 | 76,000,000,000 | |
Management fees are paid monthly and accrued daily.
The Agreement also provides for fees based on monthly gross investment income at the following annualized rates:
| | | | | |
Rate | Monthly gross investment income |
In excess of | Up to |
2.25% | $ 0 | $ 8,333,333 |
2.00 | 8,333,333 | 41,666,667 |
1.75 | 41,666,667 | |
For the purposes of such computations under the Agreement, the fund’s gross investment income is determined in accordance with generally accepted accounting principles and does not reflect any net realized gains or losses on the sale of portfolio securities.
For the fiscal years ended December 31, 2021, 2020 and 2019, the investment adviser earned from the fund management fees of $117,038,000, $98,524,000 and $83,255,000, respectively. The fund’s board of trustees approved an amended Investment Advisory and Service Agreement, pursuant to which the annualized rate payable to the investment adviser on daily net assets in excess of certain levels would be decreased. The investment adviser voluntarily waived management fees to give effect to the approved rates in advance of the effective date of the amended Agreement. Accordingly, after giving effect to the fee waivers, the fund paid the investment adviser management fees of $98,515,000 (a reduction of $9,000) for the fiscal year ended December 31, 2020.
The Bond Fund of America — Page 53
Administrative services — The investment adviser and its affiliates provide certain administrative services for shareholders of the fund’s Class A, C, T, F, R and 529 shares. Administrative services are provided by the investment adviser and its affiliates to help assist third parties providing non-distribution services to fund shareholders. These services include providing in-depth information on the fund and market developments that impact fund investments. Administrative services also include, but are not limited to, coordinating, monitoring and overseeing third parties that provide services to fund shareholders.
These services are provided pursuant to an Administrative Services Agreement (the “Administrative Agreement”) between the fund and the investment adviser relating to the fund’s Class A, C, T, F, R and 529 shares. The Administrative Agreement will continue in effect until April 30, 2022, unless sooner renewed or terminated, and may be renewed from year to year thereafter, provided that any such renewal has been specifically approved by the vote of a majority of the members of the fund’s board who are not parties to the Administrative Agreement or interested persons (as defined in the 1940 Act) of any such party. The fund may terminate the Administrative Agreement at any time by vote of a majority of independent board members. The investment adviser has the right to terminate the Administrative Agreement upon 60 days’ written notice to the fund. The Administrative Agreement automatically terminates in the event of its assignment (as defined in the 1940 Act).
The Administrative Services Agreement between the fund and the investment adviser provides the fund the ability to charge an administrative services fee of .05% for all share classes. The fund’s investment adviser receives an administrative services fee at the annual rate of .03% of the average daily net assets of the fund attributable to each of the share classes (which could be increased as noted above) for its provision of administrative services. Administrative services fees are paid monthly and accrued daily.
During the 2021 fiscal year, administrative services fees were:
| | |
| | Administrative services fee |
Class A | $8,962,000 |
Class C | 234,000 |
Class T | —* |
Class F-1 | 334,000 |
Class F-2 | 5,661,000 |
Class F-3 | 1,760,000 |
Class 529-A | 450,000 |
Class 529-C | 24,000 |
Class 529-E | 15,000 |
Class 529-T | —* |
Class 529-F-1 | —* |
Class 529-F-2 | 51,000 |
Class 529-F-3 | —* |
Class R-1 | 12,000 |
Class R-2 | 129,000 |
Class R-2E | 14,000 |
Class R-3 | 211,000 |
Class R-4 | 190,000 |
Class R-5E | 39,000 |
Class R-5 | 64,000 |
Class R-6 | 4,214,000 |
*Amount less than $1,000.
The Bond Fund of America — Page 54
Principal Underwriter and plans of distribution — American Funds Distributors, Inc. (the “Principal Underwriter”) is the principal underwriter of the fund’s shares. The Principal Underwriter is located at 333 South Hope Street, Los Angeles, CA 90071; 6455 Irvine Center Drive, Irvine, CA 92618; 3500 Wiseman Boulevard, San Antonio, TX 78251; and 12811 North Meridian Street, Carmel, IN 46032.
The Principal Underwriter receives revenues relating to sales of the fund’s shares, as follows:
· For Class A and 529-A shares, the Principal Underwriter receives commission revenue consisting of the balance of the Class A and 529-A sales charge remaining after the allowances by the Principal Underwriter to investment dealers.
· For Class C and 529-C shares, the Principal Underwriter receives any contingent deferred sales charges that apply during the first year after purchase.
In addition, the fund reimburses the Principal Underwriter for advancing immediate service fees to qualified dealers and financial professionals upon the sale of Class C and 529-C shares. The fund also reimburses the Principal Underwriter for service fees (and, in the case of Class 529-E shares, commissions) paid on a quarterly basis to intermediaries, such as qualified dealers or financial professionals, in connection with investments in Class T, F-1, 529-E, 529-T, 529-F-1, R-1, R-2, R-2E, R-3 and R-4 shares.
The Bond Fund of America — Page 55
Commissions, revenue or service fees retained by the Principal Underwriter after allowances or compensation to dealers were:
| | | | |
| | Fiscal year | Commissions,
revenue
or fees retained | Allowance or
compensation
to dealers |
Class A | 2021 | $8,434,000 | $31,793,000 |
| | 2020 | 9,574,000 | 37,267,000 |
| | 2019 | 7,788,000 | 29,801,000 |
Class C | 2021 | 664,000 | 1,177,000 |
| | 2020 | — | 2,274,000 |
| | 2019 | — | 1,313,000 |
Class 529-A | 2021 | 265,000 | 998,000 |
| | 2020 | 277,000 | 1,070,000 |
| | 2019 | 262,000 | 1,012,000 |
Class 529-C | 2021 | 13,000 | 126,000 |
| | 2020 | 33,000 | 155,000 |
| | 2019 | 5,000 | 182,000 |
Plans of distribution — The fund has adopted plans of distribution (the “Plans”) pursuant to rule 12b-1 under the 1940 Act. The Plans permit the fund to expend amounts to finance any activity primarily intended to result in the sale of fund shares, provided the fund’s board of trustees has approved the category of expenses for which payment is being made.
Each Plan is specific to a particular share class of the fund. As the fund has not adopted a Plan for Class F-2, F-3, 529-F-2, 529-F-3, R-5E, R-5 or R-6, no 12b-1 fees are paid from Class F-2, F-3, 529-F-2, 529-F-3, R-5E, R-5 or R-6 share assets and the following disclosure is not applicable to these share classes.
Payments under the Plans may be made for service-related and/or distribution-related expenses. Service-related expenses include paying service fees to qualified dealers. Distribution-related expenses include commissions paid to qualified dealers. The amounts actually paid under the Plans for the past fiscal year, expressed as a percentage of the fund’s average daily net assets attributable to the applicable share class, are disclosed in the prospectus under “Fees and expenses of the fund.” Further information regarding the amounts available under each Plan is in the “Plans of Distribution” section of the prospectus.
The Bond Fund of America — Page 56
Following is a brief description of the Plans:
Class A and 529-A — For Class A and 529-A shares, up to .25% of the fund’s average daily net assets attributable to such shares is reimbursed to the Principal Underwriter for paying service-related expenses, and the balance available under the applicable Plan may be paid to the Principal Underwriter for distribution-related expenses. The fund may annually expend up to .25% for Class A shares and up to .50% for Class 529-A shares under the applicable Plan; however, for Class 529-A shares, the board of trustees has approved payments to the Principal Underwriter of up to .25% of the fund’s average daily net assets, in the aggregate, for paying service- and distribution-related expenses.
Distribution-related expenses for Class A and 529-A shares include dealer commissions and wholesaler compensation paid on sales of shares of $1 million or more purchased without a sales charge. Commissions on these “no load” purchases (which are described in further detail under the “Sales Charges” section of this statement of additional information) in excess of the Class A and 529-A Plan limitations and not reimbursed to the Principal Underwriter during the most recent fiscal quarter are recoverable for 15 months, provided that the reimbursement of such commissions does not cause the fund to exceed the annual expense limit. After 15 months, these commissions are not recoverable. As of the fund’s most recent fiscal year, unreimbursed expenses that remained subject to reimbursement under the Plan for Class A shares totaled $13,982,000 or less than 1% of Class A net assets.
Class T and 529-T — For Class T and 529-T shares, the fund may annually expend up to .50% under the applicable Plan; however, the fund’s board of trustees has approved payments to the Principal Underwriter of up to .25% of the fund’s average daily net assets attributable to Class T and 529-T shares for paying service-related expenses.
Other share classes — The Plans for each of the other share classes that have adopted Plans provide for payments to the Principal Underwriter for paying service-related and distribution-related expenses of up to the following amounts of the fund’s average daily net assets attributable to such shares:
| | | | |
Share class | Service
related
payments1 | Distribution
related
payments1 | Total
allowable
under
the Plans2 |
Class C | 0.25% | 0.75% | 1.00% |
Class F-1 | 0.25 | — | 0.50 |
Class 529-C | 0.25 | 0.75 | 1.00 |
Class 529-E | 0.25 | 0.25 | 0.75 |
Class 529-F-1 | 0.25 | — | 0.50 |
Class R-1 | 0.25 | 0.75 | 1.00 |
Class R-2 | 0.25 | 0.50 | 1.00 |
Class R-2E | 0.25 | 0.35 | 0.85 |
Class R-3 | 0.25 | 0.25 | 0.75 |
Class R-4 | 0.25 | — | 0.50 |
1 Amounts in these columns represent the amounts approved by the board of trustees under the applicable Plan.
2 The fund may annually expend the amounts set forth in this column under the current Plans with the approval of the board of trustees.
Payment of service fees — For purchases of less than $1 million, payment of service fees to investment dealers generally begins accruing immediately after establishment of an account in Class A, C, 529-A or 529-C shares. For purchases of $1 million or more, payment of service fees to investment dealers generally begins accruing 12 months after establishment of an account in Class A or 529-A shares.
The Bond Fund of America — Page 57
Service fees are not paid on certain investments made at net asset value including accounts established by registered representatives and their family members as described in the “Sales charges” section of the prospectus.
During the 2021 fiscal year, 12b-1 expenses accrued and paid, and if applicable, unpaid, were:
| | | | |
| | 12b-1 expenses | 12b-1 unpaid liability
outstanding |
Class A | $74,680,000 | $6,024,000 |
Class C | 7,777,000 | 687,000 |
Class T | — | — |
Class F-1 | 2,787,000 | 307,000 |
Class 529-A | 3,585,000 | 327,000 |
Class 529-C | 780,000 | 71,000 |
Class 529-E | 246,000 | 23,000 |
Class 529-T | — | — |
Class 529-F-1 | — | —* |
Class 529-F-2 | — | — |
Class 529-F-3 | — | — |
Class R-1 | 406,000 | 39,000 |
Class R-2 | 3,235,000 | 723,000 |
Class R-2E | 271,000 | 23,000 |
Class R-3 | 3,516,000 | 650,000 |
Class R-4 | 1,587,000 | 229,000 |
* Amount less than $1,000.
The Bond Fund of America — Page 58
Approval of the Plans — As required by rule 12b-1 and the 1940 Act, the Plans (together with the Principal Underwriting Agreement) have been approved by the full board of trustees and separately by a majority of the independent trustees of the fund who have no direct or indirect financial interest in the operation of the Plans or the Principal Underwriting Agreement. In addition, the selection and nomination of independent trustees of the fund are committed to the discretion of the independent trustees during the existence of the Plans.
Potential benefits of the Plans to the fund and its shareholders include enabling shareholders to obtain advice and other services from a financial professional at a reasonable cost, the likelihood that the Plans will stimulate sales of the fund benefiting the investment process through growth or stability of assets and the ability of shareholders to choose among various alternatives in paying for sales and service. The Plans may not be amended to materially increase the amount spent for distribution without shareholder approval. Plan expenses are reviewed quarterly by the board of trustees and the Plans must be renewed annually by the board of trustees.
A portion of the fund’s 12b-1 expense is paid to financial professionals to compensate them for providing ongoing services. If you have questions regarding your investment in the fund or need assistance with your account, please contact your financial professional. If you need a financial professional, please call American Funds Distributors at (800) 421-4120 for assistance.
Fee to Virginia529 — Class 529 shares are offered to certain American Funds by Virginia529 through CollegeAmerica and Class ABLE shares are offered to certain American Funds by Virginia529 through ABLEAmerica, a tax-advantaged savings program for individuals with disabilities. As compensation for its oversight and administration of the CollegeAmerica and ABLEAmerica savings plans, Virginia529 is entitled to receive a quarterly fee based on the combined net assets invested in Class 529 shares and Class ABLE shares across all American Funds. The quarterly fee is accrued daily and calculated at the annual rate of .09% on the first $20 billion of net assets invested in American Funds Class 529 shares and Class ABLE shares, .05% on net assets between $20 billion and $75 billion and .03% on net assets over $75 billion. The fee for any given calendar quarter is accrued and calculated on the basis of average net assets of American Funds Class 529 and Class ABLE shares for the last month of the prior calendar quarter. Virginia529 is currently waiving that portion of its fee attributable to Class ABLE shares. Such waiver is expected to remain in effect until the earlier of (a) the date on which total net assets invested in Class ABLE shares reach $300 million and (b) June 30, 2023.
The Bond Fund of America — Page 59
Other compensation to dealers — As of February 2021, the top dealers (or their affiliates) that American Funds Distributors anticipates will receive additional compensation (as described in the prospectus) include:
| | |
Advisor Group | |
FSC Securities Corporation | |
Investacorp, Inc. | |
KMS Financial Services, Inc. | |
Ladenburg, Thalmann & Co., Inc. | |
Ladenburg Thalmann Asset Management Inc. | |
Royal Alliance Associates, Inc. | |
SagePoint Financial, Inc. | |
Securities America, Inc. | |
Securities Service Network Inc. | |
Triad Advisors LLC | |
Woodbury Financial Services, Inc. | |
American Portfolios Financial Services, Inc. | |
Ameriprise | |
Ameriprise Financial Services, Inc. | |
Cambridge | |
Cambridge Investment Research Advisors, Inc. | |
Cambridge Investment Research, Inc. | |
Cetera Financial Group | |
Cetera Advisor Networks LLC | |
Cetera Advisors LLC | |
Cetera Financial Specialists LLC | |
Cetera Investment Services LLC | |
First Allied Securities Inc. | |
Charles Schwab Network | |
Charles Schwab & Co., Inc. | |
Charles Schwab Trust Bank | |
Commonwealth | |
Commonwealth Financial Network | |
D.A. Davidson & Co. | |
Edward Jones | |
Equitable Advisors | |
Equitable Advisors LLC | |
Fidelity | |
Fidelity Investments | |
Fidelity Retirement Network | |
National Financial Services LLC | |
Hefren-Tillotson | |
Hefren-Tillotson, Inc. | |
HTK | |
Hornor, Townsend & Kent, LLC | |
J.P. Morgan Chase Banc One | |
J.P. Morgan Securities LLC | |
JP Morgan Chase Bank, N.A. | |
Janney Montgomery Scott | |
Janney Montgomery Scott LLC | |
The Bond Fund of America — Page 60
| | |
Kestra Securities | |
H. Beck, Inc. | |
Kestra Investment Services LLC | |
NFP Advisor Services LLC | |
Lincoln Network | |
Lincoln Financial Advisors Corporation | |
Lincoln Financial Securities Corporation | |
LPL Group | |
LPL Financial LLC | |
Private Advisor Group, LLC | |
Merrill | |
Bank of America, NA | |
Bank of America Private Bank | |
Merrill Lynch, Pierce, Fenner & Smith Incorporated | |
MML Investors Services | |
MassMutual Trust Company FSB | |
MML Distributors LLC | |
MML Investors Services, LLC | |
The MassMutual Trust Company FSB | |
Morgan Stanley Wealth Management | |
Northwestern Mutual | |
Northwestern Mutual Investment Services, LLC | |
Park Avenue Securities LLC | |
Raymond James Group | |
Raymond James & Associates, Inc. | |
Raymond James Financial Services Inc. | |
RBC | |
RBC Capital Markets LLC | |
Robert W. Baird | |
Robert W. Baird & Co, Incorporated | |
Stifel, Nicolaus & Co | |
Stifel, Nicolaus & Company, Incorporated | |
U.S. Bancorp Investments, Inc. | |
U.S. Bancorp Investments, Inc. | |
US Bank NA | |
UBS | |
UBS Financial Services, Inc. | |
UBS Securities, LLC | |
Voya Financial | |
Voya Financial Advisors, Inc. | |
Wells Fargo Network | |
Wells Fargo Advisors Financial Network, LLC | |
Wells Fargo Advisors Latin American Channel | |
Wells Fargo Advisors LLC (WBS) | |
Wells Fargo Advisors Private Client Group | |
Wells Fargo Bank, N.A. | |
Wells Fargo Clearing Services LLC | |
Wells Fargo Securities, LLC | |
The Bond Fund of America — Page 61
Execution of portfolio transactions
The investment adviser places orders with broker-dealers for the fund’s portfolio transactions. Purchases and sales of equity securities on a securities exchange or an over-the-counter market are effected through broker-dealers who receive commissions for their services. Generally, commissions relating to securities traded on foreign exchanges will be higher than commissions relating to securities traded on U.S. exchanges and may not be subject to negotiation. Equity securities may also be purchased from underwriters at prices that include underwriting fees. Purchases and sales of fixed income securities are generally made with an issuer or a primary market maker acting as principal with no stated brokerage commission. The price paid to an underwriter for fixed income securities includes underwriting fees. Prices for fixed income securities in secondary trades usually include undisclosed compensation to the market maker reflecting the spread between the bid and ask prices for the securities.
In selecting broker-dealers, the investment adviser strives to obtain “best execution” (the most favorable total price reasonably attainable under the circumstances) for the fund’s portfolio transactions, taking into account a variety of factors. These factors include the size and type of transaction, the nature and character of the markets for the security to be purchased or sold, the cost, quality, likely speed and reliability of execution and settlement, the broker-dealer’s or execution venue’s ability to offer liquidity and anonymity and the trade-off between market impact and opportunity costs. The investment adviser considers these factors, which involve qualitative judgments, when selecting broker-dealers and execution venues for fund portfolio transactions. The investment adviser views best execution as a process that should be evaluated over time as part of an overall relationship with particular broker-dealer firms. The investment adviser and its affiliates negotiate commission rates with broker-dealers based on what they believe is reasonably necessary to obtain best execution. They seek, on an ongoing basis, to determine what the reasonable levels of commission rates for execution services are in the marketplace, taking various considerations into account, including the extent to which a broker-dealer has put its own capital at risk, historical commission rates and commission rates that other institutional investors are paying. The fund does not consider the investment adviser as having an obligation to obtain the lowest commission rate available for a portfolio transaction to the exclusion of price, service and qualitative considerations. Brokerage commissions are only a small part of total execution costs and other factors, such as market impact and speed of execution, contribute significantly to overall transaction costs.
The investment adviser may execute portfolio transactions with broker-dealers who provide certain brokerage and/or investment research services to it but only when in the investment adviser’s judgment the broker-dealer is capable of providing best execution for that transaction. The investment adviser makes decisions for procurement of research separately and distinctly from decisions on the choice of brokerage and execution services. The receipt of these research services permits the investment adviser to supplement its own research and analysis and makes available the views of, and information from, individuals and the research staffs of other firms. Such views and information may be provided in the form of written reports, telephone contacts and meetings with securities analysts. These services may include, among other things, reports and other communications with respect to individual companies, industries, countries and regions, economic, political and legal developments, as well as scheduling meetings with corporate executives and seminars and conferences related to relevant subject matters. Research services that the investment adviser receives from broker-dealers may be used by the investment adviser in servicing the fund and other funds and accounts that it advises; however, not all such services will necessarily benefit the fund.
The investment adviser bears the cost of all third-party investment research services for all client accounts it advises. However, in order to compensate certain U.S. broker-dealers for research consumed, and valued, by the investment adviser’s investment professionals, the investment adviser continues to operate a limited commission sharing arrangement with commissions on equity trades for certain registered investment companies it advises. The investment adviser voluntarily reimburses such
The Bond Fund of America — Page 62
registered investment companies for all amounts collected into the commission sharing arrangement. In order to operate the commission sharing arrangement, the investment adviser may cause such registered investment companies to pay commissions in excess of what other broker-dealers might have charged for certain portfolio transactions in recognition of brokerage and/or investment research services. In this regard, the investment adviser has adopted a brokerage allocation procedure consistent with the requirements of Section 28(e) of the Securities Exchange Act of 1934. Section 28(e) permits the investment adviser and its affiliates to cause an account to pay a higher commission to a broker-dealer to compensate the broker-dealer or another service provider for certain brokerage and/or investment research services provided to the investment adviser and its affiliates, if the investment adviser and each affiliate makes a good faith determination that such commissions are reasonable in relation to the value of the services provided by such broker-dealer to the investment adviser and its affiliates in terms of that particular transaction or the investment adviser’s overall responsibility to the fund and other accounts that it advises. Certain brokerage and/or investment research services may not necessarily benefit all accounts paying commissions to each such broker-dealer; therefore, the investment adviser and its affiliates assess the reasonableness of commissions in light of the total brokerage and investment research services provided to the investment adviser and its affiliates. Further, investment research services may be used by all investment associates of the investment adviser and its affiliates, regardless of whether they advise accounts with trading activity that generates eligible commissions.
In accordance with their internal brokerage allocation procedure, the investment adviser and its affiliates periodically assess the brokerage and investment research services provided by each broker-dealer and each other service provider from which they receive such services. As part of its ongoing relationships, the investment adviser and its affiliates routinely meet with firms to discuss the level and quality of the brokerage and research services provided, as well as the value and cost of such services. In valuing the brokerage and investment research services the investment adviser and its affiliates receive from broker-dealers and other research providers in connection with its good faith determination of reasonableness, the investment adviser and its affiliates take various factors into consideration, including the quantity, quality and usefulness of the services to the investment adviser and its affiliates. Based on this information and applying their judgment, the investment adviser and its affiliates set an annual research budget.
Research analysts and portfolio managers periodically participate in a research poll to determine the usefulness and value of the research provided by individual broker-dealers and research providers. Based on the results of this research poll, the investment adviser and its affiliates may, through commission sharing arrangements with certain broker-dealers, direct a portion of commissions paid to a broker-dealer by the fund and other registered investment companies managed by the investment adviser or its affiliates to be used to compensate the broker-dealer and/or other research providers for research services they provide. While the investment adviser and its affiliates may negotiate commission rates and enter into commission sharing arrangements with certain broker-dealers with the expectation that such broker-dealers will be providing brokerage and research services, none of the investment adviser, any of its affiliates or any of their clients incurs any obligation to any broker-dealer to pay for research by generating trading commissions. The investment adviser and its affiliates negotiate prices for certain research that may be paid through commission sharing arrangements or by themselves with cash.
When executing portfolio transactions in the same equity security for the funds and accounts, or portions of funds and accounts, over which the investment adviser, through its equity investment divisions, has investment discretion, each investment division within the adviser and its affiliates normally aggregates its respective purchases or sales and executes them as part of the same transaction or series of transactions. When executing portfolio transactions in the same fixed income security for the fund and the other funds or accounts over which it or one of its affiliated companies has investment discretion, the investment adviser normally aggregates such purchases or sales and executes them as part of the same transaction or series of transactions. The objective of aggregating
The Bond Fund of America — Page 63
purchases and sales of a security is to allocate executions in an equitable manner among the funds and other accounts that have concurrently authorized a transaction in such security. The investment adviser and its affiliates serve as investment adviser for certain accounts that are designed to be substantially similar to another account. This type of account will often generate a large number of relatively small trades when it is rebalanced to its reference fund due to differing cash flows or when the account is initially started up. The investment adviser may not aggregate program trades or electronic list trades executed as part of this process. Non-aggregated trades performed for these accounts will be allocated entirely to that account. This is done only when the investment adviser believes doing so will not have a material impact on the price or quality of other transactions.
The investment adviser currently owns an interest in IEX Group and Luminex Trading and Analytics. The investment adviser may place orders on these or other exchanges or alternative trading systems in which it, or one of its affiliates, has an ownership interest, provided such ownership interest is less than five percent of the total ownership interests in the entity. The investment adviser is subject to the same best execution obligations when trading on any such exchange or alternative trading system.
Purchase and sale transactions may be effected directly among and between certain funds or accounts advised by the investment adviser or its affiliates, including the fund. The investment adviser maintains cross-trade policies and procedures and places a cross-trade only when such a trade is in the best interest of all participating clients and is not prohibited by the participating funds’ or accounts’ investment management agreement or applicable law.
The investment adviser may place orders for the fund’s portfolio transactions with broker-dealers who have sold shares of the funds managed by the investment adviser or its affiliated companies; however, it does not consider whether a broker-dealer has sold shares of the funds managed by the investment adviser or its affiliated companies when placing any such orders for the fund’s portfolio transactions.
Purchases and sales of futures contracts for the fund will be effected through executing brokers and FCMs that specialize in the types of futures contracts that the fund expects to hold. The investment adviser will use reasonable efforts to choose executing brokers and FCMs capable of providing the services necessary to obtain the most favorable price and execution available. The full range and quality of services available will be considered in making these determinations. The investment adviser will monitor the executing brokers and FCMs used for purchases and sales of futures contracts for their ability to execute trades based on many factors, such as the sizes of the orders, the difficulty of executions, the operational facilities of the firm involved and other factors.
Forward currency contracts are traded directly between currency traders (usually large commercial banks) and their customers. The cost to the fund of engaging in such contracts varies with factors such as the currency involved, the length of the contract period and the market conditions then prevailing. Because such contracts are entered into on a principal basis, their prices usually include undisclosed compensation to the market maker reflecting the spread between the bid and ask prices for the contracts. The fund may incur additional fees in connection with the purchase or sale of certain contracts.
No brokerage commissions were paid by the fund on portfolio transactions for the fiscal years ended December 31, 2021, 2020 and 2019. Increases (or decreases) in the dollar amount of brokerage commissions paid by the fund over the last three fiscal years resulted from increases (or decreases) in the volume of trading activity.
The fund is required to disclose information regarding investments in the securities of its “regular” broker-dealers (or parent companies of its regular broker-dealers) that derive more than 15% of their revenue from broker-dealer, underwriter or investment adviser activities. A regular broker-dealer is (a) one of the 10 broker-dealers that received from the fund the largest amount of brokerage
The Bond Fund of America — Page 64
commissions by participating, directly or indirectly, in the fund’s portfolio transactions during the fund’s most recently completed fiscal year; (b) one of the 10 broker-dealers that engaged as principal in the largest dollar amount of portfolio transactions of the fund during the fund’s most recently completed fiscal year; or (c) one of the 10 broker-dealers that sold the largest amount of securities of the fund during the fund’s most recently completed fiscal year.
At the end of the fund’s most recently completed fiscal year, the fund’s regular broker-dealers included Charles Schwab & Co., Inc., Goldman Sachs & Co., Citigroup Global Markets Inc., J.P. Morgan Securities LLC, Wells Fargo Securities, LLC, Credit Suisse Group AG, Morgan Stanley & Co. LLC and LPL Holdings, Inc. At the end of the fund’s most recently completed fiscal year, the fund held debt securities of Charles Schwab Corporation in the amount of $4,097,000, Goldman Sachs Group, Inc. in the amount of $588,712,000, Citigroup Inc. in the amount of $62,619,000, J.P. Morgan Securities LLC in the amount of $476,133,000, Wells Fargo Securities LLC in the amount of $190,995,000, Credit Suisse Group AG in the amount of $228,559,000, Morgan Stanley & Co. LLC in the amount of $413,860,000 and LPL Holdings, Inc. in the amount of $280,000.
The Bond Fund of America — Page 65
Disclosure of portfolio holdings
The fund’s investment adviser, on behalf of the fund, has adopted policies and procedures with respect to the disclosure of information about fund portfolio securities. These policies and procedures have been reviewed by the fund’s board of trustees, and compliance will be periodically assessed by the board in connection with reporting from the fund’s Chief Compliance Officer.
Under these policies and procedures, the fund’s complete list of portfolio holdings available for public disclosure, dated as of the end of each calendar quarter, is permitted to be posted on the Capital Group website no earlier than the 10th day after such calendar quarter. In practice, the publicly disclosed portfolio is typically posted on the Capital Group website within 30 days after the end of the calendar quarter. The publicly disclosed portfolio may exclude certain securities when deemed to be in the best interest of the fund as permitted by applicable regulations. In addition, the fund’s list of top 10 equity portfolio holdings measured by percentage of net assets, dated as of the end of each calendar month, is permitted to be posted on the Capital Group website no earlier than the 10th day after such month. Such portfolio holdings information may be disclosed to any person pursuant to an ongoing arrangement to disclose portfolio holdings information to such person no earlier than one day after the day on which the information is posted on the Capital Group website.
Certain intermediaries are provided additional information about the fund’s management team, including information on the fund’s portfolio securities they have selected. This information is provided to larger intermediaries that require the information to make the fund available for investment on the firm’s platform. Intermediaries receiving the information are required to keep it confidential and use it only to analyze the fund.
The fund’s custodian, outside counsel, auditor, financial printers, proxy voting service providers, pricing information vendors, consultants or agents operating under a contract with the investment adviser or its affiliates, co-litigants (such as in connection with a bankruptcy proceeding related to a fund holding) and certain other third parties described below, each of which requires portfolio holdings information for legitimate business and fund oversight purposes, may receive fund portfolio holdings information earlier. See the “General information” section in this statement of additional information for further information about the fund’s custodian, outside counsel and auditor.
The fund‘s portfolio holdings, dated as of the end of each calendar month, are made available to up to 20 key broker-dealer relationships with research departments to help them evaluate the fund for eligibility on approved lists or in model portfolios. These firms include certain of those listed under the “Other compensation to dealers” section of this statement of additional information and certain broker-dealer firms that offer trading platforms for registered investment advisers. Monthly holdings may be provided to these intermediaries no earlier than the 10th day after the end of the calendar month. In practice, monthly holdings are provided within 30 days after the end of the calendar month. Holdings may also be disclosed more frequently to certain statistical and data collection agencies including Morningstar, Lipper, Inc., Value Line, Vickers Stock Research, Bloomberg and Thomson Financial Research.
Affiliated persons of the fund, including officers of the fund and employees of the investment adviser and its affiliates, who receive portfolio holdings information are subject to restrictions and limitations on the use and handling of such information pursuant to applicable codes of ethics, including requirements not to trade in securities based on confidential and proprietary investment information, to maintain the confidentiality of such information, and to pre-clear securities trades and report securities transactions activity, as applicable. For more information on these restrictions and limitations, please see the “Code of ethics” section in this statement of additional information and the Code of Ethics. Third-party service providers of the fund and other entities, as described in this statement of additional information, receiving such information are subject to confidentiality
The Bond Fund of America — Page 66
obligations and obligations that would prohibit them from trading in securities based on such information. When portfolio holdings information is disclosed other than through the Capital Group website to persons not affiliated with the fund, such persons will be bound by agreements (including confidentiality agreements) or fiduciary or other obligations that restrict and limit their use of the information to legitimate business uses only. None of the fund, its investment adviser or any of their affiliates receives compensation or other consideration in connection with the disclosure of information about portfolio securities.
Subject to board policies, the authority to disclose a fund’s portfolio holdings, and to establish policies with respect to such disclosure, resides with the appropriate investment-related committees of the fund’s investment adviser. In exercising their authority, the committees determine whether disclosure of information about the fund’s portfolio securities is appropriate and in the best interest of fund shareholders. The investment adviser has implemented policies and procedures to address conflicts of interest that may arise from the disclosure of fund holdings. For example, the investment adviser’s code of ethics specifically requires, among other things, the safeguarding of information about fund holdings and contains prohibitions designed to prevent the personal use of confidential, proprietary investment information in a way that would conflict with fund transactions. In addition, the investment adviser believes that its current policy of not selling portfolio holdings information and not disclosing such information to unaffiliated third parties until such holdings have been made public on the Capital Group website (other than to certain fund service providers and other third parties for legitimate business and fund oversight purposes) helps reduce potential conflicts of interest between fund shareholders and the investment adviser and its affiliates.
The fund’s investment adviser and its affiliates provide investment advice to clients other than the fund that have investment objectives that may be substantially similar to those of the fund. These clients also may have portfolios consisting of holdings substantially similar to those of the fund and generally have access to current portfolio holdings information for their accounts. These clients do not owe the fund’s investment adviser or the fund a duty of confidentiality with respect to disclosure of their portfolio holdings.
The Bond Fund of America — Page 67
Price of shares
Shares are purchased at the offering price or sold at the net asset value price next determined after the purchase or sell order is received by the fund or the Transfer Agent provided that your request contains all information and legal documentation necessary to process the transaction. The Transfer Agent may accept written orders for the sale of fund shares on a future date. These orders are subject to the Transfer Agent’s policies, which generally allow shareholders to provide a written request to sell shares at the net asset value on a specified date no more than five business days after receipt of the order by the Transfer Agent. Any request to sell shares on a future date will be rejected if the request is not in writing, if the requested transaction date is more than five business days after the Transfer Agent receives the request or if the request does not contain all information and legal documentation necessary to process the transaction.
The offering or net asset value price is effective for orders received prior to the time of determination of the net asset value and, in the case of orders placed with dealers or their authorized designees, accepted by the Principal Underwriter, the Transfer Agent, a dealer or any of their designees. In the case of orders sent directly to the fund or the Transfer Agent, an investment dealer should be indicated. The dealer is responsible for promptly transmitting purchase and sell orders to the Principal Underwriter.
Prices that appear in the newspaper do not always indicate prices at which you will be purchasing and redeeming shares of the fund, since such prices generally reflect the previous day’s closing price, while purchases and redemptions are made at the next calculated price. The price you pay for shares, the offering price, is based on the net asset value per share, which is calculated once daily as of the close of regular trading on the New York Stock Exchange, normally 4 p.m. New York time, each day the New York Stock Exchange is open. If the New York Stock Exchange makes a scheduled (e.g. the day after Thanksgiving) or an unscheduled close prior to 4 p.m. New York time, the net asset value of the fund will be determined at approximately the time the New York Stock Exchange closes on that day. If on such a day market quotations and prices from third-party pricing services are not based as of the time of the early close of the New York Stock Exchange but are as of a later time (up to approximately 4 p.m. New York time), for example because the market remains open after the close of the New York Stock Exchange, those later market quotations and prices will be used in determining the fund’s net asset value.
Orders in good order received after the New York Stock Exchange closes (scheduled or unscheduled) will be processed at the net asset value (plus any applicable sales charge) calculated on the following business day. The New York Stock Exchange is currently closed on weekends and on the following holidays: New Year’s Day; Martin Luther King Jr. Day; Presidents’ Day; Good Friday; Memorial Day; Juneteenth National Independence Day; Independence Day; Labor Day; Thanksgiving Day; and Christmas Day. Each share class of the fund has a separately calculated net asset value (and share price).
Orders received by the investment dealer or authorized designee, the Transfer Agent or the fund after the time of the determination of the net asset value will be entered at the next calculated offering price. Note that investment dealers or other intermediaries may have their own rules about share transactions and may have earlier cut-off times than those of the fund. For more information about how to purchase through your intermediary, contact your intermediary directly.
All portfolio securities of funds managed by Capital Research and Management Company (other than American Funds U.S. Government Money Market Fund) are valued, and the net asset values per share for each share class are determined, as indicated below. The fund follows standard industry practice by typically reflecting changes in its holdings of portfolio securities on the first business day following a portfolio trade.
The Bond Fund of America — Page 68
Equity securities, including depositary receipts, are generally valued at the official closing price of, or the last reported sale price on, the exchange or market on which such securities are traded, as of the close of business on the day the securities are being valued or, lacking any sales, at the last available bid price. Prices for each security are taken from the principal exchange or market on which the security trades.
Fixed income securities, including short-term securities, are generally valued at prices obtained from one or more pricing vendors. The pricing vendors base prices on, among other things, benchmark yields, transactions, bids, offers, quotations from dealers and trading systems, new issues, underlying equity of the issuer, interest rate volatilities, spreads and other relationships observed in the markets among comparable securities and proprietary pricing models such as yield measures calculated using factors such as cash flows, prepayment information, default rates, delinquency and loss assumptions, financial or collateral characteristics or performance, credit enhancements, liquidation value calculations, specific deal information and other reference data. The fund’s investment adviser performs certain checks on vendor prices prior to calculation of the fund’s net asset value. When the investment adviser deems it appropriate to do so (such as when vendor prices are unavailable or not deemed to be representative), fixed income securities will be valued in good faith at the mean quoted bid and ask prices that are reasonably and timely available (or bid prices, if ask prices are not available) or at prices for securities of comparable maturity, quality and type.
Securities with both fixed income and equity characteristics (e.g., convertible bonds, preferred stocks, units comprised of more than one type of security, etc.), or equity securities traded principally among fixed income dealers, are generally valued in the manner described above for either equity or fixed income securities, depending on which method is deemed most appropriate by the investment adviser.
Forward currency contracts are valued at the mean of representative quoted bid and ask prices, generally based on prices supplied by one or more pricing vendors.
Futures contracts are generally valued at the official settlement price of, or the last reported sale price on, the principal exchange or market on which such instruments are traded, as of the close of business on the day the contracts are being valued or, lacking any sales, at the last available bid price.
Swaps, including both interest rate swaps and positions in credit default swap indices, are valued using market quotations or valuations provided by one or more pricing vendors.
Assets or liabilities initially expressed in terms of currencies other than U.S. dollars are translated prior to the next determination of the net asset value of the fund’s shares into U.S. dollars at the prevailing market rates.
Securities and other assets for which representative market quotations are not readily available or are considered unreliable by the investment adviser are valued at fair value as determined in good faith under fair value guidelines adopted by authority of the fund’s board. Subject to board oversight, the fund’s board has appointed the fund’s investment adviser to make fair valuation determinations, which are directed by a valuation committee established by the fund’s investment adviser. The board receives regular reports describing fair-valued securities and the valuation methods used.
The valuation committee has adopted guidelines and procedures (consistent with SEC rules and guidance) to consider certain relevant principles and factors when making fair value determinations. As a general principle, securities lacking readily available market quotations, or that have quotations that are considered unreliable by the investment adviser, are valued in good faith by the valuation committee based upon what the fund might reasonably expect to receive upon their current sale. Fair valuations and valuations of investments that are not actively trading involve judgment and may differ
The Bond Fund of America — Page 69
materially from valuations that would have been used had greater market activity occurred. The valuation committee considers relevant indications of value that are reasonably and timely available to it in determining the fair value to be assigned to a particular security, such as the type and cost of the security, contractual or legal restrictions on resale of the security, relevant financial or business developments of the issuer, actively traded similar or related securities, conversion or exchange rights on the security, related corporate actions, significant events occurring after the close of trading in the security and changes in overall market conditions. The valuation committee employs additional fair value procedures to address issues related to equity securities that trade principally in markets outside the United States. Such securities may trade in markets that open and close at different times, reflecting time zone differences. If significant events occur after the close of a market (and before the fund’s net asset values are next determined) which affect the value of equity securities held in the fund’s portfolio, appropriate adjustments from closing market prices may be made to reflect these events. Events of this type could include, for example, earthquakes and other natural disasters or significant price changes in other markets (e.g., U.S. stock markets).
Each class of shares represents interests in the same portfolio of investments and is identical in all respects to each other class, except for differences relating to distribution, service and other charges and expenses, certain voting rights, differences relating to eligible investors, the designation of each class of shares, conversion features and exchange privileges. Expenses attributable to the fund, but not to a particular class of shares, are borne by each class pro rata based on relative aggregate net assets of the classes. Expenses directly attributable to a class of shares are borne by that class of shares. Liabilities attributable to particular share classes, such as liabilities for repurchase of fund shares, are deducted from total assets attributable to such share classes.
Net assets so obtained for each share class are then divided by the total number of shares outstanding of that share class, and the result, rounded to the nearest cent, is the net asset value per share for that class.
The Bond Fund of America — Page 70
Taxes and distributions
Disclaimer: Some of the following information may not apply to certain shareholders, including those holding fund shares in a tax-favored account, such as a retirement plan or education savings account. Shareholders should consult their tax advisors about the application of federal, state and local tax law in light of their particular situation.
Taxation as a regulated investment company — The fund intends to qualify each year as a “regulated investment company” under Subchapter M of the Internal Revenue Code of 1986, as amended (the “Code”), so that it will not be liable for federal tax on income and capital gains distributed to shareholders. In order to qualify as a regulated investment company, and avoid being subject to federal income taxes, the fund intends to distribute substantially all of its net investment income and realized net capital gains on a fiscal year basis, and intends to comply with other tests applicable to regulated investment companies under Subchapter M.
The Code includes savings provisions allowing the fund to cure inadvertent failures of certain qualification tests required under Subchapter M. However, should the fund fail to qualify under Subchapter M, the fund would be subject to federal, and possibly state, corporate taxes on its taxable income and gains.
Amounts not distributed by the fund on a timely basis in accordance with a calendar year distribution requirement may be subject to a nondeductible 4% excise tax. Unless an applicable exception applies, to avoid the tax, the fund must distribute during each calendar year an amount equal to the sum of (a) at least 98% of its ordinary income (not taking into account any capital gains or losses) for the calendar year, (b) at least 98.2% of its capital gains in excess of its capital losses for the twelve month period ending on October 31, and (c) all ordinary income and capital gains for previous years that were not distributed during such years and on which the fund paid no U.S. federal income tax.
Dividends paid by the fund from ordinary income or from an excess of net short-term capital gain over net long-term capital loss are taxable to shareholders as ordinary income dividends. Shareholders of the fund that are individuals and meet certain holding period requirements with respect to their fund shares may be eligible for reduced tax rates on “qualified dividend income,” if any, distributed by the fund to such shareholders. In the event the fund's distribution of net investment income exceeds its earnings and profits for tax purposes, a portion of such distribution may be classified as return of capital. Returns of capital distributions decrease your cost basis and are not taxable until your cost basis has been reduced to zero. If your cost basis is zero, returns of capital distributions are treated as capital gains.
The fund may declare a capital gain distribution consisting of the excess of net realized long-term capital gains over net realized short-term capital losses. Net capital gains for a fiscal year are computed by taking into account any capital loss carryforward of the fund.
The fund may retain a portion of net capital gain for reinvestment and may elect to treat such capital gain as having been distributed to shareholders of the fund. Shareholders may receive a credit for the tax that the fund paid on such undistributed net capital gain and would increase the basis in their shares of the fund by the difference between the amount of includible gains and the tax deemed paid by the shareholder.
Distributions of net capital gain that the fund properly reports as a capital gain distribution generally will be taxable as long-term capital gain, regardless of the length of time the shares of the fund have been held by a shareholder. Any loss realized upon the redemption of shares held at the time of redemption for six months or less from the date of their purchase will be treated as a long-term capital
The Bond Fund of America — Page 71
loss to the extent of any capital gain distributions (including any undistributed amounts treated as distributed capital gains, as described above) during such six-month period.
Capital gain distributions by the fund result in a reduction in the net asset value of the fund’s shares. Investors should consider the tax implications of buying shares just prior to a capital gain distribution. The price of shares purchased at that time includes the amount of the forthcoming distribution. Those purchasing just prior to a distribution will subsequently receive a partial return of their investment capital upon payment of the distribution, which will be taxable to them.
Certain distributions reported by the fund as Section 163(j) interest dividends may be treated as interest income by shareholders for purposes of the tax rules applicable to interest expense limitations under Section 163(j) of the Code. Such treatment by the shareholder is generally subject to holding period requirements and other potential limitations, although the holding period requirements are generally not applicable to dividends declared by money market funds and certain other funds that declare dividends daily and pay such dividends on a monthly or more frequent basis. The amount that the fund is eligible to report as a Section 163(j) dividend for a tax year is generally limited to the excess of the fund’s business interest income over the sum of the fund’s (i) business interest expense and (ii) other deductions properly allocable to the fund’s business interest income.
Individuals (and certain other non-corporate entities) are generally eligible for a 20% deduction with respect to taxable ordinary REIT dividends. Applicable Treasury regulations allow the fund to pass through to its shareholders such taxable ordinary REIT dividends. Accordingly, individual (and certain other non-corporate) shareholders of the fund that have received such taxable ordinary REIT dividends may be able to take advantage of this 20% deduction with respect to any such amounts passed through.
Redemptions and exchanges of fund shares — Redemptions of shares, including exchanges for shares of other American Funds, may result in federal, state and local tax consequences (gain or loss) to the shareholder.
Any loss realized on a redemption or exchange of shares of the fund will be disallowed to the extent substantially identical shares are reacquired within the 61-day period beginning 30 days before and ending 30 days after the shares are disposed of. Any loss disallowed under this rule will be added to the shareholder’s tax basis in the new shares purchased.
If a shareholder exchanges or otherwise disposes of shares of the fund within 90 days of having acquired such shares, and if, as a result of having acquired those shares, the shareholder subsequently pays a reduced or no sales charge for shares of the fund, or of a different fund acquired before January 31st of the year following the year the shareholder exchanged or otherwise disposed of the original fund shares, the sales charge previously incurred in acquiring the fund’s shares will not be taken into account (to the extent such previous sales charges do not exceed the reduction in sales charges) for the purposes of determining the amount of gain or loss on the exchange, but will be treated as having been incurred in the acquisition of such other fund(s).
Tax consequences of investing in non-U.S. securities — Dividend and interest income received by the fund from sources outside the United States may be subject to withholding and other taxes imposed by such foreign jurisdictions. Tax conventions between certain countries and the United States, however, may reduce or eliminate these foreign taxes. Some foreign countries impose taxes on capital gains with respect to investments by foreign investors.
If more than 50% of the value of the total assets of the fund at the close of the taxable year consists of securities of foreign corporations, the fund may elect to pass through to shareholders the foreign taxes paid by the fund. If such an election is made, shareholders may claim a credit or deduction on their
The Bond Fund of America — Page 72
federal income tax returns for, and will be required to treat as part of the amounts distributed to them, their pro rata portion of qualified taxes paid by the fund to foreign countries. The application of the foreign tax credit depends upon the particular circumstances of each shareholder.
Foreign currency gains and losses, including the portion of gain or loss on the sale of debt securities attributable to fluctuations in foreign exchange rates, are generally taxable as ordinary income or loss. These gains or losses may increase or decrease the amount of dividends payable by the fund to shareholders. A fund may elect to treat gain and loss on certain foreign currency contracts as capital gain and loss instead of ordinary income or loss.
If the fund invests in stock of certain passive foreign investment companies (PFICs), the fund intends to mark-to-market these securities and recognize any gains at the end of its fiscal and excise tax years. Deductions for losses are allowable only to the extent of any previously recognized gains. Both gains and losses will be treated as ordinary income or loss, and the fund is required to distribute any resulting income. If the fund is unable to identify an investment as a PFIC security and thus does not make a timely mark-to-market election, the fund may be subject to adverse tax consequences.
Tax consequences of investing in derivatives — The fund may enter into transactions involving derivatives, such as futures, swaps and forward contracts. Special tax rules may apply to these types of transactions that could defer losses to the fund, accelerate the fund’s income, alter the holding period of certain securities or change the classification of capital gains. These tax rules may therefore impact the amount, timing and character of fund distributions.
Other tax considerations — After the end of each calendar year, individual shareholders holding fund shares in taxable accounts will receive a statement of the federal income tax status of all distributions. Shareholders of the fund also may be subject to state and local taxes on distributions received from the fund.
For fund shares acquired on or after January 1, 2012, the fund is required to report cost basis information for redemptions, including exchanges, to both shareholders and the IRS.
Shareholders may obtain more information about cost basis online at capitalgroup.com/costbasis.
Under the backup withholding provisions of the Code, the fund generally will be required to withhold federal income tax on all payments made to a shareholder if the shareholder either does not furnish the fund with the shareholder’s correct taxpayer identification number or fails to certify that the shareholder is not subject to backup withholding. Backup withholding also applies if the IRS notifies the shareholder or the fund that the taxpayer identification number provided by the shareholder is incorrect or that the shareholder has previously failed to properly report interest or dividend income.
The foregoing discussion of U.S. federal income tax law relates solely to the application of that law to U.S. persons (i.e., U.S. citizens and legal residents and U.S. corporations, partnerships, trusts and estates). Each shareholder who is not a U.S. person should consider the U.S. and foreign tax consequences of ownership of shares of the fund, including the possibility that such a shareholder may be subject to U.S. withholding taxes.
The Bond Fund of America — Page 73
Unless otherwise noted, all references in the following pages to Class A, C, T or F shares also refer to the corresponding Class 529-A, 529-C, 529-T or 529-F shares. Class 529 shareholders should also refer to the applicable program description for information on policies and services specifically relating to these accounts. Shareholders holding shares through an eligible retirement plan should contact their plan’s administrator or recordkeeper for information regarding purchases, sales and exchanges.
Purchase and exchange of shares
Purchases by individuals — As described in the prospectus, you may generally open an account and purchase fund shares by contacting a financial professional or investment dealer authorized to sell the fund’s shares. You may make investments by any of the following means:
Contacting your financial professional — Deliver or mail a check to your financial professional.
By mail — For initial investments, you may mail a check, made payable to the fund, directly to the address indicated on the account application. Please indicate an investment dealer on the account application. You may make additional investments by filling out the “Account Additions” form at the bottom of a recent transaction confirmation and mailing the form, along with a check made payable to the fund, using the envelope provided with your confirmation.
The amount of time it takes for us to receive regular U.S. postal mail may vary and there is no assurance that we will receive such mail on the day you expect. Mailing addresses for regular U.S. postal mail can be found in the prospectus. To send investments or correspondence to us via overnight mail or courier service, use either of the following addresses:
American Funds
12711 North Meridian Street
Carmel, IN 46032-9181
American Funds
5300 Robin Hood Road
Norfolk, VA 23513-2407
By telephone — Calling American Funds Service Company. Please see the “Shareholder account services and privileges” section of this statement of additional information for more information regarding this service.
By Internet — Using capitalgroup.com. Please see the “Shareholder account services and privileges” section of this statement of additional information for more information regarding this service.
The Bond Fund of America — Page 74
By wire — If you are making a wire transfer, instruct your bank to wire funds to:
Wells Fargo Bank
ABA Routing No. 121000248
Account No. 4600-076178
Your bank should include the following information when wiring funds:
For credit to the account of:
American Funds Service Company
(fund’s name)
For further credit to:
(shareholder’s fund account number)
(shareholder’s name)
You may contact American Funds Service Company at (800) 421-4225 if you have questions about making wire transfers.
Other purchase information — Class 529 shares may be purchased only through CollegeAmerica by investors establishing qualified higher education savings accounts. Class 529-E shares may be purchased only by investors participating in CollegeAmerica through an eligible employer plan. American Funds state tax-exempt funds are qualified for sale only in certain jurisdictions, and tax-exempt funds in general should not serve as retirement plan investments. In addition, the fund and the Principal Underwriter reserve the right to reject any purchase order.
Class R-5 and R-6 shares may be made available to certain charitable foundations organized and maintained by The Capital Group Companies, Inc. or its affiliates. Class R-6 shares are also available to corporate investment accounts established by The Capital Group Companies, Inc. and its affiliates.
Class R-5 and R-6 shares may also be made available to Virginia529 for use in the Virginia Education Savings Trust and the Virginia Prepaid Education Program and other registered investment companies approved by the fund’s investment adviser or distributor. Class R-6 shares are also available to other post employment benefits plans.
Purchase minimums and maximums — All investments are subject to the purchase minimums and maximums described in the prospectus. As noted in the prospectus, purchase minimums may be waived or reduced in certain cases.
In the case of American Funds non-tax-exempt funds, the initial purchase minimum of $25 may be waived for the following account types:
· Payroll deduction retirement plan accounts (such as, but not limited to, 403(b), 401(k), SIMPLE IRA, SARSEP and deferred compensation plan accounts); and
· Employer-sponsored CollegeAmerica accounts.
The Bond Fund of America — Page 75
The following account types may be established without meeting the initial purchase minimum:
· Retirement accounts that are funded with employer contributions; and
· Accounts that are funded with monies set by court decree.
The following account types may be established without meeting the initial purchase minimum, but shareholders wishing to invest in two or more funds must meet the normal initial purchase minimum of each fund:
· Accounts that are funded with (a) transfers of assets, (b) rollovers from retirement plans, (c) rollovers from 529 college savings plans or (d) required minimum distribution automatic exchanges; and
· American Funds U.S. Government Money Market Fund accounts registered in the name of clients of Capital Group Private Client Services.
Certain accounts held on the fund’s books, known as omnibus accounts, contain multiple underlying accounts that are invested in shares of the fund. These underlying accounts are maintained by entities such as financial intermediaries and are subject to the applicable initial purchase minimums as described in the prospectus and this statement of additional information. However, in the case where the entity maintaining these accounts aggregates the accounts’ purchase orders for fund shares, such accounts are not required to meet the fund’s minimum amount for subsequent purchases.
Exchanges — With the exception of Class T shares, for which rights of exchange are not generally available, you may only exchange shares without a sales charge into other American Funds within the same share class; however, Class A, C, T or F shares may also generally be exchanged without a sales charge for the corresponding 529 share class. Clients of Capital Group Private Client Services may exchange the shares of the fund for those of any other fund(s) managed by Capital Research and Management Company or its affiliates.
Notwithstanding the above, exchanges from Class A shares of American Funds U.S. Government Money Market Fund may be made to Class C shares of other American Funds for dollar cost averaging purposes.
Exchange purchases are subject to the minimum investment requirements of the fund purchased and no sales charge generally applies. However, exchanges of shares from American Funds U.S. Government Money Market Fund are subject to applicable sales charges, unless the American Funds U.S. Government Money Market Fund shares were acquired by an exchange from a fund having a sales charge, or by reinvestment or cross-reinvestment of dividends or capital gain distributions.
Exchanges of Class F shares generally may only be made through fee-based programs of investment firms that have special agreements with the fund’s distributor and certain registered investment advisors.
You may exchange shares of other classes by contacting your financial professional by calling American Funds Service Company at (800) 421-4225 or using capitalgroup.com, or faxing (see “American Funds Service Company service areas” in the prospectus for the appropriate fax numbers) the Transfer Agent. For more information, see “Shareholder account services and privileges” in this statement of additional information. These transactions have the same tax consequences as ordinary sales and purchases.
Shares held in employer-sponsored retirement plans may be exchanged into other American Funds by contacting your plan administrator or recordkeeper. Exchange redemptions and purchases are
The Bond Fund of America — Page 76
processed simultaneously at the share prices next determined after the exchange order is received (see “Price of shares” in this statement of additional information).
Conversion — Class C shares of the fund automatically convert to Class A shares in the month of the 8-year anniversary of the purchase date. Class 529-C shares of the fund automatically convert to Class 529-A shares in the month of the 5-year anniversary of the purchase date. The board of trustees of the fund reserves the right at any time, without shareholder approval, to amend the conversion features of the Class C and Class 529-C shares, including without limitation, providing for conversion into a different share class or for no conversion. In making its decision, the board of trustees will consider, among other things, the effect of any such amendment on shareholders.
Frequent trading of fund shares — As noted in the prospectus, certain redemptions may trigger a restriction under the fund’s “frequent trading policy.” Under this policy, systematic redemptions will not trigger a restriction and systematic purchases will not be prevented if the entity maintaining the shareholder account is able to identify the transaction as a systematic redemption or purchase. For purposes of this policy, systematic redemptions include, for example, regular periodic automatic redemptions and statement of intention escrow share redemptions. Systematic purchases include, for example, regular periodic automatic purchases and automatic reinvestments of dividends and capital gain distributions. Generally, purchases and redemptions will not be considered “systematic” unless the transaction is prescheduled for a specific date.
Potentially abusive activity — American Funds Service Company will monitor for the types of activity that could potentially be harmful to the American Funds — for example, short-term trading activity in multiple funds. When identified, American Funds Service Company will request that the shareholder discontinue the activity. If the activity continues, American Funds Service Company will freeze the shareholder account to prevent all activity other than redemptions of fund shares.
Moving between share classes
If you wish to “move” your investment between share classes (within the same fund or between different funds), we generally will process your request as an exchange of the shares you currently hold for shares in the new class or fund. Below is more information about how sales charges are handled for various scenarios.
Exchanging Class C shares for Class A or Class T shares — If you exchange Class C shares for Class A or Class T shares, you are still responsible for paying any Class C contingent deferred sales charges and applicable Class A or Class T sales charges.
Exchanging Class C shares for Class F shares — If you are part of a qualified fee-based program or approved self-directed platform and you wish to exchange your Class C shares for Class F shares to be held in the program, you are still responsible for paying any applicable Class C contingent deferred sales charges.
Exchanging Class F shares for Class A shares — You can exchange Class F shares held in a qualified fee-based program for Class A shares without paying an initial Class A sales charge if you are leaving or have left the fee-based program. Your financial intermediary can also convert Class F-1 shares to Class A shares without a sales charge if they are held in a brokerage account and they were initially transferred to the account or converted from Class C shares. You can exchange Class F shares received in a conversion from Class C shares for Class A shares at any time without paying an initial Class A sales charge if you notify American Funds Service Company of the conversion when you make your request. If you have already redeemed your Class F shares, the foregoing requirements apply and you must purchase Class
The Bond Fund of America — Page 77
A shares within 90 days after redeeming your Class F shares to receive the Class A shares without paying an initial Class A sales charge.
Exchanging Class A or Class T shares for Class F shares — If you are part of a qualified fee-based program or approved self-directed platform and you wish to exchange your Class A or Class T shares for Class F shares to be held in the program, any Class A or Class T sales charges (including contingent deferred sales charges) that you paid or are payable will not be credited back to your account.
Exchanging Class A shares for Class R shares — Provided it is eligible to invest in Class R shares, a retirement plan currently invested in Class A shares may exchange its shares for Class R shares. Any Class A sales charges that the retirement plan previously paid will not be credited back to the plan’s account. No contingent deferred sales charge will be assessed as part of the share class conversion.
Moving between Class F shares — If you are part of a qualified fee-based program that offers Class F shares, you may exchange your Class F shares for any other Class F shares to be held in the program. For example, if you hold Class F-2 shares, you may exchange your shares for Class F-1 or Class F-3 shares to be held in the program.
Moving between other share classes — If you desire to move your investment between share classes and the particular scenario is not described in this statement of additional information, please contact American Funds Service Company at (800) 421-4225 for more information.
Non-reportable transactions — Automatic conversions described in the prospectus will be non-reportable for tax purposes. In addition, an exchange of shares from one share class of a fund to another share class of the same fund will be treated as a non-reportable exchange for tax purposes, provided that the exchange request is received in writing by American Funds Service Company and processed as a single transaction. However, a movement between a 529 share class and a non-529 share class of the same fund will be reportable.
The Bond Fund of America — Page 78
Sales charges
Class A purchases
Purchases by certain 403(b) plans
A 403(b) plan may not invest in American Funds Class A or C shares unless such plan was invested in Class A or C shares before January 1, 2009.
Participant accounts of a 403(b) plan that invested in American Funds Class A or C shares and were treated as an individual-type plan for sales charge purposes before January 1, 2009, may continue to be treated as accounts of an individual-type plan for sales charge purposes. Participant accounts of a 403(b) plan that invested in American Funds Class A or C shares and were treated as an employer-sponsored plan for sales charge purposes before January 1, 2009, may continue to be treated as accounts of an employer-sponsored plan for sales charge purposes. Participant accounts of a 403(b) plan that was established on or after January 1, 2009, are treated as accounts of an employer-sponsored plan for sales charge purposes.
Purchases by SEP plans and SIMPLE IRA plans
Participant accounts in a Simplified Employee Pension (SEP) plan or a Savings Incentive Match Plan for Employees of Small Employers IRA (SIMPLE IRA) will be aggregated at the plan level for Class A sales charge purposes if an employer adopts a prototype plan produced by American Funds Distributors, Inc. or (a) the employer or plan sponsor submits all contributions for all participating employees in a single contribution transmittal or the contributions are identified as related to the same plan; (b) each transmittal is accompanied by checks or wire transfers and generally must be submitted through the transfer agent’s automated contribution system if held on the fund’s books; and (c) if the fund is expected to carry separate accounts in the name of each plan participant and (i) the employer or plan sponsor notifies the funds’ transfer agent or the intermediary holding the account that the separate accounts of all plan participants should be linked and (ii) all new participant accounts are established by submitting the appropriate documentation on behalf of each new participant. Participant accounts in a SEP or SIMPLE plan that are eligible to aggregate their assets at the plan level may not also aggregate the assets with their individual accounts.
The Bond Fund of America — Page 79
Other purchases
In addition, American Funds Class A and Class 529-A shares may be offered at net asset value to companies exchanging securities with the fund through a merger, acquisition or exchange offer and to certain individuals meeting the criteria described above who invested in Class A and Class 529-A shares before Class F-2 and Class 529-F-2 shares were made available under this privilege.
Transfers to CollegeAmerica — A transfer from the Virginia Prepaid Education ProgramSM or the Virginia Education Savings TrustSM to a CollegeAmerica account will be made with no sales charge. No commission will be paid to the dealer on such a transfer. Investment dealers will be compensated solely with an annual service fee that begins to accrue immediately.
Class F-2 and Class 529-F-2 purchases
If requested, American Funds Class F-2 and Class 529-F-2 shares will be sold to:
| | | |
| | (1) | current or retired directors, trustees, officers and advisory board members of, and certain lawyers who provide services to the funds managed by Capital Research and Management Company, current or retired employees of The Capital Group Companies, Inc. and its affiliated companies, certain family members of the above persons, and trusts or plans primarily for such persons; and |
| | (2) | The Capital Group Companies, Inc. and its affiliated companies. |
Once an account in Class F-2 or Class 529-F-2 is established under this privilege, additional investments can be made in Class F-2 or Class 529-F-2 for the life of the account. Depending on the financial intermediary holding your account, these privileges may be unavailable. Investors should consult their financial intermediary for further information.
Moving between accounts — American Funds investments by certain account types may be moved to other account types without incurring additional Class A sales charges. These transactions include:
· redemption proceeds from a non-retirement account (for example, a joint tenant account) used to purchase fund shares in an IRA or other individual-type retirement account;
· required minimum distributions from an IRA or other individual-type retirement account used to purchase fund shares in a non-retirement account; and
· death distributions paid to a beneficiary’s account that are used by the beneficiary to purchase fund shares in a different account.
Investors may not move investments from a Capital Bank & Trust Company SIMPLE IRA Plus to a Capital Bank & Trust Company SIMPLE IRA unless it is part of a plan transfer or to a current employer’s Capital Bank & Trust Company SIMPLE IRA plan.
These privileges are generally available only if your account is held directly with the fund’s transfer agent or if the financial intermediary holding your account has the systems, policies and procedures to support providing the privileges on its systems. Investors should consult their financial intermediary for further information.
Loan repayments — Repayments on loans taken from a retirement plan are not subject to sales charges if American Funds Service Company is notified of the repayment.
The Bond Fund of America — Page 80
Dealer commissions and compensation — Commissions (up to 1.00%) are paid to dealers who initiate and are responsible for certain Class A share purchases not subject to initial sales charges. These purchases consist of a) purchases of $1 million or more, and b) purchases by employer-sponsored defined contribution-type retirement plans investing $1 million or more or with 100 or more eligible employees. Commissions on such investments (other than IRA rollover assets that roll over at no sales charge under the fund’s IRA rollover policy as described in the prospectus) are paid to dealers at the following rates: 1.00% on amounts of less than $10 million, .50% on amounts of at least $10 million but less than $25 million and .25% on amounts of at least $25 million. Commissions are based on cumulative investments over the life of the account with no adjustment for redemptions, transfers, or market declines. For example, if a shareholder has accumulated investments in excess of $10 million (but less than $25 million) and subsequently redeems all or a portion of the account(s), purchases following the redemption will generate a dealer commission of .50%.
A dealer concession of up to 1% may be paid by the fund under its Class A plan of distribution to reimburse the Principal Underwriter in connection with dealer and wholesaler compensation paid by it with respect to investments made with no initial sales charge.
The Bond Fund of America — Page 81
Sales charge reductions and waivers
Reducing your Class A sales charge — As described in the prospectus, there are various ways to reduce your sales charge when purchasing Class A shares. Additional information about Class A sales charge reductions is provided below.
Statement of intention — By establishing a statement of intention (the "Statement"), you enter into a nonbinding commitment to purchase shares of American Funds (excluding American Funds U.S. Government Money Market Fund) over a 13-month period and receive the same sales charge (expressed as a percentage of your purchases) as if all shares had been purchased at once, unless the Statement is upgraded as described below.
The Statement period starts on the date on which your first purchase made toward satisfying the Statement is processed. Your accumulated holdings (as described in the paragraph below titled “Rights of accumulation”) eligible to be aggregated as of the day immediately before the start of the Statement period may be credited toward satisfying the Statement.
You may revise the commitment you have made in your Statement upward at any time during the Statement period. If your prior commitment has not been met by the time of the revision, the Statement period during which purchases must be made will remain unchanged. Purchases made from the date of the revision will receive the reduced sales charge, if any, resulting from the revised Statement. If your prior commitment has been met by the time of the revision, your original Statement will be considered met and a new Statement will be established.
The Statement will be considered completed if the shareholder dies within the 13-month Statement period. Commissions to dealers will not be adjusted or paid on the difference between the Statement amount and the amount actually invested before the shareholder’s death.
When a shareholder elects to use a Statement, shares equal to 5% of the dollar amount specified in the Statement may be held in escrow in the shareholder’s account out of the initial purchase (or subsequent purchases, if necessary) by the Transfer Agent. All dividends and any capital gain distributions on shares held in escrow will be credited to the shareholder’s account in shares (or paid in cash, if requested). If the intended investment is not completed within the specified Statement period the investments made during the statement period will be adjusted to reflect the difference between the sales charge actually paid and the sales charge which would have been paid if the total of such purchases had been made at a single time. Any dealers assigned to the shareholder’s account at the time a purchase was made during the Statement period will receive a corresponding commission adjustment if appropriate.
In addition, if you currently have individual holdings in American Legacy variable annuity contracts or variable life insurance policies that were established on or before March 31, 2007, you may continue to apply purchases under such contracts and policies to a Statement.
Shareholders purchasing shares at a reduced sales charge under a Statement indicate their acceptance of these terms and those in the prospectus with their first purchase.
The Statement period may be extended in cases where the fund’s distributor determines it is appropriate to do so; for example in periods when there are extenuating circumstances such as a natural disaster that may limit an individual’s ability to meet the investment required under the Statement.
The Bond Fund of America — Page 82
Aggregation — Qualifying investments for aggregation include those made by you and your “immediate family” as defined in the prospectus, if all parties are purchasing shares for their own accounts and/or:
· individual-type employee benefit plans, such as an IRA, single-participant Keogh-type plan, or a participant account of a 403(b) plan that is treated as an individual-type plan for sales charge purposes (see “Purchases by certain 403(b) plans” under “Sales charges” in this statement of additional information);
· SEP plans and SIMPLE IRA plans established after November 15, 2004, by an employer adopting any plan document other than a prototype plan produced by American Funds Distributors, Inc.;
· business accounts solely controlled by you or your immediate family (for example, you own the entire business);
· trust accounts established by you or your immediate family (for trusts with only one primary beneficiary, upon the trustor’s death the trust account may be aggregated with such beneficiary’s own accounts; for trusts with multiple primary beneficiaries, upon the trustor’s death the trustees of the trust may instruct American Funds Service Company to establish separate trust accounts for each primary beneficiary; each primary beneficiary’s separate trust account may then be aggregated with such beneficiary’s own accounts);
· endowments or foundations established and controlled by you or your immediate family; or
· 529 accounts, which will be aggregated at the account owner level (Class 529-E accounts may only be aggregated with an eligible employer plan).
Individual purchases by a trustee(s) or other fiduciary(ies) may also be aggregated if the investments are:
· for a single trust estate or fiduciary account, including employee benefit plans other than the individual-type employee benefit plans described above;
· made for two or more employee benefit plans of a single employer or of affiliated employers as defined in the 1940 Act, excluding the individual-type employee benefit plans described above;
· for a diversified common trust fund or other diversified pooled account not specifically formed for the purpose of accumulating fund shares;
· for nonprofit, charitable or educational organizations, or any endowments or foundations established and controlled by such organizations, or any employer-sponsored retirement plans established for the benefit of the employees of such organizations, their endowments, or their foundations;
· for participant accounts of a 403(b) plan that is treated as an employer-sponsored plan for sales charge purposes (see “Purchases by certain 403(b) plans” under “Sales charges” in this statement of additional information), or made for participant accounts of two or more such plans, in each case of a single employer or affiliated employers as defined in the 1940 Act; or
· for a SEP or SIMPLE IRA plan established after November 15, 2004, by an employer adopting a prototype plan produced by American Funds Distributors, Inc.
Purchases made for nominee or street name accounts (securities held in the name of an investment dealer or another nominee such as a bank trust department instead of the
The Bond Fund of America — Page 83
customer) may not be aggregated with those made for other accounts and may not be aggregated with other nominee or street name accounts unless otherwise qualified as described above.
Joint accounts may be aggregated with other accounts belonging to the primary owner and/or his or her immediate family. The primary owner of a joint account is the individual responsible for taxes on the account.
Concurrent purchases — As described in the prospectus, you may reduce your Class A sales charge by combining purchases of all classes of shares in American Funds. Shares of American Funds U.S. Government Money Market Fund purchased through an exchange, reinvestment or cross-reinvestment from a fund having a sales charge also qualify. However, direct purchases of American Funds U.S. Government Money Market Fund Class A shares are excluded. If you currently have individual holdings in American Legacy variable annuity contracts or variable life insurance policies that were established on or before March 31, 2007, you may continue to combine purchases made under such contracts and policies to reduce your Class A sales charge.
Rights of accumulation — Subject to the limitations described in the aggregation policy, you may take into account your accumulated holdings in all share classes of American Funds to determine your sales charge on investments in accounts eligible to be aggregated. Direct purchases of American Funds U.S. Government Money Market Fund Class A shares are excluded. Subject to your investment dealer’s or recordkeeper’s capabilities, your accumulated holdings will be calculated as the higher of (a) the current value of your existing holdings (the “market value”) as of the day prior to your American Funds investment or (b) the amount you invested (including reinvested dividends and capital gains, but excluding capital appreciation) less any withdrawals (the “cost value”). Depending on the entity on whose books your account is held, the value of your holdings in that account may not be eligible for calculation at cost value. For example, accounts held in nominee or street name may not be eligible for calculation at cost value and instead may be calculated at market value for purposes of rights of accumulation.
The value of all of your holdings in accounts established in calendar year 2005 or earlier will be assigned an initial cost value equal to the market value of those holdings as of the last business day of 2005. Thereafter, the cost value of such accounts will increase or decrease according to actual investments or withdrawals. You must contact your financial professional or American Funds Service Company if you have additional information that is relevant to the calculation of the value of your holdings.
When determining your American Funds Class A sales charge, if your investment is not in an employer-sponsored retirement plan, you may also continue to take into account the market value (as of the day prior to your American Funds investment) of your individual holdings in various American Legacy variable annuity contracts and variable life insurance policies that were established on or before March 31, 2007. An employer-sponsored retirement plan may also continue to take into account the market value of its investments in American Legacy Retirement Investment Plans that were established on or before March 31, 2007.
You may not purchase Class C or 529-C shares if such combined holdings cause you to be eligible to purchase Class A or 529-A shares at the $1 million or more sales charge discount rate (i.e. at net asset value).
The Bond Fund of America — Page 84
If you make a gift of American Funds Class A shares, upon your request, you may purchase the shares at the sales charge discount allowed under rights of accumulation of all of your American Funds and applicable American Legacy accounts.
The Bond Fund of America — Page 85
Reducing your Class T sales charge — As described in the prospectus, the initial sales charge you pay each time you buy Class T shares may differ depending upon the amount you invest and may be reduced for larger purchases. Additionally, Class T shares acquired through reinvestment of dividends or capital gain distributions are not subject to an initial sales charge. Sales charges on Class T shares are applied on a transaction-by-transaction basis, and, accordingly, Class T shares are not eligible for any other sales charge waivers or reductions, including through the aggregation of Class T shares concurrently purchased by other related accounts or in other American Funds. The sales charge applicable to Class T shares may not be reduced by establishing a statement of intention, and rights of accumulation are not available for Class T shares.
CDSC waivers for Class A and C shares — As noted in the prospectus, a contingent deferred sales charge (“CDSC”) will be waived for redemptions due to death or post-purchase disability of a shareholder (this generally excludes accounts registered in the names of trusts and other entities). In the case of joint tenant accounts, if one joint tenant dies, a surviving joint tenant, at the time he or she notifies the Transfer Agent of the other joint tenant’s death and removes the decedent’s name from the account, may redeem shares from the account without incurring a CDSC. Redemptions made after the Transfer Agent is notified of the death of a joint tenant will be subject to a CDSC.
In addition, a CDSC will be waived for the following types of transactions, if they do not exceed 12% of the value of an “account” (defined below) annually (the “12% limit”):
· Required minimum distributions taken from retirement accounts in accordance with IRS regulations.
· Redemptions through an automatic withdrawal plan (“AWP”) (see “Automatic withdrawals” under “Shareholder account services and privileges” in this statement of additional information). For each AWP payment, assets that are not subject to a CDSC, such as shares acquired through reinvestment of dividends and/or capital gain distributions, will be redeemed first and will count toward the 12% limit. If there is an insufficient amount of assets not subject to a CDSC to cover a particular AWP payment, shares subject to the lowest CDSC will be redeemed next until the 12% limit is reached. Any dividends and/or capital gain distributions taken in cash by a shareholder who receives payments through an AWP will also count toward the 12% limit. In the case of an AWP, the 12% limit is calculated at the time an automatic redemption is first made, and is recalculated at the time each additional automatic redemption is made. Shareholders who establish an AWP should be aware that the amount of a payment not subject to a CDSC may vary over time depending on fluctuations in the value of their accounts. This privilege may be revised or terminated at any time.
For purposes of this paragraph, “account” means your investment in the applicable class of shares of the particular fund from which you are making the redemption.
The CDSC on American Funds Class A shares may be waived in cases where the fund’s transfer agent determines the benefit to the fund of collecting the CDSC would be outweighed by the cost of applying it.
CDSC waivers are allowed only in the cases listed here and in the prospectus. For example, CDSC waivers will not be allowed on redemptions of Class 529-C shares due to termination of CollegeAmerica; a determination by the Internal Revenue Service that CollegeAmerica does not qualify as a qualified tuition program under the Code; proposal or enactment of law that eliminates or limits the tax-favored status of CollegeAmerica; or elimination of the fund by Virginia529 as an option for additional investment within CollegeAmerica.
The Bond Fund of America — Page 86
Selling shares
The methods for selling (redeeming) shares are described more fully in the prospectus. If you wish to sell your shares by contacting American Funds Service Company directly, any such request must be signed by the registered shareholders. To contact American Funds Service Company via overnight mail or courier service, see “Purchase and exchange of shares.”
A signature guarantee may be required for certain redemptions. In such an event, your signature may be guaranteed by a domestic stock exchange or the Financial Industry Regulatory Authority, bank, savings association or credit union that is an eligible guarantor institution. The Transfer Agent reserves the right to require a signature guarantee on any redemptions.
Additional documentation may be required for sales of shares held in corporate, partnership or fiduciary accounts. You must include with your written request any shares you wish to sell that are in certificate form.
If you sell Class A or C shares and request a specific dollar amount to be sold, we will sell sufficient shares so that the sale proceeds, after deducting any applicable CDSC, equals the dollar amount requested.
If you hold multiple American Funds and a CDSC applies to the shares you are redeeming, the CDSC will be calculated based on the applicable class of shares of the particular fund from which you are making the redemption.
Redemption proceeds will not be mailed until sufficient time has passed to provide reasonable assurance that checks or drafts (including certified or cashier’s checks) for shares purchased have cleared (normally seven business days from the purchase date). Except for delays relating to clearance of checks for share purchases or in extraordinary circumstances (and as permissible under the 1940 Act), the fund typically expects to pay redemption proceeds one business day following receipt and acceptance of a redemption order. Interest will not accrue or be paid on amounts that represent uncashed distribution or redemption checks.
You may request that redemption proceeds of $1,000 or more from American Funds U.S. Government Money Market Fund be wired to your bank by writing American Funds Service Company. A signature guarantee is required on all requests to wire funds and you may be subject to a fee for the transaction.
The Bond Fund of America — Page 87
Shareholder account services and privileges
The following services and privileges are generally available to all shareholders. However, certain services and privileges described in the prospectus and this statement of additional information may not be available for Class 529 shareholders or if your account is held with an investment dealer or through an employer-sponsored retirement plan.
Automatic investment plan — An automatic investment plan enables you to make monthly or quarterly investments in American Funds through automatic debits from your bank account. To set up a plan, you must fill out an account application and specify the amount that you would like to invest and the date on which you would like your investments to occur. The plan will begin within 30 days after your account application is received. Your bank account will be debited on the day or a few days before your investment is made, depending on the bank’s capabilities. The Transfer Agent will then invest your money into the fund you specified on or around the date you specified. If the date you specified falls on a weekend or holiday, your money will be invested on the following business day. However, if the following business day falls in the next month, your money will be invested on the business day immediately preceding the weekend or holiday. If your bank account cannot be debited due to insufficient funds, a stop-payment or the closing of the account, the plan may be terminated and the related investment reversed. You may change the amount of the investment or discontinue the plan at any time by contacting the Transfer Agent.
Automatic reinvestment — Dividends and capital gain distributions are reinvested in additional shares of the same class and fund at net asset value unless you indicate otherwise on the account application. You also may elect to have dividends and/or capital gain distributions paid in cash by informing the fund, the Transfer Agent or your investment dealer. Dividends and capital gain distributions paid to retirement plan shareholders or shareholders of the 529 share classes will be automatically reinvested.
If you have elected to receive dividends and/or capital gain distributions in cash, and the postal or other delivery service is unable to deliver checks to your address of record, or you do not respond to mailings from American Funds Service Company with regard to uncashed distribution checks, your distribution option may be automatically converted to having all dividends and other distributions reinvested in additional shares.
Cross-reinvestment of dividends and distributions — For all share classes, except Class T shares and the 529 classes of shares, you may cross-reinvest dividends and capital gains (distributions) into other American Funds in the same share class at net asset value, subject to the following conditions:
(1) the aggregate value of your account(s) in the fund(s) paying distributions equals or exceeds $5,000 (this is waived if the value of the account in the fund receiving the distributions equals or exceeds that fund’s minimum initial investment requirement);
(2) if the value of the account of the fund receiving distributions is below the minimum initial investment requirement, distributions must be automatically reinvested; and
(3) if you discontinue the cross-reinvestment of distributions, the value of the account of the fund receiving distributions must equal or exceed the minimum initial investment requirement. If you do not meet this requirement within 90 days of notification, the fund has the right to automatically redeem the account.
Depending on the financial intermediary holding your account, your reinvestment privileges may be unavailable or differ from those described in this statement of additional information. Investors should consult their financial intermediary for further information.
The Bond Fund of America — Page 88
Automatic exchanges — For all share classes other than Class T shares, you may automatically exchange shares of the same class in amounts of $50 or more among any American Funds on any day (or preceding business day if the day falls on a nonbusiness day) of each month you designate.
Automatic withdrawals — Depending on the type of account, for all share classes except R shares, you may automatically withdraw shares from any of the American Funds. You can make automatic withdrawals of $50 or more. You can designate the day of each period for withdrawals and request that checks be sent to you or someone else. Withdrawals may also be electronically deposited to your bank account. The Transfer Agent will withdraw your money from the fund you specify on or around the date you specify. If the date you specified falls on a weekend or holiday, the redemption will take place on the previous business day. However, if the previous business day falls in the preceding month, the redemption will take place on the following business day after the weekend or holiday. You should consult with your financial professional or intermediary to determine if your account is eligible for automatic withdrawals.
Withdrawal payments are not to be considered as dividends, yield or income. Generally, automatic investments may not be made into a shareholder account from which there are automatic withdrawals. Withdrawals of amounts exceeding reinvested dividends and distributions and increases in share value would reduce the aggregate value of the shareholder’s account. The Transfer Agent arranges for the redemption by the fund of sufficient shares, deposited by the shareholder with the Transfer Agent, to provide the withdrawal payment specified.
Redemption proceeds from an automatic withdrawal plan are not eligible for reinvestment without a sales charge.
Account statements — Your account is opened in accordance with your registration instructions. Transactions in the account, such as additional investments, will be reflected on regular confirmation statements from the Transfer Agent. Dividend and capital gain reinvestments, purchases through automatic investment plans and certain retirement plans, as well as automatic exchanges and withdrawals, will be confirmed at least quarterly.
American Funds Service Company and capitalgroup.com — You may check your share balance, the price of your shares or your most recent account transaction; redeem shares (up to $125,000 per American Funds shareholder each day); or exchange shares by calling American Funds Service Company at (800) 421-4225 or using capitalgroup.com. Redemptions and exchanges through American Funds Service Company and capitalgroup.com are subject to the conditions noted above and in “Telephone and Internet purchases, redemptions and exchanges” below. You will need your fund number (see the list of American Funds under the “General information — fund numbers” section in this statement of additional information), personal identification number (generally the last four digits of your Social Security number or other tax identification number associated with your account) and account number.
Generally, all shareholders are automatically eligible to use these services. However, if you are not currently authorized to do so, please contact American Funds Service Company for assistance. Once you establish this privilege, you, your financial professional or any person with your account information may use these services.
Telephone and Internet purchases, redemptions and exchanges — By using the telephone or the Internet (including capitalgroup.com), or fax purchase, redemption and/or exchange options, you agree to hold the fund, the Transfer Agent, any of its affiliates or mutual funds managed by such affiliates, and each of their respective directors, trustees, officers, employees and agents harmless from any losses, expenses, costs or liabilities (including attorney fees) that may be incurred in connection with the exercise of these privileges. Generally, all shareholders are automatically eligible to use these
The Bond Fund of America — Page 89
services. However, you may elect to opt out of these services by writing the Transfer Agent (you may also reinstate them at any time by writing the Transfer Agent). If the Transfer Agent does not employ reasonable procedures to confirm that the instructions received from any person with appropriate account information are genuine, it and/or the fund may be liable for losses due to unauthorized or fraudulent instructions. In the event that shareholders are unable to reach the fund by telephone because of technical difficulties, market conditions or a natural disaster, redemption and exchange requests may be made in writing only.
Redemption of shares — The fund’s declaration of trust permits the fund to direct the Transfer Agent to redeem the shares of any shareholder for their then current net asset value per share if at such time the shareholder of record owns shares having an aggregate net asset value of less than the minimum initial investment amount required of new shareholders as set forth in the fund’s current registration statement under the 1940 Act, and subject to such further terms and conditions as the board of trustees of the fund may from time to time adopt.
While payment of redemptions normally will be in cash, the fund’s declaration of trust permits payment of the redemption price wholly or partly with portfolio securities or other fund assets under conditions and circumstances determined by the fund’s board of trustees. For example, redemptions could be made in this manner if the board determined that making payments wholly in cash over a particular period would be unfair and/or harmful to other fund shareholders.
Share certificates — Shares are credited to your account. The fund does not issue share certificates.
The Bond Fund of America — Page 90
General information
Custodian of assets — Securities and cash owned by the fund, including proceeds from the sale of shares of the fund and of securities in the fund’s portfolio, are held by JP Morgan Chase Bank N.A., 270 Park Avenue, New York, NY 10017-2070, as custodian. If the fund holds securities of issuers outside the U.S., the custodian may hold these securities pursuant to subcustodial arrangements in banks outside the U.S. or branches of U.S. banks outside the U.S.
Transfer agent services — American Funds Service Company, a wholly owned subsidiary of the investment adviser, maintains the records of shareholder accounts, processes purchases and redemptions of the fund’s shares, acts as dividend and capital gain distribution disbursing agent, and performs other related shareholder service functions. The principal office of American Funds Service Company is located at 6455 Irvine Center Drive, Irvine, CA 92618. Transfer agent fees are paid according to a fee schedule, based on the number of accounts serviced or a percentage of fund assets, contained in a Shareholder Services Agreement between the fund and American Funds Service Company.
In the case of certain shareholder accounts, third parties who may be unaffiliated with the investment adviser provide transfer agency and shareholder services in place of American Funds Service Company. These services are rendered under agreements with American Funds Service Company or its affiliates and the third parties receive compensation according to such agreements. Compensation for transfer agency and shareholder services, whether paid to American Funds Service Company or such third parties, is ultimately paid from fund assets and is reflected in the expenses of the fund as disclosed in the prospectus.
During the 2021 fiscal year, transfer agent fees, gross of any payments made by American Funds Service Company to third parties, were:
| | |
| | Transfer agent fee |
Class A | $29,796,000 |
Class C | 775,000 |
Class T | —* |
Class F-1 | 1,616,000 |
Class F-2 | 20,883,000 |
Class F-3 | 74,000 |
Class 529-A | 1,423,000 |
Class 529-C | 76,000 |
Class 529-E | 18,000 |
Class 529-T | —* |
Class 529-F-1 | —* |
Class 529-F-2 | 122,000 |
Class 529-F-3 | —* |
Class R-1 | 40,000 |
Class R-2 | 1,510,000 |
Class R-2E | 93,000 |
Class R-3 | 1,062,000 |
Class R-4 | 627,000 |
Class R-5E | 189,000 |
Class R-5 | 108,000 |
Class R-6 | 124,000 |
*Amount less than $1,000.
The Bond Fund of America — Page 91
Independent registered public accounting firm — Deloitte & Touche LLP, 695 Town Center Drive, Costa Mesa, CA 92626, serves as the fund’s independent registered public accounting firm, providing audit services and review of certain documents to be filed with the SEC. Deloitte Tax LLP prepares tax returns for the fund. The financial statements included in this statement of additional information that are from the fund's annual report have been audited by Deloitte & Touche LLP, an independent registered public accounting firm, as stated in their report appearing herein. Such financial statements have been so included in reliance upon the report of such firm given upon their authority as experts in accounting and auditing. The selection of the fund’s independent registered public accounting firm is reviewed and determined annually by the board of trustees.
Independent legal counsel — Morgan, Lewis & Bockius LLP, One Federal Street, Boston, MA 02110-1726, serves as independent legal counsel (“counsel”) for the fund and for independent trustees in their capacities as such. A determination with respect to the independence of the fund’s counsel will be made at least annually by the independent trustees of the fund, as prescribed by applicable 1940 Act rules.
Prospectuses, reports to shareholders and proxy statements — The fund’s fiscal year ends on December 31. Shareholders are provided updated summary prospectuses annually and at least semi-annually with reports showing the fund’s investment portfolio or summary investment portfolio, financial statements and other information. Shareholders may request a copy of the fund’s current prospectus at no cost by calling (800) 421-4225 or by sending an email request to prospectus@americanfunds.com. Shareholders may also access the fund’s current summary prospectus, prospectus, statement of additional information and shareholder reports at capitalgroup.com/prospectus. The fund’s annual financial statements are audited by the fund’s independent registered public accounting firm, Deloitte & Touche LLP. In addition, shareholders may also receive proxy statements for the fund. In an effort to reduce the volume of mail shareholders receive from the fund when a household owns more than one account, the Transfer Agent has taken steps to eliminate duplicate mailings of summary prospectuses, shareholder reports and proxy statements. To receive additional copies of a summary prospectus, report or proxy statement, shareholders should contact the Transfer Agent.
Shareholders may also elect to receive updated summary prospectuses, annual reports and semi-annual reports electronically by signing up for electronic delivery on our website, capitalgroup.com. Shareholders who elect to receive documents electronically will receive such documents in electronic form and will not receive documents in paper form by mail. A shareholder who elects electronic delivery is able to cancel this service at any time and return to receiving updated summary prospectuses and other reports in paper form by mail.
Summary prospectuses, prospectuses, annual reports and semi-annual reports that are mailed to shareholders by the Capital Group organization are printed with ink containing soy and/or vegetable oil on paper containing recycled fibers.
Codes of ethics — The fund and Capital Research and Management Company and its affiliated companies, including the fund’s Principal Underwriter, have adopted codes of ethics that allow for personal investments, including securities in which the fund may invest from time to time. These codes include a ban on acquisitions of securities pursuant to an initial public offering; restrictions on acquisitions of private placement securities; preclearance and reporting requirements; review of duplicate confirmation statements; annual recertification of compliance with codes of ethics; blackout periods on personal investing for certain investment personnel; ban on short-term trading profits for investment personnel; limitations on service as a director of publicly traded companies; disclosure of personal securities transactions; and policies regarding political contributions.
The Bond Fund of America — Page 92
Determination of net asset value, redemption price and maximum offering price per share for Class A shares — December 31, 2021
| | |
Net asset value and redemption price per share
(Net assets divided by shares outstanding) | $13.39 |
Maximum offering price per share
(100/96.25 of net asset value per share, which takes into account the fund’s current maximum sales charge) | $13.91 |
Other information — The fund reserves the right to modify the privileges described in this statement of additional information at any time.
The fund’s financial statements, including the investment portfolio and the report of the fund’s independent registered public accounting firm contained in the annual report, are included in this statement of additional information.
The Bond Fund of America — Page 93
Fund numbers — Here are the fund numbers for use when making share transactions:
| | | | | | | |
| | Fund numbers |
Fund | Class A | Class C | Class T | Class F-1 | Class F-2 | Class F-3 |
Stock and stock/fixed income funds | | | | | | |
AMCAP Fund® | 002 | 302 | 43002 | 402 | 602 | 702 |
American Balanced Fund® | 011 | 311 | 43011 | 411 | 611 | 711 |
American Funds Developing World Growth and Income FundSM | 30100 | 33100 | 43100 | 34100 | 36100 | 37100 |
American Funds Global Balanced FundSM | 037 | 337 | 43037 | 437 | 637 | 737 |
American Funds Global Insight FundSM | 30122 | 33122 | 43122 | 34122 | 36122 | 37122 |
American Funds International Vantage FundSM | 30123 | 33123 | 43123 | 34123 | 36123 | 37123 |
American Mutual Fund® | 003 | 303 | 43003 | 403 | 603 | 703 |
Capital Income Builder® | 012 | 312 | 43012 | 412 | 612 | 712 |
Capital World Growth and Income Fund® | 033 | 333 | 43033 | 433 | 633 | 733 |
EuroPacific Growth Fund® | 016 | 316 | 43016 | 416 | 616 | 716 |
Fundamental Investors® | 010 | 310 | 43010 | 410 | 610 | 710 |
The Growth Fund of America® | 005 | 305 | 43005 | 405 | 605 | 705 |
The Income Fund of America® | 006 | 306 | 43006 | 406 | 606 | 706 |
International Growth and Income FundSM | 034 | 334 | 43034 | 434 | 634 | 734 |
The Investment Company of America® | 004 | 304 | 43004 | 404 | 604 | 704 |
The New Economy Fund® | 014 | 314 | 43014 | 414 | 614 | 714 |
New Perspective Fund® | 007 | 307 | 43007 | 407 | 607 | 707 |
New World Fund® | 036 | 336 | 43036 | 436 | 636 | 736 |
SMALLCAP World Fund® | 035 | 335 | 43035 | 435 | 635 | 735 |
Washington Mutual Investors FundSM | 001 | 301 | 43001 | 401 | 601 | 701 |
Fixed income funds | | | | | | |
American Funds Emerging Markets Bond Fund ® | 30114 | 33114 | 43114 | 34114 | 36114 | 37114 |
American Funds Corporate Bond Fund ® | 032 | 332 | 43032 | 432 | 632 | 732 |
American Funds Inflation Linked Bond Fund® | 060 | 360 | 43060 | 460 | 660 | 760 |
American Funds Mortgage Fund® | 042 | 342 | 43042 | 442 | 642 | 742 |
American Funds Multi-Sector Income FundSM | 30126 | 33126 | 43126 | 34126 | 36126 | 37126 |
American Funds Short-Term Tax-Exempt
Bond Fund® | 039 | N/A | 43039 | 439 | 639 | 739 |
American Funds Strategic Bond FundSM | 30112 | 33112 | 43112 | 34112 | 36112 | 37112 |
American Funds Tax-Exempt Fund of
New York® | 041 | 341 | 43041 | 441 | 641 | 741 |
American High-Income Municipal Bond Fund® | 040 | 340 | 43040 | 440 | 640 | 740 |
American High-Income Trust® | 021 | 321 | 43021 | 421 | 621 | 721 |
The Bond Fund of America® | 008 | 308 | 43008 | 408 | 608 | 708 |
Capital World Bond Fund® | 031 | 331 | 43031 | 431 | 631 | 731 |
Intermediate Bond Fund of America® | 023 | 323 | 43023 | 423 | 623 | 723 |
Limited Term Tax-Exempt Bond Fund
of America® | 043 | 343 | 43043 | 443 | 643 | 743 |
Short-Term Bond Fund of America® | 048 | 348 | 43048 | 448 | 648 | 748 |
The Tax-Exempt Bond Fund of America® | 019 | 319 | 43019 | 419 | 619 | 719 |
The Tax-Exempt Fund of California® | 020 | 320 | 43020 | 420 | 620 | 720 |
U.S. Government Securities Fund® | 022 | 322 | 43022 | 422 | 622 | 722 |
Money market fund | | | | | | |
American Funds U.S. Government
Money Market FundSM | 059 | 359 | 43059 | 459 | 659 | 759 |
The Bond Fund of America — Page 94
| | | | | | | | | | |
| | Fund numbers |
Fund | Class
529-A | Class
529-C | Class
529-E | Class
529-T | Class
529-F-1 | Class
529-F-2 | Class
529-F-3 | Class
ABLE-A | Class
ABLE-F-2 |
Stock and stock/fixed income funds | | | | | | | | | |
AMCAP Fund | 1002 | 1302 | 1502 | 46002 | 1402 | 1602 | 1702 | N/A | N/A |
American Balanced Fund | 1011 | 1311 | 1511 | 46011 | 1411 | 1611 | 1711 | N/A | N/A |
American Funds Developing World Growth and Income Fund | 10100 | 13100 | 15100 | 46100 | 14100 | 16100 | 17100 | N/A | N/A |
American Funds Global Balanced Fund | 1037 | 1337 | 1537 | 46037 | 1437 | 1637 | 1737 | N/A | N/A |
American Funds Global Insight Fund | 10122 | 13122 | 15122 | 46122 | 14122 | 16122 | 17122 | N/A | N/A |
American Funds International Vantage Fund | 10123 | 13123 | 15123 | 46123 | 14123 | 16123 | 17123 | N/A | N/A |
American Mutual Fund | 1003 | 1303 | 1503 | 46003 | 1403 | 1603 | 1703 | N/A | N/A |
Capital Income Builder | 1012 | 1312 | 1512 | 46012 | 1412 | 1612 | 1712 | N/A | N/A |
Capital World Growth and Income Fund | 1033 | 1333 | 1533 | 46033 | 1433 | 1633 | 1733 | N/A | N/A |
EuroPacific Growth Fund | 1016 | 1316 | 1516 | 46016 | 1416 | 1616 | 1716 | N/A | N/A |
Fundamental Investors | 1010 | 1310 | 1510 | 46010 | 1410 | 1610 | 1710 | N/A | N/A |
The Growth Fund of America | 1005 | 1305 | 1505 | 46005 | 1405 | 1605 | 1705 | N/A | N/A |
The Income Fund of America | 1006 | 1306 | 1506 | 46006 | 1406 | 1606 | 1706 | N/A | N/A |
International Growth and Income Fund | 1034 | 1334 | 1534 | 46034 | 1434 | 1634 | 1734 | N/A | N/A |
The Investment Company of America | 1004 | 1304 | 1504 | 46004 | 1404 | 1604 | 1704 | N/A | N/A |
The New Economy Fund | 1014 | 1314 | 1514 | 46014 | 1414 | 1614 | 1714 | N/A | N/A |
New Perspective Fund | 1007 | 1307 | 1507 | 46007 | 1407 | 1607 | 1707 | N/A | N/A |
New World Fund | 1036 | 1336 | 1536 | 46036 | 1436 | 1636 | 1736 | N/A | N/A |
SMALLCAP World Fund | 1035 | 1335 | 1535 | 46035 | 1435 | 1635 | 1735 | N/A | N/A |
Washington Mutual Investors Fund | 1001 | 1301 | 1501 | 46001 | 1401 | 1601 | 1701 | N/A | N/A |
Fixed income funds | | | | | | | | | |
American Funds Emerging Markets Bond Fund | 10114 | 13114 | 15114 | 46114 | 14114 | 16114 | 17114 | N/A | N/A |
American Funds Corporate Bond Fund | 1032 | 1332 | 1532 | 46032 | 1432 | 1632 | 1732 | N/A | N/A |
American Funds Inflation Linked Bond Fund | 1060 | 1360 | 1560 | 46060 | 1460 | 1660 | 1760 | N/A | N/A |
American Funds Mortgage Fund | 1042 | 1342 | 1542 | 46042 | 1442 | 1642 | 1742 | N/A | N/A |
American Funds Multi-Sector Income Fund | 10126 | 13126 | 15126 | 46126 | 14126 | 16126 | 17126 | N/A | N/A |
American Funds Strategic Bond Fund | 10112 | 13112 | 15112 | 46112 | 14112 | 16112 | 17112 | N/A | N/A |
American High-Income Trust | 1021 | 1321 | 1521 | 46021 | 1421 | 1621 | 1721 | N/A | N/A |
The Bond Fund of America | 1008 | 1308 | 1508 | 46008 | 1408 | 1608 | 1708 | N/A | N/A |
Capital World Bond Fund | 1031 | 1331 | 1531 | 46031 | 1431 | 1631 | 1731 | N/A | N/A |
Intermediate Bond Fund of America | 1023 | 1323 | 1523 | 46023 | 1423 | 1623 | 1723 | N/A | N/A |
Short-Term Bond Fund of America | 1048 | 1348 | 1548 | 46048 | 1448 | 1648 | 1748 | N/A | N/A |
U.S. Government Securities Fund | 1022 | 1322 | 1522 | 46022 | 1422 | 1622 | 1722 | N/A | N/A |
Money market fund | | | | | | | | | |
American Funds U.S. Government
Money Market Fund | 1059 | 1359 | 1559 | 46059 | 1459 | 1659 | 1759 | 48059 | 60059 |
The Bond Fund of America — Page 95
| | | | | | | | | |
| | Fund numbers |
Fund | Class
R-1 | Class
R-2 | Class
R-2E | Class
R-3 | Class
R-4 | Class
R-5E | Class
R-5 | Class
R-6 |
Stock and stock/fixed income funds | | | | | | | | |
AMCAP Fund | 2102 | 2202 | 4102 | 2302 | 2402 | 2702 | 2502 | 2602 |
American Balanced Fund | 2111 | 2211 | 4111 | 2311 | 2411 | 2711 | 2511 | 2611 |
American Funds Developing World Growth and Income Fund | 21100 | 22100 | 41100 | 23100 | 24100 | 27100 | 25100 | 26100 |
American Funds Global Balanced Fund | 2137 | 2237 | 4137 | 2337 | 2437 | 2737 | 2537 | 2637 |
American Funds Global Insight Fund | 21122 | 22122 | 41122 | 23122 | 24122 | 27122 | 25122 | 26122 |
American Funds International Vantage Fund | 21123 | 22123 | 41123 | 23123 | 24123 | 27123 | 25123 | 26123 |
American Mutual Fund | 2103 | 2203 | 4103 | 2303 | 2403 | 2703 | 2503 | 2603 |
Capital Income Builder | 2112 | 2212 | 4112 | 2312 | 2412 | 2712 | 2512 | 2612 |
Capital World Growth and Income Fund | 2133 | 2233 | 4133 | 2333 | 2433 | 2733 | 2533 | 2633 |
EuroPacific Growth Fund | 2116 | 2216 | 4116 | 2316 | 2416 | 2716 | 2516 | 2616 |
Fundamental Investors | 2110 | 2210 | 4110 | 2310 | 2410 | 2710 | 2510 | 2610 |
The Growth Fund of America | 2105 | 2205 | 4105 | 2305 | 2405 | 2705 | 2505 | 2605 |
The Income Fund of America | 2106 | 2206 | 4106 | 2306 | 2406 | 2706 | 2506 | 2606 |
International Growth and Income Fund | 2134 | 2234 | 41034 | 2334 | 2434 | 27034 | 2534 | 2634 |
The Investment Company of America | 2104 | 2204 | 4104 | 2304 | 2404 | 2704 | 2504 | 2604 |
The New Economy Fund | 2114 | 2214 | 4114 | 2314 | 2414 | 2714 | 2514 | 2614 |
New Perspective Fund | 2107 | 2207 | 4107 | 2307 | 2407 | 2707 | 2507 | 2607 |
New World Fund | 2136 | 2236 | 4136 | 2336 | 2436 | 2736 | 2536 | 2636 |
SMALLCAP World Fund | 2135 | 2235 | 4135 | 2335 | 2435 | 2735 | 2535 | 2635 |
Washington Mutual Investors Fund | 2101 | 2201 | 4101 | 2301 | 2401 | 2701 | 2501 | 2601 |
Fixed income funds | | | | | | | | |
American Funds Emerging Markets Bond Fund | 21114 | 22114 | 41114 | 23114 | 24114 | 27114 | 25114 | 26114 |
American Funds Corporate Bond Fund | 2132 | 2232 | 4132 | 2332 | 2432 | 2732 | 2532 | 2632 |
American Funds Inflation Linked Bond Fund | 2160 | 2260 | 4160 | 2360 | 2460 | 2760 | 2560 | 2660 |
American Funds Mortgage Fund | 2142 | 2242 | 4142 | 2342 | 2442 | 2742 | 2542 | 2642 |
American Funds Multi-Sector Income Fund | 21126 | 22126 | 41126 | 23126 | 24126 | 27126 | 25126 | 26126 |
American Funds Strategic Bond Fund | 21112 | 22112 | 41112 | 23112 | 24112 | 27112 | 25112 | 26112 |
American High-Income Trust | 2121 | 2221 | 4121 | 2321 | 2421 | 2721 | 2521 | 2621 |
The Bond Fund of America | 2108 | 2208 | 4108 | 2308 | 2408 | 2708 | 2508 | 2608 |
Capital World Bond Fund | 2131 | 2231 | 4131 | 2331 | 2431 | 2731 | 2531 | 2631 |
Intermediate Bond Fund of America | 2123 | 2223 | 4123 | 2323 | 2423 | 2723 | 2523 | 2623 |
Short-Term Bond Fund of America | 2148 | 2248 | 4148 | 2348 | 2448 | 2748 | 2548 | 2648 |
U.S. Government Securities Fund | 2122 | 2222 | 4122 | 2322 | 2422 | 2722 | 2522 | 2622 |
Money market fund | | | | | | | | |
American Funds U.S. Government
Money Market Fund | 2159 | 2259 | 4159 | 2359 | 2459 | 2759 | 2559 | 2659 |
The Bond Fund of America — Page 96
| | | | | | | |
| | Fund numbers |
Fund | Class A | Class C | Class T | Class F-1 | Class F-2 | Class F-3 |
American Funds Target Date Retirement Series® | | | | | | |
American Funds 2065 Target Date Retirement FundSM | 30185 | 33185 | 43185 | 34185 | 36185 | 37185 |
American Funds 2060 Target Date Retirement Fund® | 083 | 383 | 43083 | 483 | 683 | 783 |
American Funds 2055 Target Date Retirement Fund® | 082 | 382 | 43082 | 482 | 682 | 782 |
American Funds 2050 Target Date Retirement Fund® | 069 | 369 | 43069 | 469 | 669 | 769 |
American Funds 2045 Target Date Retirement Fund® | 068 | 368 | 43068 | 468 | 668 | 768 |
American Funds 2040 Target Date Retirement Fund® | 067 | 367 | 43067 | 467 | 667 | 767 |
American Funds 2035 Target Date Retirement Fund® | 066 | 366 | 43066 | 466 | 36066 | 766 |
American Funds 2030 Target Date Retirement Fund® | 065 | 365 | 43065 | 465 | 665 | 765 |
American Funds 2025 Target Date Retirement Fund® | 064 | 364 | 43064 | 464 | 664 | 764 |
American Funds 2020 Target Date Retirement Fund® | 063 | 363 | 43063 | 463 | 663 | 763 |
American Funds 2015 Target Date Retirement Fund® | 062 | 362 | 43062 | 462 | 662 | 762 |
American Funds 2010 Target Date Retirement Fund® | 061 | 361 | 43061 | 461 | 661 | 761 |
| | | | | | | | | |
| | Fund numbers |
Fund | Class
R-1 | Class
R-2 | Class
R-2E | Class
R-3 | Class
R-4 | Class
R-5E | Class
R-5 | Class
R-6 |
American Funds Target Date Retirement Series® | | | | | | | | |
American Funds 2065
Target Date Retirement FundSM | 21185 | 22185 | 41185 | 23185 | 24185 | 27185 | 25185 | 26185 |
American Funds 2060
Target Date Retirement Fund® | 2183 | 2283 | 4183 | 2383 | 2483 | 2783 | 2583 | 2683 |
American Funds 2055
Target Date Retirement Fund® | 2182 | 2282 | 4182 | 2382 | 2482 | 2782 | 2582 | 2682 |
American Funds 2050
Target Date Retirement Fund® | 2169 | 2269 | 4169 | 2369 | 2469 | 2769 | 2569 | 2669 |
American Funds 2045
Target Date Retirement Fund® | 2168 | 2268 | 4168 | 2368 | 2468 | 2768 | 2568 | 2668 |
American Funds 2040
Target Date Retirement Fund® | 2167 | 2267 | 4167 | 2367 | 2467 | 2767 | 2567 | 2667 |
American Funds 2035
Target Date Retirement Fund® | 2166 | 2266 | 4166 | 2366 | 2466 | 2766 | 2566 | 2666 |
American Funds 2030
Target Date Retirement Fund® | 2165 | 2265 | 4165 | 2365 | 2465 | 2765 | 2565 | 2665 |
American Funds 2025
Target Date Retirement Fund® | 2164 | 2264 | 4164 | 2364 | 2464 | 2764 | 2564 | 2664 |
American Funds 2020
Target Date Retirement Fund® | 2163 | 2263 | 4163 | 2363 | 2463 | 2763 | 2563 | 2663 |
American Funds 2015
Target Date Retirement Fund® | 2162 | 2262 | 4162 | 2362 | 2462 | 2762 | 2562 | 2662 |
American Funds 2010
Target Date Retirement Fund® | 2161 | 2261 | 4161 | 2361 | 2461 | 2761 | 2561 | 2661 |
The Bond Fund of America — Page 97
| | | | | | | | |
| | Fund numbers |
Fund | Class
529-A | Class
529-C | Class
529-E | Class
529-T | Class
529-F-1 | Class
529-F-2 | Class
529-F-3 |
American Funds College Target Date Series® | | | | | | | |
American Funds College 2039 FundSM | 10136 | 13136 | 15136 | 46136 | 14136 | 16136 | 17136 |
American Funds College 2036 FundSM | 10125 | 13125 | 15125 | 46125 | 14125 | 16125 | 17125 |
American Funds College 2033 Fund® | 10103 | 13103 | 15103 | 46103 | 14103 | 16103 | 17103 |
American Funds College 2030 Fund® | 1094 | 1394 | 1594 | 46094 | 1494 | 1694 | 1794 |
American Funds College 2027 Fund® | 1093 | 1393 | 1593 | 46093 | 1493 | 1693 | 1793 |
American Funds College 2024 Fund® | 1092 | 1392 | 1592 | 46092 | 1492 | 1692 | 1792 |
American Funds College Enrollment Fund® | 1088 | 1388 | 1588 | 46088 | 1488 | 1688 | 1788 |
The Bond Fund of America — Page 98
| | | | | | | |
| | Fund numbers |
Fund | Class A | Class C | Class T | Class F-1 | Class F-2 | Class F-3 |
American Funds Portfolio SeriesSM | | | | | | |
American Funds Global Growth PortfolioSM | 055 | 355 | 43055 | 455 | 655 | 755 |
American Funds Growth PortfolioSM | 053 | 353 | 43053 | 453 | 653 | 753 |
American Funds Growth and Income PortfolioSM | 051 | 351 | 43051 | 451 | 651 | 751 |
American Funds Moderate Growth and Income PortfolioSM | 050 | 350 | 43050 | 450 | 650 | 750 |
American Funds Conservative Growth and Income PortfolioSM | 047 | 347 | 43047 | 447 | 647 | 747 |
American Funds Tax-Aware Conservative
Growth and Income PortfolioSM | 046 | 346 | 43046 | 446 | 646 | 746 |
American Funds Preservation PortfolioSM | 045 | 345 | 43045 | 445 | 645 | 745 |
American Funds Tax-Exempt Preservation PortfolioSM | 044 | 344 | 43044 | 444 | 644 | 744 |
| | | | | | | | | | |
| | Fund numbers |
Fund | Class
529-A | Class
529-C | Class
529-E | Class
529-T | Class
529-F-1 | Class
529-F-2 | Class
529-F-3 | Class
ABLE-A | Class
ABLE-F-2 |
American Funds Global Growth Portfolio | 1055 | 1355 | 1555 | 46055 | 1455 | 1655 | 1755 | 48055 | 60055 |
American Funds Growth Portfolio | 1053 | 1353 | 1553 | 46053 | 1453 | 1653 | 1753 | 48053 | 60053 |
American Funds Growth and Income Portfolio | 1051 | 1351 | 1551 | 46051 | 1451 | 1651 | 1751 | 48051 | 60051 |
American Funds Moderate Growth and Income Portfolio | 1050 | 1350 | 1550 | 46050 | 1450 | 1650 | 1750 | 48050 | 60050 |
American Funds Conservative Growth and Income Portfolio | 1047 | 1347 | 1547 | 46047 | 1447 | 1647 | 1747 | 48047 | 60047 |
American Funds Tax-Aware Conservative Growth and Income Portfolio | N/A | N/A | N/A | N/A | N/A | N/A | N/A | N/A | N/A |
American Funds Preservation Portfolio | 1045 | 1345 | 1545 | 46045 | 1445 | 1645 | 1745 | 48045 | 60045 |
American Funds Tax-Exempt Preservation Portfolio | N/A | N/A | N/A | N/A | N/A | N/A | N/A | N/A | N/A |
| | | | | | | | | |
| | Fund numbers |
Fund | Class
R-1 | Class
R-2 | Class
R-2E | Class
R-3 | Class
R-4 | Class
R-5E | Class
R-5 | Class
R-6 |
American Funds Global Growth Portfolio | 2155 | 2255 | 4155 | 2355 | 2455 | 2755 | 2555 | 2655 |
American Funds Growth Portfolio | 2153 | 2253 | 4153 | 2353 | 2453 | 2753 | 2553 | 2653 |
American Funds Growth and Income Portfolio | 2151 | 2251 | 4151 | 2351 | 2451 | 2751 | 2551 | 2651 |
American Funds Moderate Growth and Income Portfolio | 2150 | 2250 | 4150 | 2350 | 2450 | 2750 | 2550 | 2650 |
American Funds Conservative Growth and Income Portfolio | 2147 | 2247 | 4147 | 2347 | 2447 | 2747 | 2547 | 2647 |
American Funds Tax-Aware Conservative
Growth and Income Portfolio | N/A | N/A | N/A | N/A | N/A | N/A | N/A | N/A |
American Funds Preservation Portfolio | 2145 | 2245 | 4145 | 2345 | 2445 | 2745 | 2545 | 2645 |
American Funds Tax-Exempt Preservation Portfolio | N/A | N/A | N/A | N/A | N/A | N/A | N/A | N/A |
The Bond Fund of America — Page 99
| | | | | | | |
| | Fund numbers |
Fund | Class A | Class C | Class T | Class F-1 | Class F-2 | Class F-3 |
American Funds Retirement Income Portfolio SeriesSM | | | | | | |
American Funds Retirement Income Portfolio – ConservativeSM | 30109 | 33109 | 43109 | 34109 | 36109 | 37109 |
American Funds Retirement Income Portfolio – ModerateSM | 30110 | 33110 | 43110 | 34110 | 36110 | 37110 |
American Funds Retirement Income Portfolio – EnhancedSM | 30111 | 33111 | 43111 | 34111 | 36111 | 37111 |
| | | | | | | | | |
| | Fund numbers |
Fund | Class
R-1 | Class
R-2 | Class
R-2E | Class
R-3 | Class
R-4 | Class
R-5E | Class
R-5 | Class
R-6 |
American Funds Retirement Income Portfolio – Conservative | 21109 | 22109 | 41109 | 23109 | 24109 | 27109 | 25109 | 26109 |
American Funds Retirement Income Portfolio – Moderate | 21110 | 22110 | 41110 | 23110 | 24110 | 27110 | 25110 | 26110 |
American Funds Retirement Income Portfolio – Enhanced | 21111 | 22111 | 41111 | 23111 | 24111 | 27111 | 25111 | 26111 |
The Bond Fund of America — Page 100
Appendix
The following descriptions of debt security ratings are based on information provided by Moody’s Investors Service, Standard & Poor’s Ratings Services and Fitch Ratings, Inc.
Description of bond ratings
Moody’s
Long-term rating scale
Aaa
Obligations rated Aaa are judged to be of the highest quality, subject to the lowest level of credit risk.
Aa
Obligations rated Aa are judged to be of high quality and are subject to very low credit risk.
A
Obligations rated A are considered upper-medium grade and are subject to low credit risk.
Baa
Obligations rated Baa are judged to be medium-grade and subject to moderate credit risk and as such may possess certain speculative characteristics.
Ba
Obligations rated Ba are judged to be speculative and are subject to substantial credit risk.
B
Obligations rated B are considered speculative and are subject to high credit risk.
Caa
Obligations rated Caa are judged to be speculative and of poor standing and are subject to very high credit risk.
Ca
Obligations rated Ca are highly speculative and are likely in, or very near, default, with some prospect of recovery of principal and interest.
C
Obligations rated C are the lowest rated and are typically in default, with little prospect for recovery of principal or interest.
Note: Moody’s appends numerical modifiers 1, 2, and 3 to each generic rating classification from Aa through Caa. The modifier 1 indicates that the obligation ranks in the higher end of its generic rating category; the modifier 2 indicates a mid-range ranking; and the modifier 3 indicates a ranking in the lower end of that generic rating category. Additionally, a “(hyb)” indicator is appended to all ratings of hybrid securities issued by banks, insurers, finance companies and securities firms.
The Bond Fund of America — Page 101
Standard & Poor’s
Long-term issue credit ratings
AAA
An obligation rated AAA has the highest rating assigned by Standard & Poor’s. The obligor’s capacity to meet its financial commitment on the obligation is extremely strong.
AA
An obligation rated AA differs from the highest-rated obligations only to a small degree. The obligor’s capacity to meet its financial commitment on the obligation is very strong.
A
An obligation rated A is somewhat more susceptible to the adverse effects of changes in circumstances and economic conditions than obligations in higher-rated categories. However, the obligor’s capacity to meet its financial commitment on the obligation is still strong.
BBB
An obligation rated BBB exhibits adequate protection parameters. However, adverse economic conditions or changing circumstances are more likely to lead to a weakened capacity of the obligor to meet its financial commitment on the obligation.
BB, B, CCC, CC, and C
Obligations rated BB, B, CCC, CC, and C are regarded as having significant speculative characteristics. BB indicates the least degree of speculation and C the highest. While such obligations will likely have some quality and protective characteristics, these may be outweighed by large uncertainties or major exposures to adverse conditions.
BB
An obligation rated BB is less vulnerable to nonpayment than other speculative issues. However, it faces major ongoing uncertainties or exposure to adverse business, financial, or economic conditions which could lead to the obligor’s inadequate capacity to meet its financial commitment on the obligation.
B
An obligation rated B is more vulnerable to nonpayment than obligations rated BB, but the obligor currently has the capacity to meet its financial commitment on the obligation. Adverse business, financial, or economic conditions will likely impair the obligor’s capacity or willingness to meet its financial commitment on the obligation.
CCC
An obligation rated CCC is currently vulnerable to nonpayment and is dependent upon favorable business, financial, and economic conditions for the obligor to meet its financial commitment on the obligation. In the event of adverse business, financial, or economic conditions, the obligor is not likely to have the capacity to meet its financial commitment on the obligation.
CC
An obligation rated CC is currently highly vulnerable to nonpayment. The CC rating is used when a default has not occurred, but Standard & Poor’s expects default to be a virtual certainty, regardless of the anticipated time to default.
The Bond Fund of America — Page 102
C
An obligation rated C is currently highly vulnerable to nonpayment, and the obligation is expected to have lower relative seniority or lower ultimate recovery compared to obligations that are rated higher.
D
An obligation rated D is in default or in breach of an imputed promise. For non-hybrid capital instruments, the D rating category is used when payments on an obligation are not made on the date due, unless Standard & Poor’s believes that such payments will be made within five business days in the absence of a stated grace period or within the earlier of the stated grace period or 30 calendar days. The D rating also will be used upon the filing of a bankruptcy petition or the taking of similar action and where default on an obligation is a virtual certainty, for example due to automatic stay provisions. An obligation’s rating is lowered to D if it is subject to a distressed exchange offer.
Plus (+) or minus (–)
The ratings from AA to CCC may be modified by the addition of a plus or minus sign to show relative standing within the major rating categories.
NR
This indicates that no rating has been requested, that there is insufficient information on which to base a rating, or that Standard & Poor’s does not rate a particular obligation as a matter of policy.
The Bond Fund of America — Page 103
Fitch Ratings, Inc.
Long-term credit ratings
AAA
Highest credit quality. AAA ratings denote the lowest expectation of default risk. They are assigned only in case of exceptionally strong capacity for payment of financial commitments. This capacity is highly unlikely to be adversely affected by foreseeable events.
AA
Very high credit quality. AA ratings denote expectations of very low default risk. They indicate very strong capacity for payment of financial commitments. This capacity is not significantly vulnerable to foreseeable events.
A
High credit quality. A ratings denote expectations of low default risk. The capacity for payment of financial commitments is considered strong. This capacity may, nevertheless, be more vulnerable to changes in circumstances or in economic conditions than is the case for higher ratings.
BBB
Good credit quality. BBB ratings indicate that expectations of default risk are low. The capacity for payment of financial commitments is considered adequate but adverse changes in circumstances and economic conditions are more likely to impair this capacity.
BB
Speculative. BB ratings indicate an elevated vulnerability to default risk, particularly in the event of adverse changes in business or economic conditions over time; however, business or financial flexibility exists which supports the servicing of financial commitments.
B
Highly speculative. B ratings indicate that material default risk is present, but a limited margin of safety remains. Financial commitments are currently being met; however, capacity for continued payment is vulnerable to deterioration in the business and economic environment.
CCC
Substantial credit risk. Default is a real possibility.
CC
Very high levels of credit risk. Default of some kind appears probable.
C
Exceptionally high levels of credit risk. Default is imminent or inevitable, or the issuer is in standstill. Conditions that are indicative of a C category rating for an issuer include:
· The issuer has entered into a grace or cure period following nonpayment of a material financial obligation;
· The issuer has entered into a temporary negotiated waiver or standstill agreement following a payment default on a material financial obligation; or
· Fitch Ratings otherwise believes a condition of RD or D to be imminent or inevitable, including through the formal announcement of a distressed debt exchange.
The Bond Fund of America — Page 104
RD
Restricted default. RD ratings indicate an issuer that in Fitch Ratings’ opinion has experienced an uncured payment default on a bond, loan or other material financial obligation but which has not entered into bankruptcy filings, administration, receivership, liquidation or other formal winding up procedure, and which has not otherwise ceased operating. This would include:
· The selective payment default on a specific class or currency of debt;
· The uncured expiry of any applicable grace period, cure period or default forbearance period following a payment default on a bank loan, capital markets security or other material financial obligation;
· The extension of multiple waivers or forbearance periods upon a payment default on one or more material financial obligations, either in series or in parallel; or
· Execution of a distressed debt exchange on one or more material financial obligations.
D
Default. D ratings indicate an issuer that in Fitch Ratings’ opinion has entered into bankruptcy filings, administration, receivership, liquidation or other formal winding up procedure, or which has otherwise ceased business.
Default ratings are not assigned prospectively to entities or their obligations; within this context, nonpayment on an instrument that contains a deferral feature or grace period will generally not be considered a default until after the expiration of the deferral or grace period, unless a default is otherwise driven by bankruptcy or other similar circumstance, or by a distressed debt exchange.
Imminent default typically refers to the occasion where a payment default has been intimated by the issuer, and is all but inevitable. This may, for example, be where an issuer has missed a scheduled payment, but (as is typical) has a grace period during which it may cure the payment default. Another alternative would be where an issuer has formally announced a distressed debt exchange, but the date of the exchange still lies several days or weeks in the immediate future.
In all cases, the assignment of a default rating reflects the agency’s opinion as to the most appropriate rating category consistent with the rest of its universe of ratings, and may differ from the definition of default under the terms of an issuer’s financial obligations or local commercial practice.
Note: The modifiers “+” or “–” may be appended to a rating to denote relative status within major rating categories. Such suffixes are not added to the AAA long-term rating category, or to categories below B.
The Bond Fund of America — Page 105
Description of commercial paper ratings
Moody’s
Global short-term rating scale
P-1
Issuers (or supporting institutions) rated Prime-1 have a superior ability to repay short-term debt obligations.
P-2
Issuers (or supporting institutions) rated Prime-2 have a strong ability to repay short-term debt obligations.
P-3
Issuers (or supporting institutions) rated Prime-3 have an acceptable ability to repay short-term obligations.
NP
Issuers (or supporting institutions) rated Not Prime do not fall within any of the Prime rating categories.
Standard & Poor’s
Commercial paper ratings (highest three ratings)
A-1
A short-term obligation rated A-1 is rated in the highest category by Standard & Poor’s. The obligor’s capacity to meet its financial commitment on the obligation is strong. Within this category, certain obligations are designated with a plus sign (+). This indicates that the obligor’s capacity to meet its financial commitment on these obligations is extremely strong.
A-2
A short-term obligation rated A-2 is somewhat more susceptible to the adverse effects of changes in circumstances and economic conditions than obligations in higher rating categories. However, the obligor’s capacity to meet its financial commitment on the obligation is satisfactory.
A-3
A short-term obligation rated A-3 exhibits adequate protection parameters. However, adverse economic conditions or changing circumstances are more likely to lead to a weakened capacity of the obligor to meet its financial commitment on the obligation.
The Bond Fund of America — Page 106
| Investment portfolio December 31, 2021 | |
| | |
| Portfolio by type of security | Percent of net assets |
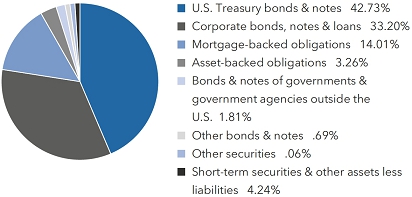
| Portfolio quality summary* | | Percent of
net assets | |
| U.S. Treasury and agency† | | | 42.76 | % |
| AAA/Aaa | | | 15.13 | |
| AA/Aa | | | 4.96 | |
| A/A | | | 11.44 | |
| BBB/Baa | | | 18.15 | |
| Below investment grade | | | 3.27 | |
| Unrated | | | .05 | |
| Short-term securities & other assets less liabilities | | | 4.24 | |
| | |
| * | Bond ratings, which typically range from AAA/Aaa (highest) to D (lowest), are assigned by credit rating agencies such as Standard & Poor’s, Moody’s and/or Fitch as an indication of an issuer’s creditworthiness. In assigning a credit rating to a security, the fund looks specifically to the ratings assigned to the issuer of the security by Standard & Poor’s, Moody’s and/or Fitch. If agency ratings differ, the security will be considered to have received the highest of those ratings, consistent with the fund’s investment policies. Securities in the “unrated” category (above) have not been rated by a rating agency; however, the investment adviser performs its own credit analysis and assigns comparable ratings that are used for compliance with the fund’s investment policies. The ratings are not covered by the Report of Independent Registered Public Accounting Firm. |
| † | These securities are guaranteed by the full faith and credit of the U.S. government. |
| | |
| Bonds, notes & other debt instruments 95.70% | | Principal amount
(000) | | | Value
(000) | |
| U.S. Treasury bonds & notes 42.73% | | | | | | |
| U.S. Treasury 31.83% | | | | | | | | |
| U.S. Treasury 0.125% 2022 | | $ | 276,582 | | | $ | 276,442 | |
| U.S. Treasury 0.125% 2022 | | | 265,905 | | | | 265,499 | |
| U.S. Treasury 0.125% 2022 | | | 84,840 | | | | 84,593 | |
| U.S. Treasury 0.125% 2022 | | | 50,000 | | | | 50,004 | |
| U.S. Treasury 0.125% 2022 | | | 10,000 | | | | 9,979 | |
| U.S. Treasury 0.375% 2022 | | | 213 | | | | 213 | |
| U.S. Treasury 1.375% 2022 | | | 100,000 | | | | 100,098 | |
| U.S. Treasury 1.375% 2022 | | | 75,000 | | | | 75,616 | |
| U.S. Treasury 1.75% 2022 | | | 45,000 | | | | 45,366 | |
| U.S. Treasury 1.875% 2022 | | | 54,500 | | | | 54,816 | |
| U.S. Treasury 2.125% 20221 | | | 32,000 | | | | 32,534 | |
| U.S. Treasury 2.50% 2022 | | | 800,000 | | | | 800,632 | |
| U.S. Treasury 0.125% 20231 | | | 2,046,012 | | | | 2,028,538 | |
| U.S. Treasury 0.125% 2023 | | | 521,057 | | | | 516,986 | |
| U.S. Treasury 0.125% 2023 | | | 195,679 | | | | 194,650 | |
| U.S. Treasury 0.125% 2023 | | | 141,672 | | | | 141,034 | |
| U.S. Treasury 0.125% 2023 | | | 85,000 | | | | 84,172 | |
| U.S. Treasury 0.125% 2023 | | | 40,000 | | | | 39,780 | |
| U.S. Treasury 0.125% 2023 | | | 40,000 | | | | 39,735 | |
| U.S. Treasury 0.125% 2023 | | | 25,000 | | | | 24,715 | |
| U.S. Treasury 0.125% 2023 | | | 24,176 | | | | 24,096 | |
| U.S. Treasury 0.125% 2023 | | | 10,981 | | | | 10,916 | |
| U.S. Treasury 0.125% 2023 | | | 1,000 | | | | 996 | |
| U.S. Treasury 0.25% 2023 | | | 40,000 | | | | 39,671 | |
| U.S. Treasury 0.25% 2023 | | | 8,377 | | | | 8,319 | |
| 6 | The Bond Fund of America |
| Bonds, notes & other debt instruments (continued) | | Principal amount
(000) | | | Value
(000) | |
| U.S. Treasury bonds & notes (continued) | | | | | | |
| U.S. Treasury (continued) | | | | | | |
| U.S. Treasury 0.375% 2023 | | $ | 88,710 | | | $ | 88,209 | |
| U.S. Treasury 0.50% 2023 | | | 28,000 | | | | 27,896 | |
| U.S. Treasury 0.75% 2023 | | | 20,000 | | | | 20,012 | |
| U.S. Treasury 1.375% 2023 | | | 7,000 | | | | 7,084 | |
| U.S. Treasury 1.75% 2023 | | | 3,100 | | | | 3,152 | |
| U.S. Treasury 2.125% 2023 | | | 16,428 | | | | 16,868 | |
| U.S. Treasury 2.50% 2023 | | | 47,000 | | | | 48,164 | |
| U.S. Treasury 2.625% 2023 | | | 15,000 | | | | 15,455 | |
| U.S. Treasury 2.75% 2023 | | | 25,000 | | | | 25,774 | |
| U.S. Treasury 2.875% 2023 | | | 54,729 | | | | 56,832 | |
| U.S. Treasury 0.125% 2024 | | | 584,803 | | | | 577,233 | |
| U.S. Treasury 0.125% 2024 | | | 100,000 | | | | 98,757 | |
| U.S. Treasury 0.25% 2024 | | | 165,200 | | | | 163,289 | |
| U.S. Treasury 0.25% 2024 | | | 65,563 | | | | 64,681 | |
| U.S. Treasury 0.375% 2024 | | | 561,802 | | | | 554,493 | |
| U.S. Treasury 0.375% 2024 | | | 275,120 | | | | 271,292 | |
| U.S. Treasury 0.375% 2024 | | | 8,919 | | | | 8,831 | |
| U.S. Treasury 0.625% 2024 | | | 47,014 | | | | 46,643 | |
| U.S. Treasury 0.75% 2024 | | | 2,992 | | | | 2,976 | |
| U.S. Treasury 1.00% 2024 | | | 6,466 | | | | 6,474 | |
| U.S. Treasury 1.25% 2024 | | | 75,000 | | | | 75,694 | |
| U.S. Treasury 1.50% 2024 | | | 130,000 | | | | 132,071 | |
| U.S. Treasury 1.50% 2024 | | | 98,200 | | | | 99,752 | |
| U.S. Treasury 1.50% 2024 | | | 1,000 | | | | 1,016 | |
| U.S. Treasury 1.75% 2024 | | | 40,000 | | | | 40,876 | |
| U.S. Treasury 2.00% 2024 | | | 442,300 | | | | 454,491 | |
| U.S. Treasury 2.00% 2024 | | | 55,000 | | | | 56,554 | |
| U.S. Treasury 2.00% 2024 | | | 19,000 | | | | 19,517 | |
| U.S. Treasury 2.125% 2024 | | | 105,265 | | | | 108,381 | |
| U.S. Treasury 2.125% 2024 | | | 18,000 | | | | 18,602 | |
| U.S. Treasury 2.125% 2024 | | | 8,000 | | | | 8,265 | |
| U.S. Treasury 2.25% 2024 | | | 50,633 | | | | 52,290 | |
| U.S. Treasury 2.25% 2024 | | | 3,000 | | | | 3,114 | |
| U.S. Treasury 2.375% 2024 | | | 67,233 | | | | 69,520 | |
| U.S. Treasury 2.50% 2024 | | | 4,000 | | | | 4,157 | |
| U.S. Treasury 0.25% 2025 | | | 220,000 | | | | 213,820 | |
| U.S. Treasury 0.25% 2025 | | | 59,311 | | | | 57,347 | |
| U.S. Treasury 0.25% 2025 | | | 5,000 | | | | 4,843 | |
| U.S. Treasury 0.25% 2025 | | | 1,000 | | | | 973 | |
| U.S. Treasury 0.375% 2025 | | | 1,976,312 | | | | 1,916,347 | |
| U.S. Treasury 0.375% 2025 | | | 788,900 | | | | 765,428 | |
| U.S. Treasury 2.625% 2025 | | | 135,324 | | | | 142,258 | |
| U.S. Treasury 2.625% 2025 | | | 63,822 | | | | 67,514 | |
| U.S. Treasury 2.75% 20251 | | | 900,000 | | | | 948,468 | �� |
| U.S. Treasury 2.75% 2025 | | | 31,813 | | | | 33,638 | |
| U.S. Treasury 2.875% 2025 | | | 272,175 | | | | 288,701 | |
| U.S. Treasury 0.375% 2026 | | | 752,665 | | | | 728,619 | |
| U.S. Treasury 0.50% 2026 | | | 71,143 | | | | 69,147 | |
| U.S. Treasury 0.625% 2026 | | | 160,154 | | | | 155,803 | |
| U.S. Treasury 0.75% 2026 | | | 678,267 | | | | 665,653 | |
| U.S. Treasury 0.75% 2026 | | | 606,692 | | | | 594,933 | |
| U.S. Treasury 0.75% 2026 | | | 175,077 | | | | 171,237 | |
| U.S. Treasury 0.75% 2026 | | | 45,560 | | | | 44,647 | |
| U.S. Treasury 0.875% 2026 | | | 1,127,608 | | | | 1,108,243 | |
| U.S. Treasury 0.875% 2026 | | | 8,802 | | | | 8,667 | |
| U.S. Treasury 1.125% 2026 | | | 31,859 | | | | 31,666 | |
| U.S. Treasury 1.25% 2026 | | | 47,163 | | | | 47,163 | |
| U.S. Treasury 1.625% 2026 | | | — | 2 | | | — | 2 |
| U.S. Treasury 2.00% 2026 | | | 15,600 | | | | 16,149 | |
| U.S. Treasury 2.125% 2026 | | | 31,000 | | | | 32,215 | |
| U.S. Treasury 2.25% 2026 | | | 8,000 | | | | 8,348 | |
| U.S. Treasury 2.625% 2026 | | | 109,585 | | | | 115,925 | |
| U.S. Treasury 0.375% 2027 | | | 75,000 | | | | 71,026 | |
| U.S. Treasury 0.50% 2027 | | | 549,480 | | | | 524,586 | |
| U.S. Treasury 0.50% 2027 | | | 55,500 | | | | 52,847 | |
| U.S. Treasury 0.50% 2027 | | | 16,000 | | | | 15,326 | |
| U.S. Treasury 0.50% 2027 | | | 6,000 | | | | 5,743 | |
| The Bond Fund of America | 7 |
| Bonds, notes & other debt instruments (continued) | | Principal amount
(000) | | | Value
(000) | |
| U.S. Treasury bonds & notes (continued) | | | | | | |
| U.S. Treasury (continued) | | | | | | |
| U.S. Treasury 0.625% 2027 | | $ | 112,389 | | | $ | 107,586 | |
| U.S. Treasury 0.625% 2027 | | | 42,000 | | | | 40,248 | |
| U.S. Treasury 2.25% 2027 | | | 100,000 | | | | 105,051 | |
| U.S. Treasury 2.25% 2027 | | | 3,000 | | | | 3,145 | |
| U.S. Treasury 0.75% 2028 | | | 13,450 | | | | 12,959 | |
| U.S. Treasury 1.00% 2028 | | | 35,000 | | | | 34,091 | |
| U.S. Treasury 1.125% 2028 | | | 165,881 | | | | 163,552 | |
| U.S. Treasury 1.125% 2028 | | | 14,045 | | | | 13,781 | |
| U.S. Treasury 1.25% 2028 | | | 140,850 | | | | 139,669 | |
| U.S. Treasury 1.25% 2028 | | | 118,900 | | | | 117,738 | |
| U.S. Treasury 1.25% 2028 | | | 33,700 | | | | 33,410 | |
| U.S. Treasury 1.25% 2028 | | | 23,762 | | | | 23,539 | |
| U.S. Treasury 1.375% 2028 | | | 82,000 | | | | 81,697 | |
| U.S. Treasury 1.50% 2028 | | | 148,000 | | | | 148,658 | |
| U.S. Treasury 2.75% 2028 | | | 17,398 | | | | 18,810 | |
| U.S. Treasury 2.875% 2028 | | | 61,335 | | | | 66,854 | |
| U.S. Treasury 2.875% 2028 | | | 3,760 | | | | 4,108 | |
| U.S. Treasury 1.625% 2029 | | | 398 | | | | 404 | |
| U.S. Treasury 2.375% 2029 | | | 2,000 | | | | 2,133 | |
| U.S. Treasury 0.625% 2030 | | | 50,987 | | | | 47,565 | |
| U.S. Treasury 0.625% 2030 | | | 17,638 | | | | 16,497 | |
| U.S. Treasury 0.875% 2030 | | | 12,500 | | | | 11,889 | |
| U.S. Treasury 1.50% 2030 | | | 11,399 | | | | 11,461 | |
| U.S. Treasury 1.125% 2031 | | | 121,311 | | | | 117,768 | |
| U.S. Treasury 1.25% 2031 | | | 170,088 | | | | 166,353 | |
| U.S. Treasury 1.375% 2031 | | | 334,767 | | | | 330,606 | |
| U.S. Treasury 1.625% 2031 | | | 117,533 | | | | 119,053 | |
| U.S. Treasury 3.50% 2039 | | | 4,000 | | | | 5,024 | |
| U.S. Treasury 1.125% 2040 | | | 285,245 | | | | 249,129 | |
| U.S. Treasury 1.125% 2040 | | | 255,059 | | | | 223,714 | |
| U.S. Treasury 1.375% 2040 | | | 200,615 | | | | 182,842 | |
| U.S. Treasury 4.625% 2040 | | | 9,400 | | | | 13,510 | |
| U.S. Treasury 1.75% 2041 | | | 102,806 | | | | 99,657 | |
| U.S. Treasury 1.875% 2041 | | | 236,248 | | | | 233,881 | |
| U.S. Treasury 2.00% 2041 | | | 1,273 | | | | 1,286 | |
| U.S. Treasury 3.125% 2041 | | | 20,000 | | | | 24,073 | |
| U.S. Treasury 4.375% 2041 | | | 11,500 | | | | 16,224 | |
| U.S. Treasury 2.75% 2042 | | | 18,500 | | | | 21,119 | |
| U.S. Treasury 2.75% 2042 | | | 7,000 | | | | 7,991 | |
| U.S. Treasury 2.875% 2043 | | | 23,810 | | | | 27,718 | |
| U.S. Treasury 3.00% 2044 | | | 900 | | | | 1,075 | |
| U.S. Treasury 3.375% 2044 | | | 38,700 | | | | 48,805 | |
| U.S. Treasury 2.50% 2045 | | | 360 | | | | 397 | |
| U.S. Treasury 3.00% 2045 | | | 10,552 | | | | 12,704 | |
| U.S. Treasury 3.00% 2045 | | | 560 | | | | 671 | |
| U.S. Treasury 2.25% 2046 | | | 4,500 | | | | 4,766 | |
| U.S. Treasury 2.50% 2046 | | | 173,562 | | | | 192,063 | |
| U.S. Treasury 2.50% 2046 | | | 18,730 | | | | 20,741 | |
| U.S. Treasury 2.875% 2046 | | | 9,369 | | | | 11,107 | |
| U.S. Treasury 2.75% 2047 | | | 20,593 | | | | 24,011 | |
| U.S. Treasury 2.75% 2047 | | | 5,300 | | | | 6,184 | |
| U.S. Treasury 3.00% 2047 | | | 92,013 | | | | 111,594 | |
| U.S. Treasury 3.00% 2047 | | | 86,916 | | | | 105,648 | |
| U.S. Treasury 3.00% 20481 | | | 167,901 | | | | 205,311 | |
| U.S. Treasury 3.00% 2048 | | | 11,100 | | | | 13,606 | |
| U.S. Treasury 3.125% 2048 | | | 5,150 | | | | 6,447 | |
| U.S. Treasury 3.375% 2048 | | | 12,545 | | | | 16,442 | |
| U.S. Treasury 2.25% 2049 | | | 160,047 | | | | 171,593 | |
| U.S. Treasury 2.375% 2049 | | | 95,544 | | | | 105,167 | |
| U.S. Treasury 2.875% 2049 | | | 194,300 | | | | 234,458 | |
| U.S. Treasury 3.00% 2049 | | | 55,766 | | | | 68,676 | |
| U.S. Treasury 1.25% 2050 | | | 418,645 | | | | 356,162 | |
| U.S. Treasury 1.375% 20501 | | | 942,530 | | | | 827,438 | |
| U.S. Treasury 1.625% 2050 | | | 785,434 | | | | 732,936 | |
| U.S. Treasury 2.00% 2050 | | | 31,100 | | | | 31,652 | |
| U.S. Treasury 1.875% 2051 | | | 296,000 | | | | 293,999 | |
| 8 | The Bond Fund of America |
| Bonds, notes & other debt instruments (continued) | | Principal amount
(000) | | | Value
(000) | |
| U.S. Treasury bonds & notes (continued) | | | | | | |
| U.S. Treasury (continued) | | | | | | |
| U.S. Treasury 1.875% 2051 | | $ | 147,687 | | | $ | 146,388 | |
| U.S. Treasury 2.00% 2051 | | | 1,008,487 | | | | 1,029,359 | |
| U.S. Treasury 2.375% 2051 | | | 357,008 | | | | 394,992 | |
| | | | | | | | 25,324,280 | |
| | | | | | | | | |
| U.S. Treasury inflation-protected securities 10.90% | | | | | | | | |
| U.S. Treasury Inflation-Protected Security 0.125% 20223 | | | 318,067 | | | | 326,145 | |
| U.S. Treasury Inflation-Protected Security 0.125% 20223 | | | 307,538 | | | | 312,261 | |
| U.S. Treasury Inflation-Protected Security 0.125% 20233 | | | 228,888 | | | | 236,598 | |
| U.S. Treasury Inflation-Protected Security 0.375% 20233 | | | 177,913 | | | | 187,239 | |
| U.S. Treasury Inflation-Protected Security 0.625% 20233 | | | 719,123 | | | | 752,389 | |
| U.S. Treasury Inflation-Protected Security 0.125% 20243 | | | 1,208,406 | | | | 1,289,442 | |
| U.S. Treasury Inflation-Protected Security 0.125% 20243 | | | 669,499 | | | | 715,589 | |
| U.S. Treasury Inflation-Protected Security 0.50% 20243 | | | 82,396 | | | | 87,923 | |
| U.S. Treasury Inflation-Protected Security 0.625% 20243 | | | 398,629 | | | | 424,764 | |
| U.S. Treasury Inflation-Protected Security 0.125% 20253 | | | 97,297 | | | | 104,998 | |
| U.S. Treasury Inflation-Protected Security 0.25% 20253 | | | 157,086 | | | | 168,411 | |
| U.S. Treasury Inflation-Protected Security 0.375% 20253 | | | 573,182 | | | | 623,704 | |
| U.S. Treasury Inflation-Protected Security 0.125% 20263 | | | 1,094,879 | | | | 1,182,191 | |
| U.S. Treasury Inflation-Protected Security 0.125% 20263 | | | 1,006,157 | | | | 1,095,021 | |
| U.S. Treasury Inflation-Protected Security 0.125% 20303 | | | 60,864 | | | | 67,642 | |
| U.S. Treasury Inflation-Protected Security 0.125% 20313 | | | 423,936 | | | | 474,688 | |
| U.S. Treasury Inflation-Protected Security 0.125% 20313 | | | 387,116 | | | | 435,158 | |
| U.S. Treasury Inflation-Protected Security 2.125% 20413 | | | 2,996 | | | | 4,640 | |
| U.S. Treasury Inflation-Protected Security 0.75% 20423 | | | 145,318 | | | | 183,681 | |
| U.S. Treasury Inflation-Protected Security 0.125% 20513 | | | 1,580 | | | | 1,871 | |
| | | | | | | | 8,674,355 | |
| | | | | | | | | |
| Total U.S. Treasury bonds & notes | | | | | | | 33,998,635 | |
| | | | | | | | | |
| Corporate bonds, notes & loans 33.20% | | | | | | | | |
| Financials 7.96% | | | | | | | | |
| ACE INA Holdings, Inc. 2.875% 2022 | | | 1,585 | | | | 1,610 | |
| ACE INA Holdings, Inc. 3.35% 2026 | | | 100 | | | | 107 | |
| ACE INA Holdings, Inc. 4.35% 2045 | | | 1,465 | | | | 1,816 | |
| AerCap Holdings NV 6.50% 2025 | | | 4,854 | | | | 5,551 | |
| AerCap Ireland Capital, Ltd. / AerCap Global Aviation Trust 1.15% 2023 | | | 18,000 | | | | 17,929 | |
| AerCap Ireland Capital, Ltd. / AerCap Global Aviation Trust 1.65% 2024 | | | 50,868 | | | | 50,802 | |
| AerCap Ireland Capital, Ltd. / AerCap Global Aviation Trust 2.45% 2026 | | | 60,098 | | | | 60,626 | |
| AerCap Ireland Capital, Ltd. / AerCap Global Aviation Trust 3.00% 2028 | | | 71,609 | | | | 72,677 | |
| AerCap Ireland Capital, Ltd. / AerCap Global Aviation Trust 3.30% 2032 | | | 66,396 | | | | 67,698 | |
| AerCap Ireland Capital, Ltd. / AerCap Global Aviation Trust 3.40% 2033 | | | 26,819 | | | | 27,338 | |
| AerCap Ireland Capital, Ltd. / AerCap Global Aviation Trust 3.85% 2041 | | | 8,351 | | | | 8,714 | |
| Allstate Corp. 0.75% 2025 | | | 2,089 | | | | 2,038 | |
| Allstate Corp. 1.45% 2030 | | | 10,000 | | | | 9,465 | |
| Allstate Corp. 3.85% 2049 | | | 9,000 | | | | 10,541 | |
| Ally Financial, Inc. 5.125% 2024 | | | 3,863 | | | | 4,224 | |
| Ally Financial, Inc. 5.80% 2025 | | | 6,400 | | | | 7,228 | |
| Ally Financial, Inc. 8.00% 2031 | | | 23,019 | | | | 31,675 | |
| Ally Financial, Inc. 8.00% 2031 | | | 16,630 | | | | 23,569 | |
| American Express Co. 3.00% 2024 | | | 20,000 | | | | 20,974 | |
| American Express Co. 3.625% 2024 | | | 26,350 | | | | 28,176 | |
| American Express Co. 1.65% 2026 | | | 18,875 | | | | 18,938 | |
| American Express Co. 3.125% 2026 | | | 650 | | | | 689 | |
| American International Group, Inc. 2.50% 2025 | | | 8,500 | | | | 8,771 | |
| American International Group, Inc. 3.90% 2026 | | | 2,625 | | | | 2,848 | |
| American International Group, Inc. 3.40% 2030 | | | 14,120 | | | | 15,286 | |
| American International Group, Inc. 4.80% 2045 | | | 1,150 | | | | 1,477 | |
| American International Group, Inc. 4.375% 2050 | | | 15,900 | | | | 19,874 | |
| Aon Corp. / Aon Global Holdings PLC 2.60% 2031 | | | 10,000 | | | | 10,185 | |
| Arthur J. Gallagher & Co. 3.50% 2051 | | | 8,275 | | | | 8,760 | |
| ASB Bank, Ltd. 2.375% 20314 | | | 9,150 | | | | 9,105 | |
| Australia & New Zealand Banking Group, Ltd. 2.625% 2022 | | | 15,000 | | | | 15,122 | |
| AXA Equitable Holdings, Inc. 3.90% 2023 | | | 3,617 | | | | 3,744 | |
| Banco de Crédito del Perú 3.25% 2031 (5-year UST Yield Curve Rate T Note Constant Maturity + 2.45% on 9/30/2026)4,5 | | | 11,225 | | | | 11,101 | |
| Banco Santander México, SA, Institución de Banca Múltiple, Grupo Financiero Santander México 5.375% 20254 | | | 7,500 | | | | 8,194 | |
| The Bond Fund of America | 9 |
| Bonds, notes & other debt instruments (continued) | | Principal amount
(000) | | | Value
(000) | |
| Corporate bonds, notes & loans (continued) | | | | | | |
| Financials (continued) | | | | | | | | |
| Banco Santander, SA 1.722% 2027 | | | | | | | | |
| (1-year UST Yield Curve Rate T Note Constant Maturity + 0.90% on 9/14/2026)5 | | $ | 7,800 | | | $ | 7,662 | |
| Bangkok Bank PCL 3.733% 2034 | | | | | | | | |
| (5-year UST Yield Curve Rate T Note Constant Maturity + 1.90% on 9/25/2029)5 | | | 16,965 | | | | 17,365 | |
| Bank of America Corp. 1.53% 2025 (USD-SOFR + 0.65% on 12/6/2024)5 | | | 37,000 | | | | 37,084 | |
| Bank of America Corp. 1.658% 2027 (USD-SOFR + 0.91% on 3/11/2026)5 | | | 42,219 | | | | 41,937 | |
| Bank of America Corp. 1.734% 2027 (USD-SOFR + 0.96% on 7/22/2026)5 | | | 23,330 | | | | 23,173 | |
| Bank of America Corp. 3.419% 2028 (3-month USD-LIBOR + 1.04% on 12/20/2027)5 | | | 57,555 | | | | 61,489 | |
| Bank of America Corp. 2.087% 2029 (USD-SOFR + 1.06% on 6/14/2028)5 | | | 36,694 | | | | 36,464 | |
| Bank of America Corp. 1.898% 2031 (USD-SOFR + 1.53% on 7/23/2030)5 | | | 80,349 | | | | 76,986 | |
| Bank of America Corp. 1.922% 2031 (USD-SOFR + 1.37% on 10/24/2030)5 | | | 70,216 | | | | 67,306 | |
| Bank of America Corp. 2.299% 2032 (USD-SOFR + 1.22% on 7/21/2031)5 | | | 154,479 | | | | 152,050 | |
| Bank of America Corp. 2.572% 2032 (USD-SOFR + 1.21% on 10/20/2031)5 | | | 14,590 | | | | 14,671 | |
| Bank of America Corp. 2.651% 2032 (USD-SOFR + 1.22% on 3/11/2031)5 | | | 56,487 | | | | 57,272 | |
| Bank of America Corp. 2.687% 2032 (USD-SOFR + 1.32% on 4/22/2031)5 | | | 67,807 | | | | 68,885 | |
| Bank of America Corp. 2.676% 2041 (USD-SOFR + 1.93% on 6/19/2040)5 | | | 6,000 | | | | 5,785 | |
| Bank of China, Ltd. (Hong Kong Branch) 3.875% 2025 | | | 667 | | | | 717 | |
| Bank of China, Ltd. (Hong Kong Branch) 4.00% 2028 | | | 244 | | | | 270 | |
| Bank of New Zealand 1.00% 20264 | | | 37,025 | | | | 36,048 | |
| Bank of Nova Scotia 1.35% 2026 | | | 20,503 | | | | 20,279 | |
| Barclays Bank PLC 3.65% 2025 | | | 2,000 | | | | 2,115 | |
| Barclays Bank PLC 4.95% 2047 | | | 5,000 | | | | 6,489 | |
| Berkshire Hathaway Finance Corp. 4.20% 2048 | | | 21,490 | | | | 26,141 | |
| Berkshire Hathaway Finance Corp. 4.25% 2049 | | | 3,000 | | | | 3,693 | |
| Berkshire Hathaway, Inc. 3.125% 2026 | | | 4,100 | | | | 4,382 | |
| Berkshire Hathaway, Inc. 4.50% 2043 | | | 1,500 | | | | 1,855 | |
| BNP Paribas 3.80% 20244 | | | 30,525 | | | | 32,034 | |
| BNP Paribas 2.819% 2025 (3-month USD-LIBOR + 1.111% on 11/19/2024)4,5 | | | 5,050 | | | | 5,200 | |
| BNP Paribas 3.375% 20254 | | | 22,250 | | | | 23,377 | |
| BNP Paribas 2.219% 2026 (USD-SOFR + 2.074% on 6/9/2025)4,5 | | | 27,900 | | | | 28,182 | |
| BNP Paribas 1.323% 2027 (USD-SOFR + 1.004% on 1/13/2026)4,5 | | | 22,650 | | | | 22,052 | |
| BNP Paribas 1.675% 2027 (USD-SOFR + 0.912% on 6/30/2026)4,5 | | | 7,292 | | | | 7,173 | |
| BNP Paribas 2.159% 2029 (USD-SOFR + 1.218% on 9/15/2028)4,5 | | | 19,125 | | | | 18,764 | |
| BNP Paribas 2.871% 2032 (USD-SOFR + 1.387% on 4/19/2031)4,5 | | | 80,935 | | | | 82,147 | |
| Capital One Financial Corp. 1.343% 2024 (USD-SOFR + 0.69% on 12/6/2023)5 | | | 37,000 | | | | 37,240 | |
| Capital One Financial Corp. 4.25% 2025 | | | 17,500 | | | | 18,923 | |
| Charles Schwab Corp. 5.375% junior subordinated perpetual bonds (5-year UST Yield Curve Rate T Note Constant Maturity + 4.971% on 6/1/2025)5 | | | 3,750 | | | | 4,097 | |
| China CITIC Bank International, Ltd. 4.625% 2029 (5-year UST Yield Curve Rate T Note Constant Maturity + 2.25% on 2/28/2024)5 | | | 17,500 | | | | 18,308 | |
| China Construction Bank Corp. 2.45% 2030 (5-year UST Yield Curve Rate T Note Constant Maturity + 2.15% on 6/24/2025)5 | | | 33,800 | | | | 34,274 | |
| China Ping An Insurance Overseas (Holdings), Ltd. 2.85% 2031 | | | 6,203 | | | | 5,955 | |
| Chubb INA Holdings, Inc. 1.375% 2030 | | | 4,000 | | | | 3,772 | |
| Chubb INA Holdings, Inc. 2.85% 2051 | | | 2,157 | | | | 2,168 | |
| Chubb INA Holdings, Inc. 3.05% 2061 | | | 3,758 | | | | 3,846 | |
| CIT Group, Inc. 3.929% 2024 (USD-SOFR + 3.827% on 6/19/2023)5 | | | 35,287 | | | | 36,468 | |
| CIT Group, Inc. 5.25% 2025 | | | 15,651 | | | | 17,260 | |
| Citigroup, Inc. 4.60% 2026 | | | 4,175 | | | | 4,609 | |
| Citigroup, Inc. 1.462% 2027 (USD-SOFR + 0.67% on 6/9/2026)5 | | | 12,356 | | | | 12,150 | |
| Citigroup, Inc. 2.572% 2031 (USD-SOFR + 2.107% on 6/3/2030)5 | | | 20,000 | | | | 20,195 | |
| Citigroup, Inc. 2.561% 2032 (USD-SOFR + 1.167% on 5/1/2031)5 | | | 25,506 | | | | 25,665 | |
| Commonwealth Bank of Australia 2.688% 20314 | | | 26,500 | | | | 26,088 | |
| Commonwealth Bank of Australia 3.61% 2034 (5-year UST Yield Curve Rate T Note Constant Maturity + 2.05% on 9/12/2029)4,5 | | | 17,850 | | | | 18,681 | |
| Cooperatieve Rabobank UA 2.75% 2023 | | | 17,000 | | | | 17,362 | |
| Cooperatieve Rabobank UA 2.625% 20244 | | | 5,450 | | | | 5,630 | |
| Credit Acceptance Corp. 6.625% 2026 | | | 1,488 | | | | 1,550 | |
| Crédit Agricole SA 3.375% 20224 | | | 10,250 | | | | 10,254 | |
| Crédit Agricole SA 3.75% 20234 | | | 21,000 | | | | 21,764 | |
| Crédit Agricole SA 3.25% 20244 | | | 6,200 | | | | 6,489 | |
| Crédit Agricole SA 4.375% 20254 | | | 3,500 | | | | 3,764 | |
| Crédit Agricole SA 1.907% 2026 (USD-SOFR + 1.676% on 6/16/2025)4,5 | | | 15,750 | | | | 15,793 | |
| Crédit Agricole SA 1.247% 2027 (USD-SOFR + 0.892% on 1/26/2026)4,5 | | | 18,625 | | | | 18,132 | |
| Credit Suisse Group AG 2.997% 2023 (3-month USD-LIBOR + 1.20% on 12/14/2022)4,5 | | | 20,250 | | | | 20,581 | |
| Credit Suisse Group AG 3.80% 2023 | | | 29,264 | | | | 30,330 | |
| 10 | The Bond Fund of America |
| Bonds, notes & other debt instruments (continued) | | Principal amount
(000) | | | Value
(000) | |
| Corporate bonds, notes & loans (continued) | | | | | | |
| Financials (continued) | | | | | | | | |
| Credit Suisse Group AG 2.593% 2025 (USD-SOFR + 1.56% on 9/11/2024)4,5 | | $ | 3,100 | | | $ | 3,168 | |
| Credit Suisse Group AG 2.95% 2025 | | | 7,425 | | | | 7,778 | |
| Credit Suisse Group AG 2.193% 2026 (USD-SOFR + 2.044% on 6/5/2025)4,5 | | | 14,950 | | | | 15,046 | |
| Credit Suisse Group AG 1.305% 2027 (USD-SOFR + 0.98% on 2/2/2026)4,5 | | | 30,575 | | | | 29,571 | |
| Credit Suisse Group AG 3.869% 2029 (3-month USD-LIBOR + 1.41% on 1/12/2028)4,5 | | | 8,385 | | | | 8,983 | |
| Credit Suisse Group AG 4.194% 2031 (USD-SOFR + 3.73% on 4/1/2030)4,5 | | | 60,419 | | | | 66,704 | |
| Credit Suisse Group AG 3.091% 2032 (USD-SOFR + 1.73% on 5/14/2031)4,5 | | | 45,550 | | | | 46,398 | |
| Danske Bank AS 2.70% 20224 | | | 13,475 | | | | 13,527 | |
| Danske Bank AS 3.875% 20234 | | | 15,165 | | | | 15,780 | |
| Danske Bank AS 1.549% 2027 (UST Yield Curve Rate T Note Constant Maturity 1-year + 0.73% on 9/10/2026)4,5 | | | 17,000 | | | | 16,619 | |
| Deutsche Bank AG 3.30% 2022 | | | 4,575 | | | | 4,671 | |
| Deutsche Bank AG 5.00% 2022 | | | 4,675 | | | | 4,696 | |
| Deutsche Bank AG 3.95% 2023 | | | 9,097 | | | | 9,383 | |
| Deutsche Bank AG 0.898% 2024 | | | 15,450 | | | | 15,322 | |
| Deutsche Bank AG 2.222% 2024 (USD-SOFR + 2.159% on 9/18/2023)5 | | | 89,334 | | | | 90,520 | |
| Deutsche Bank AG 3.70% 2024 | | | 15,250 | | | | 16,038 | |
| Deutsche Bank AG 3.70% 2024 | | | 4,603 | | | | 4,837 | |
| Deutsche Bank AG 1.447% 2025 (USD-SOFR + 1.131% on 4/1/2024)5 | | | 30,000 | | | | 29,829 | |
| Deutsche Bank AG 3.961% 2025 (USD-SOFR + 2.581% on 11/26/2024)5 | | | 41,050 | | | | 43,377 | |
| Deutsche Bank AG 2.129% 2026 (USD-SOFR + 1.87% on 11/24/2025)5 | | | 135,895 | | | | 135,726 | |
| Deutsche Bank AG 4.10% 2026 | | | 16,415 | | | | 17,533 | |
| Deutsche Bank AG 4.10% 2026 | | | 4,936 | | | | 5,304 | |
| Deutsche Bank AG 2.311% 2027 (USD-SOFR + 1.219% on 11/16/2026)5 | | | 22,675 | | | | 22,678 | |
| Deutsche Bank AG 3.547% 2031 (USD-SOFR + 3.043% on 9/18/2030)5 | | | 27,917 | | | | 29,415 | |
| Deutsche Bank AG 3.035% 2032 (USD-SOFR + 1.718% on 5/28/2031)5 | | | 12,975 | | | | 13,086 | |
| DNB Bank ASA 1.535% 2027 (5-year UST Yield Curve Rate T Note Constant Maturity + 0.72% on 5/25/2026)4,5 | | | 7,450 | | | | 7,348 | |
| Five Corners Funding Trust II 2.85% 20304 | | | 4,300 | | | | 4,460 | |
| Goldman Sachs Group, Inc. 1.217% 2023 | | | 36,000 | | | | 36,099 | |
| Goldman Sachs Group, Inc. 2.905% 2023 (3-month USD-LIBOR + 0.99% on 7/24/2022)5 | | | 14,747 | | | | 14,915 | |
| Goldman Sachs Group, Inc. 3.50% 2025 | | | 14,230 | | | | 15,058 | |
| Goldman Sachs Group, Inc. 1.093% 2026 (USD-SOFR + 0.789% on 12/9/2025)5 | | | 23,967 | | | | 23,367 | |
| Goldman Sachs Group, Inc. (3-month USD-LIBOR + 1.17%) 1.326% 20266 | | | 7,000 | | | | 7,145 | |
| Goldman Sachs Group, Inc. 1.542% 2027 (USD-SOFR + 0.818% on 9/10/2026)5 | | | 81,083 | | | | 79,486 | |
| Goldman Sachs Group, Inc. 1.948% 2027 (USD-SOFR + 0.913% on 10/21/2026)5 | | | 103,268 | | | | 102,861 | |
| Goldman Sachs Group, Inc. 3.814% 2029 (3-month USD-LIBOR + 1.158% on 4/23/2028)5 | | | 5,000 | | | | 5,443 | |
| Goldman Sachs Group, Inc. 2.60% 2030 | | | 16,925 | | | | 17,226 | |
| Goldman Sachs Group, Inc. 3.80% 2030 | | | 9,419 | | | | 10,379 | |
| Goldman Sachs Group, Inc. 1.992% 2032 (USD-SOFR + 1.09% on 1/27/2031)5 | | | 29,458 | | | | 28,274 | |
| Goldman Sachs Group, Inc. 2.383% 2032 (USD-SOFR + 1.248% on 7/21/2031)5 | | | 90,764 | | | | 89,441 | |
| Goldman Sachs Group, Inc. 2.615% 2032 (USD-SOFR + 1.281% on 4/22/2031)5 | | | 90,964 | | | | 91,713 | |
| Goldman Sachs Group, Inc. 2.65% 2032 (USD-SOFR + 1.264% on 10/21/2031)5 | | | 35,329 | | | | 35,585 | |
| Goldman Sachs Group, Inc. 2.908% 2042 (USD-SOFR + 1.40% on 7/21/2041)5 | | | 10,000 | | | | 9,961 | |
| Goldman Sachs Group, Inc. 3.21% 2042 (USD-SOFR + 1.513% on 4/22/2041)5 | | | 20,943 | | | | 21,760 | |
| Groupe BPCE SA 2.75% 20234 | | | 8,600 | | | | 8,780 | |
| Groupe BPCE SA 5.70% 20234 | | | 27,768 | | | | 29,863 | |
| Groupe BPCE SA 4.625% 20244 | | | 20,600 | | | | 22,031 | |
| Groupe BPCE SA 5.15% 20244 | | | 28,454 | | | | 30,834 | |
| Groupe BPCE SA 1.652% 2026 (USD-SOFR + 1.52% on 10/6/2025)4,5 | | | 38,255 | | | | 37,763 | |
| Groupe BPCE SA 2.045% 2027 (USD-SOFR + 1.087% on 10/19/2026)4,5 | | | 5,000 | | | | 4,960 | |
| Groupe BPCE SA 2.277% 2032 (USD-SOFR + 1.312% on 1/20/2031)4,5 | | | 6,975 | | | | 6,728 | |
| Hartford Financial Services Group, Inc. 2.90% 2051 | | | 7,144 | | | | 7,057 | |
| HSBC Holdings PLC 2.633% 2025 (3-month USD-LIBOR + 1.14% on 11/7/2024)5 | | | 18,500 | | | | 18,987 | |
| HSBC Holdings PLC 2.251% 2027 (USD-SOFR + 1.10% on 11/22/2026)5 | | | 31,240 | | | | 31,323 | |
| HSBC Holdings PLC 2.206% 2029 (USD-SOFR + 1.285% on 8/17/2028)5 | | | 2,485 | | | | 2,439 | |
| HSBC Holdings PLC 3.973% 2030 (3-month USD-LIBOR + 1.61% on 5/22/2029)5 | | | 41,521 | | | | 45,082 | |
| HSBC Holdings PLC 4.95% 2030 | | | 3,150 | | | | 3,700 | |
| HSBC Holdings PLC 2.848% 2031 (USD-SOFR + 2.387% on 6/4/2030)5 | | | 16,489 | | | | 16,697 | |
| HSBC Holdings PLC 2.804% 2032 (USD-SOFR + 1.187% on 5/24/2031)5 | | | 46,800 | | | | 46,994 | |
| Huarong Finance 2017 Co., Ltd. 4.25% 2027 | | | 36,000 | | | | 36,465 | |
| Huarong Finance 2017 Co., Ltd. 4.75% 2027 | | | 4,213 | | | | 4,355 | |
| Huarong Finance 2019 Co., Ltd. (3-month USD-LIBOR + 1.125%) 1.295% 20236 | | | 11,519 | | | | 11,289 | |
| Huarong Finance 2019 Co., Ltd. (3-month USD-LIBOR + 1.25%) 1.43% 20256 | | | 2,556 | | | | 2,441 | |
| The Bond Fund of America | 11 |
| Bonds, notes & other debt instruments (continued) | | Principal amount
(000) | | | Value
(000) | |
| Corporate bonds, notes & loans (continued) | | | | | | |
| Financials (continued) | | | | | | | | |
| Huarong Finance II Co., Ltd. 5.00% 2025 | | $ | 3,637 | | | $ | 3,787 | |
| Huarong Finance II Co., Ltd. 5.50% 2025 | | | 38,773 | | | | 40,760 | |
| Huarong Finance II Co., Ltd. 4.625% 2026 | | | 360 | | | | 372 | |
| Huarong Finance II Co., Ltd. 4.875% 2026 | | | 12,224 | | | | 12,701 | |
| Intercontinental Exchange, Inc. 2.65% 2040 | | | 5,700 | | | | 5,525 | |
| Intercontinental Exchange, Inc. 3.00% 2050 | | | 9,722 | | | | 9,878 | |
| Intercontinental Exchange, Inc. 3.00% 2060 | | | 841 | | | | 832 | |
| Intesa Sanpaolo SpA 3.125% 20224 | | | 17,025 | | | | 17,221 | |
| Intesa Sanpaolo SpA 3.375% 20234 | | | 42,466 | | | | 43,400 | |
| Intesa Sanpaolo SpA 3.25% 20244 | | | 8,260 | | | | 8,604 | |
| Intesa Sanpaolo SpA 5.017% 20244 | | | 125,758 | | | | 134,835 | |
| Intesa Sanpaolo SpA 5.71% 20264 | | | 24,105 | | | | 26,687 | |
| Intesa Sanpaolo SpA 3.875% 20274 | | | 10,275 | | | | 10,909 | |
| Intesa Sanpaolo SpA 3.875% 20284 | | | 4,974 | | | | 5,266 | |
| Intesa Sanpaolo SpA 4.00% 20294 | | | 3,000 | | | | 3,221 | |
| Iron Mountain Information Management Services, Inc. 5.00% 20324 | | | 12,345 | | | | 12,659 | |
| JPMorgan Chase & Co. 4.023% 2024 (3-month USD-LIBOR + 1.00% on 12/5/2023)5 | | | 5,000 | | | | 5,274 | |
| JPMorgan Chase & Co. 1.561% 2025 (USD-SOFR + 0.605% on 12/10/2024)5 | | | 168,739 | | | | 169,013 | |
| JPMorgan Chase & Co. 2.301% 2025 (USD-SOFR + 1.16% on 10/15/2024)5 | | | 61,584 | | | | 63,022 | |
| JPMorgan Chase & Co. 1.045% 2026 (USD-SOFR + 0.80% on 11/19/2025)5 | | | 26,914 | | | | 26,234 | |
| JPMorgan Chase & Co. 2.005% 2026 (USD-SOFR + 1.585% on 3/13/2025)5 | | | 22,000 | | | | 22,276 | |
| JPMorgan Chase & Co. 1.47% 2027 (USD-SOFR + 0.765% on 9/22/2026)5 | | | 34,000 | | | | 33,343 | |
| JPMorgan Chase & Co. 1.578% 2027 (USD-SOFR + 0.885% on 4/22/2026)5 | | | 19,422 | | | | 19,203 | |
| JPMorgan Chase & Co. 2.069% 2029 (USD-SOFR + 1.015% on 6/1/2028)5 | | | 41,999 | | | | 41,680 | |
| JPMorgan Chase & Co. 2.545% 2032 (USD-SOFR + 1.18% on 11/8/2031)5 | | | 46,061 | | | | 46,371 | |
| JPMorgan Chase & Co. 2.58% 2032 (USD-SOFR + 1.25% on 4/22/2031)5 | | | 20,078 | | | | 20,357 | |
| JPMorgan Chase & Co. 3.109% 2051 (USD-SOFR + 3.109% on 4/22/2050)5 | | | 9,972 | | | | 10,331 | |
| JPMorgan Chase & Co. 3.328% 2052 (USD-SOFR + 1.58% on 4/22/2051)5 | | | 17,740 | | | | 19,029 | |
| Kasikornbank PCL HK 3.343% 2031 (5-year UST Yield Curve Rate T Note Constant Maturity + 1.70% on 10/2/2026)5 | | | 15,035 | | | | 15,056 | |
| Lloyds Banking Group PLC 2.907% 2023 (3-month USD-LIBOR + 0.81% on 11/7/2022)5 | | | 16,500 | | | | 16,769 | |
| Lloyds Banking Group PLC 4.05% 2023 | | | 7,100 | | | | 7,441 | |
| Lloyds Banking Group PLC 3.87% 2025 (1-year UST Yield Curve Rate T Note Constant Maturity + 3.50% on 7/9/2024)5 | | | 13,460 | | | | 14,227 | |
| Lloyds Banking Group PLC 2.438% 2026 (1-year UST Yield Curve Rate T Note Constant Maturity + 1.00% on 2/5/2025)5 | | | 13,875 | | | | 14,155 | |
| Lloyds Banking Group PLC 1.627% 2027 (1-year UST Yield Curve Rate T Note Constant Maturity + 0.85% on 5/11/2026)5 | | | 3,525 | | | | 3,472 | |
| Lloyds Banking Group PLC 4.375% 2028 | | | 2,560 | | | | 2,874 | |
| Lloyds Banking Group PLC 4.55% 2028 | | | 3,500 | | | | 3,984 | |
| LPL Holdings, Inc. 4.625% 20274 | | | 270 | | | | 280 | |
| Marsh & McLennan Companies, Inc. 3.875% 2024 | | | 17,120 | | | | 18,116 | |
| Marsh & McLennan Companies, Inc. 4.375% 2029 | | | 2,460 | | | | 2,807 | |
| Marsh & McLennan Companies, Inc. 2.25% 2030 | | | 3,506 | | | | 3,503 | |
| Marsh & McLennan Companies, Inc. 2.375% 2031 | | | 2,192 | | | | 2,215 | |
| Marsh & McLennan Companies, Inc. 4.75% 2039 | | | 750 | | | | 937 | |
| Marsh & McLennan Companies, Inc. 4.90% 2049 | | | 5,250 | | | | 7,074 | |
| Marsh & McLennan Companies, Inc. 2.90% 2051 | | | 3,000 | | | | 3,002 | |
| MetLife Capital Trust IV, junior subordinated, 7.875% 2067 (3-month USD-LIBOR + 3.96% on 12/1/2037)4,5 | | | 100 | | | | 137 | |
| MetLife, Inc. 3.60% 2025 | | | 100 | | | | 108 | |
| MetLife, Inc. 4.55% 2030 | | | 3,000 | | | | 3,549 | |
| MetLife, Inc. 4.60% 2046 | | | 800 | | | | 1,025 | |
| Metropolitan Life Global Funding I 2.40% 20224 | | | 5,965 | | | | 6,021 | |
| Metropolitan Life Global Funding I 3.375% 20224 | | | 3,000 | | | | 3,002 | |
| Metropolitan Life Global Funding I 1.95% 20234 | | | 1,000 | | | | 1,013 | |
| Metropolitan Life Global Funding I 0.40% 20244 | | | 17,648 | | | | 17,432 | |
| Metropolitan Life Global Funding I 0.70% 20244 | | | 12,711 | | | | 12,530 | |
| Metropolitan Life Global Funding I 3.60% 20244 | | | 3,000 | | | | 3,156 | |
| Metropolitan Life Global Funding I 0.95% 20254 | | | 5,007 | | | | 4,940 | |
| Metropolitan Life Global Funding I 3.45% 20264 | | | 2,315 | | | | 2,498 | |
| Metropolitan Life Global Funding I 3.00% 20274 | | | 3,500 | | | | 3,721 | |
| Metropolitan Life Global Funding I 3.05% 20294 | | | 5,000 | | | | 5,353 | |
| Metropolitan Life Global Funding I 1.55% 20314 | | | 2,284 | | | | 2,162 | |
| Mitsubishi UFJ Financial Group, Inc. 2.665% 2022 | | | 16,000 | | | | 16,190 | |
| Mitsubishi UFJ Financial Group, Inc. 2.998% 2022 | | | 9,825 | | | | 9,860 | |
| 12 | The Bond Fund of America |
| Bonds, notes & other debt instruments (continued) | | Principal amount
(000) | | | Value
(000) | |
| Corporate bonds, notes & loans (continued) | | | | | | |
| Financials (continued) | | | | | | |
| Mitsubishi UFJ Financial Group, Inc. 2.801% 2024 | | $ | 4,600 | | | $ | 4,771 | |
| Mitsubishi UFJ Financial Group, Inc. 0.962% 2025 (1-year UST Yield Curve Rate T Note Constant Maturity + 0.45% on 10/11/2024)5 | | 17,000 | | | | 16,774 | |
| Mitsubishi UFJ Financial Group, Inc. 1.538% 2027 (1-year UST Yield Curve Rate T Note Constant Maturity + 0.75% on 7/20/2026)5 | | | 35,000 | | | | 34,396 | |
| Mitsubishi UFJ Financial Group, Inc. 1.64% 2027 (1-year UST Yield Curve Rate T Note Constant Maturity + 0.67% on 10/13/2026)5 | | | 12,800 | | | | 12,640 | |
| Mizuho Financial Group, Inc. 1.554% 2027 (1-year UST Yield Curve Rate T Note Constant Maturity + 0.75% on 7/9/2026)5 | | | 26,000 | | | | 25,593 | |
| Mizuho Financial Group, Ltd. 3.549% 2023 | | | 17,000 | | | | 17,535 | |
| Morgan Stanley 2.75% 2022 | | | 13,054 | | | | 13,172 | |
| Morgan Stanley 3.125% 2023 | | | 10,000 | | | | 10,255 | |
| Morgan Stanley 0.529% 2024 (USD-SOFR + 0.455% on 1/25/2023)5 | | | 20,000 | | | | 19,936 | |
| Morgan Stanley 3.737% 2024 (3-month USD-LIBOR + 0.847% on 4/24/2023)5 | | | 57,500 | | | | 59,504 | |
| Morgan Stanley 1.164% 2025 (USD-SOFR + 0.56% on 10/21/2024)5 | | | 17,933 | | | | 17,802 | |
| Morgan Stanley 0.985% 2026 (USD-SOFR + 0.72% on 12/10/2025)5 | | | 9,115 | | | | 8,846 | |
| Morgan Stanley 2.188% 2026 (USD-SOFR + 1.99% on 4/28/2025)5 | | | 15,000 | | | | 15,306 | |
| Morgan Stanley 1.512% 2027 (USD-SOFR + 0.858% on 7/20/2026)5 | | | 85,147 | | | | 83,837 | |
| Morgan Stanley 1.593% 2027 (USD-SOFR + 0.879% on 5/4/2026)5 | | | 14,216 | | | | 14,083 | |
| Morgan Stanley 1.794% 2032 (USD-SOFR + 1.034% on 2/13/2031)5 | | | 29,670 | | | | 28,118 | |
| Morgan Stanley 1.928% 2032 (USD-SOFR + 1.02% on 4/28/2031)5 | | | 5,104 | | | | 4,882 | |
| Morgan Stanley 2.239% 2032 (USD-SOFR + 1.178% on 7/21/2031)5 | | | 111,472 | | | | 109,147 | |
| Morgan Stanley 2.511% 2032 (USD-SOFR + 1.20% on 10/20/2031)5 | | | 22,978 | | | | 22,981 | |
| Morgan Stanley 3.217% 2042 (USD-SOFR + 1.485% on 4/22/2041)5 | | | 5,708 | | | | 5,991 | |
| MSCI, Inc. 3.625% 20304 | | | 16,200 | | | | 16,589 | |
| MSCI, Inc. 3.25% 20334 | | | 15,450 | | | | 15,648 | |
| National Australia Bank, Ltd. 2.50% 2022 | | | 15,500 | | | | 15,632 | |
| National Australia Bank, Ltd. 2.875% 2023 | | | 13,200 | | | | 13,558 | |
| National Australia Bank, Ltd. 2.332% 20304 | | | 5,000 | | | | 4,796 | |
| Nationwide Building Society 3.766% 2024 (3-month USD-LIBOR + 1.064% on 3/8/2023)4,5 | | | 5,000 | | | | 5,151 | |
| Nationwide Building Society 4.363% 2024 (3-month USD-LIBOR + 1.392% on 8/1/2023)4,5 | | | 33,400 | | | | 34,990 | |
| Nationwide Building Society 4.125% 2032 (5-year USD-ICE Swap + 1.849% on 10/18/2027)4,5 | | | 3,000 | | | | 3,201 | |
| Navient Corp. 5.50% 2023 | | | 7,000 | | | | 7,299 | |
| Navient Corp. 5.875% 2024 | | | 1,000 | | | | 1,067 | |
| Navient Corp. 6.75% 2025 | | | 5,000 | | | | 5,505 | |
| Navient Corp. 5.00% 2027 | | | 6,250 | | | | 6,380 | |
| New York Life Global Funding 2.25% 20224 | | | 10,195 | | | | 10,291 | |
| New York Life Global Funding 0.95% 20254 | | | 1,403 | | | | 1,384 | |
| New York Life Global Funding 0.85% 20264 | | | 32,280 | | | | 31,538 | |
| New York Life Global Funding 3.00% 20284 | | | 2,250 | | | | 2,399 | |
| New York Life Global Funding 1.20% 20304 | | | 15,487 | | | | 14,468 | |
| New York Life Global Funding 1.85% 20314 | | | 1,250 | | | | 1,215 | |
| Northwestern Mutual Global Funding 0.80% 20264 | | | 19,494 | | | | 18,951 | |
| Nuveen, LLC 4.00% 20284 | | | 1,515 | | | | 1,681 | |
| OneMain Holdings, Inc. 7.125% 2026 | | | 9,300 | | | | 10,616 | |
| Oversea-Chinese Banking Corp., Ltd. 1.832% 2030 (5-year UST Yield Curve Rate T Note Constant Maturity + 1.58% on 9/10/2025)4,5 | | | 7,786 | | | | 7,730 | |
| PNC Bank 3.50% 2023 | | | 17,840 | | | | 18,515 | |
| PNC Financial Services Group, Inc. 3.50% 2024 | | | 11,700 | | | | 12,256 | |
| PNC Financial Services Group, Inc., Series O, (3-month USD-LIBOR + 3.678%) 3.81% junior subordinated perpetual bonds6 | | | 10,170 | | | | 10,188 | |
| Power Financial Corp., Ltd. 4.50% 2029 | | | 5,000 | | | | 5,340 | |
| Power Financial Corp., Ltd. 3.95% 2030 | | | 32,000 | | | | 33,139 | |
| Power Financial Corp., Ltd. 3.35% 2031 | | | 8,670 | | | | 8,563 | |
| PRICOA Global Funding I 2.45% 20224 | | | 3,090 | | | | 3,135 | |
| PRICOA Global Funding I 3.45% 20234 | | | 11,825 | | | | 12,333 | |
| Prudential Financial, Inc. 3.905% 2047 | | | 850 | | | | 989 | |
| Prudential Financial, Inc. 4.418% 2048 | | | 1,000 | | | | 1,242 | |
| Prudential Financial, Inc. 4.35% 2050 | | | 5,000 | | | | 6,253 | |
| Prudential Financial, Inc. 3.70% 2051 | | | 10,125 | | | | 11,552 | |
| Prudential Financial, Inc., junior subordinated, 5.70% 2048 (3-month USD-LIBOR + 2.665% on 9/15/2028)5 | | | 3,500 | | | | 3,924 | |
| Rede D’Or Finance SARL 4.50% 20304 | | | 3,800 | | | | 3,705 | |
| Royal Bank of Canada 0.75% 2024 | | | 20,780 | | | | 20,581 | |
| The Bond Fund of America | 13 |
| Bonds, notes & other debt instruments (continued) | | Principal amount
(000) | | | Value
(000) | |
| Corporate bonds, notes & loans (continued) | | | | | | |
| Financials (continued) | | | | | | |
| Royal Bank of Canada 1.20% 2026 | | $ | 54,076 | | | $ | 53,165 | |
| Royal Bank of Scotland PLC 4.65% 2024 (3-month USD-LIBOR + 1.55% on 6/25/2023)5 | | | 14,130 | | | | 14,787 | |
| Royal Bank of Scotland PLC 3.073% 2028 (1-year UST Yield Curve Rate T Note Constant Maturity + 2.55% on 5/22/2027)5 | | | 7,500 | | | | 7,806 | |
| Royal Bank of Scotland PLC 4.445% 2030 (3-month USD-LIBOR + 1.871% on 5/5/2029)5 | | | 11,600 | | | | 13,041 | |
| Royal Bank of Scotland PLC 5.076% 2030 (3-month USD-LIBOR + 1.905% on 1/27/2029)5 | | | 2,650 | | | | 3,076 | |
| Santander Holdings USA, Inc. 3.40% 2023 | | | 17,000 | | | | 17,379 | |
| Santander Holdings USA, Inc. 3.50% 2024 | | | 13,325 | | | | 13,897 | |
| Springleaf Finance Corp. 6.125% 2024 | | | 500 | | | | 531 | |
| Starwood Property Trust, Inc. 5.50% 20234 | | | 2,295 | | | | 2,378 | |
| Sumitomo Mitsui Banking Corp. 3.102% 2023 | | | 28,940 | | | | 29,634 | |
| SVB Financial Group 4.70% junior subordinated perpetual bonds (5-year UST Yield Curve Rate T Note Constant Maturity + 3.064% on 11/15/2031)5 | | | 11,614 | | | | 11,969 | |
| Synchrony Financial 2.85% 2022 | | | 8,750 | | | | 8,840 | |
| Synchrony Financial 4.375% 2024 | | | 5,825 | | | | 6,149 | |
| Synchrony Financial 3.95% 2027 | | | 10,350 | | | | 11,123 | |
| Synchrony Financial 2.875% 2031 | | | 5,050 | | | | 5,045 | |
| Toronto-Dominion Bank 0.75% 2025 | | | 23,900 | | | | 23,280 | |
| Toronto-Dominion Bank 2.00% 2031 | | | 19,945 | | | | 19,682 | |
| Travelers Companies, Inc. 4.00% 2047 | | | 2,250 | | | | 2,695 | |
| Travelers Companies, Inc. 4.10% 2049 | | | 1,500 | | | | 1,823 | |
| Travelers Companies, Inc. 2.55% 2050 | | | 3,815 | | | | 3,638 | |
| U.S. Bancorp 2.40% 2024 | | | 19,000 | | | | 19,642 | |
| U.S. Bank NA 2.85% 2023 | | | 21,000 | | | | 21,452 | |
| U.S. Bank NA 3.40% 2023 | | | 13,125 | | | | 13,652 | |
| UBS Group AG 1.364% 2027 (5-year UST Yield Curve Rate T Note Constant Maturity + 1.08% on 1/30/2026)4,5 | | | 20,772 | | | | 20,313 | |
| UBS Group AG 1.49% 2027 (1-year UST Yield Curve Rate T Note Constant Maturity + 0.85% on 8/10/2026)4,5 | | | 22,475 | | | | 21,936 | |
| UBS Group AG 3.126% 2030 (3-month USD-LIBOR + 1.468% on 8/13/2029)4,5 | | | 2,600 | | | | 2,720 | |
| UniCredit SpA 3.75% 20224 | | | 37,450 | | | | 37,736 | |
| UniCredit SpA 6.572% 20224 | | | 34,360 | | | | 34,410 | |
| UniCredit SpA 4.625% 20274 | | | 17,010 | | | | 18,658 | |
| UniCredit SpA 5.861% 2032 (5-year USD-ICE Swap + 3.703% on 6/19/2027)4,5 | | | 29,477 | | | | 32,361 | |
| United Overseas Bank, Ltd. 2.00% 2031 (5-year UST Yield Curve Rate T Note Constant Maturity + 1.23% on 10/14/2026)4,5 | | | 16,430 | | | | 16,330 | |
| VEB Finance, Ltd. 6.80% 20254 | | | 500 | | | | 571 | |
| Vigorous Champion International, Ltd. 4.25% 2029 | | | 2,263 | | | | 2,391 | |
| Wells Fargo & Company 2.406% 2025 (3-month USD-LIBOR + 0.825% on 10/30/2024)5 | | | 88,587 | | | | 90,857 | |
| Wells Fargo & Company 3.00% 2026 | | | 34,533 | | | | 36,310 | |
| Wells Fargo & Company 3.00% 2026 | | | 3,301 | | | | 3,470 | |
| Wells Fargo & Company 3.196% 2027 (3-month USD-LIBOR + 1.17% on 6/17/2026)5 | | | 38,880 | | | | 41,012 | |
| Wells Fargo & Company 2.879% 2030 (3-month USD-LIBOR + 1.17% on 10/30/2029)5 | | | 9,049 | | | | 9,417 | |
| Wells Fargo & Company 2.572% 2031 (3-month USD-LIBOR + 1.00% on 2/11/2030)5 | | | 9,716 | | | | 9,929 | |
| Westpac Banking Corp. 1.953% 2028 | | | 25,344 | | | | 25,263 | |
| Westpac Banking Corp. 2.894% 2030 (5-year UST Yield Curve Rate T Note Constant Maturity + 1.35% on 2/4/2025)5 | | | 10,000 | | | | 10,218 | |
| Westpac Banking Corp. 4.11% 2034 (5-year UST Yield Curve Rate T Note Constant Maturity + 2.00% on 7/24/2029)5 | | | 11,339 | | | | 12,252 | |
| Westpac Banking Corp. 2.668% 2035 (5-year UST Yield Curve Rate T Note Constant Maturity + 1.75% on 11/15/2030)5 | | | 20,125 | | | | 19,628 | |
| Willis North America, Inc. 3.875% 2049 | | | 5,458 | | | | 5,938 | |
| | | | | | | | 6,336,721 | |
| | | | | | | | | |
| Utilities 4.61% | | | | | | | | |
| Abu Dhabi National Energy Company PJSC (TAQA) 4.375% 20254 | | | 20,500 | | | | 22,319 | |
| AEP Texas, Inc. 3.45% 2051 | | | 9,375 | | | | 9,466 | |
| AEP Transmission Co. LLC 3.10% 2026 | | | 16,975 | | | | 17,923 | |
| AEP Transmission Co. LLC 3.65% 2050 | | | 110 | | | | 122 | |
| AEP Transmission Co. LLC 2.75% 2051 | | | 3,966 | | | | 3,783 | |
| AES Panama Generation Holdings SRL 4.375% 20304 | | | 8,565 | | | | 8,932 | |
| Alabama Power Co. 3.00% 2052 | | | 31,630 | | | | 31,633 | |
| Alfa Desarrollo SpA 4.55% 20514 | | | 5,730 | | | | 5,665 | |
| 14 | The Bond Fund of America |
| Bonds, notes & other debt instruments (continued) | | Principal amount
(000) | | | Value
(000) | |
| Corporate bonds, notes & loans (continued) | | | | | | |
| Utilities (continued) | | | | | | | | |
| Ameren Corp. 2.50% 2024 | | $ | 1,616 | | | $ | 1,660 | |
| American Electric Power Company, Inc. 1.00% 2025 | | | 3,075 | | | | 3,010 | |
| American Electric Power Company, Inc. 4.30% 2028 | | | 31,133 | | | | 34,720 | |
| American Electric Power Company, Inc. 3.25% 2050 | | | 22,050 | | | | 21,848 | |
| Atlantic City Electric Co. 2.30% 2031 | | | 4,100 | | | | 4,124 | |
| Berkshire Hathaway Energy Company 2.80% 2023 | | | 8,650 | | | | 8,812 | |
| Berkshire Hathaway Energy Company 4.50% 2045 | | | 200 | | | | 243 | |
| Calpine Corp. 5.25% 20264 | | | 3,398 | | | | 3,490 | |
| Calpine Corp. 4.50% 20284 | | | 4,000 | | | | 4,157 | |
| Cemig Geração e Transmissão SA 9.25% 2024 | | | 291 | | | | 326 | |
| CenterPoint Energy, Inc. 2.65% 2031 | | | 8,897 | | | | 9,027 | |
| CenterPoint Energy, Inc. 3.70% 2049 | | | 2,775 | | | | 3,014 | |
| Cleveland Electric Illuminating Co. 4.55% 20304 | | | 5,500 | | | | 6,330 | |
| CMS Energy Corp. 3.45% 2027 | | | 1,950 | | | | 2,094 | |
| Colbun SA 3.95% 20274 | | | 8,215 | | | | 8,692 | |
| Comisión Federal de Electricidad 3.348% 20314 | | | 18,263 | | | | 17,939 | |
| Comisión Federal de Electricidad 3.875% 20334 | | | 7,530 | | | | 7,412 | |
| Comisión Federal de Electricidad 4.677% 20514 | | | 23,419 | | | | 22,078 | |
| Connecticut Light and Power Co. 2.05% 2031 | | | 16,690 | | | | 16,462 | |
| Consolidated Edison Company of New York, Inc. 2.40% 2031 | | | 7,579 | | | | 7,633 | |
| Consumers Energy Co. 3.25% 2046 | | | 4,919 | | | | 5,225 | |
| Consumers Energy Co. 4.05% 2048 | | | 1,784 | | | | 2,134 | |
| Consumers Energy Co. 3.10% 2050 | | | 13,231 | | | | 13,815 | |
| Consumers Energy Co. 3.75% 2050 | | | 8,844 | | | | 10,182 | |
| Consumers Energy Co. 3.50% 2051 | | | 1,104 | | | | 1,240 | |
| Consumers Energy Co. 2.65% 2052 | | | 17,495 | | | | 17,071 | |
| Consumers Energy Co. 2.50% 2060 | | | 387 | | | | 342 | |
| Dominion Energy, Inc. 2.25% 2031 | | | 10,085 | | | | 9,859 | |
| Dominion Resources, Inc. 3.30% 2025 | | | 2,113 | | | | 2,213 | |
| Dominion Resources, Inc. 3.375% 2030 | | | 11,425 | | | | 12,137 | |
| Dominion Resources, Inc., junior subordinated, 3.071% 20245 | | | 17,600 | | | | 18,229 | |
| DPL, Inc. 4.125% 2025 | | | 1,040 | | | | 1,088 | |
| DTE Electric Company 2.625% 2031 | | | 11,239 | | | | 11,580 | |
| DTE Electric Company 3.70% 2045 | | | 1,016 | | | | 1,127 | |
| DTE Energy Company 2.85% 2026 | | | 6,100 | | | | 6,363 | |
| DTE Energy Company 1.90% 2028 | | | 1,505 | | | | 1,491 | |
| DTE Energy Company 2.25% 2030 | | | 5,650 | | | | 5,671 | |
| DTE Energy Company 2.95% 2050 | | | 5,649 | | | | 5,707 | |
| Duke Energy Carolinas, LLC 3.95% 2028 | | | 3,050 | | | | 3,407 | |
| Duke Energy Carolinas, LLC 2.45% 2029 | | | 32,180 | | | | 32,799 | |
| Duke Energy Carolinas, LLC 2.55% 2031 | | | 5,437 | | | | 5,587 | |
| Duke Energy Corp. 0.90% 2025 | | | 3,125 | | | | 3,039 | |
| Duke Energy Corp. 3.40% 2029 | | | 5,000 | | | | 5,308 | |
| Duke Energy Florida, LLC 2.50% 2029 | | | 6,781 | | | | 6,975 | |
| Duke Energy Florida, LLC 1.75% 2030 | | | 14,747 | | | | 14,169 | |
| Duke Energy Florida, LLC 3.00% 2051 | | | 8,684 | | | | 8,774 | |
| Duke Energy Indiana, Inc. 2.75% 2050 | | | 1,100 | | | | 1,073 | |
| Duke Energy Ohio, Inc. 2.125% 2030 | | | 8,850 | | | | 8,720 | |
| Duke Energy Progress, LLC 2.00% 2031 | | | 4,000 | | | | 3,912 | |
| Duke Energy Progress, LLC 2.50% 2050 | | | 7,500 | | | | 6,948 | |
| Duke Energy Progress, LLC 2.90% 2051 | | | 3,675 | | | | 3,653 | |
| Edison International 3.125% 2022 | | | 13,250 | | | | 13,460 | |
| Edison International 3.55% 2024 | | | 19,920 | | | | 20,849 | |
| Edison International 4.95% 2025 | | | 8,925 | | | | 9,715 | |
| Edison International 5.75% 2027 | | | 34,743 | | | | 39,641 | |
| Edison International 4.125% 2028 | | | 52,447 | | | | 55,401 | |
| Electricité de France SA 2.625% junior subordinated perpetual bonds (5-year EUR Mid-Swap + 2.86% on 6/1/2028)5 | | € | 45,000 | | | | 51,515 | |
| Emera US Finance LP 0.833% 2024 | | $ | 3,750 | | | | 3,682 | |
| Emera US Finance LP 2.639% 2031 | | | 27,050 | | | | 26,619 | |
| Emera, Inc. 6.75% 2076 (3-month USD-LIBOR + 5.44% on 6/15/2026)5 | | | 16,700 | | | | 19,268 | |
| Empresas Publicas de Medellin ESP 4.25% 20294 | | | 846 | | | | 804 | |
| Empresas Publicas de Medellin ESP 4.375% 20314 | | | 9,208 | | | | 8,671 | |
| Enel Chile SA 4.875% 2028 | | | 3,045 | | | | 3,362 | |
| Engie Energia Chile SA 3.40% 20304 | | | 7,054 | | | | 7,152 | |
| ENN Clean Energy International Investment, Ltd. 3.375% 20264 | | | 8,250 | | | | 8,210 | |
| ENN Energy Holdings, Ltd. 2.625% 20304 | | | 24,093 | | | | 23,970 | |
| The Bond Fund of America | 15 |
| Bonds, notes & other debt instruments (continued) | | Principal amount
(000) | | | Value
(000) | |
| Corporate bonds, notes & loans (continued) | | | | | | |
| Utilities (continued) | | | | | | |
| Entergy Corp. 3.12% 2027 | | $ | 5,000 | | | $ | 5,269 | |
| Entergy Corp. 1.90% 2028 | | | 36,984 | | | | 36,267 | |
| Entergy Corp. 1.60% 2030 | | | 4,400 | | | | 4,151 | |
| Entergy Corp. 2.40% 2031 | | | 25,025 | | | | 24,674 | |
| Entergy Louisiana, LLC 2.90% 2051 | | | 17,787 | | | | 17,478 | |
| Entergy Texas, Inc. 1.75% 2031 | | | 13,150 | | | | 12,345 | |
| Eversource Energy 1.65% 2030 | | | 10,000 | | | | 9,361 | |
| Exelon Corp. 4.05% 2030 | | | 12,425 | | | | 13,820 | |
| Exelon Corp. 4.70% 2050 | | | 1,725 | | | | 2,171 | |
| Exelon Corp., junior subordinated, 3.497% 20225 | | | 21,000 | | | | 21,196 | |
| FirstEnergy Corp. 2.05% 2025 | | | 9,065 | | | | 8,997 | |
| FirstEnergy Corp. 1.60% 2026 | | | 50,767 | | | | 49,117 | |
| FirstEnergy Corp. 3.50% 20284 | | | 15,958 | | | | 17,020 | |
| FirstEnergy Corp. 4.10% 20284 | | | 6,025 | | | | 6,624 | |
| FirstEnergy Corp. 2.25% 2030 | | | 117,043 | | | | 112,844 | |
| FirstEnergy Corp. 2.65% 2030 | | | 54,663 | | | | 54,116 | |
| FirstEnergy Corp. 7.375% 2031 | | | 2,703 | | | | 3,654 | |
| FirstEnergy Corp. 3.40% 2050 | | | 8,323 | | | | 8,177 | |
| FirstEnergy Corp., Series A, 3.35% 20225 | | | 53,907 | | | | 54,141 | |
| FirstEnergy Corp., Series B, 4.40% 2027 (4.15% on 1/15/2022)5 | | | 80,856 | | | | 87,150 | |
| FirstEnergy Transmission LLC 2.866% 20284 | | | 74,825 | | | | 75,021 | |
| Florida Power & Light Company 2.875% 2051 | | | 47,272 | | | | 48,064 | |
| Georgia Power Co. 3.70% 2050 | | | 625 | | | | 666 | |
| Gulf Power Co. 3.30% 2027 | | | 10,000 | | | | 10,684 | |
| Interchile SA 4.50% 20564 | | | 2,443 | | | | 2,600 | |
| Interstate Power and Light Co. 3.25% 2024 | | | 17,557 | | | | 18,445 | |
| Israel Electric Corp., Ltd. 4.25% 20284 | | | 19,722 | | | | 21,707 | |
| Israel Electric Corp., Ltd. 8.10% 20964 | | | 6,250 | | | | 9,171 | |
| Jersey Central Power & Light Co. 4.30% 20264 | | | 4,480 | | | | 4,863 | |
| Jersey Central Power & Light Co. 2.75% 20324 | | | 9,243 | | | | 9,378 | |
| Metropolitan Edison Co. 4.30% 20294 | | | 5,000 | | | | 5,569 | |
| MidAmerican Energy Holdings Co. 3.65% 2029 | | | 2,300 | | | | 2,537 | |
| MidAmerican Energy Holdings Co. 2.70% 2052 | | | 15,305 | | | | 14,897 | |
| Mississippi Power Co. 3.95% 2028 | | | 10,100 | | | | 11,078 | |
| Mississippi Power Co. 4.25% 2042 | | | 14,426 | | | | 16,593 | |
| Monongahela Power Co. 3.55% 20274 | | | 4,800 | | | | 5,138 | |
| NextEra Energy Capital Holdings, Inc. 1.875% 2027 | | | 18,000 | | | | 18,118 | |
| NextEra Energy Capital Holdings, Inc. 1.90% 2028 | | | 20,325 | | | | 20,126 | |
| NextEra Energy Capital Holdings, Inc. 2.44% 2032 | | | 34,075 | | | | 34,181 | |
| NextEra Energy Partners LP 4.25% 20244 | | | 4,715 | | | | 4,904 | |
| NextEra Energy Partners LP 3.875% 20264 | | | 3,535 | | | | 3,753 | |
| Northern States Power Co. 2.25% 2031 | | | 4,458 | | | | 4,499 | |
| Northern States Power Co. 2.90% 2050 | | | 2,821 | | | | 2,856 | |
| Northern States Power Co. 2.60% 2051 | | | 26,667 | | | | 25,516 | |
| Oncor Electric Delivery Company LLC 0.55% 2025 | | | 8,100 | | | | 7,805 | |
| Oncor Electric Delivery Company, LLC 2.70% 20514 | | | 8,893 | | | | 8,575 | |
| Pacific Gas and Electric Co. 1.75% 2022 | | | 33,900 | | | | 33,900 | |
| Pacific Gas and Electric Co. 1.367% 2023 | | | 50,800 | | | | 50,496 | |
| Pacific Gas and Electric Co. 3.25% 2023 | | | 3,421 | | | | 3,486 | |
| Pacific Gas and Electric Co. 3.85% 2023 | | | 6,301 | | | | 6,511 | |
| Pacific Gas and Electric Co. 4.25% 2023 | | | 508 | | | | 526 | |
| Pacific Gas and Electric Co. 3.40% 2024 | | | 13,465 | | | | 13,934 | |
| Pacific Gas and Electric Co. 2.95% 2026 | | | 72,655 | | | | 73,969 | |
| Pacific Gas and Electric Co. 3.15% 2026 | | | 140,083 | | | | 143,321 | |
| Pacific Gas and Electric Co. 2.10% 2027 | | | 21,982 | | | | 21,240 | |
| Pacific Gas and Electric Co. 3.30% 2027 | | | 54,404 | | | | 55,340 | |
| Pacific Gas and Electric Co. 3.30% 2027 | | | 35,769 | | | | 36,422 | |
| Pacific Gas and Electric Co. 3.00% 2028 | | | 41,127 | | | | 41,457 | |
| Pacific Gas and Electric Co. 3.75% 2028 | | | 32,678 | | | | 34,010 | |
| Pacific Gas and Electric Co. 4.65% 2028 | | | 48,518 | | | | 52,967 | |
| Pacific Gas and Electric Co. 4.55% 2030 | | | 178,087 | | | | 192,731 | |
| Pacific Gas and Electric Co. 2.50% 2031 | | | 77,374 | | | | 73,794 | |
| Pacific Gas and Electric Co. 3.25% 2031 | | | 40,994 | | | | 41,172 | |
| Pacific Gas and Electric Co. 3.30% 2040 | | | 29,430 | | | | 27,340 | |
| Pacific Gas and Electric Co. 3.75% 2042 | | | 38,150 | | | | 35,671 | |
| Pacific Gas and Electric Co. 3.50% 2050 | | | 64,182 | | | | 59,616 | |
| Peco Energy Co. 2.80% 2050 | | | 18,872 | | | | 18,542 | |
| 16 | The Bond Fund of America |
| Bonds, notes & other debt instruments (continued) | | Principal amount
(000) | | | Value
(000) | |
| Corporate bonds, notes & loans (continued) | | | | | | |
| Utilities (continued) | | | | | | | | |
| PG&E Corp. 5.00% 2028 | | $ | 9,485 | | | $ | 9,993 | |
| PG&E Corp. 5.25% 2030 | | | 3,450 | | | | 3,624 | |
| Progress Energy, Inc. 7.00% 2031 | | | 8,568 | | | | 11,618 | |
| Public Service Company of Colorado 1.875% 2031 | | | 51,922 | | | | 50,529 | |
| Public Service Company of Colorado 1.90% 2031 | | | 1,500 | | | | 1,459 | |
| Public Service Electric and Gas Co. 0.95% 2026 | | | 17,350 | | | | 17,004 | |
| Public Service Electric and Gas Co. 3.65% 2028 | | | 425 | | | | 467 | |
| Public Service Electric and Gas Co. 3.20% 2029 | | | 5,000 | | | | 5,382 | |
| Public Service Electric and Gas Co. 2.45% 2030 | | | 2,005 | | | | 2,043 | |
| Public Service Electric and Gas Co. 1.90% 2031 | | | 8,539 | | | | 8,318 | |
| Public Service Electric and Gas Co. 2.05% 2050 | | | 6,501 | | | | 5,508 | |
| Public Service Electric and Gas Co. 2.70% 2050 | | | 2,024 | | | | 1,961 | |
| Public Service Electric and Gas Co. 3.15% 2050 | | | 15,000 | | | | 15,769 | |
| Public Service Enterprise Group, Inc. 2.65% 2022 | | | 6,225 | | | | 6,314 | |
| Public Service Enterprise Group, Inc. 2.45% 2031 | | | 10,000 | | | | 9,893 | |
| Public Service Enterprise Group, Inc. 3.20% 2049 | | | 2,475 | | | | 2,606 | |
| Puget Energy, Inc. 5.625% 2022 | | | 7,536 | | | | 7,639 | |
| San Diego Gas & Electric Co. 1.70% 2030 | | | 218 | | | | 209 | |
| San Diego Gas & Electric Co. 3.75% 2047 | | | 60 | | | | 67 | |
| San Diego Gas & Electric Co. 4.10% 2049 | | | 23 | | | | 27 | |
| San Diego Gas & Electric Co. 3.32% 2050 | | | 2,925 | | | | 3,089 | |
| San Diego Gas & Electric Co. 2.95% 2051 | | | 32,268 | | | | 32,557 | |
| Southern California Edison Co. 1.845% 2022 | | | 905 | | | | 906 | |
| Southern California Edison Co. 0.70% 2023 | | | 400 | | | | 398 | |
| Southern California Edison Co. 1.10% 2024 | | | 28,252 | | | | 28,159 | |
| Southern California Edison Co. 3.70% 2025 | | | 11,000 | | | | 11,754 | |
| Southern California Edison Co. 1.20% 2026 | | | 7,500 | | | | 7,356 | |
| Southern California Edison Co. 3.65% 2028 | | | 10,056 | | | | 10,873 | |
| Southern California Edison Co. 2.85% 2029 | | | 70,582 | | | | 73,086 | |
| Southern California Edison Co. 4.20% 2029 | | | 20,806 | | | | 23,223 | |
| Southern California Edison Co. 2.25% 2030 | | | 27,600 | | | | 27,267 | |
| Southern California Edison Co. 2.50% 2031 | | | 17,417 | | | | 17,502 | |
| Southern California Edison Co. 6.00% 2034 | | | 10,119 | | | | 13,141 | |
| Southern California Edison Co. 5.35% 2035 | | | 30,475 | | | | 38,002 | |
| Southern California Edison Co. 5.75% 2035 | | | 6,666 | | | | 8,589 | |
| Southern California Edison Co. 5.625% 2036 | | | 5,649 | | | | 7,126 | |
| Southern California Edison Co. 5.55% 2037 | | | 6,946 | | | | 8,668 | |
| Southern California Edison Co. 5.95% 2038 | | | 12,088 | | | | 15,655 | |
| Southern California Edison Co. 4.50% 2040 | | | 20,920 | | | | 23,661 | |
| Southern California Edison Co. 4.00% 2047 | | | 25,040 | | | | 27,670 | |
| Southern California Edison Co. 4.125% 2048 | | | 17,199 | | | | 19,338 | |
| Southern California Edison Co. 4.875% 2049 | | | 1,925 | | | | 2,356 | |
| Southern California Edison Co. 3.65% 2050 | | | 54,286 | | | | 57,588 | |
| Southern California Edison Co. 2.95% 2051 | | | 12,545 | | | | 11,979 | |
| Southern California Edison Co. 3.65% 2051 | | | 22,117 | | | | 24,021 | |
| Southern California Edison Co., Series C, 3.60% 2045 | | | 10,910 | | | | 11,203 | |
| Southern California Gas Company 2.55% 2030 | | | 6,775 | | | | 6,954 | |
| Southwestern Electric Power Co. 1.65% 2026 | | | 12,675 | | | | 12,583 | |
| Southwestern Electric Power Co. 3.25% 2051 | | | 13,364 | | | | 13,283 | |
| Talen Energy Corp. 7.25% 20274 | | | 12,024 | | | | 10,653 | |
| Talen Energy Corp. 6.625% 20284 | | | 8,215 | | | | 7,220 | |
| Talen Energy Supply, LLC 7.625% 20284 | | | 1,590 | | | | 1,418 | |
| Tampa Electric Co. 2.60% 2022 | | | 4,350 | | | | 4,384 | |
| Union Electric Co. 2.15% 2032 | | | 19,875 | | | | 19,530 | |
| Virginia Electric and Power Co. 2.875% 2029 | | | 4,944 | | | | 5,195 | |
| Virginia Electric and Power Co. 2.30% 2031 | | | 8,575 | | | | 8,650 | |
| Virginia Electric and Power Co. 4.00% 2043 | | | 1,437 | | | | 1,655 | |
| Virginia Electric and Power Co. 2.45% 2050 | | | 21,900 | | | | 20,235 | |
| Vistra Operations Co. LLC 3.55% 20244 | | | 8,000 | | | | 8,243 | |
| Vistra Operations Co. LLC 5.00% 20274 | | | 1,000 | | | | 1,039 | |
| WEC Energy Group, Inc. 2.20% 2028 | | | 9,475 | | | | 9,469 | |
| Wisconsin Electric Power Co. 2.85% 2051 | | | 5,167 | | | | 5,088 | |
| Wisconsin Power and Light Co. 1.95% 2031 | | | 15,450 | | | | 15,051 | |
| Wisconsin Power and Light Co. 3.65% 2050 | | | 2,675 | | | | 3,013 | |
| Xcel Energy, Inc. 3.35% 2026 | | | 14,219 | | | | 15,121 | |
| Xcel Energy, Inc. 1.75% 2027 | | | 19,250 | | | | 19,089 | |
| The Bond Fund of America | 17 |
| Bonds, notes & other debt instruments (continued) | | Principal amount
(000) | | | Value
(000) | |
| Corporate bonds, notes & loans (continued) | | | | | | |
| Utilities (continued) | | | | | | | | |
| Xcel Energy, Inc. 2.60% 2029 | | $ | 13,202 | | | $ | 13,509 | |
| Xcel Energy, Inc. 2.35% 2031 | | | 37,475 | | | | 37,328 | |
| Xcel Energy, Inc. 3.50% 2049 | | | 7,975 | | | | 8,503 | |
| | | | | | | | 3,669,642 | |
| | | | | | | | | |
| Energy 4.05% | | | | | | | | |
| Antero Resources Corp. 5.375% 20304 | | | 1,735 | | | | 1,858 | |
| Apache Corp. 4.25% 2030 | | | 9,050 | | | | 9,834 | |
| Apache Corp. 6.00% 2037 | | | 6,135 | | | | 7,518 | |
| Apache Corp. 5.10% 2040 | | | 4,860 | | | | 5,500 | |
| Apache Corp. 4.75% 2043 | | | 15,000 | | | | 16,500 | |
| Apache Corp. 5.35% 2049 | | | 16,725 | | | | 19,133 | |
| Baker Hughes, a GE Co. 2.061% 2026 | | | 6,787 | | | | 6,852 | |
| Boardwalk Pipeline Partners LP 3.375% 2023 | | | 1,900 | | | | 1,935 | |
| BP Capital Markets America, Inc. 2.772% 2050 | | | 451 | | | | 426 | |
| Canadian Natural Resources, Ltd. 2.95% 2023 | | | 16,235 | | | | 16,548 | |
| Canadian Natural Resources, Ltd. 3.80% 2024 | | | 10,500 | | | | 11,018 | |
| Canadian Natural Resources, Ltd. 2.05% 2025 | | | 3,547 | | | | 3,584 | |
| Canadian Natural Resources, Ltd. 3.85% 2027 | | | 49,448 | | | | 53,016 | |
| Canadian Natural Resources, Ltd. 2.95% 2030 | | | 8,752 | | | | 8,873 | |
| Canadian Natural Resources, Ltd. 4.95% 2047 | | | 179 | | | | 220 | |
| Cenovus Energy, Inc. 5.375% 2025 | | | 32,721 | | | | 36,138 | |
| Cenovus Energy, Inc. 4.25% 2027 | | | 72,145 | | | | 78,692 | |
| Cenovus Energy, Inc. 2.65% 2032 | | | 17,538 | | | | 17,178 | |
| Cenovus Energy, Inc. 5.25% 2037 | | | 9,149 | | | | 10,828 | |
| Cenovus Energy, Inc. 5.40% 2047 | | | 56,113 | | | | 70,020 | |
| Cheniere Energy Partners LP 4.50% 2029 | | | 5,050 | | | | 5,362 | |
| Cheniere Energy Partners LP 3.25% 20324 | | | 5,374 | | | | 5,439 | |
| Cheniere Energy, Inc. 4.625% 2028 | | | 8,875 | | | | 9,455 | |
| Cheniere Energy, Inc. 3.70% 2029 | | | 46,156 | | | | 49,479 | |
| Chesapeake Energy Corp. 5.50% 20264 | | | 1,405 | | | | 1,480 | |
| Chesapeake Energy Corp. 5.875% 20294 | | | 1,210 | | | | 1,296 | |
| Chevron Corp. 2.498% 2022 | | | 9,675 | | | | 9,692 | |
| Chevron Corp. 2.954% 2026 | | | 25,490 | | | | 27,013 | |
| Chevron Corp. 1.995% 2027 | | | 22,156 | | | | 22,503 | |
| Chevron Corp. 2.236% 2030 | | | 24,807 | | | | 25,118 | |
| Chevron Corp. 3.078% 2050 | | | 4,177 | | | | 4,447 | |
| Chevron USA, Inc. 1.018% 2027 | | | 16,054 | | | | 15,471 | |
| CNX Resources Corp. 7.25% 20274 | | | 20 | | | | 21 | |
| CNX Resources Corp. 6.00% 20294 | | | 1,608 | | | | 1,675 | |
| Constellation Oil Services Holding SA 10.00% PIK 20244,7,8 | | | 3,538 | | | | 1,107 | |
| Continental Resources, Inc. 2.875% 20324 | | | 12,140 | | | | 11,893 | |
| DCP Midstream Operating LP 4.95% 2022 | | | 1,495 | | | | 1,495 | |
| Devon Energy Corp. 5.25% 2024 | | | 638 | | | | 691 | |
| Devon Energy Corp. 5.25% 2027 | | | 1,624 | | | | 1,713 | |
| Devon Energy Corp. 5.875% 2028 | | | 1,347 | | | | 1,459 | |
| Devon Energy Corp. 4.50% 2030 | | | 12,331 | | | | 13,244 | |
| Diamondback Energy, Inc. 4.40% 2051 | | | 23,781 | | | | 27,320 | |
| DT Midstream, Inc. 4.125% 20294 | | | 3,430 | | | | 3,517 | |
| Enbridge Energy Partners LP 7.375% 2045 | | | 22,442 | | | | 35,123 | |
| Enbridge, Inc. 4.00% 2023 | | | 10,100 | | | | 10,548 | |
| Endeavor Energy Resources LP 6.625% 20254 | | | 1,995 | | | | 2,113 | |
| Energy Transfer Operating LP 5.875% 2024 | | | 2,043 | | | | 2,200 | |
| Energy Transfer Operating LP 2.90% 2025 | | | 23,003 | | | | 23,782 | |
| Energy Transfer Operating LP 3.75% 2030 | | | 27,624 | | | | 29,303 | |
| Energy Transfer Operating LP 5.00% 2050 | | | 108,654 | | | | 125,332 | |
| Energy Transfer Partners LP 4.20% 2023 | | | 5,725 | | | | 5,981 | |
| Energy Transfer Partners LP 4.50% 2024 | | | 2,975 | | | | 3,155 | |
| Energy Transfer Partners LP 4.95% 2028 | | | 7,500 | | | | 8,444 | |
| Energy Transfer Partners LP 6.125% 2045 | | | 16,640 | | | | 20,744 | |
| Energy Transfer Partners LP 5.30% 2047 | | | 31,022 | | | | 36,032 | |
| Energy Transfer Partners LP 6.00% 2048 | | | 14,487 | | | | 18,038 | |
| Energy Transfer Partners LP 6.25% 2049 | | | 15,547 | | | | 20,347 | |
| Energy Transfer Partners LP 6.625% junior subordinated perpetual bonds (3-month USD-LIBOR + 4.155% on 2/15/2028)5 | | | 17,000 | | | | 16,170 | |
| Enterprise Products Operating LLC 2.80% 2030 | | | 3,768 | | | | 3,933 | |
| Enterprise Products Operating LLC 3.20% 2052 | | | 17,550 | | | | 17,259 | |
| 18 | The Bond Fund of America |
| Bonds, notes & other debt instruments (continued) | | Principal amount
(000) | | | Value
(000) | |
| Corporate bonds, notes & loans (continued) | | | | | | |
| Energy (continued) | | | | | | |
| Enterprise Products Operating LLC 3.30% 2053 | | $ | 33,993 | | | $ | 33,884 | |
| EQM Midstream Partners LP 4.75% 2023 | | | 2,500 | | | | 2,603 | |
| EQM Midstream Partners LP 6.50% 20274 | | | 4,020 | | | | 4,508 | |
| EQM Midstream Partners LP 5.50% 2028 | | | 8,300 | | | | 9,080 | |
| EQM Midstream Partners LP 4.50% 20294 | | | 5,120 | | | | 5,332 | |
| EQT Corp. 3.00% 2022 | | | 23,035 | | | | 23,297 | |
| EQT Corp. 6.625% 20255 | | | 5,812 | | | | 6,560 | |
| EQT Corp. 3.90% 2027 | | | 11,000 | | | | 11,811 | |
| EQT Corp. 5.00% 2029 | | | 1,175 | | | | 1,303 | |
| EQT Corp. 7.50% 20305 | | | 15,000 | | | | 19,299 | |
| EQT Corp. 3.625% 20314 | | | 3,945 | | | | 4,099 | |
| Equinor ASA 3.625% 2028 | | | 8,379 | | | | 9,213 | |
| Equinor ASA 3.125% 2030 | | | 22,503 | | | | 24,200 | |
| Equinor ASA 3.25% 2049 | | | 5,687 | | | | 6,040 | |
| Exxon Mobil Corp. 2.019% 2024 | | | 24,204 | | | | 24,814 | |
| Exxon Mobil Corp. 2.44% 2029 | | | 4,098 | | | | 4,207 | |
| Exxon Mobil Corp. 2.61% 2030 | | | 39,385 | | | | 40,864 | |
| Exxon Mobil Corp. 2.995% 2039 | | | 890 | | | | 902 | |
| Exxon Mobil Corp. 4.227% 2040 | | | 2,000 | | | | 2,365 | |
| Exxon Mobil Corp. 3.452% 2051 | | | 6,327 | | | | 6,869 | |
| Harvest Midstream I, LP 7.50% 20284 | | | 1,988 | | | | 2,130 | |
| Hilcorp Energy I, LP 5.75% 20294 | | | 2,125 | | | | 2,193 | |
| Kinder Morgan, Inc. 2.00% 2031 | | | 4,717 | | | | 4,494 | |
| Kinder Morgan, Inc. 5.20% 2048 | | | 9,524 | | | | 11,792 | |
| Kinder Morgan, Inc. 3.25% 2050 | | | 3,345 | | | | 3,210 | |
| Kinder Morgan, Inc. 3.60% 2051 | | | 52,875 | | | | 53,297 | |
| Marathon Oil Corp. 4.40% 2027 | | | 5,755 | | | | 6,308 | |
| MPLX LP 3.50% 2022 | | | 140 | | | | 143 | |
| MPLX LP 1.75% 2026 | | | 20,211 | | | | 20,028 | |
| MPLX LP 2.65% 2030 | | | 28,512 | | | | 28,415 | |
| MPLX LP 4.70% 2048 | | | 5,660 | | | | 6,546 | |
| MPLX LP 5.50% 2049 | | | 51,288 | | | | 65,650 | |
| Murphy Oil Corp. 6.375% 2028 | | | 6,250 | | | | 6,652 | |
| Murphy Oil USA, Inc. 3.75% 20314 | | | 1,335 | | | | 1,329 | |
| MV24 Capital BV 6.748% 20344 | | | 1,793 | | | | 1,851 | |
| New Fortress Energy, Inc. 6.50% 20264 | | | 6,595 | | | | 6,553 | |
| NGL Energy Operating LLC 7.50% 20264 | | | 6,555 | | | | 6,769 | |
| Occidental Petroleum Corp. 8.00% 2025 | | | 3,930 | | | | 4,592 | |
| Occidental Petroleum Corp. 4.20% 2048 | | | 4,250 | | | | 4,257 | |
| Oleoducto Central SA 4.00% 20274 | | | 9,840 | | | | 9,796 | |
| Oleoducto Central SA 4.00% 2027 | | | 9,063 | | | | 9,022 | |
| ONEOK, Inc. 2.20% 2025 | | | 439 | | | | 444 | |
| ONEOK, Inc. 5.85% 2026 | | | 35,267 | | | | 40,480 | |
| ONEOK, Inc. 4.00% 2027 | | | 5,403 | | | | 5,846 | |
| ONEOK, Inc. 4.55% 2028 | | | 910 | | | | 1,006 | |
| ONEOK, Inc. 3.40% 2029 | | | 2,882 | | | | 2,988 | |
| ONEOK, Inc. 4.35% 2029 | | | 3,154 | | | | 3,441 | |
| ONEOK, Inc. 3.10% 2030 | | | 25,930 | | | | 26,439 | |
| ONEOK, Inc. 6.35% 2031 | | | 14,286 | | | | 17,956 | |
| ONEOK, Inc. 4.95% 2047 | | | 947 | | | | 1,098 | |
| ONEOK, Inc. 5.20% 2048 | | | 31,762 | | | | 38,476 | |
| ONEOK, Inc. 4.45% 2049 | | | 11,094 | | | | 12,289 | |
| ONEOK, Inc. 4.50% 2050 | | | 7,917 | | | | 8,795 | |
| ONEOK, Inc. 7.15% 2051 | | | 9,461 | | | | 13,685 | |
| Petróleos Mexicanos (3-month USD-LIBOR + 3.65%) 3.851% 20226 | | | 7,000 | | | | 7,014 | |
| Petróleos Mexicanos 4.875% 2022 | | | 20,506 | | | | 20,565 | |
| Petróleos Mexicanos 5.375% 2022 | | | 13,457 | | | | 13,591 | |
| Petróleos Mexicanos 3.50% 2023 | | | 600 | | | | 607 | |
| Petróleos Mexicanos 4.625% 2023 | | | 5,840 | | | | 5,994 | |
| Petróleos Mexicanos 4.875% 2024 | | | 1,881 | | | | 1,949 | |
| Petróleos Mexicanos 6.875% 20254 | | | 66,015 | | | | 72,208 | |
| Petróleos Mexicanos 6.875% 2025 | | | 4,291 | | | | 4,694 | |
| Petróleos Mexicanos 4.50% 2026 | | | 9,922 | | | | 10,050 | |
| Petróleos Mexicanos 6.875% 2026 | | | 110,761 | | | | 121,931 | |
| Petróleos Mexicanos 7.47% 2026 | | MXN | 70,000 | | | | 3,109 | |
| Petróleos Mexicanos 6.49% 2027 | | $ | 20,000 | | | | 21,347 | |
| Petróleos Mexicanos 6.50% 2027 | | | 89,091 | | | | 95,159 | |
| The Bond Fund of America | 19 |
| Bonds, notes & other debt instruments (continued) | | Principal amount
(000) | | | Value
(000) | |
| Corporate bonds, notes & loans (continued) | | | | | | |
| Energy (continued) | | | | | | |
| Petróleos Mexicanos 6.50% 2029 | | $ | 15,417 | | | $ | 16,021 | |
| Petróleos Mexicanos 5.95% 2031 | | | 22,178 | | | | 21,595 | |
| Petróleos Mexicanos 6.70% 20324 | | | 140,205 | | | | 141,884 | |
| Petróleos Mexicanos 7.69% 2050 | | | 23,125 | | | | 22,361 | |
| Pioneer Natural Resources Company 1.125% 2026 | | | 1,055 | | | | 1,025 | |
| Pioneer Natural Resources Company 2.15% 2031 | | | 1,178 | | | | 1,138 | |
| Plains All American Pipeline LP 3.80% 2030 | | | 1,543 | | | | 1,613 | |
| PTT Exploration and Production PCL 2.587% 20274 | | | 7,780 | | | | 7,939 | |
| Qatar Petroleum 1.375% 20264 | | | 62,305 | | | | 61,175 | |
| Qatar Petroleum 2.25% 20314 | | | 65,510 | | | | 65,058 | |
| Qatar Petroleum 3.125% 20414 | | | 39,145 | | | | 39,664 | |
| Qatar Petroleum 3.30% 20514 | | | 9,730 | | | | 10,051 | |
| Rattler Midstream Partners LP 5.625% 20254 | | | 4,317 | | | | 4,494 | |
| SA Global Sukuk, Ltd. 0.946% 20244 | | | 48,525 | | | | 47,847 | |
| SA Global Sukuk, Ltd. 1.602% 20264 | | | 152,204 | | | | 150,035 | |
| SA Global Sukuk, Ltd. 2.694% 20314 | | | 35,490 | | | | 35,764 | |
| Sabine Pass Liquefaction, LLC 5.625% 20235 | | | 14,000 | | | | 14,647 | |
| Sabine Pass Liquefaction, LLC 5.75% 2024 | | | 13,100 | | | | 14,254 | |
| Sabine Pass Liquefaction, LLC 5.625% 2025 | | | 21,015 | | | | 23,348 | |
| Sabine Pass Liquefaction, LLC 5.875% 2026 | | | 33,750 | | | | 38,758 | |
| Sabine Pass Liquefaction, LLC 4.50% 2030 | | | 19,990 | | | | 22,569 | |
| Saudi Arabian Oil Co. 2.875% 20244 | | | 8,448 | | | | 8,731 | |
| Saudi Arabian Oil Co. 1.625% 20254 | | | 2,980 | | | | 2,968 | |
| Saudi Arabian Oil Co. 3.50% 20294 | | | 4,835 | | | | 5,177 | |
| Saudi Arabian Oil Co. 4.375% 20494 | | | 1,325 | | | | 1,539 | |
| Shell International Finance BV 3.50% 2023 | | | 7,500 | | | | 7,850 | |
| Shell International Finance BV 2.00% 2024 | | | 3,250 | | | | 3,333 | |
| Shell International Finance BV 3.875% 2028 | | | 4,680 | | | | 5,234 | |
| Shell International Finance BV 2.375% 2029 | | | 19,511 | | | | 19,948 | |
| Shell International Finance BV 2.75% 2030 | | | 15,190 | | | | 15,882 | |
| Shell International Finance BV 3.125% 2049 | | | 3,490 | | | | 3,601 | |
| Shell International Finance BV 3.25% 2050 | | | 7,811 | | | | 8,333 | |
| Sinopec Group Overseas Development (2018), Ltd. 1.45% 20264 | | | 10,500 | | | | 10,379 | |
| Sinopec Group Overseas Development (2018), Ltd. 2.95% 2029 | | | 21,257 | | | | 22,209 | |
| Sinopec Group Overseas Development (2018), Ltd. 2.95% 20294 | | | 18,886 | | | | 19,682 | |
| Sinopec Group Overseas Development (2018), Ltd. 2.95% 2029 | | | 3,140 | | | | 3,272 | |
| Sinopec Group Overseas Development (2018), Ltd. 2.30% 20314 | | | 11,940 | | | | 11,778 | |
| Sinopec Group Overseas Development (2018), Ltd. 3.10% 20514 | | | 27,125 | | | | 26,107 | |
| Sinopec Group Overseas Development (2018), Ltd. 2.95% 20294 | | | 6,717 | | | | 7,018 | |
| Southwestern Energy Co. 6.45% 2025 (6.20% on 1/23/2022)5 | | | 880 | | | | 968 | |
| Southwestern Energy Co. 8.375% 2028 | | | 1,300 | | | | 1,453 | |
| Suncor Energy, Inc. 3.75% 2051 | | | 9,758 | | | | 10,498 | |
| Sunoco Logistics Operating Partners LP 4.00% 2027 | | | 15,000 | | | | 16,118 | |
| Sunoco Logistics Operating Partners LP 5.40% 2047 | | | 34,048 | | | | 40,044 | |
| Sunoco LP 6.00% 2027 | | | 4,210 | | | | 4,395 | |
| Sunoco LP 4.50% 2029 | | | 3,215 | | | | 3,270 | |
| Tallgrass Energy Partners, LP 7.50% 20254 | | | 1,370 | | | | 1,484 | |
| Targa Resources Partners LP 5.875% 2026 | | | 8,530 | | | | 8,912 | |
| Targa Resources Partners LP 6.875% 2029 | | | 6,000 | | | | 6,721 | |
| Targa Resources Partners LP 5.50% 2030 | | | 8,660 | | | | 9,476 | |
| Targa Resources Partners LP 4.875% 2031 | | | 2,190 | | | | 2,382 | |
| Total Capital International 3.455% 2029 | | | 10,040 | | | | 10,886 | |
| Total Capital International 2.829% 2030 | | | 7,860 | | | | 8,238 | |
| Total Capital International 3.461% 2049 | | | 2,600 | | | | 2,816 | |
| Total Capital International 3.127% 2050 | | | 6,508 | | | | 6,689 | |
| TransCanada PipeLines, Ltd. 4.10% 2030 | | | 24,741 | | | | 27,627 | |
| Transportadora de Gas Peru SA 4.25% 20284 | | | 2,535 | | | | 2,688 | |
| Western Gas Partners LP 5.30% 2048 | | | 2,000 | | | | 2,413 | |
| Western Midstream Operating, LP 4.35% 2025 (4.10% on 2/1/2022)5 | | | 8,964 | | | | 9,379 | |
| Western Midstream Operating, LP 5.30% 2030 (5.05% on 2/1/2022)5 | | | 6,606 | | | | 7,273 | |
| Western Midstream Operating, LP 6.50% 2050 (6.25% on 2/1/2022)5 | | | 15,036 | | | | 17,803 | |
| Williams Companies, Inc. 3.50% 2030 | | | 29,821 | | | | 31,734 | |
| Williams Companies, Inc. 2.60% 2031 | | | 17,836 | | | | 17,733 | |
| Williams Partners LP 6.30% 2040 | | | 2,246 | | | | 3,047 | |
| | | | | | | | 3,220,831 | |
| 20 | The Bond Fund of America |
| Bonds, notes & other debt instruments (continued) | | Principal amount
(000) | | | Value
(000) | |
| Corporate bonds, notes & loans (continued) | | | | | | |
| Consumer discretionary 3.57% | | | | | | |
| Allied Universal Holdco LLC 4.625% 20284 | | $ | 2,105 | | | $ | 2,107 | |
| Amazon.com, Inc. 1.20% 2027 | | | 4,519 | | | | 4,460 | |
| Amazon.com, Inc. 1.65% 2028 | | | 43,100 | | | | 43,201 | |
| Amazon.com, Inc. 1.50% 2030 | | | 37,712 | | | | 36,587 | |
| Amazon.com, Inc. 2.10% 2031 | | | 50,819 | | | | 51,558 | |
| Amazon.com, Inc. 3.875% 2037 | | | 550 | | | | 648 | |
| Amazon.com, Inc. 2.875% 2041 | | | 14,907 | | | | 15,509 | |
| Amazon.com, Inc. 2.50% 2050 | | | 12,280 | | | | 11,726 | |
| Amazon.com, Inc. 3.10% 2051 | | | 33,000 | | | | 35,319 | |
| Amazon.com, Inc. 2.70% 2060 | | | 10,560 | | | | 10,210 | |
| American Honda Finance Corp. 2.60% 2022 | | | 106 | | | | 108 | |
| American Honda Finance Corp. 0.875% 2023 | | | 50,000 | | | | 50,035 | |
| American Honda Finance Corp. 0.55% 2024 | | | 14,780 | | | | 14,595 | |
| American Honda Finance Corp. 0.75% 2024 | | | 2,000 | | | | 1,979 | |
| American Honda Finance Corp. 1.00% 2025 | | | 3,000 | | | | 2,955 | |
| American Honda Finance Corp. 1.20% 2025 | | | 14,987 | | | | 14,940 | |
| American Honda Finance Corp. 1.30% 2026 | | | 4,000 | | | | 3,954 | |
| American Honda Finance Corp. 2.00% 2028 | | | 5,425 | | | | 5,483 | |
| American Honda Finance Corp. 1.80% 2031 | | | 1,500 | | | | 1,464 | |
| Atlas LuxCo 4 SARL 4.625% 20284 | | | 1,610 | | | | 1,583 | |
| Bayerische Motoren Werke AG 2.95% 20224 | | | 3,500 | | | | 3,525 | |
| Bayerische Motoren Werke AG 3.45% 20234 | | | 16,128 | | | | 16,635 | |
| Bayerische Motoren Werke AG 3.80% 20234 | | | 1,985 | | | | 2,059 | |
| Bayerische Motoren Werke AG 3.90% 20254 | | | 21,240 | | | | 22,857 | |
| Bayerische Motoren Werke AG 1.25% 20264 | | | 600 | | | | 591 | |
| Bayerische Motoren Werke AG 1.95% 20314 | | | 3,500 | | | | 3,411 | |
| Bayerische Motoren Werke AG 2.55% 20314 | | | 14,011 | | | | 14,389 | |
| BMW Finance NV 2.25% 20224 | | | 7,500 | | | | 7,580 | |
| Daimler Trucks Finance North America, LLC 1.125% 20234 | | | 18,000 | | | | 18,013 | |
| Daimler Trucks Finance North America, LLC 1.625% 20244 | | | 29,500 | | | | 29,741 | |
| Daimler Trucks Finance North America, LLC 2.00% 20264 | | | 10,800 | | | | 10,853 | |
| Daimler Trucks Finance North America, LLC 2.375% 20284 | | | 23,725 | | | | 23,852 | |
| Daimler Trucks Finance North America, LLC 2.50% 20314 | | | 61,516 | | | | 61,554 | |
| DaimlerChrysler North America Holding Corp. 2.55% 20224 | | | 12,750 | | | | 12,896 | |
| DaimlerChrysler North America Holding Corp. 1.75% 20234 | | | 18,000 | | | | 18,185 | |
| DaimlerChrysler North America Holding Corp. 0.75% 20244 | | | 22,000 | | | | 21,805 | |
| DaimlerChrysler North America Holding Corp. 2.70% 20244 | | | 19,500 | | | | 20,168 | |
| DaimlerChrysler North America Holding Corp. 3.65% 20244 | | | 9,710 | | | | 10,223 | |
| DaimlerChrysler North America Holding Corp. 1.45% 20264 | | | 11,725 | | | | 11,618 | |
| DaimlerChrysler North America Holding Corp. 2.45% 20314 | | | 9,990 | | | | 10,160 | |
| Expedia Group, Inc. 6.25% 20254 | | | 2,734 | | | | 3,087 | |
| Ford Motor Co. 4.75% 2043 | | | 3,500 | | | | 3,869 | |
| Ford Motor Credit Company LLC 3.219% 2022 | | | 300 | | | | 300 | |
| Ford Motor Credit Company LLC 3.339% 2022 | | | 945 | | | | 948 | |
| Ford Motor Credit Company LLC 3.087% 2023 | | | 1,510 | | | | 1,538 | |
| Ford Motor Credit Company LLC 3.096% 2023 | | | 14,729 | | | | 15,025 | |
| Ford Motor Credit Company LLC 4.375% 2023 | | | 1,125 | | | | 1,172 | |
| Ford Motor Credit Company LLC 3.664% 2024 | | | 5,756 | | | | 5,985 | |
| Ford Motor Credit Company LLC 3.81% 2024 | | | 8,710 | | | | 9,045 | |
| Ford Motor Credit Company LLC 5.584% 2024 | | | 423 | | | | 456 | |
| Ford Motor Credit Company LLC 4.134% 2025 | | | 400 | | | | 425 | |
| Ford Motor Credit Company LLC 5.125% 2025 | | | 7,390 | | | | 8,046 | |
| Ford Motor Credit Company LLC 2.70% 2026 | | | 66,960 | | | | 67,630 | |
| Ford Motor Credit Company LLC 4.542% 2026 | | | 18,000 | | | | 19,571 | |
| Ford Motor Credit Company LLC 3.815% 2027 | | | 3,010 | | | | 3,187 | |
| Ford Motor Credit Company LLC 4.125% 2027 | | | 19,805 | | | | 21,402 | |
| Ford Motor Credit Company LLC 4.271% 2027 | | | 41,650 | | | | 44,821 | |
| Ford Motor Credit Company LLC 2.90% 2028 | | | 3,400 | | | | 3,413 | |
| General Motors Company 5.40% 2023 | | | 4,478 | | | | 4,795 | |
| General Motors Company 4.35% 2025 | | | 14,354 | | | | 15,454 | |
| General Motors Company 6.125% 2025 | | | 33,548 | | | | 38,570 | |
| General Motors Company 4.20% 2027 | | | 3,437 | | | | 3,764 | |
| General Motors Company 6.80% 2027 | | | 18,998 | | | | 23,335 | |
| General Motors Company 6.75% 2046 | | | 1,000 | | | | 1,433 | |
| General Motors Financial Co. 3.45% 2022 | | | 14,955 | | | | 15,001 | |
| General Motors Financial Co. 3.55% 2022 | | | 1,850 | | | | 1,877 | |
| General Motors Financial Co. 1.70% 2023 | | | 5,939 | | | | 5,998 | |
| The Bond Fund of America | 21 |
| Bonds, notes & other debt instruments (continued) | | Principal amount
(000) | | | Value
(000) | |
| Corporate bonds, notes & loans (continued) | | | | | | |
| Consumer discretionary (continued) | | | | | | |
| General Motors Financial Co. 3.25% 2023 | | $ | 22,403 | | | $ | 22,893 | |
| General Motors Financial Co. 3.70% 2023 | | | 15,126 | | | | 15,582 | |
| General Motors Financial Co. 4.15% 2023 | | | 14,010 | | | | 14,576 | |
| General Motors Financial Co. 1.05% 2024 | | | 425 | | | | 423 | |
| General Motors Financial Co. 1.20% 2024 | | | 11,400 | | | | 11,323 | |
| General Motors Financial Co. 3.50% 2024 | | | 15,365 | | | | 16,141 | |
| General Motors Financial Co. 3.95% 2024 | | | 14,909 | | | | 15,696 | |
| General Motors Financial Co. 5.10% 2024 | | | 16,550 | | | | 17,754 | |
| General Motors Financial Co. 2.75% 2025 | | | 14,475 | | | | 14,948 | |
| General Motors Financial Co. 2.90% 2025 | | | 750 | | | | 776 | |
| General Motors Financial Co. 1.25% 2026 | | | 13,900 | | | | 13,614 | |
| General Motors Financial Co. 1.50% 2026 | | | 55,810 | | | | 54,968 | |
| General Motors Financial Co. 4.00% 2026 | | | 11,454 | | | | 12,376 | |
| General Motors Financial Co. 2.70% 2027 | | | 24,230 | | | | 24,665 | |
| General Motors Financial Co. 2.40% 2028 | | | 36,175 | | | | 36,103 | |
| General Motors Financial Co. 2.40% 2028 | | | 12,928 | | | | 12,991 | |
| General Motors Financial Co. 3.60% 2030 | | | 1,735 | | | | 1,852 | |
| General Motors Financial Co. 2.35% 2031 | | | 30,100 | | | | 29,332 | |
| General Motors Financial Co. 2.70% 2031 | | | 23,400 | | | | 23,342 | |
| Grand Canyon University 4.125% 2024 | | | 25,000 | | | | 25,593 | |
| Hanesbrands, Inc. 4.625% 20244 | | | 5,430 | | | | 5,692 | |
| Home Depot, Inc. 3.90% 2028 | | | 831 | | | | 937 | |
| Home Depot, Inc. 2.95% 2029 | | | 42,205 | | | | 45,004 | |
| Home Depot, Inc. 2.70% 2030 | | | 25,000 | | | | 26,258 | |
| Home Depot, Inc. 1.375% 2031 | | | 34,165 | | | | 32,246 | |
| Home Depot, Inc. 3.125% 2049 | | | 5 | | | | 5 | |
| Home Depot, Inc. 3.35% 2050 | | | 110 | | | | 120 | |
| Home Depot, Inc. 2.375% 2051 | | | 6,847 | | | | 6,308 | |
| Hyundai Capital America 2.85% 20224 | | | 7,412 | | | | 7,541 | |
| Hyundai Capital America 3.10% 20224 | | | 13,890 | | | | 13,984 | |
| Hyundai Capital America 3.25% 20224 | | | 24,685 | | | | 25,157 | |
| Hyundai Capital America 3.95% 20224 | | | 15,000 | | | | 15,036 | |
| Hyundai Capital America 1.25% 20234 | | | 24,257 | | | | 24,247 | |
| Hyundai Capital America 2.375% 20234 | | | 21,815 | | | | 22,123 | |
| Hyundai Capital America 5.75% 20234 | | | 10,000 | | | | 10,561 | |
| Hyundai Capital America 0.875% 20244 | | | 17,000 | | | | 16,680 | |
| Hyundai Capital America 1.00% 20244 | | | 15,600 | | | | 15,340 | |
| Hyundai Capital America 1.80% 20254 | | | 55,906 | | | | 55,650 | |
| Hyundai Capital America 2.65% 20254 | | | 28,554 | | | | 29,283 | |
| Hyundai Capital America 5.875% 20254 | | | 10,000 | | | | 11,197 | |
| Hyundai Capital America 1.30% 20264 | | | 17,000 | | | | 16,530 | |
| Hyundai Capital America 1.50% 20264 | | | 37,265 | | | | 36,262 | |
| Hyundai Capital America 1.65% 20264 | | | 39,800 | | | | 39,051 | |
| Hyundai Capital America 2.375% 20274 | | | 11,397 | | | | 11,345 | |
| Hyundai Capital America 3.00% 20274 | | | 22,768 | | | | 23,576 | |
| Hyundai Capital America 1.80% 20284 | | | 15,000 | | | | 14,509 | |
| Hyundai Capital America 2.00% 20284 | | | 37,888 | | | | 36,967 | |
| Hyundai Capital America 2.10% 20284 | | | 27,625 | | | | 26,860 | |
| Hyundai Capital Services, Inc. 1.25% 20264 | | | 6,570 | | | | 6,415 | |
| International Game Technology PLC 6.50% 20254 | | | 1,560 | | | | 1,695 | |
| International Game Technology PLC 4.125% 20264 | | | 2,115 | | | | 2,181 | |
| International Game Technology PLC 6.25% 20274 | | | 3,500 | | | | 3,924 | |
| International Game Technology PLC 5.25% 20294 | | | 6,940 | | | | 7,364 | |
| KB Home 6.875% 2027 | | | 5,000 | | | | 5,868 | |
| Lennar Corp. 4.50% 2024 | | | 3,015 | | | | 3,206 | |
| Limited Brands, Inc. 6.875% 2035 | | | 4,500 | | | | 5,598 | |
| Limited Brands, Inc. 6.75% 2036 | | | 4,800 | | | | 5,935 | |
| Lowe’s Companies, Inc. 1.30% 2028 | | | 684 | | | | 656 | |
| Lowe’s Companies, Inc. 1.70% 2030 | | | 5,216 | | | | 4,962 | |
| Lowe’s Companies, Inc. 2.625% 2031 | | | 2,250 | | | | 2,304 | |
| Lowe’s Companies, Inc. 4.05% 2047 | | | 2,427 | | | | 2,799 | |
| Lowe’s Companies, Inc. 3.00% 2050 | | | 5,431 | | | | 5,371 | |
| Lowe’s Companies, Inc. 5.125% 2050 | | | 867 | | | | 1,177 | |
| M.D.C. Holdings, Inc. 6.00% 2043 | | | 7,475 | | | | 9,467 | |
| Marriott International, Inc. 5.75% 2025 | | | 1,196 | | | | 1,347 | |
| Marriott International, Inc. 3.125% 2026 | | | 1,235 | | | | 1,284 | |
| Marriott International, Inc. 2.85% 2031 | | | 16,535 | | | | 16,502 | |
| 22 | The Bond Fund of America |
| Bonds, notes & other debt instruments (continued) | | Principal amount
(000) | | | Value
(000) | |
| Corporate bonds, notes & loans (continued) | | | | | | |
| Consumer discretionary (continued) | | | | | | |
| Marriott International, Inc. 2.75% 2033 | | $ | 4,827 | | | $ | 4,689 | |
| McDonald’s Corp. 2.125% 2030 | | | 8,994 | | | | 8,963 | |
| McDonald’s Corp. 4.45% 2048 | | | 1,750 | | | | 2,160 | |
| McDonald’s Corp. 3.625% 2049 | | | 6,857 | | | | 7,603 | |
| McDonald’s Corp. 4.20% 2050 | | | 5,396 | | | | 6,549 | |
| Meituan Dianping 2.125% 20254 | | | 5,041 | | | | 4,861 | |
| Meituan Dianping 3.05% 20304 | | | 17,000 | | | | 15,752 | |
| Meituan Dianping 3.05% 2030 | | | 15,000 | | | | 13,899 | |
| Melco International Development, Ltd. 4.875% 20254 | | | 300 | | | | 296 | |
| Melco International Development, Ltd. 5.75% 20284 | | | 3,990 | | | | 4,018 | |
| Melco International Development, Ltd. 5.375% 20294 | | | 885 | | | | 860 | |
| MGM Growth Properties LLC 5.625% 2024 | | | 3,885 | | | | 4,157 | |
| MGM Growth Properties LLC 3.875% 20294 | | | 2,835 | | | | 2,981 | |
| MGM Resorts International 6.75% 2025 | | | 3,000 | | | | 3,138 | |
| Morongo Band of Mission Indians 7.00% 20394 | | | 11,225 | | | | 14,850 | |
| NIKE, Inc. 2.40% 2025 | | | 8,656 | | | | 8,968 | |
| NIKE, Inc. 3.25% 2040 | | | 5,469 | | | | 5,961 | |
| NIKE, Inc. 3.375% 2050 | | | 4,272 | | | | 4,840 | |
| Nissan Motor Acceptance Co. LLC 1.125% 20244 | | | 16,200 | | | | 15,927 | |
| Nissan Motor Acceptance Co. LLC 1.85% 20264 | | | 36,749 | | | | 35,893 | |
| Nissan Motor Acceptance Co. LLC 2.45% 20284 | | | 22,958 | | | | 22,331 | |
| Nissan Motor Co., Ltd. 2.60% 20224 | | | 44,825 | | | | 45,302 | |
| Nissan Motor Co., Ltd. 3.043% 20234 | | | 8,756 | | | | 8,988 | |
| Nissan Motor Co., Ltd. 3.522% 20254 | | | 48,235 | | | | 50,603 | |
| Nissan Motor Co., Ltd. 2.00% 20264 | | | 31,075 | | | | 30,639 | |
| Nissan Motor Co., Ltd. 4.345% 20274 | | | 32,162 | | | | 34,747 | |
| Nissan Motor Co., Ltd. 2.75% 20284 | | | 39,575 | | | | 39,327 | |
| Nissan Motor Co., Ltd. 4.81% 20304 | | | 24,600 | | | | 27,541 | |
| President & Fellows of Harvard College 2.517% 2050 | | | 5,500 | | | | 5,531 | |
| S.A.C.I. Falabella 3.75% 20274 | | | 8,295 | | | | 8,649 | |
| Sally Holdings LLC and Sally Capital, Inc. 5.625% 2025 | | | 200 | | | | 205 | |
| Sally Holdings LLC and Sally Capital, Inc. 8.75% 20254 | | | 500 | | | | 533 | |
| Sands China, Ltd. 3.80% 2026 | | | 2,330 | | | | 2,344 | |
| Sands China, Ltd. 5.40% 2028 | | | 43,750 | | | | 47,162 | |
| Sands China, Ltd. 4.375% 2030 | | | 6,500 | | | | 6,642 | |
| Starbucks Corp. 3.10% 2023 | | | 15,237 | | | | 15,604 | |
| Starbucks Corp. 3.80% 2025 | | | 14,000 | | | | 15,116 | |
| Stellantis Finance US, Inc. 1.711% 20274 | | | 29,225 | | | | 28,743 | |
| Stellantis Finance US, Inc. 2.691% 20314 | | | 42,075 | | | | 41,420 | |
| Taylor Morrison Home Corp. 5.75% 20284 | | | 3,500 | | | | 3,916 | |
| Toyota Motor Corp. 0.681% 2024 | | | 6,731 | | | | 6,694 | |
| Toyota Motor Credit Corp. 2.60% 2022 | | | 9,860 | | | | 9,864 | |
| Toyota Motor Credit Corp. 0.50% 2023 | | | 6,377 | | | | 6,356 | |
| Toyota Motor Credit Corp. 1.35% 2023 | | | 19,170 | | | | 19,347 | |
| Toyota Motor Credit Corp. 2.70% 2023 | | | 5,300 | | | | 5,420 | |
| Toyota Motor Credit Corp. 0.45% 2024 | | | 2,530 | | | | 2,510 | |
| Toyota Motor Credit Corp. 0.80% 2025 | | | 23,287 | | | | 22,756 | |
| Toyota Motor Credit Corp. 3.00% 2025 | | | 8,710 | | | | 9,144 | |
| Toyota Motor Credit Corp. 1.15% 2027 | | | 6,086 | | | | 5,916 | |
| Toyota Motor Credit Corp. 3.20% 2027 | | | 2,330 | | | | 2,501 | |
| Toyota Motor Credit Corp. 1.90% 2028 | | | 13,370 | | | | 13,408 | |
| Toyota Motor Credit Corp. 3.05% 2028 | | | 2,589 | | | | 2,780 | |
| Toyota Motor Credit Corp. 3.375% 2030 | | | 15,094 | | | | 16,559 | |
| Travel + Leisure Co. 4.50% 20294 | | | 2,000 | | | | 2,020 | |
| VICI Properties LP 4.25% 20264 | | | 5,700 | | | | 5,944 | |
| VICI Properties LP 4.625% 20294 | | | 715 | | | | 762 | |
| VICI Properties LP / VICI Note Co., Inc. 3.50% 20254 | | | 2,675 | | | | 2,718 | |
| VICI Properties LP / VICI Note Co., Inc. 4.125% 20304 | | | 2,500 | | | | 2,648 | |
| Volkswagen Group of America Finance, LLC 2.90% 20224 | | | 27,250 | | | | 27,475 | |
| Volkswagen Group of America Finance, LLC 3.125% 20234 | | | 21,938 | | | | 22,560 | |
| Volkswagen Group of America Finance, LLC 4.25% 20234 | | | 3,000 | | | | 3,169 | |
| Volkswagen Group of America Finance, LLC 2.85% 20244 | | | 22,214 | | | | 22,987 | |
| Volkswagen Group of America Finance, LLC 1.25% 20254 | | | 16,205 | | | | 15,864 | |
| Volkswagen Group of America Finance, LLC 3.35% 20254 | | | 21,089 | | | | 22,204 | |
| Volkswagen Group of America Finance, LLC 4.625% 20254 | | | 514 | | | | 567 | |
| Volkswagen Group of America Finance, LLC 1.625% 20274 | | | 6,950 | | | | 6,746 | |
| Wyndham Destinations, Inc. 6.625% 20264 | | | 4,000 | | | | 4,440 | |
| The Bond Fund of America | 23 |
| Bonds, notes & other debt instruments (continued) | | Principal amount
(000) | | | Value
(000) | |
| Corporate bonds, notes & loans (continued) | | | | | | |
| Consumer discretionary (continued) | | | | | | |
| Wynn Macau, Ltd. 5.125% 20294 | | $ | 1,200 | | | $ | 1,092 | |
| Wynn Resorts, Ltd. 7.75% 20254 | | | 4,380 | | | | 4,598 | |
| Wynn Resorts, Ltd. 5.125% 20294 | | | 2,500 | | | | 2,541 | |
| | | | | | | | 2,843,453 | |
| Health care 3.09% | | | | | | | | |
| Abbott Laboratories 3.75% 2026 | | | 1,025 | | | | 1,133 | |
| AbbVie, Inc. 3.45% 2022 | | | 16,500 | | | | 16,515 | |
| AbbVie, Inc. 2.60% 2024 | | | 30,200 | | | | 31,355 | |
| AbbVie, Inc. 2.95% 2026 | | | 23,018 | | | | 24,271 | |
| AbbVie, Inc. 3.20% 2029 | | | 44,253 | | | | 47,364 | |
| AmerisourceBergen Corp. 2.70% 2031 | | | 42,338 | | | | 42,821 | |
| Amgen, Inc. 2.45% 2030 | | | 25,000 | | | | 25,472 | |
| Anthem, Inc. 2.95% 2022 | | | 11,000 | | | | 11,216 | |
| Anthem, Inc. 2.375% 2025 | | | 1,534 | | | | 1,583 | |
| AstraZeneca Finance LLC 1.75% 2028 | | | 8,826 | | | | 8,781 | |
| AstraZeneca Finance LLC 2.25% 2031 | | | 13,536 | | | | 13,646 | |
| AstraZeneca PLC 2.375% 2022 | | | 14,650 | | | | 14,744 | |
| AstraZeneca PLC 3.50% 2023 | | | 15,207 | | | | 15,875 | |
| AstraZeneca PLC 3.375% 2025 | | | 25,790 | | | | 27,704 | |
| AstraZeneca PLC 0.70% 2026 | | | 6,589 | | | | 6,380 | |
| AstraZeneca PLC 4.00% 2029 | | | 2,027 | | | | 2,291 | |
| AstraZeneca PLC 1.375% 2030 | | | 10,000 | | | | 9,452 | |
| AstraZeneca PLC 3.00% 2051 | | | 6,295 | | | | 6,615 | |
| Avantor Funding, Inc. 4.625% 20284 | | | 6,320 | | | | 6,599 | |
| Bausch Health Companies, Inc. 4.875% 20284 | | | 5,125 | | | | 5,237 | |
| Baxter International, Inc. 2.539% 20324 | | | 23,238 | | | | 23,502 | |
| Bayer US Finance II LLC 3.875% 20234 | | | 14,400 | | | | 15,055 | |
| Bayer US Finance II LLC 4.25% 20254 | | | 32,819 | | | | 35,529 | |
| Bayer US Finance II LLC 4.375% 20284 | | | 31,520 | | | | 35,237 | |
| Bayer US Finance II LLC 4.875% 20484 | | | 1,402 | | | | 1,727 | |
| Becton, Dickinson and Company 3.363% 2024 | | | 16,218 | | | | 16,988 | |
| Boston Scientific Corp. 3.375% 2022 | | | 3,118 | | | | 3,150 | |
| Boston Scientific Corp. 3.45% 2024 | | | 2,000 | | | | 2,092 | |
| Boston Scientific Corp. 3.75% 2026 | | | 14,087 | | | | 15,148 | |
| Boston Scientific Corp. 2.65% 2030 | | | 42,491 | | | | 43,364 | |
| Boston Scientific Corp. 4.70% 2049 | | | 1,031 | | | | 1,309 | |
| Bristol-Myers Squibb Company 2.90% 2024 | | | 9,095 | | | | 9,523 | |
| Bristol-Myers Squibb Company 3.20% 2026 | | | 11,838 | | | | 12,742 | |
| Bristol-Myers Squibb Company 3.40% 2029 | | | 7,107 | | | | 7,789 | |
| Bristol-Myers Squibb Company 1.45% 2030 | | | 7,812 | | | | 7,451 | |
| Centene Corp. 4.25% 2027 | | | 58,085 | | | | 60,654 | |
| Centene Corp. 2.45% 2028 | | | 86,515 | | | | 85,350 | |
| Centene Corp. 4.625% 2029 | | | 42,335 | | | | 45,730 | |
| Centene Corp. 3.00% 2030 | | | 23,055 | | | | 23,476 | |
| Centene Corp. 3.375% 2030 | | | 45,137 | | | | 46,042 | |
| Centene Corp. 2.50% 2031 | | | 74,200 | | | | 72,358 | |
| Centene Corp. 2.625% 2031 | | | 14,110 | | | | 13,851 | |
| Charles River Laboratories International, Inc. 3.75% 20294 | | | 4,335 | | | | 4,385 | |
| Cigna Corp. 4.375% 2028 | | | 17,336 | | | | 19,716 | |
| Cigna Corp. 2.375% 2031 | | | 33,018 | | | | 33,222 | |
| CVS Health Corp. 1.30% 2027 | | | 10,000 | | | | 9,702 | |
| CVS Health Corp. 4.30% 2028 | | | 3,547 | | | | 3,984 | |
| CVS Health Corp. 3.25% 2029 | | | 6,815 | | | | 7,273 | |
| CVS Health Corp. 1.75% 2030 | | | 10,000 | | | | 9,541 | |
| CVS Health Corp. 1.875% 2031 | | | 13,185 | | | | 12,663 | |
| CVS Health Corp. 5.05% 2048 | | | 1,707 | | | | 2,236 | |
| CVS Health Corp. 4.25% 2050 | | | 8,451 | | | | 10,242 | |
| Danaher Corp. 2.80% 2051 | | | 6,500 | | | | 6,426 | |
| Elanco Animal Health, Inc. 5.272% 2023 | | | 4,700 | | | | 5,006 | |
| Eli Lilly and Company 3.375% 2029 | | | 6,016 | | | | 6,636 | |
| EMD Finance LLC 2.95% 20224 | | | 9,600 | | | | 9,609 | |
| EMD Finance LLC 3.25% 20254 | | | 16,185 | | | | 17,044 | |
| GlaxoSmithKline PLC 2.875% 2022 | | | 1,996 | | | | 2,013 | |
| GlaxoSmithKline PLC 3.375% 2023 | | | 35,700 | | | | 36,978 | |
| GlaxoSmithKline PLC 3.00% 2024 | | | 14,515 | | | | 15,193 | |
| GlaxoSmithKline PLC 3.625% 2025 | | | 26,180 | | | | 28,215 | |
| 24 | The Bond Fund of America |
| Bonds, notes & other debt instruments (continued) | | Principal amount
(000) | | | Value
(000) | |
| Corporate bonds, notes & loans (continued) | | | | | | |
| Health care (continued) | | | | | | |
| GlaxoSmithKline PLC 3.875% 2028 | | $ | 2,917 | | | $ | 3,267 | |
| HCA, Inc. 5.875% 2023 | | | 3,750 | | | | 3,975 | |
| HCA, Inc. 5.875% 2026 | | | 4,700 | | | | 5,307 | |
| HCA, Inc. 4.125% 2029 | | | 2,825 | | | | 3,112 | |
| HCA, Inc. 5.875% 2029 | | | 7,130 | | | | 8,507 | |
| HCA, Inc. 3.50% 2030 | | | 5,225 | | | | 5,533 | |
| HCA, Inc. 5.25% 2049 | | | 8,300 | | | | 10,680 | |
| IMS Health Holdings, Inc. 5.00% 20264 | | | 5,750 | | | | 5,908 | |
| Johnson & Johnson 2.25% 2022 | | | 12,240 | | | | 12,261 | |
| Johnson & Johnson 2.10% 2040 | | | 8,620 | | | | 8,175 | |
| Kaiser Foundation Hospitals 2.81% 2041 | | | 5,555 | | | | 5,596 | |
| Laboratory Corporation of America Holdings 1.55% 2026 | | | 7,500 | | | | 7,422 | |
| Laboratory Corporation of America Holdings 2.70% 2031 | | | 5,051 | | | | 5,133 | |
| Laboratory Corporation of America Holdings 4.70% 2045 | | | 1,310 | | | | 1,598 | |
| Medtronic, Inc. 3.50% 2025 | | | 626 | | | | 667 | |
| Merck & Co., Inc. 2.75% 2025 | | | 36,590 | | | | 38,344 | |
| Merck & Co., Inc. 1.70% 2027 | | | 18,478 | | | | 18,600 | |
| Merck & Co., Inc. 1.45% 2030 | | | 15,050 | | | | 14,426 | |
| Merck & Co., Inc. 2.15% 2031 | | | 34,914 | | | | 35,040 | |
| Merck & Co., Inc. 2.75% 2051 | | | 4,827 | | | | 4,785 | |
| Merck & Co., Inc. 2.90% 2061 | | | 7,590 | | | | 7,567 | |
| Molina Healthcare, Inc. 4.375% 20284 | | | 2,125 | | | | 2,192 | |
| Molina Healthcare, Inc. 3.875% 20304 | | | 2,665 | | | | 2,769 | |
| Novartis Capital Corp. 1.75% 2025 | | | 9,604 | | | | 9,745 | |
| Novartis Capital Corp. 2.00% 2027 | | | 11,893 | | | | 12,091 | |
| Novartis Capital Corp. 2.20% 2030 | | | 26,714 | | | | 27,139 | |
| Pfizer, Inc. 2.80% 2022 | | | 3,707 | | | | 3,724 | |
| Pfizer, Inc. 3.20% 2023 | | | 32,648 | | | | 33,931 | |
| Pfizer, Inc. 2.95% 2024 | | | 7,674 | | | | 7,994 | |
| Pfizer, Inc. 2.75% 2026 | | | 21,057 | | | | 22,323 | |
| Pfizer, Inc. 1.70% 2030 | | | 20,880 | | | | 20,475 | |
| Roche Holdings, Inc. 1.93% 20284 | | | 46,849 | | | | 47,167 | |
| Roche Holdings, Inc. 2.076% 20314 | | | 88,026 | | | | 87,841 | |
| Roche Holdings, Inc. 2.607% 20514 | | | 21,077 | | | | 20,738 | |
| Rotech Healthcare, Inc., Term Loan, (3-month USD-LIBOR + 11.00%) 13.00% PIK 20236,8,9,10,11 | | | 5,302 | | | | 5,302 | |
| Shire PLC 2.875% 2023 | | | 8,790 | | | | 9,044 | |
| Shire PLC 3.20% 2026 | | | 27,089 | | | | 28,765 | |
| Summa Health 3.511% 2051 | | | 1,655 | | | | 1,750 | |
| Syneos Health, Inc. 3.625% 20294 | | | 2,315 | | | | 2,289 | |
| Takeda Pharmaceutical Company, Ltd. 4.40% 2023 | | | 31,550 | | | | 33,395 | |
| Takeda Pharmaceutical Company, Ltd. 5.00% 2028 | | | 7,500 | | | | 8,818 | |
| Tenet Healthcare Corp. 4.625% 2024 | | | 4,240 | | | | 4,298 | |
| Tenet Healthcare Corp. 4.875% 20264 | | | 5,535 | | | | 5,694 | |
| Tenet Healthcare Corp. 5.125% 20274 | | | 4,565 | | | | 4,760 | |
| Teva Pharmaceutical Finance Co. BV 2.95% 2022 | | | 3,832 | | | | 3,843 | |
| Teva Pharmaceutical Finance Co. BV 6.00% 2024 | | | 85,316 | | | | 89,503 | |
| Teva Pharmaceutical Finance Co. BV 7.125% 2025 | | | 66,000 | | | | 70,697 | |
| Teva Pharmaceutical Finance Co. BV 3.15% 2026 | | | 136,785 | | | | 128,793 | |
| Teva Pharmaceutical Finance Co. BV 4.75% 2027 | | | 35,500 | | | | 35,220 | |
| Teva Pharmaceutical Finance Co. BV 6.75% 2028 | | | 108,089 | | | | 115,279 | |
| Teva Pharmaceutical Finance Co. BV 4.10% 2046 | | | 116,226 | | | | 98,393 | |
| Teva Pharmaceutical Finance Co., LLC 6.15% 2036 | | | 11,690 | | | | 12,271 | |
| Thermo Fisher Scientific, Inc. 1.75% 2028 | | | 2,252 | | | | 2,239 | |
| Thermo Fisher Scientific, Inc. 2.00% 2031 | | | 14,213 | | | | 14,017 | |
| Thermo Fisher Scientific, Inc. 2.80% 2041 | | | 3,895 | | | | 3,948 | |
| UnitedHealth Group, Inc. 3.35% 2022 | | | 200 | | | | 203 | |
| UnitedHealth Group, Inc. 2.375% 2024 | | | 7,903 | | | | 8,188 | |
| UnitedHealth Group, Inc. 3.50% 2024 | | | 6,860 | | | | 7,233 | |
| UnitedHealth Group, Inc. 3.70% 2025 | | | 15,430 | | | | 16,793 | |
| UnitedHealth Group, Inc. 3.75% 2025 | | | 5,900 | | | | 6,403 | |
| UnitedHealth Group, Inc. 2.875% 2029 | | | 7,309 | | | | 7,739 | |
| UnitedHealth Group, Inc. 2.00% 2030 | | | 10,000 | | | | 9,938 | |
| UnitedHealth Group, Inc. 2.30% 2031 | | | 9,989 | | | | 10,174 | |
| UnitedHealth Group, Inc. 3.05% 2041 | | | 8,000 | | | | 8,385 | |
| UnitedHealth Group, Inc. 4.45% 2048 | | | 2,015 | | | | 2,578 | |
| UnitedHealth Group, Inc. 3.70% 2049 | | | 6,795 | | | | 7,839 | |
| The Bond Fund of America | 25 |
| Bonds, notes & other debt instruments (continued) | | Principal amount
(000) | | | Value
(000) | |
| Corporate bonds, notes & loans (continued) | | | | | | |
| Health care (continued) | | | | | | |
| UnitedHealth Group, Inc. 2.90% 2050 | | $ | 10,000 | | | $ | 10,214 | |
| UnitedHealth Group, Inc. 3.25% 2051 | | | 11,679 | | | | 12,660 | |
| Valeant Pharmaceuticals International, Inc. 5.50% 20254 | | | 10,000 | | | | 10,175 | |
| WellPoint, Inc. 3.50% 2024 | | | 9,349 | | | | 9,878 | |
| Zimmer Holdings, Inc. 3.15% 2022 | | | 14,296 | | | | 14,325 | |
| | | | | | | | 2,462,280 | |
| Industrials 2.71% | | | | | | | | |
| ADT Security Corp. 4.125% 20294 | | | 3,000 | | | | 2,960 | |
| AerCap Ireland Capital, Ltd. / AerCap Global Aviation Trust 1.75% 2026 | | | 7,812 | | | | 7,670 | |
| Aeropuerto International de Tocume SA 4.00% 20414 | | | 4,100 | | | | 4,185 | |
| Aeropuerto International de Tocume SA 5.125% 20614 | | | 3,180 | | | | 3,340 | |
| Air Lease Corp. 0.80% 2024 | | | 17,900 | | | | 17,544 | |
| Air Lease Corp. 2.875% 2026 | | | 28,382 | | | | 29,302 | |
| Air Lease Corp. 2.10% 2028 | | | 13,775 | | | | 13,297 | |
| American Airlines, Inc. 5.50% 20264 | | | 11,235 | | | | 11,700 | |
| Autoridad del Canal de Panama 4.95% 20354 | | | 5,500 | | | | 6,708 | |
| Autoridad del Canal de Panama 4.95% 2035 | | | 1,025 | | | | 1,250 | |
| Avolon Holdings Funding, Ltd. 3.625% 20224 | | | 27,802 | | | | 27,983 | |
| Avolon Holdings Funding, Ltd. 3.95% 20244 | | | 35,726 | | | | 37,456 | |
| Avolon Holdings Funding, Ltd. 2.125% 20264 | | | 35,436 | | | | 34,813 | |
| Avolon Holdings Funding, Ltd. 4.25% 20264 | | | 9,306 | | | | 9,871 | |
| Avolon Holdings Funding, Ltd. 4.375% 20264 | | | 3,500 | | | | 3,754 | |
| Avolon Holdings Funding, Ltd. 2.528% 20274 | | | 2,795 | | | | 2,717 | |
| Avolon Holdings Funding, Ltd. 3.25% 20274 | | | 16,000 | | | | 16,123 | |
| Avolon Holdings Funding, Ltd. 2.75% 20284 | | | 20,000 | | | | 19,638 | |
| Boeing Company 4.508% 2023 | | | 35,219 | | | | 36,796 | |
| Boeing Company 1.95% 2024 | | | 10,227 | | | | 10,348 | |
| Boeing Company 2.80% 2024 | | | 4,441 | | | | 4,565 | |
| Boeing Company 4.875% 2025 | | | 121,293 | | | | 132,806 | |
| Boeing Company 2.196% 2026 | | | 80,259 | | | | 80,305 | |
| Boeing Company 2.75% 2026 | | | 112,914 | | | | 116,254 | |
| Boeing Company 3.10% 2026 | | | 18,239 | | | | 19,024 | |
| Boeing Company 2.70% 2027 | | | 4,854 | | | | 4,939 | |
| Boeing Company 5.04% 2027 | | | 76,507 | | | | 86,207 | |
| Boeing Company 3.25% 2028 | | | 104,518 | | | | 108,997 | |
| Boeing Company 3.25% 2028 | | | 10,176 | | | | 10,550 | |
| Boeing Company 5.15% 2030 | | | 145,603 | | | | 169,781 | |
| Boeing Company 3.625% 2031 | | | 21,057 | | | | 22,481 | |
| Boeing Company 3.60% 2034 | | | 6,790 | | | | 7,125 | |
| Boeing Company 3.50% 2039 | | | 545 | | | | 555 | |
| Boeing Company 3.90% 2049 | | | 8,665 | | | | 9,109 | |
| Boeing Company 3.75% 2050 | | | 4,934 | | | | 5,142 | |
| Boeing Company 5.805% 2050 | | | 50,520 | | | | 68,541 | |
| Boeing Company 5.93% 2060 | | | 2,000 | | | | 2,783 | |
| Burlington Northern Santa Fe LLC 3.05% 2051 | | | 15,695 | | | | 16,286 | |
| Burlington Northern Santa Fe LLC 3.30% 2051 | | | 45,421 | | | | 49,435 | |
| Burlington Northern Santa Fe LLC 2.875% 2052 | | | 6,125 | | | | 6,142 | |
| BWX Technologies, Inc. 4.125% 20284 | | | 1,675 | | | | 1,703 | |
| Canadian National Railway Company 3.20% 2046 | | | 1,220 | | | | 1,279 | |
| Canadian Pacific Railway, Ltd. 1.75% 2026 | | | 12,290 | | | | 12,341 | |
| Canadian Pacific Railway, Ltd. 2.45% 2031 | | | 38,598 | | | | 39,397 | |
| Canadian Pacific Railway, Ltd. 3.00% 2041 | | | 7,587 | | | | 7,773 | |
| Canadian Pacific Railway, Ltd. 3.10% 2051 | | | 30,755 | | | | 31,687 | |
| Carrier Global Corp. 2.242% 2025 | | | 11,566 | | | | 11,852 | |
| Carrier Global Corp. 2.493% 2027 | | | 6,000 | | | | 6,168 | |
| Carrier Global Corp. 2.722% 2030 | | | 15,767 | | | | 16,119 | |
| Carrier Global Corp. 3.377% 2040 | | | 17,500 | | | | 18,322 | |
| Carrier Global Corp. 3.577% 2050 | | | 3,000 | | | | 3,198 | |
| Clean Harbors, Inc. 4.875% 20274 | | | 1,100 | | | | 1,134 | |
| Clean Harbors, Inc. 5.125% 20294 | | | 10,000 | | | | 10,625 | |
| CSX Corp. 3.80% 2028 | | | 2,460 | | | | 2,706 | |
| CSX Corp. 4.25% 2029 | | | 4,277 | | | | 4,813 | |
| CSX Corp. 2.40% 2030 | | | 17,855 | | | | 18,160 | |
| CSX Corp. 2.50% 2051 | | | 10,725 | | | | 9,940 | |
| Delta Air Lines, Inc. 7.00% 20254 | | | 2,750 | | | | 3,147 | |
| 26 | The Bond Fund of America |
| Bonds, notes & other debt instruments (continued) | | Principal amount
(000) | | | Value
(000) | |
| Corporate bonds, notes & loans (continued) | | | | | | |
| Industrials (continued) | | | | | | |
| Dianjian Haiyu, Ltd. 3.50% perpetual bonds (5-year UST Yield Curve Rate T Note Constant Maturity + 6.773% on 6/14/2022)5 | | $ | 4,148 | | | $ | 4,190 | |
| Dianjian International Finance, Ltd. 4.60% perpetual bonds (5-year UST Yield Curve Rate T Note Constant Maturity + 6.933% on 3/13/2023)5 | | | 14,000 | | | | 14,429 | |
| Dun & Bradstreet Corp. 6.875% 20264 | | | 6,055 | | | | 6,304 | |
| Dun & Bradstreet Corp. 5.00% 20294 | | | 16,863 | | | | 17,280 | |
| ENA Master Trust 4.00% 20484 | | | 8,154 | | | | 8,204 | |
| General Dynamics Corp. 3.375% 2023 | | | 6,645 | | | | 6,868 | |
| General Dynamics Corp. 3.50% 2025 | | | 8,025 | | | | 8,562 | |
| General Dynamics Corp. 1.15% 2026 | | | 7,280 | | | | 7,220 | |
| General Dynamics Corp. 3.625% 2030 | | | 10,250 | | | | 11,397 | |
| General Dynamics Corp. 2.25% 2031 | | | 2,377 | | | | 2,420 | |
| General Electric Capital Corp. 4.418% 2035 | | | 13,944 | | | | 16,663 | |
| Herc Holdings, Inc. 5.50% 20274 | | | 1,600 | | | | 1,666 | |
| Honeywell International, Inc. 2.30% 2024 | | | 3,387 | | | | 3,502 | |
| Honeywell International, Inc. 1.35% 2025 | | | 165 | | | | 166 | |
| Honeywell International, Inc. 2.70% 2029 | | | 8,333 | | | | 8,733 | |
| Honeywell International, Inc. 1.95% 2030 | | | 22,750 | | | | 22,644 | |
| Honeywell International, Inc. 2.80% 2050 | | | 400 | | | | 417 | |
| Icahn Enterprises Finance Corp. 4.75% 2024 | | | 2,500 | | | | 2,597 | |
| Icahn Enterprises Finance Corp. 6.25% 2026 | | | 5,200 | | | | 5,423 | |
| L3Harris Technologies, Inc. 1.80% 2031 | | | 3,725 | | | | 3,560 | |
| Lima Metro Line 2 Finance, Ltd. 5.875% 20344 | | | 2,585 | | | | 2,975 | |
| Lima Metro Line 2 Finance, Ltd. 5.875% 2034 | | | 550 | | | | 633 | |
| Lima Metro Line 2 Finance, Ltd. 4.35% 2036 | | | 2,362 | | | | 2,495 | |
| Lima Metro Line 2 Finance, Ltd. 4.35% 20364 | | | 922 | | | | 974 | |
| Lockheed Martin Corp. 1.85% 2030 | | | 8,250 | | | | 8,115 | |
| Lockheed Martin Corp. 3.60% 2035 | | | 3,758 | | | | 4,207 | |
| Lockheed Martin Corp. 4.50% 2036 | | | 3,131 | | | | 3,832 | |
| Lockheed Martin Corp. 4.07% 2042 | | | 1,850 | | | | 2,182 | |
| Lockheed Martin Corp. 2.80% 2050 | | | 11,483 | | | | 11,478 | |
| Lockheed Martin Corp. 4.09% 2052 | | | 2,324 | | | | 2,877 | |
| Masco Corp. 1.50% 2028 | | | 10,810 | | | | 10,471 | |
| Masco Corp. 2.00% 2031 | | | 14,724 | | | | 14,126 | |
| Masco Corp. 3.125% 2051 | | | 2,112 | | | | 2,104 | |
| Mexico City Airport Trust 4.25% 2026 | | | 200 | | | | 212 | |
| Mexico City Airport Trust 3.875% 2028 | | | 11,400 | | | | 11,829 | |
| Mexico City Airport Trust 3.875% 20284 | | | 690 | | | | 716 | |
| Mexico City Airport Trust 5.50% 2046 | | | 4,093 | | | | 4,093 | |
| Mexico City Airport Trust 5.50% 2047 | | | 15,685 | | | | 15,732 | |
| Mexico City Airport Trust 5.50% 20474 | | | 4,796 | | | | 4,810 | |
| Nielsen Finance LLC and Nielsen Finance Co. 5.625% 20284 | | | 2,300 | | | | 2,379 | |
| Nielsen Finance LLC and Nielsen Finance Co. 5.875% 20304 | | | 4,650 | | | | 4,916 | |
| Norfolk Southern Corp. 3.05% 2050 | | | 1,558 | | | | 1,592 | |
| Northrop Grumman Corp. 2.93% 2025 | | | 25,040 | | | | 26,102 | |
| Northrop Grumman Corp. 3.25% 2028 | | | 8,475 | | | | 9,078 | |
| Northrop Grumman Corp. 5.25% 2050 | | | 1,922 | | | | 2,699 | |
| Otis Worldwide Corp. 2.056% 2025 | | | 28,882 | | | | 29,384 | |
| Otis Worldwide Corp. 2.293% 2027 | | | 5,750 | | | | 5,864 | |
| Otis Worldwide Corp. 2.565% 2030 | | | 4,900 | | | | 4,975 | |
| Otis Worldwide Corp. 3.362% 2050 | | | 1,500 | | | | 1,585 | |
| Pitney Bowes, Inc. 6.875% 20274 | | | 6,000 | | | | 6,237 | |
| Prime Security Services Borrower, LLC 5.25% 20244 | | | 2,500 | | | | 2,663 | |
| Prime Security Services Borrower, LLC 5.75% 20264 | | | 2,000 | | | | 2,150 | |
| Prime Security Services Borrower, LLC 3.375% 20274 | | | 3,100 | | | | 2,997 | |
| Raytheon Technologies Corp. 3.20% 2024 | | | 10,105 | | | | 10,521 | |
| Raytheon Technologies Corp. 2.25% 2030 | | | 3,750 | | | | 3,744 | |
| Raytheon Technologies Corp. 1.90% 2031 | | | 18,596 | | | | 17,963 | |
| Raytheon Technologies Corp. 2.375% 2032 | | | 10,474 | | | | 10,474 | |
| Raytheon Technologies Corp. 2.82% 2051 | | | 3,750 | | | | 3,630 | |
| Raytheon Technologies Corp. 3.03% 2052 | | | 7,000 | | | | 7,049 | |
| Republic Services, Inc. 2.50% 2024 | | | 7,000 | | | | 7,208 | |
| Republic Services, Inc. 2.375% 2033 | | | 9,620 | | | | 9,587 | |
| Rolls-Royce PLC 5.75% 20274 | | | 1,935 | | | | 2,142 | |
| Roper Technologies, Inc. 1.00% 2025 | | | 2,000 | | | | 1,956 | |
| Roper Technologies, Inc. 1.40% 2027 | | | 4,250 | | | | 4,127 | |
| Roper Technologies, Inc. 1.75% 2031 | | | 5,000 | | | | 4,701 | |
| The Bond Fund of America | 27 |
| Bonds, notes & other debt instruments (continued) | | Principal amount
(000) | | | Value
(000) | |
| Corporate bonds, notes & loans (continued) | | | | | | |
| Industrials (continued) | | | | | | |
| Rutas 2 and 7 Finance, Ltd. 0% 20364 | | $ | 1,795 | | | $ | 1,326 | |
| Siemens AG 2.70% 20224 | | | 28,620 | | | | 28,759 | |
| Siemens AG 2.90% 20224 | | | 10,000 | | | | 10,098 | |
| Siemens AG 1.20% 20264 | | | 24,978 | | | | 24,593 | |
| Stericycle, Inc. 5.375% 20244 | | | 5,000 | | | | 5,105 | |
| Summit Digitel Infrastructure Private, Ltd. 2.875% 20314 | | | 14,355 | | | | 13,848 | |
| TransDigm, Inc. 6.25% 20264 | | | 656 | | | | 683 | |
| Triton Container International, Ltd. 1.15% 20244 | | | 9,938 | | | | 9,802 | |
| Triton Container International, Ltd. 3.15% 20314 | | | 15,346 | | | | 15,493 | |
| Union Pacific Corp. 3.15% 2024 | | | 5,705 | | | | 5,949 | |
| Union Pacific Corp. 3.75% 2025 | | | 2,000 | | | | 2,162 | |
| Union Pacific Corp. 2.15% 2027 | | | 4,740 | | | | 4,871 | |
| Union Pacific Corp. 2.40% 2030 | | | 9,549 | | | | 9,742 | |
| Union Pacific Corp. 2.375% 2031 | | | 36,045 | | | | 36,780 | |
| Union Pacific Corp. 2.891% 2036 | | | 15,705 | | | | 16,483 | |
| Union Pacific Corp. 4.30% 2049 | | | 4,550 | | | | 5,675 | |
| Union Pacific Corp. 3.25% 2050 | | | 18,198 | | | | 19,559 | |
| Union Pacific Corp. 2.95% 2052 | | | 7,956 | | | | 8,071 | |
| Union Pacific Corp. 3.95% 2059 | | | 11,880 | | | | 14,107 | |
| United Airlines Holdings, Inc. 6.50% 20274 | | | 10,440 | | | | 11,160 | |
| United Technologies Corp. 3.65% 2023 | | | 437 | | | | 455 | |
| United Technologies Corp. 3.95% 2025 | | | 17,415 | | | | 18,899 | |
| United Technologies Corp. 3.125% 2027 | | | 1,000 | | | | 1,063 | |
| United Technologies Corp. 4.125% 2028 | | | 6,320 | | | | 7,076 | |
| United Technologies Corp. 4.50% 2042 | | | 1,625 | | | | 2,013 | |
| Vinci SA 3.75% 20294 | | | 10,456 | | | | 11,434 | |
| WESCO Distribution, Inc. 7.125% 20254 | | | 2,165 | | | | 2,298 | |
| WESCO Distribution, Inc. 7.25% 20284 | | | 4,355 | | | | 4,782 | |
| XPO Logistics, Inc. 6.25% 20254 | | | 5,000 | | | | 5,238 | |
| | | | | | | | 2,158,199 | |
| Communication services 2.50% | | | | | | | | |
| Alphabet, Inc. 1.10% 2030 | | | 9,030 | | | | 8,546 | |
| América Móvil, SAB de CV, 8.46% 2036 | | MXN | 27,000 | | | | 1,270 | |
| AT&T, Inc. 0.90% 2024 | | $ | 27,345 | | | | 27,235 | |
| AT&T, Inc. 1.70% 2026 | | | 38,150 | | | | 37,990 | |
| AT&T, Inc. 2.30% 2027 | | | 14,975 | | | | 15,246 | |
| AT&T, Inc. 1.65% 2028 | | | 23,275 | | | | 22,802 | |
| AT&T, Inc. 4.30% 2030 | | | 30,000 | | | | 33,799 | |
| AT&T, Inc. 2.75% 2031 | | | 83,090 | | | | 84,863 | |
| AT&T, Inc. 2.25% 2032 | | | 50,814 | | | | 49,156 | |
| AT&T, Inc. 2.55% 2033 | | | 73,196 | | | | 71,674 | |
| AT&T, Inc. 3.30% 2052 | | | 28,162 | | | | 27,658 | |
| AT&T, Inc. 3.50% 2053 | | | 94,523 | | | | 95,542 | |
| AT&T, Inc. 3.55% 2055 | | | 8,300 | | | | 8,344 | |
| Axiata SPV2 Bhd. 2.163% 2030 | | | 4,883 | | | | 4,838 | |
| Cablevision Systems Corp. 5.375% 20284 | | | 4,850 | | | | 5,029 | |
| CCO Holdings LLC and CCO Holdings Capital Corp. 5.50% 20264 | | | 1,907 | | | | 1,967 | |
| CCO Holdings LLC and CCO Holdings Capital Corp. 5.00% 20284 | | | 12,250 | | | | 12,765 | |
| CCO Holdings LLC and CCO Holdings Capital Corp. 2.25% 2029 | | | 17,000 | | | | 16,601 | |
| CCO Holdings LLC and CCO Holdings Capital Corp. 5.375% 20294 | | | 10,700 | | | | 11,565 | |
| CCO Holdings LLC and CCO Holdings Capital Corp. 4.50% 20304 | | | 18,675 | | | | 19,146 | |
| CCO Holdings LLC and CCO Holdings Capital Corp. 4.75% 20304 | | | 9,665 | | | | 10,069 | |
| CCO Holdings LLC and CCO Holdings Capital Corp. 2.80% 2031 | | | 26,986 | | | | 26,736 | |
| CCO Holdings LLC and CCO Holdings Capital Corp. 2.30% 2032 | | | 25,960 | | | | 24,676 | |
| CCO Holdings LLC and CCO Holdings Capital Corp. 4.50% 2032 | | | 2,225 | | | | 2,293 | |
| CCO Holdings LLC and CCO Holdings Capital Corp. 4.50% 20334 | | | 530 | | | | 542 | |
| CCO Holdings LLC and CCO Holdings Capital Corp. 4.25% 20344 | | | 21,825 | | | | 21,512 | |
| CCO Holdings LLC and CCO Holdings Capital Corp. 6.484% 2045 | | | 6,850 | | | | 9,375 | |
| CCO Holdings LLC and CCO Holdings Capital Corp. 5.125% 2049 | | | 18,943 | | | | 22,026 | |
| CCO Holdings LLC and CCO Holdings Capital Corp. 4.80% 2050 | | | 5,000 | | | | 5,612 | |
| CCO Holdings LLC and CCO Holdings Capital Corp. 3.70% 2051 | | | 8,400 | | | | 8,143 | |
| CenturyLink, Inc. 4.00% 20274 | | | 95,075 | | | | 96,577 | |
| Comcast Corp. 3.95% 2025 | | | 5,250 | | | | 5,736 | |
| Comcast Corp. 2.65% 2030 | | | 60,290 | | | | 62,590 | |
| Comcast Corp. 1.95% 2031 | | | 14,746 | | | | 14,465 | |
| Comcast Corp. 3.25% 2039 | | | 2,120 | | | | 2,241 | |
| 28 | The Bond Fund of America |
| Bonds, notes & other debt instruments (continued) | | Principal amount
(000) | | | Value
(000) | |
| Corporate bonds, notes & loans (continued) | | | | | | |
| Communication services (continued) | | | | | | |
| Comcast Corp. 3.75% 2040 | | $ | 8,930 | | | $ | 10,016 | |
| Comcast Corp. 2.80% 2051 | | | 22,600 | | | | 21,834 | |
| Comcast Corp. 2.45% 2052 | | | 5,000 | | | | 4,490 | |
| Diamond Sports Group LLC 5.375% 20264 | | | 3,500 | | | | 1,754 | |
| Grupo Televisa, SAB 7.25% 2043 | | MXN | 25,290 | | | | 891 | |
| iHeartCommunications, Inc. 6.375% 2026 | | $ | 8,475 | | | | 8,802 | |
| Level 3 Communications, Inc. 5.25% 2026 | | | 5,015 | | | | 5,133 | |
| Level 3 Communications, Inc. 3.875% 20294 | | | 6,900 | | | | 7,031 | |
| Level 3 Financing, Inc. 3.75% 20294 | | | 3,053 | | | | 2,905 | |
| Netflix, Inc. 4.875% 2028 | | | 35,663 | | | | 40,717 | |
| Netflix, Inc. 5.875% 2028 | | | 62,879 | | | | 75,718 | |
| Netflix, Inc. 5.375% 20294 | | | 52,289 | | | | 62,183 | |
| Netflix, Inc. 4.875% 20304 | | | 39,200 | | | | 45,785 | |
| Quebecor Media, Inc. 5.75% 2023 | | | 3,600 | | | | 3,748 | |
| SBA Tower Trust 1.631% 20264 | | | 61,789 | | | | 60,864 | |
| Scripps Escrow II, Inc. 3.875% 20294 | | | 1,307 | | | | 1,307 | |
| Sinclair Television Group, Inc. 4.125% 20304 | | | 3,625 | | | | 3,440 | |
| Sirius XM Radio, Inc. 4.00% 20284 | | | 4,300 | | | | 4,331 | |
| Sprint Corp. 7.875% 2023 | | | 6,163 | | | | 6,796 | |
| Sprint Corp. 7.125% 2024 | | | 10,010 | | | | 11,250 | |
| Sprint Corp. 7.625% 2025 | | | 39,000 | | | | 44,899 | |
| TEGNA, Inc. 5.00% 2029 | | | 8,500 | | | | 8,707 | |
| Tencent Holdings, Ltd. 3.28% 20244 | | | 15,000 | | | | 15,663 | |
| Tencent Holdings, Ltd. 3.595% 2028 | | | 7,500 | | | | 7,967 | |
| Tencent Holdings, Ltd. 2.39% 20304 | | | 30,000 | | | | 29,424 | |
| Tencent Holdings, Ltd. 3.24% 20504 | | | 14,870 | | | | 14,059 | |
| Tencent Holdings, Ltd. 3.29% 20604 | | | 10,000 | | | | 9,272 | |
| Tencent Music Entertainment Group 2.00% 2030 | | | 2,575 | | | | 2,412 | |
| T-Mobile US, Inc. 3.50% 2025 | | | 6,550 | | | | 6,944 | |
| T-Mobile US, Inc. 1.50% 2026 | | | 4,900 | | | | 4,845 | |
| T-Mobile US, Inc. 2.25% 20264 | | | 11,036 | | | | 11,080 | |
| T-Mobile US, Inc. 2.25% 2026 | | | 2,402 | | | | 2,412 | |
| T-Mobile US, Inc. 2.625% 2026 | | | 46,064 | | | | 46,354 | |
| T-Mobile US, Inc. 3.75% 2027 | | | 20,800 | | | | 22,535 | |
| T-Mobile US, Inc. 2.05% 2028 | | | 2,500 | | | | 2,483 | |
| T-Mobile US, Inc. 4.75% 2028 | | | 9,066 | | | | 9,558 | |
| T-Mobile US, Inc. 2.40% 20294 | | | 6,204 | | | | 6,269 | |
| T-Mobile US, Inc. 2.625% 2029 | | | 17,611 | | | | 17,377 | |
| T-Mobile US, Inc. 3.375% 20294 | | | 8,000 | | | | 8,165 | |
| T-Mobile US, Inc. 3.875% 2030 | | | 18,318 | | | | 20,053 | |
| T-Mobile US, Inc. 2.55% 2031 | | | 16,052 | | | | 15,984 | |
| T-Mobile US, Inc. 2.875% 2031 | | | 22,912 | | | | 22,668 | |
| T-Mobile US, Inc. 3.50% 2031 | | | 25,000 | | | | 26,053 | |
| T-Mobile US, Inc. 3.50% 20314 | | | 816 | | | | 850 | |
| T-Mobile US, Inc. 2.70% 20324 | | | 21,108 | | | | 21,262 | |
| T-Mobile US, Inc. 3.00% 2041 | | | 7,490 | | | | 7,326 | |
| T-Mobile US, Inc. 3.30% 2051 | | | 10,603 | | | | 10,380 | |
| T-Mobile US, Inc. 3.40% 20524 | | | 36,991 | | | | 36,889 | |
| Verizon Communications, Inc. 2.10% 2028 | | | 4,800 | | | | 4,813 | |
| Verizon Communications, Inc. 4.329% 2028 | | | 13,420 | | | | 15,258 | |
| Verizon Communications, Inc. 3.875% 2029 | | | 2,071 | | | | 2,297 | |
| Verizon Communications, Inc. 4.016% 2029 | | | 5,000 | | | | 5,611 | |
| Verizon Communications, Inc. 1.68% 2030 | | | 38,817 | | | | 36,920 | |
| Verizon Communications, Inc. 1.75% 2031 | | | 38,919 | | | | 36,882 | |
| Verizon Communications, Inc. 2.55% 2031 | | | 10,477 | | | | 10,581 | |
| Verizon Communications, Inc. 2.355% 20324 | | | 20,027 | | | | 19,756 | |
| Verizon Communications, Inc. 2.65% 2040 | | | 13,091 | | | | 12,462 | |
| Verizon Communications, Inc. 2.85% 2041 | | | 20,079 | | | | 19,848 | |
| Verizon Communications, Inc. 3.40% 2041 | | | 36,154 | | | | 37,919 | |
| Verizon Communications, Inc. 3.85% 2042 | | | 855 | | | | 957 | |
| Verizon Communications, Inc. 2.875% 2050 | | | 48,052 | | | | 45,731 | |
| Verizon Communications, Inc. 3.55% 2051 | | | 5,993 | | | | 6,469 | |
| Videotron, Ltd. 5.375% 20244 | | | 3,100 | | | | 3,320 | |
| Virgin Media O2 4.25% 20314 | | | 5,475 | | | | 5,374 | |
| Virgin Media Secured Finance PLC 5.50% 20294 | | | 5,000 | | | | 5,288 | |
| Virgin Media Secured Finance PLC 4.50% 20304 | | | 500 | | | | 504 | |
| Vodafone Group PLC 5.25% 2048 | | | 6,992 | | | | 9,129 | |
| The Bond Fund of America | 29 |
| Bonds, notes & other debt instruments (continued) | | Principal amount
(000) | | | Value
(000) | |
| Corporate bonds, notes & loans (continued) | | | | | | |
| Communication services (continued) | | | | | | |
| Vodafone Group PLC 4.25% 2050 | | $ | 17,875 | | | $ | 20,686 | |
| Ziggo Bond Finance BV 5.50% 20274 | | | 5,450 | | | | 5,606 | |
| Ziggo Bond Finance BV 4.875% 20304 | | | 500 | | | | 514 | |
| | | | | | | | 1,985,439 | |
| Consumer staples 1.82% | | | | | | | | |
| 7-Eleven, Inc. 0.95% 20264 | | | 14,861 | | | | 14,403 | |
| 7-Eleven, Inc. 1.30% 20284 | | | 18,485 | | | | 17,619 | |
| 7-Eleven, Inc. 1.80% 20314 | | | 99,105 | | | | 93,887 | |
| 7-Eleven, Inc. 2.80% 20514 | | | 8,505 | | | | 7,908 | |
| Albertsons Companies, Inc. 3.50% 20234 | | | 3,575 | | | | 3,641 | |
| Altria Group, Inc. 2.35% 2025 | | | 785 | | | | 804 | |
| Altria Group, Inc. 4.40% 2026 | | | 8,325 | | | | 9,178 | |
| Altria Group, Inc. 4.80% 2029 | | | 9,905 | | | | 11,182 | |
| Altria Group, Inc. 3.40% 2030 | | | 3,247 | | | | 3,363 | |
| Altria Group, Inc. 2.45% 2032 | | | 6,000 | | | | 5,703 | |
| Altria Group, Inc. 5.80% 2039 | | | 900 | | | | 1,083 | |
| Altria Group, Inc. 4.50% 2043 | | | 100 | | | | 104 | |
| Altria Group, Inc. 5.375% 2044 | | | 2,433 | | | | 2,814 | |
| Altria Group, Inc. 5.95% 2049 | | | 50,296 | | | | 62,899 | |
| Altria Group, Inc. 4.45% 2050 | | | 13,107 | | | | 13,553 | |
| Altria Group, Inc. 3.70% 2051 | | | 18,697 | | | | 17,462 | |
| Anheuser-Busch Co. / InBev Worldwide 4.90% 2046 | | | 33,000 | | | | 41,806 | |
| Anheuser-Busch InBev NV 4.00% 2028 | | | 2,000 | | | | 2,226 | |
| Anheuser-Busch InBev NV 4.75% 2029 | | | 36,001 | | | | 41,941 | |
| Anheuser-Busch InBev NV 3.50% 2030 | | | 2,455 | | | | 2,694 | |
| Anheuser-Busch InBev NV 4.90% 2031 | | | 3,000 | | | | 3,607 | |
| Anheuser-Busch InBev NV 5.45% 2039 | | | 10,000 | | | | 13,111 | |
| Anheuser-Busch InBev NV 4.60% 2048 | | | 9,275 | | | | 11,366 | |
| Anheuser-Busch InBev NV 5.55% 2049 | | | 4,979 | | | | 6,905 | |
| Anheuser-Busch InBev NV 4.50% 2050 | | | 15,238 | | | | 18,824 | |
| British American Tobacco International Finance PLC 3.95% 20254 | | | 20,022 | | | | 21,283 | |
| British American Tobacco International Finance PLC 1.668% 2026 | | | 17,162 | | | | 16,865 | |
| British American Tobacco PLC 3.222% 2024 | | | 51,000 | | | | 53,037 | |
| British American Tobacco PLC 3.215% 2026 | | | 8,750 | | | | 9,116 | |
| British American Tobacco PLC 3.557% 2027 | | | 57,335 | | | | 60,178 | |
| British American Tobacco PLC 4.70% 2027 | | | 911 | | | | 1,003 | |
| British American Tobacco PLC 2.259% 2028 | | | 32,106 | | | | 31,313 | |
| British American Tobacco PLC 4.906% 2030 | | | 17,868 | | | | 20,077 | |
| British American Tobacco PLC 2.726% 2031 | | | 23,635 | | | | 22,964 | |
| British American Tobacco PLC 4.39% 2037 | | | 50,000 | | | | 52,772 | |
| British American Tobacco PLC 4.54% 2047 | | | 44,120 | | | | 46,249 | |
| British American Tobacco PLC 4.758% 2049 | | | 49,691 | | | | 53,486 | |
| British American Tobacco PLC 3.984% 2050 | | | 15,837 | | | | 15,263 | |
| British American Tobacco PLC 5.282% 2050 | | | 9,163 | | | | 10,398 | |
| Central Garden & Pet Co. 4.125% 2030 | | | 1,325 | | | | 1,339 | |
| Coca-Cola Company 1.00% 2028 | | | 2,785 | | | | 2,679 | |
| Coca-Cola Company 1.375% 2031 | | | 3,424 | | | | 3,234 | |
| Coca-Cola Company 2.50% 2051 | | | 1,634 | | | | 1,573 | |
| Coca-Cola FEMSA, SAB de CV, 1.85% 2032 | | | 5,500 | | | | 5,191 | |
| Conagra Brands, Inc. 4.30% 2024 | | | 22,146 | | | | 23,578 | |
| Conagra Brands, Inc. 4.60% 2025 | | | 11,307 | | | | 12,442 | |
| Conagra Brands, Inc. 1.375% 2027 | | | 7,200 | | | | 6,882 | |
| Conagra Brands, Inc. 5.30% 2038 | | | 780 | | | | 987 | |
| Conagra Brands, Inc. 5.40% 2048 | | | 14,298 | | | | 19,303 | |
| Constellation Brands, Inc. 3.20% 2023 | | | 10,638 | | | | 10,869 | |
| Constellation Brands, Inc. 4.25% 2023 | | | 8,588 | | | | 8,952 | |
| Constellation Brands, Inc. 3.70% 2026 | | | 3,350 | | | | 3,621 | |
| Constellation Brands, Inc. 3.60% 2028 | | | 1,650 | | | | 1,783 | |
| Constellation Brands, Inc. 2.875% 2030 | | | 26,447 | | | | 27,172 | |
| Constellation Brands, Inc. 2.25% 2031 | | | 5,951 | | | | 5,823 | |
| Constellation Brands, Inc. 4.10% 2048 | | | 1,000 | | | | 1,137 | |
| Darling Ingredients, Inc. 5.25% 20274 | | | 6,000 | | | | 6,201 | |
| Imperial Tobacco Finance PLC 3.50% 20234 | | | 3,173 | | | | 3,233 | |
| InRetail Consumer 3.25% 20284 | | | 5,400 | | | | 5,354 | |
| JBS Luxembourg SARL 2.50% 20274 | | | 32,544 | | | | 32,219 | |
| JBS Luxembourg SARL 3.625% 20324 | | | 10,189 | | | | 10,245 | |
| 30 | The Bond Fund of America |
| Bonds, notes & other debt instruments (continued) | | Principal amount
(000) | | | Value
(000) | |
| Corporate bonds, notes & loans (continued) | | | | | | |
| Consumer staples (continued) | | | | | | | | |
| JBS Luxembourg SARL 3.625% 2032 | | $ | 212 | | | $ | 213 | |
| JBS USA Lux SA 5.50% 20304 | | | 2,375 | | | | 2,587 | |
| JBS USA Lux SA 3.00% 20324 | | | 18,250 | | | | 18,273 | |
| Keurig Dr Pepper, Inc. 4.057% 2023 | | | 15,660 | | | | 16,332 | |
| Keurig Dr Pepper, Inc. 4.417% 2025 | | | 10,993 | | | | 11,969 | |
| Keurig Dr Pepper, Inc. 4.597% 2028 | | | 17,199 | | | | 19,576 | |
| Keurig Dr Pepper, Inc. 3.20% 2030 | | | 13,597 | | | | 14,391 | |
| Keurig Dr Pepper, Inc. 4.985% 2038 | | | 10,000 | | | | 12,394 | |
| Keurig Dr Pepper, Inc. 5.085% 2048 | | | 14,925 | | | | 19,523 | |
| Kimberly-Clark Corp. 1.05% 2027 | | | 1,820 | | | | 1,764 | |
| Kimberly-Clark Corp. 3.10% 2030 | | | 921 | | | | 993 | |
| Kimberly-Clark Corp. 2.00% 2031 | | | 24,870 | | | | 24,770 | |
| Kimberly-Clark de México, SAB de CV, 2.431% 20314 | | | 2,510 | | | | 2,484 | |
| Kraft Heinz Company 3.00% 2026 | | | 2,599 | | | | 2,721 | |
| Kraft Heinz Company 4.375% 2046 | | | 14,000 | | | | 16,430 | |
| Kraft Heinz Company 4.875% 2049 | | | 3,570 | | | | 4,493 | |
| Molson Coors Brewing Co. 4.20% 2046 | | | 2,500 | | | | 2,778 | |
| Nestlé Holdings, Inc. 0.625% 20264 | | | 15,343 | | | | 14,885 | |
| Nestlé Holdings, Inc. 1.00% 20274 | | | 9,795 | | | | 9,405 | |
| Nestlé Holdings, Inc. 1.15% 20274 | | | 7,500 | | | | 7,322 | |
| Nestlé Holdings, Inc. 1.875% 20314 | | | 10,000 | | | | 9,835 | |
| Nestlé Holdings, Inc. 2.625% 20514 | | | 10,000 | | | | 9,923 | |
| PepsiCo, Inc. 1.625% 2030 | | | 6,401 | | | | 6,215 | |
| PepsiCo, Inc. 1.40% 2031 | | | 5,307 | | | | 5,067 | |
| PepsiCo, Inc. 1.95% 2031 | | | 40,560 | | | | 40,585 | |
| PepsiCo, Inc. 2.75% 2051 | | | 3,000 | | | | 3,083 | |
| Philip Morris International, Inc. 2.50% 2022 | | | 16,500 | | | | 16,738 | |
| Philip Morris International, Inc. 2.875% 2024 | | | 11,985 | | | | 12,467 | |
| Philip Morris International, Inc. 1.50% 2025 | | | 1,286 | | | | 1,288 | |
| Philip Morris International, Inc. 0.875% 2026 | | | 4,170 | | | | 4,023 | |
| Philip Morris International, Inc. 3.375% 2029 | | | 13,550 | | | | 14,614 | |
| Philip Morris International, Inc. 1.75% 2030 | | | 13,517 | | | | 12,875 | |
| Philip Morris International, Inc. 2.10% 2030 | | | 3,718 | | | | 3,642 | |
| Philip Morris International, Inc. 4.125% 2043 | | | 3,680 | | | | 4,078 | |
| Philip Morris International, Inc. 4.875% 2043 | | | 8,500 | | | | 10,368 | |
| Philip Morris International, Inc. 4.25% 2044 | | | 1,774 | | | | 2,030 | |
| Procter & Gamble Company 0.55% 2025 | | | 11,444 | | | | 11,175 | |
| Procter & Gamble Company 1.00% 2026 | | | 1,229 | | | | 1,216 | |
| Procter & Gamble Company 1.20% 2030 | | | 4,005 | | | | 3,792 | |
| Procter & Gamble Company 3.00% 2030 | | | 1,183 | | | | 1,287 | |
| PT Indofood CBP Sukses Makmur Tbk 3.398% 2031 | | | 17,570 | | | | 17,765 | |
| PT Indofood CBP Sukses Makmur Tbk 4.745% 2051 | | | 4,185 | | | | 4,311 | |
| Reckitt Benckiser Treasury Services PLC 2.75% 20244 | | | 4,305 | | | | 4,451 | |
| Reynolds American, Inc. 4.45% 2025 | | | 7,158 | | | | 7,737 | |
| Reynolds American, Inc. 4.75% 2042 | | | 2,500 | | | | 2,703 | |
| Reynolds American, Inc. 5.85% 2045 | | | 10,195 | | | | 12,414 | |
| Spectrum Brands, Inc. 5.75% 2025 | | | 2,750 | | | | 2,811 | |
| Wal-Mart Stores, Inc. 2.35% 2022 | | | 4,000 | | | | 4,067 | |
| | | | | | | | 1,449,767 | |
| | | | | | | | | |
| Information technology 1.42% | | | | | | | | |
| Adobe, Inc. 2.30% 2030 | | | 6,009 | | | | 6,148 | |
| Analog Devices, Inc. 1.70% 2028 | | | 11,225 | | | | 11,198 | |
| Analog Devices, Inc. 2.10% 2031 | | | 31,386 | | | | 31,486 | |
| Analog Devices, Inc. 2.80% 2041 | | | 2,973 | | | | 3,013 | |
| Analog Devices, Inc. 2.95% 2051 | | | 25,538 | | | | 26,294 | |
| Apple, Inc. 0.55% 2025 | | | 9,225 | | | | 8,981 | |
| Apple, Inc. 1.125% 2025 | | | 12,963 | | | | 12,932 | |
| Apple, Inc. 1.20% 2028 | | | 13,500 | | | | 13,120 | |
| Apple, Inc. 1.65% 2031 | | | 20,000 | | | | 19,547 | |
| Apple, Inc. 2.375% 2041 | | | 4,625 | | | | 4,497 | |
| Apple, Inc. 2.40% 2050 | | | 6,530 | | | | 6,149 | |
| Apple, Inc. 2.65% 2051 | | | 29,770 | | | | 29,346 | |
| Apple, Inc. 2.70% 2051 | | | 4,500 | | | | 4,460 | |
| Apple, Inc. 2.55% 2060 | | | 5,750 | | | | 5,419 | |
| Black Knight, Inc. 3.625% 20284 | | | 3,200 | | | | 3,201 | |
| Broadcom Corp. / Broadcom Cayman Finance, Ltd. 3.875% 2027 | | | 14,359 | | | | 15,578 | |
| The Bond Fund of America | 31 |
| Bonds, notes & other debt instruments (continued) | | Principal amount
(000) | | | Value
(000) | |
| Corporate bonds, notes & loans (continued) | | | | | | | | |
| Information technology (continued) | | | | | | | | |
| Broadcom, Inc. 4.75% 2029 | | $ | 10,375 | | | $ | 11,821 | |
| Broadcom, Inc. 4.15% 2030 | | | 36,500 | | | | 40,513 | |
| Broadcom, Inc. 5.00% 2030 | | | 650 | | | | 757 | |
| Broadcom, Inc. 3.419% 20334 | | | 6,938 | | | | 7,281 | |
| Broadcom, Inc. 3.469% 20344 | | | 111,198 | | | | 116,535 | |
| Broadcom, Inc. 3.137% 20354 | | | 4,909 | | | | 4,943 | |
| Broadcom, Inc. 3.187% 20364 | | | 57,589 | | | | 57,576 | |
| Broadcom, Inc. 3.50% 20414 | | | 11,842 | | | | 12,176 | |
| Broadcom, Inc. 3.75% 20514 | | | 7,205 | | | | 7,551 | |
| Broadcom, Ltd. 2.65% 2023 | | | 16,500 | | | | 16,798 | |
| CDW Corp. 4.125% 2025 | | | 5,275 | | | | 5,426 | |
| Fidelity National Information Services, Inc. 1.15% 2026 | | | 22,429 | | | | 21,868 | |
| Fidelity National Information Services, Inc. 2.25% 2031 | | | 13,937 | | | | 13,644 | |
| Fidelity National Information Services, Inc. 3.10% 2041 | | | 1,129 | | | | 1,142 | |
| Fiserv, Inc. 2.75% 2024 | | | 19,000 | | | | 19,663 | |
| Fiserv, Inc. 3.50% 2029 | | | 22,008 | | | | 23,692 | |
| Fiserv, Inc. 2.65% 2030 | | | 10,229 | | | | 10,391 | |
| Gartner, Inc. 4.50% 20284 | | | 1,850 | | | | 1,935 | |
| Global Payments, Inc. 2.90% 2030 | | | 18,806 | | | | 19,169 | |
| Global Payments, Inc. 2.90% 2031 | | | 12,750 | | | | 12,946 | |
| Imola Merger Corp. 4.75% 20294 | | | 2,500 | | | | 2,570 | |
| Mastercard, Inc. 1.90% 2031 | | | 10,297 | | | | 10,364 | |
| Mastercard, Inc. 2.00% 2031 | | | 11,959 | | | | 11,933 | |
| Mastercard, Inc. 2.95% 2051 | | | 8,056 | | | | 8,357 | |
| Microsoft Corp. 3.125% 2025 | | | 5,290 | | | | 5,648 | |
| Microsoft Corp. 2.525% 2050 | | | 14,910 | | | | 14,582 | |
| NCR Corp. 5.75% 20274 | | | 2,500 | | | | 2,615 | |
| NCR Corp. 6.125% 20294 | | | 1,730 | | | | 1,856 | |
| NCR Corp. 5.25% 20304 | | | 7,250 | | | | 7,460 | |
| Open Text Corp. 3.875% 20284 | | | 6,500 | | | | 6,635 | |
| Oracle Corp. 2.50% 2025 | | | 11,500 | | | | 11,777 | |
| Oracle Corp. 1.65% 2026 | | | 25,637 | | | | 25,460 | |
| Oracle Corp. 2.30% 2028 | | | 8,095 | | | | 8,074 | |
| Oracle Corp. 2.875% 2031 | | | 58,258 | | | | 58,675 | |
| Oracle Corp. 3.60% 2050 | | | 55,665 | | | | 54,609 | |
| Oracle Corp. 3.95% 2051 | | | 7,204 | | | | 7,491 | |
| PayPal Holdings, Inc. 2.40% 2024 | | | 43,150 | | | | 44,686 | |
| PayPal Holdings, Inc. 2.65% 2026 | | | 12,234 | | | | 12,850 | |
| PayPal Holdings, Inc. 2.85% 2029 | | | 12,955 | | | | 13,647 | |
| PayPal Holdings, Inc. 2.30% 2030 | | | 14,574 | | | | 14,818 | |
| PayPal Holdings, Inc. 3.25% 2050 | | | 5,009 | | | | 5,380 | |
| salesforce.com, inc. 1.95% 2031 | | | 13,025 | | | | 12,914 | |
| salesforce.com, inc. 2.70% 2041 | | | 4,875 | | | | 4,878 | |
| salesforce.com, inc. 2.90% 2051 | | | 46,700 | | | | 47,647 | |
| salesforce.com, inc. 3.05% 2061 | | | 7,460 | | | | 7,695 | |
| ServiceNow, Inc. 1.40% 2030 | | | 72,310 | | | | 67,390 | |
| SK hynix, Inc. 1.50% 20264 | | | 19,275 | | | | 18,875 | |
| SK hynix, Inc. 2.375% 20314 | | | 9,830 | | | | 9,472 | |
| Square, Inc. 3.50% 20314 | | | 5,025 | | | | 5,159 | |
| Unisys Corp. 6.875% 20274 | | | 1,700 | | | | 1,843 | |
| VeriSign, Inc. 2.70% 2031 | | | 9,426 | | | | 9,487 | |
| Xerox Corp. 5.50% 20284 | | | 6,000 | | | | 6,333 | |
| | | | | | | | 1,128,376 | |
| | | | | | | | | |
| Real estate 0.77% | | | | | | | | |
| Alexandria Real Estate Equities, Inc. 3.80% 2026 | | | 2,442 | | | | 2,645 | |
| Alexandria Real Estate Equities, Inc. 4.30% 2026 | | | 1,440 | | | | 1,579 | |
| Alexandria Real Estate Equities, Inc. 3.95% 2028 | | | 1,072 | | | | 1,185 | |
| Alexandria Real Estate Equities, Inc. 2.75% 2029 | | | 1,672 | | | | 1,726 | |
| Alexandria Real Estate Equities, Inc. 4.50% 2029 | | | 2,110 | | | | 2,430 | |
| Alexandria Real Estate Equities, Inc. 3.375% 2031 | | | 3,158 | | | | 3,404 | |
| Alexandria Real Estate Equities, Inc. 1.875% 2033 | | | 1,758 | | | | 1,654 | |
| American Campus Communities, Inc. 3.75% 2023 | | | 5,145 | | | | 5,286 | |
| American Campus Communities, Inc. 4.125% 2024 | | | 9,432 | | | | 10,081 | |
| American Campus Communities, Inc. 3.30% 2026 | | | 20,742 | | | | 21,876 | |
| American Campus Communities, Inc. 3.625% 2027 | | | 3,776 | | | | 4,037 | |
| American Campus Communities, Inc. 2.85% 2030 | | | 4,967 | | | | 5,073 | |
| 32 | The Bond Fund of America |
| Bonds, notes & other debt instruments (continued) | | Principal amount
(000) | | | Value
(000) | |
| Corporate bonds, notes & loans (continued) | | | | | | |
| Real estate (continued) | | | | | | |
| American Campus Communities, Inc. 3.875% 2031 | | $ | 1,414 | | | $ | 1,568 | |
| American Tower Corp. 1.45% 2026 | | | 3,752 | | | | 3,675 | |
| American Tower Corp. 1.60% 2026 | | | 6,213 | | | | 6,156 | |
| American Tower Corp. 2.30% 2031 | | | 7,754 | | | | 7,539 | |
| American Tower Corp. 2.70% 2031 | | | 19,986 | | | | 20,068 | |
| American Tower Corp. 2.95% 2051 | | | 570 | | | | 542 | |
| Corporacion Inmobiliaria Vesta, SAB de CV 3.625% 20314 | | | 2,490 | | | | 2,444 | |
| Corporate Office Properties LP 2.25% 2026 | | | 14,337 | | | | 14,520 | |
| Corporate Office Properties LP 2.00% 2029 | | | 6,408 | | | | 6,167 | |
| Corporate Office Properties LP 2.75% 2031 | | | 10,067 | | | | 10,020 | |
| Corporate Office Properties LP 2.90% 2033 | | | 3,302 | | | | 3,232 | |
| Crown Castle International Corp. 2.50% 2031 | | | 32,375 | | | | 32,171 | |
| Equinix, Inc. 2.625% 2024 | | | 40,151 | | | | 41,398 | |
| Equinix, Inc. 1.25% 2025 | | | 9,870 | | | | 9,702 | |
| Equinix, Inc. 1.45% 2026 | | | 5,950 | | | | 5,838 | |
| Equinix, Inc. 2.90% 2026 | | | 17,754 | | | | 18,405 | |
| Equinix, Inc. 1.80% 2027 | | | 2,871 | | | | 2,827 | |
| Equinix, Inc. 1.55% 2028 | | | 10,115 | | | | 9,738 | |
| Equinix, Inc. 2.00% 2028 | | | 1,318 | | | | 1,295 | |
| Equinix, Inc. 3.20% 2029 | | | 29,707 | | | | 31,253 | |
| Equinix, Inc. 2.15% 2030 | | | 36,619 | | | | 35,639 | |
| Equinix, Inc. 2.50% 2031 | | | 33,976 | | | | 33,990 | |
| Equinix, Inc. 3.00% 2050 | | | 6,651 | | | | 6,381 | |
| Equinix, Inc. 2.95% 2051 | | | 400 | | | | 379 | |
| Equinix, Inc. 3.40% 2052 | | | 8,582 | | | | 8,771 | |
| Essex Portfolio LP 3.25% 2023 | | | 4,520 | | | | 4,630 | |
| Essex Portfolio LP 3.875% 2024 | | | 5,500 | | | | 5,793 | |
| Essex Portfolio LP 3.50% 2025 | | | 3 | | | | 3 | |
| Essex Portfolio LP 3.375% 2026 | | | 1,079 | | | | 1,146 | |
| Extra Space Storage, Inc. 2.35% 2032 | | | 4,089 | | | | 3,980 | |
| Fibra SOMA 4.375% 20314 | | | 8,260 | | | | 7,927 | |
| Hospitality Properties Trust 5.00% 2022 | | | 14,650 | | | | 14,651 | |
| Hospitality Properties Trust 4.50% 2023 | | | 9,680 | | | | 9,688 | |
| Hospitality Properties Trust 4.50% 2025 | | | 6,875 | | | | 6,703 | |
| Hospitality Properties Trust 3.95% 2028 | | | 100 | | | | 92 | |
| Howard Hughes Corp. 5.375% 20284 | | | 7,525 | | | | 8,025 | |
| Howard Hughes Corp. 4.125% 20294 | | | 1,925 | | | | 1,953 | |
| Howard Hughes Corp. 4.375% 20314 | | | 5,400 | | | | 5,462 | |
| Invitation Homes Operating Partnership LP 2.30% 2028 | | | 4,513 | | | | 4,468 | |
| Invitation Homes Operating Partnership LP 2.00% 2031 | | | 6,088 | | | | 5,740 | |
| Invitation Homes Operating Partnership LP 2.70% 2034 | | | 3,883 | | | | 3,813 | |
| Iron Mountain, Inc. 4.875% 20274 | | | 1,605 | | | | 1,667 | |
| Iron Mountain, Inc. 5.25% 20284 | | | 12,959 | | | | 13,500 | |
| Iron Mountain, Inc. 4.875% 20294 | | | 8,367 | | | | 8,673 | |
| Iron Mountain, Inc. 5.25% 20304 | | | 7,950 | | | | 8,392 | |
| Iron Mountain, Inc. 4.50% 20314 | | | 3,750 | | | | 3,797 | |
| Kennedy-Wilson Holdings, Inc. 4.75% 2029 | | | 2,325 | | | | 2,381 | |
| Kennedy-Wilson Holdings, Inc. 5.00% 2031 | | | 2,300 | | | | 2,372 | |
| Kimco Realty Corp. 2.70% 2024 | | | 16,980 | | | | 17,445 | |
| Kimco Realty Corp. 3.30% 2025 | | | 5,000 | | | | 5,259 | |
| Omega Healthcare Investors, Inc. 4.375% 2023 | | | 433 | | | | 452 | |
| Piedmont Operating Partnership LP 3.40% 2023 | | | 2,800 | | | | 2,872 | |
| Piedmont Operating Partnership LP 4.45% 2024 | | | 3,000 | | | | 3,165 | |
| Public Storage 1.50% 2026 | | | 4,503 | | | | 4,494 | |
| Public Storage 1.95% 2028 | | | 5,850 | | | | 5,834 | |
| Public Storage 2.25% 2031 | | | 4,305 | | | | 4,332 | |
| Public Storage 2.30% 2031 | | | 12,069 | | | | 12,192 | |
| Scentre Group 3.25% 20254 | | | 1,265 | | | | 1,331 | |
| Scentre Group 3.50% 20254 | | | 9,846 | | | | 10,374 | |
| Sun Communities Operating LP 2.30% 2028 | | | 5,866 | | | | 5,863 | |
| Sun Communities Operating LP 2.70% 2031 | | | 25,386 | | | | 25,207 | |
| WEA Finance LLC 3.75% 20244 | | | 2,480 | | | | 2,603 | |
| Westfield Corp., Ltd. 3.50% 20294 | | | 7,335 | | | | 7,594 | |
| | | | | | | | 608,567 | |
| The Bond Fund of America | 33 |
| Bonds, notes & other debt instruments (continued) | | Principal amount
(000) | | | Value
(000) | |
| Corporate bonds, notes & loans (continued) | | | | | | |
| Materials 0.70% | | | | | | | | |
| Air Products and Chemicals, Inc. 1.50% 2025 | | $ | 3,535 | | | $ | 3,549 | |
| Air Products and Chemicals, Inc. 1.85% 2027 | | | 802 | | | | 814 | |
| Air Products and Chemicals, Inc. 2.05% 2030 | | | 768 | | | | 773 | |
| Air Products and Chemicals, Inc. 2.70% 2040 | | | 11,472 | | | | 11,593 | |
| Air Products and Chemicals, Inc. 2.80% 2050 | | | 4,295 | | | | 4,413 | |
| Alpek, SAB de CV 3.25% 20314 | | | 5,000 | | | | 4,995 | |
| Anglo American Capital PLC 2.25% 20284 | | | 4,816 | | | | 4,733 | |
| Anglo American Capital PLC 5.625% 20304 | | | 10,000 | | | | 11,858 | |
| Anglo American Capital PLC 2.875% 20314 | | | 3,600 | | | | 3,587 | |
| Anglo American Capital PLC 3.95% 20504 | | | 4,980 | | | | 5,300 | |
| ArcelorMittal 7.00% 2039 | | | 3,250 | | | | 4,482 | |
| ArcelorMittal 6.75% 2041 | | | 2,780 | | | | 3,761 | |
| Ardagh Packaging Finance 5.25% 20254 | | | 3,640 | | | | 3,762 | |
| Ardagh Packaging Finance 4.125% 20264 | | | 2,500 | | | | 2,559 | |
| Ball Corp. 4.00% 2023 | | | 6,000 | | | | 6,270 | |
| Berry Global Escrow Corp. 4.875% 20264 | | | 9,875 | | | | 10,228 | |
| Braskem Idesa SAPI 7.45% 20294 | | | 1,540 | | | | 1,598 | |
| Braskem SA 4.50% 20304 | | | 4,600 | | | | 4,900 | |
| Braskem SA 5.875% 20504 | | | 4,000 | | | | 4,616 | |
| BWAY Parent Co., Inc. 5.50% 20244 | | | 6,500 | | | | 6,568 | |
| Chevron Phillips Chemical Co. LLC 3.30% 20234 | | | 6,630 | | | | 6,829 | |
| Cleveland-Cliffs, Inc. 9.875% 20254 | | | 5,271 | | | | 5,972 | |
| Cleveland-Cliffs, Inc. 6.75% 20264 | | | 12,450 | | | | 13,196 | |
| Crown Holdings, Inc. 4.25% 2026 | | | 4,000 | | | | 4,275 | |
| Dow Chemical Co. 4.55% 2025 | | | 33 | | | | 36 | |
| Dow Chemical Co. 3.625% 2026 | | | 4,058 | | | | 4,376 | |
| Dow Chemical Co. 4.80% 2028 | | | 4,000 | | | | 4,670 | |
| Dow Chemical Co. 2.10% 2030 | | | 13,250 | | | | 13,042 | |
| Dow Chemical Co. 4.625% 2044 | | | 1,100 | | | | 1,333 | |
| Dow Chemical Co. 5.55% 2048 | | | 8,600 | | | | 12,096 | |
| Dow Chemical Co. 4.80% 2049 | | | 7,671 | | | | 9,784 | |
| Dow Chemical Co. 3.60% 2050 | | | 13,708 | | | | 14,885 | |
| Ecolab, Inc. 1.65% 2027 | | | 5,000 | | | | 5,025 | |
| Ecolab, Inc. 2.125% 2032 | | | 15,400 | | | | 15,290 | |
| Ecolab, Inc. 2.125% 2050 | | | 4,000 | | | | 3,536 | |
| Ecolab, Inc. 2.70% 2051 | | | 2,000 | | | | 1,968 | |
| Freeport-McMoRan, Inc. 3.875% 2023 | | | 9,000 | | | | 9,315 | |
| Freeport-McMoRan, Inc. 4.125% 2028 | | | 4,000 | | | | 4,156 | |
| Freeport-McMoRan, Inc. 4.25% 2030 | | | 40 | | | | 42 | |
| Freeport-McMoRan, Inc. 5.40% 2034 | | | 1,450 | | | | 1,767 | |
| Freeport-McMoRan, Inc. 5.45% 2043 | | | 2,566 | | | | 3,231 | |
| Fresnillo PLC 4.25% 20504 | | | 9,516 | | | | 9,984 | |
| Glencore Funding LLC 4.125% 20244 | | | 25,850 | | | | 27,195 | |
| Glencore Funding LLC 1.625% 20264 | | | 6,168 | | | | 6,057 | |
| Glencore Funding LLC 2.625% 20314 | | | 9,100 | | | | 8,853 | |
| Glencore Funding LLC 3.375% 20514 | | | 2,100 | | | | 2,027 | |
| Glencore Funding LLC 3.875% 20514 | | | 1,900 | | | | 1,989 | |
| Graphic Packaging International, Inc. 3.50% 20284 | | | 8,000 | | | | 7,991 | |
| Huntsman International LLC 2.95% 2031 | | | 4,272 | | | | 4,337 | |
| Industrias Peñoles, SAB de CV, 4.75% 20504 | | | 6,090 | | | | 6,671 | |
| International Flavors & Fragrances, Inc. 1.23% 20254 | | | 5,000 | | | | 4,894 | |
| International Flavors & Fragrances, Inc. 1.832% 20274 | | | 8,022 | | | | 7,881 | |
| International Flavors & Fragrances, Inc. 2.30% 20304 | | | 30,114 | | | | 29,552 | |
| International Flavors & Fragrances, Inc. 3.268% 20404 | | | 4,500 | | | | 4,578 | |
| International Flavors & Fragrances, Inc. 3.468% 20504 | | | 10,360 | | | | 10,879 | |
| LYB International Finance III, LLC 1.25% 2025 | | | 3,952 | | | | 3,889 | |
| LYB International Finance III, LLC 2.25% 2030 | | | 15,225 | | | | 15,161 | |
| LYB International Finance III, LLC 3.375% 2040 | | | 4,250 | | | | 4,436 | |
| LYB International Finance III, LLC 4.20% 2049 | | | 1,740 | | | | 2,015 | |
| LYB International Finance III, LLC 4.20% 2050 | | | 4,500 | | | | 5,215 | |
| LYB International Finance III, LLC 3.625% 2051 | | | 5,503 | | | | 5,840 | |
| Methanex Corp. 5.125% 2027 | | | 13,150 | | | | 13,821 | |
| Methanex Corp. 5.25% 2029 | | | 1,125 | | | | 1,188 | |
| Methanex Corp. 5.65% 2044 | | | 1,000 | | | | 1,006 | |
| Newcrest Finance Pty, Ltd. 3.25% 20304 | | | 5,229 | | | | 5,483 | |
| Newcrest Finance Pty, Ltd. 4.20% 20504 | | | 2,714 | | | | 3,088 | |
| Nova Chemicals Corp. 4.875% 20244 | | | 2,000 | | | | 2,067 | |
| 34 | The Bond Fund of America |
| Bonds, notes & other debt instruments (continued) | | Principal amount
(000) | | | Value
(000) | |
| Corporate bonds, notes & loans (continued) | | | | | | |
| Materials (continued) | | | | | | | | |
| Nova Chemicals Corp. 5.25% 20274 | | $ | 7,500 | | | $ | 7,995 | |
| Nova Chemicals Corp. 4.25% 20294 | | | 5,535 | | | | 5,566 | |
| Nutrien, Ltd. 4.20% 2029 | | | 500 | | | | 565 | |
| Nutrien, Ltd. 5.00% 2049 | | | 3,850 | | | | 5,168 | |
| Olin Corp. 5.625% 2029 | | | 2,500 | | | | 2,712 | |
| Praxair, Inc. 1.10% 2030 | | | 14,464 | | | | 13,528 | |
| Praxair, Inc. 2.00% 2050 | | | 5,729 | | | | 5,017 | |
| Rio Tinto Finance (USA), Ltd. 2.75% 2051 | | | 8,451 | | | | 8,394 | |
| Sealed Air Corp. 5.25% 20234 | | | 111 | | | | 115 | |
| Sherwin-Williams Company 2.75% 2022 | | | 212 | | | | 213 | |
| Sherwin-Williams Company 3.125% 2024 | | | 7,250 | | | | 7,572 | |
| Sherwin-Williams Company 3.45% 2027 | | | 2,862 | | | | 3,099 | |
| Sherwin-Williams Company 2.95% 2029 | | | 5,150 | | | | 5,423 | |
| Sherwin-Williams Company 2.30% 2030 | | | 2,771 | | | | 2,768 | |
| Sherwin-Williams Company 2.20% 2032 | | | 5,250 | | | | 5,195 | |
| Sherwin-Williams Company 4.50% 2047 | | | 2,601 | | | | 3,250 | |
| Sherwin-Williams Company 3.80% 2049 | | | 1,500 | | | | 1,694 | |
| Sherwin-Williams Company 3.30% 2050 | | | 1,700 | | | | 1,796 | |
| Sherwin-Williams Company 2.90% 2052 | | | 2,500 | | | | 2,448 | |
| Silgan Holdings, Inc. 4.75% 2025 | | | 5,000 | | | | 5,037 | |
| Silgan Holdings, Inc. 4.125% 2028 | | | 2,500 | | | | 2,557 | |
| Summit Materials, Inc. 5.25% 20294 | | | 4,160 | | | | 4,363 | |
| Suzano Austria GmbH 6.00% 2029 | | | 1,900 | | | | 2,202 | |
| Suzano Austria GmbH 3.75% 2031 | | | 6,660 | | | | 6,780 | |
| Vale Overseas, Ltd. 3.75% 2030 | | | 6,457 | | | | 6,694 | |
| Westlake Chemical Corp. 5.00% 2046 | | | 7,090 | | | | 8,987 | |
| Westlake Chemical Corp. 4.375% 2047 | | | 1,960 | | | | 2,311 | |
| | | | | | | | 552,729 | |
| | | | | | | | | |
| Total corporate bonds, notes & loans | | | | | | | 26,416,004 | |
| | | | | | | | | |
| Mortgage-backed obligations 14.01% | | | | | | | | |
| Federal agency mortgage-backed obligations 11.06% | | | | | | | | |
| Fannie Mae Pool #976945 5.50% 202312 | | | — | 2 | | | — | 2 |
| Fannie Mae Pool #976948 6.00% 202312 | | | 6 | | | | 6 | |
| Fannie Mae Pool #932119 4.50% 202412 | | | 563 | | | | 587 | |
| Fannie Mae Pool #AD6392 4.50% 202512 | | | 628 | | | | 655 | |
| Fannie Mae Pool #AD3149 4.50% 202512 | | | 360 | | | | 378 | |
| Fannie Mae Pool #AD5692 4.50% 202512 | | | 298 | | | | 311 | |
| Fannie Mae Pool #AB1068 4.50% 202512 | | | 2 | | | | 2 | |
| Fannie Mae Pool #MA3131 3.00% 202712 | | | 68 | | | | 71 | |
| Fannie Mae Pool #MA2973 3.00% 202712 | | | 8 | | | | 8 | |
| Fannie Mae Pool #AL9668 3.00% 203012 | | | 11 | | | | 11 | |
| Fannie Mae Pool #AZ0554 3.50% 203012 | | | 287 | | | | 304 | |
| Fannie Mae Pool #AY1948 3.50% 203012 | | | 235 | | | | 248 | |
| Fannie Mae Pool #AZ4646 3.50% 203012 | | | 187 | | | | 197 | |
| Fannie Mae Pool #CA3178 3.00% 203112 | | | 778 | | | | 817 | |
| Fannie Mae Pool #890710 3.00% 203112 | | | 13 | | | | 13 | |
| Fannie Mae Pool #BH7659 3.00% 203212 | | | 9,018 | | | | 9,479 | |
| Fannie Mae Pool #CA3274 3.00% 203212 | | | 625 | | | | 658 | |
| Fannie Mae Pool #BH9235 3.00% 203312 | | | 923 | | | | 971 | |
| Fannie Mae Pool #BJ4890 3.00% 203312 | | | 621 | | | | 660 | |
| Fannie Mae Pool #BJ4856 3.00% 203312 | | | 403 | | | | 428 | |
| Fannie Mae Pool #BM5111 3.00% 203312 | | | 306 | | | | 324 | |
| Fannie Mae Pool #MA3247 3.00% 203312 | | | 250 | | | | 263 | |
| Fannie Mae Pool #BK7453 3.00% 203312 | | | 42 | | | | 44 | |
| Fannie Mae Pool #CA2106 3.50% 203312 | | | 130 | | | | 137 | |
| Fannie Mae Pool #MA3518 4.00% 203312 | | | 19 | | | | 20 | |
| Fannie Mae Pool #695412 5.00% 203312 | | | 8 | | | | 9 | |
| Fannie Mae Pool #CA4453 2.50% 203412 | | | 4,557 | | | | 4,735 | |
| Fannie Mae Pool #BO1359 2.50% 203412 | | | 2,388 | | | | 2,485 | |
| Fannie Mae Pool #FM1490 3.50% 203412 | | | 5,946 | | | | 6,283 | |
| Fannie Mae Pool #AD3566 5.00% 203512 | | | 107 | | | | 117 | |
| Fannie Mae Pool #AS8355 3.00% 203612 | | | 10,111 | | | | 10,625 | |
| Fannie Mae Pool #AS8554 3.00% 203612 | | | 1,043 | | | | 1,095 | |
| Fannie Mae Pool #MA2746 4.00% 203612 | | | 2,216 | | | | 2,412 | |
| Fannie Mae Pool #MA2588 4.00% 203612 | | | 1,879 | | | | 2,038 | |
| Fannie Mae Pool #MA2787 4.00% 203612 | | | 1,271 | | | | 1,380 | |
| The Bond Fund of America | 35 |
| Bonds, notes & other debt instruments (continued) | | Principal amount
(000) | | | Value
(000) | |
| Mortgage-backed obligations (continued) | | | | | | |
| Federal agency mortgage-backed obligations (continued) | | | | | | |
| Fannie Mae Pool #MA2717 4.00% 203612 | | $ | 389 | | | $ | 424 | |
| Fannie Mae Pool #893837 7.00% 203612 | | | 120 | | | | 127 | |
| Fannie Mae Pool #924866 1.515% 20376,12 | | | 27 | | | | 27 | |
| Fannie Mae Pool #MA2897 3.00% 203712 | | | 21,903 | | | | 23,002 | |
| Fannie Mae Pool #MA2866 3.00% 203712 | | | 12,577 | | | | 13,208 | |
| Fannie Mae Pool #945680 6.00% 203712 | | | 24 | | | | 28 | |
| Fannie Mae Pool #913966 6.00% 203712 | | | 2 | | | | 2 | |
| Fannie Mae Pool #924069 7.00% 203712 | | | 105 | | | | 110 | |
| Fannie Mae Pool #954927 7.00% 203712 | | | 102 | | | | 109 | |
| Fannie Mae Pool #966170 7.00% 203712 | | | 81 | | | | 84 | |
| Fannie Mae Pool #954936 7.00% 203712 | | | 38 | | | | 42 | |
| Fannie Mae Pool #914612 7.50% 203712 | | | 56 | | | | 58 | |
| Fannie Mae Pool #889101 1.549% 20386,12 | | | 108 | | | | 110 | |
| Fannie Mae Pool #964279 2.095% 20386,12 | | | 105 | | | | 107 | |
| Fannie Mae Pool #964708 2.265% 20386,12 | | | 14 | | | | 14 | |
| Fannie Mae Pool #MA3539 4.50% 203812 | | | 56 | | | | 60 | |
| Fannie Mae Pool #889982 5.50% 203812 | | | 22 | | | | 25 | |
| Fannie Mae Pool #988588 5.50% 203812 | | | 4 | | | | 4 | |
| Fannie Mae Pool #AC2641 4.50% 203912 | | | 4,003 | | | | 4,427 | |
| Fannie Mae Pool #AC0794 5.00% 203912 | | | 158 | | | | 176 | |
| Fannie Mae Pool #931768 5.00% 203912 | | | 80 | | | | 91 | |
| Fannie Mae Pool #AE7629 2.06% 20406,12 | | | 16 | | | | 17 | |
| Fannie Mae Pool #AL9335 2.07% 20406,12 | | | 3,682 | | | | 3,872 | |
| Fannie Mae Pool #AE7567 4.00% 204012 | | | 2,299 | | | | 2,525 | |
| Fannie Mae Pool #AE1761 4.00% 204012 | | | 2,234 | | | | 2,454 | |
| Fannie Mae Pool #AH0007 4.00% 204012 | | | 2,198 | | | | 2,407 | |
| Fannie Mae Pool #AH0539 4.00% 204012 | | | 894 | | | | 982 | |
| Fannie Mae Pool #AE8073 4.00% 204012 | | | 439 | | | | 482 | |
| Fannie Mae Pool #AD8522 4.00% 204012 | | | 116 | | | | 127 | |
| Fannie Mae Pool #AE5471 4.50% 204012 | | | 711 | | | | 787 | |
| Fannie Mae Pool #AB1297 5.00% 204012 | | | 321 | | | | 360 | |
| Fannie Mae Pool #932606 5.00% 204012 | | | 225 | | | | 253 | |
| Fannie Mae Pool #MA4387 2.00% 204112 | | | 3,952 | | | | 4,017 | |
| Fannie Mae Pool #AL9326 2.107% 20416,12 | | | 4,152 | | | | 4,372 | |
| Fannie Mae Pool #AL9327 2.108% 20416,12 | | | 3,164 | | | | 3,334 | |
| Fannie Mae Pool #AL9531 2.105% 20416,12 | | | 2,697 | | | | 2,840 | |
| Fannie Mae Pool #AE0844 2.137% 20416,12 | | | 241 | | | | 253 | |
| Fannie Mae Pool #AL0073 2.146% 20416,12 | | | 182 | | | | 192 | |
| Fannie Mae Pool #AE0789 2.155% 20416,12 | | | 240 | | | | 252 | |
| Fannie Mae Pool #AB4050 4.00% 204112 | | | 781 | | | | 858 | |
| Fannie Mae Pool #AJ7471 4.00% 204112 | | | 695 | | | | 755 | |
| Fannie Mae Pool #AI5172 4.00% 204112 | | | 572 | | | | 628 | |
| Fannie Mae Pool #AJ4189 4.00% 204112 | | | 505 | | | | 555 | |
| Fannie Mae Pool #AJ4154 4.00% 204112 | | | 427 | | | | 469 | |
| Fannie Mae Pool #AJ1873 4.00% 204112 | | | 369 | | | | 406 | |
| Fannie Mae Pool #AJ0257 4.00% 204112 | | | 151 | | | | 165 | |
| Fannie Mae Pool #AL0658 4.50% 204112 | | | 752 | | | | 829 | |
| Fannie Mae Pool #AI1862 5.00% 204112 | | | 1,761 | | | | 1,997 | |
| Fannie Mae Pool #AH6099 5.00% 204112 | | | 1,396 | | | | 1,561 | |
| Fannie Mae Pool #AI3510 5.00% 204112 | | | 1,084 | | | | 1,229 | |
| Fannie Mae Pool #AJ0704 5.00% 204112 | | | 922 | | | | 1,046 | |
| Fannie Mae Pool #AJ5391 5.00% 204112 | | | 586 | | | | 663 | |
| Fannie Mae Pool #AE1248 5.00% 204112 | | | 299 | | | | 337 | |
| Fannie Mae Pool #AE1277 5.00% 204112 | | | 263 | | | | 297 | |
| Fannie Mae Pool #AE1274 5.00% 204112 | | | 189 | | | | 214 | |
| Fannie Mae Pool #AE1283 5.00% 204112 | | | 145 | | | | 160 | |
| Fannie Mae Pool #AH9479 5.00% 204112 | | | 42 | | | | 48 | |
| Fannie Mae Pool #AH8144 5.00% 204112 | | | 39 | | | | 44 | |
| Fannie Mae Pool #AP7819 1.91% 20426,12 | | | 246 | | | | 258 | |
| Fannie Mae Pool #AL2000 1.942% 20426,12 | | | 278 | | | | 291 | |
| Fannie Mae Pool #AL1941 1.952% 20426,12 | | | 330 | | | | 347 | |
| Fannie Mae Pool #AL2184 1.981% 20426,12 | | | 571 | | | | 600 | |
| Fannie Mae Pool #AL9532 1.991% 20426,12 | | | 3,181 | | | | 3,340 | |
| Fannie Mae Pool #AL9533 2.03% 20426,12 | | | 1,518 | | | | 1,595 | |
| Fannie Mae Pool #AL9530 2.082% 20426,12 | | | 2,168 | | | | 2,281 | |
| Fannie Mae Pool #AX3703 4.00% 204212 | | | 4,591 | | | | 5,044 | |
| Fannie Mae Pool #AK6740 4.00% 204212 | | | 4,338 | | | | 4,810 | |
| 36 | The Bond Fund of America |
| | | | | | | |
| Bonds, notes & other debt instruments (continued) | | Principal amount
(000) | | | Value
(000) | |
| Mortgage-backed obligations (continued) | | | | | | |
| Federal agency mortgage-backed obligations (continued) | | | | | | | | |
| Fannie Mae Pool #AL2745 4.00% 204212 | | $ | 3,400 | | | $ | 3,736 | |
| Fannie Mae Pool #890407 4.00% 204212 | | | 1,176 | | | | 1,292 | |
| Fannie Mae Pool #AK4949 4.00% 204212 | | | 247 | | | | 270 | |
| Fannie Mae Pool #AE1290 5.00% 204212 | | | 308 | | | | 346 | |
| Fannie Mae Pool #AT5898 3.00% 204312 | | | 19,128 | | | | 20,188 | |
| Fannie Mae Pool #AL3829 3.50% 204312 | | | 2,726 | | | | 2,953 | |
| Fannie Mae Pool #AT7161 3.50% 204312 | | | 1,057 | | | | 1,137 | |
| Fannie Mae Pool #AR1512 3.50% 204312 | | | 672 | | | | 724 | |
| Fannie Mae Pool #AT0412 3.50% 204312 | | | 274 | | | | 295 | |
| Fannie Mae Pool #AT3954 3.50% 204312 | | | 168 | | | | 179 | |
| Fannie Mae Pool #AT0300 3.50% 204312 | | | 99 | | | | 105 | |
| Fannie Mae Pool #AV0786 4.00% 204312 | | | 3,605 | | | | 3,961 | |
| Fannie Mae Pool #AT2683 4.00% 204312 | | | 2,521 | | | | 2,743 | |
| Fannie Mae Pool #BM6240 2.05% 20446,12 | | | 3,490 | | | | 3,668 | |
| Fannie Mae Pool #AL8421 3.50% 204412 | | | 16,198 | | | | 17,485 | |
| Fannie Mae Pool #AX8521 3.50% 204412 | | | 372 | | | | 401 | |
| Fannie Mae Pool #AY1829 3.50% 204412 | | | 111 | | | | 117 | |
| Fannie Mae Pool #AW8240 3.50% 204412 | | | 55 | | | | 58 | |
| Fannie Mae Pool #AX0817 4.00% 204412 | | | 204 | | | | 217 | |
| Fannie Mae Pool #BE5017 3.50% 204512 | | | 1,404 | | | | 1,509 | |
| Fannie Mae Pool #BE5009 3.50% 204512 | | | 740 | | | | 791 | |
| Fannie Mae Pool #AZ7366 4.00% 204512 | | | 22,326 | | | | 24,449 | |
| Fannie Mae Pool #AS6348 4.00% 204512 | | | 3,909 | | | | 4,274 | |
| Fannie Mae Pool #BC4764 3.00% 204612 | | | 2,936 | | | | 3,083 | |
| Fannie Mae Pool #AS8310 3.00% 204612 | | | 811 | | | | 864 | |
| Fannie Mae Pool #MA2833 3.00% 204612 | | | 45 | | | | 48 | |
| Fannie Mae Pool #BC9077 3.50% 204612 | | | 20,659 | | | | 22,103 | |
| Fannie Mae Pool #BD9236 3.50% 204612 | | | 506 | | | | 536 | |
| Fannie Mae Pool #AL8522 3.50% 204612 | | | 37 | | | | 40 | |
| Fannie Mae Pool #AS6839 4.00% 204612 | | | 4,783 | | | | 5,191 | |
| Fannie Mae Pool #BC1352 4.00% 204612 | | | 1,743 | | | | 1,890 | |
| Fannie Mae Pool #BD1968 4.00% 204612 | | | 61 | | | | 65 | |
| Fannie Mae Pool #MA2809 4.50% 204612 | | | 886 | | | | 935 | |
| Fannie Mae Pool #BC8647 4.50% 204612 | | | 678 | | | | 732 | |
| Fannie Mae Pool #BD1550 4.50% 204612 | | | 345 | | | | 376 | |
| Fannie Mae Pool #BD7529 4.50% 204612 | | | 319 | | | | 343 | |
| Fannie Mae Pool #MA2821 4.50% 204612 | | | 324 | | | | 342 | |
| Fannie Mae Pool #BD9248 4.50% 204612 | | | 235 | | | | 252 | |
| Fannie Mae Pool #BD7600 4.50% 204612 | | | 81 | | | | 87 | |
| Fannie Mae Pool #BM1179 3.00% 204712 | | | 944 | | | | 1,002 | |
| Fannie Mae Pool #CA0854 3.50% 204712 | | | 15,896 | | | | 17,051 | |
| Fannie Mae Pool #BD2440 3.50% 204712 | | | 2,261 | | | | 2,409 | |
| Fannie Mae Pool #BE8740 3.50% 204712 | | | 1,310 | | | | 1,405 | |
| Fannie Mae Pool #BE8742 3.50% 204712 | | | 406 | | | | 438 | |
| Fannie Mae Pool #CA0770 3.50% 204712 | | | 227 | | | | 240 | |
| Fannie Mae Pool #BH2846 3.50% 204712 | | | 158 | | | | 170 | |
| Fannie Mae Pool #BH2848 3.50% 204712 | | | 146 | | | | 156 | |
| Fannie Mae Pool #BH2847 3.50% 204712 | | | 108 | | | | 114 | |
| Fannie Mae Pool #CA0453 4.00% 204712 | | | 8,029 | | | | 8,578 | |
| Fannie Mae Pool #MA3211 4.00% 204712 | | | 4,892 | | | | 5,242 | |
| Fannie Mae Pool #BJ5015 4.00% 204712 | | | 2,684 | | | | 2,936 | |
| Fannie Mae Pool #BD3554 4.00% 204712 | | | 932 | | | | 994 | |
| Fannie Mae Pool #BH3122 4.00% 204712 | | | 71 | | | | 76 | |
| Fannie Mae Pool #BM4413 4.50% 204712 | | | 7,220 | | | | 7,807 | |
| Fannie Mae Pool #BH0876 4.50% 204712 | | | 3,102 | | | | 3,355 | |
| Fannie Mae Pool #BJ3558 4.50% 204712 | | | 1,891 | | | | 2,038 | |
| Fannie Mae Pool #BJ3525 4.50% 204712 | | | 1,444 | | | | 1,556 | |
| Fannie Mae Pool #BJ3581 4.50% 204712 | | | 994 | | | | 1,071 | |
| Fannie Mae Pool #MA3002 4.50% 204712 | | | 745 | | | | 783 | |
| Fannie Mae Pool #257063 7.00% 204712 | | | 46 | | | | 52 | |
| Fannie Mae Pool #256893 7.00% 204712 | | | 12 | | | | 14 | |
| Fannie Mae Pool #BF0293 3.00% 204812 | | | 8,582 | | | | 9,066 | |
| Fannie Mae Pool #FM5658 3.00% 204812 | | | 5,843 | | | | 6,117 | |
| Fannie Mae Pool #BM4488 3.376% 20486,12 | | | 7,021 | | | | 7,254 | |
| Fannie Mae Pool #BF0318 3.50% 204812 | | | 43,813 | | | | 47,001 | |
| Fannie Mae Pool #CA1532 3.50% 204812 | | | 7,256 | | | | 7,693 | |
| Fannie Mae Pool #CA1189 3.50% 204812 | | | 1,766 | | | | 1,870 | |
| The Bond Fund of America | 37 |
| Bonds, notes & other debt instruments (continued) | | Principal amount
(000) | | | Value
(000) | |
| Mortgage-backed obligations (continued) | | | | | | |
| Federal agency mortgage-backed obligations (continued) | | | | | | |
| Fannie Mae Pool #BJ4901 3.50% 204812 | | $ | 978 | | | $ | 1,053 | |
| Fannie Mae Pool #CA2850 4.00% 204812 | | | 3,242 | | | | 3,547 | |
| Fannie Mae Pool #BK6840 4.00% 204812 | | | 1,700 | | | | 1,862 | |
| Fannie Mae Pool #BK5232 4.00% 204812 | | | 1,240 | | | | 1,350 | |
| Fannie Mae Pool #BK9743 4.00% 204812 | | | 499 | | | | 546 | |
| Fannie Mae Pool #BK0163 4.50% 204812 | | | 1,943 | | | | 2,090 | |
| Fannie Mae Pool #BN1576 4.50% 204812 | | | 1,313 | | | | 1,410 | |
| Fannie Mae Pool #BK9761 4.50% 204812 | | | 290 | | | | 315 | |
| Fannie Mae Pool #CA2166 4.50% 204812 | | | 18 | | | | 20 | |
| Fannie Mae Pool #CA2493 4.50% 204812 | | | 4 | | | | 4 | |
| Fannie Mae Pool #CA3807 3.00% 204912 | | | 1,491 | | | | 1,571 | |
| Fannie Mae Pool #CA3806 3.00% 204912 | | | 918 | | | | 970 | |
| Fannie Mae Pool #BJ8402 3.456% 20496,12 | | | 1,162 | | | | 1,202 | |
| Fannie Mae Pool #FM2318 3.50% 204912 | | | 53,815 | | | | 57,524 | |
| Fannie Mae Pool #CA4021 3.50% 204912 | | | 32,884 | | | | 34,983 | |
| Fannie Mae Pool #CA4802 3.50% 204912 | | | 31,008 | | | | 33,442 | |
| Fannie Mae Pool #CA4151 3.50% 204912 | | | 13,631 | | | | 14,793 | |
| Fannie Mae Pool #BN6708 3.50% 204912 | | | 11,689 | | | | 12,546 | |
| Fannie Mae Pool #FM1062 3.50% 204912 | | | 10,952 | | | | 11,847 | |
| Fannie Mae Pool #FM1443 3.50% 204912 | | | 8,076 | | | | 8,710 | |
| Fannie Mae Pool #BJ8411 3.50% 204912 | | | 2,694 | | | | 2,905 | |
| Fannie Mae Pool #FM1963 4.00% 204912 | | | 48,951 | | | | 53,612 | |
| Fannie Mae Pool #FM1913 4.00% 204912 | | | 2,265 | | | | 2,434 | |
| Fannie Mae Pool #BF0320 5.50% 204912 | | | 7,658 | | | | 8,741 | |
| Fannie Mae Pool #CA8285 3.00% 205012 | | | 67,174 | | | | 71,196 | |
| Fannie Mae Pool #CA5506 3.00% 205012 | | | 57,883 | | | | 61,029 | |
| Fannie Mae Pool #BP1948 3.00% 205012 | | | 18,389 | | | | 19,484 | |
| Fannie Mae Pool #CA5338 3.00% 205012 | | | 13,885 | | | | 14,465 | |
| Fannie Mae Pool #FM2664 3.50% 205012 | | | 33,389 | | | | 36,093 | |
| Fannie Mae Pool #BP1954 3.50% 205012 | | | 23,508 | | | | 25,174 | |
| Fannie Mae Pool #CB2319 2.50% 205112 | | | 69,503 | | | | 71,793 | |
| Fannie Mae Pool #CB2371 2.50% 205112 | | | 46,692 | | | | 48,272 | |
| Fannie Mae Pool #CB2372 2.50% 205112 | | | 33,574 | | | | 34,690 | |
| Fannie Mae Pool #BT9510 2.50% 205112 | | | 27,100 | | | | 28,017 | |
| Fannie Mae Pool #FM9492 2.50% 205112 | | | 26,231 | | | | 27,099 | |
| Fannie Mae Pool #BT9483 2.50% 205112 | | | 26,000 | | | | 26,824 | |
| Fannie Mae Pool #FM9804 2.50% 205112 | | | 14,170 | | | | 14,640 | |
| Fannie Mae Pool #FM9694 2.50% 205112 | | | 13,038 | | | | 13,507 | |
| Fannie Mae Pool #CB2373 2.50% 205112 | | | 12,955 | | | | 13,366 | |
| Fannie Mae Pool #CB2375 2.50% 205112 | | | 11,264 | | | | 11,585 | |
| Fannie Mae Pool #CA9391 3.00% 205112 | | | 227,251 | | | | 238,341 | |
| Fannie Mae Pool #CA8623 3.00% 205112 | | | 103,273 | | | | 109,704 | |
| Fannie Mae Pool #FM9632 3.00% 205112 | | | 91,513 | | | | 96,509 | |
| Fannie Mae Pool #CB0041 3.00% 205112 | | | 72,338 | | | | 76,630 | |
| Fannie Mae Pool #FM9631 3.00% 205112 | | | 38,741 | | | | 40,887 | |
| Fannie Mae Pool #CB2414 3.00% 205112 | | | 37,533 | | | | 39,999 | |
| Fannie Mae Pool #FM7694 3.00% 205112 | | | 23,595 | | | | 24,910 | |
| Fannie Mae Pool #CB2292 3.00% 205112 | | | 16,022 | | | | 16,984 | |
| Fannie Mae Pool #CB2293 3.00% 205112 | | | 16,023 | | | | 16,939 | |
| Fannie Mae Pool #CA8969 3.00% 205112 | | | 6,504 | | | | 6,820 | |
| Fannie Mae Pool #BF0145 3.50% 205712 | | | 18,837 | | | | 20,411 | |
| Fannie Mae Pool #BF0299 3.50% 205812 | | | 32,848 | | | | 35,401 | |
| Fannie Mae Pool #BF0264 3.50% 205812 | | | 18,527 | | | | 19,986 | |
| Fannie Mae Pool #BF0379 3.50% 205912 | | | 48,894 | | | | 52,963 | |
| Fannie Mae Pool #BM6693 3.50% 205912 | | | 37,321 | | | | 40,242 | |
| Fannie Mae Pool #BF0497 3.00% 206012 | | | 22,757 | | | | 24,025 | |
| Fannie Mae Pool #BF0481 3.50% 206012 | | | 81,181 | | | | 87,932 | |
| Fannie Mae Pool #BF0480 3.50% 206012 | | | 49,866 | | | | 54,295 | |
| Fannie Mae, Series 2001-4, Class NA, 9.00% 20256,12 | | | 1 | | | | 2 | |
| Fannie Mae, Series 2001-4, Class GA, 9.00% 20256,12 | | | — | 2 | | | — | 2 |
| Fannie Mae, Series 1998-W5, Class B3, 6.50% 20284,12 | | | 262 | | | | 250 | |
| Fannie Mae, Series 2002-W7, Class A5, 7.50% 202912 | | | 61 | | | | 73 | |
| Fannie Mae, Series 2001-25, Class ZA, 6.50% 203112 | | | 608 | | | | 673 | |
| Fannie Mae, Series 2001-T10, Class A1, 7.00% 204112 | | | 1,046 | | | | 1,189 | |
| Fannie Mae, Series 2001-50, Class BA, 7.00% 204112 | | | 180 | | | | 203 | |
| Fannie Mae, Series 2002-W3, Class A5, 7.50% 204112 | | | 600 | | | | 715 | |
| Fannie Mae, Series 2002-W1, Class 2A, 5.199% 20426,12 | | | 800 | | | | 865 | |
| 38 | The Bond Fund of America |
| Bonds, notes & other debt instruments (continued) | | Principal amount
(000) | | | Value
(000) | |
| Mortgage-backed obligations (continued) | | | | | | |
| Federal agency mortgage-backed obligations (continued) | | | | | | |
| Fannie Mae, Series 2017-M3, Class A2, Multi Family, 2.466% 20266,12 | | $ | 9 | | | $ | 10 | |
| Fannie Mae, Series 2017-M15, Class A2, Multi Family, 2.959% 20276,12 | | | 3,700 | | | | 3,974 | |
| Fannie Mae, Series 2017-M12, Class A2, Multi Family, 3.069% 20276,12 | | | 4,201 | | | | 4,508 | |
| Fannie Mae, Series 2019-M5, Class A2, Multi Family, 3.273% 202912 | | | 430 | | | | 472 | |
| Fannie Mae, Series 2006-32, Class OA, principal only, 0% 203612 | | | 451 | | | | 412 | |
| Fannie Mae, Series 2006-51, Class PO, principal only, 0% 203612 | | | 407 | | | | 387 | |
| Fannie Mae, Series 2006-96, Class OP, principal only, 0% 203612 | | | 156 | | | | 145 | |
| Freddie Mac Pool #G15732 3.00% 203012 | | | 7,930 | | | | 8,361 | |
| Freddie Mac Pool #ZT1332 3.00% 203012 | | | 7,041 | | | | 7,412 | |
| Freddie Mac Pool #D98356 4.50% 203012 | | | 129 | | | | 139 | |
| Freddie Mac Pool #G16634 3.00% 203112 | | | 12,088 | | | | 12,766 | |
| Freddie Mac Pool #V61960 3.00% 203312 | | | 5,161 | | | | 5,434 | |
| Freddie Mac Pool #A15120 5.50% 203312 | | | 3 | | | | 3 | |
| Freddie Mac Pool #G30911 4.00% 203612 | | | 3,658 | | | | 3,971 | |
| Freddie Mac Pool #K93532 4.00% 203612 | | | 1,101 | | | | 1,193 | |
| Freddie Mac Pool #C91883 4.00% 203612 | | | 596 | | | | 649 | |
| Freddie Mac Pool #C91917 3.00% 203712 | | | 641 | | | | 674 | |
| Freddie Mac Pool #C91948 4.00% 203712 | | | 4,042 | | | | 4,382 | |
| Freddie Mac Pool #G04804 4.50% 203712 | | | 1,579 | | | | 1,743 | |
| Freddie Mac Pool #A56076 5.50% 203712 | | | 14 | | | | 16 | |
| Freddie Mac Pool #G03695 5.50% 203712 | | | 3 | | | | 3 | |
| Freddie Mac Pool #H09093 7.50% 203712 | | | 63 | | | | 73 | |
| Freddie Mac Pool #ZT1449 3.00% 203812 | | | 57,891 | | | | 61,221 | |
| Freddie Mac Pool #G08248 5.50% 203812 | | | 37 | | | | 43 | |
| Freddie Mac Pool #G05267 5.50% 203812 | | | 2 | | | | 3 | |
| Freddie Mac Pool #G05196 5.50% 203812 | | | 2 | | | | 2 | |
| Freddie Mac Pool #A87873 5.00% 203912 | | | 2,883 | | | | 3,273 | |
| Freddie Mac Pool #G06020 5.50% 203912 | | | 5 | | | | 5 | |
| Freddie Mac Pool #840222 2.13% 20406,12 | | | 1,004 | | | | 1,057 | |
| Freddie Mac Pool #G05937 4.50% 204012 | | | 6,123 | | | | 6,772 | |
| Freddie Mac Pool #A93948 4.50% 204012 | | | 7 | | | | 8 | |
| Freddie Mac Pool #G05860 5.50% 204012 | | | 15 | | | | 18 | |
| Freddie Mac Pool #Q02705 4.50% 204112 | | | 2,776 | | | | 3,065 | |
| Freddie Mac Pool #G06956 4.50% 204112 | | | 625 | | | | 691 | |
| Freddie Mac Pool #G06769 4.50% 204112 | | | 278 | | | | 305 | |
| Freddie Mac Pool #Q01992 4.50% 204112 | | | 39 | | | | 42 | |
| Freddie Mac Pool #G06868 4.50% 204112 | | | 6 | | | | 7 | |
| Freddie Mac Pool #G06648 5.00% 204112 | | | 1,178 | | | | 1,336 | |
| Freddie Mac Pool #Q01658 5.00% 204112 | | | 240 | | | | 263 | |
| Freddie Mac Pool #G06841 5.50% 204112 | | | 21 | | | | 24 | |
| Freddie Mac Pool #841039 2.186% 20436,12 | | | 3,071 | | | | 3,241 | |
| Freddie Mac Pool #Q18236 3.50% 204312 | | | 1,138 | | | | 1,225 | |
| Freddie Mac Pool #Q19133 3.50% 204312 | | | 755 | | | | 815 | |
| Freddie Mac Pool #Q17696 3.50% 204312 | | | 700 | | | | 757 | |
| Freddie Mac Pool #Q22946 4.00% 204312 | | | 5,495 | | | | 6,041 | |
| Freddie Mac Pool #Q15874 4.00% 204312 | | | 88 | | | | 94 | |
| Freddie Mac Pool #Q28558 3.50% 204412 | | | 3,157 | | | | 3,404 | |
| Freddie Mac Pool #760014 2.843% 20456,12 | | | 2,386 | | | | 2,470 | |
| Freddie Mac Pool #760012 3.113% 20456,12 | | | 677 | | | | 704 | |
| Freddie Mac Pool #760013 3.169% 20456,12 | | | 500 | | | | 521 | |
| Freddie Mac Pool #G60238 3.50% 204512 | | | 17,256 | | | | 18,593 | |
| Freddie Mac Pool #G60138 3.50% 204512 | | | 712 | | | | 772 | |
| Freddie Mac Pool #G60344 4.00% 204512 | | | 13,539 | | | | 14,909 | |
| Freddie Mac Pool #V81992 4.00% 204512 | | | 720 | | | | 783 | |
| Freddie Mac Pool #G67700 3.50% 204612 | | | 6,341 | | | | 6,831 | |
| Freddie Mac Pool #T65375 3.50% 204612 | | | 158 | | | | 164 | |
| Freddie Mac Pool #Q43312 4.50% 204612 | | | 633 | | | | 692 | |
| Freddie Mac Pool #Q44689 4.50% 204612 | | | 633 | | | | 680 | |
| Freddie Mac Pool #Q42633 4.50% 204612 | | | 560 | | | | 610 | |
| Freddie Mac Pool #Q43461 4.50% 204612 | | | 530 | | | | 575 | |
| Freddie Mac Pool #Q42034 4.50% 204612 | | | 313 | | | | 338 | |
| Freddie Mac Pool #760015 2.627% 20476,12 | | | 2,655 | | | | 2,738 | |
| Freddie Mac Pool #ZT2100 3.00% 204712 | | | 6,341 | | | | 6,650 | |
| Freddie Mac Pool #G61733 3.00% 204712 | | | 5,968 | | | | 6,302 | |
| Freddie Mac Pool #ZS4747 3.50% 204712 | | | 10,671 | | | | 11,317 | |
| Freddie Mac Pool #ZS4735 3.50% 204712 | | | 5,291 | | | | 5,610 | |
| Freddie Mac Pool #Q52069 3.50% 204712 | | | 2,000 | | | | 2,146 | |
| The Bond Fund of America | 39 |
| | | | | | | |
| Bonds, notes & other debt instruments (continued) | | Principal amount
(000) | | | Value
(000) | |
| Mortgage-backed obligations (continued) | | | | | | |
| Federal agency mortgage-backed obligations (continued) | | | | | | | | |
| Freddie Mac Pool #Q51622 3.50% 204712 | | $ | 1,512 | | | $ | 1,630 | |
| Freddie Mac Pool #Q47615 3.50% 204712 | | | 1,164 | | | | 1,248 | |
| Freddie Mac Pool #Q47620 4.00% 204712 | | | 11,048 | | | | 11,978 | |
| Freddie Mac Pool #Q52613 4.00% 204712 | | | 6,256 | | | | 6,789 | |
| Freddie Mac Pool #G08793 4.00% 204712 | | | 4,123 | | | | 4,415 | |
| Freddie Mac Pool #Q52596 4.50% 204712 | | | 1,658 | | | | 1,792 | |
| Freddie Mac Pool #Q47828 4.50% 204712 | | | 765 | | | | 825 | |
| Freddie Mac Pool #G67709 3.50% 204812 | | | 31,072 | | | | 33,450 | |
| Freddie Mac Pool #Q54701 3.50% 204812 | | | 1,335 | | | | 1,432 | |
| Freddie Mac Pool #Q54709 3.50% 204812 | | | 1,224 | | | | 1,313 | |
| Freddie Mac Pool #Q54700 3.50% 204812 | | | 1,002 | | | | 1,073 | |
| Freddie Mac Pool #Q54781 3.50% 204812 | | | 962 | | | | 1,036 | |
| Freddie Mac Pool #Q54782 3.50% 204812 | | | 960 | | | | 1,025 | |
| Freddie Mac Pool #Q55056 3.50% 204812 | | | 938 | | | | 999 | |
| Freddie Mac Pool #Q56590 3.50% 204812 | | | 658 | | | | 707 | |
| Freddie Mac Pool #Q54699 3.50% 204812 | | | 518 | | | | 560 | |
| Freddie Mac Pool #Q56589 3.50% 204812 | | | 475 | | | | 508 | |
| Freddie Mac Pool #Q54698 3.50% 204812 | | | 393 | | | | 426 | |
| Freddie Mac Pool #Q54831 3.50% 204812 | | | 389 | | | | 421 | |
| Freddie Mac Pool #Q55060 3.50% 204812 | | | 354 | | | | 379 | |
| Freddie Mac Pool #Q56591 3.50% 204812 | | | 320 | | | | 341 | |
| Freddie Mac Pool #G61628 3.50% 204812 | | | 193 | | | | 208 | |
| Freddie Mac Pool #G67711 4.00% 204812 | | | 30,125 | | | | 32,976 | |
| Freddie Mac Pool #Q53878 4.00% 204812 | | | 6,993 | | | | 7,590 | |
| Freddie Mac Pool #ZA5889 4.00% 204812 | | | 2,164 | | | | 2,326 | |
| Freddie Mac Pool #Q56599 4.00% 204812 | | | 2,020 | | | | 2,213 | |
| Freddie Mac Pool #G08805 4.00% 204812 | | | 1,535 | | | | 1,634 | |
| Freddie Mac Pool #Q56175 4.00% 204812 | | | 1,369 | | | | 1,487 | |
| Freddie Mac Pool #Q55971 4.00% 204812 | | | 1,330 | | | | 1,449 | |
| Freddie Mac Pool #Q55970 4.00% 204812 | | | 670 | | | | 733 | |
| Freddie Mac Pool #Q58411 4.50% 204812 | | | 4,099 | | | | 4,495 | |
| Freddie Mac Pool #Q58436 4.50% 204812 | | | 1,851 | | | | 2,047 | |
| Freddie Mac Pool #Q58378 4.50% 204812 | | | 1,470 | | | | 1,601 | |
| Freddie Mac Pool #Q57242 4.50% 204812 | | | 714 | | | | 778 | |
| Freddie Mac Pool #QA4692 3.00% 204912 | | | 22,814 | | | | 24,027 | |
| Freddie Mac Pool #QA4673 3.00% 204912 | | | 9,668 | | | | 10,198 | |
| Freddie Mac Pool #SD7507 3.00% 204912 | | | 5,727 | | | | 6,027 | |
| Freddie Mac Pool #SD0185 3.00% 204912 | | | 5,722 | | | | 6,004 | |
| Freddie Mac Pool #SD7508 3.50% 204912 | | | 79,276 | | | | 85,486 | |
| Freddie Mac Pool #QA5125 3.50% 204912 | | | 29,159 | | | | 31,447 | |
| Freddie Mac Pool #RA1580 3.50% 204912 | | | 9,620 | | | | 10,440 | |
| Freddie Mac Pool #RA1463 3.50% 204912 | | | 9,592 | | | | 10,409 | |
| Freddie Mac Pool #QA1885 3.50% 204912 | | | 5,932 | | | | 6,373 | |
| Freddie Mac Pool #QA0284 3.50% 204912 | | | 5,186 | | | | 5,593 | |
| Freddie Mac Pool #QA2748 3.50% 204912 | | | 1,334 | | | | 1,438 | |
| Freddie Mac Pool #RA2596 2.50% 205012 | | | 4,479 | | | | 4,608 | |
| Freddie Mac Pool #SD7517 3.00% 205012 | | | 36,320 | | | | 38,347 | |
| Freddie Mac Pool #SD0234 3.00% 205012 | | | 33,827 | | | | 35,510 | |
| Freddie Mac Pool #RA2319 3.00% 205012 | | | 23,097 | | | | 24,060 | |
| Freddie Mac Pool #SD0187 3.00% 205012 | | | 16,590 | | | | 17,503 | |
| Freddie Mac Pool #SD7545 2.50% 205112 | | | 78,527 | | | | 81,079 | |
| Freddie Mac Pool #QD3220 2.50% 205112 | | | 32,319 | | | | 33,412 | |
| Freddie Mac Pool #RA6483 2.50% 205112 | | | 9,753 | | | | 10,042 | |
| Freddie Mac Pool #RA4658 3.00% 205112 | | | 51,614 | | | | 54,358 | |
| Freddie Mac Pool #RA5971 3.00% 205112 | | | 4,931 | | | | 5,199 | |
| Freddie Mac, Series 2122, Class QM, 6.25% 202912 | | | 296 | | | | 326 | |
| Freddie Mac, Series 3257, Class PA, 5.50% 203612 | | | 2,881 | | | | 3,289 | |
| Freddie Mac, Series 3286, Class JN, 5.50% 203712 | | | 2,160 | | | | 2,406 | |
| Freddie Mac, Series 3318, Class JT, 5.50% 203712 | | | 1,271 | | | | 1,438 | |
| Freddie Mac, Series 4582, Class GA, 3.75% 20526,12 | | | 2,116 | | | | 2,154 | |
| Freddie Mac, Series KS01, Class A2, Multi Family, 2.522% 202312 | | | 2,721 | | | | 2,746 | |
| Freddie Mac, Series K036, Class A2, Multi Family, 3.527% 202312 | | | 2,000 | | | | 2,083 | |
| Freddie Mac, Series K044, Class A2, Multi Family, 2.811% 202512 | | | 23,390 | | | | 24,414 | |
| Freddie Mac, Series K049, Class A2, Multi Family, 3.01% 202512 | | | 774 | | | | 817 | |
| Freddie Mac, Series K734, Class A2, Multi Family, 3.208% 202612 | | | 5,065 | | | | 5,407 | |
| Freddie Mac, Series K060, Class A2, Multi Family, 3.30% 202612 | | | 400 | | | | 433 | |
| Freddie Mac, Series K061, Class A2, Multi Family, 3.347% 202612 | | | 2,951 | | | | 3,201 | |
| 40 | The Bond Fund of America |
| Bonds, notes & other debt instruments (continued) | | Principal amount
(000) | | | Value
(000) | |
| Mortgage-backed obligations (continued) | | | | | | |
| Federal agency mortgage-backed obligations (continued) | | | | | | |
| Freddie Mac, Series K064, Class A2, Multi Family, 3.224% 20276,12 | | $ | 1,000 | | | $ | 1,082 | |
| Freddie Mac, Series K065, Class A2, Multi Family, 3.243% 202712 | | | 1,170 | | | | 1,269 | |
| Freddie Mac, Series K074, Class A2, Multi Family, 3.60% 202812 | | | 955 | | | | 1,064 | |
| Freddie Mac, Series K084, Class A2, Multi Family, 3.78% 20286,12 | | | 6,045 | | | | 6,843 | |
| Freddie Mac, Series K078, Class A2, Multi Family, 3.854% 202812 | | | 4,000 | | | | 4,525 | |
| Freddie Mac, Series K076, Class A2, Multi Family, 3.90% 202812 | | | 3,965 | | | | 4,495 | |
| Freddie Mac, Series K081, Class A2, Multi Family, 3.90% 20286,12 | | | 1,700 | | | | 1,935 | |
| Freddie Mac, Series K082, Class A2, Multi Family, 3.92% 20286,12 | | | 1,680 | | | | 1,915 | |
| Freddie Mac, Series K079, Class A2, Multi Family, 3.926% 202812 | | | 172 | | | | 196 | |
| Freddie Mac, Series K083, Class A2, Multi Family, 4.05% 20286,12 | | | 3,000 | | | | 3,449 | |
| Freddie Mac, Series K101, Class A2, Multi Family, 2.524% 202912 | | | 62 | | | | 66 | |
| Freddie Mac, Series K090, Class A2, Multi Family, 3.422% 202912 | | | 5,000 | | | | 5,558 | |
| Freddie Mac, Series K089, Class A2, Multi Family, 3.563% 202912 | | | 5,249 | | | | 5,879 | |
| Freddie Mac, Series K105, Class A2, Multi Family, 1.872% 205312 | | | 23 | | | | 23 | |
| Freddie Mac, Series 3156, Class PO, principal only, 0% 203612 | | | 1,194 | | | | 1,098 | |
| Freddie Mac, Series 3136, Class OP, principal only, 0% 203612 | | | 328 | | | | 308 | |
| Freddie Mac, Series 3147, Class OD, principal only, 0% 203612 | | | 322 | | | | 301 | |
| Freddie Mac, Series 3149, Class MO, principal only, 0% 203612 | | | 219 | | | | 206 | |
| Freddie Mac, Series 3149, Class AO, principal only, 0% 203612 | | | 153 | | | | 142 | |
| Freddie Mac Seasoned Credit Risk Transfer Trust, Series 2017-2, Class MA, 3.00% 205612 | | | 37,363 | | | | 38,601 | |
| Freddie Mac Seasoned Credit Risk Transfer Trust, Series 2017-2, Class HA, 3.00% 20566,12 | | | 36,104 | | | | 37,248 | |
| Freddie Mac Seasoned Credit Risk Transfer Trust, Series 2017-1, Class HA, 3.00% 20566,12 | | | 29,696 | | | | 30,625 | |
| Freddie Mac Seasoned Credit Risk Transfer Trust, Series 2017-3, Class MT, 3.00% 205612 | | | 6,290 | | | | 6,506 | |
| Freddie Mac Seasoned Credit Risk Transfer Trust, Series 2017-1, Class MA, 3.00% 205612 | | | 4,068 | | | | 4,205 | |
| Freddie Mac Seasoned Credit Risk Transfer Trust, Series 2017-3, Class HA, 3.25% 20566,12 | | | 12,349 | | | | 12,771 | |
| Freddie Mac Seasoned Credit Risk Transfer Trust, Series 2017-3, Class HT, 3.25% 205612 | | | 1,256 | | | | 1,332 | |
| Freddie Mac Seasoned Credit Risk Transfer Trust, Series 2018-1, Class HT, 3.00% 205712 | | | 6,806 | | | | 7,131 | |
| Freddie Mac Seasoned Credit Risk Transfer Trust, Series 2017-4, Class HT, 3.25% 20576,12 | | | 17,304 | | | | 18,205 | |
| Freddie Mac Seasoned Credit Risk Transfer Trust, Series 2018-3, Class MA, 3.50% 205712 | | | 63,312 | | | | 65,698 | |
| Freddie Mac Seasoned Credit Risk Transfer Trust, Series 2018-2, Class MT, 3.50% 205712 | | | 17,892 | | | | 18,923 | |
| Freddie Mac Seasoned Credit Risk Transfer Trust, Series 2017-4, Class MT, 3.50% 205712 | | | 12,158 | | | | 12,930 | |
| Freddie Mac Seasoned Credit Risk Transfer Trust, Series 2017-4, Class M45T, 4.50% 205712 | | | 6,098 | | | | 6,592 | |
| Freddie Mac Seasoned Credit Risk Transfer Trust, Series 2019-2, Class MA, 3.50% 205812 | | | 27,953 | | | | 29,172 | |
| Freddie Mac Seasoned Credit Risk Transfer Trust, Series 2019-1, Class MT, 3.50% 205812 | | | 3,538 | | | | 3,742 | |
| Freddie Mac Seasoned Credit Risk Transfer Trust, Series 2019-2, Class MT, 3.50% 205812 | | | 2,961 | | | | 3,132 | |
| Freddie Mac Seasoned Credit Risk Transfer Trust, Series 2019-3, Class MT, 3.50% 205812 | | | 1,870 | | | | 1,978 | |
| Freddie Mac Seasoned Credit Risk Transfer Trust, Series 2019-1, Class MA, 3.50% 205812 | | | 1,732 | | | | 1,801 | |
| Freddie Mac Seasoned Credit Risk Transfer Trust, Series 2019-3, Class MA, 3.50% 205812 | | | 745 | | | | 774 | |
| Freddie Mac Seasoned Credit Risk Transfer Trust, Series 2019-4, Class MA, 3.00% 205912 | | | 136,714 | | | | 141,208 | |
| Freddie Mac Seasoned Loan Structured Transaction Trust, Series 2018-2, Class A1, 3.50% 202812 | | | 38,196 | | | | 39,398 | |
| Freddie Mac Seasoned Loan Structured Transaction Trust, Series 2018-1, Class A1, 3.50% 202812 | | | 23,898 | | | | 24,564 | |
| Freddie Mac Seasoned Loan Structured Transaction Trust, Series 2019-2, Class A1C, 2.75% 202912 | | | 64,950 | | | | 67,262 | |
| Freddie Mac Seasoned Loan Structured Transaction Trust, Series 2019-3, Class A1C, 2.75% 202912 | | | 54,613 | | | | 56,374 | |
| The Bond Fund of America | 41 |
| Bonds, notes & other debt instruments (continued) | | Principal amount
(000) | | | Value
(000) | |
| Mortgage-backed obligations (continued) | | | | | | |
| Federal agency mortgage-backed obligations (continued) | | | | | | |
| Freddie Mac Seasoned Loan Structured Transaction Trust, Series 2019-1, Class A1, 3.50% 202912 | | $ | 17,282 | | | $ | 17,972 | |
| Government National Mortgage Assn. 2.00% 205212,13 | | | 249,273 | | | | 251,542 | |
| Government National Mortgage Assn. 2.50% 205212,13 | | | 100,481 | | | | 102,683 | |
| Government National Mortgage Assn. 2.50% 205212,13 | | | 49,634 | | | | 50,832 | |
| Government National Mortgage Assn. 2.50% 205212,13 | | | 24,606 | | | | 25,096 | |
| Government National Mortgage Assn. 3.00% 205212,13 | | | 19,735 | | | | 20,420 | |
| Government National Mortgage Assn. 4.00% 205212,13 | | | 7,457 | | | | 7,853 | |
| Government National Mortgage Assn. Pool #MA0908 2.50% 202812 | | | 798 | | | | 826 | |
| Government National Mortgage Assn. Pool #AB3820 5.00% 203512 | | | 228 | | | | 244 | |
| Government National Mortgage Assn. Pool #AB3587 6.50% 203812 | | | 155 | | | | 171 | |
| Government National Mortgage Assn. Pool #AB3819 5.00% 203912 | | | 288 | | | | 308 | |
| Government National Mortgage Assn. Pool #004636 4.50% 204012 | | | 1,036 | | | | 1,136 | |
| Government National Mortgage Assn. Pool #783689 5.50% 204012 | | | 1,966 | | | | 2,245 | |
| Government National Mortgage Assn. Pool #783687 4.50% 204112 | | | 4,409 | | | | 4,750 | |
| Government National Mortgage Assn. Pool #AC2886 4.50% 204112 | | | 636 | | | | 684 | |
| Government National Mortgage Assn. Pool #AB3664 4.50% 204112 | | | 129 | | | | 137 | |
| Government National Mortgage Assn. Pool #AB3818 4.50% 204112 | | | 72 | | | | 77 | |
| Government National Mortgage Assn. Pool #783688 5.00% 204112 | | | 1,654 | | | | 1,824 | |
| Government National Mortgage Assn. Pool #754353 3.50% 204212 | | | 326 | | | | 338 | |
| Government National Mortgage Assn. Pool #AD7620 3.50% 204312 | | | 1,028 | | | | 1,091 | |
| Government National Mortgage Assn. Pool #MA2893 4.00% 204512 | | | 111 | | | | 120 | |
| Government National Mortgage Assn. Pool #BC1530 3.00% 204712 | | | 8,167 | | | | 8,262 | |
| Government National Mortgage Assn. Pool #BC1565 3.00% 204712 | | | 3,092 | | | | 3,114 | |
| Government National Mortgage Assn. Pool #MA5594 3.50% 204812 | | | 3,342 | | | | 3,496 | |
| Government National Mortgage Assn. Pool #MA5263 3.50% 204812 | | | 2,693 | | | | 2,828 | |
| Government National Mortgage Assn. Pool #MA5527 3.50% 204812 | | | 2,136 | | | | 2,239 | |
| Government National Mortgage Assn. Pool #MA5019 3.50% 204812 | | | 337 | | | | 354 | |
| Government National Mortgage Assn. Pool #MA5652 4.50% 204812 | | | 3,196 | | | | 3,383 | |
| Government National Mortgage Assn. Pool #MA5332 5.00% 204812 | | | 59 | | | | 63 | |
| Government National Mortgage Assn. Pool #MA5876 4.00% 204912 | | | 49,956 | | | | 52,716 | |
| Government National Mortgage Assn. Pool #MA5817 4.00% 204912 | | | 15,588 | | | | 16,515 | |
| Government National Mortgage Assn. Pool #MA5764 4.50% 204912 | | | 13,006 | | | | 13,749 | |
| Government National Mortgage Assn. Pool #MA5877 4.50% 204912 | | | 9,272 | | | | 9,801 | |
| Government National Mortgage Assn. Pool #MA5711 4.50% 204912 | | | 5,477 | | | | 5,796 | |
| Government National Mortgage Assn. Pool #MA6156 4.50% 204912 | | | 2,947 | | | | 3,114 | |
| Government National Mortgage Assn. Pool #MA5818 4.50% 204912 | | | 2,925 | | | | 3,095 | |
| Government National Mortgage Assn. Pool #MA6092 4.50% 204912 | | | 1,182 | | | | 1,250 | |
| Government National Mortgage Assn. Pool #MA6041 4.50% 204912 | | | 477 | | | | 505 | |
| Government National Mortgage Assn. Pool #MA5754 4.50% 204912 | | | 45 | | | | 47 | |
| Government National Mortgage Assn. Pool #MA5755 5.00% 204912 | | | 381 | | | | 403 | |
| Government National Mortgage Assn. Pool #MA6042 5.00% 204912 | | | 120 | | | | 128 | |
| Government National Mortgage Assn. Pool #MA6602 4.50% 205012 | | | 696 | | | | 734 | |
| Government National Mortgage Assn. Pool #MA7419 3.00% 205112 | | | 34,341 | | | | 35,583 | |
| Government National Mortgage Assn. Pool #MA7259 4.50% 205112 | | | 33,265 | | | | 35,321 | |
| Government National Mortgage Assn. Pool #694836 5.636% 205912 | | | 1 | | | | 1 | |
| Government National Mortgage Assn. Pool #725879 4.899% 206112 | | | 2 | | | | 2 | |
| Government National Mortgage Assn. Pool #725876 4.91% 206112 | | | 1 | | | | 1 | |
| Government National Mortgage Assn. Pool #765136 5.00% 206112 | | | 2 | | | | 2 | |
| Government National Mortgage Assn. Pool #710085 5.016% 206112 | | | 4 | | | | 4 | |
| Government National Mortgage Assn. Pool #721648 5.05% 206112 | | | 3 | | | | 3 | |
| Government National Mortgage Assn. Pool #AC1008 4.439% 206312 | | | 1 | | | | 1 | |
| Government National Mortgage Assn. Pool #AG8238 4.911% 206412 | | | 3 | | | | 3 | |
| Government National Mortgage Assn. Pool #725893 5.20% 206412 | | | — | 2 | | | — | 2 |
| Government National Mortgage Assn. Pool #AA7554 6.64% 206412 | | | — | 2 | | | — | 2 |
| Government National Mortgage Assn. Pool #AE9612 4.905% 206512 | | | 2 | | | | 2 | |
| JPMorgan Structured Financing Trust, Series 2021-EBO1, Class A, (1-month USD-LIBOR + 1.00%) 1.102% 20224,6,9,10,12 | | | 2,175 | | | | 2,175 | |
| Uniform Mortgage-Backed Security 1.50% 203712,13 | | | 13,210 | | | | 13,223 | |
| Uniform Mortgage-Backed Security 1.50% 203712,13 | | | 8,630 | | | | 8,654 | |
| Uniform Mortgage-Backed Security 2.00% 203712,13 | | | 25,077 | | | | 25,678 | |
| Uniform Mortgage-Backed Security 2.00% 203712,13 | | | 22,493 | | | | 22,995 | |
| Uniform Mortgage-Backed Security 3.00% 203712,13 | | | 21,774 | | | | 22,768 | |
| Uniform Mortgage-Backed Security 2.00% 205212,13 | | | 518,354 | | | | 514,550 | |
| Uniform Mortgage-Backed Security 2.00% 205212,13 | | | 73,566 | | | | 73,181 | |
| Uniform Mortgage-Backed Security 2.50% 205212,13 | | | 2,282,167 | | | | 2,317,570 | |
| Uniform Mortgage-Backed Security 2.50% 205212,13 | | | 850,417 | | | | 865,536 | |
| 42 | The Bond Fund of America |
| Bonds, notes & other debt instruments (continued) | | Principal amount
(000) | | | Value
(000) | |
| Mortgage-backed obligations (continued) | | | | | | | | |
| Federal agency mortgage-backed obligations (continued) | | | | | | | | |
| Uniform Mortgage-Backed Security 3.00% 205212,13 | | $ | 248,159 | | | $ | 256,725 | |
| Uniform Mortgage-Backed Security 3.00% 205212,13 | | | 114,574 | | | | 118,703 | |
| Uniform Mortgage-Backed Security 3.50% 205212,13 | | | 45,290 | | | | 47,681 | |
| Uniform Mortgage-Backed Security 4.00% 205212,13 | | | 6,720 | | | | 7,149 | |
| Uniform Mortgage-Backed Security 4.50% 205212,13 | | | 30,231 | | | | 32,389 | |
| | | | | | | | 8,804,660 | |
| | | | | | | | | |
| Collateralized mortgage-backed obligations (privately originated) 1.60% | | | | | | | | |
| Arroyo Mortgage Trust, Series 2021-1R, Class A1, 1.175% 20484,6,12 | | | 20,238 | | | | 20,147 | |
| Arroyo Mortgage Trust, Series 2020-1, Class A1A, 1.662% 20554,12 | | | 816 | | | | 817 | |
| Bellemeade Re, Ltd., Series 2019-3A, Class M1B, (1-month USD-LIBOR + 1.60%) 1.702% 20294,6,12 | | | 4,877 | | | | 4,879 | |
| BRAVO Residential Funding Trust, Series 2020-RPL2, Class A1, 2.00% 20594,6,12 | | | 3,107 | | | | 3,112 | |
| BRAVO Residential Funding Trust, Series 2020-RPL1, Class A1, 2.50% 20594,6,12 | | | 2,285 | | | | 2,310 | |
| Cascade Funding Mortgage Trust, Series 2020-HB4, Class A, 0.946% 20304,6,12 | | | 13,613 | | | | 13,634 | |
| Cascade Funding Mortgage Trust, Series 2021-HB7, Class A, 1.151% 20314,6,12 | | | 22,629 | | | | 22,575 | |
| Cascade Funding Mortgage Trust, Series 2021-HB6, Class A, 0.898% 20364,6,12 | | | 14,786 | | | | 14,780 | |
| CFCRE Commercial Mortgage Trust, Series 2016-C7, Class A2, 3.585% 205412 | | | 1,927 | | | | 2,043 | |
| Citigroup Mortgage Loan Trust, Inc., Series 2020-EXP1, Class A1A, 1.804% 20604,6,12 | | | 1,148 | | | | 1,156 | |
| Citigroup Mortgage Loan Trust, Inc., Series 2018-RP1, Class M1, 3.00% 20644,6,12 | | | 3,731 | | | | 3,848 | |
| COLT Funding, LLC, Series 2021-5, Class A1, 1.726% 20614,6,12 | | | 12,849 | | | | 12,825 | |
| COLT Funding, LLC, Series 2021-5, Class A2, 2.606% 20614,6,12 | | | 1,554 | | | | 1,551 | |
| Connecticut Avenue Securities, Series 2021-R01, Class 1M1, (1-month USD-SOFR + 0.75%) 0.80% 20414,6,12 | | | 608 | | | | 608 | |
| Credit Suisse Mortgage Trust, Series 2020-NET, Class A, 2.257% 20374,12 | | | 6,770 | | | | 6,831 | |
| Credit Suisse Mortgage Trust, Series 2019-RPL1, Class A1A, 3.65% 20584,6,12 | | | 1,067 | | | | 1,101 | |
| Credit Suisse Mortgage Trust, Series 2017-RPL3, Class A1, 2.00% 20604,6,12 | | | 5,940 | | | | 5,975 | |
| CS First Boston Mortgage Securities Corp., Series 2002-30, Class IA1, 7.50% 203212 | | | 179 | | | | 192 | |
| CS First Boston Mortgage Securities Corp., Series 2002-34, Class IA1, 7.50% 203212 | | | 69 | | | | 73 | |
| CS First Boston Mortgage Securities Corp., Series 2003-21, Class VA1, 6.50% 203312 | | | 963 | | | | 1,012 | |
| CS First Boston Mortgage Securities Corp., Series 2003-29, Class VA1, 7.00% 203312 | | | 213 | | | | 220 | |
| Finance of America HECM Buyout, Series 2020-HB2, Class A, 1.71% 20304,6,12 | | | 13,001 | | | | 13,030 | |
| Finance of America Structured Securities Trust, Series 2019-JR1, Class A, 2.00% 20694,12 | | | 15,248 | | | | 16,993 | |
| Finance of America Structured Securities Trust, Series 2019-JR2, Class A1, 2.00% 20694,12 | | | 14,970 | | | | 16,405 | |
| Flagstar Mortgage Trust, Series 2021-10INV, Class A3, 2.50% 20514,6,12 | | | 45,222 | | | | 45,308 | |
| Flagstar Mortgage Trust, Series 2021-8INV, Class A3, 2.50% 20514,6,12 | | | 19,669 | | | | 19,663 | |
| Flagstar Mortgage Trust, Series 2021-11INV, Class A4, 2.50% 20514,6,12 | | | 17,424 | | | | 17,436 | |
| Flagstar Mortgage Trust, Series 2021-5INV, Class A2, 2.50% 20514,6,12 | | | 15,991 | | | | 16,087 | |
| Flagstar Mortgage Trust, Series 2021-6INV, Class A4, 2.50% 20514,6,12 | | | 14,918 | | | | 14,914 | |
| Flagstar Mortgage Trust, Series 2021-11INV, Class A2, 3.00% 20514,6,12 | | | 2,948 | | | | 3,029 | |
| Freddie Mac Structured Agency Credit Risk Debt Notes, Series 2021-DNA2, Class M2, (1-month USD-SOFR + 2.30%) 2.35% 20334,6,12 | | | 6,500 | | | | 6,625 | |
| Freddie Mac Structured Agency Credit Risk Debt Notes, Series 2021-DNA5, Class M2, (1-month USD-SOFR + 1.65%) 1.70% 20344,6,12 | | | 330 | | | | 332 | |
| Freddie Mac Structured Agency Credit Risk Debt Notes, Series 2021-DNA7, Class M1, (1-month USD-SOFR + 0.85%) 0.90% 20414,6,12 | | | 2,275 | | | | 2,276 | |
| Freddie Mac Structured Agency Credit Risk Debt Notes, Series 2021-DNA6, Class M2, (1-month USD-SOFR + 1.50%) 1.55% 20414,6,12 | | | 17,026 | | | | 17,034 | |
| Freddie Mac Structured Agency Credit Risk Debt Notes, Series 2021-DNA7, Class M2, (1-month USD-SOFR + 1.80%) 1.85% 20414,6,12 | | | 1,619 | | | | 1,625 | |
| Freddie Mac Structured Agency Credit Risk Debt Notes, Series 2020-DNA2, Class M2, (1-month USD-LIBOR + 1.85%) 1.952% 20504,6,12 | | | 5,694 | | | | 5,718 | |
| Freddie Mac Structured Agency Credit Risk Debt Notes, Series 2020-DNA3, Class M2, (1-month USD-LIBOR + 3.00%) 3.102% 20504,6,12 | | | 1,597 | | | | 1,600 | |
| GCAT, Series 2021-NQM6, Class A1, 1.855% 20664,6,12 | | | 27,693 | | | | 27,604 | |
| Home Partners of America Trust, Series 2021-2, Class A, 1.901% 20264,12 | | | 28,624 | | | | 28,359 | |
| Home Partners of America Trust, Series 2021-2, Class B, 2.302% 20264,12 | | | 1,999 | | | | 1,977 | |
| HSI Asset Securitization Corp. Trust, Series 2006-OPT2, Class M2, 0.687% 20366,12 | | | 2,964 | | | | 2,966 | |
| Hundred Acre Wood Trust, Series 2021-INV1, Class A3, 2.50% 20514,6,12 | | | 5,357 | | | | 5,379 | |
| Imperial Fund, LLC, Series 2021-NQM4, Class A1, 2.091% 20574,6,12 | | | 2,044 | | | | 2,039 | |
| JPMDB Commercial Mortgage Securities Trust, Series 2017-C7, Class A5, 3.409% 205012 | | | 1,683 | | | | 1,809 | |
| JPMDB Commercial Mortgage Securities Trust, Series 2019-COR6, Class A4, 3.057% 205212 | | | 975 | | | | 1,036 | |
| Legacy Mortgage Asset Trust, Series 2019-GS5, Class A1, 3.20% 20594,6,12 | | | 4,629 | | | | 4,645 | |
| The Bond Fund of America | 43 |
| Bonds, notes & other debt instruments (continued) | | Principal amount
(000) | | | Value
(000) | |
| Mortgage-backed obligations (continued) | | | | | | | | |
| Collateralized mortgage-backed obligations (privately originated) (continued) |
| Legacy Mortgage Asset Trust, Series 2019-GS2, Class A1, 3.75% 20594,6,12 | | $ | 5,071 | | | $ | 5,081 | |
| Legacy Mortgage Asset Trust, Series 2021-GS2, Class A1, 1.75% 20614,6,12 | | | 9,481 | | | | 9,408 | |
| Legacy Mortgage Asset Trust, Series 2021-GS5, Class A1, 2.25% 2067 (5.25% on 11/25/2024)4,5,12 | | | 10,438 | | | | 10,416 | |
| Mello Warehouse Securitization Trust, Series 2020-2, Class A, (1-month USD-LIBOR + 0.80%) 0.902% 20534,6,12 | | | 15,541 | | | | 15,498 | |
| Mello Warehouse Securitization Trust, Series 2020-1, Class A, (1-month USD-LIBOR + 0.90%) 1.002% 20534,6,12 | | | 34,517 | | | | 34,535 | |
| Mello Warehouse Securitization Trust, Series 2021-2, Class A, (1-month USD-LIBOR + 0.75%) 0.852% 20554,6,12 | | | 16,464 | | | | 16,425 | |
| Mello Warehouse Securitization Trust, Series 2021-3, Class A, (1-month USD-LIBOR + 0.85%) 0.952% 20554,6,12 | | | 88,549 | | | | 88,489 | |
| MFRA Trust, Series 2021-RPL1, Class A1, 1.131% 20604,6,12 | | | 24,436 | | | | 24,061 | |
| Mill City Mortgage Trust, Series 2019-GS2, Class A1, 2.75% 20594,6,12 | | | 5,291 | | | | 5,381 | |
| Mill City Mortgage Trust, Series 2018-1, Class A1, 3.25% 20624,6,12 | | | 252 | | | | 256 | |
| Mortgage Repurchase Agreement Financing Trust, Series 2020-5, (1-month USD-LIBOR + 1.00%) 1.101% 20234,6,12 | | | 38,698 | | | | 38,741 | |
| MRA Issuance Trust, Series 2020-10, Class A, (1-month USD-LIBOR + 1.70%) 1.786% 20224,6,12 | | | 104,386 | | | | 104,482 | |
| MRA Issuance Trust, Series 2020-10, Class A2, (1-month USD-LIBOR + 1.70%) 1.786% 20224,6,12 | | | 52,286 | | | | 52,354 | |
| MRA Issuance Trust, Series 2021-16, Class A1, (1-month USD-LIBOR + 1.55%) 1.644% 20514,6,12 | | | 116,362 | | | | 116,378 | |
| New Residential Mortgage Loan Trust, Series 2019-2A, Class A1, 4.25% 20574,6,12 | | | 2,817 | | | | 2,946 | |
| New Residential Mortgage Loan Trust, Series 2020-RPL1, Class A1, 2.75% 20594,6,12 | | | 2,855 | | | | 2,907 | |
| NewRez Warehouse Securitization Trust, Series 2021-1, Class A, (1-month USD-LIBOR + 0.75%) 0.852% 20554,6,12 | | | 44,457 | | | | 44,398 | |
| One Market Plaza Trust, Series 2017-1MKT, Class A, 3.614% 20324,12 | | | 1,220 | | | | 1,225 | |
| One Market Plaza Trust, Series 2017-1MKT, Class C, 4.016% 20324,12 | | | 1,000 | | | | 1,000 | |
| PRKCM Trust, Series 2021-AFC2, Class A1, 2.071% 20564,6,12 | | | 21,500 | | | | 21,460 | |
| Progress Residential Trust, Series 2021-SFR10, Class A, 2.393% 20384,12 | | | 853 | | | | 860 | |
| Progress Residential Trust, Series 2021-SFR10, Class B, 2.722% 20384,12 | | | 800 | | | | 801 | |
| Provident Funding Mortgage Warehouse Securitization Trust, Series 2021-1, Class A, (1-month USD-LIBOR + 0.70%) 0.802% 20554,6,12 | | | 10,672 | | | | 10,626 | |
| Reverse Mortgage Investment Trust, Series 2021-HB1, Class A, 1.259% 20314,6,12 | | | 39,831 | | | | 39,778 | |
| RMF Proprietary Issuance Trust, Series 2019-1, Class A, 2.75% 20634,6,12 | | | 4,081 | | | | 4,089 | |
| Sequoia Mortgage Trust, Series 2007-2, Class 1A2, (1-month USD-LIBOR + 0.38%) 0.294% 20366,12 | | | 6,239 | | | | 6,141 | |
| Station Place Securitization Trust, Series 2021-WL1, Class A, (1-month USD-LIBOR + 0.65%) 0.752% 20544,6,12 | | | 10,859 | | | | 10,869 | |
| Station Place Securitization Trust, Series 2021-WL2, Class A, (1-month USD-LIBOR + 0.70%) 0.802% 20544,6,12 | | | 27,050 | | | | 27,078 | |
| TBW Mortgage-Backed Trust, Series 2007-2, Class A4B, (1-month USD-LIBOR + 0.42%) 0.943% 20376,12 | | | 8,030 | | | | 7,253 | |
| Towd Point Mortgage Trust, Series 2015-3, Class M2, 4.00% 20544,6,12 | | | 6,600 | | | | 6,767 | |
| Towd Point Mortgage Trust, Series 2016-2, Class A1A, 2.75% 20554,6,12 | | | 133 | | | | 133 | |
| Towd Point Mortgage Trust, Series 2016-4, Class A1, 2.25% 20564,6,12 | | | 2,444 | | | | 2,454 | |
| Towd Point Mortgage Trust, Series 2016-5, Class A1, 2.50% 20564,6,12 | | | 2,037 | | | | 2,055 | |
| Towd Point Mortgage Trust, Series 2017-5, Class A1, 0.702% 20574,6,12 | | | 528 | | | | 528 | |
| Towd Point Mortgage Trust, Series 2017-6, Class A1, 2.75% 20574,6,12 | | | 1,377 | | | | 1,395 | |
| Towd Point Mortgage Trust, Series 2017-4, Class A1, 2.75% 20574,6,12 | | | 914 | | | | 930 | |
| Towd Point Mortgage Trust, Series 2017-3, Class A1, 2.75% 20574,6,12 | | | 597 | | | | 604 | |
| Towd Point Mortgage Trust, Series 2017-6, Class M2, 3.25% 20574,6,12 | | | 4,677 | | | | 4,847 | |
| Towd Point Mortgage Trust, Series 2018-1, Class A2, 3.25% 20584,6,12 | | | 10,000 | | | | 10,286 | |
| Towd Point Mortgage Trust, Series 2018-2, Class A1, 3.25% 20584,6,12 | | | 9,001 | | | | 9,201 | |
| Towd Point Mortgage Trust, Series 2018-5, Class A1A, 3.25% 20584,6,12 | | | 6,383 | | | | 6,486 | |
| Towd Point Mortgage Trust, Series 2019-A2, Class A2, 3.75% 20584,6,12 | | | 3,615 | | | | 3,797 | |
| Towd Point Mortgage Trust, Series 2018-3, Class M2, 3.875% 20584,6,12 | | | 6,000 | | | | 6,387 | |
| Towd Point Mortgage Trust, Series 2019-4, Class M1B, 3.00% 20594,6,12 | | | 5,000 | | | | 5,118 | |
| Towd Point Mortgage Trust, Series 2020-4, Class A1, 1.75% 20604,12 | | | 28,834 | | | | 28,794 | |
| Tricon Residential, Series 2021-SFR1, Class A, 1.943% 20384,12 | | | 29,735 | | | | 29,644 | |
| Verus Securitization Trust, Series 2021-7, Class A1, 1.829% 20664,6,12 | | | 39,383 | | | | 39,325 | |
| ZH Trust, Series 2021-1, Class A, 2.253% 20274,12 | | | 1,057 | | | | 1,043 | |
| ZH Trust, Series 2021-2, Class A, 2.349% 20274,12 | | | 14,181 | | | | 14,177 | |
| | | | | | | | 1,270,485 | |
| 44 | The Bond Fund of America |
| Bonds, notes & other debt instruments (continued) | | Principal amount
(000) | | | Value
(000) | |
| Mortgage-backed obligations (continued) | | | | | | | | |
| Commercial mortgage-backed securities 1.12% | | | | | | | | |
| Banc of America Commercial Mortgage, Inc., Series 2015-UBS7, Class A4, 3.705% 204812 | | $ | 2,750 | | | $ | 2,915 | |
| Banc of America Commercial Mortgage, Inc., Series 2017-BNK3, Class A4, 3.574% 205012 | | | 115 | | | | 124 | |
| Bank Commercial Mortgage Trust, Series 2019-BN17, Class A4, 3.714% 205212 | | | 255 | | | | 282 | |
| Bank Commercial Mortgage Trust, Series 2019-BN16, Class A4, 4.005% 205212 | | | 3,920 | | | | 4,406 | |
| Bank Commercial Mortgage Trust, Series 2017-BNK9, Class A4, 3.538% 205412 | | | 135 | | | | 147 | |
| Bank Commercial Mortgage Trust, Series 2017-BNK7, Class A5, 3.435% 206012 | | | 3,750 | | | | 4,048 | |
| Bank Commercial Mortgage Trust, Series 2019-BN19, Class A3, 3.183% 206112 | | | 2,546 | | | | 2,731 | |
| Bank Commercial Mortgage Trust, Series 2018-BN10, Class A4, 3.428% 206112 | | | 330 | | | | 352 | |
| Bank Commercial Mortgage Trust, Series 2018-BN10, Class A5, 3.688% 206112 | | | 2,510 | | | | 2,749 | |
| Bank Commercial Mortgage Trust, Series 2019-BN12, Class A3, 3.99% 206112 | | | 500 | | | | 557 | |
| Bank Commercial Mortgage Trust, Series 2018-BN15, Class A3, 4.138% 206112 | | | 500 | | | | 556 | |
| Bank Commercial Mortgage Trust, Series 2018-BN13, Class A5, 4.217% 20616,12 | | | 250 | | | | 282 | |
| Bank Commercial Mortgage Trust, Series 2018-BN12, Class A4, 4.255% 20616,12 | | | 11,116 | | | | 12,559 | |
| Bank Commercial Mortgage Trust, Series 2020-BN26, Class A4, 2.403% 206312 | | | 1,654 | | | | 1,688 | |
| Bank of America Merrill Lynch Large Loan, Inc., Series 2015-200P, Class A, 3.218% 20334,12 | | | 2,000 | | | | 2,089 | |
| Barclays Commercial Mortgage Securities LLC, Series 2017-DELC, Class A, 0.96% 20364,6,12 | | | 1,000 | | | | 1,000 | |
| Benchmark Mortgage Trust, Series 2018-B2, Class A4, 3.615% 205112 | | | 3,475 | | | | 3,754 | |
| Benchmark Mortgage Trust, Series 2018-B3, Class A5, 4.025% 205112 | | | 5,890 | | | | 6,547 | |
| Benchmark Mortgage Trust, Series 2018-B4, Class A5, 4.121% 20516,12 | | | 90 | | | | 101 | |
| Benchmark Mortgage Trust, Series 2018-B8, Class A5, 4.232% 205212 | | | 6,351 | | | | 7,198 | |
| Benchmark Mortgage Trust, Series 2020-B17, Class A5, 2.289% 205312 | | | 944 | | | | 951 | |
| Benchmark Mortgage Trust, Series 2018-B7, Class A3, 4.241% 205312 | | | 1,000 | | | | 1,114 | |
| Benchmark Mortgage Trust, Series 2018-B7, Class A4, 4.51% 20536,12 | | | 6,954 | | | | 8,000 | |
| Benchmark Mortgage Trust, Series 2019-B13, Class A4, 2.952% 205712 | | | 730 | | | | 770 | |
| Benchmark Mortgage Trust, Series 2019-B14, Class AS, 3.049% 206212 | | | 5,000 | | | | 5,312 | |
| Benchmark Mortgage Trust, Series 2019-B10, Class A3, 3.455% 206212 | | | 500 | | | | 537 | |
| BX Trust, Series 2018-GW, Class A, 0.91% 20354,6,12 | | | 2,684 | | | | 2,683 | |
| BX Trust, Series 2021-ACNT, Class A, (1-month USD-LIBOR + 0.85%) 0.95% 20264,6,12 | | | 58,843 | | | | 58,850 | |
| BX Trust, Series 2021-ACNT, Class B, (1-month USD-LIBOR + 1.25%) 1.35% 20264,6,12 | | | 1,996 | | | | 1,993 | |
| BX Trust, Series 2021-ACNT, Class C, (1-month USD-LIBOR + 1.50%) 1.60% 20264,6,12 | | | 392 | | | | 391 | |
| BX Trust, Series 2021-ACNT, Class D, (1-month USD-LIBOR + 1.85%) 1.95% 20264,6,12 | | | 561 | | | | 559 | |
| BX Trust, Series 2021-SDMF, Class A, (1-month USD-LIBOR + 0.589%) 0.699% 20344,6,12 | | | 5,954 | | | | 5,893 | |
| BX Trust, Series 2021-SDMF, Class D, (1-month USD-LIBOR + 1.387%) 1.497% 20344,6,12 | | | 3,000 | | | | 2,956 | |
| BX Trust, Series 2021-VOLT, Class A, (1-month USD-LIBOR + 0.70%) 0.81% 20364,6,12 | | | 83,858 | | | | 83,688 | |
| BX Trust, Series 2021-RISE, Class A, (1-month USD-LIBOR + 0.74%) 0.848% 20364,6,12 | | | 74,996 | | | | 75,023 | |
| BX Trust, Series 2021-ARIA, Class A, (1-month USD-LIBOR + 0.899%) 1.009% 20364,6,12 | | | 31,873 | | | | 31,863 | |
| BX Trust, Series 2021-VOLT, Class B, (1-month USD-LIBOR + 0.95%) 1.06% 20364,6,12 | | | 2,036 | | | | 2,027 | |
| BX Trust, Series 2021-ARIA, Class B, (1-month USD-LIBOR + 1.297%) 1.407% 20364,6,12 | | | 2,984 | | | | 2,982 | |
| BX Trust, Series 2021-ARIA, Class C, (1-month USD-LIBOR + 1.646%) 1.756% 20364,6,12 | | | 1,992 | | | | 1,989 | |
| BX Trust, Series 2021-ARIA, Class D, (1-month USD-LIBOR + 1.895%) 2.005% 20364,6,12 | | | 690 | | | | 689 | |
| BX Trust, Series 2021-SOAR, Class A, (1-month USD-LIBOR + 0.67%) 0.78% 20384,6,12 | | | 15,655 | | | | 15,588 | |
| BX Trust, Series 2021-SOAR, Class B, (1-month USD-LIBOR + 0.87%) 0.98% 20384,6,12 | | | 1,089 | | | | 1,085 | |
| BX Trust, Series 2021-SOAR, Class C, (1-month USD-LIBOR + 1.10%) 1.21% 20384,6,12 | | | 737 | | | | 734 | |
| BX Trust, Series 2021-SOAR, Class D, (1-month USD-LIBOR + 1.40%) 1.51% 20384,6,12 | | | 1,866 | | | | 1,859 | |
| BXP Trust, Series 2017-GM, Class A, 3.379% 20394,12 | | | 4,500 | | | | 4,760 | |
| CD Commercial Mortgage Trust, Series 2017-CD6, Class A5, 3.456% 205012 | | | 5,576 | | | | 6,011 | |
| CIM Retail Portfolio Trust, Series 2021-RETL, Class A, (1-month USD-LIBOR + 1.40%) 1.51% 20364,6,12 | | | 7,550 | | | | 7,545 | |
| Citigroup Commercial Mortgage Trust, Series 2012-GC8, Class B, 4.285% 20454,12 | | | 500 | | | | 506 | |
| Citigroup Commercial Mortgage Trust, Series 2014-GC21, Class AS, 4.026% 204712 | | | 2,000 | | | | 2,096 | |
| Citigroup Commercial Mortgage Trust, Series 2014-GC21, Class B, 4.328% 20476,12 | | | 1,800 | | | | 1,878 | |
| Citigroup Commercial Mortgage Trust, Series 2015-GC27, Class A4, 2.878% 204812 | | | 1,006 | | | | 1,028 | |
| Citigroup Commercial Mortgage Trust, Series 2016-GC37, Class A4, 3.314% 204912 | | | 2,740 | | | | 2,893 | |
| Citigroup Commercial Mortgage Trust, Series 2016-C1, Class AS, 3.514% 204912 | | | 600 | | | | 633 | |
| Citigroup Commercial Mortgage Trust, Series 2016-GC36, Class A5, 3.616% 204912 | | | 1,525 | | | | 1,627 | |
| Citigroup Commercial Mortgage Trust, Series 2017-B1, Class A3, 3.197% 205012 | | | 6,250 | | | | 6,568 | |
| Citigroup Commercial Mortgage Trust, Series 2017-C4, Class A4, 3.471% 205012 | | | 2,930 | | | | 3,150 | |
| Citigroup Commercial Mortgage Trust, Series 2019-GC41, Class AA, 2.62% 205612 | | | 200 | | | | 207 | |
| Citigroup Commercial Mortgage Trust, Series 2015-GC33, Class A3, 3.515% 205812 | | | 4,900 | | | | 5,143 | |
| Commercial Mortgage Trust, Series 2012-CRS, Class A4, 2.771% 204512 | | | 1,871 | | | | 1,898 | |
| The Bond Fund of America | 45 |
| Bonds, notes & other debt instruments (continued) | | Principal amount
(000) | | | Value
(000) | |
| Mortgage-backed obligations (continued) | | | | | | | | |
| Commercial mortgage-backed securities (continued) | | | | | | | | |
| Commercial Mortgage Trust, Series 2012-CR3, Class AM, 3.416% 20454,12 | | $ | 700 | | | $ | 700 | |
| Commercial Mortgage Trust, Series 2012-CR2, Class B, 4.393% 204512 | | | 700 | | | | 707 | |
| Commercial Mortgage Trust, Series 2013-CR6, Class B, 3.397% 20464,12 | | | 2,000 | | | | 2,026 | |
| Commercial Mortgage Trust, Series 2013-CRE7, Class B, 3.613% 20464,12 | | | 2,000 | | | | 2,047 | |
| Commercial Mortgage Trust, Series 2013-CR7, Class C, 4.063% 20464,6,12 | | | 2,743 | | | | 2,804 | |
| Commercial Mortgage Trust, Series 2013-LC13, Class B, 5.009% 20464,6,12 | | | 830 | | | | 868 | |
| Commercial Mortgage Trust, Series 2014-UBS4, Class A5, 3.694% 204712 | | | 910 | | | | 956 | |
| Commercial Mortgage Trust, Series 2014-CR16, Class A3, 3.775% 204712 | | | 1,972 | | | | 2,052 | |
| Commercial Mortgage Trust, Series 2014-LC17, Class A5, 3.917% 204712 | | | 886 | | | | 941 | |
| Commercial Mortgage Trust, Series 2014-UBS2, Class AM, 4.048% 204712 | | | 875 | | | | 924 | |
| Commercial Mortgage Trust, Series 2014-CR15, Class A4, 4.074% 20476,12 | | | 3,000 | | | | 3,140 | |
| Commercial Mortgage Trust, Series 2014-CR19, Class AM, 4.08% 204712 | | | 750 | | | | 792 | |
| Commercial Mortgage Trust, Series 2014-LC15, Class AM, 4.198% 204712 | | | 850 | | | | 892 | |
| Commercial Mortgage Trust, Series 2014-CR16, Class AM, 4.278% 204712 | | | 1,070 | | | | 1,129 | |
| Commercial Mortgage Trust, Series 2014-LC17, Class B, 4.49% 20476,12 | | | 2,200 | | | | 2,308 | |
| Commercial Mortgage Trust, Series 2014-UBS4, Class B, 4.701% 204712 | | | 1,000 | | | | 1,050 | |
| Commercial Mortgage Trust, Series 2015-CR22, Class B, 3.926% 20486,12 | | | 4,250 | | | | 4,460 | |
| Commercial Mortgage Trust, Series 2016-COR1, Class A4, 3.091% 204912 | | | 4,000 | | | | 4,204 | |
| Commercial Mortgage Trust, Series 2017-COR2, Class A2, 3.239% 205012 | | | 970 | | | | 1,019 | |
| Commercial Mortgage Trust, Series 2017-COR2, Class A3, 3.51% 205012 | | | 2,261 | | | | 2,439 | |
| Commercial Mortgage Trust, Series 2015-PC1, Class A4, 3.62% 205012 | | | 2,309 | | | | 2,372 | |
| Commercial Mortgage Trust, Series 2015-PC1, Class AM, 4.29% 20506,12 | | | 1,250 | | | | 1,336 | |
| Commercial Mortgage Trust, Series 2013-CR11, Class B, 5.111% 20506,12 | | | 500 | | | | 526 | |
| CSAIL Commercial Mortgage Trust, Series 2015-C4, Class C, 4.561% 20486,12 | | | 556 | | | | 581 | |
| CSAIL Commercial Mortgage Trust, Series 2017-CX9, Class A4, 3.176% 205012 | | | 2,375 | | | | 2,473 | |
| CSAIL Commercial Mortgage Trust, Series 2015-C1, Class B, 4.044% 20506,12 | | | 600 | | | | 608 | |
| CSAIL Commercial Mortgage Trust, Series 2015-C2, Class A3, 3.231% 205712 | | | 2,759 | | | | 2,853 | |
| Deutsche Bank Commercial Mortgage Trust, Series 2016-C1, Class AM, 3.539% 204912 | | | 500 | | | | 527 | |
| Ellington Financial Mortgage Trust, Series 2021-3, Class A1, 1.241% 20664,6,12 | | | 2,450 | | | | 2,411 | |
| Extended Stay America Trust, Series 2021-ESH, Class A, (1-month USD-LIBOR + 1.08%) 1.19% 20384,6,12 | | | 17,540 | | | | 17,590 | |
| Extended Stay America Trust, Series 2021-ESH, Class B, (1-month USD-LIBOR + 1.38%) 1.49% 20384,6,12 | | | 4,002 | | | | 4,009 | |
| Extended Stay America Trust, Series 2021-ESH, Class C, (1-month USD-LIBOR + 1.70%) 1.81% 20384,6,12 | | | 4,180 | | | | 4,188 | |
| Extended Stay America Trust, Series 2021-ESH, Class D, (1-month USD-LIBOR + 2.25%) 2.36% 20384,6,12 | | | 4,171 | | | | 4,181 | |
| Fontainebleau Miami Beach Trust, CMO, Series 2019-FBLU, Class A, 3.144% 20364,12 | | | 5,000 | | | | 5,115 | |
| Grace Mortgage Trust, Series 2020-GRCE, Class A, 2.347% 20404,12 | | | 7,590 | | | | 7,596 | |
| GS Mortgage Securities Trust, Series 2018-HULA, Class A, 1.03% 20254,6,12 | | | 923 | | | | 923 | |
| GS Mortgage Securities Trust, Series 2019-BOCA, Class A, (1-month USD-LIBOR + 1.20%) 1.31% 20384,6,12 | | | 1,000 | | | | 1,001 | |
| GS Mortgage Securities Trust, Series 2012-GCJ7, Class A4, 3.377% 204512 | | | 103 | | | | 103 | |
| GS Mortgage Securities Trust, Series 2013-GC12, Class A4, 3.135% 204612 | | | 1,250 | | | | 1,281 | |
| GS Mortgage Securities Trust, Series 2013-GC10, Class B, 3.682% 20464,12 | | | 4,500 | | | | 4,575 | |
| GS Mortgage Securities Trust, Series 2013-GC12, Class B, 3.777% 20466,12 | | | 1,500 | | | | 1,537 | |
| GS Mortgage Securities Trust, Series 2020-GS1, Class A2, 3.47% 204812 | | | 3,000 | | | | 3,109 | |
| GS Mortgage Securities Trust, Series 2016-GS4, Class A3, 3.178% 204912 | | | 2,500 | | | | 2,604 | |
| GS Mortgage Securities Trust, Series 2016-GS4, Class A4, 3.442% 20496,12 | | | 2,654 | | | | 2,836 | |
| GS Mortgage Securities Trust, Series 2017-GS7, Class A3, 3.167% 205012 | | | 855 | | | | 902 | |
| GS Mortgage Securities Trust, Series 2017-GS7, Class A4, 3.43% 205012 | | | 1,000 | | | | 1,074 | |
| GS Mortgage Securities Trust, Series 2019-GC38, Class A4, 3.968% 205212 | | | 255 | | | | 285 | |
| GS Mortgage Securities Trust, Series 2020-GC47, Class A5, 2.377% 205312 | | | 7,483 | | | | 7,596 | |
| GS Mortgage Securities Trust, Series 2020-GC45, Class A5, 2.911% 205312 | | | 174 | | | | 183 | |
| Hawaii Hotel Trust, Series 2019-MAUI, Class A, (1-month USD-LIBOR + 1.15%) 1.26% 20384,6,12 | | | 7,000 | | | | 7,010 | |
| JPMBB Commercial Mortgage Securities Trust, Series 2014-C19, Class A4, 3.997% 204712 | | | 2,450 | | | | 2,566 | |
| JPMBB Commercial Mortgage Securities Trust, Series 2014-C18, Class A5, 4.079% 204712 | | | 8,195 | | | | 8,591 | |
| JPMBB Commercial Mortgage Securities Trust, Series 2014-C19, Class B, 4.394% 20476,12 | | | 600 | | | | 629 | |
| JPMBB Commercial Mortgage Securities Trust, Series 2014-C23, Class B, 4.484% 20476,12 | | | 100 | | | | 105 | |
| JPMBB Commercial Mortgage Securities Trust, Series 2014-C26, Class B, 3.951% 204812 | | | 3,500 | | | | 3,586 | |
| 46 | The Bond Fund of America |
| Bonds, notes & other debt instruments (continued) | | Principal amount
(000) | | | Value
(000) | |
| Mortgage-backed obligations (continued) | | | | | | | | |
| Commercial mortgage-backed securities (continued) | | | | | | | | |
| JPMDB Commercial Mortgage Securities Trust, Series 2017-C5, Class A5, 3.694% 205012 | | $ | 1,600 | | | $ | 1,728 | |
| JPMorgan Chase Commercial Mortgage Securities Trust, Series 2018-BCON, Class A, 3.735% 20314,12 | | | 3,955 | | | | 4,043 | |
| JPMorgan Chase Commercial Mortgage Securities Trust, Series 2021-410T, Class A, 2.287% 20424,12 | | | 1,920 | | | | 1,926 | |
| JPMorgan Chase Commercial Mortgage Securities Trust, Series 2013-C16, Class A4, 4.166% 204612 | | | 1,020 | | | | 1,066 | |
| JPMorgan Chase Commercial Mortgage Securities Trust, Series 2013-C10, Class AS, 3.372% 204712 | | | 2,500 | | | | 2,551 | |
| JPMorgan Chase Commercial Mortgage Securities Trust, Series 2013-C10, Class B, 3.674% 20476,12 | | | 2,600 | | | | 2,649 | |
| JPMorgan Chase Commercial Mortgage Securities Trust, Series 2013-C10, Class C, 4.10% 20476,12 | | | 750 | | | | 758 | |
| JPMorgan Chase Commercial Mortgage Securities Trust, Series 2016-JP4, Class A4, 3.648% 20496,12 | | | 5,095 | | | | 5,493 | |
| LUXE Commercial Mortgage Trust, Series 2021-TRIP, Class A, (1-month USD-LIBOR + 1.05%) 1.16% 20384,6,12 | | | 26,104 | | | | 26,135 | |
| LUXE Commercial Mortgage Trust, Series 2021-TRIP, Class B, (1-month USD-LIBOR + 1.40%) 1.51% 20384,6,12 | | | 762 | | | | 762 | |
| LUXE Commercial Mortgage Trust, Series 2021-TRIP, Class C, (1-month USD-LIBOR + 1.75%) 1.86% 20384,6,12 | | | 1,500 | | | | 1,500 | |
| Manhattan West Mortgage Trust, Series 2020-1MW, Class A, 2.13% 20394,12 | | | 3,126 | | | | 3,120 | |
| MHC Commercial Mortgage Trust, CMO, Series 2021-MHC, Class A, (1-month USD-LIBOR + 0.801%) 0.911% 20264,6,12 | | | 23,390 | | | | 23,376 | |
| Morgan Stanley Bank of America Merrill Lynch Trust, Series 2013-C9, Class A4, 3.102% 204612 | | | 2,175 | | | | 2,213 | |
| Morgan Stanley Bank of America Merrill Lynch Trust, Series 2013-C9, Class B, 3.708% 20466,12 | | | 1,511 | | | | 1,542 | |
| Morgan Stanley Bank of America Merrill Lynch Trust, Series 2013-C13, Class A-4, 4.039% 204612 | | | 1,934 | | | | 2,022 | |
| Morgan Stanley Bank of America Merrill Lynch Trust, Series 2013-C11, Class A4, 4.151% 20466,12 | | | 4,035 | | | | 4,163 | |
| Morgan Stanley Bank of America Merrill Lynch Trust, Series 2014-C16, Class A4, 3.60% 204712 | | | 959 | | | | 990 | |
| Morgan Stanley Bank of America Merrill Lynch Trust, Series 2014-C17, Class A5, 3.741% 204712 | | | 24,171 | | | | 25,368 | |
| Morgan Stanley Bank of America Merrill Lynch Trust, Series 2015-C27, Class A4, 3.753% 204712 | | | 525 | | | | 563 | |
| Morgan Stanley Bank of America Merrill Lynch Trust, Series 2014-C19, Class B, 4.00% 20476,12 | | | 2,000 | | | | 2,103 | |
| Morgan Stanley Bank of America Merrill Lynch Trust, Series 2015-C22, Class A4, 4.051% 204712 | | | 250 | | | | 263 | |
| Morgan Stanley Bank of America Merrill Lynch Trust, Series 2015-C22, Class A-4, 3.306% 204812 | | | 1,870 | | | | 1,959 | |
| Morgan Stanley Bank of America Merrill Lynch Trust, Series 2015-C25, Class A-4, 3.372% 204812 | | | 1,300 | | | | 1,366 | |
| Morgan Stanley Bank of America Merrill Lynch Trust, Series 2016-C30, Class A4, 2.60% 204912 | | | 250 | | | | 256 | |
| Morgan Stanley Bank of America Merrill Lynch Trust, Series 2016-C31, Class A-S, 3.102% 204912 | | | 3,000 | | | | 3,167 | |
| Morgan Stanley Bank of America Merrill Lynch Trust, Series 2016-C32, Class A-4, 3.72% 204912 | | | 5,280 | | | | 5,723 | |
| Morgan Stanley Bank of America Merrill Lynch Trust, Series 2015-C23, Class A3, 3.451% 205012 | | | 559 | | | | 582 | |
| Morgan Stanley Capital I Trust, Series 2015-UBS8, Class AS, 4.114% 204812 | | | 1,730 | | | | 1,843 | |
| Morgan Stanley Capital I Trust, Series 2016-UBS9, Class C, 4.761% 20496,12 | | | 567 | | | | 587 | |
| Motel 6 Trust, Series 2021-MTL6, Class A, (1-month USD-LIBOR + 0.90%) 1.01% 20384,6,12 | | | 4,174 | | | | 4,175 | |
| Motel 6 Trust, Series 2021-MTL6, Class B, (1-month USD-LIBOR + 1.20%) 1.31% 20384,6,12 | | | 1,048 | | | | 1,048 | |
| Motel 6 Trust, Series 2021-MTL6, Class C, (1-month USD-LIBOR + 1.50%) 1.61% 20384,6,12 | | | 314 | | | | 314 | |
| SLG Office Trust, Series 2021-OVA, Class A, 2.585% 20414,12 | | | 28,432 | | | | 29,167 | |
| The Bond Fund of America | 47 |
| Bonds, notes & other debt instruments (continued) | | Principal amount
(000) | | | Value
(000) | |
| Mortgage-backed obligations (continued) | | | | | | | | |
| Commercial mortgage-backed securities (continued) | | | | | | | | |
| SREIT Trust, Series 2021-FLWR, Class A, (1-month USD-LIBOR + 0.577%) 0.686% 20364,6,12 | | $ | 51,039 | | | $ | 50,500 | |
| SREIT Trust, Series 2021-FLWR, Class B, (1-month USD-LIBOR + 0.926%) 1.036% 20364,6,12 | | | 2,000 | | | | 1,979 | |
| SREIT Trust, Series 2021-MFP, Class A, (1-month USD-LIBOR + 0.731%) 0.841% 20384,6,12 | | | 51,446 | | | | 51,281 | |
| SREIT Trust, Series 2021-MFP, Class B, (1-month USD-LIBOR + 1.079%) 1.19% 20384,6,12 | | | 1,546 | | | | 1,538 | |
| SREIT Trust, Series 2021-MFP, Class C, (1-month USD-LIBOR + 1.329%) 1.439% 20384,6,12 | | | 831 | | | | 826 | |
| Wells Fargo Commercial Mortgage Trust, Series 2014-LC18, Class A5, 3.405% 204712 | | | 290 | | | | 305 | |
| Wells Fargo Commercial Mortgage Trust, Series 2015-C28, Class A4, 3.54% 204812 | | | 4,380 | | | | 4,636 | |
| Wells Fargo Commercial Mortgage Trust, Series 2015-C31, Class A4, 3.695% 204812 | | | 1,400 | | | | 1,499 | |
| Wells Fargo Commercial Mortgage Trust, Series 2015-SG1, Class A-4, 3.789% 204812 | | | 7,021 | | | | 7,398 | |
| Wells Fargo Commercial Mortgage Trust, Series 2015-P2, Class A4, 3.809% 204812 | | | 1,137 | | | | 1,223 | |
| Wells Fargo Commercial Mortgage Trust, Series 2015-C28, Class C, 4.093% 20486,12 | | | 585 | | | | 603 | |
| Wells Fargo Commercial Mortgage Trust, Series 2016-C34, Class A4, 3.096% 204912 | | | 6,190 | | | | 6,436 | |
| Wells Fargo Commercial Mortgage Trust, Series 2016-C34, Class AS, 3.484% 204912 | | | 380 | | | | 388 | |
| Wells Fargo Commercial Mortgage Trust, Series 2016-C37, Class A5, 3.794% 204912 | | | 6,370 | | | | 6,938 | |
| Wells Fargo Commercial Mortgage Trust, Series 2017-C40, Class A4, 3.581% 205012 | | | 1,154 | | | | 1,251 | |
| Wells Fargo Commercial Mortgage Trust, Series 2014-LC16, Class A5, 3.817% 205012 | | | 2,302 | | | | 2,414 | |
| Wells Fargo Commercial Mortgage Trust, Series 2018-C46, Class A3, 3.888% 205112 | | | 6,500 | | | | 7,071 | |
| Wells Fargo Commercial Mortgage Trust, Series 2019-C54, Class A4, 3.146% 205212 | | | 3,898 | | | | 4,175 | |
| Wells Fargo Commercial Mortgage Trust, Series 2015-NXS3, Class D, 3.153% 20574,12 | | | 1,667 | | | | 1,617 | |
| Wells Fargo Commercial Mortgage Trust, Series 2015-LC22, Class C, 4.557% 20586,12 | | | 1,000 | | | | 1,038 | |
| Wells Fargo Commercial Mortgage Trust, Series 2016-C36, Class A4, 3.065% 205912 | | | 3,853 | | | | 4,015 | |
| Wells Fargo Commercial Mortgage Trust, Series 2016-C33, Class A4, 3.426% 205912 | | | 1,320 | | | | 1,405 | |
| Wells Fargo Commercial Mortgage Trust, Series 2016-NXS5, Class AS, 3.988% 205912 | | | 600 | | | | 639 | |
| Wells Fargo Commercial Mortgage Trust, Series 2017-RC1, Class A4, 3.631% 206012 | | | 510 | | | | 553 | |
| WF-RBS Commercial Mortgage Trust, Series 2013-C11, Class AS, 3.311% 204512 | | | 255 | | | | 260 | |
| WF-RBS Commercial Mortgage Trust, Series 2013-C13, Class B, 3.553% 204512 | | | 500 | | | | 510 | |
| WF-RBS Commercial Mortgage Trust, Series 2013-C11, Class B, 3.714% 20456,12 | | | 1,000 | | | | 1,018 | |
| WF-RBS Commercial Mortgage Trust, Series 2012-C8, Class B, 4.311% 204512 | | | 5,000 | | | | 5,056 | |
| WF-RBS Commercial Mortgage Trust, Series 2012-C6, Class B, 4.697% 204512 | | | 298 | | | | 299 | |
| WF-RBS Commercial Mortgage Trust, Series 2013-C16, Class B, 5.542% 20466,12 | | | 1,450 | | | | 1,502 | |
| WF-RBS Commercial Mortgage Trust, Series 2014-C19, Class B, 4.723% 20476,12 | | | 2,000 | | | | 2,078 | |
| WF-RBS Commercial Mortgage Trust, Series 2013-C12, Class B, 3.863% 20486,12 | | | 2,000 | | | | 2,044 | |
| WF-RBS Commercial Mortgage Trust, Series 2014-C22, Class A4, 3.488% 205712 | | | 2,025 | | | | 2,095 | |
| | | | | | | | 888,995 | |
| | | | | | | | | |
| Other mortgage-backed securities 0.23% | | | | | | | | |
| Nykredit Realkredit AS, Series 01E, 1.00% 205312 | | DKr | 627,970 | | | | 90,609 | |
| Nykredit Realkredit AS, Series CCE, 1.00% 205012 | | | 451,530 | | | | 65,980 | |
| Realkredit Danmark AS 1.00% 205312 | | | 170,500 | | | | 24,621 | |
| | | | | | | | 181,210 | |
| | | | | | | | | |
| Total mortgage-backed obligations | | | | | | | 11,145,350 | |
| | | | | | | | | |
| Asset-backed obligations 3.26% | | | | | | | | |
| Aesop Funding LLC, Series 2019-1A, Class A, 3.45% 20234,12 | | $ | 5,803 | | | | 5,826 | |
| Aesop Funding LLC, Series 2017-2A, Class A, 2.97% 20244,12 | | | 6,155 | | | | 6,283 | |
| Aesop Funding LLC, Series 2018-1A, Class A, 3.70% 20244,12 | | | 10,350 | | | | 10,742 | |
| Aesop Funding LLC, Series 2019-2A, Class D, 3.04% 20254,12 | | | 9,000 | | | | 8,921 | |
| Aesop Funding LLC, Series 2019-2A, Class A, 3.35% 20254,12 | | | 9,410 | | | | 9,866 | |
| Aesop Funding LLC, Series 2018-2A, Class A, 4.00% 20254,12 | | | 47,950 | | | | 50,587 | |
| Aesop Funding LLC, Series 2020-1A, Class A, 2.33% 20264,12 | | | 12,814 | | | | 13,141 | |
| Aesop Funding LLC, Series 2019-3A, Class A, 2.36% 20264,12 | | | 6,460 | | | | 6,613 | |
| Aesop Funding LLC, Series 2021-1A, Class A, 1.38% 20274,12 | | | 22,390 | | | | 22,036 | |
| Aesop Funding LLC, Series 2021-1A, Class B, 1.63% 20274,12 | | | 3,398 | | | | 3,342 | |
| Aesop Funding LLC, Series 2020-2, Class A, 2.02% 20274,12 | | | 6,472 | | | | 6,553 | |
| Aesop Funding LLC, Series 2021-1A, Class C, 2.13% 20274,12 | | | 1,211 | | | | 1,193 | |
| Aesop Funding LLC, Series 2020-2A, Class B, 2.96% 20274,12 | | | 1,660 | | | | 1,723 | |
| Aesop Funding LLC, Series 2021-1A, Class D, 3.71% 20274,12 | | | 5,000 | | | | 4,956 | |
| Aesop Funding LLC, Series 2020-2A, Class C, 4.25% 20274,12 | | | 3,581 | | | | 3,814 | |
| Affirm Asset Securitization Trust, Series 2021-A, Class A, 0.88% 20254,12 | | | 14,038 | | | | 14,044 | |
| Affirm Asset Securitization Trust, Series 2020-A, Class A, 2.10% 20254,12 | | | 3,186 | | | | 3,194 | |
| Affirm Asset Securitization Trust, Series 2021-B, Class A, 1.03% 20264,12 | | | 3,927 | | | | 3,903 | |
| 48 | The Bond Fund of America |
| Bonds, notes & other debt instruments (continued) | | Principal amount
(000) | | | Value
(000) | |
| Asset-backed obligations (continued) | | | | | | | | |
| Affirm Asset Securitization Trust, Series 2021-Z2, Class A, 1.17% 20264,12 | | $ | 16,222 | | | $ | 16,163 | |
| American Credit Acceptance Receivables Trust, Series 2020-3, Class C, 1.85% 20264,12 | | | 7,643 | | | | 7,699 | |
| American Credit Acceptance Receivables Trust, Series 2020-1, Class D, 2.39% 20264,12 | | | 1,530 | | | | 1,551 | |
| American Credit Acceptance Receivables Trust, Series 2021-1, Class C, 0.83% 20274,12 | | | 4,048 | | | | 4,032 | |
| American Credit Acceptance Receivables Trust, Series 2021-3, Class C, 0.98% 20274,12 | | | 12,733 | | | | 12,597 | |
| American Credit Acceptance Receivables Trust, Series 2021-1, Class D, 1.14% 20274,12 | | | 2,226 | | | | 2,209 | |
| American Credit Acceptance Receivables Trust, Series 2021-3, Class D, 1.34% 20274,12 | | | 8,103 | | | | 7,999 | |
| AmeriCredit Automobile Receivables Trust, Series 2021-2, Class B, 0.69% 202712 | | | 6,085 | | | | 6,014 | |
| AmeriCredit Automobile Receivables Trust, Series 2021-2, Class C, 1.01% 202712 | | | 6,765 | | | | 6,658 | |
| AmeriCredit Automobile Receivables Trust, Series 2021-2, Class D, 1.29% 202712 | | | 15,943 | | | | 15,698 | |
| Ballyrock CLO, Ltd., Series 2019-2A, Class A1AR, (3-month USD-LIBOR + 1.00%) 1.16% 20304,6,12 | | | 3,290 | | | | 3,290 | |
| Bankers Healthcare Group Securitization Trust, Series 2020-A, Class A, 2.56% 20314,12 | | | 605 | | | | 612 | |
| Bankers Healthcare Group Securitization Trust, Series 2020-A, Class B, 3.59% 20314,12 | | | 4,310 | | | | 4,426 | |
| Bankers Healthcare Group Securitization Trust, Series 2021-A, Class A, 1.42% 20334,12 | | | 1,651 | | | | 1,641 | |
| Bankers Healthcare Group Securitization Trust, Series 2021-A, Class B, 2.79% 20334,12 | | | 914 | | | | 919 | |
| Bankers Healthcare Group Securitization Trust, Series 2021-B, Class A, 0.90% 20344,12 | | | 1,708 | | | | 1,699 | |
| Bankers Healthcare Group Securitization Trust, Series 2021-B, Class B, 1.67% 20344,12 | | | 1,533 | | | | 1,510 | |
| Blackbird Capital II Aircraft Lease, Ltd. / Blackbird Capital II Aircraft Lease US, LLC, Series 2021-1, Class A, 2.443% 20464,12 | | | 22,335 | | | | 22,094 | |
| Blackbird Capital II Aircraft Lease, Ltd. / Blackbird Capital II Aircraft Lease US, LLC, Series 2021-1, Class B, 3.446% 20464,12 | | | 2,825 | | | | 2,797 | |
| CarMaxAuto Owner Trust, Series 2019-2, Class C, 3.16% 202512 | | | 650 | | | | 666 | |
| CarMaxAuto Owner Trust, Series 2021-1, Class C, 0.94% 202612 | | | 580 | | | | 570 | |
| CarMaxAuto Owner Trust, Series 2021-1, Class D, 1.28% 202712 | | | 568 | | | | 560 | |
| Carvana Auto Receivables Trust, Series 2021-N4, Class C, 1.72% 202812 | | | 3,206 | | | | 3,207 | |
| Carvana Auto Receivables Trust, Series 2021-N4, Class A2, 1.80% 202812 | | | 5,268 | | | | 5,286 | |
| Castlelake Aircraft Securitization Trust, Series 2021-2A, Class A, 2.868% 20374,12 | | | 96,517 | | | | 95,828 | |
| Castlelake Aircraft Securitization Trust, Series 2021-2A, Class C, 3.602% 20374,12 | | | 15,591 | | | | 15,680 | |
| Castlelake Aircraft Securitization Trust, Series 2021-2A, Class C, 5.75% 20374,12 | | | 3,988 | | | | 4,015 | |
| Castlelake Aircraft Securitization Trust, Series 2017-1R, Class A, 2.741% 20414,12 | | | 5,953 | | | | 5,885 | |
| CF Hippolyta LLC, Series 2020-1, Class A1, 1.69% 20604,12 | | | 88,092 | | | | 87,467 | |
| CF Hippolyta LLC, Series 2020-1, Class A2, 1.99% 20604,12 | | | 14,332 | | | | 14,101 | |
| CF Hippolyta LLC, Series 2020-1, Class B1, 2.28% 20604,12 | | | 9,292 | | | | 9,294 | |
| CF Hippolyta LLC, Series 2020-1, Class B2, 2.60% 20604,12 | | | 1,013 | | | | 1,011 | |
| CF Hippolyta LLC, Series 2021-1, Class A1, 1.53% 20614,12 | | | 61,022 | | | | 59,945 | |
| CF Hippolyta LLC, Series 2021-1, Class B1, 1.98% 20614,12 | | | 5,828 | | | | 5,749 | |
| CLI Funding V LLC, Series 2020-2A, Class B, 3.56% 20454,12 | | | 585 | | | | 589 | |
| CLI Funding V LLC, Series 2020-1A, Class B, 3.62% 20454,12 | | | 1,074 | | | | 1,084 | |
| CLI Funding VI LLC, Series 2020-2A, Class A, 2.03% 20454,12 | | | 7,789 | | | | 7,744 | |
| CLI Funding VI LLC, Series 2020-3A, Class A, 2.07% 20454,12 | | | 2,748 | | | | 2,734 | |
| CLI Funding VI LLC, Series 2020-1A, Class A, 2.08% 20454,12 | | | 1,079 | | | | 1,075 | |
| CLI Funding VI LLC, Series 2020-3A, Class B, 3.30% 20454,12 | | | 1,791 | | | | 1,803 | |
| CLI Funding VIII LLC, Series 2021-1A, Class A, 1.64% 20464,12 | | | 12,399 | | | | 12,134 | |
| CLI Funding VIII LLC, Series 2021-1A, Class B, 2.38% 20464,12 | | | 1,392 | | | | 1,371 | |
| Cloud Pass-Through Trust, Series 2019-1A, Class CLOU, 3.554% 20224,6,12 | | | 228 | | | | 229 | |
| CPS Auto Receivables Trust, Series 2019-B, Class C, 3.35% 20244,12 | | | 179 | | | | 179 | |
| CPS Auto Receivables Trust, Series 2019-C, Class C, 2.84% 20254,12 | | | 830 | | | | 833 | |
| CPS Auto Receivables Trust, Series 2019-C, Class D, 3.17% 20254,12 | | | 4,273 | | | | 4,339 | |
| CPS Auto Receivables Trust, Series 2019-B, Class D, 3.69% 20254,12 | | | 5,325 | | | | 5,385 | |
| CPS Auto Receivables Trust, Series 2021-A, Class C, 0.83% 20264,12 | | | 1,915 | | | | 1,902 | |
| CPS Auto Receivables Trust, Series 2021-A, Class D, 1.16% 20264,12 | | | 1,643 | | | | 1,626 | |
| CPS Auto Receivables Trust, Series 2020-C, Class C, 1.71% 20264,12 | | | 2,829 | | | | 2,845 | |
| CPS Auto Receivables Trust, Series 2020-B, Class C, 3.30% 20264,12 | | | 681 | | | | 688 | |
| CPS Auto Receivables Trust, Series 2020-B, Class D, 4.75% 20264,12 | | | 598 | | | | 620 | |
| Credit Acceptance Auto Loan Trust, Series 2020-2A, Class A, 1.37% 20294,12 | | | 3,739 | | | | 3,752 | |
| Credit Acceptance Auto Loan Trust, Series 2020-1A, Class A, 2.01% 20294,12 | | | 15,748 | | | | 15,876 | |
| Credit Acceptance Auto Loan Trust, Series 2020-1A, Class B, 2.39% 20294,12 | | | 4,118 | | | | 4,174 | |
| Credit Acceptance Auto Loan Trust, Series 2021-3A, Class A, 1.00% 20304,12 | | | 12,100 | | | | 12,009 | |
| CWHEQ Revolving Home Equity Loan Trust, Series 2005-C, Class 2A, FSA insured, (1-month USD-LIBOR + 0.18%) 0.29% 20356,12 | | | 983 | | | | 963 | |
| CWHEQ Revolving Home Equity Loan Trust, Series 2006-I, Class 2A, FSA insured, (1-month USD-LIBOR + 0.14%) 0.25% 20376,12 | | | 1,633 | | | | 1,561 | |
| CWHEQ Revolving Home Equity Loan Trust, Series 2007-B, Class A, FSA insured, (1-month USD-LIBOR + 0.15%) 0.26% 20376,12 | | | 2,502 | | | | 2,408 | |
| Drive Auto Receivables Trust, Series 2021-1, Class A2, 0.36% 202312 | | | 3,625 | | | | 3,625 | |
| Drive Auto Receivables Trust, Series 2021-1, Class A3, 0.44% 202412 | | | 12,750 | | | | 12,738 | |
| The Bond Fund of America | 49 |
| Bonds, notes & other debt instruments (continued) | | Principal amount
(000) | | | Value
(000) | |
| Asset-backed obligations (continued) | | | | | | | | |
| Drive Auto Receivables Trust, Series 2018-1, Class D, 3.81% 202412 | | $ | 9 | | | $ | 9 | |
| Drive Auto Receivables Trust, Series 2021-1, Class B, 0.65% 202512 | | | 7,572 | | | | 7,563 | |
| Drive Auto Receivables Trust, Series 2020-2, Class B, 1.42% 202512 | | | 1,535 | | | | 1,539 | |
| Drive Auto Receivables Trust, Series 2019-3, Class C, 2.90% 202512 | | | 9,952 | | | | 10,038 | |
| Drive Auto Receivables Trust, Series 2019-2, Class C, 3.42% 202512 | | | 4,168 | | | | 4,200 | |
| Drive Auto Receivables Trust, Series 2020-2, Class C, 2.28% 202612 | | | 8,278 | | | | 8,388 | |
| Drive Auto Receivables Trust, Series 2020-1, Class C, 2.36% 202612 | | | 3,573 | | | | 3,602 | |
| Drive Auto Receivables Trust, Series 2019-3, Class D, 3.18% 202612 | | | 6,030 | | | | 6,155 | |
| Drive Auto Receivables Trust, Series 2021-1, Class C, 1.02% 202712 | | | 16,107 | | | | 16,112 | |
| Drive Auto Receivables Trust, Series 2020-2, Class D, 3.05% 202812 | | | 10,586 | | | | 10,869 | |
| Drive Auto Receivables Trust, Series 2021-1, Class D, 1.45% 202912 | | | 12,158 | | | | 12,107 | |
| Drivetime Auto Owner Trust, Series 2020-1, Class B, 2.16% 20244,12 | | | 1,416 | | | | 1,421 | |
| Drivetime Auto Owner Trust, Series 2019-3, Class C, 2.74% 20254,12 | | | 1,221 | | | | 1,230 | |
| Drivetime Auto Owner Trust, Series 2019-3, Class D, 2.96% 20254,12 | | | 2,870 | | | | 2,931 | |
| Drivetime Auto Owner Trust, Series 2019-2A, Class C, 3.18% 20254,12 | | | 3,129 | | | | 3,148 | |
| Drivetime Auto Owner Trust, Series 2019-2A, Class D, 3.48% 20254,12 | | | 6,800 | | | | 6,955 | |
| Drivetime Auto Owner Trust, Series 2021-1A, Class C, 0.84% 20264,12 | | | 2,279 | | | | 2,261 | |
| Drivetime Auto Owner Trust, Series 2021-1A, Class D, 1.16% 20264,12 | | | 1,242 | | | | 1,225 | |
| Drivetime Auto Owner Trust, Series 2020-3A, Class C, 1.47% 20264,12 | | | 3,269 | | | | 3,278 | |
| Drivetime Auto Owner Trust, Series 2020-2A, Class C, 3.28% 20264,12 | | | 1,861 | | | | 1,911 | |
| Drivetime Auto Owner Trust, Series 2020-2A, Class D, 4.73% 20264,12 | | | 1,813 | | | | 1,920 | |
| Drivetime Auto Owner Trust, Series 2021-2A, Class B, 0.81% 20274,12 | | | 3,538 | | | | 3,531 | |
| Drivetime Auto Owner Trust, Series 2021-2A, Class C, 1.10% 20274,12 | | | 3,693 | | | | 3,666 | |
| Drivetime Auto Owner Trust, Series 2021-2A, Class D, 1.50% 20274,12 | | | 2,495 | | | | 2,470 | |
| Dryden Senior Loan Fund, CLO, Series 2014-33A, Class AR3, (3-month USD-LIBOR + 1.00%) 1.124% 20294,6,12 | | | 2,230 | | | | 2,229 | |
| EDvestinU Private Education Loan LLC, Series 2021-A, Class A, 1.80% 20454,12 | | | 1,400 | | | | 1,380 | |
| Exeter Automobile Receivables Trust, Series 2017-3A, Class C, 3.68% 20234,12 | | | 579 | | | | 583 | |
| Exeter Automobile Receivables Trust, Series 2020-2A, Class B, 2.08% 20244,12 | | | 832 | | | | 834 | |
| Exeter Automobile Receivables Trust, Series 2020-1A, Class B, 2.26% 20244,12 | | | 435 | | | | 435 | |
| Exeter Automobile Receivables Trust, Series 2019-3A, Class C, 2.79% 20244,12 | | | 4,958 | | | | 4,985 | |
| Exeter Automobile Receivables Trust, Series 2019-2A, Class C, 3.30% 20244,12 | | | 2,478 | | | | 2,488 | |
| Exeter Automobile Receivables Trust, Series 2021-2, Class B, 0.57% 202512 | | | 10,267 | | | | 10,238 | |
| Exeter Automobile Receivables Trust, Series 2020-3A, Class C, 1.32% 202512 | | | 3,432 | | | | 3,448 | |
| Exeter Automobile Receivables Trust, Series 2020-1A, Class C, 2.49% 20254,12 | | | 6,890 | | | | 6,946 | |
| Exeter Automobile Receivables Trust, Series 2019-4A, Class D, 2.58% 20254,12 | | | 15,000 | | | | 15,249 | |
| Exeter Automobile Receivables Trust, Series 2020-1A, Class D, 2.73% 20254,12 | | | 5,000 | | | | 5,104 | |
| Exeter Automobile Receivables Trust, Series 2019-3A, Class D, 3.11% 20254,12 | | | 15,535 | | | | 15,894 | |
| Exeter Automobile Receivables Trust, Series 2020-2A, Class C, 3.28% 20254,12 | | | 2,715 | | | | 2,764 | |
| Exeter Automobile Receivables Trust, Series 2019-2A, Class D, 3.71% 20254,12 | | | 10,000 | | | | 10,246 | |
| Exeter Automobile Receivables Trust, Series 2021-2, Class C, 0.98% 202612 | | | 11,158 | | | | 11,121 | |
| Exeter Automobile Receivables Trust, Series 2020-3A, Class D, 1.73% 202612 | | | 2,977 | | | | 3,001 | |
| Exeter Automobile Receivables Trust, Series 2020-2, Class D, 4.73% 20264,12 | | | 2,055 | | | | 2,155 | |
| Exeter Automobile Receivables Trust, Series 2021-2, Class D, 1.40% 202712 | | | 16,131 | | | | 15,972 | |
| First Investors Auto Owner Trust, Series 2021-1A, Class B, 0.89% 20274,12 | | | 2,100 | | | | 2,083 | |
| First Investors Auto Owner Trust, Series 2021-1A, Class D, 1.62% 20274,12 | | | 950 | | | | 947 | |
| FirstKey Homes Trust, Series 2020-SFR2, Class A, 1.266% 20374,12 | | | 29,358 | | | | 28,648 | |
| FirstKey Homes Trust, Series 2021-SFR3, Class A, 2.135% 20384,12 | | | 4,186 | | | | 4,187 | |
| Ford Credit Auto Owner Trust, Series 2020-1, Class A, 2.04% 20314,12 | | | 43,830 | | | | 44,661 | |
| Ford Credit Auto Owner Trust, Series 2018-1, Class A, 3.19% 20314,12 | | | 19,385 | | | | 20,439 | |
| Ford Credit Auto Owner Trust, Series 2021-1, Class A, 1.37% 20334,12 | | | 21,970 | | | | 21,734 | |
| Ford Credit Floorplan Master Owner Trust, Series 2019-3, Class A1, 2.23% 202412 | | | 2,625 | | | | 2,657 | |
| FREED ABS Trust, Series 2021-2, Class A, 0.68% 20284,12 | | | 3,530 | | | | 3,528 | |
| Freedom Financial, Series 2021-3FP, Class A, 0.62% 20284,12 | | | 1,998 | | | | 1,997 | |
| GCI Funding I LLC, Series 2020-1, Class A, 2.82% 20454,12 | | | 1,549 | | | | 1,556 | |
| GCI Funding I LLC, Series 2020-1, Class B, 3.81% 20454,12 | | | 870 | | | | 878 | |
| GCI Funding I LLC, Series 2021-1, Class A, 2.38% 20464,12 | | | 7,319 | | | | 7,274 | |
| GCI Funding I LLC, Series 2021-1, Class B, 3.04% 20464,12 | | | 262 | | | | 259 | |
| Global SC Finance V SRL, Series 2019-1A, Class B, 4.81% 20394,12 | | | 9,353 | | | | 9,990 | |
| Global SC Finance V SRL, Series 2020-1A, Class A, 2.17% 20404,12 | | | 3,189 | | | | 3,187 | |
| Global SC Finance V SRL, Series 2020-1A, Class B, 3.55% 20404,12 | | | 1,348 | | | | 1,359 | |
| Global SC Finance VII SRL, Series 2020-2A, Class A, 2.26% 20404,12 | | | 4,460 | | | | 4,472 | |
| Global SC Finance VII SRL, Series 2020-2A, Class B, 3.32% 20404,12 | | | 1,301 | | | | 1,309 | |
| Global SC Finance VII SRL, Series 2021-1A, Class A, 1.86% 20414,12 | | | 59,983 | | | | 59,125 | |
| Global SC Finance VII SRL, Series 2021-2A, Class A, 1.95% 20414,12 | | | 43,353 | | | | 42,897 | |
| Global SC Finance VII SRL, Series 2021-2A, Class B, 2.49% 20414,12 | | | 3,510 | | | | 3,463 | |
| GM Financial Automobile Leasing Trust, Series 2020-2, Class C, 2.56% 202412 | | | 786 | | | | 801 | |
| 50 | The Bond Fund of America |
| Bonds, notes & other debt instruments (continued) | | Principal amount
(000) | | | Value
(000) | |
| Asset-backed obligations (continued) | | | | | | | | |
| GM Financial Automobile Leasing Trust, Series 2020-2, Class D, 3.21% 202412 | | $ | 1,111 | | | $ | 1,139 | |
| GM Financial Automobile Leasing Trust, Series 2020-4, Class C, 1.05% 202612 | | | 3,700 | | | | 3,671 | |
| Henderson Receivables LLC, Series 2006-3A, Class A1, (1-month USD-LIBOR + 0.20%) 0.31% 20414,6,12 | | | 526 | | | | 517 | |
| Henderson Receivables LLC, Series 2006-4A, Class A1, (1-month USD-LIBOR + 0.20%) 0.31% 20414,6,12 | | | 196 | | | | 196 | |
| Hertz Vehicle Financing III, LLC, Series 2021-A, Class B, 3.65% 20234,9,12 | | | 49,770 | | | | 49,658 | |
| Hertz Vehicle Financing III, LLC, Series 2021-1A, Class A, 1.21% 20254,12 | | | 81,838 | | | | 81,140 | |
| Hertz Vehicle Financing III, LLC, Series 2021-1A, Class B, 1.56% 20254,12 | | | 6,809 | | | | 6,750 | |
| Hertz Vehicle Financing III, LLC, Series 2021-1A, Class C, 2.05% 20254,12 | | | 3,902 | | | | 3,867 | |
| Hertz Vehicle Financing III, LLC, Series 2021-2A, Class A, 1.68% 20274,12 | | | 92,439 | | | | 91,269 | |
| Hertz Vehicle Financing III, LLC, Series 2021-2A, Class B, 2.12% 20274,12 | | | 8,169 | | | | 8,110 | |
| Hertz Vehicle Financing III, LLC, Series 2021-2A, Class C, 2.52% 20274,12 | | | 3,138 | | | | 3,122 | |
| Home Equity Asset Trust, Series 2004-7, Class M1, (1-month USD-LIBOR + 0.62%) 1.033% 20356,12 | | | 653 | | | | 654 | |
| LAD Auto Receivables Trust, Series 2021-1A, Class A, 1.30% 20264,12 | | | 17,478 | | | | 17,451 | |
| LAD Auto Receivables Trust, Series 2021-1A, Class B, 1.94% 20264,12 | | | 1,804 | | | | 1,802 | |
| Lunar Structured Aircraft Portfolio Notes, Series 2021-1, Class A, 2.636% 20464,12 | | | 15,839 | | | | 15,789 | |
| Madison Park Funding, Ltd., CLO, Series 2015-17A, Class AR2, (3-month USD-LIBOR + 1.00%) 1.13% 20304,6,12 | | | 5,100 | | | | 5,097 | |
| Marathon CLO, Ltd., Series 2017-9A, Class A1AR, (3-month USD-LIBOR + 1.15%) 1.274% 20294,6,12 | | | 4,970 | | | | 4,970 | |
| Mercury Financial Credit Card Master Trust, Series 2021-1A, Class A, 1.54% 20264,12 | | | 23,200 | | | | 23,189 | |
| Mission Lane Credit Card Master Trust, Series 2021-A, Class A, 1.59% 20264,12 | | | 6,958 | | | | 6,913 | |
| Mission Lane Credit Card Master Trust, Series 2021-A, Class B, 2.24% 20264,12 | | | 1,291 | | | | 1,285 | |
| Navient Student Loan Trust, Series 2021-A, Class A, 0.84% 20694,12 | | | 8,156 | | | | 8,060 | |
| Navient Student Loan Trust, Series 2021-B, Class A, 0.94% 20694,12 | | | 7,350 | | | | 7,279 | |
| Navient Student Loan Trust, Series 2021-EA, Class A, 0.97% 20694,12 | | | 13,483 | | | | 13,266 | |
| Navient Student Loan Trust, Series 2021-C, Class A, 1.06% 20694,12 | | | 36,948 | | | | 36,431 | |
| Navient Student Loan Trust, Series 2021-G, Class A, 1.58% 20704,12 | | | 6,212 | | | | 6,195 | |
| Navigator Aircraft ABS, Ltd., Series 2021-1, Class A, 2.771% 20464,12 | | | 27,799 | | | | 27,765 | |
| Nelnet Student Loan Trust, Series 2021-C, Class AFL, (1-month USD-LIBOR + 0.74%) 0.844% 20624,6,12 | | | 30,069 | | | | 30,178 | |
| Nelnet Student Loan Trust, Series 2021-C, Class AFX, 1.32% 20624,12 | | | 2,329 | | | | 2,295 | |
| Nelnet Student Loan Trust, Series 2021-A, Class APT1, 1.36% 20624,12 | | | 43,804 | | | | 43,081 | |
| Nelnet Student Loan Trust, Series 2021-B, Class AFX, 1.42% 20624,12 | | | 98,689 | | | | 97,373 | |
| New Economy Assets Phase 1 Issuer, LLC, Series 2021-1, Class A1, 1.91% 20614,12 | | | 292,757 | | | | 287,509 | |
| Newark BSL CLO 2, Ltd., Series 2017-1A, Class A1R, (3-month USD-LIBOR + 0.97%) 1.094% 20304,6,12 | | | 1,645 | | | | 1,645 | |
| OnDeck Asset Securitization Trust LLC, Series 2021-1A, Class A, 1.59% 20274,12 | | | 15,641 | | | | 15,565 | |
| OnDeck Asset Securitization Trust LLC, Series 2021-1A, Class B, 2.28% 20274,12 | | | 700 | | | | 697 | |
| Oportun Funding LLC, Series 2021-A, Class A, 1.21% 20284,12 | | | 5,033 | | | | 5,024 | |
| Oportun Funding LLC, Series 2021-B, Class A, 1.47% 20314,12 | | | 10,536 | | | | 10,477 | |
| OSW Structured Asset Trust, Series 2020-RPL1, Class A2, 4.569% 20594,6,12 | | | 4,521 | | | | 4,531 | |
| OSW Structured Asset Trust, Series 2020-RPL1, Class A1, 3.072% 20594,6,12 | | | 7,287 | | | | 7,297 | |
| Palmer Square Loan Funding, CLO, Series 2019-2, Class A1, (3-month USD-LIBOR + 0.97%) 1.102% 20274,6,12 | | | 4,841 | | | | 4,842 | |
| Palmer Square Loan Funding, CLO, Series 2019-1A, Class A1, (3-month USD-LIBOR + 1.05%) 1.182% 20274,6,12 | | | 8,495 | | | | 8,497 | |
| Palmer Square Loan Funding, CLO, Series 2020-4, Class A1, (3-month USD-LIBOR + 1.00%) 1.18% 20284,6,12 | | | 9,552 | | | | 9,556 | |
| Palmer Square Loan Funding, CLO, Series 2021-1, Class A1, (3-month USD-LIBOR + 0.90%) 1.032% 20294,6,12 | | | 2,078 | | | | 2,078 | |
| PFS Financing Corp., Series 2021-B, Class A, 0.775% 20264,12 | | | 35,117 | | | | 34,594 | |
| Prestige Auto Receivables Trust, Series 2019-1A, Class C, 2.70% 20244,12 | | | 3,940 | | | | 3,975 | |
| Prestige Auto Receivables Trust, Series 2019-1A, Class D, 3.01% 20254,12 | | | 2,435 | | | | 2,470 | |
| Prodigy Finance DAC, Series 2021-1A, Class A, (1-month USD-LIBOR + 1.25%) 1.352% 20514,6,12 | | | 5,742 | | | | 5,744 | |
| Residential Funding Mortgage Securities II, Inc., Series 2006-HSA3, Class A, | | | | | | | | |
| FSA insured, (1-month USD-LIBOR + 0.13%) 0.232% 20366,12 | | | 103 | | | | 102 | |
| Santander Drive Auto Receivables Trust, Series 2020-2, Class B, 0.96% 202412 | | | 2,551 | | | | 2,554 | |
| Santander Drive Auto Receivables Trust, Series 2020-1, Class B, 3.03% 202412 | | | 8,621 | | | | 8,680 | |
| Santander Drive Auto Receivables Trust, Series 2021-2, Class B, 0.59% 202512 | | | 9,308 | | | | 9,290 | |
| Santander Drive Auto Receivables Trust, Series 2020-2, Class C, 1.46% 202512 | | | 6,125 | | | | 6,155 | |
| Santander Drive Auto Receivables Trust, Series 2019-2, Class D, 3.22% 202512 | | | 4,975 | | | | 5,074 | |
| Santander Drive Auto Receivables Trust, Series 2020-1, Class C, 4.11% 202512 | | | 25,000 | | | | 25,740 | |
| Santander Drive Auto Receivables Trust, Series 2021-2, Class C, 0.90% 202612 | | | 17,331 | | | | 17,287 | |
| The Bond Fund of America | 51 |
| Bonds, notes & other debt instruments (continued) | | Principal amount
(000) | | | Value
(000) | |
| Asset-backed obligations (continued) | | | | | | | | |
| Santander Drive Auto Receivables Trust, Series 2020-3, Class C, 1.12% 202612 | | $ | 12,159 | | | $ | 12,197 | |
| Santander Drive Auto Receivables Trust, Series 2020-3, Class D, 1.64% 202612 | | | 5,159 | | | | 5,196 | |
| Santander Drive Auto Receivables Trust, Series 2021-3, Class C, 0.95% 202712 | | | 9,395 | | | | 9,311 | |
| Santander Drive Auto Receivables Trust, Series 2021-3, Class D, 1.33% 202712 | | | 12,526 | | | | 12,375 | |
| Santander Drive Auto Receivables Trust, Series 2021-2, Class D, 1.35% 202712 | | | 11,111 | | | | 11,053 | |
| Slam, Ltd., Series 2021-1, Class A, 2.434% 20464,12 | | | 17,434 | | | | 17,137 | |
| Slam, Ltd., Series 2021-1, Class B, 3.422% 20464,12 | | | 3,210 | | | | 3,171 | |
| SMB Private Education Loan Trust, Series 2021-A, Class A1, (1-month USD-LIBOR + 0.50%) 0.61% 20534,6,12 | | | 2,135 | | | | 2,136 | |
| SMB Private Education Loan Trust, Series 2021-A, Class APT2, 1.07% 20534,12 | | | 7,407 | | | | 7,220 | |
| Sound Point CLO, Ltd., Series 2015-1RA, Class AR, (3-month USD-LIBOR + 1.08%) 1.204% 20304,6,12 | | | 2,680 | | | | 2,680 | |
| Sprite, Ltd., Series 2021-1, Class A, 3.75% 20464,12 | | | 20,929 | | | | 20,611 | |
| Stellar Jay Ireland DAC, Series 2021-1, Class A, 3.967% 20414,12 | | | 2,539 | | | | 2,526 | |
| Stonepeak Infrastructure Partners, Series 2021-1A, Class AA, 2.301% 20334,12 | | | 8,036 | | | | 7,963 | |
| Stonepeak Infrastructure Partners, Series 2021-1A, Class A, 2.675% 20334,12 | | | 9,192 | | | | 9,162 | |
| SuttonPark Structured Settlements, Series 2021-1, Class A, 1.95% 20754,12 | | | 16,157 | | | | 15,963 | |
| TAL Advantage V LLC, Series 2020-1A, Class A, 2.05% 20454,12 | | | 6,632 | | | | 6,598 | |
| TAL Advantage V LLC, Series 2020-1A, Class B, 3.29% 20454,12 | | | 489 | | | | 491 | |
| Textainer Marine Containers, Ltd., Series 2020-2A, Class A, 2.10% 20454,12 | | | 3,570 | | | | 3,556 | |
| Textainer Marine Containers, Ltd., Series 2020-1A, Class A, 2.73% 20454,12 | | | 16,132 | | | | 16,200 | |
| Textainer Marine Containers, Ltd., Series 2020-1A, Class B, 4.94% 20454,12 | | | 6,815 | | | | 6,926 | |
| Textainer Marine Containers, Ltd., Series 2021-2A, Class A, 2.23% 20464,12 | | | 17,040 | | | | 17,012 | |
| TIF Funding II LLC, Series 2020-1A, Class B, 3.82% 20454,12 | | | 1,662 | | | | 1,683 | |
| Towd Point Mortgage Trust, Series 2015-3, Class M1, 4.00% 20544,6,12 | | | 4,715 | | | | 4,773 | |
| Towd Point Mortgage Trust, Series 2016-2, Class B2, 3.402% 20554,6,12 | | | 2,900 | | | | 2,999 | |
| Toyota Auto Loan Extended Note Trust, Series 2019-1, Class A, 2.56% 20314,12 | | | 6,000 | | | | 6,199 | |
| Toyota Auto Loan Extended Note Trust, Series 2020-1, Class A, 1.35% 20334,12 | | | 5,335 | | | | 5,326 | |
| Toyota Auto Loan Extended Note Trust, Series 2021-1, Class A, 1.07% 20344,6,12 | | | 27,912 | | | | 27,414 | |
| Triton Container Finance VIII LLC, Series 2020-1, Class A, 2.11% 20454,12 | | | 3,123 | | | | 3,104 | |
| Triton Container Finance VIII LLC, Series 2021-1, Class A, 1.86% 20464,12 | | | 13,095 | | | | 12,854 | |
| Triton Container Finance VIII LLC, Series 2021-1A, Class B, 2.58% 20464,12 | | | 1,080 | | | | 1,067 | |
| Westlake Automobile Receivables Trust, Series 2020-3A, Class C, 1.24% 20254,12 | | | 4,153 | | | | 4,163 | |
| Westlake Automobile Receivables Trust, Series 2020-2, Class C, 2.01% 20254,12 | | | 3,345 | | | | 3,383 | |
| Westlake Automobile Receivables Trust, Series 2021-2, Class B, 0.62% 20264,12 | | | 10,314 | | | | 10,235 | |
| Westlake Automobile Receivables Trust, Series 2021-2, Class C, 0.89% 20264,12 | | | 13,309 | | | | 13,192 | |
| Westlake Automobile Receivables Trust, Series 2021-2, Class D, 1.23% 20264,12 | | | 8,825 | | | | 8,691 | |
| Westlake Automobile Receivables Trust, Series 2020-3A, Class D, 1.65% 20264,12 | | | 8,060 | | | | 8,084 | |
| Westlake Automobile Receivables Trust, Series 2020-2, Class D, 2.76% 20264,12 | | | 5,225 | | | | 5,338 | |
| | | | | | | | 2,594,831 | |
| | | | | | | | | |
| Bonds & notes of governments & government agencies outside the U.S. 1.81% | | | | | |
| Abu Dhabi (Emirate of) 3.125% 20274 | | | 17,700 | | | | 19,040 | |
| Abu Dhabi (Emirate of) 3.875% 20504 | | | 9,900 | | | | 11,557 | |
| Abu Dhabi (Emirate of) 2.70% 20704 | | | 4,925 | | | | 4,495 | |
| Angola (Republic of) 8.00% 20294 | | | 5,000 | | | | 4,948 | |
| Argentine Republic 1.00% 2029 | | | 1,034 | | | | 377 | |
| Argentine Republic 0.50% 2030 (0.75% on 7/9/2023)5 | | | 12,086 | | | | 4,261 | |
| Argentine Republic 0% 2035 | | | 25,700 | | | | 218 | |
| Argentine Republic 1.125% 2035 (1.50% on 7/9/2022)5 | | | 5,349 | | | | 1,719 | |
| Asian Development Bank 1.50% 2024 | | | 15,979 | | | | 16,210 | |
| Asian Development Bank 2.50% 2027 | | | 3,451 | | | | 3,663 | |
| Asian Development Bank 2.75% 2028 | | | 3 | | | | 3 | |
| Bermuda 2.375% 20304 | | | 2,840 | | | | 2,847 | |
| Bermuda 3.375% 20504 | | | 8,200 | | | | 8,231 | |
| Caisse d’Amortissement de la Dette Sociale 1.125% 20244 | | | 10,000 | | | | 10,007 | |
| Chile (Republic of) 3.10% 2041 | | | 13,200 | | | | 12,943 | |
| China (People’s Republic of), Series INBK, 3.81% 2050 | | CNY | 75,960 | | | | 12,776 | |
| China (People’s Republic of), Series INBK, 3.72% 2051 | | | 274,040 | | | | 45,643 | |
| China Development Bank Corp., Series 2012, 3.34% 2025 | | | 53,800 | | | | 8,625 | |
| Colombia (Republic of) 4.125% 2051 | | $ | 18,640 | | | | 15,192 | |
| Colombia (Republic of), Series B, 5.75% 2027 | | COP | 152,975,600 | | | | 34,001 | |
| Costa Rica (Republic of) 7.00% 2044 | | $ | 2,178 | | | | 2,143 | |
| Cote d’Ivoire (Republic of) 6.375% 20284 | | | 7,275 | | | | 7,920 | |
| CPPIB Capital, Inc. 0.50% 20244 | | | 7,990 | | | | 7,883 | |
| CPPIB Capital, Inc. (USD-SOFR + 1.25%) 0.05% 20264,6 | | | 6,621 | | | | 6,911 | |
| 52 | The Bond Fund of America |
| Bonds, notes & other debt instruments (continued) | | Principal amount
(000) | | | Value
(000) | |
| Bonds & notes of governments & government agencies outside the U.S. (continued) |
| CPPIB Capital, Inc. 0.875% 20264 | | $ | 8,156 | | | $ | 7,894 | |
| Dominican Republic 6.875% 20264 | | | 4,300 | | | | 4,909 | |
| Dominican Republic 6.40% 20494 | | | 1,648 | | | | 1,735 | |
| Egypt (Arab Republic of) 4.75% 2026 | | € | 3,000 | | | | 3,309 | |
| Egypt (Arab Republic of) 6.588% 20284 | | $ | 1,610 | | | | 1,570 | |
| Egypt (Arab Republic of) 5.625% 2030 | | € | 1,060 | | | | 1,093 | |
| Egypt (Arab Republic of) 7.053% 20324 | | $ | 5,100 | | | | 4,724 | |
| Egypt (Arab Republic of) 8.50% 20474 | | | 2,245 | | | | 1,997 | |
| European Investment Bank 1.625% 2025 | | | 23,000 | | | | 23,375 | |
| Export-Import Bank of China 2.93% 2025 | | CNY | 242,000 | | | | 38,271 | |
| Export-Import Bank of India 3.375% 2026 | | $ | 7,000 | | | | 7,346 | |
| Export-Import Bank of India 3.875% 2028 | | | 3,000 | | | | 3,215 | |
| Export-Import Bank of India 3.25% 2030 | | | 9,100 | | | | 9,279 | |
| Export-Import Bank of India 2.25% 20314 | | | 25,000 | | | | 23,569 | |
| Gabonese Republic 6.95% 2025 | | | 700 | | | | 729 | |
| Gabonese Republic 6.625% 20314 | | | 600 | | | | 584 | |
| Honduras (Republic of) 7.50% 2024 | | | 3,330 | | | | 3,530 | |
| Honduras (Republic of) 6.25% 20274 | | | 1,400 | | | | 1,519 | |
| Honduras (Republic of) 6.25% 2027 | | | 968 | | | | 1,050 | |
| Hungary (Republic of) 2.125% 20314 | | | 12,195 | | | | 12,026 | |
| Indonesia (Republic of) 6.625% 2037 | | | 12,000 | | | | 16,784 | |
| Indonesia (Republic of) 4.20% 2050 | | | 1,785 | | | | 2,040 | |
| Inter-American Development Bank 0.50% 2024 | | | 826 | | | | 815 | |
| Inter-American Development Bank 1.125% 2028 | | | 1 | | | | 1 | |
| International Bank for Reconstruction and Development 0.75% 2025 | | | 4,974 | | | | 4,923 | |
| International Bank for Reconstruction and Development 1.625% 2025 | | | 12,573 | | | | 12,791 | |
| International Bank for Reconstruction and Development 1.625% 2031 | | | 8,431 | | | | 8,440 | |
| Israel (State of) 3.375% 2050 | | | 5,000 | | | | 5,419 | |
| Israel (State of) 3.875% 2050 | | | 42,900 | | | | 50,181 | |
| Japan Bank for International Cooperation 1.875% 2031 | | | 6,576 | | | | 6,654 | |
| Jordan (Hashemite Kingdom of) 6.125% 20264 | | | 2,890 | | | | 3,089 | |
| Jordan (Hashemite Kingdom of) 5.75% 20274 | | | 615 | | | | 648 | |
| Kenya (Republic of) 6.875% 20244 | | | 6,425 | | | | 6,804 | |
| KfW 0.625% 2026 | | | 6,778 | | | | 6,620 | |
| Kommuninvest i Sverige Aktiebolag 0.50% 20234 | | | 10,129 | | | | 10,107 | |
| Morocco (Kingdom of) 2.375% 20274 | | | 7,000 | | | | 6,840 | |
| Morocco (Kingdom of) 1.50% 2031 | | € | 15,000 | | | | 15,735 | |
| Morocco (Kingdom of) 3.00% 20324 | | $ | 10,000 | | | | 9,572 | |
| Morocco (Kingdom of) 5.50% 2042 | | | 25,300 | | | | 28,022 | |
| Morocco (Kingdom of) 5.50% 20424 | | | 1,500 | | | | 1,661 | |
| Morocco (Kingdom of) 4.00% 20504 | | | 7,700 | | | | 7,007 | |
| Oesterreichische Kontrollbank AG 0.50% 2024 | | | 6,622 | | | | 6,537 | |
| Ontario Teachers’ Finance Trust 0.875% 20264 | | | 7,433 | | | | 7,240 | |
| Ontario Teachers’ Finance Trust 2.00% 20314 | | | 6,787 | | | | 6,818 | |
| Panama (Republic of) 3.75% 20264 | | | 41,695 | | | | 44,347 | |
| Panama (Republic of) 3.875% 2028 | | | 10,000 | | | | 10,810 | |
| Panama (Republic of) 2.252% 2032 | | | 36,365 | | | | 34,574 | |
| Panama (Republic of) 4.50% 2047 | | | 1,090 | | | | 1,204 | |
| Panama (Republic of) 4.50% 2050 | | | 5,925 | | | | 6,541 | |
| Panama (Republic of) 4.30% 2053 | | | 3,242 | | | | 3,492 | |
| Panama (Republic of) 4.50% 2056 | | | 8,915 | | | | 9,853 | |
| Panama (Republic of) 3.87% 2060 | | | 19,858 | | | | 19,932 | |
| Panama Bonos Del Tesoro 3.362% 2031 | | | 28,000 | | | | 28,210 | |
| Paraguay (Republic of) 4.95% 20314 | | | 5,000 | | | | 5,631 | |
| Paraguay (Republic of) 2.739% 20334 | | | 1,618 | | | | 1,563 | |
| Paraguay (Republic of) 5.60% 20484 | | | 1,422 | | | | 1,650 | |
| Peru (Republic of) 6.35% 2028 | | PEN | 33,100 | | | | 8,732 | |
| Peru (Republic of) 5.94% 2029 | | | 41,000 | | | | 10,525 | |
| Peru (Republic of) 2.783% 2031 | | $ | 41,600 | | | | 41,496 | |
| Peru (Republic of) 6.15% 2032 | | PEN | 76,900 | | | | 19,361 | |
| Peru (Republic of) 3.00% 2034 | | $ | 14,110 | | | | 14,089 | |
| Peru (Republic of) 2.78% 2060 | | | 39,745 | | | | 34,976 | |
| PETRONAS Capital, Ltd. 3.50% 20304 | | | 4,450 | | | | 4,819 | |
| PETRONAS Capital, Ltd. 4.55% 20504 | | | 5,695 | | | | 7,072 | |
| Philippines (Republic of) 1.648% 2031 | | | 17,514 | | | | 17,002 | |
| Philippines (Republic of) 6.375% 2034 | | | 18,000 | | | | 25,035 | |
| Philippines (Republic of) 3.95% 2040 | | | 4,000 | | | | 4,477 | |
| The Bond Fund of America | 53 |
| Bonds, notes & other debt instruments (continued) | | Principal amount
(000) | | | Value
(000) | |
| Bonds & notes of governments & government agencies outside the U.S. (continued) |
| Philippines (Republic of) 3.70% 2041 | | $ | 19,000 | | | $ | 20,775 | |
| Philippines (Republic of) 3.70% 2042 | | | 21,300 | | | | 23,289 | |
| Philippines (Republic of) 2.65% 2045 | | | 13,236 | | | | 12,562 | |
| Philippines (Republic of) 2.95% 2045 | | | 15,091 | | | | 14,914 | |
| Philippines (Republic of) 3.20% 2046 | | | 9,100 | | | | 9,276 | |
| PT Indonesia Asahan Aluminium Tbk 5.71% 20234 | | | 2,050 | | | | 2,201 | |
| PT Indonesia Asahan Aluminium Tbk 4.75% 2025 | | | 10,000 | | | | 10,646 | |
| PT Indonesia Asahan Aluminium Tbk 4.75% 20254 | | | 3,310 | | | | 3,524 | |
| PT Indonesia Asahan Aluminium Tbk 6.53% 2028 | | | 8,528 | | | | 10,316 | |
| PT Indonesia Asahan Aluminium Tbk 6.53% 20284 | | | 1,867 | | | | 2,259 | |
| PT Indonesia Asahan Aluminium Tbk 5.45% 20304 | | | 910 | | | | 1,039 | |
| PT Indonesia Asahan Aluminium Tbk 6.757% 20484 | | | 655 | | | | 839 | |
| PT Indonesia Asahan Aluminium Tbk 5.80% 20504 | | | 2,690 | | | | 3,116 | |
| Qatar (State of) 3.875% 20234 | | | 10,830 | | | | 11,268 | |
| Qatar (State of) 3.75% 20304 | | | 39,070 | | | | 43,894 | |
| Qatar (State of) 4.40% 20504 | | | 32,960 | | | | 41,017 | |
| Romania 3.624% 2030 | | € | 3,592 | | | | 4,443 | |
| Romania 2.00% 2032 | | | 1,400 | | | | 1,484 | |
| Romania 3.50% 2034 | | | 7,600 | | | | 9,132 | |
| Romania 3.50% 2034 | | | 6,485 | | | | 7,792 | |
| Russian Federation 2.875% 2025 | | | 7,500 | | | | 9,183 | |
| Russian Federation 4.375% 2029 | | $ | 23,400 | | | | 25,837 | |
| Russian Federation 1.85% 2032 | | € | 12,500 | | | | 14,173 | |
| Russian Federation 5.10% 2035 | | $ | 52,800 | | | | 62,370 | |
| Russian Federation 5.10% 20354 | | | 800 | | | | 945 | |
| Russian Federation 5.25% 2047 | | | 10,000 | | | | 12,685 | |
| Saudi Arabia (Kingdom of) 3.25% 20264 | | | 4,170 | | | | 4,449 | |
| Saudi Arabia (Kingdom of) 3.628% 20274 | | | 3,800 | | | | 4,125 | |
| Saudi Arabia (Kingdom of) 3.625% 20284 | | | 3,110 | | | | 3,393 | |
| Saudi Arabia (Kingdom of) 2.25% 20334 | | | 25,000 | | | | 24,433 | |
| Saudi Arabia (Kingdom of) 4.50% 2046 | | | 8,000 | | | | 9,399 | |
| Saudi Arabia (Kingdom of) 3.45% 20614 | | | 23,000 | | | | 23,272 | |
| Tunisia (Republic of) 5.625% 2024 | | € | 3,000 | | | | 2,721 | |
| Turkey (Republic of) 4.25% 2026 | | $ | 3,300 | | | | 2,966 | |
| Turkey (Republic of) 4.875% 2026 | | | 2,380 | | | | 2,163 | |
| Ukraine 6.75% 2026 | | € | 453 | | | | 492 | |
| United Mexican States 3.25% 2030 | | $ | 1,515 | | | | 1,555 | |
| United Mexican States 2.659% 2031 | | | 3,293 | | | | 3,221 | |
| United Mexican States 4.75% 2044 | | | 2,500 | | | | 2,733 | |
| United Mexican States 5.00% 2051 | | | 9,010 | | | | 10,244 | |
| United Mexican States 3.75% 2071 | | | 11,315 | | | | 10,200 | |
| United Mexican States 5.75% 2110 | | | 3,850 | | | | 4,430 | |
| | | | | | | | 1,442,251 | |
| | | | | | | | | |
| Municipals 0.66% California 0.02% | | | | | | | | |
| Golden State Tobacco Securitization Corp., Enhanced Tobacco Settlement Asset-Backed Bonds, Series 2021-B, 2.746% 2034 | | | 3,725 | | | | 3,757 | |
| Regents of the University of California, General Rev. Bonds, Series 2020-BG, 1.316% 2027 | | | 6,585 | | | | 6,469 | |
| Regents of the University of California, General Rev. Bonds, Series 2020-BG, 1.614% 2030 | | | 5,150 | | | | 5,001 | |
| Dept. of Veterans Affairs, Veterans G.O. Rev. Ref. Bonds, Series 2015-CM, AMT, 2.45% 2031 | | | 240 | | | | 243 | |
| | | | | | | | 15,470 | |
| | | | | | | | | |
| Connecticut 0.00% | | | | | | | | |
| Housing Fin. Auth., Housing Mortgage Fin. Program Rev. Ref. Bonds, Series 2015-C-1, 3.50% 2045 | | | 1,685 | | | | 1,755 | |
| 54 | The Bond Fund of America |
| Bonds, notes & other debt instruments (continued) | Principal amount
(000) | | | Value
(000) | |
| Municipals (continued) | | | | | | | | |
| Illinois 0.49% | | | | | | | | |
| City of Chicago, Board of Education, Unlimited Tax G.O. Bonds (Dedicated Rev.), Series 2010-C, 6.319% 2029 | | $ | 14,400 | | | $ | 17,125 | |
| City of Chicago, Board of Education, Unlimited Tax G.O. Bonds (Dedicated Rev.), Series 2009-E, 6.138% 2039 | | | 56,485 | | | | 69,824 | |
| City of Chicago, Board of Education, Unlimited Tax G.O. Bonds (Dedicated Rev.), Series 2010-D, 6.519% 2040 | | | 5,770 | | | | 7,343 | |
| City of Chicago, Board of Education, Unlimited Tax G.O. Bonds (Qualified School Construction Bonds), Series 2009-G, 1.75% 2025 | | | 13,760 | | | | 13,160 | |
| G.O. Bonds, Series 2013-B, 4.11% 2022 | | | 2,280 | | | | 2,299 | |
| G.O. Bonds, Series 2012-B, 4.85% 2022 | | | 2,305 | | | | 2,305 | |
| G.O. Bonds, Series 2013-B, 4.31% 2023 | | | 7,325 | | | | 7,603 | |
| G.O. Bonds, Series 2020-A, 3.14% 2024 | | | 1,520 | | | | 1,575 | |
| G.O. Bonds, Series 2020-A, 3.24% 2025 | | | 2,245 | | | | 2,345 | |
| G.O. Bonds, Series 2013-B, 4.91% 2027 | | | 3,250 | | | | 3,664 | |
| G.O. Bonds, Series 2019-A, 5.70% 2031 | | | 7,530 | | | | 8,873 | |
| G.O. Bonds, Pension Funding, Series 2003, 4.95% 2023 | | | 22,504 | | | | 23,369 | |
| G.O. Bonds, Pension Funding, Series 2003, 5.10% 2033 | | | 161,540 | | | | 186,843 | |
| G.O. Bonds, Pension Funding, Series 2003, Assured Guaranty Municipal insured, 5.10% 2033 | | | 7,945 | | | | 9,279 | |
| G.O. Bonds, Taxable Build America Bonds, Series 2010-2, 5.85% 2022 | | | 3,155 | | | | 3,181 | |
| G.O. Bonds, Taxable Build America Bonds, Series 2010-2, 5.95% 2023 | | | 6,495 | | | | 6,851 | |
| G.O. Bonds, Taxable Build America Bonds, Series 2010-2, 6.05% 2024 | | | 1,905 | | | | 2,084 | |
| G.O. Bonds, Taxable Build America Bonds, Series 2010-1, 6.63% 2035 | | | 5,725 | | | | 6,999 | |
| G.O. Rev. Ref. Bonds, Series 2016, 6.15% 2025 | | | 6,205 | | | | 7,013 | |
| Housing Dev. Auth., Multi Family Housing Rev. Bonds (Marshall Field Garden Apartment Homes), Series 2015, (SIFMA Municipal Swap Index + 1.00%) 1.10% 2050 (put 2025)6 | | | 6,275 | | | | 6,427 | |
| Housing Dev. Auth., Rev. Bonds, Series 2016-A, 4.00% 2046 | | | 670 | | | | 712 | |
| | | | | | | | 388,874 | |
| | | | | | | | | |
| Iowa 0.00% | | | | | | | | |
| Fin. Auth., Single Family Mortgage Bonds (Mortgage-Backed Securities Program), Series 2016-A, 4.00% 2046 | | | 560 | | | | 590 | |
| | | | | | | | | |
| Kentucky 0.00% | | | | | | | | |
| Housing Corp., Housing Rev. Bonds, Series 2013-D, 3.50% 2033 | | | 690 | | | | 710 | |
| | | | | | | | | |
| Maine 0.00% | | | | | | | | |
| Housing Auth., Mortgage Purchase Rev. Ref. Bonds, Series 2015-E-1, AMT, 3.50% 2035 | | | 1,780 | | | | 1,850 | |
| | | | | | | | | |
| Maryland 0.00% | | | | | | | | |
| Community Dev. Administration, Dept. of Housing and Community Dev., Residential Rev. Bonds, Series 2014-B, AMT, 3.25% 2044 | | | 995 | | | | 1,020 | |
| | | | | | | | | |
| Massachusetts 0.00% | | | | | | | | |
| Housing Fin. Agcy., Single Family Housing Rev. Bonds, Series 178, 3.50% 2042 | | | 400 | | | | 420 | |
| | | | | | | | | |
| Michigan 0.01% | | | | | | | | |
| Fin. Auth., Local Government Loan Program Rev. Bonds (Detroit Fin. Recovery Income Tax Local Project Bonds), Series 2014-F-2, 4.60% 2022 | | | 1,370 | | | | 1,391 | |
| Housing Dev. Auth., Single Family Mortgage Rev. Bonds, Series 2016-B, 3.50% 2047 | | | 8,315 | | | | 8,794 | |
| | | | | | | | 10,185 | |
| | | | | | | | | |
| Minnesota 0.01% | | | | | | | | |
| Housing Fin. Agcy., Residential Housing Fin. Bonds, Series 2015-A, AMT, 4.00% 2041 | | | 300 | | | | 313 | |
| Housing Fin. Agcy., Residential Housing Fin. Bonds, Series 2014-C, AMT, 4.00% 2045 | | | 2,540 | | | | 2,690 | |
| Housing Fin. Agcy., Residential Housing Fin. Bonds, Series 2015-E, AMT, 3.50% 2046 | | | 1,610 | | | | 1,688 | |
| | | | | | | | 4,691 | |
| | |
| The Bond Fund of America | 55 |
| Bonds, notes & other debt instruments (continued) | Principal amount
(000) | | | Value
(000) | |
| Municipals (continued) | | | | | | | | |
| Missouri 0.00% | | | | | | | | |
| Housing Dev. Commission, Single Family Mortgage Rev. Bonds (Special Homeownership Loan Program), Series 2015-A, 3.75% 2038 | | $ | 625 | | | $ | 659 | |
| | | | | | | | | |
| Nebraska 0.00% | | | | | | | | |
| Investment Fin. Auth., Single Family Housing Rev. Bonds, Series 2015-C, 3.50% 2045 | | | 485 | | | | 502 | |
| Investment Fin. Auth., Single Family Housing Rev. Bonds, Series 2016-A, 3.50% 2046 | | | 1,870 | | | | 1,966 | |
| | | | | | | | 2,468 | |
| | | | | | | | | |
| New Jersey 0.01% | | | | | | | | |
| Econ. Dev. Auth., State Pension Funding Bonds, Series 1997-A, National insured, 7.425% 2029 | | | 4,400 | | | | 5,538 | |
| | | | | | | | | |
| New York 0.05% | | | | | | | | |
| Dormitory Auth., Taxable State Personal Income Tax Rev. Bonds (General Purpose), Series 2021-C, 2.202% 2034 | | | 39,115 | | | | 38,623 | |
| Mortgage Agcy., Homeowner Mortgage Rev. Bonds, Series 52, AMT, 3.50% 2030 | | | 960 | | | | 999 | |
| | | | | | | | 39,622 | |
| | | | | | | | | |
| Ohio 0.03% | | | | | | | | |
| Cleveland-Cuyahoga Port Auth., Federal Lease Rev. Bonds (VA Cleveland Health Care Center Project), Series 2021, 4.425% 2031 | | | 24,585 | | | | 25,896 | |
| | | | | | | | | |
| South Carolina 0.01% | | | | | | | | |
| Housing Fin. and Dev. Auth., Mortgage Rev. Ref. Bonds, Series 2016-A, 4.00% 2036 | | | 505 | | | | 543 | |
| Housing Fin. Auth., Mortgage Rev. Ref. Bonds, Series 2014, AMT, 4.00% 2041 | | | 1,940 | | | | 2,031 | |
| | | | | | | | 2,574 | |
| | | | | | | | | |
| Tennessee 0.01% | | | | | | | | |
| Housing Dev. Agcy., Homeownership Program Bonds, Series 2015-A, 3.50% 2045 | | | 700 | | | | 742 | |
| Housing Dev. Agcy., Residential Fin. Program Bonds, Series 2013-2-A, AMT, 4.00% 2043 | | | 275 | | | | 284 | |
| Housing Dev. Agcy., Residential Fin. Program Bonds, Series 2015-1-A, AMT, 4.00% 2045 | | | 1,550 | | | | 1,634 | |
| Housing Dev. Agcy., Residential Fin. Program Bonds, Series 2015-2-A, AMT, 4.00% 2046 | | | 2,055 | | | | 2,179 | |
| | | | | | | | 4,839 | |
| | | | | | | | | |
| Texas 0.02% | | | | | | | | |
| Grand Parkway Transportation Corp., Grand Parkway System Toll Rev. Ref. Bonds, Series 2020-B, 3.236% 2052 | | | 8,155 | | | | 8,257 | |
| SA Energy Acquisition Public Fac. Corp., Gas Supply Rev. Bonds, Series 2007, 5.50% 2023 | | | 6,000 | | | | 6,462 | |
| | | | | | | | 14,719 | |
| | | | | | | | | |
| Utah 0.00% | | | | | | | | |
| Housing Corp., Single Family Mortgage Bonds, Class III, Series 2015-D-2, 4.00% 2045 | | | 575 | | | | 612 | |
| | | | | | | | | |
| Wisconsin 0.00% | | | | | | | | |
| Housing and Econ. Dev. Auth., Home Ownership Rev. Bonds, Series 2015-A, AMT, 4.00% 2045 | | | 975 | | | | 1,016 | |
| Housing and Econ. Dev. Auth., Home Ownership Rev. Bonds, Series 2016-A, AMT, 3.50% 2046 | | | 1,445 | | | | 1,509 | |
| | | | | | | | 2,525 | |
| | | | | | | | | |
| Wyoming 0.00% | | | | | | | | |
| Community Dev. Auth., Housing Rev. Bonds, Series 2015-6, 4.00% 2045 | | | 345 | | | | 358 | |
| | | | | | | | | |
| Total municipals | | | | | | | 525,375 | |
| | | | | | | | | |
| 56 | The Bond Fund of America |
| Bonds, notes & other debt instruments (continued) | Principal amount
(000) | | | Value
(000) | |
| Federal agency bonds & notes 0.03% | | | | | | | | |
| Development Bank of Japan, Inc. 1.25% 20264 | | $ | 8,230 | | | $ | 8,157 | |
| Development Bank of Japan, Inc. 1.75% 20314 | | | 3,068 | | | | 3,065 | |
| Fannie Mae 1.625% 20251 | | | 7 | | | | 7 | |
| Federal Farm Credit Banks 1.60% 2033 | | | 1,957 | | | | 1,911 | |
| PSP Capital, Inc. 1.625% 20284 | | | 6,054 | | | | 6,040 | |
| | | | | | | | 19,180 | |
| | | | | | | | | |
| Total bonds, notes & other debt instruments (cost: $75,359,116,000) | | | | | | | 76,141,626 | |
| | | | | | | | | |
| Common stocks 0.05% | | | Shares | | | | | |
| Health care 0.05% | | | | | | | | |
| Rotech Healthcare, Inc.9,10,14,15 | | | 342,069 | | | | 36,944 | |
| | | | | | | | | |
| Consumer discretionary 0.00% | | | | | | | | |
| MYT Holding Co., Class B9,14 | | | 521,407 | | | | 2,216 | |
| NMG Parent LLC14 | | | 4,595 | | | | 698 | |
| | | | | | | | 2,914 | |
| | | | | | | | | |
| Energy 0.00% | | | | | | | | |
| Diamond Offshore Drilling, Inc.14 | | | 472,031 | | | | 2,006 | |
| | | | | | | | | |
| Total common stocks (cost: $25,286,000) | | | | | | | 41,864 | |
| | | | | | | | | |
| Preferred securities 0.01% | | | | | | | | |
| Financials 0.01% | | | | | | | | |
| CoBank, ACB, Class E, 1.304% noncumulative preferred shares4 | | | 6,250 | | | | 5,047 | |
| | | | | | | | | |
| Total preferred securities (cost: $5,820,000) | | | | | | | 5,047 | |
| | | | | | | | | |
| Rights & warrants 0.00% | | | | | | | | |
| Consumer discretionary 0.00% | | | | | | | | |
| NMG Parent LLC, warrants, expire 20279,14 | | | 18,410 | | | | 544 | |
| | | | | | | | | |
| Total rights & warrants (cost: $112,000) | | | | | | | 544 | |
| | | | | | | | | |
| Short-term securities 9.79% | | | | | | | | |
| Money market investments 9.79% | | | | | | | | |
| Capital Group Central Cash Fund 0.09%16,17 | | | 77,899,245 | | | | 7,790,703 | |
| | | | | | | | | |
| Total short-term securities (cost: $7,789,992,000) | | | | | | | 7,790,703 | |
| | | | | | | | | |
| Total investment securities 105.55% (cost: $83,180,326,000) | | | | | | | 83,979,784 | |
| Other assets less liabilities (5.55)% | | | | | | | (4,413,336 | ) |
| | | | | | | | | |
| Net assets 100.00% | | | | | | $ | 79,566,448 | |
Futures contracts
| Contracts | | Type | | Number of
contracts | | Expiration | | Notional
amount
(000) | | | Value and
unrealized
(depreciation)
appreciation
at 12/31/2021 (000) | |
| 90 Day Euro Dollar Futures | | Long | | 28 | | March 2022 | | $ | 6,976 | | | $ | (14 | ) |
| 90 Day Euro Dollar Futures | | Long | | 18,305 | | September 2022 | | | 4,539,411 | | | | (9,135 | ) |
| 2 Year U.S. Treasury Note Futures | | Long | | 5,963 | | March 2022 | | | 1,300,959 | | | | (306 | ) |
| 5 Year Euro-Bobl Futures | | Short | | 414 | | March 2022 | | | (62,801 | ) | | | 525 | |
| 5 Year U.S. Treasury Note Futures | | Short | | 10,069 | | March 2022 | | | (1,218,113 | ) | | | (971 | ) |
| 10 Year Euro-Bund Futures | | Short | | 1,185 | | March 2022 | | | (231,199 | ) | | | 4,457 | |
| 10 Year U.S. Treasury Note Futures | | Long | | 193 | | March 2022 | | | 25,180 | | | | (46 | ) |
| | |
| The Bond Fund of America | 57 |
Futures contracts (continued)
| Contracts | | Type | | Number of
contracts | | Expiration | | Notional
amount
(000) | | | Value and
unrealized
(depreciation)
appreciation
at 12/31/2021
(000) | |
| 10 Year Ultra U.S. Treasury Note Futures | | Short | | 27,367 | | March 2022 | | $ | (4,007,555 | ) | | $ | (63,509 | ) |
| 20 Year U.S. Treasury Bond Futures | | Long | | 12,280 | | March 2022 | | | 1,970,172 | | | | 16,835 | |
| 30 Year Ultra U.S. Treasury Bond Futures | | Long | | 18,422 | | March 2022 | | | 3,631,437 | | | | 61,688 | |
| | | | | | | | | | | | | $ | 9,524 | |
Forward currency contracts
| | | | | | | | | | | Unrealized | |
| | | | | | | | | | | appreciation | |
| Contract amount | | | | | | | (depreciation) | |
Currency purchased
(000) | | | Currency sold
(000) | | | Counterparty | | Settlement
date | | at 12/31/2021
(000) | |
| USD | 38,330 | | | COP | 151,894,400 | | | Citibank | | 1/7/2022 | | $ | 1,002 | |
| KRW | 50,350,000 | | | USD | 42,493 | | | Citibank | | 1/7/2022 | | | (162 | ) |
| USD | 21,938 | | | EUR | 19,334 | | | JPMorgan Chase | | 1/10/2022 | | | (78 | ) |
| USD | 45,423 | | | CNH | 290,000 | | | UBS AG | | 1/10/2022 | | | (168 | ) |
| USD | 40,745 | | | EUR | 35,991 | | | Morgan Stanley | | 1/10/2022 | | | (239 | ) |
| USD | 20,790 | | | PEN | 85,000 | | | UBS AG | | 1/10/2022 | | | (497 | ) |
| USD | 44,713 | | | JPY | 5,071,403 | | | Bank of New York Mellon | | 1/13/2022 | | | 621 | |
| USD | 89,532 | | | EUR | 79,212 | | | Morgan Stanley | | 1/13/2022 | | | (675 | ) |
| USD | 9,277 | | | PEN | 37,750 | | | Citibank | | 1/14/2022 | | | (175 | ) |
| USD | 2,954 | | | MXN | 62,944 | | | BNP Paribas | | 1/18/2022 | | | (111 | ) |
| USD | 178,003 | | | DKK | 1,172,950 | | | JPMorgan Chase | | 1/18/2022 | | | (1,635 | ) |
| USD | 2,239 | | | MXN | 47,221 | | | JPMorgan Chase | | 1/20/2022 | | | (59 | ) |
| USD | 47,529 | | | EUR | 41,998 | | | Morgan Stanley | | 1/20/2022 | | | (305 | ) |
| KRW | 96,400,000 | | | USD | 81,161 | | | Citibank | | 1/21/2022 | | | (146 | ) |
| USD | 3,654 | | | PEN | 15,060 | | | Morgan Stanley | | 8/26/2022 | | | (56 | ) |
| USD | 4,716 | | | PEN | 19,550 | | | Citibank | | 8/26/2022 | | | (99 | ) |
| | | | | | | | | | | | | $ | (2,782 | ) |
Swap contracts
Interest rate swaps
Centrally cleared interest rate swaps
| | | | | | | | | | | | | | | | | Upfront | | | Unrealized | |
| | | | | | | | | | | | | | | | | premium | | | appreciation | |
| Receive | | Pay | | | | | | | Value at | | | paid | | | (depreciation) | |
| | | Payment | | | | Payment | | Expiration | | Notional | | | 12/31/2021 | | | (received) | | | at 12/31/2021 | |
| Rate | | frequency | | Rate | | frequency | | date | | (000) | | | (000) | | | (000) | | | (000) | |
| SOFR | | Quarterly | | U.S. EFFR | | Quarterly | | 11/17/2022 | | $ | 1,000 | | | $ | — | 2 | | $ | — | | | $ | — | 2 |
| 2.432% | | Semi-annual | | 3-month USD-LIBOR | | Quarterly | | 9/21/2037 | | | 2,000 | | | | 210 | | | | — | | | | 210 | |
| 2.987% | | Semi-annual | | 3-month USD-LIBOR | | Quarterly | | 2/7/2038 | | | 37,000 | | | | 6,900 | | | | — | | | | 6,900 | |
| 3.193% | | Semi-annual | | 3-month USD-LIBOR | | Quarterly | | 5/21/2038 | | | 45,000 | | | | 9,860 | | | | — | | | | 9,860 | |
| 3.062% | | Semi-annual | | 3-month USD-LIBOR | | Quarterly | | 7/31/2038 | | | 23,500 | | | | 4,738 | | | | — | | | | 4,738 | |
| 2.835% | | Semi-annual | | 3-month USD-LIBOR | | Quarterly | | 1/10/2039 | | | 21,500 | | | | 3,665 | | | | — | | | | 3,665 | |
| 2.874% | | Semi-annual | | 3-month USD-LIBOR | | Quarterly | | 2/6/2039 | | | 13,900 | | | | 2,459 | | | | — | | | | 2,459 | |
| 2.7055% | | Semi-annual | | 3-month USD-LIBOR | | Quarterly | | 4/17/2039 | | | 41,900 | | | | 6,383 | | | | — | | | | 6,383 | |
| 3-month USD-LIBOR | | Quarterly | | 0.81% | | Semi-annual | | 7/28/2045 | | | 449,300 | | | | 83,325 | | | | (266 | ) | | | 83,591 | |
| 2.5095% | | Semi-annual | | 3-month USD-LIBOR | | Quarterly | | 7/24/2047 | | | 3,000 | | | | 502 | | | | — | | | | 502 | |
| 2.9075% | | Semi-annual | | 3-month USD-LIBOR | | Quarterly | | 4/16/2048 | | | 7,000 | | | | 1,813 | | | | — | | | | 1,813 | |
| 3-month USD-LIBOR | | Quarterly | | 0.811% | | Semi-annual | | 7/27/2050 | | | 445,000 | | | | 94,120 | | | | — | | | | 94,120 | |
| 3-month USD-LIBOR | | Quarterly | | 1.972% | | Semi-annual | | 4/26/2051 | | | 65,600 | | | | (4,100 | ) | | | — | | | | (4,100 | ) |
| 3-month USD-LIBOR | | Quarterly | | 1.9855% | | Semi-annual | | 4/26/2051 | | | 97,700 | | | | (6,422 | ) | | | — | | | | (6,422 | ) |
| 3-month USD-LIBOR | | Quarterly | | 1.953% | | Semi-annual | | 4/27/2051 | | | 65,600 | | | | (3,802 | ) | | | — | | | | (3,802 | ) |
| | |
| 58 | The Bond Fund of America |
Swap contracts (continued)
Interest rate swaps (continued)
Centrally cleared interest rate swaps (continued)
| | | | | | | | | | | | | | | | | Upfront | | | Unrealized | |
| | | | | | | | | | | | | | | | | premium | | | appreciation | |
| Receive | | Pay | | | | | | | Value at | | | paid | | | (depreciation) | |
| | | Payment | | | | Payment | | Expiration | | Notional | | | 12/31/2021 | | | (received) | | | at 12/31/2021 | |
| Rate | | frequency | | Rate | | frequency | | date | | (000) | | | (000) | | | (000) | | | (000) | |
| 3-month USD-LIBOR | | Quarterly | | 1.9895% | | Semi-annual | | 4/27/2051 | | $ | 101,200 | | | $ | (6,749 | ) | | $ | — | | | $ | (6,749 | ) |
| 3-month USD-LIBOR | | Quarterly | | 1.9778% | | Semi-annual | | 4/28/2051 | | | 38,400 | | | | (2,454 | ) | | | — | | | | (2,454 | ) |
| | | | | | | | | | | | | | | | | | | $ | (266 | ) | | $ | 190,714 | |
Credit default swaps
Centrally cleared credit default swaps on credit indices — sell protection
Financing
rate received | | Payment
frequency | | Reference
index | | Expiration
date | | Notional
(000) | | | Value at
12/31/2021
(000) | | | Upfront
premium
paid
(000) | | | Unrealized
appreciation
at 12/31/2021 (000) | |
| 1.00% | | Quarterly | | CDX.NA.IG.37 | | 12/20/2026 | | | $300,000 | | | | $7,288 | | | | $7,141 | | | | $147 | |
Investments in affiliates17
| | | Value of
affiliate at
1/1/2021
(000) | | | Additions
(000) | | | Reductions
(000) | | | Net
realized
loss
(000) | | | Net
unrealized
appreciation
(000) | | | Value of
affiliate at
12/31/2021
(000) | | | Dividend
income
(000) | |
| Short-term securities 9.79% | | | | | | | | | | | | | | | | | | | | | | | | | | | | |
| Money market investments 9.79% | | | | | | | | | | | | | | | | | | | | | | | | | | | | |
| Capital Group Central Cash Fund 0.09%16 | | $ | 16,368,185 | | | $ | 22,502,091 | | | $ | 31,079,107 | | | $ | (775 | ) | | $ | 309 | | | $ | 7,790,703 | | | $ | 7,533 | |
| | |
| 1 | All or a portion of this security was pledged as collateral. The total value of pledged collateral was $267,746,000, which represented .34% of the net assets of the fund. |
| 2 | Amount less than one thousand. |
| 3 | Index-linked bond whose principal amount moves with a government price index. |
| 4 | Acquired in a transaction exempt from registration under Rule 144A of the Securities Act of 1933. May be resold in the U.S. in transactions exempt from registration, normally to qualified institutional buyers. The total value of all such securities was $10,841,123,000, which represented 13.63% of the net assets of the fund. |
| 5 | Step bond; coupon rate may change at a later date. |
| 6 | Coupon rate may change periodically. Reference rate and spread are as of the most recent information available. Some coupon rates are determined by the issuer or agent based on current market conditions; therefore, the reference rate and spread are not available. |
| 7 | Scheduled interest and/or principal payment was not received. |
| 8 | Payment in kind; the issuer has the option of paying additional securities in lieu of cash. Payment methods and rates are as of the most recent payment when available. |
| 9 | Valued under fair value procedures adopted by authority of the board of trustees. The total value of all such securities was $96,839,000, which represented .12% of the net assets of the fund. |
| 10 | Value determined using significant unobservable inputs. |
| 11 | Loan participations and assignments; may be subject to legal or contractual restrictions on resale. The total value of all such loans was $5,302,000, which represented less than .01% of the net assets of the fund. |
| 12 | Principal payments may be made periodically. Therefore, the effective maturity date may be earlier than the stated maturity date. |
| 13 | Purchased on a TBA basis. |
| 14 | Security did not produce income during the last 12 months. |
| 15 | Acquired through a private placement transaction exempt from registration under the Securities Act of 1933. May be subject to legal or contractual restrictions on resale. Further details on this holding appear below. |
| 16 | Rate represents the seven-day yield at 12/31/2021. |
| 17 | Part of the same “group of investment companies” as the fund as defined under the Investment Company Act of 1940, as amended. |
| | |
| Private placement security | | Acquisition
date | | Cost
(000) | | | Value
(000) | | | Percent
of net
assets | |
| Rotech Healthcare, Inc. | | 9/26/2013 | | | $12,646 | | | | $36,944 | | | | .05 | % |
| The Bond Fund of America | 59 |
Key to abbreviations and symbols
Agcy. = Agency
AMT = Alternative Minimum Tax
Auth. = Authority
CLO = Collateralized Loan Obligations
CMO = Collateralized Mortgage Obligations
CNH/CNY = Chinese yuan renminbi
COP = Colombian pesos
Dept. = Department
Dev. = Development
DKK/DKr = Danish kroner
Econ. = Economic
EFFR = Effective Federal Funds Rate
EUR/€ = Euros
Fac. = Facility
Fin. = Finance
G.O. = General Obligation
ICE = Intercontinental Exchange, Inc.
JPY = Japanese yen
KRW = South Korean won
LIBOR = London Interbank Offered Rate
MXN = Mexican pesos
PEN = Peruvian nuevos soles
Ref. = Refunding
Rev. = Revenue
SIFMA = Securities Industry and Financial Markets Association
SOFR = Secured Overnight Financing Rate
TBA = To-be-announced
USD/$ = U.S. dollars
See notes to financial statements.
| 60 | The Bond Fund of America |
Financial statements
Statement of assets and liabilities
at December 31, 2021 | (dollars in thousands) |
| | |
| Assets: | | | | | | | | |
| Investment securities, at value: | | | | | | | | |
| Unaffiliated issuers (cost: $75,390,334) | | $ | 76,189,081 | | | | | |
| Affiliated issuers (cost: $7,789,992) | | | 7,790,703 | | | $ | 83,979,784 | |
| Cash | | | | | | | 7,743 | |
| Cash denominated in currencies other than U.S. dollars (cost: $56) | | | | | | | 57 | |
| Unrealized appreciation on open forward currency contracts | | | | | | | 1,623 | |
| Receivables for: | | | | | | | | |
| Sales of investments | | | 11,712,719 | | | | | |
| Sales of fund’s shares | | | 134,491 | | | | | |
| Dividends and interest | | | 337,149 | | | | | |
| Variation margin on futures contracts | | | 36,419 | | | | | |
| Variation margin on centrally cleared swap contracts | | | 796 | | | | 12,221,574 | |
| | | | | | | | 96,210,781 | |
| Liabilities: | | | | | | | | |
| Unrealized depreciation on open forward currency contracts | | | | | | | 4,405 | |
| Payables for: | | | | | | | | |
| Purchases of investments | | | 16,493,507 | | | | | |
| Repurchases of fund’s shares | | | 95,995 | | | | | |
| Dividends on fund’s shares | | | 8,664 | | | | | |
| Investment advisory services | | | 11,073 | | | | | |
| Services provided by related parties | | | 12,654 | | | | | |
| Trustees’ deferred compensation | | | 732 | | | | | |
| Variation margin on futures contracts | | | 7,977 | | | | | |
| Variation margin on centrally cleared swap contracts | | | 8,937 | | | | | |
| Other | | | 389 | | | | 16,639,928 | |
| Net assets at December 31, 2021 | | | | | | $ | 79,566,448 | |
| | | | | | | | | |
| Net assets consist of: | | | | | | | | |
| Capital paid in on shares of beneficial interest | | | | | | $ | 78,718,080 | |
| Total distributable earnings | | | | | | | 848,368 | |
| Net assets at December 31, 2021 | | | | | | $ | 79,566,448 | |
See notes to financial statements.
| The Bond Fund of America | 61 |
Financial statements (continued)
Statement of assets and liabilities
at December 31, 2021 (continued)
(dollars and shares in thousands, except per-share amounts)
Shares of beneficial interest issued and outstanding (no stated par value) —
unlimited shares authorized (5,944,397 total shares outstanding)
| | | Net
assets | | | Shares
outstanding | | | Net asset value
per share | |
| Class A | | $ | 30,200,514 | | | | 2,256,276 | | | $ | 13.39 | |
| Class C | | | 717,237 | | | | 53,585 | | | | 13.39 | |
| Class T | | | 11 | | | | 1 | | | | 13.39 | |
| Class F-1 | | | 1,010,925 | | | | 75,526 | | | | 13.39 | |
| Class F-2 | | | 20,613,315 | | | | 1,540,017 | | | | 13.39 | |
| Class F-3 | | | 7,934,153 | | | | 592,759 | | | | 13.39 | |
| Class 529-A | | | 1,473,308 | | | | 110,071 | | | | 13.39 | |
| Class 529-C | | | 69,859 | | | | 5,219 | | | | 13.39 | |
| Class 529-E | | | 46,161 | | | | 3,449 | | | | 13.39 | |
| Class 529-T | | | 12 | | | | 1 | | | | 13.39 | |
| Class 529-F-1 | | | 10 | | | | 1 | | | | 13.39 | |
| Class 529-F-2 | | | 176,499 | | | | 13,186 | | | | 13.39 | |
| Class 529-F-3 | | | 10 | | | | 1 | | | | 13.39 | |
| Class R-1 | | | 41,770 | | | | 3,121 | | | | 13.39 | |
| Class R-2 | | | 409,230 | | | | 30,573 | | | | 13.39 | |
| Class R-2E | | | 44,359 | | | | 3,314 | | | | 13.39 | |
| Class R-3 | | | 673,150 | | | | 50,291 | | | | 13.39 | |
| Class R-4 | | | 588,472 | | | | 43,965 | | | | 13.39 | |
| Class R-5E | | | 159,651 | | | | 11,927 | | | | 13.39 | |
| Class R-5 | | | 372,792 | | | | 27,851 | | | | 13.39 | |
| Class R-6 | | | 15,035,010 | | | | 1,123,263 | | | | 13.39 | |
See notes to financial statements.
| 62 | The Bond Fund of America |
Financial statements (continued)
| Statement of operations | |
| for the year ended December 31, 2021 | (dollars in thousands) |
| Investment income: | | | | | | | | |
| Income: | | | | | | | | |
| Interest (net of non-U.S. taxes of $193) | | $ | 1,413,053 | | | | | |
| Dividends (includes $7,533 from affiliates) | | | 7,596 | | | $ | 1,420,649 | |
| Fees and expenses*: | | | | | | | | |
| Investment advisory services | | | 117,038 | | | | | |
| Distribution services | | | 98,870 | | | | | |
| Transfer agent services | | | 58,536 | | | | | |
| Administrative services | | | 22,364 | | | | | |
| Reports to shareholders | | | 1,898 | | | | | |
| Registration statement and prospectus | | | 3,992 | | | | | |
| Trustees’ compensation | | | 261 | | | | | |
| Auditing and legal | | | 247 | | | | | |
| Custodian | | | 274 | | | | | |
| Other | | | 1,167 | | | | 304,647 | |
| Net investment income | | | | | | | 1,116,002 | |
| | | | | | | | | |
| Net realized gain and unrealized depreciation: | | | | | | | | |
| Net realized gain (loss) on: | | | | | | | | |
| Investments: | | | | | | | | |
| Unaffiliated issuers | | | 122,871 | | | | | |
| Affiliated issuers | | | (775 | ) | | | | |
| Futures contracts | | | 119,270 | | | | | |
| Forward currency contracts | | | 18,338 | | | | | |
| Swap contracts | | | 43,855 | | | | | |
| Currency transactions | | | 302 | | | | 303,861 | |
| Net unrealized (depreciation) appreciation on: | | | | | | | | |
| Investments: | | | | | | | | |
| Unaffiliated issuers | | | (1,995,545 | ) | | | | |
| Affiliated issuers | | | 309 | | | | | |
| Futures contracts | | | 3,393 | | | | | |
| Forward currency contracts | | | (2,462 | ) | | | | |
| Swap contracts | | | (669 | ) | | | | |
| Currency translations | | | (65 | ) | | | (1,995,039 | ) |
| Net realized gain and unrealized depreciation | | | | | | | (1,691,178 | ) |
| Net decrease in net assets resulting from operations | | | | | | $ | (575,176 | ) |
| | |
| * | Additional information related to class-specific fees and expenses is included in the notes to financial statements. |
See notes to financial statements.
| The Bond Fund of America | 63 |
Financial statements (continued)
| Statements of changes in net assets | |
| | (dollars in thousands) |
| | | Year ended December 31, | |
| | | 2021 | | | 2020 | |
| Operations: | | | | | | | | |
| Net investment income | | $ | 1,116,002 | | | $ | 1,012,536 | |
| Net realized gain | | | 303,861 | | | | 2,750,281 | |
| Net unrealized (depreciation) appreciation | | | (1,995,039 | ) | | | 2,021,287 | |
| Net (decrease) increase in net assets resulting from operations | | | (575,176 | ) | | | 5,784,104 | |
| | | | | | | | | |
| Distributions paid or accrued to shareholders | | | (1,605,741 | ) | | | (3,310,485 | ) |
| | | | | | | | | |
| Net capital share transactions | | | 11,507,974 | | | | 17,318,680 | |
| | | | | | | | | |
| Total increase in net assets | | | 9,327,057 | | | | 19,792,299 | |
| | | | | | | | | |
| Net assets: | | | | | | | | |
| Beginning of year | | | 70,239,391 | | | | 50,447,092 | |
| End of year | | $ | 79,566,448 | | | $ | 70,239,391 | |
| | | | | | | | | |
| See notes to financial statements. | | | | | | | | |
| 64 | The Bond Fund of America |
Notes to financial statements
1. Organization
The Bond Fund of America (the “fund”) is registered under the Investment Company Act of 1940, as amended (the “1940 Act”), as an open-end, diversified management investment company. The fund seeks as high a level of current income as is consistent with the preservation of capital.
The fund has 21 share classes consisting of six retail share classes (Classes A, C, T, F-1, F-2 and F-3), seven 529 college savings plan share classes (Classes 529-A, 529-C, 529-E, 529-T, 529-F-1, 529-F-2 and 529-F-3) and eight retirement plan share classes (Classes R-1, R-2, R-2E, R-3, R-4, R-5E, R-5 and R-6). The 529 college savings plan share classes can be used to save for college education. The retirement plan share classes are generally offered only through eligible employer-sponsored retirement plans. The fund’s share classes are described further in the following table:
| Share class | | Initial sales charge | | Contingent deferred sales
charge upon redemption | | Conversion feature |
| Classes A and 529-A | | Up to 3.75% for Class A; up to 3.50% for Class 529-A | | None (except 1.00% for certain redemptions within 18 months of purchase without an initial sales charge) | | None |
| Classes C and 529-C | | None | | 1.00% for redemptions within one year of purchase | | Class C converts to Class A after eight years and Class 529-C converts to Class 529-A after five years |
| Class 529-E | | None | | None | | None |
| Classes T and 529-T* | | Up to 2.50% | | None | | None |
| Classes F-1, F-2, F-3, 529-F-1, 529-F-2 and 529-F-3 | | None | | None | | None |
| Classes R-1, R-2, R-2E, R-3, R-4, R-5E, R-5 and R-6 | | None | | None | | None |
| | | |
| * | Class T and 529-T shares are not available for purchase. |
Holders of all share classes have equal pro rata rights to the assets, dividends and liquidation proceeds of the fund. Each share class has identical voting rights, except for the exclusive right to vote on matters affecting only its class. Share classes have different fees and expenses (“class-specific fees and expenses”), primarily due to different arrangements for distribution, transfer agent and administrative services. Differences in class-specific fees and expenses will result in differences in net investment income and, therefore, the payment of different per-share dividends by each share class.
2. Significant accounting policies
The fund is an investment company that applies the accounting and reporting guidance issued in Topic 946 by the U.S. Financial Accounting Standards Board. The fund’s financial statements have been prepared to comply with U.S. generally accepted accounting principles (“U.S. GAAP”). These principles require the fund’s investment adviser to make estimates and assumptions that affect reported amounts and disclosures. Actual results could differ from those estimates. Subsequent events, if any, have been evaluated through the date of issuance in the preparation of the financial statements. The fund follows the significant accounting policies described in this section, as well as the valuation policies described in the next section on valuation.
Security transactions and related investment income — Security transactions are recorded by the fund as of the date the trades are executed with brokers. Realized gains and losses from security transactions are determined based on the specific identified cost of the securities. In the event a security is purchased with a delayed payment date, the fund will segregate liquid assets sufficient to meet its payment obligations. Dividend income is recognized on the ex-dividend date and interest income is recognized on an accrual basis. Market discounts, premiums and original issue discounts on fixed-income securities are amortized daily over the expected life of the security.
Class allocations — Income, fees and expenses (other than class-specific fees and expenses) are allocated daily among the various share classes based on the relative value of their settled shares. Realized gains and losses and unrealized appreciation and depreciation are allocated daily among the various share classes based on their relative net assets. Class-specific fees and expenses, such as distribution, transfer agent and administrative services, are charged directly to the respective share class.
Distributions paid or accrued to shareholders — Income dividends are declared daily after the determination of the fund’s net investment income and are paid to shareholders monthly. Capital gain distributions are recorded on the ex-dividend date.
| The Bond Fund of America | 65 |
Currency translation — Assets and liabilities, including investment securities, denominated in currencies other than U.S. dollars are translated into U.S. dollars at the exchange rates supplied by one or more pricing vendors on the valuation date. Purchases and sales of investment securities and income and expenses are translated into U.S. dollars at the exchange rates on the dates of such transactions. The effects of changes in exchange rates on investment securities are included with the net realized gain or loss and net unrealized appreciation or depreciation on investments in the fund’s statement of operations. The realized gain or loss and unrealized appreciation or depreciation resulting from all other transactions denominated in currencies other than U.S. dollars are disclosed separately.
3. Valuation
Capital Research and Management Company (“CRMC”), the fund’s investment adviser, values the fund’s investments at fair value as defined by U.S. GAAP. The net asset value per share is calculated once daily as of the close of regular trading on the New York Stock Exchange, normally 4 p.m. New York time, each day the New York Stock Exchange is open.
Methods and inputs — The fund’s investment adviser uses the following methods and inputs to establish the fair value of the fund’s assets and liabilities. Use of particular methods and inputs may vary over time based on availability and relevance as market and economic conditions evolve.
Equity securities are generally valued at the official closing price of, or the last reported sale price on, the exchange or market on which such securities are traded, as of the close of business on the day the securities are being valued or, lacking any sales, at the last available bid price. Prices for each security are taken from the principal exchange or market on which the security trades.
Fixed-income securities, including short-term securities, are generally valued at prices obtained from one or more pricing vendors. Vendors value such securities based on one or more of the inputs described in the following table. The table provides examples of inputs that are commonly relevant for valuing particular classes of fixed-income securities in which the fund is authorized to invest. However, these classifications are not exclusive, and any of the inputs may be used to value any other class of fixed-income security.
| Fixed-income class | Examples of standard inputs |
| All | Benchmark yields, transactions, bids, offers, quotations from dealers and trading systems, new issues, spreads and other relationships observed in the markets among comparable securities; and proprietary pricing models such as yield measures calculated using factors such as cash flows, financial or collateral performance and other reference data (collectively referred to as “standard inputs”) |
| Corporate bonds, notes & loans; convertible securities | Standard inputs and underlying equity of the issuer |
| Bonds & notes of governments & government agencies | Standard inputs and interest rate volatilities |
| Mortgage-backed; asset-backed obligations | Standard inputs and cash flows, prepayment information, default rates, delinquency and loss assumptions, collateral characteristics, credit enhancements and specific deal information |
| Municipal securities | Standard inputs and, for certain distressed securities, cash flows or liquidation values using a net present value calculation based on inputs that include, but are not limited to, financial statements and debt contracts |
When the fund’s investment adviser deems it appropriate to do so (such as when vendor prices are unavailable or deemed to be not representative), fixed-income securities will be valued in good faith at the mean quoted bid and ask prices that are reasonably and timely available (or bid prices, if ask prices are not available) or at prices for securities of comparable maturity, quality and type.
Securities with both fixed-income and equity characteristics, or equity securities traded principally among fixed-income dealers, are generally valued in the manner described for either equity or fixed-income securities, depending on which method is deemed most appropriate by the fund’s investment adviser. The Capital Group Central Cash Fund (“CCF”), a fund within the Capital Group Central Fund Series (“Central Funds”), is valued based upon a floating net asset value, which fluctuates with changes in the value of CCF’s portfolio securities. The underlying securities are valued based on the policies and procedures in CCF’s statement of additional information. Exchange-traded futures are generally valued at the official settlement price of the exchange or market on which such instruments are traded, as of the close of business on the day the futures are being valued. Forward currency contracts are valued based on the spot and forward exchange rates obtained from one or more pricing vendors. Interest rate swaps and credit default swaps are generally valued by pricing vendors based on market inputs that include the index and term of index, reset frequency, payer/receiver, currency and pay frequency.
| 66 | The Bond Fund of America |
Securities and other assets for which representative market quotations are not readily available or are considered unreliable by the fund’s investment adviser are fair valued as determined in good faith under fair valuation guidelines adopted by authority of the fund’s board of trustees as further described. The investment adviser follows fair valuation guidelines, consistent with U.S. Securities and Exchange Commission rules and guidance, to consider relevant principles and factors when making fair value determinations. The investment adviser considers relevant indications of value that are reasonably and timely available to it in determining the fair value to be assigned to a particular security, such as the type and cost of the security; contractual or legal restrictions on resale of the security; relevant financial or business developments of the issuer; actively traded similar or related securities; conversion or exchange rights on the security; related corporate actions; significant events occurring after the close of trading in the security; and changes in overall market conditions. In addition, the closing prices of equity securities that trade in markets outside U.S. time zones may be adjusted to reflect significant events that occur after the close of local trading but before the net asset value of each share class of the fund is determined. Fair valuations and valuations of investments that are not actively trading involve judgment and may differ materially from valuations that would have been used had greater market activity occurred.
Processes and structure — The fund’s board of trustees has delegated authority to the fund’s investment adviser to make fair value determinations, subject to board oversight. The investment adviser has established a Joint Fair Valuation Committee (the “Fair Valuation Committee”) to administer, implement and oversee the fair valuation process, and to make fair value decisions. The Fair Valuation Committee regularly reviews its own fair value decisions, as well as decisions made under its standing instructions to the investment adviser’s valuation teams. The Fair Valuation Committee reviews changes in fair value measurements from period to period and may, as deemed appropriate, update the fair valuation guidelines to better reflect the results of back testing and address new or evolving issues. The Fair Valuation Committee reports any changes to the fair valuation guidelines to the board of trustees. The fund’s board and audit committee also regularly review reports that describe fair value determinations and methods.
The fund’s investment adviser has also established a Fixed-Income Pricing Review Group to administer and oversee the fixed-income valuation process, including the use of fixed-income pricing vendors. This group regularly reviews pricing vendor information and market data. Pricing decisions, processes and controls over security valuation are also subject to additional internal reviews facilitated by the investment adviser’s global risk management group.
Classifications — The fund’s investment adviser classifies the fund’s assets and liabilities into three levels based on the inputs used to value the assets or liabilities. Level 1 values are based on quoted prices in active markets for identical securities. Level 2 values are based on significant observable market inputs, such as quoted prices for similar securities and quoted prices in inactive markets. Certain securities trading outside the U.S. may transfer between Level 1 and Level 2 due to valuation adjustments resulting from significant market movements following the close of local trading. Level 3 values are based on significant unobservable inputs that reflect the investment adviser’s determination of assumptions that market participants might reasonably use in valuing the securities. The valuation levels are not necessarily an indication of the risk or liquidity associated with the underlying investment. For example, U.S. government securities are reflected as Level 2 because the inputs used to determine fair value may not always be quoted prices in an active market. The following tables present the fund’s valuation levels as of December 31, 2021 (dollars in thousands):
| | | Investment securities | |
| | | Level 1 | | | Level 2 | | | Level 3 | | | Total | |
| Assets: | | | | | | | | | | | | | | | | |
| Bonds, notes & other debt instruments: | | | | | | | | | | | | | | | | |
| U.S. Treasury bonds & notes | | $ | — | | | $ | 33,998,635 | | | $ | — | | | $ | 33,998,635 | |
| Corporate bonds, notes & loans | | | — | | | | 26,410,702 | | | | 5,302 | | | | 26,416,004 | |
| Mortgage-backed obligations | | | — | | | | 11,143,175 | | | | 2,175 | | | | 11,145,350 | |
| Asset-backed obligations | | | — | | | | 2,594,831 | | | | — | | | | 2,594,831 | |
| Bonds & notes of governments & government agencies outside the U.S. | | | — | | | | 1,442,251 | | | | — | | | | 1,442,251 | |
| Municipals | | | — | | | | 525,375 | | | | — | | | | 525,375 | |
| Federal agency bonds & notes | | | — | | | | 19,180 | | | | — | | | | 19,180 | |
| Common stocks | | | — | | | | 4,920 | | | | 36,944 | | | | 41,864 | |
| Preferred securities | | | — | | | | 5,047 | | | | — | | | | 5,047 | |
| Rights & warrants | | | — | | | | 544 | | | | — | | | | 544 | |
| Short-term securities | | | 7,790,703 | | | | — | | | | — | | | | 7,790,703 | |
| Total | | $ | 7,790,703 | | | $ | 76,144,660 | | | $ | 44,421 | | | $ | 83,979,784 | |
| The Bond Fund of America | 67 |
| | | Other investments* | |
| | | Level 1 | | | Level 2 | | | Level 3 | | | Total | |
| Assets: | | | | | | | | | | | | | | | | |
| Unrealized appreciation on futures contracts | | $ | 83,505 | | | $ | — | | | $ | — | | | $ | 83,505 | |
| Unrealized appreciation on open forward currency contracts | | | — | | | | 1,623 | | | | — | | | | 1,623 | |
| Unrealized appreciation on centrally cleared interest rate swaps | | | — | | | | 214,241 | | | | — | | | | 214,241 | |
| Unrealized appreciation on credit default swaps | | | — | | | | 147 | | | | — | | | | 147 | |
| Liabilities: | | | | | | | | | | | | | | | | |
| Unrealized depreciation on futures contracts | | | (73,981 | ) | | | — | | | | — | | | | (73,981 | ) |
| Unrealized depreciation on open forward currency contracts | | | — | | | | (4,405 | ) | | | — | | | | (4,405 | ) |
| Unrealized depreciation on centrally cleared interest rate swaps | | | — | | | | (23,527 | ) | | | — | | | | (23,527 | ) |
| Total | | $ | 9,524 | | | $ | 188,079 | | | $ | — | | | $ | 197,603 | |
| * | Futures contracts, forward currency contracts, interest rate swaps and credit default swaps are not included in the fund’s investment portfolio. |
4. Risk factors
Investing in the fund may involve certain risks including, but not limited to, those described below.
Market conditions — The prices of, and the income generated by, the securities held by the fund may decline — sometimes rapidly or unpredictably — due to various factors, including events or conditions affecting the general economy or particular industries; overall market changes; local, regional or global political, social or economic instability; governmental, governmental agency or central bank responses to economic conditions; and currency exchange rate, interest rate and commodity price fluctuations.
Economies and financial markets throughout the world are highly interconnected. Economic, financial or political events, trading and tariff arrangements, wars, terrorism, cybersecurity events, natural disasters, public health emergencies (such as the spread of infectious disease) and other circumstances in one country or region, including actions taken by governmental or quasi-governmental authorities in response to any of the foregoing, could have impacts on global economies or markets. As a result, whether or not the fund invests in securities of issuers located in or with significant exposure to the countries affected, the value and liquidity of the fund’s investments may be negatively affected by developments in other countries and regions.
Issuer risks — The prices of, and the income generated by, securities held by the fund may decline in response to various factors directly related to the issuers of such securities, including reduced demand for an issuer’s goods or services, poor management performance, major litigation, investigations or other controversies related to the issuer, changes in government regulations affecting the issuer or its competitive environment and strategic initiatives such as mergers, acquisitions or dispositions and the market response to any such initiatives.
Investing in debt instruments — The prices of, and the income generated by, bonds and other debt securities held by the fund may be affected by factors such as the interest rates, maturities and credit ratings of these securities.
Rising interest rates will generally cause the prices of bonds and other debt securities to fall. A general rise in interest rates may cause investors to sell debt securities on a large scale, which could also adversely affect the price and liquidity of debt securities and could also result in increased redemptions from the fund. Falling interest rates may cause an issuer to redeem, call or refinance a debt security before its stated maturity, which may result in the fund failing to recoup the full amount of its initial investment and having to reinvest the proceeds in lower yielding securities. Longer maturity debt securities generally have greater sensitivity to changes in interest rates and may be subject to greater price fluctuations than shorter maturity debt securities.
Bonds and other debt securities are also subject to credit risk, which is the possibility that the credit strength of an issuer or guarantor will weaken or be perceived to be weaker, and/or an issuer of a debt security will fail to make timely payments of principal or interest and the security will go into default. A downgrade or default affecting any of the fund’s securities could cause the value of the fund’s shares to decrease. Lower quality debt securities generally have higher rates of interest and may be subject to greater price fluctuations than higher quality debt securities. Credit risk is gauged, in part, by the credit ratings of the debt securities in which the fund invests. However, ratings are only the opinions of the rating agencies issuing them and are not guarantees as to credit quality or an evaluation of market risk. The fund’s investment adviser relies on its own credit analysts to research issuers and issues in seeking to assess credit and default risks.
| 68 | The Bond Fund of America |
Investing in mortgage-related and other asset-backed securities — Mortgage-related securities, such as mortgage-backed securities, and other asset-backed securities, include debt obligations that represent interests in pools of mortgages or other income-bearing assets, such as consumer loans or receivables. While such securities are subject to the risks associated with investments in debt instruments generally (for example, credit, extension and interest rate risks), they are also subject to other and different risks. Mortgage-backed and other asset-backed securities are subject to changes in the payment patterns of borrowers of the underlying debt, potentially increasing the volatility of the securities and the fund’s net asset value. When interest rates fall, borrowers are more likely to refinance or prepay their debt before its stated maturity. This may result in the fund having to reinvest the proceeds in lower yielding securities, effectively reducing the fund’s income. Conversely, if interest rates rise and borrowers repay their debt more slowly than expected, the time in which the mortgage-backed and other asset-backed securities are paid off could be extended, reducing the fund’s cash available for reinvestment in higher yielding securities. Mortgage-backed securities are also subject to the risk that underlying borrowers will be unable to meet their obligations and the value of property that secures the mortgages may decline in value and be insufficient, upon foreclosure, to repay the associated loans. Investments in asset-backed securities are subject to similar risks.
Investing in securities backed by the U.S. government — Securities backed by the U.S. Treasury or the full faith and credit of the U.S. government are guaranteed only as to the timely payment of interest and principal when held to maturity. Accordingly, the current market values for these securities will fluctuate with changes in interest rates and the credit rating of the U.S. government. Securities issued by U.S. government-sponsored entities and federal agencies and instrumentalities that are not backed by the full faith and credit of the U.S. government are neither issued nor guaranteed by the U.S. government.
Liquidity risk — Certain fund holdings may be or may become difficult or impossible to sell, particularly during times of market turmoil. Liquidity may be impacted by the lack of an active market for a holding, legal or contractual restrictions on resale, or the reduced number and capacity of market participants to make a market in such holding. Market prices for less liquid or illiquid holdings may be volatile, and reduced liquidity may have an adverse impact on the market price of such holdings. Additionally, the sale of less liquid or illiquid holdings may involve substantial delays (including delays in settlement) and additional costs and the fund may be unable to sell such holdings when necessary to meet its liquidity needs or may be forced to sell at a loss.
Investing outside the U.S. — Securities of issuers domiciled outside the U.S., or with significant operations or revenues outside the U.S., may lose value because of adverse political, social, economic or market developments (including social instability, regional conflicts, terrorism and war) in the countries or regions in which the issuers operate or generate revenue. These securities may also lose value due to changes in foreign currency exchange rates against the U.S. dollar and/or currencies of other countries. Issuers of these securities may be more susceptible to actions of foreign governments, such as nationalization, currency blockage or the imposition of price controls or punitive taxes, each of which could adversely impact the value of these securities. Securities markets in certain countries may be more volatile and/or less liquid than those in the U.S. Investments outside the U.S. may also be subject to different accounting and auditing practices and standards and different regulatory, legal and reporting requirements, and may be more difficult to value, than those in the U.S. In addition, the value of investments outside the U.S. may be reduced by foreign taxes, including foreign withholding taxes on interest and dividends. Further, there may be increased risks of delayed settlement of securities purchased or sold by the fund. The risks of investing outside the U.S. may be heightened in connection with investments in emerging markets.
Investing in future delivery contracts — The fund may enter into contracts, such as to-be-announced contracts and mortgage dollar rolls, that involve the fund selling mortgage-related securities and simultaneously contracting to repurchase similar securities for delivery at a future date at a predetermined price. This can increase the fund’s market exposure, and the market price of the securities that the fund contracts to repurchase could drop below their purchase price. While the fund can preserve and generate capital through the use of such contracts by, for example, realizing the difference between the sale price and the future purchase price, the income generated by the fund may be reduced by engaging in such transactions. In addition, these transactions increase the turnover rate of the fund.
Investing in inflation-linked bonds — The values of inflation-linked bonds generally fluctuate in response to changes in real interest rates — i.e., rates of interest after factoring in inflation. A rise in real interest rates may cause the prices of inflation-linked securities to fall, while a decline in real interest rates may cause the prices to increase. Inflation-linked bonds may experience greater losses than other debt securities with similar durations when real interest rates rise faster than nominal interest rates. There can be no assurance that the value of an inflation-linked security will be directly correlated to changes in interest rates; for example, if interest rates rise for reasons other than inflation, the increase may not be reflected in the security’s inflation measure.
Investing in inflation-linked bonds may also reduce the fund’s distributable income during periods of deflation. If prices for goods and services decline throughout the economy, the principal and income on inflation-linked securities may decline and result in losses to the fund.
| The Bond Fund of America | 69 |
Investing in derivatives — The use of derivatives involves a variety of risks, which may be different from, or greater than, the risks associated with investing in traditional securities, such as stocks and bonds. Changes in the value of a derivative may not correlate perfectly with, and may be more sensitive to market events than, the underlying asset, rate or index, and a derivative instrument may expose the fund to losses in excess of its initial investment. Derivatives may be difficult to value, difficult for the fund to buy or sell at an opportune time or price and difficult, or even impossible, to terminate or otherwise offset. The fund’s use of derivatives may result in losses to the fund, and investing in derivatives may reduce the fund’s returns and increase the fund’s price volatility. The fund’s counterparty to a derivative transaction (including, if applicable, the fund’s clearing broker, the derivatives exchange or the clearinghouse) may be unable or unwilling to honor its financial obligations in respect of the transaction. In certain cases, the fund may be hindered or delayed in exercising remedies against or closing out derivative instruments with a counterparty, which may result in additional losses.
Management — The investment adviser to the fund actively manages the fund’s investments. Consequently, the fund is subject to the risk that the methods and analyses, including models, tools and data, employed by the investment adviser in this process may be flawed or incorrect and may not produce the desired results. This could cause the fund to lose value or its investment results to lag relevant benchmarks or other funds with similar objectives.
5. Certain investment techniques
Index-linked bonds — The fund has invested in index-linked bonds, which are fixed-income securities whose principal value is periodically adjusted to a government price index. Over the life of an index-linked bond, interest is paid on the adjusted principal value. Increases or decreases in the principal value of index-linked bonds are recorded as interest income in the fund’s statement of operations.
Mortgage dollar rolls — The fund has entered into mortgage dollar roll transactions in which the fund sells a mortgage-backed security to a counterparty and simultaneously enters into an agreement with the same counterparty to buy back a similar security on a specific future date at a predetermined price. Mortgage dollar rolls are accounted for as purchase and sale transactions. Portfolio turnover rates excluding and including mortgage dollar rolls are presented at the end of the fund’s financial highlights table.
Loan transactions — The fund has entered into loan transactions in which the fund acquires a loan either through an agent, by assignment from another holder, or as a participation interest in another holder’s portion of a loan. The loan is often administered by a financial institution that acts as agent for the holders of the loan, and the fund may be required to receive approval from the agent and/or borrower prior to the sale of the investment. The loan’s interest rate and maturity date may change based on the terms of the loan, including potential early payments of principal.
Futures contracts — The fund has entered into futures contracts, which provide for the future sale by one party and purchase by another party of a specified amount of a specific financial instrument for a specified price, date, time and place designated at the time the contract is made. Futures contracts are used to strategically manage the fund’s interest rate sensitivity by increasing or decreasing the duration of the fund or a portion of the fund’s portfolio.
Upon entering into futures contracts, and to maintain the fund’s open positions in futures contracts, the fund is required to deposit with a futures broker, known as a futures commission merchant (“FCM”), in a segregated account in the name of the FCM an amount of cash, U.S. government securities or other liquid securities, known as initial margin. The margin required for a particular futures contract is set by the exchange on which the contract is traded to serve as collateral, and may be significantly modified from time to time by the exchange during the term of the contract.
On a daily basis, the fund pays or receives variation margin based on the increase or decrease in the value of the futures contracts and records variation margin on futures contracts in the statement of assets and liabilities. In addition, the fund segregates liquid assets equivalent to the fund’s outstanding obligations under the contract in excess of the initial margin and variation margin, if any. Futures contracts may involve a risk of loss in excess of the variation margin shown on the fund’s statement of assets and liabilities. The fund records realized gains or losses at the time the futures contract is closed or expires. Net realized gains or losses and net unrealized appreciation or depreciation from futures contracts are recorded in the fund’s statement of operations. The average month-end notional amount of futures contracts while held was $22,399,480,000.
Forward currency contracts — The fund has entered into forward currency contracts, which represent agreements to exchange currencies on specific future dates at predetermined rates. The fund’s investment adviser uses forward currency contracts to manage the fund’s exposure to changes in exchange rates. Upon entering into these contracts, risks may arise from the potential inability of counterparties to meet the terms of their contracts and from possible movements in exchange rates.
| 70 | The Bond Fund of America |
On a daily basis, the fund’s investment adviser values forward currency contracts and records unrealized appreciation or depreciation for open forward currency contracts in the fund’s statement of assets and liabilities. Realized gains or losses are recorded at the time the forward currency contract is closed or offset by another contract with the same broker for the same settlement date and currency.
Closed forward currency contracts that have not reached their settlement date are included in the respective receivables or payables for closed forward currency contracts in the fund’s statement of assets and liabilities. Net realized gains or losses from closed forward currency contracts and net unrealized appreciation or depreciation from open forward currency contracts are recorded in the fund’s statement of operations. The average month-end notional amount of open forward currency contracts while held was $470,711,000.
Swap contracts — The fund has entered into swap agreements, which are two-party contracts entered into primarily by institutional investors for a specified time period. In a typical swap transaction, two parties agree to exchange the returns earned or realized from one or more underlying assets or rates of return. Swap agreements can be traded on a swap execution facility (SEF) and cleared through a central clearinghouse (cleared), traded over-the-counter (OTC) and cleared, or traded bilaterally and not cleared. Because clearing interposes a central clearinghouse as the ultimate counterparty to each participant’s swap, and margin is required to be exchanged under the rules of the clearinghouse, central clearing is intended to decrease (but not eliminate) counterparty risk relative to uncleared bilateral swaps. To the extent the fund enters into bilaterally negotiated swap transactions, the fund will enter into swap agreements only with counterparties that meet certain credit standards and subject to agreed collateralized procedures. The term of a swap can be days, months or years and certain swaps may be less liquid than others.
Upon entering into a centrally cleared swap contract, the fund is required to deposit cash, U.S. government securities or other liquid securities, which is known as initial margin. Generally, the initial margin required for a particular swap is set and held as collateral by the clearinghouse on which the contract is cleared. The amount of initial margin required may be significantly modified from time to time by the clearinghouse during the term of the contract.
On a daily basis, interest accruals related to the exchange of future payments are recorded as a receivable and payable in the fund’s statement of assets and liabilities for centrally cleared swaps and as unrealized appreciation or depreciation in the fund’s statement of assets and liabilities for bilateral swaps. For centrally cleared swaps, the fund also pays or receives a variation margin based on the increase or decrease in the value of the swaps, including accrued interest as applicable, and records variation margin in the statement of assets and liabilities. The fund records realized gains and losses on both the net accrued interest and any gain or loss recognized at the time the swap is closed or expires. Net realized gains or losses, as well as any net unrealized appreciation or depreciation, from swaps are recorded in the fund’s statement of operations.
Swap agreements can take different forms. The fund has entered into the following types of swap agreements:
Interest rate swaps — The fund has entered into interest rate swaps, which seek to manage the interest rate sensitivity of the fund by increasing or decreasing the duration of the fund or a portion of the fund’s portfolio. An interest rate swap is an agreement between two parties to exchange or swap payments based on changes in an interest rate or rates. Typically, one interest rate is fixed and the other is variable based on a designated short-term interest rate such as the Secured Overnight Financing Rate (SOFR), prime rate or other benchmark. In other types of interest rate swaps, known as basis swaps, the parties agree to swap variable interest rates based on different designated short-term interest rates. Interest rate swaps generally do not involve the delivery of securities or other principal amounts. Rather, cash payments are exchanged by the parties based on the application of the designated interest rates to a notional amount, which is the predetermined dollar principal of the trade upon which payment obligations are computed. Accordingly, the fund’s current obligation or right under the swap agreement is generally equal to the net amount to be paid or received under the swap agreement based on the relative value of the position held by each party. The average month-end notional amount of interest rate swaps while held was $6,544,156,000.
Credit default swap indices — The fund has entered into centrally cleared credit default swap indices, including CDX and iTraxx indices (collectively referred to as “CDSIs”), in order to assume exposure to a diversified portfolio of credits or to hedge against existing credit risks. A CDSI is based on a portfolio of credit default swaps with similar characteristics, such as credit default swaps on high-yield bonds. In a typical CDSI transaction, one party (the protection buyer) is obligated to pay the other party (the protection seller) a stream of periodic payments over the term of the contract. If a credit event, such as a default or restructuring, occurs with respect to any of the underlying reference obligations, the protection seller must pay the protection buyer the loss on those credits.
The fund may enter into a CDSI transaction as either protection buyer or protection seller. If the fund is a protection buyer, it would pay the counterparty a periodic stream of payments over the term of the contract and would not recover any of those payments if no credit events were to occur with respect to any of the underlying reference obligations. However, if a credit event did occur, the fund, as a protection buyer, would have the right to deliver the referenced debt obligations or a specified amount of cash, depending on the terms of the applicable agreement, and to receive the par value of such debt obligations from the counterparty protection seller.
| The Bond Fund of America | 71 |
As a protection seller, the fund would receive fixed payments throughout the term of the contract if no credit events were to occur with respect to any of the underlying reference obligations. If a credit event were to occur, however, the value of any deliverable obligation received by the fund, coupled with the periodic payments previously received by the fund, may be less than the full notional value that the fund, as a protection seller, pays to the counterparty protection buyer, effectively resulting in a loss of value to the fund. Furthermore, as a protection seller, the fund would effectively add leverage to its portfolio because it would have investment exposure to the notional amount of the swap transaction. The average month-end notional amount of credit default swaps while held was $510,444,000.
The following tables identify the location and fair value amounts on the fund’s statement of assets and liabilities and the effect on the fund’s statement of operations resulting from the fund’s use of futures contracts, forward currency contracts, interest rate swaps and credit default swaps as of, or for the year ended, December 31, 2021 (dollars in thousands):
| | | | Assets | | | Liabilities | |
| Contracts | | Risk type | | Location on statement of
assets and liabilities | | Value | | | Location on statement of
assets and liabilities | | Value | |
| Futures | | Interest | | Unrealized appreciation* | | $ | 83,505 | | | Unrealized depreciation* | | $ | 73,981 | |
| Forward currency | | Currency | | Unrealized appreciation on open forward currency contracts | | | 1,623 | | | Unrealized depreciation on open forward currency contracts | | | 4,405 | |
| Swap (centrally cleared) | | Interest | | Unrealized appreciation* | | | 214,241 | | | Unrealized depreciation* | | | 23,527 | |
| Swap (centrally cleared) | | Credit | | Unrealized appreciation* | | | 147 | | | Unrealized depreciation* | | | — | |
| | | | | | | $ | 299,516 | | | | | $ | 101,913 | |
| | | | | | | | | | | | | | | |
| | | | | Net realized gain (loss) | | | Net unrealized appreciation (depreciation) | |
| Contracts | | Risk type | | Location on statement of operations | | | Value | | | Location on statement of operations | | | Value | |
| Futures | | Interest | | Net realized gain on futures contracts | | $ | 119,270 | | | Net unrealized appreciation on futures contracts | | $ | 3,393 | |
| Forward currency | | Currency | | Net realized gain on forward currency contracts | | | 18,338 | | | Net unrealized depreciation on forward currency contracts | | | (2,462 | ) |
| Swap | | Interest | | Net realized gain on swap contracts | | | 45,141 | | | Net unrealized appreciation on swap contracts | | | 6 | |
| Swap | | Credit | | Net realized loss on swap contracts | | | (1,286 | ) | | Net unrealized depreciation on swap contracts | | | (675 | ) |
| | | | | | | $ | 181,463 | | | | | $ | 262 | |
| * | Includes cumulative appreciation/depreciation on futures contracts, centrally cleared interest rate swaps and credit default swaps as reported in the applicable tables following the fund’s investment portfolio. Only current day’s variation margin is reported within the fund’s statement of assets and liabilities. |
Collateral — The fund receives or pledges highly liquid assets, such as cash or U.S. government securities, as collateral due to its use of futures contracts, forward currency contracts, interest rate swaps, credit default swaps and future delivery contracts. For futures contracts, centrally cleared interest rate swaps and credit default swaps, the fund pledges collateral for initial and variation margin by contract. For forward currency contracts, the fund either receives or pledges collateral based on the net gain or loss on unsettled contracts by counterparty. For future delivery contracts, the fund either receives or pledges collateral based on the net gain or loss on unsettled contracts by certain counterparties. The purpose of the collateral is to cover potential losses that could occur in the event that either party cannot meet its contractual obligation. Non-cash collateral pledged by the fund, if any, is disclosed in the fund’s investment portfolio, and cash collateral pledged by the fund, if any, is held in a segregated account with the fund’s custodian, which is reflected as pledged cash collateral in the fund’s statement of assets and liabilities.
Rights of offset — The fund has entered into enforceable master netting agreements with certain counterparties for forward currency contracts, where on any date amounts payable by each party to the other (in the same currency with respect to the same transaction) may be closed or offset by each party’s payment obligation. If an early termination date occurs under these agreements following an event of default or termination event, all obligations of each party to its counterparty are settled net through a single payment in a single currency (“close-out netting”). For financial reporting purposes, the fund does not offset financial assets and financial liabilities that are subject to these master netting arrangements in the statement of assets and liabilities.
| 72 | The Bond Fund of America |
The following table presents the fund’s forward currency contracts by counterparty that are subject to master netting agreements but that are not offset in the fund’s statement of assets and liabilities. The net amount column shows the impact of offsetting on the fund’s statement of assets and liabilities as of December 31, 2021, if close-out netting was exercised (dollars in thousands):
| | | Gross amounts
recognized in the | | | Gross amounts not offset in the
statement of assets and liabilities and
subject to a master netting agreement | | | | |
| Counterparty | | statement of assets
and liabilities | | | Available
to offset | | | Non-cash
collateral* | | | Cash
collateral* | | | Net
amount | |
| Assets: | | | | | | | | | | | | | | | | | | | | |
| Bank of New York Mellon | | $ | 621 | | | $ | — | | | $ | (561 | ) | | $ | — | | | $ | 60 | |
| Citibank | | | 1,002 | | | | (582 | ) | | | — | | | | — | | | | 420 | |
| Total | | $ | 1,623 | | | $ | (582 | ) | | $ | (561 | ) | | $ | — | | | $ | 480 | |
| Liabilities: | | | | | | | | | | | | | | | | | | | | |
| BNP Paribas | | $ | 111 | | | $ | — | | | $ | — | | | $ | — | | | $ | 111 | |
| Citibank | | | 582 | | | | (582 | ) | | | — | | | | — | | | | — | |
| JPMorgan Chase | | | 1,772 | | | | — | | | | (821 | ) | | | — | | | | 951 | |
| Morgan Stanley | | | 1,275 | | | | — | | | | (668 | ) | | | — | | | | 607 | |
| UBS AG | | | 665 | | | | — | | | | (474 | ) | | | — | | | | 191 | |
| Total | | $ | 4,405 | | | $ | (582 | ) | | $ | (1,963 | ) | | $ | — | | | $ | 1,860 | |
| * | Collateral is shown on a settlement basis. |
6. Taxation and distributions
Federal income taxation — The fund complies with the requirements under Subchapter M of the Internal Revenue Code applicable to regulated investment companies and intends to distribute substantially all of its net taxable income and net capital gains each year. The fund is not subject to income taxes to the extent such distributions are made. Therefore, no federal income tax provision is required.
As of and during the year ended December 31, 2021, the fund did not have a liability for any unrecognized tax benefits. The fund recognizes interest and penalties, if any, related to unrecognized tax benefits as income tax expense in the statement of operations. During the year, the fund did not incur any significant interest or penalties.
The fund’s tax returns are generally not subject to examination by federal, state and, if applicable, non-U.S. tax authorities after the expiration of each jurisdiction’s statute of limitations, which is typically three years after the date of filing but can be extended in certain jurisdictions.
Non-U.S. taxation — Dividend and interest income are recorded net of non-U.S. taxes paid. The fund may file withholding tax reclaims in certain jurisdictions to recover a portion of amounts previously withheld. These reclaims are recorded when the amount is known and there are no significant uncertainties on collectability. Gains realized by the fund on the sale of securities in certain countries, if any, may be subject to non-U.S. taxes. If applicable, the fund records an estimated deferred tax liability based on unrealized gains to provide for potential non-U.S. taxes payable upon the sale of these securities.
Distributions — Distributions determined on a tax basis may differ from net investment income and net realized gains for financial reporting purposes. These differences are due primarily to different treatment for items such as currency gains and losses; short-term capital gains and losses; capital losses related to sales of certain securities within 30 days of purchase; cost of investments sold; paydowns on fixed-income securities and income on certain investments. The fiscal year in which amounts are distributed may differ from the year in which the net investment income and net realized gains are recorded by the fund for financial reporting purposes. The fund may also designate a portion of the amount paid to redeeming shareholders as a distribution for tax purposes.
During the year ended December 31, 2021, the fund reclassified $16,057,000 from total distributable earnings to capital paid in on shares of beneficial interest to align financial reporting with tax reporting.
| The Bond Fund of America | 73 |
As of December 31, 2021, the tax basis components of distributable earnings, unrealized appreciation (depreciation) and cost of investments were as follows (dollars in thousands):
| Undistributed ordinary income | | $ | 192,572 | |
| Undistributed long-term capital gains | | | 88,414 | |
| Gross unrealized appreciation on investments | | | 1,756,328 | |
| Gross unrealized depreciation on investments | | | (798,411 | ) |
| Net unrealized appreciation on investments | | | 957,917 | |
| Cost of investments | | | 83,212,595 | |
Distributions paid or accrued were characterized for tax purposes as follows (dollars in thousands):
| | | Year ended December 31, 2021 | | | Year ended December 31, 2020 | |
| Share class | | Ordinary
income | | | Long-term
capital gains | | | Total
distributions
paid or
accrued | | | Ordinary
income | | | Long-term
capital gains | | | Total
distributions
paid or
accrued | |
| Class A | | $ | 431,914 | | | $ | 163,952 | | | $ | 595,866 | | | $ | 1,135,597 | | | $ | 260,675 | | | $ | 1,396,272 | |
| Class C | | | 5,421 | | | | 4,005 | | | | 9,426 | | | | 27,884 | | | | 7,480 | | | | 35,364 | |
| Class T | | | — | * | | | — | * | | | — | * | | | — | * | | | — | * | | | — | * |
| Class F-1 | | | 15,522 | | | | 5,669 | | | | 21,191 | | | | 49,443 | | | | 11,581 | | | | 61,024 | |
| Class F-2 | | | 318,827 | | | | 109,456 | | | | 428,283 | | | | 618,245 | | | | 145,365 | | | | 763,610 | |
| Class F-3 | | | 105,868 | | | | 39,500 | | | | 145,368 | | | | 163,945 | | | | 39,329 | | | | 203,274 | |
| Class 529-A | | | 21,024 | | | | 8,089 | | | | 29,113 | | | | 57,819 | | | | 13,417 | | | | 71,236 | |
| Class 529-C | | | 511 | | | | 397 | | | | 908 | | | | 3,631 | | | | 786 | | | | 4,417 | |
| Class 529-E | | | 594 | | | | 258 | | | | 852 | | | | 1,983 | | | | 463 | | | | 2,446 | |
| Class 529-T | | | — | * | | | — | * | | | — | * | | | — | * | | | — | * | | | — | * |
| Class 529-F-1 | | | — | * | | | — | * | | | — | * | | | 2,578 | | | | — | * | | | 2,578 | |
| Class 529-F-2† | | | 2,834 | | | | 952 | | | | 3,786 | | | | 4,047 | | | | 1,458 | | | | 5,505 | |
| Class 529-F-3† | | | — | * | | | — | * | | | — | * | | | — | * | | | — | * | | | — | * |
| Class R-1 | | | 288 | | | | 227 | | | | 515 | | | | 1,283 | | | | 348 | | | | 1,631 | |
| Class R-2 | | | 2,981 | | | | 2,266 | | | | 5,247 | | | | 15,217 | | | | 4,120 | | | | 19,337 | |
| Class R-2E | | | 448 | | | | 244 | | | | 692 | | | | 1,561 | | | | 400 | | | | 1,961 | |
| Class R-3 | | | 8,015 | | | | 3,713 | | | | 11,728 | | | | 27,171 | | | | 6,544 | | | | 33,715 | |
| Class R-4 | | | 9,139 | | | | 3,247 | | | | 12,386 | | | | 26,795 | | | | 6,064 | | | | 32,859 | |
| Class R-5E | | | 2,205 | | | | 860 | | | | 3,065 | | | | 3,282 | | | | 771 | | | | 4,053 | |
| Class R-5 | | | 3,788 | | | | 1,733 | | | | 5,521 | | | | 8,031 | | | | 1,691 | | | | 9,722 | |
| Class R-6 | | | 252,562 | | | | 79,232 | | | | 331,794 | | | | 543,708 | | | | 117,773 | | | | 661,481 | |
| Total | | $ | 1,181,941 | | | $ | 423,800 | | | $ | 1,605,741 | | | $ | 2,692,220 | | | $ | 618,265 | | | $ | 3,310,485 | |
| * | Amount less than one thousand. |
| † | Class 529-F-2 and 529-F-3 shares began investment operations on October 30, 2020. |
7. Fees and transactions with related parties
CRMC, the fund’s investment adviser, is the parent company of American Funds Distributors®, Inc. (“AFD”), the principal underwriter of the fund’s shares, and American Funds Service Company® (“AFS”), the fund’s transfer agent. CRMC, AFD and AFS are considered related parties to the fund.
Investment advisory services — The fund has an investment advisory and service agreement with CRMC that provides for monthly fees accrued daily. At the beginning of the year, these fees were based on a series of decreasing annual rates beginning with 0.300% on the first $60 million of daily net assets and decreasing to 0.107% on such assets in excess of $52 billion. On March 10, 2021, the fund’s board of trustees approved an amended investment advisory and service agreement effective May 1, 2021, decreasing the annual rate to 0.105% on daily net assets in excess of $76 billion. The agreement also provides for monthly fees, accrued daily, based on a series of decreasing rates beginning with 2.25% on the first $8,333,333 of the fund’s monthly gross income and decreasing to 1.75% on such income in excess of $41,666,667. For the year ended December 31, 2021, the investment advisory services fees were $117,038,000, which were equivalent to an annualized rate of 0.157% of average daily net assets.
| 74 | The Bond Fund of America |
Class-specific fees and expenses — Expenses that are specific to individual share classes are accrued directly to the respective share class. The principal class-specific fees and expenses are further described below:
Distribution services — The fund has plans of distribution for all share classes, except Class F-2, F-3, 529-F-2, 529-F-3, R-5E, R-5 and R-6 shares. Under the plans, the board of trustees approves certain categories of expenses that are used to finance activities primarily intended to sell fund shares and service existing accounts. The plans provide for payments, based on an annualized percentage of average daily net assets, ranging from 0.25% to 1.00% as noted in this section. In some cases, the board of trustees has limited the amounts that may be paid to less than the maximum allowed by the plans. All share classes with a plan may use up to 0.25% of average daily net assets to pay service fees, or to compensate AFD for paying service fees, to firms that have entered into agreements with AFD to provide certain shareholder services. The remaining amounts available to be paid under each plan are paid to dealers to compensate them for their sales activities.
| | Share class | | Currently approved limits | | Plan limits |
| | Class A | | | 0.25 | % | | | 0.25 | % |
| | Class 529-A | | | 0.25 | | | | 0.50 | |
| | Classes C, 529-C and R-1 | | | 1.00 | | | | 1.00 | |
| | Class R-2 | | | 0.75 | | | | 1.00 | |
| | Class R-2E | | | 0.60 | | | | 0.85 | |
| | Classes 529-E and R-3 | | | 0.50 | | | | 0.75 | |
| | Classes T, F-1, 529-T, 529-F-1 and R-4 | | | 0.25 | | | | 0.50 | |
For Class A and 529-A shares, distribution-related expenses include the reimbursement of dealer and wholesaler commissions paid by AFD for certain shares sold without a sales charge. These share classes reimburse AFD for amounts billed within the prior 15 months but only to the extent that the overall annual expense limits are not exceeded. As of December 31, 2021, unreimbursed expenses subject to reimbursement totaled $13,982,000 for Class A shares. There were no unreimbursed expenses subject to reimbursement for Class 529-A shares.
Transfer agent services — The fund has a shareholder services agreement with AFS under which the fund compensates AFS for providing transfer agent services to each of the fund’s share classes. These services include recordkeeping, shareholder communications and transaction processing. In addition, the fund reimburses AFS for amounts paid to third parties for performing transfer agent services on behalf of fund shareholders.
Administrative services — The fund has an administrative services agreement with CRMC under which the fund compensates CRMC for providing administrative services to all share classes. Administrative services are provided by CRMC and its affiliates to help assist third parties providing non-distribution services to fund shareholders. These services include providing in-depth information on the fund and market developments that impact fund investments. Administrative services also include, but are not limited to, coordinating, monitoring and overseeing third parties that provide services to fund shareholders. The agreement provides the fund the ability to charge an administrative services fee at the annual rate of 0.05% of the average daily net assets attributable to each share class of the fund. Currently the fund pays CRMC an administrative services fee at the annual rate of 0.03% of the average daily net assets attributable to each share class of the fund for CRMC’s provision of administrative services.
529 plan services — Each 529 share class is subject to service fees to compensate the Virginia College Savings Plan (“Virginia529”) for its oversight and administration of the CollegeAmerica 529 college savings plan. The fee is based on the combined net assets invested in Class 529 and ABLE shares of the American Funds. Class ABLE shares are offered on other American Funds by Virginia529 through ABLEAmerica®, a tax-advantaged savings program for individuals with disabilities. The quarterly fee is based on a series of decreasing annual rates beginning with 0.09% on the first $20 billion of the combined net assets invested in the American Funds and decreasing to 0.03% on such assets in excess of $100 billion. Effective January 1, 2022, the quarterly fee will be amended to a series of decreasing annual rates beginning with 0.09% on the first $20 billion of the combined net assets invested in the American Funds and decreasing to 0.03% on such assets in excess of $75 billion. The fee for any given calendar quarter is accrued and calculated on the basis of the average net assets of Class 529 and ABLE shares of the American Funds for the last month of the prior calendar quarter. The fee is included in other expenses in the fund’s statement of operations. Virginia529 is not considered a related party to the fund.
| The Bond Fund of America | 75 |
For the year ended December 31, 2021, class-specific expenses under the agreements were as follows (dollars in thousands):
| | Share class | | Distribution
services | | | Transfer agent
services | | | Administrative
services | | | 529 plan
services | |
| | Class A | | $ | 74,680 | | | $ | 29,796 | | | $ | 8,962 | | | | Not applicable | |
| | Class C | | | 7,777 | | | | 775 | | | | 234 | | | | Not applicable | |
| | Class T | | | — | | | | — | * | | | — | * | | | Not applicable | |
| | Class F-1 | | | 2,787 | | | | 1,616 | | | | 334 | | | | Not applicable | |
| | Class F-2 | | | Not applicable | | | | 20,883 | | | | 5,661 | | | | Not applicable | |
| | Class F-3 | | | Not applicable | | | | 74 | | | | 1,760 | | | | Not applicable | |
| | Class 529-A | | | 3,585 | | | | 1,423 | | | | 450 | | | $ | 889 | |
| | Class 529-C | | | 780 | | | | 76 | | | | 24 | | | | 47 | |
| | Class 529-E | | | 246 | | | | 18 | | | | 15 | | | | 29 | |
| | Class 529-T | | | — | | | | — | * | | | — | * | | | — | * |
| | Class 529-F-1 | | | — | | | | — | * | | | — | * | | | — | * |
| | Class 529-F-2 | | | Not applicable | | | | 122 | | | | 51 | | | | 101 | |
| | Class 529-F-3 | | | Not applicable | | | | — | * | | | — | * | | | — | * |
| | Class R-1 | | | 406 | | | | 40 | | | | 12 | | | | Not applicable | |
| | Class R-2 | | | 3,235 | | | | 1,510 | | | | 129 | | | | Not applicable | |
| | Class R-2E | | | 271 | | | | 93 | | | | 14 | | | | Not applicable | |
| | Class R-3 | | | 3,516 | | | | 1,062 | | | | 211 | | | | Not applicable | |
| | Class R-4 | | | 1,587 | | | | 627 | | | | 190 | | | | Not applicable | |
| | Class R-5E | | | Not applicable | | | | 189 | | | | 39 | | | | Not applicable | |
| | Class R-5 | | | Not applicable | | | | 108 | | | | 64 | | | | Not applicable | |
| | Class R-6 | | | Not applicable | | | | 124 | | | | 4,214 | | | | Not applicable | |
| | Total class-specific expenses | | $ | 98,870 | | | $ | 58,536 | | | $ | 22,364 | | | $ | 1,066 | |
| * | Amount less than one thousand. |
Trustees’ deferred compensation — Trustees who are unaffiliated with CRMC may elect to defer the cash payment of part or all of their compensation. These deferred amounts, which remain as liabilities of the fund, are treated as if invested in shares of the fund or other American Funds. These amounts represent general, unsecured liabilities of the fund and vary according to the total returns of the selected funds. Trustees’ compensation of $261,000 in the fund’s statement of operations reflects $157,000 in current fees (either paid in cash or deferred) and a net increase of $104,000 in the value of the deferred amounts.
Affiliated officers and trustees — Officers and certain trustees of the fund are or may be considered to be affiliated with CRMC, AFD and AFS. No affiliated officers or trustees received any compensation directly from the fund.
Investment in CCF — The fund holds shares of CCF, an institutional prime money market fund managed by CRMC. CCF invests in high-quality, short-term money market instruments. CCF is used as the primary investment vehicle for the fund’s short-term instruments. CCF shares are only available for purchase by CRMC, its affiliates, and other funds managed by CRMC or its affiliates, and are not available to the public. CRMC does not receive an investment advisory services fee from CCF.
Security transactions with related funds — The fund purchased securities from, and sold securities to, other funds managed by CRMC (or funds managed by certain affiliates of CRMC) under procedures adopted by the fund’s board of trustees. The funds involved in such transactions are considered related by virtue of having a common investment adviser (or affiliated investment advisers), common trustees and/or common officers. Each transaction was executed at the current market price of the security and no brokerage commissions or fees were paid in accordance with Rule 17a-7 of the 1940 Act. During the year ended December 31, 2021, the fund engaged in such purchase and sale transactions with related funds in the amounts of $1,052,381,000 and $379,118,000, respectively, which generated $18,552,000 of net realized gains from such sales.
Interfund lending — Pursuant to an exemptive order issued by the SEC, the fund, along with other CRMC-managed funds (or funds managed by certain affiliates of CRMC), may participate in an interfund lending program. The program provides an alternate credit facility that permits the funds to lend or borrow cash for temporary purposes directly to or from one another, subject to the conditions of the exemptive order. The fund did not lend or borrow cash through the interfund lending program at any time during the year ended December 31, 2021.
| 76 | The Bond Fund of America |
8. Indemnifications
The fund’s organizational documents provide board members and officers with indemnification against certain liabilities or expenses in connection with the performance of their duties to the fund. In the normal course of business, the fund may also enter into contracts that provide general indemnifications. The fund’s maximum exposure under these arrangements is unknown since it is dependent on future claims that may be made against the fund. The risk of material loss from such claims is considered remote. Insurance policies are also available to the fund’s board members and officers.
9. Capital share transactions
Capital share transactions in the fund were as follows (dollars and shares in thousands):
| | | Sales1 | | | Reinvestments of
distributions | | | Repurchases1 | | | Net increase
(decrease) | |
| Share class | | Amount | | | Shares | | | Amount | | | Shares | | | Amount | | | Shares | | | Amount | | | Shares | |
| | | | | | | | | | | | | | | | | | | |
| Year ended December 31, 2021 | | | | | | | | | | | | | | | | | | |
| | | | | | | | | | | | | | | | | | | |
| Class A | | $ | 5,399,156 | | | | 399,358 | | | $ | 596,876 | | | | 44,285 | | | $ | (4,480,861 | ) | | | (331,893 | ) | | $ | 1,515,171 | | | | 111,750 | |
| Class C | | | 156,104 | | | | 11,539 | | | | 10,024 | | | | 743 | | | | (273,093 | ) | | | (20,227 | ) | | | (106,965 | ) | | | (7,945 | ) |
| Class T | | | — | | | | — | | | | — | | | | — | | | | — | | | | — | | | | — | | | | — | |
| Class F-1 | | | 258,812 | | | | 19,155 | | | | 22,271 | | | | 1,651 | | | | (550,345 | ) | | | (40,683 | ) | | | (269,262 | ) | | | (19,877 | ) |
| Class F-2 | | | 9,182,796 | | | | 679,095 | | | | 424,331 | | | | 31,484 | | | | (4,949,570 | ) | | | (366,729 | ) | | | 4,657,557 | | | | 343,850 | |
| Class F-3 | | | 4,966,620 | | | | 368,216 | | | | 143,670 | | | | 10,669 | | | | (1,482,730 | ) | | | (109,949 | ) | | | 3,627,560 | | | | 268,936 | |
| Class 529-A | | | 273,918 | | | | 20,253 | | | | 29,897 | | | | 2,217 | | | | (311,596 | ) | | | (23,033 | ) | | | (7,781 | ) | | | (563 | ) |
| Class 529-C | | | 21,693 | | | | 1,604 | | | | 952 | | | | 71 | | | | (39,708 | ) | | | (2,936 | ) | | | (17,063 | ) | | | (1,261 | ) |
| Class 529-E | | | 7,846 | | | | 580 | | | | 861 | | | | 64 | | | | (13,769 | ) | | | (1,019 | ) | | | (5,062 | ) | | | (375 | ) |
| Class 529-T | | | — | | | | — | | | | — | 2 | | | — | 2 | | | — | | | | — | | | | — | 2 | | | — | 2 |
| Class 529-F-1 | | | — | | | | — | | | | — | 2 | | | — | 2 | | | — | | | | — | | | | — | 2 | | | — | 2 |
| Class 529-F-2 | | | 50,199 | | | | 3,714 | | | | 3,779 | | | | 280 | | | | (38,310 | ) | | | (2,833 | ) | | | 15,668 | | | | 1,161 | |
| Class 529-F-3 | | | — | | | | — | | | | — | 2 | | | — | 2 | | | — | | | | — | | | | — | 2 | | | — | 2 |
| Class R-1 | | | 13,301 | | | | 986 | | | | 514 | | | | 38 | | | | (10,332 | ) | | | (765 | ) | | | 3,483 | | | | 259 | |
| Class R-2 | | | 109,434 | | | | 8,090 | | | | 5,231 | | | | 388 | | | | (160,588 | ) | | | (11,881 | ) | | | (45,923 | ) | | | (3,403 | ) |
| Class R-2E | | | 17,056 | | | | 1,259 | | | | 690 | | | | 51 | | | | (17,512 | ) | | | (1,296 | ) | | | 234 | | | | 14 | |
| Class R-3 | | | 172,879 | | | | 12,779 | | | | 11,786 | | | | 875 | | | | (233,176 | ) | | | (17,257 | ) | | | (48,511 | ) | | | (3,603 | ) |
| Class R-4 | | | 172,188 | | | | 12,728 | | | | 12,480 | | | | 926 | | | | (264,316 | ) | | | (19,566 | ) | | | (79,648 | ) | | | (5,912 | ) |
| Class R-5E | | | 100,893 | | | | 7,459 | | | | 3,058 | | | | 227 | | | | (28,766 | ) | | | (2,132 | ) | | | 75,185 | | | | 5,554 | |
| Class R-5 | | | 243,353 | | | | 18,023 | | | | 5,675 | | | | 421 | | | | (61,171 | ) | | | (4,527 | ) | | | 187,857 | | | | 13,917 | |
| Class R-6 | | | 4,789,022 | | | | 354,533 | | | | 330,424 | | | | 24,522 | | | | (3,113,972 | ) | | | (231,163 | ) | | | 2,005,474 | | | | 147,892 | |
| Total net increase (decrease) | | $ | 25,935,270 | | | | 1,919,371 | | | $ | 1,602,519 | | | | 118,912 | | | $ | (16,029,815 | ) | | | (1,187,889 | ) | | $ | 11,507,974 | | | | 850,394 | |
See end of table for footnotes.
| The Bond Fund of America | 77 |
| | | Sales1 | | | Reinvestments of
distributions | | | Repurchases1 | | | Net increase
(decrease) | |
| Share class | | Amount | | | Shares | | | Amount | | | Shares | | | Amount | | | Shares | | | Amount | | | Shares | |
| | | | | | | | | | | | | | | | | | | | | | | | | |
| Year ended December 31, 2020 | | | | | | | | | | | | | | | | | | |
| | | | | | | | | | | | | | | | | | | | | | | | | |
| Class A | | $ | 7,577,330 | | | | 547,419 | | | $ | 1,375,595 | | | | 99,645 | | | $ | (3,786,344 | ) | | | (275,341 | ) | | $ | 5,166,581 | | | | 371,723 | |
| Class C | | | 381,139 | | | | 27,552 | | | | 34,643 | | | | 2,513 | | | | (396,635 | ) | | | (28,589 | ) | | | 19,147 | | | | 1,476 | |
| Class T | | | — | | | | — | | | | — | | | | — | | | | — | | | | — | | | | — | | | | — | |
| Class F-1 | | | 540,494 | | | | 38,951 | | | | 58,925 | | | | 4,270 | | | | (310,432 | ) | | | (22,462 | ) | | | 288,987 | | | | 20,759 | |
| Class F-2 | | | 9,295,368 | | | | 668,599 | | | | 740,296 | | | | 53,596 | | | | (3,376,383 | ) | | | (245,568 | ) | | | 6,659,281 | | | | 476,627 | |
| Class F-3 | | | 2,722,424 | | | | 195,260 | | | | 200,563 | | | | 14,517 | | | | (757,259 | ) | | | (54,996 | ) | | | 2,165,728 | | | | 154,781 | |
| Class 529-A | | | 484,048 | | | | 34,875 | | | | 70,405 | | | | 5,100 | | | | (263,429 | ) | | | (19,020 | ) | | | 291,024 | | | | 20,955 | |
| Class 529-C | | | 42,518 | | | | 3,097 | | | | 4,400 | | | | 320 | | | | (149,126 | ) | | | (10,687 | ) | | | (102,208 | ) | | | (7,270 | ) |
| Class 529-E | | | 14,371 | | | | 1,044 | | | | 2,430 | | | | 176 | | | | (13,052 | ) | | | (942 | ) | | | 3,749 | | | | 278 | |
| Class 529-T | | | — | | | | — | | | | 1 | | | | — | 2 | | | — | | | | — | | | | 1 | | | | — | 2 |
| Class 529-F-1 | | | 43,715 | | | | 3,163 | | | | 2,343 | | | | 170 | | | | (182,892 | ) | | | (13,093 | ) | | | (136,834 | ) | | | (9,760 | ) |
| Class 529-F-23 | | | 169,310 | | | | 12,086 | | | | 5,496 | | | | 398 | | | | (6,497 | ) | | | (459 | ) | | | 168,309 | | | | 12,025 | |
| Class 529-F-33 | | | 10 | | | | 1 | | | | — | 2 | | | — | 2 | | | — | | | | — | | | | 10 | | | | 1 | |
| Class R-1 | | | 12,614 | | | | 911 | | | | 1,628 | | | | 118 | | | | (15,788 | ) | | | (1,153 | ) | | | (1,546 | ) | | | (124 | ) |
| Class R-2 | | | 192,313 | | | | 13,950 | | | | 19,247 | | | | 1,395 | | | | (174,314 | ) | | | (12,674 | ) | | | 37,246 | | | | 2,671 | |
| Class R-2E | | | 21,840 | | | | 1,587 | | | | 1,960 | | | | 142 | | | | (13,198 | ) | | | (956 | ) | | | 10,602 | | | | 773 | |
| Class R-3 | | | 310,798 | | | | 22,534 | | | | 33,500 | | | | 2,428 | | | | (267,678 | ) | | | (19,450 | ) | | | 76,620 | | | | 5,512 | |
| Class R-4 | | | 279,386 | | | | 20,220 | | | | 32,546 | | | | 2,357 | | | | (220,289 | ) | | | (16,038 | ) | | | 91,643 | | | | 6,539 | |
| Class R-5E | | | 62,998 | | | | 4,557 | | | | 4,037 | | | | 292 | | | | (24,781 | ) | | | (1,788 | ) | | | 42,254 | | | | 3,061 | |
| Class R-5 | | | 74,561 | | | | 5,396 | | | | 9,489 | | | | 687 | | | | (73,345 | ) | | | (5,385 | ) | | | 10,705 | | | | 698 | |
| Class R-6 | | | 3,960,909 | | | | 284,931 | | | | 658,960 | | | | 47,721 | | | | (2,092,488 | ) | | | (154,656 | ) | | | 2,527,381 | | | | 177,996 | |
| Total net increase (decrease) | | $ | 26,186,146 | | | | 1,886,133 | | | $ | 3,256,464 | | | | 235,845 | | | $ | (12,123,930 | ) | | | (883,257 | ) | | $ | 17,318,680 | | | | 1,238,721 | |
| 1 | Includes exchanges between share classes of the fund. |
| | 2 | Amount less than one thousand. |
| 3 | Class 529-F-2 and 529-F-3 shares began investment operations on October 30, 2020. |
10. Investment transactions
The fund made purchases and sales of investment securities, excluding short-term securities and U.S. government obligations, if any, of $216,834,679,000 and $222,158,556,000, respectively, during the year ended December 31, 2021.
| 78 | The Bond Fund of America |
Financial highlights
| | | | | | (Loss) income from
investment operations1 | | | Dividends and distributions | | | | | | | | | | | | | | | | | | | |
| Period ended | | Net asset
value,
beginning
of period | | | Net
investment
income | | | Net (losses)
gains on
securities
(both
realized and
unrealized) | | | Total from
investment
operations | | | Dividends
(from net
investment
income) | | | Distributions
(from capital
gains) | | | Total
dividends
and
distributions | | | Net asset
value,
end
of period | | | Total
return2,3 | | | Net assets,
end of period
(in millions) | | | Ratio of
expenses to
average net
assets before
waivers/
reimbursements4 | | | Ratio of
expenses to
average net
assets after
waivers/
reimbursements3,4 | | | Ratio of
net income
to average
net assets3 | |
| Class A: | | | | | | | | | | | | | | | | | | | | | | | | | | | | | | | | | | | | | | | | | | | | | | | | | | | | |
| 12/31/2021 | | $ | 13.79 | | | $ | .18 | | | $ | (.31 | ) | | $ | (.13 | ) | | $ | (.19 | ) | | $ | (.08 | ) | | $ | (.27 | ) | | $ | 13.39 | | | | (.95 | )% | | $ | 30,201 | | | | .55 | % | | | .55 | % | | | 1.36 | % |
| 12/31/2020 | | | 13.09 | | | | .22 | | | | 1.18 | | | | 1.40 | | | | (.26 | ) | | | (.44 | ) | | | (.70 | ) | | | 13.79 | | | | 10.71 | | | | 29,570 | | | | .57 | | | | .57 | | | | 1.59 | |
| 12/31/2019 | | | 12.57 | | | | .31 | | | | .69 | | | | 1.00 | | | | (.30 | ) | | | (.18 | ) | | | (.48 | ) | | | 13.09 | | | | 8.02 | | | | 23,197 | | | | .60 | | | | .60 | | | | 2.35 | |
| 12/31/2018 | | | 12.89 | | | | .30 | | | | (.32 | ) | | | (.02 | ) | | | (.30 | ) | | | — | | | | (.30 | ) | | | 12.57 | | | | (.13 | ) | | | 19,352 | | | | .60 | | | | .60 | | | | 2.37 | |
| 12/31/2017 | | | 12.72 | | | | .25 | | | | .16 | | | | .41 | | | | (.24 | ) | | | — | | | | (.24 | ) | | | 12.89 | | | | 3.21 | | | | 19,939 | | | | .60 | | | | .60 | | | | 1.91 | |
| Class C: | | | | | | | | | | | | | | | | | | | | | | | | | | | | | | | | | | | | | | | | | | | | | | | | | | | | |
| 12/31/2021 | | | 13.79 | | | | .08 | | | | (.31 | ) | | | (.23 | ) | | | (.09 | ) | | | (.08 | ) | | | (.17 | ) | | | 13.39 | | | | (1.68 | ) | | | 717 | | | | 1.29 | | | | 1.29 | | | | .60 | |
| 12/31/2020 | | | 13.09 | | | | .11 | | | | 1.18 | | | | 1.29 | | | | (.15 | ) | | | (.44 | ) | | | (.59 | ) | | | 13.79 | | | | 9.90 | | | | 848 | | | | 1.31 | | | | 1.31 | | | | .87 | |
| 12/31/2019 | | | 12.57 | | | | .21 | | | | .69 | | | | .90 | | | | (.20 | ) | | | (.18 | ) | | | (.38 | ) | | | 13.09 | | | | 7.20 | | | | 786 | | | | 1.36 | | | | 1.36 | | | | 1.60 | |
| 12/31/2018 | | | 12.89 | | | | .20 | | | | (.32 | ) | | | (.12 | ) | | | (.20 | ) | | | — | | | | (.20 | ) | | | 12.57 | | | | (.91 | ) | | | 825 | | | | 1.39 | | | | 1.39 | | | | 1.58 | |
| 12/31/2017 | | | 12.72 | | | | .15 | | | | .16 | | | | .31 | | | | (.14 | ) | | | — | | | | (.14 | ) | | | 12.89 | | | | 2.40 | | | | 1,041 | | | | 1.40 | | | | 1.40 | | | | 1.11 | |
| Class T: | | | | | | | | | | | | | | | | | | | | | | | | | | | | | | | | | | | | | | | | | | | | | | | | | | | | |
| 12/31/2021 | | | 13.79 | | | | .21 | | | | (.31 | ) | | | (.10 | ) | | | (.22 | ) | | | (.08 | ) | | | (.30 | ) | | | 13.39 | | | | (.74 | )5 | | | — | 6 | | | .33 | 5 | | | .33 | 5 | | | 1.55 | 5 |
| 12/31/2020 | | | 13.09 | | | | .25 | | | | 1.18 | | | | 1.43 | | | | (.29 | ) | | | (.44 | ) | | | (.73 | ) | | | 13.79 | | | | 10.98 | 5 | | | — | 6 | | | .34 | 5 | | | .34 | 5 | | | 1.81 | 5 |
| 12/31/2019 | | | 12.57 | | | | .34 | | | | .69 | | | | 1.03 | | | | (.33 | ) | | | (.18 | ) | | | (.51 | ) | | | 13.09 | | | | 8.24 | 5 | | | — | 6 | | | .37 | 5 | | | .37 | 5 | | | 2.56 | 5 |
| 12/31/2018 | | | 12.89 | | | | .33 | | | | (.32 | ) | | | .01 | | | | (.33 | ) | | | — | | | | (.33 | ) | | | 12.57 | | | | .09 | 5 | | | — | 6 | | | .39 | 5 | | | .39 | 5 | | | 2.58 | 5 |
| 12/31/20177,8 | | | 12.81 | | | | .20 | | | | .07 | | | | .27 | | | | (.19 | ) | | | — | | | | (.19 | ) | | | 12.89 | | | | 2.15 | 5,9 | | | — | 6 | | | .38 | 5,10 | | | .38 | 5,10 | | | 2.15 | 5,10 |
| Class F-1: | | | | | | | | | | | | | | | | | | | | | | | | | | | | | | | | | | | | | | | | | | | | | | | | | | | | |
| 12/31/2021 | | | 13.79 | | | | .18 | | | | (.31 | ) | | | (.13 | ) | | | (.19 | ) | | | (.08 | ) | | | (.27 | ) | | | 13.39 | | | | (.99 | ) | | | 1,011 | | | | .59 | | | | .59 | | | | 1.30 | |
| 12/31/2020 | | | 13.09 | | | | .21 | | | | 1.18 | | | | 1.39 | | | | (.25 | ) | | | (.44 | ) | | | (.69 | ) | | | 13.79 | | | | 10.68 | | | | 1,315 | | | | .60 | | | | .60 | | | | 1.55 | |
| 12/31/2019 | | | 12.57 | | | | .31 | | | | .69 | | | | 1.00 | | | | (.30 | ) | | | (.18 | ) | | | (.48 | ) | | | 13.09 | | | | 7.97 | | | | 977 | | | | .64 | | | | .64 | | | | 2.31 | |
| 12/31/2018 | | | 12.89 | | | | .29 | | | | (.32 | ) | | | (.03 | ) | | | (.29 | ) | | | — | | | | (.29 | ) | | | 12.57 | | | | (.18 | ) | | | 745 | | | | .66 | | | | .66 | | | | 2.32 | |
| 12/31/2017 | | | 12.72 | | | | .24 | | | | .16 | | | | .40 | | | | (.23 | ) | | | — | | | | (.23 | ) | | | 12.89 | | | | 3.17 | | | | 801 | | | | .65 | | | | .65 | | | | 1.86 | |
| Class F-2: | | | | | | | | | | | | | | | | | | | | | | | | | | | | | | | | | | | | | | | | | | | | | | | | | | | | |
| 12/31/2021 | | | 13.79 | | | | .22 | | | | (.31 | ) | | | (.09 | ) | | | (.23 | ) | | | (.08 | ) | | | (.31 | ) | | | 13.39 | | | | (.71 | ) | | | 20,613 | | | | .31 | | | | .31 | | | | 1.60 | |
| 12/31/2020 | | | 13.09 | | | | .25 | | | | 1.18 | | | | 1.43 | | | | (.29 | ) | | | (.44 | ) | | | (.73 | ) | | | 13.79 | | | | 10.99 | | | | 16,494 | | | | .32 | | | | .32 | | | | 1.81 | |
| 12/31/2019 | | | 12.57 | | | | .35 | | | | .69 | | | | 1.04 | | | | (.34 | ) | | | (.18 | ) | | | (.52 | ) | | | 13.09 | | | | 8.28 | | | | 9,415 | | | | .35 | | | | .35 | | | | 2.59 | |
| 12/31/2018 | | | 12.89 | | | | .33 | | | | (.32 | ) | | | .01 | | | | (.33 | ) | | | — | | | | (.33 | ) | | | 12.57 | | | | .14 | | | | 5,728 | | | | .34 | | | | .34 | | | | 2.65 | |
| 12/31/2017 | | | 12.72 | | | | .28 | | | | .16 | | | | .44 | | | | (.27 | ) | | | — | | | | (.27 | ) | | | 12.89 | | | | 3.47 | | | | 4,067 | | | | .35 | | | | .35 | | | | 2.16 | |
| Class F-3: | | | | | | | | | | | | | | | | | | | | | | | | | | | | | | | | | | | | | | | | | | | | | | | | | | | | |
| 12/31/2021 | | | 13.79 | | | | .23 | | | | (.31 | ) | | | (.08 | ) | | | (.24 | ) | | | (.08 | ) | | | (.32 | ) | | | 13.39 | | | | (.60 | ) | | | 7,934 | | | | .20 | | | | .20 | | | | 1.72 | |
| 12/31/2020 | | | 13.09 | | | | .27 | | | | 1.18 | | | | 1.45 | | | | (.31 | ) | | | (.44 | ) | | | (.75 | ) | | | 13.79 | | | | 11.10 | | | | 4,465 | | | | .21 | | | | .21 | | | | 1.90 | |
| 12/31/2019 | | | 12.57 | | | | .36 | | | | .69 | | | | 1.05 | | | | (.35 | ) | | | (.18 | ) | | | (.53 | ) | | | 13.09 | | | | 8.40 | | | | 2,212 | | | | .25 | | | | .24 | | | | 2.70 | |
| 12/31/2018 | | | 12.89 | | | | .34 | | | | (.32 | ) | | | .02 | | | | (.34 | ) | | | — | | | | (.34 | ) | | | 12.57 | | | | .21 | | | | 1,483 | | | | .27 | | | | .27 | | | | 2.70 | |
| 12/31/20177,11 | | | 12.74 | | | | .27 | | | | .14 | | | | .41 | | | | (.26 | ) | | | — | | | | (.26 | ) | | | 12.89 | | | | 3.25 | 9 | | | 2,061 | | | | .26 | 10 | | | .26 | 10 | | | 2.29 | 10 |
| Class 529-A: | | | | | | | | | | | | | | | | | | | | | | | | | | | | | | | | | | | | | | | | | | | | | | | | | | | | |
| 12/31/2021 | | | 13.79 | | | | .18 | | | | (.31 | ) | | | (.13 | ) | | | (.19 | ) | | | (.08 | ) | | | (.27 | ) | | | 13.39 | | | | (.99 | ) | | | 1,473 | | | | .59 | | | | .59 | | | | 1.31 | |
| 12/31/2020 | | | 13.09 | | | | .21 | | | | 1.18 | | | | 1.39 | | | | (.25 | ) | | | (.44 | ) | | | (.69 | ) | | | 13.79 | | | | 10.67 | | | | 1,526 | | | | .61 | | | | .61 | | | | 1.54 | |
| 12/31/2019 | | | 12.57 | | | | .30 | | | | .69 | | | | .99 | | | | (.29 | ) | | | (.18 | ) | | | (.47 | ) | | | 13.09 | | | | 7.95 | | | | 1,174 | | | | .66 | | | | .66 | | | | 2.29 | |
| 12/31/2018 | | | 12.89 | | | | .29 | | | | (.32 | ) | | | (.03 | ) | | | (.29 | ) | | | — | | | | (.29 | ) | | | 12.57 | | | | (.21 | ) | | | 1,003 | | | | .69 | | | | .69 | | | | 2.29 | |
| 12/31/2017 | | | 12.72 | | | | .24 | | | | .16 | | | | .40 | | | | (.23 | ) | | | — | | | | (.23 | ) | | | 12.89 | | | | 3.14 | | | | 1,022 | | | | .68 | | | | .68 | | | | 1.84 | |
See end of table for footnotes.
| The Bond Fund of America | 79 |
Financial highlights (continued)
| | | | | | (Loss) income from
investment operations1 | | | Dividends and distributions | | | | | | | | | | | | | | | | | | | |
| Period ended | | Net asset
value,
beginning
of period | | | Net
investment
income | | | Net (losses)
gains on
securities
(both
realized and
unrealized) | | | Total from
investment
operations | | | Dividends
(from net
investment
income) | | | Distributions
(from capital
gains) | | | Total
dividends
and
distributions | | | Net asset
value,
end
of period | | | Total
return2,3 | | | Net assets,
end of period
(in millions) | | | Ratio of
expenses to
average net
assets before
waivers/
reimbursements4 | | | Ratio of
expenses to
average net
assets after
waivers/
reimbursements3,4 | | | Ratio of
net income
to average
net assets3 | |
| Class 529-C: | | | | | | | | | | | | | | | | | | | | | | | | | | | | | | | | | | | | | | | | | | | | | | | | | | | | |
| 12/31/2021 | | $ | 13.79 | | | $ | .08 | | | $ | (.31 | ) | | $ | (.23 | ) | | $ | (.09 | ) | | $ | (.08 | ) | | $ | (.17 | ) | | $ | 13.39 | | | | (1.73 | )% | | $ | 70 | | | | 1.34 | % | | | 1.34 | % | | | .56 | % |
| 12/31/2020 | | | 13.09 | | | | .11 | | | | 1.18 | | | | 1.29 | | | | (.15 | ) | | | (.44 | ) | | | (.59 | ) | | | 13.79 | | | | 9.85 | | | | 89 | | | | 1.36 | | | | 1.36 | | | | .90 | |
| 12/31/2019 | | | 12.57 | | | | .21 | | | | .69 | | | | .90 | | | | (.20 | ) | | | (.18 | ) | | | (.38 | ) | | | 13.09 | | | | 7.16 | | | | 180 | | | | 1.40 | | | | 1.40 | | | | 1.56 | |
| 12/31/2018 | | | 12.89 | | | | .20 | | | | (.32 | ) | | | (.12 | ) | | | (.20 | ) | | | — | | | | (.20 | ) | | | 12.57 | | | | (.94 | ) | | | 191 | | | | 1.43 | | | | 1.43 | | | | 1.55 | |
| 12/31/2017 | | | 12.72 | | | | .14 | | | | .16 | | | | .30 | | | | (.13 | ) | | | — | | | | (.13 | ) | | | 12.89 | | | | 2.35 | | | | 232 | | | | 1.44 | | | | 1.44 | | | | 1.07 | |
| Class 529-E: | | | | | | | | | | | | | | | | | | | | | | | | | | | | | | | | | | | | | | | | | | | | | | | | | | | | |
| 12/31/2021 | | | 13.79 | | | | .15 | | | | (.31 | ) | | | (.16 | ) | | | (.16 | ) | | | (.08 | ) | | | (.24 | ) | | | 13.39 | | | | (1.19 | ) | | | 46 | | | | .79 | | | | .79 | | | | 1.11 | |
| 12/31/2020 | | | 13.09 | | | | .18 | | | | 1.18 | | | | 1.36 | | | | (.22 | ) | | | (.44 | ) | | | (.66 | ) | | | 13.79 | | | | 10.46 | | | | 53 | | | | .80 | | | | .80 | | | | 1.37 | |
| 12/31/2019 | | | 12.57 | | | | .28 | | | | .69 | | | | .97 | | | | (.27 | ) | | | (.18 | ) | | | (.45 | ) | | | 13.09 | | | | 7.75 | | | | 46 | | | | .85 | | | | .85 | | | | 2.11 | |
| 12/31/2018 | | | 12.89 | | | | .27 | | | | (.32 | ) | | | (.05 | ) | | | (.27 | ) | | | — | | | | (.27 | ) | | | 12.57 | | | | (.40 | ) | | | 43 | | | | .88 | | | | .88 | | | | 2.10 | |
| 12/31/2017 | | | 12.72 | | | | .21 | | | | .16 | | | | .37 | | | | (.20 | ) | | | — | | | | (.20 | ) | | | 12.89 | | | | 2.93 | | | | 47 | | | | .88 | | | | .88 | | | | 1.63 | |
| Class 529-T: | | | | | | | | | | | | | | | | | | | | | | | | | | | | | | | | | | | | | | | | | | | | | | | | | | | | |
| 12/31/2021 | | | 13.79 | | | | .21 | | | | (.31 | ) | | | (.10 | ) | | | (.22 | ) | | | (.08 | ) | | | (.30 | ) | | | 13.39 | | | | (.78 | )5 | | | — | 6 | | | .37 | 5 | | | .37 | 5 | | | 1.52 | 5 |
| 12/31/2020 | | | 13.09 | | | | .24 | | | | 1.18 | | | | 1.42 | | | | (.28 | ) | | | (.44 | ) | | | (.72 | ) | | | 13.79 | | | | 10.91 | 5 | | | — | 6 | | | .39 | 5 | | | .39 | 5 | | | 1.77 | 5 |
| 12/31/2019 | | | 12.57 | | | | .33 | | | | .69 | | | | 1.02 | | | | (.32 | ) | | | (.18 | ) | | | (.50 | ) | | | 13.09 | | | | 8.20 | 5 | | | — | 6 | | | .42 | 5 | | | .42 | 5 | | | 2.51 | 5 |
| 12/31/2018 | | | 12.89 | | | | .32 | | | | (.32 | ) | | | — | 12 | | | (.32 | ) | | | — | | | | (.32 | ) | | | 12.57 | | | | .04 | 5 | | | — | 6 | | | .44 | 5 | | | .44 | 5 | | | 2.54 | 5 |
| 12/31/20177,8 | | | 12.81 | | | | .20 | | | | .07 | | | | .27 | | | | (.19 | ) | | | — | | | | (.19 | ) | | | 12.89 | | | | 2.10 | 5,9 | | | — | 6 | | | .45 | 5,10 | | | .45 | 5,10 | | | 2.08 | 5,10 |
| Class 529-F-1: | | | | | | | | | | | | | | | | | | | | | | | | | | | | | | | | | | | | | | | | | | | | | | | | | | | | |
| 12/31/2021 | | | 13.79 | | | | .20 | | | | (.31 | ) | | | (.11 | ) | | | (.21 | ) | | | (.08 | ) | | | (.29 | ) | | | 13.39 | | | | (.82 | )5 | | | — | 6 | | | .41 | 5 | | | .41 | 5 | | | 1.48 | 5 |
| 12/31/2020 | | | 13.09 | | | | .24 | | | | 1.18 | | | | 1.42 | | | | (.28 | ) | | | (.44 | ) | | | (.72 | ) | | | 13.79 | | | | 10.92 | 5 | | | — | 6 | | | .38 | 5 | | | .38 | 5 | | | 1.87 | 5 |
| 12/31/2019 | | | 12.57 | | | | .34 | | | | .69 | | | | 1.03 | | | | (.33 | ) | | | (.18 | ) | | | (.51 | ) | | | 13.09 | | | | 8.20 | | | | 128 | | | | .42 | | | | .42 | | | | 2.53 | |
| 12/31/2018 | | | 12.89 | | | | .32 | | | | (.32 | ) | | | — | 12 | | | (.32 | ) | | | — | | | | (.32 | ) | | | 12.57 | | | | .03 | | | | 102 | | | | .44 | | | | .44 | | | | 2.54 | |
| 12/31/2017 | | | 12.72 | | | | .27 | | | | .16 | | | | .43 | | | | (.26 | ) | | | — | | | | (.26 | ) | | | 12.89 | | | | 3.37 | | | | 88 | | | | .45 | | | | .45 | | | | 2.06 | |
| Class 529-F-2: | | | | | | | | | | | | | | | | | | | | | | | | | | | | | | | | | | | | | | | | | | | | | | | | | | | | |
| 12/31/2021 | | | 13.79 | | | | .21 | | | | (.31 | ) | | | (.10 | ) | | | (.22 | ) | | | (.08 | ) | | | (.30 | ) | | | 13.39 | | | | (.73 | ) | | | 177 | | | | .33 | | | | .33 | | | | 1.58 | |
| 12/31/20207,13 | | | 14.00 | | | | .03 | | | | .24 | | | | .27 | | | | (.04 | ) | | | (.44 | ) | | | (.48 | ) | | | 13.79 | | | | 1.88 | 9 | | | 166 | | | | .06 | 9 | | | .06 | 9 | | | .24 | 9 |
| Class 529-F-3: | | | | | | | | | | | | | | | | | | | | | | | | | | | | | | | | | | | | | | | | | | | | | | | | | | | | |
| 12/31/2021 | | | 13.79 | | | | .22 | | | | (.31 | ) | | | (.09 | ) | | | (.23 | ) | | | (.08 | ) | | | (.31 | ) | | | 13.39 | | | | (.69 | ) | | | — | 6 | | | .27 | | | | .27 | | | | 1.62 | |
| 12/31/20207,13 | | | 14.00 | | | | .04 | | | | .23 | | | | .27 | | | | (.04 | ) | | | (.44 | ) | | | (.48 | ) | | | 13.79 | | | | 1.90 | 9 | | | — | 6 | | | .08 | 9 | | | .04 | 9 | | | .25 | 9 |
| Class R-1: | | | | | | | | | | | | | | | | | | | | | | | | | | | | | | | | | | | | | | | | | | | | | | | | | | | | |
| 12/31/2021 | | | 13.79 | | | | .08 | | | | (.31 | ) | | | (.23 | ) | | | (.09 | ) | | | (.08 | ) | | | (.17 | ) | | | 13.39 | | | | (1.69 | ) | | | 42 | | | | 1.29 | | | | 1.29 | | | | .62 | |
| 12/31/2020 | | | 13.09 | | | | .11 | | | | 1.18 | | | | 1.29 | | | | (.15 | ) | | | (.44 | ) | | | (.59 | ) | | | 13.79 | | | | 9.88 | | | | 39 | | | | 1.33 | | | | 1.33 | | | | .85 | |
| 12/31/2019 | | | 12.57 | | | | .21 | | | | .69 | | | | .90 | | | | (.20 | ) | | | (.18 | ) | | | (.38 | ) | | | 13.09 | | | | 7.21 | | | | 39 | | | | 1.35 | | | | 1.35 | | | | 1.61 | |
| 12/31/2018 | | | 12.89 | | | | .20 | | | | (.32 | ) | | | (.12 | ) | | | (.20 | ) | | | — | | | | (.20 | ) | | | 12.57 | | | | (.89 | ) | | | 30 | | | | 1.37 | | | | 1.37 | | | | 1.60 | |
| 12/31/2017 | | | 12.72 | | | | .15 | | | | .16 | | | | .31 | | | | (.14 | ) | | | — | | | | (.14 | ) | | | 12.89 | | | | 2.43 | | | | 34 | | | | 1.37 | | | | 1.37 | | | | 1.14 | |
See end of table for footnotes.
| 80 | The Bond Fund of America |
Financial highlights (continued)
| | | | | | (Loss) income from
investment operations1 | | | Dividends and distributions | | | | | | | | | | | | | | | | | | | |
| Period ended | | Net asset
value,
beginning
of period | | | Net
investment
income | | | Net (losses)
gains on
securities
(both
realized and
unrealized) | | | Total from
investment
operations | | | Dividends
(from net
investment
income) | | | Distributions
(from capital
gains) | | | Total
dividends
and
distributions | | | Net asset
value,
end
of period | | | Total
return2,3 | | | Net assets,
end of period
(in millions) | | | Ratio of
expenses to
average net
assets before
waivers/
reimbursements4 | | | Ratio of
expenses to
average net
assets after
waivers/
reimbursements3,4 | | | Ratio of
net income
to average
net assets3 | |
| Class R-2: | | | | | | | | | | | | | | | | | | | | | | | | | | | | | | | | | | | | | | | | | | | | | | | | | | | | |
| 12/31/2021 | | $ | 13.79 | | | $ | .08 | | | $ | (.31 | ) | | $ | (.23 | ) | | $ | (.09 | ) | | $ | (.08 | ) | | $ | (.17 | ) | | $ | 13.39 | | | | (1.69 | )% | | $ | 409 | | | | 1.30 | % | | | 1.30 | % | | | .60 | % |
| 12/31/2020 | | | 13.09 | | | | .12 | | | | 1.18 | | | | 1.30 | | | | (.16 | ) | | | (.44 | ) | | | (.60 | ) | | | 13.79 | | | | 9.91 | | | | 468 | | | | 1.30 | | | | 1.30 | | | | .87 | |
| 12/31/2019 | | | 12.57 | | | | .22 | | | | .69 | | | | .91 | | | | (.21 | ) | | | (.18 | ) | | | (.39 | ) | | | 13.09 | | | | 7.22 | | | | 410 | | | | 1.34 | | | | 1.34 | | | | 1.61 | |
| 12/31/2018 | | | 12.89 | | | | .20 | | | | (.32 | ) | | | (.12 | ) | | | (.20 | ) | | | — | | | | (.20 | ) | | | 12.57 | | | | (.88 | ) | | | 400 | | | | 1.36 | | | | 1.36 | | | | 1.61 | |
| 12/31/2017 | | | 12.72 | | | | .15 | | | | .16 | | | | .31 | | | | (.14 | ) | | | — | | | | (.14 | ) | | | 12.89 | | | | 2.44 | | | | 456 | | | | 1.36 | | | | 1.36 | | | | 1.15 | |
| Class R-2E: | | | | | | | | | | | | | | | | | | | | | | | | | | | | | | | | | | | | | | | | | | | | | | | | | | | | |
| 12/31/2021 | | | 13.79 | | | | .12 | | | | (.31 | ) | | | (.19 | ) | | | (.13 | ) | | | (.08 | ) | | | (.21 | ) | | | 13.39 | | | | (1.40 | ) | | | 44 | | | | 1.00 | | | | 1.00 | | | | .90 | |
| 12/31/2020 | | | 13.09 | | | | .16 | | | | 1.18 | | | | 1.34 | | | | (.20 | ) | | | (.44 | ) | | | (.64 | ) | | | 13.79 | | | | 10.22 | | | | 46 | | | | 1.02 | | | | 1.02 | | | | 1.14 | |
| 12/31/2019 | | | 12.57 | | | | .25 | | | | .69 | | | | .94 | | | | (.24 | ) | | | (.18 | ) | | | (.42 | ) | | | 13.09 | | | | 7.53 | | | | 33 | | | | 1.05 | | | | 1.05 | | | | 1.90 | |
| 12/31/2018 | | | 12.89 | | | | .24 | | | | (.32 | ) | | | (.08 | ) | | | (.24 | ) | | | — | | | | (.24 | ) | | | 12.57 | | | | (.59 | ) | | | 26 | | | | 1.07 | | | | 1.07 | | | | 1.92 | |
| 12/31/2017 | | | 12.72 | | | | .19 | | | | .16 | | | | .35 | | | | (.18 | ) | | | — | | | | (.18 | ) | | | 12.89 | | | | 2.75 | | | | 20 | | | | 1.06 | | | | 1.06 | | | | 1.48 | |
| Class R-3: | | | | | | | | | | | | | | | | | | | | | | | | | | | | | | | | | | | | | | | | | | | | | | | | | | | | |
| 12/31/2021 | | | 13.79 | | | | .14 | | | | (.31 | ) | | | (.17 | ) | | | (.15 | ) | | | (.08 | ) | | | (.23 | ) | | | 13.39 | | | | (1.25 | ) | | | 673 | | | | .85 | | | | .85 | | | | 1.05 | |
| 12/31/2020 | | | 13.09 | | | | .18 | | | | 1.18 | | | | 1.36 | | | | (.22 | ) | | | (.44 | ) | | | (.66 | ) | | | 13.79 | | | | 10.40 | | | | 743 | | | | .86 | | | | .86 | | | | 1.31 | |
| 12/31/2019 | | | 12.57 | | | | .27 | | | | .69 | | | | .96 | | | | (.26 | ) | | | (.18 | ) | | | (.44 | ) | | | 13.09 | | | | 7.70 | | | | 633 | | | | .89 | | | | .89 | | | | 2.06 | |
| 12/31/2018 | | | 12.89 | | | | .26 | | | | (.32 | ) | | | (.06 | ) | | | (.26 | ) | | | — | | | | (.26 | ) | | | 12.57 | | | | (.43 | ) | | | 582 | | | | .91 | | | | .91 | | | | 2.06 | |
| 12/31/2017 | | | 12.72 | | | | .21 | | | | .16 | | | | .37 | | | | (.20 | ) | | | — | | | | (.20 | ) | | | 12.89 | | | | 2.90 | | | | 622 | | | | .91 | | | | .91 | | | | 1.61 | |
| Class R-4: | | | | | | | | | | | | | | | | | | | | | | | | | | | | | | | | | | | | | | | | | | | | | | | | | | | | |
| 12/31/2021 | | | 13.79 | | | | .18 | | | | (.31 | ) | | | (.13 | ) | | | (.19 | ) | | | (.08 | ) | | | (.27 | ) | | | 13.39 | | | | (.94 | ) | | | 588 | | | | .54 | | | | .54 | | | | 1.35 | |
| 12/31/2020 | | | 13.09 | | | | .22 | | | | 1.18 | | | | 1.40 | | | | (.26 | ) | | | (.44 | ) | | | (.70 | ) | | | 13.79 | | | | 10.73 | | | | 688 | | | | .55 | | | | .55 | | | | 1.61 | |
| 12/31/2019 | | | 12.57 | | | | .31 | | | | .69 | | | | 1.00 | | | | (.30 | ) | | | (.18 | ) | | | (.48 | ) | | | 13.09 | | | | 8.03 | | | | 567 | | | | .59 | | | | .59 | | | | 2.37 | |
| 12/31/2018 | | | 12.89 | | | | .30 | | | | (.32 | ) | | | (.02 | ) | | | (.30 | ) | | | — | | | | (.30 | ) | | | 12.57 | | | | (.13 | ) | | | 518 | | | | .61 | | | | .61 | | | | 2.37 | |
| 12/31/2017 | | | 12.72 | | | | .25 | | | | .16 | | | | .41 | | | | (.24 | ) | | | — | | | | (.24 | ) | | | 12.89 | | | | 3.22 | | | | 583 | | | | .60 | | | | .60 | | | | 1.91 | |
| Class R-5E: | | | | | | | | | | | | | | | | | | | | | | | | | | | | | | | | | | | | | | | | | | | | | | | | | | | | |
| 12/31/2021 | | | 13.79 | | | | .21 | | | | (.31 | ) | | | (.10 | ) | | | (.22 | ) | | | (.08 | ) | | | (.30 | ) | | | 13.39 | | | | (.75 | ) | | | 160 | | | | .34 | | | | .34 | | | | 1.60 | |
| 12/31/2020 | | | 13.09 | | | | .25 | | | | 1.18 | | | | 1.43 | | | | (.29 | ) | | | (.44 | ) | | | (.73 | ) | | | 13.79 | | | | 10.95 | | | | 88 | | | | .35 | | | | .35 | | | | 1.78 | |
| 12/31/2019 | | | 12.57 | | | | .34 | | | | .69 | | | | 1.03 | | | | (.33 | ) | | | (.18 | ) | | | (.51 | ) | | | 13.09 | | | | 8.25 | | | | 43 | | | | .37 | | | | .37 | | | | 2.53 | |
| 12/31/2018 | | | 12.89 | | | | .33 | | | | (.32 | ) | | | .01 | | | | (.33 | ) | | | — | | | | (.33 | ) | | | 12.57 | | | | .09 | | | | 8 | | | | .40 | | | | .40 | | | | 2.63 | |
| 12/31/2017 | | | 12.72 | | | | .27 | | | | .16 | | | | .43 | | | | (.26 | ) | | | — | | | | (.26 | ) | | | 12.89 | | | | 3.39 | | | | — | 6 | | | .42 | | | | .40 | | | | 2.11 | |
| Class R-5: | | | | | | | | | | | | | | | | | | | | | | | | | | | | | | | | | | | | | | | | | | | | | | | | | | | | |
| 12/31/2021 | | | 13.79 | | | | .22 | | | | (.31 | ) | | | (.09 | ) | | | (.23 | ) | | | (.08 | ) | | | (.31 | ) | | | 13.39 | | | | (.65 | ) | | | 373 | | | | .25 | | | | .25 | | | | 1.69 | |
| 12/31/2020 | | | 13.09 | | | | .26 | | | | 1.18 | | | | 1.44 | | | | (.30 | ) | | | (.44 | ) | | | (.74 | ) | | | 13.79 | | | | 11.06 | | | | 192 | | | | .26 | | | | .26 | | | | 1.91 | |
| 12/31/2019 | | | 12.57 | | | | .35 | | | | .69 | | | | 1.04 | | | | (.34 | ) | | | (.18 | ) | | | (.52 | ) | | | 13.09 | | | | 8.35 | | | | 173 | | | | .29 | | | | .29 | | | | 2.67 | |
| 12/31/2018 | | | 12.89 | | | | .34 | | | | (.32 | ) | | | .02 | | | | (.34 | ) | | | — | | | | (.34 | ) | | | 12.57 | | | | .17 | | | | 163 | | | | .31 | | | | .31 | | | | 2.67 | |
| 12/31/2017 | | | 12.72 | | | | .29 | | | | .16 | | | | .45 | | | | (.28 | ) | | | — | | | | (.28 | ) | | | 12.89 | | | | 3.52 | | | | 176 | | | | .30 | | | | .30 | | | | 2.21 | |
| Class R-6: | | | | | | | | | | | | | | | | | | | | | | | | | | | | | | | | | | | | | | | | | | | | | | | | | | | | |
| 12/31/2021 | | | 13.79 | | | | .23 | | | | (.31 | ) | | | (.08 | ) | | | (.24 | ) | | | (.08 | ) | | | (.32 | ) | | | 13.39 | | | | (.60 | ) | | | 15,035 | | | | .20 | | | | .20 | | | | 1.71 | |
| 12/31/2020 | | | 13.09 | | | | .27 | | | | 1.18 | | | | 1.45 | | | | (.31 | ) | | | (.44 | ) | | | (.75 | ) | | | 13.79 | | | | 11.11 | | | | 13,449 | | | | .21 | | | | .21 | | | | 1.95 | |
| 12/31/2019 | | | 12.57 | | | | .36 | | | | .69 | | | | 1.05 | | | | (.35 | ) | | | (.18 | ) | | | (.53 | ) | | | 13.09 | | | | 8.40 | | | | 10,434 | | | | .24 | | | | .24 | | | | 2.72 | |
| 12/31/2018 | | | 12.89 | | | | .34 | | | | (.32 | ) | | | .02 | | | | (.34 | ) | | | — | | | | (.34 | ) | | | 12.57 | | | | .22 | | | | 8,116 | | | | .26 | | | | .26 | | | | 2.73 | |
| 12/31/2017 | | | 12.72 | | | | .29 | | | | .16 | | | | .45 | | | | (.28 | ) | | | — | | | | (.28 | ) | | | 12.89 | | | | 3.58 | | | | 6,351 | | | | .25 | | | | .25 | | | | 2.27 | |
See end of table for footnotes.
| The Bond Fund of America | 81 |
Financial highlights (continued)
| | | Year ended December 31, |
| Portfolio turnover rate for all share classes14,15 | | 2021 | | 2020 | | 2019 | | 2018 | | 2017 |
| Excluding mortgage dollar roll transactions | | | 74 | % | | | 113 | % | | | 127 | % | | | 121 | % | | | 170 | % |
| Including mortgage dollar roll transactions | | | 368 | % | | | 535 | % | | | 286 | % | | | 356 | % | | | 379 | % |
| 1 | Based on average shares outstanding. |
| 2 | Total returns exclude any applicable sales charges, including contingent deferred sales charges. |
| 3 | This column reflects the impact, if any, of certain waivers/reimbursements from AFS and/or CRMC. During one of the periods shown, AFS waived a portion of transfer agent services fees for Class F-3 shares. In addition, during some of the periods shown, CRMC reimbursed a portion of transfer agent services fees for certain share classes. |
| 4 | Ratios do not include expenses of any Central Funds. The fund indirectly bears its proportionate share of the expenses of any Central Funds. |
| 5 | All or a significant portion of assets in this class consisted of seed capital invested by CRMC and/or its affiliates. Fees for distribution services are not charged or accrued on these seed capital assets. If such fees were paid by the fund on seed capital assets, fund expenses would have been higher and net income and total return would have been lower. |
| 6 | Amount less than $1 million. |
| 7 | Based on operations for a period that is less than a full year. |
| 8 | Class T and 529-T shares began investment operations on April 7, 2017. |
| 9 | Not annualized. |
| 10 | Annualized. |
| 11 | Class F-3 shares began investment operations on January 27, 2017. |
| 12 | Amount less than $.01. |
| 13 | Class 529-F-2 and 529-F-3 shares began investment operations on October 30, 2020. |
| 14 | Rates do not include the fund’s portfolio activity with respect to any Central Funds. |
| 15 | Refer to Note 5 for more information on mortgage dollar rolls. |
See notes to financial statements.
| 82 | The Bond Fund of America |
Report of Independent Registered Public Accounting Firm
To the Shareholders and Board of Trustees of The Bond Fund of America:
Opinion on the Financial Statements and Financial Highlights
We have audited the accompanying statement of assets and liabilities of The Bond Fund of America (the “Fund”), including the investment portfolio, as of December 31, 2021, the related statement of operations for the year then ended, the statements of changes in net assets for each of the two years in the period then ended, the financial highlights for each of the five years in the period then ended, and the related notes. In our opinion, the financial statements and financial highlights present fairly, in all material respects, the financial position of the Fund as of December 31, 2021, and the results of its operations for the year then ended, the changes in its net assets for each of the two years in the period then ended, and the financial highlights for each of the five years in the period then ended, in conformity with accounting principles generally accepted in the United States of America.
Basis for Opinion
These financial statements and financial highlights are the responsibility of the Fund’s management. Our responsibility is to express an opinion on the Fund’s financial statements and financial highlights based on our audits. We are a public accounting firm registered with the Public Company Accounting Oversight Board (United States) (PCAOB) and are required to be independent with respect to the Fund in accordance with the U.S. federal securities laws and the applicable rules and regulations of the Securities and Exchange Commission and the PCAOB.
We conducted our audits in accordance with the standards of the PCAOB. Those standards require that we plan and perform the audit to obtain reasonable assurance about whether the financial statements and financial highlights are free of material misstatement, whether due to error or fraud. The Fund is not required to have, nor were we engaged to perform, an audit of its internal control over financial reporting. As part of our audits we are required to obtain an understanding of internal control over financial reporting but not for the purpose of expressing an opinion on the effectiveness of the Fund’s internal control over financial reporting. Accordingly, we express no such opinion.
Our audits included performing procedures to assess the risks of material misstatement of the financial statements and financial highlights, whether due to error or fraud, and performing procedures that respond to those risks. Such procedures included examining, on a test basis, evidence regarding the amounts and disclosures in the financial statements and financial highlights. Our audits also included evaluating the accounting principles used and significant estimates made by management, as well as evaluating the overall presentation of the financial statements and financial highlights. Our procedures included confirmation of securities owned as of December 31, 2021, by correspondence with the custodian and brokers; when replies were not received from brokers, we performed other auditing procedures. We believe that our audits provide a reasonable basis for our opinion.
Deloitte & Touche LLP
Costa Mesa, California
February 11, 2022
We have served as the auditor of one or more American Funds investment companies since 1956.
| The Bond Fund of America | 83 |
Capital Group Private Client Services FundsSM
Part B
Statement of Additional Information
January 1, 2022
This document is not a prospectus but should be read in conjunction with the current prospectus of Capital Group Core Municipal Fund, Capital Group Short-Term Municipal Fund, Capital Group California Core Municipal Fund, Capital Group California Short-Term Municipal Fund (collectively the “Municipal Bond Funds”) and Capital Group Core Bond Fund (the “Core Bond Fund”) (each of the Municipal Bond Funds and the Core Bond Fund a “fund” and collectively the “funds”) dated January 1, 2022. Except where the context indicates otherwise, all references herein to the “fund” apply to each of the funds listed below. The prospectus may be obtained from your Capital Group Private Client Services® investment counselor, by calling American Funds Service Company® at (800) 421-4996 or by writing to the fund at the following address:
Capital Group Private Client Services Funds
Attention: Secretary
6455 Irvine Center Drive
Irvine, California 92618
| | |
| | |
Capital Group Core Municipal FundSM | CCMPX |
Capital Group Short-Term Municipal FundSM | CSTMX |
Capital Group California Core Municipal FundSM | CCCMX |
Capital Group California Short-Term Municipal FundSM | CCSTX |
Capital Group Core Bond FundSM | CCBPX |
Table of Contents
| | |
Certain investment limitations and guidelines | 2 |
Description of certain securities, investment techniques and risks | 5 |
Fund policies | 33 |
Management of the fund | 35 |
Execution of portfolio transactions | 53 |
Disclosure of portfolio holdings | 57 |
Price of shares | 59 |
Taxes and distributions | 62 |
Purchase and exchange of shares | 66 |
Selling shares | 67 |
General information | 69 |
Appendix | 73 |
Schedule of investments
Financial statements
Capital Group Private Client Services Funds — Page 1
Certain investment limitations and guidelines
The following limitations and guidelines are considered at the time of purchase, under normal circumstances, and are based on a percentage of the fund’s net assets unless otherwise noted. This summary is not intended to reflect all of the fund’s investment limitations.
Capital Group Core Municipal Fund
· Under normal circumstances, the fund will invest at least 80% of its assets in, or derive at least 80% of its income from, securities that are exempt from federal income tax. The fund will not invest in securities that subject you to the federal alternative minimum tax.
· The fund invests primarily in municipal bonds with quality ratings of A- or A3 or better by Nationally Recognized Statistical Rating Organizations (“NRSROs”) designated by the fund’s investment adviser or unrated but determined by the fund’s investment adviser to be of equivalent quality, including money market instruments or cash equivalents.
· The fund may invest up to 20% of its assets in municipal bonds in the rating categories of BBB or Baa by NRSROs designated by the fund’s investment adviser or unrated but determined by the fund’s investment adviser to be of equivalent quality.
· Under normal circumstances, the dollar-weighted average effective maturity of the fund’s portfolio will be between three and 10 years.
Capital Group Short-Term Municipal Fund
· Under normal circumstances, the fund will invest at least 80% of its assets in, or derive at least 80% of its income from, securities that are exempt from federal income tax. The fund will not invest in securities that subject you to the federal alternative minimum tax.
· The fund invests primarily in municipal bonds with quality ratings of AA- or Aa3 or better by NRSROs designated by the fund’s investment adviser or unrated but determined by the fund’s investment adviser to be of equivalent quality, including money market instruments or cash equivalents.
· The fund may invest up to 20% of its assets in municipal bonds in the rating categories of A- or A3 by NRSROs designated by the fund’s investment adviser or unrated but determined by the fund’s investment adviser to be of equivalent quality.
· Under normal circumstances, the dollar-weighted average effective maturity of the fund’s portfolio will be no greater than three years.
Capital Group Private Client Services Funds — Page 2
Capital Group California Core Municipal Fund
· Under normal circumstances, the fund will invest at least 80% of its assets in, or derive at least 80% of its income from, securities that are exempt from federal and California income taxes. The fund will not invest in securities that subject you to the federal alternative minimum tax.
· The fund invests primarily in municipal bonds with quality ratings of A- or A3 or better by NRSROs designated by the fund’s investment adviser or unrated but determined by the fund’s investment adviser to be of equivalent quality, including money market instruments or cash equivalents.
· The fund may invest up to 20% of its assets in municipal bonds in the rating categories of BBB or Baa by NRSROs designated by the fund’s investment adviser or unrated but determined by the fund’s investment adviser to be of equivalent quality.
· Under normal circumstances, the dollar-weighted average effective maturity of the fund’s portfolio will be between three and 10 years.
Capital Group California Short-Term Municipal Fund
· Under normal circumstances, the fund will invest at least 80% of its assets in, or derive at least 80% of its income from, securities that are exempt from both federal and California income taxes. The fund will not invest in securities that subject you to the federal alternative minimum tax.
· The fund invests primarily in municipal bonds with quality ratings of A- or A3 or better by NRSROs designated by the fund’s investment adviser or unrated but determined by the fund’s investment adviser to be of equivalent quality, including money market instruments or cash equivalents.
· The fund may also invest a portion of its assets in municipal bonds with quality ratings below A- or A3 by NRSROs designated by the fund’s investment adviser or unrated but determined by the fund’s investment adviser to be of equivalent quality.
· Under normal circumstances, the dollar-weighted average effective maturity of the fund’s portfolio will be no greater than three years.
Capital Group Core Bond Fund
· The fund will invest at least 80% of its assets in bonds (for purposes of this limit, bonds include any debt instrument and cash equivalents, and may include certain preferred securities), which may be represented by other investment instruments, including derivatives.
· The fund primarily invests in debt securities with quality ratings of A- or A3 or better by NRSROs designated by the fund’s investment adviser or unrated but determined to be of equivalent quality by the fund’s investment adviser, including money market instruments or cash equivalents.
· The fund may invest up to 10% of its assets in debt securities rated in the BBB or Baa rating categories by NRSROs designated by the fund’s investment adviser or unrated but determined to be of equivalent quality by the fund’s investment adviser.
· Under normal circumstances, the dollar-weighted average effective maturity of the fund’s portfolio will be between three and 10 years.
· The fund may invest only in securities of issuers domiciled outside the U.S. if they are U.S. dollar-denominated and are in the four highest rating categories.
Capital Group Private Client Services Funds — Page 3
· In determining the domicile of an issuer, the fund’s investment adviser will consider the domicile determination of a leading provider of global indexes, such as Morgan Stanley Capital International, and may also take into account such factors as where the issuer’s securities are listed and where the issuer is legally organized, maintains principal corporate offices, conducts its principal operations and/or generates revenues.
Municipal Bond Funds and Core Bond Fund
· In determining the quality rating of a particular bond, the fund currently intends to look to the ratings from Moody’s Investors Service, Standard & Poor’s Ratings Services and Fitch Ratings. If agency ratings of a bond differ, the bond will be considered to have received the highest of those ratings.
Municipal Bond Funds
· The funds may invest more than 25% of their assets in industrial development bonds.
* * * * * *
The funds may experience difficulty liquidating certain portfolio securities during significant market declines or periods of heavy redemptions.
Capital Group Private Client Services Funds — Page 4
Description of certain securities, investment techniques and risks
The descriptions below are intended to supplement the material in the prospectus under “Investment objectives, strategies and risks.”
Applicable to all funds
Market conditions – The value of, and the income generated by, the securities in which the fund invests may decline, sometimes rapidly or unpredictably, due to factors affecting certain issuers, particular industries or sectors, or the overall markets. Rapid or unexpected changes in market conditions could cause the fund to liquidate its holdings at inopportune times or at a loss or depressed value. The value of a particular holding may decrease due to developments related to that issuer, but also due to general market conditions, including real or perceived economic developments such as changes in interest rates, credit quality, inflation, or currency rates, or generally adverse investor sentiment. The value of a holding may also decline due to factors that negatively affect a particular industry or sector, such as labor shortages, increased production costs, or competitive conditions.
Global economies and financial markets are highly interconnected, and conditions and events in one country, region or financial market may adversely impact issuers in a different country, region or financial market. Furthermore, local, regional and global events such as war, acts of terrorism, social unrest, natural disasters, the spread of infectious illness or other public health threats could also adversely impact issuers, markets and economies, including in ways that cannot necessarily be foreseen. The fund could be negatively impacted if the value of a portfolio holding were harmed by such conditions or events.
Significant market disruptions, such as those caused by pandemics, natural or environmental disasters, war, acts of terrorism, or other events, can adversely affect local and global markets and normal market operations. Market disruptions may exacerbate political, social, and economic risks. Additionally, market disruptions may result in increased market volatility; regulatory trading halts; closure of domestic or foreign exchanges, markets, or governments; or market participants operating pursuant to business continuity plans for indeterminate periods of time. Such events can be highly disruptive to economies and markets and significantly impact individual companies, sectors, industries, markets, currencies, interest and inflation rates, credit ratings, investor sentiment, and other factors affecting the value of the fund’s investments and operation of the fund. These events could disrupt businesses that are integral to the fund’s operations or impair the ability of employees of fund service providers to perform essential tasks on behalf of the fund.
Governmental and quasi-governmental authorities may take a number of actions designed to support local and global economies and the financial markets in response to economic disruptions. Such actions may include a variety of significant fiscal and monetary policy changes, including, for example, direct capital infusions into companies, new monetary programs and significantly lower interest rates. These actions may result in significant expansion of public debt and may result in greater market risk. Additionally, an unexpected or quick reversal of these policies, or the ineffectiveness of these policies, could negatively impact overall investor sentiment and further increase volatility in securities markets.
Debt instruments — Debt securities, also known as “fixed income securities,” are used by issuers to borrow money. Bonds, notes, debentures, asset-backed securities (including those backed by mortgages), and loan participations and assignments are common types of debt securities. Generally, issuers pay investors periodic interest and repay the amount borrowed either periodically during the life of the security and/or at maturity. Some debt securities, such as zero coupon bonds, do not pay current interest, but are purchased at a discount from their face values and their values accrete over time to face value at maturity. Some debt securities bear interest at rates that are not fixed, but that vary with changes in specified market rates or indices. The market prices of debt securities fluctuate
Capital Group Private Client Services Funds — Page 5
depending on such factors as interest rates, credit quality and maturity. In general, market prices of debt securities decline when interest rates rise and increase when interest rates fall. These fluctuations will generally be greater for longer-term debt securities than for shorter-term debt securities. Prices of these securities can also be affected by financial contracts held by the issuer or third parties (such as derivatives) relating to the security or other assets or indices. Borrowers that are in bankruptcy or restructuring may never pay off their indebtedness, or they may pay only a small fraction of the amount owed. Direct indebtedness of countries, particularly developing countries, also involves a risk that the governmental entities responsible for the repayment of the debt may be unable, or unwilling, to pay interest and repay principal when due.
Lower rated debt securities, rated Ba1/BB+ or below by Nationally Recognized Statistical Rating Organizations, are described by the rating agencies as speculative and involve greater risk of default or price changes due to changes in the issuer’s creditworthiness than higher rated debt securities, or they may already be in default. Such securities are sometimes referred to as “junk bonds” or high yield bonds. The market prices of these securities may fluctuate more than higher quality securities and may decline significantly in periods of general economic difficulty. It may be more difficult to dispose of, and to determine the value of, lower rated debt securities. Investment grade bonds in the ratings categories A or Baa/BBB also may be more susceptible to changes in market or economic conditions than bonds rated in the highest rating categories.
Certain additional risk factors relating to debt securities are discussed below:
Sensitivity to interest rate and economic changes — Debt securities may be sensitive to economic changes, political and corporate developments, and interest rate changes. In addition, during an economic downturn or a period of rising interest rates, issuers that are highly leveraged may experience increased financial stress that could adversely affect their ability to meet projected business goals, to obtain additional financing and to service their principal and interest payment obligations. Periods of economic change and uncertainty also can be expected to result in increased volatility of market prices and yields of certain debt securities and derivative instruments. As discussed under “Market conditions” above in this statement of additional information, governments and quasi-governmental authorities may take actions to support local and global economies and financial markets during periods of economic crisis, including direct capital infusions into companies, new monetary programs and significantly lower interest rates. Such actions may expose fixed income markets to heightened volatility and may reduce liquidity for certain investments, which could cause the value of the fund’s portfolio to decline.
Payment expectations — Debt securities may contain redemption or call provisions. If an issuer exercises these provisions in a lower interest rate market, the fund may have to replace the security with a lower yielding security, resulting in decreased income to investors. If the issuer of a debt security defaults on its obligations to pay interest or principal or is the subject of bankruptcy proceedings, the fund may incur losses or expenses in seeking recovery of amounts owed to it.
Liquidity and valuation — There may be little trading in the secondary market for particular debt securities, which may affect adversely the fund’s ability to value accurately or dispose of such debt securities. Adverse publicity and investor perceptions, whether or not based on fundamental analysis, may decrease the value and/or liquidity of debt securities.
Credit ratings for debt securities provided by rating agencies reflect an evaluation of the safety of principal and interest payments, not market value risk. The rating of an issuer is a rating agency’s view of past and future potential developments related to the issuer and may not necessarily reflect actual outcomes. There can be a lag between the time of developments relating to an issuer and the time a
Capital Group Private Client Services Funds — Page 6
rating is assigned and updated. The investment adviser considers these ratings of securities as one of many criteria in making its investment decisions.
Bond rating agencies may assign modifiers (such as +/–) to ratings categories to signify the relative position of a credit within the rating category. Investment policies that are based on ratings categories should be read to include any security within that category, without giving consideration to the modifier except where otherwise provided. See the Appendix to this statement of additional information for more information about credit ratings.
Municipal bonds — Municipal bonds are debt obligations that are exempt from federal, state and/or local income taxes. Opinions relating to the validity of municipal bonds, exclusion of municipal bond interest from an investor’s gross income for federal income tax purposes and, where applicable, state and local income tax, are rendered by bond counsel to the issuing authorities at the time of issuance.
The two principal classifications of municipal bonds are general obligation bonds and limited obligation or revenue bonds. General obligation bonds are secured by the issuer’s pledge of its full faith and credit including, if available, its taxing power for the payment of principal and interest. Issuers of general obligation bonds include states, counties, cities, towns and various regional or special districts. The proceeds of these obligations are used to fund a wide range of public facilities, such as the construction or improvement of schools, highways and roads, water and sewer systems and facilities for a variety of other public purposes. Lease revenue bonds or certificates of participation in leases are payable from annual lease rental payments from a state or locality. Annual rental payments are payable to the extent such rental payments are appropriated annually.
Typically, the only security for a limited obligation or revenue bond is the net revenue derived from a particular facility or class of facilities financed thereby or, in some cases, from the proceeds of a special tax or other special revenues. Revenue bonds have been issued to fund a wide variety of revenue-producing public capital projects including: electric, gas, water and sewer systems; highways, bridges and tunnels; port and airport facilities; colleges and universities; hospitals; and convention, recreational, tribal gaming and housing facilities. Although the security behind these bonds varies widely, many provide additional security in the form of a debt service reserve fund which may also be used to make principal and interest payments on the issuer's obligations. In addition, some revenue obligations (as well as general obligations) are insured by a bond insurance company or backed by a letter of credit issued by a banking institution.
Revenue bonds also include, for example, pollution control, health care and housing bonds, which, although nominally issued by municipal authorities, are generally not secured by the taxing power of the municipality but by the revenues of the authority derived from payments by the private entity which owns or operates the facility financed with the proceeds of the bonds. Obligations of housing finance authorities have a wide range of security features, including reserve funds and insured or subsidized mortgages, as well as the net revenues from housing or other public projects. Many of these bonds do not generally constitute the pledge of the credit of the issuer of such bonds. The credit quality of such revenue bonds is usually directly related to the credit standing of the user of the facility being financed or of an institution which provides a guarantee, letter of credit or other credit enhancement for the bond issue.
Insured municipal bonds — The fund may invest in municipal bonds that are insured generally as to the timely payment of interest and repayment of principal. The insurance for such bonds may be purchased by the bond issuer, the fund or any other party, and is usually purchased from private, non-governmental insurance companies. Insurance that covers a municipal bond is expected to protect the fund against losses caused by a bond issuer’s failure to make interest or principal payments. However, insurance does not guarantee the market value of the bond or the prices of the fund’s shares. Also, the investment adviser cannot be certain that the insurance company will make payments it guarantees.
Capital Group Private Client Services Funds — Page 7
The market value of the bond could drop if a bond's insurer fails to fulfill its obligations. Market conditions or changes to ratings criteria could adversely impact the ratings of municipal bond insurers. When rating agencies lower or withdraw the credit rating of the insurer, the insurance may be providing little or no enhancement of credit or resale value to the municipal bond.
Variable and floating rate obligations — The interest rates payable on certain securities and other instruments in which the fund may invest may not be fixed but may fluctuate based upon changes in market interest rates or credit ratings. Variable and floating rate obligations bear coupon rates that are adjusted at designated intervals, based on the then current market interest rates or credit ratings. The rate adjustment features tend to limit the extent to which the market value of the obligations will fluctuate. When the fund holds variable or floating rate securities, a decrease in market interest rates will adversely affect the income received from such securities and the net asset value of the fund’s shares.
The London Interbank Offered Rate (“LIBOR”) is one of the most widely used interest rate benchmarks and is intended to represent the rate at which contributing banks may obtain short-term borrowings from each other in the London interbank market. On July 27, 2017, the U.K. Financial Conduct Authority (“FCA”), which regulates LIBOR, announced that the FCA will no longer persuade or compel banks to submit rates for the calculation of LIBOR after 2021. On March 5, 2021, the FCA and ICE Benchmark Administration, Limited (IBA), the administrator of LIBOR, announced that the publication of the one-week and two-month USD LIBOR maturities and non-USD LIBOR maturities will cease immediately after December 31, 2021, with the remaining USD LIBOR maturities ceasing immediately after June 30, 2023. As a result, LIBOR may no longer be available or may no longer be deemed an appropriate reference rate upon which to determine the interest rate on certain loans, bonds, derivatives and other instruments in the fund’s portfolio.
Public and private sector industry initiatives have been underway to identify new or alternative reference rates to be used in place of LIBOR. In the US, the Alternative Reference Rates Committee (ARCC), a group of market participants convened to help ensure a successful transition away from USD LIBOR, has identified the Secured Overnight Financing Rate (“SOFR”), which is intended to be a broad measure of secured overnight U.S. Treasury repo rates, as its preferred alternative rate. Working groups and regulators in other countries have suggested other alternative rates for their markets. There is no assurance that the composition or characteristics of any such alternative reference rate will be similar to or produce the same value or economic equivalence as LIBOR or that instruments using an alternative rate will have the same volume or liquidity. This, in turn, may affect the value or return on certain of the fund’s investments, result in costs incurred in connection with closing out positions and entering into new trades and reduce the effectiveness of related fund transactions such as hedges. Relatedly, there are outstanding contracts governing bonds and other instruments which reference LIBOR that are due to mature beyond the LIBOR cessation date. These “legacy contracts” will need to be transitioned to an alternative reference rate, and a failure to do so may adversely impact the security (for example, under existing contract language the instrument could fall back to a fixed rate or have no fallback rate) and create contractual uncertainty, as well as market and litigation risk. Although there are ongoing efforts among certain government entities and other organizations to address these uncertainties, the ultimate effectiveness of such efforts is not yet known. These risks may also apply with respect to potential changes in connection with other interbank offering rates (e.g., Euribor) and other indices, rates and values that may be used as “benchmarks” and are the subject of recent regulatory reform.
Maturity — In calculating the effective maturity or average life of a particular debt security, a put, call, sinking fund or other feature will be considered to the extent it results in a security whose market characteristics indicate an effective maturity or average life that is shorter than its nominal or stated maturity. The investment adviser will consider the impact on effective maturity of potential changes in the financial condition of issuers and in market interest rates in making investment selections for the fund.
Capital Group Private Client Services Funds — Page 8
Adjustment of maturities — The investment adviser seeks to anticipate movements in interest rates and may adjust the maturity distribution of a portfolio accordingly, keeping in mind the fund’s objectives.
Derivatives — In pursuing its investment objective, the fund may invest in derivative instruments. A derivative is a financial instrument, the value of which depends on, or is otherwise derived from, another underlying variable. Most often, the variable underlying a derivative is the price of a traded asset, such as a traditional cash security (e.g., a stock or bond), a currency or a commodity; however, the value of a derivative can be dependent on almost any variable, from the level of an index or a specified rate to the occurrence (or non-occurrence) of a credit event with respect to a specified reference asset. The fund may take positions in futures contracts and swaps, each of which is a derivative instrument described in greater detail below.
Derivative instruments may be distinguished by the manner in which they trade: some are standardized instruments that trade on an organized exchange while others are individually negotiated and traded in the over-the-counter (OTC) market. Derivatives also range broadly in complexity, from simple derivatives to more complex instruments. As a general matter, however, all derivatives — regardless of the manner in which they trade or their relative complexities — entail certain risks, some of which are different from, and potentially greater than, the risks associated with investing directly in traditional cash securities.
As is the case with traditional cash securities, derivative instruments are generally subject to counterparty credit risk; however, in some cases, derivatives may pose counterparty risks greater than those posed by cash securities. The use of derivatives involves the risk that a loss may be sustained by the fund as a result of the failure of the fund’s counterparty to make required payments or otherwise to comply with its contractual obligations. For some derivatives, though, the value of — and, in effect, the return on — the instrument may be dependent on both the individual credit of the fund’s counterparty and on the credit of one or more issuers of any underlying assets. If the fund does not correctly evaluate the creditworthiness of its counterparty and, where applicable, of issuers of any underlying reference assets, the fund’s investment in a derivative instrument may result in losses. Further, if a fund’s counterparty were to default on its obligations, the fund’s contractual remedies against such counterparty may be subject to applicable bankruptcy and insolvency laws, which could affect the fund’s rights as a creditor and delay or impede the fund’s ability to receive the net amount of payments that it is contractually entitled to receive.
The value of some derivative instruments in which the fund invests may be particularly sensitive to changes in prevailing interest rates, currency exchange rates or other market conditions. Like the fund’s other investments, the ability of the fund to successfully utilize such derivative instruments may depend in part upon the ability of the fund’s investment adviser to accurately forecast interest rates and other economic factors. The success of the fund’s derivative investment strategy will also depend on the investment adviser’s ability to assess and predict the impact of market or economic developments on the derivative instruments in which the fund invests, in some cases without having had the benefit of observing the performance of a derivative under all possible market conditions. If the investment adviser incorrectly forecasts such factors and has taken positions in derivative instruments contrary to prevailing market trends, or if the investment adviser incorrectly predicts the impact of developments on a derivative instrument, the fund could be exposed to the risk of loss.
Certain derivatives may also be subject to liquidity and valuation risks. The potential lack of a liquid secondary market for a derivative (and, particularly, for an OTC derivative) may cause difficulty in valuing or selling the instrument. If a derivative transaction is particularly large or if the relevant market is illiquid, as is often the case with many privately-negotiated OTC derivatives, the fund may not be able to initiate a transaction or to liquidate a position at an advantageous time or price. Particularly when there is no liquid secondary market for the fund’s derivative positions, the fund may encounter difficulty in valuing such illiquid positions. The value of a derivative instrument does not always correlate perfectly with its underlying asset, rate or index, and many derivatives, and OTC derivatives
Capital Group Private Client Services Funds — Page 9
in particular, are complex and often valued subjectively. Improper valuations can result in increased cash payment requirements to counterparties or a loss of value to the fund.
Because certain derivative instruments may obligate the fund to make one or more potential future payments, which could significantly exceed the value of the fund’s initial investments in such instruments, derivative instruments may also have a leveraging effect on the fund’s portfolio. Certain derivatives have the potential for unlimited loss, irrespective of the size of the fund’s investment in the instrument. When a fund leverages its portfolio, investments in that fund will tend to be more volatile, resulting in larger gains or losses in response to market changes. In accordance with currently applicable regulatory requirements, the fund will generally segregate or earmark liquid assets, or enter into offsetting financial positions, to cover its obligations under derivative instruments, effectively limiting the risk of leveraging the fund’s portfolio. Because the fund is legally required to maintain asset coverage or offsetting positions in connection with leveraging derivative instruments, the fund’s investments in such derivatives may also require the fund to buy or sell portfolio securities at disadvantageous times or prices in order to comply with applicable requirements.
In October 2020, the SEC adopted a new rule applicable to the fund’s use of derivatives. The new rule, among other things, generally requires a fund to adopt a derivatives risk management program, appoint a derivatives risk manager and comply with an outer limit on fund leverage risk based on value at risk, or “VaR”. However, subject to certain conditions, if a fund uses derivatives only in a limited manner, it may be deemed a limited derivatives user and would not be subject to the full requirements of the new rule. The SEC also eliminated the asset segregation and cover framework, described above, arising from prior SEC guidance for covering derivatives and certain financial instruments effective at the time that a fund complies with the new rule. Compliance with the new rule will be required beginning in August 2022. The implementation of these requirements may limit the ability of the fund to use derivatives as part of its investment strategy.
Futures — The fund may enter into futures contracts to seek to manage the fund’s interest rate sensitivity by increasing or decreasing the duration of the fund or a portion of the fund’s portfolio. A futures contract is an agreement to buy or sell a security or other financial instrument (the “reference asset”) for a set price on a future date. Futures contracts are standardized, exchange-traded contracts, and, when a futures contract is bought or sold, the fund will incur brokerage fees and will be required to maintain margin deposits.
Unlike when the fund purchases or sells a security, such as a stock or bond, no price is paid or received by the fund upon the purchase or sale of a futures contract. When the fund enters into a futures contract, the fund is required to deposit with its futures broker, known as a futures commission merchant (FCM), a specified amount of liquid assets in a segregated account in the name of the FCM at the applicable derivatives clearinghouse or exchange. This amount, known as initial margin, is set by the futures exchange on which the contract is traded and may be significantly modified during the term of the contract. The initial margin is in the nature of a performance bond or good faith deposit on the futures contract, which is returned to the fund upon termination of the contract, assuming all contractual obligations have been satisfied. Additionally, on a daily basis, the fund pays or receives cash, or variation margin, equal to the daily change in value of the futures contract. Variation margin does not represent a borrowing or loan by the fund but is instead a settlement between the fund and the FCM of the amount one party would owe the other if the futures contract expired. In computing daily net asset value, the fund will mark-to-market its open futures positions. In the event of the bankruptcy or insolvency of an FCM that holds margin on behalf of the fund, the fund may be entitled to return of margin owed to it only in proportion to the amount received by the FCM’s other customers, potentially resulting in losses to the fund. An event of bankruptcy or insolvency at a clearinghouse or exchange holding initial margin could also result in losses for the fund.
Capital Group Private Client Services Funds — Page 10
When the fund invests in futures contracts and deposits margin with an FCM, the fund becomes subject to so-called “fellow customer” risk – that is, the risk that one or more customers of the FCM will default on their obligations and that the resulting losses will be so great that the FCM will default on its obligations and margin posted by one customer, such as the fund, will be used to cover a loss caused by a different defaulting customer. Applicable rules generally prohibit the use of one customer’s funds to meet the obligations of another customer and limit the ability of an FCM to use margin posed by non-defaulting customers to satisfy losses caused by defaulting customers. As a general matter, an FCM is required to use its own funds to meet a defaulting customer’s obligations. While a customer’s loss would likely need to be substantial before non-defaulting customers would be exposed to loss on account of fellow customer risk, applicable rules nevertheless permit the commingling of margin and do not limit the mutualization of customer losses from investment losses, custodial failures, fraud or other causes. If the loss is so great that, notwithstanding the application of an FCM’s own funds, there is a shortfall in the amount of customer funds required to be held in segregation, the FCM could default and be placed into bankruptcy. Under these circumstances, bankruptcy law provides that non-defaulting customers will share pro rata in any shortfall. A shortfall in customer segregated funds may also make the transfer of the accounts of non-defaulting customers to another FCM more difficult.
Although certain futures contracts, by their terms, require actual future delivery of and payment for the reference asset, in practice, most futures contracts are usually closed out before the delivery date by offsetting purchases or sales of matching futures contracts. Closing out an open futures contract purchase or sale is effected by entering into an offsetting futures contract sale or purchase, respectively, for the same aggregate amount of the identical reference asset and the same delivery date with the same FCM. If the offsetting purchase price is less than the original sale price (in each case taking into account transaction costs, including brokerage fees), the fund realizes a gain; if it is more, the fund realizes a loss. Conversely, if the offsetting sale price is more than the original purchase price (in each case taking into account transaction costs, including brokerage fees), the fund realizes a gain; if it is less, the fund realizes a loss.
Under current regulations, the fund is generally required to segregate liquid assets equivalent to the fund’s outstanding obligations under each futures contract. With respect to long positions in futures contracts that are not legally required to cash settle, the fund will segregate or earmark liquid assets in an amount equal to the contract price the fund will be required to pay on settlement less the amount of margin deposited with an FCM. For short positions in futures contracts that are not legally required to cash settle, the fund will segregate or earmark liquid assets in an amount that, when added to the amounts deposited with an FCM as margin, equals the market value of the reference asset underlying the futures contract. With respect to futures contracts that are required to cash settle, however, the fund is permitted to segregate or earmark liquid assets in an amount that, when added to the amounts deposited with an FCM as margin, equals the fund’s daily marked-to-market (net) obligation under the contract (i.e., the daily market value of the contract itself), if any; in other words, the fund may set aside its daily net liability, if any, rather than the notional value of the futures contract. By segregating or earmarking assets equal only to its net obligation under cash-settled futures, the fund may be able to utilize these contracts to a greater extent than if the fund were required to segregate or earmark assets equal to the full contract price or current market value of the futures contract. Such segregation of assets is intended to ensure that the fund has assets available to satisfy its obligations with respect to futures contracts and to limit any potential leveraging of the fund’s portfolio. However, segregation of liquid assets will not limit the fund’s exposure to loss. To maintain a sufficient amount of segregated assets, the fund may also have to sell less liquid portfolio securities at disadvantageous prices, and the earmarking of liquid assets will have the effect of limiting the fund’s ability to otherwise invest those assets in other securities or instruments.
Capital Group Private Client Services Funds — Page 11
The value of a futures contract tends to increase and decrease in tandem with the value of its underlying reference asset. Purchasing futures contracts will, therefore, tend to increase the fund’s exposure to positive and negative price fluctuations in the reference asset, much as if the fund had purchased the reference asset directly. When the fund sells a futures contract, by contrast, the value of its futures position will tend to move in a direction contrary to the market for the reference asset. Accordingly, selling futures contracts will tend to offset both positive and negative market price changes, much as if the reference asset had been sold.
There is no assurance that a liquid market will exist for any particular futures contract at any particular time. Futures exchanges may establish daily price fluctuation limits for futures contracts and may halt trading if a contract’s price moves upward or downward more than the limit in a given day. On volatile trading days, when the price fluctuation limit is reached and a trading halt is imposed, it may be impossible to enter into new positions or close out existing positions. If the market for a futures contract is not liquid because of price fluctuation limits or other market conditions, the fund may be prevented from promptly liquidating unfavorable futures positions and the fund could be required to continue to hold a position until delivery or expiration regardless of changes in its value, potentially subjecting the fund to substantial losses. Additionally, the fund may not be able to take other actions or enter into other transactions to limit or reduce its exposure to the position. Under such circumstances, the fund would remain obligated to meet margin requirements until the position is cleared. As a result, the fund’s access to other assets held to cover its futures positions could also be impaired.
Although futures exchanges generally operate similarly in the United States and abroad, foreign futures exchanges may follow trading, settlement and margin procedures that are different than those followed by futures exchanges in the United States. Futures contracts traded outside the United States may not involve a clearing mechanism or related guarantees and may involve greater risk of loss than U.S.-traded contracts, including potentially greater risk of losses due to insolvency of a futures broker, exchange member, or other party that may owe initial or variation margin to the fund. Margin requirements on foreign futures exchanges may be different than those of futures exchanges in the United States, and, because initial and variation margin payments may be measured in foreign currency, a futures contract traded outside the United States may also involve the risk of foreign currency fluctuations.
Swaps — The fund may enter into swap agreements, which are two-party contracts entered into primarily by institutional investors for a specified time period. In a typical swap transaction, two parties agree to exchange the returns earned or realized from one or more underlying assets or rates of return.
Swap agreements can be traded on an exchange and cleared through a central clearinghouse, traded bilaterally and cleared, or traded bilaterally and not cleared. For example, standardized interest rate swaps and credit default swap indices are traded on exchanges and cleared through central clearinghouses. Other forms of swap agreements, such as total return swaps, are entered into on a bilateral basis. Because clearing interposes a central clearinghouse as the ultimate counterparty to each participant’s swap, central clearing is intended to decrease (but not eliminate) counterparty risk relative to uncleared bilateral swaps. To the extent the fund enters into bilaterally negotiated swap transactions, the fund will enter into swap agreements only with counterparties that meet certain credit standards; however, if the counterparty’s creditworthiness deteriorates rapidly and the counterparty defaults on its obligations under the swap agreement or declares bankruptcy, the fund may lose any amount it expected to receive from the counterparty. In addition, uncleared swaps are subject to certain regulatory margin requirements that mandate the posting and collection of minimum margin amounts, which may result in the fund and its counterparties posting higher margin amounts for uncleared swaps than would otherwise be the case.
Capital Group Private Client Services Funds — Page 12
The term of a swap can be days, months or years and, as a result, certain swaps may be less liquid than others. If a swap transaction is particularly large or if the relevant market is illiquid, it may not be possible to initiate a transaction or liquidate a position at an advantageous time or price, which may result in significant losses.
Swap agreements can take different forms. The fund may enter into the following types of swap agreements:
Interest rate swaps — The fund may enter into interest rate swaps to seek to manage the interest rate sensitivity of the fund by increasing or decreasing the duration of the fund or a portion of the fund’s portfolio. An interest rate swap is an agreement between two parties to exchange or swap payments based on changes in an interest rate or rates. Typically, one interest rate is fixed and the other is variable based on a designated short-term interest rate such as the Secured Overnight Financing Rate (SOFR), prime rate or other benchmark. In other types of interest rate swaps, known as basis swaps, the parties agree to swap variable interest rates based on different designated short-term interest rates. Interest rate swaps generally do not involve the delivery of securities or other principal amounts. Rather, cash payments are exchanged by the parties based on the application of the designated interest rates to a notional amount, which is the predetermined dollar principal of the trade upon which payment obligations are computed. Accordingly, the fund’s current obligation or right under the swap agreement is generally equal to the net amount to be paid or received under the swap agreement based on the relative value of the position held by each party. Under current regulations, the fund will generally segregate assets with a daily value at least equal to the excess, if any, of the fund’s accrued obligations under the swap agreement over the accrued amount the fund is entitled to receive under the agreement, less the value of any posted margin or collateral on deposit with respect to the position.
In addition to the risks of entering into swaps discussed above, the use of interest rate swaps involves the risk of losses if interest rates change.
Credit default swap indices — In order to assume exposure to a diversified portfolio of credits or to hedge against existing credit risks, the fund may invest in credit default swap indices, including CDX and iTraxx indices (collectively referred to as “CDSIs”). A CDSI is based on a portfolio of credit default swaps with similar characteristics, such as credit default swaps on high-yield bonds. In a typical CDSI transaction, one party — the protection buyer — is obligated to pay the other party — the protection seller — a stream of periodic payments over the term of the contract. If a credit event, such as a default or restructuring, occurs with respect to any of the underlying reference obligations, the protection seller must pay the protection buyer the loss on those credits. Also, if a restructuring credit event occurs in an iTraxx index, the fund as protection buyer may receive a single name credit default swap (CDS) contract representing the relevant constituent.
The fund may enter into a CDSI transaction as either protection buyer or protection seller. If the fund is a protection buyer, it would pay the counterparty a periodic stream of payments over the term of the contract and would not recover any of those payments if no credit events were to occur with respect to any of the underlying reference obligations. However, if a credit event did occur, the fund, as a protection buyer, would have the right to deliver the referenced debt obligations or a specified amount of cash, depending on the terms of the applicable agreement, and to receive the par value of such debt obligations from the counterparty protection seller. As a protection seller, the fund would receive fixed payments throughout the term of the
Capital Group Private Client Services Funds — Page 13
contract if no credit events were to occur with respect to any of the underlying reference obligations. If a credit event were to occur, however, the value of any deliverable obligation received by the fund, coupled with the periodic payments previously received by the fund, may be less than the full notional value that the fund, as a protection seller, pays to the counterparty protection buyer, effectively resulting in a loss of value to the fund. Furthermore, as a protection seller, the fund would effectively add leverage to its portfolio because it would have investment exposure to the notional amount of the swap transaction.
The use of CDSI, like all other swap agreements, is subject to certain risks, including the risk that the fund’s counterparty will default on its obligations. If such a default were to occur, any contractual remedies that the fund might have may be subject to applicable bankruptcy laws, which could delay or limit the fund’s recovery. Thus, if the fund’s counterparty to a CDSI transaction defaults on its obligation to make payments thereunder, the fund may lose such payments altogether or collect only a portion thereof, which collection could involve substantial costs or delays.
Additionally, when the fund invests in a CDSI as a protection seller, the fund will be indirectly exposed to the creditworthiness of issuers of the underlying reference obligations in the index. If the investment adviser to the fund does not correctly evaluate the creditworthiness of issuers of the underlying instruments on which the CDSI is based, the investment could result in losses to the fund.
Pursuant to current regulations and published positions of the U.S. Securities and Exchange Commission, the fund’s obligations under a CDSI agreement will be accrued daily and, where applicable, offset against any amounts owing to the fund. In connection with CDSI transactions in which the fund acts as protection buyer, the fund will segregate liquid assets with a value at least equal to the fund’s exposure (i.e., any accrued but unpaid net amounts owed by the fund to any counterparty), on a marked-to-market basis, less the value of any posted margin. When the fund acts as protection seller, the fund will segregate liquid assets with a value at least equal to the full notional amount of the swap, less the value of any posted margin. Such segregation is intended to ensure that the fund has assets available to satisfy its obligations with respect to CDSI transactions and to limit any potential leveraging of the fund’s portfolio. However, segregation of liquid assets will not limit the fund’s exposure to loss. To maintain this required margin, the fund may also have to sell portfolio securities at disadvantageous prices, and the earmarking of liquid assets will have the effect of limiting the fund’s ability to otherwise invest those assets in other securities or instruments.
Securities with equity and debt characteristics — Certain securities have a combination of equity and debt characteristics. Such securities may at times behave more like equity than debt or vice versa.
Preferred stock — Preferred stock represents an equity interest in an issuer that generally entitles the holder to receive, in preference to common stockholders and the holders of certain other stocks, dividends and a fixed share of the proceeds resulting from a liquidation of the issuer. Preferred stocks may pay fixed or adjustable rates of return, and preferred stock dividends may be cumulative or non-cumulative and participating or non-participating. Cumulative dividend provisions require all or a portion of prior unpaid dividends to be paid before dividends can be paid to the issuer’s common stockholders, while prior unpaid dividends on non-cumulative preferred stock are forfeited. Participating preferred stock may be entitled to a dividend exceeding the issuer’s declared dividend in certain cases, while non-participating preferred stock is entitled only to the stipulated dividend. Preferred stock is subject to issuer-specific and market risks applicable generally to equity securities. As with
Capital Group Private Client Services Funds — Page 14
debt securities, the prices and yields of preferred stocks often move with changes in interest rates and the issuer’s credit quality. Additionally, a company’s preferred stock typically pays dividends only after the company makes required payments to holders of its bonds and other debt. Accordingly, the price of preferred stock will usually react more strongly than bonds and other debt to actual or perceived changes in the issuing company’s financial condition or prospects. Preferred stock of smaller companies may be more vulnerable to adverse developments than preferred stock of larger companies.
Convertible securities — A convertible security is a debt obligation, preferred stock or other security that may be converted, within a specified period of time and at a stated conversion rate, into common stock or other equity securities of the same or a different issuer. The conversion may occur automatically upon the occurrence of a predetermined event or at the option of either the issuer or the security holder. Under certain circumstances, a convertible security may also be called for redemption or conversion by the issuer after a particular date and at predetermined price specified upon issue. If a convertible security held by the fund is called for redemption or conversion, the fund could be required to tender the security for redemption, convert it into the underlying common stock, or sell it to a third party.
The holder of a convertible security is generally entitled to participate in the capital appreciation resulting from a market price increase in the issuer’s common stock and to receive interest paid or accrued until the convertible security matures or is redeemed, converted or exchanged. Before conversion, convertible securities have characteristics similar to non-convertible debt or preferred securities, as applicable. Convertible securities rank senior to common stock in an issuer’s capital structure and, therefore, normally entail less risk than the issuer’s common stock. However, convertible securities may also be subordinate to any senior debt obligations of the issuer, and, therefore, an issuer’s convertible securities may entail more risk than such senior debt obligations. Convertible securities usually offer lower interest or dividend yields than non-convertible debt securities of similar credit quality because of the potential for capital appreciation. In addition, convertible securities are often lower-rated securities.
Because of the conversion feature, the price of a convertible security will normally fluctuate in some proportion to changes in the price of the underlying asset, and, accordingly, convertible securities are subject to risks relating to the activities of the issuer and/or general market and economic conditions. The income component of a convertible security may cushion the security against declines in the price of the underlying asset but may also cause the price of the security to fluctuate based upon changes in interest rates and the credit quality of the issuer. As with a straight fixed income security, the price of a convertible security tends to increase when interest rates decline and decrease when interest rates rise. Like the price of a common stock, the price of a convertible security also tends to increase as the price of the underlying stock rises and to decrease as the price of the underlying stock declines.
Hybrid securities — A hybrid security is a type of security that also has equity and debt characteristics. Like equities, which have no final maturity, a hybrid security may be perpetual. On the other hand, like debt securities, a hybrid security may be callable at the option of the issuer on a date specified at issue. Additionally, like common equities, which may stop paying dividends at virtually any time without violating any contractual terms or conditions, hybrids typically allow for issuers to withhold payment of interest until a later date or to suspend coupon payments entirely without triggering an event of default. Hybrid securities are normally at the bottom of an issuer’s debt capital structure because holders of an issuer’s hybrid securities are structurally subordinated to the issuer’s senior creditors. In bankruptcy, hybrid security holders should only get paid after all senior creditors of the issuer have been paid but before any disbursements are made to the issuer’s equity holders. Accordingly, hybrid securities may be more sensitive to economic changes than more senior debt securities. Such
Capital Group Private Client Services Funds — Page 15
securities may also be viewed as more equity-like by the market when the issuer or its parent company experiences financial difficulties.
Contingent convertible securities, which are also known as contingent capital securities, are a form of hybrid security that are intended to either convert into equity or have their principal written down upon the occurrence of certain trigger events. One type of contingent convertible security has characteristics designed to absorb losses, by providing that the liquidation value of the security may be adjusted downward to below the original par value or written off entirely under certain circumstances. For instance, if losses have eroded the issuer’s capital level below a specified threshold, the liquidation value of the security may be reduced in whole or in part. The write-down of the security’s par value may occur automatically and would not entitle holders to institute bankruptcy proceedings against the issuer. In addition, an automatic write-down could result in a reduced income rate if the dividend or interest payment associated with the security is based on the security’s par value. Such securities may, but are not required to, provide for circumstances under which the liquidation value of the security may be adjusted back up to par, such as an improvement in capitalization or earnings. Another type of contingent convertible security provides for mandatory conversion of the security into common shares of the issuer under certain circumstances. The mandatory conversion might relate, for example, to the issuer’s failure to maintain a capital minimum. Since the common stock of the issuer may not pay a dividend, investors in such instruments could experience reduced yields (or no yields at all) and conversion would deepen the subordination of the investor, effectively worsening the investor’s standing in the case of the issuer’s insolvency. An automatic write-down or conversion event with respect to a contingent convertible security will typically be triggered by a reduction in the issuer’s capital level, but may also be triggered by regulatory actions, such as a change in regulatory capital requirements, or by other factors.
Restricted or illiquid securities — The fund may purchase securities subject to restrictions on resale. Difficulty in selling such securities may result in a loss or be costly to the fund. Some fund holdings (including some restricted securities) may be deemed illiquid if the fund expects that a reasonable portion of the holding cannot be sold in seven calendar days or less without the sale significantly changing the market value of the investment. The determination of whether a holding is considered illiquid is made by the fund’s adviser under a liquidity risk management program adopted by the fund’s board and administered by the fund’s adviser. The fund may incur significant additional costs in disposing of illiquid securities.
Repurchase agreements — The fund may enter into repurchase agreements, or “repos”, under which the fund buys a security and obtains a simultaneous commitment from the seller to repurchase the security at a specified time and price. Because the security purchased constitutes collateral for the repurchase obligation, a repo may be considered a loan by the fund that is collateralized by the security purchased. Repos permit the fund to maintain liquidity and earn income over periods of time as short as overnight.
The seller must maintain with a custodian collateral equal to at least the repurchase price, including accrued interest. In tri-party repos, a third party custodian, called a clearing bank, facilitates repo clearing and settlement, including by providing collateral management services. However, as an alternative to tri-party repos, the fund could enter into bilateral repos, where the parties themselves are responsible for settling transactions.
The fund will only enter into repos involving securities of the type in which it could otherwise invest. If the seller under the repo defaults, the fund may incur a loss if the value of the collateral securing the repo has declined and may incur disposition costs and delays in connection with liquidating the collateral. If bankruptcy proceedings are commenced with respect to the seller, realization of the collateral by the fund may be delayed or limited.
Capital Group Private Client Services Funds — Page 16
Indirect exposure to cryptocurrencies – Cryptocurrencies are currencies which exist in a digital form and may act as a store of wealth, a medium of exchange or an investment asset. There are thousands of cryptocurrencies, such as bitcoin. Although the fund has no current intention of directly investing in cryptocurrencies, some issuers have begun to accept cryptocurrency for payment of services, use cryptocurrencies as reserve assets or invest in cryptocurrencies, and the fund may invest in securities of such issuers. The fund may also invest in securities of issuers which provide cryptocurrency-related services.
Cryptocurrencies are subject to fluctuations in value. Cryptocurrencies are not backed by any government, corporation or other identified body. Rather, the value of a cryptocurrency is determined by other factors, such as the perceived future prospects or the supply and demand for such cryptocurrency in the global market for the trading of cryptocurrency. Such trading markets are unregulated and may be more exposed to operational or technical issues as well as fraud or manipulation in comparison to established, regulated exchanges for securities, derivatives and traditional currencies. The value of a cryptocurrency may decline precipitously (including to zero) for a variety of reasons, including, but not limited to, regulatory changes, a loss of confidence in its network or a change in user preference to other cryptocurrencies. An issuer that owns cryptocurrencies may experience custody issues, and may lose its cryptocurrency holdings through theft, hacking, and technical glitches in the applicable blockchain. The fund may experience losses as a result of the decline in value of its securities of issuers that own cryptocurrencies or which provide cryptocurrency-related services. If an issuer that owns cryptocurrencies intends to pay a dividend using such holdings or to otherwise make a distribution of such holdings to its stockholders, such dividends or distributions may face regulatory, operational and technical issues.
Factors affecting the further development of cryptocurrency include, but are not limited to: continued worldwide growth of, or possible cessation of or reversal in, the adoption and use of cryptocurrencies and other digital assets; the developing regulatory environment relating to cryptocurrencies, including the characterization of cryptocurrencies as currencies, commodities, or securities, the tax treatment of cryptocurrencies, and government and quasi-government regulation or restrictions on, or regulation of access to and operation of, cryptocurrency networks and the exchanges on which cryptocurrencies trade, including anti-money laundering regulations and requirements; perceptions regarding the environmental impact of a cryptocurrency; changes in consumer demographics and public preferences; general economic conditions; maintenance and development of open-source software protocols; the availability and popularity of other forms or methods of buying and selling goods and services; the use of the networks supporting digital assets, such as those for developing smart contracts and distributed applications; and general risks tied to the use of information technologies, including cyber risks. A hack or failure of one cryptocurrency may lead to a loss in confidence in, and thus decreased usage and/or value of, other cryptocurrencies.
Cash and cash equivalents — The fund may hold cash or invest in cash equivalents. For the Municipal Bond Funds, cash equivalents include, but are not limited to: (a) shares of money market or similar funds managed by the investment adviser or its affiliates; (b) shares of other money market funds; (c) tax-exempt commercial paper (e.g., short-term notes obligations issued by municipalities that mature, or that may be redeemed in 270 days or less); (d) municipal notes (e.g., bond anticipation notes, revenue anticipation notes, and tax anticipation notes issued by municipalities that mature, or that may be redeemed in one year or less); (e) municipal obligations backed by letters of credit issued by banks or other financial institutions or government agencies that mature, or that may be redeemed in one year or less; (f) tax-exempt variable rate debt issued by municipal conduits for corporate obligors; and (g) securities of the U.S. government, its agencies or instrumentalities that mature, or that may be redeemed in one year or less.
For the Core Bond Fund, cash equivalents include, but are not limited to: (a) shares of money market or similar funds managed by the investment adviser or its affiliates; (b) shares of other money market funds; (c) commercial paper; (d) short-term bank obligations (for example, certificates of deposit,
Capital Group Private Client Services Funds — Page 17
bankers’ acceptances (time drafts on a commercial bank where the bank accepts an irrevocable obligation to pay at maturity)) or bank notes; (e) savings association and savings bank obligations (for example, bank notes and certificates of deposit issued by savings banks or savings associations); (f) securities of the U.S. government, its agencies or instrumentalities that mature, or that may be redeemed, in one year or less; and (g) higher quality corporate bonds and notes that mature, or that may be redeemed, in one year or less.
Commercial paper — The fund may purchase commercial paper. Commercial paper refers to short-term promissory notes issued by a corporation to finance its current operations. Such securities normally have maturities of thirteen months or less and, though commercial paper is often unsecured, commercial paper may be supported by letters of credit, surety bonds or other forms of collateral. Maturing commercial paper issuances are usually repaid by the issuer from the proceeds of new commercial paper issuances. As a result, investment in commercial paper is subject to rollover risk, or the risk that the issuer cannot issue enough new commercial paper to satisfy its outstanding commercial paper. Like all fixed income securities, commercial paper prices are susceptible to fluctuations in interest rates. If interest rates rise, commercial paper prices will decline and vice versa. However, the short-term nature of a commercial paper investment makes it less susceptible to volatility than many other fixed income securities because interest rate risk typically increases as maturity lengths increase. Commercial paper tends to yield smaller returns than longer-term corporate debt because securities with shorter maturities typically have lower effective yields than those with longer maturities. As with all fixed income securities, there is a chance that the issuer will default on its commercial paper obligations and commercial paper may become illiquid or suffer from reduced liquidity in these or other situations.
Commercial paper in which the fund may invest includes commercial paper issued in reliance on the exemption from registration afforded by Section 4(a)(2) of the 1933 Act. Section 4(a)(2) commercial paper has substantially the same price and liquidity characteristics as commercial paper generally, except that the resale of Section 4(a)(2) commercial paper is limited to institutional investors who agree that they are purchasing the paper for investment purposes and not with a view to public distribution. Technically, such a restriction on resale renders Section 4(a)(2) commercial paper a restricted security under the 1933 Act. In practice, however, Section 4(a)(2) commercial paper typically can be resold as easily as any other unrestricted security held by the fund. Accordingly, Section 4(a)(2) commercial paper has been generally determined to be liquid under procedures adopted by the fund’s board of trustees.
Forward commitment, when issued and delayed delivery transactions — The fund may enter into commitments to purchase or sell securities at a future date. When the fund agrees to purchase such securities, it assumes the risk of any decline in value of the security from the date of the agreement. If the other party to such a transaction fails to deliver or pay for the securities, the fund could miss a favorable price or yield opportunity, or could experience a loss.
The fund may enter into roll transactions, such as a mortgage dollar roll where the fund sells mortgage-backed securities for delivery in the current month and simultaneously contracts to repurchase substantially similar (same type, coupon, and maturity) securities on a specified future date, at a pre-determined price. During the period between the sale and repurchase (the “roll period”), the fund forgoes principal and interest paid on the mortgage-backed securities. The fund is compensated by the difference between the current sales price and the lower forward price for the future purchase (often referred to as the “drop”), if any, as well as by the interest earned on the cash proceeds of the initial sale. The fund could suffer a loss if the contracting party fails to perform the future transaction and the fund is therefore unable to buy back the mortgage-backed securities it initially sold. The fund also takes the risk that the mortgage-backed securities that it repurchases at a later date will have less favorable market characteristics than the securities originally sold (e.g., greater prepayment risk). These transactions are accounted for as purchase and sale transactions, which contribute to the fund’s portfolio turnover rate.
Capital Group Private Client Services Funds — Page 18
With to be announced (TBA) transactions, the particular securities (i.e., specified mortgage pools) to be delivered or received are not identified at the trade date, but are “to be announced” at a later settlement date. However, securities to be delivered must meet specified criteria, including face value, coupon rate and maturity, and be within industry-accepted “good delivery” standards.
The fund will not use these transactions for the purpose of leveraging and will segregate liquid assets that will be marked to market daily in an amount sufficient to meet its payment obligations in these transactions. Although these transactions will not be entered into for leveraging purposes, to the extent the fund’s aggregate commitments in connection with these transactions exceed its segregated assets, the fund temporarily could be in a leveraged position (because it may have an amount greater than its net assets subject to market risk). Should market values of the fund’s portfolio securities decline while the fund is in a leveraged position, greater depreciation of its net assets would likely occur than if it were not in such a position. The fund will not borrow money to settle these transactions and, therefore, will liquidate other portfolio securities in advance of settlement if necessary to generate additional cash to meet its obligations. After a transaction is entered into, the fund may still dispose of or renegotiate the transaction. Additionally, prior to receiving delivery of securities as part of a transaction, the fund may sell such securities.
Capital Group Private Client Services Funds — Page 19
Cybersecurity risks — With the increased use of technologies such as the Internet to conduct business, the fund has become potentially more susceptible to operational and information security risks through breaches in cybersecurity. In general, a breach in cybersecurity can result from either a deliberate attack or an unintentional event. Cybersecurity breaches may involve, among other things, infection by computer viruses or other malicious software code or unauthorized access to digital information systems, networks or devices used directly or indirectly by the fund or its service providers through “hacking” or other means, in each case for the purpose of misappropriating assets or sensitive information (including, for example, personal shareholder information), corrupting data or causing operational disruption or failures in the physical infrastructure or operating systems that support the fund. Cybersecurity risks also include the risk of losses of service resulting from external attacks that do not require unauthorized access to the fund’s systems, networks or devices. For example, denial-of-service attacks on the investment adviser’s or an affiliate’s website could effectively render the fund’s network services unavailable to fund shareholders and other intended end-users. Any such cybersecurity breaches or losses of service may cause the fund to lose proprietary information, suffer data corruption or lose operational capacity or may result in unauthorized release or other misuse of confidential information. These, in turn, could cause the fund to incur regulatory penalties, reputational damage, additional compliance costs associated with corrective measures and/or financial loss. While the fund and its investment adviser have established business continuity plans and risk management systems designed to prevent or reduce the impact of cybersecurity attacks, there are inherent limitations in such plans and systems due in part to the ever-changing nature of technology and cybersecurity attack tactics, and there is a possibility that certain risks have not been adequately identified or prepared for.
In addition, cybersecurity failures by or breaches of the fund’s third-party service providers (including, but not limited to, the fund’s investment adviser, transfer agent, custodian, administrators and other financial intermediaries) may disrupt the business operations of the service providers and of the fund, potentially resulting in financial losses, the inability of fund shareholders to transact business with the fund and of the fund to process transactions, the inability of the fund to calculate its net asset value, violations of applicable privacy and other laws, rules and regulations, regulatory fines, penalties, reputational damage, reimbursement or other compensatory costs and/or additional compliance costs associated with implementation of any corrective measures. The fund and its shareholders could be negatively impacted as a result of any such cybersecurity breaches, and there can be no assurance that the fund will not suffer losses relating to cybersecurity attacks or other informational security breaches affecting the fund’s third-party service providers in the future, particularly as the fund cannot control any cybersecurity plans or systems implemented by such service providers.
Cybersecurity risks may also impact issuers of securities in which the fund invests, which may cause the fund’s investments in such issuers to lose value.
Interfund borrowing and lending — Pursuant to an exemptive order issued by the U.S. Securities and Exchange Commission, the fund may lend money to, and borrow money from, other funds advised by Capital Research and Management Company or its affiliates. The fund will borrow through the program only when the costs are equal to or lower than the costs of bank loans. The fund will lend through the program only when the returns are higher than those available from an investment in repurchase agreements. Interfund loans and borrowings normally extend overnight, but can have a maximum duration of seven days. Loans may be called on one day's notice. The fund may have to borrow from a bank at a higher interest rate if an interfund loan is called or not renewed. Any delay in repayment to a lending fund could result in a lost investment opportunity or additional borrowing costs.
Affiliated investment companies — The fund may purchase shares of another investment company managed by the investment adviser or its affiliates. The risks of owning another investment company are similar to the risks of investing directly in the securities in which that investment company invests. When investing in another investment company managed by the investment adviser or its affiliates, the
Capital Group Private Client Services Funds — Page 20
fund bears its proportionate share of the expenses of any such investment company in which it invests but will not bear additional management fees through its investment in such investment company. Investments in other investment companies could allow the fund to obtain the benefits of a more diversified portfolio than might otherwise be available through direct investments in a particular asset class, and will subject the fund to the risks associated with the particular asset class or asset classes in which an underlying fund invests. However, an investment company may not achieve its investment objective or execute its investment strategy effectively, which may adversely affect the fund’s performance. Any investment in another investment company will be consistent with the fund’s objective(s) and applicable regulatory limitations.
Capital Group Private Client Services Funds — Page 21
Capital Group Core Municipal Fund
Capital Group Short-Term Municipal Fund
Capital Group California Core Municipal Fund
Capital Group California Short-Term Municipal Fund
U.S. Territories and Commonwealth obligations — The fund may invest in obligations of the territories and Commonwealths of the United States, such as Puerto Rico, the U.S. Virgin Islands, Guam and their agencies and authorities (“territories and Commonwealth”), to the extent such obligations are exempt from federal income taxes. Adverse political and economic conditions and developments affecting any territory or Commonwealth may, in turn, negatively affect the value of the fund’s holdings in such obligations. Territories and Commonwealths face significant fiscal challenges, including persistent government deficits, underfunded retirement systems, sizable debt service obligations and a high unemployment rate. A restructuring of some or all of the debt or a decline in market prices of the territories’ and Commonwealths’ debt obligations, may affect the fund’s investment in these securities. If the economic situation in the territories and Commonwealths persists or worsens, the volatility, credit quality and performance of the fund could be adversely affected.
Zero coupon bonds — Municipalities may issue zero coupon securities which are debt obligations that do not entitle the holder to any periodic payments of interest prior to maturity or a specified date when the securities begin paying current interest. They are issued and traded at a discount from their face amount or par value, which discount varies depending on the time remaining until cash payments begin, prevailing interest rates, liquidity of the security, and the perceived credit quality of the issuer.
Pre-refunded/Escrowed to maturity bonds — From time to time, a municipality may refund a bond that it has already issued prior to, or in the case of escrowed to maturity bonds on, the original bond’s call or maturity date by issuing a second bond, the proceeds of which are typically used to purchase securities of the U.S. government (including its agencies and instrumentalities). The U.S. government securities are placed in an escrow account. The original bonds then become "pre-refunded" or "escrowed to maturity" and while the security is still tax-exempt, the proceeds of the escrow account act as collateral and the original bonds are considered high-quality in nature as a result. The principal and interest payments on the escrowed securities are then used to pay off the original bondholders on the call or maturity date. The escrow account securities do not guarantee the price movement of the bond before maturity. Investment in pre-refunded and escrowed to maturity bonds held by the fund may subject the fund to interest rate risk, market risk and credit risk. For purposes of diversification, pre-refunded and escrowed to maturity bonds will be treated as U.S. governmental issues.
Temporary investments — The fund may invest in short-term municipal obligations of up to one year in maturity when temporary defensive strategies are used as a result of abnormal market conditions, or when such investments are considered advisable for liquidity. Generally, the income from such short-term municipal obligations is exempt from federal income tax. Further, a portion of a fund’s assets may be held in cash or invested in high-quality taxable short-term securities of up to one year in maturity. Such investments may include: (a) obligations of the U.S. Treasury; (b) obligations of agencies and instrumentalities of the U.S. government; (c) money market instruments, such as certificates of deposit issued by domestic banks, corporate commercial paper, and bankers' acceptances; and (d) repurchase agreements.
Issue classification — Securities with the same general quality rating and maturity characteristics, but which vary according to the purpose for which they were issued, often tend to trade at different yields. Correspondingly, securities issued for similar purposes and with the same general maturity characteristics, but which vary according to the creditworthiness of their respective issuers, tend to trade at different yields. These yield differentials tend to fluctuate in response to political and economic developments, as well as temporary imbalances in normal supply/demand relationships. The investment adviser monitors these fluctuations closely, and will attempt to adjust portfolio
Capital Group Private Client Services Funds — Page 22
concentrations in various issue classifications according to the value disparities brought about by these yield relationship fluctuations.
The investment adviser believes that, in general, the market for municipal bonds is less liquid than that for taxable fixed income securities. Accordingly, the ability of the fund to make purchases and sales of securities in the foregoing manner may, at any particular time and with respect to any particular securities, be limited or non-existent.
Private placements — Generally, municipal securities acquired in private placements are subject to contractual restrictions on resale. Accordingly, all private placements will be considered illiquid unless they have been specifically determined to be liquid, taking into account factors such as the frequency and volume of trading and the commitment of dealers to make markets under procedures adopted by the fund’s board of trustees.
Concentration of investments — Certain economic, business or political developments might adversely affect all municipal bonds of a similar category or type, or adversely affect all municipal bonds issued by issuers within a particular geographical area or jurisdiction.
Tax-exempt securities — While the fund seeks to purchase securities which bear interest that is exempt from federal income taxes – and in the case of Capital Group California Core Municipal Fund and Capital Group California Short–Term Municipal Fund, also seeks to purchase securities which bear interest that is exempt from California income taxes – there are risks that such interest may be reclassified as taxable by the Internal Revenue Service, or a state tax authority. Actions by the issuer or future legislative, administrative or court actions also could adversely affect the tax-exempt status of interest paid by such securities. Such reclassifications or actions could cause interest from a security to become includable in the gross income of the holder of the security, possibly retroactively, subjecting fund shareholders to increased tax liability. In addition, such reclassifications or actions could cause the value of a security, and therefore the value of the fund’s shares, to decline.
Capital Group California Core Municipal Fund
Capital Group California Short-Term Municipal Fund
Risk factors relating to California debt obligations — Because the fund invests in securities issued by the State of California, its agencies and municipalities, the fund is more susceptible to developments adversely affecting issuers of California securities than a municipal bond fund that does not concentrate its investments in a single state. The information below constitutes only a brief summary and does not purport to be a complete description of risk factors relating to California debt obligations. Certain information is drawn from official statements relating to securities offerings of the State of California and various local agencies in California available as of the date of this statement of additional information.
Many factors including both state and national economic, political, regulatory, social and environmental policies and conditions, which are not within the control of the issuers of state related bonds, could have an adverse impact on the financial condition of the state, its various agencies and political subdivisions, as well as other municipal issuers in California. A variety of events, such as, tax base erosion, state constitutional limits on tax increases, budget deficits and other financial difficulties, and changes in the credit ratings assigned to California’s municipal issuers may have an adverse impact on the fund. In addition, natural disasters, such as earthquakes and droughts, may have an adverse effect on the state’s economy.
California’s economy and general financial condition affect the ability of state and local governments to raise revenues to make timely payments on their obligations. Events such as budgetary problems at the state level, fiscal weakness or an overall slowdown in the California economy could adversely
Capital Group Private Client Services Funds — Page 23
impact the fund. Such events can negatively impact the state’s credit rating, make it more expensive for the state to borrow money, and impact municipal issuers’ ability to pay their obligations. Such events could also heighten the risk that prices of debt obligations purchased by the fund, and the fund’s net asset value, will experience greater volatility.
California is the most populous state in the nation and has a diverse economy. Major employers include the agriculture, manufacturing, high technology, services, trade, entertainment and construction sectors. However, certain of California’s significant industries are sensitive to economic disruptions in their export markets. The state’s rate of economic growth, therefore, could be adversely affected by any such disruption. A significant downturn in the housing market or U.S. stock market prices could adversely affect California’s economy by reducing household spending and business investment, particularly in the high technology sector. Moreover, a large and increasing share of the State of California’s General Fund revenue in the form of income and capital gains taxes is directly related to, and would be adversely affected by a significant downturn in the performance of, the stock markets.
Future California constitutional amendments, legislative measures, executive orders, administrative regulations, court decisions and voter initiatives could have an adverse effect on the debt obligations of California issuers. The initiative process is used quite often in California, resulting in numerous initiative items on the ballot for most state and many local elections, any of which could affect the ability of municipal issuers to pay their obligations. For example, revenue and expenditure limitations adopted by California voters, such as Propositions 13 (limiting ad valorem taxes on real property and restricting local taxing entities’ ability to raise real property taxes) and 218 (limiting local governments' ability to impose “property related” fees, assessments and taxes) have constrained local governments’ ability to raise revenue, consequently raising concerns about whether municipalities have sufficient revenue to pay their debt obligations.
While the fund’s portfolio managers try to reduce risks by investing in a diversified portfolio of securities, including state related bonds, it is not possible to predict the extent to which any or all of the factors described above will affect the ability of the state or other municipal issuers to pay interest or principal on their bonds or the ability of such bonds to maintain market value or marketability.
Capital Group Core Bond Fund
Obligations backed by the “full faith and credit” of the U.S. government — U.S. government obligations include the following types of securities:
U.S. Treasury securities — U.S. Treasury securities include direct obligations of the U.S. Treasury, such as Treasury bills, notes and bonds. For these securities, the payment of principal and interest is unconditionally guaranteed by the U.S. government, and thus they are of high credit quality. Such securities are subject to variations in market value due to fluctuations in interest rates and in government policies, but, if held to maturity, are expected to be paid in full (either at maturity or thereafter).
Federal agency securities — The securities of certain U.S. government agencies and government-sponsored entities are guaranteed as to the timely payment of principal and interest by the full faith and credit of the U.S. government. Such agencies and entities include, but are not limited to, the Federal Financing Bank (“FFB”), the Government National Mortgage Association (“Ginnie Mae”), the U.S. Department of Veterans Affairs (“VA”), the Federal Housing Administration (“FHA”), the Export-Import Bank of the United States (“Exim Bank”), the U.S. International Development Finance Corporation (“DFC”), the Commodity Credit Corporation (“CCC”) and the U.S. Small Business Administration (“SBA”).
Capital Group Private Client Services Funds — Page 24
Other federal agency obligations — Additional federal agency securities are neither direct obligations of, nor guaranteed by, the U.S. government. These obligations include securities issued by certain U.S. government agencies and government-sponsored entities. However, they generally involve some form of federal sponsorship: some operate under a congressional charter; some are backed by collateral consisting of “full faith and credit” obligations as described above; some are supported by the issuer’s right to borrow from the Treasury; and others are supported only by the credit of the issuing government agency or entity. These agencies and entities include, but are not limited to: the Federal Home Loan Banks, the Federal Home Loan Mortgage Corporation (“Freddie Mac”), the Federal National Mortgage Association (“Fannie Mae”), the Tennessee Valley Authority and the Federal Farm Credit Bank System.
In 2008, Freddie Mac and Fannie Mae were placed into conservatorship by their new regulator, the Federal Housing Finance Agency (“FHFA”). Simultaneously, the U.S. Treasury made a commitment of indefinite duration to maintain the positive net worth of both firms. As conservator, the FHFA has the authority to repudiate any contract either firm has entered into prior to the FHFA’s appointment as conservator (or receiver should either firm go into default) if the FHFA, in its sole discretion determines that performance of the contract is burdensome and repudiation would promote the orderly administration of Fannie Mae’s or Freddie Mac’s affairs. While the FHFA has indicated that it does not intend to repudiate the guaranty obligations of either entity, doing so could adversely affect holders of their mortgage-backed securities. For example, if a contract were repudiated, the liability for any direct compensatory damages would accrue to the entity’s conservatorship estate and could only be satisfied to the extent the estate had available assets. As a result, if interest payments on Fannie Mae or Freddie Mac mortgage-backed securities held by the fund were reduced because underlying borrowers failed to make payments or such payments were not advanced by a loan servicer, the fund’s only recourse might be against the conservatorship estate, which might not have sufficient assets to offset any shortfalls.
The FHFA, in its capacity as conservator, has the power to transfer or sell any asset or liability of Fannie Mae or Freddie Mac. The FHFA has indicated it has no current intention to do this; however, should it do so a holder of a Fannie Mae or Freddie Mac mortgage-backed security would have to rely on another party for satisfaction of the guaranty obligations and would be exposed to the credit risk of that party.
Certain rights provided to holders of mortgage-backed securities issued by Fannie Mae or Freddie Mac under their operative documents may not be enforceable against the FHFA, or enforcement may be delayed during the course of the conservatorship or any future receivership. For example, the operative documents may provide that upon the occurrence of an event of default by Fannie Mae or Freddie Mac, holders of a requisite percentage of the mortgage-backed security may replace the entity as trustee. However, under the Federal Housing Finance Regulatory Reform Act of 2008, holders may not enforce this right if the event of default arises solely because a conservator or receiver has been appointed.
Pass-through securities — The fund may invest in various debt obligations backed by pools of mortgages, corporate loans or other assets including, but not limited to, residential mortgage loans, home equity loans, mortgages on commercial buildings, consumer loans and equipment leases. Principal and interest payments made on the underlying asset pools backing these obligations are typically passed through to investors, net of any fees paid to any insurer or any guarantor of the securities. Pass-through securities may have either fixed or adjustable coupons. The risks of an investment in these obligations depend in part on the type of the collateral securing the obligations and the class of the instrument in which the fund invests. These securities include:
Mortgage-backed securities — These securities may be issued by U.S. government agencies and government-sponsored entities, such as Ginnie Mae, Fannie Mae and Freddie Mac, and by private entities. The payment of interest and principal on mortgage-backed obligations issued
Capital Group Private Client Services Funds — Page 25
by U.S. government agencies may be guaranteed by the full faith and credit of the U.S. government (in the case of Ginnie Mae), or may be guaranteed by the issuer (in the case of Fannie Mae and Freddie Mac). However, these guarantees do not apply to the market prices and yields of these securities, which vary with changes in interest rates.
Mortgage-backed securities issued by private entities are structured similarly to those issued by U.S. government agencies. However, these securities and the underlying mortgages are not guaranteed by any government agencies and the underlying mortgages are not subject to the same underwriting requirements. These securities generally are structured with one or more types of credit enhancements such as insurance or letters of credit issued by private companies. Borrowers on the underlying mortgages are usually permitted to prepay their underlying mortgages. Prepayments can alter the effective maturity of these instruments. In addition, delinquencies, losses or defaults by borrowers can adversely affect the prices and volatility of these securities. Such delinquencies and losses can be exacerbated by declining or flattening housing and property values. This, along with other outside pressures, such as bankruptcies and financial difficulties experienced by mortgage loan originators, decreased investor demand for mortgage loans and mortgage-related securities and increased investor demand for yield, can adversely affect the value and liquidity of mortgage-backed securities.
Collateralized mortgage obligations (CMOs) — CMOs are also backed by a pool of mortgages or mortgage loans, which are divided into two or more separate bond issues. CMOs issued by U.S. government agencies are backed by agency mortgages, while privately issued CMOs may be backed by either government agency mortgages or private mortgages. Payments of principal and interest are passed through to each bond issue at varying schedules resulting in bonds with different coupons, effective maturities and sensitivities to interest rates. Some CMOs may be structured in a way that when interest rates change, the impact of changing prepayment rates on the effective maturities of certain issues of these securities is magnified. CMOs may be less liquid or may exhibit greater price volatility than other types of mortgage or asset-backed securities.
Commercial mortgage-backed securities — These securities are backed by mortgages on commercial property, such as hotels, office buildings, retail stores, hospitals and other commercial buildings. These securities may have a lower prepayment uncertainty than other mortgage-related securities because commercial mortgage loans generally prohibit or impose penalties on prepayments of principal. In addition, commercial mortgage-related securities often are structured with some form of credit enhancement to protect against potential losses on the underlying mortgage loans. Many of the risks of investing in commercial mortgage-backed securities reflect the risks of investing in the real estate securing the underlying mortgage loans, including the effects of local and other economic conditions on real estate markets, the ability of tenants to make rental payments and the ability of a property to attract and retain tenants. Commercial mortgage-backed securities may be less liquid or exhibit greater price volatility than other types of mortgage or asset-backed securities and may be more difficult to value.
Asset-backed securities — These securities are backed by other assets such as credit card, automobile or consumer loan receivables, retail installment loans or participations in pools of leases. Credit support for these securities may be based on the underlying assets and/or provided through credit enhancements by a third party. The values of these securities are sensitive to changes in the credit quality of the underlying collateral, the credit strength of the credit enhancement, changes in interest rates and at times the financial condition of the issuer. Obligors of the underlying assets also may make prepayments that can change effective maturities of the asset-backed securities. These securities may be less liquid and more difficult to value than other securities.
Capital Group Private Client Services Funds — Page 26
Collateralized bond obligations (CBOs) and collateralized loan obligations (CLOs) — A CBO is a trust typically backed by a diversified pool of fixed-income securities, which may include high risk, lower rated securities. A CLO is a trust typically collateralized by a pool of loans, which may include, among others, senior secured loans, senior unsecured loans, and subordinate corporate loans, including lower rated loans. CBOs and CLOs may charge management fees and administrative expenses.
For both CBOs and CLOs, the cash flows from the trust are split into two or more portions, called tranches, varying in risk and yield. The riskiest and highest yielding portion is the “equity” tranche which bears the bulk of any default by the bonds or loans in the trust and is constructed to protect the other, more senior tranches from default. Since they are partially protected from defaults, the more senior tranches typically have higher ratings and lower yields than the underlying securities in the trust and can be rated investment grade. Despite the protection from the equity tranche, the more senior tranches can still experience substantial losses due to actual defaults of the underlying assets, increased sensitivity to defaults due to impairment of the collateral or the more junior tranches, market anticipation of defaults, as well as potential general aversions to CBO or CLO securities as a class. Normally, these securities are privately offered and sold, and thus, are not registered under the securities laws. CBOs and CLOs may be less liquid, may exhibit greater price volatility and may be more difficult to value than other securities.
Inflation-linked bonds — The fund may invest in inflation-linked bonds issued by governments, their agencies or instrumentalities and corporations.
The principal amount of an inflation-linked bond is adjusted in response to changes in the level of an inflation index, such as the Consumer Price Index for Urban Consumers (“CPURNSA”). If the index measuring inflation falls, the principal value or coupon of these securities will be adjusted downward. Consequently, the interest payable on these securities will be reduced. Also, if the principal value of these securities is adjusted according to the rate of inflation, the adjusted principal value repaid at maturity may be less than the original principal. In the case of U.S. Treasury Inflation-Protected Securities (“TIPS”), currently the only inflation-linked security that is issued by the U.S Treasury, the principal amounts are adjusted daily based upon changes in the rate of inflation (as currently represented by the non-seasonally adjusted CPURNSA, calculated with a three-month lag). TIPS may pay interest semi-annually, equal to a fixed percentage of the inflation-adjusted principal amount. The interest rate on these bonds is fixed at issuance, but over the life of the bond this interest may be paid on an increasing or decreasing principal amount that has been adjusted for inflation. The current market value of TIPS is not guaranteed and will fluctuate. However, the U.S. government guarantees that, at maturity, principal will be repaid at the higher of the original face value of the security (in the event of deflation) or the inflation adjusted value.
Other non-U.S. sovereign governments also issue inflation-linked securities that are tied to their own local consumer price indexes and that offer similar deflationary protection. In certain of these non-U.S. jurisdictions, the repayment of the original bond principal upon the maturity of an inflation-linked bond is not guaranteed, allowing for the amount of the bond repaid at maturity to be less than par. Corporations also periodically issue inflation-linked securities tied to CPURNSA or similar inflationary indexes. While TIPS and non-U.S. sovereign inflation-linked securities are currently the largest part of the inflation-linked market, the fund may invest in corporate inflation-linked securities.
The value of inflation-linked securities is expected to change in response to the changes in real interest rates. Real interest rates, in turn, are tied to the relationship between nominal interest rates and the rate of inflation. If inflation were to rise at a faster rate than nominal interest rates, real interest rates would decline, leading to an increase in value of the inflation-linked securities. In contrast, if nominal interest rates were to increase at a faster rate than inflation, real interest rates might rise, leading to a decrease in value of inflation-linked securities. There can be no assurance, however, that the value of
Capital Group Private Client Services Funds — Page 27
inflation-linked securities will be directly correlated to the changes in interest rates. If interest rates rise due to reasons other than inflation, investors in these securities may not be protected to the extent that the increase is not reflected in the security’s inflation measure.
The interest rate for inflation-linked bonds is fixed at issuance as a percentage of this adjustable principal. Accordingly, the actual interest income may both rise and fall as the principal amount of the bonds adjusts in response to movements of the consumer price index. For example, typically interest income would rise during a period of inflation and fall during a period of deflation.
The market for inflation-linked securities may be less developed or liquid, and more volatile, than certain other securities markets. There is a limited number of inflation-linked securities currently available for the fund to purchase, making the market less liquid and more volatile than the U.S. Treasury and agency markets.
Equity securities — Equity securities represent an ownership position in a company. Equity securities held by the fund typically consist of common stocks. The prices of equity securities fluctuate based on, among other things, events specific to their issuers and market, economic and other conditions. For example, prices of these securities can be affected by financial contracts held by the issuer or third parties (such as derivatives) relating to the security or other assets or indices. Holders of equity securities are not creditors of the issuer. If an issuer liquidates, holders of equity securities are entitled to their pro rata share of the issuer’s assets, if any, after creditors (including the holders of fixed income securities and senior equity securities) are paid.
There may be little trading in the secondary market for particular equity securities, which may adversely affect the fund’s ability to value accurately or dispose of such equity securities. Adverse publicity and investor perceptions, whether or not based on fundamental analysis, may decrease the value and/or liquidity of equity securities.
Investing outside the U.S. — Securities of issuers domiciled outside the United States, or with significant operations or revenues outside the United States, may lose value because of adverse political, social, economic or market developments (including social instability, regional conflicts, terrorism and war) in the countries or regions in which the issuers are domiciled, operate or generate revenue. These issuers may also be more susceptible to actions of foreign governments such as the imposition of price controls or punitive taxes that could adversely impact the value of these securities. To the extent the fund invests in securities that are denominated in currencies other than the U.S. dollar, these securities may also lose value due to changes in foreign currency exchange rates against the U.S. dollar and/or currencies of other countries. Securities markets in certain countries may be more volatile or less liquid than those in the United States. Investments outside the United States may also be subject to different accounting practices and different regulatory, legal and reporting standards, and may be more difficult to value, than those in the United States. In addition, the value of investments outside the United States may be reduced by foreign taxes, including foreign withholding taxes on interest and dividends. Further, there may be increased risks of delayed settlement of securities purchased or sold by the fund. The risks of investing outside the United States may be heightened in connection with investments in emerging markets.
Additional costs could be incurred in connection with the fund’s investment activities outside the United States. Brokerage commissions may be higher outside the United States, and the fund will bear certain expenses in connection with its currency transactions. Furthermore, increased custodian costs may be associated with maintaining assets in certain jurisdictions.
Investing in emerging markets — Investing in emerging markets may involve risks in addition to and greater than those generally associated with investing in the securities markets of developed countries. For instance, emerging market countries tend to have less developed political, economic
Capital Group Private Client Services Funds — Page 28
and legal systems and accounting and auditing practices and standards than those in developed countries. Accordingly, the governments of these countries may be less stable and more likely to intervene in the market economy, for example, by imposing capital controls, nationalizing a company or industry, placing restrictions on foreign ownership and on withdrawing sale proceeds of securities from the country, and/or imposing punitive taxes that could adversely affect the prices of securities. Information regarding issuers in emerging markets may be limited, incomplete or inaccurate, and there may be fewer rights and remedies available to the fund and its shareholders. In addition, the economies of these countries may be dependent on relatively few industries, may have limited access to capital and may be more susceptible to changes in local and global trade conditions and downturns in the world economy. Securities markets in these countries can also be relatively small and have substantially lower trading volumes. As a result, securities issued in these countries may be more volatile and less liquid, and may be more difficult to value, than securities issued in countries with more developed economies and/or markets. Less certainty with respect to security valuations may lead to additional challenges and risks in calculating the fund’s net asset value. Additionally, emerging markets are more likely to experience problems with the clearing and settling of trades and the holding of securities by banks, agents and depositories that are less established than those in developed countries.
In countries where direct foreign investment is limited or prohibited, the fund may invest in operating companies based in such countries through an offshore intermediary entity that, based on contractual agreements, seeks to replicate the rights and obligations of direct equity ownership in such operating company. Because the contractual arrangements do not in fact bestow the fund with actual equity ownership in the operating company, these investment structures may limit the fund’s rights as an investor and create significant additional risks. For example, local government authorities may determine that such structures do not comply with applicable laws and regulations, including those relating to restrictions on foreign ownership. In such event, the intermediary entity and/or the operating company may be subject to penalties, revocation of business and operating licenses or forfeiture of foreign ownership interests, and the fund’s economic interests in the underlying operating company and its rights as an investor may not be recognized, resulting in a loss to the fund and its shareholders. In addition, exerting control through contractual arrangements may be less effective than direct equity ownership, and a company may incur substantial costs to enforce the terms of such arrangements, including those relating to the distribution of the funds among the entities. These special investment structures may also be disregarded for tax purposes by local tax authorities, resulting in increased tax liabilities, and the fund’s control over – and distributions due from – such structures may be jeopardized if the individuals who hold the equity interest in such structures breach the terms of the agreements. While these structures may be widely used to circumvent limits on foreign ownership in certain jurisdictions, there is no assurance that they will be upheld by local regulatory authorities or that disputes regarding the same will be resolved consistently.
Although there is no universally accepted definition, the investment adviser generally considers an emerging market to be a market that is in the earlier stages of its industrialization cycle with a low per capita gross domestic product (“GDP”) and a low market capitalization to GDP ratio relative to those in the United States and the European Union, and would include markets commonly referred to as “frontier markets.”
Certain risk factors related to emerging markets
Currency fluctuations — Certain emerging markets’ currencies have experienced and in the future may experience significant declines against the U.S. dollar. For example, if the U.S. dollar appreciates against foreign currencies, the value of the fund’s emerging markets securities holdings would generally depreciate and vice versa. Further, the fund may lose money due to losses and other expenses incurred in converting various currencies to purchase and sell securities valued in currencies other than the U.S. dollar, as well as from currency restrictions, exchange control regulation and currency devaluations.
Capital Group Private Client Services Funds — Page 29
Government regulation — Certain developing countries lack uniform accounting, auditing and financial reporting and disclosure standards, have less governmental supervision of financial markets than in the United States, and may not honor legal rights or protections enjoyed by investors in the United States. Certain governments may be more unstable and present greater risks of nationalization or restrictions on foreign ownership of local companies. Repatriation of investment income, capital and the proceeds of sales by foreign investors may require governmental registration and/or approval in some developing countries. While the fund will only invest in markets where these restrictions are considered acceptable by the investment adviser, a country could impose new or additional repatriation restrictions after the fund’s investment. If this happened, the fund’s response might include, among other things, applying to the appropriate authorities for a waiver of the restrictions or engaging in transactions in other markets designed to offset the risks of decline in that country. Such restrictions will be considered in relation to the fund’s liquidity needs and other factors. Further, some attractive equity securities may not be available to the fund if foreign shareholders already hold the maximum amount legally permissible.
While government involvement in the private sector varies in degree among developing countries, such involvement may in some cases include government ownership of companies in certain sectors, wage and price controls or imposition of trade barriers and other protectionist measures. With respect to any developing country, there is no guarantee that some future economic or political crisis will not lead to price controls, forced mergers of companies, expropriation, or creation of government monopolies to the possible detriment of the fund’s investments.
Fluctuations in inflation rates — Rapid fluctuations in inflation rates may have negative impacts on the economies and securities markets of certain emerging market countries.
Less developed securities markets — Emerging markets may be less well-developed and regulated than other markets. These markets have lower trading volumes than the securities markets of more developed countries and may be unable to respond effectively to increases in trading volume. Consequently, these markets may be substantially less liquid than those of more developed countries, and the securities of issuers located in these markets may have limited marketability. These factors may make prompt liquidation of substantial portfolio holdings difficult or impossible at times.
Settlement risks — Settlement systems in developing countries are generally less well organized than those of developed markets. Supervisory authorities may also be unable to apply standards comparable to those in developed markets. Thus, there may be risks that settlement may be delayed and that cash or securities belonging to the fund may be in jeopardy because of failures of or defects in the systems. In particular, market practice may require that payment be made before receipt of the security being purchased or that delivery of a security be made before payment is received. In such cases, default by a broker or bank (the “counterparty”) through whom the transaction is effected might cause the fund to suffer a loss. The fund will seek, where possible, to use counterparties whose financial status is such that this risk is reduced. However, there can be no certainty that the fund will be successful in eliminating this risk, particularly as counterparties operating in developing countries frequently lack the standing or financial resources of those in developed countries. There may also be a danger that, because of uncertainties in the operation of settlement systems in individual markets, competing claims may arise with respect to securities held by or to be transferred to the fund.
Limited market information — The fund may encounter problems assessing investment opportunities in certain emerging markets in light of limitations on available information and different accounting, auditing and financial reporting standards. For example, due to
Capital Group Private Client Services Funds — Page 30
jurisdictional limitations, the Public Company Accounting Oversight Board (“PCAOB”) may be unable to inspect the audit work and practices of PCAOB-registered auditing firms in certain developing countries that audit U.S. reporting companies with operations in those countries. As a result, there is greater risk that financial records and information relating to an issuer’s operations in developing countries will be incomplete or misleading, which may negatively impact the fund’s investments in such company. When faced with limited market information, the fund’s investment adviser will seek alternative sources of information, and to the extent the investment adviser is not satisfied with the sufficiency or accuracy of the information obtained with respect to a particular market or security, the fund will not invest in such market or security.
Taxation — Taxation of dividends, interest and capital gains received by the fund varies among developing countries and, in some cases, is comparatively high. In addition, developing countries typically have less well-defined tax laws and procedures and such laws may permit retroactive taxation so that the fund could become subject in the future to local tax liability that it had not reasonably anticipated in conducting its investment activities or valuing its assets.
Fraudulent securities — Securities purchased by the fund may subsequently be found to be fraudulent or counterfeit, resulting in a loss to the fund.
Remedies — Developing countries may offer less protection to investors than U.S. markets and, in the event of investor harm, there may be substantially less recourse available to the fund and its shareholders. In addition, as a matter of law or practicality, the fund and its shareholders - as well as U.S. regulators - may encounter substantial difficulties in obtaining and enforcing judgments and other actions against non-U.S. individuals and companies.
* * * * * *
Capital Group Private Client Services Funds — Page 31
Portfolio turnover — Portfolio changes will be made without regard to the length of time particular investments may have been held. Short-term trading profits are not the fund’s objective, and changes in its investments are generally accomplished gradually, though short-term transactions may occasionally be made. Higher portfolio turnover may involve correspondingly greater transaction costs in the form of dealer spreads or brokerage commissions. It may also result in the realization of net capital gains, which are taxable when distributed to shareholders, unless the shareholder is exempt from taxation or his or her account is tax-favored.
Fixed income securities are generally traded on a net basis and usually neither brokerage commissions nor transfer taxes are involved. Transaction costs are usually reflected in the spread between the bid and asked price.
The fund’s portfolio turnover rates for the fiscal years ended October 31, 2021 and 2020, are as follows:
| | | |
Fund | Fiscal year | Portfolio turnover rate1 |
Capital Group Core Municipal Fund | 2021 | 48% |
2020 | 62 |
Capital Group Short-Term Municipal Fund | 2021 | 51 |
2020 | 58 |
Capital Group California Core Municipal Fund | 2021 | 38 |
2020 | 37 |
Capital Group California Short-Term Municipal Fund | 2021 | 43 |
2020 | 42 |
Capital Group Core Bond Fund2 | 2021 | 217 |
2020 | 158 |
1 Increases (or decreases) in turnover were due to increased (or decreased) trading activity during the period.
2 The fund’s portfolio turnover rate excluding mortgage dollar roll transactions for the fiscal years ended October 31, 2021 and 2020, were 48% and 80%, respectively. See “Forward commitment, when issued and delayed delivery transactions” above for more information on mortgage dollar rolls.
A fund’s portfolio turnover rate would equal 100% if each security in the fund’s portfolio were replaced once per year. See “Financial highlights” in the prospectus for the fund’s annual portfolio turnover rate for each of the last five fiscal years.
Capital Group Private Client Services Funds — Page 32
Fund policies
All percentage limitations in the following fund policies are considered at the time securities are purchased and are based on the fund’s net assets unless otherwise indicated. None of the following policies involving a maximum percentage of assets will be considered violated unless the excess occurs immediately after, and is caused by, an acquisition by the fund. In managing the fund, the fund’s investment adviser may apply more restrictive policies than those listed below.
Fundamental policies — The fund has adopted the following policies, which may not be changed without approval by holders of a majority of its outstanding shares. Such majority is currently defined in the Investment Company Act of 1940, as amended (the “1940 Act”), as the vote of the lesser of (a) 67% or more of the voting securities present at a shareholder meeting, if the holders of more than 50% of the outstanding voting securities are present in person or by proxy, or (b) more than 50% of the outstanding voting securities.
1. Except as permitted by (i) the 1940 Act and the rules and regulations thereunder, or other successor law governing the regulation of registered investment companies, or interpretations or modifications thereof by the U.S. Securities and Exchange Commission (“SEC”), SEC staff or other authority of competent jurisdiction, or (ii) exemptive or other relief or permission from the SEC, SEC staff or other authority of competent jurisdiction, the fund may not:
a. Borrow money;
b. Issue senior securities;
c. Underwrite the securities of other issuers;
d. Purchase or sell real estate or commodities;
e. Make loans; or
f. Purchase the securities of any issuer if, as a result of such purchase, the fund’s investments would be concentrated in any particular industry.
2. The Municipal Bond Funds will maintain their status as tax-exempt funds consistent with (i) the 1940 Act and the rules and regulations thereunder, or other successor law governing the regulation of registered investment companies, or interpretations or modifications thereof by the SEC, SEC staff or other authority of competent jurisdiction, or (ii) exemptive or other relief or permission from the SEC, SEC staff or other authority of competent jurisdiction.
3. The fund may not invest in companies for the purpose of exercising control or management.
Capital Group Private Client Services Funds — Page 33
Additional information about the fund’s policies — The information below is not part of the fund’s fundamental or nonfundamental policies. This information is intended to provide a summary of what is currently required or permitted by the 1940 Act and the rules and regulations thereunder, or by the interpretive guidance thereof by the SEC or SEC staff, for particular fundamental policies of the fund. Information is also provided regarding the fund’s current intention with respect to certain investment practices permitted by the 1940 Act.
For purposes of fundamental policy 1a, the fund may borrow money in amounts of up to 33-1/3% of its total assets from banks for any purpose. Additionally, the fund may borrow up to 5% of its total assets from banks or other lenders for temporary purposes (a loan is presumed to be for temporary purposes if it is repaid within 60 days and is not extended or renewed). The percentage limitations in this policy are considered at the time of borrowing and thereafter.
For purposes of fundamental policies 1a and 1e, the fund may borrow money from, or loan money to, other funds managed by Capital Research and Management Company or its affiliates to the extent permitted by applicable law and an exemptive order issued by the SEC.
For purposes of fundamental policy 1b, a senior security does not include any promissory note or evidence of indebtedness if such loan is for temporary purposes only and in an amount not exceeding 5% of the value of the total assets of the fund at the time the loan is made (a loan is presumed to be for temporary purposes if it is repaid within 60 days and is not extended or renewed). Further, to the extent the fund covers its commitments under certain types of agreements and transactions, including derivatives, mortgage-dollar-roll transactions, sale-buybacks, when-issued, delayed-delivery, or forward commitment transactions, and other similar trading practices, by segregating or earmarking liquid assets equal in value to the amount of the fund’s commitment (in accordance with applicable SEC or SEC staff guidance), such agreement or transaction will not be considered a senior security by the fund.
For purposes of fundamental policy 1c, the policy will not apply to the fund to the extent the fund may be deemed an underwriter within the meaning of the 1933 Act in connection with the purchase and sale of fund portfolio securities in the ordinary course of pursuing its investment objectives and strategies.
For purposes of fundamental policy 1e, the fund may not lend more than 33-1/3% of its total assets, provided that this limitation shall not apply to the fund’s purchase of debt obligations.
For purposes of fundamental policy 1f, the fund may not invest more than 25% of its total assets in the securities of issuers in a particular industry. This policy does not apply to investments in securities of the U.S. government, its agencies or government sponsored enterprises or repurchase agreements with respect thereto.
For purposes of fundamental policy 2, each of the Municipal Bond Funds will, under normal circumstances, invest at least 80% of its assets in, or derive at least 80% of its income from securities that are exempt from regular federal income tax.
Capital Group Private Client Services Funds — Page 34
Management of the fund
Board of trustees and officers
Independent trustees1
The fund’s nominating and governance committee and board select independent trustees with a view toward constituting a board that, as a body, possesses the qualifications, skills, attributes and experience to appropriately oversee the actions of the fund’s service providers, decide upon matters of general policy and represent the long-term interests of fund shareholders. In doing so, they consider the qualifications, skills, attributes and experience of the current board members, with a view toward maintaining a board that is diverse in viewpoint, experience, education and skills.
The fund seeks independent trustees who have high ethical standards and the highest levels of integrity and commitment, who have inquiring and independent minds, mature judgment, good communication skills, and other complementary personal qualifications and skills that enable them to function effectively in the context of the fund’s board and committee structure and who have the ability and willingness to dedicate sufficient time to effectively fulfill their duties and responsibilities.
Each independent trustee has a significant record of accomplishments in governance, business, not-for-profit organizations, government service, academia, law, accounting or other professions. Although no single list could identify all experience upon which the fund’s independent trustees draw in connection with their service, the following table summarizes key experience for each independent trustee. These references to the qualifications, attributes and skills of the trustees are pursuant to the disclosure requirements of the SEC, and shall not be deemed to impose any greater responsibility or liability on any trustee or the board as a whole. Notwithstanding the accomplishments listed below, none of the independent trustees is considered an “expert” within the meaning of the federal securities laws with respect to information in the fund’s registration statement.
Capital Group Private Client Services Funds — Page 35
| | | | | |
Name, year of birth and position with fund (year first elected as a trustee2) | Principal
occupation(s)
during the
past five years | Number of
portfolios
in fund complex overseen
by
trustee3 | Other directorships
held
by trustee during the past five years4 | Other relevant experience |
Vanessa C. L. Chang, 1952
Chair of the Board (Independent and Non-Executive)
(2015) | Former Director, EL & EL Investments (real estate) | 22 | Edison International/
Southern California Edison; Transocean Ltd. (offshore drilling contractor) Former director of Sykes Enterprises (outsourced customer engagement service provider) (until 2021) | · Service as a chief executive officer, insurance-related (claims/dispute resolution) internet company · Senior management experience, investment banking · Former partner, public accounting firm · Corporate board experience · Service on advisory and trustee boards for charitable, educational and nonprofit organizations · Former member of the Governing Council of the Independent Directors Council · CPA (inactive) |
Capital Group Private Client Services Funds — Page 36
| | | | | |
Name, year of birth and position with fund (year first elected as a trustee2) | Principal
occupation(s)
during the
past five years | Number of
portfolios
in fund complex overseen
by
trustee3 | Other directorships
held
by trustee during the past five years4 | Other relevant experience |
James G. Ellis, 1947
Trustee (2019) | Former Dean and Professor of Marketing, Marshall School of Business, University of Southern California | 99 | Advanced Merger Partners; EVe Mobility Acquisition Corp (acquisitions of companies in the electric vehicle market); J. G. Boswell (agricultural production); Mercury General Corporation | · Service as chief executive officer for multiple companies · Corporate board experience · Service on advisory and trustee boards for charitable, municipal and nonprofit organizations · MBA |
Jennifer C. Feikin, 1968
Trustee (2019) | Business Advisor; previously held positions at Google, AOL, 20th Century Fox and McKinsey & Company; Trustee, The Nature Conservancy of Utah; former Trustee, The Nature Conservancy of California; former Director, First Descents | 15 | Hertz Global Holdings, Inc. | · Senior corporate management experience · Corporate board experience · Business consulting experience · Service on advisory and trustee boards for charitable and nonprofit organizations · JD |
Pablo R. González Guajardo, 1967
Trustee (2019) | CEO, Kimberly-Clark de México, SAB de CV | 22 | América Móvil, SAB de CV (telecommunications company); Grupo Lala, SAB de CV (dairy company); Grupo Sanborns, SAB de CV (retail stores and restaurants); Kimberly-Clark de México, SAB de CV (consumer staples) | · Service as a chief executive officer · Senior corporate management experience · Corporate board experience · Service on advisory and trustee boards for nonprofit organizations · MBA |
Capital Group Private Client Services Funds — Page 37
| | | | | |
Name, year of birth and position with fund (year first elected as a trustee2) | Principal
occupation(s)
during the
past five years | Number of
portfolios
in fund complex overseen
by
trustee3 | Other directorships
held
by trustee during the past five years4 | Other relevant experience |
Leslie Stone Heisz, 1961
Trustee (2019) | Former Managing Director, Lazard (retired, 2010); Director, Edwards Lifesciences; Trustee, Public Storage; Director, Kaiser Permanente (California public benefit corporation) | 15 | None | · Senior corporate management experience, investment banking · Business consulting experience · Corporate board experience · Service on advisory and trustee boards for charitable and nonprofit organizations · MBA |
William D. Jones, 1955
Trustee (2019) | Real estate developer/owner, President and CEO, CityLink Investment Corporation (acquires, develops and manages real estate ventures in urban communities) and for the former City Scene Management Company (provided commercial asset management services) | 23 | Biogen Inc.; Sempra Energy | · Senior investment and management experience, real estate · Corporate board experience · Service as director, Federal Reserve Boards of San Francisco and Los Angeles · Service on advisory and trustee boards for charitable, educational, municipal and nonprofit organizations · MBA |
Capital Group Private Client Services Funds — Page 38
Interested trustees5
Interested trustees have similar qualifications, skills and attributes as the independent trustees. Interested trustees are senior executive officers of Capital Research and Management Company or its affiliates. This management role also permits them to make a significant contribution to the fund’s board.
| | | | |
Name, year of birth
and position with fund
(year first elected
as a trustee/officer2) | Principal occupation(s)
during the
past five years
and positions
held with affiliated
entities or the
Principal Underwriter
of the fund | Number of
portfolios
in fund complex overseen
by trustee3 | Other directorships4
held by trustee
during the
past five years |
John S. Armour, 1957
President and Trustee (2013) | President – Capital Group Private Client Services, Inc.* | 9 | None |
Other officers6
| | |
Name, year of birth
and position with fund
(year first elected
as an officer2) | Principal occupation(s) during the past five years
and positions held with affiliated entities
or the Principal Underwriter of the fund |
|
Michael Stockton, 1967
Executive Vice President (2021) | Senior Vice President – Fund Business Management Group, Capital Research and Management Company |
|
Aaron Applebaum, 1979
Senior Vice President (2017) | Partner – Capital Fixed Income Investors, Capital Research and Management Company |
Mark Marinella, 1958
Senior Vice President (2016) | Partner – Capital Fixed Income Investors, Capital Research and Management Company |
|
John R. Queen, 1965
Senior Vice President (2009) | Partner – Capital Fixed Income Investors, Capital Research and Management Company; Senior Vice President – Capital Group Private Client Services, Inc.* |
|
Timothy W. McHale, 1978
Vice President (2009) | Senior Vice President and Senior Counsel – Fund Business Management Group, Capital Research and Management Company; Secretary, American Funds Distributors, Inc.* |
Courtney R. Taylor, 1975
Secretary (2009) | Assistant Vice President – Fund Business Management Group, Capital Research and Management Company |
Gregory F. Niland, 1971
Treasurer (2014) | Vice President - Investment Operations, Capital Research and Management Company |
Susan K. Countess, 1966
Assistant Secretary (2012) | Associate – Fund Business Management Group, Capital Research and Management Company |
Capital Group Private Client Services Funds — Page 39
| | |
Name, year of birth
and position with fund
(year first elected
as an officer2) | Principal occupation(s) during the past five years
and positions held with affiliated entities
or the Principal Underwriter of the fund |
Sandra Chuon, 1972
Assistant Treasurer (2019) | Assistant Vice President – Investment Operations, Capital Research and Management Company |
Kyle J. Ilsley, 1980
Assistant Treasurer (2020) | Assistant Vice President – Investment Operations, Capital Research and Management Company |
* Company affiliated with Capital Research and Management Company.
1 The term independent trustee refers to a trustee who is not an “interested person” of the fund within the meaning of the 1940 Act.
2 Trustees and officers of the fund serve until their resignation, removal or retirement.
3 "Fund complex" consists of the funds, Capital Group U.S. Equity Fund and Emerging Markets Growth Fund, Inc.SM and funds in the American Funds family of funds, all of which are managed by the investment adviser or its affiliates.
4 This includes all directorships/trusteeships (other than those in the fund or other funds managed by Capital Research and Management Company or its affiliates) that are held by each trustee as a director/trustee of a public company or a registered investment company. Unless otherwise noted, all directorships/trusteeships are current.
5 The term interested trustee refers to a trustee who is an “interested person” of the fund within the meaning of the 1940 Act, on the basis of his or her affiliation with the fund’s investment adviser, Capital Research and Management Company, or affiliated entities (including the fund’s principal underwriter).
6 All of the trustees and/or officers listed are officers of one or more of the other funds for which Capital Research and Management Company or an affiliate serves as investment adviser.
The address for all trustees and officers of the fund is 333 South Hope Street, 55th Floor, Los Angeles, California 90071, Attention: Secretary.
Capital Group Private Client Services Funds — Page 40
Fund shares owned by trustees as of December 31, 2020:
| | | |
Name | Dollar range
of fund
shares owned1 | Aggregate
dollar range1
of shares owned
in all funds
overseen by
trustee
in same family of
investment
companies as the fund |
|
Independent trustees |
|
Vanessa C. L. Chang | Over $100,000 | Over $100,000 |
James G. Ellis | None | Over $100,000 |
|
Jennifer C. Feikin | None | $10,001-$50,000 |
Pablo R. González Guajardo | None | Over $100,000 |
|
Leslie Stone Heisz | Over $100,000 | Over $100,000 |
|
William D. Jones | None | Over $100,000 |
| | | |
|
Name | Dollar range
of fund
shares owned1 | Aggregate
dollar range1
of shares owned
in all funds
overseen by
trustee
in same family of
investment
companies as the fund |
|
|
|
Interested trustees2 |
|
John S. Armour | Over $100,000 | Over $100,000 |
1 Ownership disclosure is made using the following ranges: None; $1 – $10,000; $10,001 – $50,000; $50,001 – $100,000; and Over $100,000.
2 The term interested trustee refers to a trustee who is an “interested person” of the fund within the meaning of the 1940 Act, on the basis of his or her affiliation with the fund’s investment adviser, Capital Research and Management Company, or affiliated entities (including the fund’s principal underwriter).
Capital Group Private Client Services Funds — Page 41
Trustee compensation — No compensation is paid by the funds to any officer or trustee who is a director, officer or employee of the investment adviser or its affiliates. Except for the independent trustees listed in the “Board of trustees and officers — Independent trustees” table under the “Management of the fund” section in this statement of additional information, all other officers and trustees of the fund are directors, officers or employees of the investment adviser or its affiliates. The series pays each independent trustee an annual retainer fee.
Board and committee chairs receive additional fees for their services.
Independent trustees also receive attendance fees for certain special joint meetings and information sessions with directors and trustees of other groupings of funds advised by the investment adviser or its affiliates. The fund and the other funds served by each independent trustee each pay a portion of these attendance fees.
No pension or retirement benefits are accrued as part of fund expenses. The series also reimburses certain expenses of the independent trustees.
Trustee compensation earned during the fiscal year ended October 31, 2021:
| | | |
Name | Aggregate compensation
from the series | Total compensation from all funds
managed by
Capital Research and
Management Company
or its affiliates |
Joseph C. Berenato (Retired December 31, 2021) | $27,779 | $442,625 |
Vanessa C. L. Chang | 28,225 | 404,250 |
James G. Ellis | 27,338 | 489,250 |
Jennifer C. Feikin | 28,769 | 80,875 |
Pablo R. González Guajardo | 27,626 | 379,000 |
Leslie Stone Heisz | 28,986 | 81,500 |
William D. Jones | 26,719 | 460,625 |
Capital Group Private Client Services Funds — Page 42
Series organization and the board of trustees — The series, an open-end, diversified management investment company, was organized as a Delaware statutory trust on October 22, 2009. Although the board of trustees has delegated day-to-day oversight to the investment adviser, all fund operations are supervised by the series' board of trustees which meets periodically and performs duties required by applicable state and federal laws.
Delaware law charges trustees with the duty of managing the business affairs of the trust. Trustees are considered to be fiduciaries of the trust and owe duties of care and loyalty to the trust and its shareholders.
The series has five funds and one class of shares. Fund shares have pro rata rights as to voting, redemption, dividends and liquidation. In addition, the trustees have the authority to establish new funds and classes of shares, and to split or combine outstanding shares into a greater or lesser number, without shareholder approval.
The series does not hold annual meetings of shareholders. However, significant matters that require shareholder approval, such as certain elections of board members or a change in a fundamental investment policy, will be presented to shareholders at a meeting called for such purpose. Shareholders have one vote per share owned. At the request of the holders of at least 10% of the shares, the series will hold a meeting at which any member of the board could be removed by a majority vote.
The series’ declaration of trust and by-laws that the trust has entered into provide in effect that, subject to certain conditions, the series will indemnify its officers and trustees against liabilities or expenses actually and reasonably incurred by them relating to their service to the series. However, trustees are not protected from liability by reason of their willful misfeasance, bad faith, gross negligence or reckless disregard of the duties involved in the conduct of their office.
Leadership structure — The board’s chair is currently an independent trustee who is not an “interested person” of the series within the meaning of the 1940 Act. The board has determined that an independent chair facilitates oversight and enhances the effectiveness of the board. The independent chair’s duties include, without limitation, generally presiding at meetings of the board, approving board meeting schedules and agendas, leading meetings of the independent trustees in executive session, facilitating communication with committee chairs, and serving as the principal independent trustee contact for series management and counsel to the independent trustees and the series.
Risk oversight — Day-to-day management of the series, including risk management, is the responsibility of the series’ contractual service providers, including the series’ investment adviser, principal underwriter/distributor and transfer agent. Each of these entities is responsible for specific portions of the series’ operations, including the processes and associated risks relating to the series’ investments, integrity of cash movements, financial reporting, operations and compliance. The board of trustees oversees the service providers’ discharge of their responsibilities, including the processes they use to manage relevant risks. In that regard, the board receives reports regarding the operations of the series’ service providers, including risks. For example, the board receives reports from investment professionals regarding risks related to the series’ investments and trading. The board also receives compliance reports from the series’ and the investment adviser’s chief compliance officers addressing certain areas of risk.
Committees of the series’ board, which are comprised of independent board members, none of whom is an “interested person” of the fund within the meaning of the 1940 Act, also explore risk management procedures in particular areas and then report back to the full board. For example, the series’ audit committee oversees the processes and certain attendant risks relating to financial reporting, valuation of fund assets, and related controls.
Capital Group Private Client Services Funds — Page 43
Not all risks that may affect the series can be identified or processes and controls developed to eliminate or mitigate their effect. Moreover, it is necessary to bear certain risks (such as investment-related risks) to achieve the fund’s objectives. As a result of the foregoing and other factors, the ability of the series’ service providers to eliminate or mitigate risks is subject to limitations.
Committees of the board of trustees — The series has an audit committee comprised of all of its independent board members. The committee provides oversight regarding the series’ accounting and financial reporting policies and practices, its internal controls and the internal controls of the series’ principal service providers. The committee acts as a liaison between the series’ independent registered public accounting firm and the full board of trustees. The audit committee held five meetings during the 2021 fiscal year.
The series has a contracts committee comprised of all of the independent trustees. The committee’s principal function is to request, review and consider the information deemed necessary to evaluate the terms of certain agreements between the series and its investment adviser or the investment adviser's affiliates, such as the Investment Advisory and Service Agreement, Principal Underwriting Agreement, and Shareholder Services Agreement, that the fund may enter into, renew or continue, and to make its recommendations to the full board of trustees on these matters. The contracts committee held one meeting during the 2021 fiscal year.
The series has a nominating and governance committee comprised of all its independent board members. The committee periodically reviews such issues as the board’s composition, responsibilities, committees, compensation and other relevant issues, and recommends any appropriate changes to the full board of trustees. The committee also coordinates annual self-assessments of the board and evaluates, selects and nominates independent trustee candidates to the full board of trustees. While the committee normally is able to identify from its own and other resources an ample number of qualified candidates, it will consider shareholder suggestions of persons to be considered as nominees to fill future vacancies on the board. Such suggestions must be sent in writing to the nominating and governance committee of the series, addressed to the series’ secretary, and must be accompanied by complete biographical and occupational data on the prospective nominee, along with a written consent of the prospective nominee for consideration of his or her name by the committee. The nominating and governance committee held two meetings during the 2021 fiscal year.
Proxy voting procedures and principles — The fund’s investment adviser, in consultation with the fund’s board, has adopted Proxy Voting Procedures and Principles (the “Principles”) with respect to voting proxies of securities held by the fund, and other funds managed by the investment adviser or its affiliates. The complete text of these principles is available at capitalgroup.com. Proxies are voted by a committee of the appropriate equity investment division of the investment adviser under authority delegated by the funds’ boards. The Boards of the funds and the American Funds have established a Joint Proxy Committee (“JPC”) composed of independent board members from each fund and American Funds board. The JPC’s role is to facilitate appropriate oversight of the proxy voting process and provide valuable input on corporate governance and related matters.
The Principles, which have been in effect in substantially their current form for many years, provide an important framework for analysis and decision-making by all funds. However, they are not exhaustive and do not address all potential issues. The Principles provide a certain amount of flexibility so that all relevant facts and circumstances can be considered in connection with every vote. As a result, each proxy received is voted on a case-by-case basis considering the specific circumstances of each proposal. The voting process reflects the funds’ understanding of the company’s business, its management and its relationship with shareholders over time.
The investment adviser seeks to vote all U.S. proxies; however, in certain circumstances it may be impracticable or impossible to do so. Proxies for companies outside the U.S. also are voted, provided
Capital Group Private Client Services Funds — Page 44
there is sufficient time and information available. Certain regulators have granted investment limit relief to the investment adviser and its affiliates, conditioned upon limiting its voting power to specific voting ceilings. To comply with these voting ceilings, the investment adviser will scale back its votes across all funds and clients on a pro-rata basis based on assets. After a proxy statement is received, the investment adviser prepares a summary of the proposals contained in the proxy statement. A notation of any potential conflicts of interest also is included in the summary (see below for a description of Capital Research and Management Company’s special review procedures).
For proxies of securities managed by a particular equity investment division of the investment adviser, the initial voting recommendation is made by one or more of the division’s investment analysts familiar with the company and industry. A second recommendation is made by a proxy coordinator (an investment analyst or other individual with experience in corporate governance and proxy voting matters) within the appropriate investment division, based on knowledge of these Principles and familiarity with proxy-related issues. The proxy summary and voting recommendations are made available to the appropriate proxy voting committee for a final voting decision. In cases where a fund is co-managed and a security is held by more than one of the investment adviser’s equity investment divisions, the divisions may develop different voting recommendations for individual ballot proposals. If this occurs, and if permitted by local market conventions, the fund’s position will generally be voted proportionally by divisional holding, according to their respective decisions. Otherwise, the outcome will be determined by the equity investment division or divisions with the larger position in the security as of the record date for the shareholder meeting.
In addition to its proprietary proxy voting, governance and executive compensation research, Capital Research and Management Company may utilize research provided by Institutional Shareholder Services, Glass-Lewis & Co. or other third-party advisory firms on a case-by-case basis. It does not, as a policy, follow the voting recommendations provided by these firms. It periodically assesses the information provided by the advisory firms and reports to the JPC as appropriate.
From time to time the investment adviser may vote proxies issued by, or on proposals sponsored or publicly supported by (a) a client with substantial assets managed by the investment adviser or its affiliates, (b) an entity with a significant business relationship with Capital Group, or (c) a company with a director of the fund or an American Fund on its board (each referred to as an “Interested Party”). Other persons or entities may also be deemed an Interested Party if facts or circumstances appear to give rise to a potential conflict. The investment adviser analyzes these proxies and proposals on their merits and does not consider these relationships when casting its vote.
The investment adviser has developed procedures to identify and address instances where a vote could appear to be influenced by such a relationship. Under the procedures, prior to a final vote being cast by the investment adviser, the relevant proxy committees’ voting results for proxies issued by Interested Parties are reviewed by a Special Review Committee (“SRC”) of the investment division voting the proxy if the vote was in favor of the Interested Party.
If a potential conflict is identified according to the procedure above, the SRC will be provided with a summary of any relevant communications with the Interested Party, the rationale for the voting decision, information on the organization’s relationship with the party and any other pertinent information. The SRC will evaluate the information and determine whether the decision was in the best interest of fund shareholders. It will then accept or override the voting decision or determine alternative action. The SRC includes senior investment professionals and legal and compliance professionals.
Information regarding how the fund voted proxies relating to portfolio securities during the 12-month period ended June 30 of each year will be available on or about September 1 of such year (a) without
Capital Group Private Client Services Funds — Page 45
charge, upon request by calling American Funds Service Company at (800) 421-4225, and (b) on the SEC’s website at sec.gov.
The following summary sets forth the general positions of the fund and the investment adviser on various proposals. A copy of the full Principles is available upon request, free of charge, by calling American Funds Service Company.
Director matters — The election of a company’s slate of nominees for director generally is supported. Votes may be withheld for some or all of the nominees if this is determined to be in the best interest of shareholders or if, in the opinion of the investment adviser, such nominee has not fulfilled his or her fiduciary duty. Separation of the chairman and CEO positions also may be supported.
Governance provisions — Typically, proposals to declassify a board (elect all directors annually) are supported based on the belief that this increases the directors’ sense of accountability to shareholders. Proposals for cumulative voting generally are supported in order to promote management and board accountability and an opportunity for leadership change. Proposals designed to make director elections more meaningful, either by requiring a majority vote or by requiring any director receiving more withhold votes than affirmative votes to tender his or her resignation, generally are supported.
Shareholder rights — Proposals to repeal an existing poison pill generally are supported. (There may be certain circumstances, however, when a proxy voting committee of a fund or an investment division of the investment adviser believes that a company needs to maintain anti-takeover protection.) Proposals to eliminate the right of shareholders to act by written consent or to take away a shareholder’s right to call a special meeting typically are not supported.
Compensation and benefit plans — Option plans are complicated, and many factors are considered in evaluating a plan. Each plan is evaluated based on protecting shareholder interests and a knowledge of the company and its management. Considerations include the pricing (or repricing) of options awarded under the plan and the impact of dilution on existing shareholders from past and future equity awards. Compensation packages should be structured to attract, motivate and retain existing employees and qualified directors; however, they should not be excessive.
Routine matters — The ratification of auditors, procedural matters relating to the annual meeting and changes to company name are examples of items considered routine. Such items generally are voted in favor of management’s recommendations unless circumstances indicate otherwise.
Capital Group Private Client Services Funds — Page 46
Principal fund shareholders — The following table identifies those investors who own of record, or are known by the fund to own beneficially, 5% or more of any class of its shares as of the opening of business on December 1, 2021. Unless otherwise indicated, the ownership percentages below represent ownership of record rather than beneficial ownership.
| | | | |
Name and address | Fund | Ownership | Ownership percentage |
Capital Group Private Client Services Omnibus Account #1 Irvine, CA | Capital Group Core Municipal Fund | Record | 84.56% |
Capital Group Private Client Services Omnibus Account #2 Irvine, CA | Capital Group Core Municipal Fund | Record | 14.84 |
Capital Group Private Client Services Omnibus Account #3 Irvine, CA | Capital Group Short-Term Municipal Fund | Record | 90.52 |
Capital Group Private Client Services Omnibus Account #4 Irvine, CA | Capital Group Short-Term Municipal Fund | Record | 6.93 |
Capital Group Private Client Services Omnibus Account #5 Irvine, CA | Capital Group California Core Municipal Fund | Record | 82.66 |
Capital Group Private Client Services Omnibus Account #6 Irvine, CA | Capital Group California Core Municipal Fund | Record | 17.02 |
Capital Group Private Client Services Omnibus Account #7 Irvine, CA | Capital Group California Short-Term Municipal Fund | Record | 76.61 |
Capital Group Private Client Services Omnibus Account #8 Irvine, CA | Capital Group California Short-Term Municipal Fund | Record | 18.93 |
Capital Group Private Client Services Omnibus Account #9 Irvine, CA | Capital Group Core Bond Fund | Record | 83.02 |
Capital Group Private Client Services Omnibus Account #10 Irvine, CA | Capital Group Core Bond Fund | Record | 10.07 |
As of December 1, 2021, the officers and trustees of the fund, as a group, owned beneficially or of record less than 1% of the outstanding shares of the fund.
Capital Group Private Client Services Funds — Page 47
Investment adviser — Capital Research and Management Company, the fund’s investment adviser, founded in 1931, maintains research facilities in the United States and abroad (Beijing, Geneva, Hong Kong, London, Los Angeles, Mumbai, New York, San Francisco, Singapore, Tokyo and Washington, D.C.). These facilities are staffed with experienced investment professionals. The investment adviser is located at 333 South Hope Street, Los Angeles, CA 90071. It is a wholly owned subsidiary of The Capital Group Companies, Inc., a holding company for several investment management subsidiaries. Capital Research and Management Company manages equity assets through three equity investment divisions and fixed income assets through its fixed income investment division, Capital Fixed Income Investors. The three equity investment divisions — Capital World Investors, Capital Research Global Investors and Capital International Investors — make investment decisions independently of one another. Portfolio managers in Capital International Investors rely on a research team that also provides investment services to institutional clients and other accounts advised by affiliates of Capital Research and Management Company. The investment adviser, which is deemed under the Commodity Exchange Act (the “CEA”) to be the operator of the funds, has claimed an exclusion from the definition of the term commodity pool operator under the CEA with respect to the funds and, therefore, is not subject to registration or regulation as such under the CEA with respect to the funds.
The investment adviser has adopted policies and procedures that address issues that may arise as a result of an investment professional’s management of the fund and other funds and accounts. Potential issues could involve allocation of investment opportunities and trades among funds and accounts, use of information regarding the timing of fund trades, investment professional compensation and voting relating to portfolio securities. The investment adviser believes that its policies and procedures are reasonably designed to address these issues.
On July 1, 2019, the investment adviser of the funds changed from Capital Guardian Trust Company (“CGTC”) to Capital Research and Management Company (“CRMC”), an affiliate of CGTC. Accordingly, CRMC has assumed CGTC’s duties and obligations as investment adviser. Importantly, there has not been a change in the actual control or management of the fund’s investment adviser, and this change did not require shareholder approval.
Compensation of investment professionals — As described in the prospectus, the investment adviser uses a system of multiple portfolio managers in managing fund assets. In addition, a portion of a fund's portfolio may include the investment decisions of Capital Research and Management Company’s investment analysts. Notwithstanding this system, certain of the funds are currently managed by one portfolio manager.
Portfolio managers and investment analysts are paid competitive salaries by Capital Research and Management Company. In addition, they may receive bonuses based on their individual portfolio results. Investment professionals also may participate in profit-sharing plans. The relative mix of compensation represented by bonuses, salary and profit-sharing plans will vary depending on the individual’s portfolio results, contributions to the organization and other factors.
To encourage a long-term focus, bonuses based on investment results are calculated by comparing pretax total investment returns to relevant benchmarks over the most recent one-, three-, five- and eight-year periods, with increasing weight placed on each succeeding measurement period. For portfolio managers, benchmarks may include measures of the marketplaces in which the fund invests and measures of the results of comparable mutual funds. For investment analysts, benchmarks may include relevant market measures and appropriate industry or sector indexes reflecting their areas of expertise. Capital Research and Management Company makes periodic subjective assessments of analysts’ contributions to the investment process and this is an element of their overall compensation. The investment results of each of the fund’s portfolio managers may be measured against one or more benchmarks, depending on his or her investment focus, such as:
Capital Group Private Client Services Funds — Page 48
Capital Group Core Municipal Fund – Bloomberg Municipal Short-Intermediate 1-10 Years Index; and a custom average consisting of funds that disclose investment objectives and strategies comparable to those of the fund;
Capital Group Short-Term Municipal Fund – Bloomberg Municipal Short 1-5 Years Index; and a custom average consisting of funds that disclose investment objectives and strategies comparable to those of the fund;
Capital Group California Core Municipal Fund – Bloomberg California Short-Intermediate Municipal Index; and a custom average consisting of funds that disclose investment objectives and strategies comparable to those of the fund;
Capital Group California Short-Term Municipal Fund – Bloomberg California Short Municipal Index; and a custom average consisting of funds that disclose investment objectives and strategies comparable to those of the fund; and
Capital Group Core Bond Fund – Bloomberg Intermediate A+ U.S. Government/Credit Index; and a custom average consisting of funds that disclose investment objectives and strategies comparable to those of the fund.
From time to time, Capital Research and Management Company may adjust or customize these benchmarks to better reflect the universe of comparably managed funds of competitive investment management firms.
Portfolio manager fund holdings and other managed accounts — As described below, portfolio managers may personally own shares of the fund. In addition, portfolio managers may manage portions of other mutual funds or accounts advised by Capital Research and Management Company or its affiliates.
Capital Group Private Client Services Funds — Page 49
The following table reflects information as of October 31, 2021:
| | | | | | | | | |
Portfolio
manager | Dollar range
of fund shares
owned1 | Number
of other
registered
investment
companies (RICs)
for which
portfolio
manager
is a manager
(assets of RICs
in billions)2 | Number
of other
pooled
investment
vehicles (PIVs)
for which
portfolio
manager
is a manager
(assets of PIVs
in billions)2 | Number
of other
accounts
for which
portfolio
manager
is a manager
(assets of
other accounts
in billions) 2,3 |
Capital Group Core Municipal Fund |
Aaron Applebaum | $10,001 – $50,000 | 3 | $9.7 | None | 1 | $1.65 |
Mark Marinella | $10,001 – $50,000 | 6 | $13.8 | None | 473 | $4.62 |
Capital Group Short-Term Municipal Fund |
Aaron Applebaum | $100,001 – $500,000 | 3 | $10.3 | None | 1 | $1.65 |
Mark Marinella | $0 – $10,000 | 6 | $14.4 | None | 473 | $4.62 |
Capital Group California Core Municipal Fund |
Mark Marinella | $100,001 – $500,000 | 6 | $13.9 | None | 473 | $4.62 |
Capital Group California Short-Term Municipal Fund |
Mark Marinella | $0 – $10,000 | 6 | $14.4 | None | 473 | $4.62 |
Capital Group Core Bond Fund |
John R. Queen | $100,001 – $500,000 | 21 | $498.0 | 3 | $2.89 | 100 | $0.58 |
1 Ownership disclosure is made using the following ranges: None; $1 – $10,000; $10,001 – $50,000; $50,001 – $100,000; $100,001 – $500,000; $500,001 – $1,000,000; and Over $1,000,000.
2 Indicates other RIC(s), PIV(s) or other accounts managed by Capital Research and Management Company or its affiliates for which the portfolio manager also has significant day to day management responsibilities. Assets noted are the total net assets of the RIC(s) , PIV(s) or other accounts and are not the total assets managed by the individual, which is a substantially lower amount. No RIC, PIV or other account has an advisory fee that is based on the performance of the RIC, PIV or other account.
3 Personal brokerage accounts of portfolio managers and their families are not reflected.
The fund’s investment adviser has adopted policies and procedures to mitigate material conflicts of interest that may arise in connection with a portfolio manager’s management of the fund, on the one hand, and investments in the other pooled investment vehicles and other accounts, on the other hand, such as material conflicts relating to the allocation of investment opportunities that may be suitable for both the fund and such other accounts.
Capital Group Private Client Services Funds — Page 50
Investment Advisory and Service Agreement — The Investment Advisory and Service Agreement (the “Agreement”) between the series and the investment adviser will continue in effect until July 31, 2022, unless sooner terminated, and may be renewed from year to year thereafter, provided that any such renewal has been specifically approved at least annually by (a) the board of trustees, or by the vote of a majority (as defined in the 1940 Act) of the outstanding voting securities of the applicable fund in the series, and (b) the vote of a majority of trustees who are not parties to the Agreement or interested persons (as defined in the 1940 Act) of any such party, in accordance with applicable laws and regulations. The Agreement provides that the investment adviser has no liability to the series for its acts or omissions in the performance of its obligations to the series not involving willful misconduct, bad faith, gross negligence or reckless disregard of its obligations under the Agreement. The Agreement also provides that either party has the right to terminate it, without penalty, upon 60 days’ written notice to the other party, and that the Agreement automatically terminates in the event of its assignment (as defined in the 1940 Act). In addition, the Agreement provides that the investment adviser may delegate all, or a portion of, its investment management responsibilities to one or more subsidiary advisers approved by the series’ board, pursuant to an agreement between the investment adviser and such subsidiary. Any such subsidiary adviser will be paid solely by the investment adviser out of its fees.
In addition to providing investment advisory services, the investment adviser furnishes the services and pays the compensation and travel expenses of persons to perform the series’ executive, administrative, clerical and bookkeeping functions, and provides suitable office space, necessary small office equipment and utilities, supplies and postage used at the series’ offices.
The series will pay all expenses not assumed by the investment adviser, including, but not limited to: custodian, stock transfer and dividend disbursing fees and expenses; shareholder recordkeeping and administrative expenses; costs of the designing, printing and mailing of reports, prospectuses, proxy statements and notices to shareholders; taxes; expenses of the issuance and redemption of fund shares (including registration and qualification fees and expenses); legal, accounting and auditing expenses; compensation, fees and expenses paid to independent trustees (including legal counsel fees); association dues; costs of stationery and forms prepared exclusively for the funds; and costs of assembling and storing shareholder account data.
The investment adviser is currently reimbursing a portion of the expenses for Capital Group Short-Term Municipal Fund. This reimbursement will be in effect through at least January 1, 2023. The adviser may elect at its discretion to extend, modify or terminate the reimbursements at that time. For the fiscal years ended October 31, 2021, 2020 and 2019, the total expenses reimbursed by the investment adviser were as follows:
| | | |
Capital Group Short-Term Municipal Fund | 2021 2020
2019 | $11,000 36,000 67,000 |
Capital Group Private Client Services Funds — Page 51
Under the Agreement, the investment adviser receives a management fee based on the following annualized rates:
| | |
Fund | Rate |
Capital Group Core Municipal Fund | 0.250% |
Capital Group Short-Term Municipal Fund | 0.250 |
Capital Group California Core Municipal Fund | 0.250 |
Capital Group California Short-Term Municipal Fund | 0.250 |
Capital Group Core Bond Fund | 0.250 |
Management fees are paid monthly and accrued daily based on the average net assets of each fund.
For the fiscal years ended October 31, 2021, 2020 and 2018, the investment adviser earned from the funds the following management fees:
| | | |
Capital Group Core Municipal Fund | 2021 | $1,808,000 |
| | 2020 | 1,534,000 |
| | 2018 | 1,331,000 |
Capital Group Short Term Municipal Fund | 2021 | 501,000 |
| | 2020 | 425,000 |
| | 2018 | 334,000 |
Capital Group California Core Municipal Fund | 2021 | 1,597,000 |
| | 2020 | 1,479,000 |
| | 2018 | 1,267,000 |
Capital Group California Short-Term Municipal Fund | 2021 | 475,000 |
| | 2020 | 425,000 |
| | 2018 | 384,000 |
Capital Group Core Bond Fund | 2021 | 1,502,000 |
| | 2020 | 1,300,000 |
| | 2018 | 1,167,000 |
Principal Underwriter — American Funds Distributors, Inc. (the “Principal Underwriter”) is the principal underwriter of each fund’s shares. The Principal Underwriter is located at 333 South Hope Street, Los Angeles, CA 90071; 6455 Irvine Center Drive, Irvine, CA 92618; 3500 Wiseman Boulevard, San Antonio, TX 78251; and 12811 North Meridian Street, Carmel, IN 46032.
The Principal Underwriter does not receive any compensation related to the sale of shares of the fund.
Capital Group Private Client Services Funds — Page 52
Execution of portfolio transactions
The investment adviser places orders with broker-dealers for the fund’s portfolio transactions. Purchases and sales of equity securities on a securities exchange or an over-the-counter market are effected through broker-dealers who receive commissions for their services. Generally, commissions relating to securities traded on foreign exchanges will be higher than commissions relating to securities traded on U.S. exchanges and may not be subject to negotiation. Equity securities may also be purchased from underwriters at prices that include underwriting fees. Purchases and sales of fixed income securities are generally made with an issuer or a primary market maker acting as principal with no stated brokerage commission. The price paid to an underwriter for fixed income securities includes underwriting fees. Prices for fixed income securities in secondary trades usually include undisclosed compensation to the market maker reflecting the spread between the bid and ask prices for the securities.
In selecting broker-dealers, the investment adviser strives to obtain “best execution” (the most favorable total price reasonably attainable under the circumstances) for the fund’s portfolio transactions, taking into account a variety of factors. These factors include the size and type of transaction, the nature and character of the markets for the security to be purchased or sold, the cost, quality, likely speed and reliability of execution and settlement, the broker-dealer’s or execution venue’s ability to offer liquidity and anonymity and the trade-off between market impact and opportunity costs. The investment adviser considers these factors, which involve qualitative judgments, when selecting broker-dealers and execution venues for fund portfolio transactions. The investment adviser views best execution as a process that should be evaluated over time as part of an overall relationship with particular broker-dealer firms. The investment adviser and its affiliates negotiate commission rates with broker-dealers based on what they believe is reasonably necessary to obtain best execution. They seek, on an ongoing basis, to determine what the reasonable levels of commission rates for execution services are in the marketplace, taking various considerations into account, including the extent to which a broker-dealer has put its own capital at risk, historical commission rates and commission rates that other institutional investors are paying. The fund does not consider the investment adviser as having an obligation to obtain the lowest commission rate available for a portfolio transaction to the exclusion of price, service and qualitative considerations. Brokerage commissions are only a small part of total execution costs and other factors, such as market impact and speed of execution, contribute significantly to overall transaction costs.
The investment adviser may execute portfolio transactions with broker-dealers who provide certain brokerage and/or investment research services to it but only when in the investment adviser’s judgment the broker-dealer is capable of providing best execution for that transaction. The investment adviser makes decisions for procurement of research separately and distinctly from decisions on the choice of brokerage and execution services. The receipt of these research services permits the investment adviser to supplement its own research and analysis and makes available the views of, and information from, individuals and the research staffs of other firms. Such views and information may be provided in the form of written reports, telephone contacts and meetings with securities analysts. These services may include, among other things, reports and other communications with respect to individual companies, industries, countries and regions, economic, political and legal developments, as well as scheduling meetings with corporate executives and seminars and conferences related to relevant subject matters. Research services that the investment adviser receives from broker-dealers may be used by the investment adviser in servicing the fund and other funds and accounts that it advises; however, not all such services will necessarily benefit the fund.
The investment adviser bears the cost of all third-party investment research services for all client accounts it advises. However, in order to compensate certain U.S. broker-dealers for research consumed, and valued, by the investment adviser’s investment professionals, the investment adviser continues to operate a limited commission sharing arrangement with commissions on equity trades for certain registered investment companies it advises. The investment adviser voluntarily reimburses such
Capital Group Private Client Services Funds — Page 53
registered investment companies for all amounts collected into the commission sharing arrangement. In order to operate the commission sharing arrangement, the investment adviser may cause such registered investment companies to pay commissions in excess of what other broker-dealers might have charged for certain portfolio transactions in recognition of brokerage and/or investment research services. In this regard, the investment adviser has adopted a brokerage allocation procedure consistent with the requirements of Section 28(e) of the U.S. Securities Exchange Act of 1934. Section 28(e) permits the investment adviser and its affiliates to cause an account to pay a higher commission to a broker-dealer to compensate the broker-dealer or another service provider for certain brokerage and/or investment research services provided to the investment adviser and its affiliates, if the investment adviser and each affiliate makes a good faith determination that such commissions are reasonable in relation to the value of the services provided by such broker-dealer to the investment adviser and its affiliates in terms of that particular transaction or the investment adviser’s overall responsibility to the fund and other accounts that it advises. Certain brokerage and/or investment research services may not necessarily benefit all accounts paying commissions to each such broker-dealer; therefore, the investment adviser and its affiliates assess the reasonableness of commissions in light of the total brokerage and investment research services provided to the investment adviser and its affiliates. Further, investment research services may be used by all investment associates of the investment adviser and its affiliates, regardless of whether they advise accounts with trading activity that generates eligible commissions.
In accordance with their internal brokerage allocation procedure, the investment adviser and its affiliates periodically assess the brokerage and investment research services provided by each broker-dealer and each other service provider from which they receive such services. As part of its ongoing relationships, the investment adviser and its affiliates routinely meet with firms to discuss the level and quality of the brokerage and research services provided, as well as the value and cost of such services. In valuing the brokerage and investment research services the investment adviser and its affiliates receive from broker-dealers and other research providers in connection with its good faith determination of reasonableness, the investment adviser and its affiliates take various factors into consideration, including the quantity, quality and usefulness of the services to the investment adviser and its affiliates. Based on this information and applying their judgment, the investment adviser and its affiliates set an annual research budget.
Research analysts and portfolio managers periodically participate in a research poll to determine the usefulness and value of the research provided by individual broker-dealers and research providers. Based on the results of this research poll, the investment adviser and its affiliates may, through commission sharing arrangements with certain broker-dealers, direct a portion of commissions paid to a broker-dealer by the fund and other registered investment companies managed by the investment adviser or its affiliates to be used to compensate the broker-dealer and/or other research providers for research services they provide. While the investment adviser and its affiliates may negotiate commission rates and enter into commission sharing arrangements with certain broker-dealers with the expectation that such broker-dealers will be providing brokerage and research services, none of the investment adviser, any of its affiliates or any of their clients incurs any obligation to any broker-dealer to pay for research by generating trading commissions. The investment adviser and its affiliates negotiate prices for certain research that may be paid through commission sharing arrangements or by themselves with cash.
When executing portfolio transactions in the same equity security for the funds and accounts, or portions of funds and accounts, over which the investment adviser, through its equity investment divisions, has investment discretion, each investment division within the adviser and its affiliates normally aggregates its respective purchases or sales and executes them as part of the same transaction or series of transactions. When executing portfolio transactions in the same fixed income security for the fund and the other funds or accounts over which it or one of its affiliated companies has investment discretion, the investment adviser normally aggregates such purchases or sales and executes them as part of the same transaction or series of transactions. The objective of aggregating
Capital Group Private Client Services Funds — Page 54
purchases and sales of a security is to allocate executions in an equitable manner among the funds and other accounts that have concurrently authorized a transaction in such security. The investment adviser and its affiliates serve as investment adviser for certain accounts that are designed to be substantially similar to another account. This type of account will often generate a large number of relatively small trades when it is rebalanced to its reference fund due to differing cash flows or when the account is initially started up. The investment adviser may not aggregate program trades or electronic list trades executed as part of this process. Non-aggregated trades performed for these accounts will be allocated entirely to that account. This is done only when the investment adviser believes doing so will not have a material impact on the price or quality of other transactions.
The investment adviser currently owns an interest in IEX Group and Luminex Trading and Analytics. The investment adviser may place orders on these or other exchanges or alternative trading systems in which it, or one of its affiliates, has an ownership interest, provided such ownership interest is less than five percent of the total ownership interests in the entity. The investment adviser is subject to the same best execution obligations when trading on any such exchange or alternative trading system.
Purchase and sale transactions may be effected directly among and between certain funds or accounts advised by the investment adviser or its affiliates, including the fund. The investment adviser maintains cross-trade policies and procedures and places a cross-trade only when such a trade is in the best interest of all participating clients and is not prohibited by the participating funds’ or accounts’ investment management agreement or applicable law.
The investment adviser may place orders for the fund’s portfolio transactions with broker-dealers who have sold shares of the funds managed by the investment adviser or its affiliated companies; however, it does not consider whether a broker-dealer has sold shares of the funds managed by the investment adviser or its affiliated companies when placing any such orders for the fund’s portfolio transactions.
Purchases and sales of futures contracts for the fund will be effected through executing brokers and FCMs that specialize in the types of futures contracts that the fund expects to hold. The investment adviser will use reasonable efforts to choose executing brokers and FCMs capable of providing the services necessary to obtain the most favorable price and execution available. The full range and quality of services available will be considered in making these determinations. The investment adviser will monitor the executing brokers and FCMs used for purchases and sales of futures contracts for their ability to execute trades based on many factors, such as the sizes of the orders, the difficulty of executions, the operational facilities of the firm involved and other factors.
Forward currency contracts are traded directly between currency traders (usually large commercial banks) and their customers. The cost to the fund of engaging in such contracts varies with factors such as the currency involved, the length of the contract period and the market conditions then prevailing. Because such contracts are entered into on a principal basis, their prices usually include undisclosed compensation to the market maker reflecting the spread between the bid and ask prices for the contracts. The fund may incur additional fees in connection with the purchase or sale of certain contracts.
No brokerage commissions were paid by the fund on portfolio transactions for the fiscal years ended October 31, 2021, 2020 and 2019.
The series is required to disclose information regarding investments in the securities of its “regular” broker-dealers (or parent companies of its regular broker-dealers) that derive more than 15% of their revenue from broker-dealer, underwriter or investment adviser activities. A regular broker-dealer is (a) one of the 10 broker-dealers that received from the series the largest amount of brokerage commissions by participating, directly or indirectly, in the series’ portfolio transactions during the series’ most recently completed fiscal year; (b) one of the 10 broker-dealers that engaged as principal
Capital Group Private Client Services Funds — Page 55
in the largest dollar amount of portfolio transactions of the series during the series’ most recently completed fiscal year; or (c) one of the 10 broker-dealers that sold the largest amount of securities of the series during the series’ most recently completed fiscal year. At the end of the trust’s most recently completed fiscal year, the trust’s regular broker-dealers included Citigroup, Inc., Credit Suisse Group AG, Goldman Sachs Group, Inc., J.P. Morgan Securities LLC, Morgan Stanley & Co. LLC and Wells Fargo Securities, LLC. At the end of the series’ most recently completed fiscal year, the following funds held debt or equity securities of an affiliated company of such regular broker-dealers:
| | | | |
| | Affiliated company of regular broker-dealer | Type of
security | Amount |
Capital Group Core Bond Fund | Citigroup, Inc. | Debt | $ 2,255,000 |
Credit Suisse Group AG | Debt | 524,000 |
Goldman Sachs Group, Inc. | Debt | 6,486,000 |
J.P. Morgan Securities LLC | Debt | 4,070,000 |
Morgan Stanley & Co. LLC | Debt | 5,457,000 |
Wells Fargo Securities, LLC | Debt | 1,736,000 |
Capital Group Private Client Services Funds — Page 56
Disclosure of portfolio holdings
The fund’s investment adviser, on behalf of the fund, has adopted policies and procedures with respect to the disclosure of information about fund portfolio securities. These policies and procedures have been reviewed by the fund’s board of trustees and compliance will be periodically assessed by the board in connection with reporting from the fund’s Chief Compliance Officer.
Under these policies and procedures, each fund's complete list of portfolio holdings available for public disclosure, dated as of the end of each calendar quarter, is permitted to be posted on the funds’ website (capitalgrouppcsfunds.com) no earlier than the 10th day after such calendar quarter. The publicly disclosed portfolio may exclude certain securities when deemed to be in the best interest of the fund as permitted by applicable regulations. In addition, each fund’s list of top ten portfolio holdings measured by percentage of net assets invested, dated as of the end of each calendar month, is permitted to be posted on the funds’ website no earlier than the 10th day after such month. Such portfolio holdings information may then be disclosed to any person pursuant to an ongoing arrangement to disclose portfolio holdings information to such person no earlier than one day after the day on which the information is posted on the funds’ website.
Certain intermediaries are provided additional information about the fund’s management team, including information on the fund’s portfolio securities they have selected. This information is provided to larger intermediaries that require the information to make the fund available for investment on the firm’s platform. Intermediaries receiving the information are required to keep it confidential and use it only to analyze the fund.
The fund’s custodian, outside counsel, auditor, financial printers, proxy voting service providers, pricing information vendors, consultants or agents operating under a contract with the investment adviser or its affiliates and co-litigants (such as in connection with a bankruptcy proceeding related to a fund holding), each of which requires portfolio holdings information for legitimate business and fund oversight purposes, may receive fund portfolio holdings information earlier. See the “General information” section in this statement of additional information for further information about the fund’s custodian, outside counsel and auditor.
Affiliated persons of the fund, including officers of the fund and employees of the investment adviser and its affiliates, who receive portfolio holdings information are subject to restrictions and limitations on the use and handling of such information pursuant to applicable codes of ethics, including requirements not to trade in securities based on confidential and proprietary investment information, to maintain the confidentiality of such information, and to pre-clear securities trades and report securities transactions activity, as applicable. For more information on these restrictions and limitations, please see the “Code of ethics” section in this statement of additional information and the Code of Ethics. Third-party service providers of the fund, and other entities as described in this statement of additional information, receiving such information are subject to confidentiality obligations and obligations that would prohibit them from trading in securities based on such information. When portfolio holdings information is disclosed other than through the funds’ website to persons not affiliated with the fund (which, as described above, would typically occur no earlier than one day after the day on which the information is made available), such persons will be bound by agreements (including confidentiality agreements) or fiduciary or other obligations that restrict and limit their use of the information to legitimate business uses only. None of the fund nor its investment adviser or any of their affiliates receives compensation or other consideration in connection with the disclosure of information about portfolio securities.
Subject to board policies, the authority to disclose a fund's portfolio holdings, and to establish policies with respect to such disclosure, resides with the investment adviser. In exercising its authority, the investment adviser determines whether disclosure of information about a fund's portfolio securities is
Capital Group Private Client Services Funds — Page 57
appropriate and in the best interest of fund shareholders. The investment adviser has implemented policies and procedures to address conflicts of interest that may arise from the disclosure of fund holdings. For example, the investment adviser’s code of ethics specifically requires, among other things, the safeguarding of information about fund holdings and contains prohibitions designed to prevent the personal use of confidential, proprietary investment information in a way that would conflict with fund transactions. In addition, the investment adviser believes that its current policy of not selling portfolio holdings information and not disclosing such information to unaffiliated third parties until such holdings have been made public on the funds’ website (other than to certain service providers of the fund for legitimate business and fund oversight purposes) helps reduce potential conflicts of interest between fund shareholders and the investment adviser and its affiliates.
The fund’s investment adviser and its affiliates provide investment advice to clients other than the funds that have investment objectives that may be substantially similar to those of the funds. These clients also may have portfolios consisting of holdings substantially similar to those of a fund and generally have access to current portfolio holdings information for their accounts. These clients do not owe the fund’s investment adviser or a fund a duty of confidentiality with respect to disclosure of their portfolio holdings.
Capital Group Private Client Services Funds — Page 58
Price of shares
Shares are purchased at the offering price or sold at the net asset value price next determined after the purchase or sell order is received by the series or the Transfer Agent provided that your request contains all information and legal documentation necessary to process the transaction. The Transfer Agent may accept written orders for the sale of fund shares on a future date. These orders are subject to the Transfer Agent’s policies, which generally allow shareholders to provide a written request to sell shares at the net asset value on a specified date no more than five business days after receipt of the order by the Transfer Agent. Any request to sell shares on a future date will be rejected if the request is not in writing, if the requested transaction date is more than five business days after the Transfer Agent receives the request or if the request does not contain all information and legal documentation necessary to process the transaction.
The offering or net asset value price is effective for orders received prior to the time of determination of the net asset value and, in the case of orders placed with dealers or their authorized designees, accepted by the Principal Underwriter, the Transfer Agent, a dealer or any of their designees. In the case of orders sent directly to the fund or the Transfer Agent, an investment dealer should be indicated. The dealer is responsible for promptly transmitting purchase and sell orders to the Principal Underwriter.
Prices listed do not always indicate prices at which you will be purchasing and redeeming shares of the fund, since such prices generally reflect the previous day’s closing price, while purchases and redemptions are made at the next calculated price. The price you pay for shares, the offering price, is based on the net asset value per share, which is calculated once daily as of the close of regular trading on the New York Stock Exchange, normally 4 p.m. New York time, each day the New York Stock Exchange is open. If the New York Stock Exchange makes a scheduled (e.g. the day after Thanksgiving) or an unscheduled close prior to 4 p.m. New York time, the net asset value of the fund will be determined at approximately the time the New York Stock Exchange closes on that day. If on such a day market quotations and prices from third-party pricing services are not based as of the time of the early close of the New York Stock Exchange but are as of a later time (up to approximately 4 p.m. New York time), for example because the market remains open after the close of the New York Stock Exchange, those later market quotations and prices will be used in determining the fund’s net asset value.
Orders in good order received after the New York Stock Exchange closes (scheduled or unscheduled) will be processed at the net asset value (plus any applicable sales charge) calculated on the following business day. The New York Stock Exchange is currently closed on weekends and on the following holidays: New Year’s Day; Martin Luther King Jr. Day; Presidents’ Day; Good Friday; Memorial Day; Juneteenth National Independence Day; Independence Day; Labor Day; Thanksgiving Day; and Christmas Day. Each fund has a separately calculated net asset value (and share price).
Orders received by the investment dealer or authorized designee, the Transfer Agent or the series after the time of the determination of the net asset value will be entered at the next calculated offering price. Note that investment dealers, other intermediaries or Capital Group Private Client Services investment counselors may have their own rules about share transactions and may have earlier cut-off times than those of the series. For more information about how to purchase through your intermediary, contact your intermediary directly. For more information about how to purchase through Capital Group Private Client Services investment counselors, contact your Capital Group Private Client Services investment counselor directly.
All portfolio securities of funds managed by Capital Research and Management Company (other than American Funds U.S. Government Money Market Fund) are valued, and the net asset values per share
Capital Group Private Client Services Funds — Page 59
are determined, as indicated below. The fund follows standard industry practice by typically reflecting changes in its holdings of portfolio securities on the first business day following a portfolio trade.
Equity securities, including depositary receipts, are generally valued at the official closing price of, or the last reported sale price on, the exchange or market on which such securities are traded, as of the close of business on the day the securities are being valued or, lacking any sales, at the last available bid price. Prices for each security are taken from the principal exchange or market on which the security trades.
Fixed income securities, including short-term securities, are generally valued at prices obtained from one or more pricing vendors. The pricing vendors base prices on, among other things, benchmark yields, transactions, bids, offers, quotations from dealers and trading systems, new issues, underlying equity of the issuer, interest rate volatilities, spreads and other relationships observed in the markets among comparable securities and proprietary pricing models such as yield measures calculated using factors such as cash flows, prepayment information, default rates, delinquency and loss assumptions, financial or collateral characteristics or performance, credit enhancements, liquidation value calculations, specific deal information and other reference data. The fund’s investment adviser performs certain checks on vendor prices prior to calculation of the fund’s net asset value. When the investment adviser deems it appropriate to do so (such as when vendor prices are unavailable or not deemed to be representative), fixed income securities will be valued in good faith at the mean quoted bid and asked prices that are reasonably and timely available (or bid prices, if asked prices are not available) or at prices for securities of comparable maturity, quality and type.
Securities with both fixed income and equity characteristics (e.g., convertible bonds, preferred stocks, units comprised of more than one type of security, etc.), or equity securities traded principally among fixed income dealers, are generally valued in the manner described above for either equity or fixed income securities, depending on which method is deemed most appropriate by the investment adviser.
Forward currency contracts are valued at the mean of representative quoted bid and asked prices, generally based on prices supplied by one or more pricing vendors.
Futures contracts are generally valued at the official settlement price of, or the last reported sale price on, the principal exchange or market on which such instruments are traded, as of the close of business on the day the contracts are being valued or, lacking any sales, at the last available bid price.
Swaps, including both interest rate swaps and positions in credit default swap indices, are valued using market quotations or valuations provided by one or more pricing vendors.
Assets or liabilities initially expressed in terms of currencies other than U.S. dollars are translated prior to the next determination of the net asset value of the fund’s shares into U.S. dollars at the prevailing market rates.
Securities and other assets for which representative market quotations are not readily available or are considered unreliable by the investment adviser are fair-valued as determined in good faith under fair value guidelines adopted by authority of the series’ board. Subject to board oversight, the series’ board has appointed the fund’s investment adviser to make fair valuation determinations, which are directed by a valuation committee established by the fund’s investment adviser. The board receives regular reports describing fair-valued securities and the valuation methods used.
The valuation committee has adopted guidelines and procedures (consistent with SEC rules and guidance) to consider certain relevant principles and factors when making fair value determinations. As a general principle, securities lacking readily available market quotations, or that have quotations
Capital Group Private Client Services Funds — Page 60
that are considered unreliable by the investment adviser, are valued in good faith by the valuation committee based upon what the fund might reasonably expect to receive upon their current sale. Fair valuations and valuations of investments that are not actively trading involve judgment and may differ materially from valuations that would have been used had greater market activity occurred. The valuation committee considers relevant indications of value that are reasonably and timely available to it in determining the fair value to be assigned to a particular security, such as the type and cost of the security, contractual or legal restrictions on resale of the security, relevant financial or business developments of the issuer, actively traded similar or related securities, conversion or exchange rights on the security, related corporate actions, significant events occurring after the close of trading in the security and changes in overall market conditions. The valuation committee employs additional fair value procedures to address issues related to equity securities that trade principally in markets outside the United States. Such securities may trade in markets that open and close at different times, reflecting time zone differences. If significant events occur after the close of a market (and before the fund’s net asset values are next determined) which affect the value of equity securities held in the fund’s portfolio, appropriate adjustments from closing market prices may be made to reflect these events. Events of this type could include, for example, earthquakes and other natural disasters or significant price changes in other markets (e.g., U.S. stock markets).
Capital Group Private Client Services Funds — Page 61
Taxes and distributions
Disclaimer: Some of the following information may not apply to certain shareholders including those holding fund shares in a tax-deferred account, such as a retirement plan. Shareholders should consult their tax advisers about the application of federal, state and local tax law in light of their particular situation.
Taxation as a regulated investment company — The fund intends to qualify each year as a “regulated investment company” under Subchapter M of the Internal Revenue Code (“Code”) so that it will not be liable for federal tax on income and capital gains distributed to shareholders. In order to qualify as regulated investment companies, and avoid being subject to federal income taxes, the fund intends to distribute substantially all of its net investment income and realized net capital gains on a fiscal year basis, and intend to comply with other tests applicable to regulated investment companies under Subchapter M.
The Code includes savings provisions allowing the fund to cure inadvertent failures certain qualification tests required under Subchapter M. However, should the fund fail to qualify under Subchapter M, the fund would be subject to federal, and possibly state, corporate taxes on its taxable income and gains.
Amounts not distributed by the fund on a timely basis in accordance with the calendar year distribution requirement may be subject to a nondeductible 4% excise tax. Unless an applicable exception applies, to avoid the tax, the fund must distribute during each calendar year an amount equal to the sum of (a) at least 98% of its ordinary income (not taking into account any capital gains or losses) for the calendar year, (b) at least 98.2% of its capital gains in excess of its capital losses for the twelve-month period ending on October 31, and (c) all ordinary income and capital gains for previous years that were not distributed during such years and on which the fund paid no U.S. federal income tax.
Dividends paid by the fund from ordinary income or from an excess of net short-term capital gain over net long-term capital loss are taxable to shareholders as ordinary income dividends. Shareholders of the fund that are individuals and meet certain holding period requirements with respect to their fund shares may be eligible for reduced tax rates on “qualified dividend income,” if any, distributed by the fund to such shareholders.
The fund may declare a capital gain distribution consisting of the entire excess of net realized long-term capital gains over net realized short-term capital losses. Net capital gains for a fiscal year are computed by taking into account any capital loss carryforward of the fund.
The fund may retain a portion of net capital gain for reinvestment and may elect to treat such capital gain as having been distributed to shareholders of the fund. Shareholders may receive a credit for the tax that the fund paid on such undistributed net capital gain and could increase the basis of their shares of the fund by the difference between the amount of includible gains and the tax deemed paid by the shareholder.
Distributions of net capital gain that the fund properly reports as a capital gain dividend generally will be taxable as long-term capital gain, regardless of the length of time the shares of the fund have been held by a shareholder. Any loss realized upon the redemption of shares held at the time of redemption for six months or less from the date of their purchase will be treated as a long-term capital loss to the extent of any net realized long-term capital gains (including any undistributed amounts treated as distributed capital gains, as described above) during such six-month period.
Capital Group Private Client Services Funds — Page 62
Distributions by the fund result in a reduction in the net asset value of the fund’s shares. Investors should consider the tax implications of buying shares just prior to a distribution. The price of shares purchased at that time includes the amount of the forthcoming distribution. Those purchasing just prior to a distribution will subsequently receive a partial return of their investment capital upon payment of the distribution, which will be taxable to them.
Certain distributions reported by the fund as Section 163(j) interest dividends may be treated as interest income by shareholders for purposes of the tax rules applicable to interest expense limitations under Section 163(j) of the Code. Such treatment by the shareholder is generally subject to holding period requirements and other potential limitations, although the holding period requirements are generally not applicable to dividends declared by money market funds and certain other funds that declare dividends daily and pay such dividends on a monthly or more frequent basis. The amount that the fund is eligible to report as a Section 163(j) dividend for a tax year is generally limited to the excess of the fund’s business interest income over the sum of the fund’s (i) business interest expense and (ii) other deductions properly allocable to the fund’s business interest income.
Individuals (and certain other non-corporate entities) are generally eligible for a 20% deduction with respect to taxable ordinary REIT dividends. Applicable Treasury regulations allow the fund to pass through to its shareholders such taxable ordinary REIT dividends. Accordingly, individual (and certain other non-corporate) shareholders of the fund that have received such taxable ordinary REIT dividends may be able to take advantage of this 20% deduction with respect to any such amounts passed through.
Redemptions and exchanges of fund shares — Redemptions of shares, including exchanges for shares of other Capital Group Private Client Services Funds, may result in federal, state and local tax consequences (gain or loss) to the shareholder.
Any loss realized on a redemption or exchange of shares of the fund will be disallowed to the extent substantially identical shares are reacquired within the 61-day period beginning 30 days before and ending 30 days after the shares are disposed of. Any loss disallowed under this rule will be added to the shareholder’s tax basis in the new shares purchased.
Tax consequences applicable to tax-exempt funds — Interest on the municipal securities purchased by the Municipal Bond Funds is believed to be free from regular federal income tax based on opinions issued by bond counsel. However, there is no guarantee that the opinion is correct or that the IRS will agree with the opinion. If interest on a municipal security is not free from regular federal income tax, then the interest on that security would become taxable. If this were to happen, dividends derived from this interest may be taxable to shareholders.
By meeting certain requirements of the Code, the Municipal Bond Funds qualify to pay exempt-interest dividends to shareholders. These exempt-interest dividends are derived from interest income exempt from regular federal income tax, and are not subject to regular federal income tax when they are distributed to fund shareholders. In addition, to the extent that exempt-interest dividends are derived from interest on obligations of a state or its political subdivisions, or from interest on qualifying U.S. territorial obligations (including qualifying obligations of Puerto Rico, the U.S. Virgin Islands or Guam), they also may be exempt from that state's personal income taxes.
Distributions paid by a tax-exempt fund that are designated as exempt-interest dividends will not be subject to regular federal income tax. Exempt-interest dividends paid by the fund will be reported to both the IRS and shareholders of the fund.
Private activity bonds are bonds that, although federally tax-exempt, are used for purposes other than those generally performed by governmental units and that benefit non-governmental entities. Interest
Capital Group Private Client Services Funds — Page 63
on certain private activity bonds, while exempt from regular federal income tax, is a preference item for taxpayers when determining their alternative minimum tax under the Code and under the income tax provisions of several states.
The price of a bond purchased after its original issuance may reflect market discount which, depending on the particular circumstances, may result in the fund recognizing taxable ordinary income. In determining whether a bond is purchased with market discount, certain de minimis rules apply.
Tax consequences of investing in non-U.S. securities — Dividend and interest income received by a fund from sources outside the United States may be subject to withholding and other taxes imposed by such foreign jurisdictions. Tax conventions between certain countries and the United States, however, may reduce or eliminate these foreign taxes. Some foreign countries impose taxes on capital gains with respect to investments by foreign investors.
If more than 50% of the value of the total assets of the fund at the close of the taxable year consists of securities of foreign corporations, the fund may elect to pass through to shareholders the foreign taxes paid by the fund. If such an election is made, shareholders may claim a credit or deduction on their federal income tax returns for, and will be required to treat as part of the amounts distributed to them, their pro rata portion of qualified taxes paid by the fund to foreign countries. The application of the foreign tax credit depends upon the particular circumstances of each shareholder.
Foreign currency gains and losses, including the portion of gain or loss on the sale of debt securities attributable to fluctuations in foreign exchange rates, are generally taxable as ordinary income or loss. These gains or losses may increase or decrease the amount of dividends payable by the fund to shareholders. A fund may elect to treat gain and loss on certain foreign currency contracts as capital gain and loss instead of ordinary income or loss.
If the fund invests in stock of certain passive foreign investment companies (PFICs), the fund intends to mark-to-market these securities and recognize any gains at the end of its fiscal and excise tax years. Deductions for losses are allowable only to the extent of any previously recognized gains. Both gains and losses will be treated as ordinary income or loss, and the fund is required to distribute any resulting income. If the fund is unable to identify an investment as a PFIC security and thus does not make a timely mark-to-market election, the fund may be subject to adverse tax consequences.
Other tax considerations — After the end of each calendar year, individual shareholders holding fund shares in taxable accounts will receive a statement of the federal income tax status of all distributions. Shareholders of the fund also may be subject to state and local taxes on distributions received from the fund.
For fund shares acquired on or after January 1, 2012, the fund is required to report cost basis information for redemptions, including exchanges, to both shareholders and the IRS.
Under the backup withholding provisions of the Code, the fund generally will be required to withhold federal income tax on all payments made to a shareholder if the shareholder either does not furnish the fund with the shareholder’s correct taxpayer identification number or fails to certify that the shareholder is not subject to backup withholding. Backup withholding also applies if the IRS notifies the shareholder or the fund that the taxpayer identification number provided by the shareholder is incorrect or that the shareholder has previously failed to properly report interest or dividend income.
The foregoing discussion of U.S. federal income tax law relates solely to the application of that law to U.S. persons (i.e., U.S. citizens and legal residents and U.S. corporations, partnerships, trusts and estates). Each shareholder who is not a U.S. person should consider the U.S. and foreign tax
Capital Group Private Client Services Funds — Page 64
consequences of ownership of shares of the fund, including the possibility that such a shareholder may be subject to U.S. withholding taxes.
Tax consequences of investing in derivatives — The fund may enter into transactions involving derivatives, such as futures, swaps and forward contracts. Special tax rules may apply to these types of transactions that could defer losses to the fund, accelerate the fund’s income, alter the holding period of certain securities or change the classification of capital gains. These tax rules may therefore impact the amount, timing and character of fund distributions.
Capital Group Private Client Services Funds — Page 65
Purchase and exchange of shares
Shares of the fund are available to clients of Capital Group Private Client Services, Inc. ("CGPCS"), the series’ trustees and officers, and the fund’s portfolio managers. Shares may be made available to other individuals if the investment adviser determines it is appropriate. Clients of CGPCS may exchange the shares of the fund for those of any other fund(s) managed by Capital Research and Management Company or its affiliates. As described in the fund’s prospectus, please contact your CGPCS investment counselor or the fund’s Transfer Agent to purchase or exchange shares.
Capital Group Private Client Services Funds — Page 66
Selling shares
The methods for selling (redeeming) shares are described more fully in the prospectus. If you wish to sell your shares, please contact your Capital Group Private Client Services investment counselor or the fund’s Transfer Agent.
A signature guarantee may be required for certain redemptions. In such an event, your signature may be guaranteed by a domestic stock exchange or the Financial Industry Regulatory Authority, bank, savings association or credit union that is an eligible guarantor institution. The Transfer Agent reserves the right to require a signature guarantee on any redemptions.
Additional documentation may be required for sales of shares held in corporate, partnership or fiduciary accounts.
Redemption proceeds will not be mailed until sufficient time has passed to provide reasonable assurance that checks or drafts (including certified or cashier’s checks) for shares purchased have cleared (normally seven business days from the purchase date). Except for delays relating to clearance of checks for share purchases or in extraordinary circumstances (and as permissible under the 1940 Act), the fund typically expects to pay redemption proceeds one business day following receipt and acceptance of a redemption order. Interest will not accrue or be paid on amounts that represent uncashed distribution or redemption checks.
Redemption of shares — The series’ declaration of trust permits the series to direct the Transfer Agent to redeem the shares of any shareholder for their then current net asset value per share if at such time the shareholder of record owns shares having an aggregate net asset value of less than the minimum initial investment amount required of new shareholders as set forth in the trust’s current registration statement under the 1940 Act, and subject to such further terms and conditions as the board of trustees of the series may from time to time adopt.
While payment of redemptions normally will be in cash, the series’ declaration of trust permits payment of the redemption price wholly or partly with portfolio securities or other fund assets under conditions and circumstances determined by the series’ board of trustees. For example, redemptions could be made in this manner if the board determined that making payments wholly in cash over a particular period would be unfair and/or harmful to other fund shareholders.
Frequent trading of fund shares — As noted in the prospectus, certain redemptions may trigger a restriction under the fund’s “frequent trading policy.” Under this policy, systematic redemptions will not trigger a restriction and systematic purchases will not be prevented if the transaction is identified as a systematic redemption or purchase. For purposes of this policy, systematic redemptions include, for example, regular periodic automatic redemptions. Systematic purchases include, for example, regular periodic automatic purchases and automatic reinvestments of dividends and capital gain distributions. Generally, purchases and redemptions will not be considered “systematic” unless the transaction is prescheduled for a specific date.
Potentially abusive activity — American Funds Service Company will monitor for the types of activity that could potentially be harmful to the fund — for example, short-term trading activity in multiple funds. When identified, American Funds Service Company will request that the shareholder discontinue the activity. If the activity continues, American Funds Service Company will freeze the shareholder account to prevent all activity other than redemptions of fund shares.
Account statements — Your account is opened in accordance with your registration instructions. Transactions in the account, such as additional investments, will be reflected on regular confirmation
Capital Group Private Client Services Funds — Page 67
statements from the Transfer Agent. Dividend and capital gain reinvestments and purchases through certain retirement plans will be confirmed at least quarterly.
Capitalgroup.com — You may check your share balance and the price of your shares using capitalgroup.com.
Telephone purchases, redemptions and exchanges — By using the telephone purchase, redemption and/or exchange options, you agree to hold the fund, the Transfer Agent, any of its affiliates or mutual funds managed by such affiliates, and each of their respective directors, trustees, officers, employees and agents harmless from any losses, expenses, costs or liabilities (including attorney fees) that may be incurred in connection with the exercise of these privileges. Generally, all shareholders are automatically eligible to use these services. However, you may elect to opt out of these services by writing the Transfer Agent (you may also reinstate them at any time by writing the Transfer Agent). If the Transfer Agent does not employ reasonable procedures to confirm that the instructions received from any person with appropriate account information are genuine, it and/or the fund may be liable for losses due to unauthorized or fraudulent instructions. In the event that shareholders are unable to reach the fund by telephone because of technical difficulties, market conditions or a natural disaster, redemption and exchange requests may be made in writing only.
Share certificates — Shares are credited to your account. The fund does not issue share certificates.
Capital Group Private Client Services Funds — Page 68
General information
Custodian of assets — Securities and cash owned by the fund, including proceeds from the sale of shares of the fund and of securities in the fund’s portfolios, are held by State Street Bank and Trust Company, as custodian. If the fund holds securities of issuers outside the U.S., the custodian may hold these securities pursuant to sub-custodial arrangements in banks outside the U.S. or branches of U.S. banks outside the U.S. The principal office of State Street Bank and Trust Company is located at One Lincoln Street, Boston, MA 02111.
Transfer agent services — American Funds Service Company, an affiliate of the investment adviser, maintains the records of shareholder accounts, processes purchases and redemptions of the fund’s shares, acts as dividend and capital gain distribution disbursing agent, and performs other related shareholder service functions. The principal office of American Funds Service Company is located at 6455 Irvine Center Drive, Irvine, CA 92618. Transfer agent fees are paid according to a fee schedule, based on the number of accounts serviced or a percentage of fund assets, contained in a Shareholder Services Agreement between the fund and American Funds Service Company.
In the case of certain shareholder accounts, third parties who may be unaffiliated with the investment adviser provide transfer agency and shareholder services in place of American Funds Service Company. These services are rendered under agreements with American Funds Service Company or its affiliates and the third parties receive compensation according to such agreements. Compensation for transfer agency and shareholder services, whether paid to American Funds Service Company or such third parties, is ultimately paid from fund assets and is reflected in the expenses of the fund as disclosed in the prospectus.
During the 2021 fiscal year, transfer agent fees, gross of any payments made by American Funds Service Company to third parties, were:
| | |
| | Transfer agent fee |
Capital Group Core Municipal Fund | $8,000 |
Capital Group Short-Term Municipal Fund | 2,000 |
Capital Group California Core Municipal Fund | 8,000 |
Capital Group California Short-Term Municipal Fund | 2,000 |
Capital Group Core Bond Fund | 7,000 |
Independent registered public accounting firm — PricewaterhouseCoopers LLP, 601 South Figueroa Street, Los Angeles, CA 90017-3874, serves as the fund’s independent registered public accounting firm, providing audit services and review of certain documents to be filed with the SEC. PricewaterhouseCoopers LLP prepares tax returns for the fund. The selection of the fund’s independent registered public accounting firm is reviewed and determined annually by the board of trustees.
Independent legal counsel — Morgan, Lewis & Bockius LLP, One Federal Street, Boston, MA 02110-1726 serves as independent legal counsel (“counsel”) for the fund and for independent trustees in their capacities as such. A determination with respect to the independence of the fund’s counsel will be made at least annually by the independent trustees of the fund, as prescribed by the 1940 Act and related rules.
Prospectuses, reports to shareholders and proxy statements — The fund’s fiscal year ends on October 31. Shareholders are provided updated summary prospectuses annually and at least semi-annually
Capital Group Private Client Services Funds — Page 69
with reports showing the fund’s investment portfolio or summary investment portfolio, financial statements and other information. Shareholders may request a copy of the fund’s current prospectus at no cost by calling (800) 421-4996. Shareholders may also access the fund’s current summary prospectus, prospectus, statement of additional information and shareholder reports at capitalgrouppcsfunds.com. The fund’s annual financial statements are audited by the fund’s independent registered public accounting firm, PricewaterhouseCoopers LLC. In addition, shareholders may also receive proxy statements for the fund. In an effort to reduce the volume of mail shareholders receive from the fund when a household owns more than one account, the Transfer Agent has taken steps to eliminate duplicate mailings of summary prospectuses, shareholder reports and proxy statements. To receive additional copies of a summary prospectus, report or proxy statement, shareholders should contact the Transfer Agent.
Codes of ethics — The series and Capital Research and Management Company and its affiliated companies, including the fund’s Principal Underwriter, have adopted codes of ethics that allow for personal investments, including securities in which the fund may invest from time to time. These codes include a ban on acquisitions of securities pursuant to an initial public offering; restrictions on acquisitions of private placement securities; preclearance and reporting requirements; review of duplicate confirmation statements; annual recertification of compliance with codes of ethics; blackout periods on personal investing for certain investment personnel; ban on short-term trading profits for investment personnel; limitations on service as a director of publicly traded companies; disclosure of personal securities transactions; and policies regarding political contributions.
Capital Group Private Client Services Funds — Page 70
Other information — The trust reserves the right to modify the privileges described in this statement of additional information at any time.
The fund’s financial statements, including the investment portfolio and the report of the fund’s independent registered public accounting firm contained in the annual report, are included in this statement of additional information.
Capital Group Core Municipal Fund
Determination of net asset value and redemption price — October 31, 2021
| | |
Net asset value and redemption price per share
(Net assets divided by shares outstanding) | $10.62 |
Capital Group Short-Term Municipal Fund
Determination of net asset value and redemption price — October 31, 2021
| | |
Net asset value and redemption price per share
(Net assets divided by shares outstanding) | $10.26 |
Capital Group California Core Municipal Fund
Determination of net asset value and redemption price — October 31, 2021
| | |
Net asset value and redemption price per share
(Net assets divided by shares outstanding) | $10.75 |
Capital Group California Short-Term Municipal Fund
Determination of net asset value and redemption price — October 31, 2021
| | |
Net asset value and redemption price per share
(Net assets divided by shares outstanding) | $10.29 |
Capital Group Core Bond Fund
Determination of net asset value and redemption price — October 31, 2021
| | |
Net asset value and redemption price per share
(Net assets divided by shares outstanding) | $10.24 |
Capital Group Private Client Services Funds — Page 71
Fund numbers — Here are the fund numbers for use when making share transactions:
| | |
Fund | Fund numbers |
Capital Group Core Municipal FundSM ……...….......................... | 40117 |
Capital Group Short-Term Municipal FundSM ……...…............... | 40118 |
Capital Group California Core Municipal FundSM ……............... | 40119 |
Capital Group California Short-Term Municipal FundSM ……..... | 40120 |
Capital Group Core Bond FundSM ……...……...…….................. | 40121 |
Capital Group U.S. Equity FundSM ……...……...……...……...….. | 40124 |
Capital Group Private Client Services Funds — Page 72
Appendix
The following descriptions of debt security ratings are based on information provided by Moody’s Investors Service and Standard & Poor’s Ratings Services.
Description of bond ratings
Moody’s
Municipal long-term rating definitions
Aaa
Obligations rated Aaa are judged to be of the highest quality, subject to the lowest level of credit risk.
Aa
Obligations rated Aa are judged to be of high quality and are subject to very low credit risk.
A
Obligations rated A are considered upper-medium grade and are subject to low credit risk.
Baa
Obligations rated Baa are judged to be medium grade and subject to moderate credit risk and as such may possess certain speculative characteristics.
Ba
Obligations rated Ba are judged to be speculative and are subject to substantial credit risk.
B
Obligations rated B are considered speculative and are subject to high credit risk.
Caa
Obligations rated Caa are judged to be speculative and of poor standing and are subject to very high credit risk.
Ca
Obligations rated Ca are highly speculative and are likely in, or very near, default, with some prospect of recovery of principal and interest.
C
Obligations rated C are the lowest rated and are typically in default, with little prospect for recovery of principal or interest.
Note: Moody’s appends numerical modifiers 1, 2 and 3 to each generic rating classification from Aa through Caa. The modifier 1 indicates that the obligation ranks in the higher end of its generic rating category; the modifier 2 indicates a mid-range ranking; and the modifier 3 indicates a ranking in the lower end of that generic rating category. Additionally, a “(hyb)” indicator is appended to all ratings of hybrid securities issued by banks, insurers, finance companies and securities firms.
Capital Group Private Client Services Funds — Page 73
Standard & Poor’s
Long-term issue credit ratings
AAA
An obligation rated AAA has the highest rating assigned by Standard & Poor’s. The obligor’s capacity to meet its financial commitment on the obligation is extremely strong.
AA
An obligation rated AA differs from the highest-rated obligations only to a small degree. The obligor’s capacity to meet its financial commitment on the obligation is very strong.
A
An obligation rated A is somewhat more susceptible to the adverse effects of changes in circumstances and economic conditions than obligations in higher-rated categories. However, the obligor’s capacity to meet its financial commitment on the obligation is still strong.
BBB
An obligation rated BBB exhibits adequate protection parameters. However, adverse economic conditions or changing circumstances are more likely to lead to a weakened capacity of the obligor to meet its financial commitment on the obligation.
BB, B, CCC, CC, and C
Obligations rated BB, B, CCC, CC, and C are regarded as having significant speculative characteristics. BB indicates the least degree of speculation and C the highest. While such obligations will likely have some quality and protective characteristics, these may be outweighed by large uncertainties or major exposures to adverse conditions.
BB
An obligation rated BB is less vulnerable to nonpayment than other speculative issues. However, it faces major ongoing uncertainties or exposure to adverse business, financial, or economic conditions which could lead to the obligor’s inadequate capacity to meet its financial commitment on the obligation.
B
An obligation rated B is more vulnerable to nonpayment than obligations rated BB, but the obligor currently has the capacity to meet its financial commitment on the obligation. Adverse business, financial, or economic conditions will likely impair the obligor’s capacity or willingness to meet its financial commitment on the obligation.
CCC
An obligation rated CCC is currently vulnerable to nonpayment and is dependent upon favorable business, financial, and economic conditions for the obligor to meet its financial commitment on the obligation. In the event of adverse business, financial, or economic conditions, the obligor is not likely to have the capacity to meet its financial commitment on the obligation.
CC
An obligation rated CC is currently highly vulnerable to nonpayment. The CC rating is used when a default has not occurred, but Standard & Poor’s expects default to be a virtual certainty, regardless of the anticipated time to default.
Capital Group Private Client Services Funds — Page 74
C
An obligation rated C is currently highly vulnerable to nonpayment, and the obligation is expected to have lower relative seniority or lower ultimate recovery compared to obligations that are rated higher.
D
An obligation rated D is in default or in breach of an imputed promise. For non-hybrid capital instruments, the D rating category is used when payments on an obligation are not made on the date due, unless Standard & Poor’s believes that such payments will be made within five business days in the absence of a stated grace period or within the earlier of the stated grace period or 30 calendar days. The D rating also will be used upon the filing of a bankruptcy petition or the taking of similar action and where default on an obligation is a virtual certainty, for example due to automatic stay provisions. An obligation’s rating is lowered to D if it is subject to a distressed exchange offer.
Plus (+) or minus (–)
The ratings from AA to CCC may be modified by the addition of a plus or minus sign to show relative standing within the major rating categories.
NR
This indicates that no rating has been requested, that there is insufficient information on which to base a rating, or that Standard & Poor’s does not rate a particular obligation as a matter of policy.
Capital Group Private Client Services Funds — Page 75
Description of note ratings
Moody’s
Municipal short-term debt ratings
MIG 1
This designation denotes superior credit quality. Excellent protection is afforded by established cash flows, highly reliable liquidity support, or demonstrated broad-based access to the market for refinancing.
MIG 2
This designation denotes strong credit quality. Margins of protection are ample, although not as large as in the preceding group.
MIG 3
This designation denotes acceptable credit quality. Liquidity and cash-flow protection may be narrow, and market access for refinancing is likely to be less well-established.
SG
This designation denotes speculative-grade credit quality. Debt instruments in this category may lack sufficient margins of protection.
Capital Group Private Client Services Funds — Page 76
Standard & Poor’s
Short-term issue credit ratings
SP-1
Strong capacity to pay principal and interest. An issue determined to possess a very strong capacity to pay debt service is given a plus (+) designation.
SP-2
Satisfactory capacity to pay principal and interest, with some vulnerability to adverse financial and economic changes over the term of the notes.
SP-3
Speculative capacity to pay principal and interest.
Capital Group Private Client Services Funds — Page 77
Description of commercial paper ratings
Moody’s
Global short-term rating scale
P-1
Issuers (or supporting institutions) rated Prime-1 have a superior ability to repay short-term debt obligations.
P-2
Issuers (or supporting institutions) rated Prime-2 have a strong ability to repay short-term debt obligations.
P-3
Issuers (or supporting institutions) rated Prime-3 have an acceptable ability to repay short-term obligations.
NP
Issuers (or supporting institutions) rated Not Prime do not fall within any of the Prime rating categories.
Standard & Poor’s
Commercial paper ratings (highest three ratings)
A-1
A short-term obligation rated A-1 is rated in the highest category by Standard & Poor’s. The obligor’s capacity to meet its financial commitment on the obligation is strong. Within this category, certain obligations are designated with a plus sign (+). This indicates that the obligor’s capacity to meet its financial commitment on these obligations is extremely strong.
A-2
A short-term obligation rated A-2 is somewhat more susceptible to the adverse effects of changes in circumstances and economic conditions than obligations in higher rating categories. However, the obligor’s capacity to meet its financial commitment on the obligation is satisfactory.
A-3
A short-term obligation rated A-3 exhibits adequate protection parameters. However, adverse economic conditions or changing circumstances are more likely to lead to a weakened capacity of the obligor to meet its financial commitment on the obligation.
Capital Group Private Client Services Funds — Page 78
Fitch Ratings, Inc.
Long-term credit ratings
AAA
Highest credit quality. AAA ratings denote the lowest expectation of default risk. They are assigned only in case of exceptionally strong capacity for payment of financial commitments. This capacity is highly unlikely to be adversely affected by foreseeable events.
AA
Very high credit quality. AA ratings denote expectations of very low default risk. They indicate very strong capacity for payment of financial commitments. This capacity is not significantly vulnerable to foreseeable events.
A
High credit quality. A ratings denote expectations of low default risk. The capacity for payment of financial commitments is considered strong. This capacity may, nevertheless, be more vulnerable to changes in circumstances or in economic conditions than is the case for higher ratings.
BBB
Good credit quality. BBB ratings indicate that expectations of default risk are low. The capacity for payment of financial commitments is considered adequate but adverse changes in circumstances and economic conditions are more likely to impair this capacity.
BB
Speculative. BB ratings indicate an elevated vulnerability to default risk, particularly in the event of adverse changes in business or economic conditions over time; however, business or financial flexibility exists which supports the servicing of financial commitments.
B
Highly speculative. B ratings indicate that material default risk is present, but a limited margin of safety remains. Financial commitments are currently being met; however, capacity for continued payment is vulnerable to deterioration in the business and economic environment.
CCC
Substantial credit risk. Default is a real possibility.
CC
Very high levels of credit risk. Default of some kind appears probable.
C
Exceptionally high levels of credit risk. Default is imminent or inevitable, or the issuer is in standstill. Conditions that are indicative of a C category rating for an issuer include:
· The issuer has entered into a grace or cure period following nonpayment of a material financial obligation;
· The issuer has entered into a temporary negotiated waiver or standstill agreement following a payment default on a material financial obligation; or
· Fitch Ratings otherwise believes a condition of RD or D to be imminent or inevitable, including through the formal announcement of a distressed debt exchange.
Capital Group Private Client Services Funds — Page 79
RD
Restricted default. RD ratings indicate an issuer that in Fitch Ratings’ opinion has experienced an uncured payment default on a bond, loan or other material financial obligation but which has not entered into bankruptcy filings, administration, receivership, liquidation or other formal winding up procedure, and which has not otherwise ceased operating. This would include:
· The selective payment default on a specific class or currency of debt;
· The uncured expiry of any applicable grace period, cure period or default forbearance period following a payment default on a bank loan, capital markets security or other material financial obligation;
· The extension of multiple waivers or forbearance periods upon a payment default on one or more material financial obligations, either in series or in parallel; or
· Execution of a distressed debt exchange on one or more material financial obligations.
D
Default. D ratings indicate an issuer that in Fitch Ratings’ opinion has entered into bankruptcy filings, administration, receivership, liquidation or other formal winding up procedure, or which has otherwise ceased business.
Default ratings are not assigned prospectively to entities or their obligations; within this context, nonpayment on an instrument that contains a deferral feature or grace period will generally not be considered a default until after the expiration of the deferral or grace period, unless a default is otherwise driven by bankruptcy or other similar circumstance, or by a distressed debt exchange.
Imminent default typically refers to the occasion where a payment default has been intimated by the issuer, and is all but inevitable. This may, for example, be where an issuer has missed a scheduled payment, but (as is typical) has a grace period during which it may cure the payment default. Another alternative would be where an issuer has formally announced a distressed debt exchange, but the date of the exchange still lies several days or weeks in the immediate future.
In all cases, the assignment of a default rating reflects the agency’s opinion as to the most appropriate rating category consistent with the rest of its universe of ratings, and may differ from the definition of default under the terms of an issuer’s financial obligations or local commercial practice.
Note: The modifiers “+” or “–” may be appended to a rating to denote relative status within major rating categories. Such suffixes are not added to the AAA long-term rating category, or to categories below B.
Capital Group Private Client Services Funds — Page 80
Capital Group Core Municipal Fund
Investment portfolio October 31, 2021
| Portfolio quality summary* | Percent of net assets |

| * | Bond ratings, which typically range from AAA/Aaa (highest) to D (lowest), are assigned by credit rating agencies such as Standard & Poor’s, Moody’s and/or Fitch as an indication of an issuer’s creditworthiness. In assigning a credit rating to a security, the fund looks specifically to the ratings assigned to the issuer of the security by Standard & Poor’s, Moody’s and/or Fitch. If agency ratings differ, the security will be considered to have received the highest of those ratings, consistent with the fund’s investment policies. The ratings are not covered by the Report of Independent Registered Public Accounting Firm. |
| Bonds, notes & other debt instruments 82.13% | | Principal amount
(000) | | | Value
(000) | |
| Alabama 1.19% | | | | | | | | |
| Black Belt Energy Gas Dist., Gas Supply Prepay Rev. Bonds (Project No. 5), Series 2020-A-1, 4.00% 2049 (put 2026) | | $ | 825 | | | $ | 940 | |
| Black Belt Energy Gas Dist., Gas Supply Rev. Bonds, Series 2017-A, 4.00% 2047 (put 2022) | | | 2,050 | | | | 2,092 | |
| Black Belt Energy Gas Dist., Gas Supply Rev. Bonds, Series 2021-A, 4.00% 2051 (put 2023) | | | 1,000 | | | | 1,217 | |
| Federal Aid Highway Fin. Auth., Federal Highway Grant Anticipation Bonds, Series 2012, 5.00% 2023 (preref. 2022) | | | 100 | | | | 104 | |
| City of Huntsville, Electric Rev. Bonds, Series 2017-A, 5.00% 2022 | | | 450 | | | | 473 | |
| City of Huntsville, Electric Rev. Bonds, Series 2017-B, 5.00% 2022 | | | 400 | | | | 421 | |
| Southeast Energy Auth., Commodity Supply Rev. Bonds (Project No. 1), Series 2021-A, 4.00% 2051 (put 2028) | | | 1,440 | | | | 1,682 | |
| Southeast Energy Auth., Commodity Supply Rev. Bonds (Project No. 2), Series 2021-B-1, 4.00% 2051 (put 2031) | | | 1,985 | | | | 2,377 | |
| | | | | | | | 9,306 | |
| | | | | | | | | |
| Alaska 0.31% | | | | | | | | |
| Housing Fin. Corp., Collateralized Bonds (Veterans Mortgage Program), Series 2019, 4.00% 2048 | | | 865 | | | | 942 | |
| Housing Fin. Corp., General Mortgage Rev. Bonds, Series 2020-A, 3.25% 2044 | | | 910 | | | | 986 | |
| Housing Fin. Corp., General Mortgage Rev. Bonds, Series 2016-A, 3.50% 2046 | | | 150 | | | | 158 | |
| Housing Fin. Corp., State Capital Project Bonds, Series 2014-A, 5.00% 2032 (preref. 2023) | | | 230 | | | | 253 | |
| Housing Fin. Corp., State Capital Project Bonds, Series 2014-A, 5.00% 2033 (preref. 2023) | | | 110 | | | | 121 | |
| | | | | | | | 2,460 | |
| | | | | | | | | |
| Arizona 1.11% | | | | | | | | |
| Agricultural Improvement and Power Dist., Electric System Rev. Bonds (Salt River Project), Series 2021-A, 5.00% 2028 | | | 295 | | | | 368 | |
| Agricultural Improvement and Power Dist., Electric System Rev. Bonds (Salt River Project), Series 2021-A, 5.00% 2029 | | | 370 | | | | 472 | |
| Board of Regents of the Arizona State University System, Rev. Bonds, Series 2020-A, 5.00% 2027 | | | 400 | | | | 492 | |
| Board of Regents of the Arizona State University System, Rev. Bonds, Series 2020-A, 5.00% 2028 | | | 550 | | | | 692 | |
| Board of Regents of the Arizona State University System, Rev. Bonds, Series 2020-A, 5.00% 2033 | | | 80 | | | | 104 | |
| Bullhead City, Excise Taxes Rev. Obligations, Series 2021-2, 1.15% 2027 | | | 375 | | | | 368 | |
| County of Coconino, Pollution Control Corp., Pollution Control Rev. Ref. Bonds, Series 2017-B, 1.65% 2039 (put 2023) | | | 1,500 | | | | 1,526 | |
| City of Glendale, Industrial Dev. Auth., Rev. Ref. Bonds (Midwestern University), Series 2020, 5.00% 2029 | | | 1,000 | | | | 1,266 | |
| Industrial Dev. Auth., Education Rev. Bonds (Greathearts Arizona Projects), Series 2021-A, 5.00% 2029 | | | 115 | | | | 144 | |
| Industrial Dev. Auth., Hospital Rev. Bonds (Phoenix Children’s Hospital), Series 2021-A, 5.00% 2030 | | | 255 | | | | 326 | |
| Industrial Dev. Auth., Hospital Rev. Bonds (Phoenix Children’s Hospital), Series 2021-A, 5.00% 2031 | | | 75 | | | | 98 | |
| Industrial Dev. Auth., Rev. Bonds (Lincoln South Beltway Project), Series 2020, 5.00% 2023 | | | 1,000 | | | | 1,090 | |
| Kyrene Elementary School Dist. No. 28, School Improvement Bonds (2010 Project), Series 2013-B, 4.50% 2024 (preref. 2023)1 | | | 55 | | | | 59 | |
| Private Client Services Funds | 9 |
Capital Group Core Municipal Fund
| Bonds, notes & other debt instruments (continued) | | Principal amount
(000) | | | Value
(000) | |
| Arizona (continued) | | | | | | | | |
| Kyrene Elementary School Dist. No. 28, School Improvement Bonds (2010 Project), Series 2013-B, 4.50% 2025 (preref. 2023)1 | | $ | 45 | | | $ | 48 | |
| County of Maricopa, Industrial Dev. Auth., Education Rev. Bonds (GreatHearts Arizona Projects), Series 2017-A, 5.00% 2027 | | | 745 | | | | 898 | |
| City of Phoenix, Civic Improvement Corp., Water System Rev. Ref. Bonds, Series 2014-B, 5.00% 2024 | | | 115 | | | | 129 | |
| County of Pima, Industrial Dev. Auth., Rev. Bonds (Tucson Medical Center), Series 2021-A, 5.00% 2031 | | | 485 | | | | 636 | |
| | | | | | | | 8,716 | |
| | | | | | | | | |
| Arkansas 0.08% | | | | | | | | |
| Dev. Fin. Auth., Health Care Rev. Bonds (Baptist Memorial Health Care), Series 2015-B-3, (SIFMA Municipal Swap Index + 1.55%) 1.60% 2044 (put 2022)2 | | | 600 | | | | 600 | |
| | | | | | | | | |
| California 4.01% | | | | | | | | |
| Bay Area Toll Auth., San Francisco Bay Area Toll Bridge Rev. Bonds, Series 2006-C-1, (SIFMA Municipal Swap Index + 0.90%) 0.95% 2045 (put 2023)2 | | | 2,205 | | | | 2,221 | |
| Bay Area Toll Auth., San Francisco Bay Area Toll Bridge Rev. Bonds, Series 2021-C, (SIFMA Municipal Swap Index + 0.45%) 0.50% 2056 (put 2026)2 | | | 425 | | | | 430 | |
| Trustees of the California State University, Systemwide Rev. Bonds, Series 2016-B-2, 0.55% 2049 (put 2026) | | | 195 | | | | 192 | |
| Carlsbad Unified School Dist., G.O. Bonds, 2018 Election, Series 2021-B, 2.00% 2023 | | | 75 | | | | 77 | |
| Carlsbad Unified School Dist., G.O. Bonds, 2018 Election, Series 2021-B, 2.00% 2024 | | | 85 | | | | 89 | |
| Community Choice Fncg. Auth., Clean Energy Project Rev. Green Bonds, Series 2021-B-1, 4.00% 2052 (put 2031) | | | 2,415 | | | | 2,903 | |
| Eastern Municipal Water Dist., Water and Wastewater Rev. Ref. Bonds, Series 2021-A, 3.00% 2024 | | | 165 | | | | 177 | |
| Educational Facs. Auth., Rev. Bonds (University of Southern California), Series 2009-C, 5.25% 2024 (escrowed to maturity) | | | 35 | | | | 40 | |
| Fresno Unified School Dist., G.O. Bonds, 2016 Election, Series 2021-D, 2.00% 2023 | | | 105 | | | | 108 | |
| Fresno Unified School Dist., G.O. Bonds, 2016 Election, Series 2021-D, 2.00% 2024 | | | 50 | | | | 52 | |
| G.O. Bonds, Series 2020, 5.00% 2029 | | | 180 | | | | 233 | |
| G.O. Bonds, Series 2021, 5.00% 2031 | | | 30 | | | | 36 | |
| G.O. Bonds, Series 2021, 5.00% 2032 | | | 25 | | | | 30 | |
| G.O. Bonds, Series 2021, 5.00% 2034 | | | 25 | | | | 30 | |
| G.O. Rev. Ref. Bonds, Series 2021, 5.00% 2023 | | | 1,265 | | | | 1,374 | |
| G.O. Rev. Ref. Bonds, Series 2021, 5.00% 2028 | | | 1,000 | | | | 1,268 | |
| G.O. Rev. Ref. Bonds, Series 2021, 5.00% 2030 | | | 55 | | | | 73 | |
| Health Facs. Fncg. Auth., Rev. Bonds (Kaiser Permanente), Series 2017-B, 5.00% 2029 (put 2022) | | | 1,000 | | | | 1,048 | |
| Health Facs. Fncg. Auth., Rev. Ref. Bonds (Marshall Medical Center), Series 2015, 5.00% 2028 | | | 315 | | | | 353 | |
| Housing Fin. Agcy., Municipal Certs., Series 2021-A-1, 3.50% 2035 | | | 739 | | | | 852 | |
| Infrastructure and Econ. Dev. Bank, Rev. Bonds (The Colburn School), Series 2015-B, (SIFMA Municipal Swap Index + 1.20%) 1.25% 2037 (put 2022)2 | | | 1,000 | | | | 1,001 | |
| Infrastructure and Econ. Dev. Bank, Rev. Ref. Bonds (Museum of Art Project), Series 2021-B, 0.75% 2050 (put 2026)2 | | | 340 | | | | 345 | |
| Irvine Unified School Dist., Community Facs. Dist. No. 09-1, Special Tax Bonds, Series 2017-A, BAM insured, 5.00% 2025 | | | 250 | | | | 290 | |
| City of Jurupa, Public Fncg. Auth., Special Tax Rev. Ref. Bonds, Series 2020-A, BAM insured, 5.00% 2024 | | | 85 | | | | 96 | |
| City of Jurupa, Public Fncg. Auth., Special Tax Rev. Ref. Bonds, Series 2020-A, BAM insured, 4.00% 2026 | | | 60 | | | | 69 | |
| City of Los Angeles, Dept. of Water and Power, Power System Rev. Bonds, Series 2018-B, 4.00% 2022 | | | 75 | | | | 75 | |
| County of Los Angeles, Dev. Auth., Multi Family Housing Rev. Bonds (Cantamar Villas), Series 2021-D-1, 0.30% 2025 (put 2024) | | | 55 | | | | 55 | |
| County of Los Angeles, Dev. Auth., Multi Family Housing Rev. Bonds (Sunny Garden Apartments), Series 2021-C-1, 0.20% 2024 (put 2023) | | | 75 | | | | 75 | |
| County of Los Angeles, Metropolitan Transportation Auth., Measure R Sales Tax Rev. Bonds, Series 2016-A, 5.00% 2023 | | | 50 | | | | 54 | |
| County of Los Angeles, Metropolitan Transportation Auth., Measure R Sales Tax Rev. Bonds, Series 2021-A, 5.00% 2032 | | | 955 | | | | 1,287 | |
| County of Los Angeles, Metropolitan Transportation Auth., Measure R Sales Tax Rev. Ref. Green Bonds, Series 2020-A, 5.00% 2024 | | | 860 | | | | 965 | |
| Los Angeles Unified School Dist., G.O. Dedicated Unlimited Ad Valorem Property Tax Bonds, Series 2020-C, 5.00% 2029 | | | 150 | | | | 193 | |
| Los Angeles Unified School Dist., G.O. Dedicated Unlimited Ad Valorem Property Tax Bonds, Series 2020-RYQ, 5.00% 2033 | | | 570 | | | | 744 | |
| Metropolitan Water Dist. of Southern California, Water Rev. Ref. Bonds, Series 2020-A, 5.00% 2023 | | | 1,500 | | | | 1,620 | |
| Murrieta Valley Unified School Dist., Public Fncg. Auth., Special Tax Rev. Bonds, Series 2016-A, 5.00% 2022 | | | 1,250 | | | | 1,295 | |
| 10 | Private Client Services Funds |
Capital Group Core Municipal Fund
| Bonds, notes & other debt instruments (continued) | | Principal amount
(000) | | | Value
(000) | |
| California (continued) | | | | | | | | |
| Public Fin. Auth., Rev. Bonds (Henry Mayo Newhall Memorial Hospital), Series 2021-A, 4.00% 2024 | | $ | 45 | | | $ | 49 | |
| Public Fin. Auth., Rev. Bonds (Henry Mayo Newhall Memorial Hospital), Series 2021-A, 4.00% 2025 | | | 45 | | | | 50 | |
| Public Fin. Auth., Rev. Bonds (Henry Mayo Newhall Memorial Hospital), Series 2021-A, 4.00% 2026 | | | 45 | | | | 51 | |
| Public Fin. Auth., Rev. Bonds (Henry Mayo Newhall Memorial Hospital), Series 2021-A, 4.00% 2027 | | | 45 | | | | 52 | |
| Public Fin. Auth., Rev. Bonds (Henry Mayo Newhall Memorial Hospital), Series 2021-A, 4.00% 2028 | | | 40 | | | | 47 | |
| Public Works Board, Lease Rev. Ref. Bonds (Various Capital Projects), Series 2022-A, 5.00% 2028 | | | 655 | | | | 807 | |
| Public Works Board, Lease Rev. Ref. Bonds (Various Capital Projects), Series 2021-A, 5.00% 2030 | | | 1,000 | | | | 1,291 | |
| RNR School Fncg. Auth., Community Facs. Dist. No. 92-1, Special Tax Bonds, Series 2017-A, BAM insured, 5.00% 2028 | | | 1,000 | | | | 1,192 | |
| City of San Diego, Community Facs. Dist. No. 2 (Santaluz), Improvement Area No. 1, Special Tax Rev. Ref. Bonds, Series 2021, 4.00% 2029 | | | 70 | | | | 85 | |
| County of San Diego, Regional Airport Auth., Airport Rev. Ref. Bonds, Series 2020-B, 5.00% 2022 | | | 1,000 | | | | 1,032 | |
| County of San Diego, Regional Transportation Commission, Limited Sales Tax Rev. Short-Term Notes, Series 2021-A, 5.00% 2022 | | | 1,235 | | | | 1,289 | |
| County of San Diego, Water Auth., Water Rev. Ref. Green Bonds, Series 2021-B, 5.00% 2030 | | | 230 | | | | 304 | |
| City and County of San Francisco, G.O. Rev. Ref. Bonds, Series 2020-R-2, 5.00% 2023 | | | 480 | | | | 517 | |
| City and County of San Francisco, G.O. Rev. Ref. Bonds, Series 2020-R-2, 5.00% 2028 | | | 1,000 | | | | 1,271 | |
| City of Santee, Community Facs. Dist. No. 2017-1, Special Tax Bonds (Weston Infrastructure), Series 2019, 5.00% 2022 | | | 135 | | | | 140 | |
| City of Santee, Community Facs. Dist. No. 2017-1, Special Tax Bonds (Weston Infrastructure), Series 2019, 5.00% 2023 | | | 160 | | | | 173 | |
| City of Santee, Community Facs. Dist. No. 2017-1, Special Tax Bonds (Weston Infrastructure), Series 2019, 5.00% 2024 | | | 170 | | | | 190 | |
| Southern California Public Power Auth., Rev. Ref. Green Bonds (Milford Wind Corridor Phase II Project), Series 2021-1, 5.00% 2023 | | | 65 | | | | 70 | |
| Southern California Public Power Auth., Rev. Ref. Green Bonds (Milford Wind Corridor Phase II Project), Series 2021-1, 5.00% 2024 | | | 20 | | | | 22 | |
| Southern California Public Power Auth., Transmission Project Rev. Bonds (Southern Transmission Project), Series 2017-A, 5.00% 2023 | | | 490 | | | | 528 | |
| Statewide Communities Dev. Auth., Multi Family Housing Rev. Bonds (Villa Del Sol Apartments), Series 2021-A-2, 0.39% 2023 (put 2023) | | | 280 | | | | 280 | |
| Statewide Communities Dev. Auth., Multi Family Housing Rev. Bonds (Washington Court Apartments), Series 2021-E, 0.22% 2023 (put 2022) | | | 125 | | | | 125 | |
| Statewide Communities Dev. Auth., Pollution Control Rev. Ref. Bonds (Southern California Edison Co.), Series 2006-D, 2.625% 2033 (put 2023) | | | 135 | | | | 141 | |
| Statewide Communities Dev. Auth., Rev. Bonds (American Baptist Homes of the West), Series 2013-A, 5.00% 2023 (preref. 2022) | | | 80 | | | | 85 | |
| Statewide Communities Dev. Auth., Rev. Bonds (Viamonte Senior Living 1 Project), Series 2018-B, 3.00% 2025 | | | 65 | | | | 65 | |
| Statewide Communities Dev. Auth., Rev. Bonds (Viamonte Senior Living 1 Project), Series 2018-B, 3.00% 2026 | | | 500 | | | | 501 | |
| Tobacco Securitization Auth. of Northern California, Tobacco Settlement Asset-Backed Rev. Ref. Senior Bonds (Sacramento County Tobacco Securitization Corp.), Series 2021-B-1, 0.45% 2030 | | | 20 | | | | 20 | |
| Tobacco Securitization Auth. of Southern California, Tobacco Settlement Asset-Backed Rev. Ref. Bonds (San Diego County Tobacco Asset Securitization Corp.), Series 2019-A, 5.00% 2030 | | | 180 | | | | 229 | |
| Regents of the University of California, Limited Project Rev. Bonds, Series 2022-S, 5.00% 2026 | | | 165 | | | | 193 | |
| Dept. of Veterans Affairs, Veterans G.O. Bonds, Series 2019-CS, 4.00% 2049 | | | 850 | | | | 924 | |
| | | | | | | | 31,473 | |
| | | | | | | | | |
| Colorado 1.87% | | | | | | | | |
| City of Arvada, Mountain Shadows Metropolitan Dist., Limited Tax G.O. Rev. Ref. and Improvement Bonds, Series 2016, 4.00% 2026 | | | 735 | | | | 771 | |
| Certs. of Part., Series 2021-A, 5.00% 2028 | | | 495 | | | | 628 | |
| Certs. of Part., Series 2021-A, 5.00% 2029 | | | 1,000 | | | | 1,292 | |
| City of Colorado Springs, Utilities System Rev. Ref. Bonds, Series 2020-B, 5.00% 2021 | | | 75 | | | | 75 | |
| City and County of Denver, Board of Water Commissioners, Water Rev. Bonds, Series 2021-A, 5.00% 2031 | | | 1,910 | | | | 2,596 | |
| City and County of Denver, Dept. of Aviation, Airport System Rev. Bonds, Series 2019-D, 5.00% 2031 (put 2022) | | | 1,000 | | | | 1,048 | |
| E-470 Public Highway Auth., Rev. Bonds, Series 2021-B, (USD-SOFR x 0.67 + 0.35%) 0.383% 2039 (put 2024)2 | | | 285 | | | | 286 | |
| Educational and Cultural Facs. Auth., Rev. Ref. Bonds (Johnson & Wales University Project), Series 2013-B, 5.00% 2023 (escrowed to maturity) | | | 1,805 | | | | 1,922 | |
| Health Facs. Auth., Health Facs. Rev. and Rev. Ref. Bonds (Evangelical Lutheran Good Samaritan Society Project), Series 2015-A, 5.00% 2024 (escrowed to maturity) | | | 1,825 | | | | 2,045 | |
| Health Facs. Auth., Hospital Rev. Bonds (Adventist Health System/Sunbelt Obligated Group), Series 2018-A, 5.00% 2048 | | | 125 | | | | 150 | |
| Private Client Services Funds | 11 |
Capital Group Core Municipal Fund
| Bonds, notes & other debt instruments (continued) | | Principal amount
(000) | | | Value
(000) | |
| Colorado (continued) | | | | | | | | |
| Housing and Fin. Auth., Single Family Mortgage Bonds, Series 2018-C, Class I, 4.25% 2048 | | $ | 590 | | | $ | 647 | |
| Housing and Fin. Auth., Single Family Mortgage Bonds, Series 2020-B, Class I, 3.75% 2050 | | | 905 | | | | 985 | |
| Housing and Fin. Auth., Single Family Mortgage Bonds, Series 2021-L, Class I, 3.25% 2051 | | | 1,250 | | | | 1,367 | |
| Regional Transportation Dist., Private Activity Bonds (Denver Transit Partners Eagle P3 Project), Series 2020-A, 5.00% 2029 | | | 70 | | | | 87 | |
| Regional Transportation Dist., Private Activity Bonds (Denver Transit Partners Eagle P3 Project), Series 2020-A, 5.00% 2029 | | | 40 | | | | 50 | |
| Regional Transportation Dist., Private Activity Bonds (Denver Transit Partners Eagle P3 Project), Series 2020-A, 5.00% 2030 | | | 150 | | | | 189 | |
| Regional Transportation Dist., Private Activity Bonds (Denver Transit Partners Eagle P3 Project), Series 2020-A, 5.00% 2030 | | | 35 | | | | 45 | |
| Weld County School Dist. RE-5J, G.O. Bonds, Series 2021, 5.00% 2023 | | | 475 | | | | 522 | |
| | | | | | | | 14,705 | |
| | | | | | | | | |
| Connecticut 0.87% | | | | | | | | |
| Town of East Hartford, Housing Auth., Multi Family Housing Rev. Bonds (Veterans Terrace Project), Series 2021, 0.25% 2023 (put 2022) | | | 140 | | | | 140 | |
| Health and Educational Facs. Auth., Rev. Bonds (Hartford Healthcare Issue), Series 2021-A, 5.00% 2029 | | | 330 | | | | 422 | |
| Health and Educational Facs. Auth., Rev. Bonds (Stamford Hospital Issue), Series 2022-M, 5.00% 2030 | | | 450 | | | | 559 | |
| Health and Educational Facs. Auth., Rev. Bonds (Stamford Hospital Issue), Series 2022-M, 5.00% 2031 | | | 310 | | | | 391 | |
| Health and Educational Facs. Auth., Rev. Bonds (Yale University Issue), Series 2003-X-2, 0.25% 2037 (put 2024) | | | 910 | | | | 906 | |
| Health and Educational Facs. Auth., Rev. Bonds (Yale University Issue), Series 2014-A, 1.10% 2048 (put 2023) | | | 1,105 | | | | 1,117 | |
| Housing Fin. Auth., Housing Mortgage Fin. Program Bonds, Series 2014-C-1, 4.00% 2044 | | | 70 | | | | 72 | |
| Housing Fin. Auth., Housing Mortgage Fin. Program Bonds, Series 2016-A-1, 4.00% 2045 | | | 255 | | | | 266 | |
| Housing Fin. Auth., Housing Mortgage Fin. Program Bonds, Series 2017-A-1, 4.00% 2047 | | | 1,835 | | | | 1,963 | |
| Housing Fin. Auth., Housing Mortgage Fin. Program Bonds, Series 2017-C-1, 4.00% 2047 | | | 700 | | | | 748 | |
| Housing Fin. Auth., Housing Mortgage Fin. Program Bonds, Series 2017-D-1, 4.00% 2047 | | | 150 | | | | 160 | |
| Housing Fin. Auth., Housing Mortgage Fin. Program Rev. Ref. Bonds, Series 2015-A, 3.50% 2044 | | | 75 | | | | 77 | |
| | | | | | | | 6,821 | |
| | | | | | | | | |
| Delaware 0.47% | | | | | | | | |
| G.O. Bonds, Series 2021, 5.00% 2029 | | | 1,220 | | | | 1,562 | |
| G.O. Bonds, Series 2021, 5.00% 2031 | | | 945 | | | | 1,260 | |
| Health Facs. Auth., Rev. Bonds (Beebe Medical Center Project), Series 2018, 5.00% 2022 | | | 290 | | | | 297 | |
| Health Facs. Auth., Rev. Bonds (Beebe Medical Center Project), Series 2018, 5.00% 2023 | | | 200 | | | | 213 | |
| Health Facs. Auth., Rev. Bonds (Beebe Medical Center Project), Series 2018, 5.00% 2024 | | | 300 | | | | 333 | |
| | | | | | | | 3,665 | |
| | | | | | | | | |
| District of Columbia 0.55% | | | | | | | | |
| G.O. Bonds, Series 2015-A, 5.00% 2032 | | | 1,800 | | | | 2,075 | |
| Income Tax Secured Rev. Bonds, Series 2011-A, 5.00% 2029 | | | 235 | | | | 236 | |
| Income Tax Secured Rev. Bonds, Series 2020-A, 5.00% 2032 | | | 750 | | | | 970 | |
| Income Tax Secured Rev. Bonds, Series 2020-C, 5.00% 2033 | | | 215 | | | | 278 | |
| Washington Convention and Sports Auth., Dedicated Tax Rev. Ref. Bonds, Series 2018-A, 5.00% 2027 | | | 600 | | | | 736 | |
| | | | | | | | 4,295 | |
| | | | | | | | | |
| Florida 5.52% | | | | | | | | |
| County of Alachua, Health Facs. Auth., Continuing Care Retirement Community Rev. Bonds (Oak Hammock at the University of Florida, Inc. Project), Series 2021, 4.00% 2022 | | | 20 | | | | 20 | |
| County of Brevard, Health Facs. Auth., Rev. Ref. Bonds (Health First, Inc. Project), Series 2014, 5.00% 2022 | | | 500 | | | | 510 | |
| County of Brevard, Health Facs. Auth., Rev. Ref. Bonds (Health First, Inc. Project), Series 2014, 5.00% 2033 | | | 130 | | | | 143 | |
| County of Brevard, Housing Fncg. Auth., Multi Family Mortgage Rev. Bonds (Tropical Manor Apartments), Series 2021, 0.25% 2023 (put 2022) | | | 135 | | | | 135 | |
| Capital Trust Agcy., Multi Family Housing Rev. Bonds (GMF - Stonybrook Apartments), Series 2012-A, 5.50% 2047 (preref. 2022) | | | 540 | | | | 552 | |
| Central Florida Expressway Auth., Rev. Bonds, Series 2019-B, 5.00% 2030 | | | 1,000 | | | | 1,278 | |
| Citizens Property Insurance Corp., Personal Lines Account/Commercial Lines Account Secured Bonds, Series 2012-A-1, 5.00% 2022 | | | 170 | | | | 175 | |
| County of Collier, Water-Sewer Dist., Water and Sewer Rev. Bonds, Series 2021, 5.00% 2030 | | | 655 | | | | 861 | |
| 12 | Private Client Services Funds |
Capital Group Core Municipal Fund
| Bonds, notes & other debt instruments (continued) | | Principal amount
(000) | | | Value
(000) | |
| Florida (continued) | | | | | | | | |
| County of Collier, Water-Sewer Dist., Water and Sewer Rev. Bonds, Series 2021, 5.00% 2031 | | $ | 1,070 | | | $ | 1,433 | |
| Connerton West Community Dev. Dist., Improvement Rev. Ref. Bonds, Series 2018-A-1, Assured Guaranty Municipal insured, 3.00% 2026 | | | 345 | | | | 373 | |
| Connerton West Community Dev. Dist., Improvement Rev. Ref. Bonds, Series 2018-A-1, Assured Guaranty Municipal insured, 3.20% 2027 | | | 355 | | | | 391 | |
| Connerton West Community Dev. Dist., Improvement Rev. Ref. Bonds, Series 2018-A-1, Assured Guaranty Municipal insured, 3.25% 2028 | | | 370 | | | | 412 | |
| Board of Education, Public Education Capital Outlay Rev. Ref. Bonds, Series 2019-D, 5.00% 2023 | | | 120 | | | | 129 | |
| Board of Education, Public Education Capital Outlay Rev. Ref. Bonds, Series 2021-B, 5.00% 2022 | | | 1,000 | | | | 1,028 | |
| Greater Orlando Aviation Auth., Airport Facs. Rev. Bonds, Series 2016-B, 5.00% 2028 | | | 750 | | | | 897 | |
| Higher Educational Facs. Fncg. Auth., Educational Facs. Rev. Ref. Bonds (Nova Southeastern University Project), Series 2012-A, 5.00% 2022 (escrowed to maturity) | | | 1,000 | | | | 1,020 | |
| Higher Educational Facs. Fncg. Auth., Educational Facs. Rev. Ref. Bonds (Nova Southeastern University Project), Series 2016, 5.00% 2026 | | | 655 | | | | 771 | |
| Housing Fin. Corp., Homeowner Mortgage Rev. Bonds, Series 2017-1, 4.00% 2048 | | | 1,110 | | | | 1,182 | |
| Housing Fin. Corp., Homeowner Mortgage Rev. Bonds, Series 2018-1, 4.00% 2049 | | | 1,105 | | | | 1,188 | |
| Housing Fin. Corp., Homeowner Mortgage Rev. Bonds, Series 2018-2, 4.25% 2050 | | | 1,090 | | | | 1,187 | |
| Housing Fin. Corp., Homeowner Mortgage Rev. Bonds, Series 2020-1, 3.50% 2051 | | | 155 | | | | 169 | |
| Housing Fin. Corp., Homeowner Mortgage Rev. Bonds, Series 2021-2, 3.00% 2052 | | | 735 | | | | 795 | |
| Housing Fin. Corp., Homeowner Mortgage Rev. Bonds (Special Program), Series 2015-A, 3.50% 2046 | | | 45 | | | | 46 | |
| Housing Fin. Corp., Multi Family Mortgage Rev. Bonds (Valencia Park Apartments), Series 2021-A, FHA insured, 0.25% 2023 (put 2022) | | | 630 | | | | 629 | |
| JEA, Electric System Rev. Bonds, Series 2014-A-3, 5.00% 2022 | | | 600 | | | | 626 | |
| JEA, Electric System Rev. Bonds, Series 2017-B, 5.00% 2026 | | | 500 | | | | 600 | |
| JEA, Electric System Rev. Bonds, Series 2017-B-3, 5.00% 2026 | | | 340 | | | | 408 | |
| JEA, Electric System Rev. Bonds, Series 2020-A-3, 5.00% 2030 | | | 50 | | | | 64 | |
| JEA, Electric System Rev. Bonds, Series 2021-A, 5.00% 2031 | | | 2,095 | | | | 2,769 | |
| JEA, Electric System Rev. Bonds, Series 2021-A-3, 5.00% 2033 | | | 625 | | | | 826 | |
| JEA, Water and Sewer System Rev. Bonds, Series 2020-A, 5.00% 2033 | | | 50 | | | | 64 | |
| County of Manatee, University Park Recreation Dist., Non-Ad Valorem Assessment Bonds, Series 2019, BAM insured, 2.50% 2024 | | | 280 | | | | 291 | |
| County of Manatee, University Park Recreation Dist., Non-Ad Valorem Assessment Bonds, Series 2019, BAM insured, 2.50% 2025 | | | 285 | | | | 299 | |
| County of Manatee, University Park Recreation Dist., Non-Ad Valorem Assessment Bonds, Series 2019, BAM insured, 2.50% 2026 | | | 295 | | | | 312 | |
| County of Manatee, University Park Recreation Dist., Non-Ad Valorem Assessment Bonds, Series 2019, BAM insured, 2.50% 2027 | | | 300 | | | | 319 | |
| County of Manatee, University Park Recreation Dist., Non-Ad Valorem Assessment Bonds, Series 2019, BAM insured, 2.50% 2028 | | | 305 | | | | 325 | |
| County of Manatee, University Park Recreation Dist., Non-Ad Valorem Assessment Bonds, Series 2019, BAM insured, 2.625% 2029 | | | 315 | | | | 338 | |
| County of Miami-Dade, Aviation Rev. Ref. Bonds, Series 2020-A, 5.00% 2025 | | | 1,150 | | | | 1,342 | |
| County of Miami-Dade, Expressway Auth., Toll System Rev. Bonds, Series 2014-A, BAM insured, 5.00% 2026 | | | 780 | | | | 873 | |
| County of Miami-Dade, Expressway Auth., Toll System Rev. Ref. Bonds, Series 2014-B, BAM insured, 5.00% 2026 | | | 760 | | | | 851 | |
| County of Miami-Dade, Housing Fin. Auth., Multi Family Housing Rev. Bonds (Platform 3750), Series 2021, 0.25% 2024 (put 2021) | | | 510 | | | | 510 | |
| County of Miami-Dade, Housing Fin. Auth., Multi Family Housing Rev. Bonds (Sunset Bay Apartments), Series 2021, 0.25% 2023 (put 2022) | | | 420 | | | | 420 | |
| County of Miami-Dade, Industrial Dev. Auth., Solid Waste Disposal Rev. Bonds (Waste Management, Inc. of Florida Project), Series 2007, 0.45% 2027 (put 2021) | | | 4,090 | | | | 4,090 | |
| County of Miami-Dade, Transit System Sales Surtax Rev. Bonds, Series 2012, 5.00% 2025 (preref. 2022) | | | 25 | | | | 26 | |
| City of Miami Beach, Health Facs. Auth., Hospital Rev. and Rev. Ref. Bonds (Mount Sinai Medical Center of Florida), Series 2014, 5.00% 2027 | | | 145 | | | | 163 | |
| Municipal Power Agcy., All-Requirements Power Supply Project Rev. Ref. Bonds, Series 2016-A, 5.00% 2026 | | | 1,000 | | | | 1,200 | |
| County of Orange, Health Facs. Auth., Health Care Facs. Rev. Ref. Bonds (Presbyterian Retirement Communities Project), Series 2016, 5.00% 2031 | | | 300 | | | | 328 | |
| County of Orange, Housing Fin. Auth., Multi Family Housing Rev. Bonds (Dunwoodie Place Apartments), Series 2021-A, 0.20% 2024 (put 2023) | | | 200 | | | | 200 | |
| County of Orange, Housing Fin. Auth., Multi Family Housing Rev. Bonds (Jernigan Gardens), Series 2020-B, 0.35% 2023 (put 2022) | | | 2,000 | | | | 2,000 | |
| Orlando-Orange County Expressway Auth., Rev. Ref. Bonds, Series 2013-A, 5.00% 2032 (preref. 2023) | | | 1,020 | | | | 1,099 | |
| County of Palm Beach, Health Facs. Auth., Rev. Bonds (Lifespace Communities, Inc.), Series 2015-C, 5.00% 2027 | | | 300 | | | | 340 | |
| County of Polk, Utility System Rev. and Rev. Ref. Bonds, Series 2013, BAM insured, 5.00% 2043 (preref. 2023) | | | 185 | | | | 201 | |
| Private Client Services Funds | 13 |
Capital Group Core Municipal Fund
| Bonds, notes & other debt instruments (continued) | | Principal amount
(000) | | | Value
(000) | |
| Florida (continued) | | | | | | | | |
| City of Pompano Beach, Rev. Bonds (John Knox Village Project), Series 2015, 5.00% 2023 | | $ | 630 | | | $ | 674 | |
| Counties of St. Johns and Duval, Tolomato Community Dev. Dist., Rev. Ref. Bonds, Series 2018-A-1, Assured Guaranty Municipal insured, 2.625% 2024 | | | 1,065 | | | | 1,114 | |
| County of St. Johns, Sweetwater Creek Community Dev. Dist., Capital Improvement Rev. Ref. Bonds, Series 2019-A-1, Assured Guaranty Municipal insured, 2.00% 2022 | | | 340 | | | | 342 | |
| City of South Miami, Health Facs. Auth., Hospital Rev. Ref. Bonds (Baptist Health South Florida Obligated Group), Series 2017, 5.00% 2024 | | | 500 | | | | 562 | |
| City of Tallahassee, Energy System Rev. Ref. Bonds, Series 2020, 5.00% 2028 | | | 1,000 | | | | 1,262 | |
| City of Tampa, Hospital Rev. Bonds (H. Lee Moffitt Cancer Center Project), Series 2020-B, 5.00% 2028 | | | 215 | | | | 268 | |
| City of Tampa, Hospital Rev. Bonds (H. Lee Moffitt Cancer Center Project), Series 2020-B, 5.00% 2029 | | | 250 | | | | 318 | |
| City of Tampa, Hospital Rev. Bonds (H. Lee Moffitt Cancer Center Project), Series 2020-B, 5.00% 2030 | | | 260 | | | | 336 | |
| Dept. of Transportation, Right-of-Way Acquisition and Bridge Construction Bonds, Series 2019-B, 5.00% 2028 | | | 1,000 | | | | 1,260 | |
| Dept. of Transportation Fncg. Corp., Rev. Bonds, Series 2020, 5.00% 2024 | | | 430 | | | | 483 | |
| City of Winter Garden, Winter Garden Village at Fowler Groves Community Dev. Dist., Special Assessment Rev. Ref. Bonds, Series 2016, 3.00% 2024 | | | 530 | | | | 543 | |
| | | | | | | | 43,370 | |
| | | | | | | | | |
| Georgia 2.50% | | | | | | | | |
| County of Appling, Dev. Auth., Pollution Control Rev. Bonds (Oglethorpe Power Corp. Scherer Project), Series 2013-A, 1.50% 2038 (put 2025) | | | 885 | | | | 907 | |
| City of Atlanta, Urban Residential Fin. Auth., Multi Family Housing Rev. Bonds (Sylvan Hills Senior Apartments Project), Series 2020, 0.41% 2025 (put 2023) | | | 285 | | | | 285 | |
| County of Burke, Dev. Auth., Pollution Control Rev. Bonds (Georgia Power Co. Plant Vogtle Project), Series 2013, 2.925% 2053 (put 2024) | | | 600 | | | | 632 | |
| County of Burke, Dev. Auth., Pollution Control Rev. Bonds (Oglethorpe Power Corp. Vogtle Project), Series 2013-A, 1.50% 2040 (put 2025) | | | 685 | | | | 702 | |
| City of Columbus, Dev. Auth., Multi Family Housing Rev. Bonds (Highland Terrace Phase II Project), Series 2021-B, 0.34% 2025 (put 2024) | | | 425 | | | | 424 | |
| County of Dawson, Dev. Auth., Multi Family Housing Rev. Bonds (Peaks of Dawsonville Project), Series 2021, 0.28% 2023 | | | 250 | | | | 249 | |
| County of Dekalb, Housing Auth., Multi Family Housing Rev. Bonds (Columbia Village Project), Series 2021-A, 0.34% 2024 (put 2023) | | | 140 | | | | 140 | |
| G.O. Bonds, Series 2020-A, 5.00% 2023 | | | 160 | | | | 173 | |
| G.O. Bonds, Series 2020-A, 5.00% 2029 | | | 1,875 | | | | 2,434 | |
| Housing and Fin. Auth., Single Family Mortgage Bonds, Series 2014-A-1, 4.00% 2044 | | | 225 | | | | 232 | |
| Housing and Fin. Auth., Single Family Mortgage Bonds, Series 2015-A-1, 3.50% 2045 | | | 160 | | | | 167 | |
| Housing and Fin. Auth., Single Family Mortgage Bonds, Series 2017-A, 4.00% 2047 | | | 405 | | | | 431 | |
| Main Street Natural Gas, Inc., Gas Supply Rev. Bonds, Series 2018-D, (3-month USD-LIBOR x 0.67 + 0.83%) 0.885% 2048 (put 2023)2 | | | 155 | | | | 156 | |
| Main Street Natural Gas, Inc., Gas Supply Rev. Bonds, Series 2019-B, 4.00% 2049 (put 2024) | | | 980 | | | | 1,078 | |
| Main Street Natural Gas, Inc., Gas Supply Rev. Bonds, Series 2019-C, 4.00% 2050 (put 2026) | | | 1,500 | | | | 1,708 | |
| Main Street Natural Gas, Inc., Gas Supply Rev. Bonds, Series 2021-C, 4.00% 2052 (put 2028) | | | 3,305 | | | | 3,872 | |
| Metropolitan Atlanta Rapid Transit Auth., Sales Tax Rev. Ref. Bonds (Third Indenture Series), Series 2012-A, 5.00% 2030 (preref. 2022) | | | 630 | | | | 650 | |
| Municipal Electric Auth., General Resolution Projects Bonds, Series 2021-A, 5.00% 2031 | | | 415 | | | | 533 | |
| Municipal Electric Auth., Plant Vogtle Units 3 and 4 Project J Bonds, Series 2021-A, Assured Guaranty Municipal insured, 5.00% 2029 | | | 495 | | | | 624 | |
| Municipal Electric Auth., Plant Vogtle Units 3 and 4 Project J Bonds, Series 2021-A, Assured Guaranty Municipal insured, 5.00% 2030 | | | 430 | | | | 550 | |
| Municipal Electric Auth., Plant Vogtle Units 3 and 4 Project M Bonds, Series 2019-A, 5.00% 2029 | | | 120 | | | | 149 | |
| Municipal Electric Auth., Plant Vogtle Units 3 and 4 Project M Bonds, Series 2019-A, 5.00% 2030 | | | 115 | | | | 142 | |
| Municipal Electric Auth., Project One Bonds, Series 2019-A, 5.00% 2024 | | | 1,000 | | | | 1,098 | |
| Municipal Electric Auth., Project One Bonds, Series 2019-A, 5.00% 2029 | | | 870 | | | | 1,085 | |
| Municipal Electric Auth., Project One Bonds, Series 2021-A, 5.00% 2031 | | | 785 | | | | 1,008 | |
| Northwest Georgia Housing Auth., Multi Family Housing Rev. Bonds (Dallas Manor Apartments Project), Series 2021, 0.25% 2024 (put 2023) | | | 120 | | | | 120 | |
| Private Colleges and Universities Auth., Rev. Bonds (The Savannah College of Art and Design Projects), Series 2021, 5.00% 2030 | | | 80 | | | | 102 | |
| | | | | | | | 19,651 | |
| 14 | Private Client Services Funds |
Capital Group Core Municipal Fund
| Bonds, notes & other debt instruments (continued) | | Principal amount
(000) | | | Value
(000) | |
| Guam 0.06% | | | | | | | | |
| Waterworks Auth., Water and Wastewater System Rev. Bonds, Series 2013, 5.25% 2024 | | $ | 450 | | | $ | 482 | |
| | | | | | | | | |
| Hawaii 0.17% | | | | | | | | |
| Airports System Rev. Bonds, Series 2018-D, 5.00% 2030 | | | 1,000 | | | | 1,294 | |
| | | | | | | | | |
| Idaho 0.13% | | | | | | | | |
| Housing and Fin. Assn., Grant and Rev. Anticipation Bonds (Federal Highway Trust Fund), Series 2015-A, 5.00% 2022 | | | 1,000 | | | | 1,033 | |
| | | | | | | | | |
| Illinois 6.34% | | | | | | | | |
| Build Illinois Bonds, Sales Tax Rev. Ref. Bonds, Series 2016-D, 5.00% 2025 | | | 350 | | | | 403 | |
| City of Chicago, Board of Education, Unlimited Tax G.O. Bonds (Dedicated Rev.), Series 2018-A, Assured Guaranty Municipal insured, 5.00% 2023 | | | 1,100 | | | | 1,202 | |
| City of Chicago, Chicago Midway Airport, Rev. and Rev. Ref. Bonds, Series 2014-B, 5.00% 2028 | | | 500 | | | | 548 | |
| City of Chicago, G.O. Rev. Ref. Bonds, Series 2020-A, 5.00% 2022 | | | 400 | | | | 403 | |
| City of Chicago, G.O. Rev. Ref. Bonds, Series 2020-A, 5.00% 2023 | | | 560 | | | | 589 | |
| City of Chicago, Transit Auth., Capital Grant Receipts Rev. Ref. Bonds (Federal Transit Administration Section 5307 Urbanized Area Formula Funds), Series 2021, 5.00% 2024 | | | 65 | | | | 72 | |
| City of Chicago, Wastewater Transmission Rev. Bonds, Series 2012, Assured Guaranty Municipal insured, 5.00% 2023 | | | 500 | | | | 504 | |
| City of Chicago, Wastewater Transmission Rev. Project Bonds, Series 2014, 5.00% 2028 | | | 385 | | | | 421 | |
| City of Chicago, Water Rev. Bonds, Series 2004, 5.00% 2023 | | | 200 | | | | 218 | |
| City of Chicago, Water Rev. Ref. Bonds, Series 2004, 5.00% 2021 | | | 1,895 | | | | 1,895 | |
| City of Chicago, Water Rev. Ref. Bonds, Series 2014, 5.00% 2023 | | | 200 | | | | 218 | |
| City of Chicago, Water Rev. Ref. Bonds, Series 2017, 5.00% 2028 | | | 355 | | | | 438 | |
| County of Cook, Community College Dist. No. 508 (City Colleges of Chicago), Unlimited Tax G.O. Bonds, Series 2013, 5.00% 2023 | | | 200 | | | | 216 | |
| Fin. Auth., Academic Fac. Lease Rev. Bonds (Provident Group - UIUC Properties LLC - University of Illinois at Urbana-Champaign Project), Series 2019-A, 5.00% 2025 | | | 110 | | | | 128 | |
| Fin. Auth., Academic Fac. Lease Rev. Bonds (Provident Group - UIUC Properties LLC - University of Illinois at Urbana-Champaign Project), Series 2019-A, 5.00% 2027 | | | 500 | | | | 611 | |
| Fin. Auth., Academic Fac. Lease Rev. Bonds (Provident Group - UIUC Properties LLC - University of Illinois at Urbana-Champaign Project), Series 2019-A, 5.00% 2028 | | | 400 | | | | 499 | |
| Fin. Auth., Rev. Bonds (Advocate Health Care Network), Series 2008-A-1, 4.00% 2030 | | | 1,000 | | | | 1,119 | |
| Fin. Auth., Rev. Bonds (Art Institute of Chicago), Series 2016, 5.00% 2025 | | | 125 | | | | 143 | |
| Fin. Auth., Rev. Bonds (Art Institute of Chicago), Series 2016, 5.00% 2026 | | | 120 | | | | 141 | |
| Fin. Auth., Rev. Bonds (Clean Water Initiative Revolving Fund), Series 2017, 5.00% 2033 | | | 500 | | | | 600 | |
| Fin. Auth., Rev. Bonds (Lifespace Communities, Inc.), Series 2015-A, 5.00% 2027 | | | 590 | | | | 668 | |
| Fin. Auth., Rev. Bonds (Northshore University Heathsystem), Series 2020-A, 5.00% 2029 | | | 1,000 | | | | 1,281 | |
| Fin. Auth., Rev. Bonds (Northshore University Heathsystem), Series 2020-A, 5.00% 2033 | | | 280 | | | | 361 | |
| Fin. Auth., Rev. Bonds (OSF Healthcare System), Series 2015-A, 5.00% 2027 | | | 250 | | | | 290 | |
| Fin. Auth., Rev. Bonds (OSF Healthcare System), Series 2020-B-2, 5.00% 2050 (put 2026) | | | 105 | | | | 124 | |
| Fin. Auth., Rev. Bonds (Presbyterian Homes Obligated Group), Series 2016-A, 5.00% 2024 | | | 310 | | | | 343 | |
| Fin. Auth., Rev. Bonds (Presbyterian Homes Obligated Group), Series 2021-B, (SIFMA Municipal Swap Index + 0.70%) 0.75% 2042 (put 2026)2 | | | 140 | | | | 140 | |
| Fin. Auth., Rev. Bonds (Presence Health Network), Series 2016-C, 5.00% 2026 | | | 600 | | | | 710 | |
| Fin. Auth., Rev. Bonds (Presence Health Network), Series 2016-C, 5.00% 2028 | | | 400 | | | | 484 | |
| Fin. Auth., Rev. Bonds (Rush University Medical Center Obligated Group), Series 2015-A, 5.00% 2021 | | | 500 | | | | 501 | |
| Fin. Auth., Rev. Bonds (Rush University Medical Center Obligated Group), Series 2015-A, 5.00% 2028 | | | 1,000 | | | | 1,148 | |
| Fin. Auth., Rev. Bonds (Rush University Medical Center Obligated Group), Series 2015-A, 5.00% 2029 | | | 500 | | | | 573 | |
| Fin. Auth., Rev. Bonds (The Carle Foundation), Series 2021-A, 5.00% 2029 | | | 800 | | | | 1,022 | |
| Fin. Auth., Rev. Bonds (The Carle Foundation), Series 2021-A, 5.00% 2030 | | | 360 | | | | 468 | |
| Fin. Auth., Rev. Bonds (University of Chicago), Series 2021-A, 5.00% 2025 | | | 270 | | | | 316 | |
| Fin. Auth., Rev. Ref. Bonds (Northwestern Memorial Healthcare), Series 2021-A, 5.00% 2032 | | | 510 | | | | 676 | |
| Fin. Auth., Rev. Ref. Bonds (Northwestern Memorial Healthcare), Series 2021-A, 5.00% 2033 | | | 365 | | | | 482 | |
| Fin. Auth., Rev. Ref. Bonds (OSF Healthcare System), Series 2015-A, 5.00% 2026 | | | 770 | | | | 895 | |
| Fin. Auth., Water Facs. Rev. Ref. Bonds (American Water Capital Corp. Project), Series 2020, 0.70% 2040 (put 2023) | | | 215 | | | | 215 | |
| G.O. Bonds, Series 2017-D, BAM insured, 5.00% 2021 | | | 1,150 | | | | 1,150 | |
| G.O. Bonds, Series 2017-A, 5.00% 2021 | | | 500 | | | | 502 | |
| G.O. Bonds, Series 2016, 5.00% 2022 | | | 130 | | | | 131 | |
| Private Client Services Funds | 15 |
Capital Group Core Municipal Fund
| Bonds, notes & other debt instruments (continued) | | Principal amount
(000) | | | Value
(000) | |
| Illinois (continued) | | | | | | | | |
| G.O. Bonds, Series 2014, 5.00% 2022 | | $ | 110 | | | $ | 113 | |
| G.O. Bonds, Series 2017-D, 5.00% 2027 | | | 205 | | | | 246 | |
| G.O. Bonds, Series 2020-B, 5.00% 2029 | | | 2,090 | | | | 2,577 | |
| G.O. Rev. Ref. Bonds, Series 2016, 5.00% 2022 | | | 215 | | | | 218 | |
| Housing Dev. Auth., Multi Family Housing Rev. Bonds, Series 2021-C, 0.80% 2026 | | | 40 | | | | 40 | |
| Housing Dev. Auth., Multi Family Housing Rev. Bonds (Concord Commons), Series 2021, 0.25% 2024 (put 2023) | | | 810 | | | | 810 | |
| Housing Dev. Auth., Multi Family Housing Rev. Bonds (Marshall Field Garden Apartment Homes), Series 2015, (SIFMA Municipal Swap Index + 1.00%) 1.05% 2050 (put 2025)2 | | | 2,000 | | | | 2,043 | |
| Housing Dev. Auth., Rev. Bonds, Series 2019-A, 4.25% 2049 | | | 1,605 | | | | 1,770 | |
| Housing Dev. Auth., Rev. Bonds, Series 2021-D, 3.00% 2051 | | | 1,665 | | | | 1,798 | |
| Board of Trustees of Illinois State University, Auxiliary Facs. System Rev. Bonds, Series 2016, Assured Guaranty Municipal insured, 5.00% 2022 | | | 1,465 | | | | 1,493 | |
| Metropolitan Pier and Exposition Auth., McCormick Place Expansion Project Rev. Ref. Bonds, Series 2017-B, 5.00% 2025 | | | 225 | | | | 262 | |
| Municipal Electric Agcy., Power Supply System Rev. Ref. Bonds, Series 2015-A, 5.00% 2027 | | | 1,000 | | | | 1,160 | |
| Railsplitter Tobacco Settlement Auth., Tobacco Settlement Rev. Bonds, Series 2017, 5.00% 2023 | | | 620 | | | | 665 | |
| Sales Tax Securitization Corp., Sales Tax Rev. Ref. Bonds, Series 2017-A, 5.00% 2024 | | | 1,000 | | | | 1,095 | |
| Sales Tax Securitization Corp., Sales Tax Securitization Bonds, Series 2020-A, BAM insured, 5.00% 2027 | | | 1,000 | | | | 1,201 | |
| Sales Tax Securitization Corp., Sales Tax Securitization Rev. Ref. Bonds, Series 2017-A, 5.00% 2023 | | | 2,000 | | | | 2,110 | |
| Toll Highway Auth., Toll Highway Rev. Bonds, Series 2019-C, 5.00% 2025 | | | 1,180 | | | | 1,346 | |
| Toll Highway Auth., Toll Highway Rev. Bonds, Series 2015-A, 5.00% 2027 | | | 1,250 | | | | 1,448 | |
| Toll Highway Auth., Toll Highway Rev. Bonds, Series 2015-A, 5.00% 2028 | | | 1,110 | | | | 1,283 | |
| Toll Highway Auth., Toll Highway Rev. Bonds, Series 2019-C, 5.00% 2029 | | | 440 | | | | 555 | |
| Toll Highway Auth., Toll Highway Rev. Ref. Bonds, Series 2019-A, 5.00% 2024 | | | 500 | | | | 549 | |
| Toll Highway Auth., Toll Highway Rev. Ref. Bonds, Series 2019-A, 5.00% 2025 | | | 740 | | | | 844 | |
| Toll Highway Auth., Toll Highway Rev. Ref. Bonds, Series 2019-A, 5.00% 2028 | | | 635 | | | | 784 | |
| Board of Trustees of the University of Illinois, Auxiliary Facs. System Rev. Bonds, Series 2018-A, 5.00% 2025 | | | 135 | | | | 155 | |
| Board of Trustees of the University of Illinois, Auxiliary Facs. System Rev. Bonds, Series 2020-A, 5.00% 2028 | | | 1,000 | | | | 1,239 | |
| Board of Trustees of the University of Illinois, Auxiliary Facs. System Rev. Ref. Bonds, Series 2005-A, National insured, 5.50% 2023 | | | 500 | | | | 537 | |
| Board of Trustees of the University of Illinois, Auxiliary Facs. System Rev. Ref. Bonds, Series 2015-A, 5.00% 2026 | | | 500 | | | | 572 | |
| Board of Trustees of the University of Illinois, Rev. Ref. Certs. of Part., Series 2008-A, Assured Guaranty Municipal insured, 5.25% 2024 | | | 30 | | | | 30 | |
| | | | | | | | 49,791 | |
| | | | | | | | | |
| Indiana 1.41% | | | | | | | | |
| Fin. Auth., Health System Rev. Bonds (Indiana University Health), Series 2019-C, 5.00% 2022 | | | 140 | | | | 147 | |
| Fin. Auth., Hospital Rev. Bonds (Community Health Network Project), Series 2012-A, 5.00% 2042 (preref. 2023) | | | 1,165 | | | | 1,247 | |
| Fin. Auth., Rev. Bonds (Community Foundation of Northwest Indiana Obligated Group), Series 2012, 5.00% 2030 (preref. 2022) | | | 515 | | | | 523 | |
| Fin. Auth., State Revolving Fund Program Green Bonds, Series 2019-E, 5.00% 2022 | | | 750 | | | | 759 | |
| Fin. Auth., State Revolving Fund Program Green Bonds, Series 2021-B, 5.00% 2028 | | | 575 | | | | 715 | |
| Fin. Auth., Wastewater Utility Rev. Ref. Bonds, Series 2021-2, 5.00% 2022 | | | 130 | | | | 136 | |
| Fin. Auth., Wastewater Utility Rev. Ref. Bonds, Series 2021-1, 5.00% 2023 | | | 275 | | | | 300 | |
| Fin. Auth., Wastewater Utility Rev. Ref. Bonds, Series 2021-2, 5.00% 2023 | | | 85 | | | | 93 | |
| Fin. Auth., Wastewater Utility Rev. Ref. Bonds, Series 2021-2, 5.00% 2027 | | | 335 | | | | 413 | |
| City of Franklin, Econ. Dev. and Rev. Ref. Bonds (Otterbein Homes Obligated Group), Series 2019-B, 5.00% 2023 | | | 30 | | | | 32 | |
| Health Fac. Fncg. Auth., Rev. Bonds (Ascension Health Subordinate Credit Group), Series 2005-A-1, 4.00% 2023 | | | 80 | | | | 86 | |
| Housing and Community Dev. Auth., Collateralized Rev. Bonds (RD Moving Forward Justus Project), Series 2021, 0.33% 2024 (put 2023) | | | 710 | | | | 709 | |
| Housing and Community Dev. Auth., Single Family Mortgage Rev. Bonds, Series 2019-A, 4.25% 2048 | | | 1,825 | | | | 1,991 | |
| Housing and Community Dev. Auth., Single Family Mortgage Rev. Bonds, Series 2020-A, 3.75% 2049 | | | 160 | | | | 174 | |
| Housing and Community Dev. Auth., Single Family Mortgage Rev. Bonds, Series 2021-B, 3.00% 2050 | | | 110 | | | | 118 | |
| Housing and Community Dev. Auth., Single Family Mortgage Rev. Bonds, Series 2021-C-1, 3.00% 2052 | | | 355 | | | | 385 | |
| City of Indianapolis, Local Public Improvement Bond Bank Bonds (Indianapolis Airport Auth. Project), Series 2019-I-2, 5.00% 2026 | | | 340 | | | | 401 | |
| City of Indianapolis, Local Public Improvement Bond Bank Bonds (Indianapolis Airport Auth. Project), Series 2019-I-2, 5.00% 2027 | | | 330 | | | | 399 | |
| City of Indianapolis, Local Public Improvement Bond Bank Bonds (Indianapolis Airport Auth. Project), Series 2019-I-2, 5.00% 2028 | | | 435 | | | | 537 | |
| 16 | Private Client Services Funds |
Capital Group Core Municipal Fund
| Bonds, notes & other debt instruments (continued) | | Principal amount
(000) | | | Value
(000) | |
| Indiana (continued) | | | | | | | | |
| City of Indianapolis, Local Public Improvement Bond Bank Bonds (Indianapolis Airport Auth. Project), Series 2019-I-2, 5.00% 2029 | | $ | 265 | | | $ | 333 | |
| City of Indianapolis, Local Public Improvement Bond Bank Bonds (Indianapolis Airport Auth. Project), Series 2019-I-2, 5.00% 2030 | | | 435 | | | | 558 | |
| City of Kokomo, Multi Family Housing Rev. Bonds (KHA RAD I Apartments), Series 2021-A, 0.56% 2025 (put 2024) | | | 1,030 | | | | 1,030 | |
| | | | | | | | 11,086 | |
| | | | | | | | | |
| Iowa 0.35% | | | | | | | | |
| Fin. Auth., Rev. Bonds (Lifespace Communities, Inc.), Series 2019-A-2, 2.875% 2049 | | | 15 | | | | 15 | |
| Fin. Auth., Single Family Mortgage Bonds (Mortgage-Backed Securities Program), Series 2019-A, 4.00% 2047 | | | 835 | | | | 929 | |
| Fin. Auth., Single Family Mortgage Bonds (Mortgage-Backed Securities Program), Series 2019-D, 3.50% 2049 | | | 25 | | | | 27 | |
| PEFA, Inc., Gas Project Rev. Bonds, Series 2019, 5.00% 2049 (put 2026) | | | 1,000 | | | | 1,183 | |
| Tobacco Settlement Auth., Tobacco Settlement Asset-Backed Bonds, Series 2021-A-2, 5.00% 2031 | | | 320 | | | | 420 | |
| Tobacco Settlement Auth., Tobacco Settlement Asset-Backed Bonds, Series 2021-A-2, 5.00% 2033 | | | 135 | | | | 175 | |
| | | | | | | | 2,749 | |
| | | | | | | | | |
| Kansas 0.15% | | | | | | | | |
| Turnpike Auth., Rev. Ref. Bonds, Series 2020-A, 3.00% 2025 | | | 950 | | | | 1,040 | |
| Unified Government of Wyandotte County, Board of Public Utilities, Utility System Improvement Rev. Bonds, Series 2012-B, 5.00% 2026 (preref. 2022) | | | 110 | | | | 114 | |
| | | | | | | | 1,154 | |
| | | | | | | | | |
| Kentucky 0.97% | | | | | | | | |
| County of Carroll, Environmental Facs. Rev. Bonds, Series 2008-A, 2.00% 2032 | | | 725 | | | | 738 | |
| Econ. Dev. Fin. Auth., Health System Rev. Bonds (Norton Healthcare, Inc.), Capital Appreciation Bonds, Series 2000-B, National insured, 0% 2027 | | | 1,000 | | | | 894 | |
| Housing Corp., Multi Family Housing Rev. Bonds (Cambridge Square Project), Series 2021, 0.30% 2024 (put 2024) | | | 365 | | | | 364 | |
| Housing Corp., Multi Family Housing Rev. Bonds (New Hope Properties Portfolio Project), Series 2021, 0.41% 2024 (put 2023) | | | 1,575 | | | | 1,576 | |
| Housing Corp., Multi Family Housing Rev. Bonds (Winterwood II Rural Housing Portfolio), Series 2021, 0.37% 2024 (put 2023) | | | 635 | | | | 635 | |
| County of Owen, Water Facs. Rev. Ref. Bonds (Kentucky - American Water Co. Project), Series 2019, 2.45% 2039 (put 2029) | | | 750 | | | | 795 | |
| Property and Buildings Commission, Commonwealth Rev. Ref. Bonds (Project No. 125), Series 2021-A, 5.00% 2022 | | | 170 | | | | 177 | |
| Public Energy Auth., Gas Supply Rev. Bonds, Series 2018-A, 4.00% 2048 (put 2024) | | | 410 | | | | 441 | |
| Public Energy Auth., Gas Supply Rev. Bonds, Series 2019-A-1, 4.00% 2049 (put 2025) | | | 1,180 | | | | 1,308 | |
| Public Energy Auth., Gas Supply Rev. Bonds, Series 2018-B, 4.00% 2049 (put 2025) | | | 185 | | | | 203 | |
| Turnpike Auth., Econ. Dev. Road Rev. Ref. Bonds (Revitalization Projects), Series 2022-A, 5.00% 2031 | | | 270 | | | | 346 | |
| County of Warren, Hospital Rev. Ref. Bonds (Bowling Green - Warren County Community Hospital Corp.), Series 2021-A, 5.00% 2022 | | | 135 | | | | 138 | |
| | | | | | | | 7,615 | |
| | | | | | | | | |
| Louisiana 2.04% | | | | | | | | |
| Parish of East Baton Rouge, Road and Street Improvement Sales Tax Rev. Ref. Bonds, Series 2020, Assured Guaranty Municipal insured, 5.00% 2022 | | | 85 | | | | 88 | |
| Parish of East Baton Rouge, Road and Street Improvement Sales Tax Rev. Ref. Bonds, Series 2020, Assured Guaranty Municipal insured, 5.00% 2026 | | | 1,250 | | | | 1,496 | |
| Parish of East Baton Rouge, Sewerage Commission, Multi Modal Rev. Ref. Bonds, Series 2021-A, 1.30% 2041 (put 2028) | | | 1,270 | | | | 1,287 | |
| Parish of East Baton Rouge, Sewerage Commission, Rev. Ref. Bonds, Series 2020-A, 5.00% 2026 | | | 1,135 | | | | 1,337 | |
| Gasoline and Fuels Tax Rev. Ref. Bonds, Series 2017-D-1, 0.60% 2043 (put 2023) | | | 2,000 | | | | 2,001 | |
| Grant Anticipation Rev. Bonds, Series 2021, 5.00% 2023 | | | 335 | | | | 364 | |
| Housing Corp., Multi Family Housing Rev. Bonds (Arbours at Lafayette Project), Series 2021, 0.35% 2024 (put 2023) | | | 375 | | | | 375 | |
| Housing Corp., Multi Family Housing Rev. Bonds (Mabry Place Townhomes Project), Series 2021, 0.31% 2024 (put 2023) | | | 215 | | | | 214 | |
| Housing Corp., Single Family Mortgage Rev. Bonds (Home Ownership Program), Series 2021-B, 3.00% 2051 | | | 755 | | | | 813 | |
| Private Client Services Funds | 17 |
Capital Group Core Municipal Fund
| Bonds, notes & other debt instruments (continued) | | Principal amount
(000) | | | Value
(000) | |
| Louisiana (continued) | | | | | | | | |
| Parish of Jefferson, Sales Tax Rev. Ref. Bonds, Series 2019-B, Assured Guaranty Municipal insured, 5.00% 2027 | | $ | 1,000 | | | $ | 1,235 | |
| Local Government Environmental Facs. and Community Dev. Auth., Rev. Ref. Bonds (Entergy Louisiana, LLC Projects), Series 2021-A, 2.00% 2030 | | | 105 | | | | 106 | |
| Louisiana Stadium and Exposition Dist., Rev. Ref. Bonds, Series 2013-A, 5.00% 2022 | | | 1,500 | | | | 1,547 | |
| Offshore Terminal Auth., Deepwater Port Rev. Bonds (Loop LLC Project), Series 2007-A, 1.65% 2027 (put 2023) | | | 905 | | | | 923 | |
| Public Facs. Auth., Hospital Rev. Ref. Bonds (Lafayette General Health System Project), Series 2016-A, 5.00% 2041 (preref. 2025) | | | 1,000 | | | | 1,177 | |
| Parish of St. Charles, Gulf Opportunity Zone Rev. Bonds (Valero Project), Series 2010, 4.00% 2040 (put 2022) | | | 2,000 | | | | 2,042 | |
| Parish of St. John the Baptist, Rev. Ref. Bonds (Marathon Oil Corp. Project), Series 2017-B-1, 2.125% 2037 (put 2024) | | | 285 | | | | 294 | |
| City of Shreveport, Water and Sewer Rev. Bonds, Series 2019-B, Assured Guaranty Municipal insured, 3.00% 2022 | | | 115 | | | | 118 | |
| City of Shreveport, Water and Sewer Rev. Bonds, Series 2019-B, Assured Guaranty Municipal insured, 4.00% 2023 | | | 105 | | | | 112 | |
| City of Shreveport, Water and Sewer Rev. Bonds, Series 2019-B, Assured Guaranty Municipal insured, 5.00% 2024 | | | 80 | | | | 91 | |
| City of Shreveport, Water and Sewer Rev. Bonds, Series 2019-B, Assured Guaranty Municipal insured, 4.00% 2025 | | | 145 | | | | 163 | |
| City of Shreveport, Water and Sewer Rev. Bonds, Series 2019-B, Assured Guaranty Municipal insured, 5.00% 2026 | | | 140 | | | | 169 | |
| Tobacco Settlement Fncg. Corp., Tobacco Settlement Asset-Backed Rev. Ref. Bonds, Series 2013-A, 5.00% 2023 | | | 90 | | | | 96 | |
| | | | | | | | 16,048 | |
| | | | | | | | | |
| Maine 0.05% | | | | | | | | |
| Housing Auth., Mortgage Purchase Bonds, Series 2017-A, 4.00% 2047 | | | 355 | | | | 376 | |
| | | | | | | | | |
| Maryland 1.16% | | | | | | | | |
| Community Dev. Administration, Dept. of Housing and Community Dev., Multi Family Housing Dev. Rev. Bonds (Somerset Extension), Series 2019-H, 1.795% 2022 | | | 215 | | | | 216 | |
| Community Dev. Administration, Dept. of Housing and Community Dev., Residential Rev. Bonds, Series 2014-C, 4.00% 2044 | | | 235 | | | | 247 | |
| Community Dev. Administration, Dept. of Housing and Community Dev., Residential Rev. Bonds, Series 2018-A, 4.50% 2048 | | | 1,760 | | | | 1,961 | |
| G.O. Rev. Ref. Bonds, State and Local Facs. Loan of 2021, Series 2022-D-2, 4.00% 2029 | | | 585 | | | | 694 | |
| County of Montgomery, Housing Opportunities Commission, Single Family Housing Rev. Bonds, Series 2017-A, 4.00% 2048 | | | 565 | | | | 606 | |
| County of Montgomery, Housing Opportunities Commission, Single Family Housing Rev. Bonds, Series 2018-A, 4.00% 2049 | | | 1,510 | | | | 1,628 | |
| County of Prince George, Certs. of Part. (Behavioral Health Fac. and Capital Equipment), Series 2021, 5.00% 2024 | | | 165 | | | | 187 | |
| Transportation Auth., Transportation Facs. Projects Rev. Bonds, Series 2020. 5.00% 2033 | | | 745 | | | | 968 | |
| Washington Suburban Sanitary Dist., Consolidated Public Improvement Bonds, Series 2021, 5.00% 2030 | | | 2,000 | | | | 2,625 | |
| | | | | | | | 9,132 | |
| | | | | | | | | |
| Massachusetts 0.38% | | | | | | | | |
| Dev. Fin. Agcy., Multi Family Housing Rev. Bonds (Salem Heights II Preservation Associates LP Issue), Series 2021-B, 0.25% 2024 (put 2023) | | | 180 | | | | 179 | |
| Dev. Fin. Agcy., Rev. Bonds (Williams College Issue), Series 2011-N, 0.45% 2041 (put 2025) | | | 150 | | | | 149 | |
| Dev. Fin. Agcy., Rev. Ref. Bonds (Berkshire Health Systems Issue), Series 2021-I, 5.00% 2024 | | | 615 | | | | 696 | |
| Housing Fin. Agcy., Housing Green Bonds, Series 2021-A-2, 0.30% 2023 | | | 50 | | | | 50 | |
| Housing Fin. Agcy., Housing Green Bonds, Series 2021-A-2, 0.40% 2024 | | | 65 | | | | 65 | |
| Housing Fin. Agcy., Housing Green Bonds, Series 2021-B-2, 0.75% 2025 | | | 55 | | | | 55 | |
| Housing Fin. Agcy., Single Family Housing Rev. Bonds, Series 169, 4.00% 2044 | | | 165 | | | | 169 | |
| Housing Fin. Agcy., Single Family Housing Rev. Bonds, Series 172, 4.00% 2045 | | | 310 | | | | 322 | |
| Transportation Fund Rev. Ref. Bonds, Series 2021-A, 5.00% 2029 | | | 1,000 | | | | 1,289 | |
| | | | | | | | 2,974 | |
| | | | | | | | | |
| Michigan 3.00% | | | | | | | | |
| City of Detroit, Water and Sewerage Dept., Sewage Disposal System Rev. and Rev. Ref. Bonds, Series 2012-A, 5.00% 2032 (preref. 2022) | | | 185 | | | | 191 | |
| Fin. Auth., Hospital Rev. and Rev. Ref. Bonds (Trinity Health Credit Group), Series 2017-A, 5.00% 2047 (preref. 2022) | | | 2,555 | | | | 2,688 | |
| Fin. Auth., Hospital Rev. Ref. Bonds (McLaren Health Care), Series 2015-D-1, 0.25% 2022 | | | 40 | | | | 40 | |
| Fin. Auth., Local Government Loan Program Rev. Bonds (Detroit Water and Sewerage Dept., Sewage Disposal System Rev. Ref. Local Project Bonds), Series 2015-C, 5.00% 2027 | | | 250 | | | | 289 | |
| 18 | Private Client Services Funds |
Capital Group Core Municipal Fund
| Bonds, notes & other debt instruments (continued) | | Principal amount
(000) | | | Value
(000) | |
| Michigan (continued) | | | | | | | | |
| Fin. Auth., Tobacco Settlement Asset-Backed Bonds, Series 2020-A-1, 5.00% 2026 | | $ | 105 | | | $ | 124 | |
| Fin. Auth., Tobacco Settlement Asset-Backed Bonds, Series 2020-A, 5.00% 2028 | | | 1,000 | | | | 1,242 | |
| Fin. Auth., Tobacco Settlement Asset-Backed Bonds, Series 2020-A-1, 5.00% 2029 | | | 205 | | | | 260 | |
| Great Lakes Water Auth., Water Supply System Rev. Bonds, Series 2020-B, 5.00% 2032 | | | 500 | | | | 645 | |
| Hospital Fin. Auth., Hospital Rev. Bonds (Trinity Health Credit Group), Series 2009-B, 5.00% 2048 (preref. 2022) | | | 615 | | | | 632 | |
| Hospital Fin. Auth., Hospital Rev. Ref. Bonds (Trinity Health Credit Group), Series 2008-C, 5.00% 2021 | | | 650 | | | | 653 | |
| Hospital Fin. Auth., Hospital Rev. Ref. Bonds (Trinity Health Credit Group), Series 2008-C, 5.00% 2022 | | | 475 | | | | 500 | |
| Hospital Fin. Auth., Hospital Rev. Ref. Bonds (Trinity Health Credit Group), Series 2012-C, 5.00% 2026 (preref. 2022) | | | 400 | | | | 411 | |
| Housing Dev. Auth., Multi Family Housing Rev. Bonds, Series 2020, 0.32% 2023 (put 2022) | | | 1,000 | | | | 1,001 | |
| Housing Dev. Auth., Rental Housing Rev. Bonds, Series 2019-A-1, 1.50% 2022 | | | 1,210 | | | | 1,211 | |
| Housing Dev. Auth., Rental Housing Rev. Bonds, Series 2021-A, 0.55% 2025 | | | 185 | | | | 185 | |
| Housing Dev. Auth., Single Family Mortgage Rev. Bonds, Series 2016-B, 3.50% 2047 | | | 475 | | | | 503 | |
| Housing Dev. Auth., Single Family Mortgage Rev. Bonds, Series 2017-B, 3.50% 2048 | | | 270 | | | | 286 | |
| Housing Dev. Auth., Single Family Mortgage Rev. Bonds, Series 2018-A, 4.00% 2048 | | | 635 | | | | 685 | |
| Housing Dev. Auth., Single Family Mortgage Rev. Bonds, Series 2018-C, 4.25% 2049 | | | 1,750 | | | | 1,910 | |
| Housing Dev. Auth., Single Family Mortgage Rev. Bonds, Series 2019-A, 4.25% 2049 | | | 850 | | | | 934 | |
| Housing Dev. Auth., Single Family Mortgage Rev. Bonds, Series 2020-A, 3.50% 2050 | | | 970 | | | | 1,055 | |
| Housing Dev. Auth., Single Family Mortgage Rev. Bonds, Series 2021-A, 3.00% 2052 | | | 2,130 | | | | 2,302 | |
| Board of Trustees of Michigan State University, Rev. Bonds, Series 2019-B, 5.00% 2023 | | | 300 | | | | 318 | |
| Board of Trustees of Michigan State University, Rev. Bonds, Series 2019-B, 5.00% 2030 | | | 700 | | | | 886 | |
| County of Monroe, Econ. Dev. Corp., Limited Obligation Rev. Ref. Bonds (Detroit Edison Co. Project), Series 1992-AA, National insured, 6.95% 2022 | | | 1,000 | | | | 1,055 | |
| Strategic Fund, Limited Obligation Rev. Ref. Bonds (Detroit Edison Co. Pollution Control Bonds Project), Series 1995-CC, 1.45% 2030 | | | 1,630 | | | | 1,598 | |
| Trunk Line Fund Bonds, Series 2021-A, 5.00% 2031 | | | 575 | | | | 770 | |
| Trunk Line Fund Bonds, Series 2021-A, 5.00% 2032 | | | 860 | | | | 1,147 | |
| | | | | | | | 23,521 | |
| | | | | | | | | |
| Minnesota 1.43% | | | | | | | | |
| City of Hopkins, Multi Family Housing Rev. Bonds (Raspberry Ridge Project), Series 2021, 0.26% 2024 (put 2023) | | | 535 | | | | 534 | |
| Housing Fin. Agcy., Residential Housing Fin. Bonds, Series 2014-B, 4.00% 2038 | | | 260 | | | | 275 | |
| Housing Fin. Agcy., Residential Housing Fin. Bonds, Series 2015-B, 3.50% 2046 | | | 670 | | | | 708 | |
| Housing Fin. Agcy., Residential Housing Fin. Bonds, Series 2017-B, 4.00% 2047 | | | 545 | | | | 583 | |
| Housing Fin. Agcy., Residential Housing Fin. Bonds, Series 2018-B, 4.00% 2048 | | | 385 | | | | 414 | |
| Housing Fin. Agcy., Residential Housing Fin. Bonds, Series 2017-E, 4.00% 2048 | | | 305 | | | | 329 | |
| Housing Fin. Agcy., Residential Housing Fin. Bonds, Series 2018-E, 4.25% 2049 | | | 1,665 | | | | 1,829 | |
| Housing Fin. Agcy., Residential Housing Fin. Bonds, Series 2019-B, 4.25% 2049 | | | 780 | | | | 859 | |
| Housing Fin. Agcy., Residential Housing Fin. Bonds, Series 2020-E, 3.50% 2050 | | | 285 | | | | 309 | |
| Housing Fin. Agcy., Residential Housing Fin. Bonds, Series 2021-B, 3.00% 2051 | | | 535 | | | | 576 | |
| Housing Fin. Agcy., Residential Housing Fin. Bonds, Series 2021-D, 3.00% 2052 | | | 1,205 | | | | 1,300 | |
| City of Mahtomedi, Multi Family Housing Rev. Bonds (Lincoln Place / Vadnais Highlands Projects), Series 2021, 0.25% 2023 (put 2022) | | | 300 | | | | 300 | |
| City of Rochester, Health Care Facs. Rev. Bonds (Mayo Clinic), Series 2011-C, 4.50% 2038 (put 2021) | | | 1,000 | | | | 1,001 | |
| Regents of the University of Minnesota, G.O. Bonds, Series 2011-D, 5.00% 2029 (preref. 2021) | | | 1,265 | | | | 1,270 | |
| Regents of the University of Minnesota, G.O. Rev. Ref. Bonds, Series 2017B, 5.00% 2021 | | | 960 | | | | 964 | |
| | | | | | | | 11,251 | |
| | | | | | | | | |
| Mississippi 0.49% | | | | | | | | |
| Business Fin. Corp., Solid Waste Disposal Rev. Bonds (Waste Management, Inc. Project), Series 2004, 0.70% 2029 (put 2026) | | | 1,460 | | | | 1,436 | |
| Gaming Tax Rev. Bonds, Series 2019-A, 5.00% 2023 | | | 850 | | | | 924 | |
| Gaming Tax Rev. Ref. Bonds, Series 2015-E, 5.00% 2026 | | | 500 | | | | 580 | |
| Home Corp., Collateralized Multi Family Housing Bonds (J&A Dev. Portfolio Project I), Series 2021-1, 0.30% 2024 (put 2023) | | | 230 | | | | 229 | |
| Home Corp., Single Family Mortgage Rev. Bonds, Series 2019-A, 4.00% 2048 | | | 645 | | | | 700 | |
| | | | | | | | 3,869 | |
| Private Client Services Funds | 19 |
Capital Group Core Municipal Fund
| Bonds, notes & other debt instruments (continued) | | Principal amount
(000) | | | Value
(000) | |
| Missouri 0.84% | | | | | | | | |
| Health and Educational Facs. Auth., Health Facs. Rev. Bonds (BJC Health System), Series 2021-B, 5.00% 2052 (put 2028) | | $ | 2,360 | | | $ | 2,922 | |
| Housing Dev. Commission, Single Family Mortgage Rev. Bonds (First Place Homeownership Loan Program), Series 2016-B, 3.50% 2041 | | | 1,335 | | | | 1,403 | |
| Housing Dev. Commission, Single Family Mortgage Rev. Bonds (First Place Homeownership Loan Program), Series 2017-B, 3.25% 2047 | | | 293 | | | | 310 | |
| Housing Dev. Commission, Single Family Mortgage Rev. Bonds (First Place Homeownership Loan Program), Series 2020-A, 3.50% 2050 | | | 560 | | | | 608 | |
| Housing Dev. Commission, Single Family Mortgage Rev. Bonds (First Place Homeownership Loan Program), Series 2021-A, 3.00% 2052 | | | 600 | | | | 646 | |
| Housing Dev. Commission, Single Family Mortgage Rev. Bonds (Special Homeownership Loan Program), Series 2015-A, 3.75% 2038 | | | 100 | | | | 106 | |
| City of St. Louis, Airport Rev. Ref. Bonds (Lambert-St. Louis International Airport), Series 2019-C, 5.00% 2031 | | | 500 | | | | 628 | |
| | | | | | | | 6,623 | |
| | | | | | | | | |
| Montana 0.06% | | | | | | | | |
| Board of Housing, Single Family Mortgage Bonds, Series 2016-A-2, 3.50% 2044 | | | 120 | | | | 126 | |
| Board of Housing, Single Family Mortgage Bonds, Series 2020-C, 3.00% 2050 | | | 300 | | | | 322 | |
| | | | | | | | 448 | |
| | | | | | | | | |
| Nebraska 0.70% | | | | | | | | |
| Central Plains Energy Project, Gas Project Rev. Bonds (Project No. 3), Series 2012, 5.00% 2032 (preref. 2022) | | | 1,190 | | | | 1,236 | |
| Investment Fin. Auth., Single Family Housing Rev. Bonds, Series 2013-A, 3.00% 2043 | | | 15 | | | | 15 | |
| Investment Fin. Auth., Single Family Housing Rev. Bonds, Series 2014-A, 4.00% 2044 | | | 110 | | | | 116 | |
| Investment Fin. Auth., Single Family Housing Rev. Bonds, Series 2015-C, 3.50% 2045 | | | 285 | | | | 296 | |
| Investment Fin. Auth., Single Family Housing Rev. Bonds, Series 2016-C, 3.50% 2046 | | | 75 | | | | 76 | |
| Investment Fin. Auth., Single Family Housing Rev. Bonds, Series 2018-C, 4.00% 2048 | | | 1,735 | | | | 1,888 | |
| Investment Fin. Auth., Single Family Housing Rev. Bonds, Series 2018-A, 4.00% 2048 | | | 640 | | | | 695 | |
| Investment Fin. Auth., Single Family Housing Rev. Bonds, Series 2021-C, 3.00% 2050 | | | 1,120 | | | | 1,210 | |
| | | | | | | | 5,532 | |
| | | | | | | | | |
| Nevada 0.67% | | | | | | | | |
| Clark County School Dist., Limited Tax G.O. School Bonds, Series 2015-D, 5.00% 2022 | | | 500 | | | | 514 | |
| County of Clark, Airport System Rev. Ref. Bonds (McCarran International Airport), Series 2021-A, 5.00% 2033 | | | 760 | | | | 996 | |
| County of Clark, Las Vegas-McCarran International Airport, Passenger Fac. Charge Rev. Ref. Bonds, Series 2019-E, 5.00% 2029 | | | 770 | | | | 987 | |
| County of Clark, Pollution Control Rev. Ref. Bonds (Nevada Power Co. Projects), Series 2017, 1.65% 2036 (put 2023) | | | 1,355 | | | | 1,378 | |
| City of Henderson, Local Improvement Dist. No. T-17 (Madeira Canyon), Limited Obligation Rev. Ref. Bonds, Series 2017, 2.00% 2023 | | | 435 | | | | 444 | |
| Housing Division, Multi Unit Housing Rev. Bonds (Pinewood Terrace Apartments), Series 2021, 0.26% 2024 (put 2022) | | | 245 | | | | 245 | |
| Las Vegas Valley Water Dist., Limited Tax G.O. Water Rev. Ref. Bonds, Series 2020-A, 5.00% 2024 | | | 595 | | | | 666 | |
| County of Washoe, Gas and Water Facs. Rev. Ref. Bonds (Sierra Pacific Power Co. Projects), Series 2016-B, 3.00% 2036 (put 2022) | | | 10 | | | | 10 | |
| | | | | | | | 5,240 | |
| | | | | | | | | |
| New Hampshire 0.28% | | | | | | | | |
| Health and Education Facs. Auth., Rev. Bonds (Southern New Hampshire University), Series 2012, 4.00% 2022 (escrowed to maturity) | | | 575 | | | | 579 | |
| Health and Education Facs. Auth., Rev. Bonds (Southern New Hampshire University), Series 2017, 5.00% 2022 (escrowed to maturity) | | | 320 | | | | 322 | |
| Health and Education Facs. Auth., Rev. Bonds (University System of New Hampshire Issue), Series 2017-A, 5.00% 2022 | | | 500 | | | | 516 | |
| Health and Education Facs. Auth., Rev. Bonds (University System of New Hampshire Issue), Series 2017-A, 5.00% 2023 | | | 600 | | | | 646 | |
| National Fin. Auth., Municipal Certs., Series 2020-1, Class A, 4.125% 2034 | | | 98 | | | | 115 | |
| | | | | | | | 2,178 | |
| | |
| 20 | Private Client Services Funds |
Capital Group Core Municipal Fund
| Bonds, notes & other debt instruments (continued) | | Principal amount
(000) | | | Value
(000) | |
| New Jersey 0.98% | | | | | | | | |
| Atlantic City, Tax Appeal Rev. Ref. Bonds, Series 2017-A, BAM insured, 5.00% 2022 | | $ | 200 | | | $ | 203 | |
| Econ. Dev. Auth., School Facs. Construction Bonds, Series 2021-QQQ, 5.00% 2029 | | | 500 | | | | 628 | |
| Econ. Dev. Auth., Water Facs. Rev. Ref. Bonds (American Water Co., Inc. Project), Series 2020-A, 1.00% 2023 | | | 2,025 | | | | 2,045 | |
| Garden State Preservation Trust, Open Space and Farmland Preservation Rev. Ref. Bonds, Series 2012-A, 5.00% 2021 | | | 200 | | | | 200 | |
| Health Care Facs. Fncg. Auth., Rev. Bonds (RWJ Barnabas Health Obligated Group Issue), Series 2021-A, 5.00% 2033 | | | 375 | | | | 494 | |
| Housing and Mortgage Fin. Agcy., Single Family Housing Rev. Bonds, Series 2018-A, 4.50% 2048 | | | 340 | | | | 379 | |
| Housing and Mortgage Fin. Agcy., Single Family Housing Rev. Bonds, Series 2019-C, 4.75% 2050 | | | 205 | | | | 229 | |
| Tobacco Settlement Fncg. Corp., Tobacco Settlement Bonds, Series 2018-A, 5.00% 2022 | | | 1,185 | | | | 1,215 | |
| Tobacco Settlement Fncg. Corp., Tobacco Settlement Bonds, Series 2018-A, 5.00% 2023 | | | 500 | | | | 534 | |
| Tobacco Settlement Fncg. Corp., Tobacco Settlement Bonds, Series 2018-A, 5.00% 2029 | | | 225 | | | | 276 | |
| Transportation Trust Fund Auth., Transportation System Bonds, Series 2019-A, 5.00% 2028 | | | 750 | | | | 938 | |
| Turnpike Auth., Turnpike Rev. Bonds, Series 2020-D, 5.00% 2028 | | | 240 | | | | 283 | |
| Turnpike Auth., Turnpike Rev. Bonds, Series 2014-A, 5.00% 2028 | | | 230 | | | | 257 | |
| | | | | | | | 7,681 | |
| | | | | | | | | |
| New Mexico 1.36% | | | | | | | | |
| Albuquerque Municipal School Dist. No. 12, G.O. School Bonds, Series 2021-A, 5.00% 2027 | | | 400 | | | | 490 | |
| City of Farmington, Pollution Control Rev. Ref. Bonds (Public Service Co. of San Juan and Four Corners Projects), Series 2016-B, 2.15% 2033 | | | 1,130 | | | | 1,098 | |
| City of Farmington, Pollution Control Rev. Ref. Bonds (Public Service Co. of San Juan Project), Series 2010-D, 1.10% 2040 (put 2023) | | | 500 | | | | 503 | |
| City of Farmington, Pollution Control Rev. Ref. Bonds (Public Service Co. of San Juan Project), Series 2010-E, 1.15% 2040 (put 2024) | | | 2,615 | | | | 2,642 | |
| Mortgage Fin. Auth., Single Family Mortgage Program Bonds, Series 2018-B-1, Class I, 4.00% 2049 | | | 800 | | | | 870 | |
| Mortgage Fin. Auth., Single Family Mortgage Program Bonds, Series 2019-C-1, Class I, 4.00% 2050 | | | 135 | | | | 148 | |
| Mortgage Fin. Auth., Single Family Mortgage Program Bonds, Series 2019-A-1, Class I, 4.25% 2050 | | | 2,350 | | | | 2,587 | |
| Mortgage Fin. Auth., Single Family Mortgage Program Bonds, Series 2021-A, Class I, 3.00% 2052 | | | 865 | | | | 933 | |
| Mortgage Fin. Auth., Single Family Mortgage Program Bonds, Series 2021-C, Class I, 3.00% 2052 | | | 260 | | | | 281 | |
| Municipal Energy Acquisition Auth., Gas Supply Rev. Ref. and Acquisition Bonds, Series 2019, 5.00% 2039 (put 2025) | | | 960 | | | | 1,101 | |
| | | | | | | | 10,653 | |
| | | | | | | | | |
| New York 7.69% | | | | | | | | |
| Build NYC Resource Corp., Rev. Ref. Bonds (Ethical Culture Fieldston School Project), Series 2015, 5.00% 2024 | | | 395 | | | | 439 | |
| Dormitory Auth., State Personal Income Tax Rev. Bonds (General Purpose), Series 2017-A, 5.00% 2022 | | | 200 | | | | 203 | |
| Dormitory Auth., State Personal Income Tax Rev. Bonds (General Purpose), Series 2019-A, 5.00% 2028 | | | 1,000 | | | | 1,247 | |
| Dormitory Auth., State Personal Income Tax Rev. Bonds (General Purpose), Series 2020-A, 5.00% 2030 | | | 2,000 | | | | 2,597 | |
| Dormitory Auth., State Personal Income Tax Rev. Bonds (General Purpose), Series 2017-B, 5.00% 2030 | | | 1,500 | | | | 1,839 | |
| Dormitory Auth., State Personal Income Tax Rev. Bonds (General Purpose), Series 2019-D, 5.00% 2030 | | | 605 | | | | 784 | |
| Dormitory Auth., State Personal Income Tax Rev. Bonds (General Purpose), Series 2020-A-2, 5.00% 2031 | | | 165 | | | | 214 | |
| Dormitory Auth., State Sales Tax Rev. Bonds, Series 2014-A, 5.00% 2022 | | | 200 | | | | 204 | |
| Housing Fin. Agcy., Affordable Housing Rev. Green Bonds, Series 2018-H, 2.75% 2022 | | | 660 | | | | 676 | |
| Housing Fin. Agcy., Affordable Housing Rev. Green Bonds, Series 2019-P, 1.55% 2023 | | | 705 | | | | 708 | |
| Housing Fin. Agcy., Affordable Housing Rev. Green Bonds, Series 2020-E, 0.85% 2024 | | | 345 | | | | 345 | |
| Housing Fin. Agcy., Affordable Housing Rev. Green Bonds, Series 2020-L-2, 0.75% 2025 | | | 1,500 | | | | 1,501 | |
| Housing Fin. Agcy., Affordable Housing Rev. Green Bonds, Series 2020-M-2, 0.75% 2025 | | | 275 | | | | 275 | |
| Housing Fin. Agcy., Affordable Housing Rev. Green Bonds, Series 2021-D-2, 0.65% 2056 (put 2025) | | | 690 | | | | 688 | |
| Housing Fin. Agcy., Affordable Housing Rev. Green Bonds, Series 2021-I-2, 0.70% 2056 (put 2025) | | | 380 | | | | 379 | |
| Liberty Dev. Corp., Liberty Rev. Ref. Green Bonds (4 World Trade Center Project), Series 2021-A, 1.70% 2030 | | | 410 | | | | 403 | |
| Liberty Dev. Corp., Liberty Rev. Ref. Green Bonds (4 World Trade Center Project), Series 2021-A, 1.90% 2031 | | | 195 | | | | 193 | |
| Long Island Power Auth., Electric System General Rev. Bonds, Series 2014-C, (1-month USD-LIBOR x 0.70 + 0.75%) 0.807% 2033 (put 2023)2 | | | 1,000 | | | | 1,003 | |
| Long Island Power Auth., Electric System General Rev. Bonds, Series 2015-C, (1-month USD-LIBOR x 0.70 + 0.75%) 0.807% 2033 (put 2023)2 | | | 840 | | | | 843 | |
| Metropolitan Transportation Auth., Transportation Rev. Bonds, Series 2014-C, 5.00% 2023 | | | 375 | | | | 409 | |
| Metropolitan Transportation Auth., Transportation Rev. Bonds, Series 2012-C, 5.00% 2032 (preref. 2022) | | | 1,000 | | | | 1,050 | |
| Metropolitan Transportation Auth., Transportation Rev. Bonds, Series 2014-D-2, (SIFMA Municipal Swap Index + 0.45%) 0.50% 2044 (put 2022)2 | | | 750 | | | | 751 | |
| Metropolitan Transportation Auth., Transportation Rev. Bonds, Series 2015-A-2, 5.00% 2045 (put 2030) | | | 2,180 | | | | 2,757 | |
| Private Client Services Funds | 21 |
Capital Group Core Municipal Fund
| Bonds, notes & other debt instruments (continued) | | Principal amount
(000) | | | Value
(000) | |
| New York (continued) | | | | | | | | |
| Metropolitan Transportation Auth., Transportation Rev. Bonds, Series 2012-C, 5.00% 2047 (preref. 2022) | | $ | 1,100 | | | $ | 1,155 | |
| Metropolitan Transportation Auth., Transportation Rev. Ref. Bonds, Series 2002-D-2-B, Assured Guaranty Municipal insured, (USD-SOFR x 0.67 + 0.55%) 0.583% 2032 (put 2024)2 | | | 880 | | | | 883 | |
| Metropolitan Transportation Auth., Transportation Rev. Ref. Bonds, Series 2002-D-2-A-2, Assured Guaranty Municipal insured, (USD-SOFR x 0.67 + 0.80%) 0.833% 2032 (put 2026)2 | | | 315 | | | | 319 | |
| Metropolitan Transportation Auth., Transportation Rev. Ref. Green Bonds, Series 2017-B, 5.00% 2023 | | | 1,000 | | | | 1,092 | |
| Metropolitan Transportation Auth., Transportation Rev. Ref. Green Bonds, Series 2017-C-1, 5.00% 2023 | | | 305 | | | | 333 | |
| Metropolitan Transportation Auth., Transportation Rev. Ref. Green Bonds, Series 2017-C-1, 5.00% 2024 | | | 165 | | | | 187 | |
| Metropolitan Transportation Auth., Transportation Rev. Ref. Green Bonds, Series 2017-C-1, 5.00% 2027 | | | 535 | | | | 651 | |
| Mortgage Agcy., Homeowner Mortgage Rev. Bonds, Series 197, 3.50% 2044 | | | 1,015 | | | | 1,075 | |
| Mortgage Agcy., Homeowner Mortgage Rev. Bonds, Series 233, 3.00% 2045 | | | 1,465 | | | | 1,579 | |
| Mortgage Agcy., Homeowner Mortgage Rev. Bonds, Series 203, 3.50% 2047 | | | 965 | | | | 1,024 | |
| Mortgage Agcy., Homeowner Mortgage Rev. Bonds, Series 213, 4.25% 2047 | | | 750 | | | | 820 | |
| New York City G.O. Bonds, Series 2020-C-1, 5.00% 2028 | | | 2,000 | | | | 2,519 | |
| New York City G.O. Bonds, Series 2018-A, 5.00% 2028 | | | 565 | | | | 693 | |
| New York City G.O. Bonds, Series 2020-C-1, 5.00% 2030 | | | 2,350 | | | | 3,066 | |
| New York City G.O. Bonds, Series 2018-E-1, 5.00% 2031 | | | 1,635 | | | | 2,018 | |
| New York City G.O. Bonds, Series 2020-C-1, 5.00% 2032 | | | 1,750 | | | | 2,252 | |
| New York City G.O. Bonds, Series 2021-A-1, 5.00% 2032 | | | 1,435 | | | | 1,885 | |
| New York City G.O. Bonds, Series 2008-L-5, 5.00% 2032 | | | 100 | | | | 131 | |
| New York City G.O. Bonds, Series 2021-A-1, 5.00% 2033 | | | 370 | | | | 485 | |
| New York City G.O. Bonds, Series 2015-F-4, 5.00% 2044 (put 2025) | | | 290 | | | | 334 | |
| New York City Health and Hospitals Corp., Health System Bonds, Series 2020-A, 5.00% 2024 | | | 375 | | | | 414 | |
| New York City Housing Dev. Corp., Multi Family Housing Rev. Bonds (8 Spruce Street), Series 2014-E, 3.50% 2048 | | | 320 | | | | 330 | |
| New York City Housing Dev. Corp., Multi Family Housing Rev. Bonds (Sustainable Dev. Bonds), Series 2017-C-3-A, 0.20% 2022 | | | 160 | | | | 160 | |
| New York City Housing Dev. Corp., Multi Family Housing Rev. Bonds (Sustainable Dev. Bonds), Series 2016-C-2, 0.23% 2050 (put 2022) | | | 190 | | | | 190 | |
| New York City Housing Dev. Corp., Multi Family Housing Rev. Bonds (Sustainable Dev. Bonds), Series 2021-C-2, 0.70% 2060 (put 2025) | | | 325 | | | | 326 | |
| New York City Housing Dev. Corp., Multi Family Housing Rev. Bonds (Sustainable Neighborhood Bonds), Series 2017-G-2-A, 2.00% 2057 (put 2021) | | | 275 | | | | 276 | |
| New York City Housing Dev. Corp., Multi Family Housing Rev. Bonds (Sustainable Neighborhood Bonds), Series 2020-I-2, 0.70% 2060 (put 2025) | | | 700 | | | | 701 | |
| New York City Housing Dev. Corp., Multi Family Housing Rev. Green Bonds, Series 2021-F-2, 0.60% 2061 (put 2025) | | | 835 | | | | 830 | |
| New York City Municipal Water Fin. Auth., Water and Sewer System Second General Resolution Rev. Bonds, Series 2021-DD, 5.00% 2029 | | | 465 | | | | 599 | |
| New York City Transitional Fin. Auth., Future Tax Secured Bonds, Series 2020-A-1, 5.00% 2022 | | | 35 | | | | 36 | |
| New York City Transitional Fin. Auth., Future Tax Secured Bonds, Series 2021-E-1, 5.00% 2023 | | | 65 | | | | 69 | |
| New York City Transitional Fin. Auth., Future Tax Secured Bonds, Series 2021-F-1, 5.00% 2024 | | | 1,025 | | | | 1,166 | |
| New York City Transitional Fin. Auth., Future Tax Secured Bonds, Series 2021-A-1, 5.00% 2030 | | | 355 | | | | 467 | |
| New York City Transitional Fin. Auth., Future Tax Secured Bonds, Series 2020-C-1, 5.00% 2031 | | | 760 | | | | 993 | |
| New York City Transitional Fin. Auth., Future Tax Secured Bonds, Series 2021-A-1, 5.00% 2031 | | | 195 | | | | 261 | |
| New York City Transitional Fin. Auth., Future Tax Secured Bonds, Series 2021-A-1, 5.00% 2032 | | | 910 | | | | 1,208 | |
| New York City Transitional Fin. Auth., Future Tax Secured Bonds, Series 2020-C-1, 5.00% 2032 | | | 110 | | | | 143 | |
| New York City Transitional Fin. Auth., Future Tax Secured Bonds, Series 2021-B-1, 5.00% 2034 | | | 1,390 | | | | 1,825 | |
| Town of Oyster Bay, Public Improvement Rev. Ref. Bonds, Series 2021, 2.00% 2022 | | | 150 | | | | 151 | |
| Town of Oyster Bay, Public Improvement Rev. Ref. Bonds, Series 2021, 4.00% 2023 | | | 140 | | | | 147 | |
| Public Housing Capital Fund Rev. Trust I, Trust Certs., Series 2012, 4.50% 20223 | | | 63 | | | | 63 | |
| County of Suffolk, Econ. Dev. Corp., Rev. Ref. Bonds (Peconic Landing at Southold, Inc. Project), Series 2010, 3.125% 2025 | | | 225 | | | | 238 | |
| Thruway Auth., Personal Income Tax Rev. Bonds, Series 2021-A-1, 5.00% 2033 | | | 1,000 | | | | 1,299 | |
| City of Troy, Capital Resource Corp., Rev. Ref. Bonds (Rensselaer Polytechnic Institute Project), Series 2020-A, 5.00% 2030 | | | 155 | | | | 199 | |
| Urban Dev. Corp., State Personal Income Tax Rev. Bonds (General Purpose), Series 2020-C, 5.00% 2028 | | | 295 | | | | 369 | |
| Urban Dev. Corp., State Personal Income Tax Rev. Bonds (General Purpose), Series 2020-C, 5.00% 2032 | | | 2,000 | | | | 2,584 | |
| Urban Dev. Corp., State Personal Income Tax Rev. Bonds (General Purpose), Series 2020-C, 5.00% 2033 | | | 1,275 | | | | 1,642 | |
| Utility Debt Securitization Auth., Restructuring Bonds, Series 2017, 5.00% 2025 | | | 130 | | | | 143 | |
| County of Westchester, Industrial Dev. Agcy., Multi Family Housing Rev. Bonds (Marble Hall - Tuckahoe LP Project), Series 2021, 0.28% 2024 (put 2023) | | | 1,550 | | | | 1,548 | |
| | | | | | | | 60,386 | |
| 22 | Private Client Services Funds |
Capital Group Core Municipal Fund
| Bonds, notes & other debt instruments (continued) | | Principal amount
(000) | | | Value
(000) | |
| North Carolina 1.82% | | | | | | | | |
| City of Burlington, Housing Auth., Multi Family Housing Rev. Bonds (Thetford Portfolio), Series 2021, 0.30% 2024 (put 2022) | | $ | 1,130 | | | $ | 1,129 | |
| City of Durham, Housing Auth., Multi Family Housing Rev. Bonds (JJ Henderson Apartments Project), Series 2020, 0.30% 2024 (put 2023) | | | 80 | | | | 80 | |
| City of Goldsboro, Multi Family Housing Rev. Bonds (Grand at Day Point), Series 2021, 0.28% 2024 (put 2023) | | | 1,725 | | | | 1,722 | |
| Hospital Auth., Health Care Rev. Bonds (Charlotte-Mecklenburg Hospital), Series 2021-D, 5.00% 2049 (put 2031) | | | 1,170 | | | | 1,561 | |
| Hospital Auth., Health Care Rev. Bonds (Charlotte-Mecklenburg Hospital), Series 2021-C, 5.00% 2050 (put 2028) | | | 585 | | | | 744 | |
| Housing Fin. Agcy., Home Ownership Rev. Bonds, Series 40, 4.25% 2047 | | | 890 | | | | 971 | |
| Housing Fin. Agcy., Home Ownership Rev. Ref. Bonds, Series 38-B, 4.00% 2047 | | | 995 | | | | 1,066 | |
| Housing Fin. Agcy., Home Ownership Rev. Ref. Bonds, Series 44, 4.00% 2050 | | | 315 | | | | 348 | |
| Housing Fin. Agcy., Multi Family Housing Rev. Bonds (Winds Crest Senior Living, LP), Series 2021, 0.36% 2024 (put 2023) | | | 405 | | | | 405 | |
| Raleigh-Durham Airport Auth., Airport Rev. Ref. Bonds, Series 2020-B, 5.00% 2022 | | | 1,705 | | | | 1,746 | |
| University of North Carolina at Chapel Hill, General Rev. Bonds, Series 2012-B, (1-month USD-LIBOR x 0.67 + 0.40%) 0.455% 2041 (put 2022)2 | | | 1,480 | | | | 1,482 | |
| University of North Carolina at Charlotte, General Rev. Ref. Bonds, Series 2017-A, 5.00% 2023 | | | 1,000 | | | | 1,091 | |
| County of Wake, G.O. Rev. Ref. Bonds, Series 2020-A, 5.00% 2022 | | | 1,190 | | | | 1,214 | |
| County of Wake, Limited Obligation Bonds, Series 2021, 5.00% 2023 | | | 675 | | | | 718 | |
| | | | | | | | 14,277 | |
| | | | | | | | | |
| North Dakota 0.46% | | | | | | | | |
| County of Cass, Joint Water Resource Dist., Temporary Rev. Ref. Improvement Bonds, Series 2021-A, 0.48% 2024 | | | 800 | | | | 801 | |
| City of Grand Forks, Health Care System Rev. Bonds, Series 2021, 5.00% 2030 | | | 280 | | | | 358 | |
| Housing Fin. Agcy., Homeownership Rev. Bonds (Home Mortgage Fin. Program), Series 2016-D, 3.50% 2046 | | | 965 | | | | 1,023 | |
| Housing Fin. Agcy., Housing Fin. Program Bonds (Home Mortgage Fin. Program), Series 2015-B, 4.00% 2036 | | | 210 | | | | 219 | |
| Housing Fin. Agcy., Housing Fin. Program Bonds (Home Mortgage Fin. Program), Series 2017-D, 4.00% 2048 | | | 305 | | | | 327 | |
| Housing Fin. Agcy., Housing Fin. Program Bonds (Home Mortgage Fin. Program), Series 2017-F, 4.00% 2048 | | | 230 | | | | 247 | |
| Housing Fin. Agcy., Housing Fin. Program Bonds (Home Mortgage Fin. Program), Series 2019-A, 4.25% 2049 | | | 170 | | | | 186 | |
| Housing Fin. Agcy., Housing Fin. Program Bonds (Home Mortgage Fin. Program), Series 2021-A, 3.00% 2052 | | | 440 | | | | 475 | |
| | | | | | | | 3,636 | |
| | | | | | | | | |
| Ohio 2.68% | | | | | | | | |
| Air Quality Dev. Auth., Air Quality Rev. Bonds (Ohio Valley Electric Corp. Project), Series 2009-B, 1.375% 2026 (put 2024) | | | 200 | | | | 199 | |
| Air Quality Dev. Auth., Air Quality Rev. Bonds (Ohio Valley Electric Corp. Project), Series 2009-C, 1.50% 2026 (put 2025) | | | 50 | | | | 50 | |
| Akron, Bath and Copley Joint Township Hospital Dist., Hospital Facs. Rev. Ref. Bonds (Summa Health Obligated Group), Series 2020, 5.00% 2028 | | | 680 | | | | 845 | |
| Akron, Bath and Copley Joint Township Hospital Dist., Hospital Facs. Rev. Ref. Bonds (Summa Health Obligated Group), Series 2020, 5.00% 2030 | | | 350 | | | | 449 | |
| County of Allen, Hospital Facs. Rev. Bonds (Bon Secours Mercy Health, Inc.), Series 2020-A, 5.00% 2027 | | | 1,500 | | | | 1,855 | |
| County of Allen, Hospital Facs. Rev. Bonds (Bon Secours Mercy Health, Inc.), Series 2020-A, 5.00% 2030 | | | 400 | | | | 517 | |
| County of Allen, Hospital Facs. Rev. Bonds (Mercy Health), Series 2017-A, 5.00% 2022 | | | 810 | | | | 839 | |
| County of Allen, Hospital Facs. Rev. Bonds (Mercy Health), Series 2017-A, 5.00% 2027 | | | 570 | | | | 699 | |
| County of Allen, Hospital Facs. Rev. Bonds (Mercy Health), Series 2017-B, 5.00% 2047 (put 2022) | | | 575 | | | | 588 | |
| Capital Facs. Lease Appropriation Bonds, Series 2021-A, 5.00% 2029 | | | 180 | | | | 228 | |
| Capital Facs. Lease Appropriation Bonds, Series 2021-A, 5.00% 2030 | | | 115 | | | | 149 | |
| City of Cleveland, Airport System Rev. Ref. Bonds, Series 2012-A, 5.00% 2025 | | | 1,000 | | | | 1,008 | |
| City of Dayton, Metropolitan Housing Auth., Multi Family Housing Rev. Bonds (Southern Montgomery Apartments Project), Series 2021-A, 0.32% 2024 (put 2023) | | | 200 | | | | 200 | |
| G.O. Common Schools Rev. Ref. Bonds, Series 2021-B, 5.00% 2028 | | | 685 | | | | 867 | |
| G.O. Conservation Projects Bonds, Series 2019-A, 2.00% 2022 | | | 65 | | | | 65 | |
| G.O. Infrastructure Improvement Bonds, Series 2021-A, 5.00% 2030 | | | 190 | | | | 247 | |
| County of Hamilton, Hospital Facs. Rev. Bonds (UC Health), Series 2014, 5.00% 2025 | | | 400 | | | | 439 | |
| Hospital Rev. Ref. Bonds (Cleveland Clinic Health System Obligated Group), Series 2021-B, 5.00% 2029 | | | 1,000 | | | | 1,269 | |
| Hospital Rev. Ref. Bonds (Cleveland Clinic Health System Obligated Group), Series 2021-B, 5.00% 2030 | | | 280 | | | | 362 | |
| Housing Fin. Agcy., Multi Family Housing Rev. Bonds (Chevybrook Estates Apartments Project), Series 2021, 0.35% 2024 (put 2023) | | | 200 | | | | 200 | |
| Housing Fin. Agcy., Multi Family Housing Rev. Bonds (Franklin Manor North Project), Series 2021, 0.25% 2024 (put 2023) | | | 440 | | | | 439 | |
| Private Client Services Funds | 23 |
Capital Group Core Municipal Fund
| Bonds, notes & other debt instruments (continued) | | Principal amount
(000) | | | Value
(000) | |
| Ohio (continued) | | | | | | | | |
| Housing Fin. Agcy., Multi Family Housing Rev. Bonds (Glen Meadows Apartments Project), Series 2021-A, 0.40% 2024 (put 2023) | | $ | 305 | | | $ | 305 | |
| Housing Fin. Agcy., Multi Family Housing Rev. Bonds (Pinzone Tower Apartments Project), Series 2021, 0.28% 2023 (put 2022) | | | 655 | | | | 654 | |
| Housing Fin. Agcy., Residential Mortgage Rev. Bonds (Mortgage-Backed Securities Program), Series 2017-D, 4.00% 2048 | | | 320 | | | | 344 | |
| Housing Fin. Agcy., Residential Mortgage Rev. Bonds (Mortgage-Backed Securities Program), Series 2019-A, 4.50% 2049 | | | 620 | | | | 687 | |
| Housing Fin. Agcy., Residential Mortgage Rev. Bonds (Mortgage-Backed Securities Program), Series 2020-A, 3.75% 2050 | | | 620 | | | | 680 | |
| Housing Fin. Agcy., Residential Mortgage Rev. Bonds (Mortgage-Backed Securities Program), Series 2021-C, 3.25% 2051 | | | 860 | | | | 940 | |
| Madison Local School Dist., School Improvement Rev. Ref. Bonds, Series 2014, 5.25% 2037 (preref. 2022) | | | 1,095 | | | | 1,127 | |
| Major New State Infrastructure Project Rev. Bonds, Series 2019-1, 5.00% 2028 | | | 700 | | | | 891 | |
| Major New State Infrastructure Project Rev. Bonds, Series 2019-1, 5.00% 2029 | | | 300 | | | | 389 | |
| County of Montgomery, Hospital Facs. Rev. Bonds (Dayton Children’s Hospital), Series 2021, 5.00% 2030 | | | 75 | | | | 97 | |
| North East Ohio Regional Sewer Dist., Wastewater Improvement Rev. and Rev. Ref. Bonds, Series 2014, 5.00% 2044 (preref. 2024) | | | 1,000 | | | | 1,140 | |
| Public Facs. Commission, Higher Education G.O. Bonds, Series 2015-C, 5.00% 2028 | | | 1,000 | | | | 1,153 | |
| Rev. Bonds (Premier Health Partners Obligated Group), Series 2020, 5.00% 2033 | | | 85 | | | | 106 | |
| Turnpike and Infrastructure Commission, Rev. Bonds, Series 2013-A-1, 5.00% 2025 | | | 115 | | | | 122 | |
| Water Dev. Auth., Water Dev. Rev. Bonds, Series 2013-A, 5.00% 2023 | | | 155 | | | | 167 | |
| Water Dev. Auth., Water Pollution Control Loan Fund Rev. Bonds, Series 2019-A, 5.00% 2029 | | | 130 | | | | 166 | |
| Water Dev. Auth., Water Pollution Control Loan Fund Rev. Bonds, Series 2020-A, 5.00% 2032 | | | 455 | | | | 590 | |
| | | | | | | | 21,072 | |
| | | | | | | | | |
| Oklahoma 0.20% | | | | | | | | |
| Capital Improvement Auth., State Highways Capital Improvement Rev. Ref. Bonds (Oklahoma Dept. of Transportation Project), Series 2020-A, 5.00% 2023 | | | 595 | | | | 642 | |
| Housing Fin. Agcy., Collateralized Rev. Bonds (Deer Park & Apple Run Apartments), Series 2019, 1.60% 2022 | | | 750 | | | | 752 | |
| Board of Regents of Oklahoma State University, General Rev. Ref. Bonds, Series 2020-A, 5.00% 2032 | | | 120 | | | | 156 | |
| | | | | | | | 1,550 | |
| | | | | | | | | |
| Oregon 0.91% | | | | | | | | |
| County of Deschutes, Deschutes Public Library Dist., G.O. Bonds, Series 2021, 4.00% 2029 | | | 225 | | | | 272 | |
| County of Deschutes, Deschutes Public Library Dist., G.O. Bonds, Series 2021, 4.00% 2030 | | | 265 | | | | 324 | |
| Facs. Auth., Rev. Bonds (University of Portland Projects), Series 2015-A, 5.00% 2031 | | | 600 | | | | 679 | |
| G.O. Bonds (Veteran’s Welfare Bonds Series 108), Series 2021-O, 3.00% 2051 | | | 2,095 | | | | 2,274 | |
| G.O. Bonds (Veteran’s Welfare Bonds Series 99B), Series 2020, 3.50% 2050 | | | 280 | | | | 305 | |
| Housing and Community Services Dept., Housing Dev. Rev. Bonds (The Susan Emmons Apartments Project), Series 2021-S-2, 0.38% 2024 (put 2023) | | | 460 | | | | 459 | |
| Housing and Community Services Dept., Housing Dev. Rev. Bonds (Westwind Apartments Project), Series 2021-H, 0.25% 2024 (put 2023) | | | 175 | | | | 175 | |
| Housing and Community Services Dept., Mortgage Rev. Bonds (Single Family Mortgage Program), Series 2017-A, 4.00% 2047 | | | 685 | | | | 732 | |
| Housing and Community Services Dept., Mortgage Rev. Bonds (Single Family Mortgage Program), Series 2016-A, 4.00% 2047 | | | 400 | | | | 423 | |
| Housing and Community Services Dept., Mortgage Rev. Bonds (Single Family Mortgage Program), Series 2018-A, 4.50% 2049 | | | 135 | | | | 146 | |
| Housing and Community Services Dept., Mortgage Rev. Bonds (Single Family Mortgage Program), Series 2020-C, 3.00% 2052 | | | 1,235 | | | | 1,326 | |
| | | | | | | | 7,115 | |
| | | | | | | | | |
| Pennsylvania 2.76% | | | | | | | | |
| County of Allegheny, Airport Auth., Airport Rev. Bonds, Series 2013-A, 5.00% 2022 | | | 400 | | | | 406 | |
| County of Allegheny, Hospital Dev. Auth., UPMC Rev. Bonds, Series 2019-A, 5.00% 2022 | | | 1,000 | | | | 1,033 | |
| County of Allegheny, Sanitary Auth., Sewer Rev. Bonds, Series 2020-A, 5.00% 2026 | | | 500 | | | | 595 | |
| County of Berks, G.O. Bonds, Series 2015, 4.00% 2027 (preref. 2023) | | | 35 | | | | 38 | |
| Bethlehem Area School Dist. Auth., School Rev. Bonds (Bethlehem Area School Dist. Ref. Project), Series 2021-C, (USD-SOFR x 0.67 + 0.35%) 0.384% 2030 (put 2025)2 | | | 195 | | | | 195 | |
| 24 | Private Client Services Funds |
Capital Group Core Municipal Fund
| Bonds, notes & other debt instruments (continued) | | Principal amount
(000) | | | Value
(000) | |
| Pennsylvania (continued) | | | | | | | | |
| Bethlehem Area School Dist. Auth., School Rev. Bonds (Bethlehem Area School Dist. Ref. Project), Series 2021-B, (USD-SOFR x 0.67 + 0.35%) 0.384% 2031 (put 2025)2 | | $ | 265 | | | $ | 265 | |
| Bethlehem Area School Dist. Auth., School Rev. Bonds (Bethlehem Area School Dist. Ref. Project), Series 2021-C, (USD-SOFR x 0.67 + 0.35%) 0.384% 2032 (put 2025)2 | | | 205 | | | | 205 | |
| Cumberland Valley School Dist., G.O. Bonds, Series 2015, 5.00% 2032 (preref. 2023) | | | 150 | | | | 164 | |
| Cumberland Valley School Dist., G.O. Bonds, Series 2015, 5.00% 2034 (preref. 2023) | | | 130 | | | | 143 | |
| Econ. Dev. Fncg. Auth., Solid Waste Disposal Rev. Bonds (Waste Management, Inc. Project), Series 2004-A, 2.15% 2021 | | | 200 | | | | 200 | |
| Econ. Dev. Fncg. Auth., UPMC Rev. Bonds, Series 2021-A, 5.00% 2028 | | | 1,500 | | | | 1,885 | |
| Fncg. Auth., Rev. Bonds, Series 2013-A-2, 5.00% 2027 (preref. 2022) | | | 500 | | | | 514 | |
| Fncg. Auth., Rev. Bonds, Series 2013-A-2, 5.00% 2042 (preref. 2022) | | | 580 | | | | 596 | |
| G.O. Bonds, Series 2011-1, 5.00% 2025 (preref. 2021) | | | 700 | | | | 701 | |
| General Auth. of Southcentral Pennsylvania, Rev. Bonds (Wellspan Health Obligated Group), Series 2019-B, (SIFMA Municipal Swap Index + 0.60%) 0.65% 2049 (put 2024)2 | | | 455 | | | | 458 | |
| Housing Fin. Agcy., Single Family Mortgage Rev. Bonds, Series 2017-122, 4.00% 2046 | | | 1,005 | | | | 1,073 | |
| Housing Fin. Agcy., Single Family Mortgage Rev. Bonds, Series 2020-133, 3.00% 2050 | | | 1,000 | | | | 1,072 | |
| Housing Fin. Agcy., Single Family Mortgage Rev. Bonds, Series 2021-135-A, 3.00% 2051 | | | 220 | | | | 235 | |
| Housing Fin. Agcy., Special Limited Obligation, Multi Family Housing Dev. Bonds (Harrison Senior Tower), Series 2021, 0.25% 2024 (put 2023) | | | 1,030 | | | | 1,026 | |
| Housing Fin. Agcy., Special Limited Obligation, Multi Family Housing Dev. Bonds (School of Nursing), Series 2021, 0.27% 2024 (put 2023) | | | 330 | | | | 329 | |
| County of Lehigh, General Purpose Auth., Rev. Bonds (The Good Shepherd Group), Series 2021-A, 4.00% 2023 | | | 95 | | | | 102 | |
| County of Montgomery, Higher Education and Health Auth., Hospital Rev. Bonds (Abington Memorial Hospital Obligated Group), Series 2012-A, 5.00% 2031 (preref. 2022) | | | 350 | | | | 360 | |
| County of Montgomery, Higher Education and Health Auth., Rev. Bonds (Thomas Jefferson University), Series 2018-C, 0.77% 2051 (put 2023)2 | | | 400 | | | | 400 | |
| County of Montgomery, Industrial Dev. Auth., Rev. Bonds (Foulkeways at Gwynedd Project), Series 2016, 5.00% 2026 | | | 400 | | | | 455 | |
| County of Montgomery, Industrial Dev. Auth., Rev. Bonds (Waverly Heights Ltd.), Series 2019, 4.00% 2021 | | | 100 | | | | 100 | |
| County of Montgomery, Industrial Dev. Auth., Rev. Bonds (Waverly Heights Ltd.), Series 2019, 4.00% 2023 | | | 125 | | | | 134 | |
| County of Northampton, General Purpose Auth., Hospital Rev. Bonds (St. Luke’s University Health Network Project), Series 2018-B, (1-month USD-LIBOR x 0.70 + 1.04%) 1.097% 2048 (put 2022)2 | | | 175 | | | | 176 | |
| Philadelphia School Dist., G.O. Bonds, Series 2019-A, 5.00% 2022 | | | 1,050 | | | | 1,092 | |
| Philadelphia School Dist., G.O. Bonds, Series 2016-F, 5.00% 2025 | | | 415 | | | | 483 | |
| Philadelphia School Dist., G.O. Bonds, Series 2021-A, 5.00% 2030 | | | 260 | | | | 334 | |
| Philadelphia School Dist., G.O. Bonds, Series 2021-A, 5.00% 2031 | | | 125 | | | | 163 | |
| Philadelphia School Dist., G.O. Rev. Ref. Bonds, Series 2016-F, 5.00% 2023 | | | 1,500 | | | | 1,628 | |
| Scranton School Dist., G.O. Bonds, Series 2017-E, BAM insured, 5.00% 2026 | | | 1,000 | | | | 1,198 | |
| Turnpike Commission, Turnpike Rev. Bonds, Series 2011-E, 5.00% 2042 (preref. 2022) | | | 575 | | | | 605 | |
| Turnpike Commission, Turnpike Rev. Bonds, Series 2011-E, 5.00% 2029 (preref. 2021) | | | 1,315 | | | | 1,320 | |
| Turnpike Commission, Turnpike Rev. Bonds, Series 2011-E, 5.00% 2030 (preref. 2021) | | | 335 | | | | 336 | |
| Turnpike Commission, Turnpike Rev. Bonds, Series 2021-B, 5.00% 2030 | | | 165 | | | | 216 | |
| Turnpike Commission, Turnpike Rev. Bonds, Series 2021-B, 5.00% 2031 | | | 295 | | | | 387 | |
| Turnpike Commission, Turnpike Rev. Bonds (Motor License Fund), Series 2012-A, 5.00% 2026 (preref. 2021) | | | 1,000 | | | | 1,004 | |
| | | | | | | | 21,626 | |
| | | | | | | | | |
| Rhode Island 0.30% | | | | | | | | |
| Commerce Corp., Grant Anticipation Rev. Ref. Bonds (Dept. of Transportation), Series 2016-A, 5.00% 2023 | | | 500 | | | | 538 | |
| Housing and Mortgage Fin. Corp., Homeownership Opportunity Bonds, Series 75-A, 3.00% 2051 | | | 1,530 | | | | 1,655 | |
| Housing and Mortgage Fin. Corp., Multi Family Dev. Bonds, Series 2021-A-1, 0.45% 2040 (put 2023) | | | 195 | | | | 195 | |
| | | | | | | | 2,388 | |
| | | | | | | | | |
| South Carolina 1.18% | | | | | | | | |
| County of Charleston, G.O. Capital Improvement Transportation Sales Tax Bonds, Series 2011, 5.00% 2024 (preref. 2021) | | | 515 | | | | 515 | |
| City of Columbia, Housing Auth., Multi Family Housing Rev. Bonds (Palmetto Terrace Apartments Project), Series 2021, 0.31% 2024 (put 2023) | | | 460 | | | | 459 | |
| City of Columbia, Waterworks and Sewer System Rev. Bonds, Series 2019-A, 5.00% 2028 | | | 100 | | | | 125 | |
| City of Columbia, Waterworks and Sewer System Rev. Bonds, Series 2013, 5.00% 2043 (preref. 2023) | | | 1,000 | | | | 1,060 | |
| Housing Fin. and Dev. Auth., Mortgage Rev. Bonds, Series 2017-A, 4.00% 2047 | | | 365 | | | | 387 | |
| Private Client Services Funds | 25 |
Capital Group Core Municipal Fund
| Bonds, notes & other debt instruments (continued) | | Principal amount
(000) | | | Value
(000) | |
| South Carolina (continued) | | | | | | | | |
| Housing Fin. and Dev. Auth., Mortgage Rev. Bonds, Series 2017-B, 4.00% 2047 | | $ | 95 | | | $ | 102 | |
| Housing Fin. and Dev. Auth., Mortgage Rev. Bonds, Series 2020-A, 4.00% 2050 | | | 755 | | | | 837 | |
| Housing Fin. and Dev. Auth., Mortgage Rev. Bonds, Series 2021-A, 3.00% 2052 | | | 645 | | | | 699 | |
| Housing Fin. and Dev. Auth., Mortgage Rev. Ref. Bonds, Series 2016-A, 4.00% 2036 | | | 510 | | | | 546 | |
| Lexington County Health Services Dist., Inc., Hospital Rev. Ref. Bonds, Series 2017, 5.00% 2022 | | | 600 | | | | 628 | |
| Lexington County Health Services Dist., Inc., Hospital Rev. Ref. Bonds, Series 2017, 5.00% 2024 | | | 500 | | | | 566 | |
| Patriots Energy Group Fncg. Agcy., Gas Supply Rev. Bonds, Series 2018-A, 4.00% 2048 (put 2024) | | | 180 | | | | 193 | |
| Public Service Auth., Improvement Rev. Obligations, Series 2021-B, 5.00% 2029 | | | 520 | | | | 666 | |
| Public Service Auth., Rev. Obligations (Santee Cooper), Series 2014-C, 5.00% 2021 | | | 500 | | | | 502 | |
| Public Service Auth., Rev. Obligations (Santee Cooper), Series 2014-C, 5.00% 2022 | | | 350 | | | | 368 | |
| Public Service Auth., Rev. Obligations (Santee Cooper), Series 2014-C, 5.00% 2023 | | | 125 | | | | 137 | |
| Public Service Auth., Rev. Obligations (Santee Cooper), Series 2012-D, 5.00% 2028 | | | 510 | | | | 524 | |
| Public Service Auth., Rev. Obligations (Santee Cooper), Series 2012-D, 5.00% 2028 (preref. 2022) | | | 490 | | | | 504 | |
| Public Service Auth., Rev. Obligations (Santee Cooper), Series 2011-C, 5.00% 2036 | | | 340 | | | | 341 | |
| Public Service Auth., Rev. Ref. Obligations (Santee Cooper), Series 2015-A, 5.00% 2028 | | | 100 | | | | 114 | |
| | | | | | | | 9,273 | |
| | | | | | | | | |
| South Dakota 1.04% | | | | | | | | |
| Housing Dev. Auth., Homeownership Mortgage Bonds, Series 2014-E, 4.00% 2044 | | | 550 | | | | 575 | |
| Housing Dev. Auth., Homeownership Mortgage Bonds, Series 2016-D, 3.50% 2046 | | | 830 | | | | 878 | |
| Housing Dev. Auth., Homeownership Mortgage Bonds, Series 2017-B, 4.00% 2047 | | | 1,175 | | | | 1,263 | |
| Housing Dev. Auth., Homeownership Mortgage Bonds, Series 2018-B, 4.50% 2048 | | | 1,440 | | | | 1,593 | |
| Housing Dev. Auth., Homeownership Mortgage Bonds, Series 2019-B, 4.00% 2049 | | | 315 | | | | 344 | |
| Housing Dev. Auth., Homeownership Mortgage Bonds, Series 2021-B, 3.00% 2051 | | | 2,255 | | | | 2,433 | |
| Housing Dev. Auth., Homeownership Mortgage Bonds, Series 2020-C, 3.50% 2051 | | | 975 | | | | 1,064 | |
| | | | | | | | 8,150 | |
| | | | | | | | | |
| Tennessee 0.66% | | | | | | | | |
| Town of Greeneville, Health and Educational Facs. Board, Multi Family Housing Rev. Bonds (People RD Portfolio Project), Series 2019, 1.45% 2022 (put 2021) | | | 20 | | | | 20 | |
| Housing Dev. Agcy., Homeownership Program Bonds, Series 2012-1-C, 4.50% 2037 | | | 30 | | | | 30 | |
| Housing Dev. Agcy., Homeownership Program Bonds, Series 2012-2-C, 4.00% 2038 | | | 25 | | | | 25 | |
| Housing Dev. Agcy., Residential Fin. Program Bonds, Series 2017-1, 4.00% 2042 | | | 470 | | | | 504 | |
| Housing Dev. Agcy., Residential Fin. Program Bonds, Series 2017-2-B, 4.00% 2042 | | | 465 | | | | 500 | |
| Housing Dev. Agcy., Residential Fin. Program Bonds, Series 2015-2-A, 4.00% 2046 | | | 460 | | | | 488 | |
| Housing Dev. Agcy., Residential Fin. Program Bonds, Series 2020-3-A, 3.50% 2050 | | | 110 | | | | 120 | |
| Housing Dev. Agcy., Residential Fin. Program Bonds, Series 2015-2-A, 3.75% 2050 | | | 450 | | | | 493 | |
| Housing Dev. Agcy., Residential Fin. Program Bonds, Series 2019-1, 4.25% 2050 | | | 835 | | | | 913 | |
| City of Knoxville, Community Dev. Corp., Collateralized Multi Family Housing Bonds (Austin 1B Apartments Project), Series 2021, 0.22% 2024 (put 2023) | | | 155 | | | | 154 | |
| Metropolitan Government of Nashville and Davidson County, Health and Educational Facs. Board, Rev. Bonds (Vanderbilt University Medical Center), Series 2021-A, 5.00% 2031 | | | 355 | | | | 455 | |
| Metropolitan Government of Nashville and Davidson County, Water & Sewer Rev. Green Bonds, Series 2021-A, 5.00% 2030 | | | 145 | | | | 189 | |
| Tennessee Energy Acquisition Corp., Commodity Project Rev. Bonds, Series 2021-A, 5.00% 2052 (put 2031) | | | 1,000 | | | | 1,291 | |
| | | | | | | | 5,182 | |
| | | | | | | | | |
| Texas 13.85% | | | | | | | | |
| Affordable Housing Corp., Multi Family Housing Rev. Bonds (Apartments of Las Palmas I LLC), Series 2021, 0.25% 2024 (put 2022) | | | 65 | | | | 65 | |
| Alvarado Independent School Dist., Unlimited Tax School Building Bonds, Series 2020, 5.00% 2023 | | | 795 | | | | 842 | |
| Alvin Independent School Dist., Unlimited Tax Schoolhouse and Rev. Ref. Bonds, Series 2020, 5.00% 2025 | | | 600 | | | | 689 | |
| Alvin Independent School Dist., Unlimited Tax Schoolhouse and Rev. Ref. Bonds, Series 2020, 5.00% 2027 | | | 225 | | | | 274 | |
| Angleton Independent School Dist., Unlimited Tax School Building Bonds, Series 2020, 5.00% 2025 | | | 620 | | | | 711 | |
| Arlington Higher Education Fin. Corp., Education Rev. and Rev. Ref. Bonds (Uplift Education), Series 2017-A, 5.00% 2023 | | | 885 | | | | 968 | |
| Arlington Higher Education Fin. Corp., Education Rev. and Rev. Ref. Bonds (Uplift Education), Series 2017-A, 5.00% 2024 | | | 400 | | | | 454 | |
| Arlington Higher Education Fin. Corp., Education Rev. Bonds (Great Hearts America - Texas), Series 2019-A, 5.00% 2026 | | | 400 | | | | 476 | |
| 26 | Private Client Services Funds |
Capital Group Core Municipal Fund
| Bonds, notes & other debt instruments (continued) | | Principal amount
(000) | | | Value
(000) | |
| Texas (continued) | | | | | | | | |
| Arlington Higher Education Fin. Corp., Education Rev. Bonds (Great Hearts America - Texas), Series 2019-A, 5.00% 2028 | | $ | 595 | | | $ | 741 | |
| Arlington Higher Education Fin. Corp., Education Rev. Bonds (Great Hearts America - Texas), Series 2019-A, 5.00% 2029 | | | 235 | | | | 298 | |
| Arlington Higher Education Fin. Corp., Education Rev. Bonds (KIPP Texas, Inc.), Series 2019, 5.00% 2026 | | | 1,900 | | | | 2,273 | |
| Arlington Higher Education Fin. Corp., Education Rev. Bonds (KIPP Texas, Inc.), Series 2019, 5.00% 2027 | | | 1,000 | | | | 1,225 | |
| Arlington Higher Education Fin. Corp., Education Rev. Bonds (Responsive Education Solutions), Series 2021-A, 5.00% 2029 | | | 510 | | | | 650 | |
| Arlington Higher Education Fin. Corp., Education Rev. Bonds (Responsive Education Solutions), Series 2021-A, 5.00% 2030 | | | 485 | | | | 629 | |
| Arlington Higher Education Fin. Corp., Education Rev. Bonds (Riverwalk Education Foundation, Inc.), Series 2019, 5.00% 2028 | | | 650 | | | | 808 | |
| Arlington Higher Education Fin. Corp., Education Rev. Bonds (Uplift Education), Series 2017-B, 5.00% 2026 | | | 450 | | | | 540 | |
| Arlington Higher Education Fin. Corp., Education Rev. Bonds (Uplift Education), Series 2019-A, 4.00% 2027 | | | 460 | | | | 529 | |
| Arlington Higher Education Fin. Corp., Education Rev. Bonds (Uplift Education), Series 2017-B, 5.00% 2027 | | | 250 | | | | 301 | |
| Arlington Higher Education Fin. Corp., Education Rev. Bonds (Uplift Education), Series 2019-A, 4.00% 2028 | | | 475 | | | | 546 | |
| Arlington Higher Education Fin. Corp., Education Rev. Bonds (Uplift Education), Series 2019-A, 4.00% 2029 | | | 395 | | | | 451 | |
| Arlington Independent School Dist., Unlimited Tax School Building and Rev. Ref. Bonds, Series 2020, 5.00% 2026 | | | 325 | | | | 385 | |
| City of Arlington, Permanent Improvement Bonds, Series 2021-A, 5.00% 2030 | | | 140 | | | | 183 | |
| Austin Affordable PFC, Inc., Multi Family Housing Rev. Bonds (Bridge at Turtle Creek Apartments), Series 2020, 0.42% 2040 (put 2023) | | | 1,000 | | | | 1,001 | |
| Austin Community College Dist., Maintenance Tax Notes, Series 2021, 5.00% 2030 | | | 160 | | | | 210 | |
| City of Austin, Water and Wastewater System Rev. Ref. Bonds, Series 2015-A, 5.00% 2030 | | | 740 | | | | 867 | |
| City of Austin, Water and Wastewater System Rev. Ref. Bonds, Series 2021, 5.00% 2030 | | | 110 | | | | 145 | |
| City of Austin, Water and Wastewater System Rev. Ref. Bonds, Series 2021, 5.00% 2031 | | | 135 | | | | 181 | |
| Barbers Hill Independent School Dist., Unlimited Tax School Building Bonds, Series 2020, 5.00% 2030 | | | 375 | | | | 486 | |
| Beaumont Independent School Dist., Unlimited Tax Rev. Ref. Bonds, Series 2017, 5.00% 2026 | | | 1,500 | | | | 1,776 | |
| County of Bexar, Hospital Dist., Limited Tax Rev. Ref. Bonds, Series 2019, 5.00% 2031 | | | 480 | | | | 592 | |
| Brazosport Independent School Dist., Unlimited Tax School Building Bonds, Series 2019, 5.00% 2022 | | | 115 | | | | 117 | |
| Burnet Consolidated Independent School Dist., Unlimited Tax School Building Bonds, Series 2021, 5.00% 2031 | | | 215 | | | | 280 | |
| County of Cameron, Housing Fin. Corp., Multi Family Housing Rev. Bonds (Sunland Country Apartments), Series 2021, 0.28% 2024 (put 2023) | | | 205 | | | | 205 | |
| Canyon Independent School Dist., Unlimited Tax School Building Bonds, Series 2020, 5.00% 2027 | | | 1,000 | | | | 1,217 | |
| Capital Area Housing Fin. Corp., Multi Family Housing Rev. Bonds (Mission Trail at El Camino Real Apartments), Series 2019, 2.10% 2037 (put 2022) | | | 1,080 | | | | 1,081 | |
| Capital Area Housing Fin. Corp., Multi Family Housing Rev. Bonds (Redwood Apartments), Series 2020, 0.41% 2041 (put 2024) | | | 3,920 | | | | 3,922 | |
| Carroll Independent School Dist., Unlimited Tax Rev. Ref. Bonds, Series 2019, 5.00% 2026 | | | 970 | | | | 1,148 | |
| Carrollton-Farmers Branch Independent School Dist., Unlimited Tax School Building Bonds, Series 2021, 5.00% 2023 | | | 230 | | | | 244 | |
| Central Texas Regional Mobility Auth., Rev. Ref. Bonds, Series 2021-D, 5.00% 2030 | | | 320 | | | | 409 | |
| Central Texas Regional Mobility Auth., Rev. Ref. Bonds, Series 2021-D, 5.00% 2032 | | | 520 | | | | 679 | |
| Clear Creek Independent School Dist., Unlimited Tax School Building Bonds, Series 2018, 5.00% 2028 | | | 1,100 | | | | 1,335 | |
| Clear Creek Independent School Dist., Unlimited Tax School Building Bonds, Series 2013-B, 0.28% 2038 (put 2024) | | | 205 | | | | 204 | |
| Clifton Higher Education Fin. Corp., Education Rev. and Ref. Bonds (Idea Public Schools), Series 2017, 5.00% 2027 | | | 1,360 | | | | 1,672 | |
| Clifton Higher Education Fin. Corp., Education Rev. Bonds (Idea Public Schools), Series 2018, 5.00% 2025 | | | 500 | | | | 582 | |
| Clifton Higher Education Fin. Corp., Education Rev. Bonds (Idea Public Schools), Series 2019, 5.00% 2026 | | | 1,000 | | | | 1,199 | |
| Collin County Community College Dist., G.O. Bonds, Series 2020-A, 5.00% 2032 | | | 680 | | | | 876 | |
| Conroe Independent School Dist., Unlimited Tax Rev. Ref. Bonds, Series 2019, 5.00% 2022 | | | 220 | | | | 223 | |
| Corpus Christi Independent School Dist., Unlimited Tax School Building and Rev. Ref. Bonds, Series 2020, 5.00% 2027 | | | 675 | | | | 831 | |
| Port of Corpus Christi Auth. of Nueces County, Rev. Bonds, Series 2018-A, 5.00% 2027 | | | 490 | | | | 599 | |
| Crowley Independent School Dist., Unlimited Tax Rev. Ref. Bonds, Series 2015-A, 5.00% 2025 | | | 1,000 | | | | 1,163 | |
| Crowley Independent School Dist., Unlimited Tax School Building Bonds, Series 2019, 5.00% 2028 | | | 310 | | | | 389 | |
| Crowley Independent School Dist., Unlimited Tax School Building Bonds, Series 2019, 5.00% 2029 | | | 400 | | | | 508 | |
| Crowley Independent School Dist., Unlimited Tax School Building Bonds, Series 2019, 5.00% 2031 | | | 260 | | | | 327 | |
| Cities of Dallas and Fort Worth, Dallas/Fort Worth International Airport, Joint Rev. Improvement Bonds, Series 2013-B, 4.00% 2039 | | | 1,000 | | | | 1,034 | |
| City of Dallas, Housing Fin. Corp., Multi Family Housing Rev. Bonds (Midpark Towers), Series 2021, 0.35% 2024 (put 2023) | | | 675 | | | | 675 | |
| City of Dallas, Housing Fin. Corp., Multi Family Housing Rev. Notes (Estates at Shiloh), Series 2019, 1.25% 2037 (put 2023) | | | 430 | | | | 436 | |
| Private Client Services Funds | 27 |
Capital Group Core Municipal Fund
| Bonds, notes & other debt instruments (continued) | | Principal amount
(000) | | | Value
(000) | |
| Texas (continued) | | | | | | | | |
| Dallas Independent School Dist., Unlimited Tax Rev. Ref. Bonds, Series 2014-A, 5.00% 2023 | | $ | 120 | | | $ | 130 | |
| Del Valle Independent School Dist., Unlimited Tax School Building Bonds, Series 2020, 5.00% 2022 | | | 155 | | | | 160 | |
| City of Denton, Utility System Rev. Bonds, Series 2017, 5.00% 2028 | | | 2,000 | | | | 2,396 | |
| Eagle Mountain-Saginaw Independent School Dist., Unlimited Tax School Building Bonds, Series 2019, 5.00% 2027 | | | 600 | | | | 738 | |
| El Paso Independent School Dist., Unlimited Tax Rev. Ref. Bonds, Series 2015, 5.00% 2026 | | | 500 | | | | 565 | |
| Fort Bend Independent School Dist., Unlimited Tax Rev. Ref. Bonds, Series 2021-B, 0.72% 2051 (put 2026) | | | 1,515 | | | | 1,511 | |
| Fort Bend Independent School Dist., Unlimited Tax School Building and Rev. Ref. Bonds, Series 2020-B, 0.875% 2050 (put 2023) | | | 340 | | | | 343 | |
| Fort Worth Independent School Dist., Unlimited Tax School Building Bonds, Series 2021-A, 5.00% 2030 | | | 275 | | | | 357 | |
| Fort Worth Independent School Dist., Unlimited Tax School Building Bonds, Series 2021-A, 5.00% 2031 | | | 255 | | | | 337 | |
| G.O. Water Financial Assistance Rev. Ref. Bonds, Series 2021-B, 4.00% 2028 | | | 175 | | | | 197 | |
| City of Galveston, Public Fac. Corp., Multi Family Housing Rev. Bonds (The Orleanders at Broadway), Series 2021, 0.47% 2025 (put 2024) | | | 510 | | | | 509 | |
| City of Garland, Electric Utility System Rev. Ref. Bonds, Series 2021, 5.00% 2022 | | | 675 | | | | 686 | |
| City of Garland, Electric Utility System Rev. Ref. Bonds, Series 2021-A, 5.00% 2028 | | | 80 | | | | 99 | |
| City of Garland, Electric Utility System Rev. Ref. Bonds, Series 2021-A, 5.00% 2031 | | | 150 | | | | 196 | |
| City of Garland, Tax and Rev. Certs. of Obligation, Series 2021, 5.00% 2024 | | | 135 | | | | 149 | |
| Goose Creek Consolidated Independent School Dist., Unlimited Tax School Building Bonds, Series 2014-B, 0.60% 2035 (put 2026) | | | 340 | | | | 337 | |
| Goose Creek Consolidated Independent School Dist., Unlimited Tax School Building Bonds, Series 2019-B, 0.15% 2049 (put 2022) | | | 555 | | | | 555 | |
| Harlandale Independent School Dist., Maintenance Tax Notes, Series 2021, BAM insured, 2.00% 2040 (put 2024) | | | 185 | | | | 187 | |
| Harlandale Independent School Dist., Unlimited Tax Rev. Ref. Bonds, Series 2020, 0.75% 2045 (put 2025) | | | 330 | | | | 330 | |
| County of Harris, Cultural Education Facs. Fin. Corp., Hospital Rev. Bonds (Memorial Hermann Health System), Series 2020, 5.00% 2022 | | | 1,000 | | | | 1,028 | |
| County of Harris, Cultural Education Facs. Fin. Corp., Hospital Rev. Bonds (Memorial Hermann Health System), Series 2019-C-2, (SIFMA Municipal Swap Index + 0.57%) 0.62% 2049 (put 2024)2 | | | 1,000 | | | | 1,004 | |
| County of Harris, Cultural Education Facs. Fin. Corp., Hospital Rev. Bonds (Texas Children’s Hospital), Series 2019-B, 5.00% 2041 (put 2024) | | | 1,000 | | | | 1,132 | |
| County of Harris, Cultural Education Facs. Fin. Corp., Hospital Rev. Ref. Bonds (Memorial Hermann Health System), Series 2013-B, (SIFMA Municipal Swap Index + 0.90%) 0.95% 20222 | | | 250 | | | | 251 | |
| County of Harris, Cultural Education Facs. Fin. Corp., Medical Facs. Mortgage Rev. Ref. Bonds (Baylor College of Medicine), Series 2019-A, (3-month USD-LIBOR x 0.70 + 0.65%) 0.707% 2046 (put 2024)2 | | | 535 | | | | 537 | |
| County of Harris, Cultural Education Facs. Fin. Corp., Rev. Bonds (Texas Medical Center), Series 2020-A, 0.90% 2050 (put 2025) | | | 455 | | | | 455 | |
| County of Harris, Health Facs. Dev. Corp., Rev. Ref. Bonds (CHRISTUS Health), Series 2005-A-4, Assured Guaranty Municipal insured, 0.20% 20312 | | | 125 | | | | 125 | |
| County of Harris, Sports Auth., Rev. Ref. Bonds, Series 2014-A, Assured Guaranty Municipal insured, 5.00% 2022 (escrowed to maturity) | | | 365 | | | | 383 | |
| Hays Consolidated Independent School Dist., Unlimited Tax School Building Bonds, Series 2021, 4.00% 2030 | | | 2,045 | | | | 2,448 | |
| Dept. of Housing and Community Affairs, Multi Family Housing Rev. Bonds (Corona Del Valle), Series 2021, 0.37% 2025 (put 2023) | | | 185 | | | | 185 | |
| Dept. of Housing and Community Affairs, Multi Family Housing Rev. Bonds (Oso Bay Apartments), Series 2021, 0.27% 2024 (put 2022) | | | 345 | | | | 345 | |
| Dept. of Housing and Community Affairs, Multi Family Housing Rev. Bonds (Palladium Simpson Stuart Apartments), Series 2021, 0.35% 2025 (put 2024) | | | 630 | | | | 629 | |
| Dept. of Housing and Community Affairs, Residential Mortgage Rev. Bonds, Series 2019-A, 4.75% 2049 | | | 1,195 | | | | 1,322 | |
| Dept. of Housing and Community Affairs, Residential Mortgage Rev. Bonds, Series 2021-A, 3.00% 2052 | | | 2,300 | | | | 2,490 | |
| Dept. of Housing and Community Affairs, Single Family Mortgage Rev. Bonds, Series 2019-A, 4.00% 2050 | | | 1,270 | | | | 1,415 | |
| Dept. of Housing and Community Affairs, Single Family Mortgage Rev. Bonds, Series 2020-A, 3.50% 2051 | | | 370 | | | | 407 | |
| Dept. of Housing and Community Affairs, Single Family Mortgage Rev. Bonds, Series 2021-A, 3.00% 2052 | | | 850 | | | | 922 | |
| Housing Options, Inc., Multi Family Housing Rev. Bonds (Brooks Manor - The Oaks Project), Series 2021, 0.50% 2041 (put 2025) | | | 255 | | | | 254 | |
| City of Houston, Combined Utility System Rev. and Rev. Ref. Bonds, Series 2016-B, 5.00% 2027 | | | 500 | | | | 607 | |
| City of Houston, Combined Utility System Rev. Bonds, Series 2011-D, 5.00% 2026 (preref. 2021) | | | 185 | | | | 185 | |
| City of Houston, Combined Utility System Rev. Ref. Bonds, Series 2019-B, 5.00% 2027 | | | 550 | | | | 682 | |
| City of Houston, Convention and Entertainment Facs. Dept., Hotel Occupancy Tax and Special Rev. Ref. Bonds, Series 2021, 4.00% 2028 | | | 225 | | | | 264 | |
| City of Houston, Convention and Entertainment Facs. Dept., Hotel Occupancy Tax and Special Rev. Ref. Bonds, Series 2021, 4.00% 2030 | | | 25 | | | | 30 | |
| City of Houston, Convention and Entertainment Facs. Dept., Hotel Occupancy Tax and Special Rev. Ref. Bonds, Series 2021, 4.00% 2031 | | | 10 | | | | 12 | |
| | |
| 28 | Private Client Services Funds |
Capital Group Core Municipal Fund
| Bonds, notes & other debt instruments (continued) | | Principal amount
(000) | | | Value
(000) | |
| Texas (continued) | | | | | | | | |
| City of Houston, Housing Fin. Corp., Multi Family Housing Rev. Bonds (Temenos Place Apartments), Series 2021, 0.29% 2024 (put 2023) | | $ | 325 | | | $ | 324 | |
| City of Houston, Memorial City Redev. Auth., Tax Increment Contract Rev. and Rev. Ref. Bonds, Series 2019, Assured Guaranty Municipal insured, 5.00% 2027 | | | 1,050 | | | | 1,265 | |
| City of Houston, Memorial City Redev. Auth., Tax Increment Contract Rev. and Rev. Ref. Bonds, Series 2019, Assured Guaranty Municipal insured, 5.00% 2028 | | | 250 | | | | 306 | |
| Katy Independent School Dist., Unlimited Tax Rev. Ref. Bonds, Series 2019-B, 5.00% 2022 | | | 465 | | | | 471 | |
| County of Kaufman, Unlimited Tax Road Bonds, Series 2020, 5.00% 2031 | | | 115 | | | | 145 | |
| Killeen Independent School Dist., Unlimited Tax Rev. Ref. Bonds, Series 2019, 5.00% 2022 | | | 445 | | | | 451 | |
| Longview Independent School Dist., Unlimited Tax Rev. Ref. Bonds, Series 2020, 5.00% 2023 | | | 575 | | | | 610 | |
| Lower Colorado River Auth., Rev. Ref. Bonds, Series 2022, Assured Guaranty Municipal insured, 5.00% 2032 | | | 380 | | | | 484 | |
| Lower Colorado River Auth., Transmission Contract Rev. Ref. Bonds (LCRA Transmission Services Corp. Project), Series 2016, 5.00% 2022 | | | 460 | | | | 472 | |
| Lower Colorado River Auth., Transmission Contract Rev. Ref. Bonds (LCRA Transmission Services Corp. Project), Series 2018, 5.00% 2024 | | | 255 | | | | 285 | |
| Lower Colorado River Auth., Transmission Contract Rev. Ref. Bonds (LCRA Transmission Services Corp. Project), Series 2020, 5.00% 2027 | | | 1,750 | | | | 2,141 | |
| Lower Colorado River Auth., Transmission Contract Rev. Ref. Bonds (LCRA Transmission Services Corp. Project), Series 2021-A, 5.00% 2031 | | | 570 | | | | 747 | |
| Lumberton Independent School Dist., Unlimited Tax School Building Bonds, Series 2020, 5.00% 2029 | | | 245 | | | | 312 | |
| Medina Valley Independent School Dist., Unlimited Tax School Building Bonds, Series 2021, 0.82% 2051 (put 2026) | | | 325 | | | | 322 | |
| County of Midland, Public Fac. Corp., Multi Family Housing Rev. Bonds (Palladium at West Francis), Series 2020, 0.35% 2024 (put 2023) | | | 1,000 | | | | 998 | |
| Municipal Gas Acquisition and Supply Corp. I, Gas Supply Rev. Bonds, Series 2008-D, 6.25% 2026 | | | 480 | | | | 555 | |
| Municipal Gas Acquisition and Supply Corp. III, Gas Supply Rev. Ref. Bonds, Series 2021, 5.00% 2022 | | | 660 | | | | 693 | |
| Nederland Independent School Dist., Unlimited Tax School Building Bonds, Series 2021, 5.00% 2031 | | | 195 | | | | 248 | |
| New Hope Cultural Education Facs. Fin. Corp., Retirement Fac. Rev. Bonds (Westminster Project), Series 2016, 5.00% 2028 | | | 235 | | | | 265 | |
| North Central Texas Housing Fin. Corp., Multi Family Housing Rev. Bonds (Bluebonnet Ridge Apartments), Series 2021, 0.375% 2040 (put 2024) | | | 220 | | | | 219 | |
| North East Independent School Dist., Unlimited Tax Rev. Ref. Bonds, Series 2017, 2.375% 2047 (put 2022) | | | 500 | | | | 508 | |
| North East Independent School Dist., Unlimited Tax School Building and Rev. Ref. Bonds, Series 2019-A, 4.00% 2032 | | | 215 | | | | 251 | |
| North Fort Bend Water Auth., Water System Rev. and Rev. Ref. Bonds, Series 2021, BAM insured, 5.00% 2031 | | | 435 | | | | 579 | |
| North Harris County Regional Water Auth., Rev. and Rev. Ref. Bonds, Series 2016, 5.00% 2034 | | | 950 | | | | 1,139 | |
| North Texas Municipal Water Dist., Water System Rev. Ref. and Improvement Bonds, Series 2021, 5.00% 2022 | | | 170 | | | | 177 | |
| North Texas Tollway Auth., System Rev. and Rev. Ref. Bonds, Series 2017-A, 5.00% 2022 | | | 220 | | | | 222 | |
| North Texas Tollway Auth., System Rev. Ref. Bonds, Series 2016-A, 5.00% 2026 | | | 500 | | | | 549 | |
| North Texas Tollway Auth., System Rev. Ref. Bonds, Series 2015-A, 5.00% 2030 | | | 300 | | | | 340 | |
| North Texas Tollway Auth., System Rev. Ref. Bonds, Capital Appreciation Bonds, Series 2008-D, Assured Guaranty insured, 0% 2030 | | | 500 | | | | 435 | |
| Northside Independent School Dist., Unlimited Tax Rev. Ref. Bonds, Series 2020, 5.00% 2027 | | | 850 | | | | 1,048 | |
| Northwest Independent School Dist., Unlimited Tax School Building Bonds, Series 2021, 5.00% 2030 | | | 175 | | | | 227 | |
| Northwest Independent School Dist., Unlimited Tax School Building Bonds, Series 2021, 5.00% 2031 | | | 105 | | | | 137 | |
| Northwest Independent School Dist., Unlimited Tax School Building Bonds, Series 2013, 5.00% 2038 (preref. 2023) | | | 700 | | | | 743 | |
| Odessa Housing Fin. Corp., Multi Family Housing Rev. Bonds (Cove in Odessa Apartments), Series 2021, 0.37% 2024 (put 2023) | | | 755 | | | | 755 | |
| Pasadena Independent School Dist., Unlimited Tax Rev. Ref. Bonds, Series 2019, 5.00% 2029 | | | 260 | | | | 331 | |
| Pasadena Independent School Dist., Unlimited Tax School Building and Rev. Ref. Bonds, Series 2013, 5.00% 2038 | | | 1,000 | | | | 1,059 | |
| Pflugerville Independent School Dist., Unlimited Tax School Building Bonds, Series 2019-A, 5.00% 2022 | | | 1,000 | | | | 1,014 | |
| Prosper Independent School Dist., Unlimited Tax School Building Bonds, Series 2021-A, 5.00% 2030 | | | 255 | | | | 331 | |
| Prosper Independent School Dist., Unlimited Tax School Building Bonds, Series 2021-A, 5.00% 2031 | | | 60 | | | | 79 | |
| Prosper Independent School Dist., Unlimited Tax School Building Bonds, Series 2019-B, 2.00% 2050 (put 2021) | | | 415 | | | | 427 | |
| Round Rock Independent School Dist., Unlimited Tax Rev. Ref. Bonds, Series 2017, 5.00% 2022 | | | 600 | | | | 621 | |
| City of San Antonio, Electric and Gas Systems Rev. Bonds, Series 2013, 5.00% 2048 (preref. 2023) | | | 475 | | | | 503 | |
| City of San Antonio, Electric and Gas Systems Rev. Ref. Bonds, Series 2016, 5.00% 2028 | | | 1,000 | | | | 1,198 | |
| City of San Antonio, Electric and Gas Systems Rev. Ref. Bonds, Series 2015-B, 2.00% 2033 (put 2021) | | | 1,150 | | | | 1,152 | |
| City of San Antonio, Electric and Gas Systems Rev. Ref. Bonds, Series 2018, 2.75% 2048 (put 2022) | | | 250 | | | | 257 | |
| City of San Antonio, General Improvement and Rev. Ref. Bonds, Series 2016, 5.00% 2022 | | | 270 | | | | 273 | |
| City of San Antonio, Water System Rev. Ref. Bonds, Series 2019-C, 5.00% 2022 | | | 185 | | | | 190 | |
| Sheldon Independent School Dist., Unlimited Tax School Building Bonds, Series 2017, 5.00% 2022 | | | 250 | | | | 253 | |
| Private Client Services Funds | 29 |
Capital Group Core Municipal Fund
| Bonds, notes & other debt instruments (continued) | | Principal amount
(000) | | | Value
(000) | |
| Texas (continued) | | | | | | | | |
| Sherman Independent School Dist., Unlimited Tax School Building Bonds, Series 2018-A, 5.00% 2027 | | $ | 1,010 | | | $ | 1,228 | |
| Spring Independent School Dist., Unlimited Tax School Building Bonds, Series 2019, 5.00% 2031 | | | 465 | | | | 582 | |
| County of Tarrant, Cultural Education Facs. Fin. Corp., Rev. Ref. Bonds (Christus Health), Series 2018-A, 5.00% 2023 | | | 850 | | | | 916 | |
| Board of Regents of the Texas A&M University System, Rev. Fncg. System Bonds, Series 2017-E, 5.00% 2022 | | | 1,425 | | | | 1,462 | |
| Tomball Independent School Dist., Unlimited Tax School Building Bonds, Series 2020, 5.00% 2023 | | | 270 | | | | 286 | |
| Tomball Independent School Dist., Unlimited Tax School Building Bonds, Series 2020, 5.00% 2024 | | | 90 | | | | 100 | |
| Transportation Commission, Highway Improvement G.O. Bonds, Series 2016-A, 5.00% 2028 | | | 200 | | | | 237 | |
| County of Travis, Strategic Housing Fin. Corp., Multi Family Housing Rev. Bonds (Yager Flats), Series 2021, 0.46% 2041 (put 2025) | | | 3,000 | | | | 2,980 | |
| Trinity River Auth., Regional Wastewater System Rev. Ref. Bonds, Series 2021, 5.00% 2030 | | | 235 | | | | 306 | |
| Trinity River Public Fac. Corp., Multi Family Housing Rev. Bonds (Cowan Place Apartments), Series 2021, 0.28% 2024 (put 2023) | | | 500 | | | | 499 | |
| Board of Regents of the University of North Texas System, Rev. Fncg. System Rev. Ref. and Improvement Bonds, Series 2018-A, 5.00% 2025 | | | 240 | | | | 277 | |
| Board of Regents of the University of North Texas System, Rev. Fncg. System Rev. Ref. and Improvement Bonds, Series 2018-A, 5.00% 2026 | | | 760 | | | | 903 | |
| Water Dev. Board, State Revolving Fund, Rev. Bonds, Series 2021, 5.00% 2031 | | | 260 | | | | 348 | |
| Water Dev. Board, State Water Implementation Rev. Fund, Rev. Bonds (Master Trust), Series 2018-A, 5.00% 2029 | | | 990 | | | | 1,239 | |
| Water Dev. Board, State Water Implementation Rev. Fund, Rev. Bonds (Master Trust), Series 2021, 5.00% 2032 | | | 1,040 | | | | 1,392 | |
| Wylie Independent School Dist., Unlimited Tax Rev. Ref. Bonds, Series 2020-A, 5.00% 2030 | | | 1,790 | | | | 2,327 | |
| | | | | | | | 108,738 | |
| | | | | | | | | |
| Utah 0.42% | | | | | | | | |
| Canyons School Dist., Local Building Auth., Lease Rev. Bonds, Series 2021, 5.00% 2029 | | | 1,000 | | | | 1,284 | |
| Housing Corp., Single Family Mortgage Bonds, Class III, Series 2015-D-2, 4.00% 2045 | | | 155 | | | | 165 | |
| Salt Lake City, Airport Rev. Bonds (Salt Lake City International Airport), Series 2021-B, 5.00% 2025 | | | 450 | | | | 522 | |
| Salt Lake City, Airport Rev. Bonds (Salt Lake City International Airport), Series 2021-B, 5.00% 2026 | | | 620 | | | | 740 | |
| School Fin. Auth., Charter School Rev. Bonds (Utah Charter Academies Project), Series 2018, 4.00% 2022 | | | 335 | | | | 346 | |
| Transit Auth., Sales Tax Rev. Bonds, Series 2008-A, 5.25% 2023 | | | 80 | | | | 86 | |
| City of Vineyard, Redev. Agcy., Tax Increment Rev. and Rev. Ref. Bonds, Series 2021, Assured Guaranty Municipal insured, 5.00% 2026 | | | 95 | | | | 112 | |
| City of Vineyard, Redev. Agcy., Tax Increment Rev. and Rev. Ref. Bonds, Series 2021, Assured Guaranty Municipal insured, 5.00% 2030 | | | 25 | | | | 32 | |
| City of Vineyard, Redev. Agcy., Tax Increment Rev. and Rev. Ref. Bonds, Series 2021, Assured Guaranty Municipal insured, 5.00% 2031 | | | 20 | | | | 26 | |
| | | | | | | | 3,313 | |
| | | | | | | | | |
| Vermont 0.06% | | | | | | | | |
| Housing Fin. Agcy., Multiple Purpose Bonds, Series 2018-A, 4.00% 2048 | | | 245 | | | | 264 | |
| Housing Fin. Agcy., Multiple Purpose Bonds, Series 2020-A, 3.75% 2050 | | | 165 | | | | 181 | |
| | | | | | | | 445 | |
| | | | | | | | | |
| Virginia 1.51% | | | | | | | | |
| County of Arlington, Industrial Dev. Auth., Hospital Rev. Bonds (Virginia Hospital Center), Series 2020, 5.00% 2031 | | | 600 | | | | 773 | |
| County of Arlington, Industrial Dev. Auth., Hospital Rev. Bonds (Virginia Hospital Center), Series 2020, 5.00% 2032 | | | 215 | | | | 276 | |
| County of Charles City, Econ. Dev. Auth., Solid Waste Disposal Rev. Bonds (Waste Management, Inc. Project), Series 2004-A, 2.875% 2029 | | | 1,000 | | | | 1,082 | |
| College Building Auth., Educational Facs. Rev. Bonds (21st Century College and Equipment Programs), Series 2012-A, 5.00% 2024 (preref. 2022) | | | 295 | | | | 298 | |
| College Building Auth., Educational Facs. Rev. Bonds (21st Century College and Equipment Programs), Series 2013-A, 4.50% 2033 | | | 1,865 | | | | 1,965 | |
| College Building Auth., Educational Facs. Rev. Bonds (21st Century College and Equipment Programs), Series 2013-A, 4.50% 2034 | | | 975 | | | | 1,027 | |
| College Building Auth., Educational Facs. Rev. Bonds (Regent University Project), Series 2021, 5.00% 2029 | | | 375 | | | | 462 | |
| College Building Auth., Educational Facs. Rev. Bonds (Regent University Project), Series 2021, 5.00% 2030 | | | 375 | | | | 468 | |
| County of Fairfax, Redev. and Housing Auth., Multi Family Housing Rev. Bonds (Arrowbrook Apartments Project), Series 2020, 0.41% 2041 (put 2024) | | | 1,000 | | | | 1,001 | |
| County of Halifax, Industrial Dev. Auth., Recovery Zone Fac. Rev. Bonds (Virginia Electric and Power Co. Project), Series 2010-A, 0.45% 2041 (put 2022) | | | 740 | | | | 740 | |
| 30 | Private Client Services Funds |
Capital Group Core Municipal Fund
| Bonds, notes & other debt instruments (continued) | | Principal amount
(000) | | | Value
(000) | |
| Virginia (continued) | | | | | | | | |
| County of Henrico, Econ. Dev. Auth., Residential Care Fac. Rev. Ref. Bonds (Westminster Canterbury Richmond), Series 2018, 5.00% 2023 | | $ | 575 | | | $ | 623 | |
| Town of Louisa, Industrial Dev. Auth., Pollution Control Rev. Ref. Bonds (Virginia Electric and Power Co. Project), Series 2008-A, 1.90% 2035 (put 2023) | | | 1,000 | | | | 1,024 | |
| Small Business Fncg. Auth., Residential Care Facs. Rev. and Rev. Ref. Bonds (Lifespire of Virginia), Series 2021, 3.00% 2023 | | | 45 | | | | 47 | |
| Small Business Fncg. Auth., Residential Care Facs. Rev. and Rev. Ref. Bonds (Lifespire of Virginia), Series 2021, 3.00% 2024 | | | 15 | | | | 16 | |
| Small Business Fncg. Auth., Residential Care Facs. Rev. and Rev. Ref. Bonds (Lifespire of Virginia), Series 2021, 4.00% 2031 | | | 375 | | | | 426 | |
| Small Business Fncg. Auth., Rev. Bonds (National Senior Campuses, Inc. Obligated Group), Series 2020-A, 5.00% 2027 | | | 350 | | | | 422 | |
| Small Business Fncg. Auth., Rev. Bonds (National Senior Campuses, Inc. Obligated Group), Series 2020-A, 5.00% 2028 | | | 120 | | | | 148 | |
| Small Business Fncg. Auth., Rev. Bonds (National Senior Campuses, Inc. Obligated Group), Series 2020-A, 5.00% 2029 | | | 140 | | | | 173 | |
| Small Business Fncg. Auth., Rev. Bonds (National Senior Campuses, Inc. Obligated Group), Series 2020-A, 5.00% 2030 | | | 170 | | | | 209 | |
| County of Wise, Industrial Dev. Auth., Solid Waste and Sewage Disposal Rev. Bonds (Virginia Electric and Power Co. Project), Series 2010-A, 1.20% 2040 (put 2024) | | | 640 | | | | 650 | |
| | | | | | | | 11,830 | |
| | | | | | | | | |
| Washington 2.22% | | | | | | | | |
| Central Puget Sound Regional Transit Auth., Sales Tax and Motor Vehicle Excise Tax Improvement and Rev. Ref. Green Bonds, Series 2021-S-1, 5.00% 2029 | | | 510 | | | | 659 | |
| Energy Northwest, Electric Rev. and Rev. Ref. Bonds (Columbia Generating Station), Series 2020-A, 5.00% 2032 | | | 195 | | | | 254 | |
| City of Everett, Housing Auth., Multi Family Housing Rev. Bonds (Baker Heights Legacy), Series 2021, 0.30% 2024 (put 2023) | | | 285 | | | | 284 | |
| G.O. Bonds, Series 2012-D, 5.00% 2026 (preref. 2022) | | | 1,000 | | | | 1,012 | |
| G.O. Bonds, Series 2017-D, 5.00% 2028 | | | 1,000 | | | | 1,214 | |
| G.O. Bonds, Series 2019-C, 5.00% 2031 | | | 1,000 | | | | 1,264 | |
| G.O. Bonds, Series 2012-D, 5.00% 2033 (preref. 2022) | | | 2,000 | | | | 2,024 | |
| G.O. Bonds, Series 2019-A, 5.00% 2033 | | | 500 | | | | 623 | |
| G.O. Rev. Ref. Bonds, Series 2017-R-A, 5.00% 2022 | | | 340 | | | | 352 | |
| County of Grant, Public Utility Dist. No. 2, Electric System Rev. Ref. Bonds, Series 2017-O, 5.00% 2024 | | | 275 | | | | 302 | |
| Health Care Facs. Auth., Rev. Ref. Bonds (Providence St. Joseph Health), Series 2021-B, 4.00% 2042 (put 2030) | | | 1,000 | | | | 1,214 | |
| Housing Fin. Commission, Multi Family Housing Rev. Bonds (Garten Haus Apartments Project), Series 2021, 0.37% 2024 (put 2023) | | | 170 | | | | 170 | |
| Housing Fin. Commission, Municipal Certs., Series 2021-1, 3.50% 2035 | | | 979 | | | | 1,124 | |
| Housing Fin. Commission, Nonprofit Housing Rev. Ref. Bonds (Horizon House Project), Series 2017, 5.00% 20233 | | | 1,095 | | | | 1,148 | |
| Housing Fin. Commission, Single Family Program Bonds, Series 2017-1-N, 4.00% 2047 | | | 460 | | | | 488 | |
| Housing Fin. Commission, Single Family Program Bonds, Series 2019-1-N, 4.00% 2049 | | | 295 | | | | 321 | |
| Motor Vehicle Fuel Tax G.O. Bonds, Series 2021-D, 5.00% 2022 | | | 2,375 | | | | 2,442 | |
| City of Seattle, Housing Auth., Rev. and Rev. Ref. Bonds (Northgate Plaza Project), Series 2021, 1.00% 2026 | | | 460 | | | | 460 | |
| City of Seattle, Housing Auth., Rev. Bonds (Lam Bow Apartments Project), Series 2021, 1.25% 2024 | | | 55 | | | | 55 | |
| City of Seattle, Municipal Light and Power Rev. Ref. Bonds, Series 2021-B, (SIFMA Municipal Swap Index + 0.25%) 0.30% 2045 (put 2026)2 | | | 765 | | | | 772 | |
| City of Seattle, Municipal Light and Power Rev. Ref. Bonds, Series 2018-C-2, (SIFMA Municipal Swap Index + 0.49%) 0.54% 2046 (put 2023)2 | | | 825 | | | | 828 | |
| City of Seattle, Solid Waste System Rev. Ref. Bonds, Series 2021, 5.00% 2029 | | | 170 | | | | 219 | |
| City of Seattle, Solid Waste System Rev. Ref. Bonds, Series 2021, 5.00% 2030 | | | 175 | | | | 230 | |
| | | | | | | | 17,459 | |
| Private Client Services Funds | 31 |
Capital Group Core Municipal Fund
| Bonds, notes & other debt instruments (continued) | | Principal amount
(000) | | | Value
(000) | |
| West Virginia 0.32% | | | | | | | | |
| Econ. Dev. Auth., Solid Waste Disposal Facs. Rev. Bonds (Appalachian Power Co. - Amos Project), Series 2009-B, 2.625% 2042 (put 2022) | | $ | 750 | | | $ | 759 | |
| Econ. Dev. Auth., Solid Waste Disposal Facs. Rev. Ref. Bonds (Appalachian Power Co. - Amos Project), Series 2015-A, 2.55% 2040 (put 2024) | | | 500 | | | | 521 | |
| Housing Dev. Fund, Multi Family Housing Rev. Bonds (Charles Towers), Series 2021, 0.21% 2023 (put 2022) | | | 235 | | | | 235 | |
| Housing Dev. Fund, Multi Family Housing Rev. Bonds (Parkland Place / Chapmanville Towers), Series 2021, 0.28% 2024 (put 2023) | | | 1,000 | | | | 999 | |
| | | | | | | | 2,514 | |
| | | | | | | | | |
| Wisconsin 2.07% | | | | | | | | |
| Environmental Improvement Fund Rev. Green Bonds, Series 2021-A, 4.00% 2031 | | | 1,000 | | | | 1,220 | |
| G.O. Bonds, Series 2015-A, 5.00% 2031 (preref. 2023) | | | 2,000 | | | | 2,143 | |
| Health and Educational Facs. Auth., Health Facs. Rev. Bonds (SSM Health Care), Series 2018-B, 5.00% 2038 (put 2023) | | | 1,300 | | | | 1,365 | |
| Health and Educational Facs. Auth., Rev. Bonds (Advocate Aurora Health Care Credit Group), Series 2018-C-3, (SIFMA Municipal Swap Index + 0.55%) 0.60% 2054 (put 2023)2 | | | 1,130 | | | | 1,133 | |
| Health and Educational Facs. Auth., Rev. Bonds (Ascension Senior Credit Group), Series 2019-A, 5.00% 2021 | | | 325 | | | | 326 | |
| Health and Educational Facs. Auth., Rev. Bonds (Ascension Senior Credit Group), Series 2016-A, 5.00% 2021 | | | 45 | | | | 45 | |
| Health and Educational Facs. Auth., Rev. Bonds (Gundersen Lutheran), Series 2020, 5.00% 20263 | | | 1,910 | | | | 2,209 | |
| Housing and Econ. Dev. Auth., Home Ownership Rev. Bonds, Series 2017-C, 4.00% 2048 | | | 940 | | | | 1,007 | |
| Housing and Econ. Dev. Auth., Home Ownership Rev. Bonds, Series 2018-B, 4.00% 2048 | | | 710 | | | | 762 | |
| Housing and Econ. Dev. Auth., Home Ownership Rev. Bonds, Series 2020-A, 3.50% 2050 | | | 1,160 | | | | 1,265 | |
| Housing and Econ. Dev. Auth., Home Ownership Rev. Bonds, Series 2021-A, 3.00% 2052 | | | 410 | | | | 442 | |
| Housing and Econ. Dev. Auth., Housing Rev. Bonds, Series 2021-B, 0.40% 2045 (put 2023) | | | 95 | | | | 95 | |
| Housing and Econ. Dev. Auth., Housing Rev. Bonds, Series 2021-B, 0.50% 2050 (put 2024) | | | 120 | | | | 120 | |
| Public Fin. Auth., Hospital Rev. Ref. Bonds (Renown Regional Medical Center Project), Series 2016-A, 5.00% 2022 | | | 300 | | | | 308 | |
| Public Fin. Auth., Rev. Ref. Bonds (Providence St. Joseph Health), Series 2021-C, 4.00% 2041 (put 2030) | | | 1,680 | | | | 2,038 | |
| Public Fin. Auth., Student Housing Rev. Bonds (Beyond Boone, LLC - Appalachian State University Project), Series 2019-A, Assured Guaranty Municipal insured, 5.00% 2030 | | | 315 | | | | 386 | |
| University of Wisconsin, Hospitals and Clinics Auth., Rev. Green Bonds, Series 2021-B, 5.00% 2030 | | | 630 | | | | 811 | |
| WPPI Energy, Power Supply System Rev. Bonds, Series 2016-A, 5.00% 2026 | | | 500 | | | | 593 | |
| | | | | | | | 16,268 | |
| | | | | | | | | |
| Wyoming 0.48% | | | | | | | | |
| Community Dev. Auth., Housing Rev. Bonds, Series 2019-1, 4.00% 2048 | | | 745 | | | | 808 | |
| Community Dev. Auth., Housing Rev. Bonds, Series 2021-1, 3.00% 2050 | | | 1,570 | | | | 1,692 | |
| Community Dev. Auth., Housing Rev. Bonds, Series 2020-1, 4.00% 2050 | | | 1,125 | | | | 1,242 | |
| | | | | | | | 3,742 | |
| | | | | | | | | |
| Total bonds, notes & other debt instruments (cost: $635,051,000) | | | | | | | 644,756 | |
| | | | | | | | | |
| Short-term securities 18.85% | | | | | | | | |
| Municipals 18.85% | | | | | | | | |
| State of Arizona, Industrial Dev. Auth., Hospital Rev. Ref. Bonds (Phoenix Children’s Hospital), Series 2019-B, 0.02% 20482 | | | 4,500 | | | | 4,500 | |
| State of Arizona, County of Yavapai, Industrial Dev. Auth., Solid Waste Disposal Rev. Ref. Bonds (Republic Services, Inc. Project), Series 2010, 0.15% 2029 (put 2021)2,4 | | | 1,775 | | | | 1,775 | |
| State of California, Kern Community College Dist., Facs. Improvement Dist. No. 1, G.O. Bond Anticipation Notes, Capital Appreciation Notes, Series 2020, 0% 2023 | | | 135 | | | | 134 | |
| State of California, City of Los Angeles, Dept. of Water and Power, Power System Rev. Ref. Bonds, Series 2001-B-3, 0.01% 20342 | | | 1,500 | | | | 1,500 | |
| State of California, City of Los Angeles, Tax and Rev. Anticipation Notes, Series 2021, 4.00% 6/23/2022 | | | 2,000 | | | | 2,050 | |
| State of California, City of Los Angeles, Wastewater System Rev. Ref. Bonds, Series 2018-C-1, 0.04% 20322 | | | 2,500 | | | | 2,500 | |
| State of California, County of Los Angeles, Tax and Rev. Anticipation Notes, Series 2021, 4.00% 6/30/2022 | | | 2,815 | | | | 2,887 | |
| State of California, Pollution Control Fncg. Auth., Environmental Impact Rev. Bonds (Air Products and Chemicals, Inc. Project), Series 1997-B, 0.02% 20422 | | | 1,000 | | | | 1,000 | |
| State of Colorado, Regents of the University of Colorado, University Enterprise Rev. and Rev. Ref. Bonds, Series 2020-A-2, 0.03% 20502 | | | 6,630 | | | | 6,630 | |
| 32 | Private Client Services Funds |
Capital Group Core Municipal Fund
| Short-term securities (continued) | | Principal amount
(000) | | | Value
(000) | |
| Municipals (continued) | | | | | | | | |
| State of Georgia, Northwest Georgia Housing Auth., Multi Family Housing Rev. Bonds (Charles Hight Apartments Project), Series 2019, 0.25% 8/1/2022 (put 2022)4 | | $ | 160 | | | $ | 160 | |
| State of Georgia, Northwest Georgia Housing Auth., Multi Family Housing Rev. Bonds (Park Homes Apartments Project), Series 2019, 0.25% 8/1/2022 (put 2022)4 | | | 175 | | | | 175 | |
| State of Idaho, Tax Anticipation Notes, Series 2021, 3.00% 6/30/2022 | | | 5,000 | | | | 5,094 | |
| State of Illinois, Fin. Auth., Demand Rev. Bonds (University of Chicago Medical Center), Series 2011-A, 0.03% 20442 | | | 2,950 | | | | 2,950 | |
| State of Illinois, G.O. Rev. Ref. Bonds, Series 2021-C, 4.00% 3/1/2022 | | | 665 | | | | 673 | |
| State of Indiana, Bond Bank, Advance Funding Program Notes, Series 2021-A, 2.00% 1/10/2022 | | | 1,040 | | | | 1,043 | |
| State of Indiana, Fin. Auth., Environmental Rev. Ref. Bonds (Duke Energy Indiana, Inc. Project), Series 2009-A-3, 0.07% 20392 | | | 5,000 | | | | 5,000 | |
| State of Iowa, Fin. Auth., Rev. Bonds (UnityPoint Health), Series 2018-F, 0.02% 20412 | | | 6,925 | | | | 6,925 | |
| State of Louisiana, Parish of East Baton Rouge, Pollution Control Rev. Ref. Bonds (ExxonMobil Project), Series 1993, 0.03% 3/1/20222 | | | 3,345 | | | | 3,345 | |
| State of Louisiana, Public Facs. Auth., Rev. Bonds (Air Products and Chemicals Project), Series 2009-A, 0.04% 20492 | | | 5,000 | | | | 5,000 | |
| State of Louisiana, Public Facs. Auth., Rev. Bonds (Air Products and Chemicals Project), Series 2010, 0.04% 20502 | | | 500 | | | | 500 | |
| State of Michigan, Strategic Fund, Demand Limited Obligation Rev. Bonds (Air Products and Chemicals, Inc. Project), Series 2007, 0.02% 20422 | | | 4,700 | | | | 4,700 | |
| State of Michigan, Regents of the University of Michigan, General Rev. Bonds, Series 2012-B, 0.02% 20422 | | | 7,435 | | | | 7,435 | |
| State of Minnesota, City of Shakopee, Multi Family Housing Rev. Bonds (Shakopee Village Apartments Project), Series 2021, 0.25% 2024 (put 2022)4 | | | 140 | | | | 140 | |
| State of New Hampshire, Health and Education Facs. Auth., Rev. Ref. Bonds (Dartmouth College Issue), Series 2007-B, 0.02% 20412 | | | 2,000 | | | | 2,000 | |
| State of New York, Metropolitan Transportation Auth., Transportation Rev. Bond Anticipation Notes, Series 2020-A-2S, 4.00% 2/1/2022 | | | 1,160 | | | | 1,171 | |
| State of New York, New York City G.O. Bonds, Series 2013-F-3, 0.02% 20422 | | | 11,465 | | | | 11,466 | |
| State of New York, New York City G.O. Bonds, Series 2021-2, 0.11% 20422 | | | 695 | | | | 695 | |
| State of New York, New York City G.O. Bonds, Series 2021-3, 0.11% 20422 | | | 530 | | | | 530 | |
| State of New York, New York City G.O. Bonds, Series 2016-A-5, 0.03% 20442 | | | 9,000 | | | | 9,000 | |
| State of New York, New York City Municipal Water Fin. Auth., Water and Sewer System Second General Resolution Rev. Bonds, Series 2011-FF-1, 0.02% 20442 | | | 8,000 | | | | 8,000 | |
| State of New York, New York City Municipal Water Fin. Auth., Water and Sewer System Second General Resolution Rev. Bonds, Series 2021-EE-1, 0.03% 20452 | | | 5,000 | | | | 5,000 | |
| State of New York, New York City Municipal Water Fin. Auth., Water and Sewer System Second General Resolution Rev. Bonds, Series 2016-AA-1, 0.02% 20482 | | | 2,170 | | | | 2,170 | |
| State of New York, New York City Municipal Water Fin. Auth., Water and Sewer System Second General Resolution Rev. Bonds, Series 2015-BB-1, 0.02% 20492 | | | 16,500 | | | | 16,500 | |
| State of New York, New York City Transitional Fin. Auth., Future Tax Secured Bonds, Series 2016-A-4, 0.02% 20412 | | | 2,905 | | | | 2,905 | |
| State of New York, New York City Transitional Fin. Auth., Future Tax Secured Bonds, Series 2019-B-4, 0.03% 20422 | | | 1,000 | | | | 1,000 | |
| State of Ohio, Hospital Rev. Bonds (Cleveland Clinic Health System Obligated Group), Series 2019-F, 0.03% 20522 | | | 4,900 | | | | 4,900 | |
| State of Pennsylvania, Econ. Dev. Fin. Auth., Solid Waste Rev. Ref. Bonds (Republic Service, Inc. Project), Series 2010-B, 0.20% 2030 (put 2022)4 | | | 1,695 | | | | 1,695 | |
| State of South Carolina, Jobs-Econ. Dev. Auth., Hospital Rev. Bonds (Prisma Health Obligated Group), Series 2018-B, 0.03% 20482 | | | 5,000 | | | | 5,000 | |
| State of Tennessee, City of Clarksville, Public Building Auth., Pooled Fncg. Rev. Bonds, Series 2003, Bank of America LOC, 0.05% 20332 | | | 1,955 | | | | 1,955 | |
| State of Tennessee, County of Montgomery, Public Building Auth., Pooled Fncg. Rev. Bonds (Tennessee County Loan Pool), Series 2004, Bank of America LOC, 0.05% 20342 | | | 405 | | | | 405 | |
| State of Texas, Deer Park Independent School Dist., Unlimited Tax School Building Bonds, Series 2018, 0.16% 2042 (put 2022)4 | | | 135 | | | | 135 | |
| State of Texas, Lone Star College System, Limited Tax G.O. Bonds, Series 2021-A, 5.00% 2/15/2022 | | | 70 | | | | 71 | |
| State of Texas, Lone Star College System, Limited Tax G.O. Rev. Ref. Bonds, Series 2021-B, 5.00% 2/15/2022 | | | 135 | | | | 137 | |
| State of Texas, Municipal Gas Acquisition and Supply Corp. III, Gas Supply Rev. Ref. Bonds, Series 2021, 5.00% 12/15/2021 | | | 805 | | | | 809 | |
| State of Texas, North East Independent School Dist., Unlimited Tax School Building Bonds, Series 2013-B, 0.25% 2032 (put 2022)4 | | | 130 | | | | 130 | |
| Private Client Services Funds | 33 |
Capital Group Core Municipal Fund
| Short-term securities (continued) | | Principal amount
(000) | | | Value
(000) | |
| Municipals (continued) | | | | | | | | |
| State of Texas, Richardson Independent School Dist., Unlimited Tax School Building Bonds, Series 2021, 5.00% 2/15/2022 | | $ | 355 | | | $ | 360 | |
| State of Utah, Provo City School Dist., G.O. Rev. Ref. Bonds, Series 2021-B, 5.00% 6/15/2022 | | | 1,000 | | | | 1,030 | |
| State of Wyoming, County of Lincoln, Pollution Control Rev. Ref. Bonds (ExxonMobil Project), Series 2014, 0.03% 20442 | | | 4,800 | | | | 4,800 | |
| | | | | | | | | |
| Total short-term securities (cost: $147,977,000) | | | | | | | 147,980 | |
| Total investment securities 100.98% (cost: $783,028,000) | | | | | | | 792,736 | |
| Other assets less liabilities (0.98%) | | | | | | | (7,683 | ) |
| | | | | | | | | |
| Net assets 100.00% | | | | | | $ | 785,053 | |
Futures contracts
| Contracts | | Type | | Number of
contracts | | Expiration | | Notional
amount
(000) | 5
| | Value at
10/31/2021
(000) | 6
| | Unrealized
(depreciation)
appreciation
at 10/31/2021
(000) | |
| 5 Year U.S. Treasury Note Futures | | Long | | 121 | | December 2021 | | $ | 12,100 | | | $ | 14,732 | | | $ | (58 | ) |
| 10 Year U.S. Treasury Note Futures | | Short | | 33 | | December 2021 | | | (3,300 | ) | | | (4,313 | ) | | | 51 | |
| | | | | | | | | | | | | | | | | $ | (7 | ) |
| 1 | Step bond; coupon rate may change at a later date. |
| 2 | Coupon rate may change periodically. Reference rate and spread are as of the most recent information available. Some coupon rates are determined by the issuer or agent based on current market conditions; therefore, the reference rate and spread are not available. For short-term securities, the date of the next scheduled coupon rate change is considered to be the maturity date. |
| 3 | Acquired in a transaction exempt from registration under Rule 144A of the Securities Act of 1933. May be resold in the U.S. in transactions exempt from registration, normally to qualified institutional buyers. The total value of all such securities was $3,420,000, which represented .44% of the net assets of the fund. |
| 4 | For short-term securities, the mandatory put date is considered to be the maturity date. |
| 5 | Notional amount is calculated based on the number of contracts and notional contract size. |
| 6 | Value is calculated based on the notional amount and current market price. |
Key to abbreviations and symbol
Agcy. = Agency
AMT = Alternative Minimum Tax
Auth. = Authority
Certs. = Certificates
Dept. = Department
Dev. = Development
Dist. = District
Econ. = Economic
Fac. = Facility
Facs. = Facilities
Fin. = Finance
Fncg. = Financing
G.O. = General Obligation
IAM = Interest at Maturity
LIBOR = London Interbank Offered Rate
LOC = Letter of Credit
Part. = Participation
Preref. = Prerefunded
Redev. = Redevelopment
Ref. = Refunding
Rev. = Revenue
SIFMA = Securities Industry and Financial Markets Association
USD/$ = U.S. dollars
| 34 | Private Client Services Funds |
Capital Group Short-Term Municipal Fund
Investment portfolio October 31, 2021
| Portfolio quality summary* | Percent of net assets |

| * | Bond ratings, which typically range from AAA/Aaa (highest) to D (lowest), are assigned by credit rating agencies such as Standard & Poor’s, Moody’s and/or Fitch as an indication of an issuer’s creditworthiness. In assigning a credit rating to a security, the fund looks specifically to the ratings assigned to the issuer of the security by Standard & Poor’s, Moody’s and/or Fitch. If agency ratings differ, the security will be considered to have received the highest of those ratings, consistent with the fund’s investment policies. The ratings are not covered by the Report of Independent Registered Public Accounting Firm. |
| Bonds, notes & other debt instruments 81.86% | Principal amount
(000) | | | Value
(000) | |
| Alabama 1.90% | | | | | | | | |
| City of Alabaster, Board of Education, Special Tax School Warrants, Series 2014-A, | | | | | | | | |
| Assured Guaranty Municipal insured, 5.00% 2028 (preref. 2024) | | $ | 500 | | | $ | 565 | |
| City of Birmingham, Water Works Board, Water Rev. Bonds, Series 2013-B, 5.00% 2038 (preref. 2023) | | | 500 | | | | 528 | |
| Black Belt Energy Gas Dist., Gas Project Rev. Bonds (Project No. 6), Series 2021-B, 4.00% 2052 (put 2026) | | | 500 | | | | 571 | |
| Black Belt Energy Gas Dist., Gas Supply Prepay Rev. Bonds (Project No. 4), Series 2019-A, 4.00% 2049 (put 2025) | | | 750 | | | | 838 | |
| Black Belt Energy Gas Dist., Gas Supply Prepay Rev. Bonds (Project No. 5), Series 2020-A-1, 4.00% 2049 (put 2026) | | | 455 | | | | 519 | |
| Federal Aid Highway Fin. Auth., Federal Highway Grant Anticipation Bonds, Series 2012, 5.00% 2023 (preref. 2022) | | | 35 | | | | 36 | |
| Housing Fin. Auth., Multi Family Housing Rev. Bonds (Capstone at Kinsey Cove Project), Series 2020-A, 0.35% 2023 (put 2023) | | | 110 | | | | 110 | |
| South East Gas Supply Dist., Gas Supply Rev. Bonds (Project No. 2), Series 2018-A, 4.00% 2049 (put 2024) | | | 490 | | | | 529 | |
| Southeast Energy Auth., Commodity Supply Rev. Bonds (Project No. 2), Series 2021-B-1, 4.00% 2051 (put 2031) | | | 125 | | | | 150 | |
| | | | | | | | 3,846 | |
| | | | | | | | | |
| Alaska 0.15% | | | | | | | | |
| Housing Fin. Corp., General Mortgage Rev. Bonds, Series 2020-A, 3.25% 2044 | | | 275 | | | | 298 | |
| | | | | | | | | |
| Arizona 1.47% | | | | | | | | |
| Agricultural Improvement and Power Dist., Electric System Rev. Bonds (Salt River Project), Series 2021-A, 5.00% 2026 | | | 730 | | | | 862 | |
| Board of Regents of the Arizona State University System, Rev. Bonds, Series 2020-A, 5.00% 2026 | | | 300 | | | | 359 | |
| County of Coconino, Pollution Control Corp., Pollution Control Rev. Ref. Bonds, Series 2017-B, 1.65% 2039 (put 2023) | | | 500 | | | | 509 | |
| City of Glendale, Industrial Dev. Auth., Rev. Ref. Bonds (Midwestern University), Series 2020, 5.00% 2022 | | | 185 | | | | 190 | |
| Industrial Dev. Auth., Hospital Rev. Bonds (Phoenix Children’s Hospital), Series 2021-A, 5.00% 2026 | | | 190 | | | | 223 | |
| Industrial Dev. Auth., Rev. Bonds (Lincoln South Beltway Project), Series 2020, 5.00% 2023 | | | 750 | | | | 818 | |
| City of Phoenix, Civic Improvement Corp., Water System Rev. Ref. Bonds, Series 2014-B, 5.00% 2024 | | | 15 | | | | 17 | |
| | | | | | | | 2,978 | |
| | | | | | | | | |
| California 4.64% | | | | | | | | |
| Bay Area Toll Auth., San Francisco Bay Area Toll Bridge Rev. Bonds, Series 2006-C-1, (SIFMA Municipal Swap Index + 0.90%) 0.95% 2045 (put 2023)1 | | | 1,500 | | | | 1,511 | |
| Bay Area Toll Auth., San Francisco Bay Area Toll Bridge Rev. Bonds, Series 2021-C, (SIFMA Municipal Swap Index + 0.45%) 0.50% 2056 (put 2026)1 | | | 65 | | | | 66 | |
| Trustees of the California State University, Systemwide Rev. Bonds, Series 2012-A, 5.00% 2042 (preref. 2022) | | | 795 | | | | 833 | |
| Trustees of the California State University, Systemwide Rev. Bonds, Series 2016-B-2, 0.55% 2049 (put 2026) | | | 100 | | | | 99 | |
| East Side Union High School Dist., G.O. Bonds, 2008 Election, Series 2012-D, 5.00% 2037 (preref. 2022) | | | 1,000 | | | | 1,036 | |
| Eastern Municipal Water Dist., Water and Wastewater Rev. Ref. Bonds, Series 2021-A, 3.00% 2024 | | | 45 | | | | 48 | |
| Private Client Services Funds | 35 |
Capital Group Short-Term Municipal Fund
| Bonds, notes & other debt instruments (continued) | Principal amount
(000) | | | Value
(000) | |
| California (continued) | | | | | | | | |
| Fresno Unified School Dist., G.O. Bonds, 2016 Election, Series 2021-D, 2.00% 2023 | | $ | 30 | | | $ | 31 | |
| Fresno Unified School Dist., G.O. Bonds, 2016 Election, Series 2021-D, 2.00% 2024 | | | 15 | | | | 16 | |
| G.O. Bonds, Series 2021, 5.00% 2027 | | | 395 | | | | 490 | |
| G.O. Bonds, Series 2021, 5.00% 2030 | | | 160 | | | | 211 | |
| G.O. Rev. Ref. Bonds, Series 2021, 5.00% 2023 | | | 420 | | | | 456 | |
| G.O. Rev. Ref. Bonds, Series 2019, 5.00% 2029 | | | 110 | | | | 141 | |
| Health Facs. Fncg. Auth., Rev. Bonds (Stanford Health Care), Series 2021-A, 3.00% 2054 (put 2025) | | | 475 | | | | 519 | |
| Health Facs. Fncg. Auth., Rev. Green Bonds (Kaiser Permanente), Series 2017-C, 5.00% 2031 (put 2022) | | | 500 | | | | 524 | |
| Infrastructure and Econ. Dev. Bank, Rev. Ref. Bonds (Museum of Art Project), Series 2021-B, 0.75% 2050 (put 2026)1 | | 100 | | | | 102 | |
| City of Jurupa, Public Fncg. Auth., Special Tax Rev. Ref. Bonds, Series 2020-A, BAM insured, 5.00% 2022 | | | 115 | | | | 119 | |
| City of Los Angeles, Dept. of Water and Power, Power System Rev. Bonds, Series 2018-B, 4.00% 2022 | | | 15 | | | | 15 | |
| County of Los Angeles, Metropolitan Transportation Auth., Measure R Sales Tax Rev. Ref. Green Bonds, Series 2020-A, 5.00% 2024 | | | 125 | | | | 140 | |
| Public Works Board, Lease Rev. Ref. Bonds (Various Capital Projects), Series 2022-A, 5.00% 2025 | | | 180 | | | | 205 | |
| County of San Diego, Regional Transportation Commission, Limited Sales Tax Rev. Short-Term Notes, Series 2021-A, 5.00% 2022 | | | 500 | | | | 522 | |
| City and County of San Francisco, G.O. Rev. Ref. Bonds, Series 2020-R-2, 5.00% 2023 | | | 135 | | | | 145 | |
| City and County of San Francisco, G.O. Rev. Ref. Bonds, Series 2020-R-2, 5.00% 2024 | | | 310 | | | | 348 | |
| Southern California Public Power Auth., Rev. Ref. Bonds (Magnolia Power Project A), Series 2020-1, 5.00% 2023 | | | 400 | | | | 431 | |
| Southern California Public Power Auth., Rev. Ref. Green Bonds (Milford Wind Corridor Phase II Project), Series 2021-1, 5.00% 2023 | | | 20 | | | | 22 | |
| Southern California Public Power Auth., Rev. Ref. Green Bonds (Milford Wind Corridor Phase II Project), Series 2021-1, 5.00% 2024 | | | 5 | | | | 6 | |
| Southern California Public Power Auth., Transmission Project Rev. Bonds (Southern Transmission Project), Series 2017-A, 5.00% 2023 | | | 160 | | | | 173 | |
| Statewide Communities Dev. Auth., Multi Family Housing Rev. Bonds (Villa Del Sol Apartments), Series 2021-A-2, 0.39% 2023 (put 2023) | | | 80 | | | | 80 | |
| Statewide Communities Dev. Auth., Multi Family Housing Rev. Bonds (Washington Court Apartments), Series 2021-E, 0.22% 2023 (put 2022) | | | 35 | | | | 35 | |
| Statewide Communities Dev. Auth., Rev. Ref. Bonds (Enloe Medical Center), Series 2015, 5.00% 2028 | | | 250 | | | | 293 | |
| City of Tustin, Community Facs. Dist. No. 2014-1 (Tustin Legacy/Standard Pacific), Special Tax Bonds, Series 2015-A, 5.00% 2027 | | | 200 | | | | 228 | |
| Regents of the University of California, Limited Project Rev. Bonds, Series 2022-S, 5.00% 2026 | | | 25 | | | | 29 | |
| Val Verde Unified School Dist., G.O. Bonds, 2012 Election, Series 2013-A, BAM insured, 5.00% 2042 | | | 500 | | | | 542 | |
| | | | | | | | 9,416 | |
| | | | | | | | | |
| Colorado 0.88% | | | | | | | | |
| Certs. of Part., Series 2021-A, 5.00% 2025 | | | 345 | | | | 407 | |
| City of Colorado Springs, Utilities System Rev. Ref. Bonds, Series 2020-B, 5.00% 2021 | | | 20 | | | | 20 | |
| City and County of Denver, Park Creek Metropolitan Dist., Limited Property Tax Supported Rev. Ref. Bonds, Series 2015-A, 5.00% 2021 | | | 260 | | | | 261 | |
| E-470 Public Highway Auth., Rev. Bonds, Series 2021-B, (USD-SOFR x 0.67 + 0.35%) 0.383% 2039 (put 2024)1 | | | 40 | | | | 40 | |
| Health Facs. Auth., Rev. Bonds (Sanford Health), Series 2019-A, 5.00% 2022 | | | 325 | | | | 340 | |
| Housing and Fin. Auth., Single Family Mortgage Bonds, Series 2021-E, 3.00% 2051 | | | 215 | | | | 231 | |
| Housing and Fin. Auth., Single Family Mortgage Bonds, Series 2021-L, Class I, 3.25% 2051 | | | 205 | | | | 224 | |
| Regents of the University of Colorado, University Enterprise Rev. and Rev. Ref. Bonds, Series 2019-C, 2.00% 2054 (put 2024) | | | 245 | | | | 256 | |
| | | | | | | | 1,779 | |
| | | | | | | | | |
| Connecticut 2.39% | | | | | | | | |
| Town of East Hartford, Housing Auth., Multi Family Housing Rev. Bonds (Veterans Terrace Project), Series 2021, 0.25% 2023 (put 2022) | | | 45 | | | | 45 | |
| Health and Educational Facs. Auth., Rev. Bonds (Sacred Heart University Issue), Series 2017-I-1, 5.00% 2022 | | | 500 | | | | 516 | |
| Health and Educational Facs. Auth., Rev. Bonds (Yale University Issue), Series 1999-U-1, 2.00% 2033 (put 2022) | | | 500 | | | | 502 | |
| Health and Educational Facs. Auth., Rev. Bonds (Yale University Issue), Series 2015-A, 0.375% 2035 (put 2024) | | | 855 | | | | 853 | |
| Health and Educational Facs. Auth., Rev. Bonds (Yale University Issue), Series 2003-X-2, 0.25% 2037 (put 2024) | | | 265 | | | | 264 | |
| Health and Educational Facs. Auth., Rev. Bonds (Yale University Issue), Series 2014-A, 1.10% 2048 (put 2023) | | | 750 | | | | 758 | |
| Housing Fin. Auth., Housing Mortgage Fin. Program Bonds, Series 2019-F-1, 3.50% 2043 | | | 665 | | | | 717 | |
| Housing Fin. Auth., Housing Mortgage Fin. Program Bonds, Series 2014-C-1, 4.00% 2044 | | | 160 | | | | 165 | |
| Housing Fin. Auth., Housing Mortgage Fin. Program Bonds, Series 2016-A-1, 4.00% 2045 | | | 85 | | | | 89 | |
| 36 | Private Client Services Funds |
Capital Group Short-Term Municipal Fund
| Bonds, notes & other debt instruments (continued) | Principal amount
(000) | | | Value
(000) | |
| Connecticut (continued) | | | | | | | | |
| Housing Fin. Auth., Housing Mortgage Fin. Program Bonds, Series 2017-A-1, 4.00% 2047 | | $ | 460 | | | $ | 492 | |
| Housing Fin. Auth., Housing Mortgage Fin. Program Bonds, Series 2021-B-1, 3.00% 2049 | | | 125 | | | | 135 | |
| Housing Fin. Auth., Housing Mortgage Fin. Program Rev. Ref. Bonds, Series 2013-B-2, 4.00% 2032 | | | 35 | | | | 35 | |
| Housing Fin. Auth., Housing Mortgage Fin. Program Rev. Ref. Bonds, Series 2014-D-1, 4.00% 2044 | | | 85 | | | | 86 | |
| Housing Fin. Auth., Housing Mortgage Fin. Program Rev. Ref. Bonds, Series 2015-C-1, 3.50% 2045 | | | 185 | | | | 192 | |
| | | | | | | | 4,849 | |
| | | | | | | | | |
| Delaware 0.08% | | | | | | | | |
| G.O. Bonds, Series 2021, 5.00% 2031 | | | 125 | | | | 167 | |
| | | | | | | | | |
| District of Columbia 0.56% | | | | | | | | |
| G.O. Bonds, Series 2015-A, 5.00% 2032 | | | 700 | | | | 807 | |
| Income Tax Secured Rev. Bonds, Series 2011-A, 5.00% 2022 | | | 320 | | | | 321 | |
| | | | | | | | 1,128 | |
| | | | | | | | | |
| Florida 2.94% | | | | | | | | |
| County of Brevard, Housing Fncg. Auth., Multi Family Mortgage Rev. Bonds (Tropical Manor Apartments), Series 2021, 0.25% 2023 (put 2022) | | | 40 | | | | 40 | |
| Citizens Property Insurance Corp., Personal Lines Account/Commercial Lines Account Secured Bonds, Series 2012-A-1, 5.00% 2022 | | | 50 | | | | 51 | |
| County of Collier, Heritage Bay Community Dev. Dist., Capital Improvement Rev. Bonds, Series 2018-A-2, 2.50% 2022 | | | 500 | | | | 505 | |
| Board of Education, Public Education Capital Outlay Rev. Ref. Bonds, Series 2019-D, 5.00% 2023 | | | 15 | | | | 16 | |
| Higher Educational Facs. Fncg. Auth., Educational Facs. Rev. Ref. Bonds (The University of Tampa Project), Series 2012-A, 5.25% 2042 (preref. 2022) | | | 1,000 | | | | 1,021 | |
| Housing Fin. Corp., Homeowner Mortgage Rev. Bonds, Series 2018-2, 4.25% 2050 | | | 320 | | | | 348 | |
| Housing Fin. Corp., Homeowner Mortgage Rev. Bonds, Series 2020-1, 3.50% 2051 | | | 50 | | | | 55 | |
| JEA, Water and Sewer System Rev. Bonds, Series 2020-A, 5.00% 2025 | | | 280 | | | | 328 | |
| County of Miami-Dade, Industrial Dev. Auth., Solid Waste Disposal Rev. Bonds (Waste Management, Inc. of Florida Project), Series 2007, 0.45% 2027 (put 2021) | | | 1,165 | | | | 1,165 | |
| County of Miami-Dade, Water and Sewer System Rev. Ref. Bonds, Series 2008-B, Assured Guaranty Municipal insured, 5.25% 2022 | | | 195 | | | | 204 | |
| County of Orange, Housing Fin. Auth., Multi Family Housing Rev. Bonds (Jernigan Gardens), Series 2020-B, 0.35% 2023 (put 2022) | | | 1,000 | | | | 1,000 | |
| County of Orange, Sales Tax Rev. Ref. Bonds, Series 2012-B, 5.00% 2030 (preref. 2022) | | | 500 | | | | 504 | |
| County of Polk, Utility System Rev. and Rev. Ref. Bonds, Series 2013, BAM insured, 5.00% 2043 (preref. 2023) | | | 110 | | | | 120 | |
| City of Tampa, Hospital Rev. Bonds (H. Lee Moffitt Cancer Center Project), Series 2020-B, 5.00% 2024 | | | 100 | | | | 112 | |
| City of Tampa, Hospital Rev. Bonds (H. Lee Moffitt Cancer Center Project), Series 2020-B, 5.00% 2025 | | | 75 | | | | 87 | |
| City of Tampa, Hospital Rev. Bonds (H. Lee Moffitt Cancer Center Project), Series 2020-B, 5.00% 2026 | | | 100 | | | | 119 | |
| Tampa-Hillsborough County Expressway Auth., Rev. Ref. Bonds, Series 2012-B, 5.00% 2042 (preref. 2022) | | | 200 | | | | 206 | |
| Dept. of Transportation Fncg. Corp., Rev. Bonds, Series 2020, 5.00% 2024 | | | 65 | | | | 73 | |
| | | | | | | | 5,954 | |
| | | | | | | | | |
| Georgia 2.70% | | | | | | | | |
| City of Atlanta, Airport General Rev. Ref. Bonds, Series 2014-B, 5.00% 2026 | | | 800 | | | | 878 | |
| City of Atlanta, Airport General Rev. Ref. Bonds, Series 2021-B, 5.00% 2027 | | | 430 | | | | 529 | |
| City of Atlanta, Urban Residential Fin. Auth., Multi Family Housing Rev. Bonds (Sylvan Hills Senior Apartments Project), Series 2020, 0.41% 2025 (put 2023) | | | 85 | | | | 85 | |
| County of Dawson, Dev. Auth., Multi Family Housing Rev. Bonds (Peaks of Dawsonville Project), Series 2021, 0.28% 2023 | | | 500 | | | | 499 | |
| County of Dekalb, Housing Auth., Multi Family Housing Rev. Bonds (Columbia Village Project), Series 2021-A, 0.34% 2024 (put 2023) | | | 35 | | | | 35 | |
| Housing and Fin. Auth., Single Family Mortgage Bonds, Series 2015-A-1, 3.50% 2045 | | | 30 | | | | 32 | |
| Housing and Fin. Auth., Single Family Mortgage Bonds, Series 2017-A, 4.00% 2047 | | | 405 | | | | 431 | |
| Main Street Natural Gas, Inc., Gas Supply Rev. Bonds, Series 2019-C, 4.00% 2050 (put 2026) | | | 500 | | | | 569 | |
| Metropolitan Atlanta Rapid Transit Auth., Sales Tax Rev. Ref. Bonds (Third Indenture Series), Series 2012-A, 5.00% 2030 (preref. 2022) | | | 870 | | | | 898 | |
| Municipal Electric Auth., General Resolution Projects Bonds, Series 2021-A, 4.00% 2027 | | | 270 | | | | 311 | |
| Municipal Electric Auth., Project One Bonds, Series 2021-A, 5.00% 2030 | | | 40 | | | | 51 | |
| Private Client Services Funds | 37 |
Capital Group Short-Term Municipal Fund
| Bonds, notes & other debt instruments (continued) | Principal amount
(000) | | | Value
(000) | |
| Georgia (continued) | | | | | | | | |
| Private Colleges and Universities Auth., Rev. Bonds (The Savannah College of Art and Design Projects), Series 2021, 5.00% 2028 | | $ | 35 | | | $ | 43 | |
| Private Colleges and Universities Auth., Rev. Bonds (The Savannah College of Art and Design Projects), Series 2021, 5.00% 2029 | | | 5 | | | | 6 | |
| City of Sandy Springs, Public Facs. Auth., Rev. Bonds (Sandy Springs City Center Project), Series 2015, 5.00% 2047 (preref. 2026) | | | 500 | | | | 598 | |
| City of Thomaston, Housing Auth., Multi Family Housing Rev. Bonds (Eastgate Apartments Project), Series 2020-A, 0.34% 2023 (put 2022) | | | 500 | | | | 500 | |
| | | | | | | | 5,465 | |
| | | | | | | | | |
| Idaho 0.57% | | | | | | | | |
| Housing and Fin. Assn., Single Family Mortgage Bonds, Series 2019-A, 4.00% 2050 | | | 1,050 | | | | 1,149 | |
| | | | | | | | | |
| Illinois 6.46% | | | | | | | | |
| City of Chicago, Sales Tax Rev. Ref. Bonds, Series 2011-A, 5.00% 2041 (preref. 2022) | | | 205 | | | | 207 | |
| City of Chicago, Wastewater Transmission Rev. Bonds, Series 2014, 5.00% 2024 | | | 625 | | | | 686 | |
| City of Chicago, Water Rev. Ref. Bonds, Series 2017-2, 5.00% 2021 | | | 180 | | | | 180 | |
| City of Chicago, Water Rev. Ref. Bonds, Series 2017, 5.00% 2022 | | | 540 | | | | 565 | |
| Fin. Auth., Rev. Bonds (Art Institute of Chicago), Series 2016, 5.00% 2023 | | | 100 | | | | 106 | |
| Fin. Auth., Rev. Bonds (Art Institute of Chicago), Series 2016, 5.00% 2024 | | | 130 | | | | 144 | |
| Fin. Auth., Rev. Bonds (Centegra Health System), Series 2014-A, 5.00% 2027 (preref. 2024) | | | 200 | | | | 226 | |
| Fin. Auth., Rev. Bonds (Northshore University Heathsystem), Series 2020-A, 5.00% 2029 | | | 605 | | | | 775 | |
| Fin. Auth., Rev. Bonds (OSF Healthcare System), Series 2015-A, 5.00% 2021 | | | 1,100 | | | | 1,102 | |
| Fin. Auth., Rev. Bonds (OSF Healthcare System), Series 2020-B-2, 5.00% 2050 (put 2026) | | | 40 | | | | 47 | |
| Fin. Auth., Rev. Bonds (Presbyterian Homes Obligated Group), Series 2016-A, 5.00% 2023 | | | 225 | | | | 240 | |
| Fin. Auth., Rev. Bonds (Presbyterian Homes Obligated Group), Series 2021-B, (SIFMA Municipal Swap Index + 0.70%) 0.75% 2042 (put 2026)1 | | | 25 | | | | 25 | |
| Fin. Auth., Rev. Bonds (Presence Health Network), Series 2016-C, 5.00% 2026 | | | 515 | | | | 610 | |
| Fin. Auth., Rev. Bonds (University of Chicago), Series 2014-A, 5.00% 2023 | | | 200 | | | | 218 | |
| Fin. Auth., Rev. Bonds (University of Chicago), Series 2021-A, 5.00% 2025 | | | 40 | | | | 47 | |
| Fin. Auth., Rev. Ref. Bonds (Anne & Robert H. Lurie Children’s Hospital), Series 2017, 5.00% 2022 | | | 240 | | | | 249 | |
| Housing Dev. Auth., Multi Family Housing Rev. Bonds, Series 2021-C, 0.80% 2026 | | | 80 | | | | 79 | |
| Housing Dev. Auth., Multi Family Housing Rev. Bonds (Concord Commons), Series 2021, 0.25% 2024 (put 2023) | | | 595 | | | | 595 | |
| Housing Dev. Auth., Multi Family Housing Rev. Bonds (Marshall Field Garden Apartment Homes), Series 2015, (SIFMA Municipal Swap Index + 1.00%) 1.05% 2050 (put 2025)1 | | | 1,000 | | | | 1,022 | |
| Board of Trustees of Illinois State University, Auxiliary Facs. System Rev. Bonds, Series 2016, Assured Guaranty Municipal insured, 5.00% 2022 | | | 695 | | | | 708 | |
| Board of Trustees of Illinois State University, Auxiliary Facs. System Rev. Bonds, Series 2018-B, Assured Guaranty Municipal insured, 5.00% 2022 | | | 500 | | | | 510 | |
| Board of Trustees of Illinois State University, Auxiliary Facs. System Rev. Bonds, Series 2018-A, Assured Guaranty Municipal insured, 5.00% 2023 | | | 500 | | | | 532 | |
| Railsplitter Tobacco Settlement Auth., Tobacco Settlement Rev. Bonds, Series 2017, 5.00% 2022 | | | 250 | | | | 257 | |
| Railsplitter Tobacco Settlement Auth., Tobacco Settlement Rev. Bonds, Series 2017, 5.00% 2023 | | | 310 | | | | 332 | |
| City of Springfield, Water Rev. Bonds, Series 2012, 5.00% 2037 (preref. 2022) | | | 500 | | | | 508 | |
| Toll Highway Auth., Toll Highway Rev. Bonds, Series 2014-A, 5.00% 2021 | | | 120 | | | | 120 | |
| Toll Highway Auth., Toll Highway Rev. Bonds, Series 2019-C, 5.00% 2023 | | | 190 | | | | 200 | |
| Toll Highway Auth., Toll Highway Rev. Bonds, Series 2019-C, 5.00% 2025 | | | 545 | | | | 622 | |
| Toll Highway Auth., Toll Highway Rev. Ref. Bonds, Series 2014-D, 5.00% 2022 | | | 185 | | | | 186 | |
| Toll Highway Auth., Toll Highway Rev. Ref. Bonds, Series 2019-A, 5.00% 2023 | | | 175 | | | | 185 | |
| Toll Highway Auth., Toll Highway Rev. Ref. Bonds, Series 2019-A, 5.00% 2025 | | | 250 | | | | 285 | |
| Board of Trustees of the University of Illinois, Auxiliary Facs. System Rev. Bonds, Series 2018-A, 5.00% 2024 | | | 200 | | | | 222 | |
| Board of Trustees of the University of Illinois, Auxiliary Facs. System Rev. Ref. Bonds, Series 2015-A, 5.00% 2026 | | | 620 | | | | 709 | |
| County of Will, G.O. Bonds, Series 2016, 5.00% 2045 (preref. 2025) | | | 500 | | | | 588 | |
| | | | | | | | 13,087 | |
| | | | | | | | | |
| Indiana 2.05% | | | | | | | | |
| Fin. Auth., Health System Rev. Bonds (Indiana University Health), Series 2019-C, 5.00% 2022 | | | 40 | | | | 42 | |
| Fin. Auth., Hospital Rev. Bonds (Community Health Network Project), Series 2012-A, 5.00% 2042 (preref. 2023) | | | 540 | | | | 578 | |
| Fin. Auth., Hospital Rev. Ref. Bonds (Parkview Health System), Series 2012-A, 5.00% 2022 | | | 440 | | | | 450 | |
| 38 | Private Client Services Funds |
Capital Group Short-Term Municipal Fund
| Bonds, notes & other debt instruments (continued) | Principal amount
(000) | | | Value
(000) | |
| Indiana (continued) | | | | | | | | |
| Fin. Auth., Rev. Bonds (Community Foundation of Northwest Indiana Obligated Group), Series 2012, 5.00% 2030 (preref. 2022) | | $ | 245 | | | $ | 249 | |
| Fin. Auth., State Revolving Fund Program Green Bonds, Series 2021-B, 5.00% 2028 | | | 55 | | | | 68 | |
| Fin. Auth., Wastewater Utility Rev. Ref. Bonds, Series 2021-1, 5.00% 2025 | | | 155 | | | | 182 | |
| City of Franklin, Econ. Dev. and Rev. Ref. Bonds (Otterbein Homes Obligated Group), Series 2019-B, 5.00% 2023 | | | 510 | | | | 548 | |
| Health Fac. Fncg. Auth., Rev. Bonds (Ascension Health Subordinate Credit Group), Series 2005-A-1, 4.00% 2023 | | | 15 | | | | 16 | |
| Housing and Community Dev. Auth., Single Family Mortgage Rev. Bonds, Series 2019-A, 4.25% 2048 | | | 540 | | | | 589 | |
| Housing and Community Dev. Auth., Single Family Mortgage Rev. Bonds, Series 2020-A, 3.75% 2049 | | | 40 | | | | 44 | |
| Housing and Community Dev. Auth., Single Family Mortgage Rev. Bonds, Series 2021-C-1, 3.00% 2052 | | | 65 | | | | 70 | |
| City of Indianapolis, Local Public Improvement Bond Bank Bonds, Series 2021-A, 5.00% 2022 | | | 100 | | | | 103 | |
| City of Indianapolis, Local Public Improvement Bond Bank Bonds (Indianapolis Airport Auth. Project), Series 2019-I-2, 5.00% 2023 | | | 230 | | | | 243 | |
| City of Indianapolis, Local Public Improvement Bond Bank Bonds (Indianapolis Airport Auth. Project), Series 2019-I-2, 5.00% 2024 | | | 240 | | | | 264 | |
| City of Indianapolis, Local Public Improvement Bond Bank Bonds (Indianapolis Airport Auth. Project), Series 2019-I-2, 5.00% 2025 | | | 255 | | | | 291 | |
| City of Indianapolis, Local Public Improvement Bond Bank Rev. Ref. Bonds (Cityway 1 Project), Series 2021-B, 5.00% 2025 | | | 140 | | | | 154 | |
| City of Kokomo, Multi Family Housing Rev. Bonds (KHA RAD I Apartments), Series 2021-A, 0.56% 2025 (put 2024) | | | 265 | | | | 265 | |
| | | | | | | | 4,156 | |
| | | | | | | | | |
| Kansas 0.02% | | | | | | | | |
| Unified Government of Wyandotte County, Board of Public Utilities, Utility System Improvement Rev. Bonds, Series 2012-B, 5.00% 2026 (preref. 2022) | | | 35 | | | | 36 | |
| | | | | | | | | |
| Kentucky 0.63% | | | | | | | | |
| Housing Corp., Multi Family Housing Rev. Bonds (New Hope Properties Portfolio Project), Series 2021, 0.41% 2024 (put 2023) | | | 485 | | | | 485 | |
| Housing Corp., Multi Family Housing Rev. Bonds (Winterwood II Rural Housing Portfolio), Series 2021, 0.37% 2024 (put 2023) | | | 195 | | | | 195 | |
| Property and Buildings Commission, Commonwealth Rev. Ref. Bonds (Project No. 125), Series 2021-A, 5.00% 2022 | | | 45 | | | | 47 | |
| Public Energy Auth., Gas Supply Rev. Bonds, Series 2019-A-1, 4.00% 2049 (put 2025) | | | 320 | | | | 355 | |
| Public Energy Auth., Gas Supply Rev. Bonds, Series 2018-B, 4.00% 2049 (put 2025) | | | 55 | | | | 60 | |
| County of Warren, Hospital Rev. Ref. Bonds (Bowling Green - Warren County Community Hospital Corp.), Series 2021-A, 5.00% 2022 | | | 135 | | | | 138 | |
| | | | | | | | 1,280 | |
| | | | | | | | | |
| Louisiana 0.88% | | | | | | | | |
| Gasoline and Fuels Tax Rev. Ref. Bonds, Series 2017-D-2, 0.55% 2043 (put 2022) | | | 1,000 | | | | 1,000 | |
| Housing Corp., Multi Family Housing Rev. Bonds (Mabry Place Townhomes Project), Series 2021, 0.31% 2024 (put 2023) | | | 55 | | | | 55 | |
| Parish of Jefferson, Sales Tax Rev. Ref. Bonds, Series 2019-A, Assured Guaranty Municipal insured, 5.00% 2023 | | | 250 | | | | 273 | |
| Offshore Terminal Auth., Deepwater Port Rev. Bonds (Loop LLC Project), Series 2007-A, 1.65% 2027 (put 2023) | | | 105 | | | | 107 | |
| Parish of Tangipahoa, Hospital Service Dist. No. 1, Hospital Rev. Ref. Bonds (North Oaks Health System Project), Series 2021, 5.00% 2027 | | | 265 | | | | 319 | |
| Tobacco Settlement Fncg. Corp., Tobacco Settlement Asset-Backed Rev. Ref. Bonds, Series 2013-A, 5.00% 2023 | | | 30 | | | | 32 | |
| | | | | | | | 1,786 | |
| | | | | | | | | |
| Maine 0.13% | | | | | | | | |
| Housing Auth., Mortgage Purchase Bonds, Series 2017-A, 4.00% 2047 | | | 250 | | | | 265 | |
| | | | | | | | | |
| Maryland 2.04% | | | | | | | | |
| County of Baltimore, Rev. Bonds (Oak Crest Village, Inc. Fac.), Series 2016, 5.00% 2022 | | | 400 | | | | 403 | |
| Community Dev. Administration, Dept. of Housing and Community Dev., Residential Rev. Bonds, Series 2018-A, 4.50% 2048 | | | 850 | | | | 947 | |
| Community Dev. Administration, Dept. of Housing and Community Dev., Residential Rev. Bonds, Series 2019-A, 4.25% 2049 | | | 90 | | | | 99 | |
| Private Client Services Funds | 39 |
Capital Group Short-Term Municipal Fund
| Bonds, notes & other debt instruments (continued) | Principal amount
(000) | | | Value
(000) | |
| Maryland (continued) | | | | | | | | |
| County of Montgomery, Housing Opportunities Commission, Single Family Housing Rev. Bonds, Series 2017-A, 4.00% 2048 | | $ | 270 | | | $ | 290 | |
| County of Montgomery, Housing Opportunities Commission, Single Family Housing Rev. Bonds, Series 2018-A, 4.00% 2049 | | | 405 | | | | 437 | |
| Stadium Auth., Rev. Bonds (Baltimore City Public Schools Construction and Revitalization Program), Series 2016, 5.00% 2041 (preref. 2026) | | | 1,025 | | | | 1,226 | |
| Dept. of Transportation, Consolidated Transportation Rev. Ref. Bonds, Series 2015, 5.00% 2023 | | | 110 | | | | 117 | |
| Dept. of Transportation, Consolidated Transportation Rev. Ref. Bonds, Series 2022-A, 5.00% 2027 | | | 500 | | | | 609 | |
| | | | | | | | 4,128 | |
| | | | | | | | | |
| Massachusetts 0.39% | | | | | | | | |
| Dev. Fin. Agcy., Multi Family Housing Rev. Bonds (Salem Heights II Preservation Associates LP Issue), Series 2021-B, 0.25% 2024 (put 2023) | | | 50 | | | | 50 | |
| Dev. Fin. Agcy., Rev. Ref. Bonds (Berkshire Health Systems Issue), Series 2021-I, 5.00% 2023 | | | 240 | | | | 261 | |
| Housing Fin. Agcy., Housing Green Bonds, Series 2021-B-2, 0.75% 2025 | | | 15 | | | | 15 | |
| Housing Fin. Agcy., Single Family Housing Rev. Bonds, Series 169, 4.00% 2044 | | | 35 | | | | 36 | |
| Housing Fin. Agcy., Single Family Housing Rev. Bonds, Series 183, 3.50% 2046 | | | 280 | | | | 293 | |
| Housing Fin. Agcy., Single Family Housing Rev. Ref. Bonds, Series 171, 4.00% 2044 | | | 140 | | | | 143 | |
| | | | | | | | 798 | |
| | | | | | | | | |
| Michigan 2.76% | | | | | | | | |
| City of Detroit, Water and Sewerage Dept., Sewage Disposal System Rev. and Rev. Ref. Bonds, Series 2012-A, 5.00% 2023 | | | 700 | | | | 722 | |
| City of Detroit, Water and Sewerage Dept., Sewage Disposal System Rev. and Rev. Ref. Bonds, Series 2012-A, 5.00% 2032 (preref. 2022) | | | 45 | | | | 47 | |
| Fin. Auth., Hospital Rev. and Rev. Ref. Bonds (Trinity Health Credit Group), Series 2017-A, 5.00% 2047 (preref. 2022) | | | 1,290 | | | | 1,357 | |
| Fin. Auth., Hospital Rev. Ref. Bonds (McLaren Health Care), Series 2015-D-1, 0.25% 2022 | | | 5 | | | | 5 | |
| Grant Anticipation Rev. Ref. Bonds, Series 2016, 5.00% 2027 | | | 500 | | | | 611 | |
| Hospital Fin. Auth., Hospital Rev. Ref. Bonds (Trinity Health Credit Group), Series 2012-C, 5.00% 2026 (preref. 2022) | | | 120 | | | | 123 | |
| Housing Dev. Auth., Multi Family Housing Rev. Bonds, Series 2020, 0.32% 2023 (put 2022) | | | 415 | | | | 415 | |
| Housing Dev. Auth., Rental Housing Rev. Bonds, Series 2021-A, 0.55% 2025 | | | 50 | | | | 50 | |
| Housing Dev. Auth., Single Family Mortgage Rev. Bonds, Series 2017-B, 3.50% 2048 | | | 90 | | | | 96 | |
| Housing Dev. Auth., Single Family Mortgage Rev. Bonds, Series 2018-C, 4.25% 2049 | | | 550 | | | | 600 | |
| City of Lansing, Board of Water and Light, Utility System Rev. Bonds, Series 2019-A, 5.00% 2024 | | | 375 | | | | 421 | |
| County of Monroe, Econ. Dev. Corp., Limited Obligation Rev. Ref. Bonds (Detroit Edison Co. Project), Series 1992-AA, National insured, 6.95% 2022 | | | 500 | | | | 527 | |
| County of Wayne, Airport Auth., Airport Rev. Bonds (Detroit Metropolitan Wayne County Airport), Series 2015-G, 5.00% 2021 | | | 300 | | | | 301 | |
| County of Wayne, Airport Auth., Airport Rev. Bonds (Detroit Metropolitan Wayne County Airport), Series 2018-C, 5.00% 2023 | | | 290 | | | | 318 | |
| | | | | | | | 5,593 | |
| | | | | | | | | |
| Minnesota 1.19% | | | | | | | | |
| City of Hopkins, Multi Family Housing Rev. Bonds (Raspberry Ridge Project), Series 2021, 0.26% 2024 (put 2023) | | | 145 | | | | 145 | |
| Housing Fin. Agcy., Residential Housing Fin. Bonds, Series 2018-B, 4.00% 2048 | | | 350 | | | | 377 | |
| Housing Fin. Agcy., Residential Housing Fin. Bonds, Series 2018-E, 4.25% 2049 | | | 590 | | | | 648 | |
| Housing Fin. Agcy., Residential Housing Fin. Bonds, Series 2020-E, 3.50% 2050 | | | 500 | | | | 542 | |
| Housing Fin. Agcy., Residential Housing Fin. Bonds, Series 2020-B, 3.50% 2050 | | | 460 | | | | 499 | |
| City of Mahtomedi, Multi Family Housing Rev. Bonds (Lincoln Place / Vadnais Highlands Projects), Series 2021, 0.25% 2023 (put 2022) | | | 80 | | | | 80 | |
| Regents of the University of Minnesota, G.O. Rev. Ref. Bonds, Series 2017B, 5.00% 2021 | | | 120 | | | | 120 | |
| | | | | | | | 2,411 | |
| 40 | Private Client Services Funds |
Capital Group Short-Term Municipal Fund
| Bonds, notes & other debt instruments (continued) | Principal amount
(000) | | | Value
(000) | |
| Mississippi 0.11% | | | | | | | | |
| Business Fin. Corp., Solid Waste Disposal Rev. Bonds (Waste Management, Inc. Project), Series 2004, 0.70% 2029 (put 2026) | | $ | 175 | | | $ | 172 | |
| Home Corp., Collateralized Multi Family Housing Bonds (J&A Dev. Portfolio Project I), Series 2021-1, 0.30% 2024 (put 2023) | | | 60 | | | | 60 | |
| | | | | | | | 232 | |
| | | | | | | | | |
| Missouri 0.49% | | | | | | | | |
| Housing Dev. Commission, Single Family Mortgage Rev. Bonds (First Place Homeownership Loan Program), Series 2016-B, 3.50% 2041 | | | 610 | | | | 641 | |
| Housing Dev. Commission, Single Family Mortgage Rev. Bonds (First Place Homeownership Loan Program), Series 2020-A, 3.50% 2050 | | | 185 | | | | 201 | |
| Housing Dev. Commission, Single Family Mortgage Rev. Bonds (First Place Homeownership Loan Program), Series 2021-A, 3.00% 2052 | | | 60 | | | | 64 | |
| County of St. Charles, Industrial Dev. Auth., Multi Family Housing Rev. Bonds (Hidden Valley Estates), Series 2021, 0.27% 2025 (put 2023) | | | 85 | | | | 85 | |
| | | | | | | | 991 | |
| | | | | | | | | |
| Montana 0.21% | | | | | | | | |
| Board of Housing, Single Family Mortgage Bonds, Series 2016-A-2, 3.50% 2044 | | | 115 | | | | 121 | |
| Board of Housing, Single Family Mortgage Bonds, Series 2019-A, 4.25% 2045 | | | 130 | | | | 142 | |
| Board of Housing, Single Family Mortgage Bonds, Series 2020-B, 4.00% 2050 | | | 140 | | | | 155 | |
| | | | | | | | 418 | |
| | | | | | | | | |
| Nebraska 0.59% | | | | | | | | |
| Investment Fin. Auth., Single Family Housing Rev. Bonds, Series 2014-A, 4.00% 2044 | | | 220 | | | | 232 | |
| Investment Fin. Auth., Single Family Housing Rev. Bonds, Series 2016-C, 3.50% 2046 | | | 75 | | | | 76 | |
| Investment Fin. Auth., Single Family Housing Rev. Bonds, Series 2018-C, 4.00% 2048 | | | 445 | | | | 484 | |
| Investment Fin. Auth., Single Family Housing Rev. Bonds, Series 2021-C, 3.00% 2050 | | | 375 | | | | 405 | |
| | | | | | | | 1,197 | |
| | | | | | | | | |
| Nevada 0.68% | | | | | | | | |
| County of Clark, Pollution Control Rev. Ref. Bonds (Nevada Power Co. Projects), Series 2017, 1.65% 2036 (put 2023) | | | 645 | | | | 656 | |
| Housing Division, Multi Unit Housing Rev. Bonds (Pinewood Terrace Apartments), Series 2021, 0.26% 2024 (put 2022) | | | 75 | | | | 75 | |
| Las Vegas Valley Water Dist., Limited Tax G.O. Water Improvement and Rev. Ref. Bonds, Series 2016-A, 5.00% 2023 | | | 600 | | | | 645 | |
| | | | | | | | 1,376 | |
| | | | | | | | | |
| New Jersey 0.80% | | | | | | | | |
| Econ. Dev. Auth., Water Facs. Rev. Ref. Bonds (American Water Co., Inc. Project), Series 2020-A, 1.00% 2023 | | | 275 | | | | 278 | |
| Housing and Mortgage Fin. Agcy., Single Family Housing Rev. Bonds, Series 2018-A, 4.50% 2048 | | | 465 | | | | 517 | |
| Tobacco Settlement Fncg. Corp., Tobacco Settlement Bonds, Series 2018-A, 5.00% 2023 | | | 200 | | | | 214 | |
| Tobacco Settlement Fncg. Corp., Tobacco Settlement Bonds, Series 2018-A, 5.00% 2026 | | | 500 | | | | 589 | |
| Turnpike Auth., Turnpike Rev. Bonds, Series 2020-D, 5.00% 2028 | | | 30 | | | | 35 | |
| | | | | | | | 1,633 | |
| | | | | | | | | |
| New Mexico 0.29% | | | | | | | | |
| Mortgage Fin. Auth., Single Family Mortgage Program Bonds, Series 2019-A-1, Class I, 4.25% 2050 | | | 400 | | | | 440 | |
| Municipal Energy Acquisition Auth., Gas Supply Rev. Ref. and Acquisition Bonds, Series 2019, 5.00% 2039 (put 2025) | | | 135 | | | | 155 | |
| | | | | | | | 595 | |
| Private Client Services Funds | 41 |
Capital Group Short-Term Municipal Fund
| Bonds, notes & other debt instruments (continued) | Principal amount
(000) | | | Value
(000) | |
| New York 5.15% | | | | | | | | |
| Build NYC Resource Corp., Rev. Ref. Bonds (Ethical Culture Fieldston School Project), Series 2015, 5.00% 2024 | | $ | 360 | | | $ | 400 | |
| Dormitory Auth., State Personal Income Tax Rev. Bonds (General Purpose), Series 2017-A, 5.00% 2022 | | | 175 | | | | 177 | |
| Dormitory Auth., State Personal Income Tax Rev. Bonds (General Purpose), Series 2020-A-2, 5.00% 2031 | | | 15 | | | | 20 | |
| City of Geneva, Dev. Corp., Rev. Ref. Bonds (Hobart and William Smith Colleges Project), Series 2012, 5.00% 2032 (preref. 2022) | | | 40 | | | | 42 | |
| Housing Fin. Agcy., Affordable Housing Rev. Green Bonds, Series 2020-K, 0.70% 2024 | | | 85 | | | | 85 | |
| Housing Fin. Agcy., Affordable Housing Rev. Green Bonds, Series 2020-L-2, 0.75% 2025 | | | 250 | | | | 250 | |
| Housing Fin. Agcy., Affordable Housing Rev. Green Bonds, Series 2021-D-2, 0.65% 2056 (put 2025) | | | 195 | | | | 194 | |
| Housing Fin. Agcy., Affordable Housing Rev. Green Bonds, Series 2021-I-2, 0.70% 2056 (put 2025) | | | 190 | | | | 190 | |
| Long Island Power Auth., Electric System General Rev. Bonds, Series 2014-C, | | | | | | | | |
| (1-month USD-LIBOR x 0.70 + 0.75%) 0.807% 2033 (put 2023)1 | | | 300 | | | | 301 | |
| Long Island Power Auth., Electric System General Rev. Bonds, Series 2015-C, (1-month USD-LIBOR x 0.70 + 0.75%) 0.807% 2033 (put 2023)1 | | | 260 | | | | 261 | |
| Metropolitan Transportation Auth., Transportation Rev. Bonds, Series 2012-B, 5.00% 2022 | | | 195 | | | | 204 | |
| Metropolitan Transportation Auth., Transportation Rev. Bonds, Series 2012-C, 5.00% 2032 (preref. 2022) | | | 500 | | | | 525 | |
| Metropolitan Transportation Auth., Transportation Rev. Green Bonds, Series 2016-A-2, 5.00% 2024 | | | 300 | | | | 339 | |
| Metropolitan Transportation Auth., Transportation Rev. Ref. Bonds, Series 2012-F, 5.00% 2022 | | | 230 | | | | 241 | |
| Metropolitan Transportation Auth., Transportation Rev. Ref. Bonds, Series 2002-D-2-B, Assured Guaranty Municipal insured, (USD-SOFR x 0.67 + 0.55%) 0.583% 2032 (put 2024)1 | | | 255 | | | | 256 | |
| Metropolitan Transportation Auth., Transportation Rev. Ref. Bonds, Series 2002-D-2-A-2, Assured Guaranty Municipal insured, (USD-SOFR x 0.67 + 0.80%) 0.833% 2032 (put 2026)1 | | | 60 | | | | 61 | |
| Metropolitan Transportation Auth., Transportation Rev. Ref. Green Bonds, Series 2017-B, 5.00% 2023 | | | 455 | | | | 497 | |
| Metropolitan Transportation Auth., Transportation Rev. Ref. Green Bonds, Series 2017-C-1, 5.00% 2024 | | | 50 | | | | 57 | |
| Mortgage Agcy., Homeowner Mortgage Rev. Bonds, Series 197, 3.50% 2044 | | | 410 | | | | 434 | |
| Mortgage Agcy., Homeowner Mortgage Rev. Bonds, Series 233, 3.00% 2045 | | | 300 | | | | 323 | |
| Mortgage Agcy., Homeowner Mortgage Rev. Bonds, Series 213, 4.25% 2047 | | | 505 | | | | 552 | |
| New York City G.O. Bonds, Series 2018-C, 5.00% 2023 | | | 1,000 | | | | 1,083 | |
| New York City G.O. Bonds, Series 2014-I-1, 5.00% 2026 | | | 185 | | | | 205 | |
| New York City G.O. Bonds, Series 2021-A-1, 5.00% 2033 | | | 70 | | | | 92 | |
| New York City G.O. Bonds, Series 2015-F-4, 5.00% 2044 (put 2025) | | | 75 | | | | 86 | |
| New York City Housing Dev. Corp., Multi Family Housing Rev. Bonds (Sustainable Dev. Bonds), Series 2017-C-3-A, 0.20% 2022 | | | 45 | | | | 45 | |
| New York City Housing Dev. Corp., Multi Family Housing Rev. Bonds (Sustainable Dev. Bonds), Series 2016-C-2, 0.23% 2050 (put 2022) | | | 55 | | | | 55 | |
| New York City Housing Dev. Corp., Multi Family Housing Rev. Bonds (Sustainable Dev. Bonds), Series 2021-C-2, 0.70% 2060 (put 2025) | | | 330 | | | | 331 | |
| New York City Housing Dev. Corp., Multi Family Housing Rev. Bonds (Sustainable Neighborhood Bonds), Series 2017-G-2-A, 2.00% 2057 (put 2021) | | | 55 | | | | 55 | |
| New York City Housing Dev. Corp., Multi Family Housing Rev. Bonds (Sustainable Neighborhood Bonds), Series 2020-I-2, 0.70% 2060 (put 2025) | | | 230 | | | | 230 | |
| New York City Housing Dev. Corp., Multi Family Housing Rev. Green Bonds, Series 2021-F-2, 0.60% 2061 (put 2025) | | | 220 | | | | 219 | |
| New York City Municipal Water Fin. Auth., Water and Sewer System Second General Resolution Rev. Bonds, Series 2021-BB-2, 4.00% 2024 | | | 500 | | | | 548 | |
| New York City Transitional Fin. Auth., Future Tax Secured Bonds, Series 2019-C-1, 5.00% 2021 | | | 150 | | | | 150 | |
| New York City Transitional Fin. Auth., Future Tax Secured Bonds, Series 2020-A-1, 5.00% 2022 | | | 10 | | | | 10 | |
| New York City Transitional Fin. Auth., Future Tax Secured Bonds, Series 2021-E-1, 5.00% 2023 | | | 20 | | | | 21 | |
| New York City Transitional Fin. Auth., Future Tax Secured Bonds, Series 2021-F-1, 5.00% 2024 | | | 400 | | | | 455 | |
| New York City Transitional Fin. Auth., Future Tax Secured Bonds, Series 2013-I, 5.00% 2027 | | | 180 | | | | 193 | |
| Public Housing Capital Fund Rev. Trust I, Trust Certs., Series 2012, 4.50% 20222 | | | 47 | | | | 47 | |
| Triborough Bridge and Tunnel Auth., General Rev. Bonds (MTA Bridges and Tunnels), Series 2017-C-1, 5.00% 2025 | | | 500 | | | | 588 | |
| Utility Debt Securitization Auth., Restructuring Bonds, Series 2017, 5.00% 2025 | | | 10 | | | | 11 | |
| County of Westchester, Industrial Dev. Agcy., Multi Family Housing Rev. Bonds (EG Mt. Vernon Preservation, LP Project), Series 2020, 0.30% 2023 (put 2022) | | | 155 | | | | 155 | |
| County of Westchester, Industrial Dev. Agcy., Multi Family Housing Rev. Bonds (Marble Hall - Tuckahoe LP Project), Series 2021, 0.28% 2024 (put 2023) | | | 455 | | | | 454 | |
| | | | | | | | 10,442 | |
| 42 | Private Client Services Funds |
Capital Group Short-Term Municipal Fund
| Bonds, notes & other debt instruments (continued) | Principal amount
(000) | | | Value
(000) | |
| North Carolina 1.70% | | | | | | | | |
| City of Burlington, Housing Auth., Multi Family Housing Rev. Bonds (Thetford Portfolio), Series 2021, 0.30% 2024 (put 2022) | | $ | 325 | | | $ | 325 | |
| City of Durham, Housing Auth., Multi Family Housing Rev. Bonds (JJ Henderson Apartments Project), Series 2020, 0.30% 2024 (put 2023) | | | 20 | | | | 20 | |
| City of Goldsboro, Multi Family Housing Rev. Bonds (Grand at Day Point), Series 2021, 0.28% 2024 (put 2023) | | | 105 | | | | 105 | |
| Hospital Auth., Health Care Rev. Bonds (Charlotte-Mecklenburg Hospital), Series 2021-B, 5.00% 2050 (put 2024) | | | 980 | | | | 1,115 | |
| Housing Fin. Agcy., Home Ownership Rev. Ref. Bonds, Series 38-B, 4.00% 2047 | | | 205 | | | | 219 | |
| Housing Fin. Agcy., Home Ownership Rev. Ref. Bonds, Series 44, 4.00% 2050 | | | 75 | | | | 83 | |
| Housing Fin. Agcy., Home Ownership Rev. Ref. Bonds, Series 42, 4.00% 2050 | | | 70 | | | | 76 | |
| Housing Fin. Agcy., Multi Family Housing Rev. Bonds (Winds Crest Senior Living, LP), Series 2021, 0.36% 2024 (put 2023) | | | 105 | | | | 105 | |
| City of Sanford, Housing Auth., Multi Family Housing Rev. Bonds (Matthews Garden Gilmore), Series 2020, 0.30% 2023 (put 2022) | | | 750 | | | | 750 | |
| University of North Carolina at Chapel Hill, General Rev. Bonds, Series 2012-B, (1-month USD-LIBOR x 0.67 + 0.40%) 0.455% 2041 (put 2022)1 | | | 440 | | | | 441 | |
| City of Winston-Salem, Water and Sewer System Rev. Ref. Bonds, Series 2020-A, 5.00% 2022 | | | 200 | | | | 206 | |
| | | | | | | | 3,445 | |
| | | | | | | | | |
| North Dakota 0.40% | | | | | | | | |
| Housing Fin. Agcy., Homeownership Rev. Bonds (Home Mortgage Fin. Program), Series 2016-D, 3.50% 2046 | | | 125 | | | | 133 | |
| Housing Fin. Agcy., Housing Fin. Program Bonds (Home Mortgage Fin. Program), Series 2015-A, 4.00% 2038 | | | 420 | | | | 435 | |
| Housing Fin. Agcy., Housing Fin. Program Bonds (Home Mortgage Fin. Program), Series 2015-D, 4.00% 2046 | | | 240 | | | | 252 | |
| | | | | | | | 820 | |
| | | | | | | | | |
| Ohio 2.61% | | | | | | | | |
| Akron, Bath and Copley Joint Township Hospital Dist., Hospital Facs. Rev. Bonds (Akron General Health System), Series 2012, 5.00% 2031 (preref. 2022) | | | 375 | | | | 378 | |
| City of Dayton, Metropolitan Housing Auth., Multi Family Housing Rev. Bonds (Southern Montgomery Apartments Project), Series 2021-A, 0.32% 2024 (put 2023) | | | 200 | | | | 200 | |
| G.O. Conservation Projects Bonds, Series 2019-A, 2.00% 2022 | | | 20 | | | | 20 | |
| G.O. Infrastructure Improvement Bonds, Series 2021-A, 5.00% 2030 | | | 125 | | | | 162 | |
| County of Geauga, Rev. Bonds (South Franklin Circle Project), Series 2012-A, 8.00% 2047 (preref. 2022)3 | | | 890 | | | | 986 | |
| Hospital Rev. Ref. Bonds (Cleveland Clinic Health System Obligated Group), Series 2021-B, 5.00% 2024 | | | 310 | | | | 341 | |
| Hospital Rev. Ref. Bonds (Cleveland Clinic Health System Obligated Group), Series 2021-B, 5.00% 2026 | | | 500 | | | | 590 | |
| Housing Fin. Agcy., Multi Family Housing Rev. Bonds (Chevybrook Estates Apartments Project), Series 2021, 0.35% 2024 (put 2023) | | | 50 | | | | 50 | |
| Housing Fin. Agcy., Multi Family Housing Rev. Bonds (Glen Meadows Apartments Project), Series 2021-A, 0.40% 2024 (put 2023) | | | 80 | | | | 80 | |
| Housing Fin. Agcy., Multi Family Housing Rev. Bonds (Pinzone Tower Apartments Project), Series 2021, 0.28% 2023 (put 2022) | | | 190 | | | | 190 | |
| Housing Fin. Agcy., Residential Mortgage Rev. Bonds (Mortgage-Backed Securities Program), Series 2017-D, 4.00% 2048 | | | 80 | | | | 86 | |
| Housing Fin. Agcy., Residential Mortgage Rev. Bonds (Mortgage-Backed Securities Program), Series 2019-A, 4.50% 2049 | | | 185 | | | | 205 | |
| Housing Fin. Agcy., Residential Mortgage Rev. Bonds (Mortgage-Backed Securities Program), Series 2020-A, 3.75% 2050 | | | 135 | | | | 148 | |
| Housing Fin. Agcy., Residential Mortgage Rev. Bonds (Mortgage-Backed Securities Program), Series 2021-C, 3.25% 2051 | | | 225 | | | | 246 | |
| G.O. Infrastructure Improvement Rev. Ref. Bonds, Series 2016-A, 5.00% 2022 | | | 600 | | | | 633 | |
| Madison Local School Dist., School Improvement Rev. Ref. Bonds, Series 2014, 5.25% 2037 (preref. 2022) | | | 530 | | | | 545 | |
| County of Montgomery, Hospital Facs. Rev. Bonds (Dayton Children’s Hospital), Series 2021, 5.00% 2029 | | | 30 | | | | 38 | |
| County of Montgomery, Hospital Facs. Rev. Bonds (Dayton Children’s Hospital), Series 2021, 5.00% 2032 | | | 160 | | | | 210 | |
| Turnpike and Infrastructure Commission, Rev. Bonds, Series 2013-A-1, 5.00% 2025 | | | 125 | | | | 133 | |
| Water Dev. Auth., Water Dev. Rev. Bonds, Series 2013-A, 5.00% 2023 | | | 25 | | | | 27 | |
| Water Dev. Auth., Water Pollution Control Loan Fund Rev. Bonds, Series 2019-A, 5.00% 2029 | | | 15 | | | | 19 | |
| | | | | | | | 5,287 | |
| Private Client Services Funds | 43 |
Capital Group Short-Term Municipal Fund
| Bonds, notes & other debt instruments (continued) | Principal amount
(000) | | | Value
(000) | |
| Oklahoma 0.62% | | | | | | | | |
| Capital Improvement Auth., State Highways Capital Improvement Rev. Ref. Bonds (Oklahoma Dept. of Transportation Project), Series 2020-A, 5.00% 2023 | | $ | 145 | | | $ | 156 | |
| Housing Fin. Agcy., Collateralized Rev. Bonds (Deer Park & Apple Run Apartments), Series 2019, 1.60% 2022 | | | 250 | | | | 250 | |
| Housing Fin. Agcy., Single Family Mortgage Rev. Bonds (Homeownership Loan Program), Series 2012-A, 5.00% 2043 | | | 40 | | | | 41 | |
| Board of Regents of Oklahoma State University, General Rev. Ref. Bonds, Series 2020-A, 5.00% 2024 | | | 275 | | | | 311 | |
| Board of Regents of Oklahoma State University, General Rev. Ref. Bonds, Series 2020-A, 5.00% 2025 | | | 420 | | | | 491 | |
| | | | | | | | 1,249 | |
| | | | | | | | | |
| Oregon 0.21% | | | | | | | | |
| G.O. Bonds (Veteran’s Welfare Bonds Series 108), Series 2021-O, 3.00% 2051 | | | 245 | | | | 266 | |
| Housing and Community Services Dept., Housing Dev. Rev. Bonds (The Susan Emmons Apartments Project), Series 2021-S-2, 0.38% 2024 (put 2023) | | | 115 | | | | 115 | |
| Housing and Community Services Dept., Housing Dev. Rev. Bonds (Westwind Apartments Project), Series 2021-H, 0.25% 2024 (put 2023) | | | 50 | | | | 50 | |
| | | | | | | | 431 | |
| | | | | | | | | |
| Pennsylvania 1.92% | | | | | | | | |
| County of Allegheny, Hospital Dev. Auth., UPMC Rev. Bonds, Series 2019-A, 5.00% 2022 | | | 300 | | | | 310 | |
| Bethlehem Area School Dist. Auth., School Rev. Bonds (Bethlehem Area School Dist. Ref. Project), Series 2021-C, (USD-SOFR x 0.67 + 0.35%) 0.384% 2030 (put 2025)1 | | | 50 | | | | 50 | |
| Bethlehem Area School Dist. Auth., School Rev. Bonds (Bethlehem Area School Dist. Ref. Project), Series 2021-B, (USD-SOFR x 0.67 + 0.35%) 0.384% 2031 (put 2025)1 | | | 70 | | | | 70 | |
| Bethlehem Area School Dist. Auth., School Rev. Bonds (Bethlehem Area School Dist. Ref. Project), Series 2021-C, (USD-SOFR x 0.67 + 0.35%) 0.384% 2032 (put 2025)1 | | | 55 | | | | 55 | |
| Cumberland Valley School Dist., G.O. Bonds, Series 2015, 5.00% 2032 (preref. 2023) | | | 20 | | | | 22 | |
| Cumberland Valley School Dist., G.O. Bonds, Series 2015, 5.00% 2034 (preref. 2023) | | | 20 | | | | 22 | |
| Housing Fin. Agcy., Single Family Mortgage Rev. Bonds, Series 2017-122, 4.00% 2046 | | | 235 | | | | 251 | |
| Housing Fin. Agcy., Single Family Mortgage Rev. Bonds, Series 2020-133, 3.00% 2050 | | | 355 | | | | 380 | |
| Housing Fin. Agcy., Special Limited Obligation, Multi Family Housing Dev. Bonds (Harrison Senior Tower), Series 2021, 0.25% 2024 (put 2023) | | | 760 | | | | 757 | |
| Housing Fin. Agcy., Special Limited Obligation, Multi Family Housing Dev. Bonds (School of Nursing), Series 2021, 0.27% 2024 (put 2023) | | | 85 | | | | 85 | |
| County of Montgomery, Higher Education and Health Auth., Hospital Rev. Bonds (Abington Memorial Hospital Obligated Group), Series 2012-A, 5.00% 2031 (preref. 2022) | | | 775 | | | | 796 | |
| Philadelphia School Dist., G.O. Bonds, Series 2021-A, 5.00% 2027 | | | 190 | | | | 232 | |
| Turnpike Commission, Turnpike Rev. Bonds, Series 2021-B, 5.00% 2022 | | | 95 | | | | 100 | |
| Turnpike Commission, Turnpike Rev. Bonds, Series 2011-E, 5.00% 2042 (preref. 2022) | | | 275 | | | | 289 | |
| Turnpike Commission, Turnpike Rev. Bonds, Series 2011-E, 5.00% 2029 (preref. 2021) | | | 185 | | | | 186 | |
| Turnpike Commission, Turnpike Rev. Bonds, Series 2011-E, 5.00% 2030 (preref. 2021) | | | 55 | | | | 55 | |
| Wilkes-Barre Area School Dist., G.O. Bonds, Series 2019, BAM insured, 5.00% 2023 | | | 225 | | | | 240 | |
| | | | | | | | 3,900 | |
| | | | | | | | | |
| Rhode Island 0.08% | | | | | | | | |
| Housing and Mortgage Fin. Corp., Homeownership Opportunity Bonds, Series 66-A-1, 4.00% 2033 | | | 165 | | | | 170 | |
| | | | | | | | | |
| South Carolina 1.38% | | | | | | | | |
| County of Charleston, G.O. Capital Improvement Transportation Sales Tax Bonds, Series 2011, 5.00% 2024 (preref. 2021) | | | 500 | | | | 500 | |
| City of Columbia, Housing Auth., Multi Family Housing Rev. Bonds (Palmetto Terrace Apartments Project), Series 2021, 0.31% 2024 (put 2023) | | | 130 | | | | 130 | |
| Housing Fin. and Dev. Auth., Mortgage Rev. Bonds, Series 2018-A, 4.50% 2048 | | | 225 | | | | 246 | |
| Housing Fin. and Dev. Auth., Mortgage Rev. Bonds, Series 2020-A, 4.00% 2050 | | | 160 | | | | 177 | |
| Housing Fin. and Dev. Auth., Mortgage Rev. Bonds, Series 2021-A, 3.00% 2052 | | | 80 | | | | 87 | |
| Housing Fin. and Dev. Auth., Mortgage Rev. Ref. Bonds, Series 2016-A, 4.00% 2036 | | | 225 | | | | 241 | |
| Lexington County Health Services Dist., Inc., Hospital Rev. Ref. Bonds, Series 2017, 5.00% 2021 | | | 250 | | | | 250 | |
| Patriots Energy Group Fncg. Agcy., Gas Supply Rev. Bonds, Series 2018-A, 4.00% 2048 (put 2024) | | | 55 | | | | 59 | |
| Public Service Auth., Rev. Obligations (Santee Cooper), Series 2011-B, 5.00% 2021 (escrowed to maturity) | | | 405 | | | | 407 | |
| Public Service Auth., Rev. Obligations (Santee Cooper), Series 2014-C, 5.00% 2025 | | | 120 | | | | 136 | |
| 44 | Private Client Services Funds |
Capital Group Short-Term Municipal Fund
| Bonds, notes & other debt instruments (continued) | | Principal amount
(000) | | | Value
(000) | |
| South Carolina (continued) | | | | | | | | |
| Public Service Auth., Rev. Obligations (Santee Cooper), Series 2011-C, 5.00% 2036 | | $ | 110 | | | $ | 110 | |
| Public Service Auth., Rev. Ref. Obligations (Santee Cooper), Series 2015-A, 5.00% 2028 | | | 35 | | | | 40 | |
| Town of Southold, Local Dev. Corp., Rev. Bonds (Peconic Landing at Southold, Inc. Project), Series 2015, 5.00% 2022 | | | 400 | | | | 420 | |
| | | | | | | | 2,803 | |
| | | | | | | | | |
| South Dakota 0.39% | | | | | | | | |
| Housing Dev. Auth., Homeownership Mortgage Bonds, Series 2014-E, 4.00% 2044 | | | 95 | | | | 99 | |
| Housing Dev. Auth., Homeownership Mortgage Bonds, Series 2018-B, 4.50% 2048 | | | 375 | | | | 415 | |
| Housing Dev. Auth., Homeownership Mortgage Bonds, Series 2021-B, 3.00% 2051 | | | 260 | | | | 281 | |
| | | | | | | | 795 | |
| | | | | | | | | |
| Tennessee 1.58% | | | | | | | | |
| Town of Greeneville, Health and Educational Facs. Board, Multi Family Housing Rev. Bonds | | | | | | | | |
| (People RD Portfolio Project), Series 2019, 1.45% 2022 (put 2021) | | | 1,100 | | | | 1,101 | |
| Housing Dev. Agcy., Homeownership Program Bonds, Series 2012-1-C, 4.50% 2037 | | | 25 | | | | 25 | |
| Housing Dev. Agcy., Homeownership Program Bonds, Series 2012-2-C, 4.00% 2038 | | | 20 | | | | 20 | |
| Housing Dev. Agcy., Residential Fin. Program Bonds, Series 2017-1, 4.00% 2042 | | | 200 | | | | 214 | |
| Housing Dev. Agcy., Residential Fin. Program Bonds, Series 2014-2-A, 4.00% 2045 | | | 570 | | | | 601 | |
| Housing Dev. Agcy., Residential Fin. Program Bonds, Series 2014-2-C, 4.00% 2045 | | | 245 | | | | 257 | |
| Housing Dev. Agcy., Residential Fin. Program Bonds, Series 2015-2-A, 3.75% 2050 | | | 265 | | | | 290 | |
| City of Knoxville, Community Dev. Corp., Collateralized Multi Family Housing Bonds (Austin 1B Apartments Project), Series 2021, 0.22% 2024 (put 2023) | | | 40 | | | | 40 | |
| Metropolitan Government of Nashville and Davidson County, Health and Educational Facs. Board, Rev. Bonds (Vanderbilt University Medical Center), Series 2021-A, 5.00% 2031 | | | 30 | | | | 38 | |
| Metropolitan Government of Nashville and Davidson County, Water & Sewer Rev. Bonds, Series 2013, 5.00% 2025 (preref. 2023) | | | 85 | | | | 92 | |
| Tennessee Energy Acquisition Corp., Gas Project Rev. Bonds, Series 2017-A, 4.00% 2048 (put 2023) | | | 500 | | | | 524 | |
| | | | | | | | 3,202 | |
| | | | | | | | | |
| Texas 18.63% | | | | | | | | |
| Affordable Housing Corp., Multi Family Housing Rev. Bonds (Apartments of Las Palmas I LLC), Series 2021, 0.25% 2024 (put 2022) | | | 15 | | | | 15 | |
| Alvin Independent School Dist., Unlimited Tax Schoolhouse and Rev. Ref. Bonds, Series 2020, 5.00% 2022 | | | 625 | | | | 634 | |
| Arlington Higher Education Fin. Corp., Education Rev. and Rev. Ref. Bonds (Uplift Education), Series 2017-A, 5.00% 2022 | | | 645 | | | | 678 | |
| Arlington Higher Education Fin. Corp., Education Rev. Bonds (Great Hearts America - Texas), Series 2021-A, 4.00% 2025 | | | 15 | | | | 17 | |
| Arlington Higher Education Fin. Corp., Education Rev. Bonds (Great Hearts America - Texas), Series 2021-A, 4.00% 2026 | | | 15 | | | | 17 | |
| Arlington Higher Education Fin. Corp., Education Rev. Bonds (Harmony Public Schools), Series 2016-A, 5.00% 2024 | | | 310 | | | | 342 | |
| Arlington Higher Education Fin. Corp., Education Rev. Bonds (KIPP Texas, Inc.), Series 2019, 5.00% 2026 | | | 560 | | | | 670 | |
| Arlington Higher Education Fin. Corp., Education Rev. Bonds (Riverwalk Education Foundation, Inc.), Series 2019, 5.00% 2022 | | | 350 | | | | 363 | |
| Arlington Higher Education Fin. Corp., Education Rev. Bonds (Riverwalk Education Foundation, Inc.), Series 2019, 5.00% 2025 | | | 800 | | | | 928 | |
| Arlington Independent School Dist., Unlimited Tax School Building Bonds, Series 2017, 5.00% 2022 | | | 405 | | | | 411 | |
| City of Arlington, Water and Wastewater System Rev. Bonds, Series 2021, 5.00% 2023 | | | 165 | | | | 177 | |
| Austin Affordable PFC, Inc., Multi Family Housing Rev. Bonds (Bridge at Turtle Creek Apartments), Series 2020, 0.42% 2040 (put 2023) | | | 215 | | | | 215 | |
| Austin Community College Dist., Maintenance Tax Notes, Series 2021, 5.00% 2022 | | | 100 | | | | 104 | |
| City of Austin, Water and Wastewater System Rev. Ref. Bonds, Series 2020-C, 5.00% 2025 | | | 510 | | | | 601 | |
| City of Austin, Water and Wastewater System Rev. Ref. Bonds, Series 2021, 5.00% 2029 | | | 95 | | | | 123 | |
| Barbers Hill Independent School Dist., Unlimited Tax School Building Bonds, Series 2020, 5.00% 2030 | | | 70 | | | | 91 | |
| County of Bexar, Combination Tax and Rev. Certs. of Obligation, Series 2013-B, 5.00% 2033 (preref. 2023) | | | 105 | | | | 113 | |
| Brazosport Independent School Dist., Unlimited Tax School Building and Rev. Ref. Bonds, Series 2020, 5.00% 2022 | | | 1,000 | | | | 1,014 | |
| Brazosport Independent School Dist., Unlimited Tax School Building Bonds, Series 2019, 5.00% 2022 | | | 70 | | | | 71 | |
| Brownsville Independent School Dist., Unlimited Tax Rev. Ref. Bonds, Series 2020-A, 3.00% 2026 | | | 500 | | | | 555 | |
| Private Client Services Funds | 45 |
Capital Group Short-Term Municipal Fund
| Bonds, notes & other debt instruments (continued) | | Principal amount
(000) | | | Value
(000) | |
| Texas (continued) | | | | | | | | |
| County of Cameron, Housing Fin. Corp., Multi Family Housing Rev. Bonds (Sunland Country Apartments), Series 2021, 0.28% 2024 (put 2023) | | $ | 50 | | | $ | 50 | |
| Canyon Independent School Dist., Unlimited Tax School Building Bonds, Series 2019, 5.00% 2022 | | | 165 | | | | 167 | |
| Capital Area Housing Fin. Corp., Multi Family Housing Rev. Bonds (Redwood Apartments), Series 2020, 0.41% 2041 (put 2024) | | | 460 | | | | 460 | |
| Carrollton-Farmers Branch Independent School Dist., Unlimited Tax School Building Bonds, Series 2021, 5.00% 2023 | | | 135 | | | | 143 | |
| Clear Creek Independent School Dist., Unlimited Tax School Building Bonds, Series 2013-B, 0.28% 2038 (put 2024) | | | 100 | | | | 100 | |
| Conroe Independent School Dist., Unlimited Tax Rev. Ref. Bonds, Series 2019, 5.00% 2022 | | | 50 | | | | 51 | |
| Conroe Independent School Dist., Unlimited Tax School Building and Rev. Ref. Bonds, Series 2020-A, 5.00% 2025 | | | 1,000 | | | | 1,149 | |
| Cypress-Fairbanks Independent School Dist., Unlimited Tax Rev. Ref. Bonds, Series 2013, 5.00% 2025 (preref. 2023) | | | 600 | | | | 637 | |
| Cypress-Fairbanks Independent School Dist., Unlimited Tax School Building and Rev. Ref. Bonds, Series 2014-C, 5.00% 2027 | | | 500 | | | | 553 | |
| Cypress-Fairbanks Independent School Dist., Unlimited Tax School Building Bonds, Series 2015-B-2, 0.28% 2040 (put 2024) | | | 210 | | | | 208 | |
| Cities of Dallas and Fort Worth, Dallas/Fort Worth International Airport, Joint Rev. Ref. Bonds, Series 2014-E, 5.00% 2023 | | | 370 | | | | 387 | �� |
| City of Dallas, Housing Fin. Corp., Multi Family Housing Rev. Bonds (Midpark Towers), Series 2021, 0.35% 2024 (put 2023) | | | 180 | | | | 180 | |
| Dallas Independent School Dist., Unlimited Tax Rev. Ref. Bonds, Series 2014-A, 5.00% 2023 | | | 15 | | | | 16 | |
| Dallas Independent School Dist., Unlimited Tax Rev. Ref. Bonds, Series 2015, 5.00% 2030 | | | 400 | | | | 456 | |
| Del Mar College Dist., Limited Tax Bonds, Series 2020-B, 5.00% 2024 | | | 400 | | | | 450 | |
| Del Mar College Dist., Limited Tax Bonds, Series 2020-A, 5.00% 2026 | | | 335 | | | | 401 | |
| Del Valle Independent School Dist., Unlimited Tax School Building Bonds, Series 2020, 5.00% 2022 | | | 155 | | | | 160 | |
| El Paso Independent School Dist., Unlimited Tax Rev. Ref. Bonds, Series 2015, 5.00% 2026 | | | 400 | | | | 452 | |
| Fort Bend Independent School Dist., Unlimited Tax Rev. Ref. Bonds, Series 2020, 5.00% 2024 | | | 130 | | | | 147 | |
| Fort Bend Independent School Dist., Unlimited Tax Rev. Ref. Bonds, Series 2021-B, 0.72% 2051 (put 2026) | | | 500 | | | | 499 | |
| Fort Bend Independent School Dist., Unlimited Tax School Building Bonds, Series 2019-A, 1.95% 2049 (put 2022)3 | | | 420 | | | | 425 | |
| G.O. Water Financial Assistance Rev. Ref. Bonds, Series 2021-B, 4.00% 2030 | | | 50 | | | | 56 | |
| City of Galveston, Public Fac. Corp., Multi Family Housing Rev. Bonds (The Orleanders at Broadway), Series 2021, 0.47% 2025 (put 2024) | | | 150 | | | | 150 | |
| Garland Independent School Dist., Unlimited Tax School Building Bonds, Series 2016, 5.00% 2030 | | | 400 | | | | 457 | |
| Goose Creek Consolidated Independent School Dist., Unlimited Tax School Building Bonds, Series 2019-B, 0.15% 2049 (put 2022) | | | 140 | | | | 140 | |
| Grand Prairie Independent School Dist., Unlimited Tax Rev. Ref. Bonds, Series 2015, 5.25% 2024 | | | 525 | | | | 583 | |
| Hallsville Independent School Dist., Unlimited Tax School Building and Rev. Ref. Bonds, Series 2020, 5.00% 2025 | | | 515 | | | | 592 | |
| Harlandale Independent School Dist., Maintenance Tax Notes, Series 2021, BAM insured, 2.00% 2040 (put 2024) | | | 50 | | | | 51 | |
| Harlandale Independent School Dist., Unlimited Tax Rev. Ref. Bonds, Series 2020, 0.75% 2045 (put 2025) | | | 100 | | | | 100 | |
| County of Harris, Cultural Education Facs. Fin. Corp., Hospital Rev. Bonds (Memorial Hermann Health System), Series 2019-C-1, (SIFMA Municipal Swap Index + 0.42%) 0.47% 2049 (put 2022)1 | | | 375 | | | | 375 | |
| County of Harris, Cultural Education Facs. Fin. Corp., Medical Facs. Mortgage Rev. Ref. Bonds (Baylor College of Medicine), Series 2019-A, (3-month USD-LIBOR x 0.70 + 0.65%) 0.707% 2046 (put 2024)1 | | | 130 | | | | 131 | |
| County of Harris, Cultural Education Facs. Fin. Corp., Rev. Bonds (Texas Medical Center), Series 2020-A, 0.90% 2050 (put 2025) | | | 130 | | | | 130 | |
| County of Harris, Health Facs. Dev. Corp., Rev. Ref. Bonds (CHRISTUS Health), Series 2005-A-4, Assured Guaranty Municipal insured, 0.20% 20311 | | | 125 | | | | 125 | |
| County of Harris, Metropolitan Transit Auth., Sales and Use Tax Bonds, Series 2011-A, 5.00% 2023 (preref. 2021) | | | 600 | | | | 600 | |
| County of Harris, Sports Auth., Rev. Ref. Bonds, Series 2014-A, Assured Guaranty Municipal insured, 5.00% 2022 (escrowed to maturity) | | | 110 | | | | 115 | |
| County of Harris, Toll Road Rev. and Rev. Ref. Bonds, Series 2018-A, 5.00% 2024 | | | 150 | | | | 169 | |
| Dept. of Housing and Community Affairs, Multi Family Housing Rev. Bonds (Corona Del Valle), Series 2021, 0.37% 2025 (put 2023) | | | 50 | | | | 50 | |
| Dept. of Housing and Community Affairs, Multi Family Housing Rev. Bonds (Oso Bay Apartments), Series 2021, 0.27% 2024 (put 2022) | | | 100 | | | | 100 | |
| Dept. of Housing and Community Affairs, Multi Family Housing Rev. Bonds (Palladium Simpson Stuart Apartments), Series 2021, 0.35% 2025 (put 2024) | | | 165 | | | | 165 | |
| Dept. of Housing and Community Affairs, Residential Mortgage Rev. Bonds, Series 2021-A, 3.00% 2052 | | | 310 | | | | 336 | |
| Dept. of Housing and Community Affairs, Single Family Mortgage Rev. Bonds, Series 2018-A, 4.75% 2049 | | | 370 | | | | 409 | |
| Dept. of Housing and Community Affairs, Single Family Mortgage Rev. Bonds, Series 2019-A, 4.00% 2050 | | | 405 | | | | 451 | |
| Dept. of Housing and Community Affairs, Single Family Mortgage Rev. Bonds, Series 2020-A, 3.50% 2051 | | | 125 | | | | 138 | |
| 46 | Private Client Services Funds |
Capital Group Short-Term Municipal Fund
| Bonds, notes & other debt instruments (continued) | | Principal amount
(000) | | | Value
(000) | |
| Texas (continued) | | | | | | | | |
| Dept. of Housing and Community Affairs, Single Family Mortgage Rev. Bonds, Series 2021-A, 3.00% 2052 | | $ | 135 | | | $ | 146 | |
| Housing Options, Inc., Multi Family Housing Rev. Bonds (Brooks Manor - The Oaks Project), Series 2021, 0.50% 2041 (put 2025) | | | 100 | | | | 99 | |
| City of Houston, Airport System Rev. Ref. Bonds, Series 2012-B, 5.00% 2028 (preref. 2022) | | | 870 | | | | 898 | |
| City of Houston, Combined Utility System Rev. Bonds, Series 2011-D, 5.00% 2026 (preref. 2021) | | | 55 | | | | 55 | |
| City of Houston, Combined Utility System Rev. Ref. Bonds, Series 2019-B, 2.00% 2024 | | | 615 | | | | 646 | |
| City of Houston, Convention and Entertainment Facs. Dept., Hotel Occupancy Tax and Special Rev. Ref. Bonds, Series 2021, 4.00% 2022 | | | 10 | | | | 10 | |
| City of Houston, Convention and Entertainment Facs. Dept., Hotel Occupancy Tax and Special Rev. Ref. Bonds, Series 2021, 4.00% 2023 | | | 15 | | | | 16 | |
| City of Houston, Housing Fin. Corp., Multi Family Housing Rev. Bonds (Temenos Place Apartments), Series 2021, 0.29% 2024 (put 2023) | | | 85 | | | | 85 | |
| Humble Independent School Dist., Unlimited Tax Rev. Ref. Bonds, Series 2020-B, 5.00% 2022 | | | 1,000 | | | | 1,014 | |
| Katy Independent School Dist., Unlimited Tax Rev. Ref. Bonds, Series 2019-B, 5.00% 2022 | | | 100 | | | | 101 | |
| Keller Independent School Dist., Unlimited Tax Rev. Ref. Bonds, Series 2015-A, 5.00% 2027 (preref. 2025) | | | 470 | | | | 541 | |
| Killeen Independent School Dist., Unlimited Tax Rev. Ref. Bonds, Series 2019, 5.00% 2022 | | | 95 | | | | 96 | |
| Longview Independent School Dist., Unlimited Tax Rev. Ref. Bonds, Series 2017, 5.00% 2022 | | | 180 | | | | 183 | |
| Longview Independent School Dist., Unlimited Tax Rev. Ref. Bonds, Series 2020, 5.00% 2024 | | | 500 | | | | 553 | |
| Lower Colorado River Auth., Rev. Ref. Bonds, Series 2022, Assured Guaranty Municipal insured, 5.00% 2032 | | | 55 | | | | 70 | |
| Lower Colorado River Auth., Transmission Contract Rev. Ref. Bonds (LCRA Transmission Services Corp. Project), Series 2020, 5.00% 2025 | | | 1,000 | | | | 1,156 | |
| Lower Colorado River Auth., Transmission Contract Rev. Ref. Bonds (LCRA Transmission Services Corp. Project), Series 2021-A, 5.00% 2031 | | | 60 | | | | 79 | |
| Medina Valley Independent School Dist., Unlimited Tax School Building Bonds, Series 2021, 0.82% 2051 (put 2026) | | | 90 | | | | 89 | |
| Municipal Gas Acquisition and Supply Corp. I, Gas Supply Rev. Bonds, Series 2008-D, 6.25% 2026 | | | 170 | | | | 197 | |
| Municipal Gas Acquisition and Supply Corp. III, Gas Supply Rev. Ref. Bonds, Series 2021, 5.00% 2022 | | | 10 | | | | 10 | |
| Municipal Gas Acquisition and Supply Corp. III, Gas Supply Rev. Ref. Bonds, Series 2021, 5.00% 2025 | | | 120 | | | | 140 | |
| North Central Texas Housing Fin. Corp., Multi Family Housing Rev. Bonds (Bluebonnet Ridge Apartments), Series 2021, 0.375% 2040 (put 2024) | | | 85 | | | | 85 | |
| North Texas Municipal Water Dist., Water System Rev. Ref. and Improvement Bonds, Series 2021, 5.00% 2022 | | | 45 | | | | 47 | |
| North Texas Tollway Auth., System Rev. Ref. Bonds, Series 2014-A, 5.00% 2024 | | | 395 | | | | 434 | |
| North Texas Tollway Auth., System Rev. Ref. Bonds, Series 2014-A, 5.00% 2024 (escrowed to maturity) | | | 190 | | | | 209 | |
| North Texas Tollway Auth., System Rev. Ref. Bonds, Series 2016-A, 5.00% 2026 | | | 1,500 | | | | 1,647 | |
| Northside Independent School Dist., Unlimited Tax School Building Bonds, Series 2020, 0.70% 2050 (put 2025) | | | 1,000 | | | | 1,001 | |
| Odessa Housing Fin. Corp., Multi Family Housing Rev. Bonds (Cove in Odessa Apartments), Series 2021, 0.37% 2024 (put 2023) | | | 230 | | | | 230 | |
| Pasadena Independent School Dist., Unlimited Tax Rev. Ref. Bonds, Series 2019, 5.00% 2022 | | | 125 | | | | 127 | |
| Pasadena Independent School Dist., Unlimited Tax School Building and Rev. Ref. Bonds, Series 2013, 5.00% 2038 | | | 500 | | | | 529 | |
| Plainview Independent School Dist., Unlimited Tax School Building Bonds, Series 2020-A, 5.00% 2022 | | | 500 | | | | 507 | |
| Plano Independent School Dist., Unlimited Tax Rev. Ref. Bonds, Series 2020, 5.00% 2023 | | | 135 | | | | 143 | |
| Prosper Independent School Dist., Unlimited Tax School Building Bonds, Series 2021-A, 5.00% 2030 | | | 50 | | | | 65 | |
| Prosper Independent School Dist., Unlimited Tax School Building Bonds, Series 2019-B, 2.00% 2050 (put 2021) | | | 960 | | | | 989 | |
| County of Rockwall, Permanent Improvement and Rev. Ref. Bonds, Series 2020, 5.00% 2024 | | | 200 | | | | 221 | |
| County of Rockwall, Permanent Improvement and Rev. Ref. Bonds, Series 2020, 5.00% 2025 | | | 250 | | | | 286 | |
| County of Rockwall, Permanent Improvement and Rev. Ref. Bonds, Series 2020, 5.00% 2026 | | | 260 | | | | 307 | |
| Round Rock Independent School Dist., Unlimited Tax Rev. Ref. Bonds, Series 2017, 5.00% 2022 | | | 300 | | | | 311 | |
| San Angelo Independent School Dist., Unlimited Tax Rev. Ref. Bonds, Series 2015-A, 5.00% 2030 (preref. 2024) | | | 1,110 | | | | 1,227 | |
| City of San Antonio, Electric and Gas Systems Rev. Bonds, Series 2015-D, 1.125% 2045 (put 2026) | | | 230 | | | | 233 | |
| City of San Antonio, Electric and Gas Systems Rev. Bonds, Series 2013, 5.00% 2048 (preref. 2023) | | | 140 | | | | 148 | |
| City of San Antonio, Electric and Gas Systems Rev. Ref. Bonds, Series 2020, 5.00% 2026 | | | 330 | | | | 390 | |
| City of San Antonio, General Improvement and Rev. Ref. Bonds, Series 2016, 5.00% 2022 | | | 70 | | | | 71 | |
| Tomball Independent School Dist., Unlimited Tax School Building Bonds, Series 2020, 5.00% 2023 | | | 80 | | | | 85 | |
| Tomball Independent School Dist., Unlimited Tax School Building Bonds, Series 2020, 5.00% 2024 | | | 30 | | | | 33 | |
| Transportation Commission, G.O. Mobility Fund Bonds, Series 2014-B, 0.65% 2041 (put 2026) | | | 310 | | | | 307 | |
| Transportation Commission, G.O. Mobility Fund Rev. Ref. Bonds, Series 2014-B, 5.00% 2026 | | | 550 | | | | 611 | |
| County of Travis, Strategic Housing Fin. Corp., Multi Family Housing Rev. Bonds (Yager Flats), Series 2021, 0.46% 2041 (put 2025) | | | 770 | | | | 765 | |
| Trinity River Auth., Regional Wastewater System Rev. Ref. Bonds, Series 2021, 5.00% 2029 | | | 160 | | | | 205 | |
| Private Client Services Funds | 47 |
Capital Group Short-Term Municipal Fund
| Bonds, notes & other debt instruments (continued) | | Principal amount
(000) | | | Value
(000) | |
| Texas (continued) | | | | | | | | |
| Water Dev. Board, State Revolving Fund, Rev. Bonds, Series 2021, 5.00% 2031 | | $ | 80 | | | $ | 107 | |
| Water Dev. Board, State Water Implementation Rev. Fund, Rev. Bonds (Master Trust), Series 2016, 5.00% 2022 | | | 550 | | | | 562 | |
| Water Dev. Board, State Water Implementation Rev. Fund, Rev. Bonds (Master Trust), Series 2018-B, 5.00% 2023 | | | 45 | | | | 48 | |
| | | | | | | | 37,767 | |
| | | | | | | | | |
| Utah 0.44% | | | | | | | | |
| Housing Corp., Single Family Mortgage Bonds, Class III, Series 2015-D-2, 4.00% 2045 | | | 195 | | | | 208 | |
| Salt Lake City, Airport Rev. Bonds (Salt Lake City International Airport), Series 2021-B, 5.00% 2024 | | | 275 | | | | 308 | |
| County of Salt Lake, Board of Education, G.O. Rev. Ref. Bonds (Utah School Bond Guaranty Act), Series 2021, 5.00% 2024 | | | 250 | | | | 280 | |
| Transit Auth., Sales Tax Rev. Bonds, Series 2008-A, 5.25% 2023 | | | 15 | | | | 16 | |
| City of Vineyard, Redev. Agcy., Tax Increment Rev. and Rev. Ref. Bonds, Series 2021, Assured Guaranty Municipal insured, 5.00% 2024 | | | 65 | | | | 72 | |
| | | | | | | | 884 | |
| | | | | | | | | |
| Vermont 0.02% | | | | | | | | |
| Housing Fin. Agcy., Multiple Purpose Bonds, Series 2020-A, 3.75% 2050 | | | 40 | | | | 44 | |
| | | | | | | | | |
| Virginia 1.79% | | | | | | | | |
| County of Arlington, Industrial Dev. Auth., Hospital Rev. Bonds (Virginia Hospital Center), Series 2020, 5.00% 2025 | | | 130 | | | | 151 | |
| College Building Auth., Educational Facs. Rev. Bonds (21st Century College and Equipment Programs), Series 2013-A, 4.50% 2033 | | | 450 | | | | 474 | |
| College Building Auth., Educational Facs. Rev. Bonds (21st Century College and Equipment Programs), Series 2013-A, 4.50% 2034 | | | 235 | | | | 248 | |
| Commonwealth Transportation Board, Federal Transportation Grant Anticipation Rev. Notes, Series 2012-A, 5.00% 2023 (preref. 2022) | | | 555 | | | | 565 | |
| County of Fairfax, Redev. and Housing Auth., Multi Family Housing Rev. Bonds (Arrowbrook Apartments Project), Series 2020, 0.41% 2041 (put 2024) | | | 500 | | | | 500 | |
| County of Fairfax, Redev. and Housing Auth., Multi Family Housing Rev. Bonds (Oakwood North Four Project), Series 2021, 0.41% 2025 (put 2024) | | | 570 | | | | 569 | |
| County of Halifax, Industrial Dev. Auth., Recovery Zone Fac. Rev. Bonds (Virginia Electric and Power Co. Project), Series 2010-A, 0.45% 2041 (put 2022) | | | 225 | | | | 225 | |
| Small Business Fncg. Auth., Rev. Bonds (National Senior Campuses, Inc. Obligated Group), Series 2020-A, 5.00% 2024 | | | 70 | | | | 77 | |
| Small Business Fncg. Auth., Rev. Bonds (National Senior Campuses, Inc. Obligated Group), Series 2020-A, 5.00% 2026 | | | 150 | | | | 176 | |
| County of Smyth, G.O. Public Improvement Bonds, Series 2011-A, 5.00% 2031 (preref. 2021) | | | 500 | | | | 500 | |
| County of Wise, Industrial Dev. Auth., Solid Waste and Sewage Disposal Rev. Bonds (Virginia Electric and Power Co. Project), Series 2010-A, 1.20% 2040 (put 2024) | | | 140 | | | | 142 | |
| | | | | | | | 3,627 | |
| | | | | | | | | |
| Washington 3.14% | | | | | | | | |
| Central Puget Sound Regional Transit Auth., Sales Tax and Motor Vehicle Excise Tax Improvement and Rev. Ref. Green Bonds, Series 2021-S-1, 5.00% 2028 | | | 65 | | | | 82 | |
| Energy Northwest, Electric Rev. Ref. Bonds (Project No. 3), Series 2018-C, 5.00% 2023 | | | 1,000 | | | | 1,079 | |
| City of Everett, Housing Auth., Multi Family Housing Rev. Bonds (Baker Heights Legacy), Series 2021, 0.30% 2024 (put 2023) | | | 80 | | | | 80 | |
| G.O. Bonds, Series 2022-A, 5.00% 2030 | | | 765 | | | | 1,004 | |
| G.O. Rev. Ref. Bonds, Series 2017-R-A, 5.00% 2022 | | | 25 | | | | 26 | |
| Health Care Facs. Auth., Rev. Ref. Bonds (Providence St. Joseph Health), Series 2021-B, 4.00% 2042 (put 2030) | | | 250 | | | | 304 | |
| Housing Fin. Commission, Multi Family Housing Rev. Bonds (Garten Haus Apartments Project), Series 2021, 0.37% 2024 (put 2023) | | | 45 | | | | 45 | |
| Housing Fin. Commission, Single Family Program Bonds, Series 2017-1-N, 4.00% 2047 | | | 285 | | | | 302 | |
| Housing Fin. Commission, Single Family Program Bonds, Series 2019-1-N, 4.00% 2049 | | | 870 | | | | 945 | |
| Housing Fin. Commission, Single Family Program Bonds, Series 2020-2-N, 3.00% 2050 | | | 1,090 | | | | 1,170 | |
| Housing Fin. Commission, Single Family Program Bonds, Series 2020-1-N, 4.00% 2050 | | | 720 | | | | 795 | |
| City of Seattle, Housing Auth., Rev. and Rev. Ref. Bonds (Northgate Plaza Project), Series 2021, 1.00% 2026 | | | 70 | | | | 70 | |
| 48 | Private Client Services Funds |
Capital Group Short-Term Municipal Fund
| Bonds, notes & other debt instruments (continued) | | Principal amount
(000) | | | Value
(000) | |
| Washington (continued) | | | | | | | | |
| City of Seattle, Housing Auth., Rev. Bonds (Lam Bow Apartments Project), Series 2021, 1.25% 2024 | | $ | 15 | | | $ | 15 | |
| City of Seattle, Municipal Light and Power Rev. Ref. Bonds, Series 2021-B, (SIFMA Municipal Swap Index + 0.25%) 0.30% 2045 (put 2026)1 | | | 115 | | | | 116 | |
| City of Seattle, Municipal Light and Power Rev. Ref. Bonds, Series 2018-C-2, (SIFMA Municipal Swap Index + 0.49%) 0.54% 2046 (put 2023)1 | | | 325 | | | | 326 | |
| | | | | | | | 6,359 | |
| | | | | | | | | |
| West Virginia 0.47% | | | | | | | | |
| Housing Dev. Fund, Multi Family Housing Rev. Bonds (Charles Towers), Series 2021, 0.21% 2023 (put 2022) | | | 75 | | | | 75 | |
| Housing Dev. Fund, Multi Family Housing Rev. Bonds (Parkland Place / Chapmanville Towers), Series 2021, 0.28% 2024 (put 2023) | | | 875 | | | | 874 | |
| | | | | | | | 949 | |
| | | | | | | | | |
| Wisconsin 2.86% | | | | | | | | |
| G.O. Bonds, Series 2013-A, 5.00% 2025 (preref. 2022) | | | 1,000 | | | | 1,024 | |
| G.O. Bonds, Series 2014-B, 5.00% 2030 (preref. 2022) | | | 795 | | | | 814 | |
| G.O. Rev. Ref. Bonds, Series 2011-2, 5.00% 2022 (preref. 2021) | | | 230 | | | | 230 | |
| Health and Educational Facs. Auth., Rev. Bonds (Advocate Aurora Health Care Credit Group), Series 2018-C-3, (SIFMA Municipal Swap Index + 0.55%) 0.60% 2054 (put 2023)1 | | | 340 | | | | 341 | |
| Health and Educational Facs. Auth., Rev. Bonds (Ascension Senior Credit Group), Series 2019-A, 5.00% 2021 | | | 70 | | | | 70 | |
| Health and Educational Facs. Auth., Rev. Bonds (Gundersen Lutheran), Series 2020, 5.00% 20262 | | | 660 | | | | 763 | |
| Health and Educational Facs. Auth., Rev. Ref. Bonds (Aurora Health Care, Inc.), Series 2012, 5.00% 2022 (escrowed to maturity) | | | 655 | | | | 680 | |
| Health and Educational Facs. Auth., Rev. Ref. Bonds (Ministry Health Care, Inc.), Series 2012-C, | | | | | | | | |
| 5.00% 2027 (preref. 2022) | | | 210 | | | | 218 | |
| Housing and Econ. Dev. Auth., Home Ownership Rev. Bonds, Series 2017-C, 4.00% 2048 | | | 210 | | | | 225 | |
| Housing and Econ. Dev. Auth., Home Ownership Rev. Bonds, Series 2020-A, 3.50% 2050 | | | 355 | | | | 387 | |
| Housing and Econ. Dev. Auth., Home Ownership Rev. Bonds, Series 2021-A, 3.00% 2052 | | | 30 | | | | 33 | |
| Housing and Econ. Dev. Auth., Housing Rev. Bonds, Series 2021-B, 0.40% 2045 (put 2023) | | | 25 | | | | 25 | |
| Housing and Econ. Dev. Auth., Housing Rev. Bonds, Series 2021-B, 0.50% 2050 (put 2024) | | | 35 | | | | 35 | |
| Public Fin. Auth., Hospital Rev. Ref. Bonds (Renown Regional Medical Center Project), Series 2016-A, 5.00% 2022 | | | 300 | | | | 308 | |
| Public Fin. Auth., Rev. Ref. Bonds (Providence St. Joseph Health), Series 2021-C, 4.00% 2041 (put 2030) | | | 115 | | | | 140 | |
| Transportation Rev. Bonds, Series 2012-1, 5.00% 2024 (preref. 2022) | | | 500 | | | | 516 | |
| | | | | | | | 5,809 | |
| | | | | | | | | |
| Wyoming 0.47% | | | | | | | | |
| Community Dev. Auth., Housing Rev. Bonds, Series 2021-1, 3.00% 2050 | | | 705 | | | | 759 | |
| Community Dev. Auth., Housing Rev. Bonds, Series 2020-1, 4.00% 2050 | | | 170 | | | | 188 | |
| | | | | | | | 947 | |
| | | | | | | | | |
| Total bonds, notes & other debt instruments (cost: $164,432,000) | | | | | | | 165,941 | |
| | | | | | | | | |
| Short-term securities 18.79% | | | | | | | | |
| Municipals 18.79% | | | | | | | | |
| State of California, Kern Community College Dist., Facs. Improvement Dist. No. 1, G.O. Bond Anticipation Notes, Capital Appreciation Notes, Series 2020, 0% 2023 | | | 45 | | | | 45 | |
| State of California, City of Los Angeles, Wastewater System Rev. Ref. Bonds, Series 2018-C-1, 0.04% 20321 | | | 2,500 | | | | 2,500 | |
| State of California, Pollution Control Fncg. Auth., Environmental Impact Rev. Bonds (Air Products and Chemicals, Inc. Project), Series 1997-B, 0.02% 20421 | | | 500 | | | | 500 | |
| State of Georgia, Northwest Georgia Housing Auth., Multi Family Housing Rev. Bonds (Charles Hight Apartments Project), Series 2019, 0.25% 8/1/2022 (put 2022)4 | | | 40 | | | | 40 | |
| State of Georgia, Northwest Georgia Housing Auth., Multi Family Housing Rev. Bonds (Park Homes Apartments Project), Series 2019, 0.25% 8/1/2022 (put 2022)4 | | | 45 | | | | 45 | |
| State of Idaho, Tax Anticipation Notes, Series 2021, 3.00% 6/30/2022 | | | 3,000 | | | | 3,056 | |
| State of Louisiana, Parish of East Baton Rouge, Industrial Dev. Board, Gulf Opportunity Zone Rev. Bonds (ExxonMobil Project), Series 2010-B, 0.03% 20401 | | | 3,000 | | | | 3,000 | |
| Private Client Services Funds | 49 |
Capital Group Short-Term Municipal Fund
| Short-term securities (continued) | | Principal amount
(000) | | | Value
(000) | |
| Municipals (continued) | | | | | | | | |
| State of Louisiana, Public Facs. Auth., Rev. Bonds (Air Products and Chemicals Project), Series 2008-A, 0.02% 20431 | | $ | 1,000 | | | $ | 1,000 | |
| State of Louisiana, Public Facs. Auth., Rev. Bonds (Air Products and Chemicals Project), Series 2009-A, 0.04% 20491 | | | 5,000 | | | | 5,000 | |
| State of Michigan, Regents of the University of Michigan, General Rev. Bonds, Series 2012-B, 0.02% 20421 | | | 1,000 | | | | 1,000 | |
| State of Minnesota, City of Shakopee, Multi Family Housing Rev. Bonds (Shakopee Village Apartments Project), Series 2021, 0.25% 2024 (put 2022)4 | | | 35 | | | | 35 | |
| State of New Hampshire, Health and Education Facs. Auth., Rev. Ref. Bonds (Dartmouth College Issue), Series 2007-B, 0.02% 20411 | | | 5,295 | | | | 5,295 | |
| State of New York, Dormitory Auth., Rev. Bonds (Cornell University), Series 2019-B, 0.02% 20391 | | | 1,800 | | | | 1,800 | |
| State of New York, New York City G.O. Bonds, Series 2021-2, 0.11% 20421 | | | 205 | | | | 205 | |
| State of New York, New York City G.O. Bonds, Series 2021-3, 0.11% 20421 | | | 155 | | | | 155 | |
| State of New York, New York City G.O. Bonds, Series 2016-A-5, 0.03% 20441 | | | 2,000 | | | | 2,000 | |
| State of New York, New York City Municipal Water Fin. Auth., Water and Sewer System Second General Resolution Rev. Bonds, Series 2008-BB-2, 0.02% 20351 | | | 1,000 | | | | 1,000 | |
| State of New York, New York City Municipal Water Fin. Auth., Water and Sewer System Second General Resolution Rev. Bonds, Series 2015-BB-1, 0.02% 20491 | | | 3,500 | | | | 3,500 | |
| State of Ohio, Hospital Rev. Bonds (Cleveland Clinic Health System Obligated Group), Series 2013-B-3, 0.03% 20391 | | | 1,500 | | | | 1,500 | |
| State of South Carolina, Jobs-Econ. Dev. Auth., Hospital Rev. Bonds (Prisma Health Obligated Group), Series 2018-B, 0.03% 20481 | | | 700 | | | | 700 | |
| State of Texas, Deer Park Independent School Dist., Unlimited Tax School Building Bonds, Series 2018, 0.16% 2042 (put 2022)4 | | | 225 | | | | 225 | |
| State of Texas, Lone Star College System, Limited Tax G.O. Bonds, Series 2021-A, 5.00% 2/15/2022 | | | 20 | | | | 20 | |
| State of Texas, Lone Star College System, Limited Tax G.O. Rev. Ref. Bonds, Series 2021-B, 5.00% 2/15/2022 | | | 35 | | | | 36 | |
| State of Texas, Municipal Gas Acquisition and Supply Corp. III, Gas Supply Rev. Ref. Bonds, Series 2021, 5.00% 12/15/2021 | | | 10 | | | | 10 | |
| State of Texas, North East Independent School Dist., Unlimited Tax School Building Bonds, Series 2013-B, 0.25% 2032 (put 2022)4 | | | 35 | | | | 35 | |
| State of Texas, Richardson Independent School Dist., Unlimited Tax School Building Bonds, Series 2021, 5.00% 2/15/2022 | | | 95 | | | | 96 | |
| State of Virginia, College Building Auth., Educational Facs. Rev. Bonds (University of Richmond Project), Series 2006, 0.03% 20361 | | | 2,100 | | | | 2,100 | |
| State of Wyoming, County of Lincoln, Pollution Control Rev. Ref. Bonds (ExxonMobil Project), Series 2014, 0.03% 20441 | | | 3,200 | | | | 3,200 | |
| | | | | | | | | |
| Total short-term securities (cost: $38,098,000) | | | | | | | 38,098 | |
| Total investment securities 100.65% (cost: $202,530,000) | | | | | | | 204,039 | |
| Other assets less liabilities (0.65%) | | | | | | | (1,316 | ) |
| | | | | | | | | |
| Net assets 100.00% | | | | | | $ | 202,723 | |
Futures contracts
| Contracts | | Type | | Number of
contracts | | Expiration | | Notional
amount
(000) | 5
| | Value at
10/31/2021
(000) | 6
| Unrealized
depreciation
at 10/31/2021
(000) | |
| 2 Year U.S. Treasury Note Futures | | Long | | 9 | | December 2021 | | $ | 1,800 | | | $ | 1,973 | | | $ | (9 | ) |
| 5 Year U.S. Treasury Note Futures | | Long | | 26 | | December 2021 | | | 2,600 | | | | 3,166 | | | | (14 | ) |
| | | | | | | | | | | | | | | | | $ | (23 | ) |
| 50 | Private Client Services Funds |
Capital Group Short-Term Municipal Fund
| 1 | Coupon rate may change periodically. Reference rate and spread are as of the most recent information available. Some coupon rates are determined by the issuer or agent based on current market conditions; therefore, the reference rate and spread are not available. For short-term securities, the date of the next scheduled coupon rate change is considered to be the maturity date. |
| 2 | Acquired in a transaction exempt from registration under Rule 144A of the Securities Act of 1933. May be resold in the U.S. in transactions exempt from registration, normally to qualified institutional buyers. The total value of all such securities was $810,000, which represented .40% of the net assets of the fund. |
| 3 | Step bond; coupon rate may change at a later date. |
| 4 | For short-term securities, the mandatory put date is considered to be the maturity date. |
| 5 | Notional amount is calculated based on the number of contracts and notional contract size. |
| 6 | Value is calculated based on the notional amount and current market price. |
Key to abbreviations and symbol
Agcy. = Agency
AMT = Alternative Minimum Tax
Auth. = Authority
Certs. = Certificates
Dept. = Department
Dev. = Development
Dist. = District
Econ. = Economic
Fac. = Facility
Facs. = Facilities
Fin. = Finance
Fncg. = Financing
G.O. = General Obligation
IAM = Interest at Maturity
LIBOR = London Interbank Offered Rate
LOC = Letter of Credit
Part. = Participation
Preref. = Prerefunded
Redev. = Redevelopment
Ref. = Refunding
Rev. = Revenue
SIFMA = Securities Industry and Financial Markets Association
USD/$ = U.S. dollars
| Private Client Services Funds | 51 |
Capital Group California Core Municipal Fund
Investment portfolio October 31, 2021
| Portfolio quality summary* | Percent of net assets |
| | |
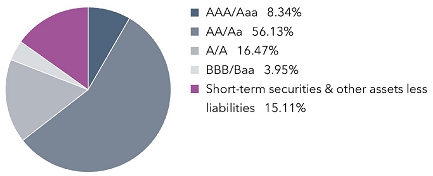 |
| | |
| * | Bond ratings, which typically range from AAA/Aaa (highest) to D (lowest), are assigned by credit rating agencies such as Standard & Poor’s, Moody’s and/or Fitch as an indication of an issuer’s creditworthiness. In assigning a credit rating to a security, the fund looks specifically to the ratings assigned to the issuer of the security by Standard & Poor’s, Moody’s and/or Fitch. If agency ratings differ, the security will be considered to have received the highest of those ratings, consistent with the fund’s investment policies. The ratings are not covered by the Report of Independent Registered Public Accounting Firm. |
| | |
| Bonds, notes & other debt instruments 84.89% | | Principal amount
(000) | | | Value
(000) | |
| California 84.30% | | | | | | | | |
| Alameda Corridor Transportation Auth., Rev. Ref. Bonds, Series 2013-A, 5.00% 2022 | | $ | 975 | | | $ | 1,016 | |
| Alameda Corridor Transportation Auth., Rev. Ref. Bonds, Series 2016-A, 5.00% 2024 | | | 600 | | | | 678 | |
| Alameda Corridor Transportation Auth., Rev. Ref. Bonds, Series 2016-A, 5.00% 2025 | | | 500 | | | | 583 | |
| City of Alhambra, Insured Rev. Ref. Bonds (Atherton Baptist Homes Project), Series 2016, 5.00% 2027 | | | 630 | | | | 739 | |
| City of Anaheim, Public Fncg. Auth., Lease Rev. Bonds (Anaheim Public Improvement Project), Capital Appreciation Bonds, Series 1997-C, Assured Guaranty Municipal insured, 0% 2022 | | | 2,000 | | | | 1,994 | |
| Antelope Valley Community College Dist., G.O. Rev. Ref. Bonds, Capital Appreciation Bonds, Series 2015, 0% 2035 (preref. 2025) | | | 2,300 | | | | 1,452 | |
| Antelope Valley Community College Dist., G.O. Rev. Ref. Bonds, Capital Appreciation Bonds, Series 2015, 0% 2036 (preref. 2025) | | | 2,800 | | | | 1,690 | |
| Assn. of Bay Area Governments, Fin. Auth. for Nonprofit Corps., Rev. Ref. Bonds (Eskaton Properties, Inc. Obligated Group), Series 2013, 5.00% 2021 | | | 495 | | | | 496 | |
| Assn. of Bay Area Governments, Fin. Auth. for Nonprofit Corps., Rev. Ref. Bonds (Eskaton Properties, Inc. Obligated Group), Series 2013, 5.00% 2022 | | | 1,000 | | | | 1,041 | |
| Assn. of Bay Area Governments, Fin. Auth. for Nonprofit Corps., Rev. Ref. Bonds (Eskaton Properties, Inc. Obligated Group), Series 2013, 5.00% 2023 | | | 500 | | | | 540 | |
| Assn. of Bay Area Governments, Fin. Auth. for Nonprofit Corps., Rev. Ref. Bonds (Windemere Ranch Infrastructure Fncg. Program), Series 2014-A, 5.00% 2023 | | | 370 | | | | 401 | |
| Assn. of Bay Area Governments, Fin. Auth. for Nonprofit Corps., Rev. Ref. Bonds (Windemere Ranch Infrastructure Fncg. Program), Series 2014-A, 5.00% 2024 | | | 395 | | | | 446 | |
| Assn. of Bay Area Governments, Fin. Auth. for Nonprofit Corps., Rev. Ref. Bonds (Windemere Ranch Infrastructure Fncg. Program), Series 2014-A, 5.00% 2025 | | | 510 | | | | 576 | |
| Bay Area Toll Auth., San Francisco Bay Area Toll Bridge Rev. Bonds, Series 2001-A, (SIFMA Municipal Swap Index + 1.25%) 1.30% 2036 (put 2027)1 | | | 1,000 | | | | 1,052 | |
| Bay Area Toll Auth., San Francisco Bay Area Toll Bridge Rev. Bonds, Series 2013-S-4, 5.00% 2043 (preref. 2023) | | | 1,000 | | | | 1,068 | |
| Bay Area Toll Auth., San Francisco Bay Area Toll Bridge Rev. Bonds, Series 2008-B-1, (SIFMA Municipal Swap Index + 1.10%) 1.15% 2045 (put 2024)1 | | | 4,275 | | | | 4,350 | |
| Bay Area Toll Auth., San Francisco Bay Area Toll Bridge Rev. Bonds, Series 2017-G, 2.00% 2053 (put 2024) | | | 4,525 | | | | 4,656 | |
| Bay Area Toll Auth., San Francisco Bay Area Toll Bridge Rev. Bonds, Series 2021-A, 2.00% 2056 (put 2028) | | | 3,000 | | | | 3,164 | |
| Bay Area Toll Auth., San Francisco Bay Area Toll Bridge Rev. Ref. Bonds, Series 2017-S-7, 5.00% 2024 | | | 1,200 | | | | 1,334 | |
| Bay Area Toll Auth., San Francisco Bay Area Toll Bridge Rev. Ref. Bonds, Series 2012-F-1, 5.00% 2027 (preref. 2022) | | | 2,965 | | | | 3,025 | |
| Bay Area Water Supply and Conservation Agcy., Rev. Bonds, Series 2013-A, 5.00% 2023 | | | 500 | | | | 534 | |
| City of Beaumont, Wastewater Rev. Bonds, Series 2018-A, Assured Guaranty Municipal insured, 5.00% 2026 | | | 500 | | | | 598 | |
| City of Burbank, Successor Agcy. to the Redev. Agcy., Tax Allocation Rev. Ref. Redev. Bonds, Series 2015, BAM insured, 5.00% 2022 | | | 1,305 | | | | 1,372 | |
| California County Tobacco Securitization Agcy., Tobacco Settlement Rev. Bonds (Los Angeles County Securitization Corp.), Series 2020-A, 5.00% 2026 | | | 600 | | | | 710 | |
| Trustees of the California State University, Systemwide Rev. Bonds, Series 2015-A, 5.00% 2024 | | | 500 | | | | 570 | |
| Trustees of the California State University, Systemwide Rev. Bonds, Series 2016-B-2, 0.55% 2049 (put 2026) | | | 4,480 | | | | 4,413 | |
| Trustees of the California State University, Systemwide Rev. Bonds, Series 2016-B-3, 4.00% 2051 (put 2023) | | | 2,500 | | | | 2,636 | |
| | |
| 52 | Private Client Services Funds |
Capital Group California Core Municipal Fund
| Bonds, notes & other debt instruments (continued) | | Principal amount
(000) | | | Value
(000) | |
| California (continued) | | | | | | | | |
| City of Carlsbad, Reassessment Dist. No. 2012-1, Limited Obligation Rev. Ref. Bonds, Series 2013, 3.55% 2023 | | $ | 350 | | | $ | 358 | |
| Cathedral City, Successor Agcy. to the Redev. Agcy., Tax Allocation Housing Rev. Ref. Bonds (Merged Redev. Project Area), Series 2021-C, BAM insured, 4.00% 2022 | | | 200 | | | | 205 | |
| Cathedral City, Successor Agcy. to the Redev. Agcy., Tax Allocation Housing Rev. Ref. Bonds (Merged Redev. Project Area), Series 2021-C, BAM insured, 4.00% 2023 | | | 225 | | | | 238 | |
| Cathedral City, Successor Agcy. to the Redev. Agcy., Tax Allocation Housing Rev. Ref. Bonds (Merged Redev. Project Area), Series 2014-B, Assured Guaranty Municipal insured, 5.00% 2024 | | | 260 | | | | 292 | |
| Cathedral City, Successor Agcy. to the Redev. Agcy., Tax Allocation Housing Rev. Ref. Bonds (Merged Redev. Project Area), Series 2014-A, Assured Guaranty Municipal insured, 5.00% 2025 | | | 620 | | | | 692 | |
| Cerritos Community College Dist., G.O. Bonds, Capital Appreciation Bonds, 2004 Election, Series 2012-D, 0% 2027 | | | 830 | | | | 772 | |
| City of Chino, Successor Agcy. to the Redev. Agcy., Tax Allocation Rev. Ref. Bonds, Series 2014-A, BAM insured, 5.00% 2022 | | | 450 | | | | 468 | |
| City of Chino, Successor Agcy. to the Redev. Agcy., Tax Allocation Rev. Ref. Bonds, Series 2014-A, BAM insured, 5.00% 2025 | | | 665 | | | | 746 | |
| City of Chino Hills, Fin. Auth., Rev. Ref. Bonds (Community Facs. Dist. Bond Program), Series 2019-D, 5.00% 2024 | | | 465 | | | | 524 | |
| City of Chino Hills, Fin. Auth., Rev. Ref. Bonds (Community Facs. Dist. Bond Program), Series 2019-D, 5.00% 2026 | | | 780 | | | | 936 | |
| City of Chino Hills, Fin. Auth., Rev. Ref. Bonds (Community Facs. Dist. Bond Program), Series 2019-D, 5.00% 2027 | | | 430 | | | | 528 | |
| City of Chino Hills, Fin. Auth., Rev. Ref. Bonds (Community Facs. Dist. Bond Program), Series 2019-D, 5.00% 2028 | | | 355 | | | | 443 | |
| City of Chino Hills, Fin. Auth., Rev. Ref. Bonds (Community Facs. Dist. Bond Program), Series 2019-D, 5.00% 2029 | | | 225 | | | | 288 | |
| City of Chino Hills, Fin. Auth., Rev. Ref. Bonds (Community Facs. Dist. Bond Program), Series 2019-D, 5.00% 2030 | | | 60 | | | | 77 | |
| City of Chula Vista, Municipal Fncg. Auth., Special Tax Rev. Ref. Bonds, Series 2013, 5.00% 2022 | | | 1,355 | | | | 1,406 | |
| Clovis Unified School Dist., G.O. Bonds, Capital Appreciation Bonds, 2004 Election, Series 2006-B, National insured, 0% 2030 | | | 1,000 | | | | 867 | |
| Community Choice Fncg. Auth., Clean Energy Project Rev. Green Bonds, Series 2021-B-1, 4.00% 2052 (put 2031) | | | 2,750 | | | | 3,306 | |
| Compton Community College Dist., G.O. Rev. Ref. Bonds, Series 2014, BAM insured, 5.00% 2026 | | | 1,290 | | | | 1,443 | |
| Compton Community College Dist., G.O. Rev. Ref. Bonds, Series 2015, BAM insured, 5.00% 2029 | | | 1,000 | | | | 1,157 | |
| Compton Unified School Dist., G.O. Bonds, Capital Appreciation Bonds, 2015 Election, Series 2019-B, BAM insured, 0% 2033 | | | 1,000 | | | | 756 | |
| City of Concord, Successor Agcy. to the Redev. Agcy., Rev. Ref. Bonds, Series 2014, BAM insured, 5.00% 2023 | | | 825 | | | | 875 | |
| Del Mar Union School Dist., Community Facs. Dist. No. 99-1, Special Tax Bonds, Series 2019, 4.00% 2026 | | | 400 | | | | 453 | |
| Del Mar Union School Dist., Community Facs. Dist. No. 99-1, Special Tax Bonds, Series 2019, 5.00% 2027 | | | 885 | | | | 1,065 | |
| Del Mar Union School Dist., Community Facs. Dist. No. 99-1, Special Tax Bonds, Series 2019, 5.00% 2028 | | | 930 | | | | 1,140 | |
| Del Mar Union School Dist., Community Facs. Dist. No. 99-1, Special Tax Bonds, Series 2019, 5.00% 2029 | | | 675 | | | | 844 | |
| Desert Community College Dist., G.O. Rev. Ref. Bonds, Series 2016, 5.00% 2032 | | | 1,885 | | | | 2,233 | |
| City of Dublin, Community Facs. Dist. No. 2015-1 (Dublin Crossing), Improvement Area No. 3, Special Tax Bonds, Series 2021, 3.00% 2023 | | | 205 | | | | 213 | |
| City of Dublin, Community Facs. Dist. No. 2015-1 (Dublin Crossing), Improvement Area No. 3, Special Tax Bonds, Series 2021, 3.00% 2025 | | | 265 | | | | 281 | |
| East Bay Municipal Utility Dist., Water System Rev. Ref. Bonds, Series 2015-A, 5.00% 2027 | | | 3,550 | | | | 4,124 | |
| East Side Union High School Dist., G.O. Bonds, 2008 Election, Series 2012-D, 5.00% 2037 (preref. 2022) | | | 500 | | | | 518 | |
| Eastern Municipal Water Dist., Fin. Auth., Water and Wastewater Rev. Ref. Bonds, Series 2020-A, 2.75% 2028 | | | 535 | | | | 596 | |
| Eastern Municipal Water Dist., Water and Wastewater Rev. Ref. Bonds, Series 2021-A, 4.00% 2029 | | | 1,210 | | | | 1,479 | |
| Educational Facs. Auth., Rev. Bonds (Chapman University), Series 2021-A, 5.00% 2028 | | | 1,375 | | | | 1,725 | |
| Educational Facs. Auth., Rev. Bonds (University of the Pacific), Series 2012-A, 4.00% 2021 | | | 560 | | | | 560 | |
| Educational Facs. Auth., Rev. Bonds (University of the Pacific), Series 2012-A, 4.00% 2022 | | | 500 | | | | 500 | |
| Educational Facs. Auth., Rev. Ref. Bonds (Stanford University), Series 2009-T-5, 5.00% 2023 | | | 1,290 | | | | 1,375 | |
| City of El Centro, Fncg. Auth., Wastewater Rev. Ref. Bonds, Series 2014-A, Assured Guaranty Municipal insured, 5.00% 2026 | | | 530 | | | | 598 | |
| City of El Centro, Fncg. Auth., Wastewater Rev. Ref. Bonds, Series 2014-A, Assured Guaranty Municipal insured, 5.00% 2027 | | | 500 | | | | 563 | |
| City of El Centro, Fncg. Auth., Wastewater Rev. Ref. Bonds, Series 2014-A, Assured Guaranty Municipal insured, 5.00% 2030 | | | 1,000 | | | | 1,125 | |
| County of El Dorado, Community Facs. Dist. No. 1992-1 (El Dorado Hills Dev.), Special Tax Rev. Ref. Bonds, Series 2012, 5.00% 2024 | | | 855 | | | | 888 | |
| City of Elk Grove, Fin. Auth., Special Tax Rev. Bonds, Series 2015, BAM insured, 5.00% 2025 | | | 580 | | | | 668 | |
| Etiwanda School Dist., G.O. Bonds, 2016 Election, Series 2020-A, 4.00% 2029 | | | 570 | | | | 691 | |
| City of Eureka, Successor Agcy. to the Redev. Agcy., Tax Allocation Rev. Ref. Bonds, Series 2017-B, 5.00% 2022 | | | 835 | | | | 872 | |
| City of Fillmore, Successor Agcy. to the Redev. Agcy., Tax Allocation Rev. Ref. Bonds, Series 2015, BAM insured, 5.00% 2024 | | | 1,000 | | | | 1,116 | |
| Folsom Cordova Unified School Dist., School Facs. Improvement Dist. No. 1, G.O. Bonds, Capital Appreciation Bonds, 2002 Election, Series 2004-B, National insured, 0% 2026 | | | 1,000 | | | | 949 | |
| City of Fontana, Community Facs. Dist. No. 22 (Sierra Hills South), Special Tax Bonds, Series 2014, 5.00% 2023 | | | 535 | | | | 576 | |
| | |
| Private Client Services Funds | 53 |
Capital Group California Core Municipal Fund
| Bonds, notes & other debt instruments (continued) | | Principal amount
(000) | | | Value
(000) | |
| California (continued) | | | | | | | | |
| City of Fontana, Community Facs. Dist. No. 86 (Etiwanda Ridge), Special Tax Bonds, Series 2020, 4.00% 2026 | | $ | 100 | | | $ | 112 | |
| City of Fontana, Community Facs. Dist. No. 86 (Etiwanda Ridge), Special Tax Bonds, Series 2020, 4.00% 2027 | | | 120 | | | | 136 | |
| City of Fontana, Public Facs. Fin. Auth., Special Tax Rev. Ref. Bonds, Series 2021-A, 4.00% 2027 | | | 625 | | | | 724 | |
| City of Fontana, Public Facs. Fin. Auth., Special Tax Rev. Ref. Bonds, Series 2021-A, 4.00% 2029 | | | 390 | | | | 463 | |
| G.O. Bonds, Series 2020, 5.00% 2026 | | | 3,000 | | | | 3,633 | |
| G.O. Bonds, Series 2019, 5.00% 2029 | | | 2,000 | | | | 2,592 | |
| G.O. Bonds, Series 2021, 5.00% 2031 | | | 85 | | | | 102 | |
| G.O. Bonds, Series 2021, 5.00% 2032 | | | 70 | | | | 84 | |
| G.O. Bonds, Series 2021, 5.00% 2034 | | | 70 | | | | 84 | |
| G.O. Rev. Ref. Bonds, Series 2007, Assured Guaranty Municipal insured, 5.25% 2032 | | | 4,125 | | | | 5,654 | |
| G.O. Rev. Ref. Bonds, Series 2019, 5.00% 2027 | | | 745 | | | | 912 | |
| G.O. Rev. Ref. Bonds, Series 2021, 5.00% 2028 | | | 3,000 | | | | 3,804 | |
| G.O. Rev. Ref. Bonds, Series 2017, 5.00% 2029 | | | 4,000 | | | | 4,995 | |
| G.O. Rev. Ref. Bonds, Series 2021, 5.00% 2029 | | | 3,000 | | | | 3,875 | |
| G.O. Rev. Ref. Bonds, Series 2020, 5.00% 2029 | | | 1,500 | | | | 1,944 | |
| G.O. Rev. Ref. Bonds, Series 2019, 5.00% 2029 | | | 1,000 | | | | 1,294 | |
| G.O. Rev. Ref. Bonds, Series 2021, 5.00% 2031 | | | 2,500 | | | | 3,350 | |
| G.O. Rev. Ref. Bonds, Series 2020, 5.00% 2035 | | | 2,000 | | | | 2,568 | |
| City of Garden Grove, Successor Agcy. to the Dev. Agcy., Tax Allocation Bonds, Series 2016, BAM insured, 5.00% 2022 | | | 400 | | | | 417 | |
| City of Glendale, Successor Agcy. to the Redev. Agcy., Tax Allocation Rev. Ref. Bonds (Central Glendale Redev. Project), Series 2016, BAM insured, 5.00% 2024 | | | 425 | | | | 483 | |
| Golden State Tobacco Securitization Corp., Enhanced Tobacco Settlement Asset-Backed Bonds, Series 2018-A, 5.00% 2022 (escrowed to maturity) | | | 3,000 | | | | 3,084 | |
| Golden State Tobacco Securitization Corp., Enhanced Tobacco Settlement Asset-Backed Bonds, Series 2017A-1, 5.00% 2022 | | | 1,730 | | | | 1,775 | |
| Golden State Tobacco Securitization Corp., Enhanced Tobacco Settlement Asset-Backed Bonds, Capital Appreciation Bonds, Series 2005-A, AMBAC insured, 0% 2024 (escrowed to maturity) | | | 2,000 | | | | 1,977 | |
| Golden State Tobacco Securitization Corp., Enhanced Tobacco Settlement Asset-Backed Bonds, Capital Appreciation Bonds, Series 2005-A, Assured Guaranty Municipal insured, 0% 2026 (escrowed to maturity) | | | 2,785 | | | | 2,689 | |
| Greenfield Elementary School Dist., G.O. Bonds, Capital Appreciation Bonds, 2006 Election, Series 2007-A, Assured Guaranty Municipal insured, 0% 2029 | | | 1,270 | | | | 1,110 | |
| City of Hawthorne, Successor Agcy. to the Redev. Agcy., Tax Allocation Rev. Ref. Bonds, Series 2016, Assured Guaranty Municipal insured, 5.00% 2024 | | | 250 | | | | 282 | |
| Health Facs. Fncg. Auth., Rev. Bonds (Adventist Health System/West), Series 2013-A, 5.00% 2023 | | | 910 | | | | 967 | |
| Health Facs. Fncg. Auth., Rev. Bonds (Adventist Health System/West), Series 2013-A, 5.00% 2024 | | | 1,105 | | | | 1,174 | |
| Health Facs. Fncg. Auth., Rev. Bonds (Cedars-Sinai Medical Center), Series 2016-A, 5.00% 2023 | | | 650 | | | | 705 | |
| Health Facs. Fncg. Auth., Rev. Bonds (City of Hope), Series 2012-A, 5.00% 2021 | | | 350 | | | | 351 | |
| Health Facs. Fncg. Auth., Rev. Bonds (El Camino Hospital), Series 2017, 5.00% 2025 | | | 1,000 | | | | 1,145 | |
| Health Facs. Fncg. Auth., Rev. Bonds (Kaiser Permanente), Series 2017-B, 5.00% 2029 (put 2022) | | | 1,025 | | | | 1,074 | |
| Health Facs. Fncg. Auth., Rev. Bonds (Kaiser Permanente), Series 2017-D, 5.00% 2032 (put 2022) | | | 2,675 | | | | 2,803 | |
| Health Facs. Fncg. Auth., Rev. Bonds (Lucile Salter Packard Children’s Hospital at Stanford), Series 2014-A, 5.00% 2025 | | | 400 | | | | 450 | |
| Health Facs. Fncg. Auth., Rev. Bonds (PIH Health), Series 2020-A, 5.00% 2030 | | | 1,900 | | | | 2,469 | |
| Health Facs. Fncg. Auth., Rev. Bonds (Providence St. Joseph Health), Series 2019-B, 5.00% 2039 (put 2027) | | | 2,135 | | | | 2,639 | |
| Health Facs. Fncg. Auth., Rev. Bonds (Scripps Health), Series 2012-A, 5.00% 2024 | | | 150 | | | | 151 | |
| Health Facs. Fncg. Auth., Rev. Bonds (Scripps Health), Series 2012-A, 5.00% 2025 | | | 375 | | | | 376 | |
| Health Facs. Fncg. Auth., Rev. Bonds (Stanford Health Care), Series 2021-A, 3.00% 2054 (put 2025) | | | 4,430 | | | | 4,836 | |
| Health Facs. Fncg. Auth., Rev. Bonds (Sutter Health), Series 2018-A, 5.00% 2024 | | | 3,000 | | | | 3,413 | |
| Health Facs. Fncg. Auth., Rev. Bonds (Sutter Health), Series 2016-A, 5.00% 2026 (preref. 2025) | | | 300 | | | | 355 | |
| Health Facs. Fncg. Auth., Rev. Bonds (Sutter Health), Series 2016-A, 5.00% 2041 (preref. 2025) | | | 680 | | | | 804 | |
| Health Facs. Fncg. Auth., Rev. Bonds (Sutter Health), Series 2013-A, 5.00% 2052 (preref. 2023) | | | 1,665 | | | | 1,806 | |
| Health Facs. Fncg. Auth., Rev. Green Bonds (Kaiser Permanente), Series 2017-A-1, 5.00% 2027 | | | 3,000 | | | | 3,737 | |
| Health Facs. Fncg. Auth., Rev. Green Bonds (Kaiser Permanente), Series 2017-C, 5.00% 2031 (put 2022) | | | 6,985 | | | | 7,319 | |
| Health Facs. Fncg. Auth., Rev. Ref. Bonds (Adventist Health System/West), Series 2016-A, 4.00% 2025 | | | 1,270 | | | | 1,418 | |
| Health Facs. Fncg. Auth., Rev. Ref. Bonds (Lucile Salter Packard Children’s Hospital at Stanford), Series 2022-A, 5.00% 2026 | | | 830 | | | | 956 | |
| Health Facs. Fncg. Auth., Rev. Ref. Bonds (Marshall Medical Center), Series 2015, 5.00% 2022 | | | 175 | | | | 183 | |
| Health Facs. Fncg. Auth., Rev. Ref. Bonds (Marshall Medical Center), Series 2015, 5.00% 2023 | | | 135 | | | | 147 | |
| Health Facs. Fncg. Auth., Rev. Ref. Bonds (Stanford Health Care), Series 2017-A, 5.00% 2024 | | | 1,000 | | | | 1,139 | |
| Health Facs. Fncg. Auth., Rev. Ref. Bonds (Stanford Health Care), Series 2017-A, 5.00% 2026 | | | 1,750 | | | | 2,121 | |
| Hemet Unified School Dist., Fncg. Auth. Special Tax Rev. Bonds, Series 2015, 5.00% 2026 | | | 600 | | | | 676 | |
| | |
| 54 | Private Client Services Funds |
Capital Group California Core Municipal Fund
| Bonds, notes & other debt instruments (continued) | | Principal amount
(000) | | | Value
(000) | |
| California (continued) | | | | | | | | |
| Hemet Unified School Dist., G.O. Rev. Ref. Bonds, Series 2014, Assured Guaranty Municipal insured, 5.00% 2023 | | $ | 885 | | | $ | 958 | |
| Infrastructure and Econ. Dev. Bank, Charter School Rev. Bonds (Equitable School Revolving Fund), Series 2019-B, 5.00% 2025 | | | 100 | | | | 117 | |
| Infrastructure and Econ. Dev. Bank, Charter School Rev. Bonds (Equitable School Revolving Fund), Series 2019-B, 5.00% 2026 | | | 125 | | | | 150 | |
| Infrastructure and Econ. Dev. Bank, Charter School Rev. Bonds (Equitable School Revolving Fund), Series 2019-B, 5.00% 2027 | | | 110 | | | | 135 | |
| Infrastructure and Econ. Dev. Bank, Charter School Rev. Bonds (Equitable School Revolving Fund), Series 2019-B, 5.00% 2028 | | | 375 | | | | 470 | |
| Infrastructure and Econ. Dev. Bank, Charter School Rev. Bonds (Equitable School Revolving Fund), Series 2019-B, 5.00% 2029 | | | 140 | | | | 175 | |
| Infrastructure and Econ. Dev. Bank, Charter School Rev. Bonds (Equitable School Revolving Fund), Series 2019-B, 5.00% 2030 | | | 340 | | | | 423 | |
| Infrastructure and Econ. Dev. Bank, Rev. Bonds (The Colburn School), Series 2015-B, (SIFMA Municipal Swap Index + 1.20%) 1.25% 2037 (put 2022)1 | | | 1,000 | | | | 1,001 | |
| City of Inglewood, Successor Agcy. to the Redev. Agcy., Tax Allocation Rev. Ref. Bonds (Merged Redev. Project), Series 2017-A, BAM insured, 5.00% 2027 | | | 650 | | | | 790 | |
| City of Irvine, Reassessment Dist. No. 12-1, Limited Obligation Improvement Bonds, Series 2012, 3.25% 2022 | | | 700 | | | | 718 | |
| City of Irvine, Reassessment Dist. No. 12-1, Limited Obligation Improvement Bonds, Series 2012, 4.00% 2022 | | | 400 | | | | 413 | |
| City of Irvine, Reassessment Dist. No. 12-1, Limited Obligation Improvement Bonds, Series 2013, 5.00% 2024 | | | 725 | | | | 788 | |
| City of Irvine, Reassessment Dist. No. 13-1, Limited Obligation Improvement Bonds, Series 2013, 3.375% 2023 | | | 850 | | | | 898 | |
| City of Irvine, Reassessment Dist. No. 19-1, Limited Obligation Improvement Bonds, Series 2019, 4.00% 2022 | | | 225 | | | | 232 | |
| City of Irvine, Reassessment Dist. No. 19-1, Limited Obligation Improvement Bonds, Series 2019, 5.00% 2023 | | | 200 | | | | 217 | |
| City of Irvine, Reassessment Dist. No. 19-1, Limited Obligation Improvement Bonds, Series 2019, 5.00% 2024 | | | 210 | | | | 237 | |
| City of Irvine, Reassessment Dist. No. 19-1, Limited Obligation Improvement Bonds, Series 2019, 5.00% 2025 | | | 250 | | | | 292 | |
| City of Irvine, Reassessment Dist. No. 21-1, Limited Obligation Improvement Bonds, Series 2021, BAM insured, 4.00% 2025 | | | 500 | | | | 565 | |
| City of Irvine, Reassessment Dist. No. 21-1, Limited Obligation Improvement Bonds, Series 2021, 4.00% 2028 | | | 500 | | | | 599 | |
| City of Irvine, Reassessment Dist. No. 21-1, Limited Obligation Improvement Bonds, Series 2021, BAM insured, 4.00% 2030 | | | 1,265 | | | | 1,556 | |
| Irvine Unified School Dist., Community Facs. Dist. No. 09-1, Special Tax Bonds, Series 2019-A, BAM insured, 5.00% 2027 | | | 140 | | | | 172 | |
| Irvine Unified School Dist., Community Facs. Dist. No. 09-1, Special Tax Bonds, Series 2019-A, BAM insured, 5.00% 2028 | | | 350 | | | | 439 | |
| Irvine Unified School Dist., Community Facs. Dist. No. 09-1, Special Tax Bonds, Series 2019-A, BAM insured, 5.00% 2030 | | | 215 | | | | 273 | |
| City of Jurupa, Public Fncg. Auth., Special Tax Rev. Bonds, Series 2014-A, 5.00% 2023 | | | 500 | | | | 541 | |
| City of Jurupa, Public Fncg. Auth., Special Tax Rev. Bonds, Series 2014-A, 5.00% 2029 | | | 710 | | | | 792 | |
| City of Jurupa, Public Fncg. Auth., Special Tax Rev. Ref. Bonds, Series 2020-A, BAM insured, 5.00% 2023 | | | 750 | | | | 812 | |
| City of Jurupa, Public Fncg. Auth., Special Tax Rev. Ref. Bonds, Series 2020-A, BAM insured, 4.00% 2027 | | | 1,615 | | | | 1,879 | |
| Kern Community College Dist., Safety Repair and Improvement G.O. Bonds, Capital Appreciation Bonds, 2002 Election, Series 2006, FSA insured, 0% 2022 | | | 1,500 | | | | 1,497 | |
| Kings Canyon Joint Unified School Dist., G.O. Rev. Ref. Bonds, Series 2016, Assured Guaranty Municipal insured, 5.00% 2029 | | | 1,600 | | | | 1,852 | |
| La Habra School Dist., G.O. Bonds, Capital Appreciation Bonds, 2000 Election, Series 2002-A, FSA insured, 0% 2026 | | | 1,010 | | | | 953 | |
| Lakeside Union School Dist., G.O. Rev. Ref. Bonds, Series 2016, 5.00% 2029 | | | 1,785 | | | | 2,138 | |
| Lammersville Joint Unified School Dist., Community Facs. Dist. No. 2002, Special Tax Bonds, Series 2017, 4.00% 2022 | | | 680 | | | | 699 | |
| City of Lodi, Public Fin. Auth., Rev. Ref. Bonds, Series 2018, Assured Guaranty Municipal insured, 5.00% 2024 | | | 260 | | | | 293 | |
| City of Long Beach, Bond Fin. Auth., Rev. Ref. Bonds (Aquarium of the Pacific Project), Series 2012, 5.00% 2021 | | | 520 | | | | 520 | |
| Long Beach Community College Dist., G.O. Bonds, Capital Appreciation Bonds, 2008 Election, Series 2008-A, Assured Guaranty Municipal insured, 0% 2027 | | | 3,865 | | | | 3,607 | |
| City of Los Angeles, Community Facs. Dist. No. 4 (Playa Vista - Phase 1), Special Tax Rev. Ref. Bonds, Series 2014, 5.00% 2023 | | | 690 | | | | 747 | |
| City of Los Angeles, Dept. of Airports, Los Angeles International Airport, Rev. and Rev. Ref. Bonds, Series 2021-B, 5.00% 2031 | | | 420 | | | | 556 | |
| City of Los Angeles, Dept. of Airports, Los Angeles International Airport, Rev. Bonds, Series 2019-E, 5.00% 2039 | | | 1,130 | | | | 1,408 | |
| City of Los Angeles, Dept. of Airports, Los Angeles International Airport, Rev. Ref. Bonds, Series 2019-C, 5.00% 2025 | | | 2,000 | | | | 2,317 | |
| City of Los Angeles, Dept. of Water and Power, Power System Rev. Bonds, Series 2021-B, 3.00% 2022 | | | 3,000 | | | | 3,057 | |
| City of Los Angeles, Dept. of Water and Power, Power System Rev. Bonds, Series 2017-C, 5.00% 2022 | | | 575 | | | | 593 | |
| City of Los Angeles, Dept. of Water and Power, Power System Rev. Bonds, Series 2013-A, 5.00% 2022 | | | 515 | | | | 532 | |
| | |
| Private Client Services Funds | 55 |
Capital Group California Core Municipal Fund
| Bonds, notes & other debt instruments (continued) | | Principal amount
(000) | | | Value
(000) | |
| California (continued) | | | | | | | | |
| City of Los Angeles, Dept. of Water and Power, Power System Rev. Bonds, Series 2018-D, 5.00% 2024 | | $ | 535 | | | $ | 601 | |
| City of Los Angeles, Dept. of Water and Power, Power System Rev. Bonds, Series 2018-B, 5.00% 2025 | | | 1,875 | | | | 2,181 | |
| City of Los Angeles, Dept. of Water and Power, Power System Rev. Bonds, Series 2018-D, 5.00% 2025 | | | 500 | | | | 582 | |
| City of Los Angeles, Dept. of Water and Power, Power System Rev. Bonds, Series 2019-D, 5.00% 2027 | | | 1,100 | | | | 1,359 | |
| City of Los Angeles, Dept. of Water and Power, Water System Rev. Bonds, Series 2020-A, 5.00% 2028 | | | 650 | | | | 823 | |
| City of Los Angeles, Solid Waste Resources Rev. Bonds, Series 2013-A, 2.00% 2023 | | | 1,110 | | | | 1,135 | |
| County of Los Angeles, Dev. Auth., Multi Family Housing Rev. Bonds (Cantamar Villas), Series 2021-D-1, 0.30% 2025 (put 2024) | | | 1,295 | | | | 1,290 | |
| County of Los Angeles, Dev. Auth., Multi Family Housing Rev. Bonds (Sunny Garden Apartments), Series 2021-C-1, 0.20% 2024 (put 2023) | | | 3,175 | | | | 3,171 | |
| County of Los Angeles, Metropolitan Transportation Auth., Proposition C Sales Tax Rev. Bonds, Series 2021-A, 5.00% 2030 | | | 6,410 | | | | 8,467 | |
| County of Los Angeles, Redev. Ref. Auth., Tax Allocation Rev. Ref. Bonds (South Gate Project No. 1), Series 2014-A, Assured Guaranty Municipal insured, 5.00% 2022 | | | 1,190 | | | | 1,235 | |
| Los Angeles Community College Dist., G.O. Bonds, 2008 Election, Series 2008-G, 4.00% 2039 (preref. 2024) | | | 3,350 | | | | 3,683 | |
| Los Angeles Unified School Dist., G.O. Rev. Ref. Bonds, Series 2014-C, 5.00% 2023 | | | 520 | | | | 561 | |
| Los Angeles Unified School Dist., G.O. Rev. Ref. Bonds, Series 2019-A, 5.00% 2027 | | | 5,000 | | | | 6,172 | |
| Madera Unified School Dist., G.O. Bonds, Capital Appreciation Bonds, 2002 Election, Series 2006, Assured Guaranty Municipal insured, 0% 2029 | | | 585 | | | | 521 | |
| Manhattan Beach Unified School Dist., G.O. Bonds, Capital Appreciation Bonds, Series 1999-C, FGIC-National insured, 0% 2024 | | | 3,875 | | | | 3,753 | |
| Manteca Unified School Dist., G.O. Bonds, Capital Appreciation Bonds, 2004 Election, Series 2006, MBIA insured, 0% 2027 | | | 560 | | | | 517 | |
| City of Merced, Irrigation Dist., Electric System Rev. Ref. Bonds, Series 2015-A, Assured Guaranty Municipal insured, 5.00% 2022 | | | 500 | | | | 522 | |
| City of Merced, Irrigation Dist., Electric System Rev. Ref. Bonds, Series 2015-A, Assured Guaranty Municipal insured, 5.00% 2028 | | | 250 | | | | 291 | |
| Montebello Unified School Dist., G.O. Rev. Ref. Bonds, Series 2015, 5.00% 2028 | | | 1,545 | | | | 1,752 | |
| Mountain View School Dist., G.O. Bonds, 2020 Election, Series 2021-A, Assured Guaranty Municipal insured, 4.00% 2023 | | | 1,290 | | | | 1,374 | |
| Municipal Fin. Auth., Educational Rev. Bonds (American Heritage Education Foundation Project), Series 2016-A, 4.00% 2026 | | | 200 | | | | 214 | |
| Municipal Fin. Auth., Rev. Bonds (California Institute of the Arts), Series 2021, 4.00% 2033 | | | 250 | | | | 298 | |
| Municipal Fin. Auth., Rev. Bonds (California Lutheran University), Series 2018, 5.00% 2026 | | | 300 | | | | 357 | |
| Municipal Fin. Auth., Rev. Bonds (Retirement Housing Foundation), Series 2017-A, 5.00% 2024 | | | 300 | | | | 339 | |
| Municipal Fin. Auth., Rev. Bonds (University of La Verne), Series 2017-A, 5.00% 2023 | | | 750 | | | | 805 | |
| Municipal Fin. Auth., Rev. Bonds (Village Grove Apartments), Series 2013-A, 3.10% 2021 (escrowed to maturity) | | | 1,210 | | | | 1,213 | |
| Municipal Fin. Auth., Rev. Ref. Bonds (Biola University), Series 2013, 5.00% 2022 | | | 470 | | | | 490 | |
| Municipal Fin. Auth., Rev. Ref. Bonds (Biola University), Series 2017, 5.00% 2026 | | | 335 | | | | 398 | |
| Municipal Fin. Auth., Rev. Ref. Bonds (Harbor Regional Center Project), Series 2015, 5.00% 2022 | | | 885 | | | | 927 | |
| Municipal Fin. Auth., Rev. Ref. Bonds (Harbor Regional Center Project), Series 2015, 5.00% 2025 | | | 500 | | | | 586 | |
| Municipal Fin. Auth., Rev. Ref. Bonds (HumanGood Obligated Group), Series 2019-A, 4.00% 2028 | | | 750 | | | | 859 | |
| Municipal Fin. Auth., Rev. Ref. Bonds (HumanGood Obligated Group), Series 2019-A, 4.00% 2029 | | | 1,085 | | | | 1,236 | |
| Municipal Fin. Auth., Rev. Ref. Bonds (HumanGood Obligated Group), Series 2019-A, 4.00% 2035 | | | 1,000 | | | | 1,127 | |
| Municipal Fin. Auth., Student Housing Rev. Bonds (CHF-Riverside I, LLC - UCR Student Housing Project), Series 2019, BAM insured, 5.00% 2027 | | | 530 | | | | 642 | |
| Murrieta Valley Unified School Dist., G.O. Bonds, 2014 Election, Series 2020, 4.00% 2023 | | | 335 | | | | 357 | |
| Murrieta Valley Unified School Dist., Public Fncg. Auth., Special Tax Rev. Bonds, Series 2016-A, 5.00% 2023 | | | 2,530 | | | | 2,727 | |
| Northern California Energy Auth., Commodity Supply Rev. Bonds, Series 2018, 4.00% 2049 (put 2024) | | | 2,500 | | | | 2,709 | |
| Oak Park Unified School Dist., G.O. Bonds, Capital Appreciation Bonds, 2006 Election, Series 2009-B, Assured Guaranty Municipal insured, 0% 2029 | | | 605 | | | | 531 | |
| Oakland Unified School Dist., G.O. Bonds, 2006 Election, Series 2016-A, 5.00% 2026 | | | 1,325 | | | | 1,584 | |
| Oakland Unified School Dist., G.O. Bonds, 2012 Election, Series 2019-A, Assured Guaranty Municipal insured, 5.00% 2028 | | | 1,000 | | | | 1,230 | |
| Oakland Unified School Dist., G.O. Bonds, 2012 Election, Series 2019-A, Assured Guaranty Municipal insured, 4.00% 2034 | | | 1,000 | | | | 1,158 | |
| Oakland Unified School Dist., G.O. Rev. Ref. Bonds, Series 2017-A, 5.00% 2022 | | | 2,000 | | | | 2,071 | |
| Oakland Unified School Dist., G.O. Rev. Ref. Bonds, Series 2016, 5.00% 2022 | | | 915 | | | | 947 | |
| Oakland Unified School Dist., G.O. Rev. Ref. Bonds, Series 2016, 5.00% 2024 | | | 1,310 | | | | 1,471 | |
| Oakland Unified School Dist., G.O. Rev. Ref. Bonds, Series 2016, 5.00% 2025 | | | 3,000 | | | | 3,486 | |
| Oakland Unified School Dist., G.O. Rev. Ref. Bonds, Series 2015, Assured Guaranty insured, 5.00% 2026 | | | 1,125 | | | | 1,309 | |
| Ohlone Community College Dist., G.O. Rev. Ref. Bonds, Series 2012, 5.00% 2023 (preref. 2022) | | | 550 | | | | 570 | |
| County of Orange, Airport Private Activity Rev. Ref. Bonds, Series 2019-B, 5.00% 2025 | | | 1,065 | | | | 1,237 | |
| | |
| 56 | Private Client Services Funds |
Capital Group California Core Municipal Fund
| Bonds, notes & other debt instruments (continued) | | Principal amount
(000) | | | Value
(000) | |
| California (continued) | | | | | | | | |
| County of Orange, Airport Private Activity Rev. Ref. Bonds, Series 2019-A, 5.00% 2025 | | $ | 1,000 | | | $ | 1,161 | |
| County of Orange, Airport Rev. Ref. Bonds, Series 2019-A, 5.00% 2022 | | | 1,000 | | | | 1,032 | |
| County of Orange, Community Facs. Dist. No. 2016-1 (Village of Esencia), Special Tax Bonds, Series 2016-A, 5.00% 2026 | | | 570 | | | | 673 | |
| County of Orange, Sanitation Dist., Wastewater Rev. Ref. Obligations, Series 2021-A, 5.00% 2032 | | | 1,500 | | | | 2,010 | |
| County of Orange, Water Dist. Rev. Certs. of Part. (Interim Obligations), Series 2019-A, 2.00% 2023 | | | 2,725 | | | | 2,787 | |
| City of Oxnard, Fncg. Auth., Wastewater Rev. Ref. Bonds, Series 2014, Assured Guaranty Municipal insured, 5.00% 2024 | | | 250 | | | | 279 | |
| City of Oxnard, Water Rev. Ref. Bonds, Series 2018, BAM insured, 5.00% 2022 | | | 700 | | | | 719 | |
| City of Oxnard, Water Rev. Ref. Bonds, Series 2018, BAM insured, 5.00% 2024 | | | 450 | | | | 502 | |
| Oxnard Unified School Dist., G.O. Bonds, 2012 Election, Series 2012-A, Assured Guaranty Municipal insured, 5.00% 2037 (preref. 2022) | | | 500 | | | | 518 | |
| Palomar Health, G.O. Rev. Ref. Bonds, Series 2016-A, 5.00% 2026 | | | 630 | | | | 739 | |
| Paramount Unified School Dist., G.O. Bonds, Capital Appreciation Bonds, 1998 Election, Series 2001-B, Assured Guaranty Municipal insured, 0% 2025 | | | 3,000 | | | | 2,907 | |
| Peninsula Corridor Joint Powers Board, Farebox Rev. Bonds, Series 2019-A, 5.00% 2026 | | | 250 | | | | 298 | |
| Peninsula Corridor Joint Powers Board, Farebox Rev. Bonds, Series 2019-A, 5.00% 2027 | | | 200 | | | | 244 | |
| Peninsula Corridor Joint Powers Board, Farebox Rev. Bonds, Series 2019-A, 5.00% 2028 | | | 285 | | | | 355 | |
| Peninsula Corridor Joint Powers Board, Farebox Rev. Bonds, Series 2019-A, 5.00% 2029 | | | 400 | | | | 507 | |
| Peralta Community College Dist., G.O. Rev. Ref. Bonds, Series 2014-A, 5.00% 2025 | | | 2,680 | | | | 3,006 | |
| City of Perris, Joint Powers Auth., Local Agcy. Rev. Ref. Bonds (CFD No. 2001-1 IA No. 4 and No. 5; CFD No. 2005-1 IA No. 4), Series 2017-B, 4.00% 2022 | | | 915 | | | | 940 | |
| Perris Union High School Dist., Fncg. Auth., Rev. Bonds, Series 2015, 5.00% 2024 | | | 1,000 | | | | 1,115 | |
| Perris Union High School Dist., G.O. Bonds, 2012 Election, Series 2021-C, 4.00% 2028 | | | 185 | | | | 222 | |
| Perris Union High School Dist., G.O. Bonds, 2012 Election, Series 2021-C, 4.00% 2029 | | | 200 | | | | 244 | |
| Perris Union High School Dist., G.O. Bonds, 2012 Election, Series 2021-C, 4.00% 2030 | | | 215 | | | | 260 | |
| Perris Union High School Dist., G.O. Bonds, 2012 Election, Series 2021-C, 4.00% 2031 | | | 350 | | | | 421 | |
| Pleasant Valley School Dist., G.O. Bonds, 2018 Election, Series A, 5.00% 2029 | | | 645 | | | | 770 | |
| Pollution Control Fncg. Auth., Water Facs. Rev. Ref. Bonds (American Water Capital Corp. Project), Series 2020, 0.60% 2040 (put 2023) | | | 3,270 | | | | 3,266 | |
| Poway Unified School Dist., Public Fncg. Auth., Special Tax Rev. Bonds, Series 2013, 4.00% 2022 | | | 440 | | | | 454 | |
| Poway Unified School Dist., Public Fncg. Auth., Special Tax Rev. Ref. Bonds, Series 2015-A, 5.00% 2022 | | | 850 | | | | 881 | |
| Poway Unified School Dist., Public Fncg. Auth., Special Tax Rev. Ref. Bonds, Series 2015-B, BAM insured, 5.00% 2022 | | | 500 | | | | 520 | |
| Poway Unified School Dist., Public Fncg. Auth., Special Tax Rev. Ref. Bonds, Series 2016-A, 5.00% 2023 | | | 885 | | | | 961 | |
| Public Fin. Auth., Electric System Rev. Ref. Bonds, Series 2018, Assured Guaranty Municipal insured, 5.00% 2023 | | | 730 | | | | 791 | |
| Public Fin. Auth., Reassessment Rev. Ref. Bonds, Series 2019, 5.00% 2022 | | | 1,115 | | | | 1,156 | |
| Public Fin. Auth., Reassessment Rev. Ref. Bonds, Series 2019, 5.00% 2029 | | | 1,000 | | | | 1,250 | |
| Public Fin. Auth., Rev. Bonds (Henry Mayo Newhall Memorial Hospital), Series 2017, Assured Guaranty Municipal insured, 5.00% 2023 | | | 500 | | | | 542 | |
| Public Fin. Auth., Rev. Ref. Bonds (O’Conner Woods), Series 2022, 4.00% 2028 | | | 450 | | | | 507 | |
| Public Fin. Auth., Rev. Ref. Bonds (O’Conner Woods), Series 2022, 4.00% 2029 | | | 500 | | | | 571 | |
| Public Fin. Auth., Rev. Ref. Bonds (O’Conner Woods), Series 2022, 4.00% 2031 | | | 520 | | | | 605 | |
| Public Works Board, Lease Rev. Bonds (Dept. of Corrections, Various State Prisons), Series 2019-D, 5.00% 2028 | | | 1,000 | | | | 1,266 | |
| Public Works Board, Lease Rev. Ref. Bonds (Dept. of Corrections, Various State Prisons), Series 2015-A, 5.00% 2023 | | | 790 | | | | 849 | |
| Public Works Board, Lease Rev. Ref. Bonds (Various Capital Projects), Series 2016-C, 5.00% 2024 | | | 1,650 | | | | 1,876 | |
| Public Works Board, Lease Rev. Ref. Bonds (Various Capital Projects), Series 2017-C, 5.00% 2026 | | | 4,060 | | | | 4,823 | |
| Public Works Board, Lease Rev. Ref. Bonds (Various Capital Projects), Series 2022-A, 5.00% 2028 | | | 5,005 | | | | 6,164 | |
| Public Works Board, Lease Rev. Ref. Bonds (Various Capital Projects), Series 2016-D, 5.00% 2028 | | | 5,000 | | | | 6,043 | |
| Public Works Board, Lease Rev. Ref. Bonds (Various Capital Projects), Series 2017-B, 5.00% 2028 | | | 1,415 | | | | 1,750 | |
| City of Rancho Cucamonga, Successor Agcy. to the Redev. Agcy., Tax Allocation Rev. Ref. Bonds (Rancho Redev. Project Area), Series 2014, Assured Guaranty Municipal insured, 5.00% 2026 | | | 600 | | | | 673 | |
| City of Rancho Cucamonga, Successor Agcy. to the Redev. Agcy., Tax Allocation Rev. Ref. Bonds (Rancho Redev. Project Area), Series 2014, Assured Guaranty Municipal insured, 5.00% 2028 | | | 300 | | | | 335 | |
| City of Redding, Joint Powers Fin. Auth., Electric System Rev. Bonds, Series 2015-A, 5.00% 2024 | | | 15 | | | | 17 | |
| Rialto Unified School Dist., G.O. Bonds, 2010 Election, Series 2019, 3.00% 2026 | | | 600 | | | | 669 | |
| Rialto Unified School Dist., G.O. Bonds, 2010 Election, Series 2019, 3.00% 2027 | | | 750 | | | | 847 | |
| City of Richmond, Successor Agcy. to the Redev. Agcy., Rev. Ref. Bonds, Series 2014-A, BAM insured, 5.00% 2025 | | | 200 | | | | 224 | |
| Rio Elementary School Dist., Community Facs. Dist. No. 1, Special Tax Bonds, Series 2016, BAM insured, 5.00% 2032 | | | 240 | | | | 282 | |
| Rio Elementary School Dist., Community Facs. Dist. No. 1, Special Tax Rev. Ref. Bonds, Series 2014, 5.00% 2022 | | | 400 | | | | 415 | |
| | |
| Private Client Services Funds | 57 |
Capital Group California Core Municipal Fund
| Bonds, notes & other debt instruments (continued) | | Principal amount
(000) | | | Value
(000) | |
| California (continued) | | | | | | | | |
| Rio Hondo Community College Dist., G.O. Bonds, Capital Appreciation Bonds, 2004 Election, Series 2010-C, 0% 2033 | | $ | 660 | | | $ | 534 | |
| County of Riverside, Public Fncg. Auth., Tax Allocation Rev. Bonds (Project Area No. 1, Desert Communities and Interstate 215 Corridor Projects), Series 2015-A, Assured Guaranty Municipal insured, 5.00% 2023 | | | 1,075 | | | | 1,169 | |
| County of Riverside, Public Fncg. Auth., Tax Allocation Rev. Ref. Bonds (Hemet Project), Series 2014, BAM insured, 5.00% 2023 | | | 500 | | | | 542 | |
| Riverside Community Properties Dev., Inc., Lease Rev. Bonds (Riverside County Law Building Project), Series 2013, 6.00% 2038 (preref. 2023) | | | 2,585 | | | | 2,876 | |
| Riverside Unified School Dist., Fncg. Auth., Special Tax Rev. Ref. Bonds, Series 2015, BAM insured, 5.00% 2025 | | | 350 | | | | 399 | |
| Riverside Unified School Dist., Fncg. Auth., Special Tax Rev. Ref. Bonds, Series 2015, BAM insured, 5.00% 2026 | | | 400 | | | | 457 | |
| Riverside Unified School Dist., G.O. Bonds, 2016 Election, Series 2019, 4.00% 2029 | | | 850 | | | | 992 | |
| City of Roseville, Community Facs. Dist. No. 1 (Westpark), Special Tax Rev. Ref. Bonds, Series 2015, 5.00% 2024 | | | 1,000 | | | | 1,117 | |
| City of Sacramento, Municipal Utility Dist., Electric Rev. Bonds, Series 1997-K, AMBAC insured, 5.25% 2024 | �� | | 770 | | | | 835 | |
| County of Sacramento, Airport System Rev. Ref. Bonds, Series 2018-E, 5.00% 2027 | | | 1,015 | | | | 1,247 | |
| County of Sacramento, Airport System Rev. Ref. Bonds, Series 2018-E, 5.00% 2030 | | | 200 | | | | 248 | |
| County of Sacramento, Sanitation Dist. Fin. Auth., Rev. Ref. Bonds, Series 2021, 5.00% 2032 | | | 500 | | | | 694 | |
| Sacramento Unified School Dist., G.O. Bonds, Series 2015, Assured Guaranty Municipal insured, 5.00% 2030 | | | 1,000 | | | | 1,107 | |
| Sacramento Unified School Dist., G.O. Bonds, 2012 Election, Series 2019-D, BAM insured, 4.00% 2027 | | | 585 | | | | 683 | |
| Sacramento Unified School Dist., G.O. Bonds, 2012 Election, Series 2017-E, 5.00% 2027 | | | 555 | | | | 677 | |
| Sacramento Unified School Dist., G.O. Bonds, 2012 Election, Series 2019-D, BAM insured, 4.00% 2028 | | | 610 | | | | 723 | |
| Sacramento Unified School Dist., G.O. Bonds, 2012 Election, Series 2019-D, BAM insured, 4.00% 2029 | | | 635 | | | | 762 | |
| Sacramento Unified School Dist., G.O. Rev. Ref. Bonds, Series 2012, 5.25% 2024 | | | 1,300 | | | | 1,340 | |
| San Bernardino Unified School Dist., G.O. Rev. Ref. Bonds, Series 2013-A, Assured Guaranty Municipal insured, 5.00% 2022 (escrowed to maturity) | | | 1,500 | | | | 1,553 | |
| City of San Diego, Community Facs. Dist. No. 2 (Santaluz), Improvement Area No. 1, Special Tax Rev. Ref. Bonds, Series 2021, 4.00% 2027 | | | 635 | | | | 743 | |
| City of San Diego, Community Facs. Dist. No. 2 (Santaluz), Improvement Area No. 1, Special Tax Rev. Ref. Bonds, Series 2021, 4.00% 2028 | | | 880 | | | | 1,047 | |
| City of San Diego, Community Facs. Dist. No. 2 (Santaluz), Improvement Area No. 1, Special Tax Rev. Ref. Bonds, Series 2021, 4.00% 2029 | | | 430 | | | | 520 | |
| City of San Diego, Limited Obligation Rev. Bonds (Sanford Burnham Prebys Medical Discovery Institute Project), Series 2015-A, 5.00% 2022 | | | 200 | | | | 209 | |
| City of San Diego, Public Facs. Fncg. Auth., Lease Rev. Bonds (Capital Improvement Projects), Series 2021-A, 5.00% 2030 | | | 200 | | | | 263 | |
| City of San Diego, Public Facs. Fncg. Auth., Lease Rev. Bonds (Capital Improvement Projects), Series 2021-A, 5.00% 2031 | | | 150 | | | | 197 | |
| City of San Diego, Public Facs. Fncg. Auth., Water Rev. Bonds, Series 2020-A, 5.00% 2029 | | | 500 | | | | 648 | |
| County of San Diego, Community Facs. Dist. No. 2008-1 (Harmony Grove Village), Improvement Area No. 2, Special Tax Bonds, Series 2020-A, 4.00% 2026 | | | 255 | | | | 288 | |
| County of San Diego, Regional Airport Auth., Airport Rev. and Rev. Ref. Bonds, Series 2019-A, 5.00% 2027 | | | 400 | | | | 490 | |
| County of San Diego, Regional Airport Auth., Airport Rev. and Rev. Ref. Bonds, Series 2019-A, 5.00% 2028 | | | 320 | | | | 401 | |
| County of San Diego, Regional Airport Auth., Airport Rev. and Rev. Ref. Bonds, Series 2019-A, 5.00% 2029 | | | 585 | | | | 745 | |
| County of San Diego, Regional Airport Auth., Airport Rev. Bonds, Series 2013-A, 5.00% 2023 | | | 245 | | | | 264 | |
| County of San Diego, Regional Airport Auth., Airport Rev. Ref. Bonds, Series 2020-B, 5.00% 2022 | | | 3,990 | | | | 4,117 | |
| County of San Diego, Regional Airport Auth., Airport Rev. Ref. Bonds, Series 2020-A, 5.00% 2028 | | | 1,000 | | | | 1,252 | |
| County of San Diego, Regional Airport Auth., Airport Rev. Ref. Bonds, Series 2020-A, 5.00% 2029 | | | 1,000 | | | | 1,274 | |
| County of San Diego, Regional Airport Auth., Airport Rev. Ref. Bonds, Series 2020-B, 5.00% 2031 | | | 1,405 | | | | 1,817 | |
| County of San Diego, Regional Transportation Commission, Limited Sales Tax Rev. Bonds, Series 2021-B, 5.00% 2029 | | | 320 | | | | 414 | |
| County of San Diego, Regional Transportation Commission, Limited Sales Tax Rev. Green Bonds, Series 2020-A, 5.00% 2028 | | | 850 | | | | 1,073 | |
| County of San Diego, Water Auth. Rev. Ref. Bonds, Series 2013-A, 5.00% 2031 (preref. 2022) | | | 900 | | | | 944 | |
| County of San Diego, Water Auth. Rev. Ref. Green Bonds, Series 2021-A, 5.00% 2028 | | | 1,000 | | | | 1,264 | |
| County of San Diego, Water Auth., Water Rev. Ref. Green Bonds, Series 2021-S-1, 5.00% 2028 | | | 1,285 | | | | 1,619 | |
| San Diego Unified School Dist., G.O. Dedicated Unlimited Ad Valorem Property Tax Bonds, Series 2016-SR-1, 4.00% 2031 | | | 3,000 | | | | 3,435 | |
| San Diego Unified School Dist., G.O. Dedicated Unlimited Ad Valorem Property Tax Rev. Ref. Bonds, Series 2015-R-4, 5.00% 2026 | | | 1,000 | | | | 1,166 | |
| San Diego Unified School Dist., G.O. Dedicated Unlimited Ad Valorem Property Tax Rev. Ref. Bonds, Series 2015-R-4, 5.00% 2027 | | | 3,000 | | | | 3,497 | |
| City and County of San Francisco, Airport Commission, San Francisco International Airport, Rev. Bonds, Series 2019-D-2, 5.00% 2024 | | | 1,000 | | | | 1,114 | |
| | |
| 58 | Private Client Services Funds |
Capital Group California Core Municipal Fund
| Bonds, notes & other debt instruments (continued) | | Principal amount
(000) | | | Value
(000) | |
| California (continued) | | | | | | | | |
| City and County of San Francisco, Airport Commission, San Francisco International Airport, Rev. Ref. Bonds, Series 2021-B-2, 5.00% 2031 | | $ | 2,780 | | | $ | 3,666 | |
| City and County of San Francisco, Public Utilities Commission, San Francisco Water Rev. Bonds, Series 2011-A, 5.00% 2029 (preref. 2021) | | | 3,000 | | | | 3,000 | |
| City and County of San Francisco, Successor Agcy. to the Redev. Agcy., Special Tax Rev. Ref. Bonds (San Francisco Redev. Projects), Series 2014-C, 5.00% 2022 | | | 305 | | | | 316 | |
| City of San Francisco, Bay Area Rapid Transit Dist., G.O. Bonds, 2016 Election, Series 2020-C-1, 5.00% 2027 | | | 1,500 | | | | 1,859 | |
| San Francisco Community College Dist., G.O. Rev. Ref. Bonds, Series 2015, 5.00% 2023 | | | 2,510 | | | | 2,701 | |
| San Francisco Community College Dist., G.O. Rev. Ref. Bonds, Series 2020, 5.00% 2027 | | | 1,525 | | | | 1,871 | |
| San Francisco Unified School Dist., G.O. Bonds, 2016 Election, Series 2020-B, 4.00% 2022 | | | 1,000 | | | | 1,024 | |
| San Francisco Unified School Dist., G.O. Bonds, 2016 Election, Series 2020-B, 4.00% 2029 | | | 1,000 | | | | 1,192 | |
| San Jacinto Unified School Dist., Fncg. Auth., Special Tax Rev. Bonds, Series 2019, 5.00% 2022 | | | 25 | | | | 26 | |
| San Jacinto Unified School Dist., Fncg. Auth., Special Tax Rev. Bonds, Series 2019, 5.00% 2023 | | | 40 | | | | 43 | |
| San Jacinto Unified School Dist., Fncg. Auth., Special Tax Rev. Bonds, Series 2019, 5.00% 2024 | | | 65 | | | | 72 | |
| San Jacinto Unified School Dist., Fncg. Auth., Special Tax Rev. Bonds, Series 2019, 5.00% 2025 | | | 90 | | | | 103 | |
| San Jacinto Unified School Dist., Fncg. Auth., Special Tax Rev. Bonds, Series 2019, 5.00% 2026 | | | 155 | | | | 183 | |
| San Joaquin Hills Transportation Corridor Agcy., Toll Road Rev. Ref. Bonds, Capital Appreciation Bonds, Series 1993, National insured, 0% 2022 (escrowed to maturity) | | | 5,000 | | | | 4,998 | |
| San Joaquin Hills Transportation Corridor Agcy., Toll Road Rev. Ref. Bonds, Capital Appreciation Bonds, Series 1997-A, National insured, 0% 2025 | | | 285 | | | | 278 | |
| City of San Jose, Airport Rev. Ref. Bonds, Series 2021-A, BAM insured, 5.00% 2029 | | | 500 | | | | 633 | |
| City of San Jose, Airport Rev. Ref. Bonds, Series 2021-A, BAM insured, 5.00% 2030 | | | 250 | | | | 322 | |
| City of San Jose, Airport Rev. Ref. Bonds, Series 2021-B, 5.00% 2032 | | | 1,250 | | | | 1,639 | |
| City of San Jose, Fin. Auth., Lease Rev. Ref. Bonds (Civic Center Project), Series 2013-A, 5.00% 2030 (preref. 2023) | | | 1,625 | | | | 1,747 | |
| City of San Jose, G.O. Bonds (Disaster Preparedness, Public Safety and Infrastructure), Series 2021-A, 5.00% 2030 | | | 2,250 | | | | 2,993 | |
| San Jose Unified School Dist., G.O. Bonds, Capital Appreciation Bonds, 2002 Election, Series 2006-C, National insured, 0% 2025 | | | 795 | | | | 776 | |
| San Jose Unified School Dist., G.O. Rev. Ref. Bonds, Series 2017, 5.00% 2022 | | | 500 | | | | 518 | |
| San Jose Unified School Dist., G.O. Rev. Ref. Bonds, Series 2017, 5.00% 2023 | | | 375 | | | | 406 | |
| San Jose Unified School Dist., G.O. Rev. Ref. Bonds, Series 2017, 5.00% 2024 | | | 500 | | | | 565 | |
| San Ramon Valley Unified School Dist., G.O. Bonds, 2012 Election, Series 2018, 5.00% 2024 | | | 1,000 | | | | 1,127 | |
| Santa Margarita Water Dist., Community Facs. Dist. No. 99-1 (Talega), Special Tax Rev. Ref. Bonds, Series 2014-B, 5.00% 2022 | | | 310 | | | | 322 | |
| Santa Margarita Water Dist., Community Facs. Dist. No. 99-1 (Talega), Special Tax Rev. Ref. Bonds, Series 2014-B, 5.00% 2024 | | | 530 | | | | 592 | |
| Santa Margarita Water Dist., Community Facs. Dist. No. 99-1 (Talega), Special Tax Rev. Ref. Bonds, Series 2014-B, 5.00% 2025 | | | 375 | | | | 418 | |
| Santa Monica-Malibu Unified School Dist., School Facs. Improvement Dist. No. 2 (Malibu Schools), G.O. Bonds, 2018 Election, Series 2021-B, 4.00% 2024 | | | 1,235 | | | | 1,361 | |
| Santa Monica-Malibu Unified School Dist., School Facs. Improvement Dist. No. 2 (Malibu Schools), G.O. Bonds, 2018 Election, Series 2021-B, 4.00% 2025 | | | 345 | | | | 391 | |
| Santa Monica-Malibu Unified School Dist., School Facs. Improvement Dist. No. 2 (Santa Monica Schools), G.O. Bonds, 2018 Election, Series 2021-B, 4.00% 2025 | | | 405 | | | | 459 | |
| Santa Rosa High School Dist., G.O. Bonds, 2014 Election, Series 2021-E, BAM insured, 4.00% 2027 | | | 500 | | | | 590 | |
| Santa Rosa High School Dist., G.O. Bonds, 2014 Election, Series 2021-E, BAM insured, 4.00% 2029 | | | 500 | | | | 609 | |
| Saugus Union School Dist., G.O. Rev. Ref. Bonds, Capital Appreciation Bonds, Series 2006, FGIC-National insured, 0% 2024 | | | 1,210 | | | | 1,187 | |
| Saugus Union School Dist., Saugus/Hart School Facs. Fin. Auth., Community Facs. Dist. No. 2006-1, Special Tax Rev. Bonds, Series 2016, 5.00% 2024 | | | 500 | | | | 558 | |
| Saugus Union School Dist., Saugus/Hart School Facs. Fin. Auth., Community Facs. Dist. No. 2006-1, Special Tax Rev. Bonds, Series 2016, 5.00% 2025 | | | 1,110 | | | | 1,275 | |
| School Fin. Auth., School Fac. Rev. Bonds (Granada Hills Charter Obligated Group), Series 2019, 4.00% 20272 | | | 740 | | | | 831 | |
| School Fin. Auth., School Fac. Rev. Bonds (Granada Hills Charter Obligated Group), Series 2019, 4.00% 20292 | | | 805 | | | | 894 | |
| School Fin. Auth., School Fac. Rev. Bonds (Granada Hills Charter Obligated Group), Series 2019, 5.00% 20312 | | | 875 | | | | 1,008 | |
| School Fin. Auth., School Fac. Rev. Bonds (Kipp LA Projects), Series 2017-A, 5.00% 20272 | | | 600 | | | | 719 | |
| School Fin. Auth., School Fac. Rev. Bonds (KIPP LA Projects), Series 2014-A, 4.125% 2024 | | | 940 | | | | 992 | |
| School Fin. Auth., School Fac. Rev. Bonds (KIPP LA Projects), Series 2017-A, 5.00% 20242 | | | 585 | | | | 648 | |
| School Fin. Auth., School Fac. Rev. Bonds (KIPP LA Projects), Series 2015-A, 3.625% 20252 | | | 600 | | | | 634 | |
| School Fin. Auth., School Fac. Rev. Bonds (KIPP LA Projects), Series 2017-A, 5.00% 20262 | | | 505 | | | | 591 | |
| School Fin. Auth., School Fac. Rev. Bonds (KIPP SoCal Projects), Series 2019-A, 5.00% 20222 | | | 200 | | | | 206 | |
| School Fin. Auth., School Fac. Rev. Bonds (KIPP SoCal Projects), Series 2019-A, 5.00% 20232 | | | 225 | | | | 241 | |
| School Fin. Auth., School Fac. Rev. Bonds (KIPP SoCal Projects), Series 2019-A, 5.00% 20242 | | | 130 | | | | 144 | |
| School Fin. Auth., School Fac. Rev. Bonds (KIPP SoCal Projects), Series 2020-A, 5.00% 20242 | | | 100 | | | | 111 | |
| | |
| Private Client Services Funds | 59 |
Capital Group California Core Municipal Fund
| Bonds, notes & other debt instruments (continued) | | Principal amount
(000) | | | Value
(000) | |
| California (continued) | | | | | | | | |
| School Fin. Auth., School Fac. Rev. Bonds (KIPP SoCal Projects), Series 2019-A, 5.00% 20252 | | $ | 150 | | | $ | 171 | |
| School Fin. Auth., School Fac. Rev. Bonds (KIPP SoCal Projects), Series 2020-A, 5.00% 20252 | | | 105 | | | | 120 | |
| School Fin. Auth., School Fac. Rev. Bonds (KIPP SoCal Projects), Series 2020-A, 5.00% 20262 | | | 110 | | | | 129 | |
| School Fin. Auth., School Fac. Rev. Bonds (KIPP SoCal Projects), Series 2019-A, 5.00% 20262 | | | 105 | | | | 123 | |
| School Fin. Auth., School Fac. Rev. Bonds (KIPP SoCal Projects), Series 2019-A, 5.00% 20272 | | | 220 | | | | 264 | |
| School Fin. Auth., School Fac. Rev. Bonds (KIPP SoCal Projects), Series 2020-A, 5.00% 20272 | | | 100 | | | | 120 | |
| School Fin. Auth., School Fac. Rev. Bonds (KIPP SoCal Projects), Series 2020-A, 5.00% 20282 | | | 100 | | | | 122 | |
| School Fin. Auth., School Fac. Rev. Bonds (KIPP SoCal Projects), Series 2020-A, 5.00% 20292 | | | 100 | | | | 124 | |
| School Fin. Auth., School Fac. Rev. Bonds (KIPP SoCal Projects), Series 2020-A, 5.00% 20302 | | | 100 | | | | 126 | |
| City of Seal Beach, Community Facs. Dist. No. 2005-1 (Pacific Gateway Business Center), Special Tax Rev. Ref. Bonds, Series 2016, 3.00% 2023 | | | 150 | | | | 155 | |
| City of Seal Beach, Community Facs. Dist. No. 2005-1 (Pacific Gateway Business Center), Special Tax Rev. Ref. Bonds, Series 2016, 3.00% 2024 | | | 145 | | | | 150 | |
| City of Seal Beach, Community Facs. Dist. No. 2005-1 (Pacific Gateway Business Center), Special Tax Rev. Ref. Bonds, Series 2016, 3.00% 2025 | | | 365 | | | | 378 | |
| City of Seal Beach, Community Facs. Dist. No. 2005-1 (Pacific Gateway Business Center), Special Tax Rev. Ref. Bonds, Series 2016, 3.00% 2026 | | | 150 | | | | 155 | |
| City of Signal Hill, Successor Agcy. to the Redev. Agcy., Tax Allocation Rev. Ref. Bonds, Series 2015-A, BAM insured, 5.00% 2023 | | | 500 | | | | 544 | |
| Silicon Valley Clean Water, Wastewater Rev. Notes, Series 2019-A, 3.00% 2024 | | | 4,065 | | | | 4,259 | |
| Silicon Valley Clean Water, Wastewater Rev. Notes, Series 2021-B, 0.50% 2026 | | | 5,040 | | | | 4,998 | |
| Solano Community College Dist., G.O. Bonds, 2015 Election, Series 2013-A, 4.375% 2047 (preref. 2023) | | | 595 | | | | 638 | |
| South Placer Wastewater Auth., Wastewater Rev. Ref. Bonds, Series 2020, 5.00% 2031 | | | 2,885 | | | | 3,825 | |
| South Placer Wastewater Auth., Wastewater Rev. Ref. Bonds, Series 2020, 5.00% 2032 | | | 500 | | | | 675 | |
| Southern California Public Power Auth., Rev. Ref. Bonds (Magnolia Power Project A), Series 2020-1, 5.00% 2027 | | | 1,100 | | | | 1,362 | |
| Southern California Public Power Auth., Rev. Ref. Green Bonds (Milford Wind Corridor Phase II Project), Series 2021-1, 5.00% 2026 | | | 200 | | | | 241 | |
| Southern California Public Power Auth., Rev. Ref. Green Bonds (Milford Wind Corridor Phase II Project), Series 2021-1, 5.00% 2027 | | | 400 | | | | 495 | |
| Stanislaus Union School Dist., G.O. Rev. Ref. Bonds, Series 2019, BAM insured, 5.00% 2025 | | | 500 | | | | 582 | |
| Statewide Communities Dev. Auth., Multi Family Housing Rev. Bonds (Harriet Tubman Terrace Apartments), Series 2021-Q, 0.24% 2024 (put 2023) | | | 7,000 | | | | 6,990 | |
| Statewide Communities Dev. Auth., Multi Family Housing Rev. Bonds (Washington Court Apartments), Series 2021-E, 0.22% 2023 (put 2022) | | | 5,000 | | | | 4,998 | |
| Statewide Communities Dev. Auth., Rev. Bonds (Adventist Health System/West), Series 2015-A, 5.00% 2025 | | | 750 | | | | 862 | |
| Statewide Communities Dev. Auth., Rev. Bonds (Adventist Health System/West), Series 2015-A, 5.00% 2028 | | | 2,085 | | | | 2,447 | |
| Statewide Communities Dev. Auth., Rev. Bonds (Adventist Health System/West), Series 2018-A, 5.00% 2034 | | | 975 | | | | 1,184 | |
| Statewide Communities Dev. Auth., Rev. Bonds (American Baptist Homes of the West), Series 2015, 5.00% 2023 | | | 1,110 | | | | 1,203 | |
| Statewide Communities Dev. Auth., Rev. Bonds (Cottage Health System Obligated Group), Series 2015, 5.00% 2043 (preref. 2024) | | | 5,000 | | | | 5,694 | |
| Statewide Communities Dev. Auth., Rev. Bonds (Henry Mayo Newhall Memorial Hospital), Series 2014, Assured Guaranty Municipal insured, 5.00% 2022 | | | 750 | | | | 782 | |
| Statewide Communities Dev. Auth., Rev. Bonds (Jewish Home of San Francisco), Series 2016, 5.00% 2026 | | | 575 | | | | 693 | |
| Statewide Communities Dev. Auth., Rev. Bonds (Viamonte Senior Living 1 Project), Series 2018-B, 3.00% 2025 | | | 310 | | | | 311 | |
| Statewide Communities Dev. Auth., Rev. Ref. Bonds (Episcopal Communities and Services), Series 2012, 5.00% 2024 | | | 300 | | | | 307 | |
| Statewide Communities Dev. Auth., Rev. Ref. Bonds (Huntington Memorial Hospital), Series 2014-B, 5.00% 2026 | | | 200 | | | | 224 | |
| Statewide Communities Dev. Auth., Rev. Ref. Bonds (Methodist Hospital of Southern California), Series 2018, 5.00% 2023 | | | 500 | | | | 526 | |
| Statewide Communities Dev. Auth., Rev. Ref. Bonds (Methodist Hospital of Southern California), Series 2018, 5.00% 2024 | | | 390 | | | | 427 | |
| Statewide Communities Dev. Auth., Rev. Ref. Bonds (Rady Children’s Hospital), Series 2016-B, 5.00% 2028 | | | 860 | | | | 1,081 | |
| Statewide Communities Dev. Auth., Student Housing Rev. Bonds (University of California, Irvine East Campus Apartments, Phase I Ref. and Phase IV-B CHF-Irvine, LLC), Series 2021, BAM insured, 5.00% 2031 | | | 3,000 | | | | 3,958 | |
| Statewide Communities Dev. Auth., Student Housing Rev. Bonds (University of California, Irvine East Campus Apartments, Phase I Ref. and Phase IV-B CHF-Irvine, LLC), Series 2021, BAM insured, 5.00% 2032 | | | 3,500 | | | | 4,588 | |
| Statewide Communities Dev. Auth., Student Housing Rev. Ref. Bonds (CHF-Irvine, LLC - University of California, Irvine East Campus Apartments), Series 2016, 5.00% 2022 | | | 1,000 | | | | 1,026 | |
| Stockton Unified School Dist., G.O. Bonds, 2012 Election, Series 2018-C, BAM insured, 5.00% 2030 | | | 2,145 | | | | 2,681 | |
| City of Suisun, Successor Agcy. to the Redev. Agcy., Tax Allocation Rev. Ref. Bonds, Series 2014-B, BAM insured, 5.00% 2022 | | | 400 | | | | 417 | |
| | |
| 60 | Private Client Services Funds |
Capital Group California Core Municipal Fund
| Bonds, notes & other debt instruments (continued) | | Principal amount
(000) | | | Value
(000) | |
| California (continued) | | | | | | | | |
| Sweetwater Union High School Dist., G.O. Bonds, 2006 Election, Series 2006, 4.00% 2026 | | $ | 515 | | | $ | 573 | |
| Sweetwater Union High School Dist., G.O. Rev. Ref. Bonds, Series 2014, BAM insured, 5.00% 2025 | | | 1,715 | | | | 1,918 | |
| Sweetwater Union High School Dist., G.O. Rev. Ref. Bonds, Series 2014, BAM insured, 5.00% 2026 | | | 6,000 | | | | 6,691 | |
| Tobacco Securitization Auth. of Northern California, Tobacco Settlement Asset-Backed Rev. Ref. Senior Bonds (Sacramento County Tobacco Securitization Corp.), Series 2021-A-1, 5.00% 2024 | | | 1,250 | | | | 1,391 | |
| Tobacco Securitization Auth. of Southern California, Tobacco Settlement Asset-Backed Rev. Ref. Bonds (San Diego County Tobacco Asset Securitization Corp.), Series 2019-A, 5.00% 2025 | | | 1,000 | | | | 1,151 | |
| City of Tracy, Successor Agcy. to the Community Dev. Agcy., Tax Allocation Rev. Ref. Bonds, Series 2016, Assured Guaranty Municipal insured, 5.00% 2030 | | | 545 | | | | 628 | |
| Transbay Joint Powers Auth., Senior Tax Allocation Green Bonds, Series 2020-A, 5.00% 2027 | | | 600 | | | | 737 | |
| Transbay Joint Powers Auth., Senior Tax Allocation Green Bonds, Series 2020-A, 5.00% 2028 | | | 700 | | | | 879 | |
| Transbay Joint Powers Auth., Senior Tax Allocation Green Bonds, Series 2020-A, 5.00% 2029 | | | 660 | | | | 845 | |
| Transbay Joint Powers Auth., Senior Tax Allocation Green Bonds, Series 2020-A, 5.00% 2030 | | | 300 | | | | 386 | |
| City of Tustin, Community Facs. Dist. No. 06-1 (Tustin Legacy/Columbus Villages), Special Tax Rev. Ref. Bonds, Series 2015-A, 5.00% 2024 | | | 860 | | | | 973 | |
| Tustin Unified School Dist., Community Facs. Dist. No. 88-1, Special Tax Rev. Ref. Bonds, Series 2015, BAM insured, 5.00% 2022 | | | 830 | | | | 862 | |
| Twin Rivers Unified School Dist., G.O. Rev. Ref. Bonds, Series 2016-B, Assured Guaranty Municipal insured, 5.00% 2024 | | | 400 | | | | 447 | |
| Ukiah Unified School Dist., G.O. Bonds, Capital Appreciation Bonds, 2005 Election, Series 2006, National insured, 0% 2022 | | | 175 | | | | 174 | |
| Ukiah Unified School Dist., G.O. Bonds, Capital Appreciation Bonds, 2005 Election, Series 2006, MBIA insured, 0% 2023 | | | 1,500 | | | | 1,486 | |
| Union City, Successor Agcy. to the Redev. Agcy., Tax Allocation Rev. Ref. Redev. Bonds, Series 2015-A, 5.00% 2023 | | | 375 | | | | 409 | |
| Regents of the University of California, G.O. Rev. Bonds, Series 2013-AK, 5.00% 2048 (put 2023) | | | 2,000 | | | | 2,146 | |
| Regents of the University of California, Limited Project Rev. Bonds, Series 2022-S, 5.00% 2031 | | | 1,150 | | | | 1,511 | |
| Val Verde Unified School Dist., G.O. Rev. Ref. Bonds, Series 2016-A, Assured Guaranty Municipal insured, 4.00% 2023 | | | 600 | | | | 637 | |
| Dept. of Veterans Affairs, Home Purchase Rev. Bonds, Series 2016-B, 3.50% 2045 | | | 1,055 | | | | 1,111 | |
| Dept. of Veterans Affairs, Home Purchase Rev. Bonds, Series 2019-A, 4.00% 2049 | | | 2,810 | | | | 3,060 | |
| Dept. of Veterans Affairs, Home Purchase Rev. Bonds, Series 2020-A, 3.00% 2050 | | | 4,975 | | | | 5,339 | |
| Dept. of Veterans Affairs, Veterans G.O. Bonds, Series 2017-CQ, 4.00% 2047 | | | 1,380 | | | | 1,481 | |
| Dept. of Veterans Affairs, Veterans G.O. Bonds, Series 2018-CR, 4.00% 2048 | | | 4,770 | | | | 5,164 | |
| Dept. of Veterans Affairs, Veterans G.O. Bonds, Series 2019-CS, 4.00% 2049 | | | 2,675 | | | | 2,908 | |
| Dept. of Veterans Affairs, Veterans G.O. Bonds, Series 2020-CT, 3.00% 2050 | | | 4,980 | | | | 5,345 | |
| Dept. of Veterans Affairs, Veterans G.O. Rev. Ref. Bonds, Series 2016-CN, 3.50% 2045 | | | 680 | | | | 710 | |
| Victor Valley Union High School Dist., G.O. Rev. Ref. Bonds, Series 2016-B, Assured Guaranty Municipal insured, 4.00% 2024 | | | 730 | | | | 801 | |
| Victor Valley Union High School Dist., G.O. Rev. Ref. Bonds, Series 2016-B, Assured Guaranty Municipal insured, 4.00% 2026 | | | 270 | | | | 311 | |
| City of Vista, Successor Agcy. to the Redev. Agcy., Tax Allocation Rev. Ref. Redev. Bonds, Series 2015-B-1, Assured Guaranty Municipal insured, 5.00% 2022 | | | 340 | | | | 353 | |
| City of Vista, Successor Agcy. to the Redev. Agcy., Tax Allocation Rev. Ref. Redev. Bonds, Series 2015-B-1, Assured Guaranty Municipal insured, 4.00% 2025 | | | 400 | | | | 451 | |
| West Basin Municipal Water Dist., Rev. Ref. Bonds, Series 2021-A, 5.00% 2030 | | | 1,065 | | | | 1,408 | |
| West Basin Municipal Water Dist., Rev. Ref. Bonds, Series 2021-A, 5.00% 2031 | | | 745 | | | | 1,006 | |
| West Contra Costa Unified School Dist., G.O. Bonds, 2010 Election, Series 2020-F, Assured Guaranty Municipal insured, 4.00% 2028 | | | 600 | | | | 715 | |
| West Contra Costa Unified School Dist., G.O. Bonds, 2012 Election, Series 2020-E, Assured Guaranty Municipal insured, 4.00% 2030 | | | 900 | | | | 1,098 | |
| West Contra Costa Unified School Dist., G.O. Rev. Ref. Bonds, 2005 Election, Series 2008-B, 6.00% 2027 | | | 3,000 | | | | 3,846 | |
| West Kern Community College Dist., G.O. Rev. Ref. Bonds, Series 2019, BAM insured, 4.00% 2032 | | | 2,700 | | | | 3,217 | |
| Westminster School Dist., G.O. Bonds, Capital Appreciation Bonds, 2008 Election, Series 2009-A-1, Assured Guaranty insured, 0% 2023 | | | 1,000 | | | | 994 | |
| Whittier City School Dist., G.O. Rev. Ref. Bonds, Series 2016, 4.00% 2030 | | | 825 | | | | 941 | |
| City of Woodland, Community Facs. Dist. No. 2004-1 (Spring Lake), Special Tax Capital Projects Bonds, Series 2021, Assured Guaranty Municipal insured, 4.00% 2029 | | | 215 | | | | 258 | |
| | |
| Private Client Services Funds | 61 |
Capital Group California Core Municipal Fund
| Bonds, notes & other debt instruments (continued) | | Principal amount
(000) | | | Value
(000) | |
| California (continued) | | | | | | | | |
| City of Woodland, Community Facs. Dist. No. 2004-1 (Spring Lake), Special Tax Capital Projects Bonds, Series 2021, Assured Guaranty Municipal insured, 4.00% 2030 | | $ | 235 | | | $ | 280 | |
| City of Woodland, Community Facs. Dist. No. 2004-1 (Spring Lake), Special Tax Capital Projects Bonds, Series 2021, Assured Guaranty Municipal insured, 4.00% 2031 | | | 260 | | | | 309 | |
| Yosemite Community College Dist., G.O. Bonds, Capital Appreciation Bonds, 2004 Election, Series 2010-D, 0% 2031 | | | 500 | | | | 428 | |
| | | | | | | | 559,873 | |
| | | | | | | | | |
| Missouri 0.02% | | | | | | | | |
| Housing Dev. Commission, Single Family Mortgage Rev. Bonds (Special Homeownership Loan Program), Series 2015-A, 3.75% 2038 | | | 95 | | | | 101 | |
| | | | | | | | | |
| Texas 0.08% | | | | | | | | |
| County of Tarrant, Cultural Education Facs. Fin. Corp., Rev. Ref. Bonds (Christus Health), Series 2018-A, 5.00% 2024 | | | 500 | | | | 558 | |
| | | | | | | | | |
| United States 0.49% | | | | | | | | |
| Freddie Mac, Multi Family Mortgage Bonds, Series 2019-ML-05, Class ACA, 3.35% 2033 | | | 2,911 | | | | 3,242 | |
| | | | | | | | | |
| Total bonds, notes & other debt instruments (cost: $553,137,000) | | | | | | | 563,774 | |
| | | | | | | | | |
| Short-term securities 13.64% | | | | | | | | |
| Municipals 13.64% | | | | | | | | |
| State of California, Fin. Auth., Recovery Zone Fac. Bonds (Chevron U.S.A., Inc. Project), Series 2010-A, 0.02% 20351 | | | 15,765 | | | | 15,765 | |
| State of California, Fin. Auth., Recovery Zone Fac. Bonds (Chevron U.S.A., Inc. Project), Series 2010-B, 0.02% 20351 | | | 4,000 | | | | 4,000 | |
| State of California, Irvine Ranch Water Dist. Nos. 105, 140, 240 and 250, Consolidated G.O. Bonds, Series 1993, 0.01% 20331 | | | 5,700 | | | | 5,700 | |
| State of California, Kern Community College Dist., Facs. Improvement Dist. No. 1, G.O. Bond Anticipation Notes, Capital Appreciation Notes, Series 2020, 0% 2023 | | | 2,000 | | | | 1,990 | |
| State of California, City of Los Angeles, Dept. of Water and Power, Power System Demand Rev. Bonds, Series 2002-A-2, 0.01% 20351 | | | 7,500 | | | | 7,500 | |
| State of California, City of Los Angeles, Dept. of Water and Power, Power System Demand Rev. Bonds, Series 2002-A-1, 0.01% 20351 | | | 2,500 | | | | 2,500 | |
| State of California, City of Los Angeles, Dept. of Water and Power, Rev. Bonds, Series 2021-A-1, 0.02% 20501 | | | 8,500 | | | | 8,500 | |
| State of California, City of Los Angeles, Dept. of Water and Power, Water System Bonds, Series 2019-A, 0.01% 20491 | | | 5,200 | | | | 5,200 | |
| State of California, County of Los Angeles, Schools Pooled Fncg. Program, Certs. of Parts., Series 2021-B, 2.00% 12/30/2021 | | | 6,000 | | | | 6,018 | |
| State of California, Metropolitan Water Dist. of Southern California, Water Rev. Ref. Bonds, Series 2016-B-2, 0.02% 20371 | | | 3,605 | | | | 3,605 | |
| State of California, Metropolitan Water Dist. of Southern California, Water Rev. Ref. Bonds, Series 2016-B-1, 0.02% 20371 | | | 750 | | | | 750 | |
| State of California, Municipal Fin. Auth., Pollution Control Rev. Ref. Bonds (Chevron U.S.A., Inc. Project), Series 2005, 0.02% 20251 | | | 3,000 | | | | 3,000 | |
| State of California, County of Riverside, Tax and Rev. Anticipation Notes, Series 2021, 2.00% 6/30/2022 | | | 5,000 | | | | 5,063 | |
| State of California, Statewide Communities Dev. Auth., Pollution Control Rev. Ref. Bonds (Chevron U.S.A., Inc. Project), Series 2002, 0.02% 20241 | | | 2,435 | | | | 2,435 | |
| State of California, City of Stockton, Public Fncg. Auth., Wastewater Bond Anticipation Notes, Series 2019, 1.40% 6/1/2022 | | | 4,525 | | | | 4,527 | |
| State of California, Regents of the University of California, General Rev. Bonds, Series 2013-AL-4, 0.01% 20481 | | | 11,295 | | | | 11,295 | |
| State of California, Regents of the University of California, Medical Center Pooled Rev. Bonds, Series 2007-B-1, 0.02% 20321 | | | 2,755 | | | | 2,755 | |
| | | | | | | | | |
| Total short-term securities (cost: $90,579,000) | | | | | | | 90,603 | |
| Total investment securities 98.53% (cost: $643,716,000) | | | | | | | 654,377 | |
| Other assets less liabilities 1.47% | | | | | | | 9,753 | |
| | | | | | | | | |
| Net assets 100.00% | | | | | | $ | 664,130 | |
| | |
| 62 | Private Client Services Funds |
Capital Group California Core Municipal Fund
| Futures contracts | | | | | | | | | | | | | | | |
| | | | | | | | | | | | | | | | |
| Contracts | | Type | | Number of
contracts | | Expiration | | Notional
amount
(000) | 3
| | Value at
10/31/2021
(000) | 4
| | Unrealized
appreciation
at 10/31/2021
(000) | |
| 10 Year U.S. Treasury Note Futures | | Short | | 63 | | December 2021 | | $ | (6,300 | ) | | $ | (8,234 | ) | | $ | 94 | |
| | |
| 1 | Coupon rate may change periodically. Reference rate and spread are as of the most recent information available. Some coupon rates are determined by the issuer or agent based on current market conditions; therefore, the reference rate and spread are not available. For short-term securities, the date of the next scheduled coupon rate change is considered to be the maturity date. |
| 2 | Acquired in a transaction exempt from registration under Rule 144A of the Securities Act of 1933. May be resold in the U.S. in transactions exempt from registration, normally to qualified institutional buyers. The total value of all such securities was $7,326,000, which represented 1.10% of the net assets of the fund. |
| 3 | Notional amount is calculated based on the number of contracts and notional contract size. |
| 4 | Value is calculated based on the notional amount and current market price. |
Key to abbreviations and symbol
Agcy. = Agency
AMT = Alternative Minimum Tax
Auth. = Authority
Certs. = Certificates
Dept. = Department
Dev. = Development
Dist. = District
Econ. = Economic
Fac. = Facility
Facs. = Facilities
Fin. = Finance
Fncg. = Financing
G.O. = General Obligation
IAM = Interest at Maturity
LIBOR = London Interbank Offered Rate
LOC = Letter of Credit
Part. = Participation
Preref. = Prerefunded
Redev. = Redevelopment
Ref. = Refunding
Rev. = Revenue
SIFMA = Securities Industry and Financial Markets Association
USD/$ = U.S. dollars
| Private Client Services Funds | 63 |
Capital Group California Short-Term Municipal Fund
Investment portfolio October 31, 2021
| Portfolio quality summary* | Percent of net assets |
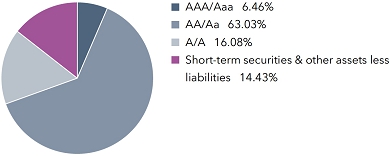
| * | Bond ratings, which typically range from AAA/Aaa (highest) to D (lowest), are assigned by credit rating agencies such as Standard & Poor’s, Moody’s and/or Fitch as an indication of an issuer’s creditworthiness. In assigning a credit rating to a security, the fund looks specifically to the ratings assigned to the issuer of the security by Standard & Poor’s, Moody’s and/or Fitch. If agency ratings differ, the security will be considered to have received the highest of those ratings, consistent with the fund’s investment policies. The ratings are not covered by the Report of Independent Registered Public Accounting Firm. |
| Bonds, notes & other debt instruments 85.57% | | Principal amount
(000) | | | Value
(000) | |
| California 85.57% | | | | | | |
| City of Alhambra, Rev. Ref. Bonds (Atherton Baptist Homes Project), Series 2016, 5.00% 2023 | | $ | 450 | | | $ | 474 | |
| Alvord Unified School Dist., G.O. Rev. Ref. Bonds, Series 2018, Assured Guaranty Municipal insured, 5.00% 2022 | | | 500 | | | | 518 | |
| City of Anaheim, Housing and Public Improvements Auth., Rev. Bonds (Electric Utility Distribution System Improvements), Series 2020-A, 5.00% 2022 | | | 230 | | | | 240 | |
| City of Anaheim, Housing and Public Improvements Auth., Rev. Bonds (Electric Utility Distribution System Improvements), Series 2020-A, 5.00% 2023 | | | 200 | | | | 218 | |
| Assn. of Bay Area Governments, Fin. Auth. for Nonprofit Corps., Rev. Ref. Bonds (Sharp HealthCare), Series 2012-A, 5.00% 2023 (preref. 2022) | | | 1,640 | | | | 1,660 | |
| Bay Area Toll Auth., San Francisco Bay Area Toll Bridge Rev. Bonds, Series 2013-S-4, 5.00% 2043 (preref. 2023) | | | 1,525 | | | | 1,629 | |
| Bay Area Toll Auth., San Francisco Bay Area Toll Bridge Rev. Bonds, Series 2021-A, 2.00% 2056 (put 2028) | | | 1,000 | | | | 1,055 | |
| Bay Area Toll Auth., San Francisco Bay Area Toll Bridge Rev. Ref. Bonds, Series 2017-S-7, 5.00% 2024 | | | 1,000 | | | | 1,112 | |
| Bay Area Toll Auth., San Francisco Bay Area Toll Bridge Rev. Ref. Bonds, Series 2012-F-1, 5.00% 2031 (preref. 2022) | | | 1,365 | | | | 1,392 | |
| City of Beaumont, Wastewater Rev. Bonds, Series 2018-A, Assured Guaranty Municipal insured, 5.00% 2022 | | | 225 | | | | 234 | |
| City of Burbank, Successor Agcy. to the Redev. Agcy., Tax Allocation Rev. Ref. Redev. Bonds, Series 2015, BAM insured, 5.00% 2022 | | | 500 | | | | 526 | |
| Burlingame Elementary School Dist., G.O. Bonds, 2020 Election, Series A, 3.00% 2022 | | | 600 | | | | 613 | |
| Trustees of the California State University, Systemwide Rev. Bonds, Series 2018-A, 5.00% 2023 | | | 1,045 | | | | 1,144 | |
| Trustees of the California State University, Systemwide Rev. Bonds, Series 2013-A, 5.00% 2023 | | | 400 | | | | 438 | |
| Trustees of the California State University, Systemwide Rev. Bonds, Series 2020-A, 5.00% 2024 | | | 800 | | | | 911 | |
| Trustees of the California State University, Systemwide Rev. Bonds, Series 2016-B-3, 4.00% 2051 (put 2023) | | | 1,650 | | | | 1,740 | |
| Chino Basin Regional Fin. Auth., Rev. Notes (Inland Empire Utilities Interim Fncg.), Series 2020-B, 4.00% 2025 | | | 1,500 | | | | 1,695 | |
| Coast Community College Dist., G.O. Bonds, Capital Appreciation Bonds, Series 2006-B, Assured Guaranty insured, 0% 2026 | | | 1,205 | | | | 1,157 | |
| Compton Unified School Dist., G.O. Bonds, 2015 Election, Series 2019-B, BAM insured, 4.00% 2022 | | | 1,350 | | | | 1,379 | |
| Compton Unified School Dist., G.O. Bonds, 2015 Election, Series 2019-B, BAM insured, 5.00% 2025 | | | 125 | | | | 144 | |
| Compton Unified School Dist., G.O. Bonds, 2015 Election, Series 2019-B, BAM insured, 5.00% 2027 | | | 500 | | | | 609 | |
| Del Mar Union School Dist., Community Facs. Dist. No. 99-1, Special Tax Bonds, Series 2019, 4.00% 2024 | | | 400 | | | | 435 | |
| Del Mar Union School Dist., Community Facs. Dist. No. 99-1, Special Tax Bonds, Series 2019, 4.00% 2025 | | | 410 | | | | 456 | |
| East Side Union High School Dist., G.O. Rev. Ref. Bonds, Series 2020, BAM insured, 5.00% 2025 | | | 845 | | | | 990 | |
| Eastern Municipal Water Dist., Community Facs. Dist. No. 2017-79 (Eagle Crest), Special Tax Bonds, Series 2021, 4.00% 2023 | | | 255 | | | | 271 | |
| Eastern Municipal Water Dist., Community Facs. Dist. No. 2017-79 (Eagle Crest), Special Tax Bonds, Series 2021, 4.00% 2025 | | | 275 | | | | 304 | |
| Eastern Municipal Water Dist., Community Facs. Dist. No. 2017-79 (Eagle Crest), Special Tax Bonds, Series 2021, 4.00% 2026 | | | 285 | | | | 319 | |
| Eastern Municipal Water Dist., Fin. Auth., Water and Wastewater Rev. Ref. Bonds, Series 2020-A, 5.00% 2024 | | | 225 | | | | 253 | |
| Eastern Municipal Water Dist., Fin. Auth., Water and Wastewater Rev. Ref. Bonds, Series 2020-A, 5.00% 2026 | | | 300 | | | | 361 | |
| Educational Facs. Auth., Rev. Bonds (Chapman University), Series 2021-A, 5.00% 2025 | | | 425 | | | | 490 | |
| County of El Dorado, Community Facs. Dist. No. 1992-1 (El Dorado Hills Dev.), Special Tax Rev. Ref. Bonds, Series 2012, 5.00% 2022 | | | 845 | | | | 879 | |
| | | | | | | | | |
| 64 | Private Client Services Funds |
Capital Group California Short-Term Municipal Fund
| Bonds, notes & other debt instruments (continued) | | Principal amount
(000) | | | Value
(000) | |
| California (continued) | | | | | | |
| Fowler Unified School Dist., G.O. Rev. Ref. Bonds, Series 2014, Assured Guaranty Municipal insured, 4.00% 2024 | | $ | 745 | | | $ | 817 | |
| County of Fresno, Central Unified School Dist., G.O. Bonds, 2020 Election, Series 2021-A, 4.00% 2024 | | | 395 | | | | 435 | |
| Fresno Joint Powers Fin. Auth., Rev. Ref. Bonds (Master Lease Projects), Series 2017-A, Assured Guaranty Municipal insured, 5.00% 2022 | | | 1,350 | | | | 1,375 | |
| G.O. Bonds, Series 2021, 5.00% 2027 | | | 1,475 | | | | 1,829 | |
| G.O. Bonds, Series 2013-E, (SIFMA Municipal Swap Index + 0.43%) 0.48% 2029 (put 2023)1 | | | 500 | | | | 501 | |
| Glendale Community College Dist., G.O. Rev. Ref. Bonds, 2016 Election, Series 2020-B, 4.00% 2023 | | | 500 | | | | 533 | |
| Glendale Unified School Dist., G.O. Bonds, 2011 Election, Series 2020-E, 4.00% 2024 | | | 475 | | | | 524 | |
| Golden State Tobacco Securitization Corp., Enhanced Tobacco Settlement Asset-Backed Bonds, Series 2017A-1, 5.00% 2022 | | | 1,500 | | | | 1,539 | |
| Golden State Tobacco Securitization Corp., Enhanced Tobacco Settlement Asset-Backed Bonds, Series 2018-A, 5.00% 2022 (escrowed to maturity) | | | 1,000 | | | | 1,028 | |
| Health Facs. Fncg. Auth., Rev. Bonds (Adventist Health System/West), Series 2013-A, 5.00% 2024 | | | 410 | | | | 436 | |
| Health Facs. Fncg. Auth., Rev. Bonds (El Camino Hospital), Series 2017, 5.00% 2025 | | | 400 | | | | 466 | |
| Health Facs. Fncg. Auth., Rev. Bonds (Kaiser Permanente), Series 2017-B, 5.00% 2029 (put 2022) | | | 1,000 | | | | 1,048 | |
| Health Facs. Fncg. Auth., Rev. Bonds (Providence St. Joseph Health), Series 2016-A, 5.00% 2022 | | | 300 | | | | 313 | |
| Health Facs. Fncg. Auth., Rev. Bonds (Providence St. Joseph Health), Series 2016-B-3, 2.00% 2036 (put 2025) | | | 1,000 | | | | 1,057 | |
| Health Facs. Fncg. Auth., Rev. Bonds (Providence St. Joseph Health), Series 2016-B-2, 4.00% 2036 (put 2024) | | | 110 | | | | 122 | |
| Health Facs. Fncg. Auth., Rev. Bonds (Stanford Health Care), Series 2021-A, 3.00% 2054 (put 2025) | | | 1,475 | | | | 1,610 | |
| Health Facs. Fncg. Auth., Rev. Bonds (Sutter Health), Series 2016-A, 5.00% 2022 (escrowed to maturity) | | | 200 | | | | 210 | |
| Health Facs. Fncg. Auth., Rev. Bonds (Sutter Health), Series 2018-A, 5.00% 2023 | | | 1,275 | | | | 1,396 | |
| Health Facs. Fncg. Auth., Rev. Bonds (Sutter Health), Series 2018-A, 5.00% 2025 | | | 400 | | | | 470 | |
| Health Facs. Fncg. Auth., Rev. Bonds (Sutter Health), Series 2016-A, 5.00% 2026 (preref. 2025) | | | 275 | | | | 325 | |
| Health Facs. Fncg. Auth., Rev. Bonds (Sutter Health), Series 2016-A, 5.00% 2046 (preref. 2025) | | | 250 | | | | 296 | |
| Health Facs. Fncg. Auth., Rev. Green Bonds (Kaiser Permanente), Series 2017-C, 5.00% 2031 (put 2022) | | | 1,150 | | | | 1,205 | |
| Health Facs. Fncg. Auth., Rev. Ref. Bonds (Adventist Health System/West), Series 2016-A, 4.00% 2022 | | | 300 | | | | 304 | |
| Health Facs. Fncg. Auth., Rev. Ref. Bonds (Lucile Salter Packard Children’s Hospital at Stanford), Series 2022-A, 5.00% 2024 | | | 680 | | | | 737 | |
| Health Facs. Fncg. Auth., Rev. Ref. Bonds (St. Joseph Health System), Series 2009-D, 1.70% 2033 (put 2022) | | | 750 | | | | 761 | |
| Health Facs. Fncg. Auth., Rev. Ref. Bonds (St. Joseph Health System), Series 2009-C, 5.00% 2034 (put 2022) | | | 1,200 | | | | 1,255 | |
| Health Facs. Fncg. Auth., Rev. Ref. Bonds (Stanford Hospital and Clinics), Series 2008-A-3, 5.50% 2040 (preref. 2021) | | | 1,500 | | | | 1,503 | |
| Health Facs. Fncg. Auth., Rev. Ref. Bonds (Sutter Health), Series 2016-B, 5.00% 2026 | | | 700 | | | | 847 | |
| Hemet Unified School Dist., G.O. Rev. Ref. Bonds, Series 2014, Assured Guaranty Municipal insured, 4.00% 2024 | | | 500 | | | | 549 | |
| Infrastructure and Econ. Dev. Bank, Rev. Bonds (Stanford Consortium Project), Series 2016-A, 5.00% 2022 | | | 265 | | | | 272 | |
| Infrastructure and Econ. Dev. Bank, Rev. Ref. Bonds (Segerstrom Center for the Arts), Series 2016-B, 5.00% 2023 | | | 1,000 | | | | 1,075 | |
| Infrastructure and Econ. Dev. Bank, Rev. Ref. Bonds (The Broad), Series 2021-A, 5.00% 2026 | | | 585 | | | | 702 | |
| City of Irvine, Reassessment Dist. No. 12-1, Limited Obligation Improvement Bonds, Series 2015, 5.00% 2024 | | | 965 | | | | 1,093 | |
| County of Kern, Water Agcy., Improvement Dist. No. 4, Water Rev. Ref. Bonds, Series 2016-A, Assured Guaranty Municipal insured, 5.00% 2023 | | | 800 | | | | 857 | |
| Kern Community College Dist., Facs. Improvement Dist. No. 1, G.O. Bonds, 2016 Election, Series 2020-C, 4.00% 2026 | | | 645 | | | | 745 | |
| Kings Canyon Joint Unified School Dist., G.O. Rev. Ref. Bonds, Series 2016, Assured Guaranty Municipal insured, 5.00% 2022 | | | 470 | | | | 487 | |
| La Canada Unified School Dist., G.O. Bonds, 2017 Election, Series 2020-B, 4.00% 2022 | | | 270 | | | | 278 | |
| La Canada Unified School Dist., G.O. Bonds, 2017 Election, Series 2020-B, 4.00% 2023 | | | 260 | | | | 277 | |
| La Canada Unified School Dist., G.O. Bonds, 2017 Election, Series 2020-B, 4.00% 2024 | | | 425 | | | | 468 | |
| Lake Elsinore Facs. Fin. Auth., Local Agcy. Rev. Ref. Bonds, Series 2021-B, Assured Guaranty Municipal insured, 4.00% 2026 | | | 195 | | | | 224 | |
| Lake Elsinore Facs. Fin. Auth., Local Agcy. Rev. Ref. Bonds, Series 2021-B, Assured Guaranty Municipal insured, 4.00% 2027 | | | 210 | | | | 245 | |
| Los Altos Union High School Dist., G.O. Bonds, Capital Appreciation Bonds, Series 1997-C, National insured, 0% 2022 | | | 460 | | | | 460 | |
| City of Los Angeles, Dept. of Water and Power, Power System Rev. Bonds, Series 2021-B, 3.00% 2022 | | | 1,000 | | | | 1,019 | |
| City of Los Angeles, Dept. of Water and Power, Power System Rev. Bonds, Series 2013-A, 5.00% 2022 | | | 590 | | | | 609 | |
| City of Los Angeles, Dept. of Water and Power, Power System Rev. Bonds, Series 2014-D, 4.00% 2023 | | | 500 | | | | 531 | |
| City of Los Angeles, Dept. of Water and Power, Power System Rev. Bonds, Series 2019-B, 5.00% 2023 | | | 1,000 | | | | 1,079 | |
| City of Los Angeles, Dept. of Water and Power, Power System Rev. Bonds, Series 2014-B, 5.00% 2023 | | | 825 | | | | 891 | |
| City of Los Angeles, Dept. of Water and Power, Power System Rev. Bonds, Series 2016-B, 5.00% 2024 | | | 800 | | | | 900 | |
| City of Los Angeles, Dept. of Water and Power, Water System Rev. Bonds, Series 2020-A, 5.00% 2025 | | | 500 | | | | 583 | |
| City of Los Angeles, Dept. of Water and Power, Water System Rev. Bonds, Series 2020-A, 5.00% 2026 | | | 300 | | | | 361 | |
| City of Los Angeles, Solid Waste Resources Rev. Bonds, Series 2013-A, 2.00% 2023 | | | 500 | | | | 511 | |
| | | | | | | | | |
| Private Client Services Funds | 65 |
Capital Group California Short-Term Municipal Fund
| Bonds, notes & other debt instruments (continued) | | Principal amount
(000) | | | Value
(000) | |
| California (continued) | | | | | | |
| County of Los Angeles, Metropolitan Transportation Auth., Measure R Sales Tax Rev. Ref. Green Bonds, Series 2020-A, 5.00% 2024 | | $ | 1,000 | | | $ | 1,122 | |
| County of Los Angeles, Metropolitan Transportation Auth., Measure R Sales Tax Rev. Ref. Green Bonds, Series 2020-A, 5.00% 2025 | | | 1,500 | | | | 1,745 | |
| County of Los Angeles, Metropolitan Transportation Auth., Measure R Sales Tax Rev. Ref. Green Bonds, Series 2020-A, 5.00% 2026 | | | 400 | | | | 481 | |
| Los Angeles Unified School Dist., G.O. Dedicated Unlimited Ad Valorem Property Tax Bonds, Series 2020-RYQ, 5.00% 2025 | | | 750 | | | | 873 | |
| Los Angeles Unified School Dist., G.O. Dedicated Unlimited Ad Valorem Property Tax Rev. Ref. Bonds, Series 2017-A, 5.00% 2025 | | | 1,000 | | | | 1,164 | |
| Los Angeles Unified School Dist., G.O. Rev. Ref. Bonds, Series 2014-A, 5.00% 2022 | | | 250 | | | | 258 | |
| Los Angeles Unified School Dist., G.O. Rev. Ref. Bonds, Series 2015-A, 5.00% 2023 | | | 685 | | | | 739 | |
| Mammoth Unified School Dist., G.O. Bonds, Capital Appreciation Bonds, 1998 Election, Series 2000, AMBAC insured, 0% 2023 | | | 1,000 | | | | 991 | |
| Menifee Union School Dist., Public Fncg. Auth., Special Tax Rev. Bonds, Series 2016-A, BAM insured, 4.00% 2022 | | | 250 | | | | 256 | |
| Menifee Union School Dist., Public Fncg. Auth., Special Tax Rev. Bonds, Series 2016-A, 5.00% 2026 | | | 755 | | | | 852 | |
| Merced City School Dist., G.O. Bonds, Capital Appreciation Bonds, 2003 Election, Series 2005, MBIA insured, 0% 2023 | | | 1,065 | | | | 1,056 | |
| Modesto Irrigation Dist., Electric System Rev. Ref. Bonds, Series 2016, 5.00% 2023 | | | 160 | | | | 174 | |
| Modesto Irrigation Dist., Electric System Rev. Ref. Bonds, Series 2021, 5.00% 2026 | | | 635 | | | | 763 | |
| Mountain View Whisman School Dist., G.O. Bonds, 2012 Election, Series 2016-B, 5.00% 2025 | | | 610 | | | | 716 | |
| Municipal Fin. Auth., Solid Waste Rev. Ref. Bonds (Republic Services, Inc. Project), Capital Appreciation Bonds, Series 2010, Assured Guaranty Municipal insured, 0% 2023 | | | 260 | | | | 258 | |
| Municipal Fin. Auth., Student Housing Rev. Bonds (CHF-Davis II, LLC - Orchard Park Student Housing Project), Series 2021, BAM insured, 5.00% 2025 | | | 400 | | | | 459 | |
| Napa Valley Unified School Dist., G.O. Rev. Ref. Bonds, Series 2013, 5.00% 2024 (preref. 2023) | | | 250 | | | | 271 | |
| New Haven Unified School Dist., G.O. Rev. Ref. Bonds, Capital Appreciation Bonds, Series 2012, Assured Guaranty Municipal insured, 0% 2023 | | | 965 | | | | 956 | |
| Newport Mesa Unified School Dist., G.O. Bonds, Capital Appreciation Bonds, 2005 Election, Series 2007, National insured, 0% 2022 | | | 1,000 | | | | 999 | |
| Northern California Energy Auth., Commodity Supply Rev. Bonds, Series 2018, 4.00% 2049 (put 2024) | | | 1,000 | | | | 1,084 | |
| Oakland Unified School Dist., G.O. Rev. Ref. Bonds, Series 2017-A, 5.00% 2022 | | | 1,000 | | | | 1,035 | |
| County of Orange, Sanitation Dist., Wastewater Rev. Ref. Obligations, Series 2021-A, 5.00% 2026 | | | 1,750 | | | | 2,082 | |
| County of Orange, Transportation Auth., Bond Anticipation Notes (I-405 Improvement Project), Series 2021, 5.00% 2024 | | | 1,185 | | | | 1,345 | |
| County of Orange, Water Dist. Rev. Ref. Bonds, Series 2019-C, 5.00% 2024 | | | 500 | | | | 565 | |
| Pasadena Unified School Dist., G.O. Rev. Ref. Bonds, Series 2016-B, 5.00% 2024 | | | 655 | | | | 739 | |
| Peralta Community College Dist., G.O. Bonds, 2006 Election, Series 2020-E-1, 5.00% 2025 | | | 1,000 | | | | 1,166 | |
| City of Perris, Joint Powers Auth., Local Agcy. Rev. Ref. Bonds (CFD No. 2001-1 IA No. 4 and No. 5; CFD No. 2005-1 IA No. 4), Series 2017-B, 5.00% 2024 | | | 990 | | | | 1,105 | |
| Perris Union High School Dist., G.O. Bonds, 2012 Election, Series 2021-C, 4.00% 2024 | | | 240 | | | | 265 | |
| Perris Union High School Dist., G.O. Bonds, 2012 Election, Series 2021-C, 4.00% 2025 | | | 400 | | | | 453 | |
| Pittsburg Unified School Dist., G.O. Bonds, Capital Appreciation Bonds, 2010 Election, Series 2012-C, 0% 2047 (preref. 2022) | | | 200 | | | | 47 | |
| Public Fin. Auth., Rev. Ref. Bonds (O’Conner Woods), Series 2022, 4.00% 2026 | | | 440 | | | | 479 | |
| Public Works Board, Lease Rev. Bonds (Various Capital Projects), Series 2014-E, 5.00% 2022 | | | 500 | | | | 520 | |
| Public Works Board, Lease Rev. Bonds (Various Capital Projects), Series 2011-A, 5.00% 2027 | | | 1,025 | | | | 1,026 | |
| Public Works Board, Lease Rev. Ref. Bonds (Dept. of State Hospitals), Series 2016-E, 5.00% 2025 | | | 1,000 | | | | 1,072 | |
| Public Works Board, Lease Rev. Ref. Bonds (Various Capital Projects), Series 2020-E, 5.00% 2024 | | | 1,000 | | | | 1,137 | |
| Public Works Board, Lease Rev. Ref. Bonds (Various Capital Projects), Series 2016-C, 5.00% 2024 | | | 505 | | | | 574 | |
| Public Works Board, Lease Rev. Ref. Bonds (Various Capital Projects), Series 2017-B, 5.00% 2024 | | | 330 | | | | 374 | |
| Public Works Board, Lease Rev. Ref. Bonds (Various Capital Projects), Series 2022-A, 5.00% 2025 | | | 1,330 | | | | 1,517 | |
| Public Works Board, Lease Rev. Ref. Bonds (Various Capital Projects), Series 2016-C, 5.00% 2027 | | | 250 | | | | 302 | |
| Public Works Board, Lease Rev. Ref. Bonds (Various State Office Buildings), Series 2015-F, 5.00% 2024 | | | 150 | | | | 167 | |
| Ravenswood City School Dist., G.O. Bonds, 2016 Election, Series 2016, 5.00% 2023 | | | 445 | | | | 482 | |
| City of Redding, Electric System Rev. Ref. Bonds, Series 2018, 5.00% 2022 | | | 725 | | | | 745 | |
| City of Richmond, Wastewater Rev. Ref. Bonds, Series 2019-B, 5.00% 2023 | | | 940 | | | | 1,019 | |
| County of Riverside, Infrastructure Fncg. Auth., Lease Rev. Ref. Bonds, Series 2015-A, 5.00% 2021 | | | 850 | | | | 850 | |
| County of Riverside, Infrastructure Fncg. Auth., Lease Rev. Ref. Bonds, Series 2015-A, 5.00% 2021 (escrowed to maturity) | | | 150 | | | | 150 | |
| Riverside Unified School Dist., G.O. Bonds, 2016 Election, Series 2019, 4.00% 2024 | | | 125 | | | | 138 | |
| Robla School Dist., G.O. Bonds, 2018 Election, Series 2019-A, Assured Guaranty Municipal insured, 4.00% 2022 | | | 740 | | | | 761 | |
| City of Roseville, Fin. Auth., Special Tax Rev. Ref. Bonds, Series 2016, 4.00% 2022 | | | 620 | | | | 639 | |
| | | | | | | | | |
| 66 | Private Client Services Funds |
Capital Group California Short-Term Municipal Fund
| Bonds, notes & other debt instruments (continued) | | Principal amount
(000) | | | Value
(000) | |
| California (continued) | | | | | | |
| City of Sacramento, Municipal Utility Dist., Electric Rev. Bonds, Series 1997-K, AMBAC insured, 5.25% 2024 | | $ | 115 | | | $ | 125 | |
| Sacramento Unified School Dist., G.O. Bonds, 2012 Election, Series 2019-D, BAM insured, 4.00% 2023 | | | 450 | | | | 478 | |
| Sacramento Unified School Dist., G.O. Bonds, 2012 Election, Series 2019-D, BAM insured, 4.00% 2024 | | | 520 | | | | 569 | |
| City of San Diego, Community Facs. Dist. No. 2 (Santaluz), Improvement Area No. 1, Special Tax Rev. Ref. Bonds, Series 2021, 4.00% 2026 | | | 490 | | | | 564 | |
| City of San Diego, Public Facs. Fncg. Auth., Lease Rev. Bonds (Capital Improvement Projects), Series 2021-A, 5.00% 2027 | | | 255 | | | | 316 | |
| City of San Diego, Public Fin. Auth., Water Rev. Bonds, Series 2020-A, 5.00% 2022 | | | 335 | | | | 347 | |
| County of San Diego, Regional Airport Auth., Airport Rev. and Rev. Ref. Bonds, Series 2019-A, 5.00% 2023 | | | 500 | | | | 539 | |
| County of San Diego, Regional Airport Auth., Airport Rev. and Rev. Ref. Bonds, Series 2019-A, 5.00% 2024 | | | 500 | | | | 561 | |
| County of San Diego, Regional Airport Auth., Airport Rev. Ref. Bonds, Series 2020-B, 5.00% 2022 | | | 1,000 | | | | 1,032 | |
| County of San Diego, Regional Transportation Commission, Limited Sales Tax Rev. Bonds, Series 2021-B, 5.00% 2026 | | | 140 | | | | 167 | |
| County of San Diego, Water Auth., Water Rev. Ref. Green Bonds, Series 2021-A, 5.00% 2025 | | | 1,000 | | | | 1,160 | |
| City and County of San Francisco, Airport Commission, San Francisco International Airport, Rev. Bonds, Series 2019-D-2, 5.00% 2024 | | | 2,000 | | | | 2,229 | |
| City and County of San Francisco, Airport Commission, San Francisco International Airport, Rev. Ref. Bonds, Series 2009-D-2, 4.00% 2023 (escrowed to maturity) | | | 400 | | | | 422 | |
| City and County of San Francisco, Airport Commission, San Francisco International Airport, Rev. Ref. Bonds, Series 2016-A-2, 5.00% 2024 | | | 400 | | | | 446 | |
| City and County of San Francisco, Airport Commission, San Francisco International Airport, Rev. Ref. Bonds, Series 2019-D-2, 5.00% 2026 | | | 500 | | | | 596 | |
| City and County of San Francisco, G.O. Bonds (Earthquake Safety and Emergency Response), Series 2021-E-1, 5.00% 2025 | | | 815 | | | | 949 | |
| City and County of San Francisco, Public Utilities Commission, San Francisco Water Rev. Bonds, Series 2011-A, 5.00% 2029 (preref. 2021) | | | 1,000 | | | | 1,000 | |
| City and County of San Francisco, Public Utilities Commission, Wastewater Rev. Green Bonds, Series 2018-C, 2.125% 2048 (put 2023) | | | 1,000 | | | | 1,026 | |
| City and County of San Francisco, Successor Agcy. to the Redev. Agcy., Special Tax Rev. Ref. Bonds (San Francisco Redev. Projects), Series 2014-C, 5.00% 2022 | | | 250 | | | | 259 | |
| San Francisco Community College Dist., G.O. Rev. Ref. Bonds, Series 2015, 5.00% 2024 | | | 865 | | | | 968 | |
| San Gabriel Unified School Dist., G.O. Bonds, Capital Appreciation Bonds, 2008 Election, Series 2012-B, 0% 2023 | | | 200 | | | | 198 | |
| City of San Jose, Airport Rev. Ref. Bonds, Series 2021-A, BAM insured, 5.00% 2026 | | | 440 | | | | 522 | |
| City of San Jose, Fin. Auth., Lease Rev. Ref. Bonds (Civic Center Project), Series 2013-A, 5.00% 2030 (preref. 2023) | | | 2,000 | | | | 2,150 | |
| San Jose Unified School Dist., G.O. Rev. Ref. Bonds, Series 2017, 5.00% 2022 | | | 155 | | | | 161 | |
| Santa Monica-Malibu Unified School Dist., Certs. of Part., Capital Appreciation Notes, Series 2001-C, National insured, 0% 2022 | | | 100 | | | | 100 | |
| Santa Monica-Malibu Unified School Dist., School Facs. Improvement Dist. No. 2 (Santa Monica Schools), G.O. Bonds, 2018 Election, Series 2021-B, 4.00% 2024 | | | 485 | | | | 535 | |
| Santa Monica-Malibu Unified School Dist., School Facs. Improvement Dist. No. 2 (Santa Monica Schools), G.O. Bonds, 2018 Election, Series 2021-B, 4.00% 2025 | | | 335 | | | | 380 | |
| Santa Rosa High School Dist., G.O. Bonds, 2014 Election, Series 2021-E, BAM insured, 4.00% 2025 | | | 1,050 | | | | 1,187 | |
| Semitropic Water Storage Dist., Water Banking Rev. Ref. Bonds, Series 2012-A, 5.00% 2035 (preref. 2022) | | | 1,325 | | | | 1,393 | |
| Silicon Valley Clean Water, Wastewater Rev. Notes, Series 2019-A, 3.00% 2024 | | | 2,500 | | | | 2,620 | |
| Silicon Valley Clean Water, Wastewater Rev. Notes, Series 2021-B, 0.50% 2026 | | | 2,025 | | | | 2,008 | |
| Southern California Public Power Auth., Rev. Ref. Bonds (Magnolia Power Project A), Series 2020-1, 5.00% 2025 | | | 1,000 | | | | 1,166 | |
| Southern California Public Power Auth., Rev. Ref. Bonds (Milford Wind Corridor Phase I Project), Series 2019-1, 5.00% 2022 | | | 200 | | | | 206 | |
| Southern California Public Power Auth., Rev. Ref. Green Bonds (Linden Wind Energy Project), Series 2020-A, 5.00% 2024 | | | 550 | | | | 606 | |
| Southern California Public Power Auth., Rev. Ref. Green Bonds (Milford Wind Corridor Phase II Project), Series 2021-1, 5.00% 2024 | | | 520 | | | | 585 | |
| Southwestern Community College Dist., G.O. Rev. Ref. Bonds (2019 Crossover), Series 2016-B, 4.00% 2022 | | | 310 | | | | 319 | |
| Statewide Communities Dev. Auth., Health Fac. Rev. Ref. Bonds (Los Angeles Jewish Home for the Aging), Series 2019-A, 4.00% 2022 | | | 265 | | | | 274 | |
| Statewide Communities Dev. Auth., Health Fac. Rev. Ref. Bonds (Los Angeles Jewish Home for the Aging), Series 2019-A, 4.00% 2021 | | | 150 | | | | 150 | |
| Statewide Communities Dev. Auth., Health Fac. Rev. Ref. Bonds (Los Angeles Jewish Home for the Aging), Series 2019-A, 4.00% 2023 | | | 250 | | | | 268 | |
| Statewide Communities Dev. Auth., Health Fac. Rev. Ref. Bonds (Los Angeles Jewish Home for the Aging), Series 2019-B, 4.00% 2023 | | | 660 | | | | 708 | |
| Statewide Communities Dev. Auth., Multi Family Housing Rev. Bonds (Harriet Tubman Terrace Apartments), Series 2021-Q, 0.24% 2024 (put 2023) | | | 2,000 | | | | 1,997 | |
| | | | | | | | | |
| Private Client Services Funds | 67 |
Capital Group California Short-Term Municipal Fund
| Bonds, notes & other debt instruments (continued) | | Principal amount
(000) | | | Value
(000) | |
| California (continued) | | | | | | |
| Statewide Communities Dev. Auth., Multi Family Housing Rev. Bonds (Washington Court Apartments), Series 2021-E, 0.22% 2023 (put 2022) | | $ | 1,000 | | | $ | 1,000 | |
| Statewide Communities Dev. Auth., Rev. Bonds (Adventist Health System/West), Series 2018, 5.00% 2022 | | | 150 | | | | 152 | |
| Statewide Communities Dev. Auth., Rev. Bonds (Adventist Health System/West), Series 2018-A, 5.00% 2023 | | | 135 | | | | 144 | |
| Statewide Communities Dev. Auth., Rev. Bonds (Adventist Health System/West), Series 2018-A, 5.00% 2024 | | | 200 | | | | 222 | |
| Statewide Communities Dev. Auth., Rev. Bonds (Adventist Health System/West), Series 2018-A, 5.00% 2025 | | | 415 | | | | 477 | |
| Statewide Communities Dev. Auth., Rev. Bonds (Cottage Health System Obligated Group), Series 2015, 5.00% 2043 (preref. 2024) | | | 1,500 | | | | 1,708 | |
| Statewide Communities Dev. Auth., Rev. Bonds (Huntington Memorial Hospital), Series 2018, 5.00% 2022 | | | 700 | | | | 722 | |
| Statewide Communities Dev. Auth., Rev. Bonds (Huntington Memorial Hospital), Series 2018, 5.00% 2026 | | | 325 | | | | 387 | |
| Statewide Communities Dev. Auth., Rev. Bonds (Viamonte Senior Living 1 Project), Series 2018-B, 3.00% 2025 | | | 155 | | | | 155 | |
| Statewide Communities Dev. Auth., Student Housing Rev. Bonds (University of California, Irvine East Campus Apartments, Phase I Ref. and Phase IV-B CHF-Irvine, LLC), Series 2021, BAM insured, 5.00% 2029 | | | 1,865 | | | | 2,379 | |
| City of Stockton, Public Fncg. Auth., Water Rev. Ref. Green Bonds, Series 2018-A, BAM insured, 5.00% 2022 | | | 1,210 | | | | 1,260 | |
| Torrance Unified School Dist., G.O. Bonds, Capital Appreciation Bonds, 2008 Election, Series 2009-B-1, 0% 2023 | | | 250 | | | | 248 | |
| City of Tracy, Successor Agcy. to the Community Dev. Agcy., Tax Allocation Rev. Ref. Bonds, Series 2016, Assured Guaranty Municipal insured, 5.00% 2022 | | | 450 | | | | 465 | |
| Transbay Joint Powers Auth., Senior Tax Allocation Green Bonds, Series 2020-A, 5.00% 2025 | | | 500 | | | | 583 | |
| Transbay Joint Powers Auth., Senior Tax Allocation Green Bonds, Series 2020-A, 5.00% 2026 | | | 550 | | | | 659 | |
| Twin Rivers Unified School Dist., G.O. Rev. Ref. Bonds, Series 2016-B, Assured Guaranty Municipal insured, 5.00% 2027 | | | 225 | | | | 269 | |
| Ukiah Unified School Dist., G.O. Bonds, Capital Appreciation Bonds, 2005 Election, Series 2006, MBIA insured, 0% 2023 | | | 440 | | | | 436 | |
| Regents of the University of California, G.O. Rev. Bonds, Series 2013-AK, 5.00% 2048 (put 2023) | | | 1,000 | | | | 1,073 | |
| Regents of the University of California, Limited Project Rev. Bonds, Series 2012-G, 5.00% 2022 | | | 150 | | | | 154 | |
| Regents of the University of California, Limited Project Rev. Bonds, Series 2022-S, 5.00% 2026 | | | 2,500 | | | | 2,930 | |
| Val Verde Unified School Dist., G.O. Bonds, 2020 Election, Series 2020-A, BAM insured, 4.00% 2023 | | | 450 | | | | 478 | |
| Dept. of Veterans Affairs, Home Purchase Rev. Bonds, Series 2016-B, 3.50% 2045 | | | 465 | | | | 490 | |
| Dept. of Veterans Affairs, Home Purchase Rev. Bonds, Series 2019-A, 4.00% 2049 | | | 1,310 | | | | 1,427 | |
| Dept. of Veterans Affairs, Home Purchase Rev. Bonds, Series 2020-A, 3.00% 2050 | | | 995 | | | | 1,068 | |
| Dept. of Veterans Affairs, Veterans G.O. Bonds, Series 2017-CQ, 4.00% 2047 | | | 655 | | | | 703 | |
| Dept. of Veterans Affairs, Veterans G.O. Bonds, Series 2018-CR, 4.00% 2048 | | | 1,195 | | | | 1,294 | |
| Dept. of Veterans Affairs, Veterans G.O. Bonds, Series 2020-CT, 3.00% 2050 | | | 1,990 | | | | 2,136 | |
| Dept. of Veterans Affairs, Veterans G.O. Rev. Ref. Bonds, Series 2016-CN, 3.50% 2045 | | | 680 | | | | 710 | |
| Dept. of Water Resources, Water System Rev. Bonds (Central Valley Project), Series 2021-BD, 5.00% 2025 | | | 1,000 | | | | 1,183 | |
| West Contra Costa Unified School Dist., G.O. Bonds, 2012 Election, Series 2020-E, Assured Guaranty Municipal insured, 4.00% 2024 | | | 300 | | | | 329 | |
| West Contra Costa Unified School Dist., G.O. Bonds, 2012 Election, Series 2020-E, Assured Guaranty Municipal insured, 4.00% 2026 | | | 640 | | | | 737 | |
| West Contra Costa Unified School Dist., G.O. Rev. Ref. Bonds, Series 2017-A-1, 5.00% 2024 | | | 250 | | | | 281 | |
| Western Riverside Water and Wastewater Fncg. Auth., Local Agcy. Rev. Ref. Bonds, Series 2016-A, 5.00% 2022 | | | 100 | | | | 104 | |
| City of Westminster, Successor Agcy. to the Redev. Agcy., Commercial Redev. Project No. 1, Tax Allocation Rev. Ref. Bonds, Series 2016-B, BAM insured, 4.00% 2022 | | | 120 | | | | 124 | |
| Whittier Union High School Dist., G.O. Rev. Ref. Bonds, Series 2015, 5.00% 2022 | | | 300 | | | | 311 | |
| City of Woodland, Community Facs. Dist. No. 2004-1 (Spring Lake), Special Tax Capital Projects Bonds, Series 2021, 4.00% 2026 | | | 160 | | | | 184 | |
| City of Woodland, Community Facs. Dist. No. 2004-1 (Spring Lake), Special Tax Capital Projects Bonds, Series 2021, Assured Guaranty Municipal insured, 4.00% 2027 | | | 180 | | | | 210 | |
| City of Woodland, Community Facs. Dist. No. 2004-1 (Spring Lake), Special Tax Capital Projects Bonds, Series 2021, Assured Guaranty Municipal insured, 4.00% 2028 | | | 200 | | | | 237 | |
| | | | | | | | | |
| Total bonds, notes & other debt instruments (cost: $154,232,000) | | | | | | | 155,490 | |
| | | | | | | | | |
| Short-term securities 15.60% | | | | | | | | |
| Municipals 15.60% | | | | | | | | |
| State of California, Fin. Auth., Recovery Zone Fac. Bonds (Chevron U.S.A., Inc. Project), Series 2010-A, 0.02% 20351 | | | 8,700 | | | | 8,700 | |
| State of California, City of Los Angeles, Dept. of Water and Power, Power System Rev. Ref. Bonds, Series 2001-B-3, 0.01% 20341 | | | 1,300 | | | | 1,300 | |
| State of California, City of Los Angeles, Dept. of Water and Power, Rev. Bonds, Series 2021-A-1, 0.02% 20501 | | | 4,000 | | | | 4,000 | |
| | | | | | | | | |
| 68 | Private Client Services Funds |
Capital Group California Short-Term Municipal Fund
| Short-term securities (continued) | | Principal amount
(000) | | | Value
(000) | |
| Municipals (continued) | | | | | | |
| State of California, Metropolitan Water Dist. of Southern California, Water Rev. Ref. Bonds, Series 2016-B-2, 0.02% 20371 | | $ | 3,500 | | | $ | 3,500 | |
| State of California, Pollution Control Fncg. Auth., Environmental Impact Rev. Bonds (Air Products and Chemicals, Inc. Project), Series 1997-B, 0.02% 20421 | | | 1,350 | | | | 1,350 | |
| State of California, Regents of the University of California, General Rev. Bonds, Series 2013-AL-4, 0.01% 20481 | | | 3,600 | | | | 3,600 | |
| State of California, Regents of the University of California, General Rev. Bonds, Series 2013-AL-1, 0.02% 20481 | | | 1,000 | | | | 1,000 | |
| State of California, Regents of the University of California, Medical Center Pooled Rev. Bonds, Series 2007-B-2, 0.01% 20321 | | | 3,000 | | | | 3,000 | |
| State of California, Regents of the University of California, Medical Center Pooled Rev. Bonds, Series 2007-B-1, 0.02% 20321 | | | 1,900 | | | | 1,900 | |
| | | | | | | | | |
| Total short-term securities (cost: $28,351,000) | | | | | | | 28,350 | |
| | | | | | | | | |
| Total investment securities 101.17% (cost: $182,583,000) | | | | | | | 183,840 | |
| Other assets less liabilities (1.17%) | | | | | | | (2,121 | ) |
| | | | | | | | | |
| Net assets 100.00% | | | | | | $ | 181,719 | |
| 1 | Coupon rate may change periodically. Reference rate and spread are as of the most recent information available. Some coupon rates are determined by the issuer or agent based on current market conditions; therefore, the reference rate and spread are not available. For short-term securities, the date of the next scheduled coupon rate change is considered to be the maturity date. |
Key to abbreviations and symbol
Agcy. = Agency
AMT = Alternative Minimum Tax
Auth. = Authority
Certs. = Certificates
Dept. = Department
Dev. = Development
Dist. = District
Econ. = Economic
Fac. = Facility
Facs. = Facilities
Fin. = Finance
Fncg. = Financing
G.O. = General Obligation
IAM = Interest at Maturity
LIBOR = London Interbank Offered Rate
LOC = Letter of Credit
Part. = Participation
Preref. = Prerefunded
Redev. = Redevelopment
Ref. = Refunding
Rev. = Revenue
SIFMA = Securities Industry and Financial Markets Association
USD/$ = U.S. dollars
| Private Client Services Funds | 69 |
Capital Group Core Bond Fund
Investment portfolio October 31, 2021
| Portfolio by type of security | Percent of net assets |

| Portfolio quality summary* | | Percent of net assets |
| U.S. Treasury and agency† | | | 42.25 | % |
| AAA/Aaa | | | 20.93 | |
| AA/Aa | | | 9.15 | |
| A/A | | | 14.63 | |
| BBB/Baa | | | 8.72 | |
| Short-term securities & other assets less liabilities | | | 4.32 | |
| * | Bond ratings, which typically range from AAA/Aaa (highest) to D (lowest), are assigned by credit rating agencies such as Standard & Poor’s, Moody’s and/or Fitch as an indication of an issuer’s creditworthiness. In assigning a credit rating to a security, the fund looks specifically to the ratings assigned to the issuer of the security by Standard & Poor’s, Moody’s and/or Fitch. If agency ratings differ, the security will be considered to have received the highest of those ratings, consistent with the fund’s investment policies. The ratings are not covered by the Report of Independent Registered Public Accounting Firm. |
| † | These securities are guaranteed by the full faith and credit of the U.S. government. |
| Bonds, notes & other debt instruments 95.68% | | Principal amount
(000) | | | Value
(000) | |
| U.S. Treasury bonds & notes 39.51% | | | | | | |
| U.S. Treasury 30.40% | | | | | | |
| U.S. Treasury 1.875% 2021 | | $ | 500 | | | $ | 501 | |
| U.S. Treasury 2.125% 2021 | | | 1,000 | | | | 1,003 | |
| U.S. Treasury 0.125% 2022 | | | 27,000 | | | | 27,008 | |
| U.S. Treasury 1.50% 2022 | | | 1,920 | | | | 1,943 | |
| U.S. Treasury 1.75% 2022 | | | — | 1 | | | — | 1 |
| U.S. Treasury 1.875% 2022 | | | 3,745 | | | | 3,784 | |
| U.S. Treasury 2.125% 2022 | | | 3,000 | | | | 3,041 | |
| U.S. Treasury 0.125% 2023 | | | 10,000 | | | | 9,986 | |
| U.S. Treasury 0.125% 2023 | | | 2,000 | | | | 1,983 | |
| U.S. Treasury 0.25% 2023 | | | 2,610 | | | | 2,605 | |
| U.S. Treasury 0.25% 2023 | | | 437 | | | | 435 | |
| U.S. Treasury 1.25% 2023 | | | 1,000 | | | | 1,015 | |
| U.S. Treasury 1.375% 20232 | | | 1,275 | | | | 1,296 | |
| U.S. Treasury 1.375% 2023 | | | 1,000 | | | | 1,017 | |
| U.S. Treasury 1.75% 2023 | | | 1,000 | | | | 1,022 | |
| U.S. Treasury 2.00% 2023 | | | 2,000 | | | | 2,045 | |
| U.S. Treasury 2.125% 2023 | | | 3,415 | | | | 3,528 | |
| U.S. Treasury 2.25% 2023 | | | 500 | | | | 518 | |
| U.S. Treasury 2.50% 2023 | | | 1,050 | | | | 1,089 | |
| U.S. Treasury 2.75% 2023 | | | 4,542 | | | | 4,706 | |
| U.S. Treasury 2.75% 2023 | | | 2,250 | | | | 2,353 | |
| U.S. Treasury 0.375% 2024 | | | 22,000 | | | | 21,790 | |
| U.S. Treasury 1.75% 2024 | | | 4,000 | | | | 4,117 | |
| U.S. Treasury 2.00% 2024 | | | 3,288 | | | | 3,405 | |
| U.S. Treasury 2.00% 2024 | | | 2,480 | | | | 2,566 | |
| U.S. Treasury 2.125% 2024 | | | 5,000 | | | | 5,202 | |
| U.S. Treasury 2.125% 20242 | | | 3,500 | | | | 3,627 | |
| U.S. Treasury 2.25% 20242 | | | 3,713 | | | | 3,863 | |
| U.S. Treasury 2.25% 2024 | | | 1,820 | | | | 1,889 | |
| 70 | Private Client Services Funds |
Capital Group Core Bond Fund
| Bonds, notes & other debt instruments (continued) | | Principal amount
(000) | | | Value
(000) | |
| U.S. Treasury bonds & notes (continued) | | | | | | |
| U.S. Treasury (continued) | | | | | | |
| U.S. Treasury 2.75% 2024 | | $ | 2,500 | | | $ | 2,624 | |
| U.S. Treasury 0.50% 2025 | | | 4,452 | | | | 4,398 | |
| U.S. Treasury 1.375% 2025 | | | 8,128 | | | | 8,276 | |
| U.S. Treasury 2.00% 2025 | | | 2,000 | | | | 2,077 | |
| U.S. Treasury 2.625% 2025 | | | 6,600 | | | | 7,028 | |
| U.S. Treasury 7.625% 20252 | | | 750 | | | | 917 | |
| U.S. Treasury 0.50% 2026 | | | 3,500 | | | | 3,414 | |
| U.S. Treasury 0.75% 2026 | | | 1,150 | | | | 1,132 | |
| U.S. Treasury 0.75% 2026 | | | 32 | | | | 31 | |
| U.S. Treasury 0.875% 2026 | | | 7,428 | | | | 7,327 | |
| U.S. Treasury 1.625% 2026 | | | 3,000 | | | | 3,070 | |
| U.S. Treasury 1.75% 20262 | | | 12,140 | | | | 12,485 | |
| U.S. Treasury 1.125% 2027 | | | 477 | | | | 475 | |
| U.S. Treasury 2.25% 2027 | | | 8,420 | | | | 8,860 | |
| U.S. Treasury 2.25% 2027 | | | 2,200 | | | | 2,316 | |
| U.S. Treasury 2.625% 2029 | | | 5,660 | | | | 6,121 | |
| U.S. Treasury 1.25% 2031 | | | 6,971 | | | | 6,777 | |
| | | | | | | | 194,665 | |
| | | | | | | | | |
| U.S. Treasury inflation-protected securities 9.11% | | | | | | | | |
| U.S. Treasury Inflation-Protected Security 0.125% 20223 | | | 12,151 | | | | 12,387 | |
| U.S. Treasury Inflation-Protected Security 0.125% 20253 | | | 10,746 | | | | 11,590 | |
| U.S. Treasury Inflation-Protected Security 0.125% 20263 | | | 14,301 | | | | 15,582 | |
| U.S. Treasury Inflation-Protected Security 0.875% 20293 | | | 4,958 | | | | 5,763 | |
| U.S. Treasury Inflation-Protected Security 0.125% 20302,3 | | | 11,775 | | | | 13,053 | |
| | | | | | | | 58,375 | |
| | | | | | | | | |
| Total U.S. Treasury bonds & notes | | | | | | | 253,040 | |
| | | | | | | | | |
| Corporate bonds, notes & loans 27.60% | | | | | | | | |
| Financials 7.13% | | | | | | | | |
| ACE INA Holdings, Inc. 2.875% 2022 | | | 150 | | | | 153 | |
| ACE INA Holdings, Inc. 3.35% 2026 | | | 45 | | | | 49 | |
| ACE INA Holdings, Inc. 4.35% 2045 | | | 50 | | | | 64 | |
| AerCap Ireland Capital, Ltd. / AerCap Global Aviation Trust 2.45% 2026 | | | 1,637 | | | | 1,653 | |
| AerCap Ireland Capital, Ltd. / AerCap Global Aviation Trust 3.00% 2028 | | | 1,190 | | | | 1,207 | |
| Allstate Corp. 0.75% 2025 | | | 637 | | | | 624 | |
| Allstate Corp. 3.28% 2026 | | | 175 | | | | 189 | |
| American International Group, Inc. 2.50% 2025 | | | 2,000 | | | | 2,078 | |
| American International Group, Inc. 3.40% 2030 | | | 1,021 | | | | 1,107 | |
| Bank of America Corp. 1.197% 2026 (USD-SOFR + 1.01% on 10/24/2025)4 | | | 1,108 | | | | 1,090 | |
| Bank of America Corp. 1.734% 2027 (USD-SOFR + 0.96% on 7/22/2026)4 | | | 1,740 | | | | 1,729 | |
| Bank of America Corp. 1.922% 2031 (USD-SOFR + 1.37% on 10/24/2030)4 | | | 1,385 | | | | 1,322 | |
| Bank of America Corp. 2.687% 2032 (USD-SOFR + 1.32% on 4/22/2031)4 | | | 748 | | | | 758 | |
| BNP Paribas 2.159% 2029 (USD-SOFR + 1.218% on 9/15/2028)4,5 | | | 475 | | | | 467 | |
| Citigroup, Inc. 4.45% 2027 | | | 400 | | | | 450 | |
| Citigroup, Inc. 2.572% 2031 (USD-SOFR + 2.107% on 6/3/2030)4 | | | 1,283 | | | | 1,294 | |
| Citigroup, Inc. 2.666% 2031 (USD-SOFR + 1.146% on 1/29/2030)4 | | | 502 | | | | 511 | |
| Credit Suisse Group AG 3.80% 2023 | | | 500 | | | | 524 | |
| GE Capital Funding, LLC 3.45% 2025 | | | 1,000 | | | | 1,070 | |
| Goldman Sachs Group, Inc. 0.925% 2024 (USD-SOFR + 0.50% on 10/21/2023)4 | | | 1,545 | | | | 1,544 | |
| Goldman Sachs Group, Inc. 3.272% 2025 (3-month USD-LIBOR + 1.201% on 9/29/2024)4 | | | 1,385 | | | | 1,462 | |
| Goldman Sachs Group, Inc. 0.855% 2026 (USD-SOFR + 0.609% on 2/12/2025)4 | | | 400 | | | | 393 | |
| Goldman Sachs Group, Inc. 1.093% 2026 (USD-SOFR + 0.789% on 12/9/2025)4 | | | 750 | | | | 732 | |
| Goldman Sachs Group, Inc. 1.948% 2027 (USD-SOFR + 0.913% on 10/21/2026)4 | | | 679 | | | | 680 | |
| Goldman Sachs Group, Inc. 3.814% 2029 (3-month USD-LIBOR + 1.158% on 4/23/2028)4 | | | 725 | | | | 795 | |
| Goldman Sachs Group, Inc. 1.992% 2032 (USD-SOFR + 1.09% on 1/27/2031)4 | | | 708 | | | | 679 | |
| Goldman Sachs Group, Inc. 4.017% 2038 (3-month USD-LIBOR + 1.373% on 10/31/2037)4 | | | 175 | | | | 201 | |
| Private Client Services Funds | 71 |
| Capital Group Core Bond Fund | | | | | | |
| | | | | | | |
| Bonds, notes & other debt instruments (continued) | | Principal amount
(000) | | | Value
(000) | |
| Corporate bonds, notes & loans (continued) | | | | | | |
| Financials (continued) | | | | | | |
| JPMorgan Chase & Co. 3.559% 2024 (3-month USD-LIBOR + 0.73% on 4/23/2023)4 | | $ | 1,125 | | | $ | 1,171 | |
| JPMorgan Chase & Co. 2.301% 2025 (USD-SOFR + 1.16% on 10/15/2024)4 | | | 1,165 | | | | 1,201 | |
| JPMorgan Chase & Co. 1.045% 2026 (USD-SOFR + 0.80% on 11/19/2025)4 | | | 1,500 | | | | 1,464 | |
| JPMorgan Chase & Co. 2.58% 2032 (USD-SOFR + 1.25% on 4/22/2031)4 | | | 232 | | | | 234 | |
| Lloyds Banking Group PLC 4.375% 2028 | | | 200 | | | | 226 | |
| Marsh & McLennan Companies, Inc. 3.875% 2024 | | | 495 | | | | 529 | |
| Marsh & McLennan Companies, Inc. 2.25% 2030 | | | 715 | | | | 715 | |
| Metropolitan Life Global Funding I 0.95% 20255 | | | 757 | | | | 748 | |
| Morgan Stanley 1.164% 2025 (USD-SOFR + 0.56% on 10/21/2024)4 | | | 995 | | | | 991 | |
| Morgan Stanley 2.72% 2025 (USD-SOFR + 1.152% on 7/22/2024)4 | | | 1,640 | | | | 1,703 | |
| Morgan Stanley 0.985% 2026 (USD-SOFR + 0.72% on 12/10/2025)4 | | | 1,386 | | | | 1,346 | |
| Morgan Stanley 1.593% 2027 (USD-SOFR + 0.879% on 5/4/2026)4 | | | 954 | | | | 945 | |
| Morgan Stanley 2.699% 2031 (USD-SOFR + 1.143% on 1/22/2030)4 | | | 461 | | | | 471 | |
| National Securities Clearing Corp. 0.40% 20235 | | | 3,000 | | | | 2,986 | |
| New York Life Global Funding 2.25% 20225 | | | 305 | | | | 310 | |
| New York Life Global Funding 0.90% 20245 | | | 2,000 | | | | 1,998 | |
| Northwestern Mutual Global Funding 0.80% 20265 | | | 1,778 | | | | 1,732 | |
| Toronto-Dominion Bank 0.45% 2023 | | | 1,353 | | | | 1,350 | |
| Toronto-Dominion Bank 1.25% 2026 | | | 1,005 | | | | 987 | |
| Wells Fargo & Company 2.572% 2031 (3-month USD-LIBOR + 1.00% on 2/11/2030)4 | | | 1,715 | | | | 1,736 | |
| | | | | | | | 45,668 | |
| | | | | | | | | |
| Consumer discretionary 4.70% | | | | | | | | |
| Amazon.com, Inc. 0.25% 2023 | | | 1,175 | | | | 1,173 | |
| Amazon.com, Inc. 0.45% 2024 | | | 1,175 | | | | 1,166 | |
| Amazon.com, Inc. 0.80% 2025 | | | 1,544 | | | | 1,529 | |
| Amazon.com, Inc. 1.20% 2027 | | | 1,287 | | | | 1,267 | |
| Amazon.com, Inc. 1.65% 2028 | | | 1,175 | | | | 1,172 | |
| Amazon.com, Inc. 2.10% 2031 | | | 1,175 | | | | 1,186 | |
| American Honda Finance Corp. 0.75% 2024 | | | 2,145 | | | | 2,132 | |
| American Honda Finance Corp. 1.30% 2026 | | | 1,535 | | | | 1,524 | |
| American Honda Finance Corp. 2.30% 2026 | | | 80 | | | | 83 | |
| American Honda Finance Corp. 3.50% 2028 | | | 325 | | | | 359 | |
| Bayerische Motoren Werke AG 0.75% 20245 | | | 1,250 | | | | 1,244 | |
| Bayerische Motoren Werke AG 0.80% 20245 | | | 1,225 | | | | 1,221 | |
| Bayerische Motoren Werke AG 1.25% 20265 | | | 1,000 | | | | 990 | |
| General Motors Company 4.20% 2027 | | | 1,020 | | | | 1,116 | |
| Home Depot, Inc. 3.25% 2022 | | | 350 | | | | 353 | |
| Home Depot, Inc. 1.50% 2028 | | | 1,840 | | | | 1,808 | |
| Hyundai Capital America 0.80% 20235 | | | 1,200 | | | | 1,200 | |
| Hyundai Capital America 1.80% 20255 | | | 481 | | | | 482 | |
| Hyundai Capital America 2.375% 20275 | | | 387 | | | | 389 | |
| Hyundai Capital America 2.10% 20285 | | | 350 | | | | 342 | |
| McDonald’s Corp. 3.70% 2026 | | | 135 | | | | 147 | |
| McDonald’s Corp. 3.50% 2027 | | | 185 | | | | 202 | |
| NIKE, Inc. 2.375% 2026 | | | 615 | | | | 645 | |
| Stellantis Finance US, Inc. 1.711% 20275 | | | 1,365 | | | | 1,344 | |
| Stellantis Finance US, Inc. 2.691% 20315 | | | 900 | | | | 887 | |
| Toyota Motor Credit Corp. 0.625% 2024 | | | 2,145 | | | | 2,128 | |
| Toyota Motor Credit Corp. 3.00% 2025 | | | 1,240 | | | | 1,313 | |
| Toyota Motor Credit Corp. 0.80% 2026 | | | 890 | | | | 874 | |
| Toyota Motor Credit Corp. 1.125% 2026 | | | 1,840 | | | | 1,815 | |
| | | | | | | | 30,091 | |
| | | | | | | | | |
| Industrials 2.34% | | | | | | | | |
| Avolon Holdings Funding, Ltd. 3.625% 20225 | | | 587 | | | | 594 | |
| Avolon Holdings Funding, Ltd. 3.95% 20245 | | | 743 | | | | 784 | |
| Avolon Holdings Funding, Ltd. 4.375% 20265 | | | 925 | | | | 999 | |
| Boeing Company 5.04% 2027 | | | 1,021 | | | | 1,160 | |
| Boeing Company 3.25% 2028 | | | 1,095 | | | | 1,147 | |
| 72 | Private Client Services Funds |
| Capital Group Core Bond Fund | | | | | | |
| | | | | | | |
| Bonds, notes & other debt instruments (continued) | | Principal amount
(000) | | | Value
(000) | |
| Corporate bonds, notes & loans (continued) | | | | | | |
| Industrials (continued) | | | | | | |
| Emerson Electric Co. 1.80% 2027 | | $ | 383 | | | $ | 386 | |
| General Dynamics Corp. 1.15% 2026 | | | 1,000 | | | | 998 | |
| General Electric Co. 3.45% 2027 | | | 1,000 | | | | 1,091 | |
| Honeywell International, Inc. 2.15% 2022 | | | 1,160 | | | | 1,175 | |
| Honeywell International, Inc. 2.30% 2024 | | | 878 | | | | 912 | |
| Masco Corp. 1.50% 2028 | | | 782 | | | | 754 | |
| Raytheon Technologies Corp. 3.20% 2024 | | | 275 | | | | 289 | |
| Siemens AG 0.40% 20235 | | | 1,140 | | | | 1,140 | |
| Siemens AG 0.65% 20245 | | | 1,425 | | | | 1,420 | |
| Siemens AG 1.20% 20265 | | | 808 | | | | 800 | |
| Union Pacific Corp. 3.75% 2025 | | | 230 | | | | 250 | |
| Union Pacific Corp. 2.15% 2027 | | | 793 | | | | 816 | |
| United Technologies Corp. 3.65% 2023 | | | 27 | | | | 28 | |
| Vinci SA 3.75% 20295 | | | 200 | | | | 222 | |
| | | | | | | | 14,965 | |
| | | | | | | | | |
| Utilities 2.02% | | | | | | | | |
| Ameren Corp. 2.50% 2024 | | | 373 | | | | 388 | |
| Connecticut Light and Power Co. 3.20% 2027 | | | 1,025 | | | | 1,107 | |
| Duke Energy Progress, LLC 3.375% 2023 | | | 786 | | | | 824 | |
| Duke Energy Progress, LLC 3.70% 2028 | | | 200 | | | | 222 | |
| Entergy Louisiana, LLC 0.95% 2024 | | | 1,860 | | | | 1,852 | |
| Eversource Energy 2.75% 2022 | | | 750 | | | | 755 | |
| FirstEnergy Transmission LLC 2.866% 20285 | | | 425 | | | | 438 | |
| Florida Power & Light Company 2.85% 2025 | | | 225 | | | | 237 | |
| NextEra Energy Capital Holdings, Inc. 2.25% 2030 | | | 1,276 | | | | 1,276 | |
| Pacific Gas and Electric Co. 3.45% 2025 | | | 150 | | | | 156 | |
| Pacific Gas and Electric Co. 3.75% 2028 | | | 150 | | | | 157 | |
| Pacific Gas and Electric Co. 2.50% 2031 | | | 175 | | | | 167 | |
| Pacific Gas and Electric Co. 3.30% 2040 | | | 50 | | | | 47 | |
| Southern California Edison Co. 0.975% 2024 | | | 925 | | | | 921 | |
| Southern California Edison Co. 3.70% 2025 | | | 1,000 | | | | 1,081 | |
| Southern California Edison Co. 2.85% 2029 | | | 1,000 | | | | 1,032 | |
| Tampa Electric Co. 2.60% 2022 | | | 350 | | | | 355 | |
| Virginia Electric and Power Co. 3.10% 2025 | | | 1,040 | | | | 1,099 | |
| Xcel Energy, Inc. 3.35% 2026 | | | 749 | | | | 803 | |
| | | | | | | | 12,917 | |
| | | | | | | | | |
| Information technology 2.00% | | | | | | | | |
| Adobe, Inc. 1.90% 2025 | | | 647 | | | | 663 | |
| Analog Devices, Inc. 1.70% 2028 | | | 418 | | | | 416 | |
| Apple, Inc. 0.70% 2026 | | | 1,135 | | | | 1,113 | |
| Apple, Inc. 1.20% 2028 | | | 1,418 | | | | 1,375 | |
| Apple, Inc. 1.25% 2030 | | | 1,470 | | | | 1,389 | |
| Broadcom Corp. / Broadcom Cayman Finance, Ltd. 3.875% 2027 | | | 185 | | | | 201 | |
| Broadcom, Inc. 1.95% 20285 | | | 123 | | | | 121 | |
| Broadcom, Ltd. 3.625% 2024 | | | 270 | | | | 284 | |
| Fidelity National Information Services, Inc. 1.15% 2026 | | | 1,283 | | | | 1,258 | |
| Fidelity National Information Services, Inc. 1.65% 2028 | | | 129 | | | | 126 | |
| Fiserv, Inc. 3.20% 2026 | | | 670 | | | | 713 | |
| Fiserv, Inc. 2.25% 2027 | | | 777 | | | | 790 | |
| Fortinet, Inc. 1.00% 2026 | | | 696 | | | | 678 | |
| Intuit, Inc. 0.95% 2025 | | | 255 | | | | 252 | |
| Intuit, Inc. 1.35% 2027 | | | 235 | | | | 230 | |
| Microsoft Corp. 2.40% 2026 | | | 1,951 | | | | 2,048 | |
| Oracle Corp. 2.30% 2028 | | | 668 | | | | 678 | |
| PayPal Holdings, Inc. 1.65% 2025 | | | 481 | | | | 488 | |
| | | | | | | | 12,823 | |
| Private Client Services Funds | 73 |
| Capital Group Core Bond Fund | | | | | | |
| | | | | | | |
| Bonds, notes & other debt instruments (continued) | | Principal amount
(000) | | | Value
(000) | |
| Corporate bonds, notes & loans (continued) | | | | | | |
| Communication services 1.95% | | | | | | |
| Alphabet, Inc. 0.80% 2027 | | $ | 490 | | | $ | 470 | |
| Alphabet, Inc. 1.10% 2030 | | | 1,605 | | | | 1,507 | |
| Alphabet, Inc. 2.05% 2050 | | | 440 | | | | 396 | |
| AT&T, Inc. 2.30% 2027 | | | 996 | | | | 1,019 | |
| AT&T, Inc. 1.65% 2028 | | | 1,065 | | | | 1,039 | |
| CCO Holdings LLC and CCO Holdings Capital Corp. 4.908% 2025 | | | 165 | | | | 183 | |
| CCO Holdings LLC and CCO Holdings Capital Corp. 2.80% 2031 | | | 502 | | | | 500 | |
| Comcast Corp. 3.95% 2025 | | | 539 | | | | 592 | |
| Comcast Corp. 1.95% 2031 | | | 704 | | | | 687 | |
| SBA Tower Trust 1.631% 20265 | | | 983 | | | | 971 | |
| T-Mobile US, Inc. 3.75% 2027 | | | 1,119 | | | | 1,215 | |
| Verizon Communications, Inc. 3.00% 2027 | | | 450 | | | | 477 | |
| Verizon Communications, Inc. 2.10% 2028 | | | 1,250 | | | | 1,254 | |
| Verizon Communications, Inc. 2.355% 20325 | | | 2,210 | | | | 2,179 | |
| | | | | | | | 12,489 | |
| | | | | | | | | |
| Consumer staples 1.94% | | | | | | | | |
| 7-Eleven, Inc. 0.95% 20265 | | | 250 | | | | 243 | |
| 7-Eleven, Inc. 1.30% 20285 | | | 175 | | | | 167 | |
| Altria Group, Inc. 2.35% 2025 | | | 156 | | | | 161 | |
| Altria Group, Inc. 4.40% 2026 | | | 117 | | | | 130 | |
| Altria Group, Inc. 3.40% 2030 | | | 89 | | | | 93 | |
| British American Tobacco PLC 3.462% 2029 | | | 1,850 | | | | 1,938 | |
| Coca-Cola Company 1.00% 2028 | | | 1,625 | | | | 1,556 | |
| Constellation Brands, Inc. 3.20% 2023 | | | 386 | | | | 398 | |
| Constellation Brands, Inc. 2.875% 2030 | | | 239 | | | | 248 | |
| Costco Wholesale Corp. 2.30% 2022 | | | 285 | | | | 288 | |
| Keurig Dr Pepper, Inc. 4.057% 2023 | | | 251 | | | | 264 | |
| Keurig Dr Pepper, Inc. 3.20% 2030 | | | 500 | | | | 531 | |
| Kimberly-Clark Corp. 1.05% 2027 | | | 185 | | | | 179 | |
| Kimberly-Clark Corp. 3.10% 2030 | | | 116 | | | | 126 | |
| Molson Coors Brewing Co. 3.00% 2026 | | | 245 | | | | 260 | |
| Nestle Holdings, Inc. 1.50% 20285 | | | 1,750 | | | | 1,714 | |
| Nestlé Holdings, Inc. 1.00% 20275 | | | 1,640 | | | | 1,582 | |
| PepsiCo, Inc. 1.625% 2030 | | | 85 | | | | 83 | |
| Philip Morris International, Inc. 1.50% 2025 | | | 274 | | | | 276 | |
| Philip Morris International, Inc. 0.875% 2026 | | | 566 | | | | 550 | |
| Procter & Gamble Company 0.55% 2025 | | | 796 | | | | 779 | |
| Procter & Gamble Company 1.00% 2026 | | | 362 | | | | 359 | |
| Procter & Gamble Company 3.00% 2030 | | | 495 | | | | 538 | |
| | | | | | | | 12,463 | |
| | | | | | | | | |
| Health care 1.93% | | | | | | | | |
| Abbott Laboratories 3.40% 2023 | | | 98 | | | | 103 | |
| Abbott Laboratories 3.75% 2026 | | | 292 | | | | 323 | |
| Aetna, Inc. 2.80% 2023 | | | 55 | | | | 57 | |
| AmerisourceBergen Corp. 0.737% 2023 | | | 853 | | | | 854 | |
| Amgen, Inc. 2.20% 2027 | | | 740 | | | | 755 | |
| AstraZeneca Finance LLC 0.70% 2024 | | | 1,486 | | | | 1,485 | |
| AstraZeneca Finance LLC 1.20% 2026 | | | 600 | | | | 595 | |
| AstraZeneca Finance LLC 1.75% 2028 | | | 444 | | | | 443 | |
| AstraZeneca PLC 3.375% 2025 | | | 445 | | | | 482 | |
| Becton, Dickinson and Company 3.734% 2024 | | | 17 | | | | 18 | |
| Boston Scientific Corp. 3.45% 2024 | | | 675 | | | | 712 | |
| Cigna Corp. 3.75% 2023 | | | 99 | | | | 104 | |
| CVS Health Corp. 1.30% 2027 | | | 1,384 | | | | 1,342 | |
| CVS Health Corp. 4.30% 2028 | | | 282 | | | | 319 | |
| GlaxoSmithKline PLC 3.375% 2023 | | | 750 | | | | 783 | |
| Novartis Capital Corp. 1.75% 2025 | | | 1,006 | | | | 1,027 | |
| Novartis Capital Corp. 2.00% 2027 | | | 275 | | | | 282 | |
| 74 | Private Client Services Funds |
| Capital Group Core Bond Fund | | | | | | |
| | | | | | | |
| Bonds, notes & other debt instruments (continued) | | Principal amount
(000) | | | | Value
(000) | |
| Corporate bonds, notes & loans (continued) | | | | | | | | |
| Health care (continued) | | | | | | | | |
| Pfizer, Inc. 2.95% 2024 | | $ | 485 | | | $ | 509 | |
| Shire PLC 2.875% 2023 | | | 120 | | | | 124 | |
| Shire PLC 3.20% 2026 | | | 300 | | | | 319 | |
| Thermo Fisher Scientific, Inc. 1.75% 2028 | | | 385 | | | | 380 | |
| UnitedHealth Group, Inc. 1.15% 2026 | | | 495 | | | | 490 | |
| UnitedHealth Group, Inc. 2.30% 2031 | | | 348 | | | | 352 | |
| Zimmer Holdings, Inc. 3.15% 2022 | | | 485 | | | | 488 | |
| | | | | | | | 12,346 | |
| | | | | | | | | |
| Energy 1.83% | | | | | | | | |
| Boardwalk Pipeline Partners LP 4.95% 2024 | | | 460 | | | | 504 | |
| BP Capital Markets PLC 4.234% 2028 | | | 437 | | | | 499 | |
| Canadian Natural Resources, Ltd. 2.05% 2025 | | | 996 | | | | 1,012 | |
| Enbridge Energy Partners LP 5.875% 2025 | | | 230 | | | | 265 | |
| Energy Transfer Operating LP 3.75% 2030 | | | 1,645 | | | | 1,754 | |
| Energy Transfer Partners LP 4.20% 2023 | | | 155 | | | | 163 | |
| Energy Transfer Partners LP 4.50% 2024 | | | 90 | | | | 97 | |
| EOG Resources, Inc. 4.375% 2030 | | | 501 | | | | 583 | |
| Equinor ASA 3.625% 2028 | | | 165 | | | | 183 | |
| Exxon Mobil Corp. 2.019% 2024 | | | 127 | | | | 131 | |
| Exxon Mobil Corp. 2.44% 2029 | | | 183 | | | | 189 | |
| Kinder Morgan, Inc. 3.15% 2023 | | | 495 | | | | 509 | |
| MPLX LP 3.375% 2023 | | | 75 | | | | 78 | |
| MPLX LP 4.00% 2028 | | | 350 | | | | 385 | |
| ONEOK, Inc. 4.55% 2028 | | | 638 | | | | 719 | |
| ONEOK, Inc. 6.35% 2031 | | | 469 | | | | 596 | |
| Phillips 66 4.30% 2022 | | | 290 | | | | 295 | |
| Phillips 66 3.85% 2025 | | | 1,253 | | | | 1,351 | |
| Pioneer Natural Resources Company 1.125% 2026 | | | 238 | | | | 233 | |
| SA Global Sukuk, Ltd. 1.602% 20265 | | | 1,505 | | | | 1,488 | |
| Saudi Arabian Oil Co. 1.625% 20255 | | | 200 | | | | 199 | |
| Schlumberger BV 4.00% 20255 | | | 165 | | | | 180 | |
| Williams Companies, Inc. 3.50% 2030 | | | 293 | | | | 315 | |
| | | | | | | | 11,728 | |
| | | | | | | | | |
| Real estate 1.16% | | | | | | | | |
| Alexandria Real Estate Equities, Inc. 3.95% 2028 | | | 60 | | | | 67 | |
| Alexandria Real Estate Equities, Inc. 1.875% 2033 | | | 596 | | | | 560 | |
| American Campus Communities, Inc. 3.75% 2023 | | | 300 | | | | 311 | |
| American Campus Communities, Inc. 4.125% 2024 | | | 415 | | | | 447 | |
| American Tower Corp. 1.45% 2026 | | | 982 | | | | 968 | |
| American Tower Corp. 1.60% 2026 | | | 717 | | | | 713 | |
| Corporate Office Properties LP 2.75% 2031 | | | 294 | | | | 295 | |
| Equinix, Inc. 2.90% 2026 | | | 929 | | | | 975 | |
| Equinix, Inc. 1.80% 2027 | | | 326 | | | | 324 | |
| Equinix, Inc. 2.00% 2028 | | | 433 | | | | 429 | |
| Essex Portfolio LP 3.50% 2025 | | | 490 | | | | 521 | |
| Gaming and Leisure Properties, Inc. 3.35% 2024 | | | 242 | | | | 255 | |
| Kimco Realty Corp. 3.40% 2022 | | | 35 | | | | 36 | |
| Public Storage 0.875% 2026 | | | 134 | | | | 131 | |
| Public Storage 1.85% 2028 | | | 553 | | | | 553 | |
| Scentre Group 3.50% 20255 | | | 250 | | | | 265 | |
| Sun Communities Operating LP 2.30% 2028 | | | 559 | | | | 555 | |
| | | | | | | | 7,405 | |
| | | | | | | | | |
| Materials 0.60% | | | | | | | | |
| Air Products and Chemicals, Inc. 1.50% 2025 | | | 757 | | | | 765 | |
| Air Products and Chemicals, Inc. 1.85% 2027 | | | 155 | | | | 158 | |
| Dow Chemical Co. 3.625% 2026 | | | 250 | | | | 271 | |
| Private Client Services Funds | 75 |
| Capital Group Core Bond Fund | | | | | | |
| | | | | | | |
| Bonds, notes & other debt instruments (continued) | | Principal amount
(000) | | | Value
(000) | |
| Corporate bonds, notes & loans (continued) | | | | | | |
| Materials (continued) | | | | | | |
| Dow Chemical Co. 2.10% 2030 | | $ | 1,000 | | | $ | 984 | |
| DowDuPont, Inc. 4.493% 2025 | | | 515 | | | | 573 | |
| LYB International Finance III, LLC 2.25% 2030 | | | 496 | | | | 494 | |
| Vale Overseas, Ltd. 3.75% 2030 | | | 587 | | | | 598 | |
| | | | | | | | 3,843 | |
| | | | | | | | | |
| Total corporate bonds, notes & loans | | | | | | | 176,738 | |
| | | | | | | | | |
| Mortgage-backed obligations 12.24% | | | | | | | | |
| Federal agency mortgage-backed obligations 8.21% | | | | | | | | |
| Fannie Mae Pool #889995 5.50% 20386 | | | 160 | | | | 184 | |
| Fannie Mae Pool #MA4387 2.00% 20416 | | | 853 | | | | 870 | |
| Fannie Mae Pool #AI5236 5.00% 20416 | | | 294 | | | | 333 | |
| Fannie Mae Pool #AI8806 5.00% 20416 | | | 52 | | | | 59 | |
| Fannie Mae, Series 2007-33, Class HE, 5.50% 20376 | | | 3 | | | | 4 | |
| Fannie Mae, Series 2012-M13, Class A2, Multi Family, 2.377% 20226 | | | 126 | | | | 127 | |
| Fannie Mae, Series 2015-M4, Class AV2, Multi Family, 2.509% 20226,7 | | | 172 | | | | 173 | |
| Fannie Mae, Series 2012-M2, Class A2, Multi Family, 2.717% 20226 | | | 23 | | | | 23 | |
| Fannie Mae, Series 2016-M2, Class AV2, Multi Family, 2.152% 20236 | | | 303 | | | | 307 | |
| Fannie Mae, Series 2016-M3, Class ASQ2, Multi Family, 2.263% 20236 | | | 40 | | | | 40 | |
| Fannie Mae, Series 2013-M12, Class APT, Multi Family, 2.405% 20236,7 | | | 300 | | | | 305 | |
| Fannie Mae, Series 2017-M3, Class AV2, Multi Family, 2.526% 20246,7 | | | 253 | | | | 259 | |
| Fannie Mae, Series 2017-M10, Class AV2, Multi Family, 2.554% 20246,7 | | | 403 | | | | 417 | |
| Fannie Mae, Series 2017-M15, Class AV2, Multi Family, 2.621% 20246,7 | | | 365 | | | | 379 | |
| Fannie Mae, Series 2015-M8, Class A1, Multi Family, 2.344% 20256 | | | 29 | | | | 30 | |
| Fannie Mae, Series 2016-M9, Class A1, Multi Family, 2.003% 20266 | | | 43 | | | | 43 | |
| Fannie Mae, Series 2016-M5, Class A1, Multi Family, 2.073% 20266 | | | 333 | | | | 341 | |
| Fannie Mae, Series 2016-M11, Class A1, Multi Family, 2.08% 20266 | | | 500 | | | | 512 | |
| Fannie Mae, Series 2016-M12, Class A1, Multi Family, 2.132% 20266 | | | 210 | | | | 215 | |
| Fannie Mae, Series 2016-M6, Class A1, Multi Family, 2.137% 20266 | | | 164 | | | | 167 | |
| Fannie Mae, Series 2016-M4, Class A1, Multi Family, 2.187% 20266 | | | 227 | | | | 233 | |
| Fannie Mae, Series 2017-M7, Class A1, Multi Family, 2.595% 20266 | | | 62 | | | | 62 | |
| Fannie Mae, Series 2017-M8, Class A1, Multi Family, 2.654% 20276 | | | 19 | | | | 19 | |
| Fannie Mae, Series 2017-M7, Class A2, Multi Family, 2.961% 20276,7 | | | 461 | | | | 493 | |
| Fannie Mae, Series 2017-M15, Class ATS1, Multi Family, 2.987% 20275,6 | | | 37 | | | | 38 | |
| Freddie Mac, Series 3272, Class PA, 6.00% 20376 | | | 10 | | | | 12 | |
| Freddie Mac, Series K020, Class A2, Multi Family, 2.373% 20226 | | | 241 | | | | 243 | |
| Freddie Mac, Series K718, Class A2, Multi Family, 2.791% 20226 | | | 606 | | | | 608 | |
| Freddie Mac Seasoned Credit Risk Transfer Trust, Series 2017-1, Class HA, 3.00% 20566,7 | | | 381 | | | | 394 | |
| Freddie Mac Seasoned Credit Risk Transfer Trust, Series 2017-2, Class MA, 3.00% 20566 | | | 280 | | | | 290 | |
| Freddie Mac Seasoned Credit Risk Transfer Trust, Series 2017-2, Class HA, 3.00% 20566,7 | | | 278 | | | | 288 | |
| Freddie Mac Seasoned Credit Risk Transfer Trust, Series 2017-4, Class HT, 3.25% 20576,7 | | | 158 | | | | 168 | |
| Freddie Mac Seasoned Credit Risk Transfer Trust, Series 2018-2, Class MT, 3.50% 20576 | | | 345 | | | | 364 | |
| Freddie Mac Seasoned Credit Risk Transfer Trust, Series 2017-4, Class MT, 3.50% 20576 | | | 173 | | | | 183 | |
| Freddie Mac Seasoned Credit Risk Transfer Trust, Series 2019-2, Class MA, 3.50% 20586 | | | 1,418 | | | | 1,478 | |
| Freddie Mac Seasoned Credit Risk Transfer Trust, Series 2019-4, Class MA, 3.00% 20596 | | | 1,398 | | | | 1,445 | |
| Freddie Mac Seasoned Loan Structured Transaction Trust, Series 2018-1, Class A1, 3.50% 20286 | | | 1,503 | | | | 1,565 | |
| Government National Mortgage Assn. 2.00% 20516,8 | | | 2,410 | | | | 2,441 | |
| Government National Mortgage Assn. 2.00% 20516,8 | | | 483 | | | | 488 | |
| Government National Mortgage Assn. Pool #694836 5.661% 20596 | | | 2 | | | | 2 | |
| Government National Mortgage Assn. Pool #776095 4.907% 20646 | | | 1 | | | | 1 | |
| Government National Mortgage Assn. Pool #AA7554 6.64% 20646 | | | 8 | | | | 8 | |
| Government National Mortgage Assn., Series 2012-H20, Class PT, 0.899% 20626,7 | | | 265 | | | | 264 | |
| Uniform Mortgage-Backed Security 2.00% 20516,8 | | | 7,666 | | | | 7,651 | |
| Uniform Mortgage-Backed Security 2.00% 20526,8 | | | 6,981 | | | | 6,953 | |
| Uniform Mortgage-Backed Security 2.50% 20526,8 | | | 21,615 | | | | 22,103 | |
| | | | | | | | 52,582 | |
| 76 | Private Client Services Funds |
| Capital Group Core Bond Fund | | | | | | |
| | | | | | | |
| Bonds, notes & other debt instruments (continued) | | Principal amount
(000) | | | Value
(000) | |
| Mortgage-backed obligations (continued) | | | | | | |
| Collateralized mortgage-backed obligations (privately originated) 2.44% | | | | | | |
| Bellemeade Re, Ltd., Series 2019-3A, Class M1A, 1.189% 20295,6,7 | | $ | 30 | | | $ | 30 | |
| Cascade Funding Mortgage Trust, Series 2020-HB4, Class A, 0.946% 20305,6,7 | | | 217 | | | | 217 | |
| Cascade Funding Mortgage Trust, Series 2021-HB6, Class A, 0.898% 20365,6,7 | | | 1,231 | | | | 1,232 | |
| Credit Suisse Mortgage Trust, Series 2017-RPL3, Class A1, 2.00% 20605,6,7 | | | 345 | | | | 349 | |
| Finance of America Structured Securities Trust, Series 2019-JR2, Class A1, 2.00% 20695,6 | | | 704 | | | | 774 | |
| Home Partners of America Trust, Series 2021-2, Class A, 1.901% 20265,6,9 | | | 565 | | | | 565 | |
| Legacy Mortgage Asset Trust, Series 2019-GS5, Class A1, 3.20% 20595,6,7 | | | 544 | | | | 547 | |
| Legacy Mortgage Asset Trust, Series 2019-GS7, Class A1, 3.25% 20595,6,7 | | | 839 | | | | 844 | |
| Legacy Mortgage Asset Trust, Series 2019-GS2, Class A1, 3.75% 20595,6,7 | | | 527 | | | | 528 | |
| Mello Warehouse Securitization Trust, Series 2020-2, Class A, (1-month USD-LIBOR + 0.80%) 0.889% 20535,6,7 | | | 777 | | | | 776 | |
| Mello Warehouse Securitization Trust, Series 2020-1, Class A, (1-month USD-LIBOR + 0.90%) 0.989% 20535,6,7 | | | 719 | | | | 722 | |
| Mello Warehouse Securitization Trust, Series 2021-3, Class A, (1-month USD-LIBOR + 0.85%) 0.934% 20555,6,7 | | | 808 | | | | 814 | |
| MRA Issuance Trust, Series 2020-10, Class A, (1-month USD-LIBOR + 1.70%) 1.782% 20225,6,7 | | | 1,305 | | | | 1,307 | |
| NewRez Warehouse Securitization Trust, Series 2021-1, Class A, (1-month USD-LIBOR + 0.75%) 0.839% 20555,6,7 | | | 5,557 | | | | 5,557 | |
| RMF Proprietary Issuance Trust, Series 2019-1, Class A, 2.75% 20635,6,7 | | | 332 | | | | 328 | |
| Station Place Securitization Trust, Series 2021-WL2, Class A, (1-month USD-LIBOR + 0.70%) 0.789% 20545,6,7 | | | 1,000 | | | | 1,001 | |
| | | | | | | | 15,591 | |
| | | | | | | | | |
| Commercial mortgage-backed securities 1.59% | | | | | | | | |
| BX Trust, Series 2021-SDMF, Class A, (1-month USD-LIBOR + 0.589%) 0.679% 20345,6,7 | | | 1,240 | | | | 1,223 | |
| BX Trust, Series 2021-VOLT, Class A, (1-month USD-LIBOR + 0.70%) 0.79% 20365,6,7 | | | 693 | | | | 694 | |
| BX Trust, Series 2021-ARIA, Class A, (1-month USD-LIBOR + 0.899%) 0.979% 20365,6,7 | | | 664 | | | | 664 | |
| BX Trust, Series 2021-VOLT, Class B, (1-month USD-LIBOR + 0.95%) 1.04% 20365,6,7 | | | 509 | | | | 510 | |
| BX Trust, Series 2021-SOAR, Class A, (1-month USD-LIBOR + 0.67%) 0.76% 20385,6,7 | | | 870 | | | | 869 | |
| BX Trust, Series 2021-SOAR, Class B, (1-month USD-LIBOR + 0.87%) 0.96% 20385,6,7 | | | 327 | | | | 327 | |
| BX Trust, Series 2021-SOAR, Class C, (1-month USD-LIBOR + 1.10%) 1.19% 20385,6,7 | | | 221 | | | | 221 | |
| Extended Stay America Trust, Series 2021-ESH, Class A, (1-month USD-LIBOR + 1.08%) 1.171% 20385,6,7 | | | 261 | | | | 262 | |
| Extended Stay America Trust, Series 2021-ESH, Class B, (1-month USD-LIBOR + 1.38%) 1.471% 20385,6,7 | | | 191 | | | | 191 | |
| Hawaii Hotel Trust, Series 2019-MAUI, Class A, (1-month USD-LIBOR + 1.15%) 1.24% 20385,6,7 | | | 1,500 | | | | 1,504 | |
| JPMorgan Chase Commercial Mortgage Securities Trust, Series 2021-410T, Class A, 2.287% 20425,6 | | | 461 | | | | 470 | |
| LUXE Commercial Mortgage Trust, Series 21-TRIP, Class A, (1-month USD-LIBOR + 1.05%) 1.15% 20385,6,7 | | | 1,343 | | | | 1,346 | |
| Manhattan West Mortgage Trust, Series 2020-1MW, Class A, 2.13% 20395,6 | | | 1,262 | | | | 1,279 | |
| MHC Commercial Mortgage Trust, CMO, Series 2021-MHC, Class A, (1-month USD-LIBOR + 0.801%) 0.891% 20265,6,7 | | | 460 | | | | 461 | |
| Motel 6 Trust, Series 2021-MTL6, Class A, (1-month USD-LIBOR + 0.90%) 0.99% 20385,6,7 | | | 164 | | | | 164 | |
| | | | | | | | 10,185 | |
| | | | | | | | | |
| Total mortgage-backed obligations | | | | | | | 78,358 | |
| | | | | | | | | |
| Asset-backed obligations 10.46% | | | | | | | | |
| Aesop Funding LLC, Series 2019-2A, Class A, 3.35% 20255,6 | | | 750 | | | | 793 | |
| Aesop Funding LLC, Series 2020-2, Class A, 2.02% 20275,6 | | | 539 | | | | 549 | |
| Aesop Funding LLC, Series 2020-2A, Class B, 2.96% 20275,6 | | | 138 | | | | 144 | |
| Affirm Asset Securitization Trust, Series 2021-A, Class A, 0.88% 20255,6 | | | 462 | | | | 463 | |
| Affirm Asset Securitization Trust, Series 2020-A, Class A, 2.10% 20255,6 | | | 473 | | | | 475 | |
| Affirm Asset Securitization Trust, Series 2021-B, Class A, 1.03% 20265,6 | | | 1,136 | | | | 1,132 | |
| Allegro CLO, Ltd., Series 2016-1A, Class AR2, (3-month USD-LIBOR + 0.95%) 1.074% 20305,6,7 | | | 750 | | | | 750 | |
| Allegro CLO, Ltd., Series 2017-1A, Class AR, (3-month USD-LIBOR + 0.95%) 1.072% 20305,6,7 | | | 492 | | | | 492 | |
| Ares CLO, Ltd., Series 2017-42A, Class AR, (3-month USD-LIBOR + 0.92%) 1.048% 20285,6,7 | | | 1,053 | | | | 1,053 | |
| Ballyrock CLO, Ltd., Series 2019-2A, Class A1AR, (3-month USD-LIBOR + 1.00%) 1.131% 20305,6,7 | | | 1,095 | | | | 1,095 | |
| Private Client Services Funds | 77 |
| Capital Group Core Bond Fund | | | | | | |
| | | | | | | |
| Bonds, notes & other debt instruments (continued) | | Principal amount
(000) | | | Value
(000) | |
| Asset-backed obligations (continued) | | | | | | |
| Bankers Healthcare Group Securitization Trust, Series 2021-A, Class A, 1.42% 20335,6 | | $ | 111 | | | $ | 111 | |
| Bankers Healthcare Group Securitization Trust, Series 2021-B, Class A, 0.90% 20345,6 | | | 228 | | | | 228 | |
| CarMaxAuto Owner Trust, Series 2020-1, Class A2, 1.87% 20236 | | | 21 | | | | 21 | |
| CarMaxAuto Owner Trust, Series 2019-2, Class A3, 2.68% 20246 | | | 408 | | | | 413 | |
| CarMaxAuto Owner Trust, Series 2019-2, Class A4, 2.77% 20246 | | | 805 | | | | 828 | |
| CarMaxAuto Owner Trust, Series 2019-2, Class B, 3.01% 20246 | | | 775 | | | | 800 | |
| CarMaxAuto Owner Trust, Series 2019-2, Class C, 3.16% 20256 | | | 1,150 | | | | 1,186 | |
| Castlelake Aircraft Securitization Trust, Series 2021-2A, Class A, 2.852% 20375,6 | | | 593 | | | | 593 | |
| Castlelake Aircraft Securitization Trust, Series 2017-1R, Class A, 2.741% 20415,6 | | | 203 | | | | 203 | |
| Cent CLO, Ltd., Series 2014-21A, Class AR, (3-month USD-LIBOR + 0.97%) 1.105% 20305,6,7 | | | 1,557 | | | | 1,557 | |
| CF Hippolyta LLC, Series 2020-1, Class A1, 1.69% 20605,6 | | | 1,016 | | | | 1,017 | |
| CF Hippolyta LLC, Series 2020-1, Class A2, 1.99% 20605,6 | | | 166 | | | | 165 | |
| CF Hippolyta LLC, Series 2020-1, Class B1, 2.28% 20605,6 | | | 266 | | | | 267 | |
| CF Hippolyta LLC, Series 2020-1, Class B2, 2.60% 20605,6 | | | 93 | | | | 94 | |
| CF Hippolyta LLC, Series 2021-1, Class A1, 1.53% 20615,6 | | | 458 | | | | 454 | |
| CLI Funding V LLC, Series 2020-1A, Class A, 2.08% 20455,6 | | | 428 | | | | 427 | |
| CLI Funding V LLC, Series 2021-1A, Class A, 1.64% 20465,6 | | | 554 | | | | 544 | |
| CPS Auto Receivables Trust, Series 2019-B, Class C, 3.35% 20245,6 | | | 150 | | | | 150 | |
| Drive Auto Receivables Trust, Series 2020-1, Class B, 2.08% 20246 | | | 1,233 | | | | 1,236 | |
| Drive Auto Receivables Trust, Series 2020-1, Class C, 2.36% 20266 | | | 2,166 | | | | 2,193 | |
| Drivetime Auto Owner Trust, Series 2020-1, Class A, 1.94% 20235,6 | | | 2 | | | | 2 | |
| Drivetime Auto Owner Trust, Series 2020-1, Class B, 2.16% 20245,6 | | | 1,000 | | | | 1,005 | |
| Dryden Senior Loan Fund, CLO, Series 2017-47A, Class A1R, (3-month USD-LIBOR + 0.98%) 1.104% 20285,6,7 | | | 1,643 | | | | 1,643 | |
| EDvestinU Private Education Loan LLC, Series 2021-A, Class A, 1.80% 20455,6 | | | 88 | | | | 87 | |
| Exeter Automobile Receivables Trust, Series 2019-2A, Class C, 3.30% 20245,6 | | | 517 | | | | 521 | |
| First Investors Auto Owner Trust, Series 2021-1A, Class A, 0.45% 20265,6 | | | 283 | | | | 283 | |
| FirstKey Homes Trust, Series 2020-SFR2, Class A, 1.266% 20375,6 | | | 237 | | | | 234 | |
| Ford Credit Auto Owner Trust, Series 2020-A, Class A3, 1.04% 20246 | | | 433 | | | | 435 | |
| Ford Credit Auto Owner Trust, Series 2020-1, Class A, 2.04% 20315,6 | | | 582 | | | | 597 | |
| Ford Credit Auto Owner Trust, Series 2021-1, Class A, 1.37% 20335,6 | | | 439 | | | | 438 | |
| GCI Funding I LLC, Series 2020-1, Class A, 2.82% 20455,6 | | | 167 | | | | 169 | |
| GCI Funding I LLC, Series 2021-1, Class A, 2.38% 20465,6 | | | 443 | | | | 445 | |
| Global SC Finance V SRL, Series 2020-1A, Class A, 2.17% 20405,6 | | | 1,336 | | | | 1,343 | |
| Global SC Finance VII SRL, Series 2020-2A, Class A, 2.26% 20405,6 | | | 893 | | | | 900 | |
| Global SC Finance VII SRL, Series 2021-1A, Class A, 1.86% 20415,6 | | | 1,074 | | | | 1,064 | |
| GM Financial Automobile Leasing Trust, Series 2020-2, Class A2A, 0.71% 20226 | | | 51 | | | | 51 | |
| GM Financial Automobile Leasing Trust, Series 2020-2, Class A3, 0.80% 20236 | | | 208 | | | | 209 | |
| Hertz Vehicle Financing LLC, Series 2021-1A, Class A, 1.21% 20255,6 | | | 1,138 | | | | 1,133 | |
| Hertz Vehicle Financing LLC, Series 2021-1A, Class B, 1.56% 20255,6 | | | 122 | | | | 122 | |
| Hertz Vehicle Financing LLC, Series 2021-2A, Class A, 1.68% 20275,6 | | | 1,234 | | | | 1,229 | |
| Hertz Vehicle Financing LLC, Series 2021-2A, Class B, 2.12% 20275,6 | | | 132 | | | | 132 | |
| Honda Auto Receivables Owner Trust, Series 2019-2, Class A3, 2.52% 20236 | | | 704 | | | | 710 | |
| Longfellow Place CLO, Ltd., Series 2013-1A, Class AR3, (3-month USD-LIBOR + 1.00%) 1.124% 20295,6,7 | | | 909 | | | | 909 | |
| Madison Park Funding, Ltd., CLO, Series 2015-17A, Class AR2, (3-month USD-LIBOR + 1.00%) 1.13% 20305,6,7 | | | 1,665 | | | | 1,667 | |
| Marathon CLO, Ltd., Series 2017-9A, Class A1AR, (3-month USD-LIBOR + 1.15%) 1.274% 20295,6,7 | | | 794 | | | | 794 | |
| Mercury Financial Credit Card Master Trust, Series 2021-1A, Class A, 1.54% 20265,6 | | | 1,100 | | | | 1,103 | |
| Mission Lane Credit Card Master Trust, Series 2021-A, Class A, 1.59% 20265,6 | | | 380 | | | | 379 | |
| Navient Student Loan Trust, Series 2021-A, Class A, 0.84% 20695,6 | | | 175 | | | | 174 | |
| Navient Student Loan Trust, Series 2021-C, Class A, 1.06% 20695,6 | | | 789 | | | | 787 | |
| Nelnet Student Loan Trust, Series 2021-C, Class AFX, 1.32% 20625,6 | | | 1,821 | | | | 1,808 | |
| Nelnet Student Loan Trust, Series 2021-A, Class APT1, 1.36% 20625,6 | | | 922 | | | | 914 | |
| Nelnet Student Loan Trust, Series 2021-B, Class AFX, 1.42% 20625,6 | | | 1,730 | | | | 1,722 | |
| New Economy Assets Phase 1 Issuer, LLC, Series 2021-1, Class A1, 1.91% 20615,6 | | | 2,723 | | | | 2,717 | |
| Newark BSL CLO 2, Ltd., Series 2017-1A, Class A1R, (3-month USD-LIBOR + 0.97%) 1.094% 20305,6,7 | | | 529 | | | | 529 | |
| Nissan Auto Receivables Owner Trust, Series 2019-A, Class A-3, 2.90% 20236 | | | 186 | | | | 188 | |
| Oportun Funding LLC, Series 2021-B, Class A, 1.47% 20315,6 | | | 288 | | | | 288 | |
| OSW Structured Asset Trust, Series 2020-RPL1, Class A1, 3.072% 20595,6,7 | | | 2,996 | | | | 3,007 | |
| Palmer Square Loan Funding, CLO, Series 2021-4A, Class A1, (3-month USD-LIBOR + 0.80%) 0.928% 20295,6,7 | | | 1,500 | | | | 1,500 | |
| Palmer Square Loan Funding, CLO, Series 2021-4A, Class A2, (3-month USD-LIBOR + 1.40%) 1.528% 20295,6,7 | | | 856 | | | | 856 | |
| Palmer Square Loan Funding, CLO, Series 2020-4, Class A1, (3-month USD-LIBOR + 1.00%) 1.129% 20285,6,7 | | | 443 | | | | 443 | |
| Palmer Square Loan Funding, CLO, Series 2021-1, Class A1, (3-month USD-LIBOR + 0.90%) 1.032% 20295,6,7 | | | 198 | | | | 198 | |
| Race Point CLO, Ltd., Series 2015-9A, Class A1A2, (3-month USD-LIBOR + 0.94%) 1.064% 20305,6,7 | | | 1,390 | | | | 1,390 | |
| Santander Drive Auto Receivables Trust, Series 2019-3, Class C, 2.49% 20256 | | | 693 | | | | 697 | |
| 78 | Private Client Services Funds |
| Capital Group Core Bond Fund | | | | | | |
| | | | | | | |
| Bonds, notes & other debt instruments (continued) | | Principal amount
(000) | | | Value
(000) | |
| Asset-backed obligations (continued) | | | | | | |
| SMB Private Education Loan Trust, Series 2021-A, Class A1, (1-month USD-LIBOR + 0.50%) 0.59% 20535,6,7 | | $ | 86 | | | $ | 86 | |
| SMB Private Education Loan Trust, Series 2021-A, Class APT2, 1.07% 20535,6 | | | 257 | | | | 252 | |
| Sound Point CLO, Ltd., Series 2017-3A, Class A1R, (3-month USD-LIBOR + 0.98%) 1.112% 20305,6,7 | | | 1,660 | | | | 1,661 | |
| Sound Point CLO, Ltd., Series 2017-2A, Class AR, (3-month USD-LIBOR + 0.98%) 1.112% 20305,6,7 | | | 970 | | | | 970 | |
| Sound Point CLO, Ltd., Series 2015-1RA, Class AR, (3-month USD-LIBOR + 1.08%) 1.204% 20305,6,7 | | | 895 | | | | 895 | |
| Stellar Jay Ireland DAC, Series 2021-1, Class A, 3.967% 20285,6,9 | | | 898 | | | | 898 | |
| Stonepeak, Series 2021-1A, Class AA, 2.301% 20335,6 | | | 377 | | | | 379 | |
| SuttonPark Structured Settlements, Series 2021-1, Class A, 1.95% 20755,6 | | | 538 | | | | 534 | |
| Textainer Marine Containers, Ltd., Series 2021-1A, Class A, 1.68% 20465,6 | | | 196 | | | | 192 | |
| Textainer Marine Containers, Ltd., Series 2021-2A, Class A, 2.23% 20465,6 | | | 1,152 | | | | 1,156 | |
| TIF Funding II LLC, Series 2021-1A, Class A, 1.65% 20465,6 | | | 658 | | | | 641 | |
| Toyota Auto Loan Extended Note Trust, Series 2019-1, Class A, 2.56% 20315,6 | | | 1,250 | | | | 1,301 | |
| Toyota Auto Loan Extended Note Trust, Series 2020-1, Class A, 1.35% 20335,6 | | | 445 | | | | 447 | |
| Toyota Auto Receivables Owner Trust, Series 2019-B, Class A3, 2.57% 20236 | | | 603 | | | | 608 | |
| Triton Container Finance VIII LLC, Series 2020-1, Class A, 2.11% 20455,6 | | | 1,163 | | | | 1,165 | |
| Triton Container Finance VIII LLC, Series 2021-1, Class A, 1.86% 20465,6 | | | 782 | | | | 771 | |
| Volkswagen Auto Lease Trust, Series 2019-A, Class A3, 1.99% 20226 | | | 750 | | | | 754 | |
| Westlake Automobile Receivables Trust, Series 2019-2A, Class B, 2.62% 20245,6 | | | 18 | | | | 18 | |
| | | | | | | | 66,983 | |
| | | | | | | | | |
| Federal agency bonds & notes 2.74% | | | | | | | | |
| Fannie Mae 2.375% 2023 | | | 2,442 | | | | 2,505 | |
| Fannie Mae 0.875% 2030 | | | 2,563 | | | | 2,411 | |
| Freddie Mac 0.25% 2023 | | | 3,439 | | | | 3,430 | |
| Freddie Mac 0.375% 2025 | | | 9,449 | | | | 9,223 | |
| | | | | | | | 17,569 | |
| | | | | | | | | |
| Bonds & notes of governments & government agencies outside the U.S. 2.51% | | | | | | | | |
| Asian Development Bank 0.625% 2024 | | | 1,526 | | | | 1,516 | |
| Canada 0.75% 2026 | | | 2,350 | | | | 2,297 | |
| Denmark (Kingdom of) 0.125% 20225 | | | 660 | | | | 658 | |
| Denmark (Kingdom of) 0.125% 2022 | | | 655 | | | | 653 | |
| European Investment Bank 2.25% 2022 | | | 751 | | | | 757 | |
| European Investment Bank 0.75% 2026 | | | 758 | | | | 741 | |
| Inter-American Development Bank 0.50% 2024 | | | 500 | | | | 495 | |
| KfW 0.375% 2025 | | | 1,010 | | | | 987 | |
| Kommunalbanken 0.50% 20245 | | | 442 | | | | 437 | |
| Kommunalbanken 0.375% 20255 | | | 2,000 | | | | 1,949 | |
| Kommuninvest i Sverige Aktiebolag 0.25% 20235 | | | 905 | | | | 902 | |
| Manitoba (Province of) 3.05% 2024 | | | 200 | | | | 211 | |
| Ontario (Province of) 3.20% 2024 | | | 500 | | | | 531 | |
| Ontario Teachers’ Finance Trust 0.875% 20265 | | | 902 | | | | 882 | |
| Quebec (Province of) 0.60% 2025 | | | 1,600 | | | | 1,573 | |
| Saudi Arabia (Kingdom of) 4.00% 20255 | | | 430 | | | | 468 | |
| Saudi Arabia (Kingdom of) 4.50% 20305 | | | 445 | | | | 518 | |
| United Mexican States 4.15% 2027 | | | 460 | | | | 514 | |
| | | | | | | | 16,089 | |
| | | | | | | | | |
| Municipals 0.62% | | | | | | | | |
| California 0.04% | | | | | | | | |
| High-Speed Passenger Train G.O. Rev. Ref. Bonds, Series 2017-A, 2.367% 2022 | | | 250 | | | | 252 | |
| | | | | | | | | |
| Florida 0.43% | | | | | | | | |
| Board of Administration Fin. Corp., Rev. Bonds, Series 2020-A, 1.258% 2025 | | | 1,140 | | | | 1,141 | |
| Board of Administration Fin. Corp., Rev. Bonds, Series 2020-A, 1.705% 2027 | | | 805 | | | | 803 | |
| Board of Administration Fin. Corp., Rev. Bonds, Series 2020-A, 2.154% 2030 | | | 810 | | | | 809 | |
| | | | | | | | 2,753 | |
| Private Client Services Funds | 79 |
| Capital Group Core Bond Fund | | | | | | |
| | | | | | | |
| Bonds, notes & other debt instruments (continued) | | Principal amount
(000) | | | Value
(000) | |
| Municipals (continued) | | | | | | |
| New York 0.15% | | | | | | |
| Dormitory Auth., Taxable State Personal Income Tax Rev. Bonds (General Purpose), Series 2021-C, 1.748% 2028 | | $ | 965 | | | $ | 963 | |
| | | | | | | | | |
| Washington 0.00% | | | | | | | | |
| Energy Northwest, Electric Rev. Bonds (Columbia Generating Station), Series 2015-B, 2.814% 2024 | | | 20 | | | | 21 | |
| | | | | | | | | |
| Total municipals | | | | | | | 3,989 | |
| | | | | | | | | |
| Total bonds, notes & other debt instruments (cost: $604,809,000) | | | | | | | 612,766 | |
| | | | | | | | | |
| Short-term securities 9.99% | | | Shares | | | | | |
| Money market investments 9.99% | | | | | | | | |
| Capital Group Central Cash Fund 0.06%10,11 | | | 639,514 | | | | 63,951 | |
| | | | | | | | | |
| Total short-term securities (cost: $63,954,000) | | | | | | | 63,951 | |
| Total investment securities 105.67% (cost: $668,763,000) | | | | | | | 676,717 | |
| Other assets less liabilities (5.67%) | | | | | | | (36,322 | ) |
| | | | | | | | | |
| Net assets 100.00% | | | | | | $ | 640,395 | |
| Futures contracts | | | | | | | | | |
| | | | | | | | | | | | | | | | |
| Contracts | | Type | | Number of
contracts | | Expiration | | | Notional
amount
(000) | 12
| | Value at
10/31/2021
(000) | 13
| | Unrealized
(depreciation)
appreciation
at 10/31/2021
(000) | |
| 90 Day Euro Dollar Futures | | Long | | 1,255 | | December 2022 | | | $313,750 | | | $ | 311,020 | | | $ | (768 | ) |
| 2 Year U.S. Treasury Note Futures | | Long | | 189 | | December 2021 | | | 37,800 | | | | 41,438 | | | | (175 | ) |
| 5 Year U.S. Treasury Note Futures | | Short | | 406 | | December 2021 | | | (40,600 | ) | | | (49,430 | ) | | | 462 | |
| 10 Year U.S. Treasury Note Futures | | Long | | 168 | | December 2021 | | | 16,800 | | | | 21,958 | | | | (196 | ) |
| 10 Year Ultra U.S. Treasury Note Futures | | Short | | 69 | | December 2021 | | | (6,900 | ) | | | (10,007 | ) | | | 172 | |
| 20 Year U.S. Treasury Bond Futures | | Short | | 13 | | December 2021 | | | (1,300 | ) | | | (2,091 | ) | | | (17 | ) |
| 30 Year Ultra U.S. Treasury Bond Futures | | Short | | 20 | | December 2021 | | | (2,000 | ) | | | (3,928 | ) | | | 15 | |
| | | | | | | | | | | | | | | | | $ | (507 | ) |
| Investments in affiliates11 | | | | | | | | | | | |
| | | | Value of
affiliate at
11/1/2020
(000) | | | | Additions
(000) | | | | Reductions
(000) | | | | Net
realized
loss
(000) | | | | Net
unrealized
depreciation
(000) | | | | Value of
affiliate at
10/31/2021
(000) | | | | Dividend
income
(000) | |
| Short-term securities 9.99% | | | | | | | | | | | | | | | | | | |
| Money market investments 9.99% | | | | | | | | | | | | | | | | | | |
| Capital Group Central Cash Fund 0.06%10 | | $ | 79,218 | | | $ | 179,027 | | | $ | 194,288 | | | $ | (2 | ) | | $ | (4 | ) | | $ | 63,951 | | | $ | 60 | |
| 80 | Private Client Services Funds |
Capital Group Core Bond Fund
| 1 | Amount less than one thousand. |
| 2 | All or a portion of this security was pledged as collateral. The total value of pledged collateral was $721,000, which represented .11% of the net assets of the fund. |
| 3 | Index-linked bond whose principal amount moves with a government price index. |
| 4 | Step bond; coupon rate may change at a later date. |
| 5 | Acquired in a transaction exempt from registration under Rule 144A of the Securities Act of 1933. May be resold in the U.S. in transactions exempt from registration, normally to qualified institutional buyers. The total value of all such securities was $120,128,000, which represented 18.76% of the net assets of the fund. |
| 6 | Principal payments may be made periodically. Therefore, the effective maturity date may be earlier than the stated maturity date. |
| 7 | Coupon rate may change periodically. Reference rate and spread are as of the most recent information available. Some coupon rates are determined by the issuer or agent based on current market conditions; therefore, the reference rate and spread are not available. |
| 8 | Purchased on a TBA basis. |
| 9 | Valued under fair value procedures adopted by authority of the board of trustees. The total value of all such securities was $1,463,000, which represented .23% of the net assets of the fund. |
| 10 | Rate represents the seven-day yield at 10/31/2021. |
| 11 | Part of the same “group of investment companies” as the fund as defined under the Investment Company Act of 1940, as amended. |
| 12 | Notional amount is calculated based on the number of contracts and notional contract size. |
| 13 | Value is calculated based on the notional amount and current market price. |
Key to abbreviations and symbol
Auth. = Authority
CLO = Collateralized Loan Obligations
DAC = Designated Activity Company
Fin. = Finance
G.O. = General Obligation
LIBOR = London Interbank Offered Rate
Ref. = Refunding
Rev. = Revenue
SOFR = Secured Overnight Financing Rate
TBA = To-be-announced
USD/$ = U.S. dollars
| Private Client Services Funds | 81 |
| Financial statements | |
| | |
Statements of assets and liabilities
at October 31, 2021 | (dollars and shares in thousands, except per-share amounts) |
| | | Capital Group
Core Municipal
Fund | | | Capital Group
Short-Term
Municipal Fund | | | Capital Group
California
Core Municipal
Fund | |
| | | | | | | | | | |
| Assets: | | | | | | | | | | | | |
| Investment securities, at value: | | | | | | | | | | | | |
| Unaffiliated issuers | | $ | 792,736 | | | $ | 204,039 | | | $ | 654,377 | |
| Affiliated issuers | | | — | | | | — | | | | — | |
| Cash | | | 6,190 | | | | 350 | | | | 6,318 | |
| Cash collateral pledged for futures contracts | | | 99 | | | | 39 | | | | 133 | |
| Receivables for: | | | | | | | | | | | | |
| Sales of investments | | | — | * | | | — | | | | 3,627 | |
| Sales of fund’s shares | | | 764 | | | | 756 | | | | 5,427 | |
| Dividends and interest | | | 6,583 | | | | 1,804 | | | | 5,782 | |
| Variation margin on futures contracts | | | 4 | | | | 1 | | | | 3 | |
| Total assets | | | 806,376 | | | | 206,989 | | | | 675,667 | |
| | | | | | | | | | | | | |
| Liabilities: | | | | | | | | | | | | |
| Payables for: | | | | | | | | | | | | |
| Purchases of investments | | | 20,733 | | | | 4,198 | | | | 11,225 | |
| Repurchases of fund’s shares | | | 424 | | | | 26 | | | | 172 | |
| Investment advisory services | | | 166 | | | | 43 | | | | 140 | |
| Services provided by related parties | | | — | | | | (1 | ) | | | — | |
| Variation margin on futures contracts | | | — | | | | — | | | | — | |
| Other | | | — | * | | | — | * | | | — | * |
| Total liabilities | | | 21,323 | | | | 4,266 | | | | 11,537 | |
| Net assets at October 31, 2021 | | $ | 785,053 | | | $ | 202,723 | | | $ | 664,130 | |
| | | | | | | | | | | | | |
| Net assets consist of: | | | | | | | | | | | | |
| Capital paid in on shares of beneficial interest | | $ | 769,940 | | | $ | 200,638 | | | $ | 648,872 | |
| Total distributable earnings | | | 15,113 | | | | 2,085 | | | | 15,258 | |
| Net assets at October 31, 2021 | | $ | 785,053 | | | $ | 202,723 | | | $ | 664,130 | |
| | | | | | | | | |
| Investment securities, at cost: | | | | | | | | | | | | |
| Unaffiliated issuers | | $ | 783,028 | | | $ | 202,530 | | | $ | 643,716 | |
| Affiliated issuers | | | — | | | | — | | | | — | |
| Shares outstanding | | | 73,891 | | | | 19,767 | | | | 61,752 | |
| Net asset value per share | | $ | 10.62 | | | $ | 10.26 | | | $ | 10.75 | |
See end of statements of assets and liabilities for footnote.
See notes to financial statements.
| 82 | Private Client Services Funds |
| Financial statements (continued) | |
| | |
Statements of assets and liabilities
at October 31, 2021 (continued) | (dollars and shares in thousands, except per-share amounts) |
| | | Capital Group
California
Short-Term
Municipal Fund | | | Capital Group
Core Bond Fund | |
| | | | | | | | | |
| Assets: | | | | | | | | |
| Investment securities, at value: | | | | | | | | |
| Unaffiliated issuers | | $ | 183,840 | | | $ | 612,766 | |
| Affiliated issuers | | | — | | | | 63,951 | |
| Cash | | | 2,424 | | | | 3 | |
| Cash collateral pledged for futures contracts | | | 25 | | | | — | |
| Receivables for: | | | | | | | | |
| Sales of investments | | | — | | | | 53,694 | |
| Sales of fund’s shares | | | — | * | | | 4,350 | |
| Dividends and interest | | | 1,778 | | | | 1,814 | |
| Variation margin on futures contracts | | | — | | | | 2 | |
| Total assets | | | 188,067 | | | | 736,580 | |
| | | | | | | | | |
| Liabilities: | | | | | | | | |
| Payables for: | | | | | | | | |
| Purchases of investments | | | 6,283 | | | | 95,897 | |
| Repurchases of fund’s shares | | | 26 | | | | 43 | |
| Investment advisory services | | | 39 | | | | 135 | |
| Services provided by related parties | | | — | | | | — | |
| Variation margin on futures contracts | | | — | | | | 110 | |
| Other | | | — | * | | | — | * |
| Total liabilities | | | 6,348 | | | | 96,185 | |
| Net assets at October 31, 2021 | | $ | 181,719 | | | $ | 640,395 | |
| | | | | | | | | |
| Net assets consist of: | | | | | | | | |
| Capital paid in on shares of beneficial interest | | $ | 179,935 | | | $ | 638,411 | |
| Total distributable earnings | | | 1,784 | | | | 1,984 | |
| Net assets at October 31, 2021 | | $ | 181,719 | | | $ | 640,395 | |
| | | | | | | | | |
| Investment securities, at cost: | | | | | | | | |
| Unaffiliated issuers | | $ | 182,583 | | | $ | 604,809 | |
| Affiliated issuers | | | — | | | | 63,954 | |
| Shares outstanding | | | 17,655 | | | | 62,511 | |
| Net asset value per share | | $ | 10.29 | | | $ | 10.24 | |
| * | Amount less than one thousand. |
See notes to financial statements.
| Private Client Services Funds | 83 |
| Financial statements (continued) | |
| | |
Statements of operations
for the year ended October 31, 2021 | (dollars in thousands) |
| | | Capital Group
Core Municipal
Fund | | | Capital Group
Short-Term
Municipal Fund | | | Capital Group
California
Core Municipal
Fund | |
| | | | | | | | | | | | | |
| Investment income: | | | | | | | | | | | | |
| Income (net of non-U.S. taxes*): | | | | | | | | | | | | |
| Dividends from affiliated issuers | | $ | — | | | $ | — | | | $ | — | |
| Interest from unaffiliated issuers | | | 10,717 | | | | 2,352 | | | | 9,237 | |
| | | | 10,717 | | | | 2,352 | | | | 9,237 | |
| Fees and expenses*: | | | | | | | | | | | | |
| Investment advisory services | | | 1,808 | | | | 501 | | | | 1,597 | |
| Transfer agent services | | | 8 | | | | 2 | | | | 8 | |
| Reports to shareholders | | | 18 | | | | 7 | | | | 16 | |
| Registration statement and prospectus | | | 66 | | | | 38 | | | | 13 | |
| Trustees’ compensation | | | 59 | | | | 17 | | | | 53 | |
| Auditing and legal | | | 48 | | | | 41 | | | | 47 | |
| Custodian | | | 10 | | | | 7 | | | | 10 | |
| Other | | | 5 | | | | 1 | | | | 4 | |
| Total fees and expenses before reimbursements | | | 2,022 | | | | 614 | | | | 1,748 | |
| Less reimbursements of fees and expenses: | | | | | | | | | | | | |
| Miscellaneous fee reimbursements | | | — | | | | 11 | | | | — | |
| Total reimbursements of fees and expenses | | | — | | | | 11 | | | | — | |
| Total fees and expenses after reimbursements | | | 2,022 | | | | 603 | | | | 1,748 | |
| Net investment income | | | 8,695 | | | | 1,749 | | | | 7,489 | |
| | | | | | | | | | | | | |
| Net realized gain (loss) and unrealized (depreciation): | | | | | | | | | | | | |
| Net realized gain (loss) on: | | | | | | | | | | | | |
| Investments in: | | | | | | | | | | | | |
| Unaffiliated issuers | | | 6,067 | | | | 1,008 | | | | 4,100 | |
| Affiliated issuers | | | — | | | | — | | | | — | |
| Futures contracts | | | (531 | ) | | | (141 | ) | | | (327 | ) |
| | | | 5,536 | | | | 867 | | | | 3,773 | |
| Net unrealized (depreciation) appreciation on: | | | | | | | | | | | | |
| Investments in: | | | | | | | | | | | | |
| Unaffiliated issuers | | | (7,884 | ) | | | (1,874 | ) | | | (7,709 | ) |
| Affiliated issuers | | | — | | | | — | | | | — | |
| Futures contracts | | | (8 | ) | | | (20 | ) | | | 115 | |
| | | | (7,892 | ) | | | (1,894 | ) | | | (7,594 | ) |
| Net realized gain (loss) and unrealized (depreciation) | | | (2,356 | ) | | | (1,027 | ) | | | (3,821 | ) |
| | | | | | | | | | | | | |
| Net increase (decrease) in net assets resulting from operations | | $ | 6,339 | | | $ | 722 | | | $ | 3,668 | |
See end of statements of operations for footnote.
See notes to financial statements.
| 84 | Private Client Services Funds |
| Financial statements (continued) | |
| | |
Statements of operations
for the year ended October 31, 2021 (continued) | (dollars in thousands) |
| | | Capital Group
California
Short-Term
Municipal Fund | | | Capital Group
Core Bond Fund | |
| | | | | | | | | |
| Investment income: | | | | | | | | |
| Income (net of non-U.S. taxes*): | | | | | | | | |
| Dividends from affiliated issuers | | $ | — | | | $ | 60 | |
| Interest from unaffiliated issuers | | | 1,998 | | | | 9,798 | |
| | | | 1,998 | | | | 9,858 | |
| Fees and expenses*: | | | | | | | | |
| Investment advisory services | | | 475 | | | | 1,502 | |
| Transfer agent services | | | 2 | | | | 7 | |
| Reports to shareholders | | | 7 | | | | 16 | |
| Registration statement and prospectus | | | 9 | | | | 49 | |
| Trustees’ compensation | | | 16 | | | | 49 | |
| Auditing and legal | | | 40 | | | | 48 | |
| Custodian | | | 7 | | | | 18 | |
| Other | | | 1 | | | | 4 | |
| Total fees and expenses before reimbursements | | | 557 | | | | 1,693 | |
| Less reimbursements of fees and expenses: | | | | | | | | |
| Miscellaneous fee reimbursements | | | — | | | | — | |
| Total fees and expenses after reimbursements | | | 557 | | | | 1,693 | |
| Net investment income | | | 1,441 | | | | 8,165 | |
| | | | | | | | | |
| Net realized gain (loss) and unrealized (depreciation): | | | | | | | | |
| Net realized gain (loss) on: | | | | | | | | |
| Investments in: | | | | | | | | |
| Unaffiliated issuers | | | 774 | | | | (751 | ) |
| Affiliated issuers | | | — | | | | (2 | ) |
| Futures contracts | | | (185 | ) | | | (54 | ) |
| Swap contracts | | | — | | | | 193 | |
| | | | 589 | | | | (614 | ) |
| Net unrealized (depreciation) appreciation on: | | | | | | | | |
| Investments in: | | | | | | | | |
| Unaffiliated issuers | | | (1,796 | ) | | | (9,946 | ) |
| Affiliated issuers | | | — | | | | (4 | ) |
| Futures contracts | | | 11 | | | | (784 | ) |
| Swap contracts | | | — | | | | (285 | ) |
| | | | (1,785 | ) | | | (11,019 | ) |
| Net realized gain (loss) and unrealized (depreciation) | | | (1,196 | ) | | | (11,633 | ) |
| | | | | | | | | |
| Net increase (decrease) in net assets resulting from operations | | $ | 245 | | | $ | (3,468 | ) |
| * | Additional information related to non-U.S. taxes and fees and expenses is included in the notes to financial statements. |
See notes to financial statements.
| Private Client Services Funds | 85 |
| Financial statements (continued) | |
| | |
| Statements of changes in net assets | (dollars in thousands) |
| | | Capital Group
Core Municipal
Fund | | | Capital Group
Short-Term
Municipal Fund | | | Capital Group
California
Core Municipal
Fund | |
| | | Year ended October 31, | | | Year ended October 31, | | | Year ended October 31, | |
| | | 2021 | | | 2020 | | | 2021 | | | 2020 | | | 2021 | | | 2020 | |
| Operations: | | | | | | | | | | | | | | | | | | | | | | | | |
| Net investment income | | $ | 8,695 | | | $ | 10,450 | | | $ | 1,749 | | | $ | 2,314 | | | $ | 7,489 | | | $ | 9,164 | |
| Net realized gain (loss) | | | 5,536 | | | | 7,512 | | | | 867 | | | | 1,171 | | | | 3,773 | | | | 5,569 | |
| Net unrealized (depreciation) appreciation | | | (7,892 | ) | | | 5,054 | | | | (1,894 | ) | | | 2,079 | | | | (7,594 | ) | | | 3,519 | |
| Net increase (decrease) in net assets resulting from operations | | | 6,339 | | | | 23,016 | | | | 722 | | | | 5,564 | | | | 3,668 | | | | 18,252 | |
| | | | | | | | | | | | | | | | | | | | | | | | | |
| Distributions paid to shareholders | | | (15,834 | ) | | | (11,198 | ) | | | (2,260 | ) | | | (2,262 | ) | | | (12,004 | ) | | | (9,836 | ) |
| | | | | | | | | | | | | | | | | | | | | | | | | |
| Net capital share transactions | | | 142,622 | | | | 56,358 | | | | (3,942 | ) | | | 78,354 | | | | 45,429 | | | | 62,052 | |
| | | | | | | | | | | | | | | | | | | | | | | | | |
| Total increase (decrease) in net assets | | | 133,127 | | | | 68,176 | | | | (5,480 | ) | | | 81,656 | | | | 37,093 | | | | 70,468 | |
| | | | | | | | | | | | | | | | | | | | | | | | | |
| Net assets: | | | | | | | | | | | | | | | | | | | | | | | | |
| Beginning of year | | | 651,926 | | | | 583,750 | | | | 208,203 | | | | 126,547 | | | | 627,037 | | | | 556,569 | |
| End of year | | $ | 785,053 | | | $ | 651,926 | | | $ | 202,723 | | | $ | 208,203 | | | $ | 664,130 | | | $ | 627,037 | |
| | | | | | | | | | | | | | | |
| | | Capital Group
California
Short-Term
Municipal Fund | | | Capital Group
Core Bond Fund | | | | | | | | | |
| | | Year ended October 31, | | | Year ended October 31, | | | | | | | | | |
| | | 2021 | | | 2020 | | | 2021 | | | 2020 | | | | | | | | | |
| Operations: | | | | | | | | | | | | | | | | | | | | | | | | |
| Net investment income | | $ | 1,441 | | | $ | 1,969 | | | $ | 8,165 | | | $ | 8,989 | | | | | | | | | |
| Net realized gain (loss) | | | 589 | | | | 898 | | | | (614 | ) | | | 10,758 | | | | | | | | | |
| Net unrealized (depreciation) appreciation | | | (1,785 | ) | | | 1,043 | | | | (11,019 | ) | | | 11,281 | | | | | | | | | |
| Net increase (decrease) in net assets resulting from operations | | | 245 | | | | 3,910 | | | | (3,468 | ) | | | 31,028 | | | | | | | | | |
| | | | | | | | | | | | | | | | | | | | | | | | | |
| Distributions paid to shareholders | | | (2,083 | ) | | | (1,955 | ) | | | (22,116 | ) | | | (12,105 | ) | | | | | | | | |
| | | | | | | | | | | | | | | | | | | | | | | | | |
| Net capital share transactions | | | (15,782 | ) | | | 33,553 | | | | 102,154 | | | | 68,147 | | | | | | | | | |
| | | | | | | | | | | | | | | | | | | | | | | | | |
| Total increase (decrease) in net assets | | | (17,620 | ) | | | 35,508 | | | | 76,570 | | | | 87,070 | | | | | | | | | |
| | | | | | | | | | | | | | | | | | | | | | | | | |
| Net assets: | | | | | | | | | | | | | | | | | | | | | | | | |
| Beginning of year | | | 199,339 | | | | 163,831 | | | | 563,825 | | | | 476,755 | | | | | | | | | |
| End of year | | $ | 181,719 | | | $ | 199,339 | | | $ | 640,395 | | | $ | 563,825 | | | | | | | | | |
See notes to financial statements.
| 86 | Private Client Services Funds |
Notes to financial statements
1. Organization
Capital Group Private Client Services Funds (the “series”) is registered under the Investment Company Act of 1940, as amended (the “1940 Act”), as an open-end, diversified management investment company. The series consists of five funds: Capital Group Core Municipal Fund, Capital Group Short-Term Municipal Fund, Capital Group California Core Municipal Fund, Capital Group California Short-Term Municipal Fund and Capital Group Core Bond Fund (each a “fund,” collectively the “funds”). The assets of each fund are segregated, with each fund accounted for separately.
Each fund’s investment objectives are as follows:
Capital Group Core Municipal Fund — Seeks to provide current income exempt from federal income tax and to preserve capital.
Capital Group Short-Term Municipal Fund — Seeks to preserve capital and secondarily to provide current income exempt from federal income tax.
Capital Group California Core Municipal Fund — Seeks to provide current income exempt from federal and California income taxes and to preserve capital.
Capital Group California Short-Term Municipal Fund — Seeks to preserve capital and secondarily to provide current income exempt from federal and California income taxes.
Capital Group Core Bond Fund — Seeks to provide current income and to preserve capital.
2. Significant accounting policies
Each fund is an investment company that applies the accounting and reporting guidance issued in Topic 946 by the U.S. Financial Accounting Standards Board. Each fund’s financial statements have been prepared to comply with U.S. generally accepted accounting principles (“U.S. GAAP”). These principles require the funds’ investment adviser to make estimates and assumptions that affect reported amounts and disclosures. Actual results could differ from those estimates. Subsequent events, if any, have been evaluated through the date of issuance in the preparation of the financial statements. The funds follow the significant accounting policies described in this section, as well as the valuation policies described in the next section on valuation.
Security transactions and related investment income — Security transactions are recorded by the funds as of the date the trades are executed with brokers. Realized gains and losses from security transactions are determined based on the specific identified cost of the securities. In the event a security is purchased with a delayed payment date, the funds will segregate liquid assets sufficient to meet their payment obligations. Dividend income is recognized on the ex-dividend date and interest income is recognized on an accrual basis. Market discounts, premiums and original issue discounts on fixed-income securities are amortized daily over the expected life of the security.
Distributions paid to shareholders — Income dividends and capital gain distributions are recorded on the ex-dividend date.
Currency translation — Assets and liabilities, including investment securities, denominated in currencies other than U.S. dollars are translated into U.S. dollars at the exchange rates supplied by one or more pricing vendors on the valuation date. Purchases and sales of investment securities and income and expenses are translated into U.S. dollars at the exchange rates on the dates of such transactions. The effects of changes in exchange rates on investment securities are included with the net realized gain or loss and net unrealized appreciation or depreciation on investments in the funds’ statements of operations. The realized gain or loss and unrealized appreciation or depreciation resulting from all other transactions denominated in currencies other than U.S. dollars are disclosed separately.
3. Valuation
Capital Research and Management Company (“CRMC”), the funds’ investment adviser, values each fund’s investments at fair value as defined by accounting principles generally accepted in the United State of America. The net asset value per share of each fund is calculated once daily as of the close of regular trading on the New York Stock Exchange, normally 4 p.m. New York time, each day the New York Stock Exchange is open.
| Private Client Services Funds | 87 |
Methods and inputs — The funds’ investment adviser uses the following methods and inputs to establish the fair value of each fund’s assets and liabilities. Use of particular methods and inputs may vary over time based on availability and relevance as market and economic conditions evolve.
Equity securities are generally valued at the official closing price of, or the last reported sale price on, the exchange or market on which such securities are traded, as of the close of business on the day the securities are being valued or, lacking any sales, at the last available bid price. Prices for each security are taken from the principal exchange or market on which the security trades.
Fixed-income securities, including short-term securities, are generally valued at prices obtained from one or more pricing vendors. Vendors value such securities based on one or more of the inputs described in the following table. The table provides examples of inputs that are commonly relevant for valuing particular classes of fixed-income securities in which the funds are authorized to invest. However, these classifications are not exclusive, and any of the inputs may be used to value any other class of fixed-income security.
| Fixed-income class | | Examples of standard inputs |
| All | | Benchmark yields, transactions, bids, offers, quotations from dealers and trading systems, new issues, spreads and other relationships observed in the markets among comparable securities; and proprietary pricing models such as yield measures calculated using factors such as cash flows, financial or collateral performance and other reference data (collectively referred to as “standard inputs”) |
| Corporate bonds, notes & loans; convertible securities | | Standard inputs and underlying equity of the issuer |
| Bonds & notes of governments & government agencies | | Standard inputs and interest rate volatilities |
| Mortgage-backed; asset-backed obligations | | Standard inputs and cash flows, prepayment information, default rates, delinquency and loss assumptions, collateral characteristics, credit enhancements and specific deal information |
| Municipal securities | | Standard inputs and, for certain distressed securities, cash flows or liquidation values using a net present value calculation based on inputs that include, but are not limited to, financial statements and debt contracts |
When the funds’ investment adviser deems it appropriate to do so (such as when vendor prices are unavailable or deemed to be not representative), fixed-income securities will be valued in good faith at the mean quoted bid and ask prices that are reasonably and timely available (or bid prices, if ask prices are not available) or at prices for securities of comparable maturity, quality and type. Some securities may be valued based on their effective maturity or average life, which may be shorter than the stated maturity.
Securities with both fixed-income and equity characteristics, or equity securities traded principally among fixed-income dealers, are generally valued in the manner described for either equity or fixed-income securities, depending on which method is deemed most appropriate by the funds’ investment adviser. The Capital Group Central Cash Fund (“CCF”), a fund within the Capital Group Central Fund Series (“Central Funds”), is valued based upon a floating net asset value, which fluctuates with changes in the value of CCF’s portfolio securities. The underlying securities are valued based on the policies and procedures in CCF’s statement of additional information. Exchange-traded futures are generally valued at the official settlement price of the exchange or market on which such instruments are traded, as of the close of business on the day the futures are being valued. Interest rate swaps and credit default swaps are generally valued by pricing vendors based on market inputs that include the index and term of index, reset frequency, payer/receiver, currency and pay frequency.
Securities and other assets for which representative market quotations are not readily available or are considered unreliable by the funds’ investment adviser are fair valued as determined in good faith under fair valuation guidelines adopted by authority of the funds’ board of trustees as further described. The investment adviser follows fair valuation guidelines, consistent with U.S. Securities and Exchange Commission rules and guidance, to consider relevant principles and factors when making fair value determinations. The investment adviser considers relevant indications of value that are reasonably and timely available to it in determining the fair value to be assigned to a particular security, such as the type and cost of the security; contractual or legal restrictions on resale of the security; relevant financial or business developments of the issuer; actively traded similar or related securities; conversion or exchange rights on the security; related corporate actions; significant events occurring after the close of trading in the security; and changes in overall market conditions. In addition, the closing prices of equity securities that trade in markets outside U.S. time zones may be adjusted to reflect significant events that occur after the close of local trading but before the net asset value of each of the funds is determined. Fair valuations and valuations of investments that are not actively trading involve judgment and may differ materially from valuations that would have been used had greater market activity occurred.
| 88 | Private Client Services Funds |
Processes and structure — The funds’ board of trustees has delegated authority to the funds’ investment adviser to make fair value determinations, subject to board oversight. The investment adviser has established a Joint Fair Valuation Committee (the “Fair Valuation Committee”) to administer, implement and oversee the fair valuation process, and to make fair value decisions. The Fair Valuation Committee regularly reviews its own fair value decisions, as well as decisions made under its standing instructions to the investment adviser’s valuation teams. The Fair Valuation Committee reviews changes in fair value measurements from period to period and may, as deemed appropriate, update the fair valuation guidelines to better reflect the results of back testing and address new or evolving issues. The Fair Valuation Committee reports any changes to the fair valuation guidelines to the board of trustees. The funds’ board and audit committee also regularly review reports that describe fair value determinations and methods.
The funds’ investment adviser has also established a Fixed-Income Pricing Review Group to administer and oversee the fixed-income valuation process, including the use of fixed-income pricing vendors. This group regularly reviews pricing vendor information and market data. Pricing decisions, processes and controls over security valuation are also subject to additional internal reviews facilitated by the investment adviser’s global risk management group.
Classifications — The funds’ investment adviser classifies each fund’s assets and liabilities into three levels based on the inputs used to value the assets or liabilities. Level 1 values are based on quoted prices in active markets for identical securities. Level 2 values are based on significant observable market inputs, such as quoted prices for similar securities and quoted prices in inactive markets. Certain securities trading outside the U.S. may transfer between Level 1 and Level 2 due to valuation adjustments resulting from significant market movements following the close of local trading. Level 3 values are based on significant unobservable inputs that reflect the investment adviser’s determination of assumptions that market participants might reasonably use in valuing the securities. The valuation levels are not necessarily an indication of the risk or liquidity associated with the underlying investment. For example, U.S. government securities are reflected as Level 2 because the inputs used to determine fair value may not always be quoted prices in an active market. The funds’ valuation levels as of October 31, 2021 are as follows (dollars in thousands):
Capital Group Core Municipal Fund
| | | Investment securities | |
| | | Level 1 | | | Level 2 | | | Level 3 | | | Total | |
| Assets: | | | | | | | | | | | | | | | | |
| Bonds, notes & other debt instruments: | | | | | | | | | | | | | | | | |
| Municipals | | $ | — | | | $ | 644,756 | | | $ | — | | | $ | 644,756 | |
| Short-term securities | | | — | | | | 147,980 | | | | — | | | | 147,980 | |
| Total | | $ | — | | | $ | 792,736 | | | $ | — | | | $ | 792,736 | |
| | | | | | | | | | | | | | | | | |
| | | Other investments* | |
| | | Level 1 | | | Level 2 | | | Level 3 | | | Total | |
| Assets: | | | | | | | | | | | | | | | | |
| Unrealized appreciation on futures contracts | | $ | 51 | | | $ | — | | | $ | — | | | $ | 51 | |
| Liabilities: | | | | | | | | | | | | | | | | |
| Unrealized depreciation on futures contracts | | | (58 | ) | | | — | | | | — | | | | (58 | ) |
| Total | | $ | (7 | ) | | $ | — | | | $ | — | | | $ | (7 | ) |
| * | Futures contracts are not included in the fund’s investment portfolio. |
Capital Group Short-Term Municipal Fund
| | | Investment securities | |
| | | Level 1 | | | Level 2 | | | Level 3 | | | Total | |
| Assets: | | | | | | | | | | | | | | | | |
| Bonds, notes & other debt instruments: | | | | | | | | | | | | | | | | |
| Municipals | | $ | — | | | $ | 165,941 | | | $ | — | | | $ | 165,941 | |
| Short-term securities | | | — | | | | 38,098 | | | | — | | | | 38,098 | |
| Total | | $ | — | | | $ | 204,039 | | | $ | — | | | $ | 204,039 | |
| | | | | | | | | | | | | | | | | |
| | | Other investments* | |
| | | Level 1 | | | Level 2 | | | Level 3 | | | Total | |
| Liabilities: | | | | | | | | | | | | | | | | |
| Unrealized depreciation on futures contracts | | $ | (23 | ) | | $ | — | | | $ | — | | | $ | (23 | ) |
| * | Futures contracts are not included in the fund’s investment portfolio. |
| Private Client Services Funds | 89 |
Capital Group California Core Municipal Fund
| | | Investment securities | |
| | | Level 1 | | | Level 2 | | | Level 3 | | | Total | |
| Assets: | | | | | | | | | | | | | | | | |
| Bonds, notes & other debt instruments: | | | | | | | | | | | | | | | | |
| Municipals | | $ | — | | | $ | 563,774 | | | $ | — | | | $ | 563,774 | |
| Short-term securities | | | — | | | | 90,603 | | | | — | | | | 90,603 | |
| Total | | $ | — | | | $ | 654,377 | | | $ | — | | | $ | 654,377 | |
| | | | | | | | | | | | | | | | | |
| | | Other investments* | |
| | | Level 1 | | | Level 2 | | | Level 3 | | | Total | |
| Assets: | | | | | | | | | | | | | | | | |
| Unrealized appreciation on futures contracts | | $ | 94 | | | $ | — | | | $ | — | | | $ | 94 | |
| * | Futures contracts are not included in the fund’s investment portfolio. |
Capital Group California Short-Term Municipal Fund
At October 31, 2021, all of the fund’s investment securities were classified as Level 2.
Capital Group Core Bond Fund
| | | Investment securities | |
| | | Level 1 | | | Level 2 | | | Level 3 | | | Total | |
| Assets: | | | | | | | | | | | | | | | | |
| Bonds, notes & other debt instruments: | | | | | | | | | | | | | | | | |
| U.S. Treasury bonds & notes | | $ | — | | | $ | 253,040 | | | $ | — | | | $ | 253,040 | |
| Corporate bonds, notes & loans | | | — | | | | 176,738 | | | | — | | | | 176,738 | |
| Mortgage-backed obligations | | | — | | | | 78,358 | | | | — | | | | 78,358 | |
| Asset-backed obligations | | | — | | | | 66,983 | | | | — | | | | 66,983 | |
| Federal agency bonds & notes | | | — | | | | 17,569 | | | | — | | | | 17,569 | |
| Bonds & notes of governments & government agencies outside the U.S. | | | — | | | | 16,089 | | | | — | | | | 16,089 | |
| Municipals | | | — | | | | 3,989 | | | | — | | | | 3,989 | |
| Short-term securities | | | 63,951 | | | | — | | | | — | | | | 63,951 | |
| Total | | $ | 63,951 | | | $ | 612,766 | | | $ | — | | | $ | 676,717 | |
| |
| | | Other investments* | |
| | | Level 1 | | | Level 2 | | | Level 3 | | | Total | |
| Assets: | | | | | | | | | | | | | | | | |
| Unrealized appreciation on futures contracts | | $ | 649 | | | $ | — | | | $ | — | | | $ | 649 | |
| Liabilities: | | | | | | | | | | | | | | | | |
| Unrealized depreciation on futures contracts | | | (1,156 | ) | | | — | | | | — | | | | (1,156 | ) |
| Total | | $ | (507 | ) | | $ | — | | | $ | — | | | $ | (507 | ) |
| * | Futures contracts are not included in the fund’s investment portfolio. |
4. Risk factors
Investing in the funds may involve certain risks including, but not limited to, those described below.
Market conditions — The prices of, and the income generated by, the securities held by the fund may decline — sometimes rapidly or unpredictably – due to various factors, including events or conditions affecting the general economy or particular industries; overall market changes; local, regional or global political, social or economic instability; governmental, governmental agency or central bank responses to economic conditions; and currency exchange rate, interest rate and commodity price fluctuations.
| 90 | Private Client Services Funds |
Economies and financial markets throughout the world are highly interconnected. Economic, financial or political events, trading and tariff arrangements, wars, terrorism, cybersecurity events, natural disasters, public health emergencies (such as the spread of infectious disease) and other circumstances in one country or region, including actions taken by governmental or quasi-governmental authorities in response to any of the foregoing, could have impacts on global economies or markets. As a result, whether or not the fund invests in securities of issuers located in or with significant exposure to the countries affected, the value and liquidity of the fund’s investments may be negatively affected by developments in other countries and regions.
Issuer risks — The prices of, and the income generated by, securities held by the fund may decline in response to various factors directly related to the issuers of such securities, including reduced demand for an issuer’s goods or services, poor management performance, major litigation, investigations or other controversies related to the issuer, changes in government regulations affecting the issuer or its competitive environment and strategic initiatives such as mergers, acquisitions or dispositions and the market response to any such initiatives.
Investing in debt instruments — The prices of, and the income generated by, bonds and other debt securities held by the fund may be affected by factors such as the interest rates, maturities and credit ratings of these securities.
Rising interest rates will generally cause the prices of bonds and other debt securities to fall. A general rise in interest rates may cause investors to sell debt securities on a large scale, which could also adversely affect the price and liquidity of debt securities and could also result in increased redemptions from the fund. Falling interest rates may cause an issuer to redeem, call or refinance a debt security before its stated maturity, which may result in the fund failing to recoup the full amount of its initial investment and having to reinvest the proceeds in lower yielding securities. Longer maturity debt securities generally have greater sensitivity to changes in interest rates and may be subject to greater price fluctuations than shorter maturity debt securities.
Bonds and other debt securities are also subject to credit risk, which is the possibility that the credit strength of an issuer or guarantor will weaken or be perceived to be weaker, and/or an issuer of a debt security will fail to make timely payments of principal or interest and the security will go into default. A downgrade or default affecting any of the fund’s securities could cause the value of the fund’s shares to decrease. Credit risk is gauged, in part, by the credit ratings of the debt securities in which the fund invests. However, ratings are only the opinions of the rating agencies issuing them and are not guarantees as to credit quality or an evaluation of market risk. The fund’s investment adviser relies on its own credit analysts to research issuers and issues in seeking to assess credit and default risks.
Credit and liquidity support — Changes in the credit quality of banks and financial institutions providing credit and liquidity support features with respect to securities held by the fund could cause the values of these securities to decline.
Investing in lower rated debt instruments — Lower rated bonds and other lower rated debt securities generally have higher rates of interest and involve greater risk of default or price declines due to changes in the issuer’s creditworthiness than those of higher quality debt securities. The market prices of these securities may fluctuate more than the prices of higher quality debt securities and may decline significantly in periods of general economic difficulty.
Liquidity risk — Certain fund holdings may be or may become difficult or impossible to sell, particularly during times of market turmoil. Liquidity may be impacted by the lack of an active market for a holding, legal or contractual restrictions on resale, or the reduced number and capacity of market participants to make a market in such holding. Market prices for less liquid or illiquid holdings may be volatile, and reduced liquidity may have an adverse impact on the market price of such holdings. Additionally, the sale of less liquid or illiquid holdings may involve substantial delays (including delays in settlement) and additional costs and the fund may be unable to sell such holdings when necessary to meet its liquidity needs or may be forced to sell at a loss.
Investing in similar municipal bonds — Investing significantly in municipal obligations of multiple issuers in the same state or backed by revenues of similar types of projects or industries may make the fund more susceptible to certain economic, political or regulatory occurrences. As a result, the fund has greater risk of volatility, and greater risk of loss, from these investments.
Investing in municipal bonds of issuers within the state of California — Because Capital Group California Core Municipal Fund and Capital Group California Short-Term Municipal Fund invest primarily in securities of issuers within the state of California, these funds are more susceptible to factors adversely affecting issuers of California securities than a comparable municipal bond mutual fund that does not concentrate its investments in a single state. For example, in the past, California voters have passed amendments to the state’s constitution and other measures that limit the taxing and spending authority of California governmental entities, and future voter initiatives may adversely affect California municipal bonds.
| Private Client Services Funds | 91 |
Investing in mortgage-related and other asset-backed securities — Mortgage-related securities, such as mortgage-backed securities, and other asset-backed securities, include debt obligations that represent interests in pools of mortgages or other income-bearing assets, such as consumer loans or receivables. While such securities are subject to the risks associated with investments in debt instruments generally (for example, credit, extension and interest rate risks), they are also subject to other and different risks. Mortgage-backed and other asset-backed securities are subject to changes in the payment patterns of borrowers of the underlying debt, potentially increasing the volatility of the securities and the fund’s net asset value. When interest rates fall, borrowers are more likely to refinance or prepay their debt before its stated maturity. This may result in the fund having to reinvest the proceeds in lower yielding securities, effectively reducing the fund’s income. Conversely, if interest rates rise and borrowers repay their debt more slowly than expected, the time in which the mortgage-backed and other asset-backed securities are paid off could be extended, reducing the fund’s cash available for reinvestment in higher yielding securities. Mortgage-backed securities are also subject to the risk that underlying borrowers will be unable to meet their obligations and the value of property that secures the mortgages may decline in value and be insufficient, upon foreclosure, to repay the associated loans. Investments in asset-backed securities are subject to similar risks.
Investing in securities backed by the U.S. government — Securities backed by the U.S. Treasury or the full faith and credit of the U.S. government are guaranteed only as to the timely payment of interest and principal when held to maturity. Accordingly, the current market values for these securities will fluctuate with changes in interest rates and the credit rating of the U.S. government. Securities issued by U.S. government-sponsored entities and federal agencies and instrumentalities that are not backed by the full faith and credit of the U.S. government are neither issued nor guaranteed by the U.S. government.
Management — The investment adviser to the fund actively manages the fund’s investments. Consequently, the fund is subject to the risk that the methods and analyses, including models, tools and data, employed by the investment adviser in this process may be flawed or incorrect and may not produce the desired results. This could cause the fund to lose value or its investment results to lag relevant benchmarks or other funds with similar objectives.
5. Certain investment techniques
Index-linked bonds — Capital Group Core Bond Fund has invested in index-linked bonds, which are fixed-income securities whose principal value is periodically adjusted to a government price index. Over the life of an index-linked bond, interest is paid on the adjusted principal value. Increases or decreases in the principal value of index-linked bonds are recorded as interest income in the fund’s statement of operations.
Mortgage dollar rolls — Capital Group Core Bond Fund has entered into mortgage dollar roll transactions in which the fund sells a mortgage-backed security to a counterparty and simultaneously enters into an agreement with the same counterparty to buy back a similar security on a specific future date at a predetermined price. Mortgage dollar rolls are accounted for as purchase and sale transactions, which may increase the funds’ portfolio turnover rates.
Futures contracts — Each fund has entered into futures contracts, which provide for the future sale by one party and purchase by another party of a specified amount of a specific financial instrument for a specified price, date, time and place designated at the time the contract is made. Futures contracts are used to strategically manage portfolio volatility and downside equity risk.
Upon entering into futures contracts, and to maintain the fund’s open positions in futures contracts, the fund is required to deposit with a futures broker, known as a futures commission merchant (“FCM”), in a segregated account in the name of the FCM an amount of cash, U.S. government securities or other liquid securities, known as initial margin. The margin required for a particular futures contract is set by the exchange on which the contract is traded to serve as collateral, and may be significantly modified from time to time by the exchange during the term of the contract.
On a daily basis, each fund pays or receives variation margin based on the increase or decrease in the value of the futures contracts and records variation margin on futures contracts in each fund’s statement of assets and liabilities. In addition, each fund segregates liquid assets equivalent to the fund’s outstanding obligations under the contract in excess of the initial margin and variation margin, if any. Futures contracts may involve a risk of loss in excess of the variation margin shown on each fund’s statement of assets and liabilities. Each fund records realized gains or losses at the time the futures contract is closed or expires. Net realized gains or losses and net unrealized appreciation or depreciation from futures contracts are recorded in each fund’s statement of operations.
| 92 | Private Client Services Funds |
Interest rate swaps — Capital Group Core Bond Fund has entered into interest rate swaps, which are agreements to exchange one stream of future interest payments for another based on a specified notional amount. Typically, interest rate swaps exchange a fixed interest rate for a payment that floats relative to a benchmark or vice versa. The series’ investment adviser uses interest rate swaps to manage the interest rate sensitivity of the fund by increasing or decreasing the duration of the fund or a portion of the fund’s portfolio. Risks may arise as a result of the series’ investment adviser incorrectly anticipating changes in interest rates, increased volatility, reduced liquidity and the potential inability of counterparties to meet the terms of their agreements.
Upon entering into an interest rate swap contract, the fund is required to deposit cash, U.S. government securities or other liquid securities, which is known as initial margin. Generally, the initial margin required for a particular interest rate swap is set and held as collateral by the clearinghouse on which the contract is cleared. The amount of initial margin required may be significantly modified from time to time by the clearinghouse during the term of the contract.
On a daily basis, the fund records daily interest accruals related to the exchange of future payments as a receivable and payable in the fund’s statement of assets and liabilities. The fund also pays or receives a variation margin based on the increase or decrease in the value of the interest rate swaps, including accrued interest, and records variation margin on interest rate swaps in the fund’s statement of assets and liabilities. The fund records realized gains and losses on both the net accrued interest and any gain or loss recognized at the time the interest rate swap is closed or expires. Net realized gains or losses, as well as any net unrealized appreciation or depreciation, from interest rate swaps are recorded in the fund’s statement of operations.
Credit default swap indices — Capital Group Core Bond Fund has entered into centrally cleared credit default swap agreements on credit indices (“CDSI”) that involve one party (the protection buyer) making a stream of payments to another party (the protection seller) in exchange for the right to receive a specified return upon the occurrence of a credit event, such as a default or restructuring, with respect to any of the underlying issuers (reference obligations) in the referenced index. The series’ investment adviser uses credit default swaps to assume exposure to a diversified portfolio of credits or to hedge against existing credit risks.
CDSI are portfolios of credit instruments or exposures designed to be representative of some part of the credit market, such as the high-yield or investment-grade credit market. CDSI are generally traded using standardized terms, including a fixed spread and standard maturity dates, and reference all the names in the index. If there is a credit event, it is settled based on that name’s weight in the index. The composition of the underlying issuers or obligations within a particular index may change periodically, usually every six months. A specified credit event may affect all or individual underlying reference obligations included in the index, and will be settled based upon the relative weighting of the affected obligation(s) within the index. The value of each CDSI can be used as a measure of the current payment/performance risk of the CDSI and represents the likelihood of an expected liability or profit should the notional amount of the CDSI be closed or sold as of the period end. An increasing value, as compared to the notional amount of the CDSI, represents a deterioration of the referenced indices’ credit soundness and a greater likelihood of risk of default or other credit event occurring as defined under the terms of the agreement. When the fund provides sell protection, its maximum exposure is the notional amount of the credit default swap agreement.
Upon entering into a centrally cleared CDSI contract, the fund is required to deposit with a derivatives clearing member (“DCM”) in a segregated account in the name of the DCM an amount of cash, U.S. government securities or other liquid securities, which is known as initial margin. Generally, the initial margin required for a particular credit default swap is set and held as collateral by the clearinghouse on which the contract is cleared. The amount of initial margin required may be significantly modified from time to time by the clearinghouse during the term of the contract.
On a daily basis, interest accruals related to the exchange of future payments are recorded as a receivable and payable in the fund’s statement of assets and liabilities. The fund also pays or receives a variation margin based on the increase or decrease in the value of the CDSI, and records variation margin in the fund’s statement of assets and liabilities. The fund records realized gains and losses on both the net accrued interest and any gain or loss recognized at the time the swap is closed or expires. Net realized gains or losses, as well as any net unrealized appreciation or depreciation, from credit default swaps are recorded in the fund’s statement of operations.
| Private Client Services Funds | 93 |
The following table presents the average month-end notional amounts of futures contracts, interest rate swaps and credit default swaps while held for each fund (dollars in thousands):
| | | Futures
contracts | | | Interest
rate
swaps | | | Credit
default
swaps | |
| Capital Group Core Municipal Fund | | | $23,692 | | | | Not applicable | | | | Not applicable | |
| Capital Group Short-Term Municipal Fund | | | 5,167 | | | | Not applicable | | | | Not applicable | |
| Capital Group California Core Municipal Fund | | | 22,667 | | | | Not applicable | | | | Not applicable | |
| Capital Group California Short-Term Municipal | | | 5,420 | * | | | Not applicable | | | | Not applicable | |
| Capital Group Core Bond Fund | | | 231,375 | | | | $53,620 | * | | | $25,000 | * |
| * | No contracts were held at the end of the reporting period; amount represents the average month-end notional amount of contracts while they were held. |
The following tables identify the location and fair value amounts on the funds’ statements of assets and liabilities and/or the effect on the funds’ statements of operations resulting from the funds’ use of futures contracts, interest rate swaps and credit default swaps as of, or for the year ended, October 31, 2021 (dollars in thousands):
Capital Group Core Municipal Fund
| | | | | Assets | | | Liabilities | |
| Contracts | | Risk type | | Location on statement of
assets and liabilities | | Value | | | Location on statement of
assets and liabilities | | Value | |
| Futures | | Interest | | Unrealized appreciation* | | $ | 51 | | | Unrealized depreciation* | | $ | 58 | |
| | | | | | | | | | | | | | |
| | | | | Net realized loss | | | Net unrealized depreciation | |
| Contracts | | Risk type | | Location on statement of
operations | | Value | | | Location on statement of
operations | | Value | |
| Futures | | Interest | | Net realized loss on futures contracts | | $ | (531 | ) | | Net unrealized depreciation on futures contracts | | $ | (8 | ) |
Capital Group Short-Term Municipal Fund
| | | | | Assets | | | Liabilities | |
| Contracts | | Risk type | | Location on statement of
assets and liabilities | | Value | | | Location on statement of
assets and liabilities | | Value | |
| Futures | | Interest | | Unrealized appreciation* | | $ | — | | | Unrealized depreciation* | | $ | 23 | |
| |
| | | | | Net realized loss | | | Net unrealized depreciation | |
| Contracts | | Risk type | | Location on statement of
operations | | Value | | | Location on statement of
operations | | Value | |
| Futures | | Interest | | Net realized loss on futures contracts | | $ | (141 | ) | | Net unrealized depreciation on futures contracts | | $ | (20 | ) |
See end of tables for footnote.
| 94 | Private Client Services Funds |
| Capital Group California Core Municipal Fund |
| | | | | Assets | | Liabilities | |
| Contracts | | Risk type | | Location on statement of
assets and liabilities | | Value | | | Location on statement of
assets and liabilities | | Value | |
| Futures | | Interest | | Unrealized appreciation* | | $ | 94 | | | Unrealized depreciation* | | $ | — | |
| | | | | | | | | | | | | | | |
| | | | | Net realized loss | | | Net unrealized appreciation | |
| Contracts | | Risk type | | Location on statement of
operations | | Value | | | Location on statement of
operations | | Value | |
| Futures | | Interest | | Net realized loss on futures contracts | | $ | (327 | ) | | Net unrealized appreciation on futures contracts | | $ | 115 | |
Capital Group California Short-Term Municipal Fund
| | | | | Net realized loss | | | Net unrealized appreciation | |
| Contracts | | Risk type | | Location on statement of
operations | | Value | | | Location on statement of
operations | | Value | |
| Futures | | Interest | | Net realized loss on futures contracts | | $ | (185 | ) | | Net unrealized appreciation on futures contracts | | $ | 11 | |
Capital Group Core Bond Fund
| | | | | Assets | | | Liabilities | |
| Contracts | | Risk type | | Location on statement of
assets and liabilities | | Value | | | Location on statement of
assets and liabilities | | Value | |
| Futures | | Interest | | Unrealized appreciation* | | $ | 649 | | | Unrealized depreciation* | | $ | 1,156 | |
| | | | | | | | | | | | | | | |
| | | | | Net realized (loss) gain | | | Net unrealized (depreciation) appreciation | |
| Contracts | | Risk type | | Location on statement of
operations | | Value | | | Location on statement of
operations | | Value | |
| Futures | | Interest | | Net realized loss on futures contracts | | $ | (54 | ) | | Net unrealized depreciation on futures contracts | | $ | (784 | ) |
| Swap | | Interest | | Net realized gain on swap contracts | | | 575 | | | Net unrealized depreciation on swap contracts | | | (285 | ) |
| Swap | | Credit | | Net realized loss on swap contracts | | | (382 | ) | | Net unrealized appreciation on swap contracts | | | — | |
| | | | | | | $ | 139 | | | | | $ | (1,069 | ) |
| * | Includes cumulative appreciation/depreciation on futures contracts as reported in the applicable table following each fund’s investment portfolio. Only current day’s variation margin is reported within each fund’s statement of assets and liabilities. |
Collateral — Each fund participates in a collateral program that calls for the funds to either receive or pledge highly liquid assets, such as cash or U.S. government securities, as collateral due to their use of futures contracts, interest rate swaps, credit default swaps and/or future delivery contracts. For futures contracts, interest rate swaps and credit default swaps, the program calls for the fund to pledge collateral for initial and variation margin by contract. For future delivery contracts, the program calls for the fund to either receive or pledge collateral based on the net gain or loss on unsettled contracts by certain counterparties. The purpose of the collateral is to cover potential losses that could occur in the event that either party cannot meet its contractual obligations. Non-cash collateral pledged by the fund, if any, is disclosed in the fund’s investment portfolio, and cash collateral pledged by the fund, if any, is held in a segregated account with the fund’s custodian, which is reflected as pledged cash collateral in each fund’s statement of assets and liabilities.
| Private Client Services Funds | 95 |
6. Taxation and distributions
Federal income taxation — Each fund complies with the requirements under Subchapter M of the Internal Revenue Code applicable to mutual funds and each intends to distribute substantially all of its net income and net capital gains each year. The funds are not subject to income taxes to the extent taxable income and net capital gains are distributed. Therefore, no federal income tax provision is required.
As of and during the year ended October 31, 2021, none of the funds had a liability for any unrecognized tax benefits. Each fund recognizes interest and penalties, if any, related to unrecognized tax benefits as income tax expense in their respective statements of operations. During the period, none of the funds incurred any significant interest or penalties.
Each fund’s tax returns are generally not subject to examination by federal, state and, if applicable, non-U.S. tax authorities after the expiration of each jurisdiction’s statute of limitations, which is typically three years after the date of filing but can be extended in certain jurisdictions.
Distributions — Distributions determined on a tax basis may differ from net investment income and net realized gains for financial reporting purposes. These differences are due primarily to different treatment for items such as short-term capital gains and losses; capital losses related to sales of certain securities within 30 days of purchase; income on certain investments; amortization of premiums and discounts; paydowns on fixed-income securities; net capital losses and cost of investments sold. The fiscal year in which amounts are distributed may differ from the year in which the net investment income and net realized gains are recorded by the funds for financial reporting purposes. The funds may also designate a portion of the amount paid to redeeming shareholders as a distribution for tax purposes.
Additional tax basis disclosures for each fund as of October 31, 2021, were as follows (dollars in thousands):
| | | Capital
Group
Core
Municipal
Fund | | | Capital
Group
Short-Term
Municipal
Fund | | | Capital
Group
California
Core
Municipal
Fund | | | Capital
Group
California
Short-Term
Municipal
Fund | | |
Capital
Group
Core Bond
Fund | |
| Undistributed ordinary income | | $ | 2,465 | | | $ | 535 | | | $ | 1,100 | | | $ | 112 | | | $ | 99 | |
| Undistributed tax-exempt income | | | 90 | | | | 26 | | | | 889 | | | | 9 | | | | — | |
| Undistributed long-term capital gains | | | 2,811 | | | | — | | | | 2,586 | | | | 405 | | | | — | |
| Capital loss carryforward* | | | — | | | | — | | | | — | | | | — | | | | (3,316 | ) |
| Gross unrealized appreciation on investments | | | 12,158 | | | | 1,795 | | | | 12,294 | | | | 1,546 | | | | 11,906 | |
| Gross unrealized depreciation on investments | | | (2,410 | ) | | | (272 | ) | | | (1,612 | ) | | | (287 | ) | | | (4,024 | ) |
| Net unrealized appreciation on investments | | | 9,748 | | | | 1,523 | | | | 10,682 | | | | 1,259 | | | | 7,882 | |
| Cost of investments | | | 782,981 | | | | 202,493 | | | | 643,789 | | | | 182,581 | | | | 668,328 | |
| Reclassification from total distributable earnings/accumulated loss to capital paid in on shares of beneficial interest | | | 254 | | | | 337 | | | | 177 | | | | 126 | | | | (1 | ) |
| * | Each fund’s capital loss carryforwards will be used to offset any capital gains realized by each fund in future years. Each fund will not make distributions from capital gains while a capital loss carryforward remains. |
| 96 | Private Client Services Funds |
Distributions paid by each fund were characterized for tax purposes as follows (dollars in thousands):
| | | Year ended October 31, 2021 | |
| | | Tax-exempt
income | | | Ordinary
income | | | Long-term
capital
gains | | | Total
distributions
paid | |
| Capital Group Core Municipal Fund | | $ | 8,677 | | | $ | 2,349 | | | $ | 4,808 | | | $ | 15,834 | |
| Capital Group Short-Term Municipal Fund | | | 1,747 | | | | 513 | | | | — | | | | 2,260 | |
| Capital Group California Core Municipal Fund | | | 6,692 | | | | 841 | | | | 4,471 | | | | 12,004 | |
| Capital Group California Short-Term Municipal Fund | | | 1,439 | | | | 117 | | | | 527 | | | | 2,083 | |
| Capital Group Core Bond Fund | | | — | | | | 15,330 | | | | 6,786 | | | | 22,116 | |
| |
| | | Year ended October 31, 2020 | |
| | | Tax-exempt
income | | | Ordinary
income | | | Long-term
capital
gains | | | Total
distributions
paid | |
| Capital Group Core Municipal Fund | | $ | 10,394 | | | $ | 620 | | | $ | 184 | | | $ | 11,198 | |
| Capital Group Short-Term Municipal Fund | | | 2,262 | | | | — | | | | — | | | | 2,262 | |
| Capital Group California Core Municipal Fund | | | 9,118 | | | | 565 | | | | 153 | | | | 9,836 | |
| Capital Group California Short-Term Municipal Fund | | | 1,955 | | | | — | | | | — | | | | 1,955 | |
| Capital Group Core Bond Fund | | | — | | | | 10,989 | | | | 1,116 | | | | 12,105 | |
7. Fees and transactions with related parties
CRMC, the funds’ investment adviser, is the parent company of American Funds Service Company® (“AFS”), the funds’ transfer agent. CRMC and AFS are considered related parties to each fund.
Investment advisory services — Each fund has an investment advisory and service agreement with CRMC that provides for monthly fees accrued daily. The fee for Capital Group Core Municipal Fund, Capital Group Short-Term Municipal Fund, Capital Group California Core Municipal Fund, Capital Group California Short-Term Municipal Fund and Capital Group Core Bond Fund is 0.25% of the daily net assets of each fund.
Transfer agent services — Each fund has a shareholder services agreement with AFS under which each fund compensates AFS for providing transfer agent services. These services include recordkeeping, shareholder communications and transaction processing. In addition, each fund reimburses AFS for amounts paid to third parties for performing transfer agent services on behalf of fund shareholders.
Miscellaneous fee reimbursements — CRMC has agreed to reimburse a portion of miscellaneous fees and expenses for Capital Group Short-Term Municipal Fund to limit the fund’s total annual operating expenses to 0.30% (as a percentage of daily net assets). Miscellaneous expenses exclude investment advisory services fees. These reimbursements may be adjusted or discontinued by CRMC, subject to any restrictions in the series’ prospectus. For the year ended October 31, 2021, total fees and expenses reimbursed by CRMC were $11,000 for Capital Group Short-Term Municipal Fund. CRMC will not recoup all or a portion of these reimbursements. Fees and expenses in each fund’s statement of operations are presented gross of any reimbursements from CRMC.
Affiliated officers and trustees — Officers and certain trustees of the series are or may be considered to be affiliated with CRMC. No affiliated officers or trustees received any compensation directly from the series.
Investment in CCF — Capital Group Core Bond Fund holds shares of CCF, an institutional prime money market fund managed by CRMC. CCF invests in high-quality, short-term money market instruments and is used as the primary investment vehicle for the fund’s short-term investments. CCF shares are only available for purchase by CRMC, its affiliates, and other funds managed by CRMC. CCF shares are not available to the public. CRMC does not receive an investment advisory services fee from CCF.
Security transactions with related funds — The funds may purchase from, or sell securities to, other CRMC-managed funds (or accounts managed by certain affiliates of CRMC) under procedures adopted by the funds’ board of trustees. The funds involved in such transactions are considered related by virtue of having a common investment adviser (or affiliated investment advisers), common trustees and/or common officers. When such transactions occur, each transaction is executed at the current market price of the security and no brokerage commissions or fees are paid in accordance with Rule 17a-7 of the 1940 Act.
| Private Client Services Funds | 97 |
The following table presents purchase and sales transactions, if any, between each fund and related funds and the net realized gains from such sales as of October 31, 2021 (dollars in thousands):
| Fund | | Purchases | | | Sales | | | Net
realized
gain | |
| Capital Group Core Municipal Fund | | $ | 5 | | | $ | 1,320 | | | $ | 25 | |
| Capital Group Short-Term Municipal Fund | | | 97 | | | | 355 | | | | 14 | |
| Capital Group California Core Municipal Fund | | | 2,215 | | | | 13,115 | | | | 635 | |
| Capital Group California Short-Term Municipal Fund | | | 2,437 | | | | 4,567 | | | | 148 | |
| Capital Group Core Bond Fund | | | — | | | | 1,194 | | | | 39 | |
Interfund lending — Pursuant to an exemptive order issued by the SEC, the funds, along with other CRMC-managed funds (or funds managed by certain affiliates of CRMC), may participate in an interfund lending program. The program provides an alternate credit facility that permits the funds to lend or borrow cash for temporary purposes directly to or from one another, subject to the conditions of the exemptive order. The funds did not lend or borrow cash through the interfund lending program at any time during the year ended ended October 31, 2021.
8. Indemnifications
The series’ organizational documents provide board members and officers with indemnification against certain liabilities or expenses in connection with the performance of their duties to the series. In the normal course of business, the series may also enter into contracts that provide general indemnifications. Each fund’s maximum exposure under these arrangements is unknown since it is dependent on future claims that may be made against the series. The risk of material loss from such claims is considered remote. Insurance policies are also available to the series’ board members and officers.
9. Capital share transactions
Capital share transactions in the funds were as follows (dollars and shares in thousands):
| | | Sales | | | Reinvestment of
distributions | | | Repurchases | | | Net increase
(decrease) | |
| Fund | | Amount | | | Shares | | | Amount | | | Shares | | | Amount | | | Shares | | | Amount | | | Shares | |
| | | | | | | | | | | | | | | | | | | | | | | | | | | | | | | | | |
| Year ended October 31, 2021 | | | | | | | | | | | | | | | | | | | | | | | | | | | | | | | | |
| | | | | | | | | | | | | | | | | | | | | | | | | | | | | | | | | |
| Capital Group Core Municipal Fund | | $ | 191,931 | | | | 17,895 | | | $ | 15,789 | | | | 1,472 | | | $ | (65,098 | ) | | | (6,065 | ) | | $ | 142,622 | | | | 13,302 | |
| Capital Group Short-Term Municipal Fund | | | 135,966 | | | | 13,169 | | | | 2,260 | | | | 219 | | | | (142,168 | ) | | | (13,767 | ) | | | (3,942 | ) | | | (379 | ) |
| Capital Group California Core Municipal Fund | | | 103,909 | | | | 9,577 | | | | 12,004 | | | | 1,106 | | | | (70,484 | ) | | | (6,480 | ) | | | 45,429 | | | | 4,203 | |
| Capital Group California Short-Term Municipal Fund | | | 68,363 | | | | 6,590 | | | | 2,083 | | | | 201 | | | | (86,228 | ) | | | (8,316 | ) | | | (15,782 | ) | | | (1,525 | ) |
| Capital Group Core Bond Fund | | | 109,167 | | | | 10,477 | | | | 21,938 | | | | 2,097 | | | | (28,951 | ) | | | (2,773 | ) | | | 102,154 | | | | 9,801 | |
| | | | | | | | | | | | | | | | | | | | | | | | | | | | | | | | | |
| Year ended October 31, 2020 | | | | | | | | | | | | | | | | | | | | | | | | | | | | | | | | |
| | | | | | | | | | | | | | | | | | | | | | | | | | | | | | | | | |
| Capital Group Core Municipal Fund | | $ | 106,929 | | | | 10,012 | | | $ | 11,142 | | | | 1,046 | | | $ | (61,713 | ) | | | (5,824 | ) | | $ | 56,358 | | | | 5,234 | |
| Capital Group Short-Term Municipal Fund | | | 154,195 | | | | 15,083 | | | | 2,262 | | | | 221 | | | | (78,103 | ) | | | (7,630 | ) | | | 78,354 | | | | 7,674 | |
| Capital Group California Core Municipal Fund | | | 106,925 | | | | 9,888 | | | | 9,834 | | | | 910 | | | | (54,707 | ) | | | (5,130 | ) | | | 62,052 | | | | 5,668 | |
| Capital Group California Short-Term Municipal Fund | | | 111,175 | | | | 10,735 | | | | 1,955 | | | | 189 | | | | (79,577 | ) | | | (7,685 | ) | | | 33,553 | | | | 3,239 | |
| Capital Group Core Bond Fund | | | 97,338 | | | | 9,219 | | | | 11,994 | | | | 1,147 | | | | (41,185 | ) | | | (3,901 | ) | | | 68,147 | | | | 6,465 | |
| 98 | Private Client Services Funds |
10. Investment transactions
The funds made purchases and sales of investment securities during the year ended October 31, 2021, as follows (dollars in thousands):
| | | Capital Group
Core Municipal
Fund | | | Capital Group
Short-Term
Municipal Fund | | | Capital Group
California
Core Municipal
Fund | | | Capital Group
California
Short-Term
Municipal Fund | | | Capital Group
Core Bond Fund | |
| Purchases of investment securities* | | $ | 330,447 | | | $ | 91,436 | | | $ | 223,741 | | | $ | 75,899 | | | $ | 1,145,566 | |
| Sales of investment securities* | | | 298,418 | | | | 108,382 | | | | 232,398 | | | | 102,309 | | | | 1,079,222 | |
| * | Excludes short-term securities and U.S. government obligations, if any. |
| Private Client Services Funds | 99 |
Financial highlights
| | | | | | Income (loss) from investment operations1 | | | Dividends and distributions | | | | | | | | | | | | | | | | | | | |
| Year ended | | Net asset
value,
beginning
of year | | | Net
investment
income | | | Net (losses)
gains on
securities (both
realized and
unrealized) | | | Total from
investment
operations | | | Dividends
(from net
investment
income) | | | Distributions
(from capital
gains) | | | Total
dividends
and
distributions | | | Net asset
value, end
of year | | | Total
return2 | | | Net assets,
end of year
(in millions) | | | Ratio of
expenses to
average net
assets before
reimbursements3 | | | Ratio of
expenses to
average net
assets after
reimbursements2,3 | | | Ratio of
net income
to average
net assets2 | |
| Capital Group Core Municipal Fund | | | | | | | | | | | | | | | | | | | | | | | | | | | | | | | | | | | | | | | | | | | | |
| 10/31/2021 | | $ | 10.76 | | | $ | .13 | | | $ | (.02 | ) | | $ | .11 | | | $ | (.13 | ) | | $ | (.12 | ) | | $ | (.25 | ) | | $ | 10.62 | | | | .99 | % | | $ | 785 | | | | .28 | % | | | .28 | % | | | 1.20 | % |
| 10/31/2020 | | | 10.55 | | | | .18 | | | | .22 | | | | .40 | | | | (.18 | ) | | | (.01 | ) | | | (.19 | ) | | | 10.76 | | | | 3.87 | | | | 652 | | | | .28 | | | | .28 | | | | 1.70 | |
| 10/31/2019 | | | 10.15 | | | | .22 | | | | .40 | | | | .62 | | | | (.22 | ) | | | — | | | | (.22 | ) | | | 10.55 | | | | 6.15 | | | | 584 | | | | .28 | | | | .28 | | | | 2.11 | |
| 10/31/2018 | | | 10.41 | | | | .21 | | | | (.26 | ) | | | (.05 | ) | | | (.19 | ) | | | (.02 | ) | | | (.21 | ) | | | 10.15 | | | | (.32 | ) | | | 474 | | | | .27 | | | | .27 | | | | 2.04 | |
| 10/31/2017 | | | 10.48 | | | | .21 | | | | (.07 | ) | | | .14 | | | | (.21 | ) | | | — | 4 | | | (.21 | ) | | | 10.41 | | | | 1.39 | | | | 442 | | | | .35 | | | | .34 | | | | 2.02 | |
| Capital Group Short-Term Municipal Fund | | | | | | | | | | | | | | | | | | | | | | | | | | | | | | | | | | | | | | | |
| 10/31/2021 | | $ | 10.33 | | | $ | .09 | | | $ | (.04 | ) | | $ | .05 | | | $ | (.09 | ) | | $ | (.03 | ) | | $ | (.12 | ) | | $ | 10.26 | | | | .43 | % | | $ | 203 | | | | .31 | % | | | .30 | % | | | .87 | % |
| 10/31/2020 | | | 10.15 | | | | .14 | | | | .18 | | | | .32 | | | | (.14 | ) | | | — | | | | (.14 | ) | | | 10.33 | | | | 3.16 | | | | 208 | | | | .32 | | | | .30 | | | | 1.36 | |
| 10/31/2019 | | | 9.93 | | | | .19 | | | | .22 | | | | .41 | | | | (.19 | ) | | | — | | | | (.19 | ) | | | 10.15 | | | | 4.19 | | | | 127 | | | | .35 | | | | .30 | | | | 1.92 | |
| 10/31/2018 | | | 10.09 | | | | .17 | | | | (.18 | ) | | | (.01 | ) | | | (.15 | ) | | | — | | | | (.15 | ) | | | 9.93 | | | | .05 | | | | 138 | | | | .32 | | | | .30 | | | | 1.67 | |
| 10/31/2017 | | | 10.11 | | | | .14 | | | | (.02 | ) | | | .12 | | | | (.14 | ) | | | — | 4 | | | (.14 | ) | | | 10.09 | | | | 1.26 | | | | 150 | | | | .41 | | | | .35 | | | | 1.42 | |
| Capital Group California Core Municipal Fund | | | | | | | | | | | | | | | | | | | | | | | | | | | | | |
| 10/31/2021 | | $ | 10.90 | | | $ | .13 | | | $ | (.08 | ) | | $ | .05 | | | $ | (.11 | ) | | $ | (.09 | ) | | $ | (.20 | ) | | $ | 10.75 | | | | .53 | % | | $ | 664 | | | | .27 | % | | | .27 | % | | | 1.17 | % |
| 10/31/2020 | | | 10.73 | | | | .17 | | | | .18 | | | | .35 | | | | (.17 | ) | | | (.01 | ) | | | (.18 | ) | | | 10.90 | | | | 3.29 | | | | 627 | | | | .28 | | | | .28 | | | | 1.55 | |
| 10/31/2019 | | | 10.34 | | | | .20 | | | | .40 | | | | .60 | | | | (.20 | ) | | | (.01 | ) | | | (.21 | ) | | | 10.73 | | | | 5.84 | | | | 557 | | | | .28 | | | | .28 | | | | 1.89 | |
| 10/31/2018 | | | 10.57 | | | | .19 | | | | (.23 | ) | | | (.04 | ) | | | (.18 | ) | | | (.01 | ) | | | (.19 | ) | | | 10.34 | | | | (.27 | ) | | | 452 | | | | .27 | | | | .27 | | | | 1.85 | |
| 10/31/2017 | | | 10.69 | | | | .20 | | | | (.11 | ) | | | .09 | | | | (.20 | ) | | | (.01 | ) | | | (.21 | ) | | | 10.57 | | | | .84 | | | | 388 | | | | .35 | | | | .34 | | | | 1.88 | |
| Capital Group California Short-Term Municipal Fund | | | | | | | | | | | | | | | | | | | | | | | | | | | | | | | | | | | | | |
| 10/31/2021 | | $ | 10.39 | | | $ | .08 | | | $ | (.07 | ) | | $ | .01 | | | $ | (.08 | ) | | $ | (.03 | ) | | $ | (.11 | ) | | $ | 10.29 | | | | .12 | % | | $ | 182 | | | | .29 | % | | | .29 | % | | | .76 | % |
| 10/31/2020 | | | 10.28 | | | | .12 | | | | .11 | | | | .23 | | | | (.12 | ) | | | — | | | | (.12 | ) | | | 10.39 | | | | 2.26 | | | | 199 | | | | .30 | | | | .30 | | | | 1.16 | |
| 10/31/2019 | | | 10.06 | | | | .15 | | | | .22 | | | | .37 | | | | (.15 | ) | | | — | | | | (.15 | ) | | | 10.28 | | | | 3.55 | | | | 164 | | | | .32 | | | | .30 | | | | 1.46 | |
| 10/31/2018 | | | 10.21 | | | | .13 | | | | (.15 | ) | | | (.02 | ) | | | (.12 | ) | | | (.01 | ) | | | (.13 | ) | | | 10.06 | | | | (.07 | ) | | | 129 | | | | .31 | | | | .30 | | | | 1.28 | |
| 10/31/2017 | | | 10.23 | | | | .11 | | | | (.02 | ) | | | .09 | | | | (.11 | ) | | | — | 4 | | | (.11 | ) | | | 10.21 | | | | .97 | | | | 120 | | | | .42 | | | | .35 | | | | 1.11 | |
| Capital Group Core Bond Fund | | | | | | | | | | | | | | | | | | | | | | | | | | | | | | | | | | | | | | | | | | |
| 10/31/2021 | | $ | 10.70 | | | $ | .14 | | | $ | (.20 | ) | | $ | (.06 | ) | | $ | (.15 | ) | | $ | (.25 | ) | | $ | (.40 | ) | | $ | 10.24 | | | | (.60 | )% | | $ | 640 | | | | .28 | % | | | .28 | % | | | 1.36 | % |
| 10/31/2020 | | | 10.31 | | | | .18 | | | | .46 | | | | .64 | | | | (.19 | ) | | | (.06 | ) | | | (.25 | ) | | | 10.70 | | | | 6.28 | | | | 564 | | | | .28 | | | | .28 | | | | 1.73 | |
| 10/31/2019 | | | 9.82 | | | | .23 | | | | .48 | | | | .71 | | | | (.22 | ) | | | — | | | | (.22 | ) | | | 10.31 | | | | 7.33 | | | | 477 | | | | .28 | | | | .28 | | | | 2.24 | |
| 10/31/2018 | | | 10.14 | | | | .21 | | | | (.34 | ) | | | (.13 | ) | | | (.19 | ) | | | — | | | | (.19 | ) | | | 9.82 | | | | (1.14 | ) | | | 446 | | | | .28 | | | | .28 | | | | 2.08 | |
| 10/31/2017 | | | 10.31 | | | | .16 | | | | (.12 | ) | | | .04 | | | | (.16 | ) | | | (.05 | ) | | | (.21 | ) | | | 10.14 | | | | .41 | | | | 416 | | | | .35 | | | | .34 | | | | 1.58 | |
| Portfolio turnover rate for all share classes | | Year ended October 31, |
| excluding mortgage dollar roll transactions5,6 | | 2021 | | 2020 | | 2019 | | 2018 | | 2017 |
| Capital Group Core Bond Fund | | | 48 | % | | | 80 | % | | | 114 | % | | | 41 | % | | | 52 | % |
| | | |
| Portfolio turnover rate for all share classes, | | Year ended October 31, |
| including mortgage dollar roll transactions6 | | 2021 | | 2020 | | 2019 | | 2018 | | 2017 |
| Capital Group Core Municipal Fund | | | 48 | % | | | 62 | % | | | 38 | % | | | 55 | % | | | 47 | % |
| Capital Group Short-Term Municipal Fund | | | 51 | | | | 58 | | | | 50 | | | | 70 | | | | 42 | |
| Capital Group California Core Municipal Fund | | | 38 | | | | 37 | | | | 22 | | | | 69 | | | | 27 | |
| Capital Group California Short-Term Municipal Fund | | | 43 | | | | 42 | | | | 39 | | | | 65 | | | | 36 | |
| Capital Group Core Bond Fund | | | 217 | | | | 158 | | | | 151 | | | | 110 | | | | 95 | |
| 1 | Based on average shares outstanding. |
| 2 | This column reflects the impact, if any, of miscellaneous fee reimbursements from CRMC. |
| 3 | Ratios do not include expenses of any Central Funds. The fund indirectly bears its proportionate share of the expenses of any Central Funds, if applicable. |
| 4 | Amount less than $.01. |
| 5 | Refer to Note 5 for further information on mortgage dollar rolls. |
| 6 | Rates do not include the fund’s portfolio activity with respect to any Central Funds, if applicable. |
See notes to financial statements.
| 100 | Private Client Services Funds |
Report of Independent Registered Public Accounting Firm
To the Board of Trustees of Capital Group Private Client Services Funds and Shareholders of Capital Group Core Municipal Fund, Capital Group Short-Term Municipal Fund, Capital Group California Core Municipal Fund, Capital Group California Short- Term Municipal Fund, and Capital Group Core Bond Fund
Opinions on the Financial Statements
We have audited the accompanying statements of assets and liabilities, including the investment portfolios, of Capital Group Core Municipal Fund, Capital Group Short-Term Municipal Fund, Capital Group California Core Municipal Fund, Capital Group California Short-Term Municipal Fund, and Capital Group Core Bond Fund (constituting Capital Group Private Client Services Funds, hereafter collectively referred to as the “Funds”) as of October 31, 2021, the related statements of operations for the year ended October 31, 2021, the statements of changes in net assets for each of the two years in the period ended October 31, 2021, including the related notes, and the financial highlights for each of the four years in the period ended October 31, 2021 (collectively referred to as the “financial statements”). In our opinion, the financial statements present fairly, in all material respects, the financial position of each of the Funds as of October 31, 2021, the results of each of their operations for the year then ended, the changes in each of their net assets for each of the two years in the period ended October 31, 2021 and each of the financial highlights for each of the four years in the period ended October 31, 2021 in conformity with accounting principles generally accepted in the United States of America.
The financial statements of the Funds as of and for the year ended October 31, 2017 and the financial highlights for each of the periods ended on or prior to October 31, 2017 (not presented herein, other than the financial highlights for the period ended October 31, 2017) were audited by other auditors whose report dated December 19, 2017 expressed an unqualified opinion on those financial statements and financial highlights.
Basis for Opinions
These financial statements are the responsibility of the Funds’ management. Our responsibility is to express an opinion on the Funds’ financial statements based on our audits. We are a public accounting firm registered with the Public Company Accounting Oversight Board (United States) (PCAOB) and are required to be independent with respect to the Funds in accordance with the U.S. federal securities laws and the applicable rules and regulations of the Securities and Exchange Commission and the PCAOB.
We conducted our audits of these financial statements in accordance with the standards of the PCAOB. Those standards require that we plan and perform the audit to obtain reasonable assurance about whether the financial statements are free of material misstatement, whether due to error or fraud.
Our audits included performing procedures to assess the risks of material misstatement of the financial statements, whether due to error or fraud, and performing procedures that respond to those risks. Such procedures included examining, on a test basis, evidence regarding the amounts and disclosures in the financial statements. Our audits also included evaluating the accounting principles used and significant estimates made by management, as well as evaluating the overall presentation of the financial statements. Our procedures included confirmation of securities owned as of October 31, 2021 by correspondence with the custodian, transfer agent and brokers; when replies were not received from brokers, we performed other auditing procedures. We believe that our audits provide a reasonable basis for our opinion.
/s/ PricewaterhouseCoopers LLP
Los Angeles, California
December 15, 2021
We have served as the auditor of one or more investment companies in The Capital Group Companies Investment Company Complex since 1934.
| Private Client Services Funds | 101 |
The Bond Fund of America® Annual report
for the year ended
December 31, 2021 |  |

Invest with a stable,
long-term approach
The Bond Fund of America seeks as high a level of current income as is consistent with the preservation of capital.
This fund is one of more than 40 offered by Capital Group, home of American Funds, one of the nation’s largest mutual fund families. For over 90 years, Capital Group has invested with a long-term focus based on thorough research and attention to risk.
Fund results shown in this report, unless otherwise indicated, are for Class F-2 shares. Class A share results are shown at net asset value unless otherwise indicated. If a sales charge (maximum 3.75%) had been deducted, the results would have been lower. Results are for past periods and are not predictive of results for future periods. Current and future results may be lower or higher than those shown. Share prices and returns will vary, so investors may lose money. Investing for short periods makes losses more likely. For current information and month-end results, visit capitalgroup.com.
See page 4 for Class F-2 and Class A share results with relevant sales charges deducted. For other share class results, visit capitalgroup.com and americanfundsretirement.com.
Investment results assume all distributions are reinvested and reflect applicable fees and expenses. When applicable, investment results reflect fee waivers, without which results would have been lower. Visit capitalgroup.com for more information.
The fund’s 30-day yield as of January 31, 2022, was 1.79% for Class F-2 shares and 1.49% for Class A shares calculated in accordance with the U.S. Securities and Exchange Commission formula. The fund’s distribution rate as of that date was 1.73% for Class F-2 shares and 1.43% for Class A shares. The Class A share results for both reflect the 3.75% maximum sales charge. The SEC yield reflects the rate at which the fund is earning income on its current portfolio of securities while the distribution rate reflects the fund’s past dividends paid to shareholders. Accordingly, the fund’s SEC yield and distribution rate may differ.
The return of principal for bond funds and for funds with significant underlying bond holdings is not guaranteed. Fund shares are subject to the same interest rate, inflation and credit risks associated with the underlying bond holdings. High-yield bonds are subject to greater fluctuations in value and risk of loss of income and principal than investment-grade bonds. Investing in bonds issued outside the U.S. may be subject to additional risks. They include currency fluctuations, political and social instability, differing securities regulations and accounting standards, higher transaction costs, possible changes in taxation, illiquidity and price volatility. These risks may be heightened in connection with investments in developing countries. Refer to the fund prospectus and the Risk Factors section of this report for more information on these and other risks associated with investing in the fund.
Investments are not FDIC-insured, nor are they deposits of or guaranteed by a bank or any other entity, so they may lose value.
Contents
Fellow investors:
U.S. growth rose sharply in 2021 as the economy continued to reopen more fully amid ample fiscal and monetary stimulus. However, with bond yields ticking up, fixed income markets were mixed. For the 12-month period ended December 31, The Bond Fund of America returned –0.71%.
By way of comparison, the Bloomberg U.S. Aggregate Index — a measure of the investment-grade (BBB/Baa and above) bond market — returned –1.54%. The fund’s peer group, as measured by the Lipper Core Bond Funds Average, returned –1.26%.
The fund paid dividends totaling 23 cents per share during the period. For investors, this amounted to an income return of 1.65% with dividends reinvested, or 1.63% if taken in cash.
Bond market overview
Despite mostly positive economic trends throughout 2021, markets were mixed. U.S. GDP is estimated to have been up sharply, over 5%. The nation’s unemployment rate also dropped from 6.7% at the end of 2020 to 3.9% by the end of 2021, low on a historical basis. A new presidential administration and Congress also passed significant new government spending measures to provide COVID relief and strengthen infrastructure. This fiscal stimulus paired with other economic improvement helped fuel strong returns for equities and other higher risk assets.
However, one of the key wrinkles in the 2021 economic boom was a much higher rate of inflation due to supply shortages and other factors. The Consumer Price Index increased by 7.0% during the year, the highest in nearly 40 years. This, paired with the strength of the U.S. labor market, led the U.S. Federal Reserve to signal policy tightening in 2022. And as the year ended, higher inflation began to look more persistent than expected, leading U.S. monetary policymakers to shift strategy and make plans to wind down asset purchases more quickly than initially planned. Additionally, they projected three or four quarter-percentage-point interest rate hikes in 2022.
These factors drove bond yields higher in 2021, sending many returns into negative
Results at a glance
For periods ended December 31, 2021, with all distributions reinvested
| | | Cumulative | | | | | | | | | |
| | | total returns | | Average annual total returns |
| | | | | | | | | | | | Lifetime |
| | | | | | | | | | | | (since Class A |
| | | | | | | | | | | | inception |
| | | 1 year | | 5 years | | 10 years | | on 5/28/74) |
| | | | | | | | | |
| The Bond Fund of America (Class F-2 shares)1 | | | –0.71 | % | | | 4.34 | % | | | 3.51 | % | | | 7.52 | % |
| The Bond Fund of America (Class A shares) | | | –0.95 | | | | 4.08 | | | | 3.25 | | | | 7.28 | |
| Bloomberg U.S. Aggregate Index2 | | | –1.54 | | | | 3.57 | | | | 2.90 | | | | 7.19 | |
| Lipper Core Bond Funds Average3 | | | –1.26 | | | | 3.65 | | | | 3.10 | | | | 7.07 | |
| 1 | Class F-2 shares were first offered on August 1, 2008. Class F-2 share results prior to the date of first sale are hypothetical based on the results of the original share class of the fund without a sales charge, adjusted for typical estimated expenses. Visit capitalgroup.com for more information on specific expense adjustments and the actual dates of first sale. |
| 2 | Bloomberg Index Services Ltd. The Bloomberg U.S. Aggregate Index began on January 1, 1976. From May 28, 1974, through December 31, 1975, the Barclays U.S. Government/Credit Index (now called “the Bloomberg U.S. Government/Credit Index”) was used. The indexes are unmanaged and, therefore, have no expenses. Investors cannot invest directly in an index. |
| 3 | Source: Lipper, Refinitiv Datastream. Results for the Lipper averages do not reflect sales charges. Lipper averages reflect the current composition of all eligible mutual funds (all share classes) within a given category. To see the number of funds included in the Lipper category for each fund’s lifetime, please view the Quarterly Statistical Update, available on our website. |
| The Bond Fund of America | 1 |
territory. The benchmark 10-year Treasury yield ended the year at 1.51%, more than half a percentage point higher than where it began. Treasuries with intermediate maturities of two through seven years saw the biggest jump, between 0.61 and 0.90 percentage points.
Rising yields, inflation and economic growth affected sectors in different ways. For example, within high-quality bonds, Treasury Inflation-Protected Securities (TIPS) benefited from rising inflation expectations. The Bloomberg U.S. Treasury Inflation-Protected Securities Index1 returned 5.96%. Similarly, high-yield corporate bonds saw a gain, with the Bloomberg U.S. Corporate High Yield Index2 up 5.28%, as investor risk premiums fell throughout the year. Municipal bonds also saw generally positive results, propelled by better prospects for the sector’s issuers and demand from investors who anticipated the possibility of rising income tax rates.
High-quality sectors generally fared worse. The Bloomberg U.S. Corporate Investment Grade Index3 returned –1.04%. For the investment-grade sector, the risk premium demanded by investors — the bonds’ spread to Treasuries — declined only slightly by the end of 2021. The Bloomberg U.S. Treasury Index4 returned –2.32%. Although mortgage bond spreads tightened modestly, the impact of higher yields led to losses for that sector as well. The Bloomberg U.S. Mortgage Backed Securities Index5 returned –1.04%. Global bonds fared worse, with other central banks also moving to tighten monetary policy in the face of rising inflation. This and other factors led many countries’ bond yields to rise as well. The Bloomberg Global Aggregate Index6 returned –4.71%, and much of emerging market debt endured losses.
Inside the portfolio
Although 2021 posed several challenges for fixed income, The Bond Fund of America outpaced its benchmark and peer average. It did so by staying true to its focus of taking measured risk while maintaining discipline, with investments backed by strong analyst and manager convictions. Positions continued to focus on interest rate and credit strategies that largely consisted of high-quality assets such as U.S. Treasuries and investment-grade bonds. Investments also included other sectors to a lesser extent, such as high-yield corporate bonds and emerging markets debt.
This period of rising yields created a headwind for bond values, but the fund was less exposed to interest rate risk than its benchmark. Consequently, interest rate positioning, in aggregate, had a positive contribution to relative results. Within the different bond maturity profiles across the Treasury curve, our managers expressed active positioning. Two tenors where exposures to interest rate changes were greater than that of the benchmark were in the 2- and 30-year parts of the curve. These positions weighed on relative results as yields rose.
One of the strongest investment results within the portfolio came from TIPS. In anticipation of rising inflation, our managers sought an exposure to these bonds, which are not contained in the fund’s benchmark. Having outpaced most other bond sectors during the year, this position had a sizable impact on relative returns.
Our managers invested in credit opportunistically, selling as risk premiums tightened and buying when they widened. Throughout the year, the fund’s investment-grade corporate exposure remained somewhat neutral compared to the index weight. However, as the year wore on, managers replaced lower quality bonds with higher quality ones. They sought to raise the quality of the fund in preparation for possible volatility as valuations soared. Through careful credit selection, investment-grade bonds provided a positive contribution to results relative to the index. The fund also held a modest position in high-yield (rated BB/Ba and below) bonds during the year. This was one of the strongest sectors in 2021 and boosted results notably.
The fund had more exposure to mortgage-backed securities than the index as the year began. As these bond values rose and risk from possible Fed tightening became apparent, the fund reduced its exposure. This strategy benefited relative results. Credit selection within U.S. dollar-denominated emerging markets debt also contributed to the fund’s results relative to the benchmark, a benefit provided by our analysts’ research.
At times, the fund’s interest rate strategies utilized interest rate swaps and futures to more efficiently execute the portfolio’s positioning based on how managers
| 1 | Bloomberg U.S. Treasury Inflation-Protected Securities (TIPS) Index consists of investment-grade, fixed-rate, publicly placed, dollar-denominated and non-convertible inflation-protected securities issued by the U.S. Treasury that have at least one year remaining to maturity, and have at least $250 million par amount outstanding. |
| 2 | Bloomberg U.S. Corporate High Yield Index covers the universe of fixed-rate, non-investment-grade debt. |
| 3 | Bloomberg U.S. Corporate Investment Grade Index represents the universe of investment-grade, publicly issued U.S. corporate and specified foreign debentures and secured notes that meet the specified maturity, liquidity, and quality requirements. |
| 4 | The Bloomberg U.S. Treasury Index includes public obligations of the U.S. Treasury, i.e. U.S. government bonds. Certain Treasury bills are excluded by a maturity constraint. In addition, certain special issues, such as state and local government series bonds (SLGs), as well as U.S. Treasury TIPS, are excluded. |
| 5 | Bloomberg U.S. Mortgage Backed Securities Index is a market-value-weighted index that covers the mortgage-backed pass-through securities of Ginnie Mae (GNMA), Fannie Mae (FNMA), and Freddie Mac (FHLMC). |
| 6 | Bloomberg Global Aggregate Index represents the global investment-grade fixed income markets. |
| 2 | The Bond Fund of America |
expected yields to move. These had a net positive impact on results by helping to express managers’ convictions more efficiently.
Looking ahead
As 2022 begins, our managers expect the U.S. economy to maintain momentum on the back of strong consumer spending and business investment, even amid elevated inflation and the Fed beginning to raise rates early this year. In addition to the three or four rate hikes the market expects this year, the central bank may begin quantitative tightening — selling assets to shrink the size of its balance sheet — to combat inflation. Alongside an economy that is already decelerating, managers expect these measures to further slow momentum late in the year or in early 2023. If that happens, the Fed may be forced to rethink its aggressive plans to withdraw monetary support.
One additional risk factor for 2022 is the potential for greater financial market volatility. Managers believe that the Fed’s asset purchases over the past two years have led to a dampening effect on market volatility. Therefore, managers are concerned that as the Fed withdraws monetary accommodation, market volatility may rise. With most financial asset valuations near record highs, investors must recognize that an aggressive Fed focused on bringing down inflation may make asset prices vulnerable to a selloff. Against this backdrop, The Bond Fund of America will seek to deemphasize credit risk and emphasize liquidity. This leads to several likely investing themes we will pursue in 2022.
First, as the Fed raises short-term rates, longer term rates may prove more resilient if growth expectations fall. This would imply a flattening of the Treasury yield curve, where the spread between shorter and longer term yields shrinks. Next, with inflation likely to remain elevated in the near term, TIPS may still offer value to the portfolio. Because central banks have less control over shorter term inflation driven more by economic trends than expectations, shorter dated TIPS could have more upside potential and offer protection in case inflation rises further.
Investing in credit markets will prove challenging given how expensive both investment-grade and high-yields bonds have become. Should volatility hit, both could see a notable negative impact. As a result, we will rely on careful security selection focused on more resilient, higher quality issuers.
Mortgage-backed securities may prove an interesting sector this year. At the beginning of 2022, these bonds were at the richer end of what managers believe is fair value. However, the Fed is reducing purchases of these bonds and may eventually sell off some portion of its mortgage holdings. This could result in opportunities to invest at more attractive valuations as the year progresses.
More broadly, the fund’s strategy for this year is likely to remain characterized as that of a gradual contrarian. As spreads move tighter, we will continue to harvest our gains and upgrade the portfolio’s quality and liquidity. And if spreads widen and volatility rises, we will look to cautiously add back bonds that our analysts like at more attractive valuations. Similarly, if yields continue to move higher beyond what we think is a reasonable expectation for Fed hikes, we will likely increase the portfolio’s interest rate exposure.
With short-term interest rates moving higher in recent months, our managers believe that investment-grade fixed income can increasingly provide downside protection to investors when market volatility rises. With the Fed becoming more eager to withdraw support and valuations at or near all-time highs, we believe that a core bond strategy remains an important part of an investor’s overall asset allocation plan. We appreciate your support and trust in our portfolio management team.
Cordially,

Pramod Atluri
President
February 11, 2022
For current information about the fund, visit capitalgroup.com.
| The Bond Fund of America | 3 |
The value of a long-term perspective
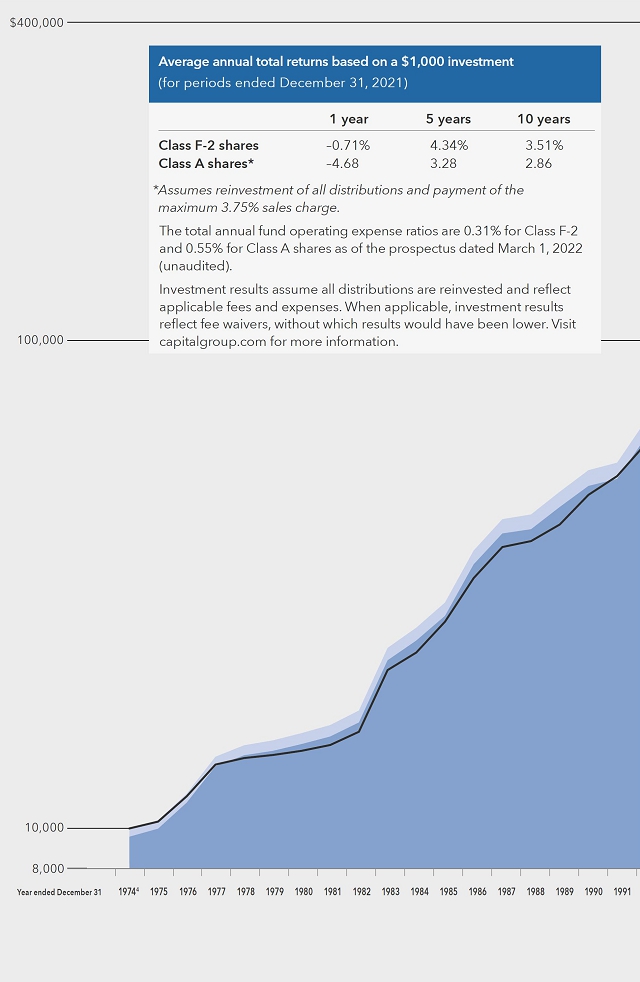
Fund results shown are for Class F-2 and Class A shares. Class A share results reflect deduction of the maximum sales charge of 3.75% on the $10,000 investment.1 Thus, the net amount invested was $9,625.2 Results are for past periods and are not predictive of results for future periods. Current and future results may be lower or higher than those shown. Share prices and returns will vary, so investors may lose money. Investing for short periods makes losses more likely. For current information and month-end results, visit capitalgroup.com.
The results shown are before taxes on fund distributions and sale of fund shares.
| 1 | As outlined in the prospectus, the sales charge is reduced for accounts (and aggregated investments) of $100,000 or more and is eliminated for purchases of $1 million or more. There is no sales charge on dividends or capital gain distributions that are reinvested in additional shares. |
| 2 | The maximum initial sales charge was 8.5% prior to December 15, 1986, when it became 4.75% until January 9, 2000. |
| 3 | Source: Bloomberg Index Services Ltd. Bloomberg U.S. Aggregate Index represents the U.S. investment-grade fixed-rate bond market. From May 28, 1974, through December 31, 1975, Bloomberg U.S. Government/Credit Index was used because Bloomberg U.S. Aggregate Index did not yet exist. Since January 1, 1976, the Bloomberg U.S. Aggregate Index has been used. These indexes are unmanaged and, therefore, have no expenses. Investors cannot invest directly in an index. |
| 4 | For the period May 28, 1974, commencement of operations, through December 31, 1974. |
| 4 | The Bond Fund of America |
How a hypothetical $10,000 investment has grown
There have always been reasons not to invest. You will find, however, that despite occasional stumbles, financial markets have tended to reward investors over the long term. Dividends, particularly when reinvested, have accounted for a large portion of the fund’s overall results.
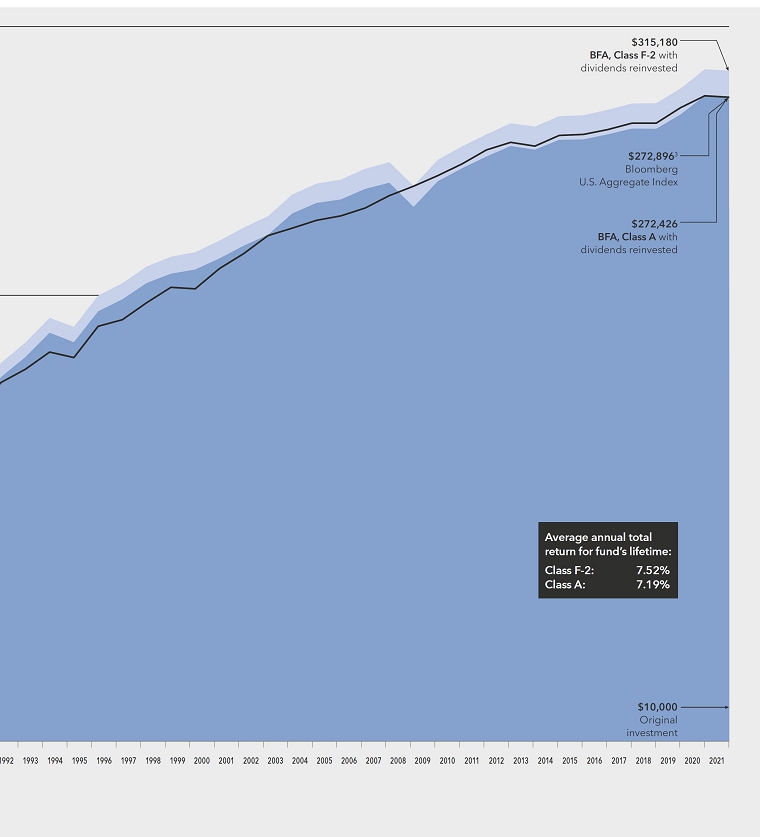
| The Bond Fund of America | 5 |
| Investment portfolio December 31, 2021 | |
| | |
| Portfolio by type of security | Percent of net assets |

| Portfolio quality summary* | | Percent of
net assets | |
| U.S. Treasury and agency† | | | 42.76 | % |
| AAA/Aaa | | | 15.13 | |
| AA/Aa | | | 4.96 | |
| A/A | | | 11.44 | |
| BBB/Baa | | | 18.15 | |
| Below investment grade | | | 3.27 | |
| Unrated | | | .05 | |
| Short-term securities & other assets less liabilities | | | 4.24 | |
| | |
| * | Bond ratings, which typically range from AAA/Aaa (highest) to D (lowest), are assigned by credit rating agencies such as Standard & Poor’s, Moody’s and/or Fitch as an indication of an issuer’s creditworthiness. In assigning a credit rating to a security, the fund looks specifically to the ratings assigned to the issuer of the security by Standard & Poor’s, Moody’s and/or Fitch. If agency ratings differ, the security will be considered to have received the highest of those ratings, consistent with the fund’s investment policies. Securities in the “unrated” category (above) have not been rated by a rating agency; however, the investment adviser performs its own credit analysis and assigns comparable ratings that are used for compliance with the fund’s investment policies. The ratings are not covered by the Report of Independent Registered Public Accounting Firm. |
| † | These securities are guaranteed by the full faith and credit of the U.S. government. |
| | |
| Bonds, notes & other debt instruments 95.70% | | Principal amount
(000) | | | Value
(000) | |
| U.S. Treasury bonds & notes 42.73% | | | | | | |
| U.S. Treasury 31.83% | | | | | | | | |
| U.S. Treasury 0.125% 2022 | | $ | 276,582 | | | $ | 276,442 | |
| U.S. Treasury 0.125% 2022 | | | 265,905 | | | | 265,499 | |
| U.S. Treasury 0.125% 2022 | | | 84,840 | | | | 84,593 | |
| U.S. Treasury 0.125% 2022 | | | 50,000 | | | | 50,004 | |
| U.S. Treasury 0.125% 2022 | | | 10,000 | | | | 9,979 | |
| U.S. Treasury 0.375% 2022 | | | 213 | | | | 213 | |
| U.S. Treasury 1.375% 2022 | | | 100,000 | | | | 100,098 | |
| U.S. Treasury 1.375% 2022 | | | 75,000 | | | | 75,616 | |
| U.S. Treasury 1.75% 2022 | | | 45,000 | | | | 45,366 | |
| U.S. Treasury 1.875% 2022 | | | 54,500 | | | | 54,816 | |
| U.S. Treasury 2.125% 20221 | | | 32,000 | | | | 32,534 | |
| U.S. Treasury 2.50% 2022 | | | 800,000 | | | | 800,632 | |
| U.S. Treasury 0.125% 20231 | | | 2,046,012 | | | | 2,028,538 | |
| U.S. Treasury 0.125% 2023 | | | 521,057 | | | | 516,986 | |
| U.S. Treasury 0.125% 2023 | | | 195,679 | | | | 194,650 | |
| U.S. Treasury 0.125% 2023 | | | 141,672 | | | | 141,034 | |
| U.S. Treasury 0.125% 2023 | | | 85,000 | | | | 84,172 | |
| U.S. Treasury 0.125% 2023 | | | 40,000 | | | | 39,780 | |
| U.S. Treasury 0.125% 2023 | | | 40,000 | | | | 39,735 | |
| U.S. Treasury 0.125% 2023 | | | 25,000 | | | | 24,715 | |
| U.S. Treasury 0.125% 2023 | | | 24,176 | | | | 24,096 | |
| U.S. Treasury 0.125% 2023 | | | 10,981 | | | | 10,916 | |
| U.S. Treasury 0.125% 2023 | | | 1,000 | | | | 996 | |
| U.S. Treasury 0.25% 2023 | | | 40,000 | | | | 39,671 | |
| U.S. Treasury 0.25% 2023 | | | 8,377 | | | | 8,319 | |
| 6 | The Bond Fund of America |
| Bonds, notes & other debt instruments (continued) | | Principal amount
(000) | | | Value
(000) | |
| U.S. Treasury bonds & notes (continued) | | | | | | |
| U.S. Treasury (continued) | | | | | | |
| U.S. Treasury 0.375% 2023 | | $ | 88,710 | | | $ | 88,209 | |
| U.S. Treasury 0.50% 2023 | | | 28,000 | | | | 27,896 | |
| U.S. Treasury 0.75% 2023 | | | 20,000 | | | | 20,012 | |
| U.S. Treasury 1.375% 2023 | | | 7,000 | | | | 7,084 | |
| U.S. Treasury 1.75% 2023 | | | 3,100 | | | | 3,152 | |
| U.S. Treasury 2.125% 2023 | | | 16,428 | | | | 16,868 | |
| U.S. Treasury 2.50% 2023 | | | 47,000 | | | | 48,164 | |
| U.S. Treasury 2.625% 2023 | | | 15,000 | | | | 15,455 | |
| U.S. Treasury 2.75% 2023 | | | 25,000 | | | | 25,774 | |
| U.S. Treasury 2.875% 2023 | | | 54,729 | | | | 56,832 | |
| U.S. Treasury 0.125% 2024 | | | 584,803 | | | | 577,233 | |
| U.S. Treasury 0.125% 2024 | | | 100,000 | | | | 98,757 | |
| U.S. Treasury 0.25% 2024 | | | 165,200 | | | | 163,289 | |
| U.S. Treasury 0.25% 2024 | | | 65,563 | | | | 64,681 | |
| U.S. Treasury 0.375% 2024 | | | 561,802 | | | | 554,493 | |
| U.S. Treasury 0.375% 2024 | | | 275,120 | | | | 271,292 | |
| U.S. Treasury 0.375% 2024 | | | 8,919 | | | | 8,831 | |
| U.S. Treasury 0.625% 2024 | | | 47,014 | | | | 46,643 | |
| U.S. Treasury 0.75% 2024 | | | 2,992 | | | | 2,976 | |
| U.S. Treasury 1.00% 2024 | | | 6,466 | | | | 6,474 | |
| U.S. Treasury 1.25% 2024 | | | 75,000 | | | | 75,694 | |
| U.S. Treasury 1.50% 2024 | | | 130,000 | | | | 132,071 | |
| U.S. Treasury 1.50% 2024 | | | 98,200 | | | | 99,752 | |
| U.S. Treasury 1.50% 2024 | | | 1,000 | | | | 1,016 | |
| U.S. Treasury 1.75% 2024 | | | 40,000 | | | | 40,876 | |
| U.S. Treasury 2.00% 2024 | | | 442,300 | | | | 454,491 | |
| U.S. Treasury 2.00% 2024 | | | 55,000 | | | | 56,554 | |
| U.S. Treasury 2.00% 2024 | | | 19,000 | | | | 19,517 | |
| U.S. Treasury 2.125% 2024 | | | 105,265 | | | | 108,381 | |
| U.S. Treasury 2.125% 2024 | | | 18,000 | | | | 18,602 | |
| U.S. Treasury 2.125% 2024 | | | 8,000 | | | | 8,265 | |
| U.S. Treasury 2.25% 2024 | | | 50,633 | | | | 52,290 | |
| U.S. Treasury 2.25% 2024 | | | 3,000 | | | | 3,114 | |
| U.S. Treasury 2.375% 2024 | | | 67,233 | | | | 69,520 | |
| U.S. Treasury 2.50% 2024 | | | 4,000 | | | | 4,157 | |
| U.S. Treasury 0.25% 2025 | | | 220,000 | | | | 213,820 | |
| U.S. Treasury 0.25% 2025 | | | 59,311 | | | | 57,347 | |
| U.S. Treasury 0.25% 2025 | | | 5,000 | | | | 4,843 | |
| U.S. Treasury 0.25% 2025 | | | 1,000 | | | | 973 | |
| U.S. Treasury 0.375% 2025 | | | 1,976,312 | | | | 1,916,347 | |
| U.S. Treasury 0.375% 2025 | | | 788,900 | | | | 765,428 | |
| U.S. Treasury 2.625% 2025 | | | 135,324 | | | | 142,258 | |
| U.S. Treasury 2.625% 2025 | | | 63,822 | | | | 67,514 | |
| U.S. Treasury 2.75% 20251 | | | 900,000 | | | | 948,468 | |
| U.S. Treasury 2.75% 2025 | | | 31,813 | | | | 33,638 | |
| U.S. Treasury 2.875% 2025 | | | 272,175 | | | | 288,701 | |
| U.S. Treasury 0.375% 2026 | | | 752,665 | | | | 728,619 | |
| U.S. Treasury 0.50% 2026 | | | 71,143 | | | | 69,147 | |
| U.S. Treasury 0.625% 2026 | | | 160,154 | | | | 155,803 | |
| U.S. Treasury 0.75% 2026 | | | 678,267 | | | | 665,653 | |
| U.S. Treasury 0.75% 2026 | | | 606,692 | | | | 594,933 | |
| U.S. Treasury 0.75% 2026 | | | 175,077 | | | | 171,237 | |
| U.S. Treasury 0.75% 2026 | | | 45,560 | | | | 44,647 | |
| U.S. Treasury 0.875% 2026 | | | 1,127,608 | | | | 1,108,243 | |
| U.S. Treasury 0.875% 2026 | | | 8,802 | | | | 8,667 | |
| U.S. Treasury 1.125% 2026 | | | 31,859 | | | | 31,666 | |
| U.S. Treasury 1.25% 2026 | | | 47,163 | | | | 47,163 | |
| U.S. Treasury 1.625% 2026 | | | — | 2 | | | — | 2 |
| U.S. Treasury 2.00% 2026 | | | 15,600 | | | | 16,149 | |
| U.S. Treasury 2.125% 2026 | | | 31,000 | | | | 32,215 | |
| U.S. Treasury 2.25% 2026 | | | 8,000 | | | | 8,348 | |
| U.S. Treasury 2.625% 2026 | | | 109,585 | | | | 115,925 | |
| U.S. Treasury 0.375% 2027 | | | 75,000 | | | | 71,026 | |
| U.S. Treasury 0.50% 2027 | | | 549,480 | | | | 524,586 | |
| U.S. Treasury 0.50% 2027 | | | 55,500 | | | | 52,847 | |
| U.S. Treasury 0.50% 2027 | | | 16,000 | | | | 15,326 | |
| U.S. Treasury 0.50% 2027 | | | 6,000 | | | | 5,743 | |
| The Bond Fund of America | 7 |
| Bonds, notes & other debt instruments (continued) | | Principal amount
(000) | | | Value
(000) | |
| U.S. Treasury bonds & notes (continued) | | | | | | |
| U.S. Treasury (continued) | | | | | | |
| U.S. Treasury 0.625% 2027 | | $ | 112,389 | | | $ | 107,586 | |
| U.S. Treasury 0.625% 2027 | | | 42,000 | | | | 40,248 | |
| U.S. Treasury 2.25% 2027 | | | 100,000 | | | | 105,051 | |
| U.S. Treasury 2.25% 2027 | | | 3,000 | | | | 3,145 | |
| U.S. Treasury 0.75% 2028 | | | 13,450 | | | | 12,959 | |
| U.S. Treasury 1.00% 2028 | | | 35,000 | | | | 34,091 | |
| U.S. Treasury 1.125% 2028 | | | 165,881 | | | | 163,552 | |
| U.S. Treasury 1.125% 2028 | | | 14,045 | | | | 13,781 | |
| U.S. Treasury 1.25% 2028 | | | 140,850 | | | | 139,669 | |
| U.S. Treasury 1.25% 2028 | | | 118,900 | | | | 117,738 | |
| U.S. Treasury 1.25% 2028 | | | 33,700 | | | | 33,410 | |
| U.S. Treasury 1.25% 2028 | | | 23,762 | | | | 23,539 | |
| U.S. Treasury 1.375% 2028 | | | 82,000 | | | | 81,697 | |
| U.S. Treasury 1.50% 2028 | | | 148,000 | | | | 148,658 | |
| U.S. Treasury 2.75% 2028 | | | 17,398 | | | | 18,810 | |
| U.S. Treasury 2.875% 2028 | | | 61,335 | | | | 66,854 | |
| U.S. Treasury 2.875% 2028 | | | 3,760 | | | | 4,108 | |
| U.S. Treasury 1.625% 2029 | | | 398 | | | | 404 | |
| U.S. Treasury 2.375% 2029 | | | 2,000 | | | | 2,133 | |
| U.S. Treasury 0.625% 2030 | | | 50,987 | | | | 47,565 | |
| U.S. Treasury 0.625% 2030 | | | 17,638 | | | | 16,497 | |
| U.S. Treasury 0.875% 2030 | | | 12,500 | | | | 11,889 | |
| U.S. Treasury 1.50% 2030 | | | 11,399 | | | | 11,461 | |
| U.S. Treasury 1.125% 2031 | | | 121,311 | | | | 117,768 | |
| U.S. Treasury 1.25% 2031 | | | 170,088 | | | | 166,353 | |
| U.S. Treasury 1.375% 2031 | | | 334,767 | | | | 330,606 | |
| U.S. Treasury 1.625% 2031 | | | 117,533 | | | | 119,053 | |
| U.S. Treasury 3.50% 2039 | | | 4,000 | | | | 5,024 | |
| U.S. Treasury 1.125% 2040 | | | 285,245 | | | | 249,129 | |
| U.S. Treasury 1.125% 2040 | | | 255,059 | | | | 223,714 | |
| U.S. Treasury 1.375% 2040 | | | 200,615 | | | | 182,842 | |
| U.S. Treasury 4.625% 2040 | | | 9,400 | | | | 13,510 | |
| U.S. Treasury 1.75% 2041 | | | 102,806 | | | | 99,657 | |
| U.S. Treasury 1.875% 2041 | | | 236,248 | | | | 233,881 | |
| U.S. Treasury 2.00% 2041 | | | 1,273 | | | | 1,286 | |
| U.S. Treasury 3.125% 2041 | | | 20,000 | | | | 24,073 | |
| U.S. Treasury 4.375% 2041 | | | 11,500 | | | | 16,224 | |
| U.S. Treasury 2.75% 2042 | | | 18,500 | | | | 21,119 | |
| U.S. Treasury 2.75% 2042 | | | 7,000 | | | | 7,991 | |
| U.S. Treasury 2.875% 2043 | | | 23,810 | | | | 27,718 | |
| U.S. Treasury 3.00% 2044 | | | 900 | | | | 1,075 | |
| U.S. Treasury 3.375% 2044 | | | 38,700 | | | | 48,805 | |
| U.S. Treasury 2.50% 2045 | | | 360 | | | | 397 | |
| U.S. Treasury 3.00% 2045 | | | 10,552 | | | | 12,704 | |
| U.S. Treasury 3.00% 2045 | | | 560 | | | | 671 | |
| U.S. Treasury 2.25% 2046 | | | 4,500 | | | | 4,766 | |
| U.S. Treasury 2.50% 2046 | | | 173,562 | | | | 192,063 | |
| U.S. Treasury 2.50% 2046 | | | 18,730 | | | | 20,741 | |
| U.S. Treasury 2.875% 2046 | | | 9,369 | | | | 11,107 | |
| U.S. Treasury 2.75% 2047 | | | 20,593 | | | | 24,011 | |
| U.S. Treasury 2.75% 2047 | | | 5,300 | | | | 6,184 | |
| U.S. Treasury 3.00% 2047 | | | 92,013 | | | | 111,594 | |
| U.S. Treasury 3.00% 2047 | | | 86,916 | | | | 105,648 | |
| U.S. Treasury 3.00% 20481 | | | 167,901 | | | | 205,311 | |
| U.S. Treasury 3.00% 2048 | | | 11,100 | | | | 13,606 | |
| U.S. Treasury 3.125% 2048 | | | 5,150 | | | | 6,447 | |
| U.S. Treasury 3.375% 2048 | | | 12,545 | | | | 16,442 | |
| U.S. Treasury 2.25% 2049 | | | 160,047 | | | | 171,593 | |
| U.S. Treasury 2.375% 2049 | | | 95,544 | | | | 105,167 | |
| U.S. Treasury 2.875% 2049 | | | 194,300 | | | | 234,458 | |
| U.S. Treasury 3.00% 2049 | | | 55,766 | | | | 68,676 | |
| U.S. Treasury 1.25% 2050 | | | 418,645 | | | | 356,162 | |
| U.S. Treasury 1.375% 20501 | | | 942,530 | | | | 827,438 | |
| U.S. Treasury 1.625% 2050 | | | 785,434 | | | | 732,936 | |
| U.S. Treasury 2.00% 2050 | | | 31,100 | | | | 31,652 | |
| U.S. Treasury 1.875% 2051 | | | 296,000 | | | | 293,999 | |
| 8 | The Bond Fund of America |
| Bonds, notes & other debt instruments (continued) | | Principal amount
(000) | | | Value
(000) | |
| U.S. Treasury bonds & notes (continued) | | | | | | |
| U.S. Treasury (continued) | | | | | | |
| U.S. Treasury 1.875% 2051 | | $ | 147,687 | | | $ | 146,388 | |
| U.S. Treasury 2.00% 2051 | | | 1,008,487 | | | | 1,029,359 | |
| U.S. Treasury 2.375% 2051 | | | 357,008 | | | | 394,992 | |
| | | | | | | | 25,324,280 | |
| | | | | | | | | |
| U.S. Treasury inflation-protected securities 10.90% | | | | | | | | |
| U.S. Treasury Inflation-Protected Security 0.125% 20223 | | | 318,067 | | | | 326,145 | |
| U.S. Treasury Inflation-Protected Security 0.125% 20223 | | | 307,538 | | | | 312,261 | |
| U.S. Treasury Inflation-Protected Security 0.125% 20233 | | | 228,888 | | | | 236,598 | |
| U.S. Treasury Inflation-Protected Security 0.375% 20233 | | | 177,913 | | | | 187,239 | |
| U.S. Treasury Inflation-Protected Security 0.625% 20233 | | | 719,123 | | | | 752,389 | |
| U.S. Treasury Inflation-Protected Security 0.125% 20243 | | | 1,208,406 | | | | 1,289,442 | |
| U.S. Treasury Inflation-Protected Security 0.125% 20243 | | | 669,499 | | | | 715,589 | |
| U.S. Treasury Inflation-Protected Security 0.50% 20243 | | | 82,396 | | | | 87,923 | |
| U.S. Treasury Inflation-Protected Security 0.625% 20243 | | | 398,629 | | | | 424,764 | |
| U.S. Treasury Inflation-Protected Security 0.125% 20253 | | | 97,297 | | | | 104,998 | |
| U.S. Treasury Inflation-Protected Security 0.25% 20253 | | | 157,086 | | | | 168,411 | |
| U.S. Treasury Inflation-Protected Security 0.375% 20253 | | | 573,182 | | | | 623,704 | |
| U.S. Treasury Inflation-Protected Security 0.125% 20263 | | | 1,094,879 | | | | 1,182,191 | |
| U.S. Treasury Inflation-Protected Security 0.125% 20263 | | | 1,006,157 | | | | 1,095,021 | |
| U.S. Treasury Inflation-Protected Security 0.125% 20303 | | | 60,864 | | | | 67,642 | |
| U.S. Treasury Inflation-Protected Security 0.125% 20313 | | | 423,936 | | | | 474,688 | |
| U.S. Treasury Inflation-Protected Security 0.125% 20313 | | | 387,116 | | | | 435,158 | |
| U.S. Treasury Inflation-Protected Security 2.125% 20413 | | | 2,996 | | | | 4,640 | |
| U.S. Treasury Inflation-Protected Security 0.75% 20423 | | | 145,318 | | | | 183,681 | |
| U.S. Treasury Inflation-Protected Security 0.125% 20513 | | | 1,580 | | | | 1,871 | |
| | | | | | | | 8,674,355 | |
| | | | | | | | | |
| Total U.S. Treasury bonds & notes | | | | | | | 33,998,635 | |
| | | | | | | | | |
| Corporate bonds, notes & loans 33.20% | | | | | | | | |
| Financials 7.96% | | | | | | | | |
| ACE INA Holdings, Inc. 2.875% 2022 | | | 1,585 | | | | 1,610 | |
| ACE INA Holdings, Inc. 3.35% 2026 | | | 100 | | | | 107 | |
| ACE INA Holdings, Inc. 4.35% 2045 | | | 1,465 | | | | 1,816 | |
| AerCap Holdings NV 6.50% 2025 | | | 4,854 | | | | 5,551 | |
| AerCap Ireland Capital, Ltd. / AerCap Global Aviation Trust 1.15% 2023 | | | 18,000 | | | | 17,929 | |
| AerCap Ireland Capital, Ltd. / AerCap Global Aviation Trust 1.65% 2024 | | | 50,868 | | | | 50,802 | |
| AerCap Ireland Capital, Ltd. / AerCap Global Aviation Trust 2.45% 2026 | | | 60,098 | | | | 60,626 | |
| AerCap Ireland Capital, Ltd. / AerCap Global Aviation Trust 3.00% 2028 | | | 71,609 | | | | 72,677 | |
| AerCap Ireland Capital, Ltd. / AerCap Global Aviation Trust 3.30% 2032 | | | 66,396 | | | | 67,698 | |
| AerCap Ireland Capital, Ltd. / AerCap Global Aviation Trust 3.40% 2033 | | | 26,819 | | | | 27,338 | |
| AerCap Ireland Capital, Ltd. / AerCap Global Aviation Trust 3.85% 2041 | | | 8,351 | | | | 8,714 | |
| Allstate Corp. 0.75% 2025 | | | 2,089 | | | | 2,038 | |
| Allstate Corp. 1.45% 2030 | | | 10,000 | | | | 9,465 | |
| Allstate Corp. 3.85% 2049 | | | 9,000 | | | | 10,541 | |
| Ally Financial, Inc. 5.125% 2024 | | | 3,863 | | | | 4,224 | |
| Ally Financial, Inc. 5.80% 2025 | | | 6,400 | | | | 7,228 | |
| Ally Financial, Inc. 8.00% 2031 | | | 23,019 | | | | 31,675 | |
| Ally Financial, Inc. 8.00% 2031 | | | 16,630 | | | | 23,569 | |
| American Express Co. 3.00% 2024 | | | 20,000 | | | | 20,974 | |
| American Express Co. 3.625% 2024 | | | 26,350 | | | | 28,176 | |
| American Express Co. 1.65% 2026 | | | 18,875 | | | | 18,938 | |
| American Express Co. 3.125% 2026 | | | 650 | | | | 689 | |
| American International Group, Inc. 2.50% 2025 | | | 8,500 | | | | 8,771 | |
| American International Group, Inc. 3.90% 2026 | | | 2,625 | | | | 2,848 | |
| American International Group, Inc. 3.40% 2030 | | | 14,120 | | | | 15,286 | |
| American International Group, Inc. 4.80% 2045 | | | 1,150 | | | | 1,477 | |
| American International Group, Inc. 4.375% 2050 | | | 15,900 | | | | 19,874 | |
| Aon Corp. / Aon Global Holdings PLC 2.60% 2031 | | | 10,000 | | | | 10,185 | |
| Arthur J. Gallagher & Co. 3.50% 2051 | | | 8,275 | | | | 8,760 | |
| ASB Bank, Ltd. 2.375% 20314 | | | 9,150 | | | | 9,105 | |
| Australia & New Zealand Banking Group, Ltd. 2.625% 2022 | | | 15,000 | | | | 15,122 | |
| AXA Equitable Holdings, Inc. 3.90% 2023 | | | 3,617 | | | | 3,744 | |
| Banco de Crédito del Perú 3.25% 2031 (5-year UST Yield Curve Rate T Note Constant Maturity + 2.45% on 9/30/2026)4,5 | | | 11,225 | | | | 11,101 | |
| Banco Santander México, SA, Institución de Banca Múltiple, Grupo Financiero Santander México 5.375% 20254 | | | 7,500 | | | | 8,194 | |
| The Bond Fund of America | 9 |
| Bonds, notes & other debt instruments (continued) | | Principal amount
(000) | | | Value
(000) | |
| Corporate bonds, notes & loans (continued) | | | | | | |
| Financials (continued) | | | | | | | | |
| Banco Santander, SA 1.722% 2027 | | | | | | | | |
| (1-year UST Yield Curve Rate T Note Constant Maturity + 0.90% on 9/14/2026)5 | | $ | 7,800 | | | $ | 7,662 | |
| Bangkok Bank PCL 3.733% 2034 | | | | | | | | |
| (5-year UST Yield Curve Rate T Note Constant Maturity + 1.90% on 9/25/2029)5 | | | 16,965 | | | | 17,365 | |
| Bank of America Corp. 1.53% 2025 (USD-SOFR + 0.65% on 12/6/2024)5 | | | 37,000 | | | | 37,084 | |
| Bank of America Corp. 1.658% 2027 (USD-SOFR + 0.91% on 3/11/2026)5 | | | 42,219 | | | | 41,937 | |
| Bank of America Corp. 1.734% 2027 (USD-SOFR + 0.96% on 7/22/2026)5 | | | 23,330 | | | | 23,173 | |
| Bank of America Corp. 3.419% 2028 (3-month USD-LIBOR + 1.04% on 12/20/2027)5 | | | 57,555 | | | | 61,489 | |
| Bank of America Corp. 2.087% 2029 (USD-SOFR + 1.06% on 6/14/2028)5 | | | 36,694 | | | | 36,464 | |
| Bank of America Corp. 1.898% 2031 (USD-SOFR + 1.53% on 7/23/2030)5 | | | 80,349 | | | | 76,986 | |
| Bank of America Corp. 1.922% 2031 (USD-SOFR + 1.37% on 10/24/2030)5 | | | 70,216 | | | | 67,306 | |
| Bank of America Corp. 2.299% 2032 (USD-SOFR + 1.22% on 7/21/2031)5 | | | 154,479 | | | | 152,050 | |
| Bank of America Corp. 2.572% 2032 (USD-SOFR + 1.21% on 10/20/2031)5 | | | 14,590 | | | | 14,671 | |
| Bank of America Corp. 2.651% 2032 (USD-SOFR + 1.22% on 3/11/2031)5 | | | 56,487 | | | | 57,272 | |
| Bank of America Corp. 2.687% 2032 (USD-SOFR + 1.32% on 4/22/2031)5 | | | 67,807 | | | | 68,885 | |
| Bank of America Corp. 2.676% 2041 (USD-SOFR + 1.93% on 6/19/2040)5 | | | 6,000 | | | | 5,785 | |
| Bank of China, Ltd. (Hong Kong Branch) 3.875% 2025 | | | 667 | | | | 717 | |
| Bank of China, Ltd. (Hong Kong Branch) 4.00% 2028 | | | 244 | | | | 270 | |
| Bank of New Zealand 1.00% 20264 | | | 37,025 | | | | 36,048 | |
| Bank of Nova Scotia 1.35% 2026 | | | 20,503 | | | | 20,279 | |
| Barclays Bank PLC 3.65% 2025 | | | 2,000 | | | | 2,115 | |
| Barclays Bank PLC 4.95% 2047 | | | 5,000 | | | | 6,489 | |
| Berkshire Hathaway Finance Corp. 4.20% 2048 | | | 21,490 | | | | 26,141 | |
| Berkshire Hathaway Finance Corp. 4.25% 2049 | | | 3,000 | | | | 3,693 | |
| Berkshire Hathaway, Inc. 3.125% 2026 | | | 4,100 | | | | 4,382 | |
| Berkshire Hathaway, Inc. 4.50% 2043 | | | 1,500 | | | | 1,855 | |
| BNP Paribas 3.80% 20244 | | | 30,525 | | | | 32,034 | |
| BNP Paribas 2.819% 2025 (3-month USD-LIBOR + 1.111% on 11/19/2024)4,5 | | | 5,050 | | | | 5,200 | |
| BNP Paribas 3.375% 20254 | | | 22,250 | | | | 23,377 | |
| BNP Paribas 2.219% 2026 (USD-SOFR + 2.074% on 6/9/2025)4,5 | | | 27,900 | | | | 28,182 | |
| BNP Paribas 1.323% 2027 (USD-SOFR + 1.004% on 1/13/2026)4,5 | | | 22,650 | | | | 22,052 | |
| BNP Paribas 1.675% 2027 (USD-SOFR + 0.912% on 6/30/2026)4,5 | | | 7,292 | | | | 7,173 | |
| BNP Paribas 2.159% 2029 (USD-SOFR + 1.218% on 9/15/2028)4,5 | | | 19,125 | | | | 18,764 | |
| BNP Paribas 2.871% 2032 (USD-SOFR + 1.387% on 4/19/2031)4,5 | | | 80,935 | | | | 82,147 | |
| Capital One Financial Corp. 1.343% 2024 (USD-SOFR + 0.69% on 12/6/2023)5 | | | 37,000 | | | | 37,240 | |
| Capital One Financial Corp. 4.25% 2025 | | | 17,500 | | | | 18,923 | |
| Charles Schwab Corp. 5.375% junior subordinated perpetual bonds (5-year UST Yield Curve Rate T Note Constant Maturity + 4.971% on 6/1/2025)5 | | | 3,750 | | | | 4,097 | |
| China CITIC Bank International, Ltd. 4.625% 2029 (5-year UST Yield Curve Rate T Note Constant Maturity + 2.25% on 2/28/2024)5 | | | 17,500 | | | | 18,308 | |
| China Construction Bank Corp. 2.45% 2030 (5-year UST Yield Curve Rate T Note Constant Maturity + 2.15% on 6/24/2025)5 | | | 33,800 | | | | 34,274 | |
| China Ping An Insurance Overseas (Holdings), Ltd. 2.85% 2031 | | | 6,203 | | | | 5,955 | |
| Chubb INA Holdings, Inc. 1.375% 2030 | | | 4,000 | | | | 3,772 | |
| Chubb INA Holdings, Inc. 2.85% 2051 | | | 2,157 | | | | 2,168 | |
| Chubb INA Holdings, Inc. 3.05% 2061 | | | 3,758 | | | | 3,846 | |
| CIT Group, Inc. 3.929% 2024 (USD-SOFR + 3.827% on 6/19/2023)5 | | | 35,287 | | | | 36,468 | |
| CIT Group, Inc. 5.25% 2025 | | | 15,651 | | | | 17,260 | |
| Citigroup, Inc. 4.60% 2026 | | | 4,175 | | | | 4,609 | |
| Citigroup, Inc. 1.462% 2027 (USD-SOFR + 0.67% on 6/9/2026)5 | | | 12,356 | | | | 12,150 | |
| Citigroup, Inc. 2.572% 2031 (USD-SOFR + 2.107% on 6/3/2030)5 | | | 20,000 | | | | 20,195 | |
| Citigroup, Inc. 2.561% 2032 (USD-SOFR + 1.167% on 5/1/2031)5 | | | 25,506 | | | | 25,665 | |
| Commonwealth Bank of Australia 2.688% 20314 | | | 26,500 | | | | 26,088 | |
| Commonwealth Bank of Australia 3.61% 2034 (5-year UST Yield Curve Rate T Note Constant Maturity + 2.05% on 9/12/2029)4,5 | | | 17,850 | | | | 18,681 | |
| Cooperatieve Rabobank UA 2.75% 2023 | | | 17,000 | | | | 17,362 | |
| Cooperatieve Rabobank UA 2.625% 20244 | | | 5,450 | | | | 5,630 | |
| Credit Acceptance Corp. 6.625% 2026 | | | 1,488 | | | | 1,550 | |
| Crédit Agricole SA 3.375% 20224 | | | 10,250 | | | | 10,254 | |
| Crédit Agricole SA 3.75% 20234 | | | 21,000 | | | | 21,764 | |
| Crédit Agricole SA 3.25% 20244 | | | 6,200 | | | | 6,489 | |
| Crédit Agricole SA 4.375% 20254 | | | 3,500 | | | | 3,764 | |
| Crédit Agricole SA 1.907% 2026 (USD-SOFR + 1.676% on 6/16/2025)4,5 | | | 15,750 | | | | 15,793 | |
| Crédit Agricole SA 1.247% 2027 (USD-SOFR + 0.892% on 1/26/2026)4,5 | | | 18,625 | | | | 18,132 | |
| Credit Suisse Group AG 2.997% 2023 (3-month USD-LIBOR + 1.20% on 12/14/2022)4,5 | | | 20,250 | | | | 20,581 | |
| Credit Suisse Group AG 3.80% 2023 | | | 29,264 | | | | 30,330 | |
| 10 | The Bond Fund of America |
| Bonds, notes & other debt instruments (continued) | | Principal amount
(000) | | | Value
(000) | |
| Corporate bonds, notes & loans (continued) | | | | | | |
| Financials (continued) | | | | | | | | |
| Credit Suisse Group AG 2.593% 2025 (USD-SOFR + 1.56% on 9/11/2024)4,5 | | $ | 3,100 | | | $ | 3,168 | |
| Credit Suisse Group AG 2.95% 2025 | | | 7,425 | | | | 7,778 | |
| Credit Suisse Group AG 2.193% 2026 (USD-SOFR + 2.044% on 6/5/2025)4,5 | | | 14,950 | | | | 15,046 | |
| Credit Suisse Group AG 1.305% 2027 (USD-SOFR + 0.98% on 2/2/2026)4,5 | | | 30,575 | | | | 29,571 | |
| Credit Suisse Group AG 3.869% 2029 (3-month USD-LIBOR + 1.41% on 1/12/2028)4,5 | | | 8,385 | | | | 8,983 | |
| Credit Suisse Group AG 4.194% 2031 (USD-SOFR + 3.73% on 4/1/2030)4,5 | | | 60,419 | | | | 66,704 | |
| Credit Suisse Group AG 3.091% 2032 (USD-SOFR + 1.73% on 5/14/2031)4,5 | | | 45,550 | | | | 46,398 | |
| Danske Bank AS 2.70% 20224 | | | 13,475 | | | | 13,527 | |
| Danske Bank AS 3.875% 20234 | | | 15,165 | | | | 15,780 | |
| Danske Bank AS 1.549% 2027 (UST Yield Curve Rate T Note Constant Maturity 1-year + 0.73% on 9/10/2026)4,5 | | | 17,000 | | | | 16,619 | |
| Deutsche Bank AG 3.30% 2022 | | | 4,575 | | | | 4,671 | |
| Deutsche Bank AG 5.00% 2022 | | | 4,675 | | | | 4,696 | |
| Deutsche Bank AG 3.95% 2023 | | | 9,097 | | | | 9,383 | |
| Deutsche Bank AG 0.898% 2024 | | | 15,450 | | | | 15,322 | |
| Deutsche Bank AG 2.222% 2024 (USD-SOFR + 2.159% on 9/18/2023)5 | | | 89,334 | | | | 90,520 | |
| Deutsche Bank AG 3.70% 2024 | | | 15,250 | | | | 16,038 | |
| Deutsche Bank AG 3.70% 2024 | | | 4,603 | | | | 4,837 | |
| Deutsche Bank AG 1.447% 2025 (USD-SOFR + 1.131% on 4/1/2024)5 | | | 30,000 | | | | 29,829 | |
| Deutsche Bank AG 3.961% 2025 (USD-SOFR + 2.581% on 11/26/2024)5 | | | 41,050 | | | | 43,377 | |
| Deutsche Bank AG 2.129% 2026 (USD-SOFR + 1.87% on 11/24/2025)5 | | | 135,895 | | | | 135,726 | |
| Deutsche Bank AG 4.10% 2026 | | | 16,415 | | | | 17,533 | |
| Deutsche Bank AG 4.10% 2026 | | | 4,936 | | | | 5,304 | |
| Deutsche Bank AG 2.311% 2027 (USD-SOFR + 1.219% on 11/16/2026)5 | | | 22,675 | | | | 22,678 | |
| Deutsche Bank AG 3.547% 2031 (USD-SOFR + 3.043% on 9/18/2030)5 | | | 27,917 | | | | 29,415 | |
| Deutsche Bank AG 3.035% 2032 (USD-SOFR + 1.718% on 5/28/2031)5 | | | 12,975 | | | | 13,086 | |
| DNB Bank ASA 1.535% 2027 (5-year UST Yield Curve Rate T Note Constant Maturity + 0.72% on 5/25/2026)4,5 | | | 7,450 | | | | 7,348 | |
| Five Corners Funding Trust II 2.85% 20304 | | | 4,300 | | | | 4,460 | |
| Goldman Sachs Group, Inc. 1.217% 2023 | | | 36,000 | | | | 36,099 | |
| Goldman Sachs Group, Inc. 2.905% 2023 (3-month USD-LIBOR + 0.99% on 7/24/2022)5 | | | 14,747 | | | | 14,915 | |
| Goldman Sachs Group, Inc. 3.50% 2025 | | | 14,230 | | | | 15,058 | |
| Goldman Sachs Group, Inc. 1.093% 2026 (USD-SOFR + 0.789% on 12/9/2025)5 | | | 23,967 | | | | 23,367 | |
| Goldman Sachs Group, Inc. (3-month USD-LIBOR + 1.17%) 1.326% 20266 | | | 7,000 | | | | 7,145 | |
| Goldman Sachs Group, Inc. 1.542% 2027 (USD-SOFR + 0.818% on 9/10/2026)5 | | | 81,083 | | | | 79,486 | |
| Goldman Sachs Group, Inc. 1.948% 2027 (USD-SOFR + 0.913% on 10/21/2026)5 | | | 103,268 | | | | 102,861 | |
| Goldman Sachs Group, Inc. 3.814% 2029 (3-month USD-LIBOR + 1.158% on 4/23/2028)5 | | | 5,000 | | | | 5,443 | |
| Goldman Sachs Group, Inc. 2.60% 2030 | | | 16,925 | | | | 17,226 | |
| Goldman Sachs Group, Inc. 3.80% 2030 | | | 9,419 | | | | 10,379 | |
| Goldman Sachs Group, Inc. 1.992% 2032 (USD-SOFR + 1.09% on 1/27/2031)5 | | | 29,458 | | | | 28,274 | |
| Goldman Sachs Group, Inc. 2.383% 2032 (USD-SOFR + 1.248% on 7/21/2031)5 | | | 90,764 | | | | 89,441 | |
| Goldman Sachs Group, Inc. 2.615% 2032 (USD-SOFR + 1.281% on 4/22/2031)5 | | | 90,964 | | | | 91,713 | |
| Goldman Sachs Group, Inc. 2.65% 2032 (USD-SOFR + 1.264% on 10/21/2031)5 | | | 35,329 | | | | 35,585 | |
| Goldman Sachs Group, Inc. 2.908% 2042 (USD-SOFR + 1.40% on 7/21/2041)5 | | | 10,000 | | | | 9,961 | |
| Goldman Sachs Group, Inc. 3.21% 2042 (USD-SOFR + 1.513% on 4/22/2041)5 | | | 20,943 | | | | 21,760 | |
| Groupe BPCE SA 2.75% 20234 | | | 8,600 | | | | 8,780 | |
| Groupe BPCE SA 5.70% 20234 | | | 27,768 | | | | 29,863 | |
| Groupe BPCE SA 4.625% 20244 | | | 20,600 | | | | 22,031 | |
| Groupe BPCE SA 5.15% 20244 | | | 28,454 | | | | 30,834 | |
| Groupe BPCE SA 1.652% 2026 (USD-SOFR + 1.52% on 10/6/2025)4,5 | | | 38,255 | | | | 37,763 | |
| Groupe BPCE SA 2.045% 2027 (USD-SOFR + 1.087% on 10/19/2026)4,5 | | | 5,000 | | | | 4,960 | |
| Groupe BPCE SA 2.277% 2032 (USD-SOFR + 1.312% on 1/20/2031)4,5 | | | 6,975 | | | | 6,728 | |
| Hartford Financial Services Group, Inc. 2.90% 2051 | | | 7,144 | | | | 7,057 | |
| HSBC Holdings PLC 2.633% 2025 (3-month USD-LIBOR + 1.14% on 11/7/2024)5 | | | 18,500 | | | | 18,987 | |
| HSBC Holdings PLC 2.251% 2027 (USD-SOFR + 1.10% on 11/22/2026)5 | | | 31,240 | | | | 31,323 | |
| HSBC Holdings PLC 2.206% 2029 (USD-SOFR + 1.285% on 8/17/2028)5 | | | 2,485 | | | | 2,439 | |
| HSBC Holdings PLC 3.973% 2030 (3-month USD-LIBOR + 1.61% on 5/22/2029)5 | | | 41,521 | | | | 45,082 | |
| HSBC Holdings PLC 4.95% 2030 | | | 3,150 | | | | 3,700 | |
| HSBC Holdings PLC 2.848% 2031 (USD-SOFR + 2.387% on 6/4/2030)5 | | | 16,489 | | | | 16,697 | |
| HSBC Holdings PLC 2.804% 2032 (USD-SOFR + 1.187% on 5/24/2031)5 | | | 46,800 | | | | 46,994 | |
| Huarong Finance 2017 Co., Ltd. 4.25% 2027 | | | 36,000 | | | | 36,465 | |
| Huarong Finance 2017 Co., Ltd. 4.75% 2027 | | | 4,213 | | | | 4,355 | |
| Huarong Finance 2019 Co., Ltd. (3-month USD-LIBOR + 1.125%) 1.295% 20236 | | | 11,519 | | | | 11,289 | |
| Huarong Finance 2019 Co., Ltd. (3-month USD-LIBOR + 1.25%) 1.43% 20256 | | | 2,556 | | | | 2,441 | |
| The Bond Fund of America | 11 |
| Bonds, notes & other debt instruments (continued) | | Principal amount
(000) | | | Value
(000) | |
| Corporate bonds, notes & loans (continued) | | | | | | |
| Financials (continued) | | | | | | | | |
| Huarong Finance II Co., Ltd. 5.00% 2025 | | $ | 3,637 | | | $ | 3,787 | |
| Huarong Finance II Co., Ltd. 5.50% 2025 | | | 38,773 | | | | 40,760 | |
| Huarong Finance II Co., Ltd. 4.625% 2026 | | | 360 | | | | 372 | |
| Huarong Finance II Co., Ltd. 4.875% 2026 | | | 12,224 | | | | 12,701 | |
| Intercontinental Exchange, Inc. 2.65% 2040 | | | 5,700 | | | | 5,525 | |
| Intercontinental Exchange, Inc. 3.00% 2050 | | | 9,722 | | | | 9,878 | |
| Intercontinental Exchange, Inc. 3.00% 2060 | | | 841 | | | | 832 | |
| Intesa Sanpaolo SpA 3.125% 20224 | | | 17,025 | | | | 17,221 | |
| Intesa Sanpaolo SpA 3.375% 20234 | | | 42,466 | | | | 43,400 | |
| Intesa Sanpaolo SpA 3.25% 20244 | | | 8,260 | | | | 8,604 | |
| Intesa Sanpaolo SpA 5.017% 20244 | | | 125,758 | | | | 134,835 | |
| Intesa Sanpaolo SpA 5.71% 20264 | | | 24,105 | | | | 26,687 | |
| Intesa Sanpaolo SpA 3.875% 20274 | | | 10,275 | | | | 10,909 | |
| Intesa Sanpaolo SpA 3.875% 20284 | | | 4,974 | | | | 5,266 | |
| Intesa Sanpaolo SpA 4.00% 20294 | | | 3,000 | | | | 3,221 | |
| Iron Mountain Information Management Services, Inc. 5.00% 20324 | | | 12,345 | | | | 12,659 | |
| JPMorgan Chase & Co. 4.023% 2024 (3-month USD-LIBOR + 1.00% on 12/5/2023)5 | | | 5,000 | | | | 5,274 | |
| JPMorgan Chase & Co. 1.561% 2025 (USD-SOFR + 0.605% on 12/10/2024)5 | | | 168,739 | | | | 169,013 | |
| JPMorgan Chase & Co. 2.301% 2025 (USD-SOFR + 1.16% on 10/15/2024)5 | | | 61,584 | | | | 63,022 | |
| JPMorgan Chase & Co. 1.045% 2026 (USD-SOFR + 0.80% on 11/19/2025)5 | | | 26,914 | | | | 26,234 | |
| JPMorgan Chase & Co. 2.005% 2026 (USD-SOFR + 1.585% on 3/13/2025)5 | | | 22,000 | | | | 22,276 | |
| JPMorgan Chase & Co. 1.47% 2027 (USD-SOFR + 0.765% on 9/22/2026)5 | | | 34,000 | | | | 33,343 | |
| JPMorgan Chase & Co. 1.578% 2027 (USD-SOFR + 0.885% on 4/22/2026)5 | | | 19,422 | | | | 19,203 | |
| JPMorgan Chase & Co. 2.069% 2029 (USD-SOFR + 1.015% on 6/1/2028)5 | | | 41,999 | | | | 41,680 | |
| JPMorgan Chase & Co. 2.545% 2032 (USD-SOFR + 1.18% on 11/8/2031)5 | | | 46,061 | | | | 46,371 | |
| JPMorgan Chase & Co. 2.58% 2032 (USD-SOFR + 1.25% on 4/22/2031)5 | | | 20,078 | | | | 20,357 | |
| JPMorgan Chase & Co. 3.109% 2051 (USD-SOFR + 3.109% on 4/22/2050)5 | | | 9,972 | | | | 10,331 | |
| JPMorgan Chase & Co. 3.328% 2052 (USD-SOFR + 1.58% on 4/22/2051)5 | | | 17,740 | | | | 19,029 | |
| Kasikornbank PCL HK 3.343% 2031 (5-year UST Yield Curve Rate T Note Constant Maturity + 1.70% on 10/2/2026)5 | | | 15,035 | | | | 15,056 | |
| Lloyds Banking Group PLC 2.907% 2023 (3-month USD-LIBOR + 0.81% on 11/7/2022)5 | | | 16,500 | | | | 16,769 | |
| Lloyds Banking Group PLC 4.05% 2023 | | | 7,100 | | | | 7,441 | |
| Lloyds Banking Group PLC 3.87% 2025 (1-year UST Yield Curve Rate T Note Constant Maturity + 3.50% on 7/9/2024)5 | | | 13,460 | | | | 14,227 | |
| Lloyds Banking Group PLC 2.438% 2026 (1-year UST Yield Curve Rate T Note Constant Maturity + 1.00% on 2/5/2025)5 | | | 13,875 | | | | 14,155 | |
| Lloyds Banking Group PLC 1.627% 2027 (1-year UST Yield Curve Rate T Note Constant Maturity + 0.85% on 5/11/2026)5 | | | 3,525 | | | | 3,472 | |
| Lloyds Banking Group PLC 4.375% 2028 | | | 2,560 | | | | 2,874 | |
| Lloyds Banking Group PLC 4.55% 2028 | | | 3,500 | | | | 3,984 | |
| LPL Holdings, Inc. 4.625% 20274 | | | 270 | | | | 280 | |
| Marsh & McLennan Companies, Inc. 3.875% 2024 | | | 17,120 | | | | 18,116 | |
| Marsh & McLennan Companies, Inc. 4.375% 2029 | | | 2,460 | | | | 2,807 | |
| Marsh & McLennan Companies, Inc. 2.25% 2030 | | | 3,506 | | | | 3,503 | |
| Marsh & McLennan Companies, Inc. 2.375% 2031 | | | 2,192 | | | | 2,215 | |
| Marsh & McLennan Companies, Inc. 4.75% 2039 | | | 750 | | | | 937 | |
| Marsh & McLennan Companies, Inc. 4.90% 2049 | | | 5,250 | | | | 7,074 | |
| Marsh & McLennan Companies, Inc. 2.90% 2051 | | | 3,000 | | | | 3,002 | |
| MetLife Capital Trust IV, junior subordinated, 7.875% 2067 (3-month USD-LIBOR + 3.96% on 12/1/2037)4,5 | | | 100 | | | | 137 | |
| MetLife, Inc. 3.60% 2025 | | | 100 | | | | 108 | |
| MetLife, Inc. 4.55% 2030 | | | 3,000 | | | | 3,549 | |
| MetLife, Inc. 4.60% 2046 | | | 800 | | | | 1,025 | |
| Metropolitan Life Global Funding I 2.40% 20224 | | | 5,965 | | | | 6,021 | |
| Metropolitan Life Global Funding I 3.375% 20224 | | | 3,000 | | | | 3,002 | |
| Metropolitan Life Global Funding I 1.95% 20234 | | | 1,000 | | | | 1,013 | |
| Metropolitan Life Global Funding I 0.40% 20244 | | | 17,648 | | | | 17,432 | |
| Metropolitan Life Global Funding I 0.70% 20244 | | | 12,711 | | | | 12,530 | |
| Metropolitan Life Global Funding I 3.60% 20244 | | | 3,000 | | | | 3,156 | |
| Metropolitan Life Global Funding I 0.95% 20254 | | | 5,007 | | | | 4,940 | |
| Metropolitan Life Global Funding I 3.45% 20264 | | | 2,315 | | | | 2,498 | |
| Metropolitan Life Global Funding I 3.00% 20274 | | | 3,500 | | | | 3,721 | |
| Metropolitan Life Global Funding I 3.05% 20294 | | | 5,000 | | | | 5,353 | |
| Metropolitan Life Global Funding I 1.55% 20314 | | | 2,284 | | | | 2,162 | |
| Mitsubishi UFJ Financial Group, Inc. 2.665% 2022 | | | 16,000 | | | | 16,190 | |
| Mitsubishi UFJ Financial Group, Inc. 2.998% 2022 | | | 9,825 | | | | 9,860 | |
| 12 | The Bond Fund of America |
| Bonds, notes & other debt instruments (continued) | | Principal amount
(000) | | | Value
(000) | |
| Corporate bonds, notes & loans (continued) | | | | | | |
| Financials (continued) | | | | | | |
| Mitsubishi UFJ Financial Group, Inc. 2.801% 2024 | | $ | 4,600 | | | $ | 4,771 | |
| Mitsubishi UFJ Financial Group, Inc. 0.962% 2025 (1-year UST Yield Curve Rate T Note Constant Maturity + 0.45% on 10/11/2024)5 | | 17,000 | | | | 16,774 | |
| Mitsubishi UFJ Financial Group, Inc. 1.538% 2027 (1-year UST Yield Curve Rate T Note Constant Maturity + 0.75% on 7/20/2026)5 | | | 35,000 | | | | 34,396 | |
| Mitsubishi UFJ Financial Group, Inc. 1.64% 2027 (1-year UST Yield Curve Rate T Note Constant Maturity + 0.67% on 10/13/2026)5 | | | 12,800 | | | | 12,640 | |
| Mizuho Financial Group, Inc. 1.554% 2027 (1-year UST Yield Curve Rate T Note Constant Maturity + 0.75% on 7/9/2026)5 | | | 26,000 | | | | 25,593 | |
| Mizuho Financial Group, Ltd. 3.549% 2023 | | | 17,000 | | | | 17,535 | |
| Morgan Stanley 2.75% 2022 | | | 13,054 | | | | 13,172 | |
| Morgan Stanley 3.125% 2023 | | | 10,000 | | | | 10,255 | |
| Morgan Stanley 0.529% 2024 (USD-SOFR + 0.455% on 1/25/2023)5 | | | 20,000 | | | | 19,936 | |
| Morgan Stanley 3.737% 2024 (3-month USD-LIBOR + 0.847% on 4/24/2023)5 | | | 57,500 | | | | 59,504 | |
| Morgan Stanley 1.164% 2025 (USD-SOFR + 0.56% on 10/21/2024)5 | | | 17,933 | | | | 17,802 | |
| Morgan Stanley 0.985% 2026 (USD-SOFR + 0.72% on 12/10/2025)5 | | | 9,115 | | | | 8,846 | |
| Morgan Stanley 2.188% 2026 (USD-SOFR + 1.99% on 4/28/2025)5 | | | 15,000 | | | | 15,306 | |
| Morgan Stanley 1.512% 2027 (USD-SOFR + 0.858% on 7/20/2026)5 | | | 85,147 | | | | 83,837 | |
| Morgan Stanley 1.593% 2027 (USD-SOFR + 0.879% on 5/4/2026)5 | | | 14,216 | | | | 14,083 | |
| Morgan Stanley 1.794% 2032 (USD-SOFR + 1.034% on 2/13/2031)5 | | | 29,670 | | | | 28,118 | |
| Morgan Stanley 1.928% 2032 (USD-SOFR + 1.02% on 4/28/2031)5 | | | 5,104 | | | | 4,882 | |
| Morgan Stanley 2.239% 2032 (USD-SOFR + 1.178% on 7/21/2031)5 | | | 111,472 | | | | 109,147 | |
| Morgan Stanley 2.511% 2032 (USD-SOFR + 1.20% on 10/20/2031)5 | | | 22,978 | | | | 22,981 | |
| Morgan Stanley 3.217% 2042 (USD-SOFR + 1.485% on 4/22/2041)5 | | | 5,708 | | | | 5,991 | |
| MSCI, Inc. 3.625% 20304 | | | 16,200 | | | | 16,589 | |
| MSCI, Inc. 3.25% 20334 | | | 15,450 | | | | 15,648 | |
| National Australia Bank, Ltd. 2.50% 2022 | | | 15,500 | | | | 15,632 | |
| National Australia Bank, Ltd. 2.875% 2023 | | | 13,200 | | | | 13,558 | |
| National Australia Bank, Ltd. 2.332% 20304 | | | 5,000 | | | | 4,796 | |
| Nationwide Building Society 3.766% 2024 (3-month USD-LIBOR + 1.064% on 3/8/2023)4,5 | | | 5,000 | | | | 5,151 | |
| Nationwide Building Society 4.363% 2024 (3-month USD-LIBOR + 1.392% on 8/1/2023)4,5 | | | 33,400 | | | | 34,990 | |
| Nationwide Building Society 4.125% 2032 (5-year USD-ICE Swap + 1.849% on 10/18/2027)4,5 | | | 3,000 | | | | 3,201 | |
| Navient Corp. 5.50% 2023 | | | 7,000 | | | | 7,299 | |
| Navient Corp. 5.875% 2024 | | | 1,000 | | | | 1,067 | |
| Navient Corp. 6.75% 2025 | | | 5,000 | | | | 5,505 | |
| Navient Corp. 5.00% 2027 | | | 6,250 | | | | 6,380 | |
| New York Life Global Funding 2.25% 20224 | | | 10,195 | | | | 10,291 | |
| New York Life Global Funding 0.95% 20254 | | | 1,403 | | | | 1,384 | |
| New York Life Global Funding 0.85% 20264 | | | 32,280 | | | | 31,538 | |
| New York Life Global Funding 3.00% 20284 | | | 2,250 | | | | 2,399 | |
| New York Life Global Funding 1.20% 20304 | | | 15,487 | | | | 14,468 | |
| New York Life Global Funding 1.85% 20314 | | | 1,250 | | | | 1,215 | |
| Northwestern Mutual Global Funding 0.80% 20264 | | | 19,494 | | | | 18,951 | |
| Nuveen, LLC 4.00% 20284 | | | 1,515 | | | | 1,681 | |
| OneMain Holdings, Inc. 7.125% 2026 | | | 9,300 | | | | 10,616 | |
| Oversea-Chinese Banking Corp., Ltd. 1.832% 2030 (5-year UST Yield Curve Rate T Note Constant Maturity + 1.58% on 9/10/2025)4,5 | | | 7,786 | | | | 7,730 | |
| PNC Bank 3.50% 2023 | | | 17,840 | | | | 18,515 | |
| PNC Financial Services Group, Inc. 3.50% 2024 | | | 11,700 | | | | 12,256 | |
| PNC Financial Services Group, Inc., Series O, (3-month USD-LIBOR + 3.678%) 3.81% junior subordinated perpetual bonds6 | | | 10,170 | | | | 10,188 | |
| Power Financial Corp., Ltd. 4.50% 2029 | | | 5,000 | | | | 5,340 | |
| Power Financial Corp., Ltd. 3.95% 2030 | | | 32,000 | | | | 33,139 | |
| Power Financial Corp., Ltd. 3.35% 2031 | | | 8,670 | | | | 8,563 | |
| PRICOA Global Funding I 2.45% 20224 | | | 3,090 | | | | 3,135 | |
| PRICOA Global Funding I 3.45% 20234 | | | 11,825 | | | | 12,333 | |
| Prudential Financial, Inc. 3.905% 2047 | | | 850 | | | | 989 | |
| Prudential Financial, Inc. 4.418% 2048 | | | 1,000 | | | | 1,242 | |
| Prudential Financial, Inc. 4.35% 2050 | | | 5,000 | | | | 6,253 | |
| Prudential Financial, Inc. 3.70% 2051 | | | 10,125 | | | | 11,552 | |
| Prudential Financial, Inc., junior subordinated, 5.70% 2048 (3-month USD-LIBOR + 2.665% on 9/15/2028)5 | | | 3,500 | | | | 3,924 | |
| Rede D’Or Finance SARL 4.50% 20304 | | | 3,800 | | | | 3,705 | |
| Royal Bank of Canada 0.75% 2024 | | | 20,780 | | | | 20,581 | |
| The Bond Fund of America | 13 |
| Bonds, notes & other debt instruments (continued) | | Principal amount
(000) | | | Value
(000) | |
| Corporate bonds, notes & loans (continued) | | | | | | |
| Financials (continued) | | | | | | |
| Royal Bank of Canada 1.20% 2026 | | $ | 54,076 | | | $ | 53,165 | |
| Royal Bank of Scotland PLC 4.65% 2024 (3-month USD-LIBOR + 1.55% on 6/25/2023)5 | | | 14,130 | | | | 14,787 | |
| Royal Bank of Scotland PLC 3.073% 2028 (1-year UST Yield Curve Rate T Note Constant Maturity + 2.55% on 5/22/2027)5 | | | 7,500 | | | | 7,806 | |
| Royal Bank of Scotland PLC 4.445% 2030 (3-month USD-LIBOR + 1.871% on 5/5/2029)5 | | | 11,600 | | | | 13,041 | |
| Royal Bank of Scotland PLC 5.076% 2030 (3-month USD-LIBOR + 1.905% on 1/27/2029)5 | | | 2,650 | | | | 3,076 | |
| Santander Holdings USA, Inc. 3.40% 2023 | | | 17,000 | | | | 17,379 | |
| Santander Holdings USA, Inc. 3.50% 2024 | | | 13,325 | | | | 13,897 | |
| Springleaf Finance Corp. 6.125% 2024 | | | 500 | | | | 531 | |
| Starwood Property Trust, Inc. 5.50% 20234 | | | 2,295 | | | | 2,378 | |
| Sumitomo Mitsui Banking Corp. 3.102% 2023 | | | 28,940 | | | | 29,634 | |
| SVB Financial Group 4.70% junior subordinated perpetual bonds (5-year UST Yield Curve Rate T Note Constant Maturity + 3.064% on 11/15/2031)5 | | | 11,614 | | | | 11,969 | |
| Synchrony Financial 2.85% 2022 | | | 8,750 | | | | 8,840 | |
| Synchrony Financial 4.375% 2024 | | | 5,825 | | | | 6,149 | |
| Synchrony Financial 3.95% 2027 | | | 10,350 | | | | 11,123 | |
| Synchrony Financial 2.875% 2031 | | | 5,050 | | | | 5,045 | |
| Toronto-Dominion Bank 0.75% 2025 | | | 23,900 | | | | 23,280 | |
| Toronto-Dominion Bank 2.00% 2031 | | | 19,945 | | | | 19,682 | |
| Travelers Companies, Inc. 4.00% 2047 | | | 2,250 | | | | 2,695 | |
| Travelers Companies, Inc. 4.10% 2049 | | | 1,500 | | | | 1,823 | |
| Travelers Companies, Inc. 2.55% 2050 | | | 3,815 | | | | 3,638 | |
| U.S. Bancorp 2.40% 2024 | | | 19,000 | | | | 19,642 | |
| U.S. Bank NA 2.85% 2023 | | | 21,000 | | | | 21,452 | |
| U.S. Bank NA 3.40% 2023 | | | 13,125 | | | | 13,652 | |
| UBS Group AG 1.364% 2027 (5-year UST Yield Curve Rate T Note Constant Maturity + 1.08% on 1/30/2026)4,5 | | | 20,772 | | | | 20,313 | |
| UBS Group AG 1.49% 2027 (1-year UST Yield Curve Rate T Note Constant Maturity + 0.85% on 8/10/2026)4,5 | | | 22,475 | | | | 21,936 | |
| UBS Group AG 3.126% 2030 (3-month USD-LIBOR + 1.468% on 8/13/2029)4,5 | | | 2,600 | | | | 2,720 | |
| UniCredit SpA 3.75% 20224 | | | 37,450 | | | | 37,736 | |
| UniCredit SpA 6.572% 20224 | | | 34,360 | | | | 34,410 | |
| UniCredit SpA 4.625% 20274 | | | 17,010 | | | | 18,658 | |
| UniCredit SpA 5.861% 2032 (5-year USD-ICE Swap + 3.703% on 6/19/2027)4,5 | | | 29,477 | | | | 32,361 | |
| United Overseas Bank, Ltd. 2.00% 2031 (5-year UST Yield Curve Rate T Note Constant Maturity + 1.23% on 10/14/2026)4,5 | | | 16,430 | | | | 16,330 | |
| VEB Finance, Ltd. 6.80% 20254 | | | 500 | | | | 571 | |
| Vigorous Champion International, Ltd. 4.25% 2029 | | | 2,263 | | | | 2,391 | |
| Wells Fargo & Company 2.406% 2025 (3-month USD-LIBOR + 0.825% on 10/30/2024)5 | | | 88,587 | | | | 90,857 | |
| Wells Fargo & Company 3.00% 2026 | | | 34,533 | | | | 36,310 | |
| Wells Fargo & Company 3.00% 2026 | | | 3,301 | | | | 3,470 | |
| Wells Fargo & Company 3.196% 2027 (3-month USD-LIBOR + 1.17% on 6/17/2026)5 | | | 38,880 | | | | 41,012 | |
| Wells Fargo & Company 2.879% 2030 (3-month USD-LIBOR + 1.17% on 10/30/2029)5 | | | 9,049 | | | | 9,417 | |
| Wells Fargo & Company 2.572% 2031 (3-month USD-LIBOR + 1.00% on 2/11/2030)5 | | | 9,716 | | | | 9,929 | |
| Westpac Banking Corp. 1.953% 2028 | | | 25,344 | | | | 25,263 | |
| Westpac Banking Corp. 2.894% 2030 (5-year UST Yield Curve Rate T Note Constant Maturity + 1.35% on 2/4/2025)5 | | | 10,000 | | | | 10,218 | |
| Westpac Banking Corp. 4.11% 2034 (5-year UST Yield Curve Rate T Note Constant Maturity + 2.00% on 7/24/2029)5 | | | 11,339 | | | | 12,252 | |
| Westpac Banking Corp. 2.668% 2035 (5-year UST Yield Curve Rate T Note Constant Maturity + 1.75% on 11/15/2030)5 | | | 20,125 | | | | 19,628 | |
| Willis North America, Inc. 3.875% 2049 | | | 5,458 | | | | 5,938 | |
| | | | | | | | 6,336,721 | |
| | | | | | | | | |
| Utilities 4.61% | | | | | | | | |
| Abu Dhabi National Energy Company PJSC (TAQA) 4.375% 20254 | | | 20,500 | | | | 22,319 | |
| AEP Texas, Inc. 3.45% 2051 | | | 9,375 | | | | 9,466 | |
| AEP Transmission Co. LLC 3.10% 2026 | | | 16,975 | | | | 17,923 | |
| AEP Transmission Co. LLC 3.65% 2050 | | | 110 | | | | 122 | |
| AEP Transmission Co. LLC 2.75% 2051 | | | 3,966 | | | | 3,783 | |
| AES Panama Generation Holdings SRL 4.375% 20304 | | | 8,565 | | | | 8,932 | |
| Alabama Power Co. 3.00% 2052 | | | 31,630 | | | | 31,633 | |
| Alfa Desarrollo SpA 4.55% 20514 | | | 5,730 | | | | 5,665 | |
| 14 | The Bond Fund of America |
| Bonds, notes & other debt instruments (continued) | | Principal amount
(000) | | | Value
(000) | |
| Corporate bonds, notes & loans (continued) | | | | | | |
| Utilities (continued) | | | | | | | | |
| Ameren Corp. 2.50% 2024 | | $ | 1,616 | | | $ | 1,660 | |
| American Electric Power Company, Inc. 1.00% 2025 | | | 3,075 | | | | 3,010 | |
| American Electric Power Company, Inc. 4.30% 2028 | | | 31,133 | | | | 34,720 | |
| American Electric Power Company, Inc. 3.25% 2050 | | | 22,050 | | | | 21,848 | |
| Atlantic City Electric Co. 2.30% 2031 | | | 4,100 | | | | 4,124 | |
| Berkshire Hathaway Energy Company 2.80% 2023 | | | 8,650 | | | | 8,812 | |
| Berkshire Hathaway Energy Company 4.50% 2045 | | | 200 | | | | 243 | |
| Calpine Corp. 5.25% 20264 | | | 3,398 | | | | 3,490 | |
| Calpine Corp. 4.50% 20284 | | | 4,000 | | | | 4,157 | |
| Cemig Geração e Transmissão SA 9.25% 2024 | | | 291 | | | | 326 | |
| CenterPoint Energy, Inc. 2.65% 2031 | | | 8,897 | | | | 9,027 | |
| CenterPoint Energy, Inc. 3.70% 2049 | | | 2,775 | | | | 3,014 | |
| Cleveland Electric Illuminating Co. 4.55% 20304 | | | 5,500 | | | | 6,330 | |
| CMS Energy Corp. 3.45% 2027 | | | 1,950 | | | | 2,094 | |
| Colbun SA 3.95% 20274 | | | 8,215 | | | | 8,692 | |
| Comisión Federal de Electricidad 3.348% 20314 | | | 18,263 | | | | 17,939 | |
| Comisión Federal de Electricidad 3.875% 20334 | | | 7,530 | | | | 7,412 | |
| Comisión Federal de Electricidad 4.677% 20514 | | | 23,419 | | | | 22,078 | |
| Connecticut Light and Power Co. 2.05% 2031 | | | 16,690 | | | | 16,462 | |
| Consolidated Edison Company of New York, Inc. 2.40% 2031 | | | 7,579 | | | | 7,633 | |
| Consumers Energy Co. 3.25% 2046 | | | 4,919 | | | | 5,225 | |
| Consumers Energy Co. 4.05% 2048 | | | 1,784 | | | | 2,134 | |
| Consumers Energy Co. 3.10% 2050 | | | 13,231 | | | | 13,815 | |
| Consumers Energy Co. 3.75% 2050 | | | 8,844 | | | | 10,182 | |
| Consumers Energy Co. 3.50% 2051 | | | 1,104 | | | | 1,240 | |
| Consumers Energy Co. 2.65% 2052 | | | 17,495 | | | | 17,071 | |
| Consumers Energy Co. 2.50% 2060 | | | 387 | | | | 342 | |
| Dominion Energy, Inc. 2.25% 2031 | | | 10,085 | | | | 9,859 | |
| Dominion Resources, Inc. 3.30% 2025 | | | 2,113 | | | | 2,213 | |
| Dominion Resources, Inc. 3.375% 2030 | | | 11,425 | | | | 12,137 | |
| Dominion Resources, Inc., junior subordinated, 3.071% 20245 | | | 17,600 | | | | 18,229 | |
| DPL, Inc. 4.125% 2025 | | | 1,040 | | | | 1,088 | |
| DTE Electric Company 2.625% 2031 | | | 11,239 | | | | 11,580 | |
| DTE Electric Company 3.70% 2045 | | | 1,016 | | | | 1,127 | |
| DTE Energy Company 2.85% 2026 | | | 6,100 | | | | 6,363 | |
| DTE Energy Company 1.90% 2028 | | | 1,505 | | | | 1,491 | |
| DTE Energy Company 2.25% 2030 | | | 5,650 | | | | 5,671 | |
| DTE Energy Company 2.95% 2050 | | | 5,649 | | | | 5,707 | |
| Duke Energy Carolinas, LLC 3.95% 2028 | | | 3,050 | | | | 3,407 | |
| Duke Energy Carolinas, LLC 2.45% 2029 | | | 32,180 | | | | 32,799 | |
| Duke Energy Carolinas, LLC 2.55% 2031 | | | 5,437 | | | | 5,587 | |
| Duke Energy Corp. 0.90% 2025 | | | 3,125 | | | | 3,039 | |
| Duke Energy Corp. 3.40% 2029 | | | 5,000 | | | | 5,308 | |
| Duke Energy Florida, LLC 2.50% 2029 | | | 6,781 | | | | 6,975 | |
| Duke Energy Florida, LLC 1.75% 2030 | | | 14,747 | | | | 14,169 | |
| Duke Energy Florida, LLC 3.00% 2051 | | | 8,684 | | | | 8,774 | |
| Duke Energy Indiana, Inc. 2.75% 2050 | | | 1,100 | | | | 1,073 | |
| Duke Energy Ohio, Inc. 2.125% 2030 | | | 8,850 | | | | 8,720 | |
| Duke Energy Progress, LLC 2.00% 2031 | | | 4,000 | | | | 3,912 | |
| Duke Energy Progress, LLC 2.50% 2050 | | | 7,500 | | | | 6,948 | |
| Duke Energy Progress, LLC 2.90% 2051 | | | 3,675 | | | | 3,653 | |
| Edison International 3.125% 2022 | | | 13,250 | | | | 13,460 | |
| Edison International 3.55% 2024 | | | 19,920 | | | | 20,849 | |
| Edison International 4.95% 2025 | | | 8,925 | | | | 9,715 | |
| Edison International 5.75% 2027 | | | 34,743 | | | | 39,641 | |
| Edison International 4.125% 2028 | | | 52,447 | | | | 55,401 | |
| Electricité de France SA 2.625% junior subordinated perpetual bonds (5-year EUR Mid-Swap + 2.86% on 6/1/2028)5 | | € | 45,000 | | | | 51,515 | |
| Emera US Finance LP 0.833% 2024 | | $ | 3,750 | | | | 3,682 | |
| Emera US Finance LP 2.639% 2031 | | | 27,050 | | | | 26,619 | |
| Emera, Inc. 6.75% 2076 (3-month USD-LIBOR + 5.44% on 6/15/2026)5 | | | 16,700 | | | | 19,268 | |
| Empresas Publicas de Medellin ESP 4.25% 20294 | | | 846 | | | | 804 | |
| Empresas Publicas de Medellin ESP 4.375% 20314 | | | 9,208 | | | | 8,671 | |
| Enel Chile SA 4.875% 2028 | | | 3,045 | | | | 3,362 | |
| Engie Energia Chile SA 3.40% 20304 | | | 7,054 | | | | 7,152 | |
| ENN Clean Energy International Investment, Ltd. 3.375% 20264 | | | 8,250 | | | | 8,210 | |
| ENN Energy Holdings, Ltd. 2.625% 20304 | | | 24,093 | | | | 23,970 | |
| The Bond Fund of America | 15 |
| Bonds, notes & other debt instruments (continued) | | Principal amount
(000) | | | Value
(000) | |
| Corporate bonds, notes & loans (continued) | | | | | | |
| Utilities (continued) | | | | | | |
| Entergy Corp. 3.12% 2027 | | $ | 5,000 | | | $ | 5,269 | |
| Entergy Corp. 1.90% 2028 | | | 36,984 | | | | 36,267 | |
| Entergy Corp. 1.60% 2030 | | | 4,400 | | | | 4,151 | |
| Entergy Corp. 2.40% 2031 | | | 25,025 | | | | 24,674 | |
| Entergy Louisiana, LLC 2.90% 2051 | | | 17,787 | | | | 17,478 | |
| Entergy Texas, Inc. 1.75% 2031 | | | 13,150 | | | | 12,345 | |
| Eversource Energy 1.65% 2030 | | | 10,000 | | | | 9,361 | |
| Exelon Corp. 4.05% 2030 | | | 12,425 | | | | 13,820 | |
| Exelon Corp. 4.70% 2050 | | | 1,725 | | | | 2,171 | |
| Exelon Corp., junior subordinated, 3.497% 20225 | | | 21,000 | | | | 21,196 | |
| FirstEnergy Corp. 2.05% 2025 | | | 9,065 | | | | 8,997 | |
| FirstEnergy Corp. 1.60% 2026 | | | 50,767 | | | | 49,117 | |
| FirstEnergy Corp. 3.50% 20284 | | | 15,958 | | | | 17,020 | |
| FirstEnergy Corp. 4.10% 20284 | | | 6,025 | | | | 6,624 | |
| FirstEnergy Corp. 2.25% 2030 | | | 117,043 | | | | 112,844 | |
| FirstEnergy Corp. 2.65% 2030 | | | 54,663 | | | | 54,116 | |
| FirstEnergy Corp. 7.375% 2031 | | | 2,703 | | | | 3,654 | |
| FirstEnergy Corp. 3.40% 2050 | | | 8,323 | | | | 8,177 | |
| FirstEnergy Corp., Series A, 3.35% 20225 | | | 53,907 | | | | 54,141 | |
| FirstEnergy Corp., Series B, 4.40% 2027 (4.15% on 1/15/2022)5 | | | 80,856 | | | | 87,150 | |
| FirstEnergy Transmission LLC 2.866% 20284 | | | 74,825 | | | | 75,021 | |
| Florida Power & Light Company 2.875% 2051 | | | 47,272 | | | | 48,064 | |
| Georgia Power Co. 3.70% 2050 | | | 625 | | | | 666 | |
| Gulf Power Co. 3.30% 2027 | | | 10,000 | | | | 10,684 | |
| Interchile SA 4.50% 20564 | | | 2,443 | | | | 2,600 | |
| Interstate Power and Light Co. 3.25% 2024 | | | 17,557 | | | | 18,445 | |
| Israel Electric Corp., Ltd. 4.25% 20284 | | | 19,722 | | | | 21,707 | |
| Israel Electric Corp., Ltd. 8.10% 20964 | | | 6,250 | | | | 9,171 | |
| Jersey Central Power & Light Co. 4.30% 20264 | | | 4,480 | | | | 4,863 | |
| Jersey Central Power & Light Co. 2.75% 20324 | | | 9,243 | | | | 9,378 | |
| Metropolitan Edison Co. 4.30% 20294 | | | 5,000 | | | | 5,569 | |
| MidAmerican Energy Holdings Co. 3.65% 2029 | | | 2,300 | | | | 2,537 | |
| MidAmerican Energy Holdings Co. 2.70% 2052 | | | 15,305 | | | | 14,897 | |
| Mississippi Power Co. 3.95% 2028 | | | 10,100 | | | | 11,078 | |
| Mississippi Power Co. 4.25% 2042 | | | 14,426 | | | | 16,593 | |
| Monongahela Power Co. 3.55% 20274 | | | 4,800 | | | | 5,138 | |
| NextEra Energy Capital Holdings, Inc. 1.875% 2027 | | | 18,000 | | | | 18,118 | |
| NextEra Energy Capital Holdings, Inc. 1.90% 2028 | | | 20,325 | | | | 20,126 | |
| NextEra Energy Capital Holdings, Inc. 2.44% 2032 | | | 34,075 | | | | 34,181 | |
| NextEra Energy Partners LP 4.25% 20244 | | | 4,715 | | | | 4,904 | |
| NextEra Energy Partners LP 3.875% 20264 | | | 3,535 | | | | 3,753 | |
| Northern States Power Co. 2.25% 2031 | | | 4,458 | | | | 4,499 | |
| Northern States Power Co. 2.90% 2050 | | | 2,821 | | | | 2,856 | |
| Northern States Power Co. 2.60% 2051 | | | 26,667 | | | | 25,516 | |
| Oncor Electric Delivery Company LLC 0.55% 2025 | | | 8,100 | | | | 7,805 | |
| Oncor Electric Delivery Company, LLC 2.70% 20514 | | | 8,893 | | | | 8,575 | |
| Pacific Gas and Electric Co. 1.75% 2022 | | | 33,900 | | | | 33,900 | |
| Pacific Gas and Electric Co. 1.367% 2023 | | | 50,800 | | | | 50,496 | |
| Pacific Gas and Electric Co. 3.25% 2023 | | | 3,421 | | | | 3,486 | |
| Pacific Gas and Electric Co. 3.85% 2023 | | | 6,301 | | | | 6,511 | |
| Pacific Gas and Electric Co. 4.25% 2023 | | | 508 | | | | 526 | |
| Pacific Gas and Electric Co. 3.40% 2024 | | | 13,465 | | | | 13,934 | |
| Pacific Gas and Electric Co. 2.95% 2026 | | | 72,655 | | | | 73,969 | |
| Pacific Gas and Electric Co. 3.15% 2026 | | | 140,083 | | | | 143,321 | |
| Pacific Gas and Electric Co. 2.10% 2027 | | | 21,982 | | | | 21,240 | |
| Pacific Gas and Electric Co. 3.30% 2027 | | | 54,404 | | | | 55,340 | |
| Pacific Gas and Electric Co. 3.30% 2027 | | | 35,769 | | | | 36,422 | |
| Pacific Gas and Electric Co. 3.00% 2028 | | | 41,127 | | | | 41,457 | |
| Pacific Gas and Electric Co. 3.75% 2028 | | | 32,678 | | | | 34,010 | |
| Pacific Gas and Electric Co. 4.65% 2028 | | | 48,518 | | | | 52,967 | |
| Pacific Gas and Electric Co. 4.55% 2030 | | | 178,087 | | | | 192,731 | |
| Pacific Gas and Electric Co. 2.50% 2031 | | | 77,374 | | | | 73,794 | |
| Pacific Gas and Electric Co. 3.25% 2031 | | | 40,994 | | | | 41,172 | |
| Pacific Gas and Electric Co. 3.30% 2040 | | | 29,430 | | | | 27,340 | |
| Pacific Gas and Electric Co. 3.75% 2042 | | | 38,150 | | | | 35,671 | |
| Pacific Gas and Electric Co. 3.50% 2050 | | | 64,182 | | | | 59,616 | |
| Peco Energy Co. 2.80% 2050 | | | 18,872 | | | | 18,542 | |
| 16 | The Bond Fund of America |
| Bonds, notes & other debt instruments (continued) | | Principal amount
(000) | | | Value
(000) | |
| Corporate bonds, notes & loans (continued) | | | | | | |
| Utilities (continued) | | | | | | | | |
| PG&E Corp. 5.00% 2028 | | $ | 9,485 | | | $ | 9,993 | |
| PG&E Corp. 5.25% 2030 | | | 3,450 | | | | 3,624 | |
| Progress Energy, Inc. 7.00% 2031 | | | 8,568 | | | | 11,618 | |
| Public Service Company of Colorado 1.875% 2031 | | | 51,922 | | | | 50,529 | |
| Public Service Company of Colorado 1.90% 2031 | | | 1,500 | | | | 1,459 | |
| Public Service Electric and Gas Co. 0.95% 2026 | | | 17,350 | | | | 17,004 | |
| Public Service Electric and Gas Co. 3.65% 2028 | | | 425 | | | | 467 | |
| Public Service Electric and Gas Co. 3.20% 2029 | | | 5,000 | | | | 5,382 | |
| Public Service Electric and Gas Co. 2.45% 2030 | | | 2,005 | | | | 2,043 | |
| Public Service Electric and Gas Co. 1.90% 2031 | | | 8,539 | | | | 8,318 | |
| Public Service Electric and Gas Co. 2.05% 2050 | | | 6,501 | | | | 5,508 | |
| Public Service Electric and Gas Co. 2.70% 2050 | | | 2,024 | | | | 1,961 | |
| Public Service Electric and Gas Co. 3.15% 2050 | | | 15,000 | | | | 15,769 | |
| Public Service Enterprise Group, Inc. 2.65% 2022 | | | 6,225 | | | | 6,314 | |
| Public Service Enterprise Group, Inc. 2.45% 2031 | | | 10,000 | | | | 9,893 | |
| Public Service Enterprise Group, Inc. 3.20% 2049 | | | 2,475 | | | | 2,606 | |
| Puget Energy, Inc. 5.625% 2022 | | | 7,536 | | | | 7,639 | |
| San Diego Gas & Electric Co. 1.70% 2030 | | | 218 | | | | 209 | |
| San Diego Gas & Electric Co. 3.75% 2047 | | | 60 | | | | 67 | |
| San Diego Gas & Electric Co. 4.10% 2049 | | | 23 | | | | 27 | |
| San Diego Gas & Electric Co. 3.32% 2050 | | | 2,925 | | | | 3,089 | |
| San Diego Gas & Electric Co. 2.95% 2051 | | | 32,268 | | | | 32,557 | |
| Southern California Edison Co. 1.845% 2022 | | | 905 | | | | 906 | |
| Southern California Edison Co. 0.70% 2023 | | | 400 | | | | 398 | |
| Southern California Edison Co. 1.10% 2024 | | | 28,252 | | | | 28,159 | |
| Southern California Edison Co. 3.70% 2025 | | | 11,000 | | | | 11,754 | |
| Southern California Edison Co. 1.20% 2026 | | | 7,500 | | | | 7,356 | |
| Southern California Edison Co. 3.65% 2028 | | | 10,056 | | | | 10,873 | |
| Southern California Edison Co. 2.85% 2029 | | | 70,582 | | | | 73,086 | |
| Southern California Edison Co. 4.20% 2029 | | | 20,806 | | | | 23,223 | |
| Southern California Edison Co. 2.25% 2030 | | | 27,600 | | | | 27,267 | |
| Southern California Edison Co. 2.50% 2031 | | | 17,417 | | | | 17,502 | |
| Southern California Edison Co. 6.00% 2034 | | | 10,119 | | | | 13,141 | |
| Southern California Edison Co. 5.35% 2035 | | | 30,475 | | | | 38,002 | |
| Southern California Edison Co. 5.75% 2035 | | | 6,666 | | | | 8,589 | |
| Southern California Edison Co. 5.625% 2036 | | | 5,649 | | | | 7,126 | |
| Southern California Edison Co. 5.55% 2037 | | | 6,946 | | | | 8,668 | |
| Southern California Edison Co. 5.95% 2038 | | | 12,088 | | | | 15,655 | |
| Southern California Edison Co. 4.50% 2040 | | | 20,920 | | | | 23,661 | |
| Southern California Edison Co. 4.00% 2047 | | | 25,040 | | | | 27,670 | |
| Southern California Edison Co. 4.125% 2048 | | | 17,199 | | | | 19,338 | |
| Southern California Edison Co. 4.875% 2049 | | | 1,925 | | | | 2,356 | |
| Southern California Edison Co. 3.65% 2050 | | | 54,286 | | | | 57,588 | |
| Southern California Edison Co. 2.95% 2051 | | | 12,545 | | | | 11,979 | |
| Southern California Edison Co. 3.65% 2051 | | | 22,117 | | | | 24,021 | |
| Southern California Edison Co., Series C, 3.60% 2045 | | | 10,910 | | | | 11,203 | |
| Southern California Gas Company 2.55% 2030 | | | 6,775 | | | | 6,954 | |
| Southwestern Electric Power Co. 1.65% 2026 | | | 12,675 | | | | 12,583 | |
| Southwestern Electric Power Co. 3.25% 2051 | | | 13,364 | | | | 13,283 | |
| Talen Energy Corp. 7.25% 20274 | | | 12,024 | | | | 10,653 | |
| Talen Energy Corp. 6.625% 20284 | | | 8,215 | | | | 7,220 | |
| Talen Energy Supply, LLC 7.625% 20284 | | | 1,590 | | | | 1,418 | |
| Tampa Electric Co. 2.60% 2022 | | | 4,350 | | | | 4,384 | |
| Union Electric Co. 2.15% 2032 | | | 19,875 | | | | 19,530 | |
| Virginia Electric and Power Co. 2.875% 2029 | | | 4,944 | | | | 5,195 | |
| Virginia Electric and Power Co. 2.30% 2031 | | | 8,575 | | | | 8,650 | |
| Virginia Electric and Power Co. 4.00% 2043 | | | 1,437 | | | | 1,655 | |
| Virginia Electric and Power Co. 2.45% 2050 | | | 21,900 | | | | 20,235 | |
| Vistra Operations Co. LLC 3.55% 20244 | | | 8,000 | | | | 8,243 | |
| Vistra Operations Co. LLC 5.00% 20274 | | | 1,000 | | | | 1,039 | |
| WEC Energy Group, Inc. 2.20% 2028 | | | 9,475 | | | | 9,469 | |
| Wisconsin Electric Power Co. 2.85% 2051 | | | 5,167 | | | | 5,088 | |
| Wisconsin Power and Light Co. 1.95% 2031 | | | 15,450 | | | | 15,051 | |
| Wisconsin Power and Light Co. 3.65% 2050 | | | 2,675 | | | | 3,013 | |
| Xcel Energy, Inc. 3.35% 2026 | | | 14,219 | | | | 15,121 | |
| Xcel Energy, Inc. 1.75% 2027 | | | 19,250 | | | | 19,089 | |
| The Bond Fund of America | 17 |
| Bonds, notes & other debt instruments (continued) | | Principal amount
(000) | | | Value
(000) | |
| Corporate bonds, notes & loans (continued) | | | | | | |
| Utilities (continued) | | | | | | | | |
| Xcel Energy, Inc. 2.60% 2029 | | $ | 13,202 | | | $ | 13,509 | |
| Xcel Energy, Inc. 2.35% 2031 | | | 37,475 | | | | 37,328 | |
| Xcel Energy, Inc. 3.50% 2049 | | | 7,975 | | | | 8,503 | |
| | | | | | | | 3,669,642 | |
| | | | | | | | | |
| Energy 4.05% | | | | | | | | |
| Antero Resources Corp. 5.375% 20304 | | | 1,735 | | | | 1,858 | |
| Apache Corp. 4.25% 2030 | | | 9,050 | | | | 9,834 | |
| Apache Corp. 6.00% 2037 | | | 6,135 | | | | 7,518 | |
| Apache Corp. 5.10% 2040 | | | 4,860 | | | | 5,500 | |
| Apache Corp. 4.75% 2043 | | | 15,000 | | | | 16,500 | |
| Apache Corp. 5.35% 2049 | | | 16,725 | | | | 19,133 | |
| Baker Hughes, a GE Co. 2.061% 2026 | | | 6,787 | | | | 6,852 | |
| Boardwalk Pipeline Partners LP 3.375% 2023 | | | 1,900 | | | | 1,935 | |
| BP Capital Markets America, Inc. 2.772% 2050 | | | 451 | | | | 426 | |
| Canadian Natural Resources, Ltd. 2.95% 2023 | | | 16,235 | | | | 16,548 | |
| Canadian Natural Resources, Ltd. 3.80% 2024 | | | 10,500 | | | | 11,018 | |
| Canadian Natural Resources, Ltd. 2.05% 2025 | | | 3,547 | | | | 3,584 | |
| Canadian Natural Resources, Ltd. 3.85% 2027 | | | 49,448 | | | | 53,016 | |
| Canadian Natural Resources, Ltd. 2.95% 2030 | | | 8,752 | | | | 8,873 | |
| Canadian Natural Resources, Ltd. 4.95% 2047 | | | 179 | | | | 220 | |
| Cenovus Energy, Inc. 5.375% 2025 | | | 32,721 | | | | 36,138 | |
| Cenovus Energy, Inc. 4.25% 2027 | | | 72,145 | | | | 78,692 | |
| Cenovus Energy, Inc. 2.65% 2032 | | | 17,538 | | | | 17,178 | |
| Cenovus Energy, Inc. 5.25% 2037 | | | 9,149 | | | | 10,828 | |
| Cenovus Energy, Inc. 5.40% 2047 | | | 56,113 | | | | 70,020 | |
| Cheniere Energy Partners LP 4.50% 2029 | | | 5,050 | | | | 5,362 | |
| Cheniere Energy Partners LP 3.25% 20324 | | | 5,374 | | | | 5,439 | |
| Cheniere Energy, Inc. 4.625% 2028 | | | 8,875 | | | | 9,455 | |
| Cheniere Energy, Inc. 3.70% 2029 | | | 46,156 | | | | 49,479 | |
| Chesapeake Energy Corp. 5.50% 20264 | | | 1,405 | | | | 1,480 | |
| Chesapeake Energy Corp. 5.875% 20294 | | | 1,210 | | | | 1,296 | |
| Chevron Corp. 2.498% 2022 | | | 9,675 | | | | 9,692 | |
| Chevron Corp. 2.954% 2026 | | | 25,490 | | | | 27,013 | |
| Chevron Corp. 1.995% 2027 | | | 22,156 | | | | 22,503 | |
| Chevron Corp. 2.236% 2030 | | | 24,807 | | | | 25,118 | |
| Chevron Corp. 3.078% 2050 | | | 4,177 | | | | 4,447 | |
| Chevron USA, Inc. 1.018% 2027 | | | 16,054 | | | | 15,471 | |
| CNX Resources Corp. 7.25% 20274 | | | 20 | | | | 21 | |
| CNX Resources Corp. 6.00% 20294 | | | 1,608 | | | | 1,675 | |
| Constellation Oil Services Holding SA 10.00% PIK 20244,7,8 | | | 3,538 | | | | 1,107 | |
| Continental Resources, Inc. 2.875% 20324 | | | 12,140 | | | | 11,893 | |
| DCP Midstream Operating LP 4.95% 2022 | | | 1,495 | | | | 1,495 | |
| Devon Energy Corp. 5.25% 2024 | | | 638 | | | | 691 | |
| Devon Energy Corp. 5.25% 2027 | | | 1,624 | | | | 1,713 | |
| Devon Energy Corp. 5.875% 2028 | | | 1,347 | | | | 1,459 | |
| Devon Energy Corp. 4.50% 2030 | | | 12,331 | | | | 13,244 | |
| Diamondback Energy, Inc. 4.40% 2051 | | | 23,781 | | | | 27,320 | |
| DT Midstream, Inc. 4.125% 20294 | | | 3,430 | | | | 3,517 | |
| Enbridge Energy Partners LP 7.375% 2045 | | | 22,442 | | | | 35,123 | |
| Enbridge, Inc. 4.00% 2023 | | | 10,100 | | | | 10,548 | |
| Endeavor Energy Resources LP 6.625% 20254 | | | 1,995 | | | | 2,113 | |
| Energy Transfer Operating LP 5.875% 2024 | | | 2,043 | | | | 2,200 | |
| Energy Transfer Operating LP 2.90% 2025 | | | 23,003 | | | | 23,782 | |
| Energy Transfer Operating LP 3.75% 2030 | | | 27,624 | | | | 29,303 | |
| Energy Transfer Operating LP 5.00% 2050 | | | 108,654 | | | | 125,332 | |
| Energy Transfer Partners LP 4.20% 2023 | | | 5,725 | | | | 5,981 | |
| Energy Transfer Partners LP 4.50% 2024 | | | 2,975 | | | | 3,155 | |
| Energy Transfer Partners LP 4.95% 2028 | | | 7,500 | | | | 8,444 | |
| Energy Transfer Partners LP 6.125% 2045 | | | 16,640 | | | | 20,744 | |
| Energy Transfer Partners LP 5.30% 2047 | | | 31,022 | | | | 36,032 | |
| Energy Transfer Partners LP 6.00% 2048 | | | 14,487 | | | | 18,038 | |
| Energy Transfer Partners LP 6.25% 2049 | | | 15,547 | | | | 20,347 | |
| Energy Transfer Partners LP 6.625% junior subordinated perpetual bonds (3-month USD-LIBOR + 4.155% on 2/15/2028)5 | | | 17,000 | | | | 16,170 | |
| Enterprise Products Operating LLC 2.80% 2030 | | | 3,768 | | | | 3,933 | |
| Enterprise Products Operating LLC 3.20% 2052 | | | 17,550 | | | | 17,259 | |
| 18 | The Bond Fund of America |
| Bonds, notes & other debt instruments (continued) | | Principal amount
(000) | | | Value
(000) | |
| Corporate bonds, notes & loans (continued) | | | | | | |
| Energy (continued) | | | | | | |
| Enterprise Products Operating LLC 3.30% 2053 | | $ | 33,993 | | | $ | 33,884 | |
| EQM Midstream Partners LP 4.75% 2023 | | | 2,500 | | | | 2,603 | |
| EQM Midstream Partners LP 6.50% 20274 | | | 4,020 | | | | 4,508 | |
| EQM Midstream Partners LP 5.50% 2028 | | | 8,300 | | | | 9,080 | |
| EQM Midstream Partners LP 4.50% 20294 | | | 5,120 | | | | 5,332 | |
| EQT Corp. 3.00% 2022 | | | 23,035 | | | | 23,297 | |
| EQT Corp. 6.625% 20255 | | | 5,812 | | | | 6,560 | |
| EQT Corp. 3.90% 2027 | | | 11,000 | | | | 11,811 | |
| EQT Corp. 5.00% 2029 | | | 1,175 | | | | 1,303 | |
| EQT Corp. 7.50% 20305 | | | 15,000 | | | | 19,299 | |
| EQT Corp. 3.625% 20314 | | | 3,945 | | | | 4,099 | |
| Equinor ASA 3.625% 2028 | | | 8,379 | | | | 9,213 | |
| Equinor ASA 3.125% 2030 | | | 22,503 | | | | 24,200 | |
| Equinor ASA 3.25% 2049 | | | 5,687 | | | | 6,040 | |
| Exxon Mobil Corp. 2.019% 2024 | | | 24,204 | | | | 24,814 | |
| Exxon Mobil Corp. 2.44% 2029 | | | 4,098 | | | | 4,207 | |
| Exxon Mobil Corp. 2.61% 2030 | | | 39,385 | | | | 40,864 | |
| Exxon Mobil Corp. 2.995% 2039 | | | 890 | | | | 902 | |
| Exxon Mobil Corp. 4.227% 2040 | | | 2,000 | | | | 2,365 | |
| Exxon Mobil Corp. 3.452% 2051 | | | 6,327 | | | | 6,869 | |
| Harvest Midstream I, LP 7.50% 20284 | | | 1,988 | | | | 2,130 | |
| Hilcorp Energy I, LP 5.75% 20294 | | | 2,125 | | | | 2,193 | |
| Kinder Morgan, Inc. 2.00% 2031 | | | 4,717 | | | | 4,494 | |
| Kinder Morgan, Inc. 5.20% 2048 | | | 9,524 | | | | 11,792 | |
| Kinder Morgan, Inc. 3.25% 2050 | | | 3,345 | | | | 3,210 | |
| Kinder Morgan, Inc. 3.60% 2051 | | | 52,875 | | | | 53,297 | |
| Marathon Oil Corp. 4.40% 2027 | | | 5,755 | | | | 6,308 | |
| MPLX LP 3.50% 2022 | | | 140 | | | | 143 | |
| MPLX LP 1.75% 2026 | | | 20,211 | | | | 20,028 | |
| MPLX LP 2.65% 2030 | | | 28,512 | | | | 28,415 | |
| MPLX LP 4.70% 2048 | | | 5,660 | | | | 6,546 | |
| MPLX LP 5.50% 2049 | | | 51,288 | | | | 65,650 | |
| Murphy Oil Corp. 6.375% 2028 | | | 6,250 | | | | 6,652 | |
| Murphy Oil USA, Inc. 3.75% 20314 | | | 1,335 | | | | 1,329 | |
| MV24 Capital BV 6.748% 20344 | | | 1,793 | | | | 1,851 | |
| New Fortress Energy, Inc. 6.50% 20264 | | | 6,595 | | | | 6,553 | |
| NGL Energy Operating LLC 7.50% 20264 | | | 6,555 | | | | 6,769 | |
| Occidental Petroleum Corp. 8.00% 2025 | | | 3,930 | | | | 4,592 | |
| Occidental Petroleum Corp. 4.20% 2048 | | | 4,250 | | | | 4,257 | |
| Oleoducto Central SA 4.00% 20274 | | | 9,840 | | | | 9,796 | |
| Oleoducto Central SA 4.00% 2027 | | | 9,063 | | | | 9,022 | |
| ONEOK, Inc. 2.20% 2025 | | | 439 | | | | 444 | |
| ONEOK, Inc. 5.85% 2026 | | | 35,267 | | | | 40,480 | |
| ONEOK, Inc. 4.00% 2027 | | | 5,403 | | | | 5,846 | |
| ONEOK, Inc. 4.55% 2028 | | | 910 | | | | 1,006 | |
| ONEOK, Inc. 3.40% 2029 | | | 2,882 | | | | 2,988 | |
| ONEOK, Inc. 4.35% 2029 | | | 3,154 | | | | 3,441 | |
| ONEOK, Inc. 3.10% 2030 | | | 25,930 | | | | 26,439 | |
| ONEOK, Inc. 6.35% 2031 | | | 14,286 | | | | 17,956 | |
| ONEOK, Inc. 4.95% 2047 | | | 947 | | | | 1,098 | |
| ONEOK, Inc. 5.20% 2048 | | | 31,762 | | | | 38,476 | |
| ONEOK, Inc. 4.45% 2049 | | | 11,094 | | | | 12,289 | |
| ONEOK, Inc. 4.50% 2050 | | | 7,917 | | | | 8,795 | |
| ONEOK, Inc. 7.15% 2051 | | | 9,461 | | | | 13,685 | |
| Petróleos Mexicanos (3-month USD-LIBOR + 3.65%) 3.851% 20226 | | | 7,000 | | | | 7,014 | |
| Petróleos Mexicanos 4.875% 2022 | | | 20,506 | | | | 20,565 | |
| Petróleos Mexicanos 5.375% 2022 | | | 13,457 | | | | 13,591 | |
| Petróleos Mexicanos 3.50% 2023 | | | 600 | | | | 607 | |
| Petróleos Mexicanos 4.625% 2023 | | | 5,840 | | | | 5,994 | |
| Petróleos Mexicanos 4.875% 2024 | | | 1,881 | | | | 1,949 | |
| Petróleos Mexicanos 6.875% 20254 | | | 66,015 | | | | 72,208 | |
| Petróleos Mexicanos 6.875% 2025 | | | 4,291 | | | | 4,694 | |
| Petróleos Mexicanos 4.50% 2026 | | | 9,922 | | | | 10,050 | |
| Petróleos Mexicanos 6.875% 2026 | | | 110,761 | | | | 121,931 | |
| Petróleos Mexicanos 7.47% 2026 | | MXN | 70,000 | | | | 3,109 | |
| Petróleos Mexicanos 6.49% 2027 | | $ | 20,000 | | | | 21,347 | |
| Petróleos Mexicanos 6.50% 2027 | | | 89,091 | | | | 95,159 | |
| The Bond Fund of America | 19 |
| Bonds, notes & other debt instruments (continued) | | Principal amount
(000) | | | Value
(000) | |
| Corporate bonds, notes & loans (continued) | | | | | | |
| Energy (continued) | | | | | | |
| Petróleos Mexicanos 6.50% 2029 | | $ | 15,417 | | | $ | 16,021 | |
| Petróleos Mexicanos 5.95% 2031 | | | 22,178 | | | | 21,595 | |
| Petróleos Mexicanos 6.70% 20324 | | | 140,205 | | | | 141,884 | |
| Petróleos Mexicanos 7.69% 2050 | | | 23,125 | | | | 22,361 | |
| Pioneer Natural Resources Company 1.125% 2026 | | | 1,055 | | | | 1,025 | |
| Pioneer Natural Resources Company 2.15% 2031 | | | 1,178 | | | | 1,138 | |
| Plains All American Pipeline LP 3.80% 2030 | | | 1,543 | | | | 1,613 | |
| PTT Exploration and Production PCL 2.587% 20274 | | | 7,780 | | | | 7,939 | |
| Qatar Petroleum 1.375% 20264 | | | 62,305 | | | | 61,175 | |
| Qatar Petroleum 2.25% 20314 | | | 65,510 | | | | 65,058 | |
| Qatar Petroleum 3.125% 20414 | | | 39,145 | | | | 39,664 | |
| Qatar Petroleum 3.30% 20514 | | | 9,730 | | | | 10,051 | |
| Rattler Midstream Partners LP 5.625% 20254 | | | 4,317 | | | | 4,494 | |
| SA Global Sukuk, Ltd. 0.946% 20244 | | | 48,525 | | | | 47,847 | |
| SA Global Sukuk, Ltd. 1.602% 20264 | | | 152,204 | | | | 150,035 | |
| SA Global Sukuk, Ltd. 2.694% 20314 | | | 35,490 | | | | 35,764 | |
| Sabine Pass Liquefaction, LLC 5.625% 20235 | | | 14,000 | | | | 14,647 | |
| Sabine Pass Liquefaction, LLC 5.75% 2024 | | | 13,100 | | | | 14,254 | |
| Sabine Pass Liquefaction, LLC 5.625% 2025 | | | 21,015 | | | | 23,348 | |
| Sabine Pass Liquefaction, LLC 5.875% 2026 | | | 33,750 | | | | 38,758 | |
| Sabine Pass Liquefaction, LLC 4.50% 2030 | | | 19,990 | | | | 22,569 | |
| Saudi Arabian Oil Co. 2.875% 20244 | | | 8,448 | | | | 8,731 | |
| Saudi Arabian Oil Co. 1.625% 20254 | | | 2,980 | | | | 2,968 | |
| Saudi Arabian Oil Co. 3.50% 20294 | | | 4,835 | | | | 5,177 | |
| Saudi Arabian Oil Co. 4.375% 20494 | | | 1,325 | | | | 1,539 | |
| Shell International Finance BV 3.50% 2023 | | | 7,500 | | | | 7,850 | |
| Shell International Finance BV 2.00% 2024 | | | 3,250 | | | | 3,333 | |
| Shell International Finance BV 3.875% 2028 | | | 4,680 | | | | 5,234 | |
| Shell International Finance BV 2.375% 2029 | | | 19,511 | | | | 19,948 | |
| Shell International Finance BV 2.75% 2030 | | | 15,190 | | | | 15,882 | |
| Shell International Finance BV 3.125% 2049 | | | 3,490 | | | | 3,601 | |
| Shell International Finance BV 3.25% 2050 | | | 7,811 | | | | 8,333 | |
| Sinopec Group Overseas Development (2018), Ltd. 1.45% 20264 | | | 10,500 | | | | 10,379 | |
| Sinopec Group Overseas Development (2018), Ltd. 2.95% 2029 | | | 21,257 | | | | 22,209 | |
| Sinopec Group Overseas Development (2018), Ltd. 2.95% 20294 | | | 18,886 | | | | 19,682 | |
| Sinopec Group Overseas Development (2018), Ltd. 2.95% 2029 | | | 3,140 | | | | 3,272 | |
| Sinopec Group Overseas Development (2018), Ltd. 2.30% 20314 | | | 11,940 | | | | 11,778 | |
| Sinopec Group Overseas Development (2018), Ltd. 3.10% 20514 | | | 27,125 | | | | 26,107 | |
| Sinopec Group Overseas Development (2018), Ltd. 2.95% 20294 | | | 6,717 | | | | 7,018 | |
| Southwestern Energy Co. 6.45% 2025 (6.20% on 1/23/2022)5 | | | 880 | | | | 968 | |
| Southwestern Energy Co. 8.375% 2028 | | | 1,300 | | | | 1,453 | |
| Suncor Energy, Inc. 3.75% 2051 | | | 9,758 | | | | 10,498 | |
| Sunoco Logistics Operating Partners LP 4.00% 2027 | | | 15,000 | | | | 16,118 | |
| Sunoco Logistics Operating Partners LP 5.40% 2047 | | | 34,048 | | | | 40,044 | |
| Sunoco LP 6.00% 2027 | | | 4,210 | | | | 4,395 | |
| Sunoco LP 4.50% 2029 | | | 3,215 | | | | 3,270 | |
| Tallgrass Energy Partners, LP 7.50% 20254 | | | 1,370 | | | | 1,484 | |
| Targa Resources Partners LP 5.875% 2026 | | | 8,530 | | | | 8,912 | |
| Targa Resources Partners LP 6.875% 2029 | | | 6,000 | | | | 6,721 | |
| Targa Resources Partners LP 5.50% 2030 | | | 8,660 | | | | 9,476 | |
| Targa Resources Partners LP 4.875% 2031 | | | 2,190 | | | | 2,382 | |
| Total Capital International 3.455% 2029 | | | 10,040 | | | | 10,886 | |
| Total Capital International 2.829% 2030 | | | 7,860 | | | | 8,238 | |
| Total Capital International 3.461% 2049 | | | 2,600 | | | | 2,816 | |
| Total Capital International 3.127% 2050 | | | 6,508 | | | | 6,689 | |
| TransCanada PipeLines, Ltd. 4.10% 2030 | | | 24,741 | | | | 27,627 | |
| Transportadora de Gas Peru SA 4.25% 20284 | | | 2,535 | | | | 2,688 | |
| Western Gas Partners LP 5.30% 2048 | | | 2,000 | | | | 2,413 | |
| Western Midstream Operating, LP 4.35% 2025 (4.10% on 2/1/2022)5 | | | 8,964 | | | | 9,379 | |
| Western Midstream Operating, LP 5.30% 2030 (5.05% on 2/1/2022)5 | | | 6,606 | | | | 7,273 | |
| Western Midstream Operating, LP 6.50% 2050 (6.25% on 2/1/2022)5 | | | 15,036 | | | | 17,803 | |
| Williams Companies, Inc. 3.50% 2030 | | | 29,821 | | | | 31,734 | |
| Williams Companies, Inc. 2.60% 2031 | | | 17,836 | | | | 17,733 | |
| Williams Partners LP 6.30% 2040 | | | 2,246 | | | | 3,047 | |
| | | | | | | | 3,220,831 | |
| 20 | The Bond Fund of America |
| Bonds, notes & other debt instruments (continued) | | Principal amount
(000) | | | Value
(000) | |
| Corporate bonds, notes & loans (continued) | | | | | | |
| Consumer discretionary 3.57% | | | | | | |
| Allied Universal Holdco LLC 4.625% 20284 | | $ | 2,105 | | | $ | 2,107 | |
| Amazon.com, Inc. 1.20% 2027 | | | 4,519 | | | | 4,460 | |
| Amazon.com, Inc. 1.65% 2028 | | | 43,100 | | | | 43,201 | |
| Amazon.com, Inc. 1.50% 2030 | | | 37,712 | | | | 36,587 | |
| Amazon.com, Inc. 2.10% 2031 | | | 50,819 | | | | 51,558 | |
| Amazon.com, Inc. 3.875% 2037 | | | 550 | | | | 648 | |
| Amazon.com, Inc. 2.875% 2041 | | | 14,907 | | | | 15,509 | |
| Amazon.com, Inc. 2.50% 2050 | | | 12,280 | | | | 11,726 | |
| Amazon.com, Inc. 3.10% 2051 | | | 33,000 | | | | 35,319 | |
| Amazon.com, Inc. 2.70% 2060 | | | 10,560 | | | | 10,210 | |
| American Honda Finance Corp. 2.60% 2022 | | | 106 | | | | 108 | |
| American Honda Finance Corp. 0.875% 2023 | | | 50,000 | | | | 50,035 | |
| American Honda Finance Corp. 0.55% 2024 | | | 14,780 | | | | 14,595 | |
| American Honda Finance Corp. 0.75% 2024 | | | 2,000 | | | | 1,979 | |
| American Honda Finance Corp. 1.00% 2025 | | | 3,000 | | | | 2,955 | |
| American Honda Finance Corp. 1.20% 2025 | | | 14,987 | | | | 14,940 | |
| American Honda Finance Corp. 1.30% 2026 | | | 4,000 | | | | 3,954 | |
| American Honda Finance Corp. 2.00% 2028 | | | 5,425 | | | | 5,483 | |
| American Honda Finance Corp. 1.80% 2031 | | | 1,500 | | | | 1,464 | |
| Atlas LuxCo 4 SARL 4.625% 20284 | | | 1,610 | | | | 1,583 | |
| Bayerische Motoren Werke AG 2.95% 20224 | | | 3,500 | | | | 3,525 | |
| Bayerische Motoren Werke AG 3.45% 20234 | | | 16,128 | | | | 16,635 | |
| Bayerische Motoren Werke AG 3.80% 20234 | | | 1,985 | | | | 2,059 | |
| Bayerische Motoren Werke AG 3.90% 20254 | | | 21,240 | | | | 22,857 | |
| Bayerische Motoren Werke AG 1.25% 20264 | | | 600 | | | | 591 | |
| Bayerische Motoren Werke AG 1.95% 20314 | | | 3,500 | | | | 3,411 | |
| Bayerische Motoren Werke AG 2.55% 20314 | | | 14,011 | | | | 14,389 | |
| BMW Finance NV 2.25% 20224 | | | 7,500 | | | | 7,580 | |
| Daimler Trucks Finance North America, LLC 1.125% 20234 | | | 18,000 | | | | 18,013 | |
| Daimler Trucks Finance North America, LLC 1.625% 20244 | | | 29,500 | | | | 29,741 | |
| Daimler Trucks Finance North America, LLC 2.00% 20264 | | | 10,800 | | | | 10,853 | |
| Daimler Trucks Finance North America, LLC 2.375% 20284 | | | 23,725 | | | | 23,852 | |
| Daimler Trucks Finance North America, LLC 2.50% 20314 | | | 61,516 | | | | 61,554 | |
| DaimlerChrysler North America Holding Corp. 2.55% 20224 | | | 12,750 | | | | 12,896 | |
| DaimlerChrysler North America Holding Corp. 1.75% 20234 | | | 18,000 | | | | 18,185 | |
| DaimlerChrysler North America Holding Corp. 0.75% 20244 | | | 22,000 | | | | 21,805 | |
| DaimlerChrysler North America Holding Corp. 2.70% 20244 | | | 19,500 | | | | 20,168 | |
| DaimlerChrysler North America Holding Corp. 3.65% 20244 | | | 9,710 | | | | 10,223 | |
| DaimlerChrysler North America Holding Corp. 1.45% 20264 | | | 11,725 | | | | 11,618 | |
| DaimlerChrysler North America Holding Corp. 2.45% 20314 | | | 9,990 | | | | 10,160 | |
| Expedia Group, Inc. 6.25% 20254 | | | 2,734 | | | | 3,087 | |
| Ford Motor Co. 4.75% 2043 | | | 3,500 | | | | 3,869 | |
| Ford Motor Credit Company LLC 3.219% 2022 | | | 300 | | | | 300 | |
| Ford Motor Credit Company LLC 3.339% 2022 | | | 945 | | | | 948 | |
| Ford Motor Credit Company LLC 3.087% 2023 | | | 1,510 | | | | 1,538 | |
| Ford Motor Credit Company LLC 3.096% 2023 | | | 14,729 | | | | 15,025 | |
| Ford Motor Credit Company LLC 4.375% 2023 | | | 1,125 | | | | 1,172 | |
| Ford Motor Credit Company LLC 3.664% 2024 | | | 5,756 | | | | 5,985 | |
| Ford Motor Credit Company LLC 3.81% 2024 | | | 8,710 | | | | 9,045 | |
| Ford Motor Credit Company LLC 5.584% 2024 | | | 423 | | | | 456 | |
| Ford Motor Credit Company LLC 4.134% 2025 | | | 400 | | | | 425 | |
| Ford Motor Credit Company LLC 5.125% 2025 | | | 7,390 | | | | 8,046 | |
| Ford Motor Credit Company LLC 2.70% 2026 | | | 66,960 | | | | 67,630 | |
| Ford Motor Credit Company LLC 4.542% 2026 | | | 18,000 | | | | 19,571 | |
| Ford Motor Credit Company LLC 3.815% 2027 | | | 3,010 | | | | 3,187 | |
| Ford Motor Credit Company LLC 4.125% 2027 | | | 19,805 | | | | 21,402 | |
| Ford Motor Credit Company LLC 4.271% 2027 | | | 41,650 | | | | 44,821 | |
| Ford Motor Credit Company LLC 2.90% 2028 | | | 3,400 | | | | 3,413 | |
| General Motors Company 5.40% 2023 | | | 4,478 | | | | 4,795 | |
| General Motors Company 4.35% 2025 | | | 14,354 | | | | 15,454 | |
| General Motors Company 6.125% 2025 | | | 33,548 | | | | 38,570 | |
| General Motors Company 4.20% 2027 | | | 3,437 | | | | 3,764 | |
| General Motors Company 6.80% 2027 | | | 18,998 | | | | 23,335 | |
| General Motors Company 6.75% 2046 | | | 1,000 | | | | 1,433 | |
| General Motors Financial Co. 3.45% 2022 | | | 14,955 | | | | 15,001 | |
| General Motors Financial Co. 3.55% 2022 | | | 1,850 | | | | 1,877 | |
| General Motors Financial Co. 1.70% 2023 | | | 5,939 | | | | 5,998 | |
| The Bond Fund of America | 21 |
| Bonds, notes & other debt instruments (continued) | | Principal amount
(000) | | | Value
(000) | |
| Corporate bonds, notes & loans (continued) | | | | | | |
| Consumer discretionary (continued) | | | | | | |
| General Motors Financial Co. 3.25% 2023 | | $ | 22,403 | | | $ | 22,893 | |
| General Motors Financial Co. 3.70% 2023 | | | 15,126 | | | | 15,582 | |
| General Motors Financial Co. 4.15% 2023 | | | 14,010 | | | | 14,576 | |
| General Motors Financial Co. 1.05% 2024 | | | 425 | | | | 423 | |
| General Motors Financial Co. 1.20% 2024 | | | 11,400 | | | | 11,323 | |
| General Motors Financial Co. 3.50% 2024 | | | 15,365 | | | | 16,141 | |
| General Motors Financial Co. 3.95% 2024 | | | 14,909 | | | | 15,696 | |
| General Motors Financial Co. 5.10% 2024 | | | 16,550 | | | | 17,754 | |
| General Motors Financial Co. 2.75% 2025 | | | 14,475 | | | | 14,948 | |
| General Motors Financial Co. 2.90% 2025 | | | 750 | | | | 776 | |
| General Motors Financial Co. 1.25% 2026 | | | 13,900 | | | | 13,614 | |
| General Motors Financial Co. 1.50% 2026 | | | 55,810 | | | | 54,968 | |
| General Motors Financial Co. 4.00% 2026 | | | 11,454 | | | | 12,376 | |
| General Motors Financial Co. 2.70% 2027 | | | 24,230 | | | | 24,665 | |
| General Motors Financial Co. 2.40% 2028 | | | 36,175 | | | | 36,103 | |
| General Motors Financial Co. 2.40% 2028 | | | 12,928 | | | | 12,991 | |
| General Motors Financial Co. 3.60% 2030 | | | 1,735 | | | | 1,852 | |
| General Motors Financial Co. 2.35% 2031 | | | 30,100 | | | | 29,332 | |
| General Motors Financial Co. 2.70% 2031 | | | 23,400 | | | | 23,342 | |
| Grand Canyon University 4.125% 2024 | | | 25,000 | | | | 25,593 | |
| Hanesbrands, Inc. 4.625% 20244 | | | 5,430 | | | | 5,692 | |
| Home Depot, Inc. 3.90% 2028 | | | 831 | | | | 937 | |
| Home Depot, Inc. 2.95% 2029 | | | 42,205 | | | | 45,004 | |
| Home Depot, Inc. 2.70% 2030 | | | 25,000 | | | | 26,258 | |
| Home Depot, Inc. 1.375% 2031 | | | 34,165 | | | | 32,246 | |
| Home Depot, Inc. 3.125% 2049 | | | 5 | | | | 5 | |
| Home Depot, Inc. 3.35% 2050 | | | 110 | | | | 120 | |
| Home Depot, Inc. 2.375% 2051 | | | 6,847 | | | | 6,308 | |
| Hyundai Capital America 2.85% 20224 | | | 7,412 | | | | 7,541 | |
| Hyundai Capital America 3.10% 20224 | | | 13,890 | | | | 13,984 | |
| Hyundai Capital America 3.25% 20224 | | | 24,685 | | | | 25,157 | |
| Hyundai Capital America 3.95% 20224 | | | 15,000 | | | | 15,036 | |
| Hyundai Capital America 1.25% 20234 | | | 24,257 | | | | 24,247 | |
| Hyundai Capital America 2.375% 20234 | | | 21,815 | | | | 22,123 | |
| Hyundai Capital America 5.75% 20234 | | | 10,000 | | | | 10,561 | |
| Hyundai Capital America 0.875% 20244 | | | 17,000 | | | | 16,680 | |
| Hyundai Capital America 1.00% 20244 | | | 15,600 | | | | 15,340 | |
| Hyundai Capital America 1.80% 20254 | | | 55,906 | | | | 55,650 | |
| Hyundai Capital America 2.65% 20254 | | | 28,554 | | | | 29,283 | |
| Hyundai Capital America 5.875% 20254 | | | 10,000 | | | | 11,197 | |
| Hyundai Capital America 1.30% 20264 | | | 17,000 | | | | 16,530 | |
| Hyundai Capital America 1.50% 20264 | | | 37,265 | | | | 36,262 | |
| Hyundai Capital America 1.65% 20264 | | | 39,800 | | | | 39,051 | |
| Hyundai Capital America 2.375% 20274 | | | 11,397 | | | | 11,345 | |
| Hyundai Capital America 3.00% 20274 | | | 22,768 | | | | 23,576 | |
| Hyundai Capital America 1.80% 20284 | | | 15,000 | | | | 14,509 | |
| Hyundai Capital America 2.00% 20284 | | | 37,888 | | | | 36,967 | |
| Hyundai Capital America 2.10% 20284 | | | 27,625 | | | | 26,860 | |
| Hyundai Capital Services, Inc. 1.25% 20264 | | | 6,570 | | | | 6,415 | |
| International Game Technology PLC 6.50% 20254 | | | 1,560 | | | | 1,695 | |
| International Game Technology PLC 4.125% 20264 | | | 2,115 | | | | 2,181 | |
| International Game Technology PLC 6.25% 20274 | | | 3,500 | | | | 3,924 | |
| International Game Technology PLC 5.25% 20294 | | | 6,940 | | | | 7,364 | |
| KB Home 6.875% 2027 | | | 5,000 | | | | 5,868 | |
| Lennar Corp. 4.50% 2024 | | | 3,015 | | | | 3,206 | |
| Limited Brands, Inc. 6.875% 2035 | | | 4,500 | | | | 5,598 | |
| Limited Brands, Inc. 6.75% 2036 | | | 4,800 | | | | 5,935 | |
| Lowe’s Companies, Inc. 1.30% 2028 | | | 684 | | | | 656 | |
| Lowe’s Companies, Inc. 1.70% 2030 | | | 5,216 | | | | 4,962 | |
| Lowe’s Companies, Inc. 2.625% 2031 | | | 2,250 | | | | 2,304 | |
| Lowe’s Companies, Inc. 4.05% 2047 | | | 2,427 | | | | 2,799 | |
| Lowe’s Companies, Inc. 3.00% 2050 | | | 5,431 | | | | 5,371 | |
| Lowe’s Companies, Inc. 5.125% 2050 | | | 867 | | | | 1,177 | |
| M.D.C. Holdings, Inc. 6.00% 2043 | | | 7,475 | | | | 9,467 | |
| Marriott International, Inc. 5.75% 2025 | | | 1,196 | | | | 1,347 | |
| Marriott International, Inc. 3.125% 2026 | | | 1,235 | | | | 1,284 | |
| Marriott International, Inc. 2.85% 2031 | | | 16,535 | | | | 16,502 | |
| 22 | The Bond Fund of America |
| Bonds, notes & other debt instruments (continued) | | Principal amount
(000) | | | Value
(000) | |
| Corporate bonds, notes & loans (continued) | | | | | | |
| Consumer discretionary (continued) | | | | | | |
| Marriott International, Inc. 2.75% 2033 | | $ | 4,827 | | | $ | 4,689 | |
| McDonald’s Corp. 2.125% 2030 | | | 8,994 | | | | 8,963 | |
| McDonald’s Corp. 4.45% 2048 | | | 1,750 | | | | 2,160 | |
| McDonald’s Corp. 3.625% 2049 | | | 6,857 | | | | 7,603 | |
| McDonald’s Corp. 4.20% 2050 | | | 5,396 | | | | 6,549 | |
| Meituan Dianping 2.125% 20254 | | | 5,041 | | | | 4,861 | |
| Meituan Dianping 3.05% 20304 | | | 17,000 | | | | 15,752 | |
| Meituan Dianping 3.05% 2030 | | | 15,000 | | | | 13,899 | |
| Melco International Development, Ltd. 4.875% 20254 | | | 300 | | | | 296 | |
| Melco International Development, Ltd. 5.75% 20284 | | | 3,990 | | | | 4,018 | |
| Melco International Development, Ltd. 5.375% 20294 | | | 885 | | | | 860 | |
| MGM Growth Properties LLC 5.625% 2024 | | | 3,885 | | | | 4,157 | |
| MGM Growth Properties LLC 3.875% 20294 | | | 2,835 | | | | 2,981 | |
| MGM Resorts International 6.75% 2025 | | | 3,000 | | | | 3,138 | |
| Morongo Band of Mission Indians 7.00% 20394 | | | 11,225 | | | | 14,850 | |
| NIKE, Inc. 2.40% 2025 | | | 8,656 | | | | 8,968 | |
| NIKE, Inc. 3.25% 2040 | | | 5,469 | | | | 5,961 | |
| NIKE, Inc. 3.375% 2050 | | | 4,272 | | | | 4,840 | |
| Nissan Motor Acceptance Co. LLC 1.125% 20244 | | | 16,200 | | | | 15,927 | |
| Nissan Motor Acceptance Co. LLC 1.85% 20264 | | | 36,749 | | | | 35,893 | |
| Nissan Motor Acceptance Co. LLC 2.45% 20284 | | | 22,958 | | | | 22,331 | |
| Nissan Motor Co., Ltd. 2.60% 20224 | | | 44,825 | | | | 45,302 | |
| Nissan Motor Co., Ltd. 3.043% 20234 | | | 8,756 | | | | 8,988 | |
| Nissan Motor Co., Ltd. 3.522% 20254 | | | 48,235 | | | | 50,603 | |
| Nissan Motor Co., Ltd. 2.00% 20264 | | | 31,075 | | | | 30,639 | |
| Nissan Motor Co., Ltd. 4.345% 20274 | | | 32,162 | | | | 34,747 | |
| Nissan Motor Co., Ltd. 2.75% 20284 | | | 39,575 | | | | 39,327 | |
| Nissan Motor Co., Ltd. 4.81% 20304 | | | 24,600 | | | | 27,541 | |
| President & Fellows of Harvard College 2.517% 2050 | | | 5,500 | | | | 5,531 | |
| S.A.C.I. Falabella 3.75% 20274 | | | 8,295 | | | | 8,649 | |
| Sally Holdings LLC and Sally Capital, Inc. 5.625% 2025 | | | 200 | | | | 205 | |
| Sally Holdings LLC and Sally Capital, Inc. 8.75% 20254 | | | 500 | | | | 533 | |
| Sands China, Ltd. 3.80% 2026 | | | 2,330 | | | | 2,344 | |
| Sands China, Ltd. 5.40% 2028 | | | 43,750 | | | | 47,162 | |
| Sands China, Ltd. 4.375% 2030 | | | 6,500 | | | | 6,642 | |
| Starbucks Corp. 3.10% 2023 | | | 15,237 | | | | 15,604 | |
| Starbucks Corp. 3.80% 2025 | | | 14,000 | | | | 15,116 | |
| Stellantis Finance US, Inc. 1.711% 20274 | | | 29,225 | | | | 28,743 | |
| Stellantis Finance US, Inc. 2.691% 20314 | | | 42,075 | | | | 41,420 | |
| Taylor Morrison Home Corp. 5.75% 20284 | | | 3,500 | | | | 3,916 | |
| Toyota Motor Corp. 0.681% 2024 | | | 6,731 | | | | 6,694 | |
| Toyota Motor Credit Corp. 2.60% 2022 | | | 9,860 | | | | 9,864 | |
| Toyota Motor Credit Corp. 0.50% 2023 | | | 6,377 | | | | 6,356 | |
| Toyota Motor Credit Corp. 1.35% 2023 | | | 19,170 | | | | 19,347 | |
| Toyota Motor Credit Corp. 2.70% 2023 | | | 5,300 | | | | 5,420 | |
| Toyota Motor Credit Corp. 0.45% 2024 | | | 2,530 | | | | 2,510 | |
| Toyota Motor Credit Corp. 0.80% 2025 | | | 23,287 | | | | 22,756 | |
| Toyota Motor Credit Corp. 3.00% 2025 | | | 8,710 | | | | 9,144 | |
| Toyota Motor Credit Corp. 1.15% 2027 | | | 6,086 | | | | 5,916 | |
| Toyota Motor Credit Corp. 3.20% 2027 | | | 2,330 | | | | 2,501 | |
| Toyota Motor Credit Corp. 1.90% 2028 | | | 13,370 | | | | 13,408 | |
| Toyota Motor Credit Corp. 3.05% 2028 | | | 2,589 | | | | 2,780 | |
| Toyota Motor Credit Corp. 3.375% 2030 | | | 15,094 | | | | 16,559 | |
| Travel + Leisure Co. 4.50% 20294 | | | 2,000 | | | | 2,020 | |
| VICI Properties LP 4.25% 20264 | | | 5,700 | | | | 5,944 | |
| VICI Properties LP 4.625% 20294 | | | 715 | | | | 762 | |
| VICI Properties LP / VICI Note Co., Inc. 3.50% 20254 | | | 2,675 | | | | 2,718 | |
| VICI Properties LP / VICI Note Co., Inc. 4.125% 20304 | | | 2,500 | | | | 2,648 | |
| Volkswagen Group of America Finance, LLC 2.90% 20224 | | | 27,250 | | | | 27,475 | |
| Volkswagen Group of America Finance, LLC 3.125% 20234 | | | 21,938 | | | | 22,560 | |
| Volkswagen Group of America Finance, LLC 4.25% 20234 | | | 3,000 | | | | 3,169 | |
| Volkswagen Group of America Finance, LLC 2.85% 20244 | | | 22,214 | | | | 22,987 | |
| Volkswagen Group of America Finance, LLC 1.25% 20254 | | | 16,205 | | | | 15,864 | |
| Volkswagen Group of America Finance, LLC 3.35% 20254 | | | 21,089 | | | | 22,204 | |
| Volkswagen Group of America Finance, LLC 4.625% 20254 | | | 514 | | | | 567 | |
| Volkswagen Group of America Finance, LLC 1.625% 20274 | | | 6,950 | | | | 6,746 | |
| Wyndham Destinations, Inc. 6.625% 20264 | | | 4,000 | | | | 4,440 | |
| The Bond Fund of America | 23 |
| Bonds, notes & other debt instruments (continued) | | Principal amount
(000) | | | Value
(000) | |
| Corporate bonds, notes & loans (continued) | | | | | | |
| Consumer discretionary (continued) | | | | | | |
| Wynn Macau, Ltd. 5.125% 20294 | | $ | 1,200 | | | $ | 1,092 | |
| Wynn Resorts, Ltd. 7.75% 20254 | | | 4,380 | | | | 4,598 | |
| Wynn Resorts, Ltd. 5.125% 20294 | | | 2,500 | | | | 2,541 | |
| | | | | | | | 2,843,453 | |
| Health care 3.09% | | | | | | | | |
| Abbott Laboratories 3.75% 2026 | | | 1,025 | | | | 1,133 | |
| AbbVie, Inc. 3.45% 2022 | | | 16,500 | | | | 16,515 | |
| AbbVie, Inc. 2.60% 2024 | | | 30,200 | | | | 31,355 | |
| AbbVie, Inc. 2.95% 2026 | | | 23,018 | | | | 24,271 | |
| AbbVie, Inc. 3.20% 2029 | | | 44,253 | | | | 47,364 | |
| AmerisourceBergen Corp. 2.70% 2031 | | | 42,338 | | | | 42,821 | |
| Amgen, Inc. 2.45% 2030 | | | 25,000 | | | | 25,472 | |
| Anthem, Inc. 2.95% 2022 | | | 11,000 | | | | 11,216 | |
| Anthem, Inc. 2.375% 2025 | | | 1,534 | | | | 1,583 | |
| AstraZeneca Finance LLC 1.75% 2028 | | | 8,826 | | | | 8,781 | |
| AstraZeneca Finance LLC 2.25% 2031 | | | 13,536 | | | | 13,646 | |
| AstraZeneca PLC 2.375% 2022 | | | 14,650 | | | | 14,744 | |
| AstraZeneca PLC 3.50% 2023 | | | 15,207 | | | | 15,875 | |
| AstraZeneca PLC 3.375% 2025 | | | 25,790 | | | | 27,704 | |
| AstraZeneca PLC 0.70% 2026 | | | 6,589 | | | | 6,380 | |
| AstraZeneca PLC 4.00% 2029 | | | 2,027 | | | | 2,291 | |
| AstraZeneca PLC 1.375% 2030 | | | 10,000 | | | | 9,452 | |
| AstraZeneca PLC 3.00% 2051 | | | 6,295 | | | | 6,615 | |
| Avantor Funding, Inc. 4.625% 20284 | | | 6,320 | | | | 6,599 | |
| Bausch Health Companies, Inc. 4.875% 20284 | | | 5,125 | | | | 5,237 | |
| Baxter International, Inc. 2.539% 20324 | | | 23,238 | | | | 23,502 | |
| Bayer US Finance II LLC 3.875% 20234 | | | 14,400 | | | | 15,055 | |
| Bayer US Finance II LLC 4.25% 20254 | | | 32,819 | | | | 35,529 | |
| Bayer US Finance II LLC 4.375% 20284 | | | 31,520 | | | | 35,237 | |
| Bayer US Finance II LLC 4.875% 20484 | | | 1,402 | | | | 1,727 | |
| Becton, Dickinson and Company 3.363% 2024 | | | 16,218 | | | | 16,988 | |
| Boston Scientific Corp. 3.375% 2022 | | | 3,118 | | | | 3,150 | |
| Boston Scientific Corp. 3.45% 2024 | | | 2,000 | | | | 2,092 | |
| Boston Scientific Corp. 3.75% 2026 | | | 14,087 | | | | 15,148 | |
| Boston Scientific Corp. 2.65% 2030 | | | 42,491 | | | | 43,364 | |
| Boston Scientific Corp. 4.70% 2049 | | | 1,031 | | | | 1,309 | |
| Bristol-Myers Squibb Company 2.90% 2024 | | | 9,095 | | | | 9,523 | |
| Bristol-Myers Squibb Company 3.20% 2026 | | | 11,838 | | | | 12,742 | |
| Bristol-Myers Squibb Company 3.40% 2029 | | | 7,107 | | | | 7,789 | |
| Bristol-Myers Squibb Company 1.45% 2030 | | | 7,812 | | | | 7,451 | |
| Centene Corp. 4.25% 2027 | | | 58,085 | | | | 60,654 | |
| Centene Corp. 2.45% 2028 | | | 86,515 | | | | 85,350 | |
| Centene Corp. 4.625% 2029 | | | 42,335 | | | | 45,730 | |
| Centene Corp. 3.00% 2030 | | | 23,055 | | | | 23,476 | |
| Centene Corp. 3.375% 2030 | | | 45,137 | | | | 46,042 | |
| Centene Corp. 2.50% 2031 | | | 74,200 | | | | 72,358 | |
| Centene Corp. 2.625% 2031 | | | 14,110 | | | | 13,851 | |
| Charles River Laboratories International, Inc. 3.75% 20294 | | | 4,335 | | | | 4,385 | |
| Cigna Corp. 4.375% 2028 | | | 17,336 | | | | 19,716 | |
| Cigna Corp. 2.375% 2031 | | | 33,018 | | | | 33,222 | |
| CVS Health Corp. 1.30% 2027 | | | 10,000 | | | | 9,702 | |
| CVS Health Corp. 4.30% 2028 | | | 3,547 | | | | 3,984 | |
| CVS Health Corp. 3.25% 2029 | | | 6,815 | | | | 7,273 | |
| CVS Health Corp. 1.75% 2030 | | | 10,000 | | | | 9,541 | |
| CVS Health Corp. 1.875% 2031 | | | 13,185 | | | | 12,663 | |
| CVS Health Corp. 5.05% 2048 | | | 1,707 | | | | 2,236 | |
| CVS Health Corp. 4.25% 2050 | | | 8,451 | | | | 10,242 | |
| Danaher Corp. 2.80% 2051 | | | 6,500 | | | | 6,426 | |
| Elanco Animal Health, Inc. 5.272% 2023 | | | 4,700 | | | | 5,006 | |
| Eli Lilly and Company 3.375% 2029 | | | 6,016 | | | | 6,636 | |
| EMD Finance LLC 2.95% 20224 | | | 9,600 | | | | 9,609 | |
| EMD Finance LLC 3.25% 20254 | | | 16,185 | | | | 17,044 | |
| GlaxoSmithKline PLC 2.875% 2022 | | | 1,996 | | | | 2,013 | |
| GlaxoSmithKline PLC 3.375% 2023 | | | 35,700 | | | | 36,978 | |
| GlaxoSmithKline PLC 3.00% 2024 | | | 14,515 | | | | 15,193 | |
| GlaxoSmithKline PLC 3.625% 2025 | | | 26,180 | | | | 28,215 | |
| 24 | The Bond Fund of America |
| Bonds, notes & other debt instruments (continued) | | Principal amount
(000) | | | Value
(000) | |
| Corporate bonds, notes & loans (continued) | | | | | | |
| Health care (continued) | | | | | | |
| GlaxoSmithKline PLC 3.875% 2028 | | $ | 2,917 | | | $ | 3,267 | |
| HCA, Inc. 5.875% 2023 | | | 3,750 | | | | 3,975 | |
| HCA, Inc. 5.875% 2026 | | | 4,700 | | | | 5,307 | |
| HCA, Inc. 4.125% 2029 | | | 2,825 | | | | 3,112 | |
| HCA, Inc. 5.875% 2029 | | | 7,130 | | | | 8,507 | |
| HCA, Inc. 3.50% 2030 | | | 5,225 | | | | 5,533 | |
| HCA, Inc. 5.25% 2049 | | | 8,300 | | | | 10,680 | |
| IMS Health Holdings, Inc. 5.00% 20264 | | | 5,750 | | | | 5,908 | |
| Johnson & Johnson 2.25% 2022 | | | 12,240 | | | | 12,261 | |
| Johnson & Johnson 2.10% 2040 | | | 8,620 | | | | 8,175 | |
| Kaiser Foundation Hospitals 2.81% 2041 | | | 5,555 | | | | 5,596 | |
| Laboratory Corporation of America Holdings 1.55% 2026 | | | 7,500 | | | | 7,422 | |
| Laboratory Corporation of America Holdings 2.70% 2031 | | | 5,051 | | | | 5,133 | |
| Laboratory Corporation of America Holdings 4.70% 2045 | | | 1,310 | | | | 1,598 | |
| Medtronic, Inc. 3.50% 2025 | | | 626 | | | | 667 | |
| Merck & Co., Inc. 2.75% 2025 | | | 36,590 | | | | 38,344 | |
| Merck & Co., Inc. 1.70% 2027 | | | 18,478 | | | | 18,600 | |
| Merck & Co., Inc. 1.45% 2030 | | | 15,050 | | | | 14,426 | |
| Merck & Co., Inc. 2.15% 2031 | | | 34,914 | | | | 35,040 | |
| Merck & Co., Inc. 2.75% 2051 | | | 4,827 | | | | 4,785 | |
| Merck & Co., Inc. 2.90% 2061 | | | 7,590 | | | | 7,567 | |
| Molina Healthcare, Inc. 4.375% 20284 | | | 2,125 | | | | 2,192 | |
| Molina Healthcare, Inc. 3.875% 20304 | | | 2,665 | | | | 2,769 | |
| Novartis Capital Corp. 1.75% 2025 | | | 9,604 | | | | 9,745 | |
| Novartis Capital Corp. 2.00% 2027 | | | 11,893 | | | | 12,091 | |
| Novartis Capital Corp. 2.20% 2030 | | | 26,714 | | | | 27,139 | |
| Pfizer, Inc. 2.80% 2022 | | | 3,707 | | | | 3,724 | |
| Pfizer, Inc. 3.20% 2023 | | | 32,648 | | | | 33,931 | |
| Pfizer, Inc. 2.95% 2024 | | | 7,674 | | | | 7,994 | |
| Pfizer, Inc. 2.75% 2026 | | | 21,057 | | | | 22,323 | |
| Pfizer, Inc. 1.70% 2030 | | | 20,880 | | | | 20,475 | |
| Roche Holdings, Inc. 1.93% 20284 | | | 46,849 | | | | 47,167 | |
| Roche Holdings, Inc. 2.076% 20314 | | | 88,026 | | | | 87,841 | |
| Roche Holdings, Inc. 2.607% 20514 | | | 21,077 | | | | 20,738 | |
| Rotech Healthcare, Inc., Term Loan, (3-month USD-LIBOR + 11.00%) 13.00% PIK 20236,8,9,10,11 | | | 5,302 | | | | 5,302 | |
| Shire PLC 2.875% 2023 | | | 8,790 | | | | 9,044 | |
| Shire PLC 3.20% 2026 | | | 27,089 | | | | 28,765 | |
| Summa Health 3.511% 2051 | | | 1,655 | | | | 1,750 | |
| Syneos Health, Inc. 3.625% 20294 | | | 2,315 | | | | 2,289 | |
| Takeda Pharmaceutical Company, Ltd. 4.40% 2023 | | | 31,550 | | | | 33,395 | |
| Takeda Pharmaceutical Company, Ltd. 5.00% 2028 | | | 7,500 | | | | 8,818 | |
| Tenet Healthcare Corp. 4.625% 2024 | | | 4,240 | | | | 4,298 | |
| Tenet Healthcare Corp. 4.875% 20264 | | | 5,535 | | | | 5,694 | |
| Tenet Healthcare Corp. 5.125% 20274 | | | 4,565 | | | | 4,760 | |
| Teva Pharmaceutical Finance Co. BV 2.95% 2022 | | | 3,832 | | | | 3,843 | |
| Teva Pharmaceutical Finance Co. BV 6.00% 2024 | | | 85,316 | | | | 89,503 | |
| Teva Pharmaceutical Finance Co. BV 7.125% 2025 | | | 66,000 | | | | 70,697 | |
| Teva Pharmaceutical Finance Co. BV 3.15% 2026 | | | 136,785 | | | | 128,793 | |
| Teva Pharmaceutical Finance Co. BV 4.75% 2027 | | | 35,500 | | | | 35,220 | |
| Teva Pharmaceutical Finance Co. BV 6.75% 2028 | | | 108,089 | | | | 115,279 | |
| Teva Pharmaceutical Finance Co. BV 4.10% 2046 | | | 116,226 | | | | 98,393 | |
| Teva Pharmaceutical Finance Co., LLC 6.15% 2036 | | | 11,690 | | | | 12,271 | |
| Thermo Fisher Scientific, Inc. 1.75% 2028 | | | 2,252 | | | | 2,239 | |
| Thermo Fisher Scientific, Inc. 2.00% 2031 | | | 14,213 | | | | 14,017 | |
| Thermo Fisher Scientific, Inc. 2.80% 2041 | | | 3,895 | | | | 3,948 | |
| UnitedHealth Group, Inc. 3.35% 2022 | | | 200 | | | | 203 | |
| UnitedHealth Group, Inc. 2.375% 2024 | | | 7,903 | | | | 8,188 | |
| UnitedHealth Group, Inc. 3.50% 2024 | | | 6,860 | | | | 7,233 | |
| UnitedHealth Group, Inc. 3.70% 2025 | | | 15,430 | | | | 16,793 | |
| UnitedHealth Group, Inc. 3.75% 2025 | | | 5,900 | | | | 6,403 | |
| UnitedHealth Group, Inc. 2.875% 2029 | | | 7,309 | | | | 7,739 | |
| UnitedHealth Group, Inc. 2.00% 2030 | | | 10,000 | | | | 9,938 | |
| UnitedHealth Group, Inc. 2.30% 2031 | | | 9,989 | | | | 10,174 | |
| UnitedHealth Group, Inc. 3.05% 2041 | | | 8,000 | | | | 8,385 | |
| UnitedHealth Group, Inc. 4.45% 2048 | | | 2,015 | | | | 2,578 | |
| UnitedHealth Group, Inc. 3.70% 2049 | | | 6,795 | | | | 7,839 | |
| The Bond Fund of America | 25 |
| Bonds, notes & other debt instruments (continued) | | Principal amount
(000) | | | Value
(000) | |
| Corporate bonds, notes & loans (continued) | | | | | | |
| Health care (continued) | | | | | | |
| UnitedHealth Group, Inc. 2.90% 2050 | | $ | 10,000 | | | $ | 10,214 | |
| UnitedHealth Group, Inc. 3.25% 2051 | | | 11,679 | | | | 12,660 | |
| Valeant Pharmaceuticals International, Inc. 5.50% 20254 | | | 10,000 | | | | 10,175 | |
| WellPoint, Inc. 3.50% 2024 | | | 9,349 | | | | 9,878 | |
| Zimmer Holdings, Inc. 3.15% 2022 | | | 14,296 | | | | 14,325 | |
| | | | | | | | 2,462,280 | |
| Industrials 2.71% | | | | | | | | |
| ADT Security Corp. 4.125% 20294 | | | 3,000 | | | | 2,960 | |
| AerCap Ireland Capital, Ltd. / AerCap Global Aviation Trust 1.75% 2026 | | | 7,812 | | | | 7,670 | |
| Aeropuerto International de Tocume SA 4.00% 20414 | | | 4,100 | | | | 4,185 | |
| Aeropuerto International de Tocume SA 5.125% 20614 | | | 3,180 | | | | 3,340 | |
| Air Lease Corp. 0.80% 2024 | | | 17,900 | | | | 17,544 | |
| Air Lease Corp. 2.875% 2026 | | | 28,382 | | | | 29,302 | |
| Air Lease Corp. 2.10% 2028 | | | 13,775 | | | | 13,297 | |
| American Airlines, Inc. 5.50% 20264 | | | 11,235 | | | | 11,700 | |
| Autoridad del Canal de Panama 4.95% 20354 | | | 5,500 | | | | 6,708 | |
| Autoridad del Canal de Panama 4.95% 2035 | | | 1,025 | | | | 1,250 | |
| Avolon Holdings Funding, Ltd. 3.625% 20224 | | | 27,802 | | | | 27,983 | |
| Avolon Holdings Funding, Ltd. 3.95% 20244 | | | 35,726 | | | | 37,456 | |
| Avolon Holdings Funding, Ltd. 2.125% 20264 | | | 35,436 | | | | 34,813 | |
| Avolon Holdings Funding, Ltd. 4.25% 20264 | | | 9,306 | | | | 9,871 | |
| Avolon Holdings Funding, Ltd. 4.375% 20264 | | | 3,500 | | | | 3,754 | |
| Avolon Holdings Funding, Ltd. 2.528% 20274 | | | 2,795 | | | | 2,717 | |
| Avolon Holdings Funding, Ltd. 3.25% 20274 | | | 16,000 | | | | 16,123 | |
| Avolon Holdings Funding, Ltd. 2.75% 20284 | | | 20,000 | | | | 19,638 | |
| Boeing Company 4.508% 2023 | | | 35,219 | | | | 36,796 | |
| Boeing Company 1.95% 2024 | | | 10,227 | | | | 10,348 | |
| Boeing Company 2.80% 2024 | | | 4,441 | | | | 4,565 | |
| Boeing Company 4.875% 2025 | | | 121,293 | | | | 132,806 | |
| Boeing Company 2.196% 2026 | | | 80,259 | | | | 80,305 | |
| Boeing Company 2.75% 2026 | | | 112,914 | | | | 116,254 | |
| Boeing Company 3.10% 2026 | | | 18,239 | | | | 19,024 | |
| Boeing Company 2.70% 2027 | | | 4,854 | | | | 4,939 | |
| Boeing Company 5.04% 2027 | | | 76,507 | | | | 86,207 | |
| Boeing Company 3.25% 2028 | | | 104,518 | | | | 108,997 | |
| Boeing Company 3.25% 2028 | | | 10,176 | | | | 10,550 | |
| Boeing Company 5.15% 2030 | | | 145,603 | | | | 169,781 | |
| Boeing Company 3.625% 2031 | | | 21,057 | | | | 22,481 | |
| Boeing Company 3.60% 2034 | | | 6,790 | | | | 7,125 | |
| Boeing Company 3.50% 2039 | | | 545 | | | | 555 | |
| Boeing Company 3.90% 2049 | | | 8,665 | | | | 9,109 | |
| Boeing Company 3.75% 2050 | | | 4,934 | | | | 5,142 | |
| Boeing Company 5.805% 2050 | | | 50,520 | | | | 68,541 | |
| Boeing Company 5.93% 2060 | | | 2,000 | | | | 2,783 | |
| Burlington Northern Santa Fe LLC 3.05% 2051 | | | 15,695 | | | | 16,286 | |
| Burlington Northern Santa Fe LLC 3.30% 2051 | | | 45,421 | | | | 49,435 | |
| Burlington Northern Santa Fe LLC 2.875% 2052 | | | 6,125 | | | | 6,142 | |
| BWX Technologies, Inc. 4.125% 20284 | | | 1,675 | | | | 1,703 | |
| Canadian National Railway Company 3.20% 2046 | | | 1,220 | | | | 1,279 | |
| Canadian Pacific Railway, Ltd. 1.75% 2026 | | | 12,290 | �� | | | 12,341 | |
| Canadian Pacific Railway, Ltd. 2.45% 2031 | | | 38,598 | | | | 39,397 | |
| Canadian Pacific Railway, Ltd. 3.00% 2041 | | | 7,587 | | | | 7,773 | |
| Canadian Pacific Railway, Ltd. 3.10% 2051 | | | 30,755 | | | | 31,687 | |
| Carrier Global Corp. 2.242% 2025 | | | 11,566 | | | | 11,852 | |
| Carrier Global Corp. 2.493% 2027 | | | 6,000 | | | | 6,168 | |
| Carrier Global Corp. 2.722% 2030 | | | 15,767 | | | | 16,119 | |
| Carrier Global Corp. 3.377% 2040 | | | 17,500 | | | | 18,322 | |
| Carrier Global Corp. 3.577% 2050 | | | 3,000 | | | | 3,198 | |
| Clean Harbors, Inc. 4.875% 20274 | | | 1,100 | | | | 1,134 | |
| Clean Harbors, Inc. 5.125% 20294 | | | 10,000 | | | | 10,625 | |
| CSX Corp. 3.80% 2028 | | | 2,460 | | | | 2,706 | |
| CSX Corp. 4.25% 2029 | | | 4,277 | | | | 4,813 | |
| CSX Corp. 2.40% 2030 | | | 17,855 | | | | 18,160 | |
| CSX Corp. 2.50% 2051 | | | 10,725 | | | | 9,940 | |
| Delta Air Lines, Inc. 7.00% 20254 | | | 2,750 | | | | 3,147 | |
| 26 | The Bond Fund of America |
| Bonds, notes & other debt instruments (continued) | | Principal amount
(000) | | | Value
(000) | |
| Corporate bonds, notes & loans (continued) | | | | | | |
| Industrials (continued) | | | | | | |
| Dianjian Haiyu, Ltd. 3.50% perpetual bonds (5-year UST Yield Curve Rate T Note Constant Maturity + 6.773% on 6/14/2022)5 | | $ | 4,148 | | | $ | 4,190 | |
| Dianjian International Finance, Ltd. 4.60% perpetual bonds (5-year UST Yield Curve Rate T Note Constant Maturity + 6.933% on 3/13/2023)5 | | | 14,000 | | | | 14,429 | |
| Dun & Bradstreet Corp. 6.875% 20264 | | | 6,055 | | | | 6,304 | |
| Dun & Bradstreet Corp. 5.00% 20294 | | | 16,863 | | | | 17,280 | |
| ENA Master Trust 4.00% 20484 | | | 8,154 | | | | 8,204 | |
| General Dynamics Corp. 3.375% 2023 | | | 6,645 | | | | 6,868 | |
| General Dynamics Corp. 3.50% 2025 | | | 8,025 | | | | 8,562 | |
| General Dynamics Corp. 1.15% 2026 | | | 7,280 | | | | 7,220 | |
| General Dynamics Corp. 3.625% 2030 | | | 10,250 | | | | 11,397 | |
| General Dynamics Corp. 2.25% 2031 | | | 2,377 | | | | 2,420 | |
| General Electric Capital Corp. 4.418% 2035 | | | 13,944 | | | | 16,663 | |
| Herc Holdings, Inc. 5.50% 20274 | | | 1,600 | | | | 1,666 | |
| Honeywell International, Inc. 2.30% 2024 | | | 3,387 | | | | 3,502 | |
| Honeywell International, Inc. 1.35% 2025 | | | 165 | | | | 166 | |
| Honeywell International, Inc. 2.70% 2029 | | | 8,333 | | | | 8,733 | |
| Honeywell International, Inc. 1.95% 2030 | | | 22,750 | | | | 22,644 | |
| Honeywell International, Inc. 2.80% 2050 | | | 400 | | | | 417 | |
| Icahn Enterprises Finance Corp. 4.75% 2024 | | | 2,500 | | | | 2,597 | |
| Icahn Enterprises Finance Corp. 6.25% 2026 | | | 5,200 | | | | 5,423 | |
| L3Harris Technologies, Inc. 1.80% 2031 | | | 3,725 | | | | 3,560 | |
| Lima Metro Line 2 Finance, Ltd. 5.875% 20344 | | | 2,585 | | | | 2,975 | |
| Lima Metro Line 2 Finance, Ltd. 5.875% 2034 | | | 550 | | | | 633 | |
| Lima Metro Line 2 Finance, Ltd. 4.35% 2036 | | | 2,362 | | | | 2,495 | |
| Lima Metro Line 2 Finance, Ltd. 4.35% 20364 | | | 922 | | | | 974 | |
| Lockheed Martin Corp. 1.85% 2030 | | | 8,250 | | | | 8,115 | |
| Lockheed Martin Corp. 3.60% 2035 | | | 3,758 | | | | 4,207 | |
| Lockheed Martin Corp. 4.50% 2036 | | | 3,131 | | | | 3,832 | |
| Lockheed Martin Corp. 4.07% 2042 | | | 1,850 | | | | 2,182 | |
| Lockheed Martin Corp. 2.80% 2050 | | | 11,483 | | | | 11,478 | |
| Lockheed Martin Corp. 4.09% 2052 | | | 2,324 | | | | 2,877 | |
| Masco Corp. 1.50% 2028 | | | 10,810 | | | | 10,471 | |
| Masco Corp. 2.00% 2031 | | | 14,724 | | | | 14,126 | |
| Masco Corp. 3.125% 2051 | | | 2,112 | | | | 2,104 | |
| Mexico City Airport Trust 4.25% 2026 | | | 200 | | | | 212 | |
| Mexico City Airport Trust 3.875% 2028 | | | 11,400 | | | | 11,829 | |
| Mexico City Airport Trust 3.875% 20284 | | | 690 | | | | 716 | |
| Mexico City Airport Trust 5.50% 2046 | | | 4,093 | | | | 4,093 | |
| Mexico City Airport Trust 5.50% 2047 | | | 15,685 | | | | 15,732 | |
| Mexico City Airport Trust 5.50% 20474 | | | 4,796 | | | | 4,810 | |
| Nielsen Finance LLC and Nielsen Finance Co. 5.625% 20284 | | | 2,300 | | | | 2,379 | |
| Nielsen Finance LLC and Nielsen Finance Co. 5.875% 20304 | | | 4,650 | | | | 4,916 | |
| Norfolk Southern Corp. 3.05% 2050 | | | 1,558 | | | | 1,592 | |
| Northrop Grumman Corp. 2.93% 2025 | | | 25,040 | | | | 26,102 | |
| Northrop Grumman Corp. 3.25% 2028 | | | 8,475 | | | | 9,078 | |
| Northrop Grumman Corp. 5.25% 2050 | | | 1,922 | | | | 2,699 | |
| Otis Worldwide Corp. 2.056% 2025 | | | 28,882 | | | | 29,384 | |
| Otis Worldwide Corp. 2.293% 2027 | | | 5,750 | | | | 5,864 | |
| Otis Worldwide Corp. 2.565% 2030 | | | 4,900 | | | | 4,975 | |
| Otis Worldwide Corp. 3.362% 2050 | | | 1,500 | | | | 1,585 | |
| Pitney Bowes, Inc. 6.875% 20274 | | | 6,000 | | | | 6,237 | |
| Prime Security Services Borrower, LLC 5.25% 20244 | | | 2,500 | | | | 2,663 | |
| Prime Security Services Borrower, LLC 5.75% 20264 | | | 2,000 | | | | 2,150 | |
| Prime Security Services Borrower, LLC 3.375% 20274 | | | 3,100 | | | | 2,997 | |
| Raytheon Technologies Corp. 3.20% 2024 | | | 10,105 | | | | 10,521 | |
| Raytheon Technologies Corp. 2.25% 2030 | | | 3,750 | | | | 3,744 | |
| Raytheon Technologies Corp. 1.90% 2031 | | | 18,596 | | | | 17,963 | |
| Raytheon Technologies Corp. 2.375% 2032 | | | 10,474 | | | | 10,474 | |
| Raytheon Technologies Corp. 2.82% 2051 | | | 3,750 | | | | 3,630 | |
| Raytheon Technologies Corp. 3.03% 2052 | | | 7,000 | | | | 7,049 | |
| Republic Services, Inc. 2.50% 2024 | | | 7,000 | | | | 7,208 | |
| Republic Services, Inc. 2.375% 2033 | | | 9,620 | | | | 9,587 | |
| Rolls-Royce PLC 5.75% 20274 | | | 1,935 | | | | 2,142 | |
| Roper Technologies, Inc. 1.00% 2025 | | | 2,000 | | | | 1,956 | |
| Roper Technologies, Inc. 1.40% 2027 | | | 4,250 | | | | 4,127 | |
| Roper Technologies, Inc. 1.75% 2031 | | | 5,000 | | | | 4,701 | |
| The Bond Fund of America | 27 |
| Bonds, notes & other debt instruments (continued) | | Principal amount
(000) | | | Value
(000) | |
| Corporate bonds, notes & loans (continued) | | | | | | |
| Industrials (continued) | | | | | | |
| Rutas 2 and 7 Finance, Ltd. 0% 20364 | | $ | 1,795 | | | $ | 1,326 | |
| Siemens AG 2.70% 20224 | | | 28,620 | | | | 28,759 | |
| Siemens AG 2.90% 20224 | | | 10,000 | | | | 10,098 | |
| Siemens AG 1.20% 20264 | | | 24,978 | | | | 24,593 | |
| Stericycle, Inc. 5.375% 20244 | | | 5,000 | | | | 5,105 | |
| Summit Digitel Infrastructure Private, Ltd. 2.875% 20314 | | | 14,355 | | | | 13,848 | |
| TransDigm, Inc. 6.25% 20264 | | | 656 | | | | 683 | |
| Triton Container International, Ltd. 1.15% 20244 | | | 9,938 | | | | 9,802 | |
| Triton Container International, Ltd. 3.15% 20314 | | | 15,346 | | | | 15,493 | |
| Union Pacific Corp. 3.15% 2024 | | | 5,705 | | | | 5,949 | |
| Union Pacific Corp. 3.75% 2025 | | | 2,000 | | | | 2,162 | |
| Union Pacific Corp. 2.15% 2027 | | | 4,740 | | | | 4,871 | |
| Union Pacific Corp. 2.40% 2030 | | | 9,549 | | | | 9,742 | |
| Union Pacific Corp. 2.375% 2031 | | | 36,045 | | | | 36,780 | |
| Union Pacific Corp. 2.891% 2036 | | | 15,705 | | | | 16,483 | |
| Union Pacific Corp. 4.30% 2049 | | | 4,550 | | | | 5,675 | |
| Union Pacific Corp. 3.25% 2050 | | | 18,198 | | | | 19,559 | |
| Union Pacific Corp. 2.95% 2052 | | | 7,956 | | | | 8,071 | |
| Union Pacific Corp. 3.95% 2059 | | | 11,880 | | | | 14,107 | |
| United Airlines Holdings, Inc. 6.50% 20274 | | | 10,440 | | | | 11,160 | |
| United Technologies Corp. 3.65% 2023 | | | 437 | | | | 455 | |
| United Technologies Corp. 3.95% 2025 | | | 17,415 | | | | 18,899 | |
| United Technologies Corp. 3.125% 2027 | | | 1,000 | | | | 1,063 | |
| United Technologies Corp. 4.125% 2028 | | | 6,320 | | | | 7,076 | |
| United Technologies Corp. 4.50% 2042 | | | 1,625 | | | | 2,013 | |
| Vinci SA 3.75% 20294 | | | 10,456 | | | | 11,434 | |
| WESCO Distribution, Inc. 7.125% 20254 | | | 2,165 | | | | 2,298 | |
| WESCO Distribution, Inc. 7.25% 20284 | | | 4,355 | | | | 4,782 | |
| XPO Logistics, Inc. 6.25% 20254 | | | 5,000 | | | | 5,238 | |
| | | | | | | | 2,158,199 | |
| Communication services 2.50% | | | | | | | | |
| Alphabet, Inc. 1.10% 2030 | | | 9,030 | | | | 8,546 | |
| América Móvil, SAB de CV, 8.46% 2036 | | MXN | 27,000 | | | | 1,270 | |
| AT&T, Inc. 0.90% 2024 | | $ | 27,345 | | | | 27,235 | |
| AT&T, Inc. 1.70% 2026 | | | 38,150 | | | | 37,990 | |
| AT&T, Inc. 2.30% 2027 | | | 14,975 | | | | 15,246 | |
| AT&T, Inc. 1.65% 2028 | | | 23,275 | | | | 22,802 | |
| AT&T, Inc. 4.30% 2030 | | | 30,000 | | | | 33,799 | |
| AT&T, Inc. 2.75% 2031 | | | 83,090 | | | | 84,863 | |
| AT&T, Inc. 2.25% 2032 | | | 50,814 | | | | 49,156 | |
| AT&T, Inc. 2.55% 2033 | | | 73,196 | | | | 71,674 | |
| AT&T, Inc. 3.30% 2052 | | | 28,162 | | | | 27,658 | |
| AT&T, Inc. 3.50% 2053 | | | 94,523 | | | | 95,542 | |
| AT&T, Inc. 3.55% 2055 | | | 8,300 | | | | 8,344 | |
| Axiata SPV2 Bhd. 2.163% 2030 | | | 4,883 | | | | 4,838 | |
| Cablevision Systems Corp. 5.375% 20284 | | | 4,850 | | | | 5,029 | |
| CCO Holdings LLC and CCO Holdings Capital Corp. 5.50% 20264 | | | 1,907 | | | | 1,967 | |
| CCO Holdings LLC and CCO Holdings Capital Corp. 5.00% 20284 | | | 12,250 | | | | 12,765 | |
| CCO Holdings LLC and CCO Holdings Capital Corp. 2.25% 2029 | | | 17,000 | | | | 16,601 | |
| CCO Holdings LLC and CCO Holdings Capital Corp. 5.375% 20294 | | | 10,700 | | | | 11,565 | |
| CCO Holdings LLC and CCO Holdings Capital Corp. 4.50% 20304 | | | 18,675 | | | | 19,146 | |
| CCO Holdings LLC and CCO Holdings Capital Corp. 4.75% 20304 | | | 9,665 | | | | 10,069 | |
| CCO Holdings LLC and CCO Holdings Capital Corp. 2.80% 2031 | | | 26,986 | | | | 26,736 | |
| CCO Holdings LLC and CCO Holdings Capital Corp. 2.30% 2032 | | | 25,960 | | | | 24,676 | |
| CCO Holdings LLC and CCO Holdings Capital Corp. 4.50% 2032 | | | 2,225 | | | | 2,293 | |
| CCO Holdings LLC and CCO Holdings Capital Corp. 4.50% 20334 | | | 530 | | | | 542 | |
| CCO Holdings LLC and CCO Holdings Capital Corp. 4.25% 20344 | | | 21,825 | | | | 21,512 | |
| CCO Holdings LLC and CCO Holdings Capital Corp. 6.484% 2045 | | | 6,850 | | | | 9,375 | |
| CCO Holdings LLC and CCO Holdings Capital Corp. 5.125% 2049 | | | 18,943 | | | | 22,026 | |
| CCO Holdings LLC and CCO Holdings Capital Corp. 4.80% 2050 | | | 5,000 | | | | 5,612 | |
| CCO Holdings LLC and CCO Holdings Capital Corp. 3.70% 2051 | | | 8,400 | | | | 8,143 | |
| CenturyLink, Inc. 4.00% 20274 | | | 95,075 | | | | 96,577 | |
| Comcast Corp. 3.95% 2025 | | | 5,250 | | | | 5,736 | |
| Comcast Corp. 2.65% 2030 | | | 60,290 | | | | 62,590 | |
| Comcast Corp. 1.95% 2031 | | | 14,746 | | | | 14,465 | |
| Comcast Corp. 3.25% 2039 | | | 2,120 | | | | 2,241 | |
| 28 | The Bond Fund of America |
| Bonds, notes & other debt instruments (continued) | | Principal amount
(000) | | | Value
(000) | |
| Corporate bonds, notes & loans (continued) | | | | | | |
| Communication services (continued) | | | | | | |
| Comcast Corp. 3.75% 2040 | | $ | 8,930 | | | $ | 10,016 | |
| Comcast Corp. 2.80% 2051 | | | 22,600 | | | | 21,834 | |
| Comcast Corp. 2.45% 2052 | | | 5,000 | | | | 4,490 | |
| Diamond Sports Group LLC 5.375% 20264 | | | 3,500 | | | | 1,754 | |
| Grupo Televisa, SAB 7.25% 2043 | | MXN | 25,290 | | | | 891 | |
| iHeartCommunications, Inc. 6.375% 2026 | | $ | 8,475 | | | | 8,802 | |
| Level 3 Communications, Inc. 5.25% 2026 | | | 5,015 | | | | 5,133 | |
| Level 3 Communications, Inc. 3.875% 20294 | | | 6,900 | | | | 7,031 | |
| Level 3 Financing, Inc. 3.75% 20294 | | | 3,053 | | | | 2,905 | |
| Netflix, Inc. 4.875% 2028 | | | 35,663 | | | | 40,717 | |
| Netflix, Inc. 5.875% 2028 | | | 62,879 | | | | 75,718 | |
| Netflix, Inc. 5.375% 20294 | | | 52,289 | | | | 62,183 | |
| Netflix, Inc. 4.875% 20304 | | | 39,200 | | | | 45,785 | |
| Quebecor Media, Inc. 5.75% 2023 | | | 3,600 | | | | 3,748 | |
| SBA Tower Trust 1.631% 20264 | | | 61,789 | | | | 60,864 | |
| Scripps Escrow II, Inc. 3.875% 20294 | | | 1,307 | | | | 1,307 | |
| Sinclair Television Group, Inc. 4.125% 20304 | | | 3,625 | | | | 3,440 | |
| Sirius XM Radio, Inc. 4.00% 20284 | | | 4,300 | | | | 4,331 | |
| Sprint Corp. 7.875% 2023 | | | 6,163 | | | | 6,796 | |
| Sprint Corp. 7.125% 2024 | | | 10,010 | | | | 11,250 | |
| Sprint Corp. 7.625% 2025 | | | 39,000 | | | | 44,899 | |
| TEGNA, Inc. 5.00% 2029 | | | 8,500 | | | | 8,707 | |
| Tencent Holdings, Ltd. 3.28% 20244 | | | 15,000 | | | | 15,663 | |
| Tencent Holdings, Ltd. 3.595% 2028 | | | 7,500 | | | | 7,967 | |
| Tencent Holdings, Ltd. 2.39% 20304 | | | 30,000 | | | | 29,424 | |
| Tencent Holdings, Ltd. 3.24% 20504 | | | 14,870 | | | | 14,059 | |
| Tencent Holdings, Ltd. 3.29% 20604 | | | 10,000 | | | | 9,272 | |
| Tencent Music Entertainment Group 2.00% 2030 | | | 2,575 | | | | 2,412 | |
| T-Mobile US, Inc. 3.50% 2025 | | | 6,550 | | | | 6,944 | |
| T-Mobile US, Inc. 1.50% 2026 | | | 4,900 | | | | 4,845 | |
| T-Mobile US, Inc. 2.25% 20264 | | | 11,036 | | | | 11,080 | |
| T-Mobile US, Inc. 2.25% 2026 | | | 2,402 | | | | 2,412 | |
| T-Mobile US, Inc. 2.625% 2026 | | | 46,064 | | | | 46,354 | |
| T-Mobile US, Inc. 3.75% 2027 | | | 20,800 | | | | 22,535 | |
| T-Mobile US, Inc. 2.05% 2028 | | | 2,500 | | | | 2,483 | |
| T-Mobile US, Inc. 4.75% 2028 | | | 9,066 | | | | 9,558 | |
| T-Mobile US, Inc. 2.40% 20294 | | | 6,204 | | | | 6,269 | |
| T-Mobile US, Inc. 2.625% 2029 | | | 17,611 | | | | 17,377 | |
| T-Mobile US, Inc. 3.375% 20294 | | | 8,000 | | | | 8,165 | |
| T-Mobile US, Inc. 3.875% 2030 | | | 18,318 | | | | 20,053 | |
| T-Mobile US, Inc. 2.55% 2031 | | | 16,052 | | | | 15,984 | |
| T-Mobile US, Inc. 2.875% 2031 | | | 22,912 | | | | 22,668 | |
| T-Mobile US, Inc. 3.50% 2031 | | | 25,000 | | | | 26,053 | |
| T-Mobile US, Inc. 3.50% 20314 | | | 816 | | | | 850 | |
| T-Mobile US, Inc. 2.70% 20324 | | | 21,108 | | | | 21,262 | |
| T-Mobile US, Inc. 3.00% 2041 | | | 7,490 | | | | 7,326 | |
| T-Mobile US, Inc. 3.30% 2051 | | | 10,603 | | | | 10,380 | |
| T-Mobile US, Inc. 3.40% 20524 | | | 36,991 | | | | 36,889 | |
| Verizon Communications, Inc. 2.10% 2028 | | | 4,800 | | | | 4,813 | |
| Verizon Communications, Inc. 4.329% 2028 | | | 13,420 | | | | 15,258 | |
| Verizon Communications, Inc. 3.875% 2029 | | | 2,071 | | | | 2,297 | |
| Verizon Communications, Inc. 4.016% 2029 | | | 5,000 | | | | 5,611 | |
| Verizon Communications, Inc. 1.68% 2030 | | | 38,817 | | | | 36,920 | |
| Verizon Communications, Inc. 1.75% 2031 | | | 38,919 | | | | 36,882 | |
| Verizon Communications, Inc. 2.55% 2031 | | | 10,477 | | | | 10,581 | |
| Verizon Communications, Inc. 2.355% 20324 | | | 20,027 | | | | 19,756 | |
| Verizon Communications, Inc. 2.65% 2040 | | | 13,091 | | | | 12,462 | |
| Verizon Communications, Inc. 2.85% 2041 | | | 20,079 | | | | 19,848 | |
| Verizon Communications, Inc. 3.40% 2041 | | | 36,154 | | | | 37,919 | |
| Verizon Communications, Inc. 3.85% 2042 | | | 855 | | | | 957 | |
| Verizon Communications, Inc. 2.875% 2050 | | | 48,052 | | | | 45,731 | |
| Verizon Communications, Inc. 3.55% 2051 | | | 5,993 | | | | 6,469 | |
| Videotron, Ltd. 5.375% 20244 | | | 3,100 | | | | 3,320 | |
| Virgin Media O2 4.25% 20314 | | | 5,475 | | | | 5,374 | |
| Virgin Media Secured Finance PLC 5.50% 20294 | | | 5,000 | | | | 5,288 | |
| Virgin Media Secured Finance PLC 4.50% 20304 | | | 500 | | | | 504 | |
| Vodafone Group PLC 5.25% 2048 | | | 6,992 | | | | 9,129 | |
| The Bond Fund of America | 29 |
| Bonds, notes & other debt instruments (continued) | | Principal amount
(000) | | | Value
(000) | |
| Corporate bonds, notes & loans (continued) | | | | | | |
| Communication services (continued) | | | | | | |
| Vodafone Group PLC 4.25% 2050 | | $ | 17,875 | | | $ | 20,686 | |
| Ziggo Bond Finance BV 5.50% 20274 | | | 5,450 | | | | 5,606 | |
| Ziggo Bond Finance BV 4.875% 20304 | | | 500 | | | | 514 | |
| | | | | | | | 1,985,439 | |
| Consumer staples 1.82% | | | | | | | | |
| 7-Eleven, Inc. 0.95% 20264 | | | 14,861 | | | | 14,403 | |
| 7-Eleven, Inc. 1.30% 20284 | | | 18,485 | | | | 17,619 | |
| 7-Eleven, Inc. 1.80% 20314 | | | 99,105 | | | | 93,887 | |
| 7-Eleven, Inc. 2.80% 20514 | | | 8,505 | | | | 7,908 | |
| Albertsons Companies, Inc. 3.50% 20234 | | | 3,575 | | | | 3,641 | |
| Altria Group, Inc. 2.35% 2025 | | | 785 | | | | 804 | |
| Altria Group, Inc. 4.40% 2026 | | | 8,325 | | | | 9,178 | |
| Altria Group, Inc. 4.80% 2029 | | | 9,905 | | | | 11,182 | |
| Altria Group, Inc. 3.40% 2030 | | | 3,247 | | | | 3,363 | |
| Altria Group, Inc. 2.45% 2032 | | | 6,000 | | | | 5,703 | |
| Altria Group, Inc. 5.80% 2039 | | | 900 | | | | 1,083 | |
| Altria Group, Inc. 4.50% 2043 | | | 100 | | | | 104 | |
| Altria Group, Inc. 5.375% 2044 | | | 2,433 | | | | 2,814 | |
| Altria Group, Inc. 5.95% 2049 | | | 50,296 | | | | 62,899 | |
| Altria Group, Inc. 4.45% 2050 | | | 13,107 | | | | 13,553 | |
| Altria Group, Inc. 3.70% 2051 | | | 18,697 | | | | 17,462 | |
| Anheuser-Busch Co. / InBev Worldwide 4.90% 2046 | | | 33,000 | | | | 41,806 | |
| Anheuser-Busch InBev NV 4.00% 2028 | | | 2,000 | | | | 2,226 | |
| Anheuser-Busch InBev NV 4.75% 2029 | | | 36,001 | | | | 41,941 | |
| Anheuser-Busch InBev NV 3.50% 2030 | | | 2,455 | | | | 2,694 | |
| Anheuser-Busch InBev NV 4.90% 2031 | | | 3,000 | | | | 3,607 | |
| Anheuser-Busch InBev NV 5.45% 2039 | | | 10,000 | | | | 13,111 | |
| Anheuser-Busch InBev NV 4.60% 2048 | | | 9,275 | | | | 11,366 | |
| Anheuser-Busch InBev NV 5.55% 2049 | | | 4,979 | | | | 6,905 | |
| Anheuser-Busch InBev NV 4.50% 2050 | | | 15,238 | | | | 18,824 | |
| British American Tobacco International Finance PLC 3.95% 20254 | | | 20,022 | | | | 21,283 | |
| British American Tobacco International Finance PLC 1.668% 2026 | | | 17,162 | | | | 16,865 | |
| British American Tobacco PLC 3.222% 2024 | | | 51,000 | | | | 53,037 | |
| British American Tobacco PLC 3.215% 2026 | | | 8,750 | | | | 9,116 | |
| British American Tobacco PLC 3.557% 2027 | | | 57,335 | | | | 60,178 | |
| British American Tobacco PLC 4.70% 2027 | | | 911 | | | | 1,003 | |
| British American Tobacco PLC 2.259% 2028 | | | 32,106 | | | | 31,313 | |
| British American Tobacco PLC 4.906% 2030 | | | 17,868 | | | | 20,077 | |
| British American Tobacco PLC 2.726% 2031 | | | 23,635 | | | | 22,964 | |
| British American Tobacco PLC 4.39% 2037 | | | 50,000 | | | | 52,772 | |
| British American Tobacco PLC 4.54% 2047 | | | 44,120 | | | | 46,249 | |
| British American Tobacco PLC 4.758% 2049 | | | 49,691 | | | | 53,486 | |
| British American Tobacco PLC 3.984% 2050 | | | 15,837 | | | | 15,263 | |
| British American Tobacco PLC 5.282% 2050 | | | 9,163 | | | | 10,398 | |
| Central Garden & Pet Co. 4.125% 2030 | | | 1,325 | | | | 1,339 | |
| Coca-Cola Company 1.00% 2028 | | | 2,785 | | | | 2,679 | |
| Coca-Cola Company 1.375% 2031 | | | 3,424 | | | | 3,234 | |
| Coca-Cola Company 2.50% 2051 | | | 1,634 | | | | 1,573 | |
| Coca-Cola FEMSA, SAB de CV, 1.85% 2032 | | | 5,500 | | | | 5,191 | |
| Conagra Brands, Inc. 4.30% 2024 | | | 22,146 | | | | 23,578 | |
| Conagra Brands, Inc. 4.60% 2025 | | | 11,307 | | | | 12,442 | |
| Conagra Brands, Inc. 1.375% 2027 | | | 7,200 | | | | 6,882 | |
| Conagra Brands, Inc. 5.30% 2038 | | | 780 | | | | 987 | |
| Conagra Brands, Inc. 5.40% 2048 | | | 14,298 | | | | 19,303 | |
| Constellation Brands, Inc. 3.20% 2023 | | | 10,638 | | | | 10,869 | |
| Constellation Brands, Inc. 4.25% 2023 | | | 8,588 | | | | 8,952 | |
| Constellation Brands, Inc. 3.70% 2026 | | | 3,350 | | | | 3,621 | |
| Constellation Brands, Inc. 3.60% 2028 | | | 1,650 | | | | 1,783 | |
| Constellation Brands, Inc. 2.875% 2030 | | | 26,447 | | | | 27,172 | |
| Constellation Brands, Inc. 2.25% 2031 | | | 5,951 | | | | 5,823 | |
| Constellation Brands, Inc. 4.10% 2048 | | | 1,000 | | | | 1,137 | |
| Darling Ingredients, Inc. 5.25% 20274 | | | 6,000 | | | | 6,201 | |
| Imperial Tobacco Finance PLC 3.50% 20234 | | | 3,173 | | | | 3,233 | |
| InRetail Consumer 3.25% 20284 | | | 5,400 | | | | 5,354 | |
| JBS Luxembourg SARL 2.50% 20274 | | | 32,544 | | | | 32,219 | |
| JBS Luxembourg SARL 3.625% 20324 | | | 10,189 | | | | 10,245 | |
| 30 | The Bond Fund of America |
| Bonds, notes & other debt instruments (continued) | | Principal amount
(000) | | | Value
(000) | |
| Corporate bonds, notes & loans (continued) | | | | | | |
| Consumer staples (continued) | | | | | | | | |
| JBS Luxembourg SARL 3.625% 2032 | | $ | 212 | | | $ | 213 | |
| JBS USA Lux SA 5.50% 20304 | | | 2,375 | | | | 2,587 | |
| JBS USA Lux SA 3.00% 20324 | | | 18,250 | | | | 18,273 | |
| Keurig Dr Pepper, Inc. 4.057% 2023 | | | 15,660 | | | | 16,332 | |
| Keurig Dr Pepper, Inc. 4.417% 2025 | | | 10,993 | | | | 11,969 | |
| Keurig Dr Pepper, Inc. 4.597% 2028 | | | 17,199 | | | | 19,576 | |
| Keurig Dr Pepper, Inc. 3.20% 2030 | | | 13,597 | | | | 14,391 | |
| Keurig Dr Pepper, Inc. 4.985% 2038 | | | 10,000 | | | | 12,394 | |
| Keurig Dr Pepper, Inc. 5.085% 2048 | | | 14,925 | | | | 19,523 | |
| Kimberly-Clark Corp. 1.05% 2027 | | | 1,820 | | | | 1,764 | |
| Kimberly-Clark Corp. 3.10% 2030 | | | 921 | | | | 993 | |
| Kimberly-Clark Corp. 2.00% 2031 | | | 24,870 | | | | 24,770 | |
| Kimberly-Clark de México, SAB de CV, 2.431% 20314 | | | 2,510 | | | | 2,484 | |
| Kraft Heinz Company 3.00% 2026 | | | 2,599 | | | | 2,721 | |
| Kraft Heinz Company 4.375% 2046 | | | 14,000 | | | | 16,430 | |
| Kraft Heinz Company 4.875% 2049 | | | 3,570 | | | | 4,493 | |
| Molson Coors Brewing Co. 4.20% 2046 | | | 2,500 | | | | 2,778 | |
| Nestlé Holdings, Inc. 0.625% 20264 | | | 15,343 | | | | 14,885 | |
| Nestlé Holdings, Inc. 1.00% 20274 | | | 9,795 | | | | 9,405 | |
| Nestlé Holdings, Inc. 1.15% 20274 | | | 7,500 | | | | 7,322 | |
| Nestlé Holdings, Inc. 1.875% 20314 | | | 10,000 | | | | 9,835 | |
| Nestlé Holdings, Inc. 2.625% 20514 | | | 10,000 | | | | 9,923 | |
| PepsiCo, Inc. 1.625% 2030 | | | 6,401 | | | | 6,215 | |
| PepsiCo, Inc. 1.40% 2031 | | | 5,307 | | | | 5,067 | |
| PepsiCo, Inc. 1.95% 2031 | | | 40,560 | | | | 40,585 | |
| PepsiCo, Inc. 2.75% 2051 | | | 3,000 | | | | 3,083 | |
| Philip Morris International, Inc. 2.50% 2022 | | | 16,500 | | | | 16,738 | |
| Philip Morris International, Inc. 2.875% 2024 | | | 11,985 | | | | 12,467 | |
| Philip Morris International, Inc. 1.50% 2025 | | | 1,286 | | | | 1,288 | |
| Philip Morris International, Inc. 0.875% 2026 | | | 4,170 | | | | 4,023 | |
| Philip Morris International, Inc. 3.375% 2029 | | | 13,550 | | | | 14,614 | |
| Philip Morris International, Inc. 1.75% 2030 | | | 13,517 | | | | 12,875 | |
| Philip Morris International, Inc. 2.10% 2030 | | | 3,718 | | | | 3,642 | |
| Philip Morris International, Inc. 4.125% 2043 | | | 3,680 | | | | 4,078 | |
| Philip Morris International, Inc. 4.875% 2043 | | | 8,500 | | | | 10,368 | |
| Philip Morris International, Inc. 4.25% 2044 | | | 1,774 | | | | 2,030 | |
| Procter & Gamble Company 0.55% 2025 | | | 11,444 | | | | 11,175 | |
| Procter & Gamble Company 1.00% 2026 | | | 1,229 | | | | 1,216 | |
| Procter & Gamble Company 1.20% 2030 | | | 4,005 | | | | 3,792 | |
| Procter & Gamble Company 3.00% 2030 | | | 1,183 | | | | 1,287 | |
| PT Indofood CBP Sukses Makmur Tbk 3.398% 2031 | | | 17,570 | | | | 17,765 | |
| PT Indofood CBP Sukses Makmur Tbk 4.745% 2051 | | | 4,185 | | | | 4,311 | |
| Reckitt Benckiser Treasury Services PLC 2.75% 20244 | | | 4,305 | | | | 4,451 | |
| Reynolds American, Inc. 4.45% 2025 | | | 7,158 | | | | 7,737 | |
| Reynolds American, Inc. 4.75% 2042 | | | 2,500 | | | | 2,703 | |
| Reynolds American, Inc. 5.85% 2045 | | | 10,195 | | | | 12,414 | |
| Spectrum Brands, Inc. 5.75% 2025 | | | 2,750 | | | | 2,811 | |
| Wal-Mart Stores, Inc. 2.35% 2022 | | | 4,000 | | | | 4,067 | |
| | | | | | | | 1,449,767 | |
| | | | | | | | | |
| Information technology 1.42% | | | | | | | | |
| Adobe, Inc. 2.30% 2030 | | | 6,009 | | | | 6,148 | |
| Analog Devices, Inc. 1.70% 2028 | | | 11,225 | | | | 11,198 | |
| Analog Devices, Inc. 2.10% 2031 | | | 31,386 | | | | 31,486 | |
| Analog Devices, Inc. 2.80% 2041 | | | 2,973 | | | | 3,013 | |
| Analog Devices, Inc. 2.95% 2051 | | | 25,538 | | | | 26,294 | |
| Apple, Inc. 0.55% 2025 | | | 9,225 | | | | 8,981 | |
| Apple, Inc. 1.125% 2025 | | | 12,963 | | | | 12,932 | |
| Apple, Inc. 1.20% 2028 | | | 13,500 | | | | 13,120 | |
| Apple, Inc. 1.65% 2031 | | | 20,000 | | | | 19,547 | |
| Apple, Inc. 2.375% 2041 | | | 4,625 | | | | 4,497 | |
| Apple, Inc. 2.40% 2050 | | | 6,530 | | | | 6,149 | |
| Apple, Inc. 2.65% 2051 | | | 29,770 | | | | 29,346 | |
| Apple, Inc. 2.70% 2051 | | | 4,500 | | | | 4,460 | |
| Apple, Inc. 2.55% 2060 | | | 5,750 | | | | 5,419 | |
| Black Knight, Inc. 3.625% 20284 | | | 3,200 | | | | 3,201 | |
| Broadcom Corp. / Broadcom Cayman Finance, Ltd. 3.875% 2027 | | | 14,359 | | | | 15,578 | |
| The Bond Fund of America | 31 |
| Bonds, notes & other debt instruments (continued) | | Principal amount
(000) | | | Value
(000) | |
| Corporate bonds, notes & loans (continued) | | | | | | | | |
| Information technology (continued) | | | | | | | | |
| Broadcom, Inc. 4.75% 2029 | | $ | 10,375 | | | $ | 11,821 | |
| Broadcom, Inc. 4.15% 2030 | | | 36,500 | | | | 40,513 | |
| Broadcom, Inc. 5.00% 2030 | | | 650 | | | | 757 | |
| Broadcom, Inc. 3.419% 20334 | | | 6,938 | | | | 7,281 | |
| Broadcom, Inc. 3.469% 20344 | | | 111,198 | | | | 116,535 | |
| Broadcom, Inc. 3.137% 20354 | | | 4,909 | | | | 4,943 | |
| Broadcom, Inc. 3.187% 20364 | | | 57,589 | | | | 57,576 | |
| Broadcom, Inc. 3.50% 20414 | | | 11,842 | | | | 12,176 | |
| Broadcom, Inc. 3.75% 20514 | | | 7,205 | | | | 7,551 | |
| Broadcom, Ltd. 2.65% 2023 | | | 16,500 | | | | 16,798 | |
| CDW Corp. 4.125% 2025 | | | 5,275 | | | | 5,426 | |
| Fidelity National Information Services, Inc. 1.15% 2026 | | | 22,429 | | | | 21,868 | |
| Fidelity National Information Services, Inc. 2.25% 2031 | | | 13,937 | | | | 13,644 | |
| Fidelity National Information Services, Inc. 3.10% 2041 | | | 1,129 | | | | 1,142 | |
| Fiserv, Inc. 2.75% 2024 | | | 19,000 | | | | 19,663 | |
| Fiserv, Inc. 3.50% 2029 | | | 22,008 | | | | 23,692 | |
| Fiserv, Inc. 2.65% 2030 | | | 10,229 | | | | 10,391 | |
| Gartner, Inc. 4.50% 20284 | | | 1,850 | | | | 1,935 | |
| Global Payments, Inc. 2.90% 2030 | | | 18,806 | | | | 19,169 | |
| Global Payments, Inc. 2.90% 2031 | | | 12,750 | | | | 12,946 | |
| Imola Merger Corp. 4.75% 20294 | | | 2,500 | | | | 2,570 | |
| Mastercard, Inc. 1.90% 2031 | | | 10,297 | | | | 10,364 | |
| Mastercard, Inc. 2.00% 2031 | | | 11,959 | | | | 11,933 | |
| Mastercard, Inc. 2.95% 2051 | | | 8,056 | | | | 8,357 | |
| Microsoft Corp. 3.125% 2025 | | | 5,290 | | | | 5,648 | |
| Microsoft Corp. 2.525% 2050 | | | 14,910 | | | | 14,582 | |
| NCR Corp. 5.75% 20274 | | | 2,500 | | | | 2,615 | |
| NCR Corp. 6.125% 20294 | | | 1,730 | | | | 1,856 | |
| NCR Corp. 5.25% 20304 | | | 7,250 | | | | 7,460 | |
| Open Text Corp. 3.875% 20284 | | | 6,500 | | | | 6,635 | |
| Oracle Corp. 2.50% 2025 | | | 11,500 | | | | 11,777 | |
| Oracle Corp. 1.65% 2026 | | | 25,637 | | | | 25,460 | |
| Oracle Corp. 2.30% 2028 | | | 8,095 | | | | 8,074 | |
| Oracle Corp. 2.875% 2031 | | | 58,258 | | | | 58,675 | |
| Oracle Corp. 3.60% 2050 | | | 55,665 | | | | 54,609 | |
| Oracle Corp. 3.95% 2051 | | | 7,204 | | | | 7,491 | |
| PayPal Holdings, Inc. 2.40% 2024 | | | 43,150 | | | | 44,686 | |
| PayPal Holdings, Inc. 2.65% 2026 | | | 12,234 | | | | 12,850 | |
| PayPal Holdings, Inc. 2.85% 2029 | | | 12,955 | | | | 13,647 | |
| PayPal Holdings, Inc. 2.30% 2030 | | | 14,574 | | | | 14,818 | |
| PayPal Holdings, Inc. 3.25% 2050 | | | 5,009 | | | | 5,380 | |
| salesforce.com, inc. 1.95% 2031 | | | 13,025 | | | | 12,914 | |
| salesforce.com, inc. 2.70% 2041 | | | 4,875 | | | | 4,878 | |
| salesforce.com, inc. 2.90% 2051 | | | 46,700 | | | | 47,647 | |
| salesforce.com, inc. 3.05% 2061 | | | 7,460 | | | | 7,695 | |
| ServiceNow, Inc. 1.40% 2030 | | | 72,310 | | | | 67,390 | |
| SK hynix, Inc. 1.50% 20264 | | | 19,275 | | | | 18,875 | |
| SK hynix, Inc. 2.375% 20314 | | | 9,830 | | | | 9,472 | |
| Square, Inc. 3.50% 20314 | | | 5,025 | | | | 5,159 | |
| Unisys Corp. 6.875% 20274 | | | 1,700 | | | | 1,843 | |
| VeriSign, Inc. 2.70% 2031 | | | 9,426 | | | | 9,487 | |
| Xerox Corp. 5.50% 20284 | | | 6,000 | | | | 6,333 | |
| | | | | | | | 1,128,376 | |
| | | | | | | | | |
| Real estate 0.77% | | | | | | | | |
| Alexandria Real Estate Equities, Inc. 3.80% 2026 | | | 2,442 | | | | 2,645 | |
| Alexandria Real Estate Equities, Inc. 4.30% 2026 | | | 1,440 | | | | 1,579 | |
| Alexandria Real Estate Equities, Inc. 3.95% 2028 | | | 1,072 | | | | 1,185 | |
| Alexandria Real Estate Equities, Inc. 2.75% 2029 | | | 1,672 | | | | 1,726 | |
| Alexandria Real Estate Equities, Inc. 4.50% 2029 | | | 2,110 | | | | 2,430 | |
| Alexandria Real Estate Equities, Inc. 3.375% 2031 | | | 3,158 | | | | 3,404 | |
| Alexandria Real Estate Equities, Inc. 1.875% 2033 | | | 1,758 | | | | 1,654 | |
| American Campus Communities, Inc. 3.75% 2023 | | | 5,145 | | | | 5,286 | |
| American Campus Communities, Inc. 4.125% 2024 | | | 9,432 | | | | 10,081 | |
| American Campus Communities, Inc. 3.30% 2026 | | | 20,742 | | | | 21,876 | |
| American Campus Communities, Inc. 3.625% 2027 | | | 3,776 | | | | 4,037 | |
| American Campus Communities, Inc. 2.85% 2030 | | | 4,967 | | | | 5,073 | |
| 32 | The Bond Fund of America |
| Bonds, notes & other debt instruments (continued) | | Principal amount
(000) | | | Value
(000) | |
| Corporate bonds, notes & loans (continued) | | | | | | |
| Real estate (continued) | | | | | | |
| American Campus Communities, Inc. 3.875% 2031 | | $ | 1,414 | | | $ | 1,568 | |
| American Tower Corp. 1.45% 2026 | | | 3,752 | | | | 3,675 | |
| American Tower Corp. 1.60% 2026 | | | 6,213 | | | | 6,156 | |
| American Tower Corp. 2.30% 2031 | | | 7,754 | | | | 7,539 | |
| American Tower Corp. 2.70% 2031 | | | 19,986 | | | | 20,068 | |
| American Tower Corp. 2.95% 2051 | | | 570 | | | | 542 | |
| Corporacion Inmobiliaria Vesta, SAB de CV 3.625% 20314 | | | 2,490 | | | | 2,444 | |
| Corporate Office Properties LP 2.25% 2026 | | | 14,337 | | | | 14,520 | |
| Corporate Office Properties LP 2.00% 2029 | | | 6,408 | | | | 6,167 | |
| Corporate Office Properties LP 2.75% 2031 | | | 10,067 | | | | 10,020 | |
| Corporate Office Properties LP 2.90% 2033 | | | 3,302 | | | | 3,232 | |
| Crown Castle International Corp. 2.50% 2031 | | | 32,375 | | | | 32,171 | |
| Equinix, Inc. 2.625% 2024 | | | 40,151 | | | | 41,398 | |
| Equinix, Inc. 1.25% 2025 | | | 9,870 | | | | 9,702 | |
| Equinix, Inc. 1.45% 2026 | | | 5,950 | | | | 5,838 | |
| Equinix, Inc. 2.90% 2026 | | | 17,754 | | | | 18,405 | |
| Equinix, Inc. 1.80% 2027 | | | 2,871 | | | | 2,827 | |
| Equinix, Inc. 1.55% 2028 | | | 10,115 | | | | 9,738 | |
| Equinix, Inc. 2.00% 2028 | | | 1,318 | | | | 1,295 | |
| Equinix, Inc. 3.20% 2029 | | | 29,707 | | | | 31,253 | |
| Equinix, Inc. 2.15% 2030 | | | 36,619 | | | | 35,639 | |
| Equinix, Inc. 2.50% 2031 | | | 33,976 | | | | 33,990 | |
| Equinix, Inc. 3.00% 2050 | | | 6,651 | | | | 6,381 | |
| Equinix, Inc. 2.95% 2051 | | | 400 | | | | 379 | |
| Equinix, Inc. 3.40% 2052 | | | 8,582 | | | | 8,771 | |
| Essex Portfolio LP 3.25% 2023 | | | 4,520 | | | | 4,630 | |
| Essex Portfolio LP 3.875% 2024 | | | 5,500 | | | | 5,793 | |
| Essex Portfolio LP 3.50% 2025 | | | 3 | | | | 3 | |
| Essex Portfolio LP 3.375% 2026 | | | 1,079 | | | | 1,146 | |
| Extra Space Storage, Inc. 2.35% 2032 | | | 4,089 | | | | 3,980 | |
| Fibra SOMA 4.375% 20314 | | | 8,260 | | | | 7,927 | |
| Hospitality Properties Trust 5.00% 2022 | | | 14,650 | | | | 14,651 | |
| Hospitality Properties Trust 4.50% 2023 | | | 9,680 | | | | 9,688 | |
| Hospitality Properties Trust 4.50% 2025 | | | 6,875 | | | | 6,703 | |
| Hospitality Properties Trust 3.95% 2028 | | | 100 | | | | 92 | |
| Howard Hughes Corp. 5.375% 20284 | | | 7,525 | | | | 8,025 | |
| Howard Hughes Corp. 4.125% 20294 | | | 1,925 | | | | 1,953 | |
| Howard Hughes Corp. 4.375% 20314 | | | 5,400 | | | | 5,462 | |
| Invitation Homes Operating Partnership LP 2.30% 2028 | | | 4,513 | | | | 4,468 | |
| Invitation Homes Operating Partnership LP 2.00% 2031 | | | 6,088 | | | | 5,740 | |
| Invitation Homes Operating Partnership LP 2.70% 2034 | | | 3,883 | | | | 3,813 | |
| Iron Mountain, Inc. 4.875% 20274 | | | 1,605 | | | | 1,667 | |
| Iron Mountain, Inc. 5.25% 20284 | | | 12,959 | | | | 13,500 | |
| Iron Mountain, Inc. 4.875% 20294 | | | 8,367 | | | | 8,673 | |
| Iron Mountain, Inc. 5.25% 20304 | | | 7,950 | | | | 8,392 | |
| Iron Mountain, Inc. 4.50% 20314 | | | 3,750 | | | | 3,797 | |
| Kennedy-Wilson Holdings, Inc. 4.75% 2029 | | | 2,325 | | | | 2,381 | |
| Kennedy-Wilson Holdings, Inc. 5.00% 2031 | | | 2,300 | | | | 2,372 | |
| Kimco Realty Corp. 2.70% 2024 | | | 16,980 | | | | 17,445 | |
| Kimco Realty Corp. 3.30% 2025 | | | 5,000 | | | | 5,259 | |
| Omega Healthcare Investors, Inc. 4.375% 2023 | | | 433 | | | | 452 | |
| Piedmont Operating Partnership LP 3.40% 2023 | | | 2,800 | | | | 2,872 | |
| Piedmont Operating Partnership LP 4.45% 2024 | | | 3,000 | | | | 3,165 | |
| Public Storage 1.50% 2026 | | | 4,503 | | | | 4,494 | |
| Public Storage 1.95% 2028 | | | 5,850 | | | | 5,834 | |
| Public Storage 2.25% 2031 | | | 4,305 | | | | 4,332 | |
| Public Storage 2.30% 2031 | | | 12,069 | | | | 12,192 | |
| Scentre Group 3.25% 20254 | | | 1,265 | | | | 1,331 | |
| Scentre Group 3.50% 20254 | | | 9,846 | | | | 10,374 | |
| Sun Communities Operating LP 2.30% 2028 | | | 5,866 | | | | 5,863 | |
| Sun Communities Operating LP 2.70% 2031 | | | 25,386 | | | | 25,207 | |
| WEA Finance LLC 3.75% 20244 | | | 2,480 | | | | 2,603 | |
| Westfield Corp., Ltd. 3.50% 20294 | | | 7,335 | | | | 7,594 | |
| | | | | | | | 608,567 | |
| The Bond Fund of America | 33 |
| Bonds, notes & other debt instruments (continued) | | Principal amount
(000) | | | Value
(000) | |
| Corporate bonds, notes & loans (continued) | | | | | | |
| Materials 0.70% | | | | | | | | |
| Air Products and Chemicals, Inc. 1.50% 2025 | | $ | 3,535 | | | $ | 3,549 | |
| Air Products and Chemicals, Inc. 1.85% 2027 | | | 802 | | | | 814 | |
| Air Products and Chemicals, Inc. 2.05% 2030 | | | 768 | | | | 773 | |
| Air Products and Chemicals, Inc. 2.70% 2040 | | | 11,472 | | | | 11,593 | |
| Air Products and Chemicals, Inc. 2.80% 2050 | | | 4,295 | | | | 4,413 | |
| Alpek, SAB de CV 3.25% 20314 | | | 5,000 | | | | 4,995 | |
| Anglo American Capital PLC 2.25% 20284 | | | 4,816 | | | | 4,733 | |
| Anglo American Capital PLC 5.625% 20304 | | | 10,000 | | | | 11,858 | |
| Anglo American Capital PLC 2.875% 20314 | | | 3,600 | | | | 3,587 | |
| Anglo American Capital PLC 3.95% 20504 | | | 4,980 | | | | 5,300 | |
| ArcelorMittal 7.00% 2039 | | | 3,250 | | | | 4,482 | |
| ArcelorMittal 6.75% 2041 | | | 2,780 | | | | 3,761 | |
| Ardagh Packaging Finance 5.25% 20254 | | | 3,640 | | | | 3,762 | |
| Ardagh Packaging Finance 4.125% 20264 | | | 2,500 | | | | 2,559 | |
| Ball Corp. 4.00% 2023 | | | 6,000 | | | | 6,270 | |
| Berry Global Escrow Corp. 4.875% 20264 | | | 9,875 | | | | 10,228 | |
| Braskem Idesa SAPI 7.45% 20294 | | | 1,540 | | | | 1,598 | |
| Braskem SA 4.50% 20304 | | | 4,600 | | | | 4,900 | |
| Braskem SA 5.875% 20504 | | | 4,000 | | | | 4,616 | |
| BWAY Parent Co., Inc. 5.50% 20244 | | | 6,500 | | | | 6,568 | |
| Chevron Phillips Chemical Co. LLC 3.30% 20234 | | | 6,630 | | | | 6,829 | |
| Cleveland-Cliffs, Inc. 9.875% 20254 | | | 5,271 | | | | 5,972 | |
| Cleveland-Cliffs, Inc. 6.75% 20264 | | | 12,450 | | | | 13,196 | |
| Crown Holdings, Inc. 4.25% 2026 | | | 4,000 | | | | 4,275 | |
| Dow Chemical Co. 4.55% 2025 | | | 33 | | | | 36 | |
| Dow Chemical Co. 3.625% 2026 | | | 4,058 | | | | 4,376 | |
| Dow Chemical Co. 4.80% 2028 | | | 4,000 | | | | 4,670 | |
| Dow Chemical Co. 2.10% 2030 | | | 13,250 | | | | 13,042 | |
| Dow Chemical Co. 4.625% 2044 | | | 1,100 | | | | 1,333 | |
| Dow Chemical Co. 5.55% 2048 | | | 8,600 | | | | 12,096 | |
| Dow Chemical Co. 4.80% 2049 | | | 7,671 | | | | 9,784 | |
| Dow Chemical Co. 3.60% 2050 | | | 13,708 | | | | 14,885 | |
| Ecolab, Inc. 1.65% 2027 | | | 5,000 | | | | 5,025 | |
| Ecolab, Inc. 2.125% 2032 | | | 15,400 | | | | 15,290 | |
| Ecolab, Inc. 2.125% 2050 | | | 4,000 | | | | 3,536 | |
| Ecolab, Inc. 2.70% 2051 | | | 2,000 | | | | 1,968 | |
| Freeport-McMoRan, Inc. 3.875% 2023 | | | 9,000 | | | | 9,315 | |
| Freeport-McMoRan, Inc. 4.125% 2028 | | | 4,000 | | | | 4,156 | |
| Freeport-McMoRan, Inc. 4.25% 2030 | | | 40 | | | | 42 | |
| Freeport-McMoRan, Inc. 5.40% 2034 | | | 1,450 | | | | 1,767 | |
| Freeport-McMoRan, Inc. 5.45% 2043 | | | 2,566 | | | | 3,231 | |
| Fresnillo PLC 4.25% 20504 | | | 9,516 | | | | 9,984 | |
| Glencore Funding LLC 4.125% 20244 | | | 25,850 | | | | 27,195 | |
| Glencore Funding LLC 1.625% 20264 | | | 6,168 | | | | 6,057 | |
| Glencore Funding LLC 2.625% 20314 | | | 9,100 | | | | 8,853 | |
| Glencore Funding LLC 3.375% 20514 | | | 2,100 | | | | 2,027 | |
| Glencore Funding LLC 3.875% 20514 | | | 1,900 | | | | 1,989 | |
| Graphic Packaging International, Inc. 3.50% 20284 | | | 8,000 | | | | 7,991 | |
| Huntsman International LLC 2.95% 2031 | | | 4,272 | | | | 4,337 | |
| Industrias Peñoles, SAB de CV, 4.75% 20504 | | | 6,090 | | | | 6,671 | |
| International Flavors & Fragrances, Inc. 1.23% 20254 | | | 5,000 | | | | 4,894 | |
| International Flavors & Fragrances, Inc. 1.832% 20274 | | | 8,022 | | | | 7,881 | |
| International Flavors & Fragrances, Inc. 2.30% 20304 | | | 30,114 | | | | 29,552 | |
| International Flavors & Fragrances, Inc. 3.268% 20404 | | | 4,500 | | | | 4,578 | |
| International Flavors & Fragrances, Inc. 3.468% 20504 | | | 10,360 | | | | 10,879 | |
| LYB International Finance III, LLC 1.25% 2025 | | | 3,952 | | | | 3,889 | |
| LYB International Finance III, LLC 2.25% 2030 | | | 15,225 | | | | 15,161 | |
| LYB International Finance III, LLC 3.375% 2040 | | | 4,250 | | | | 4,436 | |
| LYB International Finance III, LLC 4.20% 2049 | | | 1,740 | | | | 2,015 | |
| LYB International Finance III, LLC 4.20% 2050 | | | 4,500 | | | | 5,215 | |
| LYB International Finance III, LLC 3.625% 2051 | | | 5,503 | | | | 5,840 | |
| Methanex Corp. 5.125% 2027 | | | 13,150 | | | | 13,821 | |
| Methanex Corp. 5.25% 2029 | | | 1,125 | | | | 1,188 | |
| Methanex Corp. 5.65% 2044 | | | 1,000 | | | | 1,006 | |
| Newcrest Finance Pty, Ltd. 3.25% 20304 | | | 5,229 | | | | 5,483 | |
| Newcrest Finance Pty, Ltd. 4.20% 20504 | | | 2,714 | | | | 3,088 | |
| Nova Chemicals Corp. 4.875% 20244 | | | 2,000 | | | | 2,067 | |
| 34 | The Bond Fund of America |
| Bonds, notes & other debt instruments (continued) | | Principal amount
(000) | | | Value
(000) | |
| Corporate bonds, notes & loans (continued) | | | | | | |
| Materials (continued) | | | | | | | | |
| Nova Chemicals Corp. 5.25% 20274 | | $ | 7,500 | | | $ | 7,995 | |
| Nova Chemicals Corp. 4.25% 20294 | | | 5,535 | | | | 5,566 | |
| Nutrien, Ltd. 4.20% 2029 | | | 500 | | | | 565 | |
| Nutrien, Ltd. 5.00% 2049 | | | 3,850 | | | | 5,168 | |
| Olin Corp. 5.625% 2029 | | | 2,500 | | | | 2,712 | |
| Praxair, Inc. 1.10% 2030 | | | 14,464 | | | | 13,528 | |
| Praxair, Inc. 2.00% 2050 | | | 5,729 | | | | 5,017 | |
| Rio Tinto Finance (USA), Ltd. 2.75% 2051 | | | 8,451 | | | | 8,394 | |
| Sealed Air Corp. 5.25% 20234 | | | 111 | | | | 115 | |
| Sherwin-Williams Company 2.75% 2022 | | | 212 | | | | 213 | |
| Sherwin-Williams Company 3.125% 2024 | | | 7,250 | | | | 7,572 | |
| Sherwin-Williams Company 3.45% 2027 | | | 2,862 | | | | 3,099 | |
| Sherwin-Williams Company 2.95% 2029 | | | 5,150 | | | | 5,423 | |
| Sherwin-Williams Company 2.30% 2030 | | | 2,771 | | | | 2,768 | |
| Sherwin-Williams Company 2.20% 2032 | | | 5,250 | | | | 5,195 | |
| Sherwin-Williams Company 4.50% 2047 | | | 2,601 | | | | 3,250 | |
| Sherwin-Williams Company 3.80% 2049 | | | 1,500 | | | | 1,694 | |
| Sherwin-Williams Company 3.30% 2050 | | | 1,700 | | | | 1,796 | |
| Sherwin-Williams Company 2.90% 2052 | | | 2,500 | | | | 2,448 | |
| Silgan Holdings, Inc. 4.75% 2025 | | | 5,000 | | | | 5,037 | |
| Silgan Holdings, Inc. 4.125% 2028 | | | 2,500 | | | | 2,557 | |
| Summit Materials, Inc. 5.25% 20294 | | | 4,160 | | | | 4,363 | |
| Suzano Austria GmbH 6.00% 2029 | | | 1,900 | | | | 2,202 | |
| Suzano Austria GmbH 3.75% 2031 | | | 6,660 | | | | 6,780 | |
| Vale Overseas, Ltd. 3.75% 2030 | | | 6,457 | | | | 6,694 | |
| Westlake Chemical Corp. 5.00% 2046 | | | 7,090 | | | | 8,987 | |
| Westlake Chemical Corp. 4.375% 2047 | | | 1,960 | | | | 2,311 | |
| | | | | | | | 552,729 | |
| | | | | | | | | |
| Total corporate bonds, notes & loans | | | | | | | 26,416,004 | |
| | | | | | | | | |
| Mortgage-backed obligations 14.01% | | | | | | | | |
| Federal agency mortgage-backed obligations 11.06% | | | | | | | | |
| Fannie Mae Pool #976945 5.50% 202312 | | | — | 2 | | | — | 2 |
| Fannie Mae Pool #976948 6.00% 202312 | | | 6 | | | | 6 | |
| Fannie Mae Pool #932119 4.50% 202412 | | | 563 | | | | 587 | |
| Fannie Mae Pool #AD6392 4.50% 202512 | | | 628 | | | | 655 | |
| Fannie Mae Pool #AD3149 4.50% 202512 | | | 360 | | | | 378 | |
| Fannie Mae Pool #AD5692 4.50% 202512 | | | 298 | | | | 311 | |
| Fannie Mae Pool #AB1068 4.50% 202512 | | | 2 | | | | 2 | |
| Fannie Mae Pool #MA3131 3.00% 202712 | | | 68 | | | | 71 | |
| Fannie Mae Pool #MA2973 3.00% 202712 | | | 8 | | | | 8 | |
| Fannie Mae Pool #AL9668 3.00% 203012 | | | 11 | | | | 11 | |
| Fannie Mae Pool #AZ0554 3.50% 203012 | | | 287 | | | | 304 | |
| Fannie Mae Pool #AY1948 3.50% 203012 | | | 235 | | | | 248 | |
| Fannie Mae Pool #AZ4646 3.50% 203012 | | | 187 | | | | 197 | |
| Fannie Mae Pool #CA3178 3.00% 203112 | | | 778 | | | | 817 | |
| Fannie Mae Pool #890710 3.00% 203112 | | | 13 | | | | 13 | |
| Fannie Mae Pool #BH7659 3.00% 203212 | | | 9,018 | | | | 9,479 | |
| Fannie Mae Pool #CA3274 3.00% 203212 | | | 625 | | | | 658 | |
| Fannie Mae Pool #BH9235 3.00% 203312 | | | 923 | | | | 971 | |
| Fannie Mae Pool #BJ4890 3.00% 203312 | | | 621 | | | | 660 | |
| Fannie Mae Pool #BJ4856 3.00% 203312 | | | 403 | | | | 428 | |
| Fannie Mae Pool #BM5111 3.00% 203312 | | | 306 | | | | 324 | |
| Fannie Mae Pool #MA3247 3.00% 203312 | | | 250 | | | | 263 | |
| Fannie Mae Pool #BK7453 3.00% 203312 | | | 42 | | | | 44 | |
| Fannie Mae Pool #CA2106 3.50% 203312 | | | 130 | | | | 137 | |
| Fannie Mae Pool #MA3518 4.00% 203312 | | | 19 | | | | 20 | |
| Fannie Mae Pool #695412 5.00% 203312 | | | 8 | | | | 9 | |
| Fannie Mae Pool #CA4453 2.50% 203412 | | | 4,557 | | | | 4,735 | |
| Fannie Mae Pool #BO1359 2.50% 203412 | | | 2,388 | | | | 2,485 | |
| Fannie Mae Pool #FM1490 3.50% 203412 | | | 5,946 | | | | 6,283 | |
| Fannie Mae Pool #AD3566 5.00% 203512 | | | 107 | | | | 117 | |
| Fannie Mae Pool #AS8355 3.00% 203612 | | | 10,111 | | | | 10,625 | |
| Fannie Mae Pool #AS8554 3.00% 203612 | | | 1,043 | | | | 1,095 | |
| Fannie Mae Pool #MA2746 4.00% 203612 | | | 2,216 | | | | 2,412 | |
| Fannie Mae Pool #MA2588 4.00% 203612 | | | 1,879 | | | | 2,038 | |
| Fannie Mae Pool #MA2787 4.00% 203612 | | | 1,271 | | | | 1,380 | |
| The Bond Fund of America | 35 |
| Bonds, notes & other debt instruments (continued) | | Principal amount
(000) | | | Value
(000) | |
| Mortgage-backed obligations (continued) | | | | | | |
| Federal agency mortgage-backed obligations (continued) | | | | | | |
| Fannie Mae Pool #MA2717 4.00% 203612 | | $ | 389 | | | $ | 424 | |
| Fannie Mae Pool #893837 7.00% 203612 | | | 120 | | | | 127 | |
| Fannie Mae Pool #924866 1.515% 20376,12 | | | 27 | | | | 27 | |
| Fannie Mae Pool #MA2897 3.00% 203712 | | | 21,903 | | | | 23,002 | |
| Fannie Mae Pool #MA2866 3.00% 203712 | | | 12,577 | | | | 13,208 | |
| Fannie Mae Pool #945680 6.00% 203712 | | | 24 | | | | 28 | |
| Fannie Mae Pool #913966 6.00% 203712 | | | 2 | | | | 2 | |
| Fannie Mae Pool #924069 7.00% 203712 | | | 105 | | | | 110 | |
| Fannie Mae Pool #954927 7.00% 203712 | | | 102 | | | | 109 | |
| Fannie Mae Pool #966170 7.00% 203712 | | | 81 | | | | 84 | |
| Fannie Mae Pool #954936 7.00% 203712 | | | 38 | | | | 42 | |
| Fannie Mae Pool #914612 7.50% 203712 | | | 56 | | | | 58 | |
| Fannie Mae Pool #889101 1.549% 20386,12 | | | 108 | | | | 110 | |
| Fannie Mae Pool #964279 2.095% 20386,12 | | | 105 | | | | 107 | |
| Fannie Mae Pool #964708 2.265% 20386,12 | | | 14 | | | | 14 | |
| Fannie Mae Pool #MA3539 4.50% 203812 | | | 56 | | | | 60 | |
| Fannie Mae Pool #889982 5.50% 203812 | | | 22 | | | | 25 | |
| Fannie Mae Pool #988588 5.50% 203812 | | | 4 | | | | 4 | |
| Fannie Mae Pool #AC2641 4.50% 203912 | | | 4,003 | | | | 4,427 | |
| Fannie Mae Pool #AC0794 5.00% 203912 | | | 158 | | | | 176 | |
| Fannie Mae Pool #931768 5.00% 203912 | | | 80 | | | | 91 | |
| Fannie Mae Pool #AE7629 2.06% 20406,12 | | | 16 | | | | 17 | |
| Fannie Mae Pool #AL9335 2.07% 20406,12 | | | 3,682 | | | | 3,872 | |
| Fannie Mae Pool #AE7567 4.00% 204012 | | | 2,299 | | | | 2,525 | |
| Fannie Mae Pool #AE1761 4.00% 204012 | | | 2,234 | | | | 2,454 | |
| Fannie Mae Pool #AH0007 4.00% 204012 | | | 2,198 | | | | 2,407 | |
| Fannie Mae Pool #AH0539 4.00% 204012 | | | 894 | | | | 982 | |
| Fannie Mae Pool #AE8073 4.00% 204012 | | | 439 | | | | 482 | |
| Fannie Mae Pool #AD8522 4.00% 204012 | | | 116 | | | | 127 | |
| Fannie Mae Pool #AE5471 4.50% 204012 | | | 711 | | | | 787 | |
| Fannie Mae Pool #AB1297 5.00% 204012 | | | 321 | | | | 360 | |
| Fannie Mae Pool #932606 5.00% 204012 | | | 225 | | | | 253 | |
| Fannie Mae Pool #MA4387 2.00% 204112 | | | 3,952 | | | | 4,017 | |
| Fannie Mae Pool #AL9326 2.107% 20416,12 | | | 4,152 | | | | 4,372 | |
| Fannie Mae Pool #AL9327 2.108% 20416,12 | | | 3,164 | | | | 3,334 | |
| Fannie Mae Pool #AL9531 2.105% 20416,12 | | | 2,697 | | | | 2,840 | |
| Fannie Mae Pool #AE0844 2.137% 20416,12 | | | 241 | | | | 253 | |
| Fannie Mae Pool #AL0073 2.146% 20416,12 | | | 182 | | | | 192 | |
| Fannie Mae Pool #AE0789 2.155% 20416,12 | | | 240 | | | | 252 | |
| Fannie Mae Pool #AB4050 4.00% 204112 | | | 781 | | | | 858 | |
| Fannie Mae Pool #AJ7471 4.00% 204112 | | | 695 | | | | 755 | |
| Fannie Mae Pool #AI5172 4.00% 204112 | | | 572 | | | | 628 | |
| Fannie Mae Pool #AJ4189 4.00% 204112 | | | 505 | | | | 555 | |
| Fannie Mae Pool #AJ4154 4.00% 204112 | | | 427 | | | | 469 | |
| Fannie Mae Pool #AJ1873 4.00% 204112 | | | 369 | | | | 406 | |
| Fannie Mae Pool #AJ0257 4.00% 204112 | | | 151 | | | | 165 | |
| Fannie Mae Pool #AL0658 4.50% 204112 | | | 752 | | | | 829 | |
| Fannie Mae Pool #AI1862 5.00% 204112 | | | 1,761 | | | | 1,997 | |
| Fannie Mae Pool #AH6099 5.00% 204112 | | | 1,396 | | | | 1,561 | |
| Fannie Mae Pool #AI3510 5.00% 204112 | | | 1,084 | | | | 1,229 | |
| Fannie Mae Pool #AJ0704 5.00% 204112 | | | 922 | | | | 1,046 | |
| Fannie Mae Pool #AJ5391 5.00% 204112 | | | 586 | | | | 663 | |
| Fannie Mae Pool #AE1248 5.00% 204112 | | | 299 | | | | 337 | |
| Fannie Mae Pool #AE1277 5.00% 204112 | | | 263 | | | | 297 | |
| Fannie Mae Pool #AE1274 5.00% 204112 | | | 189 | | | | 214 | |
| Fannie Mae Pool #AE1283 5.00% 204112 | | | 145 | | | | 160 | |
| Fannie Mae Pool #AH9479 5.00% 204112 | | | 42 | | | | 48 | |
| Fannie Mae Pool #AH8144 5.00% 204112 | | | 39 | | | | 44 | |
| Fannie Mae Pool #AP7819 1.91% 20426,12 | | | 246 | | | | 258 | |
| Fannie Mae Pool #AL2000 1.942% 20426,12 | | | 278 | | | | 291 | |
| Fannie Mae Pool #AL1941 1.952% 20426,12 | | | 330 | | | | 347 | |
| Fannie Mae Pool #AL2184 1.981% 20426,12 | | | 571 | | | | 600 | |
| Fannie Mae Pool #AL9532 1.991% 20426,12 | | | 3,181 | | | | 3,340 | |
| Fannie Mae Pool #AL9533 2.03% 20426,12 | | | 1,518 | | | | 1,595 | |
| Fannie Mae Pool #AL9530 2.082% 20426,12 | | | 2,168 | | | | 2,281 | |
| Fannie Mae Pool #AX3703 4.00% 204212 | | | 4,591 | | | | 5,044 | |
| Fannie Mae Pool #AK6740 4.00% 204212 | | | 4,338 | | | | 4,810 | |
| 36 | The Bond Fund of America |
| | | | | | | |
| Bonds, notes & other debt instruments (continued) | | Principal amount
(000) | | | Value
(000) | |
| Mortgage-backed obligations (continued) | | | | | | |
| Federal agency mortgage-backed obligations (continued) | | | | | | | | |
| Fannie Mae Pool #AL2745 4.00% 204212 | | $ | 3,400 | | | $ | 3,736 | |
| Fannie Mae Pool #890407 4.00% 204212 | | | 1,176 | | | | 1,292 | |
| Fannie Mae Pool #AK4949 4.00% 204212 | | | 247 | | | | 270 | |
| Fannie Mae Pool #AE1290 5.00% 204212 | | | 308 | | | | 346 | |
| Fannie Mae Pool #AT5898 3.00% 204312 | | | 19,128 | | | | 20,188 | |
| Fannie Mae Pool #AL3829 3.50% 204312 | | | 2,726 | | | | 2,953 | |
| Fannie Mae Pool #AT7161 3.50% 204312 | | | 1,057 | | | | 1,137 | |
| Fannie Mae Pool #AR1512 3.50% 204312 | | | 672 | | | | 724 | |
| Fannie Mae Pool #AT0412 3.50% 204312 | | | 274 | | | | 295 | |
| Fannie Mae Pool #AT3954 3.50% 204312 | | | 168 | | | | 179 | |
| Fannie Mae Pool #AT0300 3.50% 204312 | | | 99 | | | | 105 | |
| Fannie Mae Pool #AV0786 4.00% 204312 | | | 3,605 | | | | 3,961 | |
| Fannie Mae Pool #AT2683 4.00% 204312 | | | 2,521 | | | | 2,743 | |
| Fannie Mae Pool #BM6240 2.05% 20446,12 | | | 3,490 | | | | 3,668 | |
| Fannie Mae Pool #AL8421 3.50% 204412 | | | 16,198 | | | | 17,485 | |
| Fannie Mae Pool #AX8521 3.50% 204412 | | | 372 | | | | 401 | |
| Fannie Mae Pool #AY1829 3.50% 204412 | | | 111 | | | | 117 | |
| Fannie Mae Pool #AW8240 3.50% 204412 | | | 55 | | | | 58 | |
| Fannie Mae Pool #AX0817 4.00% 204412 | | | 204 | | | | 217 | |
| Fannie Mae Pool #BE5017 3.50% 204512 | | | 1,404 | | | | 1,509 | |
| Fannie Mae Pool #BE5009 3.50% 204512 | | | 740 | | | | 791 | |
| Fannie Mae Pool #AZ7366 4.00% 204512 | | | 22,326 | | | | 24,449 | |
| Fannie Mae Pool #AS6348 4.00% 204512 | | | 3,909 | | | | 4,274 | |
| Fannie Mae Pool #BC4764 3.00% 204612 | | | 2,936 | | | | 3,083 | |
| Fannie Mae Pool #AS8310 3.00% 204612 | | | 811 | | | | 864 | |
| Fannie Mae Pool #MA2833 3.00% 204612 | | | 45 | | | | 48 | |
| Fannie Mae Pool #BC9077 3.50% 204612 | | | 20,659 | | | | 22,103 | |
| Fannie Mae Pool #BD9236 3.50% 204612 | | | 506 | | | | 536 | |
| Fannie Mae Pool #AL8522 3.50% 204612 | | | 37 | | | | 40 | |
| Fannie Mae Pool #AS6839 4.00% 204612 | | | 4,783 | | | | 5,191 | |
| Fannie Mae Pool #BC1352 4.00% 204612 | | | 1,743 | | | | 1,890 | |
| Fannie Mae Pool #BD1968 4.00% 204612 | | | 61 | | | | 65 | |
| Fannie Mae Pool #MA2809 4.50% 204612 | | | 886 | | | | 935 | |
| Fannie Mae Pool #BC8647 4.50% 204612 | | | 678 | | | | 732 | |
| Fannie Mae Pool #BD1550 4.50% 204612 | | | 345 | | | | 376 | |
| Fannie Mae Pool #BD7529 4.50% 204612 | | | 319 | | | | 343 | |
| Fannie Mae Pool #MA2821 4.50% 204612 | | | 324 | | | | 342 | |
| Fannie Mae Pool #BD9248 4.50% 204612 | | | 235 | | | | 252 | |
| Fannie Mae Pool #BD7600 4.50% 204612 | | | 81 | | | | 87 | |
| Fannie Mae Pool #BM1179 3.00% 204712 | | | 944 | | | | 1,002 | |
| Fannie Mae Pool #CA0854 3.50% 204712 | | | 15,896 | | | | 17,051 | |
| Fannie Mae Pool #BD2440 3.50% 204712 | | | 2,261 | | | | 2,409 | |
| Fannie Mae Pool #BE8740 3.50% 204712 | | | 1,310 | | | | 1,405 | |
| Fannie Mae Pool #BE8742 3.50% 204712 | | | 406 | | | | 438 | |
| Fannie Mae Pool #CA0770 3.50% 204712 | | | 227 | | | | 240 | |
| Fannie Mae Pool #BH2846 3.50% 204712 | | | 158 | | | | 170 | |
| Fannie Mae Pool #BH2848 3.50% 204712 | | | 146 | | | | 156 | |
| Fannie Mae Pool #BH2847 3.50% 204712 | | | 108 | | | | 114 | |
| Fannie Mae Pool #CA0453 4.00% 204712 | | | 8,029 | | | | 8,578 | |
| Fannie Mae Pool #MA3211 4.00% 204712 | | | 4,892 | | | | 5,242 | |
| Fannie Mae Pool #BJ5015 4.00% 204712 | | | 2,684 | | | | 2,936 | |
| Fannie Mae Pool #BD3554 4.00% 204712 | | | 932 | | | | 994 | |
| Fannie Mae Pool #BH3122 4.00% 204712 | | | 71 | | | | 76 | |
| Fannie Mae Pool #BM4413 4.50% 204712 | | | 7,220 | | | | 7,807 | |
| Fannie Mae Pool #BH0876 4.50% 204712 | | | 3,102 | | | | 3,355 | |
| Fannie Mae Pool #BJ3558 4.50% 204712 | | | 1,891 | | | | 2,038 | |
| Fannie Mae Pool #BJ3525 4.50% 204712 | | | 1,444 | | | | 1,556 | |
| Fannie Mae Pool #BJ3581 4.50% 204712 | | | 994 | | | | 1,071 | |
| Fannie Mae Pool #MA3002 4.50% 204712 | | | 745 | | | | 783 | |
| Fannie Mae Pool #257063 7.00% 204712 | | | 46 | | | | 52 | |
| Fannie Mae Pool #256893 7.00% 204712 | | | 12 | | | | 14 | |
| Fannie Mae Pool #BF0293 3.00% 204812 | | | 8,582 | | | | 9,066 | |
| Fannie Mae Pool #FM5658 3.00% 204812 | | | 5,843 | | | | 6,117 | |
| Fannie Mae Pool #BM4488 3.376% 20486,12 | | | 7,021 | | | | 7,254 | |
| Fannie Mae Pool #BF0318 3.50% 204812 | | | 43,813 | | | | 47,001 | |
| Fannie Mae Pool #CA1532 3.50% 204812 | | | 7,256 | | | | 7,693 | |
| Fannie Mae Pool #CA1189 3.50% 204812 | | | 1,766 | | | | 1,870 | |
| The Bond Fund of America | 37 |
| Bonds, notes & other debt instruments (continued) | | Principal amount
(000) | | | Value
(000) | |
| Mortgage-backed obligations (continued) | | | | | | |
| Federal agency mortgage-backed obligations (continued) | | | | | | |
| Fannie Mae Pool #BJ4901 3.50% 204812 | | $ | 978 | | | $ | 1,053 | |
| Fannie Mae Pool #CA2850 4.00% 204812 | | | 3,242 | | | | 3,547 | |
| Fannie Mae Pool #BK6840 4.00% 204812 | | | 1,700 | | | | 1,862 | |
| Fannie Mae Pool #BK5232 4.00% 204812 | | | 1,240 | | | | 1,350 | |
| Fannie Mae Pool #BK9743 4.00% 204812 | | | 499 | | | | 546 | |
| Fannie Mae Pool #BK0163 4.50% 204812 | | | 1,943 | | | | 2,090 | |
| Fannie Mae Pool #BN1576 4.50% 204812 | | | 1,313 | | | | 1,410 | |
| Fannie Mae Pool #BK9761 4.50% 204812 | | | 290 | | | | 315 | |
| Fannie Mae Pool #CA2166 4.50% 204812 | | | 18 | | | | 20 | |
| Fannie Mae Pool #CA2493 4.50% 204812 | | | 4 | | | | 4 | |
| Fannie Mae Pool #CA3807 3.00% 204912 | | | 1,491 | | | | 1,571 | |
| Fannie Mae Pool #CA3806 3.00% 204912 | | | 918 | | | | 970 | |
| Fannie Mae Pool #BJ8402 3.456% 20496,12 | | | 1,162 | | | | 1,202 | |
| Fannie Mae Pool #FM2318 3.50% 204912 | | | 53,815 | | | | 57,524 | |
| Fannie Mae Pool #CA4021 3.50% 204912 | | | 32,884 | | | | 34,983 | |
| Fannie Mae Pool #CA4802 3.50% 204912 | | | 31,008 | | | | 33,442 | |
| Fannie Mae Pool #CA4151 3.50% 204912 | | | 13,631 | | | | 14,793 | |
| Fannie Mae Pool #BN6708 3.50% 204912 | | | 11,689 | | | | 12,546 | |
| Fannie Mae Pool #FM1062 3.50% 204912 | | | 10,952 | | | | 11,847 | |
| Fannie Mae Pool #FM1443 3.50% 204912 | | | 8,076 | | | | 8,710 | |
| Fannie Mae Pool #BJ8411 3.50% 204912 | | | 2,694 | | | | 2,905 | |
| Fannie Mae Pool #FM1963 4.00% 204912 | | | 48,951 | | | | 53,612 | |
| Fannie Mae Pool #FM1913 4.00% 204912 | | | 2,265 | | | | 2,434 | |
| Fannie Mae Pool #BF0320 5.50% 204912 | | | 7,658 | | | | 8,741 | |
| Fannie Mae Pool #CA8285 3.00% 205012 | | | 67,174 | | | | 71,196 | |
| Fannie Mae Pool #CA5506 3.00% 205012 | | | 57,883 | | | | 61,029 | |
| Fannie Mae Pool #BP1948 3.00% 205012 | | | 18,389 | | | | 19,484 | |
| Fannie Mae Pool #CA5338 3.00% 205012 | | | 13,885 | | | | 14,465 | |
| Fannie Mae Pool #FM2664 3.50% 205012 | | | 33,389 | | | | 36,093 | |
| Fannie Mae Pool #BP1954 3.50% 205012 | | | 23,508 | | | | 25,174 | |
| Fannie Mae Pool #CB2319 2.50% 205112 | | | 69,503 | | | | 71,793 | |
| Fannie Mae Pool #CB2371 2.50% 205112 | | | 46,692 | | | | 48,272 | |
| Fannie Mae Pool #CB2372 2.50% 205112 | | | 33,574 | | | | 34,690 | |
| Fannie Mae Pool #BT9510 2.50% 205112 | | | 27,100 | | | | 28,017 | |
| Fannie Mae Pool #FM9492 2.50% 205112 | | | 26,231 | | | | 27,099 | |
| Fannie Mae Pool #BT9483 2.50% 205112 | | | 26,000 | | | | 26,824 | |
| Fannie Mae Pool #FM9804 2.50% 205112 | | | 14,170 | | | | 14,640 | |
| Fannie Mae Pool #FM9694 2.50% 205112 | | | 13,038 | | | | 13,507 | |
| Fannie Mae Pool #CB2373 2.50% 205112 | | | 12,955 | | | | 13,366 | |
| Fannie Mae Pool #CB2375 2.50% 205112 | | | 11,264 | | | | 11,585 | |
| Fannie Mae Pool #CA9391 3.00% 205112 | | | 227,251 | | | | 238,341 | |
| Fannie Mae Pool #CA8623 3.00% 205112 | | | 103,273 | | | | 109,704 | |
| Fannie Mae Pool #FM9632 3.00% 205112 | | | 91,513 | | | | 96,509 | |
| Fannie Mae Pool #CB0041 3.00% 205112 | | | 72,338 | | | | 76,630 | |
| Fannie Mae Pool #FM9631 3.00% 205112 | | | 38,741 | | | | 40,887 | |
| Fannie Mae Pool #CB2414 3.00% 205112 | | | 37,533 | | | | 39,999 | |
| Fannie Mae Pool #FM7694 3.00% 205112 | | | 23,595 | | | | 24,910 | |
| Fannie Mae Pool #CB2292 3.00% 205112 | | | 16,022 | | | | 16,984 | |
| Fannie Mae Pool #CB2293 3.00% 205112 | | | 16,023 | | | | 16,939 | |
| Fannie Mae Pool #CA8969 3.00% 205112 | | | 6,504 | | | | 6,820 | |
| Fannie Mae Pool #BF0145 3.50% 205712 | | | 18,837 | | | | 20,411 | |
| Fannie Mae Pool #BF0299 3.50% 205812 | | | 32,848 | | | | 35,401 | |
| Fannie Mae Pool #BF0264 3.50% 205812 | | | 18,527 | | | | 19,986 | |
| Fannie Mae Pool #BF0379 3.50% 205912 | | | 48,894 | | | | 52,963 | |
| Fannie Mae Pool #BM6693 3.50% 205912 | | | 37,321 | | | | 40,242 | |
| Fannie Mae Pool #BF0497 3.00% 206012 | | | 22,757 | | | | 24,025 | |
| Fannie Mae Pool #BF0481 3.50% 206012 | | | 81,181 | | | | 87,932 | |
| Fannie Mae Pool #BF0480 3.50% 206012 | | | 49,866 | | | | 54,295 | |
| Fannie Mae, Series 2001-4, Class NA, 9.00% 20256,12 | | | 1 | | | | 2 | |
| Fannie Mae, Series 2001-4, Class GA, 9.00% 20256,12 | | | — | 2 | | | — | 2 |
| Fannie Mae, Series 1998-W5, Class B3, 6.50% 20284,12 | | | 262 | | | | 250 | |
| Fannie Mae, Series 2002-W7, Class A5, 7.50% 202912 | | | 61 | | | | 73 | |
| Fannie Mae, Series 2001-25, Class ZA, 6.50% 203112 | | | 608 | | | | 673 | |
| Fannie Mae, Series 2001-T10, Class A1, 7.00% 204112 | | | 1,046 | | | | 1,189 | |
| Fannie Mae, Series 2001-50, Class BA, 7.00% 204112 | | | 180 | | | | 203 | |
| Fannie Mae, Series 2002-W3, Class A5, 7.50% 204112 | | | 600 | | | | 715 | |
| Fannie Mae, Series 2002-W1, Class 2A, 5.199% 20426,12 | | | 800 | | | | 865 | |
| 38 | The Bond Fund of America |
| Bonds, notes & other debt instruments (continued) | | Principal amount
(000) | | | Value
(000) | |
| Mortgage-backed obligations (continued) | | | | | | |
| Federal agency mortgage-backed obligations (continued) | | | | | | |
| Fannie Mae, Series 2017-M3, Class A2, Multi Family, 2.466% 20266,12 | | $ | 9 | | | $ | 10 | |
| Fannie Mae, Series 2017-M15, Class A2, Multi Family, 2.959% 20276,12 | | | 3,700 | | | | 3,974 | |
| Fannie Mae, Series 2017-M12, Class A2, Multi Family, 3.069% 20276,12 | | | 4,201 | | | | 4,508 | |
| Fannie Mae, Series 2019-M5, Class A2, Multi Family, 3.273% 202912 | | | 430 | | | | 472 | |
| Fannie Mae, Series 2006-32, Class OA, principal only, 0% 203612 | | | 451 | | | | 412 | |
| Fannie Mae, Series 2006-51, Class PO, principal only, 0% 203612 | | | 407 | | | | 387 | |
| Fannie Mae, Series 2006-96, Class OP, principal only, 0% 203612 | | | 156 | | | | 145 | |
| Freddie Mac Pool #G15732 3.00% 203012 | | | 7,930 | | | | 8,361 | |
| Freddie Mac Pool #ZT1332 3.00% 203012 | | | 7,041 | | | | 7,412 | |
| Freddie Mac Pool #D98356 4.50% 203012 | | | 129 | | | | 139 | |
| Freddie Mac Pool #G16634 3.00% 203112 | | | 12,088 | | | | 12,766 | |
| Freddie Mac Pool #V61960 3.00% 203312 | | | 5,161 | | | | 5,434 | |
| Freddie Mac Pool #A15120 5.50% 203312 | | | 3 | | | | 3 | |
| Freddie Mac Pool #G30911 4.00% 203612 | | | 3,658 | | | | 3,971 | |
| Freddie Mac Pool #K93532 4.00% 203612 | | | 1,101 | | | | 1,193 | |
| Freddie Mac Pool #C91883 4.00% 203612 | | | 596 | | | | 649 | |
| Freddie Mac Pool #C91917 3.00% 203712 | | | 641 | | | | 674 | |
| Freddie Mac Pool #C91948 4.00% 203712 | | | 4,042 | | | | 4,382 | |
| Freddie Mac Pool #G04804 4.50% 203712 | | | 1,579 | | | | 1,743 | |
| Freddie Mac Pool #A56076 5.50% 203712 | | | 14 | | | | 16 | |
| Freddie Mac Pool #G03695 5.50% 203712 | | | 3 | | | | 3 | |
| Freddie Mac Pool #H09093 7.50% 203712 | | | 63 | | | | 73 | |
| Freddie Mac Pool #ZT1449 3.00% 203812 | | | 57,891 | | | | 61,221 | |
| Freddie Mac Pool #G08248 5.50% 203812 | | | 37 | | | | 43 | |
| Freddie Mac Pool #G05267 5.50% 203812 | | | 2 | | | | 3 | |
| Freddie Mac Pool #G05196 5.50% 203812 | | | 2 | | | | 2 | |
| Freddie Mac Pool #A87873 5.00% 203912 | | | 2,883 | | | | 3,273 | |
| Freddie Mac Pool #G06020 5.50% 203912 | | | 5 | | | | 5 | |
| Freddie Mac Pool #840222 2.13% 20406,12 | | | 1,004 | | | | 1,057 | |
| Freddie Mac Pool #G05937 4.50% 204012 | | | 6,123 | | | | 6,772 | |
| Freddie Mac Pool #A93948 4.50% 204012 | | | 7 | | | | 8 | |
| Freddie Mac Pool #G05860 5.50% 204012 | | | 15 | | | | 18 | |
| Freddie Mac Pool #Q02705 4.50% 204112 | | | 2,776 | | | | 3,065 | |
| Freddie Mac Pool #G06956 4.50% 204112 | | | 625 | | | | 691 | |
| Freddie Mac Pool #G06769 4.50% 204112 | | | 278 | | | | 305 | |
| Freddie Mac Pool #Q01992 4.50% 204112 | | | 39 | | | | 42 | |
| Freddie Mac Pool #G06868 4.50% 204112 | | | 6 | | | | 7 | |
| Freddie Mac Pool #G06648 5.00% 204112 | | | 1,178 | | | | 1,336 | |
| Freddie Mac Pool #Q01658 5.00% 204112 | | | 240 | | | | 263 | |
| Freddie Mac Pool #G06841 5.50% 204112 | | | 21 | | | | 24 | |
| Freddie Mac Pool #841039 2.186% 20436,12 | | | 3,071 | | | | 3,241 | |
| Freddie Mac Pool #Q18236 3.50% 204312 | | | 1,138 | | | | 1,225 | |
| Freddie Mac Pool #Q19133 3.50% 204312 | | | 755 | | | | 815 | |
| Freddie Mac Pool #Q17696 3.50% 204312 | | | 700 | | | | 757 | |
| Freddie Mac Pool #Q22946 4.00% 204312 | | | 5,495 | | | | 6,041 | |
| Freddie Mac Pool #Q15874 4.00% 204312 | | | 88 | | | | 94 | |
| Freddie Mac Pool #Q28558 3.50% 204412 | | | 3,157 | | | | 3,404 | |
| Freddie Mac Pool #760014 2.843% 20456,12 | | | 2,386 | | | | 2,470 | |
| Freddie Mac Pool #760012 3.113% 20456,12 | | | 677 | | | | 704 | |
| Freddie Mac Pool #760013 3.169% 20456,12 | | | 500 | | | | 521 | |
| Freddie Mac Pool #G60238 3.50% 204512 | | | 17,256 | | | | 18,593 | |
| Freddie Mac Pool #G60138 3.50% 204512 | | | 712 | | | | 772 | |
| Freddie Mac Pool #G60344 4.00% 204512 | | | 13,539 | | | | 14,909 | |
| Freddie Mac Pool #V81992 4.00% 204512 | | | 720 | | | | 783 | |
| Freddie Mac Pool #G67700 3.50% 204612 | | | 6,341 | | | | 6,831 | |
| Freddie Mac Pool #T65375 3.50% 204612 | | | 158 | | | | 164 | |
| Freddie Mac Pool #Q43312 4.50% 204612 | | | 633 | | | | 692 | |
| Freddie Mac Pool #Q44689 4.50% 204612 | | | 633 | | | | 680 | |
| Freddie Mac Pool #Q42633 4.50% 204612 | | | 560 | | | | 610 | |
| Freddie Mac Pool #Q43461 4.50% 204612 | | | 530 | | | | 575 | |
| Freddie Mac Pool #Q42034 4.50% 204612 | | | 313 | | | | 338 | |
| Freddie Mac Pool #760015 2.627% 20476,12 | | | 2,655 | | | | 2,738 | |
| Freddie Mac Pool #ZT2100 3.00% 204712 | | | 6,341 | | | | 6,650 | |
| Freddie Mac Pool #G61733 3.00% 204712 | | | 5,968 | | | | 6,302 | |
| Freddie Mac Pool #ZS4747 3.50% 204712 | | | 10,671 | | | | 11,317 | |
| Freddie Mac Pool #ZS4735 3.50% 204712 | | | 5,291 | | | | 5,610 | |
| Freddie Mac Pool #Q52069 3.50% 204712 | | | 2,000 | | | | 2,146 | |
| The Bond Fund of America | 39 |
| | | | | | | |
| Bonds, notes & other debt instruments (continued) | | Principal amount
(000) | | | Value
(000) | |
| Mortgage-backed obligations (continued) | | | | | | |
| Federal agency mortgage-backed obligations (continued) | | | | | | | | |
| Freddie Mac Pool #Q51622 3.50% 204712 | | $ | 1,512 | | | $ | 1,630 | |
| Freddie Mac Pool #Q47615 3.50% 204712 | | | 1,164 | | | | 1,248 | |
| Freddie Mac Pool #Q47620 4.00% 204712 | | | 11,048 | | | | 11,978 | |
| Freddie Mac Pool #Q52613 4.00% 204712 | | | 6,256 | | | | 6,789 | |
| Freddie Mac Pool #G08793 4.00% 204712 | | | 4,123 | | | | 4,415 | |
| Freddie Mac Pool #Q52596 4.50% 204712 | | | 1,658 | | | | 1,792 | |
| Freddie Mac Pool #Q47828 4.50% 204712 | | | 765 | | | | 825 | |
| Freddie Mac Pool #G67709 3.50% 204812 | | | 31,072 | | | | 33,450 | |
| Freddie Mac Pool #Q54701 3.50% 204812 | | | 1,335 | | | | 1,432 | |
| Freddie Mac Pool #Q54709 3.50% 204812 | | | 1,224 | | | | 1,313 | |
| Freddie Mac Pool #Q54700 3.50% 204812 | | | 1,002 | | | | 1,073 | |
| Freddie Mac Pool #Q54781 3.50% 204812 | | | 962 | | | | 1,036 | |
| Freddie Mac Pool #Q54782 3.50% 204812 | | | 960 | | | | 1,025 | |
| Freddie Mac Pool #Q55056 3.50% 204812 | | | 938 | | | | 999 | |
| Freddie Mac Pool #Q56590 3.50% 204812 | | | 658 | | | | 707 | |
| Freddie Mac Pool #Q54699 3.50% 204812 | | | 518 | | | | 560 | |
| Freddie Mac Pool #Q56589 3.50% 204812 | | | 475 | | | | 508 | |
| Freddie Mac Pool #Q54698 3.50% 204812 | | | 393 | | | | 426 | |
| Freddie Mac Pool #Q54831 3.50% 204812 | | | 389 | | | | 421 | |
| Freddie Mac Pool #Q55060 3.50% 204812 | | | 354 | | | | 379 | |
| Freddie Mac Pool #Q56591 3.50% 204812 | | | 320 | | | | 341 | |
| Freddie Mac Pool #G61628 3.50% 204812 | | | 193 | | | | 208 | |
| Freddie Mac Pool #G67711 4.00% 204812 | | | 30,125 | | | | 32,976 | |
| Freddie Mac Pool #Q53878 4.00% 204812 | | | 6,993 | | | | 7,590 | |
| Freddie Mac Pool #ZA5889 4.00% 204812 | | | 2,164 | | | | 2,326 | |
| Freddie Mac Pool #Q56599 4.00% 204812 | | | 2,020 | | | | 2,213 | |
| Freddie Mac Pool #G08805 4.00% 204812 | | | 1,535 | | | | 1,634 | |
| Freddie Mac Pool #Q56175 4.00% 204812 | | | 1,369 | | | | 1,487 | |
| Freddie Mac Pool #Q55971 4.00% 204812 | | | 1,330 | | | | 1,449 | |
| Freddie Mac Pool #Q55970 4.00% 204812 | | | 670 | | | | 733 | |
| Freddie Mac Pool #Q58411 4.50% 204812 | | | 4,099 | | | | 4,495 | |
| Freddie Mac Pool #Q58436 4.50% 204812 | | | 1,851 | | | | 2,047 | |
| Freddie Mac Pool #Q58378 4.50% 204812 | | | 1,470 | | | | 1,601 | |
| Freddie Mac Pool #Q57242 4.50% 204812 | | | 714 | | | | 778 | |
| Freddie Mac Pool #QA4692 3.00% 204912 | | | 22,814 | | | | 24,027 | |
| Freddie Mac Pool #QA4673 3.00% 204912 | | | 9,668 | | | | 10,198 | |
| Freddie Mac Pool #SD7507 3.00% 204912 | | | 5,727 | | | | 6,027 | |
| Freddie Mac Pool #SD0185 3.00% 204912 | | | 5,722 | | | | 6,004 | |
| Freddie Mac Pool #SD7508 3.50% 204912 | | | 79,276 | | | | 85,486 | |
| Freddie Mac Pool #QA5125 3.50% 204912 | | | 29,159 | | | | 31,447 | |
| Freddie Mac Pool #RA1580 3.50% 204912 | | | 9,620 | | | | 10,440 | |
| Freddie Mac Pool #RA1463 3.50% 204912 | | | 9,592 | | | | 10,409 | |
| Freddie Mac Pool #QA1885 3.50% 204912 | | | 5,932 | | | | 6,373 | |
| Freddie Mac Pool #QA0284 3.50% 204912 | | | 5,186 | | | | 5,593 | |
| Freddie Mac Pool #QA2748 3.50% 204912 | | | 1,334 | | | | 1,438 | |
| Freddie Mac Pool #RA2596 2.50% 205012 | | | 4,479 | | | | 4,608 | |
| Freddie Mac Pool #SD7517 3.00% 205012 | | | 36,320 | | | | 38,347 | |
| Freddie Mac Pool #SD0234 3.00% 205012 | | | 33,827 | | | | 35,510 | |
| Freddie Mac Pool #RA2319 3.00% 205012 | | | 23,097 | | | | 24,060 | |
| Freddie Mac Pool #SD0187 3.00% 205012 | | | 16,590 | | | | 17,503 | |
| Freddie Mac Pool #SD7545 2.50% 205112 | | | 78,527 | | | | 81,079 | |
| Freddie Mac Pool #QD3220 2.50% 205112 | | | 32,319 | | | | 33,412 | |
| Freddie Mac Pool #RA6483 2.50% 205112 | | | 9,753 | | | | 10,042 | |
| Freddie Mac Pool #RA4658 3.00% 205112 | | | 51,614 | | | | 54,358 | |
| Freddie Mac Pool #RA5971 3.00% 205112 | | | 4,931 | | | | 5,199 | |
| Freddie Mac, Series 2122, Class QM, 6.25% 202912 | | | 296 | | | | 326 | |
| Freddie Mac, Series 3257, Class PA, 5.50% 203612 | | | 2,881 | | | | 3,289 | |
| Freddie Mac, Series 3286, Class JN, 5.50% 203712 | | | 2,160 | | | | 2,406 | |
| Freddie Mac, Series 3318, Class JT, 5.50% 203712 | | | 1,271 | | | | 1,438 | |
| Freddie Mac, Series 4582, Class GA, 3.75% 20526,12 | | | 2,116 | | | | 2,154 | |
| Freddie Mac, Series KS01, Class A2, Multi Family, 2.522% 202312 | | | 2,721 | | | | 2,746 | |
| Freddie Mac, Series K036, Class A2, Multi Family, 3.527% 202312 | | | 2,000 | | | | 2,083 | |
| Freddie Mac, Series K044, Class A2, Multi Family, 2.811% 202512 | | | 23,390 | | | | 24,414 | |
| Freddie Mac, Series K049, Class A2, Multi Family, 3.01% 202512 | | | 774 | | | | 817 | |
| Freddie Mac, Series K734, Class A2, Multi Family, 3.208% 202612 | | | 5,065 | | | | 5,407 | |
| Freddie Mac, Series K060, Class A2, Multi Family, 3.30% 202612 | | | 400 | | | | 433 | |
| Freddie Mac, Series K061, Class A2, Multi Family, 3.347% 202612 | | | 2,951 | | | | 3,201 | |
| 40 | The Bond Fund of America |
| Bonds, notes & other debt instruments (continued) | | Principal amount
(000) | | | Value
(000) | |
| Mortgage-backed obligations (continued) | | | | | | |
| Federal agency mortgage-backed obligations (continued) | | | | | | |
| Freddie Mac, Series K064, Class A2, Multi Family, 3.224% 20276,12 | | $ | 1,000 | | | $ | 1,082 | |
| Freddie Mac, Series K065, Class A2, Multi Family, 3.243% 202712 | | | 1,170 | | | | 1,269 | |
| Freddie Mac, Series K074, Class A2, Multi Family, 3.60% 202812 | | | 955 | | | | 1,064 | |
| Freddie Mac, Series K084, Class A2, Multi Family, 3.78% 20286,12 | | | 6,045 | | | | 6,843 | |
| Freddie Mac, Series K078, Class A2, Multi Family, 3.854% 202812 | | | 4,000 | | | | 4,525 | |
| Freddie Mac, Series K076, Class A2, Multi Family, 3.90% 202812 | | | 3,965 | | | | 4,495 | |
| Freddie Mac, Series K081, Class A2, Multi Family, 3.90% 20286,12 | | | 1,700 | | | | 1,935 | |
| Freddie Mac, Series K082, Class A2, Multi Family, 3.92% 20286,12 | | | 1,680 | | | | 1,915 | |
| Freddie Mac, Series K079, Class A2, Multi Family, 3.926% 202812 | | | 172 | | | | 196 | |
| Freddie Mac, Series K083, Class A2, Multi Family, 4.05% 20286,12 | | | 3,000 | | | | 3,449 | |
| Freddie Mac, Series K101, Class A2, Multi Family, 2.524% 202912 | | | 62 | | | | 66 | |
| Freddie Mac, Series K090, Class A2, Multi Family, 3.422% 202912 | | | 5,000 | | | | 5,558 | |
| Freddie Mac, Series K089, Class A2, Multi Family, 3.563% 202912 | | | 5,249 | | | | 5,879 | |
| Freddie Mac, Series K105, Class A2, Multi Family, 1.872% 205312 | | | 23 | | | | 23 | |
| Freddie Mac, Series 3156, Class PO, principal only, 0% 203612 | | | 1,194 | | | | 1,098 | |
| Freddie Mac, Series 3136, Class OP, principal only, 0% 203612 | | | 328 | | | | 308 | |
| Freddie Mac, Series 3147, Class OD, principal only, 0% 203612 | | | 322 | | | | 301 | |
| Freddie Mac, Series 3149, Class MO, principal only, 0% 203612 | | | 219 | | | | 206 | |
| Freddie Mac, Series 3149, Class AO, principal only, 0% 203612 | | | 153 | | | | 142 | |
| Freddie Mac Seasoned Credit Risk Transfer Trust, Series 2017-2, Class MA, 3.00% 205612 | | | 37,363 | | | | 38,601 | |
| Freddie Mac Seasoned Credit Risk Transfer Trust, Series 2017-2, Class HA, 3.00% 20566,12 | | | 36,104 | | | | 37,248 | |
| Freddie Mac Seasoned Credit Risk Transfer Trust, Series 2017-1, Class HA, 3.00% 20566,12 | | | 29,696 | | | | 30,625 | |
| Freddie Mac Seasoned Credit Risk Transfer Trust, Series 2017-3, Class MT, 3.00% 205612 | | | 6,290 | | | | 6,506 | |
| Freddie Mac Seasoned Credit Risk Transfer Trust, Series 2017-1, Class MA, 3.00% 205612 | | | 4,068 | | | | 4,205 | |
| Freddie Mac Seasoned Credit Risk Transfer Trust, Series 2017-3, Class HA, 3.25% 20566,12 | | | 12,349 | | | | 12,771 | |
| Freddie Mac Seasoned Credit Risk Transfer Trust, Series 2017-3, Class HT, 3.25% 205612 | | | 1,256 | | | | 1,332 | |
| Freddie Mac Seasoned Credit Risk Transfer Trust, Series 2018-1, Class HT, 3.00% 205712 | | | 6,806 | | | | 7,131 | |
| Freddie Mac Seasoned Credit Risk Transfer Trust, Series 2017-4, Class HT, 3.25% 20576,12 | | | 17,304 | | | | 18,205 | |
| Freddie Mac Seasoned Credit Risk Transfer Trust, Series 2018-3, Class MA, 3.50% 205712 | | | 63,312 | | | | 65,698 | |
| Freddie Mac Seasoned Credit Risk Transfer Trust, Series 2018-2, Class MT, 3.50% 205712 | | | 17,892 | | | | 18,923 | |
| Freddie Mac Seasoned Credit Risk Transfer Trust, Series 2017-4, Class MT, 3.50% 205712 | | | 12,158 | | | | 12,930 | |
| Freddie Mac Seasoned Credit Risk Transfer Trust, Series 2017-4, Class M45T, 4.50% 205712 | | | 6,098 | | | | 6,592 | |
| Freddie Mac Seasoned Credit Risk Transfer Trust, Series 2019-2, Class MA, 3.50% 205812 | | | 27,953 | | | | 29,172 | |
| Freddie Mac Seasoned Credit Risk Transfer Trust, Series 2019-1, Class MT, 3.50% 205812 | | | 3,538 | | | | 3,742 | |
| Freddie Mac Seasoned Credit Risk Transfer Trust, Series 2019-2, Class MT, 3.50% 205812 | | | 2,961 | | | | 3,132 | |
| Freddie Mac Seasoned Credit Risk Transfer Trust, Series 2019-3, Class MT, 3.50% 205812 | | | 1,870 | | | | 1,978 | |
| Freddie Mac Seasoned Credit Risk Transfer Trust, Series 2019-1, Class MA, 3.50% 205812 | | | 1,732 | | | | 1,801 | |
| Freddie Mac Seasoned Credit Risk Transfer Trust, Series 2019-3, Class MA, 3.50% 205812 | | | 745 | | | | 774 | |
| Freddie Mac Seasoned Credit Risk Transfer Trust, Series 2019-4, Class MA, 3.00% 205912 | | | 136,714 | | | | 141,208 | |
| Freddie Mac Seasoned Loan Structured Transaction Trust, Series 2018-2, Class A1, 3.50% 202812 | | | 38,196 | | | | 39,398 | |
| Freddie Mac Seasoned Loan Structured Transaction Trust, Series 2018-1, Class A1, 3.50% 202812 | | | 23,898 | | | | 24,564 | |
| Freddie Mac Seasoned Loan Structured Transaction Trust, Series 2019-2, Class A1C, 2.75% 202912 | | | 64,950 | | | | 67,262 | |
| Freddie Mac Seasoned Loan Structured Transaction Trust, Series 2019-3, Class A1C, 2.75% 202912 | | | 54,613 | | | | 56,374 | |
| The Bond Fund of America | 41 |
| Bonds, notes & other debt instruments (continued) | | Principal amount
(000) | | | Value
(000) | |
| Mortgage-backed obligations (continued) | | | | | | |
| Federal agency mortgage-backed obligations (continued) | | | | | | |
| Freddie Mac Seasoned Loan Structured Transaction Trust, Series 2019-1, Class A1, 3.50% 202912 | | $ | 17,282 | | | $ | 17,972 | |
| Government National Mortgage Assn. 2.00% 205212,13 | | | 249,273 | | | | 251,542 | |
| Government National Mortgage Assn. 2.50% 205212,13 | | | 100,481 | | | | 102,683 | |
| Government National Mortgage Assn. 2.50% 205212,13 | | | 49,634 | | | | 50,832 | |
| Government National Mortgage Assn. 2.50% 205212,13 | | | 24,606 | | | | 25,096 | |
| Government National Mortgage Assn. 3.00% 205212,13 | | | 19,735 | | | | 20,420 | |
| Government National Mortgage Assn. 4.00% 205212,13 | | | 7,457 | | | | 7,853 | |
| Government National Mortgage Assn. Pool #MA0908 2.50% 202812 | | | 798 | | | | 826 | |
| Government National Mortgage Assn. Pool #AB3820 5.00% 203512 | | | 228 | | | | 244 | |
| Government National Mortgage Assn. Pool #AB3587 6.50% 203812 | | | 155 | | | | 171 | |
| Government National Mortgage Assn. Pool #AB3819 5.00% 203912 | | | 288 | | | | 308 | |
| Government National Mortgage Assn. Pool #004636 4.50% 204012 | | | 1,036 | | | | 1,136 | |
| Government National Mortgage Assn. Pool #783689 5.50% 204012 | | | 1,966 | | | | 2,245 | |
| Government National Mortgage Assn. Pool #783687 4.50% 204112 | | | 4,409 | | | | 4,750 | |
| Government National Mortgage Assn. Pool #AC2886 4.50% 204112 | | | 636 | | | | 684 | |
| Government National Mortgage Assn. Pool #AB3664 4.50% 204112 | | | 129 | | | | 137 | |
| Government National Mortgage Assn. Pool #AB3818 4.50% 204112 | | | 72 | | | | 77 | |
| Government National Mortgage Assn. Pool #783688 5.00% 204112 | | | 1,654 | | | | 1,824 | |
| Government National Mortgage Assn. Pool #754353 3.50% 204212 | | | 326 | | | | 338 | |
| Government National Mortgage Assn. Pool #AD7620 3.50% 204312 | | | 1,028 | | | | 1,091 | |
| Government National Mortgage Assn. Pool #MA2893 4.00% 204512 | | | 111 | | | | 120 | |
| Government National Mortgage Assn. Pool #BC1530 3.00% 204712 | | | 8,167 | | | | 8,262 | |
| Government National Mortgage Assn. Pool #BC1565 3.00% 204712 | | | 3,092 | | | | 3,114 | |
| Government National Mortgage Assn. Pool #MA5594 3.50% 204812 | | | 3,342 | | | | 3,496 | |
| Government National Mortgage Assn. Pool #MA5263 3.50% 204812 | | | 2,693 | | | | 2,828 | |
| Government National Mortgage Assn. Pool #MA5527 3.50% 204812 | | | 2,136 | | | | 2,239 | |
| Government National Mortgage Assn. Pool #MA5019 3.50% 204812 | | | 337 | | | | 354 | |
| Government National Mortgage Assn. Pool #MA5652 4.50% 204812 | | | 3,196 | | | | 3,383 | |
| Government National Mortgage Assn. Pool #MA5332 5.00% 204812 | | | 59 | | | | 63 | |
| Government National Mortgage Assn. Pool #MA5876 4.00% 204912 | | | 49,956 | | | | 52,716 | |
| Government National Mortgage Assn. Pool #MA5817 4.00% 204912 | | | 15,588 | | | | 16,515 | |
| Government National Mortgage Assn. Pool #MA5764 4.50% 204912 | | | 13,006 | | | | 13,749 | |
| Government National Mortgage Assn. Pool #MA5877 4.50% 204912 | | | 9,272 | | | | 9,801 | |
| Government National Mortgage Assn. Pool #MA5711 4.50% 204912 | | | 5,477 | | | | 5,796 | |
| Government National Mortgage Assn. Pool #MA6156 4.50% 204912 | | | 2,947 | | | | 3,114 | |
| Government National Mortgage Assn. Pool #MA5818 4.50% 204912 | | | 2,925 | | | | 3,095 | |
| Government National Mortgage Assn. Pool #MA6092 4.50% 204912 | | | 1,182 | | | | 1,250 | |
| Government National Mortgage Assn. Pool #MA6041 4.50% 204912 | | | 477 | | | | 505 | |
| Government National Mortgage Assn. Pool #MA5754 4.50% 204912 | | | 45 | | | | 47 | |
| Government National Mortgage Assn. Pool #MA5755 5.00% 204912 | | | 381 | | | | 403 | |
| Government National Mortgage Assn. Pool #MA6042 5.00% 204912 | | | 120 | | | | 128 | |
| Government National Mortgage Assn. Pool #MA6602 4.50% 205012 | | | 696 | | | | 734 | |
| Government National Mortgage Assn. Pool #MA7419 3.00% 205112 | | | 34,341 | | | | 35,583 | |
| Government National Mortgage Assn. Pool #MA7259 4.50% 205112 | | | 33,265 | | | | 35,321 | |
| Government National Mortgage Assn. Pool #694836 5.636% 205912 | | | 1 | | | | 1 | |
| Government National Mortgage Assn. Pool #725879 4.899% 206112 | | | 2 | | | | 2 | |
| Government National Mortgage Assn. Pool #725876 4.91% 206112 | | | 1 | | | | 1 | |
| Government National Mortgage Assn. Pool #765136 5.00% 206112 | | | 2 | | | | 2 | |
| Government National Mortgage Assn. Pool #710085 5.016% 206112 | | | 4 | | | | 4 | |
| Government National Mortgage Assn. Pool #721648 5.05% 206112 | | | 3 | | | | 3 | |
| Government National Mortgage Assn. Pool #AC1008 4.439% 206312 | | | 1 | | | | 1 | |
| Government National Mortgage Assn. Pool #AG8238 4.911% 206412 | | | 3 | | | | 3 | |
| Government National Mortgage Assn. Pool #725893 5.20% 206412 | | | — | 2 | | | — | 2 |
| Government National Mortgage Assn. Pool #AA7554 6.64% 206412 | | | — | 2 | | | — | 2 |
| Government National Mortgage Assn. Pool #AE9612 4.905% 206512 | | | 2 | | | | 2 | |
| JPMorgan Structured Financing Trust, Series 2021-EBO1, Class A, (1-month USD-LIBOR + 1.00%) 1.102% 20224,6,9,10,12 | | | 2,175 | | | | 2,175 | |
| Uniform Mortgage-Backed Security 1.50% 203712,13 | | | 13,210 | | | | 13,223 | |
| Uniform Mortgage-Backed Security 1.50% 203712,13 | | | 8,630 | | | | 8,654 | |
| Uniform Mortgage-Backed Security 2.00% 203712,13 | | | 25,077 | | | | 25,678 | |
| Uniform Mortgage-Backed Security 2.00% 203712,13 | | | 22,493 | | | | 22,995 | |
| Uniform Mortgage-Backed Security 3.00% 203712,13 | | | 21,774 | | | | 22,768 | |
| Uniform Mortgage-Backed Security 2.00% 205212,13 | | | 518,354 | | | | 514,550 | |
| Uniform Mortgage-Backed Security 2.00% 205212,13 | | | 73,566 | | | | 73,181 | |
| Uniform Mortgage-Backed Security 2.50% 205212,13 | | | 2,282,167 | | | | 2,317,570 | |
| Uniform Mortgage-Backed Security 2.50% 205212,13 | | | 850,417 | | | | 865,536 | |
| 42 | The Bond Fund of America |
| Bonds, notes & other debt instruments (continued) | | Principal amount
(000) | | | Value
(000) | |
| Mortgage-backed obligations (continued) | | | | | | | | |
| Federal agency mortgage-backed obligations (continued) | | | | | | | | |
| Uniform Mortgage-Backed Security 3.00% 205212,13 | | $ | 248,159 | | | $ | 256,725 | |
| Uniform Mortgage-Backed Security 3.00% 205212,13 | | | 114,574 | | | | 118,703 | |
| Uniform Mortgage-Backed Security 3.50% 205212,13 | | | 45,290 | | | | 47,681 | |
| Uniform Mortgage-Backed Security 4.00% 205212,13 | | | 6,720 | | | | 7,149 | |
| Uniform Mortgage-Backed Security 4.50% 205212,13 | | | 30,231 | | | | 32,389 | |
| | | | | | | | 8,804,660 | |
| | | | | | | | | |
| Collateralized mortgage-backed obligations (privately originated) 1.60% | | | | | | | | |
| Arroyo Mortgage Trust, Series 2021-1R, Class A1, 1.175% 20484,6,12 | | | 20,238 | | | | 20,147 | |
| Arroyo Mortgage Trust, Series 2020-1, Class A1A, 1.662% 20554,12 | | | 816 | | | | 817 | |
| Bellemeade Re, Ltd., Series 2019-3A, Class M1B, (1-month USD-LIBOR + 1.60%) 1.702% 20294,6,12 | | | 4,877 | | | | 4,879 | |
| BRAVO Residential Funding Trust, Series 2020-RPL2, Class A1, 2.00% 20594,6,12 | | | 3,107 | | | | 3,112 | |
| BRAVO Residential Funding Trust, Series 2020-RPL1, Class A1, 2.50% 20594,6,12 | | | 2,285 | | | | 2,310 | |
| Cascade Funding Mortgage Trust, Series 2020-HB4, Class A, 0.946% 20304,6,12 | | | 13,613 | | | | 13,634 | |
| Cascade Funding Mortgage Trust, Series 2021-HB7, Class A, 1.151% 20314,6,12 | | | 22,629 | | | | 22,575 | |
| Cascade Funding Mortgage Trust, Series 2021-HB6, Class A, 0.898% 20364,6,12 | | | 14,786 | | | | 14,780 | |
| CFCRE Commercial Mortgage Trust, Series 2016-C7, Class A2, 3.585% 205412 | | | 1,927 | | | | 2,043 | |
| Citigroup Mortgage Loan Trust, Inc., Series 2020-EXP1, Class A1A, 1.804% 20604,6,12 | | | 1,148 | | | | 1,156 | |
| Citigroup Mortgage Loan Trust, Inc., Series 2018-RP1, Class M1, 3.00% 20644,6,12 | | | 3,731 | | | | 3,848 | |
| COLT Funding, LLC, Series 2021-5, Class A1, 1.726% 20614,6,12 | | | 12,849 | | | | 12,825 | |
| COLT Funding, LLC, Series 2021-5, Class A2, 2.606% 20614,6,12 | | | 1,554 | | | | 1,551 | |
| Connecticut Avenue Securities, Series 2021-R01, Class 1M1, (1-month USD-SOFR + 0.75%) 0.80% 20414,6,12 | | | 608 | | | | 608 | |
| Credit Suisse Mortgage Trust, Series 2020-NET, Class A, 2.257% 20374,12 | | | 6,770 | | | | 6,831 | |
| Credit Suisse Mortgage Trust, Series 2019-RPL1, Class A1A, 3.65% 20584,6,12 | | | 1,067 | | | | 1,101 | |
| Credit Suisse Mortgage Trust, Series 2017-RPL3, Class A1, 2.00% 20604,6,12 | | | 5,940 | | | | 5,975 | |
| CS First Boston Mortgage Securities Corp., Series 2002-30, Class IA1, 7.50% 203212 | | | 179 | | | | 192 | |
| CS First Boston Mortgage Securities Corp., Series 2002-34, Class IA1, 7.50% 203212 | | | 69 | | | | 73 | |
| CS First Boston Mortgage Securities Corp., Series 2003-21, Class VA1, 6.50% 203312 | | | 963 | | | | 1,012 | |
| CS First Boston Mortgage Securities Corp., Series 2003-29, Class VA1, 7.00% 203312 | | | 213 | | | | 220 | |
| Finance of America HECM Buyout, Series 2020-HB2, Class A, 1.71% 20304,6,12 | | | 13,001 | | | | 13,030 | |
| Finance of America Structured Securities Trust, Series 2019-JR1, Class A, 2.00% 20694,12 | | | 15,248 | | | | 16,993 | |
| Finance of America Structured Securities Trust, Series 2019-JR2, Class A1, 2.00% 20694,12 | | | 14,970 | | | | 16,405 | |
| Flagstar Mortgage Trust, Series 2021-10INV, Class A3, 2.50% 20514,6,12 | | | 45,222 | | | | 45,308 | |
| Flagstar Mortgage Trust, Series 2021-8INV, Class A3, 2.50% 20514,6,12 | | | 19,669 | | | | 19,663 | |
| Flagstar Mortgage Trust, Series 2021-11INV, Class A4, 2.50% 20514,6,12 | | | 17,424 | | | | 17,436 | |
| Flagstar Mortgage Trust, Series 2021-5INV, Class A2, 2.50% 20514,6,12 | | | 15,991 | | | | 16,087 | |
| Flagstar Mortgage Trust, Series 2021-6INV, Class A4, 2.50% 20514,6,12 | | | 14,918 | | | | 14,914 | |
| Flagstar Mortgage Trust, Series 2021-11INV, Class A2, 3.00% 20514,6,12 | | | 2,948 | | | | 3,029 | |
| Freddie Mac Structured Agency Credit Risk Debt Notes, Series 2021-DNA2, Class M2, (1-month USD-SOFR + 2.30%) 2.35% 20334,6,12 | | | 6,500 | | | | 6,625 | |
| Freddie Mac Structured Agency Credit Risk Debt Notes, Series 2021-DNA5, Class M2, (1-month USD-SOFR + 1.65%) 1.70% 20344,6,12 | | | 330 | | | | 332 | |
| Freddie Mac Structured Agency Credit Risk Debt Notes, Series 2021-DNA7, Class M1, (1-month USD-SOFR + 0.85%) 0.90% 20414,6,12 | | | 2,275 | | | | 2,276 | |
| Freddie Mac Structured Agency Credit Risk Debt Notes, Series 2021-DNA6, Class M2, (1-month USD-SOFR + 1.50%) 1.55% 20414,6,12 | | | 17,026 | | | | 17,034 | |
| Freddie Mac Structured Agency Credit Risk Debt Notes, Series 2021-DNA7, Class M2, (1-month USD-SOFR + 1.80%) 1.85% 20414,6,12 | | | 1,619 | | | | 1,625 | |
| Freddie Mac Structured Agency Credit Risk Debt Notes, Series 2020-DNA2, Class M2, (1-month USD-LIBOR + 1.85%) 1.952% 20504,6,12 | | | 5,694 | | | | 5,718 | |
| Freddie Mac Structured Agency Credit Risk Debt Notes, Series 2020-DNA3, Class M2, (1-month USD-LIBOR + 3.00%) 3.102% 20504,6,12 | | | 1,597 | | | | 1,600 | |
| GCAT, Series 2021-NQM6, Class A1, 1.855% 20664,6,12 | | | 27,693 | | | | 27,604 | |
| Home Partners of America Trust, Series 2021-2, Class A, 1.901% 20264,12 | | | 28,624 | | | | 28,359 | |
| Home Partners of America Trust, Series 2021-2, Class B, 2.302% 20264,12 | | | 1,999 | | | | 1,977 | |
| HSI Asset Securitization Corp. Trust, Series 2006-OPT2, Class M2, 0.687% 20366,12 | | | 2,964 | | | | 2,966 | |
| Hundred Acre Wood Trust, Series 2021-INV1, Class A3, 2.50% 20514,6,12 | | | 5,357 | | | | 5,379 | |
| Imperial Fund, LLC, Series 2021-NQM4, Class A1, 2.091% 20574,6,12 | | | 2,044 | | | | 2,039 | |
| JPMDB Commercial Mortgage Securities Trust, Series 2017-C7, Class A5, 3.409% 205012 | | | 1,683 | | | | 1,809 | |
| JPMDB Commercial Mortgage Securities Trust, Series 2019-COR6, Class A4, 3.057% 205212 | | | 975 | | | | 1,036 | |
| Legacy Mortgage Asset Trust, Series 2019-GS5, Class A1, 3.20% 20594,6,12 | | | 4,629 | | | | 4,645 | |
| The Bond Fund of America | 43 |
| Bonds, notes & other debt instruments (continued) | | Principal amount
(000) | | | Value
(000) | |
| Mortgage-backed obligations (continued) | | | | | | | | |
| Collateralized mortgage-backed obligations (privately originated) (continued) |
| Legacy Mortgage Asset Trust, Series 2019-GS2, Class A1, 3.75% 20594,6,12 | | $ | 5,071 | | | $ | 5,081 | |
| Legacy Mortgage Asset Trust, Series 2021-GS2, Class A1, 1.75% 20614,6,12 | | | 9,481 | | | | 9,408 | |
| Legacy Mortgage Asset Trust, Series 2021-GS5, Class A1, 2.25% 2067 (5.25% on 11/25/2024)4,5,12 | | | 10,438 | | | | 10,416 | |
| Mello Warehouse Securitization Trust, Series 2020-2, Class A, (1-month USD-LIBOR + 0.80%) 0.902% 20534,6,12 | | | 15,541 | | | | 15,498 | |
| Mello Warehouse Securitization Trust, Series 2020-1, Class A, (1-month USD-LIBOR + 0.90%) 1.002% 20534,6,12 | | | 34,517 | | | | 34,535 | |
| Mello Warehouse Securitization Trust, Series 2021-2, Class A, (1-month USD-LIBOR + 0.75%) 0.852% 20554,6,12 | | | 16,464 | | | | 16,425 | |
| Mello Warehouse Securitization Trust, Series 2021-3, Class A, (1-month USD-LIBOR + 0.85%) 0.952% 20554,6,12 | | | 88,549 | | | | 88,489 | |
| MFRA Trust, Series 2021-RPL1, Class A1, 1.131% 20604,6,12 | | | 24,436 | | | | 24,061 | |
| Mill City Mortgage Trust, Series 2019-GS2, Class A1, 2.75% 20594,6,12 | | | 5,291 | | | | 5,381 | |
| Mill City Mortgage Trust, Series 2018-1, Class A1, 3.25% 20624,6,12 | | | 252 | | | | 256 | |
| Mortgage Repurchase Agreement Financing Trust, Series 2020-5, (1-month USD-LIBOR + 1.00%) 1.101% 20234,6,12 | | | 38,698 | | | | 38,741 | |
| MRA Issuance Trust, Series 2020-10, Class A, (1-month USD-LIBOR + 1.70%) 1.786% 20224,6,12 | | | 104,386 | | | | 104,482 | |
| MRA Issuance Trust, Series 2020-10, Class A2, (1-month USD-LIBOR + 1.70%) 1.786% 20224,6,12 | | | 52,286 | | | | 52,354 | |
| MRA Issuance Trust, Series 2021-16, Class A1, (1-month USD-LIBOR + 1.55%) 1.644% 20514,6,12 | | | 116,362 | | | | 116,378 | |
| New Residential Mortgage Loan Trust, Series 2019-2A, Class A1, 4.25% 20574,6,12 | | | 2,817 | | | | 2,946 | |
| New Residential Mortgage Loan Trust, Series 2020-RPL1, Class A1, 2.75% 20594,6,12 | | | 2,855 | | | | 2,907 | |
| NewRez Warehouse Securitization Trust, Series 2021-1, Class A, (1-month USD-LIBOR + 0.75%) 0.852% 20554,6,12 | | | 44,457 | | | | 44,398 | |
| One Market Plaza Trust, Series 2017-1MKT, Class A, 3.614% 20324,12 | | | 1,220 | | | | 1,225 | |
| One Market Plaza Trust, Series 2017-1MKT, Class C, 4.016% 20324,12 | | | 1,000 | | | | 1,000 | |
| PRKCM Trust, Series 2021-AFC2, Class A1, 2.071% 20564,6,12 | | | 21,500 | | | | 21,460 | |
| Progress Residential Trust, Series 2021-SFR10, Class A, 2.393% 20384,12 | | | 853 | | | | 860 | |
| Progress Residential Trust, Series 2021-SFR10, Class B, 2.722% 20384,12 | | | 800 | | | | 801 | |
| Provident Funding Mortgage Warehouse Securitization Trust, Series 2021-1, Class A, (1-month USD-LIBOR + 0.70%) 0.802% 20554,6,12 | | | 10,672 | | | | 10,626 | |
| Reverse Mortgage Investment Trust, Series 2021-HB1, Class A, 1.259% 20314,6,12 | | | 39,831 | | | | 39,778 | |
| RMF Proprietary Issuance Trust, Series 2019-1, Class A, 2.75% 20634,6,12 | | | 4,081 | | | | 4,089 | |
| Sequoia Mortgage Trust, Series 2007-2, Class 1A2, (1-month USD-LIBOR + 0.38%) 0.294% 20366,12 | | | 6,239 | | | | 6,141 | |
| Station Place Securitization Trust, Series 2021-WL1, Class A, (1-month USD-LIBOR + 0.65%) 0.752% 20544,6,12 | | | 10,859 | | | | 10,869 | |
| Station Place Securitization Trust, Series 2021-WL2, Class A, (1-month USD-LIBOR + 0.70%) 0.802% 20544,6,12 | | | 27,050 | | | | 27,078 | |
| TBW Mortgage-Backed Trust, Series 2007-2, Class A4B, (1-month USD-LIBOR + 0.42%) 0.943% 20376,12 | | | 8,030 | | | | 7,253 | |
| Towd Point Mortgage Trust, Series 2015-3, Class M2, 4.00% 20544,6,12 | | | 6,600 | | | | 6,767 | |
| Towd Point Mortgage Trust, Series 2016-2, Class A1A, 2.75% 20554,6,12 | | | 133 | | | | 133 | |
| Towd Point Mortgage Trust, Series 2016-4, Class A1, 2.25% 20564,6,12 | | | 2,444 | | | | 2,454 | |
| Towd Point Mortgage Trust, Series 2016-5, Class A1, 2.50% 20564,6,12 | | | 2,037 | | | | 2,055 | |
| Towd Point Mortgage Trust, Series 2017-5, Class A1, 0.702% 20574,6,12 | | | 528 | | | | 528 | |
| Towd Point Mortgage Trust, Series 2017-6, Class A1, 2.75% 20574,6,12 | | | 1,377 | | | | 1,395 | |
| Towd Point Mortgage Trust, Series 2017-4, Class A1, 2.75% 20574,6,12 | | | 914 | | | | 930 | |
| Towd Point Mortgage Trust, Series 2017-3, Class A1, 2.75% 20574,6,12 | | | 597 | | | | 604 | |
| Towd Point Mortgage Trust, Series 2017-6, Class M2, 3.25% 20574,6,12 | | | 4,677 | | | | 4,847 | |
| Towd Point Mortgage Trust, Series 2018-1, Class A2, 3.25% 20584,6,12 | | | 10,000 | | | | 10,286 | |
| Towd Point Mortgage Trust, Series 2018-2, Class A1, 3.25% 20584,6,12 | | | 9,001 | | | | 9,201 | |
| Towd Point Mortgage Trust, Series 2018-5, Class A1A, 3.25% 20584,6,12 | | | 6,383 | | | | 6,486 | |
| Towd Point Mortgage Trust, Series 2019-A2, Class A2, 3.75% 20584,6,12 | | | 3,615 | | | | 3,797 | |
| Towd Point Mortgage Trust, Series 2018-3, Class M2, 3.875% 20584,6,12 | | | 6,000 | | | | 6,387 | |
| Towd Point Mortgage Trust, Series 2019-4, Class M1B, 3.00% 20594,6,12 | | | 5,000 | | | | 5,118 | |
| Towd Point Mortgage Trust, Series 2020-4, Class A1, 1.75% 20604,12 | | | 28,834 | | | | 28,794 | |
| Tricon Residential, Series 2021-SFR1, Class A, 1.943% 20384,12 | | | 29,735 | | | | 29,644 | |
| Verus Securitization Trust, Series 2021-7, Class A1, 1.829% 20664,6,12 | | | 39,383 | | | | 39,325 | |
| ZH Trust, Series 2021-1, Class A, 2.253% 20274,12 | | | 1,057 | | | | 1,043 | |
| ZH Trust, Series 2021-2, Class A, 2.349% 20274,12 | | | 14,181 | | | | 14,177 | |
| | | | | | | | 1,270,485 | |
| 44 | The Bond Fund of America |
| Bonds, notes & other debt instruments (continued) | | Principal amount
(000) | | | Value
(000) | |
| Mortgage-backed obligations (continued) | | | | | | | | |
| Commercial mortgage-backed securities 1.12% | | | | | | | | |
| Banc of America Commercial Mortgage, Inc., Series 2015-UBS7, Class A4, 3.705% 204812 | | $ | 2,750 | | | $ | 2,915 | |
| Banc of America Commercial Mortgage, Inc., Series 2017-BNK3, Class A4, 3.574% 205012 | | | 115 | | | | 124 | |
| Bank Commercial Mortgage Trust, Series 2019-BN17, Class A4, 3.714% 205212 | | | 255 | | | | 282 | |
| Bank Commercial Mortgage Trust, Series 2019-BN16, Class A4, 4.005% 205212 | | | 3,920 | | | | 4,406 | |
| Bank Commercial Mortgage Trust, Series 2017-BNK9, Class A4, 3.538% 205412 | | | 135 | | | | 147 | |
| Bank Commercial Mortgage Trust, Series 2017-BNK7, Class A5, 3.435% 206012 | | | 3,750 | | | | 4,048 | |
| Bank Commercial Mortgage Trust, Series 2019-BN19, Class A3, 3.183% 206112 | | | 2,546 | | | | 2,731 | |
| Bank Commercial Mortgage Trust, Series 2018-BN10, Class A4, 3.428% 206112 | | | 330 | | | | 352 | |
| Bank Commercial Mortgage Trust, Series 2018-BN10, Class A5, 3.688% 206112 | | | 2,510 | | | | 2,749 | |
| Bank Commercial Mortgage Trust, Series 2019-BN12, Class A3, 3.99% 206112 | | | 500 | | | | 557 | |
| Bank Commercial Mortgage Trust, Series 2018-BN15, Class A3, 4.138% 206112 | | | 500 | | | | 556 | |
| Bank Commercial Mortgage Trust, Series 2018-BN13, Class A5, 4.217% 20616,12 | | | 250 | | | | 282 | |
| Bank Commercial Mortgage Trust, Series 2018-BN12, Class A4, 4.255% 20616,12 | | | 11,116 | | | | 12,559 | |
| Bank Commercial Mortgage Trust, Series 2020-BN26, Class A4, 2.403% 206312 | | | 1,654 | | | | 1,688 | |
| Bank of America Merrill Lynch Large Loan, Inc., Series 2015-200P, Class A, 3.218% 20334,12 | | | 2,000 | | | | 2,089 | |
| Barclays Commercial Mortgage Securities LLC, Series 2017-DELC, Class A, 0.96% 20364,6,12 | | | 1,000 | | | | 1,000 | |
| Benchmark Mortgage Trust, Series 2018-B2, Class A4, 3.615% 205112 | | | 3,475 | | | | 3,754 | |
| Benchmark Mortgage Trust, Series 2018-B3, Class A5, 4.025% 205112 | | | 5,890 | | | | 6,547 | |
| Benchmark Mortgage Trust, Series 2018-B4, Class A5, 4.121% 20516,12 | | | 90 | | | | 101 | |
| Benchmark Mortgage Trust, Series 2018-B8, Class A5, 4.232% 205212 | | | 6,351 | | | | 7,198 | |
| Benchmark Mortgage Trust, Series 2020-B17, Class A5, 2.289% 205312 | | | 944 | | | | 951 | |
| Benchmark Mortgage Trust, Series 2018-B7, Class A3, 4.241% 205312 | | | 1,000 | | | | 1,114 | |
| Benchmark Mortgage Trust, Series 2018-B7, Class A4, 4.51% 20536,12 | | | 6,954 | | | | 8,000 | |
| Benchmark Mortgage Trust, Series 2019-B13, Class A4, 2.952% 205712 | | | 730 | | | | 770 | |
| Benchmark Mortgage Trust, Series 2019-B14, Class AS, 3.049% 206212 | | | 5,000 | | | | 5,312 | |
| Benchmark Mortgage Trust, Series 2019-B10, Class A3, 3.455% 206212 | | | 500 | | | | 537 | |
| BX Trust, Series 2018-GW, Class A, 0.91% 20354,6,12 | | | 2,684 | | | | 2,683 | |
| BX Trust, Series 2021-ACNT, Class A, (1-month USD-LIBOR + 0.85%) 0.95% 20264,6,12 | | | 58,843 | | | | 58,850 | |
| BX Trust, Series 2021-ACNT, Class B, (1-month USD-LIBOR + 1.25%) 1.35% 20264,6,12 | | | 1,996 | | | | 1,993 | |
| BX Trust, Series 2021-ACNT, Class C, (1-month USD-LIBOR + 1.50%) 1.60% 20264,6,12 | | | 392 | | | | 391 | |
| BX Trust, Series 2021-ACNT, Class D, (1-month USD-LIBOR + 1.85%) 1.95% 20264,6,12 | | | 561 | | | | 559 | |
| BX Trust, Series 2021-SDMF, Class A, (1-month USD-LIBOR + 0.589%) 0.699% 20344,6,12 | | | 5,954 | | | | 5,893 | |
| BX Trust, Series 2021-SDMF, Class D, (1-month USD-LIBOR + 1.387%) 1.497% 20344,6,12 | | | 3,000 | | | | 2,956 | |
| BX Trust, Series 2021-VOLT, Class A, (1-month USD-LIBOR + 0.70%) 0.81% 20364,6,12 | | | 83,858 | | | | 83,688 | |
| BX Trust, Series 2021-RISE, Class A, (1-month USD-LIBOR + 0.74%) 0.848% 20364,6,12 | | | 74,996 | | | | 75,023 | |
| BX Trust, Series 2021-ARIA, Class A, (1-month USD-LIBOR + 0.899%) 1.009% 20364,6,12 | | | 31,873 | | | | 31,863 | |
| BX Trust, Series 2021-VOLT, Class B, (1-month USD-LIBOR + 0.95%) 1.06% 20364,6,12 | | | 2,036 | | | | 2,027 | |
| BX Trust, Series 2021-ARIA, Class B, (1-month USD-LIBOR + 1.297%) 1.407% 20364,6,12 | | | 2,984 | | | | 2,982 | |
| BX Trust, Series 2021-ARIA, Class C, (1-month USD-LIBOR + 1.646%) 1.756% 20364,6,12 | | | 1,992 | | | | 1,989 | |
| BX Trust, Series 2021-ARIA, Class D, (1-month USD-LIBOR + 1.895%) 2.005% 20364,6,12 | | | 690 | | | | 689 | |
| BX Trust, Series 2021-SOAR, Class A, (1-month USD-LIBOR + 0.67%) 0.78% 20384,6,12 | | | 15,655 | | | | 15,588 | |
| BX Trust, Series 2021-SOAR, Class B, (1-month USD-LIBOR + 0.87%) 0.98% 20384,6,12 | | | 1,089 | | | | 1,085 | |
| BX Trust, Series 2021-SOAR, Class C, (1-month USD-LIBOR + 1.10%) 1.21% 20384,6,12 | | | 737 | | | | 734 | |
| BX Trust, Series 2021-SOAR, Class D, (1-month USD-LIBOR + 1.40%) 1.51% 20384,6,12 | | | 1,866 | | | | 1,859 | |
| BXP Trust, Series 2017-GM, Class A, 3.379% 20394,12 | | | 4,500 | | | | 4,760 | |
| CD Commercial Mortgage Trust, Series 2017-CD6, Class A5, 3.456% 205012 | | | 5,576 | | | | 6,011 | |
| CIM Retail Portfolio Trust, Series 2021-RETL, Class A, (1-month USD-LIBOR + 1.40%) 1.51% 20364,6,12 | | | 7,550 | | | | 7,545 | |
| Citigroup Commercial Mortgage Trust, Series 2012-GC8, Class B, 4.285% 20454,12 | | | 500 | | | | 506 | |
| Citigroup Commercial Mortgage Trust, Series 2014-GC21, Class AS, 4.026% 204712 | | | 2,000 | | | | 2,096 | |
| Citigroup Commercial Mortgage Trust, Series 2014-GC21, Class B, 4.328% 20476,12 | | | 1,800 | | | | 1,878 | |
| Citigroup Commercial Mortgage Trust, Series 2015-GC27, Class A4, 2.878% 204812 | | | 1,006 | | | | 1,028 | |
| Citigroup Commercial Mortgage Trust, Series 2016-GC37, Class A4, 3.314% 204912 | | | 2,740 | | | | 2,893 | |
| Citigroup Commercial Mortgage Trust, Series 2016-C1, Class AS, 3.514% 204912 | | | 600 | | | | 633 | |
| Citigroup Commercial Mortgage Trust, Series 2016-GC36, Class A5, 3.616% 204912 | | | 1,525 | | | | 1,627 | |
| Citigroup Commercial Mortgage Trust, Series 2017-B1, Class A3, 3.197% 205012 | | | 6,250 | | | | 6,568 | |
| Citigroup Commercial Mortgage Trust, Series 2017-C4, Class A4, 3.471% 205012 | | | 2,930 | | | | 3,150 | |
| Citigroup Commercial Mortgage Trust, Series 2019-GC41, Class AA, 2.62% 205612 | | | 200 | | | | 207 | |
| Citigroup Commercial Mortgage Trust, Series 2015-GC33, Class A3, 3.515% 205812 | | | 4,900 | | | | 5,143 | |
| Commercial Mortgage Trust, Series 2012-CRS, Class A4, 2.771% 204512 | | | 1,871 | | | | 1,898 | |
| The Bond Fund of America | 45 |
| Bonds, notes & other debt instruments (continued) | | Principal amount
(000) | | | Value
(000) | |
| Mortgage-backed obligations (continued) | | | | | | | | |
| Commercial mortgage-backed securities (continued) | | | | | | | | |
| Commercial Mortgage Trust, Series 2012-CR3, Class AM, 3.416% 20454,12 | | $ | 700 | | | $ | 700 | |
| Commercial Mortgage Trust, Series 2012-CR2, Class B, 4.393% 204512 | | | 700 | | | | 707 | |
| Commercial Mortgage Trust, Series 2013-CR6, Class B, 3.397% 20464,12 | | | 2,000 | | | | 2,026 | |
| Commercial Mortgage Trust, Series 2013-CRE7, Class B, 3.613% 20464,12 | | | 2,000 | | | | 2,047 | |
| Commercial Mortgage Trust, Series 2013-CR7, Class C, 4.063% 20464,6,12 | | | 2,743 | | | | 2,804 | |
| Commercial Mortgage Trust, Series 2013-LC13, Class B, 5.009% 20464,6,12 | | | 830 | | | | 868 | |
| Commercial Mortgage Trust, Series 2014-UBS4, Class A5, 3.694% 204712 | | | 910 | | | | 956 | |
| Commercial Mortgage Trust, Series 2014-CR16, Class A3, 3.775% 204712 | | | 1,972 | | | | 2,052 | |
| Commercial Mortgage Trust, Series 2014-LC17, Class A5, 3.917% 204712 | | | 886 | | | | 941 | |
| Commercial Mortgage Trust, Series 2014-UBS2, Class AM, 4.048% 204712 | | | 875 | | | | 924 | |
| Commercial Mortgage Trust, Series 2014-CR15, Class A4, 4.074% 20476,12 | | | 3,000 | | | | 3,140 | |
| Commercial Mortgage Trust, Series 2014-CR19, Class AM, 4.08% 204712 | | | 750 | | | | 792 | |
| Commercial Mortgage Trust, Series 2014-LC15, Class AM, 4.198% 204712 | | | 850 | | | | 892 | |
| Commercial Mortgage Trust, Series 2014-CR16, Class AM, 4.278% 204712 | | | 1,070 | | | | 1,129 | |
| Commercial Mortgage Trust, Series 2014-LC17, Class B, 4.49% 20476,12 | | | 2,200 | | | | 2,308 | |
| Commercial Mortgage Trust, Series 2014-UBS4, Class B, 4.701% 204712 | | | 1,000 | | | | 1,050 | |
| Commercial Mortgage Trust, Series 2015-CR22, Class B, 3.926% 20486,12 | | | 4,250 | | | | 4,460 | |
| Commercial Mortgage Trust, Series 2016-COR1, Class A4, 3.091% 204912 | | | 4,000 | | | | 4,204 | |
| Commercial Mortgage Trust, Series 2017-COR2, Class A2, 3.239% 205012 | | | 970 | | | | 1,019 | |
| Commercial Mortgage Trust, Series 2017-COR2, Class A3, 3.51% 205012 | | | 2,261 | | | | 2,439 | |
| Commercial Mortgage Trust, Series 2015-PC1, Class A4, 3.62% 205012 | | | 2,309 | | | | 2,372 | |
| Commercial Mortgage Trust, Series 2015-PC1, Class AM, 4.29% 20506,12 | | | 1,250 | | | | 1,336 | |
| Commercial Mortgage Trust, Series 2013-CR11, Class B, 5.111% 20506,12 | | | 500 | | | | 526 | |
| CSAIL Commercial Mortgage Trust, Series 2015-C4, Class C, 4.561% 20486,12 | | | 556 | | | | 581 | |
| CSAIL Commercial Mortgage Trust, Series 2017-CX9, Class A4, 3.176% 205012 | | | 2,375 | | | | 2,473 | |
| CSAIL Commercial Mortgage Trust, Series 2015-C1, Class B, 4.044% 20506,12 | | | 600 | | | | 608 | |
| CSAIL Commercial Mortgage Trust, Series 2015-C2, Class A3, 3.231% 205712 | | | 2,759 | | | | 2,853 | |
| Deutsche Bank Commercial Mortgage Trust, Series 2016-C1, Class AM, 3.539% 204912 | | | 500 | | | | 527 | |
| Ellington Financial Mortgage Trust, Series 2021-3, Class A1, 1.241% 20664,6,12 | | | 2,450 | | | | 2,411 | |
| Extended Stay America Trust, Series 2021-ESH, Class A, (1-month USD-LIBOR + 1.08%) 1.19% 20384,6,12 | | | 17,540 | | | | 17,590 | |
| Extended Stay America Trust, Series 2021-ESH, Class B, (1-month USD-LIBOR + 1.38%) 1.49% 20384,6,12 | | | 4,002 | | | | 4,009 | |
| Extended Stay America Trust, Series 2021-ESH, Class C, (1-month USD-LIBOR + 1.70%) 1.81% 20384,6,12 | | | 4,180 | | | | 4,188 | |
| Extended Stay America Trust, Series 2021-ESH, Class D, (1-month USD-LIBOR + 2.25%) 2.36% 20384,6,12 | | | 4,171 | | | | 4,181 | |
| Fontainebleau Miami Beach Trust, CMO, Series 2019-FBLU, Class A, 3.144% 20364,12 | | | 5,000 | | | | 5,115 | |
| Grace Mortgage Trust, Series 2020-GRCE, Class A, 2.347% 20404,12 | | | 7,590 | | | | 7,596 | |
| GS Mortgage Securities Trust, Series 2018-HULA, Class A, 1.03% 20254,6,12 | | | 923 | | | | 923 | |
| GS Mortgage Securities Trust, Series 2019-BOCA, Class A, (1-month USD-LIBOR + 1.20%) 1.31% 20384,6,12 | | | 1,000 | | | | 1,001 | |
| GS Mortgage Securities Trust, Series 2012-GCJ7, Class A4, 3.377% 204512 | | | 103 | | | | 103 | |
| GS Mortgage Securities Trust, Series 2013-GC12, Class A4, 3.135% 204612 | | | 1,250 | | | | 1,281 | |
| GS Mortgage Securities Trust, Series 2013-GC10, Class B, 3.682% 20464,12 | | | 4,500 | | | | 4,575 | |
| GS Mortgage Securities Trust, Series 2013-GC12, Class B, 3.777% 20466,12 | | | 1,500 | | | | 1,537 | |
| GS Mortgage Securities Trust, Series 2020-GS1, Class A2, 3.47% 204812 | | | 3,000 | | | | 3,109 | |
| GS Mortgage Securities Trust, Series 2016-GS4, Class A3, 3.178% 204912 | | | 2,500 | | | | 2,604 | |
| GS Mortgage Securities Trust, Series 2016-GS4, Class A4, 3.442% 20496,12 | | | 2,654 | | | | 2,836 | |
| GS Mortgage Securities Trust, Series 2017-GS7, Class A3, 3.167% 205012 | | | 855 | | | | 902 | |
| GS Mortgage Securities Trust, Series 2017-GS7, Class A4, 3.43% 205012 | | | 1,000 | | | | 1,074 | |
| GS Mortgage Securities Trust, Series 2019-GC38, Class A4, 3.968% 205212 | | | 255 | | | | 285 | |
| GS Mortgage Securities Trust, Series 2020-GC47, Class A5, 2.377% 205312 | | | 7,483 | | | | 7,596 | |
| GS Mortgage Securities Trust, Series 2020-GC45, Class A5, 2.911% 205312 | | | 174 | | | | 183 | |
| Hawaii Hotel Trust, Series 2019-MAUI, Class A, (1-month USD-LIBOR + 1.15%) 1.26% 20384,6,12 | | | 7,000 | | | | 7,010 | |
| JPMBB Commercial Mortgage Securities Trust, Series 2014-C19, Class A4, 3.997% 204712 | | | 2,450 | | | | 2,566 | |
| JPMBB Commercial Mortgage Securities Trust, Series 2014-C18, Class A5, 4.079% 204712 | | | 8,195 | | | | 8,591 | |
| JPMBB Commercial Mortgage Securities Trust, Series 2014-C19, Class B, 4.394% 20476,12 | | | 600 | | | | 629 | |
| JPMBB Commercial Mortgage Securities Trust, Series 2014-C23, Class B, 4.484% 20476,12 | | | 100 | | | | 105 | |
| JPMBB Commercial Mortgage Securities Trust, Series 2014-C26, Class B, 3.951% 204812 | | | 3,500 | | | | 3,586 | |
| 46 | The Bond Fund of America |
| Bonds, notes & other debt instruments (continued) | | Principal amount
(000) | | | Value
(000) | |
| Mortgage-backed obligations (continued) | | | | | | | | |
| Commercial mortgage-backed securities (continued) | | | | | | | | |
| JPMDB Commercial Mortgage Securities Trust, Series 2017-C5, Class A5, 3.694% 205012 | | $ | 1,600 | | | $ | 1,728 | |
| JPMorgan Chase Commercial Mortgage Securities Trust, Series 2018-BCON, Class A, 3.735% 20314,12 | | | 3,955 | | | | 4,043 | |
| JPMorgan Chase Commercial Mortgage Securities Trust, Series 2021-410T, Class A, 2.287% 20424,12 | | | 1,920 | | | | 1,926 | |
| JPMorgan Chase Commercial Mortgage Securities Trust, Series 2013-C16, Class A4, 4.166% 204612 | | | 1,020 | | | | 1,066 | |
| JPMorgan Chase Commercial Mortgage Securities Trust, Series 2013-C10, Class AS, 3.372% 204712 | | | 2,500 | | | | 2,551 | |
| JPMorgan Chase Commercial Mortgage Securities Trust, Series 2013-C10, Class B, 3.674% 20476,12 | | | 2,600 | | | | 2,649 | |
| JPMorgan Chase Commercial Mortgage Securities Trust, Series 2013-C10, Class C, 4.10% 20476,12 | | | 750 | | | | 758 | |
| JPMorgan Chase Commercial Mortgage Securities Trust, Series 2016-JP4, Class A4, 3.648% 20496,12 | | | 5,095 | | | | 5,493 | |
| LUXE Commercial Mortgage Trust, Series 2021-TRIP, Class A, (1-month USD-LIBOR + 1.05%) 1.16% 20384,6,12 | | | 26,104 | | | | 26,135 | |
| LUXE Commercial Mortgage Trust, Series 2021-TRIP, Class B, (1-month USD-LIBOR + 1.40%) 1.51% 20384,6,12 | | | 762 | | | | 762 | |
| LUXE Commercial Mortgage Trust, Series 2021-TRIP, Class C, (1-month USD-LIBOR + 1.75%) 1.86% 20384,6,12 | | | 1,500 | | | | 1,500 | |
| Manhattan West Mortgage Trust, Series 2020-1MW, Class A, 2.13% 20394,12 | | | 3,126 | | | | 3,120 | |
| MHC Commercial Mortgage Trust, CMO, Series 2021-MHC, Class A, (1-month USD-LIBOR + 0.801%) 0.911% 20264,6,12 | | | 23,390 | | | | 23,376 | |
| Morgan Stanley Bank of America Merrill Lynch Trust, Series 2013-C9, Class A4, 3.102% 204612 | | | 2,175 | | | | 2,213 | |
| Morgan Stanley Bank of America Merrill Lynch Trust, Series 2013-C9, Class B, 3.708% 20466,12 | | | 1,511 | | | | 1,542 | |
| Morgan Stanley Bank of America Merrill Lynch Trust, Series 2013-C13, Class A-4, 4.039% 204612 | | | 1,934 | | | | 2,022 | |
| Morgan Stanley Bank of America Merrill Lynch Trust, Series 2013-C11, Class A4, 4.151% 20466,12 | | | 4,035 | | | | 4,163 | |
| Morgan Stanley Bank of America Merrill Lynch Trust, Series 2014-C16, Class A4, 3.60% 204712 | | | 959 | | | | 990 | |
| Morgan Stanley Bank of America Merrill Lynch Trust, Series 2014-C17, Class A5, 3.741% 204712 | | | 24,171 | | | | 25,368 | |
| Morgan Stanley Bank of America Merrill Lynch Trust, Series 2015-C27, Class A4, 3.753% 204712 | | | 525 | | | | 563 | |
| Morgan Stanley Bank of America Merrill Lynch Trust, Series 2014-C19, Class B, 4.00% 20476,12 | | | 2,000 | | | | 2,103 | |
| Morgan Stanley Bank of America Merrill Lynch Trust, Series 2015-C22, Class A4, 4.051% 204712 | | | 250 | | | | 263 | |
| Morgan Stanley Bank of America Merrill Lynch Trust, Series 2015-C22, Class A-4, 3.306% 204812 | | | 1,870 | | | | 1,959 | |
| Morgan Stanley Bank of America Merrill Lynch Trust, Series 2015-C25, Class A-4, 3.372% 204812 | | | 1,300 | | | | 1,366 | |
| Morgan Stanley Bank of America Merrill Lynch Trust, Series 2016-C30, Class A4, 2.60% 204912 | | | 250 | | | | 256 | |
| Morgan Stanley Bank of America Merrill Lynch Trust, Series 2016-C31, Class A-S, 3.102% 204912 | | | 3,000 | | | | 3,167 | |
| Morgan Stanley Bank of America Merrill Lynch Trust, Series 2016-C32, Class A-4, 3.72% 204912 | | | 5,280 | | | | 5,723 | |
| Morgan Stanley Bank of America Merrill Lynch Trust, Series 2015-C23, Class A3, 3.451% 205012 | | | 559 | | | | 582 | |
| Morgan Stanley Capital I Trust, Series 2015-UBS8, Class AS, 4.114% 204812 | | | 1,730 | | | | 1,843 | |
| Morgan Stanley Capital I Trust, Series 2016-UBS9, Class C, 4.761% 20496,12 | | | 567 | | | | 587 | |
| Motel 6 Trust, Series 2021-MTL6, Class A, (1-month USD-LIBOR + 0.90%) 1.01% 20384,6,12 | | | 4,174 | | | | 4,175 | |
| Motel 6 Trust, Series 2021-MTL6, Class B, (1-month USD-LIBOR + 1.20%) 1.31% 20384,6,12 | | | 1,048 | | | | 1,048 | |
| Motel 6 Trust, Series 2021-MTL6, Class C, (1-month USD-LIBOR + 1.50%) 1.61% 20384,6,12 | | | 314 | | | | 314 | |
| SLG Office Trust, Series 2021-OVA, Class A, 2.585% 20414,12 | | | 28,432 | | | | 29,167 | |
| The Bond Fund of America | 47 |
| Bonds, notes & other debt instruments (continued) | | Principal amount
(000) | | | Value
(000) | |
| Mortgage-backed obligations (continued) | | | | | | | | |
| Commercial mortgage-backed securities (continued) | | | | | | | | |
| SREIT Trust, Series 2021-FLWR, Class A, (1-month USD-LIBOR + 0.577%) 0.686% 20364,6,12 | | $ | 51,039 | | | $ | 50,500 | |
| SREIT Trust, Series 2021-FLWR, Class B, (1-month USD-LIBOR + 0.926%) 1.036% 20364,6,12 | | | 2,000 | | | | 1,979 | |
| SREIT Trust, Series 2021-MFP, Class A, (1-month USD-LIBOR + 0.731%) 0.841% 20384,6,12 | | | 51,446 | | | | 51,281 | |
| SREIT Trust, Series 2021-MFP, Class B, (1-month USD-LIBOR + 1.079%) 1.19% 20384,6,12 | | | 1,546 | | | | 1,538 | |
| SREIT Trust, Series 2021-MFP, Class C, (1-month USD-LIBOR + 1.329%) 1.439% 20384,6,12 | | | 831 | | | | 826 | |
| Wells Fargo Commercial Mortgage Trust, Series 2014-LC18, Class A5, 3.405% 204712 | | | 290 | | | | 305 | |
| Wells Fargo Commercial Mortgage Trust, Series 2015-C28, Class A4, 3.54% 204812 | | | 4,380 | | | | 4,636 | |
| Wells Fargo Commercial Mortgage Trust, Series 2015-C31, Class A4, 3.695% 204812 | | | 1,400 | | | | 1,499 | |
| Wells Fargo Commercial Mortgage Trust, Series 2015-SG1, Class A-4, 3.789% 204812 | | | 7,021 | | | | 7,398 | |
| Wells Fargo Commercial Mortgage Trust, Series 2015-P2, Class A4, 3.809% 204812 | | | 1,137 | | | | 1,223 | |
| Wells Fargo Commercial Mortgage Trust, Series 2015-C28, Class C, 4.093% 20486,12 | | | 585 | | | | 603 | |
| Wells Fargo Commercial Mortgage Trust, Series 2016-C34, Class A4, 3.096% 204912 | | | 6,190 | | | | 6,436 | |
| Wells Fargo Commercial Mortgage Trust, Series 2016-C34, Class AS, 3.484% 204912 | | | 380 | | | | 388 | |
| Wells Fargo Commercial Mortgage Trust, Series 2016-C37, Class A5, 3.794% 204912 | | | 6,370 | | | | 6,938 | |
| Wells Fargo Commercial Mortgage Trust, Series 2017-C40, Class A4, 3.581% 205012 | | | 1,154 | | | | 1,251 | |
| Wells Fargo Commercial Mortgage Trust, Series 2014-LC16, Class A5, 3.817% 205012 | | | 2,302 | | | | 2,414 | |
| Wells Fargo Commercial Mortgage Trust, Series 2018-C46, Class A3, 3.888% 205112 | | | 6,500 | | | | 7,071 | |
| Wells Fargo Commercial Mortgage Trust, Series 2019-C54, Class A4, 3.146% 205212 | | | 3,898 | | | | 4,175 | |
| Wells Fargo Commercial Mortgage Trust, Series 2015-NXS3, Class D, 3.153% 20574,12 | | | 1,667 | | | | 1,617 | |
| Wells Fargo Commercial Mortgage Trust, Series 2015-LC22, Class C, 4.557% 20586,12 | | | 1,000 | | | | 1,038 | |
| Wells Fargo Commercial Mortgage Trust, Series 2016-C36, Class A4, 3.065% 205912 | | | 3,853 | | | | 4,015 | |
| Wells Fargo Commercial Mortgage Trust, Series 2016-C33, Class A4, 3.426% 205912 | | | 1,320 | | | | 1,405 | |
| Wells Fargo Commercial Mortgage Trust, Series 2016-NXS5, Class AS, 3.988% 205912 | | | 600 | | | | 639 | |
| Wells Fargo Commercial Mortgage Trust, Series 2017-RC1, Class A4, 3.631% 206012 | | | 510 | | | | 553 | |
| WF-RBS Commercial Mortgage Trust, Series 2013-C11, Class AS, 3.311% 204512 | | | 255 | | | | 260 | |
| WF-RBS Commercial Mortgage Trust, Series 2013-C13, Class B, 3.553% 204512 | | | 500 | | | | 510 | |
| WF-RBS Commercial Mortgage Trust, Series 2013-C11, Class B, 3.714% 20456,12 | | | 1,000 | | | | 1,018 | |
| WF-RBS Commercial Mortgage Trust, Series 2012-C8, Class B, 4.311% 204512 | | | 5,000 | | | | 5,056 | |
| WF-RBS Commercial Mortgage Trust, Series 2012-C6, Class B, 4.697% 204512 | | | 298 | | | | 299 | |
| WF-RBS Commercial Mortgage Trust, Series 2013-C16, Class B, 5.542% 20466,12 | | | 1,450 | | | | 1,502 | |
| WF-RBS Commercial Mortgage Trust, Series 2014-C19, Class B, 4.723% 20476,12 | | | 2,000 | | | | 2,078 | |
| WF-RBS Commercial Mortgage Trust, Series 2013-C12, Class B, 3.863% 20486,12 | | | 2,000 | | | | 2,044 | |
| WF-RBS Commercial Mortgage Trust, Series 2014-C22, Class A4, 3.488% 205712 | | | 2,025 | | | | 2,095 | |
| | | | | | | | 888,995 | |
| | | | | | | | | |
| Other mortgage-backed securities 0.23% | | | | | | | | |
| Nykredit Realkredit AS, Series 01E, 1.00% 205312 | | DKr | 627,970 | | | | 90,609 | |
| Nykredit Realkredit AS, Series CCE, 1.00% 205012 | | | 451,530 | | | | 65,980 | |
| Realkredit Danmark AS 1.00% 205312 | | | 170,500 | | | | 24,621 | |
| | | | | | | | 181,210 | |
| | | | | | | | | |
| Total mortgage-backed obligations | | | | | | | 11,145,350 | |
| | | | | | | | | |
| Asset-backed obligations 3.26% | | | | | | | | |
| Aesop Funding LLC, Series 2019-1A, Class A, 3.45% 20234,12 | | $ | 5,803 | | | | 5,826 | |
| Aesop Funding LLC, Series 2017-2A, Class A, 2.97% 20244,12 | | | 6,155 | | | | 6,283 | |
| Aesop Funding LLC, Series 2018-1A, Class A, 3.70% 20244,12 | | | 10,350 | | | | 10,742 | |
| Aesop Funding LLC, Series 2019-2A, Class D, 3.04% 20254,12 | | | 9,000 | | | | 8,921 | |
| Aesop Funding LLC, Series 2019-2A, Class A, 3.35% 20254,12 | | | 9,410 | | | | 9,866 | |
| Aesop Funding LLC, Series 2018-2A, Class A, 4.00% 20254,12 | | | 47,950 | | | | 50,587 | |
| Aesop Funding LLC, Series 2020-1A, Class A, 2.33% 20264,12 | | | 12,814 | | | | 13,141 | |
| Aesop Funding LLC, Series 2019-3A, Class A, 2.36% 20264,12 | | | 6,460 | | | | 6,613 | |
| Aesop Funding LLC, Series 2021-1A, Class A, 1.38% 20274,12 | | | 22,390 | | | | 22,036 | |
| Aesop Funding LLC, Series 2021-1A, Class B, 1.63% 20274,12 | | | 3,398 | | | | 3,342 | |
| Aesop Funding LLC, Series 2020-2, Class A, 2.02% 20274,12 | | | 6,472 | | | | 6,553 | |
| Aesop Funding LLC, Series 2021-1A, Class C, 2.13% 20274,12 | | | 1,211 | | | | 1,193 | |
| Aesop Funding LLC, Series 2020-2A, Class B, 2.96% 20274,12 | | | 1,660 | | | | 1,723 | |
| Aesop Funding LLC, Series 2021-1A, Class D, 3.71% 20274,12 | | | 5,000 | | | | 4,956 | |
| Aesop Funding LLC, Series 2020-2A, Class C, 4.25% 20274,12 | | | 3,581 | | | | 3,814 | |
| Affirm Asset Securitization Trust, Series 2021-A, Class A, 0.88% 20254,12 | | | 14,038 | | | | 14,044 | |
| Affirm Asset Securitization Trust, Series 2020-A, Class A, 2.10% 20254,12 | | | 3,186 | | | | 3,194 | |
| Affirm Asset Securitization Trust, Series 2021-B, Class A, 1.03% 20264,12 | | | 3,927 | | | | 3,903 | |
| 48 | The Bond Fund of America |
| Bonds, notes & other debt instruments (continued) | | Principal amount
(000) | | | Value
(000) | |
| Asset-backed obligations (continued) | | | | | | | | |
| Affirm Asset Securitization Trust, Series 2021-Z2, Class A, 1.17% 20264,12 | | $ | 16,222 | | | $ | 16,163 | |
| American Credit Acceptance Receivables Trust, Series 2020-3, Class C, 1.85% 20264,12 | | | 7,643 | | | | 7,699 | |
| American Credit Acceptance Receivables Trust, Series 2020-1, Class D, 2.39% 20264,12 | | | 1,530 | | | | 1,551 | |
| American Credit Acceptance Receivables Trust, Series 2021-1, Class C, 0.83% 20274,12 | | | 4,048 | | | | 4,032 | |
| American Credit Acceptance Receivables Trust, Series 2021-3, Class C, 0.98% 20274,12 | | | 12,733 | | | | 12,597 | |
| American Credit Acceptance Receivables Trust, Series 2021-1, Class D, 1.14% 20274,12 | | | 2,226 | | | | 2,209 | |
| American Credit Acceptance Receivables Trust, Series 2021-3, Class D, 1.34% 20274,12 | | | 8,103 | | | | 7,999 | |
| AmeriCredit Automobile Receivables Trust, Series 2021-2, Class B, 0.69% 202712 | | | 6,085 | | | | 6,014 | |
| AmeriCredit Automobile Receivables Trust, Series 2021-2, Class C, 1.01% 202712 | | | 6,765 | | | | 6,658 | |
| AmeriCredit Automobile Receivables Trust, Series 2021-2, Class D, 1.29% 202712 | | | 15,943 | | | | 15,698 | |
| Ballyrock CLO, Ltd., Series 2019-2A, Class A1AR, (3-month USD-LIBOR + 1.00%) 1.16% 20304,6,12 | | | 3,290 | | | | 3,290 | |
| Bankers Healthcare Group Securitization Trust, Series 2020-A, Class A, 2.56% 20314,12 | | | 605 | | | | 612 | |
| Bankers Healthcare Group Securitization Trust, Series 2020-A, Class B, 3.59% 20314,12 | | | 4,310 | | | | 4,426 | |
| Bankers Healthcare Group Securitization Trust, Series 2021-A, Class A, 1.42% 20334,12 | | | 1,651 | | | | 1,641 | |
| Bankers Healthcare Group Securitization Trust, Series 2021-A, Class B, 2.79% 20334,12 | | | 914 | | | | 919 | |
| Bankers Healthcare Group Securitization Trust, Series 2021-B, Class A, 0.90% 20344,12 | | | 1,708 | | | | 1,699 | |
| Bankers Healthcare Group Securitization Trust, Series 2021-B, Class B, 1.67% 20344,12 | | | 1,533 | | | | 1,510 | |
| Blackbird Capital II Aircraft Lease, Ltd. / Blackbird Capital II Aircraft Lease US, LLC, Series 2021-1, Class A, 2.443% 20464,12 | | | 22,335 | | | | 22,094 | |
| Blackbird Capital II Aircraft Lease, Ltd. / Blackbird Capital II Aircraft Lease US, LLC, Series 2021-1, Class B, 3.446% 20464,12 | | | 2,825 | | | | 2,797 | |
| CarMaxAuto Owner Trust, Series 2019-2, Class C, 3.16% 202512 | | | 650 | | | | 666 | |
| CarMaxAuto Owner Trust, Series 2021-1, Class C, 0.94% 202612 | | | 580 | | | | 570 | |
| CarMaxAuto Owner Trust, Series 2021-1, Class D, 1.28% 202712 | | | 568 | | | | 560 | |
| Carvana Auto Receivables Trust, Series 2021-N4, Class C, 1.72% 202812 | | | 3,206 | | | | 3,207 | |
| Carvana Auto Receivables Trust, Series 2021-N4, Class A2, 1.80% 202812 | | | 5,268 | | | | 5,286 | |
| Castlelake Aircraft Securitization Trust, Series 2021-2A, Class A, 2.868% 20374,12 | | | 96,517 | | | | 95,828 | |
| Castlelake Aircraft Securitization Trust, Series 2021-2A, Class C, 3.602% 20374,12 | | | 15,591 | | | | 15,680 | |
| Castlelake Aircraft Securitization Trust, Series 2021-2A, Class C, 5.75% 20374,12 | | | 3,988 | | | | 4,015 | |
| Castlelake Aircraft Securitization Trust, Series 2017-1R, Class A, 2.741% 20414,12 | | | 5,953 | | | | 5,885 | |
| CF Hippolyta LLC, Series 2020-1, Class A1, 1.69% 20604,12 | | | 88,092 | | | | 87,467 | |
| CF Hippolyta LLC, Series 2020-1, Class A2, 1.99% 20604,12 | | | 14,332 | | | | 14,101 | |
| CF Hippolyta LLC, Series 2020-1, Class B1, 2.28% 20604,12 | | | 9,292 | | | | 9,294 | |
| CF Hippolyta LLC, Series 2020-1, Class B2, 2.60% 20604,12 | | | 1,013 | | | | 1,011 | |
| CF Hippolyta LLC, Series 2021-1, Class A1, 1.53% 20614,12 | | | 61,022 | | | | 59,945 | |
| CF Hippolyta LLC, Series 2021-1, Class B1, 1.98% 20614,12 | | | 5,828 | | | | 5,749 | |
| CLI Funding V LLC, Series 2020-2A, Class B, 3.56% 20454,12 | | | 585 | | | | 589 | |
| CLI Funding V LLC, Series 2020-1A, Class B, 3.62% 20454,12 | | | 1,074 | | | | 1,084 | |
| CLI Funding VI LLC, Series 2020-2A, Class A, 2.03% 20454,12 | | | 7,789 | | | | 7,744 | |
| CLI Funding VI LLC, Series 2020-3A, Class A, 2.07% 20454,12 | | | 2,748 | | | | 2,734 | |
| CLI Funding VI LLC, Series 2020-1A, Class A, 2.08% 20454,12 | | | 1,079 | | | | 1,075 | |
| CLI Funding VI LLC, Series 2020-3A, Class B, 3.30% 20454,12 | | | 1,791 | | | | 1,803 | |
| CLI Funding VIII LLC, Series 2021-1A, Class A, 1.64% 20464,12 | | | 12,399 | | | | 12,134 | |
| CLI Funding VIII LLC, Series 2021-1A, Class B, 2.38% 20464,12 | | | 1,392 | | | | 1,371 | |
| Cloud Pass-Through Trust, Series 2019-1A, Class CLOU, 3.554% 20224,6,12 | | | 228 | | | | 229 | |
| CPS Auto Receivables Trust, Series 2019-B, Class C, 3.35% 20244,12 | | | 179 | | | | 179 | |
| CPS Auto Receivables Trust, Series 2019-C, Class C, 2.84% 20254,12 | | | 830 | | | | 833 | |
| CPS Auto Receivables Trust, Series 2019-C, Class D, 3.17% 20254,12 | | | 4,273 | | | | 4,339 | |
| CPS Auto Receivables Trust, Series 2019-B, Class D, 3.69% 20254,12 | | | 5,325 | | | | 5,385 | |
| CPS Auto Receivables Trust, Series 2021-A, Class C, 0.83% 20264,12 | | | 1,915 | | | | 1,902 | |
| CPS Auto Receivables Trust, Series 2021-A, Class D, 1.16% 20264,12 | | | 1,643 | | | | 1,626 | |
| CPS Auto Receivables Trust, Series 2020-C, Class C, 1.71% 20264,12 | | | 2,829 | | | | 2,845 | |
| CPS Auto Receivables Trust, Series 2020-B, Class C, 3.30% 20264,12 | | | 681 | | | | 688 | |
| CPS Auto Receivables Trust, Series 2020-B, Class D, 4.75% 20264,12 | | | 598 | | | | 620 | |
| Credit Acceptance Auto Loan Trust, Series 2020-2A, Class A, 1.37% 20294,12 | | | 3,739 | | | | 3,752 | |
| Credit Acceptance Auto Loan Trust, Series 2020-1A, Class A, 2.01% 20294,12 | | | 15,748 | | | | 15,876 | |
| Credit Acceptance Auto Loan Trust, Series 2020-1A, Class B, 2.39% 20294,12 | | | 4,118 | | | | 4,174 | |
| Credit Acceptance Auto Loan Trust, Series 2021-3A, Class A, 1.00% 20304,12 | | | 12,100 | | | | 12,009 | |
| CWHEQ Revolving Home Equity Loan Trust, Series 2005-C, Class 2A, FSA insured, (1-month USD-LIBOR + 0.18%) 0.29% 20356,12 | | | 983 | | | | 963 | |
| CWHEQ Revolving Home Equity Loan Trust, Series 2006-I, Class 2A, FSA insured, (1-month USD-LIBOR + 0.14%) 0.25% 20376,12 | | | 1,633 | | | | 1,561 | |
| CWHEQ Revolving Home Equity Loan Trust, Series 2007-B, Class A, FSA insured, (1-month USD-LIBOR + 0.15%) 0.26% 20376,12 | | | 2,502 | | | | 2,408 | |
| Drive Auto Receivables Trust, Series 2021-1, Class A2, 0.36% 202312 | | | 3,625 | | | | 3,625 | |
| Drive Auto Receivables Trust, Series 2021-1, Class A3, 0.44% 202412 | | | 12,750 | | | | 12,738 | |
| The Bond Fund of America | 49 |
| Bonds, notes & other debt instruments (continued) | | Principal amount
(000) | | | Value
(000) | |
| Asset-backed obligations (continued) | | | | | | | | |
| Drive Auto Receivables Trust, Series 2018-1, Class D, 3.81% 202412 | | $ | 9 | | | $ | 9 | |
| Drive Auto Receivables Trust, Series 2021-1, Class B, 0.65% 202512 | | | 7,572 | | | | 7,563 | |
| Drive Auto Receivables Trust, Series 2020-2, Class B, 1.42% 202512 | | | 1,535 | | | | 1,539 | |
| Drive Auto Receivables Trust, Series 2019-3, Class C, 2.90% 202512 | | | 9,952 | | | | 10,038 | |
| Drive Auto Receivables Trust, Series 2019-2, Class C, 3.42% 202512 | | | 4,168 | | | | 4,200 | |
| Drive Auto Receivables Trust, Series 2020-2, Class C, 2.28% 202612 | | | 8,278 | | | | 8,388 | |
| Drive Auto Receivables Trust, Series 2020-1, Class C, 2.36% 202612 | | | 3,573 | | | | 3,602 | |
| Drive Auto Receivables Trust, Series 2019-3, Class D, 3.18% 202612 | | | 6,030 | | | | 6,155 | |
| Drive Auto Receivables Trust, Series 2021-1, Class C, 1.02% 202712 | | | 16,107 | | | | 16,112 | |
| Drive Auto Receivables Trust, Series 2020-2, Class D, 3.05% 202812 | | | 10,586 | | | | 10,869 | |
| Drive Auto Receivables Trust, Series 2021-1, Class D, 1.45% 202912 | | | 12,158 | | | | 12,107 | |
| Drivetime Auto Owner Trust, Series 2020-1, Class B, 2.16% 20244,12 | | | 1,416 | | | | 1,421 | |
| Drivetime Auto Owner Trust, Series 2019-3, Class C, 2.74% 20254,12 | | | 1,221 | | | | 1,230 | |
| Drivetime Auto Owner Trust, Series 2019-3, Class D, 2.96% 20254,12 | | | 2,870 | | | | 2,931 | |
| Drivetime Auto Owner Trust, Series 2019-2A, Class C, 3.18% 20254,12 | | | 3,129 | | | | 3,148 | |
| Drivetime Auto Owner Trust, Series 2019-2A, Class D, 3.48% 20254,12 | | | 6,800 | | | | 6,955 | |
| Drivetime Auto Owner Trust, Series 2021-1A, Class C, 0.84% 20264,12 | | | 2,279 | | | | 2,261 | |
| Drivetime Auto Owner Trust, Series 2021-1A, Class D, 1.16% 20264,12 | | | 1,242 | | | | 1,225 | |
| Drivetime Auto Owner Trust, Series 2020-3A, Class C, 1.47% 20264,12 | | | 3,269 | | | | 3,278 | |
| Drivetime Auto Owner Trust, Series 2020-2A, Class C, 3.28% 20264,12 | | | 1,861 | | | | 1,911 | |
| Drivetime Auto Owner Trust, Series 2020-2A, Class D, 4.73% 20264,12 | | | 1,813 | | | | 1,920 | |
| Drivetime Auto Owner Trust, Series 2021-2A, Class B, 0.81% 20274,12 | | | 3,538 | | | | 3,531 | |
| Drivetime Auto Owner Trust, Series 2021-2A, Class C, 1.10% 20274,12 | | | 3,693 | | | | 3,666 | |
| Drivetime Auto Owner Trust, Series 2021-2A, Class D, 1.50% 20274,12 | | | 2,495 | | | | 2,470 | |
| Dryden Senior Loan Fund, CLO, Series 2014-33A, Class AR3, (3-month USD-LIBOR + 1.00%) 1.124% 20294,6,12 | | | 2,230 | | | | 2,229 | |
| EDvestinU Private Education Loan LLC, Series 2021-A, Class A, 1.80% 20454,12 | | | 1,400 | | | | 1,380 | |
| Exeter Automobile Receivables Trust, Series 2017-3A, Class C, 3.68% 20234,12 | | | 579 | | | | 583 | |
| Exeter Automobile Receivables Trust, Series 2020-2A, Class B, 2.08% 20244,12 | | | 832 | | | | 834 | |
| Exeter Automobile Receivables Trust, Series 2020-1A, Class B, 2.26% 20244,12 | | | 435 | | | | 435 | |
| Exeter Automobile Receivables Trust, Series 2019-3A, Class C, 2.79% 20244,12 | | | 4,958 | | | | 4,985 | |
| Exeter Automobile Receivables Trust, Series 2019-2A, Class C, 3.30% 20244,12 | | | 2,478 | | | | 2,488 | |
| Exeter Automobile Receivables Trust, Series 2021-2, Class B, 0.57% 202512 | | | 10,267 | | | | 10,238 | |
| Exeter Automobile Receivables Trust, Series 2020-3A, Class C, 1.32% 202512 | | | 3,432 | | | | 3,448 | |
| Exeter Automobile Receivables Trust, Series 2020-1A, Class C, 2.49% 20254,12 | | | 6,890 | | | | 6,946 | |
| Exeter Automobile Receivables Trust, Series 2019-4A, Class D, 2.58% 20254,12 | | | 15,000 | | | | 15,249 | |
| Exeter Automobile Receivables Trust, Series 2020-1A, Class D, 2.73% 20254,12 | | | 5,000 | | | | 5,104 | |
| Exeter Automobile Receivables Trust, Series 2019-3A, Class D, 3.11% 20254,12 | | | 15,535 | | | | 15,894 | |
| Exeter Automobile Receivables Trust, Series 2020-2A, Class C, 3.28% 20254,12 | | | 2,715 | | | | 2,764 | |
| Exeter Automobile Receivables Trust, Series 2019-2A, Class D, 3.71% 20254,12 | | | 10,000 | | | | 10,246 | |
| Exeter Automobile Receivables Trust, Series 2021-2, Class C, 0.98% 202612 | | | 11,158 | | | | 11,121 | |
| Exeter Automobile Receivables Trust, Series 2020-3A, Class D, 1.73% 202612 | | | 2,977 | | | | 3,001 | |
| Exeter Automobile Receivables Trust, Series 2020-2, Class D, 4.73% 20264,12 | | | 2,055 | | | | 2,155 | |
| Exeter Automobile Receivables Trust, Series 2021-2, Class D, 1.40% 202712 | | | 16,131 | | | | 15,972 | |
| First Investors Auto Owner Trust, Series 2021-1A, Class B, 0.89% 20274,12 | | | 2,100 | | | | 2,083 | |
| First Investors Auto Owner Trust, Series 2021-1A, Class D, 1.62% 20274,12 | | | 950 | | | | 947 | |
| FirstKey Homes Trust, Series 2020-SFR2, Class A, 1.266% 20374,12 | | | 29,358 | | | | 28,648 | |
| FirstKey Homes Trust, Series 2021-SFR3, Class A, 2.135% 20384,12 | | | 4,186 | | | | 4,187 | |
| Ford Credit Auto Owner Trust, Series 2020-1, Class A, 2.04% 20314,12 | | | 43,830 | | | | 44,661 | |
| Ford Credit Auto Owner Trust, Series 2018-1, Class A, 3.19% 20314,12 | | | 19,385 | | | | 20,439 | |
| Ford Credit Auto Owner Trust, Series 2021-1, Class A, 1.37% 20334,12 | | | 21,970 | | | | 21,734 | |
| Ford Credit Floorplan Master Owner Trust, Series 2019-3, Class A1, 2.23% 202412 | | | 2,625 | | | | 2,657 | |
| FREED ABS Trust, Series 2021-2, Class A, 0.68% 20284,12 | | | 3,530 | | | | 3,528 | |
| Freedom Financial, Series 2021-3FP, Class A, 0.62% 20284,12 | | | 1,998 | | | | 1,997 | |
| GCI Funding I LLC, Series 2020-1, Class A, 2.82% 20454,12 | | | 1,549 | | | | 1,556 | |
| GCI Funding I LLC, Series 2020-1, Class B, 3.81% 20454,12 | | | 870 | | | | 878 | |
| GCI Funding I LLC, Series 2021-1, Class A, 2.38% 20464,12 | | | 7,319 | | | | 7,274 | |
| GCI Funding I LLC, Series 2021-1, Class B, 3.04% 20464,12 | | | 262 | | | | 259 | |
| Global SC Finance V SRL, Series 2019-1A, Class B, 4.81% 20394,12 | | | 9,353 | | | | 9,990 | |
| Global SC Finance V SRL, Series 2020-1A, Class A, 2.17% 20404,12 | | | 3,189 | | | | 3,187 | |
| Global SC Finance V SRL, Series 2020-1A, Class B, 3.55% 20404,12 | | | 1,348 | | | | 1,359 | |
| Global SC Finance VII SRL, Series 2020-2A, Class A, 2.26% 20404,12 | | | 4,460 | | | | 4,472 | |
| Global SC Finance VII SRL, Series 2020-2A, Class B, 3.32% 20404,12 | | | 1,301 | | | | 1,309 | |
| Global SC Finance VII SRL, Series 2021-1A, Class A, 1.86% 20414,12 | | | 59,983 | | | | 59,125 | |
| Global SC Finance VII SRL, Series 2021-2A, Class A, 1.95% 20414,12 | | | 43,353 | | | | 42,897 | |
| Global SC Finance VII SRL, Series 2021-2A, Class B, 2.49% 20414,12 | | | 3,510 | | | | 3,463 | |
| GM Financial Automobile Leasing Trust, Series 2020-2, Class C, 2.56% 202412 | | | 786 | | | | 801 | |
| 50 | The Bond Fund of America |
| Bonds, notes & other debt instruments (continued) | | Principal amount
(000) | | | Value
(000) | |
| Asset-backed obligations (continued) | | | | | | | | |
| GM Financial Automobile Leasing Trust, Series 2020-2, Class D, 3.21% 202412 | | $ | 1,111 | | | $ | 1,139 | |
| GM Financial Automobile Leasing Trust, Series 2020-4, Class C, 1.05% 202612 | | | 3,700 | | | | 3,671 | |
| Henderson Receivables LLC, Series 2006-3A, Class A1, (1-month USD-LIBOR + 0.20%) 0.31% 20414,6,12 | | | 526 | | | | 517 | |
| Henderson Receivables LLC, Series 2006-4A, Class A1, (1-month USD-LIBOR + 0.20%) 0.31% 20414,6,12 | | | 196 | | | | 196 | |
| Hertz Vehicle Financing III, LLC, Series 2021-A, Class B, 3.65% 20234,9,12 | | | 49,770 | | | | 49,658 | |
| Hertz Vehicle Financing III, LLC, Series 2021-1A, Class A, 1.21% 20254,12 | | | 81,838 | | | | 81,140 | |
| Hertz Vehicle Financing III, LLC, Series 2021-1A, Class B, 1.56% 20254,12 | | | 6,809 | | | | 6,750 | |
| Hertz Vehicle Financing III, LLC, Series 2021-1A, Class C, 2.05% 20254,12 | | | 3,902 | | | | 3,867 | |
| Hertz Vehicle Financing III, LLC, Series 2021-2A, Class A, 1.68% 20274,12 | | | 92,439 | | | | 91,269 | |
| Hertz Vehicle Financing III, LLC, Series 2021-2A, Class B, 2.12% 20274,12 | | | 8,169 | | | | 8,110 | |
| Hertz Vehicle Financing III, LLC, Series 2021-2A, Class C, 2.52% 20274,12 | | | 3,138 | | | | 3,122 | |
| Home Equity Asset Trust, Series 2004-7, Class M1, (1-month USD-LIBOR + 0.62%) 1.033% 20356,12 | | | 653 | | | | 654 | |
| LAD Auto Receivables Trust, Series 2021-1A, Class A, 1.30% 20264,12 | | | 17,478 | | | | 17,451 | |
| LAD Auto Receivables Trust, Series 2021-1A, Class B, 1.94% 20264,12 | | | 1,804 | | | | 1,802 | |
| Lunar Structured Aircraft Portfolio Notes, Series 2021-1, Class A, 2.636% 20464,12 | | | 15,839 | | | | 15,789 | |
| Madison Park Funding, Ltd., CLO, Series 2015-17A, Class AR2, (3-month USD-LIBOR + 1.00%) 1.13% 20304,6,12 | | | 5,100 | | | | 5,097 | |
| Marathon CLO, Ltd., Series 2017-9A, Class A1AR, (3-month USD-LIBOR + 1.15%) 1.274% 20294,6,12 | | | 4,970 | | | | 4,970 | |
| Mercury Financial Credit Card Master Trust, Series 2021-1A, Class A, 1.54% 20264,12 | | | 23,200 | | | | 23,189 | |
| Mission Lane Credit Card Master Trust, Series 2021-A, Class A, 1.59% 20264,12 | | | 6,958 | | | | 6,913 | |
| Mission Lane Credit Card Master Trust, Series 2021-A, Class B, 2.24% 20264,12 | | | 1,291 | | | | 1,285 | |
| Navient Student Loan Trust, Series 2021-A, Class A, 0.84% 20694,12 | | | 8,156 | | | | 8,060 | |
| Navient Student Loan Trust, Series 2021-B, Class A, 0.94% 20694,12 | | | 7,350 | | | | 7,279 | |
| Navient Student Loan Trust, Series 2021-EA, Class A, 0.97% 20694,12 | | | 13,483 | | | | 13,266 | |
| Navient Student Loan Trust, Series 2021-C, Class A, 1.06% 20694,12 | | | 36,948 | | | | 36,431 | |
| Navient Student Loan Trust, Series 2021-G, Class A, 1.58% 20704,12 | | | 6,212 | | | | 6,195 | |
| Navigator Aircraft ABS, Ltd., Series 2021-1, Class A, 2.771% 20464,12 | | | 27,799 | | | | 27,765 | |
| Nelnet Student Loan Trust, Series 2021-C, Class AFL, (1-month USD-LIBOR + 0.74%) 0.844% 20624,6,12 | | | 30,069 | | | | 30,178 | |
| Nelnet Student Loan Trust, Series 2021-C, Class AFX, 1.32% 20624,12 | | | 2,329 | | | | 2,295 | |
| Nelnet Student Loan Trust, Series 2021-A, Class APT1, 1.36% 20624,12 | | | 43,804 | | | | 43,081 | |
| Nelnet Student Loan Trust, Series 2021-B, Class AFX, 1.42% 20624,12 | | | 98,689 | | | | 97,373 | |
| New Economy Assets Phase 1 Issuer, LLC, Series 2021-1, Class A1, 1.91% 20614,12 | | | 292,757 | | | | 287,509 | |
| Newark BSL CLO 2, Ltd., Series 2017-1A, Class A1R, (3-month USD-LIBOR + 0.97%) 1.094% 20304,6,12 | | | 1,645 | | | | 1,645 | |
| OnDeck Asset Securitization Trust LLC, Series 2021-1A, Class A, 1.59% 20274,12 | | | 15,641 | | | | 15,565 | |
| OnDeck Asset Securitization Trust LLC, Series 2021-1A, Class B, 2.28% 20274,12 | | | 700 | | | | 697 | |
| Oportun Funding LLC, Series 2021-A, Class A, 1.21% 20284,12 | | | 5,033 | | | | 5,024 | |
| Oportun Funding LLC, Series 2021-B, Class A, 1.47% 20314,12 | | | 10,536 | | | | 10,477 | |
| OSW Structured Asset Trust, Series 2020-RPL1, Class A2, 4.569% 20594,6,12 | | | 4,521 | | | | 4,531 | |
| OSW Structured Asset Trust, Series 2020-RPL1, Class A1, 3.072% 20594,6,12 | | | 7,287 | | | | 7,297 | |
| Palmer Square Loan Funding, CLO, Series 2019-2, Class A1, (3-month USD-LIBOR + 0.97%) 1.102% 20274,6,12 | | | 4,841 | | | | 4,842 | |
| Palmer Square Loan Funding, CLO, Series 2019-1A, Class A1, (3-month USD-LIBOR + 1.05%) 1.182% 20274,6,12 | | | 8,495 | | | | 8,497 | |
| Palmer Square Loan Funding, CLO, Series 2020-4, Class A1, (3-month USD-LIBOR + 1.00%) 1.18% 20284,6,12 | | | 9,552 | | | | 9,556 | |
| Palmer Square Loan Funding, CLO, Series 2021-1, Class A1, (3-month USD-LIBOR + 0.90%) 1.032% 20294,6,12 | | | 2,078 | | | | 2,078 | |
| PFS Financing Corp., Series 2021-B, Class A, 0.775% 20264,12 | | | 35,117 | | | | 34,594 | |
| Prestige Auto Receivables Trust, Series 2019-1A, Class C, 2.70% 20244,12 | | | 3,940 | | | | 3,975 | |
| Prestige Auto Receivables Trust, Series 2019-1A, Class D, 3.01% 20254,12 | | | 2,435 | | | | 2,470 | |
| Prodigy Finance DAC, Series 2021-1A, Class A, (1-month USD-LIBOR + 1.25%) 1.352% 20514,6,12 | | | 5,742 | | | | 5,744 | |
| Residential Funding Mortgage Securities II, Inc., Series 2006-HSA3, Class A, | | | | | | | | |
| FSA insured, (1-month USD-LIBOR + 0.13%) 0.232% 20366,12 | | | 103 | | | | 102 | |
| Santander Drive Auto Receivables Trust, Series 2020-2, Class B, 0.96% 202412 | | | 2,551 | | | | 2,554 | |
| Santander Drive Auto Receivables Trust, Series 2020-1, Class B, 3.03% 202412 | | | 8,621 | | | | 8,680 | |
| Santander Drive Auto Receivables Trust, Series 2021-2, Class B, 0.59% 202512 | | | 9,308 | | | | 9,290 | |
| Santander Drive Auto Receivables Trust, Series 2020-2, Class C, 1.46% 202512 | | | 6,125 | | | | 6,155 | |
| Santander Drive Auto Receivables Trust, Series 2019-2, Class D, 3.22% 202512 | | | 4,975 | | | | 5,074 | |
| Santander Drive Auto Receivables Trust, Series 2020-1, Class C, 4.11% 202512 | | | 25,000 | | | | 25,740 | |
| Santander Drive Auto Receivables Trust, Series 2021-2, Class C, 0.90% 202612 | | | 17,331 | | | | 17,287 | |
| The Bond Fund of America | 51 |
| Bonds, notes & other debt instruments (continued) | | Principal amount
(000) | | | Value
(000) | |
| Asset-backed obligations (continued) | | | | | | | | |
| Santander Drive Auto Receivables Trust, Series 2020-3, Class C, 1.12% 202612 | | $ | 12,159 | | | $ | 12,197 | |
| Santander Drive Auto Receivables Trust, Series 2020-3, Class D, 1.64% 202612 | | | 5,159 | | | | 5,196 | |
| Santander Drive Auto Receivables Trust, Series 2021-3, Class C, 0.95% 202712 | | | 9,395 | | | | 9,311 | |
| Santander Drive Auto Receivables Trust, Series 2021-3, Class D, 1.33% 202712 | | | 12,526 | | | | 12,375 | |
| Santander Drive Auto Receivables Trust, Series 2021-2, Class D, 1.35% 202712 | | | 11,111 | | | | 11,053 | |
| Slam, Ltd., Series 2021-1, Class A, 2.434% 20464,12 | | | 17,434 | | | | 17,137 | |
| Slam, Ltd., Series 2021-1, Class B, 3.422% 20464,12 | | | 3,210 | | | | 3,171 | |
| SMB Private Education Loan Trust, Series 2021-A, Class A1, (1-month USD-LIBOR + 0.50%) 0.61% 20534,6,12 | | | 2,135 | | | | 2,136 | |
| SMB Private Education Loan Trust, Series 2021-A, Class APT2, 1.07% 20534,12 | | | 7,407 | | | | 7,220 | |
| Sound Point CLO, Ltd., Series 2015-1RA, Class AR, (3-month USD-LIBOR + 1.08%) 1.204% 20304,6,12 | | | 2,680 | | | | 2,680 | |
| Sprite, Ltd., Series 2021-1, Class A, 3.75% 20464,12 | | | 20,929 | | | | 20,611 | |
| Stellar Jay Ireland DAC, Series 2021-1, Class A, 3.967% 20414,12 | | | 2,539 | | | | 2,526 | |
| Stonepeak Infrastructure Partners, Series 2021-1A, Class AA, 2.301% 20334,12 | | | 8,036 | | | | 7,963 | |
| Stonepeak Infrastructure Partners, Series 2021-1A, Class A, 2.675% 20334,12 | | | 9,192 | | | | 9,162 | |
| SuttonPark Structured Settlements, Series 2021-1, Class A, 1.95% 20754,12 | | | 16,157 | | | | 15,963 | |
| TAL Advantage V LLC, Series 2020-1A, Class A, 2.05% 20454,12 | | | 6,632 | | | | 6,598 | |
| TAL Advantage V LLC, Series 2020-1A, Class B, 3.29% 20454,12 | | | 489 | | | | 491 | |
| Textainer Marine Containers, Ltd., Series 2020-2A, Class A, 2.10% 20454,12 | | | 3,570 | | | | 3,556 | |
| Textainer Marine Containers, Ltd., Series 2020-1A, Class A, 2.73% 20454,12 | | | 16,132 | | | | 16,200 | |
| Textainer Marine Containers, Ltd., Series 2020-1A, Class B, 4.94% 20454,12 | | | 6,815 | | | | 6,926 | |
| Textainer Marine Containers, Ltd., Series 2021-2A, Class A, 2.23% 20464,12 | | | 17,040 | | | | 17,012 | |
| TIF Funding II LLC, Series 2020-1A, Class B, 3.82% 20454,12 | | | 1,662 | | | | 1,683 | |
| Towd Point Mortgage Trust, Series 2015-3, Class M1, 4.00% 20544,6,12 | | | 4,715 | | | | 4,773 | |
| Towd Point Mortgage Trust, Series 2016-2, Class B2, 3.402% 20554,6,12 | | | 2,900 | | | | 2,999 | |
| Toyota Auto Loan Extended Note Trust, Series 2019-1, Class A, 2.56% 20314,12 | | | 6,000 | | | | 6,199 | |
| Toyota Auto Loan Extended Note Trust, Series 2020-1, Class A, 1.35% 20334,12 | | | 5,335 | | | | 5,326 | |
| Toyota Auto Loan Extended Note Trust, Series 2021-1, Class A, 1.07% 20344,6,12 | | | 27,912 | | | | 27,414 | |
| Triton Container Finance VIII LLC, Series 2020-1, Class A, 2.11% 20454,12 | | | 3,123 | | | | 3,104 | |
| Triton Container Finance VIII LLC, Series 2021-1, Class A, 1.86% 20464,12 | | | 13,095 | | | | 12,854 | |
| Triton Container Finance VIII LLC, Series 2021-1A, Class B, 2.58% 20464,12 | | | 1,080 | | | | 1,067 | |
| Westlake Automobile Receivables Trust, Series 2020-3A, Class C, 1.24% 20254,12 | | | 4,153 | | | | 4,163 | |
| Westlake Automobile Receivables Trust, Series 2020-2, Class C, 2.01% 20254,12 | | | 3,345 | | | | 3,383 | |
| Westlake Automobile Receivables Trust, Series 2021-2, Class B, 0.62% 20264,12 | | | 10,314 | | | | 10,235 | |
| Westlake Automobile Receivables Trust, Series 2021-2, Class C, 0.89% 20264,12 | | | 13,309 | | | | 13,192 | |
| Westlake Automobile Receivables Trust, Series 2021-2, Class D, 1.23% 20264,12 | | | 8,825 | | | | 8,691 | |
| Westlake Automobile Receivables Trust, Series 2020-3A, Class D, 1.65% 20264,12 | | | 8,060 | | | | 8,084 | |
| Westlake Automobile Receivables Trust, Series 2020-2, Class D, 2.76% 20264,12 | | | 5,225 | | | | 5,338 | |
| | | | | | | | 2,594,831 | |
| | | | | | | | | |
| Bonds & notes of governments & government agencies outside the U.S. 1.81% | | | | | |
| Abu Dhabi (Emirate of) 3.125% 20274 | | | 17,700 | | | | 19,040 | |
| Abu Dhabi (Emirate of) 3.875% 20504 | | | 9,900 | | | | 11,557 | |
| Abu Dhabi (Emirate of) 2.70% 20704 | | | 4,925 | | | | 4,495 | |
| Angola (Republic of) 8.00% 20294 | | | 5,000 | | | | 4,948 | |
| Argentine Republic 1.00% 2029 | | | 1,034 | | | | 377 | |
| Argentine Republic 0.50% 2030 (0.75% on 7/9/2023)5 | | | 12,086 | | | | 4,261 | |
| Argentine Republic 0% 2035 | | | 25,700 | | | | 218 | |
| Argentine Republic 1.125% 2035 (1.50% on 7/9/2022)5 | | | 5,349 | | | | 1,719 | |
| Asian Development Bank 1.50% 2024 | | | 15,979 | | | | 16,210 | |
| Asian Development Bank 2.50% 2027 | | | 3,451 | | | | 3,663 | |
| Asian Development Bank 2.75% 2028 | | | 3 | | | | 3 | |
| Bermuda 2.375% 20304 | | | 2,840 | | | | 2,847 | |
| Bermuda 3.375% 20504 | | | 8,200 | | | | 8,231 | |
| Caisse d’Amortissement de la Dette Sociale 1.125% 20244 | | | 10,000 | | | | 10,007 | |
| Chile (Republic of) 3.10% 2041 | | | 13,200 | | | | 12,943 | |
| China (People’s Republic of), Series INBK, 3.81% 2050 | | CNY | 75,960 | | | | 12,776 | |
| China (People’s Republic of), Series INBK, 3.72% 2051 | | | 274,040 | | | | 45,643 | |
| China Development Bank Corp., Series 2012, 3.34% 2025 | | | 53,800 | | | | 8,625 | |
| Colombia (Republic of) 4.125% 2051 | | $ | 18,640 | | | | 15,192 | |
| Colombia (Republic of), Series B, 5.75% 2027 | | COP | 152,975,600 | | | | 34,001 | |
| Costa Rica (Republic of) 7.00% 2044 | | $ | 2,178 | | | | 2,143 | |
| Cote d’Ivoire (Republic of) 6.375% 20284 | | | 7,275 | | | | 7,920 | |
| CPPIB Capital, Inc. 0.50% 20244 | | | 7,990 | | | | 7,883 | |
| CPPIB Capital, Inc. (USD-SOFR + 1.25%) 0.05% 20264,6 | | | 6,621 | | | | 6,911 | |
| 52 | The Bond Fund of America |
| Bonds, notes & other debt instruments (continued) | | Principal amount
(000) | | | Value
(000) | |
| Bonds & notes of governments & government agencies outside the U.S. (continued) |
| CPPIB Capital, Inc. 0.875% 20264 | | $ | 8,156 | | | $ | 7,894 | |
| Dominican Republic 6.875% 20264 | | | 4,300 | | | | 4,909 | |
| Dominican Republic 6.40% 20494 | | | 1,648 | | | | 1,735 | |
| Egypt (Arab Republic of) 4.75% 2026 | | € | 3,000 | | | | 3,309 | |
| Egypt (Arab Republic of) 6.588% 20284 | | $ | 1,610 | | | | 1,570 | |
| Egypt (Arab Republic of) 5.625% 2030 | | € | 1,060 | | | | 1,093 | |
| Egypt (Arab Republic of) 7.053% 20324 | | $ | 5,100 | | | | 4,724 | |
| Egypt (Arab Republic of) 8.50% 20474 | | | 2,245 | | | | 1,997 | |
| European Investment Bank 1.625% 2025 | | | 23,000 | | | | 23,375 | |
| Export-Import Bank of China 2.93% 2025 | | CNY | 242,000 | | | | 38,271 | |
| Export-Import Bank of India 3.375% 2026 | | $ | 7,000 | | | | 7,346 | |
| Export-Import Bank of India 3.875% 2028 | | | 3,000 | | | | 3,215 | |
| Export-Import Bank of India 3.25% 2030 | | | 9,100 | | | | 9,279 | |
| Export-Import Bank of India 2.25% 20314 | | | 25,000 | | | | 23,569 | |
| Gabonese Republic 6.95% 2025 | | | 700 | | | | 729 | |
| Gabonese Republic 6.625% 20314 | | | 600 | | | | 584 | |
| Honduras (Republic of) 7.50% 2024 | | | 3,330 | | | | 3,530 | |
| Honduras (Republic of) 6.25% 20274 | | | 1,400 | | | | 1,519 | |
| Honduras (Republic of) 6.25% 2027 | | | 968 | | | | 1,050 | |
| Hungary (Republic of) 2.125% 20314 | | | 12,195 | | | | 12,026 | |
| Indonesia (Republic of) 6.625% 2037 | | | 12,000 | | | | 16,784 | |
| Indonesia (Republic of) 4.20% 2050 | | | 1,785 | | | | 2,040 | |
| Inter-American Development Bank 0.50% 2024 | | | 826 | | | | 815 | |
| Inter-American Development Bank 1.125% 2028 | | | 1 | | | | 1 | |
| International Bank for Reconstruction and Development 0.75% 2025 | | | 4,974 | | | | 4,923 | |
| International Bank for Reconstruction and Development 1.625% 2025 | | | 12,573 | | | | 12,791 | |
| International Bank for Reconstruction and Development 1.625% 2031 | | | 8,431 | | | | 8,440 | |
| Israel (State of) 3.375% 2050 | | | 5,000 | | | | 5,419 | |
| Israel (State of) 3.875% 2050 | | | 42,900 | | | | 50,181 | |
| Japan Bank for International Cooperation 1.875% 2031 | | | 6,576 | | | | 6,654 | |
| Jordan (Hashemite Kingdom of) 6.125% 20264 | | | 2,890 | | | | 3,089 | |
| Jordan (Hashemite Kingdom of) 5.75% 20274 | | | 615 | | | | 648 | |
| Kenya (Republic of) 6.875% 20244 | | | 6,425 | | | | 6,804 | |
| KfW 0.625% 2026 | | | 6,778 | | | | 6,620 | |
| Kommuninvest i Sverige Aktiebolag 0.50% 20234 | | | 10,129 | | | | 10,107 | |
| Morocco (Kingdom of) 2.375% 20274 | | | 7,000 | | | | 6,840 | |
| Morocco (Kingdom of) 1.50% 2031 | | € | 15,000 | | | | 15,735 | |
| Morocco (Kingdom of) 3.00% 20324 | | $ | 10,000 | | | | 9,572 | |
| Morocco (Kingdom of) 5.50% 2042 | | | 25,300 | | | | 28,022 | |
| Morocco (Kingdom of) 5.50% 20424 | | | 1,500 | | | | 1,661 | |
| Morocco (Kingdom of) 4.00% 20504 | | | 7,700 | | | | 7,007 | |
| Oesterreichische Kontrollbank AG 0.50% 2024 | | | 6,622 | | | | 6,537 | |
| Ontario Teachers’ Finance Trust 0.875% 20264 | | | 7,433 | | | | 7,240 | |
| Ontario Teachers’ Finance Trust 2.00% 20314 | | | 6,787 | | | | 6,818 | |
| Panama (Republic of) 3.75% 20264 | | | 41,695 | | | | 44,347 | |
| Panama (Republic of) 3.875% 2028 | | | 10,000 | | | | 10,810 | |
| Panama (Republic of) 2.252% 2032 | | | 36,365 | | | | 34,574 | |
| Panama (Republic of) 4.50% 2047 | | | 1,090 | | | | 1,204 | |
| Panama (Republic of) 4.50% 2050 | | | 5,925 | | | | 6,541 | |
| Panama (Republic of) 4.30% 2053 | | | 3,242 | | | | 3,492 | |
| Panama (Republic of) 4.50% 2056 | | | 8,915 | | | | 9,853 | |
| Panama (Republic of) 3.87% 2060 | | | 19,858 | | | | 19,932 | |
| Panama Bonos Del Tesoro 3.362% 2031 | | | 28,000 | | | | 28,210 | |
| Paraguay (Republic of) 4.95% 20314 | | | 5,000 | | | | 5,631 | |
| Paraguay (Republic of) 2.739% 20334 | | | 1,618 | | | | 1,563 | |
| Paraguay (Republic of) 5.60% 20484 | | | 1,422 | | | | 1,650 | |
| Peru (Republic of) 6.35% 2028 | | PEN | 33,100 | | | | 8,732 | |
| Peru (Republic of) 5.94% 2029 | | | 41,000 | | | | 10,525 | |
| Peru (Republic of) 2.783% 2031 | | $ | 41,600 | | | | 41,496 | |
| Peru (Republic of) 6.15% 2032 | | PEN | 76,900 | | | | 19,361 | |
| Peru (Republic of) 3.00% 2034 | | $ | 14,110 | | | | 14,089 | |
| Peru (Republic of) 2.78% 2060 | | | 39,745 | | | | 34,976 | |
| PETRONAS Capital, Ltd. 3.50% 20304 | | | 4,450 | | | | 4,819 | |
| PETRONAS Capital, Ltd. 4.55% 20504 | | | 5,695 | | | | 7,072 | |
| Philippines (Republic of) 1.648% 2031 | | | 17,514 | | | | 17,002 | |
| Philippines (Republic of) 6.375% 2034 | | | 18,000 | | | | 25,035 | |
| Philippines (Republic of) 3.95% 2040 | | | 4,000 | | | | 4,477 | |
| The Bond Fund of America | 53 |
| Bonds, notes & other debt instruments (continued) | | Principal amount
(000) | | | Value
(000) | |
| Bonds & notes of governments & government agencies outside the U.S. (continued) |
| Philippines (Republic of) 3.70% 2041 | | $ | 19,000 | | | $ | 20,775 | |
| Philippines (Republic of) 3.70% 2042 | | | 21,300 | | | | 23,289 | |
| Philippines (Republic of) 2.65% 2045 | | | 13,236 | | | | 12,562 | |
| Philippines (Republic of) 2.95% 2045 | | | 15,091 | | | | 14,914 | |
| Philippines (Republic of) 3.20% 2046 | | | 9,100 | | | | 9,276 | |
| PT Indonesia Asahan Aluminium Tbk 5.71% 20234 | | | 2,050 | | | | 2,201 | |
| PT Indonesia Asahan Aluminium Tbk 4.75% 2025 | | | 10,000 | | | | 10,646 | |
| PT Indonesia Asahan Aluminium Tbk 4.75% 20254 | | | 3,310 | | | | 3,524 | |
| PT Indonesia Asahan Aluminium Tbk 6.53% 2028 | | | 8,528 | | | | 10,316 | |
| PT Indonesia Asahan Aluminium Tbk 6.53% 20284 | | | 1,867 | | | | 2,259 | |
| PT Indonesia Asahan Aluminium Tbk 5.45% 20304 | | | 910 | | | | 1,039 | |
| PT Indonesia Asahan Aluminium Tbk 6.757% 20484 | | | 655 | | | | 839 | |
| PT Indonesia Asahan Aluminium Tbk 5.80% 20504 | | | 2,690 | | | | 3,116 | |
| Qatar (State of) 3.875% 20234 | | | 10,830 | | | | 11,268 | |
| Qatar (State of) 3.75% 20304 | | | 39,070 | | | | 43,894 | |
| Qatar (State of) 4.40% 20504 | | | 32,960 | | | | 41,017 | |
| Romania 3.624% 2030 | | € | 3,592 | | | | 4,443 | |
| Romania 2.00% 2032 | | | 1,400 | | | | 1,484 | |
| Romania 3.50% 2034 | | | 7,600 | | | | 9,132 | |
| Romania 3.50% 2034 | | | 6,485 | | | | 7,792 | |
| Russian Federation 2.875% 2025 | | | 7,500 | | | | 9,183 | |
| Russian Federation 4.375% 2029 | | $ | 23,400 | | | | 25,837 | |
| Russian Federation 1.85% 2032 | | € | 12,500 | | | | 14,173 | |
| Russian Federation 5.10% 2035 | | $ | 52,800 | | | | 62,370 | |
| Russian Federation 5.10% 20354 | | | 800 | | | | 945 | |
| Russian Federation 5.25% 2047 | | | 10,000 | | | | 12,685 | |
| Saudi Arabia (Kingdom of) 3.25% 20264 | | | 4,170 | | | | 4,449 | |
| Saudi Arabia (Kingdom of) 3.628% 20274 | | | 3,800 | | | | 4,125 | |
| Saudi Arabia (Kingdom of) 3.625% 20284 | | | 3,110 | | | | 3,393 | |
| Saudi Arabia (Kingdom of) 2.25% 20334 | | | 25,000 | | | | 24,433 | |
| Saudi Arabia (Kingdom of) 4.50% 2046 | | | 8,000 | | | | 9,399 | |
| Saudi Arabia (Kingdom of) 3.45% 20614 | | | 23,000 | | | | 23,272 | |
| Tunisia (Republic of) 5.625% 2024 | | € | 3,000 | | | | 2,721 | |
| Turkey (Republic of) 4.25% 2026 | | $ | 3,300 | | | | 2,966 | |
| Turkey (Republic of) 4.875% 2026 | | | 2,380 | | | | 2,163 | |
| Ukraine 6.75% 2026 | | € | 453 | | | | 492 | |
| United Mexican States 3.25% 2030 | | $ | 1,515 | | | | 1,555 | |
| United Mexican States 2.659% 2031 | | | 3,293 | | | | 3,221 | |
| United Mexican States 4.75% 2044 | | | 2,500 | | | | 2,733 | |
| United Mexican States 5.00% 2051 | | | 9,010 | | | | 10,244 | |
| United Mexican States 3.75% 2071 | | | 11,315 | | | | 10,200 | |
| United Mexican States 5.75% 2110 | | | 3,850 | | | | 4,430 | |
| | | | | | | | 1,442,251 | |
| | | | | | | | | |
| Municipals 0.66% California 0.02% | | | | | | | | |
| Golden State Tobacco Securitization Corp., Enhanced Tobacco Settlement Asset-Backed Bonds, Series 2021-B, 2.746% 2034 | | | 3,725 | | | | 3,757 | |
| Regents of the University of California, General Rev. Bonds, Series 2020-BG, 1.316% 2027 | | | 6,585 | | | | 6,469 | |
| Regents of the University of California, General Rev. Bonds, Series 2020-BG, 1.614% 2030 | | | 5,150 | | | | 5,001 | |
| Dept. of Veterans Affairs, Veterans G.O. Rev. Ref. Bonds, Series 2015-CM, AMT, 2.45% 2031 | | | 240 | | | | 243 | |
| | | | | | | | 15,470 | |
| | | | | | | | | |
| Connecticut 0.00% | | | | | | | | |
| Housing Fin. Auth., Housing Mortgage Fin. Program Rev. Ref. Bonds, Series 2015-C-1, 3.50% 2045 | | | 1,685 | | | | 1,755 | |
| 54 | The Bond Fund of America |
| Bonds, notes & other debt instruments (continued) | Principal amount
(000) | | | Value
(000) | |
| Municipals (continued) | | | | | | | | |
| Illinois 0.49% | | | | | | | | |
| City of Chicago, Board of Education, Unlimited Tax G.O. Bonds (Dedicated Rev.), Series 2010-C, 6.319% 2029 | | $ | 14,400 | | | $ | 17,125 | |
| City of Chicago, Board of Education, Unlimited Tax G.O. Bonds (Dedicated Rev.), Series 2009-E, 6.138% 2039 | | | 56,485 | | | | 69,824 | |
| City of Chicago, Board of Education, Unlimited Tax G.O. Bonds (Dedicated Rev.), Series 2010-D, 6.519% 2040 | | | 5,770 | | | | 7,343 | |
| City of Chicago, Board of Education, Unlimited Tax G.O. Bonds (Qualified School Construction Bonds), Series 2009-G, 1.75% 2025 | | | 13,760 | | | | 13,160 | |
| G.O. Bonds, Series 2013-B, 4.11% 2022 | | | 2,280 | | | | 2,299 | |
| G.O. Bonds, Series 2012-B, 4.85% 2022 | | | 2,305 | | | | 2,305 | |
| G.O. Bonds, Series 2013-B, 4.31% 2023 | | | 7,325 | | | | 7,603 | |
| G.O. Bonds, Series 2020-A, 3.14% 2024 | | | 1,520 | | | | 1,575 | |
| G.O. Bonds, Series 2020-A, 3.24% 2025 | | | 2,245 | | | | 2,345 | |
| G.O. Bonds, Series 2013-B, 4.91% 2027 | | | 3,250 | | | | 3,664 | |
| G.O. Bonds, Series 2019-A, 5.70% 2031 | | | 7,530 | | | | 8,873 | |
| G.O. Bonds, Pension Funding, Series 2003, 4.95% 2023 | | | 22,504 | | | | 23,369 | |
| G.O. Bonds, Pension Funding, Series 2003, 5.10% 2033 | | | 161,540 | | | | 186,843 | |
| G.O. Bonds, Pension Funding, Series 2003, Assured Guaranty Municipal insured, 5.10% 2033 | | | 7,945 | | | | 9,279 | |
| G.O. Bonds, Taxable Build America Bonds, Series 2010-2, 5.85% 2022 | | | 3,155 | | | | 3,181 | |
| G.O. Bonds, Taxable Build America Bonds, Series 2010-2, 5.95% 2023 | | | 6,495 | | | | 6,851 | |
| G.O. Bonds, Taxable Build America Bonds, Series 2010-2, 6.05% 2024 | | | 1,905 | | | | 2,084 | |
| G.O. Bonds, Taxable Build America Bonds, Series 2010-1, 6.63% 2035 | | | 5,725 | | | | 6,999 | |
| G.O. Rev. Ref. Bonds, Series 2016, 6.15% 2025 | | | 6,205 | | | | 7,013 | |
| Housing Dev. Auth., Multi Family Housing Rev. Bonds (Marshall Field Garden Apartment Homes), Series 2015, (SIFMA Municipal Swap Index + 1.00%) 1.10% 2050 (put 2025)6 | | | 6,275 | | | | 6,427 | |
| Housing Dev. Auth., Rev. Bonds, Series 2016-A, 4.00% 2046 | | | 670 | | | | 712 | |
| | | | | | | | 388,874 | |
| | | | | | | | | |
| Iowa 0.00% | | | | | | | | |
| Fin. Auth., Single Family Mortgage Bonds (Mortgage-Backed Securities Program), Series 2016-A, 4.00% 2046 | | | 560 | | | | 590 | |
| | | | | | | | | |
| Kentucky 0.00% | | | | | | | | |
| Housing Corp., Housing Rev. Bonds, Series 2013-D, 3.50% 2033 | | | 690 | | | | 710 | |
| | | | | | | | | |
| Maine 0.00% | | | | | | | | |
| Housing Auth., Mortgage Purchase Rev. Ref. Bonds, Series 2015-E-1, AMT, 3.50% 2035 | | | 1,780 | | | | 1,850 | |
| | | | | | | | | |
| Maryland 0.00% | | | | | | | | |
| Community Dev. Administration, Dept. of Housing and Community Dev., Residential Rev. Bonds, Series 2014-B, AMT, 3.25% 2044 | | | 995 | | | | 1,020 | |
| | | | | | | | | |
| Massachusetts 0.00% | | | | | | | | |
| Housing Fin. Agcy., Single Family Housing Rev. Bonds, Series 178, 3.50% 2042 | | | 400 | | | | 420 | |
| | | | | | | | | |
| Michigan 0.01% | | | | | | | | |
| Fin. Auth., Local Government Loan Program Rev. Bonds (Detroit Fin. Recovery Income Tax Local Project Bonds), Series 2014-F-2, 4.60% 2022 | | | 1,370 | | | | 1,391 | |
| Housing Dev. Auth., Single Family Mortgage Rev. Bonds, Series 2016-B, 3.50% 2047 | | | 8,315 | | | | 8,794 | |
| | | | | | | | 10,185 | |
| | | | | | | | | |
| Minnesota 0.01% | | | | | | | | |
| Housing Fin. Agcy., Residential Housing Fin. Bonds, Series 2015-A, AMT, 4.00% 2041 | | | 300 | | | | 313 | |
| Housing Fin. Agcy., Residential Housing Fin. Bonds, Series 2014-C, AMT, 4.00% 2045 | | | 2,540 | | | | 2,690 | |
| Housing Fin. Agcy., Residential Housing Fin. Bonds, Series 2015-E, AMT, 3.50% 2046 | | | 1,610 | | | | 1,688 | |
| | | | | | | | 4,691 | |
| | |
| The Bond Fund of America | 55 |
| Bonds, notes & other debt instruments (continued) | Principal amount
(000) | | | Value
(000) | |
| Municipals (continued) | | | | | | | | |
| Missouri 0.00% | | | | | | | | |
| Housing Dev. Commission, Single Family Mortgage Rev. Bonds (Special Homeownership Loan Program), Series 2015-A, 3.75% 2038 | | $ | 625 | | | $ | 659 | |
| | | | | | | | | |
| Nebraska 0.00% | | | | | | | | |
| Investment Fin. Auth., Single Family Housing Rev. Bonds, Series 2015-C, 3.50% 2045 | | | 485 | | | | 502 | |
| Investment Fin. Auth., Single Family Housing Rev. Bonds, Series 2016-A, 3.50% 2046 | | | 1,870 | | | | 1,966 | |
| | | | | | | | 2,468 | |
| | | | | | | | | |
| New Jersey 0.01% | | | | | | | | |
| Econ. Dev. Auth., State Pension Funding Bonds, Series 1997-A, National insured, 7.425% 2029 | | | 4,400 | | | | 5,538 | |
| | | | | | | | | |
| New York 0.05% | | | | | | | | |
| Dormitory Auth., Taxable State Personal Income Tax Rev. Bonds (General Purpose), Series 2021-C, 2.202% 2034 | | | 39,115 | | | | 38,623 | |
| Mortgage Agcy., Homeowner Mortgage Rev. Bonds, Series 52, AMT, 3.50% 2030 | | | 960 | | | | 999 | |
| | | | | | | | 39,622 | |
| | | | | | | | | |
| Ohio 0.03% | | | | | | | | |
| Cleveland-Cuyahoga Port Auth., Federal Lease Rev. Bonds (VA Cleveland Health Care Center Project), Series 2021, 4.425% 2031 | | | 24,585 | | | | 25,896 | |
| | | | | | | | | |
| South Carolina 0.01% | | | | | | | | |
| Housing Fin. and Dev. Auth., Mortgage Rev. Ref. Bonds, Series 2016-A, 4.00% 2036 | | | 505 | | | | 543 | |
| Housing Fin. Auth., Mortgage Rev. Ref. Bonds, Series 2014, AMT, 4.00% 2041 | | | 1,940 | | | | 2,031 | |
| | | | | | | | 2,574 | |
| | | | | | | | | |
| Tennessee 0.01% | | | | | | | | |
| Housing Dev. Agcy., Homeownership Program Bonds, Series 2015-A, 3.50% 2045 | | | 700 | | | | 742 | |
| Housing Dev. Agcy., Residential Fin. Program Bonds, Series 2013-2-A, AMT, 4.00% 2043 | | | 275 | | | | 284 | |
| Housing Dev. Agcy., Residential Fin. Program Bonds, Series 2015-1-A, AMT, 4.00% 2045 | | | 1,550 | | | | 1,634 | |
| Housing Dev. Agcy., Residential Fin. Program Bonds, Series 2015-2-A, AMT, 4.00% 2046 | | | 2,055 | | | | 2,179 | |
| | | | | | | | 4,839 | |
| | | | | | | | | |
| Texas 0.02% | | | | | | | | |
| Grand Parkway Transportation Corp., Grand Parkway System Toll Rev. Ref. Bonds, Series 2020-B, 3.236% 2052 | | | 8,155 | | | | 8,257 | |
| SA Energy Acquisition Public Fac. Corp., Gas Supply Rev. Bonds, Series 2007, 5.50% 2023 | | | 6,000 | | | | 6,462 | |
| | | | | | | | 14,719 | |
| | | | | | | | | |
| Utah 0.00% | | | | | | | | |
| Housing Corp., Single Family Mortgage Bonds, Class III, Series 2015-D-2, 4.00% 2045 | | | 575 | | | | 612 | |
| | | | | | | | | |
| Wisconsin 0.00% | | | | | | | | |
| Housing and Econ. Dev. Auth., Home Ownership Rev. Bonds, Series 2015-A, AMT, 4.00% 2045 | | | 975 | | | | 1,016 | |
| Housing and Econ. Dev. Auth., Home Ownership Rev. Bonds, Series 2016-A, AMT, 3.50% 2046 | | | 1,445 | | | | 1,509 | |
| | | | | | | | 2,525 | |
| | | | | | | | | |
| Wyoming 0.00% | | | | | | | | |
| Community Dev. Auth., Housing Rev. Bonds, Series 2015-6, 4.00% 2045 | | | 345 | | | | 358 | |
| | | | | | | | | |
| Total municipals | | | | | | | 525,375 | |
| | | | | | | | | |
| 56 | The Bond Fund of America |
| Bonds, notes & other debt instruments (continued) | Principal amount
(000) | | | Value
(000) | |
| Federal agency bonds & notes 0.03% | | | | | | | | |
| Development Bank of Japan, Inc. 1.25% 20264 | | $ | 8,230 | | | $ | 8,157 | |
| Development Bank of Japan, Inc. 1.75% 20314 | | | 3,068 | | | | 3,065 | |
| Fannie Mae 1.625% 20251 | | | 7 | | | | 7 | |
| Federal Farm Credit Banks 1.60% 2033 | | | 1,957 | | | | 1,911 | |
| PSP Capital, Inc. 1.625% 20284 | | | 6,054 | | | | 6,040 | |
| | | | | | | | 19,180 | |
| | | | | | | | | |
| Total bonds, notes & other debt instruments (cost: $75,359,116,000) | | | | | | | 76,141,626 | |
| | | | | | | | | |
| Common stocks 0.05% | | | Shares | | | | | |
| Health care 0.05% | | | | | | | | |
| Rotech Healthcare, Inc.9,10,14,15 | | | 342,069 | | | | 36,944 | |
| | | | | | | | | |
| Consumer discretionary 0.00% | | | | | | | | |
| MYT Holding Co., Class B9,14 | | | 521,407 | | | | 2,216 | |
| NMG Parent LLC14 | | | 4,595 | | | | 698 | |
| | | | | | | | 2,914 | |
| | | | | | | | | |
| Energy 0.00% | | | | | | | | |
| Diamond Offshore Drilling, Inc.14 | | | 472,031 | | | | 2,006 | |
| | | | | | | | | |
| Total common stocks (cost: $25,286,000) | | | | | | | 41,864 | |
| | | | | | | | | |
| Preferred securities 0.01% | | | | | | | | |
| Financials 0.01% | | | | | | | | |
| CoBank, ACB, Class E, 1.304% noncumulative preferred shares4 | | | 6,250 | | | | 5,047 | |
| | | | | | | | | |
| Total preferred securities (cost: $5,820,000) | | | | | | | 5,047 | |
| | | | | | | | | |
| Rights & warrants 0.00% | | | | | | | | |
| Consumer discretionary 0.00% | | | | | | | | |
| NMG Parent LLC, warrants, expire 20279,14 | | | 18,410 | | | | 544 | |
| | | | | | | | | |
| Total rights & warrants (cost: $112,000) | | | | | | | 544 | |
| | | | | | | | | |
| Short-term securities 9.79% | | | | | | | | |
| Money market investments 9.79% | | | | | | | | |
| Capital Group Central Cash Fund 0.09%16,17 | | | 77,899,245 | | | | 7,790,703 | |
| | | | | | | | | |
| Total short-term securities (cost: $7,789,992,000) | | | | | | | 7,790,703 | |
| | | | | | | | | |
| Total investment securities 105.55% (cost: $83,180,326,000) | | | | | | | 83,979,784 | |
| Other assets less liabilities (5.55)% | | | | | | | (4,413,336 | ) |
| | | | | | | | | |
| Net assets 100.00% | | | | | | $ | 79,566,448 | |
Futures contracts
| Contracts | | Type | | Number of
contracts | | Expiration | | Notional
amount
(000) | | | Value and
unrealized
(depreciation)
appreciation
at 12/31/2021 (000) | |
| 90 Day Euro Dollar Futures | | Long | | 28 | | March 2022 | | $ | 6,976 | | | $ | (14 | ) |
| 90 Day Euro Dollar Futures | | Long | | 18,305 | | September 2022 | | | 4,539,411 | | | | (9,135 | ) |
| 2 Year U.S. Treasury Note Futures | | Long | | 5,963 | | March 2022 | | | 1,300,959 | | | | (306 | ) |
| 5 Year Euro-Bobl Futures | | Short | | 414 | | March 2022 | | | (62,801 | ) | | | 525 | |
| 5 Year U.S. Treasury Note Futures | | Short | | 10,069 | | March 2022 | | | (1,218,113 | ) | | | (971 | ) |
| 10 Year Euro-Bund Futures | | Short | | 1,185 | | March 2022 | | | (231,199 | ) | | | 4,457 | |
| 10 Year U.S. Treasury Note Futures | | Long | | 193 | | March 2022 | | | 25,180 | | | | (46 | ) |
| | |
| The Bond Fund of America | 57 |
Futures contracts (continued)
| Contracts | | Type | | Number of
contracts | | Expiration | | Notional
amount
(000) | | | Value and
unrealized
(depreciation)
appreciation
at 12/31/2021
(000) | |
| 10 Year Ultra U.S. Treasury Note Futures | | Short | | 27,367 | | March 2022 | | $ | (4,007,555 | ) | | $ | (63,509 | ) |
| 20 Year U.S. Treasury Bond Futures | | Long | | 12,280 | | March 2022 | | | 1,970,172 | | | | 16,835 | |
| 30 Year Ultra U.S. Treasury Bond Futures | | Long | | 18,422 | | March 2022 | | | 3,631,437 | | | | 61,688 | |
| | | | | | | | | | | | | $ | 9,524 | |
Forward currency contracts
| | | | | | | | | | | Unrealized | |
| | | | | | | | | | | appreciation | |
| Contract amount | | | | | | | (depreciation) | |
Currency purchased
(000) | | | Currency sold
(000) | | | Counterparty | | Settlement
date | | at 12/31/2021
(000) | |
| USD | 38,330 | | | COP | 151,894,400 | | | Citibank | | 1/7/2022 | | $ | 1,002 | |
| KRW | 50,350,000 | | | USD | 42,493 | | | Citibank | | 1/7/2022 | | | (162 | ) |
| USD | 21,938 | | | EUR | 19,334 | | | JPMorgan Chase | | 1/10/2022 | | | (78 | ) |
| USD | 45,423 | | | CNH | 290,000 | | | UBS AG | | 1/10/2022 | | | (168 | ) |
| USD | 40,745 | | | EUR | 35,991 | | | Morgan Stanley | | 1/10/2022 | | | (239 | ) |
| USD | 20,790 | | | PEN | 85,000 | | | UBS AG | | 1/10/2022 | | | (497 | ) |
| USD | 44,713 | | | JPY | 5,071,403 | | | Bank of New York Mellon | | 1/13/2022 | | | 621 | |
| USD | 89,532 | | | EUR | 79,212 | | | Morgan Stanley | | 1/13/2022 | | | (675 | ) |
| USD | 9,277 | | | PEN | 37,750 | | | Citibank | | 1/14/2022 | | | (175 | ) |
| USD | 2,954 | | | MXN | 62,944 | | | BNP Paribas | | 1/18/2022 | | | (111 | ) |
| USD | 178,003 | | | DKK | 1,172,950 | | | JPMorgan Chase | | 1/18/2022 | | | (1,635 | ) |
| USD | 2,239 | | | MXN | 47,221 | | | JPMorgan Chase | | 1/20/2022 | | | (59 | ) |
| USD | 47,529 | | | EUR | 41,998 | | | Morgan Stanley | | 1/20/2022 | | | (305 | ) |
| KRW | 96,400,000 | | | USD | 81,161 | | | Citibank | | 1/21/2022 | | | (146 | ) |
| USD | 3,654 | | | PEN | 15,060 | | | Morgan Stanley | | 8/26/2022 | | | (56 | ) |
| USD | 4,716 | | | PEN | 19,550 | | | Citibank | | 8/26/2022 | | | (99 | ) |
| | | | | | | | | | | | | $ | (2,782 | ) |
Swap contracts
Interest rate swaps
Centrally cleared interest rate swaps
| | | | | | | | | | | | | | | | | Upfront | | | Unrealized | |
| | | | | | | | | | | | | | | | | premium | | | appreciation | |
| Receive | | Pay | | | | | | | Value at | | | paid | | | (depreciation) | |
| | | Payment | | | | Payment | | Expiration | | Notional | | | 12/31/2021 | | | (received) | | | at 12/31/2021 | |
| Rate | | frequency | | Rate | | frequency | | date | | (000) | | | (000) | | | (000) | | | (000) | |
| SOFR | | Quarterly | | U.S. EFFR | | Quarterly | | 11/17/2022 | | $ | 1,000 | | | $ | — | 2 | | $ | — | | | $ | — | 2 |
| 2.432% | | Semi-annual | | 3-month USD-LIBOR | | Quarterly | | 9/21/2037 | | | 2,000 | | | | 210 | | | | — | | | | 210 | |
| 2.987% | | Semi-annual | | 3-month USD-LIBOR | | Quarterly | | 2/7/2038 | | | 37,000 | | | | 6,900 | | | | — | | | | 6,900 | |
| 3.193% | | Semi-annual | | 3-month USD-LIBOR | | Quarterly | | 5/21/2038 | | | 45,000 | | | | 9,860 | | | | — | | | | 9,860 | |
| 3.062% | | Semi-annual | | 3-month USD-LIBOR | | Quarterly | | 7/31/2038 | | | 23,500 | | | | 4,738 | | | | — | | | | 4,738 | |
| 2.835% | | Semi-annual | | 3-month USD-LIBOR | | Quarterly | | 1/10/2039 | | | 21,500 | | | | 3,665 | | | | — | | | | 3,665 | |
| 2.874% | | Semi-annual | | 3-month USD-LIBOR | | Quarterly | | 2/6/2039 | | | 13,900 | | | | 2,459 | | | | — | | | | 2,459 | |
| 2.7055% | | Semi-annual | | 3-month USD-LIBOR | | Quarterly | | 4/17/2039 | | | 41,900 | | | | 6,383 | | | | — | | | | 6,383 | |
| 3-month USD-LIBOR | | Quarterly | | 0.81% | | Semi-annual | | 7/28/2045 | | | 449,300 | | | | 83,325 | | | | (266 | ) | | | 83,591 | |
| 2.5095% | | Semi-annual | | 3-month USD-LIBOR | | Quarterly | | 7/24/2047 | | | 3,000 | | | | 502 | | | | — | | | | 502 | |
| 2.9075% | | Semi-annual | | 3-month USD-LIBOR | | Quarterly | | 4/16/2048 | | | 7,000 | | | | 1,813 | | | | — | | | | 1,813 | |
| 3-month USD-LIBOR | | Quarterly | | 0.811% | | Semi-annual | | 7/27/2050 | | | 445,000 | | | | 94,120 | | | | — | | | | 94,120 | |
| 3-month USD-LIBOR | | Quarterly | | 1.972% | | Semi-annual | | 4/26/2051 | | | 65,600 | | | | (4,100 | ) | | | — | | | | (4,100 | ) |
| 3-month USD-LIBOR | | Quarterly | | 1.9855% | | Semi-annual | | 4/26/2051 | | | 97,700 | | | | (6,422 | ) | | | — | | | | (6,422 | ) |
| 3-month USD-LIBOR | | Quarterly | | 1.953% | | Semi-annual | | 4/27/2051 | | | 65,600 | | | | (3,802 | ) | | | — | | | | (3,802 | ) |
| | |
| 58 | The Bond Fund of America |
Swap contracts (continued)
Interest rate swaps (continued)
Centrally cleared interest rate swaps (continued)
| | | | | | | | | | | | | | | | | Upfront | | | Unrealized | |
| | | | | | | | | | | | | | | | | premium | | | appreciation | |
| Receive | | Pay | | | | | | | Value at | | | paid | | | (depreciation) | |
| | | Payment | | | | Payment | | Expiration | | Notional | | | 12/31/2021 | | | (received) | | | at 12/31/2021 | |
| Rate | | frequency | | Rate | | frequency | | date | | (000) | | | (000) | | | (000) | | | (000) | |
| 3-month USD-LIBOR | | Quarterly | | 1.9895% | | Semi-annual | | 4/27/2051 | | $ | 101,200 | | | $ | (6,749 | ) | | $ | — | | | $ | (6,749 | ) |
| 3-month USD-LIBOR | | Quarterly | | 1.9778% | | Semi-annual | | 4/28/2051 | | | 38,400 | | | | (2,454 | ) | | | — | | | | (2,454 | ) |
| | | | | | | | | | | | | | | | | | | $ | (266 | ) | | $ | 190,714 | |
Credit default swaps
Centrally cleared credit default swaps on credit indices — sell protection
Financing
rate received | | Payment
frequency | | Reference
index | | Expiration
date | | Notional
(000) | | | Value at
12/31/2021
(000) | | | Upfront
premium
paid
(000) | | | Unrealized
appreciation
at 12/31/2021 (000) | |
| 1.00% | | Quarterly | | CDX.NA.IG.37 | | 12/20/2026 | | | $300,000 | | | | $7,288 | | | | $7,141 | | | | $147 | |
Investments in affiliates17
| | | Value of
affiliate at
1/1/2021
(000) | | | Additions
(000) | | | Reductions
(000) | | | Net
realized
loss
(000) | | | Net
unrealized
appreciation
(000) | | | Value of
affiliate at
12/31/2021
(000) | | | Dividend
income
(000) | |
| Short-term securities 9.79% | | | | | | | | | | | | | | | | | | | | | | | | | | | | |
| Money market investments 9.79% | | | | | | | | | | | | | | | | | | | | | | | | | | | | |
| Capital Group Central Cash Fund 0.09%16 | | $ | 16,368,185 | | | $ | 22,502,091 | | | $ | 31,079,107 | | | $ | (775 | ) | | $ | 309 | | | $ | 7,790,703 | | | $ | 7,533 | |
| | |
| 1 | All or a portion of this security was pledged as collateral. The total value of pledged collateral was $267,746,000, which represented .34% of the net assets of the fund. |
| 2 | Amount less than one thousand. |
| 3 | Index-linked bond whose principal amount moves with a government price index. |
| 4 | Acquired in a transaction exempt from registration under Rule 144A of the Securities Act of 1933. May be resold in the U.S. in transactions exempt from registration, normally to qualified institutional buyers. The total value of all such securities was $10,841,123,000, which represented 13.63% of the net assets of the fund. |
| 5 | Step bond; coupon rate may change at a later date. |
| 6 | Coupon rate may change periodically. Reference rate and spread are as of the most recent information available. Some coupon rates are determined by the issuer or agent based on current market conditions; therefore, the reference rate and spread are not available. |
| 7 | Scheduled interest and/or principal payment was not received. |
| 8 | Payment in kind; the issuer has the option of paying additional securities in lieu of cash. Payment methods and rates are as of the most recent payment when available. |
| 9 | Valued under fair value procedures adopted by authority of the board of trustees. The total value of all such securities was $96,839,000, which represented .12% of the net assets of the fund. |
| 10 | Value determined using significant unobservable inputs. |
| 11 | Loan participations and assignments; may be subject to legal or contractual restrictions on resale. The total value of all such loans was $5,302,000, which represented less than .01% of the net assets of the fund. |
| 12 | Principal payments may be made periodically. Therefore, the effective maturity date may be earlier than the stated maturity date. |
| 13 | Purchased on a TBA basis. |
| 14 | Security did not produce income during the last 12 months. |
| 15 | Acquired through a private placement transaction exempt from registration under the Securities Act of 1933. May be subject to legal or contractual restrictions on resale. Further details on this holding appear below. |
| 16 | Rate represents the seven-day yield at 12/31/2021. |
| 17 | Part of the same “group of investment companies” as the fund as defined under the Investment Company Act of 1940, as amended. |
| | |
| Private placement security | | Acquisition
date | | Cost
(000) | | | Value
(000) | | | Percent
of net
assets | |
| Rotech Healthcare, Inc. | | 9/26/2013 | | | $12,646 | | | | $36,944 | | | | .05 | % |
| The Bond Fund of America | 59 |
Key to abbreviations and symbols
Agcy. = Agency
AMT = Alternative Minimum Tax
Auth. = Authority
CLO = Collateralized Loan Obligations
CMO = Collateralized Mortgage Obligations
CNH/CNY = Chinese yuan renminbi
COP = Colombian pesos
Dept. = Department
Dev. = Development
DKK/DKr = Danish kroner
Econ. = Economic
EFFR = Effective Federal Funds Rate
EUR/€ = Euros
Fac. = Facility
Fin. = Finance
G.O. = General Obligation
ICE = Intercontinental Exchange, Inc.
JPY = Japanese yen
KRW = South Korean won
LIBOR = London Interbank Offered Rate
MXN = Mexican pesos
PEN = Peruvian nuevos soles
Ref. = Refunding
Rev. = Revenue
SIFMA = Securities Industry and Financial Markets Association
SOFR = Secured Overnight Financing Rate
TBA = To-be-announced
USD/$ = U.S. dollars
See notes to financial statements.
| 60 | The Bond Fund of America |
Financial statements
Statement of assets and liabilities
at December 31, 2021 | (dollars in thousands) |
| | |
| Assets: | | | | | | | | |
| Investment securities, at value: | | | | | | | | |
| Unaffiliated issuers (cost: $75,390,334) | | $ | 76,189,081 | | | | | |
| Affiliated issuers (cost: $7,789,992) | | | 7,790,703 | | | $ | 83,979,784 | |
| Cash | | | | | | | 7,743 | |
| Cash denominated in currencies other than U.S. dollars (cost: $56) | | | | | | | 57 | |
| Unrealized appreciation on open forward currency contracts | | | | | | | 1,623 | |
| Receivables for: | | | | | | | | |
| Sales of investments | | | 11,712,719 | | | | | |
| Sales of fund’s shares | | | 134,491 | | | | | |
| Dividends and interest | | | 337,149 | | | | | |
| Variation margin on futures contracts | | | 36,419 | | | | | |
| Variation margin on centrally cleared swap contracts | | | 796 | | | | 12,221,574 | |
| | | | | | | | 96,210,781 | |
| Liabilities: | | | | | | | | |
| Unrealized depreciation on open forward currency contracts | | | | | | | 4,405 | |
| Payables for: | | | | | | | | |
| Purchases of investments | | | 16,493,507 | | | | | |
| Repurchases of fund’s shares | | | 95,995 | | | | | |
| Dividends on fund’s shares | | | 8,664 | | | | | |
| Investment advisory services | | | 11,073 | | | | | |
| Services provided by related parties | | | 12,654 | | | | | |
| Trustees’ deferred compensation | | | 732 | | | | | |
| Variation margin on futures contracts | | | 7,977 | | | | | |
| Variation margin on centrally cleared swap contracts | | | 8,937 | | | | | |
| Other | | | 389 | | | | 16,639,928 | |
| Net assets at December 31, 2021 | | | | | | $ | 79,566,448 | |
| | | | | | | | | |
| Net assets consist of: | | | | | | | | |
| Capital paid in on shares of beneficial interest | | | | | | $ | 78,718,080 | |
| Total distributable earnings | | | | | | | 848,368 | |
| Net assets at December 31, 2021 | | | | | | $ | 79,566,448 | |
See notes to financial statements.
| The Bond Fund of America | 61 |
Financial statements (continued)
Statement of assets and liabilities
at December 31, 2021 (continued)
(dollars and shares in thousands, except per-share amounts)
Shares of beneficial interest issued and outstanding (no stated par value) —
unlimited shares authorized (5,944,397 total shares outstanding)
| | | Net
assets | | | Shares
outstanding | | | Net asset value
per share | |
| Class A | | $ | 30,200,514 | | | | 2,256,276 | | | $ | 13.39 | |
| Class C | | | 717,237 | | | | 53,585 | | | | 13.39 | |
| Class T | | | 11 | | | | 1 | | | | 13.39 | |
| Class F-1 | | | 1,010,925 | | | | 75,526 | | | | 13.39 | |
| Class F-2 | | | 20,613,315 | | | | 1,540,017 | | | | 13.39 | |
| Class F-3 | | | 7,934,153 | | | | 592,759 | | | | 13.39 | |
| Class 529-A | | | 1,473,308 | | | | 110,071 | | | | 13.39 | |
| Class 529-C | | | 69,859 | | | | 5,219 | | | | 13.39 | |
| Class 529-E | | | 46,161 | | | | 3,449 | | | | 13.39 | |
| Class 529-T | | | 12 | | | | 1 | | | | 13.39 | |
| Class 529-F-1 | | | 10 | | | | 1 | | | | 13.39 | |
| Class 529-F-2 | | | 176,499 | | | | 13,186 | | | | 13.39 | |
| Class 529-F-3 | | | 10 | | | | 1 | | | | 13.39 | |
| Class R-1 | | | 41,770 | | | | 3,121 | | | | 13.39 | |
| Class R-2 | | | 409,230 | | | | 30,573 | | | | 13.39 | |
| Class R-2E | | | 44,359 | | | | 3,314 | | | | 13.39 | |
| Class R-3 | | | 673,150 | | | | 50,291 | | | | 13.39 | |
| Class R-4 | | | 588,472 | | | | 43,965 | | | | 13.39 | |
| Class R-5E | | | 159,651 | | | | 11,927 | | | | 13.39 | |
| Class R-5 | | | 372,792 | | | | 27,851 | | | | 13.39 | |
| Class R-6 | | | 15,035,010 | | | | 1,123,263 | | | | 13.39 | |
See notes to financial statements.
| 62 | The Bond Fund of America |
Financial statements (continued)
| Statement of operations | |
| for the year ended December 31, 2021 | (dollars in thousands) |
| Investment income: | | | | | | | | |
| Income: | | | | | | | | |
| Interest (net of non-U.S. taxes of $193) | | $ | 1,413,053 | | | | | |
| Dividends (includes $7,533 from affiliates) | | | 7,596 | | | $ | 1,420,649 | |
| Fees and expenses*: | | | | | | | | |
| Investment advisory services | | | 117,038 | | | | | |
| Distribution services | | | 98,870 | | | | | |
| Transfer agent services | | | 58,536 | | | | | |
| Administrative services | | | 22,364 | | | | | |
| Reports to shareholders | | | 1,898 | | | | | |
| Registration statement and prospectus | | | 3,992 | | | | | |
| Trustees’ compensation | | | 261 | | | | | |
| Auditing and legal | | | 247 | | | | | |
| Custodian | | | 274 | | | | | |
| Other | | | 1,167 | | | | 304,647 | |
| Net investment income | | | | | | | 1,116,002 | |
| | | | | | | | | |
| Net realized gain and unrealized depreciation: | | | | | | | | |
| Net realized gain (loss) on: | | | | | | | | |
| Investments: | | | | | | | | |
| Unaffiliated issuers | | | 122,871 | | | | | |
| Affiliated issuers | | | (775 | ) | | | | |
| Futures contracts | | | 119,270 | | | | | |
| Forward currency contracts | | | 18,338 | | | | | |
| Swap contracts | | | 43,855 | | | | | |
| Currency transactions | | | 302 | | | | 303,861 | |
| Net unrealized (depreciation) appreciation on: | | | | | | | | |
| Investments: | | | | | | | | |
| Unaffiliated issuers | | | (1,995,545 | ) | | | | |
| Affiliated issuers | | | 309 | | | | | |
| Futures contracts | | | 3,393 | | | | | |
| Forward currency contracts | | | (2,462 | ) | | | | |
| Swap contracts | | | (669 | ) | | | | |
| Currency translations | | | (65 | ) | | | (1,995,039 | ) |
| Net realized gain and unrealized depreciation | | | | | | | (1,691,178 | ) |
| Net decrease in net assets resulting from operations | | | | | | $ | (575,176 | ) |
| | |
| * | Additional information related to class-specific fees and expenses is included in the notes to financial statements. |
See notes to financial statements.
| The Bond Fund of America | 63 |
Financial statements (continued)
| Statements of changes in net assets | |
| | (dollars in thousands) |
| | | Year ended December 31, | |
| | | 2021 | | | 2020 | |
| Operations: | | | | | | | | |
| Net investment income | | $ | 1,116,002 | | | $ | 1,012,536 | |
| Net realized gain | | | 303,861 | | | | 2,750,281 | |
| Net unrealized (depreciation) appreciation | | | (1,995,039 | ) | | | 2,021,287 | |
| Net (decrease) increase in net assets resulting from operations | | | (575,176 | ) | | | 5,784,104 | |
| | | | | | | | | |
| Distributions paid or accrued to shareholders | | | (1,605,741 | ) | | | (3,310,485 | ) |
| | | | | | | | | |
| Net capital share transactions | | | 11,507,974 | | | | 17,318,680 | |
| | | | | | | | | |
| Total increase in net assets | | | 9,327,057 | | | | 19,792,299 | |
| | | | | | | | | |
| Net assets: | | | | | | | | |
| Beginning of year | | | 70,239,391 | | | | 50,447,092 | |
| End of year | | $ | 79,566,448 | | | $ | 70,239,391 | |
| | | | | | | | | |
| See notes to financial statements. | | | | | | | | |
| 64 | The Bond Fund of America |
Notes to financial statements
1. Organization
The Bond Fund of America (the “fund”) is registered under the Investment Company Act of 1940, as amended (the “1940 Act”), as an open-end, diversified management investment company. The fund seeks as high a level of current income as is consistent with the preservation of capital.
The fund has 21 share classes consisting of six retail share classes (Classes A, C, T, F-1, F-2 and F-3), seven 529 college savings plan share classes (Classes 529-A, 529-C, 529-E, 529-T, 529-F-1, 529-F-2 and 529-F-3) and eight retirement plan share classes (Classes R-1, R-2, R-2E, R-3, R-4, R-5E, R-5 and R-6). The 529 college savings plan share classes can be used to save for college education. The retirement plan share classes are generally offered only through eligible employer-sponsored retirement plans. The fund’s share classes are described further in the following table:
| Share class | | Initial sales charge | | Contingent deferred sales
charge upon redemption | | Conversion feature |
| Classes A and 529-A | | Up to 3.75% for Class A; up to 3.50% for Class 529-A | | None (except 1.00% for certain redemptions within 18 months of purchase without an initial sales charge) | | None |
| Classes C and 529-C | | None | | 1.00% for redemptions within one year of purchase | | Class C converts to Class A after eight years and Class 529-C converts to Class 529-A after five years |
| Class 529-E | | None | | None | | None |
| Classes T and 529-T* | | Up to 2.50% | | None | | None |
| Classes F-1, F-2, F-3, 529-F-1, 529-F-2 and 529-F-3 | | None | | None | | None |
| Classes R-1, R-2, R-2E, R-3, R-4, R-5E, R-5 and R-6 | | None | | None | | None |
| | | |
| | * | Class T and 529-T shares are not available for purchase. |
Holders of all share classes have equal pro rata rights to the assets, dividends and liquidation proceeds of the fund. Each share class has identical voting rights, except for the exclusive right to vote on matters affecting only its class. Share classes have different fees and expenses (“class-specific fees and expenses”), primarily due to different arrangements for distribution, transfer agent and administrative services. Differences in class-specific fees and expenses will result in differences in net investment income and, therefore, the payment of different per-share dividends by each share class.
2. Significant accounting policies
The fund is an investment company that applies the accounting and reporting guidance issued in Topic 946 by the U.S. Financial Accounting Standards Board. The fund’s financial statements have been prepared to comply with U.S. generally accepted accounting principles (“U.S. GAAP”). These principles require the fund’s investment adviser to make estimates and assumptions that affect reported amounts and disclosures. Actual results could differ from those estimates. Subsequent events, if any, have been evaluated through the date of issuance in the preparation of the financial statements. The fund follows the significant accounting policies described in this section, as well as the valuation policies described in the next section on valuation.
Security transactions and related investment income — Security transactions are recorded by the fund as of the date the trades are executed with brokers. Realized gains and losses from security transactions are determined based on the specific identified cost of the securities. In the event a security is purchased with a delayed payment date, the fund will segregate liquid assets sufficient to meet its payment obligations. Dividend income is recognized on the ex-dividend date and interest income is recognized on an accrual basis. Market discounts, premiums and original issue discounts on fixed-income securities are amortized daily over the expected life of the security.
Class allocations — Income, fees and expenses (other than class-specific fees and expenses) are allocated daily among the various share classes based on the relative value of their settled shares. Realized gains and losses and unrealized appreciation and depreciation are allocated daily among the various share classes based on their relative net assets. Class-specific fees and expenses, such as distribution, transfer agent and administrative services, are charged directly to the respective share class.
Distributions paid or accrued to shareholders — Income dividends are declared daily after the determination of the fund’s net investment income and are paid to shareholders monthly. Capital gain distributions are recorded on the ex-dividend date.
| The Bond Fund of America | 65 |
Currency translation — Assets and liabilities, including investment securities, denominated in currencies other than U.S. dollars are translated into U.S. dollars at the exchange rates supplied by one or more pricing vendors on the valuation date. Purchases and sales of investment securities and income and expenses are translated into U.S. dollars at the exchange rates on the dates of such transactions. The effects of changes in exchange rates on investment securities are included with the net realized gain or loss and net unrealized appreciation or depreciation on investments in the fund’s statement of operations. The realized gain or loss and unrealized appreciation or depreciation resulting from all other transactions denominated in currencies other than U.S. dollars are disclosed separately.
3. Valuation
Capital Research and Management Company (“CRMC”), the fund’s investment adviser, values the fund’s investments at fair value as defined by U.S. GAAP. The net asset value per share is calculated once daily as of the close of regular trading on the New York Stock Exchange, normally 4 p.m. New York time, each day the New York Stock Exchange is open.
Methods and inputs — The fund’s investment adviser uses the following methods and inputs to establish the fair value of the fund’s assets and liabilities. Use of particular methods and inputs may vary over time based on availability and relevance as market and economic conditions evolve.
Equity securities are generally valued at the official closing price of, or the last reported sale price on, the exchange or market on which such securities are traded, as of the close of business on the day the securities are being valued or, lacking any sales, at the last available bid price. Prices for each security are taken from the principal exchange or market on which the security trades.
Fixed-income securities, including short-term securities, are generally valued at prices obtained from one or more pricing vendors. Vendors value such securities based on one or more of the inputs described in the following table. The table provides examples of inputs that are commonly relevant for valuing particular classes of fixed-income securities in which the fund is authorized to invest. However, these classifications are not exclusive, and any of the inputs may be used to value any other class of fixed-income security.
| Fixed-income class | Examples of standard inputs |
| All | Benchmark yields, transactions, bids, offers, quotations from dealers and trading systems, new issues, spreads and other relationships observed in the markets among comparable securities; and proprietary pricing models such as yield measures calculated using factors such as cash flows, financial or collateral performance and other reference data (collectively referred to as “standard inputs”) |
| Corporate bonds, notes & loans; convertible securities | Standard inputs and underlying equity of the issuer |
| Bonds & notes of governments & government agencies | Standard inputs and interest rate volatilities |
| Mortgage-backed; asset-backed obligations | Standard inputs and cash flows, prepayment information, default rates, delinquency and loss assumptions, collateral characteristics, credit enhancements and specific deal information |
| Municipal securities | Standard inputs and, for certain distressed securities, cash flows or liquidation values using a net present value calculation based on inputs that include, but are not limited to, financial statements and debt contracts |
When the fund’s investment adviser deems it appropriate to do so (such as when vendor prices are unavailable or deemed to be not representative), fixed-income securities will be valued in good faith at the mean quoted bid and ask prices that are reasonably and timely available (or bid prices, if ask prices are not available) or at prices for securities of comparable maturity, quality and type.
Securities with both fixed-income and equity characteristics, or equity securities traded principally among fixed-income dealers, are generally valued in the manner described for either equity or fixed-income securities, depending on which method is deemed most appropriate by the fund’s investment adviser. The Capital Group Central Cash Fund (“CCF”), a fund within the Capital Group Central Fund Series (“Central Funds”), is valued based upon a floating net asset value, which fluctuates with changes in the value of CCF’s portfolio securities. The underlying securities are valued based on the policies and procedures in CCF’s statement of additional information. Exchange-traded futures are generally valued at the official settlement price of the exchange or market on which such instruments are traded, as of the close of business on the day the futures are being valued. Forward currency contracts are valued based on the spot and forward exchange rates obtained from one or more pricing vendors. Interest rate swaps and credit default swaps are generally valued by pricing vendors based on market inputs that include the index and term of index, reset frequency, payer/receiver, currency and pay frequency.
| 66 | The Bond Fund of America |
Securities and other assets for which representative market quotations are not readily available or are considered unreliable by the fund’s investment adviser are fair valued as determined in good faith under fair valuation guidelines adopted by authority of the fund’s board of trustees as further described. The investment adviser follows fair valuation guidelines, consistent with U.S. Securities and Exchange Commission rules and guidance, to consider relevant principles and factors when making fair value determinations. The investment adviser considers relevant indications of value that are reasonably and timely available to it in determining the fair value to be assigned to a particular security, such as the type and cost of the security; contractual or legal restrictions on resale of the security; relevant financial or business developments of the issuer; actively traded similar or related securities; conversion or exchange rights on the security; related corporate actions; significant events occurring after the close of trading in the security; and changes in overall market conditions. In addition, the closing prices of equity securities that trade in markets outside U.S. time zones may be adjusted to reflect significant events that occur after the close of local trading but before the net asset value of each share class of the fund is determined. Fair valuations and valuations of investments that are not actively trading involve judgment and may differ materially from valuations that would have been used had greater market activity occurred.
Processes and structure — The fund’s board of trustees has delegated authority to the fund’s investment adviser to make fair value determinations, subject to board oversight. The investment adviser has established a Joint Fair Valuation Committee (the “Fair Valuation Committee”) to administer, implement and oversee the fair valuation process, and to make fair value decisions. The Fair Valuation Committee regularly reviews its own fair value decisions, as well as decisions made under its standing instructions to the investment adviser’s valuation teams. The Fair Valuation Committee reviews changes in fair value measurements from period to period and may, as deemed appropriate, update the fair valuation guidelines to better reflect the results of back testing and address new or evolving issues. The Fair Valuation Committee reports any changes to the fair valuation guidelines to the board of trustees. The fund’s board and audit committee also regularly review reports that describe fair value determinations and methods.
The fund’s investment adviser has also established a Fixed-Income Pricing Review Group to administer and oversee the fixed-income valuation process, including the use of fixed-income pricing vendors. This group regularly reviews pricing vendor information and market data. Pricing decisions, processes and controls over security valuation are also subject to additional internal reviews facilitated by the investment adviser’s global risk management group.
Classifications — The fund’s investment adviser classifies the fund’s assets and liabilities into three levels based on the inputs used to value the assets or liabilities. Level 1 values are based on quoted prices in active markets for identical securities. Level 2 values are based on significant observable market inputs, such as quoted prices for similar securities and quoted prices in inactive markets. Certain securities trading outside the U.S. may transfer between Level 1 and Level 2 due to valuation adjustments resulting from significant market movements following the close of local trading. Level 3 values are based on significant unobservable inputs that reflect the investment adviser’s determination of assumptions that market participants might reasonably use in valuing the securities. The valuation levels are not necessarily an indication of the risk or liquidity associated with the underlying investment. For example, U.S. government securities are reflected as Level 2 because the inputs used to determine fair value may not always be quoted prices in an active market. The following tables present the fund’s valuation levels as of December 31, 2021 (dollars in thousands):
| | | Investment securities | |
| | | Level 1 | | | Level 2 | | | Level 3 | | | Total | |
| Assets: | | | | | | | | | | | | | | | | |
| Bonds, notes & other debt instruments: | | | | | | | | | | | | | | | | |
| U.S. Treasury bonds & notes | | $ | — | | | $ | 33,998,635 | | | $ | — | | | $ | 33,998,635 | |
| Corporate bonds, notes & loans | | | — | | | | 26,410,702 | | | | 5,302 | | | | 26,416,004 | |
| Mortgage-backed obligations | | | — | | | | 11,143,175 | | | | 2,175 | | | | 11,145,350 | |
| Asset-backed obligations | | | — | | | | 2,594,831 | | | | — | | | | 2,594,831 | |
| Bonds & notes of governments & government agencies outside the U.S. | | | — | | | | 1,442,251 | | | | — | | | | 1,442,251 | |
| Municipals | | | — | | | | 525,375 | | | | — | | | | 525,375 | |
| Federal agency bonds & notes | | | — | | | | 19,180 | | | | — | | | | 19,180 | |
| Common stocks | | | — | | | | 4,920 | | | | 36,944 | | | | 41,864 | |
| Preferred securities | | | — | | | | 5,047 | | | | — | | | | 5,047 | |
| Rights & warrants | | | — | | | | 544 | | | | — | | | | 544 | |
| Short-term securities | | | 7,790,703 | | | | — | | | | — | | | | 7,790,703 | |
| Total | | $ | 7,790,703 | | | $ | 76,144,660 | | | $ | 44,421 | | | $ | 83,979,784 | |
| The Bond Fund of America | 67 |
| | | Other investments* | |
| | | Level 1 | | | Level 2 | | | Level 3 | | | Total | |
| Assets: | | | | | | | | | | | | | | | | |
| Unrealized appreciation on futures contracts | | $ | 83,505 | | | $ | — | | | $ | — | | | $ | 83,505 | |
| Unrealized appreciation on open forward currency contracts | | | — | | | | 1,623 | | | | — | | | | 1,623 | |
| Unrealized appreciation on centrally cleared interest rate swaps | | | — | | | | 214,241 | | | | — | | | | 214,241 | |
| Unrealized appreciation on credit default swaps | | | — | | | | 147 | | | | — | | | | 147 | |
| Liabilities: | | | | | | | | | | | | | | | | |
| Unrealized depreciation on futures contracts | | | (73,981 | ) | | | — | | | | — | | | | (73,981 | ) |
| Unrealized depreciation on open forward currency contracts | | | — | | | | (4,405 | ) | | | — | | | | (4,405 | ) |
| Unrealized depreciation on centrally cleared interest rate swaps | | | — | | | | (23,527 | ) | | | — | | | | (23,527 | ) |
| Total | | $ | 9,524 | | | $ | 188,079 | | | $ | — | | | $ | 197,603 | |
| | * | Futures contracts, forward currency contracts, interest rate swaps and credit default swaps are not included in the fund’s investment portfolio. |
4. Risk factors
Investing in the fund may involve certain risks including, but not limited to, those described below.
Market conditions — The prices of, and the income generated by, the securities held by the fund may decline — sometimes rapidly or unpredictably — due to various factors, including events or conditions affecting the general economy or particular industries; overall market changes; local, regional or global political, social or economic instability; governmental, governmental agency or central bank responses to economic conditions; and currency exchange rate, interest rate and commodity price fluctuations.
Economies and financial markets throughout the world are highly interconnected. Economic, financial or political events, trading and tariff arrangements, wars, terrorism, cybersecurity events, natural disasters, public health emergencies (such as the spread of infectious disease) and other circumstances in one country or region, including actions taken by governmental or quasi-governmental authorities in response to any of the foregoing, could have impacts on global economies or markets. As a result, whether or not the fund invests in securities of issuers located in or with significant exposure to the countries affected, the value and liquidity of the fund’s investments may be negatively affected by developments in other countries and regions.
Issuer risks — The prices of, and the income generated by, securities held by the fund may decline in response to various factors directly related to the issuers of such securities, including reduced demand for an issuer’s goods or services, poor management performance, major litigation, investigations or other controversies related to the issuer, changes in government regulations affecting the issuer or its competitive environment and strategic initiatives such as mergers, acquisitions or dispositions and the market response to any such initiatives.
Investing in debt instruments — The prices of, and the income generated by, bonds and other debt securities held by the fund may be affected by factors such as the interest rates, maturities and credit ratings of these securities.
Rising interest rates will generally cause the prices of bonds and other debt securities to fall. A general rise in interest rates may cause investors to sell debt securities on a large scale, which could also adversely affect the price and liquidity of debt securities and could also result in increased redemptions from the fund. Falling interest rates may cause an issuer to redeem, call or refinance a debt security before its stated maturity, which may result in the fund failing to recoup the full amount of its initial investment and having to reinvest the proceeds in lower yielding securities. Longer maturity debt securities generally have greater sensitivity to changes in interest rates and may be subject to greater price fluctuations than shorter maturity debt securities.
Bonds and other debt securities are also subject to credit risk, which is the possibility that the credit strength of an issuer or guarantor will weaken or be perceived to be weaker, and/or an issuer of a debt security will fail to make timely payments of principal or interest and the security will go into default. A downgrade or default affecting any of the fund’s securities could cause the value of the fund’s shares to decrease. Lower quality debt securities generally have higher rates of interest and may be subject to greater price fluctuations than higher quality debt securities. Credit risk is gauged, in part, by the credit ratings of the debt securities in which the fund invests. However, ratings are only the opinions of the rating agencies issuing them and are not guarantees as to credit quality or an evaluation of market risk. The fund’s investment adviser relies on its own credit analysts to research issuers and issues in seeking to assess credit and default risks.
| 68 | The Bond Fund of America |
Investing in mortgage-related and other asset-backed securities — Mortgage-related securities, such as mortgage-backed securities, and other asset-backed securities, include debt obligations that represent interests in pools of mortgages or other income-bearing assets, such as consumer loans or receivables. While such securities are subject to the risks associated with investments in debt instruments generally (for example, credit, extension and interest rate risks), they are also subject to other and different risks. Mortgage-backed and other asset-backed securities are subject to changes in the payment patterns of borrowers of the underlying debt, potentially increasing the volatility of the securities and the fund’s net asset value. When interest rates fall, borrowers are more likely to refinance or prepay their debt before its stated maturity. This may result in the fund having to reinvest the proceeds in lower yielding securities, effectively reducing the fund’s income. Conversely, if interest rates rise and borrowers repay their debt more slowly than expected, the time in which the mortgage-backed and other asset-backed securities are paid off could be extended, reducing the fund’s cash available for reinvestment in higher yielding securities. Mortgage-backed securities are also subject to the risk that underlying borrowers will be unable to meet their obligations and the value of property that secures the mortgages may decline in value and be insufficient, upon foreclosure, to repay the associated loans. Investments in asset-backed securities are subject to similar risks.
Investing in securities backed by the U.S. government — Securities backed by the U.S. Treasury or the full faith and credit of the U.S. government are guaranteed only as to the timely payment of interest and principal when held to maturity. Accordingly, the current market values for these securities will fluctuate with changes in interest rates and the credit rating of the U.S. government. Securities issued by U.S. government-sponsored entities and federal agencies and instrumentalities that are not backed by the full faith and credit of the U.S. government are neither issued nor guaranteed by the U.S. government.
Liquidity risk — Certain fund holdings may be or may become difficult or impossible to sell, particularly during times of market turmoil. Liquidity may be impacted by the lack of an active market for a holding, legal or contractual restrictions on resale, or the reduced number and capacity of market participants to make a market in such holding. Market prices for less liquid or illiquid holdings may be volatile, and reduced liquidity may have an adverse impact on the market price of such holdings. Additionally, the sale of less liquid or illiquid holdings may involve substantial delays (including delays in settlement) and additional costs and the fund may be unable to sell such holdings when necessary to meet its liquidity needs or may be forced to sell at a loss.
Investing outside the U.S. — Securities of issuers domiciled outside the U.S., or with significant operations or revenues outside the U.S., may lose value because of adverse political, social, economic or market developments (including social instability, regional conflicts, terrorism and war) in the countries or regions in which the issuers operate or generate revenue. These securities may also lose value due to changes in foreign currency exchange rates against the U.S. dollar and/or currencies of other countries. Issuers of these securities may be more susceptible to actions of foreign governments, such as nationalization, currency blockage or the imposition of price controls or punitive taxes, each of which could adversely impact the value of these securities. Securities markets in certain countries may be more volatile and/or less liquid than those in the U.S. Investments outside the U.S. may also be subject to different accounting and auditing practices and standards and different regulatory, legal and reporting requirements, and may be more difficult to value, than those in the U.S. In addition, the value of investments outside the U.S. may be reduced by foreign taxes, including foreign withholding taxes on interest and dividends. Further, there may be increased risks of delayed settlement of securities purchased or sold by the fund. The risks of investing outside the U.S. may be heightened in connection with investments in emerging markets.
Investing in future delivery contracts — The fund may enter into contracts, such as to-be-announced contracts and mortgage dollar rolls, that involve the fund selling mortgage-related securities and simultaneously contracting to repurchase similar securities for delivery at a future date at a predetermined price. This can increase the fund’s market exposure, and the market price of the securities that the fund contracts to repurchase could drop below their purchase price. While the fund can preserve and generate capital through the use of such contracts by, for example, realizing the difference between the sale price and the future purchase price, the income generated by the fund may be reduced by engaging in such transactions. In addition, these transactions increase the turnover rate of the fund.
Investing in inflation-linked bonds — The values of inflation-linked bonds generally fluctuate in response to changes in real interest rates — i.e., rates of interest after factoring in inflation. A rise in real interest rates may cause the prices of inflation-linked securities to fall, while a decline in real interest rates may cause the prices to increase. Inflation-linked bonds may experience greater losses than other debt securities with similar durations when real interest rates rise faster than nominal interest rates. There can be no assurance that the value of an inflation-linked security will be directly correlated to changes in interest rates; for example, if interest rates rise for reasons other than inflation, the increase may not be reflected in the security’s inflation measure.
Investing in inflation-linked bonds may also reduce the fund’s distributable income during periods of deflation. If prices for goods and services decline throughout the economy, the principal and income on inflation-linked securities may decline and result in losses to the fund.
| The Bond Fund of America | 69 |
Investing in derivatives — The use of derivatives involves a variety of risks, which may be different from, or greater than, the risks associated with investing in traditional securities, such as stocks and bonds. Changes in the value of a derivative may not correlate perfectly with, and may be more sensitive to market events than, the underlying asset, rate or index, and a derivative instrument may expose the fund to losses in excess of its initial investment. Derivatives may be difficult to value, difficult for the fund to buy or sell at an opportune time or price and difficult, or even impossible, to terminate or otherwise offset. The fund’s use of derivatives may result in losses to the fund, and investing in derivatives may reduce the fund’s returns and increase the fund’s price volatility. The fund’s counterparty to a derivative transaction (including, if applicable, the fund’s clearing broker, the derivatives exchange or the clearinghouse) may be unable or unwilling to honor its financial obligations in respect of the transaction. In certain cases, the fund may be hindered or delayed in exercising remedies against or closing out derivative instruments with a counterparty, which may result in additional losses.
Management — The investment adviser to the fund actively manages the fund’s investments. Consequently, the fund is subject to the risk that the methods and analyses, including models, tools and data, employed by the investment adviser in this process may be flawed or incorrect and may not produce the desired results. This could cause the fund to lose value or its investment results to lag relevant benchmarks or other funds with similar objectives.
5. Certain investment techniques
Index-linked bonds — The fund has invested in index-linked bonds, which are fixed-income securities whose principal value is periodically adjusted to a government price index. Over the life of an index-linked bond, interest is paid on the adjusted principal value. Increases or decreases in the principal value of index-linked bonds are recorded as interest income in the fund’s statement of operations.
Mortgage dollar rolls — The fund has entered into mortgage dollar roll transactions in which the fund sells a mortgage-backed security to a counterparty and simultaneously enters into an agreement with the same counterparty to buy back a similar security on a specific future date at a predetermined price. Mortgage dollar rolls are accounted for as purchase and sale transactions. Portfolio turnover rates excluding and including mortgage dollar rolls are presented at the end of the fund’s financial highlights table.
Loan transactions — The fund has entered into loan transactions in which the fund acquires a loan either through an agent, by assignment from another holder, or as a participation interest in another holder’s portion of a loan. The loan is often administered by a financial institution that acts as agent for the holders of the loan, and the fund may be required to receive approval from the agent and/or borrower prior to the sale of the investment. The loan’s interest rate and maturity date may change based on the terms of the loan, including potential early payments of principal.
Futures contracts — The fund has entered into futures contracts, which provide for the future sale by one party and purchase by another party of a specified amount of a specific financial instrument for a specified price, date, time and place designated at the time the contract is made. Futures contracts are used to strategically manage the fund’s interest rate sensitivity by increasing or decreasing the duration of the fund or a portion of the fund’s portfolio.
Upon entering into futures contracts, and to maintain the fund’s open positions in futures contracts, the fund is required to deposit with a futures broker, known as a futures commission merchant (“FCM”), in a segregated account in the name of the FCM an amount of cash, U.S. government securities or other liquid securities, known as initial margin. The margin required for a particular futures contract is set by the exchange on which the contract is traded to serve as collateral, and may be significantly modified from time to time by the exchange during the term of the contract.
On a daily basis, the fund pays or receives variation margin based on the increase or decrease in the value of the futures contracts and records variation margin on futures contracts in the statement of assets and liabilities. In addition, the fund segregates liquid assets equivalent to the fund’s outstanding obligations under the contract in excess of the initial margin and variation margin, if any. Futures contracts may involve a risk of loss in excess of the variation margin shown on the fund’s statement of assets and liabilities. The fund records realized gains or losses at the time the futures contract is closed or expires. Net realized gains or losses and net unrealized appreciation or depreciation from futures contracts are recorded in the fund’s statement of operations. The average month-end notional amount of futures contracts while held was $22,399,480,000.
Forward currency contracts — The fund has entered into forward currency contracts, which represent agreements to exchange currencies on specific future dates at predetermined rates. The fund’s investment adviser uses forward currency contracts to manage the fund’s exposure to changes in exchange rates. Upon entering into these contracts, risks may arise from the potential inability of counterparties to meet the terms of their contracts and from possible movements in exchange rates.
| 70 | The Bond Fund of America |
On a daily basis, the fund’s investment adviser values forward currency contracts and records unrealized appreciation or depreciation for open forward currency contracts in the fund’s statement of assets and liabilities. Realized gains or losses are recorded at the time the forward currency contract is closed or offset by another contract with the same broker for the same settlement date and currency.
Closed forward currency contracts that have not reached their settlement date are included in the respective receivables or payables for closed forward currency contracts in the fund’s statement of assets and liabilities. Net realized gains or losses from closed forward currency contracts and net unrealized appreciation or depreciation from open forward currency contracts are recorded in the fund’s statement of operations. The average month-end notional amount of open forward currency contracts while held was $470,711,000.
Swap contracts — The fund has entered into swap agreements, which are two-party contracts entered into primarily by institutional investors for a specified time period. In a typical swap transaction, two parties agree to exchange the returns earned or realized from one or more underlying assets or rates of return. Swap agreements can be traded on a swap execution facility (SEF) and cleared through a central clearinghouse (cleared), traded over-the-counter (OTC) and cleared, or traded bilaterally and not cleared. Because clearing interposes a central clearinghouse as the ultimate counterparty to each participant’s swap, and margin is required to be exchanged under the rules of the clearinghouse, central clearing is intended to decrease (but not eliminate) counterparty risk relative to uncleared bilateral swaps. To the extent the fund enters into bilaterally negotiated swap transactions, the fund will enter into swap agreements only with counterparties that meet certain credit standards and subject to agreed collateralized procedures. The term of a swap can be days, months or years and certain swaps may be less liquid than others.
Upon entering into a centrally cleared swap contract, the fund is required to deposit cash, U.S. government securities or other liquid securities, which is known as initial margin. Generally, the initial margin required for a particular swap is set and held as collateral by the clearinghouse on which the contract is cleared. The amount of initial margin required may be significantly modified from time to time by the clearinghouse during the term of the contract.
On a daily basis, interest accruals related to the exchange of future payments are recorded as a receivable and payable in the fund’s statement of assets and liabilities for centrally cleared swaps and as unrealized appreciation or depreciation in the fund’s statement of assets and liabilities for bilateral swaps. For centrally cleared swaps, the fund also pays or receives a variation margin based on the increase or decrease in the value of the swaps, including accrued interest as applicable, and records variation margin in the statement of assets and liabilities. The fund records realized gains and losses on both the net accrued interest and any gain or loss recognized at the time the swap is closed or expires. Net realized gains or losses, as well as any net unrealized appreciation or depreciation, from swaps are recorded in the fund’s statement of operations.
Swap agreements can take different forms. The fund has entered into the following types of swap agreements:
Interest rate swaps — The fund has entered into interest rate swaps, which seek to manage the interest rate sensitivity of the fund by increasing or decreasing the duration of the fund or a portion of the fund’s portfolio. An interest rate swap is an agreement between two parties to exchange or swap payments based on changes in an interest rate or rates. Typically, one interest rate is fixed and the other is variable based on a designated short-term interest rate such as the Secured Overnight Financing Rate (SOFR), prime rate or other benchmark. In other types of interest rate swaps, known as basis swaps, the parties agree to swap variable interest rates based on different designated short-term interest rates. Interest rate swaps generally do not involve the delivery of securities or other principal amounts. Rather, cash payments are exchanged by the parties based on the application of the designated interest rates to a notional amount, which is the predetermined dollar principal of the trade upon which payment obligations are computed. Accordingly, the fund’s current obligation or right under the swap agreement is generally equal to the net amount to be paid or received under the swap agreement based on the relative value of the position held by each party. The average month-end notional amount of interest rate swaps while held was $6,544,156,000.
Credit default swap indices — The fund has entered into centrally cleared credit default swap indices, including CDX and iTraxx indices (collectively referred to as “CDSIs”), in order to assume exposure to a diversified portfolio of credits or to hedge against existing credit risks. A CDSI is based on a portfolio of credit default swaps with similar characteristics, such as credit default swaps on high-yield bonds. In a typical CDSI transaction, one party (the protection buyer) is obligated to pay the other party (the protection seller) a stream of periodic payments over the term of the contract. If a credit event, such as a default or restructuring, occurs with respect to any of the underlying reference obligations, the protection seller must pay the protection buyer the loss on those credits.
The fund may enter into a CDSI transaction as either protection buyer or protection seller. If the fund is a protection buyer, it would pay the counterparty a periodic stream of payments over the term of the contract and would not recover any of those payments if no credit events were to occur with respect to any of the underlying reference obligations. However, if a credit event did occur, the fund, as a protection buyer, would have the right to deliver the referenced debt obligations or a specified amount of cash, depending on the terms of the applicable agreement, and to receive the par value of such debt obligations from the counterparty protection seller.
| The Bond Fund of America | 71 |
As a protection seller, the fund would receive fixed payments throughout the term of the contract if no credit events were to occur with respect to any of the underlying reference obligations. If a credit event were to occur, however, the value of any deliverable obligation received by the fund, coupled with the periodic payments previously received by the fund, may be less than the full notional value that the fund, as a protection seller, pays to the counterparty protection buyer, effectively resulting in a loss of value to the fund. Furthermore, as a protection seller, the fund would effectively add leverage to its portfolio because it would have investment exposure to the notional amount of the swap transaction. The average month-end notional amount of credit default swaps while held was $510,444,000.
The following tables identify the location and fair value amounts on the fund’s statement of assets and liabilities and the effect on the fund’s statement of operations resulting from the fund’s use of futures contracts, forward currency contracts, interest rate swaps and credit default swaps as of, or for the year ended, December 31, 2021 (dollars in thousands):
| | | | Assets | | | Liabilities | |
| Contracts | | Risk type | | Location on statement of
assets and liabilities | | Value | | | Location on statement of
assets and liabilities | | Value | |
| Futures | | Interest | | Unrealized appreciation* | | $ | 83,505 | | | Unrealized depreciation* | | $ | 73,981 | |
| Forward currency | | Currency | | Unrealized appreciation on open forward currency contracts | | | 1,623 | | | Unrealized depreciation on open forward currency contracts | | | 4,405 | |
| Swap (centrally cleared) | | Interest | | Unrealized appreciation* | | | 214,241 | | | Unrealized depreciation* | | | 23,527 | |
| Swap (centrally cleared) | | Credit | | Unrealized appreciation* | | | 147 | | | Unrealized depreciation* | | | — | |
| | | | | | | $ | 299,516 | | | | | $ | 101,913 | |
| | | | | | | | | | | | | | | |
| | | | | Net realized gain (loss) | | | Net unrealized appreciation (depreciation) | |
| Contracts | | Risk type | | Location on statement of operations | | | Value | | | Location on statement of operations | | | Value | |
| Futures | | Interest | | Net realized gain on futures contracts | | $ | 119,270 | | | Net unrealized appreciation on futures contracts | | $ | 3,393 | |
| Forward currency | | Currency | | Net realized gain on forward currency contracts | | | 18,338 | | | Net unrealized depreciation on forward currency contracts | | | (2,462 | ) |
| Swap | | Interest | | Net realized gain on swap contracts | | | 45,141 | | | Net unrealized appreciation on swap contracts | | | 6 | |
| Swap | | Credit | | Net realized loss on swap contracts | | | (1,286 | ) | | Net unrealized depreciation on swap contracts | | | (675 | ) |
| | | | | | | $ | 181,463 | | | | | $ | 262 | |
| | * | Includes cumulative appreciation/depreciation on futures contracts, centrally cleared interest rate swaps and credit default swaps as reported in the applicable tables following the fund’s investment portfolio. Only current day’s variation margin is reported within the fund’s statement of assets and liabilities. |
Collateral — The fund receives or pledges highly liquid assets, such as cash or U.S. government securities, as collateral due to its use of futures contracts, forward currency contracts, interest rate swaps, credit default swaps and future delivery contracts. For futures contracts, centrally cleared interest rate swaps and credit default swaps, the fund pledges collateral for initial and variation margin by contract. For forward currency contracts, the fund either receives or pledges collateral based on the net gain or loss on unsettled contracts by counterparty. For future delivery contracts, the fund either receives or pledges collateral based on the net gain or loss on unsettled contracts by certain counterparties. The purpose of the collateral is to cover potential losses that could occur in the event that either party cannot meet its contractual obligation. Non-cash collateral pledged by the fund, if any, is disclosed in the fund’s investment portfolio, and cash collateral pledged by the fund, if any, is held in a segregated account with the fund’s custodian, which is reflected as pledged cash collateral in the fund’s statement of assets and liabilities.
Rights of offset — The fund has entered into enforceable master netting agreements with certain counterparties for forward currency contracts, where on any date amounts payable by each party to the other (in the same currency with respect to the same transaction) may be closed or offset by each party’s payment obligation. If an early termination date occurs under these agreements following an event of default or termination event, all obligations of each party to its counterparty are settled net through a single payment in a single currency (“close-out netting”). For financial reporting purposes, the fund does not offset financial assets and financial liabilities that are subject to these master netting arrangements in the statement of assets and liabilities.
| 72 | The Bond Fund of America |
The following table presents the fund’s forward currency contracts by counterparty that are subject to master netting agreements but that are not offset in the fund’s statement of assets and liabilities. The net amount column shows the impact of offsetting on the fund’s statement of assets and liabilities as of December 31, 2021, if close-out netting was exercised (dollars in thousands):
| | | Gross amounts
recognized in the | | | Gross amounts not offset in the
statement of assets and liabilities and
subject to a master netting agreement | | | | |
| Counterparty | | statement of assets
and liabilities | | | Available
to offset | | | Non-cash
collateral* | | | Cash
collateral* | | | Net
amount | |
| Assets: | | | | | | | | | | | | | | | | | | | | |
| Bank of New York Mellon | | $ | 621 | | | $ | — | | | $ | (561 | ) | | $ | — | | | $ | 60 | |
| Citibank | | | 1,002 | | | | (582 | ) | | | — | | | | — | | | | 420 | |
| Total | | $ | 1,623 | | | $ | (582 | ) | | $ | (561 | ) | | $ | — | | | $ | 480 | |
| Liabilities: | | | | | | | | | | | | | | | | | | | | |
| BNP Paribas | | $ | 111 | | | $ | — | | | $ | — | | | $ | — | | | $ | 111 | |
| Citibank | | | 582 | | | | (582 | ) | | | — | | | | — | | | | — | |
| JPMorgan Chase | | | 1,772 | | | | — | | | | (821 | ) | | | — | | | | 951 | |
| Morgan Stanley | | | 1,275 | | | | — | | | | (668 | ) | | | — | | | | 607 | |
| UBS AG | | | 665 | | | | — | | | | (474 | ) | | | — | | | | 191 | |
| Total | | $ | 4,405 | | | $ | (582 | ) | | $ | (1,963 | ) | | $ | — | | | $ | 1,860 | |
| | * | Collateral is shown on a settlement basis. |
6. Taxation and distributions
Federal income taxation — The fund complies with the requirements under Subchapter M of the Internal Revenue Code applicable to regulated investment companies and intends to distribute substantially all of its net taxable income and net capital gains each year. The fund is not subject to income taxes to the extent such distributions are made. Therefore, no federal income tax provision is required.
As of and during the year ended December 31, 2021, the fund did not have a liability for any unrecognized tax benefits. The fund recognizes interest and penalties, if any, related to unrecognized tax benefits as income tax expense in the statement of operations. During the year, the fund did not incur any significant interest or penalties.
The fund’s tax returns are generally not subject to examination by federal, state and, if applicable, non-U.S. tax authorities after the expiration of each jurisdiction’s statute of limitations, which is typically three years after the date of filing but can be extended in certain jurisdictions.
Non-U.S. taxation — Dividend and interest income are recorded net of non-U.S. taxes paid. The fund may file withholding tax reclaims in certain jurisdictions to recover a portion of amounts previously withheld. These reclaims are recorded when the amount is known and there are no significant uncertainties on collectability. Gains realized by the fund on the sale of securities in certain countries, if any, may be subject to non-U.S. taxes. If applicable, the fund records an estimated deferred tax liability based on unrealized gains to provide for potential non-U.S. taxes payable upon the sale of these securities.
Distributions — Distributions determined on a tax basis may differ from net investment income and net realized gains for financial reporting purposes. These differences are due primarily to different treatment for items such as currency gains and losses; short-term capital gains and losses; capital losses related to sales of certain securities within 30 days of purchase; cost of investments sold; paydowns on fixed-income securities and income on certain investments. The fiscal year in which amounts are distributed may differ from the year in which the net investment income and net realized gains are recorded by the fund for financial reporting purposes. The fund may also designate a portion of the amount paid to redeeming shareholders as a distribution for tax purposes.
During the year ended December 31, 2021, the fund reclassified $16,057,000 from total distributable earnings to capital paid in on shares of beneficial interest to align financial reporting with tax reporting.
| The Bond Fund of America | 73 |
As of December 31, 2021, the tax basis components of distributable earnings, unrealized appreciation (depreciation) and cost of investments were as follows (dollars in thousands):
| Undistributed ordinary income | | $ | 192,572 | |
| Undistributed long-term capital gains | | | 88,414 | |
| Gross unrealized appreciation on investments | | | 1,756,328 | |
| Gross unrealized depreciation on investments | | | (798,411 | ) |
| Net unrealized appreciation on investments | | | 957,917 | |
| Cost of investments | | | 83,212,595 | |
Distributions paid or accrued were characterized for tax purposes as follows (dollars in thousands):
| | | Year ended December 31, 2021 | | | Year ended December 31, 2020 | |
| Share class | | Ordinary
income | | | Long-term
capital gains | | | Total
distributions
paid or
accrued | | | Ordinary
income | | | Long-term
capital gains | | | Total
distributions
paid or
accrued | |
| Class A | | $ | 431,914 | | | $ | 163,952 | | | $ | 595,866 | | | $ | 1,135,597 | | | $ | 260,675 | | | $ | 1,396,272 | |
| Class C | | | 5,421 | | | | 4,005 | | | | 9,426 | | | | 27,884 | | | | 7,480 | | | | 35,364 | |
| Class T | | | — | * | | | — | * | | | — | * | | | — | * | | | — | * | | | — | * |
| Class F-1 | | | 15,522 | | | | 5,669 | | | | 21,191 | | | | 49,443 | | | | 11,581 | | | | 61,024 | |
| Class F-2 | | | 318,827 | | | | 109,456 | | | | 428,283 | | | | 618,245 | | | | 145,365 | | | | 763,610 | |
| Class F-3 | | | 105,868 | | | | 39,500 | | | | 145,368 | | | | 163,945 | | | | 39,329 | | | | 203,274 | |
| Class 529-A | | | 21,024 | | | | 8,089 | | | | 29,113 | | | | 57,819 | | | | 13,417 | | | | 71,236 | |
| Class 529-C | | | 511 | | | | 397 | | | | 908 | | | | 3,631 | | | | 786 | | | | 4,417 | |
| Class 529-E | | | 594 | | | | 258 | | | | 852 | | | | 1,983 | | | | 463 | | | | 2,446 | |
| Class 529-T | | | — | * | | | — | * | | | — | * | | | — | * | | | — | * | | | — | * |
| Class 529-F-1 | | | — | * | | | — | * | | | — | * | | | 2,578 | | | | — | * | | | 2,578 | |
| Class 529-F-2† | | | 2,834 | | | | 952 | | | | 3,786 | | | | 4,047 | | | | 1,458 | | | | 5,505 | |
| Class 529-F-3† | | | — | * | | | — | * | | | — | * | | | — | * | | | — | * | | | — | * |
| Class R-1 | | | 288 | | | | 227 | | | | 515 | | | | 1,283 | | | | 348 | | | | 1,631 | |
| Class R-2 | | | 2,981 | | | | 2,266 | | | | 5,247 | | | | 15,217 | | | | 4,120 | | | | 19,337 | |
| Class R-2E | | | 448 | | | | 244 | | | | 692 | | | | 1,561 | | | | 400 | | | | 1,961 | |
| Class R-3 | | | 8,015 | | | | 3,713 | | | | 11,728 | | | | 27,171 | | | | 6,544 | | | | 33,715 | |
| Class R-4 | | | 9,139 | | | | 3,247 | | | | 12,386 | | | | 26,795 | | | | 6,064 | | | | 32,859 | |
| Class R-5E | | | 2,205 | | | | 860 | | | | 3,065 | | | | 3,282 | | | | 771 | | | | 4,053 | |
| Class R-5 | | | 3,788 | | | | 1,733 | | | | 5,521 | | | | 8,031 | | | | 1,691 | | | | 9,722 | |
| Class R-6 | | | 252,562 | | | | 79,232 | | | | 331,794 | | | | 543,708 | | | | 117,773 | | | | 661,481 | |
| Total | | $ | 1,181,941 | | | $ | 423,800 | | | $ | 1,605,741 | | | $ | 2,692,220 | | | $ | 618,265 | | | $ | 3,310,485 | |
| | * | Amount less than one thousand. |
| | † | Class 529-F-2 and 529-F-3 shares began investment operations on October 30, 2020. |
7. Fees and transactions with related parties
CRMC, the fund’s investment adviser, is the parent company of American Funds Distributors®, Inc. (“AFD”), the principal underwriter of the fund’s shares, and American Funds Service Company® (“AFS”), the fund’s transfer agent. CRMC, AFD and AFS are considered related parties to the fund.
Investment advisory services — The fund has an investment advisory and service agreement with CRMC that provides for monthly fees accrued daily. At the beginning of the year, these fees were based on a series of decreasing annual rates beginning with 0.300% on the first $60 million of daily net assets and decreasing to 0.107% on such assets in excess of $52 billion. On March 10, 2021, the fund’s board of trustees approved an amended investment advisory and service agreement effective May 1, 2021, decreasing the annual rate to 0.105% on daily net assets in excess of $76 billion. The agreement also provides for monthly fees, accrued daily, based on a series of decreasing rates beginning with 2.25% on the first $8,333,333 of the fund’s monthly gross income and decreasing to 1.75% on such income in excess of $41,666,667. For the year ended December 31, 2021, the investment advisory services fees were $117,038,000, which were equivalent to an annualized rate of 0.157% of average daily net assets.
| 74 | The Bond Fund of America |
Class-specific fees and expenses — Expenses that are specific to individual share classes are accrued directly to the respective share class. The principal class-specific fees and expenses are further described below:
Distribution services — The fund has plans of distribution for all share classes, except Class F-2, F-3, 529-F-2, 529-F-3, R-5E, R-5 and R-6 shares. Under the plans, the board of trustees approves certain categories of expenses that are used to finance activities primarily intended to sell fund shares and service existing accounts. The plans provide for payments, based on an annualized percentage of average daily net assets, ranging from 0.25% to 1.00% as noted in this section. In some cases, the board of trustees has limited the amounts that may be paid to less than the maximum allowed by the plans. All share classes with a plan may use up to 0.25% of average daily net assets to pay service fees, or to compensate AFD for paying service fees, to firms that have entered into agreements with AFD to provide certain shareholder services. The remaining amounts available to be paid under each plan are paid to dealers to compensate them for their sales activities.
| | Share class | | Currently approved limits | | Plan limits |
| | Class A | | | 0.25 | % | | | 0.25 | % |
| | Class 529-A | | | 0.25 | | | | 0.50 | |
| | Classes C, 529-C and R-1 | | | 1.00 | | | | 1.00 | |
| | Class R-2 | | | 0.75 | | | | 1.00 | |
| | Class R-2E | | | 0.60 | | | | 0.85 | |
| | Classes 529-E and R-3 | | | 0.50 | | | | 0.75 | |
| | Classes T, F-1, 529-T, 529-F-1 and R-4 | | | 0.25 | | | | 0.50 | |
For Class A and 529-A shares, distribution-related expenses include the reimbursement of dealer and wholesaler commissions paid by AFD for certain shares sold without a sales charge. These share classes reimburse AFD for amounts billed within the prior 15 months but only to the extent that the overall annual expense limits are not exceeded. As of December 31, 2021, unreimbursed expenses subject to reimbursement totaled $13,982,000 for Class A shares. There were no unreimbursed expenses subject to reimbursement for Class 529-A shares.
Transfer agent services — The fund has a shareholder services agreement with AFS under which the fund compensates AFS for providing transfer agent services to each of the fund’s share classes. These services include recordkeeping, shareholder communications and transaction processing. In addition, the fund reimburses AFS for amounts paid to third parties for performing transfer agent services on behalf of fund shareholders.
Administrative services — The fund has an administrative services agreement with CRMC under which the fund compensates CRMC for providing administrative services to all share classes. Administrative services are provided by CRMC and its affiliates to help assist third parties providing non-distribution services to fund shareholders. These services include providing in-depth information on the fund and market developments that impact fund investments. Administrative services also include, but are not limited to, coordinating, monitoring and overseeing third parties that provide services to fund shareholders. The agreement provides the fund the ability to charge an administrative services fee at the annual rate of 0.05% of the average daily net assets attributable to each share class of the fund. Currently the fund pays CRMC an administrative services fee at the annual rate of 0.03% of the average daily net assets attributable to each share class of the fund for CRMC’s provision of administrative services.
529 plan services — Each 529 share class is subject to service fees to compensate the Virginia College Savings Plan (“Virginia529”) for its oversight and administration of the CollegeAmerica 529 college savings plan. The fee is based on the combined net assets invested in Class 529 and ABLE shares of the American Funds. Class ABLE shares are offered on other American Funds by Virginia529 through ABLEAmerica®, a tax-advantaged savings program for individuals with disabilities. The quarterly fee is based on a series of decreasing annual rates beginning with 0.09% on the first $20 billion of the combined net assets invested in the American Funds and decreasing to 0.03% on such assets in excess of $100 billion. Effective January 1, 2022, the quarterly fee will be amended to a series of decreasing annual rates beginning with 0.09% on the first $20 billion of the combined net assets invested in the American Funds and decreasing to 0.03% on such assets in excess of $75 billion. The fee for any given calendar quarter is accrued and calculated on the basis of the average net assets of Class 529 and ABLE shares of the American Funds for the last month of the prior calendar quarter. The fee is included in other expenses in the fund’s statement of operations. Virginia529 is not considered a related party to the fund.
| The Bond Fund of America | 75 |
For the year ended December 31, 2021, class-specific expenses under the agreements were as follows (dollars in thousands):
| | Share class | | Distribution
services | | | Transfer agent
services | | | Administrative
services | | | 529 plan
services | |
| | Class A | | $ | 74,680 | | | $ | 29,796 | | | $ | 8,962 | | | | Not applicable | |
| | Class C | | | 7,777 | | | | 775 | | | | 234 | | | | Not applicable | |
| | Class T | | | — | | | | — | * | | | — | * | | | Not applicable | |
| | Class F-1 | | | 2,787 | | | | 1,616 | | | | 334 | | | | Not applicable | |
| | Class F-2 | | | Not applicable | | | | 20,883 | | | | 5,661 | | | | Not applicable | |
| | Class F-3 | | | Not applicable | | | | 74 | | | | 1,760 | | | | Not applicable | |
| | Class 529-A | | | 3,585 | | | | 1,423 | | | | 450 | | | $ | 889 | |
| | Class 529-C | | | 780 | | | | 76 | | | | 24 | | | | 47 | |
| | Class 529-E | | | 246 | | | | 18 | | | | 15 | | | | 29 | |
| | Class 529-T | | | — | | | | — | * | | | — | * | | | — | * |
| | Class 529-F-1 | | | — | | | | — | * | | | — | * | | | — | * |
| | Class 529-F-2 | | | Not applicable | | | | 122 | | | | 51 | | | | 101 | |
| | Class 529-F-3 | | | Not applicable | | | | — | * | | | — | * | | | — | * |
| | Class R-1 | | | 406 | | | | 40 | | | | 12 | | | | Not applicable | |
| | Class R-2 | | | 3,235 | | | | 1,510 | | | | 129 | | | | Not applicable | |
| | Class R-2E | | | 271 | | | | 93 | | | | 14 | | | | Not applicable | |
| | Class R-3 | | | 3,516 | | | | 1,062 | | | | 211 | | | | Not applicable | |
| | Class R-4 | | | 1,587 | | | | 627 | | | | 190 | | | | Not applicable | |
| | Class R-5E | | | Not applicable | | | | 189 | | | | 39 | | | | Not applicable | |
| | Class R-5 | | | Not applicable | | | | 108 | | | | 64 | | | | Not applicable | |
| | Class R-6 | | | Not applicable | | | | 124 | | | | 4,214 | | | | Not applicable | |
| | Total class-specific expenses | | $ | 98,870 | | | $ | 58,536 | | | $ | 22,364 | | | $ | 1,066 | |
| * | Amount less than one thousand. |
Trustees’ deferred compensation — Trustees who are unaffiliated with CRMC may elect to defer the cash payment of part or all of their compensation. These deferred amounts, which remain as liabilities of the fund, are treated as if invested in shares of the fund or other American Funds. These amounts represent general, unsecured liabilities of the fund and vary according to the total returns of the selected funds. Trustees’ compensation of $261,000 in the fund’s statement of operations reflects $157,000 in current fees (either paid in cash or deferred) and a net increase of $104,000 in the value of the deferred amounts.
Affiliated officers and trustees — Officers and certain trustees of the fund are or may be considered to be affiliated with CRMC, AFD and AFS. No affiliated officers or trustees received any compensation directly from the fund.
Investment in CCF — The fund holds shares of CCF, an institutional prime money market fund managed by CRMC. CCF invests in high-quality, short-term money market instruments. CCF is used as the primary investment vehicle for the fund’s short-term instruments. CCF shares are only available for purchase by CRMC, its affiliates, and other funds managed by CRMC or its affiliates, and are not available to the public. CRMC does not receive an investment advisory services fee from CCF.
Security transactions with related funds — The fund purchased securities from, and sold securities to, other funds managed by CRMC (or funds managed by certain affiliates of CRMC) under procedures adopted by the fund’s board of trustees. The funds involved in such transactions are considered related by virtue of having a common investment adviser (or affiliated investment advisers), common trustees and/or common officers. Each transaction was executed at the current market price of the security and no brokerage commissions or fees were paid in accordance with Rule 17a-7 of the 1940 Act. During the year ended December 31, 2021, the fund engaged in such purchase and sale transactions with related funds in the amounts of $1,052,381,000 and $379,118,000, respectively, which generated $18,552,000 of net realized gains from such sales.
Interfund lending — Pursuant to an exemptive order issued by the SEC, the fund, along with other CRMC-managed funds (or funds managed by certain affiliates of CRMC), may participate in an interfund lending program. The program provides an alternate credit facility that permits the funds to lend or borrow cash for temporary purposes directly to or from one another, subject to the conditions of the exemptive order. The fund did not lend or borrow cash through the interfund lending program at any time during the year ended December 31, 2021.
| 76 | The Bond Fund of America |
8. Indemnifications
The fund’s organizational documents provide board members and officers with indemnification against certain liabilities or expenses in connection with the performance of their duties to the fund. In the normal course of business, the fund may also enter into contracts that provide general indemnifications. The fund’s maximum exposure under these arrangements is unknown since it is dependent on future claims that may be made against the fund. The risk of material loss from such claims is considered remote. Insurance policies are also available to the fund’s board members and officers.
9. Capital share transactions
Capital share transactions in the fund were as follows (dollars and shares in thousands):
| | | Sales1 | | | Reinvestments of
distributions | | | Repurchases1 | | | Net increase
(decrease) | |
| Share class | | Amount | | | Shares | | | Amount | | | Shares | | | Amount | | | Shares | | | Amount | | | Shares | |
| | | | | | | | | | | | | | | | | | | |
| Year ended December 31, 2021 | | | | | | | | | | | | | | | | | | |
| | | | | | | | | | | | | | | | | | | |
| Class A | | $ | 5,399,156 | | | | 399,358 | | | $ | 596,876 | | | | 44,285 | | | $ | (4,480,861 | ) | | | (331,893 | ) | | $ | 1,515,171 | | | | 111,750 | |
| Class C | | | 156,104 | | | | 11,539 | | | | 10,024 | | | | 743 | | | | (273,093 | ) | | | (20,227 | ) | | | (106,965 | ) | | | (7,945 | ) |
| Class T | | | — | | | | — | | | | — | | | | — | | | | — | | | | — | | | | — | | | | — | |
| Class F-1 | | | 258,812 | | | | 19,155 | | | | 22,271 | | | | 1,651 | | | | (550,345 | ) | | | (40,683 | ) | | | (269,262 | ) | | | (19,877 | ) |
| Class F-2 | | | 9,182,796 | | | | 679,095 | | | | 424,331 | | | | 31,484 | | | | (4,949,570 | ) | | | (366,729 | ) | | | 4,657,557 | | | | 343,850 | |
| Class F-3 | | | 4,966,620 | | | | 368,216 | | | | 143,670 | | | | 10,669 | | | | (1,482,730 | ) | | | (109,949 | ) | | | 3,627,560 | | | | 268,936 | |
| Class 529-A | | | 273,918 | | | | 20,253 | | | | 29,897 | | | | 2,217 | | | | (311,596 | ) | | | (23,033 | ) | | | (7,781 | ) | | | (563 | ) |
| Class 529-C | | | 21,693 | | | | 1,604 | | | | 952 | | | | 71 | | | | (39,708 | ) | | | (2,936 | ) | | | (17,063 | ) | | | (1,261 | ) |
| Class 529-E | | | 7,846 | | | | 580 | | | | 861 | | | | 64 | | | | (13,769 | ) | | | (1,019 | ) | | | (5,062 | ) | | | (375 | ) |
| Class 529-T | | | — | | | | — | | | | — | 2 | | | — | 2 | | | — | | | | — | | | | — | 2 | | | — | 2 |
| Class 529-F-1 | | | — | | | | — | | | | — | 2 | | | — | 2 | | | — | | | | — | | | | — | 2 | | | — | 2 |
| Class 529-F-2 | | | 50,199 | | | | 3,714 | | | | 3,779 | | | | 280 | | | | (38,310 | ) | | | (2,833 | ) | | | 15,668 | | | | 1,161 | |
| Class 529-F-3 | | | — | | | | — | | | | — | 2 | | | — | 2 | | | — | | | | — | | | | — | 2 | | | — | 2 |
| Class R-1 | | | 13,301 | | | | 986 | | | | 514 | | | | 38 | | | | (10,332 | ) | | | (765 | ) | | | 3,483 | | | | 259 | |
| Class R-2 | | | 109,434 | | | | 8,090 | | | | 5,231 | | | | 388 | | | | (160,588 | ) | | | (11,881 | ) | | | (45,923 | ) | | | (3,403 | ) |
| Class R-2E | | | 17,056 | | | | 1,259 | | | | 690 | | | | 51 | | | | (17,512 | ) | | | (1,296 | ) | | | 234 | | | | 14 | |
| Class R-3 | | | 172,879 | | | | 12,779 | | | | 11,786 | | | | 875 | | | | (233,176 | ) | | | (17,257 | ) | | | (48,511 | ) | | | (3,603 | ) |
| Class R-4 | | | 172,188 | | | | 12,728 | | | | 12,480 | | | | 926 | | | | (264,316 | ) | | | (19,566 | ) | | | (79,648 | ) | | | (5,912 | ) |
| Class R-5E | | | 100,893 | | | | 7,459 | | | | 3,058 | | | | 227 | | | | (28,766 | ) | | | (2,132 | ) | | | 75,185 | | | | 5,554 | |
| Class R-5 | | | 243,353 | | | | 18,023 | | | | 5,675 | | | | 421 | | | | (61,171 | ) | | | (4,527 | ) | | | 187,857 | | | | 13,917 | |
| Class R-6 | | | 4,789,022 | | | | 354,533 | | | | 330,424 | | | | 24,522 | | | | (3,113,972 | ) | | | (231,163 | ) | | | 2,005,474 | | | | 147,892 | |
| Total net increase (decrease) | | $ | 25,935,270 | | | | 1,919,371 | | | $ | 1,602,519 | | | | 118,912 | | | $ | (16,029,815 | ) | | | (1,187,889 | ) | | $ | 11,507,974 | | | | 850,394 | |
See end of table for footnotes.
| The Bond Fund of America | 77 |
| | | Sales1 | | | Reinvestments of
distributions | | | Repurchases1 | | | Net increase
(decrease) | |
| Share class | | Amount | | | Shares | | | Amount | | | Shares | | | Amount | | | Shares | | | Amount | | | Shares | |
| | | | | | | | | | | | | | | | | | | | | | | | | |
| Year ended December 31, 2020 | | | | | | | | | | | | | | | | | | |
| | | | | | | | | | | | | | | | | | | | | | | | | |
| Class A | | $ | 7,577,330 | | | | 547,419 | | | $ | 1,375,595 | | | | 99,645 | | | $ | (3,786,344 | ) | | | (275,341 | ) | | $ | 5,166,581 | | | | 371,723 | |
| Class C | | | 381,139 | | | | 27,552 | | | | 34,643 | | | | 2,513 | | | | (396,635 | ) | | | (28,589 | ) | | | 19,147 | | | | 1,476 | |
| Class T | | | — | | | | — | | | | — | | | | — | | | | — | | | | — | | | | — | | | | — | |
| Class F-1 | | | 540,494 | | | | 38,951 | | | | 58,925 | | | | 4,270 | | | | (310,432 | ) | | | (22,462 | ) | | | 288,987 | | | | 20,759 | |
| Class F-2 | | | 9,295,368 | | | | 668,599 | | | | 740,296 | | | | 53,596 | | | | (3,376,383 | ) | | | (245,568 | ) | | | 6,659,281 | | | | 476,627 | |
| Class F-3 | | | 2,722,424 | | | | 195,260 | | | | 200,563 | | | | 14,517 | | | | (757,259 | ) | | | (54,996 | ) | | | 2,165,728 | | | | 154,781 | |
| Class 529-A | | | 484,048 | | | | 34,875 | | | | 70,405 | | | | 5,100 | | | | (263,429 | ) | | | (19,020 | ) | | | 291,024 | | | | 20,955 | |
| Class 529-C | | | 42,518 | | | | 3,097 | | | | 4,400 | | | | 320 | | | | (149,126 | ) | | | (10,687 | ) | | | (102,208 | ) | | | (7,270 | ) |
| Class 529-E | | | 14,371 | | | | 1,044 | | | | 2,430 | | | | 176 | | | | (13,052 | ) | | | (942 | ) | | | 3,749 | | | | 278 | |
| Class 529-T | | | — | | | | — | | | | 1 | | | | — | 2 | | | — | | | | — | | | | 1 | | | | — | 2 |
| Class 529-F-1 | | | 43,715 | | | | 3,163 | | | | 2,343 | | | | 170 | | | | (182,892 | ) | | | (13,093 | ) | | | (136,834 | ) | | | (9,760 | ) |
| Class 529-F-23 | | | 169,310 | | | | 12,086 | | | | 5,496 | | | | 398 | | | | (6,497 | ) | | | (459 | ) | | | 168,309 | | | | 12,025 | |
| Class 529-F-33 | | | 10 | | | | 1 | | | | — | 2 | | | — | 2 | | | — | | | | — | | | | 10 | | | | 1 | |
| Class R-1 | | | 12,614 | | | | 911 | | | | 1,628 | | | | 118 | | | | (15,788 | ) | | | (1,153 | ) | | | (1,546 | ) | | | (124 | ) |
| Class R-2 | | | 192,313 | | | | 13,950 | | | | 19,247 | | | | 1,395 | | | | (174,314 | ) | | | (12,674 | ) | | | 37,246 | | | | 2,671 | |
| Class R-2E | | | 21,840 | | | | 1,587 | | | | 1,960 | | | | 142 | | | | (13,198 | ) | | | (956 | ) | | | 10,602 | | | | 773 | |
| Class R-3 | | | 310,798 | | | | 22,534 | | | | 33,500 | | | | 2,428 | | | | (267,678 | ) | | | (19,450 | ) | | | 76,620 | | | | 5,512 | |
| Class R-4 | | | 279,386 | | | | 20,220 | | | | 32,546 | | | | 2,357 | | | | (220,289 | ) | | | (16,038 | ) | | | 91,643 | | | | 6,539 | |
| Class R-5E | | | 62,998 | | | | 4,557 | | | | 4,037 | | | | 292 | | | | (24,781 | ) | | | (1,788 | ) | | | 42,254 | | | | 3,061 | |
| Class R-5 | | | 74,561 | | | | 5,396 | | | | 9,489 | | | | 687 | | | | (73,345 | ) | | | (5,385 | ) | | | 10,705 | | | | 698 | |
| Class R-6 | | | 3,960,909 | | | | 284,931 | | | | 658,960 | | | | 47,721 | | | | (2,092,488 | ) | | | (154,656 | ) | | | 2,527,381 | | | | 177,996 | |
| Total net increase (decrease) | | $ | 26,186,146 | | | | 1,886,133 | | | $ | 3,256,464 | | | | 235,845 | | | $ | (12,123,930 | ) | | | (883,257 | ) | | $ | 17,318,680 | | | | 1,238,721 | |
| | 1 | Includes exchanges between share classes of the fund. |
| | 2 | Amount less than one thousand. |
| | 3 | Class 529-F-2 and 529-F-3 shares began investment operations on October 30, 2020. |
10. Investment transactions
The fund made purchases and sales of investment securities, excluding short-term securities and U.S. government obligations, if any, of $216,834,679,000 and $222,158,556,000, respectively, during the year ended December 31, 2021.
| 78 | The Bond Fund of America |
Financial highlights
| | | | | | (Loss) income from
investment operations1 | | | Dividends and distributions | | | | | | | | | | | | | | | | | | | |
| Period ended | | Net asset
value,
beginning
of period | | | Net
investment
income | | | Net (losses)
gains on
securities
(both
realized and
unrealized) | | | Total from
investment
operations | | | Dividends
(from net
investment
income) | | | Distributions
(from capital
gains) | | | Total
dividends
and
distributions | | | Net asset
value,
end
of period | | | Total
return2,3 | | | Net assets,
end of period
(in millions) | | | Ratio of
expenses to
average net
assets before
waivers/
reimbursements4 | | | Ratio of
expenses to
average net
assets after
waivers/
reimbursements3,4 | | | Ratio of
net income
to average
net assets3 | |
| Class A: | | | | | | | | | | | | | | | | | | | | | | | | | | | | | | | | | | | | | | | | | | | | | | | | | | | | |
| 12/31/2021 | | $ | 13.79 | | | $ | .18 | | | $ | (.31 | ) | | $ | (.13 | ) | | $ | (.19 | ) | | $ | (.08 | ) | | $ | (.27 | ) | | $ | 13.39 | | | | (.95 | )% | | $ | 30,201 | | | | .55 | % | | | .55 | % | | | 1.36 | % |
| 12/31/2020 | | | 13.09 | | | | .22 | | | | 1.18 | | | | 1.40 | | | | (.26 | ) | | | (.44 | ) | | | (.70 | ) | | | 13.79 | | | | 10.71 | | | | 29,570 | | | | .57 | | | | .57 | | | | 1.59 | |
| 12/31/2019 | | | 12.57 | | | | .31 | | | | .69 | | | | 1.00 | | | | (.30 | ) | | | (.18 | ) | | | (.48 | ) | | | 13.09 | | | | 8.02 | | | | 23,197 | | | | .60 | | | | .60 | | | | 2.35 | |
| 12/31/2018 | | | 12.89 | | | | .30 | | | | (.32 | ) | | | (.02 | ) | | | (.30 | ) | | | — | | | | (.30 | ) | | | 12.57 | | | | (.13 | ) | | | 19,352 | | | | .60 | | | | .60 | | | | 2.37 | |
| 12/31/2017 | | | 12.72 | | | | .25 | | | | .16 | | | | .41 | | | | (.24 | ) | | | — | | | | (.24 | ) | | | 12.89 | | | | 3.21 | | | | 19,939 | | | | .60 | | | | .60 | | | | 1.91 | |
| Class C: | | | | | | | | | | | | | | | | | | | | | | | | | | | | | | | | | | | | | | | | | | | | | | | | | | | | |
| 12/31/2021 | | | 13.79 | | | | .08 | | | | (.31 | ) | | | (.23 | ) | | | (.09 | ) | | | (.08 | ) | | | (.17 | ) | | | 13.39 | | | | (1.68 | ) | | | 717 | | | | 1.29 | | | | 1.29 | | | | .60 | |
| 12/31/2020 | | | 13.09 | | | | .11 | | | | 1.18 | | | | 1.29 | | | | (.15 | ) | | | (.44 | ) | | | (.59 | ) | | | 13.79 | | | | 9.90 | | | | 848 | | | | 1.31 | | | | 1.31 | | | | .87 | |
| 12/31/2019 | | | 12.57 | | | | .21 | | | | .69 | | | | .90 | | | | (.20 | ) | | | (.18 | ) | | | (.38 | ) | | | 13.09 | | | | 7.20 | | | | 786 | | | | 1.36 | | | | 1.36 | | | | 1.60 | |
| 12/31/2018 | | | 12.89 | | | | .20 | | | | (.32 | ) | | | (.12 | ) | | | (.20 | ) | | | — | | | | (.20 | ) | | | 12.57 | | | | (.91 | ) | | | 825 | | | | 1.39 | | | | 1.39 | | | | 1.58 | |
| 12/31/2017 | | | 12.72 | | | | .15 | | | | .16 | | | | .31 | | | | (.14 | ) | | | — | | | | (.14 | ) | | | 12.89 | | | | 2.40 | | | | 1,041 | | | | 1.40 | | | | 1.40 | | | | 1.11 | |
| Class T: | | | | | | | | | | | | | | | | | | | | | | | | | | | | | | | | | | | | | | | | | | | | | | | | | | | | |
| 12/31/2021 | | | 13.79 | | | | .21 | | | | (.31 | ) | | | (.10 | ) | | | (.22 | ) | | | (.08 | ) | | | (.30 | ) | | | 13.39 | | | | (.74 | )5 | | | — | 6 | | | .33 | 5 | | | .33 | 5 | | | 1.55 | 5 |
| 12/31/2020 | | | 13.09 | | | | .25 | | | | 1.18 | | | | 1.43 | | | | (.29 | ) | | | (.44 | ) | | | (.73 | ) | | | 13.79 | | | | 10.98 | 5 | | | — | 6 | | | .34 | 5 | | | .34 | 5 | | | 1.81 | 5 |
| 12/31/2019 | | | 12.57 | | | | .34 | | | | .69 | | | | 1.03 | | | | (.33 | ) | | | (.18 | ) | | | (.51 | ) | | | 13.09 | | | | 8.24 | 5 | | | — | 6 | | | .37 | 5 | | | .37 | 5 | | | 2.56 | 5 |
| 12/31/2018 | | | 12.89 | | | | .33 | | | | (.32 | ) | | | .01 | | | | (.33 | ) | | | — | | | | (.33 | ) | | | 12.57 | | | | .09 | 5 | | | — | 6 | | | .39 | 5 | | | .39 | 5 | | | 2.58 | 5 |
| 12/31/20177,8 | | | 12.81 | | | | .20 | | | | .07 | | | | .27 | | | | (.19 | ) | | | — | | | | (.19 | ) | | | 12.89 | | | | 2.15 | 5,9 | | | — | 6 | | | .38 | 5,10 | | | .38 | 5,10 | | | 2.15 | 5,10 |
| Class F-1: | | | | | | | | | | | | | | | | | | | | | | | | | | | | | | | | | | | | | | | | | | | | | | | | | | | | |
| 12/31/2021 | | | 13.79 | | | | .18 | | | | (.31 | ) | | | (.13 | ) | | | (.19 | ) | | | (.08 | ) | | | (.27 | ) | | | 13.39 | | | | (.99 | ) | | | 1,011 | | | | .59 | | | | .59 | | | | 1.30 | |
| 12/31/2020 | | | 13.09 | | | | .21 | | | | 1.18 | | | | 1.39 | | | | (.25 | ) | | | (.44 | ) | | | (.69 | ) | | | 13.79 | | | | 10.68 | | | | 1,315 | | | | .60 | | | | .60 | | | | 1.55 | |
| 12/31/2019 | | | 12.57 | | | | .31 | | | | .69 | | | | 1.00 | | | | (.30 | ) | | | (.18 | ) | | | (.48 | ) | | | 13.09 | | | | 7.97 | | | | 977 | | | | .64 | | | | .64 | | | | 2.31 | |
| 12/31/2018 | | | 12.89 | | | | .29 | | | | (.32 | ) | | | (.03 | ) | | | (.29 | ) | | | — | | | | (.29 | ) | | | 12.57 | | | | (.18 | ) | | | 745 | | | | .66 | | | | .66 | | | | 2.32 | |
| 12/31/2017 | | | 12.72 | | | | .24 | | | | .16 | | | | .40 | | | | (.23 | ) | | | — | | | | (.23 | ) | | | 12.89 | | | | 3.17 | | | | 801 | | | | .65 | | | | .65 | | | | 1.86 | |
| Class F-2: | | | | | | | | | | | | | | | | | | | | | | | | | | | | | | | | | | | | | | | | | | | | | | | | | | | | |
| 12/31/2021 | | | 13.79 | | | | .22 | | | | (.31 | ) | | | (.09 | ) | | | (.23 | ) | | | (.08 | ) | | | (.31 | ) | | | 13.39 | | | | (.71 | ) | | | 20,613 | | | | .31 | | | | .31 | | | | 1.60 | |
| 12/31/2020 | | | 13.09 | | | | .25 | | | | 1.18 | | | | 1.43 | | | | (.29 | ) | | | (.44 | ) | | | (.73 | ) | | | 13.79 | | | | 10.99 | | | | 16,494 | | | | .32 | | | | .32 | | | | 1.81 | |
| 12/31/2019 | | | 12.57 | | | | .35 | | | | .69 | | | | 1.04 | | | | (.34 | ) | | | (.18 | ) | | | (.52 | ) | | | 13.09 | | | | 8.28 | | | | 9,415 | | | | .35 | | | | .35 | | | | 2.59 | |
| 12/31/2018 | | | 12.89 | | | | .33 | | | | (.32 | ) | | | .01 | | | | (.33 | ) | | | — | | | | (.33 | ) | | | 12.57 | | | | .14 | | | | 5,728 | | | | .34 | | | | .34 | | | | 2.65 | |
| 12/31/2017 | | | 12.72 | | | | .28 | | | | .16 | | | | .44 | | | | (.27 | ) | | | — | | | | (.27 | ) | | | 12.89 | | | | 3.47 | | | | 4,067 | | | | .35 | | | | .35 | | | | 2.16 | |
| Class F-3: | | | | | | | | | | | | | | | | | | | | | | | | | | | | | | | | | | | | | | | | | | | | | | | | | | | | |
| 12/31/2021 | | | 13.79 | | | | .23 | | | | (.31 | ) | | | (.08 | ) | | | (.24 | ) | | | (.08 | ) | | | (.32 | ) | | | 13.39 | | | | (.60 | ) | | | 7,934 | | | | .20 | | | | .20 | | | | 1.72 | |
| 12/31/2020 | | | 13.09 | | | | .27 | | | | 1.18 | | | | 1.45 | | | | (.31 | ) | | | (.44 | ) | | | (.75 | ) | | | 13.79 | | | | 11.10 | | | | 4,465 | | | | .21 | | | | .21 | | | | 1.90 | |
| 12/31/2019 | | | 12.57 | | | | .36 | | | | .69 | | | | 1.05 | | | | (.35 | ) | | | (.18 | ) | | | (.53 | ) | | | 13.09 | | | | 8.40 | | | | 2,212 | | | | .25 | | | | .24 | | | | 2.70 | |
| 12/31/2018 | | | 12.89 | | | | .34 | | | | (.32 | ) | | | .02 | | | | (.34 | ) | | | — | | | | (.34 | ) | | | 12.57 | | | | .21 | | | | 1,483 | | | | .27 | | | | .27 | | | | 2.70 | |
| 12/31/20177,11 | | | 12.74 | | | | .27 | | | | .14 | | | | .41 | | | | (.26 | ) | | | — | | | | (.26 | ) | | | 12.89 | | | | 3.25 | 9 | | | 2,061 | | | | .26 | 10 | | | .26 | 10 | | | 2.29 | 10 |
| Class 529-A: | | | | | | | | | | | | | | | | | | | | | | | | | | | | | | | | | | | | | | | | | | | | | | | | | | | | |
| 12/31/2021 | | | 13.79 | | | | .18 | | | | (.31 | ) | | | (.13 | ) | | | (.19 | ) | | | (.08 | ) | | | (.27 | ) | | | 13.39 | | | | (.99 | ) | | | 1,473 | | | | .59 | | | | .59 | | | | 1.31 | |
| 12/31/2020 | | | 13.09 | | | | .21 | | | | 1.18 | | | | 1.39 | | | | (.25 | ) | | | (.44 | ) | | | (.69 | ) | | | 13.79 | | | | 10.67 | | | | 1,526 | | | | .61 | | | | .61 | | | | 1.54 | |
| 12/31/2019 | | | 12.57 | | | | .30 | | | | .69 | | | | .99 | | | | (.29 | ) | | | (.18 | ) | | | (.47 | ) | | | 13.09 | | | | 7.95 | | | | 1,174 | | | | .66 | | | | .66 | | | | 2.29 | |
| 12/31/2018 | | | 12.89 | | | | .29 | | | | (.32 | ) | | | (.03 | ) | | | (.29 | ) | | | — | | | | (.29 | ) | | | 12.57 | | | | (.21 | ) | | | 1,003 | | | | .69 | | | | .69 | | | | 2.29 | |
| 12/31/2017 | | | 12.72 | | | | .24 | | | | .16 | | | | .40 | | | | (.23 | ) | | | — | | | | (.23 | ) | | | 12.89 | | | | 3.14 | | | | 1,022 | | | | .68 | | | | .68 | | | | 1.84 | |
See end of table for footnotes.
| The Bond Fund of America | 79 |
Financial highlights (continued)
| | | | | | (Loss) income from
investment operations1 | | | Dividends and distributions | | | | | | | | | | | | | | | | | | | |
| Period ended | | Net asset
value,
beginning
of period | | | Net
investment
income | | | Net (losses)
gains on
securities
(both
realized and
unrealized) | | | Total from
investment
operations | | | Dividends
(from net
investment
income) | | | Distributions
(from capital
gains) | | | Total
dividends
and
distributions | | | Net asset
value,
end
of period | | | Total
return2,3 | | | Net assets,
end of period
(in millions) | | | Ratio of
expenses to
average net
assets before
waivers/
reimbursements4 | | | Ratio of
expenses to
average net
assets after
waivers/
reimbursements3,4 | | | Ratio of
net income
to average
net assets3 | |
| Class 529-C: | | | | | | | | | | | | | | | | | | | | | | | | | | | | | | | | | | | | | | | | | | | | | | | | | | | | |
| 12/31/2021 | | $ | 13.79 | | | $ | .08 | | | $ | (.31 | ) | | $ | (.23 | ) | | $ | (.09 | ) | | $ | (.08 | ) | | $ | (.17 | ) | | $ | 13.39 | | | | (1.73 | )% | | $ | 70 | | | | 1.34 | % | | | 1.34 | % | | | .56 | % |
| 12/31/2020 | | | 13.09 | | | | .11 | | | | 1.18 | | | | 1.29 | | | | (.15 | ) | | | (.44 | ) | | | (.59 | ) | | | 13.79 | | | | 9.85 | | | | 89 | | | | 1.36 | | | | 1.36 | | | | .90 | |
| 12/31/2019 | | | 12.57 | | | | .21 | | | | .69 | | | | .90 | | | | (.20 | ) | | | (.18 | ) | | | (.38 | ) | | | 13.09 | | | | 7.16 | | | | 180 | | | | 1.40 | | | | 1.40 | | | | 1.56 | |
| 12/31/2018 | | | 12.89 | | | | .20 | | | | (.32 | ) | | | (.12 | ) | | | (.20 | ) | | | — | | | | (.20 | ) | | | 12.57 | | | | (.94 | ) | | | 191 | | | | 1.43 | | | | 1.43 | | | | 1.55 | |
| 12/31/2017 | | | 12.72 | | | | .14 | | | | .16 | | | | .30 | | | | (.13 | ) | | | — | | | | (.13 | ) | | | 12.89 | | | | 2.35 | | | | 232 | | | | 1.44 | | | | 1.44 | | | | 1.07 | |
| Class 529-E: | | | | | | | | | | | | | | | | | | | | | | | | | | | | | | | | | | | | | | | | | | | | | | | | | | | | |
| 12/31/2021 | | | 13.79 | | | | .15 | | | | (.31 | ) | | | (.16 | ) | | | (.16 | ) | | | (.08 | ) | | | (.24 | ) | | | 13.39 | | | | (1.19 | ) | | | 46 | | | | .79 | | | | .79 | | | | 1.11 | |
| 12/31/2020 | | | 13.09 | | | | .18 | | | | 1.18 | | | | 1.36 | | | | (.22 | ) | | | (.44 | ) | | | (.66 | ) | | | 13.79 | | | | 10.46 | | | | 53 | | | | .80 | | | | .80 | | | | 1.37 | |
| 12/31/2019 | | | 12.57 | | | | .28 | | | | .69 | | | | .97 | | | | (.27 | ) | | | (.18 | ) | | | (.45 | ) | | | 13.09 | | | | 7.75 | | | | 46 | | | | .85 | | | | .85 | | | | 2.11 | |
| 12/31/2018 | | | 12.89 | | | | .27 | | | | (.32 | ) | | | (.05 | ) | | | (.27 | ) | | | — | | | | (.27 | ) | | | 12.57 | | | | (.40 | ) | | | 43 | | | | .88 | | | | .88 | | | | 2.10 | |
| 12/31/2017 | | | 12.72 | | | | .21 | | | | .16 | | | | .37 | | | | (.20 | ) | | | — | | | | (.20 | ) | | | 12.89 | | | | 2.93 | | | | 47 | | | | .88 | | | | .88 | | | | 1.63 | |
| Class 529-T: | | | | | | | | | | | | | | | | | | | | | | | | | | | | | | | | | | | | | | | | | | | | | | | | | | | | |
| 12/31/2021 | | | 13.79 | | | | .21 | | | | (.31 | ) | | | (.10 | ) | | | (.22 | ) | | | (.08 | ) | | | (.30 | ) | | | 13.39 | | | | (.78 | )5 | | | — | 6 | | | .37 | 5 | | | .37 | 5 | | | 1.52 | 5 |
| 12/31/2020 | | | 13.09 | | | | .24 | | | | 1.18 | | | | 1.42 | | | | (.28 | ) | | | (.44 | ) | | | (.72 | ) | | | 13.79 | | | | 10.91 | 5 | | | — | 6 | | | .39 | 5 | | | .39 | 5 | | | 1.77 | 5 |
| 12/31/2019 | | | 12.57 | | | | .33 | | | | .69 | | | | 1.02 | | | | (.32 | ) | | | (.18 | ) | | | (.50 | ) | | | 13.09 | | | | 8.20 | 5 | | | — | 6 | | | .42 | 5 | | | .42 | 5 | | | 2.51 | 5 |
| 12/31/2018 | | | 12.89 | | | | .32 | | | | (.32 | ) | | | — | 12 | | | (.32 | ) | | | — | | | | (.32 | ) | | | 12.57 | | | | .04 | 5 | | | — | 6 | | | .44 | 5 | | | .44 | 5 | | | 2.54 | 5 |
| 12/31/20177,8 | | | 12.81 | | | | .20 | | | | .07 | | | | .27 | | | | (.19 | ) | | | — | | | | (.19 | ) | | | 12.89 | | | | 2.10 | 5,9 | | | — | 6 | | | .45 | 5,10 | | | .45 | 5,10 | | | 2.08 | 5,10 |
| Class 529-F-1: | | | | | | | | | | | | | | | | | | | | | | | | | | | | | | | | | | | | | | | | | | | | | | | | | | | | |
| 12/31/2021 | | | 13.79 | | | | .20 | | | | (.31 | ) | | | (.11 | ) | | | (.21 | ) | | | (.08 | ) | | | (.29 | ) | | | 13.39 | | | | (.82 | )5 | | | — | 6 | | | .41 | 5 | | | .41 | 5 | | | 1.48 | 5 |
| 12/31/2020 | | | 13.09 | | | | .24 | | | | 1.18 | | | | 1.42 | | | | (.28 | ) | | | (.44 | ) | | | (.72 | ) | | | 13.79 | | | | 10.92 | 5 | | | — | 6 | | | .38 | 5 | | | .38 | 5 | | | 1.87 | 5 |
| 12/31/2019 | | | 12.57 | | | | .34 | | | | .69 | | | | 1.03 | | | | (.33 | ) | | | (.18 | ) | | | (.51 | ) | | | 13.09 | | | | 8.20 | | | | 128 | | | | .42 | | | | .42 | | | | 2.53 | |
| 12/31/2018 | | | 12.89 | | | | .32 | | | | (.32 | ) | | | — | 12 | | | (.32 | ) | | | — | | | | (.32 | ) | | | 12.57 | | | | .03 | | | | 102 | | | | .44 | | | | .44 | | | | 2.54 | |
| 12/31/2017 | | | 12.72 | | | | .27 | | | | .16 | | | | .43 | | | | (.26 | ) | | | — | | | | (.26 | ) | | | 12.89 | | | | 3.37 | | | | 88 | | | | .45 | | | | .45 | | | | 2.06 | |
| Class 529-F-2: | | | | | | | | | | | | | | | | | | | | | | | | | | | | | | | | | | | | | | | | | | | | | | | | | | | | |
| 12/31/2021 | | | 13.79 | | | | .21 | | | | (.31 | ) | | | (.10 | ) | | | (.22 | ) | | | (.08 | ) | | | (.30 | ) | | | 13.39 | | | | (.73 | ) | | | 177 | | | | .33 | | | | .33 | | | | 1.58 | |
| 12/31/20207,13 | | | 14.00 | | | | .03 | | | | .24 | | | | .27 | | | | (.04 | ) | | | (.44 | ) | | | (.48 | ) | | | 13.79 | | | | 1.88 | 9 | | | 166 | | | | .06 | 9 | | | .06 | 9 | | | .24 | 9 |
| Class 529-F-3: | | | | | | | | | | | | | | | | | | | | | | | | | | | | | | | | | | | | | | | | | | | | | | | | | | | | |
| 12/31/2021 | | | 13.79 | | | | .22 | | | | (.31 | ) | | | (.09 | ) | | | (.23 | ) | | | (.08 | ) | | | (.31 | ) | | | 13.39 | | | | (.69 | ) | | | — | 6 | | | .27 | | | | .27 | | | | 1.62 | |
| 12/31/20207,13 | | | 14.00 | | | | .04 | | | | .23 | | | | .27 | | | | (.04 | ) | | | (.44 | ) | | | (.48 | ) | | | 13.79 | | | | 1.90 | 9 | | | — | 6 | | | .08 | 9 | | | .04 | 9 | | | .25 | 9 |
| Class R-1: | | | | | | | | | | | | | | | | | | | | | | | | | | | | | | | | | | | | | | | | | | | | | | | | | | | | |
| 12/31/2021 | | | 13.79 | | | | .08 | | | | (.31 | ) | | | (.23 | ) | | | (.09 | ) | | | (.08 | ) | | | (.17 | ) | | | 13.39 | | | | (1.69 | ) | | | 42 | | | | 1.29 | | | | 1.29 | | | | .62 | |
| 12/31/2020 | | | 13.09 | | | | .11 | | | | 1.18 | | | | 1.29 | | | | (.15 | ) | | | (.44 | ) | | | (.59 | ) | | | 13.79 | | | | 9.88 | | | | 39 | | | | 1.33 | | | | 1.33 | | | | .85 | |
| 12/31/2019 | | | 12.57 | | | | .21 | | | | .69 | | | | .90 | | | | (.20 | ) | | | (.18 | ) | | | (.38 | ) | | | 13.09 | | | | 7.21 | | | | 39 | | | | 1.35 | | | | 1.35 | | | | 1.61 | |
| 12/31/2018 | | | 12.89 | | | | .20 | | | | (.32 | ) | | | (.12 | ) | | | (.20 | ) | | | — | | | | (.20 | ) | | | 12.57 | | | | (.89 | ) | | | 30 | | | | 1.37 | | | | 1.37 | | | | 1.60 | |
| 12/31/2017 | | | 12.72 | | | | .15 | | | | .16 | | | | .31 | | | | (.14 | ) | | | — | | | | (.14 | ) | | | 12.89 | | | | 2.43 | | | | 34 | | | | 1.37 | | | | 1.37 | | | | 1.14 | |
See end of table for footnotes.
| 80 | The Bond Fund of America |
Financial highlights (continued)
| | | | | | (Loss) income from
investment operations1 | | | Dividends and distributions | | | | | | | | | | | | | | | | | | | |
| Period ended | | Net asset
value,
beginning
of period | | | Net
investment
income | | | Net (losses)
gains on
securities
(both
realized and
unrealized) | | | Total from
investment
operations | | | Dividends
(from net
investment
income) | | | Distributions
(from capital
gains) | | | Total
dividends
and
distributions | | | Net asset
value,
end
of period | | | Total
return2,3 | | | Net assets,
end of period
(in millions) | | | Ratio of
expenses to
average net
assets before
waivers/
reimbursements4 | | | Ratio of
expenses to
average net
assets after
waivers/
reimbursements3,4 | | | Ratio of
net income
to average
net assets3 | |
| Class R-2: | | | | | | | | | | | | | | | | | | | | | | | | | | | | | | | | | | | | | | | | | | | | | | | | | | | | |
| 12/31/2021 | | $ | 13.79 | | | $ | .08 | | | $ | (.31 | ) | | $ | (.23 | ) | | $ | (.09 | ) | | $ | (.08 | ) | | $ | (.17 | ) | | $ | 13.39 | | | | (1.69 | )% | | $ | 409 | | | | 1.30 | % | | | 1.30 | % | | | .60 | % |
| 12/31/2020 | | | 13.09 | | | | .12 | | | | 1.18 | | | | 1.30 | | | | (.16 | ) | | | (.44 | ) | | | (.60 | ) | | | 13.79 | | | | 9.91 | | | | 468 | | | | 1.30 | | | | 1.30 | | | | .87 | |
| 12/31/2019 | | | 12.57 | | | | .22 | | | | .69 | | | | .91 | | | | (.21 | ) | | | (.18 | ) | | | (.39 | ) | | | 13.09 | | | | 7.22 | | | | 410 | | | | 1.34 | | | | 1.34 | | | | 1.61 | |
| 12/31/2018 | | | 12.89 | | | | .20 | | | | (.32 | ) | | | (.12 | ) | | | (.20 | ) | | | — | | | | (.20 | ) | | | 12.57 | | | | (.88 | ) | | | 400 | | | | 1.36 | | | | 1.36 | | | | 1.61 | |
| 12/31/2017 | | | 12.72 | | | | .15 | | | | .16 | | | | .31 | | | | (.14 | ) | | | — | | | | (.14 | ) | | | 12.89 | | | | 2.44 | | | | 456 | | | | 1.36 | | | | 1.36 | | | | 1.15 | |
| Class R-2E: | | | | | | | | | | | | | | | | | | | | | | | | | | | | | | | | | | | | | | | | | | | | | | | | | | | | |
| 12/31/2021 | | | 13.79 | | | | .12 | | | | (.31 | ) | | | (.19 | ) | | | (.13 | ) | | | (.08 | ) | | | (.21 | ) | | | 13.39 | | | | (1.40 | ) | | | 44 | | | | 1.00 | | | | 1.00 | | | | .90 | |
| 12/31/2020 | | | 13.09 | | | | .16 | | | | 1.18 | | | | 1.34 | | | | (.20 | ) | | | (.44 | ) | | | (.64 | ) | | | 13.79 | | | | 10.22 | | | | 46 | | | | 1.02 | | | | 1.02 | | | | 1.14 | |
| 12/31/2019 | | | 12.57 | | | | .25 | | | | .69 | | | | .94 | | | | (.24 | ) | | | (.18 | ) | | | (.42 | ) | | | 13.09 | | | | 7.53 | | | | 33 | | | | 1.05 | | | | 1.05 | | | | 1.90 | |
| 12/31/2018 | | | 12.89 | | | | .24 | | | | (.32 | ) | | | (.08 | ) | | | (.24 | ) | | | — | | | | (.24 | ) | | | 12.57 | | | | (.59 | ) | | | 26 | | | | 1.07 | | | | 1.07 | | | | 1.92 | |
| 12/31/2017 | | | 12.72 | | | | .19 | | | | .16 | | | | .35 | | | | (.18 | ) | | | — | | | | (.18 | ) | | | 12.89 | | | | 2.75 | | | | 20 | | | | 1.06 | | | | 1.06 | | | | 1.48 | |
| Class R-3: | | | | | | | | | | | | | | | | | | | | | | | | | | | | | | | | | | | | | | | | | | | | | | | | | | | | |
| 12/31/2021 | | | 13.79 | | | | .14 | | | | (.31 | ) | | | (.17 | ) | | | (.15 | ) | | | (.08 | ) | | | (.23 | ) | | | 13.39 | | | | (1.25 | ) | | | 673 | | | | .85 | | | | .85 | | | | 1.05 | |
| 12/31/2020 | | | 13.09 | | | | .18 | | | | 1.18 | | | | 1.36 | | | | (.22 | ) | | | (.44 | ) | | | (.66 | ) | | | 13.79 | | | | 10.40 | | | | 743 | | | | .86 | | | | .86 | | | | 1.31 | |
| 12/31/2019 | | | 12.57 | | | | .27 | | | | .69 | | | | .96 | | | | (.26 | ) | | | (.18 | ) | | | (.44 | ) | | | 13.09 | | | | 7.70 | | | | 633 | | | | .89 | | | | .89 | | | | 2.06 | |
| 12/31/2018 | | | 12.89 | | | | .26 | | | | (.32 | ) | | | (.06 | ) | | | (.26 | ) | | | — | | | | (.26 | ) | | | 12.57 | | | | (.43 | ) | | | 582 | | | | .91 | | | | .91 | | | | 2.06 | |
| 12/31/2017 | | | 12.72 | | | | .21 | | | | .16 | | | | .37 | | | | (.20 | ) | | | — | | | | (.20 | ) | | | 12.89 | | | | 2.90 | | | | 622 | | | | .91 | | | | .91 | | | | 1.61 | |
| Class R-4: | | | | | | | | | | | | | | | | | | | | | | | | | | | | | | | | | | | | | | | | | | | | | | | | | | | | |
| 12/31/2021 | | | 13.79 | | | | .18 | | | | (.31 | ) | | | (.13 | ) | | | (.19 | ) | | | (.08 | ) | | | (.27 | ) | | | 13.39 | | | | (.94 | ) | | | 588 | | | | .54 | | | | .54 | | | | 1.35 | |
| 12/31/2020 | | | 13.09 | | | | .22 | | | | 1.18 | | | | 1.40 | | | | (.26 | ) | | | (.44 | ) | | | (.70 | ) | | | 13.79 | | | | 10.73 | | | | 688 | | | | .55 | | | | .55 | | | | 1.61 | |
| 12/31/2019 | | | 12.57 | | | | .31 | | | | .69 | | | | 1.00 | | | | (.30 | ) | | | (.18 | ) | | | (.48 | ) | | | 13.09 | | | | 8.03 | | | | 567 | | | | .59 | | | | .59 | | | | 2.37 | |
| 12/31/2018 | | | 12.89 | | | | .30 | | | | (.32 | ) | | | (.02 | ) | | | (.30 | ) | | | — | | | | (.30 | ) | | | 12.57 | | | | (.13 | ) | | | 518 | | | | .61 | | | | .61 | | | | 2.37 | |
| 12/31/2017 | | | 12.72 | | | | .25 | | | | .16 | | | | .41 | | | | (.24 | ) | | | — | | | | (.24 | ) | | | 12.89 | | | | 3.22 | | | | 583 | | | | .60 | | | | .60 | | | | 1.91 | |
| Class R-5E: | | | | | | | | | | | | | | | | | | | | | | | | | | | | | | | | | | | | | | | | | | | | | | | | | | | | |
| 12/31/2021 | | | 13.79 | | | | .21 | | | | (.31 | ) | | | (.10 | ) | | | (.22 | ) | | | (.08 | ) | | | (.30 | ) | | | 13.39 | | | | (.75 | ) | | | 160 | | | | .34 | | | | .34 | | | | 1.60 | |
| 12/31/2020 | | | 13.09 | | | | .25 | | | | 1.18 | | | | 1.43 | | | | (.29 | ) | | | (.44 | ) | | | (.73 | ) | | | 13.79 | | | | 10.95 | | | | 88 | | | | .35 | | | | .35 | | | | 1.78 | |
| 12/31/2019 | | | 12.57 | | | | .34 | | | | .69 | | | | 1.03 | | | | (.33 | ) | | | (.18 | ) | | | (.51 | ) | | | 13.09 | | | | 8.25 | | | | 43 | | | | .37 | | | | .37 | | | | 2.53 | |
| 12/31/2018 | | | 12.89 | | | | .33 | | | | (.32 | ) | | | .01 | | | | (.33 | ) | | | — | | | | (.33 | ) | | | 12.57 | | | | .09 | | | | 8 | | | | .40 | | | | .40 | | | | 2.63 | |
| 12/31/2017 | | | 12.72 | | | | .27 | | | | .16 | | | | .43 | | | | (.26 | ) | | | — | | | | (.26 | ) | | | 12.89 | | | | 3.39 | | | | — | 6 | | | .42 | | | | .40 | | | | 2.11 | |
| Class R-5: | | | | | | | | | | | | | | | | | | | | | | | | | | | | | | | | | | | | | | | | | | | | | | | | | | | | |
| 12/31/2021 | | | 13.79 | | | | .22 | | | | (.31 | ) | | | (.09 | ) | | | (.23 | ) | | | (.08 | ) | | | (.31 | ) | | | 13.39 | | | | (.65 | ) | | | 373 | | | | .25 | | | | .25 | | | | 1.69 | |
| 12/31/2020 | | | 13.09 | | | | .26 | | | | 1.18 | | | | 1.44 | | | | (.30 | ) | | | (.44 | ) | | | (.74 | ) | | | 13.79 | | | | 11.06 | | | | 192 | | | | .26 | | | | .26 | | | | 1.91 | |
| 12/31/2019 | | | 12.57 | | | | .35 | | | | .69 | | | | 1.04 | | | | (.34 | ) | | | (.18 | ) | | | (.52 | ) | | | 13.09 | | | | 8.35 | | | | 173 | | | | .29 | | | | .29 | | | | 2.67 | |
| 12/31/2018 | | | 12.89 | | | | .34 | | | | (.32 | ) | | | .02 | | | | (.34 | ) | | | — | | | | (.34 | ) | | | 12.57 | | | | .17 | | | | 163 | | | | .31 | | | | .31 | | | | 2.67 | |
| 12/31/2017 | | | 12.72 | | | | .29 | | | | .16 | | | | .45 | | | | (.28 | ) | | | — | | | | (.28 | ) | | | 12.89 | | | | 3.52 | | | | 176 | | | | .30 | | | | .30 | | | | 2.21 | |
| Class R-6: | | | | | | | | | | | | | | | | | | | | | | | | | | | | | | | | | | | | | | | | | | | | | | | | | | | | |
| 12/31/2021 | | | 13.79 | | | | .23 | | | | (.31 | ) | | | (.08 | ) | | | (.24 | ) | | | (.08 | ) | | | (.32 | ) | | | 13.39 | | | | (.60 | ) | | | 15,035 | | | | .20 | | | | .20 | | | | 1.71 | |
| 12/31/2020 | | | 13.09 | | | | .27 | | | | 1.18 | | | | 1.45 | | | | (.31 | ) | | | (.44 | ) | | | (.75 | ) | | | 13.79 | | | | 11.11 | | | | 13,449 | | | | .21 | | | | .21 | | | | 1.95 | |
| 12/31/2019 | | | 12.57 | | | | .36 | | | | .69 | | | | 1.05 | | | | (.35 | ) | | | (.18 | ) | | | (.53 | ) | | | 13.09 | | | | 8.40 | | | | 10,434 | | | | .24 | | | | .24 | | | | 2.72 | |
| 12/31/2018 | | | 12.89 | | | | .34 | | | | (.32 | ) | | | .02 | | | | (.34 | ) | | | — | | | | (.34 | ) | | | 12.57 | | | | .22 | | | | 8,116 | | | | .26 | | | | .26 | | | | 2.73 | |
| 12/31/2017 | | | 12.72 | | | | .29 | | | | .16 | | | | .45 | | | | (.28 | ) | | | — | | | | (.28 | ) | | | 12.89 | | | | 3.58 | | | | 6,351 | | | | .25 | | | | .25 | | | | 2.27 | |
See end of table for footnotes.
| The Bond Fund of America | 81 |
Financial highlights (continued)
| | | Year ended December 31, |
| Portfolio turnover rate for all share classes14,15 | | 2021 | | 2020 | | 2019 | | 2018 | | 2017 |
| Excluding mortgage dollar roll transactions | | | 74 | % | | | 113 | % | | | 127 | % | | | 121 | % | | | 170 | % |
| Including mortgage dollar roll transactions | | | 368 | % | | | 535 | % | | | 286 | % | | | 356 | % | | | 379 | % |
| 1 | Based on average shares outstanding. |
| 2 | Total returns exclude any applicable sales charges, including contingent deferred sales charges. |
| 3 | This column reflects the impact, if any, of certain waivers/reimbursements from AFS and/or CRMC. During one of the periods shown, AFS waived a portion of transfer agent services fees for Class F-3 shares. In addition, during some of the periods shown, CRMC reimbursed a portion of transfer agent services fees for certain share classes. |
| 4 | Ratios do not include expenses of any Central Funds. The fund indirectly bears its proportionate share of the expenses of any Central Funds. |
| 5 | All or a significant portion of assets in this class consisted of seed capital invested by CRMC and/or its affiliates. Fees for distribution services are not charged or accrued on these seed capital assets. If such fees were paid by the fund on seed capital assets, fund expenses would have been higher and net income and total return would have been lower. |
| 6 | Amount less than $1 million. |
| 7 | Based on operations for a period that is less than a full year. |
| 8 | Class T and 529-T shares began investment operations on April 7, 2017. |
| 9 | Not annualized. |
| 10 | Annualized. |
| 11 | Class F-3 shares began investment operations on January 27, 2017. |
| 12 | Amount less than $.01. |
| 13 | Class 529-F-2 and 529-F-3 shares began investment operations on October 30, 2020. |
| 14 | Rates do not include the fund’s portfolio activity with respect to any Central Funds. |
| 15 | Refer to Note 5 for more information on mortgage dollar rolls. |
See notes to financial statements.
| 82 | The Bond Fund of America |
Report of Independent Registered Public Accounting Firm
To the Shareholders and Board of Trustees of The Bond Fund of America:
Opinion on the Financial Statements and Financial Highlights
We have audited the accompanying statement of assets and liabilities of The Bond Fund of America (the “Fund”), including the investment portfolio, as of December 31, 2021, the related statement of operations for the year then ended, the statements of changes in net assets for each of the two years in the period then ended, the financial highlights for each of the five years in the period then ended, and the related notes. In our opinion, the financial statements and financial highlights present fairly, in all material respects, the financial position of the Fund as of December 31, 2021, and the results of its operations for the year then ended, the changes in its net assets for each of the two years in the period then ended, and the financial highlights for each of the five years in the period then ended, in conformity with accounting principles generally accepted in the United States of America.
Basis for Opinion
These financial statements and financial highlights are the responsibility of the Fund’s management. Our responsibility is to express an opinion on the Fund’s financial statements and financial highlights based on our audits. We are a public accounting firm registered with the Public Company Accounting Oversight Board (United States) (PCAOB) and are required to be independent with respect to the Fund in accordance with the U.S. federal securities laws and the applicable rules and regulations of the Securities and Exchange Commission and the PCAOB.
We conducted our audits in accordance with the standards of the PCAOB. Those standards require that we plan and perform the audit to obtain reasonable assurance about whether the financial statements and financial highlights are free of material misstatement, whether due to error or fraud. The Fund is not required to have, nor were we engaged to perform, an audit of its internal control over financial reporting. As part of our audits we are required to obtain an understanding of internal control over financial reporting but not for the purpose of expressing an opinion on the effectiveness of the Fund’s internal control over financial reporting. Accordingly, we express no such opinion.
Our audits included performing procedures to assess the risks of material misstatement of the financial statements and financial highlights, whether due to error or fraud, and performing procedures that respond to those risks. Such procedures included examining, on a test basis, evidence regarding the amounts and disclosures in the financial statements and financial highlights. Our audits also included evaluating the accounting principles used and significant estimates made by management, as well as evaluating the overall presentation of the financial statements and financial highlights. Our procedures included confirmation of securities owned as of December 31, 2021, by correspondence with the custodian and brokers; when replies were not received from brokers, we performed other auditing procedures. We believe that our audits provide a reasonable basis for our opinion.
Deloitte & Touche LLP
Costa Mesa, California
February 11, 2022
We have served as the auditor of one or more American Funds investment companies since 1956.
| The Bond Fund of America | 83 |
As a fund shareholder, you incur two types of costs: (1) transaction costs, such as initial sales charges on purchase payments and contingent deferred sales charges on redemptions (loads), and (2) ongoing costs, including management fees, distribution and service (12b-1) fees, and other expenses. This example is intended to help you understand your ongoing costs (in dollars) of investing in the fund so you can compare these costs with the ongoing costs of investing in other mutual funds. The example is based on an investment of $1,000 invested at the beginning of the period and held for the entire six-month period (July 1, 2021, through December 31, 2021).
Actual expenses:
The first line of each share class in the table on the following page provides information about actual account values and actual expenses. You may use the information in this line, together with the amount you invested, to estimate the expenses that you paid over the period. Simply divide your account value by $1,000 (for example, an $8,600 account value divided by $1,000 = 8.6), then multiply the result by the number in the first line under the heading titled “Expenses paid during period” to estimate the expenses you paid on your account during this period.
Hypothetical example for comparison purposes:
The second line of each share class in the table on the following page provides information about hypothetical account values and hypothetical expenses based on the actual expense ratio for the share class and an assumed rate of return of 5.00% per year before expenses, which is not the actual return of the share class. The hypothetical account values and expenses may not be used to estimate the actual ending account balance or expenses you paid for the period. You may use this information to compare the ongoing costs of investing in the fund and other funds. To do so, compare this 5.00% hypothetical example with the 5.00% hypothetical examples that appear in the shareholder reports of the other funds.
Notes:
Retirement plan participants may be subject to certain fees charged by the plan sponsor, and Class F-1, F-2, F-3, 529-F-1, 529-F-2 and 529-F-3 shareholders may be subject to fees charged by financial intermediaries, typically ranging from 0.75% to 1.50% of assets annually depending on services offered. You can estimate the impact of these fees by adding the amount of the fees to the total estimated expenses you paid on your account during the period as calculated above. In addition, your ending account value would be lower by the amount of these fees.
Note that the expenses shown in the table on the following page are meant to highlight your ongoing costs only and do not reflect any transactional costs, such as sales charges (loads). Therefore, the second line of each share class in the table is useful in comparing ongoing costs only and will not help you determine the relative total costs of owning different funds. In addition, if these transactional costs were included, your costs would have been higher.
| 84 | The Bond Fund of America |
Expense example (continued)
| | | Beginning
account value
7/1/2021 | | | Ending
account value
12/31/2021 | | | Expenses paid
during period* | | | Annualized
expense ratio | |
| Class A – actual return | | $ | 1,000.00 | | | $ | 1,004.10 | | | $ | 2.73 | | | | .54 | % |
| Class A – assumed 5% return | | | 1,000.00 | | | | 1,022.48 | | | | 2.75 | | | | .54 | |
| Class C – actual return | | | 1,000.00 | | | | 1,000.31 | | | | 6.45 | | | | 1.28 | |
| Class C – assumed 5% return | | | 1,000.00 | | | | 1,018.75 | | | | 6.51 | | | | 1.28 | |
| Class T – actual return | | | 1,000.00 | | | | 1,005.12 | | | | 1.62 | | | | .32 | |
| Class T – assumed 5% return | | | 1,000.00 | | | | 1,023.59 | | | | 1.63 | | | | .32 | |
| Class F-1 – actual return | | | 1,000.00 | | | | 1,003.83 | | | | 2.98 | | | | .59 | |
| Class F-1 – assumed 5% return | | | 1,000.00 | | | | 1,022.23 | | | | 3.01 | | | | .59 | |
| Class F-2 – actual return | | | 1,000.00 | | | | 1,005.27 | | | | 1.52 | | | | .30 | |
| Class F-2 – assumed 5% return | | | 1,000.00 | | | | 1,023.69 | | | | 1.53 | | | | .30 | |
| Class F-3 – actual return | | | 1,000.00 | | | | 1,005.84 | | | | .96 | | | | .19 | |
| Class F-3 – assumed 5% return | | | 1,000.00 | | | | 1,024.25 | | | | .97 | | | | .19 | |
| Class 529-A – actual return | | | 1,000.00 | | | | 1,003.86 | | | | 2.93 | | | | .58 | |
| Class 529-A – assumed 5% return | | | 1,000.00 | | | | 1,022.28 | | | | 2.96 | | | | .58 | |
| Class 529-C – actual return | | | 1,000.00 | | | | 1,000.07 | | | | 6.70 | | | | 1.33 | |
| Class 529-C – assumed 5% return | | | 1,000.00 | | | | 1,018.50 | | | | 6.77 | | | | 1.33 | |
| Class 529-E – actual return | | | 1,000.00 | | | | 1,002.83 | | | | 3.94 | | | | .78 | |
| Class 529-E – assumed 5% return | | | 1,000.00 | | | | 1,021.27 | | | | 3.97 | | | | .78 | |
| Class 529-T – actual return | | | 1,000.00 | | | | 1,004.91 | | | | 1.82 | | | | .36 | |
| Class 529-T – assumed 5% return | | | 1,000.00 | | | | 1,023.39 | | | | 1.84 | | | | .36 | |
| Class 529-F-1 – actual return | | | 1,000.00 | | | | 1,004.68 | | | | 2.02 | | | | .40 | |
| Class 529-F-1 – assumed 5% return | | | 1,000.00 | | | | 1,023.19 | | | | 2.04 | | | | .40 | |
| Class 529-F-2 – actual return | | | 1,000.00 | | | | 1,005.19 | | | | 1.62 | | | | .32 | |
| Class 529-F-2 – assumed 5% return | | | 1,000.00 | | | | 1,023.59 | | | | 1.63 | | | | .32 | |
| Class 529-F-3 – actual return | | | 1,000.00 | | | | 1,005.43 | | | | 1.31 | | | | .26 | |
| Class 529-F-3 – assumed 5% return | | | 1,000.00 | | | | 1,023.89 | | | | 1.33 | | | | .26 | |
| Class R-1 – actual return | | | 1,000.00 | | | | 1,000.37 | | | | 6.45 | | | | 1.28 | |
| Class R-1 – assumed 5% return | | | 1,000.00 | | | | 1,018.75 | | | | 6.51 | | | | 1.28 | |
| Class R-2 – actual return | | | 1,000.00 | | | | 1,000.35 | | | | 6.45 | | | | 1.28 | |
| Class R-2 – assumed 5% return | | | 1,000.00 | | | | 1,018.75 | | | | 6.51 | | | | 1.28 | |
| Class R-2E – actual return | | | 1,000.00 | | | | 1,001.79 | | | | 5.05 | | | | 1.00 | |
| Class R-2E – assumed 5% return | | | 1,000.00 | | | | 1,020.16 | | | | 5.09 | | | | 1.00 | |
| Class R-3 – actual return | | | 1,000.00 | | | | 1,002.59 | | | | 4.24 | | | | .84 | |
| Class R-3 – assumed 5% return | | | 1,000.00 | | | | 1,020.97 | | | | 4.28 | | | | .84 | |
| Class R-4 – actual return | | | 1,000.00 | | | | 1,004.09 | | | | 2.73 | | | | .54 | |
| Class R-4 – assumed 5% return | | | 1,000.00 | | | | 1,022.48 | | | | 2.75 | | | | .54 | |
| Class R-5E – actual return | | | 1,000.00 | | | | 1,005.12 | | | | 1.67 | | | | .33 | |
| Class R-5E – assumed 5% return | | | 1,000.00 | | | | 1,023.54 | | | | 1.68 | | | | .33 | |
| Class R-5 – actual return | | | 1,000.00 | | | | 1,005.59 | | | | 1.21 | | | | .24 | |
| Class R-5 – assumed 5% return | | | 1,000.00 | | | | 1,024.00 | | | | 1.22 | | | | .24 | |
| Class R-6 – actual return | | | 1,000.00 | | | | 1,005.84 | | | | .96 | | | | .19 | |
| Class R-6 – assumed 5% return | | | 1,000.00 | | | | 1,024.25 | | | | .97 | | | | .19 | |
| * | The “expenses paid during period” are equal to the “annualized expense ratio,” multiplied by the average account value over the period, multiplied by the number of days in the period, and divided by 365 (to reflect the one-half year period). |
| The Bond Fund of America | 85 |
We are required to advise you of the federal tax status of certain distributions received by shareholders during the fiscal year. The fund hereby designates the following amounts for the fund’s fiscal year ended December 31, 2021:
| Long-term capital gains | $439,841,000 |
| Qualified dividend income | $2,162,000 |
| Section 163(j) interest dividends | $1,171,819,000 |
| Corporate dividends received deduction | $1,696,000 |
| U.S. government income that may be exempt from state taxation | $326,801,000 |
Individual shareholders should refer to their Form 1099 or other tax information, which was mailed in January 2022, to determine the calendar year amounts to be included on their 2021 tax returns. Shareholders should consult their tax advisors.
| 86 | The Bond Fund of America |
Liquidity Risk Management Program
The fund has adopted a liquidity risk management program (the “program”). The fund’s board has designated Capital Research and Management Company (“CRMC”) as the administrator of the program. Personnel of CRMC or its affiliates conduct the day-to-day operation of the program pursuant to policies and procedures administered by the Capital Group Liquidity Risk Management Committee.
Under the program, CRMC manages the fund’s liquidity risk, which is the risk that the fund could not meet shareholder redemption requests without significant dilution of remaining shareholders’ interests in the fund. This risk is managed by monitoring the degree of liquidity of the fund’s investments, limiting the amount of the fund’s illiquid investments, and utilizing various risk management tools and facilities available to the fund for meeting shareholder redemptions, among other means. CRMC’s process of determining the degree of liquidity of the fund’s investments is supported by one or more third-party liquidity assessment vendors.
The fund’s board reviewed a report prepared by CRMC regarding the operation and effectiveness of the program for the period October 1, 2020, through September 30, 2021. No significant liquidity events impacting the fund were noted in the report. In addition, CRMC provided its assessment that the program had been effective in managing the fund’s liquidity risk.
| The Bond Fund of America | 87 |
This page was intentionally left blank.
| 88 | The Bond Fund of America |
This page was intentionally left blank.
| The Bond Fund of America | 89 |
Board of trustees and other officers
Independent trustees1
Name, Date of Birth and
Position with Fund | | Year First
Elected as
a Director/
Trustee2 | | Principal Occupation(s) During the Past Five Years | | Number of
Portfolios
Overseen by
Trustee | | Other Directorships3 Held
by Trustee During the Past
Five Years |
| Francisco G. Cigarroa, MD, 1957 | | 2021 | | Professor of Surgery, University of Texas Health San Antonio; Trustee, Ford Foundation; Clayton Research Scholar, Clayton Foundation for Biomedical Research | | 86 | | None |
| James G. Ellis, 1947 | | 2006 | | Former Dean and Professor of Marketing, Marshall School of Business, University of Southern California | | 99 | | Advanced Merger Partners; EVe Mobility Acquisition Corp (acquisitions of companies in the electric vehicle market); J. G. Boswell (agricultural production); Mercury General Corporation |
| Nariman Farvardin, 1956 | | 2018 | | President, Stevens Institute of Technology | | 87 | | None |
| Mary Davis Holt, 1950 | | 2015-2016; 2017 | | Principal, Mary Davis Holt Enterprises, LLC (leadership development consulting); former Partner, Flynn Heath Holt Leadership, LLC (leadership consulting); former COO, Time Life Inc. (1993 – 2003) | | 87 | | None |
| R. Clark Hooper, 1946 | | 2005 | | Private investor | | 91 | | None |
| Merit E. Janow, 1958 | | 2010 | | Dean and Professor, Columbia University, School of International and Public Affairs | | 93 | | Aptiv (autonomous and green vehicle technology); Mastercard Incorporated |
Margaret Spellings, 1957
Chair of the Board
(Independent and Non-Executive) | | 2010 | | President and CEO, Texas 2036; former President, Margaret Spellings & Company (public policy and strategic consulting); former President, The University of North Carolina; former President, George W. Bush Presidential Center | | 91 | | None |
| Alexandra Trower, 1964 | | 2019 | | Former Executive Vice President, Global Communications and Corporate Officer, The Estée Lauder Companies | | 86 | | None |
| Paul S. Williams, 1959 | | 2020 | | Former Partner/Managing Director, Major, Lindsey & Africa (executive recruiting firm) | | 86 | | Air Transport Services Group, Inc. (aircraft leasing and air cargo transportation); Compass Minerals, Inc. (producer of salt and specialty fertilizers); Public Storage, Inc.; Romeo Power, Inc. (manufacturer of batteries for electric vehicles) |
| 90 | The Bond Fund of America |
Interested trustees4,5
Name, Date of Birth and
Position with Fund | | Year First
Elected as
a Director/
Trustee/
Officer2 | | Principal Occupation(s) During the Past Five Years and
Positions Held with Affiliated Entities or the Principal
Underwriter of the Fund | | Number of
Portfolios
Overseen by
Trustee | | Other Directorships3 Held
by Trustee During the Past
Five Years |
| Michael C. Gitlin, 1970 | | 2015 | | Partner — Capital Fixed Income Investors, Capital Research and Management Company; Vice Chairman and Director, Capital Research and Management Company; Director, The Capital Group Companies, Inc.6; served as Head of Fixed Income at a large investment management firm prior to joining Capital Research and Management Company in 2015 | | 86 | | None |
| Karl J. Zeile, 1966 | | 2019 | | Partner — Capital Fixed Income Investors, Capital Research and Management Company | | 21 | | None |
The fund’s statement of additional information includes further details about fund trustees and is available without charge upon request by calling American Funds Service Company at (800) 421-4225 or by visiting the Capital Group website at capitalgroup.com. The address for all trustees and officers of the fund is 333 South Hope Street, Los Angeles, CA 90071, Attention: Secretary.
See page 92 for footnotes.
| The Bond Fund of America | 91 |
Other officers5
Name, Year of Birth and
Position with Fund | | Year First Elected
as an Officer2 | | Principal Occupation(s) During the Past Five Years and Positions Held with Affiliated Entities or the
Principal Underwriter of the Fund |
Pramod Atluri, 1976
President | | 2016 | | Partner — Capital Fixed Income Investors, Capital Research and Management Company; Vice President, Capital Fixed Income Investors, Capital Bank and Trust Company6; Director, Capital Research and Management Company |
Kristine M. Nishiyama, 1970
Principal Executive Officer | | 2003 | | Senior Vice President and Senior Counsel — Fund Business Management Group, Capital Research and Management Company; Chair, Senior Vice President, General Counsel and Director, Capital Bank and Trust Company6 |
Michael W. Stockton, 1967
Executive Vice President | | 2021 | | Senior Vice President — Fund Business Management Group, Capital Research and Management Company |
David J. Betanzos, 1974
Senior Vice President | | 2016 | | Partner — Capital Fixed Income Investors, Capital Research and Management Company; Director, Capital Research and Management Company |
David A. Hoag, 1965
Senior Vice President | | 2015 | | Partner — Capital Fixed Income Investors, Capital Research and Management Company; Partner — Capital Fixed Income Investors, Capital Bank and Trust Company6 |
Fergus N. MacDonald, 1969
Senior Vice President | | 2015 | | Partner — Capital Fixed Income Investors, Capital Research and Management Company; Director, The Capital Group Companies, Inc.6 |
Steven I. Koszalka, 1964
Secretary | | 2010 | | Vice President — Fund Business Management Group, Capital Research and Management Company |
Brian C. Janssen, 1972
Treasurer | | 2011 | | Senior Vice President — Investment Operations, Capital Research and Management Company |
Jane Y. Chung, 1974
Assistant Secretary | | 2014 | | Associate — Fund Business Management Group, Capital Research and Management Company |
Sandra Chuon, 1972
Assistant Treasurer | | 2019 | | Assistant Vice President — Investment Operations, Capital Research and Management Company |
Becky L. Park, 1979
Assistant Treasurer | | 2021 | | Vice President — Investment Operations, Capital Research and Management Company |
| 1 | The term independent trustee refers to a trustee who is not an “interested person” of the fund within the meaning of the Investment Company Act of 1940. |
| 2 | Trustees and officers of the fund serve until their resignation, removal or retirement. |
| 3 | This includes all directorships/trusteeships (other than those in the American Funds or other funds managed by Capital Research and Management Company or its affiliates) that are held by each trustee as a trustee or director of a public company or a registered investment company. |
| 4 | The term interested trustee refers to a trustee who is an “interested person” within the meaning of the Investment Company Act of 1940, on the basis of their affiliation with the fund’s investment adviser, Capital Research and Management Company, or affiliated entities (including the fund’s principal underwriter). |
| 5 | All of the trustees and/or officers listed are officers and/or directors/trustees of one or more of the other funds for which Capital Research and Management Company serves as investment adviser. |
| 6 | Company affiliated with Capital Research and Management Company. |
| 92 | The Bond Fund of America |
Office of the fund
333 South Hope Street
Los Angeles, CA 90071-1406
Investment adviser
Capital Research and Management Company
333 South Hope Street
Los Angeles, CA 90071-1406
Transfer agent for shareholder accounts
American Funds Service Company
(Write to the address nearest you.)
P.O. Box 6007
Indianapolis, IN 46206-6007
P.O. Box 2280
Norfolk, VA 23501-2280
Custodian of assets
JPMorgan Chase Bank
270 Park Avenue
New York, NY 10017-2070
Counsel
Morgan, Lewis & Bockius LLP
One Federal Street
Boston, MA 02110-1726
Independent registered public accounting firm
Deloitte & Touche LLP
695 Town Center Drive
Suite 1000
Costa Mesa, CA 92626-7188
Principal underwriter
American Funds Distributors, Inc.
333 South Hope Street
Los Angeles, CA 90071-1406
Investors should carefully consider investment objectives, risks, charges and expenses. This and other important information is contained in the fund prospectus and summary prospectus, which can be obtained from your financial professional and should be read carefully before investing. You may also call American Funds Service Company (AFS) at (800) 421-4225 or visit the Capital Group website at capitalgroup.com.
“American Funds Proxy Voting Procedures and Principles” — which describes how we vote proxies relating to portfolio securities — is available on the American Funds website or upon request by calling AFS. The fund files its proxy voting record with the U.S. Securities and Exchange Commission (SEC) for the 12 months ended June 30 by August 31. The proxy voting record is available free of charge on the SEC website at sec.gov or our website.
The Bond Fund of America files a complete list of its portfolio holdings with the SEC for the first and third quarters of each fiscal year on NPORT-P. The list of portfolio holdings is available free of charge on the SEC website and on our website.
This report is for the information of shareholders of The Bond Fund of America, but it also may be used as sales literature when preceded or accompanied by the current prospectus or summary prospectus, which gives details about charges, expenses, investment objectives and operating policies of the fund. If used as sales material after March 31, 2022, this report must be accompanied by an American Funds statistical update for the most recently completed calendar quarter.
Bloomberg Index Services Limited. BLOOMBERG® is a trademark and service mark of Bloomberg Finance L.P. and its affiliates (collectively “Bloomberg”). Bloomberg or Bloomberg’s licensors own all proprietary rights in the Bloomberg Indices. Neither Bloomberg nor Bloomberg’s licensors approves or endorses this material, or guarantees the accuracy or completeness of any information herein, or makes any warranty, express or implied, as to the results to be obtained therefrom and, to the maximum extent allowed by law, neither shall have any liability or responsibility for injury or damages arising in connection therewith.
American Funds Distributors, Inc., member FINRA.
The Capital Advantage®
Since 1931, Capital Group, home of American Funds, has helped investors pursue long-term investment success. Our consistent approach — in combination with The Capital SystemSM — has resulted in superior outcomes.
Aligned with investor success
We base our decisions on a long-term perspective, which we believe aligns our goals with the interests of our clients. Our portfolio managers average 27 years of investment industry experience, including 21 years at our company, reflecting a career commitment to our long-term approach.1
The Capital System
The Capital System combines individual accountability with teamwork. Funds using The Capital System are divided into portions that are managed independently by investment professionals with diverse backgrounds, ages and investment approaches. An extensive global research effort is the backbone of our system.
American Funds’ superior outcomes
Equity funds have beaten their Lipper peer indexes in 91% of 10-year periods and 98% of 20-year periods.2 Fixed income funds have helped investors achieve diversification through attention to correlation between bonds and equities.3 Fund management fees have been among the lowest in the industry.4
| | 1 | Investment industry experience as of December 31, 2020. |
| | 2 | Based on Class F-2 share results rolling calendar-year periods starting the first full calendar year after each fund’s inception through December 31, 2020. Periods covered are the shorter of the fund’s lifetime or since the comparable Lipper index inception date (except Capital Income Builder and SMALLCAP World Fund, for which the Lipper average was used). Expenses differ for each share class, so results will vary. |
| | 3 | Based on Class F-2 share results as of December 31, 2020. Thirteen of the 17 fixed income American Funds that have been in existence for the three-year period showed a three-year correlation below 0.3. Standard & Poor’s 500 Index was used as an equity market proxy. Correlation based on monthly total returns. Correlation is a statistical measure of how two securities move in relation to each other. A correlation ranges from –1 to 1. A positive correlation close to 1 implies that as one security moves, either up or down, the other security will move in “lockstep,” in the same direction. A negative correlation close to –1 indicates that the securities have moved in the opposite direction. |
| | 4 | On average, our management fees were in the lowest quintile 66% of the time, based on the 20-year period ended December 31, 2020, versus comparable Lipper categories, excluding funds of funds. |
| | | |
| Class F-2 shares were first offered on August 1, 2008. Class F-2 share results prior to the date of first sale are hypothetical based on the results of the original share class of the fund without a sales charge, adjusted for typical estimated expenses. Results for certain funds with an inception date after August 1, 2008, also include hypothetical returns because those funds’ Class F-2 shares sold after the funds’ date of first offering. Visit capitalgroup.com for more information on specific expense adjustments and the actual dates of first sale. |
All Capital Group trademarks mentioned are owned by The Capital Group Companies, Inc., an affiliated company or fund. All other company and product names mentioned are the property of their respective companies.

 | Capital Group Core Municipal FundSM
Capital Group Short-Term Municipal FundSM
Capital Group California Core Municipal FundSM
Capital Group California Short-Term Municipal FundSM
Capital Group Core Bond FundSM Annual report for the year ended October 31, 2021 |

Research-driven
approaches to seeking
wealth preservation
and income
Capital Group Core Municipal Fund seeks to provide current income exempt from federal income tax while preserving your investment.
Capital Group Short-Term Municipal Fund seeks to preserve your investment and secondarily to provide current income exempt from federal income tax.
Capital Group California Core Municipal Fund seeks to provide current income exempt from federal and California income taxes while preserving your investment.
Capital Group California Short-Term Municipal Fund seeks to preserve your investment and secondarily to provide current income exempt from federal and California income taxes.
Capital Group Core Bond Fund seeks to provide you with current income while preserving your investment.
Each fund is one of more than 40 offered by Capital Group, home of American Funds, one of the nation’s largest mutual fund families. For 90 years, Capital Group has invested with a long-term focus based on thorough research and attention to risk.
Fund results shown in this report are at net asset value. Results are for past periods and are not predictive of results for future periods. Current and future results may be lower or higher than those shown. Prices and returns will vary, so investors may lose money. Investing for short periods makes losses more likely.
Here are the total returns on a $1,000 investment with all distributions reinvested for periods ended September 30, 2021 (the most recent calendar quarter-end), and the total annual fund operating expense ratios as of the prospectus dated January 1, 2022 (unaudited):
| | | Cumulative
total returns | | Average annual
total returns | | Gross |
| | | 1 year | | 5 years | | 10 years | | Lifetime* | | expense ratios |
| | | | | | | | | | | |
| Capital Group Core Municipal Fund | | | 1.13 | % | | | 2.35 | % | | | 2.37 | % | | | 2.65 | % | | | 0.28 | % |
| Capital Group Short-Term Municipal Fund | | | 0.36 | | | | 1.78 | | | | 1.48 | | | | 1.63 | | | | 0.31 | † |
| Capital Group California Core Municipal Fund | | | 0.56 | | | | 1.92 | | | | 2.42 | | | | 2.62 | | | | 0.27 | |
| Capital Group California Short-Term Municipal Fund | | | 0.04 | | | | 1.35 | | | | 1.26 | | | | 1.34 | | | | 0.29 | |
| Capital Group Core Bond Fund | | | –0.38 | | | | 2.43 | | | | 2.22 | | | | 2.63 | | | | 0.28 | |
| * | Since April 13, 2010. |
| † | The net expense ratio for Capital Group Short-Term Municipal Fund is 0.30%. |
The investment adviser is currently reimbursing a portion of the expenses for Capital Group Short-Term Municipal Fund. This reimbursement will be in effect through at least January 1, 2023. The adviser may elect at its discretion to extend, modify or terminate the reimbursements at that time. Visit capitalgrouppcsfunds.com and capitalgroup.com for American Funds for more information.
Investments are not FDIC-insured, nor are they deposits of or guaranteed by a bank or any other entity, so they may lose value.
Contents
Fellow investors:
Bond indexes generally moved sideways in the 12 months ended October 31, 2021, as the fixed income market contended with shifting interest rates, heightened inflationary pressures and the shadow cast by the powerful equity market rally.
Despite the various challenges, the return of the Capital Group Core Bond Fund exceeded its benchmark by a notable margin, while results for Capital Group Private Client Services’ four municipal bond funds were comparable to their respective indices.
Beyond that, all five funds largely sidestepped a broad financial market pullback in September. Even though inflation fears caused yields to rise significantly during the month, the funds incurred only small declines. That stood in contrast to a far sharper drop in the stock market, underscoring the role that high-quality fixed income can play in preserving capital in portfolios.
Markets and economy
For the most part, bond indexes moved modestly during the year, generating either small gains or losses. Yields rose in the spring and again in the autumn — both times amid strengthening economic data and the specter of higher inflation. Beyond that, the attention-grabbing gains in the stock market overshadowed bonds throughout the year.
Fixed income was also weighed down by the expectation that the Federal Reserve would start scaling back its bond purchase program as a first step toward tighter monetary policies. Indeed, the central bank announced the launch of so-called tapering in November. However, the odds and timing of potential interest rate hikes remain highly uncertain, with any Fed action likely to depend on changing economic conditions and interest rates likely to remain low by historical standards.
On a positive note, the bond market’s reaction to the lead-up of the tapering announcement was subdued in comparison to the 2013 “taper tantrum,” when borrowing costs jumped sharply after the Fed unveiled similar plans to wind down bond purchases. In this case, policymakers telegraphed their thinking well in advance and soothed the market by indicating that they will move judiciously.
Capital Group Core Municipal Fund and Capital Group Short-Term Municipal Fund
Proposed tax increases in federal infrastructure and spending bills drove interest in tax-advantaged municipal bonds. The sector began the year fully priced after a rally in 2020, leading to tight spreads and limited yields. Nevertheless, each fund notched positive returns.
With a 0.99% return for the 12 months ended October 31, Capital Group Core Municipal Fund narrowly trailed its index, the Bloomberg Municipal Short-Intermediate 1–10 Years Index*, which gained 1.09%.
Capital Group Short-Term Municipal Fund rose 0.43%, compared to the 0.76% return for its index, the Bloomberg Municipal Short 1–5 Years Index*.
Capital Group California Core Municipal Fund and Capital Group California Short-Term Municipal Fund
Capital Group California Core Municipal Fund returned 0.53% for the past 12 months, slightly edging out the Bloomberg California Short-Intermediate Municipal Index*, which returned 0.52%.
Capital Group California Short-Term Municipal Fund gained 0.12%, short of the 0.42% return notched by the Bloomberg California Short Municipal Index*.
| Private Client Services Funds | 1 |
Capital Group Core Bond Fund
Capital Group Core Bond Fund declined 0.60% for the period, a much better result than the Bloomberg Intermediate A+ U.S. Government/Credit Index, which dropped 1.22%.*
The investment-grade bond market was in a holding pattern for much of the past 12 months as investors positioned themselves for a less dovish Fed. Returns were further pressured by unusually high inflation. The impact was especially apparent in securities with high sensitivity to interest rate changes. The yield on the 10-year U.S. Treasury note rose to 1.55% by October 31, up nearly 70 basis points, or 7/10ths of a percentage point, from the beginning of the period.
The Capital Group Core Bond Fund fared better than its index in part because managers reduced duration early on to make the fund less sensitive to rising rates.
Market outlook
Inflation continues to cloud the outlook for bonds, with some Fed governors suggesting they’re open to more hawkish measures if consumer prices keep climbing. Several factors are contributing to inflationary pressure: consumer demand, powered by high savings and low debt levels; snarled supply chains, which have yet to fully recover from the COVID-19 pandemic; and potentially slower growth in China, which could limit manufacturing output and complicate supply chain issues.
Nevertheless, the consensus view among Capital Group economists is that heightened inflation is likely to persist into 2022. Though inflation has been more pronounced and longer lasting than the market expected earlier this year, a return to more normal environments and previous spending patterns are expected to gradually relieve pressure on global factories and supply chains.
Furthermore, as they have in recent years, yields are expected to remain low by historical standards. As the September decline in markets indicates, high-quality fixed income can help preserve capital and provide income, helping to balance portfolios in a variety of market conditions.
Thank you for your trust and continued investment.
Sincerely,

John S. Armour
President

Mark Marinella
Senior Vice President

John R. Queen
Senior Vice President
December 15, 2021
| * | Index definitions can be found on page 3. |
The return of principal for bond funds and for funds with significant underlying bond holdings is not guaranteed. Fund shares are subject to the same interest rate, inflation and credit risks associated with the underlying bond holdings. Income from municipal bonds may be subject to state or local income taxes. Certain other income, as well as capital gain distributions, may be taxable. Refer to the funds’ prospectuses and the Risk Factors section of this report for more information on these and other risks associated with investing in the funds.
Shown in the table below are the 30-day SEC yields and 12-month distribution rates as of November 30, 2021, for Capital Group Core Municipal Fund, Capital Group Short-Term Municipal Fund, Capital Group California Core Municipal Fund, Capital Group California Short-Term Municipal Fund and Capital Group Core Bond Fund. The funds’ returns for the 12 months ended October 31, 2021, can be found on page 2.
For additional information about the funds, their investment results, holdings and portfolio managers, visit capitalgrouppcsfunds.com. You can also read our insights about the markets, industries and more at capitalgroup.com/pcs.
Funds’ 30-day yields and 12-month distribution rates
Below is a summary of each fund’s 30-day yield and 12-month distribution rate as of November 30, 2021. Each fund’s 30-day yield is calculated in accordance with the U.S. Securities and Exchange Commission (SEC) formula. The SEC yield reflects the rate at which each fund is earning income on its current portfolio of securities while the distribution rate reflects the funds’ past dividends paid to shareholders. Accordingly, the funds’ SEC yields and distribution rates may differ.
| | | SEC
30-day yield | | Distribution
rate |
| | | | | |
| Capital Group Core Municipal Fund | | | 0.62 | % | | | 1.16 | % |
| Capital Group Short-Term Municipal Fund | | | 0.40 | | | | 0.84 | |
| Capital Group California Core Municipal Fund | | | 0.43 | | | | 1.02 | |
| Capital Group California Short-Term Municipal Fund | | | 0.22 | | | | 0.73 | |
| Capital Group Core Bond Fund | | | 0.81 | | | | 1.36 | |
| 2 | Private Client Services Funds |
Results at a glance
For periods ended October 31, 2021, with all distributions reinvested
| | | Cumulative
total returns | | Average annual total returns |
| | | 1 year | | 5 years | | 10 years | | Lifetime1 |
| | | | | | | | | | | | | | | | | |
| Capital Group Core Municipal Fund | | | 0.99 | % | | | 2.39 | % | | | 2.39 | % | | | 2.61 | % |
| Bloomberg Municipal Short-Intermediate 1–10 years Index2 | | | 1.09 | | | | 2.39 | | | | 2.49 | | | | 2.74 | |
| Lipper Short-Intermediate Municipal Debt Funds Average3 | | | 1.11 | | | | 1.84 | | | | 1.93 | | | | 2.11 | |
| | | | | | | | | | | | | | | | | |
| Capital Group Short-Term Municipal Fund | | | 0.43 | | | | 1.81 | | | | 1.51 | | | | 1.61 | |
| Bloomberg Municipal Short 1–5 Years Index2 | | | 0.76 | | | | 1.82 | | | | 1.63 | | | | 1.77 | |
| Lipper Short Municipal Debt Funds Average3 | | | 0.57 | | | | 1.27 | | | | 1.08 | | | | 1.16 | |
| | | | | | | | | | | | | | | | | |
| Capital Group California Core Municipal Fund | | | 0.53 | | | | 2.02 | | | | 2.46 | | | | 2.58 | |
| Bloomberg California Short-Intermediate Municipal Index2 | | | 0.52 | | | | 2.15 | | | | 2.50 | | | | 2.75 | |
| Lipper California Short-Intermediate Municipal Debt Funds Average3 | | | 1.15 | | | | 1.49 | | | | 1.78 | | | | 1.82 | |
| | | | | | | | | | | | | | | | | |
| Capital Group California Short-Term Municipal Fund | | | 0.12 | | | | 1.36 | | | | 1.29 | | | | 1.32 | |
| Bloomberg California Short Municipal Index2 | | | 0.42 | | | | 1.59 | | | | 1.54 | | | | 1.70 | |
| Lipper Short Municipal Debt Funds Average3 | | | 0.57 | | | | 1.27 | | | | 1.08 | | | | 1.16 | |
| | | | | | | | | | | | | | | | | |
| Capital Group Core Bond Fund | | | –0.60 | | | | 2.39 | | | | 2.14 | | | | 2.57 | |
| Bloomberg Intermediate A+ U.S. Government/Credit Index2 | | | –1.22 | | | | 2.26 | | | | 2.13 | | | | 2.61 | |
| Lipper Short-Intermediate Investment Grade Debt Funds Average3 | | | 0.51 | | | | 2.25 | | | | 2.15 | | | | 2.43 | |
| 1 | Since April 13, 2010. |
| 2 | The market indexes are unmanaged and, therefore, have no expenses. Investors cannot invest directly in an index. Source: Bloomberg Index Services Ltd. |
| 3 | Lipper averages reflect the current composition of all eligible mutual funds (all share classes) within a given category. Lipper source: Refinitiv Lipper. |
Bloomberg Municipal Short-Intermediate 1–10 Years Index is a market value-weighted index that includes investment-grade tax-exempt bonds with maturities of one to 10 years. Bloomberg Municipal Short 1–5 Years Index is a market value-weighted index that includes investment-grade tax-exempt bonds with maturities of one to five years. Bloomberg California Short-Intermediate Municipal Index is a market value-weighted index that includes only investment-grade tax-exempt bonds that are issued from California with maturities of one to 10 years. Bloomberg California Short Municipal Index is a market value-weighted index that includes only investment-grade tax-exempt bonds that are issued from California with maturities of one to five years. Bloomberg Intermediate A+ U.S. Government/Credit Index is a market value-weighted index that tracks the total return of fixed-rate, publicly placed, dollar-denominated obligations issued by the U.S. Treasury, U.S. government agencies and quasi-federal corporations, corporate or foreign debt guaranteed by the U.S. government, and U.S. corporate and foreign debentures and secured notes that meet specified maturity, liquidity and quality requirements, with maturities of one to 10 years, excluding BBB-rated securities.
| Private Client Services Funds | 3 |
Capital Group Core Municipal Fund
(For the period April 13, 2010, through October 31, 2021, with dividends reinvested)
How a hypothetical $10,000 investment has grown
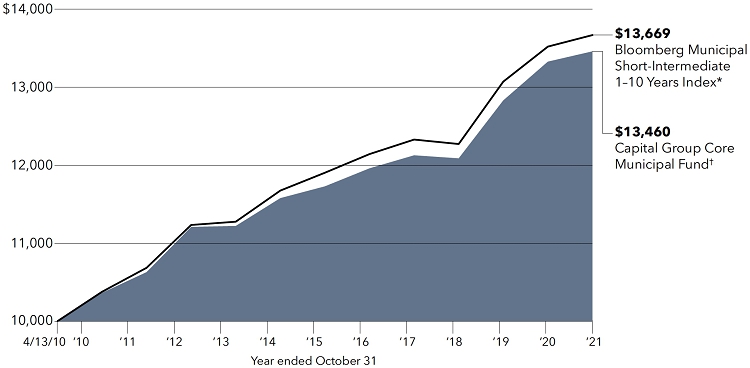
| * | Bloomberg Municipal Short-Intermediate 1–10 Years Index is a market value-weighted index that includes investment-grade tax-exempt bonds with maturities of one to 10 years. This index is unmanaged, and its results include reinvested distributions but do not reflect the effect of sales charges, commissions, account fees, expenses or U.S. federal income taxes. Investors cannot invest directly in an index. Source: Bloomberg Index Services Ltd. |
| † | Includes capital gain distributions. |
Results are for past periods and are not predictive of results for future periods. Current and future results may be lower or higher than those shown. The results shown are before taxes on fund distributions and sale of fund shares.
Average annual total returns based on a hypothetical $1,000 investment
For periods ended October 31, 2021
| | | 1 year | | 5 years | | 10 years |
| | | | | | | |
| Capital Group Core Municipal Fund | | 0.99% | | 2.39% | | 2.39% |
| 4 | Private Client Services Funds |
Capital Group Short-Term Municipal Fund
(For the period April 13, 2010, through October 31, 2021, with dividends reinvested)
How a hypothetical $10,000 investment has grown
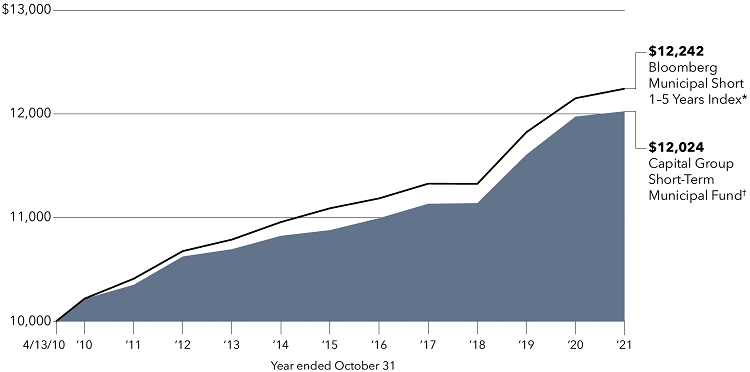
| * | Bloomberg Municipal Short 1–5 Years Index is a market value-weighted index that includes investment-grade tax-exempt bonds with maturities of one to five years. This index is unmanaged, and its results include reinvested distributions but do not reflect the effect of sales charges, commissions, account fees, expenses or U.S. federal income taxes. Investors cannot invest directly in an index. Source: Bloomberg Index Services Ltd. |
| † | Includes capital gain distributions. |
Results are for past periods and are not predictive of results for future periods. Current and future results may be lower or higher than those shown. The results shown are before taxes on fund distributions and sale of fund shares.
Investment results assume all distributions are reinvested and reflect applicable fees and expenses. When applicable, results reflect fee waivers and/or expense reimbursements, without which they would have been lower. Refer to the fund’s most recent prospectus for details.
Average annual total returns based on a hypothetical $1,000 investment
For periods ended October 31, 2021
| | | 1 year | | 5 years | | 10 years |
| | | | | | | |
| Capital Group Short-Term Municipal Fund | | 0.43% | | 1.81% | | 1.51% |
| Private Client Services Funds | 5 |
Capital Group California Core Municipal Fund
(For the period April 13, 2010, through October 31, 2021, with dividends reinvested)
How a hypothetical $10,000 investment has grown
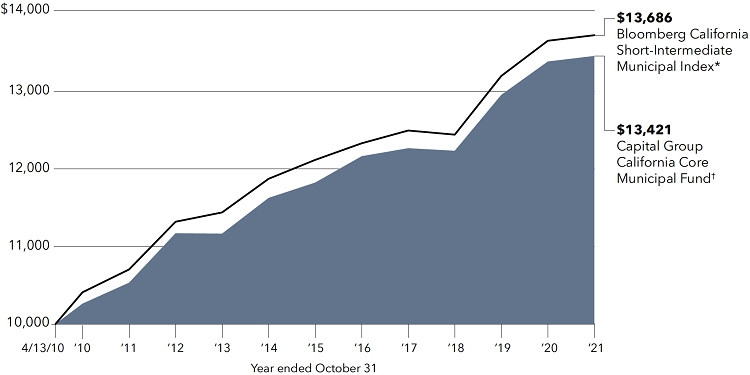
| * | Bloomberg California Short-Intermediate Municipal Index is a market value-weighted index that includes only investment-grade tax-exempt bonds that are issued from California with maturities of one to 10 years. This index is unmanaged, and its results include reinvested distributions but do not reflect the effect of commissions, account fees, expenses or U.S. federal income taxes. Investors cannot invest directly in an index. Source: Bloomberg Index Services Ltd. |
| † | Includes capital gain distributions. |
Results are for past periods and are not predictive of results for future periods. Current and future results may be lower or higher than those shown. The results shown are before taxes on fund distributions and sale of fund shares.
Average annual total returns based on a hypothetical $1,000 investment
For periods ended October 31, 2021
| | | 1 year | | 5 years | | 10 years |
| | | | | | | |
| Capital Group California Core Municipal Fund | | 0.53% | | 2.02% | | 2.46% |
| 6 | Private Client Services Funds |
Capital Group California Short-Term Municipal Fund
(For the period April 13, 2010, through October 31, 2021, with dividends reinvested)
How a hypothetical $10,000 investment has grown
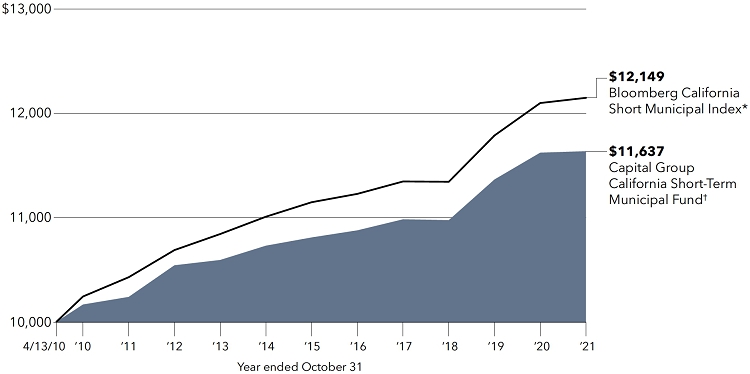
| * | Bloomberg California Short Municipal Index is a market value-weighted index that includes only investment-grade tax-exempt bonds that are issued from California with maturities of one to five years. This index is unmanaged, and its results include reinvested distributions but do not reflect the effect of commissions, account fees, expenses or U.S. federal income taxes. Investors cannot invest directly in an index. Source: Bloomberg Index Services Ltd. |
| † | Includes capital gain distributions. |
Results are for past periods and are not predictive of results for future periods. Current and future results may be lower or higher than those shown. The results shown are before taxes on fund distributions and sale of fund shares.
Average annual total returns based on a hypothetical $1,000 investment
For periods ended October 31, 2021
| | | 1 year | | 5 years | | 10 years |
| | | | | | | |
| Capital Group California Short-Term Municipal Fund | | 0.12% | | 1.36% | | 1.29% |
| Private Client Services Funds | 7 |
Capital Group Core Bond Fund
(For the period April 13, 2010, through October 31, 2021, with dividends reinvested)
How a hypothetical $10,000 investment has grown
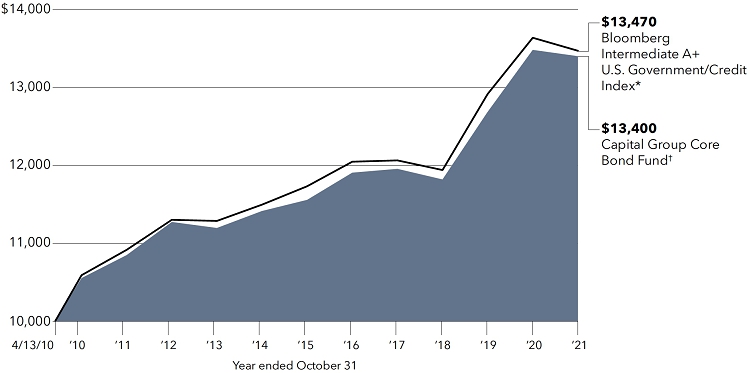
| * | The Bloomberg Intermediate A+ U.S. Government/Credit Index is a market value-weighted index that tracks the total return of fixed-rate, publicly placed, dollar-denominated obligations issued by the U.S. Treasury, U.S. government agencies and quasi-federal corporations, corporate or foreign debt guaranteed by the U.S. government, and U.S. corporate and foreign debentures and secured notes that meet specified maturity, liquidity and quality requirements, with maturities of one to 10 years, excluding BBB-rated securities. This index is unmanaged, and its results include reinvested distributions but do not reflect the effect of account fees, expenses or U.S. federal income taxes. Investors cannot invest directly in an index. Source: Bloomberg Index Services Ltd. |
| † | Includes capital gain distributions. |
Results are for past periods and are not predictive of results for future periods. Current and future results may be lower or higher than those shown. The results shown are before taxes on fund distributions and sale of fund shares.
Average annual total returns based on a hypothetical $1,000 investment
For periods ended October 31, 2021
| | | 1 year | | 5 years | | 10 years |
| | | | | | | |
| Capital Group Core Bond Fund | | –0.60% | | 2.39% | | 2.14% |
| 8 | Private Client Services Funds |
Capital Group Core Municipal Fund
Investment portfolio October 31, 2021
| Portfolio quality summary* | Percent of net assets |
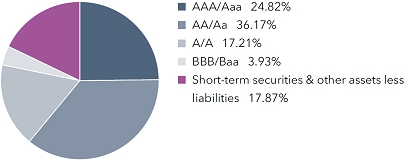
| * | Bond ratings, which typically range from AAA/Aaa (highest) to D (lowest), are assigned by credit rating agencies such as Standard & Poor’s, Moody’s and/or Fitch as an indication of an issuer’s creditworthiness. In assigning a credit rating to a security, the fund looks specifically to the ratings assigned to the issuer of the security by Standard & Poor’s, Moody’s and/or Fitch. If agency ratings differ, the security will be considered to have received the highest of those ratings, consistent with the fund’s investment policies. The ratings are not covered by the Report of Independent Registered Public Accounting Firm. |
| Bonds, notes & other debt instruments 82.13% | | Principal amount
(000) | | | Value
(000) | |
| Alabama 1.19% | | | | | | | | |
| Black Belt Energy Gas Dist., Gas Supply Prepay Rev. Bonds (Project No. 5), Series 2020-A-1, 4.00% 2049 (put 2026) | | $ | 825 | | | $ | 940 | |
| Black Belt Energy Gas Dist., Gas Supply Rev. Bonds, Series 2017-A, 4.00% 2047 (put 2022) | | | 2,050 | | | | 2,092 | |
| Black Belt Energy Gas Dist., Gas Supply Rev. Bonds, Series 2021-A, 4.00% 2051 (put 2023) | | | 1,000 | | | | 1,217 | |
| Federal Aid Highway Fin. Auth., Federal Highway Grant Anticipation Bonds, Series 2012, 5.00% 2023 (preref. 2022) | | | 100 | | | | 104 | |
| City of Huntsville, Electric Rev. Bonds, Series 2017-A, 5.00% 2022 | | | 450 | | | | 473 | |
| City of Huntsville, Electric Rev. Bonds, Series 2017-B, 5.00% 2022 | | | 400 | | | | 421 | |
| Southeast Energy Auth., Commodity Supply Rev. Bonds (Project No. 1), Series 2021-A, 4.00% 2051 (put 2028) | | | 1,440 | | | | 1,682 | |
| Southeast Energy Auth., Commodity Supply Rev. Bonds (Project No. 2), Series 2021-B-1, 4.00% 2051 (put 2031) | | | 1,985 | | | | 2,377 | |
| | | | | | | | 9,306 | |
| | | | | | | | | |
| Alaska 0.31% | | | | | | | | |
| Housing Fin. Corp., Collateralized Bonds (Veterans Mortgage Program), Series 2019, 4.00% 2048 | | | 865 | | | | 942 | |
| Housing Fin. Corp., General Mortgage Rev. Bonds, Series 2020-A, 3.25% 2044 | | | 910 | | | | 986 | |
| Housing Fin. Corp., General Mortgage Rev. Bonds, Series 2016-A, 3.50% 2046 | | | 150 | | | | 158 | |
| Housing Fin. Corp., State Capital Project Bonds, Series 2014-A, 5.00% 2032 (preref. 2023) | | | 230 | | | | 253 | |
| Housing Fin. Corp., State Capital Project Bonds, Series 2014-A, 5.00% 2033 (preref. 2023) | | | 110 | | | | 121 | |
| | | | | | | | 2,460 | |
| | | | | | | | | |
| Arizona 1.11% | | | | | | | | |
| Agricultural Improvement and Power Dist., Electric System Rev. Bonds (Salt River Project), Series 2021-A, 5.00% 2028 | | | 295 | | | | 368 | |
| Agricultural Improvement and Power Dist., Electric System Rev. Bonds (Salt River Project), Series 2021-A, 5.00% 2029 | | | 370 | | | | 472 | |
| Board of Regents of the Arizona State University System, Rev. Bonds, Series 2020-A, 5.00% 2027 | | | 400 | | | | 492 | |
| Board of Regents of the Arizona State University System, Rev. Bonds, Series 2020-A, 5.00% 2028 | | | 550 | | | | 692 | |
| Board of Regents of the Arizona State University System, Rev. Bonds, Series 2020-A, 5.00% 2033 | | | 80 | | | | 104 | |
| Bullhead City, Excise Taxes Rev. Obligations, Series 2021-2, 1.15% 2027 | | | 375 | | | | 368 | |
| County of Coconino, Pollution Control Corp., Pollution Control Rev. Ref. Bonds, Series 2017-B, 1.65% 2039 (put 2023) | | | 1,500 | | | | 1,526 | |
| City of Glendale, Industrial Dev. Auth., Rev. Ref. Bonds (Midwestern University), Series 2020, 5.00% 2029 | | | 1,000 | | | | 1,266 | |
| Industrial Dev. Auth., Education Rev. Bonds (Greathearts Arizona Projects), Series 2021-A, 5.00% 2029 | | | 115 | | | | 144 | |
| Industrial Dev. Auth., Hospital Rev. Bonds (Phoenix Children’s Hospital), Series 2021-A, 5.00% 2030 | | | 255 | | | | 326 | |
| Industrial Dev. Auth., Hospital Rev. Bonds (Phoenix Children’s Hospital), Series 2021-A, 5.00% 2031 | | | 75 | | | | 98 | |
| Industrial Dev. Auth., Rev. Bonds (Lincoln South Beltway Project), Series 2020, 5.00% 2023 | | | 1,000 | | | | 1,090 | |
| Kyrene Elementary School Dist. No. 28, School Improvement Bonds (2010 Project), Series 2013-B, 4.50% 2024 (preref. 2023)1 | | | 55 | | | | 59 | |
| Private Client Services Funds | 9 |
Capital Group Core Municipal Fund
| Bonds, notes & other debt instruments (continued) | | Principal amount
(000) | | | Value
(000) | |
| Arizona (continued) | | | | | | | | |
| Kyrene Elementary School Dist. No. 28, School Improvement Bonds (2010 Project), Series 2013-B, 4.50% 2025 (preref. 2023)1 | | $ | 45 | | | $ | 48 | |
| County of Maricopa, Industrial Dev. Auth., Education Rev. Bonds (GreatHearts Arizona Projects), Series 2017-A, 5.00% 2027 | | | 745 | | | | 898 | |
| City of Phoenix, Civic Improvement Corp., Water System Rev. Ref. Bonds, Series 2014-B, 5.00% 2024 | | | 115 | | | | 129 | |
| County of Pima, Industrial Dev. Auth., Rev. Bonds (Tucson Medical Center), Series 2021-A, 5.00% 2031 | | | 485 | | | | 636 | |
| | | | | | | | 8,716 | |
| | | | | | | | | |
| Arkansas 0.08% | | | | | | | | |
| Dev. Fin. Auth., Health Care Rev. Bonds (Baptist Memorial Health Care), Series 2015-B-3, (SIFMA Municipal Swap Index + 1.55%) 1.60% 2044 (put 2022)2 | | | 600 | | | | 600 | |
| | | | | | | | | |
| California 4.01% | | | | | | | | |
| Bay Area Toll Auth., San Francisco Bay Area Toll Bridge Rev. Bonds, Series 2006-C-1, (SIFMA Municipal Swap Index + 0.90%) 0.95% 2045 (put 2023)2 | | | 2,205 | | | | 2,221 | |
| Bay Area Toll Auth., San Francisco Bay Area Toll Bridge Rev. Bonds, Series 2021-C, (SIFMA Municipal Swap Index + 0.45%) 0.50% 2056 (put 2026)2 | | | 425 | | | | 430 | |
| Trustees of the California State University, Systemwide Rev. Bonds, Series 2016-B-2, 0.55% 2049 (put 2026) | | | 195 | | | | 192 | |
| Carlsbad Unified School Dist., G.O. Bonds, 2018 Election, Series 2021-B, 2.00% 2023 | | | 75 | | | | 77 | |
| Carlsbad Unified School Dist., G.O. Bonds, 2018 Election, Series 2021-B, 2.00% 2024 | | | 85 | | | | 89 | |
| Community Choice Fncg. Auth., Clean Energy Project Rev. Green Bonds, Series 2021-B-1, 4.00% 2052 (put 2031) | | | 2,415 | | | | 2,903 | |
| Eastern Municipal Water Dist., Water and Wastewater Rev. Ref. Bonds, Series 2021-A, 3.00% 2024 | | | 165 | | | | 177 | |
| Educational Facs. Auth., Rev. Bonds (University of Southern California), Series 2009-C, 5.25% 2024 (escrowed to maturity) | | | 35 | | | | 40 | |
| Fresno Unified School Dist., G.O. Bonds, 2016 Election, Series 2021-D, 2.00% 2023 | | | 105 | | | | 108 | |
| Fresno Unified School Dist., G.O. Bonds, 2016 Election, Series 2021-D, 2.00% 2024 | | | 50 | | | | 52 | |
| G.O. Bonds, Series 2020, 5.00% 2029 | | | 180 | | | | 233 | |
| G.O. Bonds, Series 2021, 5.00% 2031 | | | 30 | | | | 36 | |
| G.O. Bonds, Series 2021, 5.00% 2032 | | | 25 | | | | 30 | |
| G.O. Bonds, Series 2021, 5.00% 2034 | | | 25 | | | | 30 | |
| G.O. Rev. Ref. Bonds, Series 2021, 5.00% 2023 | | | 1,265 | | | | 1,374 | |
| G.O. Rev. Ref. Bonds, Series 2021, 5.00% 2028 | | | 1,000 | | | | 1,268 | |
| G.O. Rev. Ref. Bonds, Series 2021, 5.00% 2030 | | | 55 | | | | 73 | |
| Health Facs. Fncg. Auth., Rev. Bonds (Kaiser Permanente), Series 2017-B, 5.00% 2029 (put 2022) | | | 1,000 | | | | 1,048 | |
| Health Facs. Fncg. Auth., Rev. Ref. Bonds (Marshall Medical Center), Series 2015, 5.00% 2028 | | | 315 | | | | 353 | |
| Housing Fin. Agcy., Municipal Certs., Series 2021-A-1, 3.50% 2035 | | | 739 | | | | 852 | |
| Infrastructure and Econ. Dev. Bank, Rev. Bonds (The Colburn School), Series 2015-B, (SIFMA Municipal Swap Index + 1.20%) 1.25% 2037 (put 2022)2 | | | 1,000 | | | | 1,001 | |
| Infrastructure and Econ. Dev. Bank, Rev. Ref. Bonds (Museum of Art Project), Series 2021-B, 0.75% 2050 (put 2026)2 | | | 340 | | | | 345 | |
| Irvine Unified School Dist., Community Facs. Dist. No. 09-1, Special Tax Bonds, Series 2017-A, BAM insured, 5.00% 2025 | | | 250 | | | | 290 | |
| City of Jurupa, Public Fncg. Auth., Special Tax Rev. Ref. Bonds, Series 2020-A, BAM insured, 5.00% 2024 | | | 85 | | | | 96 | |
| City of Jurupa, Public Fncg. Auth., Special Tax Rev. Ref. Bonds, Series 2020-A, BAM insured, 4.00% 2026 | | | 60 | | | | 69 | |
| City of Los Angeles, Dept. of Water and Power, Power System Rev. Bonds, Series 2018-B, 4.00% 2022 | | | 75 | | | | 75 | |
| County of Los Angeles, Dev. Auth., Multi Family Housing Rev. Bonds (Cantamar Villas), Series 2021-D-1, 0.30% 2025 (put 2024) | | | 55 | | | | 55 | |
| County of Los Angeles, Dev. Auth., Multi Family Housing Rev. Bonds (Sunny Garden Apartments), Series 2021-C-1, 0.20% 2024 (put 2023) | | | 75 | | | | 75 | |
| County of Los Angeles, Metropolitan Transportation Auth., Measure R Sales Tax Rev. Bonds, Series 2016-A, 5.00% 2023 | | | 50 | | | | 54 | |
| County of Los Angeles, Metropolitan Transportation Auth., Measure R Sales Tax Rev. Bonds, Series 2021-A, 5.00% 2032 | | | 955 | | | | 1,287 | |
| County of Los Angeles, Metropolitan Transportation Auth., Measure R Sales Tax Rev. Ref. Green Bonds, Series 2020-A, 5.00% 2024 | | | 860 | | | | 965 | |
| Los Angeles Unified School Dist., G.O. Dedicated Unlimited Ad Valorem Property Tax Bonds, Series 2020-C, 5.00% 2029 | | | 150 | | | | 193 | |
| Los Angeles Unified School Dist., G.O. Dedicated Unlimited Ad Valorem Property Tax Bonds, Series 2020-RYQ, 5.00% 2033 | | | 570 | | | | 744 | |
| Metropolitan Water Dist. of Southern California, Water Rev. Ref. Bonds, Series 2020-A, 5.00% 2023 | | | 1,500 | | | | 1,620 | |
| Murrieta Valley Unified School Dist., Public Fncg. Auth., Special Tax Rev. Bonds, Series 2016-A, 5.00% 2022 | | | 1,250 | | | | 1,295 | |
| 10 | Private Client Services Funds |
Capital Group Core Municipal Fund
| Bonds, notes & other debt instruments (continued) | | Principal amount
(000) | | | Value
(000) | |
| California (continued) | | | | | | | | |
| Public Fin. Auth., Rev. Bonds (Henry Mayo Newhall Memorial Hospital), Series 2021-A, 4.00% 2024 | | $ | 45 | | | $ | 49 | |
| Public Fin. Auth., Rev. Bonds (Henry Mayo Newhall Memorial Hospital), Series 2021-A, 4.00% 2025 | | | 45 | | | | 50 | |
| Public Fin. Auth., Rev. Bonds (Henry Mayo Newhall Memorial Hospital), Series 2021-A, 4.00% 2026 | | | 45 | | | | 51 | |
| Public Fin. Auth., Rev. Bonds (Henry Mayo Newhall Memorial Hospital), Series 2021-A, 4.00% 2027 | | | 45 | | | | 52 | |
| Public Fin. Auth., Rev. Bonds (Henry Mayo Newhall Memorial Hospital), Series 2021-A, 4.00% 2028 | | | 40 | | | | 47 | |
| Public Works Board, Lease Rev. Ref. Bonds (Various Capital Projects), Series 2022-A, 5.00% 2028 | | | 655 | | | | 807 | |
| Public Works Board, Lease Rev. Ref. Bonds (Various Capital Projects), Series 2021-A, 5.00% 2030 | | | 1,000 | | | | 1,291 | |
| RNR School Fncg. Auth., Community Facs. Dist. No. 92-1, Special Tax Bonds, Series 2017-A, BAM insured, 5.00% 2028 | | | 1,000 | | | | 1,192 | |
| City of San Diego, Community Facs. Dist. No. 2 (Santaluz), Improvement Area No. 1, Special Tax Rev. Ref. Bonds, Series 2021, 4.00% 2029 | | | 70 | | | | 85 | |
| County of San Diego, Regional Airport Auth., Airport Rev. Ref. Bonds, Series 2020-B, 5.00% 2022 | | | 1,000 | | | | 1,032 | |
| County of San Diego, Regional Transportation Commission, Limited Sales Tax Rev. Short-Term Notes, Series 2021-A, 5.00% 2022 | | | 1,235 | | | | 1,289 | |
| County of San Diego, Water Auth., Water Rev. Ref. Green Bonds, Series 2021-B, 5.00% 2030 | | | 230 | | | | 304 | |
| City and County of San Francisco, G.O. Rev. Ref. Bonds, Series 2020-R-2, 5.00% 2023 | | | 480 | | | | 517 | |
| City and County of San Francisco, G.O. Rev. Ref. Bonds, Series 2020-R-2, 5.00% 2028 | | | 1,000 | | | | 1,271 | |
| City of Santee, Community Facs. Dist. No. 2017-1, Special Tax Bonds (Weston Infrastructure), Series 2019, 5.00% 2022 | | | 135 | | | | 140 | |
| City of Santee, Community Facs. Dist. No. 2017-1, Special Tax Bonds (Weston Infrastructure), Series 2019, 5.00% 2023 | | | 160 | | | | 173 | |
| City of Santee, Community Facs. Dist. No. 2017-1, Special Tax Bonds (Weston Infrastructure), Series 2019, 5.00% 2024 | | | 170 | | | | 190 | |
| Southern California Public Power Auth., Rev. Ref. Green Bonds (Milford Wind Corridor Phase II Project), Series 2021-1, 5.00% 2023 | | | 65 | | | | 70 | |
| Southern California Public Power Auth., Rev. Ref. Green Bonds (Milford Wind Corridor Phase II Project), Series 2021-1, 5.00% 2024 | | | 20 | | | | 22 | |
| Southern California Public Power Auth., Transmission Project Rev. Bonds (Southern Transmission Project), Series 2017-A, 5.00% 2023 | | | 490 | | | | 528 | |
| Statewide Communities Dev. Auth., Multi Family Housing Rev. Bonds (Villa Del Sol Apartments), Series 2021-A-2, 0.39% 2023 (put 2023) | | | 280 | | | | 280 | |
| Statewide Communities Dev. Auth., Multi Family Housing Rev. Bonds (Washington Court Apartments), Series 2021-E, 0.22% 2023 (put 2022) | | | 125 | | | | 125 | |
| Statewide Communities Dev. Auth., Pollution Control Rev. Ref. Bonds (Southern California Edison Co.), Series 2006-D, 2.625% 2033 (put 2023) | | | 135 | | | | 141 | |
| Statewide Communities Dev. Auth., Rev. Bonds (American Baptist Homes of the West), Series 2013-A, 5.00% 2023 (preref. 2022) | | | 80 | | | | 85 | |
| Statewide Communities Dev. Auth., Rev. Bonds (Viamonte Senior Living 1 Project), Series 2018-B, 3.00% 2025 | | | 65 | | | | 65 | |
| Statewide Communities Dev. Auth., Rev. Bonds (Viamonte Senior Living 1 Project), Series 2018-B, 3.00% 2026 | | | 500 | | | | 501 | |
| Tobacco Securitization Auth. of Northern California, Tobacco Settlement Asset-Backed Rev. Ref. Senior Bonds (Sacramento County Tobacco Securitization Corp.), Series 2021-B-1, 0.45% 2030 | | | 20 | | | | 20 | |
| Tobacco Securitization Auth. of Southern California, Tobacco Settlement Asset-Backed Rev. Ref. Bonds (San Diego County Tobacco Asset Securitization Corp.), Series 2019-A, 5.00% 2030 | | | 180 | | | | 229 | |
| Regents of the University of California, Limited Project Rev. Bonds, Series 2022-S, 5.00% 2026 | | | 165 | | | | 193 | |
| Dept. of Veterans Affairs, Veterans G.O. Bonds, Series 2019-CS, 4.00% 2049 | | | 850 | | | | 924 | |
| | | | | | | | 31,473 | |
| | | | | | | | | |
| Colorado 1.87% | | | | | | | | |
| City of Arvada, Mountain Shadows Metropolitan Dist., Limited Tax G.O. Rev. Ref. and Improvement Bonds, Series 2016, 4.00% 2026 | | | 735 | | | | 771 | |
| Certs. of Part., Series 2021-A, 5.00% 2028 | | | 495 | | | | 628 | |
| Certs. of Part., Series 2021-A, 5.00% 2029 | | | 1,000 | | | | 1,292 | |
| City of Colorado Springs, Utilities System Rev. Ref. Bonds, Series 2020-B, 5.00% 2021 | | | 75 | | | | 75 | |
| City and County of Denver, Board of Water Commissioners, Water Rev. Bonds, Series 2021-A, 5.00% 2031 | | | 1,910 | | | | 2,596 | |
| City and County of Denver, Dept. of Aviation, Airport System Rev. Bonds, Series 2019-D, 5.00% 2031 (put 2022) | | | 1,000 | | | | 1,048 | |
| E-470 Public Highway Auth., Rev. Bonds, Series 2021-B, (USD-SOFR x 0.67 + 0.35%) 0.383% 2039 (put 2024)2 | | | 285 | | | | 286 | |
| Educational and Cultural Facs. Auth., Rev. Ref. Bonds (Johnson & Wales University Project), Series 2013-B, 5.00% 2023 (escrowed to maturity) | | | 1,805 | | | | 1,922 | |
| Health Facs. Auth., Health Facs. Rev. and Rev. Ref. Bonds (Evangelical Lutheran Good Samaritan Society Project), Series 2015-A, 5.00% 2024 (escrowed to maturity) | | | 1,825 | | | | 2,045 | |
| Health Facs. Auth., Hospital Rev. Bonds (Adventist Health System/Sunbelt Obligated Group), Series 2018-A, 5.00% 2048 | | | 125 | | | | 150 | |
| Private Client Services Funds | 11 |
Capital Group Core Municipal Fund
| Bonds, notes & other debt instruments (continued) | | Principal amount
(000) | | | Value
(000) | |
| Colorado (continued) | | | | | | | | |
| Housing and Fin. Auth., Single Family Mortgage Bonds, Series 2018-C, Class I, 4.25% 2048 | | $ | 590 | | | $ | 647 | |
| Housing and Fin. Auth., Single Family Mortgage Bonds, Series 2020-B, Class I, 3.75% 2050 | | | 905 | | | | 985 | |
| Housing and Fin. Auth., Single Family Mortgage Bonds, Series 2021-L, Class I, 3.25% 2051 | | | 1,250 | | | | 1,367 | |
| Regional Transportation Dist., Private Activity Bonds (Denver Transit Partners Eagle P3 Project), Series 2020-A, 5.00% 2029 | | | 70 | | | | 87 | |
| Regional Transportation Dist., Private Activity Bonds (Denver Transit Partners Eagle P3 Project), Series 2020-A, 5.00% 2029 | | | 40 | | | | 50 | |
| Regional Transportation Dist., Private Activity Bonds (Denver Transit Partners Eagle P3 Project), Series 2020-A, 5.00% 2030 | | | 150 | | | | 189 | |
| Regional Transportation Dist., Private Activity Bonds (Denver Transit Partners Eagle P3 Project), Series 2020-A, 5.00% 2030 | | | 35 | | | | 45 | |
| Weld County School Dist. RE-5J, G.O. Bonds, Series 2021, 5.00% 2023 | | | 475 | | | | 522 | |
| | | | | | | | 14,705 | |
| | | | | | | | | |
| Connecticut 0.87% | | | | | | | | |
| Town of East Hartford, Housing Auth., Multi Family Housing Rev. Bonds (Veterans Terrace Project), Series 2021, 0.25% 2023 (put 2022) | | | 140 | | | | 140 | |
| Health and Educational Facs. Auth., Rev. Bonds (Hartford Healthcare Issue), Series 2021-A, 5.00% 2029 | | | 330 | | | | 422 | |
| Health and Educational Facs. Auth., Rev. Bonds (Stamford Hospital Issue), Series 2022-M, 5.00% 2030 | | | 450 | | | | 559 | |
| Health and Educational Facs. Auth., Rev. Bonds (Stamford Hospital Issue), Series 2022-M, 5.00% 2031 | | | 310 | | | | 391 | |
| Health and Educational Facs. Auth., Rev. Bonds (Yale University Issue), Series 2003-X-2, 0.25% 2037 (put 2024) | | | 910 | | | | 906 | |
| Health and Educational Facs. Auth., Rev. Bonds (Yale University Issue), Series 2014-A, 1.10% 2048 (put 2023) | | | 1,105 | | | | 1,117 | |
| Housing Fin. Auth., Housing Mortgage Fin. Program Bonds, Series 2014-C-1, 4.00% 2044 | | | 70 | | | | 72 | |
| Housing Fin. Auth., Housing Mortgage Fin. Program Bonds, Series 2016-A-1, 4.00% 2045 | | | 255 | | | | 266 | |
| Housing Fin. Auth., Housing Mortgage Fin. Program Bonds, Series 2017-A-1, 4.00% 2047 | | | 1,835 | | | | 1,963 | |
| Housing Fin. Auth., Housing Mortgage Fin. Program Bonds, Series 2017-C-1, 4.00% 2047 | | | 700 | | | | 748 | |
| Housing Fin. Auth., Housing Mortgage Fin. Program Bonds, Series 2017-D-1, 4.00% 2047 | | | 150 | | | | 160 | |
| Housing Fin. Auth., Housing Mortgage Fin. Program Rev. Ref. Bonds, Series 2015-A, 3.50% 2044 | | | 75 | | | | 77 | |
| | | | | | | | 6,821 | |
| | | | | | | | | |
| Delaware 0.47% | | | | | | | | |
| G.O. Bonds, Series 2021, 5.00% 2029 | | | 1,220 | | | | 1,562 | |
| G.O. Bonds, Series 2021, 5.00% 2031 | | | 945 | | | | 1,260 | |
| Health Facs. Auth., Rev. Bonds (Beebe Medical Center Project), Series 2018, 5.00% 2022 | | | 290 | | | | 297 | |
| Health Facs. Auth., Rev. Bonds (Beebe Medical Center Project), Series 2018, 5.00% 2023 | | | 200 | | | | 213 | |
| Health Facs. Auth., Rev. Bonds (Beebe Medical Center Project), Series 2018, 5.00% 2024 | | | 300 | | | | 333 | |
| | | | | | | | 3,665 | |
| | | | | | | | | |
| District of Columbia 0.55% | | | | | | | | |
| G.O. Bonds, Series 2015-A, 5.00% 2032 | | | 1,800 | | | | 2,075 | |
| Income Tax Secured Rev. Bonds, Series 2011-A, 5.00% 2029 | | | 235 | | | | 236 | |
| Income Tax Secured Rev. Bonds, Series 2020-A, 5.00% 2032 | | | 750 | | | | 970 | |
| Income Tax Secured Rev. Bonds, Series 2020-C, 5.00% 2033 | | | 215 | | | | 278 | |
| Washington Convention and Sports Auth., Dedicated Tax Rev. Ref. Bonds, Series 2018-A, 5.00% 2027 | | | 600 | | | | 736 | |
| | | | | | | | 4,295 | |
| | | | | | | | | |
| Florida 5.52% | | | | | | | | |
| County of Alachua, Health Facs. Auth., Continuing Care Retirement Community Rev. Bonds (Oak Hammock at the University of Florida, Inc. Project), Series 2021, 4.00% 2022 | | | 20 | | | | 20 | |
| County of Brevard, Health Facs. Auth., Rev. Ref. Bonds (Health First, Inc. Project), Series 2014, 5.00% 2022 | | | 500 | | | | 510 | |
| County of Brevard, Health Facs. Auth., Rev. Ref. Bonds (Health First, Inc. Project), Series 2014, 5.00% 2033 | | | 130 | | | | 143 | |
| County of Brevard, Housing Fncg. Auth., Multi Family Mortgage Rev. Bonds (Tropical Manor Apartments), Series 2021, 0.25% 2023 (put 2022) | | | 135 | | | | 135 | |
| Capital Trust Agcy., Multi Family Housing Rev. Bonds (GMF - Stonybrook Apartments), Series 2012-A, 5.50% 2047 (preref. 2022) | | | 540 | | | | 552 | |
| Central Florida Expressway Auth., Rev. Bonds, Series 2019-B, 5.00% 2030 | | | 1,000 | | | | 1,278 | |
| Citizens Property Insurance Corp., Personal Lines Account/Commercial Lines Account Secured Bonds, Series 2012-A-1, 5.00% 2022 | | | 170 | | | | 175 | |
| County of Collier, Water-Sewer Dist., Water and Sewer Rev. Bonds, Series 2021, 5.00% 2030 | | | 655 | | | | 861 | |
| 12 | Private Client Services Funds |
Capital Group Core Municipal Fund
| Bonds, notes & other debt instruments (continued) | | Principal amount
(000) | | | Value
(000) | |
| Florida (continued) | | | | | | | | |
| County of Collier, Water-Sewer Dist., Water and Sewer Rev. Bonds, Series 2021, 5.00% 2031 | | $ | 1,070 | | | $ | 1,433 | |
| Connerton West Community Dev. Dist., Improvement Rev. Ref. Bonds, Series 2018-A-1, Assured Guaranty Municipal insured, 3.00% 2026 | | | 345 | | | | 373 | |
| Connerton West Community Dev. Dist., Improvement Rev. Ref. Bonds, Series 2018-A-1, Assured Guaranty Municipal insured, 3.20% 2027 | | | 355 | | | | 391 | |
| Connerton West Community Dev. Dist., Improvement Rev. Ref. Bonds, Series 2018-A-1, Assured Guaranty Municipal insured, 3.25% 2028 | | | 370 | | | | 412 | |
| Board of Education, Public Education Capital Outlay Rev. Ref. Bonds, Series 2019-D, 5.00% 2023 | | | 120 | | | | 129 | |
| Board of Education, Public Education Capital Outlay Rev. Ref. Bonds, Series 2021-B, 5.00% 2022 | | | 1,000 | | | | 1,028 | |
| Greater Orlando Aviation Auth., Airport Facs. Rev. Bonds, Series 2016-B, 5.00% 2028 | | | 750 | | | | 897 | |
| Higher Educational Facs. Fncg. Auth., Educational Facs. Rev. Ref. Bonds (Nova Southeastern University Project), Series 2012-A, 5.00% 2022 (escrowed to maturity) | | | 1,000 | | | | 1,020 | |
| Higher Educational Facs. Fncg. Auth., Educational Facs. Rev. Ref. Bonds (Nova Southeastern University Project), Series 2016, 5.00% 2026 | | | 655 | | | | 771 | |
| Housing Fin. Corp., Homeowner Mortgage Rev. Bonds, Series 2017-1, 4.00% 2048 | | | 1,110 | | | | 1,182 | |
| Housing Fin. Corp., Homeowner Mortgage Rev. Bonds, Series 2018-1, 4.00% 2049 | | | 1,105 | | | | 1,188 | |
| Housing Fin. Corp., Homeowner Mortgage Rev. Bonds, Series 2018-2, 4.25% 2050 | | | 1,090 | | | | 1,187 | |
| Housing Fin. Corp., Homeowner Mortgage Rev. Bonds, Series 2020-1, 3.50% 2051 | | | 155 | | | | 169 | |
| Housing Fin. Corp., Homeowner Mortgage Rev. Bonds, Series 2021-2, 3.00% 2052 | | | 735 | | | | 795 | |
| Housing Fin. Corp., Homeowner Mortgage Rev. Bonds (Special Program), Series 2015-A, 3.50% 2046 | | | 45 | | | | 46 | |
| Housing Fin. Corp., Multi Family Mortgage Rev. Bonds (Valencia Park Apartments), Series 2021-A, FHA insured, 0.25% 2023 (put 2022) | | | 630 | | | | 629 | |
| JEA, Electric System Rev. Bonds, Series 2014-A-3, 5.00% 2022 | | | 600 | | | | 626 | |
| JEA, Electric System Rev. Bonds, Series 2017-B, 5.00% 2026 | | | 500 | | | | 600 | |
| JEA, Electric System Rev. Bonds, Series 2017-B-3, 5.00% 2026 | | | 340 | | | | 408 | |
| JEA, Electric System Rev. Bonds, Series 2020-A-3, 5.00% 2030 | | | 50 | | | | 64 | |
| JEA, Electric System Rev. Bonds, Series 2021-A, 5.00% 2031 | | | 2,095 | | | | 2,769 | |
| JEA, Electric System Rev. Bonds, Series 2021-A-3, 5.00% 2033 | | | 625 | | | | 826 | |
| JEA, Water and Sewer System Rev. Bonds, Series 2020-A, 5.00% 2033 | | | 50 | | | | 64 | |
| County of Manatee, University Park Recreation Dist., Non-Ad Valorem Assessment Bonds, Series 2019, BAM insured, 2.50% 2024 | | | 280 | | | | 291 | |
| County of Manatee, University Park Recreation Dist., Non-Ad Valorem Assessment Bonds, Series 2019, BAM insured, 2.50% 2025 | | | 285 | | | | 299 | |
| County of Manatee, University Park Recreation Dist., Non-Ad Valorem Assessment Bonds, Series 2019, BAM insured, 2.50% 2026 | | | 295 | | | | 312 | |
| County of Manatee, University Park Recreation Dist., Non-Ad Valorem Assessment Bonds, Series 2019, BAM insured, 2.50% 2027 | | | 300 | | | | 319 | |
| County of Manatee, University Park Recreation Dist., Non-Ad Valorem Assessment Bonds, Series 2019, BAM insured, 2.50% 2028 | | | 305 | | | | 325 | |
| County of Manatee, University Park Recreation Dist., Non-Ad Valorem Assessment Bonds, Series 2019, BAM insured, 2.625% 2029 | | | 315 | | | | 338 | |
| County of Miami-Dade, Aviation Rev. Ref. Bonds, Series 2020-A, 5.00% 2025 | | | 1,150 | | | | 1,342 | |
| County of Miami-Dade, Expressway Auth., Toll System Rev. Bonds, Series 2014-A, BAM insured, 5.00% 2026 | | | 780 | | | | 873 | |
| County of Miami-Dade, Expressway Auth., Toll System Rev. Ref. Bonds, Series 2014-B, BAM insured, 5.00% 2026 | | | 760 | | | | 851 | |
| County of Miami-Dade, Housing Fin. Auth., Multi Family Housing Rev. Bonds (Platform 3750), Series 2021, 0.25% 2024 (put 2021) | | | 510 | | | | 510 | |
| County of Miami-Dade, Housing Fin. Auth., Multi Family Housing Rev. Bonds (Sunset Bay Apartments), Series 2021, 0.25% 2023 (put 2022) | | | 420 | | | | 420 | |
| County of Miami-Dade, Industrial Dev. Auth., Solid Waste Disposal Rev. Bonds (Waste Management, Inc. of Florida Project), Series 2007, 0.45% 2027 (put 2021) | | | 4,090 | | | | 4,090 | |
| County of Miami-Dade, Transit System Sales Surtax Rev. Bonds, Series 2012, 5.00% 2025 (preref. 2022) | | | 25 | | | | 26 | |
| City of Miami Beach, Health Facs. Auth., Hospital Rev. and Rev. Ref. Bonds (Mount Sinai Medical Center of Florida), Series 2014, 5.00% 2027 | | | 145 | | | | 163 | |
| Municipal Power Agcy., All-Requirements Power Supply Project Rev. Ref. Bonds, Series 2016-A, 5.00% 2026 | | | 1,000 | | | | 1,200 | |
| County of Orange, Health Facs. Auth., Health Care Facs. Rev. Ref. Bonds (Presbyterian Retirement Communities Project), Series 2016, 5.00% 2031 | | | 300 | | | | 328 | |
| County of Orange, Housing Fin. Auth., Multi Family Housing Rev. Bonds (Dunwoodie Place Apartments), Series 2021-A, 0.20% 2024 (put 2023) | | | 200 | | | | 200 | |
| County of Orange, Housing Fin. Auth., Multi Family Housing Rev. Bonds (Jernigan Gardens), Series 2020-B, 0.35% 2023 (put 2022) | | | 2,000 | | | | 2,000 | |
| Orlando-Orange County Expressway Auth., Rev. Ref. Bonds, Series 2013-A, 5.00% 2032 (preref. 2023) | | | 1,020 | | | | 1,099 | |
| County of Palm Beach, Health Facs. Auth., Rev. Bonds (Lifespace Communities, Inc.), Series 2015-C, 5.00% 2027 | | | 300 | | | | 340 | |
| County of Polk, Utility System Rev. and Rev. Ref. Bonds, Series 2013, BAM insured, 5.00% 2043 (preref. 2023) | | | 185 | | | | 201 | |
| Private Client Services Funds | 13 |
Capital Group Core Municipal Fund
| Bonds, notes & other debt instruments (continued) | | Principal amount
(000) | | | Value
(000) | |
| Florida (continued) | | | | | | | | |
| City of Pompano Beach, Rev. Bonds (John Knox Village Project), Series 2015, 5.00% 2023 | | $ | 630 | | | $ | 674 | |
| Counties of St. Johns and Duval, Tolomato Community Dev. Dist., Rev. Ref. Bonds, Series 2018-A-1, Assured Guaranty Municipal insured, 2.625% 2024 | | | 1,065 | | | | 1,114 | |
| County of St. Johns, Sweetwater Creek Community Dev. Dist., Capital Improvement Rev. Ref. Bonds, Series 2019-A-1, Assured Guaranty Municipal insured, 2.00% 2022 | | | 340 | | | | 342 | |
| City of South Miami, Health Facs. Auth., Hospital Rev. Ref. Bonds (Baptist Health South Florida Obligated Group), Series 2017, 5.00% 2024 | | | 500 | | | | 562 | |
| City of Tallahassee, Energy System Rev. Ref. Bonds, Series 2020, 5.00% 2028 | | | 1,000 | | | | 1,262 | |
| City of Tampa, Hospital Rev. Bonds (H. Lee Moffitt Cancer Center Project), Series 2020-B, 5.00% 2028 | | | 215 | | | | 268 | |
| City of Tampa, Hospital Rev. Bonds (H. Lee Moffitt Cancer Center Project), Series 2020-B, 5.00% 2029 | | | 250 | | | | 318 | |
| City of Tampa, Hospital Rev. Bonds (H. Lee Moffitt Cancer Center Project), Series 2020-B, 5.00% 2030 | | | 260 | | | | 336 | |
| Dept. of Transportation, Right-of-Way Acquisition and Bridge Construction Bonds, Series 2019-B, 5.00% 2028 | | | 1,000 | | | | 1,260 | |
| Dept. of Transportation Fncg. Corp., Rev. Bonds, Series 2020, 5.00% 2024 | | | 430 | | | | 483 | |
| City of Winter Garden, Winter Garden Village at Fowler Groves Community Dev. Dist., Special Assessment Rev. Ref. Bonds, Series 2016, 3.00% 2024 | | | 530 | | | | 543 | |
| | | | | | | | 43,370 | |
| | | | | | | | | |
| Georgia 2.50% | | | | | | | | |
| County of Appling, Dev. Auth., Pollution Control Rev. Bonds (Oglethorpe Power Corp. Scherer Project), Series 2013-A, 1.50% 2038 (put 2025) | | | 885 | | | | 907 | |
| City of Atlanta, Urban Residential Fin. Auth., Multi Family Housing Rev. Bonds (Sylvan Hills Senior Apartments Project), Series 2020, 0.41% 2025 (put 2023) | | | 285 | | | | 285 | |
| County of Burke, Dev. Auth., Pollution Control Rev. Bonds (Georgia Power Co. Plant Vogtle Project), Series 2013, 2.925% 2053 (put 2024) | | | 600 | | | | 632 | |
| County of Burke, Dev. Auth., Pollution Control Rev. Bonds (Oglethorpe Power Corp. Vogtle Project), Series 2013-A, 1.50% 2040 (put 2025) | | | 685 | | | | 702 | |
| City of Columbus, Dev. Auth., Multi Family Housing Rev. Bonds (Highland Terrace Phase II Project), Series 2021-B, 0.34% 2025 (put 2024) | | | 425 | | | | 424 | |
| County of Dawson, Dev. Auth., Multi Family Housing Rev. Bonds (Peaks of Dawsonville Project), Series 2021, 0.28% 2023 | | | 250 | | | | 249 | |
| County of Dekalb, Housing Auth., Multi Family Housing Rev. Bonds (Columbia Village Project), Series 2021-A, 0.34% 2024 (put 2023) | | | 140 | | | | 140 | |
| G.O. Bonds, Series 2020-A, 5.00% 2023 | | | 160 | | | | 173 | |
| G.O. Bonds, Series 2020-A, 5.00% 2029 | | | 1,875 | | | | 2,434 | |
| Housing and Fin. Auth., Single Family Mortgage Bonds, Series 2014-A-1, 4.00% 2044 | | | 225 | | | | 232 | |
| Housing and Fin. Auth., Single Family Mortgage Bonds, Series 2015-A-1, 3.50% 2045 | | | 160 | | | | 167 | |
| Housing and Fin. Auth., Single Family Mortgage Bonds, Series 2017-A, 4.00% 2047 | | | 405 | | | | 431 | |
| Main Street Natural Gas, Inc., Gas Supply Rev. Bonds, Series 2018-D, (3-month USD-LIBOR x 0.67 + 0.83%) 0.885% 2048 (put 2023)2 | | | 155 | | | | 156 | |
| Main Street Natural Gas, Inc., Gas Supply Rev. Bonds, Series 2019-B, 4.00% 2049 (put 2024) | | | 980 | | | | 1,078 | |
| Main Street Natural Gas, Inc., Gas Supply Rev. Bonds, Series 2019-C, 4.00% 2050 (put 2026) | | | 1,500 | | | | 1,708 | |
| Main Street Natural Gas, Inc., Gas Supply Rev. Bonds, Series 2021-C, 4.00% 2052 (put 2028) | | | 3,305 | | | | 3,872 | |
| Metropolitan Atlanta Rapid Transit Auth., Sales Tax Rev. Ref. Bonds (Third Indenture Series), Series 2012-A, 5.00% 2030 (preref. 2022) | | | 630 | | | | 650 | |
| Municipal Electric Auth., General Resolution Projects Bonds, Series 2021-A, 5.00% 2031 | | | 415 | | | | 533 | |
| Municipal Electric Auth., Plant Vogtle Units 3 and 4 Project J Bonds, Series 2021-A, Assured Guaranty Municipal insured, 5.00% 2029 | | | 495 | | | | 624 | |
| Municipal Electric Auth., Plant Vogtle Units 3 and 4 Project J Bonds, Series 2021-A, Assured Guaranty Municipal insured, 5.00% 2030 | | | 430 | | | | 550 | |
| Municipal Electric Auth., Plant Vogtle Units 3 and 4 Project M Bonds, Series 2019-A, 5.00% 2029 | | | 120 | | | | 149 | |
| Municipal Electric Auth., Plant Vogtle Units 3 and 4 Project M Bonds, Series 2019-A, 5.00% 2030 | | | 115 | | | | 142 | |
| Municipal Electric Auth., Project One Bonds, Series 2019-A, 5.00% 2024 | | | 1,000 | | | | 1,098 | |
| Municipal Electric Auth., Project One Bonds, Series 2019-A, 5.00% 2029 | | | 870 | | | | 1,085 | |
| Municipal Electric Auth., Project One Bonds, Series 2021-A, 5.00% 2031 | | | 785 | | | | 1,008 | |
| Northwest Georgia Housing Auth., Multi Family Housing Rev. Bonds (Dallas Manor Apartments Project), Series 2021, 0.25% 2024 (put 2023) | | | 120 | | | | 120 | |
| Private Colleges and Universities Auth., Rev. Bonds (The Savannah College of Art and Design Projects), Series 2021, 5.00% 2030 | | | 80 | | | | 102 | |
| | | | | | | | 19,651 | |
| 14 | Private Client Services Funds |
Capital Group Core Municipal Fund
| Bonds, notes & other debt instruments (continued) | | Principal amount
(000) | | | Value
(000) | |
| Guam 0.06% | | | | | | | | |
| Waterworks Auth., Water and Wastewater System Rev. Bonds, Series 2013, 5.25% 2024 | | $ | 450 | | | $ | 482 | |
| | | | | | | | | |
| Hawaii 0.17% | | | | | | | | |
| Airports System Rev. Bonds, Series 2018-D, 5.00% 2030 | | | 1,000 | | | | 1,294 | |
| | | | | | | | | |
| Idaho 0.13% | | | | | | | | |
| Housing and Fin. Assn., Grant and Rev. Anticipation Bonds (Federal Highway Trust Fund), Series 2015-A, 5.00% 2022 | | | 1,000 | | | | 1,033 | |
| | | | | | | | | |
| Illinois 6.34% | | | | | | | | |
| Build Illinois Bonds, Sales Tax Rev. Ref. Bonds, Series 2016-D, 5.00% 2025 | | | 350 | | | | 403 | |
| City of Chicago, Board of Education, Unlimited Tax G.O. Bonds (Dedicated Rev.), Series 2018-A, Assured Guaranty Municipal insured, 5.00% 2023 | | | 1,100 | | | | 1,202 | |
| City of Chicago, Chicago Midway Airport, Rev. and Rev. Ref. Bonds, Series 2014-B, 5.00% 2028 | | | 500 | | | | 548 | |
| City of Chicago, G.O. Rev. Ref. Bonds, Series 2020-A, 5.00% 2022 | | | 400 | | | | 403 | |
| City of Chicago, G.O. Rev. Ref. Bonds, Series 2020-A, 5.00% 2023 | | | 560 | | | | 589 | |
| City of Chicago, Transit Auth., Capital Grant Receipts Rev. Ref. Bonds (Federal Transit Administration Section 5307 Urbanized Area Formula Funds), Series 2021, 5.00% 2024 | | | 65 | | | | 72 | |
| City of Chicago, Wastewater Transmission Rev. Bonds, Series 2012, Assured Guaranty Municipal insured, 5.00% 2023 | | | 500 | | | | 504 | |
| City of Chicago, Wastewater Transmission Rev. Project Bonds, Series 2014, 5.00% 2028 | | | 385 | | | | 421 | |
| City of Chicago, Water Rev. Bonds, Series 2004, 5.00% 2023 | | | 200 | | | | 218 | |
| City of Chicago, Water Rev. Ref. Bonds, Series 2004, 5.00% 2021 | | | 1,895 | | | | 1,895 | |
| City of Chicago, Water Rev. Ref. Bonds, Series 2014, 5.00% 2023 | | | 200 | | | | 218 | |
| City of Chicago, Water Rev. Ref. Bonds, Series 2017, 5.00% 2028 | | | 355 | | | | 438 | |
| County of Cook, Community College Dist. No. 508 (City Colleges of Chicago), Unlimited Tax G.O. Bonds, Series 2013, 5.00% 2023 | | | 200 | | | | 216 | |
| Fin. Auth., Academic Fac. Lease Rev. Bonds (Provident Group - UIUC Properties LLC - University of Illinois at Urbana-Champaign Project), Series 2019-A, 5.00% 2025 | | | 110 | | | | 128 | |
| Fin. Auth., Academic Fac. Lease Rev. Bonds (Provident Group - UIUC Properties LLC - University of Illinois at Urbana-Champaign Project), Series 2019-A, 5.00% 2027 | | | 500 | | | | 611 | |
| Fin. Auth., Academic Fac. Lease Rev. Bonds (Provident Group - UIUC Properties LLC - University of Illinois at Urbana-Champaign Project), Series 2019-A, 5.00% 2028 | | | 400 | | | | 499 | |
| Fin. Auth., Rev. Bonds (Advocate Health Care Network), Series 2008-A-1, 4.00% 2030 | | | 1,000 | | | | 1,119 | |
| Fin. Auth., Rev. Bonds (Art Institute of Chicago), Series 2016, 5.00% 2025 | | | 125 | | | | 143 | |
| Fin. Auth., Rev. Bonds (Art Institute of Chicago), Series 2016, 5.00% 2026 | | | 120 | | | | 141 | |
| Fin. Auth., Rev. Bonds (Clean Water Initiative Revolving Fund), Series 2017, 5.00% 2033 | | | 500 | | | | 600 | |
| Fin. Auth., Rev. Bonds (Lifespace Communities, Inc.), Series 2015-A, 5.00% 2027 | | | 590 | | | | 668 | |
| Fin. Auth., Rev. Bonds (Northshore University Heathsystem), Series 2020-A, 5.00% 2029 | | | 1,000 | | | | 1,281 | |
| Fin. Auth., Rev. Bonds (Northshore University Heathsystem), Series 2020-A, 5.00% 2033 | | | 280 | | | | 361 | |
| Fin. Auth., Rev. Bonds (OSF Healthcare System), Series 2015-A, 5.00% 2027 | | | 250 | | | | 290 | |
| Fin. Auth., Rev. Bonds (OSF Healthcare System), Series 2020-B-2, 5.00% 2050 (put 2026) | | | 105 | | | | 124 | |
| Fin. Auth., Rev. Bonds (Presbyterian Homes Obligated Group), Series 2016-A, 5.00% 2024 | | | 310 | | | | 343 | |
| Fin. Auth., Rev. Bonds (Presbyterian Homes Obligated Group), Series 2021-B, (SIFMA Municipal Swap Index + 0.70%) 0.75% 2042 (put 2026)2 | | | 140 | | | | 140 | |
| Fin. Auth., Rev. Bonds (Presence Health Network), Series 2016-C, 5.00% 2026 | | | 600 | | | | 710 | |
| Fin. Auth., Rev. Bonds (Presence Health Network), Series 2016-C, 5.00% 2028 | | | 400 | | | | 484 | |
| Fin. Auth., Rev. Bonds (Rush University Medical Center Obligated Group), Series 2015-A, 5.00% 2021 | | | 500 | | | | 501 | |
| Fin. Auth., Rev. Bonds (Rush University Medical Center Obligated Group), Series 2015-A, 5.00% 2028 | | | 1,000 | | | | 1,148 | |
| Fin. Auth., Rev. Bonds (Rush University Medical Center Obligated Group), Series 2015-A, 5.00% 2029 | | | 500 | | | | 573 | |
| Fin. Auth., Rev. Bonds (The Carle Foundation), Series 2021-A, 5.00% 2029 | | | 800 | | | | 1,022 | |
| Fin. Auth., Rev. Bonds (The Carle Foundation), Series 2021-A, 5.00% 2030 | | | 360 | | | | 468 | |
| Fin. Auth., Rev. Bonds (University of Chicago), Series 2021-A, 5.00% 2025 | | | 270 | | | | 316 | |
| Fin. Auth., Rev. Ref. Bonds (Northwestern Memorial Healthcare), Series 2021-A, 5.00% 2032 | | | 510 | | | | 676 | |
| Fin. Auth., Rev. Ref. Bonds (Northwestern Memorial Healthcare), Series 2021-A, 5.00% 2033 | | | 365 | | | | 482 | |
| Fin. Auth., Rev. Ref. Bonds (OSF Healthcare System), Series 2015-A, 5.00% 2026 | | | 770 | | | | 895 | |
| Fin. Auth., Water Facs. Rev. Ref. Bonds (American Water Capital Corp. Project), Series 2020, 0.70% 2040 (put 2023) | | | 215 | | | | 215 | |
| G.O. Bonds, Series 2017-D, BAM insured, 5.00% 2021 | | | 1,150 | | | | 1,150 | |
| G.O. Bonds, Series 2017-A, 5.00% 2021 | | | 500 | | | | 502 | |
| G.O. Bonds, Series 2016, 5.00% 2022 | | | 130 | | | | 131 | |
| Private Client Services Funds | 15 |
Capital Group Core Municipal Fund
| Bonds, notes & other debt instruments (continued) | | Principal amount
(000) | | | Value
(000) | |
| Illinois (continued) | | | | | | | | |
| G.O. Bonds, Series 2014, 5.00% 2022 | | $ | 110 | | | $ | 113 | |
| G.O. Bonds, Series 2017-D, 5.00% 2027 | | | 205 | | | | 246 | |
| G.O. Bonds, Series 2020-B, 5.00% 2029 | | | 2,090 | | | | 2,577 | |
| G.O. Rev. Ref. Bonds, Series 2016, 5.00% 2022 | | | 215 | | | | 218 | |
| Housing Dev. Auth., Multi Family Housing Rev. Bonds, Series 2021-C, 0.80% 2026 | | | 40 | | | | 40 | |
| Housing Dev. Auth., Multi Family Housing Rev. Bonds (Concord Commons), Series 2021, 0.25% 2024 (put 2023) | | | 810 | | | | 810 | |
| Housing Dev. Auth., Multi Family Housing Rev. Bonds (Marshall Field Garden Apartment Homes), Series 2015, (SIFMA Municipal Swap Index + 1.00%) 1.05% 2050 (put 2025)2 | | | 2,000 | | | | 2,043 | |
| Housing Dev. Auth., Rev. Bonds, Series 2019-A, 4.25% 2049 | | | 1,605 | | | | 1,770 | |
| Housing Dev. Auth., Rev. Bonds, Series 2021-D, 3.00% 2051 | | | 1,665 | | | | 1,798 | |
| Board of Trustees of Illinois State University, Auxiliary Facs. System Rev. Bonds, Series 2016, Assured Guaranty Municipal insured, 5.00% 2022 | | | 1,465 | | | | 1,493 | |
| Metropolitan Pier and Exposition Auth., McCormick Place Expansion Project Rev. Ref. Bonds, Series 2017-B, 5.00% 2025 | | | 225 | | | | 262 | |
| Municipal Electric Agcy., Power Supply System Rev. Ref. Bonds, Series 2015-A, 5.00% 2027 | | | 1,000 | | | | 1,160 | |
| Railsplitter Tobacco Settlement Auth., Tobacco Settlement Rev. Bonds, Series 2017, 5.00% 2023 | | | 620 | | | | 665 | |
| Sales Tax Securitization Corp., Sales Tax Rev. Ref. Bonds, Series 2017-A, 5.00% 2024 | | | 1,000 | | | | 1,095 | |
| Sales Tax Securitization Corp., Sales Tax Securitization Bonds, Series 2020-A, BAM insured, 5.00% 2027 | | | 1,000 | | | | 1,201 | |
| Sales Tax Securitization Corp., Sales Tax Securitization Rev. Ref. Bonds, Series 2017-A, 5.00% 2023 | | | 2,000 | | | | 2,110 | |
| Toll Highway Auth., Toll Highway Rev. Bonds, Series 2019-C, 5.00% 2025 | | | 1,180 | | | | 1,346 | |
| Toll Highway Auth., Toll Highway Rev. Bonds, Series 2015-A, 5.00% 2027 | | | 1,250 | | | | 1,448 | |
| Toll Highway Auth., Toll Highway Rev. Bonds, Series 2015-A, 5.00% 2028 | | | 1,110 | | | | 1,283 | |
| Toll Highway Auth., Toll Highway Rev. Bonds, Series 2019-C, 5.00% 2029 | | | 440 | | | | 555 | |
| Toll Highway Auth., Toll Highway Rev. Ref. Bonds, Series 2019-A, 5.00% 2024 | | | 500 | | | | 549 | |
| Toll Highway Auth., Toll Highway Rev. Ref. Bonds, Series 2019-A, 5.00% 2025 | | | 740 | | | | 844 | |
| Toll Highway Auth., Toll Highway Rev. Ref. Bonds, Series 2019-A, 5.00% 2028 | | | 635 | | | | 784 | |
| Board of Trustees of the University of Illinois, Auxiliary Facs. System Rev. Bonds, Series 2018-A, 5.00% 2025 | | | 135 | | | | 155 | |
| Board of Trustees of the University of Illinois, Auxiliary Facs. System Rev. Bonds, Series 2020-A, 5.00% 2028 | | | 1,000 | | | | 1,239 | |
| Board of Trustees of the University of Illinois, Auxiliary Facs. System Rev. Ref. Bonds, Series 2005-A, National insured, 5.50% 2023 | | | 500 | | | | 537 | |
| Board of Trustees of the University of Illinois, Auxiliary Facs. System Rev. Ref. Bonds, Series 2015-A, 5.00% 2026 | | | 500 | | | | 572 | |
| Board of Trustees of the University of Illinois, Rev. Ref. Certs. of Part., Series 2008-A, Assured Guaranty Municipal insured, 5.25% 2024 | | | 30 | | | | 30 | |
| | | | | | | | 49,791 | |
| | | | | | | | | |
| Indiana 1.41% | | | | | | | | |
| Fin. Auth., Health System Rev. Bonds (Indiana University Health), Series 2019-C, 5.00% 2022 | | | 140 | | | | 147 | |
| Fin. Auth., Hospital Rev. Bonds (Community Health Network Project), Series 2012-A, 5.00% 2042 (preref. 2023) | | | 1,165 | | | | 1,247 | |
| Fin. Auth., Rev. Bonds (Community Foundation of Northwest Indiana Obligated Group), Series 2012, 5.00% 2030 (preref. 2022) | | | 515 | | | | 523 | |
| Fin. Auth., State Revolving Fund Program Green Bonds, Series 2019-E, 5.00% 2022 | | | 750 | | | | 759 | |
| Fin. Auth., State Revolving Fund Program Green Bonds, Series 2021-B, 5.00% 2028 | | | 575 | | | | 715 | |
| Fin. Auth., Wastewater Utility Rev. Ref. Bonds, Series 2021-2, 5.00% 2022 | | | 130 | | | | 136 | |
| Fin. Auth., Wastewater Utility Rev. Ref. Bonds, Series 2021-1, 5.00% 2023 | | | 275 | | | | 300 | |
| Fin. Auth., Wastewater Utility Rev. Ref. Bonds, Series 2021-2, 5.00% 2023 | | | 85 | | | | 93 | |
| Fin. Auth., Wastewater Utility Rev. Ref. Bonds, Series 2021-2, 5.00% 2027 | | | 335 | | | | 413 | |
| City of Franklin, Econ. Dev. and Rev. Ref. Bonds (Otterbein Homes Obligated Group), Series 2019-B, 5.00% 2023 | | | 30 | | | | 32 | |
| Health Fac. Fncg. Auth., Rev. Bonds (Ascension Health Subordinate Credit Group), Series 2005-A-1, 4.00% 2023 | | | 80 | | | | 86 | |
| Housing and Community Dev. Auth., Collateralized Rev. Bonds (RD Moving Forward Justus Project), Series 2021, 0.33% 2024 (put 2023) | | | 710 | | | | 709 | |
| Housing and Community Dev. Auth., Single Family Mortgage Rev. Bonds, Series 2019-A, 4.25% 2048 | | | 1,825 | | | | 1,991 | |
| Housing and Community Dev. Auth., Single Family Mortgage Rev. Bonds, Series 2020-A, 3.75% 2049 | | | 160 | | | | 174 | |
| Housing and Community Dev. Auth., Single Family Mortgage Rev. Bonds, Series 2021-B, 3.00% 2050 | | | 110 | | | | 118 | |
| Housing and Community Dev. Auth., Single Family Mortgage Rev. Bonds, Series 2021-C-1, 3.00% 2052 | | | 355 | | | | 385 | |
| City of Indianapolis, Local Public Improvement Bond Bank Bonds (Indianapolis Airport Auth. Project), Series 2019-I-2, 5.00% 2026 | | | 340 | | | | 401 | |
| City of Indianapolis, Local Public Improvement Bond Bank Bonds (Indianapolis Airport Auth. Project), Series 2019-I-2, 5.00% 2027 | | | 330 | | | | 399 | |
| City of Indianapolis, Local Public Improvement Bond Bank Bonds (Indianapolis Airport Auth. Project), Series 2019-I-2, 5.00% 2028 | | | 435 | | | | 537 | |
| 16 | Private Client Services Funds |
Capital Group Core Municipal Fund
| Bonds, notes & other debt instruments (continued) | | Principal amount
(000) | | | Value
(000) | |
| Indiana (continued) | | | | | | | | |
| City of Indianapolis, Local Public Improvement Bond Bank Bonds (Indianapolis Airport Auth. Project), Series 2019-I-2, 5.00% 2029 | | $ | 265 | | | $ | 333 | |
| City of Indianapolis, Local Public Improvement Bond Bank Bonds (Indianapolis Airport Auth. Project), Series 2019-I-2, 5.00% 2030 | | | 435 | | | | 558 | |
| City of Kokomo, Multi Family Housing Rev. Bonds (KHA RAD I Apartments), Series 2021-A, 0.56% 2025 (put 2024) | | | 1,030 | | | | 1,030 | |
| | | | | | | | 11,086 | |
| | | | | | | | | |
| Iowa 0.35% | | | | | | | | |
| Fin. Auth., Rev. Bonds (Lifespace Communities, Inc.), Series 2019-A-2, 2.875% 2049 | | | 15 | | | | 15 | |
| Fin. Auth., Single Family Mortgage Bonds (Mortgage-Backed Securities Program), Series 2019-A, 4.00% 2047 | | | 835 | | | | 929 | |
| Fin. Auth., Single Family Mortgage Bonds (Mortgage-Backed Securities Program), Series 2019-D, 3.50% 2049 | | | 25 | | | | 27 | |
| PEFA, Inc., Gas Project Rev. Bonds, Series 2019, 5.00% 2049 (put 2026) | | | 1,000 | | | | 1,183 | |
| Tobacco Settlement Auth., Tobacco Settlement Asset-Backed Bonds, Series 2021-A-2, 5.00% 2031 | | | 320 | | | | 420 | |
| Tobacco Settlement Auth., Tobacco Settlement Asset-Backed Bonds, Series 2021-A-2, 5.00% 2033 | | | 135 | | | | 175 | |
| | | | | | | | 2,749 | |
| | | | | | | | | |
| Kansas 0.15% | | | | | | | | |
| Turnpike Auth., Rev. Ref. Bonds, Series 2020-A, 3.00% 2025 | | | 950 | | | | 1,040 | |
| Unified Government of Wyandotte County, Board of Public Utilities, Utility System Improvement Rev. Bonds, Series 2012-B, 5.00% 2026 (preref. 2022) | | | 110 | | | | 114 | |
| | | | | | | | 1,154 | |
| | | | | | | | | |
| Kentucky 0.97% | | | | | | | | |
| County of Carroll, Environmental Facs. Rev. Bonds, Series 2008-A, 2.00% 2032 | | | 725 | | | | 738 | |
| Econ. Dev. Fin. Auth., Health System Rev. Bonds (Norton Healthcare, Inc.), Capital Appreciation Bonds, Series 2000-B, National insured, 0% 2027 | | | 1,000 | | | | 894 | |
| Housing Corp., Multi Family Housing Rev. Bonds (Cambridge Square Project), Series 2021, 0.30% 2024 (put 2024) | | | 365 | | | | 364 | |
| Housing Corp., Multi Family Housing Rev. Bonds (New Hope Properties Portfolio Project), Series 2021, 0.41% 2024 (put 2023) | | | 1,575 | | | | 1,576 | |
| Housing Corp., Multi Family Housing Rev. Bonds (Winterwood II Rural Housing Portfolio), Series 2021, 0.37% 2024 (put 2023) | | | 635 | | | | 635 | |
| County of Owen, Water Facs. Rev. Ref. Bonds (Kentucky - American Water Co. Project), Series 2019, 2.45% 2039 (put 2029) | | | 750 | | | | 795 | |
| Property and Buildings Commission, Commonwealth Rev. Ref. Bonds (Project No. 125), Series 2021-A, 5.00% 2022 | | | 170 | | | | 177 | |
| Public Energy Auth., Gas Supply Rev. Bonds, Series 2018-A, 4.00% 2048 (put 2024) | | | 410 | | | | 441 | |
| Public Energy Auth., Gas Supply Rev. Bonds, Series 2019-A-1, 4.00% 2049 (put 2025) | | | 1,180 | | | | 1,308 | |
| Public Energy Auth., Gas Supply Rev. Bonds, Series 2018-B, 4.00% 2049 (put 2025) | | | 185 | | | | 203 | |
| Turnpike Auth., Econ. Dev. Road Rev. Ref. Bonds (Revitalization Projects), Series 2022-A, 5.00% 2031 | | | 270 | | | | 346 | |
| County of Warren, Hospital Rev. Ref. Bonds (Bowling Green - Warren County Community Hospital Corp.), Series 2021-A, 5.00% 2022 | | | 135 | | | | 138 | |
| | | | | | | | 7,615 | |
| | | | | | | | | |
| Louisiana 2.04% | | | | | | | | |
| Parish of East Baton Rouge, Road and Street Improvement Sales Tax Rev. Ref. Bonds, Series 2020, Assured Guaranty Municipal insured, 5.00% 2022 | | | 85 | | | | 88 | |
| Parish of East Baton Rouge, Road and Street Improvement Sales Tax Rev. Ref. Bonds, Series 2020, Assured Guaranty Municipal insured, 5.00% 2026 | | | 1,250 | | | | 1,496 | |
| Parish of East Baton Rouge, Sewerage Commission, Multi Modal Rev. Ref. Bonds, Series 2021-A, 1.30% 2041 (put 2028) | | | 1,270 | | | | 1,287 | |
| Parish of East Baton Rouge, Sewerage Commission, Rev. Ref. Bonds, Series 2020-A, 5.00% 2026 | | | 1,135 | | | | 1,337 | |
| Gasoline and Fuels Tax Rev. Ref. Bonds, Series 2017-D-1, 0.60% 2043 (put 2023) | | | 2,000 | | | | 2,001 | |
| Grant Anticipation Rev. Bonds, Series 2021, 5.00% 2023 | | | 335 | | | | 364 | |
| Housing Corp., Multi Family Housing Rev. Bonds (Arbours at Lafayette Project), Series 2021, 0.35% 2024 (put 2023) | | | 375 | | | | 375 | |
| Housing Corp., Multi Family Housing Rev. Bonds (Mabry Place Townhomes Project), Series 2021, 0.31% 2024 (put 2023) | | | 215 | | | | 214 | |
| Housing Corp., Single Family Mortgage Rev. Bonds (Home Ownership Program), Series 2021-B, 3.00% 2051 | | | 755 | | | | 813 | |
| Private Client Services Funds | 17 |
Capital Group Core Municipal Fund
| Bonds, notes & other debt instruments (continued) | | Principal amount
(000) | | | Value
(000) | |
| Louisiana (continued) | | | | | | | | |
| Parish of Jefferson, Sales Tax Rev. Ref. Bonds, Series 2019-B, Assured Guaranty Municipal insured, 5.00% 2027 | | $ | 1,000 | | | $ | 1,235 | |
| Local Government Environmental Facs. and Community Dev. Auth., Rev. Ref. Bonds (Entergy Louisiana, LLC Projects), Series 2021-A, 2.00% 2030 | | | 105 | | | | 106 | |
| Louisiana Stadium and Exposition Dist., Rev. Ref. Bonds, Series 2013-A, 5.00% 2022 | | | 1,500 | | | | 1,547 | |
| Offshore Terminal Auth., Deepwater Port Rev. Bonds (Loop LLC Project), Series 2007-A, 1.65% 2027 (put 2023) | | | 905 | | | | 923 | |
| Public Facs. Auth., Hospital Rev. Ref. Bonds (Lafayette General Health System Project), Series 2016-A, 5.00% 2041 (preref. 2025) | | | 1,000 | | | | 1,177 | |
| Parish of St. Charles, Gulf Opportunity Zone Rev. Bonds (Valero Project), Series 2010, 4.00% 2040 (put 2022) | | | 2,000 | | | | 2,042 | |
| Parish of St. John the Baptist, Rev. Ref. Bonds (Marathon Oil Corp. Project), Series 2017-B-1, 2.125% 2037 (put 2024) | | | 285 | | | | 294 | |
| City of Shreveport, Water and Sewer Rev. Bonds, Series 2019-B, Assured Guaranty Municipal insured, 3.00% 2022 | | | 115 | | | | 118 | |
| City of Shreveport, Water and Sewer Rev. Bonds, Series 2019-B, Assured Guaranty Municipal insured, 4.00% 2023 | | | 105 | | | | 112 | |
| City of Shreveport, Water and Sewer Rev. Bonds, Series 2019-B, Assured Guaranty Municipal insured, 5.00% 2024 | | | 80 | | | | 91 | |
| City of Shreveport, Water and Sewer Rev. Bonds, Series 2019-B, Assured Guaranty Municipal insured, 4.00% 2025 | | | 145 | | | | 163 | |
| City of Shreveport, Water and Sewer Rev. Bonds, Series 2019-B, Assured Guaranty Municipal insured, 5.00% 2026 | | | 140 | | | | 169 | |
| Tobacco Settlement Fncg. Corp., Tobacco Settlement Asset-Backed Rev. Ref. Bonds, Series 2013-A, 5.00% 2023 | | | 90 | | | | 96 | |
| | | | | | | | 16,048 | |
| | | | | | | | | |
| Maine 0.05% | | | | | | | | |
| Housing Auth., Mortgage Purchase Bonds, Series 2017-A, 4.00% 2047 | | | 355 | | | | 376 | |
| | | | | | | | | |
| Maryland 1.16% | | | | | | | | |
| Community Dev. Administration, Dept. of Housing and Community Dev., Multi Family Housing Dev. Rev. Bonds (Somerset Extension), Series 2019-H, 1.795% 2022 | | | 215 | | | | 216 | |
| Community Dev. Administration, Dept. of Housing and Community Dev., Residential Rev. Bonds, Series 2014-C, 4.00% 2044 | | | 235 | | | | 247 | |
| Community Dev. Administration, Dept. of Housing and Community Dev., Residential Rev. Bonds, Series 2018-A, 4.50% 2048 | | | 1,760 | | | | 1,961 | |
| G.O. Rev. Ref. Bonds, State and Local Facs. Loan of 2021, Series 2022-D-2, 4.00% 2029 | | | 585 | | | | 694 | |
| County of Montgomery, Housing Opportunities Commission, Single Family Housing Rev. Bonds, Series 2017-A, 4.00% 2048 | | | 565 | | | | 606 | |
| County of Montgomery, Housing Opportunities Commission, Single Family Housing Rev. Bonds, Series 2018-A, 4.00% 2049 | | | 1,510 | | | | 1,628 | |
| County of Prince George, Certs. of Part. (Behavioral Health Fac. and Capital Equipment), Series 2021, 5.00% 2024 | | | 165 | | | | 187 | |
| Transportation Auth., Transportation Facs. Projects Rev. Bonds, Series 2020. 5.00% 2033 | | | 745 | | | | 968 | |
| Washington Suburban Sanitary Dist., Consolidated Public Improvement Bonds, Series 2021, 5.00% 2030 | | | 2,000 | | | | 2,625 | |
| | | | | | | | 9,132 | |
| | | | | | | | | |
| Massachusetts 0.38% | | | | | | | | |
| Dev. Fin. Agcy., Multi Family Housing Rev. Bonds (Salem Heights II Preservation Associates LP Issue), Series 2021-B, 0.25% 2024 (put 2023) | | | 180 | | | | 179 | |
| Dev. Fin. Agcy., Rev. Bonds (Williams College Issue), Series 2011-N, 0.45% 2041 (put 2025) | | | 150 | | | | 149 | |
| Dev. Fin. Agcy., Rev. Ref. Bonds (Berkshire Health Systems Issue), Series 2021-I, 5.00% 2024 | | | 615 | | | | 696 | |
| Housing Fin. Agcy., Housing Green Bonds, Series 2021-A-2, 0.30% 2023 | | | 50 | | | | 50 | |
| Housing Fin. Agcy., Housing Green Bonds, Series 2021-A-2, 0.40% 2024 | | | 65 | | | | 65 | |
| Housing Fin. Agcy., Housing Green Bonds, Series 2021-B-2, 0.75% 2025 | | | 55 | | | | 55 | |
| Housing Fin. Agcy., Single Family Housing Rev. Bonds, Series 169, 4.00% 2044 | | | 165 | | | | 169 | |
| Housing Fin. Agcy., Single Family Housing Rev. Bonds, Series 172, 4.00% 2045 | | | 310 | | | | 322 | |
| Transportation Fund Rev. Ref. Bonds, Series 2021-A, 5.00% 2029 | | | 1,000 | | | | 1,289 | |
| | | | | | | | 2,974 | |
| | | | | | | | | |
| Michigan 3.00% | | | | | | | | |
| City of Detroit, Water and Sewerage Dept., Sewage Disposal System Rev. and Rev. Ref. Bonds, Series 2012-A, 5.00% 2032 (preref. 2022) | | | 185 | | | | 191 | |
| Fin. Auth., Hospital Rev. and Rev. Ref. Bonds (Trinity Health Credit Group), Series 2017-A, 5.00% 2047 (preref. 2022) | | | 2,555 | | | | 2,688 | |
| Fin. Auth., Hospital Rev. Ref. Bonds (McLaren Health Care), Series 2015-D-1, 0.25% 2022 | | | 40 | | | | 40 | |
| Fin. Auth., Local Government Loan Program Rev. Bonds (Detroit Water and Sewerage Dept., Sewage Disposal System Rev. Ref. Local Project Bonds), Series 2015-C, 5.00% 2027 | | | 250 | | | | 289 | |
| 18 | Private Client Services Funds |
Capital Group Core Municipal Fund
| Bonds, notes & other debt instruments (continued) | | Principal amount
(000) | | | Value
(000) | |
| Michigan (continued) | | | | | | | | |
| Fin. Auth., Tobacco Settlement Asset-Backed Bonds, Series 2020-A-1, 5.00% 2026 | | $ | 105 | | | $ | 124 | |
| Fin. Auth., Tobacco Settlement Asset-Backed Bonds, Series 2020-A, 5.00% 2028 | | | 1,000 | | | | 1,242 | |
| Fin. Auth., Tobacco Settlement Asset-Backed Bonds, Series 2020-A-1, 5.00% 2029 | | | 205 | | | | 260 | |
| Great Lakes Water Auth., Water Supply System Rev. Bonds, Series 2020-B, 5.00% 2032 | | | 500 | | | | 645 | |
| Hospital Fin. Auth., Hospital Rev. Bonds (Trinity Health Credit Group), Series 2009-B, 5.00% 2048 (preref. 2022) | | | 615 | | | | 632 | |
| Hospital Fin. Auth., Hospital Rev. Ref. Bonds (Trinity Health Credit Group), Series 2008-C, 5.00% 2021 | | | 650 | | | | 653 | |
| Hospital Fin. Auth., Hospital Rev. Ref. Bonds (Trinity Health Credit Group), Series 2008-C, 5.00% 2022 | | | 475 | | | | 500 | |
| Hospital Fin. Auth., Hospital Rev. Ref. Bonds (Trinity Health Credit Group), Series 2012-C, 5.00% 2026 (preref. 2022) | | | 400 | | | | 411 | |
| Housing Dev. Auth., Multi Family Housing Rev. Bonds, Series 2020, 0.32% 2023 (put 2022) | | | 1,000 | | | | 1,001 | |
| Housing Dev. Auth., Rental Housing Rev. Bonds, Series 2019-A-1, 1.50% 2022 | | | 1,210 | | | | 1,211 | |
| Housing Dev. Auth., Rental Housing Rev. Bonds, Series 2021-A, 0.55% 2025 | | | 185 | | | | 185 | |
| Housing Dev. Auth., Single Family Mortgage Rev. Bonds, Series 2016-B, 3.50% 2047 | | | 475 | | | | 503 | |
| Housing Dev. Auth., Single Family Mortgage Rev. Bonds, Series 2017-B, 3.50% 2048 | | | 270 | | | | 286 | |
| Housing Dev. Auth., Single Family Mortgage Rev. Bonds, Series 2018-A, 4.00% 2048 | | | 635 | | | | 685 | |
| Housing Dev. Auth., Single Family Mortgage Rev. Bonds, Series 2018-C, 4.25% 2049 | | | 1,750 | | | | 1,910 | |
| Housing Dev. Auth., Single Family Mortgage Rev. Bonds, Series 2019-A, 4.25% 2049 | | | 850 | | | | 934 | |
| Housing Dev. Auth., Single Family Mortgage Rev. Bonds, Series 2020-A, 3.50% 2050 | | | 970 | | | | 1,055 | |
| Housing Dev. Auth., Single Family Mortgage Rev. Bonds, Series 2021-A, 3.00% 2052 | | | 2,130 | | | | 2,302 | |
| Board of Trustees of Michigan State University, Rev. Bonds, Series 2019-B, 5.00% 2023 | | | 300 | | | | 318 | |
| Board of Trustees of Michigan State University, Rev. Bonds, Series 2019-B, 5.00% 2030 | | | 700 | | | | 886 | |
| County of Monroe, Econ. Dev. Corp., Limited Obligation Rev. Ref. Bonds (Detroit Edison Co. Project), Series 1992-AA, National insured, 6.95% 2022 | | | 1,000 | | | | 1,055 | |
| Strategic Fund, Limited Obligation Rev. Ref. Bonds (Detroit Edison Co. Pollution Control Bonds Project), Series 1995-CC, 1.45% 2030 | | | 1,630 | | | | 1,598 | |
| Trunk Line Fund Bonds, Series 2021-A, 5.00% 2031 | | | 575 | | | | 770 | |
| Trunk Line Fund Bonds, Series 2021-A, 5.00% 2032 | | | 860 | | | | 1,147 | |
| | | | | | | | 23,521 | |
| | | | | | | | | |
| Minnesota 1.43% | | | | | | | | |
| City of Hopkins, Multi Family Housing Rev. Bonds (Raspberry Ridge Project), Series 2021, 0.26% 2024 (put 2023) | | | 535 | | | | 534 | |
| Housing Fin. Agcy., Residential Housing Fin. Bonds, Series 2014-B, 4.00% 2038 | | | 260 | | | | 275 | |
| Housing Fin. Agcy., Residential Housing Fin. Bonds, Series 2015-B, 3.50% 2046 | | | 670 | | | | 708 | |
| Housing Fin. Agcy., Residential Housing Fin. Bonds, Series 2017-B, 4.00% 2047 | | | 545 | | | | 583 | |
| Housing Fin. Agcy., Residential Housing Fin. Bonds, Series 2018-B, 4.00% 2048 | | | 385 | | | | 414 | |
| Housing Fin. Agcy., Residential Housing Fin. Bonds, Series 2017-E, 4.00% 2048 | | | 305 | | | | 329 | |
| Housing Fin. Agcy., Residential Housing Fin. Bonds, Series 2018-E, 4.25% 2049 | | | 1,665 | | | | 1,829 | |
| Housing Fin. Agcy., Residential Housing Fin. Bonds, Series 2019-B, 4.25% 2049 | | | 780 | | | | 859 | |
| Housing Fin. Agcy., Residential Housing Fin. Bonds, Series 2020-E, 3.50% 2050 | | | 285 | | | | 309 | |
| Housing Fin. Agcy., Residential Housing Fin. Bonds, Series 2021-B, 3.00% 2051 | | | 535 | | | | 576 | |
| Housing Fin. Agcy., Residential Housing Fin. Bonds, Series 2021-D, 3.00% 2052 | | | 1,205 | | | | 1,300 | |
| City of Mahtomedi, Multi Family Housing Rev. Bonds (Lincoln Place / Vadnais Highlands Projects), Series 2021, 0.25% 2023 (put 2022) | | | 300 | | | | 300 | |
| City of Rochester, Health Care Facs. Rev. Bonds (Mayo Clinic), Series 2011-C, 4.50% 2038 (put 2021) | | | 1,000 | | | | 1,001 | |
| Regents of the University of Minnesota, G.O. Bonds, Series 2011-D, 5.00% 2029 (preref. 2021) | | | 1,265 | | | | 1,270 | |
| Regents of the University of Minnesota, G.O. Rev. Ref. Bonds, Series 2017B, 5.00% 2021 | | | 960 | | | | 964 | |
| | | | | | | | 11,251 | |
| | | | | | | | | |
| Mississippi 0.49% | | | | | | | | |
| Business Fin. Corp., Solid Waste Disposal Rev. Bonds (Waste Management, Inc. Project), Series 2004, 0.70% 2029 (put 2026) | | | 1,460 | | | | 1,436 | |
| Gaming Tax Rev. Bonds, Series 2019-A, 5.00% 2023 | | | 850 | | | | 924 | |
| Gaming Tax Rev. Ref. Bonds, Series 2015-E, 5.00% 2026 | | | 500 | | | | 580 | |
| Home Corp., Collateralized Multi Family Housing Bonds (J&A Dev. Portfolio Project I), Series 2021-1, 0.30% 2024 (put 2023) | | | 230 | | | | 229 | |
| Home Corp., Single Family Mortgage Rev. Bonds, Series 2019-A, 4.00% 2048 | | | 645 | | | | 700 | |
| | | | | | | | 3,869 | |
| Private Client Services Funds | 19 |
Capital Group Core Municipal Fund
| Bonds, notes & other debt instruments (continued) | | Principal amount
(000) | | | Value
(000) | |
| Missouri 0.84% | | | | | | | | |
| Health and Educational Facs. Auth., Health Facs. Rev. Bonds (BJC Health System), Series 2021-B, 5.00% 2052 (put 2028) | | $ | 2,360 | | | $ | 2,922 | |
| Housing Dev. Commission, Single Family Mortgage Rev. Bonds (First Place Homeownership Loan Program), Series 2016-B, 3.50% 2041 | | | 1,335 | | | | 1,403 | |
| Housing Dev. Commission, Single Family Mortgage Rev. Bonds (First Place Homeownership Loan Program), Series 2017-B, 3.25% 2047 | | | 293 | | | | 310 | |
| Housing Dev. Commission, Single Family Mortgage Rev. Bonds (First Place Homeownership Loan Program), Series 2020-A, 3.50% 2050 | | | 560 | | | | 608 | |
| Housing Dev. Commission, Single Family Mortgage Rev. Bonds (First Place Homeownership Loan Program), Series 2021-A, 3.00% 2052 | | | 600 | | | | 646 | |
| Housing Dev. Commission, Single Family Mortgage Rev. Bonds (Special Homeownership Loan Program), Series 2015-A, 3.75% 2038 | | | 100 | | | | 106 | |
| City of St. Louis, Airport Rev. Ref. Bonds (Lambert-St. Louis International Airport), Series 2019-C, 5.00% 2031 | | | 500 | | | | 628 | |
| | | | | | | | 6,623 | |
| | | | | | | | | |
| Montana 0.06% | | | | | | | | |
| Board of Housing, Single Family Mortgage Bonds, Series 2016-A-2, 3.50% 2044 | | | 120 | | | | 126 | |
| Board of Housing, Single Family Mortgage Bonds, Series 2020-C, 3.00% 2050 | | | 300 | | | | 322 | |
| | | | | | | | 448 | |
| | | | | | | | | |
| Nebraska 0.70% | | | | | | | | |
| Central Plains Energy Project, Gas Project Rev. Bonds (Project No. 3), Series 2012, 5.00% 2032 (preref. 2022) | | | 1,190 | | | | 1,236 | |
| Investment Fin. Auth., Single Family Housing Rev. Bonds, Series 2013-A, 3.00% 2043 | | | 15 | | | | 15 | |
| Investment Fin. Auth., Single Family Housing Rev. Bonds, Series 2014-A, 4.00% 2044 | | | 110 | | | | 116 | |
| Investment Fin. Auth., Single Family Housing Rev. Bonds, Series 2015-C, 3.50% 2045 | | | 285 | | | | 296 | |
| Investment Fin. Auth., Single Family Housing Rev. Bonds, Series 2016-C, 3.50% 2046 | | | 75 | | | | 76 | |
| Investment Fin. Auth., Single Family Housing Rev. Bonds, Series 2018-C, 4.00% 2048 | | | 1,735 | | | | 1,888 | |
| Investment Fin. Auth., Single Family Housing Rev. Bonds, Series 2018-A, 4.00% 2048 | | | 640 | | | | 695 | |
| Investment Fin. Auth., Single Family Housing Rev. Bonds, Series 2021-C, 3.00% 2050 | | | 1,120 | | | | 1,210 | |
| | | | | | | | 5,532 | |
| | | | | | | | | |
| Nevada 0.67% | | | | | | | | |
| Clark County School Dist., Limited Tax G.O. School Bonds, Series 2015-D, 5.00% 2022 | | | 500 | | | | 514 | |
| County of Clark, Airport System Rev. Ref. Bonds (McCarran International Airport), Series 2021-A, 5.00% 2033 | | | 760 | | | | 996 | |
| County of Clark, Las Vegas-McCarran International Airport, Passenger Fac. Charge Rev. Ref. Bonds, Series 2019-E, 5.00% 2029 | | | 770 | | | | 987 | |
| County of Clark, Pollution Control Rev. Ref. Bonds (Nevada Power Co. Projects), Series 2017, 1.65% 2036 (put 2023) | | | 1,355 | | | | 1,378 | |
| City of Henderson, Local Improvement Dist. No. T-17 (Madeira Canyon), Limited Obligation Rev. Ref. Bonds, Series 2017, 2.00% 2023 | | | 435 | | | | 444 | |
| Housing Division, Multi Unit Housing Rev. Bonds (Pinewood Terrace Apartments), Series 2021, 0.26% 2024 (put 2022) | | | 245 | | | | 245 | |
| Las Vegas Valley Water Dist., Limited Tax G.O. Water Rev. Ref. Bonds, Series 2020-A, 5.00% 2024 | | | 595 | | | | 666 | |
| County of Washoe, Gas and Water Facs. Rev. Ref. Bonds (Sierra Pacific Power Co. Projects), Series 2016-B, 3.00% 2036 (put 2022) | | | 10 | | | | 10 | |
| | | | | | | | 5,240 | |
| | | | | | | | | |
| New Hampshire 0.28% | | | | | | | | |
| Health and Education Facs. Auth., Rev. Bonds (Southern New Hampshire University), Series 2012, 4.00% 2022 (escrowed to maturity) | | | 575 | | | | 579 | |
| Health and Education Facs. Auth., Rev. Bonds (Southern New Hampshire University), Series 2017, 5.00% 2022 (escrowed to maturity) | | | 320 | | | | 322 | |
| Health and Education Facs. Auth., Rev. Bonds (University System of New Hampshire Issue), Series 2017-A, 5.00% 2022 | | | 500 | | | | 516 | |
| Health and Education Facs. Auth., Rev. Bonds (University System of New Hampshire Issue), Series 2017-A, 5.00% 2023 | | | 600 | | | | 646 | |
| National Fin. Auth., Municipal Certs., Series 2020-1, Class A, 4.125% 2034 | | | 98 | | | | 115 | |
| | | | | | | | 2,178 | |
| | |
| 20 | Private Client Services Funds |
Capital Group Core Municipal Fund
| Bonds, notes & other debt instruments (continued) | | Principal amount
(000) | | | Value
(000) | |
| New Jersey 0.98% | | | | | | | | |
| Atlantic City, Tax Appeal Rev. Ref. Bonds, Series 2017-A, BAM insured, 5.00% 2022 | | $ | 200 | | | $ | 203 | |
| Econ. Dev. Auth., School Facs. Construction Bonds, Series 2021-QQQ, 5.00% 2029 | | | 500 | | | | 628 | |
| Econ. Dev. Auth., Water Facs. Rev. Ref. Bonds (American Water Co., Inc. Project), Series 2020-A, 1.00% 2023 | | | 2,025 | | | | 2,045 | |
| Garden State Preservation Trust, Open Space and Farmland Preservation Rev. Ref. Bonds, Series 2012-A, 5.00% 2021 | | | 200 | | | | 200 | |
| Health Care Facs. Fncg. Auth., Rev. Bonds (RWJ Barnabas Health Obligated Group Issue), Series 2021-A, 5.00% 2033 | | | 375 | | | | 494 | |
| Housing and Mortgage Fin. Agcy., Single Family Housing Rev. Bonds, Series 2018-A, 4.50% 2048 | | | 340 | | | | 379 | |
| Housing and Mortgage Fin. Agcy., Single Family Housing Rev. Bonds, Series 2019-C, 4.75% 2050 | | | 205 | | | | 229 | |
| Tobacco Settlement Fncg. Corp., Tobacco Settlement Bonds, Series 2018-A, 5.00% 2022 | | | 1,185 | | | | 1,215 | |
| Tobacco Settlement Fncg. Corp., Tobacco Settlement Bonds, Series 2018-A, 5.00% 2023 | | | 500 | | | | 534 | |
| Tobacco Settlement Fncg. Corp., Tobacco Settlement Bonds, Series 2018-A, 5.00% 2029 | | | 225 | | | | 276 | |
| Transportation Trust Fund Auth., Transportation System Bonds, Series 2019-A, 5.00% 2028 | | | 750 | | | | 938 | |
| Turnpike Auth., Turnpike Rev. Bonds, Series 2020-D, 5.00% 2028 | | | 240 | | | | 283 | |
| Turnpike Auth., Turnpike Rev. Bonds, Series 2014-A, 5.00% 2028 | | | 230 | | | | 257 | |
| | | | | | | | 7,681 | |
| | | | | | | | | |
| New Mexico 1.36% | | | | | | | | |
| Albuquerque Municipal School Dist. No. 12, G.O. School Bonds, Series 2021-A, 5.00% 2027 | | | 400 | | | | 490 | |
| City of Farmington, Pollution Control Rev. Ref. Bonds (Public Service Co. of San Juan and Four Corners Projects), Series 2016-B, 2.15% 2033 | | | 1,130 | | | | 1,098 | |
| City of Farmington, Pollution Control Rev. Ref. Bonds (Public Service Co. of San Juan Project), Series 2010-D, 1.10% 2040 (put 2023) | | | 500 | | | | 503 | |
| City of Farmington, Pollution Control Rev. Ref. Bonds (Public Service Co. of San Juan Project), Series 2010-E, 1.15% 2040 (put 2024) | | | 2,615 | | | | 2,642 | |
| Mortgage Fin. Auth., Single Family Mortgage Program Bonds, Series 2018-B-1, Class I, 4.00% 2049 | | | 800 | | | | 870 | |
| Mortgage Fin. Auth., Single Family Mortgage Program Bonds, Series 2019-C-1, Class I, 4.00% 2050 | | | 135 | | | | 148 | |
| Mortgage Fin. Auth., Single Family Mortgage Program Bonds, Series 2019-A-1, Class I, 4.25% 2050 | | | 2,350 | | | | 2,587 | |
| Mortgage Fin. Auth., Single Family Mortgage Program Bonds, Series 2021-A, Class I, 3.00% 2052 | | | 865 | | | | 933 | |
| Mortgage Fin. Auth., Single Family Mortgage Program Bonds, Series 2021-C, Class I, 3.00% 2052 | | | 260 | | | | 281 | |
| Municipal Energy Acquisition Auth., Gas Supply Rev. Ref. and Acquisition Bonds, Series 2019, 5.00% 2039 (put 2025) | | | 960 | | | | 1,101 | |
| | | | | | | | 10,653 | |
| | | | | | | | | |
| New York 7.69% | | | | | | | | |
| Build NYC Resource Corp., Rev. Ref. Bonds (Ethical Culture Fieldston School Project), Series 2015, 5.00% 2024 | | | 395 | | | | 439 | |
| Dormitory Auth., State Personal Income Tax Rev. Bonds (General Purpose), Series 2017-A, 5.00% 2022 | | | 200 | | | | 203 | |
| Dormitory Auth., State Personal Income Tax Rev. Bonds (General Purpose), Series 2019-A, 5.00% 2028 | | | 1,000 | | | | 1,247 | |
| Dormitory Auth., State Personal Income Tax Rev. Bonds (General Purpose), Series 2020-A, 5.00% 2030 | | | 2,000 | | | | 2,597 | |
| Dormitory Auth., State Personal Income Tax Rev. Bonds (General Purpose), Series 2017-B, 5.00% 2030 | | | 1,500 | | | | 1,839 | |
| Dormitory Auth., State Personal Income Tax Rev. Bonds (General Purpose), Series 2019-D, 5.00% 2030 | | | 605 | | | | 784 | |
| Dormitory Auth., State Personal Income Tax Rev. Bonds (General Purpose), Series 2020-A-2, 5.00% 2031 | | | 165 | | | | 214 | |
| Dormitory Auth., State Sales Tax Rev. Bonds, Series 2014-A, 5.00% 2022 | | | 200 | | | | 204 | |
| Housing Fin. Agcy., Affordable Housing Rev. Green Bonds, Series 2018-H, 2.75% 2022 | | | 660 | | | | 676 | |
| Housing Fin. Agcy., Affordable Housing Rev. Green Bonds, Series 2019-P, 1.55% 2023 | | | 705 | | | | 708 | |
| Housing Fin. Agcy., Affordable Housing Rev. Green Bonds, Series 2020-E, 0.85% 2024 | | | 345 | | | | 345 | |
| Housing Fin. Agcy., Affordable Housing Rev. Green Bonds, Series 2020-L-2, 0.75% 2025 | | | 1,500 | | | | 1,501 | |
| Housing Fin. Agcy., Affordable Housing Rev. Green Bonds, Series 2020-M-2, 0.75% 2025 | | | 275 | | | | 275 | |
| Housing Fin. Agcy., Affordable Housing Rev. Green Bonds, Series 2021-D-2, 0.65% 2056 (put 2025) | | | 690 | | | | 688 | |
| Housing Fin. Agcy., Affordable Housing Rev. Green Bonds, Series 2021-I-2, 0.70% 2056 (put 2025) | | | 380 | | | | 379 | |
| Liberty Dev. Corp., Liberty Rev. Ref. Green Bonds (4 World Trade Center Project), Series 2021-A, 1.70% 2030 | | | 410 | | | | 403 | |
| Liberty Dev. Corp., Liberty Rev. Ref. Green Bonds (4 World Trade Center Project), Series 2021-A, 1.90% 2031 | | | 195 | | | | 193 | |
| Long Island Power Auth., Electric System General Rev. Bonds, Series 2014-C, (1-month USD-LIBOR x 0.70 + 0.75%) 0.807% 2033 (put 2023)2 | | | 1,000 | | | | 1,003 | |
| Long Island Power Auth., Electric System General Rev. Bonds, Series 2015-C, (1-month USD-LIBOR x 0.70 + 0.75%) 0.807% 2033 (put 2023)2 | | | 840 | | | | 843 | |
| Metropolitan Transportation Auth., Transportation Rev. Bonds, Series 2014-C, 5.00% 2023 | | | 375 | | | | 409 | |
| Metropolitan Transportation Auth., Transportation Rev. Bonds, Series 2012-C, 5.00% 2032 (preref. 2022) | | | 1,000 | | | | 1,050 | |
| Metropolitan Transportation Auth., Transportation Rev. Bonds, Series 2014-D-2, (SIFMA Municipal Swap Index + 0.45%) 0.50% 2044 (put 2022)2 | | | 750 | | | | 751 | |
| Metropolitan Transportation Auth., Transportation Rev. Bonds, Series 2015-A-2, 5.00% 2045 (put 2030) | | | 2,180 | | | | 2,757 | |
| Private Client Services Funds | 21 |
Capital Group Core Municipal Fund
| Bonds, notes & other debt instruments (continued) | | Principal amount
(000) | | | Value
(000) | |
| New York (continued) | | | | | | | | |
| Metropolitan Transportation Auth., Transportation Rev. Bonds, Series 2012-C, 5.00% 2047 (preref. 2022) | | $ | 1,100 | | | $ | 1,155 | |
| Metropolitan Transportation Auth., Transportation Rev. Ref. Bonds, Series 2002-D-2-B, Assured Guaranty Municipal insured, (USD-SOFR x 0.67 + 0.55%) 0.583% 2032 (put 2024)2 | | | 880 | | | | 883 | |
| Metropolitan Transportation Auth., Transportation Rev. Ref. Bonds, Series 2002-D-2-A-2, Assured Guaranty Municipal insured, (USD-SOFR x 0.67 + 0.80%) 0.833% 2032 (put 2026)2 | | | 315 | | | | 319 | |
| Metropolitan Transportation Auth., Transportation Rev. Ref. Green Bonds, Series 2017-B, 5.00% 2023 | | | 1,000 | | | | 1,092 | |
| Metropolitan Transportation Auth., Transportation Rev. Ref. Green Bonds, Series 2017-C-1, 5.00% 2023 | | | 305 | | | | 333 | |
| Metropolitan Transportation Auth., Transportation Rev. Ref. Green Bonds, Series 2017-C-1, 5.00% 2024 | | | 165 | | | | 187 | |
| Metropolitan Transportation Auth., Transportation Rev. Ref. Green Bonds, Series 2017-C-1, 5.00% 2027 | | | 535 | | | | 651 | |
| Mortgage Agcy., Homeowner Mortgage Rev. Bonds, Series 197, 3.50% 2044 | | | 1,015 | | | | 1,075 | |
| Mortgage Agcy., Homeowner Mortgage Rev. Bonds, Series 233, 3.00% 2045 | | | 1,465 | | | | 1,579 | |
| Mortgage Agcy., Homeowner Mortgage Rev. Bonds, Series 203, 3.50% 2047 | | | 965 | | | | 1,024 | |
| Mortgage Agcy., Homeowner Mortgage Rev. Bonds, Series 213, 4.25% 2047 | | | 750 | | | | 820 | |
| New York City G.O. Bonds, Series 2020-C-1, 5.00% 2028 | | | 2,000 | | | | 2,519 | |
| New York City G.O. Bonds, Series 2018-A, 5.00% 2028 | | | 565 | | | | 693 | |
| New York City G.O. Bonds, Series 2020-C-1, 5.00% 2030 | | | 2,350 | | | | 3,066 | |
| New York City G.O. Bonds, Series 2018-E-1, 5.00% 2031 | | | 1,635 | | | | 2,018 | |
| New York City G.O. Bonds, Series 2020-C-1, 5.00% 2032 | | | 1,750 | | | | 2,252 | |
| New York City G.O. Bonds, Series 2021-A-1, 5.00% 2032 | | | 1,435 | | | | 1,885 | |
| New York City G.O. Bonds, Series 2008-L-5, 5.00% 2032 | | | 100 | | | | 131 | |
| New York City G.O. Bonds, Series 2021-A-1, 5.00% 2033 | | | 370 | | | | 485 | |
| New York City G.O. Bonds, Series 2015-F-4, 5.00% 2044 (put 2025) | | | 290 | | | | 334 | |
| New York City Health and Hospitals Corp., Health System Bonds, Series 2020-A, 5.00% 2024 | | | 375 | | | | 414 | |
| New York City Housing Dev. Corp., Multi Family Housing Rev. Bonds (8 Spruce Street), Series 2014-E, 3.50% 2048 | | | 320 | | | | 330 | |
| New York City Housing Dev. Corp., Multi Family Housing Rev. Bonds (Sustainable Dev. Bonds), Series 2017-C-3-A, 0.20% 2022 | | | 160 | | | | 160 | |
| New York City Housing Dev. Corp., Multi Family Housing Rev. Bonds (Sustainable Dev. Bonds), Series 2016-C-2, 0.23% 2050 (put 2022) | | | 190 | | | | 190 | |
| New York City Housing Dev. Corp., Multi Family Housing Rev. Bonds (Sustainable Dev. Bonds), Series 2021-C-2, 0.70% 2060 (put 2025) | | | 325 | | | | 326 | |
| New York City Housing Dev. Corp., Multi Family Housing Rev. Bonds (Sustainable Neighborhood Bonds), Series 2017-G-2-A, 2.00% 2057 (put 2021) | | | 275 | | | | 276 | |
| New York City Housing Dev. Corp., Multi Family Housing Rev. Bonds (Sustainable Neighborhood Bonds), Series 2020-I-2, 0.70% 2060 (put 2025) | | | 700 | | | | 701 | |
| New York City Housing Dev. Corp., Multi Family Housing Rev. Green Bonds, Series 2021-F-2, 0.60% 2061 (put 2025) | | | 835 | | | | 830 | |
| New York City Municipal Water Fin. Auth., Water and Sewer System Second General Resolution Rev. Bonds, Series 2021-DD, 5.00% 2029 | | | 465 | | | | 599 | |
| New York City Transitional Fin. Auth., Future Tax Secured Bonds, Series 2020-A-1, 5.00% 2022 | | | 35 | | | | 36 | |
| New York City Transitional Fin. Auth., Future Tax Secured Bonds, Series 2021-E-1, 5.00% 2023 | | | 65 | | | | 69 | |
| New York City Transitional Fin. Auth., Future Tax Secured Bonds, Series 2021-F-1, 5.00% 2024 | | | 1,025 | | | | 1,166 | |
| New York City Transitional Fin. Auth., Future Tax Secured Bonds, Series 2021-A-1, 5.00% 2030 | | | 355 | | | | 467 | |
| New York City Transitional Fin. Auth., Future Tax Secured Bonds, Series 2020-C-1, 5.00% 2031 | | | 760 | | | | 993 | |
| New York City Transitional Fin. Auth., Future Tax Secured Bonds, Series 2021-A-1, 5.00% 2031 | | | 195 | | | | 261 | |
| New York City Transitional Fin. Auth., Future Tax Secured Bonds, Series 2021-A-1, 5.00% 2032 | | | 910 | | | | 1,208 | |
| New York City Transitional Fin. Auth., Future Tax Secured Bonds, Series 2020-C-1, 5.00% 2032 | | | 110 | | | | 143 | |
| New York City Transitional Fin. Auth., Future Tax Secured Bonds, Series 2021-B-1, 5.00% 2034 | | | 1,390 | | | | 1,825 | |
| Town of Oyster Bay, Public Improvement Rev. Ref. Bonds, Series 2021, 2.00% 2022 | | | 150 | | | | 151 | |
| Town of Oyster Bay, Public Improvement Rev. Ref. Bonds, Series 2021, 4.00% 2023 | | | 140 | | | | 147 | |
| Public Housing Capital Fund Rev. Trust I, Trust Certs., Series 2012, 4.50% 20223 | | | 63 | | | | 63 | |
| County of Suffolk, Econ. Dev. Corp., Rev. Ref. Bonds (Peconic Landing at Southold, Inc. Project), Series 2010, 3.125% 2025 | | | 225 | | | | 238 | |
| Thruway Auth., Personal Income Tax Rev. Bonds, Series 2021-A-1, 5.00% 2033 | | | 1,000 | | | | 1,299 | |
| City of Troy, Capital Resource Corp., Rev. Ref. Bonds (Rensselaer Polytechnic Institute Project), Series 2020-A, 5.00% 2030 | | | 155 | | | | 199 | |
| Urban Dev. Corp., State Personal Income Tax Rev. Bonds (General Purpose), Series 2020-C, 5.00% 2028 | | | 295 | | | | 369 | |
| Urban Dev. Corp., State Personal Income Tax Rev. Bonds (General Purpose), Series 2020-C, 5.00% 2032 | | | 2,000 | | | | 2,584 | |
| Urban Dev. Corp., State Personal Income Tax Rev. Bonds (General Purpose), Series 2020-C, 5.00% 2033 | | | 1,275 | | | | 1,642 | |
| Utility Debt Securitization Auth., Restructuring Bonds, Series 2017, 5.00% 2025 | | | 130 | | | | 143 | |
| County of Westchester, Industrial Dev. Agcy., Multi Family Housing Rev. Bonds (Marble Hall - Tuckahoe LP Project), Series 2021, 0.28% 2024 (put 2023) | | | 1,550 | | | | 1,548 | |
| | | | | | | | 60,386 | |
| 22 | Private Client Services Funds |
Capital Group Core Municipal Fund
| Bonds, notes & other debt instruments (continued) | | Principal amount
(000) | | | Value
(000) | |
| North Carolina 1.82% | | | | | | | | |
| City of Burlington, Housing Auth., Multi Family Housing Rev. Bonds (Thetford Portfolio), Series 2021, 0.30% 2024 (put 2022) | | $ | 1,130 | | | $ | 1,129 | |
| City of Durham, Housing Auth., Multi Family Housing Rev. Bonds (JJ Henderson Apartments Project), Series 2020, 0.30% 2024 (put 2023) | | | 80 | | | | 80 | |
| City of Goldsboro, Multi Family Housing Rev. Bonds (Grand at Day Point), Series 2021, 0.28% 2024 (put 2023) | | | 1,725 | | | | 1,722 | |
| Hospital Auth., Health Care Rev. Bonds (Charlotte-Mecklenburg Hospital), Series 2021-D, 5.00% 2049 (put 2031) | | | 1,170 | | | | 1,561 | |
| Hospital Auth., Health Care Rev. Bonds (Charlotte-Mecklenburg Hospital), Series 2021-C, 5.00% 2050 (put 2028) | | | 585 | | | | 744 | |
| Housing Fin. Agcy., Home Ownership Rev. Bonds, Series 40, 4.25% 2047 | | | 890 | | | | 971 | |
| Housing Fin. Agcy., Home Ownership Rev. Ref. Bonds, Series 38-B, 4.00% 2047 | | | 995 | | | | 1,066 | |
| Housing Fin. Agcy., Home Ownership Rev. Ref. Bonds, Series 44, 4.00% 2050 | | | 315 | | | | 348 | |
| Housing Fin. Agcy., Multi Family Housing Rev. Bonds (Winds Crest Senior Living, LP), Series 2021, 0.36% 2024 (put 2023) | | | 405 | | | | 405 | |
| Raleigh-Durham Airport Auth., Airport Rev. Ref. Bonds, Series 2020-B, 5.00% 2022 | | | 1,705 | | | | 1,746 | |
| University of North Carolina at Chapel Hill, General Rev. Bonds, Series 2012-B, (1-month USD-LIBOR x 0.67 + 0.40%) 0.455% 2041 (put 2022)2 | | | 1,480 | | | | 1,482 | |
| University of North Carolina at Charlotte, General Rev. Ref. Bonds, Series 2017-A, 5.00% 2023 | | | 1,000 | | | | 1,091 | |
| County of Wake, G.O. Rev. Ref. Bonds, Series 2020-A, 5.00% 2022 | | | 1,190 | | | | 1,214 | |
| County of Wake, Limited Obligation Bonds, Series 2021, 5.00% 2023 | | | 675 | | | | 718 | |
| | | | | | | | 14,277 | |
| | | | | | | | | |
| North Dakota 0.46% | | | | | | | | |
| County of Cass, Joint Water Resource Dist., Temporary Rev. Ref. Improvement Bonds, Series 2021-A, 0.48% 2024 | | | 800 | | | | 801 | |
| City of Grand Forks, Health Care System Rev. Bonds, Series 2021, 5.00% 2030 | | | 280 | | | | 358 | |
| Housing Fin. Agcy., Homeownership Rev. Bonds (Home Mortgage Fin. Program), Series 2016-D, 3.50% 2046 | | | 965 | | | | 1,023 | |
| Housing Fin. Agcy., Housing Fin. Program Bonds (Home Mortgage Fin. Program), Series 2015-B, 4.00% 2036 | | | 210 | | | | 219 | |
| Housing Fin. Agcy., Housing Fin. Program Bonds (Home Mortgage Fin. Program), Series 2017-D, 4.00% 2048 | | | 305 | | | | 327 | |
| Housing Fin. Agcy., Housing Fin. Program Bonds (Home Mortgage Fin. Program), Series 2017-F, 4.00% 2048 | | | 230 | | | | 247 | |
| Housing Fin. Agcy., Housing Fin. Program Bonds (Home Mortgage Fin. Program), Series 2019-A, 4.25% 2049 | | | 170 | | | | 186 | |
| Housing Fin. Agcy., Housing Fin. Program Bonds (Home Mortgage Fin. Program), Series 2021-A, 3.00% 2052 | | | 440 | | | | 475 | |
| | | | | | | | 3,636 | |
| | | | | | | | | |
| Ohio 2.68% | | | | | | | | |
| Air Quality Dev. Auth., Air Quality Rev. Bonds (Ohio Valley Electric Corp. Project), Series 2009-B, 1.375% 2026 (put 2024) | | | 200 | | | | 199 | |
| Air Quality Dev. Auth., Air Quality Rev. Bonds (Ohio Valley Electric Corp. Project), Series 2009-C, 1.50% 2026 (put 2025) | | | 50 | | | | 50 | |
| Akron, Bath and Copley Joint Township Hospital Dist., Hospital Facs. Rev. Ref. Bonds (Summa Health Obligated Group), Series 2020, 5.00% 2028 | | | 680 | | | | 845 | |
| Akron, Bath and Copley Joint Township Hospital Dist., Hospital Facs. Rev. Ref. Bonds (Summa Health Obligated Group), Series 2020, 5.00% 2030 | | | 350 | | | | 449 | |
| County of Allen, Hospital Facs. Rev. Bonds (Bon Secours Mercy Health, Inc.), Series 2020-A, 5.00% 2027 | | | 1,500 | | | | 1,855 | |
| County of Allen, Hospital Facs. Rev. Bonds (Bon Secours Mercy Health, Inc.), Series 2020-A, 5.00% 2030 | | | 400 | | | | 517 | |
| County of Allen, Hospital Facs. Rev. Bonds (Mercy Health), Series 2017-A, 5.00% 2022 | | | 810 | | | | 839 | |
| County of Allen, Hospital Facs. Rev. Bonds (Mercy Health), Series 2017-A, 5.00% 2027 | | | 570 | | | | 699 | |
| County of Allen, Hospital Facs. Rev. Bonds (Mercy Health), Series 2017-B, 5.00% 2047 (put 2022) | | | 575 | | | | 588 | |
| Capital Facs. Lease Appropriation Bonds, Series 2021-A, 5.00% 2029 | | | 180 | | | | 228 | |
| Capital Facs. Lease Appropriation Bonds, Series 2021-A, 5.00% 2030 | | | 115 | | | | 149 | |
| City of Cleveland, Airport System Rev. Ref. Bonds, Series 2012-A, 5.00% 2025 | | | 1,000 | | | | 1,008 | |
| City of Dayton, Metropolitan Housing Auth., Multi Family Housing Rev. Bonds (Southern Montgomery Apartments Project), Series 2021-A, 0.32% 2024 (put 2023) | | | 200 | | | | 200 | |
| G.O. Common Schools Rev. Ref. Bonds, Series 2021-B, 5.00% 2028 | | | 685 | | | | 867 | |
| G.O. Conservation Projects Bonds, Series 2019-A, 2.00% 2022 | | | 65 | | | | 65 | |
| G.O. Infrastructure Improvement Bonds, Series 2021-A, 5.00% 2030 | | | 190 | | | | 247 | |
| County of Hamilton, Hospital Facs. Rev. Bonds (UC Health), Series 2014, 5.00% 2025 | | | 400 | | | | 439 | |
| Hospital Rev. Ref. Bonds (Cleveland Clinic Health System Obligated Group), Series 2021-B, 5.00% 2029 | | | 1,000 | | | | 1,269 | |
| Hospital Rev. Ref. Bonds (Cleveland Clinic Health System Obligated Group), Series 2021-B, 5.00% 2030 | | | 280 | | | | 362 | |
| Housing Fin. Agcy., Multi Family Housing Rev. Bonds (Chevybrook Estates Apartments Project), Series 2021, 0.35% 2024 (put 2023) | | | 200 | | | | 200 | |
| Housing Fin. Agcy., Multi Family Housing Rev. Bonds (Franklin Manor North Project), Series 2021, 0.25% 2024 (put 2023) | | | 440 | | | | 439 | |
| Private Client Services Funds | 23 |
Capital Group Core Municipal Fund
| Bonds, notes & other debt instruments (continued) | | Principal amount
(000) | | | Value
(000) | |
| Ohio (continued) | | | | | | | | |
| Housing Fin. Agcy., Multi Family Housing Rev. Bonds (Glen Meadows Apartments Project), Series 2021-A, 0.40% 2024 (put 2023) | | $ | 305 | | | $ | 305 | |
| Housing Fin. Agcy., Multi Family Housing Rev. Bonds (Pinzone Tower Apartments Project), Series 2021, 0.28% 2023 (put 2022) | | | 655 | | | | 654 | |
| Housing Fin. Agcy., Residential Mortgage Rev. Bonds (Mortgage-Backed Securities Program), Series 2017-D, 4.00% 2048 | | | 320 | | | | 344 | |
| Housing Fin. Agcy., Residential Mortgage Rev. Bonds (Mortgage-Backed Securities Program), Series 2019-A, 4.50% 2049 | | | 620 | | | | 687 | |
| Housing Fin. Agcy., Residential Mortgage Rev. Bonds (Mortgage-Backed Securities Program), Series 2020-A, 3.75% 2050 | | | 620 | | | | 680 | |
| Housing Fin. Agcy., Residential Mortgage Rev. Bonds (Mortgage-Backed Securities Program), Series 2021-C, 3.25% 2051 | | | 860 | | | | 940 | |
| Madison Local School Dist., School Improvement Rev. Ref. Bonds, Series 2014, 5.25% 2037 (preref. 2022) | | | 1,095 | | | | 1,127 | |
| Major New State Infrastructure Project Rev. Bonds, Series 2019-1, 5.00% 2028 | | | 700 | | | | 891 | |
| Major New State Infrastructure Project Rev. Bonds, Series 2019-1, 5.00% 2029 | | | 300 | | | | 389 | |
| County of Montgomery, Hospital Facs. Rev. Bonds (Dayton Children’s Hospital), Series 2021, 5.00% 2030 | | | 75 | | | | 97 | |
| North East Ohio Regional Sewer Dist., Wastewater Improvement Rev. and Rev. Ref. Bonds, Series 2014, 5.00% 2044 (preref. 2024) | | | 1,000 | | | | 1,140 | |
| Public Facs. Commission, Higher Education G.O. Bonds, Series 2015-C, 5.00% 2028 | | | 1,000 | | | | 1,153 | |
| Rev. Bonds (Premier Health Partners Obligated Group), Series 2020, 5.00% 2033 | | | 85 | | | | 106 | |
| Turnpike and Infrastructure Commission, Rev. Bonds, Series 2013-A-1, 5.00% 2025 | | | 115 | | | | 122 | |
| Water Dev. Auth., Water Dev. Rev. Bonds, Series 2013-A, 5.00% 2023 | | | 155 | | | | 167 | |
| Water Dev. Auth., Water Pollution Control Loan Fund Rev. Bonds, Series 2019-A, 5.00% 2029 | | | 130 | | | | 166 | |
| Water Dev. Auth., Water Pollution Control Loan Fund Rev. Bonds, Series 2020-A, 5.00% 2032 | | | 455 | | | | 590 | |
| | | | | | | | 21,072 | |
| | | | | | | | | |
| Oklahoma 0.20% | | | | | | | | |
| Capital Improvement Auth., State Highways Capital Improvement Rev. Ref. Bonds (Oklahoma Dept. of Transportation Project), Series 2020-A, 5.00% 2023 | | | 595 | | | | 642 | |
| Housing Fin. Agcy., Collateralized Rev. Bonds (Deer Park & Apple Run Apartments), Series 2019, 1.60% 2022 | | | 750 | | | | 752 | |
| Board of Regents of Oklahoma State University, General Rev. Ref. Bonds, Series 2020-A, 5.00% 2032 | | | 120 | | | | 156 | |
| | | | | | | | 1,550 | |
| | | | | | | | | |
| Oregon 0.91% | | | | | | | | |
| County of Deschutes, Deschutes Public Library Dist., G.O. Bonds, Series 2021, 4.00% 2029 | | | 225 | | | | 272 | |
| County of Deschutes, Deschutes Public Library Dist., G.O. Bonds, Series 2021, 4.00% 2030 | | | 265 | | | | 324 | |
| Facs. Auth., Rev. Bonds (University of Portland Projects), Series 2015-A, 5.00% 2031 | | | 600 | | | | 679 | |
| G.O. Bonds (Veteran’s Welfare Bonds Series 108), Series 2021-O, 3.00% 2051 | | | 2,095 | | | | 2,274 | |
| G.O. Bonds (Veteran’s Welfare Bonds Series 99B), Series 2020, 3.50% 2050 | | | 280 | | | | 305 | |
| Housing and Community Services Dept., Housing Dev. Rev. Bonds (The Susan Emmons Apartments Project), Series 2021-S-2, 0.38% 2024 (put 2023) | | | 460 | | | | 459 | |
| Housing and Community Services Dept., Housing Dev. Rev. Bonds (Westwind Apartments Project), Series 2021-H, 0.25% 2024 (put 2023) | | | 175 | | | | 175 | |
| Housing and Community Services Dept., Mortgage Rev. Bonds (Single Family Mortgage Program), Series 2017-A, 4.00% 2047 | | | 685 | | | | 732 | |
| Housing and Community Services Dept., Mortgage Rev. Bonds (Single Family Mortgage Program), Series 2016-A, 4.00% 2047 | | | 400 | | | | 423 | |
| Housing and Community Services Dept., Mortgage Rev. Bonds (Single Family Mortgage Program), Series 2018-A, 4.50% 2049 | | | 135 | | | | 146 | |
| Housing and Community Services Dept., Mortgage Rev. Bonds (Single Family Mortgage Program), Series 2020-C, 3.00% 2052 | | | 1,235 | | | | 1,326 | |
| | | | | | | | 7,115 | |
| | | | | | | | | |
| Pennsylvania 2.76% | | | | | | | | |
| County of Allegheny, Airport Auth., Airport Rev. Bonds, Series 2013-A, 5.00% 2022 | | | 400 | | | | 406 | |
| County of Allegheny, Hospital Dev. Auth., UPMC Rev. Bonds, Series 2019-A, 5.00% 2022 | | | 1,000 | | | | 1,033 | |
| County of Allegheny, Sanitary Auth., Sewer Rev. Bonds, Series 2020-A, 5.00% 2026 | | | 500 | | | | 595 | |
| County of Berks, G.O. Bonds, Series 2015, 4.00% 2027 (preref. 2023) | | | 35 | | | | 38 | |
| Bethlehem Area School Dist. Auth., School Rev. Bonds (Bethlehem Area School Dist. Ref. Project), Series 2021-C, (USD-SOFR x 0.67 + 0.35%) 0.384% 2030 (put 2025)2 | | | 195 | | | | 195 | |
| 24 | Private Client Services Funds |
Capital Group Core Municipal Fund
| Bonds, notes & other debt instruments (continued) | | Principal amount
(000) | | | Value
(000) | |
| Pennsylvania (continued) | | | | | | | | |
| Bethlehem Area School Dist. Auth., School Rev. Bonds (Bethlehem Area School Dist. Ref. Project), Series 2021-B, (USD-SOFR x 0.67 + 0.35%) 0.384% 2031 (put 2025)2 | | $ | 265 | | | $ | 265 | |
| Bethlehem Area School Dist. Auth., School Rev. Bonds (Bethlehem Area School Dist. Ref. Project), Series 2021-C, (USD-SOFR x 0.67 + 0.35%) 0.384% 2032 (put 2025)2 | | | 205 | | | | 205 | |
| Cumberland Valley School Dist., G.O. Bonds, Series 2015, 5.00% 2032 (preref. 2023) | | | 150 | | | | 164 | |
| Cumberland Valley School Dist., G.O. Bonds, Series 2015, 5.00% 2034 (preref. 2023) | | | 130 | | | | 143 | |
| Econ. Dev. Fncg. Auth., Solid Waste Disposal Rev. Bonds (Waste Management, Inc. Project), Series 2004-A, 2.15% 2021 | | | 200 | | | | 200 | |
| Econ. Dev. Fncg. Auth., UPMC Rev. Bonds, Series 2021-A, 5.00% 2028 | | | 1,500 | | | | 1,885 | |
| Fncg. Auth., Rev. Bonds, Series 2013-A-2, 5.00% 2027 (preref. 2022) | | | 500 | | | | 514 | |
| Fncg. Auth., Rev. Bonds, Series 2013-A-2, 5.00% 2042 (preref. 2022) | | | 580 | | | | 596 | |
| G.O. Bonds, Series 2011-1, 5.00% 2025 (preref. 2021) | | | 700 | | | | 701 | |
| General Auth. of Southcentral Pennsylvania, Rev. Bonds (Wellspan Health Obligated Group), Series 2019-B, (SIFMA Municipal Swap Index + 0.60%) 0.65% 2049 (put 2024)2 | | | 455 | | | | 458 | |
| Housing Fin. Agcy., Single Family Mortgage Rev. Bonds, Series 2017-122, 4.00% 2046 | | | 1,005 | | | | 1,073 | |
| Housing Fin. Agcy., Single Family Mortgage Rev. Bonds, Series 2020-133, 3.00% 2050 | | | 1,000 | | | | 1,072 | |
| Housing Fin. Agcy., Single Family Mortgage Rev. Bonds, Series 2021-135-A, 3.00% 2051 | | | 220 | | | | 235 | |
| Housing Fin. Agcy., Special Limited Obligation, Multi Family Housing Dev. Bonds (Harrison Senior Tower), Series 2021, 0.25% 2024 (put 2023) | | | 1,030 | | | | 1,026 | |
| Housing Fin. Agcy., Special Limited Obligation, Multi Family Housing Dev. Bonds (School of Nursing), Series 2021, 0.27% 2024 (put 2023) | | | 330 | | | | 329 | |
| County of Lehigh, General Purpose Auth., Rev. Bonds (The Good Shepherd Group), Series 2021-A, 4.00% 2023 | | | 95 | | | | 102 | |
| County of Montgomery, Higher Education and Health Auth., Hospital Rev. Bonds (Abington Memorial Hospital Obligated Group), Series 2012-A, 5.00% 2031 (preref. 2022) | | | 350 | | | | 360 | |
| County of Montgomery, Higher Education and Health Auth., Rev. Bonds (Thomas Jefferson University), Series 2018-C, 0.77% 2051 (put 2023)2 | | | 400 | | | | 400 | |
| County of Montgomery, Industrial Dev. Auth., Rev. Bonds (Foulkeways at Gwynedd Project), Series 2016, 5.00% 2026 | | | 400 | | | | 455 | |
| County of Montgomery, Industrial Dev. Auth., Rev. Bonds (Waverly Heights Ltd.), Series 2019, 4.00% 2021 | | | 100 | | | | 100 | |
| County of Montgomery, Industrial Dev. Auth., Rev. Bonds (Waverly Heights Ltd.), Series 2019, 4.00% 2023 | | | 125 | | | | 134 | |
| County of Northampton, General Purpose Auth., Hospital Rev. Bonds (St. Luke’s University Health Network Project), Series 2018-B, (1-month USD-LIBOR x 0.70 + 1.04%) 1.097% 2048 (put 2022)2 | | | 175 | | | | 176 | |
| Philadelphia School Dist., G.O. Bonds, Series 2019-A, 5.00% 2022 | | | 1,050 | | | | 1,092 | |
| Philadelphia School Dist., G.O. Bonds, Series 2016-F, 5.00% 2025 | | | 415 | | | | 483 | |
| Philadelphia School Dist., G.O. Bonds, Series 2021-A, 5.00% 2030 | | | 260 | | | | 334 | |
| Philadelphia School Dist., G.O. Bonds, Series 2021-A, 5.00% 2031 | | | 125 | | | | 163 | |
| Philadelphia School Dist., G.O. Rev. Ref. Bonds, Series 2016-F, 5.00% 2023 | | | 1,500 | | | | 1,628 | |
| Scranton School Dist., G.O. Bonds, Series 2017-E, BAM insured, 5.00% 2026 | | | 1,000 | | | | 1,198 | |
| Turnpike Commission, Turnpike Rev. Bonds, Series 2011-E, 5.00% 2042 (preref. 2022) | | | 575 | | | | 605 | |
| Turnpike Commission, Turnpike Rev. Bonds, Series 2011-E, 5.00% 2029 (preref. 2021) | | | 1,315 | | | | 1,320 | |
| Turnpike Commission, Turnpike Rev. Bonds, Series 2011-E, 5.00% 2030 (preref. 2021) | | | 335 | | | | 336 | |
| Turnpike Commission, Turnpike Rev. Bonds, Series 2021-B, 5.00% 2030 | | | 165 | | | | 216 | |
| Turnpike Commission, Turnpike Rev. Bonds, Series 2021-B, 5.00% 2031 | | | 295 | | | | 387 | |
| Turnpike Commission, Turnpike Rev. Bonds (Motor License Fund), Series 2012-A, 5.00% 2026 (preref. 2021) | | | 1,000 | | | | 1,004 | |
| | | | | | | | 21,626 | |
| | | | | | | | | |
| Rhode Island 0.30% | | | | | | | | |
| Commerce Corp., Grant Anticipation Rev. Ref. Bonds (Dept. of Transportation), Series 2016-A, 5.00% 2023 | | | 500 | | | | 538 | |
| Housing and Mortgage Fin. Corp., Homeownership Opportunity Bonds, Series 75-A, 3.00% 2051 | | | 1,530 | | | | 1,655 | |
| Housing and Mortgage Fin. Corp., Multi Family Dev. Bonds, Series 2021-A-1, 0.45% 2040 (put 2023) | | | 195 | | | | 195 | |
| | | | | | | | 2,388 | |
| | | | | | | | | |
| South Carolina 1.18% | | | | | | | | |
| County of Charleston, G.O. Capital Improvement Transportation Sales Tax Bonds, Series 2011, 5.00% 2024 (preref. 2021) | | | 515 | | | | 515 | |
| City of Columbia, Housing Auth., Multi Family Housing Rev. Bonds (Palmetto Terrace Apartments Project), Series 2021, 0.31% 2024 (put 2023) | | | 460 | | | | 459 | |
| City of Columbia, Waterworks and Sewer System Rev. Bonds, Series 2019-A, 5.00% 2028 | | | 100 | | | | 125 | |
| City of Columbia, Waterworks and Sewer System Rev. Bonds, Series 2013, 5.00% 2043 (preref. 2023) | | | 1,000 | | | | 1,060 | |
| Housing Fin. and Dev. Auth., Mortgage Rev. Bonds, Series 2017-A, 4.00% 2047 | | | 365 | | | | 387 | |
| Private Client Services Funds | 25 |
Capital Group Core Municipal Fund
| Bonds, notes & other debt instruments (continued) | | Principal amount
(000) | | | Value
(000) | |
| South Carolina (continued) | | | | | | | | |
| Housing Fin. and Dev. Auth., Mortgage Rev. Bonds, Series 2017-B, 4.00% 2047 | | $ | 95 | | | $ | 102 | |
| Housing Fin. and Dev. Auth., Mortgage Rev. Bonds, Series 2020-A, 4.00% 2050 | | | 755 | | | | 837 | |
| Housing Fin. and Dev. Auth., Mortgage Rev. Bonds, Series 2021-A, 3.00% 2052 | | | 645 | | | | 699 | |
| Housing Fin. and Dev. Auth., Mortgage Rev. Ref. Bonds, Series 2016-A, 4.00% 2036 | | | 510 | | | | 546 | |
| Lexington County Health Services Dist., Inc., Hospital Rev. Ref. Bonds, Series 2017, 5.00% 2022 | | | 600 | | | | 628 | |
| Lexington County Health Services Dist., Inc., Hospital Rev. Ref. Bonds, Series 2017, 5.00% 2024 | | | 500 | | | | 566 | |
| Patriots Energy Group Fncg. Agcy., Gas Supply Rev. Bonds, Series 2018-A, 4.00% 2048 (put 2024) | | | 180 | | | | 193 | |
| Public Service Auth., Improvement Rev. Obligations, Series 2021-B, 5.00% 2029 | | | 520 | | | | 666 | |
| Public Service Auth., Rev. Obligations (Santee Cooper), Series 2014-C, 5.00% 2021 | | | 500 | | | | 502 | |
| Public Service Auth., Rev. Obligations (Santee Cooper), Series 2014-C, 5.00% 2022 | | | 350 | | | | 368 | |
| Public Service Auth., Rev. Obligations (Santee Cooper), Series 2014-C, 5.00% 2023 | | | 125 | | | | 137 | |
| Public Service Auth., Rev. Obligations (Santee Cooper), Series 2012-D, 5.00% 2028 | | | 510 | | | | 524 | |
| Public Service Auth., Rev. Obligations (Santee Cooper), Series 2012-D, 5.00% 2028 (preref. 2022) | | | 490 | | | | 504 | |
| Public Service Auth., Rev. Obligations (Santee Cooper), Series 2011-C, 5.00% 2036 | | | 340 | | | | 341 | |
| Public Service Auth., Rev. Ref. Obligations (Santee Cooper), Series 2015-A, 5.00% 2028 | | | 100 | | | | 114 | |
| | | | | | | | 9,273 | |
| | | | | | | | | |
| South Dakota 1.04% | | | | | | | | |
| Housing Dev. Auth., Homeownership Mortgage Bonds, Series 2014-E, 4.00% 2044 | | | 550 | | | | 575 | |
| Housing Dev. Auth., Homeownership Mortgage Bonds, Series 2016-D, 3.50% 2046 | | | 830 | | | | 878 | |
| Housing Dev. Auth., Homeownership Mortgage Bonds, Series 2017-B, 4.00% 2047 | | | 1,175 | | | | 1,263 | |
| Housing Dev. Auth., Homeownership Mortgage Bonds, Series 2018-B, 4.50% 2048 | | | 1,440 | | | | 1,593 | |
| Housing Dev. Auth., Homeownership Mortgage Bonds, Series 2019-B, 4.00% 2049 | | | 315 | | | | 344 | |
| Housing Dev. Auth., Homeownership Mortgage Bonds, Series 2021-B, 3.00% 2051 | | | 2,255 | | | | 2,433 | |
| Housing Dev. Auth., Homeownership Mortgage Bonds, Series 2020-C, 3.50% 2051 | | | 975 | | | | 1,064 | |
| | | | | | | | 8,150 | |
| | | | | | | | | |
| Tennessee 0.66% | | | | | | | | |
| Town of Greeneville, Health and Educational Facs. Board, Multi Family Housing Rev. Bonds (People RD Portfolio Project), Series 2019, 1.45% 2022 (put 2021) | | | 20 | | | | 20 | |
| Housing Dev. Agcy., Homeownership Program Bonds, Series 2012-1-C, 4.50% 2037 | | | 30 | | | | 30 | |
| Housing Dev. Agcy., Homeownership Program Bonds, Series 2012-2-C, 4.00% 2038 | | | 25 | | | | 25 | |
| Housing Dev. Agcy., Residential Fin. Program Bonds, Series 2017-1, 4.00% 2042 | | | 470 | | | | 504 | |
| Housing Dev. Agcy., Residential Fin. Program Bonds, Series 2017-2-B, 4.00% 2042 | | | 465 | | | | 500 | |
| Housing Dev. Agcy., Residential Fin. Program Bonds, Series 2015-2-A, 4.00% 2046 | | | 460 | | | | 488 | |
| Housing Dev. Agcy., Residential Fin. Program Bonds, Series 2020-3-A, 3.50% 2050 | | | 110 | | | | 120 | |
| Housing Dev. Agcy., Residential Fin. Program Bonds, Series 2015-2-A, 3.75% 2050 | | | 450 | | | | 493 | |
| Housing Dev. Agcy., Residential Fin. Program Bonds, Series 2019-1, 4.25% 2050 | | | 835 | | | | 913 | |
| City of Knoxville, Community Dev. Corp., Collateralized Multi Family Housing Bonds (Austin 1B Apartments Project), Series 2021, 0.22% 2024 (put 2023) | | | 155 | | | | 154 | |
| Metropolitan Government of Nashville and Davidson County, Health and Educational Facs. Board, Rev. Bonds (Vanderbilt University Medical Center), Series 2021-A, 5.00% 2031 | | | 355 | | | | 455 | |
| Metropolitan Government of Nashville and Davidson County, Water & Sewer Rev. Green Bonds, Series 2021-A, 5.00% 2030 | | | 145 | | | | 189 | |
| Tennessee Energy Acquisition Corp., Commodity Project Rev. Bonds, Series 2021-A, 5.00% 2052 (put 2031) | | | 1,000 | | | | 1,291 | |
| | | | | | | | 5,182 | |
| | | | | | | | | |
| Texas 13.85% | | | | | | | | |
| Affordable Housing Corp., Multi Family Housing Rev. Bonds (Apartments of Las Palmas I LLC), Series 2021, 0.25% 2024 (put 2022) | | | 65 | | | | 65 | |
| Alvarado Independent School Dist., Unlimited Tax School Building Bonds, Series 2020, 5.00% 2023 | | | 795 | | | | 842 | |
| Alvin Independent School Dist., Unlimited Tax Schoolhouse and Rev. Ref. Bonds, Series 2020, 5.00% 2025 | | | 600 | | | | 689 | |
| Alvin Independent School Dist., Unlimited Tax Schoolhouse and Rev. Ref. Bonds, Series 2020, 5.00% 2027 | | | 225 | | | | 274 | |
| Angleton Independent School Dist., Unlimited Tax School Building Bonds, Series 2020, 5.00% 2025 | | | 620 | | | | 711 | |
| Arlington Higher Education Fin. Corp., Education Rev. and Rev. Ref. Bonds (Uplift Education), Series 2017-A, 5.00% 2023 | | | 885 | | | | 968 | |
| Arlington Higher Education Fin. Corp., Education Rev. and Rev. Ref. Bonds (Uplift Education), Series 2017-A, 5.00% 2024 | | | 400 | | | | 454 | |
| Arlington Higher Education Fin. Corp., Education Rev. Bonds (Great Hearts America - Texas), Series 2019-A, 5.00% 2026 | | | 400 | | | | 476 | |
| 26 | Private Client Services Funds |
Capital Group Core Municipal Fund
| Bonds, notes & other debt instruments (continued) | | Principal amount
(000) | | | Value
(000) | |
| Texas (continued) | | | | | | | | |
| Arlington Higher Education Fin. Corp., Education Rev. Bonds (Great Hearts America - Texas), Series 2019-A, 5.00% 2028 | | $ | 595 | | | $ | 741 | |
| Arlington Higher Education Fin. Corp., Education Rev. Bonds (Great Hearts America - Texas), Series 2019-A, 5.00% 2029 | | | 235 | | | | 298 | |
| Arlington Higher Education Fin. Corp., Education Rev. Bonds (KIPP Texas, Inc.), Series 2019, 5.00% 2026 | | | 1,900 | | | | 2,273 | |
| Arlington Higher Education Fin. Corp., Education Rev. Bonds (KIPP Texas, Inc.), Series 2019, 5.00% 2027 | | | 1,000 | | | | 1,225 | |
| Arlington Higher Education Fin. Corp., Education Rev. Bonds (Responsive Education Solutions), Series 2021-A, 5.00% 2029 | | | 510 | | | | 650 | |
| Arlington Higher Education Fin. Corp., Education Rev. Bonds (Responsive Education Solutions), Series 2021-A, 5.00% 2030 | | | 485 | | | | 629 | |
| Arlington Higher Education Fin. Corp., Education Rev. Bonds (Riverwalk Education Foundation, Inc.), Series 2019, 5.00% 2028 | | | 650 | | | | 808 | |
| Arlington Higher Education Fin. Corp., Education Rev. Bonds (Uplift Education), Series 2017-B, 5.00% 2026 | | | 450 | | | | 540 | |
| Arlington Higher Education Fin. Corp., Education Rev. Bonds (Uplift Education), Series 2019-A, 4.00% 2027 | | | 460 | | | | 529 | |
| Arlington Higher Education Fin. Corp., Education Rev. Bonds (Uplift Education), Series 2017-B, 5.00% 2027 | | | 250 | | | | 301 | |
| Arlington Higher Education Fin. Corp., Education Rev. Bonds (Uplift Education), Series 2019-A, 4.00% 2028 | | | 475 | | | | 546 | |
| Arlington Higher Education Fin. Corp., Education Rev. Bonds (Uplift Education), Series 2019-A, 4.00% 2029 | | | 395 | | | | 451 | |
| Arlington Independent School Dist., Unlimited Tax School Building and Rev. Ref. Bonds, Series 2020, 5.00% 2026 | | | 325 | | | | 385 | |
| City of Arlington, Permanent Improvement Bonds, Series 2021-A, 5.00% 2030 | | | 140 | | | | 183 | |
| Austin Affordable PFC, Inc., Multi Family Housing Rev. Bonds (Bridge at Turtle Creek Apartments), Series 2020, 0.42% 2040 (put 2023) | | | 1,000 | | | | 1,001 | |
| Austin Community College Dist., Maintenance Tax Notes, Series 2021, 5.00% 2030 | | | 160 | | | | 210 | |
| City of Austin, Water and Wastewater System Rev. Ref. Bonds, Series 2015-A, 5.00% 2030 | | | 740 | | | | 867 | |
| City of Austin, Water and Wastewater System Rev. Ref. Bonds, Series 2021, 5.00% 2030 | | | 110 | | | | 145 | |
| City of Austin, Water and Wastewater System Rev. Ref. Bonds, Series 2021, 5.00% 2031 | | | 135 | | | | 181 | |
| Barbers Hill Independent School Dist., Unlimited Tax School Building Bonds, Series 2020, 5.00% 2030 | | | 375 | | | | 486 | |
| Beaumont Independent School Dist., Unlimited Tax Rev. Ref. Bonds, Series 2017, 5.00% 2026 | | | 1,500 | | | | 1,776 | |
| County of Bexar, Hospital Dist., Limited Tax Rev. Ref. Bonds, Series 2019, 5.00% 2031 | | | 480 | | | | 592 | |
| Brazosport Independent School Dist., Unlimited Tax School Building Bonds, Series 2019, 5.00% 2022 | | | 115 | | | | 117 | |
| Burnet Consolidated Independent School Dist., Unlimited Tax School Building Bonds, Series 2021, 5.00% 2031 | | | 215 | | | | 280 | |
| County of Cameron, Housing Fin. Corp., Multi Family Housing Rev. Bonds (Sunland Country Apartments), Series 2021, 0.28% 2024 (put 2023) | | | 205 | | | | 205 | |
| Canyon Independent School Dist., Unlimited Tax School Building Bonds, Series 2020, 5.00% 2027 | | | 1,000 | | | | 1,217 | |
| Capital Area Housing Fin. Corp., Multi Family Housing Rev. Bonds (Mission Trail at El Camino Real Apartments), Series 2019, 2.10% 2037 (put 2022) | | | 1,080 | | | | 1,081 | |
| Capital Area Housing Fin. Corp., Multi Family Housing Rev. Bonds (Redwood Apartments), Series 2020, 0.41% 2041 (put 2024) | | | 3,920 | | | | 3,922 | |
| Carroll Independent School Dist., Unlimited Tax Rev. Ref. Bonds, Series 2019, 5.00% 2026 | | | 970 | | | | 1,148 | |
| Carrollton-Farmers Branch Independent School Dist., Unlimited Tax School Building Bonds, Series 2021, 5.00% 2023 | | | 230 | | | | 244 | |
| Central Texas Regional Mobility Auth., Rev. Ref. Bonds, Series 2021-D, 5.00% 2030 | | | 320 | | | | 409 | |
| Central Texas Regional Mobility Auth., Rev. Ref. Bonds, Series 2021-D, 5.00% 2032 | | | 520 | | | | 679 | |
| Clear Creek Independent School Dist., Unlimited Tax School Building Bonds, Series 2018, 5.00% 2028 | | | 1,100 | | | | 1,335 | |
| Clear Creek Independent School Dist., Unlimited Tax School Building Bonds, Series 2013-B, 0.28% 2038 (put 2024) | | | 205 | | | | 204 | |
| Clifton Higher Education Fin. Corp., Education Rev. and Ref. Bonds (Idea Public Schools), Series 2017, 5.00% 2027 | | | 1,360 | | | | 1,672 | |
| Clifton Higher Education Fin. Corp., Education Rev. Bonds (Idea Public Schools), Series 2018, 5.00% 2025 | | | 500 | | | | 582 | |
| Clifton Higher Education Fin. Corp., Education Rev. Bonds (Idea Public Schools), Series 2019, 5.00% 2026 | | | 1,000 | | | | 1,199 | |
| Collin County Community College Dist., G.O. Bonds, Series 2020-A, 5.00% 2032 | | | 680 | | | | 876 | |
| Conroe Independent School Dist., Unlimited Tax Rev. Ref. Bonds, Series 2019, 5.00% 2022 | | | 220 | | | | 223 | |
| Corpus Christi Independent School Dist., Unlimited Tax School Building and Rev. Ref. Bonds, Series 2020, 5.00% 2027 | | | 675 | | | | 831 | |
| Port of Corpus Christi Auth. of Nueces County, Rev. Bonds, Series 2018-A, 5.00% 2027 | | | 490 | | | | 599 | |
| Crowley Independent School Dist., Unlimited Tax Rev. Ref. Bonds, Series 2015-A, 5.00% 2025 | | | 1,000 | | | | 1,163 | |
| Crowley Independent School Dist., Unlimited Tax School Building Bonds, Series 2019, 5.00% 2028 | | | 310 | | | | 389 | |
| Crowley Independent School Dist., Unlimited Tax School Building Bonds, Series 2019, 5.00% 2029 | | | 400 | | | | 508 | |
| Crowley Independent School Dist., Unlimited Tax School Building Bonds, Series 2019, 5.00% 2031 | | | 260 | | | | 327 | |
| Cities of Dallas and Fort Worth, Dallas/Fort Worth International Airport, Joint Rev. Improvement Bonds, Series 2013-B, 4.00% 2039 | | | 1,000 | | | | 1,034 | |
| City of Dallas, Housing Fin. Corp., Multi Family Housing Rev. Bonds (Midpark Towers), Series 2021, 0.35% 2024 (put 2023) | | | 675 | | | | 675 | |
| City of Dallas, Housing Fin. Corp., Multi Family Housing Rev. Notes (Estates at Shiloh), Series 2019, 1.25% 2037 (put 2023) | | | 430 | | | | 436 | |
| Private Client Services Funds | 27 |
Capital Group Core Municipal Fund
| Bonds, notes & other debt instruments (continued) | | Principal amount
(000) | | | Value
(000) | |
| Texas (continued) | | | | | | | | |
| Dallas Independent School Dist., Unlimited Tax Rev. Ref. Bonds, Series 2014-A, 5.00% 2023 | | $ | 120 | | | $ | 130 | |
| Del Valle Independent School Dist., Unlimited Tax School Building Bonds, Series 2020, 5.00% 2022 | | | 155 | | | | 160 | |
| City of Denton, Utility System Rev. Bonds, Series 2017, 5.00% 2028 | | | 2,000 | | | | 2,396 | |
| Eagle Mountain-Saginaw Independent School Dist., Unlimited Tax School Building Bonds, Series 2019, 5.00% 2027 | | | 600 | | | | 738 | |
| El Paso Independent School Dist., Unlimited Tax Rev. Ref. Bonds, Series 2015, 5.00% 2026 | | | 500 | | | | 565 | |
| Fort Bend Independent School Dist., Unlimited Tax Rev. Ref. Bonds, Series 2021-B, 0.72% 2051 (put 2026) | | | 1,515 | | | | 1,511 | |
| Fort Bend Independent School Dist., Unlimited Tax School Building and Rev. Ref. Bonds, Series 2020-B, 0.875% 2050 (put 2023) | | | 340 | | | | 343 | |
| Fort Worth Independent School Dist., Unlimited Tax School Building Bonds, Series 2021-A, 5.00% 2030 | | | 275 | | | | 357 | |
| Fort Worth Independent School Dist., Unlimited Tax School Building Bonds, Series 2021-A, 5.00% 2031 | | | 255 | | | | 337 | |
| G.O. Water Financial Assistance Rev. Ref. Bonds, Series 2021-B, 4.00% 2028 | | | 175 | | | | 197 | |
| City of Galveston, Public Fac. Corp., Multi Family Housing Rev. Bonds (The Orleanders at Broadway), Series 2021, 0.47% 2025 (put 2024) | | | 510 | | | | 509 | |
| City of Garland, Electric Utility System Rev. Ref. Bonds, Series 2021, 5.00% 2022 | | | 675 | | | | 686 | |
| City of Garland, Electric Utility System Rev. Ref. Bonds, Series 2021-A, 5.00% 2028 | | | 80 | | | | 99 | |
| City of Garland, Electric Utility System Rev. Ref. Bonds, Series 2021-A, 5.00% 2031 | | | 150 | | | | 196 | |
| City of Garland, Tax and Rev. Certs. of Obligation, Series 2021, 5.00% 2024 | | | 135 | | | | 149 | |
| Goose Creek Consolidated Independent School Dist., Unlimited Tax School Building Bonds, Series 2014-B, 0.60% 2035 (put 2026) | | | 340 | | | | 337 | |
| Goose Creek Consolidated Independent School Dist., Unlimited Tax School Building Bonds, Series 2019-B, 0.15% 2049 (put 2022) | | | 555 | | | | 555 | |
| Harlandale Independent School Dist., Maintenance Tax Notes, Series 2021, BAM insured, 2.00% 2040 (put 2024) | | | 185 | | | | 187 | |
| Harlandale Independent School Dist., Unlimited Tax Rev. Ref. Bonds, Series 2020, 0.75% 2045 (put 2025) | | | 330 | | | | 330 | |
| County of Harris, Cultural Education Facs. Fin. Corp., Hospital Rev. Bonds (Memorial Hermann Health System), Series 2020, 5.00% 2022 | | | 1,000 | | | | 1,028 | |
| County of Harris, Cultural Education Facs. Fin. Corp., Hospital Rev. Bonds (Memorial Hermann Health System), Series 2019-C-2, (SIFMA Municipal Swap Index + 0.57%) 0.62% 2049 (put 2024)2 | | | 1,000 | | | | 1,004 | |
| County of Harris, Cultural Education Facs. Fin. Corp., Hospital Rev. Bonds (Texas Children’s Hospital), Series 2019-B, 5.00% 2041 (put 2024) | | | 1,000 | | | | 1,132 | |
| County of Harris, Cultural Education Facs. Fin. Corp., Hospital Rev. Ref. Bonds (Memorial Hermann Health System), Series 2013-B, (SIFMA Municipal Swap Index + 0.90%) 0.95% 20222 | | | 250 | | | | 251 | |
| County of Harris, Cultural Education Facs. Fin. Corp., Medical Facs. Mortgage Rev. Ref. Bonds (Baylor College of Medicine), Series 2019-A, (3-month USD-LIBOR x 0.70 + 0.65%) 0.707% 2046 (put 2024)2 | | | 535 | | | | 537 | |
| County of Harris, Cultural Education Facs. Fin. Corp., Rev. Bonds (Texas Medical Center), Series 2020-A, 0.90% 2050 (put 2025) | | | 455 | | | | 455 | |
| County of Harris, Health Facs. Dev. Corp., Rev. Ref. Bonds (CHRISTUS Health), Series 2005-A-4, Assured Guaranty Municipal insured, 0.20% 20312 | | | 125 | | | | 125 | |
| County of Harris, Sports Auth., Rev. Ref. Bonds, Series 2014-A, Assured Guaranty Municipal insured, 5.00% 2022 (escrowed to maturity) | | | 365 | | | | 383 | |
| Hays Consolidated Independent School Dist., Unlimited Tax School Building Bonds, Series 2021, 4.00% 2030 | | | 2,045 | | | | 2,448 | |
| Dept. of Housing and Community Affairs, Multi Family Housing Rev. Bonds (Corona Del Valle), Series 2021, 0.37% 2025 (put 2023) | | | 185 | | | | 185 | |
| Dept. of Housing and Community Affairs, Multi Family Housing Rev. Bonds (Oso Bay Apartments), Series 2021, 0.27% 2024 (put 2022) | | | 345 | | | | 345 | |
| Dept. of Housing and Community Affairs, Multi Family Housing Rev. Bonds (Palladium Simpson Stuart Apartments), Series 2021, 0.35% 2025 (put 2024) | | | 630 | | | | 629 | |
| Dept. of Housing and Community Affairs, Residential Mortgage Rev. Bonds, Series 2019-A, 4.75% 2049 | | | 1,195 | | | | 1,322 | |
| Dept. of Housing and Community Affairs, Residential Mortgage Rev. Bonds, Series 2021-A, 3.00% 2052 | | | 2,300 | | | | 2,490 | |
| Dept. of Housing and Community Affairs, Single Family Mortgage Rev. Bonds, Series 2019-A, 4.00% 2050 | | | 1,270 | | | | 1,415 | |
| Dept. of Housing and Community Affairs, Single Family Mortgage Rev. Bonds, Series 2020-A, 3.50% 2051 | | | 370 | | | | 407 | |
| Dept. of Housing and Community Affairs, Single Family Mortgage Rev. Bonds, Series 2021-A, 3.00% 2052 | | | 850 | | | | 922 | |
| Housing Options, Inc., Multi Family Housing Rev. Bonds (Brooks Manor - The Oaks Project), Series 2021, 0.50% 2041 (put 2025) | | | 255 | | | | 254 | |
| City of Houston, Combined Utility System Rev. and Rev. Ref. Bonds, Series 2016-B, 5.00% 2027 | | | 500 | | | | 607 | |
| City of Houston, Combined Utility System Rev. Bonds, Series 2011-D, 5.00% 2026 (preref. 2021) | | | 185 | | | | 185 | |
| City of Houston, Combined Utility System Rev. Ref. Bonds, Series 2019-B, 5.00% 2027 | | | 550 | | | | 682 | |
| City of Houston, Convention and Entertainment Facs. Dept., Hotel Occupancy Tax and Special Rev. Ref. Bonds, Series 2021, 4.00% 2028 | | | 225 | | | | 264 | |
| City of Houston, Convention and Entertainment Facs. Dept., Hotel Occupancy Tax and Special Rev. Ref. Bonds, Series 2021, 4.00% 2030 | | | 25 | | | | 30 | |
| City of Houston, Convention and Entertainment Facs. Dept., Hotel Occupancy Tax and Special Rev. Ref. Bonds, Series 2021, 4.00% 2031 | | | 10 | | | | 12 | |
| | |
| 28 | Private Client Services Funds |
Capital Group Core Municipal Fund
| Bonds, notes & other debt instruments (continued) | | Principal amount
(000) | | | Value
(000) | |
| Texas (continued) | | | | | | | | |
| City of Houston, Housing Fin. Corp., Multi Family Housing Rev. Bonds (Temenos Place Apartments), Series 2021, 0.29% 2024 (put 2023) | | $ | 325 | | | $ | 324 | |
| City of Houston, Memorial City Redev. Auth., Tax Increment Contract Rev. and Rev. Ref. Bonds, Series 2019, Assured Guaranty Municipal insured, 5.00% 2027 | | | 1,050 | | | | 1,265 | |
| City of Houston, Memorial City Redev. Auth., Tax Increment Contract Rev. and Rev. Ref. Bonds, Series 2019, Assured Guaranty Municipal insured, 5.00% 2028 | | | 250 | | | | 306 | |
| Katy Independent School Dist., Unlimited Tax Rev. Ref. Bonds, Series 2019-B, 5.00% 2022 | | | 465 | | | | 471 | |
| County of Kaufman, Unlimited Tax Road Bonds, Series 2020, 5.00% 2031 | | | 115 | | | | 145 | |
| Killeen Independent School Dist., Unlimited Tax Rev. Ref. Bonds, Series 2019, 5.00% 2022 | | | 445 | | | | 451 | |
| Longview Independent School Dist., Unlimited Tax Rev. Ref. Bonds, Series 2020, 5.00% 2023 | | | 575 | | | | 610 | |
| Lower Colorado River Auth., Rev. Ref. Bonds, Series 2022, Assured Guaranty Municipal insured, 5.00% 2032 | | | 380 | | | | 484 | |
| Lower Colorado River Auth., Transmission Contract Rev. Ref. Bonds (LCRA Transmission Services Corp. Project), Series 2016, 5.00% 2022 | | | 460 | | | | 472 | |
| Lower Colorado River Auth., Transmission Contract Rev. Ref. Bonds (LCRA Transmission Services Corp. Project), Series 2018, 5.00% 2024 | | | 255 | | | | 285 | |
| Lower Colorado River Auth., Transmission Contract Rev. Ref. Bonds (LCRA Transmission Services Corp. Project), Series 2020, 5.00% 2027 | | | 1,750 | | | | 2,141 | |
| Lower Colorado River Auth., Transmission Contract Rev. Ref. Bonds (LCRA Transmission Services Corp. Project), Series 2021-A, 5.00% 2031 | | | 570 | | | | 747 | |
| Lumberton Independent School Dist., Unlimited Tax School Building Bonds, Series 2020, 5.00% 2029 | | | 245 | | | | 312 | |
| Medina Valley Independent School Dist., Unlimited Tax School Building Bonds, Series 2021, 0.82% 2051 (put 2026) | | | 325 | | | | 322 | |
| County of Midland, Public Fac. Corp., Multi Family Housing Rev. Bonds (Palladium at West Francis), Series 2020, 0.35% 2024 (put 2023) | | | 1,000 | | | | 998 | |
| Municipal Gas Acquisition and Supply Corp. I, Gas Supply Rev. Bonds, Series 2008-D, 6.25% 2026 | | | 480 | | | | 555 | |
| Municipal Gas Acquisition and Supply Corp. III, Gas Supply Rev. Ref. Bonds, Series 2021, 5.00% 2022 | | | 660 | | | | 693 | |
| Nederland Independent School Dist., Unlimited Tax School Building Bonds, Series 2021, 5.00% 2031 | | | 195 | | | | 248 | |
| New Hope Cultural Education Facs. Fin. Corp., Retirement Fac. Rev. Bonds (Westminster Project), Series 2016, 5.00% 2028 | | | 235 | | | | 265 | |
| North Central Texas Housing Fin. Corp., Multi Family Housing Rev. Bonds (Bluebonnet Ridge Apartments), Series 2021, 0.375% 2040 (put 2024) | | | 220 | | | | 219 | |
| North East Independent School Dist., Unlimited Tax Rev. Ref. Bonds, Series 2017, 2.375% 2047 (put 2022) | | | 500 | | | | 508 | |
| North East Independent School Dist., Unlimited Tax School Building and Rev. Ref. Bonds, Series 2019-A, 4.00% 2032 | | | 215 | | | | 251 | |
| North Fort Bend Water Auth., Water System Rev. and Rev. Ref. Bonds, Series 2021, BAM insured, 5.00% 2031 | | | 435 | | | | 579 | |
| North Harris County Regional Water Auth., Rev. and Rev. Ref. Bonds, Series 2016, 5.00% 2034 | | | 950 | | | | 1,139 | |
| North Texas Municipal Water Dist., Water System Rev. Ref. and Improvement Bonds, Series 2021, 5.00% 2022 | | | 170 | | | | 177 | |
| North Texas Tollway Auth., System Rev. and Rev. Ref. Bonds, Series 2017-A, 5.00% 2022 | | | 220 | | | | 222 | |
| North Texas Tollway Auth., System Rev. Ref. Bonds, Series 2016-A, 5.00% 2026 | | | 500 | | | | 549 | |
| North Texas Tollway Auth., System Rev. Ref. Bonds, Series 2015-A, 5.00% 2030 | | | 300 | | | | 340 | |
| North Texas Tollway Auth., System Rev. Ref. Bonds, Capital Appreciation Bonds, Series 2008-D, Assured Guaranty insured, 0% 2030 | | | 500 | | | | 435 | |
| Northside Independent School Dist., Unlimited Tax Rev. Ref. Bonds, Series 2020, 5.00% 2027 | | | 850 | | | | 1,048 | |
| Northwest Independent School Dist., Unlimited Tax School Building Bonds, Series 2021, 5.00% 2030 | | | 175 | | | | 227 | |
| Northwest Independent School Dist., Unlimited Tax School Building Bonds, Series 2021, 5.00% 2031 | | | 105 | | | | 137 | |
| Northwest Independent School Dist., Unlimited Tax School Building Bonds, Series 2013, 5.00% 2038 (preref. 2023) | | | 700 | | | | 743 | |
| Odessa Housing Fin. Corp., Multi Family Housing Rev. Bonds (Cove in Odessa Apartments), Series 2021, 0.37% 2024 (put 2023) | | | 755 | | | | 755 | |
| Pasadena Independent School Dist., Unlimited Tax Rev. Ref. Bonds, Series 2019, 5.00% 2029 | | | 260 | | | | 331 | |
| Pasadena Independent School Dist., Unlimited Tax School Building and Rev. Ref. Bonds, Series 2013, 5.00% 2038 | | | 1,000 | | | | 1,059 | |
| Pflugerville Independent School Dist., Unlimited Tax School Building Bonds, Series 2019-A, 5.00% 2022 | | | 1,000 | | | | 1,014 | |
| Prosper Independent School Dist., Unlimited Tax School Building Bonds, Series 2021-A, 5.00% 2030 | | | 255 | | | | 331 | |
| Prosper Independent School Dist., Unlimited Tax School Building Bonds, Series 2021-A, 5.00% 2031 | | | 60 | | | | 79 | |
| Prosper Independent School Dist., Unlimited Tax School Building Bonds, Series 2019-B, 2.00% 2050 (put 2021) | | | 415 | | | | 427 | |
| Round Rock Independent School Dist., Unlimited Tax Rev. Ref. Bonds, Series 2017, 5.00% 2022 | | | 600 | | | | 621 | |
| City of San Antonio, Electric and Gas Systems Rev. Bonds, Series 2013, 5.00% 2048 (preref. 2023) | | | 475 | | | | 503 | |
| City of San Antonio, Electric and Gas Systems Rev. Ref. Bonds, Series 2016, 5.00% 2028 | | | 1,000 | | | | 1,198 | |
| City of San Antonio, Electric and Gas Systems Rev. Ref. Bonds, Series 2015-B, 2.00% 2033 (put 2021) | | | 1,150 | | | | 1,152 | |
| City of San Antonio, Electric and Gas Systems Rev. Ref. Bonds, Series 2018, 2.75% 2048 (put 2022) | | | 250 | | | | 257 | |
| City of San Antonio, General Improvement and Rev. Ref. Bonds, Series 2016, 5.00% 2022 | | | 270 | | | | 273 | |
| City of San Antonio, Water System Rev. Ref. Bonds, Series 2019-C, 5.00% 2022 | | | 185 | | | | 190 | |
| Sheldon Independent School Dist., Unlimited Tax School Building Bonds, Series 2017, 5.00% 2022 | | | 250 | | | | 253 | |
| Private Client Services Funds | 29 |
Capital Group Core Municipal Fund
| Bonds, notes & other debt instruments (continued) | | Principal amount
(000) | | | Value
(000) | |
| Texas (continued) | | | | | | | | |
| Sherman Independent School Dist., Unlimited Tax School Building Bonds, Series 2018-A, 5.00% 2027 | | $ | 1,010 | | | $ | 1,228 | |
| Spring Independent School Dist., Unlimited Tax School Building Bonds, Series 2019, 5.00% 2031 | | | 465 | | | | 582 | |
| County of Tarrant, Cultural Education Facs. Fin. Corp., Rev. Ref. Bonds (Christus Health), Series 2018-A, 5.00% 2023 | | | 850 | | | | 916 | |
| Board of Regents of the Texas A&M University System, Rev. Fncg. System Bonds, Series 2017-E, 5.00% 2022 | | | 1,425 | | | | 1,462 | |
| Tomball Independent School Dist., Unlimited Tax School Building Bonds, Series 2020, 5.00% 2023 | | | 270 | | | | 286 | |
| Tomball Independent School Dist., Unlimited Tax School Building Bonds, Series 2020, 5.00% 2024 | | | 90 | | | | 100 | |
| Transportation Commission, Highway Improvement G.O. Bonds, Series 2016-A, 5.00% 2028 | | | 200 | | | | 237 | |
| County of Travis, Strategic Housing Fin. Corp., Multi Family Housing Rev. Bonds (Yager Flats), Series 2021, 0.46% 2041 (put 2025) | | | 3,000 | | | | 2,980 | |
| Trinity River Auth., Regional Wastewater System Rev. Ref. Bonds, Series 2021, 5.00% 2030 | | | 235 | | | | 306 | |
| Trinity River Public Fac. Corp., Multi Family Housing Rev. Bonds (Cowan Place Apartments), Series 2021, 0.28% 2024 (put 2023) | | | 500 | | | | 499 | |
| Board of Regents of the University of North Texas System, Rev. Fncg. System Rev. Ref. and Improvement Bonds, Series 2018-A, 5.00% 2025 | | | 240 | | | | 277 | |
| Board of Regents of the University of North Texas System, Rev. Fncg. System Rev. Ref. and Improvement Bonds, Series 2018-A, 5.00% 2026 | | | 760 | | | | 903 | |
| Water Dev. Board, State Revolving Fund, Rev. Bonds, Series 2021, 5.00% 2031 | | | 260 | | | | 348 | |
| Water Dev. Board, State Water Implementation Rev. Fund, Rev. Bonds (Master Trust), Series 2018-A, 5.00% 2029 | | | 990 | | | | 1,239 | |
| Water Dev. Board, State Water Implementation Rev. Fund, Rev. Bonds (Master Trust), Series 2021, 5.00% 2032 | | | 1,040 | | | | 1,392 | |
| Wylie Independent School Dist., Unlimited Tax Rev. Ref. Bonds, Series 2020-A, 5.00% 2030 | | | 1,790 | | | | 2,327 | |
| | | | | | | | 108,738 | |
| | | | | | | | | |
| Utah 0.42% | | | | | | | | |
| Canyons School Dist., Local Building Auth., Lease Rev. Bonds, Series 2021, 5.00% 2029 | | | 1,000 | | | | 1,284 | |
| Housing Corp., Single Family Mortgage Bonds, Class III, Series 2015-D-2, 4.00% 2045 | | | 155 | | | | 165 | |
| Salt Lake City, Airport Rev. Bonds (Salt Lake City International Airport), Series 2021-B, 5.00% 2025 | | | 450 | | | | 522 | |
| Salt Lake City, Airport Rev. Bonds (Salt Lake City International Airport), Series 2021-B, 5.00% 2026 | | | 620 | | | | 740 | |
| School Fin. Auth., Charter School Rev. Bonds (Utah Charter Academies Project), Series 2018, 4.00% 2022 | | | 335 | | | | 346 | |
| Transit Auth., Sales Tax Rev. Bonds, Series 2008-A, 5.25% 2023 | | | 80 | | | | 86 | |
| City of Vineyard, Redev. Agcy., Tax Increment Rev. and Rev. Ref. Bonds, Series 2021, Assured Guaranty Municipal insured, 5.00% 2026 | | | 95 | | | | 112 | |
| City of Vineyard, Redev. Agcy., Tax Increment Rev. and Rev. Ref. Bonds, Series 2021, Assured Guaranty Municipal insured, 5.00% 2030 | | | 25 | | | | 32 | |
| City of Vineyard, Redev. Agcy., Tax Increment Rev. and Rev. Ref. Bonds, Series 2021, Assured Guaranty Municipal insured, 5.00% 2031 | | | 20 | | | | 26 | |
| | | | | | | | 3,313 | |
| | | | | | | | | |
| Vermont 0.06% | | | | | | | | |
| Housing Fin. Agcy., Multiple Purpose Bonds, Series 2018-A, 4.00% 2048 | | | 245 | | | | 264 | |
| Housing Fin. Agcy., Multiple Purpose Bonds, Series 2020-A, 3.75% 2050 | | | 165 | | | | 181 | |
| | | | | | | | 445 | |
| | | | | | | | | |
| Virginia 1.51% | | | | | | | | |
| County of Arlington, Industrial Dev. Auth., Hospital Rev. Bonds (Virginia Hospital Center), Series 2020, 5.00% 2031 | | | 600 | | | | 773 | |
| County of Arlington, Industrial Dev. Auth., Hospital Rev. Bonds (Virginia Hospital Center), Series 2020, 5.00% 2032 | | | 215 | | | | 276 | |
| County of Charles City, Econ. Dev. Auth., Solid Waste Disposal Rev. Bonds (Waste Management, Inc. Project), Series 2004-A, 2.875% 2029 | | | 1,000 | | | | 1,082 | |
| College Building Auth., Educational Facs. Rev. Bonds (21st Century College and Equipment Programs), Series 2012-A, 5.00% 2024 (preref. 2022) | | | 295 | | | | 298 | |
| College Building Auth., Educational Facs. Rev. Bonds (21st Century College and Equipment Programs), Series 2013-A, 4.50% 2033 | | | 1,865 | | | | 1,965 | |
| College Building Auth., Educational Facs. Rev. Bonds (21st Century College and Equipment Programs), Series 2013-A, 4.50% 2034 | | | 975 | | | | 1,027 | |
| College Building Auth., Educational Facs. Rev. Bonds (Regent University Project), Series 2021, 5.00% 2029 | | | 375 | | | | 462 | |
| College Building Auth., Educational Facs. Rev. Bonds (Regent University Project), Series 2021, 5.00% 2030 | | | 375 | | | | 468 | |
| County of Fairfax, Redev. and Housing Auth., Multi Family Housing Rev. Bonds (Arrowbrook Apartments Project), Series 2020, 0.41% 2041 (put 2024) | | | 1,000 | | | | 1,001 | |
| County of Halifax, Industrial Dev. Auth., Recovery Zone Fac. Rev. Bonds (Virginia Electric and Power Co. Project), Series 2010-A, 0.45% 2041 (put 2022) | | | 740 | | | | 740 | |
| 30 | Private Client Services Funds |
Capital Group Core Municipal Fund
| Bonds, notes & other debt instruments (continued) | | Principal amount
(000) | | | Value
(000) | |
| Virginia (continued) | | | | | | | | |
| County of Henrico, Econ. Dev. Auth., Residential Care Fac. Rev. Ref. Bonds (Westminster Canterbury Richmond), Series 2018, 5.00% 2023 | | $ | 575 | | | $ | 623 | |
| Town of Louisa, Industrial Dev. Auth., Pollution Control Rev. Ref. Bonds (Virginia Electric and Power Co. Project), Series 2008-A, 1.90% 2035 (put 2023) | | | 1,000 | | | | 1,024 | |
| Small Business Fncg. Auth., Residential Care Facs. Rev. and Rev. Ref. Bonds (Lifespire of Virginia), Series 2021, 3.00% 2023 | | | 45 | | | | 47 | |
| Small Business Fncg. Auth., Residential Care Facs. Rev. and Rev. Ref. Bonds (Lifespire of Virginia), Series 2021, 3.00% 2024 | | | 15 | | | | 16 | |
| Small Business Fncg. Auth., Residential Care Facs. Rev. and Rev. Ref. Bonds (Lifespire of Virginia), Series 2021, 4.00% 2031 | | | 375 | | | | 426 | |
| Small Business Fncg. Auth., Rev. Bonds (National Senior Campuses, Inc. Obligated Group), Series 2020-A, 5.00% 2027 | | | 350 | | | | 422 | |
| Small Business Fncg. Auth., Rev. Bonds (National Senior Campuses, Inc. Obligated Group), Series 2020-A, 5.00% 2028 | | | 120 | | | | 148 | |
| Small Business Fncg. Auth., Rev. Bonds (National Senior Campuses, Inc. Obligated Group), Series 2020-A, 5.00% 2029 | | | 140 | | | | 173 | |
| Small Business Fncg. Auth., Rev. Bonds (National Senior Campuses, Inc. Obligated Group), Series 2020-A, 5.00% 2030 | | | 170 | | | | 209 | |
| County of Wise, Industrial Dev. Auth., Solid Waste and Sewage Disposal Rev. Bonds (Virginia Electric and Power Co. Project), Series 2010-A, 1.20% 2040 (put 2024) | | | 640 | | | | 650 | |
| | | | | | | | 11,830 | |
| | | | | | | | | |
| Washington 2.22% | | | | | | | | |
| Central Puget Sound Regional Transit Auth., Sales Tax and Motor Vehicle Excise Tax Improvement and Rev. Ref. Green Bonds, Series 2021-S-1, 5.00% 2029 | | | 510 | | | | 659 | |
| Energy Northwest, Electric Rev. and Rev. Ref. Bonds (Columbia Generating Station), Series 2020-A, 5.00% 2032 | | | 195 | | | | 254 | |
| City of Everett, Housing Auth., Multi Family Housing Rev. Bonds (Baker Heights Legacy), Series 2021, 0.30% 2024 (put 2023) | | | 285 | | | | 284 | |
| G.O. Bonds, Series 2012-D, 5.00% 2026 (preref. 2022) | | | 1,000 | | | | 1,012 | |
| G.O. Bonds, Series 2017-D, 5.00% 2028 | | | 1,000 | | | | 1,214 | |
| G.O. Bonds, Series 2019-C, 5.00% 2031 | | | 1,000 | | | | 1,264 | |
| G.O. Bonds, Series 2012-D, 5.00% 2033 (preref. 2022) | | | 2,000 | | | | 2,024 | |
| G.O. Bonds, Series 2019-A, 5.00% 2033 | | | 500 | | | | 623 | |
| G.O. Rev. Ref. Bonds, Series 2017-R-A, 5.00% 2022 | | | 340 | | | | 352 | |
| County of Grant, Public Utility Dist. No. 2, Electric System Rev. Ref. Bonds, Series 2017-O, 5.00% 2024 | | | 275 | | | | 302 | |
| Health Care Facs. Auth., Rev. Ref. Bonds (Providence St. Joseph Health), Series 2021-B, 4.00% 2042 (put 2030) | | | 1,000 | | | | 1,214 | |
| Housing Fin. Commission, Multi Family Housing Rev. Bonds (Garten Haus Apartments Project), Series 2021, 0.37% 2024 (put 2023) | | | 170 | | | | 170 | |
| Housing Fin. Commission, Municipal Certs., Series 2021-1, 3.50% 2035 | | | 979 | | | | 1,124 | |
| Housing Fin. Commission, Nonprofit Housing Rev. Ref. Bonds (Horizon House Project), Series 2017, 5.00% 20233 | | | 1,095 | | | | 1,148 | |
| Housing Fin. Commission, Single Family Program Bonds, Series 2017-1-N, 4.00% 2047 | | | 460 | | | | 488 | |
| Housing Fin. Commission, Single Family Program Bonds, Series 2019-1-N, 4.00% 2049 | | | 295 | | | | 321 | |
| Motor Vehicle Fuel Tax G.O. Bonds, Series 2021-D, 5.00% 2022 | | | 2,375 | | | | 2,442 | |
| City of Seattle, Housing Auth., Rev. and Rev. Ref. Bonds (Northgate Plaza Project), Series 2021, 1.00% 2026 | | | 460 | | | | 460 | |
| City of Seattle, Housing Auth., Rev. Bonds (Lam Bow Apartments Project), Series 2021, 1.25% 2024 | | | 55 | | | | 55 | |
| City of Seattle, Municipal Light and Power Rev. Ref. Bonds, Series 2021-B, (SIFMA Municipal Swap Index + 0.25%) 0.30% 2045 (put 2026)2 | | | 765 | | | | 772 | |
| City of Seattle, Municipal Light and Power Rev. Ref. Bonds, Series 2018-C-2, (SIFMA Municipal Swap Index + 0.49%) 0.54% 2046 (put 2023)2 | | | 825 | | | | 828 | |
| City of Seattle, Solid Waste System Rev. Ref. Bonds, Series 2021, 5.00% 2029 | | | 170 | | | | 219 | |
| City of Seattle, Solid Waste System Rev. Ref. Bonds, Series 2021, 5.00% 2030 | | | 175 | | | | 230 | |
| | | | | | | | 17,459 | |
| Private Client Services Funds | 31 |
Capital Group Core Municipal Fund
| Bonds, notes & other debt instruments (continued) | | Principal amount
(000) | | | Value
(000) | |
| West Virginia 0.32% | | | | | | | | |
| Econ. Dev. Auth., Solid Waste Disposal Facs. Rev. Bonds (Appalachian Power Co. - Amos Project), Series 2009-B, 2.625% 2042 (put 2022) | | $ | 750 | | | $ | 759 | |
| Econ. Dev. Auth., Solid Waste Disposal Facs. Rev. Ref. Bonds (Appalachian Power Co. - Amos Project), Series 2015-A, 2.55% 2040 (put 2024) | | | 500 | | | | 521 | |
| Housing Dev. Fund, Multi Family Housing Rev. Bonds (Charles Towers), Series 2021, 0.21% 2023 (put 2022) | | | 235 | | | | 235 | |
| Housing Dev. Fund, Multi Family Housing Rev. Bonds (Parkland Place / Chapmanville Towers), Series 2021, 0.28% 2024 (put 2023) | | | 1,000 | | | | 999 | |
| | | | | | | | 2,514 | |
| | | | | | | | | |
| Wisconsin 2.07% | | | | | | | | |
| Environmental Improvement Fund Rev. Green Bonds, Series 2021-A, 4.00% 2031 | | | 1,000 | | | | 1,220 | |
| G.O. Bonds, Series 2015-A, 5.00% 2031 (preref. 2023) | | | 2,000 | | | | 2,143 | |
| Health and Educational Facs. Auth., Health Facs. Rev. Bonds (SSM Health Care), Series 2018-B, 5.00% 2038 (put 2023) | | | 1,300 | | | | 1,365 | |
| Health and Educational Facs. Auth., Rev. Bonds (Advocate Aurora Health Care Credit Group), Series 2018-C-3, (SIFMA Municipal Swap Index + 0.55%) 0.60% 2054 (put 2023)2 | | | 1,130 | | | | 1,133 | |
| Health and Educational Facs. Auth., Rev. Bonds (Ascension Senior Credit Group), Series 2019-A, 5.00% 2021 | | | 325 | | | | 326 | |
| Health and Educational Facs. Auth., Rev. Bonds (Ascension Senior Credit Group), Series 2016-A, 5.00% 2021 | | | 45 | | | | 45 | |
| Health and Educational Facs. Auth., Rev. Bonds (Gundersen Lutheran), Series 2020, 5.00% 20263 | | | 1,910 | | | | 2,209 | |
| Housing and Econ. Dev. Auth., Home Ownership Rev. Bonds, Series 2017-C, 4.00% 2048 | | | 940 | | | | 1,007 | |
| Housing and Econ. Dev. Auth., Home Ownership Rev. Bonds, Series 2018-B, 4.00% 2048 | | | 710 | | | | 762 | |
| Housing and Econ. Dev. Auth., Home Ownership Rev. Bonds, Series 2020-A, 3.50% 2050 | | | 1,160 | | | | 1,265 | |
| Housing and Econ. Dev. Auth., Home Ownership Rev. Bonds, Series 2021-A, 3.00% 2052 | | | 410 | | | | 442 | |
| Housing and Econ. Dev. Auth., Housing Rev. Bonds, Series 2021-B, 0.40% 2045 (put 2023) | | | 95 | | | | 95 | |
| Housing and Econ. Dev. Auth., Housing Rev. Bonds, Series 2021-B, 0.50% 2050 (put 2024) | | | 120 | | | | 120 | |
| Public Fin. Auth., Hospital Rev. Ref. Bonds (Renown Regional Medical Center Project), Series 2016-A, 5.00% 2022 | | | 300 | | | | 308 | |
| Public Fin. Auth., Rev. Ref. Bonds (Providence St. Joseph Health), Series 2021-C, 4.00% 2041 (put 2030) | | | 1,680 | | | | 2,038 | |
| Public Fin. Auth., Student Housing Rev. Bonds (Beyond Boone, LLC - Appalachian State University Project), Series 2019-A, Assured Guaranty Municipal insured, 5.00% 2030 | | | 315 | | | | 386 | |
| University of Wisconsin, Hospitals and Clinics Auth., Rev. Green Bonds, Series 2021-B, 5.00% 2030 | | | 630 | | | | 811 | |
| WPPI Energy, Power Supply System Rev. Bonds, Series 2016-A, 5.00% 2026 | | | 500 | | | | 593 | |
| | | | | | | | 16,268 | |
| | | | | | | | | |
| Wyoming 0.48% | | | | | | | | |
| Community Dev. Auth., Housing Rev. Bonds, Series 2019-1, 4.00% 2048 | | | 745 | | | | 808 | |
| Community Dev. Auth., Housing Rev. Bonds, Series 2021-1, 3.00% 2050 | | | 1,570 | | | | 1,692 | |
| Community Dev. Auth., Housing Rev. Bonds, Series 2020-1, 4.00% 2050 | | | 1,125 | | | | 1,242 | |
| | | | | | | | 3,742 | |
| | | | | | | | | |
| Total bonds, notes & other debt instruments (cost: $635,051,000) | | | | | | | 644,756 | |
| | | | | | | | | |
| Short-term securities 18.85% | | | | | | | | |
| Municipals 18.85% | | | | | | | | |
| State of Arizona, Industrial Dev. Auth., Hospital Rev. Ref. Bonds (Phoenix Children’s Hospital), Series 2019-B, 0.02% 20482 | | | 4,500 | | | | 4,500 | |
| State of Arizona, County of Yavapai, Industrial Dev. Auth., Solid Waste Disposal Rev. Ref. Bonds (Republic Services, Inc. Project), Series 2010, 0.15% 2029 (put 2021)2,4 | | | 1,775 | | | | 1,775 | |
| State of California, Kern Community College Dist., Facs. Improvement Dist. No. 1, G.O. Bond Anticipation Notes, Capital Appreciation Notes, Series 2020, 0% 2023 | | | 135 | | | | 134 | |
| State of California, City of Los Angeles, Dept. of Water and Power, Power System Rev. Ref. Bonds, Series 2001-B-3, 0.01% 20342 | | | 1,500 | | | | 1,500 | |
| State of California, City of Los Angeles, Tax and Rev. Anticipation Notes, Series 2021, 4.00% 6/23/2022 | | | 2,000 | | | | 2,050 | |
| State of California, City of Los Angeles, Wastewater System Rev. Ref. Bonds, Series 2018-C-1, 0.04% 20322 | | | 2,500 | | | | 2,500 | |
| State of California, County of Los Angeles, Tax and Rev. Anticipation Notes, Series 2021, 4.00% 6/30/2022 | | | 2,815 | | | | 2,887 | |
| State of California, Pollution Control Fncg. Auth., Environmental Impact Rev. Bonds (Air Products and Chemicals, Inc. Project), Series 1997-B, 0.02% 20422 | | | 1,000 | | | | 1,000 | |
| State of Colorado, Regents of the University of Colorado, University Enterprise Rev. and Rev. Ref. Bonds, Series 2020-A-2, 0.03% 20502 | | | 6,630 | | | | 6,630 | |
| 32 | Private Client Services Funds |
Capital Group Core Municipal Fund
| Short-term securities (continued) | | Principal amount
(000) | | | Value
(000) | |
| Municipals (continued) | | | | | | | | |
| State of Georgia, Northwest Georgia Housing Auth., Multi Family Housing Rev. Bonds (Charles Hight Apartments Project), Series 2019, 0.25% 8/1/2022 (put 2022)4 | | $ | 160 | | | $ | 160 | |
| State of Georgia, Northwest Georgia Housing Auth., Multi Family Housing Rev. Bonds (Park Homes Apartments Project), Series 2019, 0.25% 8/1/2022 (put 2022)4 | | | 175 | | | | 175 | |
| State of Idaho, Tax Anticipation Notes, Series 2021, 3.00% 6/30/2022 | | | 5,000 | | | | 5,094 | |
| State of Illinois, Fin. Auth., Demand Rev. Bonds (University of Chicago Medical Center), Series 2011-A, 0.03% 20442 | | | 2,950 | | | | 2,950 | |
| State of Illinois, G.O. Rev. Ref. Bonds, Series 2021-C, 4.00% 3/1/2022 | | | 665 | | | | 673 | |
| State of Indiana, Bond Bank, Advance Funding Program Notes, Series 2021-A, 2.00% 1/10/2022 | | | 1,040 | | | | 1,043 | |
| State of Indiana, Fin. Auth., Environmental Rev. Ref. Bonds (Duke Energy Indiana, Inc. Project), Series 2009-A-3, 0.07% 20392 | | | 5,000 | | | | 5,000 | |
| State of Iowa, Fin. Auth., Rev. Bonds (UnityPoint Health), Series 2018-F, 0.02% 20412 | | | 6,925 | | | | 6,925 | |
| State of Louisiana, Parish of East Baton Rouge, Pollution Control Rev. Ref. Bonds (ExxonMobil Project), Series 1993, 0.03% 3/1/20222 | | | 3,345 | | | | 3,345 | |
| State of Louisiana, Public Facs. Auth., Rev. Bonds (Air Products and Chemicals Project), Series 2009-A, 0.04% 20492 | | | 5,000 | | | | 5,000 | |
| State of Louisiana, Public Facs. Auth., Rev. Bonds (Air Products and Chemicals Project), Series 2010, 0.04% 20502 | | | 500 | | | | 500 | |
| State of Michigan, Strategic Fund, Demand Limited Obligation Rev. Bonds (Air Products and Chemicals, Inc. Project), Series 2007, 0.02% 20422 | | | 4,700 | | | | 4,700 | |
| State of Michigan, Regents of the University of Michigan, General Rev. Bonds, Series 2012-B, 0.02% 20422 | | | 7,435 | | | | 7,435 | |
| State of Minnesota, City of Shakopee, Multi Family Housing Rev. Bonds (Shakopee Village Apartments Project), Series 2021, 0.25% 2024 (put 2022)4 | | | 140 | | | | 140 | |
| State of New Hampshire, Health and Education Facs. Auth., Rev. Ref. Bonds (Dartmouth College Issue), Series 2007-B, 0.02% 20412 | | | 2,000 | | | | 2,000 | |
| State of New York, Metropolitan Transportation Auth., Transportation Rev. Bond Anticipation Notes, Series 2020-A-2S, 4.00% 2/1/2022 | | | 1,160 | | | | 1,171 | |
| State of New York, New York City G.O. Bonds, Series 2013-F-3, 0.02% 20422 | | | 11,465 | | | | 11,466 | |
| State of New York, New York City G.O. Bonds, Series 2021-2, 0.11% 20422 | | | 695 | | | | 695 | |
| State of New York, New York City G.O. Bonds, Series 2021-3, 0.11% 20422 | | | 530 | | | | 530 | |
| State of New York, New York City G.O. Bonds, Series 2016-A-5, 0.03% 20442 | | | 9,000 | | | | 9,000 | |
| State of New York, New York City Municipal Water Fin. Auth., Water and Sewer System Second General Resolution Rev. Bonds, Series 2011-FF-1, 0.02% 20442 | | | 8,000 | | | | 8,000 | |
| State of New York, New York City Municipal Water Fin. Auth., Water and Sewer System Second General Resolution Rev. Bonds, Series 2021-EE-1, 0.03% 20452 | | | 5,000 | | | | 5,000 | |
| State of New York, New York City Municipal Water Fin. Auth., Water and Sewer System Second General Resolution Rev. Bonds, Series 2016-AA-1, 0.02% 20482 | | | 2,170 | | | | 2,170 | |
| State of New York, New York City Municipal Water Fin. Auth., Water and Sewer System Second General Resolution Rev. Bonds, Series 2015-BB-1, 0.02% 20492 | | | 16,500 | | | | 16,500 | |
| State of New York, New York City Transitional Fin. Auth., Future Tax Secured Bonds, Series 2016-A-4, 0.02% 20412 | | | 2,905 | | | | 2,905 | |
| State of New York, New York City Transitional Fin. Auth., Future Tax Secured Bonds, Series 2019-B-4, 0.03% 20422 | | | 1,000 | | | | 1,000 | |
| State of Ohio, Hospital Rev. Bonds (Cleveland Clinic Health System Obligated Group), Series 2019-F, 0.03% 20522 | | | 4,900 | | | | 4,900 | |
| State of Pennsylvania, Econ. Dev. Fin. Auth., Solid Waste Rev. Ref. Bonds (Republic Service, Inc. Project), Series 2010-B, 0.20% 2030 (put 2022)4 | | | 1,695 | | | | 1,695 | |
| State of South Carolina, Jobs-Econ. Dev. Auth., Hospital Rev. Bonds (Prisma Health Obligated Group), Series 2018-B, 0.03% 20482 | | | 5,000 | | | | 5,000 | |
| State of Tennessee, City of Clarksville, Public Building Auth., Pooled Fncg. Rev. Bonds, Series 2003, Bank of America LOC, 0.05% 20332 | | | 1,955 | | | | 1,955 | |
| State of Tennessee, County of Montgomery, Public Building Auth., Pooled Fncg. Rev. Bonds (Tennessee County Loan Pool), Series 2004, Bank of America LOC, 0.05% 20342 | | | 405 | | | | 405 | |
| State of Texas, Deer Park Independent School Dist., Unlimited Tax School Building Bonds, Series 2018, 0.16% 2042 (put 2022)4 | | | 135 | | | | 135 | |
| State of Texas, Lone Star College System, Limited Tax G.O. Bonds, Series 2021-A, 5.00% 2/15/2022 | | | 70 | | | | 71 | |
| State of Texas, Lone Star College System, Limited Tax G.O. Rev. Ref. Bonds, Series 2021-B, 5.00% 2/15/2022 | | | 135 | | | | 137 | |
| State of Texas, Municipal Gas Acquisition and Supply Corp. III, Gas Supply Rev. Ref. Bonds, Series 2021, 5.00% 12/15/2021 | | | 805 | | | | 809 | |
| State of Texas, North East Independent School Dist., Unlimited Tax School Building Bonds, Series 2013-B, 0.25% 2032 (put 2022)4 | | | 130 | | | | 130 | |
| Private Client Services Funds | 33 |
Capital Group Core Municipal Fund
| Short-term securities (continued) | | Principal amount
(000) | | | Value
(000) | |
| Municipals (continued) | | | | | | | | |
| State of Texas, Richardson Independent School Dist., Unlimited Tax School Building Bonds, Series 2021, 5.00% 2/15/2022 | | $ | 355 | | | $ | 360 | |
| State of Utah, Provo City School Dist., G.O. Rev. Ref. Bonds, Series 2021-B, 5.00% 6/15/2022 | | | 1,000 | | | | 1,030 | |
| State of Wyoming, County of Lincoln, Pollution Control Rev. Ref. Bonds (ExxonMobil Project), Series 2014, 0.03% 20442 | | | 4,800 | | | | 4,800 | |
| | | | | | | | | |
| Total short-term securities (cost: $147,977,000) | | | | | | | 147,980 | |
| Total investment securities 100.98% (cost: $783,028,000) | | | | | | | 792,736 | |
| Other assets less liabilities (0.98%) | | | | | | | (7,683 | ) |
| | | | | | | | | |
| Net assets 100.00% | | | | | | $ | 785,053 | |
Futures contracts
| Contracts | | Type | | Number of
contracts | | Expiration | | Notional
amount
(000) | 5
| | Value at
10/31/2021
(000) | 6
| | Unrealized
(depreciation)
appreciation
at 10/31/2021
(000) | |
| 5 Year U.S. Treasury Note Futures | | Long | | 121 | | December 2021 | | $ | 12,100 | | | $ | 14,732 | | | $ | (58 | ) |
| 10 Year U.S. Treasury Note Futures | | Short | | 33 | | December 2021 | | | (3,300 | ) | | | (4,313 | ) | | | 51 | |
| | | | | | | | | | | | | | | | | $ | (7 | ) |
| 1 | Step bond; coupon rate may change at a later date. |
| 2 | Coupon rate may change periodically. Reference rate and spread are as of the most recent information available. Some coupon rates are determined by the issuer or agent based on current market conditions; therefore, the reference rate and spread are not available. For short-term securities, the date of the next scheduled coupon rate change is considered to be the maturity date. |
| 3 | Acquired in a transaction exempt from registration under Rule 144A of the Securities Act of 1933. May be resold in the U.S. in transactions exempt from registration, normally to qualified institutional buyers. The total value of all such securities was $3,420,000, which represented .44% of the net assets of the fund. |
| 4 | For short-term securities, the mandatory put date is considered to be the maturity date. |
| 5 | Notional amount is calculated based on the number of contracts and notional contract size. |
| 6 | Value is calculated based on the notional amount and current market price. |
Key to abbreviations and symbol
Agcy. = Agency
AMT = Alternative Minimum Tax
Auth. = Authority
Certs. = Certificates
Dept. = Department
Dev. = Development
Dist. = District
Econ. = Economic
Fac. = Facility
Facs. = Facilities
Fin. = Finance
Fncg. = Financing
G.O. = General Obligation
IAM = Interest at Maturity
LIBOR = London Interbank Offered Rate
LOC = Letter of Credit
Part. = Participation
Preref. = Prerefunded
Redev. = Redevelopment
Ref. = Refunding
Rev. = Revenue
SIFMA = Securities Industry and Financial Markets Association
USD/$ = U.S. dollars
| 34 | Private Client Services Funds |
Capital Group Short-Term Municipal Fund
Investment portfolio October 31, 2021
| Portfolio quality summary* | Percent of net assets |
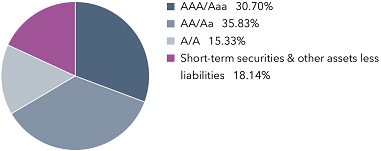
| * | Bond ratings, which typically range from AAA/Aaa (highest) to D (lowest), are assigned by credit rating agencies such as Standard & Poor’s, Moody’s and/or Fitch as an indication of an issuer’s creditworthiness. In assigning a credit rating to a security, the fund looks specifically to the ratings assigned to the issuer of the security by Standard & Poor’s, Moody’s and/or Fitch. If agency ratings differ, the security will be considered to have received the highest of those ratings, consistent with the fund’s investment policies. The ratings are not covered by the Report of Independent Registered Public Accounting Firm. |
| Bonds, notes & other debt instruments 81.86% | Principal amount
(000) | | | Value
(000) | |
| Alabama 1.90% | | | | | | | | |
| City of Alabaster, Board of Education, Special Tax School Warrants, Series 2014-A, | | | | | | | | |
| Assured Guaranty Municipal insured, 5.00% 2028 (preref. 2024) | | $ | 500 | | | $ | 565 | |
| City of Birmingham, Water Works Board, Water Rev. Bonds, Series 2013-B, 5.00% 2038 (preref. 2023) | | | 500 | | | | 528 | |
| Black Belt Energy Gas Dist., Gas Project Rev. Bonds (Project No. 6), Series 2021-B, 4.00% 2052 (put 2026) | | | 500 | | | | 571 | |
| Black Belt Energy Gas Dist., Gas Supply Prepay Rev. Bonds (Project No. 4), Series 2019-A, 4.00% 2049 (put 2025) | | | 750 | | | | 838 | |
| Black Belt Energy Gas Dist., Gas Supply Prepay Rev. Bonds (Project No. 5), Series 2020-A-1, 4.00% 2049 (put 2026) | | | 455 | | | | 519 | |
| Federal Aid Highway Fin. Auth., Federal Highway Grant Anticipation Bonds, Series 2012, 5.00% 2023 (preref. 2022) | | | 35 | | | | 36 | |
| Housing Fin. Auth., Multi Family Housing Rev. Bonds (Capstone at Kinsey Cove Project), Series 2020-A, 0.35% 2023 (put 2023) | | | 110 | | | | 110 | |
| South East Gas Supply Dist., Gas Supply Rev. Bonds (Project No. 2), Series 2018-A, 4.00% 2049 (put 2024) | | | 490 | | | | 529 | |
| Southeast Energy Auth., Commodity Supply Rev. Bonds (Project No. 2), Series 2021-B-1, 4.00% 2051 (put 2031) | | | 125 | | | | 150 | |
| | | | | | | | 3,846 | |
| | | | | | | | | |
| Alaska 0.15% | | | | | | | | |
| Housing Fin. Corp., General Mortgage Rev. Bonds, Series 2020-A, 3.25% 2044 | | | 275 | | | | 298 | |
| | | | | | | | | |
| Arizona 1.47% | | | | | | | | |
| Agricultural Improvement and Power Dist., Electric System Rev. Bonds (Salt River Project), Series 2021-A, 5.00% 2026 | | | 730 | | | | 862 | |
| Board of Regents of the Arizona State University System, Rev. Bonds, Series 2020-A, 5.00% 2026 | | | 300 | | | | 359 | |
| County of Coconino, Pollution Control Corp., Pollution Control Rev. Ref. Bonds, Series 2017-B, 1.65% 2039 (put 2023) | | | 500 | | | | 509 | |
| City of Glendale, Industrial Dev. Auth., Rev. Ref. Bonds (Midwestern University), Series 2020, 5.00% 2022 | | | 185 | | | | 190 | |
| Industrial Dev. Auth., Hospital Rev. Bonds (Phoenix Children’s Hospital), Series 2021-A, 5.00% 2026 | | | 190 | | | | 223 | |
| Industrial Dev. Auth., Rev. Bonds (Lincoln South Beltway Project), Series 2020, 5.00% 2023 | | | 750 | | | | 818 | |
| City of Phoenix, Civic Improvement Corp., Water System Rev. Ref. Bonds, Series 2014-B, 5.00% 2024 | | | 15 | | | | 17 | |
| | | | | | | | 2,978 | |
| | | | | | | | | |
| California 4.64% | | | | | | | | |
| Bay Area Toll Auth., San Francisco Bay Area Toll Bridge Rev. Bonds, Series 2006-C-1, (SIFMA Municipal Swap Index + 0.90%) 0.95% 2045 (put 2023)1 | | | 1,500 | | | | 1,511 | |
| Bay Area Toll Auth., San Francisco Bay Area Toll Bridge Rev. Bonds, Series 2021-C, (SIFMA Municipal Swap Index + 0.45%) 0.50% 2056 (put 2026)1 | | | 65 | | | | 66 | |
| Trustees of the California State University, Systemwide Rev. Bonds, Series 2012-A, 5.00% 2042 (preref. 2022) | | | 795 | | | | 833 | |
| Trustees of the California State University, Systemwide Rev. Bonds, Series 2016-B-2, 0.55% 2049 (put 2026) | | | 100 | | | | 99 | |
| East Side Union High School Dist., G.O. Bonds, 2008 Election, Series 2012-D, 5.00% 2037 (preref. 2022) | | | 1,000 | | | | 1,036 | |
| Eastern Municipal Water Dist., Water and Wastewater Rev. Ref. Bonds, Series 2021-A, 3.00% 2024 | | | 45 | | | | 48 | |
| Private Client Services Funds | 35 |
Capital Group Short-Term Municipal Fund
| Bonds, notes & other debt instruments (continued) | Principal amount
(000) | | | Value
(000) | |
| California (continued) | | | | | | | | |
| Fresno Unified School Dist., G.O. Bonds, 2016 Election, Series 2021-D, 2.00% 2023 | | $ | 30 | | | $ | 31 | |
| Fresno Unified School Dist., G.O. Bonds, 2016 Election, Series 2021-D, 2.00% 2024 | | | 15 | | | | 16 | |
| G.O. Bonds, Series 2021, 5.00% 2027 | | | 395 | | | | 490 | |
| G.O. Bonds, Series 2021, 5.00% 2030 | | | 160 | | | | 211 | |
| G.O. Rev. Ref. Bonds, Series 2021, 5.00% 2023 | | | 420 | | | | 456 | |
| G.O. Rev. Ref. Bonds, Series 2019, 5.00% 2029 | | | 110 | | | | 141 | |
| Health Facs. Fncg. Auth., Rev. Bonds (Stanford Health Care), Series 2021-A, 3.00% 2054 (put 2025) | | | 475 | | | | 519 | |
| Health Facs. Fncg. Auth., Rev. Green Bonds (Kaiser Permanente), Series 2017-C, 5.00% 2031 (put 2022) | | | 500 | | | | 524 | |
| Infrastructure and Econ. Dev. Bank, Rev. Ref. Bonds (Museum of Art Project), Series 2021-B, 0.75% 2050 (put 2026)1 | | 100 | | | | 102 | |
| City of Jurupa, Public Fncg. Auth., Special Tax Rev. Ref. Bonds, Series 2020-A, BAM insured, 5.00% 2022 | | | 115 | | | | 119 | |
| City of Los Angeles, Dept. of Water and Power, Power System Rev. Bonds, Series 2018-B, 4.00% 2022 | | | 15 | | | | 15 | |
| County of Los Angeles, Metropolitan Transportation Auth., Measure R Sales Tax Rev. Ref. Green Bonds, Series 2020-A, 5.00% 2024 | | | 125 | | | | 140 | |
| Public Works Board, Lease Rev. Ref. Bonds (Various Capital Projects), Series 2022-A, 5.00% 2025 | | | 180 | | | | 205 | |
| County of San Diego, Regional Transportation Commission, Limited Sales Tax Rev. Short-Term Notes, Series 2021-A, 5.00% 2022 | | | 500 | | | | 522 | |
| City and County of San Francisco, G.O. Rev. Ref. Bonds, Series 2020-R-2, 5.00% 2023 | | | 135 | | | | 145 | |
| City and County of San Francisco, G.O. Rev. Ref. Bonds, Series 2020-R-2, 5.00% 2024 | | | 310 | | | | 348 | |
| Southern California Public Power Auth., Rev. Ref. Bonds (Magnolia Power Project A), Series 2020-1, 5.00% 2023 | | | 400 | | | | 431 | |
| Southern California Public Power Auth., Rev. Ref. Green Bonds (Milford Wind Corridor Phase II Project), Series 2021-1, 5.00% 2023 | | | 20 | | | | 22 | |
| Southern California Public Power Auth., Rev. Ref. Green Bonds (Milford Wind Corridor Phase II Project), Series 2021-1, 5.00% 2024 | | | 5 | | | | 6 | |
| Southern California Public Power Auth., Transmission Project Rev. Bonds (Southern Transmission Project), Series 2017-A, 5.00% 2023 | | | 160 | | | | 173 | |
| Statewide Communities Dev. Auth., Multi Family Housing Rev. Bonds (Villa Del Sol Apartments), Series 2021-A-2, 0.39% 2023 (put 2023) | | | 80 | | | | 80 | |
| Statewide Communities Dev. Auth., Multi Family Housing Rev. Bonds (Washington Court Apartments), Series 2021-E, 0.22% 2023 (put 2022) | | | 35 | | | | 35 | |
| Statewide Communities Dev. Auth., Rev. Ref. Bonds (Enloe Medical Center), Series 2015, 5.00% 2028 | | | 250 | | | | 293 | |
| City of Tustin, Community Facs. Dist. No. 2014-1 (Tustin Legacy/Standard Pacific), Special Tax Bonds, Series 2015-A, 5.00% 2027 | | | 200 | | | | 228 | |
| Regents of the University of California, Limited Project Rev. Bonds, Series 2022-S, 5.00% 2026 | | | 25 | | | | 29 | |
| Val Verde Unified School Dist., G.O. Bonds, 2012 Election, Series 2013-A, BAM insured, 5.00% 2042 | | | 500 | | | | 542 | |
| | | | | | | | 9,416 | |
| | | | | | | | | |
| Colorado 0.88% | | | | | | | | |
| Certs. of Part., Series 2021-A, 5.00% 2025 | | | 345 | | | | 407 | |
| City of Colorado Springs, Utilities System Rev. Ref. Bonds, Series 2020-B, 5.00% 2021 | | | 20 | | | | 20 | |
| City and County of Denver, Park Creek Metropolitan Dist., Limited Property Tax Supported Rev. Ref. Bonds, Series 2015-A, 5.00% 2021 | | | 260 | | | | 261 | |
| E-470 Public Highway Auth., Rev. Bonds, Series 2021-B, (USD-SOFR x 0.67 + 0.35%) 0.383% 2039 (put 2024)1 | | | 40 | | | | 40 | |
| Health Facs. Auth., Rev. Bonds (Sanford Health), Series 2019-A, 5.00% 2022 | | | 325 | | | | 340 | |
| Housing and Fin. Auth., Single Family Mortgage Bonds, Series 2021-E, 3.00% 2051 | | | 215 | | | | 231 | |
| Housing and Fin. Auth., Single Family Mortgage Bonds, Series 2021-L, Class I, 3.25% 2051 | | | 205 | | | | 224 | |
| Regents of the University of Colorado, University Enterprise Rev. and Rev. Ref. Bonds, Series 2019-C, 2.00% 2054 (put 2024) | | | 245 | | | | 256 | |
| | | | | | | | 1,779 | |
| | | | | | | | | |
| Connecticut 2.39% | | | | | | | | |
| Town of East Hartford, Housing Auth., Multi Family Housing Rev. Bonds (Veterans Terrace Project), Series 2021, 0.25% 2023 (put 2022) | | | 45 | | | | 45 | |
| Health and Educational Facs. Auth., Rev. Bonds (Sacred Heart University Issue), Series 2017-I-1, 5.00% 2022 | | | 500 | | | | 516 | |
| Health and Educational Facs. Auth., Rev. Bonds (Yale University Issue), Series 1999-U-1, 2.00% 2033 (put 2022) | | | 500 | | | | 502 | |
| Health and Educational Facs. Auth., Rev. Bonds (Yale University Issue), Series 2015-A, 0.375% 2035 (put 2024) | | | 855 | | | | 853 | |
| Health and Educational Facs. Auth., Rev. Bonds (Yale University Issue), Series 2003-X-2, 0.25% 2037 (put 2024) | | | 265 | | | | 264 | |
| Health and Educational Facs. Auth., Rev. Bonds (Yale University Issue), Series 2014-A, 1.10% 2048 (put 2023) | | | 750 | | | | 758 | |
| Housing Fin. Auth., Housing Mortgage Fin. Program Bonds, Series 2019-F-1, 3.50% 2043 | | | 665 | | | | 717 | |
| Housing Fin. Auth., Housing Mortgage Fin. Program Bonds, Series 2014-C-1, 4.00% 2044 | | | 160 | | | | 165 | |
| Housing Fin. Auth., Housing Mortgage Fin. Program Bonds, Series 2016-A-1, 4.00% 2045 | | | 85 | | | | 89 | |
| 36 | Private Client Services Funds |
Capital Group Short-Term Municipal Fund
| Bonds, notes & other debt instruments (continued) | Principal amount
(000) | | | Value
(000) | |
| Connecticut (continued) | | | | | | | | |
| Housing Fin. Auth., Housing Mortgage Fin. Program Bonds, Series 2017-A-1, 4.00% 2047 | | $ | 460 | | | $ | 492 | |
| Housing Fin. Auth., Housing Mortgage Fin. Program Bonds, Series 2021-B-1, 3.00% 2049 | | | 125 | | | | 135 | |
| Housing Fin. Auth., Housing Mortgage Fin. Program Rev. Ref. Bonds, Series 2013-B-2, 4.00% 2032 | | | 35 | | | | 35 | |
| Housing Fin. Auth., Housing Mortgage Fin. Program Rev. Ref. Bonds, Series 2014-D-1, 4.00% 2044 | | | 85 | | | | 86 | |
| Housing Fin. Auth., Housing Mortgage Fin. Program Rev. Ref. Bonds, Series 2015-C-1, 3.50% 2045 | | | 185 | | | | 192 | |
| | | | | | | | 4,849 | |
| | | | | | | | | |
| Delaware 0.08% | | | | | | | | |
| G.O. Bonds, Series 2021, 5.00% 2031 | | | 125 | | | | 167 | |
| | | | | | | | | |
| District of Columbia 0.56% | | | | | | | | |
| G.O. Bonds, Series 2015-A, 5.00% 2032 | | | 700 | | | | 807 | |
| Income Tax Secured Rev. Bonds, Series 2011-A, 5.00% 2022 | | | 320 | | | | 321 | |
| | | | | | | | 1,128 | |
| | | | | | | | | |
| Florida 2.94% | | | | | | | | |
| County of Brevard, Housing Fncg. Auth., Multi Family Mortgage Rev. Bonds (Tropical Manor Apartments), Series 2021, 0.25% 2023 (put 2022) | | | 40 | | | | 40 | |
| Citizens Property Insurance Corp., Personal Lines Account/Commercial Lines Account Secured Bonds, Series 2012-A-1, 5.00% 2022 | | | 50 | | | | 51 | |
| County of Collier, Heritage Bay Community Dev. Dist., Capital Improvement Rev. Bonds, Series 2018-A-2, 2.50% 2022 | | | 500 | | | | 505 | |
| Board of Education, Public Education Capital Outlay Rev. Ref. Bonds, Series 2019-D, 5.00% 2023 | | | 15 | | | | 16 | |
| Higher Educational Facs. Fncg. Auth., Educational Facs. Rev. Ref. Bonds (The University of Tampa Project), Series 2012-A, 5.25% 2042 (preref. 2022) | | | 1,000 | | | | 1,021 | |
| Housing Fin. Corp., Homeowner Mortgage Rev. Bonds, Series 2018-2, 4.25% 2050 | | | 320 | | | | 348 | |
| Housing Fin. Corp., Homeowner Mortgage Rev. Bonds, Series 2020-1, 3.50% 2051 | | | 50 | | | | 55 | |
| JEA, Water and Sewer System Rev. Bonds, Series 2020-A, 5.00% 2025 | | | 280 | | | | 328 | |
| County of Miami-Dade, Industrial Dev. Auth., Solid Waste Disposal Rev. Bonds (Waste Management, Inc. of Florida Project), Series 2007, 0.45% 2027 (put 2021) | | | 1,165 | | | | 1,165 | |
| County of Miami-Dade, Water and Sewer System Rev. Ref. Bonds, Series 2008-B, Assured Guaranty Municipal insured, 5.25% 2022 | | | 195 | | | | 204 | |
| County of Orange, Housing Fin. Auth., Multi Family Housing Rev. Bonds (Jernigan Gardens), Series 2020-B, 0.35% 2023 (put 2022) | | | 1,000 | | | | 1,000 | |
| County of Orange, Sales Tax Rev. Ref. Bonds, Series 2012-B, 5.00% 2030 (preref. 2022) | | | 500 | | | | 504 | |
| County of Polk, Utility System Rev. and Rev. Ref. Bonds, Series 2013, BAM insured, 5.00% 2043 (preref. 2023) | | | 110 | | | | 120 | |
| City of Tampa, Hospital Rev. Bonds (H. Lee Moffitt Cancer Center Project), Series 2020-B, 5.00% 2024 | | | 100 | | | | 112 | |
| City of Tampa, Hospital Rev. Bonds (H. Lee Moffitt Cancer Center Project), Series 2020-B, 5.00% 2025 | | | 75 | | | | 87 | |
| City of Tampa, Hospital Rev. Bonds (H. Lee Moffitt Cancer Center Project), Series 2020-B, 5.00% 2026 | | | 100 | | | | 119 | |
| Tampa-Hillsborough County Expressway Auth., Rev. Ref. Bonds, Series 2012-B, 5.00% 2042 (preref. 2022) | | | 200 | | | | 206 | |
| Dept. of Transportation Fncg. Corp., Rev. Bonds, Series 2020, 5.00% 2024 | | | 65 | | | | 73 | |
| | | | | | | | 5,954 | |
| | | | | | | | | |
| Georgia 2.70% | | | | | | | | |
| City of Atlanta, Airport General Rev. Ref. Bonds, Series 2014-B, 5.00% 2026 | | | 800 | | | | 878 | |
| City of Atlanta, Airport General Rev. Ref. Bonds, Series 2021-B, 5.00% 2027 | | | 430 | | | | 529 | |
| City of Atlanta, Urban Residential Fin. Auth., Multi Family Housing Rev. Bonds (Sylvan Hills Senior Apartments Project), Series 2020, 0.41% 2025 (put 2023) | | | 85 | | | | 85 | |
| County of Dawson, Dev. Auth., Multi Family Housing Rev. Bonds (Peaks of Dawsonville Project), Series 2021, 0.28% 2023 | | | 500 | | | | 499 | |
| County of Dekalb, Housing Auth., Multi Family Housing Rev. Bonds (Columbia Village Project), Series 2021-A, 0.34% 2024 (put 2023) | | | 35 | | | | 35 | |
| Housing and Fin. Auth., Single Family Mortgage Bonds, Series 2015-A-1, 3.50% 2045 | | | 30 | | | | 32 | |
| Housing and Fin. Auth., Single Family Mortgage Bonds, Series 2017-A, 4.00% 2047 | | | 405 | | | | 431 | |
| Main Street Natural Gas, Inc., Gas Supply Rev. Bonds, Series 2019-C, 4.00% 2050 (put 2026) | | | 500 | | | | 569 | |
| Metropolitan Atlanta Rapid Transit Auth., Sales Tax Rev. Ref. Bonds (Third Indenture Series), Series 2012-A, 5.00% 2030 (preref. 2022) | | | 870 | | | | 898 | |
| Municipal Electric Auth., General Resolution Projects Bonds, Series 2021-A, 4.00% 2027 | | | 270 | | | | 311 | |
| Municipal Electric Auth., Project One Bonds, Series 2021-A, 5.00% 2030 | | | 40 | | | | 51 | |
| Private Client Services Funds | 37 |
Capital Group Short-Term Municipal Fund
| Bonds, notes & other debt instruments (continued) | Principal amount
(000) | | | Value
(000) | |
| Georgia (continued) | | | | | | | | |
| Private Colleges and Universities Auth., Rev. Bonds (The Savannah College of Art and Design Projects), Series 2021, 5.00% 2028 | | $ | 35 | | | $ | 43 | |
| Private Colleges and Universities Auth., Rev. Bonds (The Savannah College of Art and Design Projects), Series 2021, 5.00% 2029 | | | 5 | | | | 6 | |
| City of Sandy Springs, Public Facs. Auth., Rev. Bonds (Sandy Springs City Center Project), Series 2015, 5.00% 2047 (preref. 2026) | | | 500 | | | | 598 | |
| City of Thomaston, Housing Auth., Multi Family Housing Rev. Bonds (Eastgate Apartments Project), Series 2020-A, 0.34% 2023 (put 2022) | | | 500 | | | | 500 | |
| | | | | | | | 5,465 | |
| | | | | | | | | |
| Idaho 0.57% | | | | | | | | |
| Housing and Fin. Assn., Single Family Mortgage Bonds, Series 2019-A, 4.00% 2050 | | | 1,050 | | | | 1,149 | |
| | | | | | | | | |
| Illinois 6.46% | | | | | | | | |
| City of Chicago, Sales Tax Rev. Ref. Bonds, Series 2011-A, 5.00% 2041 (preref. 2022) | | | 205 | | | | 207 | |
| City of Chicago, Wastewater Transmission Rev. Bonds, Series 2014, 5.00% 2024 | | | 625 | | | | 686 | |
| City of Chicago, Water Rev. Ref. Bonds, Series 2017-2, 5.00% 2021 | | | 180 | | | | 180 | |
| City of Chicago, Water Rev. Ref. Bonds, Series 2017, 5.00% 2022 | | | 540 | | | | 565 | |
| Fin. Auth., Rev. Bonds (Art Institute of Chicago), Series 2016, 5.00% 2023 | | | 100 | | | | 106 | |
| Fin. Auth., Rev. Bonds (Art Institute of Chicago), Series 2016, 5.00% 2024 | | | 130 | | | | 144 | |
| Fin. Auth., Rev. Bonds (Centegra Health System), Series 2014-A, 5.00% 2027 (preref. 2024) | | | 200 | | | | 226 | |
| Fin. Auth., Rev. Bonds (Northshore University Heathsystem), Series 2020-A, 5.00% 2029 | | | 605 | | | | 775 | |
| Fin. Auth., Rev. Bonds (OSF Healthcare System), Series 2015-A, 5.00% 2021 | | | 1,100 | | | | 1,102 | |
| Fin. Auth., Rev. Bonds (OSF Healthcare System), Series 2020-B-2, 5.00% 2050 (put 2026) | | | 40 | | | | 47 | |
| Fin. Auth., Rev. Bonds (Presbyterian Homes Obligated Group), Series 2016-A, 5.00% 2023 | | | 225 | | | | 240 | |
| Fin. Auth., Rev. Bonds (Presbyterian Homes Obligated Group), Series 2021-B, (SIFMA Municipal Swap Index + 0.70%) 0.75% 2042 (put 2026)1 | | | 25 | | | | 25 | |
| Fin. Auth., Rev. Bonds (Presence Health Network), Series 2016-C, 5.00% 2026 | | | 515 | | | | 610 | |
| Fin. Auth., Rev. Bonds (University of Chicago), Series 2014-A, 5.00% 2023 | | | 200 | | | | 218 | |
| Fin. Auth., Rev. Bonds (University of Chicago), Series 2021-A, 5.00% 2025 | | | 40 | | | | 47 | |
| Fin. Auth., Rev. Ref. Bonds (Anne & Robert H. Lurie Children’s Hospital), Series 2017, 5.00% 2022 | | | 240 | | | | 249 | |
| Housing Dev. Auth., Multi Family Housing Rev. Bonds, Series 2021-C, 0.80% 2026 | | | 80 | | | | 79 | |
| Housing Dev. Auth., Multi Family Housing Rev. Bonds (Concord Commons), Series 2021, 0.25% 2024 (put 2023) | | | 595 | | | | 595 | |
| Housing Dev. Auth., Multi Family Housing Rev. Bonds (Marshall Field Garden Apartment Homes), Series 2015, (SIFMA Municipal Swap Index + 1.00%) 1.05% 2050 (put 2025)1 | | | 1,000 | | | | 1,022 | |
| Board of Trustees of Illinois State University, Auxiliary Facs. System Rev. Bonds, Series 2016, Assured Guaranty Municipal insured, 5.00% 2022 | | | 695 | | | | 708 | |
| Board of Trustees of Illinois State University, Auxiliary Facs. System Rev. Bonds, Series 2018-B, Assured Guaranty Municipal insured, 5.00% 2022 | | | 500 | | | | 510 | |
| Board of Trustees of Illinois State University, Auxiliary Facs. System Rev. Bonds, Series 2018-A, Assured Guaranty Municipal insured, 5.00% 2023 | | | 500 | | | | 532 | |
| Railsplitter Tobacco Settlement Auth., Tobacco Settlement Rev. Bonds, Series 2017, 5.00% 2022 | | | 250 | | | | 257 | |
| Railsplitter Tobacco Settlement Auth., Tobacco Settlement Rev. Bonds, Series 2017, 5.00% 2023 | | | 310 | | | | 332 | |
| City of Springfield, Water Rev. Bonds, Series 2012, 5.00% 2037 (preref. 2022) | | | 500 | | | | 508 | |
| Toll Highway Auth., Toll Highway Rev. Bonds, Series 2014-A, 5.00% 2021 | | | 120 | | | | 120 | |
| Toll Highway Auth., Toll Highway Rev. Bonds, Series 2019-C, 5.00% 2023 | | | 190 | | | | 200 | |
| Toll Highway Auth., Toll Highway Rev. Bonds, Series 2019-C, 5.00% 2025 | | | 545 | | | | 622 | |
| Toll Highway Auth., Toll Highway Rev. Ref. Bonds, Series 2014-D, 5.00% 2022 | | | 185 | | | | 186 | |
| Toll Highway Auth., Toll Highway Rev. Ref. Bonds, Series 2019-A, 5.00% 2023 | | | 175 | | | | 185 | |
| Toll Highway Auth., Toll Highway Rev. Ref. Bonds, Series 2019-A, 5.00% 2025 | | | 250 | | | | 285 | |
| Board of Trustees of the University of Illinois, Auxiliary Facs. System Rev. Bonds, Series 2018-A, 5.00% 2024 | | | 200 | | | | 222 | |
| Board of Trustees of the University of Illinois, Auxiliary Facs. System Rev. Ref. Bonds, Series 2015-A, 5.00% 2026 | | | 620 | | | | 709 | |
| County of Will, G.O. Bonds, Series 2016, 5.00% 2045 (preref. 2025) | | | 500 | | | | 588 | |
| | | | | | | | 13,087 | |
| | | | | | | | | |
| Indiana 2.05% | | | | | | | | |
| Fin. Auth., Health System Rev. Bonds (Indiana University Health), Series 2019-C, 5.00% 2022 | | | 40 | | | | 42 | |
| Fin. Auth., Hospital Rev. Bonds (Community Health Network Project), Series 2012-A, 5.00% 2042 (preref. 2023) | | | 540 | | | | 578 | |
| Fin. Auth., Hospital Rev. Ref. Bonds (Parkview Health System), Series 2012-A, 5.00% 2022 | | | 440 | | | | 450 | |
| 38 | Private Client Services Funds |
Capital Group Short-Term Municipal Fund
| Bonds, notes & other debt instruments (continued) | Principal amount
(000) | | | Value
(000) | |
| Indiana (continued) | | | | | | | | |
| Fin. Auth., Rev. Bonds (Community Foundation of Northwest Indiana Obligated Group), Series 2012, 5.00% 2030 (preref. 2022) | | $ | 245 | | | $ | 249 | |
| Fin. Auth., State Revolving Fund Program Green Bonds, Series 2021-B, 5.00% 2028 | | | 55 | | | | 68 | |
| Fin. Auth., Wastewater Utility Rev. Ref. Bonds, Series 2021-1, 5.00% 2025 | | | 155 | | | | 182 | |
| City of Franklin, Econ. Dev. and Rev. Ref. Bonds (Otterbein Homes Obligated Group), Series 2019-B, 5.00% 2023 | | | 510 | | | | 548 | |
| Health Fac. Fncg. Auth., Rev. Bonds (Ascension Health Subordinate Credit Group), Series 2005-A-1, 4.00% 2023 | | | 15 | | | | 16 | |
| Housing and Community Dev. Auth., Single Family Mortgage Rev. Bonds, Series 2019-A, 4.25% 2048 | | | 540 | | | | 589 | |
| Housing and Community Dev. Auth., Single Family Mortgage Rev. Bonds, Series 2020-A, 3.75% 2049 | | | 40 | | | | 44 | |
| Housing and Community Dev. Auth., Single Family Mortgage Rev. Bonds, Series 2021-C-1, 3.00% 2052 | | | 65 | | | | 70 | |
| City of Indianapolis, Local Public Improvement Bond Bank Bonds, Series 2021-A, 5.00% 2022 | | | 100 | | | | 103 | |
| City of Indianapolis, Local Public Improvement Bond Bank Bonds (Indianapolis Airport Auth. Project), Series 2019-I-2, 5.00% 2023 | | | 230 | | | | 243 | |
| City of Indianapolis, Local Public Improvement Bond Bank Bonds (Indianapolis Airport Auth. Project), Series 2019-I-2, 5.00% 2024 | | | 240 | | | | 264 | |
| City of Indianapolis, Local Public Improvement Bond Bank Bonds (Indianapolis Airport Auth. Project), Series 2019-I-2, 5.00% 2025 | | | 255 | | | | 291 | |
| City of Indianapolis, Local Public Improvement Bond Bank Rev. Ref. Bonds (Cityway 1 Project), Series 2021-B, 5.00% 2025 | | | 140 | | | | 154 | |
| City of Kokomo, Multi Family Housing Rev. Bonds (KHA RAD I Apartments), Series 2021-A, 0.56% 2025 (put 2024) | | | 265 | | | | 265 | |
| | | | | | | | 4,156 | |
| | | | | | | | | |
| Kansas 0.02% | | | | | | | | |
| Unified Government of Wyandotte County, Board of Public Utilities, Utility System Improvement Rev. Bonds, Series 2012-B, 5.00% 2026 (preref. 2022) | | | 35 | | | | 36 | |
| | | | | | | | | |
| Kentucky 0.63% | | | | | | | | |
| Housing Corp., Multi Family Housing Rev. Bonds (New Hope Properties Portfolio Project), Series 2021, 0.41% 2024 (put 2023) | | | 485 | | | | 485 | |
| Housing Corp., Multi Family Housing Rev. Bonds (Winterwood II Rural Housing Portfolio), Series 2021, 0.37% 2024 (put 2023) | | | 195 | | | | 195 | |
| Property and Buildings Commission, Commonwealth Rev. Ref. Bonds (Project No. 125), Series 2021-A, 5.00% 2022 | | | 45 | | | | 47 | |
| Public Energy Auth., Gas Supply Rev. Bonds, Series 2019-A-1, 4.00% 2049 (put 2025) | | | 320 | | | | 355 | |
| Public Energy Auth., Gas Supply Rev. Bonds, Series 2018-B, 4.00% 2049 (put 2025) | | | 55 | | | | 60 | |
| County of Warren, Hospital Rev. Ref. Bonds (Bowling Green - Warren County Community Hospital Corp.), Series 2021-A, 5.00% 2022 | | | 135 | | | | 138 | |
| | | | | | | | 1,280 | |
| | | | | | | | | |
| Louisiana 0.88% | | | | | | | | |
| Gasoline and Fuels Tax Rev. Ref. Bonds, Series 2017-D-2, 0.55% 2043 (put 2022) | | | 1,000 | | | | 1,000 | |
| Housing Corp., Multi Family Housing Rev. Bonds (Mabry Place Townhomes Project), Series 2021, 0.31% 2024 (put 2023) | | | 55 | | | | 55 | |
| Parish of Jefferson, Sales Tax Rev. Ref. Bonds, Series 2019-A, Assured Guaranty Municipal insured, 5.00% 2023 | | | 250 | | | | 273 | |
| Offshore Terminal Auth., Deepwater Port Rev. Bonds (Loop LLC Project), Series 2007-A, 1.65% 2027 (put 2023) | | | 105 | | | | 107 | |
| Parish of Tangipahoa, Hospital Service Dist. No. 1, Hospital Rev. Ref. Bonds (North Oaks Health System Project), Series 2021, 5.00% 2027 | | | 265 | | | | 319 | |
| Tobacco Settlement Fncg. Corp., Tobacco Settlement Asset-Backed Rev. Ref. Bonds, Series 2013-A, 5.00% 2023 | | | 30 | | | | 32 | |
| | | | | | | | 1,786 | |
| | | | | | | | | |
| Maine 0.13% | | | | | | | | |
| Housing Auth., Mortgage Purchase Bonds, Series 2017-A, 4.00% 2047 | | | 250 | | | | 265 | |
| | | | | | | | | |
| Maryland 2.04% | | | | | | | | |
| County of Baltimore, Rev. Bonds (Oak Crest Village, Inc. Fac.), Series 2016, 5.00% 2022 | | | 400 | | | | 403 | |
| Community Dev. Administration, Dept. of Housing and Community Dev., Residential Rev. Bonds, Series 2018-A, 4.50% 2048 | | | 850 | | | | 947 | |
| Community Dev. Administration, Dept. of Housing and Community Dev., Residential Rev. Bonds, Series 2019-A, 4.25% 2049 | | | 90 | | | | 99 | |
| Private Client Services Funds | 39 |
Capital Group Short-Term Municipal Fund
| Bonds, notes & other debt instruments (continued) | Principal amount
(000) | | | Value
(000) | |
| Maryland (continued) | | | | | | | | |
| County of Montgomery, Housing Opportunities Commission, Single Family Housing Rev. Bonds, Series 2017-A, 4.00% 2048 | | $ | 270 | | | $ | 290 | |
| County of Montgomery, Housing Opportunities Commission, Single Family Housing Rev. Bonds, Series 2018-A, 4.00% 2049 | | | 405 | | | | 437 | |
| Stadium Auth., Rev. Bonds (Baltimore City Public Schools Construction and Revitalization Program), Series 2016, 5.00% 2041 (preref. 2026) | | | 1,025 | | | | 1,226 | |
| Dept. of Transportation, Consolidated Transportation Rev. Ref. Bonds, Series 2015, 5.00% 2023 | | | 110 | | | | 117 | |
| Dept. of Transportation, Consolidated Transportation Rev. Ref. Bonds, Series 2022-A, 5.00% 2027 | | | 500 | | | | 609 | |
| | | | | | | | 4,128 | |
| | | | | | | | | |
| Massachusetts 0.39% | | | | | | | | |
| Dev. Fin. Agcy., Multi Family Housing Rev. Bonds (Salem Heights II Preservation Associates LP Issue), Series 2021-B, 0.25% 2024 (put 2023) | | | 50 | | | | 50 | |
| Dev. Fin. Agcy., Rev. Ref. Bonds (Berkshire Health Systems Issue), Series 2021-I, 5.00% 2023 | | | 240 | | | | 261 | |
| Housing Fin. Agcy., Housing Green Bonds, Series 2021-B-2, 0.75% 2025 | | | 15 | | | | 15 | |
| Housing Fin. Agcy., Single Family Housing Rev. Bonds, Series 169, 4.00% 2044 | | | 35 | | | | 36 | |
| Housing Fin. Agcy., Single Family Housing Rev. Bonds, Series 183, 3.50% 2046 | | | 280 | | | | 293 | |
| Housing Fin. Agcy., Single Family Housing Rev. Ref. Bonds, Series 171, 4.00% 2044 | | | 140 | | | | 143 | |
| | | | | | | | 798 | |
| | | | | | | | | |
| Michigan 2.76% | | | | | | | | |
| City of Detroit, Water and Sewerage Dept., Sewage Disposal System Rev. and Rev. Ref. Bonds, Series 2012-A, 5.00% 2023 | | | 700 | | | | 722 | |
| City of Detroit, Water and Sewerage Dept., Sewage Disposal System Rev. and Rev. Ref. Bonds, Series 2012-A, 5.00% 2032 (preref. 2022) | | | 45 | | | | 47 | |
| Fin. Auth., Hospital Rev. and Rev. Ref. Bonds (Trinity Health Credit Group), Series 2017-A, 5.00% 2047 (preref. 2022) | | | 1,290 | | | | 1,357 | |
| Fin. Auth., Hospital Rev. Ref. Bonds (McLaren Health Care), Series 2015-D-1, 0.25% 2022 | | | 5 | | | | 5 | |
| Grant Anticipation Rev. Ref. Bonds, Series 2016, 5.00% 2027 | | | 500 | | | | 611 | |
| Hospital Fin. Auth., Hospital Rev. Ref. Bonds (Trinity Health Credit Group), Series 2012-C, 5.00% 2026 (preref. 2022) | | | 120 | | | | 123 | |
| Housing Dev. Auth., Multi Family Housing Rev. Bonds, Series 2020, 0.32% 2023 (put 2022) | | | 415 | | | | 415 | |
| Housing Dev. Auth., Rental Housing Rev. Bonds, Series 2021-A, 0.55% 2025 | | | 50 | | | | 50 | |
| Housing Dev. Auth., Single Family Mortgage Rev. Bonds, Series 2017-B, 3.50% 2048 | | | 90 | | | | 96 | |
| Housing Dev. Auth., Single Family Mortgage Rev. Bonds, Series 2018-C, 4.25% 2049 | | | 550 | | | | 600 | |
| City of Lansing, Board of Water and Light, Utility System Rev. Bonds, Series 2019-A, 5.00% 2024 | | | 375 | | | | 421 | |
| County of Monroe, Econ. Dev. Corp., Limited Obligation Rev. Ref. Bonds (Detroit Edison Co. Project), Series 1992-AA, National insured, 6.95% 2022 | | | 500 | | | | 527 | |
| County of Wayne, Airport Auth., Airport Rev. Bonds (Detroit Metropolitan Wayne County Airport), Series 2015-G, 5.00% 2021 | | | 300 | | | | 301 | |
| County of Wayne, Airport Auth., Airport Rev. Bonds (Detroit Metropolitan Wayne County Airport), Series 2018-C, 5.00% 2023 | | | 290 | | | | 318 | |
| | | | | | | | 5,593 | |
| | | | | | | | | |
| Minnesota 1.19% | | | | | | | | |
| City of Hopkins, Multi Family Housing Rev. Bonds (Raspberry Ridge Project), Series 2021, 0.26% 2024 (put 2023) | | | 145 | | | | 145 | |
| Housing Fin. Agcy., Residential Housing Fin. Bonds, Series 2018-B, 4.00% 2048 | | | 350 | | | | 377 | |
| Housing Fin. Agcy., Residential Housing Fin. Bonds, Series 2018-E, 4.25% 2049 | | | 590 | | | | 648 | |
| Housing Fin. Agcy., Residential Housing Fin. Bonds, Series 2020-E, 3.50% 2050 | | | 500 | | | | 542 | |
| Housing Fin. Agcy., Residential Housing Fin. Bonds, Series 2020-B, 3.50% 2050 | | | 460 | | | | 499 | |
| City of Mahtomedi, Multi Family Housing Rev. Bonds (Lincoln Place / Vadnais Highlands Projects), Series 2021, 0.25% 2023 (put 2022) | | | 80 | | | | 80 | |
| Regents of the University of Minnesota, G.O. Rev. Ref. Bonds, Series 2017B, 5.00% 2021 | | | 120 | | | | 120 | |
| | | | | | | | 2,411 | |
| 40 | Private Client Services Funds |
Capital Group Short-Term Municipal Fund
| Bonds, notes & other debt instruments (continued) | Principal amount
(000) | | | Value
(000) | |
| Mississippi 0.11% | | | | | | | | |
| Business Fin. Corp., Solid Waste Disposal Rev. Bonds (Waste Management, Inc. Project), Series 2004, 0.70% 2029 (put 2026) | | $ | 175 | | | $ | 172 | |
| Home Corp., Collateralized Multi Family Housing Bonds (J&A Dev. Portfolio Project I), Series 2021-1, 0.30% 2024 (put 2023) | | | 60 | | | | 60 | |
| | | | | | | | 232 | |
| | | | | | | | | |
| Missouri 0.49% | | | | | | | | |
| Housing Dev. Commission, Single Family Mortgage Rev. Bonds (First Place Homeownership Loan Program), Series 2016-B, 3.50% 2041 | | | 610 | | | | 641 | |
| Housing Dev. Commission, Single Family Mortgage Rev. Bonds (First Place Homeownership Loan Program), Series 2020-A, 3.50% 2050 | | | 185 | | | | 201 | |
| Housing Dev. Commission, Single Family Mortgage Rev. Bonds (First Place Homeownership Loan Program), Series 2021-A, 3.00% 2052 | | | 60 | | | | 64 | |
| County of St. Charles, Industrial Dev. Auth., Multi Family Housing Rev. Bonds (Hidden Valley Estates), Series 2021, 0.27% 2025 (put 2023) | | | 85 | | | | 85 | |
| | | | | | | | 991 | |
| | | | | | | | | |
| Montana 0.21% | | | | | | | | |
| Board of Housing, Single Family Mortgage Bonds, Series 2016-A-2, 3.50% 2044 | | | 115 | | | | 121 | |
| Board of Housing, Single Family Mortgage Bonds, Series 2019-A, 4.25% 2045 | | | 130 | | | | 142 | |
| Board of Housing, Single Family Mortgage Bonds, Series 2020-B, 4.00% 2050 | | | 140 | | | | 155 | |
| | | | | | | | 418 | |
| | | | | | | | | |
| Nebraska 0.59% | | | | | | | | |
| Investment Fin. Auth., Single Family Housing Rev. Bonds, Series 2014-A, 4.00% 2044 | | | 220 | | | | 232 | |
| Investment Fin. Auth., Single Family Housing Rev. Bonds, Series 2016-C, 3.50% 2046 | | | 75 | | | | 76 | |
| Investment Fin. Auth., Single Family Housing Rev. Bonds, Series 2018-C, 4.00% 2048 | | | 445 | | | | 484 | |
| Investment Fin. Auth., Single Family Housing Rev. Bonds, Series 2021-C, 3.00% 2050 | | | 375 | | | | 405 | |
| | | | | | | | 1,197 | |
| | | | | | | | | |
| Nevada 0.68% | | | | | | | | |
| County of Clark, Pollution Control Rev. Ref. Bonds (Nevada Power Co. Projects), Series 2017, 1.65% 2036 (put 2023) | | | 645 | | | | 656 | |
| Housing Division, Multi Unit Housing Rev. Bonds (Pinewood Terrace Apartments), Series 2021, 0.26% 2024 (put 2022) | | | 75 | | | | 75 | |
| Las Vegas Valley Water Dist., Limited Tax G.O. Water Improvement and Rev. Ref. Bonds, Series 2016-A, 5.00% 2023 | | | 600 | | | | 645 | |
| | | | | | | | 1,376 | |
| | | | | | | | | |
| New Jersey 0.80% | | | | | | | | |
| Econ. Dev. Auth., Water Facs. Rev. Ref. Bonds (American Water Co., Inc. Project), Series 2020-A, 1.00% 2023 | | | 275 | | | | 278 | |
| Housing and Mortgage Fin. Agcy., Single Family Housing Rev. Bonds, Series 2018-A, 4.50% 2048 | | | 465 | | | | 517 | |
| Tobacco Settlement Fncg. Corp., Tobacco Settlement Bonds, Series 2018-A, 5.00% 2023 | | | 200 | | | | 214 | |
| Tobacco Settlement Fncg. Corp., Tobacco Settlement Bonds, Series 2018-A, 5.00% 2026 | | | 500 | | | | 589 | |
| Turnpike Auth., Turnpike Rev. Bonds, Series 2020-D, 5.00% 2028 | | | 30 | | | | 35 | |
| | | | | | | | 1,633 | |
| | | | | | | | | |
| New Mexico 0.29% | | | | | | | | |
| Mortgage Fin. Auth., Single Family Mortgage Program Bonds, Series 2019-A-1, Class I, 4.25% 2050 | | | 400 | | | | 440 | |
| Municipal Energy Acquisition Auth., Gas Supply Rev. Ref. and Acquisition Bonds, Series 2019, 5.00% 2039 (put 2025) | | | 135 | | | | 155 | |
| | | | | | | | 595 | |
| Private Client Services Funds | 41 |
Capital Group Short-Term Municipal Fund
| Bonds, notes & other debt instruments (continued) | Principal amount
(000) | | | Value
(000) | |
| New York 5.15% | | | | | | | | |
| Build NYC Resource Corp., Rev. Ref. Bonds (Ethical Culture Fieldston School Project), Series 2015, 5.00% 2024 | | $ | 360 | | | $ | 400 | |
| Dormitory Auth., State Personal Income Tax Rev. Bonds (General Purpose), Series 2017-A, 5.00% 2022 | | | 175 | | | | 177 | |
| Dormitory Auth., State Personal Income Tax Rev. Bonds (General Purpose), Series 2020-A-2, 5.00% 2031 | | | 15 | | | | 20 | |
| City of Geneva, Dev. Corp., Rev. Ref. Bonds (Hobart and William Smith Colleges Project), Series 2012, 5.00% 2032 (preref. 2022) | | | 40 | | | | 42 | |
| Housing Fin. Agcy., Affordable Housing Rev. Green Bonds, Series 2020-K, 0.70% 2024 | | | 85 | | | | 85 | |
| Housing Fin. Agcy., Affordable Housing Rev. Green Bonds, Series 2020-L-2, 0.75% 2025 | | | 250 | | | | 250 | |
| Housing Fin. Agcy., Affordable Housing Rev. Green Bonds, Series 2021-D-2, 0.65% 2056 (put 2025) | | | 195 | | | | 194 | |
| Housing Fin. Agcy., Affordable Housing Rev. Green Bonds, Series 2021-I-2, 0.70% 2056 (put 2025) | | | 190 | | | | 190 | |
| Long Island Power Auth., Electric System General Rev. Bonds, Series 2014-C, | | | | | | | | |
| (1-month USD-LIBOR x 0.70 + 0.75%) 0.807% 2033 (put 2023)1 | | | 300 | | | | 301 | |
| Long Island Power Auth., Electric System General Rev. Bonds, Series 2015-C, (1-month USD-LIBOR x 0.70 + 0.75%) 0.807% 2033 (put 2023)1 | | | 260 | | | | 261 | |
| Metropolitan Transportation Auth., Transportation Rev. Bonds, Series 2012-B, 5.00% 2022 | | | 195 | | | | 204 | |
| Metropolitan Transportation Auth., Transportation Rev. Bonds, Series 2012-C, 5.00% 2032 (preref. 2022) | | | 500 | | | | 525 | |
| Metropolitan Transportation Auth., Transportation Rev. Green Bonds, Series 2016-A-2, 5.00% 2024 | | | 300 | | | | 339 | |
| Metropolitan Transportation Auth., Transportation Rev. Ref. Bonds, Series 2012-F, 5.00% 2022 | | | 230 | | | | 241 | |
| Metropolitan Transportation Auth., Transportation Rev. Ref. Bonds, Series 2002-D-2-B, Assured Guaranty Municipal insured, (USD-SOFR x 0.67 + 0.55%) 0.583% 2032 (put 2024)1 | | | 255 | | | | 256 | |
| Metropolitan Transportation Auth., Transportation Rev. Ref. Bonds, Series 2002-D-2-A-2, Assured Guaranty Municipal insured, (USD-SOFR x 0.67 + 0.80%) 0.833% 2032 (put 2026)1 | | | 60 | | | | 61 | |
| Metropolitan Transportation Auth., Transportation Rev. Ref. Green Bonds, Series 2017-B, 5.00% 2023 | | | 455 | | | | 497 | |
| Metropolitan Transportation Auth., Transportation Rev. Ref. Green Bonds, Series 2017-C-1, 5.00% 2024 | | | 50 | | | | 57 | |
| Mortgage Agcy., Homeowner Mortgage Rev. Bonds, Series 197, 3.50% 2044 | | | 410 | | | | 434 | |
| Mortgage Agcy., Homeowner Mortgage Rev. Bonds, Series 233, 3.00% 2045 | | | 300 | | | | 323 | |
| Mortgage Agcy., Homeowner Mortgage Rev. Bonds, Series 213, 4.25% 2047 | | | 505 | | | | 552 | |
| New York City G.O. Bonds, Series 2018-C, 5.00% 2023 | | | 1,000 | | | | 1,083 | |
| New York City G.O. Bonds, Series 2014-I-1, 5.00% 2026 | | | 185 | | | | 205 | |
| New York City G.O. Bonds, Series 2021-A-1, 5.00% 2033 | | | 70 | | | | 92 | |
| New York City G.O. Bonds, Series 2015-F-4, 5.00% 2044 (put 2025) | | | 75 | | | | 86 | |
| New York City Housing Dev. Corp., Multi Family Housing Rev. Bonds (Sustainable Dev. Bonds), Series 2017-C-3-A, 0.20% 2022 | | | 45 | | | | 45 | |
| New York City Housing Dev. Corp., Multi Family Housing Rev. Bonds (Sustainable Dev. Bonds), Series 2016-C-2, 0.23% 2050 (put 2022) | | | 55 | | | | 55 | |
| New York City Housing Dev. Corp., Multi Family Housing Rev. Bonds (Sustainable Dev. Bonds), Series 2021-C-2, 0.70% 2060 (put 2025) | | | 330 | | | | 331 | |
| New York City Housing Dev. Corp., Multi Family Housing Rev. Bonds (Sustainable Neighborhood Bonds), Series 2017-G-2-A, 2.00% 2057 (put 2021) | | | 55 | | | | 55 | |
| New York City Housing Dev. Corp., Multi Family Housing Rev. Bonds (Sustainable Neighborhood Bonds), Series 2020-I-2, 0.70% 2060 (put 2025) | | | 230 | | | | 230 | |
| New York City Housing Dev. Corp., Multi Family Housing Rev. Green Bonds, Series 2021-F-2, 0.60% 2061 (put 2025) | | | 220 | | | | 219 | |
| New York City Municipal Water Fin. Auth., Water and Sewer System Second General Resolution Rev. Bonds, Series 2021-BB-2, 4.00% 2024 | | | 500 | | | | 548 | |
| New York City Transitional Fin. Auth., Future Tax Secured Bonds, Series 2019-C-1, 5.00% 2021 | | | 150 | | | | 150 | |
| New York City Transitional Fin. Auth., Future Tax Secured Bonds, Series 2020-A-1, 5.00% 2022 | | | 10 | | | | 10 | |
| New York City Transitional Fin. Auth., Future Tax Secured Bonds, Series 2021-E-1, 5.00% 2023 | | | 20 | | | | 21 | |
| New York City Transitional Fin. Auth., Future Tax Secured Bonds, Series 2021-F-1, 5.00% 2024 | | | 400 | | | | 455 | |
| New York City Transitional Fin. Auth., Future Tax Secured Bonds, Series 2013-I, 5.00% 2027 | | | 180 | | | | 193 | |
| Public Housing Capital Fund Rev. Trust I, Trust Certs., Series 2012, 4.50% 20222 | | | 47 | | | | 47 | |
| Triborough Bridge and Tunnel Auth., General Rev. Bonds (MTA Bridges and Tunnels), Series 2017-C-1, 5.00% 2025 | | | 500 | | | | 588 | |
| Utility Debt Securitization Auth., Restructuring Bonds, Series 2017, 5.00% 2025 | | | 10 | | | | 11 | |
| County of Westchester, Industrial Dev. Agcy., Multi Family Housing Rev. Bonds (EG Mt. Vernon Preservation, LP Project), Series 2020, 0.30% 2023 (put 2022) | | | 155 | | | | 155 | |
| County of Westchester, Industrial Dev. Agcy., Multi Family Housing Rev. Bonds (Marble Hall - Tuckahoe LP Project), Series 2021, 0.28% 2024 (put 2023) | | | 455 | | | | 454 | |
| | | | | | | | 10,442 | |
| 42 | Private Client Services Funds |
Capital Group Short-Term Municipal Fund
| Bonds, notes & other debt instruments (continued) | Principal amount
(000) | | | Value
(000) | |
| North Carolina 1.70% | | | | | | | | |
| City of Burlington, Housing Auth., Multi Family Housing Rev. Bonds (Thetford Portfolio), Series 2021, 0.30% 2024 (put 2022) | | $ | 325 | | | $ | 325 | |
| City of Durham, Housing Auth., Multi Family Housing Rev. Bonds (JJ Henderson Apartments Project), Series 2020, 0.30% 2024 (put 2023) | | | 20 | | | | 20 | |
| City of Goldsboro, Multi Family Housing Rev. Bonds (Grand at Day Point), Series 2021, 0.28% 2024 (put 2023) | | | 105 | | | | 105 | |
| Hospital Auth., Health Care Rev. Bonds (Charlotte-Mecklenburg Hospital), Series 2021-B, 5.00% 2050 (put 2024) | | | 980 | | | | 1,115 | |
| Housing Fin. Agcy., Home Ownership Rev. Ref. Bonds, Series 38-B, 4.00% 2047 | | | 205 | | | | 219 | |
| Housing Fin. Agcy., Home Ownership Rev. Ref. Bonds, Series 44, 4.00% 2050 | | | 75 | | | | 83 | |
| Housing Fin. Agcy., Home Ownership Rev. Ref. Bonds, Series 42, 4.00% 2050 | | | 70 | | | | 76 | |
| Housing Fin. Agcy., Multi Family Housing Rev. Bonds (Winds Crest Senior Living, LP), Series 2021, 0.36% 2024 (put 2023) | | | 105 | | | | 105 | |
| City of Sanford, Housing Auth., Multi Family Housing Rev. Bonds (Matthews Garden Gilmore), Series 2020, 0.30% 2023 (put 2022) | | | 750 | | | | 750 | |
| University of North Carolina at Chapel Hill, General Rev. Bonds, Series 2012-B, (1-month USD-LIBOR x 0.67 + 0.40%) 0.455% 2041 (put 2022)1 | | | 440 | | | | 441 | |
| City of Winston-Salem, Water and Sewer System Rev. Ref. Bonds, Series 2020-A, 5.00% 2022 | | | 200 | | | | 206 | |
| | | | | | | | 3,445 | |
| | | | | | | | | |
| North Dakota 0.40% | | | | | | | | |
| Housing Fin. Agcy., Homeownership Rev. Bonds (Home Mortgage Fin. Program), Series 2016-D, 3.50% 2046 | | | 125 | | | | 133 | |
| Housing Fin. Agcy., Housing Fin. Program Bonds (Home Mortgage Fin. Program), Series 2015-A, 4.00% 2038 | | | 420 | | | | 435 | |
| Housing Fin. Agcy., Housing Fin. Program Bonds (Home Mortgage Fin. Program), Series 2015-D, 4.00% 2046 | | | 240 | | | | 252 | |
| | | | | | | | 820 | |
| | | | | | | | | |
| Ohio 2.61% | | | | | | | | |
| Akron, Bath and Copley Joint Township Hospital Dist., Hospital Facs. Rev. Bonds (Akron General Health System), Series 2012, 5.00% 2031 (preref. 2022) | | | 375 | | | | 378 | |
| City of Dayton, Metropolitan Housing Auth., Multi Family Housing Rev. Bonds (Southern Montgomery Apartments Project), Series 2021-A, 0.32% 2024 (put 2023) | | | 200 | | | | 200 | |
| G.O. Conservation Projects Bonds, Series 2019-A, 2.00% 2022 | | | 20 | | | | 20 | |
| G.O. Infrastructure Improvement Bonds, Series 2021-A, 5.00% 2030 | | | 125 | | | | 162 | |
| County of Geauga, Rev. Bonds (South Franklin Circle Project), Series 2012-A, 8.00% 2047 (preref. 2022)3 | | | 890 | | | | 986 | |
| Hospital Rev. Ref. Bonds (Cleveland Clinic Health System Obligated Group), Series 2021-B, 5.00% 2024 | | | 310 | | | | 341 | |
| Hospital Rev. Ref. Bonds (Cleveland Clinic Health System Obligated Group), Series 2021-B, 5.00% 2026 | | | 500 | | | | 590 | |
| Housing Fin. Agcy., Multi Family Housing Rev. Bonds (Chevybrook Estates Apartments Project), Series 2021, 0.35% 2024 (put 2023) | | | 50 | | | | 50 | |
| Housing Fin. Agcy., Multi Family Housing Rev. Bonds (Glen Meadows Apartments Project), Series 2021-A, 0.40% 2024 (put 2023) | | | 80 | | | | 80 | |
| Housing Fin. Agcy., Multi Family Housing Rev. Bonds (Pinzone Tower Apartments Project), Series 2021, 0.28% 2023 (put 2022) | | | 190 | | | | 190 | |
| Housing Fin. Agcy., Residential Mortgage Rev. Bonds (Mortgage-Backed Securities Program), Series 2017-D, 4.00% 2048 | | | 80 | | | | 86 | |
| Housing Fin. Agcy., Residential Mortgage Rev. Bonds (Mortgage-Backed Securities Program), Series 2019-A, 4.50% 2049 | | | 185 | | | | 205 | |
| Housing Fin. Agcy., Residential Mortgage Rev. Bonds (Mortgage-Backed Securities Program), Series 2020-A, 3.75% 2050 | | | 135 | | | | 148 | |
| Housing Fin. Agcy., Residential Mortgage Rev. Bonds (Mortgage-Backed Securities Program), Series 2021-C, 3.25% 2051 | | | 225 | | | | 246 | |
| G.O. Infrastructure Improvement Rev. Ref. Bonds, Series 2016-A, 5.00% 2022 | | | 600 | | | | 633 | |
| Madison Local School Dist., School Improvement Rev. Ref. Bonds, Series 2014, 5.25% 2037 (preref. 2022) | | | 530 | | | | 545 | |
| County of Montgomery, Hospital Facs. Rev. Bonds (Dayton Children’s Hospital), Series 2021, 5.00% 2029 | | | 30 | | | | 38 | |
| County of Montgomery, Hospital Facs. Rev. Bonds (Dayton Children’s Hospital), Series 2021, 5.00% 2032 | | | 160 | | | | 210 | |
| Turnpike and Infrastructure Commission, Rev. Bonds, Series 2013-A-1, 5.00% 2025 | | | 125 | | | | 133 | |
| Water Dev. Auth., Water Dev. Rev. Bonds, Series 2013-A, 5.00% 2023 | | | 25 | | | | 27 | |
| Water Dev. Auth., Water Pollution Control Loan Fund Rev. Bonds, Series 2019-A, 5.00% 2029 | | | 15 | | | | 19 | |
| | | | | | | | 5,287 | |
| Private Client Services Funds | 43 |
Capital Group Short-Term Municipal Fund
| Bonds, notes & other debt instruments (continued) | Principal amount
(000) | | | Value
(000) | |
| Oklahoma 0.62% | | | | | | | | |
| Capital Improvement Auth., State Highways Capital Improvement Rev. Ref. Bonds (Oklahoma Dept. of Transportation Project), Series 2020-A, 5.00% 2023 | | $ | 145 | | | $ | 156 | |
| Housing Fin. Agcy., Collateralized Rev. Bonds (Deer Park & Apple Run Apartments), Series 2019, 1.60% 2022 | | | 250 | | | | 250 | |
| Housing Fin. Agcy., Single Family Mortgage Rev. Bonds (Homeownership Loan Program), Series 2012-A, 5.00% 2043 | | | 40 | | | | 41 | |
| Board of Regents of Oklahoma State University, General Rev. Ref. Bonds, Series 2020-A, 5.00% 2024 | | | 275 | | | | 311 | |
| Board of Regents of Oklahoma State University, General Rev. Ref. Bonds, Series 2020-A, 5.00% 2025 | | | 420 | | | | 491 | |
| | | | | | | | 1,249 | |
| | | | | | | | | |
| Oregon 0.21% | | | | | | | | |
| G.O. Bonds (Veteran’s Welfare Bonds Series 108), Series 2021-O, 3.00% 2051 | | | 245 | | | | 266 | |
| Housing and Community Services Dept., Housing Dev. Rev. Bonds (The Susan Emmons Apartments Project), Series 2021-S-2, 0.38% 2024 (put 2023) | | | 115 | | | | 115 | |
| Housing and Community Services Dept., Housing Dev. Rev. Bonds (Westwind Apartments Project), Series 2021-H, 0.25% 2024 (put 2023) | | | 50 | | | | 50 | |
| | | | | | | | 431 | |
| | | | | | | | | |
| Pennsylvania 1.92% | | | | | | | | |
| County of Allegheny, Hospital Dev. Auth., UPMC Rev. Bonds, Series 2019-A, 5.00% 2022 | | | 300 | | | | 310 | |
| Bethlehem Area School Dist. Auth., School Rev. Bonds (Bethlehem Area School Dist. Ref. Project), Series 2021-C, (USD-SOFR x 0.67 + 0.35%) 0.384% 2030 (put 2025)1 | | | 50 | | | | 50 | |
| Bethlehem Area School Dist. Auth., School Rev. Bonds (Bethlehem Area School Dist. Ref. Project), Series 2021-B, (USD-SOFR x 0.67 + 0.35%) 0.384% 2031 (put 2025)1 | | | 70 | | | | 70 | |
| Bethlehem Area School Dist. Auth., School Rev. Bonds (Bethlehem Area School Dist. Ref. Project), Series 2021-C, (USD-SOFR x 0.67 + 0.35%) 0.384% 2032 (put 2025)1 | | | 55 | | | | 55 | |
| Cumberland Valley School Dist., G.O. Bonds, Series 2015, 5.00% 2032 (preref. 2023) | | | 20 | | | | 22 | |
| Cumberland Valley School Dist., G.O. Bonds, Series 2015, 5.00% 2034 (preref. 2023) | | | 20 | | | | 22 | |
| Housing Fin. Agcy., Single Family Mortgage Rev. Bonds, Series 2017-122, 4.00% 2046 | | | 235 | | | | 251 | |
| Housing Fin. Agcy., Single Family Mortgage Rev. Bonds, Series 2020-133, 3.00% 2050 | | | 355 | | | | 380 | |
| Housing Fin. Agcy., Special Limited Obligation, Multi Family Housing Dev. Bonds (Harrison Senior Tower), Series 2021, 0.25% 2024 (put 2023) | | | 760 | | | | 757 | |
| Housing Fin. Agcy., Special Limited Obligation, Multi Family Housing Dev. Bonds (School of Nursing), Series 2021, 0.27% 2024 (put 2023) | | | 85 | | | | 85 | |
| County of Montgomery, Higher Education and Health Auth., Hospital Rev. Bonds (Abington Memorial Hospital Obligated Group), Series 2012-A, 5.00% 2031 (preref. 2022) | | | 775 | | | | 796 | |
| Philadelphia School Dist., G.O. Bonds, Series 2021-A, 5.00% 2027 | | | 190 | | | | 232 | |
| Turnpike Commission, Turnpike Rev. Bonds, Series 2021-B, 5.00% 2022 | | | 95 | | | | 100 | |
| Turnpike Commission, Turnpike Rev. Bonds, Series 2011-E, 5.00% 2042 (preref. 2022) | | | 275 | | | | 289 | |
| Turnpike Commission, Turnpike Rev. Bonds, Series 2011-E, 5.00% 2029 (preref. 2021) | | | 185 | | | | 186 | |
| Turnpike Commission, Turnpike Rev. Bonds, Series 2011-E, 5.00% 2030 (preref. 2021) | | | 55 | | | | 55 | |
| Wilkes-Barre Area School Dist., G.O. Bonds, Series 2019, BAM insured, 5.00% 2023 | | | 225 | | | | 240 | |
| | | | | | | | 3,900 | |
| | | | | | | | | |
| Rhode Island 0.08% | | | | | | | | |
| Housing and Mortgage Fin. Corp., Homeownership Opportunity Bonds, Series 66-A-1, 4.00% 2033 | | | 165 | | | | 170 | |
| | | | | | | | | |
| South Carolina 1.38% | | | | | | | | |
| County of Charleston, G.O. Capital Improvement Transportation Sales Tax Bonds, Series 2011, 5.00% 2024 (preref. 2021) | | | 500 | | | | 500 | |
| City of Columbia, Housing Auth., Multi Family Housing Rev. Bonds (Palmetto Terrace Apartments Project), Series 2021, 0.31% 2024 (put 2023) | | | 130 | | | | 130 | |
| Housing Fin. and Dev. Auth., Mortgage Rev. Bonds, Series 2018-A, 4.50% 2048 | | | 225 | | | | 246 | |
| Housing Fin. and Dev. Auth., Mortgage Rev. Bonds, Series 2020-A, 4.00% 2050 | | | 160 | | | | 177 | |
| Housing Fin. and Dev. Auth., Mortgage Rev. Bonds, Series 2021-A, 3.00% 2052 | | | 80 | | | | 87 | |
| Housing Fin. and Dev. Auth., Mortgage Rev. Ref. Bonds, Series 2016-A, 4.00% 2036 | | | 225 | | | | 241 | |
| Lexington County Health Services Dist., Inc., Hospital Rev. Ref. Bonds, Series 2017, 5.00% 2021 | | | 250 | | | | 250 | |
| Patriots Energy Group Fncg. Agcy., Gas Supply Rev. Bonds, Series 2018-A, 4.00% 2048 (put 2024) | | | 55 | | | | 59 | |
| Public Service Auth., Rev. Obligations (Santee Cooper), Series 2011-B, 5.00% 2021 (escrowed to maturity) | | | 405 | | | | 407 | |
| Public Service Auth., Rev. Obligations (Santee Cooper), Series 2014-C, 5.00% 2025 | | | 120 | | | | 136 | |
| 44 | Private Client Services Funds |
Capital Group Short-Term Municipal Fund
| Bonds, notes & other debt instruments (continued) | | Principal amount
(000) | | | Value
(000) | |
| South Carolina (continued) | | | | | | | | |
| Public Service Auth., Rev. Obligations (Santee Cooper), Series 2011-C, 5.00% 2036 | | $ | 110 | | | $ | 110 | |
| Public Service Auth., Rev. Ref. Obligations (Santee Cooper), Series 2015-A, 5.00% 2028 | | | 35 | | | | 40 | |
| Town of Southold, Local Dev. Corp., Rev. Bonds (Peconic Landing at Southold, Inc. Project), Series 2015, 5.00% 2022 | | | 400 | | | | 420 | |
| | | | | | | | 2,803 | |
| | | | | | | | | |
| South Dakota 0.39% | | | | | | | | |
| Housing Dev. Auth., Homeownership Mortgage Bonds, Series 2014-E, 4.00% 2044 | | | 95 | | | | 99 | |
| Housing Dev. Auth., Homeownership Mortgage Bonds, Series 2018-B, 4.50% 2048 | | | 375 | | | | 415 | |
| Housing Dev. Auth., Homeownership Mortgage Bonds, Series 2021-B, 3.00% 2051 | | | 260 | | | | 281 | |
| | | | | | | | 795 | |
| | | | | | | | | |
| Tennessee 1.58% | | | | | | | | |
| Town of Greeneville, Health and Educational Facs. Board, Multi Family Housing Rev. Bonds | | | | | | | | |
| (People RD Portfolio Project), Series 2019, 1.45% 2022 (put 2021) | | | 1,100 | | | | 1,101 | |
| Housing Dev. Agcy., Homeownership Program Bonds, Series 2012-1-C, 4.50% 2037 | | | 25 | | | | 25 | |
| Housing Dev. Agcy., Homeownership Program Bonds, Series 2012-2-C, 4.00% 2038 | | | 20 | | | | 20 | |
| Housing Dev. Agcy., Residential Fin. Program Bonds, Series 2017-1, 4.00% 2042 | | | 200 | | | | 214 | |
| Housing Dev. Agcy., Residential Fin. Program Bonds, Series 2014-2-A, 4.00% 2045 | | | 570 | | | | 601 | |
| Housing Dev. Agcy., Residential Fin. Program Bonds, Series 2014-2-C, 4.00% 2045 | | | 245 | | | | 257 | |
| Housing Dev. Agcy., Residential Fin. Program Bonds, Series 2015-2-A, 3.75% 2050 | | | 265 | | | | 290 | |
| City of Knoxville, Community Dev. Corp., Collateralized Multi Family Housing Bonds (Austin 1B Apartments Project), Series 2021, 0.22% 2024 (put 2023) | | | 40 | | | | 40 | |
| Metropolitan Government of Nashville and Davidson County, Health and Educational Facs. Board, Rev. Bonds (Vanderbilt University Medical Center), Series 2021-A, 5.00% 2031 | | | 30 | | | | 38 | |
| Metropolitan Government of Nashville and Davidson County, Water & Sewer Rev. Bonds, Series 2013, 5.00% 2025 (preref. 2023) | | | 85 | | | | 92 | |
| Tennessee Energy Acquisition Corp., Gas Project Rev. Bonds, Series 2017-A, 4.00% 2048 (put 2023) | | | 500 | | | | 524 | |
| | | | | | | | 3,202 | |
| | | | | | | | | |
| Texas 18.63% | | | | | | | | |
| Affordable Housing Corp., Multi Family Housing Rev. Bonds (Apartments of Las Palmas I LLC), Series 2021, 0.25% 2024 (put 2022) | | | 15 | | | | 15 | |
| Alvin Independent School Dist., Unlimited Tax Schoolhouse and Rev. Ref. Bonds, Series 2020, 5.00% 2022 | | | 625 | | | | 634 | |
| Arlington Higher Education Fin. Corp., Education Rev. and Rev. Ref. Bonds (Uplift Education), Series 2017-A, 5.00% 2022 | | | 645 | | | | 678 | |
| Arlington Higher Education Fin. Corp., Education Rev. Bonds (Great Hearts America - Texas), Series 2021-A, 4.00% 2025 | | | 15 | | | | 17 | |
| Arlington Higher Education Fin. Corp., Education Rev. Bonds (Great Hearts America - Texas), Series 2021-A, 4.00% 2026 | | | 15 | | | | 17 | |
| Arlington Higher Education Fin. Corp., Education Rev. Bonds (Harmony Public Schools), Series 2016-A, 5.00% 2024 | | | 310 | | | | 342 | |
| Arlington Higher Education Fin. Corp., Education Rev. Bonds (KIPP Texas, Inc.), Series 2019, 5.00% 2026 | | | 560 | | | | 670 | |
| Arlington Higher Education Fin. Corp., Education Rev. Bonds (Riverwalk Education Foundation, Inc.), Series 2019, 5.00% 2022 | | | 350 | | | | 363 | |
| Arlington Higher Education Fin. Corp., Education Rev. Bonds (Riverwalk Education Foundation, Inc.), Series 2019, 5.00% 2025 | | | 800 | | | | 928 | |
| Arlington Independent School Dist., Unlimited Tax School Building Bonds, Series 2017, 5.00% 2022 | | | 405 | | | | 411 | |
| City of Arlington, Water and Wastewater System Rev. Bonds, Series 2021, 5.00% 2023 | | | 165 | | | | 177 | |
| Austin Affordable PFC, Inc., Multi Family Housing Rev. Bonds (Bridge at Turtle Creek Apartments), Series 2020, 0.42% 2040 (put 2023) | | | 215 | | | | 215 | |
| Austin Community College Dist., Maintenance Tax Notes, Series 2021, 5.00% 2022 | | | 100 | | | | 104 | |
| City of Austin, Water and Wastewater System Rev. Ref. Bonds, Series 2020-C, 5.00% 2025 | | | 510 | | | | 601 | |
| City of Austin, Water and Wastewater System Rev. Ref. Bonds, Series 2021, 5.00% 2029 | | | 95 | | | | 123 | |
| Barbers Hill Independent School Dist., Unlimited Tax School Building Bonds, Series 2020, 5.00% 2030 | | | 70 | | | | 91 | |
| County of Bexar, Combination Tax and Rev. Certs. of Obligation, Series 2013-B, 5.00% 2033 (preref. 2023) | | | 105 | | | | 113 | |
| Brazosport Independent School Dist., Unlimited Tax School Building and Rev. Ref. Bonds, Series 2020, 5.00% 2022 | | | 1,000 | | | | 1,014 | |
| Brazosport Independent School Dist., Unlimited Tax School Building Bonds, Series 2019, 5.00% 2022 | | | 70 | | | | 71 | |
| Brownsville Independent School Dist., Unlimited Tax Rev. Ref. Bonds, Series 2020-A, 3.00% 2026 | | | 500 | | | | 555 | |
| Private Client Services Funds | 45 |
Capital Group Short-Term Municipal Fund
| Bonds, notes & other debt instruments (continued) | | Principal amount
(000) | | | Value
(000) | |
| Texas (continued) | | | | | | | | |
| County of Cameron, Housing Fin. Corp., Multi Family Housing Rev. Bonds (Sunland Country Apartments), Series 2021, 0.28% 2024 (put 2023) | | $ | 50 | | | $ | 50 | |
| Canyon Independent School Dist., Unlimited Tax School Building Bonds, Series 2019, 5.00% 2022 | | | 165 | | | | 167 | |
| Capital Area Housing Fin. Corp., Multi Family Housing Rev. Bonds (Redwood Apartments), Series 2020, 0.41% 2041 (put 2024) | | | 460 | | | | 460 | |
| Carrollton-Farmers Branch Independent School Dist., Unlimited Tax School Building Bonds, Series 2021, 5.00% 2023 | | | 135 | | | | 143 | |
| Clear Creek Independent School Dist., Unlimited Tax School Building Bonds, Series 2013-B, 0.28% 2038 (put 2024) | | | 100 | | | | 100 | |
| Conroe Independent School Dist., Unlimited Tax Rev. Ref. Bonds, Series 2019, 5.00% 2022 | | | 50 | | | | 51 | |
| Conroe Independent School Dist., Unlimited Tax School Building and Rev. Ref. Bonds, Series 2020-A, 5.00% 2025 | | | 1,000 | | | | 1,149 | |
| Cypress-Fairbanks Independent School Dist., Unlimited Tax Rev. Ref. Bonds, Series 2013, 5.00% 2025 (preref. 2023) | | | 600 | | | | 637 | |
| Cypress-Fairbanks Independent School Dist., Unlimited Tax School Building and Rev. Ref. Bonds, Series 2014-C, 5.00% 2027 | | | 500 | | | | 553 | |
| Cypress-Fairbanks Independent School Dist., Unlimited Tax School Building Bonds, Series 2015-B-2, 0.28% 2040 (put 2024) | | | 210 | | | | 208 | |
| Cities of Dallas and Fort Worth, Dallas/Fort Worth International Airport, Joint Rev. Ref. Bonds, Series 2014-E, 5.00% 2023 | | | 370 | | | | 387 | |
| City of Dallas, Housing Fin. Corp., Multi Family Housing Rev. Bonds (Midpark Towers), Series 2021, 0.35% 2024 (put 2023) | | | 180 | | | | 180 | |
| Dallas Independent School Dist., Unlimited Tax Rev. Ref. Bonds, Series 2014-A, 5.00% 2023 | | | 15 | | | | 16 | |
| Dallas Independent School Dist., Unlimited Tax Rev. Ref. Bonds, Series 2015, 5.00% 2030 | | | 400 | | | | 456 | |
| Del Mar College Dist., Limited Tax Bonds, Series 2020-B, 5.00% 2024 | | | 400 | | | | 450 | |
| Del Mar College Dist., Limited Tax Bonds, Series 2020-A, 5.00% 2026 | | | 335 | | | | 401 | |
| Del Valle Independent School Dist., Unlimited Tax School Building Bonds, Series 2020, 5.00% 2022 | | | 155 | | | | 160 | |
| El Paso Independent School Dist., Unlimited Tax Rev. Ref. Bonds, Series 2015, 5.00% 2026 | | | 400 | | | | 452 | |
| Fort Bend Independent School Dist., Unlimited Tax Rev. Ref. Bonds, Series 2020, 5.00% 2024 | | | 130 | | | | 147 | |
| Fort Bend Independent School Dist., Unlimited Tax Rev. Ref. Bonds, Series 2021-B, 0.72% 2051 (put 2026) | | | 500 | | | | 499 | |
| Fort Bend Independent School Dist., Unlimited Tax School Building Bonds, Series 2019-A, 1.95% 2049 (put 2022)3 | | | 420 | | | | 425 | |
| G.O. Water Financial Assistance Rev. Ref. Bonds, Series 2021-B, 4.00% 2030 | | | 50 | | | | 56 | |
| City of Galveston, Public Fac. Corp., Multi Family Housing Rev. Bonds (The Orleanders at Broadway), Series 2021, 0.47% 2025 (put 2024) | | | 150 | | | | 150 | |
| Garland Independent School Dist., Unlimited Tax School Building Bonds, Series 2016, 5.00% 2030 | | | 400 | | | | 457 | |
| Goose Creek Consolidated Independent School Dist., Unlimited Tax School Building Bonds, Series 2019-B, 0.15% 2049 (put 2022) | | | 140 | | | | 140 | |
| Grand Prairie Independent School Dist., Unlimited Tax Rev. Ref. Bonds, Series 2015, 5.25% 2024 | | | 525 | | | | 583 | |
| Hallsville Independent School Dist., Unlimited Tax School Building and Rev. Ref. Bonds, Series 2020, 5.00% 2025 | | | 515 | | | | 592 | |
| Harlandale Independent School Dist., Maintenance Tax Notes, Series 2021, BAM insured, 2.00% 2040 (put 2024) | | | 50 | | | | 51 | |
| Harlandale Independent School Dist., Unlimited Tax Rev. Ref. Bonds, Series 2020, 0.75% 2045 (put 2025) | | | 100 | | | | 100 | |
| County of Harris, Cultural Education Facs. Fin. Corp., Hospital Rev. Bonds (Memorial Hermann Health System), Series 2019-C-1, (SIFMA Municipal Swap Index + 0.42%) 0.47% 2049 (put 2022)1 | | | 375 | | | | 375 | |
| County of Harris, Cultural Education Facs. Fin. Corp., Medical Facs. Mortgage Rev. Ref. Bonds (Baylor College of Medicine), Series 2019-A, (3-month USD-LIBOR x 0.70 + 0.65%) 0.707% 2046 (put 2024)1 | | | 130 | | | | 131 | |
| County of Harris, Cultural Education Facs. Fin. Corp., Rev. Bonds (Texas Medical Center), Series 2020-A, 0.90% 2050 (put 2025) | | | 130 | | | | 130 | |
| County of Harris, Health Facs. Dev. Corp., Rev. Ref. Bonds (CHRISTUS Health), Series 2005-A-4, Assured Guaranty Municipal insured, 0.20% 20311 | | | 125 | | | | 125 | |
| County of Harris, Metropolitan Transit Auth., Sales and Use Tax Bonds, Series 2011-A, 5.00% 2023 (preref. 2021) | | | 600 | | | | 600 | |
| County of Harris, Sports Auth., Rev. Ref. Bonds, Series 2014-A, Assured Guaranty Municipal insured, 5.00% 2022 (escrowed to maturity) | | | 110 | | | | 115 | |
| County of Harris, Toll Road Rev. and Rev. Ref. Bonds, Series 2018-A, 5.00% 2024 | | | 150 | | | | 169 | |
| Dept. of Housing and Community Affairs, Multi Family Housing Rev. Bonds (Corona Del Valle), Series 2021, 0.37% 2025 (put 2023) | | | 50 | | | | 50 | |
| Dept. of Housing and Community Affairs, Multi Family Housing Rev. Bonds (Oso Bay Apartments), Series 2021, 0.27% 2024 (put 2022) | | | 100 | | | | 100 | |
| Dept. of Housing and Community Affairs, Multi Family Housing Rev. Bonds (Palladium Simpson Stuart Apartments), Series 2021, 0.35% 2025 (put 2024) | | | 165 | | | | 165 | |
| Dept. of Housing and Community Affairs, Residential Mortgage Rev. Bonds, Series 2021-A, 3.00% 2052 | | | 310 | | | | 336 | |
| Dept. of Housing and Community Affairs, Single Family Mortgage Rev. Bonds, Series 2018-A, 4.75% 2049 | | | 370 | | | | 409 | |
| Dept. of Housing and Community Affairs, Single Family Mortgage Rev. Bonds, Series 2019-A, 4.00% 2050 | | | 405 | | | | 451 | |
| Dept. of Housing and Community Affairs, Single Family Mortgage Rev. Bonds, Series 2020-A, 3.50% 2051 | | | 125 | | | | 138 | |
| 46 | Private Client Services Funds |
Capital Group Short-Term Municipal Fund
| Bonds, notes & other debt instruments (continued) | | Principal amount
(000) | | | Value
(000) | |
| Texas (continued) | | | | | | | | |
| Dept. of Housing and Community Affairs, Single Family Mortgage Rev. Bonds, Series 2021-A, 3.00% 2052 | | $ | 135 | | | $ | 146 | |
| Housing Options, Inc., Multi Family Housing Rev. Bonds (Brooks Manor - The Oaks Project), Series 2021, 0.50% 2041 (put 2025) | | | 100 | | | | 99 | |
| City of Houston, Airport System Rev. Ref. Bonds, Series 2012-B, 5.00% 2028 (preref. 2022) | | | 870 | | | | 898 | |
| City of Houston, Combined Utility System Rev. Bonds, Series 2011-D, 5.00% 2026 (preref. 2021) | | | 55 | | | | 55 | |
| City of Houston, Combined Utility System Rev. Ref. Bonds, Series 2019-B, 2.00% 2024 | | | 615 | | | | 646 | |
| City of Houston, Convention and Entertainment Facs. Dept., Hotel Occupancy Tax and Special Rev. Ref. Bonds, Series 2021, 4.00% 2022 | | | 10 | | | | 10 | |
| City of Houston, Convention and Entertainment Facs. Dept., Hotel Occupancy Tax and Special Rev. Ref. Bonds, Series 2021, 4.00% 2023 | | | 15 | | | | 16 | |
| City of Houston, Housing Fin. Corp., Multi Family Housing Rev. Bonds (Temenos Place Apartments), Series 2021, 0.29% 2024 (put 2023) | | | 85 | | | | 85 | |
| Humble Independent School Dist., Unlimited Tax Rev. Ref. Bonds, Series 2020-B, 5.00% 2022 | | | 1,000 | | | | 1,014 | |
| Katy Independent School Dist., Unlimited Tax Rev. Ref. Bonds, Series 2019-B, 5.00% 2022 | | | 100 | | | | 101 | |
| Keller Independent School Dist., Unlimited Tax Rev. Ref. Bonds, Series 2015-A, 5.00% 2027 (preref. 2025) | | | 470 | | | | 541 | |
| Killeen Independent School Dist., Unlimited Tax Rev. Ref. Bonds, Series 2019, 5.00% 2022 | | | 95 | | | | 96 | |
| Longview Independent School Dist., Unlimited Tax Rev. Ref. Bonds, Series 2017, 5.00% 2022 | | | 180 | | | | 183 | |
| Longview Independent School Dist., Unlimited Tax Rev. Ref. Bonds, Series 2020, 5.00% 2024 | | | 500 | | | | 553 | |
| Lower Colorado River Auth., Rev. Ref. Bonds, Series 2022, Assured Guaranty Municipal insured, 5.00% 2032 | | | 55 | | | | 70 | |
| Lower Colorado River Auth., Transmission Contract Rev. Ref. Bonds (LCRA Transmission Services Corp. Project), Series 2020, 5.00% 2025 | | | 1,000 | | | | 1,156 | |
| Lower Colorado River Auth., Transmission Contract Rev. Ref. Bonds (LCRA Transmission Services Corp. Project), Series 2021-A, 5.00% 2031 | | | 60 | | | | 79 | |
| Medina Valley Independent School Dist., Unlimited Tax School Building Bonds, Series 2021, 0.82% 2051 (put 2026) | | | 90 | | | | 89 | |
| Municipal Gas Acquisition and Supply Corp. I, Gas Supply Rev. Bonds, Series 2008-D, 6.25% 2026 | | | 170 | | | | 197 | |
| Municipal Gas Acquisition and Supply Corp. III, Gas Supply Rev. Ref. Bonds, Series 2021, 5.00% 2022 | | | 10 | | | | 10 | |
| Municipal Gas Acquisition and Supply Corp. III, Gas Supply Rev. Ref. Bonds, Series 2021, 5.00% 2025 | | | 120 | | | | 140 | |
| North Central Texas Housing Fin. Corp., Multi Family Housing Rev. Bonds (Bluebonnet Ridge Apartments), Series 2021, 0.375% 2040 (put 2024) | | | 85 | | | | 85 | |
| North Texas Municipal Water Dist., Water System Rev. Ref. and Improvement Bonds, Series 2021, 5.00% 2022 | | | 45 | | | | 47 | |
| North Texas Tollway Auth., System Rev. Ref. Bonds, Series 2014-A, 5.00% 2024 | | | 395 | | | | 434 | |
| North Texas Tollway Auth., System Rev. Ref. Bonds, Series 2014-A, 5.00% 2024 (escrowed to maturity) | | | 190 | | | | 209 | |
| North Texas Tollway Auth., System Rev. Ref. Bonds, Series 2016-A, 5.00% 2026 | | | 1,500 | | | | 1,647 | |
| Northside Independent School Dist., Unlimited Tax School Building Bonds, Series 2020, 0.70% 2050 (put 2025) | | | 1,000 | | | | 1,001 | |
| Odessa Housing Fin. Corp., Multi Family Housing Rev. Bonds (Cove in Odessa Apartments), Series 2021, 0.37% 2024 (put 2023) | | | 230 | | | | 230 | |
| Pasadena Independent School Dist., Unlimited Tax Rev. Ref. Bonds, Series 2019, 5.00% 2022 | | | 125 | | | | 127 | |
| Pasadena Independent School Dist., Unlimited Tax School Building and Rev. Ref. Bonds, Series 2013, 5.00% 2038 | | | 500 | | | | 529 | |
| Plainview Independent School Dist., Unlimited Tax School Building Bonds, Series 2020-A, 5.00% 2022 | | | 500 | | | | 507 | |
| Plano Independent School Dist., Unlimited Tax Rev. Ref. Bonds, Series 2020, 5.00% 2023 | | | 135 | | | | 143 | |
| Prosper Independent School Dist., Unlimited Tax School Building Bonds, Series 2021-A, 5.00% 2030 | | | 50 | | | | 65 | |
| Prosper Independent School Dist., Unlimited Tax School Building Bonds, Series 2019-B, 2.00% 2050 (put 2021) | | | 960 | | | | 989 | |
| County of Rockwall, Permanent Improvement and Rev. Ref. Bonds, Series 2020, 5.00% 2024 | | | 200 | | | | 221 | |
| County of Rockwall, Permanent Improvement and Rev. Ref. Bonds, Series 2020, 5.00% 2025 | | | 250 | | | | 286 | |
| County of Rockwall, Permanent Improvement and Rev. Ref. Bonds, Series 2020, 5.00% 2026 | | | 260 | | | | 307 | |
| Round Rock Independent School Dist., Unlimited Tax Rev. Ref. Bonds, Series 2017, 5.00% 2022 | | | 300 | | | | 311 | |
| San Angelo Independent School Dist., Unlimited Tax Rev. Ref. Bonds, Series 2015-A, 5.00% 2030 (preref. 2024) | | | 1,110 | | | | 1,227 | |
| City of San Antonio, Electric and Gas Systems Rev. Bonds, Series 2015-D, 1.125% 2045 (put 2026) | | | 230 | | | | 233 | |
| City of San Antonio, Electric and Gas Systems Rev. Bonds, Series 2013, 5.00% 2048 (preref. 2023) | | | 140 | | | | 148 | |
| City of San Antonio, Electric and Gas Systems Rev. Ref. Bonds, Series 2020, 5.00% 2026 | | | 330 | | | | 390 | |
| City of San Antonio, General Improvement and Rev. Ref. Bonds, Series 2016, 5.00% 2022 | | | 70 | | | | 71 | |
| Tomball Independent School Dist., Unlimited Tax School Building Bonds, Series 2020, 5.00% 2023 | | | 80 | | | | 85 | |
| Tomball Independent School Dist., Unlimited Tax School Building Bonds, Series 2020, 5.00% 2024 | | | 30 | | | | 33 | |
| Transportation Commission, G.O. Mobility Fund Bonds, Series 2014-B, 0.65% 2041 (put 2026) | | | 310 | | | | 307 | |
| Transportation Commission, G.O. Mobility Fund Rev. Ref. Bonds, Series 2014-B, 5.00% 2026 | | | 550 | | | | 611 | |
| County of Travis, Strategic Housing Fin. Corp., Multi Family Housing Rev. Bonds (Yager Flats), Series 2021, 0.46% 2041 (put 2025) | | | 770 | | | | 765 | |
| Trinity River Auth., Regional Wastewater System Rev. Ref. Bonds, Series 2021, 5.00% 2029 | | | 160 | | | | 205 | |
| Private Client Services Funds | 47 |
Capital Group Short-Term Municipal Fund
| Bonds, notes & other debt instruments (continued) | | Principal amount
(000) | | | Value
(000) | |
| Texas (continued) | | | | | | | | |
| Water Dev. Board, State Revolving Fund, Rev. Bonds, Series 2021, 5.00% 2031 | | $ | 80 | | | $ | 107 | |
| Water Dev. Board, State Water Implementation Rev. Fund, Rev. Bonds (Master Trust), Series 2016, 5.00% 2022 | | | 550 | | | | 562 | |
| Water Dev. Board, State Water Implementation Rev. Fund, Rev. Bonds (Master Trust), Series 2018-B, 5.00% 2023 | | | 45 | | | | 48 | |
| | | | | | | | 37,767 | |
| | | | | | | | | |
| Utah 0.44% | | | | | | | | |
| Housing Corp., Single Family Mortgage Bonds, Class III, Series 2015-D-2, 4.00% 2045 | | | 195 | | | | 208 | |
| Salt Lake City, Airport Rev. Bonds (Salt Lake City International Airport), Series 2021-B, 5.00% 2024 | | | 275 | | | | 308 | |
| County of Salt Lake, Board of Education, G.O. Rev. Ref. Bonds (Utah School Bond Guaranty Act), Series 2021, 5.00% 2024 | | | 250 | | | | 280 | |
| Transit Auth., Sales Tax Rev. Bonds, Series 2008-A, 5.25% 2023 | | | 15 | | | | 16 | |
| City of Vineyard, Redev. Agcy., Tax Increment Rev. and Rev. Ref. Bonds, Series 2021, Assured Guaranty Municipal insured, 5.00% 2024 | | | 65 | | | | 72 | |
| | | | | | | | 884 | |
| | | | | | | | | |
| Vermont 0.02% | | | | | | | | |
| Housing Fin. Agcy., Multiple Purpose Bonds, Series 2020-A, 3.75% 2050 | | | 40 | | | | 44 | |
| | | | | | | | | |
| Virginia 1.79% | | | | | | | | |
| County of Arlington, Industrial Dev. Auth., Hospital Rev. Bonds (Virginia Hospital Center), Series 2020, 5.00% 2025 | | | 130 | | | | 151 | |
| College Building Auth., Educational Facs. Rev. Bonds (21st Century College and Equipment Programs), Series 2013-A, 4.50% 2033 | | | 450 | | | | 474 | |
| College Building Auth., Educational Facs. Rev. Bonds (21st Century College and Equipment Programs), Series 2013-A, 4.50% 2034 | | | 235 | | | | 248 | |
| Commonwealth Transportation Board, Federal Transportation Grant Anticipation Rev. Notes, Series 2012-A, 5.00% 2023 (preref. 2022) | | | 555 | | | | 565 | |
| County of Fairfax, Redev. and Housing Auth., Multi Family Housing Rev. Bonds (Arrowbrook Apartments Project), Series 2020, 0.41% 2041 (put 2024) | | | 500 | | | | 500 | |
| County of Fairfax, Redev. and Housing Auth., Multi Family Housing Rev. Bonds (Oakwood North Four Project), Series 2021, 0.41% 2025 (put 2024) | | | 570 | | | | 569 | |
| County of Halifax, Industrial Dev. Auth., Recovery Zone Fac. Rev. Bonds (Virginia Electric and Power Co. Project), Series 2010-A, 0.45% 2041 (put 2022) | | | 225 | | | | 225 | |
| Small Business Fncg. Auth., Rev. Bonds (National Senior Campuses, Inc. Obligated Group), Series 2020-A, 5.00% 2024 | | | 70 | | | | 77 | |
| Small Business Fncg. Auth., Rev. Bonds (National Senior Campuses, Inc. Obligated Group), Series 2020-A, 5.00% 2026 | | | 150 | | | | 176 | |
| County of Smyth, G.O. Public Improvement Bonds, Series 2011-A, 5.00% 2031 (preref. 2021) | | | 500 | | | | 500 | |
| County of Wise, Industrial Dev. Auth., Solid Waste and Sewage Disposal Rev. Bonds (Virginia Electric and Power Co. Project), Series 2010-A, 1.20% 2040 (put 2024) | | | 140 | | | | 142 | |
| | | | | | | | 3,627 | |
| | | | | | | | | |
| Washington 3.14% | | | | | | | | |
| Central Puget Sound Regional Transit Auth., Sales Tax and Motor Vehicle Excise Tax Improvement and Rev. Ref. Green Bonds, Series 2021-S-1, 5.00% 2028 | | | 65 | | | | 82 | |
| Energy Northwest, Electric Rev. Ref. Bonds (Project No. 3), Series 2018-C, 5.00% 2023 | | | 1,000 | | | | 1,079 | |
| City of Everett, Housing Auth., Multi Family Housing Rev. Bonds (Baker Heights Legacy), Series 2021, 0.30% 2024 (put 2023) | | | 80 | | | | 80 | |
| G.O. Bonds, Series 2022-A, 5.00% 2030 | | | 765 | | | | 1,004 | |
| G.O. Rev. Ref. Bonds, Series 2017-R-A, 5.00% 2022 | | | 25 | | | | 26 | |
| Health Care Facs. Auth., Rev. Ref. Bonds (Providence St. Joseph Health), Series 2021-B, 4.00% 2042 (put 2030) | | | 250 | | | | 304 | |
| Housing Fin. Commission, Multi Family Housing Rev. Bonds (Garten Haus Apartments Project), Series 2021, 0.37% 2024 (put 2023) | | | 45 | | | | 45 | |
| Housing Fin. Commission, Single Family Program Bonds, Series 2017-1-N, 4.00% 2047 | | | 285 | | | | 302 | |
| Housing Fin. Commission, Single Family Program Bonds, Series 2019-1-N, 4.00% 2049 | | | 870 | | | | 945 | |
| Housing Fin. Commission, Single Family Program Bonds, Series 2020-2-N, 3.00% 2050 | | | 1,090 | | | | 1,170 | |
| Housing Fin. Commission, Single Family Program Bonds, Series 2020-1-N, 4.00% 2050 | | | 720 | | | | 795 | |
| City of Seattle, Housing Auth., Rev. and Rev. Ref. Bonds (Northgate Plaza Project), Series 2021, 1.00% 2026 | | | 70 | | | | 70 | |
| 48 | Private Client Services Funds |
Capital Group Short-Term Municipal Fund
| Bonds, notes & other debt instruments (continued) | | Principal amount
(000) | | | Value
(000) | |
| Washington (continued) | | | | | | | | |
| City of Seattle, Housing Auth., Rev. Bonds (Lam Bow Apartments Project), Series 2021, 1.25% 2024 | | $ | 15 | | | $ | 15 | |
| City of Seattle, Municipal Light and Power Rev. Ref. Bonds, Series 2021-B, (SIFMA Municipal Swap Index + 0.25%) 0.30% 2045 (put 2026)1 | | | 115 | | | | 116 | |
| City of Seattle, Municipal Light and Power Rev. Ref. Bonds, Series 2018-C-2, (SIFMA Municipal Swap Index + 0.49%) 0.54% 2046 (put 2023)1 | | | 325 | | | | 326 | |
| | | | | | | | 6,359 | |
| | | | | | | | | |
| West Virginia 0.47% | | | | | | | | |
| Housing Dev. Fund, Multi Family Housing Rev. Bonds (Charles Towers), Series 2021, 0.21% 2023 (put 2022) | | | 75 | | | | 75 | |
| Housing Dev. Fund, Multi Family Housing Rev. Bonds (Parkland Place / Chapmanville Towers), Series 2021, 0.28% 2024 (put 2023) | | | 875 | | | | 874 | |
| | | | | | | | 949 | |
| | | | | | | | | |
| Wisconsin 2.86% | | | | | | | | |
| G.O. Bonds, Series 2013-A, 5.00% 2025 (preref. 2022) | | | 1,000 | | | | 1,024 | |
| G.O. Bonds, Series 2014-B, 5.00% 2030 (preref. 2022) | | | 795 | | | | 814 | |
| G.O. Rev. Ref. Bonds, Series 2011-2, 5.00% 2022 (preref. 2021) | | | 230 | | | | 230 | |
| Health and Educational Facs. Auth., Rev. Bonds (Advocate Aurora Health Care Credit Group), Series 2018-C-3, (SIFMA Municipal Swap Index + 0.55%) 0.60% 2054 (put 2023)1 | | | 340 | | | | 341 | |
| Health and Educational Facs. Auth., Rev. Bonds (Ascension Senior Credit Group), Series 2019-A, 5.00% 2021 | | | 70 | | | | 70 | |
| Health and Educational Facs. Auth., Rev. Bonds (Gundersen Lutheran), Series 2020, 5.00% 20262 | | | 660 | | | | 763 | |
| Health and Educational Facs. Auth., Rev. Ref. Bonds (Aurora Health Care, Inc.), Series 2012, 5.00% 2022 (escrowed to maturity) | | | 655 | | | | 680 | |
| Health and Educational Facs. Auth., Rev. Ref. Bonds (Ministry Health Care, Inc.), Series 2012-C, | | | | | | | | |
| 5.00% 2027 (preref. 2022) | | | 210 | | | | 218 | |
| Housing and Econ. Dev. Auth., Home Ownership Rev. Bonds, Series 2017-C, 4.00% 2048 | | | 210 | | | | 225 | |
| Housing and Econ. Dev. Auth., Home Ownership Rev. Bonds, Series 2020-A, 3.50% 2050 | | | 355 | | | | 387 | |
| Housing and Econ. Dev. Auth., Home Ownership Rev. Bonds, Series 2021-A, 3.00% 2052 | | | 30 | | | | 33 | |
| Housing and Econ. Dev. Auth., Housing Rev. Bonds, Series 2021-B, 0.40% 2045 (put 2023) | | | 25 | | | | 25 | |
| Housing and Econ. Dev. Auth., Housing Rev. Bonds, Series 2021-B, 0.50% 2050 (put 2024) | | | 35 | | | | 35 | |
| Public Fin. Auth., Hospital Rev. Ref. Bonds (Renown Regional Medical Center Project), Series 2016-A, 5.00% 2022 | | | 300 | | | | 308 | |
| Public Fin. Auth., Rev. Ref. Bonds (Providence St. Joseph Health), Series 2021-C, 4.00% 2041 (put 2030) | | | 115 | | | | 140 | |
| Transportation Rev. Bonds, Series 2012-1, 5.00% 2024 (preref. 2022) | | | 500 | | | | 516 | |
| | | | | | | | 5,809 | |
| | | | | | | | | |
| Wyoming 0.47% | | | | | | | | |
| Community Dev. Auth., Housing Rev. Bonds, Series 2021-1, 3.00% 2050 | | | 705 | | | | 759 | |
| Community Dev. Auth., Housing Rev. Bonds, Series 2020-1, 4.00% 2050 | | | 170 | | | | 188 | |
| | | | | | | | 947 | |
| | | | | | | | | |
| Total bonds, notes & other debt instruments (cost: $164,432,000) | | | | | | | 165,941 | |
| | | | | | | | | |
| Short-term securities 18.79% | | | | | | | | |
| Municipals 18.79% | | | | | | | | |
| State of California, Kern Community College Dist., Facs. Improvement Dist. No. 1, G.O. Bond Anticipation Notes, Capital Appreciation Notes, Series 2020, 0% 2023 | | | 45 | | | | 45 | |
| State of California, City of Los Angeles, Wastewater System Rev. Ref. Bonds, Series 2018-C-1, 0.04% 20321 | | | 2,500 | | | | 2,500 | |
| State of California, Pollution Control Fncg. Auth., Environmental Impact Rev. Bonds (Air Products and Chemicals, Inc. Project), Series 1997-B, 0.02% 20421 | | | 500 | | | | 500 | |
| State of Georgia, Northwest Georgia Housing Auth., Multi Family Housing Rev. Bonds (Charles Hight Apartments Project), Series 2019, 0.25% 8/1/2022 (put 2022)4 | | | 40 | | | | 40 | |
| State of Georgia, Northwest Georgia Housing Auth., Multi Family Housing Rev. Bonds (Park Homes Apartments Project), Series 2019, 0.25% 8/1/2022 (put 2022)4 | | | 45 | | | | 45 | |
| State of Idaho, Tax Anticipation Notes, Series 2021, 3.00% 6/30/2022 | | | 3,000 | | | | 3,056 | |
| State of Louisiana, Parish of East Baton Rouge, Industrial Dev. Board, Gulf Opportunity Zone Rev. Bonds (ExxonMobil Project), Series 2010-B, 0.03% 20401 | | | 3,000 | | | | 3,000 | |
| Private Client Services Funds | 49 |
Capital Group Short-Term Municipal Fund
| Short-term securities (continued) | | Principal amount
(000) | | | Value
(000) | |
| Municipals (continued) | | | | | | | | |
| State of Louisiana, Public Facs. Auth., Rev. Bonds (Air Products and Chemicals Project), Series 2008-A, 0.02% 20431 | | $ | 1,000 | | | $ | 1,000 | |
| State of Louisiana, Public Facs. Auth., Rev. Bonds (Air Products and Chemicals Project), Series 2009-A, 0.04% 20491 | | | 5,000 | | | | 5,000 | |
| State of Michigan, Regents of the University of Michigan, General Rev. Bonds, Series 2012-B, 0.02% 20421 | | | 1,000 | | | | 1,000 | |
| State of Minnesota, City of Shakopee, Multi Family Housing Rev. Bonds (Shakopee Village Apartments Project), Series 2021, 0.25% 2024 (put 2022)4 | | | 35 | | | | 35 | |
| State of New Hampshire, Health and Education Facs. Auth., Rev. Ref. Bonds (Dartmouth College Issue), Series 2007-B, 0.02% 20411 | | | 5,295 | | | | 5,295 | |
| State of New York, Dormitory Auth., Rev. Bonds (Cornell University), Series 2019-B, 0.02% 20391 | | | 1,800 | | | | 1,800 | |
| State of New York, New York City G.O. Bonds, Series 2021-2, 0.11% 20421 | | | 205 | | | | 205 | |
| State of New York, New York City G.O. Bonds, Series 2021-3, 0.11% 20421 | | | 155 | | | | 155 | |
| State of New York, New York City G.O. Bonds, Series 2016-A-5, 0.03% 20441 | | | 2,000 | | | | 2,000 | |
| State of New York, New York City Municipal Water Fin. Auth., Water and Sewer System Second General Resolution Rev. Bonds, Series 2008-BB-2, 0.02% 20351 | | | 1,000 | | | | 1,000 | |
| State of New York, New York City Municipal Water Fin. Auth., Water and Sewer System Second General Resolution Rev. Bonds, Series 2015-BB-1, 0.02% 20491 | | | 3,500 | | | | 3,500 | |
| State of Ohio, Hospital Rev. Bonds (Cleveland Clinic Health System Obligated Group), Series 2013-B-3, 0.03% 20391 | | | 1,500 | | | | 1,500 | |
| State of South Carolina, Jobs-Econ. Dev. Auth., Hospital Rev. Bonds (Prisma Health Obligated Group), Series 2018-B, 0.03% 20481 | | | 700 | | | | 700 | |
| State of Texas, Deer Park Independent School Dist., Unlimited Tax School Building Bonds, Series 2018, 0.16% 2042 (put 2022)4 | | | 225 | | | | 225 | |
| State of Texas, Lone Star College System, Limited Tax G.O. Bonds, Series 2021-A, 5.00% 2/15/2022 | | | 20 | | | | 20 | |
| State of Texas, Lone Star College System, Limited Tax G.O. Rev. Ref. Bonds, Series 2021-B, 5.00% 2/15/2022 | | | 35 | | | | 36 | |
| State of Texas, Municipal Gas Acquisition and Supply Corp. III, Gas Supply Rev. Ref. Bonds, Series 2021, 5.00% 12/15/2021 | | | 10 | | | | 10 | |
| State of Texas, North East Independent School Dist., Unlimited Tax School Building Bonds, Series 2013-B, 0.25% 2032 (put 2022)4 | | | 35 | | | | 35 | |
| State of Texas, Richardson Independent School Dist., Unlimited Tax School Building Bonds, Series 2021, 5.00% 2/15/2022 | | | 95 | | | | 96 | |
| State of Virginia, College Building Auth., Educational Facs. Rev. Bonds (University of Richmond Project), Series 2006, 0.03% 20361 | | | 2,100 | | | | 2,100 | |
| State of Wyoming, County of Lincoln, Pollution Control Rev. Ref. Bonds (ExxonMobil Project), Series 2014, 0.03% 20441 | | | 3,200 | | | | 3,200 | |
| | | | | | | | | |
| Total short-term securities (cost: $38,098,000) | | | | | | | 38,098 | |
| Total investment securities 100.65% (cost: $202,530,000) | | | | | | | 204,039 | |
| Other assets less liabilities (0.65%) | | | | | | | (1,316 | ) |
| | | | | | | | | |
| Net assets 100.00% | | | | | | $ | 202,723 | |
Futures contracts
| Contracts | | Type | | Number of
contracts | | Expiration | | Notional
amount
(000) | 5
| | Value at
10/31/2021
(000) | 6
| Unrealized
depreciation
at 10/31/2021
(000) | |
| 2 Year U.S. Treasury Note Futures | | Long | | 9 | | December 2021 | | $ | 1,800 | | | $ | 1,973 | | | $ | (9 | ) |
| 5 Year U.S. Treasury Note Futures | | Long | | 26 | | December 2021 | | | 2,600 | | | | 3,166 | | | | (14 | ) |
| | | | | | | | | | | | | | | | | $ | (23 | ) |
| 50 | Private Client Services Funds |
Capital Group Short-Term Municipal Fund
| 1 | Coupon rate may change periodically. Reference rate and spread are as of the most recent information available. Some coupon rates are determined by the issuer or agent based on current market conditions; therefore, the reference rate and spread are not available. For short-term securities, the date of the next scheduled coupon rate change is considered to be the maturity date. |
| 2 | Acquired in a transaction exempt from registration under Rule 144A of the Securities Act of 1933. May be resold in the U.S. in transactions exempt from registration, normally to qualified institutional buyers. The total value of all such securities was $810,000, which represented .40% of the net assets of the fund. |
| 3 | Step bond; coupon rate may change at a later date. |
| 4 | For short-term securities, the mandatory put date is considered to be the maturity date. |
| 5 | Notional amount is calculated based on the number of contracts and notional contract size. |
| 6 | Value is calculated based on the notional amount and current market price. |
Key to abbreviations and symbol
Agcy. = Agency
AMT = Alternative Minimum Tax
Auth. = Authority
Certs. = Certificates
Dept. = Department
Dev. = Development
Dist. = District
Econ. = Economic
Fac. = Facility
Facs. = Facilities
Fin. = Finance
Fncg. = Financing
G.O. = General Obligation
IAM = Interest at Maturity
LIBOR = London Interbank Offered Rate
LOC = Letter of Credit
Part. = Participation
Preref. = Prerefunded
Redev. = Redevelopment
Ref. = Refunding
Rev. = Revenue
SIFMA = Securities Industry and Financial Markets Association
USD/$ = U.S. dollars
| Private Client Services Funds | 51 |
Capital Group California Core Municipal Fund
Investment portfolio October 31, 2021
| Portfolio quality summary* | Percent of net assets |
| | |
 |
| | |
| * | Bond ratings, which typically range from AAA/Aaa (highest) to D (lowest), are assigned by credit rating agencies such as Standard & Poor’s, Moody’s and/or Fitch as an indication of an issuer’s creditworthiness. In assigning a credit rating to a security, the fund looks specifically to the ratings assigned to the issuer of the security by Standard & Poor’s, Moody’s and/or Fitch. If agency ratings differ, the security will be considered to have received the highest of those ratings, consistent with the fund’s investment policies. The ratings are not covered by the Report of Independent Registered Public Accounting Firm. |
| | |
| Bonds, notes & other debt instruments 84.89% | | Principal amount
(000) | | | Value
(000) | |
| California 84.30% | | | | | | | | |
| Alameda Corridor Transportation Auth., Rev. Ref. Bonds, Series 2013-A, 5.00% 2022 | | $ | 975 | | | $ | 1,016 | |
| Alameda Corridor Transportation Auth., Rev. Ref. Bonds, Series 2016-A, 5.00% 2024 | | | 600 | | | | 678 | |
| Alameda Corridor Transportation Auth., Rev. Ref. Bonds, Series 2016-A, 5.00% 2025 | | | 500 | | | | 583 | |
| City of Alhambra, Insured Rev. Ref. Bonds (Atherton Baptist Homes Project), Series 2016, 5.00% 2027 | | | 630 | | | | 739 | |
| City of Anaheim, Public Fncg. Auth., Lease Rev. Bonds (Anaheim Public Improvement Project), Capital Appreciation Bonds, Series 1997-C, Assured Guaranty Municipal insured, 0% 2022 | | | 2,000 | | | | 1,994 | |
| Antelope Valley Community College Dist., G.O. Rev. Ref. Bonds, Capital Appreciation Bonds, Series 2015, 0% 2035 (preref. 2025) | | | 2,300 | | | | 1,452 | |
| Antelope Valley Community College Dist., G.O. Rev. Ref. Bonds, Capital Appreciation Bonds, Series 2015, 0% 2036 (preref. 2025) | | | 2,800 | | | | 1,690 | |
| Assn. of Bay Area Governments, Fin. Auth. for Nonprofit Corps., Rev. Ref. Bonds (Eskaton Properties, Inc. Obligated Group), Series 2013, 5.00% 2021 | | | 495 | | | | 496 | |
| Assn. of Bay Area Governments, Fin. Auth. for Nonprofit Corps., Rev. Ref. Bonds (Eskaton Properties, Inc. Obligated Group), Series 2013, 5.00% 2022 | | | 1,000 | | | | 1,041 | |
| Assn. of Bay Area Governments, Fin. Auth. for Nonprofit Corps., Rev. Ref. Bonds (Eskaton Properties, Inc. Obligated Group), Series 2013, 5.00% 2023 | | | 500 | | | | 540 | |
| Assn. of Bay Area Governments, Fin. Auth. for Nonprofit Corps., Rev. Ref. Bonds (Windemere Ranch Infrastructure Fncg. Program), Series 2014-A, 5.00% 2023 | | | 370 | | | | 401 | |
| Assn. of Bay Area Governments, Fin. Auth. for Nonprofit Corps., Rev. Ref. Bonds (Windemere Ranch Infrastructure Fncg. Program), Series 2014-A, 5.00% 2024 | | | 395 | | | | 446 | |
| Assn. of Bay Area Governments, Fin. Auth. for Nonprofit Corps., Rev. Ref. Bonds (Windemere Ranch Infrastructure Fncg. Program), Series 2014-A, 5.00% 2025 | | | 510 | | | | 576 | |
| Bay Area Toll Auth., San Francisco Bay Area Toll Bridge Rev. Bonds, Series 2001-A, (SIFMA Municipal Swap Index + 1.25%) 1.30% 2036 (put 2027)1 | | | 1,000 | | | | 1,052 | |
| Bay Area Toll Auth., San Francisco Bay Area Toll Bridge Rev. Bonds, Series 2013-S-4, 5.00% 2043 (preref. 2023) | | | 1,000 | | | | 1,068 | |
| Bay Area Toll Auth., San Francisco Bay Area Toll Bridge Rev. Bonds, Series 2008-B-1, (SIFMA Municipal Swap Index + 1.10%) 1.15% 2045 (put 2024)1 | | | 4,275 | | | | 4,350 | |
| Bay Area Toll Auth., San Francisco Bay Area Toll Bridge Rev. Bonds, Series 2017-G, 2.00% 2053 (put 2024) | | | 4,525 | | | | 4,656 | |
| Bay Area Toll Auth., San Francisco Bay Area Toll Bridge Rev. Bonds, Series 2021-A, 2.00% 2056 (put 2028) | | | 3,000 | | | | 3,164 | |
| Bay Area Toll Auth., San Francisco Bay Area Toll Bridge Rev. Ref. Bonds, Series 2017-S-7, 5.00% 2024 | | | 1,200 | | | | 1,334 | |
| Bay Area Toll Auth., San Francisco Bay Area Toll Bridge Rev. Ref. Bonds, Series 2012-F-1, 5.00% 2027 (preref. 2022) | | | 2,965 | | | | 3,025 | |
| Bay Area Water Supply and Conservation Agcy., Rev. Bonds, Series 2013-A, 5.00% 2023 | | | 500 | | | | 534 | |
| City of Beaumont, Wastewater Rev. Bonds, Series 2018-A, Assured Guaranty Municipal insured, 5.00% 2026 | | | 500 | | | | 598 | |
| City of Burbank, Successor Agcy. to the Redev. Agcy., Tax Allocation Rev. Ref. Redev. Bonds, Series 2015, BAM insured, 5.00% 2022 | | | 1,305 | | | | 1,372 | |
| California County Tobacco Securitization Agcy., Tobacco Settlement Rev. Bonds (Los Angeles County Securitization Corp.), Series 2020-A, 5.00% 2026 | | | 600 | | | | 710 | |
| Trustees of the California State University, Systemwide Rev. Bonds, Series 2015-A, 5.00% 2024 | | | 500 | | | | 570 | |
| Trustees of the California State University, Systemwide Rev. Bonds, Series 2016-B-2, 0.55% 2049 (put 2026) | | | 4,480 | | | | 4,413 | |
| Trustees of the California State University, Systemwide Rev. Bonds, Series 2016-B-3, 4.00% 2051 (put 2023) | | | 2,500 | | | | 2,636 | |
| | |
| 52 | Private Client Services Funds |
Capital Group California Core Municipal Fund
| Bonds, notes & other debt instruments (continued) | | Principal amount
(000) | | | Value
(000) | |
| California (continued) | | | | | | | | |
| City of Carlsbad, Reassessment Dist. No. 2012-1, Limited Obligation Rev. Ref. Bonds, Series 2013, 3.55% 2023 | | $ | 350 | | | $ | 358 | |
| Cathedral City, Successor Agcy. to the Redev. Agcy., Tax Allocation Housing Rev. Ref. Bonds (Merged Redev. Project Area), Series 2021-C, BAM insured, 4.00% 2022 | | | 200 | | | | 205 | |
| Cathedral City, Successor Agcy. to the Redev. Agcy., Tax Allocation Housing Rev. Ref. Bonds (Merged Redev. Project Area), Series 2021-C, BAM insured, 4.00% 2023 | | | 225 | | | | 238 | |
| Cathedral City, Successor Agcy. to the Redev. Agcy., Tax Allocation Housing Rev. Ref. Bonds (Merged Redev. Project Area), Series 2014-B, Assured Guaranty Municipal insured, 5.00% 2024 | | | 260 | | | | 292 | |
| Cathedral City, Successor Agcy. to the Redev. Agcy., Tax Allocation Housing Rev. Ref. Bonds (Merged Redev. Project Area), Series 2014-A, Assured Guaranty Municipal insured, 5.00% 2025 | | | 620 | | | | 692 | |
| Cerritos Community College Dist., G.O. Bonds, Capital Appreciation Bonds, 2004 Election, Series 2012-D, 0% 2027 | | | 830 | | | | 772 | |
| City of Chino, Successor Agcy. to the Redev. Agcy., Tax Allocation Rev. Ref. Bonds, Series 2014-A, BAM insured, 5.00% 2022 | | | 450 | | | | 468 | |
| City of Chino, Successor Agcy. to the Redev. Agcy., Tax Allocation Rev. Ref. Bonds, Series 2014-A, BAM insured, 5.00% 2025 | | | 665 | | | | 746 | |
| City of Chino Hills, Fin. Auth., Rev. Ref. Bonds (Community Facs. Dist. Bond Program), Series 2019-D, 5.00% 2024 | | | 465 | | | | 524 | |
| City of Chino Hills, Fin. Auth., Rev. Ref. Bonds (Community Facs. Dist. Bond Program), Series 2019-D, 5.00% 2026 | | | 780 | | | | 936 | |
| City of Chino Hills, Fin. Auth., Rev. Ref. Bonds (Community Facs. Dist. Bond Program), Series 2019-D, 5.00% 2027 | | | 430 | | | | 528 | |
| City of Chino Hills, Fin. Auth., Rev. Ref. Bonds (Community Facs. Dist. Bond Program), Series 2019-D, 5.00% 2028 | | | 355 | | | | 443 | |
| City of Chino Hills, Fin. Auth., Rev. Ref. Bonds (Community Facs. Dist. Bond Program), Series 2019-D, 5.00% 2029 | | | 225 | | | | 288 | |
| City of Chino Hills, Fin. Auth., Rev. Ref. Bonds (Community Facs. Dist. Bond Program), Series 2019-D, 5.00% 2030 | | | 60 | | | | 77 | |
| City of Chula Vista, Municipal Fncg. Auth., Special Tax Rev. Ref. Bonds, Series 2013, 5.00% 2022 | | | 1,355 | | | | 1,406 | |
| Clovis Unified School Dist., G.O. Bonds, Capital Appreciation Bonds, 2004 Election, Series 2006-B, National insured, 0% 2030 | | | 1,000 | | | | 867 | |
| Community Choice Fncg. Auth., Clean Energy Project Rev. Green Bonds, Series 2021-B-1, 4.00% 2052 (put 2031) | | | 2,750 | | | | 3,306 | |
| Compton Community College Dist., G.O. Rev. Ref. Bonds, Series 2014, BAM insured, 5.00% 2026 | | | 1,290 | | | | 1,443 | |
| Compton Community College Dist., G.O. Rev. Ref. Bonds, Series 2015, BAM insured, 5.00% 2029 | | | 1,000 | | | | 1,157 | |
| Compton Unified School Dist., G.O. Bonds, Capital Appreciation Bonds, 2015 Election, Series 2019-B, BAM insured, 0% 2033 | | | 1,000 | | | | 756 | |
| City of Concord, Successor Agcy. to the Redev. Agcy., Rev. Ref. Bonds, Series 2014, BAM insured, 5.00% 2023 | | | 825 | | | | 875 | |
| Del Mar Union School Dist., Community Facs. Dist. No. 99-1, Special Tax Bonds, Series 2019, 4.00% 2026 | | | 400 | | | | 453 | |
| Del Mar Union School Dist., Community Facs. Dist. No. 99-1, Special Tax Bonds, Series 2019, 5.00% 2027 | | | 885 | | | | 1,065 | |
| Del Mar Union School Dist., Community Facs. Dist. No. 99-1, Special Tax Bonds, Series 2019, 5.00% 2028 | | | 930 | | | | 1,140 | |
| Del Mar Union School Dist., Community Facs. Dist. No. 99-1, Special Tax Bonds, Series 2019, 5.00% 2029 | | | 675 | | | | 844 | |
| Desert Community College Dist., G.O. Rev. Ref. Bonds, Series 2016, 5.00% 2032 | | | 1,885 | | | | 2,233 | |
| City of Dublin, Community Facs. Dist. No. 2015-1 (Dublin Crossing), Improvement Area No. 3, Special Tax Bonds, Series 2021, 3.00% 2023 | | | 205 | | | | 213 | |
| City of Dublin, Community Facs. Dist. No. 2015-1 (Dublin Crossing), Improvement Area No. 3, Special Tax Bonds, Series 2021, 3.00% 2025 | | | 265 | | | | 281 | |
| East Bay Municipal Utility Dist., Water System Rev. Ref. Bonds, Series 2015-A, 5.00% 2027 | | | 3,550 | | | | 4,124 | |
| East Side Union High School Dist., G.O. Bonds, 2008 Election, Series 2012-D, 5.00% 2037 (preref. 2022) | | | 500 | | | | 518 | |
| Eastern Municipal Water Dist., Fin. Auth., Water and Wastewater Rev. Ref. Bonds, Series 2020-A, 2.75% 2028 | | | 535 | | | | 596 | |
| Eastern Municipal Water Dist., Water and Wastewater Rev. Ref. Bonds, Series 2021-A, 4.00% 2029 | | | 1,210 | | | | 1,479 | |
| Educational Facs. Auth., Rev. Bonds (Chapman University), Series 2021-A, 5.00% 2028 | | | 1,375 | | | | 1,725 | |
| Educational Facs. Auth., Rev. Bonds (University of the Pacific), Series 2012-A, 4.00% 2021 | | | 560 | | | | 560 | |
| Educational Facs. Auth., Rev. Bonds (University of the Pacific), Series 2012-A, 4.00% 2022 | | | 500 | | | | 500 | |
| Educational Facs. Auth., Rev. Ref. Bonds (Stanford University), Series 2009-T-5, 5.00% 2023 | | | 1,290 | | | | 1,375 | |
| City of El Centro, Fncg. Auth., Wastewater Rev. Ref. Bonds, Series 2014-A, Assured Guaranty Municipal insured, 5.00% 2026 | | | 530 | | | | 598 | |
| City of El Centro, Fncg. Auth., Wastewater Rev. Ref. Bonds, Series 2014-A, Assured Guaranty Municipal insured, 5.00% 2027 | | | 500 | | | | 563 | |
| City of El Centro, Fncg. Auth., Wastewater Rev. Ref. Bonds, Series 2014-A, Assured Guaranty Municipal insured, 5.00% 2030 | | | 1,000 | | | | 1,125 | |
| County of El Dorado, Community Facs. Dist. No. 1992-1 (El Dorado Hills Dev.), Special Tax Rev. Ref. Bonds, Series 2012, 5.00% 2024 | | | 855 | | | | 888 | |
| City of Elk Grove, Fin. Auth., Special Tax Rev. Bonds, Series 2015, BAM insured, 5.00% 2025 | | | 580 | | | | 668 | |
| Etiwanda School Dist., G.O. Bonds, 2016 Election, Series 2020-A, 4.00% 2029 | | | 570 | | | | 691 | |
| City of Eureka, Successor Agcy. to the Redev. Agcy., Tax Allocation Rev. Ref. Bonds, Series 2017-B, 5.00% 2022 | | | 835 | | | | 872 | |
| City of Fillmore, Successor Agcy. to the Redev. Agcy., Tax Allocation Rev. Ref. Bonds, Series 2015, BAM insured, 5.00% 2024 | | | 1,000 | | | | 1,116 | |
| Folsom Cordova Unified School Dist., School Facs. Improvement Dist. No. 1, G.O. Bonds, Capital Appreciation Bonds, 2002 Election, Series 2004-B, National insured, 0% 2026 | | | 1,000 | | | | 949 | |
| City of Fontana, Community Facs. Dist. No. 22 (Sierra Hills South), Special Tax Bonds, Series 2014, 5.00% 2023 | | | 535 | | | | 576 | |
| | |
| Private Client Services Funds | 53 |
Capital Group California Core Municipal Fund
| Bonds, notes & other debt instruments (continued) | | Principal amount
(000) | | | Value
(000) | |
| California (continued) | | | | | | | | |
| City of Fontana, Community Facs. Dist. No. 86 (Etiwanda Ridge), Special Tax Bonds, Series 2020, 4.00% 2026 | | $ | 100 | | | $ | 112 | |
| City of Fontana, Community Facs. Dist. No. 86 (Etiwanda Ridge), Special Tax Bonds, Series 2020, 4.00% 2027 | | | 120 | | | | 136 | |
| City of Fontana, Public Facs. Fin. Auth., Special Tax Rev. Ref. Bonds, Series 2021-A, 4.00% 2027 | | | 625 | | | | 724 | |
| City of Fontana, Public Facs. Fin. Auth., Special Tax Rev. Ref. Bonds, Series 2021-A, 4.00% 2029 | | | 390 | | | | 463 | |
| G.O. Bonds, Series 2020, 5.00% 2026 | | | 3,000 | | | | 3,633 | |
| G.O. Bonds, Series 2019, 5.00% 2029 | | | 2,000 | | | | 2,592 | |
| G.O. Bonds, Series 2021, 5.00% 2031 | | | 85 | | | | 102 | |
| G.O. Bonds, Series 2021, 5.00% 2032 | | | 70 | | | | 84 | |
| G.O. Bonds, Series 2021, 5.00% 2034 | | | 70 | | | | 84 | |
| G.O. Rev. Ref. Bonds, Series 2007, Assured Guaranty Municipal insured, 5.25% 2032 | | | 4,125 | | | | 5,654 | |
| G.O. Rev. Ref. Bonds, Series 2019, 5.00% 2027 | | | 745 | | | | 912 | |
| G.O. Rev. Ref. Bonds, Series 2021, 5.00% 2028 | | | 3,000 | | | | 3,804 | |
| G.O. Rev. Ref. Bonds, Series 2017, 5.00% 2029 | | | 4,000 | | | | 4,995 | |
| G.O. Rev. Ref. Bonds, Series 2021, 5.00% 2029 | | | 3,000 | | | | 3,875 | |
| G.O. Rev. Ref. Bonds, Series 2020, 5.00% 2029 | | | 1,500 | | | | 1,944 | |
| G.O. Rev. Ref. Bonds, Series 2019, 5.00% 2029 | | | 1,000 | | | | 1,294 | |
| G.O. Rev. Ref. Bonds, Series 2021, 5.00% 2031 | | | 2,500 | | | | 3,350 | |
| G.O. Rev. Ref. Bonds, Series 2020, 5.00% 2035 | | | 2,000 | | | | 2,568 | |
| City of Garden Grove, Successor Agcy. to the Dev. Agcy., Tax Allocation Bonds, Series 2016, BAM insured, 5.00% 2022 | | | 400 | | | | 417 | |
| City of Glendale, Successor Agcy. to the Redev. Agcy., Tax Allocation Rev. Ref. Bonds (Central Glendale Redev. Project), Series 2016, BAM insured, 5.00% 2024 | | | 425 | | | | 483 | |
| Golden State Tobacco Securitization Corp., Enhanced Tobacco Settlement Asset-Backed Bonds, Series 2018-A, 5.00% 2022 (escrowed to maturity) | | | 3,000 | | | | 3,084 | |
| Golden State Tobacco Securitization Corp., Enhanced Tobacco Settlement Asset-Backed Bonds, Series 2017A-1, 5.00% 2022 | | | 1,730 | | | | 1,775 | |
| Golden State Tobacco Securitization Corp., Enhanced Tobacco Settlement Asset-Backed Bonds, Capital Appreciation Bonds, Series 2005-A, AMBAC insured, 0% 2024 (escrowed to maturity) | | | 2,000 | | | | 1,977 | |
| Golden State Tobacco Securitization Corp., Enhanced Tobacco Settlement Asset-Backed Bonds, Capital Appreciation Bonds, Series 2005-A, Assured Guaranty Municipal insured, 0% 2026 (escrowed to maturity) | | | 2,785 | | | | 2,689 | |
| Greenfield Elementary School Dist., G.O. Bonds, Capital Appreciation Bonds, 2006 Election, Series 2007-A, Assured Guaranty Municipal insured, 0% 2029 | | | 1,270 | | | | 1,110 | |
| City of Hawthorne, Successor Agcy. to the Redev. Agcy., Tax Allocation Rev. Ref. Bonds, Series 2016, Assured Guaranty Municipal insured, 5.00% 2024 | | | 250 | | | | 282 | |
| Health Facs. Fncg. Auth., Rev. Bonds (Adventist Health System/West), Series 2013-A, 5.00% 2023 | | | 910 | | | | 967 | |
| Health Facs. Fncg. Auth., Rev. Bonds (Adventist Health System/West), Series 2013-A, 5.00% 2024 | | | 1,105 | | | | 1,174 | |
| Health Facs. Fncg. Auth., Rev. Bonds (Cedars-Sinai Medical Center), Series 2016-A, 5.00% 2023 | | | 650 | | | | 705 | |
| Health Facs. Fncg. Auth., Rev. Bonds (City of Hope), Series 2012-A, 5.00% 2021 | | | 350 | | | | 351 | |
| Health Facs. Fncg. Auth., Rev. Bonds (El Camino Hospital), Series 2017, 5.00% 2025 | | | 1,000 | | | | 1,145 | |
| Health Facs. Fncg. Auth., Rev. Bonds (Kaiser Permanente), Series 2017-B, 5.00% 2029 (put 2022) | | | 1,025 | | | | 1,074 | |
| Health Facs. Fncg. Auth., Rev. Bonds (Kaiser Permanente), Series 2017-D, 5.00% 2032 (put 2022) | | | 2,675 | | | | 2,803 | |
| Health Facs. Fncg. Auth., Rev. Bonds (Lucile Salter Packard Children’s Hospital at Stanford), Series 2014-A, 5.00% 2025 | | | 400 | | | | 450 | |
| Health Facs. Fncg. Auth., Rev. Bonds (PIH Health), Series 2020-A, 5.00% 2030 | | | 1,900 | | | | 2,469 | |
| Health Facs. Fncg. Auth., Rev. Bonds (Providence St. Joseph Health), Series 2019-B, 5.00% 2039 (put 2027) | | | 2,135 | | | | 2,639 | |
| Health Facs. Fncg. Auth., Rev. Bonds (Scripps Health), Series 2012-A, 5.00% 2024 | | | 150 | | | | 151 | |
| Health Facs. Fncg. Auth., Rev. Bonds (Scripps Health), Series 2012-A, 5.00% 2025 | | | 375 | | | | 376 | |
| Health Facs. Fncg. Auth., Rev. Bonds (Stanford Health Care), Series 2021-A, 3.00% 2054 (put 2025) | | | 4,430 | | | | 4,836 | |
| Health Facs. Fncg. Auth., Rev. Bonds (Sutter Health), Series 2018-A, 5.00% 2024 | | | 3,000 | | | | 3,413 | |
| Health Facs. Fncg. Auth., Rev. Bonds (Sutter Health), Series 2016-A, 5.00% 2026 (preref. 2025) | | | 300 | | | | 355 | |
| Health Facs. Fncg. Auth., Rev. Bonds (Sutter Health), Series 2016-A, 5.00% 2041 (preref. 2025) | | | 680 | | | | 804 | |
| Health Facs. Fncg. Auth., Rev. Bonds (Sutter Health), Series 2013-A, 5.00% 2052 (preref. 2023) | | | 1,665 | | | | 1,806 | |
| Health Facs. Fncg. Auth., Rev. Green Bonds (Kaiser Permanente), Series 2017-A-1, 5.00% 2027 | | | 3,000 | | | | 3,737 | |
| Health Facs. Fncg. Auth., Rev. Green Bonds (Kaiser Permanente), Series 2017-C, 5.00% 2031 (put 2022) | | | 6,985 | | | | 7,319 | |
| Health Facs. Fncg. Auth., Rev. Ref. Bonds (Adventist Health System/West), Series 2016-A, 4.00% 2025 | | | 1,270 | | | | 1,418 | |
| Health Facs. Fncg. Auth., Rev. Ref. Bonds (Lucile Salter Packard Children’s Hospital at Stanford), Series 2022-A, 5.00% 2026 | | | 830 | | | | 956 | |
| Health Facs. Fncg. Auth., Rev. Ref. Bonds (Marshall Medical Center), Series 2015, 5.00% 2022 | | | 175 | | | | 183 | |
| Health Facs. Fncg. Auth., Rev. Ref. Bonds (Marshall Medical Center), Series 2015, 5.00% 2023 | | | 135 | | | | 147 | |
| Health Facs. Fncg. Auth., Rev. Ref. Bonds (Stanford Health Care), Series 2017-A, 5.00% 2024 | | | 1,000 | | | | 1,139 | |
| Health Facs. Fncg. Auth., Rev. Ref. Bonds (Stanford Health Care), Series 2017-A, 5.00% 2026 | | | 1,750 | | | | 2,121 | |
| Hemet Unified School Dist., Fncg. Auth. Special Tax Rev. Bonds, Series 2015, 5.00% 2026 | | | 600 | | | | 676 | |
| | |
| 54 | Private Client Services Funds |
Capital Group California Core Municipal Fund
| Bonds, notes & other debt instruments (continued) | | Principal amount
(000) | | | Value
(000) | |
| California (continued) | | | | | | | | |
| Hemet Unified School Dist., G.O. Rev. Ref. Bonds, Series 2014, Assured Guaranty Municipal insured, 5.00% 2023 | | $ | 885 | | | $ | 958 | |
| Infrastructure and Econ. Dev. Bank, Charter School Rev. Bonds (Equitable School Revolving Fund), Series 2019-B, 5.00% 2025 | | | 100 | | | | 117 | |
| Infrastructure and Econ. Dev. Bank, Charter School Rev. Bonds (Equitable School Revolving Fund), Series 2019-B, 5.00% 2026 | | | 125 | | | | 150 | |
| Infrastructure and Econ. Dev. Bank, Charter School Rev. Bonds (Equitable School Revolving Fund), Series 2019-B, 5.00% 2027 | | | 110 | | | | 135 | |
| Infrastructure and Econ. Dev. Bank, Charter School Rev. Bonds (Equitable School Revolving Fund), Series 2019-B, 5.00% 2028 | | | 375 | | | | 470 | |
| Infrastructure and Econ. Dev. Bank, Charter School Rev. Bonds (Equitable School Revolving Fund), Series 2019-B, 5.00% 2029 | | | 140 | | | | 175 | |
| Infrastructure and Econ. Dev. Bank, Charter School Rev. Bonds (Equitable School Revolving Fund), Series 2019-B, 5.00% 2030 | | | 340 | | | | 423 | |
| Infrastructure and Econ. Dev. Bank, Rev. Bonds (The Colburn School), Series 2015-B, (SIFMA Municipal Swap Index + 1.20%) 1.25% 2037 (put 2022)1 | | | 1,000 | | | | 1,001 | |
| City of Inglewood, Successor Agcy. to the Redev. Agcy., Tax Allocation Rev. Ref. Bonds (Merged Redev. Project), Series 2017-A, BAM insured, 5.00% 2027 | | | 650 | | | | 790 | |
| City of Irvine, Reassessment Dist. No. 12-1, Limited Obligation Improvement Bonds, Series 2012, 3.25% 2022 | | | 700 | | | | 718 | |
| City of Irvine, Reassessment Dist. No. 12-1, Limited Obligation Improvement Bonds, Series 2012, 4.00% 2022 | | | 400 | | | | 413 | |
| City of Irvine, Reassessment Dist. No. 12-1, Limited Obligation Improvement Bonds, Series 2013, 5.00% 2024 | | | 725 | | | | 788 | |
| City of Irvine, Reassessment Dist. No. 13-1, Limited Obligation Improvement Bonds, Series 2013, 3.375% 2023 | | | 850 | | | | 898 | |
| City of Irvine, Reassessment Dist. No. 19-1, Limited Obligation Improvement Bonds, Series 2019, 4.00% 2022 | | | 225 | | | | 232 | |
| City of Irvine, Reassessment Dist. No. 19-1, Limited Obligation Improvement Bonds, Series 2019, 5.00% 2023 | | | 200 | | | | 217 | |
| City of Irvine, Reassessment Dist. No. 19-1, Limited Obligation Improvement Bonds, Series 2019, 5.00% 2024 | | | 210 | | | | 237 | |
| City of Irvine, Reassessment Dist. No. 19-1, Limited Obligation Improvement Bonds, Series 2019, 5.00% 2025 | | | 250 | | | | 292 | |
| City of Irvine, Reassessment Dist. No. 21-1, Limited Obligation Improvement Bonds, Series 2021, BAM insured, 4.00% 2025 | | | 500 | | | | 565 | |
| City of Irvine, Reassessment Dist. No. 21-1, Limited Obligation Improvement Bonds, Series 2021, 4.00% 2028 | | | 500 | | | | 599 | |
| City of Irvine, Reassessment Dist. No. 21-1, Limited Obligation Improvement Bonds, Series 2021, BAM insured, 4.00% 2030 | | | 1,265 | | | | 1,556 | |
| Irvine Unified School Dist., Community Facs. Dist. No. 09-1, Special Tax Bonds, Series 2019-A, BAM insured, 5.00% 2027 | | | 140 | | | | 172 | |
| Irvine Unified School Dist., Community Facs. Dist. No. 09-1, Special Tax Bonds, Series 2019-A, BAM insured, 5.00% 2028 | | | 350 | | | | 439 | |
| Irvine Unified School Dist., Community Facs. Dist. No. 09-1, Special Tax Bonds, Series 2019-A, BAM insured, 5.00% 2030 | | | 215 | | | | 273 | |
| City of Jurupa, Public Fncg. Auth., Special Tax Rev. Bonds, Series 2014-A, 5.00% 2023 | | | 500 | | | | 541 | |
| City of Jurupa, Public Fncg. Auth., Special Tax Rev. Bonds, Series 2014-A, 5.00% 2029 | | | 710 | | | | 792 | |
| City of Jurupa, Public Fncg. Auth., Special Tax Rev. Ref. Bonds, Series 2020-A, BAM insured, 5.00% 2023 | | | 750 | | | | 812 | |
| City of Jurupa, Public Fncg. Auth., Special Tax Rev. Ref. Bonds, Series 2020-A, BAM insured, 4.00% 2027 | | | 1,615 | | | | 1,879 | |
| Kern Community College Dist., Safety Repair and Improvement G.O. Bonds, Capital Appreciation Bonds, 2002 Election, Series 2006, FSA insured, 0% 2022 | | | 1,500 | | | | 1,497 | |
| Kings Canyon Joint Unified School Dist., G.O. Rev. Ref. Bonds, Series 2016, Assured Guaranty Municipal insured, 5.00% 2029 | | | 1,600 | | | | 1,852 | |
| La Habra School Dist., G.O. Bonds, Capital Appreciation Bonds, 2000 Election, Series 2002-A, FSA insured, 0% 2026 | | | 1,010 | | | | 953 | |
| Lakeside Union School Dist., G.O. Rev. Ref. Bonds, Series 2016, 5.00% 2029 | | | 1,785 | | | | 2,138 | |
| Lammersville Joint Unified School Dist., Community Facs. Dist. No. 2002, Special Tax Bonds, Series 2017, 4.00% 2022 | | | 680 | | | | 699 | |
| City of Lodi, Public Fin. Auth., Rev. Ref. Bonds, Series 2018, Assured Guaranty Municipal insured, 5.00% 2024 | | | 260 | | | | 293 | |
| City of Long Beach, Bond Fin. Auth., Rev. Ref. Bonds (Aquarium of the Pacific Project), Series 2012, 5.00% 2021 | | | 520 | | | | 520 | |
| Long Beach Community College Dist., G.O. Bonds, Capital Appreciation Bonds, 2008 Election, Series 2008-A, Assured Guaranty Municipal insured, 0% 2027 | | | 3,865 | | | | 3,607 | |
| City of Los Angeles, Community Facs. Dist. No. 4 (Playa Vista - Phase 1), Special Tax Rev. Ref. Bonds, Series 2014, 5.00% 2023 | | | 690 | | | | 747 | |
| City of Los Angeles, Dept. of Airports, Los Angeles International Airport, Rev. and Rev. Ref. Bonds, Series 2021-B, 5.00% 2031 | | | 420 | | | | 556 | |
| City of Los Angeles, Dept. of Airports, Los Angeles International Airport, Rev. Bonds, Series 2019-E, 5.00% 2039 | | | 1,130 | | | | 1,408 | |
| City of Los Angeles, Dept. of Airports, Los Angeles International Airport, Rev. Ref. Bonds, Series 2019-C, 5.00% 2025 | | | 2,000 | | | | 2,317 | |
| City of Los Angeles, Dept. of Water and Power, Power System Rev. Bonds, Series 2021-B, 3.00% 2022 | | | 3,000 | | | | 3,057 | |
| City of Los Angeles, Dept. of Water and Power, Power System Rev. Bonds, Series 2017-C, 5.00% 2022 | | | 575 | | | | 593 | |
| City of Los Angeles, Dept. of Water and Power, Power System Rev. Bonds, Series 2013-A, 5.00% 2022 | | | 515 | | | | 532 | |
| | |
| Private Client Services Funds | 55 |
Capital Group California Core Municipal Fund
| Bonds, notes & other debt instruments (continued) | | Principal amount
(000) | | | Value
(000) | |
| California (continued) | | | | | | | | |
| City of Los Angeles, Dept. of Water and Power, Power System Rev. Bonds, Series 2018-D, 5.00% 2024 | | $ | 535 | | | $ | 601 | |
| City of Los Angeles, Dept. of Water and Power, Power System Rev. Bonds, Series 2018-B, 5.00% 2025 | | | 1,875 | | | | 2,181 | |
| City of Los Angeles, Dept. of Water and Power, Power System Rev. Bonds, Series 2018-D, 5.00% 2025 | | | 500 | | | | 582 | |
| City of Los Angeles, Dept. of Water and Power, Power System Rev. Bonds, Series 2019-D, 5.00% 2027 | | | 1,100 | | | | 1,359 | |
| City of Los Angeles, Dept. of Water and Power, Water System Rev. Bonds, Series 2020-A, 5.00% 2028 | | | 650 | | | | 823 | |
| City of Los Angeles, Solid Waste Resources Rev. Bonds, Series 2013-A, 2.00% 2023 | | | 1,110 | | | | 1,135 | |
| County of Los Angeles, Dev. Auth., Multi Family Housing Rev. Bonds (Cantamar Villas), Series 2021-D-1, 0.30% 2025 (put 2024) | | | 1,295 | | | | 1,290 | |
| County of Los Angeles, Dev. Auth., Multi Family Housing Rev. Bonds (Sunny Garden Apartments), Series 2021-C-1, 0.20% 2024 (put 2023) | | | 3,175 | | | | 3,171 | |
| County of Los Angeles, Metropolitan Transportation Auth., Proposition C Sales Tax Rev. Bonds, Series 2021-A, 5.00% 2030 | | | 6,410 | | | | 8,467 | |
| County of Los Angeles, Redev. Ref. Auth., Tax Allocation Rev. Ref. Bonds (South Gate Project No. 1), Series 2014-A, Assured Guaranty Municipal insured, 5.00% 2022 | | | 1,190 | | | | 1,235 | |
| Los Angeles Community College Dist., G.O. Bonds, 2008 Election, Series 2008-G, 4.00% 2039 (preref. 2024) | | | 3,350 | | | | 3,683 | |
| Los Angeles Unified School Dist., G.O. Rev. Ref. Bonds, Series 2014-C, 5.00% 2023 | | | 520 | | | | 561 | |
| Los Angeles Unified School Dist., G.O. Rev. Ref. Bonds, Series 2019-A, 5.00% 2027 | | | 5,000 | | | | 6,172 | |
| Madera Unified School Dist., G.O. Bonds, Capital Appreciation Bonds, 2002 Election, Series 2006, Assured Guaranty Municipal insured, 0% 2029 | | | 585 | | | | 521 | |
| Manhattan Beach Unified School Dist., G.O. Bonds, Capital Appreciation Bonds, Series 1999-C, FGIC-National insured, 0% 2024 | | | 3,875 | | | | 3,753 | |
| Manteca Unified School Dist., G.O. Bonds, Capital Appreciation Bonds, 2004 Election, Series 2006, MBIA insured, 0% 2027 | | | 560 | | | | 517 | |
| City of Merced, Irrigation Dist., Electric System Rev. Ref. Bonds, Series 2015-A, Assured Guaranty Municipal insured, 5.00% 2022 | | | 500 | | | | 522 | |
| City of Merced, Irrigation Dist., Electric System Rev. Ref. Bonds, Series 2015-A, Assured Guaranty Municipal insured, 5.00% 2028 | | | 250 | | | | 291 | |
| Montebello Unified School Dist., G.O. Rev. Ref. Bonds, Series 2015, 5.00% 2028 | | | 1,545 | | | | 1,752 | |
| Mountain View School Dist., G.O. Bonds, 2020 Election, Series 2021-A, Assured Guaranty Municipal insured, 4.00% 2023 | | | 1,290 | | | | 1,374 | |
| Municipal Fin. Auth., Educational Rev. Bonds (American Heritage Education Foundation Project), Series 2016-A, 4.00% 2026 | | | 200 | | | | 214 | |
| Municipal Fin. Auth., Rev. Bonds (California Institute of the Arts), Series 2021, 4.00% 2033 | | | 250 | | | | 298 | |
| Municipal Fin. Auth., Rev. Bonds (California Lutheran University), Series 2018, 5.00% 2026 | | | 300 | | | | 357 | |
| Municipal Fin. Auth., Rev. Bonds (Retirement Housing Foundation), Series 2017-A, 5.00% 2024 | | | 300 | | | | 339 | |
| Municipal Fin. Auth., Rev. Bonds (University of La Verne), Series 2017-A, 5.00% 2023 | | | 750 | | | | 805 | |
| Municipal Fin. Auth., Rev. Bonds (Village Grove Apartments), Series 2013-A, 3.10% 2021 (escrowed to maturity) | | | 1,210 | | | | 1,213 | |
| Municipal Fin. Auth., Rev. Ref. Bonds (Biola University), Series 2013, 5.00% 2022 | | | 470 | | | | 490 | |
| Municipal Fin. Auth., Rev. Ref. Bonds (Biola University), Series 2017, 5.00% 2026 | | | 335 | | | | 398 | |
| Municipal Fin. Auth., Rev. Ref. Bonds (Harbor Regional Center Project), Series 2015, 5.00% 2022 | | | 885 | | | | 927 | |
| Municipal Fin. Auth., Rev. Ref. Bonds (Harbor Regional Center Project), Series 2015, 5.00% 2025 | | | 500 | | | | 586 | |
| Municipal Fin. Auth., Rev. Ref. Bonds (HumanGood Obligated Group), Series 2019-A, 4.00% 2028 | | | 750 | | | | 859 | |
| Municipal Fin. Auth., Rev. Ref. Bonds (HumanGood Obligated Group), Series 2019-A, 4.00% 2029 | | | 1,085 | | | | 1,236 | |
| Municipal Fin. Auth., Rev. Ref. Bonds (HumanGood Obligated Group), Series 2019-A, 4.00% 2035 | | | 1,000 | | | | 1,127 | |
| Municipal Fin. Auth., Student Housing Rev. Bonds (CHF-Riverside I, LLC - UCR Student Housing Project), Series 2019, BAM insured, 5.00% 2027 | | | 530 | | | | 642 | |
| Murrieta Valley Unified School Dist., G.O. Bonds, 2014 Election, Series 2020, 4.00% 2023 | | | 335 | | | | 357 | |
| Murrieta Valley Unified School Dist., Public Fncg. Auth., Special Tax Rev. Bonds, Series 2016-A, 5.00% 2023 | | | 2,530 | | | | 2,727 | |
| Northern California Energy Auth., Commodity Supply Rev. Bonds, Series 2018, 4.00% 2049 (put 2024) | | | 2,500 | | | | 2,709 | |
| Oak Park Unified School Dist., G.O. Bonds, Capital Appreciation Bonds, 2006 Election, Series 2009-B, Assured Guaranty Municipal insured, 0% 2029 | | | 605 | | | | 531 | |
| Oakland Unified School Dist., G.O. Bonds, 2006 Election, Series 2016-A, 5.00% 2026 | | | 1,325 | | | | 1,584 | |
| Oakland Unified School Dist., G.O. Bonds, 2012 Election, Series 2019-A, Assured Guaranty Municipal insured, 5.00% 2028 | | | 1,000 | | | | 1,230 | |
| Oakland Unified School Dist., G.O. Bonds, 2012 Election, Series 2019-A, Assured Guaranty Municipal insured, 4.00% 2034 | | | 1,000 | | | | 1,158 | |
| Oakland Unified School Dist., G.O. Rev. Ref. Bonds, Series 2017-A, 5.00% 2022 | | | 2,000 | | | | 2,071 | |
| Oakland Unified School Dist., G.O. Rev. Ref. Bonds, Series 2016, 5.00% 2022 | | | 915 | | | | 947 | |
| Oakland Unified School Dist., G.O. Rev. Ref. Bonds, Series 2016, 5.00% 2024 | | | 1,310 | | | | 1,471 | |
| Oakland Unified School Dist., G.O. Rev. Ref. Bonds, Series 2016, 5.00% 2025 | | | 3,000 | | | | 3,486 | |
| Oakland Unified School Dist., G.O. Rev. Ref. Bonds, Series 2015, Assured Guaranty insured, 5.00% 2026 | | | 1,125 | | | | 1,309 | |
| Ohlone Community College Dist., G.O. Rev. Ref. Bonds, Series 2012, 5.00% 2023 (preref. 2022) | | | 550 | | | | 570 | |
| County of Orange, Airport Private Activity Rev. Ref. Bonds, Series 2019-B, 5.00% 2025 | | | 1,065 | | | | 1,237 | |
| | |
| 56 | Private Client Services Funds |
Capital Group California Core Municipal Fund
| Bonds, notes & other debt instruments (continued) | | Principal amount
(000) | | | Value
(000) | |
| California (continued) | | | | | | | | |
| County of Orange, Airport Private Activity Rev. Ref. Bonds, Series 2019-A, 5.00% 2025 | | $ | 1,000 | | | $ | 1,161 | |
| County of Orange, Airport Rev. Ref. Bonds, Series 2019-A, 5.00% 2022 | | | 1,000 | | | | 1,032 | |
| County of Orange, Community Facs. Dist. No. 2016-1 (Village of Esencia), Special Tax Bonds, Series 2016-A, 5.00% 2026 | | | 570 | | | | 673 | |
| County of Orange, Sanitation Dist., Wastewater Rev. Ref. Obligations, Series 2021-A, 5.00% 2032 | | | 1,500 | | | | 2,010 | |
| County of Orange, Water Dist. Rev. Certs. of Part. (Interim Obligations), Series 2019-A, 2.00% 2023 | | | 2,725 | | | | 2,787 | |
| City of Oxnard, Fncg. Auth., Wastewater Rev. Ref. Bonds, Series 2014, Assured Guaranty Municipal insured, 5.00% 2024 | | | 250 | | | | 279 | |
| City of Oxnard, Water Rev. Ref. Bonds, Series 2018, BAM insured, 5.00% 2022 | | | 700 | | | | 719 | |
| City of Oxnard, Water Rev. Ref. Bonds, Series 2018, BAM insured, 5.00% 2024 | | | 450 | | | | 502 | |
| Oxnard Unified School Dist., G.O. Bonds, 2012 Election, Series 2012-A, Assured Guaranty Municipal insured, 5.00% 2037 (preref. 2022) | | | 500 | | | | 518 | |
| Palomar Health, G.O. Rev. Ref. Bonds, Series 2016-A, 5.00% 2026 | | | 630 | | | | 739 | |
| Paramount Unified School Dist., G.O. Bonds, Capital Appreciation Bonds, 1998 Election, Series 2001-B, Assured Guaranty Municipal insured, 0% 2025 | | | 3,000 | | | | 2,907 | |
| Peninsula Corridor Joint Powers Board, Farebox Rev. Bonds, Series 2019-A, 5.00% 2026 | | | 250 | | | | 298 | |
| Peninsula Corridor Joint Powers Board, Farebox Rev. Bonds, Series 2019-A, 5.00% 2027 | | | 200 | | | | 244 | |
| Peninsula Corridor Joint Powers Board, Farebox Rev. Bonds, Series 2019-A, 5.00% 2028 | | | 285 | | | | 355 | |
| Peninsula Corridor Joint Powers Board, Farebox Rev. Bonds, Series 2019-A, 5.00% 2029 | | | 400 | | | | 507 | |
| Peralta Community College Dist., G.O. Rev. Ref. Bonds, Series 2014-A, 5.00% 2025 | | | 2,680 | | | | 3,006 | |
| City of Perris, Joint Powers Auth., Local Agcy. Rev. Ref. Bonds (CFD No. 2001-1 IA No. 4 and No. 5; CFD No. 2005-1 IA No. 4), Series 2017-B, 4.00% 2022 | | | 915 | | | | 940 | |
| Perris Union High School Dist., Fncg. Auth., Rev. Bonds, Series 2015, 5.00% 2024 | | | 1,000 | | | | 1,115 | |
| Perris Union High School Dist., G.O. Bonds, 2012 Election, Series 2021-C, 4.00% 2028 | | | 185 | | | | 222 | |
| Perris Union High School Dist., G.O. Bonds, 2012 Election, Series 2021-C, 4.00% 2029 | | | 200 | | | | 244 | |
| Perris Union High School Dist., G.O. Bonds, 2012 Election, Series 2021-C, 4.00% 2030 | | | 215 | | | | 260 | |
| Perris Union High School Dist., G.O. Bonds, 2012 Election, Series 2021-C, 4.00% 2031 | | | 350 | | | | 421 | |
| Pleasant Valley School Dist., G.O. Bonds, 2018 Election, Series A, 5.00% 2029 | | | 645 | | | | 770 | |
| Pollution Control Fncg. Auth., Water Facs. Rev. Ref. Bonds (American Water Capital Corp. Project), Series 2020, 0.60% 2040 (put 2023) | | | 3,270 | | | | 3,266 | |
| Poway Unified School Dist., Public Fncg. Auth., Special Tax Rev. Bonds, Series 2013, 4.00% 2022 | | | 440 | | | | 454 | |
| Poway Unified School Dist., Public Fncg. Auth., Special Tax Rev. Ref. Bonds, Series 2015-A, 5.00% 2022 | | | 850 | | | | 881 | |
| Poway Unified School Dist., Public Fncg. Auth., Special Tax Rev. Ref. Bonds, Series 2015-B, BAM insured, 5.00% 2022 | | | 500 | | | | 520 | |
| Poway Unified School Dist., Public Fncg. Auth., Special Tax Rev. Ref. Bonds, Series 2016-A, 5.00% 2023 | | | 885 | | | | 961 | |
| Public Fin. Auth., Electric System Rev. Ref. Bonds, Series 2018, Assured Guaranty Municipal insured, 5.00% 2023 | | | 730 | | | | 791 | |
| Public Fin. Auth., Reassessment Rev. Ref. Bonds, Series 2019, 5.00% 2022 | | | 1,115 | | | | 1,156 | |
| Public Fin. Auth., Reassessment Rev. Ref. Bonds, Series 2019, 5.00% 2029 | | | 1,000 | | | | 1,250 | |
| Public Fin. Auth., Rev. Bonds (Henry Mayo Newhall Memorial Hospital), Series 2017, Assured Guaranty Municipal insured, 5.00% 2023 | | | 500 | | | | 542 | |
| Public Fin. Auth., Rev. Ref. Bonds (O’Conner Woods), Series 2022, 4.00% 2028 | | | 450 | | | | 507 | |
| Public Fin. Auth., Rev. Ref. Bonds (O’Conner Woods), Series 2022, 4.00% 2029 | | | 500 | | | | 571 | |
| Public Fin. Auth., Rev. Ref. Bonds (O’Conner Woods), Series 2022, 4.00% 2031 | | | 520 | | | | 605 | |
| Public Works Board, Lease Rev. Bonds (Dept. of Corrections, Various State Prisons), Series 2019-D, 5.00% 2028 | | | 1,000 | | | | 1,266 | |
| Public Works Board, Lease Rev. Ref. Bonds (Dept. of Corrections, Various State Prisons), Series 2015-A, 5.00% 2023 | | | 790 | | | | 849 | |
| Public Works Board, Lease Rev. Ref. Bonds (Various Capital Projects), Series 2016-C, 5.00% 2024 | | | 1,650 | | | | 1,876 | |
| Public Works Board, Lease Rev. Ref. Bonds (Various Capital Projects), Series 2017-C, 5.00% 2026 | | | 4,060 | | | | 4,823 | |
| Public Works Board, Lease Rev. Ref. Bonds (Various Capital Projects), Series 2022-A, 5.00% 2028 | | | 5,005 | | | | 6,164 | |
| Public Works Board, Lease Rev. Ref. Bonds (Various Capital Projects), Series 2016-D, 5.00% 2028 | | | 5,000 | | | | 6,043 | |
| Public Works Board, Lease Rev. Ref. Bonds (Various Capital Projects), Series 2017-B, 5.00% 2028 | | | 1,415 | | | | 1,750 | |
| City of Rancho Cucamonga, Successor Agcy. to the Redev. Agcy., Tax Allocation Rev. Ref. Bonds (Rancho Redev. Project Area), Series 2014, Assured Guaranty Municipal insured, 5.00% 2026 | | | 600 | | | | 673 | |
| City of Rancho Cucamonga, Successor Agcy. to the Redev. Agcy., Tax Allocation Rev. Ref. Bonds (Rancho Redev. Project Area), Series 2014, Assured Guaranty Municipal insured, 5.00% 2028 | | | 300 | | | | 335 | |
| City of Redding, Joint Powers Fin. Auth., Electric System Rev. Bonds, Series 2015-A, 5.00% 2024 | | | 15 | | | | 17 | |
| Rialto Unified School Dist., G.O. Bonds, 2010 Election, Series 2019, 3.00% 2026 | | | 600 | | | | 669 | |
| Rialto Unified School Dist., G.O. Bonds, 2010 Election, Series 2019, 3.00% 2027 | | | 750 | | | | 847 | |
| City of Richmond, Successor Agcy. to the Redev. Agcy., Rev. Ref. Bonds, Series 2014-A, BAM insured, 5.00% 2025 | | | 200 | | | | 224 | |
| Rio Elementary School Dist., Community Facs. Dist. No. 1, Special Tax Bonds, Series 2016, BAM insured, 5.00% 2032 | | | 240 | | | | 282 | |
| Rio Elementary School Dist., Community Facs. Dist. No. 1, Special Tax Rev. Ref. Bonds, Series 2014, 5.00% 2022 | | | 400 | | | | 415 | |
| | |
| Private Client Services Funds | 57 |
Capital Group California Core Municipal Fund
| Bonds, notes & other debt instruments (continued) | | Principal amount
(000) | | | Value
(000) | |
| California (continued) | | | | | | | | |
| Rio Hondo Community College Dist., G.O. Bonds, Capital Appreciation Bonds, 2004 Election, Series 2010-C, 0% 2033 | | $ | 660 | | | $ | 534 | |
| County of Riverside, Public Fncg. Auth., Tax Allocation Rev. Bonds (Project Area No. 1, Desert Communities and Interstate 215 Corridor Projects), Series 2015-A, Assured Guaranty Municipal insured, 5.00% 2023 | | | 1,075 | | | | 1,169 | |
| County of Riverside, Public Fncg. Auth., Tax Allocation Rev. Ref. Bonds (Hemet Project), Series 2014, BAM insured, 5.00% 2023 | | | 500 | | | | 542 | |
| Riverside Community Properties Dev., Inc., Lease Rev. Bonds (Riverside County Law Building Project), Series 2013, 6.00% 2038 (preref. 2023) | | | 2,585 | | | | 2,876 | |
| Riverside Unified School Dist., Fncg. Auth., Special Tax Rev. Ref. Bonds, Series 2015, BAM insured, 5.00% 2025 | | | 350 | | | | 399 | |
| Riverside Unified School Dist., Fncg. Auth., Special Tax Rev. Ref. Bonds, Series 2015, BAM insured, 5.00% 2026 | | | 400 | | | | 457 | |
| Riverside Unified School Dist., G.O. Bonds, 2016 Election, Series 2019, 4.00% 2029 | | | 850 | | | | 992 | |
| City of Roseville, Community Facs. Dist. No. 1 (Westpark), Special Tax Rev. Ref. Bonds, Series 2015, 5.00% 2024 | | | 1,000 | | | | 1,117 | |
| City of Sacramento, Municipal Utility Dist., Electric Rev. Bonds, Series 1997-K, AMBAC insured, 5.25% 2024 | | | 770 | | | | 835 | |
| County of Sacramento, Airport System Rev. Ref. Bonds, Series 2018-E, 5.00% 2027 | | | 1,015 | | | | 1,247 | |
| County of Sacramento, Airport System Rev. Ref. Bonds, Series 2018-E, 5.00% 2030 | | | 200 | | | | 248 | |
| County of Sacramento, Sanitation Dist. Fin. Auth., Rev. Ref. Bonds, Series 2021, 5.00% 2032 | | | 500 | | | | 694 | |
| Sacramento Unified School Dist., G.O. Bonds, Series 2015, Assured Guaranty Municipal insured, 5.00% 2030 | | | 1,000 | | | | 1,107 | |
| Sacramento Unified School Dist., G.O. Bonds, 2012 Election, Series 2019-D, BAM insured, 4.00% 2027 | | | 585 | | | | 683 | |
| Sacramento Unified School Dist., G.O. Bonds, 2012 Election, Series 2017-E, 5.00% 2027 | | | 555 | | | | 677 | |
| Sacramento Unified School Dist., G.O. Bonds, 2012 Election, Series 2019-D, BAM insured, 4.00% 2028 | | | 610 | | | | 723 | |
| Sacramento Unified School Dist., G.O. Bonds, 2012 Election, Series 2019-D, BAM insured, 4.00% 2029 | | | 635 | | | | 762 | |
| Sacramento Unified School Dist., G.O. Rev. Ref. Bonds, Series 2012, 5.25% 2024 | | | 1,300 | | | | 1,340 | |
| San Bernardino Unified School Dist., G.O. Rev. Ref. Bonds, Series 2013-A, Assured Guaranty Municipal insured, 5.00% 2022 (escrowed to maturity) | | | 1,500 | | | | 1,553 | |
| City of San Diego, Community Facs. Dist. No. 2 (Santaluz), Improvement Area No. 1, Special Tax Rev. Ref. Bonds, Series 2021, 4.00% 2027 | | | 635 | | | | 743 | |
| City of San Diego, Community Facs. Dist. No. 2 (Santaluz), Improvement Area No. 1, Special Tax Rev. Ref. Bonds, Series 2021, 4.00% 2028 | | | 880 | | | | 1,047 | |
| City of San Diego, Community Facs. Dist. No. 2 (Santaluz), Improvement Area No. 1, Special Tax Rev. Ref. Bonds, Series 2021, 4.00% 2029 | | | 430 | | | | 520 | |
| City of San Diego, Limited Obligation Rev. Bonds (Sanford Burnham Prebys Medical Discovery Institute Project), Series 2015-A, 5.00% 2022 | | | 200 | | | | 209 | |
| City of San Diego, Public Facs. Fncg. Auth., Lease Rev. Bonds (Capital Improvement Projects), Series 2021-A, 5.00% 2030 | | | 200 | | | | 263 | |
| City of San Diego, Public Facs. Fncg. Auth., Lease Rev. Bonds (Capital Improvement Projects), Series 2021-A, 5.00% 2031 | | | 150 | | | | 197 | |
| City of San Diego, Public Facs. Fncg. Auth., Water Rev. Bonds, Series 2020-A, 5.00% 2029 | | | 500 | | | | 648 | |
| County of San Diego, Community Facs. Dist. No. 2008-1 (Harmony Grove Village), Improvement Area No. 2, Special Tax Bonds, Series 2020-A, 4.00% 2026 | | | 255 | | | | 288 | |
| County of San Diego, Regional Airport Auth., Airport Rev. and Rev. Ref. Bonds, Series 2019-A, 5.00% 2027 | | | 400 | | | | 490 | |
| County of San Diego, Regional Airport Auth., Airport Rev. and Rev. Ref. Bonds, Series 2019-A, 5.00% 2028 | | | 320 | | | | 401 | |
| County of San Diego, Regional Airport Auth., Airport Rev. and Rev. Ref. Bonds, Series 2019-A, 5.00% 2029 | | | 585 | | | | 745 | |
| County of San Diego, Regional Airport Auth., Airport Rev. Bonds, Series 2013-A, 5.00% 2023 | | | 245 | | | | 264 | |
| County of San Diego, Regional Airport Auth., Airport Rev. Ref. Bonds, Series 2020-B, 5.00% 2022 | | | 3,990 | | | | 4,117 | |
| County of San Diego, Regional Airport Auth., Airport Rev. Ref. Bonds, Series 2020-A, 5.00% 2028 | | | 1,000 | | | | 1,252 | |
| County of San Diego, Regional Airport Auth., Airport Rev. Ref. Bonds, Series 2020-A, 5.00% 2029 | | | 1,000 | | | | 1,274 | |
| County of San Diego, Regional Airport Auth., Airport Rev. Ref. Bonds, Series 2020-B, 5.00% 2031 | | | 1,405 | | | | 1,817 | |
| County of San Diego, Regional Transportation Commission, Limited Sales Tax Rev. Bonds, Series 2021-B, 5.00% 2029 | | | 320 | | | | 414 | |
| County of San Diego, Regional Transportation Commission, Limited Sales Tax Rev. Green Bonds, Series 2020-A, 5.00% 2028 | | | 850 | | | | 1,073 | |
| County of San Diego, Water Auth. Rev. Ref. Bonds, Series 2013-A, 5.00% 2031 (preref. 2022) | | | 900 | | | | 944 | |
| County of San Diego, Water Auth. Rev. Ref. Green Bonds, Series 2021-A, 5.00% 2028 | | | 1,000 | | | | 1,264 | |
| County of San Diego, Water Auth., Water Rev. Ref. Green Bonds, Series 2021-S-1, 5.00% 2028 | | | 1,285 | | | | 1,619 | |
| San Diego Unified School Dist., G.O. Dedicated Unlimited Ad Valorem Property Tax Bonds, Series 2016-SR-1, 4.00% 2031 | | | 3,000 | | | | 3,435 | |
| San Diego Unified School Dist., G.O. Dedicated Unlimited Ad Valorem Property Tax Rev. Ref. Bonds, Series 2015-R-4, 5.00% 2026 | | | 1,000 | | | | 1,166 | |
| San Diego Unified School Dist., G.O. Dedicated Unlimited Ad Valorem Property Tax Rev. Ref. Bonds, Series 2015-R-4, 5.00% 2027 | | | 3,000 | | | | 3,497 | |
| City and County of San Francisco, Airport Commission, San Francisco International Airport, Rev. Bonds, Series 2019-D-2, 5.00% 2024 | | | 1,000 | | | | 1,114 | |
| | |
| 58 | Private Client Services Funds |
Capital Group California Core Municipal Fund
| Bonds, notes & other debt instruments (continued) | | Principal amount
(000) | | | Value
(000) | |
| California (continued) | | | | | | | | |
| City and County of San Francisco, Airport Commission, San Francisco International Airport, Rev. Ref. Bonds, Series 2021-B-2, 5.00% 2031 | | $ | 2,780 | | | $ | 3,666 | |
| City and County of San Francisco, Public Utilities Commission, San Francisco Water Rev. Bonds, Series 2011-A, 5.00% 2029 (preref. 2021) | | | 3,000 | | | | 3,000 | |
| City and County of San Francisco, Successor Agcy. to the Redev. Agcy., Special Tax Rev. Ref. Bonds (San Francisco Redev. Projects), Series 2014-C, 5.00% 2022 | | | 305 | | | | 316 | |
| City of San Francisco, Bay Area Rapid Transit Dist., G.O. Bonds, 2016 Election, Series 2020-C-1, 5.00% 2027 | | | 1,500 | | | | 1,859 | |
| San Francisco Community College Dist., G.O. Rev. Ref. Bonds, Series 2015, 5.00% 2023 | | | 2,510 | | | | 2,701 | |
| San Francisco Community College Dist., G.O. Rev. Ref. Bonds, Series 2020, 5.00% 2027 | | | 1,525 | | | | 1,871 | |
| San Francisco Unified School Dist., G.O. Bonds, 2016 Election, Series 2020-B, 4.00% 2022 | | | 1,000 | | | | 1,024 | |
| San Francisco Unified School Dist., G.O. Bonds, 2016 Election, Series 2020-B, 4.00% 2029 | | | 1,000 | | | | 1,192 | |
| San Jacinto Unified School Dist., Fncg. Auth., Special Tax Rev. Bonds, Series 2019, 5.00% 2022 | | | 25 | | | | 26 | |
| San Jacinto Unified School Dist., Fncg. Auth., Special Tax Rev. Bonds, Series 2019, 5.00% 2023 | | | 40 | | | | 43 | |
| San Jacinto Unified School Dist., Fncg. Auth., Special Tax Rev. Bonds, Series 2019, 5.00% 2024 | | | 65 | | | | 72 | |
| San Jacinto Unified School Dist., Fncg. Auth., Special Tax Rev. Bonds, Series 2019, 5.00% 2025 | | | 90 | | | | 103 | |
| San Jacinto Unified School Dist., Fncg. Auth., Special Tax Rev. Bonds, Series 2019, 5.00% 2026 | | | 155 | | | | 183 | |
| San Joaquin Hills Transportation Corridor Agcy., Toll Road Rev. Ref. Bonds, Capital Appreciation Bonds, Series 1993, National insured, 0% 2022 (escrowed to maturity) | | | 5,000 | | | | 4,998 | |
| San Joaquin Hills Transportation Corridor Agcy., Toll Road Rev. Ref. Bonds, Capital Appreciation Bonds, Series 1997-A, National insured, 0% 2025 | | | 285 | | | | 278 | |
| City of San Jose, Airport Rev. Ref. Bonds, Series 2021-A, BAM insured, 5.00% 2029 | | | 500 | | | | 633 | |
| City of San Jose, Airport Rev. Ref. Bonds, Series 2021-A, BAM insured, 5.00% 2030 | | | 250 | | | | 322 | |
| City of San Jose, Airport Rev. Ref. Bonds, Series 2021-B, 5.00% 2032 | | | 1,250 | | | | 1,639 | |
| City of San Jose, Fin. Auth., Lease Rev. Ref. Bonds (Civic Center Project), Series 2013-A, 5.00% 2030 (preref. 2023) | | | 1,625 | | | | 1,747 | |
| City of San Jose, G.O. Bonds (Disaster Preparedness, Public Safety and Infrastructure), Series 2021-A, 5.00% 2030 | | | 2,250 | | | | 2,993 | |
| San Jose Unified School Dist., G.O. Bonds, Capital Appreciation Bonds, 2002 Election, Series 2006-C, National insured, 0% 2025 | | | 795 | | | | 776 | |
| San Jose Unified School Dist., G.O. Rev. Ref. Bonds, Series 2017, 5.00% 2022 | | | 500 | | | | 518 | |
| San Jose Unified School Dist., G.O. Rev. Ref. Bonds, Series 2017, 5.00% 2023 | | | 375 | | | | 406 | |
| San Jose Unified School Dist., G.O. Rev. Ref. Bonds, Series 2017, 5.00% 2024 | | | 500 | | | | 565 | |
| San Ramon Valley Unified School Dist., G.O. Bonds, 2012 Election, Series 2018, 5.00% 2024 | | | 1,000 | | | | 1,127 | |
| Santa Margarita Water Dist., Community Facs. Dist. No. 99-1 (Talega), Special Tax Rev. Ref. Bonds, Series 2014-B, 5.00% 2022 | | | 310 | | | | 322 | |
| Santa Margarita Water Dist., Community Facs. Dist. No. 99-1 (Talega), Special Tax Rev. Ref. Bonds, Series 2014-B, 5.00% 2024 | | | 530 | | | | 592 | |
| Santa Margarita Water Dist., Community Facs. Dist. No. 99-1 (Talega), Special Tax Rev. Ref. Bonds, Series 2014-B, 5.00% 2025 | | | 375 | | | | 418 | |
| Santa Monica-Malibu Unified School Dist., School Facs. Improvement Dist. No. 2 (Malibu Schools), G.O. Bonds, 2018 Election, Series 2021-B, 4.00% 2024 | | | 1,235 | | | | 1,361 | |
| Santa Monica-Malibu Unified School Dist., School Facs. Improvement Dist. No. 2 (Malibu Schools), G.O. Bonds, 2018 Election, Series 2021-B, 4.00% 2025 | | | 345 | | | | 391 | |
| Santa Monica-Malibu Unified School Dist., School Facs. Improvement Dist. No. 2 (Santa Monica Schools), G.O. Bonds, 2018 Election, Series 2021-B, 4.00% 2025 | | | 405 | | | | 459 | |
| Santa Rosa High School Dist., G.O. Bonds, 2014 Election, Series 2021-E, BAM insured, 4.00% 2027 | | | 500 | | | | 590 | |
| Santa Rosa High School Dist., G.O. Bonds, 2014 Election, Series 2021-E, BAM insured, 4.00% 2029 | | | 500 | | | | 609 | |
| Saugus Union School Dist., G.O. Rev. Ref. Bonds, Capital Appreciation Bonds, Series 2006, FGIC-National insured, 0% 2024 | | | 1,210 | | | | 1,187 | |
| Saugus Union School Dist., Saugus/Hart School Facs. Fin. Auth., Community Facs. Dist. No. 2006-1, Special Tax Rev. Bonds, Series 2016, 5.00% 2024 | | | 500 | | | | 558 | |
| Saugus Union School Dist., Saugus/Hart School Facs. Fin. Auth., Community Facs. Dist. No. 2006-1, Special Tax Rev. Bonds, Series 2016, 5.00% 2025 | | | 1,110 | | | | 1,275 | |
| School Fin. Auth., School Fac. Rev. Bonds (Granada Hills Charter Obligated Group), Series 2019, 4.00% 20272 | | | 740 | | | | 831 | |
| School Fin. Auth., School Fac. Rev. Bonds (Granada Hills Charter Obligated Group), Series 2019, 4.00% 20292 | | | 805 | | | | 894 | |
| School Fin. Auth., School Fac. Rev. Bonds (Granada Hills Charter Obligated Group), Series 2019, 5.00% 20312 | | | 875 | | | | 1,008 | |
| School Fin. Auth., School Fac. Rev. Bonds (Kipp LA Projects), Series 2017-A, 5.00% 20272 | | | 600 | | | | 719 | |
| School Fin. Auth., School Fac. Rev. Bonds (KIPP LA Projects), Series 2014-A, 4.125% 2024 | | | 940 | | | | 992 | |
| School Fin. Auth., School Fac. Rev. Bonds (KIPP LA Projects), Series 2017-A, 5.00% 20242 | | | 585 | | | | 648 | |
| School Fin. Auth., School Fac. Rev. Bonds (KIPP LA Projects), Series 2015-A, 3.625% 20252 | | | 600 | | | | 634 | |
| School Fin. Auth., School Fac. Rev. Bonds (KIPP LA Projects), Series 2017-A, 5.00% 20262 | | | 505 | | | | 591 | |
| School Fin. Auth., School Fac. Rev. Bonds (KIPP SoCal Projects), Series 2019-A, 5.00% 20222 | | | 200 | | | | 206 | |
| School Fin. Auth., School Fac. Rev. Bonds (KIPP SoCal Projects), Series 2019-A, 5.00% 20232 | | | 225 | | | | 241 | |
| School Fin. Auth., School Fac. Rev. Bonds (KIPP SoCal Projects), Series 2019-A, 5.00% 20242 | | | 130 | | | | 144 | |
| School Fin. Auth., School Fac. Rev. Bonds (KIPP SoCal Projects), Series 2020-A, 5.00% 20242 | | | 100 | | | | 111 | |
| | |
| Private Client Services Funds | 59 |
Capital Group California Core Municipal Fund
| Bonds, notes & other debt instruments (continued) | | Principal amount
(000) | | | Value
(000) | |
| California (continued) | | | | | | | | |
| School Fin. Auth., School Fac. Rev. Bonds (KIPP SoCal Projects), Series 2019-A, 5.00% 20252 | | $ | 150 | | | $ | 171 | |
| School Fin. Auth., School Fac. Rev. Bonds (KIPP SoCal Projects), Series 2020-A, 5.00% 20252 | | | 105 | | | | 120 | |
| School Fin. Auth., School Fac. Rev. Bonds (KIPP SoCal Projects), Series 2020-A, 5.00% 20262 | | | 110 | | | | 129 | |
| School Fin. Auth., School Fac. Rev. Bonds (KIPP SoCal Projects), Series 2019-A, 5.00% 20262 | | | 105 | | | | 123 | |
| School Fin. Auth., School Fac. Rev. Bonds (KIPP SoCal Projects), Series 2019-A, 5.00% 20272 | | | 220 | | | | 264 | |
| School Fin. Auth., School Fac. Rev. Bonds (KIPP SoCal Projects), Series 2020-A, 5.00% 20272 | | | 100 | | | | 120 | |
| School Fin. Auth., School Fac. Rev. Bonds (KIPP SoCal Projects), Series 2020-A, 5.00% 20282 | | | 100 | | | | 122 | |
| School Fin. Auth., School Fac. Rev. Bonds (KIPP SoCal Projects), Series 2020-A, 5.00% 20292 | | | 100 | | | | 124 | |
| School Fin. Auth., School Fac. Rev. Bonds (KIPP SoCal Projects), Series 2020-A, 5.00% 20302 | | | 100 | | | | 126 | |
| City of Seal Beach, Community Facs. Dist. No. 2005-1 (Pacific Gateway Business Center), Special Tax Rev. Ref. Bonds, Series 2016, 3.00% 2023 | | | 150 | | | | 155 | |
| City of Seal Beach, Community Facs. Dist. No. 2005-1 (Pacific Gateway Business Center), Special Tax Rev. Ref. Bonds, Series 2016, 3.00% 2024 | | | 145 | | | | 150 | |
| City of Seal Beach, Community Facs. Dist. No. 2005-1 (Pacific Gateway Business Center), Special Tax Rev. Ref. Bonds, Series 2016, 3.00% 2025 | | | 365 | | | | 378 | |
| City of Seal Beach, Community Facs. Dist. No. 2005-1 (Pacific Gateway Business Center), Special Tax Rev. Ref. Bonds, Series 2016, 3.00% 2026 | | | 150 | | | | 155 | |
| City of Signal Hill, Successor Agcy. to the Redev. Agcy., Tax Allocation Rev. Ref. Bonds, Series 2015-A, BAM insured, 5.00% 2023 | | | 500 | | | | 544 | |
| Silicon Valley Clean Water, Wastewater Rev. Notes, Series 2019-A, 3.00% 2024 | | | 4,065 | | | | 4,259 | |
| Silicon Valley Clean Water, Wastewater Rev. Notes, Series 2021-B, 0.50% 2026 | | | 5,040 | | | | 4,998 | |
| Solano Community College Dist., G.O. Bonds, 2015 Election, Series 2013-A, 4.375% 2047 (preref. 2023) | | | 595 | | | | 638 | |
| South Placer Wastewater Auth., Wastewater Rev. Ref. Bonds, Series 2020, 5.00% 2031 | | | 2,885 | | | | 3,825 | |
| South Placer Wastewater Auth., Wastewater Rev. Ref. Bonds, Series 2020, 5.00% 2032 | | | 500 | | | | 675 | |
| Southern California Public Power Auth., Rev. Ref. Bonds (Magnolia Power Project A), Series 2020-1, 5.00% 2027 | | | 1,100 | | | | 1,362 | |
| Southern California Public Power Auth., Rev. Ref. Green Bonds (Milford Wind Corridor Phase II Project), Series 2021-1, 5.00% 2026 | | | 200 | | | | 241 | |
| Southern California Public Power Auth., Rev. Ref. Green Bonds (Milford Wind Corridor Phase II Project), Series 2021-1, 5.00% 2027 | | | 400 | | | | 495 | |
| Stanislaus Union School Dist., G.O. Rev. Ref. Bonds, Series 2019, BAM insured, 5.00% 2025 | | | 500 | | | | 582 | |
| Statewide Communities Dev. Auth., Multi Family Housing Rev. Bonds (Harriet Tubman Terrace Apartments), Series 2021-Q, 0.24% 2024 (put 2023) | | | 7,000 | | | | 6,990 | |
| Statewide Communities Dev. Auth., Multi Family Housing Rev. Bonds (Washington Court Apartments), Series 2021-E, 0.22% 2023 (put 2022) | | | 5,000 | | | | 4,998 | |
| Statewide Communities Dev. Auth., Rev. Bonds (Adventist Health System/West), Series 2015-A, 5.00% 2025 | | | 750 | | | | 862 | |
| Statewide Communities Dev. Auth., Rev. Bonds (Adventist Health System/West), Series 2015-A, 5.00% 2028 | | | 2,085 | | | | 2,447 | |
| Statewide Communities Dev. Auth., Rev. Bonds (Adventist Health System/West), Series 2018-A, 5.00% 2034 | | | 975 | | | | 1,184 | |
| Statewide Communities Dev. Auth., Rev. Bonds (American Baptist Homes of the West), Series 2015, 5.00% 2023 | | | 1,110 | | | | 1,203 | |
| Statewide Communities Dev. Auth., Rev. Bonds (Cottage Health System Obligated Group), Series 2015, 5.00% 2043 (preref. 2024) | | | 5,000 | | | | 5,694 | |
| Statewide Communities Dev. Auth., Rev. Bonds (Henry Mayo Newhall Memorial Hospital), Series 2014, Assured Guaranty Municipal insured, 5.00% 2022 | | | 750 | | | | 782 | |
| Statewide Communities Dev. Auth., Rev. Bonds (Jewish Home of San Francisco), Series 2016, 5.00% 2026 | | | 575 | | | | 693 | |
| Statewide Communities Dev. Auth., Rev. Bonds (Viamonte Senior Living 1 Project), Series 2018-B, 3.00% 2025 | | | 310 | | | | 311 | |
| Statewide Communities Dev. Auth., Rev. Ref. Bonds (Episcopal Communities and Services), Series 2012, 5.00% 2024 | | | 300 | | | | 307 | |
| Statewide Communities Dev. Auth., Rev. Ref. Bonds (Huntington Memorial Hospital), Series 2014-B, 5.00% 2026 | | | 200 | | | | 224 | |
| Statewide Communities Dev. Auth., Rev. Ref. Bonds (Methodist Hospital of Southern California), Series 2018, 5.00% 2023 | | | 500 | | | | 526 | |
| Statewide Communities Dev. Auth., Rev. Ref. Bonds (Methodist Hospital of Southern California), Series 2018, 5.00% 2024 | | | 390 | | | | 427 | |
| Statewide Communities Dev. Auth., Rev. Ref. Bonds (Rady Children’s Hospital), Series 2016-B, 5.00% 2028 | | | 860 | | | | 1,081 | |
| Statewide Communities Dev. Auth., Student Housing Rev. Bonds (University of California, Irvine East Campus Apartments, Phase I Ref. and Phase IV-B CHF-Irvine, LLC), Series 2021, BAM insured, 5.00% 2031 | | | 3,000 | | | | 3,958 | |
| Statewide Communities Dev. Auth., Student Housing Rev. Bonds (University of California, Irvine East Campus Apartments, Phase I Ref. and Phase IV-B CHF-Irvine, LLC), Series 2021, BAM insured, 5.00% 2032 | | | 3,500 | | | | 4,588 | |
| Statewide Communities Dev. Auth., Student Housing Rev. Ref. Bonds (CHF-Irvine, LLC - University of California, Irvine East Campus Apartments), Series 2016, 5.00% 2022 | | | 1,000 | | | | 1,026 | |
| Stockton Unified School Dist., G.O. Bonds, 2012 Election, Series 2018-C, BAM insured, 5.00% 2030 | | | 2,145 | | | | 2,681 | |
| City of Suisun, Successor Agcy. to the Redev. Agcy., Tax Allocation Rev. Ref. Bonds, Series 2014-B, BAM insured, 5.00% 2022 | | | 400 | | | | 417 | |
| | |
| 60 | Private Client Services Funds |
Capital Group California Core Municipal Fund
| Bonds, notes & other debt instruments (continued) | | Principal amount
(000) | | | Value
(000) | |
| California (continued) | | | | | | | | |
| Sweetwater Union High School Dist., G.O. Bonds, 2006 Election, Series 2006, 4.00% 2026 | | $ | 515 | | | $ | 573 | |
| Sweetwater Union High School Dist., G.O. Rev. Ref. Bonds, Series 2014, BAM insured, 5.00% 2025 | | | 1,715 | | | | 1,918 | |
| Sweetwater Union High School Dist., G.O. Rev. Ref. Bonds, Series 2014, BAM insured, 5.00% 2026 | | | 6,000 | | | | 6,691 | |
| Tobacco Securitization Auth. of Northern California, Tobacco Settlement Asset-Backed Rev. Ref. Senior Bonds (Sacramento County Tobacco Securitization Corp.), Series 2021-A-1, 5.00% 2024 | | | 1,250 | | | | 1,391 | |
| Tobacco Securitization Auth. of Southern California, Tobacco Settlement Asset-Backed Rev. Ref. Bonds (San Diego County Tobacco Asset Securitization Corp.), Series 2019-A, 5.00% 2025 | | | 1,000 | | | | 1,151 | |
| City of Tracy, Successor Agcy. to the Community Dev. Agcy., Tax Allocation Rev. Ref. Bonds, Series 2016, Assured Guaranty Municipal insured, 5.00% 2030 | | | 545 | | | | 628 | |
| Transbay Joint Powers Auth., Senior Tax Allocation Green Bonds, Series 2020-A, 5.00% 2027 | | | 600 | | | | 737 | |
| Transbay Joint Powers Auth., Senior Tax Allocation Green Bonds, Series 2020-A, 5.00% 2028 | | | 700 | | | | 879 | |
| Transbay Joint Powers Auth., Senior Tax Allocation Green Bonds, Series 2020-A, 5.00% 2029 | | | 660 | | | | 845 | |
| Transbay Joint Powers Auth., Senior Tax Allocation Green Bonds, Series 2020-A, 5.00% 2030 | | | 300 | | | | 386 | |
| City of Tustin, Community Facs. Dist. No. 06-1 (Tustin Legacy/Columbus Villages), Special Tax Rev. Ref. Bonds, Series 2015-A, 5.00% 2024 | | | 860 | | | | 973 | |
| Tustin Unified School Dist., Community Facs. Dist. No. 88-1, Special Tax Rev. Ref. Bonds, Series 2015, BAM insured, 5.00% 2022 | | | 830 | | | | 862 | |
| Twin Rivers Unified School Dist., G.O. Rev. Ref. Bonds, Series 2016-B, Assured Guaranty Municipal insured, 5.00% 2024 | | | 400 | | | | 447 | |
| Ukiah Unified School Dist., G.O. Bonds, Capital Appreciation Bonds, 2005 Election, Series 2006, National insured, 0% 2022 | | | 175 | | | | 174 | |
| Ukiah Unified School Dist., G.O. Bonds, Capital Appreciation Bonds, 2005 Election, Series 2006, MBIA insured, 0% 2023 | | | 1,500 | | | | 1,486 | |
| Union City, Successor Agcy. to the Redev. Agcy., Tax Allocation Rev. Ref. Redev. Bonds, Series 2015-A, 5.00% 2023 | | | 375 | | | | 409 | |
| Regents of the University of California, G.O. Rev. Bonds, Series 2013-AK, 5.00% 2048 (put 2023) | | | 2,000 | | | | 2,146 | |
| Regents of the University of California, Limited Project Rev. Bonds, Series 2022-S, 5.00% 2031 | | | 1,150 | | | | 1,511 | |
| Val Verde Unified School Dist., G.O. Rev. Ref. Bonds, Series 2016-A, Assured Guaranty Municipal insured, 4.00% 2023 | | | 600 | | | | 637 | |
| Dept. of Veterans Affairs, Home Purchase Rev. Bonds, Series 2016-B, 3.50% 2045 | | | 1,055 | | | | 1,111 | |
| Dept. of Veterans Affairs, Home Purchase Rev. Bonds, Series 2019-A, 4.00% 2049 | | | 2,810 | | | | 3,060 | |
| Dept. of Veterans Affairs, Home Purchase Rev. Bonds, Series 2020-A, 3.00% 2050 | | | 4,975 | | | | 5,339 | |
| Dept. of Veterans Affairs, Veterans G.O. Bonds, Series 2017-CQ, 4.00% 2047 | | | 1,380 | | | | 1,481 | |
| Dept. of Veterans Affairs, Veterans G.O. Bonds, Series 2018-CR, 4.00% 2048 | | | 4,770 | | | | 5,164 | |
| Dept. of Veterans Affairs, Veterans G.O. Bonds, Series 2019-CS, 4.00% 2049 | | | 2,675 | | | | 2,908 | |
| Dept. of Veterans Affairs, Veterans G.O. Bonds, Series 2020-CT, 3.00% 2050 | | | 4,980 | | | | 5,345 | |
| Dept. of Veterans Affairs, Veterans G.O. Rev. Ref. Bonds, Series 2016-CN, 3.50% 2045 | | | 680 | | | | 710 | |
| Victor Valley Union High School Dist., G.O. Rev. Ref. Bonds, Series 2016-B, Assured Guaranty Municipal insured, 4.00% 2024 | | | 730 | | | | 801 | |
| Victor Valley Union High School Dist., G.O. Rev. Ref. Bonds, Series 2016-B, Assured Guaranty Municipal insured, 4.00% 2026 | | | 270 | | | | 311 | |
| City of Vista, Successor Agcy. to the Redev. Agcy., Tax Allocation Rev. Ref. Redev. Bonds, Series 2015-B-1, Assured Guaranty Municipal insured, 5.00% 2022 | | | 340 | | | | 353 | |
| City of Vista, Successor Agcy. to the Redev. Agcy., Tax Allocation Rev. Ref. Redev. Bonds, Series 2015-B-1, Assured Guaranty Municipal insured, 4.00% 2025 | | | 400 | | | | 451 | |
| West Basin Municipal Water Dist., Rev. Ref. Bonds, Series 2021-A, 5.00% 2030 | | | 1,065 | | | | 1,408 | |
| West Basin Municipal Water Dist., Rev. Ref. Bonds, Series 2021-A, 5.00% 2031 | | | 745 | | | | 1,006 | |
| West Contra Costa Unified School Dist., G.O. Bonds, 2010 Election, Series 2020-F, Assured Guaranty Municipal insured, 4.00% 2028 | | | 600 | | | | 715 | |
| West Contra Costa Unified School Dist., G.O. Bonds, 2012 Election, Series 2020-E, Assured Guaranty Municipal insured, 4.00% 2030 | | | 900 | | | | 1,098 | |
| West Contra Costa Unified School Dist., G.O. Rev. Ref. Bonds, 2005 Election, Series 2008-B, 6.00% 2027 | | | 3,000 | | | | 3,846 | |
| West Kern Community College Dist., G.O. Rev. Ref. Bonds, Series 2019, BAM insured, 4.00% 2032 | | | 2,700 | | | | 3,217 | |
| Westminster School Dist., G.O. Bonds, Capital Appreciation Bonds, 2008 Election, Series 2009-A-1, Assured Guaranty insured, 0% 2023 | | | 1,000 | | | | 994 | |
| Whittier City School Dist., G.O. Rev. Ref. Bonds, Series 2016, 4.00% 2030 | | | 825 | | | | 941 | |
| City of Woodland, Community Facs. Dist. No. 2004-1 (Spring Lake), Special Tax Capital Projects Bonds, Series 2021, Assured Guaranty Municipal insured, 4.00% 2029 | | | 215 | | | | 258 | |
| | |
| Private Client Services Funds | 61 |
Capital Group California Core Municipal Fund
| Bonds, notes & other debt instruments (continued) | | Principal amount
(000) | | | Value
(000) | |
| California (continued) | | | | | | | | |
| City of Woodland, Community Facs. Dist. No. 2004-1 (Spring Lake), Special Tax Capital Projects Bonds, Series 2021, Assured Guaranty Municipal insured, 4.00% 2030 | | $ | 235 | | | $ | 280 | |
| City of Woodland, Community Facs. Dist. No. 2004-1 (Spring Lake), Special Tax Capital Projects Bonds, Series 2021, Assured Guaranty Municipal insured, 4.00% 2031 | | | 260 | | | | 309 | |
| Yosemite Community College Dist., G.O. Bonds, Capital Appreciation Bonds, 2004 Election, Series 2010-D, 0% 2031 | | | 500 | | | | 428 | |
| | | | | | | | 559,873 | |
| | | | | | | | | |
| Missouri 0.02% | | | | | | | | |
| Housing Dev. Commission, Single Family Mortgage Rev. Bonds (Special Homeownership Loan Program), Series 2015-A, 3.75% 2038 | | | 95 | | | | 101 | |
| | | | | | | | | |
| Texas 0.08% | | | | | | | | |
| County of Tarrant, Cultural Education Facs. Fin. Corp., Rev. Ref. Bonds (Christus Health), Series 2018-A, 5.00% 2024 | | | 500 | | | | 558 | |
| | | | | | | | | |
| United States 0.49% | | | | | | | | |
| Freddie Mac, Multi Family Mortgage Bonds, Series 2019-ML-05, Class ACA, 3.35% 2033 | | | 2,911 | | | | 3,242 | |
| | | | | | | | | |
| Total bonds, notes & other debt instruments (cost: $553,137,000) | | | | | | | 563,774 | |
| | | | | | | | | |
| Short-term securities 13.64% | | | | | | | | |
| Municipals 13.64% | | | | | | | | |
| State of California, Fin. Auth., Recovery Zone Fac. Bonds (Chevron U.S.A., Inc. Project), Series 2010-A, 0.02% 20351 | | | 15,765 | | | | 15,765 | |
| State of California, Fin. Auth., Recovery Zone Fac. Bonds (Chevron U.S.A., Inc. Project), Series 2010-B, 0.02% 20351 | | | 4,000 | | | | 4,000 | |
| State of California, Irvine Ranch Water Dist. Nos. 105, 140, 240 and 250, Consolidated G.O. Bonds, Series 1993, 0.01% 20331 | | | 5,700 | | | | 5,700 | |
| State of California, Kern Community College Dist., Facs. Improvement Dist. No. 1, G.O. Bond Anticipation Notes, Capital Appreciation Notes, Series 2020, 0% 2023 | | | 2,000 | | | | 1,990 | |
| State of California, City of Los Angeles, Dept. of Water and Power, Power System Demand Rev. Bonds, Series 2002-A-2, 0.01% 20351 | | | 7,500 | | | | 7,500 | |
| State of California, City of Los Angeles, Dept. of Water and Power, Power System Demand Rev. Bonds, Series 2002-A-1, 0.01% 20351 | | | 2,500 | | | | 2,500 | |
| State of California, City of Los Angeles, Dept. of Water and Power, Rev. Bonds, Series 2021-A-1, 0.02% 20501 | | | 8,500 | | | | 8,500 | |
| State of California, City of Los Angeles, Dept. of Water and Power, Water System Bonds, Series 2019-A, 0.01% 20491 | | | 5,200 | | | | 5,200 | |
| State of California, County of Los Angeles, Schools Pooled Fncg. Program, Certs. of Parts., Series 2021-B, 2.00% 12/30/2021 | | | 6,000 | | | | 6,018 | |
| State of California, Metropolitan Water Dist. of Southern California, Water Rev. Ref. Bonds, Series 2016-B-2, 0.02% 20371 | | | 3,605 | | | | 3,605 | |
| State of California, Metropolitan Water Dist. of Southern California, Water Rev. Ref. Bonds, Series 2016-B-1, 0.02% 20371 | | | 750 | | | | 750 | |
| State of California, Municipal Fin. Auth., Pollution Control Rev. Ref. Bonds (Chevron U.S.A., Inc. Project), Series 2005, 0.02% 20251 | | | 3,000 | | | | 3,000 | |
| State of California, County of Riverside, Tax and Rev. Anticipation Notes, Series 2021, 2.00% 6/30/2022 | | | 5,000 | | | | 5,063 | |
| State of California, Statewide Communities Dev. Auth., Pollution Control Rev. Ref. Bonds (Chevron U.S.A., Inc. Project), Series 2002, 0.02% 20241 | | | 2,435 | | | | 2,435 | |
| State of California, City of Stockton, Public Fncg. Auth., Wastewater Bond Anticipation Notes, Series 2019, 1.40% 6/1/2022 | | | 4,525 | | | | 4,527 | |
| State of California, Regents of the University of California, General Rev. Bonds, Series 2013-AL-4, 0.01% 20481 | | | 11,295 | | | | 11,295 | |
| State of California, Regents of the University of California, Medical Center Pooled Rev. Bonds, Series 2007-B-1, 0.02% 20321 | | | 2,755 | | | | 2,755 | |
| | | | | | | | | |
| Total short-term securities (cost: $90,579,000) | | | | | | | 90,603 | |
| Total investment securities 98.53% (cost: $643,716,000) | | | | | | | 654,377 | |
| Other assets less liabilities 1.47% | | | | | | | 9,753 | |
| | | | | | | | | |
| Net assets 100.00% | | | | | | $ | 664,130 | |
| | |
| 62 | Private Client Services Funds |
Capital Group California Core Municipal Fund
| Futures contracts | | | | | | | | | | | | | | | |
| | | | | | | | | | | | | | | | |
| Contracts | | Type | | Number of
contracts | | Expiration | | Notional
amount
(000) | 3
| | Value at
10/31/2021
(000) | 4
| | Unrealized
appreciation
at 10/31/2021
(000) | |
| 10 Year U.S. Treasury Note Futures | | Short | | 63 | | December 2021 | | $ | (6,300 | ) | | $ | (8,234 | ) | | $ | 94 | |
| | |
| 1 | Coupon rate may change periodically. Reference rate and spread are as of the most recent information available. Some coupon rates are determined by the issuer or agent based on current market conditions; therefore, the reference rate and spread are not available. For short-term securities, the date of the next scheduled coupon rate change is considered to be the maturity date. |
| 2 | Acquired in a transaction exempt from registration under Rule 144A of the Securities Act of 1933. May be resold in the U.S. in transactions exempt from registration, normally to qualified institutional buyers. The total value of all such securities was $7,326,000, which represented 1.10% of the net assets of the fund. |
| 3 | Notional amount is calculated based on the number of contracts and notional contract size. |
| 4 | Value is calculated based on the notional amount and current market price. |
Key to abbreviations and symbol
Agcy. = Agency
AMT = Alternative Minimum Tax
Auth. = Authority
Certs. = Certificates
Dept. = Department
Dev. = Development
Dist. = District
Econ. = Economic
Fac. = Facility
Facs. = Facilities
Fin. = Finance
Fncg. = Financing
G.O. = General Obligation
IAM = Interest at Maturity
LIBOR = London Interbank Offered Rate
LOC = Letter of Credit
Part. = Participation
Preref. = Prerefunded
Redev. = Redevelopment
Ref. = Refunding
Rev. = Revenue
SIFMA = Securities Industry and Financial Markets Association
USD/$ = U.S. dollars
| Private Client Services Funds | 63 |
Capital Group California Short-Term Municipal Fund
Investment portfolio October 31, 2021
| Portfolio quality summary* | Percent of net assets |

| * | Bond ratings, which typically range from AAA/Aaa (highest) to D (lowest), are assigned by credit rating agencies such as Standard & Poor’s, Moody’s and/or Fitch as an indication of an issuer’s creditworthiness. In assigning a credit rating to a security, the fund looks specifically to the ratings assigned to the issuer of the security by Standard & Poor’s, Moody’s and/or Fitch. If agency ratings differ, the security will be considered to have received the highest of those ratings, consistent with the fund’s investment policies. The ratings are not covered by the Report of Independent Registered Public Accounting Firm. |
| Bonds, notes & other debt instruments 85.57% | | Principal amount
(000) | | | Value
(000) | |
| California 85.57% | | | | | | |
| City of Alhambra, Rev. Ref. Bonds (Atherton Baptist Homes Project), Series 2016, 5.00% 2023 | | $ | 450 | | | $ | 474 | |
| Alvord Unified School Dist., G.O. Rev. Ref. Bonds, Series 2018, Assured Guaranty Municipal insured, 5.00% 2022 | | | 500 | | | | 518 | |
| City of Anaheim, Housing and Public Improvements Auth., Rev. Bonds (Electric Utility Distribution System Improvements), Series 2020-A, 5.00% 2022 | | | 230 | | | | 240 | |
| City of Anaheim, Housing and Public Improvements Auth., Rev. Bonds (Electric Utility Distribution System Improvements), Series 2020-A, 5.00% 2023 | | | 200 | | | | 218 | |
| Assn. of Bay Area Governments, Fin. Auth. for Nonprofit Corps., Rev. Ref. Bonds (Sharp HealthCare), Series 2012-A, 5.00% 2023 (preref. 2022) | | | 1,640 | | | | 1,660 | |
| Bay Area Toll Auth., San Francisco Bay Area Toll Bridge Rev. Bonds, Series 2013-S-4, 5.00% 2043 (preref. 2023) | | | 1,525 | | | | 1,629 | |
| Bay Area Toll Auth., San Francisco Bay Area Toll Bridge Rev. Bonds, Series 2021-A, 2.00% 2056 (put 2028) | | | 1,000 | | | | 1,055 | |
| Bay Area Toll Auth., San Francisco Bay Area Toll Bridge Rev. Ref. Bonds, Series 2017-S-7, 5.00% 2024 | | | 1,000 | | | | 1,112 | |
| Bay Area Toll Auth., San Francisco Bay Area Toll Bridge Rev. Ref. Bonds, Series 2012-F-1, 5.00% 2031 (preref. 2022) | | | 1,365 | | | | 1,392 | |
| City of Beaumont, Wastewater Rev. Bonds, Series 2018-A, Assured Guaranty Municipal insured, 5.00% 2022 | | | 225 | | | | 234 | |
| City of Burbank, Successor Agcy. to the Redev. Agcy., Tax Allocation Rev. Ref. Redev. Bonds, Series 2015, BAM insured, 5.00% 2022 | | | 500 | | | | 526 | |
| Burlingame Elementary School Dist., G.O. Bonds, 2020 Election, Series A, 3.00% 2022 | | | 600 | | | | 613 | |
| Trustees of the California State University, Systemwide Rev. Bonds, Series 2018-A, 5.00% 2023 | | | 1,045 | | | | 1,144 | |
| Trustees of the California State University, Systemwide Rev. Bonds, Series 2013-A, 5.00% 2023 | | | 400 | | | | 438 | |
| Trustees of the California State University, Systemwide Rev. Bonds, Series 2020-A, 5.00% 2024 | | | 800 | | | | 911 | |
| Trustees of the California State University, Systemwide Rev. Bonds, Series 2016-B-3, 4.00% 2051 (put 2023) | | | 1,650 | | | | 1,740 | |
| Chino Basin Regional Fin. Auth., Rev. Notes (Inland Empire Utilities Interim Fncg.), Series 2020-B, 4.00% 2025 | | | 1,500 | | | | 1,695 | |
| Coast Community College Dist., G.O. Bonds, Capital Appreciation Bonds, Series 2006-B, Assured Guaranty insured, 0% 2026 | | | 1,205 | | | | 1,157 | |
| Compton Unified School Dist., G.O. Bonds, 2015 Election, Series 2019-B, BAM insured, 4.00% 2022 | | | 1,350 | | | | 1,379 | |
| Compton Unified School Dist., G.O. Bonds, 2015 Election, Series 2019-B, BAM insured, 5.00% 2025 | | | 125 | | | | 144 | |
| Compton Unified School Dist., G.O. Bonds, 2015 Election, Series 2019-B, BAM insured, 5.00% 2027 | | | 500 | | | | 609 | |
| Del Mar Union School Dist., Community Facs. Dist. No. 99-1, Special Tax Bonds, Series 2019, 4.00% 2024 | | | 400 | | | | 435 | |
| Del Mar Union School Dist., Community Facs. Dist. No. 99-1, Special Tax Bonds, Series 2019, 4.00% 2025 | | | 410 | | | | 456 | |
| East Side Union High School Dist., G.O. Rev. Ref. Bonds, Series 2020, BAM insured, 5.00% 2025 | | | 845 | | | | 990 | |
| Eastern Municipal Water Dist., Community Facs. Dist. No. 2017-79 (Eagle Crest), Special Tax Bonds, Series 2021, 4.00% 2023 | | | 255 | | | | 271 | |
| Eastern Municipal Water Dist., Community Facs. Dist. No. 2017-79 (Eagle Crest), Special Tax Bonds, Series 2021, 4.00% 2025 | | | 275 | | | | 304 | |
| Eastern Municipal Water Dist., Community Facs. Dist. No. 2017-79 (Eagle Crest), Special Tax Bonds, Series 2021, 4.00% 2026 | | | 285 | | | | 319 | |
| Eastern Municipal Water Dist., Fin. Auth., Water and Wastewater Rev. Ref. Bonds, Series 2020-A, 5.00% 2024 | | | 225 | | | | 253 | |
| Eastern Municipal Water Dist., Fin. Auth., Water and Wastewater Rev. Ref. Bonds, Series 2020-A, 5.00% 2026 | | | 300 | | | | 361 | |
| Educational Facs. Auth., Rev. Bonds (Chapman University), Series 2021-A, 5.00% 2025 | | | 425 | | | | 490 | |
| County of El Dorado, Community Facs. Dist. No. 1992-1 (El Dorado Hills Dev.), Special Tax Rev. Ref. Bonds, Series 2012, 5.00% 2022 | | | 845 | | | | 879 | |
| | | | | | | | | |
| 64 | Private Client Services Funds |
Capital Group California Short-Term Municipal Fund
| Bonds, notes & other debt instruments (continued) | | Principal amount
(000) | | | Value
(000) | |
| California (continued) | | | | | | |
| Fowler Unified School Dist., G.O. Rev. Ref. Bonds, Series 2014, Assured Guaranty Municipal insured, 4.00% 2024 | | $ | 745 | | | $ | 817 | |
| County of Fresno, Central Unified School Dist., G.O. Bonds, 2020 Election, Series 2021-A, 4.00% 2024 | | | 395 | | | | 435 | |
| Fresno Joint Powers Fin. Auth., Rev. Ref. Bonds (Master Lease Projects), Series 2017-A, Assured Guaranty Municipal insured, 5.00% 2022 | | | 1,350 | | | | 1,375 | |
| G.O. Bonds, Series 2021, 5.00% 2027 | | | 1,475 | | | | 1,829 | |
| G.O. Bonds, Series 2013-E, (SIFMA Municipal Swap Index + 0.43%) 0.48% 2029 (put 2023)1 | | | 500 | | | | 501 | |
| Glendale Community College Dist., G.O. Rev. Ref. Bonds, 2016 Election, Series 2020-B, 4.00% 2023 | | | 500 | | | | 533 | |
| Glendale Unified School Dist., G.O. Bonds, 2011 Election, Series 2020-E, 4.00% 2024 | | | 475 | | | | 524 | |
| Golden State Tobacco Securitization Corp., Enhanced Tobacco Settlement Asset-Backed Bonds, Series 2017A-1, 5.00% 2022 | | | 1,500 | | | | 1,539 | |
| Golden State Tobacco Securitization Corp., Enhanced Tobacco Settlement Asset-Backed Bonds, Series 2018-A, 5.00% 2022 (escrowed to maturity) | | | 1,000 | | | | 1,028 | |
| Health Facs. Fncg. Auth., Rev. Bonds (Adventist Health System/West), Series 2013-A, 5.00% 2024 | | | 410 | | | | 436 | |
| Health Facs. Fncg. Auth., Rev. Bonds (El Camino Hospital), Series 2017, 5.00% 2025 | | | 400 | | | | 466 | |
| Health Facs. Fncg. Auth., Rev. Bonds (Kaiser Permanente), Series 2017-B, 5.00% 2029 (put 2022) | | | 1,000 | | | | 1,048 | |
| Health Facs. Fncg. Auth., Rev. Bonds (Providence St. Joseph Health), Series 2016-A, 5.00% 2022 | | | 300 | | | | 313 | |
| Health Facs. Fncg. Auth., Rev. Bonds (Providence St. Joseph Health), Series 2016-B-3, 2.00% 2036 (put 2025) | | | 1,000 | | | | 1,057 | |
| Health Facs. Fncg. Auth., Rev. Bonds (Providence St. Joseph Health), Series 2016-B-2, 4.00% 2036 (put 2024) | | | 110 | | | | 122 | |
| Health Facs. Fncg. Auth., Rev. Bonds (Stanford Health Care), Series 2021-A, 3.00% 2054 (put 2025) | | | 1,475 | | | | 1,610 | |
| Health Facs. Fncg. Auth., Rev. Bonds (Sutter Health), Series 2016-A, 5.00% 2022 (escrowed to maturity) | | | 200 | | | | 210 | |
| Health Facs. Fncg. Auth., Rev. Bonds (Sutter Health), Series 2018-A, 5.00% 2023 | | | 1,275 | | | | 1,396 | |
| Health Facs. Fncg. Auth., Rev. Bonds (Sutter Health), Series 2018-A, 5.00% 2025 | | | 400 | | | | 470 | |
| Health Facs. Fncg. Auth., Rev. Bonds (Sutter Health), Series 2016-A, 5.00% 2026 (preref. 2025) | | | 275 | | | | 325 | |
| Health Facs. Fncg. Auth., Rev. Bonds (Sutter Health), Series 2016-A, 5.00% 2046 (preref. 2025) | | | 250 | | | | 296 | |
| Health Facs. Fncg. Auth., Rev. Green Bonds (Kaiser Permanente), Series 2017-C, 5.00% 2031 (put 2022) | | | 1,150 | | | | 1,205 | |
| Health Facs. Fncg. Auth., Rev. Ref. Bonds (Adventist Health System/West), Series 2016-A, 4.00% 2022 | | | 300 | | | | 304 | |
| Health Facs. Fncg. Auth., Rev. Ref. Bonds (Lucile Salter Packard Children’s Hospital at Stanford), Series 2022-A, 5.00% 2024 | | | 680 | | | | 737 | |
| Health Facs. Fncg. Auth., Rev. Ref. Bonds (St. Joseph Health System), Series 2009-D, 1.70% 2033 (put 2022) | | | 750 | | | | 761 | |
| Health Facs. Fncg. Auth., Rev. Ref. Bonds (St. Joseph Health System), Series 2009-C, 5.00% 2034 (put 2022) | | | 1,200 | | | | 1,255 | |
| Health Facs. Fncg. Auth., Rev. Ref. Bonds (Stanford Hospital and Clinics), Series 2008-A-3, 5.50% 2040 (preref. 2021) | | | 1,500 | | | | 1,503 | |
| Health Facs. Fncg. Auth., Rev. Ref. Bonds (Sutter Health), Series 2016-B, 5.00% 2026 | | | 700 | | | | 847 | |
| Hemet Unified School Dist., G.O. Rev. Ref. Bonds, Series 2014, Assured Guaranty Municipal insured, 4.00% 2024 | | | 500 | | | | 549 | |
| Infrastructure and Econ. Dev. Bank, Rev. Bonds (Stanford Consortium Project), Series 2016-A, 5.00% 2022 | | | 265 | | | | 272 | |
| Infrastructure and Econ. Dev. Bank, Rev. Ref. Bonds (Segerstrom Center for the Arts), Series 2016-B, 5.00% 2023 | | | 1,000 | | | | 1,075 | |
| Infrastructure and Econ. Dev. Bank, Rev. Ref. Bonds (The Broad), Series 2021-A, 5.00% 2026 | | | 585 | | | | 702 | |
| City of Irvine, Reassessment Dist. No. 12-1, Limited Obligation Improvement Bonds, Series 2015, 5.00% 2024 | | | 965 | | | | 1,093 | |
| County of Kern, Water Agcy., Improvement Dist. No. 4, Water Rev. Ref. Bonds, Series 2016-A, Assured Guaranty Municipal insured, 5.00% 2023 | | | 800 | | | | 857 | |
| Kern Community College Dist., Facs. Improvement Dist. No. 1, G.O. Bonds, 2016 Election, Series 2020-C, 4.00% 2026 | | | 645 | | | | 745 | |
| Kings Canyon Joint Unified School Dist., G.O. Rev. Ref. Bonds, Series 2016, Assured Guaranty Municipal insured, 5.00% 2022 | | | 470 | | | | 487 | |
| La Canada Unified School Dist., G.O. Bonds, 2017 Election, Series 2020-B, 4.00% 2022 | | | 270 | | | | 278 | |
| La Canada Unified School Dist., G.O. Bonds, 2017 Election, Series 2020-B, 4.00% 2023 | | | 260 | | | | 277 | |
| La Canada Unified School Dist., G.O. Bonds, 2017 Election, Series 2020-B, 4.00% 2024 | | | 425 | | | | 468 | |
| Lake Elsinore Facs. Fin. Auth., Local Agcy. Rev. Ref. Bonds, Series 2021-B, Assured Guaranty Municipal insured, 4.00% 2026 | | | 195 | | | | 224 | |
| Lake Elsinore Facs. Fin. Auth., Local Agcy. Rev. Ref. Bonds, Series 2021-B, Assured Guaranty Municipal insured, 4.00% 2027 | | | 210 | | | | 245 | |
| Los Altos Union High School Dist., G.O. Bonds, Capital Appreciation Bonds, Series 1997-C, National insured, 0% 2022 | | | 460 | | | | 460 | |
| City of Los Angeles, Dept. of Water and Power, Power System Rev. Bonds, Series 2021-B, 3.00% 2022 | | | 1,000 | | | | 1,019 | |
| City of Los Angeles, Dept. of Water and Power, Power System Rev. Bonds, Series 2013-A, 5.00% 2022 | | | 590 | | | | 609 | |
| City of Los Angeles, Dept. of Water and Power, Power System Rev. Bonds, Series 2014-D, 4.00% 2023 | | | 500 | | | | 531 | |
| City of Los Angeles, Dept. of Water and Power, Power System Rev. Bonds, Series 2019-B, 5.00% 2023 | | | 1,000 | | | | 1,079 | |
| City of Los Angeles, Dept. of Water and Power, Power System Rev. Bonds, Series 2014-B, 5.00% 2023 | | | 825 | | | | 891 | |
| City of Los Angeles, Dept. of Water and Power, Power System Rev. Bonds, Series 2016-B, 5.00% 2024 | | | 800 | | | | 900 | |
| City of Los Angeles, Dept. of Water and Power, Water System Rev. Bonds, Series 2020-A, 5.00% 2025 | | | 500 | | | | 583 | |
| City of Los Angeles, Dept. of Water and Power, Water System Rev. Bonds, Series 2020-A, 5.00% 2026 | | | 300 | | | | 361 | |
| City of Los Angeles, Solid Waste Resources Rev. Bonds, Series 2013-A, 2.00% 2023 | | | 500 | | | | 511 | |
| | | | | | | | | |
| Private Client Services Funds | 65 |
Capital Group California Short-Term Municipal Fund
| Bonds, notes & other debt instruments (continued) | | Principal amount
(000) | | | Value
(000) | |
| California (continued) | | | | | | |
| County of Los Angeles, Metropolitan Transportation Auth., Measure R Sales Tax Rev. Ref. Green Bonds, Series 2020-A, 5.00% 2024 | | $ | 1,000 | | | $ | 1,122 | |
| County of Los Angeles, Metropolitan Transportation Auth., Measure R Sales Tax Rev. Ref. Green Bonds, Series 2020-A, 5.00% 2025 | | | 1,500 | | | | 1,745 | |
| County of Los Angeles, Metropolitan Transportation Auth., Measure R Sales Tax Rev. Ref. Green Bonds, Series 2020-A, 5.00% 2026 | | | 400 | | | | 481 | |
| Los Angeles Unified School Dist., G.O. Dedicated Unlimited Ad Valorem Property Tax Bonds, Series 2020-RYQ, 5.00% 2025 | | | 750 | | | | 873 | |
| Los Angeles Unified School Dist., G.O. Dedicated Unlimited Ad Valorem Property Tax Rev. Ref. Bonds, Series 2017-A, 5.00% 2025 | | | 1,000 | | | | 1,164 | |
| Los Angeles Unified School Dist., G.O. Rev. Ref. Bonds, Series 2014-A, 5.00% 2022 | | | 250 | | | | 258 | |
| Los Angeles Unified School Dist., G.O. Rev. Ref. Bonds, Series 2015-A, 5.00% 2023 | | | 685 | | | | 739 | |
| Mammoth Unified School Dist., G.O. Bonds, Capital Appreciation Bonds, 1998 Election, Series 2000, AMBAC insured, 0% 2023 | | | 1,000 | | | | 991 | |
| Menifee Union School Dist., Public Fncg. Auth., Special Tax Rev. Bonds, Series 2016-A, BAM insured, 4.00% 2022 | | | 250 | | | | 256 | |
| Menifee Union School Dist., Public Fncg. Auth., Special Tax Rev. Bonds, Series 2016-A, 5.00% 2026 | | | 755 | | | | 852 | |
| Merced City School Dist., G.O. Bonds, Capital Appreciation Bonds, 2003 Election, Series 2005, MBIA insured, 0% 2023 | | | 1,065 | | | | 1,056 | |
| Modesto Irrigation Dist., Electric System Rev. Ref. Bonds, Series 2016, 5.00% 2023 | | | 160 | | | | 174 | |
| Modesto Irrigation Dist., Electric System Rev. Ref. Bonds, Series 2021, 5.00% 2026 | | | 635 | | | | 763 | |
| Mountain View Whisman School Dist., G.O. Bonds, 2012 Election, Series 2016-B, 5.00% 2025 | | | 610 | | | | 716 | |
| Municipal Fin. Auth., Solid Waste Rev. Ref. Bonds (Republic Services, Inc. Project), Capital Appreciation Bonds, Series 2010, Assured Guaranty Municipal insured, 0% 2023 | | | 260 | | | | 258 | |
| Municipal Fin. Auth., Student Housing Rev. Bonds (CHF-Davis II, LLC - Orchard Park Student Housing Project), Series 2021, BAM insured, 5.00% 2025 | | | 400 | | | | 459 | |
| Napa Valley Unified School Dist., G.O. Rev. Ref. Bonds, Series 2013, 5.00% 2024 (preref. 2023) | | | 250 | | | | 271 | |
| New Haven Unified School Dist., G.O. Rev. Ref. Bonds, Capital Appreciation Bonds, Series 2012, Assured Guaranty Municipal insured, 0% 2023 | | | 965 | | | | 956 | |
| Newport Mesa Unified School Dist., G.O. Bonds, Capital Appreciation Bonds, 2005 Election, Series 2007, National insured, 0% 2022 | | | 1,000 | | | | 999 | |
| Northern California Energy Auth., Commodity Supply Rev. Bonds, Series 2018, 4.00% 2049 (put 2024) | | | 1,000 | | | | 1,084 | |
| Oakland Unified School Dist., G.O. Rev. Ref. Bonds, Series 2017-A, 5.00% 2022 | | | 1,000 | | | | 1,035 | |
| County of Orange, Sanitation Dist., Wastewater Rev. Ref. Obligations, Series 2021-A, 5.00% 2026 | | | 1,750 | | | | 2,082 | |
| County of Orange, Transportation Auth., Bond Anticipation Notes (I-405 Improvement Project), Series 2021, 5.00% 2024 | | | 1,185 | | | | 1,345 | |
| County of Orange, Water Dist. Rev. Ref. Bonds, Series 2019-C, 5.00% 2024 | | | 500 | | | | 565 | |
| Pasadena Unified School Dist., G.O. Rev. Ref. Bonds, Series 2016-B, 5.00% 2024 | | | 655 | | | | 739 | |
| Peralta Community College Dist., G.O. Bonds, 2006 Election, Series 2020-E-1, 5.00% 2025 | | | 1,000 | | | | 1,166 | |
| City of Perris, Joint Powers Auth., Local Agcy. Rev. Ref. Bonds (CFD No. 2001-1 IA No. 4 and No. 5; CFD No. 2005-1 IA No. 4), Series 2017-B, 5.00% 2024 | | | 990 | | | | 1,105 | |
| Perris Union High School Dist., G.O. Bonds, 2012 Election, Series 2021-C, 4.00% 2024 | | | 240 | | | | 265 | |
| Perris Union High School Dist., G.O. Bonds, 2012 Election, Series 2021-C, 4.00% 2025 | | | 400 | | | | 453 | |
| Pittsburg Unified School Dist., G.O. Bonds, Capital Appreciation Bonds, 2010 Election, Series 2012-C, 0% 2047 (preref. 2022) | | | 200 | | | | 47 | |
| Public Fin. Auth., Rev. Ref. Bonds (O’Conner Woods), Series 2022, 4.00% 2026 | | | 440 | | | | 479 | |
| Public Works Board, Lease Rev. Bonds (Various Capital Projects), Series 2014-E, 5.00% 2022 | | | 500 | | | | 520 | |
| Public Works Board, Lease Rev. Bonds (Various Capital Projects), Series 2011-A, 5.00% 2027 | | | 1,025 | | | | 1,026 | |
| Public Works Board, Lease Rev. Ref. Bonds (Dept. of State Hospitals), Series 2016-E, 5.00% 2025 | | | 1,000 | | | | 1,072 | |
| Public Works Board, Lease Rev. Ref. Bonds (Various Capital Projects), Series 2020-E, 5.00% 2024 | | | 1,000 | | | | 1,137 | |
| Public Works Board, Lease Rev. Ref. Bonds (Various Capital Projects), Series 2016-C, 5.00% 2024 | | | 505 | | | | 574 | |
| Public Works Board, Lease Rev. Ref. Bonds (Various Capital Projects), Series 2017-B, 5.00% 2024 | | | 330 | | | | 374 | |
| Public Works Board, Lease Rev. Ref. Bonds (Various Capital Projects), Series 2022-A, 5.00% 2025 | | | 1,330 | | | | 1,517 | |
| Public Works Board, Lease Rev. Ref. Bonds (Various Capital Projects), Series 2016-C, 5.00% 2027 | | | 250 | | | | 302 | |
| Public Works Board, Lease Rev. Ref. Bonds (Various State Office Buildings), Series 2015-F, 5.00% 2024 | | | 150 | | | | 167 | |
| Ravenswood City School Dist., G.O. Bonds, 2016 Election, Series 2016, 5.00% 2023 | | | 445 | | | | 482 | |
| City of Redding, Electric System Rev. Ref. Bonds, Series 2018, 5.00% 2022 | | | 725 | | | | 745 | |
| City of Richmond, Wastewater Rev. Ref. Bonds, Series 2019-B, 5.00% 2023 | | | 940 | | | | 1,019 | |
| County of Riverside, Infrastructure Fncg. Auth., Lease Rev. Ref. Bonds, Series 2015-A, 5.00% 2021 | | | 850 | | | | 850 | |
| County of Riverside, Infrastructure Fncg. Auth., Lease Rev. Ref. Bonds, Series 2015-A, 5.00% 2021 (escrowed to maturity) | | | 150 | | | | 150 | |
| Riverside Unified School Dist., G.O. Bonds, 2016 Election, Series 2019, 4.00% 2024 | | | 125 | | | | 138 | |
| Robla School Dist., G.O. Bonds, 2018 Election, Series 2019-A, Assured Guaranty Municipal insured, 4.00% 2022 | | | 740 | | | | 761 | |
| City of Roseville, Fin. Auth., Special Tax Rev. Ref. Bonds, Series 2016, 4.00% 2022 | | | 620 | | | | 639 | |
| | | | | | | | | |
| 66 | Private Client Services Funds |
Capital Group California Short-Term Municipal Fund
| Bonds, notes & other debt instruments (continued) | | Principal amount
(000) | | | Value
(000) | |
| California (continued) | | | | | | |
| City of Sacramento, Municipal Utility Dist., Electric Rev. Bonds, Series 1997-K, AMBAC insured, 5.25% 2024 | | $ | 115 | | | $ | 125 | |
| Sacramento Unified School Dist., G.O. Bonds, 2012 Election, Series 2019-D, BAM insured, 4.00% 2023 | | | 450 | | | | 478 | |
| Sacramento Unified School Dist., G.O. Bonds, 2012 Election, Series 2019-D, BAM insured, 4.00% 2024 | | | 520 | | | | 569 | |
| City of San Diego, Community Facs. Dist. No. 2 (Santaluz), Improvement Area No. 1, Special Tax Rev. Ref. Bonds, Series 2021, 4.00% 2026 | | | 490 | | | | 564 | |
| City of San Diego, Public Facs. Fncg. Auth., Lease Rev. Bonds (Capital Improvement Projects), Series 2021-A, 5.00% 2027 | | | 255 | | | | 316 | |
| City of San Diego, Public Fin. Auth., Water Rev. Bonds, Series 2020-A, 5.00% 2022 | | | 335 | | | | 347 | |
| County of San Diego, Regional Airport Auth., Airport Rev. and Rev. Ref. Bonds, Series 2019-A, 5.00% 2023 | | | 500 | | | | 539 | |
| County of San Diego, Regional Airport Auth., Airport Rev. and Rev. Ref. Bonds, Series 2019-A, 5.00% 2024 | | | 500 | | | | 561 | |
| County of San Diego, Regional Airport Auth., Airport Rev. Ref. Bonds, Series 2020-B, 5.00% 2022 | | | 1,000 | | | | 1,032 | |
| County of San Diego, Regional Transportation Commission, Limited Sales Tax Rev. Bonds, Series 2021-B, 5.00% 2026 | | | 140 | | | | 167 | |
| County of San Diego, Water Auth., Water Rev. Ref. Green Bonds, Series 2021-A, 5.00% 2025 | | | 1,000 | | | | 1,160 | |
| City and County of San Francisco, Airport Commission, San Francisco International Airport, Rev. Bonds, Series 2019-D-2, 5.00% 2024 | | | 2,000 | | | | 2,229 | |
| City and County of San Francisco, Airport Commission, San Francisco International Airport, Rev. Ref. Bonds, Series 2009-D-2, 4.00% 2023 (escrowed to maturity) | | | 400 | | | | 422 | |
| City and County of San Francisco, Airport Commission, San Francisco International Airport, Rev. Ref. Bonds, Series 2016-A-2, 5.00% 2024 | | | 400 | | | | 446 | |
| City and County of San Francisco, Airport Commission, San Francisco International Airport, Rev. Ref. Bonds, Series 2019-D-2, 5.00% 2026 | | | 500 | | | | 596 | |
| City and County of San Francisco, G.O. Bonds (Earthquake Safety and Emergency Response), Series 2021-E-1, 5.00% 2025 | | | 815 | | | | 949 | |
| City and County of San Francisco, Public Utilities Commission, San Francisco Water Rev. Bonds, Series 2011-A, 5.00% 2029 (preref. 2021) | | | 1,000 | | | | 1,000 | |
| City and County of San Francisco, Public Utilities Commission, Wastewater Rev. Green Bonds, Series 2018-C, 2.125% 2048 (put 2023) | | | 1,000 | | | | 1,026 | |
| City and County of San Francisco, Successor Agcy. to the Redev. Agcy., Special Tax Rev. Ref. Bonds (San Francisco Redev. Projects), Series 2014-C, 5.00% 2022 | | | 250 | | | | 259 | |
| San Francisco Community College Dist., G.O. Rev. Ref. Bonds, Series 2015, 5.00% 2024 | | | 865 | | | | 968 | |
| San Gabriel Unified School Dist., G.O. Bonds, Capital Appreciation Bonds, 2008 Election, Series 2012-B, 0% 2023 | | | 200 | | | | 198 | |
| City of San Jose, Airport Rev. Ref. Bonds, Series 2021-A, BAM insured, 5.00% 2026 | | | 440 | | | | 522 | |
| City of San Jose, Fin. Auth., Lease Rev. Ref. Bonds (Civic Center Project), Series 2013-A, 5.00% 2030 (preref. 2023) | | | 2,000 | | | | 2,150 | |
| San Jose Unified School Dist., G.O. Rev. Ref. Bonds, Series 2017, 5.00% 2022 | | | 155 | | | | 161 | |
| Santa Monica-Malibu Unified School Dist., Certs. of Part., Capital Appreciation Notes, Series 2001-C, National insured, 0% 2022 | | | 100 | | | | 100 | |
| Santa Monica-Malibu Unified School Dist., School Facs. Improvement Dist. No. 2 (Santa Monica Schools), G.O. Bonds, 2018 Election, Series 2021-B, 4.00% 2024 | | | 485 | | | | 535 | |
| Santa Monica-Malibu Unified School Dist., School Facs. Improvement Dist. No. 2 (Santa Monica Schools), G.O. Bonds, 2018 Election, Series 2021-B, 4.00% 2025 | | | 335 | | | | 380 | |
| Santa Rosa High School Dist., G.O. Bonds, 2014 Election, Series 2021-E, BAM insured, 4.00% 2025 | | | 1,050 | | | | 1,187 | |
| Semitropic Water Storage Dist., Water Banking Rev. Ref. Bonds, Series 2012-A, 5.00% 2035 (preref. 2022) | | | 1,325 | | | | 1,393 | |
| Silicon Valley Clean Water, Wastewater Rev. Notes, Series 2019-A, 3.00% 2024 | | | 2,500 | | | | 2,620 | |
| Silicon Valley Clean Water, Wastewater Rev. Notes, Series 2021-B, 0.50% 2026 | | | 2,025 | | | | 2,008 | |
| Southern California Public Power Auth., Rev. Ref. Bonds (Magnolia Power Project A), Series 2020-1, 5.00% 2025 | | | 1,000 | | | | 1,166 | |
| Southern California Public Power Auth., Rev. Ref. Bonds (Milford Wind Corridor Phase I Project), Series 2019-1, 5.00% 2022 | | | 200 | | | | 206 | |
| Southern California Public Power Auth., Rev. Ref. Green Bonds (Linden Wind Energy Project), Series 2020-A, 5.00% 2024 | | | 550 | | | | 606 | |
| Southern California Public Power Auth., Rev. Ref. Green Bonds (Milford Wind Corridor Phase II Project), Series 2021-1, 5.00% 2024 | | | 520 | | | | 585 | |
| Southwestern Community College Dist., G.O. Rev. Ref. Bonds (2019 Crossover), Series 2016-B, 4.00% 2022 | | | 310 | | | | 319 | |
| Statewide Communities Dev. Auth., Health Fac. Rev. Ref. Bonds (Los Angeles Jewish Home for the Aging), Series 2019-A, 4.00% 2022 | | | 265 | | | | 274 | |
| Statewide Communities Dev. Auth., Health Fac. Rev. Ref. Bonds (Los Angeles Jewish Home for the Aging), Series 2019-A, 4.00% 2021 | | | 150 | | | | 150 | |
| Statewide Communities Dev. Auth., Health Fac. Rev. Ref. Bonds (Los Angeles Jewish Home for the Aging), Series 2019-A, 4.00% 2023 | | | 250 | | | | 268 | |
| Statewide Communities Dev. Auth., Health Fac. Rev. Ref. Bonds (Los Angeles Jewish Home for the Aging), Series 2019-B, 4.00% 2023 | | | 660 | | | | 708 | |
| Statewide Communities Dev. Auth., Multi Family Housing Rev. Bonds (Harriet Tubman Terrace Apartments), Series 2021-Q, 0.24% 2024 (put 2023) | | | 2,000 | | | | 1,997 | |
| | | | | | | | | |
| Private Client Services Funds | 67 |
Capital Group California Short-Term Municipal Fund
| Bonds, notes & other debt instruments (continued) | | Principal amount
(000) | | | Value
(000) | |
| California (continued) | | | | | | |
| Statewide Communities Dev. Auth., Multi Family Housing Rev. Bonds (Washington Court Apartments), Series 2021-E, 0.22% 2023 (put 2022) | | $ | 1,000 | | | $ | 1,000 | |
| Statewide Communities Dev. Auth., Rev. Bonds (Adventist Health System/West), Series 2018, 5.00% 2022 | | | 150 | | | | 152 | |
| Statewide Communities Dev. Auth., Rev. Bonds (Adventist Health System/West), Series 2018-A, 5.00% 2023 | | | 135 | | | | 144 | |
| Statewide Communities Dev. Auth., Rev. Bonds (Adventist Health System/West), Series 2018-A, 5.00% 2024 | | | 200 | | | | 222 | |
| Statewide Communities Dev. Auth., Rev. Bonds (Adventist Health System/West), Series 2018-A, 5.00% 2025 | | | 415 | | | | 477 | |
| Statewide Communities Dev. Auth., Rev. Bonds (Cottage Health System Obligated Group), Series 2015, 5.00% 2043 (preref. 2024) | | | 1,500 | | | | 1,708 | |
| Statewide Communities Dev. Auth., Rev. Bonds (Huntington Memorial Hospital), Series 2018, 5.00% 2022 | | | 700 | | | | 722 | |
| Statewide Communities Dev. Auth., Rev. Bonds (Huntington Memorial Hospital), Series 2018, 5.00% 2026 | | | 325 | | | | 387 | |
| Statewide Communities Dev. Auth., Rev. Bonds (Viamonte Senior Living 1 Project), Series 2018-B, 3.00% 2025 | | | 155 | | | | 155 | |
| Statewide Communities Dev. Auth., Student Housing Rev. Bonds (University of California, Irvine East Campus Apartments, Phase I Ref. and Phase IV-B CHF-Irvine, LLC), Series 2021, BAM insured, 5.00% 2029 | | | 1,865 | | | | 2,379 | |
| City of Stockton, Public Fncg. Auth., Water Rev. Ref. Green Bonds, Series 2018-A, BAM insured, 5.00% 2022 | | | 1,210 | | | | 1,260 | |
| Torrance Unified School Dist., G.O. Bonds, Capital Appreciation Bonds, 2008 Election, Series 2009-B-1, 0% 2023 | | | 250 | | | | 248 | |
| City of Tracy, Successor Agcy. to the Community Dev. Agcy., Tax Allocation Rev. Ref. Bonds, Series 2016, Assured Guaranty Municipal insured, 5.00% 2022 | | | 450 | | | | 465 | |
| Transbay Joint Powers Auth., Senior Tax Allocation Green Bonds, Series 2020-A, 5.00% 2025 | | | 500 | | | | 583 | |
| Transbay Joint Powers Auth., Senior Tax Allocation Green Bonds, Series 2020-A, 5.00% 2026 | | | 550 | | | | 659 | |
| Twin Rivers Unified School Dist., G.O. Rev. Ref. Bonds, Series 2016-B, Assured Guaranty Municipal insured, 5.00% 2027 | | | 225 | | | | 269 | |
| Ukiah Unified School Dist., G.O. Bonds, Capital Appreciation Bonds, 2005 Election, Series 2006, MBIA insured, 0% 2023 | | | 440 | | | | 436 | |
| Regents of the University of California, G.O. Rev. Bonds, Series 2013-AK, 5.00% 2048 (put 2023) | | | 1,000 | | | | 1,073 | |
| Regents of the University of California, Limited Project Rev. Bonds, Series 2012-G, 5.00% 2022 | | | 150 | | | | 154 | |
| Regents of the University of California, Limited Project Rev. Bonds, Series 2022-S, 5.00% 2026 | | | 2,500 | | | | 2,930 | |
| Val Verde Unified School Dist., G.O. Bonds, 2020 Election, Series 2020-A, BAM insured, 4.00% 2023 | | | 450 | | | | 478 | |
| Dept. of Veterans Affairs, Home Purchase Rev. Bonds, Series 2016-B, 3.50% 2045 | | | 465 | | | | 490 | |
| Dept. of Veterans Affairs, Home Purchase Rev. Bonds, Series 2019-A, 4.00% 2049 | | | 1,310 | | | | 1,427 | |
| Dept. of Veterans Affairs, Home Purchase Rev. Bonds, Series 2020-A, 3.00% 2050 | | | 995 | | | | 1,068 | |
| Dept. of Veterans Affairs, Veterans G.O. Bonds, Series 2017-CQ, 4.00% 2047 | | | 655 | | | | 703 | |
| Dept. of Veterans Affairs, Veterans G.O. Bonds, Series 2018-CR, 4.00% 2048 | | | 1,195 | | | | 1,294 | |
| Dept. of Veterans Affairs, Veterans G.O. Bonds, Series 2020-CT, 3.00% 2050 | | | 1,990 | | | | 2,136 | |
| Dept. of Veterans Affairs, Veterans G.O. Rev. Ref. Bonds, Series 2016-CN, 3.50% 2045 | | | 680 | | | | 710 | |
| Dept. of Water Resources, Water System Rev. Bonds (Central Valley Project), Series 2021-BD, 5.00% 2025 | | | 1,000 | | | | 1,183 | |
| West Contra Costa Unified School Dist., G.O. Bonds, 2012 Election, Series 2020-E, Assured Guaranty Municipal insured, 4.00% 2024 | | | 300 | | | | 329 | |
| West Contra Costa Unified School Dist., G.O. Bonds, 2012 Election, Series 2020-E, Assured Guaranty Municipal insured, 4.00% 2026 | | | 640 | | | | 737 | |
| West Contra Costa Unified School Dist., G.O. Rev. Ref. Bonds, Series 2017-A-1, 5.00% 2024 | | | 250 | | | | 281 | |
| Western Riverside Water and Wastewater Fncg. Auth., Local Agcy. Rev. Ref. Bonds, Series 2016-A, 5.00% 2022 | | | 100 | | | | 104 | |
| City of Westminster, Successor Agcy. to the Redev. Agcy., Commercial Redev. Project No. 1, Tax Allocation Rev. Ref. Bonds, Series 2016-B, BAM insured, 4.00% 2022 | | | 120 | | | | 124 | |
| Whittier Union High School Dist., G.O. Rev. Ref. Bonds, Series 2015, 5.00% 2022 | | | 300 | | | | 311 | |
| City of Woodland, Community Facs. Dist. No. 2004-1 (Spring Lake), Special Tax Capital Projects Bonds, Series 2021, 4.00% 2026 | | | 160 | | | | 184 | |
| City of Woodland, Community Facs. Dist. No. 2004-1 (Spring Lake), Special Tax Capital Projects Bonds, Series 2021, Assured Guaranty Municipal insured, 4.00% 2027 | | | 180 | | | | 210 | |
| City of Woodland, Community Facs. Dist. No. 2004-1 (Spring Lake), Special Tax Capital Projects Bonds, Series 2021, Assured Guaranty Municipal insured, 4.00% 2028 | | | 200 | | | | 237 | |
| | | | | | | | | |
| Total bonds, notes & other debt instruments (cost: $154,232,000) | | | | | | | 155,490 | |
| | | | | | | | | |
| Short-term securities 15.60% | | | | | | | | |
| Municipals 15.60% | | | | | | | | |
| State of California, Fin. Auth., Recovery Zone Fac. Bonds (Chevron U.S.A., Inc. Project), Series 2010-A, 0.02% 20351 | | | 8,700 | | | | 8,700 | |
| State of California, City of Los Angeles, Dept. of Water and Power, Power System Rev. Ref. Bonds, Series 2001-B-3, 0.01% 20341 | | | 1,300 | | | | 1,300 | |
| State of California, City of Los Angeles, Dept. of Water and Power, Rev. Bonds, Series 2021-A-1, 0.02% 20501 | | | 4,000 | | | | 4,000 | |
| | | | | | | | | |
| 68 | Private Client Services Funds |
Capital Group California Short-Term Municipal Fund
| Short-term securities (continued) | | Principal amount
(000) | | | Value
(000) | |
| Municipals (continued) | | | | | | |
| State of California, Metropolitan Water Dist. of Southern California, Water Rev. Ref. Bonds, Series 2016-B-2, 0.02% 20371 | | $ | 3,500 | | | $ | 3,500 | |
| State of California, Pollution Control Fncg. Auth., Environmental Impact Rev. Bonds (Air Products and Chemicals, Inc. Project), Series 1997-B, 0.02% 20421 | | | 1,350 | | | | 1,350 | |
| State of California, Regents of the University of California, General Rev. Bonds, Series 2013-AL-4, 0.01% 20481 | | | 3,600 | | | | 3,600 | |
| State of California, Regents of the University of California, General Rev. Bonds, Series 2013-AL-1, 0.02% 20481 | | | 1,000 | | | | 1,000 | |
| State of California, Regents of the University of California, Medical Center Pooled Rev. Bonds, Series 2007-B-2, 0.01% 20321 | | | 3,000 | | | | 3,000 | |
| State of California, Regents of the University of California, Medical Center Pooled Rev. Bonds, Series 2007-B-1, 0.02% 20321 | | | 1,900 | | | | 1,900 | |
| | | | | | | | | |
| Total short-term securities (cost: $28,351,000) | | | | | | | 28,350 | |
| | | | | | | | | |
| Total investment securities 101.17% (cost: $182,583,000) | | | | | | | 183,840 | |
| Other assets less liabilities (1.17%) | | | | | | | (2,121 | ) |
| | | | | | | | | |
| Net assets 100.00% | | | | | | $ | 181,719 | |
| 1 | Coupon rate may change periodically. Reference rate and spread are as of the most recent information available. Some coupon rates are determined by the issuer or agent based on current market conditions; therefore, the reference rate and spread are not available. For short-term securities, the date of the next scheduled coupon rate change is considered to be the maturity date. |
Key to abbreviations and symbol
Agcy. = Agency
AMT = Alternative Minimum Tax
Auth. = Authority
Certs. = Certificates
Dept. = Department
Dev. = Development
Dist. = District
Econ. = Economic
Fac. = Facility
Facs. = Facilities
Fin. = Finance
Fncg. = Financing
G.O. = General Obligation
IAM = Interest at Maturity
LIBOR = London Interbank Offered Rate
LOC = Letter of Credit
Part. = Participation
Preref. = Prerefunded
Redev. = Redevelopment
Ref. = Refunding
Rev. = Revenue
SIFMA = Securities Industry and Financial Markets Association
USD/$ = U.S. dollars
| Private Client Services Funds | 69 |
Capital Group Core Bond Fund
Investment portfolio October 31, 2021
| Portfolio by type of security | Percent of net assets |
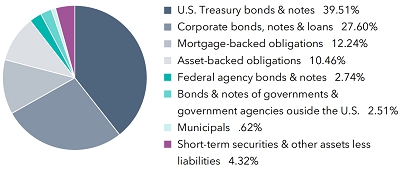
| Portfolio quality summary* | | Percent of net assets |
| U.S. Treasury and agency† | | | 42.25 | % |
| AAA/Aaa | | | 20.93 | |
| AA/Aa | | | 9.15 | |
| A/A | | | 14.63 | |
| BBB/Baa | | | 8.72 | |
| Short-term securities & other assets less liabilities | | | 4.32 | |
| * | Bond ratings, which typically range from AAA/Aaa (highest) to D (lowest), are assigned by credit rating agencies such as Standard & Poor’s, Moody’s and/or Fitch as an indication of an issuer’s creditworthiness. In assigning a credit rating to a security, the fund looks specifically to the ratings assigned to the issuer of the security by Standard & Poor’s, Moody’s and/or Fitch. If agency ratings differ, the security will be considered to have received the highest of those ratings, consistent with the fund’s investment policies. The ratings are not covered by the Report of Independent Registered Public Accounting Firm. |
| † | These securities are guaranteed by the full faith and credit of the U.S. government. |
| Bonds, notes & other debt instruments 95.68% | | Principal amount
(000) | | | Value
(000) | |
| U.S. Treasury bonds & notes 39.51% | | | | | | |
| U.S. Treasury 30.40% | | | | | | |
| U.S. Treasury 1.875% 2021 | | $ | 500 | | | $ | 501 | |
| U.S. Treasury 2.125% 2021 | | | 1,000 | | | | 1,003 | |
| U.S. Treasury 0.125% 2022 | | | 27,000 | | | | 27,008 | |
| U.S. Treasury 1.50% 2022 | | | 1,920 | | | | 1,943 | |
| U.S. Treasury 1.75% 2022 | | | — | 1 | | | — | 1 |
| U.S. Treasury 1.875% 2022 | | | 3,745 | | | | 3,784 | |
| U.S. Treasury 2.125% 2022 | | | 3,000 | | | | 3,041 | |
| U.S. Treasury 0.125% 2023 | | | 10,000 | | | | 9,986 | |
| U.S. Treasury 0.125% 2023 | | | 2,000 | | | | 1,983 | |
| U.S. Treasury 0.25% 2023 | | | 2,610 | | | | 2,605 | |
| U.S. Treasury 0.25% 2023 | | | 437 | | | | 435 | |
| U.S. Treasury 1.25% 2023 | | | 1,000 | | | | 1,015 | |
| U.S. Treasury 1.375% 20232 | | | 1,275 | | | | 1,296 | |
| U.S. Treasury 1.375% 2023 | | | 1,000 | | | | 1,017 | |
| U.S. Treasury 1.75% 2023 | | | 1,000 | | | | 1,022 | |
| U.S. Treasury 2.00% 2023 | | | 2,000 | | | | 2,045 | |
| U.S. Treasury 2.125% 2023 | | | 3,415 | | | | 3,528 | |
| U.S. Treasury 2.25% 2023 | | | 500 | | | | 518 | |
| U.S. Treasury 2.50% 2023 | | | 1,050 | | | | 1,089 | |
| U.S. Treasury 2.75% 2023 | | | 4,542 | | | | 4,706 | |
| U.S. Treasury 2.75% 2023 | | | 2,250 | | | | 2,353 | |
| U.S. Treasury 0.375% 2024 | | | 22,000 | | | | 21,790 | |
| U.S. Treasury 1.75% 2024 | | | 4,000 | | | | 4,117 | |
| U.S. Treasury 2.00% 2024 | | | 3,288 | | | | 3,405 | |
| U.S. Treasury 2.00% 2024 | | | 2,480 | | | | 2,566 | |
| U.S. Treasury 2.125% 2024 | | | 5,000 | | | | 5,202 | |
| U.S. Treasury 2.125% 20242 | | | 3,500 | | | | 3,627 | |
| U.S. Treasury 2.25% 20242 | | | 3,713 | | | | 3,863 | |
| U.S. Treasury 2.25% 2024 | | | 1,820 | | | | 1,889 | |
| 70 | Private Client Services Funds |
Capital Group Core Bond Fund
| Bonds, notes & other debt instruments (continued) | | Principal amount
(000) | | | Value
(000) | |
| U.S. Treasury bonds & notes (continued) | | | | | | |
| U.S. Treasury (continued) | | | | | | |
| U.S. Treasury 2.75% 2024 | | $ | 2,500 | | | $ | 2,624 | |
| U.S. Treasury 0.50% 2025 | | | 4,452 | | | | 4,398 | |
| U.S. Treasury 1.375% 2025 | | | 8,128 | | | | 8,276 | |
| U.S. Treasury 2.00% 2025 | | | 2,000 | | | | 2,077 | |
| U.S. Treasury 2.625% 2025 | | | 6,600 | | | | 7,028 | |
| U.S. Treasury 7.625% 20252 | | | 750 | | | | 917 | |
| U.S. Treasury 0.50% 2026 | | | 3,500 | | | | 3,414 | |
| U.S. Treasury 0.75% 2026 | | | 1,150 | | | | 1,132 | |
| U.S. Treasury 0.75% 2026 | | | 32 | | | | 31 | |
| U.S. Treasury 0.875% 2026 | | | 7,428 | | | | 7,327 | |
| U.S. Treasury 1.625% 2026 | | | 3,000 | | | | 3,070 | |
| U.S. Treasury 1.75% 20262 | | | 12,140 | | | | 12,485 | |
| U.S. Treasury 1.125% 2027 | | | 477 | | | | 475 | |
| U.S. Treasury 2.25% 2027 | | | 8,420 | | | | 8,860 | |
| U.S. Treasury 2.25% 2027 | | | 2,200 | | | | 2,316 | |
| U.S. Treasury 2.625% 2029 | | | 5,660 | | | | 6,121 | |
| U.S. Treasury 1.25% 2031 | | | 6,971 | | | | 6,777 | |
| | | | | | | | 194,665 | |
| | | | | | | | | |
| U.S. Treasury inflation-protected securities 9.11% | | | | | | | | |
| U.S. Treasury Inflation-Protected Security 0.125% 20223 | | | 12,151 | | | | 12,387 | |
| U.S. Treasury Inflation-Protected Security 0.125% 20253 | | | 10,746 | | | | 11,590 | |
| U.S. Treasury Inflation-Protected Security 0.125% 20263 | | | 14,301 | | | | 15,582 | |
| U.S. Treasury Inflation-Protected Security 0.875% 20293 | | | 4,958 | | | | 5,763 | |
| U.S. Treasury Inflation-Protected Security 0.125% 20302,3 | | | 11,775 | | | | 13,053 | |
| | | | | | | | 58,375 | |
| | | | | | | | | |
| Total U.S. Treasury bonds & notes | | | | | | | 253,040 | |
| | | | | | | | | |
| Corporate bonds, notes & loans 27.60% | | | | | | | | |
| Financials 7.13% | | | | | | | | |
| ACE INA Holdings, Inc. 2.875% 2022 | | | 150 | | | | 153 | |
| ACE INA Holdings, Inc. 3.35% 2026 | | | 45 | | | | 49 | |
| ACE INA Holdings, Inc. 4.35% 2045 | | | 50 | | | | 64 | |
| AerCap Ireland Capital, Ltd. / AerCap Global Aviation Trust 2.45% 2026 | | | 1,637 | | | | 1,653 | |
| AerCap Ireland Capital, Ltd. / AerCap Global Aviation Trust 3.00% 2028 | | | 1,190 | | | | 1,207 | |
| Allstate Corp. 0.75% 2025 | | | 637 | | | | 624 | |
| Allstate Corp. 3.28% 2026 | | | 175 | | | | 189 | |
| American International Group, Inc. 2.50% 2025 | | | 2,000 | | | | 2,078 | |
| American International Group, Inc. 3.40% 2030 | | | 1,021 | | | | 1,107 | |
| Bank of America Corp. 1.197% 2026 (USD-SOFR + 1.01% on 10/24/2025)4 | | | 1,108 | | | | 1,090 | |
| Bank of America Corp. 1.734% 2027 (USD-SOFR + 0.96% on 7/22/2026)4 | | | 1,740 | | | | 1,729 | |
| Bank of America Corp. 1.922% 2031 (USD-SOFR + 1.37% on 10/24/2030)4 | | | 1,385 | | | | 1,322 | |
| Bank of America Corp. 2.687% 2032 (USD-SOFR + 1.32% on 4/22/2031)4 | | | 748 | | | | 758 | |
| BNP Paribas 2.159% 2029 (USD-SOFR + 1.218% on 9/15/2028)4,5 | | | 475 | | | | 467 | |
| Citigroup, Inc. 4.45% 2027 | | | 400 | | | | 450 | |
| Citigroup, Inc. 2.572% 2031 (USD-SOFR + 2.107% on 6/3/2030)4 | | | 1,283 | | | | 1,294 | |
| Citigroup, Inc. 2.666% 2031 (USD-SOFR + 1.146% on 1/29/2030)4 | | | 502 | | | | 511 | |
| Credit Suisse Group AG 3.80% 2023 | | | 500 | | | | 524 | |
| GE Capital Funding, LLC 3.45% 2025 | | | 1,000 | | | | 1,070 | |
| Goldman Sachs Group, Inc. 0.925% 2024 (USD-SOFR + 0.50% on 10/21/2023)4 | | | 1,545 | | | | 1,544 | |
| Goldman Sachs Group, Inc. 3.272% 2025 (3-month USD-LIBOR + 1.201% on 9/29/2024)4 | | | 1,385 | | | | 1,462 | |
| Goldman Sachs Group, Inc. 0.855% 2026 (USD-SOFR + 0.609% on 2/12/2025)4 | | | 400 | | | | 393 | |
| Goldman Sachs Group, Inc. 1.093% 2026 (USD-SOFR + 0.789% on 12/9/2025)4 | | | 750 | | | | 732 | |
| Goldman Sachs Group, Inc. 1.948% 2027 (USD-SOFR + 0.913% on 10/21/2026)4 | | | 679 | | | | 680 | |
| Goldman Sachs Group, Inc. 3.814% 2029 (3-month USD-LIBOR + 1.158% on 4/23/2028)4 | | | 725 | | | | 795 | |
| Goldman Sachs Group, Inc. 1.992% 2032 (USD-SOFR + 1.09% on 1/27/2031)4 | | | 708 | | | | 679 | |
| Goldman Sachs Group, Inc. 4.017% 2038 (3-month USD-LIBOR + 1.373% on 10/31/2037)4 | | | 175 | | | | 201 | |
| Private Client Services Funds | 71 |
| Capital Group Core Bond Fund | | | | | | |
| | | | | | | |
| Bonds, notes & other debt instruments (continued) | | Principal amount
(000) | | | Value
(000) | |
| Corporate bonds, notes & loans (continued) | | | | | | |
| Financials (continued) | | | | | | |
| JPMorgan Chase & Co. 3.559% 2024 (3-month USD-LIBOR + 0.73% on 4/23/2023)4 | | $ | 1,125 | | | $ | 1,171 | |
| JPMorgan Chase & Co. 2.301% 2025 (USD-SOFR + 1.16% on 10/15/2024)4 | | | 1,165 | | | | 1,201 | |
| JPMorgan Chase & Co. 1.045% 2026 (USD-SOFR + 0.80% on 11/19/2025)4 | | | 1,500 | | | | 1,464 | |
| JPMorgan Chase & Co. 2.58% 2032 (USD-SOFR + 1.25% on 4/22/2031)4 | | | 232 | | | | 234 | |
| Lloyds Banking Group PLC 4.375% 2028 | | | 200 | | | | 226 | |
| Marsh & McLennan Companies, Inc. 3.875% 2024 | | | 495 | | | | 529 | |
| Marsh & McLennan Companies, Inc. 2.25% 2030 | | | 715 | | | | 715 | |
| Metropolitan Life Global Funding I 0.95% 20255 | | | 757 | | | | 748 | |
| Morgan Stanley 1.164% 2025 (USD-SOFR + 0.56% on 10/21/2024)4 | | | 995 | | | | 991 | |
| Morgan Stanley 2.72% 2025 (USD-SOFR + 1.152% on 7/22/2024)4 | | | 1,640 | | | | 1,703 | |
| Morgan Stanley 0.985% 2026 (USD-SOFR + 0.72% on 12/10/2025)4 | | | 1,386 | | | | 1,346 | |
| Morgan Stanley 1.593% 2027 (USD-SOFR + 0.879% on 5/4/2026)4 | | | 954 | | | | 945 | |
| Morgan Stanley 2.699% 2031 (USD-SOFR + 1.143% on 1/22/2030)4 | | | 461 | | | | 471 | |
| National Securities Clearing Corp. 0.40% 20235 | | | 3,000 | | | | 2,986 | |
| New York Life Global Funding 2.25% 20225 | | | 305 | | | | 310 | |
| New York Life Global Funding 0.90% 20245 | | | 2,000 | | | | 1,998 | |
| Northwestern Mutual Global Funding 0.80% 20265 | | | 1,778 | | | | 1,732 | |
| Toronto-Dominion Bank 0.45% 2023 | | | 1,353 | | | | 1,350 | |
| Toronto-Dominion Bank 1.25% 2026 | | | 1,005 | | | | 987 | |
| Wells Fargo & Company 2.572% 2031 (3-month USD-LIBOR + 1.00% on 2/11/2030)4 | | | 1,715 | | | | 1,736 | |
| | | | | | | | 45,668 | |
| | | | | | | | | |
| Consumer discretionary 4.70% | | | | | | | | |
| Amazon.com, Inc. 0.25% 2023 | | | 1,175 | | | | 1,173 | |
| Amazon.com, Inc. 0.45% 2024 | | | 1,175 | | | | 1,166 | |
| Amazon.com, Inc. 0.80% 2025 | | | 1,544 | | | | 1,529 | |
| Amazon.com, Inc. 1.20% 2027 | | | 1,287 | | | | 1,267 | |
| Amazon.com, Inc. 1.65% 2028 | | | 1,175 | | | | 1,172 | |
| Amazon.com, Inc. 2.10% 2031 | | | 1,175 | | | | 1,186 | |
| American Honda Finance Corp. 0.75% 2024 | | | 2,145 | | | | 2,132 | |
| American Honda Finance Corp. 1.30% 2026 | | | 1,535 | | | | 1,524 | |
| American Honda Finance Corp. 2.30% 2026 | | | 80 | | | | 83 | |
| American Honda Finance Corp. 3.50% 2028 | | | 325 | | | | 359 | |
| Bayerische Motoren Werke AG 0.75% 20245 | | | 1,250 | | | | 1,244 | |
| Bayerische Motoren Werke AG 0.80% 20245 | | | 1,225 | | | | 1,221 | |
| Bayerische Motoren Werke AG 1.25% 20265 | | | 1,000 | | | | 990 | |
| General Motors Company 4.20% 2027 | | | 1,020 | | | | 1,116 | |
| Home Depot, Inc. 3.25% 2022 | | | 350 | | | | 353 | |
| Home Depot, Inc. 1.50% 2028 | | | 1,840 | | | | 1,808 | |
| Hyundai Capital America 0.80% 20235 | | | 1,200 | | | | 1,200 | |
| Hyundai Capital America 1.80% 20255 | | | 481 | | | | 482 | |
| Hyundai Capital America 2.375% 20275 | | | 387 | | | | 389 | |
| Hyundai Capital America 2.10% 20285 | | | 350 | | | | 342 | |
| McDonald’s Corp. 3.70% 2026 | | | 135 | | | | 147 | |
| McDonald’s Corp. 3.50% 2027 | | | 185 | | | | 202 | |
| NIKE, Inc. 2.375% 2026 | | | 615 | | | | 645 | |
| Stellantis Finance US, Inc. 1.711% 20275 | | | 1,365 | | | | 1,344 | |
| Stellantis Finance US, Inc. 2.691% 20315 | | | 900 | | | | 887 | |
| Toyota Motor Credit Corp. 0.625% 2024 | | | 2,145 | | | | 2,128 | |
| Toyota Motor Credit Corp. 3.00% 2025 | | | 1,240 | | | | 1,313 | |
| Toyota Motor Credit Corp. 0.80% 2026 | | | 890 | | | | 874 | |
| Toyota Motor Credit Corp. 1.125% 2026 | | | 1,840 | | | | 1,815 | |
| | | | | | | | 30,091 | |
| | | | | | | | | |
| Industrials 2.34% | | | | | | | | |
| Avolon Holdings Funding, Ltd. 3.625% 20225 | | | 587 | | | | 594 | |
| Avolon Holdings Funding, Ltd. 3.95% 20245 | | | 743 | | | | 784 | |
| Avolon Holdings Funding, Ltd. 4.375% 20265 | | | 925 | | | | 999 | |
| Boeing Company 5.04% 2027 | | | 1,021 | | | | 1,160 | |
| Boeing Company 3.25% 2028 | | | 1,095 | | | | 1,147 | |
| 72 | Private Client Services Funds |
| Capital Group Core Bond Fund | | | | | | |
| | | | | | | |
| Bonds, notes & other debt instruments (continued) | | Principal amount
(000) | | | Value
(000) | |
| Corporate bonds, notes & loans (continued) | | | | | | |
| Industrials (continued) | | | | | | |
| Emerson Electric Co. 1.80% 2027 | | $ | 383 | | | $ | 386 | |
| General Dynamics Corp. 1.15% 2026 | | | 1,000 | | | | 998 | |
| General Electric Co. 3.45% 2027 | | | 1,000 | | | | 1,091 | |
| Honeywell International, Inc. 2.15% 2022 | | | 1,160 | | | | 1,175 | |
| Honeywell International, Inc. 2.30% 2024 | | | 878 | | | | 912 | |
| Masco Corp. 1.50% 2028 | | | 782 | | | | 754 | |
| Raytheon Technologies Corp. 3.20% 2024 | | | 275 | | | | 289 | |
| Siemens AG 0.40% 20235 | | | 1,140 | | | | 1,140 | |
| Siemens AG 0.65% 20245 | | | 1,425 | | | | 1,420 | |
| Siemens AG 1.20% 20265 | | | 808 | | | | 800 | |
| Union Pacific Corp. 3.75% 2025 | | | 230 | | | | 250 | |
| Union Pacific Corp. 2.15% 2027 | | | 793 | | | | 816 | |
| United Technologies Corp. 3.65% 2023 | | | 27 | | | | 28 | |
| Vinci SA 3.75% 20295 | | | 200 | | | | 222 | |
| | | | | | | | 14,965 | |
| | | | | | | | | |
| Utilities 2.02% | | | | | | | | |
| Ameren Corp. 2.50% 2024 | | | 373 | | | | 388 | |
| Connecticut Light and Power Co. 3.20% 2027 | | | 1,025 | | | | 1,107 | |
| Duke Energy Progress, LLC 3.375% 2023 | | | 786 | | | | 824 | |
| Duke Energy Progress, LLC 3.70% 2028 | | | 200 | | | | 222 | |
| Entergy Louisiana, LLC 0.95% 2024 | | | 1,860 | | | | 1,852 | |
| Eversource Energy 2.75% 2022 | | | 750 | | | | 755 | |
| FirstEnergy Transmission LLC 2.866% 20285 | | | 425 | | | | 438 | |
| Florida Power & Light Company 2.85% 2025 | | | 225 | | | | 237 | |
| NextEra Energy Capital Holdings, Inc. 2.25% 2030 | | | 1,276 | | | | 1,276 | |
| Pacific Gas and Electric Co. 3.45% 2025 | | | 150 | | | | 156 | |
| Pacific Gas and Electric Co. 3.75% 2028 | | | 150 | | | | 157 | |
| Pacific Gas and Electric Co. 2.50% 2031 | | | 175 | | | | 167 | |
| Pacific Gas and Electric Co. 3.30% 2040 | | | 50 | | | | 47 | |
| Southern California Edison Co. 0.975% 2024 | | | 925 | | | | 921 | |
| Southern California Edison Co. 3.70% 2025 | | | 1,000 | | | | 1,081 | |
| Southern California Edison Co. 2.85% 2029 | | | 1,000 | | | | 1,032 | |
| Tampa Electric Co. 2.60% 2022 | | | 350 | | | | 355 | |
| Virginia Electric and Power Co. 3.10% 2025 | | | 1,040 | | | | 1,099 | |
| Xcel Energy, Inc. 3.35% 2026 | | | 749 | | | | 803 | |
| | | | | | | | 12,917 | |
| | | | | | | | | |
| Information technology 2.00% | | | | | | | | |
| Adobe, Inc. 1.90% 2025 | | | 647 | | | | 663 | |
| Analog Devices, Inc. 1.70% 2028 | | | 418 | | | | 416 | |
| Apple, Inc. 0.70% 2026 | | | 1,135 | | | | 1,113 | |
| Apple, Inc. 1.20% 2028 | | | 1,418 | | | | 1,375 | |
| Apple, Inc. 1.25% 2030 | | | 1,470 | | | | 1,389 | |
| Broadcom Corp. / Broadcom Cayman Finance, Ltd. 3.875% 2027 | | | 185 | | | | 201 | |
| Broadcom, Inc. 1.95% 20285 | | | 123 | | | | 121 | |
| Broadcom, Ltd. 3.625% 2024 | | | 270 | | | | 284 | |
| Fidelity National Information Services, Inc. 1.15% 2026 | | | 1,283 | | | | 1,258 | |
| Fidelity National Information Services, Inc. 1.65% 2028 | | | 129 | | | | 126 | |
| Fiserv, Inc. 3.20% 2026 | | | 670 | | | | 713 | |
| Fiserv, Inc. 2.25% 2027 | | | 777 | | | | 790 | |
| Fortinet, Inc. 1.00% 2026 | | | 696 | | | | 678 | |
| Intuit, Inc. 0.95% 2025 | | | 255 | | | | 252 | |
| Intuit, Inc. 1.35% 2027 | | | 235 | | | | 230 | |
| Microsoft Corp. 2.40% 2026 | | | 1,951 | | | | 2,048 | |
| Oracle Corp. 2.30% 2028 | | | 668 | | | | 678 | |
| PayPal Holdings, Inc. 1.65% 2025 | | | 481 | | | | 488 | |
| | | | | | | | 12,823 | |
| Private Client Services Funds | 73 |
| Capital Group Core Bond Fund | | | | | | |
| | | | | | | |
| Bonds, notes & other debt instruments (continued) | | Principal amount
(000) | | | Value
(000) | |
| Corporate bonds, notes & loans (continued) | | | | | | |
| Communication services 1.95% | | | | | | |
| Alphabet, Inc. 0.80% 2027 | | $ | 490 | | | $ | 470 | |
| Alphabet, Inc. 1.10% 2030 | | | 1,605 | | | | 1,507 | |
| Alphabet, Inc. 2.05% 2050 | | | 440 | | | | 396 | |
| AT&T, Inc. 2.30% 2027 | | | 996 | | | | 1,019 | |
| AT&T, Inc. 1.65% 2028 | | | 1,065 | | | | 1,039 | |
| CCO Holdings LLC and CCO Holdings Capital Corp. 4.908% 2025 | | | 165 | | | | 183 | |
| CCO Holdings LLC and CCO Holdings Capital Corp. 2.80% 2031 | | | 502 | | | | 500 | |
| Comcast Corp. 3.95% 2025 | | | 539 | | | | 592 | |
| Comcast Corp. 1.95% 2031 | | | 704 | | | | 687 | |
| SBA Tower Trust 1.631% 20265 | | | 983 | | | | 971 | |
| T-Mobile US, Inc. 3.75% 2027 | | | 1,119 | | | | 1,215 | |
| Verizon Communications, Inc. 3.00% 2027 | | | 450 | | | | 477 | |
| Verizon Communications, Inc. 2.10% 2028 | | | 1,250 | | | | 1,254 | |
| Verizon Communications, Inc. 2.355% 20325 | | | 2,210 | | | | 2,179 | |
| | | | | | | | 12,489 | |
| | | | | | | | | |
| Consumer staples 1.94% | | | | | | | | |
| 7-Eleven, Inc. 0.95% 20265 | | | 250 | | | | 243 | |
| 7-Eleven, Inc. 1.30% 20285 | | | 175 | | | | 167 | |
| Altria Group, Inc. 2.35% 2025 | | | 156 | | | | 161 | |
| Altria Group, Inc. 4.40% 2026 | | | 117 | | | | 130 | |
| Altria Group, Inc. 3.40% 2030 | | | 89 | | | | 93 | |
| British American Tobacco PLC 3.462% 2029 | | | 1,850 | | | | 1,938 | |
| Coca-Cola Company 1.00% 2028 | | | 1,625 | | | | 1,556 | |
| Constellation Brands, Inc. 3.20% 2023 | | | 386 | | | | 398 | |
| Constellation Brands, Inc. 2.875% 2030 | | | 239 | | | | 248 | |
| Costco Wholesale Corp. 2.30% 2022 | | | 285 | | | | 288 | |
| Keurig Dr Pepper, Inc. 4.057% 2023 | | | 251 | | | | 264 | |
| Keurig Dr Pepper, Inc. 3.20% 2030 | | | 500 | | | | 531 | |
| Kimberly-Clark Corp. 1.05% 2027 | | | 185 | | | | 179 | |
| Kimberly-Clark Corp. 3.10% 2030 | | | 116 | | | | 126 | |
| Molson Coors Brewing Co. 3.00% 2026 | | | 245 | | | | 260 | |
| Nestle Holdings, Inc. 1.50% 20285 | | | 1,750 | | | | 1,714 | |
| Nestlé Holdings, Inc. 1.00% 20275 | | | 1,640 | | | | 1,582 | |
| PepsiCo, Inc. 1.625% 2030 | | | 85 | | | | 83 | |
| Philip Morris International, Inc. 1.50% 2025 | | | 274 | | | | 276 | |
| Philip Morris International, Inc. 0.875% 2026 | | | 566 | | | | 550 | |
| Procter & Gamble Company 0.55% 2025 | | | 796 | | | | 779 | |
| Procter & Gamble Company 1.00% 2026 | | | 362 | | | | 359 | |
| Procter & Gamble Company 3.00% 2030 | | | 495 | | | | 538 | |
| | | | | | | | 12,463 | |
| | | | | | | | | |
| Health care 1.93% | | | | | | | | |
| Abbott Laboratories 3.40% 2023 | | | 98 | | | | 103 | |
| Abbott Laboratories 3.75% 2026 | | | 292 | | | | 323 | |
| Aetna, Inc. 2.80% 2023 | | | 55 | | | | 57 | |
| AmerisourceBergen Corp. 0.737% 2023 | | | 853 | | | | 854 | |
| Amgen, Inc. 2.20% 2027 | | | 740 | | | | 755 | |
| AstraZeneca Finance LLC 0.70% 2024 | | | 1,486 | | | | 1,485 | |
| AstraZeneca Finance LLC 1.20% 2026 | | | 600 | | | | 595 | |
| AstraZeneca Finance LLC 1.75% 2028 | | | 444 | | | | 443 | |
| AstraZeneca PLC 3.375% 2025 | | | 445 | | | | 482 | |
| Becton, Dickinson and Company 3.734% 2024 | | | 17 | | | | 18 | |
| Boston Scientific Corp. 3.45% 2024 | | | 675 | | | | 712 | |
| Cigna Corp. 3.75% 2023 | | | 99 | | | | 104 | |
| CVS Health Corp. 1.30% 2027 | | | 1,384 | | | | 1,342 | |
| CVS Health Corp. 4.30% 2028 | | | 282 | | | | 319 | |
| GlaxoSmithKline PLC 3.375% 2023 | | | 750 | | | | 783 | |
| Novartis Capital Corp. 1.75% 2025 | | | 1,006 | | | | 1,027 | |
| Novartis Capital Corp. 2.00% 2027 | | | 275 | | | | 282 | |
| 74 | Private Client Services Funds |
| Capital Group Core Bond Fund | | | | | | |
| | | | | | | |
| Bonds, notes & other debt instruments (continued) | | Principal amount
(000) | | | | Value
(000) | |
| Corporate bonds, notes & loans (continued) | | | | | | | | |
| Health care (continued) | | | | | | | | |
| Pfizer, Inc. 2.95% 2024 | | $ | 485 | | | $ | 509 | |
| Shire PLC 2.875% 2023 | | | 120 | | | | 124 | |
| Shire PLC 3.20% 2026 | | | 300 | | | | 319 | |
| Thermo Fisher Scientific, Inc. 1.75% 2028 | | | 385 | | | | 380 | |
| UnitedHealth Group, Inc. 1.15% 2026 | | | 495 | | | | 490 | |
| UnitedHealth Group, Inc. 2.30% 2031 | | | 348 | | | | 352 | |
| Zimmer Holdings, Inc. 3.15% 2022 | | | 485 | | | | 488 | |
| | | | | | | | 12,346 | |
| | | | | | | | | |
| Energy 1.83% | | | | | | | | |
| Boardwalk Pipeline Partners LP 4.95% 2024 | | | 460 | | | | 504 | |
| BP Capital Markets PLC 4.234% 2028 | | | 437 | | | | 499 | |
| Canadian Natural Resources, Ltd. 2.05% 2025 | | | 996 | | | | 1,012 | |
| Enbridge Energy Partners LP 5.875% 2025 | | | 230 | | | | 265 | |
| Energy Transfer Operating LP 3.75% 2030 | | | 1,645 | | | | 1,754 | |
| Energy Transfer Partners LP 4.20% 2023 | | | 155 | | | | 163 | |
| Energy Transfer Partners LP 4.50% 2024 | | | 90 | | | | 97 | |
| EOG Resources, Inc. 4.375% 2030 | | | 501 | | | | 583 | |
| Equinor ASA 3.625% 2028 | | | 165 | | | | 183 | |
| Exxon Mobil Corp. 2.019% 2024 | | | 127 | | | | 131 | |
| Exxon Mobil Corp. 2.44% 2029 | | | 183 | | | | 189 | |
| Kinder Morgan, Inc. 3.15% 2023 | | | 495 | | | | 509 | |
| MPLX LP 3.375% 2023 | | | 75 | | | | 78 | |
| MPLX LP 4.00% 2028 | | | 350 | | | | 385 | |
| ONEOK, Inc. 4.55% 2028 | | | 638 | | | | 719 | |
| ONEOK, Inc. 6.35% 2031 | | | 469 | | | | 596 | |
| Phillips 66 4.30% 2022 | | | 290 | | | | 295 | |
| Phillips 66 3.85% 2025 | | | 1,253 | | | | 1,351 | |
| Pioneer Natural Resources Company 1.125% 2026 | | | 238 | | | | 233 | |
| SA Global Sukuk, Ltd. 1.602% 20265 | | | 1,505 | | | | 1,488 | |
| Saudi Arabian Oil Co. 1.625% 20255 | | | 200 | | | | 199 | |
| Schlumberger BV 4.00% 20255 | | | 165 | | | | 180 | |
| Williams Companies, Inc. 3.50% 2030 | | | 293 | | | | 315 | |
| | | | | | | | 11,728 | |
| | | | | | | | | |
| Real estate 1.16% | | | | | | | | |
| Alexandria Real Estate Equities, Inc. 3.95% 2028 | | | 60 | | | | 67 | |
| Alexandria Real Estate Equities, Inc. 1.875% 2033 | | | 596 | | | | 560 | |
| American Campus Communities, Inc. 3.75% 2023 | | | 300 | | | | 311 | |
| American Campus Communities, Inc. 4.125% 2024 | | | 415 | | | | 447 | |
| American Tower Corp. 1.45% 2026 | | | 982 | | | | 968 | |
| American Tower Corp. 1.60% 2026 | | | 717 | | | | 713 | |
| Corporate Office Properties LP 2.75% 2031 | | | 294 | | | | 295 | |
| Equinix, Inc. 2.90% 2026 | | | 929 | | | | 975 | |
| Equinix, Inc. 1.80% 2027 | | | 326 | | | | 324 | |
| Equinix, Inc. 2.00% 2028 | | | 433 | | | | 429 | |
| Essex Portfolio LP 3.50% 2025 | | | 490 | | | | 521 | |
| Gaming and Leisure Properties, Inc. 3.35% 2024 | | | 242 | | | | 255 | |
| Kimco Realty Corp. 3.40% 2022 | | | 35 | | | | 36 | |
| Public Storage 0.875% 2026 | | | 134 | | | | 131 | |
| Public Storage 1.85% 2028 | | | 553 | | | | 553 | |
| Scentre Group 3.50% 20255 | | | 250 | | | | 265 | |
| Sun Communities Operating LP 2.30% 2028 | | | 559 | | | | 555 | |
| | | | | | | | 7,405 | |
| | | | | | | | | |
| Materials 0.60% | | | | | | | | |
| Air Products and Chemicals, Inc. 1.50% 2025 | | | 757 | | | | 765 | |
| Air Products and Chemicals, Inc. 1.85% 2027 | | | 155 | | | | 158 | |
| Dow Chemical Co. 3.625% 2026 | | | 250 | | | | 271 | |
| Private Client Services Funds | 75 |
| Capital Group Core Bond Fund | | | | | | |
| | | | | | | |
| Bonds, notes & other debt instruments (continued) | | Principal amount
(000) | | | Value
(000) | |
| Corporate bonds, notes & loans (continued) | | | | | | |
| Materials (continued) | | | | | | |
| Dow Chemical Co. 2.10% 2030 | | $ | 1,000 | | | $ | 984 | |
| DowDuPont, Inc. 4.493% 2025 | | | 515 | | | | 573 | |
| LYB International Finance III, LLC 2.25% 2030 | | | 496 | | | | 494 | |
| Vale Overseas, Ltd. 3.75% 2030 | | | 587 | | | | 598 | |
| | | | | | | | 3,843 | |
| | | | | | | | | |
| Total corporate bonds, notes & loans | | | | | | | 176,738 | |
| | | | | | | | | |
| Mortgage-backed obligations 12.24% | | | | | | | | |
| Federal agency mortgage-backed obligations 8.21% | | | | | | | | |
| Fannie Mae Pool #889995 5.50% 20386 | | | 160 | | | | 184 | |
| Fannie Mae Pool #MA4387 2.00% 20416 | | | 853 | | | | 870 | |
| Fannie Mae Pool #AI5236 5.00% 20416 | | | 294 | | | | 333 | |
| Fannie Mae Pool #AI8806 5.00% 20416 | | | 52 | | | | 59 | |
| Fannie Mae, Series 2007-33, Class HE, 5.50% 20376 | | | 3 | | | | 4 | |
| Fannie Mae, Series 2012-M13, Class A2, Multi Family, 2.377% 20226 | | | 126 | | | | 127 | |
| Fannie Mae, Series 2015-M4, Class AV2, Multi Family, 2.509% 20226,7 | | | 172 | | | | 173 | |
| Fannie Mae, Series 2012-M2, Class A2, Multi Family, 2.717% 20226 | | | 23 | | | | 23 | |
| Fannie Mae, Series 2016-M2, Class AV2, Multi Family, 2.152% 20236 | | | 303 | | | | 307 | |
| Fannie Mae, Series 2016-M3, Class ASQ2, Multi Family, 2.263% 20236 | | | 40 | | | | 40 | |
| Fannie Mae, Series 2013-M12, Class APT, Multi Family, 2.405% 20236,7 | | | 300 | | | | 305 | |
| Fannie Mae, Series 2017-M3, Class AV2, Multi Family, 2.526% 20246,7 | | | 253 | | | | 259 | |
| Fannie Mae, Series 2017-M10, Class AV2, Multi Family, 2.554% 20246,7 | | | 403 | | | | 417 | |
| Fannie Mae, Series 2017-M15, Class AV2, Multi Family, 2.621% 20246,7 | | | 365 | | | | 379 | |
| Fannie Mae, Series 2015-M8, Class A1, Multi Family, 2.344% 20256 | | | 29 | | | | 30 | |
| Fannie Mae, Series 2016-M9, Class A1, Multi Family, 2.003% 20266 | | | 43 | | | | 43 | |
| Fannie Mae, Series 2016-M5, Class A1, Multi Family, 2.073% 20266 | | | 333 | | | | 341 | |
| Fannie Mae, Series 2016-M11, Class A1, Multi Family, 2.08% 20266 | | | 500 | | | | 512 | |
| Fannie Mae, Series 2016-M12, Class A1, Multi Family, 2.132% 20266 | | | 210 | | | | 215 | |
| Fannie Mae, Series 2016-M6, Class A1, Multi Family, 2.137% 20266 | | | 164 | | | | 167 | |
| Fannie Mae, Series 2016-M4, Class A1, Multi Family, 2.187% 20266 | | | 227 | | | | 233 | |
| Fannie Mae, Series 2017-M7, Class A1, Multi Family, 2.595% 20266 | | | 62 | | | | 62 | |
| Fannie Mae, Series 2017-M8, Class A1, Multi Family, 2.654% 20276 | | | 19 | | | | 19 | |
| Fannie Mae, Series 2017-M7, Class A2, Multi Family, 2.961% 20276,7 | | | 461 | | | | 493 | |
| Fannie Mae, Series 2017-M15, Class ATS1, Multi Family, 2.987% 20275,6 | | | 37 | | | | 38 | |
| Freddie Mac, Series 3272, Class PA, 6.00% 20376 | | | 10 | | | | 12 | |
| Freddie Mac, Series K020, Class A2, Multi Family, 2.373% 20226 | | | 241 | | | | 243 | |
| Freddie Mac, Series K718, Class A2, Multi Family, 2.791% 20226 | | | 606 | | | | 608 | |
| Freddie Mac Seasoned Credit Risk Transfer Trust, Series 2017-1, Class HA, 3.00% 20566,7 | | | 381 | | | | 394 | |
| Freddie Mac Seasoned Credit Risk Transfer Trust, Series 2017-2, Class MA, 3.00% 20566 | | | 280 | | | | 290 | |
| Freddie Mac Seasoned Credit Risk Transfer Trust, Series 2017-2, Class HA, 3.00% 20566,7 | | | 278 | | | | 288 | |
| Freddie Mac Seasoned Credit Risk Transfer Trust, Series 2017-4, Class HT, 3.25% 20576,7 | | | 158 | | | | 168 | |
| Freddie Mac Seasoned Credit Risk Transfer Trust, Series 2018-2, Class MT, 3.50% 20576 | | | 345 | | | | 364 | |
| Freddie Mac Seasoned Credit Risk Transfer Trust, Series 2017-4, Class MT, 3.50% 20576 | | | 173 | | | | 183 | |
| Freddie Mac Seasoned Credit Risk Transfer Trust, Series 2019-2, Class MA, 3.50% 20586 | | | 1,418 | | | | 1,478 | |
| Freddie Mac Seasoned Credit Risk Transfer Trust, Series 2019-4, Class MA, 3.00% 20596 | | | 1,398 | | | | 1,445 | |
| Freddie Mac Seasoned Loan Structured Transaction Trust, Series 2018-1, Class A1, 3.50% 20286 | | | 1,503 | | | | 1,565 | |
| Government National Mortgage Assn. 2.00% 20516,8 | | | 2,410 | | | | 2,441 | |
| Government National Mortgage Assn. 2.00% 20516,8 | | | 483 | | | | 488 | |
| Government National Mortgage Assn. Pool #694836 5.661% 20596 | | | 2 | | | | 2 | |
| Government National Mortgage Assn. Pool #776095 4.907% 20646 | | | 1 | | | | 1 | |
| Government National Mortgage Assn. Pool #AA7554 6.64% 20646 | | | 8 | | | | 8 | |
| Government National Mortgage Assn., Series 2012-H20, Class PT, 0.899% 20626,7 | | | 265 | | | | 264 | |
| Uniform Mortgage-Backed Security 2.00% 20516,8 | | | 7,666 | | | | 7,651 | |
| Uniform Mortgage-Backed Security 2.00% 20526,8 | | | 6,981 | | | | 6,953 | |
| Uniform Mortgage-Backed Security 2.50% 20526,8 | | | 21,615 | | | | 22,103 | |
| | | | | | | | 52,582 | |
| 76 | Private Client Services Funds |
| Capital Group Core Bond Fund | | | | | | |
| | | | | | | |
| Bonds, notes & other debt instruments (continued) | | Principal amount
(000) | | | Value
(000) | |
| Mortgage-backed obligations (continued) | | | | | | |
| Collateralized mortgage-backed obligations (privately originated) 2.44% | | | | | | |
| Bellemeade Re, Ltd., Series 2019-3A, Class M1A, 1.189% 20295,6,7 | | $ | 30 | | | $ | 30 | |
| Cascade Funding Mortgage Trust, Series 2020-HB4, Class A, 0.946% 20305,6,7 | | | 217 | | | | 217 | |
| Cascade Funding Mortgage Trust, Series 2021-HB6, Class A, 0.898% 20365,6,7 | | | 1,231 | | | | 1,232 | |
| Credit Suisse Mortgage Trust, Series 2017-RPL3, Class A1, 2.00% 20605,6,7 | | | 345 | | | | 349 | |
| Finance of America Structured Securities Trust, Series 2019-JR2, Class A1, 2.00% 20695,6 | | | 704 | | | | 774 | |
| Home Partners of America Trust, Series 2021-2, Class A, 1.901% 20265,6,9 | | | 565 | | | | 565 | |
| Legacy Mortgage Asset Trust, Series 2019-GS5, Class A1, 3.20% 20595,6,7 | | | 544 | | | | 547 | |
| Legacy Mortgage Asset Trust, Series 2019-GS7, Class A1, 3.25% 20595,6,7 | | | 839 | | | | 844 | |
| Legacy Mortgage Asset Trust, Series 2019-GS2, Class A1, 3.75% 20595,6,7 | | | 527 | | | | 528 | |
| Mello Warehouse Securitization Trust, Series 2020-2, Class A, (1-month USD-LIBOR + 0.80%) 0.889% 20535,6,7 | | | 777 | | | | 776 | |
| Mello Warehouse Securitization Trust, Series 2020-1, Class A, (1-month USD-LIBOR + 0.90%) 0.989% 20535,6,7 | | | 719 | | | | 722 | |
| Mello Warehouse Securitization Trust, Series 2021-3, Class A, (1-month USD-LIBOR + 0.85%) 0.934% 20555,6,7 | | | 808 | | | | 814 | |
| MRA Issuance Trust, Series 2020-10, Class A, (1-month USD-LIBOR + 1.70%) 1.782% 20225,6,7 | | | 1,305 | | | | 1,307 | |
| NewRez Warehouse Securitization Trust, Series 2021-1, Class A, (1-month USD-LIBOR + 0.75%) 0.839% 20555,6,7 | | | 5,557 | | | | 5,557 | |
| RMF Proprietary Issuance Trust, Series 2019-1, Class A, 2.75% 20635,6,7 | | | 332 | | | | 328 | |
| Station Place Securitization Trust, Series 2021-WL2, Class A, (1-month USD-LIBOR + 0.70%) 0.789% 20545,6,7 | | | 1,000 | | | | 1,001 | |
| | | | | | | | 15,591 | |
| | | | | | | | | |
| Commercial mortgage-backed securities 1.59% | | | | | | | | |
| BX Trust, Series 2021-SDMF, Class A, (1-month USD-LIBOR + 0.589%) 0.679% 20345,6,7 | | | 1,240 | | | | 1,223 | |
| BX Trust, Series 2021-VOLT, Class A, (1-month USD-LIBOR + 0.70%) 0.79% 20365,6,7 | | | 693 | | | | 694 | |
| BX Trust, Series 2021-ARIA, Class A, (1-month USD-LIBOR + 0.899%) 0.979% 20365,6,7 | | | 664 | | | | 664 | |
| BX Trust, Series 2021-VOLT, Class B, (1-month USD-LIBOR + 0.95%) 1.04% 20365,6,7 | | | 509 | | | | 510 | |
| BX Trust, Series 2021-SOAR, Class A, (1-month USD-LIBOR + 0.67%) 0.76% 20385,6,7 | | | 870 | | | | 869 | |
| BX Trust, Series 2021-SOAR, Class B, (1-month USD-LIBOR + 0.87%) 0.96% 20385,6,7 | | | 327 | | | | 327 | |
| BX Trust, Series 2021-SOAR, Class C, (1-month USD-LIBOR + 1.10%) 1.19% 20385,6,7 | | | 221 | | | | 221 | |
| Extended Stay America Trust, Series 2021-ESH, Class A, (1-month USD-LIBOR + 1.08%) 1.171% 20385,6,7 | | | 261 | | | | 262 | |
| Extended Stay America Trust, Series 2021-ESH, Class B, (1-month USD-LIBOR + 1.38%) 1.471% 20385,6,7 | | | 191 | | | | 191 | |
| Hawaii Hotel Trust, Series 2019-MAUI, Class A, (1-month USD-LIBOR + 1.15%) 1.24% 20385,6,7 | | | 1,500 | | | | 1,504 | |
| JPMorgan Chase Commercial Mortgage Securities Trust, Series 2021-410T, Class A, 2.287% 20425,6 | | | 461 | | | | 470 | |
| LUXE Commercial Mortgage Trust, Series 21-TRIP, Class A, (1-month USD-LIBOR + 1.05%) 1.15% 20385,6,7 | | | 1,343 | | | | 1,346 | |
| Manhattan West Mortgage Trust, Series 2020-1MW, Class A, 2.13% 20395,6 | | | 1,262 | | | | 1,279 | |
| MHC Commercial Mortgage Trust, CMO, Series 2021-MHC, Class A, (1-month USD-LIBOR + 0.801%) 0.891% 20265,6,7 | | | 460 | | | | 461 | |
| Motel 6 Trust, Series 2021-MTL6, Class A, (1-month USD-LIBOR + 0.90%) 0.99% 20385,6,7 | | | 164 | | | | 164 | |
| | | | | | | | 10,185 | |
| | | | | | | | | |
| Total mortgage-backed obligations | | | | | | | 78,358 | |
| | | | | | | | | |
| Asset-backed obligations 10.46% | | | | | | | | |
| Aesop Funding LLC, Series 2019-2A, Class A, 3.35% 20255,6 | | | 750 | | | | 793 | |
| Aesop Funding LLC, Series 2020-2, Class A, 2.02% 20275,6 | | | 539 | | | | 549 | |
| Aesop Funding LLC, Series 2020-2A, Class B, 2.96% 20275,6 | | | 138 | | | | 144 | |
| Affirm Asset Securitization Trust, Series 2021-A, Class A, 0.88% 20255,6 | | | 462 | | | | 463 | |
| Affirm Asset Securitization Trust, Series 2020-A, Class A, 2.10% 20255,6 | | | 473 | | | | 475 | |
| Affirm Asset Securitization Trust, Series 2021-B, Class A, 1.03% 20265,6 | | | 1,136 | | | | 1,132 | |
| Allegro CLO, Ltd., Series 2016-1A, Class AR2, (3-month USD-LIBOR + 0.95%) 1.074% 20305,6,7 | | | 750 | | | | 750 | |
| Allegro CLO, Ltd., Series 2017-1A, Class AR, (3-month USD-LIBOR + 0.95%) 1.072% 20305,6,7 | | | 492 | | | | 492 | |
| Ares CLO, Ltd., Series 2017-42A, Class AR, (3-month USD-LIBOR + 0.92%) 1.048% 20285,6,7 | | | 1,053 | | | | 1,053 | |
| Ballyrock CLO, Ltd., Series 2019-2A, Class A1AR, (3-month USD-LIBOR + 1.00%) 1.131% 20305,6,7 | | | 1,095 | | | | 1,095 | |
| Private Client Services Funds | 77 |
| Capital Group Core Bond Fund | | | | | | |
| | | | | | | |
| Bonds, notes & other debt instruments (continued) | | Principal amount
(000) | | | Value
(000) | |
| Asset-backed obligations (continued) | | | | | | |
| Bankers Healthcare Group Securitization Trust, Series 2021-A, Class A, 1.42% 20335,6 | | $ | 111 | | | $ | 111 | |
| Bankers Healthcare Group Securitization Trust, Series 2021-B, Class A, 0.90% 20345,6 | | | 228 | | | | 228 | |
| CarMaxAuto Owner Trust, Series 2020-1, Class A2, 1.87% 20236 | | | 21 | | | | 21 | |
| CarMaxAuto Owner Trust, Series 2019-2, Class A3, 2.68% 20246 | | | 408 | | | | 413 | |
| CarMaxAuto Owner Trust, Series 2019-2, Class A4, 2.77% 20246 | | | 805 | | | | 828 | |
| CarMaxAuto Owner Trust, Series 2019-2, Class B, 3.01% 20246 | | | 775 | | | | 800 | |
| CarMaxAuto Owner Trust, Series 2019-2, Class C, 3.16% 20256 | | | 1,150 | | | | 1,186 | |
| Castlelake Aircraft Securitization Trust, Series 2021-2A, Class A, 2.852% 20375,6 | | | 593 | | | | 593 | |
| Castlelake Aircraft Securitization Trust, Series 2017-1R, Class A, 2.741% 20415,6 | | | 203 | | | | 203 | |
| Cent CLO, Ltd., Series 2014-21A, Class AR, (3-month USD-LIBOR + 0.97%) 1.105% 20305,6,7 | | | 1,557 | | | | 1,557 | |
| CF Hippolyta LLC, Series 2020-1, Class A1, 1.69% 20605,6 | | | 1,016 | | | | 1,017 | |
| CF Hippolyta LLC, Series 2020-1, Class A2, 1.99% 20605,6 | | | 166 | | | | 165 | |
| CF Hippolyta LLC, Series 2020-1, Class B1, 2.28% 20605,6 | | | 266 | | | | 267 | |
| CF Hippolyta LLC, Series 2020-1, Class B2, 2.60% 20605,6 | | | 93 | | | | 94 | |
| CF Hippolyta LLC, Series 2021-1, Class A1, 1.53% 20615,6 | | | 458 | | | | 454 | |
| CLI Funding V LLC, Series 2020-1A, Class A, 2.08% 20455,6 | | | 428 | | | | 427 | |
| CLI Funding V LLC, Series 2021-1A, Class A, 1.64% 20465,6 | | | 554 | | | | 544 | |
| CPS Auto Receivables Trust, Series 2019-B, Class C, 3.35% 20245,6 | | | 150 | | | | 150 | |
| Drive Auto Receivables Trust, Series 2020-1, Class B, 2.08% 20246 | | | 1,233 | | | | 1,236 | |
| Drive Auto Receivables Trust, Series 2020-1, Class C, 2.36% 20266 | | | 2,166 | | | | 2,193 | |
| Drivetime Auto Owner Trust, Series 2020-1, Class A, 1.94% 20235,6 | | | 2 | | | | 2 | |
| Drivetime Auto Owner Trust, Series 2020-1, Class B, 2.16% 20245,6 | | | 1,000 | | | | 1,005 | |
| Dryden Senior Loan Fund, CLO, Series 2017-47A, Class A1R, (3-month USD-LIBOR + 0.98%) 1.104% 20285,6,7 | | | 1,643 | | | | 1,643 | |
| EDvestinU Private Education Loan LLC, Series 2021-A, Class A, 1.80% 20455,6 | | | 88 | | | | 87 | |
| Exeter Automobile Receivables Trust, Series 2019-2A, Class C, 3.30% 20245,6 | | | 517 | | | | 521 | |
| First Investors Auto Owner Trust, Series 2021-1A, Class A, 0.45% 20265,6 | | | 283 | | | | 283 | |
| FirstKey Homes Trust, Series 2020-SFR2, Class A, 1.266% 20375,6 | | | 237 | | | | 234 | |
| Ford Credit Auto Owner Trust, Series 2020-A, Class A3, 1.04% 20246 | | | 433 | | | | 435 | |
| Ford Credit Auto Owner Trust, Series 2020-1, Class A, 2.04% 20315,6 | | | 582 | | | | 597 | |
| Ford Credit Auto Owner Trust, Series 2021-1, Class A, 1.37% 20335,6 | | | 439 | | | | 438 | |
| GCI Funding I LLC, Series 2020-1, Class A, 2.82% 20455,6 | | | 167 | | | | 169 | |
| GCI Funding I LLC, Series 2021-1, Class A, 2.38% 20465,6 | | | 443 | | | | 445 | |
| Global SC Finance V SRL, Series 2020-1A, Class A, 2.17% 20405,6 | | | 1,336 | | | | 1,343 | |
| Global SC Finance VII SRL, Series 2020-2A, Class A, 2.26% 20405,6 | | | 893 | | | | 900 | |
| Global SC Finance VII SRL, Series 2021-1A, Class A, 1.86% 20415,6 | | | 1,074 | | | | 1,064 | |
| GM Financial Automobile Leasing Trust, Series 2020-2, Class A2A, 0.71% 20226 | | | 51 | | | | 51 | |
| GM Financial Automobile Leasing Trust, Series 2020-2, Class A3, 0.80% 20236 | | | 208 | | | | 209 | |
| Hertz Vehicle Financing LLC, Series 2021-1A, Class A, 1.21% 20255,6 | | | 1,138 | | | | 1,133 | |
| Hertz Vehicle Financing LLC, Series 2021-1A, Class B, 1.56% 20255,6 | | | 122 | | | | 122 | |
| Hertz Vehicle Financing LLC, Series 2021-2A, Class A, 1.68% 20275,6 | | | 1,234 | | | | 1,229 | |
| Hertz Vehicle Financing LLC, Series 2021-2A, Class B, 2.12% 20275,6 | | | 132 | | | | 132 | |
| Honda Auto Receivables Owner Trust, Series 2019-2, Class A3, 2.52% 20236 | | | 704 | | | | 710 | |
| Longfellow Place CLO, Ltd., Series 2013-1A, Class AR3, (3-month USD-LIBOR + 1.00%) 1.124% 20295,6,7 | | | 909 | | | | 909 | |
| Madison Park Funding, Ltd., CLO, Series 2015-17A, Class AR2, (3-month USD-LIBOR + 1.00%) 1.13% 20305,6,7 | | | 1,665 | | | | 1,667 | |
| Marathon CLO, Ltd., Series 2017-9A, Class A1AR, (3-month USD-LIBOR + 1.15%) 1.274% 20295,6,7 | | | 794 | | | | 794 | |
| Mercury Financial Credit Card Master Trust, Series 2021-1A, Class A, 1.54% 20265,6 | | | 1,100 | | | | 1,103 | |
| Mission Lane Credit Card Master Trust, Series 2021-A, Class A, 1.59% 20265,6 | | | 380 | | | | 379 | |
| Navient Student Loan Trust, Series 2021-A, Class A, 0.84% 20695,6 | | | 175 | | | | 174 | |
| Navient Student Loan Trust, Series 2021-C, Class A, 1.06% 20695,6 | | | 789 | | | | 787 | |
| Nelnet Student Loan Trust, Series 2021-C, Class AFX, 1.32% 20625,6 | | | 1,821 | | | | 1,808 | |
| Nelnet Student Loan Trust, Series 2021-A, Class APT1, 1.36% 20625,6 | | | 922 | | | | 914 | |
| Nelnet Student Loan Trust, Series 2021-B, Class AFX, 1.42% 20625,6 | | | 1,730 | | | | 1,722 | |
| New Economy Assets Phase 1 Issuer, LLC, Series 2021-1, Class A1, 1.91% 20615,6 | | | 2,723 | | | | 2,717 | |
| Newark BSL CLO 2, Ltd., Series 2017-1A, Class A1R, (3-month USD-LIBOR + 0.97%) 1.094% 20305,6,7 | | | 529 | | | | 529 | |
| Nissan Auto Receivables Owner Trust, Series 2019-A, Class A-3, 2.90% 20236 | | | 186 | | | | 188 | |
| Oportun Funding LLC, Series 2021-B, Class A, 1.47% 20315,6 | | | 288 | | | | 288 | |
| OSW Structured Asset Trust, Series 2020-RPL1, Class A1, 3.072% 20595,6,7 | | | 2,996 | | | | 3,007 | |
| Palmer Square Loan Funding, CLO, Series 2021-4A, Class A1, (3-month USD-LIBOR + 0.80%) 0.928% 20295,6,7 | | | 1,500 | | | | 1,500 | |
| Palmer Square Loan Funding, CLO, Series 2021-4A, Class A2, (3-month USD-LIBOR + 1.40%) 1.528% 20295,6,7 | | | 856 | | | | 856 | |
| Palmer Square Loan Funding, CLO, Series 2020-4, Class A1, (3-month USD-LIBOR + 1.00%) 1.129% 20285,6,7 | | | 443 | | | | 443 | |
| Palmer Square Loan Funding, CLO, Series 2021-1, Class A1, (3-month USD-LIBOR + 0.90%) 1.032% 20295,6,7 | | | 198 | | | | 198 | |
| Race Point CLO, Ltd., Series 2015-9A, Class A1A2, (3-month USD-LIBOR + 0.94%) 1.064% 20305,6,7 | | | 1,390 | | | | 1,390 | |
| Santander Drive Auto Receivables Trust, Series 2019-3, Class C, 2.49% 20256 | | | 693 | | | | 697 | |
| 78 | Private Client Services Funds |
| Capital Group Core Bond Fund | | | | | | |
| | | | | | | |
| Bonds, notes & other debt instruments (continued) | | Principal amount
(000) | | | Value
(000) | |
| Asset-backed obligations (continued) | | | | | | |
| SMB Private Education Loan Trust, Series 2021-A, Class A1, (1-month USD-LIBOR + 0.50%) 0.59% 20535,6,7 | | $ | 86 | | | $ | 86 | |
| SMB Private Education Loan Trust, Series 2021-A, Class APT2, 1.07% 20535,6 | | | 257 | | | | 252 | |
| Sound Point CLO, Ltd., Series 2017-3A, Class A1R, (3-month USD-LIBOR + 0.98%) 1.112% 20305,6,7 | | | 1,660 | | | | 1,661 | |
| Sound Point CLO, Ltd., Series 2017-2A, Class AR, (3-month USD-LIBOR + 0.98%) 1.112% 20305,6,7 | | | 970 | | | | 970 | |
| Sound Point CLO, Ltd., Series 2015-1RA, Class AR, (3-month USD-LIBOR + 1.08%) 1.204% 20305,6,7 | | | 895 | | | | 895 | |
| Stellar Jay Ireland DAC, Series 2021-1, Class A, 3.967% 20285,6,9 | | | 898 | | | | 898 | |
| Stonepeak, Series 2021-1A, Class AA, 2.301% 20335,6 | | | 377 | | | | 379 | |
| SuttonPark Structured Settlements, Series 2021-1, Class A, 1.95% 20755,6 | | | 538 | | | | 534 | |
| Textainer Marine Containers, Ltd., Series 2021-1A, Class A, 1.68% 20465,6 | | | 196 | | | | 192 | |
| Textainer Marine Containers, Ltd., Series 2021-2A, Class A, 2.23% 20465,6 | | | 1,152 | | | | 1,156 | |
| TIF Funding II LLC, Series 2021-1A, Class A, 1.65% 20465,6 | | | 658 | | | | 641 | |
| Toyota Auto Loan Extended Note Trust, Series 2019-1, Class A, 2.56% 20315,6 | | | 1,250 | | | | 1,301 | |
| Toyota Auto Loan Extended Note Trust, Series 2020-1, Class A, 1.35% 20335,6 | | | 445 | | | | 447 | |
| Toyota Auto Receivables Owner Trust, Series 2019-B, Class A3, 2.57% 20236 | | | 603 | | | | 608 | |
| Triton Container Finance VIII LLC, Series 2020-1, Class A, 2.11% 20455,6 | | | 1,163 | | | | 1,165 | |
| Triton Container Finance VIII LLC, Series 2021-1, Class A, 1.86% 20465,6 | | | 782 | | | | 771 | |
| Volkswagen Auto Lease Trust, Series 2019-A, Class A3, 1.99% 20226 | | | 750 | | | | 754 | |
| Westlake Automobile Receivables Trust, Series 2019-2A, Class B, 2.62% 20245,6 | | | 18 | | | | 18 | |
| | | | | | | | 66,983 | |
| | | | | | | | | |
| Federal agency bonds & notes 2.74% | | | | | | | | |
| Fannie Mae 2.375% 2023 | | | 2,442 | | | | 2,505 | |
| Fannie Mae 0.875% 2030 | | | 2,563 | | | | 2,411 | |
| Freddie Mac 0.25% 2023 | | | 3,439 | | | | 3,430 | |
| Freddie Mac 0.375% 2025 | | | 9,449 | | | | 9,223 | |
| | | | | | | | 17,569 | |
| | | | | | | | | |
| Bonds & notes of governments & government agencies outside the U.S. 2.51% | | | | | | | | |
| Asian Development Bank 0.625% 2024 | | | 1,526 | | | | 1,516 | |
| Canada 0.75% 2026 | | | 2,350 | | | | 2,297 | |
| Denmark (Kingdom of) 0.125% 20225 | | | 660 | | | | 658 | |
| Denmark (Kingdom of) 0.125% 2022 | | | 655 | | | | 653 | |
| European Investment Bank 2.25% 2022 | | | 751 | | | | 757 | |
| European Investment Bank 0.75% 2026 | | | 758 | | | | 741 | |
| Inter-American Development Bank 0.50% 2024 | | | 500 | | | | 495 | |
| KfW 0.375% 2025 | | | 1,010 | | | | 987 | |
| Kommunalbanken 0.50% 20245 | | | 442 | | | | 437 | |
| Kommunalbanken 0.375% 20255 | | | 2,000 | | | | 1,949 | |
| Kommuninvest i Sverige Aktiebolag 0.25% 20235 | | | 905 | | | | 902 | |
| Manitoba (Province of) 3.05% 2024 | | | 200 | | | | 211 | |
| Ontario (Province of) 3.20% 2024 | | | 500 | | | | 531 | |
| Ontario Teachers’ Finance Trust 0.875% 20265 | | | 902 | | | | 882 | |
| Quebec (Province of) 0.60% 2025 | | | 1,600 | | | | 1,573 | |
| Saudi Arabia (Kingdom of) 4.00% 20255 | | | 430 | | | | 468 | |
| Saudi Arabia (Kingdom of) 4.50% 20305 | | | 445 | | | | 518 | |
| United Mexican States 4.15% 2027 | | | 460 | | | | 514 | |
| | | | | | | | 16,089 | |
| | | | | | | | | |
| Municipals 0.62% | | | | | | | | |
| California 0.04% | | | | | | | | |
| High-Speed Passenger Train G.O. Rev. Ref. Bonds, Series 2017-A, 2.367% 2022 | | | 250 | | | | 252 | |
| | | | | | | | | |
| Florida 0.43% | | | | | | | | |
| Board of Administration Fin. Corp., Rev. Bonds, Series 2020-A, 1.258% 2025 | | | 1,140 | | | | 1,141 | |
| Board of Administration Fin. Corp., Rev. Bonds, Series 2020-A, 1.705% 2027 | | | 805 | | | | 803 | |
| Board of Administration Fin. Corp., Rev. Bonds, Series 2020-A, 2.154% 2030 | | | 810 | | | | 809 | |
| | | | | | | | 2,753 | |
| Private Client Services Funds | 79 |
| Capital Group Core Bond Fund | | | | | | |
| | | | | | | |
| Bonds, notes & other debt instruments (continued) | | Principal amount
(000) | | | Value
(000) | |
| Municipals (continued) | | | | | | |
| New York 0.15% | | | | | | |
| Dormitory Auth., Taxable State Personal Income Tax Rev. Bonds (General Purpose), Series 2021-C, 1.748% 2028 | | $ | 965 | | | $ | 963 | |
| | | | | | | | | |
| Washington 0.00% | | | | | | | | |
| Energy Northwest, Electric Rev. Bonds (Columbia Generating Station), Series 2015-B, 2.814% 2024 | | | 20 | | | | 21 | |
| | | | | | | | | |
| Total municipals | | | | | | | 3,989 | |
| | | | | | | | | |
| Total bonds, notes & other debt instruments (cost: $604,809,000) | | | | | | | 612,766 | |
| | | | | | | | | |
| Short-term securities 9.99% | | | Shares | | | | | |
| Money market investments 9.99% | | | | | | | | |
| Capital Group Central Cash Fund 0.06%10,11 | | | 639,514 | | | | 63,951 | |
| | | | | | | | | |
| Total short-term securities (cost: $63,954,000) | | | | | | | 63,951 | |
| Total investment securities 105.67% (cost: $668,763,000) | | | | | | | 676,717 | |
| Other assets less liabilities (5.67%) | | | | | | | (36,322 | ) |
| | | | | | | | | |
| Net assets 100.00% | | | | | | $ | 640,395 | |
| Futures contracts | | | | | | | | | |
| | | | | | | | | | | | | | | | |
| Contracts | | Type | | Number of
contracts | | Expiration | | | Notional
amount
(000) | 12
| | Value at
10/31/2021
(000) | 13
| | Unrealized
(depreciation)
appreciation
at 10/31/2021
(000) | |
| 90 Day Euro Dollar Futures | | Long | | 1,255 | | December 2022 | | | $313,750 | | | $ | 311,020 | | | $ | (768 | ) |
| 2 Year U.S. Treasury Note Futures | | Long | | 189 | | December 2021 | | | 37,800 | | | | 41,438 | | | | (175 | ) |
| 5 Year U.S. Treasury Note Futures | | Short | | 406 | | December 2021 | | | (40,600 | ) | | | (49,430 | ) | | | 462 | |
| 10 Year U.S. Treasury Note Futures | | Long | | 168 | | December 2021 | | | 16,800 | | | | 21,958 | | | | (196 | ) |
| 10 Year Ultra U.S. Treasury Note Futures | | Short | | 69 | | December 2021 | | | (6,900 | ) | | | (10,007 | ) | | | 172 | |
| 20 Year U.S. Treasury Bond Futures | | Short | | 13 | | December 2021 | | | (1,300 | ) | | | (2,091 | ) | | | (17 | ) |
| 30 Year Ultra U.S. Treasury Bond Futures | | Short | | 20 | | December 2021 | | | (2,000 | ) | | | (3,928 | ) | | | 15 | |
| | | | | | | | | | | | | | | | | $ | (507 | ) |
| Investments in affiliates11 | | | | | | | | | | | |
| | | | Value of
affiliate at
11/1/2020
(000) | | | | Additions
(000) | | | | Reductions
(000) | | | | Net
realized
loss
(000) | | | | Net
unrealized
depreciation
(000) | | | | Value of
affiliate at
10/31/2021
(000) | | | | Dividend
income
(000) | |
| Short-term securities 9.99% | | | | | | | | | | | | | | | | | | |
| Money market investments 9.99% | | | | | | | | | | | | | | | | | | |
| Capital Group Central Cash Fund 0.06%10 | | $ | 79,218 | | | $ | 179,027 | | | $ | 194,288 | | | $ | (2 | ) | | $ | (4 | ) | | $ | 63,951 | | | $ | 60 | |
| 80 | Private Client Services Funds |
Capital Group Core Bond Fund
| 1 | Amount less than one thousand. |
| 2 | All or a portion of this security was pledged as collateral. The total value of pledged collateral was $721,000, which represented .11% of the net assets of the fund. |
| 3 | Index-linked bond whose principal amount moves with a government price index. |
| 4 | Step bond; coupon rate may change at a later date. |
| 5 | Acquired in a transaction exempt from registration under Rule 144A of the Securities Act of 1933. May be resold in the U.S. in transactions exempt from registration, normally to qualified institutional buyers. The total value of all such securities was $120,128,000, which represented 18.76% of the net assets of the fund. |
| 6 | Principal payments may be made periodically. Therefore, the effective maturity date may be earlier than the stated maturity date. |
| 7 | Coupon rate may change periodically. Reference rate and spread are as of the most recent information available. Some coupon rates are determined by the issuer or agent based on current market conditions; therefore, the reference rate and spread are not available. |
| 8 | Purchased on a TBA basis. |
| 9 | Valued under fair value procedures adopted by authority of the board of trustees. The total value of all such securities was $1,463,000, which represented .23% of the net assets of the fund. |
| 10 | Rate represents the seven-day yield at 10/31/2021. |
| 11 | Part of the same “group of investment companies” as the fund as defined under the Investment Company Act of 1940, as amended. |
| 12 | Notional amount is calculated based on the number of contracts and notional contract size. |
| 13 | Value is calculated based on the notional amount and current market price. |
Key to abbreviations and symbol
Auth. = Authority
CLO = Collateralized Loan Obligations
DAC = Designated Activity Company
Fin. = Finance
G.O. = General Obligation
LIBOR = London Interbank Offered Rate
Ref. = Refunding
Rev. = Revenue
SOFR = Secured Overnight Financing Rate
TBA = To-be-announced
USD/$ = U.S. dollars
| Private Client Services Funds | 81 |
| Financial statements | |
| | |
Statements of assets and liabilities
at October 31, 2021 | (dollars and shares in thousands, except per-share amounts) |
| | | Capital Group
Core Municipal
Fund | | | Capital Group
Short-Term
Municipal Fund | | | Capital Group
California
Core Municipal
Fund | |
| | | | | | | | | | |
| Assets: | | | | | | | | | | | | |
| Investment securities, at value: | | | | | | | | | | | | |
| Unaffiliated issuers | | $ | 792,736 | | | $ | 204,039 | | | $ | 654,377 | |
| Affiliated issuers | | | — | | | | — | | | | — | |
| Cash | | | 6,190 | | | | 350 | | | | 6,318 | |
| Cash collateral pledged for futures contracts | | | 99 | | | | 39 | | | | 133 | |
| Receivables for: | | | | | | | | | | | | |
| Sales of investments | | | — | * | | | — | | | | 3,627 | |
| Sales of fund’s shares | | | 764 | | | | 756 | | | | 5,427 | |
| Dividends and interest | | | 6,583 | | | | 1,804 | | | | 5,782 | |
| Variation margin on futures contracts | | | 4 | | | | 1 | | | | 3 | |
| Total assets | | | 806,376 | | | | 206,989 | | | | 675,667 | |
| | | | | | | | | | | | | |
| Liabilities: | | | | | | | | | | | | |
| Payables for: | | | | | | | | | | | | |
| Purchases of investments | | | 20,733 | | | | 4,198 | | | | 11,225 | |
| Repurchases of fund’s shares | | | 424 | | | | 26 | | | | 172 | |
| Investment advisory services | | | 166 | | | | 43 | | | | 140 | |
| Services provided by related parties | | | — | | | | (1 | ) | | | — | |
| Variation margin on futures contracts | | | — | | | | — | | | | — | |
| Other | | | — | * | | | — | * | | | — | * |
| Total liabilities | | | 21,323 | | | | 4,266 | | | | 11,537 | |
| Net assets at October 31, 2021 | | $ | 785,053 | | | $ | 202,723 | | | $ | 664,130 | |
| | | | | | | | | | | | | |
| Net assets consist of: | | | | | | | | | | | | |
| Capital paid in on shares of beneficial interest | | $ | 769,940 | | | $ | 200,638 | | | $ | 648,872 | |
| Total distributable earnings | | | 15,113 | | | | 2,085 | | | | 15,258 | |
| Net assets at October 31, 2021 | | $ | 785,053 | | | $ | 202,723 | | | $ | 664,130 | |
| | | | | | | | | |
| Investment securities, at cost: | | | | | | | | | | | | |
| Unaffiliated issuers | | $ | 783,028 | | | $ | 202,530 | | | $ | 643,716 | |
| Affiliated issuers | | | — | | | | — | | | | — | |
| Shares outstanding | | | 73,891 | | | | 19,767 | | | | 61,752 | |
| Net asset value per share | | $ | 10.62 | | | $ | 10.26 | | | $ | 10.75 | |
See end of statements of assets and liabilities for footnote.
See notes to financial statements.
| 82 | Private Client Services Funds |
| Financial statements (continued) | |
| | |
Statements of assets and liabilities
at October 31, 2021 (continued) | (dollars and shares in thousands, except per-share amounts) |
| | | Capital Group
California
Short-Term
Municipal Fund | | | Capital Group
Core Bond Fund | |
| | | | | | | | | |
| Assets: | | | | | | | | |
| Investment securities, at value: | | | | | | | | |
| Unaffiliated issuers | | $ | 183,840 | | | $ | 612,766 | |
| Affiliated issuers | | | — | | | | 63,951 | |
| Cash | | | 2,424 | | | | 3 | |
| Cash collateral pledged for futures contracts | | | 25 | | | | — | |
| Receivables for: | | | | | | | | |
| Sales of investments | | | — | | | | 53,694 | |
| Sales of fund’s shares | | | — | * | | | 4,350 | |
| Dividends and interest | | | 1,778 | | | | 1,814 | |
| Variation margin on futures contracts | | | — | | | | 2 | |
| Total assets | | | 188,067 | | | | 736,580 | |
| | | | | | | | | |
| Liabilities: | | | | | | | | |
| Payables for: | | | | | | | | |
| Purchases of investments | | | 6,283 | | | | 95,897 | |
| Repurchases of fund’s shares | | | 26 | | | | 43 | |
| Investment advisory services | | | 39 | | | | 135 | |
| Services provided by related parties | | | — | | | | — | |
| Variation margin on futures contracts | | | — | | | | 110 | |
| Other | | | — | * | | | — | * |
| Total liabilities | | | 6,348 | | | | 96,185 | |
| Net assets at October 31, 2021 | | $ | 181,719 | | | $ | 640,395 | |
| | | | | | | | | |
| Net assets consist of: | | | | | | | | |
| Capital paid in on shares of beneficial interest | | $ | 179,935 | | | $ | 638,411 | |
| Total distributable earnings | | | 1,784 | | | | 1,984 | |
| Net assets at October 31, 2021 | | $ | 181,719 | | | $ | 640,395 | |
| | | | | | | | | |
| Investment securities, at cost: | | | | | | | | |
| Unaffiliated issuers | | $ | 182,583 | | | $ | 604,809 | |
| Affiliated issuers | | | — | | | | 63,954 | |
| Shares outstanding | | | 17,655 | | | | 62,511 | |
| Net asset value per share | | $ | 10.29 | | | $ | 10.24 | |
| * | Amount less than one thousand. |
See notes to financial statements.
| Private Client Services Funds | 83 |
| Financial statements (continued) | |
| | |
Statements of operations
for the year ended October 31, 2021 | (dollars in thousands) |
| | | Capital Group
Core Municipal
Fund | | | Capital Group
Short-Term
Municipal Fund | | | Capital Group
California
Core Municipal
Fund | |
| | | | | | | | | | | | | |
| Investment income: | | | | | | | | | | | | |
| Income (net of non-U.S. taxes*): | | | | | | | | | | | | |
| Dividends from affiliated issuers | | $ | — | | | $ | — | | | $ | — | |
| Interest from unaffiliated issuers | | | 10,717 | | | | 2,352 | | | | 9,237 | |
| | | | 10,717 | | | | 2,352 | | | | 9,237 | |
| Fees and expenses*: | | | | | | | | | | | | |
| Investment advisory services | | | 1,808 | | | | 501 | | | | 1,597 | |
| Transfer agent services | | | 8 | | | | 2 | | | | 8 | |
| Reports to shareholders | | | 18 | | | | 7 | | | | 16 | |
| Registration statement and prospectus | | | 66 | | | | 38 | | | | 13 | |
| Trustees’ compensation | | | 59 | | | | 17 | | | | 53 | |
| Auditing and legal | | | 48 | | | | 41 | | | | 47 | |
| Custodian | | | 10 | | | | 7 | | | | 10 | |
| Other | | | 5 | | | | 1 | | | | 4 | |
| Total fees and expenses before reimbursements | | | 2,022 | | | | 614 | | | | 1,748 | |
| Less reimbursements of fees and expenses: | | | | | | | | | | | | |
| Miscellaneous fee reimbursements | | | — | | | | 11 | | | | — | |
| Total reimbursements of fees and expenses | | | — | | | | 11 | | | | — | |
| Total fees and expenses after reimbursements | | | 2,022 | | | | 603 | | | | 1,748 | |
| Net investment income | | | 8,695 | | | | 1,749 | | | | 7,489 | |
| | | | | | | | | | | | | |
| Net realized gain (loss) and unrealized (depreciation): | | | | | | | | | | | | |
| Net realized gain (loss) on: | | | | | | | | | | | | |
| Investments in: | | | | | | | | | | | | |
| Unaffiliated issuers | | | 6,067 | | | | 1,008 | | | | 4,100 | |
| Affiliated issuers | | | — | | | | — | | | | — | |
| Futures contracts | | | (531 | ) | | | (141 | ) | | | (327 | ) |
| | | | 5,536 | | | | 867 | | | | 3,773 | |
| Net unrealized (depreciation) appreciation on: | | | | | | | | | | | | |
| Investments in: | | | | | | | | | | | | |
| Unaffiliated issuers | | | (7,884 | ) | | | (1,874 | ) | | | (7,709 | ) |
| Affiliated issuers | | | — | | | | — | | | | — | |
| Futures contracts | | | (8 | ) | | | (20 | ) | | | 115 | |
| | | | (7,892 | ) | | | (1,894 | ) | | | (7,594 | ) |
| Net realized gain (loss) and unrealized (depreciation) | | | (2,356 | ) | | | (1,027 | ) | | | (3,821 | ) |
| | | | | | | | | | | | | |
| Net increase (decrease) in net assets resulting from operations | | $ | 6,339 | | | $ | 722 | | | $ | 3,668 | |
See end of statements of operations for footnote.
See notes to financial statements.
| 84 | Private Client Services Funds |
| Financial statements (continued) | |
| | |
Statements of operations
for the year ended October 31, 2021 (continued) | (dollars in thousands) |
| | | Capital Group
California
Short-Term
Municipal Fund | | | Capital Group
Core Bond Fund | |
| | | | | | | | | |
| Investment income: | | | | | | | | |
| Income (net of non-U.S. taxes*): | | | | | | | | |
| Dividends from affiliated issuers | | $ | — | | | $ | 60 | |
| Interest from unaffiliated issuers | | | 1,998 | | | | 9,798 | |
| | | | 1,998 | | | | 9,858 | |
| Fees and expenses*: | | | | | | | | |
| Investment advisory services | | | 475 | | | | 1,502 | |
| Transfer agent services | | | 2 | | | | 7 | |
| Reports to shareholders | | | 7 | | | | 16 | |
| Registration statement and prospectus | | | 9 | | | | 49 | |
| Trustees’ compensation | | | 16 | | | | 49 | |
| Auditing and legal | | | 40 | | | | 48 | |
| Custodian | | | 7 | | | | 18 | |
| Other | | | 1 | | | | 4 | |
| Total fees and expenses before reimbursements | | | 557 | | | | 1,693 | |
| Less reimbursements of fees and expenses: | | | | | | | | |
| Miscellaneous fee reimbursements | | | — | | | | — | |
| Total fees and expenses after reimbursements | | | 557 | | | | 1,693 | |
| Net investment income | | | 1,441 | | | | 8,165 | |
| | | | | | | | | |
| Net realized gain (loss) and unrealized (depreciation): | | | | | | | | |
| Net realized gain (loss) on: | | | | | | | | |
| Investments in: | | | | | | | | |
| Unaffiliated issuers | | | 774 | | | | (751 | ) |
| Affiliated issuers | | | — | | | | (2 | ) |
| Futures contracts | | | (185 | ) | | | (54 | ) |
| Swap contracts | | | — | | | | 193 | |
| | | | 589 | | | | (614 | ) |
| Net unrealized (depreciation) appreciation on: | | | | | | | | |
| Investments in: | | | | | | | | |
| Unaffiliated issuers | | | (1,796 | ) | | | (9,946 | ) |
| Affiliated issuers | | | — | | | | (4 | ) |
| Futures contracts | | | 11 | | | | (784 | ) |
| Swap contracts | | | — | | | | (285 | ) |
| | | | (1,785 | ) | | | (11,019 | ) |
| Net realized gain (loss) and unrealized (depreciation) | | | (1,196 | ) | | | (11,633 | ) |
| | | | | | | | | |
| Net increase (decrease) in net assets resulting from operations | | $ | 245 | | | $ | (3,468 | ) |
| * | Additional information related to non-U.S. taxes and fees and expenses is included in the notes to financial statements. |
See notes to financial statements.
| Private Client Services Funds | 85 |
| Financial statements (continued) | |
| | |
| Statements of changes in net assets | (dollars in thousands) |
| | | Capital Group
Core Municipal
Fund | | | Capital Group
Short-Term
Municipal Fund | | | Capital Group
California
Core Municipal
Fund | |
| | | Year ended October 31, | | | Year ended October 31, | | | Year ended October 31, | |
| | | 2021 | | | 2020 | | | 2021 | | | 2020 | | | 2021 | | | 2020 | |
| Operations: | | | | | | | | | | | | | | | | | | | | | | | | |
| Net investment income | | $ | 8,695 | | | $ | 10,450 | | | $ | 1,749 | | | $ | 2,314 | | | $ | 7,489 | | | $ | 9,164 | |
| Net realized gain (loss) | | | 5,536 | | | | 7,512 | | | | 867 | | | | 1,171 | | | | 3,773 | | | | 5,569 | |
| Net unrealized (depreciation) appreciation | | | (7,892 | ) | | | 5,054 | | | | (1,894 | ) | | | 2,079 | | | | (7,594 | ) | | | 3,519 | |
| Net increase (decrease) in net assets resulting from operations | | | 6,339 | | | | 23,016 | | | | 722 | | | | 5,564 | | | | 3,668 | | | | 18,252 | |
| | | | | | | | | | | | | | | | | | | | | | | | | |
| Distributions paid to shareholders | | | (15,834 | ) | | | (11,198 | ) | | | (2,260 | ) | | | (2,262 | ) | | | (12,004 | ) | | | (9,836 | ) |
| | | | | | | | | | | | | | | | | | | | | | | | | |
| Net capital share transactions | | | 142,622 | | | | 56,358 | | | | (3,942 | ) | | | 78,354 | | | | 45,429 | | | | 62,052 | |
| | | | | | | | | | | | | | | | | | | | | | | | | |
| Total increase (decrease) in net assets | | | 133,127 | | | | 68,176 | | | | (5,480 | ) | | | 81,656 | | | | 37,093 | | | | 70,468 | |
| | | | | | | | | | | | | | | | | | | | | | | | | |
| Net assets: | | | | | | | | | | | | | | | | | | | | | | | | |
| Beginning of year | | | 651,926 | | | | 583,750 | | | | 208,203 | | | | 126,547 | | | | 627,037 | | | | 556,569 | |
| End of year | | $ | 785,053 | | | $ | 651,926 | | | $ | 202,723 | | | $ | 208,203 | | | $ | 664,130 | | | $ | 627,037 | |
| | | | | | | | | | | | | | | |
| | | Capital Group
California
Short-Term
Municipal Fund | | | Capital Group
Core Bond Fund | | | | | | | | | |
| | | Year ended October 31, | | | Year ended October 31, | | | | | | | | | |
| | | 2021 | | | 2020 | | | 2021 | | | 2020 | | | | | | | | | |
| Operations: | | | | | | | | | | | | | | | | | | | | | | | | |
| Net investment income | | $ | 1,441 | | | $ | 1,969 | | | $ | 8,165 | | | $ | 8,989 | | | | | | | | | |
| Net realized gain (loss) | | | 589 | | | | 898 | | | | (614 | ) | | | 10,758 | | | | | | | | | |
| Net unrealized (depreciation) appreciation | | | (1,785 | ) | | | 1,043 | | | | (11,019 | ) | | | 11,281 | | | | | | | | | |
| Net increase (decrease) in net assets resulting from operations | | | 245 | | | | 3,910 | | | | (3,468 | ) | | | 31,028 | | | | | | | | | |
| | | | | | | | | | | | | | | | | | | | | | | | | |
| Distributions paid to shareholders | | | (2,083 | ) | | | (1,955 | ) | | | (22,116 | ) | | | (12,105 | ) | | | | | | | | |
| | | | | | | | | | | | | | | | | | | | | | | | | |
| Net capital share transactions | | | (15,782 | ) | | | 33,553 | | | | 102,154 | | | | 68,147 | | | | | | | | | |
| | | | | | | | | | | | | | | | | | | | | | | | | |
| Total increase (decrease) in net assets | | | (17,620 | ) | | | 35,508 | | | | 76,570 | | | | 87,070 | | | | | | | | | |
| | | | | | | | | | | | | | | | | | | | | | | | | |
| Net assets: | | | | | | | | | | | | | | | | | | | | | | | | |
| Beginning of year | | | 199,339 | | | | 163,831 | | | | 563,825 | | | | 476,755 | | | | | | | | | |
| End of year | | $ | 181,719 | | | $ | 199,339 | | | $ | 640,395 | | | $ | 563,825 | | | | | | | | | |
See notes to financial statements.
| 86 | Private Client Services Funds |
Notes to financial statements
1. Organization
Capital Group Private Client Services Funds (the “series”) is registered under the Investment Company Act of 1940, as amended (the “1940 Act”), as an open-end, diversified management investment company. The series consists of five funds: Capital Group Core Municipal Fund, Capital Group Short-Term Municipal Fund, Capital Group California Core Municipal Fund, Capital Group California Short-Term Municipal Fund and Capital Group Core Bond Fund (each a “fund,” collectively the “funds”). The assets of each fund are segregated, with each fund accounted for separately.
Each fund’s investment objectives are as follows:
Capital Group Core Municipal Fund — Seeks to provide current income exempt from federal income tax and to preserve capital.
Capital Group Short-Term Municipal Fund — Seeks to preserve capital and secondarily to provide current income exempt from federal income tax.
Capital Group California Core Municipal Fund — Seeks to provide current income exempt from federal and California income taxes and to preserve capital.
Capital Group California Short-Term Municipal Fund — Seeks to preserve capital and secondarily to provide current income exempt from federal and California income taxes.
Capital Group Core Bond Fund — Seeks to provide current income and to preserve capital.
2. Significant accounting policies
Each fund is an investment company that applies the accounting and reporting guidance issued in Topic 946 by the U.S. Financial Accounting Standards Board. Each fund’s financial statements have been prepared to comply with U.S. generally accepted accounting principles (“U.S. GAAP”). These principles require the funds’ investment adviser to make estimates and assumptions that affect reported amounts and disclosures. Actual results could differ from those estimates. Subsequent events, if any, have been evaluated through the date of issuance in the preparation of the financial statements. The funds follow the significant accounting policies described in this section, as well as the valuation policies described in the next section on valuation.
Security transactions and related investment income — Security transactions are recorded by the funds as of the date the trades are executed with brokers. Realized gains and losses from security transactions are determined based on the specific identified cost of the securities. In the event a security is purchased with a delayed payment date, the funds will segregate liquid assets sufficient to meet their payment obligations. Dividend income is recognized on the ex-dividend date and interest income is recognized on an accrual basis. Market discounts, premiums and original issue discounts on fixed-income securities are amortized daily over the expected life of the security.
Distributions paid to shareholders — Income dividends and capital gain distributions are recorded on the ex-dividend date.
Currency translation — Assets and liabilities, including investment securities, denominated in currencies other than U.S. dollars are translated into U.S. dollars at the exchange rates supplied by one or more pricing vendors on the valuation date. Purchases and sales of investment securities and income and expenses are translated into U.S. dollars at the exchange rates on the dates of such transactions. The effects of changes in exchange rates on investment securities are included with the net realized gain or loss and net unrealized appreciation or depreciation on investments in the funds’ statements of operations. The realized gain or loss and unrealized appreciation or depreciation resulting from all other transactions denominated in currencies other than U.S. dollars are disclosed separately.
3. Valuation
Capital Research and Management Company (“CRMC”), the funds’ investment adviser, values each fund’s investments at fair value as defined by accounting principles generally accepted in the United State of America. The net asset value per share of each fund is calculated once daily as of the close of regular trading on the New York Stock Exchange, normally 4 p.m. New York time, each day the New York Stock Exchange is open.
| Private Client Services Funds | 87 |
Methods and inputs — The funds’ investment adviser uses the following methods and inputs to establish the fair value of each fund’s assets and liabilities. Use of particular methods and inputs may vary over time based on availability and relevance as market and economic conditions evolve.
Equity securities are generally valued at the official closing price of, or the last reported sale price on, the exchange or market on which such securities are traded, as of the close of business on the day the securities are being valued or, lacking any sales, at the last available bid price. Prices for each security are taken from the principal exchange or market on which the security trades.
Fixed-income securities, including short-term securities, are generally valued at prices obtained from one or more pricing vendors. Vendors value such securities based on one or more of the inputs described in the following table. The table provides examples of inputs that are commonly relevant for valuing particular classes of fixed-income securities in which the funds are authorized to invest. However, these classifications are not exclusive, and any of the inputs may be used to value any other class of fixed-income security.
| Fixed-income class | | Examples of standard inputs |
| All | | Benchmark yields, transactions, bids, offers, quotations from dealers and trading systems, new issues, spreads and other relationships observed in the markets among comparable securities; and proprietary pricing models such as yield measures calculated using factors such as cash flows, financial or collateral performance and other reference data (collectively referred to as “standard inputs”) |
| Corporate bonds, notes & loans; convertible securities | | Standard inputs and underlying equity of the issuer |
| Bonds & notes of governments & government agencies | | Standard inputs and interest rate volatilities |
| Mortgage-backed; asset-backed obligations | | Standard inputs and cash flows, prepayment information, default rates, delinquency and loss assumptions, collateral characteristics, credit enhancements and specific deal information |
| Municipal securities | | Standard inputs and, for certain distressed securities, cash flows or liquidation values using a net present value calculation based on inputs that include, but are not limited to, financial statements and debt contracts |
When the funds’ investment adviser deems it appropriate to do so (such as when vendor prices are unavailable or deemed to be not representative), fixed-income securities will be valued in good faith at the mean quoted bid and ask prices that are reasonably and timely available (or bid prices, if ask prices are not available) or at prices for securities of comparable maturity, quality and type. Some securities may be valued based on their effective maturity or average life, which may be shorter than the stated maturity.
Securities with both fixed-income and equity characteristics, or equity securities traded principally among fixed-income dealers, are generally valued in the manner described for either equity or fixed-income securities, depending on which method is deemed most appropriate by the funds’ investment adviser. The Capital Group Central Cash Fund (“CCF”), a fund within the Capital Group Central Fund Series (“Central Funds”), is valued based upon a floating net asset value, which fluctuates with changes in the value of CCF’s portfolio securities. The underlying securities are valued based on the policies and procedures in CCF’s statement of additional information. Exchange-traded futures are generally valued at the official settlement price of the exchange or market on which such instruments are traded, as of the close of business on the day the futures are being valued. Interest rate swaps and credit default swaps are generally valued by pricing vendors based on market inputs that include the index and term of index, reset frequency, payer/receiver, currency and pay frequency.
Securities and other assets for which representative market quotations are not readily available or are considered unreliable by the funds’ investment adviser are fair valued as determined in good faith under fair valuation guidelines adopted by authority of the funds’ board of trustees as further described. The investment adviser follows fair valuation guidelines, consistent with U.S. Securities and Exchange Commission rules and guidance, to consider relevant principles and factors when making fair value determinations. The investment adviser considers relevant indications of value that are reasonably and timely available to it in determining the fair value to be assigned to a particular security, such as the type and cost of the security; contractual or legal restrictions on resale of the security; relevant financial or business developments of the issuer; actively traded similar or related securities; conversion or exchange rights on the security; related corporate actions; significant events occurring after the close of trading in the security; and changes in overall market conditions. In addition, the closing prices of equity securities that trade in markets outside U.S. time zones may be adjusted to reflect significant events that occur after the close of local trading but before the net asset value of each of the funds is determined. Fair valuations and valuations of investments that are not actively trading involve judgment and may differ materially from valuations that would have been used had greater market activity occurred.
| 88 | Private Client Services Funds |
Processes and structure — The funds’ board of trustees has delegated authority to the funds’ investment adviser to make fair value determinations, subject to board oversight. The investment adviser has established a Joint Fair Valuation Committee (the “Fair Valuation Committee”) to administer, implement and oversee the fair valuation process, and to make fair value decisions. The Fair Valuation Committee regularly reviews its own fair value decisions, as well as decisions made under its standing instructions to the investment adviser’s valuation teams. The Fair Valuation Committee reviews changes in fair value measurements from period to period and may, as deemed appropriate, update the fair valuation guidelines to better reflect the results of back testing and address new or evolving issues. The Fair Valuation Committee reports any changes to the fair valuation guidelines to the board of trustees. The funds’ board and audit committee also regularly review reports that describe fair value determinations and methods.
The funds’ investment adviser has also established a Fixed-Income Pricing Review Group to administer and oversee the fixed-income valuation process, including the use of fixed-income pricing vendors. This group regularly reviews pricing vendor information and market data. Pricing decisions, processes and controls over security valuation are also subject to additional internal reviews facilitated by the investment adviser’s global risk management group.
Classifications — The funds’ investment adviser classifies each fund’s assets and liabilities into three levels based on the inputs used to value the assets or liabilities. Level 1 values are based on quoted prices in active markets for identical securities. Level 2 values are based on significant observable market inputs, such as quoted prices for similar securities and quoted prices in inactive markets. Certain securities trading outside the U.S. may transfer between Level 1 and Level 2 due to valuation adjustments resulting from significant market movements following the close of local trading. Level 3 values are based on significant unobservable inputs that reflect the investment adviser’s determination of assumptions that market participants might reasonably use in valuing the securities. The valuation levels are not necessarily an indication of the risk or liquidity associated with the underlying investment. For example, U.S. government securities are reflected as Level 2 because the inputs used to determine fair value may not always be quoted prices in an active market. The funds’ valuation levels as of October 31, 2021 are as follows (dollars in thousands):
Capital Group Core Municipal Fund
| | | Investment securities | |
| | | Level 1 | | | Level 2 | | | Level 3 | | | Total | |
| Assets: | | | | | | | | | | | | | | | | |
| Bonds, notes & other debt instruments: | | | | | | | | | | | | | | | | |
| Municipals | | $ | — | | | $ | 644,756 | | | $ | — | | | $ | 644,756 | |
| Short-term securities | | | — | | | | 147,980 | | | | — | | | | 147,980 | |
| Total | | $ | — | | | $ | 792,736 | | | $ | — | | | $ | 792,736 | |
| | | | | | | | | | | | | | | | | |
| | | Other investments* | |
| | | Level 1 | | | Level 2 | | | Level 3 | | | Total | |
| Assets: | | | | | | | | | | | | | | | | |
| Unrealized appreciation on futures contracts | | $ | 51 | | | $ | — | | | $ | — | | | $ | 51 | |
| Liabilities: | | | | | | | | | | | | | | | | |
| Unrealized depreciation on futures contracts | | | (58 | ) | | | — | | | | — | | | | (58 | ) |
| Total | | $ | (7 | ) | | $ | — | | | $ | — | | | $ | (7 | ) |
| * | Futures contracts are not included in the fund’s investment portfolio. |
Capital Group Short-Term Municipal Fund
| | | Investment securities | |
| | | Level 1 | | | Level 2 | | | Level 3 | | | Total | |
| Assets: | | | | | | | | | | | | | | | | |
| Bonds, notes & other debt instruments: | | | | | | | | | | | | | | | | |
| Municipals | | $ | — | | | $ | 165,941 | | | $ | — | | | $ | 165,941 | |
| Short-term securities | | | — | | | | 38,098 | | | | — | | | | 38,098 | |
| Total | | $ | — | | | $ | 204,039 | | | $ | — | | | $ | 204,039 | |
| | | | | | | | | | | | | | | | | |
| | | Other investments* | |
| | | Level 1 | | | Level 2 | | | Level 3 | | | Total | |
| Liabilities: | | | | | | | | | | | | | | | | |
| Unrealized depreciation on futures contracts | | $ | (23 | ) | | $ | — | | | $ | — | | | $ | (23 | ) |
| * | Futures contracts are not included in the fund’s investment portfolio. |
| Private Client Services Funds | 89 |
Capital Group California Core Municipal Fund
| | | Investment securities | |
| | | Level 1 | | | Level 2 | | | Level 3 | | | Total | |
| Assets: | | | | | | | | | | | | | | | | |
| Bonds, notes & other debt instruments: | | | | | | | | | | | | | | | | |
| Municipals | | $ | — | | | $ | 563,774 | | | $ | — | | | $ | 563,774 | |
| Short-term securities | | | — | | | | 90,603 | | | | — | | | | 90,603 | |
| Total | | $ | — | | | $ | 654,377 | | | $ | — | | | $ | 654,377 | |
| | | | | | | | | | | | | | | | | |
| | | Other investments* | |
| | | Level 1 | | | Level 2 | | | Level 3 | | | Total | |
| Assets: | | | | | | | | | | | | | | | | |
| Unrealized appreciation on futures contracts | | $ | 94 | | | $ | — | | | $ | — | | | $ | 94 | |
| * | Futures contracts are not included in the fund’s investment portfolio. |
Capital Group California Short-Term Municipal Fund
At October 31, 2021, all of the fund’s investment securities were classified as Level 2.
Capital Group Core Bond Fund
| | | Investment securities | |
| | | Level 1 | | | Level 2 | | | Level 3 | | | Total | |
| Assets: | | | | | | | | | | | | | | | | |
| Bonds, notes & other debt instruments: | | | | | | | | | | | | | | | | |
| U.S. Treasury bonds & notes | | $ | — | | | $ | 253,040 | | | $ | — | | | $ | 253,040 | |
| Corporate bonds, notes & loans | | | — | | | | 176,738 | | | | — | | | | 176,738 | |
| Mortgage-backed obligations | | | — | | | | 78,358 | | | | — | | | | 78,358 | |
| Asset-backed obligations | | | — | | | | 66,983 | | | | — | | | | 66,983 | |
| Federal agency bonds & notes | | | — | | | | 17,569 | | | | — | | | | 17,569 | |
| Bonds & notes of governments & government agencies outside the U.S. | | | — | | | | 16,089 | | | | — | | | | 16,089 | |
| Municipals | | | — | | | | 3,989 | | | | — | | | | 3,989 | |
| Short-term securities | | | 63,951 | | | | — | | | | — | | | | 63,951 | |
| Total | | $ | 63,951 | | | $ | 612,766 | | | $ | — | | | $ | 676,717 | |
| |
| | | Other investments* | |
| | | Level 1 | | | Level 2 | | | Level 3 | | | Total | |
| Assets: | | | | | | | | | | | | | | | | |
| Unrealized appreciation on futures contracts | | $ | 649 | | | $ | — | | | $ | — | | | $ | 649 | |
| Liabilities: | | | | | | | | | | | | | | | | |
| Unrealized depreciation on futures contracts | | | (1,156 | ) | | | — | | | | — | | | | (1,156 | ) |
| Total | | $ | (507 | ) | | $ | — | | | $ | — | | | $ | (507 | ) |
| * | Futures contracts are not included in the fund’s investment portfolio. |
4. Risk factors
Investing in the funds may involve certain risks including, but not limited to, those described below.
Market conditions — The prices of, and the income generated by, the securities held by the fund may decline — sometimes rapidly or unpredictably – due to various factors, including events or conditions affecting the general economy or particular industries; overall market changes; local, regional or global political, social or economic instability; governmental, governmental agency or central bank responses to economic conditions; and currency exchange rate, interest rate and commodity price fluctuations.
| 90 | Private Client Services Funds |
Economies and financial markets throughout the world are highly interconnected. Economic, financial or political events, trading and tariff arrangements, wars, terrorism, cybersecurity events, natural disasters, public health emergencies (such as the spread of infectious disease) and other circumstances in one country or region, including actions taken by governmental or quasi-governmental authorities in response to any of the foregoing, could have impacts on global economies or markets. As a result, whether or not the fund invests in securities of issuers located in or with significant exposure to the countries affected, the value and liquidity of the fund’s investments may be negatively affected by developments in other countries and regions.
Issuer risks — The prices of, and the income generated by, securities held by the fund may decline in response to various factors directly related to the issuers of such securities, including reduced demand for an issuer’s goods or services, poor management performance, major litigation, investigations or other controversies related to the issuer, changes in government regulations affecting the issuer or its competitive environment and strategic initiatives such as mergers, acquisitions or dispositions and the market response to any such initiatives.
Investing in debt instruments — The prices of, and the income generated by, bonds and other debt securities held by the fund may be affected by factors such as the interest rates, maturities and credit ratings of these securities.
Rising interest rates will generally cause the prices of bonds and other debt securities to fall. A general rise in interest rates may cause investors to sell debt securities on a large scale, which could also adversely affect the price and liquidity of debt securities and could also result in increased redemptions from the fund. Falling interest rates may cause an issuer to redeem, call or refinance a debt security before its stated maturity, which may result in the fund failing to recoup the full amount of its initial investment and having to reinvest the proceeds in lower yielding securities. Longer maturity debt securities generally have greater sensitivity to changes in interest rates and may be subject to greater price fluctuations than shorter maturity debt securities.
Bonds and other debt securities are also subject to credit risk, which is the possibility that the credit strength of an issuer or guarantor will weaken or be perceived to be weaker, and/or an issuer of a debt security will fail to make timely payments of principal or interest and the security will go into default. A downgrade or default affecting any of the fund’s securities could cause the value of the fund’s shares to decrease. Credit risk is gauged, in part, by the credit ratings of the debt securities in which the fund invests. However, ratings are only the opinions of the rating agencies issuing them and are not guarantees as to credit quality or an evaluation of market risk. The fund’s investment adviser relies on its own credit analysts to research issuers and issues in seeking to assess credit and default risks.
Credit and liquidity support — Changes in the credit quality of banks and financial institutions providing credit and liquidity support features with respect to securities held by the fund could cause the values of these securities to decline.
Investing in lower rated debt instruments — Lower rated bonds and other lower rated debt securities generally have higher rates of interest and involve greater risk of default or price declines due to changes in the issuer’s creditworthiness than those of higher quality debt securities. The market prices of these securities may fluctuate more than the prices of higher quality debt securities and may decline significantly in periods of general economic difficulty.
Liquidity risk — Certain fund holdings may be or may become difficult or impossible to sell, particularly during times of market turmoil. Liquidity may be impacted by the lack of an active market for a holding, legal or contractual restrictions on resale, or the reduced number and capacity of market participants to make a market in such holding. Market prices for less liquid or illiquid holdings may be volatile, and reduced liquidity may have an adverse impact on the market price of such holdings. Additionally, the sale of less liquid or illiquid holdings may involve substantial delays (including delays in settlement) and additional costs and the fund may be unable to sell such holdings when necessary to meet its liquidity needs or may be forced to sell at a loss.
Investing in similar municipal bonds — Investing significantly in municipal obligations of multiple issuers in the same state or backed by revenues of similar types of projects or industries may make the fund more susceptible to certain economic, political or regulatory occurrences. As a result, the fund has greater risk of volatility, and greater risk of loss, from these investments.
Investing in municipal bonds of issuers within the state of California — Because Capital Group California Core Municipal Fund and Capital Group California Short-Term Municipal Fund invest primarily in securities of issuers within the state of California, these funds are more susceptible to factors adversely affecting issuers of California securities than a comparable municipal bond mutual fund that does not concentrate its investments in a single state. For example, in the past, California voters have passed amendments to the state’s constitution and other measures that limit the taxing and spending authority of California governmental entities, and future voter initiatives may adversely affect California municipal bonds.
| Private Client Services Funds | 91 |
Investing in mortgage-related and other asset-backed securities — Mortgage-related securities, such as mortgage-backed securities, and other asset-backed securities, include debt obligations that represent interests in pools of mortgages or other income-bearing assets, such as consumer loans or receivables. While such securities are subject to the risks associated with investments in debt instruments generally (for example, credit, extension and interest rate risks), they are also subject to other and different risks. Mortgage-backed and other asset-backed securities are subject to changes in the payment patterns of borrowers of the underlying debt, potentially increasing the volatility of the securities and the fund’s net asset value. When interest rates fall, borrowers are more likely to refinance or prepay their debt before its stated maturity. This may result in the fund having to reinvest the proceeds in lower yielding securities, effectively reducing the fund’s income. Conversely, if interest rates rise and borrowers repay their debt more slowly than expected, the time in which the mortgage-backed and other asset-backed securities are paid off could be extended, reducing the fund’s cash available for reinvestment in higher yielding securities. Mortgage-backed securities are also subject to the risk that underlying borrowers will be unable to meet their obligations and the value of property that secures the mortgages may decline in value and be insufficient, upon foreclosure, to repay the associated loans. Investments in asset-backed securities are subject to similar risks.
Investing in securities backed by the U.S. government — Securities backed by the U.S. Treasury or the full faith and credit of the U.S. government are guaranteed only as to the timely payment of interest and principal when held to maturity. Accordingly, the current market values for these securities will fluctuate with changes in interest rates and the credit rating of the U.S. government. Securities issued by U.S. government-sponsored entities and federal agencies and instrumentalities that are not backed by the full faith and credit of the U.S. government are neither issued nor guaranteed by the U.S. government.
Management — The investment adviser to the fund actively manages the fund’s investments. Consequently, the fund is subject to the risk that the methods and analyses, including models, tools and data, employed by the investment adviser in this process may be flawed or incorrect and may not produce the desired results. This could cause the fund to lose value or its investment results to lag relevant benchmarks or other funds with similar objectives.
5. Certain investment techniques
Index-linked bonds — Capital Group Core Bond Fund has invested in index-linked bonds, which are fixed-income securities whose principal value is periodically adjusted to a government price index. Over the life of an index-linked bond, interest is paid on the adjusted principal value. Increases or decreases in the principal value of index-linked bonds are recorded as interest income in the fund’s statement of operations.
Mortgage dollar rolls — Capital Group Core Bond Fund has entered into mortgage dollar roll transactions in which the fund sells a mortgage-backed security to a counterparty and simultaneously enters into an agreement with the same counterparty to buy back a similar security on a specific future date at a predetermined price. Mortgage dollar rolls are accounted for as purchase and sale transactions, which may increase the funds’ portfolio turnover rates.
Futures contracts — Each fund has entered into futures contracts, which provide for the future sale by one party and purchase by another party of a specified amount of a specific financial instrument for a specified price, date, time and place designated at the time the contract is made. Futures contracts are used to strategically manage portfolio volatility and downside equity risk.
Upon entering into futures contracts, and to maintain the fund’s open positions in futures contracts, the fund is required to deposit with a futures broker, known as a futures commission merchant (“FCM”), in a segregated account in the name of the FCM an amount of cash, U.S. government securities or other liquid securities, known as initial margin. The margin required for a particular futures contract is set by the exchange on which the contract is traded to serve as collateral, and may be significantly modified from time to time by the exchange during the term of the contract.
On a daily basis, each fund pays or receives variation margin based on the increase or decrease in the value of the futures contracts and records variation margin on futures contracts in each fund’s statement of assets and liabilities. In addition, each fund segregates liquid assets equivalent to the fund’s outstanding obligations under the contract in excess of the initial margin and variation margin, if any. Futures contracts may involve a risk of loss in excess of the variation margin shown on each fund’s statement of assets and liabilities. Each fund records realized gains or losses at the time the futures contract is closed or expires. Net realized gains or losses and net unrealized appreciation or depreciation from futures contracts are recorded in each fund’s statement of operations.
| 92 | Private Client Services Funds |
Interest rate swaps — Capital Group Core Bond Fund has entered into interest rate swaps, which are agreements to exchange one stream of future interest payments for another based on a specified notional amount. Typically, interest rate swaps exchange a fixed interest rate for a payment that floats relative to a benchmark or vice versa. The series’ investment adviser uses interest rate swaps to manage the interest rate sensitivity of the fund by increasing or decreasing the duration of the fund or a portion of the fund’s portfolio. Risks may arise as a result of the series’ investment adviser incorrectly anticipating changes in interest rates, increased volatility, reduced liquidity and the potential inability of counterparties to meet the terms of their agreements.
Upon entering into an interest rate swap contract, the fund is required to deposit cash, U.S. government securities or other liquid securities, which is known as initial margin. Generally, the initial margin required for a particular interest rate swap is set and held as collateral by the clearinghouse on which the contract is cleared. The amount of initial margin required may be significantly modified from time to time by the clearinghouse during the term of the contract.
On a daily basis, the fund records daily interest accruals related to the exchange of future payments as a receivable and payable in the fund’s statement of assets and liabilities. The fund also pays or receives a variation margin based on the increase or decrease in the value of the interest rate swaps, including accrued interest, and records variation margin on interest rate swaps in the fund’s statement of assets and liabilities. The fund records realized gains and losses on both the net accrued interest and any gain or loss recognized at the time the interest rate swap is closed or expires. Net realized gains or losses, as well as any net unrealized appreciation or depreciation, from interest rate swaps are recorded in the fund’s statement of operations.
Credit default swap indices — Capital Group Core Bond Fund has entered into centrally cleared credit default swap agreements on credit indices (“CDSI”) that involve one party (the protection buyer) making a stream of payments to another party (the protection seller) in exchange for the right to receive a specified return upon the occurrence of a credit event, such as a default or restructuring, with respect to any of the underlying issuers (reference obligations) in the referenced index. The series’ investment adviser uses credit default swaps to assume exposure to a diversified portfolio of credits or to hedge against existing credit risks.
CDSI are portfolios of credit instruments or exposures designed to be representative of some part of the credit market, such as the high-yield or investment-grade credit market. CDSI are generally traded using standardized terms, including a fixed spread and standard maturity dates, and reference all the names in the index. If there is a credit event, it is settled based on that name’s weight in the index. The composition of the underlying issuers or obligations within a particular index may change periodically, usually every six months. A specified credit event may affect all or individual underlying reference obligations included in the index, and will be settled based upon the relative weighting of the affected obligation(s) within the index. The value of each CDSI can be used as a measure of the current payment/performance risk of the CDSI and represents the likelihood of an expected liability or profit should the notional amount of the CDSI be closed or sold as of the period end. An increasing value, as compared to the notional amount of the CDSI, represents a deterioration of the referenced indices’ credit soundness and a greater likelihood of risk of default or other credit event occurring as defined under the terms of the agreement. When the fund provides sell protection, its maximum exposure is the notional amount of the credit default swap agreement.
Upon entering into a centrally cleared CDSI contract, the fund is required to deposit with a derivatives clearing member (“DCM”) in a segregated account in the name of the DCM an amount of cash, U.S. government securities or other liquid securities, which is known as initial margin. Generally, the initial margin required for a particular credit default swap is set and held as collateral by the clearinghouse on which the contract is cleared. The amount of initial margin required may be significantly modified from time to time by the clearinghouse during the term of the contract.
On a daily basis, interest accruals related to the exchange of future payments are recorded as a receivable and payable in the fund’s statement of assets and liabilities. The fund also pays or receives a variation margin based on the increase or decrease in the value of the CDSI, and records variation margin in the fund’s statement of assets and liabilities. The fund records realized gains and losses on both the net accrued interest and any gain or loss recognized at the time the swap is closed or expires. Net realized gains or losses, as well as any net unrealized appreciation or depreciation, from credit default swaps are recorded in the fund’s statement of operations.
| Private Client Services Funds | 93 |
The following table presents the average month-end notional amounts of futures contracts, interest rate swaps and credit default swaps while held for each fund (dollars in thousands):
| | | Futures
contracts | | | Interest
rate
swaps | | | Credit
default
swaps | |
| Capital Group Core Municipal Fund | | | $23,692 | | | | Not applicable | | | | Not applicable | |
| Capital Group Short-Term Municipal Fund | | | 5,167 | | | | Not applicable | | | | Not applicable | |
| Capital Group California Core Municipal Fund | | | 22,667 | | | | Not applicable | | | | Not applicable | |
| Capital Group California Short-Term Municipal | | | 5,420 | * | | | Not applicable | | | | Not applicable | |
| Capital Group Core Bond Fund | | | 231,375 | | | | $53,620 | * | | | $25,000 | * |
| * | No contracts were held at the end of the reporting period; amount represents the average month-end notional amount of contracts while they were held. |
The following tables identify the location and fair value amounts on the funds’ statements of assets and liabilities and/or the effect on the funds’ statements of operations resulting from the funds’ use of futures contracts, interest rate swaps and credit default swaps as of, or for the year ended, October 31, 2021 (dollars in thousands):
Capital Group Core Municipal Fund
| | | | | Assets | | | Liabilities | |
| Contracts | | Risk type | | Location on statement of
assets and liabilities | | Value | | | Location on statement of
assets and liabilities | | Value | |
| Futures | | Interest | | Unrealized appreciation* | | $ | 51 | | | Unrealized depreciation* | | $ | 58 | |
| | | | | | | | | | | | | | |
| | | | | Net realized loss | | | Net unrealized depreciation | |
| Contracts | | Risk type | | Location on statement of
operations | | Value | | | Location on statement of
operations | | Value | |
| Futures | | Interest | | Net realized loss on futures contracts | | $ | (531 | ) | | Net unrealized depreciation on futures contracts | | $ | (8 | ) |
Capital Group Short-Term Municipal Fund
| | | | | Assets | | | Liabilities | |
| Contracts | | Risk type | | Location on statement of
assets and liabilities | | Value | | | Location on statement of
assets and liabilities | | Value | |
| Futures | | Interest | | Unrealized appreciation* | | $ | — | | | Unrealized depreciation* | | $ | 23 | |
| |
| | | | | Net realized loss | | | Net unrealized depreciation | |
| Contracts | | Risk type | | Location on statement of
operations | | Value | | | Location on statement of
operations | | Value | |
| Futures | | Interest | | Net realized loss on futures contracts | | $ | (141 | ) | | Net unrealized depreciation on futures contracts | | $ | (20 | ) |
See end of tables for footnote.
| 94 | Private Client Services Funds |
| Capital Group California Core Municipal Fund |
| | | | | Assets | | Liabilities | |
| Contracts | | Risk type | | Location on statement of
assets and liabilities | | Value | | | Location on statement of
assets and liabilities | | Value | |
| Futures | | Interest | | Unrealized appreciation* | | $ | 94 | | | Unrealized depreciation* | | $ | — | |
| | | | | | | | | | | | | | | |
| | | | | Net realized loss | | | Net unrealized appreciation | |
| Contracts | | Risk type | | Location on statement of
operations | | Value | | | Location on statement of
operations | | Value | |
| Futures | | Interest | | Net realized loss on futures contracts | | $ | (327 | ) | | Net unrealized appreciation on futures contracts | | $ | 115 | |
Capital Group California Short-Term Municipal Fund
| | | | | Net realized loss | | | Net unrealized appreciation | |
| Contracts | | Risk type | | Location on statement of
operations | | Value | | | Location on statement of
operations | | Value | |
| Futures | | Interest | | Net realized loss on futures contracts | | $ | (185 | ) | | Net unrealized appreciation on futures contracts | | $ | 11 | |
Capital Group Core Bond Fund
| | | | | Assets | | | Liabilities | |
| Contracts | | Risk type | | Location on statement of
assets and liabilities | | Value | | | Location on statement of
assets and liabilities | | Value | |
| Futures | | Interest | | Unrealized appreciation* | | $ | 649 | | | Unrealized depreciation* | | $ | 1,156 | |
| | | | | | | | | | | | | | | |
| | | | | Net realized (loss) gain | | | Net unrealized (depreciation) appreciation | |
| Contracts | | Risk type | | Location on statement of
operations | | Value | | | Location on statement of
operations | | Value | |
| Futures | | Interest | | Net realized loss on futures contracts | | $ | (54 | ) | | Net unrealized depreciation on futures contracts | | $ | (784 | ) |
| Swap | | Interest | | Net realized gain on swap contracts | | | 575 | | | Net unrealized depreciation on swap contracts | | | (285 | ) |
| Swap | | Credit | | Net realized loss on swap contracts | | | (382 | ) | | Net unrealized appreciation on swap contracts | | | — | |
| | | | | | | $ | 139 | | | | | $ | (1,069 | ) |
| * | Includes cumulative appreciation/depreciation on futures contracts as reported in the applicable table following each fund’s investment portfolio. Only current day’s variation margin is reported within each fund’s statement of assets and liabilities. |
Collateral — Each fund participates in a collateral program that calls for the funds to either receive or pledge highly liquid assets, such as cash or U.S. government securities, as collateral due to their use of futures contracts, interest rate swaps, credit default swaps and/or future delivery contracts. For futures contracts, interest rate swaps and credit default swaps, the program calls for the fund to pledge collateral for initial and variation margin by contract. For future delivery contracts, the program calls for the fund to either receive or pledge collateral based on the net gain or loss on unsettled contracts by certain counterparties. The purpose of the collateral is to cover potential losses that could occur in the event that either party cannot meet its contractual obligations. Non-cash collateral pledged by the fund, if any, is disclosed in the fund’s investment portfolio, and cash collateral pledged by the fund, if any, is held in a segregated account with the fund’s custodian, which is reflected as pledged cash collateral in each fund’s statement of assets and liabilities.
| Private Client Services Funds | 95 |
6. Taxation and distributions
Federal income taxation — Each fund complies with the requirements under Subchapter M of the Internal Revenue Code applicable to mutual funds and each intends to distribute substantially all of its net income and net capital gains each year. The funds are not subject to income taxes to the extent taxable income and net capital gains are distributed. Therefore, no federal income tax provision is required.
As of and during the year ended October 31, 2021, none of the funds had a liability for any unrecognized tax benefits. Each fund recognizes interest and penalties, if any, related to unrecognized tax benefits as income tax expense in their respective statements of operations. During the period, none of the funds incurred any significant interest or penalties.
Each fund’s tax returns are generally not subject to examination by federal, state and, if applicable, non-U.S. tax authorities after the expiration of each jurisdiction’s statute of limitations, which is typically three years after the date of filing but can be extended in certain jurisdictions.
Distributions — Distributions determined on a tax basis may differ from net investment income and net realized gains for financial reporting purposes. These differences are due primarily to different treatment for items such as short-term capital gains and losses; capital losses related to sales of certain securities within 30 days of purchase; income on certain investments; amortization of premiums and discounts; paydowns on fixed-income securities; net capital losses and cost of investments sold. The fiscal year in which amounts are distributed may differ from the year in which the net investment income and net realized gains are recorded by the funds for financial reporting purposes. The funds may also designate a portion of the amount paid to redeeming shareholders as a distribution for tax purposes.
Additional tax basis disclosures for each fund as of October 31, 2021, were as follows (dollars in thousands):
| | | Capital
Group
Core
Municipal
Fund | | | Capital
Group
Short-Term
Municipal
Fund | | | Capital
Group
California
Core
Municipal
Fund | | | Capital
Group
California
Short-Term
Municipal
Fund | | |
Capital
Group
Core Bond
Fund | |
| Undistributed ordinary income | | $ | 2,465 | | | $ | 535 | | | $ | 1,100 | | | $ | 112 | | | $ | 99 | |
| Undistributed tax-exempt income | | | 90 | | | | 26 | | | | 889 | | | | 9 | | | | — | |
| Undistributed long-term capital gains | | | 2,811 | | | | — | | | | 2,586 | | | | 405 | | | | — | |
| Capital loss carryforward* | | | — | | | | — | | | | — | | | | — | | | | (3,316 | ) |
| Gross unrealized appreciation on investments | | | 12,158 | | | | 1,795 | | | | 12,294 | | | | 1,546 | | | | 11,906 | |
| Gross unrealized depreciation on investments | | | (2,410 | ) | | | (272 | ) | | | (1,612 | ) | | | (287 | ) | | | (4,024 | ) |
| Net unrealized appreciation on investments | | | 9,748 | | | | 1,523 | | | | 10,682 | | | | 1,259 | | | | 7,882 | |
| Cost of investments | | | 782,981 | | | | 202,493 | | | | 643,789 | | | | 182,581 | | | | 668,328 | |
| Reclassification from total distributable earnings/accumulated loss to capital paid in on shares of beneficial interest | | | 254 | | | | 337 | | | | 177 | | | | 126 | | | | (1 | ) |
| * | Each fund’s capital loss carryforwards will be used to offset any capital gains realized by each fund in future years. Each fund will not make distributions from capital gains while a capital loss carryforward remains. |
| 96 | Private Client Services Funds |
Distributions paid by each fund were characterized for tax purposes as follows (dollars in thousands):
| | | Year ended October 31, 2021 | |
| | | Tax-exempt
income | | | Ordinary
income | | | Long-term
capital
gains | | | Total
distributions
paid | |
| Capital Group Core Municipal Fund | | $ | 8,677 | | | $ | 2,349 | | | $ | 4,808 | | | $ | 15,834 | |
| Capital Group Short-Term Municipal Fund | | | 1,747 | | | | 513 | | | | — | | | | 2,260 | |
| Capital Group California Core Municipal Fund | | | 6,692 | | | | 841 | | | | 4,471 | | | | 12,004 | |
| Capital Group California Short-Term Municipal Fund | | | 1,439 | | | | 117 | | | | 527 | | | | 2,083 | |
| Capital Group Core Bond Fund | | | — | | | | 15,330 | | | | 6,786 | | | | 22,116 | |
| |
| | | Year ended October 31, 2020 | |
| | | Tax-exempt
income | | | Ordinary
income | | | Long-term
capital
gains | | | Total
distributions
paid | |
| Capital Group Core Municipal Fund | | $ | 10,394 | | | $ | 620 | | | $ | 184 | | | $ | 11,198 | |
| Capital Group Short-Term Municipal Fund | | | 2,262 | | | | — | | | | — | | | | 2,262 | |
| Capital Group California Core Municipal Fund | | | 9,118 | | | | 565 | | | | 153 | | | | 9,836 | |
| Capital Group California Short-Term Municipal Fund | | | 1,955 | | | | — | | | | — | | | | 1,955 | |
| Capital Group Core Bond Fund | | | — | | | | 10,989 | | | | 1,116 | | | | 12,105 | |
7. Fees and transactions with related parties
CRMC, the funds’ investment adviser, is the parent company of American Funds Service Company® (“AFS”), the funds’ transfer agent. CRMC and AFS are considered related parties to each fund.
Investment advisory services — Each fund has an investment advisory and service agreement with CRMC that provides for monthly fees accrued daily. The fee for Capital Group Core Municipal Fund, Capital Group Short-Term Municipal Fund, Capital Group California Core Municipal Fund, Capital Group California Short-Term Municipal Fund and Capital Group Core Bond Fund is 0.25% of the daily net assets of each fund.
Transfer agent services — Each fund has a shareholder services agreement with AFS under which each fund compensates AFS for providing transfer agent services. These services include recordkeeping, shareholder communications and transaction processing. In addition, each fund reimburses AFS for amounts paid to third parties for performing transfer agent services on behalf of fund shareholders.
Miscellaneous fee reimbursements — CRMC has agreed to reimburse a portion of miscellaneous fees and expenses for Capital Group Short-Term Municipal Fund to limit the fund’s total annual operating expenses to 0.30% (as a percentage of daily net assets). Miscellaneous expenses exclude investment advisory services fees. These reimbursements may be adjusted or discontinued by CRMC, subject to any restrictions in the series’ prospectus. For the year ended October 31, 2021, total fees and expenses reimbursed by CRMC were $11,000 for Capital Group Short-Term Municipal Fund. CRMC will not recoup all or a portion of these reimbursements. Fees and expenses in each fund’s statement of operations are presented gross of any reimbursements from CRMC.
Affiliated officers and trustees — Officers and certain trustees of the series are or may be considered to be affiliated with CRMC. No affiliated officers or trustees received any compensation directly from the series.
Investment in CCF — Capital Group Core Bond Fund holds shares of CCF, an institutional prime money market fund managed by CRMC. CCF invests in high-quality, short-term money market instruments and is used as the primary investment vehicle for the fund’s short-term investments. CCF shares are only available for purchase by CRMC, its affiliates, and other funds managed by CRMC. CCF shares are not available to the public. CRMC does not receive an investment advisory services fee from CCF.
Security transactions with related funds — The funds may purchase from, or sell securities to, other CRMC-managed funds (or accounts managed by certain affiliates of CRMC) under procedures adopted by the funds’ board of trustees. The funds involved in such transactions are considered related by virtue of having a common investment adviser (or affiliated investment advisers), common trustees and/or common officers. When such transactions occur, each transaction is executed at the current market price of the security and no brokerage commissions or fees are paid in accordance with Rule 17a-7 of the 1940 Act.
| Private Client Services Funds | 97 |
The following table presents purchase and sales transactions, if any, between each fund and related funds and the net realized gains from such sales as of October 31, 2021 (dollars in thousands):
| Fund | | Purchases | | | Sales | | | Net
realized
gain | |
| Capital Group Core Municipal Fund | | $ | 5 | | | $ | 1,320 | | | $ | 25 | |
| Capital Group Short-Term Municipal Fund | | | 97 | | | | 355 | | | | 14 | |
| Capital Group California Core Municipal Fund | | | 2,215 | | | | 13,115 | | | | 635 | |
| Capital Group California Short-Term Municipal Fund | | | 2,437 | | | | 4,567 | | | | 148 | |
| Capital Group Core Bond Fund | | | — | | | | 1,194 | | | | 39 | |
Interfund lending — Pursuant to an exemptive order issued by the SEC, the funds, along with other CRMC-managed funds (or funds managed by certain affiliates of CRMC), may participate in an interfund lending program. The program provides an alternate credit facility that permits the funds to lend or borrow cash for temporary purposes directly to or from one another, subject to the conditions of the exemptive order. The funds did not lend or borrow cash through the interfund lending program at any time during the year ended ended October 31, 2021.
8. Indemnifications
The series’ organizational documents provide board members and officers with indemnification against certain liabilities or expenses in connection with the performance of their duties to the series. In the normal course of business, the series may also enter into contracts that provide general indemnifications. Each fund’s maximum exposure under these arrangements is unknown since it is dependent on future claims that may be made against the series. The risk of material loss from such claims is considered remote. Insurance policies are also available to the series’ board members and officers.
9. Capital share transactions
Capital share transactions in the funds were as follows (dollars and shares in thousands):
| | | Sales | | | Reinvestment of
distributions | | | Repurchases | | | Net increase
(decrease) | |
| Fund | | Amount | | | Shares | | | Amount | | | Shares | | | Amount | | | Shares | | | Amount | | | Shares | |
| | | | | | | | | | | | | | | | | | | | | | | | | | | | | | | | | |
| Year ended October 31, 2021 | | | | | | | | | | | | | | | | | | | | | | | | | | | | | | | | |
| | | | | | | | | | | | | | | | | | | | | | | | | | | | | | | | | |
| Capital Group Core Municipal Fund | | $ | 191,931 | | | | 17,895 | | | $ | 15,789 | | | | 1,472 | | | $ | (65,098 | ) | | | (6,065 | ) | | $ | 142,622 | | | | 13,302 | |
| Capital Group Short-Term Municipal Fund | | | 135,966 | | | | 13,169 | | | | 2,260 | | | | 219 | | | | (142,168 | ) | | | (13,767 | ) | | | (3,942 | ) | | | (379 | ) |
| Capital Group California Core Municipal Fund | | | 103,909 | | | | 9,577 | | | | 12,004 | | | | 1,106 | | | | (70,484 | ) | | | (6,480 | ) | | | 45,429 | | | | 4,203 | |
| Capital Group California Short-Term Municipal Fund | | | 68,363 | | | | 6,590 | | | | 2,083 | | | | 201 | | | | (86,228 | ) | | | (8,316 | ) | | | (15,782 | ) | | | (1,525 | ) |
| Capital Group Core Bond Fund | | | 109,167 | | | | 10,477 | | | | 21,938 | | | | 2,097 | | | | (28,951 | ) | | | (2,773 | ) | | | 102,154 | | | | 9,801 | |
| | | | | | | | | | | | | | | | | | | | | | | | | | | | | | | | | |
| Year ended October 31, 2020 | | | | | | | | | | | | | | | | | | | | | | | | | | | | | | | | |
| | | | | | | | | | | | | | | | | | | | | | | | | | | | | | | | | |
| Capital Group Core Municipal Fund | | $ | 106,929 | | | | 10,012 | | | $ | 11,142 | | | | 1,046 | | | $ | (61,713 | ) | | | (5,824 | ) | | $ | 56,358 | | | | 5,234 | |
| Capital Group Short-Term Municipal Fund | | | 154,195 | | | | 15,083 | | | | 2,262 | | | | 221 | | | | (78,103 | ) | | | (7,630 | ) | | | 78,354 | | | | 7,674 | |
| Capital Group California Core Municipal Fund | | | 106,925 | | | | 9,888 | | | | 9,834 | | | | 910 | | | | (54,707 | ) | | | (5,130 | ) | | | 62,052 | | | | 5,668 | |
| Capital Group California Short-Term Municipal Fund | | | 111,175 | | | | 10,735 | | | | 1,955 | | | | 189 | | | | (79,577 | ) | | | (7,685 | ) | | | 33,553 | | | | 3,239 | |
| Capital Group Core Bond Fund | | | 97,338 | | | | 9,219 | | | | 11,994 | | | | 1,147 | | | | (41,185 | ) | | | (3,901 | ) | | | 68,147 | | | | 6,465 | |
| 98 | Private Client Services Funds |
10. Investment transactions
The funds made purchases and sales of investment securities during the year ended October 31, 2021, as follows (dollars in thousands):
| | | Capital Group
Core Municipal
Fund | | | Capital Group
Short-Term
Municipal Fund | | | Capital Group
California
Core Municipal
Fund | | | Capital Group
California
Short-Term
Municipal Fund | | | Capital Group
Core Bond Fund | |
| Purchases of investment securities* | | $ | 330,447 | | | $ | 91,436 | | | $ | 223,741 | | | $ | 75,899 | | | $ | 1,145,566 | |
| Sales of investment securities* | | | 298,418 | | | | 108,382 | | | | 232,398 | | | | 102,309 | | | | 1,079,222 | |
| * | Excludes short-term securities and U.S. government obligations, if any. |
| Private Client Services Funds | 99 |
Financial highlights
| | | | | | Income (loss) from investment operations1 | | | Dividends and distributions | | | | | | | | | | | | | | | | | | | |
| Year ended | | Net asset
value,
beginning
of year | | | Net
investment
income | | | Net (losses)
gains on
securities (both
realized and
unrealized) | | | Total from
investment
operations | | | Dividends
(from net
investment
income) | | | Distributions
(from capital
gains) | | | Total
dividends
and
distributions | | | Net asset
value, end
of year | | | Total
return2 | | | Net assets,
end of year
(in millions) | | | Ratio of
expenses to
average net
assets before
reimbursements3 | | | Ratio of
expenses to
average net
assets after
reimbursements2,3 | | | Ratio of
net income
to average
net assets2 | |
| Capital Group Core Municipal Fund | | | | | | | | | | | | | | | | | | | | | | | | | | | | | | | | | | | | | | | | | | | | |
| 10/31/2021 | | $ | 10.76 | | | $ | .13 | | | $ | (.02 | ) | | $ | .11 | | | $ | (.13 | ) | | $ | (.12 | ) | | $ | (.25 | ) | | $ | 10.62 | | | | .99 | % | | $ | 785 | | | | .28 | % | | | .28 | % | | | 1.20 | % |
| 10/31/2020 | | | 10.55 | | | | .18 | | | | .22 | | | | .40 | | | | (.18 | ) | | | (.01 | ) | | | (.19 | ) | | | 10.76 | | | | 3.87 | | | | 652 | | | | .28 | | | | .28 | | | | 1.70 | |
| 10/31/2019 | | | 10.15 | | | | .22 | | | | .40 | | | | .62 | | | | (.22 | ) | | | — | | | | (.22 | ) | | | 10.55 | | | | 6.15 | | | | 584 | | | | .28 | | | | .28 | | | | 2.11 | |
| 10/31/2018 | | | 10.41 | | | | .21 | | | | (.26 | ) | | | (.05 | ) | | | (.19 | ) | | | (.02 | ) | | | (.21 | ) | | | 10.15 | | | | (.32 | ) | | | 474 | | | | .27 | | | | .27 | | | | 2.04 | |
| 10/31/2017 | | | 10.48 | | | | .21 | | | | (.07 | ) | | | .14 | | | | (.21 | ) | | | — | 4 | | | (.21 | ) | | | 10.41 | | | | 1.39 | | | | 442 | | | | .35 | | | | .34 | | | | 2.02 | |
| Capital Group Short-Term Municipal Fund | | | | | | | | | | | | | | | | | | | | | | | | | | | | | | | | | | | | | | | |
| 10/31/2021 | | $ | 10.33 | | | $ | .09 | | | $ | (.04 | ) | | $ | .05 | | | $ | (.09 | ) | | $ | (.03 | ) | | $ | (.12 | ) | | $ | 10.26 | | | | .43 | % | | $ | 203 | | | | .31 | % | | | .30 | % | | | .87 | % |
| 10/31/2020 | | | 10.15 | | | | .14 | | | | .18 | | | | .32 | | | | (.14 | ) | | | — | | | | (.14 | ) | | | 10.33 | | | | 3.16 | | | | 208 | | | | .32 | | | | .30 | | | | 1.36 | |
| 10/31/2019 | | | 9.93 | | | | .19 | | | | .22 | | | | .41 | | | | (.19 | ) | | | — | | | | (.19 | ) | | | 10.15 | | | | 4.19 | | | | 127 | | | | .35 | | | | .30 | | | | 1.92 | |
| 10/31/2018 | | | 10.09 | | | | .17 | | | | (.18 | ) | | | (.01 | ) | | | (.15 | ) | | | — | | | | (.15 | ) | | | 9.93 | | | | .05 | | | | 138 | | | | .32 | | | | .30 | | | | 1.67 | |
| 10/31/2017 | | | 10.11 | | | | .14 | | | | (.02 | ) | | | .12 | | | | (.14 | ) | | | — | 4 | | | (.14 | ) | | | 10.09 | | | | 1.26 | | | | 150 | | | | .41 | | | | .35 | | | | 1.42 | |
| Capital Group California Core Municipal Fund | | | | | | | | | | | | | | | | | | | | | | | | | | | | | |
| 10/31/2021 | | $ | 10.90 | | | $ | .13 | | | $ | (.08 | ) | | $ | .05 | | | $ | (.11 | ) | | $ | (.09 | ) | | $ | (.20 | ) | | $ | 10.75 | | | | .53 | % | | $ | 664 | | | | .27 | % | | | .27 | % | | | 1.17 | % |
| 10/31/2020 | | | 10.73 | | | | .17 | | | | .18 | | | | .35 | | | | (.17 | ) | | | (.01 | ) | | | (.18 | ) | | | 10.90 | | | | 3.29 | | | | 627 | | | | .28 | | | | .28 | | | | 1.55 | |
| 10/31/2019 | | | 10.34 | | | | .20 | | | | .40 | | | | .60 | | | | (.20 | ) | | | (.01 | ) | | | (.21 | ) | | | 10.73 | | | | 5.84 | | | | 557 | | | | .28 | | | | .28 | | | | 1.89 | |
| 10/31/2018 | | | 10.57 | | | | .19 | | | | (.23 | ) | | | (.04 | ) | | | (.18 | ) | | | (.01 | ) | | | (.19 | ) | | | 10.34 | | | | (.27 | ) | | | 452 | | | | .27 | | | | .27 | | | | 1.85 | |
| 10/31/2017 | | | 10.69 | | | | .20 | | | | (.11 | ) | | | .09 | | | | (.20 | ) | | | (.01 | ) | | | (.21 | ) | | | 10.57 | | | | .84 | | | | 388 | | | | .35 | | | | .34 | | | | 1.88 | |
| Capital Group California Short-Term Municipal Fund | | | | | | | | | | | | | | | | | | | | | | | | | | | | | | | | | | | | | |
| 10/31/2021 | | $ | 10.39 | | | $ | .08 | | | $ | (.07 | ) | | $ | .01 | | | $ | (.08 | ) | | $ | (.03 | ) | | $ | (.11 | ) | | $ | 10.29 | | | | .12 | % | | $ | 182 | | | | .29 | % | | | .29 | % | | | .76 | % |
| 10/31/2020 | | | 10.28 | | | | .12 | | | | .11 | | | | .23 | | | | (.12 | ) | | | — | | | | (.12 | ) | | | 10.39 | | | | 2.26 | | | | 199 | | | | .30 | | | | .30 | | | | 1.16 | |
| 10/31/2019 | | | 10.06 | | | | .15 | | | | .22 | | | | .37 | | | | (.15 | ) | | | — | | | | (.15 | ) | | | 10.28 | | | | 3.55 | | | | 164 | | | | .32 | | | | .30 | | | | 1.46 | |
| 10/31/2018 | | | 10.21 | | | | .13 | | | | (.15 | ) | | | (.02 | ) | | | (.12 | ) | | | (.01 | ) | | | (.13 | ) | | | 10.06 | | | | (.07 | ) | | | 129 | | | | .31 | | | | .30 | | | | 1.28 | |
| 10/31/2017 | | | 10.23 | | | | .11 | | | | (.02 | ) | | | .09 | | | | (.11 | ) | | | — | 4 | | | (.11 | ) | | | 10.21 | | | | .97 | | | | 120 | | | | .42 | | | | .35 | | | | 1.11 | |
| Capital Group Core Bond Fund | | | | | | | | | | | | | | | | | | | | | | | | | | | | | | | | | | | | | | | | | | |
| 10/31/2021 | | $ | 10.70 | | | $ | .14 | | | $ | (.20 | ) | | $ | (.06 | ) | | $ | (.15 | ) | | $ | (.25 | ) | | $ | (.40 | ) | | $ | 10.24 | | | | (.60 | )% | | $ | 640 | | | | .28 | % | | | .28 | % | | | 1.36 | % |
| 10/31/2020 | | | 10.31 | | | | .18 | | | | .46 | | | | .64 | | | | (.19 | ) | | | (.06 | ) | | | (.25 | ) | | | 10.70 | | | | 6.28 | | | | 564 | | | | .28 | | | | .28 | | | | 1.73 | |
| 10/31/2019 | | | 9.82 | | | | .23 | | | | .48 | | | | .71 | | | | (.22 | ) | | | — | | | | (.22 | ) | | | 10.31 | | | | 7.33 | | | | 477 | | | | .28 | | | | .28 | | | | 2.24 | |
| 10/31/2018 | | | 10.14 | | | | .21 | | | | (.34 | ) | | | (.13 | ) | | | (.19 | ) | | | — | | | | (.19 | ) | | | 9.82 | | | | (1.14 | ) | | | 446 | | | | .28 | | | | .28 | | | | 2.08 | |
| 10/31/2017 | | | 10.31 | | | | .16 | | | | (.12 | ) | | | .04 | | | | (.16 | ) | | | (.05 | ) | | | (.21 | ) | | | 10.14 | | | | .41 | | | | 416 | | | | .35 | | | | .34 | | | | 1.58 | |
| Portfolio turnover rate for all share classes | | Year ended October 31, |
| excluding mortgage dollar roll transactions5,6 | | 2021 | | 2020 | | 2019 | | 2018 | | 2017 |
| Capital Group Core Bond Fund | | | 48 | % | | | 80 | % | | | 114 | % | | | 41 | % | | | 52 | % |
| | | |
| Portfolio turnover rate for all share classes, | | Year ended October 31, |
| including mortgage dollar roll transactions6 | | 2021 | | 2020 | | 2019 | | 2018 | | 2017 |
| Capital Group Core Municipal Fund | | | 48 | % | | | 62 | % | | | 38 | % | | | 55 | % | | | 47 | % |
| Capital Group Short-Term Municipal Fund | | | 51 | | | | 58 | | | | 50 | | | | 70 | | | | 42 | |
| Capital Group California Core Municipal Fund | | | 38 | | | | 37 | | | | 22 | | | | 69 | | | | 27 | |
| Capital Group California Short-Term Municipal Fund | | | 43 | | | | 42 | | | | 39 | | | | 65 | | | | 36 | |
| Capital Group Core Bond Fund | | | 217 | | | | 158 | | | | 151 | | | | 110 | | | | 95 | |
| 1 | Based on average shares outstanding. |
| 2 | This column reflects the impact, if any, of miscellaneous fee reimbursements from CRMC. |
| 3 | Ratios do not include expenses of any Central Funds. The fund indirectly bears its proportionate share of the expenses of any Central Funds, if applicable. |
| 4 | Amount less than $.01. |
| 5 | Refer to Note 5 for further information on mortgage dollar rolls. |
| 6 | Rates do not include the fund’s portfolio activity with respect to any Central Funds, if applicable. |
See notes to financial statements.
| 100 | Private Client Services Funds |
Report of Independent Registered Public Accounting Firm
To the Board of Trustees of Capital Group Private Client Services Funds and Shareholders of Capital Group Core Municipal Fund, Capital Group Short-Term Municipal Fund, Capital Group California Core Municipal Fund, Capital Group California Short- Term Municipal Fund, and Capital Group Core Bond Fund
Opinions on the Financial Statements
We have audited the accompanying statements of assets and liabilities, including the investment portfolios, of Capital Group Core Municipal Fund, Capital Group Short-Term Municipal Fund, Capital Group California Core Municipal Fund, Capital Group California Short-Term Municipal Fund, and Capital Group Core Bond Fund (constituting Capital Group Private Client Services Funds, hereafter collectively referred to as the “Funds”) as of October 31, 2021, the related statements of operations for the year ended October 31, 2021, the statements of changes in net assets for each of the two years in the period ended October 31, 2021, including the related notes, and the financial highlights for each of the four years in the period ended October 31, 2021 (collectively referred to as the “financial statements”). In our opinion, the financial statements present fairly, in all material respects, the financial position of each of the Funds as of October 31, 2021, the results of each of their operations for the year then ended, the changes in each of their net assets for each of the two years in the period ended October 31, 2021 and each of the financial highlights for each of the four years in the period ended October 31, 2021 in conformity with accounting principles generally accepted in the United States of America.
The financial statements of the Funds as of and for the year ended October 31, 2017 and the financial highlights for each of the periods ended on or prior to October 31, 2017 (not presented herein, other than the financial highlights for the period ended October 31, 2017) were audited by other auditors whose report dated December 19, 2017 expressed an unqualified opinion on those financial statements and financial highlights.
Basis for Opinions
These financial statements are the responsibility of the Funds’ management. Our responsibility is to express an opinion on the Funds’ financial statements based on our audits. We are a public accounting firm registered with the Public Company Accounting Oversight Board (United States) (PCAOB) and are required to be independent with respect to the Funds in accordance with the U.S. federal securities laws and the applicable rules and regulations of the Securities and Exchange Commission and the PCAOB.
We conducted our audits of these financial statements in accordance with the standards of the PCAOB. Those standards require that we plan and perform the audit to obtain reasonable assurance about whether the financial statements are free of material misstatement, whether due to error or fraud.
Our audits included performing procedures to assess the risks of material misstatement of the financial statements, whether due to error or fraud, and performing procedures that respond to those risks. Such procedures included examining, on a test basis, evidence regarding the amounts and disclosures in the financial statements. Our audits also included evaluating the accounting principles used and significant estimates made by management, as well as evaluating the overall presentation of the financial statements. Our procedures included confirmation of securities owned as of October 31, 2021 by correspondence with the custodian, transfer agent and brokers; when replies were not received from brokers, we performed other auditing procedures. We believe that our audits provide a reasonable basis for our opinion.
/s/ PricewaterhouseCoopers LLP
Los Angeles, California
December 15, 2021
We have served as the auditor of one or more investment companies in The Capital Group Companies Investment Company Complex since 1934.
| Private Client Services Funds | 101 |
As a shareholder of the funds, you incur ongoing costs, including management fees and other expenses. This example is intended to help you understand your ongoing costs (in dollars) of investing in the funds so you can compare these costs with the ongoing costs of investing in other mutual funds. The example is based on an investment of $1,000 invested at the beginning of the period and held for the entire six-month period (May 1, 2021, through October 31, 2021).
Actual expenses:
The first line of each fund in the table below provides information about actual account values and actual expenses. You may use the information in this line, together with the amount you invested, to estimate the expenses that you paid over the period. Simply divide your account value by $1,000 (for example, an $8,600 account value divided by $1,000 = 8.6), then multiply the result by the number in the first line under the heading titled “Expenses paid during period” to estimate the expenses you paid on your account during this period.
Hypothetical example for comparison purposes:
The second line of each fund in the table below provides information about hypothetical account values and hypothetical expenses based on the actual expense ratio for the share class and an assumed rate of return of 5.00% per year before expenses, which is not the actual return of the share class. The hypothetical account values and expenses may not be used to estimate the actual ending account balance or expenses you paid for the period. You may use this information to compare the ongoing costs of investing in the fund and other funds. To do so, compare this 5.00% hypothetical example with the 5.00% hypothetical examples that appear in the shareholder reports of the other funds.
Notes:
Shareholders of the funds may be subject to an additional fee charged by CRMC’s Capital Group Private Client Services division for the ongoing services provided to the shareholder. You can estimate the impact of these fees by adding the amount of the fees to the total estimated expenses you paid on your account during the period as calculated above. In addition, your ending account value would be lower by the amount of these fees. Note that the expenses shown in the table are meant to highlight your ongoing costs only. The second line of each fund in the table below is useful in comparing ongoing costs only and will not help you determine the relative total costs of owning different funds.
| 102 | Private Client Services Funds |
| | | Beginning
account value
5/1/2021 | | | Ending
account value
10/31/2021 | | | Expenses
paid during
period* | | | Annualized
expense ratio | |
| Capital Group Core Municipal Fund | | | | | | | | | | | | | | | | |
| Actual return | | $ | 1,000.00 | | | $ | 996.86 | | | $ | 1.41 | | | | .28 | % |
| Assumed 5% return | | | 1,000.00 | | | | 1,023.79 | | | | 1.43 | | | | .28 | |
| Capital Group Short-Term Municipal Fund | | | | | | | | | | | | | | | | |
| Actual return | | $ | 1,000.00 | | | $ | 997.84 | | | $ | 1.66 | | | | .33 | % |
| Assumed 5% return | | | 1,000.00 | | | | 1,023.54 | | | | 1.68 | | | | .33 | |
| Capital Group California Core Municipal Fund | | | | | | | | | | | | | | | | |
| Actual return | | $ | 1,000.00 | | | $ | 997.46 | | | $ | 1.41 | | | | .28 | % |
| Assumed 5% return | | | 1,000.00 | | | | 1,023.79 | | | | 1.43 | | | | .28 | |
| Capital Group California Short-Term Municipal Fund | | | | | | | | | | | | | | | | |
| Actual return | | $ | 1,000.00 | | | $ | 997.49 | | | $ | 1.56 | | | | .31 | % |
| Assumed 5% return | | | 1,000.00 | | | | 1,023.64 | | | | 1.58 | | | | .31 | |
| Capital Group Core Bond Fund | | | | | | | | | | | | | | | | |
| Actual return | | $ | 1,000.00 | | | $ | 996.06 | | | $ | 1.41 | | | | .28 | % |
| Assumed 5% return | | | 1,000.00 | | | | 1,023.79 | | | | 1.43 | | | | .28 | |
| | |
| * | The “expenses paid during period” are equal to the “annualized expense ratio,” multiplied by the average account value over the period, multiplied by the number of days in the period, and divided by 365 (to reflect the one-half year period). |
| | |
| Private Client Services Funds | 103 |
We are required to advise you of the federal tax status of certain distributions received by shareholders during the fiscal year. The funds hereby designate the following amounts for the funds’ fiscal year ended October 31, 2021:
| | | Capital Group
Core Municipal
Fund | | | Capital Group
Short-Term
Municipal Fund | | | Capital Group
California
Core Municipal
Fund | | | Capital Group
California
Short-Term
Municipal Fund | | | Capital Group
Core Bond Fund | |
| Long-term capital gains | | $ | 4,808,000 | | | | — | | | $ | 4,471,000 | | | $ | 527,000 | | | $ | 6,782,000 | |
| Section 163(j) interest dividends | | | — | | | | — | | | | — | | | | — | | | $ | 9,195,000 | |
| Exempt interest dividends | | | 100 | % | | | 100 | % | | | 100 | % | | | 100 | % | | | — | |
Individual shareholders should refer to their Form 1099 or other tax information, which will be mailed in January 2022, to determine the calendar year amounts to be included on their 2021 tax returns. Shareholders should consult their tax advisors.
| 104 | Private Client Services Funds |
Board of trustees and other officers
Independent trustees1
| Name and year of birth | | Year first
elected
a trustee
of the fund2 | | Principal occupation(s) during past five years | | Number of
portfolios in fund
complex overseen
by trustee | | Other directorships3
held by trustee |
| Joseph C. Berenato, 1946 | | 2015 | | Former Chairman and CEO, Ducommun Incorporated (aerospace components manufacturer) | | 15 | | None |
Vanessa C. L. Chang, 1952
Chair of the Board
(Independent and Non-Executive) | | 2015 | | Former Director, EL & EL Investments (real estate) | | 16 | | Edison International/Southern California Edison; Transocean Ltd. |
| James G. Ellis, 1947 | | 2019 | | Professor of Marketing and former Dean, Marshall School of Business, University of Southern California | | 99 | | Advanced Merger Partners; EVe Mobility Acquisition Corp (acquisitions of companies in the electric vehicle market); J. G. Boswell (agricultural production); Mercury General Corporation |
| Jennifer C. Feikin, 1968 | | 2019 | | Business Advisor; previously held positions at Google, AOL, 20th Century Fox and McKinsey & Company; Trustee, The Nature Conservancy of California; former Director, First Descents | | 9 | | Hertz Global Holdings, Inc. |
| Pablo R. González Guajardo, 1967 | | 2019 | | CEO, Kimberly-Clark de México, S.A.B. de C.V. | | 16 | | América Móvil, S.A.B. de C.V. (telecommunications company); Grupo Lala, S.A.B. de C.V. (dairy company); Grupo Sanborns, S.A.B. de C.V. (retail stores and restaurants); Kimberly-Clark de México, S.A.B. de C.V. (consumer staples) |
| Leslie Stone Heisz, 1961 | | 2019 | | Former Managing Director, Lazard (retired, 2010); Director, Edwards Lifesciences; Trustee, Public Storage; Director, Kaiser Permanente (California public benefit corporation); Lecturer, UCLA Anderson School of Management | | 9 | | None |
| William D. Jones, 1955 | | 2019 | | Real estate developer/owner, President and CEO, CityLink Investment Corporation (acquires, develops and manages real estate ventures in urban communities) and for the former City Scene Management Company (provided commercial asset management services) | | 17 | | Biogen Inc.; Sempra Energy |
Interested trustee5
Name, year of birth and
position with fund | | Year first
elected a
trustee
or officer
of the fund2 | | Principal occupation(s) during past five years and
positions held with affiliated entities or the principal
underwriter of the fund | | Number of
portfolios overseen
by trustee | | Other directorships3
held by trustee |
John S. Armour, 1957
President and Trustee | | 2013 | | President — Capital Group Private Client Services, Inc.6 | | 9 | | None |
The funds’ statement of additional information includes further details about fund trustees and is available without charge upon request by calling your relationship manager at (800) 266-9532. The address for all trustees and officers of the fund is 333 South Hope Street, Los Angeles, CA 90071, Attention: Secretary.
See page 106 for footnotes.
| Private Client Services Funds | 105 |
Other officers7
Name, year of birth and
position with fund | | Year first
elected
an officer
of the fund2 | | Principal occupation(s) during past five years and positions held with affiliated entities or the principal
underwriter of the fund |
Michael W. Stockton, 1967
Executive Vice President | | 2021 | | Senior Vice President — Fund Business Management Group, Capital Research and Management |
Aaron Applebaum, 1979
Senior Vice President | | 2017 | | Partner — Capital Fixed Income Investors, Capital Research and Management Company |
Mark Marinella, 1958
Senior Vice President | | 2016 | | Partner — Capital Fixed Income Investors, Capital Research and Management Company |
John R. Queen, 1965
Senior Vice President | | 2009 | | Partner — Capital Fixed Income Investors, Capital Research and Management Company;
Senior Vice President — Capital Group Private Client Services, Inc.6 |
Timothy W. McHale, 1978
Vice President | | 2009 | | Senior Vice President and Senior Counsel — Fund Business Management Group, Capital Research and Management Company; Secretary, American Funds Distributors, Inc.6 |
Courtney R. Taylor, 1975
Secretary | | 2009 | | Assistant Vice President — Investment Operations, Capital Research and Management Company |
Gregory F. Niland, 1971
Treasurer | | 2014 | | Vice President — Investment Operations, Capital Research and Management Company |
Susan K. Countess, 1966
Assistant Secretary | | 2012 | | Associate — Fund Business Management Group, Capital Research and Management Company |
Sandra Chuon, 1972
Assistant Treasurer | | 2019 | | Assistant Vice President — Investment Operations, Capital Research and Management Company |
Kyle J. Ilsley, 1980
Assistant Treasurer | | 2020 | | Assistant Vice President — Investment Operations, Capital Research and Management Company |
| | |
| 1 | The term independent trustee refers to a trustee who is not an “interested person” of the fund within the meaning of the Investment Company Act of 1940. |
| 2 | Trustees and officers of the fund serve until their resignation, removal or retirement. |
| 3 | Funds managed by Capital Research and Management Company or its affiliates. |
| 4 | This includes all directorships (other than the fund or other funds managed by Capital Research and Management Company or its affiliates) that are held by each trustee as a trustee or director of a public company or its affiliates. Unless otherwise noted, all directorships are current. |
| 5 | The term interested trustee refers to a trustee who is an “interested person” of the fund within the meaning of the Investment Company Act of 1940, on the basis of his or her affiliation with the fund’s investment adviser, Capital Research and Management Company, or affiliated entities (including the fund’s principal underwriter). |
| 6 | Company affiliated with Capital Research and Management Company. |
| 7 | All of the officers listed are officers of one or more of the other funds for which Capital Research and Management Company serves as investment adviser. |
| | |
| 106 | Private Client Services Funds |

Office of the fund
6455 Irvine Center Drive Irvine,
CA 92618-4518
Investment adviser
Capital Research and Management Company
333 South Hope Street
Los Angeles, CA 90071-1406
Transfer agent for shareholder accounts
American Funds Service Company
(Write to the address nearest you.)
P.O. Box 6007
Indianapolis, IN 46206-6007
P.O. Box 2280
Norfolk, VA 23501-2280
Custodian of assets
State Street Bank and Trust Company
One Lincoln Street
Boston, MA 02111
Counsel
Morgan, Lewis & Bockius LLP
One Federal Street
Boston, MA 02110-1726
Independent registered public accounting firm
PricewaterhouseCoopers LLP
601 South Figueroa Street
Los Angeles, CA 90017-3874
Principal underwriter
American Funds Distributors, Inc.
333 South Hope Street
Los Angeles, CA 90071-1406
Investors should carefully consider investment objectives, risks, charges and expenses. This and other important information is contained in the fund prospectuses, which can be obtained from Capital Research and Management Company by calling (800) 266-9532 and should be read carefully before investing.
Capital Group Private Client Services Fund files a complete list of its portfolio holdings with the U.S. Securities and Exchange Commission (SEC) for the first and third quarters of each fiscal year on Form NPORT-P. This filing is available free of charge on the SEC website (www.sec.gov). Additionally, the list of portfolio holdings is available by calling your relationship manager at (800) 266-9532.
The proxy voting procedures and policies of Capital Group Private Client Services Fund — which describe how we vote proxies relating to portfolio securities — are available upon request by calling your relationship manager at (800) 266-9532. The funds file their proxy voting records with the SEC for the 12 months ended June 30 by August 31. The report also is available on the SEC website or by calling your relationship manager.
BLOOMBERG® is a trademark and service mark of Bloomberg Finance L.P. and its affiliates (collectively “Bloomberg”). Bloomberg or Bloomberg’s licensors own all proprietary rights in the Bloomberg Indices. Neither Bloomberg nor Bloomberg’s licensors approves or endorses this material, or guarantees the accuracy or completeness of any information herein, or makes any warranty, express or implied, as to the results to be obtained therefrom and, to the maximum extent allowed by law, neither shall have any liability or responsibility for injury or damages arising in connection therewith.
All Capital Group trademarks mentioned are owned by The Capital Group Companies, Inc., an affiliated company or fund. All other company and product names mentioned are the property of their respective companies.
American Funds Distributors, Inc., member FINRA.

 | Capital Group Core Municipal FundSM Capital Group Short-Term Municipal FundSM Capital Group California Core Municipal FundSM Capital Group California Short-Term Municipal FundSM Capital Group Core Bond FundSM Semi-annual report for the six months ended April 30, 2022 |

Research-driven
approaches to seeking
wealth preservation
and income
Capital Group Core Municipal Fund seeks to provide current income exempt from federal income tax while preserving your investment.
Capital Group Short-Term Municipal Fund seeks to preserve your investment and secondarily to provide current income exempt from federal income tax.
Capital Group California Core Municipal Fund seeks to provide current income exempt from federal and California income taxes while preserving your investment.
Capital Group California Short-Term Municipal Fund seeks to preserve your investment and secondarily to provide current income exempt from federal and California income taxes.
Capital Group Core Bond Fund seeks to provide you with current income while preserving your investment.
Each fund is one of more than 40 offered by Capital Group, home of American Funds, one of the nation’s largest mutual fund families. For 90 years, Capital Group has invested with a long-term focus based on thorough research and attention to risk.
Fund results shown in this report are at net asset value. Results are for past periods and are not predictive of results for future periods. Current and future results may be lower or higher than those shown. Prices and returns will vary, so investors may lose money. Investing for short periods makes losses more likely.
Here are the total returns on a $1,000 investment with all distributions reinvested for periods ended March 31, 2022 (the most recent calendar quarter-end), and the total annual fund operating expense ratios as of the prospectus dated January 1, 2022:
| | | Cumulative
total returns | | Average annual
total returns | | Gross |
| | | 1 year | | 5 years | | 10 years | | Lifetime* | | expense ratios |
| | | | | | | | | | | |
| Capital Group Core Municipal Fund | | | –3.37 | % | | | 1.83 | % | | | 1.77 | % | | | 2.21 | % | | | 0.28 | % |
| Capital Group Short-Term Municipal Fund | | | –2.72 | | | | 1.28 | | | | 1.09 | | | | 1.32 | | | | 0.31 | † |
| Capital Group California Core Municipal Fund | | | –3.47 | | | | 1.54 | | | | 1.81 | | | | 2.19 | | | | 0.27 | |
| Capital Group California Short-Term Municipal Fund | | | –2.81 | | | | 0.82 | | | | 0.84 | | | | 1.04 | | | | 0.29 | |
| Capital Group Core Bond Fund | | | –3.74 | | | | 1.78 | | | | 1.63 | | | | 2.15 | | | | 0.28 | |
| * | Since April 13, 2010. |
| † | The net expense ratio for Capital Group Short-Term Municipal Fund was 0.30%. |
Investment results assume all distributions are reinvested and reflect applicable fees and expenses. The investment adviser is currently reimbursing a portion of the expenses for Capital Group Short-Term Municipal Fund. This reimbursement will be in effect through at least January 1, 2023. The adviser may elect at its discretion to extend, modify or terminate the reimbursement at that time. Visit capitalgrouppcsfunds.com for more information.
Investments are not FDIC-insured, nor are they deposits of or guaranteed by a bank or any other entity, so they may lose value.
Contents
Fellow investors:
Shown in the table below are the semi-annual returns for Capital Group Core Municipal Fund, Capital Group Short-Term Municipal Fund, Capital Group California Core Municipal Fund, Capital Group California Short-Term Municipal Fund and Capital Group Core Bond Fund for the six months ended April 30, 2022. Also shown are the results of their benchmarks and peer group averages.
On March 11, 2022, the Board of Trustees of Capital Group Private Client Services Funds unanimously determined that it would be in the best interests of three Capital Group funds to merge into three similar American Funds. Under the proposal, Capital Group Core Municipal Fund would be reorganized into Limited Term Tax-Exempt Bond Fund of America®; Capital Group Short-Term Municipal Fund into American Funds Short-Term Tax-Exempt Bond Fund®; and Capital Group Core Bond Fund into The Bond Fund of America®. The Board also determined that the interests of Capital Group bond fund shareholders would not be diluted as a result of the change. Shareholders will receive materials outlining the proposal as well as information on the affected funds. The reorganizations are not contingent on each other and, if approved by shareholders, are expected to take place later this year. More information can be found in the funds’ amended prospectus at capitalgroup.com/pcs/fund-details.html.
For additional information about the funds, their investment results, holdings and portfolio managers, visit capitalgrouppcsfunds.com. You can also access information about Capital Group’s American Funds and read our insights about the markets, retirement, saving for college, investing fundamentals and more at capitalgroup.com.
Funds’ 30-day yields and 12-month distribution rates
Below is a summary of each fund’s 30-day yield and 12-month distribution rate as of April 30, 2022. Each fund’s 30-day yield is calculated in accordance with the U.S. Securities and Exchange Commission (SEC) formula. The SEC yield reflects the rate at which each fund is earning income on its current portfolio of securities while the distribution rate reflects the funds’ past dividends paid to shareholders. Accordingly, the funds’ SEC yields and distribution rates may differ.
| | | SEC
30-day yield | | 12-month
distribution
rate |
| | | | | |
| Capital Group Core Municipal Fund | | | 1.77 | % | | | 1.15 | % |
| Capital Group Short-Term Municipal Fund | | | 1.52 | * | | | 0.86 | |
| Capital Group California Core Municipal Fund | | | 1.78 | | | | 1.20 | |
| Capital Group California Short-Term Municipal Fund | | | 1.51 | | | | 0.71 | |
| Capital Group Core Bond Fund | | | 3.02 | | | | 1.60 | |
| * | The SEC 30-day yield for Capital Group Short-Term Municipal Fund is 1.71% with the fund’s reimbursement. |
The return of principal for bond funds and for funds with significant underlying bond holdings is not guaranteed. Fund shares are subject to the same interest rate, inflation and credit risks associated with the underlying bond holdings. Income may be subject to state or local income taxes and/or federal alternative minimum taxes. Also, certain other income, as well as capital gain distributions, may be taxable. State tax-exempt funds are more susceptible to factors adversely affecting issuers of their state’s tax-exempt securities than a more widely diversified municipal bond fund. Refer to the funds’ prospectus and the Risk Factors section of this report for more information on these and other risks associated with investing in the funds.
| Private Client Services Funds | 1 |
Results at a glance
For periods ended April 30, 2022, with all distributions reinvested
| | | Cumulative total returns | | Average annual total returns |
| | | 6 months | | 1 year | | 5 years | | 10 years | | Lifetime1 |
| | | | | | | | | | | |
| Capital Group Core Municipal Fund | | | –4.96 | % | | | –5.26 | % | | | 1.38 | % | | | 1.53 | % | | | 2.06 | % |
| Bloomberg Municipal Short-Intermediate 1–10 years Index2 | | | –5.62 | | | | –5.76 | | | | 1.17 | | | | 1.56 | | | | 2.14 | |
| Lipper Short-Intermediate Municipal Debt Funds Average3 | | | –5.10 | | | | –5.30 | | | | 0.85 | | | | 1.09 | | | | 1.58 | |
| Capital Group Short-Term Municipal Fund | | | –3.57 | | | | –3.78 | | | | 1.01 | | | | 0.97 | | | | 1.24 | |
| Bloomberg Municipal Short 1–5 Years Index2 | | | –4.17 | | | | –4.20 | | | | 0.85 | | | | 1.03 | | | | 1.33 | |
| Lipper Short Municipal Debt Funds Average3 | | | –2.78 | | | | –2.93 | | | | 0.61 | | | | 0.61 | | | | 0.83 | |
| Capital Group California Core Municipal Fund | | | –4.99 | | | | –5.23 | | | | 1.09 | | | | 1.55 | | | | 2.04 | |
| Bloomberg California Short-Intermediate Municipal Index2 | | | –5.74 | | | | –5.98 | | | | 0.93 | | | | 1.52 | | | | 2.14 | |
| Lipper California Short-Intermediate Municipal Debt Funds Average3 | | | –4.62 | | | | –4.63 | | | | 0.59 | | | | 1.00 | | | | 1.34 | |
| Capital Group California Short-Term Municipal Fund | | | –3.64 | | | | –3.88 | | | | 0.57 | | | | 0.70 | | | | 0.96 | |
| Bloomberg California Short Municipal Index2 | | | –4.13 | | | | –4.22 | | | | 0.65 | | | | 0.95 | | | | 1.27 | |
| Lipper Short Municipal Debt Funds Average3 | | | –2.78 | | | | –2.93 | | | | 0.61 | | | | 0.61 | | | | 0.83 | |
| Capital Group Core Bond Fund | | | –5.56 | | | | –5.93 | | | | 1.30 | | | | 1.35 | | | | 1.97 | |
| Bloomberg Intermediate A+ U.S. Government/Credit Index2 | | | –6.06 | | | | –6.26 | | | | 1.09 | | | | 1.31 | | | | 1.97 | |
| Lipper Short-Intermediate Investment Grade Debt Funds Average3 | | | –4.91 | | | | –4.95 | | | | 1.18 | | | | 1.41 | | | | 1.90 | |
| 1 | Since April 13, 2010. |
| 2 | The market indexes are unmanaged and, therefore, have no expenses. Investors cannot invest directly in an index. Source: Bloomberg Index Services Ltd. |
| 3 | Lipper averages reflect the current composition of all eligible mutual funds (all share classes) within a given category. Source: Refinitiv Lipper. |
Bloomberg Municipal Short-Intermediate 1–10 Years Index is a market value-weighted index that includes investment-grade tax-exempt bonds with maturities of one to 10 years. Bloomberg Municipal Short 1–5 Years Index is a market value-weighted index that includes investment-grade tax-exempt bonds with maturities of one to five years. Bloomberg California Short-Intermediate Municipal Index is a market value-weighted index that includes only investment-grade tax-exempt bonds that are issued from California with maturities of one to 10 years. Bloomberg California Short Municipal Index is a market value-weighted index that includes only investment-grade tax-exempt bonds that are issued from California with maturities of one to five years. Bloomberg Intermediate A+ U.S. Government/Credit Index is a market value-weighted index that tracks the total return of fixed-rate, publicly placed, dollar-denominated obligations issued by the U.S. Treasury, U.S. government agencies and quasi-federal corporations, corporate or foreign debt guaranteed by the U.S. government, and U.S. corporate and foreign debentures and secured notes that meet specified maturity, liquidity and quality requirements, with maturities of one to 10 years, excluding BBB-rated securities.
| 2 | Private Client Services Funds |
| Capital Group Core Municipal Fund | unaudited |
| Investment portfolio April 30, 2022 | |
| | |
| Portfolio quality summary* | Percent of net assets |

| * | Bond ratings, which typically range from AAA/Aaa (highest) to D (lowest), are assigned by credit rating agencies such as Standard & Poor’s, Moody’s and/or Fitch as an indication of an issuer’s creditworthiness. In assigning a credit rating to a security, the fund looks specifically to the ratings assigned to the issuer of the security by Standard & Poor’s, Moody’s and/or Fitch. If agency ratings differ, the security will be considered to have received the highest of those ratings, consistent with the fund’s investment policies. |
| Bonds, notes & other debt instruments 86.09% | Principal amount
(000) | | | Value
(000) | |
| Alabama 2.48% | | | | | | | | |
| Black Belt Energy Gas Dist., Gas Project Rev. Bonds, Series 2022-B-1, 4.00% 2053 (put 2027) | | USD | 3,500 | | | $ | 3,561 | |
| Black Belt Energy Gas Dist., Gas Project Rev. Bonds (Project No. 6), Series 2021-B, 4.00% 2052 (put 2026) | | | 1,050 | | | | 1,067 | |
| Black Belt Energy Gas Dist., Gas Project Rev. Bonds (Project No. 7), Series 2021-C-1, 4.00% 2052 (put 2026) | | | 940 | | | | 956 | |
| Black Belt Energy Gas Dist., Gas Supply Prepay Rev. Bonds (Project No. 5), Series 2020-A-1, 4.00% 2049 (put 2026) | | | 825 | | | | 839 | |
| Black Belt Energy Gas Dist., Gas Supply Rev. Bonds, Series 2017-A, 4.00% 2047 (put 2022) | | | 2,050 | | | | 2,058 | |
| Black Belt Energy Gas Dist., Gas Supply Rev. Bonds, Series 2021-A, 4.00% 2051 (put 2023) | | | 1,000 | | | | 1,029 | |
| Federal Aid Highway Fin. Auth., Federal Highway Grant Anticipation Bonds, Series 2012, 5.00% 2023 (preref. 2022) | | | 100 | | | | 101 | |
| City of Homewood, G.O. Warrants, Series 2016, 5.00% 2033 (preref. 2026) | | | 50 | | | | 55 | |
| Housing Fin. Auth., Multi Family Housing Rev. Bonds (ECG Monrovia Project), Series 2022-A, 2.00% 2025 (put 2024) | | | 2,050 | | | | 2,007 | |
| City of Huntsville, Electric Rev. Bonds, Series 2017-A, 5.00% 2022 | | | 450 | | | | 459 | |
| City of Huntsville, Electric Rev. Bonds, Series 2017-B, 5.00% 2022 | | | 400 | | | | 408 | |
| Southeast Energy Auth., Commodity Supply Rev. Bonds (Project No. 1), Series 2021-A, 4.00% 2051 (put 2028) | | | 2,460 | | | | 2,500 | |
| Southeast Energy Auth., Commodity Supply Rev. Bonds (Project No. 2), Series 2021-B-1, 4.00% 2051 (put 2031) | | | 2,065 | | | | 2,094 | |
| | | | | | | | 17,134 | |
| | | | | | | | | |
| Alaska 0.31% | | | | | | | | |
| Housing Fin. Corp., Collateralized Bonds (Veterans Mortgage Program), Series 2019, 4.00% 2048 | | | 820 | | | | 835 | |
| Housing Fin. Corp., General Mortgage Rev. Bonds, Series 2020-A, 3.25% 2044 | | | 850 | | | | 846 | |
| Housing Fin. Corp., General Mortgage Rev. Bonds, Series 2016-A, 3.50% 2046 | | | 130 | | | | 131 | |
| Housing Fin. Corp., State Capital Project Bonds, Series 2014-A, 5.00% 2032 (preref. 2023) | | | 230 | | | | 240 | |
| Housing Fin. Corp., State Capital Project Bonds, Series 2014-A, 5.00% 2033 (preref. 2023) | | | 110 | | | | 115 | |
| | | | | | | | 2,167 | |
| | | | | | | | | |
| Arizona 1.10% | | | | | | | | |
| Agricultural Improvement and Power Dist., Electric System Rev. Bonds (Salt River Project), Series 2021-A, 5.00% 2028 | | | 295 | | | | 332 | |
| Agricultural Improvement and Power Dist., Electric System Rev. Bonds (Salt River Project), Series 2021-A, 5.00% 2029 | | | 370 | | | | 422 | |
| Board of Regents of the Arizona State University System, Rev. Bonds, Series 2020-A, 5.00% 2027 | | | 400 | | | | 443 | |
| Board of Regents of the Arizona State University System, Rev. Bonds, Series 2020-A, 5.00% 2028 | | | 550 | | | | 618 | |
| Board of Regents of the Arizona State University System, Rev. Bonds, Series 2020-A, 5.00% 2033 | | | 80 | | | | 91 | |
| Bullhead City, Excise Taxes Rev. Obligations, Series 2021-2, 1.15% 2027 | | | 375 | | | | 330 | |
| Coconino County Pollution Control Corp., Pollution Control Rev. Ref. Bonds, Series 2017-B, 1.65% 2039 (put 2023) | | | 1,500 | | | | 1,494 | |
| City of Glendale Industrial Dev. Auth., Rev. Ref. Bonds (Midwestern University), Series 2020, 5.00% 2029 | | | 1,000 | | | | 1,132 | |
| Industrial Dev. Auth., Education Rev. Bonds (GreatHearts Arizona Projects), Series 2021-A, 5.00% 2029 | | | 115 | | | | 128 | |
| Private Client Services Funds | 3 |
Capital Group Core Municipal Fund
| Bonds, notes & other debt instruments (continued) | Principal amount
(000) | | | Value
(000) | |
| Arizona (continued) | | | | | | | | |
| Industrial Dev. Auth., Rev. Bonds (Lincoln South Beltway Project), Series 2020, 5.00% 2023 | | USD | 1,000 | | | $ | 1,039 | |
| Kyrene Elementary School Dist. No. 28, School Improvement Bonds (2010 Project), Series 2013-B, 4.50% 2024 (preref. 2023)1 | | | 55 | | | | 57 | |
| Kyrene Elementary School Dist. No. 28, School Improvement Bonds (2010 Project), Series 2013-B, 4.50% 2025 (preref. 2023)1 | | | 45 | | | | 46 | |
| County of Maricopa, Industrial Dev. Auth., Education Rev. Bonds (GreatHearts Arizona Projects), Series 2017-A, 5.00% 2027 | | | 745 | | | | 814 | |
| City of Phoenix Civic Improvement Corp., Water System Rev. Ref. Bonds, Series 2014-B, 5.00% 2024 | | | 115 | | | | 121 | |
| County of Pima, Industrial Dev. Auth., Rev. Bonds (Tucson Medical Center), Series 2021-A, 5.00% 2031 | | | 485 | | | | 558 | |
| | | | | | | | 7,625 | |
| | | | | | | | | |
| Arkansas 0.09% | | | | | | | | |
| Dev. Fin. Auth., Health Care Rev. Bonds (Baptist Memorial Health Care), Series 2015-B-3, (SIFMA Municipal Swap Index + 1.55%) 1.99% 2044 (put 2022)2 | | | 600 | | | | 600 | |
| | | | | | | | | |
| California 5.24% | | | | | | | | |
| Bay Area Toll Auth., San Francisco Bay Area Toll Bridge Rev. Bonds, Series 2006-C-1, (SIFMA Municipal Swap Index + 0.90%) 1.34% 2045 (put 2023)2 | | | 2,205 | | | | 2,204 | |
| Bay Area Toll Auth., San Francisco Bay Area Toll Bridge Rev. Bonds, Series 2021-C, (SIFMA Municipal Swap Index + 0.45%) 0.89% 2056 (put 2026)2 | | | 425 | | | | 420 | |
| Trustees of the California State University, Systemwide Rev. Bonds, Series 2017-A, 5.00% 2026 | | | 380 | | | | 419 | |
| Trustees of the California State University, Systemwide Rev. Bonds, Series 2016-A, 5.00% 2027 | | | 365 | | | | 398 | |
| Trustees of the California State University, Systemwide Rev. Bonds, Series 2016-B-2, 0.55% 2049 (put 2026) | | | 195 | | | | 171 | |
| Carlsbad Unified School Dist., G.O. Bonds, 2018 Election, Series 2021-B, 2.00% 2023 | | | 75 | | | | 75 | |
| Carlsbad Unified School Dist., G.O. Bonds, 2018 Election, Series 2021-B, 2.00% 2024 | | | 85 | | | | 84 | |
| Community Choice Fncg. Auth., Clean Energy Project Rev. Green Bonds, Series 2021-B-1, 4.00% 2052 (put 2031) | | | 2,415 | | | | 2,452 | |
| Eastern Municipal Water Dist., Water and Wastewater Rev. Ref. Bonds, Series 2021-A, 3.00% 2024 | | | 165 | | | | 167 | |
| Educational Facs. Auth., Rev. Bonds (University of Southern California), Series 2009-C, 5.25% 2024 (escrowed to maturity) | | | 35 | | | | 37 | |
| Fresno Unified School Dist., G.O. Bonds, 2016 Election, Series 2021-D, 2.00% 2023 | | | 105 | | | | 105 | |
| Fresno Unified School Dist., G.O. Bonds, 2016 Election, Series 2021-D, 2.00% 2024 | | | 50 | | | | 49 | |
| G.O. Bonds, Series 2021, 5.00% 2031 | | | 30 | | | | 33 | |
| G.O. Bonds, Series 2021, 5.00% 2032 | | | 25 | | | | 27 | |
| G.O. Bonds, Series 2021, 5.00% 2034 | | | 25 | | | | 27 | |
| G.O. Rev. Ref. Bonds, Series 2021, 5.00% 2023 | | | 1,265 | | | | 1,313 | |
| G.O. Rev. Ref. Bonds, Series 2021, 5.00% 2027 | | | 4,625 | | | | 5,168 | |
| G.O. Rev. Ref. Bonds, Series 2020, 5.00% 2027 | | | 1,000 | | | | 1,120 | |
| G.O. Rev. Ref. Bonds, Series 2021, 5.00% 2030 | | | 55 | | | | 64 | |
| Golden State Tobacco Securitization Corp., Enhanced Tobacco Settlement Asset-Backed Bonds, Series 2015-A, 5.00% 2040 (preref. 2025) | | | 120 | | | | 129 | |
| Health Facs. Fncg. Auth., Rev. Bonds (Kaiser Permanente), Series 2017-B, 5.00% 2029 (put 2022) | | | 1,000 | | | | 1,016 | |
| Health Facs. Fncg. Auth., Rev. Ref. Bonds (Marshall Medical Center), Series 2015, 5.00% 2028 | | | 315 | | | | 334 | |
| Housing Fin. Agcy., Municipal Certs., Series 2021-A-1, 3.50% 2035 | | | 733 | | | | 734 | |
| Housing Fin. Agcy., Municipal Certs., Series 2021-A-3, 3.25% 2036 | | | 467 | | | | 448 | |
| Infrastructure and Econ. Dev. Bank, Rev. Ref. Bonds (Los Angeles County Museum of Art Project), Series 2021-B, 1.14% 2050 (put 2026)2 | | | 340 | | | | 338 | |
| Irvine Unified School Dist., Community Facs. Dist. No. 09-1, Special Tax Bonds, Series 2017-A, BAM insured, 5.00% 2025 | | | 250 | | | | 267 | |
| City of Jurupa, Public Fncg. Auth., Special Tax Rev. Ref. Bonds, Series 2020-A, BAM insured, 5.00% 2024 | | | 85 | | | | 90 | |
| City of Jurupa, Public Fncg. Auth., Special Tax Rev. Ref. Bonds, Series 2020-A, BAM insured, 4.00% 2026 | | | 60 | | | | 63 | |
| City of Los Angeles, Dept. of Airports, Los Angeles International Airport, Rev. Ref. Bonds, Series 2022-E, 5.00% 2030 | | | 250 | | | | 285 | |
| City of Los Angeles, Dept. of Water and Power, Power System Rev. Bonds, Series 2020-A, 5.00% 2026 | | | 710 | | | | 779 | |
| City of Los Angeles, Dept. of Water and Power, Power System Rev. Bonds, Series 2022-B, 5.00% 2032 | | | 180 | | | | 213 | |
| City of Los Angeles, Dept. of Water and Power, Water System Rev. Bonds, Series 2020-B, 4.00% 2026 | | | 605 | | | | 640 | |
| City of Los Angeles, Wastewater System Rev. Ref. Bonds, Series 2018-B, 5.00% 2027 | | | 625 | | | | 696 | |
| County of Los Angeles, Dev. Auth., Multi Family Housing Mortgage Rev. Bonds (Long Beach Senior Housing), Series 2022, 2.00% 2026 (put 2025) | | | 1,550 | | | | 1,513 | |
| County of Los Angeles, Dev. Auth., Multi Family Housing Rev. Bonds (Cantamar Villas), Series 2021-D-1, 0.30% 2025 (put 2024) | | | 55 | | | | 52 | |
| 4 | Private Client Services Funds |
Capital Group Core Municipal Fund
| Bonds, notes & other debt instruments (continued) | Principal amount
(000) | | | Value
(000) | |
| California (continued) | | | | | | | | |
| County of Los Angeles, Dev. Auth., Multi Family Housing Rev. Bonds (Sunny Garden Apartments), Series 2021-C-1, 0.20% 2024 (put 2023) | | USD | 75 | | | $ | 74 | |
| County of Los Angeles, Metropolitan Transportation Auth., Measure R Sales Tax Rev. Bonds, Series 2016-A, 5.00% 2023 | | | 50 | | | | 52 | |
| County of Los Angeles, Metropolitan Transportation Auth., Measure R Sales Tax Rev. Bonds, Series 2021-A, 5.00% 2032 | | | 960 | | | | 1,118 | |
| Los Angeles Unified School Dist., G.O. Dedicated Unlimited Ad Valorem Property Tax Bonds, Series 2020-C, 5.00% 2025 | | | 640 | | | | 688 | |
| Los Angeles Unified School Dist., G.O. Dedicated Unlimited Ad Valorem Property Tax Bonds, Series 2020-C, 5.00% 2029 | | | 150 | | | | 172 | |
| Metropolitan Water Dist. of Southern California, Water Rev. Ref. Bonds, Series 2020-A, 5.00% 2023 | | | 1,500 | | | | 1,550 | |
| Municipal Fin. Auth., Senior Living Rev. Bonds (Mt. San Antonio Gardens Project), Series 2022-B-2, 2.125% 2026 | | | 15 | | | | 14 | |
| Murrieta Valley Unified School Dist., Public Fncg. Auth., Special Tax Rev. Bonds, Series 2016-A, 5.00% 2022 | | | 1,250 | | | | 1,262 | |
| Public Fin. Auth., Rev. Bonds (Henry Mayo Newhall Memorial Hospital), Series 2021-A, 4.00% 2024 | | | 45 | | | | 46 | |
| Public Fin. Auth., Rev. Bonds (Henry Mayo Newhall Memorial Hospital), Series 2021-A, 4.00% 2025 | | | 45 | | | | 47 | |
| Public Fin. Auth., Rev. Bonds (Henry Mayo Newhall Memorial Hospital), Series 2021-A, 4.00% 2026 | | | 45 | | | | 47 | |
| Public Fin. Auth., Rev. Bonds (Henry Mayo Newhall Memorial Hospital), Series 2021-A, 4.00% 2027 | | | 45 | | | | 47 | |
| Public Fin. Auth., Rev. Bonds (Henry Mayo Newhall Memorial Hospital), Series 2021-A, 4.00% 2028 | | | 40 | | | | 42 | |
| Public Works Board, Lease Rev. Green Bonds (Dept. of General Services, Sacramento Region New Natural Resources Headquarters), Series 2021-C, 5.00% 2032 | | | 1,000 | | | | 1,155 | |
| Public Works Board, Lease Rev. Ref. Bonds (Various Capital Projects), Series 2022-A, 5.00% 2028 | | | 655 | | | | 736 | |
| RNR School Fncg. Auth., Community Facs. Dist. No. 92-1, Special Tax Bonds, Series 2017-A, BAM insured, 5.00% 2028 | | | 1,000 | | | | 1,095 | |
| City of San Diego, Community Facs. Dist. No. 2 (Santaluz), Improvement Area No. 1, Special Tax Rev. Ref. Bonds, Series 2021, 4.00% 2029 | | | 70 | | | | 73 | |
| County of San Diego, Regional Airport Auth., Airport Rev. Ref. Bonds, Series 2020-B, 5.00% 2022 | | | 1,000 | | | | 1,006 | |
| County of San Diego, Water Auth., Water Rev. Ref. Green Bonds, Series 2021-B, 5.00% 2030 | | | 230 | | | | 266 | |
| City and County of San Francisco, G.O. Rev. Ref. Bonds, Series 2020-R-2, 5.00% 2023 | | | 480 | | | | 496 | |
| City of San Jose, Redev. Agcy., Tax Allocation Rev. Ref. Bonds, Series 2017-B, 5.00% 2026 | | | 285 | | | | 312 | |
| City of Santee, Community Facs. Dist. No. 2017-1, Special Tax Bonds (Weston Infrastructure), Series 2019, 5.00% 2022 | | | 135 | | | | 136 | |
| City of Santee, Community Facs. Dist. No. 2017-1, Special Tax Bonds (Weston Infrastructure), Series 2019, 5.00% 2023 | | | 160 | | | | 165 | |
| City of Santee, Community Facs. Dist. No. 2017-1, Special Tax Bonds (Weston Infrastructure), Series 2019, 5.00% 2024 | | | 170 | | | | 178 | |
| Southern California Public Power Auth., Rev. Ref. Green Bonds (Milford Wind Corridor Phase II Project), Series 2021-1, 5.00% 2023 | | | 65 | | | | 67 | |
| Southern California Public Power Auth., Rev. Ref. Green Bonds (Milford Wind Corridor Phase II Project), Series 2021-1, 5.00% 2024 | | | 20 | | | | 21 | |
| Southern California Public Power Auth., Transmission Project Rev. Bonds (Southern Transmission Project), Series 2017-A, 5.00% 2023 | | | 490 | | | | 506 | |
| Statewide Communities Dev. Auth., Multi Family Housing Rev. Bonds (Villa Del Sol Apartments), Series 2021-A-2, 0.39% 2023 (put 2023) | | | 280 | | | | 274 | |
| Statewide Communities Dev. Auth., Multi Family Housing Rev. Bonds (Washington Court Apartments), Series 2021-E, 0.22% 2023 (put 2022) | | | 125 | | | | 125 | |
| Statewide Communities Dev. Auth., Pollution Control Rev. Ref. Bonds (Southern California Edison Co.), Series 2006-D, 2.625% 2033 (put 2023) | | | 135 | | | | 134 | |
| Statewide Communities Dev. Auth., Rev. Bonds (American Baptist Homes of the West), Series 2013-A, 5.00% 2023 (preref. 2022) | | | 80 | | | | 82 | |
| Statewide Communities Dev. Auth., Rev. Bonds (Viamonte Senior Living 1 Project), Series 2018-B, 3.00% 2025 | | | 65 | | | | 65 | |
| Statewide Communities Dev. Auth., Rev. Bonds (Viamonte Senior Living 1 Project), Series 2018-B, 3.00% 2026 | | | 500 | | | | 500 | |
| Tobacco Securitization Auth. of Northern California, Tobacco Settlement Asset-Backed Rev. Ref. Senior Bonds (Sacramento County Tobacco Securitization Corp.), Series 2021-B-1, 0.45% 2030 | | | 20 | | | | 20 | |
| Tobacco Securitization Auth. of Southern California, Tobacco Settlement Asset-Backed Rev. Ref. Bonds (San Diego County Tobacco Asset Securitization Corp.), Series 2019-A, 5.00% 2030 | | | 180 | | | | 197 | |
| Regents of the University of California, Limited Project Rev. Bonds, Series 2022-S, 5.00% 2026 | | | 165 | | | | 181 | |
| Dept. of Veterans Affairs, Veterans G.O. Bonds, Series 2019-CS, 4.00% 2049 | | | 785 | | | | 801 | |
| Dept. of Water Resources, Water System Rev. Bonds (Central Valley Project), Series 2016-AW, 5.00% 2033 (preref. 2026) | | | 255 | | | | 283 | |
| Dept. of Water Resources, Water System Rev. Bonds (Central Valley Project), Series 2017-AX, 5.00% 2033 (preref. 2027) | | | 230 | | | | 260 | |
| | | | | | | | 36,223 | |
| Private Client Services Funds | 5 |
Capital Group Core Municipal Fund
| Bonds, notes & other debt instruments (continued) | Principal amount
(000) | | | Value
(000) | |
| Colorado 1.87% | | | | | | | | |
| City of Arvada, Mountain Shadows Metropolitan Dist., Limited Tax G.O. Rev. Ref. and Improvement Bonds, Series 2016, 4.00% 2026 | | USD | 603 | | | $ | 603 | |
| Certs. of Part., Series 2021-A, 5.00% 2028 | | | 495 | | | | 560 | |
| Certs. of Part., Series 2021-A, 5.00% 2029 | | | 1,000 | | | | 1,143 | |
| Board of Governors of the Colorado State University System, System Enterprise Rev. and Rev. Ref. Bonds, Series 2016-B, 5.00% 2041 (preref. 2027) | | | 140 | | | | 155 | |
| City and County of Denver, Dept. of Aviation, Airport System Rev. Bonds, Series 2019-D, 5.00% 2031 (put 2022) | | | 1,000 | | | | 1,015 | |
| E-470 Public Highway Auth., Rev. Bonds, Series 2021-B, (USD-SOFR x 0.67 + 0.35%) 0.537% 2039 (put 2024)2 | | | 285 | | | | 279 | |
| Educational and Cultural Facs. Auth., Rev. Ref. Bonds (Johnson & Wales University Project), Series 2013-B, 5.00% 2023 (escrowed to maturity) | | | 1,805 | | | | 1,853 | |
| Health Facs. Auth., Health Facs. Rev. and Rev. Ref. Bonds (Evangelical Lutheran Good Samaritan Society Project), Series 2015-A, 5.00% 2024 (escrowed to maturity) | | | 1,825 | | | | 1,924 | |
| Health Facs. Auth., Hospital Rev. Bonds (Adventist Health System/Sunbelt Obligated Group), Series 2018-A, 5.00% 2048 | | | 125 | | | | 135 | |
| Housing and Fin. Auth., Multi Family Housing Rev. Bonds (Wildhorse Ridge Apartments Project), Series 2022, 2.00% 2026 (put 2025) | | | 1,850 | | | | 1,810 | |
| Housing and Fin. Auth., Single Family Mortgage Bonds, Series 2018-C, Class I, 4.25% 2048 | | | 530 | | | | 543 | |
| Housing and Fin. Auth., Single Family Mortgage Bonds, Series 2020-B, Class I, 3.75% 2050 | | | 840 | | | | 851 | |
| Housing and Fin. Auth., Single Family Mortgage Bonds, Series 2021-L, Class I, 3.25% 2051 | | | 1,250 | | | | 1,241 | |
| Regional Transportation Dist., Private Activity Bonds (Denver Transit Partners Eagle P3 Project), Series 2020-A, 5.00% 2029 | | | 70 | | | | 75 | |
| Regional Transportation Dist., Private Activity Bonds (Denver Transit Partners Eagle P3 Project), Series 2020-A, 5.00% 2029 | | | 40 | | | | 43 | |
| Regional Transportation Dist., Private Activity Bonds (Denver Transit Partners Eagle P3 Project), Series 2020-A, 5.00% 2030 | | | 150 | | | | 162 | |
| Regional Transportation Dist., Private Activity Bonds (Denver Transit Partners Eagle P3 Project), Series 2020-A, 5.00% 2030 | | | 35 | | | | 38 | |
| Weld County School Dist. RE-5J, G.O. Bonds, Series 2021, 5.00% 2023 | | | 475 | | | | 496 | |
| | | | | | | | 12,926 | |
| | | | | | | | | |
| Connecticut 0.79% | | | | | | | | |
| Town of East Hartford, Housing Auth., Multi Family Housing Rev. Bonds (Veterans Terrace Project), Series 2021, 0.25% 2023 (put 2022) | | | 140 | | | | 139 | |
| Health and Educational Facs. Auth., Rev. Bonds (Hartford Healthcare Issue), Series 2021-A, 5.00% 2029 | | | 330 | | | | 367 | |
| Health and Educational Facs. Auth., Rev. Bonds (Yale University Issue), Series 2003-X-2, 0.25% 2037 (put 2024) | | | 910 | | | | 869 | |
| Health and Educational Facs. Auth., Rev. Bonds (Yale University Issue), Series 2014-A, 1.10% 2048 (put 2023) | | | 1,105 | | | | 1,097 | |
| Housing Fin. Auth., Housing Mortgage Fin. Program Bonds, Series 2014-C-1, 4.00% 2044 | | | 50 | | | | 51 | |
| Housing Fin. Auth., Housing Mortgage Fin. Program Bonds, Series 2016-A-1, 4.00% 2045 | | | 200 | | | | 203 | |
| Housing Fin. Auth., Housing Mortgage Fin. Program Bonds, Series 2017-A-1, 4.00% 2047 | | | 1,585 | | | | 1,609 | |
| Housing Fin. Auth., Housing Mortgage Fin. Program Bonds, Series 2017-C-1, 4.00% 2047 | | | 605 | | | | 614 | |
| Housing Fin. Auth., Housing Mortgage Fin. Program Bonds, Series 2017-D-1, 4.00% 2047 | | | 130 | | | | 132 | |
| Housing Fin. Auth., Housing Mortgage Fin. Program Bonds, Series 2022-A-1, 3.50% 2051 | | | 290 | | | | 290 | |
| Housing Fin. Auth., Housing Mortgage Fin. Program Rev. Ref. Bonds, Series 2015-A, 3.50% 2044 | | | 60 | | | | 60 | |
| | | | | | | | 5,431 | |
| | | | | | | | | |
| Delaware 0.13% | | | | | | | | |
| County of Harris, Metropolitan Transportation Auth., Sales and Use Tax Contractual Obligations, Series 2015-B, 5.00% 2025 | | | 85 | | | | 92 | |
| Health Facs. Auth., Rev. Bonds (Beebe Medical Center Project), Series 2018, 5.00% 2022 | | | 290 | | | | 291 | |
| Health Facs. Auth., Rev. Bonds (Beebe Medical Center Project), Series 2018, 5.00% 2023 | | | 200 | | | | 206 | |
| Health Facs. Auth., Rev. Bonds (Beebe Medical Center Project), Series 2018, 5.00% 2024 | | | 300 | | | | 314 | |
| | | | | | | | 903 | |
| | | | | | | | | |
| District of Columbia 0.87% | | | | | | | | |
| G.O. Bonds, Series 2015-A, 5.00% 2032 | | | 1,800 | | | | 1,916 | |
| G.O. Rev. Ref. Bonds, Series 2021-E, 5.00% 2029 | | | 230 | | | | 263 | |
| G.O. Rev. Ref. Bonds, Series 2021-E, 5.00% 2030 | | | 960 | | | | 1,112 | |
| Housing Fin. Agcy., Collateralized Multi Family Housing Rev. Bonds (Kenilworth 166 Apartments Project), Series 2021, 1.25% 2025 (put 2024) | | | 410 | | | | 394 | |
| 6 | Private Client Services Funds |
Capital Group Core Municipal Fund
| Bonds, notes & other debt instruments (continued) | Principal amount
(000) | | | Value
(000) | |
| District of Columbia (continued) | | | | | | | | |
| Housing Fin. Agcy., Collateralized Multi Family Housing Rev. Bonds (Parcel 42 Project), Series 2022, 1.70% 2041 (put 2025) | | USD | 500 | | | $ | 483 | |
| Income Tax Secured Rev. Bonds, Series 2020-A, 5.00% 2032 | | | 750 | | | | 855 | |
| Income Tax Secured Rev. Bonds, Series 2020-C, 5.00% 2033 | | | 215 | | | | 244 | |
| Rev. Ref. Bonds (National Public Radio, Inc. Issue), Series 2016, 5.00% 2028 (preref. 2028) | | | 50 | | | | 55 | |
| Rev. Ref. Bonds (National Public Radio, Inc. Issue), Series 2016, 5.00% 2029 (preref. 2029) | | | 50 | | | | 55 | |
| Washington Convention and Sports Auth., Dedicated Tax Rev. Ref. Bonds, Series 2018-A, 5.00% 2027 | | | 600 | | | | 669 | |
| | | | | | | | 6,046 | |
| | | | | | | | | |
| Florida 6.60% | | | | | | | | |
| County of Alachua, Health Facs. Auth., Continuing Care Retirement Community Rev. Bonds (Oak Hammock at the University of Florida, Inc. Project), Series 2021, 4.00% 2022 | | | 20 | | | | 20 | |
| County of Brevard, Health Facs. Auth., Rev. Ref. Bonds (Health First, Inc. Project), Series 2014, 5.00% 2033 | | | 130 | | | | 136 | |
| County of Brevard, Housing Fncg. Auth., Multi Family Mortgage Rev. Bonds (Tropical Manor Apartments), Series 2021, 0.25% 2023 (put 2022) | | | 135 | | | | 134 | |
| County of Broward, Housing Fin. Auth., Multi Family Housing Rev. Bonds (Solaris Apartments), Series 2021-B, 0.70% 2025 (put 2024) | | | 370 | | | | 353 | |
| Central Florida Expressway Auth., Rev. Bonds, Series 2019-B, 5.00% 2030 | | | 1,000 | | | | 1,127 | |
| Citizens Property Insurance Corp., Personal Lines Account/Commercial Lines Account Secured Bonds, Series 2012-A-1, 5.00% 2022 | | | 170 | | | | 171 | |
| City of Daytona Beach, Housing Auth., Multi Family Housing Rev. Bonds (The WM at the River Project), Series 2021-B, 1.25% 2025 (put 2024) | | | 605 | | | | 582 | |
| Dev. Fin. Corp., Healthcare Facs. Rev. Bonds (UF Health - Jacksonville Project), Series 2022-A, 5.00% 2033 | | | 1,115 | | | | 1,215 | |
| Board of Education, Public Education Capital Outlay Rev. Ref. Bonds, Series 2013-A, 5.00% 2022 | | | 1,000 | | | | 1,003 | |
| Board of Education, Public Education Capital Outlay Rev. Ref. Bonds, Series 2019-D, 5.00% 2023 | | | 120 | | | | 124 | |
| Board of Education, Public Education Capital Outlay Rev. Ref. Bonds, Series 2022-A, 5.00% 2025 | | | 949 | | | | 1,022 | |
| Board of Education, Public Education Capital Outlay Rev. Ref. Bonds, Series 2022-A, 5.00% 2026 | | | 1,000 | | | | 1,099 | |
| Greater Orlando Aviation Auth., Airport Facs. Rev. Bonds, Series 2016-B, 5.00% 2028 | | | 750 | | | | 825 | |
| Higher Educational Facs. Fncg. Auth., Educational Facs. Rev. Ref. Bonds (Nova Southeastern University Project), Series 2016, 5.00% 2026 | | | 655 | | | | 708 | |
| Housing Fin. Corp., Homeowner Mortgage Rev. Bonds, Series 2017-1, 4.00% 2048 | | | 980 | | | | 995 | |
| Housing Fin. Corp., Homeowner Mortgage Rev. Bonds, Series 2018-1, 4.00% 2049 | | | 985 | | | | 1,002 | |
| Housing Fin. Corp., Homeowner Mortgage Rev. Bonds, Series 2018-2, 4.25% 2050 | | | 985 | | | | 1,009 | |
| Housing Fin. Corp., Homeowner Mortgage Rev. Bonds, Series 2020-1, 3.50% 2051 | | | 150 | | | | 151 | |
| Housing Fin. Corp., Homeowner Mortgage Rev. Bonds, Series 2021-2, 3.00% 2052 | | | 2,230 | | | | 2,192 | |
| Housing Fin. Corp., Homeowner Mortgage Rev. Bonds (Special Program), Series 2015-A, 3.50% 2046 | | | 35 | | | | 35 | |
| Housing Fin. Corp., Multi Family Mortgage Rev. Bonds (The Canopy at West River Towers 1 & 2), Series 2022-A-2, 3.25% 2026 (put 2025) | | | 519 | | | | 522 | |
| Housing Fin. Corp., Multi Family Mortgage Rev. Bonds (Valencia Park Apartments), Series 2021-A, FHA insured, 0.25% 2023 (put 2022) | | | 630 | | | | 620 | |
| JEA, Electric System Rev. Bonds, Series 2014-A-3, 5.00% 2022 | | | 600 | | | | 609 | |
| JEA, Electric System Rev. Bonds, Series 2017-B, 5.00% 2026 | | | 500 | | | | 547 | |
| JEA, Electric System Rev. Bonds, Series 2017-B-3, 5.00% 2026 | | | 340 | | | | 373 | |
| JEA, Electric System Rev. Bonds, Series 2020-A-3, 5.00% 2030 | | | 50 | | | | 57 | |
| JEA, Electric System Rev. Bonds, Series 2021-A, 5.00% 2031 | | | 2,095 | | | | 2,398 | |
| JEA, Electric System Rev. Bonds, Series 2021-A-3, 5.00% 2033 | | | 625 | | | | 719 | |
| JEA, Water and Sewer System Rev. Bonds, Series 2020-A, 5.00% 2033 | | | 50 | | | | 57 | |
| County of Manatee, University Park Recreation Dist., Non-Ad Valorem Assessment Bonds, Series 2019, BAM insured, 2.50% 2024 | | | 280 | | | | 278 | |
| County of Manatee, University Park Recreation Dist., Non-Ad Valorem Assessment Bonds, Series 2019, BAM insured, 2.50% 2025 | | | 285 | | | | 281 | |
| County of Manatee, University Park Recreation Dist., Non-Ad Valorem Assessment Bonds, Series 2019, BAM insured, 2.50% 2026 | | | 295 | | | | 289 | |
| County of Manatee, University Park Recreation Dist., Non-Ad Valorem Assessment Bonds, Series 2019, BAM insured, 2.50% 2027 | | | 300 | | | | 291 | |
| County of Manatee, University Park Recreation Dist., Non-Ad Valorem Assessment Bonds, Series 2019, BAM insured, 2.50% 2028 | | | 305 | | | | 293 | |
| County of Manatee, University Park Recreation Dist., Non-Ad Valorem Assessment Bonds, Series 2019, BAM insured, 2.625% 2029 | | | 315 | | | | 303 | |
| County of Miami-Dade, Aviation Rev. Ref. Bonds, Series 2020-A, 5.00% 2025 | | | 1,150 | | | | 1,230 | |
| County of Miami-Dade, Expressway Auth., Toll System Rev. Bonds, Series 2014-A, BAM insured, 5.00% 2026 | | | 780 | | | | 821 | |
| County of Miami-Dade, Expressway Auth., Toll System Rev. Ref. Bonds, Series 2014-B, BAM insured, 5.00% 2026 | | | 760 | | | | 800 | |
| Private Client Services Funds | 7 |
Capital Group Core Municipal Fund
| Bonds, notes & other debt instruments (continued) | Principal amount
(000) | | | Value
(000) | |
| Florida (continued) | | | | | | | | |
| County of Miami-Dade, Housing Fin. Auth., Multi Family Housing Rev. Bonds (Platform 3750), Series 2021, 0.25% 2024 (put 2023) | | USD | 510 | | | $ | 495 | |
| County of Miami-Dade, Housing Fin. Auth., Multi Family Housing Rev. Bonds (Sunset Bay Apartments), Series 2021, 0.25% 2023 (put 2022) | | | 420 | | | | 415 | |
| County of Miami-Dade, Industrial Dev. Auth., Solid Waste Disposal Rev. Bonds (Waste Management, Inc. of Florida Project), Series 2007, 0.32% 2027 (put 2022) | | | 2,205 | | | | 2,191 | |
| County of Miami-Dade, Transit System Sales Surtax Rev. Bonds, Series 2012, 5.00% 2025 (preref. 2022) | | | 25 | | | | 25 | |
| City of Miami Beach, Health Facs. Auth., Hospital Rev. and Rev. Ref. Bonds (Mount Sinai Medical Center of Florida), Series 2014, 5.00% 2027 | | | 145 | | | | 152 | |
| Municipal Power Agcy., All-Requirements Power Supply Project Rev. Ref. Bonds, Series 2016-A, 5.00% 2026 | | | 1,000 | | | | 1,093 | |
| County of Orange, Health Facs. Auth., Health Care Facs. Rev. Ref. Bonds (Presbyterian Retirement Communities Project), Series 2016, 5.00% 2031 | | | 300 | | | | 319 | |
| County of Orange, Health Facs. Auth., Rev. Bonds (Presbyterian Retirement Communities Obligated Group Project), Series 2023-A, 5.00% 2029 | | | 320 | | | | 335 | |
| County of Orange, Health Facs. Auth., Rev. Bonds (Presbyterian Retirement Communities Obligated Group Project), Series 2023-A, 5.00% 2031 | | | 500 | | | | 526 | |
| County of Orange, Housing Fin. Auth., Multi Family Housing Rev. Bonds (Dunwoodie Place Apartments), Series 2021-A, 0.20% 2024 (put 2023) | | | 200 | | | | 193 | |
| County of Orange, Housing Fin. Auth., Multi Family Housing Rev. Bonds (Jernigan Gardens), Series 2020-B, 0.35% 2023 (put 2022) | | | 2,000 | | | | 1,988 | |
| County of Orange, Housing Fin. Auth., Multi Family Housing Rev. Bonds (Stratford Point Apartments), Series 2021-B, 0.55% 2025 (put 2024) | | | 635 | | | | 604 | |
| Orlando Utilities Commission, Utility System Rev. Ref. Bonds, Series 2021-B, 1.25% 2046 (put 2028) | | | 1,000 | | | | 859 | |
| Orlando-Orange County Expressway Auth., Rev. Ref. Bonds, Series 2013-A, 5.00% 2032 (preref. 2023) | | | 1,020 | | | | 1,054 | |
| County of Palm Beach, Housing Fin. Auth., Multi Family Housing Rev. Bonds (Christian Manor), Series 2022, 1.25% 2025 (put 2024) | | | 2,875 | | | | 2,810 | |
| County of Pasco, Connerton West Community Dev. Dist., Improvement Rev. Ref. Bonds, Series 2018-A-1, Assured Guaranty Municipal insured, 3.00% 2026 | | | 345 | | | | 346 | |
| County of Pasco, Connerton West Community Dev. Dist., Improvement Rev. Ref. Bonds, Series 2018-A-1, Assured Guaranty Municipal insured, 3.20% 2027 | | | 355 | | | | 361 | |
| County of Pasco, Connerton West Community Dev. Dist., Improvement Rev. Ref. Bonds, Series 2018-A-1, Assured Guaranty Municipal insured, 3.25% 2028 | | | 370 | | | | 375 | |
| County of Pinellas, Housing Fin. Auth., Multi Family Mortgage Backed Bonds (Jordan Park Apartments), Series 2021-B, 0.65% 2025 (put 2024) | | | 525 | | | | 500 | |
| County of Polk, Utility System Rev. and Rev. Ref. Bonds, Series 2013, BAM insured, 5.00% 2043 (preref. 2023) | | | 185 | | | | 192 | |
| City of Pompano Beach, Rev. Bonds (John Knox Village Project), Series 2015, 5.00% 2023 | | | 630 | | | | 648 | |
| Counties of St. Johns and Duval, Tolomato Community Dev. Dist., Rev. Ref. Bonds, Series 2018-A-1, Assured Guaranty Municipal insured, 2.625% 2024 | | | 1,055 | | | | 1,051 | |
| County of St. Johns, Sweetwater Creek Community Dev. Dist., Capital Improvement Rev. Ref. Bonds, Series 2019-A-1, Assured Guaranty Municipal insured, 2.00% 2022 | | | 340 | | | | 340 | |
| City of South Miami, Health Facs. Auth., Hospital Rev. Ref. Bonds (Baptist Health South Florida Obligated Group), Series 2017, 5.00% 2024 | | | 500 | | | | 525 | |
| City of Tallahassee, Energy System Rev. Ref. Bonds, Series 2020, 5.00% 2028 | | | 1,000 | | | | 1,131 | |
| City of Tampa, Hospital Rev. Bonds (H. Lee Moffitt Cancer Center Project), Series 2020-B, 5.00% 2028 | | | 215 | | | | 239 | |
| City of Tampa, Hospital Rev. Bonds (H. Lee Moffitt Cancer Center Project), Series 2020-B, 5.00% 2029 | | | 250 | | | | 281 | |
| City of Tampa, Hospital Rev. Bonds (H. Lee Moffitt Cancer Center Project), Series 2020-B, 5.00% 2030 | | | 260 | | | | 295 | |
| Dept. of Transportation, Right-of-Way Acquisition and Bridge Construction Bonds, Series 2022-A, 5.00% 2026 | | | 510 | | | | 562 | |
| Dept. of Transportation, Turnpike Rev. Bonds, Series 2018-A, 5.00% 2026 | | | 292 | | | | 321 | |
| Dept. of Transportation Fncg. Corp., Rev. Bonds, Series 2020, 5.00% 2024 | | | 430 | | | | 454 | |
| City of Winter Garden, Winter Garden Village at Fowler Groves Community Dev. Dist., Special Assessment Rev. Ref. Bonds, Series 2016, 3.00% 2024 | | | 530 | | | | 529 | |
| | | | | | | | 45,600 | |
| | | | | | | | | |
| Georgia 2.56% | | | | | | | | |
| County of Appling, Dev. Auth., Pollution Control Rev. Bonds (Oglethorpe Power Corp. Scherer Project), Series 2013-A, 1.50% 2038 (put 2025) | | | 885 | | | | 854 | |
| City of Atlanta, Urban Residential Fin. Auth., Multi Family Housing Rev. Bonds (Sylvan Hills Senior Apartments Project), Series 2020, 0.41% 2025 (put 2023) | | | 285 | | | | 274 | |
| County of Burke, Dev. Auth., Pollution Control Rev. Bonds (Georgia Power Co. Plant Vogtle Project), Series 1995-5, 2.20% 2032 | | | 500 | | | | 466 | |
| County of Burke, Dev. Auth., Pollution Control Rev. Bonds (Georgia Power Co. Plant Vogtle Project), Series 2013, 2.925% 2053 (put 2024) | | | 600 | | | | 598 | |
| 8 | Private Client Services Funds |
Capital Group Core Municipal Fund
| Bonds, notes & other debt instruments (continued) | Principal amount
(000) | | | Value
(000) | |
| Georgia (continued) | | | | | | | | |
| County of Burke, Dev. Auth., Pollution Control Rev. Bonds (Oglethorpe Power Corp. Vogtle Project), Series 2013-A, 1.50% 2040 (put 2025) | | USD | 685 | | | $ | 661 | |
| City of Columbus, Dev. Auth., Multi Family Housing Rev. Bonds (Highland Terrance Phase II Project), Series 2021-B, 0.34% 2025 (put 2024) | | | 425 | | | | 403 | |
| County of Dawson, Dev. Auth., Multi Family Housing Rev. Bonds (Peaks of Dawsonville Project), Series 2021, 0.28% 2023 | | | 250 | | | | 243 | |
| County of Dekalb, Housing Auth., Multi Family Housing Rev. Bonds (Columbia Village Project), Series 2021-A, 0.34% 2024 (put 2023) | | | 140 | | | | 136 | |
| G.O. Bonds, Series 2020-A, 5.00% 2023 | | | 160 | | | | 166 | |
| G.O. Rev. Ref. Bonds, Series 2016-E, 5.00% 2026 | | | 225 | | | | 250 | |
| Housing and Fin. Auth., Single Family Mortgage Bonds, Series 2014-A-1, 4.00% 2044 | | | 155 | | | | 157 | |
| Housing and Fin. Auth., Single Family Mortgage Bonds, Series 2015-A-1, 3.50% 2045 | | | 125 | | | | 126 | |
| Housing and Fin. Auth., Single Family Mortgage Bonds, Series 2017-A, 4.00% 2047 | | | 350 | | | | 355 | |
| City of Lawrenceville, Housing Auth., Multi Family Housing Rev. Bonds (Hearthside Lawrenceville Project), Series 2022, 2.25% 2025 (put 2024) | | | 1,565 | | | | 1,537 | |
| Main Street Natural Gas, Inc., Gas Supply Rev. Bonds, Series 2018-D, (3-month USD-LIBOR x 0.67 + 0.83%) 1.134% 2048 (put 2023)2 | | | 155 | | | | 154 | |
| Main Street Natural Gas, Inc., Gas Supply Rev. Bonds, Series 2019-B, 4.00% 2049 (put 2024) | | | 980 | | | | 1,004 | |
| Main Street Natural Gas, Inc., Gas Supply Rev. Bonds, Series 2019-C, 4.00% 2050 (put 2026) | | | 1,500 | | | | 1,529 | |
| Main Street Natural Gas, Inc., Gas Supply Rev. Bonds, Series 2021-C, 4.00% 2052 (put 2028) | | | 2,305 | | | | 2,349 | |
| Main Street Natural Gas, Inc., Gas Supply Rev. Bonds, Series 2021-A, 4.00% 2052 (put 2027) | | | 1,000 | | | | 1,028 | |
| Municipal Electric Auth., General Resolution Projects Bonds, Series 2021-A, 5.00% 2031 | | | 415 | | | | 471 | |
| Municipal Electric Auth., Plant Vogtle Units 3 and 4 Project J Bonds, Series 2021-A, Assured Guaranty Municipal insured, 5.00% 2029 | | | 495 | | | | 558 | |
| Municipal Electric Auth., Plant Vogtle Units 3 and 4 Project J Bonds, Series 2021-A, Assured Guaranty Municipal insured, 5.00% 2030 | | | 430 | | | | 489 | |
| Municipal Electric Auth., Plant Vogtle Units 3 and 4 Project M Bonds, Series 2019-A, 5.00% 2029 | | | 120 | | | | 133 | |
| Municipal Electric Auth., Plant Vogtle Units 3 and 4 Project M Bonds, Series 2019-A, 5.00% 2030 | | | 115 | | | | 127 | |
| Municipal Electric Auth., Project One Bonds, Series 2019-A, 5.00% 2024 | | | 1,000 | | | | 1,039 | |
| Municipal Electric Auth., Project One Bonds, Series 2019-A, 5.00% 2029 | | | 870 | | | | 970 | |
| Municipal Electric Auth., Project One Bonds, Series 2021-A, 5.00% 2031 | | | 785 | | | | 891 | |
| Northwest Georgia Housing Auth., Multi Family Housing Rev. Bonds (Dallas Manor Apartments Project), Series 2021, 0.25% 2024 (put 2023) | | | 120 | | | | 116 | |
| City of Valdosta, Housing Auth., Multi Family Housing Rev. Bonds (TISHCO Rural Rental Housing Portfolio Project), Series 2022, 1.25% 2025 (put 2024) | | | 185 | | | | 181 | |
| County of Walker, Dev. Auth., Multi Family Housing Rev. Bonds (Gateway at Rossville Project), Series 2021-B, 0.46% 2024 (put 2023) | | | 465 | | | | 448 | |
| | | | | | | | 17,713 | |
| | | | | | | | | |
| Guam 0.07% | | | | | | | | |
| Waterworks Auth., Water and Wastewater System Rev. Bonds, Series 2013, 5.25% 2024 | | | 450 | | | | 463 | |
| | | | | | | | | |
| Hawaii 0.50% | | | | | | | | |
| Airports System Rev. Bonds, Series 2018-D, 5.00% 2030 | | | 1,000 | | | | 1,138 | |
| City and County of Honolulu, G.O. Bonds (Honolulu Rail Transit Project), Series 2020-B, 5.00% 2031 | | | 2,020 | | | | 2,320 | |
| | | | | | | | 3,458 | |
| | | | | | | | | |
| Idaho 0.17% | | | | | | | | |
| Health Facs. Auth., Rev. Bonds (St. Luke’s Health System Project), Series 2021-A, 5.00% 2031 | | | 60 | | | | 68 | |
| Health Facs. Auth., Rev. Bonds (St. Luke’s Health System Project), Series 2021-A, 5.00% 2032 | | | 90 | | | | 103 | |
| Housing and Fin. Assn., Grant and Rev. Anticipation Bonds (Federal Highway Trust Fund), Series 2015-A, 5.00% 2022 | | | 1,000 | | | | 1,007 | |
| | | | | | | | 1,178 | |
| | | | | | | | | |
| Illinois 5.63% | | | | | | | | |
| Build Illinois Bonds, Sales Tax Rev. Ref. Bonds, Series 2016-D, 5.00% 2025 | | | 475 | | | | 501 | |
| City of Chicago, Board of Education, Unlimited Tax G.O. Bonds (Dedicated Rev.), Series 2018-A, Assured Guaranty Municipal insured, 5.00% 2023 | | | 1,100 | | | | 1,144 | |
| City of Chicago, Chicago Midway Airport, Rev. and Rev. Ref. Bonds, Series 2014-B, 5.00% 2028 | | | 500 | | | | 518 | |
| Private Client Services Funds | 9 |
Capital Group Core Municipal Fund
| Bonds, notes & other debt instruments (continued) | Principal amount
(000) | | | Value
(000) | |
| Illinois (continued) | | | | | | | | |
| City of Chicago, G.O. Rev. Ref. Bonds, Series 2020-A, 5.00% 2023 | | USD | 560 | | | $ | 569 | |
| City of Chicago, Transit Auth., Capital Grant Receipts Rev. Ref. Bonds (Federal Transit Administration Section 5307 Urbanized Area Formula Funds), Series 2021, 5.00% 2024 | | | 65 | | | | 68 | |
| City of Chicago, Wastewater Transmission Rev. Bonds, Series 2012, Assured Guaranty Municipal insured, 5.00% 2023 | | | 500 | | | | 501 | |
| City of Chicago, Wastewater Transmission Rev. Project Bonds, Series 2014, 5.00% 2028 | | | 385 | | | | 397 | |
| City of Chicago, Water Rev. Bonds, Series 2004, 5.00% 2023 | | | 200 | | | | 208 | |
| City of Chicago, Water Rev. Ref. Bonds, Series 2014, 5.00% 2023 | | | 200 | | | | 208 | |
| City of Chicago, Water Rev. Ref. Bonds, Series 2017, 5.00% 2028 | | | 355 | | | | 393 | |
| County of Cook, Community College Dist. No. 508 (City Colleges of Chicago), Unlimited Tax G.O. Bonds, Series 2013, 5.00% 2023 | | | 200 | | | | 207 | |
| Fin. Auth., Academic Fac. Lease Rev. Bonds (Provident Group - UIUC Properties LLC - University of Illinois at Urbana-Champaign Project), Series 2019-A, 5.00% 2025 | | | 110 | | | | 118 | |
| Fin. Auth., Academic Fac. Lease Rev. Bonds (Provident Group - UIUC Properties LLC - University of Illinois at Urbana-Champaign Project), Series 2019-A, 5.00% 2027 | | | 500 | | | | 555 | |
| Fin. Auth., Academic Fac. Lease Rev. Bonds (Provident Group - UIUC Properties LLC - University of Illinois at Urbana-Champaign Project), Series 2019-A, 5.00% 2028 | | | 400 | | | | 449 | |
| Fin. Auth., Rev. Bonds (Advocate Health Care Network), Series 2008-A-1, 4.00% 2030 | | | 1,000 | | | | 1,024 | |
| Fin. Auth., Rev. Bonds (Art Institute of Chicago), Series 2016, 5.00% 2025 | | | 125 | | | | 133 | |
| Fin. Auth., Rev. Bonds (Art Institute of Chicago), Series 2016, 5.00% 2026 | | | 120 | | | | 130 | |
| Fin. Auth., Rev. Bonds (Clean Water Initiative Revolving Fund), Series 2017, 5.00% 2033 | | | 500 | | | | 548 | |
| Fin. Auth., Rev. Bonds (Northshore University Heathsystem), Series 2020-A, 5.00% 2033 | | | 280 | | | | 313 | |
| Fin. Auth., Rev. Bonds (OSF Healthcare System), Series 2015-A, 5.00% 2027 | | | 250 | | | | 268 | |
| Fin. Auth., Rev. Bonds (OSF Healthcare System), Series 2020-B-2, 5.00% 2050 (put 2026) | | | 105 | | | | 114 | |
| Fin. Auth., Rev. Bonds (Presbyterian Homes Obligated Group), Series 2016-A, 5.00% 2024 | | | 310 | | | | 323 | |
| Fin. Auth., Rev. Bonds (Presbyterian Homes Obligated Group), Series 2021-B, (SIFMA Municipal Swap Index + 0.70%) 1.14% 2042 (put 2026)2 | | | 140 | | | | 140 | |
| Fin. Auth., Rev. Bonds (Presence Health Network), Series 2016-C, 5.00% 2026 | | | 600 | | | | 650 | |
| Fin. Auth., Rev. Bonds (Presence Health Network), Series 2016-C, 5.00% 2028 | | | 400 | | | | 440 | |
| Fin. Auth., Rev. Bonds (Rush University Medical Center Obligated Group), Series 2015-A, 5.00% 2028 | | | 1,000 | | | | 1,064 | |
| Fin. Auth., Rev. Bonds (Rush University Medical Center Obligated Group), Series 2015-A, 5.00% 2029 | | | 500 | | | | 531 | |
| Fin. Auth., Rev. Bonds (The Carle Foundation), Series 2021-A, 5.00% 2029 | | | 800 | | | | 898 | |
| Fin. Auth., Rev. Bonds (The Carle Foundation), Series 2021-A, 5.00% 2030 | | | 360 | | | | 408 | |
| Fin. Auth., Rev. Bonds (University of Chicago), Series 2021-A, 5.00% 2025 | | | 270 | | | | 292 | |
| Fin. Auth., Rev. Ref. Bonds (Northwestern Memorial Healthcare), Series 2021-A, 5.00% 2033 | | | 365 | | | | 420 | |
| Fin. Auth., Rev. Ref. Bonds (OSF Healthcare System), Series 2015-A, 5.00% 2026 | | | 770 | | | | 828 | |
| Fin. Auth., Water Facs. Rev. Ref. Bonds (American Water Capital Corp. Project), Series 2020, 0.70% 2040 (put 2023) | | | 215 | | | | 210 | |
| G.O. Bonds, Series 2014, 5.00% 2022 | | | 110 | | | | 110 | |
| G.O. Bonds, Series 2020-B, 5.00% 2029 | | | 2,090 | | | | 2,277 | |
| G.O. Bonds, Series 2019-A, 5.00% 2029 | | | 1,000 | | | | 1,089 | |
| Housing Dev. Auth., Multi Family Housing Rev. Bonds, Series 2021-C, 0.80% 2026 | | | 40 | | | | 37 | |
| Housing Dev. Auth., Multi Family Housing Rev. Bonds (Concord Commons), Series 2021, 0.25% 2024 (put 2023) | | | 810 | | | | 796 | |
| Housing Dev. Auth., Multi Family Housing Rev. Bonds (Marshall Field Garden Apartment Homes), Series 2015, (SIFMA Municipal Swap Index + 1.00%) 1.44% 2050 (put 2025)2 | | | 2,000 | | | | 2,019 | |
| Housing Dev. Auth., Multi Family Housing Rev. Bonds (Terrance Senior), Series 2022, 2.375% 2025 (put 2024) | | | 770 | | | | 763 | |
| Housing Dev. Auth., Rev. Bonds, Series 2019-A, 4.25% 2049 | | | 1,290 | | | | 1,323 | |
| Housing Dev. Auth., Rev. Bonds, Series 2021-D, 3.00% 2051 | | | 1,640 | | | | 1,608 | |
| Metropolitan Pier and Exposition Auth., McCormick Place Expansion Project Rev. Ref. Bonds, Series 2017-B, 5.00% 2025 | | | 225 | | | | 239 | |
| Municipal Electric Agcy., Power Supply System Rev. Ref. Bonds, Series 2015-A, 5.00% 2027 | | | 1,000 | | | | 1,072 | |
| Railsplitter Tobacco Settlement Auth., Tobacco Settlement Rev. Bonds, Series 2017, 5.00% 2023 | | | 620 | | | | 636 | |
| Sales Tax Securitization Corp., Sales Tax Rev. Ref. Bonds, Series 2017-A, 5.00% 2024 | | | 1,000 | | | | 1,043 | |
| Sales Tax Securitization Corp., Sales Tax Securitization Rev. Ref. Bonds, Series 2017-A, 5.00% 2023 | | | 2,000 | | | | 2,043 | |
| Toll Highway Auth., Toll Highway Rev. Bonds, Series 2019-C, 5.00% 2025 | | | 1,180 | | | | 1,252 | |
| Toll Highway Auth., Toll Highway Rev. Bonds, Series 2015-A, 5.00% 2027 | | | 1,250 | | | | 1,344 | |
| Toll Highway Auth., Toll Highway Rev. Bonds, Series 2015-A, 5.00% 2028 | | | 1,110 | | | | 1,191 | |
| Toll Highway Auth., Toll Highway Rev. Bonds, Series 2019-C, 5.00% 2029 | | | 440 | | | | 494 | |
| Toll Highway Auth., Toll Highway Rev. Ref. Bonds, Series 2019-A, 5.00% 2024 | | | 500 | | | | 522 | |
| Toll Highway Auth., Toll Highway Rev. Ref. Bonds, Series 2019-A, 5.00% 2025 | | | 740 | | | | 785 | |
| Toll Highway Auth., Toll Highway Rev. Ref. Bonds, Series 2019-A, 5.00% 2028 | | | 635 | | | | 707 | |
| Board of Trustees of the University of Illinois, Auxiliary Facs. System Rev. Bonds, Series 2018-A, 5.00% 2025 | | | 135 | | | | 144 | |
| Board of Trustees of the University of Illinois, Auxiliary Facs. System Rev. Bonds, Series 2020-A, 5.00% 2028 | | | 1,000 | | | | 1,103 | |
| 10 | Private Client Services Funds |
Capital Group Core Municipal Fund
| Bonds, notes & other debt instruments (continued) | Principal amount
(000) | | | Value
(000) | |
| Illinois (continued) | | | | | | | | |
| Board of Trustees of the University of Illinois, Auxiliary Facs. System Rev. Ref. Bonds, Series 2005-A, National insured, 5.50% 2023 | | USD | 500 | | | $ | 514 | |
| Board of Trustees of the University of Illinois, Auxiliary Facs. System Rev. Ref. Bonds, Series 2015-A, 5.00% 2026 | | | 1,120 | | | | 1,191 | |
| Board of Trustees of the University of Illinois, Rev. Ref. Certs. of Part., Series 2008-A, Assured Guaranty Municipal insured, 5.25% 2024 | | | 30 | | | | 30 | |
| | | | | | | | 38,902 | |
| | | | | | | | | |
| Indiana 1.32% | | | | | | | | |
| Fin. Auth., Health System Rev. Bonds (Indiana University Health), Series 2019-C, 5.00% 2022 | | | 140 | | | | 142 | |
| Fin. Auth., Hospital Rev. Bonds (Community Health Network Project), Series 2012-A, 5.00% 2042 (preref. 2023) | | | 1,165 | | | | 1,199 | |
| Fin. Auth., State Revolving Fund Program Green Bonds, Series 2021-B, 5.00% 2028 | | | 575 | | | | 645 | |
| Fin. Auth., Wastewater Utility Rev. Ref. Bonds (CWA Auth. Project), Series 2021-2, 5.00% 2022 | | | 130 | | | | 132 | |
| Fin. Auth., Wastewater Utility Rev. Ref. Bonds (CWA Auth. Project), Series 2021-1, 5.00% 2023 | | | 275 | | | | 286 | |
| Fin. Auth., Wastewater Utility Rev. Ref. Bonds (CWA Auth. Project), Series 2021-2, 5.00% 2023 | | | 85 | | | | 88 | |
| Fin. Auth., Wastewater Utility Rev. Ref. Bonds (CWA Auth. Project), Series 2021-2, 5.00% 2027 | | | 335 | | | | 375 | |
| City of Franklin, Econ. Dev. and Rev. Ref. Bonds (Otterbein Homes Obligated Group), Series 2019-B, 5.00% 2023 | | | 30 | | | | 31 | |
| Health Fac. Fncg. Auth., Rev. Bonds (Ascension Health Subordinate Credit Group), Series 2005-A-1, 4.00% 2023 | | | 80 | | | | 82 | |
| Housing and Community Dev. Auth., Collateralized Rev. Bonds (RD Moving Forward Biggs Project), Series 2022, 2.00% 2025 (put 2024) | | | 185 | | | | 182 | |
| Housing and Community Dev. Auth., Collateralized Rev. Bonds (RD Moving Forward Justus Project), Series 2021, 0.33% 2024 (put 2023) | | | 710 | | | | 691 | |
| Housing and Community Dev. Auth., Single Family Mortgage Rev. Bonds, Series 2019-A, 4.25% 2048 | | | 1,655 | | | | 1,696 | |
| Housing and Community Dev. Auth., Single Family Mortgage Rev. Bonds, Series 2020-A, 3.75% 2049 | | | 150 | | | | 152 | |
| Housing and Community Dev. Auth., Single Family Mortgage Rev. Bonds, Series 2021-B, 3.00% 2050 | | | 110 | | | | 108 | |
| Housing and Community Dev. Auth., Single Family Mortgage Rev. Bonds, Series 2021-C-1, 3.00% 2052 | | | 355 | | | | 348 | |
| City of Indianapolis, Local Public Improvement Bond Bank Bonds (Indianapolis Airport Auth. Project), Series 2019-I-2, 5.00% 2026 | | | 340 | | | | 366 | |
| City of Indianapolis, Local Public Improvement Bond Bank Bonds (Indianapolis Airport Auth. Project), Series 2019-I-2, 5.00% 2027 | | | 330 | | | | 361 | |
| City of Indianapolis, Local Public Improvement Bond Bank Bonds (Indianapolis Airport Auth. Project), Series 2019-I-2, 5.00% 2028 | | | 435 | | | | 483 | |
| City of Indianapolis, Local Public Improvement Bond Bank Bonds (Indianapolis Airport Auth. Project), Series 2019-I-2, 5.00% 2029 | | | 265 | | | | 298 | |
| City of Indianapolis, Local Public Improvement Bond Bank Bonds (Indianapolis Airport Auth. Project), Series 2019-I-2, 5.00% 2030 | | | 435 | | | | 493 | |
| City of Kokomo, Multi Family Housing Rev. Bonds (KHA RAD I Apartments), Series 2021-A, 0.56% 2025 (put 2024) | | | 1,030 | | | | 990 | |
| | | | | | | | 9,148 | |
| | | | | | | | | |
| Iowa 0.52% | | | | | | | | |
| Fin. Auth., Single Family Mortgage Bonds (Mortgage-Backed Securities Program), Series 2019-A, 4.00% 2047 | | | 760 | | | | 776 | |
| Fin. Auth., Single Family Mortgage Bonds (Mortgage-Backed Securities Program), Series 2019-D, 3.50% 2049 | | | 25 | | | | 25 | |
| PEFA, Inc., Gas Project Rev. Bonds, Series 2019, 5.00% 2049 (put 2026) | | | 2,150 | | | | 2,270 | |
| Tobacco Settlement Auth., Tobacco Settlement Asset-Backed Bonds, Series 2021-A-2, 5.00% 2031 | | | 320 | | | | 353 | |
| Tobacco Settlement Auth., Tobacco Settlement Asset-Backed Bonds, Series 2021-A-2, 5.00% 2033 | | | 135 | | | | 148 | |
| | | | | | | | 3,572 | |
| | | | | | | | | |
| Kansas 0.31% | | | | | | | | |
| Johnson County Unified School Dist. No. 512, G.O. Rev. Ref. and Improvement Bonds (Shawnee Mission), Series 2015-A, 5.00% 2031 (preref. 2025) | | | 1,000 | | | | 1,083 | |
| Turnpike Auth., Rev. Ref. Bonds, Series 2020-A, 3.00% 2025 | | | 950 | | | | 963 | |
| Unified Government of Wyandotte County, Board of Public Utilities, Utility System Improvement Rev. Bonds, Series 2012-B, 5.00% 2026 (preref. 2022) | | | 110 | | | | 111 | |
| | | | | | | | 2,157 | |
| Private Client Services Funds | 11 |
Capital Group Core Municipal Fund
| Bonds, notes & other debt instruments (continued) | Principal amount
(000) | | | Value
(000) | |
| Kentucky 1.03% | | | | | | | | |
| Econ. Dev. Fin. Auth., Health System Rev. Bonds (Norton Healthcare, Inc.), Capital Appreciation Bonds, Series 2000-B, National insured, 0% 2027 | | USD | 1,000 | | | $ | 826 | |
| Housing Corp., Multi Family Housing Rev. Bonds (Cambridge Square Project), Series 2021, 0.30% 2024 (put 2024) | | | 365 | | | | 348 | |
| Housing Corp., Multi Family Housing Rev. Bonds (New Hope Properties Portfolio Project), Series 2021, 0.41% 2024 (put 2023) | | | 1,575 | | | | 1,524 | |
| Housing Corp., Multi Family Housing Rev. Bonds (Winterwood II Rural Housing Portfolio), Series 2021, 0.37% 2024 (put 2023) | | | 635 | | | | 613 | |
| County of Owen, Water Facs. Rev. Ref. Bonds (Kentucky - American Water Co. Project), Series 2019, 2.45% 2039 (put 2029) | | | 750 | | | | 679 | |
| Property and Buildings Commission, Commonwealth Rev. Ref. Bonds (Project No. 125), Series 2021-A, 5.00% 2022 | | | 170 | | | | 172 | |
| Public Energy Auth., Gas Supply Rev. Bonds, Series 2018-A, 4.00% 2048 (put 2024) | | | 410 | | | | 416 | |
| Public Energy Auth., Gas Supply Rev. Bonds, Series 2019-A-1, 4.00% 2049 (put 2025) | | | 1,180 | | | | 1,197 | |
| Public Energy Auth., Gas Supply Rev. Bonds, Series 2018-B, 4.00% 2049 (put 2025) | | | 185 | | | | 189 | |
| Public Energy Auth., Gas Supply Rev. Bonds, Series 2022-A-1, 4.00% 2052 (put 2030) | | | 855 | | | | 871 | |
| Turnpike Auth., Econ. Dev. Road Rev. Ref. Bonds (Revitalization Projects), Series 2022-A, 5.00% 2031 | | | 270 | | | | 311 | |
| | | | | | | | 7,146 | |
| | | | | | | | | |
| Louisiana 2.27% | | | | | | | | |
| Parish of East Baton Rouge, Road and Street Improvement Sales Tax Rev. Ref. Bonds, Series 2020, Assured Guaranty Municipal insured, 5.00% 2022 | | | 85 | | | | 86 | |
| Parish of East Baton Rouge, Road and Street Improvement Sales Tax Rev. Ref. Bonds, Series 2020, Assured Guaranty Municipal insured, 5.00% 2026 | | | 1,250 | | | | 1,365 | |
| Parish of East Baton Rouge, Sewerage Commission, Multi Modal Rev. Ref. Bonds, Series 2021-A, 1.30% 2041 (put 2028) | | | 1,270 | | | | 1,107 | |
| Parish of East Baton Rouge, Sewerage Commission, Rev. Ref. Bonds, Series 2020-A, 5.00% 2026 | | | 1,135 | | | | 1,235 | |
| Gasoline and Fuels Tax Rev. Ref. Bonds, Series 2017-D-1, 0.60% 2043 (put 2023) | | | 2,000 | | | | 1,978 | |
| Gasoline and Fuels Tax Rev. Ref. Bonds, Series 2022-A, (USD-SOFR x 0.50 + 0.50%) 0.689% 2043 (put 2026)2 | | | 575 | | | | 573 | |
| Grant Anticipation Rev. Bonds, Series 2021, 5.00% 2023 | | | 335 | | | | 348 | |
| Housing Corp., Multi Family Housing Rev. Bonds (Arbours at Lafayette Project), Series 2021, 0.35% 2024 (put 2023) | | | 375 | | | | 363 | |
| Housing Corp., Multi Family Housing Rev. Bonds (Hollywood Acres and Hollywood Heights Projects), Series 2019, 0.55% 2023 | | | 750 | | | | 724 | |
| Housing Corp., Multi Family Housing Rev. Bonds (Mabry Place Townhomes Project), Series 2021, 0.31% 2024 (put 2023) | | | 215 | | | | 208 | |
| Parish of Jefferson, Sales Tax Rev. Ref. Bonds, Series 2019-B, Assured Guaranty Municipal insured, 5.00% 2027 | | | 1,000 | | | | 1,116 | |
| Local Government Environmental Facs. and Community Dev. Auth., Rev. Ref. Bonds (Entergy Louisiana, LLC Projects), Series 2021-A, 2.00% 2030 | | | 105 | | | | 92 | |
| Louisiana Stadium and Exposition Dist., Rev. Ref. Bonds, Series 2013-A, 5.00% 2022 | | | 1,500 | | | | 1,509 | |
| Offshore Terminal Auth., Deepwater Port Rev. Bonds (Loop LLC Project), Series 2007-A, 1.65% 2027 (put 2023) | | | 905 | | | | 893 | |
| Public Facs. Auth., Hospital Rev. Ref. Bonds (Lafayette General Health System Project), Series 2016-A, 5.00% 2041 (preref. 2025) | | | 1,000 | | | | 1,086 | |
| Parish of St. Charles, Gulf Opportunity Zone Rev. Bonds (Valero Project), Series 2010, 4.00% 2040 (put 2022) | | | 2,000 | | | | 2,003 | |
| Parish of St. John the Baptist, Rev. Ref. Bonds (Marathon Oil Corp. Project), Series 2017-B-1, 2.125% 2037 (put 2024) | | | 285 | | | | 277 | |
| City of Shreveport, Water and Sewer Rev. Bonds, Series 2019-B, Assured Guaranty Municipal insured, 3.00% 2022 | | | 115 | | | | 116 | |
| City of Shreveport, Water and Sewer Rev. Bonds, Series 2019-B, Assured Guaranty Municipal insured, 4.00% 2023 | | | 105 | | | | 108 | |
| City of Shreveport, Water and Sewer Rev. Bonds, Series 2019-B, Assured Guaranty Municipal insured, 5.00% 2024 | | | 80 | | | | 85 | |
| City of Shreveport, Water and Sewer Rev. Bonds, Series 2019-B, Assured Guaranty Municipal insured, 4.00% 2025 | | | 145 | | | | 151 | |
| City of Shreveport, Water and Sewer Rev. Bonds, Series 2019-B, Assured Guaranty Municipal insured, 5.00% 2026 | | | 140 | | | | 154 | |
| Tobacco Settlement Fncg. Corp., Tobacco Settlement Asset-Backed Rev. Ref. Bonds, Series 2013-A, 5.00% 2023 | | | 90 | | | | 92 | |
| | | | | | | | 15,669 | |
| | | | | | | | | |
| Maine 0.08% | | | | | | | | |
| Housing Auth., Mortgage Purchase Bonds, Series 2017-A, 4.00% 2047 | | | 300 | | | | 305 | |
| Turnpike Auth., Turnpike Rev. Ref. Bonds, Series 2022, 5.00% 2031 | | | 195 | | | | 227 | |
| | | | | | | | 532 | |
| 12 | Private Client Services Funds |
Capital Group Core Municipal Fund
| Bonds, notes & other debt instruments (continued) | Principal amount
(000) | | | Value
(000) | |
| Maryland 1.38% | | | | | | | | |
| County of Anne Arundel, G.O. Rev. Ref. Water and Sewer Bonds, Series 2022, 5.00% 2026 | | USD | 885 | | | $ | 970 | |
| Community Dev. Administration, Dept. of Housing and Community Dev., Residential Rev. Bonds, Series 2014-C, 4.00% 2044 | | | 190 | | | | 193 | |
| Community Dev. Administration, Dept. of Housing and Community Dev., Residential Rev. Bonds, Series 2020-D, 3.25% 2050 | | | 600 | | | | 598 | |
| Community Dev. Administration, Dept. of Housing and Community Dev., Residential Rev. Bonds, Series 2021-C, 3.00% 2051 | | | 783 | | | | 769 | |
| G.O. Rev. Ref. Bonds, State and Local Facs. Loan of 2021, Series 2022-D-2, 4.00% 2029 | | | 585 | | | | 635 | |
| County of Montgomery, Housing Opportunities Commission, Single Family Housing Rev. Bonds, Series 2017-A, 4.00% 2048 | | | 500 | | | | 508 | |
| County of Montgomery, Housing Opportunities Commission, Single Family Housing Rev. Bonds, Series 2018-A, 4.00% 2049 | | | 1,355 | | | | 1,379 | |
| County of Prince George, Certs. of Part. (Behavioral Health Fac. and Capital Equipment), Series 2021, 5.00% 2024 | | | 165 | | | | 175 | |
| Dept. of Transportation, Consolidated Transportation Bonds, Series 2018-2, 5.00% 2026 | | | 1,000 | | | | 1,104 | |
| Transportation Auth., Transportation Facs. Projects Rev. Bonds, Series 2020. 5.00% 2033 | | | 745 | | | | 850 | |
| Washington Suburban Sanitary Dist., Consolidated Public Improvement Bonds, Series 2021, 5.00% 2030 | | | 2,000 | | | | 2,335 | |
| | | | | | | | 9,516 | |
| | | | | | | | | |
| Massachusetts 0.46% | | | | | | | | |
| Dev. Fin. Agcy., Multi Family Housing Rev. Bonds (Salem Heights II Preservation Associates LP Issue), Series 2021-B, 0.25% 2024 (put 2023) | | | 180 | | | | 175 | |
| Dev. Fin. Agcy., Rev. Bonds (Mass General Brigham, Inc.), Series 2019-T-1, 1.04% 2049 (put 2026)2,3 | | | 235 | | | | 235 | |
| Dev. Fin. Agcy., Rev. Ref. Bonds (Berkshire Health Systems Issue), Series 2021-I, 5.00% 2024 | | | 615 | | | | 650 | |
| Housing Fin. Agcy., Housing Green Bonds, Series 2021-A-2, 0.30% 2023 | | | 50 | | | | 48 | |
| Housing Fin. Agcy., Housing Green Bonds, Series 2021-A-2, 0.40% 2024 | | | 65 | | | | 62 | |
| Housing Fin. Agcy., Housing Green Bonds, Series 2021-B-2, 0.75% 2025 | | | 55 | | | | 52 | |
| Housing Fin. Agcy., Single Family Housing Rev. Bonds, Series 169, 4.00% 2044 | | | 85 | | | | 85 | |
| Housing Fin. Agcy., Single Family Housing Rev. Bonds, Series 172, 4.00% 2045 | | | 235 | | | | 238 | |
| Massachusetts Bay Transportation Auth., Sales Tax Green Bond Anticipation Notes, Series 2021, 4.00% 2025 | | | 455 | | | | 474 | |
| Transportation Fund Rev. Ref. Bonds, Series 2021-A, 5.00% 2029 | | | 1,000 | | | | 1,145 | |
| | | | | | | | 3,164 | |
| | | | | | | | | |
| Michigan 2.66% | | | | | | | | |
| City of Detroit, Water and Sewerage Dept., Sewage Disposal System Rev. and Rev. Ref. Bonds, Series 2012-A, 5.00% 2032 (preref. 2022) | | | 185 | | | | 186 | |
| Fin. Auth., Hospital Rev. and Rev. Ref. Bonds (Trinity Health Credit Group), Series 2017-A, 5.00% 2047 (preref. 2022) | | | 2,555 | | | | 2,604 | |
| Fin. Auth., Hospital Rev. Ref. Bonds (McLaren Health Care), Series 2015-D-1, 0.25% 2022 | | | 40 | | | | 40 | |
| Fin. Auth., Local Government Loan Program Rev. Bonds (Detroit Water and Sewerage Dept., Sewage Disposal System Rev. Ref. Local Project Bonds), Series 2015-C, 5.00% 2027 | | | 250 | | | | 268 | |
| Fin. Auth., Tobacco Settlement Asset-Backed Bonds, Series 2020-A-1, 5.00% 2026 | | | 105 | | | | 112 | |
| Fin. Auth., Tobacco Settlement Asset-Backed Bonds, Series 2020-A, 5.00% 2028 | | | 1,000 | | | | 1,083 | |
| Fin. Auth., Tobacco Settlement Asset-Backed Bonds, Series 2020-A-1, 5.00% 2029 | | | 205 | | | | 224 | |
| Great Lakes Water Auth., Water Supply System Rev. Bonds, Series 2020-B, 5.00% 2032 | | | 500 | | | | 563 | |
| Hospital Fin. Auth., Hospital Rev. Bonds (Trinity Health Credit Group), Series 2009-B, 5.00% 2048 (preref. 2022) | | | 615 | | | | 617 | |
| Hospital Fin. Auth., Hospital Rev. Ref. Bonds (Trinity Health Credit Group), Series 2008-C, 5.00% 2022 | | | 475 | | | | 484 | |
| Housing Dev. Auth., Multi Family Housing Rev. Bonds, Series 2020, 0.32% 2023 (put 2022) | | | 1,000 | | | | 991 | |
| Housing Dev. Auth., Rental Housing Rev. Bonds, Series 2019-A-1, 1.50% 2022 | | | 1,195 | | | | 1,193 | |
| Housing Dev. Auth., Rental Housing Rev. Bonds, Series 2021-A, 0.55% 2025 | | | 185 | | | | 175 | |
| Housing Dev. Auth., Single Family Mortgage Rev. Bonds, Series 2016-B, 3.50% 2047 | | | 415 | | | | 418 | |
| Housing Dev. Auth., Single Family Mortgage Rev. Bonds, Series 2017-B, 3.50% 2048 | | | 240 | | | | 241 | |
| Housing Dev. Auth., Single Family Mortgage Rev. Bonds, Series 2018-A, 4.00% 2048 | | | 565 | | | | 575 | |
| Housing Dev. Auth., Single Family Mortgage Rev. Bonds, Series 2018-C, 4.25% 2049 | | | 1,580 | | | | 1,619 | |
| Housing Dev. Auth., Single Family Mortgage Rev. Bonds, Series 2019-A, 4.25% 2049 | | | 775 | | | | 795 | |
| Housing Dev. Auth., Single Family Mortgage Rev. Bonds, Series 2020-A, 3.50% 2050 | | | 1,410 | | | | 1,417 | |
| Housing Dev. Auth., Single Family Mortgage Rev. Bonds, Series 2021-A, 3.00% 2052 | | | 2,125 | | | | 2,090 | |
| Board of Trustees of Michigan State University, Rev. Bonds, Series 2019-B, 5.00% 2023 | | | 300 | | | | 307 | |
| Private Client Services Funds | 13 |
Capital Group Core Municipal Fund
| Bonds, notes & other debt instruments (continued) | Principal amount
(000) | | | Value
(000) | |
| Michigan (continued) | | | | | | | | |
| Board of Trustees of Michigan State University, Rev. Bonds, Series 2019-B, 5.00% 2030 | | USD | 700 | | | $ | 786 | |
| Strategic Fund, Limited Obligation Rev. Ref. Bonds (Detroit Edison Co. Pollution Control Bonds Project), Series 1995-CC, 1.45% 2030 | | | 1,630 | | | | 1,358 | |
| Trunk Line Fund Bonds, Series 2021-A, 5.00% 2031 | | | 230 | | | | 270 | |
| | | | | | | | 18,416 | |
| | | | | | | | | |
| Minnesota 1.31% | | | | | | | | |
| City of Hopkins, Multi Family Housing Rev. Bonds (Raspberry Ridge Project), Series 2021, 0.26% 2024 (put 2023) | | | 535 | | | | 526 | |
| Housing Fin. Agcy., Residential Housing Fin. Bonds, Series 2014-B, 4.00% 2038 | | | 220 | | | | 224 | |
| Housing Fin. Agcy., Residential Housing Fin. Bonds, Series 2015-B, 3.50% 2046 | | | 575 | | | | 578 | |
| Housing Fin. Agcy., Residential Housing Fin. Bonds, Series 2017-B, 4.00% 2047 | | | 465 | | | | 472 | |
| Housing Fin. Agcy., Residential Housing Fin. Bonds, Series 2018-B, 4.00% 2048 | | | 355 | | | | 360 | |
| Housing Fin. Agcy., Residential Housing Fin. Bonds, Series 2017-E, 4.00% 2048 | | | 275 | | | | 280 | |
| Housing Fin. Agcy., Residential Housing Fin. Bonds, Series 2018-E, 4.25% 2049 | | | 1,490 | | | | 1,528 | |
| Housing Fin. Agcy., Residential Housing Fin. Bonds, Series 2019-B, 4.25% 2049 | | | 700 | | | | 718 | |
| Housing Fin. Agcy., Residential Housing Fin. Bonds, Series 2020-E, 3.50% 2050 | | | 260 | | | | 261 | |
| Housing Fin. Agcy., Residential Housing Fin. Bonds, Series 2021-B, 3.00% 2051 | | | 525 | | | | 517 | |
| Housing Fin. Agcy., Residential Housing Fin. Bonds, Series 2021-D, 3.00% 2052 | | | 1,185 | | | | 1,167 | |
| Housing Fin. Agcy., Residential Housing Fin. Bonds, Series 2021-H, 3.00% 2052 | | | 880 | | | | 864 | |
| Housing Fin. Agcy., Residential Housing Fin. Bonds, Series 2022-A, 3.00% 2052 | | | 350 | | | | 343 | |
| City of Mahtomedi, Multi Family Housing Rev. Bonds (Lincoln Place / Vadnais Highlands Projects), Series 2021, 0.25% 2023 (put 2022) | | | 300 | | | | 299 | |
| Municipal Gas Agcy., Commodity Supply Rev. Bonds, Series 2022-A, 4.00% 2052 (put 2027) | | | 875 | | | | 904 | |
| | | | | | | | 9,041 | |
| | | | | | | | | |
| Mississippi 0.54% | | | | | | | | |
| Business Fin. Corp., Solid Waste Disposal Rev. Bonds (Waste Management, Inc. Project), Series 2004, 0.70% 2029 (put 2026) | | | 1,460 | | | | 1,288 | |
| Gaming Tax Rev. Bonds, Series 2019-A, 5.00% 2023 | | | 850 | | | | 880 | |
| Gaming Tax Rev. Ref. Bonds, Series 2015-E, 5.00% 2026 | | | 500 | | | | 536 | |
| Home Corp., Collateralized Multi Family Housing Rev. Bonds (J&A Dev. Portfolio Project I), Series 2021-1, 0.30% 2024 (put 2023) | | | 230 | | | | 226 | |
| Home Corp., Multi Family Housing Rev. Bonds (Southwest Village Apartments Project), Series 2022-2, 1.30% 2025 (put 2024) | | | 215 | | | | 213 | |
| Home Corp., Single Family Mortgage Rev. Bonds, Series 2019-A, 4.00% 2048 | | | 575 | | | | 586 | |
| | | | | | | | 3,729 | |
| | | | | | | | | |
| Missouri 0.85% | | | | | | | | |
| Health and Educational Facs. Auth., Health Facs. Rev. Bonds (BJC Health System), Series 2021-B, 5.00% 2052 (put 2028) | | | 2,360 | | | | 2,597 | |
| Housing Dev. Commission, Single Family Mortgage Rev. Bonds (First Place Homeownership Loan Program), Series 2016-B, 3.50% 2041 | | | 1,105 | | | | 1,115 | |
| Housing Dev. Commission, Single Family Mortgage Rev. Bonds (First Place Homeownership Loan Program), Series 2017-B, 3.25% 2047 | | | 252 | | | | 249 | |
| Housing Dev. Commission, Single Family Mortgage Rev. Bonds (First Place Homeownership Loan Program), Series 2020-A, 3.50% 2050 | | | 530 | | | | 533 | |
| Housing Dev. Commission, Single Family Mortgage Rev. Bonds (First Place Homeownership Loan Program), Series 2021-A, 3.00% 2052 | | | 560 | | | | 551 | |
| Housing Dev. Commission, Single Family Mortgage Rev. Bonds (First Place Homeownership Loan Program), Series 2021-C, 3.25% 2052 | | | 185 | | | | 184 | |
| Housing Dev. Commission, Single Family Mortgage Rev. Bonds (Special Homeownership Loan Program), Series 2015-A, 3.75% 2038 | | | 105 | | | | 106 | |
| City of St. Louis, Airport Rev. Ref. Bonds (Lambert-St. Louis International Airport), Series 2019-C, 5.00% 2031 | | | 500 | | | | 555 | |
| | | | | | | | 5,890 | |
| 14 | Private Client Services Funds |
Capital Group Core Municipal Fund
| Bonds, notes & other debt instruments (continued) | Principal amount
(000) | | | Value
(000) | |
| Montana 0.23% | | | | | | | | |
| Board of Housing, Single Family Mortgage Bonds, Series 2016-A-2, 3.50% 2044 | | USD | 105 | | | $ | 106 | |
| Board of Housing, Single Family Mortgage Bonds, Series 2020-C, 3.00% 2050 | | | 290 | | | | 287 | |
| Board of Housing, Single Family Mortgage Bonds, Series 2022-A, 3.00% 2052 | | | 1,200 | | | | 1,177 | |
| | | | | | | | 1,570 | |
| | | | | | | | | |
| Nebraska 0.70% | | | | | | | | |
| Central Plains Energy Project, Gas Project Rev. Bonds (Project No. 3), Series 2012, 5.00% 2032 (preref. 2022) | | | 1,190 | | | | 1,202 | |
| Investment Fin. Auth., Single Family Housing Rev. Bonds, Series 2013-A, 3.00% 2043 | | | 10 | | | | 10 | |
| Investment Fin. Auth., Single Family Housing Rev. Bonds, Series 2014-A, 4.00% 2044 | | | 80 | | | | 81 | |
| Investment Fin. Auth., Single Family Housing Rev. Bonds, Series 2015-C, 3.50% 2045 | | | 225 | | | | 227 | |
| Investment Fin. Auth., Single Family Housing Rev. Bonds, Series 2016-C, 3.50% 2046 | | | 15 | | | | 15 | |
| Investment Fin. Auth., Single Family Housing Rev. Bonds, Series 2018-C, 4.00% 2048 | | | 1,605 | | | | 1,634 | |
| Investment Fin. Auth., Single Family Housing Rev. Bonds, Series 2018-A, 4.00% 2048 | | | 570 | | | | 581 | |
| Investment Fin. Auth., Single Family Housing Rev. Bonds, Series 2021-C, 3.00% 2050 | | | 1,100 | | | | 1,082 | |
| | | | | | | | 4,832 | |
| | | | | | | | | |
| Nevada 0.70% | | | | | | | | |
| Clark County School Dist., Limited Tax G.O. School Bonds, Series 2015-D, 5.00% 2022 | | | 500 | | | | 502 | |
| County of Clark, Airport System Rev. Ref. Bonds (McCarran International Airport), Series 2021-A, 5.00% 2033 | | | 760 | | | | 862 | |
| County of Clark, Las Vegas-McCarran International Airport, Passenger Fac. Charge Rev. Ref. Bonds, Series 2019-E, 5.00% 2029 | | | 770 | | | | 870 | |
| County of Clark, Pollution Control Rev. Ref. Bonds (Nevada Power Co. Projects), Series 2017, 1.65% 2036 (put 2023) | | | 1,355 | | | | 1,349 | |
| City of Henderson, Local Improvement Dist. No. T-17 (Madeira Canyon), Limited Obligation Rev. Ref. Bonds, Series 2017, 2.00% 2023 | | | 420 | | | | 415 | |
| Housing Division, Multi Family Housing Rev. Bonds (Southwest Village Apartments), Series 2021, 0.47% 2024 (put 2023) | | | 200 | | | | 194 | |
| Las Vegas Valley Water Dist., Limited Tax G.O. Water Rev. Ref. Bonds, Series 2020-A, 5.00% 2024 | | | 595 | | | | 627 | |
| County of Washoe, Gas and Water Facs. Rev. Ref. Bonds (Sierra Pacific Power Co. Projects), Series 2016-B, 3.00% 2036 (put 2022) | | | 10 | | | | 10 | |
| | | | | | | | 4,829 | |
| | | | | | | | | |
| New Hampshire 0.18% | | | | | | | | |
| Health and Education Facs. Auth., Rev. Bonds (University System of New Hampshire Issue), Series 2017-A, 5.00% 2022 | | | 500 | | | | 503 | |
| Health and Education Facs. Auth., Rev. Bonds (University System of New Hampshire Issue), Series 2017-A, 5.00% 2023 | | | 600 | | | | 619 | |
| National Fin. Auth., Municipal Certs., Series 2020-1, Class A, 4.125% 2034 | | | 97 | | | | 100 | |
| | | | | | | | 1,222 | |
| | | | | | | | | |
| New Jersey 0.97% | | | | | | | | |
| Econ. Dev. Auth., School Facs. Construction Bonds, Series 2021-QQQ, 5.00% 2029 | | | 500 | | | | 548 | |
| Econ. Dev. Auth., Water Facs. Rev. Ref. Bonds (American Water Co., Inc. Project), Series 2020-A, 1.00% 2023 | | | 2,025 | | | | 1,988 | |
| Housing and Mortgage Fin. Agcy., Multi Family Conduit Rev. Bonds (Browns Woods Apartments Project), Series 2021-A, 1.25% 2024 (put 2023) | | | 395 | | | | 387 | |
| Housing and Mortgage Fin. Agcy., Single Family Housing Rev. Bonds, Series 2018-A, 4.50% 2048 | | | 310 | | | | 321 | |
| Housing and Mortgage Fin. Agcy., Single Family Housing Rev. Bonds, Series 2019-C, 4.75% 2050 | | | 185 | | | | 193 | |
| Tobacco Settlement Fncg. Corp., Tobacco Settlement Bonds, Series 2018-A, 5.00% 2022 | | | 1,185 | | | | 1,188 | |
| Tobacco Settlement Fncg. Corp., Tobacco Settlement Bonds, Series 2018-A, 5.00% 2023 | | | 500 | | | | 511 | |
| Tobacco Settlement Fncg. Corp., Tobacco Settlement Bonds, Series 2018-A, 5.00% 2029 | | | 225 | | | | 243 | |
| Transportation Trust Fund Auth., Transportation System Bonds, Series 2019-A, 5.00% 2028 | | | 750 | | | | 822 | |
| Turnpike Auth., Turnpike Rev. Bonds, Series 2020-D, 5.00% 2028 | | | 240 | | | | 261 | |
| Turnpike Auth., Turnpike Rev. Bonds, Series 2014-A, 5.00% 2028 | | | 230 | | | | 241 | |
| | | | | | | | 6,703 | |
| Private Client Services Funds | 15 |
Capital Group Core Municipal Fund
| Bonds, notes & other debt instruments (continued) | Principal amount
(000) | | | Value
(000) | |
| New Mexico 1.38% | | | | | | | | |
| Albuquerque Municipal School Dist. No. 12, G.O. School Bonds, Series 2021-A, 5.00% 2027 | | USD | 400 | | | $ | 447 | |
| City of Farmington, Pollution Control Rev. Ref. Bonds (Public Service Co. of San Juan and Four Corners Projects), Series 2016-B, 2.15% 2033 | | | 1,130 | | | | 936 | |
| City of Farmington, Pollution Control Rev. Ref. Bonds (Public Service Co. of San Juan Project), Series 2010-D, 1.10% 2040 (put 2023) | | | 500 | | | | 491 | |
| City of Farmington, Pollution Control Rev. Ref. Bonds (Public Service Co. of San Juan Project), Series 2010-E, 1.15% 2040 (put 2024) | | | 2,615 | | | | 2,507 | |
| Mortgage Fin. Auth., Single Family Mortgage Program Bonds, Series 2018-B-1, Class I, 4.00% 2049 | | | 720 | | | | 733 | |
| Mortgage Fin. Auth., Single Family Mortgage Program Bonds, Series 2019-C-1, Class I, 4.00% 2050 | | | 125 | | | | 127 | |
| Mortgage Fin. Auth., Single Family Mortgage Program Bonds, Series 2019-A-1, Class I, 4.25% 2050 | | | 2,130 | | | | 2,186 | |
| Mortgage Fin. Auth., Single Family Mortgage Program Bonds, Series 2021-A, Class I, 3.00% 2052 | | | 840 | | | | 827 | |
| Mortgage Fin. Auth., Single Family Mortgage Program Bonds, Series 2021-C, Class I, 3.00% 2052 | | | 260 | | | | 256 | |
| Municipal Energy Acquisition Auth., Gas Supply Rev. Ref. and Acquisition Bonds, Series 2019, 5.00% 2039 (put 2025) | | | 960 | | | | 1,013 | |
| | | | | | | | 9,523 | |
| | | | | | | | | |
| New York 8.06% | | | | | | | | |
| Build NYC Resource Corp., Rev. Ref. Bonds (Ethical Culture Fieldston School Project), Series 2015, 5.00% 2024 | | | 395 | | | | 413 | |
| Dormitory Auth., State Personal Income Tax Rev. Bonds (General Purpose), Series 2019-A, 5.00% 2028 | | | 1,000 | | | | 1,122 | |
| Dormitory Auth., State Personal Income Tax Rev. Bonds (General Purpose), Series 2020-A, 5.00% 2030 | | | 2,000 | | | | 2,289 | |
| Dormitory Auth., State Personal Income Tax Rev. Bonds (General Purpose), Series 2017-B, 5.00% 2030 | | | 1,500 | | | | 1,652 | |
| Dormitory Auth., State Personal Income Tax Rev. Bonds (General Purpose), Series 2019-D, 5.00% 2030 | | | 605 | | | | 692 | |
| Dormitory Auth., State Personal Income Tax Rev. Bonds (General Purpose), Series 2020-A-2, 5.00% 2031 | | | 165 | | | | 189 | |
| Dormitory Auth., State Personal Income Tax Rev. Bonds (General Purpose), Series 2022-A, 5.00% 2032 | | | 565 | | | | 656 | |
| Housing Fin. Agcy., Affordable Housing Rev. Green Bonds, Series 2018-H, 2.75% 2022 | | | 480 | | | | 482 | |
| Housing Fin. Agcy., Affordable Housing Rev. Green Bonds, Series 2019-P, 1.55% 2023 | | | 610 | | | | 602 | |
| Housing Fin. Agcy., Affordable Housing Rev. Green Bonds, Series 2020-E, 0.85% 2024 | | | 345 | | | | 331 | |
| Housing Fin. Agcy., Affordable Housing Rev. Green Bonds, Series 2020-L-2, 0.75% 2025 | | | 4,500 | | | | 4,158 | |
| Housing Fin. Agcy., Affordable Housing Rev. Green Bonds, Series 2020-M-2, 0.75% 2025 | | | 275 | | | | 256 | |
| Housing Fin. Agcy., Affordable Housing Rev. Green Bonds, Series 2021-D-2, 0.65% 2056 (put 2025) | | | 690 | | | | 633 | |
| Housing Fin. Agcy., Affordable Housing Rev. Green Bonds, Series 2021-I-2, 0.70% 2056 (put 2025) | | | 380 | | | | 349 | |
| Housing Fin. Agcy., Affordable Housing Rev. Green Bonds, Series 2021-J-2, 1.10% 2061 (put 2027) | | | 1,900 | | | | 1,721 | |
| Liberty Dev. Corp., Liberty Rev. Ref. Green Bonds (4 World Trade Center Project), Series 2021-A, 1.70% 2030 | | | 410 | | | | 335 | |
| Liberty Dev. Corp., Liberty Rev. Ref. Green Bonds (4 World Trade Center Project), Series 2021-A, 1.90% 2031 | | | 195 | | | | 158 | |
| Long Island Power Auth., Electric System General Rev. Bonds, Series 2014-C, (1-month USD-LIBOR x 0.70 + 0.75%) 1.068% 2033 (put 2023)2 | | | 1,000 | | | | 995 | |
| Long Island Power Auth., Electric System General Rev. Bonds, Series 2015-C, (1-month USD-LIBOR x 0.70 + 0.75%) 1.068% 2033 (put 2023)2 | | | 840 | | | | 836 | |
| Metropolitan Transportation Auth., Transportation Rev. Bonds, Series 2014-C, 5.00% 2023 | | | 375 | | | | 389 | |
| Metropolitan Transportation Auth., Transportation Rev. Bonds, Series 2012-C, 5.00% 2032 (preref. 2022) | | | 1,000 | | | | 1,018 | |
| Metropolitan Transportation Auth., Transportation Rev. Bonds, Series 2014-D-2, (SIFMA Municipal Swap Index + 0.45%) 0.89% 2044 (put 2022)2 | | | 750 | | | | 750 | |
| Metropolitan Transportation Auth., Transportation Rev. Bonds, Series 2015-A-2, 5.00% 2045 (put 2030) | | | 2,180 | | | | 2,375 | |
| Metropolitan Transportation Auth., Transportation Rev. Bonds, Series 2012-C, 5.00% 2047 (preref. 2022) | | | 1,100 | | | | 1,120 | |
| Metropolitan Transportation Auth., Transportation Rev. Ref. Bonds, Series 2002-D-2-B, Assured Guaranty Municipal insured, (USD-SOFR x 0.67 + 0.55%) 0.737% 2032 (put 2024)2 | | | 880 | | | | 880 | |
| Metropolitan Transportation Auth., Transportation Rev. Ref. Bonds, Series 2002-D-2-A-2, Assured Guaranty Municipal insured, (USD-SOFR x 0.67 + 0.80%) 0.987% 2032 (put 2026)2 | | | 315 | | | | 313 | |
| Metropolitan Transportation Auth., Transportation Rev. Ref. Green Bonds, Series 2017-C-1, 5.00% 2023 | | | 305 | | | | 316 | |
| Metropolitan Transportation Auth., Transportation Rev. Ref. Green Bonds, Series 2017-C-1, 5.00% 2027 | | | 535 | | | | 579 | |
| Mortgage Agcy., Homeowner Mortgage Rev. Bonds, Series 197, 3.50% 2044 | | | 865 | | | | 870 | |
| Mortgage Agcy., Homeowner Mortgage Rev. Bonds, Series 233, 3.00% 2045 | | | 1,455 | | | | 1,434 | |
| Mortgage Agcy., Homeowner Mortgage Rev. Bonds, Series 203, 3.50% 2047 | | | 840 | | | | 845 | |
| Mortgage Agcy., Homeowner Mortgage Rev. Bonds, Series 213, 4.25% 2047 | | | 670 | | | | 687 | |
| Mortgage Agcy., Homeowner Mortgage Rev. Bonds, Series 239, 3.25% 2051 | | | 205 | | | | 203 | |
| Mortgage Agcy., Homeowner Mortgage Rev. Bonds, Series 242, 3.50% 2052 | | | 435 | | | | 436 | |
| New York City G.O. Bonds, Series 2020-C-1, 5.00% 2028 | | | 1,000 | | | | 1,121 | |
| New York City G.O. Bonds, Series 2018-A, 5.00% 2028 | | | 565 | | | | 625 | |
| New York City G.O. Bonds, Series 2020-C-1, 5.00% 2030 | | | 2,350 | | | �� | 2,682 | |
| New York City G.O. Bonds, Series 2018-E-1, 5.00% 2031 | | | 1,635 | | | | 1,807 | |
| New York City G.O. Bonds, Series 2022-C, 5.00% 2031 | | | 1,000 | | | | 1,151 | |
| New York City G.O. Bonds, Series 2020-C-1, 5.00% 2032 | | | 1,750 | | | | 1,986 | |
| 16 | Private Client Services Funds |
Capital Group Core Municipal Fund
| Bonds, notes & other debt instruments (continued) | Principal amount
(000) | | | Value
(000) | |
| New York (continued) | | | | | | | | |
| New York City G.O. Bonds, Series 2021-A-1, 5.00% 2032 | | USD | 1,435 | | | $ | 1,649 | |
| New York City G.O. Bonds, Series 2008-L-5, 5.00% 2032 | | | 100 | | | | 115 | |
| New York City G.O. Bonds, Series 2021-A-1, 5.00% 2033 | | | 95 | | | | 109 | |
| New York City G.O. Bonds, Series 2015-F-4, 5.00% 2044 (put 2025) | | | 290 | | | | 311 | |
| New York City Health and Hospitals Corp., Health System Bonds, Series 2020-A, 5.00% 2024 | | | 375 | | | | 392 | |
| New York City Housing Dev. Corp., Multi Family Housing Rev. Bonds (8 Spruce Street), Series 2014-E, 3.50% 2048 | | | 320 | | | | 310 | |
| New York City Housing Dev. Corp., Multi Family Housing Rev. Bonds (Sustainable Dev. Bonds), Series 2017-C-3-A, 0.20% 2022 | | | 160 | | | | 160 | |
| New York City Housing Dev. Corp., Multi Family Housing Rev. Bonds (Sustainable Dev. Bonds), Series 2021-C-2, 0.70% 2060 (put 2025) | | | 325 | | | | 301 | |
| New York City Housing Dev. Corp., Multi Family Housing Rev. Bonds (Sustainable Neighborhood Bonds), Series 2020-I-2, 0.70% 2060 (put 2025) | | | 700 | | | | 651 | |
| New York City Housing Dev. Corp., Multi Family Housing Rev. Green Bonds (Sustainable Dev. Bonds), Series 2021-F-2, 0.60% 2061 (put 2025) | | | 835 | | | | 770 | |
| New York City Municipal Water Fin. Auth., Water and Sewer System Second General Resolution Rev. Bonds, Series 2021-DD, 5.00% 2026 | | | 75 | | | | 82 | |
| New York City Municipal Water Fin. Auth., Water and Sewer System Second General Resolution Rev. Bonds, Series 2021-DD, 5.00% 2029 | | | 465 | | | | 531 | |
| New York City Municipal Water Fin. Auth., Water and Sewer System Second General Resolution Rev. Bonds, Series 2022-EE, 5.00% 2030 | | | 580 | | | | 669 | |
| New York City Transitional Fin. Auth., Future Tax Secured Bonds, Series 2020-A-1, 5.00% 2022 | | | 35 | | | | 35 | |
| New York City Transitional Fin. Auth., Future Tax Secured Bonds, Series 2021-E-1, 5.00% 2023 | | | 65 | | | | 67 | |
| New York City Transitional Fin. Auth., Future Tax Secured Bonds, Series 2021-F-1, 5.00% 2024 | | | 1,025 | | | | 1,089 | |
| New York City Transitional Fin. Auth., Future Tax Secured Bonds, Series 2018-1, 5.00% 2025 | | | 105 | | | | 114 | |
| New York City Transitional Fin. Auth., Future Tax Secured Bonds, Series 2021-A-1, 5.00% 2030 | | | 355 | | | | 408 | |
| New York City Transitional Fin. Auth., Future Tax Secured Bonds, Series 2020-C-1, 5.00% 2031 | | | 760 | | | | 870 | |
| New York City Transitional Fin. Auth., Future Tax Secured Bonds, Series 2021-A-1, 5.00% 2031 | | | 195 | | | | 226 | |
| New York City Transitional Fin. Auth., Future Tax Secured Bonds, Series 2021-A-1, 5.00% 2032 | | | 910 | | | | 1,048 | |
| New York City Transitional Fin. Auth., Future Tax Secured Bonds, Series 2020-C-1, 5.00% 2032 | | | 110 | | | | 125 | |
| New York City Transitional Fin. Auth., Future Tax Secured Bonds, Series 2022-D-1, 5.00% 2033 | | | 180 | | | | 206 | |
| New York City Transitional Fin. Auth., Future Tax Secured Bonds, Series 2021-B-1, 5.00% 2034 | | | 795 | | | | 903 | |
| Town of Oyster Bay, Public Improvement Rev. Ref. Bonds, Series 2021, 4.00% 2023 | | | 140 | | | | 142 | |
| Public Housing Capital Fund Rev. Trust I, Trust Certs., Series 2012, 4.50% 20223 | | | 20 | | | | 20 | |
| Suffolk County Econ. Dev. Corp., Rev. Ref. Bonds (Peconic Landing at Southold, Inc. Project), Series 2010, 3.125% 2025 | | | 225 | | | | 226 | |
| City of Troy Capital Resource Corp., Rev. Ref. Bonds (Rensselaer Polytechnic Institute Project), Series 2020-A, 5.00% 2030 | | | 155 | | | | 175 | |
| Urban Dev. Corp., State Personal Income Tax Rev. Bonds (General Purpose), Series 2020-C, 5.00% 2028 | | | 295 | | | | 331 | |
| Urban Dev. Corp., State Personal Income Tax Rev. Bonds (General Purpose), Series 2020-C, 5.00% 2032 | | | 1,000 | | | | 1,135 | |
| Urban Dev. Corp., State Personal Income Tax Rev. Bonds (General Purpose), Series 2020-C, 5.00% 2033 | | | 1,275 | | | | 1,439 | |
| Utility Debt Securitization Auth., Restructuring Bonds, Series 2017, 5.00% 2025 | | | 130 | | | | 136 | |
| County of Westchester, Industrial Dev. Agcy., Multi Family Housing Rev. Bonds (Marble Hall - Tuckahoe Limited Partnership Project), Series 2021, 0.28% 2024 (put 2023) | | | 1,550 | | | | 1,516 | |
| | | | | | | | 55,717 | |
| | | | | | | | | |
| North Carolina 1.75% | | | | | | | | |
| City of Burlington, Housing Auth., Multi Family Housing Rev. Bonds (Thetford Portfolio), Series 2021, 0.30% 2024 (put 2022) | | | 1,130 | | | | 1,115 | |
| City of Durham, Housing Auth., Multi Family Housing Rev. Bonds (JJ Henderson Apartments Project), Series 2020, 0.30% 2024 (put 2023) | | | 80 | | | | 78 | |
| City of Goldsboro, Multi Family Housing Rev. Bonds (Grand at Day Point), Series 2021, 0.28% 2024 (put 2023) | | | 1,725 | | | | 1,682 | |
| Hospital Auth., Health Care Rev. Bonds (Charlotte-Mecklenburg Hospital), Series 2021-D, 5.00% 2049 (put 2031) | | | 1,170 | | | | 1,325 | |
| Housing Fin. Agcy., Home Ownership Rev. Bonds, Series 40, 4.25% 2047 | | | 790 | | | | 810 | |
| Housing Fin. Agcy., Home Ownership Rev. Ref. Bonds, Series 38-B, 4.00% 2047 | | | 860 | | | | 874 | |
| Housing Fin. Agcy., Home Ownership Rev. Ref. Bonds, Series 44, 4.00% 2050 | | | 705 | | | | 720 | |
| Housing Fin. Agcy., Multi Family Housing Rev. Bonds (Winds Crest Senior Living, LP), Series 2021, 0.36% 2024 (put 2023) | �� | | 405 | | | | 397 | |
| Raleigh-Durham Airport Auth., Airport Rev. Ref. Bonds, Series 2020-B, 5.00% 2022 | | | 1,705 | | | | 1,705 | |
| University of North Carolina at Chapel Hill, General Rev. Bonds, Series 2012-B, (1-month USD-LIBOR x 0.67 + 0.40%) 0.705% 2041 (put 2022)2 | | | 1,480 | | | | 1,477 | |
| Private Client Services Funds | 17 |
Capital Group Core Municipal Fund
| Bonds, notes & other debt instruments (continued) | Principal amount
(000) | | | Value
(000) | |
| North Carolina (continued) | | | | | | | | |
| University of North Carolina at Charlotte, General Rev. Ref. Bonds, Series 2017-A, 5.00% 2023 | | USD | 1,000 | | | $ | 1,040 | |
| County of Wake, Limited Obligation Bonds, Series 2021, 5.00% 2023 | | | 675 | | | | 692 | |
| City of Winston-Salem, Water and Sewer System Rev. Ref. Bonds, Series 2020-A, 5.00% 2026 | | | 140 | | | | 154 | |
| | | | | | | | 12,069 | |
| | | | | | | | | |
| North Dakota 0.57% | | | | | | | | |
| County of Cass, Joint Water Resource Dist., Temporary Rev. Ref. Improvement Bonds, Series 2021-A, 0.48% 2024 | | | 800 | | | | 762 | |
| City of Grand Forks, Health Care System Rev. Bonds, Series 2021, 5.00% 2030 | | | 280 | | | | 311 | |
| Housing Fin. Agcy., Homeownership Rev. Bonds (Home Mortgage Fin. Program), Series 2016-D, 3.50% 2046 | | | 850 | | | | 855 | |
| Housing Fin. Agcy., Housing Fin. Program Bonds (Home Mortgage Fin. Program), Series 2015-B, 4.00% 2036 | | | 170 | | | | 172 | |
| Housing Fin. Agcy., Housing Fin. Program Bonds (Home Mortgage Fin. Program), Series 2017-D, 4.00% 2048 | | | 270 | | | | 275 | |
| Housing Fin. Agcy., Housing Fin. Program Bonds (Home Mortgage Fin. Program), Series 2017-F, 4.00% 2048 | | | 205 | | | | 209 | |
| Housing Fin. Agcy., Housing Fin. Program Bonds (Home Mortgage Fin. Program), Series 2019-A, 4.25% 2049 | | | 155 | | | | 159 | |
| Housing Fin. Agcy., Housing Fin. Program Bonds (Home Mortgage Fin. Program), Series 2021-B, 3.00% 2052 | | | 750 | | | | 734 | |
| Housing Fin. Agcy., Housing Fin. Program Bonds (Home Mortgage Fin. Program), Series 2021-A, 3.00% 2052 | | | 440 | | | | 433 | |
| | | | | | | | 3,910 | |
| | | | | | | | | |
| Ohio 2.35% | | | | | | | | |
| Air Quality Dev. Auth., Air Quality Rev. Bonds (Ohio Valley Electric Corp. Project), Series 2009-B, 1.375% 2026 (put 2024) | | | 200 | | | | 189 | |
| Air Quality Dev. Auth., Air Quality Rev. Bonds (Ohio Valley Electric Corp. Project), Series 2009-C, 1.50% 2026 (put 2025) | | | 50 | | | | 46 | |
| Akron, Bath and Copley Joint Township Hospital Dist., Hospital Facs. Rev. Ref. Bonds (Summa Health Obligated Group), Series 2020, 5.00% 2028 | | | 680 | | | | 743 | |
| Akron, Bath and Copley Joint Township Hospital Dist., Hospital Facs. Rev. Ref. Bonds (Summa Health Obligated Group), Series 2020, 5.00% 2030 | | | 350 | | | | 388 | |
| County of Allen, Hospital Facs. Rev. Bonds (Bon Secours Mercy Health, Inc.), Series 2020-A, 5.00% 2030 | | | 400 | | | | 449 | |
| County of Allen, Hospital Facs. Rev. Bonds (Mercy Health), Series 2017-A, 5.00% 2022 | | | 810 | | | | 817 | |
| County of Allen, Hospital Facs. Rev. Bonds (Mercy Health), Series 2017-A, 5.00% 2027 | | | 570 | | | | 628 | |
| County of Allen, Hospital Facs. Rev. Bonds (Mercy Health), Series 2017-B, 5.00% 2047 (put 2022) | | | 575 | | | | 575 | |
| Capital Facs. Lease Appropriation Bonds, Series 2021-A, 5.00% 2029 | | | 180 | | | | 205 | |
| Capital Facs. Lease Appropriation Bonds, Series 2021-A, 5.00% 2030 | | | 115 | | | | 133 | |
| City of Dayton, Metropolitan Housing Auth., Multi Family Housing Rev. Bonds (Southern Montgomery Apartments Project), Series 2021-A, 0.32% 2024 (put 2023) | | | 200 | | | | 193 | |
| County of Hamilton, Hospital Facs. Rev. Bonds (UC Health), Series 2014, 5.00% 2025 | | | 400 | | | | 417 | |
| Healthcare Fac. Rev. Bonds (Otterbein Homes Obligated Group), Series 2021-B, 4.00% 2024 | | | 40 | | | | 41 | |
| Hospital Rev. Ref. Bonds (Cleveland Clinic Health System Obligated Group), Series 2021-B, 5.00% 2030 | | | 280 | | | | 320 | |
| Housing Fin. Agcy., Multi Family Housing Rev. Bonds (Chevybrook Estates Apartments Project), Series 2021, 0.35% 2024 (put 2023) | | | 200 | | | | 196 | |
| Housing Fin. Agcy., Multi Family Housing Rev. Bonds (Franklin Manor North Project), Series 2021, 0.25% 2024 (put 2023) | | | 440 | | | | 425 | |
| Housing Fin. Agcy., Multi Family Housing Rev. Bonds (Glen Meadows Apartments Project), Series 2021-A, 0.40% 2024 (put 2023) | | | 305 | | | | 294 | |
| Housing Fin. Agcy., Multi Family Housing Rev. Bonds (Marianna Terrace Apartments), Series 2022-A, 1.30% 2025 (put 2024) | | | 1,017 | | | | 992 | |
| Housing Fin. Agcy., Multi Family Housing Rev. Bonds (Pinzone Tower Apartments Project), Series 2021, 0.28% 2023 (put 2022) | | | 655 | | | | 646 | |
| Housing Fin. Agcy., Residential Mortgage Rev. Bonds (Mortgage-Backed Securities Program), Series 2017-D, 4.00% 2048 | | | 280 | | | | 285 | |
| Housing Fin. Agcy., Residential Mortgage Rev. Bonds (Mortgage-Backed Securities Program), Series 2019-A, 4.50% 2049 | | | 560 | | | | 578 | |
| Housing Fin. Agcy., Residential Mortgage Rev. Bonds (Mortgage-Backed Securities Program), Series 2020-A, 3.75% 2050 | | | 585 | | | | 593 | |
| Housing Fin. Agcy., Residential Mortgage Rev. Bonds (Mortgage-Backed Securities Program), Series 2021-C, 3.25% 2051 | | | 860 | | | | 854 | |
| Major New State Infrastructure Project Rev. Bonds, Series 2019-1, 5.00% 2028 | | | 700 | | | | 797 | |
| Major New State Infrastructure Project Rev. Bonds, Series 2019-1, 5.00% 2029 | | | 300 | | | | 346 | |
| Miami University, General Receipts and Rev. Ref. Bonds, Series 2022-A, 5.00% 2031 | | | 335 | | | | 389 | |
| County of Montgomery, Hospital Facs. Rev. Bonds (Dayton Children’s Hospital), Series 2021, 5.00% 2030 | | | 75 | | | | 85 | |
| North East Ohio Regional Sewer Dist., Wastewater Improvement Rev. and Rev. Ref. Bonds, Series 2014, 5.00% 2044 (preref. 2024) | | | 1,000 | | | | 1,065 | |
| 18 | Private Client Services Funds |
Capital Group Core Municipal Fund
| Bonds, notes & other debt instruments (continued) | Principal amount
(000) | | | Value
(000) | |
| Ohio (continued) | | | | | | | | |
| Public Facs. Commission, Higher Education G.O. Bonds, Series 2015-C, 5.00% 2028 | | USD | 1,000 | | | $ | 1,069 | |
| Rev. Bonds (Premier Health Partners Obligated Group), Series 2020, 5.00% 2033 | | | 85 | | | | 94 | |
| Turnpike and Infrastructure Commission, Rev. Bonds, Series 2013-A-1, 5.00% 2025 | | | 115 | | | | 118 | |
| Turnpike and Infrastructure Commission, Turnpike Rev. Ref. Bonds (Infrastructure Projects), Series 2022-A, 5.00% 2029 | | | 1,085 | | | | 1,203 | |
| Turnpike and Infrastructure Commission, Turnpike Rev. Ref. Bonds (Infrastructure Projects), Series 2022-A, 5.00% 2030 | | | 325 | | | | 364 | |
| Turnpike and Infrastructure Commission, Turnpike Rev. Ref. Bonds (Infrastructure Projects), Series 2022-A, 5.00% 2031 | | | 485 | | | | 548 | |
| Water Dev. Auth., Water Dev. Rev. Bonds, Series 2013-A, 5.00% 2023 | | | 155 | | | | 160 | |
| | | | | | | | 16,245 | |
| | | | | | | | | |
| Oklahoma 0.11% | | | | | | | | |
| Capital Improvement Auth., State Highways Capital Improvement Rev. Ref. Bonds (Oklahoma Dept. of Transportation Project), Series 2020-A, 5.00% 2023 | | | 595 | | | | 615 | |
| Board of Regents of Oklahoma State University, General Rev. Ref. Bonds, Series 2020-A, 5.00% 2032 | | | 120 | | | | 136 | |
| | | | | | | | 751 | |
| | | | | | | | | |
| Oregon 1.17% | | | | | | | | |
| Dept. of Administrative Services, State Lottery Rev. Bonds, Series 2015-A, 5.00% 2026 | | | 330 | | | | 353 | |
| County of Deschutes, Deschutes Public Library Dist., G.O. Bonds, Series 2021, 4.00% 2029 | | | 225 | | | | 243 | |
| County of Deschutes, Deschutes Public Library Dist., G.O. Bonds, Series 2021, 4.00% 2030 | | | 265 | | | | 287 | |
| Facs. Auth., Rev. Bonds (University of Portland Projects), Series 2015-A, 5.00% 2031 | | | 600 | | | | 638 | |
| G.O. Bonds (Veteran’s Welfare Bonds Series 99B), Series 2020, 3.50% 2050 | | | 270 | | | | 271 | |
| G.O. Bonds (Veteran’s Welfare Bonds Series 108), Series 2021-O, 3.00% 2051 | | | 2,095 | | | | 2,044 | |
| Housing and Community Services Dept., Housing Dev. Rev. Bonds (Anna Mann Apartments Project), Series 2021-AA, 0.75% 2041 (put 2024) | | | 1,400 | | | | 1,324 | |
| Housing and Community Services Dept., Housing Dev. Rev. Bonds (The Susan Emmons Apartments Project), Series 2021-S-2, 0.38% 2024 (put 2023) | | | 460 | | | | 442 | |
| Housing and Community Services Dept., Housing Dev. Rev. Bonds (Westwind Apartments Project), Series 2021-H, 0.25% 2024 (put 2023) | | | 175 | | | | 172 | |
| Housing and Community Services Dept., Mortgage Rev. Bonds (Single Family Mortgage Program), Series 2017-A, 4.00% 2047 | | | 595 | | | | 604 | |
| Housing and Community Services Dept., Mortgage Rev. Bonds (Single Family Mortgage Program), Series 2016-A, 4.00% 2047 | | | 385 | | | | 391 | |
| Housing and Community Services Dept., Mortgage Rev. Bonds (Single Family Mortgage Program), Series 2018-A, 4.50% 2049 | | | 135 | | | | 138 | |
| Housing and Community Services Dept., Mortgage Rev. Bonds (Single Family Mortgage Program), Series 2020-C, 3.00% 2052 | | | 1,210 | | | | 1,194 | |
| | | | | | | | 8,101 | |
| | | | | | | | | |
| Pennsylvania 2.18% | | | | | | | | |
| County of Allegheny, Sanitary Auth., Sewer Rev. Bonds, Series 2020-A, 5.00% 2026 | | | 500 | | | | 546 | |
| County of Berks, G.O. Bonds, Series 2015, 4.00% 2027 (preref. 2023) | | | 35 | | | | 36 | |
| Bethlehem Area School Dist. Auth., School Rev. Bonds (Bethlehem Area School Dist. Ref. Project), Series 2021-C, (USD-SOFR x 0.67 + 0.35%) 0.53% 2030 (put 2025)2 | | | 195 | | | | 193 | |
| Bethlehem Area School Dist. Auth., School Rev. Bonds (Bethlehem Area School Dist. Ref. Project), Series 2021-B, (USD-SOFR x 0.67 + 0.35%) 0.53% 2031 (put 2025)2 | | | 265 | | | | 262 | |
| Bethlehem Area School Dist. Auth., School Rev. Bonds (Bethlehem Area School Dist. Ref. Project), Series 2021-C, (USD-SOFR x 0.67 + 0.35%) 0.53% 2032 (put 2025)2 | | | 205 | | | | 203 | |
| Cumberland Valley School Dist., G.O. Bonds, Series 2015, 5.00% 2032 (preref. 2023) | | | 150 | | | | 156 | |
| Cumberland Valley School Dist., G.O. Bonds, Series 2015, 5.00% 2034 (preref. 2023) | | | 130 | | | | 136 | |
| Fncg. Auth., Rev. Bonds, Series 2013-A-2, 5.00% 2027 (preref. 2022) | | | 500 | | | | 502 | |
| Fncg. Auth., Rev. Bonds, Series 2013-A-2, 5.00% 2042 (preref. 2022) | | | 580 | | | | 582 | |
| General Auth. of Southcentral Pennsylvania, Rev. Bonds (Wellspan Health Obligated Group), Series 2019-B, (SIFMA Municipal Swap Index + 0.60%) 1.04% 2049 (put 2024)2 | | | 455 | | | | 453 | |
| Housing Fin. Agcy., Single Family Mortgage Rev. Bonds, Series 2017-122, 4.00% 2046 | | | 870 | | | | 883 | |
| Housing Fin. Agcy., Single Family Mortgage Rev. Bonds, Series 2020-133, 3.00% 2050 | | | 965 | | | | 954 | |
| Housing Fin. Agcy., Single Family Mortgage Rev. Bonds, Series 2021-137, 3.00% 2051 | | | 975 | | | | 950 | |
| Housing Fin. Agcy., Single Family Mortgage Rev. Bonds, Series 2021-135-A, 3.00% 2051 | | | 220 | | | | 217 | |
| Private Client Services Funds | 19 |
Capital Group Core Municipal Fund
| Bonds, notes & other debt instruments (continued) | Principal amount
(000) | | | Value
(000) | |
| Pennsylvania (continued) | | | | | | | | |
| Housing Fin. Agcy., Single Family Mortgage Rev. Bonds, Series 2022-138-A, 3.00% 2052 | | USD | 2,340 | | | $ | 2,276 | |
| Housing Fin. Agcy., Special Limited Obligation, Multi Family Housing Dev. Bonds (Harrison Senior Tower), Series 2021, 0.25% 2024 (put 2023) | | | 1,030 | | | | 1,002 | |
| Housing Fin. Agcy., Special Limited Obligation, Multi Family Housing Dev. Bonds (School of Nursing), Series 2021, 0.27% 2024 (put 2023) | | | 330 | | | | 320 | |
| County of Lehigh, General Purpose Auth., Rev. Bonds (The Good Shepherd Group), Series 2021-A, 4.00% 2023 | | | 95 | | | | 97 | |
| County of Montgomery, Higher Education and Health Auth., Rev. Bonds (Thomas Jefferson University), Series 2022-B, 4.00% 2035 | | | 110 | | | | 111 | |
| County of Montgomery, Industrial Dev. Auth., Rev. Bonds (Foulkeways at Gwynedd Project), Series 2016, 5.00% 2026 | | | 400 | | | | 421 | |
| County of Montgomery, Industrial Dev. Auth., Rev. Bonds (Waverly Heights Ltd.), Series 2019, 4.00% 2023 | | | 125 | | | | 128 | |
| County of Northampton, General Purpose Auth., Hospital Rev. Bonds (St. Luke’s University Health Network Project), Series 2018-B, (1-month USD-LIBOR x 0.70 + 1.04%) 1.358% 2048 (put 2022)2 | | | 175 | | | | 175 | |
| City of Philadelphia, Hospitals and Higher Education Facs. Auth., Rev. Bonds (Temple University Health System Obligated Group), Series 2022, Assured Guaranty Municipal insured, 5.00% 2035 | | | 155 | | | | 172 | |
| Philadelphia School Dist., G.O. Bonds, Series 2019-A, 5.00% 2022 | | | 1,050 | | | | 1,062 | |
| Philadelphia School Dist., G.O. Bonds, Series 2016-F, 5.00% 2025 | | | 415 | | | | 444 | |
| Philadelphia School Dist., G.O. Bonds, Series 2021-A, 5.00% 2030 | | | 260 | | | | 295 | |
| Philadelphia School Dist., G.O. Bonds, Series 2021-A, 5.00% 2031 | | | 125 | | | | 143 | |
| Philadelphia School Dist., G.O. Rev. Ref. Bonds, Series 2016-F, 5.00% 2023 | | | 1,500 | | | | 1,552 | |
| Turnpike Commission, Turnpike Rev. Bonds, Series 2021-C, 5.00% 2029 | | | 220 | | | | 250 | |
| Turnpike Commission, Turnpike Rev. Bonds, Series 2021-B, 5.00% 2030 | | | 165 | | | | 190 | |
| Turnpike Commission, Turnpike Rev. Bonds, Series 2021-B, 5.00% 2031 | | | 295 | | | | 340 | |
| | | | | | | | 15,051 | |
| | | | | | | | | |
| Puerto Rico 0.02% | | | | | | | | |
| Industrial, Tourist, Educational, Medical and Environmental Control Facs. Fncg. Auth., Hospital Rev. and Rev. Ref. Bonds (Hospital Auxilio Mutuo Obligated Group Project), Series 2021, 5.00% 2030 | | | 40 | | | | 45 | |
| Industrial, Tourist, Educational, Medical and Environmental Control Facs. Fncg. Auth., Hospital Rev. and Rev. Ref. Bonds (Hospital Auxilio Mutuo Obligated Group Project), Series 2021, 5.00% 2031 | | | 65 | | | | 73 | |
| | | | | | | | 118 | |
| | | | | | | | | |
| Rhode Island 0.31% | | | | | | | | |
| Commerce Corp., Grant Anticipation Rev. Ref. Bonds (Dept. of Transportation), Series 2016-A, 5.00% 2023 | | | 500 | | | | 516 | |
| Housing and Mortgage Fin. Corp., Homeownership Opportunity Bonds, Series 75-A, 3.00% 2051 | | | 1,525 | | | | 1,500 | |
| Housing and Mortgage Fin. Corp., Multi Family Dev. Bonds, Series 2021-A-1, 0.45% 2040 (put 2023) | | | 160 | | | | 155 | |
| | | | | | | | 2,171 | |
| | | | | | | | | |
| South Carolina 1.53% | | | | | | | | |
| City of Columbia, Housing Auth., Multi Family Housing Rev. Bonds (Haven at Congaree Pointe), Series 2022, 2.25% 2043 (put 2025) | | | 1,884 | | | | 1,841 | |
| City of Columbia, Housing Auth., Multi Family Housing Rev. Bonds (Palmetto Terrace Apartments Project), Series 2021, 0.31% 2024 (put 2023) | | | 460 | | | | 448 | |
| City of Columbia, Waterworks and Sewer System Rev. Bonds, Series 2019-A, 5.00% 2028 | | | 100 | | | | 113 | |
| Housing Fin. and Dev. Auth., Mortgage Rev. Bonds, Series 2017-A, 4.00% 2047 | | | 310 | | | | 315 | |
| Housing Fin. and Dev. Auth., Mortgage Rev. Bonds, Series 2017-B, 4.00% 2047 | | | 85 | | | | 86 | |
| Housing Fin. and Dev. Auth., Mortgage Rev. Bonds, Series 2020-A, 4.00% 2050 | | | 720 | | | | 736 | |
| Housing Fin. and Dev. Auth., Mortgage Rev. Bonds, Series 2021-A, 3.00% 2052 | | | 640 | | | | 629 | |
| Housing Fin. and Dev. Auth., Mortgage Rev. Bonds, Series 2022-A, 4.00% 2052 | | | 710 | | | | 728 | |
| Housing Fin. and Dev. Auth., Mortgage Rev. Ref. Bonds, Series 2016-A, 4.00% 2036 | | | 435 | | | | 442 | |
| Housing Fin. and Dev. Auth., Multi Family Housing Rev. Bonds (Villages at Congaree Pointe Project), Series 2021-B, 1.25% 2025 (put 2024) | | | 415 | | | | 403 | |
| Lexington County Health Services Dist., Inc., Hospital Rev. Ref. Bonds, Series 2017, 5.00% 2022 | | | 600 | | | | 610 | |
| Lexington County Health Services Dist., Inc., Hospital Rev. Ref. Bonds, Series 2017, 5.00% 2024 | | | 500 | | | | 529 | |
| Patriots Energy Group Fncg. Agcy., Gas Supply Rev. Bonds, Series 2018-A, 4.00% 2048 (put 2024) | | | 180 | | | | 183 | |
| Public Service Auth., Improvement Rev. Obligations, Series 2021-B, 5.00% 2029 | | | 520 | | | | 588 | |
| Public Service Auth., Rev. Obligations (Santee Cooper), Series 2014-C, 5.00% 2022 | | | 350 | | | | 357 | |
| Public Service Auth., Rev. Obligations (Santee Cooper), Series 2014-C, 5.00% 2023 | | | 125 | | | | 130 | |
| 20 | Private Client Services Funds |
Capital Group Core Municipal Fund
| Bonds, notes & other debt instruments (continued) | Principal amount
(000) | | | Value
(000) | |
| South Carolina (continued) | | | | | | | | |
| Public Service Auth., Rev. Obligations (Santee Cooper), Series 2012-D, 5.00% 2028 (preref. 2022) | | USD | 510 | | | $ | 512 | |
| Public Service Auth., Rev. Obligations (Santee Cooper), Series 2012-D, 5.00% 2028 (preref. 2022) | | | 490 | | | | 491 | |
| Public Service Auth., Rev. Ref. Obligations (Santee Cooper), Series 2015-A, 5.00% 2028 | | | 100 | | | | 106 | |
| Public Service Auth., Rev. Ref. Obligations (Santee Cooper), Series 2022-A, 5.00% 2029 | | | 180 | | | | 204 | |
| Public Service Auth., Rev. Ref. Obligations (Santee Cooper), Series 2022-A, 5.00% 2031 | | | 455 | | | | 522 | |
| City of Spartanburg, Housing Auth., Multi Family Housing Rev. Bonds (Connecticut Village Apartments), Series 2022, 1.05% 2025 (put 2023) | | | 100 | | | | 98 | |
| Spartanburg Regional Health Services Dist., Hospital Rev. Ref. Bonds, Series 2022, 5.00% 2030 | | | 310 | | | | 347 | |
| Spartanburg Regional Health Services Dist., Hospital Rev. Ref. Bonds, Series 2022, 5.00% 2032 | | | 130 | | | | 147 | |
| | | | | | | | 10,565 | |
| | | | | | | | | |
| South Dakota 1.00% | | | | | | | | |
| Housing Dev. Auth., Homeownership Mortgage Bonds, Series 2014-E, 4.00% 2044 | | | 420 | | | | 426 | |
| Housing Dev. Auth., Homeownership Mortgage Bonds, Series 2016-D, 3.50% 2046 | | | 705 | | | | 709 | |
| Housing Dev. Auth., Homeownership Mortgage Bonds, Series 2017-B, 4.00% 2047 | | | 1,025 | | | | 1,042 | |
| Housing Dev. Auth., Homeownership Mortgage Bonds, Series 2018-B, 4.50% 2048 | | | 1,295 | | | | 1,337 | |
| Housing Dev. Auth., Homeownership Mortgage Bonds, Series 2019-B, 4.00% 2049 | | | 280 | | | | 285 | |
| Housing Dev. Auth., Homeownership Mortgage Bonds, Series 2021-B, 3.00% 2051 | | | 2,195 | | | | 2,160 | |
| Housing Dev. Auth., Homeownership Mortgage Bonds, Series 2020-C, 3.50% 2051 | | | 935 | | | | 939 | |
| | | | | | | | 6,898 | |
| | | | | | | | | |
| Tennessee 0.81% | | | | | | | | |
| Housing Dev. Agcy., Residential Fin. Program Bonds, Series 2017-1, 4.00% 2042 | | | 420 | | | | 427 | |
| Housing Dev. Agcy., Residential Fin. Program Bonds, Series 2017-2-B, 4.00% 2042 | | | 410 | | | | 417 | |
| Housing Dev. Agcy., Residential Fin. Program Bonds, Series 2015-2-A, 4.00% 2046 | | | 390 | | | | 397 | |
| Housing Dev. Agcy., Residential Fin. Program Bonds, Series 2020-3-A, 3.50% 2050 | | | 105 | | | | 105 | |
| Housing Dev. Agcy., Residential Fin. Program Bonds, Series 2015-2-A, 3.75% 2050 | | | 420 | | | | 426 | |
| Housing Dev. Agcy., Residential Fin. Program Bonds, Series 2019-1, 4.25% 2050 | | | 750 | | | | 769 | |
| County of Knox, Health, Educational and Housing Fac. Board, Multi Family Housing Rev. Bonds (Farragut Pointe Apartments Project), Series 2021, 0.65% 2026 (put 2024) | | | 845 | | | | 797 | |
| City of Knoxville Community Dev. Corp., Collateralized Multi Family Housing Rev. Bonds (Austin 1B Apartments Project), Series 2021, 0.22% 2024 (put 2023) | | | 155 | | | | 149 | |
| Metropolitan Government of Nashville and Davidson County, Health and Educational Facs. Board, Rev. Bonds (Vanderbilt University Medical Center), Series 2021-A, 5.00% 2031 | | | 415 | | | | 466 | |
| Tennessee Energy Acquisition Corp., Commodity Project Rev. Bonds, Series 2021-A, 5.00% 2052 (put 2031) | | | 1,500 | | | | 1,632 | |
| | | | | | | | 5,585 | |
| | | | | | | | | |
| Texas 12.44% | | | | | | | | |
| Affordable Housing Corp., Multi Family Housing Rev. Bonds (Apartments of Las Palmas I LLC), Series 2021, 0.25% 2024 (put 2022) | | | 65 | | | | 64 | |
| Alvarado Independent School Dist., Unlimited Tax School Building Bonds, Series 2020, 5.00% 2023 | | | 795 | | | | 814 | |
| Alvin Independent School Dist., Unlimited Tax Schoolhouse and Rev. Ref. Bonds, Series 2020, 5.00% 2025 | | | 600 | | | | 642 | |
| Alvin Independent School Dist., Unlimited Tax Schoolhouse and Rev. Ref. Bonds, Series 2020, 5.00% 2027 | | | 225 | | | | 250 | |
| Angleton Independent School Dist., Unlimited Tax School Building Bonds, Series 2020, 5.00% 2025 | | | 620 | | | | 662 | |
| Arlington Higher Education Fin. Corp., Education Rev. and Rev. Ref. Bonds (Uplift Education), Series 2017-A, 5.00% 2023 | | | 885 | | | | 922 | |
| Arlington Higher Education Fin. Corp., Education Rev. and Rev. Ref. Bonds (Uplift Education), Series 2017-A, 5.00% 2024 | | | 400 | | | | 425 | |
| Arlington Higher Education Fin. Corp., Education Rev. Bonds (Great Hearts America - Texas), Series 2019-A, 5.00% 2026 | | | 400 | | | | 436 | |
| Arlington Higher Education Fin. Corp., Education Rev. Bonds (Great Hearts America - Texas), Series 2019-A, 5.00% 2028 | | | 595 | | | | 668 | |
| Arlington Higher Education Fin. Corp., Education Rev. Bonds (Great Hearts America - Texas), Series 2019-A, 5.00% 2029 | | | 235 | | | | 267 | |
| Arlington Higher Education Fin. Corp., Education Rev. Bonds (KIPP Texas, Inc.), Series 2019, 5.00% 2026 | | | 1,900 | | | | 2,078 | |
| Arlington Higher Education Fin. Corp., Education Rev. Bonds (KIPP Texas, Inc.), Series 2019, 5.00% 2027 | | | 1,000 | | | | 1,109 | |
| Arlington Higher Education Fin. Corp., Education Rev. Bonds (Responsive Education Solutions), Series 2021-A, 5.00% 2029 | | | 510 | | | | 579 | |
| Arlington Higher Education Fin. Corp., Education Rev. Bonds (Responsive Education Solutions), Series 2021-A, 5.00% 2030 | | | 485 | | | | 557 | |
| Private Client Services Funds | 21 |
Capital Group Core Municipal Fund
| Bonds, notes & other debt instruments (continued) | Principal amount
(000) | | | Value
(000) | |
| Texas (continued) | | | | | | | | |
| Arlington Higher Education Fin. Corp., Education Rev. Bonds (Riverwalk Education Foundation, Inc.), Series 2019, 5.00% 2028 | | USD | 650 | | | $ | 730 | |
| Arlington Higher Education Fin. Corp., Education Rev. Bonds (Uplift Education), Series 2017-B, 5.00% 2026 | | | 450 | | | | 494 | |
| Arlington Higher Education Fin. Corp., Education Rev. Bonds (Uplift Education), Series 2019-A, 4.00% 2027 | | | 460 | | | | 484 | |
| Arlington Higher Education Fin. Corp., Education Rev. Bonds (Uplift Education), Series 2017-B, 5.00% 2027 | | | 250 | | | | 276 | |
| Arlington Higher Education Fin. Corp., Education Rev. Bonds (Uplift Education), Series 2019-A, 4.00% 2028 | | | 475 | | | | 500 | |
| Arlington Higher Education Fin. Corp., Education Rev. Bonds (Uplift Education), Series 2019-A, 4.00% 2029 | | | 395 | | | | 415 | |
| Arlington Independent School Dist., Unlimited Tax School Building and Rev. Ref. Bonds, Series 2020, 5.00% 2026 | | | 325 | | | | 354 | |
| City of Arlington, Permanent Improvement Bonds, Series 2021-A, 5.00% 2030 | | | 140 | | | | 162 | |
| Austin Affordable PFC, Inc., Multi Family Housing Rev. Bonds (Bridge at Turtle Creek Apartments), Series 2020, 0.42% 2040 (put 2023) | | | 1,000 | | | | 978 | |
| Austin Community College Dist., Maintenance Tax Notes, Series 2021, 5.00% 2030 | | | 160 | | | | 185 | |
| City of Austin, Water and Wastewater System Rev. Ref. Bonds, Series 2015-A, 5.00% 2030 | | | 740 | | | | 799 | |
| City of Austin, Water and Wastewater System Rev. Ref. Bonds, Series 2021, 5.00% 2030 | | | 110 | | | | 128 | |
| City of Austin, Water and Wastewater System Rev. Ref. Bonds, Series 2021, 5.00% 2031 | | | 335 | | | | 392 | |
| Beaumont Independent School Dist., Unlimited Tax Rev. Ref. Bonds, Series 2017, 5.00% 2026 | | | 1,500 | | | | 1,636 | |
| County of Bexar, Hospital Dist., Limited Tax Rev. Ref. Bonds, Series 2019, 5.00% 2031 | | | 480 | | | | 532 | |
| Cameron County Housing Fin. Corp., Multi Family Housing Rev. Bonds (Sunland Country Apartments), Series 2021, 0.28% 2024 (put 2023) | | | 205 | | | | 199 | |
| Capital Area Housing Fin. Corp., Multi Family Housing Rev. Bonds (Redwood Apartments), Series 2020, 0.41% 2041 (put 2024) | | | 920 | | | | 881 | |
| Carroll Independent School Dist., Unlimited Tax Rev. Ref. Bonds, Series 2019, 5.00% 2026 | | | 970 | | | | 1,058 | |
| Carrollton-Farmers Branch Independent School Dist., Unlimited Tax School Building Bonds, Series 2021, 5.00% 2023 | | | 230 | | | | 236 | |
| Central Texas Regional Mobility Auth., Rev. Ref. Bonds, Series 2021-D, 5.00% 2030 | | | 320 | | | | 354 | |
| Central Texas Regional Mobility Auth., Rev. Ref. Bonds, Series 2021-D, 5.00% 2032 | | | 520 | | | | 579 | |
| Clear Creek Independent School Dist., Unlimited Tax School Building Bonds, Series 2013-B, 0.28% 2038 (put 2024) | | | 205 | | | | 190 | |
| Clear Creek Independent School Dist., Unlimited Tax School Building Bonds, Series 2018, 5.00% 2028 | | | 1,100 | | | | 1,220 | |
| Clifton Higher Education Fin. Corp., Education Rev. and Ref. Bonds (Idea Public Schools), Series 2017, 5.00% 2027 | | | 1,360 | | | | 1,498 | |
| Clifton Higher Education Fin. Corp., Education Rev. Bonds (Idea Public Schools), Series 2021-T, 5.00% 2023 | | | 25 | | | | 26 | |
| Clifton Higher Education Fin. Corp., Education Rev. Bonds (Idea Public Schools), Series 2021-T, 5.00% 2024 | | | 30 | | | | 32 | |
| Clifton Higher Education Fin. Corp., Education Rev. Bonds (Idea Public Schools), Series 2018, 5.00% 2025 | | | 500 | | | | 536 | |
| Clifton Higher Education Fin. Corp., Education Rev. Bonds (Idea Public Schools), Series 2021-T, 5.00% 2025 | | | 30 | | | | 32 | |
| Clifton Higher Education Fin. Corp., Education Rev. Bonds (Idea Public Schools), Series 2019, 5.00% 2026 | | | 1,000 | | | | 1,086 | |
| Clifton Higher Education Fin. Corp., Education Rev. Bonds (Idea Public Schools), Series 2021-T, 5.00% 2026 | | | 25 | | | | 27 | |
| Clifton Higher Education Fin. Corp., Education Rev. Bonds (Idea Public Schools), Series 2021-T, 5.00% 2027 | | | 30 | | | | 33 | |
| Clifton Higher Education Fin. Corp., Education Rev. Bonds (Idea Public Schools), Series 2021-T, 5.00% 2028 | | | 15 | | | | 17 | |
| Clifton Higher Education Fin. Corp., Education Rev. Bonds (Idea Public Schools), Series 2021-T, 5.00% 2029 | | | 230 | | | | 259 | |
| Corpus Christi Independent School Dist., Unlimited Tax School Building and Rev. Ref. Bonds, Series 2020, 5.00% 2027 | | | 675 | | | | 756 | |
| Port of Corpus Christi Auth. of Nueces County, Rev. Bonds, Series 2018-A, 5.00% 2027 | | | 490 | | | | 543 | |
| Crowley Independent School Dist., Unlimited Tax Rev. Ref. Bonds, Series 2015-A, 5.00% 2025 | | | 1,000 | | | | 1,078 | |
| Crowley Independent School Dist., Unlimited Tax School Building Bonds, Series 2019, 5.00% 2028 | | | 310 | | | | 350 | |
| Crowley Independent School Dist., Unlimited Tax School Building Bonds, Series 2019, 5.00% 2029 | | | 400 | | | | 457 | |
| Crowley Independent School Dist., Unlimited Tax School Building Bonds, Series 2019, 5.00% 2031 | | | 260 | | | | 296 | |
| Cities of Dallas and Fort Worth, Dallas/Fort Worth International Airport, Joint Rev. Improvement Bonds, Series 2013-B, 4.00% 2039 | | | 1,000 | | | | 1,001 | |
| City of Dallas Housing Fin. Corp., Multi Family Housing Rev. Bonds (Estates at Shiloh), Series 2019, 1.25% 2037 (put 2023) | | | 430 | | | | 425 | |
| City of Dallas Housing Fin. Corp., Multi Family Housing Rev. Bonds (Midpark Towers), Series 2021, 0.35% 2024 (put 2023) | | | 675 | | | | 666 | |
| Dallas Independent School Dist., Unlimited Tax Rev. Ref. Bonds, Series 2014-A, 5.00% 2023 | | | 120 | | | | 124 | |
| Del Valle Independent School Dist., Unlimited Tax School Building Bonds, Series 2020, 5.00% 2022 | | | 155 | | | | 156 | |
| City of Denton, Utility System Rev. Bonds, Series 2017, 5.00% 2028 | | | 2,000 | | | | 2,191 | |
| Eagle Mountain-Saginaw Independent School Dist., Unlimited Tax School Building Bonds, Series 2019, 5.00% 2027 | | | 600 | | | | 671 | |
| El Paso Independent School Dist., Unlimited Tax Rev. Ref. Bonds, Series 2015, 5.00% 2026 | | | 500 | | | | 530 | |
| Fort Bend Grand Parkway Toll Road Auth., Limited Contract Tax and Toll Road Rev. Ref. Bonds, Series 2021-A, 4.00% 2032 | | | 185 | | | | 200 | |
| Fort Bend Independent School Dist., Unlimited Tax Rev. Ref. Bonds, Series 2021-B, 0.72% 2051 (put 2026) | | | 515 | | | | 467 | |
| Fort Bend Independent School Dist., Unlimited Tax School Building and Rev. Ref. Bonds, Series 2020-B, 0.875% 2050 (put 2023) | | | 340 | | | | 320 | |
| 22 | Private Client Services Funds |
Capital Group Core Municipal Fund
| Bonds, notes & other debt instruments (continued) | Principal amount
(000) | | | Value
(000) | |
| Texas (continued) | | | | | | | | |
| G.O. Water Financial Assistance Rev. Ref. Bonds, Series 2021-B, 4.00% 2028 | | USD | 175 | | | $ | 182 | |
| City of Galveston Public Fac. Corp., Multi Family Housing Rev. Bonds (The Orleanders at Broadway), Series 2021, 0.47% 2025 (put 2024) | | | 510 | | | | 481 | |
| City of Garland, Electric Utility System Rev. Ref. Bonds, Series 2021-A, 5.00% 2028 | | | 80 | | | | 89 | |
| City of Garland, Electric Utility System Rev. Ref. Bonds, Series 2021-A, 5.00% 2031 | | | 150 | | | | 173 | |
| City of Garland, Tax and Rev. Certs. of Obligation, Series 2021, 5.00% 2024 | | | 135 | | | | 141 | |
| Goose Creek Consolidated Independent School Dist., Unlimited Tax School Building Bonds, Series 2014-B, 0.60% 2035 (put 2026) | | | 340 | | | | 309 | |
| Goose Creek Consolidated Independent School Dist., Unlimited Tax School Building Bonds, Series 2019-B, 0.15% 2049 (put 2022) | | | 555 | | | | 551 | |
| Harlandale Independent School Dist., Maintenance Tax Notes, Series 2021, BAM insured, 2.00% 2040 (put 2024) | | | 185 | | | | 185 | |
| Harlandale Independent School Dist., Unlimited Tax Rev. Ref. Bonds, Series 2020, 0.75% 2045 (put 2025) | | | 330 | | | | 310 | |
| Harris County Cultural Education Facs. Fin. Corp., Hospital Rev. Bonds (Memorial Hermann Health System), Series 2020, 5.00% 2022 | | | 1,000 | | | | 1,003 | |
| Harris County Cultural Education Facs. Fin. Corp., Hospital Rev. Bonds (Memorial Hermann Health System), Series 2019-C-2, (SIFMA Municipal Swap Index + 0.57%) 1.01% 2049 (put 2024)2 | | | 1,000 | | | | 1,003 | |
| Harris County Cultural Education Facs. Fin. Corp., Hospital Rev. Bonds (Texas Children’s Hospital), Series 2019-B, 5.00% 2041 (put 2024) | | | 1,000 | | | | 1,056 | |
| Harris County Cultural Education Facs. Fin. Corp., Hospital Rev. Ref. Bonds (Memorial Hermann Health System), Series 2013-B, (SIFMA Municipal Swap Index + 0.90%) 1.34% 20222 | | | 250 | | | | 250 | |
| Harris County Cultural Education Facs. Fin. Corp., Medical Facs. Mortgage Rev. Ref. Bonds (Baylor College of Medicine), Series 2019-A, (3-month USD-LIBOR x 0.70 + 0.65%) 0.968% 2046 (put 2024)2 | | | 535 | | | | 535 | |
| Harris County Cultural Education Facs. Fin. Corp., Rev. Bonds (Texas Medical Center), Series 2020-A, 0.90% 2050 (put 2025) | | | 455 | | | | 444 | |
| Harris County Health Facs. Dev. Corp., Rev. Ref. Bonds (CHRISTUS Health), Series 2005-A-4, Assured Guaranty Municipal insured, 0.05% 20312 | | | 125 | | | | 125 | |
| Dept. of Housing and Community Affairs, Multi Family Housing Rev. Bonds (Corona Del Valle), Series 2021, 0.37% 2025 (put 2023) | | | 185 | | | | 179 | |
| Dept. of Housing and Community Affairs, Multi Family Housing Rev. Bonds (Oso Bay Apartments), Series 2021, 0.27% 2024 (put 2022) | | | 345 | | | | 343 | |
| Dept. of Housing and Community Affairs, Multi Family Housing Rev. Bonds (Palladium Simpson Stuart Apartments), Series 2021, 0.35% 2025 (put 2024) | | | 630 | | | | 603 | |
| Dept. of Housing and Community Affairs, Multi Family Housing Rev. Bonds (The Park at Kirkstall), Series 2021, 0.65% 2025 (put 2024) | | | 870 | | | | 821 | |
| Dept. of Housing and Community Affairs, Residential Mortgage Rev. Bonds, Series 2019-A, 4.75% 2049 | | | 1,090 | | | | 1,127 | |
| Dept. of Housing and Community Affairs, Residential Mortgage Rev. Bonds, Series 2021-A, 3.00% 2052 | | | 2,275 | | | | 2,236 | |
| Dept. of Housing and Community Affairs, Single Family Mortgage Rev. Bonds, Series 2019-A, 4.00% 2050 | | | 1,200 | | | | 1,227 | |
| Dept. of Housing and Community Affairs, Single Family Mortgage Rev. Bonds, Series 2020-A, 3.50% 2051 | | | 350 | | | | 351 | |
| Dept. of Housing and Community Affairs, Single Family Mortgage Rev. Bonds, Series 2021-A, 3.00% 2052 | | | 850 | | | | 833 | |
| Housing Options, Inc., Multi Family Housing Rev. Bonds (Brooks Manor - The Oaks Project), Series 2021, 0.50% 2041 (put 2025) | | | 255 | | | | 237 | |
| City of Houston Housing Fin. Corp., Multi Family Housing Rev. Bonds (Temenos Place Apartments), Series 2021, 0.29% 2024 (put 2023) | | | 325 | | | | 315 | |
| City of Houston, Combined Utility System Rev. and Rev. Ref. Bonds, Series 2016-B, 5.00% 2027 | | | 500 | | | | 548 | |
| City of Houston, Combined Utility System Rev. Ref. Bonds, Series 2019-B, 5.00% 2027 | | | 550 | | | | 614 | |
| City of Houston, Convention and Entertainment Facs. Dept., Hotel Occupancy Tax and Special Rev. Ref. Bonds, Series 2021, 4.00% 2028 | | | 225 | | | | 238 | |
| City of Houston, Convention and Entertainment Facs. Dept., Hotel Occupancy Tax and Special Rev. Ref. Bonds, Series 2021, 4.00% 2030 | | | 25 | | | | 27 | |
| City of Houston, Convention and Entertainment Facs. Dept., Hotel Occupancy Tax and Special Rev. Ref. Bonds, Series 2021, 4.00% 2031 | | | 10 | | | | 11 | |
| City of Houston, Memorial City Redev. Auth., Tax Increment Contract Rev. and Rev. Ref. Bonds, Series 2019, Assured Guaranty Municipal insured, 5.00% 2027 | | | 1,050 | | | | 1,151 | |
| City of Houston, Memorial City Redev. Auth., Tax Increment Contract Rev. and Rev. Ref. Bonds, Series 2019, Assured Guaranty Municipal insured, 5.00% 2028 | | | 250 | | | | 276 | |
| County of Kaufman, Unlimited Tax Road Bonds, Series 2020, 5.00% 2031 | | | 115 | | | | 130 | |
| Kilgore Independent School Dist., Unlimited Tax School Building Bonds, Series 2022, 5.00% 2026 | | | 205 | | | | 223 | |
| Longview Independent School Dist., Unlimited Tax Rev. Ref. Bonds, Series 2020, 5.00% 2023 | | | 575 | | | | 589 | |
| Lower Colorado River Auth., Rev. Ref. Bonds, Series 2022, Assured Guaranty Municipal insured, 5.00% 2032 | | | 380 | | | | 438 | |
| Lower Colorado River Auth., Transmission Contract Rev. Ref. Bonds (LCRA Transmission Services Corp. Project), Series 2016, 5.00% 2022 | | | 460 | | | | 461 | |
| Lower Colorado River Auth., Transmission Contract Rev. Ref. Bonds (LCRA Transmission Services Corp. Project), Series 2018, 5.00% 2024 | | | 255 | | | | 267 | |
| Private Client Services Funds | 23 |
Capital Group Core Municipal Fund
| Bonds, notes & other debt instruments (continued) | Principal amount
(000) | | | Value
(000) | |
| Texas (continued) | | | | | | | | |
| Lower Colorado River Auth., Transmission Contract Rev. Ref. Bonds (LCRA Transmission Services Corp. Project), Series 2020, 5.00% 2026 | | USD | 1,000 | | | $ | 1,086 | |
| Lower Colorado River Auth., Transmission Contract Rev. Ref. Bonds (LCRA Transmission Services Corp. Project), Series 2020, 5.00% 2027 | | | 1,750 | | | | 1,933 | |
| Lower Colorado River Auth., Transmission Contract Rev. Ref. Bonds (LCRA Transmission Services Corp. Project), Series 2021-A, 5.00% 2031 | | | 570 | | | | 654 | |
| Lumberton Independent School Dist., Unlimited Tax School Building Bonds, Series 2020, 5.00% 2029 | | | 245 | | | | 279 | |
| Medina Valley Independent School Dist., Unlimited Tax School Building Bonds, Series 2021, 0.82% 2051 (put 2026) | | | 325 | | | | 296 | |
| Midland County Public Fac. Corp., Multi Family Housing Rev. Bonds (Palladium at West Francis), Series 2020, 0.35% 2024 (put 2023) | | | 1,000 | | | | 970 | |
| Municipal Gas Acquisition and Supply Corp. I, Gas Supply Rev. Bonds, Series 2008-D, 6.25% 2026 | | | 415 | | | | 445 | |
| Municipal Gas Acquisition and Supply Corp. III, Gas Supply Rev. Ref. Bonds, Series 2021, 5.00% 2022 | | | 660 | | | | 670 | |
| Nederland Independent School Dist., Unlimited Tax School Building Bonds, Series 2021, 5.00% 2031 | | | 195 | | | | 224 | |
| New Hope Cultural Education Facs. Fin. Corp., Retirement Fac. Rev. Bonds (Westminster Project), Series 2016, 5.00% 2028 | | | 235 | | | | 248 | |
| North Central Texas Housing Fin. Corp., Multi Family Housing Rev. Bonds (Bluebonnet Ridge Apartments), Series 2021, 0.375% 2040 (put 2024) | | | 220 | | | | 207 | |
| North East Independent School Dist., Unlimited Tax Rev. Ref. Bonds, Series 2017, 2.375% 2047 (put 2022) | | | 500 | | | | 501 | |
| North East Independent School Dist., Unlimited Tax School Building and Rev. Ref. Bonds, Series 2019-A, 4.00% 2032 | | | 215 | | | | 228 | |
| North Fort Bend Water Auth., Water System Rev. and Rev. Ref. Bonds, Series 2021, BAM insured, 5.00% 2031 | | | 435 | | | | 506 | |
| North Harris County Regional Water Auth., Rev. and Rev. Ref. Bonds, Series 2016, 5.00% 2034 | | | 950 | | | | 1,035 | |
| North Texas Municipal Water Dist., Water System Rev. Ref. and Improvement Bonds, Series 2021, 5.00% 2022 | | | 170 | | | | 172 | |
| North Texas Tollway Auth., System Rev. Ref. Bonds, Series 2016-A, 5.00% 2026 | | | 500 | | | | 520 | |
| North Texas Tollway Auth., System Rev. Ref. Bonds, Series 2015-A, 5.00% 2030 | | | 300 | | | | 316 | |
| North Texas Tollway Auth., System Rev. Ref. Bonds, Capital Appreciation Bonds, Series 2008-D, Assured Guaranty insured, 0% 2030 | | | 500 | | | | 384 | |
| Northside Independent School Dist., Unlimited Tax Rev. Ref. Bonds, Series 2020, 5.00% 2027 | | | 850 | | | | 949 | |
| Northwest Independent School Dist., Unlimited Tax School Building Bonds, Series 2021, 5.00% 2030 | | | 175 | | | | 202 | |
| Northwest Independent School Dist., Unlimited Tax School Building Bonds, Series 2021, 5.00% 2031 | | | 105 | | | | 121 | |
| Northwest Independent School Dist., Unlimited Tax School Building Bonds, Series 2013, 5.00% 2038 (preref. 2023) | | | 700 | | | | 718 | |
| Odessa Housing Fin. Corp., Multi Family Housing Rev. Bonds (Cove in Odessa Apartments), Series 2021, 0.37% 2024 (put 2023) | | | 755 | | | | 730 | |
| Pasadena Independent School Dist., Unlimited Tax Rev. Ref. Bonds, Series 2019, 5.00% 2029 | | | 260 | | | | 296 | |
| Pasadena Independent School Dist., Unlimited Tax School Building and Rev. Ref. Bonds, Series 2013, 5.00% 2038 | | | 1,000 | | | | 1,021 | |
| Plano Public Fac. Corp., Multi Family Housing Rev. Bonds (K Avenue Lofts), Series 2021, 0.65% 2041 (put 2024) | | | 1,000 | | | | 1,000 | |
| Prosper Independent School Dist., Unlimited Tax School Building Bonds, Series 2019-B, 2.00% 2050 (put 2023) | | | 415 | | | | 413 | |
| Round Rock Independent School Dist., Unlimited Tax Rev. Ref. Bonds, Series 2017, 5.00% 2022 | | | 600 | | | | 605 | |
| City of San Antonio Housing Trust Fin. Corp., Multi Family Housing Rev. Bonds (The Arbors at West Avenue Apartments), Series 2022, 1.45% 2026 (put 2025) | | | 370 | | | | 356 | |
| City of San Antonio, Electric and Gas Systems Rev. Bonds, Series 2013, 5.00% 2048 (preref. 2023) | | | 475 | | | | 486 | |
| City of San Antonio, Electric and Gas Systems Rev. Ref. Bonds, Series 2022, 5.00% 2023 | | | 295 | | | | 301 | |
| City of San Antonio, Electric and Gas Systems Rev. Ref. Bonds, Series 2022, 5.00% 2027 | | | 180 | | | | 198 | |
| City of San Antonio, Electric and Gas Systems Rev. Ref. Bonds, Series 2016, 5.00% 2028 | | | 1,000 | | | | 1,091 | |
| City of San Antonio, Electric and Gas Systems Rev. Ref. Bonds, Series 2022, 5.00% 2028 | | | 115 | | | | 128 | |
| City of San Antonio, Electric and Gas Systems Rev. Ref. Bonds, Series 2022, 5.00% 2029 | | | 125 | | | | 141 | |
| City of San Antonio, Electric and Gas Systems Rev. Ref. Bonds, Series 2018, 2.75% 2048 (put 2022) | | | 250 | | | | 251 | |
| City of San Antonio, Water System Rev. Ref. Bonds, Series 2019-C, 5.00% 2022 | | | 185 | | | | 185 | |
| Spring Independent School Dist., Unlimited Tax School Building Bonds, Series 2019, 5.00% 2031 | | | 465 | | | | 525 | |
| Tarrant County Cultural Education Facs. Fin. Corp., Rev. Ref. Bonds (Christus Health), Series 2018-A, 5.00% 2023 | | | 850 | | | | 878 | |
| Board of Regents of the Texas A&M University System, Rev. Fncg. System Bonds, Series 2017-E, 5.00% 2022 | | | 1,425 | | | | 1,427 | |
| Tomball Independent School Dist., Unlimited Tax School Building Bonds, Series 2020, 5.00% 2023 | | | 270 | | | | 277 | |
| Tomball Independent School Dist., Unlimited Tax School Building Bonds, Series 2020, 5.00% 2024 | | | 90 | | | | 94 | |
| Transportation Commission, Highway Improvement G.O. Bonds, Series 2016-A, 5.00% 2028 | | | 200 | | | | 217 | |
| Travis County Strategic Housing Fin. Corp., Multi Family Housing Rev. Bonds (Yager Flats), Series 2021, 0.46% 2041 (put 2025) | | | 3,000 | | | | 2,709 | |
| Trinity River Public Fac. Corp., Multi Family Housing Rev. Bonds (Cowan Place Apartments), Series 2021, 0.28% 2024 (put 2023) | | | 500 | | | | 482 | |
| Board of Regents of the University of North Texas System, Rev. Fncg. System Rev. Ref. and Improvement Bonds, Series 2018-A, 5.00% 2025 | | | 240 | | | | 257 | |
| 24 | Private Client Services Funds |
Capital Group Core Municipal Fund
| Bonds, notes & other debt instruments (continued) | Principal amount
(000) | | | Value
(000) | |
| Texas (continued) | | | | | | | | |
| Board of Regents of the University of North Texas System, Rev. Fncg. System Rev. Ref. and Improvement Bonds, Series 2018-A, 5.00% 2026 | | USD | 760 | | | $ | 826 | |
| Water Dev. Board, State Water Implementation Rev. Fund, Rev. Bonds (Master Trust), Series 2018-A, 5.00% 2029 | | | 990 | | | | 1,115 | |
| Water Dev. Board, State Water Implementation Rev. Fund, Rev. Bonds (Master Trust), Series 2021, 5.00% 2032 | | | 1,040 | | | | 1,212 | |
| | | | | | | | 85,999 | |
| | | | | | | | | |
| Utah 1.11% | | | | | | | | |
| Board of Higher Education, General Rev. Green Bonds (University of Utah), Series 2022-A, 5.00% 2033 | | | 1,750 | | | | 2,023 | |
| Canyons School Dist., Board of Education, G.O. Bonds (Utah School Bond Guaranty Program), Series 2021-A, 5.00% 2027 | | | 80 | | | | 90 | |
| Canyons School Dist., Local Building Auth., Lease Rev. Bonds, Series 2021, 5.00% 2029 | | | 1,000 | | | | 1,148 | |
| Housing Corp., Multi Family Housing Rev. Bonds (Fellowship Manor Apartments), Series 2022, 2.00% 2024 (put 2023) | | | 2,000 | | | | 1,984 | |
| Housing Corp., Multi Family Housing Rev. Bonds (Three Link Towers Apartments), Series 2022, 2.00% 2024 (put 2023) | | | 584 | | | | 579 | |
| Housing Corp., Single Family Mortgage Bonds, Class III, Series 2015-D-2, 4.00% 2045 | | | 135 | | | | 137 | |
| Salt Lake City, Airport Rev. Bonds (Salt Lake City International Airport), Series 2021-B, 5.00% 2025 | | | 450 | | | | 480 | |
| Salt Lake City, Airport Rev. Bonds (Salt Lake City International Airport), Series 2021-B, 5.00% 2026 | | | 620 | | | | 672 | |
| School Fin. Auth., Charter School Rev. Bonds (Utah Charter Academies Project), Series 2018, 4.00% 2022 | | | 335 | | | | 338 | |
| Transit Auth., Sales Tax Rev. Bonds, Series 2008-A, 5.25% 2023 | | | 80 | | | | 83 | |
| City of Vineyard, Redev. Agcy., Tax Increment Rev. and Rev. Ref. Bonds, Series 2021, Assured Guaranty Municipal insured, 5.00% 2026 | | | 95 | | | | 103 | |
| City of Vineyard, Redev. Agcy., Tax Increment Rev. and Rev. Ref. Bonds, Series 2021, Assured Guaranty Municipal insured, 5.00% 2030 | | | 25 | | | | 29 | |
| City of Vineyard, Redev. Agcy., Tax Increment Rev. and Rev. Ref. Bonds, Series 2021, Assured Guaranty Municipal insured, 5.00% 2031 | | | 20 | | | | 23 | |
| | | | | | | | 7,689 | |
| | | | | | | | | |
| Vermont 0.06% | | | | | | | | |
| Housing Fin. Agcy., Multiple Purpose Bonds, Series 2018-A, 4.00% 2048 | | | 220 | | | | 224 | |
| Housing Fin. Agcy., Multiple Purpose Bonds, Series 2020-A, 3.75% 2050 | | | 160 | | | | 162 | |
| | | | | | | | 386 | |
| | | | | | | | | |
| Virginia 1.58% | | | | | | | | |
| County of Arlington, Industrial Dev. Auth., Hospital Rev. Bonds (Virginia Hospital Center), Series 2020, 5.00% 2031 | | | 600 | | | | 674 | |
| County of Arlington, Industrial Dev. Auth., Hospital Rev. Bonds (Virginia Hospital Center), Series 2020, 5.00% 2032 | | | 215 | | | | 241 | |
| County of Charles City, Econ. Dev. Auth., Solid Waste Disposal Rev. Bonds (Waste Management, Inc. Project), Series 2004-A, 2.875% 2029 | | | 1,000 | | | | 959 | |
| College Building Auth., Educational Facs. Rev. Bonds (Regent University Project), Series 2021, 5.00% 2029 | | | 375 | | | | 405 | |
| College Building Auth., Educational Facs. Rev. Bonds (Regent University Project), Series 2021, 5.00% 2030 | | | 375 | | | | 406 | |
| County of Fairfax, Redev. and Housing Auth., Multi Family Housing Rev. Bonds (Arrowbrook Apartments Project), Series 2020, 0.41% 2041 (put 2024) | | | 1,000 | | | | 958 | |
| Town of Farmville, Industrial Dev. Auth., Educational Facs. Rev. Ref. Bonds (Longwood University Student Housing Project), Series 2018-A, 5.00% 2031 | | | 400 | | | | 422 | |
| County of Henrico, Econ. Dev. Auth., Residential Care Fac. Rev. Ref. Bonds (Westminster Canterbury Richmond), Series 2018, 5.00% 2023 | | | 575 | | | | 593 | |
| City of Hopewell, Redev. And Housing Auth., Multi Family Housing Rev. Bonds (Hopewell Heights Apartments), Series 2021-A, 0.49% 2024 (put 2023) | | | 1,100 | | | | 1,061 | |
| County of Loudoun, Econ. Dev. Auth., Multi Family Housing Rev. Bonds (The View at Broadlands Project), Series 2022, 2.00% 2025 (put 2024) | | | 1,875 | | | | 1,851 | |
| Town of Louisa, Industrial Dev. Auth., Pollution Control Rev. Ref. Bonds (Virginia Electric and Power Co. Project), Series 2008-A, 1.90% 2035 (put 2023) | | | 1,000 | | | | 993 | |
| City of Lynchburg, Econ. Dev. Auth., Hospital Rev. and Rev. Ref. Bonds (Centra Health Obligated Group), Series 2021, 5.00% 2033 | | | 660 | | | | 745 | |
| City of Norfolk, G.O. Capital Improvement Bonds, Series 2019, 5.00% 2044 (preref. 2028) | | | 780 | | | | 886 | |
| Small Business Fncg. Auth., Residential Care Facs. Rev. and Rev. Ref. Bonds (LifeSpire of Virginia), Series 2021, 3.00% 2023 | | | 45 | | | | 45 | |
| Small Business Fncg. Auth., Residential Care Facs. Rev. and Rev. Ref. Bonds (Lifespire of Virginia), Series 2021, 3.00% 2024 | | | 15 | | | | 15 | |
| Private Client Services Funds | 25 |
Capital Group Core Municipal Fund
| Bonds, notes & other debt instruments (continued) | Principal amount
(000) | | | Value
(000) | |
| Virginia (continued) | | | | | | | | |
| Small Business Fncg. Auth., Residential Care Facs. Rev. and Rev. Ref. Bonds (Lifespire of Virginia), Series 2021, 4.00% 2031 | | USD | 375 | | | $ | 366 | |
| Small Business Fncg. Auth., Rev. Bonds (National Senior Campuses, Inc. Obligated Group), Series 2020-A, 5.00% 2029 | | | 140 | | | | 153 | |
| Small Business Fncg. Auth., Rev. Bonds (National Senior Campuses, Inc. Obligated Group), Series 2020-A, 5.00% 2030 | | | 170 | | | | 185 | |
| | | | | | | | 10,958 | |
| | | | | | | | | |
| Washington 2.66% | | | | | | | | |
| Central Puget Sound Regional Transit Auth., Sales Tax and Motor Vehicle Excise Tax Improvement and Rev. Ref. Green Bonds, Series 2021-S-1, 5.00% 2029 | | | 510 | | | | 589 | |
| Energy Northwest, Electric Rev. and Rev. Ref. Bonds (Columbia Generating Station), Series 2020-A, 5.00% 2032 | | | 195 | | | | 225 | |
| City of Everett, Housing Auth., Multi Family Housing Rev. Bonds (Baker Heights Legacy), Series 2021, 0.30% 2024 (put 2023) | | | 285 | | | | 275 | |
| G.O. Bonds, Series 2017-D, 5.00% 2028 | | | 1,000 | | | | 1,107 | |
| G.O. Bonds, Series 2019-C, 5.00% 2031 | | | 1,000 | | | | 1,137 | |
| G.O. Bonds, Series 2019-A, 5.00% 2033 | | | 500 | | | | 561 | |
| G.O. Rev. Ref. Bonds, Series 2017-R-A, 5.00% 2022 | | | 340 | | | | 343 | |
| G.O. Rev. Ref. Bonds, Series 2022-D, 5.00% 2025 | | | 2,000 | | | | 2,153 | |
| County of Grant, Public Utility Dist. No. 2, Electric System Rev. Ref. Bonds, Series 2017-O, 5.00% 2024 | | | 275 | | | | 287 | |
| Health Care Facs. Auth., Rev. Ref. Bonds (Providence St. Joseph Health), Series 2021-B, 4.00% 2042 (put 2030) | | | 1,000 | | | | 1,052 | |
| Housing Fin. Commission, Multi Family Housing Rev. Bonds (Garten Haus Apartments Project), Series 2021, 0.37% 2024 (put 2023) | | | 170 | | | | 165 | |
| Housing Fin. Commission, Multi Family Housing Rev. Bonds (HopeSource III Portfolio Projects), Series 2022, 1.25% 2025 (put 2024) | | | 1,150 | | | | 1,126 | |
| Housing Fin. Commission, Municipal Certs., Series 2021-1, 3.50% 2035 | | | 972 | | | | 888 | |
| Housing Fin. Commission, Nonprofit Housing Rev. Ref. Bonds (Horizon House Project), Series 2017, 5.00% 20233 | | | 1,095 | | | | 1,112 | |
| Housing Fin. Commission, Single Family Program Bonds, Series 2017-1-N, 4.00% 2047 | | | 390 | | | | 397 | |
| Housing Fin. Commission, Single Family Program Bonds, Series 2019-1-N, 4.00% 2049 | | | 265 | | | | 270 | |
| Housing Fin. Commission, Single Family Program Bonds, Series 2021-2-N, 3.00% 2051 | | | 695 | | | | 681 | |
| Motor Vehicle Fuel Tax G.O. Bonds, Series 2021-D, 5.00% 2022 | | | 2,375 | | | | 2,382 | |
| Motor Vehicle Fuel Tax G.O. Rev. Ref. Bonds, Series R-2022-B, 5.00% 2031 | | | 1,000 | | | | 1,168 | |
| City of Seattle, Housing Auth., Rev. and Rev. Ref. Bonds (Northgate Plaza Project), Series 2021, 1.00% 2026 | | | 460 | | | | 429 | |
| City of Seattle, Housing Auth., Rev. Bonds (Lam Bow Apartments Project), Series 2021, 1.25% 2024 | | | 55 | | | | 53 | |
| City of Seattle, Municipal Light and Power Rev. Ref. Bonds, Series 2021-B, (SIFMA Municipal Swap Index + 0.25%) 0.69% 2045 (put 2026)2 | | | 765 | | | | 758 | |
| City of Seattle, Municipal Light and Power Rev. Ref. Bonds, Series 2018-C-2, (SIFMA Municipal Swap Index + 0.49%) 0.93% 2046 (put 2023)2 | | | 825 | | | | 826 | |
| City of Seattle, Solid Waste System Rev. Ref. Bonds, Series 2021, 5.00% 2029 | | | 170 | | | | 195 | |
| City of Seattle, Solid Waste System Rev. Ref. Bonds, Series 2021, 5.00% 2030 | | | 175 | | | | 203 | |
| | | | | | | | 18,382 | |
| | | | | | | | | |
| West Virginia 0.37% | | | | | | | | |
| Econ. Dev. Auth., Solid Waste Disposal Facs. Rev. Bonds (Appalachian Power Co. - Amos Project), Series 2009-B, 2.625% 2042 (put 2022) | | | 750 | | | | 750 | |
| Econ. Dev. Auth., Solid Waste Disposal Facs. Rev. Ref. Bonds (Appalachian Power Co. - Amos Project), Series 2015-A, 2.55% 2040 (put 2024) | | | 500 | | | | 498 | |
| G.O. State Road Bonds, Series 2021-A, 5.00% 2025 | | | 65 | | | | 71 | |
| Housing Dev. Fund, Multi Family Housing Rev. Bonds (Charles Towers), Series 2021, 0.21% 2023 (put 2022) | | | 235 | | | | 234 | |
| Housing Dev. Fund, Multi Family Housing Rev. Bonds (Parkland Place / Chapmanville Towers), Series 2021, 0.28% 2024 (put 2023) | | | 1,000 | | | | 978 | |
| | | | | | | | 2,531 | |
| | | | | | | | | |
| Wisconsin 2.24% | | | | | | | | |
| Environmental Improvement Fund Rev. Green Bonds, Series 2021-A, 5.00% 2028 | | | 705 | | | | 799 | |
| Environmental Improvement Fund Rev. Green Bonds, Series 2021-A, 4.00% 2031 | | | 1,000 | | | | 1,086 | |
| G.O. Bonds, Series 2015-A, 5.00% 2031 (preref. 2023) | | | 2,000 | | | | 2,058 | |
| G.O. Rev. Ref. Bonds, Series 2017-2, 5.00% 2027 | | | 100 | | | | 111 | |
| Health and Educational Facs. Auth., Health Facs. Rev. Bonds (SSM Health Care), Series 2018-B, 5.00% 2038 (put 2023) | | | 1,300 | | | | 1,324 | |
| 26 | Private Client Services Funds |
Capital Group Core Municipal Fund
| Bonds, notes & other debt instruments (continued) | Principal amount
(000) | | | Value
(000) | |
| Wisconsin (continued) | | | | | | | | |
| Health and Educational Facs. Auth., Rev. Bonds (Advocate Aurora Health Care Credit Group), Series 2018-C-3, (SIFMA Municipal Swap Index + 0.55%) 0.99% 2054 (put 2023)2 | | USD | 1,130 | | | $ | 1,126 | |
| Health and Educational Facs. Auth., Rev. Bonds (Gundersen Lutheran), Series 2020, 5.00% 20263 | | | 1,910 | | | | 2,039 | |
| Housing and Econ. Dev. Auth., Home Ownership Rev. Bonds, Series 2017-C, 4.00% 2048 | | | 795 | | | | 808 | |
| Housing and Econ. Dev. Auth., Home Ownership Rev. Bonds, Series 2018-B, 4.00% 2048 | | | 625 | | | | 635 | |
| Housing and Econ. Dev. Auth., Home Ownership Rev. Bonds, Series 2020-A, 3.50% 2050 | | | 1,085 | | | | 1,089 | |
| Housing and Econ. Dev. Auth., Home Ownership Rev. Bonds, Series 2021-A, 3.00% 2052 | | | 400 | | | | 394 | |
| Housing and Econ. Dev. Auth., Home Ownership Rev. Bonds, Series 2021-C, 3.00% 2052 | | | 200 | | | | 196 | |
| Housing and Econ. Dev. Auth., Housing Rev. Bonds, Series 2021-B, 0.40% 2045 (put 2023) | | | 95 | | | | 91 | |
| Housing and Econ. Dev. Auth., Housing Rev. Bonds, Series 2021-B, 0.50% 2050 (put 2024) | | | 120 | | | | 110 | |
| Public Fin. Auth., Hospital Rev. Ref. Bonds (Renown Regional Medical Center Project), Series 2016-A, 5.00% 2022 | | | 300 | | | | 301 | |
| Public Fin. Auth., Retirement Facs. First Mortgage Rev. and Rev. Ref. Bonds (The United Methodist Retirement Homes), Series 2021-A, 4.00% 2026 | | | 20 | | | | 21 | |
| Public Fin. Auth., Rev. Ref. Bonds (Providence St. Joseph Health), Series 2021-C, 4.00% 2041 (put 2030) | | | 1,680 | | | | 1,702 | |
| Public Fin. Auth., Student Housing Rev. Bonds (Beyond Boone, LLC - Appalachian State University Project), Series 2019-A, Assured Guaranty Municipal insured, 5.00% 2030 | | | 315 | | | | 347 | |
| University of Wisconsin, Hospitals and Clinics Auth., Rev. Green Bonds, Series 2021-B, 5.00% 2030 | | | 630 | | | | 718 | |
| WPPI Energy, Power Supply System Rev. Bonds, Series 2016-A, 5.00% 2026 | | | 500 | | | | 545 | |
| | | | | | | | 15,500 | |
| | | | | | | | | |
| Wyoming 0.47% | | | | | | | | |
| Community Dev. Auth., Housing Rev. Bonds, Series 2019-1, 4.00% 2048 | | | 680 | | | | 693 | |
| Community Dev. Auth., Housing Rev. Bonds, Series 2021-1, 3.00% 2050 | | | 1,490 | | | | 1,464 | |
| Community Dev. Auth., Housing Rev. Bonds, Series 2020-1, 4.00% 2050 | | | 1,050 | | | | 1,072 | |
| | | | | | | | 3,229 | |
| | | | | | | | | |
| Total bonds, notes & other debt instruments (cost: $625,919,000) | | | | | | | 594,883 | |
| | | | | | | | | |
| Short-term securities 13.57% | | | | | | | | |
| Municipals 13.57% | | | | | | | | |
| State of Arizona, Industrial Dev. Auth., Hospital Rev. Ref. Bonds (Phoenix Children’s Hospital), Series 2019-B, 0.31% 20482 | | | 2,500 | | | | 2,500 | |
| State of Arizona, City of Phoenix, Industrial Dev. Auth., Health Care Facs. Rev. Bonds (Mayo Clinic), Series 2014-A, 0.31% 20522 | | | 1,500 | | | | 1,500 | |
| State of California, Fin. Auth., Recovery Zone Fac. Bonds (Chevron U.S.A., Inc. Project), Series 2010-B, 0.30% 20352 | | | 900 | | | | 900 | |
| State of California, Irvine Ranch Water Dist. Nos. 105, 140, 240 and 250, Consolidated G.O. Bonds, Series 1993, 0.27% 20332 | | | 1,200 | | | | 1,200 | |
| State of California, Kern Community College Dist., Facs. Improvement Dist. No. 1, G.O. Bond Anticipation Notes, Capital Appreciation Notes, Series 2020, 0% 2023 | | | 135 | | | | 130 | |
| State of California, City of Los Angeles, Dept. of Water and Power, Power System Rev. Ref. Bonds, Series 2001-B-3, 0.27% 20342 | | | 800 | | | | 800 | |
| State of California, City of Los Angeles, Dept. of Water and Power, Rev. Bonds, Series 2021-1, 0.26% 20512 | | | 1,500 | | | | 1,500 | |
| State of California, Municipal Fin. Auth., Pollution Control Rev. Ref. Bonds (Chevron U.S.A., Inc. Project), Series 2005, 0.30% 20252 | | | 1,500 | | | | 1,500 | |
| State of California, Pollution Control Fncg. Auth., Environmental Impact Rev. Bonds (Air Products and Chemicals, Inc. Project), Series 1997-B, 0.27% 20422 | | | 1,900 | | | | 1,900 | |
| State of California, Regents of the University of California, Medical Center Pooled Rev. Bonds, Series 2007-B-1, 0.26% 20322 | | | 3,300 | | | | 3,300 | |
| State of Idaho, Tax Anticipation Notes, Series 2021, 3.00% 6/30/2022 | | | 5,000 | | | | 5,015 | |
| State of Illinois, Fin. Auth., Demand Rev. Bonds (University of Chicago Medical Center), Series 2011-A, 0.32% 20442 | | | 7,450 | | | | 7,450 | |
| State of Indiana, Fin. Auth., Environmental Rev. Ref. Bonds (Duke Energy Indiana, Inc. Project), Series 2009-A-3, 0.48% 20392 | | | 5,000 | | | | 5,000 | |
| State of Iowa, Fin. Auth., Rev. Bonds (UnityPoint Health), Series 2018-E, 0.31% 20412 | | | 9,915 | | | | 9,915 | |
| State of Louisiana, Public Facs. Auth., Rev. Bonds (Air Products and Chemicals Project), Series 2009-A, 0.45% 20492 | | | 5,000 | | | | 5,000 | |
| State of Louisiana, Public Facs. Auth., Rev. Bonds (Air Products and Chemicals Project), Series 2010, 0.39% 20502 | | | 500 | | | | 500 | |
| State of Massachusetts, Housing Fin. Agcy., Single Family Housing Notes, Series 2021, 0.25% 12/1/2022 | | | 205 | | | | 202 | |
| Private Client Services Funds | 27 |
Capital Group Core Municipal Fund
| Short-term securities (continued) | Principal amount
(000) | | | Value
(000) | |
| Municipals (continued) | | | | | | | | |
| State of Michigan, Strategic Fund, Demand Limited Obligation Rev. Bonds (Air Products and Chemicals, Inc. Project), Series 2007, 0.31% 20422 | | USD | 4,700 | | | $ | 4,700 | |
| State of Michigan, Regents of the University of Michigan, General Rev. Bonds, Series 2012-B, 0.30% 20422 | | | 6,435 | | | | 6,435 | |
| State of Nevada, Housing Division, Single Family Mortgage Rev. Bonds, Series 2021-D, 0.25% 12/1/2022 | | | 275 | | | | 273 | |
| State of New Hampshire, Health and Education Facs. Auth., Rev. Ref. Bonds (Dartmouth College Issue), Series 2007-B, 0.31% 20412 | | | 5,000 | | | | 5,000 | |
| State of New York, New York City G.O. Bonds, Series 2013-F-3, 0.33% 20422 | | | 3,165 | | | | 3,165 | |
| State of New York, New York City Municipal Water Fin. Auth., Water and Sewer System Second General Resolution Rev. Bonds, Series 2011-FF-1, 0.33% 20442 | | | 2,000 | | | | 2,000 | |
| State of New York, New York City Municipal Water Fin. Auth., Water and Sewer System Second General Resolution Rev. Bonds, Series 2021-EE-1, 0.36% 20452 | | | 1,500 | | | | 1,500 | |
| State of New York, New York City Municipal Water Fin. Auth., Water and Sewer System Second General Resolution Rev. Bonds, Series 2016-AA-1, 0.33% 20482 | | | 2,170 | | | | 2,170 | |
| State of New York, New York City Transitional Fin. Auth., Future Tax Secured Bonds, Series 2016-A-4, 0.33% 20412 | | | 2,905 | | | | 2,905 | |
| State of New York, New York City Transitional Fin. Auth., Future Tax Secured Bonds, Series 2019-B-4, 0.33% 20422 | | | 1,500 | | | | 1,500 | |
| State of Ohio, Hospital Rev. Bonds (Cleveland Clinic Health System Obligated Group), Series 2019-F, 0.36% 20522 | | | 4,900 | | | | 4,900 | |
| State of South Carolina, Jobs-Econ. Dev. Auth., Hospital Rev. Bonds (Prisma Health Obligated Group), Series 2018-B, 0.36% 20482 | | | 5,000 | | | | 5,000 | |
| State of Tennessee, City of Clarksville, Public Building Auth., Pooled Fncg. Rev. Bonds, Series 2003, Bank of America LOC, 0.36% 20332 | | | 1,955 | | | | 1,955 | |
| State of Tennessee, Housing Dev. Agcy., Residential Fin. Program Bonds, Series 2021-3-B, 0.25% 7/1/2022 | | | 955 | | | | 955 | |
| State of Tennessee, County of Montgomery, Public Building Auth., Pooled Fncg. Rev. Bonds (Tennessee County Loan Pool), Series 2004, Bank of America LOC, 0.36% 20342 | | | 405 | | | | 405 | |
| State of Texas, Clifton Higher Education Fin. Corp., Education Rev. Bonds (Idea Public Schools), Series 2021-T, 5.00% 8/15/2022 | | | 20 | | | | 20 | |
| State of Texas, Deer Park Independent School Dist., Unlimited Tax School Building Bonds, Series 2018, 0.16% 2042 (put 2022)4 | | | 135 | | | | 134 | |
| State of Texas, North East Independent School Dist., Unlimited Tax School Building Bonds, Series 2013-B, 0.25% 2032 (put 2022)4 | | | 130 | | | | 130 | |
| State of Utah, Provo City School Dist., G.O. Rev. Ref. Bonds, Series 2021-B, 5.00% 6/15/2022 | | | 1,000 | | | | 1,004 | |
| State of Wyoming, County of Lincoln, Pollution Control Rev. Ref. Bonds (ExxonMobil Project), Series 2014, 0.32% 20442 | | | 1,300 | | | | 1,300 | |
| | | | | | | | | |
| Total short-term securities (cost: $93,783,000) | | | | | | | 93,763 | |
| Total investment securities 99.66% (cost: $719,702,000) | | | | | | | 688,646 | |
| Other assets less liabilities 0.34% | | | | | | | 2,355 | |
| | | | | | | | | |
| Net assets 100.00% | | | | | | $ | 691,001 | |
Futures contracts
| Contracts | | Type | | Number of
contracts | | Expiration | | Notional
amount
(000) | | | Value and
unrealized
appreciation
at 4/30/2022
(000) | |
| 2 Year U.S. Treasury Note Futures | | Short | | 200 | | June 2022 | | | USD(42,162 | ) | | | $ | 310 | |
| 5 Year U.S. Treasury Note Futures | | Short | | 40 | | June 2022 | | | (4,507 | ) | | | | 30 | |
| | | | | | | | | | | | | | $ | 340 | |
| 1 | Step bond; coupon rate may change at a later date. |
| 2 | Coupon rate may change periodically. Reference rate and spread are as of the most recent information available. Some coupon rates are determined by the issuer or agent based on current market conditions; therefore, the reference rate and spread are not available. For short-term securities, the date of the next scheduled coupon rate change is considered to be the maturity date. |
| 3 | Acquired in a transaction exempt from registration under Rule 144A of the Securities Act of 1933. May be resold in the U.S. in transactions exempt from registration, normally to qualified institutional buyers. The total value of all such securities was $3,406,000, which represented .49% of the net assets of the fund. |
| 4 | For short-term securities, the mandatory put date is considered to be the maturity date. |
| 28 | Private Client Services Funds |
Capital Group Core Municipal Fund
Key to abbreviations
Agcy. = Agency
Assn. = Association
Auth. = Authority
Certs. = Certificates
Dept. = Department
Dev. = Development
Dist. = District
Econ. = Economic
Fac. = Facility
Facs. = Facilities
Fin. = Finance
Fncg. = Financing
G.O. = General Obligation
LIBOR = London Interbank Offered Rate
LOC = Letter of credit
Part. = Participation
Preref. = Prerefunded
Redev. = Redevelopment
Ref. = Refunding
Rev. = Revenue
SIFMA = Securities Industry and Financial Markets Association
SOFR = Secured Overnight Financing Rate
USD = U.S. dollars
| Private Client Services Funds | 29 |
Capital Group Short-Term Municipal Fund
| Investment portfolio April 30, 2022 | unaudited |
| | |
| Portfolio quality summary* | Percent of net assets |
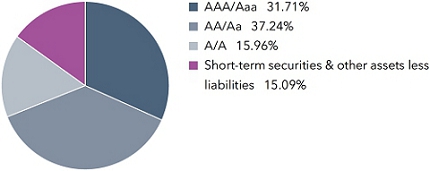
| * | Bond ratings, which typically range from AAA/Aaa (highest) to D (lowest), are assigned by credit rating agencies such as Standard & Poor’s, Moody’s and/or Fitch as an indication of an issuer’s creditworthiness. In assigning a credit rating to a security, the fund looks specifically to the ratings assigned to the issuer of the security by Standard & Poor’s, Moody’s and/or Fitch. If agency ratings differ, the security will be considered to have received the highest of those ratings, consistent with the fund’s investment policies. |
| Bonds, notes & other debt instruments 84.91% | | Principal amount
(000) | | | Value
(000) | |
| Alabama 3.23% | | | | | | |
| City of Alabaster, Board of Education, Special Tax School Warrants, Series 2014-A, Assured Guaranty Municipal insured, 5.00% 2028 (preref. 2024) | | USD | 500 | | | $ | 528 | |
| City of Birmingham, Water Works Board, Water Rev. Bonds, Series 2013-B, 5.00% 2038 (preref. 2023) | | | 500 | | | | 510 | |
| Black Belt Energy Gas Dist., Gas Project Rev. Bonds, Series 2022-B-1, 4.00% 2053 (put 2027) | | | 500 | | | | 509 | |
| Black Belt Energy Gas Dist., Gas Project Rev. Bonds (Project No. 6), Series 2021-B, 4.00% 2052 (put 2026) | | | 1,000 | | | | 1,017 | |
| Black Belt Energy Gas Dist., Gas Project Rev. Bonds (Project No. 7), Series 2021-C-1, 4.00% 2052 (put 2026) | | | 175 | | | | 178 | |
| Black Belt Energy Gas Dist., Gas Supply Prepay Rev. Bonds (Project No. 5), Series 2020-A-1, 4.00% 2049 (put 2026) | | | 455 | | | | 463 | |
| Federal Aid Highway Fin. Auth., Federal Highway Grant Anticipation Bonds, Series 2012, 5.00% 2023 (preref. 2022) | | | 35 | | | | 35 | |
| City of Homewood, G.O. Warrants, Series 2016, 5.00% 2033 (preref. 2026) | | | 10 | | | | 11 | |
| Housing Fin. Auth., Multi Family Housing Rev. Bonds (Capstone at Kinsey Cove Project), Series 2020-A, 0.35% 2023 (put 2023) | | | 110 | | | | 108 | |
| South East Gas Supply Dist., Gas Supply Rev. Bonds (Project No. 2), Series 2018-A, 4.00% 2049 (put 2024) | | | 490 | | | | 497 | |
| Southeast Energy Auth., Commodity Supply Rev. Bonds (Project No. 2), Series 2021-B-1, 4.00% 2051 (put 2031) | | | 145 | | | | 147 | |
| | | | | | | | 4,003 | |
| | | | | | | | | |
| Alaska 0.21% | | | | | | | | |
| Housing Fin. Corp., General Mortgage Rev. Bonds, Series 2020-A, 3.25% 2044 | | | 260 | | | | 259 | |
| | | | | | | | | |
| Arizona 1.47% | | | | | | | | |
| Board of Regents of the Arizona State University System, Rev. Bonds, Series 2020-A, 5.00% 2026 | | | 300 | | | | 327 | |
| Coconino County Pollution Control Corp., Pollution Control Rev. Ref. Bonds, Series 2017-B, 1.65% 2039 (put 2023) | | | 500 | | | | 498 | |
| Industrial Dev. Auth., Hospital Rev. Bonds (Phoenix Children’s Hospital), Series 2021-A, 5.00% 2026 | | | 190 | | | | 206 | |
| Industrial Dev. Auth., Rev. Bonds (Lincoln South Beltway Project), Series 2020, 5.00% 2023 | | | 750 | | | | 779 | |
| City of Phoenix Civic Improvement Corp., Water System Rev. Ref. Bonds, Series 2014-B, 5.00% 2024 | | | 15 | | | | 16 | |
| | | | | | | | 1,826 | |
| | | | | | | | | |
| California 5.85% | | | | | | | | |
| Bay Area Toll Auth., San Francisco Bay Area Toll Bridge Rev. Bonds, Series 2021-C, (SIFMA Municipal Swap Index + 0.45%) 0.89% 2056 (put 2026)1 | | | 65 | | | | 64 | |
| Trustees of the California State University, Systemwide Rev. Bonds, Series 2017-A, 5.00% 2026 | | | 120 | | | | 132 | |
| Trustees of the California State University, Systemwide Rev. Bonds, Series 2016-A, 5.00% 2027 | | | 115 | | | | 126 | |
| Trustees of the California State University, Systemwide Rev. Bonds, Series 2016-B-2, 0.55% 2049 (put 2026) | | | 100 | | | | 88 | |
| Eastern Municipal Water Dist., Water and Wastewater Rev. Ref. Bonds, Series 2021-A, 3.00% 2024 | | | 45 | | | | 46 | |
| Fresno Unified School Dist., G.O. Bonds, 2016 Election, Series 2021-D, 2.00% 2023 | | | 30 | | | | 30 | |
| Fresno Unified School Dist., G.O. Bonds, 2016 Election, Series 2021-D, 2.00% 2024 | | | 15 | | | | 15 | |
| G.O. Rev. Ref. Bonds, Series 2021, 5.00% 2023 | | | 420 | | | | 436 | |
| 30 | Private Client Services Funds |
Capital Group Short-Term Municipal Fund
| Bonds, notes & other debt instruments (continued) | | Principal amount
(000) | | | Value
(000) | |
| California (continued) | | | | | | |
| G.O. Rev. Ref. Bonds, Series 2021, 5.00% 2027 | | USD | 945 | | | $ | 1,056 | |
| G.O. Rev. Ref. Bonds, Series 2021, 5.00% 2027 | | | 600 | | | | 673 | |
| Golden State Tobacco Securitization Corp., Enhanced Tobacco Settlement Asset-Backed Bonds, Series 2015-A, 5.00% 2040 (preref. 2025) | | | 35 | | | | 38 | |
| Health Facs. Fncg. Auth., Rev. Bonds (Stanford Health Care), Series 2021-A, 3.00% 2054 (put 2025) | | | 475 | | | | 475 | |
| Infrastructure and Econ. Dev. Bank, Rev. Ref. Bonds (Los Angeles County Museum of Art Project), Series 2021-B, 1.14% 2050 (put 2026)1 | | | 100 | | | | 100 | |
| City of Jurupa, Public Fncg. Auth., Special Tax Rev. Ref. Bonds, Series 2020-A, BAM insured, 5.00% 2022 | | | 115 | | | | 116 | |
| City of Los Angeles, Dept. of Water and Power, Power System Rev. Bonds, Series 2020-A, 5.00% 2026 | | | 220 | | | | 241 | |
| City of Los Angeles, Dept. of Water and Power, Water System Rev. Bonds, Series 2020-B, 4.00% 2026 | | | 195 | | | | 206 | |
| City of Los Angeles, Wastewater System Rev. Ref. Bonds, Series 2018-B, 5.00% 2027 | | | 195 | | | | 217 | |
| Municipal Fin. Auth., Multi Family Housing Rev. Bonds (Walnut Apartments), Series 2021-A, 0.45% 2024 (put 2023) | | | 75 | | | | 72 | |
| Public Works Board, Lease Rev. Ref. Bonds (Various Capital Projects), Series 2022-A, 5.00% 2025 | | | 180 | | | | 194 | |
| Public Works Board, Lease Rev. Ref. Bonds (Various Capital Projects), Series 2016-C, 5.00% 2026 | | | 565 | | | | 622 | |
| City and County of San Francisco, G.O. Rev. Ref. Bonds, Series 2020-R-2, 5.00% 2023 | | | 135 | | | | 139 | |
| City and County of San Francisco, G.O. Rev. Ref. Bonds, Series 2020-R-2, 5.00% 2024 | | | 310 | | | | 327 | |
| City of San Jose, Redev. Agcy., Tax Allocation Rev. Ref. Bonds, Series 2017-B, 5.00% 2026 | | | 90 | | | | 99 | |
| Southern California Public Power Auth., Rev. Ref. Bonds (Magnolia Power Project A), Series 2020-1, 5.00% 2023 | | | 400 | | | | 413 | |
| Southern California Public Power Auth., Rev. Ref. Green Bonds (Milford Wind Corridor Phase II Project), Series 2021-1, 5.00% 2023 | | | 20 | | | | 21 | |
| Southern California Public Power Auth., Rev. Ref. Green Bonds (Milford Wind Corridor Phase II Project), Series 2021-1, 5.00% 2024 | | | 5 | | | | 5 | |
| Southern California Public Power Auth., Transmission Project Rev. Bonds (Southern Transmission Project), Series 2017-A, 5.00% 2023 | | | 160 | | | | 165 | |
| Statewide Communities Dev. Auth., Multi Family Housing Rev. Bonds (Villa Del Sol Apartments), Series 2021-A-2, 0.39% 2023 (put 2023) | | | 80 | | | | 78 | |
| Statewide Communities Dev. Auth., Multi Family Housing Rev. Bonds (Washington Court Apartments), Series 2021-E, 0.22% 2023 (put 2022) | | | 35 | | | | 35 | |
| Statewide Communities Dev. Auth., Rev. Ref. Bonds (Enloe Medical Center), Series 2015, 5.00% 2028 | | | 250 | | | | 272 | |
| City of Tustin, Community Facs. Dist. No. 2014-1 (Tustin Legacy / Standard Pacific), Special Tax Bonds, Series 2015-A, 5.00% 2027 | | | 200 | | | | 212 | |
| Regents of the University of California, Limited Project Rev. Bonds, Series 2022-S, 5.00% 2026 | | | 25 | | | | 27 | |
| Val Verde Unified School Dist., G.O. Bonds, 2012 Election, Series 2013-A, BAM insured, 5.00% 2042 | | | 500 | | | | 518 | |
| | | | | | | | 7,258 | |
| | | | | | | | | |
| Colorado 1.15% | | | | | | | | |
| Certs. of Part., Series 2021-A, 5.00% 2025 | | | 345 | | | | 374 | |
| Board of Governors of the Colorado State University System, System Enterprise Rev. and Rev. Ref. Bonds, Series 2016-B, 5.00% 2041 (preref. 2027) | | | 30 | | | | 33 | |
| E-470 Public Highway Auth., Rev. Bonds, Series 2021-B, (USD-SOFR x 0.67 + 0.35%) 0.537% 2039 (put 2024)1 | | | 40 | | | | 39 | |
| Health Facs. Auth., Rev. Bonds (Sanford Health), Series 2019-A, 5.00% 2022 | | | 325 | | | | 330 | |
| Housing and Fin. Auth., Single Family Mortgage Bonds, Series 2021-E, Class I, 3.00% 2051 | | | 205 | | | | 202 | |
| Housing and Fin. Auth., Single Family Mortgage Bonds, Series 2021-L, Class I, 3.25% 2051 | | | 205 | | | | 204 | |
| Regents of the University of Colorado, University Enterprise Rev. and Rev. Ref. Bonds, Series 2019-C, 2.00% 2054 (put 2024) | | | 245 | | | | 240 | |
| | | | | | | | 1,422 | |
| | | | | | | | | |
| Connecticut 2.21% | | | | | | | | |
| Town of East Hartford, Housing Auth., Multi Family Housing Rev. Bonds (Veterans Terrace Project), Series 2021, 0.25% 2023 (put 2022) | | | 45 | | | | 45 | |
| Health and Educational Facs. Auth., Rev. Bonds (Sacred Heart University Issue), Series 2017-I-1, 5.00% 2022 | | | 500 | | | | 503 | |
| Health and Educational Facs. Auth., Rev. Bonds (Yale University Issue), Series 2003-X-2, 0.25% 2037 (put 2024) | | | 265 | | | | 253 | |
| Health and Educational Facs. Auth., Rev. Bonds (Yale University Issue), Series 2014-A, 1.10% 2048 (put 2023) | | | 750 | | | | 744 | |
| Housing Fin. Auth., Housing Mortgage Fin. Program Bonds, Series 2019-F-1, 3.50% 2043 | | | 310 | | | | 312 | |
| Housing Fin. Auth., Housing Mortgage Fin. Program Bonds, Series 2014-C-1, 4.00% 2044 | | | 115 | | | | 116 | |
| Housing Fin. Auth., Housing Mortgage Fin. Program Bonds, Series 2016-A-1, 4.00% 2045 | | | 70 | | | | 71 | |
| Housing Fin. Auth., Housing Mortgage Fin. Program Bonds, Series 2017-A-1, 4.00% 2047 | | | 400 | | | | 406 | |
| Private Client Services Funds | 31 |
Capital Group Short-Term Municipal Fund
| Bonds, notes & other debt instruments (continued) | | Principal amount
(000) | | | Value
(000) | |
| Connecticut (continued) | | | | | | |
| Housing Fin. Auth., Housing Mortgage Fin. Program Bonds, Series 2021-B-1, 3.00% 2049 | | USD | 120 | | | $ | 118 | |
| Housing Fin. Auth., Housing Mortgage Fin. Program Rev. Ref. Bonds, Series 2014-D-1, 4.00% 2044 | | | 25 | | | | 25 | |
| Housing Fin. Auth., Housing Mortgage Fin. Program Rev. Ref. Bonds, Series 2015-C-1, 3.50% 2045 | | | 150 | | | | 151 | |
| | | | | | | | 2,744 | |
| | | | | | | | | |
| Delaware 0.00% | | | | | | | | |
| County of Harris, Metropolitan Transportation Auth., Sales and Use Tax Contractual Obligations, Series 2015-B, 5.00% 2025 | | | 5 | | | | 5 | |
| | | | | | | | | |
| District of Columbia 0.70% | | | | | | | | |
| G.O. Bonds, Series 2015-A, 5.00% 2032 | | | 700 | | | | 745 | |
| Housing Fin. Agcy., Collateralized Multi Family Housing Rev. Bonds (Kenilworth 166 Apartments Project), Series 2021, 1.25% 2025 (put 2024) | | | 100 | | | | 96 | |
| Rev. Ref. Bonds (National Public Radio, Inc. Issue), Series 2016, 5.00% 2028 (preref. 2028) | | | 15 | | | | 17 | |
| Rev. Ref. Bonds (National Public Radio, Inc. Issue), Series 2016, 5.00% 2029 (preref. 2029) | | | 10 | | | | 11 | |
| | | | | | | | 869 | |
| | | | | | | | | |
| Florida 4.27% | | | | | | | | |
| County of Brevard, Housing Fncg. Auth., Multi Family Mortgage Rev. Bonds (Tropical Manor Apartments), Series 2021, 0.25% 2023 (put 2022) | | | 40 | | | | 40 | |
| County of Broward, Housing Fin. Auth., Multi Family Housing Rev. Bonds (Solaris Apartments), Series 2021-B, 0.70% 2025 (put 2024) | | | 85 | | | | 81 | |
| Citizens Property Insurance Corp., Personal Lines Account/Commercial Lines Account Secured Bonds, Series 2012-A-1, 5.00% 2022 | | | 50 | | | | 50 | |
| County of Collier, Heritage Bay Community Dev. Dist., Capital Improvement Rev. Bonds, Series 2018-A-2, 2.50% 2022 | | | 500 | | | | 500 | |
| City of Daytona Beach, Housing Auth., Multi Family Housing Rev. Bonds (The WM at the River Project), Series 2021-B, 1.25% 2025 (put 2024) | | | 150 | | | | 144 | |
| Board of Education, Public Education Capital Outlay Rev. Ref. Bonds, Series 2019-D, 5.00% 2023 | | | 15 | | | | 15 | |
| Board of Education, Public Education Capital Outlay Rev. Ref. Bonds, Series 2022-A, 5.00% 2025 | | | 298 | | | | 321 | |
| Board of Education, Public Education Capital Outlay Rev. Ref. Bonds, Series 2022-A, 5.00% 2026 | | | 500 | | | | 550 | |
| Housing Fin. Corp., Homeowner Mortgage Rev. Bonds, Series 2018-2, 4.25% 2050 | | | 290 | | | | 297 | |
| Housing Fin. Corp., Homeowner Mortgage Rev. Bonds, Series 2020-1, 3.50% 2051 | | | 50 | | | | 50 | |
| JEA, Water and Sewer System Rev. Bonds, Series 2020-A, 5.00% 2025 | | | 280 | | | | 303 | |
| County of Miami-Dade, Industrial Dev. Auth., Solid Waste Disposal Rev. Bonds (Waste Management, Inc. of Florida Project), Series 2007, 0.32% 2027 (put 2022) | | | 550 | | | | 547 | |
| County of Miami-Dade, Water and Sewer System Rev. Ref. Bonds, Series 2008-B, Assured Guaranty Municipal insured, 5.25% 2022 | | | 195 | | | | 198 | |
| County of Orange, Housing Fin. Auth., Multi Family Housing Rev. Bonds (Jernigan Gardens), Series 2020-B, 0.35% 2023 (put 2022) | | | 1,000 | | | | 994 | |
| County of Orange, Housing Fin. Auth., Multi Family Housing Rev. Bonds (Stratford Point Apartments), Series 2021-B, 0.55% 2025 (put 2024) | | | 190 | | | | 181 | |
| County of Pinellas, Housing Fin. Auth., Multi Family Mortgage Backed Bonds (Jordan Park Apartments), Series 2021-B, 0.65% 2025 (put 2024) | | | 130 | | | | 124 | |
| County of Polk, Utility System Rev. and Rev. Ref. Bonds, Series 2013, BAM insured, 5.00% 2043 (preref. 2023) | | | 110 | | | | 114 | |
| City of Tampa, Hospital Rev. Bonds (H. Lee Moffitt Cancer Center Project), Series 2020-B, 5.00% 2024 | | | 100 | | | | 105 | |
| City of Tampa, Hospital Rev. Bonds (H. Lee Moffitt Cancer Center Project), Series 2020-B, 5.00% 2025 | | | 75 | | | | 80 | |
| City of Tampa, Hospital Rev. Bonds (H. Lee Moffitt Cancer Center Project), Series 2020-B, 5.00% 2026 | | | 100 | | | | 109 | |
| Tampa-Hillsborough County Expressway Auth., Rev. Ref. Bonds, Series 2012-B, 5.00% 2042 (preref. 2022) | | | 200 | | | | 201 | |
| Dept. of Transportation, Right-of-Way Acquisition and Bridge Construction Bonds, Series 2022-A, 5.00% 2026 | | | 111 | | | | 122 | |
| Dept. of Transportation, Turnpike Rev. Bonds, Series 2018-A, 5.00% 2026 | | | 92 | | | | 101 | |
| Dept. of Transportation Fncg. Corp., Rev. Bonds, Series 2020, 5.00% 2024 | | | 65 | | | | 69 | |
| | | | | | | | 5,296 | |
| | | | | | | | | |
| Georgia 3.04% | | | | | | | | |
| City of Atlanta, Airport General Rev. Ref. Bonds, Series 2014-B, 5.00% 2026 | | | 800 | | | | 832 | |
| City of Atlanta, Airport General Rev. Ref. Bonds, Series 2021-B, 5.00% 2027 | | | 430 | | | | 474 | |
| City of Atlanta, Urban Residential Fin. Auth., Multi Family Housing Rev. Bonds (Sylvan Hills Senior Apartments Project), Series 2020, 0.41% 2025 (put 2023) | | | 85 | | | | 82 | |
| 32 | Private Client Services Funds |
Capital Group Short-Term Municipal Fund
| Bonds, notes & other debt instruments (continued) | | Principal amount
(000) | | | Value
(000) | |
| Georgia (continued) | | | | | | |
| County of Dawson, Dev. Auth., Multi Family Housing Rev. Bonds (Peaks of Dawsonville Project), Series 2021, 0.28% 2023 | | USD | 500 | | | $ | 486 | |
| County of Dekalb, Housing Auth., Multi Family Housing Rev. Bonds (Columbia Village Project), Series 2021-A, 0.34% 2024 (put 2023) | | | 35 | | | | 34 | |
| Housing and Fin. Auth., Single Family Mortgage Bonds, Series 2015-A-1, 3.50% 2045 | | | 25 | | | | 25 | |
| Housing and Fin. Auth., Single Family Mortgage Bonds, Series 2017-A, 4.00% 2047 | | | 345 | | | | 350 | |
| Main Street Natural Gas, Inc., Gas Supply Rev. Bonds, Series 2019-C, 4.00% 2050 (put 2026) | | | 500 | | | | 510 | |
| Municipal Electric Auth., General Resolution Projects Bonds, Series 2021-A, 4.00% 2027 | | | 270 | | | | 282 | |
| Municipal Electric Auth., Project One Bonds, Series 2021-A, 5.00% 2030 | | | 40 | | | | 45 | |
| Private Colleges and Universities Auth., Rev. Bonds (The Savannah College of Art and Design Projects), Series 2021, 5.00% 2028 | | | 35 | | | | 39 | |
| City of Thomaston, Housing Auth., Multi Family Housing Rev. Bonds (Eastgate Apartments Project), Series 2020-A, 0.34% 2023 (put 2022) | | | 500 | | | | 493 | |
| County of Walker, Dev. Auth., Multi Family Housing Rev. Bonds (Gateway at Rossville Project), Series 2021-B, 0.46% 2024 (put 2023) | | | 120 | | | | 116 | |
| | | | | | | | 3,768 | |
| | | | | | | | | |
| Idaho 0.84% | | | | | | | | |
| Health Facs. Auth., Rev. Bonds (St. Luke’s Health System Project), Series 2021-A, 5.00% 2027 | | | 50 | | | | 54 | |
| Housing and Fin. Assn., Single Family Mortgage Bonds, Series 2019-A, 4.00% 2050 | | | 965 | | | | 984 | |
| | | | | | | | 1,038 | |
| | | | | | | | | |
| Illinois 4.66% | | | | | | | | |
| City of Chicago, Wastewater Transmission Rev. Bonds, Series 2014, 5.00% 2024 | | | 625 | | | | 650 | |
| City of Chicago, Water Rev. Ref. Bonds, Series 2017, 5.00% 2022 | | | 540 | | | | 548 | |
| Fin. Auth., Rev. Bonds (Art Institute of Chicago), Series 2016, 5.00% 2023 | | | 100 | | | | 102 | |
| Fin. Auth., Rev. Bonds (Art Institute of Chicago), Series 2016, 5.00% 2024 | | | 130 | | | | 136 | |
| Fin. Auth., Rev. Bonds (Centegra Health System), Series 2014-A, 5.00% 2027 (preref. 2024) | | | 200 | | | | 212 | |
| Fin. Auth., Rev. Bonds (OSF Healthcare System), Series 2020-B-2, 5.00% 2050 (put 2026) | | | 40 | | | | 43 | |
| Fin. Auth., Rev. Bonds (Presbyterian Homes Obligated Group), Series 2016-A, 5.00% 2023 | | | 225 | | | | 231 | |
| Fin. Auth., Rev. Bonds (Presbyterian Homes Obligated Group), Series 2021-B, (SIFMA Municipal Swap Index + 0.70%) 1.14% 2042 (put 2026)1 | | | 25 | | | | 25 | |
| Fin. Auth., Rev. Bonds (Presence Health Network), Series 2016-C, 5.00% 2026 | | | 515 | | | | 558 | |
| Fin. Auth., Rev. Bonds (University of Chicago), Series 2014-A, 5.00% 2023 | | | 200 | | | | 208 | |
| Fin. Auth., Rev. Bonds (University of Chicago), Series 2021-A, 5.00% 2025 | | | 40 | | | | 43 | |
| Fin. Auth., Rev. Ref. Bonds (Anne & Robert H. Lurie Children’s Hospital), Series 2017, 5.00% 2022 | | | 240 | | | | 242 | |
| Housing Dev. Auth., Multi Family Housing Rev. Bonds, Series 2021-C, 0.80% 2026 | | | 80 | | | | 74 | |
| Housing Dev. Auth., Multi Family Housing Rev. Bonds (Concord Commons), Series 2021, 0.25% 2024 (put 2023) | | | 595 | | | | 585 | |
| Housing Dev. Auth., Multi Family Housing Rev. Bonds (Marshall Field Garden Apartment Homes), Series 2015, (SIFMA Municipal Swap Index + 1.00%) 1.44% 2050 (put 2025)1 | | | 400 | | | | 404 | |
| Board of Trustees of Illinois State University, Auxiliary Facs. System Rev. Bonds, Series 2018-A, Assured Guaranty Municipal insured, 5.00% 2023 | | | 500 | | | | 513 | |
| Railsplitter Tobacco Settlement Auth., Tobacco Settlement Rev. Bonds, Series 2017, 5.00% 2023 | | | 310 | | | | 318 | |
| Toll Highway Auth., Toll Highway Rev. Bonds, Series 2019-C, 5.00% 2023 | | | 190 | | | | 194 | |
| Toll Highway Auth., Toll Highway Rev. Bonds, Series 2019-C, 5.00% 2025 | | | 45 | | | | 48 | |
| Toll Highway Auth., Toll Highway Rev. Ref. Bonds, Series 2019-A, 5.00% 2023 | | | 175 | | | | 179 | |
| Toll Highway Auth., Toll Highway Rev. Ref. Bonds, Series 2019-A, 5.00% 2025 | | | 250 | | | | 265 | |
| Board of Trustees of the University of Illinois, Auxiliary Facs. System Rev. Bonds, Series 2018-A, 5.00% 2024 | | | 200 | | | | 209 | |
| | | | | | | | 5,787 | |
| | | | | | | | | |
| Indiana 2.30% | | | | | | | | |
| Fin. Auth., Health System Rev. Bonds (Indiana University Health), Series 2019-C, 5.00% 2022 | | | 40 | | | | 41 | |
| Fin. Auth., Hospital Rev. Ref. Bonds (Parkview Health System), Series 2012-A, 5.00% 2022 | | | 440 | | | | 440 | |
| Fin. Auth., State Revolving Fund Program Green Bonds, Series 2021-B, 5.00% 2028 | | | 55 | | | | 62 | |
| Fin. Auth., Wastewater Utility Rev. Ref. Bonds (CWA Auth. Project), Series 2021-1, 5.00% 2025 | | | 155 | | | | 168 | |
| City of Franklin, Econ. Dev. and Rev. Ref. Bonds (Otterbein Homes Obligated Group), Series 2019-B, 5.00% 2023 | | | 510 | | | | 525 | |
| Health Fac. Fncg. Auth., Rev. Bonds (Ascension Health Subordinate Credit Group), Series 2005-A-1, 4.00% 2023 | | | 15 | | | | 15 | |
| Housing and Community Dev. Auth., Single Family Mortgage Rev. Bonds, Series 2019-A, 4.25% 2048 | | | 240 | | | | 246 | |
| Housing and Community Dev. Auth., Single Family Mortgage Rev. Bonds, Series 2020-A, 3.75% 2049 | | | 35 | | | | 35 | |
| Housing and Community Dev. Auth., Single Family Mortgage Rev. Bonds, Series 2021-C-1, 3.00% 2052 | | | 65 | | | | 64 | |
| Private Client Services Funds | 33 |
Capital Group Short-Term Municipal Fund
| Bonds, notes & other debt instruments (continued) | | Principal amount
(000) | | | Value
(000) | |
| Indiana (continued) | | | | | | |
| City of Indianapolis, Local Public Improvement Bond Bank Bonds, Series 2021-A, 5.00% 2022 | | USD | 100 | | | $ | 100 | |
| City of Indianapolis, Local Public Improvement Bond Bank Bonds (Indianapolis Airport Auth. Project), Series 2019-I-2, 5.00% 2023 | | | 230 | | | | 234 | |
| City of Indianapolis, Local Public Improvement Bond Bank Bonds (Indianapolis Airport Auth. Project), Series 2019-I-2, 5.00% 2024 | | | 240 | | | | 250 | |
| City of Indianapolis, Local Public Improvement Bond Bank Bonds (Indianapolis Airport Auth. Project), Series 2019-I-2, 5.00% 2025 | | | 255 | | | | 270 | |
| City of Indianapolis, Local Public Improvement Bond Bank Rev. Ref. Bonds (Cityway 1 Project), Series 2021-B, 5.00% 2025 | | | 140 | | | | 146 | |
| City of Kokomo, Multi Family Housing Rev. Bonds (KHA RAD I Apartments), Series 2021-A, 0.56% 2025 (put 2024) | | | 265 | | | | 255 | |
| | | | | | | | 2,851 | |
| | | | | | | | | |
| Iowa 0.21% | | | | | | | | |
| PEFA, Inc., Gas Project Rev. Bonds, Series 2019, 5.00% 2049 (put 2026) | | | 245 | | | | 259 | |
| | | | | | | | | |
| Kansas 0.03% | | | | | | | | |
| Unified Government of Wyandotte County, Board of Public Utilities, Utility System Improvement Rev. Bonds, Series 2012-B, 5.00% 2026 (preref. 2022) | | | 35 | | | | 35 | |
| | | | | | | | | |
| Kentucky 0.87% | | | | | | | | |
| Housing Corp., Multi Family Housing Rev. Bonds (New Hope Properties Portfolio Project), Series 2021, 0.41% 2024 (put 2023) | | | 485 | | | | 469 | |
| Housing Corp., Multi Family Housing Rev. Bonds (Winterwood II Rural Housing Portfolio), Series 2021, 0.37% 2024 (put 2023) | | | 195 | | | | 188 | |
| Property and Buildings Commission, Commonwealth Rev. Ref. Bonds (Project No. 125), Series 2021-A, 5.00% 2022 | | | 45 | | | | 46 | |
| Public Energy Auth., Gas Supply Rev. Bonds, Series 2019-A-1, 4.00% 2049 (put 2025) | | | 320 | | | | 325 | |
| Public Energy Auth., Gas Supply Rev. Bonds, Series 2018-B, 4.00% 2049 (put 2025) | | | 55 | | | | 56 | |
| | | | | | | | 1,084 | |
| | | | | | | | | |
| Louisiana 0.75% | | | | | | | | |
| Housing Corp., Multi Family Housing Rev. Bonds (Hollywood Acres and Hollywood Heights Projects), Series 2019, 0.55% 2023 | | | 200 | | | | 193 | |
| Housing Corp., Multi Family Housing Rev. Bonds (Mabry Place Townhomes Project), Series 2021, 0.31% 2024 (put 2023) | | | 55 | | | | 53 | |
| Parish of Jefferson, Sales Tax Rev. Ref. Bonds, Series 2019-A, Assured Guaranty Municipal insured, 5.00% 2023 | | | 250 | | | | 260 | |
| Offshore Terminal Auth., Deepwater Port Rev. Bonds (Loop LLC Project), Series 2007-A, 1.65% 2027 (put 2023) | | | 105 | | | | 104 | |
| Parish of Tangipahoa, Hospital Service Dist. No. 1, Hospital Rev. Ref. Bonds (North Oaks Health System Project), Series 2021, 5.00% 2027 | | | 265 | | | | 287 | |
| Tobacco Settlement Fncg. Corp., Tobacco Settlement Asset-Backed Rev. Ref. Bonds, Series 2013-A, 5.00% 2023 | | | 30 | | | | 31 | |
| | | | | | | | 928 | |
| | | | | | | | | |
| Maine 0.54% | | | | | | | | |
| Housing Auth., Mortgage Purchase Bonds, Series 2017-A, 4.00% 2047 | | | 215 | | | | 219 | |
| Housing Auth., Mortgage Purchase Bonds, Series 2021-D, 3.00% 2051 | | | 455 | | | | 447 | |
| | | | | | | | 666 | |
| | | | | | | | | |
| Maryland 1.10% | | | | | | | | |
| Community Dev. Administration, Dept. of Housing and Community Dev., Residential Rev. Bonds, Series 2019-A, 4.25% 2049 | | | 70 | | | | 72 | |
| Community Dev. Administration, Dept. of Housing and Community Dev., Residential Rev. Bonds, Series 2020-D, 3.25% 2050 | | | 200 | | | | 200 | |
| Community Dev. Administration, Dept. of Housing and Community Dev., Residential Rev. Bonds, Series 2021-C, 3.00% 2051 | | | 48 | | | | 47 | |
| 34 | Private Client Services Funds |
Capital Group Short-Term Municipal Fund
| Bonds, notes & other debt instruments (continued) | | Principal amount
(000) | | | Value
(000) | |
| Maryland (continued) | | | | | | |
| County of Montgomery, Housing Opportunities Commission, Single Family Housing Rev. Bonds, Series 2018-A, 4.00% 2049 | | USD | 365 | | | $ | 371 | |
| Dept. of Transportation, Consolidated Transportation Rev. Ref. Bonds, Series 2015, 5.00% 2023 | | | 110 | | | | 113 | |
| Dept. of Transportation, Consolidated Transportation Rev. Ref. Bonds, Series 2022-A, 5.00% 2027 | | | 500 | | | | 562 | |
| | | | | | | | 1,365 | |
| | | | | | | | | |
| Massachusetts 0.60% | | | | | | | | |
| Dev. Fin. Agcy., Multi Family Housing Rev. Bonds (Salem Heights II Preservation Associates LP Issue), Series 2021-B, 0.25% 2024 (put 2023) | | | 50 | | | | 49 | |
| Dev. Fin. Agcy., Rev. Ref. Bonds (Berkshire Health Systems Issue), Series 2021-I, 5.00% 2023 | | | 240 | | | | 249 | |
| Housing Fin. Agcy., Housing Green Bonds, Series 2021-B-2, 0.75% 2025 | | | 15 | | | | 14 | |
| Housing Fin. Agcy., Single Family Housing Rev. Bonds, Series 169, 4.00% 2044 | | | 20 | | | | 20 | |
| Housing Fin. Agcy., Single Family Housing Rev. Bonds, Series 183, 3.50% 2046 | | | 220 | | | | 222 | |
| Housing Fin. Agcy., Single Family Housing Rev. Ref. Bonds, Series 171, 4.00% 2044 | | | 85 | | | | 86 | |
| Water Resources Auth., General Rev. Green Bonds, Series 2021-B, 5.00% 2026 | | | 95 | | | | 105 | |
| | | | | | | | 745 | |
| | | | | | | | | |
| Michigan 2.25% | | | | | | | | |
| City of Detroit, Water and Sewerage Dept., Sewage Disposal System Rev. and Rev. Ref. Bonds, Series 2012-A, 5.00% 2023 | | | 700 | | | | 704 | |
| City of Detroit, Water and Sewerage Dept., Sewage Disposal System Rev. and Rev. Ref. Bonds, Series 2012-A, 5.00% 2032 (preref. 2022) | | | 45 | | | | 45 | |
| Fin. Auth., Hospital Rev. Ref. Bonds (McLaren Health Care), Series 2015-D-1, 0.25% 2022 | | | 5 | | | | 5 | |
| Grant Anticipation Rev. Ref. Bonds, Series 2016, 5.00% 2027 | | | 500 | | | | 551 | |
| Housing Dev. Auth., Multi Family Housing Rev. Bonds, Series 2020, 0.32% 2023 (put 2022) | | | 415 | | | | 411 | |
| Housing Dev. Auth., Rental Housing Rev. Bonds, Series 2021-A, 0.55% 2025 | | | 50 | | | | 47 | |
| Housing Dev. Auth., Single Family Mortgage Rev. Bonds, Series 2017-B, 3.50% 2048 | | | 80 | | | | 81 | |
| Housing Dev. Auth., Single Family Mortgage Rev. Bonds, Series 2018-C, 4.25% 2049 | | | 245 | | | | 251 | |
| City of Lansing, Board of Water and Light, Utility System Rev. Bonds, Series 2019-A, 5.00% 2024 | | | 375 | | | | 396 | |
| County of Wayne, Airport Auth., Airport Rev. Bonds (Detroit Metropolitan Wayne County Airport), Series 2018-C, 5.00% 2023 | | | 290 | | | | 301 | |
| | | | | | | | 2,792 | |
| | | | | | | | | |
| Minnesota 1.62% | | | | | | | | |
| City of Hopkins, Multi Family Housing Rev. Bonds (Raspberry Ridge Project), Series 2021, 0.26% 2024 (put 2023) | | | 145 | | | | 143 | |
| Housing Fin. Agcy., Residential Housing Fin. Bonds, Series 2018-B, 4.00% 2048 | | | 335 | | | | 340 | |
| Housing Fin. Agcy., Residential Housing Fin. Bonds, Series 2018-E, 4.25% 2049 | | | 530 | | | | 543 | |
| Housing Fin. Agcy., Residential Housing Fin. Bonds, Series 2020-E, 3.50% 2050 | | | 475 | | | | 476 | |
| Housing Fin. Agcy., Residential Housing Fin. Bonds, Series 2020-B, 3.50% 2050 | | | 5 | | | | 5 | |
| Housing Fin. Agcy., Residential Housing Fin. Bonds, Series 2022-A, 3.00% 2052 | | | 80 | | | | 78 | |
| City of Mahtomedi, Multi Family Housing Rev. Bonds (Lincoln Place / Vadnais Highlands Projects), Series 2021, 0.25% 2023 (put 2022) | | | 80 | | | | 80 | |
| Municipal Gas Agcy., Commodity Supply Rev. Bonds, Series 2022-A, 4.00% 2052 (put 2027) | | | 330 | | | | 341 | |
| | | | | | | | 2,006 | |
| | | | | | | | | |
| Mississippi 0.09% | | | | | | | | |
| Home Corp., Collateralized Multi Family Housing Rev. Bonds (J&A Dev. Portfolio Project I), Series 2021-1, 0.30% 2024 (put 2023) | | | 60 | | | | 59 | |
| Home Corp., Multi Family Housing Rev. Bonds (Southwest Village Apartments Project), Series 2022-2, 1.30% 2025 (put 2024) | | | 50 | | | | 49 | |
| | | | | | | | 108 | |
| Private Client Services Funds | 35 |
Capital Group Short-Term Municipal Fund
| Bonds, notes & other debt instruments (continued) | | Principal amount
(000) | | | Value
(000) | |
| Missouri 0.57% | | | | | | |
| Housing Dev. Commission, Single Family Mortgage Rev. Bonds (First Place Homeownership Loan Program), Series 2016-B, 3.50% 2041 | | USD | 515 | | | $ | 520 | |
| Housing Dev. Commission, Single Family Mortgage Rev. Bonds (First Place Homeownership Loan Program), Series 2021-A, 3.00% 2052 | | | 60 | | | | 59 | |
| Housing Dev. Commission, Single Family Mortgage Rev. Bonds (First Place Homeownership Loan Program), Series 2021-C, 3.25% 2052 | | | 50 | | | | 49 | |
| County of St. Charles, Industrial Dev. Auth., Multi Family Housing Rev. Bonds (Hidden Valley Estates), Series 2021, 0.27% 2025 (put 2023) | | | 85 | | | | 82 | |
| | | | | | | | 710 | |
| | | | | | | | | |
| Montana 0.29% | | | | | | | | |
| Board of Housing, Single Family Mortgage Bonds, Series 2016-A-2, 3.50% 2044 | | | 100 | | | | 100 | |
| Board of Housing, Single Family Mortgage Bonds, Series 2019-A, 4.25% 2045 | | | 120 | | | | 123 | |
| Board of Housing, Single Family Mortgage Bonds, Series 2020-B, 4.00% 2050 | | | 135 | | | | 138 | |
| | | | | | | | 361 | |
| | | | | | | | | |
| Nebraska 0.78% | | | | | | | | |
| Investment Fin. Auth., Single Family Housing Rev. Bonds, Series 2014-A, 4.00% 2044 | | | 190 | | | | 193 | |
| Investment Fin. Auth., Single Family Housing Rev. Bonds, Series 2016-C, 3.50% 2046 | | | 15 | | | | 15 | |
| Investment Fin. Auth., Single Family Housing Rev. Bonds, Series 2018-C, 4.00% 2048 | | | 390 | | | | 397 | |
| Investment Fin. Auth., Single Family Housing Rev. Bonds, Series 2021-C, 3.00% 2050 | | | 365 | | | | 359 | |
| | | | | | | | 964 | |
| | | | | | | | | |
| Nevada 0.56% | | | | | | | | |
| County of Clark, Pollution Control Rev. Ref. Bonds (Nevada Power Co. Projects), Series 2017, 1.65% 2036 (put 2023) | | | 645 | | | | 642 | |
| Housing Division, Multi Family Housing Rev. Bonds (Southwest Village Apartments), Series 2021, 0.47% 2024 (put 2023) | | | 50 | | | | 49 | |
| | | | | | | | 691 | |
| | | | | | | | | |
| New Jersey 0.84% | | | | | | | | |
| Econ. Dev. Auth., Water Facs. Rev. Ref. Bonds (American Water Co., Inc. Project), Series 2020-A, 1.00% 2023 | | | 275 | | | | 270 | |
| Housing and Mortgage Fin. Agcy., Multi Family Conduit Rev. Bonds (Browns Woods Apartments Project), Series 2021-A, 1.25% 2024 (put 2023) | | | 100 | | | | 98 | |
| Housing and Mortgage Fin. Agcy., Single Family Housing Rev. Bonds, Series 2018-A, 4.50% 2048 | | | 420 | | | | 435 | |
| Tobacco Settlement Fncg. Corp., Tobacco Settlement Bonds, Series 2018-A, 5.00% 2023 | | | 200 | | | | 204 | |
| Turnpike Auth., Turnpike Rev. Bonds, Series 2020-D, 5.00% 2028 | | | 30 | | | | 33 | |
| | | | | | | | 1,040 | |
| | | | | | | | | |
| New Mexico 0.42% | | | | | | | | |
| Mortgage Fin. Auth., Single Family Mortgage Program Bonds, Series 2019-A-1, Class I, 4.25% 2050 | | | 365 | | | | 375 | |
| Municipal Energy Acquisition Auth., Gas Supply Rev. Ref. and Acquisition Bonds, Series 2019, 5.00% 2039 (put 2025) | | | 135 | | | | 142 | |
| | | | | | | | 517 | |
| | | | | | | | | |
| New York 7.50% | | | | | | | | |
| Build NYC Resource Corp., Rev. Ref. Bonds (Ethical Culture Fieldston School Project), Series 2015, 5.00% 2024 | | | 360 | | | | 376 | |
| Dormitory Auth., Health Facs. Improvement Program Lease Rev. Bonds (New York City Issue), Series 2018-1, 5.00% 2027 | | | 500 | | | | 550 | |
| Dormitory Auth., State Personal Income Tax Rev. Bonds (General Purpose), Series 2021-A, 5.00% 2027 | | | 500 | | | | 554 | |
| Dormitory Auth., State Personal Income Tax Rev. Bonds (General Purpose), Series 2022-A, 5.00% 2027 | | | 335 | | | | 371 | |
| City of Geneva Dev. Corp., Rev. Ref. Bonds (Hobart and William Smith Colleges Project), Series 2012, 5.00% 2032 (preref. 2022) | | | 40 | | | | 40 | |
| Housing Fin. Agcy., Affordable Housing Rev. Green Bonds, Series 2020-K, 0.70% 2024 | | | 85 | | | | 81 | |
| Housing Fin. Agcy., Affordable Housing Rev. Green Bonds, Series 2020-L-2, 0.75% 2025 | | | 750 | | | | 693 | |
| Housing Fin. Agcy., Affordable Housing Rev. Green Bonds, Series 2021-D-2, 0.65% 2056 (put 2025) | | | 195 | | | | 179 | |
| Housing Fin. Agcy., Affordable Housing Rev. Green Bonds, Series 2021-I-2, 0.70% 2056 (put 2025) | | | 190 | | | | 174 | |
| 36 | Private Client Services Funds |
Capital Group Short-Term Municipal Fund
| Bonds, notes & other debt instruments (continued) | | Principal amount
(000) | | | Value
(000) | |
| New York (continued) | | | | | | |
| Housing Fin. Agcy., Affordable Housing Rev. Green Bonds, Series 2021-J-2, 1.10% 2061 (put 2027) | | USD | 470 | | | $ | 426 | |
| Long Island Power Auth., Electric System General Rev. Bonds, Series 2014-C, (1-month USD-LIBOR x 0.70 + 0.75%) 1.068% 2033 (put 2023)1 | | | 300 | | | | 299 | |
| Long Island Power Auth., Electric System General Rev. Bonds, Series 2015-C, (1-month USD-LIBOR x 0.70 + 0.75%) 1.068% 2033 (put 2023)1 | | | 260 | | | | 259 | |
| Metropolitan Transportation Auth., Transportation Rev. Bonds, Series 2012-B, 5.00% 2022 | | | 195 | | | | 198 | |
| Metropolitan Transportation Auth., Transportation Rev. Green Bonds, Series 2016-A-2, 5.00% 2024 | | | 300 | | | | 316 | |
| Metropolitan Transportation Auth., Transportation Rev. Ref. Bonds, Series 2012-F, 5.00% 2022 | | | 230 | | | | 234 | |
| Metropolitan Transportation Auth., Transportation Rev. Ref. Bonds, Series 2002-D-2-B, Assured Guaranty Municipal insured, (USD-SOFR x 0.67 + 0.55%) 0.737% 2032 (put 2024)1 | | | 255 | | | | 255 | |
| Metropolitan Transportation Auth., Transportation Rev. Ref. Bonds, Series 2002-D-2-A-2, Assured Guaranty Municipal insured, (USD-SOFR x 0.67 + 0.80%) 0.987% 2032 (put 2026)1 | | | 60 | | | | 60 | |
| Mortgage Agcy., Homeowner Mortgage Rev. Bonds, Series 197, 3.50% 2044 | | | 150 | | | | 151 | |
| Mortgage Agcy., Homeowner Mortgage Rev. Bonds, Series 233, 3.00% 2045 | | | 300 | | | | 296 | |
| Mortgage Agcy., Homeowner Mortgage Rev. Bonds, Series 213, 4.25% 2047 | | | 455 | | | | 466 | |
| Mortgage Agcy., Homeowner Mortgage Rev. Bonds, Series 239, 3.25% 2051 | | | 30 | | | | 30 | |
| New York City G.O. Bonds, Series 2014-I-1, 5.00% 2026 | | | 185 | | | | 194 | |
| New York City G.O. Bonds, Series 2020-A, 5.00% 2027 | | | 500 | | | | 554 | |
| New York City G.O. Bonds, Series 2021-A-1, 5.00% 2033 | | | 15 | | | | 17 | |
| New York City G.O. Bonds, Series 2015-F-4, 5.00% 2044 (put 2025) | | | 75 | | | | 80 | |
| New York City Housing Dev. Corp., Multi Family Housing Rev. Bonds (Sustainable Dev. Bonds), Series 2017-C-3-A, 0.20% 2022 | | | 45 | | | | 45 | |
| New York City Housing Dev. Corp., Multi Family Housing Rev. Bonds (Sustainable Dev. Bonds), Series 2021-C-2, 0.70% 2060 (put 2025) | | | 330 | | | | 305 | |
| New York City Housing Dev. Corp., Multi Family Housing Rev. Bonds (Sustainable Neighborhood Bonds), Series 2020-I-2, 0.70% 2060 (put 2025) | | | 230 | | | | 214 | |
| New York City Housing Dev. Corp., Multi Family Housing Rev. Green Bonds (Sustainable Dev. Bonds), Series 2021-F-2, 0.60% 2061 (put 2025) | | | 220 | | | | 203 | |
| New York City Transitional Fin. Auth., Future Tax Secured Bonds, Series 2020-A-1, 5.00% 2022 | | | 10 | | | | 10 | |
| New York City Transitional Fin. Auth., Future Tax Secured Bonds, Series 2021-E-1, 5.00% 2023 | | | 20 | | | | 20 | |
| New York City Transitional Fin. Auth., Future Tax Secured Bonds, Series 2018-1, 5.00% 2025 | | | 30 | | | | 32 | |
| New York City Transitional Fin. Auth., Future Tax Secured Bonds, Series 2022-D-1, 5.00% 2026 | | | 250 | | | | 275 | |
| New York City Transitional Fin. Auth., Future Tax Secured Bonds, Series 2013-I, 5.00% 2027 | | | 180 | | | | 185 | |
| Public Housing Capital Fund Rev. Trust I, Trust Certs., Series 2012, 4.50% 20222 | | | 15 | | | | 15 | |
| Triborough Bridge and Tunnel Auth., General Rev. Bonds (MTA Bridges and Tunnels), Series 2017-C-1, 5.00% 2025 | | | 500 | | | | 542 | |
| Utility Debt Securitization Auth., Restructuring Bonds, Series 2017, 5.00% 2025 | | | 10 | | | | 10 | |
| County of Westchester, Industrial Dev. Agcy., Multi Family Housing Rev. Bonds (EG Mt. Vernon Preservation, LP Project), Series 2020, 0.30% 2023 (put 2022) | | | 155 | | | | 153 | |
| County of Westchester, Industrial Dev. Agcy., Multi Family Housing Rev. Bonds (Marble Hall - Tuckahoe Limited Partnership Project), Series 2021, 0.28% 2024 (put 2023) | | | 455 | | | | 445 | |
| | | | | | | | 9,307 | |
| | | | | | | | | |
| North Carolina 1.23% | | | | | | | | |
| City of Durham, Housing Auth., Multi Family Housing Rev. Bonds (JJ Henderson Apartments Project), Series 2020, 0.30% 2024 (put 2023) | | | 20 | | | | 20 | |
| City of Goldsboro, Multi Family Housing Rev. Bonds (Grand at Day Point), Series 2021, 0.28% 2024 (put 2023) | | | 105 | | | | 102 | |
| Housing Fin. Agcy., Home Ownership Rev. Ref. Bonds, Series 38-B, 4.00% 2047 | | | 180 | | | | 183 | |
| Housing Fin. Agcy., Home Ownership Rev. Ref. Bonds, Series 42, 4.00% 2050 | | | 65 | | | | 66 | |
| Housing Fin. Agcy., Home Ownership Rev. Ref. Bonds, Series 44, 4.00% 2050 | | | 60 | | | | 61 | |
| Housing Fin. Agcy., Multi Family Housing Rev. Bonds (Winds Crest Senior Living, LP), Series 2021, 0.36% 2024 (put 2023) | | | 105 | | | | 103 | |
| City of Sanford, Housing Auth., Multi Family Housing Rev. Bonds (Matthews Garden Gilmore), Series 2020, 0.30% 2023 (put 2022) | | | 750 | | | | 742 | |
| City of Winston-Salem, Water and Sewer System Rev. Ref. Bonds, Series 2020-A, 5.00% 2022 | | | 200 | | | | 201 | |
| City of Winston-Salem, Water and Sewer System Rev. Ref. Bonds, Series 2020-A, 5.00% 2026 | | | 40 | | | | 44 | |
| | | | | | | | 1,522 | |
| Private Client Services Funds | 37 |
Capital Group Short-Term Municipal Fund
| Bonds, notes & other debt instruments (continued) | | Principal amount
(000) | | | Value
(000) | |
| North Dakota 0.60% | | | | | | |
| Housing Fin. Agcy., Homeownership Rev. Bonds (Home Mortgage Fin. Program), Series 2016-D, 3.50% 2046 | | USD | 110 | | | $ | 111 | |
| Housing Fin. Agcy., Housing Fin. Program Bonds (Home Mortgage Fin. Program), Series 2015-A, 4.00% 2038 | | | 310 | | | | 313 | |
| Housing Fin. Agcy., Housing Fin. Program Bonds (Home Mortgage Fin. Program), Series 2015-D, 4.00% 2046 | | | 200 | | | | 203 | |
| Housing Fin. Agcy., Housing Fin. Program Bonds (Home Mortgage Fin. Program), Series 2021-B, 3.00% 2052 | | | 120 | | | | 117 | |
| | | | | | | | 744 | |
| | | | | | | | | |
| Ohio 2.24% | | | | | | | | |
| City of Dayton, Metropolitan Housing Auth., Multi Family Housing Rev. Bonds (Southern Montgomery Apartments Project), Series 2021-A, 0.32% 2024 (put 2023) | | | 200 | | | | 193 | |
| County of Geauga, Rev. Bonds (South Franklin Circle Project), Series 2012-A, 8.00% 2047 (preref. 2022)3 | | | 880 | | | | 933 | |
| Healthcare Fac. Rev. Bonds (Otterbein Homes Obligated Group), Series 2021-B, 4.00% 2023 | | | 10 | | | | 10 | |
| Hospital Rev. Ref. Bonds (Cleveland Clinic Health System Obligated Group), Series 2021-B, 5.00% 2024 | | | 310 | | | | 323 | |
| Housing Fin. Agcy., Multi Family Housing Rev. Bonds (Chevybrook Estates Apartments Project), Series 2021, 0.35% 2024 (put 2023) | | | 50 | | | | 49 | |
| Housing Fin. Agcy., Multi Family Housing Rev. Bonds (Glen Meadows Apartments Project), Series 2021-A, 0.40% 2024 (put 2023) | | | 80 | | | | 77 | |
| Housing Fin. Agcy., Multi Family Housing Rev. Bonds (Marianna Terrace Apartments), Series 2022-A, 1.30% 2025 (put 2024) | | | 40 | | | | 39 | |
| Housing Fin. Agcy., Multi Family Housing Rev. Bonds (Pinzone Tower Apartments Project), Series 2021, 0.28% 2023 (put 2022) | | | 190 | | | | 187 | |
| Housing Fin. Agcy., Residential Mortgage Rev. Bonds (Mortgage-Backed Securities Program), Series 2017-D, 4.00% 2048 | | | 70 | | | | 71 | |
| Housing Fin. Agcy., Residential Mortgage Rev. Bonds (Mortgage-Backed Securities Program), Series 2019-A, 4.50% 2049 | | | 170 | | | | 176 | |
| Housing Fin. Agcy., Residential Mortgage Rev. Bonds (Mortgage-Backed Securities Program), Series 2020-A, 3.75% 2050 | | | 130 | | | | 132 | |
| Housing Fin. Agcy., Residential Mortgage Rev. Bonds (Mortgage-Backed Securities Program), Series 2021-C, 3.25% 2051 | | | 225 | | | | 223 | |
| County of Montgomery, Hospital Facs. Rev. Bonds (Dayton Children’s Hospital), Series 2021, 5.00% 2029 | | | 30 | | | | 34 | |
| County of Montgomery, Hospital Facs. Rev. Bonds (Dayton Children’s Hospital), Series 2021, 5.00% 2032 | | | 160 | | | | 184 | |
| Turnpike and Infrastructure Commission, Rev. Bonds, Series 2013-A-1, 5.00% 2025 | | | 125 | | | | 128 | |
| Water Dev. Auth., Water Dev. Rev. Bonds, Series 2013-A, 5.00% 2023 | | | 25 | | | | 26 | |
| | | | | | | | 2,785 | |
| | | | | | | | | |
| Oklahoma 0.72% | | | | | | | | |
| Capital Improvement Auth., State Highways Capital Improvement Rev. Ref. Bonds (Oklahoma Dept. of Transportation Project), Series 2020-A, 5.00% 2023 | | | 145 | | | | 150 | |
| Board of Regents of Oklahoma State University, General Rev. Ref. Bonds, Series 2020-A, 5.00% 2024 | | | 275 | | | | 290 | |
| Board of Regents of Oklahoma State University, General Rev. Ref. Bonds, Series 2020-A, 5.00% 2025 | | | 420 | | | | 452 | |
| | | | | | | | 892 | |
| | | | | | | | | |
| Oregon 0.32% | | | | | | | | |
| G.O. Bonds (Veteran’s Welfare Bonds Series 108), Series 2021-O, 3.00% 2051 | | | 245 | | | | 239 | |
| Housing and Community Services Dept., Housing Dev. Rev. Bonds (The Susan Emmons Apartments Project), Series 2021-S-2, 0.38% 2024 (put 2023) | | | 115 | | | | 110 | |
| Housing and Community Services Dept., Housing Dev. Rev. Bonds (Westwind Apartments Project), Series 2021-H, 0.25% 2024 (put 2023) | | | 50 | | | | 49 | |
| | | | | | | | 398 | |
| | | | | | | | | |
| Pennsylvania 1.97% | | | | | | | | |
| Bethlehem Area School Dist. Auth., School Rev. Bonds (Bethlehem Area School Dist. Ref. Project), Series 2021-C, (USD-SOFR x 0.67 + 0.35%) 0.53% 2030 (put 2025)1 | | | 50 | | | | 50 | |
| Bethlehem Area School Dist. Auth., School Rev. Bonds (Bethlehem Area School Dist. Ref. Project), Series 2021-B, (USD-SOFR x 0.67 + 0.35%) 0.53% 2031 (put 2025)1 | | | 70 | | | | 69 | |
| Bethlehem Area School Dist. Auth., School Rev. Bonds (Bethlehem Area School Dist. Ref. Project), Series 2021-C, (USD-SOFR x 0.67 + 0.35%) 0.53% 2032 (put 2025)1 | | | 55 | | | | 55 | |
| Cumberland Valley School Dist., G.O. Bonds, Series 2015, 5.00% 2032 (preref. 2023) | | | 20 | | | | 21 | |
| Cumberland Valley School Dist., G.O. Bonds, Series 2015, 5.00% 2034 (preref. 2023) | | | 20 | | | | 21 | |
| Housing Fin. Agcy., Single Family Mortgage Rev. Bonds, Series 2017-122, 4.00% 2046 | | | 205 | | | | 208 | |
| 38 | Private Client Services Funds |
Capital Group Short-Term Municipal Fund
| Bonds, notes & other debt instruments (continued) | | Principal amount
(000) | | | Value
(000) | |
| Pennsylvania (continued) | | | | | | |
| Housing Fin. Agcy., Single Family Mortgage Rev. Bonds, Series 2020-133, 3.00% 2050 | | USD | 345 | | | $ | 341 | |
| Housing Fin. Agcy., Single Family Mortgage Rev. Bonds, Series 2021-137, 3.00% 2051 | | | 190 | | | | 185 | |
| Housing Fin. Agcy., Single Family Mortgage Rev. Bonds, Series 2022-138-A, 3.00% 2052 | | | 145 | | | | 141 | |
| Housing Fin. Agcy., Special Limited Obligation, Multi Family Housing Dev. Bonds (Harrison Senior Tower), Series 2021, 0.25% 2024 (put 2023) | | | 760 | | | | 739 | |
| Housing Fin. Agcy., Special Limited Obligation, Multi Family Housing Dev. Bonds (School of Nursing), Series 2021, 0.27% 2024 (put 2023) | | | 85 | | | | 82 | |
| Philadelphia School Dist., G.O. Bonds, Series 2021-A, 5.00% 2027 | | | 190 | | | | 209 | |
| Turnpike Commission, Turnpike Rev. Bonds, Series 2021-B, 5.00% 2022 | | | 95 | | | | 97 | |
| Wilkes-Barre Area School Dist., G.O. Bonds, Series 2019, BAM insured, 5.00% 2023 | | | 225 | | | | 231 | |
| | | | | | | | 2,449 | |
| | | | | | | | | |
| Rhode Island 0.09% | | | | | | | | |
| Housing and Mortgage Fin. Corp., Homeownership Opportunity Bonds, Series 66-A-1, 4.00% 2033 | | | 110 | | | | 111 | |
| | | | | | | | | |
| South Carolina 1.41% | | | | | | | | |
| City of Columbia, Housing Auth., Multi Family Housing Rev. Bonds (Palmetto Terrace Apartments Project), Series 2021, 0.31% 2024 (put 2023) | | | 130 | | | | 126 | |
| Housing Fin. and Dev. Auth., Mortgage Rev. Bonds, Series 2018-A, 4.50% 2048 | | | 200 | | | | 206 | |
| Housing Fin. and Dev. Auth., Mortgage Rev. Bonds, Series 2020-A, 4.00% 2050 | | | 150 | | | | 153 | |
| Housing Fin. and Dev. Auth., Mortgage Rev. Bonds, Series 2021-A, 3.00% 2052 | | | 80 | | | | 79 | |
| Housing Fin. and Dev. Auth., Mortgage Rev. Ref. Bonds, Series 2016-A, 4.00% 2036 | | | 190 | | | | 193 | |
| Housing Fin. and Dev. Auth., Multi Family Housing Rev. Bonds (Villages at Congaree Pointe Project), Series 2021-B, 1.25% 2025 (put 2024) | | | 100 | | | | 97 | |
| Patriots Energy Group Fncg. Agcy., Gas Supply Rev. Bonds, Series 2018-A, 4.00% 2048 (put 2024) | | | 55 | | | | 56 | |
| Public Service Auth., Rev. Obligations (Santee Cooper), Series 2014-C, 5.00% 2025 | | | 120 | | | | 127 | |
| Public Service Auth., Rev. Ref. Obligations (Santee Cooper), Series 2015-A, 5.00% 2028 | | | 35 | | | | 37 | |
| Southold Local Dev. Corp., Rev. Bonds (Peconic Landing at Southold, Inc. Project), Series 2015, 5.00% 2022 | | | 400 | | | | 407 | |
| City of Spartanburg, Housing Auth., Multi Family Housing Rev. Bonds (Connecticut Village Apartments), Series 2022, 1.05% 2025 (put 2023) | | | 125 | | | | 123 | |
| Spartanburg Regional Health Services Dist., Hospital Rev. Ref. Bonds, Series 2022, 5.00% 2028 | | | 135 | | | | 149 | |
| | | | | | | | 1,753 | |
| | | | | | | | | |
| South Dakota 0.54% | | | | | | | | |
| Housing Dev. Auth., Homeownership Mortgage Bonds, Series 2014-E, 4.00% 2044 | | | 70 | | | | 71 | |
| Housing Dev. Auth., Homeownership Mortgage Bonds, Series 2018-B, 4.50% 2048 | | | 335 | | | | 346 | |
| Housing Dev. Auth., Homeownership Mortgage Bonds, Series 2021-B, 3.00% 2051 | | | 255 | | | | 251 | |
| | | | | | | | 668 | |
| | | | | | | | | |
| Tennessee 2.02% | | | | | | | | |
| Housing Dev. Agcy., Residential Fin. Program Bonds, Series 2017-1, 4.00% 2042 | | | 175 | | | | 178 | |
| Housing Dev. Agcy., Residential Fin. Program Bonds, Series 2014-2-A, 4.00% 2045 | | | 465 | | | | 473 | |
| Housing Dev. Agcy., Residential Fin. Program Bonds, Series 2014-2-C, 4.00% 2045 | | | 195 | | | | 198 | |
| Housing Dev. Agcy., Residential Fin. Program Bonds, Series 2015-2-A, 3.75% 2050 | | | 250 | | | | 253 | |
| City of Knoxville Community Dev. Corp., Collateralized Multi Family Housing Rev. Bonds (Austin 1B Apartments Project), Series 2021, 0.22% 2024 (put 2023) | | | 40 | | | | 38 | |
| City of Memphis, Health, Educational and Housing Facs. Board, Collateralized Multi Family Housing Rev. Bonds (Tillman Cove Apartments), Series 2020, 0.55% 2024 (put 2024) | | | 590 | | | | 551 | |
| Metropolitan Government of Nashville and Davidson County, Health and Educational Facs. Board, Rev. Bonds (Vanderbilt University Medical Center), Series 2021-A, 5.00% 2031 | | | 205 | | | | 230 | |
| Metropolitan Government of Nashville and Davidson County, Water & Sewer Rev. Bonds, Series 2013, 5.00% 2025 (preref. 2023) | | | 85 | | | | 88 | |
| Tennessee Energy Acquisition Corp., Gas Project Rev. Bonds, Series 2017-A, 4.00% 2048 (put 2023) | | | 500 | | | | 504 | |
| | | | | | | | 2,513 | |
| Private Client Services Funds | 39 |
Capital Group Short-Term Municipal Fund
| Bonds, notes & other debt instruments (continued) | | Principal amount
(000) | | | Value
(000) | |
| Texas 18.67% | | | | | | |
| Affordable Housing Corp., Multi Family Housing Rev. Bonds (Apartments of Las Palmas I LLC), Series 2021, 0.25% 2024 (put 2022) | | USD | 15 | | | $ | 15 | |
| Arlington Higher Education Fin. Corp., Education Rev. and Rev. Ref. Bonds (Uplift Education), Series 2017-A, 5.00% 2022 | | | 645 | | | | 657 | |
| Arlington Higher Education Fin. Corp., Education Rev. Bonds (Great Hearts America - Texas), Series 2021-A, 4.00% 2025 | | | 15 | | | | 16 | |
| Arlington Higher Education Fin. Corp., Education Rev. Bonds (Great Hearts America - Texas), Series 2021-A, 4.00% 2026 | | | 15 | | | | 16 | |
| Arlington Higher Education Fin. Corp., Education Rev. Bonds (Harmony Public Schools), Series 2016-A, 5.00% 2024 | | | 310 | | | | 324 | |
| Arlington Higher Education Fin. Corp., Education Rev. Bonds (KIPP Texas, Inc.), Series 2019, 5.00% 2026 | | | 560 | | | | 613 | |
| Arlington Higher Education Fin. Corp., Education Rev. Bonds (Riverwalk Education Foundation, Inc.), Series 2019, 5.00% 2022 | | | 350 | | | | 353 | |
| Arlington Higher Education Fin. Corp., Education Rev. Bonds (Riverwalk Education Foundation, Inc.), Series 2019, 5.00% 2025 | | | 800 | | | | 860 | |
| City of Arlington, Water and Wastewater System Rev. Bonds, Series 2021, 5.00% 2023 | | | 165 | | | | 170 | |
| Austin Affordable PFC, Inc., Multi Family Housing Rev. Bonds (Bridge at Turtle Creek Apartments), Series 2020, 0.42% 2040 (put 2023) | | | 215 | | | | 210 | |
| Austin Community College Dist., Maintenance Tax Notes, Series 2021, 5.00% 2022 | | | 100 | | | | 101 | |
| City of Austin, Water and Wastewater System Rev. Ref. Bonds, Series 2020-C, 5.00% 2025 | | | 510 | | | | 553 | |
| County of Bexar, Combination Tax and Rev. Certs. of Obligation, Series 2013-B, 5.00% 2033 (preref. 2023) | | | 105 | | | | 108 | |
| Brownsville Independent School Dist., Unlimited Tax Rev. Ref. Bonds, Series 2020-A, 3.00% 2026 | | | 500 | | | | 509 | |
| Cameron County Housing Fin. Corp., Multi Family Housing Rev. Bonds (Sunland Country Apartments), Series 2021, 0.28% 2024 (put 2023) | | | 50 | | | | 48 | |
| Capital Area Housing Fin. Corp., Multi Family Housing Rev. Bonds (Redwood Apartments), Series 2020, 0.41% 2041 (put 2024) | | | 460 | | | | 441 | |
| Carrollton-Farmers Branch Independent School Dist., Unlimited Tax School Building Bonds, Series 2021, 5.00% 2023 | | | 135 | | | | 138 | |
| Clear Creek Independent School Dist., Unlimited Tax School Building Bonds, Series 2013-B, 0.28% 2038 (put 2024) | | | 100 | | | | 93 | |
| Clifton Higher Education Fin. Corp., Education Rev. Bonds (Idea Public Schools), Series 2021-T, 5.00% 2023 | | | 5 | | | | 5 | |
| Clifton Higher Education Fin. Corp., Education Rev. Bonds (Idea Public Schools), Series 2021-T, 5.00% 2024 | | | 5 | | | | 5 | |
| Clifton Higher Education Fin. Corp., Education Rev. Bonds (Idea Public Schools), Series 2021-T, 5.00% 2025 | | | 10 | | | | 11 | |
| Clifton Higher Education Fin. Corp., Education Rev. Bonds (Idea Public Schools), Series 2021-T, 5.00% 2026 | | | 5 | | | | 5 | |
| Cypress-Fairbanks Independent School Dist., Unlimited Tax School Building and Rev. Ref. Bonds, Series 2014-C, 5.00% 2027 | | | 500 | | | | 522 | |
| Cypress-Fairbanks Independent School Dist., Unlimited Tax School Building Bonds, Series 2015-B-2, 0.28% 2040 (put 2024) | | | 200 | | | | 190 | |
| Cities of Dallas and Fort Worth, Dallas/Fort Worth International Airport, Joint Rev. Ref. Bonds, Series 2014-E, 5.00% 2023 | | | 370 | | | | 375 | |
| City of Dallas Housing Fin. Corp., Multi Family Housing Rev. Bonds (Midpark Towers), Series 2021, 0.35% 2024 (put 2023) | | | 180 | | | | 177 | |
| Dallas Independent School Dist., Unlimited Tax Rev. Ref. Bonds, Series 2014-A, 5.00% 2023 | | | 15 | | | | 16 | |
| Dallas Independent School Dist., Unlimited Tax Rev. Ref. Bonds, Series 2015, 5.00% 2030 (preref. 2025) | | | 400 | | | | 428 | |
| Del Mar College Dist., Limited Tax Bonds, Series 2020-B, 5.00% 2024 | | | 400 | | | | 423 | |
| Del Mar College Dist., Limited Tax Bonds, Series 2020-A, 5.00% 2026 | | | 335 | | | | 368 | |
| Del Valle Independent School Dist., Unlimited Tax School Building Bonds, Series 2020, 5.00% 2022 | | | 155 | | | | 156 | |
| El Paso Independent School Dist., Unlimited Tax Rev. Ref. Bonds, Series 2015, 5.00% 2026 | | | 400 | | | | 424 | |
| Fort Bend Grand Parkway Toll Road Auth., Limited Contract Tax and Toll Road Rev. Ref. Bonds, Series 2021-A, 5.00% 2028 | | | 120 | | | | 135 | |
| Fort Bend Independent School Dist., Unlimited Tax Rev. Ref. Bonds, Series 2020, 5.00% 2024 | | | 130 | | | | 137 | |
| Fort Bend Independent School Dist., Unlimited Tax School Building Bonds, Series 2019-A, 1.95% 2049 (put 2022)3 | | | 420 | | | | 420 | |
| G.O. Water Financial Assistance Rev. Ref. Bonds, Series 2021-B, 4.00% 2030 | | | 50 | | | | 52 | |
| City of Galveston Public Fac. Corp., Multi Family Housing Rev. Bonds (The Orleanders at Broadway), Series 2021, 0.47% 2025 (put 2024) | | | 150 | | | | 141 | |
| Garland Independent School Dist., Unlimited Tax School Building Bonds, Series 2016, 5.00% 2030 | | | 400 | | | | 426 | |
| Goose Creek Consolidated Independent School Dist., Unlimited Tax School Building Bonds, Series 2019-B, 0.15% 2049 (put 2022) | | | 140 | | | | 139 | |
| Grand Prairie Independent School Dist., Unlimited Tax Rev. Ref. Bonds, Series 2015, 5.25% 2024 | | | 525 | | | | 552 | |
| Harlandale Independent School Dist., Maintenance Tax Notes, Series 2021, BAM insured, 2.00% 2040 (put 2024) | | | 50 | | | | 50 | |
| Harlandale Independent School Dist., Unlimited Tax Rev. Ref. Bonds, Series 2020, 0.75% 2045 (put 2025) | | | 100 | | | | 94 | |
| County of Harris, Toll Road Rev. and Rev. Ref. Bonds, Series 2018-A, 5.00% 2024 | | | 150 | | | | 159 | |
| 40 | Private Client Services Funds |
Capital Group Short-Term Municipal Fund
| Bonds, notes & other debt instruments (continued) | | Principal amount
(000) | | | Value
(000) | |
| Texas (continued) | | | | | | |
| Harris County Cultural Education Facs. Fin. Corp., Hospital Rev. Bonds (Memorial Hermann Health System), Series 2019-C-1, (SIFMA Municipal Swap Index + 0.42%) 0.86% 2049 (put 2022)1 | | USD | 375 | | | $ | 375 | |
| Harris County Cultural Education Facs. Fin. Corp., Medical Facs. Mortgage Rev. Ref. Bonds (Baylor College of Medicine), Series 2019-A, (3-month USD-LIBOR x 0.70 + 0.65%) 0.968% 2046 (put 2024)1 | | | 130 | | | | 130 | |
| Harris County Cultural Education Facs. Fin. Corp., Rev. Bonds (Texas Medical Center), Series 2020-A, 0.90% 2050 (put 2025) | | | 130 | | | | 127 | |
| Harris County Health Facs. Dev. Corp., Rev. Ref. Bonds (CHRISTUS Health), Series 2005-A-4, Assured Guaranty Municipal insured, 0.05% 20311 | | | 125 | | | | 125 | |
| Dept. of Housing and Community Affairs, Multi Family Housing Rev. Bonds (Corona Del Valle), Series 2021, 0.37% 2025 (put 2023) | | | 50 | | | | 48 | |
| Dept. of Housing and Community Affairs, Multi Family Housing Rev. Bonds (Oso Bay Apartments), Series 2021, 0.27% 2024 (put 2022) | | | 100 | | | | 99 | |
| Dept. of Housing and Community Affairs, Multi Family Housing Rev. Bonds (Palladium Simpson Stuart Apartments), Series 2021, 0.35% 2025 (put 2024) | | | 165 | | | | 158 | |
| Dept. of Housing and Community Affairs, Multi Family Housing Rev. Bonds (The Park at Kirkstall), Series 2021, 0.65% 2025 (put 2024) | | | 325 | | | | 307 | |
| Dept. of Housing and Community Affairs, Residential Mortgage Rev. Bonds, Series 2021-A, 3.00% 2052 | | | 310 | | | | 305 | |
| Dept. of Housing and Community Affairs, Single Family Mortgage Rev. Bonds, Series 2018-A, 4.75% 2049 | | | 330 | | | | 342 | |
| Dept. of Housing and Community Affairs, Single Family Mortgage Rev. Bonds, Series 2019-A, 4.00% 2050 | | | 380 | | | | 388 | |
| Dept. of Housing and Community Affairs, Single Family Mortgage Rev. Bonds, Series 2020-A, 3.50% 2051 | | | 125 | | | | 125 | |
| Dept. of Housing and Community Affairs, Single Family Mortgage Rev. Bonds, Series 2021-A, 3.00% 2052 | | | 135 | | | | 132 | |
| Housing Options, Inc., Multi Family Housing Rev. Bonds (Brooks Manor - The Oaks Project), Series 2021, 0.50% 2041 (put 2025) | | | 100 | | | | 93 | |
| City of Houston Housing Fin. Corp., Multi Family Housing Rev. Bonds (Temenos Place Apartments), Series 2021, 0.29% 2024 (put 2023) | | | 85 | | | | 82 | |
| City of Houston, Combined Utility System Rev. Ref. Bonds, Series 2019-B, 2.00% 2024 | | | 615 | | | | 605 | |
| City of Houston, Convention and Entertainment Facs. Dept., Hotel Occupancy Tax and Special Rev. Ref. Bonds, Series 2021, 4.00% 2022 | | | 10 | | | | 10 | |
| City of Houston, Convention and Entertainment Facs. Dept., Hotel Occupancy Tax and Special Rev. Ref. Bonds, Series 2021, 4.00% 2023 | | | 15 | | | | 15 | |
| Keller Independent School Dist., Unlimited Tax Rev. Ref. Bonds, Series 2015-A, 5.00% 2027 (preref. 2025) | | | 470 | | | | 502 | |
| Longview Independent School Dist., Unlimited Tax Rev. Ref. Bonds, Series 2020, 5.00% 2024 | | | 500 | | | | 524 | |
| Medina Valley Independent School Dist., Unlimited Tax School Building Bonds, Series 2021, 0.82% 2051 (put 2026) | | | 90 | | | | 82 | |
| Municipal Gas Acquisition and Supply Corp. I, Gas Supply Rev. Bonds, Series 2008-D, 6.25% 2026 | | | 150 | | | | 161 | |
| Municipal Gas Acquisition and Supply Corp. III, Gas Supply Rev. Ref. Bonds, Series 2021, 5.00% 2022 | | | 10 | | | | 10 | |
| Municipal Gas Acquisition and Supply Corp. III, Gas Supply Rev. Ref. Bonds, Series 2021, 5.00% 2025 | | | 120 | | | | 126 | |
| North Central Texas Housing Fin. Corp., Multi Family Housing Rev. Bonds (Bluebonnet Ridge Apartments), Series 2021, 0.375% 2040 (put 2024) | | | 85 | | | | 80 | |
| North Texas Municipal Water Dist., Water System Rev. Ref. and Improvement Bonds, Series 2021, 5.00% 2022 | | | 45 | | | | 46 | |
| North Texas Tollway Auth., System Rev. Ref. Bonds, Series 2014-A, 5.00% 2024 | | | 395 | | | | 412 | |
| North Texas Tollway Auth., System Rev. Ref. Bonds, Series 2014-A, 5.00% 2024 (escrowed to maturity) | | | 190 | | | | 199 | |
| North Texas Tollway Auth., System Rev. Ref. Bonds, Series 2016-A, 5.00% 2026 | | | 1,500 | | | | 1,559 | |
| Northside Independent School Dist., Unlimited Tax School Building Bonds, Series 2020, 0.70% 2050 (put 2025) | | | 1,000 | | | | 936 | |
| Odessa Housing Fin. Corp., Multi Family Housing Rev. Bonds (Cove in Odessa Apartments), Series 2021, 0.37% 2024 (put 2023) | | | 230 | | | | 222 | |
| Pasadena Independent School Dist., Unlimited Tax School Building and Rev. Ref. Bonds, Series 2013, 5.00% 2038 | | | 500 | | | | 511 | |
| Plano Independent School Dist., Unlimited Tax Rev. Ref. Bonds, Series 2020, 5.00% 2023 | | | 135 | | | | 138 | |
| Prosper Independent School Dist., Unlimited Tax School Building Bonds, Series 2019-B, 2.00% 2050 (put 2023) | | | 210 | | | | 209 | |
| County of Rockwall, Permanent Improvement and Rev. Ref. Bonds, Series 2020, 5.00% 2024 | | | 200 | | | | 209 | |
| County of Rockwall, Permanent Improvement and Rev. Ref. Bonds, Series 2020, 5.00% 2025 | | | 250 | | | | 267 | |
| County of Rockwall, Permanent Improvement and Rev. Ref. Bonds, Series 2020, 5.00% 2026 | | | 260 | | | | 283 | |
| Round Rock Independent School Dist., Unlimited Tax Rev. Ref. Bonds, Series 2017, 5.00% 2022 | | | 300 | | | | 303 | |
| City of San Antonio Housing Trust Fin. Corp., Multi Family Housing Rev. Bonds (The Arbors at West Avenue Apartments), Series 2022, 1.45% 2026 (put 2025) | | | 90 | | | | 87 | |
| City of San Antonio, Electric and Gas Systems Rev. Bonds, Series 2015-D, 1.125% 2045 (put 2026) | | | 230 | | | | 211 | |
| City of San Antonio, Electric and Gas Systems Rev. Bonds, Series 2013, 5.00% 2048 (preref. 2023) | | | 140 | | | | 143 | |
| City of San Antonio, Electric and Gas Systems Rev. Ref. Bonds, Series 2022, 5.00% 2023 | | | 60 | | | | 61 | |
| City of San Antonio, Electric and Gas Systems Rev. Ref. Bonds, Series 2020, 5.00% 2026 | | | 330 | | | | 357 | |
| City of San Antonio, Electric and Gas Systems Rev. Ref. Bonds, Series 2022, 5.00% 2027 | | | 110 | | | | 121 | |
| Tomball Independent School Dist., Unlimited Tax School Building Bonds, Series 2020, 5.00% 2023 | | | 80 | | | | 82 | |
| Tomball Independent School Dist., Unlimited Tax School Building Bonds, Series 2020, 5.00% 2024 | | | 30 | | | | 31 | |
| Private Client Services Funds | 41 |
Capital Group Short-Term Municipal Fund
| Bonds, notes & other debt instruments (continued) | | Principal amount
(000) | | | Value
(000) | |
| Texas (continued) | | | | | | |
| Transportation Commission, G.O. Mobility Fund Bonds, Series 2014-B, 0.65% 2041 (put 2026) | | USD | 500 | | | $ | 456 | |
| Travis County Strategic Housing Fin. Corp., Multi Family Housing Rev. Bonds (Yager Flats), Series 2021, 0.46% 2041 (put 2025) | | | 770 | | | | 695 | |
| Water Dev. Board, State Water Implementation Rev. Fund of Texas Rev. Bonds (Master Trust), Series 2018-B, 5.00% 2023 | | | 45 | | | | 46 | |
| | | | | | | | 23,170 | |
| | | | | | | | | |
| Utah 0.67% | | | | | | | | |
| Canyons School Dist., Board of Education, G.O. Bonds (Utah School Bond Guaranty Program), Series 2021-A, 5.00% 2027 | | | 25 | | | | 28 | |
| Housing Corp., Single Family Mortgage Bonds, Class III, Series 2015-D-2, 4.00% 2045 | | | 170 | | | | 172 | |
| Salt Lake City, Airport Rev. Bonds (Salt Lake City International Airport), Series 2021-B, 5.00% 2024 | | | 275 | | | | 289 | |
| County of Salt Lake, Board of Education, G.O. Rev. Ref. Bonds (Utah School Bond Guaranty Act), Series 2021, 5.00% 2024 | | | 250 | | | | 264 | |
| Transit Auth., Sales Tax Rev. Bonds, Series 2008-A, 5.25% 2023 | | | 15 | | | | 16 | |
| City of Vineyard, Redev. Agcy., Tax Increment Rev. and Rev. Ref. Bonds, Series 2021, Assured Guaranty Municipal insured, 5.00% 2024 | | | 65 | | | | 68 | |
| | | | | | | | 837 | |
| | | | | | | | | |
| Vermont 0.03% | | | | | | | | |
| Housing Fin. Agcy., Multiple Purpose Bonds, Series 2020-A, 3.75% 2050 | | | 40 | | | | 41 | |
| | | | | | | | | |
| Virginia 1.08% | | | | | | | | |
| County of Arlington, Industrial Dev. Auth., Hospital Rev. Bonds (Virginia Hospital Center), Series 2020, 5.00% 2025 | | | 130 | | | | 139 | |
| County of Fairfax, Redev. and Housing Auth., Multi Family Housing Rev. Bonds (Arrowbrook Apartments Project), Series 2020, 0.41% 2041 (put 2024) | | | 500 | | | | 479 | |
| County of Fairfax, Redev. and Housing Auth., Multi Family Housing Rev. Bonds (Oakwood North Four Project), Series 2021, 0.41% 2025 (put 2024) | | | 570 | | | | 540 | |
| City of Hopewell, Redev. And Housing Auth., Multi Family Housing Rev. Bonds (Hopewell Heights Apartments), Series 2021-A, 0.49% 2024 (put 2023) | | | 85 | | | | 82 | |
| City of Lynchburg, Econ. Dev. Auth., Hospital Rev. and Rev. Ref. Bonds (Centra Health Obligated Group), Series 2021, 5.00% 2029 | | | 95 | | | | 106 | |
| | | | | | | | 1,346 | |
| | | | | | | | | |
| Washington 1.57% | | | | | | | | |
| Central Puget Sound Regional Transit Auth., Sales Tax and Motor Vehicle Excise Tax Improvement and Rev. Ref. Green Bonds, Series 2021-S-1, 5.00% 2028 | | | 65 | | | | 74 | |
| City of Everett, Housing Auth., Multi Family Housing Rev. Bonds (Baker Heights Legacy), Series 2021, 0.30% 2024 (put 2023) | | | 80 | | | | 77 | |
| G.O. Rev. Ref. Bonds, Series 2017-R-A, 5.00% 2022 | | | 25 | | | | 25 | |
| Health Care Facs. Auth., Rev. Ref. Bonds (Providence St. Joseph Health), Series 2021-B, 4.00% 2042 (put 2030) | | | 250 | | | | 263 | |
| Housing Fin. Commission, Multi Family Housing Rev. Bonds (Garten Haus Apartments Project), Series 2021, 0.37% 2024 (put 2023) | | | 45 | | | | 44 | |
| Housing Fin. Commission, Single Family Program Bonds, Series 2017-1-N, 4.00% 2047 | | | 240 | | | | 244 | |
| Housing Fin. Commission, Single Family Program Bonds, Series 2020-1-N, 4.00% 2050 | | | 345 | | | | 352 | |
| Housing Fin. Commission, Single Family Program Bonds, Series 2021-2-N, 3.00% 2051 | | | 90 | | | | 88 | |
| City of Seattle, Housing Auth., Rev. and Rev. Ref. Bonds (Northgate Plaza Project), Series 2021, 1.00% 2026 | | | 70 | | | | 65 | |
| City of Seattle, Housing Auth., Rev. Bonds (Lam Bow Apartments Project), Series 2021, 1.25% 2024 | | | 15 | | | | 15 | |
| City of Seattle, Municipal Light and Power Rev. Ref. Bonds, Series 2021-B, (SIFMA Municipal Swap Index + 0.25%) 0.69% 2045 (put 2026)1 | | | 115 | | | | 114 | |
| City of Seattle, Municipal Light and Power Rev. Ref. Bonds, Series 2018-C-2, (SIFMA Municipal Swap Index + 0.49%) 0.93% 2046 (put 2023)1 | | | 325 | | | | 325 | |
| University of Washington, General Rev. Ref. Bonds, Series 2020-C, 5.00% 2025 | | | 250 | | | | 268 | |
| | | | | | | | 1,954 | |
| 42 | Private Client Services Funds |
Capital Group Short-Term Municipal Fund
| Bonds, notes & other debt instruments (continued) | | Principal amount
(000) | | | Value
(000) | |
| West Virginia 0.76% | | | | | | |
| G.O. State Road Bonds, Series 2021-A, 5.00% 2025 | | USD | 15 | | | $ | 16 | |
| Housing Dev. Fund, Multi Family Housing Rev. Bonds (Charles Towers), Series 2021, 0.21% 2023 (put 2022) | | | 75 | | | | 75 | |
| Housing Dev. Fund, Multi Family Housing Rev. Bonds (Parkland Place / Chapmanville Towers), Series 2021, 0.28% 2024 (put 2023) | | | 875 | | | | 856 | |
| | | | | | | | 947 | |
| | | | | | | | | |
| Wisconsin 1.91% | | | | | | | | |
| Health and Educational Facs. Auth., Rev. Bonds (Advocate Aurora Health Care Credit Group), Series 2018-C-3, (SIFMA Municipal Swap Index + 0.55%) 0.99% 2054 (put 2023)1 | | | 340 | | | | 339 | |
| Health and Educational Facs. Auth., Rev. Bonds (Gundersen Lutheran), Series 2020, 5.00% 20262 | | | 660 | | | | 705 | |
| Health and Educational Facs. Auth., Rev. Ref. Bonds (Ministry Health Care, Inc.), Series 2012-C, 5.00% 2027 (preref. 2022) | | | 210 | | | | 212 | |
| Housing and Econ. Dev. Auth., Home Ownership Rev. Bonds, Series 2017-C, 4.00% 2048 | | | 180 | | | | 183 | |
| Housing and Econ. Dev. Auth., Home Ownership Rev. Bonds, Series 2020-A, 3.50% 2050 | | | 330 | | | | 331 | |
| Housing and Econ. Dev. Auth., Home Ownership Rev. Bonds, Series 2021-A, 3.00% 2052 | | | 30 | | | | 29 | |
| Housing and Econ. Dev. Auth., Housing Rev. Bonds, Series 2021-B, 0.40% 2045 (put 2023) | | | 25 | | | | 24 | |
| Housing and Econ. Dev. Auth., Housing Rev. Bonds, Series 2021-B, 0.50% 2050 (put 2024) | | | 35 | | | | 32 | |
| Housing and Econ. Dev. Auth., Housing Rev. Bonds, Series 2021-C, 0.81% 2052 (put 2025) | | | 110 | | | | 103 | |
| Public Fin. Auth., Hospital Rev. Ref. Bonds (Renown Regional Medical Center Project), Series 2016-A, 5.00% 2022 | | | 300 | | | | 301 | |
| Public Fin. Auth., Rev. Ref. Bonds (Providence St. Joseph Health), Series 2021-C, 4.00% 2041 (put 2030) | | | 115 | | | | 117 | |
| | | | | | | | 2,376 | |
| | | | | | | | | |
| Wyoming 0.13% | | | | | | | | |
| Community Dev. Auth., Housing Rev. Bonds, Series 2020-1, 4.00% 2050 | | | 160 | | | | 163 | |
| | | | | | | | | |
| Total bonds, notes & other debt instruments (cost: $109,338,000) | | | | | | | 105,373 | |
| | | | | | | | | |
| Short-term securities 13.95% | | | | | | | | |
| Municipals 13.95% | | | | | | | | |
| State of Arizona, Industrial Dev. Auth., Hospital Rev. Ref. Bonds (Phoenix Children’s Hospital), Series 2019-B, 0.31% 20481 | | | 3,300 | | | | 3,300 | |
| State of California, Kern Community College Dist., Facs. Improvement Dist. No. 1, G.O. Bond Anticipation Notes, Capital Appreciation Notes, Series 2020, 0% 2023 | | | 45 | | | | 43 | |
| State of Idaho, Tax Anticipation Notes, Series 2021, 3.00% 6/30/2022 | | | 3,000 | | | | 3,009 | |
| State of Iowa, Fin. Auth., Rev. Bonds (UnityPoint Health), Series 2018-E, 0.31% 20411 | | | 3,500 | | | | 3,500 | |
| State of Massachusetts, Housing Fin. Agcy., Single Family Housing Notes, Series 2021, 0.25% 12/1/2022 | | | 50 | | | | 49 | |
| State of Michigan, Regents of the University of Michigan, General Rev. Bonds, Series 2008-A, 0.30% 20381 | | | 2,500 | | | | 2,500 | |
| State of Michigan, Regents of the University of Michigan, General Rev. Bonds, Series 2012-B, 0.30% 20421 | | | 1,000 | | | | 1,000 | |
| State of Nevada, Housing Division, Single Family Mortgage Rev. Bonds, Series 2021-D, 0.25% 12/1/2022 | | | 65 | | | | 65 | |
| State of New York, Dormitory Auth., Rev. Bonds (Cornell University), Series 2019-B, 0.34% 20391 | | | 1,600 | | | | 1,600 | |
| State of Ohio, Hospital Rev. Bonds (Cleveland Clinic Health System Obligated Group), Series 2019-F, 0.36% 20521 | | | 1,290 | | | | 1,290 | |
| State of South Carolina, Jobs-Econ. Dev. Auth., Hospital Rev. Bonds (Prisma Health Obligated Group), Series 2018-B, 0.36% 20481 | | | 700 | | | | 700 | |
| State of Texas, Deer Park Independent School Dist., Unlimited Tax School Building Bonds, Series 2018, 0.16% 2042 (put 2022)4 | | | 225 | | | | 224 | |
| State of Texas, North East Independent School Dist., Unlimited Tax School Building Bonds, Series 2013-B, 0.25% 2032 (put 2022)4 | | | 35 | | | | 35 | |
| | | | | | | | | |
| Total short-term securities (cost: $17,324,000) | | | | | | | 17,315 | |
| Total investment securities 98.86% (cost: $126,662,000) | | | | | | | 122,688 | |
| Other assets less liabilities 1.14% | | | | | | | 1,416 | |
| | | | | | | | | |
| Net assets 100.00% | | | | | | $ | 124,104 | |
| Private Client Services Funds | 43 |
Capital Group Short-Term Municipal Fund
| Futures contracts | | | | | | | | | | | | | |
| | | | | | | | | | | | | | |
| Contracts | | Type | | Number of
contracts | | Expiration | | Notional
amount
(000) | | | Value and
unrealized
appreciation
at 4/30/2022
(000) | |
| 2 Year U.S. Treasury Note Futures | | Short | | 32 | | June 2022 | | | USD | (6,746) | | | | $ | 32 | |
| 1 | Coupon rate may change periodically. Reference rate and spread are as of the most recent information available. Some coupon rates are determined by the issuer or agent based on current market conditions; therefore, the reference rate and spread are not available. For short-term securities, the date of the next scheduled coupon rate change is considered to be the maturity date. |
| 2 | Acquired in a transaction exempt from registration under Rule 144A of the Securities Act of 1933. May be resold in the U.S. in transactions exempt from registration, normally to qualified institutional buyers. The total value of all such securities was $720,000, which represented .58% of the net assets of the fund. |
| 3 | Step bond; coupon rate may change at a later date. |
| 4 | For short-term securities, the mandatory put date is considered to be the maturity date. |
Key to abbreviations
Agcy. = Agency
Assn. = Association
Auth. = Authority
Certs. = Certificates
Dept. = Department
Dev. = Development
Dist. = District
Econ. = Economic
Fac. = Facility
Facs. = Facilities
Fin. = Finance
Fncg. = Financing
G.O. = General Obligation
LIBOR = London Interbank Offered Rate
Part. = Participation
Preref. = Prerefunded
Redev. = Redevelopment
Ref. = Refunding
Rev. = Revenue
SIFMA = Securities Industry and Financial Markets Association
SOFR = Secured Overnight Financing Rate
USD = U.S. dollars
| 44 | Private Client Services Funds |
| Capital Group California Core Municipal Fund | unaudited |
| Investment portfolio April 30, 2022 | |
| | |
| Portfolio quality summary* | Percent of net assets |
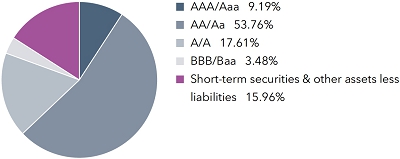
| * | Bond ratings, which typically range from AAA/Aaa (highest) to D (lowest), are assigned by credit rating agencies such as Standard & Poor’s, Moody’s and/or Fitch as an indication of an issuer’s creditworthiness. In assigning a credit rating to a security, the fund looks specifically to the ratings assigned to the issuer of the security by Standard & Poor’s, Moody’s and/or Fitch. If agency ratings differ, the security will be considered to have received the highest of those ratings, consistent with the fund’s investment policies. |
| Bonds, notes & other debt instruments 84.04% | Principal amount
(000) | | | Value
(000) | |
| California 83.48% | | | | | | | | |
| Alameda Corridor Transportation Auth., Rev. Ref. Bonds, Series 2013-A, 5.00% 2022 | | USD | 975 | | | $ | 989 | |
| Alameda Corridor Transportation Auth., Rev. Ref. Bonds, Series 2016-A, 5.00% 2024 | | | 600 | | | | 627 | |
| Alameda Corridor Transportation Auth., Rev. Ref. Bonds, Series 2016-A, 5.00% 2025 | | | 500 | | | | 530 | |
| City of Alhambra, Insured Rev. Ref. Bonds (Atherton Baptist Homes Project), Series 2016, 5.00% 2027 | | | 630 | | | | 680 | |
| City of Anaheim, Public Fncg. Auth., Lease Rev. Bonds (Anaheim Public Improvement Project), Capital Appreciation Bonds, Series 1997-C, Assured Guaranty Municipal insured, 0% 2022 | | | 2,000 | | | | 1,989 | |
| Antelope Valley Community College Dist., G.O. Rev. Ref. Bonds, Capital Appreciation Bonds, Series 2015, 0% 2035 (preref. 2025) | | | 2,300 | | | | 1,377 | |
| Antelope Valley Community College Dist., G.O. Rev. Ref. Bonds, Capital Appreciation Bonds, Series 2015, 0% 2036 (preref. 2025) | | | 2,800 | | | | 1,603 | |
| Assn. of Bay Area Governments, Fin. Auth. for Nonprofit Corps., Rev. Ref. Bonds (Eskaton Properties, Inc. Obligated Group), Series 2013, 5.00% 2022 | | | 1,000 | | | | 1,012 | |
| Assn. of Bay Area Governments, Fin. Auth. for Nonprofit Corps., Rev. Ref. Bonds (Eskaton Properties, Inc. Obligated Group), Series 2013, 5.00% 2023 | | | 500 | | | | 517 | |
| Assn. of Bay Area Governments, Fin. Auth. for Nonprofit Corps., Rev. Ref. Bonds (Windemere Ranch Infrastructure Fncg. Program), Series 2014-A, 5.00% 2023 | | | 370 | | | | 384 | |
| Assn. of Bay Area Governments, Fin. Auth. for Nonprofit Corps., Rev. Ref. Bonds (Windemere Ranch Infrastructure Fncg. Program), Series 2014-A, 5.00% 2024 | | | 395 | | | | 418 | |
| Assn. of Bay Area Governments, Fin. Auth. for Nonprofit Corps., Rev. Ref. Bonds (Windemere Ranch Infrastructure Fncg. Program), Series 2014-A, 5.00% 2025 | | | 510 | | | | 540 | |
| Bay Area Toll Auth., San Francisco Bay Area Toll Bridge Rev. Bonds, Series 2001-A, (SIFMA Municipal Swap Index + 1.25%) 1.69% 2036 (put 2027)1 | | | 1,000 | | | | 1,017 | |
| Bay Area Toll Auth., San Francisco Bay Area Toll Bridge Rev. Bonds, Series 2013-S-4, 5.00% 2043 (preref. 2023) | | | 1,000 | | | | 1,028 | |
| Bay Area Toll Auth., San Francisco Bay Area Toll Bridge Rev. Bonds, Series 2008-B-1, (SIFMA Municipal Swap Index + 1.10%) 1.54% 2045 (put 2024)1 | | | 4,275 | | | | 4,296 | |
| Bay Area Toll Auth., San Francisco Bay Area Toll Bridge Rev. Bonds, Series 2017-G, 2.00% 2053 (put 2024) | | | 2,525 | | | | 2,495 | |
| Bay Area Toll Auth., San Francisco Bay Area Toll Bridge Rev. Bonds, Series 2021-D, (SIFMA Municipal Swap Index + 0.30%) 0.74% 2056 (put 2027)1 | | | 1,895 | | | | 1,850 | |
| Bay Area Toll Auth., San Francisco Bay Area Toll Bridge Rev. Ref. Bonds, Series 2017-S-7, 5.00% 2024 | | | 1,200 | | | | 1,261 | |
| Bay Area Water Supply and Conservation Agcy., Rev. Bonds, Series 2013-A, 5.00% 2023 | | | 500 | | | | 513 | |
| City of Beaumont, Wastewater Rev. Bonds, Series 2018-A, Assured Guaranty Municipal insured, 5.00% 2026 | | | 500 | | | | 551 | |
| City of Burbank, Successor Agcy. to the Redev. Agcy., Tax Allocation Rev. Ref. Redev. Bonds, Series 2015, BAM insured, 5.00% 2022 | | | 1,305 | | | | 1,330 | |
| California County Tobacco Securitization Agcy., Tobacco Settlement Rev. Bonds (Los Angeles County Securitization Corp.), Series 2020-A, 5.00% 2026 | | | 600 | | | | 639 | |
| Trustees of the California State University, Systemwide Rev. Bonds, Series 2015-A, 5.00% 2024 | | | 500 | | | | 531 | |
| Trustees of the California State University, Systemwide Rev. Bonds, Series 2016-A, 5.00% 2028 | | | 2,705 | | | | 2,945 | |
| Trustees of the California State University, Systemwide Rev. Bonds, Series 2016-B-2, 0.55% 2049 (put 2026) | | | 1,980 | | | | 1,736 | |
| Trustees of the California State University, Systemwide Rev. Bonds, Series 2016-B-3, 4.00% 2051 (put 2023) | | | 2,500 | | | | 2,540 | |
| City of Carlsbad, Reassessment Dist. No. 2012-1, Limited Obligation Rev. Ref. Bonds, Series 2013, 3.55% 2023 | | | 350 | | | | 351 | |
| Private Client Services Funds | 45 |
Capital Group California Core Municipal Fund
| Bonds, notes & other debt instruments (continued) | Principal amount
(000) | | | Value
(000) | |
| California (continued) | | | | | | | | |
| Cathedral City, Successor Agcy. to the Redev. Agcy., Tax Allocation Housing Rev. Ref. Bonds (Merged Redev. Project Area), Series 2021-C, BAM insured, 4.00% 2022 | | USD | 200 | | | $ | 201 | |
| Cathedral City, Successor Agcy. to the Redev. Agcy., Tax Allocation Housing Rev. Ref. Bonds (Merged Redev. Project Area), Series 2021-C, BAM insured, 4.00% 2023 | | | 225 | | | | 229 | |
| Cathedral City, Successor Agcy. to the Redev. Agcy., Tax Allocation Housing Rev. Ref. Bonds (Merged Redev. Project Area), Series 2014-B, Assured Guaranty Municipal insured, 5.00% 2024 | | | 260 | | | | 274 | |
| Cathedral City, Successor Agcy. to the Redev. Agcy., Tax Allocation Housing Rev. Ref. Bonds (Merged Redev. Project Area), Series 2014-A, Assured Guaranty Municipal insured, 5.00% 2025 | | | 620 | | | | 652 | |
| Cerritos Community College Dist., G.O. Bonds, Capital Appreciation Bonds, 2004 Election, Series 2012-D, 0% 2027 | | | 830 | | | | 709 | |
| City of Chino, Community Facs. Dist. No. 2003-3, Special Tax Bonds, Series 2021, 4.00% 2027 | | | 465 | | | | 471 | |
| City of Chino, Community Facs. Dist. No. 2003-3, Special Tax Bonds, Series 2021, 4.00% 2028 | | | 480 | | | | 484 | |
| City of Chino, Community Facs. Dist. No. 2003-3, Special Tax Bonds, Series 2021, 4.00% 2029 | | | 500 | | | | 504 | |
| City of Chino, Community Facs. Dist. No. 2003-3, Special Tax Bonds, Series 2021, 4.00% 2030 | | | 520 | | | | 521 | |
| City of Chino, Community Facs. Dist. No. 2003-3, Special Tax Bonds, Series 2021, 4.00% 2031 | | | 540 | | | | 538 | |
| City of Chino, Successor Agcy. to the Redev. Agcy., Tax Allocation Rev. Ref. Bonds, Series 2014-A, BAM insured, 5.00% 2022 | | | 450 | | | | 455 | |
| City of Chino, Successor Agcy. to the Redev. Agcy., Tax Allocation Rev. Ref. Bonds, Series 2014-A, BAM insured, 5.00% 2025 | | | 665 | | | | 702 | |
| City of Chino Hills, Fin. Auth., Rev. Ref. Bonds (Community Facs. Dist. Bond Program), Series 2019-D, 5.00% 2024 | | | 465 | | | | 486 | |
| City of Chino Hills, Fin. Auth., Rev. Ref. Bonds (Community Facs. Dist. Bond Program), Series 2019-D, 5.00% 2026 | | | 780 | | | | 838 | |
| City of Chino Hills, Fin. Auth., Rev. Ref. Bonds (Community Facs. Dist. Bond Program), Series 2019-D, 5.00% 2027 | | | 430 | | | | 466 | |
| City of Chino Hills, Fin. Auth., Rev. Ref. Bonds (Community Facs. Dist. Bond Program), Series 2019-D, 5.00% 2028 | | | 355 | | | | 388 | |
| City of Chino Hills, Fin. Auth., Rev. Ref. Bonds (Community Facs. Dist. Bond Program), Series 2019-D, 5.00% 2029 | | | 225 | | | | 248 | |
| City of Chino Hills, Fin. Auth., Rev. Ref. Bonds (Community Facs. Dist. Bond Program), Series 2019-D, 5.00% 2030 | | | 60 | | | | 66 | |
| City of Chula Vista, Municipal Fncg. Auth., Special Tax Rev. Ref. Bonds, Series 2013, 5.00% 2022 | | | 1,355 | | | | 1,371 | |
| Clovis Unified School Dist., G.O. Bonds, Capital Appreciation Bonds, 2004 Election, Series 2006-B, National insured, 0% 2030 | | | 1,000 | | | | 761 | |
| Community Choice Fncg. Auth., Clean Energy Project Rev. Green Bonds, Series 2021-B-1, 4.00% 2052 (put 2031) | | | 3,750 | | | | 3,808 | |
| Community Choice Fncg. Auth., Clean Energy Project Rev. Green Bonds, Series 2021-A, 4.00% 2052 (put 2027) | | | 1,170 | | | | 1,200 | |
| Compton Community College Dist., G.O. Rev. Ref. Bonds, Series 2014, BAM insured, 5.00% 2026 (preref. 2024) | | | 1,290 | | | | 1,363 | |
| Compton Community College Dist., G.O. Rev. Ref. Bonds, Series 2015, BAM insured, 5.00% 2029 (preref. 2025) | | | 1,000 | | | | 1,080 | |
| Compton Unified School Dist., G.O. Bonds, Capital Appreciation Bonds, 2015 Election, Series 2019-B, BAM insured, 0% 2033 | | | 1,000 | | | | 651 | |
| City of Concord, Successor Agcy. to the Redev. Agcy., Rev. Ref. Bonds, Series 2014, BAM insured, 5.00% 2023 | | | 825 | | | | 845 | |
| Del Mar Union School Dist., Community Facs. Dist. No. 99-1, Special Tax Bonds, Series 2019, 4.00% 2026 | | | 400 | | | | 412 | |
| Del Mar Union School Dist., Community Facs. Dist. No. 99-1, Special Tax Bonds, Series 2019, 5.00% 2027 | | | 885 | | | | 964 | |
| Del Mar Union School Dist., Community Facs. Dist. No. 99-1, Special Tax Bonds, Series 2019, 5.00% 2028 | | | 930 | | | | 1,024 | |
| Del Mar Union School Dist., Community Facs. Dist. No. 99-1, Special Tax Bonds, Series 2019, 5.00% 2029 | | | 675 | | | | 750 | |
| Desert Community College Dist., G.O. Rev. Ref. Bonds, Series 2016, 5.00% 2032 (preref. 2026) | | | 1,885 | | | | 2,057 | |
| City of Dublin, Community Facs. Dist. No. 2015-1 (Dublin Crossing), Improvement Area No. 3, Special Tax Bonds, Series 2021, 3.00% 2023 | | | 205 | | | | 205 | |
| City of Dublin, Community Facs. Dist. No. 2015-1 (Dublin Crossing), Improvement Area No. 3, Special Tax Bonds, Series 2021, 3.00% 2025 | | | 265 | | | | 260 | |
| East Bay Municipal Utility Dist., Water System Rev. Ref. Bonds, Series 2015-A, 5.00% 2027 | | | 3,550 | | | | 3,814 | |
| East Side Union High School Dist., G.O. Bonds, 2008 Election, Series 2012-D, 5.00% 2037 (preref. 2022) | | | 500 | | | | 505 | |
| Eastern Municipal Water Dist., Fin. Auth., Water and Wastewater Rev. Ref. Bonds, Series 2020-A, 2.75% 2028 | | | 535 | | | | 537 | |
| Eastern Municipal Water Dist., Water and Wastewater Rev. Ref. Bonds, Series 2021-A, 4.00% 2029 | | | 1,210 | | | | 1,309 | |
| Educational Facs. Auth., Rev. Bonds (Chapman University), Series 2021-A, 5.00% 2028 | | | 1,375 | | | | 1,534 | |
| Educational Facs. Auth., Rev. Ref. Bonds (Stanford University), Series 2009-T-5, 5.00% 2023 | | | 1,290 | | | | 1,325 | |
| City of El Centro, Fncg. Auth., Wastewater Rev. Ref. Bonds, Series 2014-A, Assured Guaranty Municipal insured, 5.00% 2026 | | | 530 | | | | 560 | |
| City of El Centro, Fncg. Auth., Wastewater Rev. Ref. Bonds, Series 2014-A, Assured Guaranty Municipal insured, 5.00% 2027 | | | 500 | | | | 528 | |
| City of El Centro, Fncg. Auth., Wastewater Rev. Ref. Bonds, Series 2014-A, Assured Guaranty Municipal insured, 5.00% 2030 | | | 1,000 | | | | 1,055 | |
| County of El Dorado, Community Facs. Dist. No. 1992-1 (El Dorado Hills Dev.), Special Tax Rev. Ref. Bonds, Series 2012, 5.00% 2024 | | | 855 | | | | 865 | |
| City of Elk Grove, Fin. Auth., Special Tax Rev. Bonds, Series 2015, BAM insured, 5.00% 2025 | | | 580 | | | | 619 | |
| Etiwanda School Dist., G.O. Bonds, 2016 Election, Series 2020-A, 4.00% 2029 | | | 570 | | | | 611 | |
| City of Eureka, Successor Agcy. to the Redev. Agcy., Tax Allocation Rev. Ref. Bonds, Series 2017-B, 5.00% 2022 | | | 835 | | | | 848 | |
| City of Fillmore, Successor Agcy. to the Redev. Agcy., Tax Allocation Rev. Ref. Bonds, Series 2015, BAM insured, 5.00% 2024 | | | 1,000 | | | | 1,051 | |
| 46 | Private Client Services Funds |
Capital Group California Core Municipal Fund
| Bonds, notes & other debt instruments (continued) | | Principal amount
(000) | | Value
(000) | |
| California (continued) | | | | | | | | |
| Folsom Cordova Unified School Dist., School Facs. Improvement Dist. No. 1, G.O. Bonds, Capital Appreciation Bonds, 2002 Election, Series 2004-B, National insured, 0% 2026 | | USD | 1,000 | | | $ | 876 | |
| City of Fontana, Community Facs. Dist. No. 22 (Sierra Hills South), Special Tax Bonds, Series 2014, 5.00% 2023 | | | 535 | | | | 551 | |
| City of Fontana, Community Facs. Dist. No. 86 (Etiwanda Ridge), Special Tax Bonds, Series 2020, 4.00% 2026 | | | 100 | | | | 103 | |
| City of Fontana, Community Facs. Dist. No. 86 (Etiwanda Ridge), Special Tax Bonds, Series 2020, 4.00% 2027 | | | 120 | | | | 123 | |
| City of Fontana, Public Facs. Fin. Auth., Special Tax Rev. Ref. Bonds, Series 2021-A, 4.00% 2027 | | | 625 | | | | 646 | |
| City of Fontana, Public Facs. Fin. Auth., Special Tax Rev. Ref. Bonds, Series 2021-A, 4.00% 2029 | | | 390 | | | | 403 | |
| G.O. Bonds, Series 2021, 5.00% 2029 | | | 2,000 | | | | 2,285 | |
| G.O. Bonds, Series 2018, 5.00% 2030 | | | 1,000 | | | | 1,125 | |
| G.O. Bonds, Series 2021, 5.00% 2031 | | | 85 | | | | 92 | |
| G.O. Bonds, Series 2021, 5.00% 2032 | | | 70 | | | | 76 | |
| G.O. Bonds, Series 2022, 5.00% 2033 | | | 1,250 | | | | 1,459 | |
| G.O. Bonds, Series 2021, 5.00% 2034 | | | 70 | | | | 76 | |
| G.O. Rev. Ref. Bonds, Series 2019, 5.00% 2027 | | | 745 | | | | 827 | |
| G.O. Rev. Ref. Bonds, Series 2021, 5.00% 2028 | | | 1,000 | | | | 1,129 | |
| G.O. Rev. Ref. Bonds, Series 2019, 5.00% 2028 | | | 685 | | | | 769 | |
| G.O. Rev. Ref. Bonds, Series 2017, 5.00% 2029 | | | 6,000 | | | | 6,695 | |
| G.O. Rev. Ref. Bonds, Series 2020, 5.00% 2029 | | | 3,500 | | | | 4,003 | |
| G.O. Rev. Ref. Bonds, Series 2021, 5.00% 2029 | | | 3,000 | | | | 3,424 | |
| G.O. Rev. Ref. Bonds, Series 2019, 5.00% 2029 | | | 1,000 | | | | 1,143 | |
| G.O. Rev. Ref. Bonds, Series 2021, 5.00% 2030 | | | 3,500 | | | | 4,034 | |
| G.O. Rev. Ref. Bonds, Series 2020, 5.00% 2030 | | | 2,850 | | | | 3,291 | |
| G.O. Rev. Ref. Bonds, Series 2019, 5.00% 2031 | | | 3,000 | | | | 3,481 | |
| G.O. Rev. Ref. Bonds, Series 2021, 5.00% 2031 | | | 2,500 | | | | 2,914 | |
| G.O. Rev. Ref. Bonds, Series 2020, 5.00% 2032 | | | 4,000 | | | | 4,569 | |
| G.O. Rev. Ref. Bonds, Series 2007, Assured Guaranty Municipal insured, 5.25% 2032 | | | 2,125 | | | | 2,520 | |
| G.O. Rev. Ref. Bonds, Series 2020, 5.00% 2035 | | | 2,000 | | | | 2,263 | |
| City of Garden Grove, Successor Agcy. to the Dev. Agcy., Tax Allocation Bonds, Series 2016, BAM insured, 5.00% 2022 | | | 400 | | | | 405 | |
| City of Glendale, Successor Agcy. to the Redev. Agcy., Tax Allocation Rev. Ref. Bonds (Central Glendale Redev. Project), Series 2016, BAM insured, 5.00% 2024 | | | 425 | | | | 451 | |
| Golden State Tobacco Securitization Corp., Enhanced Tobacco Settlement Asset-Backed Bonds, Series 2018-A, 5.00% 2022 (escrowed to maturity) | | | 3,000 | | | | 3,009 | |
| Golden State Tobacco Securitization Corp., Enhanced Tobacco Settlement Asset-Backed Bonds, Series 2017-A-1, 5.00% 2022 | | | 1,730 | | | | 1,735 | |
| Golden State Tobacco Securitization Corp., Enhanced Tobacco Settlement Asset-Backed Bonds, Capital Appreciation Bonds, Series 2005-A, AMBAC insured, 0% 2024 (escrowed to maturity) | | | 2,000 | | | | 1,904 | |
| Golden State Tobacco Securitization Corp., Enhanced Tobacco Settlement Asset-Backed Bonds, Capital Appreciation Bonds, Series 2005-A, Assured Guaranty Municipal insured, 0% 2026 (escrowed to maturity) | | | 2,785 | | | | 2,514 | |
| Greenfield Elementary School Dist., G.O. Bonds, Capital Appreciation Bonds, 2006 Election, Series 2007-A, Assured Guaranty Municipal insured, 0% 2029 | | | 1,270 | | | | 987 | |
| City of Grossmont, Healthcare Dist., G.O. Bonds, Capital Appreciation Bonds, 2006 Election, Series 2007-A, AMBAC insured, 0% 2032 | | | 1,500 | | | | 1,052 | |
| City of Hawthorne, Successor Agcy. to the Redev. Agcy., Tax Allocation Rev. Ref. Bonds, Series 2016, Assured Guaranty Municipal insured, 5.00% 2024 | | | 250 | | | | 264 | |
| Health Facs. Fncg. Auth., Rev. Bonds (Adventist Health System/West), Series 2013-A, 5.00% 2023 | | | 910 | | | | 933 | |
| Health Facs. Fncg. Auth., Rev. Bonds (Adventist Health System/West), Series 2013-A, 5.00% 2024 | | | 1,105 | | | | 1,132 | |
| Health Facs. Fncg. Auth., Rev. Bonds (Cedars-Sinai Medical Center), Series 2016-A, 5.00% 2023 | | | 650 | | | | 674 | |
| Health Facs. Fncg. Auth., Rev. Bonds (El Camino Hospital), Series 2017, 5.00% 2025 | | | 1,000 | | | | 1,066 | |
| Health Facs. Fncg. Auth., Rev. Bonds (Kaiser Permanente), Series 2017-B, 5.00% 2029 (put 2022) | | | 1,025 | | | | 1,041 | |
| Health Facs. Fncg. Auth., Rev. Bonds (Lucile Salter Packard Children’s Hospital at Stanford), Series 2014-A, 5.00% 2025 | | | 400 | | | | 422 | |
| Health Facs. Fncg. Auth., Rev. Bonds (PIH Health), Series 2020-A, 5.00% 2030 | | | 1,900 | | | | 2,171 | |
| Health Facs. Fncg. Auth., Rev. Bonds (Providence St. Joseph Health), Series 2019-B, 5.00% 2039 (put 2027) | | | 2,135 | | | | 2,333 | |
| Health Facs. Fncg. Auth., Rev. Bonds (Sutter Health), Series 2018-A, 5.00% 2024 | | | 3,000 | | | | 3,182 | |
| Health Facs. Fncg. Auth., Rev. Bonds (Sutter Health), Series 2016-A, 5.00% 2026 (preref. 2025) | | | 300 | | | | 326 | |
| Health Facs. Fncg. Auth., Rev. Bonds (Sutter Health), Series 2013-A, 5.00% 2052 (preref. 2023) | | | 1,665 | | | | 1,726 | |
| Health Facs. Fncg. Auth., Rev. Ref. Bonds (Adventist Health System/West), Series 2016-A, 4.00% 2025 | | | 1,270 | | | | 1,324 | |
| Health Facs. Fncg. Auth., Rev. Ref. Bonds (Lucile Salter Packard Children’s Hospital at Stanford), Series 2022-A, 5.00% 2026 | | | 830 | | | | 904 | |
| Health Facs. Fncg. Auth., Rev. Ref. Bonds (Marshall Medical Center), Series 2015, 5.00% 2022 | | | 175 | | | | 178 | |
| Health Facs. Fncg. Auth., Rev. Ref. Bonds (Marshall Medical Center), Series 2015, 5.00% 2023 | | | 135 | | | | 140 | |
| Private Client Services Funds | 47 |
Capital Group California Core Municipal Fund
| Bonds, notes & other debt instruments (continued) | | Principal amount
(000) | | | Value
(000) | |
| California (continued) | | | | | | | | |
| Health Facs. Fncg. Auth., Rev. Ref. Bonds (Stanford Health Care), Series 2017-A, 5.00% 2024 | | USD | 1,000 | | | $ | 1,062 | |
| Health Facs. Fncg. Auth., Rev. Ref. Bonds (Stanford Health Care), Series 2017-A, 5.00% 2026 | | | 1,750 | | | | 1,927 | |
| Hemet Unified School Dist., Fncg. Auth., Special Tax Rev. Bonds, Series 2015, 5.00% 2026 | | | 600 | | | | 632 | |
| Hemet Unified School Dist., G.O. Rev. Ref. Bonds, Series 2014, Assured Guaranty Municipal insured, 5.00% 2023 | | | 885 | | | | 917 | |
| Housing Fin. Agcy., Municipal Certs., Series 2021-A-3, 3.25% 2036 | | | 1,252 | | | | 1,200 | |
| Infrastructure and Econ. Dev. Bank, Charter School Rev. Bonds (Equitable School Revolving Fund), Series 2019-B, 5.00% 2025 | | | 100 | | | | 107 | |
| Infrastructure and Econ. Dev. Bank, Charter School Rev. Bonds (Equitable School Revolving Fund), Series 2019-B, 5.00% 2026 | | | 125 | | | | 135 | |
| Infrastructure and Econ. Dev. Bank, Charter School Rev. Bonds (Equitable School Revolving Fund), Series 2019-B, 5.00% 2027 | | | 110 | | | | 120 | |
| Infrastructure and Econ. Dev. Bank, Charter School Rev. Bonds (Equitable School Revolving Fund), Series 2019-B, 5.00% 2028 | | | 375 | | | | 411 | |
| Infrastructure and Econ. Dev. Bank, Charter School Rev. Bonds (Equitable School Revolving Fund), Series 2019-B, 5.00% 2029 | | | 140 | | | | 153 | |
| Infrastructure and Econ. Dev. Bank, Charter School Rev. Bonds (Equitable School Revolving Fund), Series 2019-B, 5.00% 2030 | | | 340 | | | | 370 | |
| Infrastructure and Econ. Dev. Bank, Rev. Ref. Bonds (J. Paul Getty Trust), Series 2020-A-1, 4.00% 2030 | | | 825 | | | | 894 | |
| City of Inglewood, Successor Agcy. to the Redev. Agcy., Tax Allocation Rev. Ref. Bonds (Merged Redev. Project), Series 2017-A, BAM insured, 5.00% 2027 | | | 650 | | | | 720 | |
| City of Irvine, Reassessment Dist. No. 12-1, Limited Obligation Improvement Bonds, Series 2012, 3.25% 2022 | | | 700 | | | | 704 | |
| City of Irvine, Reassessment Dist. No. 12-1, Limited Obligation Improvement Bonds, Series 2012, 4.00% 2022 | | | 400 | | | | 403 | |
| City of Irvine, Reassessment Dist. No. 12-1, Limited Obligation Improvement Bonds, Series 2013, 5.00% 2024 | | | 725 | | | | 751 | |
| City of Irvine, Reassessment Dist. No. 13-1, Limited Obligation Improvement Bonds, Series 2013, 3.375% 2023 | | | 850 | | | | 864 | |
| City of Irvine, Reassessment Dist. No. 19-1, Limited Obligation Improvement Bonds, Series 2019, 4.00% 2022 | | | 225 | | | | 227 | |
| City of Irvine, Reassessment Dist. No. 19-1, Limited Obligation Improvement Bonds, Series 2019, 5.00% 2023 | | | 200 | | | | 207 | |
| City of Irvine, Reassessment Dist. No. 19-1, Limited Obligation Improvement Bonds, Series 2019, 5.00% 2024 | | | 210 | | | | 221 | |
| City of Irvine, Reassessment Dist. No. 19-1, Limited Obligation Improvement Bonds, Series 2019, 5.00% 2025 | | | 250 | | | | 267 | |
| City of Irvine, Reassessment Dist. No. 21-1, Limited Obligation Improvement Bonds, Series 2021, BAM insured, 4.00% 2025 | | | 500 | | | | 517 | |
| City of Irvine, Reassessment Dist. No. 21-1, Limited Obligation Improvement Bonds, Series 2021, 4.00% 2028 | | | 500 | | | | 524 | |
| City of Irvine, Reassessment Dist. No. 21-1, Limited Obligation Improvement Bonds, Series 2021, BAM insured, 4.00% 2030 | | | 1,265 | | | | 1,327 | |
| Irvine Unified School Dist., Community Facs. Dist. No. 09-1, Special Tax Bonds, Series 2019-A, BAM insured, 5.00% 2027 | | | 140 | | | | 154 | |
| Irvine Unified School Dist., Community Facs. Dist. No. 09-1, Special Tax Bonds, Series 2019-A, BAM insured, 5.00% 2028 | | | 350 | | | | 389 | |
| Irvine Unified School Dist., Community Facs. Dist. No. 09-1, Special Tax Bonds, Series 2019-A, BAM insured, 5.00% 2030 | | | 215 | | | | 237 | |
| City of Jurupa, Public Fncg. Auth., Special Tax Rev. Bonds, Series 2014-A, 5.00% 2023 | | | 500 | | | | 517 | |
| City of Jurupa, Public Fncg. Auth., Special Tax Rev. Bonds, Series 2014-A, 5.00% 2029 | | | 710 | | | | 748 | |
| City of Jurupa, Public Fncg. Auth., Special Tax Rev. Ref. Bonds, Series 2020-A, BAM insured, 5.00% 2023 | | | 750 | | | | 776 | |
| City of Jurupa, Public Fncg. Auth., Special Tax Rev. Ref. Bonds, Series 2020-A, BAM insured, 4.00% 2027 | | | 1,615 | | | | 1,711 | |
| Jurupa Unified School Dist., Fncg. Auth., Special Tax Rev. Ref. Bonds (Community Facs. Dists. Nos. 10, 12, 13 and 15), Series 2021-A, BAM insured, 4.00% 2029 | | | 335 | | | | 360 | |
| Jurupa Unified School Dist., Fncg. Auth., Special Tax Rev. Ref. Bonds (Community Facs. Dists. Nos. 10, 12, 13 and 15), Series 2021-A, BAM insured, 4.00% 2031 | | | 375 | | | | 406 | |
| Kern Community College Dist., Safety Repair and Improvement G.O. Bonds, Capital Appreciation Bonds, 2002 Election, Series 2006, FSA insured, 0% 2022 | | | 1,500 | | | | 1,487 | |
| Kings Canyon Joint Unified School Dist., G.O. Rev. Ref. Bonds, Series 2016, Assured Guaranty Municipal insured, 5.00% 2029 | | | 1,600 | | | | 1,717 | |
| La Habra School Dist., G.O. Bonds, Capital Appreciation Bonds, 2000 Election, Series 2002-A, FSA insured, 0% 2026 | | | 1,010 | | | | 883 | |
| Lakeside Union School Dist., G.O. Rev. Ref. Bonds, Series 2016, 5.00% 2029 | | | 1,785 | | | | 1,957 | |
| Lammersville Joint Unified School Dist., Community Facs. Dist. No. 2002, Special Tax Bonds, Series 2017, 4.00% 2022 | | | 680 | | | | 684 | |
| City of Lodi, Public Fin. Auth., Rev. Ref. Bonds, Series 2018, Assured Guaranty Municipal insured, 5.00% 2024 | | | 260 | | | | 275 | |
| Long Beach Community College Dist., G.O. Bonds, Capital Appreciation Bonds, 2008 Election, Series 2008-A, Assured Guaranty Municipal insured, 0% 2027 | | | 3,865 | | | | 3,322 | |
| City of Los Angeles, Community Facs. Dist. No. 4 (Playa Vista - Phase 1), Special Tax Rev. Ref. Bonds, Series 2014, 5.00% 2023 | | | 690 | | | | 714 | |
| City of Los Angeles, Dept. of Airports, Los Angeles International Airport, Rev. and Rev. Ref. Bonds, Series 2021-B, 5.00% 2031 | | | 420 | | | | 483 | |
| 48 | Private Client Services Funds |
Capital Group California Core Municipal Fund
| Bonds, notes & other debt instruments (continued) | Principal amount
(000) | | | Value
(000) | |
| California (continued) | | | | | | | | |
| City of Los Angeles, Dept. of Airports, Los Angeles International Airport, Rev. and Rev. Ref. Bonds, Series 2021-B, 5.00% 2034 | | USD | 1,025 | | | $ | 1,159 | |
| City of Los Angeles, Dept. of Airports, Los Angeles International Airport, Rev. Bonds, Series 2019-E, 5.00% 2039 | | | 1,130 | | | | 1,234 | |
| City of Los Angeles, Dept. of Water and Power, Power System Rev. Bonds, Series 2021-B, 3.00% 2022 | | | 3,000 | | | | 3,009 | |
| City of Los Angeles, Dept. of Water and Power, Power System Rev. Bonds, Series 2017-C, 5.00% 2022 | | | 575 | | | | 579 | |
| City of Los Angeles, Dept. of Water and Power, Power System Rev. Bonds, Series 2013-A, 5.00% 2022 | | | 515 | | | | 518 | |
| City of Los Angeles, Dept. of Water and Power, Power System Rev. Bonds, Series 2018-D, 5.00% 2024 | | | 535 | | | | 564 | |
| City of Los Angeles, Dept. of Water and Power, Power System Rev. Bonds, Series 2018-B, 5.00% 2025 | | | 1,875 | | | | 2,016 | |
| City of Los Angeles, Dept. of Water and Power, Power System Rev. Bonds, Series 2018-D, 5.00% 2025 | | | 500 | | | | 539 | |
| City of Los Angeles, Dept. of Water and Power, Power System Rev. Bonds, Series 2018-B, 5.00% 2026 | | | 2,000 | | | | 2,194 | |
| City of Los Angeles, Dept. of Water and Power, Power System Rev. Bonds, Series 2018-A, 5.00% 2027 | | | 1,555 | | | | 1,734 | |
| City of Los Angeles, Dept. of Water and Power, Power System Rev. Bonds, Series 2019-D, 5.00% 2027 | | | 1,100 | | | | 1,227 | |
| City of Los Angeles, Dept. of Water and Power, Power System Rev. Bonds, Series 2022-A, 5.00% 2030 | | | 775 | | | | 899 | |
| City of Los Angeles, Dept. of Water and Power, Power System Rev. Bonds, Series 2022-B, 5.00% 2032 | | | 690 | | | | 815 | |
| City of Los Angeles, Dept. of Water and Power, Power System Rev. Bonds, Series 2021-C, 5.00% 2033 | | | 1,500 | | | | 1,737 | |
| City of Los Angeles, Dept. of Water and Power, Power System Rev. Bonds, Series 2022-B, 5.00% 2033 | | | 1,345 | | | | 1,578 | |
| City of Los Angeles, Dept. of Water and Power, Water System Rev. Bonds, Series 2020-A, 5.00% 2028 | | | 650 | | | | 737 | |
| City of Los Angeles, Solid Waste Resources Rev. Bonds, Series 2013-A, 2.00% 2023 | | | 1,110 | | | | 1,112 | |
| County of Los Angeles, Dev. Auth., Multi Family Housing Mortgage Rev. Bonds (Long Beach Senior Housing), Series 2022, 2.00% 2026 (put 2025) | | | 3,350 | | | | 3,269 | |
| County of Los Angeles, Dev. Auth., Multi Family Housing Rev. Bonds (Cantamar Villas), Series 2021-D-1, 0.30% 2025 (put 2024) | | | 1,295 | | | | 1,235 | |
| County of Los Angeles, Dev. Auth., Multi Family Housing Rev. Bonds (Sunny Garden Apartments), Series 2021-C-1, 0.20% 2024 (put 2023) | | | 3,175 | | | | 3,139 | |
| County of Los Angeles, Metropolitan Transportation Auth., Proposition C Sales Tax Rev. Bonds, Series 2021-A, 5.00% 2030 | | | 3,610 | | | | 4,208 | |
| County of Los Angeles, Redev. Ref. Auth., Tax Allocation Rev. Ref. Bonds (South Gate Project No. 1), Series 2014-A, Assured Guaranty Municipal insured, 5.00% 2022 | | | 1,190 | | | | 1,203 | |
| Los Angeles Community College Dist., G.O. Bonds, 2008 Election, Series 2008-G, 4.00% 2039 (preref. 2024) | | | 3,350 | | | | 3,473 | |
| Los Angeles Unified School Dist., G.O. Rev. Ref. Bonds, Series 2014-C, 5.00% 2023 | | | 520 | | | | 538 | |
| Madera Unified School Dist., G.O. Bonds, Capital Appreciation Bonds, 2002 Election, Series 2006, Assured Guaranty Municipal insured, 0% 2029 | | | 585 | | | | 462 | |
| Manhattan Beach Unified School Dist., G.O. Bonds, Capital Appreciation Bonds, Series 1999-C, FGIC-National insured, 0% 2024 | | | 3,875 | | | | 3,615 | |
| Manteca Unified School Dist., G.O. Bonds, Capital Appreciation Bonds, 2004 Election, Series 2006, MBIA insured, 0% 2027 | | | 560 | | | | 474 | |
| Menifee Union School Dist., Community Facs. Dist. No. 2011-1, Improvement Area No. 5, Special Tax Bonds, Series 2021, 4.00% 2028 | | | 275 | | | | 279 | |
| City of Merced, Irrigation Dist., Electric System Rev. Ref. Bonds, Series 2015-A, Assured Guaranty Municipal insured, 5.00% 2022 | | | 500 | | | | 507 | |
| City of Merced, Irrigation Dist., Electric System Rev. Ref. Bonds, Series 2015-A, Assured Guaranty Municipal insured, 5.00% 2028 | | | 250 | | | | 269 | |
| Merced Union High School Dist., G.O. Bonds, Capital Appreciation Bonds, 2008 Election, Series 2011-C, 0% 2033 | | | 615 | | | | 407 | |
| Montebello Unified School Dist., G.O. Rev. Ref. Bonds, Series 2015, 5.00% 2028 | | | 1,545 | | | | 1,640 | |
| Mountain View School Dist., G.O. Bonds, 2020 Election, Series 2021-A, Assured Guaranty Municipal insured, 4.00% 2023 | | | 1,290 | | | | 1,320 | |
| Municipal Fin. Auth., Educational Rev. Bonds (American Heritage Education Foundation Project), Series 2016-A, 4.00% 2026 | | | 200 | | | | 201 | |
| Municipal Fin. Auth., Multi Family Housing Rev. Bonds (Walnut Apartments), Series 2021-A, 0.45% 2024 (put 2023) | | | 2,935 | | | | 2,828 | |
| Municipal Fin. Auth., Rev. Bonds (California Institute of the Arts), Series 2021, 4.00% 2033 | | | 250 | | | | 255 | |
| Municipal Fin. Auth., Rev. Bonds (California Lutheran University), Series 2018, 5.00% 2026 | | | 300 | | | | 323 | |
| Municipal Fin. Auth., Rev. Bonds (Community Health System), Series 2021-A, Assured Guaranty Municipal insured, 5.00% 2027 | | | 800 | | | | 881 | |
| Municipal Fin. Auth., Rev. Bonds (Community Health System), Series 2021-A, Assured Guaranty Municipal insured, 5.00% 2028 | | | 750 | | | | 837 | |
| Municipal Fin. Auth., Rev. Bonds (Community Health System), Series 2021-A, Assured Guaranty Municipal insured, 5.00% 2029 | | | 825 | | | | 933 | |
| Municipal Fin. Auth., Rev. Bonds (Retirement Housing Foundation), Series 2017-A, 5.00% 2024 | | | 300 | | | | 317 | |
| Municipal Fin. Auth., Rev. Bonds (University of La Verne), Series 2017-A, 5.00% 2023 | | | 750 | | | | 773 | |
| Municipal Fin. Auth., Rev. Ref. Bonds (Biola University), Series 2013, 5.00% 2022 | | | 470 | | | | 476 | |
| Municipal Fin. Auth., Rev. Ref. Bonds (Biola University), Series 2017, 5.00% 2026 | | | 335 | | | | 361 | |
| Municipal Fin. Auth., Rev. Ref. Bonds (Harbor Regional Center Project), Series 2015, 5.00% 2022 | | | 885 | | | | 900 | |
| Private Client Services Funds | 49 |
Capital Group California Core Municipal Fund
| Bonds, notes & other debt instruments (continued) | | Principal amount
(000) | | | Value
(000) | |
| California (continued) | | | | | | | | |
| Municipal Fin. Auth., Rev. Ref. Bonds (Harbor Regional Center Project), Series 2015, 5.00% 2025 | | USD | 500 | | | $ | 542 | |
| Municipal Fin. Auth., Rev. Ref. Bonds (HumanGood Obligated Group), Series 2019-A, 4.00% 2028 | | | 750 | | | | 782 | |
| Municipal Fin. Auth., Rev. Ref. Bonds (HumanGood Obligated Group), Series 2019-A, 4.00% 2029 | | | 1,085 | | | | 1,134 | |
| Municipal Fin. Auth., Rev. Ref. Bonds (HumanGood Obligated Group), Series 2019-A, 4.00% 2035 | | | 1,000 | | | | 1,027 | |
| Municipal Fin. Auth., Student Housing Rev. Bonds (CHF-Riverside I, LLC - UCR Student Housing Project), Series 2019, BAM insured, 5.00% 2027 | | | 530 | | | | 575 | |
| Murrieta Valley Unified School Dist., G.O. Bonds, 2014 Election, Series 2020, 4.00% 2023 | | | 335 | | | | 342 | |
| Murrieta Valley Unified School Dist., Public Fncg. Auth., Special Tax Rev. Bonds, Series 2016-A, 5.00% 2023 | | | 2,530 | | | | 2,607 | |
| Northern California Energy Auth., Commodity Supply Rev. Bonds, Series 2018, 4.00% 2049 (put 2024) | | | 4,500 | | | | 4,578 | |
| Oak Park Unified School Dist., G.O. Bonds, Capital Appreciation Bonds, 2006 Election, Series 2009-B, Assured Guaranty Municipal insured, 0% 2029 | | | 605 | | | | 472 | |
| Oakland Unified School Dist., G.O. Bonds, 2006 Election, Series 2016-A, 5.00% 2026 | | | 1,325 | | | | 1,451 | |
| Oakland Unified School Dist., G.O. Bonds, 2012 Election, Series 2019-A, Assured Guaranty Municipal insured, 5.00% 2028 | | | 1,000 | | | | 1,116 | |
| Oakland Unified School Dist., G.O. Bonds, 2012 Election, Series 2019-A, Assured Guaranty Municipal insured, 4.00% 2034 | | | 1,000 | | | | 1,033 | |
| Oakland Unified School Dist., G.O. Rev. Ref. Bonds, Series 2017-A, 5.00% 2022 | | | 2,000 | | | | 2,018 | |
| Oakland Unified School Dist., G.O. Rev. Ref. Bonds, Series 2016, 5.00% 2022 | | | 915 | | | | 923 | |
| Oakland Unified School Dist., G.O. Rev. Ref. Bonds, Series 2016, 5.00% 2024 | | | 1,310 | | | | 1,383 | |
| Oakland Unified School Dist., G.O. Rev. Ref. Bonds, Series 2016, 5.00% 2025 | | | 3,000 | | | | 3,227 | |
| Oakland Unified School Dist., G.O. Rev. Ref. Bonds, Series 2015, Assured Guaranty insured, 5.00% 2026 | | | 1,125 | | | | 1,212 | |
| Ohlone Community College Dist., G.O. Rev. Ref. Bonds, Series 2012, 5.00% 2023 (preref. 2022) | | | 550 | | | | 555 | |
| County of Orange, Airport Private Activity Rev. Ref. Bonds, Series 2019-B, 5.00% 2025 | | | 1,065 | | | | 1,141 | |
| County of Orange, Airport Private Activity Rev. Ref. Bonds, Series 2019-A, 5.00% 2025 | | | 1,000 | | | | 1,071 | |
| County of Orange, Airport Rev. Ref. Bonds, Series 2019-A, 5.00% 2022 | | | 1,000 | | | | 1,006 | |
| County of Orange, Community Facs. Dist. No. 2016-1 (Village of Esencia), Special Tax Bonds, Series 2016-A, 5.00% 2026 | | | 570 | | | | 612 | |
| County of Orange, Transportation Auth., Bond Anticipation Notes (I-405 Improvement Project), Series 2021, 5.00% 2024 | | | 2,000 | | | | 2,121 | |
| County of Orange, Water Dist. Rev. Certs. of Part. (Interim Obligations), Series 2019-A, 2.00% 2023 | | | 2,725 | | | | 2,723 | |
| City of Oxnard, Fncg. Auth., Wastewater Rev. Ref. Bonds, Series 2014, Assured Guaranty Municipal insured, 5.00% 2024 | | | 250 | | | | 263 | |
| City of Oxnard, Water Rev. Ref. Bonds, Series 2018, BAM insured, 5.00% 2022 | | | 700 | | | | 702 | |
| City of Oxnard, Water Rev. Ref. Bonds, Series 2018, BAM insured, 5.00% 2024 | | | 450 | | | | 473 | |
| Oxnard Unified School Dist., G.O. Bonds, 2012 Election, Series 2012-A, Assured Guaranty Municipal insured, 5.00% 2037 (preref. 2022) | | | 500 | | | | 505 | |
| Palo Alto Unified School Dist., G.O. Bonds, Capital Appreciation Bonds, 2008 Election, Series 2008-2, 0% 2031 | | | 1,000 | | | | 737 | |
| Palomar Health, G.O. Rev. Ref. Bonds, Series 2016-A, 5.00% 2026 | | | 630 | | | | 679 | |
| Paramount Unified School Dist., G.O. Bonds, Capital Appreciation Bonds, 1998 Election, Series 2001-B, Assured Guaranty Municipal insured, 0% 2025 | | | 3,000 | | | | 2,744 | |
| Peninsula Corridor Joint Powers Board, Farebox Rev. Bonds, Series 2019-A, 5.00% 2026 | | | 250 | | | | 273 | |
| Peninsula Corridor Joint Powers Board, Farebox Rev. Bonds, Series 2019-A, 5.00% 2027 | | | 200 | | | | 222 | |
| Peninsula Corridor Joint Powers Board, Farebox Rev. Bonds, Series 2019-A, 5.00% 2028 | | | 285 | | | | 319 | |
| Peninsula Corridor Joint Powers Board, Farebox Rev. Bonds, Series 2019-A, 5.00% 2029 | | | 400 | | | | 454 | |
| Peralta Community College Dist., G.O. Rev. Ref. Bonds, Series 2014-A, 5.00% 2025 | | | 2,680 | | | | 2,825 | |
| City of Perris, Joint Powers Auth., Local Agcy. Rev. Ref. Bonds (CFD No. 2001-1 IA No. 4 and No. 5; CFD No. 2005-1 IA No. 4), Series 2017-B, 4.00% 2022 | | | 915 | | | | 920 | |
| Perris Union High School Dist., Fncg. Auth., Rev. Bonds, Series 2015, 5.00% 2024 | | | 1,000 | | | | 1,048 | |
| Perris Union High School Dist., G.O. Bonds, 2012 Election, Series 2021-C, 4.00% 2028 | | | 185 | | | | 197 | |
| Perris Union High School Dist., G.O. Bonds, 2012 Election, Series 2021-C, 4.00% 2029 | | | 200 | | | | 215 | |
| Perris Union High School Dist., G.O. Bonds, 2012 Election, Series 2021-C, 4.00% 2030 | | | 215 | | | | 226 | |
| Perris Union High School Dist., G.O. Bonds, 2012 Election, Series 2021-C, 4.00% 2031 | | | 350 | | | | 367 | |
| Pleasant Valley School Dist., G.O. Bonds, 2018 Election, Series A, 5.00% 2029 (preref. 2026) | | | 645 | | | | 710 | |
| Pollution Control Fncg. Auth., Water Facs. Rev. Ref. Bonds (American Water Capital Corp. Project), Series 2020, 0.60% 2040 (put 2023) | | | 3,270 | | | | 3,186 | |
| Poway Unified School Dist., Public Fncg. Auth., Special Tax Rev. Bonds, Series 2013, 4.00% 2022 (escrowed to maturity) | | | 440 | | | | 444 | |
| Poway Unified School Dist., Public Fncg. Auth., Special Tax Rev. Ref. Bonds, Series 2015-A, 5.00% 2022 | | | 850 | | | | 858 | |
| Poway Unified School Dist., Public Fncg. Auth., Special Tax Rev. Ref. Bonds, Series 2015-B, BAM insured, 5.00% 2022 | | | 500 | | | | 506 | |
| Poway Unified School Dist., Public Fncg. Auth., Special Tax Rev. Ref. Bonds, Series 2016-A, 5.00% 2023 | | | 885 | | | | 918 | |
| Public Fin. Auth., Electric System Rev. Ref. Bonds, Series 2018, Assured Guaranty Municipal insured, 5.00% 2023 | | | 730 | | | | 756 | |
| Public Fin. Auth., Reassessment Rev. Ref. Bonds, Series 2019, 5.00% 2022 | | | 1,115 | | | | 1,126 | |
| 50 | Private Client Services Funds |
Capital Group California Core Municipal Fund
| Bonds, notes & other debt instruments (continued) | | Principal amount
(000) | | Value
(000) | |
| California (continued) | | | | | | | | |
| Public Fin. Auth., Reassessment Rev. Ref. Bonds, Series 2019, 5.00% 2029 | | USD | 1,000 | | | $ | 1,104 | |
| Public Fin. Auth., Rev. Bonds (Henry Mayo Newhall Memorial Hospital), Series 2017, Assured Guaranty Municipal insured, 5.00% 2023 | | | 500 | | | | 518 | |
| Public Fin. Auth., Rev. Bonds (Hoag Memorial Hospital Presbyterian), Series 2022-A, 5.00% 2028 | | | 250 | | | | 279 | |
| Public Fin. Auth., Rev. Bonds (Hoag Memorial Hospital Presbyterian), Series 2022-A, 5.00% 2030 | | | 250 | | | | 286 | |
| Public Fin. Auth., Rev. Bonds (Hoag Memorial Hospital Presbyterian), Series 2022-A, 5.00% 2033 | | | 330 | | | | 384 | |
| Public Fin. Auth., Rev. Bonds (Hoag Memorial Hospital Presbyterian), Series 2022-A, 5.00% 2034 | | | 350 | | | | 406 | |
| Public Fin. Auth., Rev. Ref. Bonds (O’Conner Woods), Series 2022, 4.00% 2028 | | | 450 | | | | 468 | |
| Public Fin. Auth., Rev. Ref. Bonds (O’Conner Woods), Series 2022, 4.00% 2029 | | | 500 | | | | 522 | |
| Public Fin. Auth., Rev. Ref. Bonds (O’Conner Woods), Series 2022, 4.00% 2031 | | | 520 | | | | 543 | |
| Public Works Board, Lease Rev. Bonds (Dept. of Corrections, Various State Prisons), Series 2019-D, 5.00% 2028 | | | 1,000 | | | | 1,127 | |
| Public Works Board, Lease Rev. Green Bonds (Dept. of General Services, Sacramento Region New Natural Resources Headquarters), Series 2021-C, 5.00% 2032 | | | 2,440 | | | | 2,819 | |
| Public Works Board, Lease Rev. Ref. Bonds (Dept. of Corrections, Various State Prisons), Series 2015-A, 5.00% 2023 | | | 790 | | | | 815 | |
| Public Works Board, Lease Rev. Ref. Bonds (Various Capital Projects), Series 2016-C, 5.00% 2024 | | | 1,650 | | | | 1,751 | |
| Public Works Board, Lease Rev. Ref. Bonds (Various Capital Projects), Series 2022-A, 5.00% 2028 | | | 5,005 | | | | 5,622 | |
| Public Works Board, Lease Rev. Ref. Bonds (Various Capital Projects), Series 2016-D, 5.00% 2028 | | | 5,000 | | | | 5,476 | |
| Public Works Board, Lease Rev. Ref. Bonds (Various Capital Projects), Series 2017-B, 5.00% 2028 | | | 1,415 | | | | 1,577 | |
| Public Works Board, Lease Rev. Ref. Bonds (Various Capital Projects), Series 2021-A, 5.00% 2032 | | | 1,000 | | | | 1,161 | |
| City of Rancho Cucamonga, Successor Agcy. to the Redev. Agcy., Tax Allocation Rev. Ref. Bonds (Rancho Redev. Project Area), Series 2014, Assured Guaranty Municipal insured, 5.00% 2026 | | | 600 | | | | 634 | |
| City of Rancho Cucamonga, Successor Agcy. to the Redev. Agcy., Tax Allocation Rev. Ref. Bonds (Rancho Redev. Project Area), Series 2014, Assured Guaranty Municipal insured, 5.00% 2028 | | | 300 | | | | 317 | |
| City of Redding, Joint Powers Fin. Auth., Electric System Rev. Bonds, Series 2015-A, 5.00% 2024 | | | 15 | | | | 16 | |
| Rialto Unified School Dist., G.O. Bonds, 2010 Election, Series 2019, 3.00% 2026 | | | 600 | | | | 611 | |
| Rialto Unified School Dist., G.O. Bonds, 2010 Election, Series 2019, 3.00% 2027 | | | 750 | | | | 761 | |
| City of Richmond, Successor Agcy. to the Redev. Agcy., Rev. Ref. Bonds, Series 2014-A, BAM insured, 5.00% 2025 | | | 200 | | | | 210 | |
| Rio Elementary School Dist., Community Facs. Dist. No. 1, Special Tax Bonds, Series 2016, BAM insured, 5.00% 2032 | | | 240 | | | | 259 | |
| Rio Elementary School Dist., Community Facs. Dist. No. 1, Special Tax Rev. Ref. Bonds, Series 2014, 5.00% 2022 | | | 400 | | | | 404 | |
| County of Riverside, Public Fncg. Auth., Tax Allocation Rev. Bonds (Project Area No. 1, Desert Communities and Interstate 215 Corridor Projects), Series 2015-A, Assured Guaranty Municipal insured, 5.00% 2023 | | | 1,075 | | | | 1,116 | |
| County of Riverside, Public Fncg. Auth., Tax Allocation Rev. Ref. Bonds (Hemet Project), Series 2014, BAM insured, 5.00% 2023 | | | 500 | | | | 518 | |
| Riverside Community Properties Dev., Inc., Lease Rev. Bonds (Riverside County Law Building Project), Series 2013, 6.00% 2038 (preref. 2023) | | | 2,585 | | | | 2,727 | |
| Riverside Unified School Dist., Fncg. Auth., Special Tax Rev. Ref. Bonds, Series 2015, BAM insured, 5.00% 2025 | | | 350 | | | | 373 | |
| Riverside Unified School Dist., Fncg. Auth., Special Tax Rev. Ref. Bonds, Series 2015, BAM insured, 5.00% 2026 | | | 400 | | | | 427 | |
| Riverside Unified School Dist., G.O. Bonds, 2016 Election, Series 2019, 4.00% 2029 | | | 850 | | | | 897 | |
| City of Roseville, Community Facs. Dist. No. 1 (Westpark), Special Tax Rev. Ref. Bonds, Series 2015, 5.00% 2024 | | | 1,000 | | | | 1,045 | |
| City of Sacramento, Municipal Utility Dist., Electric Rev. Bonds, Series 1997-K, AMBAC insured, 5.25% 2024 | | | 770 | | | | 796 | |
| County of Sacramento, Airport System Rev. Ref. Bonds, Series 2018-E, 5.00% 2027 | | | 1,015 | | | | 1,116 | |
| County of Sacramento, Airport System Rev. Ref. Bonds, Series 2018-E, 5.00% 2030 | | | 200 | | | | 221 | |
| Sacramento Unified School Dist., G.O. Bonds, Series 2015, Assured Guaranty Municipal insured, 5.00% 2030 | | | 1,000 | | | | 1,050 | |
| Sacramento Unified School Dist., G.O. Bonds, 2012 Election, Series 2019-D, BAM insured, 4.00% 2027 | | | 585 | | | | 619 | |
| Sacramento Unified School Dist., G.O. Bonds, 2012 Election, Series 2017-E, 5.00% 2027 | | | 555 | | | | 613 | |
| Sacramento Unified School Dist., G.O. Bonds, 2012 Election, Series 2019-D, BAM insured, 4.00% 2028 | | | 610 | | | | 649 | |
| Sacramento Unified School Dist., G.O. Bonds, 2012 Election, Series 2019-D, BAM insured, 4.00% 2029 | | | 635 | | | | 679 | |
| Sacramento Unified School Dist., G.O. Rev. Ref. Bonds, Series 2012, 5.25% 2024 | | | 1,300 | | | | 1,307 | |
| San Bernardino Unified School Dist., G.O. Rev. Ref. Bonds, Series 2013-A, Assured Guaranty Municipal insured, 5.00% 2022 (escrowed to maturity) | | | 1,500 | | | | 1,513 | |
| City of San Diego, Community Facs. Dist. No. 2 (Santaluz), Improvement Area No. 1, Special Tax Rev. Ref. Bonds, Series 2021, 4.00% 2027 | | | 635 | | | | 669 | |
| City of San Diego, Community Facs. Dist. No. 2 (Santaluz), Improvement Area No. 1, Special Tax Rev. Ref. Bonds, Series 2021, 4.00% 2028 | | | 880 | | | | 926 | |
| City of San Diego, Community Facs. Dist. No. 2 (Santaluz), Improvement Area No. 1, Special Tax Rev. Ref. Bonds, Series 2021, 4.00% 2029 | | | 430 | | | | 451 | |
| City of San Diego, Limited Obligation Rev. Bonds (Sanford Burnham Prebys Medical Discovery Institute Project), Series 2015-A, 5.00% 2022 | | | 200 | | | | 203 | |
| City of San Diego, Public Facs. Fncg. Auth., Lease Rev. Bonds (Capital Improvement Projects), Series 2021-A, 5.00% 2030 | | | 200 | | | | 232 | |
| Private Client Services Funds | 51 |
Capital Group California Core Municipal Fund
| Bonds, notes & other debt instruments (continued) | Principal amount
(000) | | | Value
(000) | |
| California (continued) | | | | | | | | |
| City of San Diego, Public Facs. Fncg. Auth., Lease Rev. Bonds (Capital Improvement Projects), Series 2021-A, 5.00% 2031 | | USD | 150 | | | $ | 173 | |
| City of San Diego, Public Facs. Fncg. Auth., Water Rev. Bonds, Series 2020-A, 5.00% 2029 | | | 500 | | | | 574 | |
| County of San Diego, Community Facs. Dist. No. 2008-1 (Harmony Grove Village), Improvement Area No. 2, Special Tax Bonds, Series 2020-A, 4.00% 2026 | | | 255 | | | | 261 | |
| County of San Diego, Grossmont Healthcare Dist., G.O. Rev. Ref. Bonds, Series 2021-E, 5.00% 2030 | | | 500 | | | | 571 | |
| County of San Diego, Grossmont Healthcare Dist., G.O. Rev. Ref. Bonds, Series 2021-E, 5.00% 2031 | | | 625 | | | | 720 | |
| County of San Diego, Regional Airport Auth., Airport Rev. and Rev. Ref. Bonds, Series 2019-A, 5.00% 2027 | | | 400 | | | | 439 | |
| County of San Diego, Regional Airport Auth., Airport Rev. and Rev. Ref. Bonds, Series 2019-A, 5.00% 2028 | | | 320 | | | | 356 | |
| County of San Diego, Regional Airport Auth., Airport Rev. and Rev. Ref. Bonds, Series 2019-A, 5.00% 2029 | | | 585 | | | | 655 | |
| County of San Diego, Regional Airport Auth., Airport Rev. Bonds, Series 2013-A, 5.00% 2023 (escrowed to maturity) | | | 245 | | | | 253 | |
| County of San Diego, Regional Airport Auth., Airport Rev. Ref. Bonds, Series 2020-B, 5.00% 2022 | | | 3,990 | | | | 4,012 | |
| County of San Diego, Regional Airport Auth., Airport Rev. Ref. Bonds, Series 2020-A, 5.00% 2028 | | | 1,000 | | | | 1,111 | |
| County of San Diego, Regional Airport Auth., Airport Rev. Ref. Bonds, Series 2020-A, 5.00% 2029 | | | 1,000 | | | | 1,119 | |
| County of San Diego, Regional Airport Auth., Airport Rev. Ref. Bonds, Series 2020-B, 5.00% 2031 | | | 1,405 | | | | 1,576 | |
| County of San Diego, Regional Transportation Commission, Limited Sales Tax Rev. Bonds, Series 2021-B, 5.00% 2029 | | | 320 | | | | 366 | |
| County of San Diego, Regional Transportation Commission, Limited Sales Tax Rev. Green Bonds, Series 2020-A, 5.00% 2028 | | | 850 | | | | 963 | |
| County of San Diego, Water Auth. Rev. Ref. Bonds, Series 2013-A, 5.00% 2031 (preref. 2022) | | | 900 | | | | 915 | |
| County of San Diego, Water Auth. Rev. Ref. Green Bonds, Series 2021-A, 5.00% 2028 | | | 1,000 | | | | 1,130 | |
| County of San Diego, Water Auth., Water Rev. Bonds, Series 2022-A, 5.00% 2028 | | | 250 | | | | 282 | |
| County of San Diego, Water Auth., Water Rev. Bonds, Series 2022-A, 5.00% 2029 | | | 500 | | | | 573 | |
| County of San Diego, Water Auth., Water Rev. Ref. Green Bonds, Series 2021-S-1, 5.00% 2028 | | | 1,285 | | | | 1,448 | |
| San Diego Unified School Dist., G.O. Dedicated Unlimited Ad Valorem Property Tax Bonds, Series 2016-SR-1, 4.00% 2031 | | | 3,000 | | | | 3,113 | |
| San Diego Unified School Dist., G.O. Dedicated Unlimited Ad Valorem Property Tax Rev. Ref. Bonds, Series 2015-R-4, 5.00% 2026 | | | 1,000 | | | | 1,077 | |
| San Diego Unified School Dist., G.O. Dedicated Unlimited Ad Valorem Property Tax Rev. Ref. Bonds, Series 2015-R-4, 5.00% 2027 | | | 3,000 | | | | 3,229 | |
| San Diego Unified School Dist., G.O. Dedicated Unlimited Ad Valorem Property Tax Rev. Ref. Bonds, Series 2016-R-5, 5.00% 2029 | | | 1,500 | | | | 1,638 | |
| City and County of San Francisco, Airport Commission, San Francisco International Airport, Rev. Bonds, Series 2019-D-2, 5.00% 2024 | | | 1,000 | | | | 1,047 | |
| City and County of San Francisco, Airport Commission, San Francisco International Airport, Rev. Ref. Bonds, Series 2022-B-2, 5.00% 2027 | | | 4,000 | | | | 4,402 | |
| City and County of San Francisco, Airport Commission, San Francisco International Airport, Rev. Ref. Bonds, Series 2021-B-2, 5.00% 2031 | | | 2,780 | | | | 3,174 | |
| City and County of San Francisco, G.O. Bonds (Earthquake Safety and Emergency Response), Series 2021-E-1, 5.00% 2028 | | | 1,450 | | | | 1,647 | |
| City and County of San Francisco, Successor Agcy. to the Redev. Agcy., Special Tax Rev. Ref. Bonds (San Francisco Redev. Projects), Series 2014-C, 5.00% 2022 | | | 305 | | | | 308 | |
| City of San Francisco, Bay Area Rapid Transit Dist., G.O. Bonds, 2016 Election, Series 2020-C-1, 5.00% 2027 | | | 1,500 | | | | 1,683 | |
| San Francisco Community College Dist., G.O. Rev. Ref. Bonds, Series 2020, 5.00% 2027 | | | 1,525 | | | | 1,693 | |
| San Francisco Unified School Dist., G.O. Bonds, 2016 Election, Series 2020-B, 4.00% 2022 | | | 1,000 | | | | 1,003 | |
| San Francisco Unified School Dist., G.O. Bonds, 2016 Election, Series 2020-B, 4.00% 2029 | | | 1,000 | | | | 1,065 | |
| San Jacinto Unified School Dist., Fncg. Auth., Special Tax Rev. Bonds, Series 2019, 5.00% 2022 | | | 25 | | | | 25 | |
| San Jacinto Unified School Dist., Fncg. Auth., Special Tax Rev. Bonds, Series 2019, 5.00% 2023 | | | 40 | | | | 41 | |
| San Jacinto Unified School Dist., Fncg. Auth., Special Tax Rev. Bonds, Series 2019, 5.00% 2024 | | | 65 | | | | 68 | |
| San Jacinto Unified School Dist., Fncg. Auth., Special Tax Rev. Bonds, Series 2019, 5.00% 2025 | | | 90 | | | | 96 | |
| San Jacinto Unified School Dist., Fncg. Auth., Special Tax Rev. Bonds, Series 2019, 5.00% 2026 | | | 155 | | | | 167 | |
| San Joaquin Hills Transportation Corridor Agcy., Toll Road Rev. Ref. Bonds, Capital Appreciation Bonds, Series 1997-A, National insured, 0% 2025 | | | 285 | | | | 261 | |
| City of San Jose, Airport Rev. Ref. Bonds, Series 2021-A, BAM insured, 5.00% 2029 | | | 500 | | | | 558 | |
| City of San Jose, Airport Rev. Ref. Bonds, Series 2021-A, BAM insured, 5.00% 2030 | | | 250 | | | | 281 | |
| City of San Jose, Airport Rev. Ref. Bonds, Series 2021-B, 5.00% 2032 | | | 1,250 | | | | 1,405 | |
| City of San Jose, Fin. Auth., Lease Rev. Ref. Bonds (Civic Center Project), Series 2013-A, 5.00% 2030 (preref. 2023) | | | 1,625 | | | | 1,675 | |
| City of San Jose, G.O. Bonds (Disaster Preparedness, Public Safety and Infrastructure), Series 2021-A, 5.00% 2030 | | | 2,250 | | | | 2,617 | |
| San Jose Unified School Dist., G.O. Bonds, Capital Appreciation Bonds, 2002 Election, Series 2006-C, National insured, 0% 2025 | | | 795 | | | | 724 | |
| San Jose Unified School Dist., G.O. Rev. Ref. Bonds, Series 2017, 5.00% 2022 | | | 500 | | | | 505 | |
| San Jose Unified School Dist., G.O. Rev. Ref. Bonds, Series 2017, 5.00% 2023 | | | 375 | | | | 389 | |
| 52 | Private Client Services Funds |
Capital Group California Core Municipal Fund
| Bonds, notes & other debt instruments (continued) | Principal amount
(000) | | | Value
(000) | |
| California (continued) | | | | | | | | |
| San Jose Unified School Dist., G.O. Rev. Ref. Bonds, Series 2017, 5.00% 2024 | | USD | 500 | | | $ | 528 | |
| San Ramon Valley Unified School Dist., G.O. Bonds, 2012 Election, Series 2018, 5.00% 2024 | | | 1,000 | | | | 1,057 | |
| Santa Margarita Water Dist., Community Facs. Dist. No. 99-1 (Talega), Special Tax Rev. Ref. Bonds, Series 2014-B, 5.00% 2022 | | | 310 | | | | 313 | |
| Santa Margarita Water Dist., Community Facs. Dist. No. 99-1 (Talega), Special Tax Rev. Ref. Bonds, Series 2014-B, 5.00% 2024 | | | 530 | | | | 555 | |
| Santa Margarita Water Dist., Community Facs. Dist. No. 99-1 (Talega), Special Tax Rev. Ref. Bonds, Series 2014-B, 5.00% 2025 | | | 375 | | | | 392 | |
| Santa Monica-Malibu Unified School Dist., School Facs. Improvement Dist. No. 1 (Santa Monica Schools), G.O. Bonds, 2018 Election, Series 2021-B, 4.00% 2025 | | | 405 | | | | 424 | |
| Santa Monica-Malibu Unified School Dist., School Facs. Improvement Dist. No. 2 (Malibu Schools), G.O. Bonds, 2018 Election, Series 2021-B, 4.00% 2024 | | | 1,235 | | | | 1,278 | |
| Santa Monica-Malibu Unified School Dist., School Facs. Improvement Dist. No. 2 (Malibu Schools), G.O. Bonds, 2018 Election, Series 2021-B, 4.00% 2025 | | | 345 | | | | 361 | |
| Santa Rosa High School Dist., G.O. Bonds, 2014 Election, Series 2021-E, BAM insured, 4.00% 2027 | | | 500 | | | | 531 | |
| Santa Rosa High School Dist., G.O. Bonds, 2014 Election, Series 2021-E, BAM insured, 4.00% 2029 | | | 500 | | | | 538 | |
| Saugus Union School Dist., G.O. Rev. Ref. Bonds, Capital Appreciation Bonds, Series 2006, FGIC-National insured, 0% 2024 | | | 1,210 | | | | 1,136 | |
| Saugus Union School Dist., Saugus/Hart School Facs. Fin. Auth., Community Facs. Dist. No. 2006-1, Special Tax Rev. Bonds, Series 2016, 5.00% 2024 | | | 500 | | | | 523 | |
| Saugus Union School Dist., Saugus/Hart School Facs. Fin. Auth., Community Facs. Dist. No. 2006-1, Special Tax Rev. Bonds, Series 2016, 5.00% 2025 | | | 1,110 | | | | 1,180 | |
| School Fin. Auth., School Fac. Rev. Bonds (Granada Hills Charter Obligated Group), Series 2019, 4.00% 20272 | | | 740 | | | | 748 | |
| School Fin. Auth., School Fac. Rev. Bonds (Granada Hills Charter Obligated Group), Series 2019, 4.00% 20292 | | | 805 | | | | 809 | |
| School Fin. Auth., School Fac. Rev. Bonds (Granada Hills Charter Obligated Group), Series 2019, 5.00% 20312 | | | 875 | | | | 911 | |
| School Fin. Auth., School Fac. Rev. Bonds (KIPP LA Projects), Series 2014-A, 4.125% 2024 | | | 940 | | | | 951 | |
| School Fin. Auth., School Fac. Rev. Bonds (KIPP LA Projects), Series 2017-A, 5.00% 20242 | | | 585 | | | | 608 | |
| School Fin. Auth., School Fac. Rev. Bonds (KIPP LA Projects), Series 2015-A, 3.625% 20252 | | | 600 | | | | 604 | |
| School Fin. Auth., School Fac. Rev. Bonds (KIPP LA Projects), Series 2017-A, 5.00% 20262 | | | 505 | | | | 537 | |
| School Fin. Auth., School Fac. Rev. Bonds (KIPP LA Projects), Series 2017-A, 5.00% 20272 | | | 600 | | | | 643 | |
| School Fin. Auth., School Fac. Rev. Bonds (KIPP SoCal Projects), Series 2019-A, 5.00% 20222 | | | 200 | | | | 201 | |
| School Fin. Auth., School Fac. Rev. Bonds (KIPP SoCal Projects), Series 2019-A, 5.00% 20232 | | | 225 | | | | 231 | |
| School Fin. Auth., School Fac. Rev. Bonds (KIPP SoCal Projects), Series 2019-A, 5.00% 20242 | | | 130 | | | | 135 | |
| School Fin. Auth., School Fac. Rev. Bonds (KIPP SoCal Projects), Series 2020-A, 5.00% 20242 | | | 100 | | | | 104 | |
| School Fin. Auth., School Fac. Rev. Bonds (KIPP SoCal Projects), Series 2019-A, 5.00% 20252 | | | 150 | | | | 158 | |
| School Fin. Auth., School Fac. Rev. Bonds (KIPP SoCal Projects), Series 2020-A, 5.00% 20252 | | | 105 | | | | 110 | |
| School Fin. Auth., School Fac. Rev. Bonds (KIPP SoCal Projects), Series 2020-A, 5.00% 20262 | | | 110 | | | | 117 | |
| School Fin. Auth., School Fac. Rev. Bonds (KIPP SoCal Projects), Series 2019-A, 5.00% 20262 | | | 105 | | | | 112 | |
| School Fin. Auth., School Fac. Rev. Bonds (KIPP SoCal Projects), Series 2019-A, 5.00% 20272 | | | 220 | | | | 236 | |
| School Fin. Auth., School Fac. Rev. Bonds (KIPP SoCal Projects), Series 2020-A, 5.00% 20272 | | | 100 | | | | 107 | |
| School Fin. Auth., School Fac. Rev. Bonds (KIPP SoCal Projects), Series 2020-A, 5.00% 20282 | | | 100 | | | | 108 | |
| School Fin. Auth., School Fac. Rev. Bonds (KIPP SoCal Projects), Series 2020-A, 5.00% 20292 | | | 100 | | | | 108 | |
| School Fin. Auth., School Fac. Rev. Bonds (KIPP SoCal Projects), Series 2020-A, 5.00% 20302 | | | 100 | | | | 109 | |
| City of Seal Beach, Community Facs. Dist. No. 2005-1 (Pacific Gateway Business Center), Special Tax Rev. Ref. Bonds, Series 2016, 3.00% 2023 | | | 150 | | | | 150 | |
| City of Seal Beach, Community Facs. Dist. No. 2005-1 (Pacific Gateway Business Center), Special Tax Rev. Ref. Bonds, Series 2016, 3.00% 2024 | | | 145 | | | | 144 | |
| City of Seal Beach, Community Facs. Dist. No. 2005-1 (Pacific Gateway Business Center), Special Tax Rev. Ref. Bonds, Series 2016, 3.00% 2025 | | | 365 | | | | 361 | |
| City of Seal Beach, Community Facs. Dist. No. 2005-1 (Pacific Gateway Business Center), Special Tax Rev. Ref. Bonds, Series 2016, 3.00% 2026 | | | 150 | | | | 147 | |
| City of Signal Hill, Successor Agcy. to the Redev. Agcy., Tax Allocation Rev. Ref. Bonds, Series 2015-A, BAM insured, 5.00% 2023 | | | 500 | | | | 519 | |
| Silicon Valley Clean Water, Wastewater Rev. Notes, Series 2019-A, 3.00% 2024 | | | 4,065 | | | | 4,105 | |
| Silicon Valley Clean Water, Wastewater Rev. Notes, Series 2021-B, 0.50% 2026 | | | 5,040 | | | | 4,573 | |
| Solano Community College Dist., G.O. Bonds, 2015 Election, Series 2013-A, 4.375% 2047 (preref. 2023) | | | 595 | | | | 611 | |
| South Placer Wastewater Auth., Wastewater Rev. Ref. Bonds, Series 2020, 5.00% 2031 | | | 2,885 | | | | 3,351 | |
| South Placer Wastewater Auth., Wastewater Rev. Ref. Bonds, Series 2020, 5.00% 2032 | | | 500 | | | | 586 | |
| Southern California Public Power Auth., Rev. Ref. Bonds (Magnolia Power Project A), Series 2020-1, 5.00% 2027 | | | 1,100 | | | | 1,227 | |
| Southern California Public Power Auth., Rev. Ref. Green Bonds (Milford Wind Corridor Phase II Project), Series 2021-1, 5.00% 2026 | | | 200 | | | | 219 | |
| Southern California Public Power Auth., Rev. Ref. Green Bonds (Milford Wind Corridor Phase II Project), Series 2021-1, 5.00% 2027 | | | 400 | | | | 446 | |
| Private Client Services Funds | 53 |
Capital Group California Core Municipal Fund
| Bonds, notes & other debt instruments (continued) | Principal amount
(000) | | | Value
(000) | |
| California (continued) | | | | | | | | |
| Stanislaus Union School Dist., G.O. Rev. Ref. Bonds, Series 2019, BAM insured, 5.00% 2025 | | USD | 500 | | | $ | 538 | |
| Statewide Communities Dev. Auth., Multi Family Housing Rev. Bonds (Harriet Tubman Terrace Apartments), Series 2021-Q, 0.24% 2024 (put 2023) | | | 7,000 | | | | 6,844 | |
| Statewide Communities Dev. Auth., Multi Family Housing Rev. Bonds (Washington Court Apartments), Series 2021-E, 0.22% 2023 (put 2022) | | | 5,000 | | | | 4,980 | |
| Statewide Communities Dev. Auth., Rev. Bonds (Adventist Health System/West), Series 2015-A, 5.00% 2025 | | | 750 | | | | 800 | |
| Statewide Communities Dev. Auth., Rev. Bonds (Adventist Health System/West), Series 2015-A, 5.00% 2028 | | | 2,085 | | | | 2,263 | |
| Statewide Communities Dev. Auth., Rev. Bonds (Adventist Health System/West), Series 2018-A, 5.00% 2034 | | | 975 | | | | 1,074 | |
| Statewide Communities Dev. Auth., Rev. Bonds (American Baptist Homes of the West), Series 2015, 5.00% 2023 | | | 1,110 | | | | 1,148 | |
| Statewide Communities Dev. Auth., Rev. Bonds (Cottage Health System Obligated Group), Series 2015, 5.00% 2043 (preref. 2024) | | | 5,000 | | | | 5,310 | |
| Statewide Communities Dev. Auth., Rev. Bonds (Henry Mayo Newhall Memorial Hospital), Series 2014, Assured Guaranty Municipal insured, 5.00% 2022 | | | 750 | | | | 760 | |
| Statewide Communities Dev. Auth., Rev. Bonds (Jewish Home of San Francisco), Series 2016, 5.00% 2026 | | | 575 | | | | 633 | |
| Statewide Communities Dev. Auth., Rev. Bonds (Viamonte Senior Living 1 Project), Series 2018-B, 3.00% 2025 | | | 310 | | | | 310 | |
| Statewide Communities Dev. Auth., Rev. Ref. Bonds (Episcopal Communities and Services), Series 2012, 5.00% 2024 | | | 300 | | | | 301 | |
| Statewide Communities Dev. Auth., Rev. Ref. Bonds (Huntington Memorial Hospital), Series 2014-B, 5.00% 2026 (preref. 2024) | | | 200 | | | | 211 | |
| Statewide Communities Dev. Auth., Rev. Ref. Bonds (Methodist Hospital of Southern California), Series 2018, 5.00% 2023 | | | 500 | | | | 510 | |
| Statewide Communities Dev. Auth., Rev. Ref. Bonds (Methodist Hospital of Southern California), Series 2018, 5.00% 2024 | | | 390 | | | | 406 | |
| Statewide Communities Dev. Auth., Rev. Ref. Bonds (Rady Children’s Hospital), Series 2016-B, 5.00% 2028 | | | 860 | | | | 970 | |
| Statewide Communities Dev. Auth., Student Housing Rev. Bonds (CHF-Irvine, LLC - University of California, Irvine East Campus Apartments, Phase I Ref. and Phase IV-B), Series 2021, BAM insured, 5.00% 2031 | | | 3,000 | | | | 3,351 | |
| Statewide Communities Dev. Auth., Student Housing Rev. Bonds (CHF-Irvine, LLC - University of California, Irvine East Campus Apartments, Phase I Ref. and Phase IV-B), Series 2021, BAM insured, 5.00% 2032 | | | 3,500 | | | | 3,886 | |
| Statewide Communities Dev. Auth., Student Housing Rev. Ref. Bonds (CHF-Irvine, LLC - University of California, Irvine East Campus Apartments), Series 2016, 5.00% 2022 | | | 1,000 | | | | 1,001 | |
| Statewide Communities Dev. Auth., Student Housing Rev. Ref. Bonds (CHF-Irvine, LLC - University of California, Irvine East Campus Apartments), Series 2016, 5.00% 2029 | | | 1,250 | | | | 1,338 | |
| Stockton Unified School Dist., G.O. Bonds, 2012 Election, Series 2018-C, BAM insured, 5.00% 2030 | | | 2,145 | | | | 2,419 | |
| City of Suisun, Successor Agcy. to the Redev. Agcy., Tax Allocation Rev. Ref. Bonds, Series 2014-B, BAM insured, 5.00% 2022 | | | 400 | | | | 405 | |
| Sweetwater Union High School Dist., G.O. Bonds, 2006 Election, Series 2006, 4.00% 2026 | | | 515 | | | | 531 | |
| Sweetwater Union High School Dist., G.O. Rev. Ref. Bonds, Series 2014, BAM insured, 5.00% 2025 | | | 1,715 | | | | 1,806 | |
| Sweetwater Union High School Dist., G.O. Rev. Ref. Bonds, Series 2014, BAM insured, 5.00% 2026 | | | 6,000 | | | | 6,310 | |
| Tobacco Securitization Auth. of Northern California, Tobacco Settlement Asset-Backed Rev. Ref. Senior Bonds (Sacramento County Tobacco Securitization Corp.), Series 2021-A-1, 5.00% 2024 | | | 1,250 | | | | 1,298 | |
| Tobacco Securitization Auth. of Southern California, Tobacco Settlement Asset-Backed Rev. Ref. Bonds (San Diego County Tobacco Asset Securitization Corp.), Series 2019-A, 5.00% 2025 | | | 1,000 | | | | 1,052 | |
| City of Tracy, Successor Agcy. to the Community Dev. Agcy., Tax Allocation Rev. Ref. Bonds, Series 2016, Assured Guaranty Municipal insured, 5.00% 2030 | | | 545 | | | | 585 | |
| Transbay Joint Powers Auth., Senior Tax Allocation Green Bonds, Series 2020-A, 5.00% 2027 | | | 600 | | | | 665 | |
| Transbay Joint Powers Auth., Senior Tax Allocation Green Bonds, Series 2020-A, 5.00% 2028 | | | 700 | | | | 786 | |
| Transbay Joint Powers Auth., Senior Tax Allocation Green Bonds, Series 2020-A, 5.00% 2029 | | | 660 | | | | 750 | |
| Transbay Joint Powers Auth., Senior Tax Allocation Green Bonds, Series 2020-A, 5.00% 2030 | | | 300 | | | | 342 | |
| City of Turlock, Irrigation Dist., Rev. Ref. Bonds, Series 2020, 5.00% 2031 | | | 1,600 | | | | 1,831 | |
| City of Tustin, Community Facs. Dist. No. 06-1 (Tustin Legacy / Columbus Villages), Special Tax Rev. Ref. Bonds, Series 2015-A, 5.00% 2024 | | | 860 | | | | 909 | |
| Tustin Unified School Dist., Community Facs. Dist. No. 88-1, Special Tax Rev. Ref. Bonds, Series 2015, BAM insured, 5.00% 2022 | | | 830 | | | | 839 | |
| Twin Rivers Unified School Dist., G.O. Rev. Ref. Bonds, Series 2016-B, Assured Guaranty Municipal insured, 5.00% 2024 | | | 400 | | | | 421 | |
| Ukiah Unified School Dist., G.O. Bonds, Capital Appreciation Bonds, 2005 Election, Series 2006, National insured, 0% 2022 | | | 175 | | | | 174 | |
| Ukiah Unified School Dist., G.O. Bonds, Capital Appreciation Bonds, 2005 Election, Series 2006, MBIA insured, 0% 2023 | | | 1,500 | | | | 1,454 | |
| Union City, Successor Agcy. to the Redev. Agcy., Tax Allocation Rev. Ref. Redev. Bonds, Series 2015-A, 5.00% 2023 | | | 375 | | | | 390 | |
| Regents of the University of California, Limited Project Rev. Bonds, Series 2022-S, 5.00% 2031 | | | 1,150 | | | | 1,339 | |
| Val Verde Unified School Dist., G.O. Rev. Ref. Bonds, Series 2016-A, Assured Guaranty Municipal insured, 4.00% 2023 | | | 600 | | | | 613 | |
| 54 | Private Client Services Funds |
Capital Group California Core Municipal Fund
| Bonds, notes & other debt instruments (continued) | Principal amount
(000) | | | Value
(000) | |
| California (continued) | | | | | | | | |
| City of Vernon, Electric System Rev. Bonds, Series 2022-A, 5.00% 2028 | | USD | 590 | | | $ | 642 | |
| Dept. of Veterans Affairs, Home Purchase Rev. Bonds, Series 2016-B, 3.50% 2045 | | | 915 | | | | 922 | |
| Dept. of Veterans Affairs, Home Purchase Rev. Bonds, Series 2019-A, 4.00% 2049 | | | 2,580 | | | | 2,634 | |
| Dept. of Veterans Affairs, Home Purchase Rev. Bonds, Series 2020-A, 3.00% 2050 | | | 6,900 | | | | 6,835 | |
| Dept. of Veterans Affairs, Veterans G.O. Bonds, Series 2017-CQ, 4.00% 2047 | | | 1,225 | | | | 1,247 | |
| Dept. of Veterans Affairs, Veterans G.O. Bonds, Series 2018-CR, 4.00% 2048 | | | 4,260 | | | | 4,345 | |
| Dept. of Veterans Affairs, Veterans G.O. Bonds, Series 2019-CS, 4.00% 2049 | | | 2,465 | | | | 2,516 | |
| Dept. of Veterans Affairs, Veterans G.O. Bonds, Series 2020-CT, 3.00% 2050 | | | 4,885 | | | | 4,838 | |
| Dept. of Veterans Affairs, Veterans G.O. Rev. Ref. Bonds, Series 2016-CN, 3.50% 2045 | | | 570 | | | | 575 | |
| Victor Valley Union High School Dist., G.O. Rev. Ref. Bonds, Series 2016-B, Assured Guaranty Municipal insured, 4.00% 2024 | | | 730 | | | | 755 | |
| Victor Valley Union High School Dist., G.O. Rev. Ref. Bonds, Series 2016-B, Assured Guaranty Municipal insured, 4.00% 2026 | | | 270 | | | | 285 | |
| City of Vista, Successor Agcy. to the Redev. Agcy., Tax Allocation Rev. Ref. Redev. Bonds, Series 2015-B-1, Assured Guaranty Municipal insured, 5.00% 2022 | | | 340 | | | | 344 | |
| City of Vista, Successor Agcy. to the Redev. Agcy., Tax Allocation Rev. Ref. Redev. Bonds, Series 2015-B-1, Assured Guaranty Municipal insured, 4.00% 2025 | | | 400 | | | | 418 | |
| Dept. of Water Resources, Water System Rev. Bonds (Central Valley Project), Series 2021-BD, 5.00% 2028 | | | 1,400 | | | | 1,602 | |
| West Basin Municipal Water Dist., Rev. Ref. Bonds, Series 2021-A, 5.00% 2030 | | | 1,575 | | | | 1,830 | |
| West Basin Municipal Water Dist., Rev. Ref. Bonds, Series 2021-A, 5.00% 2031 | | | 745 | | | | 875 | |
| West Contra Costa Unified School Dist., G.O. Bonds, 2010 Election, Series 2020-F, Assured Guaranty Municipal insured, 4.00% 2028 | | | 600 | | | | 640 | |
| West Contra Costa Unified School Dist., G.O. Bonds, 2012 Election, Series 2020-E, Assured Guaranty Municipal insured, 4.00% 2030 | | | 900 | | | | 966 | |
| West Contra Costa Unified School Dist., G.O. Rev. Ref. Bonds, 2005 Election, Series 2008-B, 6.00% 2027 | | | 3,000 | | | | 3,490 | |
| Westminster School Dist., G.O. Bonds, Capital Appreciation Bonds, 2008 Election, Series 2009-A-1, Assured Guaranty insured, 0% 2023 | | | 1,000 | | | | 971 | |
| Whittier City School Dist., G.O. Rev. Ref. Bonds, Series 2016, 4.00% 2030 | | | 825 | | | | 861 | |
| City of Woodland, Community Facs. Dist. No. 2004-1 (Spring Lake), Special Tax Capital Projects Bonds, Series 2021, Assured Guaranty Municipal insured, 4.00% 2029 | | | 215 | | | | 231 | |
| City of Woodland, Community Facs. Dist. No. 2004-1 (Spring Lake), Special Tax Capital Projects Bonds, Series 2021, Assured Guaranty Municipal insured, 4.00% 2030 | | | 235 | | | | 253 | |
| City of Woodland, Community Facs. Dist. No. 2004-1 (Spring Lake), Special Tax Capital Projects Bonds, Series 2021, Assured Guaranty Municipal insured, 4.00% 2031 | | | 260 | | | | 280 | |
| Yosemite Community College Dist., G.O. Bonds, Capital Appreciation Bonds, 2004 Election, Series 2010-D, 0% 2031 | | | 500 | | | | 370 | |
| | | | | | | | 527,006 | |
| | | | | | | | | |
| Missouri 0.02% | | | | | | | | |
| Housing Dev. Commission, Single Family Mortgage Rev. Bonds (Special Homeownership Loan Program), Series 2015-A, 3.75% 2038 | | | 85 | | | | 86 | |
| | | | | | | | | |
| Texas 0.08% | | | | | | | | |
| Tarrant County Cultural Education Facs. Fin. Corp., Rev. Ref. Bonds (Christus Health), Series 2018-A, 5.00% 2024 | | | 500 | | | | 525 | |
| | | | | | | | | |
| United States 0.46% | | | | | | | | |
| Freddie Mac, Multi Family Mortgage Bonds, Series 2019-ML-05, Class ACA, 3.35% 2033 | | | 2,888 | | | | 2,878 | |
| | | | | | | | | |
| Total bonds, notes & other debt instruments (cost: $557,175,000) | | | | | | | 530,495 | |
| | | | | | | | | |
| Short-term securities 14.59% | | | | | | | | |
| Municipals 14.59% | | | | | | | | |
| State of California, Fin. Auth., Recovery Zone Fac. Bonds (Chevron U.S.A., Inc. Project), Series 2010-A, 0.30% 20351 | | | 15,950 | | | | 15,950 | |
| State of California, City of Irvine, Reassessment Dist. No. 87-8, Limited Obligation Improvement Bonds, Series 1999, 0.28% 20241 | | | 1,000 | | | | 1,000 | |
| State of California, Irvine Ranch Water Dist. Nos. 105, 140, 240 and 250, Consolidated G.O. Bonds, Series 1993, 0.27% 20331 | | | 16,200 | | | | 16,200 | |
| State of California, Kern Community College Dist., Facs. Improvement Dist. No. 1, G.O. Bond Anticipation Notes, Capital Appreciation Notes, Series 2020, 0% 2023 | | | 2,000 | | | | 1,923 | |
| Private Client Services Funds | 55 |
Capital Group California Core Municipal Fund
| Short-term securities (continued) | Principal amount
(000) | | | Value
(000) | |
| Municipals (continued) | | | | | | | | |
| State of California, City of Los Angeles, Dept. of Water and Power, Power System Demand Rev. Bonds, Series 2002-A-2, 0.27% 20351 | | USD | 8,500 | | | $ | 8,500 | |
| State of California, City of Los Angeles, Dept. of Water and Power, Rev. Bonds, Series 2021-A-1, 0.27% 20501 | | | 8,500 | | | | 8,500 | |
| State of California, Metropolitan Water Dist. of Southern California, Water Rev. Ref. Bonds, Series 2016-B-2, 0.27% 20371 | | | 3,605 | | | | 3,605 | |
| State of California, Metropolitan Water Dist. of Southern California, Water Rev. Ref. Bonds, Series 2016-B-1, 0.27% 20371 | | | 750 | | | | 750 | |
| State of California, Pollution Control Fncg. Auth., Environmental Impact Rev. Bonds (Air Products and Chemicals, Inc. Project), Series 1997-B, 0.27% 20421 | | | 10,600 | | | | 10,600 | |
| State of California, County of Riverside, Tax and Rev. Anticipation Notes, Series 2021, 2.00% 6/30/2022 | | | 5,000 | | | | 5,007 | |
| State of California, Statewide Communities Dev. Auth., Pollution Control Rev. Ref. Bonds (Chevron U.S.A., Inc. Project), Series 2002, 0.30% 20241 | | | 2,435 | | | | 2,435 | |
| State of California, Regents of the University of California, General Rev. Bonds, Series 2013-AL-4, 0.26% 20481 | | | 6,795 | | | | 6,795 | |
| State of California, Regents of the University of California, General Rev. Bonds, Series 2013-AL-1, 0.26% 20481 | | | 3,000 | | | | 3,000 | |
| State of California, Regents of the University of California, General Rev. Bonds, Series 2013-AL-2, 0.30% 20481 | | | 4,100 | | | | 4,100 | |
| State of California, Regents of the University of California, Medical Center Pooled Rev. Bonds, Series 2007-B-1, 0.26% 20321 | | | 3,755 | | | | 3,755 | |
| | | | | | | | | |
| Total short-term securities (cost: $92,182,000) | | | | | | | 92,120 | |
| Total investment securities 98.63% (cost: $649,357,000) | | | | | | | 622,615 | |
| Other assets less liabilities 1.37% | | | | | | | 8,676 | |
| | | | | | | | | |
| Net assets 100.00% | | | | | | $ | 631,291 | |
| 1 | Coupon rate may change periodically. Reference rate and spread are as of the most recent information available. Some coupon rates are determined by the issuer or agent based on current market conditions; therefore, the reference rate and spread are not available. For short-term securities, the date of the next scheduled coupon rate change is considered to be the maturity date. |
| 2 | Acquired in a transaction exempt from registration under Rule 144A of the Securities Act of 1933. May be resold in the U.S. in transactions exempt from registration, normally to qualified institutional buyers. The total value of all such securities was $6,696,000, which represented 1.06% of the net assets of the fund. |
Futures contracts
| Contracts | | Type | | Number of
contracts | | | Expiration | | Notional
amount
(000) | | | Value and
unrealized
appreciation
at 4/30/2022
(000) | |
| 2 Year U.S. Treasury Note Futures | | Short | | | 351 | | | June 2022 | | USD | (73,995 | ) | | $ | 561 | |
| 5 Year U.S. Treasury Note Futures | | Short | | | 60 | | | June 2022 | | | (6,761 | ) | | | 45 | |
| | | | | | | | | | | | | | | $ | 606 | |
Key to abbreviations
Agcy. = Agency
Assn. = Association
Auth. = Authority
Certs. = Certificates
Dept. = Department
Dev. = Development
Dist. = District
Econ. = Economic
Fac. = Facility
Facs. = Facilities
Fin. = Finance
Fncg. = Financing
G.O. = General Obligation
Part. = Participation
Preref. = Prerefunded
Redev. = Redevelopment
Ref. = Refunding
Rev. = Revenue
SIFMA = Securities Industry and Financial Markets Association
USD = U.S. dollars
| 56 | Private Client Services Funds |
| Capital Group California Short-Term Municipal Fund | unaudited |
| Investment portfolio April 30, 2022 | |
| | |
| Portfolio quality summary* | Percent of net assets |
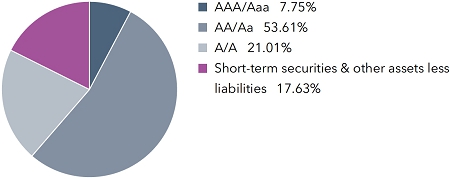
| * | Bond ratings, which typically range from AAA/Aaa (highest) to D (lowest), are assigned by credit rating agencies such as Standard & Poor’s, Moody’s and/or Fitch as an indication of an issuer’s creditworthiness. In assigning a credit rating to a security, the fund looks specifically to the ratings assigned to the issuer of the security by Standard & Poor’s, Moody’s and/or Fitch. If agency ratings differ, the security will be considered to have received the highest of those ratings, consistent with the fund’s investment policies. |
| Bonds, notes & other debt instruments 82.37% | Principal amount
(000) | | | Value
(000) | |
| California 82.37% | | | | | | | | |
| City of Alhambra, Rev. Ref. Bonds (Atherton Baptist Homes Project), Series 2016, 5.00% 2023 | | USD | 450 | | | $ | 459 | |
| City of Anaheim, Housing and Public Improvements Auth., Rev. Bonds (Electric Utility Distribution System Improvements), Series 2020-A, 5.00% 2022 | | | 230 | | | | 233 | |
| City of Anaheim, Housing and Public Improvements Auth., Rev. Bonds (Electric Utility Distribution System Improvements), Series 2020-A, 5.00% 2023 | | | 200 | | | | 208 | |
| City of Beaumont, Wastewater Rev. Bonds, Series 2018-A, Assured Guaranty Municipal insured, 5.00% 2022 | | | 225 | | | | 228 | |
| City of Burbank, Successor Agcy. to the Redev. Agcy., Tax Allocation Rev. Ref. Redev. Bonds, Series 2015, BAM insured, 5.00% 2022 | | | 500 | | | | 510 | |
| Trustees of the California State University, Systemwide Rev. Bonds, Series 2013-A, 5.00% 2023 | | | 400 | | | | 417 | |
| Trustees of the California State University, Systemwide Rev. Bonds, Series 2020-A, 5.00% 2024 | | | 800 | | | | 850 | |
| Trustees of the California State University, Systemwide Rev. Bonds, Series 2016-B-3, 4.00% 2051 (put 2023) | | | 650 | | | | 661 | |
| Central Unified School Dist., G.O. Bonds, 2020 Election, Series 2021-A, 4.00% 2024 | | | 395 | | | | 408 | |
| Chino Basin Regional Fin. Auth., Rev. Notes (Inland Empire Utilities Interim Fncg.), Series 2020-B, 4.00% 2025 | | | 500 | | | | 522 | |
| City of Chino, Community Facs. Dist. No. 2003-3, Special Tax Bonds, Series 2021, 4.00% 2023 | | | 395 | | | | 400 | |
| City of Chino, Community Facs. Dist. No. 2003-3, Special Tax Bonds, Series 2021, 4.00% 2024 | | | 410 | | | | 416 | |
| City of Chino, Community Facs. Dist. No. 2003-3, Special Tax Bonds, Series 2021, 4.00% 2025 | | | 430 | | | | 437 | |
| City of Chino, Community Facs. Dist. No. 2003-3, Special Tax Bonds, Series 2021, 4.00% 2026 | | | 445 | | | | 451 | |
| Citrus Community College Dist., G.O. Bonds, 2020 Election, Series 2021-A, 4.00% 2025 | | | 370 | | | | 387 | |
| Coast Community College Dist., G.O. Bonds, Capital Appreciation Bonds, Series 2006-B, Assured Guaranty insured, 0% 2026 | | | 1,205 | | | | 1,058 | |
| Compton Unified School Dist., G.O. Bonds, 2015 Election, Series 2019-B, BAM insured, 4.00% 2022 | | | 350 | | | | 351 | |
| Compton Unified School Dist., G.O. Bonds, 2015 Election, Series 2019-B, BAM insured, 5.00% 2025 | | | 125 | | | | 134 | |
| Compton Unified School Dist., G.O. Bonds, 2015 Election, Series 2019-B, BAM insured, 5.00% 2027 | | | 500 | | | | 557 | |
| Del Mar Union School Dist., Community Facs. Dist. No. 99-1, Special Tax Bonds, Series 2019, 4.00% 2024 | | | 400 | | | | 408 | |
| Del Mar Union School Dist., Community Facs. Dist. No. 99-1, Special Tax Bonds, Series 2019, 4.00% 2025 | | | 410 | | | | 421 | |
| East Side Union High School Dist., G.O. Rev. Ref. Bonds, Series 2020, BAM insured, 5.00% 2025 | | | 845 | | | | 910 | |
| Eastern Municipal Water Dist., Community Facs. Dist. No. 2017-79 (Eagle Crest), Special Tax Bonds, Series 2021, 4.00% 2023 | | | 255 | | | | 259 | |
| Eastern Municipal Water Dist., Community Facs. Dist. No. 2017-79 (Eagle Crest), Special Tax Bonds, Series 2021, 4.00% 2025 | | | 275 | | | | 282 | |
| Eastern Municipal Water Dist., Community Facs. Dist. No. 2017-79 (Eagle Crest), Special Tax Bonds, Series 2021, 4.00% 2026 | | | 285 | | | | 293 | |
| Eastern Municipal Water Dist., Fin. Auth., Water and Wastewater Rev. Ref. Bonds, Series 2020-A, 5.00% 2024 | | | 225 | | | | 237 | |
| Eastern Municipal Water Dist., Fin. Auth., Water and Wastewater Rev. Ref. Bonds, Series 2020-A, 5.00% 2026 | | | 300 | | | | 329 | |
| Educational Facs. Auth., Rev. Bonds (Chapman University), Series 2021-A, 5.00% 2025 | | | 425 | | | | 453 | |
| County of El Dorado, Community Facs. Dist. No. 1992-1 (El Dorado Hills Dev.), Special Tax Rev. Ref. Bonds, Series 2012, 5.00% 2022 | | | 845 | | | | 855 | |
| Fowler Unified School Dist., G.O. Rev. Ref. Bonds, Series 2014, Assured Guaranty Municipal insured, 4.00% 2024 | | | 745 | | | | 769 | |
| G.O. Bonds, Series 2021, 5.00% 2027 | | | 1,475 | | | | 1,650 | |
| G.O. Bonds, Series 2022, 5.00% 2027 | | | 1,000 | | | | 1,110 | |
| G.O. Bonds, Series 2013-E, (SIFMA Municipal Swap Index + 0.43%) 0.87% 2029 (put 2023)1 | | | 500 | | | | 500 | |
| Private Client Services Funds | 57 |
Capital Group California Short-Term Municipal Fund
| Bonds, notes & other debt instruments (continued) | Principal amount
(000) | | | Value
(000) | |
| California (continued) | | | | | | | | |
| Glendale Community College Dist., G.O. Rev. Ref. Bonds, 2016 Election, Series 2020-B, 4.00% 2023 | | USD | 500 | | | $ | 512 | |
| Glendale Unified School Dist., G.O. Bonds, 2011 Election, Series 2020-E, 4.00% 2024 | | | 475 | | | | 492 | |
| Health Facs. Fncg. Auth., Rev. Bonds (Adventist Health System/West), Series 2013-A, 5.00% 2024 | | | 410 | | | | 420 | |
| Health Facs. Fncg. Auth., Rev. Bonds (El Camino Hospital), Series 2017, 5.00% 2025 | | | 400 | | | | 431 | |
| Health Facs. Fncg. Auth., Rev. Bonds (Providence St. Joseph Health), Series 2016-A, 5.00% 2022 | | | 300 | | | | 304 | |
| Health Facs. Fncg. Auth., Rev. Bonds (Providence St. Joseph Health), Series 2016-B-3, 2.00% 2036 (put 2025) | | | 1,000 | | | | 979 | |
| Health Facs. Fncg. Auth., Rev. Bonds (Providence St. Joseph Health), Series 2016-B-2, 4.00% 2036 (put 2024) | | | 110 | | | | 114 | |
| Health Facs. Fncg. Auth., Rev. Bonds (Sutter Health), Series 2016-A, 5.00% 2022 (escrowed to maturity) | | | 200 | | | | 204 | |
| Health Facs. Fncg. Auth., Rev. Bonds (Sutter Health), Series 2018-A, 5.00% 2025 | | | 400 | | | | 433 | |
| Health Facs. Fncg. Auth., Rev. Bonds (Sutter Health), Series 2016-A, 5.00% 2026 (preref. 2025) | | | 275 | | | | 299 | |
| Health Facs. Fncg. Auth., Rev. Bonds (Sutter Health), Series 2016-A, 5.00% 2046 (preref. 2025) | | | 250 | | | | 272 | |
| Health Facs. Fncg. Auth., Rev. Ref. Bonds (Lucile Salter Packard Children’s Hospital at Stanford), Series 2022-A, 5.00% 2024 | | | 680 | | | | 713 | |
| Health Facs. Fncg. Auth., Rev. Ref. Bonds (St. Joseph Health System), Series 2009-D, 1.70% 2033 (put 2022) | | | 750 | | | | 750 | |
| Health Facs. Fncg. Auth., Rev. Ref. Bonds (St. Joseph Health System), Series 2009-C, 5.00% 2034 (put 2022) | | | 1,200 | | | | 1,218 | |
| Health Facs. Fncg. Auth., Rev. Ref. Bonds (Sutter Health), Series 2016-B, 5.00% 2026 | | | 700 | | | | 770 | |
| Hemet Unified School Dist., G.O. Rev. Ref. Bonds, Series 2014, Assured Guaranty Municipal insured, 4.00% 2024 | | | 500 | | | | 516 | |
| Infrastructure and Econ. Dev. Bank, Rev. Bonds (Stanford Consortium Project), Series 2016-A, 5.00% 2022 | | | 265 | | | | 265 | |
| Infrastructure and Econ. Dev. Bank, Rev. Ref. Bonds (J. Paul Getty Trust), Series 2021-B-2, 3.00% 2047 (put 2026) | | | 1,500 | | | | 1,518 | |
| Infrastructure and Econ. Dev. Bank, Rev. Ref. Bonds (Segerstrom Center for the Arts), Series 2016-B, 5.00% 2023 | | | 1,000 | | | | 1,031 | |
| Infrastructure and Econ. Dev. Bank, Rev. Ref. Bonds (The Broad), Series 2021-A, 5.00% 2026 | | | 585 | | | | 639 | |
| City of Irvine, Reassessment Dist. No. 12-1, Limited Obligation Improvement Bonds, Series 2015, 5.00% 2024 | | | 965 | | | | 1,018 | |
| Jurupa Unified School Dist., Fncg. Auth., Special Tax Rev. Ref. Bonds (Community Facs. Dists. Nos. 10, 12, 13 and 15), Series 2021-A, 4.00% 2027 | | | 285 | | | | 298 | |
| Jurupa Unified School Dist., Fncg. Auth., Special Tax Rev. Ref. Bonds (Community Facs. Dists. Nos. 10, 12, 13 and 15), Series 2021-A, BAM insured, 4.00% 2028 | | | 275 | | | | 293 | |
| County of Kern, Water Agcy., Improvement Dist. No. 4, Water Rev. Ref. Bonds, Series 2016-A, Assured Guaranty Municipal insured, 5.00% 2023 | | | 800 | | | | 824 | |
| Kern Community College Dist., Facs. Improvement Dist. No. 1, G.O. Bonds, 2016 Election, Series 2020-C, 4.00% 2026 | | | 645 | | | | 681 | |
| Kings Canyon Joint Unified School Dist., G.O. Rev. Ref. Bonds, Series 2016, Assured Guaranty Municipal insured, 5.00% 2022 | | | 470 | | | | 474 | |
| La Canada Unified School Dist., G.O. Bonds, 2017 Election, Series 2020-B, 4.00% 2022 | | | 270 | | | | 272 | |
| La Canada Unified School Dist., G.O. Bonds, 2017 Election, Series 2020-B, 4.00% 2023 | | | 260 | | | | 266 | |
| La Canada Unified School Dist., G.O. Bonds, 2017 Election, Series 2020-B, 4.00% 2024 | | | 425 | | | | 440 | |
| City of Lake Elsinore, Facs. Fin. Auth., Local Agcy. Rev. Ref. Bonds, Series 2021-B, Assured Guaranty Municipal insured, 4.00% 2026 | | | 195 | | | | 206 | |
| City of Lake Elsinore, Facs. Fin. Auth., Local Agcy. Rev. Ref. Bonds, Series 2021-B, Assured Guaranty Municipal insured, 4.00% 2027 | | | 210 | | | | 223 | |
| Los Altos Union High School Dist., G.O. Bonds, Capital Appreciation Bonds, Series 1997-C, National insured, 0% 2022 | | | 460 | | | | 460 | |
| City of Los Angeles, Dept. of Water and Power, Power System Rev. Bonds, Series 2021-B, 3.00% 2022 | | | 1,000 | | | | 1,003 | |
| City of Los Angeles, Dept. of Water and Power, Power System Rev. Bonds, Series 2013-A, 5.00% 2022 | | | 590 | | | | 594 | |
| City of Los Angeles, Dept. of Water and Power, Power System Rev. Bonds, Series 2014-D, 4.00% 2023 | | | 500 | | | | 511 | |
| City of Los Angeles, Dept. of Water and Power, Power System Rev. Bonds, Series 2014-B, 5.00% 2023 | | | 825 | | | | 853 | |
| City of Los Angeles, Dept. of Water and Power, Power System Rev. Bonds, Series 2016-B, 5.00% 2024 | | | 800 | | | | 845 | |
| City of Los Angeles, Dept. of Water and Power, Power System Rev. Bonds, Series 2022-B, 5.00% 2028 | | | 500 | | | | 566 | |
| City of Los Angeles, Dept. of Water and Power, Water System Rev. Bonds, Series 2020-A, 5.00% 2025 | | | 500 | | | | 539 | |
| City of Los Angeles, Dept. of Water and Power, Water System Rev. Bonds, Series 2020-A, 5.00% 2026 | | | 300 | | | | 330 | |
| City of Los Angeles, Solid Waste Resources Rev. Bonds, Series 2013-A, 2.00% 2023 | | | 500 | | | | 501 | |
| County of Los Angeles, Metropolitan Transportation Auth., Measure R Sales Tax Rev. Ref. Green Bonds, Series 2020-A, 5.00% 2025 | | | 1,500 | | | | 1,614 | |
| County of Los Angeles, Metropolitan Transportation Auth., Measure R Sales Tax Rev. Ref. Green Bonds, Series 2020-A, 5.00% 2026 | | | 400 | | | | 438 | |
| Los Angeles Unified School Dist., G.O. Dedicated Unlimited Ad Valorem Property Tax Bonds, Series 2020-RYQ, 5.00% 2025 | | | 750 | | | | 806 | |
| Los Angeles Unified School Dist., G.O. Rev. Ref. Bonds, Series 2014-A, 5.00% 2022 | | | 250 | | | | 252 | |
| Los Angeles Unified School Dist., G.O. Rev. Ref. Bonds, Series 2015-A, 5.00% 2023 | | | 685 | | | | 708 | |
| Menifee Union School Dist., Community Facs. Dist. No. 2011-1, Improvement Area No. 5, Special Tax Bonds, Series 2021, 4.00% 2026 | | | 230 | | | | 234 | |
| Menifee Union School Dist., Public Fncg. Auth., Special Tax Rev. Bonds, Series 2016-A, BAM insured, 4.00% 2022 | | | 250 | | | | 251 | |
| Menifee Union School Dist., Public Fncg. Auth., Special Tax Rev. Bonds, Series 2016-A, 5.00% 2026 | | | 755 | | | | 793 | |
| Modesto Irrigation Dist., Electric System Rev. Ref. Bonds, Series 2016, 5.00% 2023 | | | 160 | | | | 166 | |
| 58 | Private Client Services Funds |
Capital Group California Short-Term Municipal Fund
| Bonds, notes & other debt instruments (continued) | Principal amount
(000) | | | Value
(000) | |
| California (continued) | | | | | | | | |
| Modesto Irrigation Dist., Electric System Rev. Ref. Bonds, Series 2021, 5.00% 2026 | | USD | 635 | | | $ | 697 | |
| Mountain View Whisman School Dist., G.O. Bonds, 2012 Election, Series 2016-B, 5.00% 2025 | | | 610 | | | | 661 | |
| Municipal Fin. Auth., Multi Family Housing Rev. Bonds (Walnut Apartments), Series 2021-A, 0.45% 2024 (put 2023) | | | 625 | | | | 602 | |
| Municipal Fin. Auth., Solid Waste Rev. Ref. Bonds (Republic Services, Inc. Project), Capital Appreciation Bonds, Series 2010, Assured Guaranty Municipal insured, 0% 2023 | | | 260 | | | | 252 | |
| Municipal Fin. Auth., Student Housing Rev. Bonds (CHF-Davis II, LLC - Orchard Park Student Housing Project), Series 2021, BAM insured, 5.00% 2025 | | | 400 | | | | 423 | |
| Napa Valley Unified School Dist., G.O. Rev. Ref. Bonds, Series 2013, 5.00% 2024 (preref. 2023) | | | 250 | | | | 259 | |
| New Haven Unified School Dist., G.O. Rev. Ref. Bonds, Capital Appreciation Bonds, Series 2012, Assured Guaranty Municipal insured, 0% 2023 | | | 965 | | | | 936 | |
| Northern California Energy Auth., Commodity Supply Rev. Bonds, Series 2018, 4.00% 2049 (put 2024) | | | 1,460 | | | | 1,485 | |
| County of Orange, Sanitation Dist., Wastewater Rev. Ref. Obligations, Series 2021-A, 5.00% 2026 | | | 750 | | | | 819 | |
| County of Orange, Water Dist. Rev. Ref. Bonds, Series 2019-C, 5.00% 2024 | | | 500 | | | | 530 | |
| Pasadena Unified School Dist., G.O. Rev. Ref. Bonds, Series 2016-B, 5.00% 2024 | | | 655 | | | | 694 | |
| Peralta Community College Dist., G.O. Bonds, 2006 Election, Series 2020-E-1, 5.00% 2025 | | | 1,000 | | | | 1,076 | |
| City of Perris, Joint Powers Auth., Local Agcy. Rev. Ref. Bonds (CFD No. 2001-1 IA No. 4 and No. 5; CFD No. 2005-1 IA No. 4), Series 2017-B, 5.00% 2024 | | | 990 | | | | 1,036 | |
| Perris Union High School Dist., G.O. Bonds, 2012 Election, Series 2021-C, 4.00% 2024 | | | 240 | | | | 248 | |
| Perris Union High School Dist., G.O. Bonds, 2012 Election, Series 2021-C, 4.00% 2025 | | | 400 | | | | 419 | |
| Pittsburg Unified School Dist., G.O. Bonds, Capital Appreciation Bonds, 2010 Election, Series 2012-C, 0% 2047 (preref. 2022) | | | 200 | | | | 47 | |
| Public Fin. Auth., Rev. Ref. Bonds (O’Conner Woods), Series 2022, 4.00% 2026 | | | 440 | | | | 453 | |
| Public Works Board, Lease Rev. Bonds (Various Capital Projects), Series 2014-E, 5.00% 2022 | | | 500 | | | | 506 | |
| Public Works Board, Lease Rev. Ref. Bonds (Various Capital Projects), Series 2016-C, 5.00% 2024 | | | 505 | | | | 536 | |
| Public Works Board, Lease Rev. Ref. Bonds (Various Capital Projects), Series 2017-B, 5.00% 2024 | | | 330 | | | | 350 | |
| Public Works Board, Lease Rev. Ref. Bonds (Various Capital Projects), Series 2022-A, 5.00% 2025 | | | 1,330 | | | | 1,430 | |
| Public Works Board, Lease Rev. Ref. Bonds (Various Capital Projects), Series 2016-C, 5.00% 2027 | | | 250 | | | | 275 | |
| Public Works Board, Lease Rev. Ref. Bonds (Various State Office Buildings), Series 2015-F, 5.00% 2024 | | | 150 | | | | 157 | |
| City of Rancho Cordova, Community Facs. Dist. No. 2018-1 (Grantline), Special Tax Bonds, Series 2021-B, 3.00% 2024 | | | 85 | | | | 84 | |
| City of Rancho Cordova, Community Facs. Dist. No. 2018-1 (Grantline), Special Tax Bonds, Series 2021-B, 4.00% 2026 | | | 105 | | | | 107 | |
| City of Rancho Cordova, Community Facs. Dist. No. 2018-1 (Grantline), Special Tax Bonds, Series 2021-B, 4.00% 2028 | | | 120 | | | | 122 | |
| Ravenswood City School Dist., G.O. Bonds, 2016 Election, Series 2016, 5.00% 2023 | | | 445 | | | | 461 | |
| City of Redding, Electric System Rev. Ref. Bonds, Series 2018, 5.00% 2022 | | | 725 | | | | 727 | |
| City of Richmond, Wastewater Rev. Ref. Bonds, Series 2019-B, 5.00% 2023 | | | 940 | | | | 974 | |
| Riverside Unified School Dist., G.O. Bonds, 2016 Election, Series 2019, 4.00% 2024 | | | 125 | | | | 129 | |
| Robla School Dist., G.O. Bonds, 2018 Election, Series 2019-A, Assured Guaranty Municipal insured, 4.00% 2022 | | | 740 | | | | 745 | |
| City of Roseville, Fin. Auth., Special Tax Rev. Ref. Bonds, Series 2016, 4.00% 2022 | | | 620 | | | | 625 | |
| City of Sacramento, Municipal Utility Dist., Electric Rev. Bonds, Series 1997-K, AMBAC insured, 5.25% 2024 | | | 115 | | | | 119 | |
| City of Sacramento, Municipal Utility Dist., Electric Rev. Ref. Bonds, Series 2018-F, 5.00% 2026 | | | 500 | | | | 548 | |
| Sacramento Unified School Dist., G.O. Bonds, 2012 Election, Series 2019-D, BAM insured, 4.00% 2023 | | | 450 | | | | 460 | |
| Sacramento Unified School Dist., G.O. Bonds, 2012 Election, Series 2019-D, BAM insured, 4.00% 2024 | | | 520 | | | | 536 | |
| City of San Diego, Community Facs. Dist. No. 2 (Santaluz), Improvement Area No. 1, Special Tax Rev. Ref. Bonds, Series 2021, 4.00% 2026 | | | 490 | | | | 515 | |
| City of San Diego, Public Facs. Fncg. Auth., Lease Rev. Bonds (Capital Improvement Projects), Series 2021-A, 5.00% 2027 | | | 255 | | | | 286 | |
| City of San Diego, Public Facs. Fncg. Auth., Sewer Rev. Bonds, Series 2022-A, 5.00% 2027 | | | 500 | | | | 557 | |
| City of San Diego, Public Fin. Auth., Water Rev. Bonds, Series 2020-A, 5.00% 2022 | | | 335 | | | | 338 | |
| County of San Diego, Grossmont Healthcare Dist., G.O. Rev. Ref. Bonds, Series 2021-E, 5.00% 2028 | | | 320 | | | | 358 | |
| County of San Diego, Regional Airport Auth., Airport Rev. and Rev. Ref. Bonds, Series 2019-A, 5.00% 2023 | | | 500 | | | | 515 | |
| County of San Diego, Regional Airport Auth., Airport Rev. and Rev. Ref. Bonds, Series 2019-A, 5.00% 2024 | | | 500 | | | | 523 | |
| County of San Diego, Regional Airport Auth., Airport Rev. Ref. Bonds, Series 2020-B, 5.00% 2022 | | | 1,000 | | | | 1,006 | |
| County of San Diego, Regional Transportation Commission, Limited Sales Tax Rev. Bonds, Series 2021-B, 5.00% 2026 | | | 140 | | | | 153 | |
| City and County of San Francisco, Airport Commission, San Francisco International Airport, Rev. Ref. Bonds, Series 2009-D-2, 4.00% 2023 (escrowed to maturity) | | | 400 | | | | 408 | |
| City and County of San Francisco, Airport Commission, San Francisco International Airport, Rev. Ref. Bonds, Series 2016-A-2, 5.00% 2024 | | | 400 | | | | 419 | |
| City and County of San Francisco, Airport Commission, San Francisco International Airport, Rev. Ref. Bonds, Series 2019-D-2, 5.00% 2026 | | | 500 | | | | 542 | |
| Private Client Services Funds | 59 |
Capital Group California Short-Term Municipal Fund
| Bonds, notes & other debt instruments (continued) | Principal amount
(000) | | | Value
(000) | |
| California (continued) | | | | | | | | |
| City and County of San Francisco, G.O. Bonds (Earthquake Safety and Emergency Response), Series 2021-E-1, 5.00% 2025 | | USD | 815 | | | $ | 878 | |
| City and County of San Francisco, Successor Agcy. to the Redev. Agcy., Special Tax Rev. Ref. Bonds (San Francisco Redev. Projects), Series 2014-C, 5.00% 2022 | | | 250 | | | | 252 | |
| San Francisco Community College Dist., G.O. Rev. Ref. Bonds, Series 2015, 5.00% 2024 | | | 865 | | | | 910 | |
| San Gabriel Unified School Dist., G.O. Bonds, Capital Appreciation Bonds, 2008 Election, Series 2012-B, 0% 2023 | | | 200 | | | | 194 | |
| City of San Jacinto, Community Facs. Dist. No. 2002-1 (Rancho San Jacinto Phase 2), Special Tax Rev. Ref. Bonds, Series 2016, 5.00% 2027 | | | 900 | | | | 969 | |
| City of San Jose, Airport Rev. Ref. Bonds, Series 2021-A, BAM insured, 5.00% 2026 | | | 440 | | | | 474 | |
| San Jose Unified School Dist., G.O. Rev. Ref. Bonds, Series 2017, 5.00% 2022 | | | 155 | | | | 156 | |
| Santa Monica-Malibu Unified School Dist., Certs. of Part., Capital Appreciation Notes, Series 2001-C, National insured, 0% 2022 | | | 100 | | | | 99 | |
| Santa Monica-Malibu Unified School Dist., School Facs. Improvement Dist. No. 1 (Santa Monica Schools), G.O. Bonds, 2018 Election, Series 2021-B, 4.00% 2024 | | | 485 | | | | 502 | |
| Santa Monica-Malibu Unified School Dist., School Facs. Improvement Dist. No. 1 (Santa Monica Schools), G.O. Bonds, 2018 Election, Series 2021-B, 4.00% 2025 | | | 335 | | | | 351 | |
| Silicon Valley Clean Water, Wastewater Rev. Notes, Series 2021-B, 0.50% 2026 | | | 1,025 | | | | 930 | |
| Southern California Public Power Auth., Rev. Ref. Bonds (Milford Wind Corridor Phase I Project), Series 2019-1, 5.00% 2022 | | | 200 | | | | 201 | |
| Southern California Public Power Auth., Rev. Ref. Green Bonds (Linden Wind Energy Project), Series 2020-A, 5.00% 2024 | | | 550 | | | | 574 | |
| Southern California Public Power Auth., Rev. Ref. Green Bonds (Milford Wind Corridor Phase II Project), Series 2021-1, 5.00% 2024 | | | 520 | | | | 549 | |
| Southwestern Community College Dist., G.O. Rev. Ref. Bonds (2019 Crossover), Series 2016-B, 4.00% 2022 | | | 310 | | | | 312 | |
| Statewide Communities Dev. Auth., Health Fac. Rev. Ref. Bonds (Los Angeles Jewish Home for the Aging), Series 2019-A, 4.00% 2022 | | | 265 | | | | 268 | |
| Statewide Communities Dev. Auth., Health Fac. Rev. Ref. Bonds (Los Angeles Jewish Home for the Aging), Series 2019-A, 4.00% 2023 | | | 250 | | | | 257 | |
| Statewide Communities Dev. Auth., Health Fac. Rev. Ref. Bonds (Los Angeles Jewish Home for the Aging), Series 2019-B, 4.00% 2023 | | | 660 | | | | 677 | |
| Statewide Communities Dev. Auth., Multi Family Housing Rev. Bonds (Harriet Tubman Terrace Apartments), Series 2021-Q, 0.24% 2024 (put 2023) | | | 2,000 | | | | 1,956 | |
| Statewide Communities Dev. Auth., Multi Family Housing Rev. Bonds (Washington Court Apartments), Series 2021-E, 0.22% 2023 (put 2022) | | | 1,000 | | | | 996 | |
| Statewide Communities Dev. Auth., Rev. Bonds (Adventist Health System/West), Series 2018-A, 5.00% 2023 | | | 135 | | | | 138 | |
| Statewide Communities Dev. Auth., Rev. Bonds (Adventist Health System/West), Series 2018-A, 5.00% 2024 | | | 200 | | | | 210 | |
| Statewide Communities Dev. Auth., Rev. Bonds (Adventist Health System/West), Series 2018-A, 5.00% 2025 | | | 415 | | | | 443 | |
| Statewide Communities Dev. Auth., Rev. Bonds (Cottage Health System Obligated Group), Series 2015, 5.00% 2043 (preref. 2024) | | | 1,500 | | | | 1,593 | |
| Statewide Communities Dev. Auth., Rev. Bonds (Huntington Memorial Hospital), Series 2018, 5.00% 2022 | | | 700 | | | | 704 | |
| Statewide Communities Dev. Auth., Rev. Bonds (Huntington Memorial Hospital), Series 2018, 5.00% 2026 | | | 325 | | | | 355 | |
| Statewide Communities Dev. Auth., Rev. Bonds (Viamonte Senior Living 1 Project), Series 2018-B, 3.00% 2025 | | | 155 | | | | 155 | |
| Statewide Communities Dev. Auth., Student Housing Rev. Bonds (CHF-Irvine, LLC - University of California, Irvine East Campus Apartments, Phase I Ref. and Phase IV-B), Series 2021, BAM insured, 5.00% 2029 | | | 1,865 | | | | 2,058 | |
| Torrance Unified School Dist., G.O. Bonds, Capital Appreciation Bonds, 2008 Election, Series 2009-B-1, 0% 2023 | | | 250 | | | | 243 | |
| City of Tracy, Successor Agcy. to the Community Dev. Agcy., Tax Allocation Rev. Ref. Bonds, Series 2016, Assured Guaranty Municipal insured, 5.00% 2022 | | | 450 | | | | 454 | |
| Transbay Joint Powers Auth., Senior Tax Allocation Green Bonds, Series 2020-A, 5.00% 2025 | | | 500 | | | | 537 | |
| Transbay Joint Powers Auth., Senior Tax Allocation Green Bonds, Series 2020-A, 5.00% 2026 | | | 550 | | | | 601 | |
| Twin Rivers Unified School Dist., G.O. Rev. Ref. Bonds, Series 2016-B, Assured Guaranty Municipal insured, 5.00% 2027 | | | 225 | | | | 247 | |
| Ukiah Unified School Dist., G.O. Bonds, Capital Appreciation Bonds, 2005 Election, Series 2006, MBIA insured, 0% 2023 | | | 440 | | | | 426 | |
| Regents of the University of California, Limited Project Rev. Bonds, Series 2012-G, 5.00% 2022 | | | 150 | | | | 150 | |
| Val Verde Unified School Dist., G.O. Bonds, 2020 Election, Series 2020-A, BAM insured, 4.00% 2023 | | | 450 | | | | 460 | |
| Dept. of Veterans Affairs, Home Purchase Rev. Bonds, Series 2016-B, 3.50% 2045 | | | 405 | | | | 408 | |
| Dept. of Veterans Affairs, Home Purchase Rev. Bonds, Series 2019-A, 4.00% 2049 | | | 1,205 | | | | 1,230 | |
| Dept. of Veterans Affairs, Home Purchase Rev. Bonds, Series 2020-A, 3.00% 2050 | | | 1,360 | | | | 1,347 | |
| Dept. of Veterans Affairs, Veterans G.O. Bonds, Series 2017-CQ, 4.00% 2047 | | | 580 | | | | 590 | |
| Dept. of Veterans Affairs, Veterans G.O. Bonds, Series 2018-CR, 4.00% 2048 | | | 1,070 | | | | 1,091 | |
| Dept. of Veterans Affairs, Veterans G.O. Bonds, Series 2020-CT, 3.00% 2050 | | | 1,950 | | | | 1,931 | |
| Dept. of Veterans Affairs, Veterans G.O. Rev. Ref. Bonds, Series 2016-CN, 3.50% 2045 | | | 575 | | | | 580 | |
| 60 | Private Client Services Funds |
Capital Group California Short-Term Municipal Fund
| Bonds, notes & other debt instruments (continued) | Principal amount
(000) | | | Value
(000) | |
| California (continued) | | | | | | | | |
| West Contra Costa Unified School Dist., G.O. Bonds, 2012 Election, Series 2020-E, Assured Guaranty Municipal insured, 4.00% 2024 | | USD | 300 | | | $ | 310 | |
| West Contra Costa Unified School Dist., G.O. Bonds, 2012 Election, Series 2020-E, Assured Guaranty Municipal insured, 4.00% 2026 | | | 640 | | | | 673 | |
| West Contra Costa Unified School Dist., G.O. Rev. Ref. Bonds, Series 2017-A-1, 5.00% 2024 | | | 250 | | | | 264 | |
| Western Riverside Water and Wastewater Fncg. Auth., Local Agcy. Rev. Ref. Bonds, Series 2016-A, 5.00% 2022 | | | 100 | | | | 101 | |
| City of Westminster, Successor Agcy. to the Redev. Agcy., Commercial Redev. Project No. 1, Tax Allocation Rev. Ref. Bonds, Series 2016-B, BAM insured, 4.00% 2022 | | | 120 | | | | 121 | |
| Whittier Union High School Dist., G.O. Rev. Ref. Bonds, Series 2015, 5.00% 2022 | | | 300 | | | | 303 | |
| City of Woodland, Community Facs. Dist. No. 2004-1 (Spring Lake), Special Tax Capital Projects Bonds, Series 2021, 4.00% 2026 | | | 160 | | | | 167 | |
| City of Woodland, Community Facs. Dist. No. 2004-1 (Spring Lake), Special Tax Capital Projects Bonds, Series 2021, Assured Guaranty Municipal insured, 4.00% 2027 | | | 180 | | | | 192 | |
| City of Woodland, Community Facs. Dist. No. 2004-1 (Spring Lake), Special Tax Capital Projects Bonds, Series 2021, Assured Guaranty Municipal insured, 4.00% 2028 | | | 200 | | | | 214 | |
| | | | | | | | | |
| Total bonds, notes & other debt instruments (cost: $104,562,000) | | | | | | | 100,451 | |
| | | | | | | | | |
| Short-term securities 18.04% | | | | | | | | |
| Municipals 18.04% | | | | | | | | |
| State of California, Irvine Ranch Water Dist. Nos. 105, 140, 240 and 250, Consolidated G.O. Bonds, Series 1993, 0.27% 20331 | | | 2,300 | | | | 2,300 | |
| State of California, City of Los Angeles, Dept. of Water and Power, Rev. Bonds, Series 2021-A-1, 0.27% 20501 | | | 4,000 | | | | 4,000 | |
| State of California, Metropolitan Water Dist. of Southern California, Water Rev. Ref. Bonds, Series 2016-B-2, 0.27% 20371 | | | 3,500 | | | | 3,500 | |
| State of California, Pollution Control Fncg. Auth., Environmental Impact Rev. Bonds (Air Products and Chemicals, Inc. Project), Series 1997-B, 0.27% 20421 | | | 6,500 | | | | 6,500 | |
| State of California, Regents of the University of California, General Rev. Bonds, Series 2013-AL-1, 0.26% 20481 | | | 2,400 | | | | 2,400 | |
| State of California, Regents of the University of California, Medical Center Pooled Rev. Bonds, Series 2007-B-1, 0.26% 20321 | | | 3,300 | | | | 3,300 | |
| | | | | | | | | |
| Total short-term securities (cost: $22,000,000) | | | | | | | 22,000 | |
| Total investment securities 100.41% (cost: $126,562,000) | | | | | | | 122,451 | |
| Other assets less liabilities (0.41%) | | | | | | | (494 | ) |
| | | | | | | | | |
| Net assets 100.00% | | | | | | $ | 121,957 | |
Futures contracts
| Contracts | | Type | | Number of
contracts | | Expiration | | Notional
amount
(000) | | | Value and
unrealized
appreciation
at 4/30/2022
(000) | |
| 2 Year U.S. Treasury Note Futures | | Short | | 60 | | June 2022 | | | USD(12,649 | ) | | | $ | 62 | |
| 1 | Coupon rate may change periodically. Reference rate and spread are as of the most recent information available. Some coupon rates are determined by the issuer or agent based on current market conditions; therefore, the reference rate and spread are not available. For short-term securities, the date of the next scheduled coupon rate change is considered to be the maturity date. |
Key to abbreviations
Agcy. = Agency
Auth. = Authority
Certs. = Certificates
Dept. = Department
Dev. = Development
Dist. = District
Econ. = Economic
Fac. = Facility
Facs. = Facilities
Fin. = Finance
Fncg. = Financing
G.O. = General Obligation
Part. = Participation
Preref. = Prerefunded
Redev. = Redevelopment
Ref. = Refunding
Rev. = Revenue
SIFMA = Securities Industry and Financial Markets Association
USD = U.S. dollars
| Private Client Services Funds | 61 |
| Capital Group Core Bond Fund | unaudited |
| Investment portfolio April 30, 2022 | |
| | |
| Portfolio by type of security | Percent of net assets |
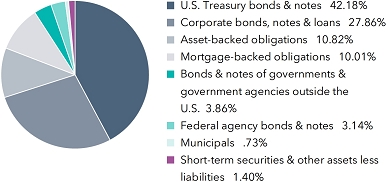
| Portfolio quality summary* | | Percent of
net assets |
| U.S. Treasury bonds & notes† | | | 45.32 | % |
| AAA/Aaa | | | 20.42 | |
| AA/Aa | | | 9.02 | |
| A/A | | | 15.33 | |
| BBB/Baa | | | 8.51 | |
| Short-term securities & other assets less liabilities | | | 1.40 | |
| * | Bond ratings, which typically range from AAA/Aaa (highest) to D (lowest), are assigned by credit rating agencies such as Standard & Poor’s, Moody’s and/or Fitch as an indication of an issuer’s creditworthiness. In assigning a credit rating to a security, the fund looks specifically to the ratings assigned to the issuer of the security by Standard & Poor’s, Moody’s and/or Fitch. If agency ratings differ, the security will be considered to have received the highest of those ratings, consistent with the fund’s investment policies. |
| † | These securities are guaranteed by the full faith and credit of the U.S. government. |
| Bonds, notes & other debt instruments 98.60% | | Principal amount
(000) | | | Value
(000) | |
| U.S. Treasury bonds & notes 42.18% | | | | | | |
| U.S. Treasury 32.18% | | | | | | |
| U.S. Treasury 0.125% 2022 | | USD | 27,000 | | | $ | 26,977 | |
| U.S. Treasury 1.50% 2022 | | | 1,920 | | | | 1,922 | |
| U.S. Treasury 1.75% 2022 | | | — | 1 | | | — | 1 |
| U.S. Treasury 2.125% 2022 | | | 3,000 | | | | 3,007 | |
| U.S. Treasury 0.125% 2023 | | | 10,000 | | | | 9,875 | |
| U.S. Treasury 0.125% 2023 | | | 2,000 | | | | 1,922 | |
| U.S. Treasury 0.25% 2023 | | | 437 | | | | 424 | |
| U.S. Treasury 0.375% 2023 | | | 82 | | | | 79 | |
| U.S. Treasury 1.25% 2023 | | | 1,000 | | | | 986 | |
| U.S. Treasury 1.375% 2023 | | | 1,275 | | | | 1,262 | |
| U.S. Treasury 1.375% 2023 | | | 1,000 | | | | 986 | |
| U.S. Treasury 1.75% 2023 | | | 1,000 | | | | 996 | |
| U.S. Treasury 2.00% 2023 | | | 2,000 | | | | 2,002 | |
| U.S. Treasury 2.125% 2023 | | | 3,415 | | | | 3,391 | |
| U.S. Treasury 2.25% 2023 | | | 500 | | | | 497 | |
| U.S. Treasury 2.50% 2023 | | | 1,050 | | | | 1,052 | |
| U.S. Treasury 2.75% 2023 | | | 4,542 | | | | 4,569 | |
| U.S. Treasury 2.75% 2023 | | | 2,250 | | | | 2,256 | |
| U.S. Treasury 1.75% 2024 | | | 4,000 | | | | 3,909 | |
| U.S. Treasury 2.00% 2024 | | | 3,288 | | | | 3,235 | |
| U.S. Treasury 2.125% 20242 | | | 3,500 | | | | 3,465 | |
| U.S. Treasury 2.25% 2024 | | | 4,538 | | | | 4,498 | |
| U.S. Treasury 2.25% 20242 | | | 3,713 | | | | 3,679 | |
| U.S. Treasury 2.25% 2024 | | | 1,820 | | | | 1,807 | |
| U.S. Treasury 2.75% 2024 | | | 2,500 | | | | 2,503 | |
| U.S. Treasury 0.50% 2025 | | | 4,452 | | | | 4,155 | |
| U.S. Treasury 1.375% 2025 | | | 8,128 | | | | 7,803 | |
| U.S. Treasury 2.00% 2025 | | | 2,000 | | | | 1,952 | |
| 62 | Private Client Services Funds |
Capital Group Core Bond Fund
| Bonds, notes & other debt instruments (continued) | | Principal amount
(000) | | | Value
(000) | |
| U.S. Treasury bonds & notes (continued) | | | | | | |
| U.S. Treasury (continued) | | | | | | | | |
| U.S. Treasury 2.625% 2025 | | USD | 6,600 | | | $ | 6,525 | |
| U.S. Treasury 2.625% 2025 | | | 1,429 | | | | 1,418 | |
| U.S. Treasury 7.625% 20252 | | | 481 | | | | 543 | |
| U.S. Treasury 0.50% 2026 | | | 3,500 | | | | 3,189 | |
| U.S. Treasury 0.75% 2026 | | | 1,150 | | | | 1,055 | |
| U.S. Treasury 0.75% 2026 | | | 32 | | | | 29 | |
| U.S. Treasury 0.875% 2026 | | | 4,928 | | | | 4,500 | |
| U.S. Treasury 1.625% 2026 | | | 3,000 | | | | 2,856 | |
| U.S. Treasury 1.75% 2026 | | | 12,140 | | | | 11,500 | |
| U.S. Treasury 1.125% 2027 | | | 477 | | | | 438 | |
| U.S. Treasury 2.25% 2027 | | | 8,420 | | | | 8,146 | |
| U.S. Treasury 2.25% 2027 | | | 2,200 | | | | 2,121 | |
| U.S. Treasury 2.50% 2027 | | | 11,270 | | | | 11,036 | |
| U.S. Treasury 1.375% 2028 | | | 1,000 | | | | 904 | |
| U.S. Treasury 1.50% 20282 | | | 13,500 | | | | 12,303 | |
| U.S. Treasury 2.625% 2029 | | | 5,660 | | | | 5,538 | |
| U.S. Treasury 1.875% 2032 | | | 12,046 | | | | 10,994 | |
| U.S. Treasury 2.00% 20502 | | | 1,000 | | | | 806 | |
| U.S. Treasury 1.875% 2051 | | | 369 | | | | 289 | |
| | | | | | | | 183,399 | |
| | | | | | | | | |
| U.S. Treasury inflation-protected securities 10.00% | | | | | | | | |
| U.S. Treasury Inflation-Protected Security 0.125% 20253 | | | 14,107 | | | | 14,589 | |
| U.S. Treasury Inflation-Protected Security 0.125% 20253 | | | 1,093 | | | | 1,131 | |
| U.S. Treasury Inflation-Protected Security 0.25% 20253 | | | 8,742 | | | | 9,086 | |
| U.S. Treasury Inflation-Protected Security 0.375% 20253 | | | 1,316 | | | | 1,376 | |
| U.S. Treasury Inflation-Protected Security 0.125% 20263 | | | 12,557 | | | | 12,926 | |
| U.S. Treasury Inflation-Protected Security 0.875% 20293 | | | 5,141 | | | | 5,503 | |
| U.S. Treasury Inflation-Protected Security 0.125% 20302,3 | | | 12,209 | | | | 12,391 | |
| | | | | | | | 57,002 | |
| | | | | | | | | |
| Total U.S. Treasury bonds & notes | | | | | | | 240,401 | |
| | | | | | | | | |
| Corporate bonds, notes & loans 27.86% | | | | | | | | |
| Financials 9.45% | | | | | | | | |
| ACE INA Holdings, Inc. 2.875% 2022 | | | 150 | | | | 151 | |
| ACE INA Holdings, Inc. 3.35% 2026 | | | 45 | | | | 45 | |
| ACE INA Holdings, Inc. 4.35% 2045 | | | 50 | | | | 49 | |
| AerCap Ireland Capital, Ltd. / AerCap Global Aviation Trust 2.45% 2026 | | | 1,637 | | | | 1,458 | |
| AerCap Ireland Capital, Ltd. / AerCap Global Aviation Trust 3.00% 2028 | | | 1,190 | | | | 1,036 | |
| Allstate Corp. 0.75% 2025 | | | 637 | | | | 580 | |
| Allstate Corp. 3.28% 2026 | | | 175 | | | | 173 | |
| American International Group, Inc. 2.50% 2025 | | | 2,000 | | | | 1,924 | |
| Bank of America Corp. 1.197% 2026 (USD-SOFR + 1.01% on 10/24/2025)4 | | | 1,108 | | | | 1,000 | |
| Bank of America Corp. 1.734% 2027 (USD-SOFR + 0.96% on 7/22/2026)4 | | | 935 | | | | 840 | |
| Bank of America Corp. 2.551% 2028 (USD-SOFR + 1.05% on 2/4/2027)4 | | | 1,860 | | | | 1,720 | |
| Bank of America Corp. 1.922% 2031 (USD-SOFR + 1.37% on 10/24/2030)4 | | | 1,385 | | | | 1,128 | |
| Bank of America Corp. 2.687% 2032 (USD-SOFR + 1.32% on 4/22/2031)4 | | | 748 | | | | 643 | |
| BNP Paribas 2.159% 2029 (USD-SOFR + 1.218% on 9/15/2028)4,5 | | | 475 | | | | 405 | |
| Citigroup, Inc. 4.45% 2027 | | | 400 | | | | 397 | |
| Citigroup, Inc. 2.572% 2031 (USD-SOFR + 2.107% on 6/3/2030)4 | | | 1,283 | | | | 1,102 | |
| Citigroup, Inc. 2.666% 2031 (USD-SOFR + 1.146% on 1/29/2030)4 | | | 502 | | | | 437 | |
| Corebridge Financial, Inc. 3.50% 20255 | | | 1,028 | | | | 1,019 | |
| Corebridge Financial, Inc. 3.65% 20275 | | | 1,462 | | | | 1,420 | |
| Corebridge Financial, Inc. 3.85% 20295 | | | 497 | | | | 475 | |
| Corebridge Financial, Inc. 3.90% 20325 | | | 281 | | | | 264 | |
| Credit Suisse Group AG 3.80% 2023 | | | 500 | | | | 502 | |
| Deutsche Bank AG 2.552% 2028 (USD-SOFR + 1.318% on 1/7/2027)4 | | | 1,500 | | | | 1,334 | |
| Goldman Sachs Group, Inc. 1.757% 2025 (USD-SOFR + 0.73% on 1/24/2024)4 | | | 2,500 | | | | 2,416 | |
| Private Client Services Funds | 63 |
Capital Group Core Bond Fund
| Bonds, notes & other debt instruments (continued) | | Principal amount
(000) | | | Value
(000) | |
| Corporate bonds, notes & loans (continued) | | | | | | | | |
| Financials (continued) | | | | | | | | |
| Goldman Sachs Group, Inc. 0.855% 2026 (USD-SOFR + 0.609% on 2/12/2025)4 | | USD | 400 | | | $ | 365 | |
| Goldman Sachs Group, Inc. 1.093% 2026 (USD-SOFR + 0.789% on 12/9/2025)4 | | | 750 | | | | 671 | |
| Goldman Sachs Group, Inc. 1.948% 2027 (USD-SOFR + 0.913% on 10/21/2026)4 | | | 679 | | | | 611 | |
| Goldman Sachs Group, Inc. 3.814% 2029 (3-month USD-LIBOR + 1.158% on 4/23/2028)4 | | | 725 | | | | 697 | |
| Goldman Sachs Group, Inc. 1.992% 2032 (USD-SOFR + 1.09% on 1/27/2031)4 | | | 708 | | | | 573 | |
| Goldman Sachs Group, Inc. 4.017% 2038 (3-month USD-LIBOR + 1.373% on 10/31/2037)4 | | | 175 | | | | 160 | |
| JPMorgan Chase & Co. 3.559% 2024 (3-month USD-LIBOR + 0.73% on 4/23/2023)4 | | | 1,125 | | | | 1,125 | |
| JPMorgan Chase & Co. 2.301% 2025 (USD-SOFR + 1.16% on 10/15/2024)4 | | | 1,165 | | | | 1,118 | |
| JPMorgan Chase & Co. 1.045% 2026 (USD-SOFR + 0.80% on 11/19/2025)4 | | | 1,500 | | | | 1,349 | |
| JPMorgan Chase & Co. 4.08% 2026 (USD-SOFR + 1.32% on 4/26/2025)4 | | | 1,500 | | | | 1,497 | |
| JPMorgan Chase & Co. 4.323% 2028 (USD-SOFR + 1.56% on 4/26/2027)4 | | | 1,250 | | | | 1,246 | |
| JPMorgan Chase & Co. 2.58% 2032 (USD-SOFR + 1.25% on 4/22/2031)4 | | | 232 | | | | 199 | |
| Lloyds Banking Group PLC 4.375% 2028 | | | 200 | | | | 198 | |
| Marsh & McLennan Companies, Inc. 3.875% 2024 | | | 495 | | | | 501 | |
| Marsh & McLennan Companies, Inc. 2.25% 2030 | | | 715 | | | | 620 | |
| Metropolitan Life Global Funding I 0.95% 20255 | | | 757 | | | | 700 | |
| Metropolitan Life Global Funding I 1.875% 20275 | | | 1,500 | | | | 1,376 | |
| Morgan Stanley 1.164% 2025 (USD-SOFR + 0.56% on 10/21/2024)4 | | | 995 | | | | 930 | |
| Morgan Stanley 2.72% 2025 (USD-SOFR + 1.152% on 7/22/2024)4 | | | 1,640 | | | | 1,596 | |
| Morgan Stanley 0.985% 2026 (USD-SOFR + 0.72% on 12/10/2025)4 | | | 1,386 | | | | 1,238 | |
| Morgan Stanley 1.593% 2027 (USD-SOFR + 0.879% on 5/4/2026)4 | | | 954 | | | | 859 | |
| Morgan Stanley 2.699% 2031 (USD-SOFR + 1.143% on 1/22/2030)4 | | | 461 | | | | 406 | |
| National Australia Bank, Ltd. 1.887% 20275 | | | 1,500 | | | | 1,382 | |
| National Securities Clearing Corp. 0.40% 20235 | | | 3,000 | | | | 2,879 | |
| New York Life Global Funding 2.25% 20225 | | | 305 | | | | 305 | |
| New York Life Global Funding 0.90% 20245 | | | 2,000 | | | | 1,892 | |
| Northwestern Mutual Global Funding 0.80% 20265 | | | 1,778 | | | | 1,613 | |
| Toronto-Dominion Bank 0.45% 2023 | | | 1,353 | | | | 1,311 | |
| Toronto-Dominion Bank 1.45% 2025 | | | 1,500 | | | | 1,424 | |
| Toronto-Dominion Bank 1.25% 2026 | | | 1,005 | | | | 902 | |
| Toronto-Dominion Bank 1.95% 2027 | | | 1,250 | | | | 1,148 | |
| Wells Fargo & Company 3.526% 2028 (USD-SOFR + 1.51% on 3/24/2027)4 | | | 998 | | | | 959 | |
| Wells Fargo & Company 2.572% 2031 (3-month USD-LIBOR + 1.00% on 2/11/2030)4 | | | 1,715 | | | | 1,498 | |
| | | | | | | | 53,866 | |
| |
| Consumer discretionary 4.34% | | | | | | | | |
| Amazon.com, Inc. 0.25% 2023 | | | 1,175 | | | | 1,151 | |
| Amazon.com, Inc. 0.45% 2024 | | | 1,175 | | | | 1,122 | |
| Amazon.com, Inc. 0.80% 2025 | | | 1,544 | | | | 1,443 | |
| Amazon.com, Inc. 1.20% 2027 | | | 1,287 | | | | 1,153 | |
| Amazon.com, Inc. 1.65% 2028 | | | 1,175 | | | | 1,046 | |
| American Honda Finance Corp. 0.75% 2024 | | | 2,145 | | | | 2,031 | |
| American Honda Finance Corp. 1.30% 2026 | | | 1,535 | | | | 1,397 | |
| American Honda Finance Corp. 2.30% 2026 | | | 80 | | | | 76 | |
| American Honda Finance Corp. 3.50% 2028 | | | 325 | | | | 320 | |
| Bayerische Motoren Werke AG 0.75% 20245 | | | 1,250 | | | | 1,184 | |
| Bayerische Motoren Werke AG 0.80% 20245 | | | 1,225 | | | | 1,170 | |
| Bayerische Motoren Werke AG 1.25% 20265 | | | 813 | | | | 739 | |
| Daimler Trucks Finance North America, LLC 3.50% 20255 | | | 1,200 | | | | 1,189 | |
| Daimler Trucks Finance North America, LLC 2.00% 20265 | | | 1,000 | | | | 915 | |
| Daimler Trucks Finance North America, LLC 3.65% 20275 | | | 275 | | | | 268 | |
| Daimler Trucks Finance North America, LLC 2.375% 20285 | | | 325 | | | | 287 | |
| Home Depot, Inc. 1.50% 2028 | | | 1,840 | | | | 1,617 | |
| Hyundai Capital America 0.80% 20235 | | | 1,200 | | | | 1,173 | |
| Hyundai Capital America 1.80% 20255 | | | 481 | | | | 444 | |
| Hyundai Capital America 2.375% 20275 | | | 387 | | | | 345 | |
| Hyundai Capital America 2.10% 20285 | | | 350 | | | | 301 | |
| McDonald’s Corp. 3.70% 2026 | | | 135 | | | | 135 | |
| McDonald’s Corp. 3.50% 2027 | | | 185 | | | | 183 | |
| NIKE, Inc. 2.375% 2026 | | | 615 | | | | 589 | |
| 64 | Private Client Services Funds |
Capital Group Core Bond Fund
| Bonds, notes & other debt instruments (continued) | | Principal amount
(000) | | | Value
(000) | |
| Corporate bonds, notes & loans (continued) | | | | | | | | |
| Consumer discretionary (continued) | | | | | | | | |
| Stellantis Finance US, Inc. 1.711% 20275 | | USD | 1,000 | | | $ | 888 | |
| Stellantis Finance US, Inc. 2.691% 20315 | | | 900 | | | | 745 | |
| Toyota Motor Credit Corp. 0.625% 2024 | | | 2,145 | | | | 2,025 | |
| Toyota Motor Credit Corp. 0.80% 2026 | | | 890 | | | | 807 | |
| | | | | | | | 24,743 | |
| |
| Industrials 2.16% | | | | | | | | |
| Avolon Holdings Funding, Ltd. 3.95% 20245 | | | 743 | | | | 731 | |
| Avolon Holdings Funding, Ltd. 4.375% 20265 | | | 925 | | | | 892 | |
| Boeing Company 5.04% 2027 | | | 1,021 | | | | 1,034 | |
| Boeing Company 3.25% 2028 | | | 1,095 | | | | 1,011 | |
| Canadian Pacific Railway, Ltd. 1.75% 2026 | | | 222 | | | | 204 | |
| Emerson Electric Co. 1.80% 2027 | | | 383 | | | | 347 | |
| General Dynamics Corp. 1.15% 2026 | | | 1,000 | | | | 910 | |
| Honeywell International, Inc. 2.15% 2022 | | | 1,160 | | | | 1,161 | |
| Honeywell International, Inc. 2.30% 2024 | | | 878 | | | | 867 | |
| Masco Corp. 1.50% 2028 | | | 782 | | | | 667 | |
| Raytheon Technologies Corp. 3.20% 2024 | | | 275 | | | | 276 | |
| Siemens AG 0.40% 20235 | | | 1,140 | | | | 1,119 | |
| Siemens AG 0.65% 20245 | | | 1,425 | | | | 1,362 | |
| Siemens AG 1.20% 20265 | | | 808 | | | | 737 | |
| Union Pacific Corp. 3.75% 2025 | | | 230 | | | | 232 | |
| Union Pacific Corp. 2.15% 2027 | | | 793 | | | | 743 | |
| United Technologies Corp. 3.65% 2023 | | | 27 | | | | 27 | |
| | | | | | | | 12,320 | |
| |
| Communication services 2.08% | | | | | | | | |
| Alphabet, Inc. 0.80% 2027 | | | 490 | | | | 431 | |
| Alphabet, Inc. 1.10% 2030 | | | 500 | | | | 410 | |
| AT&T, Inc. 1.65% 2028 | | | 1,065 | | | | 930 | |
| CCO Holdings, LLC and CCO Holdings Capital Corp. 4.908% 2025 | | | 165 | | | | 168 | |
| CCO Holdings, LLC and CCO Holdings Capital Corp. 2.80% 2031 | | | 502 | | | | 417 | |
| Comcast Corp. 3.95% 2025 | | | 539 | | | | 546 | |
| Comcast Corp. 1.95% 2031 | | | 704 | | | | 596 | |
| Magallanes, Inc. 3.638% 20255 | | | 1,143 | | | | 1,125 | |
| Magallanes, Inc. 3.755% 20275 | | | 880 | | | | 852 | |
| Magallanes, Inc. 4.054% 20295 | | | 359 | | | | 343 | |
| Netflix, Inc. 4.875% 2028 | | | 475 | | | | 466 | |
| Netflix, Inc. 5.875% 2028 | | | 250 | | | | 258 | |
| Netflix, Inc. 6.375% 2029 | | | 25 | | | | 27 | |
| SBA Tower Trust 1.631% 20265 | | | 983 | | | | 907 | |
| Take-Two Interactive Software, Inc. 3.30% 2024 | | | 551 | | | | 548 | |
| Take-Two Interactive Software, Inc. 3.70% 2027 | | | 367 | | | | 360 | |
| Take-Two Interactive Software, Inc. 4.00% 2032 | | | 217 | | | | 207 | |
| T-Mobile US, Inc. 3.75% 2027 | | | 1,119 | | | | 1,089 | |
| Verizon Communications, Inc. 3.00% 2027 | | | 450 | | | | 431 | |
| Verizon Communications, Inc. 2.10% 2028 | | | 1,250 | | | | 1,121 | |
| Verizon Communications, Inc. 2.355% 20325 | | | 710 | | | | 597 | |
| | | | | | | | 11,829 | |
| |
| Consumer staples 1.83% | | | | | | | | |
| 7-Eleven, Inc. 0.95% 20265 | | | 250 | | | | 224 | |
| 7-Eleven, Inc. 1.30% 20285 | | | 175 | | | | 149 | |
| Altria Group, Inc. 2.35% 2025 | | | 156 | | | | 149 | |
| Altria Group, Inc. 4.40% 2026 | | | 117 | | | | 118 | |
| Altria Group, Inc. 3.40% 2030 | | | 89 | | | | 80 | |
| British American Tobacco PLC 3.462% 2029 | | | 1,850 | | | | 1,650 | |
| Coca-Cola Company 1.00% 2028 | | | 1,625 | | | | 1,409 | |
| Constellation Brands, Inc. 3.20% 2023 | | | 386 | | | | 387 | |
| Private Client Services Funds | 65 |
Capital Group Core Bond Fund
| Bonds, notes & other debt instruments (continued) | | Principal amount
(000) | | | Value
(000) | |
| Corporate bonds, notes & loans (continued) | | | | | | | | |
| Consumer staples (continued) | | | | | | | | |
| Constellation Brands, Inc. 2.875% 2030 | | USD | 239 | | | $ | 213 | |
| Keurig Dr Pepper, Inc. 3.20% 2030 | | | 500 | | | | 457 | |
| Molson Coors Brewing Co. 3.00% 2026 | | | 245 | | | | 233 | |
| Nestlé Holdings, Inc. 1.00% 20275 | | | 1,640 | | | | 1,441 | |
| Nestlé Holdings, Inc. 1.50% 20285 | | | 1,750 | | | | 1,541 | |
| PepsiCo, Inc. 1.625% 2030 | | | 85 | | | | 73 | |
| Philip Morris International, Inc. 1.50% 2025 | | | 274 | | | | 258 | |
| Philip Morris International, Inc. 0.875% 2026 | | | 566 | | | | 508 | |
| Procter & Gamble Company 0.55% 2025 | | | 796 | | | | 733 | |
| Procter & Gamble Company 1.00% 2026 | | | 362 | | | | 331 | |
| Procter & Gamble Company 3.00% 2030 | | | 495 | | | | 471 | |
| | | | | | | | 10,425 | |
| |
| Health care 1.79% | | | | | | | | |
| Abbott Laboratories 3.40% 2023 | | | 98 | | | | 99 | |
| Abbott Laboratories 3.75% 2026 | | | 292 | | | | 295 | |
| Aetna, Inc. 2.80% 2023 | | | 55 | | | | 55 | |
| AmerisourceBergen Corp. 0.737% 2023 | | | 853 | | | | 840 | |
| AstraZeneca Finance LLC 1.20% 2026 | | | 600 | | | | 546 | |
| AstraZeneca Finance LLC 1.75% 2028 | | | 444 | | | | 396 | |
| AstraZeneca PLC 3.375% 2025 | | | 445 | | | | 443 | |
| Baxter International, Inc. 2.272% 20285 | | | 979 | | | | 873 | |
| Becton, Dickinson and Company 3.734% 2024 | | | 17 | | | | 17 | |
| Boston Scientific Corp. 3.45% 2024 | | | 296 | | | | 296 | |
| CVS Health Corp. 1.30% 2027 | | | 1,134 | | | | 994 | |
| CVS Health Corp. 4.30% 2028 | | | 282 | | | | 283 | |
| GlaxoSmithKline PLC 3.375% 2023 | | | 750 | | | | 756 | |
| HCA, Inc. 3.375% 20295 | | | 483 | | | | 445 | |
| Merck & Co., Inc. 1.90% 2028 | | | 1,138 | | | | 1,027 | |
| Novartis Capital Corp. 1.75% 2025 | | | 1,006 | | | | 970 | |
| Novartis Capital Corp. 2.00% 2027 | | | 275 | | | | 259 | |
| Pfizer, Inc. 2.95% 2024 | | | 485 | | | | 485 | |
| Shire PLC 2.875% 2023 | | | 48 | | | | 48 | |
| Thermo Fisher Scientific, Inc. 1.75% 2028 | | | 385 | | | | 340 | |
| UnitedHealth Group, Inc. 1.15% 2026 | | | 495 | | | | 451 | |
| UnitedHealth Group, Inc. 2.00% 2030 | | | 148 | | | | 128 | |
| UnitedHealth Group, Inc. 2.30% 2031 | | | 200 | | | | 175 | |
| | | | | | | | 10,221 | |
| |
| Utilities 1.58% | | | | | | | | |
| Ameren Corp. 2.50% 2024 | | | 373 | | | | 366 | |
| Connecticut Light and Power Co. 3.20% 2027 | | | 1,025 | | | | 1,002 | |
| Duke Energy Progress, LLC 3.375% 2023 | | | 786 | | | | 792 | |
| Duke Energy Progress, LLC 3.70% 2028 | | | 200 | | | | 198 | |
| Florida Power & Light Company 2.85% 2025 | | | 225 | | | | 222 | |
| NextEra Energy Capital Holdings, Inc. 2.25% 2030 | | | 1,276 | | | | 1,092 | |
| Pacific Gas and Electric Co. 3.45% 2025 | | | 150 | | | | 144 | |
| Pacific Gas and Electric Co. 3.75% 2028 | | | 150 | | | | 138 | |
| Pacific Gas and Electric Co. 2.50% 2031 | | | 175 | | | | 139 | |
| Pacific Gas and Electric Co. 3.30% 2040 | | | 50 | | | | 36 | |
| Southern California Edison Co. 0.975% 2024 | | | 925 | | | | 875 | |
| Southern California Edison Co. 3.70% 2025 | | | 1,000 | | | | 999 | |
| Southern California Edison Co. 2.85% 2029 | | | 1,000 | | | | 903 | |
| Tampa Electric Co. 2.60% 2022 | | | 350 | | | | 350 | |
| Virginia Electric and Power Co. 3.10% 2025 | | | 1,040 | | | | 1,027 | |
| Xcel Energy, Inc. 3.35% 2026 | | | 749 | | | | 733 | |
| | | | | | | | 9,016 | |
| 66 | Private Client Services Funds |
Capital Group Core Bond Fund
| Bonds, notes & other debt instruments (continued) | | Principal amount
(000) | | | Value
(000) | |
| Corporate bonds, notes & loans (continued) | | | | | | | | |
| Information technology 1.47% | | | | | | | | |
| Adobe, Inc. 1.90% 2025 | | USD | 647 | | | $ | 625 | |
| Analog Devices, Inc. 1.70% 2028 | | | 418 | | | | 367 | |
| Apple, Inc. 0.70% 2026 | | | 1,135 | | | | 1,037 | |
| Apple, Inc. 1.20% 2028 | | | 1,418 | | | | 1,243 | |
| Broadcom Corp. / Broadcom Cayman Finance, Ltd. 3.875% 2027 | | | 185 | | | | 181 | |
| Broadcom, Inc. 1.95% 20285 | | | 123 | | | | 107 | |
| Broadcom, Ltd. 3.625% 2024 | | | 270 | | | | 272 | |
| Fidelity National Information Services, Inc. 1.15% 2026 | | | 783 | | | | 709 | |
| Fidelity National Information Services, Inc. 1.65% 2028 | | | 129 | | | | 112 | |
| Fiserv, Inc. 3.20% 2026 | | | 670 | | | | 649 | |
| Fiserv, Inc. 2.25% 2027 | | | 527 | | | | 483 | |
| Fortinet, Inc. 1.00% 2026 | | | 696 | | | | 620 | |
| Intuit, Inc. 0.95% 2025 | | | 255 | | | | 236 | |
| Intuit, Inc. 1.35% 2027 | | | 235 | | | | 209 | |
| Microsoft Corp. 2.40% 2026 | | | 500 | | | | 483 | |
| Oracle Corp. 2.30% 2028 | | | 668 | | | | 583 | |
| PayPal Holdings, Inc. 1.65% 2025 | | | 481 | | | | 455 | |
| | | | | | | | 8,371 | |
| |
| Energy 1.47% | | | | | | | | |
| Boardwalk Pipeline Partners LP 4.95% 2024 | | | 460 | | | | 471 | |
| BP Capital Markets PLC 4.234% 2028 | | | 437 | | | | 439 | |
| Canadian Natural Resources, Ltd. 2.05% 2025 | | | 996 | | | | 939 | |
| Enbridge Energy Partners LP 5.875% 2025 | | | 230 | | | | 244 | |
| Energy Transfer Partners LP 4.20% 2023 | | | 155 | | | | 157 | |
| Energy Transfer Partners LP 4.50% 2024 | | | 90 | | | | 91 | |
| Equinor ASA 3.625% 2028 | | | 165 | | | | 163 | |
| Exxon Mobil Corp. 2.019% 2024 | | | 127 | | | | 124 | |
| Exxon Mobil Corp. 2.44% 2029 | | | 183 | | | | 168 | |
| Kinder Morgan, Inc. 3.15% 2023 | | | 495 | | | | 496 | |
| MPLX LP 3.375% 2023 | | | 75 | | | | 75 | |
| MPLX LP 4.00% 2028 | | | 350 | | | | 340 | |
| ONEOK, Inc. 4.55% 2028 | | | 638 | | | | 636 | |
| ONEOK, Inc. 6.35% 2031 | | | 469 | | | | 513 | |
| Phillips 66 3.85% 2025 | | | 1,253 | | | | 1,262 | |
| Pioneer Natural Resources Company 1.125% 2026 | | | 238 | | | | 216 | |
| SA Global Sukuk, Ltd. 1.602% 20265 | | | 1,505 | | | | 1,388 | |
| Saudi Arabian Oil Co. 1.625% 20255 | | | 200 | | | | 186 | |
| Schlumberger BV 4.00% 20255 | | | 165 | | | | 166 | |
| Williams Companies, Inc. 3.50% 2030 | | | 248 | | | | 231 | |
| Williams Companies, Inc. 2.60% 2031 | | | 45 | | | | 39 | |
| | | | | | | | 8,344 | |
| |
| Real estate 1.11% | | | | | | | | |
| Alexandria Real Estate Equities, Inc. 3.95% 2028 | | | 60 | | | | 59 | |
| Alexandria Real Estate Equities, Inc. 1.875% 2033 | | | 596 | | | | 469 | |
| American Campus Communities, Inc. 3.75% 2023 | | | 300 | | | | 302 | |
| American Campus Communities, Inc. 4.125% 2024 | | | 415 | | | | 420 | |
| American Tower Corp. 1.45% 2026 | | | 982 | | | | 877 | |
| American Tower Corp. 1.60% 2026 | | | 717 | | | | 652 | |
| Corporate Office Properties LP 2.75% 2031 | | | 294 | | | | 250 | |
| Equinix, Inc. 1.80% 2027 | | | 326 | | | | 287 | |
| Equinix, Inc. 2.00% 2028 | | | 433 | | | | 377 | |
| Essex Portfolio LP 3.50% 2025 | | | 490 | | | | 487 | |
| Gaming and Leisure Properties, Inc. 3.35% 2024 | | | 242 | | | | 239 | |
| Public Storage 1.85% 2028 | | | 553 | | | | 493 | |
| Private Client Services Funds | 67 |
Capital Group Core Bond Fund
| Bonds, notes & other debt instruments (continued) | | Principal amount
(000) | | | Value
(000) | |
| Corporate bonds, notes & loans (continued) | | | | | | | | |
| Real estate (continued) | | | | | | | | |
| Public Storage 1.95% 2028 | | USD | 770 | | | $ | 685 | |
| Scentre Group 3.50% 20255 | | | 250 | | | | 248 | |
| Sun Communities Operating LP 2.30% 2028 | | | 559 | | | | 491 | |
| | | | | | | | 6,336 | |
| |
| Materials 0.58% | | | | | | | | |
| Air Products and Chemicals, Inc. 1.50% 2025 | | | 757 | | | | 711 | |
| Dow Chemical Co. 3.625% 2026 | | | 250 | | | | 249 | |
| Dow Chemical Co. 2.10% 2030 | | | 1,000 | | | | 849 | |
| DowDuPont, Inc. 4.493% 2025 | | | 515 | | | | 525 | |
| LYB International Finance III, LLC 2.25% 2030 | | | 496 | | | | 422 | |
| Vale Overseas, Ltd. 3.75% 2030 | | | 587 | | | | 531 | |
| | | | | | | | 3,287 | |
| |
| Total corporate bonds, notes & loans | | | | | | | 158,758 | |
| |
| Asset-backed obligations 10.82% | | | | | | | | |
| Aesop Funding LLC, Series 2019-2A, Class A, 3.35% 20255,6 | | | 750 | | | | 744 | |
| Aesop Funding LLC, Series 2020-2, Class A, 2.02% 20275,6 | | | 539 | | | | 505 | |
| Aesop Funding LLC, Series 2020-2A, Class B, 2.96% 20275,6 | | | 138 | | | | 132 | |
| Affirm Asset Securitization Trust, Series 2021-A, Class A, 0.88% 20255,6 | | | 462 | | | | 459 | |
| Affirm Asset Securitization Trust, Series 2021-B, Class A, 1.03% 20265,6 | | | 1,136 | | | | 1,087 | |
| Affirm Asset Securitization Trust, Series 2021-Z2, Class A, 1.17% 20265,6 | | | 521 | | | | 507 | |
| Allegro CLO, Ltd., Series 2016-1A, Class AR2, (3-month USD-LIBOR + 0.95%) 1.994% 20305,6,7 | | | 708 | | | | 707 | |
| Allegro CLO, Ltd., Series 2017-1A, Class AR, (3-month USD-LIBOR + 0.95%) 1.994% 20305,6,7 | | | 492 | | | | 489 | |
| Ares CLO, Ltd., Series 2017-42A, Class AR, (3-month USD-LIBOR + 0.92%) 2.056% 20285,6,7 | | | 913 | | | | 910 | |
| Ballyrock CLO, Ltd., Series 2019-2A, Class A1AR, (3-month USD-LIBOR + 1.00%) 1.48% 20305,6,7 | | | 1,095 | | | | 1,087 | |
| Bankers Healthcare Group Securitization Trust, Series 2021-A, Class A, 1.42% 20335,6 | | | 90 | | | | 85 | |
| Bankers Healthcare Group Securitization Trust, Series 2021-B, Class A, 0.90% 20345,6 | | | 176 | | | | 171 | |
| CarMaxAuto Owner Trust, Series 2019-2, Class A3, 2.68% 20246 | | | 199 | | | | 200 | |
| CarMaxAuto Owner Trust, Series 2019-2, Class A4, 2.77% 20246 | | | 805 | | | | 807 | |
| CarMaxAuto Owner Trust, Series 2019-2, Class B, 3.01% 20246 | | | 775 | | | | 776 | |
| CarMaxAuto Owner Trust, Series 2019-2, Class C, 3.16% 20256 | | | 1,150 | | | | 1,152 | |
| Castlelake Aircraft Securitization Trust, Series 2021-1, Class A, 2.868% 20375,6 | | | 586 | | | | 530 | |
| Castlelake Aircraft Securitization Trust, Series 2017-1R, Class A, 2.741% 20415,6 | | | 181 | | | | 159 | |
| Cent CLO, Ltd., Series 2014-21A, Class AR, (3-month USD-LIBOR + 0.97%) 2.195% 20305,6,7 | | | 1,557 | | | | 1,548 | |
| CF Hippolyta LLC, Series 2020-1, Class A1, 1.69% 20605,6 | | | 1,003 | | | | 932 | |
| CF Hippolyta LLC, Series 2020-1, Class A2, 1.99% 20605,6 | | | 163 | | | | 146 | |
| CF Hippolyta LLC, Series 2020-1, Class B1, 2.28% 20605,6 | | | 262 | | | | 245 | |
| CF Hippolyta LLC, Series 2020-1, Class B2, 2.60% 20605,6 | | | 92 | | | | 83 | |
| CF Hippolyta LLC, Series 2021-1, Class A1, 1.53% 20615,6 | | | 452 | | | | 412 | |
| CLI Funding VI, LLC, Series 2020-1A, Class A, 2.08% 20455,6 | | | 404 | | | | 370 | |
| CLI Funding VIII, LLC, Series 2021-1A, Class A, 1.64% 20465,6 | | | 524 | | | | 473 | |
| CPS Auto Receivables Trust, Series 2022-B, Class A, 2.88% 20265,6 | | | 682 | | | | 681 | |
| Drive Auto Receivables Trust, Series 2020-1, Class C, 2.36% 20266 | | | 1,614 | | | | 1,616 | |
| Drivetime Auto Owner Trust, Series 2020-1, Class B, 2.16% 20245,6 | | | 86 | | | | 86 | |
| Dryden Senior Loan Fund, CLO, Series 2017-47A, Class A1R, (3-month USD-LIBOR + 0.98%) 2.024% 20285,6,7 | | | 1,614 | | | | 1,608 | |
| EDvestinU Private Education Loan LLC, Series 2021-A, Class A, 1.80% 20455,6 | | | 77 | | | | 70 | |
| Enterprise Fleet Financing, LLC, Series 2022-1, Class A2, 3.03% 20285,6 | | | 1,201 | | | | 1,190 | |
| Exeter Automobile Receivables Trust, Series 2021-4A, Class A3, 0.68% 20256 | | | 628 | | | | 619 | |
| First Investors Auto Owner Trust, Series 2021-1A, Class A, 0.45% 20265,6 | | | 160 | | | | 158 | |
| FirstKey Homes Trust, Series 2020-SFR2, Class A, 1.266% 20375,6 | | | 237 | | | | 216 | |
| Ford Credit Auto Owner Trust, Series 2020-A, Class A3, 1.04% 20246 | | | 271 | | | | 270 | |
| Ford Credit Auto Owner Trust, Series 2020-1, Class A, 2.04% 20315,6 | | | 582 | | | | 558 | |
| Ford Credit Auto Owner Trust, Series 2021-1, Class A, 1.37% 20335,6 | | | 439 | | | | 402 | |
| GCI Funding I LLC, Series 2020-1, Class A, 2.82% 20455,6 | | | 156 | | | | 147 | |
| GCI Funding I LLC, Series 2021-1, Class A, 2.38% 20465,6 | | | 423 | | | | 383 | |
| Global SC Finance V SRL, Series 2020-1A, Class A, 2.17% 20405,6 | | | 1,256 | | | | 1,171 | |
| Global SC Finance VII SRL, Series 2020-2A, Class A, 2.26% 20405,6 | | | 839 | | | | 782 | |
| Global SC Finance VII SRL, Series 2021-1A, Class A, 1.86% 20415,6 | | | 1,016 | | | | 925 | |
| 68 | Private Client Services Funds |
Capital Group Core Bond Fund
| Bonds, notes & other debt instruments (continued) | | Principal amount
(000) | | | Value
(000) | |
| Asset-backed obligations (continued) | | | | | | | | |
| Hertz Vehicle Financing III, LLC, Series 2021-1A, Class A, 1.21% 20255,6 | | USD | 1,138 | | | $ | 1,070 | |
| Hertz Vehicle Financing III, LLC, Series 2021-1A, Class B, 1.56% 20255,6 | | | 122 | | | | 115 | |
| Hertz Vehicle Financing III, LLC, Series 2022-1A, Class A, 1.99% 20265,6 | | | 614 | | | | 581 | |
| Hertz Vehicle Financing III, LLC, Series 2022-4A, Class A, 3.73% 20265,6 | | | 1,200 | | | | 1,191 | |
| Hertz Vehicle Financing III, LLC, Series 2021-2A, Class A, 1.68% 20275,6 | | | 1,234 | | | | 1,105 | |
| Hertz Vehicle Financing III, LLC, Series 2021-2A, Class B, 2.12% 20275,6 | | | 132 | | | | 119 | |
| Hertz Vehicle Financing III, LLC, Series 2022-2A, Class A, 2.33% 20285,6 | | | 1,680 | | | | 1,543 | |
| Hertz Vehicle Financing III, LLC, Series 2022-5A, Class A, 3.89% 20285,6 | | | 1,250 | | | | 1,238 | |
| Honda Auto Receivables Owner Trust, Series 2019-2, Class A3, 2.52% 20236 | | | 268 | | | | 269 | |
| Longfellow Place CLO, Ltd., Series 2013-1A, Class AR3, (3-month USD-LIBOR + 1.00%) 2.044% 20295,6,7 | | | 524 | | | | 522 | |
| Madison Park Funding, Ltd., CLO, Series 2015-17A, Class AR2, (3-month USD-LIBOR + 1.00%) 2.098% 20305,6,7 | | | 1,665 | | | | 1,657 | |
| Marathon CLO, Ltd., Series 2017-9A, Class A1AR, (3-month USD-LIBOR + 1.15%) 2.194% 20295,6,7 | | | 597 | | | | 595 | |
| Mercury Financial Credit Card Master Trust, Series 2021-1A, Class A, 1.54% 20265,6 | | | 1,100 | | | | 1,065 | |
| Mission Lane Credit Card Master Trust, Series 2021-A, Class A, 1.59% 20265,6 | | | 380 | | | | 369 | |
| Navient Student Loan Trust, Series 2021-A, Class A, 0.84% 20695,6 | | | 136 | | | | 127 | |
| Navient Student Loan Trust, Series 2021-C, Class A, 1.06% 20695,6 | | | 655 | | | | 617 | |
| Navient Student Loan Trust, Series 2021-G, Class A, 1.58% 20705,6 | | | 1,455 | | | | 1,367 | |
| Navigator Aircraft ABS, Ltd., Series 2021-1, Class A, 2.771% 20465,6 | | | 1,167 | | | | 1,060 | |
| Nelnet Student Loan Trust, Series 2021-C, Class AFX, 1.32% 20625,6 | | | 1,563 | | | | 1,461 | |
| Nelnet Student Loan Trust, Series 2021-A, Class APT1, 1.36% 20625,6 | | | 781 | | | | 724 | |
| Nelnet Student Loan Trust, Series 2021-B, Class AFX, 1.42% 20625,6 | | | 1,466 | | | | 1,354 | |
| New Economy Assets Phase 1 Issuer, LLC, Series 2021-1, Class A1, 1.91% 20615,6 | | | 2,723 | | | | 2,447 | |
| Newark BSL CLO 2, Ltd., Series 2017-1A, Class A1R, (3-month USD-LIBOR + 0.97%) 2.154% 20305,6,7 | | | 529 | | | | 525 | |
| Nissan Auto Receivables Owner Trust, Series 2019-A, Class A-3, 2.90% 20236 | | | 66 | | | | 66 | |
| Oportun Funding LLC, Series 2021-B, Class A, 1.47% 20315,6 | | | 288 | | | | 270 | |
| Palmer Square Loan Funding, CLO, Series 2021-4A, Class A1, (3-month USD-LIBOR + 0.80%) 1.844% 20295,6,7 | | | 1,371 | | | | 1,361 | |
| Palmer Square Loan Funding, CLO, Series 2021-1, Class A1, (3-month USD-LIBOR + 0.90%) 1.963% 20295,6,7 | | | 162 | | | | 161 | |
| Palmer Square Loan Funding, CLO, Series 2021-4A, Class A2, (3-month USD-LIBOR + 1.40%) 2.444% 20295,6,7 | | | 856 | | | | 851 | |
| Palmer Square Loan Funding, CLO, Series 2020-4, Class A1, (3-month USD-LIBOR + 1.00%) 1.498% 20285,6,7 | | | 332 | | | | 331 | |
| Race Point CLO, Ltd., Series 2015-9A, Class A1A2, (3-month USD-LIBOR + 0.94%) 1.984% 20305,6,7 | | | 1,390 | | | | 1,386 | |
| Santander Drive Auto Receivables Trust, Series 2019-3, Class C, 2.49% 20256 | | | 158 | | | | 158 | |
| SMB Private Education Loan Trust, Series 2021-A, Class A1, (1-month USD-LIBOR + 0.50%) 1.054% 20535,6,7 | | | 18 | | | | 18 | |
| SMB Private Education Loan Trust, Series 2021-A, Class APT2, 1.07% 20535,6 | | | 220 | | | | 200 | |
| SOLRR Aircraft Aviation Holding, Ltd., Series 2021-1, Class A, 2.636% 20465,6 | | | 633 | | | | 577 | |
| Sound Point CLO, Ltd., Series 2015-1RA, Class AR, (3-month USD-LIBOR + 1.08%) 2.124% 20305,6,7 | | | 895 | | | | 891 | |
| Sprite, Ltd., Series 2021-1, Class A, 3.75% 20465,6 | | | 965 | | | | 880 | |
| Stellar Jay Ireland DAC, Series 2021-1, Class A, 3.967% 20415,6 | | | 857 | | | | 796 | |
| Stonepeak Infrastructure Partners, Series 2021-1A, Class AA, 2.301% 20335,6 | | | 342 | | | | 321 | |
| SuttonPark Structured Settlements, Series 2021-1, Class A, 1.95% 20755,6 | | | 479 | | | | 451 | |
| Textainer Marine Containers, Ltd., Series 2021-1A, Class A, 1.68% 20465,6 | | | 188 | | | | 168 | |
| Textainer Marine Containers, Ltd., Series 2021-2A, Class A, 2.23% 20465,6 | | | 1,104 | | | | 1,009 | |
| Toyota Auto Loan Extended Note Trust, Series 2019-1, Class A, 2.56% 20315,6 | | | 1,250 | | | | 1,232 | |
| Toyota Auto Loan Extended Note Trust, Series 2020-1, Class A, 1.35% 20335,6 | | | 445 | | | | 417 | |
| Toyota Auto Receivables Owner Trust, Series 2019-B, Class A3, 2.57% 20236 | | | 242 | | | | 243 | |
| Triton Container Finance VIII LLC, Series 2020-1, Class A, 2.11% 20455,6 | | | 1,109 | | | | 1,013 | |
| Triton Container Finance VIII LLC, Series 2021-1, Class A, 1.86% 20465,6 | | | 747 | | | | 665 | |
| Westlake Automobile Receivables Trust, Series 2021-3A, Class A2, 0.57% 20245,6 | | | 1,471 | | | | 1,457 | |
| | | | | | | | 61,641 | |
| |
| Mortgage-backed obligations 10.01% | | | | | | | | |
| Federal agency mortgage-backed obligations 5.79% | | | | | | | | |
| Fannie Mae Pool #889995 5.50% 20386 | | | 139 | | | | 147 | |
| Fannie Mae Pool #MA4387 2.00% 20416 | | | 804 | | | | 723 | |
| Fannie Mae Pool #AI5236 5.00% 20416 | | | 253 | | | | 270 | |
| Fannie Mae Pool #AI8806 5.00% 20416 | | | 44 | | | | 47 | |
| Fannie Mae, Series 2007-33, Class HE, 5.50% 20376 | | | 3 | | | | 3 | |
| Fannie Mae, Series 2012-M13, Class A2, Multi Family, 2.377% 20226 | | | 7 | | | | 7 | |
| Fannie Mae, Series 2015-M4, Class AV2, Multi Family, 2.509% 20226,7 | | | 2 | | | | 2 | |
| Fannie Mae, Series 2016-M2, Class AV2, Multi Family, 2.152% 20236 | | | 249 | | | | 248 | |
| Fannie Mae, Series 2016-M3, Class ASQ2, Multi Family, 2.263% 20236 | | | 13 | | | | 13 | |
| Fannie Mae, Series 2013-M12, Class APT, Multi Family, 2.478% 20236,7 | | | 237 | | | | 236 | |
| Private Client Services Funds | 69 |
Capital Group Core Bond Fund
| Bonds, notes & other debt instruments (continued) | | Principal amount
(000) | | | Value
(000) | |
| Mortgage-backed obligations (continued) | | | | | | | | |
| Federal agency mortgage-backed obligations (continued) | | | | | | | | |
| Fannie Mae, Series 2017-M3, Class AV2, Multi Family, 2.631% 20246,7 | | USD | 232 | | | $ | 229 | |
| Fannie Mae, Series 2017-M10, Class AV2, Multi Family, 2.639% 20246,7 | | | 401 | | | | 399 | |
| Fannie Mae, Series 2017-M15, Class AV2, Multi Family, 2.662% 20246,7 | | | 267 | | | | 263 | |
| Fannie Mae, Series 2016-M9, Class A1, Multi Family, 2.003% 20266 | | | 26 | | | | 26 | |
| Fannie Mae, Series 2016-M5, Class A1, Multi Family, 2.073% 20266 | | | 295 | | | | 290 | |
| Fannie Mae, Series 2016-M11, Class A1, Multi Family, 2.08% 20266 | | | 450 | | | | 441 | |
| Fannie Mae, Series 2016-M12, Class A1, Multi Family, 2.132% 20266 | | | 43 | | | | 43 | |
| Fannie Mae, Series 2016-M4, Class A1, Multi Family, 2.187% 20266 | | | 204 | | | | 200 | |
| Fannie Mae, Series 2017-M7, Class A2, Multi Family, 2.961% 20276,7 | | | 454 | | | | 451 | |
| Freddie Mac, Series 3272, Class PA, 6.00% 20376 | | | 9 | | | | 9 | |
| Freddie Mac Seasoned Credit Risk Transfer Trust, Series 2017-1, Class HA, 3.00% 20566,7 | | | 338 | | | | 330 | |
| Freddie Mac Seasoned Credit Risk Transfer Trust, Series 2017-2, Class MA, 3.00% 20566 | | | 241 | | | | 237 | |
| Freddie Mac Seasoned Credit Risk Transfer Trust, Series 2017-2, Class HA, 3.00% 20566,7 | | | 241 | | | | 235 | |
| Freddie Mac Seasoned Credit Risk Transfer Trust, Series 2017-4, Class HT, 3.25% 20576,7 | | | 143 | | | | 139 | |
| Freddie Mac Seasoned Credit Risk Transfer Trust, Series 2018-2, Class MT, 3.50% 20576 | | | 309 | | | | 303 | |
| Freddie Mac Seasoned Credit Risk Transfer Trust, Series 2017-4, Class MT, 3.50% 20576 | | | 153 | | | | 150 | |
| Freddie Mac Seasoned Credit Risk Transfer Trust, Series 2019-2, Class MA, 3.50% 20586 | | | 1,225 | | | | 1,219 | |
| Freddie Mac Seasoned Credit Risk Transfer Trust, Series 2019-4, Class MA, 3.00% 20596 | | | 1,225 | | | | 1,202 | |
| Freddie Mac Seasoned Loan Structured Transaction Trust, Series 2018-1, Class A1, 3.50% 20286 | | | 1,334 | | | | 1,319 | |
| Government National Mortgage Assn. 2.00% 20526,8 | | | 2,893 | | | | 2,620 | |
| Government National Mortgage Assn. 3.00% 20526,8 | | | 6,000 | | | | 5,720 | |
| Government National Mortgage Assn. Pool #694836 5.665% 20596 | | | 1 | | | | 2 | |
| Government National Mortgage Assn. Pool #776095 4.851% 20646 | | | 1 | | | | 1 | |
| Government National Mortgage Assn. Pool #AA7554 6.64% 20646 | | | 8 | | | | 8 | |
| Government National Mortgage Assn., Series 2012-H20, Class PT, 1.419% 20626,7 | | | 229 | | | | 229 | |
| Uniform Mortgage-Backed Security 3.00% 20526,8 | | | 10,000 | | | | 9,411 | |
| Uniform Mortgage-Backed Security 3.50% 20526,8 | | | 6,000 | | | | 5,806 | |
| | | | | | | | 32,978 | |
| |
| Collateralized mortgage-backed obligations (privately originated) 2.34% | | | | | | | | |
| Cascade Funding Mortgage Trust, Series 2020-HB4, Class A, 0.946% 20305,6,7 | | | 164 | | | | 162 | |
| Cascade Funding Mortgage Trust, Series 2021-HB6, Class A, 0.898% 20365,6,7 | | | 1,042 | | | | 1,030 | |
| Credit Suisse Mortgage Trust, Series 2017-RPL3, Class A1, 2.00% 20605,6,7 | | | 298 | | | | 287 | |
| Finance of America Structured Securities Trust, Series 2019-JR2, Class A1, 2.00% 20695,6 | | | 564 | | | | 607 | |
| GCAT, Series 2021-NQM6, Class A1, 1.855% 20665,6,7 | | | 1,011 | | | | 967 | |
| Home Partners of America Trust, Series 2021-2, Class A, 1.901% 20265,6 | | | 552 | | | | 505 | |
| Legacy Mortgage Asset Trust, Series 2019-GS5, Class A1, 3.20% 20595,6,7 | | | 458 | | | | 458 | |
| Legacy Mortgage Asset Trust, Series 2019-GS7, Class A1, 3.25% 20595,6,7 | | | 772 | | | | 771 | |
| Mello Warehouse Securitization Trust, Series 2020-2, Class A, (1-month USD-LIBOR + 0.80%) 1.468% 20535,6,7 | | | 466 | | | | 464 | |
| Mello Warehouse Securitization Trust, Series 2021-3, Class A, (1-month USD-LIBOR + 0.85%) 1.518% 20555,6,7 | | | 808 | | | | 797 | |
| MRA Issuance Trust, Series 2020-10, Class A3, (1-month USD-LIBOR + 1.30%) 1.755% 20225,6,7 | | | 436 | | | | 433 | |
| NewRez Warehouse Securitization Trust, Series 2021-1, Class A, (1-month USD-LIBOR + 0.75%) 1.418% 20555,6,7 | | | 5,557 | | | | 5,520 | |
| RMF Proprietary Issuance Trust, Series 2019-1, Class A, 2.75% 20635,6,7 | | | 254 | | | | 248 | |
| Tricon Residential, Series 2021-SFR1, Class A, 1.943% 20385,6 | | | 1,174 | | | | 1,075 | |
| | | | | | | | 13,324 | |
| |
| Commercial mortgage-backed securities 1.88% | | | | | | | | |
| Bank Commercial Mortgage Trust, Series 2022-BNK40, Class A4, 3.051% 20646,7 | | | 255 | | | | 245 | |
| BX Trust, Series 2021-SDMF, Class A, (1-month USD-LIBOR + 0.589%) 1.143% 20345,6,7 | | | 1,240 | | | | 1,201 | |
| BX Trust, Series 2021-VOLT, Class A, (1-month USD-LIBOR + 0.70%) 1.254% 20365,6,7 | | | 693 | | | | 679 | |
| 70 | Private Client Services Funds |
Capital Group Core Bond Fund
| Bonds, notes & other debt instruments (continued) | | Principal amount
(000) | | | Value
(000) | |
| Mortgage-backed obligations (continued) | | | | | | | | |
| Commercial mortgage-backed securities (continued) | | | | | | | | |
| BX Trust, Series 2021-ARIA, Class A, (1-month USD-LIBOR + 0.899%) 1.453% 20365,6,7 | | USD | 664 | | | $ | 648 | |
| BX Trust, Series 2021-VOLT, Class B, (1-month USD-LIBOR + 0.95%) 1.504% 20365,6,7 | | | 509 | | | | 497 | |
| BX Trust, Series 2021-SOAR, Class A, (1-month USD-LIBOR + 0.67%) 1.224% 20385,6,7 | | | 870 | | | | 849 | |
| BX Trust, Series 2021-SOAR, Class B, (1-month USD-LIBOR + 0.87%) 1.424% 20385,6,7 | | | 327 | | | | 319 | |
| BX Trust, Series 2021-SOAR, Class C, (1-month USD-LIBOR + 1.10%) 1.654% 20385,6,7 | | | 221 | | | | 215 | |
| Extended Stay America Trust, Series 2021-ESH, Class A, (1-month USD-LIBOR + 1.08%) 1.635% 20385,6,7 | | | 260 | | | | 257 | |
| Extended Stay America Trust, Series 2021-ESH, Class B, (1-month USD-LIBOR + 1.38%) 1.935% 20385,6,7 | | | 191 | | | | 188 | |
| Hawaii Hotel Trust, Series 2019-MAUI, Class A, (1-month USD-LIBOR + 1.15%) 1.704% 20385,6,7 | | | 1,500 | | | | 1,484 | |
| JPMorgan Chase Commercial Mortgage Securities Trust, Series 2021-410T, Class A, 2.287% 20425,6 | | | 461 | | | | 417 | |
| LUXE Commercial Mortgage Trust, Series 2021-TRIP, Class A, (1-month USD-LIBOR + 1.05%) 1.604% 20385,6,7 | | | 1,343 | | | | 1,318 | |
| Manhattan West Mortgage Trust, Series 2020-1MW, Class A, 2.13% 20395,6 | | | 1,262 | | | | 1,143 | |
| MHC Commercial Mortgage Trust, CMO, Series 2021-MHC, Class A, (1-month USD-LIBOR + 0.801%) 1.355% 20265,6,7 | | | 460 | | | | 452 | |
| Motel 6 Trust, Series 2021-MTL6, Class A, (1-month USD-LIBOR + 0.90%) 1.454% 20385,6,7 | | | 120 | | | | 119 | |
| SREIT Trust, Series 2021-MFP, Class A, (1-month USD-LIBOR + 0.731%) 1.285% 20385,6,7 | | | 721 | | | | 708 | |
| | | | | | | | 10,739 | |
| |
| Total mortgage-backed obligations | | | | | | | 57,041 | |
| |
| Bonds & notes of governments & government agencies outside the U.S. 3.86% | | | | | | | | |
| Asian Development Bank 0.625% 2024 | | | 1,526 | | | | 1,446 | |
| Canada 2.875% 2025 | | | 2,555 | | | | 2,551 | |
| Canada 0.75% 2026 | | | 2,350 | | | | 2,149 | |
| Denmark (Kingdom of) 0.125% 20225 | | | 660 | | | | 655 | |
| Denmark (Kingdom of) 0.125% 2022 | | | 655 | | | | 650 | |
| European Investment Bank 2.75% 2025 | | | 2,249 | | | | 2,237 | |
| European Investment Bank 0.75% 2026 | | | 758 | | | | 687 | |
| Inter-American Development Bank 0.50% 2024 | | | 500 | | | | 473 | |
| Japan Bank for International Cooperation 2.875% 2025 | | | 792 | | | | 786 | |
| KfW 0.375% 2025 | | | 1,010 | | | | 930 | |
| Kommunalbanken 0.50% 20245 | | | 442 | | | | 416 | |
| Kommunalbanken 0.375% 20255 | | | 2,000 | | | | 1,830 | |
| Kommuninvest i Sverige Aktiebolag 0.25% 20235 | | | 905 | | | | 879 | |
| Manitoba (Province of) 3.05% 2024 | | | 200 | | | | 201 | |
| Ontario (Province of) 3.20% 2024 | | | 500 | | | | 503 | |
| Ontario Teachers’ Finance Trust 0.875% 20265 | | | 902 | | | | 816 | |
| Ontario Teachers’ Finance Trust 3.00% 20275 | | | 2,000 | | | | 1,977 | |
| Quebec (Province of) 0.60% 2025 | | | 1,600 | | | | 1,475 | |
| Saudi Arabia (Kingdom of) 4.00% 20255 | | | 430 | | | | 437 | |
| Saudi Arabia (Kingdom of) 4.50% 20305 | | | 445 | | | | 466 | |
| United Mexican States 4.15% 2027 | | | 460 | | | | 461 | |
| | | | | | | | 22,025 | |
| |
| Federal agency bonds & notes 3.14% | | | | | | | | |
| Fannie Mae 2.375% 2023 | | | 2,442 | | | | 2,452 | |
| Fannie Mae 0.875% 2030 | | | 2,563 | | | | 2,139 | |
| Federal Farm Credit Banks 1.75% 2025 | | | 1,333 | | | | 1,292 | |
| Freddie Mac 0.25% 2023 | | | 3,439 | | | | 3,358 | |
| Freddie Mac 0.375% 2025 | | | 9,449 | | | | 8,670 | |
| | | | | | | | 17,911 | |
| Private Client Services Funds | 71 |
Capital Group Core Bond Fund
| Bonds, notes & other debt instruments (continued) | | Principal amount
(000) | | | Value
(000) | |
| Municipals 0.73% | | | | | | |
| California 0.13% | | | | | | |
| Golden State Tobacco Securitization Corp., Enhanced Tobacco Settlement Asset-Backed Bonds, Series 2021-A-1, 2.532% 2028 | | USD | 830 | | | $ | 760 | |
| | | | | | | | | |
| Florida 0.44% | | | | | | | | |
| Board of Administration Fin. Corp., Rev. Bonds, Series 2020-A, 1.258% 2025 | | | 1,140 | | | | 1,066 | |
| Board of Administration Fin. Corp., Rev. Bonds, Series 2020-A, 1.705% 2027 | | | 805 | | | | 733 | |
| Board of Administration Fin. Corp., Rev. Bonds, Series 2020-A, 2.154% 2030 | | | 810 | | | | 710 | |
| | | | | | | | 2,509 | |
| New York 0.15% | | | | | | | | |
| Dormitory Auth., Taxable State Personal Income Tax Rev. Bonds (General Purpose), Series 2021-C, 1.748% 2028 | | | 965 | | | | 860 | |
| | | | | | | | | |
| Washington 0.01% | | | | | | | | |
| Energy Northwest, Electric Rev. Bonds (Columbia Generating Station), Series 2015-B, 2.814% 2024 | | | 20 | | | | 20 | |
| | | | | | | | | |
| Total municipals | | | | | | | 4,149 | |
| | | | | | | | | |
| Total bonds, notes & other debt instruments (cost: $587,870,000) | | | | | | | 561,926 | |
| |
| Short-term securities 5.40% | | | Shares | | | | | |
| Money market investments 5.40% | | | | | | | | |
| Capital Group Central Cash Fund 0.32%9,10 | | | 307,824 | | | | 30,782 | |
| | | | | | | | | |
| Total short-term securities (cost: $30,782,000) | | | | | | | 30,782 | |
| Total investment securities 104.00% (cost: $618,652,000) | | | | | | | 592,708 | |
| Other assets less liabilities (4.00%) | | | | | | | (22,823 | ) |
| | | | | | | | | |
| Net assets 100.00% | | | | | | $ | 569,885 | |
Futures contracts
| Contracts | | Type | | Number of
contracts | | | Expiration | | Notional
amount
(000) | | | Value and
unrealized
(depreciation)
appreciation
at 4/30/2022
(000) | |
| 2 Year U.S. Treasury Note Futures | | Long | | | 31 | | | June 2022 | | USD | 6,535 | | | $ | (17 | ) |
| 10 Year Ultra U.S. Treasury Note Futures | | Long | | | 136 | | | June 2022 | | | 17,544 | | | | (1,553 | ) |
| 10 Year U.S. Treasury Note Futures | | Short | | | 43 | | | June 2022 | | | (5,123 | ) | | | 138 | |
| 20 Year U.S. Treasury Bond Futures | | Short | | | 4 | | | June 2022 | | | (563 | ) | | | 5 | |
| 30 Year Ultra U.S. Treasury Bond Futures | | Short | | | 3 | | | June 2022 | | | (481 | ) | | | 72 | |
| | | | | | | | | | | | | | | $ | (1,355 | ) |
Investments in affiliates10
| | | Value of
affiliate at
11/1/2021
(000) | | | Additions
(000) | | | Reductions
(000) | | | Net realized
loss
(000) | | | Net
unrealized
appreciation
(000) | | | Value of
affiliate at
4/30/2022
(000) | | | Dividend
income
(000) | |
| Short-term securities 5.40% | | | | | | | | | | | | | | | | | | | | | | | | | | | | |
| Money market investments 5.40% | | | | | | | | | | | | | | | | | | | | | | | | | | | | |
| Capital Group Central Cash Fund 0.32%9 | | $ | 63,951 | | | $ | 80,082 | | | $ | 113,253 | | | $ | (1 | ) | | $ | 3 | | | $ | 30,782 | | | $ | 35 | |
| 72 | Private Client Services Funds |
Capital Group Core Bond Fund
| 1 | Amount less than one thousand. |
| 2 | All or a portion of this security was pledged as collateral. The total value of pledged collateral was $611,000, which represented .11% of the net assets of the fund. |
| 3 | Index-linked bond whose principal amount moves with a government price index. |
| 4 | Step bond; coupon rate may change at a later date. |
| 5 | Acquired in a transaction exempt from registration under Rule 144A of the Securities Act of 1933. May be resold in the U.S. in transactions exempt from registration, normally to qualified institutional buyers. The total value of all such securities was $125,570,000, which represented 22.03% of the net assets of the fund. |
| 6 | Principal payments may be made periodically. Therefore, the effective maturity date may be earlier than the stated maturity date. |
| 7 | Coupon rate may change periodically. Reference rate and spread are as of the most recent information available. Some coupon rates are determined by the issuer or agent based on current market conditions; therefore, the reference rate and spread are not available. |
| 8 | Purchased on a TBA basis. |
| 9 | Rate represents the seven-day yield at 4/30/2022. |
| 10 | Part of the same “group of investment companies” as the fund as defined under the Investment Company Act of 1940, as amended. |
Key to abbreviations
Assn. = Association
Auth. = Authority
CLO = Collateralized Loan Obligations
CMO = Collateralized Mortgage Obligations
DAC = Designated Activity Company
Fin. = Finance
LIBOR = London Interbank Offered Rate
Rev. = Revenue
SOFR = Secured Overnight Financing Rate
TBA = To be announced
USD = U.S. dollars
| Private Client Services Funds | 73 |
| Financial statements | |
| | |
| Statements of assets and liabilities | unaudited |
| at April 30, 2022 | (dollars in thousands) |
| | | Capital Group
Core Municipal
Fund | | | Capital Group
Short-Term
Municipal Fund | | | Capital Group
California
Core Municipal
Fund | |
| Assets: | | | | | | | | | | | | |
| Investment securities, at value: | | | | | | | | | | | | |
| Unaffiliated issuers | | $ | 688,646 | | | $ | 122,688 | | | $ | 622,615 | |
| Affiliated issuers | | | — | | | | — | | | | — | |
| Cash | | | 3,693 | | | | 118 | | | | 3,888 | |
| Cash collateral pledged for futures contracts | | | 278 | | | | 50 | | | | 438 | |
| Receivables for: | | | | | | | | | | | | |
| Sales of investments | | | 881 | | | | 203 | | | | — | |
| Sales of fund’s shares | | | 108 | | | | 15 | | | | 1,683 | |
| Dividends and interest | | | 6,333 | | | | 1,141 | | | | 5,607 | |
| Services provided by related parties | | | — | | | | 3 | | | | — | |
| Variation margin on futures contracts | | | 46 | | | | 6 | | | | 79 | |
| Total assets | | | 699,985 | | | | 124,224 | | | | 634,310 | |
| | | | | | | | | | | | | |
| Liabilities: | | | | | | | | | | | | |
| Payables for: | | | | | | | | | | | | |
| Purchases of investments | | | 6,771 | | | | 62 | | | | 2,664 | |
| Repurchases of fund’s shares | | | 2,067 | | | | 31 | | | | 224 | |
| Investment advisory services | | | 146 | | | | 27 | | | | 131 | |
| Variation margin on futures contracts | | | — | | | | — | | | | — | |
| Other | | | — | * | | | — | | | | — | * |
| Total liabilities | | | 8,984 | | | | 120 | | | | 3,019 | |
| Net assets at April 30, 2022 | | $ | 691,001 | | | $ | 124,104 | | | $ | 631,291 | |
| | | | | | | | | | | | | |
| Net assets consist of: | | | | | | | | | | | | |
| Capital paid in on shares of beneficial interest | | $ | 724,480 | | | $ | 129,281 | | | $ | 657,824 | |
| Total accumulated loss | | | (33,479 | ) | | | (5,177 | ) | | | (26,533 | ) |
| Net assets at April 30, 2022 | | $ | 691,001 | | | $ | 124,104 | | | $ | 631,291 | |
| | | | | | | | | | | | | |
| Investment securities, at cost: | | | | | | | | | | | | |
| Unaffiliated issuers | | $ | 719,702 | | | $ | 126,662 | | | $ | 649,357 | |
| Affiliated issuers | | | — | | | | — | | | | — | |
| Shares outstanding | | | 69,309 | | | | 12,639 | | | | 62,568 | |
| Net asset value per share | | $ | 9.97 | | | $ | 9.82 | | | $ | 10.09 | |
See end of statements of assets and liabilities for footnote.
See notes to financial statements.
| 74 | Private Client Services Funds |
| Financial statements (continued) | |
| | |
| Statements of assets and liabilities | unaudited |
| at April 30, 2022 (continued) | (dollars in thousands) |
| | | Capital Group
California
Short-Term
Municipal Fund | | | Capital Group
Core Bond Fund | |
| Assets: | | | | | | | | |
| Investment securities, at value: | | | | | | | | |
| Unaffiliated issuers | | $ | 122,451 | | | $ | 561,926 | |
| Affiliated issuers | | | — | | | | 30,782 | |
| Cash | | | 93 | | | | 21 | |
| Cash collateral pledged for futures contracts | | | 101 | | | | — | |
| Receivables for: | | | | | | | | |
| Sales of investments | | | — | | | | 2,076 | |
| Sales of fund’s shares | | | — | * | | | 43 | |
| Dividends and interest | | | 1,137 | | | | 1,855 | |
| Services provided by related parties | | | 2 | | | | — | |
| Variation margin on futures contracts | | | 12 | | | | 13 | |
| Total assets | | | 123,796 | | | | 596,716 | |
| | | | | | | | | |
| Liabilities: | | | | | | | | |
| Payables for: | | | | | | | | |
| Purchases of investments | | | 1,776 | | | | 26,462 | |
| Repurchases of fund’s shares | | | 37 | | | | 211 | |
| Investment advisory services | | | 26 | | | | 118 | |
| Variation margin on futures contracts | | | — | | | | 40 | |
| Other | | | — | * | | | — | * |
| Total liabilities | | | 1,839 | | | | 26,831 | |
| Net assets at April 30, 2022 | | $ | 121,957 | | | $ | 569,885 | |
| | | | | | | | | |
| Net assets consist of: | | | | | | | | |
| Capital paid in on shares of beneficial interest | | $ | 126,699 | | | $ | 608,238 | |
| Total accumulated loss | | | (4,742 | ) | | | (38,353 | ) |
| Net assets at April 30, 2022 | | $ | 121,957 | | | $ | 569,885 | |
| | | | | | | | | |
| Investment securities, at cost: | | | | | | | | |
| Unaffiliated issuers | | $ | 126,562 | | | $ | 587,870 | |
| Affiliated issuers | | | — | | | | 30,782 | |
| Shares outstanding | | | 12,377 | | | | 59,422 | |
| Net asset value per share | | $ | 9.85 | | | $ | 9.59 | |
| * | Amount less than one thousand. |
See notes to financial statements.
| Private Client Services Funds | 75 |
| Financial statements (continued) | |
| | |
| Statements of operations | unaudited |
| for the six months ended April 30, 2022 | (dollars in thousands) |
| | | Capital Group
Core Municipal
Fund | | | Capital Group
Short-Term
Municipal Fund | | | Capital Group
California
Core Municipal
Fund | |
| Investment income: | | | | | | | | | | | | |
| Income (net of non-U.S. taxes*): | | | | | | | | | | | | |
| Dividends from affiliated issuers | | $ | — | | | $ | — | | | $ | — | |
| Interest | | | 5,302 | | | | 1,006 | | | | 4,365 | |
| | | | 5,302 | | | | 1,006 | | | | 4,365 | |
| Fees and expenses*: | | | | | | | | | | | | |
| Investment advisory services | | | 958 | | | | 218 | | | | 818 | |
| Transfer agent services | | | 6 | | | | 1 | | | | 5 | |
| Reports to shareholders | | | 7 | | | | 3 | | | | 6 | |
| Registration statement and prospectus | | | 50 | | | | 40 | | | | 7 | |
| Trustees’ compensation | | | 27 | | | | 6 | | | | 23 | |
| Auditing and legal | | | 12 | | | | 3 | | | | 10 | |
| Custodian | | | 3 | | | | 2 | | | | 3 | |
| Other | | | 4 | | | | 1 | | | | 4 | |
| Total fees and expenses before reimbursements | | | 1,067 | | | | 274 | | | | 876 | |
| Less reimbursements of fees and expenses: | | | | | | | | | | | | |
| Miscellaneous fee reimbursements | | | — | | | | 37 | | | | — | |
| Total reimbursements of fees and expenses | | | — | | | | 37 | | | | — | |
| Total fees and expenses after reimbursements | | | 1,067 | | | | 237 | | | | 876 | |
| Net investment income | | | 4,235 | | | | 769 | | | | 3,489 | |
| | | | | | | | | | | | | |
| Net realized loss and unrealized depreciation: | | | | | | | | | | | | |
| Net realized (loss) gain on: | | | | | | | | | | | | |
| Investments in: | | | | | | | | | | | | |
| Unaffiliated issuers | | | (3,382 | ) | | | (1,314 | ) | | | (1,964 | ) |
| Affiliated issuers | | | — | | | | — | | | | — | |
| Futures contracts | | | 548 | | | | 32 | | | | 1,617 | |
| | | | (2,834 | ) | | | (1,282 | ) | | | (347 | ) |
| Net unrealized (depreciation) appreciation on: | | | | | | | | | | | | |
| Investments in: | | | | | | | | | | | | |
| Unaffiliated issuers | | | (40,764 | ) | | | (5,483 | ) | | | (37,403 | ) |
| Affiliated issuers | | | — | | | | — | | | | — | |
| Futures contracts | | | 347 | | | | 55 | | | | 512 | |
| | | | (40,417 | ) | | | (5,428 | ) | | | (36,891 | ) |
| Net realized loss and unrealized depreciation | | | (43,251 | ) | | | (6,710 | ) | | | (37,238 | ) |
| | | | | | | | | | | | | |
| Net decrease in net assets resulting from operations | | $ | (39,016 | ) | | $ | (5,941 | ) | | $ | (33,749 | ) |
See end of statements of operations for footnote.
See notes to financial statements.
| 76 | Private Client Services Funds |
| Financial statements (continued) | |
| | |
| Statements of operations | unaudited |
| for the six months ended April 30, 2022 (continued) | (dollars in thousands) |
| | | Capital Group
California
Short-Term
Municipal Fund | | | Capital Group
Core Bond Fund | |
| Investment income: | | | | | | | | |
| Income (net of non-U.S. taxes*): | | | | | | | | |
| Dividends from affiliated issuers | | $ | — | | | $ | 35 | |
| Interest | | | 747 | | | | 5,993 | |
| | | | 747 | | | | 6,028 | |
| | | | | | | | | |
| Fees and expenses*: | | | | | | | | |
| Investment advisory services | | | 195 | | | | 769 | |
| Transfer agent services | | | 1 | | | | 5 | |
| Reports to shareholders | | | 3 | | | | 6 | |
| Registration statement and prospectus | | | 2 | | | | 44 | |
| Trustees’ compensation | | | 6 | | | | 22 | |
| Auditing and legal | | | 3 | | | | 10 | |
| Custodian | | | 2 | | | | 3 | |
| Other | | | 1 | | | | 3 | |
| Total fees and expenses before reimbursements | | | 213 | | | | 862 | |
| Less reimbursements of fees and expenses: | | | | | | | | |
| Miscellaneous fee reimbursements | | | 3 | | | | — | |
| Total reimbursements of fees and expenses | | | 3 | | | | — | |
| Total fees and expenses after reimbursements | | | 210 | | | | 862 | |
| Net investment income | | | 537 | | | | 5,166 | |
| | | | | | | | | |
| Net realized loss and unrealized depreciation: | | | | | | | | |
| Net realized (loss) gain on: | | | | | | | | |
| Investments in: | | | | | | | | |
| Unaffiliated issuers | | | (946 | ) | | | (3,933 | ) |
| Affiliated issuers | | | — | | | | (1 | ) |
| Futures contracts | | | 248 | | | | (1,624 | ) |
| | | | (698 | ) | | | (5,558 | ) |
| Net unrealized (depreciation) appreciation on: | | | | | | | | |
| Investments in: | | | | | | | | |
| Unaffiliated issuers | | | (5,368 | ) | | | (33,901 | ) |
| Affiliated issuers | | | — | | | | 3 | |
| Futures contracts | | | 62 | | | | (848 | ) |
| | | | (5,306 | ) | | | (34,746 | ) |
| Net realized loss and unrealized depreciation | | | (6,004 | ) | | | (40,304 | ) |
| | | | | | | | | |
| Net decrease in net assets resulting from operations | | $ | (5,467 | ) | | $ | (35,138 | ) |
| * | Additional information related to non-U.S. taxes and fees and expenses is included in the notes to financial statements. |
See notes to financial statements.
| Private Client Services Funds | 77 |
| Financial statements (continued) | |
| | |
| Statements of changes in net assets | (dollars in thousands) |
| | | Capital Group
Core Municipal
Fund | | | Capital Group
Short-Term
Municipal Fund | | | Capital Group
California
Core Municipal
Fund | |
| | | Six months
ended
April 30,
2022* | | | Year ended
October 31,
2021 | | | Six months
ended
April 30,
2022* | | | Year ended
October 31,
2021 | | | Six months
ended
April 30,
2022* | | | Year ended
October 31,
2021 | |
| Operations: | | | | | | | | | | | | | | | | | | | | | | | | |
| Net investment income | | $ | 4,235 | | | $ | 8,695 | | | $ | 769 | | | $ | 1,749 | | | $ | 3,489 | | | $ | 7,489 | |
| Net realized (loss) gain | | | (2,834 | ) | | | 5,536 | | | | (1,282 | ) | | | 867 | | | | (347 | ) | | | 3,773 | |
| Net unrealized depreciation | | | (40,417 | ) | | | (7,892 | ) | | | (5,428 | ) | | | (1,894 | ) | | | (36,891 | ) | | | (7,594 | ) |
| Net (decrease) increase in net assets resulting from operations | | | (39,016 | ) | | | 6,339 | | | | (5,941 | ) | | | 722 | | | | (33,749 | ) | | | 3,668 | |
| | | | | | | | | | | | | | | | | | | | | | | | | |
| Distributions paid to shareholders | | | (9,576 | ) | | | (15,834 | ) | | | (1,321 | ) | | | (2,260 | ) | | | (8,042 | ) | | | (12,004 | ) |
| | | | | | | | | | | | | | | | | | | | | | | | | |
| Net capital share transactions | | | (45,460 | ) | | | 142,622 | | | | (71,357 | ) | | | (3,942 | ) | | | 8,952 | | | | 45,429 | |
| | | | | | | | | | | | | | | | | | | | | | | | | |
| Total (decrease) increase in net assets | | | (94,052 | ) | | | 133,127 | | | | (78,619 | ) | | | (5,480 | ) | | | (32,839 | ) | | | 37,093 | |
| | | | | | | | | | | | | | | | | | | | | | | | | |
| Net assets: | | | | | | | | | | | | | | | | | | | | | | | | |
| Beginning of period | | | 785,053 | | | | 651,926 | | | | 202,723 | | | | 208,203 | | | | 664,130 | | | | 627,037 | |
| End of period | | $ | 691,001 | | | $ | 785,053 | | | $ | 124,104 | | | $ | 202,723 | | | $ | 631,291 | | | $ | 664,130 | |
| | | | | | | | | | | | | | | | | | | | | |
| | | Capital Group
California
Short-Term
Municipal Fund | | | Capital Group
Core Bond Fund | |
| | | Six months
ended
April 30,
2022* | | | Year ended
October 31,
2021 | | | Six months
ended
April 30,
2022* | | | Year ended
October 31,
2021 | |
| Operations: | | | | | | | | | | | | | | | | |
| Net investment income | | $ | 537 | | | $ | 1,441 | | | $ | 5,166 | | | $ | 8,165 | |
| Net realized (loss) gain | | | (698 | ) | | | 589 | | | | (5,558 | ) | | | (614 | ) |
| Net unrealized depreciation | | | (5,306 | ) | | | (1,785 | ) | | | (34,746 | ) | | | (11,019 | ) |
| Net (decrease) increase in net assets resulting from operations | | | (5,467 | ) | | | 245 | | | | (35,138 | ) | | | (3,468 | ) |
| | | | | | | | | | | | | | | | | |
| Distributions paid to shareholders | | | (1,059 | ) | | | (2,083 | ) | | | (5,199 | ) | | | (22,116 | ) |
| | | | | | | | | | | | | | | | | |
| Net capital share transactions | | | (53,236 | ) | | | (15,782 | ) | | | (30,173 | ) | | | 102,154 | |
| | | | | | | | | | | | | | | | | |
| Total (decrease) increase in net assets | | | (59,762 | ) | | | (17,620 | ) | | | (70,510 | ) | | | 76,570 | |
| | | | | | | | | | | | | | | | | |
| Net assets: | | | | | | | | | | | | | | | | |
| Beginning of period | | | 181,719 | | | | 199,339 | | | | 640,395 | | | | 563,825 | |
| End of period | | $ | 121,957 | | | $ | 181,719 | | | $ | 569,885 | | | $ | 640,395 | |
See notes to financial statements.
| 78 | Private Client Services Funds |
| Notes to financial statements | unaudited |
1. Organization
Capital Group Private Client Services Funds (the “series”) is registered under the Investment Company Act of 1940, as amended (the “1940 Act”), as an open-end, diversified management investment company. The series consists of five funds: Capital Group Core Municipal Fund, Capital Group Short-Term Municipal Fund, Capital Group California Core Municipal Fund, Capital Group California Short-Term Municipal Fund and Capital Group Core Bond Fund (each a “fund,” collectively the “funds”). The assets of each fund are segregated, with each fund accounted for separately.
Each fund’s investment objectives are as follows:
Capital Group Core Municipal Fund — Seeks to provide current income exempt from federal income tax and to preserve capital.
Capital Group Short-Term Municipal Fund — Seeks to preserve capital and secondarily to provide current income exempt from federal income tax.
Capital Group California Core Municipal Fund — Seeks to provide current income exempt from federal and California income taxes and to preserve capital.
Capital Group California Short-Term Municipal Fund — Seeks to preserve capital and secondarily to provide current income exempt from federal and California income taxes.
Capital Group Core Bond Fund — Seeks to provide current income and to preserve capital.
On March 11, 2022, the board of trustees unanimously approved participation in the reorganizations of Capital Group Core Municipal Fund with and into Limited Term Tax-Exempt Bond Fund of America, Capital Group Short-Term Municipal Fund with and into American Funds Short-Term Tax-Exempt Bond Fund, and Capital Group Core Bond Fund with and into The Bond Fund of America. The proposed reorganizations are subject to shareholder approval. If approved by shareholders, the proposed reorganizations are expected to take effect by December 31, 2022.
2. Significant accounting policies
Each fund is an investment company that applies the accounting and reporting guidance issued in Topic 946 by the U.S. Financial Accounting Standards Board. Each fund’s financial statements have been prepared to comply with U.S. generally accepted accounting principles (“U.S. GAAP”). These principles require the funds’ investment adviser to make estimates and assumptions that affect reported amounts and disclosures. Actual results could differ from those estimates. Subsequent events, if any, have been evaluated through the date of issuance in the preparation of the financial statements. The funds follow the significant accounting policies described in this section, as well as the valuation policies described in the next section on valuation.
Security transactions and related investment income — Security transactions are recorded by the funds as of the date the trades are executed with brokers. Realized gains and losses from security transactions are determined based on the specific identified cost of the securities. In the event a security is purchased with a delayed payment date, the funds will segregate liquid assets sufficient to meet their payment obligations. Dividend income is recognized on the ex-dividend date and interest income is recognized on an accrual basis. Market discounts, premiums and original issue discounts on fixed-income securities are amortized daily over the expected life of the security.
Distributions paid to shareholders — Income dividends and capital gain distributions are recorded on the ex-dividend date.
Currency translation — Assets and liabilities, including investment securities, denominated in currencies other than U.S. dollars are translated into U.S. dollars at the exchange rates supplied by one or more pricing vendors on the valuation date. Purchases and sales of investment securities and income and expenses are translated into U.S. dollars at the exchange rates on the dates of such transactions. The effects of changes in exchange rates on investment securities are included with the net realized gain or loss and net unrealized appreciation or depreciation on investments in the funds’ statements of operations. The realized gain or loss and unrealized appreciation or depreciation resulting from all other transactions denominated in currencies other than U.S. dollars are disclosed separately.
| Private Client Services Funds | 79 |
3. Valuation
Capital Research and Management Company (“CRMC”), the funds’ investment adviser, values each fund’s investments at fair value as defined by accounting principles generally accepted in the United State of America. The net asset value per share of each fund is calculated once daily as of the close of regular trading on the New York Stock Exchange, normally 4 p.m. New York time, each day the New York Stock Exchange is open.
Methods and inputs — The funds’ investment adviser uses the following methods and inputs to establish the fair value of each fund’s assets and liabilities. Use of particular methods and inputs may vary over time based on availability and relevance as market and economic conditions evolve.
Equity securities are generally valued at the official closing price of, or the last reported sale price on, the exchange or market on which such securities are traded, as of the close of business on the day the securities are being valued or, lacking any sales, at the last available bid price. Prices for each security are taken from the principal exchange or market on which the security trades.
Fixed-income securities, including short-term securities, are generally valued at prices obtained from one or more pricing vendors. Vendors value such securities based on one or more of the inputs described in the following table. The table provides examples of inputs that are commonly relevant for valuing particular classes of fixed-income securities in which the funds are authorized to invest. However, these classifications are not exclusive, and any of the inputs may be used to value any other class of fixed-income security.
| Fixed-income class | | Examples of standard inputs |
| All | | Benchmark yields, transactions, bids, offers, quotations from dealers and trading systems, new issues, spreads and other relationships observed in the markets among comparable securities; and proprietary pricing models such as yield measures calculated using factors such as cash flows, financial or collateral performance and other reference data (collectively referred to as “standard inputs”) |
| Corporate bonds, notes & loans; convertible securities | | Standard inputs and underlying equity of the issuer |
| Bonds & notes of governments & government agencies | | Standard inputs and interest rate volatilities |
| Mortgage-backed; asset-backed obligations | | Standard inputs and cash flows, prepayment information, default rates, delinquency and loss assumptions, collateral characteristics, credit enhancements and specific deal information |
| Municipal securities | | Standard inputs and, for certain distressed securities, cash flows or liquidation values using a net present value calculation based on inputs that include, but are not limited to, financial statements and debt contracts |
When the funds’ investment adviser deems it appropriate to do so (such as when vendor prices are unavailable or deemed to be not representative), fixed-income securities will be valued in good faith at the mean quoted bid and ask prices that are reasonably and timely available (or bid prices, if ask prices are not available) or at prices for securities of comparable maturity, quality and type. Some securities may be valued based on their effective maturity or average life, which may be shorter than the stated maturity.
Securities with both fixed-income and equity characteristics, or equity securities traded principally among fixed-income dealers, are generally valued in the manner described for either equity or fixed-income securities, depending on which method is deemed most appropriate by the funds’ investment adviser. The Capital Group Central Cash Fund (“CCF”), a fund within the Capital Group Central Fund Series (“Central Funds”), is valued based upon a floating net asset value, which fluctuates with changes in the value of CCF’s portfolio securities. The underlying securities are valued based on the policies and procedures in CCF’s statement of additional information. Exchange-traded futures are generally valued at the official settlement price of the exchange or market on which such instruments are traded, as of the close of business on the day the futures are being valued.
| 80 | Private Client Services Funds |
Securities and other assets for which representative market quotations are not readily available or are considered unreliable by the funds’ investment adviser are fair valued as determined in good faith under fair valuation guidelines adopted by authority of the funds’ board of trustees as further described. The investment adviser follows fair valuation guidelines, consistent with U.S. Securities and Exchange Commission rules and guidance, to consider relevant principles and factors when making fair value determinations. The investment adviser considers relevant indications of value that are reasonably and timely available to it in determining the fair value to be assigned to a particular security, such as the type and cost of the security; contractual or legal restrictions on resale of the security; relevant financial or business developments of the issuer; actively traded similar or related securities; conversion or exchange rights on the security; related corporate actions; significant events occurring after the close of trading in the security; and changes in overall market conditions. In addition, the closing prices of equity securities that trade in markets outside U.S. time zones may be adjusted to reflect significant events that occur after the close of local trading but before the net asset value of each of the funds is determined. Fair valuations and valuations of investments that are not actively trading involve judgment and may differ materially from valuations that would have been used had greater market activity occurred.
Processes and structure — The funds’ board of trustees has delegated authority to the funds’ investment adviser to make fair value determinations, subject to board oversight. The investment adviser has established a Joint Fair Valuation Committee (the “Fair Valuation Committee”) to administer, implement and oversee the fair valuation process, and to make fair value decisions. The Fair Valuation Committee regularly reviews its own fair value decisions, as well as decisions made under its standing instructions to the investment adviser’s valuation teams. The Fair Valuation Committee reviews changes in fair value measurements from period to period and may, as deemed appropriate, update the fair valuation guidelines to better reflect the results of back testing and address new or evolving issues. The Fair Valuation Committee reports any changes to the fair valuation guidelines to the board of trustees. The funds’ board and audit committee also regularly review reports that describe fair value determinations and methods.
The funds’ investment adviser has also established a Fixed-Income Pricing Review Group to administer and oversee the fixed-income valuation process, including the use of fixed-income pricing vendors. This group regularly reviews pricing vendor information and market data. Pricing decisions, processes and controls over security valuation are also subject to additional internal reviews facilitated by the investment adviser’s global risk management group.
Classifications — The funds’ investment adviser classifies each fund’s assets and liabilities into three levels based on the inputs used to value the assets or liabilities. Level 1 values are based on quoted prices in active markets for identical securities. Level 2 values are based on significant observable market inputs, such as quoted prices for similar securities and quoted prices in inactive markets. Certain securities trading outside the U.S. may transfer between Level 1 and Level 2 due to valuation adjustments resulting from significant market movements following the close of local trading. Level 3 values are based on significant unobservable inputs that reflect the investment adviser’s determination of assumptions that market participants might reasonably use in valuing the securities. The valuation levels are not necessarily an indication of the risk or liquidity associated with the underlying investment. For example, U.S. government securities are reflected as Level 2 because the inputs used to determine fair value may not always be quoted prices in an active market. The funds’ valuation levels as of April 30, 2022 are as follows (dollars in thousands):
Capital Group Core Municipal Fund
| | | Investment securities | |
| | | Level 1 | | | Level 2 | | | Level 3 | | | Total | |
| Assets: | | | | | | | | | | | | |
| Bonds, notes & other debt instruments: | | | | | | | | | | | | |
| Municipals | | $ | — | | | $ | 594,883 | | | $ | — | | | $ | 594,883 | |
| Short-term securities | | | — | | | | 93,763 | | | | — | | | | 93,763 | |
| Total | | $ | — | | | $ | 688,646 | | | $ | — | | | $ | 688,646 | |
| | | | | |
| | | | Other investments* | |
| | | | Level 1 | | | | Level 2 | | | | Level 3 | | | | Total | |
| Assets: | | | | | | | | | | | | | | | | |
| Unrealized appreciation on futures contracts | | $ | 340 | | | $ | — | | | $ | — | | | $ | 340 | |
| * | Futures contracts are not included in the fund’s investment portfolio. |
| Private Client Services Funds | 81 |
Capital Group Short-Term Municipal Fund
| | | Investment securities | |
| | | Level 1 | | | Level 2 | | | Level 3 | | | Total | |
| Assets: | | | | | | | | | | | | |
| Bonds, notes & other debt instruments: | | | | | | | | | | | | |
| Municipals | | $ | — | | | $ | 105,373 | | | $ | — | | | $ | 105,373 | |
| Short-term securities | | | — | | | | 17,315 | | | | — | | | | 17,315 | |
| Total | | $ | — | | | $ | 122,688 | | | $ | — | | | $ | 122,688 | |
| | | Other investments* | |
| | | Level 1 | | | Level 2 | | | Level 3 | | | Total | |
| Assets: | | | | | | | | | | | | | | | | |
| Unrealized appreciation on futures contracts | | $ | 32 | | | $ | — | | | $ | — | | | $ | 32 | |
| * | Futures contracts are not included in the fund’s investment portfolio. |
Capital Group California Core Municipal Fund
| | | Investment securities | |
| | | Level 1 | | | Level 2 | | | Level 3 | | | Total | |
| Assets: | | | | | | | | | | | | | | | | |
| Bonds, notes & other debt instruments: | | | | | | | | | | | | | | | | |
| Municipals | | $ | — | | | $ | 530,495 | | | $ | — | | | $ | 530,495 | |
| Short-term securities | | | — | | | | 92,120 | | | | — | | | | 92,120 | |
| Total | | $ | — | | | $ | 622,615 | | | $ | — | | | $ | 622,615 | |
| | | Other investments* | |
| | | Level 1 | | | Level 2 | | | Level 3 | | | Total | |
| Assets: | | | | | | | | | | | | |
| Unrealized appreciation on futures contracts | | $ | 606 | | | $ | — | | | $ | — | | | $ | 606 | |
| * | Futures contracts are not included in the fund’s investment portfolio. |
| | | Investment securities | |
| | | Level 1 | | | Level 2 | | | Level 3 | | | Total | |
| Assets: | | | | | | | | | | | | | | | | |
| Bonds, notes & other debt instruments: | | | | | | | | | | | | | | | | |
| Municipals | | $ | — | | | $ | 100,451 | | | $ | — | | | $ | 100,451 | |
| Short-term securities | | | — | | | | 22,000 | | | | — | | | | 22,000 | |
| Total | | $ | — | | | $ | 122,451 | | | $ | — | | | $ | 122,451 | |
| | | Other investments* | |
| | | Level 1 | | | Level 2 | | | Level 3 | | | Total | |
| Assets: | | | | | | | | | | | | |
| Unrealized appreciation on futures contracts | | $ | 62 | | | $ | — | | | $ | — | | | $ | 62 | |
| * | Futures contracts are not included in the fund’s investment portfolio. |
| | |
| 82 | Private Client Services Funds |
Capital Group Core Bond Fund
| | | Investment securities | |
| | | Level 1 | | | Level 2 | | | Level 3 | | | Total | |
| Assets: | | | | | | | | | | | | | | | | |
| Bonds, notes & other debt instruments: | | | | | | | | | | | | | | | | |
| U.S. Treasury bonds & notes | | $ | — | | | $ | 240,401 | | | $ | — | | | $ | 240,401 | |
| Corporate bonds, notes & loans | | | — | | | | 158,758 | | | | — | | | | 158,758 | |
| Asset-backed obligations | | | — | | | | 61,641 | | | | — | | | | 61,641 | |
| Mortgage-backed obligations | | | — | | | | 57,041 | | | | — | | | | 57,041 | |
| Bonds & notes of governments & government agencies outside the U.S. | | | — | | | | 22,025 | | | | — | | | | 22,025 | |
| Federal agency bonds & notes | | | — | | | | 17,911 | | | | — | | | | 17,911 | |
| Municipals | | | — | | | | 4,149 | | | | — | | | | 4,149 | |
| Short-term securities | | | 30,782 | | | | — | | | | — | | | | 30,782 | |
| Total | | $ | 30,782 | | | $ | 561,926 | | | $ | — | | | $ | 592,708 | |
| | | | | | |
| | | Other investments* | |
| | | Level 1 | | | Level 2 | | | Level 3 | | | Total | |
| Assets: | | | | | | | | | | | | | | | | |
| Unrealized appreciation on futures contracts | | $ | 215 | | | $ | — | | | $ | — | | | $ | 215 | |
| Liabilities: | | | | | | | | | | | | | | | | |
| Unrealized depreciation on futures contracts | | | (1,570 | ) | | | — | | | | — | | | | (1,570 | ) |
| Total | | $ | (1,355 | ) | | $ | — | | | $ | — | | | $ | (1,355 | ) |
| * | Futures contracts are not included in the fund’s investment portfolio. |
4. Risk factors
Investing in the funds may involve certain risks including, but not limited to, those described below.
Market conditions — The prices of, and the income generated by, the securities held by the fund may decline — sometimes rapidly or unpredictably – due to various factors, including events or conditions affecting the general economy or particular industries; overall market changes; local, regional or global political, social or economic instability; governmental, governmental agency or central bank responses to economic conditions; and currency exchange rate, interest rate and commodity price fluctuations.
Economies and financial markets throughout the world are highly interconnected. Economic, financial or political events, trading and tariff arrangements, wars, terrorism, cybersecurity events, natural disasters, public health emergencies (such as the spread of infectious disease) and other circumstances in one country or region, including actions taken by governmental or quasi-governmental authorities in response to any of the foregoing, could have impacts on global economies or markets. As a result, whether or not the fund invests in securities of issuers located in or with significant exposure to the countries affected, the value and liquidity of the fund’s investments may be negatively affected by developments in other countries and regions.
Issuer risks — The prices of, and the income generated by, securities held by the fund may decline in response to various factors directly related to the issuers of such securities, including reduced demand for an issuer’s goods or services, poor management performance, major litigation, investigations or other controversies related to the issuer, changes in government regulations affecting the issuer or its competitive environment and strategic initiatives such as mergers, acquisitions or dispositions and the market response to any such initiatives.
Investing in debt instruments — The prices of, and the income generated by, bonds and other debt securities held by the fund may be affected by factors such as the interest rates, maturities and credit ratings of these securities.
Rising interest rates will generally cause the prices of bonds and other debt securities to fall. A general rise in interest rates may cause investors to sell debt securities on a large scale, which could also adversely affect the price and liquidity of debt securities and could also result in increased redemptions from the fund. Falling interest rates may cause an issuer to redeem, call or refinance a debt security before its stated maturity, which may result in the fund failing to recoup the full amount of its initial investment and having to reinvest the proceeds in lower yielding securities. Longer maturity debt securities generally have greater sensitivity to changes in interest rates and may be subject to greater price fluctuations than shorter maturity debt securities.
| Private Client Services Funds | 83 |
Bonds and other debt securities are also subject to credit risk, which is the possibility that the credit strength of an issuer or guarantor will weaken or be perceived to be weaker, and/or an issuer of a debt security will fail to make timely payments of principal or interest and the security will go into default. A downgrade or default affecting any of the fund’s securities could cause the value of the fund’s shares to decrease. Credit risk is gauged, in part, by the credit ratings of the debt securities in which the fund invests. However, ratings are only the opinions of the rating agencies issuing them and are not guarantees as to credit quality or an evaluation of market risk. The fund’s investment adviser relies on its own credit analysts to research issuers and issues in seeking to assess credit and default risks.
Credit and liquidity support — Changes in the credit quality of banks and financial institutions providing credit and liquidity support features with respect to securities held by the fund could cause the values of these securities to decline.
Investing in lower rated debt instruments — Lower rated bonds and other lower rated debt securities generally have higher rates of interest and involve greater risk of default or price declines due to changes in the issuer’s creditworthiness than those of higher quality debt securities. The market prices of these securities may fluctuate more than the prices of higher quality debt securities and may decline significantly in periods of general economic difficulty.
Liquidity risk — Certain fund holdings may be or may become difficult or impossible to sell, particularly during times of market turmoil. Liquidity may be impacted by the lack of an active market for a holding, legal or contractual restrictions on resale, or the reduced number and capacity of market participants to make a market in such holding. Market prices for less liquid or illiquid holdings may be volatile, and reduced liquidity may have an adverse impact on the market price of such holdings. Additionally, the sale of less liquid or illiquid holdings may involve substantial delays (including delays in settlement) and additional costs and the fund may be unable to sell such holdings when necessary to meet its liquidity needs or may be forced to sell at a loss.
Investing in similar municipal bonds — Investing significantly in municipal obligations of multiple issuers in the same state or backed by revenues of similar types of projects or industries may make the fund more susceptible to certain economic, political or regulatory occurrences. As a result, the fund has greater risk of volatility, and greater risk of loss, from these investments.
Investing in municipal bonds of issuers within the state of California — Because Capital Group California Core Municipal Fund and Capital Group California Short-Term Municipal Fund invest primarily in securities of issuers within the state of California, these funds are more susceptible to factors adversely affecting issuers of California securities than a comparable municipal bond mutual fund that does not concentrate its investments in a single state. For example, in the past, California voters have passed amendments to the state’s constitution and other measures that limit the taxing and spending authority of California governmental entities, and future voter initiatives may adversely affect California municipal bonds.
Investing in mortgage-related and other asset-backed securities — Mortgage-related securities, such as mortgage-backed securities, and other asset-backed securities, include debt obligations that represent interests in pools of mortgages or other income-bearing assets, such as consumer loans or receivables. While such securities are subject to the risks associated with investments in debt instruments generally (for example, credit, extension and interest rate risks), they are also subject to other and different risks. Mortgage-backed and other asset-backed securities are subject to changes in the payment patterns of borrowers of the underlying debt, potentially increasing the volatility of the securities and the fund’s net asset value. When interest rates fall, borrowers are more likely to refinance or prepay their debt before its stated maturity. This may result in the fund having to reinvest the proceeds in lower yielding securities, effectively reducing the fund’s income. Conversely, if interest rates rise and borrowers repay their debt more slowly than expected, the time in which the mortgage-backed and other asset-backed securities are paid off could be extended, reducing the fund’s cash available for reinvestment in higher yielding securities. Mortgage-backed securities are also subject to the risk that underlying borrowers will be unable to meet their obligations and the value of property that secures the mortgages may decline in value and be insufficient, upon foreclosure, to repay the associated loans. Investments in asset-backed securities are subject to similar risks.
Investing in securities backed by the U.S. government — Securities backed by the U.S. Treasury or the full faith and credit of the U.S. government are guaranteed only as to the timely payment of interest and principal when held to maturity. Accordingly, the current market values for these securities will fluctuate with changes in interest rates and the credit rating of the U.S. government. Securities issued by U.S. government-sponsored entities and federal agencies and instrumentalities that are not backed by the full faith and credit of the U.S. government are neither issued nor guaranteed by the U.S. government.
Management — The investment adviser to the fund actively manages the fund’s investments. Consequently, the fund is subject to the risk that the methods and analyses, including models, tools and data, employed by the investment adviser in this process may be flawed or incorrect and may not produce the desired results. This could cause the fund to lose value or its investment results to lag relevant benchmarks or other funds with similar objectives.
| 84 | Private Client Services Funds |
5. Certain investment techniques
Index-linked bonds — Capital Group Core Bond Fund has invested in index-linked bonds, which are fixed-income securities whose principal value is periodically adjusted to a government price index. Over the life of an index-linked bond, interest is paid on the adjusted principal value. Increases or decreases in the principal value of index-linked bonds are recorded as interest income in the fund’s statement of operations.
Mortgage dollar rolls — Capital Group Core Bond Fund has entered into mortgage dollar roll transactions in which the fund sells a mortgage-backed security to a counterparty and simultaneously enters into an agreement with the same counterparty to buy back a similar security on a specific future date at a predetermined price. Mortgage dollar rolls are accounted for as purchase and sale transactions, which may increase the funds’ portfolio turnover rates.
Futures contracts — Each fund has entered into futures contracts, which provide for the future sale by one party and purchase by another party of a specified amount of a specific financial instrument for a specified price, date, time and place designated at the time the contract is made. Futures contracts are used to strategically manage portfolio volatility and downside equity risk.
Upon entering into futures contracts, and to maintain the fund’s open positions in futures contracts, the fund is required to deposit with a futures broker, known as a futures commission merchant (“FCM”), in a segregated account in the name of the FCM an amount of cash, U.S. government securities or other liquid securities, known as initial margin. The margin required for a particular futures contract is set by the exchange on which the contract is traded to serve as collateral, and may be significantly modified from time to time by the exchange during the term of the contract.
On a daily basis, each fund pays or receives variation margin based on the increase or decrease in the value of the futures contracts and records variation margin on futures contracts in each fund’s statement of assets and liabilities. In addition, each fund segregates liquid assets equivalent to the fund’s outstanding obligations under the contract in excess of the initial margin and variation margin, if any. Futures contracts may involve a risk of loss in excess of the variation margin shown on each fund’s statement of assets and liabilities. Each fund records realized gains or losses at the time the futures contract is closed or expires. Net realized gains or losses and net unrealized appreciation or depreciation from futures contracts are recorded in each fund’s statement of operations.
The following table presents the average month-end notional amounts of futures contracts while held for each fund (dollars in thousands):
| | | Futures
contracts | |
| Capital Group Core Municipal Fund | | $ | 29,645 | |
| Capital Group Short-Term Municipal Fund | | | 5,398 | |
| Capital Group California Core Municipal Fund | | | 49,576 | |
| Capital Group California Short-Term Municipal | | | 8,978 | |
| Capital Group Core Bond Fund | | | 184,799 | |
| Private Client Services Funds | 85 |
The following tables identify the location and fair value amounts on the funds’ statements of assets and liabilities and/or the effect on the funds’ statements of operations resulting from the funds’ use of futures contracts, interest rate swaps and credit default swaps as of, or for the six months ended April 30, 2022 (dollars in thousands):
Capital Group Core Municipal Fund
| | | | | Assets | | | Liabilities | |
| Contracts | | Risk type | | Location on statement of
assets and liabilities | | | Value | | | Location on statement of
assets and liabilities | | | Value | |
| Futures | | Interest | | Unrealized appreciation* | | $ | 340 | | | Unrealized depreciation* | | $ | — | |
| | | | | Net realized gain | | | Net unrealized appreciation | |
| Contracts | | Risk type | | Location on statement of
operations | | | Value | | | Location on statement of
operations | | | Value | |
| Futures | | Interest | | Net realized gain on futures
contracts | | $ | 548 | | | Net unrealized appreciation on
futures contracts | | $ | 347 | |
Capital Group Short-Term Municipal Fund
| | | | | Assets | | | Liabilities | |
| Contracts | | Risk type | | Location on statement of
assets and liabilities | | | Value | | | Location on statement of
assets and liabilities | | | Value | |
| Futures | | Interest | | Unrealized appreciation* | | $ | 32 | | | Unrealized depreciation* | | $ | — | |
| | | | | Net realized gain | | | Net unrealized appreciation | |
| Contracts | | Risk type | | Location on statement of
operations | | | Value | | | Location on statement of
operations | | | Value | |
| Futures | | Interest | | Net realized gain on futures contracts | | $ | 32 | | | Net unrealized appreciation on futures contracts | | $ | 55 | |
Capital Group California Core Municipal Fund
| | | | | Assets | | | Liabilities | |
| Contracts | | Risk type | | Location on statement of
assets and liabilities | | | Value | | | Location on statement of
assets and liabilities | | | Value | |
| Futures | | Interest | | Unrealized appreciation* | | $ | 606 | | | Unrealized depreciation* | | $ | — | |
| | | | | Net realized gain | | | Net unrealized appreciation | |
| Contracts | | Risk type | | Location on statement of
operations | | | Value | | | Location on statement of
operations | | | Value | |
| Futures | | Interest | | Net realized gain on futures contracts | | $ | 1,617 | | | Net unrealized appreciation on futures contracts | | $ | 512 | |
See end of tables for footnote.
| 86 | Private Client Services Funds |
Capital Group California Short-Term Municipal Fund
| | | | | Assets | | | Liabilities | |
| Contracts | | Risk type | | Location on statement of
assets and liabilities | | | Value | | | Location on statement of
assets and liabilities | | | Value | |
| Futures | | Interest | | Unrealized appreciation* | | $ | 62 | | | Unrealized depreciation* | | $ | — | |
| | | | | Net realized gain | | | Net unrealized appreciation | |
| Contracts | | Risk type | | Location on statement of
operations | | | Value | | | Location on statement of
operations | | | Value | |
| Futures | | Interest | | Net realized gain on futures contracts | | $ | 248 | | | Net unrealized appreciation on futures contracts | | $ | 62 | |
Capital Group Core Bond Fund
| | | | | Assets | | | Liabilities | |
| Contracts | | Risk type | | Location on statement of
assets and liabilities | | | Value | | | Location on statement of
assets and liabilities | | | Value | |
| Futures | | Interest | | Unrealized appreciation* | | $ | 215 | | | Unrealized depreciation* | | $ | 1,570 | |
| | | | | Net realized loss | | | Net unrealized depreciation | |
| Contracts | | Risk type | | Location on statement of
operations | | | Value | | | Location on statement of
operations | | | Value | |
| Futures | | Interest | | Net realized loss on futures contracts | | $ | (1,624 | ) | | Net unrealized depreciation on futures contracts | | $ | (848 | ) |
| * | Includes cumulative appreciation/depreciation on futures contracts as reported in the applicable table following each fund’s investment portfolio. Only current day’s variation margin is reported within each fund’s statement of assets and liabilities. |
Collateral — Each fund participates in a collateral program that calls for the funds to either receive or pledge highly liquid assets, such as cash or U.S. government securities, as collateral due to their use of futures contracts and/or future delivery contracts. For futures contracts, the program calls for the fund to pledge collateral for initial and variation margin by contract. For future delivery contracts, the program calls for the fund to either receive or pledge collateral based on the net gain or loss on unsettled contracts by certain counterparties. The purpose of the collateral is to cover potential losses that could occur in the event that either party cannot meet its contractual obligations. Non-cash collateral pledged by the fund, if any, is disclosed in the fund’s investment portfolio, and cash collateral pledged by the fund, if any, is held in a segregated account with the fund’s custodian, which is reflected as pledged cash collateral in each fund’s statement of assets and liabilities.
6. Taxation and distributions
Federal income taxation — Each fund complies with the requirements under Subchapter M of the Internal Revenue Code applicable to regulated investment companies and each intends to distribute substantially all of its net income and net capital gains each year. The funds are not subject to income taxes to the extent taxable income and net capital gains are distributed. Therefore, no federal income tax provision is required.
As of and during the period ended April 30, 2022, none of the funds had a liability for any unrecognized tax benefits. Each fund recognizes interest and penalties, if any, related to unrecognized tax benefits as income tax expense in their respective statements of operations. During the period, none of the funds incurred any significant interest or penalties.
Each fund’s tax returns are generally not subject to examination by federal, state and, if applicable, non-U.S. tax authorities after the expiration of each jurisdiction’s statute of limitations, which is typically three years after the date of filing but can be extended in certain jurisdictions.
| Private Client Services Funds | 87 |
Distributions — Distributions determined on a tax basis may differ from net investment income and net realized gains for financial reporting purposes. These differences are due primarily to different treatment for items such as short-term capital gains and losses; capital losses related to sales of certain securities within 30 days of purchase; income on certain investments; amortization of premiums and discounts; paydowns on fixed-income securities; net capital losses and cost of investments sold. The fiscal year in which amounts are distributed may differ from the year in which the net investment income and net realized gains are recorded by the funds for financial reporting purposes.
Additional tax basis disclosures for each fund are as follows (dollars in thousands):
| | | Capital
Group
Core
Municipal
Fund | | | Capital
Group
Short-Term
Municipal
Fund | | | Capital
Group
California
Core
Municipal
Fund | | | Capital
Group
California
Short-Term
Municipal
Fund | | | Capital
Group
Core Bond
Fund | |
| As of October 31, 2021 | | | | | | | | | | | | | | | |
| Undistributed ordinary income | | $ | 2,465 | | | $ | 535 | | | $ | 1,100 | | | $ | 112 | | | $ | 99 | |
| Undistributed tax-exempt income | | | 90 | | | | 26 | | | | 889 | | | | 9 | | | | — | |
| Undistributed long-term capital gains | | | 2,811 | | | | — | | | | 2,586 | | | | 405 | | | | — | |
| Capital loss carryforward* | | | — | | | | — | | | | — | | | | — | | | | (3,316 | ) |
| As of April 30, 2022 | | | | | | | | | | | | | | | | | | | | |
| Gross unrealized appreciation on investments | | | 866 | | | | 61 | | | | 930 | | | | 70 | | | | 1,089 | |
| Gross unrealized depreciation on investments | | | (31,536 | ) | | | (4,002 | ) | | | (27,075 | ) | | | (4,117 | ) | | | (28,406 | ) |
| Net unrealized depreciation on investments | | | (30,670 | ) | | | (3,941 | ) | | | (26,145 | ) | | | (4,047 | ) | | | (27,317 | ) |
| Cost of investments | | | 719,656 | | | | 126,661 | | | | 649,366 | | | | 126,559 | | | | 618,670 | |
| * | Each fund’s capital loss carryforwards will be used to offset any capital gains realized by each fund in the current year or in subsequent years. Each fund will not make distributions from capital gains while a capital loss carryforward remains. |
Distributions paid by each fund were characterized for tax purposes as follows (dollars in thousands):
| | | Six months ended April 30, 2022 | |
| | | Tax-exempt
income | | | Ordinary
income | | | Long-term
capital
gains | | | Total
distributions
paid | |
| Capital Group Core Municipal Fund | | $ | 4,295 | | | $ | 2,469 | | | $ | 2,812 | | | $ | 9,576 | |
| Capital Group Short-Term Municipal Fund | | | 785 | | | | 536 | | | | — | | | | 1,321 | |
| Capital Group California Core Municipal Fund | | | 4,350 | | | | 1,103 | | | | 2,589 | | | | 8,042 | |
| Capital Group California Short-Term Municipal Fund | | | 540 | | | | 113 | | | | 406 | | | | 1,059 | |
| Capital Group Core Bond Fund | | | — | | | | 5,199 | | | | — | | | | 5,199 | |
| | | Year ended October 31, 2021 | |
| | | Tax-exempt
income | | | Ordinary
income | | | Long-term
capital
gains | | | Total
distributions
paid | |
| Capital Group Core Municipal Fund | | $ | 8,677 | | | $ | 2,349 | | | $ | 4,808 | | | $ | 15,834 | |
| Capital Group Short-Term Municipal Fund | | | 1,747 | | | | 513 | | | | — | | | | 2,260 | |
| Capital Group California Core Municipal Fund | | | 6,692 | | | | 841 | | | | 4,471 | | | | 12,004 | |
| Capital Group California Short-Term Municipal Fund | | | 1,439 | | | | 117 | | | | 527 | | | | 2,083 | |
| Capital Group Core Bond Fund | | | — | | | | 15,330 | | | | 6,786 | | | | 22,116 | |
7. Fees and transactions with related parties
CRMC, the funds’ investment adviser, is the parent company of American Funds Service Company® (“AFS”), the funds’ transfer agent. CRMC and AFS are considered related parties to each fund.
Investment advisory services — Each fund has an investment advisory and service agreement with CRMC that provides for monthly fees accrued daily. The fee for Capital Group Core Municipal Fund, Capital Group Short-Term Municipal Fund, Capital Group California Core Municipal Fund, Capital Group California Short-Term Municipal Fund and Capital Group Core Bond Fund is 0.25% of the daily net assets of each fund.
| 88 | Private Client Services Funds |
Transfer agent services — Each fund has a shareholder services agreement with AFS under which each fund compensates AFS for providing transfer agent services. These services include recordkeeping, shareholder communications and transaction processing. In addition, each fund reimburses AFS for amounts paid to third parties for performing transfer agent services on behalf of fund shareholders.
Miscellaneous fee reimbursements — CRMC has agreed to reimburse a portion of miscellaneous fees and expenses for Capital Group Short-Term Municipal Fund to limit the fund’s total annual operating expenses to 0.30% (as a percentage of daily net assets). Miscellaneous expenses exclude investment advisory services fees. These reimbursements may be adjusted or discontinued by CRMC, subject to any restrictions in the series’ prospectus. For the six months ended April 30, 2022, total fees and expenses reimbursed by CRMC were $37,000 for Capital Group Short-Term Municipal Fund. CRMC will not recoup all or a portion of these reimbursements. Fees and expenses in each fund’s statement of operations are presented gross of any reimbursements from CRMC.
Affiliated officers and trustees — Officers and certain trustees of the series are or may be considered to be affiliated with CRMC. No affiliated officers or trustees received any compensation directly from the series.
Investment in CCF — Capital Group Core Bond Fund holds shares of CCF, an institutional prime money market fund managed by CRMC. CCF invests in high-quality, short-term money market instruments and is used as the primary investment vehicle for the fund’s short-term investments. CCF shares are only available for purchase by CRMC, its affiliates, and other funds managed by CRMC. CCF shares are not available to the public. CRMC does not receive an investment advisory services fee from CCF.
Security transactions with related funds — The funds may purchase from, or sell securities to, other CRMC-managed funds (or accounts managed by certain affiliates of CRMC) under procedures adopted by the funds’ board of trustees. The funds involved in such transactions are considered related by virtue of having a common investment adviser (or affiliated investment advisers), common trustees and/or common officers. When such transactions occur, each transaction is executed at the current market price of the security and no brokerage commissions or fees are paid in accordance with Rule 17a-7 of the 1940 Act.
The following table presents purchase and sales transactions, if any, between each fund and related funds and the net realized gains from such sales as of April 30, 2022 (dollars in thousands):
| Fund | | | Purchases | | | | Sales | | | | Net
realized
loss | |
| Capital Group Core Municipal Fund | | $ | 903 | | | $ | 5,393 | | | $ | (124 | ) |
| Capital Group Short-Term Municipal Fund | | | — | | | | 14,661 | | | | (346 | ) |
| Capital Group California Core Municipal Fund | | | 4,261 | | | | 2,904 | | | | (160 | ) |
| Capital Group California Short-Term Municipal Fund | | | 1,069 | | | | — | | | | — | |
| Capital Group Core Bond Fund | | | — | | | | 396 | | | | (30 | ) |
Interfund lending — Pursuant to an exemptive order issued by the SEC, the funds, along with other CRMC-managed funds (or funds managed by certain affiliates of CRMC), may participate in an interfund lending program. The program provides an alternate credit facility that permits the funds to lend or borrow cash for temporary purposes directly to or from one another, subject to the conditions of the exemptive order. The funds did not lend or borrow cash through the interfund lending program at any time during the six months ended ended April 30, 2022.
| Private Client Services Funds | 89 |
8. Indemnifications
The series’ organizational documents provide board members and officers with indemnification against certain liabilities or expenses in connection with the performance of their duties to the series. In the normal course of business, the series may also enter into contracts that provide general indemnifications. Each fund’s maximum exposure under these arrangements is unknown since it is dependent on future claims that may be made against the series. The risk of material loss from such claims is considered remote. Insurance policies are also available to the series’ board members and officers.
9. Capital share transactions
Capital share transactions in the funds were as follows (dollars and shares in thousands):
| �� | | Sales | | | Reinvestment of
distributions | | | Repurchases | | | Net (decrease)
increase | |
| Fund | | Amount | | | Shares | | | Amount | | | Shares | | | Amount | | | Shares | | | Amount | | | Shares | |
| | | | | | | | | | | | | | | |
| Six months ended April 30, 2022 | | | | | | | | | | | | | | |
| | | | | | | | | | | | | | | |
Capital Group
Core Municipal Fund | | $ | 55,574 | | | | 5,303 | | | $ | 9,552 | | | | 912 | | | $ | (110,586 | ) | | | (10,797 | ) | | $ | (45,460 | ) | | | (4,582 | ) |
Capital Group
Short-Term Municipal Fund | | |
37,788 | | | |
3,701 | | | |
1,319 | | | |
130 | | | |
(110,464 |
) | | |
(10,959 |
) | | |
(71,357 |
) | | |
(7,128 |
) |
Capital Group
California Core Municipal Fund | | |
51,203 | | | |
4,851 | | | |
8,043 | | | |
760 | | | |
(50,294 |
) | | |
(4,795 |
) | | |
8,952 | | | |
816 | |
Capital Group California
Short-Term Municipal Fund | | |
10,753 | | | |
1,063 | | | |
1,059 | | | |
104 | | | |
(65,048 |
) | | |
(6,445 |
) | | |
(53,236 |
) | | |
(5,278 |
) |
Capital Group
Core Bond Fund | | |
50,773 | | | |
5,074 | | | |
5,160 | | | |
519 | | | |
(86,106 |
) | | |
(8,682 |
) | | |
(30,173 |
) | | |
(3,089 |
) |
| | | | | | | | | | | |
| Year ended October 31, 2021 | | | | | | | | | | |
| | | | | | | | | | | | | | | | | | | | | | | | | | | | | | | | | |
Capital Group
Core Municipal Fund | |
$ |
191,931 | | | |
17,895 | | |
$ |
15,789 | | | |
1,472 | | |
$ |
(65,098 |
) | | |
(6,065 |
) | |
$ |
142,622 | | | |
13,302 | |
Capital Group
Short-Term Municipal Fund | | |
135,966 | | | |
13,169 | | | |
2,260 | | | |
219 | | | |
(142,168 |
) | | |
(13,767 |
) | | |
(3,942 |
) | | |
(379 |
) |
Capital Group
California Core Municipal Fund | | |
103,909 | | | |
9,577 | | | |
12,004 | | | |
1,106 | | | |
(70,484 |
) | | |
(6,480 |
) | | |
45,429 | | | |
4,203 | |
Capital Group California
Short-Term Municipal Fund | | |
68,363 | | | |
6,590 | | | |
2,083 | | | |
201 | | | |
(86,228 |
) | | |
(8,316 |
) | | |
(15,782 |
) | | |
(1,525 |
) |
Capital Group
Core Bond Fund | | |
109,167 | | | |
10,477 | | | |
21,938 | | | |
2,097 | | | |
(28,951 |
) | | |
(2,773 |
) | | |
102,154 | | | |
9,801 | |
10. Investment transactions
The funds made purchases and sales of investment securities during the six months ended April 30, 2022, as follows (dollars in thousands):
| | | Capital Group
Core Municipal
Fund | | | Capital Group
Short-Term
Municipal Fund | | | Capital Group
California
Core Municipal
Fund | | | Capital Group
California
Short-Term
Municipal Fund | | | Capital Group
Core Bond Fund | |
| Purchases of investment securities* | | $ | 127,558 | | | $ | 25,421 | | | $ | 117,713 | | | $ | 25,982 | | | $ | 354,460 | |
| Sales of investment securities* | | | 146,901 | | | | 80,490 | | | | 110,996 | | | | 72,573 | | | | 369,294 | |
| * | Excludes short-term securities and U.S. government obligations, if any. |
| | |
| 90 | Private Client Services Funds |
Financial highlights
| | | | | | (Loss) income from investment operations1 | | | Dividends and distributions | | | | | | | | | | | | | | | | | | | |
| Year ended | | Net asset
value,
beginning
of year | | | Net
investment
income | | | Net (losses)
gains on
securities (both
realized and
unrealized) | | | Total from
investment
operations | | | Dividends
(from net
investment
income) | | | Distributions
(from capital
gains) | | | Total
dividends
and
distributions | | | Net asset
value, end
of year | | | Total
return2 | | | Net assets,
end of year
(in millions) | | | Ratio of
expenses to
average net
assets before
reimbursements3 | | | Ratio of
expenses to
average net
assets after
reimbursements2,3 | | | Ratio of
net income
to average
net assets2 | |
| Capital Group Core Municipal Fund | | | | | | | | | | | | | | | | | | | | | | | | | | | | | | | | | | | | | | | | | |
| 4/30/20224,5 | | $ | 10.62 | | | $ | .06 | | | $ | (.58 | ) | | $ | (.52 | ) | | $ | (.06 | ) | | $ | (.07 | ) | | $ | (.13 | ) | | $ | 9.97 | | | | (4.96 | )%6 | | $ | 691 | | | | .28 | %7 | | | .28 | %7 | | | 1.11 | %7 |
| 10/31/2021 | | | 10.76 | | | | .13 | | | | (.02 | ) | | | .11 | | | | (.13 | ) | | | (.12 | ) | | | (.25 | ) | | | 10.62 | | | | .99 | | | | 785 | | | | .28 | | | | .28 | | | | 1.20 | |
| 10/31/2020 | | | 10.55 | | | | .18 | | | | .22 | | | | .40 | | | | (.18 | ) | | | (.01 | ) | | | (.19 | ) | | | 10.76 | | | | 3.87 | | | | 652 | | | | .28 | | | | .28 | | | | 1.70 | |
| 10/31/2019 | | | 10.15 | | | | .22 | | | | .40 | | | | .62 | | | | (.22 | ) | | | — | | | | (.22 | ) | | | 10.55 | | | | 6.15 | | | | 584 | | | | .28 | | | | .28 | | | | 2.11 | |
| 10/31/2018 | | | 10.41 | | | | .21 | | | | (.26 | ) | | | (.05 | ) | | | (.19 | ) | | | (.02 | ) | | | (.21 | ) | | | 10.15 | | | | (.32 | ) | | | 474 | | | | .27 | | | | .27 | | | | 2.04 | |
| 10/31/2017 | | | 10.48 | | | | .21 | | | | (.07 | ) | | | .14 | | | | (.21 | ) | | | — | 8 | | | (.21 | ) | | | 10.41 | | | | 1.39 | | | | 442 | | | | .35 | | | | .34 | | | | 2.02 | |
| Capital Group Short-Term Municipal Fund | | | | | | | | | | | | | | | | | | | | | | | | | | | | | | | | | | | | | | | | | |
| 4/30/20224,5 | | $ | 10.26 | | | $ | .04 | | | $ | (.40 | ) | | $ | (.36 | ) | | $ | (.05 | ) | | $ | (.03 | ) | | $ | (.08 | ) | | $ | 9.82 | | | | (3.57 | )%6 | | $ | 124 | | | | .32 | %7 | | | .27 | %7 | | | .88 | %7 |
| 10/31/2021 | | | 10.33 | | | | .09 | | | | (.04 | ) | | | .05 | | | | (.09 | ) | | | (.03 | ) | | | (.12 | ) | | | 10.26 | | | | .43 | | | | 203 | | | | .31 | | | | .30 | | | | .87 | |
| 10/31/2020 | | | 10.15 | | | | .14 | | | | .18 | | | | .32 | | | | (.14 | ) | | | — | | | | (.14 | ) | | | 10.33 | | | | 3.16 | | | | 208 | | | | .32 | | | | .30 | | | | 1.36 | |
| 10/31/2019 | | | 9.93 | | | | .19 | | | | .22 | | | | .41 | | | | (.19 | ) | | | — | | | | (.19 | ) | | | 10.15 | | | | 4.19 | | | | 127 | | | | .35 | | | | .30 | | | | 1.92 | |
| 10/31/2018 | | | 10.09 | | | | .17 | | | | (.18 | ) | | | (.01 | ) | | | (.15 | ) | | | — | | | | (.15 | ) | | | 9.93 | | | | .05 | | | | 138 | | | | .32 | | | | .30 | | | | 1.67 | |
| 10/31/2017 | | | 10.11 | | | | .14 | | | | (.02 | ) | | | .12 | | | | (.14 | ) | | | — | 8 | | | (.14 | ) | | | 10.09 | | | | 1.26 | | | | 150 | | | | .41 | | | | .35 | | | | 1.42 | |
| Capital Group California Core Municipal Fund | | | | | | | | | | | | | | | | | | | | | | | | | | | | | | | | | | | | | | | | |
| 4/30/20224,5 | | $ | 10.75 | | | $ | .06 | | | $ | (.59 | ) | | $ | (.53 | ) | | $ | (.07 | ) | | $ | (.06 | ) | | $ | (.13 | ) | | $ | 10.09 | | | | (4.99 | )%6 | | $ | 631 | | | | .27 | %7 | | | .27 | %7 | | | 1.07 | %7 |
| 10/31/2021 | | | 10.90 | | | | .13 | | | | (.08 | ) | | | .05 | | | | (.11 | ) | | | (.09 | ) | | | (.20 | ) | | | 10.75 | | | | .53 | | | | 664 | | | | .27 | | | | .27 | | | | 1.17 | |
| 10/31/2020 | | | 10.73 | | | | .17 | | | | .18 | | | | .35 | | | | (.17 | ) | | | (.01 | ) | | | (.18 | ) | | | 10.90 | | | | 3.29 | | | | 627 | | | | .28 | | | | .28 | | | | 1.55 | |
| 10/31/2019 | | | 10.34 | | | | .20 | | | | .40 | | | | .60 | | | | (.20 | ) | | | (.01 | ) | | | (.21 | ) | | | 10.73 | | | | 5.84 | | | | 557 | | | | .28 | | | | .28 | | | | 1.89 | |
| 10/31/2018 | | | 10.57 | | | | .19 | | | | (.23 | ) | | | (.04 | ) | | | (.18 | ) | | | (.01 | ) | | | (.19 | ) | | | 10.34 | | | | (.27 | ) | | | 452 | | | | .27 | | | | .27 | | | | 1.85 | |
| 10/31/2017 | | | 10.69 | | | | .20 | | | | (.11 | ) | | | .09 | | | | (.20 | ) | | | (.01 | ) | | | (.21 | ) | | | 10.57 | | | | .84 | | | | 388 | | | | .35 | | | | .34 | | | | 1.88 | |
| Capital Group California Short-Term Municipal Fund | | | | | | | | | | | | | | | | | | | | | | | | | | | | | | | | | | | | | |
| 4/30/20224,5 | | $ | 10.29 | | | $ | .03 | | | $ | (.40 | ) | | $ | (.37 | ) | | $ | (.04 | ) | | $ | (.03 | ) | | $ | (.07 | ) | | $ | 9.85 | | | | (3.64 | )%6 | | $ | 122 | | | | .27 | %7 | | | .27 | %7 | | | .69 | %7 |
| 10/31/2021 | | | 10.39 | | | | .08 | | | | (.07 | ) | | | .01 | | | | (.08 | ) | | | (.03 | ) | | | (.11 | ) | | | 10.29 | | | | .12 | | | | 182 | | | | .29 | | | | .29 | | | | .76 | |
| 10/31/2020 | | | 10.28 | | | | .12 | | | | .11 | | | | .23 | | | | (.12 | ) | | | — | | | | (.12 | ) | | | 10.39 | | | | 2.26 | | | | 199 | | | | .30 | | | | .30 | | | | 1.16 | |
| 10/31/2019 | | | 10.06 | | | | .15 | | | | .22 | | | | .37 | | | | (.15 | ) | | | — | | | | (.15 | ) | | | 10.28 | | | | 3.55 | | | | 164 | | | | .32 | | | | .30 | | | | 1.46 | |
| 10/31/2018 | | | 10.21 | | | | .13 | | | | (.15 | ) | | | (.02 | ) | | | (.12 | ) | | | (.01 | ) | | | (.13 | ) | | | 10.06 | | | | (.07 | ) | | | 129 | | | | .31 | | | | .30 | | | | 1.28 | |
| 10/31/2017 | | | 10.23 | | | | .11 | | | | (.02 | ) | | | .09 | | | | (.11 | ) | | | — | 8 | | | (.11 | ) | | | 10.21 | | | | .97 | | | | 120 | | | | .42 | | | | .35 | | | | 1.11 | |
| Capital Group Core Bond Fund | | | | | | | | | | | | | | | | | | | | | | | | | | | | | | | | | | | | | | | | |
| 4/30/20224,5 | | $ | 10.24 | | | $ | .08 | | | $ | (.65 | ) | | $ | (.57 | ) | | $ | (.08 | ) | | $ | — | | | $ | (.08 | ) | | $ | 9.59 | | | | (5.56 | )%6 | | $ | 570 | | | | .28 | %7 | | | .28 | %7 | | | 1.68 | %7 |
| 10/31/2021 | | | 10.70 | | | | .14 | | | | (.20 | ) | | | (.06 | ) | | | (.15 | ) | | | (.25 | ) | | | (.40 | ) | | | 10.24 | | | | (.60 | ) | | | 640 | | | | .28 | | | | .28 | | | | 1.36 | |
| 10/31/2020 | | | 10.31 | | | | .18 | | | | .46 | | | | .64 | | | | (.19 | ) | | | (.06 | ) | | | (.25 | ) | | | 10.70 | | | | 6.28 | | | | 564 | | | | .28 | | | | .28 | | | | 1.73 | |
| 10/31/2019 | | | 9.82 | | | | .23 | | | | .48 | | | | .71 | | | | (.22 | ) | | | — | | | | (.22 | ) | | | 10.31 | | | | 7.33 | | | | 477 | | | | .28 | | | | .28 | | | | 2.24 | |
| 10/31/2018 | | | 10.14 | | | | .21 | | | | (.34 | ) | | | (.13 | ) | | | (.19 | ) | | | — | | | | (.19 | ) | | | 9.82 | | | | (1.14 | ) | | | 446 | | | | .28 | | | | .28 | | | | 2.08 | |
| 10/31/2017 | | | 10.31 | | | | .16 | | | | (.12 | ) | | | .04 | | | | (.16 | ) | | | (.05 | ) | | | (.21 | ) | | | 10.14 | | | | .41 | | | | 416 | | | | .35 | | | | .34 | | | | 1.58 | |
| Portfolio turnover rate for all share classes, | | Six months ended | | Year ended October 31, |
| including mortgage dollar roll transactions9,10 | | April 30, 20224,5,6 | | 2021 | | 2020 | | 2019 | | 2018 | | 2017 |
| Capital Group Core Bond Fund | | | 27 | % | | | 48 | % | | | 80 | % | | | 114 | % | | | 41 | % | | | 52 | % |
| Portfolio turnover rate for all share classes, | | Six months ended | | Year ended October 31, |
| including mortgage dollar roll transactions10 | | April 30, 20224,5,6 | | 2021 | | 2020 | | 2019 | | 2018 | | 2017 |
| Capital Group Core Municipal Fund | | | 20 | % | | | 48 | % | | | 62 | % | | | 38 | % | | | 55 | % | | | 47 | % |
| Capital Group Short-Term Municipal Fund | | | 17 | | | | 51 | | | | 58 | | | | 50 | | | | 70 | | | | 42 | |
| Capital Group California Core Municipal Fund | | | 19 | | | | 38 | | | | 37 | | | | 22 | | | | 69 | | | | 27 | |
| Capital Group California Short-Term Municipal Fund | | | 19 | | | | 43 | | | | 42 | | | | 39 | | | | 65 | | | | 36 | |
| Capital Group Core Bond Fund | | | 78 | | | | 217 | | | | 158 | | | | 151 | | | | 110 | | | | 95 | |
See end of tables for footnotes.
| Private Client Services Funds | 91 |
Financial highlights (continued)
| 1 | Based on average shares outstanding. |
| 2 | This column reflects the impact, if any, of miscellaneous fee reimbursements from CRMC. |
| 3 | Ratios do not include expenses of any Central Funds. The fund indirectly bears its proportionate share of the expenses of any Central Funds, if applicable. |
| 4 | Based on operations for a period that is less than a full year. |
| 5 | Unaudited. |
| 6 | Not annualized. |
| 7 | Annualized. |
| 8 | Amount less than $.01. |
| 9 | Refer to Note 5 for further information on mortgage dollar rolls. |
| 10 | Rates do not include the fund’s portfolio activity with respect to any Central Funds, if applicable. |
See notes to financial statements.
| 92 | Private Client Services Funds |
As a shareholder of the funds, you incur ongoing costs, including management fees and other expenses. This example is intended to help you understand your ongoing costs (in dollars) of investing in the funds so you can compare these costs with the ongoing costs of investing in other mutual funds. The example is based on an investment of $1,000 invested at the beginning of the period and held for the entire six-month period (November 1, 2021, through April 30, 2022).
Actual expenses:
The first line of each fund in the table below provides information about actual account values and actual expenses. You may use the information in this line, together with the amount you invested, to estimate the expenses that you paid over the period. Simply divide your account value by $1,000 (for example, an $8,600 account value divided by $1,000 = 8.6), then multiply the result by the number in the first line under the heading titled “Expenses paid during period” to estimate the expenses you paid on your account during this period.
Hypothetical example for comparison purposes:
The second line of each fund in the table below provides information about hypothetical account values and hypothetical expenses based on the actual expense ratio for the share class and an assumed rate of return of 5.00% per year before expenses, which is not the actual return of the share class. The hypothetical account values and expenses may not be used to estimate the actual ending account balance or expenses you paid for the period. You may use this information to compare the ongoing costs of investing in the fund and other funds. To do so, compare this 5.00% hypothetical example with the 5.00% hypothetical examples that appear in the shareholder reports of the other funds.
Notes:
Shareholders of the funds may be subject to an additional fee charged by CRMC’s Capital Group Private Client Services division for the ongoing services provided to the shareholder. You can estimate the impact of these fees by adding the amount of the fees to the total estimated expenses you paid on your account during the period as calculated above. In addition, your ending account value would be lower by the amount of these fees. Note that the expenses shown in the table are meant to highlight your ongoing costs only. The second line of each fund in the table below is useful in comparing ongoing costs only and will not help you determine the relative total costs of owning different funds.
| | | Beginning
account value
11/1/2021 | | | Ending
account value
4/30/2022 | | | Expenses
paid during
period* | | | Annualized
expense ratio | |
| Capital Group Core Municipal Fund | | | | | | | | | | | | | | | | |
| Actual return | | $ | 1,000.00 | | | $ | 950.43 | | | $ | 1.35 | | | | .28 | % |
| Assumed 5% return | | | 1,000.00 | | | | 1,023.41 | | | | 1.40 | | | | .28 | |
| Capital Group Short-Term Municipal Fund | | | | | | | | | | | | | | | | |
| Actual return | | $ | 1,000.00 | | | $ | 964.27 | | | $ | 1.31 | | | | .27 | % |
| Assumed 5% return | | | 1,000.00 | | | | 1,023.46 | | | | 1.35 | | | | .27 | |
| Capital Group California Core Municipal Fund | | | | | | | | | | | | | | | | |
| Actual return | | $ | 1,000.00 | | | $ | 950.09 | | | $ | 1.31 | | | | .27 | % |
| Assumed 5% return | | | 1,000.00 | | | | 1,023.46 | | | | 1.35 | | | | .27 | |
| Capital Group California Short-Term Municipal Fund | | | | | | | | | | | | | | | | |
| Actual return | | $ | 1,000.00 | | | $ | 963.59 | | | $ | 1.31 | | | | .27 | % |
| Assumed 5% return | | | 1,000.00 | | | | 1,023.46 | | | | 1.35 | | | | .27 | |
| Capital Group Core Bond Fund | | | | | | | | | | | | | | | | |
| Actual return | | $ | 1,000.00 | | | $ | 944.44 | | | $ | 1.35 | | | | .28 | % |
| Assumed 5% return | | | 1,000.00 | | | | 1,023.41 | | | | 1.40 | | | | .28 | |
| * | The “expenses paid during period” are equal to the “annualized expense ratio,” multiplied by the average account value over the period, multiplied by the number of days in the period, and divided by 365 (to reflect the one-half year period). |
| Private Client Services Funds | 93 |
Approval of Investment Advisory and Service Agreement
The series’ board has approved the continuation of the series’ Investment Advisory and Service Agreement (the “agreement”) with Capital Research and Management Company (“CRMC”) for an additional one-year term through July 31, 2023, with respect to the various series of the funds (each a “fund”). The board approved the agreement following the recommendation of the series’ Contracts Committee (the “committee”), which is composed of all the series’ independent board members. The board and the committee determined in the exercise of their business judgment that each fund’s advisory fee structure was fair and reasonable in relation to the services provided, and that approving the agreement was in the best interests of each fund and its shareholders.
The board and the committee noted that the board has approved the reorganization of each of Capital Group Core Bond Fund with and into The Bond Fund of America, Capital Group Core Municipal Fund with and into Limited Term Tax-Exempt Bond Fund of America, and Capital Group Short-Term Municipal Fund with and into American Funds Short-Term Tax-Exempt Bond Fund. The board and the committee took these approvals into account in their deliberations about the agreement and noted that each reorganization would be consummated only if approved by shareholders of the applicable fund party thereto.
In reaching the decision to approve the agreement, the board and the committee took into account their interactions with CRMC as well as information furnished to them throughout the year and otherwise provided to them, as well as information prepared specifically in connection with their review of the agreement, and were advised by their independent counsel with respect to the matters considered. They considered the following factors, among others, but did not identify any single issue or particular piece of information that, in isolation, was the controlling factor, and each board and committee member did not necessarily attribute the same weight to each factor.
1. Nature, extent and quality of services
The board and the committee considered the depth and quality of CRMC’s investment management process, including its global research capabilities; the experience, capability and integrity of its senior management and other personnel; the low turnover rates of its key personnel; the overall financial strength and stability of CRMC and the Capital Group organization; the resources and systems CRMC devotes to investment management (the manner in which each fund’s assets are managed, including liquidity management), financial, investment operations, compliance, trading, proxy voting, shareholder communications, and other services; and the ongoing evolution of CRMC’s organizational structure designed to maintain and strengthen these qualities. The board and the committee also considered the nature, extent and quality of administrative and shareholder services provided by CRMC to the funds under the agreement and other agreements, as well as the benefits to fund shareholders from investing in a fund that is part of a large family of funds. The board and the committee considered the risks assumed by CRMC in providing services to the funds, including operational, business, financial, reputational, regulatory and litigation risks. The board and the committee concluded that the nature, extent and quality of the services provided by CRMC have benefited and should continue to benefit the funds and their shareholders.
2. Investment results
The board and the committee considered the investment results of each fund in light of its objective. They compared each fund’s investment results with those of other funds (including funds that currently form the basis of the Lipper index for the category in which each fund is included) and data such as relevant market and fund indexes over various periods (including each fund’s lifetime) through December 31, 2021. They generally placed greater emphasis on investment results over longer term periods. On the basis of this evaluation and the board’s and the committee’s ongoing review of investment results, and considering the relative market conditions during certain reporting periods, the board and the committee concluded that each fund’s investment results have been sufficient for renewal of the agreement, and that CRMC’s record in managing the funds indicated that its continued management should benefit the funds and their shareholders.
3. Advisory fees and total expenses
The board and the committee compared the advisory fees and total expense levels of the funds to those of other relevant funds. They observed that each fund’s advisory fees and expenses generally compared favorably to those of other similar funds included in the comparable Lipper category. The board and the committee noted that, although the fees paid by CRMC clients with separately managed accounts generally were lower than those paid by the funds, the differences appropriately reflected the investment, operational, regulatory and market differences between advising the funds and separately managed accounts. They also recognized that the fees for certain separately managed accounts could be lower than those of the funds due to the sizes of the accounts and the clients’ overall relationships with CRMC. The board and the committee concluded that each fund’s cost structure was fair and reasonable in relation to the services provided, as well as in relation to the risks assumed by the adviser in sponsoring and managing the fund, and that each fund’s shareholders receive reasonable value in return for the advisory fees and other amounts paid to CRMC by each fund.
| 94 | Private Client Services Funds |
4. Ancillary benefits
The board and the committee considered a variety of other benefits that CRMC and its affiliates receive as a result of CRMC’s relationship with the funds, including fees paid to CRMC’s affiliated transfer agent; sales charges and distribution fees received and retained by the funds’ principal underwriter, an affiliate of CRMC; and possible ancillary benefits to CRMC and its institutional management affiliates in managing other investment vehicles. The board and the committee reviewed CRMC’s portfolio trading practices, noting that through December 31, 2018, CRMC benefited from research obtained with commissions from portfolio transactions made on behalf of each fund, and since that time has undertaken to bear the cost of obtaining such research. The board and the committee took these ancillary benefits into account in evaluating the reasonableness of the advisory fees and other amounts paid to CRMC by the funds.
5. Adviser financial information
The board and the committee reviewed information regarding CRMC’s costs of providing services to the funds, including personnel, systems and resources of investment, compliance, trading, accounting and other administrative operations. They considered CRMC’s costs and related cost allocation methodology as well as its track record of investing in technology, infrastructure and staff to maintain and expand services and capabilities, respond to industry and regulatory developments, and attract and retain qualified personnel. They noted information regarding the compensation structure for CRMC’s investment professionals. They reviewed information on the profitability of the investment adviser and its affiliates. The board and the committee also compared CRMC’s profitability and compensation data to the reported results and data of a number of large, publicly held investment management companies. The board and the committee noted the competitiveness and cyclicality of both the mutual fund industry and the capital markets, and the importance in that environment of CRMC’s long-term profitability for maintaining its independence, company culture and management continuity. They further considered CRMC’s reimbursement of fund expenses through voluntary fee caps and, as applicable, the sharing of potential economies of scale, or efficiencies, through breakpoints and other fee reductions and costs voluntarily absorbed. The board and the committee concluded that each fund’s advisory fee structure reflected a reasonable sharing of benefits between CRMC and the fund’s shareholders.
| Private Client Services Funds | 95 |
| Liquidity Risk Management Program | unaudited |
The series has adopted a liquidity risk management program (the “program”). The series’ board has designated Capital Research and Management Company (“CRMC”) as the administrator of the program. Personnel of CRMC or its affiliates conduct the day-to-day operation of the program pursuant to policies and procedures administered by the Capital Group Liquidity Risk Management Committee.
Under the program, CRMC manages each fund’s liquidity risk, which is the risk that the fund could not meet shareholder redemption requests without significant dilution of remaining shareholders’ interests in the fund. This risk is managed by monitoring the degree of liquidity of each fund’s investments, limiting the amount of each fund’s illiquid investments, and utilizing various risk management tools and facilities available to each fund for meeting shareholder redemptions, among other means. CRMC’s process of determining the degree of liquidity of each fund’s investments is supported by one or more third-party liquidity assessment vendors.
The series’ board reviewed a report prepared by CRMC regarding the operation and effectiveness of the program for the period October 1, 2020, through September 30, 2021. No significant liquidity events impacting any of the funds were noted in the report. In addition, CRMC provided its assessment that the program had been effective in managing each fund’s liquidity risk.
| 96 | Private Client Services Funds |

Office of the fund
6455 Irvine Center Drive
Irvine, CA 92618-4518
Investment adviser
Capital Research and Management Company
333 South Hope Street
Los Angeles, CA 90071-1406
Transfer agent for shareholder accounts
American Funds Service Company
(Write to the address nearest you.)
P.O. Box 6007
Indianapolis, IN 46206-6007
P.O. Box 2280
Norfolk, VA 23501-2280
Custodian of assets
State Street Bank and Trust Company
One Lincoln Street
Boston, MA 02111-2900
Counsel
Morgan, Lewis & Bockius LLP
One Federal Street
Boston, MA 02110-1726
Independent registered public accounting firm
PricewaterhouseCoopers LLP
601 South Figueroa Street
Los Angeles, CA 90017-3874
Principal underwriter
American Funds Distributors, Inc.
333 South Hope Street
Los Angeles, CA 90071-1406
Investors should carefully consider investment objectives, risks, charges and expenses. This and other important information is contained in the fund prospectuses, which can be obtained from Capital Research and Management Company by calling (800) 266-9532 and should be read carefully before investing.
Capital Group Private Client Services Fund files a complete list of its portfolio holdings with the U.S. Securities and Exchange Commission (SEC) for the first and third quarters of each fiscal year on Form NPORT-P. This filing is available free of charge on the SEC website (www.sec.gov). Additionally, the list of portfolio holdings is available by calling your relationship manager at (800) 266-9532.
The proxy voting procedures and policies of Capital Group Private Client Services Fund — which describe how we vote proxies relating to portfolio securities — are available upon request by calling your relationship manager at (800) 266-9532. The funds file their proxy voting records with the SEC for the 12 months ended June 30 by August 31. The report also is available on the SEC website or by calling your relationship manager.
BLOOMBERG® is a trademark and service mark of Bloomberg Finance L.P. and its affiliates (collectively “Bloomberg”). Bloomberg or Bloomberg’s licensors own all proprietary rights in the Bloomberg Indices. Neither Bloomberg nor Bloomberg’s licensors approves or endorses this material, or guarantees the accuracy or completeness of any information herein, or makes any warranty, express or implied, as to the results to be obtained therefrom and, to the maximum extent allowed by law, neither shall have any liability or responsibility for injury or damages arising in connection therewith.
All Capital Group trademarks mentioned are owned by The Capital Group Companies, Inc., an affiliated company or fund. All other company and product names mentioned are the property of their respective companies.
If used as sales material after June 30, 2022, this report must be accompanied by the Capital Group Core Municipal Fund, Capital Group Short-Term Municipal Fund, Capital Group California Core Municipal Fund, Capital Group California Short-Term Municipal Fund and Capital Group Core Bond Fund quarterly results documents for the most recently completed calendar quarter.
American Funds Distributors, Inc., member FINRA.

[logo - The Capital Group]
Code of Ethics
June 2022
Capital Group associates are responsible for maintaining the highest ethical standards. The Code of Ethics is intended to help associates observe exemplary standards of integrity, honesty and trust. It sets out standards for our personal conduct, including personal investing, gifts and entertainment, outside business interests and affiliations, political contributions, insider trading, and client confidentiality.
Our fund shareholders and clients have placed their trust in Capital to manage their assets. As investment advisers, we act as fiduciaries to our clients. This means we owe them both a duty of care and a duty of loyalty.
Capital has earned a reputation over many years for acting with the highest integrity and ethics. Reputations are fragile, however, and Capital’s reputation can be harmed if any of us fails to act ethically and in the best interests of our clients. We each must hold ourselves to the highest standards of behavior, regardless of business custom, and strive to avoid even the appearance of impropriety. We all share this responsibility — if you have any doubt whether an action or circumstance is consistent with our standards, raise it.
Associates should be aware that their actions outside of the workplace can reflect on the ethics of our organization and potentially harm our reputation. For this reason, associates should exercise caution and good judgment in order to avoid having their actions outside of the workplace impact Capital, our workplace or our associates.
No set of rules can anticipate every possible situation, so it is essential that associates adhere to the spirit as well as the letter of the Code of Ethics. Any activity that compromises the trust our clients have placed in us, even if it does not expressly violate a rule, has the potential to harm our reputation. Associates are reminded of one of Capital’s core principles: that we must do the right thing as a matter of principle, not just in observance of policy.
In addition to the specific policies described below, associates have the following fundamental obligations under the Code of Ethics:
| | − | Associates must avoid those situations that might place, or appear to place, their personal interests in conflict with the interests of Capital, our clients or fund shareholders. |
| | − | Associates must not take advantage of their role with Capital to benefit themselves or another party. |
| | − | Associates must comply with the laws, rules and regulations that apply to us in the conduct of our business. |
| | − | Associates must promptly report violations of the Code of Ethics. |
It is important that all associates comply with the Code of Ethics, including its related guidelines and policies. Failure to do so could result in disciplinary action, including termination.
Questions regarding the Code of Ethics may be directed to the Code of Ethics Team.
Working ethically
In order to maintain the highest ethical standards, Capital strives to recruit, hire and retain exceptional and diverse talent. We can only do so by offering a work environment where associates have a voice, feel respected and can thrive, grow, and bring their most authentic selves to the workplace. In order to help foster such an environment, we have established certain employment policies designed in part to ensure associates interact in a professional, productive and inclusive manner. All associates are expected to be familiar and comply with these and the other policies included in our Associate Handbooks. Because we hold ourselves to the highest ethical standards, our policies often exceed what may be required by law or observed at other companies.
The following sections summarize some of your obligations under the Associate Handbook. Due to their importance to our workplace, violation of the policies in our Associate Handbooks could result in disciplinary action, up to and including termination of employment.
Providing equal employment opportunities and preventing discrimination and harassment
All associates at Capital are responsible for maintaining a professional, inclusive work environment. As an equal opportunity employer, we do not tolerate discrimination. Our policies prohibit unlawful discrimination on the basis of race, religion, color, national origin, ancestry, sex (including gender, gender expression and gender identity), pregnancy, childbirth and related medical conditions, age, physical or mental disability, medical condition, genetic information, marital status, sexual orientation, citizenship status, AIDS/HIV status, political activities or affiliations, military or veteran status, status as a victim of domestic violence, assault or stalking or any other characteristic protected by federal, state or local law.
Harassment is a form of discrimination and violates our commitment to equal employment opportunities. Harassment in violation of our policies occurs when unwelcome comments or conduct based on a protected status unreasonably interfere with an associate’s work performance or create an intimidating, hostile or offensive work environment.
We are committed to promptly investigating and taking action to eliminate any discrimination and harassment that occurs in the workplace. When requested by our Human Resources or Legal Department, all associates are expected to cooperate fully in any investigation into a violation of our policies against discrimination and harassment. Our commitment is to address such claims promptly and to take corrective action as appropriate.
Associates are encouraged to report harassment to Human Resources, any manager in the organization or through our Open Line (contact information for Open Line is outlined below in Reporting requirements).
Close personal relationships in the office
When associates have a close personal, intimate or familial relationship in the workplace, it can create an actual or potential conflict of interest. It can also negatively impact the work environment. For this reason, Capital requires that all associates report any personal intimate or familial relationship with another associate or a business partner employee to Human Resources. Under this policy, certain relationships are prohibited, such as intimate relationships between managers and associates in their reporting lines.
Interacting with the public
Regardless of whether you are speaking on behalf of Capital or simply using social media for personal use, we expect all associates to maintain both client and firm confidentiality, and to protect the firm’s reputation. The lines between public and private, personal and professional, can become blurred, particularly within the realm of social media. By identifying yourself as a Capital associate within a social network, you are connected, either directly or indirectly, to colleagues, managers, clients and investors. Information originally intended for friends and family can be forwarded and, ultimately, lead to unintended consequences. For this reason, associates should exercise extra caution and good judgment and avoid mixing personal and business social networks and ensure that they abide by all local laws and regulations and applicable Capital policies, such as the policy against harassment.
Protecting sensitive information
Capital Group regularly creates, collects, and maintains valuable proprietary information, which is essential to our business operations and the performance of services for our clients. This information derives its value, in part, from not being generally known outside of Capital (hereinafter “Confidential Information”). It includes confidential electronic information in any medium, hard-copy information, and information shared orally or visually (such as by telephone or video conference). The confidentiality, integrity and limited availability of such information is regarded as fundamental to the successful business operations of Capital Group. The purpose of the Confidential Information Policy is to protect our information from disclosure – intentional or inadvertent – and to ensure that associates understand their obligation to protect and maintain its confidentiality.
Code of Ethics guidelines
No special treatment from broker-dealers
Associates may not accept negotiated commission rates or any other terms they believe may be more favorable than the broker-dealer grants to accounts with similar characteristics. U.S. broker-dealers are subject to certain rules designed to prevent favoritism toward such accounts. Favors or preferential treatment from broker-dealers may not be accepted. This rule applies to the associate’s spouse/spouse equivalent and any immediate family member residing in the same household.
No excessive trading of Capital-affiliated funds
Associates should not engage in excessive trading of the American Funds or other Capital-managed investment vehicles worldwide in order to take advantage of short-term market movements. Excessive activity, such as a frequent pattern of exchanges, could involve actual or potential harm to shareholders or clients. This rule applies to the associate’s spouse/spouse equivalent and any immediate family member residing in the same household.
Ban on Initial Public Offerings (IPOs) and Initial Coin Offerings (ICOs)
All associates and immediate family members residing in the same household may not participate in IPOs or ICOs.
Exceptions for participation in IPOs are rarely granted; however, they will be considered on a case-by-case basis (for example, where a family member is employed by the IPO company and IPO shares are considered part of that family member’s compensation).
Avoiding conflicts
Associates must avoid conflicts of interest that can occur when their business, financial or other interests interfere, or reasonably appear to interfere, with their duty to serve the interests of Capital and our clients. Conflicts of interest include any situation where financial or other personal factors compromise objectivity or professional judgment. Even the appearance of conflict could negatively impact Capital and harm our reputation.
Portfolio managers and investment analysts should be aware of the potential conflicts that can arise when they invest on behalf of fund shareholders and clients. The investments we make for our clients must be based on their best interests, and should not be, or appear to be, based on the self-interest of our associates. Accordingly, members of the investment group must disclose to the Code of Ethics Team if they or any of their family members, such as parents, children, siblings, in-laws or other family members with whom they have a close relationship, has a material business, financial or personal relationship with a company that they hold or are eligible to purchase professionally. Examples of a material relationship include: (1) a family member serving as a senior officer or executive of a portfolio company, (2) significant beneficial ownership of a portfolio company by the associate or their family members, and (3) involvement by the associate or a family member in a significant transaction or business opportunity with a portfolio company.
In addition, associates should avoid conflicts related to Capital’s business, and therefore must not:
| | − | Engage in a business that competes, directly or indirectly, with the interests of Capital, or is related to their role or responsibilities at Capital; |
| | − | Act for Capital in any transaction or business relationship that involves the associate, members of their family or other people or organizations with whom the associate or their family member(s) have a significant personal connection or financial interest; |
| | − | Negotiate with Capital on behalf of any such people or organizations; or |
| | − | Use or attempt to use their position at Capital to obtain any improper personal benefit for themselves, family member(s) or any other party. |
No policy can anticipate every possible conflict of interest and all associates must be vigilant in guarding against anything that could color our judgment. Any associate who is aware of a transaction or relationship that could reasonably be expected to give rise to a conflict of interest or perceived conflict of interest must disclose the matter promptly to a member of the Code of Ethics Team. If there is any doubt or if something does not feel consistent with our standards, raise the issue.
Any changes in a previously disclosed potential conflict, outside business interest or affiliation that could be relevant to an evaluation of a potential conflict must also be promptly disclosed. Examples of changes to disclose include: (1) a change in research coverage of an investment analyst to include a company with a family member serving as a senior executive (even if the senior executive relationship had previously been disclosed); (2) a change in an associate’s role to trader if the associate had previously disclosed a sibling who works as a sell-side trader; and 3) a change in the line of business or activities of an outside business interest of an associate.
Outside business interests/affiliations
Associates should avoid outside business interests or affiliations that may give rise to conflicts of interest or that may create divided loyalties, divert substantial amounts of their time, or compromise their independent judgment.
Associates must obtain approval from the Code of Ethics Team to serve on the board of directors or as an advisory board member of any public or private company. This rule does not apply to: (1) boards of Capital companies or funds; (2) board service that is a direct result of the associate’s responsibilities at Capital, such as for portfolio companies of private equity funds managed by Capital; or (3) boards of non-profit and charitable organizations. Associates must disclose to the Code of Ethics Team if they serve on the board of a non-profit or charitable organization that has issued or has future plans to issue publicly held securities, including debt obligations.
In addition, associates must disclose to the Code of Ethics Team if they or any of their family members, such as parents, children, siblings, in-laws or other family members with whom they have a close relationship:
| | − | serves as a board director or as an advisory board member of, |
| | − | holds a senior officer position, such as CEO, CFO or Treasurer with, or |
| | − | owns 5% or more, individually or together with other such family members, of |
any public company or any private company that may be reasonably expected to go public.
In addition to the disclosure obligations set forth above, associates should be mindful of and must disclose to the Code of Ethics Team any other outside business interest or activity that may present a conflict of interest or the appearance of a conflict of interest or that may compromise their independent judgment. For example, associates must disclose if they have a significant interest in a private company that does business with or competes with Capital, even if that company is not reasonably expected to go public.
Family members employed by a financial institution
Associates who are “Covered Associates” (as defined below) must disclose if any of their family members, such as parents, children, siblings, in-laws or other family members with whom they have a close relationship, is employed by a broker-dealer, investment adviser or other firm that provides investment research or trade execution services to Capital.
Requests for approval or questions may be directed to the Code of Ethics Team.
Other guidelines
Statements and disclosures about Capital, including those made to fund shareholders and clients and in regulatory filings, should be accurate and not misleading.
Reporting requirements
Annual certification of the Code of Ethics
All associates are required to certify at least annually that they have read and understand the Code of Ethics. Questions or issues relating to the Code of Ethics should be directed to the associate’s manager or the Code of Ethics Team.
Reporting violations
All associates are responsible for complying with the Code of Ethics. As part of that responsibility, associates are obligated to report violations of the Code of Ethics promptly, including: (1) fraud or illegal acts involving any aspect of Capital’s business; (2) noncompliance with applicable laws, rules and regulations; (3) intentional or material misstatements in regulatory filings, internal books and records, or client records and reports; or (4) activity that is harmful to fund shareholders or clients. Deviations from controls or procedures that safeguard Capital, including the assets of shareholders and clients, should also be reported. Reported violations of the Code of Ethics will be investigated and appropriate action will be taken, which may include reporting the matter to the firm’s regulator if determined to be appropriate by legal counsel. Once a violation has been reported, all associates are required to cooperate with Capital in the internal investigation of any matter by providing honest, truthful and complete information.
Associates may report confidentially to a manager/department head or to the Open Line Committee.
Associates may also contact the Chief Compliance Officers of CB&T, CIInc, CRC, CIAM, CRMC, or legal counsel employed with Capital.
Capital strictly prohibits retaliation against any associate who in good faith makes a complaint, raises a concern, provides information or otherwise assists in an investigation regarding any conduct that he or she reasonably believes to be in violation of the Code of Ethics. This policy is designed to ensure that associates comply with their obligations to report violations without fear of retaliation.
Policies
Capital’s policies regarding gifts and entertainment, political contributions, insider trading and personal investing are summarized below.
Gifts and Entertainment Policy
The Gifts and Entertainment Policy (Policy) is intended to ensure that gifts and entertainment involving associates do not raise questions of propriety regarding Capital’s business relationships or prospective business relationships, or Capital’s interactions with government officials. If a gift or entertainment is excessive, repetitive or extravagant, it can raise the appearance of favoritism or the potential for a conflict of interest. By understanding and following the Policy requirements, associates help Capital safeguard the company and ensure compliance with regulatory rules.
| | − | Associates may not accept from or give to any one individual or entity a gift or group of gifts exceeding in aggregate $100 in a 12-month calendar year period if such a person or entity conducts, or may conduct, business with Capital. Trading department associates are subject to different limits and reporting requirements and are generally not permitted to receive gifts. Trading associates may be asked to return gifts received. |
| | − | Associates must receive approval from their manager and the Code of Ethics Team before accepting or extending entertainment with a market value greater than $500. This value is cumulative for associates and their invited guests. Trading department associates are prohibited from accepting entertainment, regardless of value, unless the associate or Capital pays. |
Gifts or entertainment extended to a private-sector person by a Capital associate and approved by the associate’s manager for reimbursement by Capital do not need to be reported (or precleared). Trading department associates should report gifts and entertainment extended regardless of reimbursement. Dollar amounts refer to U.S. dollars.
Please note AFD/CGIIS associates are subject to separate policies regarding extending gifts and entertainment and are also required under the Policy to report all gifts and entertainment, regardless of value.
Capital Group is registered as a federal lobbyist and special rules apply to gifts and entertainment involving government officials and employees as a result. Associates must receive approval from Capital’s Code of Ethics Team prior to either: (1) hosting a federal government official or employee at a Capital facility if anything of value (e.g. food, tangible item) will be presented to that individual; or (2) providing anything of value to a federal government official or employee if Capital will pay or reimburse for the related cost.
Reporting
The limitations relating to gifts and entertainment apply to all associates as described above, and associates will be asked to complete quarterly disclosures. Associates must report any gift exceeding $50 and business entertainment in which an event exceeds $75 (although it is recommended that associates report all gifts and entertainment). Trading department associates should notify the Code of Ethics Team when gifts are received and report such gifts quarterly, whether the gift is received by an individual associate or by a department. In addition, trading associates should report gifts and entertainment extended regardless of reimbursement.
Charitable contributions
Associates must not allow Capital’s present or anticipated business to be a factor in soliciting political or charitable contributions from outside parties. In addition, it is generally not appropriate to solicit these outside parties or Capital associates for donations to a family-run non-profit organization, family foundation, donor-advised fund or other charitable organization in which an associate or their family members are significantly involved. Board membership alone would not be considered significant involvement.
Gifts and Entertainment Committee
The Gifts and Entertainment Committee oversees administration of the Policy. Questions regarding the Gifts and Entertainment Policy may be directed to the Code of Ethics Team.
Political Contributions Policy
Associates must be cautious when engaging in personal political activities, particularly when supporting officials, candidates, or organizations that may be in a position to influence decisions to award business to investment management firms. Associates should not make political contributions to officials or candidates (in any country) for the purpose of influencing the hiring of a Capital Group company as an advisor to a governmental entity. Associates are encouraged to contact the Code of Ethics Team with any questions about this policy.
Associates may not use Capital offices or equipment to engage in political fundraising or solicitation activity, for example, hosting a fundraising event at the office or using Capital phones or email systems to help solicit donations for an elected official, a candidate, Political Action Committee (PAC) or political party. Associates may volunteer their time on behalf of a candidate or political organization but should limit volunteer activities to non-work hours.
For contributions or activities supporting candidates or political organizations within the U.S., we have adopted the guidelines set forth below, which apply to associates classified as “Restricted Associates.”
Guidelines for political contributions and activities within the U.S.
U.S. Securities and Exchange Commission (SEC) regulations limit political contributions to certain Covered Government Officials by certain employees of investment advisory firms and certain affiliated companies. “Covered Government Official,” for purposes of the Political Contributions Policy, is defined as: (1) a state or local official; (2) a candidate for state or local office; or (3) a federal candidate currently holding state or local office.
Many U.S. cities and states have also adopted regulations restricting political contributions by associates of investment management firms seeking to provide services to a governmental entity. Some associates are also subject to these regulations.
Restricted Associates
Certain associates are deemed “Restricted Associates” under this Policy. Restricted Associates include (1) “covered associates” as defined in the SEC’s rule relating to political contributions by investment advisers (Rule 206(4)-5 under the Investment Advisors Act of 1940); and (2) other associates who do not meet that definition but whom Capital has determined should be subject to the restrictions on political contributions contained in the Policy based on their roles and responsibilities at Capital. Contributions by Restricted Associates and their spouse/spouse equivalent are subject to specific limitations, preclearance, and reporting requirements as described below.
Preclearance of political contributions
Contributions by Restricted Associates to any of the following must be precleared:
| | − | State or local officials, or candidates for state or local office |
| | − | Federal candidate campaigns and affiliated committees, including federal incumbents and presidential candidates |
| | − | Political organizations such as Political Action Committees (PACs), Super PACs and 527 organizations and ballot measure committees |
| | − | Non-profit organizations that may engage in political activities, such as 501(c)(4) and 501(c)(6) organizations |
Restricted Associates must also preclear U.S. political contributions by their spouse/spouse equivalent to any of the foregoing, as well as contributions to any state, local or federal political party or political party committee, if the aggregate contributions by the Restricted Associate and spouse/spouse equivalent to any one candidate or political entity equals or exceeds $100,000 in a calendar year.
Certain documentation is required for contributions to Covered Governmental Officials, PACs or Super PACs, and may be required for contributions to other entities that engage in political activity. See “Required documentation” below for further details. To preclear a contribution, please contact the Code of Ethics Team.
Contributions include:
| | − | Monetary contributions, gifts or loans |
| | − | “In kind” contributions (for example, donations of goods or services or underwriting or hosting fundraisers) |
| | − | Contributions to help pay a debt incurred in connection with an election (including transition or inaugural expenses, and purchasing tickets to inaugural events) |
| | − | Contributions to joint fund-raising committees |
| | − | Contributions made by a Political Action Committee (PAC) controlled by a Restricted Associate[1] |
[1] “Control” for this purpose includes service as an officer or member of the board (or other governing body) of a PAC.
Required documentation
Restricted Associates must obtain additional documentation from an independent legal authority before they will be approved to contribute to Covered Government Officials. The purpose of the legal documentation is to verify that a specific state or local office does not have the ability to directly or indirectly influence the awarding of business to an investment manager. For contributions to PACs, Super PACs, or other entities that engage in political activities, Restricted Associates may be required to obtain a certification that the entity does not contribute to Covered Government Officials. The Code of Ethics Team will provide language for the documentation when you preclear the contribution.
If a candidate currently holds a state/local office and is running for a different state/local office, legal documentation must be obtained for both the current position and the office for which the candidate is running. Exceptions to the documentation requirements may be granted on a case-by-case basis.
Special political contribution requirements – CollegeAmerica and ABLEAmerica
Certain associates involved with “CollegeAmerica,” the American Funds 529 college savings plan and “ABLEAmerica,” the American Funds nationwide plan for individuals with disabilities, sponsored by the Commonwealth of Virginia, are subject to additional restrictions which prohibit them from contributing to Virginia political candidates or parties.
Administration of the Political Contributions Policy
The U.S. Public Policy Coordinating Group oversees the administration of this Policy, including considering and granting possible exceptions. Questions regarding the Political Contributions Policy may be directed to the Code of Ethics Team.
Insider Trading Policy
Antifraud provisions of U.S. securities laws as well as the laws of other countries generally prohibit persons in possession of material non-public information from trading on or communicating the information to others. Sanctions for violations can include civil injunctions, permanent bars from the securities industry, civil penalties up to three times the profits made or losses avoided, criminal fines and jail sentences. In addition, trading in fund shares while in possession of material, non-public information that may have an immediate impact on the value of the fund’s shares may constitute insider trading.
While investment research analysts are most likely to come in contact with material non-public information, the rules (and sanctions) in this area apply to all Capital associates and extend to activities both within and outside each associate's duties. Associates who believe they have material non-public information should contact any lawyer in the organization.
Personal Investing Policy
This policy applies only to “Covered Associates.” Special rules apply to certain associates in some non-U.S. offices.
The Personal Investing Policy (Policy) sets forth specific rules regarding personal investments that apply to "covered" associates. These associates may have access to confidential information that places them in a position of special trust. Under the Code of Ethics, associates are responsible for maintaining the highest ethical standards. Associates are reminded that the requirements of the Code of Ethics apply to personal investing activities, even if the matter is not covered by a specific provision of the Policy.
Personal investing should be viewed as a privilege, not a right. As such, the Personal Investing Committee may place limitations on the number of preclearance requests and/or transactions associates make.
Covered Associates
“Covered Associates” are associates with access to non-public information relating to current or imminent fund/client transactions, investment recommendations or fund portfolio holdings.
The Policy applies to the personal investments of Covered Associates, as well as those of any immediate family member residing in their household – for example, spouse or a person with whom they have a committed relationship, children, siblings and parents – including adoptive, step and in-law relationships.
Questions regarding coverage status should be directed to the Code of Ethics Team.
Additional rules apply to Investment Professionals
“Investment Professionals” include portfolio managers, research directors, investment counselors, investment analysts and research associates, investment group administrative assistants, trading associates, and global investment control associates, including assistants. See “Additional policies for Investment Professionals and CIKK associates” below for more details.
Prohibited transactions
The following transactions are prohibited:
| | − | Initial Public Offering (IPO) investments (this prohibition applies to all Capital associates) |
Note: Exceptions are rarely granted; however, they will be considered on a case-by-case basis (for example, where a family member is employed by the IPO company and IPO shares are considered part of that family member’s compensation).
| | − | Initial Coin Offering (ICO) investments (this prohibition applies to all Capital associates) |
| | − | Excessive trading of Capital-affiliated funds |
| | − | Spread betting/contracts for difference (CFD) on securities |
| | − | Transactions in derivatives on securities and financial contracts, such as options, futures and forwards contracts, with limited exceptions described below |
| | − | Short selling of securities – including short selling “against the box,” with limited exceptions described below |
| | − | Transactions in inverse or inverse/long ETFs, with limited exceptions described below |
| | − | Interest rate swaps (IRS), with limited exceptions described below |
Exceptions:
| | − | Derivatives, financial contracts, short selling and investments in inverse or inverse/long ETF transactions are permitted only if they are based on non-reportable instruments (such as currencies and commodities) or if they are based on the S&P 500, Russell 2000 or MSCI EAFE indices |
| | − | Interest rate swaps are permitted if based on currencies and government bonds of the G7 |
Reporting requirements
Covered Associates are required to report any securities accounts, holdings and transactions: (1) in which the Covered Associate or any immediate family member residing in their household has a pecuniary interest (in other words, the ability to obtain an economic benefit or otherwise profit from a security) or (2) over which the Covered Associate or any immediate family member residing in their household exercises investment discretion or has direct or indirect influence or control. Quarterly and annual certifications of accounts, holdings and transactions must also be submitted. An electronic reporting platform is available for these disclosures.
Examples of accounts that must be disclosed include: (1) trusts if the Covered Associate or family member are the grantor or serve as trustee or custodian or have the ability to appoint or remove the trustee, (2) trusts that you or a family member have the power to revoke, (3) trusts for which you or a family member are a beneficiary and exercise investment discretion or have direct or indirect influence or control, and (4) accounts of another person or entity if the Covered Associate or family member makes or influences investment decisions, such as by suggesting purchases and sales of securities in the account. The obligation to disclose accounts includes professionally managed accounts. Please see “Professionally managed accounts” in the Personal Investing Policy for more information.
Covered Associates should immediately notify the Code of Ethics Team when opening new securities accounts; associates may also disclose accounts by logging into Protegent PTA and entering the account information directly.
All Covered Associates and immediate family members residing in their household must use an approved electronic reporting firm for all U.S.-based brokerage accounts. There are some exceptions to this requirement which include professionally managed accounts, employer-sponsored retirement accounts, and employee stock purchase plans. Contact the Code of Ethics Team with questions.
Duplicate statements and trade confirmations (or approved equivalent documentation) are required for accounts holding securities subject to preclearance and/or reporting and due no later than 30 days after the documents’ issuance date. This requirement includes employer-sponsored retirement accounts and employee stock purchase plans (ESPP, ESOP, 401(k)). Documentation allowing the acquisition of shares via an employer-sponsored plan may be required.
Preclearance procedures
Certain transactions may be exempt from preclearance; please refer to the Personal Investing Policy for more details.
Before any purchase or sale of securities subject to preclearance, including securities that are not publicly traded, Covered Associates must receive approval from the Code of Ethics Team. This requirement applies to any purchase or sale of securities in which the Covered Associate or any immediate family member residing in the same household (1) has, or by reason of such transaction may acquire, pecuniary interest (in other words, the ability to obtain an economic benefit or otherwise profit from a security), or (2) exercises investment discretion or direct or indirect influence or control. Transactions in an approved professionally managed account are not subject to preclearance, except for private investments or other limited offerings which require preclearance and reporting. Please refer to the Personal Investing Policy for more details on preclearable securities.
Submitting preclearance requests
Submit preclearance requests directly in Protegent. Click on the PreClear button on the Dashboard and enter the request details.
Requests are reviewed during New York Stock Exchange (NYSE) hours. A response will generally be sent within one business day.
Unless a different period is specified, clearance is good until the close of the NYSE on the day of the request.
If the precleared trade has not been executed within the cleared timeframe, preclearance must be requested again. For this reason, limit orders and margin accounts are strongly discouraged.
Private investments or other limited offerings
Participation in private investments or other limited offerings are subject to special review. The following types of private investments must be precleared:
| | − | Limited Liability Companies (LLCs) |
| | − | Limited Partnerships (LPs) |
| | − | Private real estate investment companies |
In addition, opportunities to acquire a stock that is "limited" (that is, a broker-dealer is only given a certain number of shares to sell and is offering the opportunity to buy) may be subject to the Gifts and Entertainment Policy.
Preclearance procedures for private investments
Complete the Private Investment Preclear Form and return it to the Code of Ethics Team for review. Pre-approval is also required for additional investments in the same vehicle and a new form must be completed.
Additional policies for Investment Professionals and CIKK associates
Report cross-holdings for certain Investment Professionals
Portfolio managers, research directors and investment analysts are required to report issuers owned personally by you or an immediate family member residing in your household that you also own professionally, on a quarterly basis. If you are a research director or an investment analyst, you are also required to report issuers owned personally by you or an immediate family member residing in your household that are within your research responsibilities. This reporting must be made to the Code of Ethics Team and may be reviewed by various Capital committees.
When recommending a security for purchase or sale in a fund or client account that you or a family member residing in your household own personally, you should first disclose such personal ownership either in writing (in a company write-up) or verbally (when discussing the company at investment meetings) prior to making a recommendation. This disclosure requirement is consistent with both the CFA Institute standards as well as the ICI Advisory Group Guidelines.
Ban on short-term trading
Investment Professionals and CIKK associates are prohibited from engaging in short-term trading of reportable securities and economically equivalent instruments.
Associates and their family members may not buy and then sell or sell and then buy the same security and/or economically equivalent instruments:
| | − | Within 60 -calendar days for Investment Professionals |
| | − | Within 6 months for CIKK associates |
Economically equivalent instruments include derivatives or other securities or instruments with a value derived from the value of the subject security. Additionally, they may not enter into an option or other derivative instrument that expires within 60 days from purchase.
Investment Professionals and CIKK associates should contact the Code of Ethics Team before transacting if they have any questions about the application of this rule to transactions in derivatives.
Failure to comply with this requirement may result in remedial action, including disgorgement of the profits.
Blackout periods
Investment Professionals may not buy or sell a security during the seven calendar days after Capital has transacted in that security’s issuer for a fund or client account. If you are affiliated with an investment group, the blackout period applies to trades in the same investment group with which you are affiliated.
If Capital transacts in securities of the same issuer within seven calendar days after you transact, your personal transaction may be reviewed to determine the appropriate action, if any. For example, if you received a better price than the fund or client accounts, you may be subject to a price adjustment, and may be asked to donate to a charitable organization. This blackout period helps mitigate the appearance of front running.
Penalties for violating the Personal Investing Policy
Covered Associates may be subject to penalties for violating the Personal Investing Policy, such as restrictions on personal trading, disgorgement of profits, and other disciplinary action, up to and including termination. In addition, information about particular transactions may be provided to an associate’s manager, appropriate Human Resources manager and/or a Chief Compliance Officer (CCO) by the Code of Ethics Team if the transactions are in violation of this Policy. These violations may raise conflict of interest-related issues or impact the associate’s performance review.
Violations to the Policy include failing to preclear or report securities transactions, failing to report securities accounts or submit statements, and failing to submit timely initial, quarterly and annual certifications.
Personal Investing Committee
The Personal Investing Committee oversees the administration of the Policy. Among other duties, the Committee considers certain types of preclearance requests as well as requests for exceptions to the Policy.
Questions regarding the Personal Investing Policy may be directed to the Code of Ethics Team.
* * * * *
[Logo – American Funds®]
The following is representative of the Code of Ethics in effect for each Fund:
CODE OF ETHICS
With respect to non-affiliated Board members and all other access persons to the extent that they are not covered by The Capital Group Companies, Inc. policies:
| | · | No Board member shall so use his or her position or knowledge gained therefrom as to create a conflict between his or her personal interest and that of the Fund. |
| | · | No Board member shall engage in excessive trading of shares of the fund or any other affiliated fund to take advantage of short-term market movements. |
| | · | Each non-affiliated Board member shall report to the Secretary of the Fund not later than thirty (30) days after the end of each calendar quarter any transaction in securities which such Board member has effected during the quarter which the Board member then knows to have been effected within fifteen (15) days before or after a date on which the Fund purchased or sold, or considered the purchase or sale of, the same security. |
| | · | For purposes of this Code of Ethics, transactions involving United States Government securities as defined in the Investment Company Act of 1940, bankers’ acceptances, bank certificates of deposit, commercial paper, or shares of registered open-end investment companies are exempt from reporting as are non-volitional transactions such as dividend reinvestment programs and transactions over which the Board member exercises no control. |
* * * *
In addition, the Fund has adopted the following standards in accordance with the requirements of Form N-CSR adopted by the Securities and Exchange Commission pursuant to Section 406 of the Sarbanes-Oxley Act of 2002 for the purpose of deterring wrongdoing and promoting: 1) honest and ethical conduct, including handling of actual or apparent conflicts of interest between personal and professional relationships; 2) full, fair, accurate, timely and understandable disclosure in reports and documents that a fund files with or submits to the Commission and in other public communications made by the fund; 3) compliance with applicable governmental laws, rules and regulations; 4) the prompt internal reporting of violations of the Code of Ethics to an appropriate person or persons identified in the Code of Ethics; and 5) accountability for adherence to the Code of Ethics. These provisions shall apply to the principal executive officer or chief executive officer and treasurer (“Covered Officers”) of the Fund.
| | 1. | It is the responsibility of Covered Officers to foster, by their words and actions, a corporate culture that encourages honest and ethical conduct, including the ethical resolution of, and appropriate disclosure of conflicts of interest. Covered Officers should work to assure a working environment that is characterized by respect for law and compliance with applicable rules and regulations. |
| | 2. | Each Covered Officer must act in an honest and ethical manner while conducting the affairs of the Fund, including the ethical handling of actual or apparent conflicts of interest between personal and professional relationships. Duties of Covered Officers include: |
| | · | Adhering to a high standard of business ethics; and |
| | · | Not using personal influence or personal relationships to improperly influence investment decisions or financial reporting whereby the Covered Officer would benefit personally to the detriment of the Fund. |
| | 3. | Each Covered Officer should act to promote full, fair, accurate, timely and understandable disclosure in reports and documents that the Fund files with or submits to, the Securities and Exchange Commission and in other public communications made by the Fund. |
| | · | Covered Officers should familiarize themselves with disclosure requirements applicable to the Fund and disclosure controls and procedures in place to meet these requirements; and |
| | · | Covered Officers must not knowingly misrepresent, or cause others to misrepresent facts about the Fund to others, including the Fund’s auditors, independent directors, governmental regulators and self-regulatory organizations. |
| | 4. | Any existing or potential violations of this Code of Ethics should be reported to The Capital Group Companies’ Personal Investing Committee. The Personal Investing Committee is authorized to investigate any such violations and report their findings to the Chairman of the Audit Committee of the Fund. The Chairman of the Audit Committee may report violations of the Code of Ethics to the Board or other appropriate entity including the Audit Committee, if he or she believes such a reporting is appropriate. The Personal Investing Committee may also determine the appropriate sanction for any violations of this Code of Ethics, including removal from office, provided that removal from office shall only be carried out with the approval of the Board. |
| | 5. | Application of this Code of Ethics is the responsibility of the Personal Investing Committee, which shall report periodically to the Chairman of the Audit Committee of the Fund. |
| | 6. | Material amendments to these provisions must be ratified by a majority vote of the Board. As required by applicable rules, substantive amendments to the Code of Ethics must be filed or appropriately disclosed. |