UNITED STATES
SECURITIES AND EXCHANGE COMMISSION
Washington, D.C. 20549
FORM N-CSR
Certified Shareholder Report of
Registered Management Investment Companies
Investment Company Act File Number: 811-02444
The Bond Fund of America
(Exact Name of Registrant as Specified in Charter)
333 South Hope Street, 55th Floor
Los Angeles, California 90071
(Address of Principal Executive Offices)
Registrant's telephone number, including area code: (949) 975-5000
Date of fiscal year end: December 31
Date of reporting period: December 31, 2023
Becky L. Park
The Bond Fund of America
6455 Irvine Center Drive
Irvine, California 92618
(Name and Address of Agent for Service)
ITEM 1 – Reports to Stockholders
The Bond Fund of America® Annual report
for the year ended
December 31, 2023 |  |

Invest with a stable,
long-term approach
The Securities and Exchange Commission has adopted new regulations that will change the content and design of annual and semi-annual shareholder reports beginning in July 2024. Certain types of information, including investment portfolio and financial statements, will not be included in the shareholder reports but will be available online, delivered free of charge upon request, and filed on a semi-annual basis on Form N-CSR.
If you would like to receive shareholder reports and other communications from the fund electronically, you may update your mailing preferences with your financial intermediary or enroll in e-delivery at capitalgroup.com (for accounts held directly with the fund).
The Bond Fund of America seeks as high a level of current income as is consistent with the preservation of capital.
This fund is one of more than 40 offered by Capital Group, home of American Funds, one of the nation’s largest mutual fund families. For over 90 years, Capital Group has invested with a long-term focus based on thorough research and attention to risk.
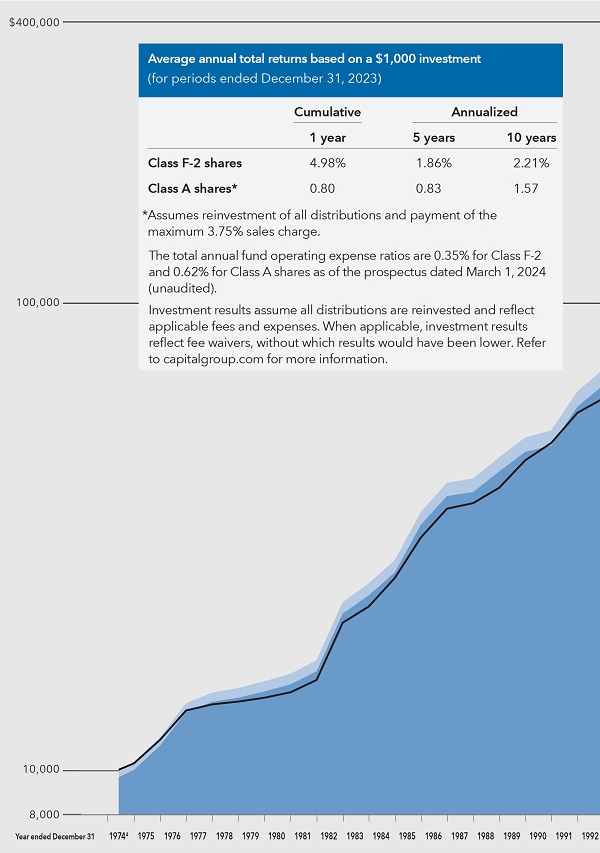
Fund results shown in this report, unless otherwise indicated, are for Class F-2 shares. Class A share results are shown at net asset value unless otherwise indicated. If a sales charge (maximum 3.75%) had been deducted, the results would have been lower. Results are for past periods and are not predictive of results for future periods. Current and future results may be lower or higher than those shown. Share prices and returns will vary, so investors may lose money. Investing for short periods makes losses more likely. For current information and month-end results, refer to capitalgroup.com.
Refer to page 4 for Class F-2 and Class A share results with relevant sales charges deducted. For other share class results, refer to capitalgroup.com and americanfundsretirement.com.
Investment results assume all distributions are reinvested and reflect applicable fees and expenses. When applicable, investment results reflect fee waivers, without which results would have been lower. Refer to capitalgroup.com for more information.
The fund’s 30-day yield as of December 31, 2023, was 4.61% for Class F-2 shares and 4.18% for Class A shares calculated in accordance with the U.S. Securities and Exchange Commission formula. The fund’s distribution rate as of that date was 3.84% for Class F-2 shares and 3.44% for Class A shares. The Class A share results for both reflect the 3.75% maximum sales charge. The SEC yield reflects the rate at which the fund is earning income on its current portfolio of securities while the distribution rate reflects the fund’s past dividends paid to shareholders. Accordingly, the fund’s SEC yield and distribution rate may differ.
The return of principal for bond funds and for funds with significant underlying bond holdings is not guaranteed. Fund shares are subject to the same interest rate, inflation and credit risks associated with the underlying bond holdings. High-yield bonds are subject to greater fluctuations in value and risk of loss of income and principal than investment-grade bonds. Investing in bonds issued outside the U.S. may be subject to additional risks. They include currency fluctuations, political and social instability, differing securities regulations and accounting standards, higher transaction costs, possible changes in taxation, illiquidity and price volatility. These risks may be heightened in connection with investments in developing countries. Refer to the fund prospectus and the Risk Factors section of this report for more information on these and other risks associated with investing in the fund.
Investments are not FDIC-insured, nor are they deposits of or guaranteed by a bank or any other entity, so they may lose value.
Contents
Fellow investors:
Slowing inflation and moderating economic growth led the U.S. Federal Reserve (the Fed) to soften its stance, marking a potential end to a hiking cycle that began in March 2022. Bond markets experienced a year-end rally, providing relief to investors after one of the most aggressive rate-hiking campaigns in decades. For the 12-month period ended December 31, The Bond Fund of America returned 4.98% for class F-2 shares.
By way of comparison, the Bloomberg U.S. Aggregate Index, a measure of the broader investment-grade (BBB/Baa and above) bond market, returned 5.53%. The fund’s peer group, as measured by the Lipper Core Bond Funds Average, returned 5.84%.
The fund paid dividends totaling just over 44 cents per share during the period. For investors, this amounted to an income return of 3.94% with dividends reinvested, or 3.87% if taken in cash.
Bond market overview
Last year was characterized by intense volatility as the market seesawed in response to murky readings on the path of inflation, Fed policy changes and the health of the U.S. economy. Early in the year, many investors hoped that declining inflation could pave the way for a more accommodative Fed. Markets were also on watch for a potential recession and signs of strain from higher interest rates. In March, those fears appeared to manifest with the collapse of several banks. Yields plunged on fears of a broader downturn, but the fallout was brief as regulators moved swiftly to seize failed lenders and limit contagion and panic.
A downturn did not materialize, and instead the U.S. economy came surging back with GDP growth reaching nearly 5% annualized in the third quarter. “Surprisingly resilient” was a phrase that came to characterize everything from the state of the labor market to consumer spending and the U.S. economy at large. Against this backdrop, the Fed raised the federal funds rate a full percentage point over the year, bringing the policy target range to a nearly 22-year high of 5.25%–5.5%. The Fed implemented what may be its final rate hike of the cycle in July, but volatility remained high. In September, the Fed slashed its projections for future rate cuts, and a narrative of “higher for longer” came to dominate markets.
Results at a glance
For periods ended December 31, 2023, with all distributions reinvested
| | | Cumulative
total returns | | Average annual total returns |
| | | 1 year | | 5 years | | 10 years | | Lifetime
(since class A
inception on
5/28/74) |
| | | | | | | | | |
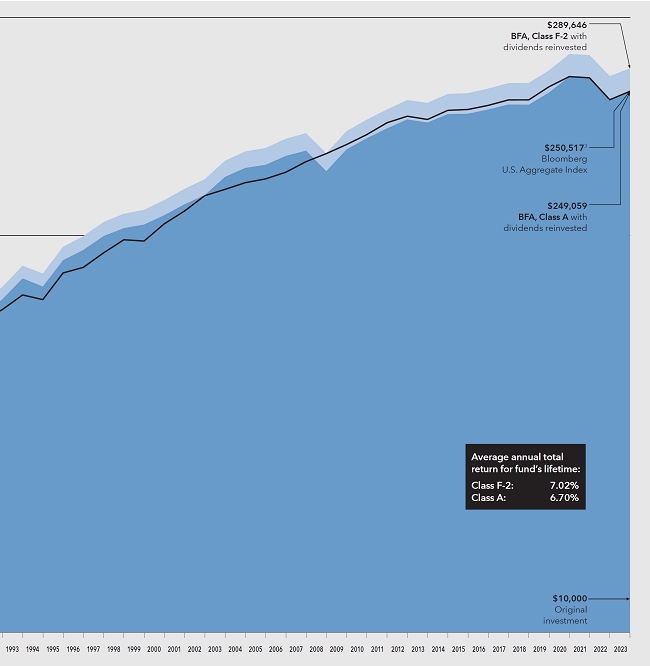
| The Bond Fund of America (Class F-2 shares)1 | | | 4.98 | % | | | 1.86 | % | | | 2.21 | % | | | 7.02 | % |
| The Bond Fund of America (Class A shares) | | | 4.70 | | | | 1.61 | | | | 1.95 | | | | 6.78 | |
| Bloomberg U.S. Aggregate Index2 | | | 5.53 | | | | 1.10 | | | | 1.81 | | | | 6.71 | |
| Lipper Core Bond Funds Average3 | | | 5.84 | | | | 1.24 | | | | 1.73 | | | | 6.57 | |
| Past results are not predictive of results in future periods. |
| | |
| 1 | Class F-2 shares were first offered on August 1, 2008. Class F-2 share results prior to the date of first sale are hypothetical based on the results of the original share class of the fund without a sales charge, adjusted for typical estimated expenses. Refer to capitalgroup.com for more information on specific expense adjustments and the actual dates of first sale. |
| 2 | Bloomberg Index Services Limited. The Bloomberg U.S. Aggregate Index began on January 1, 1976. From May 28, 1974, through December 31, 1975, the Barclays U.S. Government/Credit Index (now called “the Bloomberg U.S. Government/Credit Index”) was used. The indexes are unmanaged and, therefore, have no expenses. Investors cannot invest directly in an index. Bloomberg U.S. Aggregate Index represents the U.S. investment-grade fixed-rate bond market. |
| 3 | Source: Refinitiv Lipper. Results for the Lipper averages do not reflect sales charges. Lipper averages reflect the current composition of all eligible mutual funds (all share classes) within a given category. To review the number of funds included in the Lipper category for each fund’s lifetime, please review the Quarterly Statistical Update, available on our website. |
| The Bond Fund of America | 1 |
Inflation, which peaked at 9.1% in June 2022 and started the year at 6.4%, dropped to 3.4% by December — shifting closer to the Fed’s 2% target. By December, the Fed appeared to have reversed course on its restrictive rhetoric and provided its clearest indication yet that it was done hiking rates. The move caught the market by surprise and accelerated a building rally that drove down yields further and lifted bond returns. The 10-year U.S. Treasury yield finished 2023 at 3.88%, exactly where it started the year and down from an October high of near 5%.
The shape of the Treasury yield curve has been inverted — meaning shorter term bond yields are higher than longer term bond yields — since 2022. Two-year U.S. Treasuries ended the year at 4.25%, down from 4.43% at its start and after an October high of 5.22%. The relatively larger year-over-year decline in these shorter term Treasury yields versus 10-year Treasury yields led this part of the curve to steepen, meaning it became less inverted.
The annual return for the Bloomberg U.S. Aggregate Index1 (the “benchmark”) reached 5.53%, a stark reversal from a loss of 13.01% in 2022. The Bloomberg Global Aggregate Index2 recorded a 5.72% return in 2023.
As economic growth surprised to the upside, the Bloomberg U.S. Corporate Investment Grade Index3 gained 8.52%, with its risk premium relative to Treasuries (or “spread”) tightening 31 basis points. High-yield corporates did even better, with the Bloomberg U.S. Corporate High Yield Index4 returning 13.44% as spreads tightened by 146 basis points. Emerging markets debt also experienced double-digit returns, with the JPM EMBI Global Diversified Index5 gaining 11.09%.
The Bloomberg U.S. Mortgage Backed Securities Index6 posted a gain of 5.05%, with the sector bouncing back in the fourth quarter after being hampered by heightened interest rate volatility. The Bloomberg Municipal Bond Index7 posted higher gains than some of the taxable debt market, rising 6.40%. With inflation falling, the Bloomberg U.S. Treasury Inflation-Protected Securities Index8 posted a weaker relative return of 3.90%.
Inside the portfolio
Managers remained agile in response to changing market conditions, with the macro backdrop switching course a surprising number of times throughout the year. Through our gradual contrarian approach, we sought to be opportunistic in adding exposure when markets were favorable and to be disciplined sellers when valuations moved higher. We remained focused on building a highly liquid, conservative and higher quality portfolio that maintained a balanced profile across different risk factors.
In a year where the economy surprised to the upside, the portfolio experienced relative gains from both sector and security selection in asset classes ranging from securitized to corporate bonds and emerging markets debt. The fund moved from holding less exposure to agency mortgage-backed securities (MBS) than the benchmark to holding more exposure, increasing exposure by about 14 percentage points during the year. Managers had been adding exposure through much of the year but shifted to higher exposure relative to the benchmark in May after the sector was battered by the earlier banking industry turmoil. The decision helped the portfolio as the sector rallied significantly later in the year. The portfolio favored senior tranches of securitized credit such as asset-backed securities, holding more than the index through the year. That led to relative gains, as did security selection within the sector.
In corporate bonds, managers held modestly higher exposure relative to the index, which benefited the portfolio as corporate bonds rallied strongly in 2023. While managers moderated exposures as the rally continued and valuations became less compelling, security selection within corporate bonds such as a preference for high-quality industrials and financials —especially select money center banks — also contributed. Further down the credit spectrum, the portfolio benefited from some holdings that were upgraded from high yield to investment grade, which boosted returns alongside a broader credit rally. Managers are hopeful that more of the fund’s lower rated issuers, where it has modest exposure, will follow suit in the coming year.
The portfolio’s interest rate exposure collectively detracted, including yield curve positioning and duration (a measure of a portfolio’s sensitivity to interest rates changing). We maintained a steepening bias — favoring the shorter maturities of the yield curve against longer maturities —for much of the year. The yield curve did eventually steepen modestly over the course of the year, but not enough to overcome the negative income drag associated with the position. Duration positioning, particularly having a greater interest rate sensitivity than the benchmark at times through the year, was a detractor to results relative to the benchmark.
The fund’s interest rate strategies utilized interest rate swaps and futures to more efficiently execute the portfolio’s positioning based on how managers expected yields to move. These had mixed impacts on results, but ultimately helped to express managers’ convictions more efficiently.
Looking ahead
The market experienced elevated volatility in 2023, but two broad themes remained in place — slowing economic growth and decelerating inflation. Managers expect both themes to continue through 2024.
Managers expect that inflation will continue to decelerate this year, as a broader set of categories within inflation measures like the Consumer Price Index9 are experiencing slower price growth. The prices of material goods are trending toward deflation while those of services, where inflation has been more stubborn, are beginning to moderate. Though the path to lower overall inflation may be bumpy, we believe both headline and core inflation could fall within striking distance of the Fed’s 2% target rate by the second half of this year. Of course, there are risks that inflation could reaccelerate, but managers view that as an unlikely outcome. Several components of inflation, such as rents, work with long lags, which
| 2 | The Bond Fund of America |
means we have yet to see their potential disinflationary impact.
If inflation continues its downward trend, managers believe the Fed will lower its policy rate by the middle of 2024, if not sooner. Should the economy stay on its present course, managers anticipate that the Fed will need to cut rates simply to maintain the current restrictive stance of policy as inflation slows, and then cut even more to shift policy away from one that seeks to dampen economic growth toward one that is neither restrictive nor stimulative. And if the economy loses momentum or falls into a recession, the Fed may choose to cut rates even further. On balance, managers see potential for economic growth to moderate to a 1–2% range.
The combination of slow, but positive, economic growth and easing monetary policy could lead to positive outcomes for both interest rate and credit exposures. This may be magnified by favorable market dynamics as managers expect significant allocations to core bond funds in 2024 as investors look to lock in yields that are at the higher end of the last 20-year range, ahead of expected Fed cuts.
While the likelihood of recession may have diminished for now, managers are mindful that downside risks remain prevalent, as slowing growth, softening labor markets, rising geopolitical tensions and the 2024 presidential election all have the potential to impact markets. Managers have a higher exposure relative to the benchmark on the shorter end of the rate curve, from the two-year to seven-year portion, which should benefit from expected Fed cuts in 2024. Managers have a lower exposure relative to the benchmark on the long end of the curve, from the 10-year to 30-year portion, which is less likely to benefit from rate cuts and could be negatively affected by elevated U.S. Treasury issuance to fund sustained high government deficits. Managers believe investors will be rewarded for taking greater interest rate exposure by the end of the year, but also expect market volatility could create opportunities to profit from shorter term duration positioning.
As valuations for risky assets like corporate bonds continue to move higher, managers will continue to harvest gains where possible. The room for upside given valuations in corporate bonds is becoming limited, but we are leaning into security selection to unearth compelling opportunities.
Managers see greater value in agency MBS, which didn’t gain as much during the recent rally and may have room for valuations to rise further. They feature a high-quality profile and minimal credit risk, which we believe makes them an attractive option relative to other sectors. Agency MBS may also disproportionately benefit if interest rate volatility falls as inflation moves closer to the Fed’s target and the Fed’s cutting cycle begins.
Select opportunities in high-quality securitized credit also look compelling given robust yields and valuations in that sector. Overall, managers expect that research-driven security selection across sectors can be an important contributor to results over the course of the year.
Following last year’s market reset, managers are responding with a more conservative, higher quality and balanced approach to the new landscape. We believe this stance boosts our role as a diversifier and a high-quality ballast in portfolios. While the bond market experienced an extremely difficult period as rates rose, we are optimistic that higher rates may now serve as a tailwind for investors. Relatively high starting yields and the potential for price appreciation as rates fall has brightened the outlook for core bonds in 2024. We see them continuing their vital role in pursuing attractive income and total returns while also diversifying investors’ portfolios.
This year we celebrate the 50th anniversary of The Bond Fund of America, and we are grateful for the support and trust of our investors and those who have been with us throughout our five-decade history.
Cordially,

Pramod Atluri
President
February 12, 2024
For current information about the fund, refer to capitalgroup.com.
The indexes are unmanaged, and their results include reinvested dividends and/or distributions but do not reflect the effect of sales charges, commissions, account fees,expenses or U.S. federal income taxes. There have been periods when the fund has lagged the index.
| 1 | Bloomberg U.S. Aggregate Index represents the U.S. investment-grade fixed-rate bond market. |
| 2 | Bloomberg Global Aggregate Index represents the global investment-grade fixed income markets. |
| 3 | Bloomberg U.S. Corporate Investment Grade Index represents the universe of investment-grade, publicly issued U.S. corporate and specified foreign debentures and secured notes that meet the specified maturity, liquidity, and quality requirements. |
| 4 | Bloomberg U.S. Corporate High Yield Index covers the universe of fixed-rate, non-investment-grade debt. |
| 5 | J.P. Morgan Emerging Market Bond Index (EMBI) Global Diversified is a uniquely weighted emerging market debt benchmark that tracks total returns for U.S. dollar-denominated bonds issued by emerging market sovereign and quasi-sovereign entities. |
| 6 | Bloomberg U.S. Mortgage Backed Securities Index is a market-value-weighted index that covers the mortgage-backed pass-through securities of Ginnie Mae (GNMA), Fannie Mae (FNMA), and Freddie Mac (FHLMC). |
| 7 | Bloomberg Municipal Bond Index is a market-value-weighted index designed to represent the long-term investment-grade tax-exempt bond market. |
| 8 | Bloomberg U.S. Treasury Inflation-Protected Securities (TIPS) Index consists of investment-grade, fixed-rate, publicly placed, dollar-denominated and non-convertible inflation-protected securities issued by the U.S. Treasury that have at least one year remaining to maturity, and have at least $250 million par amount outstanding. |
| 9 | Consumer Price Index (CPI) is a measure of the average change over time in the prices paid by urban consumers for a market basket of consumer goods and services. Widely used as a measure of inflation, the CPI is computed by the U.S. Department of Labor, Bureau of Labor Statistics. |
| The Bond Fund of America | 3 |
The value of a long-term perspective
Fund results shown are for Class F-2 and Class A shares. Class A share results reflect deduction of the maximum sales charge of 3.75% on the $10,000 investment.1 Thus, the net amount invested was $9,625.2 Results are for past periods and are not predictive of results for future periods. Current and future results may be lower or higher than those shown. Share prices and returns will vary, so investors may lose money. Investing for short periods makes losses more likely. For current information and month-end results, refer to capitalgroup.com.
The results shown are before taxes on fund distributions and sale of fund shares.
| 1 | As outlined in the prospectus, the sales charge is reduced for accounts (and aggregated investments) of $100,000 or more and is eliminated for purchases of $500,000 or more. There is no sales charge on dividends or capital gain distributions that are reinvested in additional shares. |
| 2 | The maximum initial sales charge was 8.5% prior to December 15, 1986, when it became 4.75% until January 9, 2000. |
| 3 | Source: Bloomberg Index Services Ltd. Bloomberg U.S. Aggregate Index represents the U.S. investment-grade fixed-rate bond market. From May 28, 1974, through December 31, 1975, Bloomberg U.S. Government/Credit Index was used because Bloomberg U.S. Aggregate Index did not yet exist. Since January 1, 1976, the Bloomberg U.S. Aggregate Index has been used. These indexes are unmanaged and, therefore, have no expenses. Investors cannot invest directly in an index. |
| 4 | For the period May 28, 1974, commencement of operations, through December 31, 1974. |
| 4 | The Bond Fund of America |
How a hypothetical $10,000 investment has grown
There have always been reasons not to invest. You will find, however, that despite occasional stumbles, financial markets have tended to reward investors over the long term. Dividends, particularly when reinvested, have accounted for a large portion of the fund’s overall results.
| The Bond Fund of America | 5 |
Investment portfolio December 31, 2023
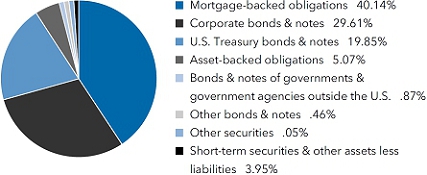
| Portfolio by type of security | Percent of net assets |
| Portfolio quality summary* | | Percent of
net assets |
| U.S. Treasury and agency† | | 19.88 | % |
| AAA/Aaa | | 43.23 | |
| AA/Aa | | 3.58 | |
| A/A | | 12.00 | |
| BBB/Baa | | 15.05 | |
| Below investment grade | | 2.26 | |
| Unrated | | .05 | |
| Short-term securities & other assets less liabilities | | 3.95 | |
| * | Bond ratings, which typically range from AAA/Aaa (highest) to D (lowest), are assigned by credit rating agencies such as Standard & Poor’s, Moody’s and/or Fitch as an indication of an issuer’s creditworthiness. In assigning a credit rating to a security, the fund looks specifically to the ratings assigned to the issuer of the security by Standard & Poor’s, Moody’s and/or Fitch. If agency ratings differ, the security will be considered to have received the highest of those ratings, consistent with the fund’s investment policies. Securities in the “unrated” category (above) have not been rated by a rating agency; however, the investment adviser performs its own credit analysis and assigns comparable ratings that are used for compliance with the fund’s investment policies. The ratings are not covered by the Report of Independent Registered Public Accounting Firm. |
| † | These securities are guaranteed by the full faith and credit of the U.S. government. |
| Bonds, notes & other debt instruments 96.00% | | Principal amount
(000) | | | Value
(000) | |
| Mortgage-backed obligations 40.14% | | | | | | | | |
| Federal agency mortgage-backed obligations 36.96% | | | | | | | | |
| Fannie Mae Pool #932119 4.50% 11/1/20241 | | USD | 101 | | | $ | 100 | |
| Fannie Mae Pool #AD3149 4.50% 4/1/20251 | | | 66 | | | | 65 | |
| Fannie Mae Pool #AD6392 4.50% 5/1/20251 | | | 134 | | | | 133 | |
| Fannie Mae Pool #AD5692 4.50% 5/1/20251 | | | 78 | | | | 78 | |
| Fannie Mae Pool #AB1068 4.50% 5/1/20251 | | | — | 2 | | | — | 2 |
| Fannie Mae Pool #303591 6.50% 11/1/20251 | | | — | 2 | | | — | 2 |
| Fannie Mae Pool #745316 6.50% 2/1/20261 | | | 7 | | | | 7 | |
| Fannie Mae Pool #AL1237 6.50% 2/1/20261 | | | 1 | | | | 2 | |
| Fannie Mae Pool #256449 6.50% 10/1/20261 | | | 11 | | | | 11 | |
| Fannie Mae Pool #MA2973 3.00% 4/1/20271 | | | 3 | | | | 3 | |
| Fannie Mae Pool #256821 6.50% 7/1/20271 | | | 1 | | | | 1 | |
| Fannie Mae Pool #256856 6.50% 8/1/20271 | | | 25 | | | | 26 | |
| Fannie Mae Pool #MA3131 3.00% 9/1/20271 | | | 31 | | | | 31 | |
| Fannie Mae Pool #256886 6.50% 9/1/20271 | | | 17 | | | | 18 | |
| Fannie Mae Pool #995401 6.50% 10/1/20271 | | | — | 2 | | | — | 2 |
| Fannie Mae Pool #257145 6.50% 3/1/20281 | | | 6 | | | | 7 | |
| Fannie Mae Pool #251752 6.50% 6/1/20281 | | | — | 2 | | | — | 2 |
| Fannie Mae Pool #257431 6.50% 10/1/20281 | | | 1 | | | | 1 | |
| Fannie Mae Pool #AL8822 6.50% 11/1/20281 | | | — | 2 | | | — | 2 |
| Fannie Mae Pool #496029 6.50% 1/1/20291 | | | — | 2 | | | — | 2 |
| Fannie Mae Pool #AY1948 3.50% 1/1/20301 | | | 177 | | | | 171 | |
| Fannie Mae Pool #AL9668 3.00% 10/1/20301 | | | 5 | | | | 4 | |
| Fannie Mae Pool #AZ0554 3.50% 10/1/20301 | | | 229 | | | | 221 | |
| Fannie Mae Pool #AL6344 5.00% 2/1/20311 | | | 140 | | | | 140 | |
| Fannie Mae Pool #FM9892 5.00% 9/1/20311 | | | 69 | | | | 68 | |
| Fannie Mae Pool #BJ4856 3.00% 2/1/20331 | | | 315 | | | | 300 | |
| Fannie Mae Pool #695412 5.00% 6/1/20331 | | | 4 | | | | 4 | |
| 6 | The Bond Fund of America |
| Bonds, notes & other debt instruments (continued) | | Principal amount
(000) | | | Value
(000) | |
| Mortgage-backed obligations (continued) | | | | | | | | |
| Federal agency mortgage-backed obligations (continued) | | | | | | | | |
| Fannie Mae Pool #MA3518 4.00% 11/1/20331 | | USD | 11 | | | $ | 11 | |
| Fannie Mae Pool #BO1359 2.50% 8/1/20341 | | | 1,380 | | | | 1,285 | |
| Fannie Mae Pool #AD3566 5.00% 10/1/20351 | | | 24 | | | | 25 | |
| Fannie Mae Pool #745140 5.00% 11/1/20351 | | | 149 | | | | 151 | |
| Fannie Mae Pool #MA2588 4.00% 4/1/20361 | | | 1,238 | | | | 1,211 | |
| Fannie Mae Pool #MA2717 4.00% 8/1/20361 | | | 257 | | | | 251 | |
| Fannie Mae Pool #MA2746 4.00% 9/1/20361 | | | 1,560 | | | | 1,525 | |
| Fannie Mae Pool #MA2787 4.00% 10/1/20361 | | | 873 | | | | 854 | |
| Fannie Mae Pool #AS8355 3.00% 11/1/20361 | | | 7,586 | | | | 7,069 | |
| Fannie Mae Pool #AS8554 3.00% 12/1/20361 | | | 775 | | | | 722 | |
| Fannie Mae Pool #MA2866 3.00% 1/1/20371 | | | 9,133 | | | | 8,510 | |
| Fannie Mae Pool #MA2897 3.00% 2/1/20371 | | | 16,069 | | | | 14,972 | |
| Fannie Mae Pool #913966 6.00% 2/1/20371 | | | 2 | | | | 2 | |
| Fannie Mae Pool #914612 7.50% 3/1/20371 | | | 52 | | | | 52 | |
| Fannie Mae Pool #924069 7.00% 5/1/20371 | | | 96 | | | | 96 | |
| Fannie Mae Pool #954927 7.00% 7/1/20371 | | | 93 | | | | 95 | |
| Fannie Mae Pool #966170 7.00% 7/1/20371 | | | 70 | | | | 72 | |
| Fannie Mae Pool #954936 7.00% 7/1/20371 | | | 36 | | | | 36 | |
| Fannie Mae Pool #945680 6.00% 9/1/20371 | | | 15 | | | | 16 | |
| Fannie Mae Pool #924866 4.765% 10/1/20371,3 | | | 5 | | | | 5 | |
| Fannie Mae Pool #988588 5.50% 8/1/20381 | | | 3 | | | | 3 | |
| Fannie Mae Pool #889982 5.50% 11/1/20381 | | | 15 | | | | 16 | |
| Fannie Mae Pool #MA3539 4.50% 12/1/20381 | | | 33 | | | | 33 | |
| Fannie Mae Pool #931768 5.00% 8/1/20391 | | | 37 | | | | 38 | |
| Fannie Mae Pool #AC2641 4.50% 10/1/20391 | | | 3,350 | | | | 3,347 | |
| Fannie Mae Pool #AC0794 5.00% 10/1/20391 | | | 26 | | | | 26 | |
| Fannie Mae Pool #932606 5.00% 2/1/20401 | | | 62 | | | | 63 | |
| Fannie Mae Pool #MA4093 2.00% 8/1/20401 | | | 6,350 | | | | 5,470 | |
| Fannie Mae Pool #AD8522 4.00% 8/1/20401 | | | 82 | | | | 80 | |
| Fannie Mae Pool #AB1297 5.00% 8/1/20401 | | | 264 | | | | 268 | |
| Fannie Mae Pool #AE1761 4.00% 9/1/20401 | | | 1,685 | | | | 1,644 | |
| Fannie Mae Pool #MA4152 2.00% 10/1/20401 | | | 7,139 | | | | 6,149 | |
| Fannie Mae Pool #AE5471 4.50% 10/1/20401 | | | 496 | | | | 495 | |
| Fannie Mae Pool #AE7567 4.00% 11/1/20401 | | | 1,769 | | | | 1,725 | |
| Fannie Mae Pool #AH0007 4.00% 12/1/20401 | | | 1,680 | | | | 1,638 | |
| Fannie Mae Pool #AH0539 4.00% 12/1/20401 | | | 424 | | | | 413 | |
| Fannie Mae Pool #AE8073 4.00% 12/1/20401 | | | 321 | | | | 313 | |
| Fannie Mae Pool #MA4287 2.00% 3/1/20411 | | | 82,154 | | | | 70,615 | |
| Fannie Mae Pool #AH6099 5.00% 3/1/20411 | | | 970 | | | | 985 | |
| Fannie Mae Pool #AH8144 5.00% 4/1/20411 | | | 31 | | | | 31 | |
| Fannie Mae Pool #AH9479 5.00% 4/1/20411 | | | 30 | | | | 30 | |
| Fannie Mae Pool #MA4333 2.00% 5/1/20411 | | | 67,145 | | | | 57,590 | |
| Fannie Mae Pool #AI1862 5.00% 5/1/20411 | | | 1,192 | | | | 1,210 | |
| Fannie Mae Pool #MA4364 2.00% 6/1/20411 | | | 117,028 | | | | 100,373 | |
| Fannie Mae Pool #AI3510 5.00% 6/1/20411 | | | 652 | | | | 662 | |
| Fannie Mae Pool #AE1248 5.00% 6/1/20411 | | | 43 | | | | 43 | |
| Fannie Mae Pool #MA4387 2.00% 7/1/20411 | | | 110,212 | | | | 94,458 | |
| Fannie Mae Pool #FM7690 2.00% 7/1/20411 | | | 32,136 | | | | 27,552 | |
| Fannie Mae Pool #BT5941 2.00% 7/1/20411 | | | 12,602 | | | | 10,804 | |
| Fannie Mae Pool #MA4407 2.00% 8/1/20411 | | | 240,546 | | | | 206,087 | |
| Fannie Mae Pool #FM8120 2.00% 8/1/20411 | | | 21,827 | | | | 18,782 | |
| Fannie Mae Pool #AI5172 4.00% 8/1/20411 | | | 400 | | | | 387 | |
| Fannie Mae Pool #AL0658 4.50% 8/1/20411 | | | 543 | | | | 542 | |
| Fannie Mae Pool #AJ0257 4.00% 9/1/20411 | | | 109 | | | | 107 | |
| Fannie Mae Pool #AJ0704 5.00% 9/1/20411 | | | 548 | | | | 557 | |
| Fannie Mae Pool #AJ1873 4.00% 10/1/20411 | | | 322 | | | | 314 | |
| Fannie Mae Pool #AJ4154 4.00% 11/1/20411 | | | 329 | | | | 320 | |
| Fannie Mae Pool #AJ5391 5.00% 11/1/20411 | | | 374 | | | | 380 | |
| Fannie Mae Pool #AE1277 5.00% 11/1/20411 | | | 107 | | | | 109 | |
| Fannie Mae Pool #MA4501 2.00% 12/1/20411 | | | 74,409 | | | | 63,633 | |
| Fannie Mae Pool #AB4050 4.00% 12/1/20411 | | | 622 | | | | 606 | |
| Fannie Mae Pool #AJ7471 4.00% 12/1/20411 | | | 392 | | | | 381 | |
| Fannie Mae Pool #AJ4189 4.00% 12/1/20411 | | | 371 | | | | 361 | |
| Fannie Mae Pool #AE1283 5.00% 12/1/20411 | | | 68 | | | | 69 | |
| Fannie Mae Pool #MA4540 2.00% 2/1/20421 | | | 31,839 | | | | 27,208 | |
| Fannie Mae Pool #890407 4.00% 2/1/20421 | | | 865 | | | | 842 | |
| Fannie Mae Pool #AE1290 5.00% 2/1/20421 | | | 133 | | | | 135 | |
| The Bond Fund of America | 7 |
| Bonds, notes & other debt instruments (continued) | | Principal amount
(000) | | | Value
(000) | |
| Mortgage-backed obligations (continued) | | | | | | | | |
| Federal agency mortgage-backed obligations (continued) | | | | | | | | |
| Fannie Mae Pool #MA4570 2.00% 3/1/20421 | | USD | 18,278 | | | $ | 15,614 | |
| Fannie Mae Pool #AK6740 4.00% 3/1/20421 | | | 3,212 | | | | 3,142 | |
| Fannie Mae Pool #AL2745 4.00% 3/1/20421 | | | 2,534 | | | | 2,467 | |
| Fannie Mae Pool #AK4949 4.00% 3/1/20421 | | | 187 | | | | 182 | |
| Fannie Mae Pool #MA4586 2.00% 4/1/20421 | | | 5,924 | | | | 5,061 | |
| Fannie Mae Pool #AX3703 4.00% 9/1/20421 | | | 3,696 | | | | 3,596 | |
| Fannie Mae Pool #AR1512 3.50% 1/1/20431 | | | 465 | | | | 440 | |
| Fannie Mae Pool #MA4908 6.00% 1/1/20431 | | | 56 | | | | 57 | |
| Fannie Mae Pool #AT0412 3.50% 3/1/20431 | | | 229 | | | | 215 | |
| Fannie Mae Pool #AT0300 3.50% 3/1/20431 | | | 63 | | | | 60 | |
| Fannie Mae Pool #AT3954 3.50% 4/1/20431 | | | 105 | | | | 100 | |
| Fannie Mae Pool #AT2683 4.00% 5/1/20431 | | | 1,517 | | | | 1,477 | |
| Fannie Mae Pool #AT5898 3.00% 6/1/20431 | | | 14,847 | | | | 13,653 | |
| Fannie Mae Pool #AL3829 3.50% 6/1/20431 | | | 2,158 | | | | 2,040 | |
| Fannie Mae Pool #AT7161 3.50% 6/1/20431 | | | 705 | | | | 664 | |
| Fannie Mae Pool #AV0786 4.00% 11/1/20431 | | | 2,787 | | | | 2,712 | |
| Fannie Mae Pool #AL8421 3.50% 1/1/20441 | | | 12,057 | | | | 11,387 | |
| Fannie Mae Pool #AX0817 4.00% 9/1/20441 | | | 187 | | | | 182 | |
| Fannie Mae Pool #AX8521 3.50% 12/1/20441 | | | 302 | | | | 285 | |
| Fannie Mae Pool #AY1829 3.50% 12/1/20441 | | | 100 | | | | 94 | |
| Fannie Mae Pool #BE5009 3.50% 1/1/20451 | | | 676 | | | | 632 | |
| Fannie Mae Pool #BE5017 3.50% 2/1/20451 | | | 1,195 | | | | 1,121 | |
| Fannie Mae Pool #FM9416 3.50% 7/1/20451 | | | 1,703 | | | | 1,590 | |
| Fannie Mae Pool #AZ7366 4.00% 11/1/20451 | | | 16,250 | | | | 15,678 | |
| Fannie Mae Pool #AS6348 4.00% 12/1/20451 | | | 2,866 | | | | 2,765 | |
| Fannie Mae Pool #AS6839 4.00% 3/1/20461 | | | 3,723 | | | | 3,588 | |
| Fannie Mae Pool #BC1352 4.00% 3/1/20461 | | | 1,083 | | | | 1,044 | |
| Fannie Mae Pool #AL8522 3.50% 5/1/20461 | | | 27 | | | | 26 | |
| Fannie Mae Pool #BC8647 4.50% 6/1/20461 | | | 259 | | | | 256 | |
| Fannie Mae Pool #BD1968 4.00% 7/1/20461 | | | 32 | | | | 31 | |
| Fannie Mae Pool #BD1550 4.50% 7/1/20461 | | | 245 | | | | 242 | |
| Fannie Mae Pool #BD7600 4.50% 9/1/20461 | | | 78 | | | | 77 | |
| Fannie Mae Pool #BD9236 3.50% 10/1/20461 | | | 319 | | | | 298 | |
| Fannie Mae Pool #BM5148 4.00% 10/1/20461 | | | 36,278 | | | | 34,899 | |
| Fannie Mae Pool #MA2809 4.50% 10/1/20461 | | | 614 | | | | 586 | |
| Fannie Mae Pool #MA2821 4.50% 10/1/20461 | | | 310 | | | | 298 | |
| Fannie Mae Pool #BD9248 4.50% 10/1/20461 | | | 225 | | | | 221 | |
| Fannie Mae Pool #AS8310 3.00% 11/1/20461 | | | 508 | | | | 465 | |
| Fannie Mae Pool #MA2833 3.00% 12/1/20461 | | | 35 | | | | 32 | |
| Fannie Mae Pool #BC9077 3.50% 12/1/20461 | | | 15,278 | | | | 14,264 | |
| Fannie Mae Pool #BD2440 3.50% 1/1/20471 | | | 1,671 | | | | 1,560 | |
| Fannie Mae Pool #BD7087 4.00% 3/1/20471 | | | 34,190 | | | | 32,986 | |
| Fannie Mae Pool #BM1179 3.00% 4/1/20471 | | | 600 | | | | 546 | |
| Fannie Mae Pool #BH0876 4.50% 4/1/20471 | | | 2,439 | | | | 2,414 | |
| Fannie Mae Pool #MA3002 4.50% 4/1/20471 | | | 431 | | | | 411 | |
| Fannie Mae Pool #BE8740 3.50% 5/1/20471 | | | 986 | | | | 925 | |
| Fannie Mae Pool #BE8742 3.50% 5/1/20471 | | | 324 | | | | 305 | |
| Fannie Mae Pool #BH2846 3.50% 5/1/20471 | | | 150 | | | | 141 | |
| Fannie Mae Pool #BH2848 3.50% 5/1/20471 | | | 130 | | | | 122 | |
| Fannie Mae Pool #BH2847 3.50% 5/1/20471 | | | 67 | | | | 63 | |
| Fannie Mae Pool #BH3122 4.00% 6/1/20471 | | | 68 | | | | 65 | |
| Fannie Mae Pool #BD3554 4.00% 7/1/20471 | | | 423 | | | | 405 | |
| Fannie Mae Pool #256893 7.00% 8/1/20471 | | | 10 | | | | 10 | |
| Fannie Mae Pool #CA0453 4.00% 9/1/20471 | | | 5,955 | | | | 5,738 | |
| Fannie Mae Pool #BH5696 4.00% 10/1/20471 | | | 42,725 | | | | 41,224 | |
| Fannie Mae Pool #CA0770 3.50% 11/1/20471 | | | 164 | | | | 153 | |
| Fannie Mae Pool #BJ3525 4.50% 11/1/20471 | | | 1,045 | | | | 1,031 | |
| Fannie Mae Pool #CA0854 3.50% 12/1/20471 | | | 12,266 | | | | 11,498 | |
| Fannie Mae Pool #MA3211 4.00% 12/1/20471 | | | 3,257 | | | | 3,147 | |
| Fannie Mae Pool #BJ5015 4.00% 12/1/20471 | | | 1,708 | | | | 1,649 | |
| Fannie Mae Pool #BM4413 4.50% 12/1/20471 | | | 4,520 | | | | 4,463 | |
| Fannie Mae Pool #BJ3558 4.50% 12/1/20471 | | | 1,438 | | | | 1,419 | |
| Fannie Mae Pool #BJ3581 4.50% 12/1/20471 | | | 528 | | | | 522 | |
| Fannie Mae Pool #CA1189 3.50% 2/1/20481 | | | 1,284 | | | | 1,201 | |
| Fannie Mae Pool #BK0163 4.50% 2/1/20481 | | | 1,320 | | | | 1,302 | |
| Fannie Mae Pool #BJ4901 3.50% 3/1/20481 | | | 752 | | | | 704 | |
| Fannie Mae Pool #CA1532 3.50% 4/1/20481 | | | 5,007 | | | | 4,690 | |
| 8 | The Bond Fund of America |
| Bonds, notes & other debt instruments (continued) | | Principal amount
(000) | | | Value
(000) | |
| Mortgage-backed obligations (continued) | | | | | | | | |
| Federal agency mortgage-backed obligations (continued) | | | | | | | | |
| Fannie Mae Pool #BK5232 4.00% 5/1/20481 | | USD | 963 | | | $ | 929 | |
| Fannie Mae Pool #BK6840 4.00% 6/1/20481 | | | 1,297 | | | | 1,252 | |
| Fannie Mae Pool #BF0293 3.00% 7/1/20481 | | | 6,286 | | | | 5,691 | |
| Fannie Mae Pool #CA2102 5.00% 7/1/20481 | | | 420 | | | | 423 | |
| Fannie Mae Pool #BF0318 3.50% 8/1/20481 | | | 29,554 | | | | 27,472 | |
| Fannie Mae Pool #BK9743 4.00% 8/1/20481 | | | 414 | | | | 399 | |
| Fannie Mae Pool #BK9761 4.50% 8/1/20481 | | | 217 | | | | 216 | |
| Fannie Mae Pool #CA2166 4.50% 8/1/20481 | | | 14 | | | | 13 | |
| Fannie Mae Pool #BM5349 4.00% 9/1/20481 | | | 73,915 | | | | 71,322 | |
| Fannie Mae Pool #CA2850 4.00% 12/1/20481 | | | 2,336 | | | | 2,264 | |
| Fannie Mae Pool #BF0320 5.50% 1/1/20491 | | | 5,437 | | | | 5,706 | |
| Fannie Mae Pool #FM3280 3.50% 5/1/20491 | | | 448 | | | | 417 | |
| Fannie Mae Pool #FM1062 3.50% 6/1/20491 | | | 8,127 | | | | 7,622 | |
| Fannie Mae Pool #BN6708 3.50% 6/1/20491 | | | 8,130 | | | | 7,597 | |
| Fannie Mae Pool #CA3807 3.00% 7/1/20491 | | | 1,199 | | | | 1,081 | |
| Fannie Mae Pool #CA3806 3.00% 7/1/20491 | | | 782 | | | | 709 | |
| Fannie Mae Pool #CA4021 3.50% 8/1/20491 | | | 22,792 | | | | 21,223 | |
| Fannie Mae Pool #BJ8411 3.50% 8/1/20491 | | | 2,028 | | | | 1,897 | |
| Fannie Mae Pool #FM2318 3.50% 9/1/20491 | | | 39,945 | | | | 37,315 | |
| Fannie Mae Pool #CA4151 3.50% 9/1/20491 | | | 10,546 | | | | 9,908 | |
| Fannie Mae Pool #FM1443 3.50% 9/1/20491 | | | 6,011 | | | | 5,621 | |
| Fannie Mae Pool #FM1913 4.00% 9/1/20491 | | | 1,587 | | | | 1,529 | |
| Fannie Mae Pool #FM1963 4.00% 11/1/20491 | | | 35,570 | | | | 34,322 | |
| Fannie Mae Pool #CA4802 3.50% 12/1/20491 | | | 22,104 | | | | 20,654 | |
| Fannie Mae Pool #FS5313 3.50% 1/1/20501 | | | 206,872 | | | | 192,698 | |
| Fannie Mae Pool #CA5338 3.00% 3/1/20501 | | | 11,322 | | | | 10,071 | |
| Fannie Mae Pool #FM2664 3.50% 3/1/20501 | | | 26,078 | | | | 24,283 | |
| Fannie Mae Pool #CA5506 3.00% 4/1/20501 | | | 46,189 | | | | 41,611 | |
| Fannie Mae Pool #BP1948 3.00% 4/1/20501 | | | 15,713 | | | | 14,084 | |
| Fannie Mae Pool #BP1954 3.50% 4/1/20501 | | | 17,014 | | | | 15,842 | |
| Fannie Mae Pool #FS3189 4.00% 4/1/20501 | | | 19,193 | | | | 18,489 | |
| Fannie Mae Pool #CA5968 2.50% 6/1/20501 | | | 41,797 | | | | 36,153 | |
| Fannie Mae Pool #BP5717 2.50% 6/1/20501 | | | 10,033 | | | | 8,582 | |
| Fannie Mae Pool #CA6309 3.00% 7/1/20501 | | | 41,243 | | | | 37,376 | |
| Fannie Mae Pool #CA6349 3.00% 7/1/20501 | | | 13,972 | | | | 12,480 | |
| Fannie Mae Pool #FS3745 2.00% 8/1/20501 | | | 18,603 | | | | 15,302 | |
| Fannie Mae Pool #CA6593 2.50% 8/1/20501 | | | 12,910 | | | | 11,173 | |
| Fannie Mae Pool #CA6740 3.00% 8/1/20501 | | | 8,101 | | | | 7,236 | |
| Fannie Mae Pool #BQ1226 2.00% 9/1/20501 | | | 17,781 | | | | 14,622 | |
| Fannie Mae Pool #BP6715 2.00% 9/1/20501 | | | 7 | | | | 6 | |
| Fannie Mae Pool #FM4256 2.50% 9/1/20501 | | | 31,198 | | | | 27,047 | |
| Fannie Mae Pool #CA7028 2.50% 9/1/20501 | | | 7,009 | | | | 6,077 | |
| Fannie Mae Pool #CA7052 3.00% 9/1/20501 | | | 2,657 | | | | 2,370 | |
| Fannie Mae Pool #CA7325 2.00% 10/1/20501 | | | 36,011 | | | | 30,056 | |
| Fannie Mae Pool #FP0051 2.00% 10/1/20501 | | | 18,228 | | | | 15,008 | |
| Fannie Mae Pool #CA7257 2.50% 10/1/20501 | | | 2,423 | | | | 2,096 | |
| Fannie Mae Pool #CA7381 3.00% 10/1/20501 | | | 12,728 | | | | 11,369 | |
| Fannie Mae Pool #CA7739 2.50% 11/1/20501 | | | 93,636 | | | | 80,716 | |
| Fannie Mae Pool #CA7603 2.50% 11/1/20501 | | | 53,505 | | | | 45,835 | |
| Fannie Mae Pool #CA7599 2.50% 11/1/20501 | | | 4,397 | | | | 3,808 | |
| Fannie Mae Pool #MA4208 2.00% 12/1/20501 | | | 8,259 | | | | 6,800 | |
| Fannie Mae Pool #CA8108 2.00% 12/1/20501 | | | 1,021 | | | | 844 | |
| Fannie Mae Pool #CA8130 2.50% 12/1/20501 | | | 19,537 | | | | 16,736 | |
| Fannie Mae Pool #FM5173 2.50% 12/1/20501 | | | 8,835 | | | | 7,613 | |
| Fannie Mae Pool #CA8044 2.50% 12/1/20501 | | | 8,019 | | | | 6,869 | |
| Fannie Mae Pool #CA8285 3.00% 12/1/20501 | | | 52,833 | | | | 47,789 | |
| Fannie Mae Pool #CA8046 3.00% 12/1/20501 | | | 36,061 | | | | 32,663 | |
| Fannie Mae Pool #FM5166 3.00% 12/1/20501 | | | 8,511 | | | | 7,603 | |
| Fannie Mae Pool #MA4237 2.00% 1/1/20511 | | | 45,820 | | | | 37,691 | |
| Fannie Mae Pool #CA8623 3.00% 1/1/20511 | | | 88,637 | | | | 78,763 | |
| Fannie Mae Pool #FM6293 3.00% 1/1/20511 | | | 16,204 | | | | 14,371 | |
| Fannie Mae Pool #BR2666 2.00% 2/1/20511 | | | 3,257 | | | | 2,710 | |
| Fannie Mae Pool #CA8820 2.00% 2/1/20511 | | | 1,959 | | | | 1,619 | |
| Fannie Mae Pool #CA8828 2.50% 2/1/20511 | | | 39,631 | | | | 34,177 | |
| Fannie Mae Pool #FS1971 2.50% 2/1/20511 | | | 17,559 | | | | 15,027 | |
| Fannie Mae Pool #FM5778 2.50% 2/1/20511 | | | 9,544 | | | | 8,225 | |
| Fannie Mae Pool #CA8969 3.00% 2/1/20511 | | | 4,501 | | | | 4,013 | |
| The Bond Fund of America | 9 |
| Bonds, notes & other debt instruments (continued) | | Principal amount
(000) | | | Value
(000) | |
| Mortgage-backed obligations (continued) | | | | | | | | |
| Federal agency mortgage-backed obligations (continued) | | | | | | | | |
| Fannie Mae Pool #FM6548 2.00% 3/1/20511 | | USD | 35,369 | | | $ | 29,490 | |
| Fannie Mae Pool #MA4282 2.50% 3/1/20511 | | | 10,430 | | | | 8,925 | |
| Fannie Mae Pool #CA9391 3.00% 3/1/20511 | | | 187,423 | | | | 166,429 | |
| Fannie Mae Pool #CB0290 2.00% 4/1/20511 | | | 2,984 | | | | 2,451 | |
| Fannie Mae Pool #MA4305 2.00% 4/1/20511 | | | 214 | | | | 176 | |
| Fannie Mae Pool #MA4306 2.50% 4/1/20511 | | | 29,619 | | | | 25,364 | |
| Fannie Mae Pool #CB0041 3.00% 4/1/20511 | | | 54,370 | | | | 48,874 | |
| Fannie Mae Pool #CB0191 3.00% 4/1/20511 | | | 25,169 | | | | 22,482 | |
| Fannie Mae Pool #CB0046 3.00% 4/1/20511 | | | 8,550 | | | | 7,585 | |
| Fannie Mae Pool #CB0193 3.00% 4/1/20511 | | | 3,028 | | | | 2,703 | |
| Fannie Mae Pool #CB0449 2.00% 5/1/20511 | | | 23,796 | | | | 19,516 | |
| Fannie Mae Pool #BR1035 2.00% 5/1/20511 | | | 127 | | | | 104 | |
| Fannie Mae Pool #CB0457 2.50% 5/1/20511 | | | 4,996 | | | | 4,280 | |
| Fannie Mae Pool #FM7803 2.00% 6/1/20511 | | | 4,225 | | | | 3,516 | |
| Fannie Mae Pool #BT3317 2.50% 6/1/20511 | | | 5,193 | | | | 4,466 | |
| Fannie Mae Pool #FM7694 3.00% 6/1/20511 | | | 18,980 | | | | 16,971 | |
| Fannie Mae Pool #CB0737 3.00% 6/1/20511 | | | 16,767 | | | | 14,868 | |
| Fannie Mae Pool #FM7687 3.00% 6/1/20511 | | | 7,402 | | | | 6,646 | |
| Fannie Mae Pool #FM7909 3.00% 6/1/20511 | | | 2,365 | | | | 2,111 | |
| Fannie Mae Pool #FS3744 2.00% 7/1/20511 | | | 54,819 | | | | 45,065 | |
| Fannie Mae Pool #CB1136 2.50% 7/1/20511 | | | 150,334 | | | | 128,936 | |
| Fannie Mae Pool #FM7957 2.50% 7/1/20511 | | | 121,717 | | | | 104,752 | |
| Fannie Mae Pool #CB0988 2.50% 7/1/20511 | | | 106,703 | | | | 91,803 | |
| Fannie Mae Pool #BR2095 2.50% 7/1/20511 | | | 53,733 | | | | 45,929 | |
| Fannie Mae Pool #FM7900 2.50% 7/1/20511 | | | 3,962 | | | | 3,417 | |
| Fannie Mae Pool #BR2219 2.50% 8/1/20511 | | | 109,611 | | | | 93,690 | |
| Fannie Mae Pool #FM8442 2.50% 8/1/20511 | | | 59,824 | | | | 51,069 | |
| Fannie Mae Pool #FS1057 2.50% 8/1/20511 | | | 1,037 | | | | 886 | |
| Fannie Mae Pool #CB1304 3.00% 8/1/20511 | | | 19,951 | | | | 17,900 | |
| Fannie Mae Pool #FS4783 4.00% 8/1/20511 | | | 76,529 | | | | 73,355 | |
| Fannie Mae Pool #CB1527 2.50% 9/1/20511 | | | 14,562 | | | | 12,466 | |
| Fannie Mae Pool #BT4537 3.50% 9/1/20511 | | | 373 | | | | 343 | |
| Fannie Mae Pool #FM9068 2.50% 10/1/20511 | | | 12,500 | | | | 10,694 | |
| Fannie Mae Pool #FS4628 3.00% 10/1/20511 | | | 26,313 | | | | 23,487 | |
| Fannie Mae Pool #BU1498 3.50% 10/1/20511 | | | 343 | | | | 315 | |
| Fannie Mae Pool #FS0965 2.00% 11/1/20511 | | | 997 | | | | 823 | |
| Fannie Mae Pool #MA4465 2.00% 11/1/20511 | | | 882 | | | | 723 | |
| Fannie Mae Pool #FM9492 2.50% 11/1/20511 | | | 21,109 | | | | 18,205 | |
| Fannie Mae Pool #FM9694 2.50% 11/1/20511 | | | 11,002 | | | | 9,532 | |
| Fannie Mae Pool #FM9632 3.00% 11/1/20511 | | | 15,625 | | | | 13,963 | |
| Fannie Mae Pool #FM9810 3.00% 11/1/20511 | | | 7,729 | | | | 6,895 | |
| Fannie Mae Pool #FM9631 3.00% 11/1/20511 | | | 6,723 | | | | 6,022 | |
| Fannie Mae Pool #CB2292 3.00% 11/1/20511 | | | 1,943 | | | | 1,744 | |
| Fannie Mae Pool #BU3013 3.50% 11/1/20511 | | | 406 | | | | 375 | |
| Fannie Mae Pool #BU5976 4.00% 11/1/20511 | | | 61 | | | | 58 | |
| Fannie Mae Pool #CB2319 2.50% 12/1/20511 | | | 60,733 | | | | 52,301 | |
| Fannie Mae Pool #FS0433 2.50% 12/1/20511 | | | 52,824 | | | | 46,018 | |
| Fannie Mae Pool #CB2371 2.50% 12/1/20511 | | | 36,916 | | | | 31,834 | |
| Fannie Mae Pool #CB2372 2.50% 12/1/20511 | | | 29,378 | | | | 25,268 | |
| Fannie Mae Pool #BT9510 2.50% 12/1/20511 | | | 23,626 | | | | 20,368 | |
| Fannie Mae Pool #BT9483 2.50% 12/1/20511 | | | 22,939 | | | | 19,754 | |
| Fannie Mae Pool #CB2286 2.50% 12/1/20511 | | | 17,836 | | | | 15,329 | |
| Fannie Mae Pool #FM9804 2.50% 12/1/20511 | | | 11,880 | | | | 10,246 | |
| Fannie Mae Pool #CB2373 2.50% 12/1/20511 | | | 11,027 | | | | 9,487 | |
| Fannie Mae Pool #CB2375 2.50% 12/1/20511 | | | 9,783 | | | | 8,408 | |
| Fannie Mae Pool #MA4493 2.50% 12/1/20511 | | | 3,179 | | | | 2,707 | |
| Fannie Mae Pool #CB2414 3.00% 12/1/20511 | | | 32,643 | | | | 29,401 | |
| Fannie Mae Pool #FM9976 3.00% 12/1/20511 | | | 14,972 | | | | 13,516 | |
| Fannie Mae Pool #CB2293 3.00% 12/1/20511 | | | 1,921 | | | | 1,723 | |
| Fannie Mae Pool #BT9498 3.50% 12/1/20511 | | | 8,874 | | | | 8,187 | |
| Fannie Mae Pool #BU8404 3.50% 12/1/20511 | | | 491 | | | | 451 | |
| Fannie Mae Pool #BU8481 3.50% 12/1/20511 | | | 26 | | | | 24 | |
| Fannie Mae Pool #CB2544 3.00% 1/1/20521 | | | 31,828 | | | | 28,413 | |
| Fannie Mae Pool #FS0454 3.00% 1/1/20521 | | | 7,897 | | | | 7,049 | |
| Fannie Mae Pool #FS0972 3.50% 1/1/20521 | | | 27,246 | | | | 25,436 | |
| Fannie Mae Pool #FS0268 3.50% 1/1/20521 | | | 976 | | | | 895 | |
| Fannie Mae Pool #BV0783 3.50% 1/1/20521 | | | 852 | | | | 793 | |
| 10 | The Bond Fund of America |
| Bonds, notes & other debt instruments (continued) | | Principal amount
(000) | | | Value
(000) | |
| Mortgage-backed obligations (continued) | | | | | | | | |
| Federal agency mortgage-backed obligations (continued) | | | | | | | | |
| Fannie Mae Pool #BV0790 3.50% 1/1/20521 | | USD | 713 | | | $ | 654 | |
| Fannie Mae Pool #BU7425 3.50% 1/1/20521 | | | 391 | | | | 359 | |
| Fannie Mae Pool #BU7427 3.50% 1/1/20521 | | | 57 | | | | 53 | |
| Fannie Mae Pool #BV3076 2.00% 2/1/20521 | | | 136,704 | | | | 111,927 | |
| Fannie Mae Pool #BV3080 2.00% 2/1/20521 | | | 111,743 | | | | 91,499 | |
| Fannie Mae Pool #BV3023 2.00% 2/1/20521 | | | 91,785 | | | | 75,113 | |
| Fannie Mae Pool #CB2765 2.00% 2/1/20521 | | | 57,213 | | | | 47,072 | |
| Fannie Mae Pool #BV3083 2.00% 2/1/20521 | | | 5,749 | | | | 4,704 | |
| Fannie Mae Pool #BV3013 2.00% 2/1/20521 | | | 192 | | | | 157 | |
| Fannie Mae Pool #BV3022 2.00% 2/1/20521 | | | 161 | | | | 132 | |
| Fannie Mae Pool #BU1330 2.50% 2/1/20521 | | | 21,835 | | | | 18,825 | |
| Fannie Mae Pool #BU7285 2.50% 2/1/20521 | | | 1,645 | | | | 1,414 | |
| Fannie Mae Pool #BU7294 3.50% 2/1/20521 | | | 52 | | | | 48 | |
| Fannie Mae Pool #BV4172 2.00% 3/1/20521 | | | 29,749 | | | | 24,326 | |
| Fannie Mae Pool #BV4128 2.00% 3/1/20521 | | | 29,554 | | | | 24,194 | |
| Fannie Mae Pool #BV3101 2.00% 3/1/20521 | | | 16,356 | | | | 13,384 | |
| Fannie Mae Pool #BV4118 2.00% 3/1/20521 | | | 8,780 | | | | 7,180 | |
| Fannie Mae Pool #BV4169 2.00% 3/1/20521 | | | 6,863 | | | | 5,615 | |
| Fannie Mae Pool #BV3316 3.50% 3/1/20521 | | | 46 | | | | 43 | |
| Fannie Mae Pool #FS2448 2.00% 5/1/20521 | | | 21,817 | | | | 17,878 | |
| Fannie Mae Pool #BV9644 2.50% 5/1/20521 | | | 380 | | | | 323 | |
| Fannie Mae Pool #BV7810 3.50% 5/1/20521 | | | 280 | | | | 257 | |
| Fannie Mae Pool #BW0958 5.00% 7/1/20521 | | | 23,244 | | | | 23,035 | |
| Fannie Mae Pool #CB4135 5.00% 7/1/20521 | | | 179 | | | | 177 | |
| Fannie Mae Pool #BW5402 5.50% 7/1/20521 | | | 617 | | | | 622 | |
| Fannie Mae Pool #FS2654 4.00% 8/1/20521 | | | 3,453 | | | | 3,267 | |
| Fannie Mae Pool #MA4737 5.00% 8/1/20521 | | | 685 | | | | 679 | |
| Fannie Mae Pool #CB5019 5.00% 8/1/20521 | | | 196 | | | | 194 | |
| Fannie Mae Pool #MA4731 3.50% 9/1/20521 | | | 66,078 | | | | 60,669 | |
| Fannie Mae Pool #MA4732 4.00% 9/1/20521 | | | 133 | | | | 126 | |
| Fannie Mae Pool #BW1192 4.50% 9/1/20521 | | | 2,049 | | | | 1,988 | |
| Fannie Mae Pool #BW9049 4.50% 9/1/20521 | | | 423 | | | | 411 | |
| Fannie Mae Pool #CB4852 4.50% 10/1/20521 | | | 25,003 | | | | 24,254 | |
| Fannie Mae Pool #BW5232 4.50% 10/1/20521 | | | 3,330 | | | | 3,230 | |
| Fannie Mae Pool #BW8175 4.50% 10/1/20521 | | | 1,937 | | | | 1,879 | |
| Fannie Mae Pool #BW1289 5.50% 10/1/20521 | | | 24,214 | | | | 24,388 | |
| Fannie Mae Pool #BW1243 5.50% 10/1/20521 | | | 21,550 | | | | 21,708 | |
| Fannie Mae Pool #FS5554 4.50% 11/1/20521 | | | 9,497 | | | | 9,213 | |
| Fannie Mae Pool #BW5182 4.50% 11/1/20521 | | | 2,741 | | | | 2,659 | |
| Fannie Mae Pool #BW1296 5.00% 11/1/20521 | | | 41,260 | | | | 40,889 | |
| Fannie Mae Pool #BW5057 5.00% 12/1/20521 | | | 25,464 | | | | 25,235 | |
| Fannie Mae Pool #BX5673 5.00% 12/1/20521 | | | 197 | | | | 195 | |
| Fannie Mae Pool #MA4842 5.50% 12/1/20521 | | | 41,587 | | | | 41,854 | |
| Fannie Mae Pool #BX2476 5.50% 12/1/20521 | | | 7,110 | | | | 7,161 | |
| Fannie Mae Pool #CB5778 6.00% 12/1/20521 | | | 1,506 | | | | 1,531 | |
| Fannie Mae Pool #MA4866 4.00% 1/1/20531 | | | 70,406 | | | | 66,615 | |
| Fannie Mae Pool #FS4947 4.00% 1/1/20531 | | | 219 | | | | 207 | |
| Fannie Mae Pool #MA4867 4.50% 1/1/20531 | | | 7,553 | | | | 7,327 | |
| Fannie Mae Pool #FS3981 5.50% 1/1/20531 | | | 34,580 | | | | 34,810 | |
| Fannie Mae Pool #BX6633 5.50% 1/1/20531 | | | 497 | | | | 500 | |
| Fannie Mae Pool #MA4894 6.00% 1/1/20531 | | | 283,635 | | | | 288,249 | |
| Fannie Mae Pool #BX5931 6.00% 1/1/20531 | | | 5,518 | | | | 5,611 | |
| Fannie Mae Pool #BX5040 6.00% 1/1/20531 | | | 2,797 | | | | 2,842 | |
| Fannie Mae Pool #BX4070 6.00% 1/1/20531 | | | 2,044 | | | | 2,078 | |
| Fannie Mae Pool #BX5666 6.00% 1/1/20531 | | | 1,207 | | | | 1,226 | |
| Fannie Mae Pool #FS3411 6.00% 1/1/20531 | | | 53 | | | | 54 | |
| Fannie Mae Pool #CB5525 6.00% 1/1/20531 | | | 51 | | | | 51 | |
| Fannie Mae Pool #MA4919 5.50% 2/1/20531 | | | 52,682 | | | | 52,933 | |
| Fannie Mae Pool #BX6216 5.50% 2/1/20531 | | | 853 | | | | 858 | |
| Fannie Mae Pool #MA4920 6.00% 2/1/20531 | | | 207,910 | | | | 211,253 | |
| Fannie Mae Pool #FS4238 5.00% 3/1/20531 | | | 899 | | | | 891 | |
| Fannie Mae Pool #CB5986 5.00% 3/1/20531 | | | 97 | | | | 96 | |
| Fannie Mae Pool #BX8515 5.50% 3/1/20531 | | | 4,946 | | | | 4,971 | |
| Fannie Mae Pool #BX7779 5.50% 3/1/20531 | | | 3,729 | | | | 3,753 | |
| Fannie Mae Pool #BX8514 5.50% 3/1/20531 | | | 1,914 | | | | 1,923 | |
| Fannie Mae Pool #BX9431 5.50% 3/1/20531 | | | 1,864 | | | | 1,877 | |
| Fannie Mae Pool #FS4774 5.50% 3/1/20531 | | | 908 | | | | 913 | |
| The Bond Fund of America | 11 |
| Bonds, notes & other debt instruments (continued) | | Principal amount
(000) | | | Value
(000) | |
| Mortgage-backed obligations (continued) | | | | | | | | |
| Federal agency mortgage-backed obligations (continued) | | | | | | | | |
| Fannie Mae Pool #BX8389 5.50% 3/1/20531 | | USD | 497 | | | $ | 500 | |
| Fannie Mae Pool #FS4152 5.50% 3/1/20531 | | | 378 | | | | 380 | |
| Fannie Mae Pool #BX8835 5.50% 3/1/20531 | | | 354 | | | | 357 | |
| Fannie Mae Pool #MA4942 6.00% 3/1/20531 | | | 259,273 | | | | 263,358 | |
| Fannie Mae Pool #MA4993 4.00% 4/1/20531 | | | 5,589 | | | | 5,286 | |
| Fannie Mae Pool #MA4977 4.50% 4/1/20531 | | | 4,599 | | | | 4,462 | |
| Fannie Mae Pool #BX8625 5.00% 4/1/20531 | | | 24,177 | | | | 23,928 | |
| Fannie Mae Pool #BX9135 5.00% 4/1/20531 | | | 5,912 | | | | 5,858 | |
| Fannie Mae Pool #BX8434 5.00% 4/1/20531 | | | 2,259 | | | | 2,236 | |
| Fannie Mae Pool #BY0889 5.00% 4/1/20531 | | | 1,943 | | | | 1,925 | |
| Fannie Mae Pool #BX8880 5.00% 4/1/20531 | | | 1,345 | | | | 1,331 | |
| Fannie Mae Pool #BX8673 5.00% 4/1/20531 | | | 942 | | | | 932 | |
| Fannie Mae Pool #BY0879 5.00% 4/1/20531 | | | 901 | | | | 892 | |
| Fannie Mae Pool #BX9041 5.00% 4/1/20531 | | | 191 | | | | 189 | |
| Fannie Mae Pool #MA4979 5.50% 4/1/20531 | | | 86,733 | | | | 87,247 | |
| Fannie Mae Pool #BY0003 5.50% 4/1/20531 | | | 6,955 | | | | 6,991 | |
| Fannie Mae Pool #BY0007 5.50% 4/1/20531 | | | 2,999 | | | | 3,015 | |
| Fannie Mae Pool #BX8556 5.50% 4/1/20531 | | | 1,986 | | | | 1,995 | |
| Fannie Mae Pool #BX9116 5.50% 4/1/20531 | | | 1,668 | | | | 1,676 | |
| Fannie Mae Pool #BW5286 5.50% 4/1/20531 | | | 51 | | | | 51 | |
| Fannie Mae Pool #MA4980 6.00% 4/1/20531 | | | 161,744 | | | | 164,420 | |
| Fannie Mae Pool #BW5278 6.00% 4/1/20531 | | | 2,622 | | | | 2,664 | |
| Fannie Mae Pool #CB6106 6.50% 4/1/20531 | | | 5,956 | | | | 6,170 | |
| Fannie Mae Pool #FS4919 2.50% 5/1/20531 | | | 13,750 | | | | 11,710 | |
| Fannie Mae Pool #MA5009 5.00% 5/1/20531 | | | 25,513 | | | | 25,250 | |
| Fannie Mae Pool #FS4563 5.00% 5/1/20531 | | | 11,741 | | | | 11,630 | |
| Fannie Mae Pool #BY2022 5.00% 5/1/20531 | | | 5,764 | | | | 5,705 | |
| Fannie Mae Pool #BY1497 5.00% 5/1/20531 | | | 3,980 | | | | 3,938 | |
| Fannie Mae Pool #BY1265 5.00% 5/1/20531 | | | 2,708 | | | | 2,680 | |
| Fannie Mae Pool #BY2251 5.00% 5/1/20531 | | | 2,263 | | | | 2,240 | |
| Fannie Mae Pool #BY0545 5.00% 5/1/20531 | | | 1,965 | | | | 1,946 | |
| Fannie Mae Pool #BY2247 5.00% 5/1/20531 | | | 581 | | | | 575 | |
| Fannie Mae Pool #MA5010 5.50% 5/1/20531 | | | 142,687 | | | | 143,319 | |
| Fannie Mae Pool #BY1223 5.50% 5/1/20531 | | | 7,538 | | | | 7,574 | |
| Fannie Mae Pool #BY0204 5.50% 5/1/20531 | | | 3,770 | | | | 3,788 | |
| Fannie Mae Pool #BY0091 5.50% 5/1/20531 | | | 2,774 | | | | 2,789 | |
| Fannie Mae Pool #BY3208 5.50% 5/1/20531 | �� | | 248 | | | | 250 | |
| Fannie Mae Pool #MA5011 6.00% 5/1/20531 | | | 501,534 | | | | 509,435 | |
| Fannie Mae Pool #MA5054 4.00% 6/1/20531 | | | 31,945 | | | | 30,220 | |
| Fannie Mae Pool #MA5037 4.50% 6/1/20531 | | | 12,805 | | | | 12,419 | |
| Fannie Mae Pool #MA5038 5.00% 6/1/20531 | | | 499,673 | | | | 494,526 | |
| Fannie Mae Pool #BY4405 5.00% 6/1/20531 | | | 31,586 | | | | 31,288 | |
| Fannie Mae Pool #BY4222 5.00% 6/1/20531 | | | 5,865 | | | | 5,805 | |
| Fannie Mae Pool #BY5875 5.00% 6/1/20531 | | | 5,500 | | | | 5,443 | |
| Fannie Mae Pool #BY2305 5.00% 6/1/20531 | | | 3,848 | | | | 3,808 | |
| Fannie Mae Pool #BY3600 5.00% 6/1/20531 | | | 2,543 | | | | 2,516 | |
| Fannie Mae Pool #BY4170 5.00% 6/1/20531 | | | 2,215 | | | | 2,193 | |
| Fannie Mae Pool #BX7642 5.00% 6/1/20531 | | | 2,101 | | | | 2,081 | |
| Fannie Mae Pool #MA5039 5.50% 6/1/20531 | | | 165,172 | | | | 165,904 | |
| Fannie Mae Pool #FS5192 5.50% 6/1/20531 | | | 67,220 | | | | 67,658 | |
| Fannie Mae Pool #BY3337 5.50% 6/1/20531 | | | 6,295 | | | | 6,327 | |
| Fannie Mae Pool #BY4223 5.50% 6/1/20531 | | | 215 | | | | 216 | |
| Fannie Mae Pool #MA5040 6.00% 6/1/20531 | | | 118,933 | | | | 120,807 | |
| Fannie Mae Pool #CB6485 6.00% 6/1/20531 | | | 32,469 | | | | 32,991 | |
| Fannie Mae Pool #CB6486 6.00% 6/1/20531 | | | 20,197 | | | | 20,556 | |
| Fannie Mae Pool #CB6465 6.00% 6/1/20531 | | | 14,489 | | | | 14,745 | |
| Fannie Mae Pool #BO9414 6.00% 6/1/20531 | | | 5,359 | | | | 5,444 | |
| Fannie Mae Pool #BY4290 6.00% 6/1/20531 | | | 994 | | | | 1,010 | |
| Fannie Mae Pool #CB6491 6.50% 6/1/20531 | | | 28,608 | | | | 29,466 | |
| Fannie Mae Pool #CB6490 6.50% 6/1/20531 | | | 9,975 | | | | 10,225 | |
| Fannie Mae Pool #CB6468 6.50% 6/1/20531 | | | 7,194 | | | | 7,397 | |
| Fannie Mae Pool #MA5070 4.50% 7/1/20531 | | | 43,643 | | | | 42,329 | |
| Fannie Mae Pool #CB6719 4.50% 7/1/20531 | | | 7,711 | | | | 7,479 | |
| Fannie Mae Pool #MA5071 5.00% 7/1/20531 | | | 301,271 | | | | 298,120 | |
| Fannie Mae Pool #BY6759 5.00% 7/1/20531 | | | 17,510 | | | | 17,327 | |
| Fannie Mae Pool #BU4046 5.00% 7/1/20531 | | | 7,701 | | | | 7,623 | |
| Fannie Mae Pool #BY2604 5.00% 7/1/20531 | | | 2,988 | | | | 2,957 | |
| 12 | The Bond Fund of America |
| Bonds, notes & other debt instruments (continued) | | Principal amount
(000) | | | Value
(000) | |
| Mortgage-backed obligations (continued) | | | | | | | | |
| Federal agency mortgage-backed obligations (continued) | | | | | | | | |
| Fannie Mae Pool #BU4112 5.00% 7/1/20531 | | USD | 99 | | | $ | 98 | |
| Fannie Mae Pool #MA5072 5.50% 7/1/20531 | | | 214,354 | | | | 215,348 | |
| Fannie Mae Pool #MA5073 6.00% 7/1/20531 | | | 76,439 | | | | 77,631 | |
| Fannie Mae Pool #MA5105 4.50% 8/1/20531 | | | 30,500 | | | | 29,581 | |
| Fannie Mae Pool #CB6853 4.50% 8/1/20531 | | | 12,011 | | | | 11,649 | |
| Fannie Mae Pool #BY6723 5.00% 8/1/20531 | | | 5,939 | | | | 5,877 | |
| Fannie Mae Pool #BY8986 5.00% 8/1/20531 | | | 2,479 | | | | 2,453 | |
| Fannie Mae Pool #MA5136 4.50% 9/1/20531 | | | 10,157 | | | | 9,851 | |
| Fannie Mae Pool #MA5139 6.00% 9/1/20531 | | | 71,345 | | | | 72,458 | |
| Fannie Mae Pool #FS5749 6.50% 9/1/20531 | | | 147,613 | | | | 151,320 | |
| Fannie Mae Pool #CB7139 6.50% 9/1/20531 | | | 9,846 | | | | 10,124 | |
| Fannie Mae Pool #MA5163 4.50% 10/1/20531 | | | 909 | | | | 882 | |
| Fannie Mae Pool #MA5165 5.50% 10/1/20531 | | | 1,880 | | | | 1,888 | |
| Fannie Mae Pool #MA5166 6.00% 10/1/20531 | | | 76,513 | | | | 77,706 | |
| Fannie Mae Pool #MA5167 6.50% 10/1/20531 | | | 152,413 | | | | 156,239 | |
| Fannie Mae Pool #MA5190 5.50% 11/1/20531 | | | 39,685 | | | | 39,855 | |
| Fannie Mae Pool #MA5191 6.00% 11/1/20531 | | | 103,488 | | | | 105,102 | |
| Fannie Mae Pool #MA5192 6.50% 11/1/20531 | | | 196,602 | | | | 201,538 | |
| Fannie Mae Pool #MA5216 6.00% 12/1/20531 | | | 34,817 | | | | 35,360 | |
| Fannie Mae Pool #MA5218 7.00% 12/1/20531 | | | 3,689 | | | | 3,807 | |
| Fannie Mae Pool #MA5247 6.00% 1/1/20541 | | | 13,791 | | | | 14,007 | |
| Fannie Mae Pool #BF0145 3.50% 3/1/20571 | | | 14,161 | | | | 12,864 | |
| Fannie Mae Pool #BF0264 3.50% 5/1/20581 | | | 13,965 | | | | 12,686 | |
| Fannie Mae Pool #BF0299 3.50% 8/1/20581 | | | 22,995 | | | | 20,888 | |
| Fannie Mae Pool #BF0379 3.50% 4/1/20591 | | | 35,787 | | | | 32,509 | |
| Fannie Mae Pool #BM6693 3.50% 8/1/20591 | | | 25,821 | | | | 23,459 | |
| Fannie Mae Pool #BF0481 3.50% 6/1/20601 | | | 57,323 | | | | 52,079 | |
| Fannie Mae Pool #BF0480 3.50% 6/1/20601 | | | 36,684 | | | | 33,873 | |
| Fannie Mae Pool #BF0497 3.00% 7/1/20601 | | | 46,611 | | | | 40,007 | |
| Fannie Mae Pool #BF0548 3.00% 7/1/20611 | | | 23,206 | | | | 20,318 | |
| Fannie Mae Pool #BF0563 4.00% 9/1/20611 | | | 10,696 | | | | 10,224 | |
| Fannie Mae Pool #BF0585 4.50% 12/1/20611 | | | 8,383 | | | | 8,154 | |
| Fannie Mae, Series 2001-4, Class GA, 9.00% 4/17/20251,3 | | | — | 2 | | | — | 2 |
| Fannie Mae, Series 2001-4, Class NA, 9.00% 10/25/20251,3 | | | — | 2 | | | — | 2 |
| Fannie Mae, Series 1998-W5, Class B3, 6.50% 7/25/20281,4 | | | 230 | | | | 45 | |
| Fannie Mae, Series 2002-W7, Class A5, 7.50% 2/25/20291 | | | 43 | | | | 47 | |
| Fannie Mae, Series 2001-25, Class ZA, 6.50% 6/25/20311 | | | 305 | | | | 308 | |
| Fannie Mae, Series 2001-50, Class BA, 7.00% 10/25/20411 | | | 112 | | | | 113 | |
| Fannie Mae, Series 2002-W3, Class A5, 7.50% 11/25/20411 | | | 463 | | | | 495 | |
| Fannie Mae, Series 2001-T10, Class A1, 7.00% 12/25/20411 | | | 714 | | | | 728 | |
| Fannie Mae, Series 2002-W1, Class 2A, 4.68% 2/25/20421,3 | | | 592 | | | | 575 | |
| Fannie Mae, Series 2017-M3, Class A2, Multi Family, 2.465% 12/25/20261,3 | | | 7 | | | | 7 | |
| Fannie Mae, Series 2019-M5, Class A2, Multi Family, 3.273% 1/25/20291 | | | 419 | | | | 399 | |
| Fannie Mae, Series 2018-M12, Class A2, Multi Family, 3.631% 8/25/20301,3 | | | 3,050 | | | | 2,930 | |
| Fannie Mae, Series 2006-51, Class PO, principal only, 0% 3/25/20361 | | | 216 | | | | 201 | |
| Fannie Mae, Series 2006-32, Class OA, principal only, 0% 5/25/20361 | | | 310 | | | | 262 | |
| Fannie Mae, Series 2006-96, Class OP, principal only, 0% 10/25/20361 | | | 107 | | | | 94 | |
| Freddie Mac Pool #ZA1886 5.00% 6/1/20251 | | | 49 | | | | 48 | |
| Freddie Mac Pool #ZS8948 6.50% 3/1/20261 | | | 6 | | | | 6 | |
| Freddie Mac Pool #ZS8801 6.50% 3/1/20261 | | | 5 | | | | 5 | |
| Freddie Mac Pool #ZA1940 6.50% 4/1/20261 | | | 8 | | | | 8 | |
| Freddie Mac Pool #ZA1955 6.50% 9/1/20261 | | | 2 | | | | 2 | |
| Freddie Mac Pool #ZA1959 6.50% 10/1/20261 | | | 2 | | | | 2 | |
| Freddie Mac Pool #ZA0583 6.50% 3/1/20291 | | | — | 2 | | | — | 2 |
| Freddie Mac Pool #D98356 4.50% 5/1/20301 | | | 42 | | | | 41 | |
| Freddie Mac Pool #ZT0799 5.00% 9/1/20311 | | | 38 | | | | 38 | |
| Freddie Mac Pool #A15120 5.50% 10/1/20331 | | | 2 | | | | 2 | |
| Freddie Mac Pool #G30911 4.00% 3/1/20361 | | | 2,397 | | | | 2,347 | |
| Freddie Mac Pool #K93532 4.00% 4/1/20361 | | | 725 | | | | 709 | |
| Freddie Mac Pool #C91883 4.00% 6/1/20361 | | | 360 | | | | 353 | |
| Freddie Mac Pool #A56076 5.50% 1/1/20371 | | | 6 | | | | 7 | |
| Freddie Mac Pool #C91917 3.00% 2/1/20371 | | | 467 | | | | 436 | |
| Freddie Mac Pool #G04804 4.50% 5/1/20371 | | | 1,116 | | | | 1,118 | |
| Freddie Mac Pool #C91948 4.00% 7/1/20371 | | | 2,768 | | | | 2,707 | |
| Freddie Mac Pool #ZS1566 6.50% 8/1/20371 | | | 1 | | | | 1 | |
| Freddie Mac Pool #G03695 5.50% 11/1/20371 | | | 2 | | | | 2 | |
| Freddie Mac Pool #G08248 5.50% 2/1/20381 | | | 28 | | | | 28 | |
| The Bond Fund of America | 13 |
| Bonds, notes & other debt instruments (continued) | | Principal amount
(000) | | | Value
(000) | |
| Mortgage-backed obligations (continued) | | | | | | | | |
| Federal agency mortgage-backed obligations (continued) | | | | | | | | |
| Freddie Mac Pool #ZT1449 3.00% 6/1/20381 | | USD | 41,906 | | | $ | 39,049 | |
| Freddie Mac Pool #G05196 5.50% 10/1/20381 | | | 1 | | | | 1 | |
| Freddie Mac Pool #G05267 5.50% 12/1/20381 | | | 2 | | | | 2 | |
| Freddie Mac Pool #A87873 5.00% 8/1/20391 | | | 2,044 | | | | 2,070 | |
| Freddie Mac Pool #G06020 5.50% 12/1/20391 | | | 3 | | | | 3 | |
| Freddie Mac Pool #G05860 5.50% 2/1/20401 | | | 11 | | | | 11 | |
| Freddie Mac Pool #G05937 4.50% 8/1/20401 | | | 4,294 | | | | 4,296 | |
| Freddie Mac Pool #RB5071 2.00% 9/1/20401 | | | 6,931 | | | | 5,969 | |
| Freddie Mac Pool #A93948 4.50% 9/1/20401 | | | 6 | | | | 6 | |
| Freddie Mac Pool #SC0113 2.00% 12/1/20401 | | | 5,824 | | | | 5,016 | |
| Freddie Mac Pool #RB5105 2.00% 3/1/20411 | | | 122,949 | | | | 105,775 | |
| Freddie Mac Pool #SC0149 2.00% 3/1/20411 | | | 23,617 | | | | 20,318 | |
| Freddie Mac Pool #G06868 4.50% 4/1/20411 | | | 5 | | | | 5 | |
| Freddie Mac Pool #RB5114 2.00% 6/1/20411 | | | 114,018 | | | | 97,737 | |
| Freddie Mac Pool #RB0544 2.00% 6/1/20411 | | | 28,006 | | | | 24,016 | |
| Freddie Mac Pool #SC0169 2.00% 6/1/20411 | | | 10,299 | | | | 8,825 | |
| Freddie Mac Pool #G06648 5.00% 6/1/20411 | | | 496 | | | | 504 | |
| Freddie Mac Pool #Q01658 5.00% 6/1/20411 | | | 225 | | | | 228 | |
| Freddie Mac Pool #G06841 5.50% 6/1/20411 | | | 15 | | | | 15 | |
| Freddie Mac Pool #RB5118 2.00% 7/1/20411 | | | 141,646 | | | | 121,376 | |
| Freddie Mac Pool #SC0148 2.00% 7/1/20411 | | | 76,733 | | | | 65,800 | |
| Freddie Mac Pool #Q01992 4.50% 7/1/20411 | | | 36 | | | | 36 | |
| Freddie Mac Pool #RB5121 2.00% 8/1/20411 | | | 220,697 | | | | 189,114 | |
| Freddie Mac Pool #Q02705 4.50% 8/1/20411 | | | 1,937 | | | | 1,937 | |
| Freddie Mac Pool #G06956 4.50% 8/1/20411 | | | 462 | | | | 462 | |
| Freddie Mac Pool #G06769 4.50% 8/1/20411 | | | 189 | | | | 189 | |
| Freddie Mac Pool #SC0175 2.00% 9/1/20411 | | | 20,085 | | | | 17,223 | |
| Freddie Mac Pool #QK1181 2.00% 11/1/20411 | | | 11,378 | | | | 9,732 | |
| Freddie Mac Pool #RB5138 2.00% 12/1/20411 | | | 75,491 | | | | 64,547 | |
| Freddie Mac Pool #RB5145 2.00% 2/1/20421 | | | 15,406 | | | | 13,163 | |
| Freddie Mac Pool #RB5148 2.00% 3/1/20421 | | | 61,449 | | | | 52,483 | |
| Freddie Mac Pool #RB5153 2.00% 4/1/20421 | | | 19,491 | | | | 16,640 | |
| Freddie Mac Pool #Q15874 4.00% 2/1/20431 | | | 43 | | | | 42 | |
| Freddie Mac Pool #Q17696 3.50% 4/1/20431 | | | 501 | | | | 474 | |
| Freddie Mac Pool #Q18236 3.50% 5/1/20431 | | | 709 | | | | 671 | |
| Freddie Mac Pool #Q19133 3.50% 6/1/20431 | | | 578 | | | | 543 | |
| Freddie Mac Pool #Q22946 4.00% 11/1/20431 | | | 4,047 | | | | 3,917 | |
| Freddie Mac Pool #Q28558 3.50% 9/1/20441 | | | 2,483 | | | | 2,326 | |
| Freddie Mac Pool #760012 3.113% 4/1/20451,3 | | | 603 | | | | 598 | |
| Freddie Mac Pool #760013 3.194% 4/1/20451,3 | | | 319 | | | | 318 | |
| Freddie Mac Pool #760014 2.71% 8/1/20451,3 | | | 1,612 | | | | 1,559 | |
| Freddie Mac Pool #G60138 3.50% 8/1/20451 | | | 531 | | | | 501 | |
| Freddie Mac Pool #G60238 3.50% 10/1/20451 | | | 12,859 | | | | 12,081 | |
| Freddie Mac Pool #V81992 4.00% 10/1/20451 | | | 500 | | | | 480 | |
| Freddie Mac Pool #G60344 4.00% 12/1/20451 | | | 9,824 | | | | 9,492 | |
| Freddie Mac Pool #T65375 3.50% 7/1/20461 | | | 104 | | | | 95 | |
| Freddie Mac Pool #Q42034 4.50% 7/1/20461 | | | 92 | | | | 91 | |
| Freddie Mac Pool #G67700 3.50% 8/1/20461 | | | 4,762 | | | | 4,477 | |
| Freddie Mac Pool #Q42633 4.50% 8/1/20461 | | | 259 | | | | 257 | |
| Freddie Mac Pool #Q43312 4.50% 9/1/20461 | | | 467 | | | | 463 | |
| Freddie Mac Pool #Q43461 4.50% 10/1/20461 | | | 254 | | | | 252 | |
| Freddie Mac Pool #Q44689 4.50% 12/1/20461 | | | 360 | | | | 355 | |
| Freddie Mac Pool #760015 2.597% 1/1/20471,3 | | | 1,839 | | | | 1,749 | |
| Freddie Mac Pool #Q47615 3.50% 4/1/20471 | | | 918 | | | | 851 | |
| Freddie Mac Pool #Q47620 4.00% 4/1/20471 | | | 7,002 | | | | 6,796 | |
| Freddie Mac Pool #Q47828 4.50% 5/1/20471 | | | 250 | | | | 246 | |
| Freddie Mac Pool #ZS4735 3.50% 9/1/20471 | | | 67 | | | | 62 | |
| Freddie Mac Pool #Q51622 3.50% 10/1/20471 | | | 1,112 | | | | 1,030 | |
| Freddie Mac Pool #Q52069 3.50% 11/1/20471 | | | 1,372 | | | | 1,289 | |
| Freddie Mac Pool #SD0470 4.00% 11/1/20471 | | | 6,349 | | | | 6,104 | |
| Freddie Mac Pool #G61733 3.00% 12/1/20471 | | | 4,709 | | | | 4,282 | |
| Freddie Mac Pool #ZS4747 3.50% 12/1/20471 | | | 7,687 | | | | 7,160 | |
| Freddie Mac Pool #Q52613 4.00% 12/1/20471 | | | 4,210 | | | | 4,068 | |
| Freddie Mac Pool #G08793 4.00% 12/1/20471 | | | 2,872 | | | | 2,772 | |
| Freddie Mac Pool #Q52596 4.50% 12/1/20471 | | | 1,591 | | | | 1,571 | |
| Freddie Mac Pool #Q53878 4.00% 1/1/20481 | | | 4,088 | | | | 3,951 | |
| Freddie Mac Pool #G67709 3.50% 3/1/20481 | | | 23,079 | | | | 21,688 | |
| 14 | The Bond Fund of America |
| Bonds, notes & other debt instruments (continued) | | Principal amount
(000) | | | Value
(000) | |
| Mortgage-backed obligations (continued) | | | | | | | | |
| Federal agency mortgage-backed obligations (continued) | | | | | | | | |
| Freddie Mac Pool #Q54709 3.50% 3/1/20481 | | USD | 973 | | | $ | 913 | |
| Freddie Mac Pool #Q54701 3.50% 3/1/20481 | | | 967 | | | | 908 | |
| Freddie Mac Pool #Q54700 3.50% 3/1/20481 | | | 734 | | | | 690 | |
| Freddie Mac Pool #Q54781 3.50% 3/1/20481 | | | 687 | | | | 645 | |
| Freddie Mac Pool #Q55056 3.50% 3/1/20481 | | | 646 | | | | 604 | |
| Freddie Mac Pool #Q54782 3.50% 3/1/20481 | | | 542 | | | | 507 | |
| Freddie Mac Pool #Q54699 3.50% 3/1/20481 | | | 396 | | | | 374 | |
| Freddie Mac Pool #Q54698 3.50% 3/1/20481 | | | 281 | | | | 265 | |
| Freddie Mac Pool #Q54831 3.50% 3/1/20481 | | | 278 | | | | 262 | |
| Freddie Mac Pool #G67711 4.00% 3/1/20481 | | | 21,729 | | | | 21,002 | |
| Freddie Mac Pool #G08805 4.00% 3/1/20481 | | | 1,024 | | | | 985 | |
| Freddie Mac Pool #Q55060 3.50% 4/1/20481 | | | 217 | | | | 202 | |
| Freddie Mac Pool #Q55971 4.00% 5/1/20481 | | | 898 | | | | 867 | |
| Freddie Mac Pool #Q56175 4.00% 5/1/20481 | | | 807 | | | | 779 | |
| Freddie Mac Pool #Q55970 4.00% 5/1/20481 | | | 423 | | | | 410 | |
| Freddie Mac Pool #Q56590 3.50% 6/1/20481 | | | 496 | | | | 466 | |
| Freddie Mac Pool #Q56589 3.50% 6/1/20481 | | | 331 | | | | 311 | |
| Freddie Mac Pool #Q56591 3.50% 6/1/20481 | | | 182 | | | | 170 | |
| Freddie Mac Pool #Q56599 4.00% 6/1/20481 | | | 1,301 | | | | 1,255 | |
| Freddie Mac Pool #Q57242 4.50% 7/1/20481 | | | 318 | | | | 313 | |
| Freddie Mac Pool #ZT2265 4.00% 8/1/20481 | | | 6,246 | | | | 5,994 | |
| Freddie Mac Pool #G61628 3.50% 9/1/20481 | | | 132 | | | | 124 | |
| Freddie Mac Pool #Q58411 4.50% 9/1/20481 | | | 2,566 | | | | 2,535 | |
| Freddie Mac Pool #Q58436 4.50% 9/1/20481 | | | 1,413 | | | | 1,393 | |
| Freddie Mac Pool #Q58378 4.50% 9/1/20481 | | | 951 | | | | 937 | |
| Freddie Mac Pool #ZA5889 4.00% 11/1/20481 | | | 1,588 | | | | 1,528 | |
| Freddie Mac Pool #QA0284 3.50% 6/1/20491 | | | 3,335 | | | | 3,119 | |
| Freddie Mac Pool #QA1885 3.50% 8/1/20491 | | | 4,342 | | | | 4,054 | |
| Freddie Mac Pool #QA2748 3.50% 9/1/20491 | | | 960 | | | | 897 | |
| Freddie Mac Pool #SD7508 3.50% 10/1/20491 | | | 57,916 | | | | 54,023 | |
| Freddie Mac Pool #RA1580 3.50% 10/1/20491 | | | 7,439 | | | | 6,987 | |
| Freddie Mac Pool #RA1463 3.50% 10/1/20491 | | | 7,232 | | | | 6,793 | |
| Freddie Mac Pool #QA4692 3.00% 11/1/20491 | | | 17,999 | | | | 16,213 | |
| Freddie Mac Pool #QA4673 3.00% 11/1/20491 | | | 7,502 | | | | 6,765 | |
| Freddie Mac Pool #SD0185 3.00% 12/1/20491 | | | 4,386 | | | | 3,931 | |
| Freddie Mac Pool #QA5125 3.50% 12/1/20491 | | | 21,557 | | | | 20,143 | |
| Freddie Mac Pool #SD0234 3.00% 1/1/20501 | | | 27,593 | | | | 24,738 | |
| Freddie Mac Pool #SD0187 3.00% 1/1/20501 | | | 12,038 | | | | 10,856 | |
| Freddie Mac Pool #RA2319 3.00% 3/1/20501 | | | 18,211 | | | | 16,225 | |
| Freddie Mac Pool #RA2596 2.50% 5/1/20501 | | | 3,855 | | | | 3,326 | |
| Freddie Mac Pool #SD7517 3.00% 5/1/20501 | | | 28,058 | | | | 25,302 | |
| Freddie Mac Pool #QB1368 2.50% 7/1/20501 | | | 38,137 | | | | 33,061 | |
| Freddie Mac Pool #RA3384 3.00% 8/1/20501 | | | 2,872 | | | | 2,566 | |
| Freddie Mac Pool #SI2077 2.00% 9/1/20501 | | | 14,115 | | | | 11,630 | |
| Freddie Mac Pool #SD8090 2.00% 9/1/20501 | | | 8,802 | | | | 7,246 | |
| Freddie Mac Pool #RA3506 3.00% 9/1/20501 | | | 14,090 | | | | 12,584 | |
| Freddie Mac Pool #SD7525 2.50% 10/1/20501 | | | 36,021 | | | | 31,226 | |
| Freddie Mac Pool #SD8106 2.00% 11/1/20501 | | | 27,689 | | | | 22,789 | |
| Freddie Mac Pool #RA4070 2.50% 11/1/20501 | | | 28,359 | | | | 24,289 | |
| Freddie Mac Pool #RA3987 2.50% 11/1/20501 | | | 23,002 | | | | 19,701 | |
| Freddie Mac Pool #RA4352 2.00% 1/1/20511 | | | 1,796 | | | | 1,483 | |
| Freddie Mac Pool #QB8605 2.00% 2/1/20511 | | | 3,480 | | | | 2,895 | |
| Freddie Mac Pool #SD8128 2.00% 2/1/20511 | | | 743 | | | | 610 | |
| Freddie Mac Pool #SD7535 2.50% 2/1/20511 | | | 4,174 | | | | 3,614 | |
| Freddie Mac Pool #RA4658 3.00% 2/1/20511 | | | 38,938 | | | | 34,827 | |
| Freddie Mac Pool #SD8134 2.00% 3/1/20511 | | | 63,797 | | | | 52,401 | |
| Freddie Mac Pool #RA5287 2.00% 5/1/20511 | | | 33,425 | | | | 27,456 | |
| Freddie Mac Pool #RA5288 2.00% 5/1/20511 | | | 24,200 | | | | 19,878 | |
| Freddie Mac Pool #RA5259 2.50% 5/1/20511 | | | 4,858 | | | | 4,161 | |
| Freddie Mac Pool #RA5267 3.00% 5/1/20511 | | | 9,051 | | | | 8,052 | |
| Freddie Mac Pool #SD1852 2.50% 6/1/20511 | | | 89,921 | | | | 76,752 | |
| Freddie Mac Pool #QC2817 2.50% 6/1/20511 | | | 16,060 | | | | 13,811 | |
| Freddie Mac Pool #SD0644 2.50% 7/1/20511 | | | 15,921 | | | | 13,620 | |
| Freddie Mac Pool #SD7544 3.00% 7/1/20511 | | | 82,608 | | | | 74,242 | |
| Freddie Mac Pool #RA5836 2.50% 9/1/20511 | | | 128,663 | | | | 110,551 | |
| Freddie Mac Pool #SD7545 2.50% 9/1/20511 | | | 65,601 | | | | 56,641 | |
| Freddie Mac Pool #RA5901 3.00% 9/1/20511 | | | 9,248 | | | | 8,254 | |
| The Bond Fund of America | 15 |
| Bonds, notes & other debt instruments (continued) | | Principal amount
(000) | | | Value
(000) | |
| Mortgage-backed obligations (continued) | | | | | | | | |
| Federal agency mortgage-backed obligations (continued) | | | | | | | | |
| Freddie Mac Pool #RA5971 3.00% 9/1/20511 | | USD | 4,151 | | | $ | 3,724 | |
| Freddie Mac Pool #QC7626 3.00% 9/1/20511 | | | 750 | | | | 669 | |
| Freddie Mac Pool #SD8172 2.00% 10/1/20511 | | | 874 | | | | 716 | |
| Freddie Mac Pool #SD2880 3.00% 10/1/20511 | | | 52,710 | | | | 47,028 | |
| Freddie Mac Pool #SD0734 3.00% 10/1/20511 | | | 25,582 | | | | 22,947 | |
| Freddie Mac Pool #RA6406 2.00% 11/1/20511 | | | 132,503 | | | | 108,707 | |
| Freddie Mac Pool #SD7548 2.50% 11/1/20511 | | | 14,016 | | | | 12,096 | |
| Freddie Mac Pool #SD1385 2.50% 11/1/20511 | | | 10,620 | | | | 9,151 | |
| Freddie Mac Pool #RA6411 2.50% 11/1/20511 | | | 866 | | | | 737 | |
| Freddie Mac Pool #RA6347 3.00% 11/1/20511 | | | 10,489 | | | | 9,362 | |
| Freddie Mac Pool #RA6483 2.50% 12/1/20511 | | | 8,424 | | | | 7,241 | |
| Freddie Mac Pool #QD3310 3.00% 12/1/20511 | | | 4,448 | | | | 3,938 | |
| Freddie Mac Pool #QD1946 3.50% 12/1/20511 | | | 246 | | | | 226 | |
| Freddie Mac Pool #SD7552 2.50% 1/1/20521 | | | 73,039 | | | | 62,918 | |
| Freddie Mac Pool #SD0855 2.50% 1/1/20521 | | | 30,374 | | | | 25,865 | |
| Freddie Mac Pool #QD5941 2.50% 1/1/20521 | | | 1,431 | | | | 1,230 | |
| Freddie Mac Pool #SD0813 3.00% 1/1/20521 | | | 42,181 | | | | 37,830 | |
| Freddie Mac Pool #SD0803 3.00% 1/1/20521 | | | 1,780 | | | | 1,587 | |
| Freddie Mac Pool #QD7321 3.50% 1/1/20521 | | | 354 | | | | 325 | |
| Freddie Mac Pool #RA6114 2.00% 2/1/20521 | | | 70,744 | | | | 57,873 | |
| Freddie Mac Pool #SD0881 2.50% 2/1/20521 | | | 27,770 | | | | 23,809 | |
| Freddie Mac Pool #SD7550 3.00% 2/1/20521 | | | 60,667 | | | | 54,647 | |
| Freddie Mac Pool #SD0873 3.50% 2/1/20521 | | | 24,894 | | | | 23,209 | |
| Freddie Mac Pool #QD7089 3.50% 2/1/20521 | | | 5,300 | | | | 4,889 | |
| Freddie Mac Pool #QD8207 2.00% 3/1/20521 | | | 19,563 | | | | 16,015 | |
| Freddie Mac Pool #QD8010 2.00% 3/1/20521 | | | 691 | | | | 565 | |
| Freddie Mac Pool #QD7603 2.00% 3/1/20521 | | | 40 | | | | 33 | |
| Freddie Mac Pool #SD1450 2.50% 3/1/20521 | | | 2,707 | | | | 2,332 | |
| Freddie Mac Pool #SD7553 3.00% 3/1/20521 | | | 32,323 | | | | 28,986 | |
| Freddie Mac Pool #QD9030 3.50% 3/1/20521 | | | 894 | | | | 821 | |
| Freddie Mac Pool #QE0562 3.50% 3/1/20521 | | | 63 | | | | 59 | |
| Freddie Mac Pool #QD8208 3.50% 3/1/20521 | | | 43 | | | | 40 | |
| Freddie Mac Pool #QD9527 4.00% 3/1/20521 | | | 19 | | | | 18 | |
| Freddie Mac Pool #SD8204 2.00% 4/1/20521 | | | 668 | | | | 546 | |
| Freddie Mac Pool #SD7554 2.50% 4/1/20521 | | | 27,887 | | | | 24,049 | |
| Freddie Mac Pool #QD9911 2.50% 4/1/20521 | | | 208 | | | | 177 | |
| Freddie Mac Pool #QE0917 3.50% 4/1/20521 | | | 499 | | | | 458 | |
| Freddie Mac Pool #QE0316 3.50% 4/1/20521 | | | 40 | | | | 37 | |
| Freddie Mac Pool #8D0226 2.546% 5/1/20521,3 | | | 8,931 | | | | 7,958 | |
| Freddie Mac Pool #SD8214 3.50% 5/1/20521 | | | 7,688 | | | | 7,057 | |
| Freddie Mac Pool #QE8663 3.50% 5/1/20521 | | | 984 | | | | 903 | |
| Freddie Mac Pool #QE5301 3.50% 5/1/20521 | | | 817 | | | | 749 | |
| Freddie Mac Pool #QE5589 3.50% 5/1/20521 | | | 709 | | | | 651 | |
| Freddie Mac Pool #SD1318 3.50% 6/1/20521 | | | 935 | | | | 858 | |
| Freddie Mac Pool #QE3580 3.50% 6/1/20521 | | | 408 | | | | 375 | |
| Freddie Mac Pool #QE4273 3.50% 6/1/20521 | | | 86 | | | | 79 | |
| Freddie Mac Pool #SD3245 4.00% 6/1/20521 | | | 43,851 | | | | 42,027 | |
| Freddie Mac Pool #QE4383 4.00% 6/1/20521 | | | 887 | | | | 839 | |
| Freddie Mac Pool #RA7556 4.50% 6/1/20521 | | | 25,419 | | | | 24,657 | |
| Freddie Mac Pool #RA7502 5.00% 6/1/20521 | | | 134 | | | | 133 | |
| Freddie Mac Pool #SD1502 4.00% 7/1/20521 | | | 5,553 | | | | 5,255 | |
| Freddie Mac Pool #QE5750 5.00% 7/1/20521 | | | 30,559 | | | | 30,284 | |
| Freddie Mac Pool #QE6185 5.00% 7/1/20521 | | | 711 | | | | 705 | |
| Freddie Mac Pool #RA7618 5.00% 7/1/20521 | | | 383 | | | | 380 | |
| Freddie Mac Pool #SD8234 2.50% 8/1/20521 | | | 777 | | | | 661 | |
| Freddie Mac Pool #SD7556 3.00% 8/1/20521 | | | 30,110 | | | | 26,958 | |
| Freddie Mac Pool #SD8237 4.00% 8/1/20521 | | | 840 | | | | 795 | |
| Freddie Mac Pool #QE7539 4.50% 8/1/20521 | | | 13,693 | | | | 13,283 | |
| Freddie Mac Pool #QE8579 4.50% 8/1/20521 | | | 551 | | | | 535 | |
| Freddie Mac Pool #QE8282 5.00% 8/1/20521 | | | 28 | | | | 28 | |
| Freddie Mac Pool #QE7987 5.50% 8/1/20521 | | | 309 | | | | 312 | |
| Freddie Mac Pool #SD8242 3.00% 9/1/20521 | | | 848 | | | | 751 | |
| Freddie Mac Pool #QF0212 4.50% 9/1/20521 | | | 2,520 | | | | 2,445 | |
| Freddie Mac Pool #QE9497 4.50% 9/1/20521 | | | 629 | | | | 610 | |
| Freddie Mac Pool #SD1608 4.50% 9/1/20521 | | | 373 | | | | 362 | |
| Freddie Mac Pool #RA7938 5.00% 9/1/20521 | | | 9,868 | | | | 9,789 | |
| Freddie Mac Pool #SD2079 4.00% 10/1/20521 | | | 8,422 | | | | 7,969 | |
| 16 | The Bond Fund of America |
| Bonds, notes & other debt instruments (continued) | | Principal amount
(000) | | | Value
(000) | |
| Mortgage-backed obligations (continued) | | | | | | | | |
| Federal agency mortgage-backed obligations (continued) | | | | | | | | |
| Freddie Mac Pool #QF2221 4.00% 10/1/20521 | | USD | 4,838 | | | $ | 4,578 | |
| Freddie Mac Pool #QF2223 4.00% 10/1/20521 | | | 328 | | | | 310 | |
| Freddie Mac Pool #SD8257 4.50% 10/1/20521 | | | 21,948 | | | | 21,291 | |
| Freddie Mac Pool #QF1254 4.50% 10/1/20521 | | | 21,517 | | | | 20,872 | |
| Freddie Mac Pool #QF1236 4.50% 10/1/20521 | | | 3,673 | | | | 3,563 | |
| Freddie Mac Pool #QF2368 4.50% 10/1/20521 | | | 3,105 | | | | 3,012 | |
| Freddie Mac Pool #QF2009 4.50% 10/1/20521 | | | 348 | | | | 338 | |
| Freddie Mac Pool #SD2465 4.50% 10/1/20521 | | | 248 | | | | 241 | |
| Freddie Mac Pool #QF1352 5.00% 10/1/20521 | | | 25,149 | | | | 24,922 | |
| Freddie Mac Pool #RA8059 5.50% 10/1/20521 | | | 47,656 | | | | 47,988 | |
| Freddie Mac Pool #SD1896 4.00% 11/1/20521 | | | 130,857 | | | | 125,778 | |
| Freddie Mac Pool #SD1894 4.00% 11/1/20521 | | | 44,941 | | | | 43,224 | |
| Freddie Mac Pool #QF2960 4.50% 11/1/20521 | | | 2,801 | | | | 2,717 | |
| Freddie Mac Pool #SD2948 5.50% 11/1/20521 | | | 59,796 | | | | 60,193 | |
| Freddie Mac Pool #SD2066 4.00% 12/1/20521 | | | 2,878 | | | | 2,723 | |
| Freddie Mac Pool #SD8276 5.00% 12/1/20521 | | | 153,889 | | | | 152,361 | |
| Freddie Mac Pool #QF4623 5.00% 12/1/20521 | | | 87,566 | | | | 86,778 | |
| Freddie Mac Pool #SD1961 5.50% 12/1/20521 | | | 10,973 | | | | 11,033 | |
| Freddie Mac Pool #SD8286 4.00% 1/1/20531 | | | 11,882 | | | | 11,242 | |
| Freddie Mac Pool #SD8287 4.50% 1/1/20531 | | | 8,687 | | | | 8,427 | |
| Freddie Mac Pool #SD8288 5.00% 1/1/20531 | | | 1,571 | | | | 1,556 | |
| Freddie Mac Pool #SD8290 6.00% 1/1/20531 | | | 360,742 | | | | 366,534 | |
| Freddie Mac Pool #QF6121 6.00% 1/1/20531 | | | 577 | | | | 587 | |
| Freddie Mac Pool #SD2246 6.00% 1/1/20531 | | | 65 | | | | 66 | |
| Freddie Mac Pool #QF7774 5.50% 2/1/20531 | | | 6,012 | | | | 6,047 | |
| Freddie Mac Pool #QF7144 5.50% 2/1/20531 | | | 5,278 | | | | 5,312 | |
| Freddie Mac Pool #QF7483 5.50% 2/1/20531 | | | 889 | | | | 894 | |
| Freddie Mac Pool #QF8331 5.50% 2/1/20531 | | | 583 | | | | 587 | |
| Freddie Mac Pool #SD8301 6.00% 2/1/20531 | | | 95,156 | | | | 96,915 | |
| Freddie Mac Pool #SD2618 6.00% 2/1/20531 | | | 60 | | | | 61 | |
| Freddie Mac Pool #SD8306 4.50% 3/1/20531 | | | 394 | | | | 382 | |
| Freddie Mac Pool #QF8462 5.50% 3/1/20531 | | | 23,552 | | | | 23,696 | |
| Freddie Mac Pool #QF9076 5.50% 3/1/20531 | | | 7,945 | | | | 7,992 | |
| Freddie Mac Pool #SD8314 4.50% 4/1/20531 | | | 1,694 | | | | 1,643 | |
| Freddie Mac Pool #SD8315 5.00% 4/1/20531 | | | 28,666 | | | | 28,371 | |
| Freddie Mac Pool #SD2716 5.00% 4/1/20531 | | | 19,024 | | | | 18,850 | |
| Freddie Mac Pool #QG0749 5.00% 4/1/20531 | | | 9,414 | | | | 9,322 | |
| Freddie Mac Pool #SD2654 5.00% 4/1/20531 | | | 2,120 | | | | 2,098 | |
| Freddie Mac Pool #QG1829 5.00% 4/1/20531 | | | 1,100 | | | | 1,088 | |
| Freddie Mac Pool #SD8316 5.50% 4/1/20531 | | | 34,702 | | | | 34,862 | |
| Freddie Mac Pool #QG1266 5.50% 4/1/20531 | | | 495 | | | | 498 | |
| Freddie Mac Pool #RA8647 4.50% 5/1/20531 | | | 255 | | | | 247 | |
| Freddie Mac Pool #QG3743 5.00% 5/1/20531 | | | 17,916 | | | | 17,731 | |
| Freddie Mac Pool #SD8323 5.00% 5/1/20531 | | | 11,974 | | | | 11,851 | |
| Freddie Mac Pool #QG2060 5.00% 5/1/20531 | | | 1,030 | | | | 1,020 | |
| Freddie Mac Pool #SD8324 5.50% 5/1/20531 | | | 185,410 | | | | 186,232 | |
| Freddie Mac Pool #SD3369 5.50% 5/1/20531 | | | 73,832 | | | | 74,277 | |
| Freddie Mac Pool #QG3382 5.50% 5/1/20531 | | | 7,158 | | | | 7,194 | |
| Freddie Mac Pool #QG3365 5.50% 5/1/20531 | | | 4,965 | | | | 4,988 | |
| Freddie Mac Pool #QG1719 5.50% 5/1/20531 | | | 46 | | | | 47 | |
| Freddie Mac Pool #SD8325 6.00% 5/1/20531 | | | 182,724 | | | | 185,653 | |
| Freddie Mac Pool #SD3214 4.00% 6/1/20531 | | | 20,543 | | | | 19,435 | |
| Freddie Mac Pool #SD8328 4.50% 6/1/20531 | | | 13,737 | | | | 13,324 | |
| Freddie Mac Pool #SD8329 5.00% 6/1/20531 | | | 45,353 | | | | 44,879 | |
| Freddie Mac Pool #QG4778 5.00% 6/1/20531 | | | 993 | | | | 983 | |
| Freddie Mac Pool #SD8331 5.50% 6/1/20531 | | | 185,060 | | | | 185,880 | |
| Freddie Mac Pool #QG4632 5.50% 6/1/20531 | | | 15,572 | | | | 15,646 | |
| Freddie Mac Pool #QG5136 5.50% 6/1/20531 | | | 8,284 | | | | 8,323 | |
| Freddie Mac Pool #QG5097 5.50% 6/1/20531 | | | 7,681 | | | | 7,727 | |
| Freddie Mac Pool #QG4732 5.50% 6/1/20531 | | | 36 | | | | 36 | |
| Freddie Mac Pool #QG3775 5.50% 6/1/20531 | | | 24 | | | | 24 | |
| Freddie Mac Pool #SD8332 6.00% 6/1/20531 | | | 259,835 | | | | 263,928 | |
| Freddie Mac Pool #SD3240 6.00% 6/1/20531 | | | 62,298 | | | | 63,327 | |
| Freddie Mac Pool #SD3083 6.00% 6/1/20531 | | | 24,275 | | | | 24,679 | |
| Freddie Mac Pool #RA9279 6.00% 6/1/20531 | | | 20,397 | | | | 20,801 | |
| Freddie Mac Pool #RA9283 6.00% 6/1/20531 | | | 19,136 | | | | 19,506 | |
| Freddie Mac Pool #RA9281 6.00% 6/1/20531 | | | 12,563 | | | | 12,767 | |
| | |
| The Bond Fund of America | 17 |
| Bonds, notes & other debt instruments (continued) | | Principal amount
(000) | | | Value
(000) | |
| Mortgage-backed obligations (continued) | | | | | | | | |
| Federal agency mortgage-backed obligations (continued) | | | | | | | | |
| Freddie Mac Pool #RA9284 6.00% 6/1/20531 | | USD | 8,825 | | | $ | 9,130 | |
| Freddie Mac Pool #QG4096 6.00% 6/1/20531 | | | 473 | | | | 480 | |
| Freddie Mac Pool #RA9294 6.50% 6/1/20531 | | | 8,924 | | | | 9,178 | |
| Freddie Mac Pool #RA9292 6.50% 6/1/20531 | | | 7,707 | | | | 7,924 | |
| Freddie Mac Pool #RA9289 6.50% 6/1/20531 | | | 7,240 | | | | 7,500 | |
| Freddie Mac Pool #RA9288 6.50% 6/1/20531 | | | 7,048 | | | | 7,326 | |
| Freddie Mac Pool #RA9287 6.50% 6/1/20531 | | | 4,881 | | | | 5,088 | |
| Freddie Mac Pool #RA9290 6.50% 6/1/20531 | | | 3,717 | | | | 3,838 | |
| Freddie Mac Pool #RA9291 6.50% 6/1/20531 | | | 2,722 | | | | 2,790 | |
| Freddie Mac Pool #RA9295 6.50% 6/1/20531 | | | 2,007 | | | | 2,098 | |
| Freddie Mac Pool #SD8353 4.00% 7/1/20531 | | | 28,331 | | | | 26,794 | |
| Freddie Mac Pool #SD8341 5.00% 7/1/20531 | | | 138,902 | | | | 137,450 | |
| Freddie Mac Pool #QG6641 5.00% 7/1/20531 | | | 11,437 | | | | 11,322 | |
| Freddie Mac Pool #QG9079 5.00% 7/1/20531 | | | 8,681 | | | | 8,591 | |
| Freddie Mac Pool #QG7072 5.00% 7/1/20531 | | | 5,838 | | | | 5,777 | |
| Freddie Mac Pool #QG6394 5.00% 7/1/20531 | | | 936 | | | | 926 | |
| Freddie Mac Pool #SD8342 5.50% 7/1/20531 | | | 751,537 | | | | 754,751 | |
| Freddie Mac Pool #SD8343 6.00% 7/1/20531 | | | 149,981 | | | | 152,321 | |
| Freddie Mac Pool #SD3356 6.00% 7/1/20531 | | | 48,413 | | | | 49,199 | |
| Freddie Mac Pool #SD8357 4.00% 8/1/20531 | | | 16,882 | | | | 15,966 | |
| Freddie Mac Pool #QG8013 5.00% 8/1/20531 | | | 1,048 | | | | 1,037 | |
| Freddie Mac Pool #QG9140 5.00% 8/1/20531 | | | 1,032 | | | | 1,021 | |
| Freddie Mac Pool #SD8360 4.50% 9/1/20531 | | | 15,125 | | | | 14,670 | |
| Freddie Mac Pool #SD8362 5.50% 9/1/20531 | | | 5,495 | | | | 5,518 | |
| Freddie Mac Pool #SD8379 4.00% 10/1/20531 | | | 22,786 | | | | 21,549 | |
| Freddie Mac Pool #SD8367 5.50% 10/1/20531 | | | 46,888 | | | | 47,097 | |
| Freddie Mac Pool #SD8368 6.00% 10/1/20531 | | | 305,970 | | | | 310,742 | |
| Freddie Mac Pool #SD4053 6.00% 10/1/20531 | | | 114,024 | | | | 115,856 | |
| Freddie Mac Pool #SD8369 6.50% 10/1/20531 | | | 36,817 | | | | 37,744 | |
| Freddie Mac Pool #SD8370 4.50% 11/1/20531 | | | 9,987 | | | | 9,687 | |
| Freddie Mac Pool #SD8372 5.50% 11/1/20531 | | | 24,305 | | | | 24,409 | |
| Freddie Mac Pool #SD8373 6.00% 11/1/20531 | | | 136,270 | | | | 138,396 | |
| Freddie Mac Pool #SD8381 4.50% 12/1/20531 | | | 11,069 | | | | 10,736 | |
| Freddie Mac Pool #SD8384 6.00% 12/1/20531 | | | 226,228 | | | | 229,757 | |
| Freddie Mac Pool #SD8385 6.50% 12/1/20531 | | | 46,646 | | | | 47,818 | |
| Freddie Mac Pool #SD8386 7.00% 12/1/20531 | | | 10,189 | | | | 10,516 | |
| Freddie Mac Pool #SD8393 4.50% 1/1/20541 | | | 2,372 | | | | 2,301 | |
| Freddie Mac Pool #SD8396 6.00% 1/1/20541 | | | 84,042 | | | | 85,353 | |
| Freddie Mac, Series 2122, Class QM, 6.25% 2/15/20291 | | | 158 | | | | 158 | |
| Freddie Mac, Series K749, Class AM, 2.12% 6/25/20291 | | | 2,069 | | | | 1,849 | |
| Freddie Mac, Series K127, Class A2, 2.108% 1/25/20311 | | | 1,000 | | | | 862 | |
| Freddie Mac, Series K136, Class A2, 2.127% 11/25/20311 | | | 142 | | | | 121 | |
| Freddie Mac, Series 3257, Class PA, 5.50% 12/15/20361 | | | 2,078 | | | | 2,132 | |
| Freddie Mac, Series 3286, Class JN, 5.50% 2/15/20371 | | | 1,587 | | | | 1,627 | |
| Freddie Mac, Series 3318, Class JT, 5.50% 5/15/20371 | | | 826 | | | | 844 | |
| Freddie Mac, Series K044, Class A2, Multi Family, 2.811% 1/25/20251 | | | 17,099 | | | | 16,705 | |
| Freddie Mac, Series K048, Class A2, Multi Family, 3.284% 6/25/20251,3 | | | 562 | | | | 550 | |
| Freddie Mac, Series K060, Class A2, Multi Family, 3.30% 10/25/20261 | | | 400 | | | | 388 | |
| Freddie Mac, Series K742, Class A2, Multi Family, 1.76% 3/25/20281 | | | 3,000 | | | | 2,708 | |
| Freddie Mac, Series K079, Class A2, Multi Family, 3.926% 6/25/20281 | | | 172 | | | | 169 | |
| Freddie Mac, Series K082, Class A2, Multi Family, 3.92% 9/25/20281,3 | | | 1,680 | | | | 1,648 | |
| Freddie Mac, Series K083, Class A2, Multi Family, 4.05% 9/25/20281,3 | | | 3,000 | | | | 2,958 | |
| Freddie Mac, Series K089, Class A2, Multi Family, 3.563% 1/25/20291 | | | 5,249 | | | | 5,067 | |
| Freddie Mac, Series K749, Class A2, Multi Family, 2.12% 6/25/20291 | | | 2,113 | | | | 1,903 | |
| Freddie Mac, Series K101, Class A2, Multi Family, 2.524% 10/25/20291 | | | 62 | | | | 56 | |
| Freddie Mac, Series K751, Class A2, Multi Family, 4.412% 3/25/20301 | | | 118,468 | | | | 118,541 | |
| Freddie Mac, Series K137, Class A2, Multi Family, 2.347% 11/25/20311,3 | | | 306 | | | | 264 | |
| Freddie Mac, Series K140, Class A2, Multi Family, 2.25% 1/25/20321 | | | 417 | | | | 356 | |
| Freddie Mac, Series K144, Class A2, Multi Family, 2.45% 4/25/20321 | | | 7,501 | | | | 6,484 | |
| Freddie Mac, Series K143, Class A2, Multi Family, 2.35% 6/25/20321 | | | 7,984 | | | | 6,855 | |
| Freddie Mac, Series K144, Class AM, Multi Family, 2.45% 7/25/20321 | | | 5,000 | | | | 4,312 | |
| Freddie Mac, Series K144, Class A2, Multi Family, 2.45% 7/25/20321 | | | 3,551 | | | | 3,069 | |
| Freddie Mac, Series K152, Class A2, Multi Family, 3.80% 10/25/20321,3 | | | 2,010 | | | | 1,918 | |
| Freddie Mac, Series K152, Class A2, Multi Family, 3.78% 11/25/20321 | | | 21,945 | | | | 20,911 | |
| Freddie Mac, Series K151, Class A2, Multi Family, 3.80% 12/25/20321 | | | 6,865 | | | | 6,552 | |
| Freddie Mac, Series K153, Class A2, Multi Family, 3.82% 1/25/20331 | | | 13,000 | | | | 12,412 | |
| Freddie Mac, Series K156, Class A2, Multi Family, 4.43% 2/25/20331,3 | | | 24,842 | | | | 24,824 | |
| | |
| 18 | The Bond Fund of America |
| Bonds, notes & other debt instruments (continued) | | Principal amount
(000) | | | Value
(000) | |
| Mortgage-backed obligations (continued) | | | | | | | | |
| Federal agency mortgage-backed obligations (continued) | | | | | | | | |
| Freddie Mac, Series K155, Class A2, Multi Family, 4.25% 4/25/20331 | | USD | 4,000 | | | $ | 3,943 | |
| Freddie Mac, Series K105, Class A2, Multi Family, 1.872% 3/25/20531 | | | 23 | | | | 20 | |
| Freddie Mac, Series 3147, Class OD, principal only, 0% 4/15/20361 | | | 233 | | | | 205 | |
| Freddie Mac, Series 3136, Class OP, principal only, 0% 4/15/20361 | | | 221 | | | | 174 | |
| Freddie Mac, Series 3156, Class PO, principal only, 0% 5/15/20361 | | | 787 | | | | 671 | |
| Freddie Mac, Series 3149, Class MO, principal only, 0% 5/15/20361 | | | 92 | | | | 80 | |
| Freddie Mac, Series 3149, Class AO, principal only, 0% 5/15/20361 | | | 82 | | | | 70 | |
| Freddie Mac Seasoned Credit Risk Transfer Trust, Series 2017-1, Class HA, 3.00% 1/25/20561,3 | | | 22,951 | | | | 20,990 | |
| Freddie Mac Seasoned Credit Risk Transfer Trust, Series 2017-1, Class MA, 3.00% 1/25/20561 | | | 3,151 | | | | 2,891 | |
| Freddie Mac Seasoned Credit Risk Transfer Trust, Series 2017-3, Class MT, 3.00% 7/25/20561 | | | 5,372 | | | | 4,604 | |
| Freddie Mac Seasoned Credit Risk Transfer Trust, Series 2017-3, Class HA, 3.25% 7/25/20561,3 | | | 9,516 | | | | 8,744 | |
| Freddie Mac Seasoned Credit Risk Transfer Trust, Series 2017-3, Class HT, 3.25% 7/25/20561 | | | 1,088 | | | | 915 | |
| Freddie Mac Seasoned Credit Risk Transfer Trust, Series 2017-2, Class MA, 3.00% 8/25/20561 | | | 27,839 | | | | 25,610 | |
| Freddie Mac Seasoned Credit Risk Transfer Trust, Series 2017-2, Class HA, 3.00% 8/25/20561,3 | | | 26,735 | | | | 24,465 | |
| Freddie Mac Seasoned Credit Risk Transfer Trust, Series 2018-1, Class HT, 3.00% 5/25/20571 | | | 5,700 | | | | 4,845 | |
| Freddie Mac Seasoned Credit Risk Transfer Trust, Series 2017-4, Class HT, 3.25% 6/25/20571,3 | | | 8,215 | | | | 7,241 | |
| Freddie Mac Seasoned Credit Risk Transfer Trust, Series 2017-4, Class MT, 3.50% 6/25/20571 | | | 5,085 | | | | 4,576 | |
| Freddie Mac Seasoned Credit Risk Transfer Trust, Series 2017-4, Class M45T, 4.50% 6/25/20571 | | | 4,500 | | | | 4,278 | |
| Freddie Mac Seasoned Credit Risk Transfer Trust, Series 2018-3, Class MA, 3.50% 8/25/20571 | | | 43,167 | | | | 40,792 | |
| Freddie Mac Seasoned Credit Risk Transfer Trust, Series 2018-2, Class MT, 3.50% 11/25/20571 | | | 8,474 | | | | 7,570 | |
| Freddie Mac Seasoned Credit Risk Transfer Trust, Series 2019-1, Class MT, 3.50% 7/25/20581 | | | 2,845 | | | | 2,537 | |
| Freddie Mac Seasoned Credit Risk Transfer Trust, Series 2019-1, Class MA, 3.50% 7/25/20581 | | | 1,181 | | | | 1,118 | |
| Freddie Mac Seasoned Credit Risk Transfer Trust, Series 2019-2, Class MA, 3.50% 8/25/20581 | | | 19,940 | | | | 18,802 | |
| Freddie Mac Seasoned Credit Risk Transfer Trust, Series 2019-2, Class MT, 3.50% 8/26/20581 | | | 2,414 | | | | 2,153 | |
| Freddie Mac Seasoned Credit Risk Transfer Trust, Series 2019-3, Class MT, 3.50% 10/25/20581 | | | 1,486 | | | | 1,327 | |
| Freddie Mac Seasoned Credit Risk Transfer Trust, Series 2019-3, Class MA, 3.50% 10/25/20581 | | | 496 | | | | 468 | |
| Freddie Mac Seasoned Credit Risk Transfer Trust, Series 2019-4, Class MA, 3.00% 2/25/20591 | | | 87,941 | | | | 80,518 | |
| Freddie Mac Seasoned Loan Structured Transaction Trust, Series 2018-1, Class A1, 3.50% 6/25/20281 | | | 17,753 | | | | 17,067 | |
| Freddie Mac Seasoned Loan Structured Transaction Trust, Series 2018-2, Class A1, 3.50% 11/25/20281 | | | 13,375 | | | | 12,755 | |
| Freddie Mac Seasoned Loan Structured Transaction Trust, Series 2019-2, Class A1C, 2.75% 9/25/20291 | | | 47,247 | | | | 43,633 | |
| Freddie Mac Seasoned Loan Structured Transaction Trust, Series 2019-3, Class A1C, 2.75% 11/25/20291 | | | 24,341 | | | | 22,439 | |
| Freddie Mac Seasoned Loan Structured Transaction Trust, Series 2022-1, Class A1, 3.50% 5/25/20321 | | | 34,374 | | | | 32,518 | |
| FREMF Mortgage Trust, Series K-142, Class A2, 2.40% 3/25/20321 | | | 7,924 | | | | 6,839 | |
| Government National Mortgage Assn. 3.50% 12/1/20531,5 | | | 5,000 | | | | 4,652 | |
| Government National Mortgage Assn. 2.50% 1/1/20541,5 | | | 6,100 | | | | 5,337 | |
| Government National Mortgage Assn. 3.00% 1/1/20541,5 | | | 41,283 | | | | 37,384 | |
| Government National Mortgage Assn. 4.00% 1/1/20541,5 | | | 96,270 | | | | 91,923 | |
| Government National Mortgage Assn. 5.50% 1/1/20541,5 | | | 403,272 | | | | 406,235 | |
| Government National Mortgage Assn. 2.50% 2/1/20541,5 | | | 12,300 | | | | 10,789 | |
| Government National Mortgage Assn. 4.00% 2/1/20541,5 | | | 23,200 | | | | 22,219 | |
| Government National Mortgage Assn. Pool #MA0908 2.50% 4/20/20281 | | | 401 | | | | 385 | |
| Government National Mortgage Assn. Pool #AB3820 5.00% 12/20/20351 | | | 172 | | | | 172 | |
| | |
| The Bond Fund of America | 19 |
| Bonds, notes & other debt instruments (continued) | | Principal amount
(000) | | | Value
(000) | |
| Mortgage-backed obligations (continued) | | | | | | | | |
| Federal agency mortgage-backed obligations (continued) | | | | | | | | |
| Government National Mortgage Assn. Pool #AB3587 6.50% 12/20/20381 | | USD | 29 | | | $ | 30 | |
| Government National Mortgage Assn. Pool #AB3819 5.00% 12/20/20391 | | | 267 | | | | 266 | |
| Government National Mortgage Assn. Pool #004636 4.50% 2/20/20401 | | | 756 | | | | 757 | |
| Government National Mortgage Assn. Pool #783689 5.50% 2/20/20401 | | | 1,288 | | | | 1,329 | |
| Government National Mortgage Assn. Pool #AB3818 4.50% 6/20/20411 | | | 64 | | | | 63 | |
| Government National Mortgage Assn. Pool #783688 5.00% 6/20/20411 | | | 1,116 | | | | 1,147 | |
| Government National Mortgage Assn. Pool #AC2886 4.50% 8/20/20411 | | | 586 | | | | 580 | |
| Government National Mortgage Assn. Pool #AB3664 4.50% 8/20/20411 | | | 112 | | | | 110 | |
| Government National Mortgage Assn. Pool #783687 4.50% 12/20/20411 | | | 3,562 | | | | 3,529 | |
| Government National Mortgage Assn. Pool #754353 3.50% 4/20/20421 | | | 278 | | | | 259 | |
| Government National Mortgage Assn. Pool #AD7620 3.50% 3/20/20431 | | | 823 | | | | 766 | |
| Government National Mortgage Assn. Pool #BC1530 3.00% 8/20/20471 | | | 3,206 | | | | 2,918 | |
| Government National Mortgage Assn. Pool #BC1565 3.00% 8/20/20471 | | | 1,296 | | | | 1,179 | |
| Government National Mortgage Assn. Pool #MA5019 3.50% 2/20/20481 | | | 225 | | | | 212 | |
| Government National Mortgage Assn. Pool #MA5263 3.50% 6/20/20481 | | | 1,805 | | | | 1,696 | |
| Government National Mortgage Assn. Pool #MA5332 5.00% 7/20/20481 | | | 35 | | | | 35 | |
| Government National Mortgage Assn. Pool #MA5527 3.50% 10/20/20481 | | | 1,400 | | | | 1,318 | |
| Government National Mortgage Assn. Pool #MA5594 3.50% 11/20/20481 | | | 2,241 | | | | 2,110 | |
| Government National Mortgage Assn. Pool #MA5652 4.50% 12/20/20481 | | | 1,949 | | | | 1,926 | |
| Government National Mortgage Assn. Pool #MA5754 4.50% 2/20/20491 | | | 28 | | | | 27 | |
| Government National Mortgage Assn. Pool #MA5755 5.00% 2/20/20491 | | | 119 | | | | 117 | |
| Government National Mortgage Assn. Pool #MA5817 4.00% 3/20/20491 | | | 9,820 | | | | 9,471 | |
| Government National Mortgage Assn. Pool #MA5818 4.50% 3/20/20491 | | | 1,716 | | | | 1,696 | |
| Government National Mortgage Assn. Pool #MA6041 4.50% 7/20/20491 | | | 285 | | | | 281 | |
| Government National Mortgage Assn. Pool #MA6042 5.00% 7/20/20491 | | | 68 | | | | 69 | |
| Government National Mortgage Assn. Pool #MA6156 4.50% 9/20/20491 | | | 1,714 | | | | 1,686 | |
| Government National Mortgage Assn. Pool #MA6600 3.50% 4/20/20501 | | | 69,613 | | | | 65,446 | |
| Government National Mortgage Assn. Pool #MA6602 4.50% 4/20/20501 | | | 423 | | | | 412 | |
| Government National Mortgage Assn. Pool #MA6994 2.00% 11/20/20501 | | | 15,857 | | | | 13,436 | |
| Government National Mortgage Assn. Pool #BZ3978 2.50% 11/20/20501 | | | 1,491 | | | | 1,299 | |
| Government National Mortgage Assn. Pool #MA7051 2.00% 12/20/20501 | | | 23,318 | | | | 19,757 | |
| Government National Mortgage Assn. Pool #MA7259 4.50% 3/20/20511 | | | 19,227 | | | | 19,009 | |
| Government National Mortgage Assn. Pool #785607 2.50% 8/20/20511 | | | 49,446 | | | | 42,628 | |
| Government National Mortgage Assn. Pool #785575 2.50% 8/20/20511 | | | 31,507 | | | | 27,101 | |
| Government National Mortgage Assn. Pool #785659 2.50% 10/20/20511 | | | 37,305 | | | | 31,982 | |
| Government National Mortgage Assn. Pool #785813 2.50% 12/20/20511 | | | 23,415 | | | | 20,241 | |
| Government National Mortgage Assn. Pool #786706 2.50% 12/20/20511 | | | 9,694 | | | | 8,522 | |
| Government National Mortgage Assn. Pool #785847 2.50% 1/20/20521 | | | 34,393 | | | | 29,573 | |
| Government National Mortgage Assn. Pool #MA7827 2.50% 1/20/20521 | | | 10,000 | | | | 8,746 | |
| Government National Mortgage Assn. Pool #786502 2.50% 2/20/20521 | | | 1,777 | | | | 1,549 | |
| Government National Mortgage Assn. Pool #785998 2.50% 3/20/20521 | | | 3,036 | | | | 2,611 | |
| Government National Mortgage Assn. Pool #786701 2.50% 3/20/20521 | | | 619 | | | | 540 | |
| Government National Mortgage Assn. Pool #786647 2.50% 3/20/20521 | | | 104 | | | | 91 | |
| Government National Mortgage Assn. Pool #MA8099 3.50% 6/20/20521 | | | 1,000 | | | | 931 | |
| Government National Mortgage Assn. Pool #MA8147 2.50% 7/20/20521 | | | 843 | | | | 737 | |
| Government National Mortgage Assn. Pool #MA8148 3.00% 7/20/20521 | | | 41,276 | | | | 37,377 | |
| Government National Mortgage Assn. Pool #MA8266 3.50% 9/20/20521 | | | 172,652 | | | | 160,749 | |
| Government National Mortgage Assn. Pool #MA8267 4.00% 9/20/20521 | | | 62,345 | | | | 59,512 | |
| Government National Mortgage Assn. Pool #MA8346 4.00% 10/20/20521 | | | 17,762 | | | | 16,954 | |
| Government National Mortgage Assn. Pool #MA8425 3.50% 11/20/20521 | | | 4,000 | | | | 3,724 | |
| Government National Mortgage Assn. Pool #MA8426 4.00% 11/20/20521 | | | 2,000 | | | | 1,909 | |
| Government National Mortgage Assn. Pool #MA8487 3.50% 12/20/20521 | | | 36 | | | | 33 | |
| Government National Mortgage Assn. Pool #MA8488 4.00% 12/20/20521 | | | 1,198 | | | | 1,144 | |
| Government National Mortgage Assn. Pool #MA8799 4.50% 4/20/20531 | | | 209,490 | | | | 204,407 | |
| Government National Mortgage Assn. Pool #MA8800 5.00% 4/20/20531 | | | 4,309 | | | | 4,282 | |
| Government National Mortgage Assn. Pool #MA8878 5.00% 5/20/20531 | | | 10,036 | | | | 9,965 | |
| Government National Mortgage Assn. Pool #MA8947 5.00% 6/20/20531 | | | 3,211 | | | | 3,188 | |
| Government National Mortgage Assn. Pool #MA9015 4.50% 7/20/20531 | | | 209,399 | | | | 204,318 | |
| Government National Mortgage Assn. Pool #MA9016 5.00% 7/20/20531 | | | 33,290 | | | | 33,053 | |
| Government National Mortgage Assn. Pool #MA9104 4.50% 8/20/20531 | | | 59,631 | | | | 58,188 | |
| Government National Mortgage Assn. Pool #MA9169 4.50% 9/20/20531 | | | 98,735 | | | | 96,344 | |
| Government National Mortgage Assn. Pool #MA9170 5.00% 9/20/20531 | | | 56,054 | | | | 55,655 | |
| Government National Mortgage Assn. Pool #MA9240 5.00% 10/20/20531 | | | 2,701 | | | | 2,682 | |
| Government National Mortgage Assn. Pool #694836 5.75% 9/20/20591 | | | — | 2 | | | — | 2 |
| Government National Mortgage Assn. Pool #721648 5.05% 4/20/20611 | | | 3 | | | | 3 | |
| Government National Mortgage Assn. Pool #725876 4.899% 9/20/20611 | | | — | 2 | | | — | 2 |
| Government National Mortgage Assn. Pool #710085 5.024% 9/20/20611 | | | 3 | | | | 3 | |
| | |
| 20 | The Bond Fund of America |
| Bonds, notes & other debt instruments (continued) | | Principal amount
(000) | | | Value
(000) | |
| Mortgage-backed obligations (continued) | | | | | | | | |
| Federal agency mortgage-backed obligations (continued) | | | | | | | | |
| Government National Mortgage Assn. Pool #725879 4.892% 10/20/20611 | | USD | 1 | | | $ | 1 | |
| Government National Mortgage Assn. Pool #AC1008 4.339% 10/20/20631 | | | 1 | | | | 1 | |
| Government National Mortgage Assn. Pool #776095 4.853% 2/20/20641 | | | — | 2 | | | — | 2 |
| Government National Mortgage Assn. Pool #725893 5.20% 9/20/20641 | | | — | 2 | | | — | 2 |
| Government National Mortgage Assn. Pool #AG8238 4.904% 12/20/20641 | | | 2 | | | | 2 | |
| Government National Mortgage Assn. Pool #AE9612 4.851% 1/20/20651 | | | 2 | | | | 2 | |
| Government National Mortgage Assn., Series 2021-2, Class AH, 1.50% 6/16/20631 | | | 11,796 | | | | 8,997 | |
| Uniform Mortgage-Backed Security 2.00% 1/1/20391,5 | | | 25,144 | | | | 22,547 | |
| Uniform Mortgage-Backed Security 2.50% 1/1/20391,5 | | | 26,442 | | | | 24,366 | |
| Uniform Mortgage-Backed Security 3.50% 1/1/20391,5 | | | 37,000 | | | | 35,623 | |
| Uniform Mortgage-Backed Security 2.00% 2/1/20391,5 | | | 16,856 | | | | 15,022 | |
| Uniform Mortgage-Backed Security 2.50% 2/1/20391,5 | | | 21,558 | | | | 19,876 | |
| Uniform Mortgage-Backed Security 4.00% 2/1/20391,5 | | | 29,000 | | | | 28,465 | |
| Uniform Mortgage-Backed Security 2.00% 1/1/20541,5 | | | 309,341 | | | | 252,886 | |
| Uniform Mortgage-Backed Security 2.50% 1/1/20541,5 | | | 329,786 | | | | 280,602 | |
| Uniform Mortgage-Backed Security 3.00% 1/1/20541,5 | | | 510,119 | | | | 451,316 | |
| Uniform Mortgage-Backed Security 3.50% 1/1/20541,5 | | | 140,846 | | | | 129,226 | |
| Uniform Mortgage-Backed Security 4.00% 1/1/20541,5 | | | 473,259 | | | | 447,654 | |
| Uniform Mortgage-Backed Security 4.50% 1/1/20541,5 | | | 444,879 | | | | 431,289 | |
| Uniform Mortgage-Backed Security 5.00% 1/1/20541,5 | | | 161,944 | | | | 160,236 | |
| Uniform Mortgage-Backed Security 5.50% 1/1/20541,5 | | | 77,030 | | | | 77,367 | |
| Uniform Mortgage-Backed Security 6.00% 1/1/20541,5 | | | 749,602 | | | | 761,198 | |
| Uniform Mortgage-Backed Security 6.50% 1/1/20541,5 | | | 165,784 | | | | 169,909 | |
| Uniform Mortgage-Backed Security 7.00% 1/1/20541,5 | | | 224,062 | | | | 231,143 | |
| Uniform Mortgage-Backed Security 2.50% 2/1/20541,5 | | | 306,500 | | | | 261,124 | |
| Uniform Mortgage-Backed Security 3.00% 2/1/20541,5 | | | 128,000 | | | | 113,365 | |
| Uniform Mortgage-Backed Security 3.50% 2/1/20541,5 | | | 696,804 | | | | 639,971 | |
| Uniform Mortgage-Backed Security 4.00% 2/1/20541,5 | | | 823,200 | | | | 779,371 | |
| Uniform Mortgage-Backed Security 4.50% 2/1/20541,5 | | | 1,332,576 | | | | 1,292,651 | |
| Uniform Mortgage-Backed Security 5.00% 2/1/20541,5 | | | 122,600 | | | | 121,355 | |
| Uniform Mortgage-Backed Security 5.50% 2/1/20541,5 | | | 45,250 | | | | 45,455 | |
| Uniform Mortgage-Backed Security 6.00% 2/1/20541,5 | | | 1,044,681 | | | | 1,060,800 | |
| Uniform Mortgage-Backed Security 6.50% 2/1/20541,5 | | | 2,077,782 | | | | 2,129,160 | |
| Uniform Mortgage-Backed Security 7.00% 2/1/20541,5 | | | 368,950 | | | | 380,235 | |
| Uniform Mortgage-Backed Security 6.00% 3/1/20541,5 | | | 700 | | | | 710 | |
| | | | | | | | 29,806,498 | |
| | | | | | | | | |
| Commercial mortgage-backed securities 2.06% | | | | | | | | |
| 3650R Commercial Mortgage Trust, Series 2022-PF2, Class A5, 5.29% 11/15/20551,3 | | | 2,275 | | | | 2,306 | |
| AMSR Trust, Series 2023-SFR2, Class A, 3.95% 6/17/20401,4 | | | 3,657 | | | | 3,448 | |
| Arbor Multi Family Mortgage Securities Trust, Series 2020-MF1, Class A5, 2.756% 5/15/20531,4 | | | 1,000 | | | | 884 | |
| Banc of America Commercial Mortgage, Inc., Series 2015-UBS7, Class A4, 3.705% 9/15/20481 | | | 2,750 | | | | 2,645 | |
| Banc of America Commercial Mortgage, Inc., Series 2017-BNK3, Class A4, 3.574% 2/15/20501 | | | 115 | | | | 110 | |
| Bank Commercial Mortgage Trust, Series 2023-5YR2, Class AS, 7.14% 6/15/20281,3 | | | 1,940 | | | | 2,025 | |
| Bank Commercial Mortgage Trust, Series 2017-BNK4, Class A3, 3.362% 5/15/20501 | | | 1,639 | | | | 1,562 | |
| Bank Commercial Mortgage Trust, Series 2017-BNK4, Class A4, 3.625% 5/15/20501 | | | 1,660 | | | | 1,568 | |
| Bank Commercial Mortgage Trust, Series 2019-BN16, Class A4, 4.005% 2/15/20521 | | | 3,920 | | | | 3,724 | |
| Bank Commercial Mortgage Trust, Series 2019-BN17, Class A4, 3.714% 4/15/20521 | | | 255 | | | | 239 | |
| Bank Commercial Mortgage Trust, Series 2020-BNK29, Class A4, 1.997% 11/15/20531 | | | 5,624 | | | | 4,421 | |
| Bank Commercial Mortgage Trust, Series 2021-BN31, Class A4, 2.036% 2/15/20541 | | | 235 | | | | 193 | |
| Bank Commercial Mortgage Trust, Series 2017-BNK9, Class A4, 3.538% 11/15/20541 | | | 135 | | | | 127 | |
| Bank Commercial Mortgage Trust, Series 2022-BNK39, Class A4, 2.928% 2/15/20551,3 | | | 686 | | | | 592 | |
| Bank Commercial Mortgage Trust, Series 2022-BNK42, Class A5, 4.493% 6/15/20551,3 | | | 4,000 | | | | 3,848 | |
| Bank Commercial Mortgage Trust, Series 2022-BNK43, Class A5, 4.399% 8/15/20551 | | | 28,219 | | | | 26,986 | |
| Bank Commercial Mortgage Trust, Series 2023-5YR1, Class A3, 6.26% 3/15/20561,3 | | | 24,749 | | | | 25,691 | |
| Bank Commercial Mortgage Trust, Series 2023-5YR3, Class AS, 7.315% 9/15/20561,3 | | | 4,984 | | | | 5,268 | |
| Bank Commercial Mortgage Trust, Series 2023-5YR4, Class AS, 7.274% 12/15/20561,3 | | | 3,632 | | | | 3,868 | |
| Bank Commercial Mortgage Trust, Series 2017-BNK7, Class A5, 3.435% 9/15/20601 | | | 3,750 | | | | 3,537 | |
| Bank Commercial Mortgage Trust, Series 2018-BN10, Class A5, 3.688% 2/15/20611 | | | 2,510 | | | | 2,379 | |
| Bank Commercial Mortgage Trust, Series 2018-BN10, Class A4, 3.428% 2/17/20611 | | | 321 | | | | 302 | |
| Bank Commercial Mortgage Trust, Series 2019-BN12, Class A3, 3.99% 5/15/20611 | | | 500 | | | | 479 | |
| Bank Commercial Mortgage Trust, Series 2018-BN12, Class A4, 4.255% 5/15/20611,3 | | | 11,116 | | | | 10,741 | |
| Bank Commercial Mortgage Trust, Series 2019-BN19, Class A3, 3.183% 8/15/20611 | | | 9,039 | | | | 7,921 | |
| Bank Commercial Mortgage Trust, Series 2018-BN13, Class A5, 4.217% 8/15/20611,3 | | | 250 | | | | 240 | |
| | |
| The Bond Fund of America | 21 |
| Bonds, notes & other debt instruments (continued) | | Principal amount
(000) | | | Value
(000) | |
| Mortgage-backed obligations (continued) | | | | | | | | |
| Commercial mortgage-backed securities (continued) | | | | | | | | |
| Bank Commercial Mortgage Trust, Series 2018-BN15, Class A3, 4.138% 11/15/20611 | | USD | 490 | | | $ | 474 | |
| Bank Commercial Mortgage Trust, Series 2019-BN18, Class A4, 3.584% 5/15/20621 | | | 5,000 | | | | 4,487 | |
| Bank Commercial Mortgage Trust, Series 2020-BN28, Class A4, 1.844% 3/15/20631 | | | 1,766 | | | | 1,453 | |
| Bank Commercial Mortgage Trust, Series 2020-BN26, Class A4, 2.403% 3/15/20631 | | | 1,654 | | | | 1,410 | |
| Bank of America Merrill Lynch Large Loan, Inc., Series 2015-200P, Class A, 3.218% 4/14/20331,4 | | | 5,800 | | | | 5,542 | |
| Barclays Commercial Mortgage Securities, LLC, Series 2018-TALL, Class A, ((1-month USD CME Term SOFR + 0.047%) + 0.872%) 6.281% 3/15/20371,3,4 | | | 1,574 | | | | 1,463 | |
| Barclays Commercial Mortgage Securities, LLC, Series 2022-C15, Class A5, 3.662% 4/15/20551,3 | | | 10,030 | | | | 9,097 | |
| Barclays Commercial Mortgage Securities, LLC, Series 2023-C20, Class A5, 5.576% 7/15/20561 | | | 3,000 | | | | 3,133 | |
| Barclays Commercial Mortgage Securities, LLC, Series 2023-C22, Class A5, 6.804% 11/15/20561,3 | | | 4,925 | | | | 5,609 | |
| Barclays Commercial Mortgage Securities, LLC, Series 23-5C23, Class AS, 7.703% 12/15/20561,3 | | | 796 | | | | 845 | |
| Benchmark Mortgage Trust, Series 2018-B2, Class A4, 3.615% 2/15/20511 | | | 3,475 | | | | 3,261 | |
| Benchmark Mortgage Trust, Series 2018-B2, Class A5, 3.882% 2/15/20511,3 | | | 1,906 | | | | 1,791 | |
| Benchmark Mortgage Trust, Series 2018-B3, Class A5, 4.025% 4/10/20511 | | | 5,890 | | | | 5,587 | |
| Benchmark Mortgage Trust, Series 2018-B4, Class A5, 4.121% 7/15/20511,3 | | | 90 | | | | 86 | |
| Benchmark Mortgage Trust, Series 2018-B8, Class A5, 4.232% 1/15/20521 | | | 6,351 | | | | 6,003 | |
| Benchmark Mortgage Trust, Series 2019-B9, Class A5, 4.016% 3/15/20521 | | | 5,135 | | | | 4,803 | |
| Benchmark Mortgage Trust, Series 2020-B17, Class A5, 2.289% 3/15/20531 | | | 944 | | | | 788 | |
| Benchmark Mortgage Trust, Series 2018-B7, Class A3, 4.241% 5/15/20531 | | | 1,000 | | | | 953 | |
| Benchmark Mortgage Trust, Series 2018-B7, Class A4, 4.51% 5/15/20531,3 | | | 6,954 | | | | 6,690 | |
| Benchmark Mortgage Trust, Series 2020-B19, Class A5, 1.85% 9/15/20531 | | | 13,503 | | | | 10,801 | |
| Benchmark Mortgage Trust, Series 2020-B20, Class AS, 2.375% 10/15/20531 | | | 1,450 | | | | 1,114 | |
| Benchmark Mortgage Trust, Series 2020-B21, Class AS, 2.254% 12/17/20531 | | | 1,600 | | | | 1,258 | |
| Benchmark Mortgage Trust, Series 2021-B23, Class A5, 2.07% 2/15/20541 | | | 5,000 | | | | 3,944 | |
| Benchmark Mortgage Trust, Series 2021-B24, Class A4, 2.264% 3/15/20541 | | | 900 | | | | 737 | |
| Benchmark Mortgage Trust, Series 2021-B25, Class A5, 2.577% 4/15/20541 | | | 17,498 | | | | 14,146 | |
| Benchmark Mortgage Trust, Series 2021-B27, Class A5, 2.39% 7/15/20541 | | | 8,785 | | | | 7,043 | |
| Benchmark Mortgage Trust, Series 2021-B31, Class A5, 2.669% 12/15/20541 | | | 5,000 | | | | 4,215 | |
| Benchmark Mortgage Trust, Series 2022-B32, Class A5, 3.002% 1/15/20551 | | | 11,500 | | | | 9,419 | |
| Benchmark Mortgage Trust, Series 2022-B33, Class A5, 3.458% 3/15/20551 | | | 3,000 | | | | 2,669 | |
| Benchmark Mortgage Trust, Series 2022-B34, Class A5, 3.786% 4/15/20551,3 | | | 7,034 | | | | 6,105 | |
| Benchmark Mortgage Trust, Series 2022-B35, Class A5, 4.444% 5/15/20551,3 | | | 14,428 | | | | 13,359 | |
| Benchmark Mortgage Trust, Series 2022-B36, Class A5, 4.47% 7/15/20551,3 | | | 29,367 | | | | 28,054 | |
| Benchmark Mortgage Trust, Series 2022-B37, Class A5, 5.751% 11/15/20551,3 | | | 2,522 | | | | 2,658 | |
| Benchmark Mortgage Trust, Series 2023-B38, Class A4, 5.525% 4/15/20561 | | | 7,636 | | | | 7,879 | |
| Benchmark Mortgage Trust, Series 2023-V3, Class A3, 6.363% 7/15/20561 | | | 7,720 | | | | 8,098 | |
| Benchmark Mortgage Trust, Series 2019-B13, Class A4, 2.952% 8/15/20571 | | | 730 | | | | 653 | |
| Benchmark Mortgage Trust, Series 2019-B10, Class A3, 3.455% 3/15/20621 | | | 500 | | | | 464 | |
| Benchmark Mortgage Trust, Series 2019-B14, Class AS, 3.049% 12/15/20621 | | | 5,000 | | | | 4,491 | |
| BMO Mortgage Trust, Series 2023-5C1, Class A3, 6.534% 8/15/20561,3 | | | 2,482 | | | | 2,618 | |
| BMO Mortgage Trust, Series 2023-5C1, Class AS, 7.118% 8/15/20561,3 | | | 2,661 | | | | 2,800 | |
| BMO Mortgage Trust, Series 2023-C6, Class AS, 6.55% 9/15/20561,3 | | | 6,880 | | | | 7,292 | |
| BOCA Commercial Mortgage Trust, Series 2022-BOCA, Class A, (1-month USD CME Term SOFR + 1.77%) 7.131% 5/15/20391,3,4 | | | 60,445 | | | | 60,193 | |
| BPR Trust, Series 2022-OANA, Class A, (1-month USD CME Term SOFR + 1.898%) 7.26% 4/15/20371,3,4 | | | 20,378 | | | | 20,119 | |
| BX Trust, Series 2022-CSMO, Class A, (1-month USD CME Term SOFR + 2.115%) 7.477% 6/15/20271,3,4 | | | 54,030 | | | | 54,217 | |
| BX Trust, Series 2021-SDMF, Class A, (1-month USD CME Term SOFR + 0.703%) 6.065% 9/15/20341,3,4 | | | 915 | | | | 895 | |
| BX Trust, Series 2021-VOLT, Class A, (1-month USD CME Term SOFR + 0.814%) 6.176% 9/15/20361,3,4 | | | 103,652 | | | | 101,099 | |
| BX Trust, Series 2021-ARIA, Class A, (1-month USD CME Term SOFR + 1.014%) 6.375% 10/15/20361,3,4 | | | 26,873 | | | | 26,297 | |
| BX Trust, Series 2021-RISE, Class A, (1-month USD CME Term SOFR + 0.862%) 6.224% 11/15/20361,3,4 | | | 68,774 | | | | 67,719 | |
| BX Trust, Series 2022-IND, Class A, (1-month USD CME Term SOFR + 1.491%) 6.853% 4/15/20371,3,4 | | | 28,974 | | | | 28,794 | |
| BX Trust, Series 2021-SOAR, Class A, (1-month USD CME Term SOFR + 0.784%) 6.146% 6/15/20381,3,4 | | | 40,112 | | | | 39,503 | |
| BX Trust, Series 2021-ACNT, Class A, (1-month USD CME Term SOFR + 0.964%) 6.326% 11/15/20381,3,4 | | | 66,291 | | | | 65,420 | |
| | |
| 22 | The Bond Fund of America |
| Bonds, notes & other debt instruments (continued) | | Principal amount
(000) | | | Value
(000) | |
| Mortgage-backed obligations (continued) | | | | | | | | |
| Commercial mortgage-backed securities (continued) | | | | | | | | |
| BX Trust, Series 2022-PSB, Class A, (1-month USD CME Term SOFR + 2.451%) 7.813% 8/15/20391,3,4 | | USD | 8,652 | | | $ | 8,686 | |
| BX Trust, Series 2022-GPA, Class A, (1-month USD CME Term SOFR + 2.165%) 7.532% 10/15/20391,3,4 | | | 21,702 | | | | 21,760 | |
| BX Trust, Series 2023-VLT2, Class A, (1-month USD CME Term SOFR + 2.281%) 7.643% 6/15/20401,3,4 | | | 28,351 | | | | 28,436 | |
| BXP Trust, Series 2017-GM, Class A, 3.379% 6/13/20391,4 | | | 5,963 | | | | 5,549 | |
| CD Commercial Mortgage Trust, Series 2017-CD3, Class A4, 3.631% 2/10/20501 | | | 1,000 | | | | 929 | |
| CD Commercial Mortgage Trust, Series 2017-CD6, Class A5, 3.456% 11/13/20501 | | | 5,576 | | | | 5,220 | |
| Citigroup Commercial Mortgage Trust, Series 2023-SMRT, Class A, 5.82% 6/10/20281,3,4 | | | 142,455 | | | | 144,443 | |
| Citigroup Commercial Mortgage Trust, Series 2023-PRM3, Class A, 6.36% 7/10/20281,3,4 | | | 8,000 | | | | 8,234 | |
| Citigroup Commercial Mortgage Trust, Series 2014-GC21, Class B, 4.328% 5/10/20471,3 | | | 1,800 | | | | 1,675 | |
| Citigroup Commercial Mortgage Trust, Series 2015-GC27, Class A4, 2.878% 2/10/20481 | | | 755 | | | | 741 | |
| Citigroup Commercial Mortgage Trust, Series 2016-GC36, Class A5, 3.616% 2/10/20491 | | | 1,525 | | | | 1,455 | |
| Citigroup Commercial Mortgage Trust, Series 2016-GC37, Class A4, 3.314% 4/10/20491 | | | 2,740 | | | | 2,610 | |
| Citigroup Commercial Mortgage Trust, Series 2016-C1, Class AS, 3.514% 5/10/20491 | | | 500 | | | | 468 | |
| Citigroup Commercial Mortgage Trust, Series 2017-B1, Class A3, 3.197% 8/15/20501 | | | 6,048 | | | | 5,669 | |
| Citigroup Commercial Mortgage Trust, Series 2017-C4, Class A4, 3.471% 10/12/20501 | | | 2,930 | | | | 2,729 | |
| Citigroup Commercial Mortgage Trust, Series 2019-GC41, Class AA, 2.62% 8/10/20561 | | | 200 | | | | 176 | |
| Citigroup Commercial Mortgage Trust, Series 2015-GC33, Class A3, 3.515% 9/10/20581 | | | 4,563 | | | | 4,422 | |
| COMM Mortgage Trust, Series 2019-GC44, Class AM, 3.263% 8/15/20571 | | | 805 | | | | 695 | |
| Commercial Mortgage Trust, Series 2012-CR3, Class AM, 3.416% 10/15/20451,4 | | | 22 | | | | 20 | |
| Commercial Mortgage Trust, Series 2014-CR15, Class A4, 4.074% 2/10/20471,3 | | | 1,879 | | | | 1,876 | |
| Commercial Mortgage Trust, Series 2014-CR16, Class A3, 3.775% 4/10/20471 | | | 1,378 | | | | 1,375 | |
| Commercial Mortgage Trust, Series 2014-LC15, Class AM, 4.198% 4/10/20471 | | | 850 | | | | 839 | |
| Commercial Mortgage Trust, Series 2014-CR16, Class AM, 4.278% 4/10/20471 | | | 1,070 | | | | 1,023 | |
| Commercial Mortgage Trust, Series 2014-UBS4, Class A5, 3.694% 8/10/20471 | | | 910 | | | | 892 | |
| Commercial Mortgage Trust, Series 2014-CR19, Class AM, 4.08% 8/10/20471 | | | 750 | | | | 725 | |
| Commercial Mortgage Trust, Series 2014-LC17, Class A5, 3.917% 10/10/20471 | | | 886 | | | | 871 | |
| Commercial Mortgage Trust, Series 2014-LC17, Class B, 4.49% 10/10/20471,3 | | | 2,200 | | | | 2,118 | |
| Commercial Mortgage Trust, Series 2016-COR1, Class A4, 3.091% 10/10/20491 | | | 4,000 | | | | 3,707 | |
| Commercial Mortgage Trust, Series 2015-PC1, Class A4, 3.62% 7/10/20501 | | | 772 | | | | 760 | |
| Commercial Mortgage Trust, Series 2017-COR2, Class A2, 3.239% 9/10/20501 | | | 825 | | | | 774 | |
| Commercial Mortgage Trust, Series 2017-COR2, Class A3, 3.51% 9/10/20501 | | | 2,261 | | | | 2,108 | |
| CSAIL Commercial Mortgage Trust, Series 2015-C4, Class AS, 4.174% 11/15/20481,3 | | | 999 | | | | 952 | |
| CSAIL Commercial Mortgage Trust, Series 2015-C1, Class B, 4.044% 4/15/20501,3 | | | 600 | | | | 539 | |
| CSAIL Commercial Mortgage Trust, Series 2017-CX9, Class A4, 3.176% 9/15/20501 | | | 2,375 | | | | 2,229 | |
| CSAIL Commercial Mortgage Trust, Series 2019-C17, Class A5, 3.016% 9/15/20521 | | | 2,000 | | | | 1,749 | |
| CSAIL Commercial Mortgage Trust, Series 2015-C2, Class A3, 3.231% 6/15/20571 | | | 2,354 | | | | 2,295 | |
| DATA 2023-CNTR Mortgage Trust, Series 2023-CNTR, Class A, 5.728% 8/12/20431,3,4 | | | 65,864 | | | | 65,498 | |
| DC Commercial Mortgage Trust, Series 2023-DC, Class A, 6.314% 9/10/20401,4 | | | 6,865 | | | | 7,093 | |
| DC Commercial Mortgage Trust, Series 2023-DC, Class B, 6.804% 9/10/20401,4 | | | 7,957 | | | | 8,190 | |
| DC Commercial Mortgage Trust, Series 2023-DC, Class C, 7.14% 9/10/20401,3,4 | | | 6,119 | | | | 6,287 | |
| Deutsche Bank Commercial Mortgage Trust, Series 2016-C1, Class AM, 3.539% 5/10/20491 | | | 500 | | | | 466 | |
| Extended Stay America Trust, Series 2021-ESH, Class A, (1-month USD CME Term SOFR + 1.194%) 6.556% 7/15/20381,3,4 | | | 13,657 | | | | 13,541 | |
| Extended Stay America Trust, Series 2021-ESH, Class B, (1-month USD CME Term SOFR + 1.494%) 6.856% 7/15/20381,3,4 | | | 3,398 | | | | 3,349 | |
| Extended Stay America Trust, Series 2021-ESH, Class C, (1-month USD CME Term SOFR + 1.814%) 7.176% 7/15/20381,3,4 | | | 3,362 | | | | 3,312 | |
| Extended Stay America Trust, Series 2021-ESH, Class D, (1-month USD CME Term SOFR + 2.364%) 7.726% 7/15/20381,3,4 | | | 3,523 | | | | 3,467 | |
| FIVE Mortgage Trust, Series 2023-V1, Class A3, 5.668% 2/10/20561 | | | 11,246 | | | | 11,440 | |
| Fontainebleau Miami Beach Trust, CMO, Series 2019-FBLU, Class A, 3.144% 12/10/20361,4 | | | 8,686 | | | | 8,417 | |
| FS Commercial Trust, Series 2023-4SZN, Class A, 7.066% 11/10/20391,4 | | | 16,156 | | | | 16,808 | |
| Grace Mortgage Trust, Series 2020-GRCE, Class A, 2.347% 12/10/20401,4 | | | 7,590 | | | | 6,146 | |
| Great Wolf Trust, Series 2019-WOLF, Class A, (1-month USD CME Term SOFR + 1.348%) 6.252% 12/15/20361,3,4 | | | 42,526 | | | | 42,383 | |
| | |
| The Bond Fund of America | 23 |
| Bonds, notes & other debt instruments (continued) | | Principal amount
(000) | | | Value
(000) | |
| Mortgage-backed obligations (continued) | | | | | | | | |
| Commercial mortgage-backed securities (continued) | | | | | | | | |
| GS Mortgage Securities Trust, Series 2014-GC24, Class A5, 3.931% 9/10/20471 | | USD | 5,708 | | | $ | 5,605 | |
| GS Mortgage Securities Trust, Series 2020-GS1, Class A2, 3.47% 11/10/20481 | | | 3,000 | | | | 2,899 | |
| GS Mortgage Securities Trust, Series 2016-GS4, Class A3, 3.178% 11/10/20491 | | | 2,372 | | | | 2,251 | |
| GS Mortgage Securities Trust, Series 2016-GS4, Class A4, 3.442% 11/10/20491,3 | | | 2,654 | | | | 2,522 | |
| GS Mortgage Securities Trust, Series 2017-GS7, Class A3, 3.167% 8/10/20501 | | | 855 | | | | 786 | |
| GS Mortgage Securities Trust, Series 2017-GS7, Class A4, 3.43% 8/10/20501 | | | 3,000 | | | | 2,769 | |
| GS Mortgage Securities Trust, Series 2019-GC38, Class A4, 3.968% 2/10/20521 | | | 255 | | | | 241 | |
| GS Mortgage Securities Trust, Series 2020-GC45, Class A5, 2.911% 2/13/20531 | | | 174 | | | | 154 | |
| GS Mortgage Securities Trust, Series 2020-GC47, Class A5, 2.377% 5/12/20531 | | | 7,483 | | | | 6,316 | |
| GS Mortgage Securities Trust, Series 2020-GSA2, Class A5, 2.012% 12/12/20531 | | | 1,556 | | | | 1,237 | |
| JPMBB Commercial Mortgage Securities Trust, Series 2014-C18, Class A5, 4.079% 2/15/20471 | | | 5,263 | | | | 5,234 | |
| JPMBB Commercial Mortgage Securities Trust, Series 2014-C19, Class A4, 3.997% 4/15/20471 | | | 553 | | | | 550 | |
| JPMBB Commercial Mortgage Securities Trust, Series 2014-C19, Class B, 4.394% 4/15/20471,3 | | | 600 | | | | 592 | |
| JPMBB Commercial Mortgage Securities Trust, Series 2014-C23, Class B, 4.482% 9/15/20471,3 | | | 100 | | | | 96 | |
| JPMBB Commercial Mortgage Securities Trust, Series 2014-C26, Class B, 3.951% 1/15/20481 | | | 2,333 | | | | 2,159 | |
| JPMDB Commercial Mortgage Securities Trust, Series 2017-C5, Class A5, 3.694% 3/15/20501 | | | 1,600 | | | | 1,501 | |
| JPMDB Commercial Mortgage Securities Trust, Series 2017-C7, Class A5, 3.409% 10/15/20501 | | | 1,683 | | | | 1,561 | |
| JPMDB Commercial Mortgage Securities Trust, Series 2019-COR6, Class A4, 3.057% 11/13/20521 | | | 975 | | | | 809 | |
| JPMorgan Chase Commercial Mortgage Securities Trust, Series 2022-OPO, Class A, 3.024% 1/5/20391,4 | | | 27,523 | | | | 23,194 | |
| JPMorgan Chase Commercial Mortgage Securities Trust, Series 2021-410T, Class A, 2.287% 3/5/20421,4 | | | 1,920 | | | | 1,547 | |
| JPMorgan Chase Commercial Mortgage Securities Trust, Series 2016-JP4, Class A4, 3.648% 12/15/20491,3 | | | 5,095 | | | | 4,796 | |
| JPMorgan Chase Commercial Mortgage Securities Trust, Series 2017-JP5, Class AS, 3.723% 3/15/20501 | | | 1,000 | | | | 943 | |
| Manhattan West Mortgage Trust, Series 2020-1MW, Class A, 2.13% 9/10/20391,4 | | | 4,555 | | | | 4,030 | |
| MHC Commercial Mortgage Trust, CMO, Series 2021-MHC, Class A, (1-month USD CME Term SOFR + 0.915%) 6.277% 4/15/20381,3,4 | | | 19,732 | | | | 19,540 | |
| Morgan Stanley Bank of America Merrill Lynch Trust, Series 2014-C17, Class A5, 3.741% 8/15/20471 | | | 22,927 | | | | 22,625 | |
| Morgan Stanley Bank of America Merrill Lynch Trust, Series 2015-C27, Class A4, 3.753% 12/15/20471 | | | 525 | | | | 508 | |
| Morgan Stanley Bank of America Merrill Lynch Trust, Series 2015-C22, Class A-4, 3.306% 4/15/20481 | | | 1,870 | | | | 1,804 | |
| Morgan Stanley Bank of America Merrill Lynch Trust, Series 2015-C25, Class A-4, 3.372% 10/15/20481 | | | 1,300 | | | | 1,258 | |
| Morgan Stanley Bank of America Merrill Lynch Trust, Series 2016-C30, Class A4, 2.60% 9/15/20491 | | | 243 | | | | 227 | |
| Morgan Stanley Bank of America Merrill Lynch Trust, Series 2016-C31, Class A-S, 3.102% 11/15/20491 | | | 3,000 | | | | 2,797 | |
| Morgan Stanley Bank of America Merrill Lynch Trust, Series 2016-C32, Class A-4, 3.72% 12/15/20491 | | | 5,280 | | | | 5,019 | |
| Morgan Stanley Bank of America Merrill Lynch Trust, Series 2015-C23, Class A3, 3.451% 7/15/20501 | | | 550 | | | | 535 | |
| Morgan Stanley Capital I Trust, Series 2015-UBS8, Class AS, 4.114% 12/15/20481 | | | 1,730 | | | | 1,619 | |
| MSWF Commercial Mortgage Trust, Series 2023-2, Class A5, 6.014% 12/15/20561,3 | | | 7,810 | | | | 8,429 | |
| MSWF Commercial Mortgage Trust, Series 2023-2, Class AS, 6.491% 12/15/20561,3 | | | 3,463 | | | | 3,734 | |
| One Market Plaza Trust, Series 2017-1MKT, Class A, 3.614% 2/10/20321,4 | | | 6,220 | | | | 5,690 | |
| One Market Plaza Trust, Series 2017-1MKT, Class C, 4.016% 2/10/20321,4 | | | 1,000 | | | | 839 | |
| SFO Commercial Mortgage Trust, Series 2021-555, Class A, (1-month USD CME Term SOFR + 1.264%) 6.626% 5/15/2038 (1-month USD CME Term SOFR + 1.514% on 5/15/2026)1,4,6 | | | 5,600 | | | | 5,254 | |
| SFO Commercial Mortgage Trust, Series 2021-555, Class B, (1-month USD CME Term SOFR + 1.614%) 6.976% 5/15/20381,3,4 | | | 1,500 | | | | 1,365 | |
| SG Commercial Mortgage Securities Trust, Series 2016-C5, Class A3, 2.779% 10/10/20481 | | | 11,876 | | | | 11,286 | |
| SLG Office Trust, Series 2021-OVA, Class A, 2.585% 7/15/20411,4 | | | 23,334 | | | | 19,326 | |
| | |
| 24 | The Bond Fund of America |
| Bonds, notes & other debt instruments (continued) | | Principal amount
(000) | | | Value
(000) | |
| Mortgage-backed obligations (continued) | | | | | | | | |
| Commercial mortgage-backed securities (continued) | | | | | | | | |
| SREIT Trust, Series 2021-FLWR, Class A, (1-month USD CME Term SOFR + 0.691%) 6.053% 7/15/20361,3,4 | | USD | 46,039 | | | $ | 45,226 | |
| SREIT Trust, Series 2021-MFP, Class A, (1-month USD CME Term SOFR + 0.845%) 6.207% 11/15/20381,3,4 | | | 49,227 | | | | 48,456 | |
| StorageMart Commercial Mortgage Trust, Series 2022-MINI, Class A, (1-month USD CME Term SOFR + 1.00%) 6.362% 1/15/20391,3,4 | | | 55,785 | | | | 54,662 | |
| Wells Fargo Commercial Mortgage Trust, Series 2014-LC18, Class A5, 3.405% 12/15/20471 | | | 290 | | | | 282 | |
| Wells Fargo Commercial Mortgage Trust, Series 2015-C28, Class A4, 3.54% 5/15/20481 | | | 4,380 | | | | 4,236 | |
| Wells Fargo Commercial Mortgage Trust, Series 2015-SG1, Class A4, 3.789% 9/15/20481 | | | 6,906 | | | | 6,694 | |
| Wells Fargo Commercial Mortgage Trust, Series 2015-C31, Class A4, 3.695% 11/15/20481 | | | 1,400 | | | | 1,350 | |
| Wells Fargo Commercial Mortgage Trust, Series 2015-P2, Class A4, 3.809% 12/15/20481 | | | 1,137 | | | | 1,098 | |
| Wells Fargo Commercial Mortgage Trust, Series 2016-C34, Class A4, 3.096% 6/15/20491 | | | 6,190 | | | | 5,822 | |
| Wells Fargo Commercial Mortgage Trust, Series 2016-C34, Class AS, 3.484% 6/15/20491 | | | 380 | | | | 353 | |
| Wells Fargo Commercial Mortgage Trust, Series 2016-C37, Class A5, 3.794% 12/15/20491 | | | 6,370 | | | | 6,105 | |
| Wells Fargo Commercial Mortgage Trust, Series 2014-LC16, Class A5, 3.817% 8/15/20501 | | | 2,302 | | | | 2,271 | |
| Wells Fargo Commercial Mortgage Trust, Series 2017-C40, Class A4, 3.581% 10/15/20501 | | | 1,154 | | | | 1,090 | |
| Wells Fargo Commercial Mortgage Trust, Series 2018-C46, Class A3, 3.888% 8/15/20511 | | | 6,500 | | | | 6,115 | |
| Wells Fargo Commercial Mortgage Trust, Series 2019-C54, Class A4, 3.146% 12/15/20521 | | | 3,898 | | | | 3,503 | |
| Wells Fargo Commercial Mortgage Trust, Series 2015-NXS3, Class D, 3.153% 9/15/20571,4 | | | 1,667 | | | | 1,462 | |
| Wells Fargo Commercial Mortgage Trust, Series 2015-NXS-2, Class A-5, 3.767% 7/15/20581,3 | | | 7,000 | | | | 6,747 | |
| Wells Fargo Commercial Mortgage Trust, Series 2015-LC22, Class C, 4.545% 9/15/20581,3 | | | 1,000 | | | | 920 | |
| Wells Fargo Commercial Mortgage Trust, Series 2016-C33, Class A4, 3.426% 3/15/20591 | | | 1,320 | | | | 1,262 | |
| Wells Fargo Commercial Mortgage Trust, Series 2016-C36, Class A4, 3.065% 11/15/20591 | | | 3,853 | | | | 3,580 | |
| Wells Fargo Commercial Mortgage Trust, Series 2017-RC1, Class A4, 3.631% 1/15/20601 | | | 510 | | | | 486 | |
| WF-RBS Commercial Mortgage Trust, Series 2014-C19, Class B, 4.723% 3/15/20471,3 | | | 2,000 | | | | 1,980 | |
| WF-RBS Commercial Mortgage Trust, Series 2014-C22, Class A4, 3.488% 9/15/20571 | | | 9,415 | | | | 9,284 | |
| WMRK Commercial Mortgage Trust, Series 2022-WMRK, Class A, (1-month USD CME Term SOFR + 2.789%) 8.151% 11/15/20271,3,4 | | | 15,228 | | | | 15,264 | |
| | | | | | | | 1,659,693 | |
| | | | | | | | | |
| Collateralized mortgage-backed obligations (privately originated) 1.12% | | | | | | | | |
| Arroyo Mortgage Trust, Series 2021-1R, Class A1, 1.175% 10/25/20481,3,4 | | | 11,900 | | | | 9,772 | |
| Arroyo Mortgage Trust, Series 2020-1, Class A1A, 1.662% 3/25/20551,4 | | | 393 | | | | 365 | |
| Arroyo Mortgage Trust, Series 2022-1, Class A1A, 2.495% 12/25/2056 (3.495% on 2/25/2026)1,4,6 | | | 40,166 | | | | 37,239 | |
| BRAVO Residential Funding Trust, Series 2020-RPL2, Class A1, 2.00% 5/25/20591,3,4 | | | 2,196 | | | | 1,990 | |
| BRAVO Residential Funding Trust, Series 2020-RPL1, Class A1, 2.50% 5/26/20591,3,4 | | | 1,241 | | | | 1,185 | |
| BRAVO Residential Funding Trust, Series 2022-RPL1, Class A1, 2.75% 9/25/20611,4 | | | 16,016 | | | | 14,526 | |
| BRAVO Residential Funding Trust, Series 2022-NQM2, Class A1, 4.272% 11/25/2061 (5.272% on 5/25/2026)1,4,6 | | | 1,954 | | | | 1,961 | |
| BRAVO Residential Funding Trust, Series 2022-NQM3, Class A1, 5.108% 7/25/2062 (6.108% on 9/1/2026)1,4,6 | | | 3,058 | | | | 3,070 | |
| BRAVO Residential Funding Trust, Series 2022-R1, Class A, 3.125% 1/29/2070 (6.125% on 1/29/2025)1,4,6 | | | 3,055 | | | | 2,868 | |
| Cantor Commercial Real Estate Lending, Series 2019-CF1, Class AS, 4.027% 5/15/20521 | | | 1,255 | | | | 1,101 | |
| Cascade Funding Mortgage Trust, Series 2021-HB7, Class A, 1.151% 10/27/20311,3,4 | | | 12,354 | | | | 11,966 | |
| Cascade Funding Mortgage Trust, Series 2023-HB12, Class A, 4.25% 4/25/20331,3,4 | | | 3,170 | | | | 3,081 | |
| Cascade Funding Mortgage Trust, Series 2021-HB6, Class A, 0.898% 6/25/20361,3,4 | | | 7,292 | | | | 6,988 | |
| CFCRE Commercial Mortgage Trust, Series 2016-C7, Class A2, 3.585% 12/10/20541 | | | 1,760 | | | | 1,665 | |
| | |
| The Bond Fund of America | 25 |
| Bonds, notes & other debt instruments (continued) | | Principal amount
(000) | | | Value
(000) | |
| Mortgage-backed obligations (continued) | | | | | | | | |
| Collateralized mortgage-backed obligations (privately originated) (continued) | | | | | | | | |
| CIM Trust, Series 2018-R3, Class A1, 5.00% 12/25/20571,3,4 | | USD | 2,529 | | | $ | 2,497 | |
| CIM Trust, Series 2022-R2, Class A1, 3.75% 12/25/20611,3,4 | | | 34,871 | | | | 32,779 | |
| Citigroup Mortgage Loan Trust, Series 2021-J1, Class A4A, 2.50% 4/25/20511,3,4 | | | 1,779 | | | | 1,428 | |
| Citigroup Mortgage Loan Trust, Series 2020-EXP1, Class A1A, 1.804% 5/25/20601,3,4 | | | 509 | | | | 464 | |
| Citigroup Mortgage Loan Trust, Series 2018-RP1, Class M1, 3.00% 9/25/20641,3,4 | | | 3,731 | | | | 3,396 | |
| COLT Mortgage Loan Trust, Series 2021-5, Class A1, 1.726% 11/26/20661,3,4 | | | 5,475 | | | | 4,663 | |
| Connecticut Avenue Securities Trust, Series 2014-C01, Class M2, (30-day Average USD-SOFR + 4.514%) 9.852% 1/25/20241,3 | | | 2,513 | | | | 2,520 | |
| Connecticut Avenue Securities Trust, Series 2014-C02A, Class 1M2, (30-day Average USD-SOFR + 2.714%) 8.052% 5/25/20241,3 | | | 1,820 | | | | 1,833 | |
| Connecticut Avenue Securities Trust, Series 2014-C04, Class 1M2, (30-day Average USD-SOFR + 5.014%) 10.352% 11/25/20241,3 | | | 1,592 | | | | 1,642 | |
| Connecticut Avenue Securities Trust, Series 2021-R01, Class 1M1, (30-day Average USD-SOFR + 0.75%) 6.087% 10/25/20411,3,4 | | | 102 | | | | 102 | |
| Connecticut Avenue Securities Trust, Series 2022-R06, Class 1M1, (30-day Average USD-SOFR + 2.75%) 8.087% 5/25/20421,3,4 | | | 788 | | | | 810 | |
| Connecticut Avenue Securities Trust, Series 2023-R01, Class 1M1, (30-day Average USD-SOFR + 2.40%) 7.737% 12/25/20421,3,4 | | | 1,218 | | | | 1,242 | |
| Credit Suisse Mortgage Trust, Series 2020-NET, Class A, 2.257% 8/15/20371,4 | | | 6,487 | | | | 6,006 | |
| Credit Suisse Mortgage Trust, Series 2019-RPL1, Class A1A, 3.65% 7/25/20581,3,4 | | | 602 | | | | 586 | |
| Credit Suisse Mortgage Trust, Series 2022-ATH3, Class A1, 4.991% 8/25/20671,3,4 | | | 630 | | | | 619 | |
| CS First Boston Mortgage Securities Corp., Series 2002-30, Class IA1, 7.50% 11/25/20321 | | | 115 | | | | 116 | |
| CS First Boston Mortgage Securities Corp., Series 2002-34, Class IA1, 7.50% 12/25/20321 | | | 57 | | | | 59 | |
| CS First Boston Mortgage Securities Corp., Series 2003-21, Class VA1, 6.50% 7/25/20331 | | | 566 | | | | 544 | |
| CS First Boston Mortgage Securities Corp., Series 2003-29, Class VA1, 7.00% 12/25/20331 | | | 131 | | | | 133 | |
| Finance of America Structured Securities Trust, Series 2019-JR1, Class A, 2.00% 3/25/20691,4 | | | 11,053 | | | | 12,294 | |
| Finance of America Structured Securities Trust, Series 2019-JR2, Class A1, 2.00% 6/25/20691,4 | | | 11,989 | | | | 13,363 | |
| Flagstar Mortgage Trust, Series 2021-5INV, Class A2, 2.50% 7/25/20511,3,4 | | | 13,469 | | | | 11,094 | |
| Flagstar Mortgage Trust, Series 2021-6INV, Class A4, 2.50% 8/25/20511,3,4 | | | 12,552 | | | | 10,323 | |
| Flagstar Mortgage Trust, Series 2021-8INV, Class A3, 2.50% 9/25/20511,3,4 | | | 14,324 | | | | 11,816 | |
| Flagstar Mortgage Trust, Series 2021-10INV, Class A3, 2.50% 10/25/20511,3,4 | | | 36,593 | | | | 30,140 | |
| Flagstar Mortgage Trust, Series 2021-11INV, Class A4, 2.50% 11/25/20511,3,4 | | | 14,929 | | | | 12,278 | |
| Flagstar Mortgage Trust, Series 2021-11INV, Class A2, 3.00% 11/25/20511,3,4 | | | 2,526 | | | | 2,163 | |
| Freddie Mac Structured Agency Credit Risk Debt Notes, Series 2016-DNA1, Class M3, (30-day Average USD-SOFR + 5.664%) 11.002% 7/25/20281,3 | | | 1,905 | | | | 2,023 | |
| Freddie Mac Structured Agency Credit Risk Debt Notes, Series 2021-DNA6, Class M1, (30-day Average USD-SOFR + 0.80%) 6.137% 10/25/20411,3,4 | | | 579 | | | | 577 | |
| Freddie Mac Structured Agency Credit Risk Debt Notes, Series 2022-DNA3, Class M1A, (30-day Average USD-SOFR + 2.00%) 7.337% 4/25/20421,3,4 | | | 7,749 | | | | 7,822 | |
| Freddie Mac Structured Agency Credit Risk Debt Notes, Series 2022-DNA4, Class M1A, (30-day Average USD-SOFR + 2.20%) 7.537% 5/25/20421,3,4 | | | 184 | | | | 187 | |
| Freddie Mac Structured Agency Credit Risk Debt Notes, Series 2022-DNA5, Class M1A, (30-day Average USD-SOFR + 2.95%) 8.287% 6/25/20421,3,4 | | | 1,969 | | | | 2,022 | |
| Freddie Mac Structured Agency Credit Risk Debt Notes, Series 2022-DNA6, Class M1A, (30-day Average USD-SOFR + 2.15%) 7.487% 9/25/20421,3,4 | | | 3,042 | | | | 3,071 | |
| Freddie Mac Structured Agency Credit Risk Debt Notes, Series 2022-DNA6, Class M1B, (30-day Average USD-SOFR + 3.70%) 9.037% 9/25/20421,3,4 | | | 7,561 | | | | 7,968 | |
| Freddie Mac Structured Agency Credit Risk Debt Notes, Series 2020-DNA1, Class M2, (30-day Average USD-SOFR + 1.814%) 7.152% 1/25/20501,3,4 | | | 595 | | | | 596 | |
| Freddie Mac Structured Agency Credit Risk Debt Notes, Series 2020-DNA2, Class M2, (30-day Average USD-SOFR + 1.964%) 7.302% 2/25/20501,3,4 | | | 1,348 | | | | 1,369 | |
| Freddie Mac Structured Agency Credit Risk Debt Notes, Series 2020-DNA3, Class B1, (30-day Average USD-SOFR + 5.214%) 10.552% 6/27/20501,3,4 | | | 3,480 | | | | 3,816 | |
| Freddie Mac Structured Agency Credit Risk Debt Notes, Series 2020-DNA4, Class B1, (30-day Average USD-SOFR + 6.114%) 11.452% 8/25/20501,3,4 | | | 3,756 | | | | 4,228 | |
| Freddie Mac Structured Agency Credit Risk Debt Notes, Series 2020-DNA5, Class M2, (30-day Average USD-SOFR + 2.80%) 8.121% 10/25/20501,3,4 | | | 1,355 | | | | 1,374 | |
| GCAT Trust, Series 2021-NQM6, Class A1, 1.855% 8/25/20661,3,4 | | | 16,412 | | | | 14,272 | |
| GS Mortgage-Backed Securities Trust, Series 2022-PJ5, Class A4, 2.50% 10/25/20521,3,4 | | | 40,146 | | | | 33,017 | |
| Home Partners of America Trust, Series 2021-2, Class A, 1.901% 12/17/20261,4 | | | 25,604 | | | | 23,164 | |
| | |
| 26 | The Bond Fund of America |
| Bonds, notes & other debt instruments (continued) | | Principal amount
(000) | | | Value
(000) | |
| Mortgage-backed obligations (continued) | | | | | | | | |
| Collateralized mortgage-backed obligations (privately originated) (continued) | | | | | | | | |
| Home Partners of America Trust, Series 2022-1, Class A, 3.93% 4/17/20391,4 | | USD | 2,813 | | | $ | 2,696 | |
| Hundred Acre Wood Trust, Series 2021-INV1, Class A3, 2.50% 7/25/20511,3,4 | | | 4,545 | | | | 3,744 | |
| Imperial Fund Mortgage Trust, Series 2022-NQM7, Class A1, 7.369% 11/25/2067 (8.369% on 11/1/2026)1,4,6 | | | 27,278 | | | | 27,799 | |
| Imperial Fund Mortgage Trust, Series 2023-NQM1, Class A1, 5.941% 2/25/2068 (6.941% on 1/1/2027)1,4,6 | | | 6,234 | | | | 6,224 | |
| Legacy Mortgage Asset Trust, Series 2020-GS1, Class A1, 5.882% 10/25/2059 (6.882% on 1/25/2024)1,4,6 | | | 10,654 | | | | 10,654 | |
| Legacy Mortgage Asset Trust, Series 2020-GS4, Class A1, 3.25% 2/25/20601,3,4 | | | 3,901 | | | | 3,901 | |
| Legacy Mortgage Asset Trust, Series 2020-GS3, Class A1, 3.25% 5/25/2060 (7.25% on 4/25/2024)1,4,6 | | | 7,816 | | | | 7,814 | |
| Legacy Mortgage Asset Trust, Series 2020-GS5, Class A1, 6.25% 6/25/2060 (7.25% on 8/26/2024)1,4,6 | | | 17,306 | | | | 17,307 | |
| Legacy Mortgage Asset Trust, Series 2022-GS1, Class A1, 4.00% 2/25/2061 (7.00% on 4/25/2025)1,4,6 | | | 19,788 | | | | 19,675 | |
| Legacy Mortgage Asset Trust, Series 2021-GS2, Class A1, 1.75% 4/25/20611,3,4 | | | 8,877 | | | | 8,598 | |
| Legacy Mortgage Asset Trust, Series 2021-GS5, Class A1, 2.25% 7/25/2067 (5.25% on 11/25/2024)1,4,6 | | | 7,757 | | | | 7,513 | |
| Mello Mortgage Capital Acceptance Trust, Series 2021-MTG2, Class A1, 2.50% 6/25/20511,3,4 | | | 18,584 | | | | 15,307 | |
| Mello Mortgage Capital Acceptance Trust, Series 2021-MTG3, Class A3, 2.50% 7/1/20511,3,4 | | | 14,331 | | | | 11,804 | |
| Mello Warehouse Securitization Trust, Series 2021-3, Class A, (3-month USD CME Term SOFR + 0.965%) 6.32% 11/25/20551,3,4 | | | 88,549 | | | | 88,235 | |
| MFRA Trust, Series 2021-RPL1, Class A1, 1.131% 7/25/20601,3,4 | | | 16,297 | | | | 14,468 | |
| Mill City Mortgage Trust, Series 2016-1, Class M3, 3.35% 4/25/20571,3,4 | | | 3,000 | | | | 2,879 | |
| Mill City Mortgage Trust, Series 2019-GS2, Class A1, 2.75% 8/25/20591,3,4 | | | 3,922 | | | | 3,718 | |
| Mill City Mortgage Trust, Series 2018-1, Class A1, 3.25% 5/25/20621,3,4 | | | 102 | | | | 100 | |
| New Residential Mortgage Loan Trust, Series 2019-2A, Class A1, 4.25% 12/25/20571,3,4 | | | 1,817 | | | | 1,753 | |
| New Residential Mortgage Loan Trust, Series 2020-RPL1, Class A1, 2.75% 11/25/20591,3,4 | | | 8,775 | | | | 8,252 | |
| NewRez Warehouse Securitization Trust, Series 2021-1, Class A, (1-month USD CME Term SOFR + 0.865%) 6.22% 5/25/20551,3,4 | | | 42,288 | | | | 42,267 | |
| Onslow Bay Financial Mortgage Loan Trust, Series 2022-J1, Class A2, 2.50% 2/25/20521,3,4 | | | 1,064 | | | | 875 | |
| Onslow Bay Financial Mortgage Loan Trust, Series 2022-NQM9, Class A1A, 6.45% 9/25/2062 (7.45% on 11/1/2026)1,4,6 | | | 2,650 | | | | 2,680 | |
| Onslow Bay Financial Mortgage Loan Trust, Series 2023-NQM1, Class A1, 6.12% 11/25/2062 (7.12% on 12/1/2026)1,4,6 | | | 1,766 | | | | 1,777 | |
| Onslow Bay Financial Mortgage Loan Trust, Series 2023-NQM4, Class A1, 6.113% 3/25/2063 (7.113% on 5/1/2027)1,4,6 | | | 7,935 | | | | 7,986 | |
| PRKCM Trust, Series 2021-AFC2, Class A1, 2.071% 11/25/20561,3,4 | | | 17,630 | | | | 14,780 | |
| Progress Residential Trust, Series 2022-SFR3, Class A, 3.20% 4/17/20391,4 | | | 7,198 | | | | 6,733 | |
| Reverse Mortgage Investment Trust, Series 2021-HB1, Class A, 1.259% 11/25/20311,3,4 | | | 9,213 | | | | 8,898 | |
| TBW Mortgage-Backed Trust, Series 2007-2, Class A4B, (1-month USD CME Term SOFR + 0.955%) 6.31% 7/25/20371,3 | | | 7,239 | | | | 6,382 | |
| Towd Point Mortgage Trust, Series 2015-3, Class M2, 4.00% 3/25/20541,3,4 | | | 12,268 | | | | 12,132 | |
| Towd Point Mortgage Trust, Series 2015-3, Class B1, 4.214% 3/25/20541,3,4 | | | 1,500 | | | | 1,465 | |
| Towd Point Mortgage Trust, Series 2016-1, Class B1, 4.281% 2/25/20551,3,4 | | | 4,000 | | | | 3,886 | |
| Towd Point Mortgage Trust, Series 2016-2, Class M1, 3.00% 8/25/20551,3,4 | | | 7,000 | | | | 6,746 | |
| Towd Point Mortgage Trust, Series 2016-2, Class B2, 3.569% 8/25/20551,3,4 | | | 3,200 | | | | 2,811 | |
| Towd Point Mortgage Trust, Series 2016-5, Class A1, 2.50% 10/25/20561,3,4 | | | 213 | | | | 211 | |
| Towd Point Mortgage Trust, Series 2017-1, Class A2, 3.50% 10/25/20561,3,4 | | | 3,000 | | | | 2,934 | |
| Towd Point Mortgage Trust, Series 2017-5, Class A1, 6.07% 2/25/20571,3,4 | | | 175 | | | | 176 | |
| Towd Point Mortgage Trust, Series 2017-2, Class A2, 3.25% 4/25/20571,3,4 | | | 6,986 | | | | 6,832 | |
| Towd Point Mortgage Trust, Series 2017-4, Class A1, 2.75% 6/25/20571,3,4 | | | 482 | | | | 464 | |
| Towd Point Mortgage Trust, Series 2017-4, Class M1, 3.25% 6/25/20571,3,4 | | | 1,575 | | | | 1,401 | |
| Towd Point Mortgage Trust, Series 2017-3, Class A1, 2.75% 7/25/20571,3,4 | | | 197 | | | | 193 | |
| Towd Point Mortgage Trust, Series 2017-6, Class A1, 2.75% 10/25/20571,3,4 | | | 837 | | | | 804 | |
| Towd Point Mortgage Trust, Series 2017-6, Class A2, 3.00% 10/25/20571,3,4 | | | 3,000 | | | | 2,750 | |
| Towd Point Mortgage Trust, Series 2018-1, Class A2, 3.25% 1/25/20581,3,4 | | | 10,000 | | | | 9,507 | |
| Towd Point Mortgage Trust, Series 2018-2, Class A1, 3.25% 3/25/20581,3,4 | | | 7,477 | | | | 7,261 | |
| Towd Point Mortgage Trust, Series 2018-3, Class M2, 3.875% 5/25/20581,3,4 | | | 6,000 | | | | 5,235 | |
| Towd Point Mortgage Trust, Series 2018-5, Class A1A, 3.25% 7/25/20581,3,4 | | | 237 | | | | 230 | |
| Towd Point Mortgage Trust, Series 2019-2, Class A1, 3.746% 12/25/20581,3,4 | | | 6,484 | | | | 6,221 | |
| The Bond Fund of America | 27 |
| Bonds, notes & other debt instruments (continued) | | Principal amount
(000) | | | Value
(000) | |
| Mortgage-backed obligations (continued) | | | | | | | | |
| Collateralized mortgage-backed obligations (privately originated) (continued) | | | | | | | | |
| Towd Point Mortgage Trust, Series 2019-A2, Class A2, 3.75% 12/25/20581,3,4 | | USD | 3,615 | | | $ | 3,241 | |
| Towd Point Mortgage Trust, Series 2019-4, Class M1B, 3.00% 10/25/20591,3,4 | | | 5,000 | | | | 4,098 | |
| Towd Point Mortgage Trust, Series 2019-4, Class A2, 3.25% 10/25/20591,3,4 | | | 4,590 | | | | 4,041 | |
| Towd Point Mortgage Trust, Series 2020-4, Class A1, 1.75% 10/25/20601,4 | | | 20,222 | | | | 17,882 | |
| Towd Point Mortgage Trust, Series 2023-1, Class A1, 3.75% 1/25/20631,4 | | | 1,938 | | | | 1,841 | |
| Treehouse Park Improvement Association No.1 9.75% 12/1/20334,7 | | | 10,592 | | | | 9,841 | |
| Tricon Residential Trust, Series 2023-SFR2, Class A, 5.00% 12/17/20281,4 | | | 19,898 | | | | 19,644 | |
| Tricon Residential Trust, Series 2021-SFR1, Class A, 1.943% 7/17/20381,4 | | | 29,677 | | | | 27,096 | |
| Tricon Residential Trust, Series 2023-SFR1, Class A, 5.10% 7/17/20401,4 | | | 10,764 | | | | 10,643 | |
| Tricon Residential Trust, Series 2023-SFR1, Class B, 5.10% 7/17/20401,4 | | | 7,963 | | | | 7,762 | |
| Tricon Residential Trust, Series 2023-SFR1, Class C, 5.10% 7/17/20401,4 | | | 1,536 | | | | 1,489 | |
| Verus Securitization Trust, Series 2023-1, Class A1, 5.85% 12/25/2067 (6.85% on 1/1/2027)1,4,6 | | | 5,140 | | | | 5,139 | |
| Verus Securitization Trust, Series 2023-3, Class A1, 5.93% 3/25/2068 (6.93% on 4/1/2027)1,4,6 | | | 186 | | | | 186 | |
| Verus Securitization Trust, Series 2023-5, Class A5, 6.476% 6/25/2068 (7.476% on 6/1/2027)1,4,6 | | | 657 | | | | 664 | |
| | | | | | | | 907,838 | |
| | | | | | | | | |
| Total mortgage-backed obligations | | | | | | | 32,374,029 | |
| | | | | | | | | |
| Corporate bonds, notes & loans 29.61% | | | | | | | | |
| Financials 9.68% | | | | | | | | |
| AerCap Ireland Capital DAC 1.65% 10/29/2024 | | | 13,302 | | | | 12,845 | |
| AerCap Ireland Capital DAC 6.50% 7/15/2025 | | | 4,854 | | | | 4,918 | |
| AerCap Ireland Capital DAC 1.75% 1/30/2026 | | | 7,812 | | | | 7,259 | |
| AerCap Ireland Capital DAC 2.45% 10/29/2026 | | | 60,098 | | | | 55,673 | |
| AerCap Ireland Capital DAC 6.45% 4/15/20274 | | | 33,890 | | | | 35,113 | |
| AerCap Ireland Capital DAC 5.75% 6/6/2028 | | | 28,777 | | | | 29,479 | |
| AerCap Ireland Capital DAC 3.00% 10/29/2028 | | | 48,387 | | | | 44,201 | |
| AerCap Ireland Capital DAC 3.30% 1/30/2032 | | | 41,921 | | | | 36,500 | |
| AerCap Ireland Capital DAC 3.40% 10/29/2033 | | | 17,747 | | | | 15,250 | |
| AerCap Ireland Capital DAC 3.85% 10/29/2041 | | | 290 | | | | 234 | |
| AIA Group, Ltd. 0.88% 9/9/2033 (5-year EUR Mid-Swap + 1.10% on 9/9/2028)6 | | EUR | 9,525 | | | | 8,981 | |
| AIB Group PLC 6.608% 9/13/2029 (USD-SOFR + 2.33% on 9/13/2028)4,6 | | USD | 12,534 | | | | 13,218 | |
| Ally Financial, Inc. 5.125% 9/30/2024 | | | 3,863 | | | | 3,834 | |
| Ally Financial, Inc. 5.80% 5/1/2025 | | | 6,400 | | | | 6,411 | |
| Ally Financial, Inc. 8.00% 11/1/2031 | | | 22,786 | | | | 24,881 | |
| Alpha Bank SA 6.875% 6/27/2029 (1-year EUR-ICE Swap EURIBOR + 3.793% on 6/27/2028)6 | | EUR | 3,446 | | | | 4,052 | |
| American Express Co. 6.338% 10/30/2026 (USD-SOFR + 1.33% on 10/30/2025)6 | | USD | 4,374 | | | | 4,462 | |
| American Express Co. 5.85% 11/5/2027 | | | 1,700 | | | | 1,774 | |
| American Express Co. 6.489% 10/30/2031 (USD-SOFR + 1.94% on 10/30/2030)6 | | | 2,593 | | | | 2,814 | |
| American Express Co. 4.42% 8/3/2033 (USD-SOFR + 1.76% on 8/3/2032)6 | | | 21,950 | | | | 21,141 | |
| American Express Co. 5.043% 5/1/2034 (USD-SOFR + 1.835% on 5/1/2033)6 | | | 55,975 | | | | 55,903 | |
| American International Group, Inc. 5.125% 3/27/2033 | | | 26,501 | | | | 26,911 | |
| American International Group, Inc. 4.375% 6/30/2050 | | | 2,730 | | | | 2,442 | |
| Aon Corp. 2.85% 5/28/2027 | | | 1,000 | | | | 945 | |
| Aon Corp. 2.60% 12/2/2031 | | | 10,750 | | | | 9,122 | |
| Aon Corp. 5.00% 9/12/2032 | | | 6,000 | | | | 5,995 | |
| Aon Corp. 5.35% 2/28/2033 | | | 7,209 | | | | 7,397 | |
| Aon Corp. 3.90% 2/28/2052 | | | 1,000 | | | | 796 | |
| Australia and New Zealand Banking Group, Ltd. 4.829% 2/3/20254 | | | 955 | | | | 955 | |
| Australia and New Zealand Banking Group, Ltd. 6.742% 12/8/20324 | | | 1,518 | | | | 1,624 | |
| Banco de Sabadell, SA 5.50% 9/8/2029 (1-year EUR-ICE Swap EURIBOR + 2.40% on 9/8/2028)6 | | EUR | 10,000 | | | | 11,501 | |
| Banco Santander México, SA, Institución de Banca Múltiple, Grupo Financiero Santander México 5.375% 4/17/20254 | | USD | 7,500 | | | | 7,493 | |
| Banco Santander, SA 5.147% 8/18/2025 | | | 17,200 | | | | 17,107 | |
| Banco Santander, SA 5.294% 8/18/2027 | | | 9,800 | | | | 9,837 | |
| Banco Santander, SA 1.722% 9/14/2027 (1-year UST Yield Curve Rate T Note Constant Maturity + 0.90% on 9/14/2026)6 | | | 7,800 | | | | 7,059 | |
| Bangkok Bank Public Co., Ltd. 3.733% 9/25/2034 (5-year UST Yield Curve Rate T Note Constant Maturity + 1.90% on 9/25/2029)6 | | | 19,965 | | | | 17,761 | |
| Bank of America Corp. 2.456% 10/22/2025 (3-month USD CME Term SOFR + 1.132% on 10/22/2024)6 | | | 11,619 | | | | 11,317 | |
| Bank of America Corp. 5.08% 1/20/2027 (USD-SOFR + 1.29% on 1/20/2026)6 | | | 8,343 | | | | 8,328 | |
| Bank of America Corp. 1.658% 3/11/2027 (USD-SOFR + 0.91% on 3/11/2026)6 | | | 29,913 | | | | 27,684 | |
| 28 | The Bond Fund of America |
| Bonds, notes & other debt instruments (continued) | | Principal amount
(000) | | | Value
(000) | |
| Corporate bonds, notes & loans (continued) | | | | | | | | |
| Financials (continued) | | | | | | | | |
| Bank of America Corp. 2.551% 2/4/2028 (USD-SOFR + 1.05% on 2/4/2027)6 | | USD | 30,000 | | | $ | 27,806 | |
| Bank of America Corp. 4.376% 4/27/2028 (USD-SOFR + 1.58% on 4/27/2027)6 | | | 18,149 | | | | 17,748 | |
| Bank of America Corp. 4.948% 7/22/2028 (USD-SOFR + 2.04% on 7/22/2027)6 | | | 69,406 | | | | 69,428 | |
| Bank of America Corp. 6.204% 11/10/2028 (USD-SOFR + 1.99% on 11/10/2027)6 | | | 8,654 | | | | 9,033 | |
| Bank of America Corp. 3.419% 12/20/2028 (3-month USD CME Term SOFR + 1.302% on 12/20/2027)6 | | | 5,681 | | | | 5,355 | |
| Bank of America Corp. 5.202% 4/25/2029 (USD-SOFR + 1.63% on 4/25/2028)6 | | | 84,282 | | | | 84,857 | |
| Bank of America Corp. 2.087% 6/14/2029 (USD-SOFR + 1.06% on 6/14/2028)6 | | | 53,866 | | | | 47,502 | |
| Bank of America Corp. 5.819% 9/15/2029 (USD-SOFR + 1.57% on 9/15/2028)6 | | | 28,779 | | | | 29,726 | |
| Bank of America Corp. 2.592% 4/29/2031 (USD-SOFR + 2.15% on 4/29/2030)6 | | | 5,097 | | | | 4,395 | |
| Bank of America Corp. 1.898% 7/23/2031 (USD-SOFR + 1.53% on 7/23/2030)6 | | | 39,020 | | | | 31,941 | |
| Bank of America Corp. 1.922% 10/24/2031 (USD-SOFR + 1.37% on 10/24/2030)6 | | | 14,757 | | | | 11,988 | |
| Bank of America Corp. 2.651% 3/11/2032 (USD-SOFR + 1.22% on 3/11/2031)6 | | | 5,706 | | | | 4,821 | |
| Bank of America Corp. 2.687% 4/22/2032 (USD-SOFR + 1.32% on 4/22/2031)6 | | | 13,833 | | | | 11,685 | |
| Bank of America Corp. 2.299% 7/21/2032 (USD-SOFR + 1.22% on 7/21/2031)6 | | | 76,308 | | | | 62,338 | |
| Bank of America Corp. 5.288% 4/25/2034 (USD-SOFR + 1.91% on 4/25/2033)6 | | | 15,190 | | | | 15,233 | |
| Bank of America Corp. 5.872% 9/15/2034 (USD-SOFR + 1.84% on 9/15/2033)6 | | | 92,510 | | | | 96,894 | |
| Bank of America Corp. 2.676% 6/19/2041 (USD-SOFR + 1.93% on 6/19/2040)6 | | | 530 | | | | 379 | |
| Bank of East Asia, Ltd. 4.875% 4/22/2032 (5-year UST Yield Curve Rate T Note Constant Maturity + 2.30% on 4/22/2027)6 | | | 12,000 | | | | 10,866 | |
| Bank of Ireland Group PLC 6.253% 9/16/2026 (1-year UST Yield Curve Rate T Note Constant Maturity + 2.65% on 9/16/2025)4,6 | | | 32,600 | | | | 32,983 | |
| Bank of Ireland Group PLC 2.029% 9/30/2027 (1-year UST Yield Curve Rate T Note Constant Maturity + 1.10% on 9/30/2026)4,6 | | | 9,200 | | | | 8,400 | |
| Bank of Montreal 5.30% 6/5/2026 | | | 10,000 | | | | 10,103 | |
| Bank of Montreal 5.203% 2/1/2028 | | | 4,000 | | | | 4,078 | |
| Bank of New York Mellon Corp. 4.947% 4/26/2027 (USD-SOFR + 1.026% on 4/26/2026)6 | | | 15,000 | | | | 15,011 | |
| Bank of New York Mellon Corp. 5.802% 10/25/2028 (USD-SOFR + 1.802% on 10/25/2027)6 | | | 10,000 | | | | 10,374 | |
| Bank of New York Mellon Corp. 4.534% 2/1/2029 (USD-SOFR + 1.169% on 2/1/2029)6 | | | 18,000 | | | | 17,877 | |
| Bank of New York Mellon Corp. 4.705% 2/1/2034 (USD-SOFR + 1.512% on 2/1/2033)6 | | | 22,105 | | | | 21,632 | |
| Bank of Nova Scotia (The) 5.25% 6/12/2028 | | | 10,000 | | | | 10,159 | |
| Barclays PLC 5.304% 8/9/2026 (1-year UST Yield Curve Rate T Note Constant Maturity + 2.30% on 8/9/2025)6 | | | 725 | | | | 722 | |
| Barclays PLC 5.829% 5/9/2027 (USD-SOFR + 2.21% on 5/9/2026)6 | | | 16,500 | | | | 16,653 | |
| Barclays PLC 5.501% 8/9/2028 (1-year UST Yield Curve Rate T Note Constant Maturity + 2.65% on 8/5/2027)6 | | | 29,640 | | | | 29,793 | |
| Barclays PLC 6.49% 9/13/2029 (USD-SOFR + 2.22% on 9/13/2028)6 | | | 7,000 | | | | 7,295 | |
| Barclays PLC 6.224% 5/9/2034 (USD-SOFR + 2.98% on 5/9/2033)6 | | | 14,115 | | | | 14,647 | |
| Barclays PLC 6.692% 9/13/2034 (USD-SOFR + 2.62% on 9/13/2033)6 | | | 3,000 | | | | 3,209 | |
| BBVA Bancomer SA 8.45% 6/29/2038 (5-year UST Yield Curve Rate T Note Constant Maturity + 4.661% on 6/29/2033)4,6 | | | 14,100 | | | | 15,046 | |
| Berkshire Hathaway Finance Corp. 2.875% 3/15/2032 | | | 2,032 | | | | 1,833 | |
| Berkshire Hathaway Finance Corp. 4.20% 8/15/2048 | | | 9,744 | | | | 8,984 | |
| Berkshire Hathaway Finance Corp. 3.85% 3/15/2052 | | | 3,293 | | | | 2,756 | |
| BlackRock, Inc. 2.10% 2/25/2032 | | | 9,025 | | | | 7,541 | |
| BlackRock, Inc. 4.75% 5/25/2033 | | | 1,050 | | | | 1,060 | |
| Blackstone Holdings Finance Co., LLC 5.90% 11/3/20274 | | | 12,375 | | | | 12,848 | |
| Blackstone Holdings Finance Co., LLC 6.20% 4/22/20334 | | | 3,520 | | | | 3,761 | |
| Block, Inc. 2.75% 6/1/2026 | | | 8,000 | | | | 7,549 | |
| Block, Inc. 3.50% 6/1/2031 | | | 5,025 | | | | 4,471 | |
| BNP Paribas SA 3.375% 1/9/20254 | | | 11,000 | | | | 10,776 | |
| BNP Paribas SA 1.323% 1/13/2027 (USD-SOFR + 1.004% on 1/13/2026)4,6 | | | 9,000 | | | | 8,305 | |
| BNP Paribas SA 1.675% 6/30/2027 (USD-SOFR + 0.912% on 6/30/2026)4,6 | | | 1,011 | | | | 926 | |
| BNP Paribas SA 2.591% 1/20/2028 (USD-SOFR + 1.228% on 1/20/2027)4,6 | | | 64,976 | | | | 60,149 | |
| BNP Paribas SA 2.159% 9/15/2029 (USD-SOFR + 1.218% on 9/15/2028)4,6 | | | 15,819 | | | | 13,774 | |
| BNP Paribas SA 3.052% 1/13/2031 (USD-SOFR + 1.507% on 1/13/2030)4,6 | | | 487 | | | | 428 | |
| BNP Paribas SA 2.871% 4/19/2032 (USD-SOFR + 1.387% on 4/19/2031)4,6 | | | 63,372 | | | | 53,652 | |
| Bocom Leasing Management Hong Kong Co., Ltd. 4.375% 1/22/2024 | | | 1,500 | | | | 1,499 | |
| BPCE SA 4.625% 7/11/20244 | | | 20,600 | | | | 20,383 | |
| BPCE SA 5.15% 7/21/20244 | | | 28,454 | | | | 28,216 | |
| BPCE SA 1.625% 1/14/20254 | | | 12,250 | | | | 11,807 | |
| BPCE SA 1.652% 10/6/2026 (USD-SOFR + 1.52% on 10/6/2025)4,6 | | | 26,407 | | | | 24,595 | |
| BPCE SA 5.975% 1/18/2027 (USD-SOFR + 2.10% on 1/18/2026)4,6 | | | 17,000 | | | | 17,143 | |
| BPCE SA 2.045% 10/19/2027 (USD-SOFR + 1.087% on 10/19/2026)4,6 | | | 10,656 | | | | 9,679 | |
| BPCE SA 6.714% 10/19/2029 (USD-SOFR + 2.27% on 10/19/2028)4,6 | | | 40,500 | | | | 42,688 | |
| The Bond Fund of America | 29 |
| Bonds, notes & other debt instruments (continued) | | Principal amount
(000) | | | Value
(000) | |
| Corporate bonds, notes & loans (continued) | | | | | | | | |
| Financials (continued) | | | | | | | | |
| BPCE SA 2.277% 1/20/2032 (USD-SOFR + 1.312% on 1/20/2031)4,6 | | USD | 36,234 | | | $ | 29,054 | |
| BPCE SA 5.748% 7/19/2033 (USD-SOFR + 2.865% on 7/19/2032)4,6 | | | 27,495 | | | | 27,633 | |
| CaixaBank, SA 6.684% 9/13/2027 (USD-SOFR + 2.08% on 9/13/2026)4,6 | | | 7,000 | | | | 7,181 | |
| CaixaBank, SA 6.208% 1/18/2029 (USD-SOFR + 2.70% on 1/18/2028)4,6 | | | 23,950 | | | | 24,451 | |
| CaixaBank, SA 6.84% 9/13/2034 (USD-SOFR + 2.77% on 9/13/2033)4,6 | | | 5,000 | | | | 5,285 | |
| Canadian Imperial Bank of Commerce 5.144% 4/28/2025 | | | 10,000 | | | | 10,008 | |
| Canadian Imperial Bank of Commerce 3.60% 4/7/2032 | | | 197 | | | | 180 | |
| Canadian Imperial Bank of Commerce 6.092% 10/3/2033 | | | 21,867 | | | | 23,348 | |
| Capital One Financial Corp. 4.985% 7/24/2026 (USD-SOFR + 2.16% on 7/24/2025)6 | | | 16,000 | | | | 15,824 | |
| Capital One Financial Corp. 4.927% 5/10/2028 (USD-SOFR + 2.057% on 5/10/2027)6 | | | 16,300 | | | | 16,030 | |
| Capital One Financial Corp. 5.468% 2/1/2029 (USD-SOFR + 2.08% on 2/1/2028)6 | | | 4,165 | | | | 4,156 | |
| Charles Schwab Corp. (The) 5.643% 5/19/2029 (USD-SOFR + 2.21% on 5/19/2028)6 | | | 15,000 | | | | 15,395 | |
| Charles Schwab Corp. (The) 6.196% 11/17/2029 (USD-SOFR + 1.878% on 11/17/2028)6 | | | 15,850 | | | | 16,631 | |
| China Ping An Insurance Overseas (Holdings), Ltd. 2.85% 8/12/2031 | | | 5,188 | | | | 4,209 | |
| Chubb INA Holdings, Inc. 3.35% 5/3/2026 | | | 100 | | | | 97 | |
| Chubb INA Holdings, Inc. 4.35% 11/3/2045 | | | 100 | | | | 94 | |
| Citigroup, Inc. 2.014% 1/25/2026 (USD-SOFR + 0.694% on 1/25/2025)6 | | | 16,208 | | | | 15,582 | |
| Citigroup, Inc. 4.45% 9/29/2027 | | | 400 | | | | 391 | |
| Citigroup, Inc. 3.07% 2/24/2028 (USD-SOFR + 1.28% on 2/24/2027)6 | | | 40,549 | | | | 38,226 | |
| Citigroup, Inc. 3.98% 3/20/2030 (3-month USD CME Term SOFR + 1.597% on 3/20/2029)6 | | | 4,669 | | | | 4,435 | |
| Citigroup, Inc. 2.976% 11/5/2030 (USD-SOFR + 1.422% on 11/5/2029)6 | | | 2,488 | | | | 2,217 | |
| Citigroup, Inc. 2.666% 1/29/2031 (USD-SOFR + 1.146% on 1/29/2030)6 | | | 8,934 | | | | 7,754 | |
| Citigroup, Inc. 2.572% 6/3/2031 (USD-SOFR + 2.107% on 6/3/2030)6 | | | 56,184 | | | | 48,022 | |
| Citigroup, Inc. 2.561% 5/1/2032 (USD-SOFR + 1.167% on 5/1/2031)6 | | | 812 | | | | 678 | |
| Citigroup, Inc. 2.52% 11/3/2032 (USD-SOFR + 1.177% on 11/3/2031)6 | | | 15,956 | | | | 13,161 | |
| Citigroup, Inc. 3.057% 1/25/2033 (USD-SOFR + 1.351% on 1/25/2032)6 | | | 741 | | | | 632 | |
| Citigroup, Inc. 3.785% 3/17/2033 (USD-SOFR + 1.939% on 3/17/2032)6 | | | 1,869 | | | | 1,682 | |
| Citigroup, Inc. 4.91% 5/24/2033 (USD-SOFR + 2.086% on 5/24/2032)6 | | | 3,564 | | | | 3,491 | |
| Citigroup, Inc. 6.27% 11/17/2033 (USD-SOFR + 2.338% on 11/17/2032)6 | | | 77,382 | | | | 82,836 | |
| Citigroup, Inc. 6.174% 5/25/2034 (USD-SOFR + 2.661% on 5/25/2033)6 | | | 925 | | | | 958 | |
| Commonwealth Bank of Australia 2.688% 3/11/20314 | | | 17,450 | | | | 14,367 | |
| Cooperatieve Rabobank UA 2.625% 7/22/20244 | | | 698 | | | | 687 | |
| Corebridge Financial, Inc. 3.50% 4/4/2025 | | | 1,642 | | | | 1,602 | |
| Corebridge Financial, Inc. 3.65% 4/5/2027 | | | 26,338 | | | | 25,351 | |
| Corebridge Financial, Inc. 3.85% 4/5/2029 | | | 37,493 | | | | 35,367 | |
| Corebridge Financial, Inc. 3.90% 4/5/2032 | | | 24,060 | | | | 21,767 | |
| Corebridge Financial, Inc. 4.35% 4/5/2042 | | | 2,317 | | | | 1,968 | |
| Corebridge Financial, Inc. 4.40% 4/5/2052 | | | 2,692 | | | | 2,263 | |
| Crédit Agricole SA 3.25% 10/4/20244 | | | 6,200 | | | | 6,095 | |
| Crédit Agricole SA 4.375% 3/17/20254 | | | 3,500 | | | | 3,445 | |
| Crédit Agricole SA 1.907% 6/16/2026 (USD-SOFR + 1.676% on 6/16/2025)4,6 | | | 12,000 | | | | 11,391 | |
| Crédit Agricole SA 1.247% 1/26/2027 (USD-SOFR + 0.892% on 1/26/2026)4,6 | | | 12,327 | | | | 11,356 | |
| Credit Suisse AG 2.95% 4/9/2025 | | | 2,350 | | | | 2,280 | |
| Credit Suisse AG 7.50% 2/15/2028 | | | 17,000 | | | | 18,629 | |
| Danske Bank AS 6.466% 1/9/2026 (1-year UST Yield Curve Rate T Note Constant Maturity + 2.10% on 1/9/2025)4,6 | | | 3,831 | | | | 3,860 | |
| Danske Bank AS 1.549% 9/10/2027 (1-year UST Yield Curve Rate T Note Constant Maturity + 0.73% on 9/10/2026)4,6 | | | 14,200 | | | | 12,820 | |
| Danske Bank AS 4.298% 4/1/2028 (1-year UST Yield Curve Rate T Note Constant Maturity + 1.75% on 4/1/2027)4,6 | | | 19,150 | | | | 18,572 | |
| DBS Bank, Ltd. (3-month AUD-BBSW + 0.55%) 4.91% 9/10/20243 | | AUD | 24,980 | | | | 17,041 | |
| DBS Bank, Ltd. (3-month AUD-BBSW + 0.57%) 4.937% 12/2/20243 | | | 14,970 | | | | 10,205 | |
| Deutsche Bank AG 0.898% 5/28/2024 | | USD | 15,450 | | | | 15,178 | |
| Deutsche Bank AG 3.70% 5/30/2024 | | | 12,900 | | | | 12,769 | |
| Deutsche Bank AG 1.447% 4/1/2025 (USD-SOFR + 1.131% on 4/1/2024)6 | | | 24,716 | | | | 24,422 | |
| Deutsche Bank AG 3.961% 11/26/2025 (USD-SOFR + 2.581% on 11/26/2024)6 | | | 17,750 | | | | 17,463 | |
| Deutsche Bank AG 4.10% 1/13/2026 | | | 16,415 | | | | 15,968 | |
| Deutsche Bank AG 4.10% 1/13/2026 | | | 4,936 | | | | 4,844 | |
| Deutsche Bank AG 2.129% 11/24/2026 (USD-SOFR + 1.87% on 11/24/2025)6 | | | 49,618 | | | | 46,539 | |
| Deutsche Bank AG 7.146% 7/13/2027 (USD-SOFR + 2.52% on 7/13/2026)6 | | | 15,264 | | | | 15,852 | |
| Deutsche Bank AG 2.311% 11/16/2027 (USD-SOFR + 1.219% on 11/16/2026)6 | | | 95,259 | | | | 87,155 | |
| Deutsche Bank AG 2.552% 1/7/2028 (USD-SOFR + 1.318% on 1/7/2027)6 | | | 118,767 | | | | 109,087 | |
| Deutsche Bank AG 6.72% 1/18/2029 (USD-SOFR + 3.18% on 1/18/2028)6 | | | 65,940 | | | | 69,091 | |
| Deutsche Bank AG 6.819% 11/20/2029 (USD-SOFR + 2.51% on 11/20/2028)6 | | | 33,710 | | | | 35,513 | |
| Deutsche Bank AG 3.547% 9/18/2031 (USD-SOFR + 3.043% on 9/18/2030)6 | | | 38,234 | | | | 33,576 | |
| 30 | The Bond Fund of America |
| Bonds, notes & other debt instruments (continued) | | Principal amount
(000) | | | Value
(000) | |
| Corporate bonds, notes & loans (continued) | | | | | | | | |
| Financials (continued) | | | | | | | | |
| Deutsche Bank AG 3.729% 1/14/2032 (USD-SOFR + 2.757% on 1/14/2031)6 | | USD | 23,000 | | | $ | 19,290 | |
| Deutsche Bank AG 3.035% 5/28/2032 (USD-SOFR + 1.718% on 5/28/2031)6 | | | 2,083 | | | | 1,741 | |
| Discover Bank 3.45% 7/27/2026 | | | 2,343 | | | | 2,216 | |
| Discover Financial Services 6.70% 11/29/2032 | | | 1,546 | | | | 1,621 | |
| Discover Financial Services 7.964% 11/2/2034 (USD-SOFR Index + 3.37% on 11/2/2033)6 | | | 7,350 | | | | 8,180 | |
| DNB Bank ASA 1.127% 9/16/2026 (1-year UST Yield Curve Rate T Note Constant Maturity + 0.85% on 9/16/2025)4,6 | | | 2,882 | | | | 2,676 | |
| DNB Bank ASA 5.896% 10/9/2026 (USD-SOFR + 1.95% on 10/9/2025)4,6 | | | 2,000 | | | | 2,020 | |
| DNB Bank ASA 1.535% 5/25/2027 (5-year UST Yield Curve Rate T Note Constant Maturity + 0.72% on 5/25/2026)4,6 | | | 8,037 | | | | 7,337 | |
| Eurobank SA 2.00% 5/5/2027 (1-year EUR Mid-Swap + 2.398% on 5/5/2026)6 | | EUR | 7,770 | | | | 8,141 | |
| Eurobank SA 2.25% 3/14/2028 (1-year EUR Mid-Swap + 2.634% on 3/14/2027)6 | | | 10,200 | | | | 10,500 | |
| Eurobank SA 7.00% 1/26/2029 (1-year EUR Mid-Swap + 4.418% on 1/26/2028)6 | | | 23,290 | | | | 27,791 | |
| Fidelity National Information Services, Inc. 1.15% 3/1/2026 | | USD | 22,429 | | | | 20,733 | |
| Fidelity National Information Services, Inc. 2.25% 3/1/2031 | | | 4,699 | | | | 3,972 | |
| Fifth Third Bancorp 6.339% 7/27/2029 (USD-SOFR + 2.34% on 7/27/2028)6 | | | 1,285 | | | | 1,338 | |
| Fiserv, Inc. 2.75% 7/1/2024 | | | 19,000 | | | | 18,722 | |
| Fiserv, Inc. 3.50% 7/1/2029 | | | 406 | | | | 382 | |
| Fiserv, Inc. 2.65% 6/1/2030 | | | 900 | | | | 792 | |
| Five Corners Funding Trust II 2.85% 5/15/20304 | | | 4,300 | | | | 3,805 | |
| Five Corners Funding Trust III 5.791% 2/15/20334 | | | 15,060 | | | | 16,007 | |
| Five Corners Funding Trust IV 5.997% 2/15/20534 | | | 2,500 | | | | 2,709 | |
| Global Payments, Inc. 2.90% 5/15/2030 | | | 631 | | | | 555 | |
| Goldman Sachs Group, Inc. 1.757% 1/24/2025 (USD-SOFR + 0.73% on 1/24/2024)6 | | | 2,500 | | | | 2,491 | |
| Goldman Sachs Group, Inc. 3.50% 4/1/2025 | | | 14,230 | | | | 13,918 | |
| Goldman Sachs Group, Inc. 0.855% 2/12/2026 (USD-SOFR + 0.609% on 2/12/2025)6 | | | 400 | | | | 379 | |
| Goldman Sachs Group, Inc. (3-month USD CME Term SOFR + 1.432%) 6.811% 5/15/20263 | | | 7,000 | | | | 7,047 | |
| Goldman Sachs Group, Inc. 1.542% 9/10/2027 (USD-SOFR + 0.818% on 9/10/2026)6 | | | 61,000 | | | | 55,352 | |
| Goldman Sachs Group, Inc. 1.948% 10/21/2027 (USD-SOFR + 0.913% on 10/21/2026)6 | | | 85,837 | | | | 78,552 | |
| Goldman Sachs Group, Inc. 2.64% 2/24/2028 (USD-SOFR + 1.114% on 2/24/2027)6 | | | 19,614 | | | | 18,190 | |
| Goldman Sachs Group, Inc. 3.615% 3/15/2028 (USD-SOFR + 1.846% on 3/15/2027)6 | | | 59,425 | | | | 57,016 | |
| Goldman Sachs Group, Inc. 4.482% 8/23/2028 (USD-SOFR + 1.725% on 8/23/2027)6 | | | 47,811 | | | | 46,988 | |
| Goldman Sachs Group, Inc. 3.814% 4/23/2029 (3-month USD CME Term SOFR + 1.42% on 4/23/2028)6 | | | 5,725 | | | | 5,439 | |
| Goldman Sachs Group, Inc. 6.484% 10/24/2029 (USD-SOFR + 1.77% on 10/24/2028)6 | | | 29,253 | | | | 31,060 | |
| Goldman Sachs Group, Inc. 2.60% 2/7/2030 | | | 5,356 | | | | 4,709 | |
| Goldman Sachs Group, Inc. 3.80% 3/15/2030 | | | 9,419 | | | | 8,856 | |
| Goldman Sachs Group, Inc. 1.992% 1/27/2032 (USD-SOFR + 1.09% on 1/27/2031)6 | | | 51,903 | | | | 41,958 | |
| Goldman Sachs Group, Inc. 2.615% 4/22/2032 (USD-SOFR + 1.281% on 4/22/2031)6 | | | 10,416 | | | | 8,747 | |
| Goldman Sachs Group, Inc. 3.102% 2/24/2033 (USD-SOFR + 1.41% on 2/24/2032)6 | | | 36,016 | | | | 30,927 | |
| Goldman Sachs Group, Inc. 6.561% 10/24/2034 (USD-SOFR + 1.95% on 10/24/2033)6 | | | 672 | | | | 739 | |
| Goldman Sachs Group, Inc. 2.908% 7/21/2042 (USD-SOFR + 1.40% on 7/21/2041)6 | | | 10,000 | | | | 7,301 | |
| Goldman Sachs Group, Inc. 3.436% 2/24/2043 (USD-SOFR + 1.632% on 2/24/2042)6 | | | 9,000 | | | | 7,036 | |
| GTCR W-2 Merger Sub, LLC 7.50% 1/15/20314 | | | 3,350 | | | | 3,542 | |
| Hongkong Land Finance (Cayman Islands) Co., Ltd. (The) 4.625% 1/16/2024 | | | 4,000 | | | | 3,998 | |
| HSBC Holdings PLC 2.633% 11/7/2025 (USD-SOFR + 1.402% on 11/7/2024)6 | | | 5,000 | | | | 4,877 | |
| HSBC Holdings PLC 2.256% 11/13/2026 (1-year GBP-ICE Swap + 1.317% on 11/13/2025)6 | | GBP | 6,050 | | | | 7,315 | |
| HSBC Holdings PLC (USD-SOFR + 1.57%) 5.35% 8/14/20273 | | USD | 20,000 | | | | 20,107 | |
| HSBC Holdings PLC 2.251% 11/22/2027 (USD-SOFR + 1.10% on 11/22/2026)6 | | | 11,240 | | | | 10,321 | |
| HSBC Holdings PLC 4.755% 6/9/2028 (USD-SOFR + 2.11% on 6/9/2027)6 | | | 23,007 | | | | 22,683 | |
| HSBC Holdings PLC 7.39% 11/03/2028 (USD-SOFR + 7.39% on 11/3/2027)6 | | | 3,357 | | | | 3,599 | |
| HSBC Holdings PLC 6.161% 3/9/2029 (USD-SOFR + 1.97% on 3/9/2028)6 | | | 8,557 | | | | 8,842 | |
| HSBC Holdings PLC 2.206% 8/17/2029 (USD-SOFR + 1.285% on 8/17/2028)6 | | | 47,596 | | | | 41,579 | |
| HSBC Holdings PLC 4.95% 3/31/2030 | | | 3,150 | | | | 3,126 | |
| HSBC Holdings PLC 3.973% 5/22/2030 (3-month USD CME Term SOFR + 1.872% on 5/22/2029)6 | | | 2,609 | | | | 2,439 | |
| HSBC Holdings PLC 3.00% 5/29/2030 (1-year EUR Annual (vs. 6-month GBP-LIBOR) + 1.77% on 5/29/2029)6 | | GBP | 3,613 | | | | 4,145 | |
| HSBC Holdings PLC 2.804% 5/24/2032 (USD-SOFR + 1.187% on 5/24/2031)6 | | USD | 48,184 | | | | 40,246 | |
| HSBC Holdings PLC 2.871% 11/22/2032 (USD-SOFR + 1.41% on 11/22/2031)6 | | | 4,574 | | | | 3,803 | |
| HSBC Holdings PLC 8.113% 11/3/2033 (USD-SOFR + 4.25% on 11/3/2032)6 | | | 11,963 | | | | 13,832 | |
| HSBC Holdings PLC 6.254% 3/9/2034 (USD-SOFR + 2.39% on 3/9/2033)6 | | | 5,137 | | | | 5,463 | |
| HSBC Holdings PLC 7.399% 11/13/2034 (USD-SOFR + 3.02% on 11/13/2033)6 | | | 30,917 | | | | 33,927 | |
| HSBC Holdings PLC 6.332% 3/9/2044 (USD-SOFR + 2.65% on 3/9/2043)6 | | | 4,198 | | | | 4,530 | |
| The Bond Fund of America | 31 |
| Bonds, notes & other debt instruments (continued) | | Principal amount
(000) | | | Value
(000) | |
| Corporate bonds, notes & loans (continued) | | | | | | | | |
| Financials (continued) | | | | | | | | |
| Huarong Finance 2017 Co., Ltd. 4.75% 4/27/2027 | | USD | 7,854 | | | $ | 7,373 | |
| Huarong Finance 2017 Co., Ltd. 4.25% 11/7/2027 | | | 39,663 | | | | 36,260 | |
| Huarong Finance 2019 Co., Ltd. 4.50% 5/29/2029 | | | 11,367 | | | | 10,081 | |
| Huarong Finance II Co., Ltd. 5.50% 1/16/2025 | | | 34,000 | | | | 33,703 | |
| Huarong Finance II Co., Ltd. 5.00% 11/19/2025 | | | 3,637 | | | | 3,513 | |
| Huarong Finance II Co., Ltd. 4.625% 6/3/2026 | | | 360 | | | | 342 | |
| Huarong Finance II Co., Ltd. 4.875% 11/22/2026 | | | 10,000 | | | | 9,501 | |
| Huntington Bancshares, Inc. 6.208% 8/21/2029 (USD-SOFR + 2.02% on 8/21/2028)6 | | | 13,535 | | | | 13,965 | |
| Huntington Bancshares, Inc. 4.45% junior subordinated perpetual bonds (7-year UST Yield Curve Rate T Note Constant Maturity + 4.045% on 10/15/2027)6 | | | 4,000 | | | | 3,518 | |
| Industrial and Commercial Bank of China, Ltd. 2.875% 9/12/2029 (5-year UST Yield Curve Rate T Note Constant Maturity + 1.65% on 9/12/2024)3 | | | 3,000 | | | | 2,948 | |
| ING Groep NV 6.083% 9/11/2027 (USD-SOFR + 1.56% on 9/11/2026)6 | | | 12,000 | | | | 12,254 | |
| ING Groep NV 6.114% 9/11/2034 (USD-SOFR + 1.85% on 9/11/2033)6 | | | 6,000 | | | | 6,300 | |
| Insurance Australia Group, Ltd. (3-month AUD-BBSW + 2.45%) 6.80% 12/15/20363 | | AUD | 10,280 | | | | 7,090 | |
| Intercontinental Exchange, Inc. 4.00% 9/15/2027 | | USD | 259 | | | | 255 | |
| Intercontinental Exchange, Inc. 4.35% 6/15/2029 | | | 15,430 | | | | 15,399 | |
| Intercontinental Exchange, Inc. 2.10% 6/15/2030 | | | 20,000 | | | | 17,219 | |
| Intercontinental Exchange, Inc. 4.60% 3/15/2033 | | | 17,419 | | | | 17,351 | |
| Intercontinental Exchange, Inc. 2.65% 9/15/2040 | | | 3,875 | | | | 2,893 | |
| Intercontinental Exchange, Inc. 3.00% 6/15/2050 | | | 4,806 | | | | 3,443 | |
| Intercontinental Exchange, Inc. 4.95% 6/15/2052 | | | 4,094 | | | | 4,094 | |
| Intercontinental Exchange, Inc. 3.00% 9/15/2060 | | | 6,311 | | | | 4,274 | |
| Intesa Sanpaolo SpA 5.017% 6/26/20244 | | | 125,758 | | | | 124,495 | |
| Intesa Sanpaolo SpA 3.25% 9/23/20244 | | | 8,260 | | | | 8,112 | |
| Intesa Sanpaolo SpA 7.00% 11/21/20254 | | | 20,450 | | | | 20,965 | |
| Intesa Sanpaolo SpA 5.71% 1/15/20264 | | | 24,105 | | | | 24,002 | |
| Intesa Sanpaolo SpA 3.875% 7/14/20274 | | | 10,275 | | | | 9,575 | |
| Intesa Sanpaolo SpA 3.875% 1/12/20284 | | | 4,974 | | | | 4,620 | |
| Intesa Sanpaolo SpA 4.00% 9/23/20294 | | | 3,000 | | | | 2,733 | |
| Intesa Sanpaolo SpA 8.248% 11/21/2033 (1-year UST Yield Curve Rate T Note Constant Maturity + 4.40% on 11/21/2032)4,6 | | | 2,525 | | | | 2,742 | |
| Intesa Sanpaolo SpA 7.20% 11/28/20334 | | | 11,600 | | | | 12,374 | |
| Intesa Sanpaolo SpA 7.778% 6/20/2054 (1-year UST Yield Curve Rate T Note Constant Maturity + 3.90% on 6/20/2053)4,6 | | | 37,275 | | | | 38,480 | |
| Iron Mountain Information Management Services, Inc. 5.00% 7/15/20324 | | | 2,470 | | | | 2,268 | |
| JPMorgan Chase & Co. 2.301% 10/15/2025 (USD-SOFR + 1.16% on 10/15/2024)6 | | | 6,280 | | | | 6,121 | |
| JPMorgan Chase & Co. 1.561% 12/10/2025 (USD-SOFR + 0.605% on 12/10/2024)6 | | | 124,828 | | | | 120,220 | |
| JPMorgan Chase & Co. 5.546% 12/15/2025 (USD-SOFR + 1.07% on 12/15/2024)6 | | | 17,248 | | | | 17,265 | |
| JPMorgan Chase & Co. 2.005% 3/13/2026 (USD-SOFR + 1.585% on 3/13/2025)6 | | | 22,000 | | | | 21,143 | |
| JPMorgan Chase & Co. 2.083% 4/22/2026 (USD-SOFR + 1.85% on 4/22/2025)6 | | | 2,547 | | | | 2,440 | |
| JPMorgan Chase & Co. 4.08% 4/26/2026 (USD-SOFR + 1.32% on 4/26/2025)6 | | | 7,400 | | | | 7,283 | |
| JPMorgan Chase & Co. 1.04% 2/4/2027 (USD-SOFR + 0.695% on 2/4/2026)6 | | | 7,980 | | | | 7,337 | |
| JPMorgan Chase & Co. 1.578% 4/22/2027 (USD-SOFR + 0.885% on 4/22/2026)6 | | | 12,218 | | | | 11,280 | |
| JPMorgan Chase & Co. 1.47% 9/22/2027 (USD-SOFR + 0.765% on 9/22/2026)6 | | | 31,459 | | | | 28,515 | |
| JPMorgan Chase & Co. 6.07% 10/22/2027 (USD-SOFR + 1.33% on 10/22/2026)6 | | | 10,000 | | | | 10,291 | |
| JPMorgan Chase & Co. 2.947% 2/24/2028 (USD-SOFR + 1.17% on 2/24/2027)6 | | | 67,908 | | | | 63,920 | |
| JPMorgan Chase & Co. 4.323% 4/26/2028 (USD-SOFR + 1.56% on 4/26/2027)6 | | | 49,000 | | | | 48,294 | |
| JPMorgan Chase & Co. 4.851% 7/25/2028 (USD-SOFR + 1.99% on 7/25/2027)6 | | | 20,154 | | | | 20,170 | |
| JPMorgan Chase & Co. 3.509% 1/23/2029 (3-month USD CME Term SOFR + 1.207% on 1/23/2028)6 | | | 3,265 | | | | 3,096 | |
| JPMorgan Chase & Co. 2.069% 6/1/2029 (USD-SOFR + 1.015% on 6/1/2028)6 | | | 15,175 | | | | 13,463 | |
| JPMorgan Chase & Co. 5.299% 7/24/2029 (USD-SOFR + 1.45% on 7/24/2028)6 | | | 16,666 | | | | 16,921 | |
| JPMorgan Chase & Co. 6.087% 10/23/2029 (USD-SOFR + 1.57% on 10/23/2028)6 | | | 3,685 | | | | 3,876 | |
| JPMorgan Chase & Co. 1.953% 2/4/2032 (USD-SOFR + 1.065% on 2/4/2031)6 | | | 13,501 | | | | 10,978 | |
| JPMorgan Chase & Co. 2.58% 4/22/2032 (USD-SOFR + 1.25% on 4/22/2031)6 | | | 1,483 | | | | 1,255 | |
| JPMorgan Chase & Co. 2.545% 11/8/2032 (USD-SOFR + 1.18% on 11/8/2031)6 | | | 20,053 | | | | 16,738 | |
| JPMorgan Chase & Co. 2.963% 1/25/2033 (USD-SOFR + 1.26% on 1/25/2032)6 | | | 485 | | | | 416 | |
| JPMorgan Chase & Co. 4.912% 7/25/2033 (USD-SOFR + 2.08% on 7/25/2032)6 | | | 11,966 | | | | 11,835 | |
| JPMorgan Chase & Co. 5.35% 6/1/2034 (USD-SOFR + 1.845% on 6/1/2033)6 | | | 60,898 | | | | 61,801 | |
| JPMorgan Chase & Co. 6.254% 10/23/2034 (USD-SOFR + 1.81% on 10/23/2033)6 | | | 19,265 | | | | 20,894 | |
| JPMorgan Chase & Co. 3.328% 4/22/2052 (USD-SOFR + 1.58% on 4/22/2051)6 | | | 1,907 | | | | 1,426 | |
| Kasikornbank PCL (Hong Kong Branch) 5.458% 3/7/2028 | | | 3,000 | | | | 3,060 | |
| Kasikornbank PCL (Hong Kong Branch) 3.343% 10/2/2031 (5-year UST Yield Curve Rate T Note Constant Maturity + 1.70% on 10/2/2026)6 | | | 19,035 | | | | 17,519 | |
| KBC Groep NV 5.796% 1/19/2029 (1-year UST Yield Curve Rate T Note Constant Maturity + 2.10% on 1/19/2028)4,6 | | | 9,675 | | | | 9,846 | |
| 32 | The Bond Fund of America |
| Bonds, notes & other debt instruments (continued) | | Principal amount
(000) | | | Value
(000) | |
| Corporate bonds, notes & loans (continued) | | | | | | | | |
| Financials (continued) | | | | | | | | |
| KBC Groep NV 6.324% 9/21/2034 (1-year UST Yield Curve Rate T Note Constant Maturity + 2.05% on 9/21/2033)4,6 | | USD | 42,000 | | | $ | 44,417 | |
| Korea Exchange Bank 3.25% 3/30/20274 | | | 3,350 | | | | 3,204 | |
| Lloyds Banking Group PLC 3.87% 7/9/2025 (1-year UST Yield Curve Rate T Note Constant Maturity + 3.50% on 7/9/2024)6 | | | 523 | | | | 518 | |
| Lloyds Banking Group PLC 2.438% 2/5/2026 (1-year UST Yield Curve Rate T Note Constant Maturity + 1.00% on 2/5/2025)6 | | | 13,875 | | | | 13,394 | |
| Lloyds Banking Group PLC 1.627% 5/11/2027 (1-year UST Yield Curve Rate T Note Constant Maturity + 0.85% on 5/11/2026)6 | | | 312 | | | | 286 | |
| Lloyds Banking Group PLC 5.985% 8/7/2027 (1-year UST Yield Curve Rate T Note Constant Maturity + 1.48% on 8/7/2026)6 | | | 19,425 | | | | 19,779 | |
| Lloyds Banking Group PLC 3.75% 3/18/2028 (1-year UST Yield Curve Rate T Note Constant Maturity + 1.80% on 3/18/2027)6 | | | 26,573 | | | | 25,449 | |
| Lloyds Banking Group PLC 4.375% 3/22/2028 | | | 6,323 | | | | 6,187 | |
| Lloyds Banking Group PLC 5.871% 3/6/2029 (1-year UST Yield Curve Rate T Note Constant Maturity + 1.70% on 3/6/2028)6 | | | 20,547 | | | | 21,066 | |
| Lloyds Banking Group PLC 4.976% 8/11/2033 (1-year UST Yield Curve Rate T Note Constant Maturity + 2.30% on 8/11/2032)6 | | | 16,390 | | | | 15,975 | |
| LPL Holdings, Inc. 4.625% 11/15/20274 | | | 270 | | | | 261 | |
| LPL Holdings, Inc. 6.75% 11/17/2028 | | | 26,490 | | | | 28,255 | |
| LPL Holdings, Inc. 4.375% 5/15/20314 | | | 1,800 | | | | 1,632 | |
| M&T Bank Corp. 7.413% 10/30/2029 (USD-SOFR + 2.80% on 10/30/2028)6 | | | 27,182 | | | | 29,260 | |
| M&T Bank Corp. 5.053% 1/27/2034 (USD-SOFR + 1.85% on 1/27/2033)6 | | | 19,743 | | | | 18,715 | |
| M&T Bank Corp. 5.00% junior subordinated perpetual bonds (5-year UST Yield Curve Rate T Note Constant Maturity + 3.174% on 8/1/2024)6 | | | 5,000 | | | | 4,537 | |
| Macquarie Bank, Ltd. 5.208% 6/15/20264 | | | 5,000 | | | | 5,028 | |
| Macquarie Bank, Ltd. 5.391% 12/7/20264 | | | 5,000 | | | | 5,069 | |
| Marsh & McLennan Companies, Inc. 3.875% 3/15/2024 | | | 13,440 | | | | 13,386 | |
| Marsh & McLennan Companies, Inc. 2.25% 11/15/2030 | | | 4,221 | | | | 3,636 | |
| Marsh & McLennan Companies, Inc. 2.375% 12/15/2031 | | | 1,032 | | | | 880 | |
| Marsh & McLennan Companies, Inc. 5.40% 9/15/2033 | | | 3,250 | | | | 3,424 | |
| Marsh & McLennan Companies, Inc. 2.90% 12/15/2051 | | | 4,875 | | | | 3,298 | |
| Marsh & McLennan Companies, Inc. 5.70% 9/15/2053 | | | 1,687 | | | | 1,837 | |
| Mastercard, Inc. 4.85% 3/9/2033 | | | 8,644 | | | | 8,933 | |
| Mastercard, Inc. 2.95% 3/15/2051 | | | 4,308 | | | | 3,200 | |
| Met Tower Global Funding 5.40% 6/20/20264 | | | 10,000 | | | | 10,154 | |
| MetLife Capital Trust IV, junior subordinated, 7.875% 12/15/2067 (3-month USD-LIBOR + 3.96% on 12/1/2037)4,6,8 | | | 100 | | | | 108 | |
| MetLife, Inc. 3.60% 11/13/2025 | | | 100 | | | | 98 | |
| MetLife, Inc. 4.55% 3/23/2030 | | | 2,417 | | | | 2,433 | |
| MetLife, Inc. 5.375% 7/15/2033 | | | 12,814 | | | | 13,368 | |
| MetLife, Inc. 4.60% 5/13/2046 | | | 800 | | | | 760 | |
| Metropolitan Life Global Funding I 3.60% 1/11/20244 | | | 3,000 | | | | 2,999 | |
| Metropolitan Life Global Funding I 0.95% 7/2/20254 | | | 5,764 | | | | 5,437 | |
| Metropolitan Life Global Funding I 3.45% 12/18/20264 | | | 2,315 | | | | 2,231 | |
| Metropolitan Life Global Funding I 4.40% 6/30/20274 | | | 4,574 | | | | 4,499 | |
| Metropolitan Life Global Funding I 5.05% 1/6/20284 | | | 1,418 | | | | 1,434 | |
| Metropolitan Life Global Funding I 5.40% 9/12/20284 | | | 6,000 | | | | 6,165 | |
| Metropolitan Life Global Funding I 3.05% 6/17/20294 | | | 5,000 | | | | 4,549 | |
| Metropolitan Life Global Funding I 4.30% 8/25/20294 | | | 8,134 | | | | 7,929 | |
| Metropolitan Life Global Funding I 2.95% 4/9/20304 | | | 980 | | | | 871 | |
| Metropolitan Life Global Funding I 1.55% 1/7/20314 | | | 2,284 | | | | 1,830 | |
| Metropolitan Life Global Funding I 2.40% 1/11/20324 | | | 3,250 | | | | 2,697 | |
| Metropolitan Life Global Funding I 5.15% 3/28/20334 | | | 6,068 | | | | 6,179 | |
| Mitsubishi UFJ Financial Group, Inc. 0.962% 10/11/2025 (1-year UST Yield Curve Rate T Note Constant Maturity + 0.45% on 10/11/2024)6 | | | 17,000 | | | | 16,394 | |
| Mitsubishi UFJ Financial Group, Inc. 1.538% 7/20/2027 (1-year UST Yield Curve Rate T Note Constant Maturity + 0.75% on 7/20/2026)6 | | | 35,000 | | | | 31,996 | |
| Mitsubishi UFJ Financial Group, Inc. 1.64% 10/13/2027 (1-year UST Yield Curve Rate T Note Constant Maturity + 0.67% on 10/13/2026)6 | | | 12,800 | | | | 11,660 | |
| Mitsubishi UFJ Financial Group, Inc. 2.341% 1/19/2028 (1-year UST Yield Curve Rate T Note Constant Maturity + 0.83% on 1/19/2027)6 | | | 18,000 | | | | 16,665 | |
| Mitsubishi UFJ Financial Group, Inc. 4.08% 4/19/2028 (1-year UST Yield Curve Rate T Note Constant Maturity + 1.30% on 4/19/2027)6 | | | 19,000 | | | | 18,485 | |
| Mitsubishi UFJ Financial Group, Inc. 5.422% 2/22/2029 (1-year UST Yield Curve Rate T Note Constant Maturity + 1.38% on 2/22/2028)6 | | | 10,000 | | | | 10,188 | |
| The Bond Fund of America | 33 |
| Bonds, notes & other debt instruments (continued) | | Principal amount
(000) | | | Value
(000) | |
| Corporate bonds, notes & loans (continued) | | | | | | | | |
| Financials (continued) | | | | | | | | |
| Mitsubishi UFJ Financial Group, Inc. 5.133% 7/20/2033 (1-year UST Yield Curve Rate T Note Constant Maturity + 2.125% on 7/20/2032)6 | | USD | 631 | | | $ | 641 | |
| Mizuho Financial Group, Inc. 1.234% 5/22/2027 (1-year UST Yield Curve Rate T Note Constant Maturity + 0.67% on 5/22/2026)6 | | | 10,000 | | | | 9,115 | |
| Mizuho Financial Group, Inc. 1.554% 7/9/2027 (1-year UST Yield Curve Rate T Note Constant Maturity + 0.75% on 7/9/2026)6 | | | 26,000 | | | | 23,770 | |
| Mizuho Financial Group, Inc. 5.778% 7/6/2029 (1-year UST Yield Curve Rate T Note Constant Maturity + 1.65% on 7/6/2028)6 | | | 12,530 | | | | 12,899 | |
| Mizuho Financial Group, Inc. 5.669% 9/13/2033 (1-year UST Yield Curve Rate T Note Constant Maturity + 2.40% on 9/13/2032)6 | | | 16,070 | | | | 16,602 | |
| Morgan Stanley 2.72% 7/22/2025 (USD-SOFR + 1.152% on 7/22/2024)6 | | | 1,640 | | | | 1,613 | |
| Morgan Stanley 1.164% 10/21/2025 (USD-SOFR + 0.56% on 10/21/2024)6 | | | 995 | | | | 958 | |
| Morgan Stanley 4.754% 4/21/2026 | | | 25,000 | | | | 24,992 | |
| Morgan Stanley 4.679% 7/17/2026 (USD-SOFR + 1.669% on 7/17/2025)6 | | | 1,121 | | | | 1,111 | |
| Morgan Stanley 1.593% 5/4/2027 (USD-SOFR + 0.879% on 5/4/2026)6 | | | 9,411 | | | | 8,675 | |
| Morgan Stanley 1.512% 7/20/2027 (USD-SOFR + 0.858% on 7/20/2026)6 | | | 65,131 | | | | 59,520 | |
| Morgan Stanley 2.475% 1/21/2028 (USD-SOFR + 1.00% on 1/21/2027)6 | | | 2,594 | | | | 2,409 | |
| Morgan Stanley 4.21% 4/20/2028 (USD-SOFR + 1.61% on 4/20/2027)6 | | | 6,143 | | | | 6,007 | |
| Morgan Stanley 5.123% 2/1/2029 (USD-SOFR + 1.73% on 2/1/2028)6 | | | 69,283 | | | | 69,637 | |
| Morgan Stanley 5.164% 4/20/2029 (USD-SOFR + 1.59% on 4/20/2028)6 | | | 40,799 | | | | 41,056 | |
| Morgan Stanley 5.449% 7/20/2029 (USD-SOFR + 1.63% on 7/20/2028)6 | | | 321 | | | | 327 | |
| Morgan Stanley 6.407% 11/1/2029 (USD-SOFR + 1.83% on 11/1/2028)6 | | | 17,749 | | | | 18,822 | |
| Morgan Stanley 2.699% 1/22/2031 (USD-SOFR + 1.143% on 1/22/2030)6 | | | 2,300 | | | | 2,012 | |
| Morgan Stanley 3.622% 4/1/2031 (USD-SOFR + 3.12% on 4/1/2030)6 | | | 3,103 | | | | 2,860 | |
| Morgan Stanley 1.794% 2/13/2032 (USD-SOFR + 1.034% on 2/13/2031)6 | | | 38,966 | | | | 31,133 | |
| Morgan Stanley 2.239% 7/21/2032 (USD-SOFR + 1.178% on 7/21/2031)6 | | | 33,844 | | | | 27,638 | |
| Morgan Stanley 2.511% 10/20/2032 (USD-SOFR + 1.20% on 10/20/2031)6 | | | 9,792 | | | | 8,112 | |
| Morgan Stanley 2.943% 1/21/2033 (USD-SOFR + 1.29% on 1/21/2032)6 | | | 12,484 | | | | 10,624 | |
| Morgan Stanley 4.889% 7/20/2033 (USD-SOFR + 2.077% on 7/20/2032)6 | | | 11,150 | | | | 10,878 | |
| Morgan Stanley 5.25% 4/21/2034 (USD-SOFR + 1.87% on 4/21/2033)6 | | | 30,000 | | | | 30,011 | |
| Morgan Stanley 5.424% 7/21/2034 (USD-SOFR + 1.88% on 7/21/2033)6 | | | 44,901 | | | | 45,591 | |
| Morgan Stanley 6.627% 11/1/2034 (USD-SOFR + 2.05% on 11/1/2033)6 | | | 71,108 | | | | 78,766 | |
| Morgan Stanley 5.297% 4/20/2037 (USD-SOFR + 2.62% on 4/20/2032)6 | | | 13,453 | | | | 13,098 | |
| Morgan Stanley 3.217% 4/22/2042 (USD-SOFR + 1.485% on 4/22/2041)6 | | | 5,708 | | | | 4,395 | |
| Morgan Stanley Bank, N.A. 5.479% 7/16/2025 | | | 8,125 | | | | 8,203 | |
| MSCI, Inc. 3.625% 9/1/20304 | | | 16,200 | | | | 14,676 | |
| MSCI, Inc. 3.25% 8/15/20334 | | | 15,450 | | | | 12,932 | |
| Münchener Rückversicherungs-Gesellschaft AG 5.875% 5/23/2042 (5-year UST Yield Curve Rate T Note Constant Maturity + 3.982% on 5/23/2032)4,6 | | | 6,000 | | | | 6,030 | |
| Nasdaq, Inc. 5.35% 6/28/2028 | | | 4,393 | | | | 4,528 | |
| Nasdaq, Inc. 5.55% 2/15/2034 | | | 9,368 | | | | 9,738 | |
| Nasdaq, Inc. 5.95% 8/15/2053 | | | 2,304 | | | | 2,479 | |
| Nasdaq, Inc. 6.10% 6/28/2063 | | | 792 | | | | 857 | |
| National Australia Bank, Ltd. 4.944% 1/12/2028 | | | 3,474 | | | | 3,512 | |
| National Australia Bank, Ltd. 4.90% 6/13/2028 | | | 5,000 | | | | 5,062 | |
| NatWest Group PLC 5.847% 3/2/2027 (1-year UST Yield Curve Rate T Note Constant Maturity + 1.35% on 3/2/2026)6 | | | 25,000 | | | | 25,230 | |
| NatWest Group PLC 3.073% 5/22/2028 (1-year UST Yield Curve Rate T Note Constant Maturity + 2.55% on 5/22/2027)6 | | | 7,500 | | | | 6,969 | |
| NatWest Group PLC 5.076% 1/27/2030 (3-month USD-LIBOR + 1.905% on 1/27/2029)6,8 | | | 2,650 | | | | 2,612 | |
| NatWest Group PLC 4.445% 5/8/2030 (3-month USD-LIBOR + 1.871% on 5/5/2029)6,8 | | | 11,600 | | | | 11,125 | |
| NatWest Group PLC 6.016% 3/2/2034 (1-year UST Yield Curve Rate T Note Constant Maturity + 2.10% on 3/2/2033)6 | | | 8,000 | | | | 8,408 | |
| Navient Corp. 5.875% 10/25/2024 | | | 1,000 | | | | 1,001 | |
| Navient Corp. 6.75% 6/25/2025 | | | 10,000 | | | | 10,125 | |
| Navient Corp. 5.00% 3/15/2027 | | | 6,250 | | | | 6,040 | |
| Navient Corp. 5.625% 8/1/2033 | | | 3,000 | | | | 2,466 | |
| New York Life Global Funding 0.95% 6/24/20254 | | | 1,034 | | | | 977 | |
| New York Life Global Funding 0.85% 1/15/20264 | | | 6,053 | | | | 5,597 | |
| New York Life Global Funding 3.25% 4/7/20274 | | | 2,164 | | | | 2,077 | |
| New York Life Global Funding 4.90% 6/13/20284 | | | 7,500 | | | | 7,577 | |
| New York Life Global Funding 1.20% 8/7/20304 | | | 8,750 | | | | 7,024 | |
| New York Life Global Funding 1.85% 8/1/20314 | | | 2,250 | | | | 1,816 | |
| New York Life Global Funding 4.55% 1/28/20334 | | | 4,751 | | | | 4,687 | |
| NongHyup Bank 4.875% 7/3/20284 | | | 16,213 | | | | 16,319 | |
| Northwestern Mutual Global Funding 0.80% 1/14/20264 | | | 2,062 | | | | 1,908 | |
| 34 | The Bond Fund of America |
| Bonds, notes & other debt instruments (continued) | | Principal amount
(000) | | | Value
(000) | |
| Corporate bonds, notes & loans (continued) | | | | | | | | |
| Financials (continued) | | | | | | | | |
| Northwestern Mutual Life Insurance Co. (The) 4.90% 6/12/20284 | | USD | 12,000 | | | $ | 12,060 | |
| Onemain Finance Corp. 7.125% 3/15/2026 | | | 9,300 | | | | 9,481 | |
| Onemain Finance Corp. 7.875% 3/15/2030 | | | 9,120 | | | | 9,396 | |
| Oversea-Chinese Banking Corp., Ltd. (3-month AUD-BBSW + 0.70%) 4.852% 4/14/20253 | | AUD | 29,750 | | | | 20,304 | |
| Oversea-Chinese Banking Corp., Ltd. 1.832% 9/10/2030 (5-year UST Yield Curve Rate T Note Constant Maturity + 1.58% on 9/10/2025)6 | | USD | 2,250 | | | | 2,117 | |
| PayPal Holdings, Inc. 3.90% 6/1/2027 | | | 5,603 | | | | 5,514 | |
| PayPal Holdings, Inc. 4.40% 6/1/2032 | | | 15,247 | | | | 15,158 | |
| PayPal Holdings, Inc. 3.25% 6/1/2050 | | | 61 | | | | 46 | |
| PayPal Holdings, Inc. 5.05% 6/1/2052 | | | 19,695 | | | | 19,880 | |
| PayPal Holdings, Inc. 5.25% 6/1/2062 | | | 321 | | | | 319 | |
| PNC Financial Services Group, Inc. 5.354% 12/2/2028 (USD-SOFR + 1.62% on 12/2/2027)6 | | | 10,000 | | | | 10,123 | |
| PNC Financial Services Group, Inc. 5.582% 6/12/2029 (USD-SOFR + 1.841% on 6/12/2028)6 | | | 49,534 | | | | 50,625 | |
| PNC Financial Services Group, Inc. 6.037% 10/28/2033 (USD-SOFR + 2.14% on 10/28/2032)6 | | | 9,176 | | | | 9,592 | |
| PNC Financial Services Group, Inc. 5.939% 8/18/2034 (USD-SOFR + 1.946% on 8/18/2033)6 | | | 2,378 | | | | 2,474 | |
| PNC Financial Services Group, Inc. 6.875% 10/20/2034 (USD-SOFR + 2.284% on 10/20/2033)6 | | | 18,349 | | | | 20,378 | |
| PNC Financial Services Group, Inc. 3.40% junior subordinated perpetual bonds (5-year UST Yield Curve Rate T Note Constant Maturity + 2.595% on 9/15/2026)6 | | | 4,562 | | | | 3,661 | |
| Power Finance Corp., Ltd. 3.95% 4/23/2030 | | | 32,000 | | | | 29,629 | |
| Power Finance Corp., Ltd. 3.35% 5/16/2031 | | | 8,670 | | | | 7,647 | |
| Prudential Financial, Inc. 3.905% 12/7/2047 | | | 850 | | | | 697 | |
| Prudential Financial, Inc. 4.418% 3/27/2048 | | | 1,000 | | | | 883 | |
| Prudential Financial, Inc. 3.70% 3/13/2051 | | | 5,583 | | | | 4,420 | |
| QBE Insurance Group, Ltd. (3-month AUD-BBSW + 2.75%) 7.128% 8/25/20363 | | AUD | 12,200 | | | | 8,492 | |
| QBE Insurance Group, Ltd. 2.50% 9/13/2038 (5-year GBP-GILT + 2.061% on 9/13/2028)6 | | GBP | 3,840 | | | | 4,158 | |
| QBE Insurance Group, Ltd. 5.875% 6/17/2046 (10-year USD-ICE SOFR Spread-Adjusted Swap + 4.395% on 6/17/2026)6 | | USD | 4,000 | | | | 3,927 | |
| Royal Bank of Canada 0.75% 10/7/2024 | | | 1,347 | | | | 1,301 | |
| Royal Bank of Canada 4.95% 4/25/2025 | | | 5,000 | | | | 5,005 | |
| Royal Bank of Canada 3.625% 5/4/2027 | | | 748 | | | | 723 | |
| Royal Bank of Canada 6.00% 11/1/2027 | | | 1,098 | | | | 1,151 | |
| Royal Bank of Canada 4.90% 1/12/2028 | | | 1,650 | | | | 1,669 | |
| Royal Bank of Canada 5.00% 2/1/2033 | | | 16,627 | | | | 16,917 | |
| Santander Holdings USA, Inc. 3.50% 6/7/2024 | | | 13,325 | | | | 13,187 | |
| Santander Holdings USA, Inc. 2.49% 1/6/2028 (USD-SOFR + 1.249% on 1/6/2027)6 | | | 10,775 | | | | 9,873 | |
| Santander Holdings USA, Inc. 6.499% 3/9/2029 (USD-SOFR + 2.356% on 3/9/2028)6 | | | 24,328 | | | | 25,157 | |
| Santander Holdings USA, Inc. 6.565% 6/12/2029 (USD-SOFR + 2.70% on 6/12/2028)6 | | | 3,644 | | | | 3,763 | |
| SMBC Aviation Capital Finance DAC 5.70% 7/25/20334 | | | 7,915 | | | | 8,007 | |
| Standard Chartered PLC 7.018% 2/8/2030 (1-year UST Yield Curve Rate T Note Constant Maturity + 2.20% on 2/8/2029)4,6 | | | 4,930 | | | | 5,208 | |
| Standard Chartered PLC 4.866% 3/15/2033 (5-year USD-ICE Swap + 1.97% on 3/15/2028)4,6 | | | 7,000 | | | | 6,592 | |
| Standard Chartered PLC 4.866% 3/15/2033 (5-year USD-ICE Swap + 1.97% on 3/15/2028)6 | | | 5,200 | | | | 4,897 | |
| Standard Chartered PLC 6.296% 7/6/2034 (1-year UST Yield Curve Rate T Note Constant Maturity + 2.58% on 7/6/2033)4,6 | | | 13,701 | | | | 14,398 | |
| Standard Chartered PLC 3.265% 2/18/2036 (5-year UST Yield Curve Rate T Note Constant Maturity + 2.30% on 2/18/2031)4,6 | | | 2,554 | | | | 2,093 | |
| State Street Corp. 5.82% 11/4/2028 (USD-SOFR + 1.715% on 11/4/2027)6 | | | 430 | | | | 446 | |
| State Street Corp. 4.164% 8/4/2033 (USD-SOFR + 1.726% on 8/4/2032)6 | | | 10,825 | | | | 10,210 | |
| State Street Corp. 4.821% 1/26/2034 (USD-SOFR + 1.567% on 1/26/2033)6 | | | 18,331 | | | | 18,047 | |
| State Street Corp. 5.159% 5/18/2034 (USD-SOFR + 1.89% on 5/18/2033)6 | | | 45,934 | | | | 46,292 | |
| Sumitomo Mitsui Financial Group, Inc. 5.88% 7/13/2026 | | | 10,264 | | | | 10,500 | |
| Sumitomo Mitsui Financial Group, Inc. 2.174% 1/14/2027 | | | 6,775 | | | | 6,266 | |
| Sumitomo Mitsui Financial Group, Inc. 5.80% 7/13/2028 | | | 7,500 | | | | 7,769 | |
| Sumitomo Mitsui Financial Group, Inc. 5.766% 1/13/2033 | | | 427 | | | | 451 | |
| Sumitomo Mitsui Trust Bank, Ltd. 5.55% 9/14/20284 | | | 10,000 | | | | 10,293 | |
| Suncorp Group, Ltd. (3-month AUD-BBSW + 2.30%) 6.67% 6/1/20373 | | AUD | 7,500 | | | | 5,175 | |
| Suncorp Group, Ltd. (3-month AUD-BBSW + 2.65%) 7.02% 12/1/20383 | | | 50 | | | | 35 | |
| Suncorp-Metway, Ltd. (3-month AUD-BBSW + 0.78%) 5.122% 7/30/20243 | | | 24,500 | | | | 16,713 | |
| The Bond Fund of America | 35 |
| Bonds, notes & other debt instruments (continued) | | Principal amount
(000) | | | Value
(000) | |
| Corporate bonds, notes & loans (continued) | | | | | | | | |
| Financials (continued) | | | | | | | | |
| SVB Financial Group 4.70% junior subordinated perpetual bonds (5-year UST Yield Curve Rate T Note Constant Maturity + 3.064% on 11/15/2031)6,9 | | USD | 11,614 | | | $ | 157 | |
| Svenska Handelsbanken AB 5.50% 6/15/20284 | | | 5,000 | | | | 5,095 | |
| Swedbank AB 6.136% 9/12/20264 | | | 12,825 | | | | 13,088 | |
| Synchrony Bank 5.40% 8/22/2025 | | | 17,000 | | | | 16,754 | |
| Synchrony Bank 5.625% 8/23/2027 | | | 17,000 | | | | 16,723 | |
| Synchrony Financial 4.375% 3/19/2024 | | | 5,825 | | | | 5,805 | |
| Toronto-Dominion Bank (The) 0.75% 9/11/2025 | | | 23,900 | | | | 22,309 | |
| Toronto-Dominion Bank (The) 5.156% 1/10/2028 | | | 9,935 | | | | 10,092 | |
| Toronto-Dominion Bank (The) 5.523% 7/17/2028 | | | 25,000 | | | | 25,757 | |
| Toronto-Dominion Bank (The) 4.456% 6/8/2032 | | | 61 | | | | 59 | |
| Travelers Companies, Inc. 4.00% 5/30/2047 | | | 2,250 | | | | 1,943 | |
| Travelers Companies, Inc. 4.10% 3/4/2049 | | | 1,500 | | | | 1,308 | |
| Travelers Companies, Inc. 2.55% 4/27/2050 | | | 1,601 | | | | 1,055 | |
| Travelers Companies, Inc. 5.45% 5/25/2053 | | | 1,914 | | | | 2,067 | |
| Truist Financial Corp. 4.873% 1/26/2029 (USD-SOFR + 1.435% on 1/26/2028)6 | | | 18,000 | | | | 17,745 | |
| Truist Financial Corp. 7.161% 10/30/2029 (USD-SOFR + 2.446% on 10/30/2028)6 | | | 17,382 | | | | 18,786 | |
| Truist Financial Corp. 5.122% 1/26/2034 (USD-SOFR + 1.60% on 1/26/2033)6 | | | 18,975 | | | | 18,388 | |
| Truist Financial Corp. 5.867% 6/8/2034 (USD-SOFR + 2.361% on 6/8/2033)6 | | | 19,540 | | | | 19,946 | |
| U.S. Bancorp 2.40% 7/30/2024 | | | 19,000 | | | | 18,679 | |
| U.S. Bancorp 3.10% 4/27/2026 | | | 7,000 | | | | 6,711 | |
| U.S. Bancorp 4.548% 7/22/2028 (USD-SOFR + 1.66% on 7/27/2027)6 | | | 16,000 | | | | 15,772 | |
| U.S. Bancorp 4.653% 2/1/2029 (USD-SOFR + 1.23% on 2/1/2028)6 | | | 7,500 | | | | 7,386 | |
| U.S. Bancorp 5.775% 6/12/2029 (USD-SOFR + 2.02% on 6/12/2028)6 | | | 7,500 | | | | 7,710 | |
| U.S. Bancorp 2.677% 1/27/2033 (USD-SOFR + 1.02% on 1/27/2032)6 | | | 2,675 | | | | 2,232 | |
| U.S. Bancorp 4.839% 2/1/2034 (USD-SOFR + 1.60% on 2/1/2033)6 | | | 49,596 | | | | 47,529 | |
| U.S. Bancorp 5.836% 6/12/2034 (USD-SOFR + 2.26% on 6/10/2033)6 | | | 17,758 | | | | 18,326 | |
| U.S. Bancorp 3.70% junior subordinated perpetual bonds (5-year UST Yield Curve Rate T Note Constant Maturity + 2.541% on 1/15/2027)6 | | | 4,711 | | | | 3,710 | |
| UBS Group AG 4.49% 8/5/2025 (1-year UST Yield Curve Rate T Note Constant Maturity + 1.60% on 8/5/2024)4,6 | | | 2,360 | | | | 2,343 | |
| UBS Group AG 2.593% 9/11/2025 (USD-SOFR + 1.56% on 9/11/2024)4,6 | | | 3,418 | | | | 3,345 | |
| UBS Group AG 4.55% 4/17/2026 | | | 7,000 | | | | 6,912 | |
| UBS Group AG 2.193% 6/5/2026 (USD-SOFR + 2.044% on 6/5/2025)4,6 | | | 26,727 | | | | 25,432 | |
| UBS Group AG 5.711% 1/12/2027 (1-year UST Yield Curve Rate T Note Constant Maturity + 1.55% on 1/12/2026)4,6 | | | 20,000 | | | | 20,118 | |
| UBS Group AG 1.364% 1/30/2027 (5-year UST Yield Curve Rate T Note Constant Maturity + 1.08% on 1/30/2026)4,6 | | | 10,300 | | | | 9,449 | |
| UBS Group AG 1.305% 2/2/2027 (USD-SOFR + 0.98% on 2/2/2026)4,6 | | | 38,389 | | | | 35,231 | |
| UBS Group AG 4.703% 8/5/2027 (1-year UST Yield Curve Rate T Note Constant Maturity + 2.05% on 8/5/2026)4,6 | | | 50,000 | | | | 49,312 | |
| UBS Group AG 1.494% 8/10/2027 (1-year UST Yield Curve Rate T Note Constant Maturity + 0.85% on 8/10/2026)4,6 | | | 22,475 | | | | 20,318 | |
| UBS Group AG 4.751% 5/12/2028 (5-year UST Yield Curve Rate T Note Constant Maturity + 1.75% on 5/12/2027)4,6 | | | 10,224 | | | | 10,074 | |
| UBS Group AG 6.442% 8/11/2028 (USD-SOFR + 3.70% on 8/11/2027)4,6 | | | 8,250 | | | | 8,573 | |
| UBS Group AG 3.869% 1/12/2029 (3-month USD-LIBOR + 1.41% on 1/12/2028)4,6,8 | | | 12,135 | | | | 11,450 | |
| UBS Group AG 6.246% 9/22/2029 (1-year UST Yield Curve Rate T Note Constant Maturity + 1.80% on 9/22/2028)4,6 | | | 19,000 | | | | 19,835 | |
| UBS Group AG 3.126% 8/13/2030 (3-month USD-LIBOR + 1.468% on 8/13/2029)4,6,8 | | | 11,000 | | | | 9,824 | |
| UBS Group AG 4.194% 4/1/2031 (USD-SOFR + 3.73% on 4/1/2030)4,6 | | | 82,501 | | | | 76,890 | |
| UBS Group AG 2.095% 2/11/2032 (1-year UST Yield Curve Rate T Note Constant Maturity + 1.00% on 2/11/2031)4,6 | | | 15,199 | | | | 12,132 | |
| UBS Group AG 3.091% 5/14/2032 (USD-SOFR + 1.73% on 5/14/2031)4,6 | | | 76,007 | | | | 64,770 | |
| UBS Group AG 2.746% 2/11/2033 (1-year UST Yield Curve Rate T Note Constant Maturity + 1.10% on 2/11/2032)4,6 | | | 22,071 | | | | 18,117 | |
| UBS Group AG 6.537% 8/12/2033 (USD-SOFR + 3.92% on 8/12/2032)4,6 | | | 5,631 | | | | 6,013 | |
| UBS Group AG 9.016% 11/15/2033 (USD-SOFR + 5.02% on 11/15/2032)4,6 | | | 51,875 | | | | 63,807 | |
| UBS Group AG 6.301% 9/22/2034 (1-year UST Yield Curve Rate T Note Constant Maturity + 2.00% on 9/22/2033)4,6 | | | 3,325 | | | | 3,522 | |
| UniCredit SpA 4.625% 4/12/20274 | | | 17,010 | | | | 16,632 | |
| UniCredit SpA 5.861% 6/19/2032 (5-year USD-ICE Swap + 3.703% on 6/19/2027)4,6 | | | 29,477 | | | | 28,871 | |
| United Overseas Bank, Ltd. 2.00% 10/14/2031 (5-year UST Yield Curve Rate T Note Constant Maturity + 1.23% on 10/14/2026)4,6 | | | 8,430 | | | | 7,684 | |
| Vigorous Champion International, Ltd. 4.25% 5/28/2029 | | | 1,708 | | | | 1,574 | |
| Vnesheconombank Via VEB Finance PLC 6.80% 11/22/20254,7,9 | | | 500 | | | | — | 2 |
| 36 | The Bond Fund of America |
| Bonds, notes & other debt instruments (continued) | | Principal amount
(000) | | | Value
(000) | |
| Corporate bonds, notes & loans (continued) | | | | | | |
| Financials (continued) | | | | | | | | |
| Wells Fargo & Co. 2.406% 10/30/2025 (3-month USD CME Term SOFR + 1.087% on 10/30/2024)6 | | USD | 36,060 | | | $ | 35,087 | |
| Wells Fargo & Co. 3.00% 4/22/2026 | | | 3,053 | | | | 2,926 | |
| Wells Fargo & Co. 3.908% 4/25/2026 (USD-SOFR + 1.32% on 4/25/2025)6 | | | 9,960 | | | | 9,769 | |
| Wells Fargo & Co. 3.00% 10/23/2026 | | | 9,980 | | | | 9,479 | |
| Wells Fargo & Co. 3.196% 6/17/2027 (3-month USD CME Term SOFR + 1.432% on 6/17/2026)6 | | | 11,147 | | | | 10,661 | |
| Wells Fargo & Co. 3.526% 3/24/2028 (USD-SOFR + 1.51% on 3/24/2027)6 | | | 46,148 | | | | 44,048 | |
| Wells Fargo & Co. 2.393% 6/2/2028 (USD-SOFR + 2.10% on 6/2/2027)6 | | | 19,741 | | | | 18,090 | |
| Wells Fargo & Co. 4.808% 7/25/2028 (USD-SOFR + 1.98% on 7/25/2027)6 | | | 73,674 | | | | 73,171 | |
| Wells Fargo & Co. 5.574% 7/25/2029 (USD-SOFR + 1.74% on 7/25/2028)6 | | | 18,000 | | | | 18,390 | |
| Wells Fargo & Co. 6.303% 10/23/2029 (USD-SOFR + 1.79% on 10/23/2028)6 | | | 49,300 | | | | 51,989 | |
| Wells Fargo & Co. 5.389% 4/24/2034 (USD-SOFR + 2.02% on 4/24/2033)6 | | | 103,678 | | | | 104,189 | |
| Wells Fargo & Co. 5.557% 7/25/2034 (USD-SOFR + 1.99% on 7/25/2033)6 | | | 27,531 | | | | 28,044 | |
| Wells Fargo & Co. 6.491% 10/23/2034 (USD-SOFR + 2.06% on 10/23/2033)6 | | | 47,035 | | | | 51,196 | |
| Wells Fargo & Co. 4.611% 4/25/2053 (USD-SOFR + 2.13% on 4/25/2052)6 | | | 71,327 | | | | 64,208 | |
| Westpac Banking Corp. 2.894% 2/4/2030 (5-year UST Yield Curve Rate T Note Constant Maturity + 1.35% on 2/4/2025)6 | | | 10,000 | | | | 9,637 | |
| Westpac Banking Corp. 4.11% 7/24/2034 (5-year UST Yield Curve Rate T Note Constant Maturity + 2.00% on 7/24/2029)6 | | | 11,339 | | | | 10,383 | |
| Westpac Banking Corp. 2.668% 11/15/2035 (5-year UST Yield Curve Rate T Note Constant Maturity + 1.75% on 11/15/2030)6 | | | 20,125 | | | | 16,390 | |
| Willis North America, Inc. 4.65% 6/15/2027 | | | 5,185 | | | | 5,133 | |
| Willis North America, Inc. 5.35% 5/15/2033 | | | 8,500 | | | | 8,592 | |
| Willis North America, Inc. 3.875% 9/15/2049 | | | 4,700 | | | | 3,642 | |
| Xiaomi Best Time International, Ltd. 3.375% 4/29/2030 | | | 2,865 | | | | 2,516 | |
| Xiaomi Best Time International, Ltd. 2.875% 7/14/2031 | | | 2,000 | | | | 1,665 | |
| Xiaomi Best Time International, Ltd. 4.10% 7/14/2051 | | | 5,000 | | | | 3,560 | |
| | | | | | | | 7,806,579 | |
| | | | | | | | | |
| Utilities 3.84% | | | | | | | | |
| Adani Transmission Step-One, Ltd. 4.00% 8/3/2026 | | | 2,000 | | | | 1,837 | |
| AEP Texas, Inc. 3.45% 5/15/2051 | | | 2,638 | | | | 1,892 | |
| AEP Transmission Co., LLC 3.10% 12/1/2026 | | | 4,075 | | | | 3,917 | |
| AEP Transmission Co., LLC 2.75% 8/15/2051 | | | 2,831 | | | | 1,840 | |
| AES Panama Generation Holdings SRL 4.375% 5/31/20304 | | | 8,412 | | | | 7,078 | |
| Alabama Power Co. 3.00% 3/15/2052 | | | 22,980 | | | | 16,086 | |
| Alfa Desarrollo SpA 4.55% 9/27/2051 | | | 8,944 | | | | 6,991 | |
| Alfa Desarrollo SpA 4.55% 9/27/20514 | | | 5,694 | | | | 4,451 | |
| Ameren Corp. 2.50% 9/15/2024 | | | 1,616 | | | | 1,581 | |
| American Electric Power Co., Inc. 1.00% 11/1/2025 | | | 317 | | | | 294 | |
| American Electric Power Co., Inc. 4.30% 12/1/2028 | | | 31,133 | | | | 30,476 | |
| American Transmission Systems, Inc. 2.65% 1/15/20324 | | | 1,695 | | | | 1,435 | |
| Atlantic City Electric Co. 2.30% 3/15/2031 | | | 2,175 | | | | 1,836 | |
| Baltimore Gas and Electric Co. 4.55% 6/1/2052 | | | 3,150 | | | | 2,892 | |
| Berkshire Hathaway Energy Co. 4.50% 2/1/2045 | | | 200 | | | | 185 | |
| Berkshire Hathaway Energy Co. 4.60% 5/1/2053 | | | 3,618 | | | | 3,230 | |
| Calpine Corp. 5.25% 6/1/20264 | | | 3,398 | | | | 3,355 | |
| Calpine Corp. 4.50% 2/15/20284 | | | 4,000 | | | | 3,807 | |
| CenterPoint Energy Houston Electric, LLC 4.95% 4/1/2033 | | | 5,750 | | | | 5,857 | |
| CenterPoint Energy Houston Electric, LLC 2.90% 7/1/2050 | | | 5,867 | | | | 4,105 | |
| CenterPoint Energy Houston Electric, LLC 3.60% 3/1/2052 | | | 5,392 | | | | 4,285 | |
| CenterPoint Energy, Inc. 2.65% 6/1/2031 | | | 13,900 | | | | 11,868 | |
| CenterPoint Energy, Inc. 3.70% 9/1/2049 | | | 2,775 | | | | 2,104 | |
| Chile Electricity Lux MPC SARL 6.01% 1/20/20334 | | | 3,300 | | | | 3,387 | |
| Cleveland Electric Illuminating Co. (The) 3.50% 4/1/20284 | | | 15,958 | | | | 14,958 | |
| Cleveland Electric Illuminating Co. (The) 4.55% 11/15/20304 | | | 5,500 | | | | 5,220 | |
| CMS Energy Corp. 3.00% 5/15/2026 | | | 7,689 | | | | 7,353 | |
| CMS Energy Corp. 3.45% 8/15/2027 | | | 1,460 | | | | 1,392 | |
| Comision Federal de Electricidad 4.688% 5/15/20294 | | | 30,765 | | | | 28,986 | |
| Commonwealth Edison Co. 3.125% 3/15/2051 | | | 2,000 | | | | 1,418 | |
| Connecticut Light and Power Co. (The) 3.20% 3/15/2027 | | | 857 | | | | 824 | |
| Connecticut Light and Power Co. (The) 2.05% 7/1/2031 | | | 12,036 | | | | 9,996 | |
| Consumers Energy Co. 4.90% 2/15/2029 | | | 17,976 | | | | 18,307 | |
| Consumers Energy Co. 3.60% 8/15/2032 | | | 48,605 | | | | 45,084 | |
| Consumers Energy Co. 4.625% 5/15/2033 | | | 10,001 | | | | 9,991 | |
| Dominion Energy, Inc. 3.30% 3/15/2025 | | | 2,113 | | | | 2,064 | |
| The Bond Fund of America | 37 |
| Bonds, notes & other debt instruments (continued) | | Principal amount
(000) | | | Value
(000) | |
| Corporate bonds, notes & loans (continued) | | | | | | | | |
| Utilities (continued) | | | | | | | | |
| Dominion Energy, Inc. 3.375% 4/1/2030 | | USD | 20,716 | | | $ | 19,084 | |
| Dominion Energy, Inc., junior subordinated, 3.071% 8/15/2024 | | | 4,825 | | | | 4,747 | |
| DPL, Inc. 4.125% 7/1/2025 | | | 1,040 | | | | 1,015 | |
| DTE Electric Co. 2.625% 3/1/2031 | | | 586 | | | | 513 | |
| DTE Electric Co. 3.70% 3/15/2045 | | | 107 | | | | 88 | |
| DTE Electric Co. 3.65% 3/1/2052 | | | 2,146 | | | | 1,698 | |
| DTE Energy Co. 2.85% 10/1/2026 | | | 6,100 | | | | 5,770 | |
| DTE Energy Co. 2.25% 3/1/2030 | | | 12,769 | | | | 11,211 | |
| DTE Energy Co. 3.00% 3/1/2032 | | | 33,359 | | | | 29,593 | |
| DTE Energy Co. 2.95% 3/1/2050 | | | 1,994 | | | | 1,397 | |
| Duke Energy Carolinas, LLC 2.45% 8/15/2029 | | | 27,831 | | | | 24,768 | |
| Duke Energy Carolinas, LLC 2.55% 4/15/2031 | | | 419 | | | | 364 | |
| Duke Energy Carolinas, LLC 3.20% 8/15/2049 | | | 77 | | | | 56 | |
| Duke Energy Carolinas, LLC 5.35% 1/15/2053 | | | 3,528 | | | | 3,622 | |
| Duke Energy Corp. 2.55% 6/15/2031 | | | 348 | | | | 297 | |
| Duke Energy Corp. 5.75% 9/15/2033 | | | 33,869 | | | | 35,857 | |
| Duke Energy Corp. 3.50% 6/15/2051 | | | 599 | | | | 441 | |
| Duke Energy Corp. 5.00% 8/15/2052 | | | 331 | | | | 310 | |
| Duke Energy Florida, LLC 1.75% 6/15/2030 | | | 9,021 | | | | 7,531 | |
| Duke Energy Florida, LLC 5.875% 11/15/2033 | | | 4,050 | | | | 4,368 | |
| Duke Energy Florida, LLC 3.00% 12/15/2051 | | | 8,566 | | | | 5,856 | |
| Duke Energy Florida, LLC 5.95% 11/15/2052 | | | 2,500 | | | | 2,740 | |
| Duke Energy Ohio, Inc. 2.125% 6/1/2030 | | | 5,250 | | | | 4,473 | |
| Duke Energy Progress, LLC 2.00% 8/15/2031 | | | 769 | | | | 636 | |
| Duke Energy Progress, LLC 2.50% 8/15/2050 | | | 4,494 | | | | 2,830 | |
| Edison International 3.55% 11/15/2024 | | | 16,725 | | | | 16,427 | |
| Edison International 4.95% 4/15/2025 | | | 6,354 | | | | 6,315 | |
| Edison International 5.75% 6/15/2027 | | | 13,234 | | | | 13,523 | |
| Edison International 4.125% 3/15/2028 | | | 57,701 | | | | 55,784 | |
| Edison International 5.25% 11/15/2028 | | | 24,301 | | | | 24,474 | |
| Edison International 6.95% 11/15/2029 | | | 16,809 | | | | 18,258 | |
| Electricité de France SA 5.70% 5/23/20284 | | | 4,900 | | | | 5,074 | |
| Electricité de France SA 6.25% 5/23/20334 | | | 9,350 | | | | 10,127 | |
| Electricité de France SA 6.90% 5/23/20534 | | | 17,350 | | | | 19,657 | |
| Electricité de France SA 2.625% junior subordinated perpetual bonds (5-year EUR Mid-Swap + 2.86% on 6/1/2028)6 | | EUR | 15,000 | | | | 14,771 | |
| Electricité de France SA 9.125% junior subordinated perpetual bonds (5-year UST Yield Curve Rate T Note Constant Maturity + 5.411% on 6/15/2033)4,6 | | USD | 7,450 | | | | 8,336 | |
| Emera US Finance, LP 0.833% 6/15/2024 | | | 3,750 | | | | 3,656 | |
| Emera US Finance, LP 2.639% 6/15/2031 | | | 19,066 | | | | 15,666 | |
| Emera, Inc. 6.75% 6/15/2076 (3-month USD-LIBOR + 5.44% on 6/15/2026)6,8 | | | 319 | | | | 314 | |
| Enfragen Energia Sur SA 5.375% 12/30/2030 | | | 885 | | | | 692 | |
| Engie Energia Chile SA 3.40% 1/28/20304 | | | 7,054 | | | | 6,076 | |
| ENN Clean Energy International Investment, Ltd. 3.375% 5/12/20264 | | | 8,250 | | | | 7,742 | |
| ENN Energy Holdings, Ltd. 2.625% 9/17/20304 | | | 1,143 | | | | 979 | |
| Entergy Corp. 1.90% 6/15/2028 | | | 9,031 | | | | 8,006 | |
| Entergy Corp. 2.40% 6/15/2031 | | | 20,182 | | | | 16,906 | |
| Entergy Louisiana, LLC 3.12% 9/1/2027 | | | 4,780 | | | | 4,511 | |
| Entergy Louisiana, LLC 1.60% 12/15/2030 | | | 1,700 | | | | 1,364 | |
| Entergy Louisiana, LLC 2.35% 6/15/2032 | | | 395 | | | | 329 | |
| Entergy Louisiana, LLC 2.90% 3/15/2051 | | | 18,061 | | | | 12,068 | |
| Entergy Louisiana, LLC 4.75% 9/15/2052 | | | 281 | | | | 259 | |
| Entergy Texas, Inc. 1.75% 3/15/2031 | | | 446 | | | | 366 | |
| Exelon Corp. 4.10% 3/15/2052 | | | 1,725 | | | | 1,399 | |
| FirstEnergy Corp. 2.05% 3/1/2025 | | | 25,920 | | | | 25,032 | |
| FirstEnergy Corp. 1.60% 1/15/2026 | | | 54,542 | | | | 50,768 | |
| FirstEnergy Corp. 2.65% 3/1/2030 | | | 39,440 | | | | 34,119 | |
| FirstEnergy Corp. 2.25% 9/1/2030 | | | 108,103 | | | | 91,175 | |
| FirstEnergy Corp. 3.40% 3/1/2050 | | | 19,301 | | | | 13,626 | |
| FirstEnergy Corp., Series B, 4.15% 7/15/2027 | | | 91,819 | | | | 88,369 | |
| FirstEnergy Transmission, LLC 4.35% 1/15/20254 | | | 1,260 | | | | 1,241 | |
| FirstEnergy Transmission, LLC 2.866% 9/15/20284 | | | 74,825 | | | | 67,917 | |
| Florida Power & Light Co. 3.30% 5/30/2027 | | | 10,000 | | | | 9,591 | |
| Florida Power & Light Co. 5.05% 4/1/2028 | | | 2,275 | | | | 2,327 | |
| Florida Power & Light Co. 4.40% 5/15/2028 | | | 12,000 | | | | 12,029 | |
| Florida Power & Light Co. 2.45% 2/3/2032 | | | 20,000 | | | | 17,186 | |
| Florida Power & Light Co. 5.10% 4/1/2033 | | | 9,000 | | | | 9,295 | |
| 38 | The Bond Fund of America |
| Bonds, notes & other debt instruments (continued) | | Principal amount
(000) | | | Value
(000) | |
| Corporate bonds, notes & loans (continued) | | | | | | | | |
| Utilities (continued) | | | | | | | | |
| Florida Power & Light Co. 4.80% 5/15/2033 | | USD | 15,247 | | | $ | 15,431 | |
| Florida Power & Light Co. 2.875% 12/4/2051 | | | 11,934 | | | | 8,288 | |
| Florida Power & Light Co. 5.30% 4/1/2053 | | | 7 | | | | 7 | |
| Georgia Power Co. 4.65% 5/16/2028 | | | 7,500 | | | | 7,563 | |
| Georgia Power Co. 4.95% 5/17/2033 | | | 35,436 | | | | 35,748 | |
| Grupo Energia Bogota SA ESP 7.85% 11/9/20334 | | | 2,500 | | | | 2,721 | |
| Jersey Central Power & Light Co. 4.30% 1/15/20264 | | | 4,480 | | | | 4,386 | |
| Jersey Central Power & Light Co. 2.75% 3/1/20324 | | | 7,574 | | | | 6,401 | |
| Korea East-West Power Co., Ltd. 1.75% 5/6/2025 | | | 1,500 | | | | 1,434 | |
| Korea East-West Power Co., Ltd. 3.60% 5/6/2025 | | | 1,500 | | | | 1,472 | |
| Korea Electric Power Corp. 4.00% 6/14/2027 | | | 3,931 | | | | 3,846 | |
| Metropolitan Edison Co. 4.30% 1/15/20294 | | | 5,000 | | | | 4,845 | |
| MidAmerican Energy Co. 3.10% 5/1/2027 | | | 2,273 | | | | 2,178 | |
| MidAmerican Energy Co. 3.65% 4/15/2029 | | | 2,300 | | | | 2,200 | |
| MidAmerican Energy Co. 5.35% 1/15/2034 | | | 350 | | | | 369 | |
| MidAmerican Energy Co. 3.15% 4/15/2050 | | | 5,000 | | | | 3,580 | |
| MidAmerican Energy Co. 5.85% 9/15/2054 | | | 10,000 | | | | 11,091 | |
| Mid-Atlantic Interstate Transmission, LLC 4.10% 5/15/20284 | | | 6,025 | | | | 5,823 | |
| Minejesa Capital BV 4.625% 8/10/2030 | | | 5,135 | | | | 4,885 | |
| Minejesa Capital BV 5.625% 8/10/2037 | | | 12,000 | | | | 10,544 | |
| Mississippi Power Co. 4.25% 3/15/2042 | | | 14,426 | | | | 12,326 | |
| Monongahela Power Co. 3.55% 5/15/20274 | | | 4,800 | | | | 4,599 | |
| NextEra Energy Capital Holdings, Inc. 6.051% 3/1/2025 | | | 4,050 | | | | 4,089 | |
| NextEra Energy Capital Holdings, Inc. 1.875% 1/15/2027 | | | 13,042 | | | | 12,002 | |
| NextEra Energy Capital Holdings, Inc. 4.625% 7/15/2027 | | | 428 | | | | 428 | |
| NextEra Energy Operating Partners, LP 4.25% 7/15/20244 | | | 4,715 | | | | 4,665 | |
| NextEra Energy Operating Partners, LP 3.875% 10/15/20264 | | | 3,535 | | | | 3,368 | |
| NiSource, Inc. 5.40% 6/30/2033 | | | 5,000 | | | | 5,159 | |
| NiSource, Inc. 5.00% 6/15/2052 | | | 24 | | | | 23 | |
| Northern States Power Co. 2.25% 4/1/2031 | | | 5,287 | | | | 4,539 | |
| Northern States Power Co. 2.60% 6/1/2051 | | | 13,915 | | | | 9,125 | |
| Northern States Power Co. 4.50% 6/1/2052 | | | 2,789 | | | | 2,569 | |
| Northern States Power Co. 5.10% 5/15/2053 | | | 1,006 | | | | 1,016 | |
| NRG Energy, Inc. 3.625% 2/15/20314 | | | 5,000 | | | | 4,302 | |
| NRG Energy, Inc. 3.875% 2/15/20324 | | | 270 | | | | 231 | |
| NTPC, Ltd. 3.75% 4/3/2024 | | | 3,000 | | | | 2,986 | |
| NTPC, Ltd. 4.375% 11/26/2024 | | | 3,000 | | | | 2,970 | |
| Oncor Electric Delivery Co., LLC 0.55% 10/1/2025 | | | 8,100 | | | | 7,540 | |
| Oncor Electric Delivery Co., LLC 4.55% 9/15/2032 | | | 8,239 | | | | 8,167 | |
| Oncor Electric Delivery Co., LLC 5.65% 11/15/20334 | | | 16,950 | | | | 18,068 | |
| Oncor Electric Delivery Co., LLC 2.70% 11/15/2051 | | | 7,613 | | | | 5,033 | |
| Pacific Gas and Electric Co. 3.15% 1/1/2026 | | | 136,174 | | | | 130,670 | |
| Pacific Gas and Electric Co. 2.95% 3/1/2026 | | | 53,431 | | | | 50,644 | |
| Pacific Gas and Electric Co. 3.30% 3/15/2027 | | | 27,575 | | | | 25,802 | |
| Pacific Gas and Electric Co. 2.10% 8/1/2027 | | | 61,183 | | | | 55,185 | |
| Pacific Gas and Electric Co. 3.30% 12/1/2027 | | | 38,713 | | | | 36,167 | |
| Pacific Gas and Electric Co. 3.00% 6/15/2028 | | | 36,906 | | | | 33,663 | |
| Pacific Gas and Electric Co. 3.75% 7/1/2028 | | | 23,868 | | | | 22,376 | |
| Pacific Gas and Electric Co. 4.65% 8/1/2028 | | | 44,620 | | | | 42,883 | |
| Pacific Gas and Electric Co. 6.10% 1/15/2029 | | | 24,440 | | | | 25,313 | |
| Pacific Gas and Electric Co. 4.55% 7/1/2030 | | | 148,305 | | | | 141,381 | |
| Pacific Gas and Electric Co. 2.50% 2/1/2031 | | | 192,825 | | | | 159,248 | |
| Pacific Gas and Electric Co. 3.25% 6/1/2031 | | | 30,505 | | | | 26,447 | |
| Pacific Gas and Electric Co. 5.90% 6/15/2032 | | | 3,226 | | | | 3,284 | |
| Pacific Gas and Electric Co. 6.15% 1/15/2033 | | | 22,456 | | | | 23,301 | |
| Pacific Gas and Electric Co. 6.40% 6/15/2033 | | | 67,732 | | | | 71,336 | |
| Pacific Gas and Electric Co. 6.95% 3/15/2034 | | | 9,625 | | | | 10,585 | |
| Pacific Gas and Electric Co. 3.30% 8/1/2040 | | | 26,904 | | | | 19,735 | |
| Pacific Gas and Electric Co. 3.75% 8/15/2042 | | | 29,730 | | | | 22,023 | |
| Pacific Gas and Electric Co. 4.95% 7/1/2050 | | | 2,846 | | | | 2,437 | |
| Pacific Gas and Electric Co. 3.50% 8/1/2050 | | | 50,437 | | | | 34,928 | |
| Pacific Gas and Electric Co. 6.75% 1/15/2053 | | | 5,645 | | | | 6,156 | |
| PacifiCorp 4.15% 2/15/2050 | | | 1,375 | | | | 1,116 | |
| PacifiCorp 3.30% 3/15/2051 | | | 7,577 | | | | 5,264 | |
| PacifiCorp 2.90% 6/15/2052 | | | 12,470 | | | | 8,034 | |
| PacifiCorp 5.35% 12/1/2053 | | | 8,717 | | | | 8,398 | |
| PacifiCorp 5.50% 5/15/2054 | | | 21,367 | | | | 21,014 | |
| The Bond Fund of America | 39 |
| Bonds, notes & other debt instruments (continued) | | Principal amount
(000) | | | Value
(000) | |
| Corporate bonds, notes & loans (continued) | | | | | | |
| Utilities (continued) | | | | | | | | |
| PECO Energy Co. 2.80% 6/15/2050 | | USD | 10,000 | | | $ | 6,767 | |
| PG&E Corp. 5.00% 7/1/2028 | | | 9,485 | | | | 9,235 | |
| PG&E Corp. 5.25% 7/1/2030 | | | 7,450 | | | | 7,194 | |
| Progress Energy, Inc. 7.00% 10/30/2031 | | | 8,568 | | | | 9,679 | |
| Public Service Company of Colorado 3.70% 6/15/2028 | | | 1,551 | | | | 1,492 | |
| Public Service Company of Colorado 1.90% 1/15/2031 | | | 111 | | | | 92 | |
| Public Service Company of Colorado 1.875% 6/15/2031 | | | 15,100 | | | | 12,441 | |
| Public Service Company of Colorado 4.10% 6/15/2048 | | | 3,671 | | | | 2,996 | |
| Public Service Company of Colorado 3.20% 3/1/2050 | | | 5,465 | | | | 3,929 | |
| Public Service Company of Colorado 2.70% 1/15/2051 | | | 8,928 | | | | 5,630 | |
| Public Service Company of Colorado 4.50% 6/1/2052 | | | 3,463 | | | | 3,034 | |
| Public Service Company of Colorado 5.25% 4/1/2053 | | | 8,127 | | | | 8,110 | |
| Public Service Electric and Gas Co. 0.95% 3/15/2026 | | | 12,926 | | | | 11,952 | |
| Public Service Electric and Gas Co. 3.65% 9/1/2028 | | | 2,978 | | | | 2,874 | |
| Public Service Electric and Gas Co. 3.20% 5/15/2029 | | | 6,989 | | | | 6,529 | |
| Public Service Electric and Gas Co. 2.45% 1/15/2030 | | | 4,830 | | | | 4,276 | |
| Public Service Electric and Gas Co. 1.90% 8/15/2031 | | | 500 | | | | 411 | |
| Public Service Electric and Gas Co. 3.10% 3/15/2032 | | | 8,811 | | | | 7,872 | |
| Public Service Electric and Gas Co. 5.20% 8/1/2033 | | | 8,393 | | | | 8,717 | |
| Public Service Electric and Gas Co. 3.20% 8/1/2049 | | | 2,475 | | | | 1,836 | |
| Public Service Electric and Gas Co. 3.15% 1/1/2050 | | | 15,000 | | | | 11,106 | |
| Public Service Electric and Gas Co. 2.05% 8/1/2050 | | | 864 | | | | 502 | |
| Public Service Electric and Gas Co. 5.45% 8/1/2053 | | | 1,250 | | | | 1,351 | |
| San Diego Gas & Electric Co. 4.95% 8/15/2028 | | | 10,000 | | | | 10,212 | |
| San Diego Gas & Electric Co. 3.32% 4/15/2050 | | | 2,025 | | | | 1,443 | |
| Southern California Edison Co. 1.10% 4/1/2024 | | | 19,782 | | | | 19,567 | |
| Southern California Edison Co. 1.20% 2/1/2026 | | | 16,697 | | | | 15,555 | |
| Southern California Edison Co. 4.90% 6/1/2026 | | | 10,000 | | | | 10,049 | |
| Southern California Edison Co. 4.70% 6/1/2027 | | | 25,013 | | | | 25,177 | |
| Southern California Edison Co. 5.85% 11/1/2027 | | | 1,367 | | | | 1,428 | |
| Southern California Edison Co. 3.65% 3/1/2028 | | | 19,403 | | | | 18,621 | |
| Southern California Edison Co. 4.20% 3/1/2029 | | | 25,042 | | | | 24,575 | |
| Southern California Edison Co. 2.85% 8/1/2029 | | | 66,401 | | | | 60,576 | |
| Southern California Edison Co. 2.25% 6/1/2030 | | | 13,636 | | | | 11,713 | |
| Southern California Edison Co. 2.50% 6/1/2031 | | | 21,923 | | | | 18,800 | |
| Southern California Edison Co. 2.75% 2/1/2032 | | | 16,770 | | | | 14,441 | |
| Southern California Edison Co. 5.75% 4/1/2035 | | | 6,666 | | | | 6,955 | |
| Southern California Edison Co. 5.35% 7/15/2035 | | | 30,475 | | | | 31,620 | |
| Southern California Edison Co. 5.625% 2/1/2036 | | | 5,649 | | | | 5,767 | |
| Southern California Edison Co. 5.55% 1/15/2037 | | | 6,946 | | | | 6,971 | |
| Southern California Edison Co. 5.95% 2/1/2038 | | | 12,088 | | | | 12,695 | |
| Southern California Edison Co. 4.50% 9/1/2040 | | | 20,350 | | | | 18,324 | |
| Southern California Edison Co. 3.60% 2/1/2045 | | | 2,451 | | | | 1,909 | |
| Southern California Edison Co. 4.00% 4/1/2047 | | | 1,649 | | | | 1,348 | |
| Southern California Edison Co. 3.65% 2/1/2050 | | | 15,867 | | | | 12,306 | |
| Southern California Edison Co. 2.95% 2/1/2051 | | | 19,979 | | | | 13,584 | |
| Southern California Edison Co. 3.65% 6/1/2051 | | | 1,887 | | | | 1,424 | |
| Southern California Edison Co. 3.45% 2/1/2052 | | | 11,610 | | | | 8,485 | |
| Southern California Gas Co. 2.55% 2/1/2030 | | | 6,775 | | | | 5,962 | |
| Southwestern Electric Power Co. 1.65% 3/15/2026 | | | 12,675 | | | | 11,808 | |
| Southwestern Electric Power Co. 3.25% 11/1/2051 | | | 5,219 | | | | 3,528 | |
| Talen Energy Supply, LLC 8.625% 6/1/20304 | | | 14,808 | | | | 15,745 | |
| Tierra Mojada Luxembourg II SARL 5.75% 12/1/2040 | | | 2,714 | | | | 2,452 | |
| TNB Global Ventures Capital Bhd 4.851% 11/1/2028 | | | 4,000 | | | | 3,982 | |
| Union Electric Co. 2.15% 3/15/2032 | | | 12,550 | | | | 10,413 | |
| Union Electric Co. 2.625% 3/15/2051 | | | 132 | | | | 84 | |
| Union Electric Co. 3.90% 4/1/2052 | | | 5,303 | | | | 4,371 | |
| Virginia Electric & Power 2.95% 11/15/2026 | | | 3,000 | | | | 2,866 | |
| Virginia Electric & Power 2.875% 7/15/2029 | | | 1,425 | | | | 1,311 | |
| Virginia Electric & Power 2.30% 11/15/2031 | | | 10,008 | | | | 8,417 | |
| Virginia Electric & Power 2.40% 3/30/2032 | | | 9,744 | | | | 8,207 | |
| Vistra Operations Co., LLC 3.55% 7/15/20244 | | | 8,000 | | | | 7,889 | |
| Vistra Operations Co., LLC 5.00% 7/31/20274 | | | 1,000 | | | | 974 | |
| WEC Energy Group, Inc. 4.75% 1/9/2026 | | | 5,000 | | | | 4,983 | |
| WEC Energy Group, Inc. 5.60% 9/12/2026 | | | 2,800 | | | | 2,851 | |
| WEC Energy Group, Inc. 5.15% 10/1/2027 | | | 14,568 | | | | 14,790 | |
| WEC Energy Group, Inc. 2.20% 12/15/2028 | | | 5,400 | | | | 4,808 | |
| 40 | The Bond Fund of America |
| Bonds, notes & other debt instruments (continued) | | Principal amount
(000) | | | Value
(000) | |
| Corporate bonds, notes & loans (continued) | | | | | | | | |
| Utilities (continued) | | | | | | | | |
| Wisconsin Power and Light Co. 1.95% 9/16/2031 | | USD | 15,450 | | | $ | 12,575 | |
| Wisconsin Power and Light Co. 3.95% 9/1/2032 | | | 1,276 | | | | 1,209 | |
| Wisconsin Power and Light Co. 3.65% 4/1/2050 | | | 2,675 | | | | 2,063 | |
| Xcel Energy, Inc. 3.35% 12/1/2026 | | | 10,439 | | | | 10,051 | |
| Xcel Energy, Inc. 1.75% 3/15/2027 | | | 1,353 | | | | 1,235 | |
| Xcel Energy, Inc. 2.60% 12/1/2029 | | | 24,612 | | | | 22,072 | |
| Xcel Energy, Inc. 2.35% 11/15/2031 | | | 30,760 | | | | 25,443 | |
| Xcel Energy, Inc. 4.60% 6/1/2032 | | | 1,993 | | | | 1,945 | |
| Xcel Energy, Inc. 5.45% 8/15/2033 | | | 50,950 | | | | 52,573 | |
| | | | | | | | 3,094,985 | |
| | | | | | | | | |
| Health care 3.27% | | | | | | | | |
| AbbVie, Inc. 2.60% 11/21/2024 | | | 30,200 | | | | 29,517 | |
| AbbVie, Inc. 2.95% 11/21/2026 | | | 16,395 | | | | 15,726 | |
| AbbVie, Inc. 3.20% 11/21/2029 | | | 4,409 | | | | 4,124 | |
| AbbVie, Inc. 4.25% 11/21/2049 | | | 202 | | | | 180 | |
| Amgen, Inc. 5.507% 3/2/2026 | | | 3,000 | | | | 3,001 | |
| Amgen, Inc. 5.15% 3/2/2028 | | | 35,867 | | | | 36,734 | |
| Amgen, Inc. 3.00% 2/22/2029 | | | 3,098 | | | | 2,916 | |
| Amgen, Inc. 4.05% 8/18/2029 | | | 29,461 | | | | 28,860 | |
| Amgen, Inc. 2.45% 2/21/2030 | | | 18,829 | | | | 16,706 | |
| Amgen, Inc. 5.25% 3/2/2030 | | | 7,956 | | | | 8,182 | |
| Amgen, Inc. 2.30% 2/25/2031 | | | 5,000 | | | | 4,279 | |
| Amgen, Inc. 4.20% 3/1/2033 | | | 36,903 | | | | 35,125 | |
| Amgen, Inc. 5.25% 3/2/2033 | | | 53,930 | | | | 55,310 | |
| Amgen, Inc. 3.375% 2/21/2050 | | | 122 | | | | 91 | |
| Amgen, Inc. 4.875% 3/1/2053 | | | 6,500 | | | | 6,081 | |
| Amgen, Inc. 5.65% 3/2/2053 | | | 30,427 | | | | 32,035 | |
| AstraZeneca Finance, LLC 1.75% 5/28/2028 | | | 564 | | | | 505 | |
| AstraZeneca Finance, LLC 2.25% 5/28/2031 | | | 6,852 | | | | 5,911 | |
| AstraZeneca Finance, LLC 4.875% 3/3/2033 | | | 17,730 | | | | 18,344 | |
| AstraZeneca PLC 3.375% 11/16/2025 | | | 20,139 | | | | 19,704 | |
| AstraZeneca PLC 0.70% 4/8/2026 | | | 6,589 | | | | 6,067 | |
| AstraZeneca PLC 4.00% 1/17/2029 | | | 2,027 | | | | 2,002 | |
| AstraZeneca PLC 1.375% 8/6/2030 | | | 17,516 | | | | 14,570 | |
| AstraZeneca PLC 3.00% 5/28/2051 | | | 3,294 | | | | 2,463 | |
| Avantor Funding, Inc. 4.625% 7/15/20284 | | | 6,320 | | | | 6,113 | |
| Bausch Health Companies, Inc. 5.50% 11/1/20254 | | | 17,750 | | | | 16,254 | |
| Bausch Health Companies, Inc. 4.875% 6/1/20284 | | | 8,125 | | | | 4,903 | |
| Baxter International, Inc. 2.272% 12/1/2028 | | | 3,250 | | | | 2,911 | |
| Baxter International, Inc. 2.539% 2/1/2032 | | | 37,704 | | | | 31,633 | |
| Baxter International, Inc. 3.132% 12/1/2051 | | | 2,284 | | | | 1,573 | |
| Bayer US Finance II, LLC 4.375% 12/15/20284 | | | 4,250 | | | | 4,043 | |
| Bayer US Finance, LLC 6.25% 1/21/20294 | | | 36,732 | | | | 37,577 | |
| Bayer US Finance, LLC 6.375% 11/21/20304 | | | 37,000 | | | | 38,096 | |
| Bayer US Finance, LLC 6.50% 11/21/20334 | | | 9,282 | | | | 9,599 | |
| Bayer US Finance, LLC 6.875% 11/21/20534 | | | 3,535 | | | | 3,769 | |
| Becton, Dickinson and Co. 3.363% 6/6/2024 | | | 8,545 | | | | 8,465 | |
| Becton, Dickinson and Co. 4.298% 8/22/2032 | | | 3,327 | | | | 3,212 | |
| Boston Scientific Corp. 3.45% 3/1/2024 | | | 875 | | | | 871 | |
| Boston Scientific Corp. 2.65% 6/1/2030 | | | 26,488 | | | | 23,663 | |
| Boston Scientific Corp. 4.70% 3/1/2049 | | | 340 | | | | 327 | |
| Bristol-Myers Squibb Co. 2.90% 7/26/2024 | | | 9,095 | | | | 8,975 | |
| Bristol-Myers Squibb Co. 3.20% 6/15/2026 | | | 7,768 | | | | 7,539 | |
| Bristol-Myers Squibb Co. 3.40% 7/26/2029 | | | 2,197 | | | | 2,085 | |
| Bristol-Myers Squibb Co. 2.95% 3/15/2032 | | | 20,158 | | | | 17,920 | |
| Bristol-Myers Squibb Co. 5.90% 11/15/2033 | | | 15,624 | | | | 17,029 | |
| Bristol-Myers Squibb Co. 2.55% 11/13/2050 | | | 15,075 | | | | 9,568 | |
| Bristol-Myers Squibb Co. 3.70% 3/15/2052 | | | 15,681 | | | | 12,335 | |
| Bristol-Myers Squibb Co. 6.25% 11/15/2053 | | | 12,623 | | | | 14,458 | |
| Catalent Pharma Solutions, Inc. 3.50% 4/1/20304 | | | 16,500 | | | | 14,372 | |
| Cencora, Inc. 2.70% 3/15/2031 | | | 17,987 | | | | 15,784 | |
| Centene Corp. 4.25% 12/15/2027 | | | 58,085 | | | | 56,012 | |
| Centene Corp. 2.45% 7/15/2028 | | | 82,808 | | | | 73,811 | |
| Centene Corp. 4.625% 12/15/2029 | | | 42,335 | | | | 40,641 | |
| Centene Corp. 3.375% 2/15/2030 | | | 45,137 | | | | 40,555 | |
| Centene Corp. 3.00% 10/15/2030 | | | 23,055 | | | | 19,996 | |
| The Bond Fund of America | 41 |
| Bonds, notes & other debt instruments (continued) | | Principal amount
(000) | | | Value
(000) | |
| Corporate bonds, notes & loans (continued) | | | | | | | | |
| Health care (continued) | | | | | | | | |
| Centene Corp. 2.50% 3/1/2031 | | USD | 71,209 | | | $ | 59,425 | |
| Centene Corp. 2.625% 8/1/2031 | | | 14,110 | | | | 11,724 | |
| Charles River Laboratories International, Inc. 3.75% 3/15/20294 | | | 4,335 | | | | 3,975 | |
| CHS / Community Health Systems, Inc. 4.75% 2/15/20314 | | | 6,000 | | | | 4,725 | |
| CVS Health Corp. 1.30% 8/21/2027 | | | 10,000 | | | | 8,886 | |
| CVS Health Corp. 3.25% 8/15/2029 | | | 10,362 | | | | 9,662 | |
| CVS Health Corp. 5.125% 2/21/2030 | | | 12,000 | | | | 12,193 | |
| CVS Health Corp. 1.75% 8/21/2030 | | | 5,660 | | | | 4,678 | |
| CVS Health Corp. 5.25% 1/30/2031 | | | 7,000 | | | | 7,184 | |
| CVS Health Corp. 1.875% 2/28/2031 | | | 13,185 | | | | 10,857 | |
| CVS Health Corp. 5.25% 2/21/2033 | | | 14,789 | | | | 15,123 | |
| CVS Health Corp. 5.30% 6/1/2033 | | | 17,469 | | | | 17,934 | |
| CVS Health Corp. 5.05% 3/25/2048 | | | 1,707 | | | | 1,598 | |
| CVS Health Corp. 4.25% 4/1/2050 | | | 8,451 | | | | 7,068 | |
| CVS Health Corp. 5.875% 6/1/2053 | | | 34,944 | | | | 36,801 | |
| CVS Health Corp. 6.00% 6/1/2063 | | | 9,811 | | | | 10,423 | |
| Elevance Health, Inc. 3.50% 8/15/2024 | | | 9,349 | | | | 9,227 | |
| Elevance Health, Inc. 2.375% 1/15/2025 | | | 1,534 | | | | 1,490 | |
| Elevance Health, Inc. 4.10% 5/15/2032 | | | 18,865 | | | | 18,026 | |
| Elevance Health, Inc. 4.75% 2/15/2033 | | | 6,060 | | | | 6,065 | |
| Elevance Health, Inc. 4.55% 5/15/2052 | | | 8,353 | | | | 7,631 | |
| Elevance Health, Inc. 5.125% 2/15/2053 | | | 2,415 | | | | 2,421 | |
| Eli Lilly and Co. 3.375% 3/15/2029 | | | 9,000 | | | | 8,661 | |
| Eli Lilly and Co. 4.70% 2/27/2033 | | | 38,455 | | | | 39,450 | |
| Eli Lilly and Co. 4.875% 2/27/2053 | | | 34,163 | | | | 35,363 | |
| Eli Lilly and Co. 4.95% 2/27/2063 | | | 916 | | | | 950 | |
| EMD Finance, LLC 3.25% 3/19/20254 | | | 16,185 | | | | 15,813 | |
| Fortrea Holdings, Inc. 7.50% 7/1/20304 | | | 2,825 | | | | 2,905 | |
| Fortrea Holdings, Inc., Term Loan B, (3-month USD CME Term SOFR + 3.75%) 9.106% 7/1/20303,10 | | | 2,706 | | | | 2,706 | |
| GE HealthCare Technologies, Inc. 5.65% 11/15/2027 | | | 33,699 | | | | 34,899 | |
| GE HealthCare Technologies, Inc. 5.857% 3/15/2030 | | | 1,022 | | | | 1,074 | |
| GE HealthCare Technologies, Inc. 5.905% 11/22/2032 | | | 27,792 | | | | 29,658 | |
| GE HealthCare Technologies, Inc. 6.377% 11/22/2052 | | | 1,482 | | | | 1,723 | |
| Gilead Sciences, Inc. 5.25% 10/15/2033 | | | 23,821 | | | | 24,839 | |
| Gilead Sciences, Inc. 2.80% 10/1/2050 | | | 65 | | | | 45 | |
| Gilead Sciences, Inc. 5.55% 10/15/2053 | | | 35,505 | | | | 38,502 | |
| GlaxoSmithKline Capital, Inc. 3.625% 5/15/2025 | | | 11,425 | | | | 11,241 | |
| HCA, Inc. 5.875% 2/15/2026 | | | 4,700 | | | | 4,742 | |
| HCA, Inc. 5.20% 6/1/2028 | | | 30,000 | | | | 30,327 | |
| HCA, Inc. 5.875% 2/1/2029 | | | 7,130 | | | | 7,366 | |
| HCA, Inc. 3.375% 3/15/2029 | | | 401 | | | | 370 | |
| HCA, Inc. 4.125% 6/15/2029 | | | 2,825 | | | | 2,703 | |
| HCA, Inc. 3.50% 9/1/2030 | | | 5,225 | | | | 4,738 | |
| HCA, Inc. 2.375% 7/15/2031 | | | 2,704 | | | | 2,230 | |
| HCA, Inc. 3.625% 3/15/2032 | | | 13,278 | | | | 11,878 | |
| HCA, Inc. 5.25% 6/15/2049 | | | 8,300 | | | | 7,726 | |
| HCA, Inc. 4.625% 3/15/2052 | | | 323 | | | | 275 | |
| Humana, Inc. 3.70% 3/23/2029 | | | 9,140 | | | | 8,785 | |
| IQVIA, Inc. 5.00% 10/15/20264 | | | 5,750 | | | | 5,699 | |
| Johnson & Johnson 0.95% 9/1/2027 | | | 6,000 | | | | 5,357 | |
| Johnson & Johnson 1.30% 9/1/2030 | | | 28,696 | | | | 24,097 | |
| Johnson & Johnson 2.10% 9/1/2040 | | | 4,000 | | | | 2,849 | |
| Johnson & Johnson 2.25% 9/1/2050 | | | 11,000 | | | | 7,287 | |
| Kaiser Foundation Hospitals 2.81% 6/1/2041 | | | 701 | | | | 526 | |
| Laboratory Corporation of America Holdings 1.55% 6/1/2026 | | | 4,555 | | | | 4,210 | |
| Medtronic Global Holdings S.C.A. 4.50% 3/30/2033 | | | 10,500 | | | | 10,508 | |
| Merck & Co., Inc. 2.75% 2/10/2025 | | | 34,000 | | | | 33,268 | |
| Merck & Co., Inc. 1.70% 6/10/2027 | | | 18,478 | | | | 16,946 | |
| Merck & Co., Inc. 1.45% 6/24/2030 | | | 17,874 | | | | 14,945 | |
| Merck & Co., Inc. 4.90% 5/17/2044 | | | 2,749 | | | | 2,783 | |
| Merck & Co., Inc. 2.75% 12/10/2051 | | | 10,000 | | | | 6,880 | |
| Merck & Co., Inc. 5.00% 5/17/2053 | | | 6,482 | | | | 6,670 | |
| Merck & Co., Inc. 5.15% 5/17/2063 | | | 1,400 | | | | 1,461 | |
| Molina Healthcare, Inc. 4.375% 6/15/20284 | | | 2,125 | | | | 2,012 | |
| Molina Healthcare, Inc. 3.875% 11/15/20304 | | | 2,665 | | | | 2,399 | |
| Molina Healthcare, Inc. 3.875% 5/15/20324 | | | 15,500 | | | | 13,561 | |
| 42 | The Bond Fund of America |
| Bonds, notes & other debt instruments (continued) | | Principal amount
(000) | | | Value
(000) | |
| Corporate bonds, notes & loans (continued) | | | | | | | | |
| Health care (continued) | | | | | | | | |
| Novartis Capital Corp. 1.75% 2/14/2025 | | USD | 1,167 | | | $ | 1,131 | |
| Novartis Capital Corp. 2.00% 2/14/2027 | | | 6,000 | | | | 5,623 | |
| Novartis Capital Corp. 2.20% 8/14/2030 | | | 22,078 | | | | 19,445 | |
| Pfizer Investment Enterprises Pte., Ltd. 4.45% 5/19/2028 | | | 1,890 | | | | 1,890 | |
| Pfizer Investment Enterprises Pte., Ltd. 4.75% 5/19/2033 | | | 38,653 | | | | 38,754 | |
| Pfizer Investment Enterprises Pte., Ltd. 5.30% 5/19/2053 | | | 27,222 | | | | 27,811 | |
| Pfizer, Inc. 2.95% 3/15/2024 | | | 2,150 | | | | 2,139 | |
| Pfizer, Inc. 1.70% 5/28/2030 | | | 690 | | | | 588 | |
| Regeneron Pharmaceuticals, Inc. 1.75% 9/15/2030 | | | 17,136 | | | | 14,097 | |
| Roche Holdings, Inc. 1.93% 12/13/20284 | | | 28,439 | | | | 25,409 | |
| Roche Holdings, Inc. 2.076% 12/13/20314 | | | 72,783 | | | | 61,312 | |
| Shire Acquisitions Investments Ireland DAC 3.20% 9/23/2026 | | | 23,317 | | | | 22,440 | |
| Summa Health 3.511% 11/15/2051 | | | 187 | | | | 134 | |
| Takeda Pharmaceutical Co., Ltd. 5.00% 11/26/2028 | | | 7,500 | | | | 7,616 | |
| Tenet Healthcare Corp. 4.875% 1/1/2026 | | | 5,535 | | | | 5,477 | |
| Tenet Healthcare Corp. 5.125% 11/1/2027 | | | 4,565 | | | | 4,466 | |
| Tenet Healthcare Corp. 6.125% 6/15/2030 | | | 4,000 | | | | 4,049 | |
| Tenet Healthcare Corp. 6.75% 5/15/20314 | | | 10,000 | | | | 10,233 | |
| Teva Pharmaceutical Finance Co., LLC 6.15% 2/1/2036 | | | 11,690 | | | | 11,204 | |
| Teva Pharmaceutical Finance Netherlands III BV 6.00% 4/15/2024 | | | 74,546 | | | | 74,364 | |
| Teva Pharmaceutical Finance Netherlands III BV 3.15% 10/1/2026 | | | 147,495 | | | | 136,674 | |
| Teva Pharmaceutical Finance Netherlands III BV 4.75% 5/9/2027 | | | 58,320 | | | | 55,914 | |
| Teva Pharmaceutical Finance Netherlands III BV 6.75% 3/1/2028 | | | 168,379 | | | | 172,252 | |
| Teva Pharmaceutical Finance Netherlands III BV 5.125% 5/9/2029 | | | 20,815 | | | | 19,902 | |
| Teva Pharmaceutical Finance Netherlands III BV 4.10% 10/1/2046 | | | 173,286 | | | | 117,539 | |
| Thermo Fisher Scientific, Inc. 4.80% 11/21/2027 | | | 12,000 | | | | 12,231 | |
| Thermo Fisher Scientific, Inc. 5.086% 8/10/2033 | | | 7,000 | | | | 7,299 | |
| Thermo Fisher Scientific, Inc. 5.20% 1/31/2034 | | | 13,414 | | | | 14,050 | |
| UnitedHealth Group, Inc. 3.50% 2/15/2024 | | | 6,860 | | | | 6,843 | |
| UnitedHealth Group, Inc. 2.375% 8/15/2024 | | | 7,903 | | | | 7,765 | |
| UnitedHealth Group, Inc. 3.75% 7/15/2025 | | | 5,900 | | | | 5,817 | |
| UnitedHealth Group, Inc. 3.70% 12/15/2025 | | | 15,430 | | | | 15,192 | |
| UnitedHealth Group, Inc. 5.25% 2/15/2028 | | | 3,011 | | | | 3,115 | |
| UnitedHealth Group, Inc. 2.875% 8/15/2029 | | | 1,172 | | | | 1,088 | |
| UnitedHealth Group, Inc. 2.00% 5/15/2030 | | | 13,538 | | | | 11,706 | |
| UnitedHealth Group, Inc. 4.20% 5/15/2032 | | | 6,397 | | | | 6,263 | |
| UnitedHealth Group, Inc. 5.35% 2/15/2033 | | | 5,984 | | | | 6,333 | |
| UnitedHealth Group, Inc. 3.05% 5/15/2041 | | | 7,293 | | | | 5,703 | |
| UnitedHealth Group, Inc. 4.25% 6/15/2048 | | | 3,314 | | | | 2,966 | |
| UnitedHealth Group, Inc. 4.45% 12/15/2048 | | | 2,015 | | | | 1,847 | |
| UnitedHealth Group, Inc. 3.70% 8/15/2049 | | | 3,098 | | | | 2,523 | |
| UnitedHealth Group, Inc. 2.90% 5/15/2050 | | | 9,116 | | | | 6,385 | |
| UnitedHealth Group, Inc. 3.25% 5/15/2051 | | | 5,408 | | | | 4,100 | |
| UnitedHealth Group, Inc. 4.75% 5/15/2052 | | | 4,604 | | | | 4,430 | |
| Zoetis, Inc. 5.60% 11/16/2032 | | | 15,969 | | | | 17,126 | |
| | | | | | | | 2,633,310 | |
| | | | | | | | | |
| Consumer discretionary 2.99% | | | | | | | | |
| Alibaba Group Holding, Ltd. 2.125% 2/9/2031 | | | 5,000 | | | | 4,146 | |
| Alibaba Group Holding, Ltd. 2.70% 2/9/2041 | | | 6,206 | | | | 4,251 | |
| Allied Universal Holdco, LLC 4.625% 6/1/20284 | | | 2,105 | | | | 1,916 | |
| Allwyn Entertainment Financing (UK) PLC 7.875% 4/30/20294 | | | 2,471 | | | | 2,527 | |
| Amazon.com, Inc. 1.65% 5/12/2028 | | | 25,000 | | | | 22,522 | |
| Amazon.com, Inc. 3.45% 4/13/2029 | | | 3,434 | | | | 3,328 | |
| Amazon.com, Inc. 1.50% 6/3/2030 | | | 6,278 | | | | 5,320 | |
| Amazon.com, Inc. 2.10% 5/12/2031 | | | 25,000 | | | | 21,567 | |
| Amazon.com, Inc. 2.875% 5/12/2041 | | | 5,827 | | | | 4,583 | |
| Amazon.com, Inc. 3.10% 5/12/2051 | | | 7,293 | | | | 5,428 | |
| American Honda Finance Corp. 1.20% 7/8/2025 | | | 10,182 | | | | 9,652 | |
| Atlas LuxCo 4 SARL 4.625% 6/1/20284 | | | 1,610 | | | | 1,473 | |
| Bath & Body Works, Inc. 6.875% 11/1/2035 | | | 4,500 | | | | 4,563 | |
| Bath & Body Works, Inc. 6.75% 7/1/2036 | | | 4,800 | | | | 4,837 | |
| BMW US Capital, LLC 3.90% 4/9/20254 | | | 21,240 | | | | 21,007 | |
| BMW US Capital, LLC 3.45% 4/1/20274 | | | 1,300 | | | | 1,251 | |
| BMW US Capital, LLC 5.05% 8/11/20284 | | | 13,400 | | | | 13,658 | |
| BMW US Capital, LLC 2.55% 4/1/20314 | | | 14,011 | | | | 12,170 | |
| BMW US Capital, LLC 3.70% 4/1/20324 | | | 6,842 | | | | 6,380 | |
| The Bond Fund of America | 43 |
| Bonds, notes & other debt instruments (continued) | | Principal amount
(000) | | | Value
(000) | |
| Corporate bonds, notes & loans (continued) | | | | | | | | |
| Consumer discretionary (continued) | | | | | | | | |
| Carnival Corp. 4.00% 8/1/20284 | | USD | 1,000 | | | $ | 930 | |
| Daimler Trucks Finance North America, LLC 1.625% 12/13/20244 | | | 18,450 | | | | 17,786 | |
| Daimler Trucks Finance North America, LLC 5.15% 1/16/20264 | | | 6,983 | | | | 7,006 | |
| Daimler Trucks Finance North America, LLC 2.00% 12/14/20264 | | | 10,500 | | | | 9,664 | |
| Daimler Trucks Finance North America, LLC 3.65% 4/7/20274 | | | 15,333 | | | | 14,786 | |
| Daimler Trucks Finance North America, LLC 5.125% 1/19/20284 | | | 3,772 | | | | 3,797 | |
| Daimler Trucks Finance North America, LLC 5.40% 9/20/20284 | | | 5,895 | | | | 6,014 | |
| Daimler Trucks Finance North America, LLC 2.375% 12/14/20284 | | | 19,527 | | | | 17,407 | |
| Daimler Trucks Finance North America, LLC 2.50% 12/14/20314 | | | 49,882 | | | | 41,417 | |
| Falabella SA 3.75% 10/30/20274 | | | 8,295 | | | | 7,324 | |
| Ford Motor Co. 3.25% 2/12/2032 | | | 6,305 | | | | 5,247 | |
| Ford Motor Co. 6.10% 8/19/2032 | | | 3,695 | | | | 3,727 | |
| Ford Motor Co. 4.75% 1/15/2043 | | | 16,150 | | | | 13,351 | |
| Ford Motor Co. 5.291% 12/8/2046 | | | 3,066 | | | | 2,705 | |
| Ford Motor Credit Co., LLC 3.81% 1/9/2024 | | | 3,935 | | | | 3,933 | |
| Ford Motor Credit Co., LLC 5.584% 3/18/2024 | | | 423 | | | | 423 | |
| Ford Motor Credit Co., LLC 3.664% 9/8/2024 | | | 5,756 | | | | 5,667 | |
| Ford Motor Credit Co., LLC 2.30% 2/10/2025 | | | 33,110 | | | | 31,864 | |
| Ford Motor Credit Co., LLC 5.125% 6/16/2025 | | | 1,000 | | | | 988 | |
| Ford Motor Credit Co., LLC 4.134% 8/4/2025 | | | 400 | | | | 389 | |
| Ford Motor Credit Co., LLC 3.375% 11/13/2025 | | | 1,565 | | | | 1,498 | |
| Ford Motor Credit Co., LLC 6.95% 3/6/2026 | | | 8,381 | | | | 8,589 | |
| Ford Motor Credit Co., LLC 6.95% 6/10/2026 | | | 5,920 | | | | 6,077 | |
| Ford Motor Credit Co., LLC 4.542% 8/1/2026 | | | 18,000 | | | | 17,439 | |
| Ford Motor Credit Co., LLC 2.70% 8/10/2026 | | | 67,985 | | | | 62,997 | |
| Ford Motor Credit Co., LLC 4.271% 1/9/2027 | | | 42,685 | | | | 40,963 | |
| Ford Motor Credit Co., LLC 4.95% 5/28/2027 | | | 23,710 | | | | 23,149 | |
| Ford Motor Credit Co., LLC 4.125% 8/17/2027 | | | 24,460 | | | | 23,177 | |
| Ford Motor Credit Co., LLC 3.815% 11/2/2027 | | | 7,305 | | | | 6,825 | |
| Ford Motor Credit Co., LLC 7.35% 11/4/2027 | | | 101,876 | | | | 107,503 | |
| Ford Motor Credit Co., LLC 2.90% 2/16/2028 | | | 14,880 | | | | 13,372 | |
| Ford Motor Credit Co., LLC 6.80% 5/12/2028 | | | 22,310 | | | | 23,318 | |
| Ford Motor Credit Co., LLC 6.798% 11/7/2028 | | | 11,114 | | | | 11,636 | |
| Ford Motor Credit Co., LLC 2.90% 2/10/2029 | | | 66,400 | | | | 58,207 | |
| Ford Motor Credit Co., LLC 5.113% 5/3/2029 | | | 86,886 | | | | 84,570 | |
| Ford Motor Credit Co., LLC 7.35% 3/6/2030 | | | 76,140 | | | | 81,858 | |
| Ford Motor Credit Co., LLC 7.20% 6/10/2030 | | | 11,305 | | | | 12,053 | |
| Ford Motor Credit Co., LLC 4.00% 11/13/2030 | | | 4,468 | | | | 4,012 | |
| Ford Motor Credit Co., LLC 3.625% 6/17/2031 | | | 2,070 | | | | 1,786 | |
| Ford Motor Credit Co., LLC 7.122% 11/7/2033 | | | 3,615 | | | | 3,897 | |
| General Motors Co. 6.80% 10/1/2027 | | | 17,934 | | | | 19,022 | |
| General Motors Co. 5.40% 10/15/2029 | | | 16,960 | | | | 17,275 | |
| General Motors Co. 5.40% 4/1/2048 | | | 4,000 | | | | 3,660 | |
| General Motors Co. 5.95% 4/1/2049 | | | 39,731 | | | | 38,956 | |
| General Motors Financial Co., Inc. 1.25% 1/8/2026 | | | 6,450 | | | | 5,970 | |
| General Motors Financial Co., Inc. 1.50% 6/10/2026 | | | 57,097 | | | | 52,338 | |
| General Motors Financial Co., Inc. 4.00% 10/6/2026 | | | 7,285 | | | | 7,092 | |
| General Motors Financial Co., Inc. 2.35% 2/26/2027 | | | 41,494 | | | | 38,219 | |
| General Motors Financial Co., Inc. 2.70% 8/20/2027 | | | 37,175 | | | | 34,316 | |
| General Motors Financial Co., Inc. 2.40% 4/10/2028 | | | 12,928 | | | | 11,608 | |
| General Motors Financial Co., Inc. 5.80% 6/23/2028 | | | 19,000 | | | | 19,538 | |
| General Motors Financial Co., Inc. 2.40% 10/15/2028 | | | 40,580 | | | | 36,058 | |
| General Motors Financial Co., Inc. 5.80% 1/7/2029 | | | 62,561 | | | | 64,064 | |
| General Motors Financial Co., Inc. 4.30% 4/6/2029 | | | 13,600 | | | | 13,110 | |
| General Motors Financial Co., Inc. 3.60% 6/21/2030 | | | 1,735 | | | | 1,576 | |
| General Motors Financial Co., Inc. 2.35% 1/8/2031 | | | 23,347 | | | | 19,312 | |
| General Motors Financial Co., Inc. 2.70% 6/10/2031 | | | 19,905 | | | | 16,700 | |
| General Motors Financial Co., Inc. 6.40% 1/9/2033 | | | 3,581 | | | | 3,813 | |
| GOHL Capital, Ltd. 4.25% 1/24/2027 | | | 15,000 | | | | 14,439 | |
| Grand Canyon University 4.125% 10/1/2024 | | | 25,000 | | | | 23,628 | |
| Hanesbrands, Inc. 9.00% 2/15/20314 | | | 3,681 | | | | 3,611 | |
| Hilton Domestic Operating Co., Inc. 4.00% 5/1/20314 | | | 13,960 | | | | 12,801 | |
| Hilton Domestic Operating Co., Inc. 3.625% 2/15/20324 | | | 11,040 | | | | 9,648 | |
| Home Depot, Inc. 2.95% 6/15/2029 | | | 32,205 | | | | 30,289 | |
| Home Depot, Inc. 2.70% 4/15/2030 | | | 25,000 | | | | 22,846 | |
| Home Depot, Inc. 1.375% 3/15/2031 | | | 8,666 | | | | 7,084 | |
| Home Depot, Inc. 2.375% 3/15/2051 | | | 7,293 | | | | 4,612 | |
| 44 | The Bond Fund of America |
| Bonds, notes & other debt instruments (continued) | | Principal amount
(000) | | | Value
(000) | |
| Corporate bonds, notes & loans (continued) | | | | | | | | |
| Consumer discretionary (continued) | | | | | | | | |
| Hyundai Capital America 2.65% 2/10/20254 | | USD | 15,928 | | | $ | 15,464 | |
| Hyundai Capital America 5.875% 4/7/20254 | | | 10,000 | | | | 10,056 | |
| Hyundai Capital America 1.80% 10/15/20254 | | | 56,387 | | | | 53,017 | |
| Hyundai Capital America 6.25% 11/3/20254 | | | 6,000 | | | | 6,092 | |
| Hyundai Capital America 1.30% 1/8/20264 | | | 17,000 | | | | 15,701 | |
| Hyundai Capital America 5.50% 3/30/20264 | | | 5,000 | | | | 5,028 | |
| Hyundai Capital America 1.50% 6/15/20264 | | | 33,915 | | | | 30,985 | |
| Hyundai Capital America 1.65% 9/17/20264 | | | 36,910 | | | | 33,561 | |
| Hyundai Capital America 3.00% 2/10/20274 | | | 19,717 | | | | 18,436 | |
| Hyundai Capital America 2.375% 10/15/20274 | | | 14,154 | | | | 12,757 | |
| Hyundai Capital America 1.80% 1/10/20284 | | | 15,611 | | | | 13,698 | |
| Hyundai Capital America 5.60% 3/30/20284 | | | 9,800 | | | | 9,952 | |
| Hyundai Capital America 2.00% 6/15/20284 | | | 36,819 | | | | 32,185 | |
| Hyundai Capital America 5.68% 6/26/20284 | | | 19,000 | | | | 19,380 | |
| Hyundai Capital America 2.10% 9/15/20284 | | | 14,290 | | | | 12,502 | |
| Hyundai Capital America 6.10% 9/21/20284 | | | 19,000 | | | | 19,756 | |
| Hyundai Capital America 6.50% 1/16/20294 | | | 27,758 | | | | 29,327 | |
| Hyundai Capital America 5.80% 4/1/20304 | | | 16,980 | | | | 17,506 | |
| Hyundai Capital America 5.70% 6/26/20304 | | | 11,395 | | | | 11,675 | |
| Hyundai Capital America 6.20% 9/21/20304 | | | 19,000 | | | | 20,022 | |
| Hyundai Capital Services, Inc. 2.125% 4/24/20254 | | | 5,225 | | | | 5,014 | |
| Hyundai Capital Services, Inc. 1.25% 2/8/20264 | | | 6,570 | | | | 6,040 | |
| International Game Technology PLC 6.50% 2/15/20254 | | | 1,160 | | | | 1,162 | |
| International Game Technology PLC 4.125% 4/15/20264 | | | 2,115 | | | | 2,057 | |
| International Game Technology PLC 6.25% 1/15/20274 | | | 3,500 | | | | 3,554 | |
| International Game Technology PLC 5.25% 1/15/20294 | | | 6,940 | | | | 6,800 | |
| KB Home 6.875% 6/15/2027 | | | 5,000 | | | | 5,203 | |
| KIA Corp. 1.00% 4/16/2024 | | | 5,000 | | | | 4,933 | |
| Lennar Corp. 4.50% 4/30/2024 | | | 3,015 | | | | 3,000 | |
| M.D.C. Holdings, Inc. 6.00% 1/15/2043 | | | 7,475 | | | | 6,965 | |
| Marriott International, Inc. 5.75% 5/1/2025 | | | 208 | | | | 209 | |
| Marriott International, Inc. 5.00% 10/15/2027 | | | 20,000 | | | | 20,249 | |
| Marriott International, Inc. 4.90% 4/15/2029 | | | 4,024 | | | | 4,053 | |
| Marriott International, Inc. 2.85% 4/15/2031 | | | 2,120 | | | | 1,836 | |
| Marriott International, Inc. 2.75% 10/15/2033 | | | 25,167 | | | | 20,781 | |
| McDonald’s Corp. 3.70% 1/30/2026 | | | 135 | | | | 133 | |
| McDonald’s Corp. 3.50% 3/1/2027 | | | 185 | | | | 180 | |
| McDonald’s Corp. 2.125% 3/1/2030 | | | 5,793 | | | | 5,065 | |
| McDonald’s Corp. 4.60% 9/9/2032 | | | 3,772 | | | | 3,810 | |
| McDonald’s Corp. 4.95% 8/14/2033 | | | 6,390 | | | | 6,571 | |
| McDonald’s Corp. 4.45% 9/1/2048 | | | 242 | | | | 225 | |
| McDonald’s Corp. 3.625% 9/1/2049 | | | 6,857 | | | | 5,503 | |
| McDonald’s Corp. 4.20% 4/1/2050 | | | 708 | | | | 627 | |
| McDonald’s Corp. 5.15% 9/9/2052 | | | 3,265 | | | | 3,322 | |
| McDonald’s Corp. 5.45% 8/14/2053 | | | 2,473 | | | | 2,634 | |
| Meituan 3.05% 10/28/2030 | | | 15,000 | | | | 12,672 | |
| Mercedes-Benz Finance North America, LLC 0.75% 3/1/20244 | | | 5,000 | | | | 4,960 | |
| Mercedes-Benz Finance North America, LLC 2.70% 6/14/20244 | | | 7,500 | | | | 7,404 | |
| Mercedes-Benz Finance North America, LLC 5.375% 11/26/20254 | | | 275 | | | | 278 | |
| MGM Resorts International 6.75% 5/1/2025 | | | 3,000 | | | | 3,011 | |
| Morongo Band of Mission Indians (The) 7.00% 10/1/20394 | | | 11,225 | | | | 11,997 | |
| NIKE, Inc. 2.40% 3/27/2025 | | | 8,656 | | | | 8,424 | |
| NIKE, Inc. 3.25% 3/27/2040 | | | 5,469 | | | | 4,597 | |
| Nissan Motor Acceptance Co., LLC 6.95% 9/15/20264 | | | 4,190 | | | | 4,331 | |
| Nissan Motor Acceptance Co., LLC 1.85% 9/16/20264 | | | 4,874 | | | | 4,385 | |
| Nissan Motor Acceptance Co., LLC 2.75% 3/9/20284 | | | 11,315 | | | | 9,992 | |
| Nissan Motor Acceptance Co., LLC 2.45% 9/15/20284 | | | 15,000 | | | | 12,860 | |
| Nissan Motor Acceptance Co., LLC 7.05% 9/15/20284 | | | 20,950 | | | | 22,125 | |
| President and Fellows of Harvard College 2.517% 10/15/2050 | | | 5,500 | | | | 3,720 | |
| QVC, Inc. 4.85% 4/1/2024 | | | 11,050 | | | | 10,948 | |
| QVC, Inc. 4.45% 2/15/2025 | | | 1,500 | | | | 1,410 | |
| Sally Holdings, LLC 5.625% 12/1/2025 | | | 200 | | | | 200 | |
| Sands China, Ltd. 5.375% 8/8/2025 | | | 10,000 | | | | 9,868 | |
| Sands China, Ltd. 4.30% 1/8/2026 | | | 3,000 | | | | 2,883 | |
| Sands China, Ltd. 2.55% 3/8/2027 | | | 3,000 | | | | 2,729 | |
| Sands China, Ltd. 5.65% 8/8/2028 | | | 53,750 | | | | 53,335 | |
| Sands China, Ltd. 4.625% 6/18/2030 | | | 7,000 | | | | 6,379 | |
| The Bond Fund of America | 45 |
| Bonds, notes & other debt instruments (continued) | | Principal amount
(000) | | | Value
(000) | |
| Corporate bonds, notes & loans (continued) | | | | | | | | |
| Consumer discretionary (continued) | | | | | | | | |
| Sands China, Ltd. 3.50% 8/8/2031 | | USD | 7,000 | | | $ | 5,872 | |
| St Engineering Rhq, Ltd. 1.50% 4/29/2025 | | | 5,000 | | | | 4,782 | |
| Stellantis Finance US, Inc. 1.711% 1/29/20274 | | | 14,400 | | | | 13,084 | |
| Stellantis Finance US, Inc. 5.625% 1/12/20284 | | | 51,318 | | | | 53,160 | |
| Stellantis Finance US, Inc. 2.691% 9/15/20314 | | | 23,325 | | | | 19,528 | |
| Stellantis Finance US, Inc. 6.375% 9/12/20324 | | | 44,540 | | | | 48,032 | |
| Taylor Morrison Communities, Inc. 5.75% 1/15/20284 | | | 3,500 | | | | 3,520 | |
| Toyota Motor Corp. 0.681% 3/25/2024 | | | 849 | | | | 840 | |
| Toyota Motor Credit Corp. 1.90% 1/13/2027 | | | 2,568 | | | | 2,390 | |
| Toyota Motor Credit Corp. 1.15% 8/13/2027 | | | 3,086 | | | | 2,762 | |
| Toyota Motor Credit Corp. 1.90% 4/6/2028 | | | 3,802 | | | | 3,448 | |
| Toyota Motor Credit Corp. 4.45% 6/29/2029 | | | 616 | | | | 619 | |
| Toyota Motor Credit Corp. 3.375% 4/1/2030 | | | 8,330 | | | | 7,833 | |
| Toyota Motor Credit Corp. 4.55% 5/17/2030 | | | 11,800 | | | | 11,881 | |
| Toyota Motor Credit Corp. 5.55% 11/20/2030 | | | 5,000 | | | | 5,269 | |
| Travel + Leisure Co. 6.625% 7/31/20264 | | | 4,000 | | | | 4,039 | |
| Volkswagen Group of America Finance, LLC 6.45% 11/16/20304 | | | 37,465 | | | | 39,914 | |
| Wynn Resorts Finance, LLC 5.125% 10/1/20294 | | | 2,500 | | | | 2,362 | |
| ZF North America Capital, Inc. 7.125% 4/14/20304 | | | 9,500 | | | | 10,136 | |
| | | | | | | | 2,414,520 | |
| | | | | | | | | |
| Industrials 2.36% | | | | | | | | |
| Adani Ports & Special Economic Zone, Ltd. 3.375% 7/24/2024 | | | 3,000 | | | | 2,942 | |
| Adani Ports & Special Economic Zone, Ltd. 4.00% 7/30/2027 | | | 3,000 | | | | 2,675 | |
| Adani Ports & Special Economic Zone, Ltd. 4.375% 7/3/2029 | | | 2,000 | | | | 1,755 | |
| ADT Security Corp. 4.125% 8/1/20294 | | | 3,000 | | | | 2,764 | |
| ADT Security Corp. 4.875% 7/15/20324 | | | 3,000 | | | | 2,778 | |
| Air Lease Corp. 0.80% 8/18/2024 | | | 17,900 | | | | 17,357 | |
| Air Lease Corp. 2.875% 1/15/2026 | | | 25,208 | | | | 24,026 | |
| Air Lease Corp. 2.20% 1/15/2027 | | | 21,674 | | | | 19,861 | |
| Air Lease Corp. 5.30% 2/1/2028 | | | 26,000 | | | | 26,307 | |
| Air Lease Corp. 2.10% 9/1/2028 | | | 13,775 | | | | 12,068 | |
| Allison Transmission, Inc. 3.75% 1/30/20314 | | | 4,000 | | | | 3,538 | |
| Avolon Holdings Funding, Ltd. 3.95% 7/1/20244 | | | 36,469 | | | | 35,992 | |
| Avolon Holdings Funding, Ltd. 2.125% 2/21/20264 | | | 21,286 | | | | 19,737 | |
| Avolon Holdings Funding, Ltd. 4.375% 5/1/20264 | | | 3,500 | | | | 3,390 | |
| Avolon Holdings Funding, Ltd. 3.25% 2/15/20274 | | | 9,187 | | | | 8,504 | |
| Avolon Holdings Funding, Ltd. 2.75% 2/21/20284 | | | 20,000 | | | | 17,788 | |
| BOC Aviation, Ltd. 4.00% 1/25/2024 | | | 3,000 | | | | 2,997 | |
| Boeing Co. 1.95% 2/1/2024 | | | 2,850 | | | | 2,841 | |
| Boeing Co. 2.80% 3/1/2024 | | | 3,485 | | | | 3,466 | |
| Boeing Co. 4.875% 5/1/2025 | | | 92,984 | | | | 92,596 | |
| Boeing Co. 2.75% 2/1/2026 | | | 149,702 | | | | 143,339 | |
| Boeing Co. 2.196% 2/4/2026 | | | 106,123 | | | | 100,293 | |
| Boeing Co. 2.70% 2/1/2027 | | | 11,304 | | | | 10,664 | |
| Boeing Co. 5.04% 5/1/2027 | | | 56,328 | | | | 56,850 | |
| Boeing Co. 3.25% 2/1/2028 | | | 100,083 | | | | 95,016 | |
| Boeing Co. 3.25% 3/1/2028 | | | 10,176 | | | | 9,564 | |
| Boeing Co. 5.15% 5/1/2030 | | | 90,777 | | | | 92,463 | |
| Boeing Co. 3.625% 2/1/2031 | | | 27,063 | | | | 25,149 | |
| Boeing Co. 3.60% 5/1/2034 | | | 6,790 | | | | 6,003 | |
| Boeing Co. 5.705% 5/1/2040 | | | 10,907 | | | | 11,288 | |
| Boeing Co. 3.90% 5/1/2049 | | | 8,086 | | | | 6,414 | |
| Boeing Co. 3.75% 2/1/2050 | | | 537 | | | | 417 | |
| Boeing Co. 5.805% 5/1/2050 | | | 19,494 | | | | 20,201 | |
| Boeing Co. 5.93% 5/1/2060 | | | 5,250 | | | | 5,446 | |
| Burlington Northern Santa Fe, LLC 3.05% 2/15/2051 | | | 7,293 | | | | 5,277 | |
| Burlington Northern Santa Fe, LLC 3.30% 9/15/2051 | | | 35,207 | | | | 26,783 | |
| BWX Technologies, Inc. 4.125% 6/30/20284 | | | 1,675 | | | | 1,555 | |
| Canadian National Railway Co. 5.85% 11/1/2033 | | | 3,375 | | | | 3,710 | |
| Canadian National Railway Co. 6.125% 11/1/2053 | | | 989 | | | | 1,183 | |
| Canadian Pacific Railway Co. 1.75% 12/2/2026 | | | 5,820 | | | | 5,371 | |
| Canadian Pacific Railway Co. 3.10% 12/2/2051 | | | 39,192 | | | | 28,351 | |
| Carrier Global Corp. 2.242% 2/15/2025 | | | 1,029 | | | | 998 | |
| Carrier Global Corp. 5.80% 11/30/20254 | | | 4,750 | | | | 4,815 | |
| Carrier Global Corp. 2.493% 2/15/2027 | | | 1,332 | | | | 1,253 | |
| Carrier Global Corp. 2.722% 2/15/2030 | | | 16,965 | | | | 15,186 | |
| 46 | The Bond Fund of America |
| Bonds, notes & other debt instruments (continued) | | Principal amount
(000) | | | Value
(000) | |
| Corporate bonds, notes & loans (continued) | | | | | | | | |
| Industrials (continued) | | | | | | | | |
| Carrier Global Corp. 2.70% 2/15/2031 | | USD | 1,198 | | | $ | 1,047 | |
| Carrier Global Corp. 5.90% 3/15/20344 | | | 8,387 | | | | 9,075 | |
| Carrier Global Corp. 3.377% 4/5/2040 | | | 15,500 | | | | 12,483 | |
| Carrier Global Corp. 3.577% 4/5/2050 | | | 4,092 | | | | 3,205 | |
| Carrier Global Corp. 6.20% 3/15/20544 | | | 4,279 | | | | 4,951 | |
| CK Hutchison International (19), Ltd. 3.25% 4/11/2024 | | | 5,000 | | | | 4,973 | |
| CK Hutchison International (19) II, Ltd. 3.375% 9/6/2049 | | | 1,800 | | | | 1,383 | |
| CK Hutchison International (20), Ltd. 3.375% 5/8/2050 | | | 3,200 | | | | 2,448 | |
| CK Hutchison International (23), Ltd. 4.75% 4/21/20284 | | | 9,430 | | | | 9,449 | |
| CK Hutchison International (23), Ltd. 4.75% 4/21/2028 | | | 7,500 | | | | 7,515 | |
| Clean Harbors, Inc. 4.875% 7/15/20274 | | | 1,100 | | | | 1,079 | |
| Clean Harbors, Inc. 5.125% 7/15/20294 | | | 10,000 | | | | 9,607 | |
| Clean Harbors, Inc. 6.375% 2/1/20314 | | | 808 | | | | 821 | |
| Competition Team Technologies, Ltd. 3.75% 3/12/2024 | | | 23,800 | | | | 23,710 | |
| Competition Team Technologies, Ltd. 4.25% 3/12/2029 | | | 3,000 | | | | 2,889 | |
| Covanta Holding Corp., Term Loan B, (3-month USD CME Term SOFR + 3.00%) 8.36% 11/30/20283,10 | | | 6,224 | | | | 6,242 | |
| Covanta Holding Corp., Term Loan C, (3-month USD CME Term SOFR + 3.00%) 8.36% 11/30/20283,10 | | | 549 | | | | 550 | |
| CSX Corp. 3.80% 3/1/2028 | | | 2,460 | | | | 2,419 | |
| CSX Corp. 4.25% 3/15/2029 | | | 4,277 | | | | 4,277 | |
| CSX Corp. 2.40% 2/15/2030 | | | 11,598 | | | | 10,260 | |
| CSX Corp. 4.10% 11/15/2032 | | | 13,284 | | | | 12,926 | |
| CSX Corp. 5.20% 11/15/2033 | | | 9,390 | | | | 9,797 | |
| CSX Corp. 2.50% 5/15/2051 | | | 4,238 | | | | 2,741 | |
| CSX Corp. 4.50% 11/15/2052 | | | 27,800 | | | | 25,834 | |
| Dianjian Haiyu, Ltd. 4.30% perpetual bonds (5-year UST Yield Curve Rate T Note Constant Maturity + 5.451% on 6/20/2024)6 | | | 5,000 | | | | 4,965 | |
| Dun & Bradstreet Corp. (The) 5.00% 12/15/20294 | | | 3,592 | | | | 3,355 | |
| Eaton Corp. 4.15% 3/15/2033 | | | 654 | | | | 640 | |
| General Dynamics Corp. 3.50% 5/15/2025 | | | 8,025 | | | | 7,884 | |
| General Dynamics Corp. 3.75% 5/15/2028 | | | 5,969 | | | | 5,865 | |
| General Dynamics Corp. 3.625% 4/1/2030 | | | 5,879 | | | | 5,650 | |
| General Dynamics Corp. 2.25% 6/1/2031 | | | 2,377 | | | | 2,068 | |
| Honeywell International, Inc. 2.30% 8/15/2024 | | | 3,387 | | | | 3,328 | |
| Honeywell International, Inc. 1.35% 6/1/2025 | | | 165 | | | | 158 | |
| Honeywell International, Inc. 1.95% 6/1/2030 | | | 19,413 | | | | 16,825 | |
| Honeywell International, Inc. 5.00% 2/15/2033 | | | 4,000 | | | | 4,187 | |
| Howmet Aerospace, Inc. 5.95% 2/1/2037 | | | 29,000 | | | | 30,305 | |
| Hutchison Whampoa International (14), Ltd. 3.625% 10/31/2024 | | | 6,821 | | | | 6,732 | |
| Hutchison Whampoa International, Ltd. 7.45% 11/24/2033 | | | 3,000 | | | | 3,555 | |
| Icahn Enterprises, LP 4.75% 9/15/2024 | | | 2,966 | | | | 2,950 | |
| Icahn Enterprises, LP 6.25% 5/15/2026 | | | 11,205 | | | | 10,701 | |
| Icahn Enterprises, LP 5.25% 5/15/2027 | | | 995 | | | | 895 | |
| Ingersoll-Rand, Inc. 5.40% 8/14/2028 | | | 5,676 | | | | 5,853 | |
| Ingersoll-Rand, Inc. 5.70% 8/14/2033 | | | 8,208 | | | | 8,688 | |
| L3Harris Technologies, Inc. 5.40% 7/31/2033 | | | 7,962 | | | | 8,282 | |
| Lima Metro Line 2 Finance, Ltd. 5.875% 7/5/20344 | | | 2,295 | | | | 2,273 | |
| Lima Metro Line 2 Finance, Ltd. 5.875% 7/5/2034 | | | 489 | | | | 484 | |
| Lima Metro Line 2 Finance, Ltd. 4.35% 4/5/20364 | | | 2,691 | | | | 2,470 | |
| Lima Metro Line 2 Finance, Ltd. 4.35% 4/5/2036 | | | 2,117 | | | | 1,944 | |
| Lockheed Martin Corp. 5.10% 11/15/2027 | | | 835 | | | | 862 | |
| Lockheed Martin Corp. 1.85% 6/15/2030 | | | 213 | | | | 183 | |
| Lockheed Martin Corp. 5.25% 1/15/2033 | | | 51,999 | | | | 55,184 | |
| Lockheed Martin Corp. 4.75% 2/15/2034 | | | 1,437 | | | | 1,463 | |
| Lockheed Martin Corp. 5.70% 11/15/2054 | | | 21,152 | | | | 23,822 | |
| Lockheed Martin Corp. 5.20% 2/15/2055 | | | 2,087 | | | | 2,193 | |
| Masco Corp. 1.50% 2/15/2028 | | | 795 | | | | 696 | |
| Masco Corp. 2.00% 2/15/2031 | | | 1,173 | | | | 965 | |
| Mexico City Airport Trust 4.25% 10/31/2026 | | | 6,200 | | | | 5,984 | |
| Mexico City Airport Trust 3.875% 4/30/2028 | | | 11,400 | | | | 10,712 | |
| Mexico City Airport Trust 3.875% 4/30/20284 | | | 690 | | | | 648 | |
| Mexico City Airport Trust 5.50% 10/31/2046 | | | 3,106 | | | | 2,683 | |
| Mexico City Airport Trust 5.50% 7/31/2047 | | | 14,409 | | | | 12,454 | |
| Mexico City Airport Trust 5.50% 7/31/20474 | | | 2,485 | | | | 2,148 | |
| Mileage Plus Holdings, LLC 6.50% 6/20/20274 | | | 7,308 | | | | 7,334 | |
| MISC Capital Two (Labuan), Ltd. 3.625% 4/6/2025 | | | 3,000 | | | | 2,935 | |
| The Bond Fund of America | 47 |
| Bonds, notes & other debt instruments (continued) | | Principal amount
(000) | | | Value
(000) | |
| Corporate bonds, notes & loans (continued) | | | | | | | | |
| Industrials (continued) | | | | | | | | |
| MISC Capital Two (Labuan), Ltd. 3.75% 4/6/20274 | | USD | 16,872 | | | $ | 16,255 | |
| MISC Capital Two (Labuan), Ltd. 3.75% 4/6/2027 | | | 8,000 | | | | 7,708 | |
| Norfolk Southern Corp. 5.05% 8/1/2030 | | | 12,273 | | | | 12,576 | |
| Norfolk Southern Corp. 4.45% 3/1/2033 | | | 2,194 | | | | 2,167 | |
| Norfolk Southern Corp. 5.35% 8/1/2054 | | | 10,307 | | | | 10,727 | |
| Northrop Grumman Corp. 2.93% 1/15/2025 | | | 15,040 | | | | 14,703 | |
| Northrop Grumman Corp. 3.25% 1/15/2028 | | | 8,475 | | | | 8,104 | |
| Northrop Grumman Corp. 4.70% 3/15/2033 | | | 29,043 | | | | 29,307 | |
| Northrop Grumman Corp. 4.95% 3/15/2053 | | | 15,969 | | | | 15,837 | |
| Otis Worldwide Corp. 2.056% 4/5/2025 | | | 21,882 | | | | 21,053 | |
| Otis Worldwide Corp. 5.25% 8/16/2028 | | | 11,000 | | | | 11,314 | |
| Pitney Bowes, Inc. 6.875% 3/15/20274 | | | 6,000 | | | | 5,610 | |
| Prime Security Services Borrower, LLC 5.25% 4/15/20244 | | | 334 | | | | 332 | |
| Prime Security Services Borrower, LLC 5.75% 4/15/20264 | | | 2,000 | | | | 2,012 | |
| Prime Security Services Borrower, LLC 3.375% 8/31/20274 | | | 3,100 | | | | 2,876 | |
| Republic Services, Inc. 2.50% 8/15/2024 | | | 7,000 | | | | 6,870 | |
| Republic Services, Inc. 2.375% 3/15/2033 | | | 1,252 | | | | 1,047 | |
| Ritchie Bros. Holdings, Inc. 7.75% 3/15/20314 | | | 1,511 | | | | 1,613 | |
| RTX Corp. 3.20% 3/15/2024 | | | 10,380 | | | | 10,330 | |
| RTX Corp. 3.95% 8/16/2025 | | | 17,415 | | | | 17,167 | |
| RTX Corp. 5.75% 11/8/2026 | | | 4,000 | | | | 4,111 | |
| RTX Corp. 3.125% 5/4/2027 | | | 1,000 | | | | 951 | |
| RTX Corp. 4.125% 11/16/2028 | | | 6,320 | | | | 6,180 | |
| RTX Corp. 5.75% 1/15/2029 | | | 3,000 | | | | 3,138 | |
| RTX Corp. 2.25% 7/1/2030 | | | 3,750 | | | | 3,242 | |
| RTX Corp. 6.00% 3/15/2031 | | | 2,833 | | | | 3,019 | |
| RTX Corp. 1.90% 9/1/2031 | | | 11,488 | | | | 9,344 | |
| RTX Corp. 2.375% 3/15/2032 | | | 7,474 | | | | 6,233 | |
| RTX Corp. 5.15% 2/27/2033 | | | 6,941 | | | | 7,077 | |
| RTX Corp. 6.10% 3/15/2034 | | | 2,914 | | | | 3,164 | |
| RTX Corp. 4.50% 6/1/2042 | | | 1,375 | | | | 1,250 | |
| RTX Corp. 2.82% 9/1/2051 | | | 3,750 | | | | 2,483 | |
| RTX Corp. 3.03% 3/15/2052 | | | 7,000 | | | | 4,837 | |
| RTX Corp. 5.375% 2/27/2053 | | | 3,194 | | | | 3,248 | |
| RTX Corp. 6.40% 3/15/2054 | | | 7,323 | | | | 8,484 | |
| Ste Transcore Holdings, Inc. 3.375% 5/5/202711 | | | 3,000 | | | | 2,893 | |
| Stericycle, Inc. 5.375% 7/15/20244 | | | 5,000 | | | | 4,988 | |
| Summit Digitel Infrastructure Pvt, Ltd. 2.875% 8/12/20314 | | | 14,355 | | | | 11,789 | |
| TransDigm, Inc. 6.25% 3/15/20264 | | | 656 | | | | 656 | |
| Triton Container International, Ltd. 1.15% 6/7/20244 | | | 8,063 | | | | 7,869 | |
| Triton Container International, Ltd. 3.15% 6/15/20314 | | | 15,346 | | | | 12,225 | |
| TSMC Arizona Corp. 4.25% 4/22/2032 | | | 8,000 | | | | 7,888 | |
| TSMC Arizona Corp. 3.125% 10/25/2041 | | | 5,000 | | | | 4,009 | |
| TSMC Arizona Corp. 3.25% 10/25/2051 | | | 11,000 | | | | 8,723 | |
| Union Pacific Corp. 3.15% 3/1/2024 | | | 5,705 | | | | 5,680 | |
| Union Pacific Corp. 3.75% 7/15/2025 | | | 2,230 | | | | 2,197 | |
| Union Pacific Corp. 2.15% 2/5/2027 | | | 5,533 | | | | 5,167 | |
| Union Pacific Corp. 2.375% 5/20/2031 | | | 23,375 | | | | 20,331 | |
| Union Pacific Corp. 2.80% 2/14/2032 | | | 16,869 | | | | 14,974 | |
| Union Pacific Corp. 4.50% 1/20/2033 | | | 1,050 | | | | 1,056 | |
| Union Pacific Corp. 2.891% 4/6/2036 | | | 7,702 | | | | 6,506 | |
| Union Pacific Corp. 4.30% 3/1/2049 | | | 1,367 | | | | 1,212 | |
| Union Pacific Corp. 3.25% 2/5/2050 | | | 27,698 | | | | 21,238 | |
| Union Pacific Corp. 2.95% 3/10/2052 | | | 7,553 | | | | 5,363 | |
| Union Pacific Corp. 3.50% 2/14/2053 | | | 4,558 | | | | 3,615 | |
| Union Pacific Corp. 3.95% 8/15/2059 | | | 1,980 | | | | 1,620 | |
| Veralto Corp. 5.50% 9/18/20264 | | | 2,500 | | | | 2,533 | |
| Veralto Corp. 5.35% 9/18/20284 | | | 20,750 | | | | 21,251 | |
| Veralto Corp. 5.45% 9/18/20334 | | | 14,000 | | | | 14,511 | |
| Waste Management, Inc. 4.15% 4/15/2032 | | | 1,103 | | | | 1,078 | |
| Waste Management, Inc. 4.875% 2/15/2034 | | | 20,000 | | | | 20,412 | |
| WESCO Distribution, Inc. 7.125% 6/15/20254 | | | 2,165 | | | | 2,182 | |
| WESCO Distribution, Inc. 7.25% 6/15/20284 | | | 4,355 | | | | 4,479 | |
| | | | | | | | 1,901,789 | |
| 48 | The Bond Fund of America |
| Bonds, notes & other debt instruments (continued) | | Principal amount
(000) | | | Value
(000) | |
| Corporate bonds, notes & loans (continued) | | | | | | |
| Energy 2.09% | | | | | | |
| Antero Resources Corp. 5.375% 3/1/20304 | | USD | 5,735 | | | $ | 5,504 | |
| Apache Corp. 4.25% 1/15/2030 | | | 9,050 | | | | 8,466 | |
| Apache Corp. 6.00% 1/15/2037 | | | 6,135 | | | | 6,045 | |
| Apache Corp. 5.10% 9/1/2040 | | | 4,860 | | | | 4,172 | |
| Apache Corp. 4.75% 4/15/2043 | | | 15,000 | | | | 11,828 | |
| Baker Hughes Holdings, LLC 2.061% 12/15/2026 | | | 397 | | | | 372 | |
| Bharat Petroleum Corp., Ltd. 4.00% 5/8/2025 | | | 5,599 | | | | 5,512 | |
| BP Capital Markets America, Inc. 2.721% 1/12/2032 | | | 17,670 | | | | 15,403 | |
| BP Capital Markets America, Inc. 4.893% 9/11/2033 | | | 22,005 | | | | 22,400 | |
| BP Capital Markets America, Inc. 2.772% 11/10/2050 | | | 451 | | | | 302 | |
| BP Capital Markets America, Inc. 3.001% 3/17/2052 | | | 5,000 | | | | 3,511 | |
| Canadian Natural Resources, Ltd. 3.80% 4/15/2024 | | | 10,500 | | | | 10,440 | |
| Canadian Natural Resources, Ltd. 2.05% 7/15/2025 | | | 4,543 | | | | 4,330 | |
| Canadian Natural Resources, Ltd. 3.85% 6/1/2027 | | | 8,484 | | | | 8,244 | |
| Canadian Natural Resources, Ltd. 2.95% 7/15/2030 | | | 206 | | | | 182 | |
| Cenovus Energy, Inc. 5.375% 7/15/2025 | | | 32,721 | | | | 32,790 | |
| Cenovus Energy, Inc. 4.25% 4/15/2027 | | | 43,338 | | | | 42,390 | |
| Cenovus Energy, Inc. 5.25% 6/15/2037 | | | 822 | | | | 787 | |
| Cenovus Energy, Inc. 5.40% 6/15/2047 | | | 12,727 | | | | 12,044 | |
| Cheniere Corpus Christi Holdings, LLC 3.70% 11/15/2029 | | | 3,388 | | | | 3,202 | |
| Cheniere Energy Partners, LP 4.50% 10/1/2029 | | | 5,050 | | | | 4,837 | |
| Cheniere Energy, Inc. 4.625% 10/15/2028 | | | 8,875 | | | | 8,669 | |
| Chesapeake Energy Corp. 5.50% 2/1/20264 | | | 1,405 | | | | 1,394 | |
| Chesapeake Energy Corp. 5.875% 2/1/20294 | | | 1,210 | | | | 1,187 | |
| Chevron Corp. 2.954% 5/16/2026 | | | 25,490 | | | | 24,668 | |
| Chevron Corp. 1.995% 5/11/2027 | | | 22,156 | | | | 20,576 | |
| Chevron Corp. 2.236% 5/11/2030 | | | 11,857 | | | | 10,510 | |
| Chevron Corp. 3.078% 5/11/2050 | | | 3,943 | | | | 2,981 | |
| Chevron USA, Inc. 1.018% 8/12/2027 | | | 4,385 | | | | 3,901 | |
| Civitas Resources, Inc. 8.625% 11/1/20304 | | | 4,665 | | | | 4,952 | |
| Civitas Resources, Inc. 8.75% 7/1/20314 | | | 10,300 | | | | 10,978 | |
| CNX Resources Corp. 7.25% 3/14/20274 | | | 20 | | | | 20 | |
| CNX Resources Corp. 6.00% 1/15/20294 | | | 1,608 | | | | 1,543 | |
| CNX Resources Corp. 7.375% 1/15/20314 | | | 1,437 | | | | 1,449 | |
| Columbia Pipelines Holding Co., LLC 6.544% 11/15/20534 | | | 8,155 | | | | 8,993 | |
| Columbia Pipelines Operating Co., LLC 5.927% 8/15/20304 | | | 8,611 | | | | 8,911 | |
| Columbia Pipelines Operating Co., LLC 6.036% 11/15/20334 | | | 10,508 | | | | 11,010 | |
| Columbia Pipelines Operating Co., LLC 6.497% 8/15/20434 | | | 3,869 | | | | 4,150 | |
| ConocoPhillips Co. 3.80% 3/15/2052 | | | 22,105 | | | | 17,880 | |
| ConocoPhillips Co. 5.30% 5/15/2053 | | | 31,790 | | | | 32,701 | |
| ConocoPhillips Co. 5.55% 3/15/2054 | | | 12,115 | | | | 12,874 | |
| Crescent Energy Finance, LLC 9.25% 2/15/20284 | | | 7,724 | | | | 8,020 | |
| Devon Energy Corp. 5.25% 9/15/2024 | | | 638 | | | | 637 | |
| Devon Energy Corp. 5.25% 10/15/2027 | | | 1,624 | | | | 1,634 | |
| Devon Energy Corp. 5.875% 6/15/2028 | | | 1,347 | | | | 1,362 | |
| Devon Energy Corp. 4.50% 1/15/2030 | | | 1,947 | | | | 1,871 | |
| DT Midstream, Inc. 4.125% 6/15/20294 | | | 5,685 | | | | 5,237 | |
| DT Midstream, Inc. 4.375% 6/15/20314 | | | 745 | | | | 673 | |
| Ecopetrol SA 8.625% 1/19/2029 | | | 2,000 | | | | 2,134 | |
| Ecopetrol SA 4.625% 11/2/2031 | | | 1,870 | | | | 1,588 | |
| Ecopetrol SA 8.875% 1/13/2033 | | | 131,045 | | | | 142,532 | |
| Enbridge, Inc. 6.20% 11/15/2030 | | | 12,000 | | | | 12,846 | |
| Enbridge, Inc. 6.70% 11/15/2053 | | | 27,097 | | | | 31,551 | |
| Energy Transfer, LP 4.50% 4/15/2024 | | | 2,975 | | | | 2,964 | |
| Energy Transfer, LP 6.40% 12/1/2030 | | | 3,440 | | | | 3,682 | |
| Energy Transfer, LP 6.55% 12/1/2033 | | | 11,646 | | | | 12,655 | |
| Energy Transfer, LP 6.625% junior subordinated perpetual bonds (3-month USD-LIBOR + 4.155% on 2/15/2028)6,8 | | | 12,000 | | | | 10,065 | |
| EQM Midstream Partners, LP 7.50% 6/1/20274 | | | 2,168 | | | | 2,235 | |
| EQM Midstream Partners, LP 5.50% 7/15/2028 | | | 8,300 | | | | 8,229 | |
| EQM Midstream Partners, LP 4.50% 1/15/20294 | | | 5,120 | | | | 4,842 | |
| EQM Midstream Partners, LP 6.50% 7/15/2048 | | | 6,000 | | | | 6,157 | |
| EQT Corp. 6.125% 2/1/20256 | | | 3,216 | | | | 3,232 | |
| EQT Corp. 3.90% 10/1/2027 | | | 11,000 | | | | 10,530 | |
| EQT Corp. 5.70% 4/1/2028 | | | 8,267 | | | | 8,397 | |
| EQT Corp. 5.00% 1/15/2029 | | | 1,175 | | | | 1,165 | |
| EQT Corp. 7.25% 2/1/20306 | | | 15,000 | | | | 16,116 | |
| The Bond Fund of America | 49 |
| Bonds, notes & other debt instruments (continued) | | Principal amount
(000) | | | Value
(000) | |
| Corporate bonds, notes & loans (continued) | | | | | | | | |
| Energy (continued) | | | | | | | | |
| Equinor ASA 3.625% 9/10/2028 | | USD | 8,379 | | | $ | 8,173 | |
| Equinor ASA 3.125% 4/6/2030 | | | 22,503 | | | | 21,141 | |
| Equinor ASA 2.375% 5/22/2030 | | | 3,444 | | | | 3,078 | |
| Equinor ASA 3.25% 11/18/2049 | | | 5,687 | | | | 4,316 | |
| Exxon Mobil Corp. 2.61% 10/15/2030 | | | 27,900 | | | | 24,964 | |
| Exxon Mobil Corp. 4.227% 3/19/2040 | | | 2,000 | | | | 1,858 | |
| Exxon Mobil Corp. 3.452% 4/15/2051 | | | 22,797 | | | | 17,906 | |
| Harvest Midstream I, LP 7.50% 9/1/20284 | | | 1,988 | | | | 1,978 | |
| Hilcorp Energy I, LP 5.75% 2/1/20294 | | | 2,125 | | | | 2,054 | |
| Hilcorp Energy I, LP 6.25% 4/15/20324 | | | 9,000 | | | | 8,671 | |
| Kinder Morgan, Inc. 5.20% 6/1/2033 | | | 11,780 | | | | 11,716 | |
| Marathon Oil Corp. 4.40% 7/15/2027 | | | 5,755 | | | | 5,618 | |
| Matador Resources Co. 6.875% 4/15/20284 | | | 4,950 | | | | 5,026 | |
| Modec Finance BV 7.84% 7/15/20267,11 | | | 5,000 | | | | 5,027 | |
| MPLX, LP 4.95% 9/1/2032 | | | 104 | | | | 102 | |
| MPLX, LP 4.95% 3/14/2052 | | | 28 | | | | 25 | |
| Murphy Oil Corp. 6.375% 7/15/2028 | | | 5,116 | | | | 5,144 | |
| Murphy Oil Corp. 5.875% 12/1/20426 | | | 1,395 | | | | 1,235 | |
| Murphy Oil USA, Inc. 3.75% 2/15/20314 | | | 10,160 | | | | 8,859 | |
| MV24 Capital BV 6.748% 6/1/20344 | | | 1,601 | | | | 1,500 | |
| New Fortress Energy, Inc. 6.75% 9/15/20254 | | | 4,000 | | | | 3,971 | |
| New Fortress Energy, Inc. 6.50% 9/30/20264 | | | 6,595 | | | | 6,340 | |
| NGL Energy Operating, LLC 7.50% 2/1/20264 | | | 6,555 | | | | 6,626 | |
| Noble Finance II, LLC 8.00% 4/15/20304 | | | 800 | | | | 833 | |
| Occidental Petroleum Corp. 8.875% 7/15/2030 | | | 34,500 | | | | 40,412 | |
| Occidental Petroleum Corp. 6.45% 9/15/2036 | | | 5,000 | | | | 5,297 | |
| Occidental Petroleum Corp. 6.60% 3/15/2046 | | | 3,377 | | | | 3,661 | |
| Occidental Petroleum Corp. 4.20% 3/15/2048 | | | 4,250 | | | | 3,349 | |
| Oil & Natural Gas Corp., Ltd. 3.375% 12/5/2029 | | | 5,000 | | | | 4,556 | |
| Oleoducto Central SA 4.00% 7/14/2027 | | | 8,569 | | | | 7,971 | |
| Oleoducto Central SA 4.00% 7/14/20274 | | | 4,960 | | | | 4,614 | |
| ONEOK, Inc. 5.85% 1/15/2026 | | | 432 | | | | 439 | |
| ONEOK, Inc. 5.55% 11/1/2026 | | | 2,484 | | | | 2,528 | |
| ONEOK, Inc. 5.65% 11/1/2028 | | | 11,679 | | �� | | 12,099 | |
| ONEOK, Inc. 5.80% 11/1/2030 | | | 2,104 | | | | 2,189 | |
| ONEOK, Inc. 6.05% 9/1/2033 | | | 30,123 | | | | 31,930 | |
| ONEOK, Inc. 6.625% 9/1/2053 | | | 18,686 | | | | 20,936 | |
| ONGC Videsh, Ltd. 4.625% 7/15/2024 | | | 401 | | | | 399 | |
| Petroleos Mexicanos 4.875% 1/18/2024 | | | 11,170 | | | | 11,150 | |
| Petroleos Mexicanos 4.25% 1/15/2025 | | | 240 | | | | 235 | |
| Petroleos Mexicanos 6.875% 10/16/2025 | | | 69,634 | | | | 68,557 | |
| Petroleos Mexicanos 6.875% 8/4/2026 | | | 114,526 | | | | 111,288 | |
| Petroleos Mexicanos 6.49% 1/23/2027 | | | 51,803 | | | | 48,643 | |
| Petroleos Mexicanos 6.50% 3/13/2027 | | | 90,773 | | | | 84,677 | |
| Petroleos Mexicanos 6.50% 1/23/2029 | | | 1,833 | | | | 1,618 | |
| Petroleos Mexicanos 8.75% 6/2/2029 | | | 39,334 | | | | 38,266 | |
| Petroleos Mexicanos 5.95% 1/28/2031 | | | 12,702 | | | | 10,158 | |
| Petroleos Mexicanos 6.70% 2/16/2032 | | | 49,336 | | | | 40,996 | |
| Phillips 66 3.85% 4/9/2025 | | | 1,253 | | | | 1,234 | |
| Pioneer Natural Resources Co. 1.125% 1/15/2026 | | | 238 | | | | 221 | |
| PTTEP Treasury Center Co., Ltd. 2.587% 6/10/20274 | | | 7,780 | | | | 7,230 | |
| PTTEP Treasury Center Co., Ltd. 2.993% 1/15/2030 | | | 3,500 | | | | 3,161 | |
| Qatar Energy 1.375% 9/12/20264 | | | 18,535 | | | | 17,033 | |
| Qatar Energy 2.25% 7/12/20314 | | | 41,974 | | | | 35,785 | |
| Qatar Energy 3.125% 7/12/20414 | | | 6,631 | | | | 5,111 | |
| Qatar Energy 3.30% 7/12/20514 | | | 3,725 | | | | 2,729 | |
| Reliance Industries, Ltd. 4.125% 1/28/2025 | | | 3,000 | | | | 2,963 | |
| Reliance Industries, Ltd. 3.667% 11/30/2027 | | | 3,000 | | | | 2,866 | |
| Reliance Industries, Ltd. 2.875% 1/12/2032 | | | 3,000 | | | | 2,572 | |
| Reliance Industries, Ltd. 4.875% 2/10/2045 | | | 3,000 | | | | 2,780 | |
| Reliance Industries, Ltd. 3.625% 1/12/2052 | | | 2,000 | | | | 1,470 | |
| Reliance Industries, Ltd. 3.75% 1/12/2062 | | | 1,500 | | | | 1,084 | |
| Sabine Pass Liquefaction, LLC 5.75% 5/15/2024 | | | 1,430 | | | | 1,430 | |
| Seadrill Finance, Ltd. 8.375% 8/1/20304 | | | 1,500 | | | | 1,566 | |
| Shell International Finance BV 2.00% 11/7/2024 | | | 3,250 | | | | 3,168 | |
| Shell International Finance BV 3.875% 11/13/2028 | | | 6,720 | | | | 6,619 | |
| Shell International Finance BV 2.375% 11/7/2029 | | | 9,441 | | | | 8,501 | |
| 50 | The Bond Fund of America |
| Bonds, notes & other debt instruments (continued) | | Principal amount
(000) | | | Value
(000) | |
| Corporate bonds, notes & loans (continued) | | | | | | | | |
| Energy (continued) | | | | | | | | |
| Shell International Finance BV 2.75% 4/6/2030 | | USD | 17,667 | | | $ | 16,147 | |
| Shell International Finance BV 3.25% 4/6/2050 | | | 580 | | | | 436 | |
| Shell International Finance BV 3.00% 11/26/2051 | | | 6,662 | | | | 4,751 | |
| Southwestern Energy Co. 5.70% 1/23/20256 | | | 880 | | | | 877 | |
| Southwestern Energy Co. 8.375% 9/15/2028 | | | 1,300 | | | | 1,347 | |
| Southwestern Energy Co. 4.75% 2/1/2032 | | | 12,000 | | | | 11,118 | |
| Sunoco, LP 6.00% 4/15/2027 | | | 4,210 | | | | 4,222 | |
| Sunoco, LP 7.00% 9/15/20284 | | | 6,715 | | | | 6,933 | |
| Sunoco, LP 4.50% 5/15/2029 | | | 5,215 | | | | 4,850 | |
| Tallgrass Energy Partners, LP 7.50% 10/1/20254 | | | 1,370 | | | | 1,378 | |
| Targa Resources Partners, LP 6.875% 1/15/2029 | | | 6,000 | | | | 6,202 | |
| Targa Resources Partners, LP 5.50% 3/1/2030 | | | 8,660 | | | | 8,667 | |
| Targa Resources Partners, LP 4.875% 2/1/2031 | | | 2,190 | | | | 2,130 | |
| Thaioil Treasury Center Co., Ltd. 4.625% 11/20/2028 | | | 4,252 | | | | 4,202 | |
| Thaioil Treasury Center Co., Ltd. 5.375% 11/20/2048 | | | 2,000 | | | | 1,830 | |
| Thaioil Treasury Center Co., Ltd. 3.50% 10/17/2049 | | | 6,000 | | | | 4,065 | |
| Thaioil Treasury Center Co., Ltd. 3.75% 6/18/2050 | | | 10,748 | | | | 7,583 | |
| TotalEnergies Capital International SA 3.455% 2/19/2029 | | | 4,700 | | | | 4,536 | |
| TotalEnergies Capital International SA 2.829% 1/10/2030 | | | 10,340 | | | | 9,503 | |
| TotalEnergies Capital International SA 3.461% 7/12/2049 | | | 2,600 | | | | 2,055 | |
| TotalEnergies Capital International SA 3.127% 5/29/2050 | | | 5,487 | | | | 4,027 | |
| TransCanada Pipelines, Ltd. 4.10% 4/15/2030 | | | 16,811 | | | | 16,001 | |
| Transportadora de Gas del Perú SA 4.25% 4/30/20284 | | | 2,535 | | | | 2,498 | |
| Venture Global Calcasieu Pass, LLC 3.875% 11/1/20334 | | | 22,500 | | | | 19,095 | |
| Weatherford International, Ltd. 6.50% 9/15/20284 | | | 2,496 | | | | 2,585 | |
| Western Midstream Operating, LP 3.10% 2/1/20256 | | | 8,964 | | | | 8,729 | |
| Western Midstream Operating, LP 4.05% 2/1/20306 | | | 6,606 | | | | 6,185 | |
| Western Midstream Operating, LP 5.30% 3/1/2048 | | | 2,000 | | | | 1,743 | |
| Western Midstream Operating, LP 5.25% 2/1/20506 | | | 15,036 | | | | 13,500 | |
| | | | | | | | 1,689,309 | |
| | | | | | | | | |
| Communication services 1.94% | | | | | | | | |
| América Móvil, SAB de CV, 9.50% 1/27/2031 | | MXN | 117,330 | | | | 6,724 | |
| AT&T, Inc. 1.70% 3/25/2026 | | USD | 12,880 | | | | 12,053 | |
| AT&T, Inc. 2.30% 6/1/2027 | | | 6,931 | | | | 6,436 | |
| AT&T, Inc. 1.65% 2/1/2028 | | | 15,971 | | | | 14,227 | |
| AT&T, Inc. 4.35% 3/1/2029 | | | 14,011 | | | | 13,835 | |
| AT&T, Inc. 4.30% 2/15/2030 | | | 71,889 | | | | 70,455 | |
| AT&T, Inc. 2.75% 6/1/2031 | | | 38,703 | | | | 33,947 | |
| AT&T, Inc. 2.25% 2/1/2032 | | | 32,537 | | | | 26,920 | |
| AT&T, Inc. 2.55% 12/1/2033 | | | 18,907 | | | | 15,419 | |
| AT&T, Inc. 5.40% 2/15/2034 | | | 5,082 | | | | 5,243 | |
| AT&T, Inc. 3.50% 9/15/2053 | | | 39,154 | | | | 28,447 | |
| Axiata SPV2 Berhad 2.163% 8/19/2030 | | | 4,883 | | | | 4,159 | |
| Bharti Airtel International (Netherlands) BV 5.35% 5/20/2024 | | | 3,000 | | | | 2,998 | |
| Bharti Airtel, Ltd. 4.375% 6/10/2025 | | | 3,000 | | | | 2,959 | |
| CCO Holdings, LLC 5.375% 6/1/20294 | | | 2,700 | | | | 2,549 | |
| CCO Holdings, LLC 4.75% 3/1/20304 | | | 9,665 | | | | 8,845 | |
| CCO Holdings, LLC 4.50% 8/15/20304 | | | 18,675 | | | | 16,860 | |
| CCO Holdings, LLC 4.75% 2/1/20324 | | | 8,000 | | | | 7,065 | |
| CCO Holdings, LLC 4.50% 5/1/2032 | | | 2,225 | | | | 1,909 | |
| CCO Holdings, LLC 4.25% 1/15/20344 | | | 21,825 | | | | 17,765 | |
| Charter Communications Operating, LLC 4.908% 7/23/2025 | | | 165 | | | | 164 | |
| Charter Communications Operating, LLC 2.80% 4/1/2031 | | | 41,711 | | | | 35,211 | |
| Charter Communications Operating, LLC 2.30% 2/1/2032 | | | 13,963 | | | | 11,122 | |
| Charter Communications Operating, LLC 4.40% 4/1/2033 | | | 5,163 | | | | 4,770 | |
| Charter Communications Operating, LLC 6.484% 10/23/2045 | | | 6,850 | | | | 6,737 | |
| Charter Communications Operating, LLC 5.125% 7/1/2049 | | | 7,400 | | | | 6,020 | |
| Charter Communications Operating, LLC 4.80% 3/1/2050 | | | 5,000 | | | | 3,877 | |
| Charter Communications Operating, LLC 3.70% 4/1/2051 | | | 21,047 | | | | 13,711 | |
| Charter Communications Operating, LLC 5.25% 4/1/2053 | | | 4,558 | | | | 3,823 | |
| Comcast Corp. 4.55% 1/15/2029 | | | 11,600 | | | | 11,657 | |
| Comcast Corp. 2.65% 2/1/2030 | | | 20,000 | | | | 18,012 | |
| Comcast Corp. 1.95% 1/15/2031 | | | 7,446 | | | | 6,288 | |
| Comcast Corp. 1.50% 2/15/2031 | | | 1,000 | | | | 820 | |
| Comcast Corp. 4.80% 5/15/2033 | | | 42,300 | | | | 42,847 | |
| Comcast Corp. 3.75% 4/1/2040 | | | 8,930 | | | | 7,686 | |
| The Bond Fund of America | 51 |
| Bonds, notes & other debt instruments (continued) | | Principal amount
(000) | | | Value
(000) | |
| Corporate bonds, notes & loans (continued) | | | | | | |
| Communication services (continued) | | | | | | |
| Comcast Corp. 2.887% 11/1/2051 | | USD | 4,558 | | | $ | 3,086 | |
| Comcast Corp. 5.35% 5/15/2053 | | | 17,606 | | | | 18,227 | |
| Comcast Corp. 5.50% 5/15/2064 | | | 1,800 | | | | 1,896 | |
| CSC Holdings, LLC 5.375% 2/1/20284 | | | 4,850 | | | | 4,289 | |
| Diamond Sports Group, LLC 5.375% 8/15/20264,9 | | | 3,500 | | | | 179 | |
| DIRECTV Financing, LLC 5.875% 8/15/20274 | | | 8,750 | | | | 8,228 | |
| DISH Network Corp. 11.75% 11/15/20274 | | | 14,925 | | | | 15,592 | |
| Frontier Communications Holdings, LLC 6.00% 1/15/20304 | | | 2,000 | | | | 1,708 | |
| Gray Escrow II, Inc. 5.375% 11/15/20314 | | | 5,950 | | | | 4,496 | |
| Gray Television, Inc. 5.875% 7/15/20264 | | | 1,682 | | | | 1,638 | |
| Gray Television, Inc. 4.75% 10/15/20304 | | | 8,418 | | | | 6,346 | |
| iHeartCommunications, Inc. 6.375% 5/1/2026 | | | 8,475 | | | | 7,234 | |
| Level 3 Financing, Inc. 3.75% 7/15/20294 | | | 3,053 | | | | 1,300 | |
| Lumen Technologies, Inc. 4.00% 2/15/20274 | | | 5,775 | | | | 3,732 | |
| Midas OpCo Holdings, LLC 5.625% 8/15/20294 | | | 3,500 | | | | 3,223 | |
| Netflix, Inc. 4.875% 4/15/2028 | | | 56,452 | | | | 57,243 | |
| Netflix, Inc. 5.875% 11/15/2028 | | | 104,989 | | | | 110,793 | |
| Netflix, Inc. 6.375% 5/15/2029 | | | 22,283 | | | | 24,250 | |
| Netflix, Inc. 5.375% 11/15/20294 | | | 86,040 | | | | 88,979 | |
| Netflix, Inc. 4.875% 6/15/20304 | | | 63,446 | | | | 64,307 | |
| News Corp. 3.875% 5/15/20294 | | | 6,000 | | | | 5,523 | |
| News Corp. 5.125% 2/15/20324 | | | 8,175 | | | | 7,769 | |
| SBA Tower Trust 1.631% 11/15/20264 | | | 62,772 | | | | 56,111 | |
| Scripps Escrow II, Inc. 3.875% 1/15/20294 | | | 7,921 | | | | 7,014 | |
| Singapore Telecommunications, Ltd. 7.375% 12/1/2031 | | | 5,000 | | | | 5,874 | |
| Sirius XM Radio, Inc. 4.00% 7/15/20284 | | | 4,300 | | | | 3,980 | |
| Sirius XM Radio, Inc. 4.125% 7/1/20304 | | | 8,000 | | | | 7,139 | |
| Sirius XM Radio, Inc. 3.875% 9/1/20314 | | | 5,000 | | | | 4,284 | |
| Sprint Capital Corp. 6.875% 11/15/2028 | | | 5,000 | | | | 5,421 | |
| Sprint Capital Corp. 8.75% 3/15/2032 | | | 4,500 | | | | 5,559 | |
| Sprint, LLC 7.125% 6/15/2024 | | | 10,010 | | | | 10,060 | |
| TEGNA, Inc. 5.00% 9/15/2029 | | | 8,500 | | | | 7,799 | |
| Tencent Holdings, Ltd. 3.28% 4/11/20244 | | | 15,000 | | | | 14,911 | |
| Tencent Holdings, Ltd. 3.28% 4/11/2024 | | | 2,000 | | | | 1,988 | |
| Tencent Holdings, Ltd. 3.595% 1/19/2028 | | | 7,500 | | | | 7,140 | |
| Tencent Holdings, Ltd. 2.39% 6/3/20304 | | | 20,000 | | | | 17,054 | |
| Tencent Holdings, Ltd. 3.68% 4/22/2041 | | | 794 | | | | 625 | |
| Tencent Holdings, Ltd. 3.24% 6/3/20504 | | | 9,870 | | | | 6,590 | |
| Tencent Holdings, Ltd. 3.29% 6/3/20604 | | | 10,000 | | | | 6,342 | |
| T-Mobile USA, Inc. 3.50% 4/15/2025 | | | 6,550 | | | | 6,415 | |
| T-Mobile USA, Inc. 1.50% 2/15/2026 | | | 4,900 | | | | 4,564 | |
| T-Mobile USA, Inc. 2.25% 2/15/2026 | | | 13,438 | | | | 12,743 | |
| T-Mobile USA, Inc. 2.625% 4/15/2026 | | | 37,391 | | | | 35,587 | |
| T-Mobile USA, Inc. 3.75% 4/15/2027 | | | 21,300 | | | | 20,666 | |
| T-Mobile USA, Inc. 4.75% 2/1/2028 | | | 4,566 | | | | 4,552 | |
| T-Mobile USA, Inc. 2.05% 2/15/2028 | | | 221 | | | | 200 | |
| T-Mobile USA, Inc. 4.80% 7/15/2028 | | | 1,270 | | | | 1,281 | |
| T-Mobile USA, Inc. 2.625% 2/15/2029 | | | 9,705 | | | | 8,747 | |
| T-Mobile USA, Inc. 2.40% 3/15/2029 | | | 5,365 | | | | 4,818 | |
| T-Mobile USA, Inc. 3.375% 4/15/2029 | | | 8,000 | | | | 7,442 | |
| T-Mobile USA, Inc. 3.875% 4/15/2030 | | | 18,318 | | | | 17,376 | |
| T-Mobile USA, Inc. 2.55% 2/15/2031 | | | 16,912 | | | | 14,575 | |
| T-Mobile USA, Inc. 2.875% 2/15/2031 | | | 22,945 | | | | 20,242 | |
| T-Mobile USA, Inc. 3.50% 4/15/2031 | | | 10,000 | | | | 9,154 | |
| T-Mobile USA, Inc. 2.70% 3/15/2032 | | | 429 | | | | 366 | |
| T-Mobile USA, Inc. 5.05% 7/15/2033 | | | 15,402 | | | | 15,527 | |
| T-Mobile USA, Inc. 5.75% 1/15/2034 | | | 5,230 | | | | 5,550 | |
| T-Mobile USA, Inc. 3.00% 2/15/2041 | | | 10,790 | | | | 8,082 | |
| T-Mobile USA, Inc. 3.30% 2/15/2051 | | | 5,002 | | | | 3,618 | |
| T-Mobile USA, Inc. 3.40% 10/15/2052 | | | 42,790 | | | | 31,202 | |
| T-Mobile USA, Inc. 5.75% 1/15/2054 | | | 165 | | | | 175 | |
| T-Mobile USA, Inc. 6.00% 6/15/2054 | | | 6,704 | | | | 7,359 | |
| Verizon Communications, Inc. 3.00% 3/22/2027 | | | 1,287 | | | | 1,224 | |
| Verizon Communications, Inc. 4.329% 9/21/2028 | | | 13,420 | | | | 13,284 | |
| Verizon Communications, Inc. 3.875% 2/8/2029 | | | 2,071 | | | | 2,009 | |
| Verizon Communications, Inc. 4.016% 12/3/2029 | | | 1,981 | | | | 1,917 | |
| Verizon Communications, Inc. 1.68% 10/30/2030 | | | 3,445 | | | | 2,839 | |
| 52 | The Bond Fund of America |
| Bonds, notes & other debt instruments (continued) | | Principal amount
(000) | | | Value
(000) | |
| Corporate bonds, notes & loans (continued) | | | | | | | | |
| Communication services (continued) | | | | | | | | |
| Verizon Communications, Inc. 1.75% 1/20/2031 | | USD | 22,494 | | | $ | 18,512 | |
| Verizon Communications, Inc. 2.55% 3/21/2031 | | | 133 | | | | 115 | |
| Verizon Communications, Inc. 2.355% 3/15/2032 | | | 330 | | | | 275 | |
| Verizon Communications, Inc. 2.65% 11/20/2040 | | | 27,348 | | | | 19,725 | |
| Verizon Communications, Inc. 3.40% 3/22/2041 | | | 6,600 | | | | 5,258 | |
| Verizon Communications, Inc. 2.85% 9/3/2041 | | | 9,116 | | | | 6,741 | |
| Verizon Communications, Inc. 2.875% 11/20/2050 | | | 34,934 | | | | 23,780 | |
| Verizon Communications, Inc. 3.55% 3/22/2051 | | | 10,300 | | | | 7,944 | |
| Verizon Communications, Inc. 3.875% 3/1/2052 | | | 10,000 | | | | 8,110 | |
| Videotron, Ltd. 5.375% 6/15/20244 | | | 3,100 | | | | 3,087 | |
| Virgin Media Secured Finance PLC 5.50% 5/15/20294 | | | 5,000 | | | | 4,837 | |
| Virgin Media Secured Finance PLC 4.50% 8/15/20304 | | | 500 | | | | 446 | |
| VMED O2 UK Financing I PLC 4.25% 1/31/20314 | | | 5,475 | | | | 4,788 | |
| Vodafone Group PLC 4.25% 9/17/2050 | | | 14,575 | | | | 12,111 | |
| VZ Secured Financing BV 5.00% 1/15/20324 | | | 2,000 | | | | 1,710 | |
| WarnerMedia Holdings, Inc. 3.638% 3/15/2025 | | | 19,418 | | | | 19,007 | |
| WarnerMedia Holdings, Inc. 3.755% 3/15/2027 | | | 54,211 | | | | 51,963 | |
| WarnerMedia Holdings, Inc. 4.054% 3/15/2029 | | | 3,789 | | | | 3,597 | |
| WarnerMedia Holdings, Inc. 4.279% 3/15/2032 | | | 6,554 | | | | 6,000 | |
| WarnerMedia Holdings, Inc. 5.05% 3/15/2042 | | | 583 | | | | 514 | |
| WarnerMedia Holdings, Inc. 5.141% 3/15/2052 | | | 3,885 | | | | 3,337 | |
| WMG Acquisition Corp. 3.75% 12/1/20294 | | | 5,000 | | | | 4,558 | |
| WMG Acquisition Corp. 3.00% 2/15/20314 | | | 12,500 | | | | 10,726 | |
| Ziggo BV 4.875% 1/15/20304 | | | 6,000 | | | | 5,359 | |
| ZipRecruiter, Inc. 5.00% 1/15/20304 | | | 6,000 | | | | 5,245 | |
| | | | | | | | 1,568,748 | |
| | | | | | | | | |
| Consumer staples 1.27% | | | | | | | | |
| 7-Eleven, Inc. 0.95% 2/10/20264 | | | 6,722 | | | | 6,215 | |
| 7-Eleven, Inc. 1.30% 2/10/20284 | | | 6,036 | | | | 5,285 | |
| 7-Eleven, Inc. 1.80% 2/10/20314 | | | 15,567 | | | | 12,661 | |
| 7-Eleven, Inc. 2.80% 2/10/20514 | | | 8,505 | | | | 5,478 | |
| Albertsons Companies, Inc. 3.50% 3/15/20294 | | | 8,727 | | | | 7,934 | |
| Altria Group, Inc. 4.40% 2/14/2026 | | | 7,928 | | | | 7,859 | |
| Altria Group, Inc. 3.40% 5/6/2030 | | | 1,827 | | | | 1,667 | |
| Altria Group, Inc. 2.45% 2/4/2032 | | | 530 | | | | 433 | |
| Altria Group, Inc. 4.50% 5/2/2043 | | | 100 | | | | 84 | |
| Altria Group, Inc. 3.70% 2/4/2051 | | | 9,367 | | | | 6,603 | |
| Anheuser-Busch Companies, LLC 4.70% 2/1/2036 | | | 17,560 | | | | 17,513 | |
| Anheuser-Busch Companies, LLC 4.90% 2/1/2046 | | | 4,555 | | | | 4,469 | |
| Anheuser-Busch InBev Worldwide, Inc. 4.00% 4/13/2028 | | | 2,000 | | | | 1,978 | |
| Anheuser-Busch InBev Worldwide, Inc. 4.75% 1/23/2029 | | | 46,001 | | | | 46,761 | |
| Anheuser-Busch InBev Worldwide, Inc. 3.50% 6/1/2030 | | | 5,455 | | | | 5,191 | |
| Anheuser-Busch InBev Worldwide, Inc. 5.45% 1/23/2039 | | | 10,000 | | | | 10,554 | |
| Anheuser-Busch InBev Worldwide, Inc. 5.55% 1/23/2049 | | | 2,979 | | | | 3,206 | |
| BAT Capital Corp. 3.222% 8/15/2024 | | | 41,000 | | | | 40,348 | |
| BAT Capital Corp. 3.215% 9/6/2026 | | | 8,750 | | | | 8,373 | |
| BAT Capital Corp. 3.557% 8/15/2027 | | | 44,004 | | | | 42,024 | |
| BAT Capital Corp. 2.259% 3/25/2028 | | | 17,526 | | | | 15,695 | |
| BAT Capital Corp. 3.462% 9/6/2029 | | | 960 | | | | 885 | |
| BAT Capital Corp. 6.343% 8/2/2030 | | | 38,099 | | | | 40,034 | |
| BAT Capital Corp. 2.726% 3/25/2031 | | | 1,768 | | | | 1,484 | |
| BAT Capital Corp. 4.742% 3/16/2032 | | | 17,000 | | | | 16,323 | |
| BAT Capital Corp. 6.421% 8/2/2033 | | | 45,128 | | | | 47,258 | |
| BAT Capital Corp. 4.39% 8/15/2037 | | | 29,384 | | | | 24,645 | |
| BAT Capital Corp. 7.079% 8/2/2043 | | | 9,360 | | | | 9,950 | |
| BAT Capital Corp. 4.54% 8/15/2047 | | | 19,978 | | | | 15,372 | |
| BAT Capital Corp. 4.758% 9/6/2049 | | | 3,873 | | | | 3,076 | |
| BAT Capital Corp. 3.984% 9/25/2050 | | | 18,976 | | | | 13,381 | |
| BAT Capital Corp. 7.081% 8/2/2053 | | | 29,774 | | | | 31,860 | |
| BAT International Finance PLC 3.95% 6/15/20254 | | | 200 | | | | 196 | |
| BAT International Finance PLC 1.668% 3/25/2026 | | | 17,162 | | | | 15,948 | |
| BAT International Finance PLC 4.448% 3/16/2028 | | | 18,500 | | | | 18,209 | |
| Central Garden & Pet Co. 4.125% 10/15/2030 | | | 1,325 | | | | 1,207 | |
| Conagra Brands, Inc. 4.30% 5/1/2024 | | | 22,027 | | | | 21,914 | |
| Conagra Brands, Inc. 4.60% 11/1/2025 | | | 11,234 | | | | 11,132 | |
| Conagra Brands, Inc. 1.375% 11/1/2027 | | | 3,559 | | | | 3,126 | |
| The Bond Fund of America | 53 |
| Bonds, notes & other debt instruments (continued) | | Principal amount
(000) | | | Value
(000) | |
| Corporate bonds, notes & loans (continued) | | | | | | | | |
| Consumer staples (continued) | | | | | | | | |
| Conagra Brands, Inc. 5.30% 11/1/2038 | | USD | 7,483 | | | $ | 7,338 | |
| Conagra Brands, Inc. 5.40% 11/1/2048 | | | 6,403 | | | | 6,210 | |
| Constellation Brands, Inc. 4.35% 5/9/2027 | | | 5,757 | | | | 5,711 | |
| Constellation Brands, Inc. 3.60% 2/15/2028 | | | 1,650 | | | | 1,585 | |
| Constellation Brands, Inc. 2.875% 5/1/2030 | | | 13,545 | | | | 12,140 | |
| Constellation Brands, Inc. 2.25% 8/1/2031 | | | 5,951 | | | | 5,004 | |
| Constellation Brands, Inc. 4.75% 5/9/2032 | | | 16,773 | | | | 16,720 | |
| Constellation Brands, Inc. 4.90% 5/1/2033 | | | 19,120 | | | | 19,248 | |
| Constellation Brands, Inc. 4.10% 2/15/2048 | | | 1,000 | | | | 852 | |
| Coty, Inc. 4.75% 1/15/20294 | | | 275 | | | | 263 | |
| Coty, Inc. 6.625% 7/15/20304 | | | 3,380 | | | | 3,474 | |
| Darling Ingredients, Inc. 5.25% 4/15/20274 | | | 6,000 | | | | 5,917 | |
| Darling Ingredients, Inc. 6.00% 6/15/20304 | | | 755 | | | | 756 | |
| H.J. Heinz Co. 3.00% 6/1/2026 | | | 2,599 | | | | 2,498 | |
| H.J. Heinz Co. 4.375% 6/1/2046 | | | 16,000 | | | | 13,981 | |
| Indofood CBP Sukses Makmur Tbk PT 3.398% 6/9/2031 | | | 17,570 | | | | 15,224 | |
| Indofood CBP Sukses Makmur Tbk PT 4.745% 6/9/2051 | | | 8,185 | | | | 6,654 | |
| Indofood CBP Sukses Makmur Tbk PT 4.805% 4/27/2052 | | | 809 | | | | 661 | |
| InRetail Consumer 3.25% 3/22/20284 | | | 5,400 | | | | 4,850 | |
| InRetail Consumer 3.25% 3/22/2028 | | | 2,000 | | | | 1,796 | |
| J. M. Smucker Co. (The) 6.20% 11/15/2033 | | | 5,043 | | | | 5,503 | |
| J. M. Smucker Co. (The) 6.50% 11/15/2053 | | | 2,221 | | | | 2,564 | |
| JBS USA Lux SA 2.50% 1/15/2027 | | | 26,124 | | | | 24,057 | |
| JBS USA Lux SA 3.00% 2/2/2029 | | | 22,321 | | | | 19,653 | |
| JBS USA Lux SA 5.50% 1/15/2030 | | | 2,375 | | | | 2,336 | |
| JBS USA Lux SA 3.625% 1/15/2032 | | | 9,350 | | | | 8,024 | |
| JBS USA Lux SA 3.00% 5/15/2032 | | | 15,283 | | | | 12,456 | |
| JBS USA Lux SA 5.75% 4/1/2033 | | | 3,456 | | | | 3,428 | |
| Keurig Dr Pepper, Inc. 4.417% 5/25/2025 | | | 1,028 | | | | 1,018 | |
| Keurig Dr Pepper, Inc. 3.20% 5/1/2030 | | | 2,557 | | | | 2,352 | |
| Nestle Holdings, Inc. 1.875% 9/14/20314 | | | 884 | | | | 742 | |
| PepsiCo, Inc. 1.625% 5/1/2030 | | | 588 | | | | 501 | |
| PepsiCo, Inc. 1.40% 2/25/2031 | | | 666 | | | | 551 | |
| PepsiCo, Inc. 2.75% 10/21/2051 | | | 2,067 | | | | 1,470 | |
| Philip Morris International, Inc. 1.50% 5/1/2025 | | | 274 | | | | 262 | |
| Philip Morris International, Inc. 5.00% 11/17/2025 | | | 32,200 | | | | 32,349 | |
| Philip Morris International, Inc. 4.875% 2/13/2026 | | | 17,505 | | | | 17,571 | |
| Philip Morris International, Inc. 0.875% 5/1/2026 | | | 4,736 | | | | 4,341 | |
| Philip Morris International, Inc. 5.125% 11/17/2027 | | | 16,175 | | | | 16,474 | |
| Philip Morris International, Inc. 5.25% 9/7/2028 | | | 20,000 | | | | 20,588 | |
| Philip Morris International, Inc. 3.375% 8/15/2029 | | | 780 | | | | 732 | |
| Philip Morris International, Inc. 5.625% 11/17/2029 | | | 15,422 | | | | 16,182 | |
| Philip Morris International, Inc. 5.125% 2/15/2030 | | | 6,873 | | | | 6,990 | |
| Philip Morris International, Inc. 2.10% 5/1/2030 | | | 3,718 | | | | 3,191 | |
| Philip Morris International, Inc. 5.50% 9/7/2030 | | | 32,600 | | | | 33,812 | |
| Philip Morris International, Inc. 1.75% 11/1/2030 | | | 4,207 | | | | 3,470 | |
| Philip Morris International, Inc. 5.75% 11/17/2032 | | | 27,560 | | | | 28,936 | |
| Philip Morris International, Inc. 5.375% 2/15/2033 | | | 14,900 | | | | 15,290 | |
| Philip Morris International, Inc. 4.125% 3/4/2043 | | | 3,788 | | | | 3,207 | |
| Philip Morris International, Inc. 4.25% 11/10/2044 | | | 106 | | | | 91 | |
| Procter & Gamble Co. 0.55% 10/29/2025 | | | 4,261 | | | | 3,984 | |
| Procter & Gamble Co. 1.00% 4/23/2026 | | | 1,229 | | | | 1,142 | |
| Procter & Gamble Co. 3.95% 1/26/2028 | | | 18,289 | | | | 18,273 | |
| Procter & Gamble Co. 3.00% 3/25/2030 | | | 1,183 | | | | 1,108 | |
| Procter & Gamble Co. 1.20% 10/29/2030 | | | 4,005 | | | | 3,320 | |
| Reckitt Benckiser Treasury Services PLC 2.75% 6/26/20244 | | | 4,305 | | | | 4,245 | |
| Reynolds American, Inc. 4.45% 6/12/2025 | | | 3,478 | | | | 3,441 | |
| Reynolds American, Inc. 4.75% 11/1/2042 | | | 2,500 | | | | 1,969 | |
| Reynolds American, Inc. 5.85% 8/15/2045 | | | 2,260 | | | | 2,120 | |
| Target Corp. 4.50% 9/15/2032 | | | 2,233 | | | | 2,257 | |
| Target Corp. 4.80% 1/15/2053 | | | 9,038 | | | | 8,979 | |
| Walmart, Inc. 4.10% 4/15/2033 | | | 20,000 | | | | 19,818 | |
| Walmart, Inc. 4.50% 4/15/2053 | | | 6,020 | | | | 5,856 | |
| | | | | | | | 1,021,866 | |
| 54 | The Bond Fund of America |
| Bonds, notes & other debt instruments (continued) | | Principal amount
(000) | | | Value
(000) | |
| Corporate bonds, notes & loans (continued) | | | | | | | | |
| Real estate 0.97% | | | | | | | | |
| Alexandria Real Estate Equities, Inc. 3.80% 4/15/2026 | | USD | 231 | | | $ | 225 | |
| Alexandria Real Estate Equities, Inc. 3.95% 1/15/2028 | | | 100 | | | | 96 | |
| Alexandria Real Estate Equities, Inc. 3.375% 8/15/2031 | | | 1,980 | | | | 1,786 | |
| American Tower Corp. 3.65% 3/15/2027 | | | 427 | | | | 411 | |
| American Tower Corp. 2.70% 4/15/2031 | | | 5,000 | | | | 4,297 | |
| Boston Properties, LP 2.90% 3/15/2030 | | | 17,683 | | | | 15,153 | |
| Boston Properties, LP 3.25% 1/30/2031 | | | 2,475 | | | | 2,126 | |
| Boston Properties, LP 2.55% 4/1/2032 | | | 70,663 | | | | 56,323 | |
| Boston Properties, LP 2.45% 10/1/2033 | | | 24,492 | | | | 18,665 | |
| Boston Properties, LP 6.50% 1/15/2034 | | | 77,692 | | | | 82,043 | |
| Corp. Inmobiliaria Vesta, SAB de CV 3.625% 5/13/20314 | | | 2,490 | | | | 2,141 | |
| Corp. Inmobiliaria Vesta, SAB de CV 3.625% 5/13/2031 | | | 2,000 | | | | 1,720 | |
| Corporate Office Properties, LP 2.25% 3/15/2026 | | | 14,337 | | | | 13,379 | |
| Corporate Office Properties, LP 2.00% 1/15/2029 | | | 6,408 | | | | 5,344 | |
| Corporate Office Properties, LP 2.75% 4/15/2031 | | | 13,897 | | | | 11,250 | |
| Corporate Office Properties, LP 2.90% 12/1/2033 | | | 5,754 | | | | 4,498 | |
| Crown Castle, Inc. 5.00% 1/11/2028 | | | 33,013 | | | | 32,913 | |
| Equinix, Inc. 2.625% 11/18/2024 | | | 32,830 | | | | 31,991 | |
| Equinix, Inc. 1.25% 7/15/2025 | | | 9,870 | | | | 9,289 | |
| Equinix, Inc. 1.45% 5/15/2026 | | | 5,950 | | | | 5,500 | |
| Equinix, Inc. 2.90% 11/18/2026 | | | 14,009 | | | | 13,312 | |
| Equinix, Inc. 1.80% 7/15/2027 | | | 2,871 | | | | 2,601 | |
| Equinix, Inc. 1.55% 3/15/2028 | | | 7,130 | | | | 6,261 | |
| Equinix, Inc. 2.00% 5/15/2028 | | | 1,318 | | | | 1,177 | |
| Equinix, Inc. 3.20% 11/18/2029 | | | 17,775 | | | | 16,342 | |
| Equinix, Inc. 2.15% 7/15/2030 | | | 2,678 | | | | 2,271 | |
| Equinix, Inc. 2.50% 5/15/2031 | | | 2,800 | | | | 2,379 | |
| Equinix, Inc. 3.90% 4/15/2032 | | | 933 | | | | 867 | |
| Equinix, Inc. 3.00% 7/15/2050 | | | 739 | | | | 502 | |
| Equinix, Inc. 2.95% 9/15/2051 | | | 400 | | | | 268 | |
| Equinix, Inc. 3.40% 2/15/2052 | | | 3,120 | | | | 2,288 | |
| Essex Portfolio, LP 3.875% 5/1/2024 | | | 5,500 | | | | 5,469 | |
| FibraSOMA 4.375% 7/22/20314 | | | 8,260 | | | | 6,267 | |
| FibraSOMA 4.375% 7/22/2031 | | | 4,000 | | | | 3,035 | |
| Forestar Group, Inc. 3.85% 5/15/20264 | | | 3,815 | | | | 3,638 | |
| Forestar Group, Inc. 5.00% 3/1/20284 | | | 2,000 | | | | 1,935 | |
| Howard Hughes Corp. (The) 5.375% 8/1/20284 | | | 10,550 | | | | 10,154 | |
| Howard Hughes Corp. (The) 4.125% 2/1/20294 | | | 19,350 | | | | 17,276 | |
| Howard Hughes Corp. (The) 4.375% 2/1/20314 | | | 23,920 | | | | 20,787 | |
| Invitation Homes Operating Partnership, LP 2.30% 11/15/2028 | | | 4,513 | | | | 4,005 | |
| Invitation Homes Operating Partnership, LP 2.00% 8/15/2031 | | | 1,088 | | | | 867 | |
| Iron Mountain, Inc. 5.25% 3/15/20284 | | | 9,459 | | | | 9,202 | |
| Iron Mountain, Inc. 4.875% 9/15/20294 | | | 8,367 | | | | 7,933 | |
| Iron Mountain, Inc. 5.25% 7/15/20304 | | | 7,950 | | | | 7,577 | |
| Iron Mountain, Inc. 4.50% 2/15/20314 | | | 8,750 | | | | 7,941 | |
| Kennedy-Wilson, Inc. 4.75% 3/1/2029 | | | 2,325 | | | | 1,944 | |
| Kennedy-Wilson, Inc. 5.00% 3/1/2031 | | | 5,870 | | | | 4,669 | |
| KRC Interim Corp. 2.70% 3/1/2024 | | | 16,980 | | | | 16,888 | |
| KRC Interim Corp. 3.30% 2/1/2025 | | | 5,000 | | | | 4,894 | |
| Prologis, LP 4.875% 6/15/2028 | | | 7,672 | | | | 7,777 | |
| Prologis, LP 4.75% 6/15/2033 | | | 9,650 | | | | 9,787 | |
| Prologis, LP 5.125% 1/15/2034 | | | 45,474 | | | | 46,971 | |
| Prologis, LP 5.25% 6/15/2053 | | | 826 | | | | 864 | |
| Public Storage Operating Co. 1.95% 11/9/2028 | | | 721 | | | | 643 | |
| Public Storage Operating Co. 5.125% 1/15/2029 | | | 9,106 | | | | 9,406 | |
| Public Storage Operating Co. 2.30% 5/1/2031 | | | 20,718 | | | | 17,817 | |
| Public Storage Operating Co. 5.10% 8/1/2033 | | | 2,798 | | | | 2,899 | |
| Scentre Group Trust 1 3.50% 2/12/20254 | | | 5,950 | | | | 5,825 | |
| Service Properties Trust 4.50% 3/15/2025 | | | 6,875 | | | | 6,720 | |
| Service Properties Trust 3.95% 1/15/2028 | | | 100 | | | | 82 | |
| Service Properties Trust 8.625% 11/15/20314 | | | 24,925 | | | | 26,128 | |
| Sun Communities Operating, LP 2.30% 11/1/2028 | | | 419 | | | | 367 | |
| Sun Communities Operating, LP 2.70% 7/15/2031 | | | 1,537 | | | | 1,282 | |
| Sun Communities Operating, LP 4.20% 4/15/2032 | | | 541 | | | | 494 | |
| VICI Properties, LP 5.625% 5/1/20244 | | | 3,885 | | | | 3,875 | |
| VICI Properties, LP 3.50% 2/15/20254 | | | 2,675 | | | | 2,608 | |
| VICI Properties, LP 4.375% 5/15/2025 | | | 4,312 | | | | 4,240 | |
| The Bond Fund of America | 55 |
| Bonds, notes & other debt instruments (continued) | | Principal amount
(000) | | | Value
(000) | |
| Corporate bonds, notes & loans (continued) | | | | | | | | |
| Real estate (continued) | | | | | | | | |
| VICI Properties, LP 4.625% 6/15/20254 | | USD | 3,475 | | | $ | 3,415 | |
| VICI Properties, LP 4.25% 12/1/20264 | | | 5,700 | | | | 5,489 | |
| VICI Properties, LP 4.50% 1/15/20284 | | | 6,770 | | | | 6,463 | |
| VICI Properties, LP 4.75% 2/15/2028 | | | 27,430 | | | | 26,870 | |
| VICI Properties, LP 3.875% 2/15/20294 | | | 2,835 | | | | 2,606 | |
| VICI Properties, LP 4.625% 12/1/20294 | | | 715 | | | | 674 | |
| VICI Properties, LP 4.95% 2/15/2030 | | | 27,015 | | | | 26,240 | |
| VICI Properties, LP 4.125% 8/15/20304 | | | 2,500 | | | | 2,280 | |
| VICI Properties, LP 5.125% 5/15/2032 | | | 66,704 | | | | 65,098 | |
| VICI Properties, LP 5.625% 5/15/2052 | | | 2,370 | | | | 2,275 | |
| WEA Finance, LLC 3.75% 9/17/20244 | | | 2,480 | | | | 2,436 | |
| WEA Finance, LLC 3.50% 6/15/20294 | | | 6,247 | | | | 5,318 | |
| | | | | | | | 778,848 | |
| | | | | | | | | |
| Information technology 0.58% | | | | | | | | |
| Adobe, Inc. 1.90% 2/1/2025 | | | 647 | | | | 628 | |
| Adobe, Inc. 2.30% 2/1/2030 | | | 6,009 | | | | 5,386 | |
| Analog Devices, Inc. 1.70% 10/1/2028 | | | 4,539 | | | | 4,028 | |
| Analog Devices, Inc. 2.10% 10/1/2031 | | | 16,080 | | | | 13,693 | |
| Analog Devices, Inc. 2.80% 10/1/2041 | | | 2,973 | | | | 2,220 | |
| Analog Devices, Inc. 2.95% 10/1/2051 | | | 18,184 | | | | 13,018 | |
| Apple, Inc. 2.375% 2/8/2041 | | | 4,625 | | | | 3,384 | |
| Apple, Inc. 3.95% 8/8/2052 | | | 14,757 | | | | 12,927 | |
| Apple, Inc. 4.85% 5/10/2053 | | | 17,900 | | | | 18,262 | |
| Black Knight InfoServ, LLC 3.625% 9/1/20284 | | | 3,200 | | | | 3,036 | |
| Broadcom Corp. 3.625% 1/15/2024 | | | 270 | | | | 270 | |
| Broadcom Corp. 3.875% 1/15/2027 | | | 6,802 | | | | 6,641 | |
| Broadcom, Inc. 1.95% 2/15/20284 | | | 373 | | | | 335 | |
| Broadcom, Inc. 4.00% 4/15/20294 | | | 3,178 | | | | 3,070 | |
| Broadcom, Inc. 4.75% 4/15/2029 | | | 537 | | | | 539 | |
| Broadcom, Inc. 4.15% 11/15/2030 | | | 6,522 | | | | 6,233 | |
| Broadcom, Inc. 4.15% 4/15/20324 | | | 346 | | | | 326 | |
| Broadcom, Inc. 3.469% 4/15/20344 | | | 31,678 | | | | 27,574 | |
| Broadcom, Inc. 3.137% 11/15/20354 | | | 2,092 | | | | 1,719 | |
| Broadcom, Inc. 3.187% 11/15/20364 | | | 6,007 | | | | 4,871 | |
| Broadcom, Inc. 4.926% 5/15/20374 | | | 23,446 | | | | 22,705 | |
| Broadcom, Inc. 3.50% 2/15/20414 | | | 4,709 | | | | 3,737 | |
| Broadcom, Inc. 3.75% 2/15/20514 | | | 3,180 | | | | 2,504 | |
| CDW, LLC 4.125% 5/1/2025 | | | 5,275 | | | | 5,176 | |
| Gartner, Inc. 4.50% 7/1/20284 | | | 1,850 | | | | 1,756 | |
| Hewlett Packard Enterprise Co. 5.90% 10/1/2024 | | | 5,000 | | | | 5,014 | |
| Imola Merger Corp. 4.75% 5/15/20294 | | | 2,500 | | | | 2,378 | |
| Lenovo Group, Ltd. 3.421% 11/2/2030 | | | 4,000 | | | | 3,535 | |
| Lenovo Group, Ltd. 6.536% 7/27/2032 | | | 3,000 | | | | 3,196 | |
| Microsoft Corp. 2.40% 8/8/2026 | | | 21,100 | | | | 20,116 | |
| Microsoft Corp. 3.30% 2/6/2027 | | | 18,325 | | | | 17,858 | |
| NCR Atleos Corp. 9.50% 4/1/20294 | | | 9,383 | | | | 9,978 | |
| NCR Voyix Corp. 5.25% 10/1/20304 | | | 7,250 | | | | 6,667 | |
| Open Text Corp. 3.875% 2/15/20284 | | | 6,500 | | | | 6,044 | |
| Oracle Corp. 5.80% 11/10/2025 | | | 3,000 | | | | 3,048 | |
| Oracle Corp. 3.60% 4/1/2050 | | | 59,660 | | | | 44,243 | |
| Oracle Corp. 3.95% 3/25/2051 | | | 1,126 | | | | 883 | |
| Oracle Corp. 5.55% 2/6/2053 | | | 12,108 | | | | 12,125 | |
| Salesforce, Inc. 1.95% 7/15/2031 | | | 22,350 | | | | 19,100 | |
| Salesforce, Inc. 2.70% 7/15/2041 | | | 1,504 | | | | 1,150 | |
| Salesforce, Inc. 2.90% 7/15/2051 | | | 7,853 | | | | 5,620 | |
| Salesforce, Inc. 3.05% 7/15/2061 | | | 4,060 | | | | 2,851 | |
| ServiceNow, Inc. 1.40% 9/1/2030 | | | 75,297 | | | | 61,940 | |
| SK hynix, Inc. 1.50% 1/19/20264 | | | 19,275 | | | | 17,758 | |
| SK hynix, Inc. 6.375% 1/17/2028 | | | 4,000 | | | | 4,131 | |
| SK hynix, Inc. 2.375% 1/19/20314 | | | 9,830 | | | | 7,979 | |
| SK hynix, Inc. 6.50% 1/17/2033 | | | 2,000 | | | | 2,113 | |
| TSMC Global, Ltd. 0.75% 9/28/2025 | | | 10,000 | | | | 9,296 | |
| TSMC Global, Ltd. 1.25% 4/23/2026 | | | 10,000 | | | | 9,237 | |
| TSMC Global, Ltd. 1.00% 9/28/2027 | | | 10,000 | | | | 8,784 | |
| TSMC Global, Ltd. 1.75% 4/23/2028 | | | 5,000 | | | | 4,463 | |
| 56 | The Bond Fund of America |
| Bonds, notes & other debt instruments (continued) | | Principal amount
(000) | | | Value
(000) | |
| Corporate bonds, notes & loans (continued) | | | | | | |
| Information technology (continued) | | | | | | | | |
| TSMC Global, Ltd. 2.25% 4/23/2031 | | USD | 11,000 | | | $ | 9,375 | |
| Unisys Corp. 6.875% 11/1/20274 | | | 1,700 | | | | 1,532 | |
| Xerox Holdings Corp. 5.50% 8/15/20284 | | | 6,000 | | | | 5,421 | |
| | | | | | | | 469,873 | |
| | | | | | | | | |
| Materials 0.57% | | | | | | | | |
| Air Products and Chemicals, Inc. 2.70% 5/15/2040 | | | 11,472 | | | | 8,753 | |
| Alpek, SAB de CV 3.25% 2/25/20314 | | | 5,000 | | | | 4,288 | |
| ArcelorMittal SA 7.00% 10/15/2039 | | | 3,250 | | | | 3,525 | |
| ArcelorMittal SA 6.75% 3/1/2041 | | | 2,780 | | | | 2,948 | |
| Ardagh Packaging Finance PLC 5.25% 4/30/20254 | | | 3,640 | | | | 3,543 | |
| Ardagh Packaging Finance PLC 4.125% 8/15/20264 | | | 2,500 | | | | 2,283 | |
| Berry Plastics Corp. 4.875% 7/15/20264 | | | 9,875 | | | | 9,710 | |
| BHP Billiton Finance (USA), Ltd. 4.875% 2/27/2026 | | | 8,600 | | | | 8,646 | |
| BHP Billiton Finance (USA), Ltd. 5.25% 9/8/2026 | | | 13,215 | | | | 13,517 | |
| BHP Billiton Finance (USA), Ltd. 4.75% 2/28/2028 | | | 8,600 | | | | 8,695 | |
| BHP Billiton Finance (USA), Ltd. 5.10% 9/8/2028 | | | 5,810 | | | | 5,968 | |
| BHP Billiton Finance (USA), Ltd. 5.25% 9/8/2030 | | | 4,385 | | | | 4,545 | |
| BHP Billiton Finance (USA), Ltd. 4.90% 2/28/2033 | | | 2,016 | | | | 2,063 | |
| BHP Billiton Finance (USA), Ltd. 5.25% 9/8/2033 | | | 4,229 | | | | 4,388 | |
| BHP Billiton Finance (USA), Ltd. 5.50% 9/8/2053 | | | 7,286 | | | | 7,957 | |
| Braskem Netherlands Finance BV 4.50% 1/10/2028 | | | 1,777 | | | | 1,456 | |
| Braskem Netherlands Finance BV 4.50% 1/31/2030 | | | 5,180 | | | | 4,027 | |
| Braskem Netherlands Finance BV 4.50% 1/31/20304 | | | 4,600 | | | | 3,576 | |
| Braskem Netherlands Finance BV 8.50% 1/12/20314 | | | 1,235 | | | | 1,150 | |
| Braskem Netherlands Finance BV 8.50% 1/12/2031 | | | 1,043 | | | | 971 | |
| Braskem Netherlands Finance BV 7.25% 2/13/20334 | | | 4,765 | | | | 4,018 | |
| Braskem Netherlands Finance BV 5.875% 1/31/20504 | | | 4,000 | | | | 2,776 | |
| Celanese US Holdings, LLC 6.165% 7/15/2027 | | | 19,250 | | | | 19,749 | |
| Celanese US Holdings, LLC 6.35% 11/15/2028 | | | 3,501 | | | | 3,675 | |
| Celanese US Holdings, LLC 6.33% 7/15/2029 | | | 2,583 | | | | 2,710 | |
| Celanese US Holdings, LLC 6.55% 11/15/2030 | | | 3,301 | | | | 3,494 | |
| Celanese US Holdings, LLC 6.379% 7/15/2032 | | | 5,762 | | | | 6,096 | |
| Celanese US Holdings, LLC 6.70% 11/15/2033 | | | 7,324 | | | | 7,948 | |
| Cleveland-Cliffs, Inc. 6.75% 3/15/20264 | | | 12,450 | | | | 12,512 | |
| Cleveland-Cliffs, Inc. 4.625% 3/1/20294 | | | 4,175 | | | | 3,878 | |
| Cleveland-Cliffs, Inc. 4.875% 3/1/20314 | | | 2,825 | | | | 2,558 | |
| CROWN Americas, LLC 4.25% 9/30/2026 | | | 4,000 | | | | 3,884 | |
| Dow Chemical Co. (The) 4.55% 11/30/2025 | | | 33 | | | | 32 | |
| Dow Chemical Co. (The) 4.80% 11/30/2028 | | | 4,000 | | | | 4,051 | |
| Dow Chemical Co. (The) 5.55% 11/30/2048 | | | 6,500 | | | | 6,661 | |
| Dow Chemical Co. (The) 4.80% 5/15/2049 | | | 10,493 | | | | 9,636 | |
| Dow Chemical Co. (The) 3.60% 11/15/2050 | | | 2,190 | | | | 1,695 | |
| EIDP, Inc. 4.50% 5/15/2026 | | | 10,834 | | | | 10,798 | |
| EIDP, Inc. 4.80% 5/15/2033 | | | 25,693 | | | | 25,982 | |
| Freeport-McMoRan, Inc. 5.40% 11/14/2034 | | | 1,450 | | | | 1,462 | |
| Freeport-McMoRan, Inc. 5.45% 3/15/2043 | | | 2,566 | | | | 2,501 | |
| Fresnillo PLC 4.25% 10/2/20504 | | | 9,516 | | | | 7,281 | |
| GC Treasury Center Co., Ltd. 2.98% 3/18/2031 | | | 6,000 | | | | 5,078 | |
| GC Treasury Center Co., Ltd. 4.40% 3/30/2032 | | | 8,000 | | | | 7,312 | |
| GC Treasury Center Co., Ltd. 4.30% 3/18/2051 | | | 4,268 | | | | 3,244 | |
| GC Treasury Center Co., Ltd. 5.20% 3/30/2052 | | | 7,732 | | | | 6,689 | |
| Graphic Packaging International, LLC 3.50% 3/15/20284 | | | 8,000 | | | | 7,432 | |
| International Flavors & Fragrances, Inc. 1.23% 10/1/20254 | | | 5,000 | | | | 4,631 | |
| International Flavors & Fragrances, Inc. 1.832% 10/15/20274 | | | 5,356 | | | | 4,699 | |
| International Flavors & Fragrances, Inc. 2.30% 11/1/20304 | | | 5,238 | | | | 4,335 | |
| International Flavors & Fragrances, Inc. 3.268% 11/15/20404 | | | 9,022 | | | | 6,472 | |
| International Flavors & Fragrances, Inc. 3.468% 12/1/20504 | | | 7,967 | | | | 5,454 | |
| Linde, Inc. 4.70% 12/5/2025 | | | 5,000 | | | | 5,007 | |
| Linde, Inc. 1.10% 8/10/2030 | | | 5,648 | | | | 4,679 | |
| Linde, Inc. 2.00% 8/10/2050 | | | 5,829 | | | | 3,456 | |
| Methanex Corp. 5.125% 10/15/2027 | | | 13,150 | | | | 12,860 | |
| Methanex Corp. 5.25% 12/15/2029 | | | 1,125 | | | | 1,084 | |
| Methanex Corp. 5.65% 12/1/2044 | | | 1,000 | | | | 874 | |
| Mineral Resources, Ltd. 8.00% 11/1/20274 | | | 5,475 | | | | 5,621 | |
| Mineral Resources, Ltd. 9.25% 10/1/20284 | | | 7,085 | | | | 7,546 | |
| NOVA Chemicals Corp. 4.875% 6/1/20244 | | | 2,000 | | | | 1,984 | |
| | |
| The Bond Fund of America | 57 |
| Bonds, notes & other debt instruments (continued) | | Principal amount
(000) | | | Value
(000) | |
| Corporate bonds, notes & loans (continued) | | | | | | | | |
| Materials (continued) | | | | | | | | |
| NOVA Chemicals Corp. 5.25% 6/1/20274 | | USD | 7,500 | | | $ | 7,041 | |
| NOVA Chemicals Corp. 8.50% 11/15/20284 | | | 1,490 | | | | 1,564 | |
| NOVA Chemicals Corp. 4.25% 5/15/20294 | | | 5,535 | | | | 4,667 | |
| Nutrien, Ltd. 5.90% 11/7/2024 | | | 577 | | | | 579 | |
| Nutrien, Ltd. 4.90% 3/27/2028 | | | 3,800 | | | | 3,838 | |
| Nutrien, Ltd. 4.20% 4/1/2029 | | | 500 | | | | 490 | |
| Nutrien, Ltd. 5.00% 4/1/2049 | | | 3,850 | | | | 3,652 | |
| Nutrien, Ltd. 5.80% 3/27/2053 | | | 1,029 | | | | 1,102 | |
| OCI NV 6.70% 3/16/20334 | | | 10,849 | | | | 11,090 | |
| Olin Corp. 5.625% 8/1/2029 | | | 2,500 | | | | 2,463 | |
| Orbia Advance Corp, SAB de CV 2.875% 5/11/2031 | | | 7,000 | | | | 5,799 | |
| POSCO 2.75% 7/15/2024 | | | 4,000 | | | | 3,945 | |
| POSCO 5.75% 1/17/20284 | | | 5,195 | | | | 5,333 | |
| POSCO 5.875% 1/17/20334 | | | 630 | | | | 661 | |
| PT Freeport Indonesia 4.763% 4/14/2027 | | | 5,000 | | | | 4,937 | |
| PT Freeport Indonesia 5.315% 4/14/2032 | | | 7,000 | | | | 6,882 | |
| Sherwin-Williams Co. 3.125% 6/1/2024 | | | 7,250 | | | | 7,175 | |
| Sherwin-Williams Co. 3.45% 6/1/2027 | | | 2,862 | | | | 2,765 | |
| Sherwin-Williams Co. 2.95% 8/15/2029 | | | 5,150 | | | | 4,743 | |
| Sherwin-Williams Co. 2.20% 3/15/2032 | | | 1,383 | | | | 1,151 | |
| Sherwin-Williams Co. 3.80% 8/15/2049 | | | 1,750 | | | | 1,406 | |
| Sherwin-Williams Co. 3.30% 5/15/2050 | | | 2,083 | | | | 1,531 | |
| Sherwin-Williams Co. 2.90% 3/15/2052 | | | 2,500 | | | | 1,726 | |
| Silgan Holdings, Inc. 4.125% 2/1/2028 | | | 2,500 | | | | 2,390 | |
| South32 Treasury, Ltd. 4.35% 4/14/20324 | | | 6,919 | | | | 6,242 | |
| Summit Materials, LLC 5.25% 1/15/20294 | | | 4,160 | | | | 4,029 | |
| Suzano Austria GmbH 3.75% 1/15/2031 | | | 6,660 | | | | 5,847 | |
| Tronox, Inc. 4.625% 3/15/20294 | | | 6,000 | | | | 5,319 | |
| Westlake Corp. 5.00% 8/15/2046 | | | 5,265 | | | | 4,804 | |
| Westlake Corp. 4.375% 11/15/2047 | | | 1,110 | | | | 927 | |
| | | | | | | | 457,961 | |
| | | | | | | | | |
| Municipals 0.05% | | | | | | | | |
| Aeropuerto Internacional de Tocumen, SA 4.00% 8/11/20414 | | | 4,100 | | | | 3,088 | |
| Aeropuerto Internacional de Tocumen, SA 5.125% 8/11/20614 | | | 3,180 | | | | 2,425 | |
| ENA Master Trust 4.00% 5/19/20484 | | | 5,000 | | | | 3,514 | |
| Enel Finance America, LLC 7.10% 10/14/20274 | | | 30,000 | | | | 32,034 | |
| HPHT Finance 19, Ltd. 2.875% 11/5/2024 | | | 2,000 | | | | 1,959 | |
| Rutas 2 & 7 Finance, Ltd. 0% 9/30/20364 | | | 1,556 | | | | 1,036 | |
| | | | | | | | 44,056 | |
| | | | | | | | | |
| Total corporate bonds, notes & loans | | | | | | | 23,881,844 | |
| | | | | | | | | |
| U.S. Treasury bonds & notes 19.85% | | | | | | | | |
| U.S. Treasury 19.05% | | | | | | | | |
| U.S. Treasury 0.875% 1/31/2024 | | | 19,719 | | | | 19,650 | |
| U.S. Treasury 1.50% 2/29/2024 | | | 17,578 | | | | 17,472 | |
| U.S. Treasury 2.375% 2/29/2024 | | | 17,639 | | | | 17,558 | |
| U.S. Treasury 0.25% 3/15/2024 | | | 200 | | | | 198 | |
| U.S. Treasury 2.125% 3/31/2024 | | | 105,265 | | | | 104,463 | |
| U.S. Treasury 2.25% 3/31/2024 | | | 175,000 | | | | 173,735 | |
| U.S. Treasury 0.375% 4/15/2024 | | | 995 | | | | 982 | |
| U.S. Treasury 2.25% 4/30/2024 | | | 50,633 | | | | 50,143 | |
| U.S. Treasury 0.25% 5/15/2024 | | | 58,889 | | | | 57,840 | |
| U.S. Treasury 2.00% 5/31/202412 | | | 277,283 | | | | 273,633 | |
| U.S. Treasury 0.25% 6/15/2024 | | | 8,800 | | | | 8,607 | |
| U.S. Treasury 2.00% 6/30/2024 | | | 88,000 | | | | 86,639 | |
| U.S. Treasury 0.375% 8/15/2024 | | | 1,486 | | | | 1,444 | |
| U.S. Treasury 3.25% 8/31/2024 | | | 42,830 | | | | 42,330 | |
| U.S. Treasury 0.375% 9/15/2024 | | | 2,346 | | | | 2,272 | |
| U.S. Treasury 2.125% 9/30/2024 | | | 8,000 | | | | 7,837 | |
| U.S. Treasury 4.25% 9/30/2024 | | | 95,493 | | | | 95,031 | |
| U.S. Treasury 0.625% 10/15/2024 | | | 959 | | | | 928 | |
| U.S. Treasury 1.50% 11/30/2024 | | | 1,000 | | | | 970 | |
| U.S. Treasury 2.125% 11/30/2024 | | | 33,000 | | | | 32,205 | |
| U.S. Treasury 1.00% 12/15/2024 | | | 813 | | | | 784 | |
| U.S. Treasury 2.25% 12/31/2024 | | | 3,000 | | | | 2,927 | |
| U.S. Treasury 4.25% 12/31/2024 | | | 8,810 | | | | 8,765 | |
| | |
| 58 | The Bond Fund of America |
| Bonds, notes & other debt instruments (continued) | | Principal amount
(000) | | | Value
(000) | |
| U.S. Treasury bonds & notes (continued) | | | | | | | | |
| U.S. Treasury (continued) | | | | | | | | |
| U.S. Treasury 1.125% 2/28/2025 | | USD | 125,000 | | | $ | 120,085 | |
| U.S. Treasury 2.75% 2/28/202512 | | | 356,926 | | | | 349,355 | |
| U.S. Treasury 4.625% 2/28/2025 | | | 1,499,326 | | | | 1,498,623 | |
| U.S. Treasury 1.75% 3/15/2025 | | | 21,000 | | | | 20,298 | |
| U.S. Treasury 2.625% 3/31/2025 | | | 100,126 | | | | 97,791 | |
| U.S. Treasury 3.875% 3/31/2025 | | | 240,275 | | | | 238,209 | |
| U.S. Treasury 3.875% 4/30/2025 | | | 307,899 | | | | 305,181 | |
| U.S. Treasury 0.25% 5/31/2025 | | | 1,000 | | | | 942 | |
| U.S. Treasury 4.25% 5/31/2025 | | | 199,607 | | | | 198,913 | |
| U.S. Treasury 4.625% 6/30/2025 | | | 102,878 | | | | 103,127 | |
| U.S. Treasury 3.00% 7/15/2025 | | | 57,470 | | | | 56,237 | |
| U.S. Treasury 4.75% 7/31/2025 | | | 5,439 | | | | 5,465 | |
| U.S. Treasury 3.125% 8/15/2025 | | | 92,500 | | | | 90,673 | |
| U.S. Treasury 5.00% 8/31/2025 | | | 173,828 | | | | 175,462 | |
| U.S. Treasury 3.00% 9/30/2025 | | | 380 | | | | 371 | |
| U.S. Treasury 5.00% 9/30/2025 | | | 250,000 | | | | 252,586 | |
| U.S. Treasury 3.00% 10/31/2025 | | | 26,469 | | | | 25,864 | |
| U.S. Treasury 5.00% 10/31/2025 | | | 105,872 | | | | 107,095 | |
| U.S. Treasury 2.25% 11/15/2025 | | | 50,000 | | | | 48,174 | |
| U.S. Treasury 4.50% 11/15/2025 | | | 76,376 | | | | 76,659 | |
| U.S. Treasury 0.375% 11/30/2025 | | | 522,200 | | | | 485,061 | |
| U.S. Treasury 4.00% 12/15/2025 | | | 160,001 | | | | 159,191 | |
| U.S. Treasury 0.375% 12/31/2025 | | | 50,000 | | | | 46,354 | |
| U.S. Treasury 2.625% 12/31/2025 | | | 822 | | | | 797 | |
| U.S. Treasury 3.875% 1/15/2026 | | | 10,870 | | | | 10,790 | |
| U.S. Treasury 0.375% 1/31/2026 | | | 133,331 | | | | 123,199 | |
| U.S. Treasury 4.00% 2/15/2026 | | | 46,978 | | | | 46,778 | |
| U.S. Treasury 0.50% 2/28/2026 | | | 150 | | | | 139 | |
| U.S. Treasury 4.625% 3/15/2026 | | | 1,770 | | | | 1,786 | |
| U.S. Treasury 3.75% 4/15/2026 | | | 355 | | | | 352 | |
| U.S. Treasury 3.625% 5/15/2026 | | | 19,304 | | | | 19,086 | |
| U.S. Treasury 0.75% 5/31/2026 | | | 1,245 | | | | 1,150 | |
| U.S. Treasury 4.50% 7/15/2026 | | | 157,826 | | | | 159,336 | |
| U.S. Treasury 4.375% 8/15/2026 | | | 118,839 | | | | 119,679 | |
| U.S. Treasury 0.75% 8/31/2026 | | | 38,676 | | | | 35,478 | |
| U.S. Treasury 4.625% 9/15/2026 | | | 154,603 | | | | 156,766 | |
| U.S. Treasury 0.875% 9/30/2026 | | | 4,857 | | | | 4,463 | |
| U.S. Treasury 1.125% 10/31/2026 | | | 5,265 | | | | 4,860 | |
| U.S. Treasury 2.00% 11/15/2026 | | | 15,600 | | | | 14,755 | |
| U.S. Treasury 4.625% 11/15/2026 | | | 73,676 | | | | 74,856 | |
| U.S. Treasury 1.25% 11/30/2026 | | | 75,500 | | | | 69,829 | |
| U.S. Treasury 1.625% 11/30/2026 | | | — | 2 | | | — | 2 |
| U.S. Treasury 4.375% 12/15/2026 | | | 118,065 | | | | 119,250 | |
| U.S. Treasury 2.25% 2/15/2027 | | | 3,000 | | | | 2,849 | |
| U.S. Treasury 1.875% 2/28/2027 | | | 183,051 | | | | 171,689 | |
| U.S. Treasury 0.50% 4/30/2027 | | | 40,000 | | | | 35,725 | |
| U.S. Treasury 2.375% 5/15/2027 | | | 14,700 | | | | 13,968 | |
| U.S. Treasury 0.50% 5/31/2027 | | | 16,000 | | | | 14,250 | |
| U.S. Treasury 2.625% 5/31/2027 | | | 328,902 | | | | 314,937 | |
| U.S. Treasury 0.50% 6/30/2027 | | | 6,000 | | | | 5,331 | |
| U.S. Treasury 0.375% 7/31/2027 | | | 18,600 | | | | 16,409 | |
| U.S. Treasury 0.50% 8/31/2027 | | | 28,274 | | | | 24,990 | |
| U.S. Treasury 4.125% 10/31/2027 | | | 22,500 | | | | 22,649 | |
| U.S. Treasury 3.875% 11/30/2027 | | | 70,000 | | | | 69,866 | |
| U.S. Treasury 3.875% 12/31/2027 | | | 112,100 | | | | 111,951 | |
| U.S. Treasury 3.50% 1/31/2028 | | | 11,709 | | | | 11,528 | |
| U.S. Treasury 2.75% 2/15/2028 | | | 17,398 | | | | 16,634 | |
| U.S. Treasury 1.125% 2/29/2028 | | | 23,306 | | | | 20,844 | |
| U.S. Treasury 4.00% 2/29/2028 | | | 122,298 | | | | 122,738 | |
| U.S. Treasury 1.25% 3/31/2028 | | | 50,580 | | | | 45,380 | |
| U.S. Treasury 3.625% 3/31/2028 | | | 4,054 | | | | 4,010 | |
| U.S. Treasury 2.875% 5/15/2028 | | | 16,027 | | | | 15,375 | |
| U.S. Treasury 1.25% 5/31/2028 | | | 11,954 | | | | 10,684 | |
| U.S. Treasury 3.625% 5/31/2028 | | | 77,735 | | | | 76,937 | |
| U.S. Treasury 1.25% 6/30/2028 | | | 42,000 | | | | 37,469 | |
| U.S. Treasury 4.125% 7/31/2028 | | | 285,000 | | | | 287,984 | |
| U.S. Treasury 2.875% 8/15/2028 | | | 3,760 | | | | 3,599 | |
| | |
| The Bond Fund of America | 59 |
| Bonds, notes & other debt instruments (continued) | | Principal amount
(000) | | | Value
(000) | |
| U.S. Treasury bonds & notes (continued) | | | | | | | | |
| U.S. Treasury (continued) | | | | | | | | |
| U.S. Treasury 1.125% 8/31/2028 | | USD | 104,431 | | | $ | 92,230 | |
| U.S. Treasury 1.25% 9/30/2028 | | | 14,100 | | | | 12,499 | |
| U.S. Treasury 4.625% 9/30/2028 | | | 180,657 | | | | 186,528 | |
| U.S. Treasury 4.875% 10/31/2028 | | | 4,930 | | | | 5,147 | |
| U.S. Treasury 5.25% 11/15/2028 | | | 42,000 | | | | 44,536 | |
| U.S. Treasury 1.50% 11/30/2028 | | | 36,458 | | | | 32,603 | |
| U.S. Treasury 4.375% 11/30/2028 | | | 324,249 | | | | 331,886 | |
| U.S. Treasury 3.75% 12/31/2028 | | | 6,982 | | | | 6,950 | |
| U.S. Treasury 1.75% 1/31/2029 | | | 51,932 | | | | 46,873 | |
| U.S. Treasury 2.875% 4/30/202912 | | | 283,760 | | | | 270,104 | |
| U.S. Treasury 2.375% 5/15/2029 | | | 5,000 | | | | 4,638 | |
| U.S. Treasury 1.625% 8/15/2029 | | | 398 | | | | 354 | |
| U.S. Treasury 3.875% 9/30/2029 | | | 65,000 | | | | 64,902 | |
| U.S. Treasury 3.875% 12/31/2029 | | | 169,618 | | | | 169,412 | |
| U.S. Treasury 3.50% 1/31/2030 | | | 59,120 | | | | 57,859 | |
| U.S. Treasury 1.50% 2/15/2030 | | | 40,500 | | | | 35,306 | |
| U.S. Treasury 3.75% 5/31/2030 | | | 180,000 | | | | 178,478 | |
| U.S. Treasury 4.00% 7/31/2030 | | | 15,360 | | | | 15,452 | |
| U.S. Treasury 4.125% 8/31/2030 | | | 80,500 | | | | 81,550 | |
| U.S. Treasury 4.625% 9/30/203012 | | | 1,198,320 | | | | 1,249,721 | |
| U.S. Treasury 4.875% 10/31/2030 | | | 467,853 | | | | 495,156 | |
| U.S. Treasury 4.375% 11/30/2030 | | | 2,830 | | | | 2,911 | |
| U.S. Treasury 3.75% 12/31/2030 | | | 5,262 | | | | 5,226 | |
| U.S. Treasury 1.625% 5/15/2031 | | | 47,450 | | | | 40,719 | |
| U.S. Treasury 1.25% 8/15/2031 | | | 20,109 | | | | 16,654 | |
| U.S. Treasury 1.375% 11/15/2031 | | | 1,027 | | | | 853 | |
| U.S. Treasury 1.875% 2/15/2032 | | | 25,000 | | | | 21,506 | |
| U.S. Treasury 2.875% 5/15/2032 | | | 529 | | | | 490 | |
| U.S. Treasury 2.75% 8/15/2032 | | | 27,904 | | | | 25,571 | |
| U.S. Treasury 4.125% 11/15/2032 | | | 8,914 | | | | 9,066 | |
| U.S. Treasury 3.50% 2/15/2033 | | | 2,117 | | | | 2,054 | |
| U.S. Treasury 3.375% 5/15/2033 | | | 129,000 | | | | 123,890 | |
| U.S. Treasury 4.50% 11/15/2033 | | | 153,417 | | | | 161,148 | |
| U.S. Treasury 4.25% 5/15/2039 | | | 32,154 | | | | 33,172 | |
| U.S. Treasury 4.50% 8/15/203912 | | | 138,505 | | | | 146,729 | |
| U.S. Treasury 4.625% 2/15/2040 | | | 14,600 | | | | 15,653 | |
| U.S. Treasury 1.125% 5/15/2040 | | | 38,625 | | | | 24,961 | |
| U.S. Treasury 1.125% 8/15/2040 | | | 35,000 | | | | 22,396 | |
| U.S. Treasury 1.375% 11/15/2040 | | | 30,124 | | | | 20,043 | |
| U.S. Treasury 1.875% 2/15/2041 | | | 330,839 | | | | 238,359 | |
| U.S. Treasury 1.75% 8/15/2041 | | | 50,819 | | | | 35,426 | |
| U.S. Treasury 2.00% 11/15/2041 | | | 17,595 | | | | 12,762 | |
| U.S. Treasury 3.125% 11/15/2041 | | | 300 | | | | 261 | |
| U.S. Treasury 2.375% 2/15/204212 | | | 257,616 | | | | 198,123 | |
| U.S. Treasury 3.00% 5/15/2042 | | | 8 | | | | 7 | |
| U.S. Treasury 3.25% 5/15/2042 | | | 51,187 | | | | 45,001 | |
| U.S. Treasury 2.75% 8/15/2042 | | | 7,000 | | | | 5,689 | |
| U.S. Treasury 4.00% 11/15/2042 | | | 10,583 | | | | 10,308 | |
| U.S. Treasury 3.875% 2/15/2043 | | | 19,000 | | | | 18,158 | |
| U.S. Treasury 2.875% 5/15/2043 | | | 46,035 | | | | 37,885 | |
| U.S. Treasury 3.875% 5/15/2043 | | | 16,620 | | | | 15,882 | |
| U.S. Treasury 3.625% 8/15/204312 | | | 90,000 | | | | 82,939 | |
| U.S. Treasury 4.375% 8/15/2043 | | | 2,690 | | | | 2,751 | |
| U.S. Treasury 4.75% 11/15/2043 | | | 81,929 | | | | 88,042 | |
| U.S. Treasury 3.375% 5/15/2044 | | | 38,700 | | | | 34,191 | |
| U.S. Treasury 2.50% 2/15/2045 | | | 51,000 | | | | 38,692 | |
| U.S. Treasury 3.00% 5/15/2045 | | | 1,460 | | | | 1,207 | |
| U.S. Treasury 3.00% 11/15/2045 | | | 250 | | | | 206 | |
| U.S. Treasury 2.50% 2/15/2046 | | | 1,167 | | | | 877 | |
| U.S. Treasury 2.25% 8/15/2046 | | | 4,500 | | | | 3,207 | |
| U.S. Treasury 2.875% 11/15/2046 | | | 4 | | | | 3 | |
| U.S. Treasury 3.00% 2/15/2047 | | | 39,950 | | | | 32,731 | |
| U.S. Treasury 3.00% 5/15/2047 | | | 26,000 | | | | 21,292 | |
| U.S. Treasury 2.75% 8/15/2047 | | | 500 | | | | 390 | |
| U.S. Treasury 2.75% 11/15/2047 | | | 5,300 | | | | 4,136 | |
| U.S. Treasury 3.00% 2/15/204812 | | | 123,621 | | | | 100,969 | |
| U.S. Treasury 3.125% 5/15/2048 | | | 16,150 | | | | 13,487 | |
| | |
| 60 | The Bond Fund of America |
| Bonds, notes & other debt instruments (continued) | | Principal amount
(000) | | | Value
(000) | |
| U.S. Treasury bonds & notes (continued) | | | | | | | | |
| U.S. Treasury (continued) | | | | | | | | |
| U.S. Treasury 3.375% 11/15/2048 | | USD | 4,545 | | | $ | 3,970 | |
| U.S. Treasury 3.00% 2/15/2049 | | | 81,941 | | | | 66,865 | |
| U.S. Treasury 2.875% 5/15/2049 | | | 74,849 | | | | 59,651 | |
| U.S. Treasury 2.25% 8/15/2049 | | | 80,123 | | | | 56,098 | |
| U.S. Treasury 2.375% 11/15/2049 | | | 5,108 | | | | 3,675 | |
| U.S. Treasury 2.00% 2/15/2050 | | | 51,200 | | | | 33,782 | |
| U.S. Treasury 1.25% 5/15/205012 | | | 209,788 | | | | 113,466 | |
| U.S. Treasury 1.375% 8/15/205012 | | | 440,830 | | | | 246,382 | |
| U.S. Treasury 1.625% 11/15/2050 | | | 80,405 | | | | 48,047 | |
| U.S. Treasury 1.875% 2/15/2051 | | | 46,906 | | | | 29,844 | |
| U.S. Treasury 2.375% 5/15/2051 | | | 33,648 | | | | 24,087 | |
| U.S. Treasury 2.00% 8/15/2051 | | | 157,105 | | | | 102,895 | |
| U.S. Treasury 1.875% 11/15/2051 | | | 38,320 | | | | 24,299 | |
| U.S. Treasury 2.25% 2/15/2052 | | | 203,900 | | | | 141,724 | |
| U.S. Treasury 2.875% 5/15/205212 | | | 234,000 | | | | 186,778 | |
| U.S. Treasury 4.00% 11/15/2052 | | | 79,562 | | | | 78,698 | |
| U.S. Treasury 3.625% 2/15/2053 | | | 8,000 | | | | 7,407 | |
| U.S. Treasury 3.625% 5/15/2053 | | | 23,250 | | | | 21,555 | |
| U.S. Treasury 4.125% 8/15/2053 | | | 920,001 | | | | 932,462 | |
| U.S. Treasury 4.75% 11/15/2053 | | | 175,910 | | | | 197,816 | |
| | | | | | | | 15,366,982 | |
| | | | | | | | | |
| U.S. Treasury inflation-protected securities 0.80% | | | | | | | | |
| U.S. Treasury Inflation-Protected Security 0.625% 1/15/202413 | | | 145,283 | | | | 144,898 | |
| U.S. Treasury Inflation-Protected Security 0.50% 4/15/202413 | | | 55,083 | | | | 54,410 | |
| U.S. Treasury Inflation-Protected Security 0.125% 7/15/202413 | | | 264,422 | | | | 259,998 | |
| U.S. Treasury Inflation-Protected Security 0.125% 10/15/202413 | | | — | 2 | | | — | 2 |
| U.S. Treasury Inflation-Protected Security 0.375% 7/15/202513 | | | 9,269 | | | | 8,983 | |
| U.S. Treasury Inflation-Protected Security 0.125% 10/15/202513 | | | 8,157 | | | | 7,845 | |
| U.S. Treasury Inflation-Protected Security 0.625% 1/15/202613 | | | — | 2 | | | — | 2 |
| U.S. Treasury Inflation-Protected Security 0.125% 4/15/202613 | | | 106,828 | | | | 101,700 | |
| U.S. Treasury Inflation-Protected Security 0.125% 10/15/202613 | | | — | 2 | | | — | 2 |
| U.S. Treasury Inflation-Protected Security 0.125% 1/15/203013 | | | 47,373 | | | | 42,984 | |
| U.S. Treasury Inflation-Protected Security 0.125% 2/15/205113 | | | 118 | | | | 74 | |
| U.S. Treasury Inflation-Protected Security 1.50% 2/15/205313 | | | 23,108 | | | | 21,041 | |
| | | | | | | | 641,933 | |
| | | | | | | | | |
| Total U.S. Treasury bonds & notes | | | | | | | 16,008,915 | |
| | | | | | | | | |
| Asset-backed obligations 5.07% | | | | | | | | |
| ABPCI Direct Lending Fund CLO, Ltd., Series 2020-9, Class A1R, (3-month USD CME Term SOFR + 1.662%) 7.049% 11/18/20311,3,4 | | | 4,000 | | | | 3,998 | |
| ACHV ABS Trust, Series 2023-2PL, Class A, 6.42% 5/20/20301,4 | | | 65 | | | | 65 | |
| ACHV ABS Trust, Series 2023-2PL, Class B, 6.88% 5/20/20301,4 | | | 1,327 | | | | 1,329 | |
| ACHV ABS Trust, Series 2023-3PL, Class A, 6.60% 8/19/20301,4 | | | 469 | | | | 469 | |
| ACHV ABS Trust, Series 2023-3PL, Class B, 7.17% 8/19/20301,4 | | | 1,787 | | | | 1,788 | |
| ACHV ABS Trust, Series 2023-4CP, Class A, 6.81% 11/25/20301,4 | | | 3,876 | | | | 3,881 | |
| Affirm Asset Securitization Trust, Series 2021-Z2, Class A, 1.17% 11/16/20261,4 | | | 2,707 | | | | 2,636 | |
| Affirm Asset Securitization Trust, Series 2023-A, Class A, 6.61% 1/18/20281,4 | | | 2,679 | | | | 2,695 | |
| Affirm, Inc., Series 2023-X1, Class A, 7.11% 11/15/20281,4 | | | 2,665 | | | | 2,673 | |
| AGL CLO, Ltd., Series 2022-18A, Class A1, (3-month USD CME Term SOFR + 1.32%) 6.732% 4/21/20311,3,4 | | | 60,171 | | | | 60,159 | |
| AGL CLO, Ltd., Series 2022-18A, Class B, (3-month USD CME Term SOFR + 2.00%) 7.412% 4/21/20311,3,4 | | | 5,000 | | | | 5,010 | |
| AGL CLO, Ltd., Series 2021-13, Class D, (3-month USD CME Term SOFR + 3.412%) 8.827% 10/20/20341,3,4 | | | 350 | | | | 340 | |
| AGL CLO, Ltd., Series 2023-24, Class A1, (3-month USD CME Term SOFR + 2.00%) 7.378% 7/25/20361,3,4 | | | 22,438 | | | | 22,593 | |
| Allegro CLO, Ltd., Series 2021-2, Class A1, (3-month USD CME Term SOFR + 1.422%) 6.815% 10/15/20341,3,4 | | | 2,550 | | | | 2,541 | |
| American Credit Acceptance Receivables Trust, Series 2020-1, Class D, 2.39% 3/13/20261,4 | | | 80 | | | | 80 | |
| American Credit Acceptance Receivables Trust, Series 2022-4, Class A, 6.20% 5/13/20261,4 | | | 79 | | | | 79 | |
| American Credit Acceptance Receivables Trust, Series 2022-3, Class B, 4.55% 10/13/20261,4 | | | 1,388 | | | | 1,386 | |
| | |
| The Bond Fund of America | 61 |
| Bonds, notes & other debt instruments (continued) | | Principal amount
(000) | | | Value
(000) | |
| Asset-backed obligations (continued) | | | | | | | | |
| American Credit Acceptance Receivables Trust, Series 2023-2, Class A, 5.89% 10/13/20261,4 | | USD | 4,893 | | | $ | 4,893 | |
| American Credit Acceptance Receivables Trust, Series 2023-3, Class A, 6.00% 3/12/20271,4 | | | 1,792 | | | | 1,794 | |
| American Credit Acceptance Receivables Trust, Series 2021-1, Class C, 0.83% 3/15/20271,4 | | | 109 | | | | 109 | |
| American Credit Acceptance Receivables Trust, Series 2021-1, Class D, 1.14% 3/15/20271,4 | | | 2,226 | | | | 2,187 | |
| American Credit Acceptance Receivables Trust, Series 2021-3, Class C, 0.98% 11/15/20271,4 | | | 2,692 | | | | 2,676 | |
| American Credit Acceptance Receivables Trust, Series 2021-3, Class D, 1.34% 11/15/20271,4 | | | 4,780 | | | | 4,624 | |
| American Express Credit Account Master Trust, Series 2023-2, Class A, 4.80% 5/15/20301 | | | 23,956 | | | | 24,265 | |
| American Express Credit Account Master Trust, Series 2023-4, Class A, 5.15% 9/16/20301 | | | 16,546 | | | | 17,031 | |
| American Homes 4 Rent, Series 2014-SFR2, Class A, 3.786% 10/17/20361,4 | | | 12,930 | | | | 12,722 | |
| American Homes 4 Rent, Series 2015-SFR2, Class A, 3.732% 10/17/20521,4 | | | 31,045 | | | | 30,114 | |
| American Homes 4 Rent, Series 2015-SFR2, Class B, 4.295% 10/17/20521,4 | | | 8,478 | | | | 8,285 | |
| AmeriCredit Automobile Receivables Trust, Series 2023-1, Class A2A, 5.84% 10/19/20261 | | | 7,552 | | | | 7,553 | |
| AmeriCredit Automobile Receivables Trust, Series 2021-2, Class D, 1.29% 6/18/20271 | | | 15,943 | | | | 14,733 | |
| AmeriCredit Automobile Receivables Trust, Series 2023-2, Class A3, 5.81% 5/18/20281 | | | 9,883 | | | | 10,007 | |
| Apex Credit CLO, LLC, Series 2022-1, Class C, (3-month USD CME Term SOFR + 2.71%) 8.122% 4/22/20331,3,4 | | | 900 | | | | 892 | |
| Apidos CLO, Ltd., Series 2022-42, Class D, (3-month USD CME Term SOFR + 5.76%) 11.176% 1/20/20361,3,4 | | | 750 | | | | 753 | |
| Apidos CLO, Ltd., Series 2023-45, Class D, (3-month USD CME Term SOFR + 5.20%) 10.58% 4/26/20361,3,4 | | | 1,700 | | | | 1,708 | |
| Ares CLO, Ltd., Series 2022-65A, Class A2, (3-month USD CME Term SOFR + 1.75%) 7.128% 7/25/20341,3,4 | | | 18,000 | | | | 17,930 | |
| Atlas Static Senior Loan Fund, Ltd., Series 2022-1, Class DR, (3-month USD CME Term SOFR + 5.00%) 10.372% 7/15/20301,3,4 | | | 2,000 | | | | 2,010 | |
| Avis Budget Rental Car Funding (AESOP), LLC, Series 2018-2A, Class A, 4.00% 3/20/20251,4 | | | 12,500 | | | | 12,470 | |
| Avis Budget Rental Car Funding (AESOP), LLC, Series 2019-2A, Class D, 3.04% 9/22/20251,4 | | | 9,000 | | | | 8,722 | |
| Avis Budget Rental Car Funding (AESOP), LLC, Series 2019-2A, Class A, 3.35% 9/22/20251,4 | | | 10,160 | | | | 10,039 | |
| Avis Budget Rental Car Funding (AESOP), LLC, Series 2019-3A, Class A, 2.36% 3/20/20261,4 | | | 6,460 | | | | 6,263 | |
| Avis Budget Rental Car Funding (AESOP), LLC, Series 2020-1A, Class A, 2.33% 8/20/20261,4 | | | 25,693 | | | | 24,579 | |
| Avis Budget Rental Car Funding (AESOP), LLC, Series 2020-2, Class A, 2.02% 2/20/20271,4 | | | 20,845 | | | | 19,466 | |
| Avis Budget Rental Car Funding (AESOP), LLC, Series 2020-2A, Class B, 2.96% 2/20/20271,4 | | | 1,798 | | | | 1,703 | |
| Avis Budget Rental Car Funding (AESOP), LLC, Series 2020-2, Class C, 4.25% 2/20/20271,4 | | | 3,581 | | | | 3,407 | |
| Avis Budget Rental Car Funding (AESOP), LLC, Series 2022-5, Class A, 6.12% 4/20/20271,4 | | | 7,921 | | | | 8,052 | |
| Avis Budget Rental Car Funding (AESOP), LLC, Series 2021-1A, Class A, 1.38% 8/20/20271,4 | | | 22,390 | | | | 20,391 | |
| Avis Budget Rental Car Funding (AESOP), LLC, Series 2021-1A, Class B, 1.63% 8/20/20271,4 | | | 3,398 | | | | 3,071 | |
| Avis Budget Rental Car Funding (AESOP), LLC, Series 2021-1A, Class C, 2.13% 8/20/20271,4 | | | 1,211 | | | | 1,084 | |
| Avis Budget Rental Car Funding (AESOP), LLC, Series 2021-1A, Class D, 3.71% 8/20/20271,4 | | | 5,000 | | | | 4,466 | |
| Avis Budget Rental Car Funding (AESOP), LLC, Series 2023-2, Class A, 5.20% 10/20/20271,4 | | | 4,434 | | | | 4,445 | |
| Avis Budget Rental Car Funding (AESOP), LLC, Series 2023-3A, Class A, 5.44% 2/22/20281,4 | | | 10,532 | | | | 10,635 | |
| Avis Budget Rental Car Funding (AESOP), LLC, Series 2023-5, Class A, 5.78% 4/20/20281,4 | | | 49,213 | | | | 49,885 | |
| Avis Budget Rental Car Funding (AESOP), LLC, Series 2023-1, Class A, 5.25% 4/20/20291,4 | | | 8,202 | | | | 8,173 | |
| | |
| 62 | The Bond Fund of America |
| Bonds, notes & other debt instruments (continued) | | Principal amount
(000) | | | Value
(000) | |
| Asset-backed obligations (continued) | | | | | | | | |
| Avis Budget Rental Car Funding (AESOP), LLC, Series 2023-4, Class A, 5.49% 6/20/20291,4 | | USD | 12,830 | | | $ | 12,949 | |
| Avis Budget Rental Car Funding (AESOP), LLC, Series 2023-6, Class A, 5.81% 12/20/20291,4 | | | 40,430 | | | | 41,372 | |
| Avis Budget Rental Car Funding (AESOP), LLC, Series 2023-8, Class A, 6.02% 2/20/20301,4 | | | 4,925 | | | | 5,083 | |
| BA Credit Card Trust, Series 2022-A2, Class A2, 5.00% 4/17/20281 | | | 1,020 | | | | 1,027 | |
| Bain Capital Credit CLO, Ltd., Series 2020-2, Class AR, (3-month USD CME Term SOFR + 1.432%) 6.828% 7/19/20341,3,4 | | | 3,470 | | | | 3,464 | |
| Bain Capital Credit CLO, Ltd., Series 2022-4, Class A2, (3-month USD CME Term SOFR + 1.96%) 7.354% 7/16/20351,3,4 | | | 5,000 | | | | 5,003 | |
| Bain Capital Credit CLO, Ltd., Series 2023-3, Class D, (3-month USD CME Term SOFR + 5.25%) 10.621% 7/24/20361,3,4 | | | 500 | | | | 504 | |
| Ballyrock CLO, Ltd., Series 2019-2A, Class A1AR, (3-month USD CME Term SOFR + 1.262%) 6.629% 11/20/20301,3,4 | | | 9,398 | | | | 9,395 | |
| Bankers Healthcare Group Securitization Trust, Series 2020-A, Class A, 2.56% 9/17/20311,4 | | | 87 | | | | 87 | |
| Bankers Healthcare Group Securitization Trust, Series 2020-A, Class B, 3.59% 9/17/20311,4 | | | 4,310 | | | | 4,169 | |
| Bankers Healthcare Group Securitization Trust, Series 2021-A, Class A, 1.42% 11/17/20331,4 | | | 759 | | | | 716 | |
| Bankers Healthcare Group Securitization Trust, Series 2021-A, Class B, 2.79% 11/17/20331,4 | | | 914 | | | | 821 | |
| Bankers Healthcare Group Securitization Trust, Series 2021-B, Class A, 0.90% 10/17/20341,4 | | | 509 | | | | 493 | |
| Bankers Healthcare Group Securitization Trust, Series 2021-B, Class B, 1.67% 10/17/20341,4 | | | 1,533 | | | | 1,399 | |
| Bardin Hill CLO, Ltd., Series 2021-2, Class C, (3-month USD CME Term SOFR + 2.702%) 8.08% 10/25/20341,3,4 | | | 1,240 | | | | 1,184 | |
| Battalion CLO, Ltd., Series 2017-11, Class AR, (3-month USD CME Term SOFR + 1.412%) 6.81% 4/24/20341,3,4 | | | 2,000 | | | | 1,984 | |
| Battalion CLO, Ltd., Series 2021-21, Class C, (3-month USD CME Term SOFR + 2.362%) 7.755% 7/15/20341,3,4 | | | 1,000 | | | | 970 | |
| Battalion CLO, Ltd., Series 2016-10, Class A1R2, (3-month USD CME Term SOFR + 1.432%) 6.83% 1/25/20351,3,4 | | | 3,125 | | | | 3,112 | |
| Battalion CLO, Ltd., Series 2022-23A, Class A, (3-month USD CME Term SOFR + 1.44%) 6.834% 5/19/20361,3,4 | | | 8,000 | | | | 7,991 | |
| Birch Grove CLO, Ltd., Series 2023-6, Class A1, (3-month USD CME Term SOFR + 2.20%) 7.489% 7/20/20351,3,4 | | | 3,703 | | | | 3,718 | |
| Blackbird Capital II Aircraft Lease, Ltd. / Blackbird Capital II Aircraft Lease US, LLC, Series 2021-1, Class A, 2.443% 7/15/20461,4 | | | 17,564 | | | | 15,176 | |
| Blackbird Capital II Aircraft Lease, Ltd. / Blackbird Capital II Aircraft Lease US, LLC, Series 2021-1, Class B, 3.446% 7/15/20461,4 | | | 2,245 | | | | 1,868 | |
| Blackrock Elbert CLO V, LLC, Series 5, Class AR, (3-month USD CME Term SOFR + 1.85%) 7.235% 6/15/20341,3,4 | | | 2,400 | | | | 2,380 | |
| Blackrock Mt. Hood CLO X, LLC, Series 2023-1, Class A1, (3-month USD CME Term SOFR + 2.50%) 7.665% 4/20/20351,3,4 | | | 3,000 | | | | 3,012 | |
| BlueMountain CLO, Ltd., Series 2015-3, Class CR, (3-month USD CME Term SOFR + 2.862%) 8.277% 4/20/20311,3,4 | | | 250 | | | | 225 | |
| BlueMountain CLO, Ltd., Series 2022-35A, Class A, (3-month USD CME Term SOFR + 1.55%) 6.962% 7/22/20351,3,4 | | | 3,000 | | | | 2,999 | |
| Bridgecrest Lending Auto Securitization Trust, Series 2023-1, Class A3, 6.51% 11/15/20271 | | | 6,283 | | | | 6,359 | |
| Carlyle Global Market Strategies, Series 2021-6A, Class A1, (3-month USD CME Term SOFR + 1.422%) 6.815% 7/15/20341,3,4 | | | 250 | | | | 250 | |
| CarMax Auto Owner Trust, Series 2023-1, Class A2A, 5.23% 1/15/20261 | | | 412 | | | | 411 | |
| CarMax Auto Owner Trust, Series 2023-2, Class A2A, 5.50% 6/15/20261 | | | 5,306 | | | | 5,301 | |
| CarMax Auto Owner Trust, Series 2021-1, Class C, 0.94% 12/15/20261 | | | 580 | | | | 546 | |
| CarMax Auto Owner Trust, Series 2021-1, Class D, 1.28% 7/15/20271 | | | 568 | | | | 535 | |
| CarMax Auto Owner Trust, Series 2023-3, Class A3, 5.28% 5/15/20281 | | | 547 | | | | 553 | |
| Carvana Auto Receivables Trust, Series 2023-N3, Class A, 6.41% 9/10/20271,4 | | | 2,289 | | | | 2,300 | |
| Carvana Auto Receivables Trust, Series 2023-P3, Class A3, 5.82% 8/10/20281,4 | | | 1,939 | | | | 1,965 | |
| Carvana Auto Receivables Trust, Series 2021-N4, Class C, 1.72% 9/11/20281 | | | 772 | | | | 729 | |
| Carvana Auto Receivables Trust, Series 2021-N4, Class A2, 1.80% 9/11/20281 | | | 3,896 | | | | 3,679 | |
| Carvana Auto Receivables Trust, Series 2023-P5, Class A3, 5.62% 1/10/20291,4 | | | 2,515 | | | | 2,538 | |
| Carvana Auto Receivables Trust, Series 2023-P3, Class A4, 5.71% 7/10/20291,4 | | | 1,210 | | | | 1,232 | |
| Castlelake Aircraft Securitization Trust, Series 2021-1, Class A, 2.868% 5/11/20371,4 | | | 87,200 | | | | 75,695 | |
| | |
| The Bond Fund of America | 63 |
| Bonds, notes & other debt instruments (continued) | | Principal amount
(000) | | | Value
(000) | |
| Asset-backed obligations (continued) | | | | | | | | |
| Castlelake Aircraft Securitization Trust, Series 2021-1, Class C, 3.464% 5/11/20371,4 | | USD | 14,070 | | | $ | 11,785 | |
| Castlelake Aircraft Securitization Trust, Series 2021-1, Class C, 6.171% 5/11/20371,4 | | | 3,674 | | | | 2,931 | |
| Castlelake Aircraft Securitization Trust, Series 2017-1R, Class A, 2.741% 8/15/20411,4 | | | 2,905 | | | | 2,640 | |
| CF Hippolyta, LLC, Series 2020-1, Class A1, 1.69% 7/15/20601,4 | | | 80,144 | | | | 74,134 | |
| CF Hippolyta, LLC, Series 2020-1, Class A2, 1.99% 7/15/20601,4 | | | 15,662 | | | | 13,377 | |
| CF Hippolyta, LLC, Series 2020-1, Class B1, 2.28% 7/15/20601,4 | | | 9,080 | | | | 8,320 | |
| CF Hippolyta, LLC, Series 2020-1, Class B2, 2.60% 7/15/20601,4 | | | 989 | | | | 810 | |
| CF Hippolyta, LLC, Series 2021-1, Class A1, 1.53% 3/15/20611,4 | | | 69,912 | | | | 62,572 | |
| CF Hippolyta, LLC, Series 2021-1, Class B1, 1.98% 3/15/20611,4 | | | 5,694 | | | | 4,843 | |
| CF Hippolyta, LLC, Series 2022-1, Class A1, 5.97% 8/15/20621,4 | | | 99,103 | | | | 97,638 | |
| CF Hippolyta, LLC, Series 2022-1, Class A2, 6.11% 8/15/20621,4 | | | 43,496 | | | | 42,595 | |
| Chesapeake Funding II, LLC, Series 2023-2, Class A1, 6.16% 10/15/20351,4 | | | 2,211 | | | | 2,235 | |
| CIFC Funding, Ltd., CLO, Series 2022-4, Class A2, (3-month USD CME Term SOFR + 1.70%) 7.094% 7/16/20351,3,4 | | | 10,000 | | | | 10,000 | |
| CIFC Funding, Ltd., CLO, Series 2022-4, Class B, (3-month USD CME Term SOFR + 2.00%) 7.394% 7/16/20351,3,4 | | | 10,000 | | | | 10,028 | |
| Citizens Auto Receivables Trust, Series 2023-2, Class A3, 5.83% 2/15/20281,4 | | | 11,631 | | | | 11,803 | |
| Citizens Auto Receivables Trust, Series 2023-2, Class A4, 5.74% 10/15/20301,4 | | | 5,676 | | | | 5,802 | |
| CLI Funding V, LLC, Series 2020-2A, Class B, 3.56% 9/15/20451,4 | | | 446 | | | | 404 | |
| CLI Funding V, LLC, Series 2020-1A, Class B, 3.62% 9/18/20451,4 | | | 828 | | | | 754 | |
| CLI Funding VI, LLC, Series 2020-2A, Class A, 2.03% 9/15/20451,4 | | | 5,933 | | | | 5,315 | |
| CLI Funding VI, LLC, Series 2020-1A, Class A, 2.08% 9/18/20451,4 | | | 1,156 | | | | 1,034 | |
| CLI Funding VI, LLC, Series 2020-3A, Class A, 2.07% 10/18/20451,4 | | | 2,049 | | | | 1,841 | |
| CLI Funding VIII, LLC, Series 2021-1A, Class A, 1.64% 2/18/20461,4 | | | 9,966 | | | | 8,805 | |
| CLI Funding VIII, LLC, Series 2021-1A, Class A, 2.38% 2/18/20461,4 | | | 1,072 | | | | 937 | |
| CPS Auto Receivables Trust, Series 2023-A, Class A, 5.54% 3/16/20261,4 | | | 539 | | | | 538 | |
| CPS Auto Receivables Trust, Series 2020-B, Class D, 4.75% 4/15/20261,4 | | | 50 | | | | 50 | |
| CPS Auto Receivables Trust, Series 2022-B, Class A, 2.88% 6/15/20261,4 | | | 2,804 | | | | 2,790 | |
| CPS Auto Receivables Trust, Series 2023-C, Class A, 6.13% 9/15/20261,4 | | | 3,224 | | | | 3,229 | |
| CPS Auto Receivables Trust, Series 2023-A, Class B, 5.47% 11/16/20261,4 | | | 1,102 | | | | 1,097 | |
| CPS Auto Receivables Trust, Series 2021-A, Class D, 1.16% 12/15/20261,4 | | | 1,256 | | | | 1,227 | |
| CPS Auto Receivables Trust, Series 2023-B, Class A, 5.91% 8/16/20271,4 | | | 6,654 | | | | 6,659 | |
| CPS Auto Receivables Trust, Series 2022-B, Class B, 3.88% 8/15/20281,4 | | | 13,609 | | | | 13,432 | |
| CPS Auto Receivables Trust, Series 2022-B, Class C, 4.33% 8/15/20281,4 | | | 18,032 | | | | 17,664 | |
| CPS Auto Receivables Trust, Series 2023-A, Class C, 5.54% 4/16/20291,4 | | | 2,352 | | | | 2,331 | |
| CPS Auto Receivables Trust, Series 2023-A, Class D, 6.44% 4/16/20291,4 | | | 3,525 | | | | 3,523 | |
| CPS Auto Receivables Trust, Series 2023-C, Class C, 6.27% 10/15/20291,4 | | | 3,866 | | | | 3,901 | |
| CPS Auto Receivables Trust, Series 2022-C, Class A, 4.18% 4/15/20301,4 | | | 4,635 | | | | 4,619 | |
| CPS Auto Trust, Series 2023-D, Class A, 6.40% 6/15/20271,4 | | | 12,773 | | | | 12,818 | |
| CPS Auto Trust, Series 2023-C, Class D, 6.77% 10/15/20291,4 | | | 3,489 | | | | 3,529 | |
| Credit Acceptance Auto Loan Trust, Series 2021-3A, Class A, 1.00% 5/15/20301,4 | | | 2,690 | | | | 2,653 | |
| Crestline Denali CLO XVII, LLC, Series 2018-1, Class C, (3-month USD CME Term SOFR + 2.612%) 8.005% 10/15/20311,3,4 | | | 2,000 | | | | 1,996 | |
| CWHEQ Revolving Home Equity Loan Trust, Series 2005-C, Class 2A, FSA insured, (1-month USD CME Term SOFR + 0.294%) 5.656% 7/15/20351,3 | | | 569 | | | | 541 | |
| CWHEQ Revolving Home Equity Loan Trust, Series 2006-I, Class 2A, FSA insured, (1-month USD CME Term SOFR + 0.254%) 5.616% 1/15/20371,3 | | | 1,012 | | | | 926 | |
| CWHEQ Revolving Home Equity Loan Trust, Series 2007-B, Class A, FSA insured, (1-month USD CME Term SOFR + 0.264%) 5.626% 2/15/20371,3 | | | 1,473 | | | | 1,391 | |
| Diameter Capital CLO, Series 2023-5, Class A1, (3-month USD CME Term SOFR + 1.85%) 7.164% 10/15/20361,3,4 | | | 3,333 | | | | 3,340 | |
| Diameter Capital CLO, Series 2023-5, Class A2, (3-month USD CME Term SOFR + 2.40%) 7.714% 10/15/20361,3,4 | | | 4,286 | | | | 4,295 | |
| Discover Card Execution Note Trust, Series 2023-A1, Class A, 4.31% 3/15/20281 | | | 59,645 | | | | 59,271 | |
| Drive Auto Receivables Trust, Series 2020-2, Class D, 3.05% 5/15/20281 | | | 6,683 | | | | 6,605 | |
| Drive Auto Receivables Trust, Series 2021-1, Class D, 1.45% 1/16/20291 | | | 7,271 | | | | 6,977 | |
| DriveTime Auto Owner Trust, Series 2020-2A, Class C, 3.28% 3/16/20261,4 | | | 75 | | | | 75 | |
| DriveTime Auto Owner Trust, Series 2020-3A, Class C, 1.47% 6/15/20261,4 | | | 992 | | | | 981 | |
| DriveTime Auto Owner Trust, Series 2022-2A, Class A, 2.88% 6/15/20261,4 | | | 22 | | | | 22 | |
| DriveTime Auto Owner Trust, Series 2021-1A, Class C, 0.84% 10/15/20261,4 | | | 976 | | | | 964 | |
| DriveTime Auto Owner Trust, Series 2021-1A, Class D, 1.16% 11/16/20261,4 | | | 1,242 | | | | 1,188 | |
| DriveTime Auto Owner Trust, Series 2021-2A, Class C, 1.10% 2/16/20271,4 | | | 2,662 | | | | 2,625 | |
| DriveTime Auto Owner Trust, Series 2021-2A, Class D, 1.50% 2/16/20271,4 | | | 2,495 | | | | 2,379 | |
| DriveTime Auto Owner Trust, Series 2023-1, Class A, 5.48% 4/15/20271,4 | | | 1,560 | | | | 1,557 | |
| DriveTime Auto Owner Trust, Series 2023-2, Class A, 5.88% 4/15/20271,4 | | | 3,378 | | | | 3,380 | |
| DriveTime Auto Owner Trust, Series 2023-3, Class A, 6.29% 8/16/20271,4 | | | 3,364 | | | | 3,379 | |
| DriveTime Auto Owner Trust, Series 2023-1, Class C, 5.55% 10/16/20281,4 | | | 2,681 | | | | 2,657 | |
| | |
| 64 | The Bond Fund of America |
| Bonds, notes & other debt instruments (continued) | | Principal amount
(000) | | | Value
(000) | |
| Asset-backed obligations (continued) | | | | | | | | |
| DriveTime Auto Owner Trust, Series 2023-1, Class D, 6.44% 11/15/20281,4 | | USD | 8,340 | | | $ | 8,348 | |
| DriveTime Auto Owner Trust, Series 2023-3, Class C, 6.40% 5/15/20291,4 | | | 5,863 | | | | 5,929 | |
| DriveTime Auto Owner Trust, Series 2023-3, Class D, 7.12% 5/15/20291,4 | | | 6,061 | | | | 6,166 | |
| Dryden Senior Loan Fund, CLO, Series 2014-36, Class AR3, (3-month USD CME Term SOFR + 1.282%) 6.675% 4/15/20291,3,4 | | | 3,724 | | | | 3,724 | |
| Dryden Senior Loan Fund, CLO, Series 2015-41, Class AR, (3-month USD CME Term SOFR + 1.232%) 6.625% 4/15/20311,3,4 | | | 18,790 | | | | 18,759 | |
| Dryden Senior Loan Fund, CLO, Series 2022-94A, Class A, (3-month USD CME Term SOFR + 1.44%) 6.834% 7/15/20371,3,4 | | | 1,000 | | | | 1,001 | |
| Eaton Vance CDO, Ltd., CLO, Series 2020-2A, Class AR, (3-month USD CME Term SOFR + 1.412%) 6.805% 1/15/20351,3,4 | | | 1,100 | | | | 1,098 | |
| EDvestinU Private Education Loan, LLC, Series 2021-A, Class A, 1.80% 11/25/20451,4 | | | 1,042 | | | | 922 | |
| Elmwood CLO 18, Ltd., Series 2022-5, Class AR, (3-month USD CME Term SOFR + 1.65%) 7.053% 7/17/20331,3,4 | | | 11,500 | | | | 11,513 | |
| Elmwood CLO X, Ltd., Series 2021-3, Class A, (3-month USD CME Term SOFR + 1.302%) 6.717% 10/20/20341,3,4 | | | 2,000 | | | | 2,000 | |
| Enterprise Fleet Financing, LLC, Series 2022-3, Class A3, 4.29% 7/20/20291,4 | | | 5,938 | | | | 5,827 | |
| Enterprise Fleet Financing, LLC, Series 2022-3, Class A2, 4.38% 7/20/20291,4 | | | 7,169 | | | | 7,092 | |
| Enterprise Fleet Financing, LLC, Series 2022-4, Class A2, 5.76% 10/22/20291,4 | | | 4,834 | | | | 4,850 | |
| Exeter Automobile Receivables Trust, Series 2019-2A, Class D, 3.71% 3/17/20251,4 | | | 792 | | | | 792 | |
| Exeter Automobile Receivables Trust, Series 2023-1, Class A2, 5.61% 6/16/20251 | | | 443 | | | | 443 | |
| Exeter Automobile Receivables Trust, Series 2019-3A, Class D, 3.11% 8/15/20251,4 | | | 2,619 | | | | 2,602 | |
| Exeter Automobile Receivables Trust, Series 2019-4A, Class D, 2.58% 9/15/20251,4 | | | 4,031 | | | | 3,990 | |
| Exeter Automobile Receivables Trust, Series 2023-3, Class A2, 6.11% 9/15/20251 | | | 1,205 | | | | 1,206 | |
| Exeter Automobile Receivables Trust, Series 2022-6, Class A2, 5.73% 11/17/20251 | | | 50 | | | | 50 | |
| Exeter Automobile Receivables Trust, Series 2020-1A, Class D, 2.73% 12/15/20251,4 | | | 1,955 | | | | 1,929 | |
| Exeter Automobile Receivables Trust, Series 2020-2, Class D, 4.73% 4/15/20261,4 | | | 976 | | | | 972 | |
| Exeter Automobile Receivables Trust, Series 2023-1, Class A3, 5.58% 4/15/20261 | | | 783 | | | | 782 | |
| Exeter Automobile Receivables Trust, Series 2020-3A, Class D, 1.73% 7/15/20261 | | | 1,697 | | | | 1,677 | |
| Exeter Automobile Receivables Trust, Series 2023-3, Class A3, 6.04% 7/15/20261 | | | 552 | | | | 553 | |
| Exeter Automobile Receivables Trust, Series 2022-2A, Class B, 3.65% 10/15/20261 | | | 15,917 | | | | 15,838 | |
| Exeter Automobile Receivables Trust, Series 2022-4A, Class B, 4.57% 1/15/20271 | | | 3,744 | | | | 3,725 | |
| Exeter Automobile Receivables Trust, Series 2023-5, Class A3, 6.32% 3/15/20271 | | | 6,627 | | | | 6,687 | |
| Exeter Automobile Receivables Trust, Series 2021-2, Class D, 1.40% 4/15/20271 | | | 16,131 | | | | 15,237 | |
| Exeter Automobile Receivables Trust, Series 2022-6, Class B, 6.03% 8/16/20271 | | | 2,928 | | | | 2,934 | |
| Exeter Automobile Receivables Trust, Series 2023-3, Class B, 6.11% 9/15/20271 | | | 1,705 | | | | 1,712 | |
| Exeter Automobile Receivables Trust, Series 2022-6, Class C, 6.32% 5/15/20281 | | | 6,335 | | | | 6,369 | |
| Exeter Automobile Receivables Trust, Series 2023-3, Class C, 6.21% 6/15/20281 | | | 3,075 | | | | 3,103 | |
| Exeter Automobile Receivables Trust, Series 2022-2A, Class D, 4.56% 7/17/20281 | | | 7,739 | | | | 7,510 | |
| Exeter Automobile Receivables Trust, Series 2022-4A, Class C, 4.92% 12/15/20281 | | | 6,194 | | | | 6,119 | |
| Exeter Automobile Receivables Trust, Series 2022-6, Class D, 8.03% 4/6/20291 | | | 1,913 | | | | 1,987 | |
| Exeter Automobile Receivables Trust, Series 2023-3, Class D, 6.68% 4/16/20291 | | | 5,584 | | | | 5,642 | |
| Exeter Automobile Receivables Trust, Series 2023-1, Class D, 6.69% 6/15/20291 | | | 3,227 | | | | 3,254 | |
| Exeter Automobile Receivables Trust, Series 2023-3, Class E, 9.98% 1/15/20311,4 | | | 1,150 | | | | 1,192 | |
| First Investors Auto Owner Trust, Series 2021-1A, Class B, 0.89% 3/15/20271,4 | | | 746 | | | | 742 | |
| First Investors Auto Owner Trust, Series 2021-1A, Class D, 1.62% 3/15/20271,4 | | | 950 | | | | 908 | |
| First Investors Auto Owner Trust, Series 2023-1A, Class A, 6.44% 10/16/20281,4 | | | 7,016 | | | | 7,091 | |
| First National Master Note Trust, Series 2023-1, Class A, 5.13% 4/16/20291 | | | 8,282 | | | | 8,315 | |
| First National Master Note Trust, Series 2023-2, Class A, 5.77% 9/17/20291 | | | 5,548 | | | | 5,676 | |
| FirstKey Homes Trust, Series 2020-SFR1, Class A, 1.339% 9/17/20251,4 | | | 13,252 | | | | 12,357 | |
| FirstKey Homes Trust, Series 2020-SFR2, Class A, 1.266% 10/19/20371,4 | | | 19,998 | | | | 18,546 | |
| FirstKey Homes Trust, Series 2021-SFR3, Class A, 2.135% 12/17/20381,4 | | | 4,136 | | | | 3,762 | |
| FirstKey Homes Trust, Series 2022-SFR2, Class A, 4.145% 5/17/20391,4 | | | 8,669 | | | | 8,330 | |
| Flagship Credit Auto Trust, Series 2023-3, Class A3, 5.44% 4/17/20281,4 | | | 2,768 | | | | 2,776 | |
| Flagship Credit Auto Trust, Series 2023-3, Class B, 5.64% 7/16/20291,4 | | | 2,211 | | | | 2,227 | |
| Flagship Credit Auto Trust, Series 2023-3, Class C, 6.01% 7/16/20291,4 | | | 3,215 | | | | 3,229 | |
| Flagship Credit Auto Trust, Series 2023-3, Class D, 6.58% 8/15/20291,4 | | | 1,800 | | | | 1,795 | |
| Ford Credit Auto Lease Trust, Series 2023-A, Class A3, 4.94% 3/15/20261 | | | 1,244 | | | | 1,240 | |
| Ford Credit Auto Lease Trust, Series 2023-A, Class A4, 4.83% 5/15/20261 | | | 1,108 | | | | 1,102 | |
| Ford Credit Auto Owner Trust, Series 2019-2, Class A, 3.06% 4/15/20261 | | | 10,000 | | | | 9,923 | |
| Ford Credit Auto Owner Trust, Series 2018-1, Class A, 3.52% 7/15/20301,4 | | | 13,729 | | | | 13,717 | |
| Ford Credit Auto Owner Trust, Series 2018-1, Class A, 3.19% 7/15/20311,4 | | | 19,385 | | | | 18,991 | |
| Ford Credit Auto Owner Trust, Series 2020-1, Class A, 2.04% 8/15/20311,4 | | | 47,950 | | | | 46,351 | |
| Ford Credit Auto Owner Trust, Series 2021-1, Class A, 1.37% 10/17/20331,4 | | | 21,970 | | | | 20,323 | |
| Ford Credit Auto Owner Trust, Series 2023-1, Class A, 4.85% 8/15/20351,4 | | | 15,800 | | | | 15,867 | |
| Ford Credit Auto Owner Trust, Series 2023-2, Class A, 5.28% 2/15/20361,4 | | | 100,669 | | | | 102,971 | |
| | |
| The Bond Fund of America | 65 |
| Bonds, notes & other debt instruments (continued) | | Principal amount
(000) | | | Value
(000) | |
| Asset-backed obligations (continued) | | | | | | | | |
| Ford Credit Floorplan Master Owner Trust, Series 2023-1, Class A1, 4.92% 5/15/20281,4 | | USD | 25,883 | | | $ | 25,966 | |
| Fortress Credit BSL, Ltd., CLO, Series 2022-2, Class C1, (3-month USD CME Term SOFR + 4.45%) 9.845% 10/18/20331,3,4 | | | 2,000 | | | | 2,009 | |
| Fortress Credit Opportunities CLO, LLC, Series 2018-11, Class A1T, (3-month USD CME Term SOFR + 1.562%) 6.955% 4/15/20311,3,4 | | | 1,604 | | | | 1,601 | |
| Galaxy CLO, Ltd., Series 2017-23, Class AR, (3-month USD CME Term SOFR + 1.132%) 6.53% 4/24/20291,3,4 | | | 2,108 | | | | 2,107 | |
| GCI Funding I, LLC, Series 2020-1, Class A, 2.82% 10/18/20451,4 | | | 1,223 | | | | 1,108 | |
| GCI Funding I, LLC, Series 2020-1, Class B, 3.81% 10/18/20451,4 | | | 621 | | | | 563 | |
| GCI Funding I, LLC, Series 2021-1, Class A, 2.38% 6/18/20461,4 | | | 6,324 | | | | 5,567 | |
| GCI Funding I, LLC, Series 2021-1, Class B, 3.04% 6/18/20461,4 | | | 213 | | | | 178 | |
| Generate CLO, Ltd., Series 4A, Class A1R, (3-month USD CME Term SOFR + 1.352%) 6.767% 4/20/20321,3,4 | | | 963 | | | | 963 | |
| Global SC Finance V SRL, Series 2019-1A, Class B, 4.81% 9/17/20391,4 | | | 6,913 | | | | 6,555 | |
| Global SC Finance V SRL, Series 2020-1A, Class B, 3.55% 10/17/20401,4 | | | 998 | | | | 925 | |
| Global SC Finance VII SRL, Series 2021-1A, Class A, 1.86% 4/17/20411,4 | | | 47,334 | | | | 42,256 | |
| Global SC Finance VII SRL, Series 2021-2A, Class A, 1.95% 8/17/20411,4 | | | 33,730 | | | | 30,290 | |
| Global SC Finance VII SRL, Series 2021-2A, Class B, 2.49% 8/17/20411,4 | | | 2,731 | | | | 2,412 | |
| GLS Auto Receivables Trust, Series 2023-4, Class A2, 6.40% 12/15/20261,4 | | | 14,848 | | | | 14,901 | |
| GLS Auto Receivables Trust, Series 2023-2, Class A2, 5.70% 1/15/20271,4 | | | 5,056 | | | | 5,049 | |
| GLS Auto Receivables Trust, Series 2023-3, Class B, 5.89% 1/18/20281,4 | | | 10,153 | | | | 10,208 | |
| GLS Auto Receivables Trust, Series 2023-3, Class C, 6.01% 5/15/20291,4 | | | 3,969 | | | | 4,009 | |
| GLS Auto Receivables Trust, Series 2023-3, Class D, 6.44% 5/15/20291,4 | | | 3,589 | | | | 3,606 | |
| GLS Auto Select Receivables Trust, Series 2023-2A, Class A2, 6.37% 6/15/20281,4 | | | 4,338 | | | | 4,377 | |
| GM Financial Automobile Leasing Trust, Series 2020-4, Class C, 1.05% 5/18/20261 | | | 3,700 | | | | 3,580 | |
| GM Financial Automobile Leasing Trust, Series 2023-3, Class A3, 5.38% 11/20/20261 | | | 3,983 | | | | 4,012 | |
| GM Financial Automobile Leasing Trust, Series 2023-3, Class A4, 5.44% 8/20/20271 | | | 711 | | | | 717 | |
| GM Financial Revolving Receivables Trust, Series 2023-1, Class A, 5.12% 4/11/20351,4 | | | 35,338 | | | | 35,977 | |
| GM Financial Revolving Receivables Trust, Series 2022-1, Class A, 5.91% 10/11/20351,4 | | | 42,166 | | | | 43,918 | |
| GMF Floorplan Owner Revolving Trust, Series 2023-1, Class A, 5.34% 6/17/20301,4 | | | 6,944 | | | | 7,105 | |
| GoldenTree Loan Opportunities X, Ltd., Series 2015-10, Class AR, (3-month USD CME Term SOFR + 1.382%) 6.797% 7/20/20311,3,4 | | | 11,488 | | | | 11,497 | |
| GoldenTree Loan Opportunities XI, Ltd., CLO, Series 2015-11A, Class AR2, (3-month USD CME Term SOFR + 1.332%) 6.727% 1/18/20311,3,4 | | | 8,139 | | | | 8,139 | |
| Golub Capital BDC 3 CLO 1, LLC, Series 2021-1, Class A, (3-month USD CME Term SOFR + 1.862%) 7.255% 4/15/20331,3,4 | | | 4,000 | | | | 3,977 | |
| Golub Capital Partners CLO, Ltd., Series 2014-21, Class AR, (3-month USD CME Term SOFR + 1.732%) 7.11% 1/25/20311,3,4 | | | 2,658 | | | | 2,657 | |
| Greywolf CLO, Ltd., Series 2013-1A, Class B1RR, ((3-month USD CME Term SOFR + 2.60%) + 2.30%) 7.955% 4/15/20341,3,4 | | | 500 | | | | 491 | |
| GT Loan Financing, Ltd., Series 2013-1, Class AR, (3-month USD CME Term SOFR + 1.362%) 6.752% 7/28/20311,3,4 | | | 4,507 | | | | 4,508 | |
| Guggenheim 1828 CLO, LLC, Series 2016-1A, Class A1S1, (3-month USD CME Term SOFR + 1.492%) 6.885% 10/15/20311,3,4 | | | 747 | | | | 747 | |
| Guggenheim CLO, Ltd., Series 2022-2, Class D, (3-month USD CME Term SOFR + 5.95%) 11.344% 1/15/20351,3,4 | | | 1,000 | | | | 1,010 | |
| Gulf Stream Meridian 1, Ltd., CLO, Series 2021-4, Class A1, (3-month USD CME Term SOFR + 1.462%) 6.855% 7/15/20341,3,4 | | | 3,000 | | | | 3,000 | |
| Halcyon Loan Advisors Funding, Ltd., Series 2018-2, Class C, (3-month USD CME Term SOFR + 3.662%) 9.074% 1/22/20311,3,4 | | | 714 | | | | 662 | |
| HalseyPoint CLO II, Ltd., Series 2020-2A, Class A1, (3-month USD CME Term SOFR + 2.122%) 7.537% 7/20/20311,3,4 | | | 2,673 | | | | 2,674 | |
| Henderson Receivables, LLC, Series 2006-3A, Class A1, (1-month USD CME Term SOFR + 0.314%) 5.676% 9/15/20411,3,4 | | | 290 | | | | 280 | |
| Hertz Vehicle Financing III, LLC, Series 2021-A, Class B, 9.44% 6/25/20251,4,7 | | | 50,483 | | | | 50,483 | |
| Hertz Vehicle Financing III, LLC, Series 2021-1A, Class A, 1.21% 12/26/20251,4 | | | 52,896 | | | | 51,081 | |
| Hertz Vehicle Financing III, LLC, Series 2021-1A, Class B, 1.56% 12/26/20251,4 | | | 6,931 | | | | 6,679 | |
| Hertz Vehicle Financing III, LLC, Series 2021-1A, Class C, 2.05% 12/26/20251,4 | | | 3,902 | | | | 3,757 | |
| Hertz Vehicle Financing III, LLC, Series 2022-1A, Class A, 1.99% 6/25/20261,4 | | | 38,456 | | | | 36,770 | |
| Hertz Vehicle Financing III, LLC, Series 2022-1A, Class B, 2.19% 6/25/20261,4 | | | 2,237 | | | | 2,125 | |
| Hertz Vehicle Financing III, LLC, Series 2022-1A, Class C, 2.63% 6/25/20261,4 | | | 943 | | | | 894 | |
| Hertz Vehicle Financing III, LLC, Series 2022-4A, Class A, 3.73% 9/25/20261,4 | | | 17,787 | | | | 17,334 | |
| Hertz Vehicle Financing III, LLC, Series 2023-1, Class 1D, 9.13% 6/25/20271,4 | | | 2,352 | | | | 2,367 | |
| Hertz Vehicle Financing III, LLC, Series 2021-2A, Class A, 1.68% 12/27/20271,4 | | | 78,330 | | | | 71,045 | |
| | |
| 66 | The Bond Fund of America |
| Bonds, notes & other debt instruments (continued) | | Principal amount
(000) | | | Value
(000) | |
| Asset-backed obligations (continued) | | | | | | | | |
| Hertz Vehicle Financing III, LLC, Series 2021-2A, Class B, 2.12% 12/27/20271,4 | | USD | 6,275 | | | $ | 5,676 | |
| Hertz Vehicle Financing III, LLC, Series 2021-2A, Class C, 2.52% 12/27/20271,4 | | | 3,138 | | | | 2,817 | |
| Hertz Vehicle Financing III, LLC, Series 2023-3, Class B, 6.53% 2/25/20281,4 | | | 2,817 | | | | 2,871 | |
| Hertz Vehicle Financing III, LLC, Series 2023-3, Class C, 7.26% 2/25/20281,4 | | | 4,162 | | | | 4,232 | |
| Hertz Vehicle Financing III, LLC, Series 2022-2, Class D, 5.16% 6/26/20281,4 | | | 8,361 | | | | 7,519 | |
| Hertz Vehicle Financing III, LLC, Series 2022-5, Class D, 6.78% 9/25/20281,4 | | | 6,271 | | | | 5,901 | |
| Hertz Vehicle Financing III, LLC, Series 2023-4, Class A, 6.15% 3/25/20301,4 | | | 8,409 | | | | 8,735 | |
| Hertz Vehicle Financing III, LLC, Series 2023-4, Class B, 6.73% 3/25/20301,4 | | | 3,231 | | | | 3,342 | |
| Hertz Vehicle Financing III, LLC, Series 2023-4, Class C, 7.51% 3/25/20301,4 | | | 2,055 | | | | 2,135 | |
| Home Equity Asset Trust, Series 2004-7, Class M1, (1-month USD CME Term SOFR + 1.045%) 6.40% 1/25/20351,3 | | | 122 | | | | 122 | |
| Honda Auto Receivables Owner Trust, Series 2023-1, Class A3, 5.04% 4/21/20271 | | | 1,426 | | | | 1,429 | |
| HPS Loan Management 6-2015, Ltd., Series 6A-2015, Class A1R, (3-month USD CME Term SOFR + 1.262%) 6.654% 2/5/20311,3,4 | | | 4,432 | | | | 4,428 | |
| ICG US CLO, Ltd., Series 2017-1, Class ARR, (3-month USD CME Term SOFR + 1.432%) 6.822% 7/28/20341,3,4 | | | 4,000 | | | | 3,967 | |
| Juniper Valley Park CLO, Ltd., Series 2023-1, Class A1, (3-month USD CME Term SOFR + 1.85%) 7.266% 7/20/20351,3,4 | | | 17,438 | | | | 17,493 | |
| KKR Financial CLO, Ltd., Series 11, Class AR, (3-month USD CME Term SOFR + 1.442%) 6.835% 1/15/20311,3,4 | | | 18,842 | | | | 18,864 | |
| KKR Financial CLO, Ltd., Series 2017, Class AR, (3-month USD CME Term SOFR + 1.342%) 6.735% 4/15/20341,3,4 | | | 3,000 | | | | 2,975 | |
| KKR Financial CLO, Ltd., Series 22-42A, Class B, (3-month USD CME Term SOFR + 2.05%) 7.466% 7/20/20341,3,4 | | | 15,000 | | | | 15,006 | |
| KKR Static CLO I, Ltd., Series 2021-1A, Class C, (3-month USD CME Term SOFR + 3.40%) 8.816% 7/20/20311,3,4 | | | 3,000 | | | | 3,000 | |
| LAD Auto Receivables Trust, Series 2021-1A, Class A, 1.30% 8/17/20261,4 | | | 2,435 | | | | 2,406 | |
| LAD Auto Receivables Trust, Series 2023-1, Class A2, 5.68% 10/15/20261,4 | | | 5,946 | | | | 5,940 | |
| LAD Auto Receivables Trust, Series 2021-1A, Class B, 1.94% 11/16/20261,4 | | | 1,804 | | | | 1,752 | |
| LAD Auto Receivables Trust, Series 2022-1, Class A, 5.21% 6/15/20271,4 | | | 4,338 | | | | 4,317 | |
| LAD Auto Receivables Trust, Series 2023-1, Class A3, 5.48% 6/15/20271,4 | | | 6,324 | | | | 6,325 | |
| LAD Auto Receivables Trust, Series 2023-2, Class A2, 5.93% 6/15/20271,4 | | | 5,188 | | | | 5,193 | |
| LAD Auto Receivables Trust, Series 2022-1, Class B, 5.87% 9/15/20271,4 | | | 2,901 | | | | 2,907 | |
| LAD Auto Receivables Trust, Series 2023-4, Class A3, 6.10% 12/15/20271,4 | | | 3,145 | | | | 3,179 | |
| LAD Auto Receivables Trust, Series 2023-1, Class C, 6.18% 12/15/20271,4 | | | 927 | | | | 932 | |
| LAD Auto Receivables Trust, Series 2023-2, Class A3, 5.42% 2/15/20281,4 | | | 21,187 | | | | 21,201 | |
| LAD Auto Receivables Trust, Series 2023-2, Class B, 5.45% 4/15/20281,4 | | | 4,473 | | | | 4,469 | |
| LAD Auto Receivables Trust, Series 2023-3, Class B, 6.09% 6/15/20281,4 | | | 6,005 | | | | 6,092 | |
| LAD Auto Receivables Trust, Series 2023-2, Class C, 5.58% 9/15/20281,4 | | | 9,891 | | | | 9,877 | |
| LAD Auto Receivables Trust, Series 2023-3, Class C, 6.43% 12/15/20281,4 | | | 5,058 | | | | 5,154 | |
| LAD Auto Receivables Trust, Series 2022-1, Class C, 6.85% 4/15/20301,4 | | | 4,131 | | | | 4,148 | |
| LAD Auto Receivables Trust, Series 2023-1, Class D, 7.30% 6/17/20301,4 | | | 981 | | | | 997 | |
| LAD Auto Receivables Trust, Series 2023-3, Class D, 6.92% 12/16/20301,4 | | | 3,430 | | | | 3,488 | |
| LAD Auto Receivables Trust, Series 2023-2, Class D, 6.30% 2/15/20311,4 | | | 895 | | | | 891 | |
| LCM, LP, Series 2027, Class A1, (3-month USD CME Term SOFR + 1.342%) 6.735% 7/16/20311,3,4 | | | 10,642 | | | | 10,642 | |
| Madison Park Funding, Ltd., CLO, Series 2015-17A, Class AR2, (3-month USD CME Term SOFR + 1.262%) 6.674% 7/21/20301,3,4 | | | 4,883 | | | | 4,884 | |
| Madison Park Funding, Ltd., CLO, Series 2021-50A, Class A, (3-month USD CME Term SOFR + 1.402%) 6.798% 4/19/20341,3,4 | | | 250 | | | | 250 | |
| Madison Park Funding, Ltd., CLO, Series 2020-45A, Class AR, (3-month USD CME Term SOFR + 1.382%) 6.775% 7/15/20341,3,4 | | | 500 | | | | 499 | |
| Marathon CLO, Ltd., Series 2017-9A, Class A1AR, (3-month USD CME Term SOFR + 1.412%) 6.805% 4/15/20291,3,4 | | | 1,366 | | | | 1,366 | |
| Marble Point CLO, Ltd., Series 2020-1, Class D, (3-month USD CME Term SOFR + 4.012%) 9.427% 4/20/20331,3,4 | | | 1,500 | | | | 1,452 | |
| Merchants Fleet Funding, LLC, Series 2023-1, Class A, 7.21% 5/20/20361,4 | | | 9,986 | | | | 10,095 | |
| MidOcean Credit CLO, Series 2018-9, Class D, (3-month USD CME Term SOFR + 3.562%) 8.977% 7/20/20311,3,4 | | | 2,500 | | | | 2,425 | |
| MidOcean Credit CLO, Series 2019-10, Class A1R, (3-month USD CME Term SOFR + 1.492%) 6.904% 10/23/20341,3,4 | | | 1,000 | | | | 999 | |
| Mission Lane Credit Card Master Trust, Series 2022-B, Class A1, 8.25% 1/15/20281,7,11 | | | 6,581 | | | | 6,599 | |
| Mission Lane Credit Card Master Trust, Series 2022-B, Class A2, 8.73% 1/15/20281,7,11 | | | 1,050 | | | | 1,053 | |
| Mission Lane Credit Card Master Trust, Series 2023-A, Class A, 7.23% 7/17/20281,4 | | | 22,893 | | | | 22,928 | |
| Monroe Capital MML CLO X, LLC, Series 2020-1, Class A1R, (3-month USD CME Term SOFR + 1.87%) 7.237% 5/20/20341,3,4 | | | 1,540 | | | | 1,520 | |
| | |
| The Bond Fund of America | 67 |
| Bonds, notes & other debt instruments (continued) | | Principal amount
(000) | | | Value
(000) | |
| Asset-backed obligations (continued) | | | | | | | | |
| Monroe Capital MML CLO XI, Ltd., Series 2021-1, Class A1, (3-month USD CME Term SOFR + 1.811%) 7.179% 5/20/20331,3,4 | | USD | 2,500 | | | $ | 2,471 | |
| Monroe Capital MML CLO XI, Ltd., Series 2021-2, Class A1, (3-month USD CME Term SOFR + 1.762%) 7.148% 9/14/20331,3,4 | | | 3,500 | | | | 3,445 | |
| Navient Student Loan Trust, Series 2021-A, Class A, 0.84% 5/15/20691,4 | | | 4,946 | | | | 4,362 | |
| Navient Student Loan Trust, Series 2021-B, Class A, 0.94% 7/15/20691,4 | | | 4,752 | | | | 4,137 | |
| Navient Student Loan Trust, Series 2021-C, Class A, 1.06% 10/15/20691,4 | | | 24,680 | | | | 21,415 | |
| Navient Student Loan Trust, Series 2021-EA, Class A, 0.97% 12/16/20691,4 | | | 9,331 | | | | 8,050 | |
| Navient Student Loan Trust, Series 2021-FA, Class A, 1.11% 2/18/20701,4 | | | 3,121 | | | | 2,661 | |
| Navient Student Loan Trust, Series 2021-G, Class A, 1.58% 4/15/20701,4 | | | 5,736 | | | | 4,979 | |
| Navigator Aircraft ABS, Ltd., Series 2021-1, Class A, 2.771% 11/15/20461,4 | | | 22,096 | | | | 19,326 | |
| Nelnet Student Loan Trust, Series 2021-C, Class AFX, 1.32% 4/20/20621,4 | | | 2,374 | | | | 2,132 | |
| Nelnet Student Loan Trust, Series 2021-A, Class APT1, 1.36% 4/20/20621,4 | | | 26,867 | | | | 24,343 | |
| Nelnet Student Loan Trust, Series 2021-B, Class AFX, 1.42% 4/20/20621,4 | | | 60,052 | | | | 54,580 | |
| Nelnet Student Loan Trust, Series 2021-C, Class AFL, (1-month USD CME Term SOFR + 0.854%) 6.212% 4/20/20621,3,4 | | | 17,562 | | | | 17,287 | |
| Neuberger Berman CLO, Ltd., Series 2018-29, Class C, (3-month USD CME Term SOFR + 2.412%) 7.808% 10/19/20311,3,4 | | | 1,000 | | | | 992 | |
| Neuberger Berman CLO, Ltd., Series 2022-49A, Class A, (3-month USD CME Term SOFR + 1.42%) 1.42% 7/25/20341,3,4 | | | 2,100 | | | | 2,097 | |
| Neuberger Berman Loan Advisers LaSalle Street Lending CLO, Ltd., Series 2023-1, Class D1, (3-month USD CME Term SOFR + 5.00%) 10.416% 10/25/20361,3,4 | | | 1,000 | | | | 1,007 | |
| New Economy Assets Phase 1 Issuer, LLC, Series 2021-1, Class A1, 1.91% 10/20/20611,4 | | | 305,300 | | | | 267,656 | |
| Newark BSL CLO 1, Ltd., Series 2016-1A, Class A1R, (3-month USD CME Term SOFR + 1.362%) 6.749% 12/21/20291,3,4 | | | 990 | | | | 990 | |
| Newark BSL CLO 2, Ltd., Series 2017-1A, Class A1R, (3-month USD CME Term SOFR + 1.232%) 6.61% 7/25/20301,3,4 | | | 1,937 | | | | 1,935 | |
| Nissan Auto Lease Trust, Series 2023-A, Class A3, 4.91% 1/15/20261 | | | 1,074 | | | | 1,070 | |
| Nissan Auto Receivables Owner Trust, Series 2023-B, Class A3, 5.93% 3/15/20281 | | | 4,270 | | | | 4,376 | |
| Northwoods Capital, Ltd., CLO, Series 2018-11B, Class A1, (3-month USD CME Term SOFR + 1.362%) 6.758% 4/19/20311,3,4 | | | 2,429 | | | | 2,429 | |
| Northwoods Capital, Ltd., CLO, Series 2018-17, Class D, (3-month USD CME Term SOFR + 3.112%) 8.524% 4/22/20311,3,4 | | | 1,838 | | | | 1,734 | |
| Ocean Trails CLO, Series 2023-14, Class A1, (3-month USD CME Term SOFR + 2.00%) 7.416% 1/20/20351,3,4 | | | 19,600 | | | | 19,649 | |
| Ocean Trails CLO, Series 2023-14, Class B1, (3-month USD CME Term SOFR + 2.75%) 8.166% 1/20/20351,3,4 | | | 500 | | | | 501 | |
| Ocean Trails CLO, Series 2022-12A, Class A2, (3-month USD CME Term SOFR + 1.80%) 7.216% 7/20/20351,3,4 | | | 8,000 | | | | 7,890 | |
| OCP CLO, Ltd., Series 2018-15A, Class A1, (3-month USD CME Term SOFR + 1.362%) 6.777% 7/20/20311,3,4 | | | 10,147 | | | | 10,146 | |
| OCP CLO, Ltd., Series 2019-16A, Class AR, (3-month USD CME Term SOFR + 1.262%) 6.668% 4/10/20331,3,4 | | | 2,000 | | | | 1,994 | |
| OCP CLO, Ltd., Series 2023-29, Class C, (3-month USD CME Term SOFR + 3.10%) 8.43% 1/20/20351,3,4 | | | 1,800 | | | | 1,805 | |
| OCP CLO, Ltd., Series 2023-29, Class D, (3-month USD CME Term SOFR + 5.00%) 10.33% 1/20/20351,3,4 | | | 3,000 | | | | 3,011 | |
| OCP CLO, Ltd., Series 2023-28, Class D, (3-month USD CME Term SOFR + 5.35%) 10.77% 7/16/20361,3,4 | | | 500 | | | | 509 | |
| Octagon 64, Ltd., CLO, Series 2022-1A, Class B1, (3-month USD CME Term SOFR + 2.10%) 7.512% 7/21/20371,3,4 | | | 1,000 | | | | 1,003 | |
| Octagon Investment Partners 48, Ltd., CLO, Series 2020-3, Class DR, (3-month USD CME Term SOFR + 3.362%) 8.777% 10/20/20341,3,4 | | | 250 | | | | 242 | |
| OnDeck Asset Securitization Trust, LLC, Series 2021-1A, Class A, 1.59% 5/17/20271,4 | | | 15,641 | | | | 15,305 | |
| OnDeck Asset Securitization Trust, LLC, Series 2021-1A, Class B, 2.28% 5/17/20271,4 | | | 700 | | | | 683 | |
| Oportun Funding, LLC, Series 2021-A, Class A, 1.21% 3/8/20281,4 | | | 2,565 | | | | 2,449 | |
| Oportun Funding, LLC, Series 2021-B, Class A, 1.47% 5/8/20311,4 | | | 10,824 | | | | 10,116 | |
| Palmer Square Loan Funding, CLO, Series 2020-4, Class A1, (3-month USD CME Term SOFR + 1.262%) 6.641% 11/25/20281,3,4 | | | 2,315 | | | | 2,318 | |
| Palmer Square Loan Funding, CLO, Series 2021-1, Class A1, (3-month USD CME Term SOFR + 1.162%) 6.577% 4/20/20291,3,4 | | | 967 | | | | 967 | |
| Palmer Square Loan Funding, CLO, Series 2021-2A, Class A1, (3-month USD CME Term SOFR + 1.062%) 6.431% 5/20/20291,3,4 | | | 442 | | | | 440 | |
| Palmer Square Loan Funding, CLO, Series 2021-3, Class A1, (3-month USD CME Term SOFR + 1.062%) 6.477% 7/20/20291,3,4 | | | 2,681 | | | | 2,675 | |
| | |
| 68 | The Bond Fund of America |
| Bonds, notes & other debt instruments (continued) | | Principal amount
(000) | | | Value
(000) | |
| Asset-backed obligations (continued) | | | | | | | | |
| Palmer Square Loan Funding, CLO, Series 2021-4A, Class A1, (3-month USD CME Term SOFR + 1.062%) 6.455% 10/15/20291,3,4 | | USD | 7,922 | | | $ | 7,904 | |
| Palmer Square Loan Funding, CLO, Series 2021-4A, Class A2, (3-month USD CME Term SOFR + 1.662%) 7.055% 10/15/20291,3,4 | | | 856 | | | | 851 | |
| Palmer Square Loan Funding, CLO, Series 2022-1A, Class A1, (3-month USD CME Term SOFR + 1.05%) 6.444% 4/15/20301,3,4 | | | 9,083 | | | | 9,053 | |
| Palmer Square Loan Funding, CLO, Series 2022-2A, Class A1, (3-month USD CME Term SOFR + 1.27%) 6.664% 10/15/20301,3,4 | | | 333 | | | | 332 | |
| Palmer Square Loan Funding, CLO, Series 2022-3, Class A1A, (3-month USD CME Term SOFR + 1.82%) 7.214% 4/15/20311,3,4 | | | 4,059 | | | | 4,062 | |
| Palmer Square Loan Funding, CLO, Series 2018-2, Class A1A, (3-month USD CME Term SOFR + 1.362%) 6.755% 7/16/20311,3,4 | | | 4,629 | | | | 4,633 | |
| Palmer Square Loan Funding, CLO, Series 2023-1, Class A1, (3-month USD CME Term SOFR + 1.70%) 6.812% 7/20/20311,3,4 | | | 12,000 | | | | 12,016 | |
| Palmer Square Loan Funding, CLO, Series 2022-4, Class A1, (3-month USD-CME Term SOFR + 1.75%) 7.148% 7/24/20311,3,4 | | | 4,117 | | | | 4,124 | |
| Palmer Square Loan Funding, CLO, Series 2022-4, Class C, (3-month USD CME Term SOFR + 4.50%) 9.898% 7/24/20311,3,4 | | | 3,000 | | | | 3,009 | |
| Parallel, Ltd., Series 2020-1, Class A1R, (3-month USD CME Term SOFR + 1.482%) 6.897% 7/20/20341,3,4 | | | 5,000 | | | | 4,984 | |
| Park Blue CLO, Ltd., Series 2022-1, Class A1, (3-month USD CME Term SOFR + 2.45%) 7.866% 10/20/20341,3,4 | | | 1,500 | | | | 1,507 | |
| PFS Financing Corp., Series 2021-B, Class A, 0.775% 8/17/20261,4 | | | 35,117 | | | | 34,031 | |
| PFS Financing Corp., Series 2022-D, Class A, 4.27% 8/16/20271,4 | | | 4,297 | | | | 4,224 | |
| PFS Financing Corp., Series 2022-D, Class B, 4.90% 8/16/20271,4 | | | 862 | | | | 845 | |
| PFS Financing Corp., Series 2023-D, Class A, (30-day Average USD-SOFR + 1.15%) 6.488% 8/16/20271,3,4 | | | 10,757 | | | | 10,766 | |
| PFS Financing Corp., Series 2023-A, Class A, 5.80% 3/15/20281,4 | | | 12,000 | | | | 12,184 | |
| PFS Financing Corp., Series 2023-B, Class A, 5.27% 5/15/20281,4 | | | 35,047 | | | | 35,241 | |
| PFS Financing Corp., Series 2023-C, Class A, 5.52% 10/16/20281,4 | | | 6,434 | | | | 6,514 | |
| Pikes Peak CLO, Series 2022-11, Class A2, (3-month USD CME Term SOFR + 2.20%) 7.578% 7/25/20341,3,4 | | | 7,000 | | | | 7,016 | |
| Post CLO, Ltd., Series 2021-1, Class A, (3-month USD CME Term SOFR + 1.462%) 6.855% 10/15/20341,3,4 | | | 3,050 | | | | 3,036 | |
| Prestige Auto Receivables Trust, Series 2023-1, Class A2, 5.88% 3/16/20261,4 | | | 2,482 | | | | 2,481 | |
| Prodigy Finance DAC, Series 2021-1A, Class A, (1-month USD CME Term SOFR + 1.364%) 6.72% 7/25/20511,3,4 | | | 1,827 | | | | 1,813 | |
| Reach Financial, LLC, Series 2023-1, Class A, 7.05% 2/18/20311,4 | | | 3,290 | | | | 3,300 | |
| Regatta VI Funding, Ltd., CLO, Series 2016-1, Class AR2, (3-month USD CME Term SOFR + 1.422%) 6.837% 4/20/20341,3,4 | | | 3,000 | | | | 2,996 | |
| Regatta XVI Funding, Ltd., Series 2019-2, Class D, (3-month USD CME Term SOFR + 4.162%) 9.555% 1/15/20331,3,4 | | | 2,000 | | | | 1,994 | |
| Regatta XXII Funding, Ltd., Series 2022-2A, Class C, (3-month USD CME Term SOFR + 2.50%) 7.916% 7/20/20351,3,4 | | | 3,500 | | | | 3,504 | |
| Research-Driven Pagaya Motor Asset Trust I, Series 2022-3, Class A, 5.38% 11/25/20301,4 | | | 4,153 | | | | 4,113 | |
| Residential Funding Mortgage Securities II, Inc., Series 2006-HSA3, Class A, FSA insured, (1-month USD CME Term SOFR + 0.244%) 5.60% 5/25/20361,3 | | | 4 | | | | 4 | |
| Rockford Tower CLO, Ltd., Series 2021-1, Class D, (3-month USD CME Term SOFR + 3.262%) 8.677% 7/20/20341,3,4 | | | 2,002 | | | | 1,931 | |
| Rockford Tower CLO, Ltd., Series 2022-1A, Class B, (3-month USD CME Term SOFR + 2.10%) 7.516% 7/20/20351,3,4 | | | 10,000 | | | | 10,025 | |
| Santander Drive Auto Receivables Trust, Series 2022-7, Class A2, 5.81% 1/15/20261 | | | 686 | | | | 687 | |
| Santander Drive Auto Receivables Trust, Series 2023-2, Class A2, 5.87% 3/16/20261 | | | 1,886 | | | | 1,887 | |
| Santander Drive Auto Receivables Trust, Series 2023-1, Class A2, 5.36% 5/15/20261 | | | 777 | | | | 776 | |
| Santander Drive Auto Receivables Trust, Series 2022-5, Class A3, 4.11% 8/17/20261 | | | 79 | | | | 78 | |
| Santander Drive Auto Receivables Trust, Series 2022-5, Class B, 4.43% 3/15/20271 | | | 6,249 | | | | 6,177 | |
| Santander Drive Auto Receivables Trust, Series 2022-7, Class A3, 5.75% 4/15/20271 | | | 557 | | | | 557 | |
| Santander Drive Auto Receivables Trust, Series 2022-6, Class B, 4.72% 6/15/20271 | | | 4,737 | | | | 4,695 | |
| Santander Drive Auto Receivables Trust, Series 2021-2, Class D, 1.35% 7/15/20271 | | | 7,017 | | | | 6,760 | |
| Santander Drive Auto Receivables Trust, Series 2021-3, Class C, 0.95% 9/15/20271 | | | 3,764 | | | | 3,731 | |
| Santander Drive Auto Receivables Trust, Series 2021-3, Class D, 1.33% 9/15/20271 | | | 7,003 | | | | 6,693 | |
| Santander Drive Auto Receivables Trust, Series 2023-3, Class A3, 5.61% 10/15/20271 | | | 12,738 | | | | 12,797 | |
| Santander Drive Auto Receivables Trust, Series 2022-7, Class B, 5.95% 1/17/20281 | | | 1,309 | | | | 1,316 | |
| Santander Drive Auto Receivables Trust, Series 2023-1, Class B, 4.98% 2/15/20281 | | | 5,650 | | | | 5,611 | |
| Santander Drive Auto Receivables Trust, Series 2023-4, Class A3, 5.73% 4/17/20281 | | | 5,490 | | | | 5,549 | |
| Santander Drive Auto Receivables Trust, Series 2023-3, Class B, 5.61% 7/17/20281 | | | 7,609 | | | | 7,650 | |
| | |
| The Bond Fund of America | 69 |
| Bonds, notes & other debt instruments (continued) | | Principal amount
(000) | | | Value
(000) | |
| Asset-backed obligations (continued) | | | | | | | | |
| Santander Drive Auto Receivables Trust, Series 2023-6, Class A3, 5.93% 7/17/20281 | | USD | 5,270 | | | $ | 5,362 | |
| Santander Drive Auto Receivables Trust, Series 2023-5, Class A3, 6.02% 9/15/20281 | | | 3,536 | | | | 3,590 | |
| Santander Drive Auto Receivables Trust, Series 2022-5, Class C, 4.74% 10/15/20281 | | | 5,663 | | | | 5,580 | |
| Santander Drive Auto Receivables Trust, Series 2022-6, Class C, 4.96% 11/15/20281 | | | 4,624 | | | | 4,561 | |
| Santander Drive Auto Receivables Trust, Series 2023-4, Class B, 5.77% 12/15/20281 | | | 4,957 | | | | 5,029 | |
| Santander Drive Auto Receivables Trust, Series 2023-1, Class C, 5.09% 5/15/20301 | | | 3,968 | | | | 3,939 | |
| Santander Drive Auto Receivables Trust, Series 2023-3, Class C, 5.77% 11/15/20301 | | | 5,960 | | | | 6,042 | |
| Santander Drive Auto Receivables Trust, Series 2022-7, Class C, 6.69% 3/17/20311 | | | 2,368 | | | | 2,415 | |
| SFS Auto Receivables Securitization Trust, Series 2023-1, Class A2A, 5.89% 3/22/20271,4 | | | 13,526 | | | | 13,552 | |
| SFS Auto Receivables Securitization Trust, Series 2023-1, Class A3, 5.47% 10/20/20281,4 | | | 4,569 | | | | 4,619 | |
| SFS Auto Receivables Securitization Trust, Series 2023-1, Class A4, 5.47% 12/20/20291,4 | | | 2,641 | | | | 2,680 | |
| SFS Auto Receivables Securitization Trust, Series 2023-1, Class B, 5.71% 1/22/20301,4 | | | 2,244 | | | | 2,263 | |
| SFS Auto Receivables Securitization Trust, Series 2023-1, Class C, 5.97% 2/20/20311,4 | | | 3,578 | | | | 3,597 | |
| Signal Peak CLO, LLC, Series 2015-1, (3-month USD CME Term SOFR + 1.242%) 6.657% 4/20/20291,3,4 | | | 733 | | | | 732 | |
| SLAM, Ltd., Series 2021-1, Class A, 2.434% 6/15/20461,4 | | | 15,182 | | | | 13,151 | |
| SLAM, Ltd., Series 2021-1, Class B, 3.422% 6/15/20461,4 | | | 2,795 | | | | 2,354 | |
| SMB Private Education Loan Trust, Series 2023-C, Class A1A, 5.67% 11/15/20521,4 | | | 3,829 | | | | 3,853 | |
| SMB Private Education Loan Trust, Series 2023-C, Class A1B, (30-day Average USD-SOFR + 1.55%) 6.888% 11/15/20521,3,4 | | | 2,971 | | | | 2,977 | |
| SMB Private Education Loan Trust, Series 2021-A, Class APT2, 1.07% 1/15/20531,4 | | | 4,303 | | | | 3,770 | |
| SOLRR Aircraft Aviation Holding, Ltd., Series 2021-1, Class A, 2.636% 10/15/20461,4 | | | 12,074 | | | | 10,436 | |
| Sound Point CLO, Ltd., Series 2015-1RA, Class AR, (3-month USD CME Term SOFR + 1.342%) 6.735% 4/15/20301,3,4 | | | 1,311 | | | | 1,311 | |
| Sound Point CLO, Ltd., Series 2020-3, Class D, (3-month USD CME Term SOFR + 3.912%) 9.29% 1/25/20321,3,4 | | | 2,500 | | | | 2,435 | |
| Sound Point CLO, Ltd., Series 2021-1, Class C1, (3-month USD CME Term SOFR + 2.562%) 7.94% 4/25/20341,3,4 | | | 2,000 | | | | 1,950 | |
| SPRITE, Ltd., Series 2021-1, Class A, 3.75% 11/15/20461,4 | | | 16,706 | | | | 15,335 | |
| Steele Creek CLO, Ltd., Series 2019-2, Class D, (3-month USD CME Term SOFR + 4.612%) 10.005% 7/15/20321,3,4 | | | 3,000 | | | | 2,916 | |
| Stellar Jay Ireland DAC, Series 2021-1, Class A, 3.967% 10/15/20411,4 | | | 1,776 | | | | 1,513 | |
| Stonepeak Infrastructure Partners, Series 2021-1A, Class AA, 2.301% 2/28/20331,4 | | | 3,989 | | | | 3,669 | |
| Stonepeak Infrastructure Partners, Series 2021-1A, Class A, 2.675% 2/28/20331,4 | | | 5,321 | | | | 4,856 | |
| Stratus Static CLO, Ltd., Series 2021-1, Class A, (3-month USD CME Term SOFR + 1.062%) 6.477% 12/29/20291,3,4 | | | 268 | | | | 267 | |
| Stratus Static CLO, Ltd., Series 2022-1, Class A, (3-month USD CME Term SOFR + 1.75%) 7.166% 7/20/20301,3,4 | | | 7,990 | | | | 7,991 | |
| Stratus Static CLO, Ltd., Series 2022-3, Class A, (3-month USD CME Term SOFR + 2.15%) 7.566% 10/20/20311,3,4 | | | 11,177 | | | | 11,179 | |
| Stratus Static CLO, Ltd., Series 2022-3, Class B, (3-month USD CME Term SOFR + 3.05%) 8.466% 10/20/20311,3,4 | | | 11,033 | | | | 11,056 | |
| SuttonPark Structured Settlements, Series 2021-1, Class A, 1.95% 9/15/20751,4 | | | 9,679 | | | | 9,014 | |
| Sycamore Tree CLO, Ltd., Series 2023-3, Class A1, (3-month USD CME Term SOFR + 2.20%) 7.616% 4/20/20351,3,4 | | | 23,500 | | | | 23,520 | |
| Sycamore Tree CLO, Ltd., Series 2023-4, Class D, (3-month USD CME Term SOFR + 5.55%) 10.889% 10/20/20361,3,4 | | | 2,000 | | | | 2,040 | |
| Symphony CLO, Ltd., Series 2020-24, Class D, (3-month USD CME Term SOFR + 3.662%) 9.074% 1/23/20321,3,4 | | | 1,250 | | | | 1,232 | |
| Symphony CLO, Ltd., Series 2023-39, Class B, (3-month USD CME Term SOFR + 2.30%) 7.712% 4/25/20341,3,4 | | | 3,000 | | | | 3,007 | |
| Symphony Static CLO, Ltd., Series 2021-1, Class A, (3-month USD CME Term SOFR + 1.092%) 6.47% 10/25/20291,3,4 | | | 1,813 | | | | 1,805 | |
| Synchrony Card Issuance Trust, Series 2023-A, Class A, 5.54% 7/15/20291 | | | 42,659 | | | | 43,484 | |
| TAL Advantage V, LLC, Series 2020-1A, Class A, 2.05% 9/20/20451,4 | | | 15,241 | | | | 13,853 | |
| TCW Gem, Ltd., CLO, Series 2020-1, Class DRR, (3-month USD CME Term SOFR + 3.662%) 9.077% 4/20/20341,3,4 | | | 750 | | | | 706 | |
| Textainer Marine Containers, Ltd., Series 2020-1A, Class A, 2.73% 8/21/20451,4 | | | 11,750 | | | | 10,978 | |
| Textainer Marine Containers, Ltd., Series 2020-1A, Class B, 4.94% 8/21/20451,4 | | | 4,726 | | | | 4,525 | |
| Textainer Marine Containers, Ltd., Series 2020-2A, Class A, 2.10% 9/20/20451,4 | | | 9,989 | | | | 9,053 | |
| Textainer Marine Containers, Ltd., Series 2021-2A, Class A, 2.23% 4/20/20461,4 | | | 25,942 | | | | 23,192 | |
| TICP CLO, Ltd., Series 2019-14, Class A1R, (3-month USD CME Term SOFR + 1.342%) 6.757% 10/20/20321,3,4 | | | 1,000 | | | | 998 | |
| TIF Funding II, LLC, Series 2020-1A, Class B, 3.82% 8/20/20451,4 | | | 1,366 | | | | 1,253 | |
| | |
| 70 | The Bond Fund of America |
| Bonds, notes & other debt instruments (continued) | | Principal amount
(000) | | | Value
(000) | |
| Asset-backed obligations (continued) | | | | | | | | |
| Toyota Auto Loan Extended Note Trust, Series 2019-1, Class A, 2.56% 11/25/20311,4 | | USD | 7,250 | | | $ | 7,160 | |
| Toyota Auto Loan Extended Note Trust, Series 2020-1, Class A, 1.35% 5/25/20331,4 | | | 5,335 | | | | 5,066 | |
| Toyota Auto Loan Extended Note Trust, Series 2021-1, Class A, 1.07% 2/27/20341,3,4 | | | 27,912 | | | | 25,734 | |
| Toyota Auto Loan Extended Note Trust, Series 2023-1, Class A, 4.93% 6/25/20361,4 | | | 39,268 | | | | 39,676 | |
| Toyota Auto Receivables Owner Trust, Series 2023-C, Class A3, 5.16% 4/17/20281 | | | 2,489 | | | | 2,508 | |
| Toyota Auto Receivables Owner Trust, Series 2023-C, Class A4, 5.01% 2/15/20291 | | | 963 | | | | 972 | |
| Toyota Lease Owner Trust, Series 2023-A, Class A2, 5.30% 8/20/20251,4 | | | 11,264 | | | | 11,249 | |
| Tralee CDO, Ltd., Series 2021-7, Class D, (3-month USD CME Term SOFR + 3.442%) 8.82% 4/25/20341,3,4 | | | 1,000 | | | | 956 | |
| Trestles CLO, Ltd., Series 2023-6, Class A, (3-month USD CME Term SOFR + 1.70%) 7.08% 1/25/20361,3,4 | | | 45,000 | | | | 44,992 | |
| Trimaran Advisors CAVU, CLO, Series 2019-2, Class C, (3-month USD CME Term SOFR + 4.982%) 10.377% 11/26/20321,3,4 | | | 1,265 | | | | 1,270 | |
| Trinitas CLO, Ltd., Series 2023-22A, Class D, (3-month USD CME Term SOFR + 6.19%) 11.263% 7/20/20361,3,4 | | | 1,500 | | | | 1,509 | |
| Triton Container Finance VIII, LLC, Series 2020-1, Class A, 2.11% 9/20/20451,4 | | | 12,018 | | | | 10,698 | |
| Triton Container Finance VIII, LLC, Series 2021-1, Class A, 1.86% 3/20/20461,4 | | | 11,127 | | | | 9,712 | |
| Triton Container Finance VIII, LLC, Series 2021-1A, Class B, 2.58% 3/20/20461,4 | | | 884 | | | | 762 | |
| TSTAT 2022-1, Ltd., Series 2022-1, Class A2R, (3-month USD CME Term SOFR + 1.90%) 7.28% 7/20/20311,3,4 | | | 14,971 | | | | 14,997 | |
| TSTAT 2022-1, Ltd., Series 2022-1, Class BR, (3-month USD CME Term SOFR + 2.35%) 7.73% 7/20/20311,3,4 | | | 21,000 | | | | 21,052 | |
| TSTAT 2022-1, Ltd., Series 2022-1, Class CR, (3-month USD CME Term SOFR + 2.85%) 8.23% 7/20/20311,3,4 | | | 2,500 | | | | 2,509 | |
| Valley Stream Park CLO, Ltd., Series 2022-1, Class AR, (3-month USD CME Term SOFR + 1.63%) 7.046% 10/20/20341,3,4 | | | 10,000 | | | | 10,003 | |
| Venture CDO, Ltd., CLO, Series 2017-29, Class AR, (3-month USD CME Term SOFR + 1.252%) 6.631% 9/7/20301,3,4 | | | 1,264 | | | | 1,262 | |
| Venture CDO, Ltd., CLO, Series 2018-32, Class A2A, (3-month USD CME Term SOFR + 1.332%) 6.727% 7/18/20311,3,4 | | | 1,480 | | | | 1,478 | |
| Verizon Master Trust, Series 2022-7, Class A1A, 5.23% 11/22/2027 (5.98% on 11/20/2024)1,6 | | | 2,425 | | | | 2,426 | |
| Verizon Master Trust, Series 2023-2, Class A, 4.89% 4/13/20281 | | | 8,677 | | | | 8,654 | |
| Verizon Master Trust, Series 2023-3, Class A, 4.73% 4/21/20311,4 | | | 21,370 | | | | 21,550 | |
| Vibrant CLO, Ltd., Series 2017-7, Class A1R, (3-month USD CME Term SOFR + 1.302%) 6.717% 9/15/20301,3,4 | | | 2,998 | | | | 2,996 | |
| Vibrant CLO, Ltd., Series 2023-16, Class A2, (3-month USD CME Term SOFR + 2.80%) 8.194% 4/15/20361,3,4 | | | 2,000 | | | | 2,006 | |
| Wellfleet CLO, Ltd., Series 2022-1, Class A2, (3-month USD CME Term SOFR + 1.95%) 7.344% 4/15/20341,3,4 | | | 5,000 | | | | 4,910 | |
| Wellfleet CLO, Ltd., Series 2022-1, Class C, (3-month USD CME Term SOFR + 2.85%) 8.253% 4/15/20341,3,4 | | | 1,100 | | | | 1,102 | |
| Westlake Automobile Receivables Trust, Series 2022-2A, Class A2A, 3.36% 8/15/20251,4 | | | 30 | | | | 30 | |
| Westlake Automobile Receivables Trust, Series 2020-3A, Class C, 1.24% 11/17/20251,4 | | | 107 | | | | 106 | |
| Westlake Automobile Receivables Trust, Series 2020-3A, Class D, 1.65% 2/17/20261,4 | | | 8,060 | | | | 7,933 | |
| Westlake Automobile Receivables Trust, Series 2023-1, Class A2A, 5.51% 6/15/20261,4 | | | 2,032 | | | | 2,030 | |
| Westlake Automobile Receivables Trust, Series 2021-2, Class C, 0.89% 7/15/20261,4 | | | 13,309 | | | | 13,075 | |
| Westlake Automobile Receivables Trust, Series 2023-2, Class A2A, 5.87% 7/15/20261,4 | | | 950 | | | | 950 | |
| Westlake Automobile Receivables Trust, Series 2021-2, Class D, 1.23% 12/15/20261,4 | | | 8,825 | | | | 8,397 | |
| Westlake Automobile Receivables Trust, Series 2023-4, Class A2, 6.23% 1/15/20271,4 | | | 12,426 | | | | 12,497 | |
| Westlake Automobile Receivables Trust, Series 2023-2, Class A3, 5.80% 2/16/20271,4 | | | 12,615 | | | | 12,658 | |
| Westlake Automobile Receivables Trust, Series 2022-1A, Class D, 3.49% 3/15/20271,4 | | | 5,523 | | | | 5,328 | |
| Westlake Automobile Receivables Trust, Series 2023-3, Class A3, 5.82% 5/17/20271,4 | | | 21,780 | | | | 21,899 | |
| Westlake Automobile Receivables Trust, Series 2022-3, Class B, 5.99% 12/15/20271,4 | | | 5,950 | | | | 5,961 | |
| Westlake Automobile Receivables Trust, Series 2022-3, Class C, 6.44% 12/15/20271,4 | | | 4,531 | | | | 4,551 | |
| Westlake Automobile Receivables Trust, Series 2023-1, Class A3, 5.21% 1/18/20281,4 | | | 993 | | | | 991 | |
| Westlake Automobile Receivables Trust, Series 2023-1, Class B, 5.41% 1/18/20281,4 | | | 1,062 | | | | 1,057 | |
| Westlake Automobile Receivables Trust, Series 2023-1, Class C, 5.74% 8/15/20281,4 | | | 2,059 | | | | 2,053 | |
| Westlake Automobile Receivables Trust, Series 2023-3, Class B, 5.92% 9/15/20281,4 | | | 13,431 | | | | 13,503 | |
| Westlake Automobile Receivables Trust, Series 2023-3, Class C, 6.02% 9/15/20281,4 | | | 15,698 | | | | 15,762 | |
| Westlake Automobile Receivables Trust, Series 2023-1, Class D, 6.79% 11/15/20281,4 | | | 4,024 | | | | 4,074 | |
| Westlake Automobile Receivables Trust, Series 2023-3, Class D, 6.47% 3/15/20291,4 | | | 8,740 | | | | 8,752 | |
| Wind River CLO, Ltd., Series 2021-3A, Class A, (3-month USD CME Term SOFR + 1.412%) 6.827% 7/20/20331,3,4 | | | 311 | | | | 309 | |
| Wind River CLO, Ltd., Series 2019-2, Class CR, (3-month USD CME Term SOFR + 2.25%) 7.644% 1/15/20351,3,4 | | | 2,000 | | | | 1,927 | |
| | |
| The Bond Fund of America | 71 |
| Bonds, notes & other debt instruments (continued) | | Principal amount
(000) | | | Value
(000) | |
| Asset-backed obligations (continued) | | | | | | | | |
| Wind River CLO, Ltd., Series 2022-1A, Class A, (3-month USD CME Term SOFR + 1.53%) 6.946% 7/20/20351,3,4 | | USD | 5,000 | | | $ | 4,991 | |
| World Financial Network Credit Card Master Trust, Series 2023-A, Class A, 5.02% 3/15/20301 | | | 8,349 | | | | 8,363 | |
| World Omni Auto Receivables Trust, Series 2023-C, Class A3, 5.15% 11/15/20281 | | | 2,033 | | | | 2,051 | |
| World Omni Auto Receivables Trust, Series 2023-C, Class A4, 5.03% 11/15/20291 | | | 1,626 | | | | 1,640 | |
| | | | | | | | 4,088,037 | |
| | | | | | | | | |
| Bonds & notes of governments & government agencies outside the U.S. 0.87% | | | | | | | | |
| Asian Development Bank 4.125% 9/27/2024 | | | 7,629 | | | | 7,577 | |
| Asian Development Bank 1.50% 10/18/2024 | | | 15,979 | | | | 15,550 | |
| Asian Development Bank 2.50% 11/2/2027 | | | 3,451 | | | | 3,264 | |
| Asian Development Bank 2.75% 1/19/2028 | | | 3 | | | | 3 | |
| Asian Development Bank 3.875% 9/28/2032 | | | 1,768 | | | | 1,744 | |
| British Columbia (Province of) 4.20% 7/6/2033 | | | 24,796 | | | | 24,491 | |
| Caisse d’Amortissement de la Dette Sociale 1.125% 11/29/20244 | | | 10,000 | | | | 9,653 | |
| Colombia (Republic of) 7.50% 2/2/2034 | | | 17,480 | | | | 18,494 | |
| CPPIB Capital, Inc. 0.50% 9/16/20244 | | | 3,887 | | | | 3,765 | |
| CPPIB Capital, Inc. (USD-SOFR + 1.25%) 5.38% 3/11/20263,4 | | | 6,621 | | | | 6,754 | |
| CPPIB Capital, Inc. 0.875% 9/9/20264 | | | 8,156 | | | | 7,457 | |
| Development Bank of Japan, Inc. 1.75% 2/18/20254 | | | 6,928 | | | | 6,684 | |
| Development Bank of Japan, Inc. 1.25% 10/20/20264 | | | 8,230 | | | | 7,544 | |
| Development Bank of Japan, Inc. 1.75% 10/20/20314 | | | 3,068 | | | | 2,548 | |
| Dominican Republic 7.05% 2/3/20314 | | | 4,690 | | | | 4,936 | |
| Greece (Hellenic Republic of) 1.50% 6/18/2030 | | EUR | 77,550 | | | | 79,127 | |
| Greece (Hellenic Republic of) 0.75% 6/18/2031 | | | 68,950 | | | | 65,200 | |
| Greece (Hellenic Republic of) 4.25% 6/15/2033 | | | 176,100 | | | | 213,421 | |
| Indonesia (Republic of) 6.625% 2/15/2034 | | IDR | 83,964,000 | | | | 5,458 | |
| Indonesia (Republic of), Series 96, 7.00% 2/15/2033 | | | 309,196,000 | | | | 20,824 | |
| Indonesia (Republic of), Series 68, 8.375% 3/15/2034 | | | 377,840,000 | | | | 27,447 | |
| Indonesia Asahan Aluminium (Persero) PT 6.53% 11/15/2028 | | USD | 8,528 | | | | 8,953 | |
| Indonesia Asahan Aluminium (Persero) PT 6.53% 11/15/20284 | | | 1,867 | | | | 1,960 | |
| Indonesia Asahan Aluminium (Persero) PT 5.45% 5/15/2030 | | | 8,000 | | | | 8,080 | |
| Indonesia Asahan Aluminium (Persero) PT 6.757% 11/15/20484 | | | 655 | | | | 698 | |
| Indonesia Asahan Aluminium (Persero) PT 5.80% 5/15/2050 | | | 3,000 | | | | 2,918 | |
| Indonesia Asahan Aluminium (Persero) PT 5.80% 5/15/20504 | | | 2,690 | | | | 2,617 | |
| Inter-American Development Bank 4.50% 5/15/2026 | | | 11,746 | | | | 11,823 | |
| Inter-American Development Bank 1.125% 7/20/2028 | | | 1 | | | | 1 | |
| International Bank for Reconstruction and Development 1.625% 1/15/2025 | | | 4 | | | | 4 | |
| International Bank for Reconstruction and Development 0.75% 3/11/2025 | | | 4,974 | | | | 4,750 | |
| Japan Bank for International Cooperation 2.875% 4/14/2025 | | | 5,488 | | | | 5,353 | |
| Japan Bank for International Cooperation 1.875% 4/15/2031 | | | 6,576 | | | | 5,552 | |
| KfW 5.125% 9/29/2025 | | | 22,405 | | | | 22,657 | |
| OMERS Finance Trust 3.50% 4/19/20324 | | | 3,470 | | | | 3,201 | |
| Ontario Teachers’ Finance Trust 0.875% 9/21/20264 | | | 7,433 | | | | 6,778 | |
| Ontario Teachers’ Finance Trust 3.00% 4/13/20274 | | | 4,279 | | | | 4,102 | |
| Ontario Teachers’ Finance Trust 2.00% 4/16/20314 | | | 6,787 | | | | 5,735 | |
| Panama (Republic of) 3.75% 4/17/2026 | | | 22,039 | | | | 20,762 | |
| Panama (Republic of) 2.252% 9/29/2032 | | | 1,462 | | | | 1,070 | |
| Peru (Republic of) 2.783% 1/23/2031 | | | 18,960 | | | | 16,558 | |
| PETRONAS Capital, Ltd. 3.50% 4/21/20304 | | | 4,450 | | | | 4,181 | |
| PETRONAS Capital, Ltd. 4.55% 4/21/20504 | | | 5,695 | | | | 5,242 | |
| PSP Capital, Inc. 1.625% 10/26/20284 | | | 6,054 | | | | 5,371 | |
| Swedish Export Credit Corp. 3.625% 9/3/2024 | | | 4,489 | | | | 4,439 | |
| United Mexican States 4.875% 5/19/2033 | | | 390 | | | | 377 | |
| United Mexican States 6.35% 2/9/2035 | | | 743 | | | | 780 | |
| United Mexican States 5.00% 4/27/2051 | | | 5,100 | | | | 4,440 | |
| United Mexican States 4.40% 2/12/2052 | | | 229 | | | | 182 | |
| United Mexican States 6.338% 5/4/2053 | | | 7,175 | | | | 7,322 | |
| United Mexican States 3.75% 4/19/2071 | | | 465 | | | | 312 | |
| | | | | | | | 698,159 | |
| | |
| 72 | The Bond Fund of America |
| Bonds, notes & other debt instruments (continued) | | Principal amount
(000) | | | Value
(000) | |
| Municipals 0.43% | | | | | | | | |
| California 0.00% | | | | | | | | |
| Golden State Tobacco Securitization Corp., Enhanced Tobacco Settlement Asset- Backed Bonds, Series 2021-B, 2.746% 6/1/2034 | | USD | 2,685 | | | $ | 2,265 | |
| | | | | | | | | |
| Connecticut 0.00% | | | | | | | | |
| Housing Fin. Auth., Housing Mortgage Fin. Program Rev. Ref. Bonds, Series 2015-C-1, 3.50% 11/15/2045 | | | 475 | | | | 473 | |
| | | | | | | | | |
| Illinois 0.33% | | | | | | | | |
| City of Chicago, Board of Education, Unlimited Tax G.O. Bonds (Dedicated Rev.), Series 2010-C, 6.319% 11/1/2029 | | | 14,400 | | | | 14,432 | |
| City of Chicago, Board of Education, Unlimited Tax G.O. Bonds (Dedicated Rev.), Series 2009-E, 6.138% 12/1/2039 | | | 57,980 | | | | 54,947 | |
| City of Chicago, Board of Education, Unlimited Tax G.O. Bonds (Dedicated Rev.), Series 2010-D, 6.519% 12/1/2040 | | | 5,770 | | | | 5,534 | |
| City of Chicago, Board of Education, Unlimited Tax G.O. Bonds (Qualified School Construction Bonds), Series 2009-G, 1.75% 12/15/2025 | | | 13,760 | | | | 12,657 | |
| G.O. Bonds, Series 2019-A, 5.70% 4/1/2031 | | | 7,530 | | | | 7,721 | |
| G.O. Bonds, Pension Funding, Series 2003, 5.10% 6/1/2033 | | | 161,540 | | | | 159,991 | |
| G.O. Bonds, Taxable Build America Bonds, Series 2010-1, 6.63% 2/1/2035 | | | 5,285 | | | | 5,540 | |
| Housing Dev. Auth., Multi Family Housing Rev. Bonds (Marshall Field Garden Apartment Homes), Series 2015, (SIFMA Municipal Swap Index + 1.00%) 4.87% 5/15/2050 (put 5/15/2025)3 | | | 6,275 | | | | 6,258 | |
| Housing Dev. Auth., Rev. Bonds, Series 2016-A, 4.00% 4/1/2046 | | | 310 | | | | 309 | |
| | | | | | | | 267,389 | |
| | | | | | | | | |
| Iowa 0.00% | | | | | | | | |
| Fin. Auth., Single Family Mortgage Bonds (Mortgage-Backed Securities Program), Series 2016-A, 4.00% 7/1/2046 | | | 250 | | | | 250 | |
| | | | | | | | | |
| Kentucky 0.00% | | | | | | | | |
| Housing Corp., Housing Rev. Bonds, Series 2013-D, 3.50% 1/1/2033 | | | 435 | | | | 435 | |
| | | | | | | | | |
| Maine 0.00% | | | | | | | | |
| Housing Auth., Mortgage Purchase Rev. Ref. Bonds, Series 2015-E-1, AMT, 3.50% 11/15/2035 | | | 320 | | | | 318 | |
| | | | | | | | | |
| Maryland 0.00% | | | | | | | | |
| Community Dev. Administration, Dept. of Housing and Community Dev., Residential Rev. Bonds, Series 2014-B, AMT, 3.25% 9/1/2044 | | | 245 | | | | 244 | |
| | | | | | | | | |
| Massachusetts 0.00% | | | | | | | | |
| Housing Fin. Agcy., Single Family Housing Rev. Bonds, Series 178, 3.50% 6/1/2042 | | | 150 | | | | 149 | |
| | | | | | | | | |
| Michigan 0.01% | | | | | | | | |
| Housing Dev. Auth., Single Family Mortgage Rev. Bonds, Series 2016-B, 3.50% 6/1/2047 | | | 4,185 | | | | 4,144 | |
| | | | | | | | | |
| Minnesota 0.00% | | | | | | | | |
| Housing Fin. Agcy., Residential Housing Fin. Bonds, Series 2015-A, AMT, 4.00% 1/1/2041 | | | 95 | | | | 95 | |
| Housing Fin. Agcy., Residential Housing Fin. Bonds, Series 2014-C, AMT, 4.00% 1/1/2045 | | | 1,295 | | | | 1,291 | |
| Housing Fin. Agcy., Residential Housing Fin. Bonds, Series 2015-E, AMT, 3.50% 1/1/2046 | | | 790 | | | | 784 | |
| | | | | | | | 2,170 | |
| | |
| The Bond Fund of America | 73 |
| Bonds, notes & other debt instruments (continued) | | Principal amount
(000) | | | Value
(000) | |
| Municipals (continued) | | | | | | | | |
| Missouri 0.00% | | | | | | | | |
| Housing Dev. Commission, Single Family Mortgage Rev. Bonds (Special Homeownership Loan Program), Series 2015-A, 3.75% 5/1/2038 | | USD | 265 | | | $ | 264 | |
| | | | | | | | | |
| Nebraska 0.00% | | | | | | | | |
| Investment Fin. Auth., Single Family Housing Rev. Bonds, Series 2015-C, 3.50% 9/1/2045 | | | 140 | | | | 140 | |
| Investment Fin. Auth., Single Family Housing Rev. Bonds, Series 2016-A, 3.50% 9/1/2046 | | | 990 | | | | 981 | |
| | | | | | | | 1,121 | |
| | | | | | | | | |
| New Jersey 0.01% | | | | | | | | |
| Econ. Dev. Auth., State Pension Funding Bonds, Series 1997-A, National insured, 7.425% 2/15/2029 | | | 4,400 | | | | 4,757 | |
| | | | | | | | | |
| New York 0.00% | | | | | | | | |
| Mortgage Agcy., Homeowner Mortgage Rev. Bonds, Series 52, AMT, 3.50% 10/1/2030 | | | 365 | | | | 363 | |
| | | | | | | | | |
| Ohio 0.03% | | | | | | | | |
| Cleveland-Cuyahoga Port Auth., Federal Lease Rev. Bonds (VA Cleveland Health Care Center Project), Series 2021, 4.425% 5/1/2031 | | | 24,000 | | | | 21,039 | |
| | | | | | | | | |
| South Carolina 0.00% | | | | | | | | |
| Housing Fin. and Dev. Auth., Mortgage Rev. Ref. Bonds, Series 2016-A, 4.00% 7/1/2036 | | | 295 | | | | 294 | |
| Housing Fin. Auth., Mortgage Rev. Ref. Bonds, Series 2014, AMT, 4.00% 7/1/2041 | | | 700 | | | | 699 | |
| | | | | | | | 993 | |
| | | | | | | | | |
| Tennessee 0.00% | | | | | | | | |
| Housing Dev. Agcy., Homeownership Program Bonds, Series 2015-A, 3.50% 7/1/2045 | | | 425 | | | | 422 | |
| Housing Dev. Agcy., Residential Fin. Program Bonds, Series 2013-2-A, AMT, 4.00% 7/1/2043 | | | 25 | | | | 25 | |
| Housing Dev. Agcy., Residential Fin. Program Bonds, Series 2015-1-A, AMT, 4.00% 7/1/2045 | | | 745 | | | | 742 | |
| Housing Dev. Agcy., Residential Fin. Program Bonds, Series 2015-2-A, AMT, 4.00% 1/1/2046 | | | 1,100 | | | | 1,095 | |
| | | | | | | | 2,284 | |
| | | | | | | | | |
| Texas 0.01% | | | | | | | | |
| Grand Parkway Transportation Corp., Grand Parkway System Toll Rev. Ref. Bonds, Series 2020-B, 3.236% 10/1/2052 | | | 8,155 | | | | 6,146 | |
| | | | | | | | | |
| Utah 0.00% | | | | | | | | |
| Housing Corp., Single Family Mortgage Bonds, Class III, Series 2015-D-2, 4.00% 1/1/2045 | | | 385 | | | | 384 | |
| | | | | | | | | |
| Wisconsin 0.04% | | | | | | | | |
| Housing and Econ. Dev. Auth., Home Ownership Rev. Bonds, Series 2015-A, AMT, 4.00% 9/1/2045 | | | 290 | | | | 289 | |
| Housing and Econ. Dev. Auth., Home Ownership Rev. Bonds, Series 2016-A, AMT, 3.50% 3/1/2046 | | | 585 | | | | 580 | |
| Public Fin. Auth., Federal Lease Rev. Bonds (Fort Sam Acquisition Fncg.), Series 2022, 4.95% 3/1/2034 | | | 28,425 | | | | 26,931 | |
| | | | | | | | 27,800 | |
| | | | | | | | | |
| Wyoming 0.00% | | | | | | | | |
| Community Dev. Auth., Housing Rev. Bonds, Series 2015-6, 4.00% 6/1/2045 | | | 70 | | | | 70 | |
| | | | | | | | | |
| Total municipals | | | | | | | 343,058 | |
| | |
| 74 | The Bond Fund of America |
| Bonds, notes & other debt instruments (continued) | | | Principal amount
(000) | | | Value
(000) | |
| Federal agency bonds & notes 0.03% | | | | | | | | | | | | |
| Fannie Mae 1.625% 1/7/2025 | | | | | | USD | 7 | | | $ | 7 | |
| Federal Farm Credit Banks 1.60% 7/13/2033 | | | | | | | 1,957 | | | | 1,549 | |
| Korea Gas Corp. 3.875% 2/12/2024 | | | | | | | 12,000 | | | | 11,980 | |
| Korea National Oil Corp. 3.25% 7/10/2024 | | | | | | | 2,000 | | | | 1,979 | |
| Korea National Oil Corp. 2.125% 4/18/2027 | | | | | | | 2,069 | | | | 1,906 | |
| Korea National Oil Corp. 2.625% 4/18/2032 | | | | | | | 3,000 | | | | 2,538 | |
| Tennessee Valley Authority 3.875% 3/15/2028 | | | | | | | 1,734 | | | | 1,727 | |
| | | | | | | | | | | | 21,686 | |
| | | | | | | | | | | | | |
| Preferred securities 0.00% | | | | | | | | | | | | |
| Huntington Bancshares, Inc., Series F, 5.625% preferred depositary shares (10-year UST Yield Curve Rate T Note Constant Maturity + 4.945% on 7/15/2030)6 | | | 1,476 | | | | 1,340 | |
| | | | | | | | | | | | | |
| Total bonds, notes & other debt instruments (cost: $78,853,846,000) | | | | | | | | 77,417,068 | |
| | | | | | | | | | | | | |
| Common stocks 0.04% | | | | | | Shares | | | | | |
| Health care 0.04% | | | | | | | | | | | | |
| Rotech Healthcare, Inc.7,11,14 | | | | | | | 342,069 | | | | 35,917 | |
| | | | | | | | | | | | | |
| Consumer discretionary 0.00% | | | | | | | | | | | | |
| NMG Parent, LLC14 | | | | | | | 4,595 | | | | 505 | |
| MYT Holding Co., Class B7,14 | | | | | | | 521,407 | | | | 391 | |
| | | | | | | | | | | | 896 | |
| | | | | | | | | | | | | |
| Energy 0.00% | | | | | | | | | | | | |
| Constellation Oil Services Holding SA, Class B-17,14 | | | | | | | 1,568,158 | | | | 220 | |
| | | | | | | | | | | | | |
| Total common stocks (cost: $16,909,000) | | | | | | | | | | | 37,033 | |
| | | | | | | | | |
| Preferred securities 0.01% | | | | | | | | | | | | |
| Financials 0.01% | | | | | | | | | | | | |
| CoBank, ACB, Class E, 6.848% noncumulative preferred shares3,4 | | | | 6,250 | | | | 4,969 | |
| | | | | | | | | | | | | |
| Total preferred securities (cost: $5,820,000) | | | | | | | | | | | 4,969 | |
| | | | | | | | | |
| Rights & warrants 0.00% | | | | | | | | | | | | |
| Consumer discretionary 0.00% | | | | | | | | | | | | |
| NMG Parent, LLC, warrants, expire 9/24/202714 | | | | | | | 18,410 | | | | 147 | |
| | | | | | | | | | | | | |
| Total rights & warrants (cost: $111,000) | | | | | | | | | | | 147 | |
| | | | | | | | | |
| Short-term securities 16.00% | | | | | | | | | | | | |
| Money market investments 15.99% | | | | | | | | | | | | |
| Capital Group Central Cash Fund 5.44%15,16 | | | | | | | 128,980,578 | | | | 12,896,768 | |
| | | | | | | | | | | | | |
| | Weighted
average yield
at acquisition | | | Principal amount
(000) | | | | | |
| U.S. Treasury bills 0.01% | | | | | | | | | | | | |
| U.S. Treasury bill 8/8/2024 | | | 5.080 | % | | USD | 8,000 | | | | 7,770 | |
| | | | | | | | | | | | | |
| Total short-term securities (cost: $12,904,209,000) | | | | | | | | | | | 12,904,538 | |
| Total investment securities 112.05% (cost: $91,780,895,000) | | | | | | | | 90,363,755 | |
| Other assets less liabilities (12.05)% | | | | | | | | | | | (9,719,534 | ) |
| | | | | | | | | | | | | |
| Net assets 100.00% | | | | | | | | | | $ | 80,644,221 | |
| | | | | | | | | | | | | |
| The Bond Fund of America | 75 |
Futures contracts
| Contracts | | Type | | Number of
contracts | | Expiration
date | | | Notional
amount
(000) | | | | Value and
unrealized
appreciation
(depreciation)
at 12/31/2023
(000) | |
| 30 Day Federal Funds Futures | | Short | | 184 | | 5/1/2024 | | | USD(72,785) | | | $ | (54 | ) |
| 3 Month SOFR Futures | | Short | | 36,271 | | 3/20/2024 | | | (8,581,945 | ) | | | 1,672 | |
| 3 Month SOFR Futures | | Long | | 1,655 | | 3/19/2025 | | | 398,317 | | | | 3,776 | |
| 2 Year U.S. Treasury Note Futures | | Long | | 56,843 | | 4/3/2024 | | | 11,704,773 | | | | 96,087 | |
| 5 Year U.S. Treasury Note Futures | | Long | | 120,840 | | 4/3/2024 | | | 13,144,182 | | | | 258,071 | |
| 10 Year French Government Bond Futures | | Long | | 3,255 | | 3/11/2024 | | | 472,562 | | | | 16,498 | |
| 10 Year Euro-Bund Futures | | Short | | 3,098 | | 3/11/2024 | | | (469,297 | ) | | | (13,885 | ) |
| 10 Year Japanese Government Bond Futures | | Short | | 774 | | 3/20/2024 | | | (805,344 | ) | | | (2,807 | ) |
| 10 Year U.S. Treasury Note Futures | | Long | | 53,814 | | 3/28/2024 | | | 6,075,096 | | | | 141,856 | |
| 10 Year Ultra U.S. Treasury Note Futures | | Short | | 1,728 | | 3/28/2024 | | | (203,931 | ) | | | 174 | |
| 20 Year U.S. Treasury Bond Futures | | Short | | 24,967 | | 3/28/2024 | | | (3,119,315 | ) | | | (216,580 | ) |
| 30 Year Ultra U.S. Treasury Bond Futures | | Long | | 22,624 | | 3/28/2024 | | | 3,022,425 | | | | 266,705 | |
| | | | | | | | | | | | | $ | 551,513 | |
Forward currency contracts
| Contract amount | | | | | | | Unrealized
appreciation
(depreciation) | |
Currency purchased
(000) | | | Currency sold
(000) | | | Counterparty | | Settlement
date | | at 12/31/2023
(000) | |
| USD | 5,630 | | | EUR | 5,202 | | | Citibank | | 1/8/2024 | | $ | (116 | ) |
| USD | 6,724 | | | MXN | 116,925 | | | Goldman Sachs | | 1/8/2024 | | | (150 | ) |
| USD | 11,190 | | | EUR | 10,388 | | | Bank of America | | 1/8/2024 | | | (282 | ) |
| USD | 86,795 | | | EUR | 80,350 | | | Citibank | | 1/9/2024 | | | (1,947 | ) |
| USD | 8,402 | | | EUR | 7,650 | | | Standard Chartered Bank | | 1/22/2024 | | | (52 | ) |
| USD | 432,202 | | | EUR | 395,035 | | | Bank of America | | 1/22/2024 | | | (4,346 | ) |
| USD | 3,749 | | | AUD | 5,581 | | | Citibank | | 1/23/2024 | | | (57 | ) |
| USD | 14,516 | | | GBP | 11,473 | | | Standard Chartered Bank | | 1/23/2024 | | | (110 | ) |
| USD | 81,371 | | | AUD | 120,536 | | | Goldman Sachs | | 1/23/2024 | | | (840 | ) |
| | | | | | | | | | | | | $ | (7,900 | ) |
Swap contracts
Interest rate swaps
Centrally cleared interest rate swaps
| Receive | | Pay | | | | Notional | | Value at | | | Upfront premium
paid | | | Unrealized
appreciation
(depreciation) | |
| Rate | | Payment
frequency | | Rate | | Payment
frequency | | Expiration
date | | amount
(000) | | 12/31/2023
(000) | | | (received)
(000) | | | at 12/31/2023 (000) | |
| 4.8585% | | Annual | | U.S. EFFR | | Annual | | 1/12/2024 | | USD456,892 | | $ | (118 | ) | | $ | — | | | $ | (118 | ) |
| 4.8674% | | Annual | | U.S. EFFR | | Annual | | 1/12/2024 | | 669,408 | | | (171 | ) | | | — | | | | (171 | ) |
| 4.8615% | | Annual | | U.S. EFFR | | Annual | | 1/12/2024 | | 913,700 | | | (235 | ) | | | — | | | | (235 | ) |
| 3.497% | | Annual | | U.S. EFFR | | Annual | | 6/16/2024 | | 171,500 | | | (1,383 | ) | | | — | | | | (1,383 | ) |
| 3.52647% | | Annual | | U.S. EFFR | | Annual | | 6/16/2024 | | 461,406 | | | (3,660 | ) | | | — | | | | (3,660 | ) |
| 3.5291% | | Annual | | U.S. EFFR | | Annual | | 6/16/2024 | | 498,594 | | | (3,950 | ) | | | — | | | | (3,950 | ) |
| 3.4585% | | Annual | | U.S. EFFR | | Annual | | 6/17/2024 | | 26,567 | | | (219 | ) | | | — | | | | (219 | ) |
| 3.4325% | | Annual | | U.S. EFFR | | Annual | | 6/17/2024 | | 125,900 | | | (1,051 | ) | | | — | | | | (1,051 | ) |
| 4.912% | | Annual | | SOFR | | Annual | | 8/24/2025 | | 360,000 | | | 3,508 | | | | — | | | | 3,508 | |
| 4.8189% | | Annual | | SOFR | | Annual | | 8/25/2025 | | 360,000 | | | 2,981 | | | | — | | | | 2,981 | |
| 4.8195% | | Annual | | SOFR | | Annual | | 9/1/2025 | | 299,992 | | | 2,589 | | | | — | | | | 2,589 | |
| 4.9035% | | Annual | | SOFR | | Annual | | 9/14/2025 | | 300,008 | | | 3,170 | | | | — | | | | 3,170 | |
| 4.4555% | | Annual | | SOFR | | Annual | | 12/6/2025 | | 696,111 | | | 4,372 | | | | — | | | | 4,372 | |
| 4.28% | | Annual | | SOFR | | Annual | | 2/29/2028 | | 37,150 | | | 980 | | | | — | | | | 980 | |
| 4.269% | | Annual | | SOFR | | Annual | | 2/29/2028 | | 37,100 | | | 963 | | | | — | | | | 963 | |
| | |
| 76 | The Bond Fund of America |
Swap contracts (continued)
Interest rate swaps (continued)
Centrally cleared interest rate swaps (continued)
| Receive | | Pay | | | | Notional | | Value at | | Upfront
premium
Paid | | | Unrealized
appreciation
(depreciation) | |
| Rate | | Payment
frequency | | Rate | | Payment
frequency | | Expiration
date | | amount
(000) | | 12/31/2023
(000) | | (received) (000) | | | at 12/31/2023 (000) | |
| 3.998% | | Annual | | SOFR | | Annual | | 12/4/2028 | | USD | 291,102 | | | $ | 5,893 | | | $ | — | | | | $ | 5,893 | |
| SOFR | | Annual | | 3.2915% | | Annual | | 1/12/2033 | | | 30,370 | | | | 437 | | | | — | | | | | 437 | |
| SOFR | | Annual | | 4.15% | | Annual | | 5/15/2033 | | | 18,560 | | | | (992 | ) | | | — | | | | | (992 | ) |
| SOFR | | Annual | | 4.1615% | | Annual | | 5/15/2033 | | | 18,600 | | | | (1,012 | ) | | | — | | | | | (1,012 | ) |
| 4.0135% | | Annual | | SOFR | | Annual | | 8/21/2033 | | | 26,800 | | | | 1,158 | | | | — | | | | | 1,158 | |
| SOFR | | Annual | | 4.061% | | Annual | | 8/24/2033 | | | 83,000 | | | | (3,909 | ) | | | — | | | | | (3,909 | ) |
| SOFR | | Annual | | 3.9519% | | Annual | | 8/25/2033 | | | 83,000 | | | | (3,173 | ) | | | — | | | | | (3,173 | ) |
| SOFR | | Annual | | 3.8275% | | Annual | | 9/1/2033 | | | 68,300 | | | | (1,923 | ) | | | — | | | | | (1,923 | ) |
| SOFR | | Annual | | 3.997% | | Annual | | 9/14/2033 | | | 68,700 | | | | (2,893 | ) | | | — | | | | | (2,893 | ) |
| SOFR | | Annual | | 3.41% | | Annual | | 7/28/2045 | | | 319,700 | | | | 2,846 | | | | — | | | | | 2,846 | |
| | | | | | | | | | | | | | | $ | 4,208 | | | $ | — | | | | $ | 4,208 | |
Credit default swaps
Centrally cleared credit default swaps on credit indices — buy protection
Reference
index | | Financing rate paid | | Payment frequency | | Expiration date | | Notional
amount
(000) | | Value at 12/31/2023 (000) | | Upfront
premium paid (received) (000) | | | Unrealized
appreciation
(depreciation)
at 12/31/2023
(000) | |
| CDX.NA.IG.41 | | 1.00% | | Quarterly | | 12/20/2028 | | | USD462,500 | | | | $(8,988 | ) | | $ | (6,011 | ) | | | | $(2,977 | ) |
| | | | | | | | | | | | | | | | | | | | | | | | |
| Centrally cleared credit default swaps on credit indices — sell protection | | |
| | | | | | | | | | | | | | | | | | | | | | | | |
Financing
rate received | | Payment
frequency | | Reference
index | | Expiration
date | | Notional
amount
(000) | 17
| Value at
12/31/2023
(000) | 18
| Upfront
premium
paid
(received)
(000) | | | Unrealized
appreciation
(depreciation)
at 12/31/2023
(000) | |
| 5.00% | | Quarterly | | CDX.NA.HY.41 | | 12/20/2028 | | | USD260,370 | | | | $15,186 | | | | $1,816 | | | | | $13,370 | |
Investments in affiliates16
| | | Value at
1/1/2023
(000) | | | Additions
(000) | | | Reductions
(000) | | | Net
realized
gain (loss)
(000) | | | Net
unrealized
appreciation
(depreciation)
(000) | | | Value at 12/31/2023 (000) | | | Dividend
or interest
income
(000) | |
| Short-term securities 15.99% | | | | | | | | | | | | | | | | | | | | | | | | | | | | |
| Money market investments 15.99% | | | | | | | | | | | | | | | | | | | | | | | | | | | | |
| Capital Group Central Cash Fund 5.44%15 | | $ | 9,990,291 | | | $ | 35,513,110 | | | $ | 32,606,916 | | | $ | 1,526 | | | $ | (1,243 | ) | | $ | 12,896,768 | | | $ | 647,639 | |
| The Bond Fund of America | 77 |
Restricted securities11
| | | Acquisition
date(s) | | Cost
(000) | | | Value
(000) | | | Percent
of net
assets | |
| Rotech Healthcare, Inc.7,14 | | 9/26/2013 | | $ | 12,646 | | | $ | 35,917 | | | | .04 | % |
| Mission Lane Credit Card Master Trust, Series 2022-B, Class A1, 8.25% 1/15/20281,7 | | 12/6/2022 | | | 6,580 | | | | 6,599 | | | | .01 | |
| Mission Lane Credit Card Master Trust, Series 2022-B, Class A2, 8.73% 1/15/20281,7 | | 12/6/2022 | | | 1,050 | | | | 1,053 | | | | .00 | 19 |
| Modec Finance BV 7.84% 7/15/20267 | | 7/28/2023 | | | 5,000 | | | | 5,027 | | | | .01 | |
| Ste Transcore Holdings, Inc. 3.375% 5/5/2027 | | 6/26/2023 | | | 2,887 | | | | 2,893 | | | | .00 | 19 |
| Total | | | | $ | 28,163 | | | $ | 51,489 | | | | .06 | % |
| 1 | Principal payments may be made periodically. Therefore, the effective maturity date may be earlier than the stated maturity date. |
| 2 | Amount less than one thousand. |
| 3 | Coupon rate may change periodically. Reference rate and spread are as of the most recent information available. Some coupon rates are determined by the issuer or agent based on current market conditions; therefore, the reference rate and spread are not available. |
| 4 | Acquired in a transaction exempt from registration under Rule 144A or, for commercial paper, Section 4(a)(2) of the Securities Act of 1933. May be resold in the U.S. in transactions exempt from registration, normally to qualified institutional buyers. The total value of all such securities was $10,367,976,000, which represented 12.86% of the net assets of the fund. |
| 5 | Purchased on a TBA basis. |
| 6 | Step bond; coupon rate may change at a later date. |
| 7 | Value determined using significant unobservable inputs. |
| 8 | Securities referencing LIBOR are expected to transition to an alternative reference rate by the security’s next scheduled coupon reset date. |
| 9 | Scheduled interest and/or principal payment was not received. |
| 10 | Loan participations and assignments; may be subject to legal or contractual restrictions on resale. The total value of all such loans was $9,498,000, which represented .01% of the net assets of the fund. |
| 11 | Restricted security, other than Rule 144A securities or commercial paper issued pursuant to Section 4(a)(2) of the Securities Act of 1933. The total value of all such restricted securities was $51,489,000, which represented .06% of the net assets of the fund. |
| 12 | All or a portion of this security was pledged as collateral. The total value of pledged collateral was $470,865,000, which represented .58% of the net assets of the fund. |
| 13 | Index-linked bond whose principal amount moves with a government price index. |
| 14 | Security did not produce income during the last 12 months. |
| 15 | Rate represents the seven-day yield at 12/31/2023. |
| 16 | Part of the same “group of investment companies” as the fund as defined under the Investment Company Act of 1940, as amended. |
| 17 | The maximum potential amount the fund may pay as a protection seller should a credit event occur. |
| 18 | The prices and resulting values for credit default swap indices serve as an indicator of the current status of the payment/performance risk. As the value of a sell protection credit default swap increases or decreases, when compared to the notional amount of the swap, the payment/performance risk may decrease or increase, respectively. |
| 19 | Amount less than .01%. |
Key to abbreviation(s)
Agcy. = Agency
AMT = Alternative Minimum Tax
Assn. = Association
AUD = Australian dollars
Auth. = Authority
BBSW = Bank Bill Swap Rate
CLO = Collateralized Loan Obligations
CME = CME Group
CMO = Collateralized Mortgage Obligations
DAC = Designated Activity Company
Dept. = Department
Dev. = Development
Econ. = Economic
EFFR = Effective Federal Funds Rate
EUR = Euros
EURIBOR = Euro Interbank Offered Rate
Fin. = Finance
Fncg. = Financing
G.O. = General Obligation
GBP = British pounds
ICE = Intercontinental Exchange, Inc.
IDR = Indonesian rupiah
LIBOR = London Interbank Offered Rate
MXN = Mexican pesos
Ref. = Refunding
Rev. = Revenue
SIFMA = Securities Industry and Financial Markets Association
SOFR = Secured Overnight Financing Rate
TBA = To be announced
USD = U.S. dollars
Refer to the notes to financial statements.
| 78 | The Bond Fund of America |
Financial statements
| Statement of assets and liabilities | |
| at December 31, 2023 | (dollars in thousands) |
| Assets: | | | | | | | | |
| Investment securities, at value: | | | | | | | | |
| Unaffiliated issuers (cost: $78,884,437) | | $ | 77,466,987 | | | | | |
| Affiliated issuers (cost: $12,896,458) | | | 12,896,768 | | | $ | 90,363,755 | |
| Cash | | | | | | | 6,499 | |
| Receivables for: | | | | | | | | |
| Sales of investments | | | 10,094,462 | | | | | |
| Sales of fund’s shares | | | 205,522 | | | | | |
| Dividends and interest | | | 617,532 | | | | | |
| Variation margin on futures contracts | | | 29,221 | | | | | |
| Variation margin on centrally cleared swap contracts | | | 5,649 | | | | | |
| Other | | | 221 | | | | 10,952,607 | |
| | | | | | | | 101,322,861 | |
| Liabilities: | | | | | | | | |
| Unrealized depreciation on open forward currency contracts | | | | | | | 7,900 | |
| Payables for: | | | | | | | | |
| Purchases of investments | | | 20,513,434 | | | | | |
| Repurchases of fund’s shares | | | 103,068 | | | | | |
| Dividends on fund’s shares | | | 6,302 | | | | | |
| Investment advisory services | | | 13,492 | | | | | |
| Services provided by related parties | | | 11,059 | | | | | |
| Trustees’ deferred compensation | | | 727 | | | | | |
| Variation margin on futures contracts | | | 19,131 | | | | | |
| Variation margin on centrally cleared swap contracts | | | 3,157 | | | | | |
| Other | | | 370 | | | | 20,670,740 | |
| Net assets at December 31, 2023 | | | | | | $ | 80,644,221 | |
| | | | | | | | | |
| Net assets consist of: | | | | | | | | |
| Capital paid in on shares of beneficial interest | | | | | | $ | 91,156,829 | |
| Total distributable earnings (accumulated loss) | | | | | | | (10,512,608 | ) |
| Net assets at December 31, 2023 | | | | | | $ | 80,644,221 | |
Refer to the notes to financial statements.
| The Bond Fund of America | 79 |
Financial statements (continued)
| Statement of assets and liabilities | |
| at December 31, 2023 (continued) | |
| | (dollars and shares in thousands, except per-share amounts) |
Shares of beneficial interest issued and outstanding (no stated par value) —
unlimited shares authorized (7,017,996 total shares outstanding)
| | | Net assets | | | Shares
outstanding | | | Net asset value
per share | |
| Class A | | $ | 25,198,741 | | | | 2,192,899 | | | $ | 11.49 | |
| Class C | | | 430,196 | | | | 37,437 | | | | 11.49 | |
| Class T | | | 9 | | | | 1 | | | | 11.49 | |
| Class F-1 | | | 715,893 | | | | 62,300 | | | | 11.49 | |
| Class F-2 | | | 25,329,202 | | | | 2,204,252 | | | | 11.49 | |
| Class F-3 | | | 9,375,142 | | | | 815,864 | | | | 11.49 | |
| Class 529-A | | | 1,181,004 | | | | 102,776 | | | | 11.49 | |
| Class 529-C | | | 39,749 | | | | 3,459 | | | | 11.49 | |
| Class 529-E | | | 32,782 | | | | 2,853 | | | | 11.49 | |
| Class 529-T | | | 11 | | | | 1 | | | | 11.49 | |
| Class 529-F-1 | | | 9 | | | | 1 | | | | 11.49 | |
| Class 529-F-2 | | | 168,156 | | | | 14,634 | | | | 11.49 | |
| Class 529-F-3 | | | 9 | | | | 1 | | | | 11.49 | |
| Class R-1 | | | 50,229 | | | | 4,371 | | | | 11.49 | |
| Class R-2 | | | 312,544 | | | | 27,199 | | | | 11.49 | |
| Class R-2E | | | 36,284 | | | | 3,157 | | | | 11.49 | |
| Class R-3 | | | 522,658 | | | | 45,484 | | | | 11.49 | |
| Class R-4 | | | 510,498 | | | | 44,426 | | | | 11.49 | |
| Class R-5E | | | 182,980 | | | | 15,924 | | | | 11.49 | |
| Class R-5 | | | 302,653 | | | | 26,338 | | | | 11.49 | |
| Class R-6 | | | 16,255,472 | | | | 1,414,619 | | | | 11.49 | |
Refer to the notes to financial statements.
| 80 | The Bond Fund of America |
Financial statements (continued)
| Statement of operations | |
| for the year ended December 31, 2023 | |
| | (dollars in thousands) |
| Investment income: | | | | | | | | |
| Income: | | | | | | | | |
| Interest from unaffiliated issuers (net of non-U.S. taxes of $119) | | $ | 2,638,703 | | | | | |
| Dividends (includes $647,639 from affiliates) | | | 648,128 | | | $ | 3,286,831 | |
| Fees and expenses*: | | | | | | | | |
| Investment advisory services | | | 150,802 | | | | | |
| Distribution services | | | 77,256 | | | | | |
| Transfer agent services | | | 62,923 | | | | | |
| Administrative services | | | 22,676 | | | | | |
| 529 plan services | | | 821 | | | | | |
| Reports to shareholders | | | 2,386 | | | | | |
| Registration statement and prospectus | | | 1,995 | | | | | |
| Trustees’ compensation | | | 233 | | | | | |
| Auditing and legal | | | 104 | | | | | |
| Custodian | | | 296 | | | | | |
| Other | | | 99 | | | | | |
| Total fees and expenses before waiver | | | 319,591 | | | | | |
| Less waiver of fees and expenses: | | | | | | | | |
| Investment advisory services waiver | | | 358 | | | | | |
| Total fees and expenses after waiver | | | | | | | 319,233 | |
| Net investment income | | | | | | | 2,967,598 | |
| | | | | | | | | |
| Net realized gain (loss) and unrealized appreciation (depreciation): | | | | | | | | |
| Net realized gain (loss) on: | | | | | | | | |
| Investments (net of non-U.S. taxes of $114): | | | | | | | | |
| Unaffiliated issuers | | | (3,174,980 | ) | | | | |
| Affiliated issuers | | | 1,526 | | | | | |
| Futures contracts | | | (1,371,460 | ) | | | | |
| Forward currency contracts | | | 13,064 | | | | | |
| Swap contracts | | | 153,624 | | | | | |
| Currency transactions | | | (1,280 | ) | | | (4,379,506 | ) |
| Net unrealized appreciation (depreciation) on: | | | | | | | | |
| Investments: | | | | | | | | |
| Unaffiliated issuers | | | 4,689,621 | | | | | |
| Affiliated issuers | | | (1,243 | ) | | | | |
| Futures contracts | | | 602,081 | | | | | |
| Forward currency contracts | | | (32,653 | ) | | | | |
| Swap contracts | | | (151,947 | ) | | | | |
| Currency translations | | | 155 | | | | 5,106,014 | |
| Net realized gain (loss) and unrealized appreciation (depreciation) | | | | | | | 726,508 | |
| | | | | | | | | |
| Net increase (decrease) in net assets resulting from operations | | | | | | $ | 3,694,106 | |
| * | Additional information related to class-specific fees and expenses is included in the notes to financial statements. |
Refer to the notes to financial statements.
| The Bond Fund of America | 81 |
Financial statements (continued)
| Statements of changes in net assets | |
| | (dollars in thousands) |
| | | Year ended December 31, | |
| | | 2023 | | | 2022 | |
| Operations: | | | | | | | | |
| Net investment income | | $ | 2,967,598 | | | $ | 1,976,697 | |
| Net realized gain (loss) | | | (4,379,506 | ) | | | (5,079,909 | ) |
| Net unrealized appreciation (depreciation) | | | 5,106,014 | | | | (6,961,755 | ) |
| Net increase (decrease) in net assets resulting from operations | | | 3,694,106 | | | | (10,064,967 | ) |
| | | | | | | | | |
| Distributions paid or accrued to shareholders | | | (2,898,001 | ) | | | (2,071,532 | ) |
| | | | | | | | | |
| Net capital share transactions | | | 8,686,785 | | | | 3,731,382 | |
| | | | | | | | | |
| Total increase (decrease) in net assets | | | 9,482,890 | | | | (8,405,117 | ) |
| | | | | | | | | |
| Net assets: | | | | | | | | |
| Beginning of year | | | 71,161,331 | | | | 79,566,448 | |
| End of year | | $ | 80,644,221 | | | $ | 71,161,331 | |
Refer to the notes to financial statements.
| 82 | The Bond Fund of America |
Notes to financial statements
1. Organization
The Bond Fund of America (the “fund”) is registered under the Investment Company Act of 1940, as amended (the “1940 Act”), as an open-end, diversified management investment company. The fund seeks as high a level of current income as is consistent with the preservation of capital.
The fund has 21 share classes consisting of six retail share classes (Classes A, C, T, F-1, F-2 and F-3), seven 529 college savings plan share classes (Classes 529-A, 529-C, 529-E, 529-T, 529-F-1, 529-F-2 and 529-F-3) and eight retirement plan share classes (Classes R-1, R-2, R-2E, R-3, R-4, R-5E, R-5 and R-6). The 529 college savings plan share classes can be used to save for college education. The retirement plan share classes are generally offered only through eligible employer-sponsored retirement plans. The fund’s share classes are described further in the following table:
| Share class | | Initial sales charge | | Contingent deferred sales
charge upon redemption | | Conversion feature |
| Class A | | Up to 3.75% | | None (except 0.75% for certain redemptions within 18 months of purchase without an initial sales charge) | | None |
| Class 529-A | | Up to 3.50% | | None (except 1.00% for certain redemptions within 18 months of purchase without an initial sales charge) | | None |
| Classes C and 529-C | | None | | 1.00% for redemptions within one year of purchase | | Class C converts to Class A after eight years and Class 529-C converts to Class 529-A after five years |
| Class 529-E | | None | | None | | None |
| Classes T and 529-T* | | Up to 2.50% | | None | | None |
| Classes F-1, F-2, F-3, 529-F-1, 529-F-2 and 529-F-3 | | None | | None | | None |
| Classes R-1, R-2, R-2E, R-3, R-4, R-5E, R-5 and R-6 | | None | | None | | None |
| * | Class T and 529-T shares are not available for purchase. |
Holders of all share classes have equal pro rata rights to the assets, dividends and liquidation proceeds of the fund. Each share class has identical voting rights, except for the exclusive right to vote on matters affecting only its class. Share classes have different fees and expenses (“class-specific fees and expenses”), primarily due to different arrangements for distribution, transfer agent and administrative services. Differences in class-specific fees and expenses will result in differences in net investment income and, therefore, the payment of different per-share dividends by each share class.
2. Significant accounting policies
The fund is an investment company that applies the accounting and reporting guidance issued in Topic 946 by the U.S. Financial Accounting Standards Board. The fund’s financial statements have been prepared to comply with U.S. generally accepted accounting principles (“U.S. GAAP”). These principles require the fund’s investment adviser to make estimates and assumptions that affect reported amounts and disclosures. Actual results could differ from those estimates. Subsequent events, if any, have been evaluated through the date of issuance in the preparation of the financial statements. The fund follows the significant accounting policies described in this section, as well as the valuation policies described in the next section on valuation.
Security transactions and related investment income — Security transactions are recorded by the fund as of the date the trades are executed with brokers. Realized gains and losses from security transactions are determined based on the specific identified cost of the securities. In the event a security is purchased with a delayed payment date, the fund will segregate liquid assets sufficient to meet its payment obligations. Dividend income is recognized on the ex-dividend date and interest income is recognized on an accrual basis. Market discounts, premiums and original issue discounts on fixed-income securities are amortized daily over the expected life of the security.
Class allocations — Income, fees and expenses (other than class-specific fees and expenses) are allocated daily among the various share classes based on the relative value of their settled shares. Realized gains and losses and unrealized appreciation and depreciation are allocated daily among the various share classes based on their relative net assets. Class-specific fees and expenses, such as distribution, transfer agent and administrative services, are charged directly to the respective share class.
| The Bond Fund of America | 83 |
Distributions paid or accrued to shareholders — Income dividends are declared daily after the determination of the fund’s net investment income and are paid to shareholders monthly. Capital gain distributions are recorded on the ex-dividend date. The fund may deem a portion of the income dividends and/or capital gain distributions as a return of capital for tax purposes.
Currency translation — Assets and liabilities, including investment securities, denominated in currencies other than U.S. dollars are translated into U.S. dollars at the exchange rates supplied by one or more pricing vendors on the valuation date. Purchases and sales of investment securities and income and expenses are translated into U.S. dollars at the exchange rates on the dates of such transactions. The effects of changes in exchange rates on investment securities are included with the net realized gain or loss and net unrealized appreciation or depreciation on investments in the fund’s statement of operations. The realized gain or loss and unrealized appreciation or depreciation resulting from all other transactions denominated in currencies other than U.S. dollars are disclosed separately.
3. Valuation
Capital Research and Management Company (“CRMC”), the fund’s investment adviser, values the fund’s investments at fair value as defined by U.S. GAAP. The net asset value per share is calculated once daily as of the close of regular trading on the New York Stock Exchange, normally 4 p.m. New York time, each day the New York Stock Exchange is open.
Methods and inputs — The fund’s investment adviser uses the following methods and inputs to establish the fair value of the fund’s assets and liabilities. Use of particular methods and inputs may vary over time based on availability and relevance as market and economic conditions evolve.
Equity securities, including depositary receipts, are generally valued at the official closing price of, or the last reported sale price on, the exchange or market on which such securities are traded, as of the close of business on the day the securities are being valued or, lacking any sales, at the last available bid price. Prices for each security are taken from the principal exchange or market on which the security trades.
Fixed-income securities, including short-term securities, are generally valued at evaluated prices obtained from third-party pricing vendors. Vendors value such securities based on one or more of the inputs described in the following table. The table provides examples of inputs that are commonly relevant for valuing particular classes of fixed-income securities in which the fund is authorized to invest. However, these classifications are not exclusive, and any of the inputs may be used to value any other class of fixed-income security.
| Fixed-income class | Examples of standard inputs |
| All | Benchmark yields, transactions, bids, offers, quotations from dealers and trading systems, new issues, spreads and other relationships observed in the markets among comparable securities; and proprietary pricing models such as yield measures calculated using factors such as cash flows, financial or collateral performance and other reference data (collectively referred to as “standard inputs”) |
| Corporate bonds, notes & loans; convertible securities | Standard inputs and underlying equity of the issuer |
| Bonds & notes of governments & government agencies | Standard inputs and interest rate volatilities |
| Mortgage-backed; asset-backed obligations | Standard inputs and cash flows, prepayment information, default rates, delinquency and loss assumptions, collateral characteristics, credit enhancements and specific deal information |
| Municipal securities | Standard inputs and, for certain distressed securities, cash flows or liquidation values using a net present value calculation based on inputs that include, but are not limited to, financial statements and debt contracts |
Securities with both fixed-income and equity characteristics, or equity securities traded principally among fixed-income dealers, are generally valued in the manner described for either equity or fixed-income securities, depending on which method is deemed most appropriate by the fund’s investment adviser. The Capital Group Central Cash Fund (“CCF”), a fund within the Capital Group Central Fund Series (“Central Funds”), is valued based upon a floating net asset value, which fluctuates with changes in the value of CCF’s portfolio securities. The underlying securities are valued based on the policies and procedures in CCF’s statement of additional information. Exchange-traded futures are generally valued at the official settlement price of the exchange or market on which such instruments are traded, as of the close of business on the day the futures are being valued. Forward currency contracts are valued based on the spot and forward exchange rates obtained from a third-party pricing vendor. Swaps are generally valued using evaluated prices obtained from third-party pricing vendors who calculate these values based on market inputs that may include the yields of the indices referenced in the instrument and the relevant curve, dealer quotes, default probabilities and recovery rates, and terms of the contract.
| 84 | The Bond Fund of America |
Securities and other assets for which representative market quotations are not readily available or are considered unreliable by the fund’s investment adviser are fair valued as determined in good faith under fair valuation guidelines adopted by the fund’s investment adviser and approved by the board of trustees as further described. The investment adviser follows fair valuation guidelines, consistent with U.S. Securities and Exchange Commission rules and guidance, to consider relevant principles and factors when making fair value determinations. The investment adviser considers relevant indications of value that are reasonably and timely available to it in determining the fair value to be assigned to a particular security, such as the type and cost of the security, restrictions on resale of the security, relevant financial or business developments of the issuer, actively traded similar or related securities, dealer or broker quotes, conversion or exchange rights on the security, related corporate actions, significant events occurring after the close of trading in the security, and changes in overall market conditions. In addition, the closing prices of equity securities that trade in markets outside U.S. time zones may be adjusted to reflect significant events that occur after the close of local trading but before the net asset value of each share class of the fund is determined. Fair valuations of investments that are not actively trading involve judgment and may differ materially from valuations that would have been used had greater market activity occurred.
Processes and structure — The fund’s board of trustees has designated the fund’s investment adviser to make fair value determinations, subject to board oversight. The investment adviser has established a Joint Fair Valuation Committee (the “Committee”) to administer, implement and oversee the fair valuation process and to make fair value decisions. The Committee regularly reviews its own fair value decisions, as well as decisions made under its standing instructions to the investment adviser’s valuation team. The Committee reviews changes in fair value measurements from period to period, pricing vendor information and market data, and may, as deemed appropriate, update the fair valuation guidelines to better reflect the results of back testing and address new or evolving issues. Pricing decisions, processes and controls over security valuation are also subject to additional internal reviews facilitated by the investment adviser’s global risk management group. The Committee reports changes to the fair valuation guidelines to the board of trustees. The fund’s board and audit committee also regularly review reports that describe fair value determinations and methods.
Classifications — The fund’s investment adviser classifies the fund’s assets and liabilities into three levels based on the inputs used to value the assets or liabilities. Level 1 values are based on quoted prices in active markets for identical securities. Level 2 values are based on significant observable market inputs, such as quoted prices for similar securities and quoted prices in inactive markets. Certain securities trading outside the U.S. may transfer between Level 1 and Level 2 due to valuation adjustments resulting from significant market movements following the close of local trading. Level 3 values are based on significant unobservable inputs that reflect the investment adviser’s determination of assumptions that market participants might reasonably use in valuing the securities. The valuation levels are not necessarily an indication of the risk or liquidity associated with the underlying investment. For example, U.S. government securities are reflected as Level 2 because the inputs used to determine fair value may not always be quoted prices in an active market. The following tables present the fund’s valuation levels as of December 31, 2023 (dollars in thousands):
| | | Investment securities | |
| | | Level 1 | | | Level 2 | | | Level 3 | | | Total | |
| Assets: | | | | | | | | | | | | | | | | |
| Bonds, notes & other debt instruments: | | | | | | | | | | | | | | | | |
| Mortgage-backed obligations | | $ | — | | | $ | 32,364,188 | | | $ | 9,841 | | | $ | 32,374,029 | |
| Corporate bonds, notes & loans | | | — | | | | 23,876,817 | | | | 5,027 | | | | 23,881,844 | |
| U.S. Treasury bonds & notes | | | — | | | | 16,008,915 | | | | — | | | | 16,008,915 | |
| Asset-backed obligations | | | — | | | | 4,029,902 | | | | 58,135 | | | | 4,088,037 | |
| Bonds & notes of governments & government agencies outside the U.S. | | | — | | | | 698,159 | | | | — | | | | 698,159 | |
| Municipals | | | — | | | | 343,058 | | | | — | | | | 343,058 | |
| Federal agency bonds & notes | | | — | | | | 21,686 | | | | — | | | | 21,686 | |
| Preferred securities | | | — | | | | 1,340 | | | | — | | | | 1,340 | |
| Common stocks | | | — | | | | 505 | | | | 36,528 | | | | 37,033 | |
| Preferred securities | | | — | | | | 4,969 | | | | — | | | | 4,969 | |
| Rights & warrants | | | — | | | | 147 | | | | — | | | | 147 | |
| Short-term securities | | | 12,896,768 | | | | 7,770 | | | | — | | | | 12,904,538 | |
| Total | | $ | 12,896,768 | | | $ | 77,357,456 | | | $ | 109,531 | | | $ | 90,363,755 | |
| The Bond Fund of America | 85 |
| | | Other investments* | |
| | | Level 1 | | | Level 2 | | | Level 3 | | | Total | |
| Assets: | | | | | | | | | | | | | | | | |
| Unrealized appreciation on futures contracts | | $ | 784,839 | | | $ | — | | | $ | — | | | $ | 784,839 | |
| Unrealized appreciation on centrally cleared interest rate swaps | | | — | | | | 28,897 | | | | — | | | | 28,897 | |
| Unrealized appreciation on centrally cleared credit default swaps | | | — | | | | 13,370 | | | | — | | | | 13,370 | |
| Liabilities: | | | | | | | | | | | | | | | | |
| Unrealized depreciation on futures contracts | | | (233,326 | ) | | | — | | | | — | | | | (233,326 | ) |
| Unrealized depreciation on open forward currency contracts | | | — | | | | (7,900 | ) | | | — | | | | (7,900 | ) |
| Unrealized depreciation on centrally cleared interest rate swaps | | | — | | | | (24,689 | ) | | | — | | | | (24,689 | ) |
| Unrealized depreciation on centrally cleared credit default swaps | | | — | | | | (2,977 | ) | | | — | | | | (2,977 | ) |
| Total | | $ | 551,513 | | | $ | 6,701 | | | $ | — | | | $ | 558,214 | |
| * | Futures contracts, forward currency contracts, interest rate swaps and credit default swaps are not included in the fund’s investment portfolio. |
4. Risk factors
Investing in the fund may involve certain risks including, but not limited to, those described below.
Market conditions — The prices of, and the income generated by, the securities held by the fund may decline — sometimes rapidly or unpredictably — due to various factors, including events or conditions affecting the general economy or particular industries or companies; overall market changes; local, regional or global political, social or economic instability; governmental, governmental agency or central bank responses to economic conditions; changes in inflation rates; and currency exchange rate, interest rate and commodity price fluctuations.
Economies and financial markets throughout the world are highly interconnected. Economic, financial or political events, trading and tariff arrangements, wars, terrorism, cybersecurity events, natural disasters, public health emergencies (such as the spread of infectious disease), bank failures and other circumstances in one country or region, including actions taken by governmental or quasi-governmental authorities in response to any of the foregoing, could have impacts on global economies or markets. As a result, whether or not the fund invests in securities of issuers located in or with significant exposure to the countries affected, the value and liquidity of the fund’s investments may be negatively affected by developments in other countries and regions.
Issuer risks — The prices of, and the income generated by, securities held by the fund may decline in response to various factors directly related to the issuers of such securities, including reduced demand for an issuer’s goods or services, poor management performance, major litigation, investigations or other controversies related to the issuer, changes in the issuer’s financial condition or credit rating, changes in government regulations affecting the issuer or its competitive environment and strategic initiatives such as mergers, acquisitions or dispositions and the market response to any such initiatives. An individual security may also be affected by factors relating to the industry or sector of the issuer or the securities markets as a whole, and conversely an industry or sector or the securities markets may be affected by a change in financial condition or other event affecting a single issuer.
Investing in debt instruments — The prices of, and the income generated by, bonds and other debt securities held by the fund may be affected by factors such as the interest rates, maturities and credit quality of these securities.
Rising interest rates will generally cause the prices of bonds and other debt securities to fall. Also, when interest rates rise, issuers of debt securities that may be prepaid at any time, such as mortgage- or other asset-backed securities, are less likely to refinance existing debt securities, causing the average life of such securities to extend. A general change in interest rates may cause investors to sell debt securities on a large scale, which could also adversely affect the price and liquidity of debt securities and could also result in increased redemptions from the fund. Falling interest rates may cause an issuer to redeem, call or refinance a debt security before its stated maturity, which may result in the fund having to reinvest the proceeds in lower yielding securities. Longer maturity debt securities generally have greater sensitivity to changes in interest rates and may be subject to greater price fluctuations than shorter maturity debt securities.
| 86 | The Bond Fund of America |
Bonds and other debt securities are also subject to credit risk, which is the possibility that the credit strength of an issuer or guarantor will weaken or be perceived to be weaker, and/or an issuer of a debt security will fail to make timely payments of principal or interest and the security will go into default. Changes in actual or perceived creditworthiness may occur quickly. A downgrade or default affecting any of the fund’s securities could cause the value of the fund’s shares to decrease. Lower quality debt securities generally have higher rates of interest and may be subject to greater price fluctuations than higher quality debt securities. Credit risk is gauged, in part, by the credit ratings of the debt securities in which the fund invests. However, ratings are only the opinions of the rating agencies issuing them and are not guarantees as to credit quality or an evaluation of market risk. The fund’s investment adviser relies on its own credit analysts to research issuers and issues in assessing credit and default risks.
Investing in mortgage-related and other asset-backed securities — Mortgage-related securities, such as mortgage-backed securities, and other asset-backed securities, include debt obligations that represent interests in pools of mortgages or other income-bearing assets, such as consumer loans or receivables. While such securities are subject to the risks associated with investments in debt instruments generally (for example, credit, extension and interest rate risks), they are also subject to other and different risks. Mortgage-backed and other asset-backed securities are subject to changes in the payment patterns of borrowers of the underlying debt, potentially increasing the volatility of the securities and the fund’s net asset value. When interest rates fall, borrowers are more likely to refinance or prepay their debt before its stated maturity. This may result in the fund having to reinvest the proceeds in lower yielding securities, effectively reducing the fund’s income. Conversely, if interest rates rise and borrowers repay their debt more slowly than expected, the time in which the mortgage-backed and other asset-backed securities are paid off could be extended, reducing the fund’s cash available for reinvestment in higher yielding securities. Mortgage-backed securities are also subject to the risk that underlying borrowers will be unable to meet their obligations and the value of property that secures the mortgages may decline in value and be insufficient, upon foreclosure, to repay the associated loans. Investments in asset-backed securities are subject to similar risks.
Investing in securities backed by the U.S. government — Securities backed by the U.S. Treasury or the full faith and credit of the U.S. government are guaranteed only as to the timely payment of interest and principal when held to maturity. Accordingly, the current market values for these securities will fluctuate with changes in interest rates and the credit rating of the U.S. government. Notwithstanding that these securities are backed by the full faith and credit of the U.S. government, circumstances could arise that would prevent or delay the payment of interest or principal on these securities, which could adversely affect their value and cause the fund to suffer losses. Such an event could lead to significant disruptions in U.S. and global markets. Securities issued by U.S. government-sponsored entities and federal agencies and instrumentalities that are not backed by the full faith and credit of the U.S. government are neither issued nor guaranteed by the U.S. government. U.S. government securities are subject to market risk, interest rate risk and credit risk.
Liquidity risk — Certain fund holdings may be or may become difficult or impossible to sell, particularly during times of market turmoil. Liquidity may be impacted by the lack of an active market for a holding, legal or contractual restrictions on resale, or the reduced number and capacity of market participants to make a market in such holding. Market prices for less liquid or illiquid holdings may be volatile or difficult to determine, and reduced liquidity may have an adverse impact on the market price of such holdings. Additionally, the sale of less liquid or illiquid holdings may involve substantial delays (including delays in settlement) and additional costs and the fund may be unable to sell such holdings when necessary to meet its liquidity needs or to try to limit losses, or may be forced to sell at a loss.
Investing outside the U.S. — Securities of issuers domiciled outside the U.S., or with significant operations or revenues outside the U.S., and securities tied economically to countries outside the U.S., may lose value because of adverse political, social, economic or market developments (including social instability, regional conflicts, terrorism and war) in the countries or regions in which the issuers are domiciled, operate or generate revenue or to which the securities are tied economically. These securities may also lose value due to changes in foreign currency exchange rates against the U.S. dollar and/or currencies of other countries. Issuers of these securities may be more susceptible to actions of foreign governments, such as nationalization, currency blockage or the imposition of price controls, sanctions, or punitive taxes, each of which could adversely impact the value of these securities. Securities markets in certain countries may be more volatile and/or less liquid than those in the U.S. Investments outside the U.S. may also be subject to different regulatory, legal, accounting, auditing, financial reporting and recordkeeping requirements, and may be more difficult to value, than those in the U.S. In addition, the value of investments outside the U.S. may be reduced by foreign taxes, including foreign withholding taxes on interest and dividends. Further, there may be increased risks of delayed settlement of securities purchased or sold by the fund, which could impact the liquidity of the fund’s portfolio. The risks of investing outside the U.S. may be heightened in connection with investments in emerging markets.
| The Bond Fund of America | 87 |
Investing in future delivery contracts — The fund may enter into contracts, such as to-be-announced contracts and mortgage dollar rolls, that involve the fund selling mortgage-related securities and simultaneously contracting to repurchase similar securities for delivery at a future date at a predetermined price. This can increase the fund’s market exposure, and the market price of the securities that the fund contracts to repurchase could drop below their purchase price. While the fund can preserve and generate capital through the use of such contracts by, for example, realizing the difference between the sale price and the future purchase price, the income generated by the fund may be reduced by engaging in such transactions. In addition, these transactions increase the turnover rate of the fund.
Investing in inflation-linked bonds — The values of inflation-linked bonds generally fluctuate in response to changes in real interest rates — i.e., rates of interest after factoring in inflation. A rise in real interest rates may cause the prices of inflation-linked securities to fall, while a decline in real interest rates may cause the prices to increase. Inflation-linked bonds may experience greater losses than other debt securities with similar durations when real interest rates rise faster than nominal interest rates. There can be no assurance that the value of an inflation-linked security will be directly correlated to changes in interest rates; for example, if interest rates rise for reasons other than inflation, the increase may not be reflected in the security’s inflation measure.
Investing in inflation-linked bonds may also reduce the fund’s distributable income during periods of deflation. If prices for goods and services decline throughout the economy, the principal and income on inflation-linked securities may decline and result in losses to the fund.
Investing in derivatives — The use of derivatives involves a variety of risks, which may be different from, or greater than, the risks associated with investing in traditional securities, such as stocks and bonds. Changes in the value of a derivative may not correlate perfectly with, and may be more sensitive to market events than, the underlying asset, rate or index, and a derivative instrument may cause the fund to lose significantly more than its initial investment. Derivatives may be difficult to value, difficult for the fund to buy or sell at an opportune time or price and difficult, or even impossible, to terminate or otherwise offset. The fund’s use of derivatives may result in losses to the fund, and investing in derivatives may reduce the fund’s returns and increase the fund’s price volatility. The fund’s counterparty to a derivative transaction (including, if applicable, the fund’s clearing broker, the derivatives exchange or the clearinghouse) may be unable or unwilling to honor its financial obligations in respect of the transaction. In certain cases, the fund may be hindered or delayed in exercising remedies against or closing out derivative instruments with a counterparty, which may result in additional losses. Derivatives are also subject to operational risk (such as documentation issues, settlement issues and systems failures) and legal risk (such as insufficient documentation, insufficient capacity or authority of a counterparty, and issues with the legality or enforceability of a contract).
Management — The investment adviser to the fund actively manages the fund’s investments. Consequently, the fund is subject to the risk that the methods and analyses, including models, tools and data, employed by the investment adviser in this process may be flawed or incorrect and may not produce the desired results. This could cause the fund to lose value or its investment results to lag relevant benchmarks or other funds with similar objectives.
5. Certain investment techniques
Index-linked bonds — The fund has invested in index-linked bonds, which are fixed-income securities whose principal value is periodically adjusted to a government price index. Over the life of an index-linked bond, interest is paid on the adjusted principal value. Increases or decreases in the principal value of index-linked bonds are recorded as interest income in the fund’s statement of operations.
Mortgage dollar rolls — The fund has entered into mortgage dollar roll transactions of TBA securities in which the fund sells a TBA mortgage-backed security to a counterparty and simultaneously enters into an agreement with the same counterparty to buy back a similar TBA security on a specific future date at a predetermined price. Mortgage dollar rolls are accounted for as purchase and sale transactions and may result in an increase to the fund’s portfolio turnover rate. Portfolio turnover rates excluding and including mortgage dollar rolls are presented at the end of the fund’s financial highlights table.
Loan transactions — The fund has entered into loan transactions in which the fund acquires a loan either through an agent, by assignment from another holder, or as a participation interest in another holder’s portion of a loan. The loan is often administered by a financial institution that acts as agent for the holders of the loan, and the fund may be required to receive approval from the agent and/or borrower prior to the sale of the investment. The loan’s interest rate and maturity date may change based on the terms of the loan, including potential early payments of principal.
Futures contracts — The fund has entered into futures contracts, which provide for the future sale by one party and purchase by another party of a specified amount of a specific financial instrument for a specified price, date, time and place designated at the time the contract
| 88 | The Bond Fund of America |
is made. Futures contracts are used to strategically manage the fund’s interest rate sensitivity by increasing or decreasing the duration of the fund or a portion of the fund’s portfolio.
Upon entering into futures contracts, and to maintain the fund’s open positions in futures contracts, the fund is required to deposit with a futures broker, known as a futures commission merchant (“FCM”), in a segregated account in the name of the FCM an amount of cash, U.S. government securities or other liquid securities, known as initial margin. The margin required for a particular futures contract is set by the exchange on which the contract is traded to serve as collateral, and may be significantly modified from time to time by the exchange during the term of the contract.
On a daily basis, the fund pays or receives variation margin based on the increase or decrease in the value of the futures contracts and records variation margin on futures contracts in the statement of assets and liabilities. Futures contracts may involve a risk of loss in excess of the variation margin shown on the fund’s statement of assets and liabilities. The fund records realized gains or losses at the time the futures contract is closed or expires. Net realized gains or losses and net unrealized appreciation or depreciation from futures contracts are recorded in the fund’s statement of operations. The average month-end notional amount of futures contracts while held was $48,449,530,000.
Forward currency contracts — The fund has entered into forward currency contracts, which represent agreements to exchange currencies on specific future dates at predetermined rates. The fund’s investment adviser uses forward currency contracts to manage the fund’s exposure to changes in exchange rates. Upon entering into these contracts, risks may arise from the potential inability of counterparties to meet the terms of their contracts and from possible movements in exchange rates.
On a daily basis, the fund’s investment adviser values forward currency contracts and records unrealized appreciation or depreciation for open forward currency contracts in the fund’s statement of assets and liabilities. Realized gains or losses are recorded at the time the forward currency contract is closed or offset by another contract with the same broker for the same settlement date and currency.
Closed forward currency contracts that have not reached their settlement date are included in the respective receivables or payables for closed forward currency contracts in the fund’s statement of assets and liabilities. Net realized gains or losses from closed forward currency contracts and net unrealized appreciation or depreciation from open forward currency contracts are recorded in the fund’s statement of operations. The average month-end notional amount of open forward currency contracts while held was $750,677,000.
Swap contracts — The fund has entered into swap agreements, which are two-party contracts entered into primarily by institutional investors for a specified time period. In a typical swap transaction, two parties agree to exchange the returns earned or realized from one or more underlying assets or rates of return. Swap agreements can be traded on a swap execution facility (SEF) and cleared through a central clearinghouse (cleared), traded over-the-counter (OTC) and cleared, or traded bilaterally and not cleared. Because clearing interposes a central clearinghouse as the ultimate counterparty to each participant’s swap, and margin is required to be exchanged under the rules of the clearinghouse, central clearing is intended to decrease (but not eliminate) counterparty risk relative to uncleared bilateral swaps. To the extent the fund enters into bilaterally negotiated swap transactions, the fund will enter into swap agreements only with counterparties that meet certain credit standards and subject to agreed collateralized procedures. The term of a swap can be days, months or years and certain swaps may be less liquid than others.
Upon entering into a centrally cleared swap contract, the fund is required to deposit cash, U.S. government securities or other liquid securities, which is known as initial margin. Generally, the initial margin required for a particular swap is set and held as collateral by the clearinghouse on which the contract is cleared. The amount of initial margin required may be significantly modified from time to time by the clearinghouse during the term of the contract.
On a daily basis, interest accruals related to the exchange of future payments are recorded as a receivable and payable in the fund’s statement of assets and liabilities for centrally cleared swaps and as unrealized appreciation or depreciation in the fund’s statement of assets and liabilities for bilateral swaps. For centrally cleared swaps, the fund also pays or receives a variation margin based on the increase or decrease in the value of the swaps, including accrued interest as applicable, and records variation margin in the statement of assets and liabilities. The fund records realized gains and losses on both the net accrued interest and any gain or loss recognized at the time the swap is closed or expires. Net realized gains or losses, as well as any net unrealized appreciation or depreciation, from swaps are recorded in the fund’s statement of operations.
Swap agreements can take different forms. The fund has entered into the following types of swap agreements:
| The Bond Fund of America | 89 |
Interest rate swaps — The fund has entered into interest rate swaps, which seek to manage the interest rate sensitivity of the fund by increasing or decreasing the duration of the fund or a portion of the fund’s portfolio. An interest rate swap is an agreement between two parties to exchange or swap payments based on changes in an interest rate or rates. Typically, one interest rate is fixed and the other is variable based on a designated short-term interest rate such as the Secured Overnight Financing Rate (SOFR), prime rate or other benchmark, or on an inflation index such as the U.S. Consumer Price Index (which is a measure that examines the weighted average of prices of a basket of consumer goods and services and measures changes in the purchasing power of the U.S. dollar and the rate of inflation). In other types of interest rate swaps, known as basis swaps, the parties agree to swap variable interest rates based on different designated short-term interest rates. Interest rate swaps generally do not involve the delivery of securities or other principal amounts. Rather, cash payments are exchanged by the parties based on the application of the designated interest rates to a notional amount, which is the predetermined dollar principal of the trade upon which payment obligations are computed. Accordingly, the fund’s current obligation or right under the swap agreement is generally equal to the net amount to be paid or received under the swap agreement based on the relative value of the position held by each party. The average month-end notional amount of interest rate swaps while held was $5,100,555,000.
Credit default swap indices — The fund has entered into centrally cleared credit default swap indices, including CDX and iTraxx indices (collectively referred to as “CDSI”), in order to assume exposure to a diversified portfolio of credits or to hedge against existing credit risks. A CDSI is based on a portfolio of credit default swaps with similar characteristics, such as credit default swaps on high-yield bonds. In a typical CDSI transaction, one party (the protection buyer) is obligated to pay the other party (the protection seller) a stream of periodic payments over the term of the contract. If a credit event, such as a default or restructuring, occurs with respect to any of the underlying reference obligations, the protection seller must pay the protection buyer the loss on those credits.
The fund may enter into a CDSI transaction as either protection buyer or protection seller. If the fund is a protection buyer, it would pay the counterparty a periodic stream of payments over the term of the contract and would not recover any of those payments if no credit events were to occur with respect to any of the underlying reference obligations. However, if a credit event did occur, the fund, as a protection buyer, would have the right to deliver the referenced debt obligations or a specified amount of cash, depending on the terms of the applicable agreement, and to receive the par value of such debt obligations from the counterparty protection seller. As a protection seller, the fund would receive fixed payments throughout the term of the contract if no credit events were to occur with respect to any of the underlying reference obligations. If a credit event were to occur, however, the value of any deliverable obligation received by the fund, coupled with the periodic payments previously received by the fund, may be less than the full notional value that the fund, as a protection seller, pays to the counterparty protection buyer, effectively resulting in a loss of value to the fund. Furthermore, as a protection seller, the fund would effectively add leverage to its portfolio because it would have investment exposure to the notional amount of the swap transaction. The average month-end notional amount of credit default swaps while held was $692,618,000.
The following tables identify the location and fair value amounts on the fund’s statement of assets and liabilities and the effect on the fund’s statement of operations resulting from the fund’s use of futures contracts, forward currency contracts, interest rate swaps and credit default swaps as of, or for the year ended, December 31, 2023 (dollars in thousands):
| | | | | Assets | | | Liabilities | |
| Contracts | | Risk type | | Location on statement of
assets and liabilities | | Value | | | Location on statement of
assets and liabilities | | Value | |
| Futures | | Interest | | Unrealized appreciation* | | $ | 784,839 | | | Unrealized depreciation* | | $ | 233,326 | |
| Forward currency | | Currency | | Unrealized appreciation on open forward currency contracts | | | — | | | Unrealized depreciation on open forward currency contracts | | | 7,900 | |
| Swap (centrally cleared) | | Interest | | Unrealized appreciation* | | | 28,897 | | | Unrealized depreciation* | | | 24,689 | |
| Swap (centrally cleared) | | Credit | | Unrealized appreciation* | | | 13,370 | | | Unrealized depreciation* | | | 2,977 | |
| | | | | | | $ | 827,106 | | | | | $ | 268,892 | |
Refer to the end of the table for footnote.
| 90 | The Bond Fund of America |
| | | | | Net realized gain (loss) | | | Net unrealized appreciation (depreciation) | |
| Contracts | | Risk type | | Location on statement of operations | | Value | | | Location on statement of operations | | Value | |
| Futures | | Interest | | Net realized loss on futures contracts | | $ | (1,371,460 | ) | | Net unrealized appreciation on futures contracts | | $ | 602,081 | |
| Forward currency | | Currency | | Net realized gain on forward currency contracts | | | 13,064 | | | Net unrealized depreciation on forward currency contracts | | | (32,653 | ) |
| Swap | | Interest | | Net realized gain on swap contracts | | | 183,465 | | | Net unrealized depreciation on swap contracts | | | (171,726 | ) |
| Swap | | Credit | | Net realized loss on swap contracts | | | (29,841 | ) | | Net unrealized appreciation on swap contracts | | | 19,779 | |
| | | | | | | $ | (1,204,772 | ) | | | | $ | 417,481 | |
| * | Includes cumulative appreciation/depreciation on futures contracts, centrally cleared interest rate swaps and centrally cleared credit default swaps as reported in the applicable tables following the fund’s investment portfolio. Only current day’s variation margin is reported within the fund’s statement of assets and liabilities. |
Collateral — The fund receives or pledges highly liquid assets, such as cash or U.S. government securities, as collateral due to its use of futures contracts, forward currency contracts, interest rate swaps, credit default swaps and future delivery contracts. For futures contracts, centrally cleared interest rate swaps and centrally cleared credit default swaps, the fund pledges collateral for initial and variation margin by contract. For forward currency contracts, the fund either receives or pledges collateral based on the net gain or loss on unsettled contracts by counterparty. For future delivery contracts, the fund either receives or pledges collateral based on the net gain or loss on unsettled contracts by certain counterparties. The purpose of the collateral is to cover potential losses that could occur in the event that either party cannot meet its contractual obligation. Non-cash collateral pledged by the fund, if any, is disclosed in the fund’s investment portfolio, and cash collateral pledged by the fund, if any, is held in a segregated account with the fund’s custodian, which is reflected as pledged cash collateral in the fund’s statement of assets and liabilities.
Rights of offset — The fund has entered into enforceable master netting agreements with certain counterparties for forward currency contracts, where on any date amounts payable by each party to the other (in the same currency with respect to the same transaction) may be closed or offset by each party’s payment obligation. If an early termination date occurs under these agreements following an event of default or termination event, all obligations of each party to its counterparty are settled net through a single payment in a single currency (“close-out netting”). For financial reporting purposes, the fund does not offset financial assets and financial liabilities that are subject to these master netting arrangements in the statement of assets and liabilities.
The following table presents the fund’s forward currency contracts by counterparty that are subject to master netting agreements but that are not offset in the fund’s statement of assets and liabilities. The net amount column shows the impact of offsetting on the fund’s statement of assets and liabilities as of December 31, 2023, if close-out netting was exercised (dollars in thousands):
| | | Gross amounts
recognized in the | | | Gross amounts not offset in the
statement of assets and liabilities and
subject to a master netting agreement | | | | |
| Counterparty | | statement of assets
and liabilities | | | Available
to offset | | | Non-cash
collateral* | | | Cash
collateral* | | | Net
amount | |
| Liabilities: | | | | | | | | | | | | | | | | | | | | |
| Bank of America | | $ | 4,628 | | | $ | — | | | $ | (4,628 | ) | | $ | — | | | $ | — | |
| Citibank | | | 2,120 | | | | — | | | | (2,120 | ) | | | — | | | | — | |
| Goldman Sachs | | | 990 | | | | — | | | | (990 | ) | | | — | | | | — | |
| Standard Chartered Bank | | | 162 | | | | — | | | | (162 | ) | | | — | | | | — | |
| Total | | $ | 7,900 | | | $ | — | | | $ | (7,900 | ) | | $ | — | | | $ | — | |
| * | Collateral is shown on a settlement basis. |
6. Taxation and distributions
Federal income taxation — The fund complies with the requirements under Subchapter M of the Internal Revenue Code applicable to regulated investment companies and intends to distribute substantially all of its net taxable income and net capital gains each year. The fund is not subject to income taxes to the extent such distributions are made. Therefore, no federal income tax provision is required.
| The Bond Fund of America | 91 |
As of and during the year ended December 31, 2023, the fund did not have a liability for any unrecognized tax benefits. The fund recognizes interest and penalties, if any, related to unrecognized tax benefits as income tax expense in the statement of operations. During the year, the fund did not incur any significant interest or penalties.
The fund’s tax returns are generally not subject to examination by federal, state and, if applicable, non-U.S. tax authorities after the expiration of each jurisdiction’s statute of limitations, which is typically three years after the date of filing but can be extended in certain jurisdictions.
Non-U.S. taxation — Dividend and interest income are recorded net of non-U.S. taxes paid. The fund may file withholding tax reclaims in certain jurisdictions to recover a portion of amounts previously withheld. These reclaims are recorded when the amount is known and there are no significant uncertainties on collectability. Gains realized by the fund on the sale of securities in certain countries, if any, may be subject to non-U.S. taxes. The fund generally records an estimated deferred tax liability based on unrealized gains to provide for potential non-U.S. taxes payable upon the sale of these securities.
Distributions — Distributions determined on a tax basis may differ from net investment income and net realized gains for financial reporting purposes. These differences are due primarily to different treatment for items such as currency gains and losses; short-term capital gains and losses; capital losses related to sales of certain securities within 30 days of purchase; cost of investments sold; paydowns on fixed-income securities; net capital losses; amortization of premiums and discounts and income on certain investments. The fiscal year in which amounts are distributed may differ from the year in which the net investment income and net realized gains are recorded by the fund for financial reporting purposes.
During the year ended December 31, 2023, the fund reclassified $20,546,000 from total accumulated loss to capital paid in on shares of beneficial interest to align financial reporting with tax reporting.
As of December 31, 2023, the tax basis components of distributable earnings, unrealized appreciation (depreciation) and cost of investments were as follows (dollars in thousands):
| Undistributed ordinary income | | $ | 125,581 | |
| Capital loss carryforward* | | | (9,061,001 | ) |
| Gross unrealized appreciation on investments | | | 1,401,972 | |
| Gross unrealized depreciation on investments | | | (2,876,610 | ) |
| Net unrealized appreciation (depreciation) on investments | | | (1,474,638 | ) |
| Cost of investments | | | 92,400,802 | |
| * | The capital loss carryforward will be used to offset any capital gains realized by the fund in future years. The fund will not make distributions from capital gains while a capital loss carryforward remains. |
| 92 | The Bond Fund of America |
Distributions paid or accrued were characterized for tax purposes as follows (dollars in thousands):
| | | Year ended December 31, 2023 | | | Year ended December 31, 2022 | |
| Share class | | Ordinary
income | | | Long-term
capital gains | | | Total
distributions
paid or
accrued | | | Ordinary
income | | | Long-term
capital gains | | | Total
distributions
paid or
accrued | |
| Class A | | $ | 883,797 | | | $ | — | | | $ | 883,797 | | | $ | 672,348 | | | $ | 32,609 | | | $ | 704,957 | |
| Class C | | | 12,956 | | | | — | | | | 12,956 | | | | 10,275 | | | | 705 | | | | 10,980 | |
| Class T | | | — | † | | | — | | | | — | † | | | — | † | | | — | † | | | — | † |
| Class F-1 | | | 27,805 | | | | — | | | | 27,805 | | | | 21,766 | | | | 1,065 | | | | 22,831 | |
| Class F-2 | | | 890,734 | | | | — | | | | 890,734 | | | | 543,800 | | | | 23,306 | | | | 567,106 | |
| Class F-3 | | | 348,579 | | | | — | | | | 348,579 | | | | 217,380 | | | | 8,833 | | | | 226,213 | |
| Class 529-A | | | 41,402 | | | | — | | | | 41,402 | | | | 32,109 | | | | 1,605 | | | | 33,714 | |
| Class 529-C | | | 1,170 | | | | — | | | | 1,170 | | | | 951 | | | | 69 | | | | 1,020 | |
| Class 529-E | | | 1,121 | | | | — | | | | 1,121 | | | | 906 | | | | 49 | | | | 955 | |
| Class 529-T | | | 1 | | | | — | | | | 1 | | | | — | † | | | — | † | | | — | † |
| Class 529-F-1 | | | — | † | | | — | | | | — | † | | | — | † | | | — | † | | | — | † |
| Class 529-F-2 | | | 6,067 | | | | — | | | | 6,067 | | | | 4,426 | | | | 198 | | | | 4,624 | |
| Class 529-F-3 | | | — | † | | | — | | | | — | † | | | — | † | | | — | † | | | — | † |
| Class R-1 | | | 1,166 | | | | — | | | | 1,166 | | | | 701 | | | | 47 | | | | 748 | |
| Class R-2 | | | 9,070 | | | | — | | | | 9,070 | | | | 6,235 | | | | 428 | | | | 6,663 | |
| Class R-2E | | | 1,135 | | | | — | | | | 1,135 | | | | 795 | | | | 47 | | | | 842 | |
| Class R-3 | | | 17,232 | | | | — | | | | 17,232 | | | | 12,926 | | | | 711 | | | | 13,637 | |
| Class R-4 | | | 18,011 | | | | — | | | | 18,011 | | | | 13,148 | | | | 632 | | | | 13,780 | |
| Class R-5E | | | 6,650 | | | | — | | | | 6,650 | | | | 4,159 | | | | 188 | | | | 4,347 | |
| Class R-5 | | | 11,301 | | | | — | | | | 11,301 | | | | 8,984 | | | | 395 | | | | 9,379 | |
| Class R-6 | | | 619,804 | | | | — | | | | 619,804 | | | | 431,640 | | | | 18,096 | | | | 449,736 | |
| Total | | $ | 2,898,001 | | | $ | — | | | $ | 2,898,001 | | | $ | 1,982,549 | | | $ | 88,983 | | | $ | 2,071,532 | |
| † | Amount less than one thousand. |
7. Fees and transactions with related parties
CRMC, the fund’s investment adviser, is the parent company of American Funds Distributors®, Inc. (“AFD”), the principal underwriter of the fund’s shares, and American Funds Service Company® (“AFS”), the fund’s transfer agent. CRMC, AFD and AFS are considered related parties to the fund.
Investment advisory services — The fund has an investment advisory and service agreement with CRMC that provides for monthly fees accrued daily. These fees are based on a series of decreasing annual rates beginning with 0.300% on the first $60 million of daily net assets and decreasing to 0.105% on such assets in excess of $76 billion. The agreement also provides for monthly fees, accrued daily, based on a series of decreasing rates beginning with 2.25% on the first $8,333,333 of the fund’s monthly gross income and decreasing to 1.75% on such income in excess of $41,666,667. During the year ended December 31, 2023, CRMC waived investment advisory services fees of $358,000. CRMC does not intend to recoup this waiver. As a result, the fees shown on the fund’s statement of operations of $150,802,000, which were equivalent to an annualized rate of 0.200% of average daily net assets, were reduced to $150,444,000, which were equivalent to an annualized rate of 0.199% of average daily net assets.
| The Bond Fund of America | 93 |
Class-specific fees and expenses — Expenses that are specific to individual share classes are accrued directly to the respective share class. The principal class-specific fees and expenses are further described below:
Distribution services — The fund has plans of distribution for all share classes, except Class F-2, F-3, 529-F-2, 529-F-3, R-5E, R-5 and R-6 shares. Under the plans, the board of trustees approves certain categories of expenses that are used to finance activities primarily intended to sell fund shares and service existing accounts. The plans provide for payments, based on an annualized percentage of average daily net assets, ranging from 0.25% to 1.00% as noted in this section. In some cases, the board of trustees has limited the amounts that may be paid to less than the maximum allowed by the plans. All share classes with a plan may use up to 0.25% of average daily net assets to pay service fees, or to compensate AFD for paying service fees, to firms that have entered into agreements with AFD to provide certain shareholder services. The remaining amounts available to be paid under each plan are paid to dealers to compensate them for their sales activities.
| Share class | | Currently approved limits | | Plan limits |
| Class A | | | 0.25 | % | | | 0.25 | % |
| Class 529-A | | | 0.25 | | | | 0.50 | |
| Classes C, 529-C and R-1 | | | 1.00 | | | | 1.00 | |
| Class R-2 | | | 0.75 | | | | 1.00 | |
| Class R-2E | | | 0.60 | | | | 0.85 | |
| Classes 529-E and R-3 | | | 0.50 | | | | 0.75 | |
| Classes T, F-1, 529-T, 529-F-1 and R-4 | | | 0.25 | | | | 0.50 | |
For Class A and 529-A shares, distribution-related expenses include the reimbursement of dealer and wholesaler commissions paid by AFD for certain shares sold without a sales charge. These share classes reimburse AFD for amounts billed within the prior 15 months but only to the extent that the overall annual expense limits are not exceeded. As of December 31, 2023, unreimbursed expenses subject to reimbursement totaled $6,295,000 for Class A shares. There were no unreimbursed expenses subject to reimbursement for Class 529-A shares.
Transfer agent services — The fund has a shareholder services agreement with AFS under which the fund compensates AFS for providing transfer agent services to each of the fund’s share classes. These services include recordkeeping, shareholder communications and transaction processing. In addition, the fund reimburses AFS for amounts paid to third parties for performing transfer agent services on behalf of fund shareholders.
Administrative services — The fund has an administrative services agreement with CRMC under which the fund compensates CRMC for providing administrative services to all share classes. Administrative services are provided by CRMC and its affiliates to help assist third parties providing non-distribution services to fund shareholders. These services include providing in-depth information on the fund and market developments that impact fund investments. Administrative services also include, but are not limited to, coordinating, monitoring and overseeing third parties that provide services to fund shareholders. The agreement provides the fund the ability to charge an administrative services fee at the annual rate of 0.05% of the average daily net assets attributable to each share class of the fund. Currently the fund pays CRMC an administrative services fee at the annual rate of 0.03% of the average daily net assets attributable to each share class of the fund for CRMC’s provision of administrative services.
529 plan services — Each 529 share class is subject to service fees to compensate the Virginia College Savings Plan (“Virginia529”) for its oversight and administration of the CollegeAmerica 529 college savings plan. The fees are based on the combined net assets invested in Class 529 and ABLE shares of the American Funds. Class ABLE shares are offered on other American Funds by Virginia529 through ABLEAmerica®, a tax-advantaged savings program for individuals with disabilities. Virginia529 is not considered a related party to the fund.
The quarterly fees are based on a series of decreasing annual rates beginning with 0.09% on the first $20 billion of the combined net assets invested in the American Funds and decreasing to 0.03% on such assets in excess of $75 billion. The fees for any given calendar quarter are accrued and calculated on the basis of the average net assets of Class 529 and ABLE shares of the American Funds for the last month of the prior calendar quarter. For the year ended December 31, 2023, the 529 plan services fees were $821,000, which were equivalent to 0.059% of the average daily net assets of each 529 share class.
| 94 | The Bond Fund of America |
For the year ended December 31, 2023, class-specific expenses under the agreements were as follows (dollars in thousands):
| Share class | | Distribution
services | | | Transfer agent
services | | | Administrative
services | | | 529 plan
services | |
| Class A | | | $60,828 | | | | $31,617 | | | | $7,299 | | | | Not applicable | |
| Class C | | | 4,486 | | | | 588 | | | | 135 | | | | Not applicable | |
| Class T | | | — | | | | — | * | | | — | * | | | Not applicable | |
| Class F-1 | | | 1,907 | | | | 1,274 | | | | 233 | | | | Not applicable | |
| Class F-2 | | | Not applicable | | | | 24,763 | | | | 6,809 | | | | Not applicable | |
| Class F-3 | | | Not applicable | | | | 108 | | | | 2,599 | | | | Not applicable | |
| Class 529-A | | | 2,719 | | | | 1,412 | | | | 346 | | | | $685 | |
| Class 529-C | | | 415 | | | | 52 | | | | 12 | | | | 25 | |
| Class 529-E | | | 164 | | | | 17 | | | | 10 | | | | 20 | |
| Class 529-T | | | — | | | | — | * | | | — | * | | | — | * |
| Class 529-F-1 | | | — | | | | — | * | | | — | * | | | — | * |
| Class 529-F-2 | | | Not applicable | | | | 45 | | | | 46 | | | | 91 | |
| Class 529-F-3 | | | Not applicable | | | | — | * | | | — | * | | | — | * |
| Class R-1 | | | 394 | | | | 38 | | | | 12 | | | | Not applicable | |
| Class R-2 | | | 2,338 | | | | 1,078 | | | | 94 | | | | Not applicable | |
| Class R-2E | | | 212 | | | | 72 | | | | 11 | | | | Not applicable | |
| Class R-3 | | | 2,565 | | | | 771 | | | | 154 | | | | Not applicable | |
| Class R-4 | | | 1,228 | | | | 484 | | | | 147 | | | | Not applicable | |
| Class R-5E | | | Not applicable | | | | 259 | | | | 51 | | | | Not applicable | |
| Class R-5 | | | Not applicable | | | | 150 | | | | 86 | | | | Not applicable | |
| Class R-6 | | | Not applicable | | | | 195 | | | | 4,632 | | | | Not applicable | |
| Total class-specific expenses | | | $77,256 | | | | $62,923 | | | | $22,676 | | | | $821 | |
| * | Amount less than one thousand. |
Trustees’ deferred compensation — Trustees who are unaffiliated with CRMC may elect to defer the cash payment of part or all of their compensation. These deferred amounts, which remain as liabilities of the fund, are treated as if invested in shares of the fund or other American Funds. These amounts represent general, unsecured liabilities of the fund and vary according to the total returns of the selected funds. Trustees’ compensation of $233,000 in the fund’s statement of operations reflects $175,000 in current fees (either paid in cash or deferred) and a net increase of $58,000 in the value of the deferred amounts.
Affiliated officers and trustees — Officers and certain trustees of the fund are or may be considered to be affiliated with CRMC, AFD and AFS. No affiliated officers or trustees received any compensation directly from the fund.
Investment in CCF — The fund holds shares of CCF, an institutional prime money market fund managed by CRMC. CCF invests in high-quality, short-term money market instruments. CCF is used as the primary investment vehicle for the fund’s short-term instruments. CCF shares are only available for purchase by CRMC, its affiliates, and other funds managed by CRMC or its affiliates, and are not available to the public. CRMC does not receive an investment advisory services fee from CCF.
Security transactions with related funds — The fund may purchase investment securities from, or sell investment securities to, other funds managed by CRMC (or funds managed by certain affiliates of CRMC) under procedures adopted by the fund’s board of trustees. The funds involved in such transactions are considered related by virtue of having a common investment adviser (or affiliated investment advisers), common trustees and/or common officers. When such transactions occur, each transaction is executed at the current market price of the security and no brokerage commissions or fees are paid in accordance with Rule 17a-7 of the 1940 Act. During the year ended December 31, 2023, the fund did not engage in any such purchase or sale transactions with any related funds.
| The Bond Fund of America | 95 |
Interfund lending — Pursuant to an exemptive order issued by the SEC, the fund, along with other CRMC-managed funds (or funds managed by certain affiliates of CRMC), may participate in an interfund lending program. The program provides an alternate credit facility that permits the funds to lend or borrow cash for temporary purposes directly to or from one another, subject to the conditions of the exemptive order. The fund did not lend or borrow cash through the interfund lending program at any time during the year ended December 31, 2023.
8. Indemnifications
The fund’s organizational documents provide board members and officers with indemnification against certain liabilities or expenses in connection with the performance of their duties to the fund. In the normal course of business, the fund may also enter into contracts that provide general indemnifications. The fund’s maximum exposure under these arrangements is unknown since it is dependent on future claims that may be made against the fund. The risk of material loss from such claims is considered remote. Insurance policies are also available to the fund’s board members and officers.
9. Capital share transactions
Capital share transactions in the fund were as follows (dollars and shares in thousands):
| | | Sales* | | | Issued in connection with
the merger of
Capital Group
Core Bond Fund | | | Reinvestments of
distributions | | | Repurchases* | | | Net increase
(decrease) | |
| Share class | | Amount | | | Shares | | | Amount | | Shares | | | Amount | | | Shares | | | Amount | | | Shares | | | Amount | | | Shares | |
| | | | | | | | | | | | | | | | | | | | | | | | | | | | | | |
| Year ended December 31, 2023 | | | | | | | | | | | | | | | | | | | | | | | | | | | | | |
| | | | | | | | | | | | | | | | | | | | | | | | | | | | | | |
| Class A | | $ | 3,828,344 | | | | 338,385 | | | | | | | | | $ | 873,059 | | | | 77,347 | | | $ | (3,831,974 | ) | | | (339,734 | ) | | $ | 869,429 | | | | 75,998 | |
| Class C | | | 86,914 | | | | 7,676 | | | | | | | | | | 12,765 | | | | 1,130 | | | | (159,895 | ) | | | (14,147 | ) | | | (60,216 | ) | | | (5,341 | ) |
| Class T | | | — | | | | — | | | | | | | | | | — | | | | — | | | | — | | | | — | | | | — | | | | — | |
| Class F-1 | | | 169,608 | | | | 14,908 | | | | | | | | | | 27,043 | | | | 2,394 | | | | (279,106 | ) | | | (24,936 | ) | | | (82,455 | ) | | | (7,634 | ) |
| Class F-2 | | | 11,415,382 | | | | 1,013,267 | | | | | | | | | | 865,350 | | | | 76,717 | | | | (7,198,670 | ) | | | (641,816 | ) | | | 5,082,062 | | | | 448,168 | |
| Class F-3 | | | 3,522,646 | | | | 310,896 | | | | | | | | | | 345,753 | | | | 30,644 | | | | (2,444,812 | ) | | | (216,986 | ) | | | 1,423,587 | | | | 124,554 | |
| Class 529-A | | | 211,987 | | | | 18,740 | | | | | | | | | | 41,262 | | | | 3,655 | | | | (240,280 | ) | | | (21,245 | ) | | | 12,969 | | | | 1,150 | |
| Class 529-C | | | 14,579 | | | | 1,288 | | | | | | | | | | 1,164 | | | | 103 | | | | (21,174 | ) | | | (1,871 | ) | | | (5,431 | ) | | | (480 | ) |
| Class 529-E | | | 6,420 | | | | 567 | | | | | | | | | | 1,114 | | | | 99 | | | | (9,550 | ) | | | (842 | ) | | | (2,016 | ) | | | (176 | ) |
| Class 529-T | | | — | | | | — | | | | | | | | | | — | † | | | — | † | | | — | | | | — | | | | — | † | | | — | † |
| Class 529-F-1 | | | — | | | | — | | | | | | | | | | — | † | | | — | † | | | — | | | | — | | | | — | † | | | — | † |
| Class 529-F-2 | | | 44,944 | | | | 3,975 | | | | | | | | | | 6,045 | | | | 536 | | | | (31,423 | ) | | | (2,779 | ) | | | 19,566 | | | | 1,732 | |
| Class 529-F-3 | | | — | | | | — | | | | | | | | | | — | † | | | — | † | | | — | | | | — | | | | — | † | | | — | † |
| Class R-1 | | | 20,036 | | | | 1,828 | | | | | | | | | | 1,164 | | | | 103 | | | | (8,838 | ) | | | (785 | ) | | | 12,362 | | | | 1,146 | |
| Class R-2 | | | 69,055 | | | | 6,092 | | | | | | | | | | 9,004 | | | | 798 | | | | (87,036 | ) | | | (7,699 | ) | | | (8,977 | ) | | | (809 | ) |
| Class R-2E | | | 11,759 | | | | 1,047 | | | | | | | | | | 1,131 | | | | 100 | | | | (11,369 | ) | | | (1,010 | ) | | | 1,521 | | | | 137 | |
| Class R-3 | | | 128,988 | | | | 11,395 | | | | | | | | | | 17,082 | | | | 1,513 | | | | (146,452 | ) | | | (12,957 | ) | | | (382 | ) | | | (49 | ) |
| Class R-4 | | | 142,225 | | | | 12,532 | | | | | | | | | | 17,866 | | | | 1,583 | | | | (130,594 | ) | | | (11,531 | ) | | | 29,497 | | | | 2,584 | |
| Class R-5E | | | 72,143 | | | | 6,382 | | | | | | | | | | 6,608 | | | | 586 | | | | (47,067 | ) | | | (4,231 | ) | | | 31,684 | | | | 2,737 | |
| Class R-5 | | | 58,266 | | | | 5,192 | | | | | | | | | | 11,245 | | | | 996 | | | | (53,497 | ) | | | (4,722 | ) | | | 16,014 | | | | 1,466 | |
| Class R-6 | | | 3,433,312 | | | | 302,499 | | | | | | | | | | 617,591 | | | | 54,701 | | | | (2,703,332 | ) | | | (238,396 | ) | | | 1,347,571 | | | | 118,804 | |
| Total net increase (decrease) | | $ | 23,236,608 | | | | 2,056,669 | | | | | | | | | $ | 2,855,246 | | | | 253,005 | | | $ | (17,405,069 | ) | | | (1,545,687 | ) | | $ | 8,686,785 | | | | 763,987 | |
Refer to the end of the table for footnotes.
| 96 | The Bond Fund of America |
| | | Sales* | | | Issued in connection with
the merger of
Capital Group
Core Bond Fund | | | Reinvestments of
distributions | | | Repurchases* | | | Net increase
(decrease) | |
| Share class | | Amount | | | Shares | | | Amount | | | Shares | | | Amount | | | Shares | | | Amount | | | Shares | | | Amount | | | Shares | |
| | | | | | | | | | | | | | | | | | | | | | | | | | | | | | | |
| Year ended December 31, 2022 | | | | | | | | | | | | | | | | | | | | | | | | | | | | | | | | | |
| | | | | | | | | | | | | | | | | | | | | | | | | | | | | | | | | | | | | | | | | |
| Class A | | $ | 2,802,059 | | | | 232,234 | | | $ | — | | | | — | | | $ | 697,441 | | | | 58,445 | | | $ | (5,156,600 | ) | | | (430,054 | ) | | $ | (1,657,100 | ) | | | (139,375 | ) |
| Class C | | | 82,137 | | | | 6,785 | | | | — | | | | — | | | | 10,896 | | | | 913 | | | | (223,685 | ) | | | (18,505 | ) | | | (130,652 | ) | | | (10,807 | ) |
| Class T | | | — | | | | — | | | | — | | | | — | | | | — | | | | — | | | | — | | | | — | | | | — | | | | — | |
| Class F-1 | | | 216,444 | | | | 18,247 | | | | — | | | | — | | | | 22,239 | | | | 1,864 | | | | (307,581 | ) | | | (25,703 | ) | | | (68,898 | ) | | | (5,592 | ) |
| Class F-2 | | | 10,281,657 | | | | 859,458 | | | | — | | | | — | | | | 553,366 | | | | 46,464 | | | | (8,286,236 | ) | | | (689,855 | ) | | | 2,548,787 | | | | 216,067 | |
| Class F-3 | | | 3,206,936 | | | | 266,296 | | | | 482,759 | | | | 41,769 | | | | 224,558 | | | | 18,863 | | | | (2,734,209 | ) | | | (228,377 | ) | | | 1,180,044 | | | | 98,551 | |
| Class 529-A | | | 141,506 | | | | 11,670 | | | | — | | | | — | | | | 33,719 | | | | 2,824 | | | | (277,394 | ) | | | (22,939 | ) | | | (102,169 | ) | | | (8,445 | ) |
| Class 529-C | | | 11,658 | | | | 963 | | | | — | | | | — | | | | 1,020 | | | | 86 | | | | (28,197 | ) | | | (2,329 | ) | | | (15,519 | ) | | | (1,280 | ) |
| Class 529-E | | | 4,040 | | | | 332 | | | | — | | | | — | | | | 952 | | | | 80 | | | | (10,044 | ) | | | (832 | ) | | | (5,052 | ) | | | (420 | ) |
| Class 529-T | | | — | | | | — | | | | — | | | | — | | | | — | † | | | — | † | | | — | | | | — | | | | — | † | | | — | † |
| Class 529-F-1 | | | — | | | | — | | | | — | | | | — | | | | — | † | | | — | † | | | — | | | | — | | | | — | † | | | — | † |
| Class 529-F-2 | | | 29,657 | | | | 2,451 | | | | — | | | | — | | | | 4,607 | | | | 386 | | | | (37,653 | ) | | | (3,121 | ) | | | (3,389 | ) | | | (284 | ) |
| Class 529-F-3 | | | — | | | | — | | | | — | | | | — | | | | — | † | | | — | † | | | — | | | | — | | | | — | † | | | — | † |
| Class R-1 | | | 9,092 | | | | 751 | | | | — | | | | — | | | | 747 | | | | 63 | | | | (8,541 | ) | | | (710 | ) | | | 1,298 | | | | 104 | |
| Class R-2 | | | 68,487 | | | | 5,664 | | | | — | | | | — | | | | 6,621 | | | | 557 | | | | (107,121 | ) | | | (8,786 | ) | | | (32,013 | ) | | | (2,565 | ) |
| Class R-2E | | | 10,645 | | | | 871 | | | | — | | | | — | | | | 837 | | | | 70 | | | | (15,116 | ) | | | (1,235 | ) | | | (3,634 | ) | | | (294 | ) |
| Class R-3 | | | 111,908 | | | | 9,205 | | | | — | | | | — | | | | 13,530 | | | | 1,135 | | | | (183,591 | ) | | | (15,098 | ) | | | (58,153 | ) | | | (4,758 | ) |
| Class R-4 | | | 121,051 | | | | 9,950 | | | | — | | | | — | | | | 13,746 | | | | 1,152 | | | | (160,515 | ) | | | (13,225 | ) | | | (25,718 | ) | | | (2,123 | ) |
| Class R-5E | | | 41,924 | | | | 3,473 | | | | — | | | | — | | | | 4,337 | | | | 364 | | | | (31,125 | ) | | | (2,577 | ) | | | 15,136 | | | | 1,260 | |
| Class R-5 | | | 64,785 | | | | 5,386 | | | | — | | | | — | | | | 9,381 | | | | 786 | | | | (110,546 | ) | | | (9,151 | ) | | | (36,380 | ) | | | (2,979 | ) |
| Class R-6 | | | 3,963,031 | | | | 325,394 | | | | — | | | | — | | | | 448,352 | | | | 37,633 | | | | (2,286,589 | ) | | | (190,475 | ) | | | 2,124,794 | | | | 172,552 | |
| Total net increase (decrease) | | $ | 21,167,017 | | | | 1,759,130 | | | $ | 482,759 | | | | 41,769 | | | $ | 2,046,349 | | | | 171,685 | | | $ | (19,964,743 | ) | | | (1,662,972 | ) | | $ | 3,731,382 | | | | 309,612 | |
| * | Includes exchanges between share classes of the fund. |
| † | Amount less than one thousand. |
10. Investment transactions
The fund engaged in purchases and sales of investment securities, excluding short-term securities and U.S. government obligations, if any, of $314,359,507,000 and $301,377,670,000, respectively, during the year ended December 31, 2023.
| The Bond Fund of America | 97 |
Financial highlights
| | | | | | Income (loss) from
investment operations1 | | | Dividends and distributions | | | | | | | | | | | | | | | | | | | |
| Year ended | | Net asset
value,
beginning
of year | | | Net
investment
income | | | Net gains
(losses) on
securities
(both
realized and
unrealized) | | | Total from
investment
operations | | | Dividends
(from net
investment
income) | | | Distributions
(from capital
gains) | | | Total
dividends
and
distributions | | | Net asset
value,
end
of year | | | Total return2,3 | | | Net assets,
end of year
(in millions) | | | Ratio of
expenses to
average net
assets before
waivers/
reimbursements4 | | | Ratio of
expenses to
average net
assets after
waivers/
reimbursements3,4 | | | Ratio of
net income
to average
net assets3 | |
| Class A: | | | | | | | | | | | | | | | | | | | | | | | | | | | | | | | | | | | | | | | | | | | | | | | | | | | | |
| 12/31/2023 | | $ | 11.38 | | | $ | .42 | | | $ | .10 | | | $ | .52 | | | $ | (.41 | ) | | $ | — | | | $ | (.41 | ) | | $ | 11.49 | | | | 4.70 | % | | $ | 25,199 | | | | .62 | % | | | .62 | % | | | 3.72 | % |
| 12/31/2022 | | | 13.39 | | | | .31 | | | | (1.99 | ) | | | (1.68 | ) | | | (.31 | ) | | | (.02 | ) | | | (.33 | ) | | | 11.38 | | | | (12.68 | ) | | | 24,087 | | | | .58 | | | | .58 | | | | 2.54 | |
| 12/31/2021 | | | 13.79 | | | | .18 | | | | (.31 | ) | | | (.13 | ) | | | (.19 | ) | | | (.08 | ) | | | (.27 | ) | | | 13.39 | | | | (.95 | ) | | | 30,201 | | | | .55 | | | | .55 | | | | 1.36 | |
| 12/31/2020 | | | 13.09 | | | | .22 | | | | 1.18 | | | | 1.40 | | | | (.26 | ) | | | (.44 | ) | | | (.70 | ) | | | 13.79 | | | | 10.71 | | | | 29,570 | | | | .57 | | | | .57 | | | | 1.59 | |
| 12/31/2019 | | | 12.57 | | | | .31 | | | | .69 | | | | 1.00 | | | | (.30 | ) | | | (.18 | ) | | | (.48 | ) | | | 13.09 | | | | 8.02 | | | | 23,197 | | | | .60 | | | | .60 | | | | 2.35 | |
| Class C: | | | | | | | | | | | | | | | | | | | | | | | | | | | | | | | | | | | | | | | | | | | | | | | | | | | | |
| 12/31/2023 | | | 11.38 | | | | .34 | | | | .10 | | | | .44 | | | | (.33 | ) | | | — | | | | (.33 | ) | | | 11.49 | | | | 3.93 | | | | 430 | | | | 1.36 | | | | 1.36 | | | | 2.96 | |
| 12/31/2022 | | | 13.39 | | | | .22 | | | | (1.99 | ) | | | (1.77 | ) | | | (.22 | ) | | | (.02 | ) | | | (.24 | ) | | | 11.38 | | | | (13.33 | ) | | | 487 | | | | 1.33 | | | | 1.33 | | | | 1.78 | |
| 12/31/2021 | | | 13.79 | | | | .08 | | | | (.31 | ) | | | (.23 | ) | | | (.09 | ) | | | (.08 | ) | | | (.17 | ) | | | 13.39 | | | | (1.68 | ) | | | 717 | | | | 1.29 | | | | 1.29 | | | | .60 | |
| 12/31/2020 | | | 13.09 | | | | .11 | | | | 1.18 | | | | 1.29 | | | | (.15 | ) | | | (.44 | ) | | | (.59 | ) | | | 13.79 | | | | 9.90 | | | | 848 | | | | 1.31 | | | | 1.31 | | | | .87 | |
| 12/31/2019 | | | 12.57 | | | | .21 | | | | .69 | | | | .90 | | | | (.20 | ) | | | (.18 | ) | | | (.38 | ) | | | 13.09 | | | | 7.20 | | | | 786 | | | | 1.36 | | | | 1.36 | | | | 1.60 | |
| Class T: | | | | | | | | | | | | | | | | | | | | | | | | | | | | | | | | | | | | | | | | | | | | | | | | | | | | |
| 12/31/2023 | | | 11.38 | | | | .46 | | | | .10 | | | | .56 | | | | (.45 | ) | | | — | | | | (.45 | ) | | | 11.49 | | | | 5.03 | 5 | | | — | 6 | | | .29 | 5 | | | .29 | 5 | | | 4.04 | 5 |
| 12/31/2022 | | | 13.39 | | | | .34 | | | | (1.99 | ) | | | (1.65 | ) | | | (.34 | ) | | | (.02 | ) | | | (.36 | ) | | | 11.38 | | | | (12.47 | )5 | | | — | 6 | | | .33 | 5 | | | .33 | 5 | | | 2.78 | 5 |
| 12/31/2021 | | | 13.79 | | | | .21 | | | | (.31 | ) | | | (.10 | ) | | | (.22 | ) | | | (.08 | ) | | | (.30 | ) | | | 13.39 | | | | (.74 | )5 | | | — | 6 | | | .33 | 5 | | | .33 | 5 | | | 1.55 | 5 |
| 12/31/2020 | | | 13.09 | | | | .25 | | | | 1.18 | | | | 1.43 | | | | (.29 | ) | | | (.44 | ) | | | (.73 | ) | | | 13.79 | | | | 10.98 | 5 | | | — | 6 | | | .34 | 5 | | | .34 | 5 | | | 1.81 | 5 |
| 12/31/2019 | | | 12.57 | | | | .34 | | | | .69 | | | | 1.03 | | | | (.33 | ) | | | (.18 | ) | | | (.51 | ) | | | 13.09 | | | | 8.24 | 5 | | | — | 6 | | | .37 | 5 | | | .37 | 5 | | | 2.56 | 5 |
| Class F-1: | | | | | | | | | | | | | | | | | | | | | | | | | | | | | | | | | | | | | | | | | | | | | | | | | | | | |
| 12/31/2023 | | | 11.38 | | | | .42 | | | | .10 | | | | .52 | | | | (.41 | ) | | | — | | | | (.41 | ) | | | 11.49 | | | | 4.67 | | | | 716 | | | | .65 | | | | .65 | | | | 3.68 | |
| 12/31/2022 | | | 13.39 | | | | .30 | | | | (1.99 | ) | | | (1.69 | ) | | | (.30 | ) | | | (.02 | ) | | | (.32 | ) | | | 11.38 | | | | (12.71 | ) | | | 796 | | | | .61 | | | | .61 | | | | 2.51 | |
| 12/31/2021 | | | 13.79 | | | | .18 | | | | (.31 | ) | | | (.13 | ) | | | (.19 | ) | | | (.08 | ) | | | (.27 | ) | | | 13.39 | | | | (.99 | ) | | | 1,011 | | | | .59 | | | | .59 | | | | 1.30 | |
| 12/31/2020 | | | 13.09 | | | | .21 | | | | 1.18 | | | | 1.39 | | | | (.25 | ) | | | (.44 | ) | | | (.69 | ) | | | 13.79 | | | | 10.68 | | | | 1,315 | | | | .60 | | | | .60 | | | | 1.55 | |
| 12/31/2019 | | | 12.57 | | | | .31 | | | | .69 | | | | 1.00 | | | | (.30 | ) | | | (.18 | ) | | | (.48 | ) | | | 13.09 | | | | 7.97 | | | | 977 | | | | .64 | | | | .64 | | | | 2.31 | |
| Class F-2: | | | | | | | | | | | | | | | | | | | | | | | | | | | | | | | | | | | | | | | | | | | | | | | | | | | | |
| 12/31/2023 | | | 11.38 | | | | .45 | | | | .10 | | | | .55 | | | | (.44 | ) | | | — | | | | (.44 | ) | | | 11.49 | | | | 4.98 | | | | 25,329 | | | | .35 | | | | .35 | | | | 4.02 | |
| 12/31/2022 | | | 13.39 | | | | .34 | | | | (1.99 | ) | | | (1.65 | ) | | | (.34 | ) | | | (.02 | ) | | | (.36 | ) | | | 11.38 | | | | (12.46 | ) | | | 19,982 | | | | .33 | | | | .33 | | | | 2.81 | |
| 12/31/2021 | | | 13.79 | | | | .22 | | | | (.31 | ) | | | (.09 | ) | | | (.23 | ) | | | (.08 | ) | | | (.31 | ) | | | 13.39 | | | | (.71 | ) | | | 20,613 | | | | .31 | | | | .31 | | | | 1.60 | |
| 12/31/2020 | | | 13.09 | | | | .25 | | | | 1.18 | | | | 1.43 | | | | (.29 | ) | | | (.44 | ) | | | (.73 | ) | | | 13.79 | | | | 10.99 | | | | 16,494 | | | | .32 | | | | .32 | | | | 1.81 | |
| 12/31/2019 | | | 12.57 | | | | .35 | | | | .69 | | | | 1.04 | | | | (.34 | ) | | | (.18 | ) | | | (.52 | ) | | | 13.09 | | | | 8.28 | | | | 9,415 | | | | .35 | | | | .35 | | | | 2.59 | |
| Class F-3: | | | | | | | | | | | | | | | | | | | | | | | | | | | | | | | | | | | | | | | | | | | | | | | | | | | | |
| 12/31/2023 | | | 11.38 | | | | .46 | | | | .10 | | | | .56 | | | | (.45 | ) | | | — | | | | (.45 | ) | | | 11.49 | | | | 5.09 | | | | 9,375 | | | | .24 | | | | .24 | | | | 4.12 | |
| 12/31/2022 | | | 13.39 | | | | .35 | | | | (1.99 | ) | | | (1.64 | ) | | | (.35 | ) | | | (.02 | ) | | | (.37 | ) | | | 11.38 | | | | (12.36 | ) | | | 7,866 | | | | .22 | | | | .22 | | | | 2.92 | |
| 12/31/2021 | | | 13.79 | | | | .23 | | | | (.31 | ) | | | (.08 | ) | | | (.24 | ) | | | (.08 | ) | | | (.32 | ) | | | 13.39 | | | | (.60 | ) | | | 7,934 | | | | .20 | | | | .20 | | | | 1.72 | |
| 12/31/2020 | | | 13.09 | | | | .27 | | | | 1.18 | | | | 1.45 | | | | (.31 | ) | | | (.44 | ) | | | (.75 | ) | | | 13.79 | | | | 11.10 | | | | 4,465 | | | | .21 | | | | .21 | | | | 1.90 | |
| 12/31/2019 | | | 12.57 | | | | .36 | | | | .69 | | | | 1.05 | | | | (.35 | ) | | | (.18 | ) | | | (.53 | ) | | | 13.09 | | | | 8.40 | | | | 2,212 | | | | .25 | | | | .24 | | | | 2.70 | |
| Class 529-A: | | | | | | | | | | | | | | | | | | | | | | | | | | | | | | | | | | | | | | | | | | | | | | | | | | |
| 12/31/2023 | | | 11.38 | | | | .42 | | | | .10 | | | | .52 | | | | (.41 | ) | | | — | | | | (.41 | ) | | | 11.49 | | | | 4.66 | | | | 1,181 | | | | .65 | | | | .65 | | | | 3.68 | |
| 12/31/2022 | | | 13.39 | | | | .30 | | | | (1.99 | ) | | | (1.69 | ) | | | (.30 | ) | | | (.02 | ) | | | (.32 | ) | | | 11.38 | | | | (12.71 | ) | | | 1,156 | | | | .62 | | | | .62 | | | | 2.51 | |
| 12/31/2021 | | | 13.79 | | | | .18 | | | | (.31 | ) | | | (.13 | ) | | | (.19 | ) | | | (.08 | ) | | | (.27 | ) | | | 13.39 | | | | (.99 | ) | | | 1,473 | | | | .59 | | | | .59 | | | | 1.31 | |
| 12/31/2020 | | | 13.09 | | | | .21 | | | | 1.18 | | | | 1.39 | | | | (.25 | ) | | | (.44 | ) | | | (.69 | ) | | | 13.79 | | | | 10.67 | | | | 1,526 | | | | .61 | | | | .61 | | | | 1.54 | |
| 12/31/2019 | | | 12.57 | | | | .30 | | | | .69 | | | | .99 | | | | (.29 | ) | | | (.18 | ) | | | (.47 | ) | | | 13.09 | | | | 7.95 | | | | 1,174 | | | | .66 | | | | .66 | | | | 2.29 | |
Refer to the end of the table for footnotes.
| 98 | The Bond Fund of America |
Financial highlights (continued)
| | | | | | Income (loss) from
investment operations1 | | | Dividends and distributions | | | | | | | | | | | | | | | | | | | |
| Year ended | | Net asset
value,
beginning
of year | | | Net
investment
income | | | Net gains
(losses) on
securities
(both
realized and
unrealized) | | | Total from
investment
operations | | | Dividends
(from net
investment
income) | | | Distributions
(from capital
gains) | | | Total
dividends
and
distributions | | | Net asset
value,
end
of year | | | Total return2,3 | | | Net assets,
end of year
(in millions) | | | Ratio of
expenses to
average net
assets before
waivers/
reimbursements4 | | | Ratio of
expenses to
average net
assets after
waivers/
reimbursements3,4 | | | Ratio of
net income
to average
net assets3 | |
| Class 529-C: | | | | | | | | | | | | | | | | | | | | | | | | | | | | | | | | | | | | | | | | | | | | | | | | | | | | |
| 12/31/2023 | | $ | 11.38 | | | $ | .33 | | | $ | .10 | | | $ | .43 | | | $ | (.32 | ) | | $ | — | | | $ | (.32 | ) | | $ | 11.49 | | | | 3.87 | % | | $ | 40 | | | | 1.42 | % | | | 1.42 | % | | | 2.90 | % |
| 12/31/2022 | | | 13.39 | | | | .21 | | | | (1.99 | ) | | | (1.78 | ) | | | (.21 | ) | | | (.02 | ) | | | (.23 | ) | | | 11.38 | | | | (13.38 | ) | | | 45 | | | | 1.38 | | | | 1.38 | | | | 1.72 | |
| 12/31/2021 | | | 13.79 | | | | .08 | | | | (.31 | ) | | | (.23 | ) | | | (.09 | ) | | | (.08 | ) | | | (.17 | ) | | | 13.39 | | | | (1.73 | ) | | | 70 | | | | 1.34 | | | | 1.34 | | | | .56 | |
| 12/31/2020 | | | 13.09 | | | | .11 | | | | 1.18 | | | | 1.29 | | | | (.15 | ) | | | (.44 | ) | | | (.59 | ) | | | 13.79 | | | | 9.85 | | | | 89 | | | | 1.36 | | | | 1.36 | | | | .90 | |
| 12/31/2019 | | | 12.57 | | | | .21 | | | | .69 | | | | .90 | | | | (.20 | ) | | | (.18 | ) | | | (.38 | ) | | | 13.09 | | | | 7.16 | | | | 180 | | | | 1.40 | | | | 1.40 | | | | 1.56 | |
| Class 529-E: | | | | | | | | | | | | | | | | | | | | | | | | | | | | | | | | | | | | | | | | | | | | | | | | | | | | |
| 12/31/2023 | | | 11.38 | | | | .39 | | | | .10 | | | | .49 | | | | (.38 | ) | | | — | | | | (.38 | ) | | | 11.49 | | | | 4.46 | | | | 33 | | | | .84 | | | | .84 | | | | 3.49 | |
| 12/31/2022 | | | 13.39 | | | | .28 | | | | (1.99 | ) | | | (1.71 | ) | | | (.28 | ) | | | (.02 | ) | | | (.30 | ) | | | 11.38 | | | | (12.88 | ) | | | 34 | | | | .81 | | | | .81 | | | | 2.30 | |
| 12/31/2021 | | | 13.79 | | | | .15 | | | | (.31 | ) | | | (.16 | ) | | | (.16 | ) | | | (.08 | ) | | | (.24 | ) | | | 13.39 | | | | (1.19 | ) | | | 46 | | | | .79 | | | | .79 | | | | 1.11 | |
| 12/31/2020 | | | 13.09 | | | | .18 | | | | 1.18 | | | | 1.36 | | | | (.22 | ) | | | (.44 | ) | | | (.66 | ) | | | 13.79 | | | | 10.46 | | | | 53 | | | | .80 | | | | .80 | | | | 1.37 | |
| 12/31/2019 | | | 12.57 | | | | .28 | | | | .69 | | | | .97 | | | | (.27 | ) | | | (.18 | ) | | | (.45 | ) | | | 13.09 | | | | 7.75 | | | | 46 | | | | .85 | | | | .85 | | | | 2.11 | |
| Class 529-T: | | | | | | | | | | | | | | | | | | | | | | | | | | | | | | | | | | | | | | | | | | | | | | | | | | | | |
| 12/31/2023 | | | 11.38 | | | | .45 | | | | .10 | | | | .55 | | | | (.44 | ) | | | — | | | | (.44 | ) | | | 11.49 | | | | 4.95 | 5 | | | — | 6 | | | .36 | 5 | | | .36 | 5 | | | 3.97 | 5 |
| 12/31/2022 | | | 13.39 | | | | .33 | | | | (1.99 | ) | | | (1.66 | ) | | | (.33 | ) | | | (.02 | ) | | | (.35 | ) | | | 11.38 | | | | (12.51 | )5 | | | — | 6 | | | .38 | 5 | | | .38 | 5 | | | 2.74 | 5 |
| 12/31/2021 | | | 13.79 | | | | .21 | | | | (.31 | ) | | | (.10 | ) | | | (.22 | ) | | | (.08 | ) | | | (.30 | ) | | | 13.39 | | | | (.78 | )5 | | | — | 6 | | | .37 | 5 | | | .37 | 5 | | | 1.52 | 5 |
| 12/31/2020 | | | 13.09 | | | | .24 | | | | 1.18 | | | | 1.42 | | | | (.28 | ) | | | (.44 | ) | | | (.72 | ) | | | 13.79 | | | | 10.91 | 5 | | | — | 6 | | | .39 | 5 | | | .39 | 5 | | | 1.77 | 5 |
| 12/31/2019 | | | 12.57 | | | | .33 | | | | .69 | | | | 1.02 | | | | (.32 | ) | | | (.18 | ) | | | (.50 | ) | | | 13.09 | | | | 8.20 | 5 | | | — | 6 | | | .42 | 5 | | | .42 | 5 | | | 2.51 | 5 |
| Class 529-F-1: | | | | | | | | | | | | | | | | | | | | | | | | | | | | | | | | | | | | | | | | | | | | | | | | | | |
| 12/31/2023 | | | 11.38 | | | | .44 | | | | .10 | | | | .54 | | | | (.43 | ) | | | — | | | | (.43 | ) | | | 11.49 | | | | 4.87 | 5 | | | — | 6 | | | .44 | 5 | | | .44 | 5 | | | 3.89 | 5 |
| 12/31/2022 | | | 13.39 | | | | .33 | | | | (1.99 | ) | | | (1.66 | ) | | | (.33 | ) | | | (.02 | ) | | | (.35 | ) | | | 11.38 | | | | (12.53 | )5 | | | — | 6 | | | .40 | 5 | | | .40 | 5 | | | 2.71 | 5 |
| 12/31/2021 | | | 13.79 | | | | .20 | | | | (.31 | ) | | | (.11 | ) | | | (.21 | ) | | | (.08 | ) | | | (.29 | ) | | | 13.39 | | | | (.82 | )5 | | | — | 6 | | | .41 | 5 | | | .41 | 5 | | | 1.48 | 5 |
| 12/31/2020 | | | 13.09 | | | | .24 | | | | 1.18 | | | | 1.42 | | | | (.28 | ) | | | (.44 | ) | | | (.72 | ) | | | 13.79 | | | | 10.92 | 5 | | | — | 6 | | | .38 | 5 | | | .38 | 5 | | | 1.87 | 5 |
| 12/31/2019 | | | 12.57 | | | | .34 | | | | .69 | | | | 1.03 | | | | (.33 | ) | | | (.18 | ) | | | (.51 | ) | | | 13.09 | | | | 8.20 | | | | 128 | | | | .42 | | | | .42 | | | | 2.53 | |
| Class 529-F-2: | | | | | | | | | | | | | | | | | | | | | | | | | | | | | | | | | | | | | | | | | | | | | | | | | | |
| 12/31/2023 | | | 11.38 | | | | .45 | | | | .10 | | | | .55 | | | | (.44 | ) | | | — | | | | (.44 | ) | | | 11.49 | | | | 5.00 | | | | 168 | | | | .33 | | | | .32 | | | | 4.03 | |
| 12/31/2022 | | | 13.39 | | | | .34 | | | | (1.99 | ) | | | (1.65 | ) | | | (.34 | ) | | | (.02 | ) | | | (.36 | ) | | | 11.38 | | | | (12.45 | ) | | | 147 | | | | .32 | | | | .32 | | | | 2.81 | |
| 12/31/2021 | | | 13.79 | | | | .21 | | | | (.31 | ) | | | (.10 | ) | | | (.22 | ) | | | (.08 | ) | | | (.30 | ) | | | 13.39 | | | | (.73 | ) | | | 177 | | | | .33 | | | | .33 | | | | 1.58 | |
| 12/31/20207,8 | | | 14.00 | | | | .03 | | | | .24 | | | | .27 | | | | (.04 | ) | | | (.44 | ) | | | (.48 | ) | | | 13.79 | | | | 1.88 | 9 | | | 166 | | | | .06 | 9 | | | .06 | 9 | | | .24 | 9 |
| Class 529-F-3: | | | | | | | | | | | | | | | | | | | | | | | | | | | | | | | | | | | | | | | | | | | | | | | | | | |
| 12/31/2023 | | | 11.38 | | | | .46 | | | | .10 | | | | .56 | | | | (.45 | ) | | | — | | | | (.45 | ) | | | 11.49 | | | | 5.03 | | | | — | 6 | | | .29 | | | | .28 | | | | 4.05 | |
| 12/31/2022 | | | 13.39 | | | | .34 | | | | (1.99 | ) | | | (1.65 | ) | | | (.34 | ) | | | (.02 | ) | | | (.36 | ) | | | 11.38 | | | | (12.42 | ) | | | — | 6 | | | .27 | | | | .27 | | | | 2.85 | |
| 12/31/2021 | | | 13.79 | | | | .22 | | | | (.31 | ) | | | (.09 | ) | | | (.23 | ) | | | (.08 | ) | | | (.31 | ) | | | 13.39 | | | | (.69 | ) | | | — | 6 | | | .27 | | | | .27 | | | | 1.62 | |
| 12/31/20207,8 | | | 14.00 | | | | .04 | | | | .23 | | | | .27 | | | | (.04 | ) | | | (.44 | ) | | | (.48 | ) | | | 13.79 | | | | 1.90 | 9 | | | — | 6 | | | .08 | 9 | | | .04 | 9 | | | .25 | 9 |
| Class R-1: | | | | | | | | | | | | | | | | | | | | | | | | | | | | | | | | | | | | | | | | | | | | | | | | | | | | |
| 12/31/2023 | | | 11.38 | | | | .34 | | | | .10 | | | | .44 | | | | (.33 | ) | | | — | | | | (.33 | ) | | | 11.49 | | | | 3.96 | | | | 50 | | | | 1.33 | | | | 1.33 | | | | 3.05 | |
| 12/31/2022 | | | 13.39 | | | | .22 | | | | (1.99 | ) | | | (1.77 | ) | | | (.22 | ) | | | (.02 | ) | | | (.24 | ) | | | 11.38 | | | | (13.31 | ) | | | 37 | | | | 1.31 | | | | 1.31 | | | | 1.83 | |
| 12/31/2021 | | | 13.79 | | | | .08 | | | | (.31 | ) | | | (.23 | ) | | | (.09 | ) | | | (.08 | ) | | | (.17 | ) | | | 13.39 | | | | (1.69 | ) | | | 42 | | | | 1.29 | | | | 1.29 | | | | .62 | |
| 12/31/2020 | | | 13.09 | | | | .11 | | | | 1.18 | | | | 1.29 | | | | (.15 | ) | | | (.44 | ) | | | (.59 | ) | | | 13.79 | | | | 9.88 | | | | 39 | | | | 1.33 | | | | 1.33 | | | | .85 | |
| 12/31/2019 | | | 12.57 | | | | .21 | | | | .69 | | | | .90 | | | | (.20 | ) | | | (.18 | ) | | | (.38 | ) | | | 13.09 | | | | 7.21 | | | | 39 | | | | 1.35 | | | | 1.35 | | | | 1.61 | |
Refer to the end of the table for footnotes.
| The Bond Fund of America | 99 |
Financial highlights (continued)
| | | | | | Income (loss) from
investment operations1 | | | Dividends and distributions | | | | | | | | | | | | | | | | | | | |
| Year ended | | Net asset
value,
beginning
of year | | | Net
investment
income | | | Net gains
(losses) on
securities
(both
realized and
unrealized) | | | Total from
investment
operations | | | Dividends
(from net
investment
income) | | | Distributions
(from capital
gains) | | | Total
dividends
and
distributions | | | Net asset
value,
end
of year | | | Total return2,3 | | | Net assets,
end of year
(in millions) | | | Ratio of
expenses to
average net
assets before
waivers/
reimbursements4 | | | Ratio of
expenses to
average net
assets after
waivers/
reimbursements3,4 | | | Ratio of
net income
to average
net assets3 | |
| Class R-2: | | | | | | | | | | | | | | | | | | | | | | | | | | | | | | | | | | | | | | | | | | | | | | | | | | | | |
| 12/31/2023 | | $ | 11.38 | | | $ | .34 | | | $ | .10 | | | $ | 44 | | | $ | (.33 | ) | | $ | — | | | $ | (.33 | ) | | $ | 11.49 | | | | 3.95 | % | | $ | 313 | | | | 1.33 | % | | | 1.33 | % | | | 3.00 | % |
| 12/31/2022 | | | 13.39 | | | | .22 | | | | (1.99 | ) | | | (1.77 | ) | | | (.22 | ) | | | (.02 | ) | | | (.24 | ) | | | 11.38 | | | | (13.33 | ) | | | 319 | | | | 1.33 | | | | 1.33 | | | | 1.79 | |
| 12/31/2021 | | | 13.79 | | | | .08 | | | | (.31 | ) | | | (.23 | ) | | | (.09 | ) | | | (.08 | ) | | | (.17 | ) | | | 13.39 | | | | (1.69 | ) | | | 409 | | | | 1.30 | | | | 1.30 | | | | .60 | |
| 12/31/2020 | | | 13.09 | | | | .12 | | | | 1.18 | | | | 1.30 | | | | (.16 | ) | | | (.44 | ) | | | (.60 | ) | | | 13.79 | | | | 9.91 | | | | 468 | | | | 1.30 | | | | 1.30 | | | | .87 | |
| 12/31/2019 | | | 12.57 | | | | .22 | | | | .69 | | | | .91 | | | | (.21 | ) | | | (.18 | ) | | | (.39 | ) | | | 13.09 | | | | 7.22 | | | | 410 | | | | 1.34 | | | | 1.34 | | | | 1.61 | |
| Class R-2E: | | | | | | | | | | | | | | | | | | | | | | | | | | | | | | | | | | | | | | | | | | | | | | | | | | | | |
| 12/31/2023 | | | 11.38 | | | | .37 | | | | .10 | | | | .47 | | | | (.36 | ) | | | — | | | | (.36 | ) | | | 11.49 | | | | 4.26 | | | | 36 | | | | 1.04 | | | | 1.04 | | | | 3.31 | |
| 12/31/2022 | | | 13.39 | | | | .25 | | | | (1.99 | ) | | | (1.74 | ) | | | (.25 | ) | | | (.02 | ) | | | (.27 | ) | | | 11.38 | | | | (13.07 | ) | | | 34 | | | | 1.03 | | | | 1.03 | | | | 2.09 | |
| 12/31/2021 | | | 13.79 | | | | .12 | | | | (.31 | ) | | | (.19 | ) | | | (.13 | ) | | | (.08 | ) | | | (.21 | ) | | | 13.39 | | | | (1.40 | ) | | | 44 | | | | 1.00 | | | | 1.00 | | | | .90 | |
| 12/31/2020 | | | 13.09 | | | | .16 | | | | 1.18 | | | | 1.34 | | | | (.20 | ) | | | (.44 | ) | | | (.64 | ) | | | 13.79 | | | | 10.22 | | | | 46 | | | | 1.02 | | | | 1.02 | | | | 1.14 | |
| 12/31/2019 | | | 12.57 | | | | .25 | | | | .69 | | | | .94 | | | | (.24 | ) | | | (.18 | ) | | | (.42 | ) | | | 13.09 | | | | 7.53 | | | | 33 | | | | 1.05 | | | | 1.05 | | | | 1.90 | |
| Class R-3: | | | | | | | | | | | | | | | | | | | | | | | | | | | | | | | | | | | | | | | | | | | | | | | | | | | | |
| 12/31/2023 | | | 11.38 | | | | .39 | | | | .10 | | | | .49 | | | | (.38 | ) | | | — | | | | (.38 | ) | | | 11.49 | | | | 4.42 | | | | 523 | | | | .89 | | | | .89 | | | | 3.45 | |
| 12/31/2022 | | | 13.39 | | | | .27 | | | | (1.99 | ) | | | (1.72 | ) | | | (.27 | ) | | | (.02 | ) | | | (.29 | ) | | | 11.38 | | | | (12.93 | ) | | | 518 | | | | .87 | | | | .87 | | | | 2.25 | |
| 12/31/2021 | | | 13.79 | | | | .14 | | | | (.31 | ) | | | (.17 | ) | | | (.15 | ) | | | (.08 | ) | | | (.23 | ) | | | 13.39 | | | | (1.25 | ) | | | 673 | | | | .85 | | | | .85 | | | | 1.05 | |
| 12/31/2020 | | | 13.09 | | | | .18 | | | | 1.18 | | | | 1.36 | | | | (.22 | ) | | | (.44 | ) | | | (.66 | ) | | | 13.79 | | | | 10.40 | | | | 743 | | | | .86 | | | | .86 | | | | 1.31 | |
| 12/31/2019 | | | 12.57 | | | | .27 | | | | .69 | | | | .96 | | | | (.26 | ) | | | (.18 | ) | | | (.44 | ) | | | 13.09 | | | | 7.70 | | | | 633 | | | | .89 | | | | .89 | | | | 2.06 | |
| Class R-4: | | | | | | | | | | | | | | | | | | | | | | | | | | | | | | | | | | | | | | | | | | | | | | | | | | | | |
| 12/31/2023 | | | 11.38 | | | | .42 | | | | .10 | | | | .52 | | | | (.41 | ) | | | — | | | | (.41 | ) | | | 11.49 | | | | 4.73 | | | | 510 | | | | .58 | | | | .58 | | | | 3.76 | |
| 12/31/2022 | | | 13.39 | | | | .31 | | | | (1.99 | ) | | | (1.68 | ) | | | (.31 | ) | | | (.02 | ) | | | (.33 | ) | | | 11.38 | | | | (12.67 | ) | | | 476 | | | | .57 | | | | .57 | | | | 2.55 | |
| 12/31/2021 | | | 13.79 | | | | .18 | | | | (.31 | ) | | | (.13 | ) | | | (.19 | ) | | | (.08 | ) | | | (.27 | ) | | | 13.39 | | | | (.94 | ) | | | 588 | | | | .54 | | | | .54 | | | | 1.35 | |
| 12/31/2020 | | | 13.09 | | | | .22 | | | | 1.18 | | | | 1.40 | | | | (.26 | ) | | | (.44 | ) | | | (.70 | ) | | | 13.79 | | | | 10.73 | | | | 688 | | | | .55 | | | | .55 | | | | 1.61 | |
| 12/31/2019 | | | 12.57 | | | | .31 | | | | .69 | | | | 1.00 | | | | (.30 | ) | | | (.18 | ) | | | (.48 | ) | | | 13.09 | | | | 8.03 | | | | 567 | | | | .59 | | | | .59 | | | | 2.37 | |
| Class R-5E: | | | | | | | | | | | | | | | | | | | | | | | | | | | | | | | | | | | | | | | | | | | | | | | | | | | | |
| 12/31/2023 | | | 11.38 | | | | .45 | | | | .10 | | | | .55 | | | | (.44 | ) | | | — | | | | (.44 | ) | | | 11.49 | | | | 4.94 | | | | 183 | | | | .39 | | | | .39 | | | | 3.98 | |
| 12/31/2022 | | | 13.39 | | | | .33 | | | | (1.99 | ) | | | (1.66 | ) | | | (.33 | ) | | | (.02 | ) | | | (.35 | ) | | | 11.38 | | | | (12.50 | ) | | | 150 | | | | .37 | | | | .37 | | | | 2.77 | |
| 12/31/2021 | | | 13.79 | | | | .21 | | | | (.31 | ) | | | (.10 | ) | | | (.22 | ) | | | (.08 | ) | | | (.30 | ) | | | 13.39 | | | | (.75 | ) | | | 160 | | | | .34 | | | | .34 | | | | 1.60 | |
| 12/31/2020 | | | 13.09 | | | | .25 | | | | 1.18 | | | | 1.43 | | | | (.29 | ) | | | (.44 | ) | | | (.73 | ) | | | 13.79 | | | | 10.95 | | | | 88 | | | | .35 | | | | .35 | | | | 1.78 | |
| 12/31/2019 | | | 12.57 | | | | .34 | | | | .69 | | | | 1.03 | | | | (.33 | ) | | | (.18 | ) | | | (.51 | ) | | | 13.09 | | | | 8.25 | | | | 43 | | | | .37 | | | | .37 | | | | 2.53 | |
| Class R-5: | | | | | | | | | | | | | | | | | | | | | | | | | | | | | | | | | | | | | | | | | | | | | | | | | | | | |
| 12/31/2023 | | | 11.38 | | | | .46 | | | | .10 | | | | .56 | | | | (.45 | ) | | | — | | | | (.45 | ) | | | 11.49 | | | | 5.04 | | | | 303 | | | | .29 | | | | .29 | | | | 4.06 | |
| 12/31/2022 | | | 13.39 | | | | .35 | | | | (1.99 | ) | | | (1.64 | ) | | | (.35 | ) | | | (.02 | ) | | | (.37 | ) | | | 11.38 | | | | (12.40 | ) | | | 283 | | | | .27 | | | | .27 | | | | 2.85 | |
| 12/31/2021 | | | 13.79 | | | | .22 | | | | (.31 | ) | | | (.09 | ) | | | (.23 | ) | | | (.08 | ) | | | (.31 | ) | | | 13.39 | | | | (.65 | ) | | | 373 | | | | .25 | | | | .25 | | | | 1.69 | |
| 12/31/2020 | | | 13.09 | | | | .26 | | | | 1.18 | | | | 1.44 | | | | (.30 | ) | | | (.44 | ) | | | (.74 | ) | | | 13.79 | | | | 11.06 | | | | 192 | | | | .26 | | | | .26 | | | | 1.91 | |
| 12/31/2019 | | | 12.57 | | | | .35 | | | | .69 | | | | 1.04 | | | | (.34 | ) | | | (.18 | ) | | | (.52 | ) | | | 13.09 | | | | 8.35 | | | | 173 | | | | .29 | | | | .29 | | | | 2.67 | |
| Class R-6: | | | | | | | | | | | | | | | | | | | | | | | | | | | | | | | | | | | | | | | | | | | | | | | | | | | | |
| 12/31/2023 | | | 11.38 | | | | .46 | | | | .10 | | | | .56 | | | | (.45 | ) | | | — | | | | (.45 | ) | | | 11.49 | | | | 5.09 | | | | 16,255 | | | | .24 | | | | .24 | | | | 4.11 | |
| 12/31/2022 | | | 13.39 | | | | .35 | | | | (1.99 | ) | | | (1.64 | ) | | | (.35 | ) | | | (.02 | ) | | | (.37 | ) | | | 11.38 | | | | (12.36 | ) | | | 14,744 | | | | .22 | | | | .22 | | | | 2.93 | |
| 12/31/2021 | | | 13.79 | | | | .23 | | | | (.31 | ) | | | (.08 | ) | | | (.24 | ) | | | (.08 | ) | | | (.32 | ) | | | 13.39 | | | | (.60 | ) | | | 15,035 | | | | .20 | | | | .20 | | | | 1.71 | |
| 12/31/2020 | | | 13.09 | | | | .27 | | | | 1.18 | | | | 1.45 | | | | (.31 | ) | | | (.44 | ) | | | (.75 | ) | | | 13.79 | | | | 11.11 | | | | 13,449 | | | | .21 | | | | .21 | | | | 1.95 | |
| 12/31/2019 | | | 12.57 | | | | .36 | | | | .69 | | | | 1.05 | | | | (.35 | ) | | | (.18 | ) | | | (.53 | ) | | | 13.09 | | | | 8.40 | | | | 10,434 | | | | .24 | | | | .24 | | | | 2.72 | |
Refer to the end of the table for footnotes.
| 100 | The Bond Fund of America |
Financial highlights (continued)
| | | Year ended December 31, |
| Portfolio turnover rate for all share classes10,11 | | 2023 | | 2022 | | 2021 | | 2020 | | 2019 |
| Excluding mortgage dollar roll transactions | | | 91 | % | | | 74 | % | | | 74 | % | | | 113 | % | | | 127 | % |
| Including mortgage dollar roll transactions | | | 466 | % | | | 412 | % | | | 368 | % | | | 535 | % | | | 286 | % |
| 1 | Based on average shares outstanding. |
| 2 | Total returns exclude any applicable sales charges, including contingent deferred sales charges. |
| 3 | This column reflects the impact, if any, of certain waivers/reimbursements from CRMC and/or AFS. During one of the years shown, CRMC waived a portion of investment advisory services fees. In addition, during one of the years shown, AFS waived a portion of transfer agent services fees for Class F-3 shares. In addition, during one of the years shown, CRMC reimbursed a portion of transfer agent services fees for Class 529-F-3 shares. |
| 4 | Ratios do not include expenses of any Central Funds. The fund indirectly bears its proportionate share of the expenses of any Central Funds. |
| 5 | All or a significant portion of assets in this class consisted of seed capital invested by CRMC and/or its affiliates. Fees for distribution services are not charged or accrued on these seed capital assets. If such fees were paid by the fund on seed capital assets, fund expenses would have been higher and net income and total return would have been lower. |
| 6 | Amount less than $1 million. |
| 7 | Based on operations for a period that is less than a full year. |
| 8 | Class 529-F-2 and 529-F-3 shares began investment operations on October 30, 2020. |
| 9 | Not annualized. |
| 10 | Rates do not include the fund’s portfolio activity with respect to any Central Funds. |
| 11 | Refer to Note 5 for more information on mortgage dollar rolls. |
Refer to the notes to financial statements.
| The Bond Fund of America | 101 |
Report of Independent Registered Public Accounting Firm
To the Shareholders and Board of Trustees of The Bond Fund of America:
Opinion on the Financial Statements and Financial Highlights
We have audited the accompanying statement of assets and liabilities of The Bond Fund of America (the “Fund”), including the investment portfolio, as of December 31, 2023, the related statement of operations for the year then ended, the statements of changes in net assets for each of the two years in the period then ended, the financial highlights for each of the five years in the period then ended, and the related notes. In our opinion, the financial statements and financial highlights present fairly, in all material respects, the financial position of the Fund as of December 31, 2023, and the results of its operations for the year then ended, the changes in its net assets for each of the two years in the period then ended, and the financial highlights for each of the five years in the period then ended in conformity with accounting principles generally accepted in the United States of America.
Basis for Opinion
These financial statements and financial highlights are the responsibility of the Fund’s management. Our responsibility is to express an opinion on the Fund’s financial statements and financial highlights based on our audits. We are a public accounting firm registered with the Public Company Accounting Oversight Board (United States) (PCAOB) and are required to be independent with respect to the Fund in accordance with the U.S. federal securities laws and the applicable rules and regulations of the Securities and Exchange Commission and the PCAOB.
We conducted our audits in accordance with the standards of the PCAOB. Those standards require that we plan and perform the audit to obtain reasonable assurance about whether the financial statements and financial highlights are free of material misstatement, whether due to error or fraud. The Fund is not required to have, nor were we engaged to perform, an audit of its internal control over financial reporting. As part of our audits we are required to obtain an understanding of internal control over financial reporting but not for the purpose of expressing an opinion on the effectiveness of the Fund’s internal control over financial reporting. Accordingly, we express no such opinion.
Our audits included performing procedures to assess the risks of material misstatement of the financial statements and financial highlights, whether due to error or fraud, and performing procedures that respond to those risks. Such procedures included examining, on a test basis, evidence regarding the amounts and disclosures in the financial statements and financial highlights. Our audits also included evaluating the accounting principles used and significant estimates made by management, as well as evaluating the overall presentation of the financial statements and financial highlights. Our procedures included confirmation of securities owned as of December 31, 2023, by correspondence with the custodian and brokers; when replies were not received from brokers, we performed other auditing procedures. We believe that our audits provide a reasonable basis for our opinion.
/s/ Deloitte & Touche LLP
Costa Mesa, California
February 12, 2024
We have served as the auditor of one or more American Funds investment companies since 1956.
| 102 | The Bond Fund of America |
As a fund shareholder, you incur two types of costs: (1) transaction costs, such as initial sales charges on purchase payments and contingent deferred sales charges on redemptions (loads), and (2) ongoing costs, including management fees, distribution and service (12b-1) fees, and other expenses. This example is intended to help you understand your ongoing costs (in dollars) of investing in the fund so you can compare these costs with the ongoing costs of investing in other mutual funds. The example is based on an investment of $1,000 invested at the beginning of the period and held for the entire six-month period (July 1, 2023, through December 31, 2023).
Actual expenses:
The first line of each share class in the table on the following page provides information about actual account values and actual expenses. You may use the information in this line, together with the amount you invested, to estimate the expenses that you paid over the period. Simply divide your account value by $1,000 (for example, an $8,600 account value divided by $1,000 = 8.6), then multiply the result by the number in the first line under the heading titled “Expenses paid during period” to estimate the expenses you paid on your account during this period.
Hypothetical example for comparison purposes:
The second line of each share class in the table on the following page provides information about hypothetical account values and hypothetical expenses based on the actual expense ratio for the share class and an assumed rate of return of 5.00% per year before expenses, which is not the actual return of the share class. The hypothetical account values and expenses may not be used to estimate the actual ending account balance or expenses you paid for the period. You may use this information to compare the ongoing costs of investing in the fund and other funds. To do so, compare this 5.00% hypothetical example with the 5.00% hypothetical examples that appear in the shareholder reports of the other funds.
Notes:
Retirement plan participants may be subject to certain fees charged by the plan sponsor, and Class F-1, F-2, F-3, 529-F-1, 529-F-2 and 529-F-3 shareholders may be subject to fees charged by financial intermediaries, typically ranging from 0.75% to 1.50% of assets annually depending on services offered. You can estimate the impact of these fees by adding the amount of the fees to the total estimated expenses you paid on your account during the period as calculated above. In addition, your ending account value would be lower by the amount of these fees.
Note that the expenses shown in the table on the following page are meant to highlight your ongoing costs only and do not reflect any transactional costs, such as sales charges (loads). Therefore, the second line of each share class in the table is useful in comparing ongoing costs only and will not help you determine the relative total costs of owning different funds. In addition, if these transactional costs were included, your costs would have been higher.
| The Bond Fund of America | 103 |
Expense example (continued)
| | | Beginning
account value
7/1/2023 | | Ending
account value
12/31/2023 | | Expenses paid
during period* | | Annualized
expense ratio |
| Class A – actual return | | $ | 1,000.00 | | | $ | 1,033.51 | | | $ | 3.18 | | | | .62 | % |
| Class A – assumed 5% return | | | 1,000.00 | | | | 1,022.08 | | | | 3.16 | | | | .62 | |
| Class C – actual return | | | 1,000.00 | | | | 1,029.64 | | | | 7.01 | | | | 1.37 | |
| Class C – assumed 5% return | | | 1,000.00 | | | | 1,018.30 | | | | 6.97 | | | | 1.37 | |
| Class T – actual return | | | 1,000.00 | | | | 1,035.05 | | | | 1.69 | | | | .33 | |
| Class T – assumed 5% return | | | 1,000.00 | | | | 1,023.54 | | | | 1.68 | | | | .33 | |
| Class F-1 – actual return | | | 1,000.00 | | | | 1,033.31 | | | | 3.38 | | | | .66 | |
| Class F-1 – assumed 5% return | | | 1,000.00 | | | | 1,021.88 | | | | 3.36 | | | | .66 | |
| Class F-2 – actual return | | | 1,000.00 | | | | 1,034.92 | | | | 1.80 | | | | .35 | |
| Class F-2 – assumed 5% return | | | 1,000.00 | | | | 1,023.44 | | | | 1.79 | | | | .35 | |
| Class F-3 – actual return | | | 1,000.00 | | | | 1,035.48 | | | | 1.23 | | | | .24 | |
| Class F-3 – assumed 5% return | | | 1,000.00 | | | | 1,024.00 | | | | 1.22 | | | | .24 | |
| Class 529-A – actual return | | | 1,000.00 | | | | 1,033.28 | | | | 3.38 | | | | .66 | |
| Class 529-A – assumed 5% return | | | 1,000.00 | | | | 1,021.88 | | | | 3.36 | | | | .66 | |
| Class 529-C – actual return | | | 1,000.00 | | | | 1,029.39 | | | | 7.26 | | | | 1.42 | |
| Class 529-C – assumed 5% return | | | 1,000.00 | | | | 1,018.05 | | | | 7.22 | | | | 1.42 | |
| Class 529-E – actual return | | | 1,000.00 | | | | 1,032.38 | | | | 4.30 | | | | .84 | |
| Class 529-E – assumed 5% return | | | 1,000.00 | | | | 1,020.97 | | | | 4.28 | | | | .84 | |
| Class 529-T – actual return | | | 1,000.00 | | | | 1,034.57 | | | | 2.10 | | | | .41 | |
| Class 529-T – assumed 5% return | | | 1,000.00 | | | | 1,023.14 | | | | 2.09 | | | | .41 | |
| Class 529-F-1 – actual return | | | 1,000.00 | | | | 1,034.42 | | | | 2.31 | | | | .45 | |
| Class 529-F-1 – assumed 5% return | | | 1,000.00 | | | | 1,022.94 | | | | 2.29 | | | | .45 | |
| Class 529-F-2 – actual return | | | 1,000.00 | | | | 1,034.93 | | | | 1.80 | | | | .35 | |
| Class 529-F-2 – assumed 5% return | | | 1,000.00 | | | | 1,023.44 | | | | 1.79 | | | | .35 | |
| Class 529-F-3 – actual return | | | 1,000.00 | | | | 1,035.27 | | | | 1.44 | | | | .28 | |
| Class 529-F-3 – assumed 5% return | | | 1,000.00 | | | | 1,023.79 | | | | 1.43 | | | | .28 | |
| Class R-1 – actual return | | | 1,000.00 | | | | 1,029.81 | | | | 6.86 | | | | 1.34 | |
| Class R-1 – assumed 5% return | | | 1,000.00 | | | | 1,018.45 | | | | 6.82 | | | | 1.34 | |
| Class R-2 – actual return | | | 1,000.00 | | | | 1,029.79 | | | | 6.86 | | | | 1.34 | |
| Class R-2 – assumed 5% return | | | 1,000.00 | | | | 1,018.45 | | | | 6.82 | | | | 1.34 | |
| Class R-2E – actual return | | | 1,000.00 | | | | 1,031.32 | | | | 5.38 | | | | 1.05 | |
| Class R-2E – assumed 5% return | | | 1,000.00 | | | | 1,019.91 | | | | 5.35 | | | | 1.05 | |
| Class R-3 – actual return | | | 1,000.00 | | | | 1,032.10 | | | | 4.56 | | | | .89 | |
| Class R-3 – assumed 5% return | | | 1,000.00 | | | | 1,020.72 | | | | 4.53 | | | | .89 | |
| Class R-4 – actual return | | | 1,000.00 | | | | 1,033.67 | | | | 3.02 | | | | .59 | |
| Class R-4 – assumed 5% return | | | 1,000.00 | | | | 1,022.23 | | | | 3.01 | | | | .59 | |
| Class R-5E – actual return | | | 1,000.00 | | | | 1,034.67 | | | | 2.05 | | | | .40 | |
| Class R-5E – assumed 5% return | | | 1,000.00 | | | | 1,023.19 | | | | 2.04 | | | | .40 | |
| Class R-5 – actual return | | | 1,000.00 | | | | 1,035.20 | | | | 1.49 | | | | .29 | |
| Class R-5 – assumed 5% return | | | 1,000.00 | | | | 1,023.74 | | | | 1.48 | | | | .29 | |
| Class R-6 – actual return | | | 1,000.00 | | | | 1,035.48 | | | | 1.23 | | | | .24 | |
| Class R-6 – assumed 5% return | | | 1,000.00 | | | | 1,024.00 | | | | 1.22 | | | | .24 | |
| * | The “expenses paid during period” are equal to the “annualized expense ratio,” multiplied by the average account value over the period, multiplied by the number of days in the period, and divided by 365 (to reflect the one-half year period). |
| 104 | The Bond Fund of America |
We are required to advise you of the federal tax status of certain distributions received by shareholders during the fiscal year. The fund hereby designates the following amounts for the fund’s fiscal year ended December 31, 2023:
| Qualified dividend income | $3,023,000 |
| Section 163(j) interest dividends | $2,897,132,000 |
| Corporate dividends received deduction | $1,005,000 |
| U.S. government income that may be exempt from state taxation | $777,430,000 |
Individual shareholders should refer to their Form 1099 or other tax information, which was mailed in January 2024, to determine the calendar year amounts to be included on their 2023 tax returns. Shareholders should consult their tax advisors.
| The Bond Fund of America | 105 |
| Liquidity Risk Management Program | unaudited |
The fund has adopted a liquidity risk management program (the “program”). The fund’s board has designated Capital Research and Management Company (“CRMC”) as the administrator of the program. Personnel of CRMC or its affiliates conduct the day-to-day operation of the program pursuant to policies and procedures administered by the Capital Group Liquidity Risk Management Committee.
Under the program, CRMC manages the fund’s liquidity risk, which is the risk that the fund could not meet shareholder redemption requests without significant dilution of remaining shareholders’ interests in the fund. This risk is managed by monitoring the degree of liquidity of the fund’s investments, limiting the amount of the fund’s illiquid investments, and utilizing various risk management tools and facilities available to the fund for meeting shareholder redemptions, among other means. CRMC’s process of determining the degree of liquidity of the fund’s investments is supported by one or more third-party liquidity assessment vendors.
The fund’s board reviewed a report prepared by CRMC regarding the operation and effectiveness of the program for the period October 1, 2022, through September 30, 2023. No significant liquidity events impacting the fund were noted in the report. In addition, CRMC provided its assessment that the program had been effective in managing the fund’s liquidity risk.
| 106 | The Bond Fund of America |
Board of trustees and other officers
Independent trustees1
Name, year of birth and
position with fund | | Year first
elected as
a trustee2 | | Principal occupation(s) during the past five years | | Number of
portfolios
overseen by
trustee | | Other directorships3 held
by trustee during the past
five years |
| Francisco G. Cigarroa, MD, 1957 | | 2021 | | Professor of Surgery, University of Texas Health San Antonio; Trustee, Ford Foundation; Clayton Research Scholar, Clayton Foundation for Biomedical Research | | 88 | | None |
| Nariman Farvardin, 1956 | | 2018 | | President, Stevens Institute of Technology | | 93 | | None |
| Jennifer C. Feikin, 1968 | | 2022 | | Business Advisor; previously held positions at Google, AOL, 20th Century Fox and McKinsey & Company; Trustee, The Nature Conservancy of Utah; former Trustee, The Nature Conservancy of California | | 102 | | Hertz Global Holdings, Inc. |
| Leslie Stone Heisz, 1961 | | 2022 | | Former Managing Director, Lazard (retired, 2010); Director, Kaiser Permanente (California public benefit corporation); former Lecturer, UCLA Anderson School of Management | | 102 | | Edwards Lifesciences; Public Storage, Inc. |
| Mary Davis Holt, 1950 | | 2015–2016;
2017 | | Principal, Mary Davis Holt Enterprises, LLC (leadership development consulting); former COO, Time Life Inc. (1993–2003) | | 89 | | None |
| Merit E. Janow, 1958 | | 2010 | | Dean Emerita and Professor of Practice, International Economic Law & International Affairs, Columbia University, School of International and Public Affairs | | 99 | | Aptiv (autonomous and green vehicle technology); Mastercard Incorporated |
Margaret Spellings, 1957
Chair of the Board (Independent and
Non-Executive) | | 2010 | | President and CEO, Bipartisan Policy Center; former President and CEO, Texas 2036; former President, Margaret Spellings & Company (public policy and strategic consulting); former President, The University of North Carolina | | 93 | | None |
| Alexandra Trower, 1964 | | 2019 | | Former Executive Vice President, Global Communications and Corporate Officer, The Estée Lauder Companies | | 88 | | None |
| Paul S. Williams, 1959 | | 2020 | | Former Partner/Managing Director, Major, Lindsey & Africa (executive recruiting firm) | | 88 | | Air Transport Services Group, Inc. (aircraft leasing and air cargo transportation); Public Storage, Inc. |
Interested trustees4,5
Name, year of birth and
position with fund | | Year first
elected as
a trustee/
officer2 | | Principal occupation(s) during the past five years and
positions held with affiliated entities or the principal
underwriter of the fund | | Number of
portfolios
overseen by
trustee | | Other directorships3 held
by trustee during the past
five years |
| Michael C. Gitlin, 1970 | | 2015 | | Partner – Capital Fixed Income Investors, Capital Research and Management Company; President, Chief Executive Officer and Director, The Capital Group Companies, Inc.6; Vice Chairman and Director, Capital Research and Management Company | | 88 | | None |
| Karl J. Zeile, 1966 | | 2019 | | Partner – Capital Fixed Income Investors, Capital Research and Management Company | | 23 | | None |
The fund’s statement of additional information includes further details about fund trustees and is available without charge upon request by calling American Funds Service Company at (800) 421-4225 or by referring to the Capital Group website at capitalgroup.com. The address for all trustees and officers of the fund is 333 South Hope Street, Los Angeles, CA 90071, Attention: Secretary.
Refer to page 108 for footnotes.
| The Bond Fund of America | 107 |
Other officers5
Name, year of birth and
position with fund | | Year first elected
as an officer2 | | Principal occupation(s) during the past five years and positions held with affiliated entities or the principal
underwriter of the fund |
Pramod Atluri, 1976
President | | 2016 | | Partner – Capital Fixed Income Investors, Capital Research and Management Company; Partner – Capital Fixed Income Investors, Capital Bank and Trust Company6; Director, Capital Research and Management Company |
Kristine M. Nishiyama, 1970
Principal Executive Officer | | 2003 | | Senior Vice President and Senior Counsel – Fund Business Management Group, Capital Research and Management Company; Chair, Senior Vice President, General Counsel and Director, Capital Bank and Trust Company6 |
Michael W. Stockton, 1967
Executive Vice President | | 2021 | | Senior Vice President – Fund Business Management Group, Capital Research and Management Company |
David J. Betanzos, 1974
Senior Vice President | | 2016 | | Partner – Capital Fixed Income Investors, Capital Research and Management Company |
David A. Hoag, 1965
Senior Vice President | | 2015 | | Partner – Capital Fixed Income Investors, Capital Research and Management Company |
Fergus N. MacDonald, 1969
Senior Vice President | | 2015 | | Partner – Capital Fixed Income Investors, Capital Research and Management Company; Partner – Capital Fixed Income Investors, Capital Bank and Trust Company6 |
| Courtney R. Taylor, 1975 Secretary | | 2006-2014,
2023 | | Assistant Vice President – Fund Business Management Group, Capital Research and Management Company |
Becky L. Park, 1979
Treasurer | | 2021 | | Vice President – Investment Operations, Capital Research and Management Company |
Jane Y. Chung, 1974
Assistant Secretary | | 2014 | | Associate – Fund Business Management Group, Capital Research and Management Company |
Sandra Chuon, 1972
Assistant Treasurer | | 2019 | | Vice President – Investment Operations, Capital Research and Management Company |
Brian C. Janssen, 1972
Assistant Treasurer | | 2011 | | Senior Vice President – Investment Operations, Capital Research and Management Company |
| 1 | The term independent trustee refers to a trustee who is not an “interested person” of the fund within the meaning of the Investment Company Act of 1940. |
| 2 | Trustees and officers of the fund serve until their resignation, removal or retirement. |
| 3 | This includes all directorships/trusteeships (other than those in the American Funds or other funds managed by Capital Research and Management Company or its affiliates) that are held by each trustee as a trustee or director of a public company or a registered investment company. |
| 4 | The term interested trustee refers to a trustee who is an “interested person” within the meaning of the Investment Company Act of 1940, on the basis of their affiliation with the fund’s investment adviser, Capital Research and Management Company, or affiliated entities (including the fund’s principal underwriter). |
| 5 | All of the trustees and/or officers listed are officers and/or directors/trustees of one or more of the other funds for which Capital Research and Management Company serves as investment adviser. |
| 6 | Company affiliated with Capital Research and Management Company. |
| 108 | The Bond Fund of America |
Office of the fund
333 South Hope Street
Los Angeles, CA 90071-1406
Investment adviser
Capital Research and Management Company
333 South Hope Street
Los Angeles, CA 90071-1406
Transfer agent for shareholder accounts
American Funds Service Company
(Write to the address nearest you.)
P.O. Box 6007
Indianapolis, IN 46206-6007
P.O. Box 2280
Norfolk, VA 23501-2280
Custodian of assets
JPMorgan Chase Bank
270 Park Avenue
New York, NY 10017-2070
Counsel
Morgan, Lewis & Bockius LLP
One Federal Street
Boston, MA 02110-1726
Independent registered public accounting firm
Deloitte & Touche LLP
695 Town Center Drive
Suite 1000
Costa Mesa, CA 92626-7188
Principal underwriter
American Funds Distributors, Inc.
333 South Hope Street
Los Angeles, CA 90071-1406
Investors should carefully consider investment objectives, risks, charges and expenses. This and other important information is contained in the fund prospectus and summary prospectus, which can be obtained from your financial professional and should be read carefully before investing. You may also call American Funds Service Company (AFS) at (800) 421-4225 or refer to the Capital Group website at capitalgroup.com.
“American Funds Proxy Voting Procedures and Principles” — which describes how we vote proxies relating to portfolio securities — is available on the American Funds website or upon request by calling AFS. The fund files its proxy voting record with the U.S. Securities and Exchange Commission (SEC) for the 12 months ended June 30 by August 31. The proxy voting record is available free of charge on the SEC website at sec.gov or our website.
The Bond Fund of America files a complete list of its portfolio holdings with the SEC for the first and third quarters of each fiscal year on NPORT-P. The list of portfolio holdings is available free of charge on the SEC website and on our website.
This report is for the information of shareholders of The Bond Fund of America, but it also may be used as sales literature when preceded or accompanied by the current prospectus or summary prospectus, which gives details about charges, expenses, investment objectives and operating policies of the fund. If used as sales material after March 31, 2024, this report must be accompanied by an American Funds statistical update for the most recently completed calendar quarter.
Bloomberg Index Services Limited. BLOOMBERG® is a trademark and service mark of Bloomberg Finance L.P. and its affiliates (collectively “Bloomberg”). Bloomberg or Bloomberg’s licensors own all proprietary rights in the Bloomberg Indices. Neither Bloomberg nor Bloomberg’s licensors approves or endorses this material, or guarantees the accuracy or completeness of any information herein, or makes any warranty, express or implied, as to the results to be obtained therefrom and, to the maximum extent allowed by law, neither shall have any liability or responsibility for injury or damages arising in connection therewith.
This report, and any product, index or fund referred to herein, is not sponsored, endorsed or promoted in any way by J.P. Morgan or any of its affiliates who provide no warranties whatsoever, express or implied, and shall have no liability to any prospective investor, in connection with this report. J.P. Morgan disclaimer: https://www.jpmm.com/research/disclosures.
American Funds Distributors, Inc.
The Capital Advantage®
Since 1931, Capital Group, home of American Funds, has helped investors pursue long-term investment success. Our consistent approach — in combination with The Capital SystemTM — has resulted in superior outcomes.
Aligned with investor success
We base our decisions on a long-term perspective, which we believe aligns our goals with the interests of our clients. Our portfolio managers average 28 years of investment industry experience, including 22 years at our company, reflecting a career commitment to our long-term approach.1
The Capital System
The Capital System combines individual accountability with teamwork. Funds using The Capital System are divided into portions that are managed independently by investment professionals with diverse backgrounds, ages and investment approaches. An extensive global research effort is the backbone of our system.
American Funds’ superior outcomes
Equity-focused funds have beaten their Lipper peer indexes in 90% of 10-year periods and 99% of 20-year periods.2 Relative to their peers, our fixed income funds have helped investors achieve better diversification through attention to correlation between bonds and equities.3 Fund management fees have been among the lowest in the industry.4
| | 1 | Investment industry experience as of December 31, 2022. |
| | 2 | Based on Class F-2 share results for rolling monthly 10- and 20-year periods starting with the first 10- or 20-year period after each mutual fund’s inception through December 31, 2022. Periods covered are the shorter of the fund’s lifetime or since the comparable Lipper index inception date (except Capital Income Builder and SMALLCAP World Fund, for which the Lipper average was used). Expenses differ for each share class, so results will vary. Past results are not predictive of results in future periods. |
| | 3 | Based on Class F-2 share results as of December 31, 2022. Sixteen of the 18 fixed income American Funds that have been in existence for the three-year period showed a three-year correlation lower than their respective Morningstar peer group averages. S&P 500 Index was used as an equity market proxy. Correlation based on monthly total returns. Correlation is a statistical measure of how two securities move in relation to each other. A correlation ranges from –1 to 1. A positive correlation close to 1 implies that as one security moves, either up or down, the other security will move in “lockstep,” in the same direction. A negative correlation close to –1 indicates that the securities have moved in the opposite direction. |
| | 4 | On average, our mutual fund management fees were in the lowest quintile 62% of the time, based on the 20-year period ended December 31, 2022, versus comparable Lipper categories, excluding funds of funds. |
Class F-2 shares were first offered on August 1, 2008. Class F-2 share results prior to the date of first sale are hypothetical based on the results of the original share class of the fund without a sales charge, adjusted for typical estimated expenses. Results for certain funds with an inception date after August 1, 2008, also include hypothetical returns because those funds’ Class F-2 shares sold after the funds’ date of first offering. Refer to capitalgroup.com for more information on specific expense adjustments and the actual dates of first sale.
All Capital Group trademarks mentioned are owned by The Capital Group Companies, Inc., an affiliated company or fund. All other company and product names mentioned are the property of their respective companies.

ITEM 2 – Code of Ethics
The Registrant has adopted a Code of Ethics that applies to its Principal Executive Officer and Principal Financial Officer. The Registrant undertakes to provide to any person without charge, upon request, a copy of the Code of Ethics. Such request can be made by calling 800/421-4225 or to the Secretary of the Registrant, 333 South Hope Street, 55th Floor, Los Angeles, California 90071.
ITEM 3 – Audit Committee Financial Expert
The Registrant’s board has determined that Paul S. Williams, a member of the Registrant’s audit committee, is an “audit committee financial expert” and "independent," as such terms are defined in this Item. This designation will not increase the designee’s duties, obligations or liability as compared to his or her duties, obligations and liability as a member of the audit committee and of the board, nor will it reduce the responsibility of the other audit committee members. There may be other individuals who, through education or experience, would qualify as "audit committee financial experts" if the board had designated them as such. Most importantly, the board believes each member of the audit committee contributes significantly to the effective oversight of the Registrant’s financial statements and condition.
ITEM 4 – Principal Accountant Fees and Services
| a) Audit Fees: | | |
| Audit | 2022 | 206,000 |
| | 2023 | 31,000 |
| | | |
| b) Audit-Related Fees: | | |
| | 2022 | 13,000 |
| | 2023 | 12,000 |
| | | |
| c) Tax Fees: | | |
| | 2022 | 10,000 |
| | 2023 | 10,000 |
| | The tax fees consist of professional services relating to the preparation of the Registrant’s tax returns. | |
| | | |
| d) All Other Fees: | | |
| | 2022 | None |
| | 2023 | None |
| | | |
| | Adviser and affiliates (includes only fees for non-audit services billed to the adviser and affiliates for engagements that relate directly to the operations and financial reporting of the Registrant and were subject to the pre-approval policies described below): | |
| a) Audit Fees: | | |
| | Not Applicable | |
| | | |
| b) Audit-Related Fees: | | |
| | 2022 | 2,394,000 |
| | 2023 | 1,979,000 |
| | The audit-related fees consist of assurance and related services relating to the examination of the Registrant’s transfer agent, principal underwriter and investment adviser conducted in accordance with Statement on Standards for Attestation Engagements Number 18 issued by the American Institute of Certified Public Accountants. | |
| | | |
| c) Tax Fees: | | |
| | 2022 | 394,000 |
| | 2023 | None |
| | The tax fees consist of consulting services relating to the Registrant’s investments. | |
| | | |
| | | |
| d) All Other Fees: | | |
| | 2022 | None |
| | 2023 | None |
| | The other fees consist of subscription services related to an accounting research tool. | |
| | | |
| | | |
| | All audit and permissible non-audit services that the Registrant’s audit committee considers compatible with maintaining the independent registered public accounting firm’s independence are required to be pre-approved by the committee. The pre-approval requirement will extend to all non-audit services provided to the Registrant, the investment adviser, and any entity controlling, controlled by, or under common control with the investment adviser that provides ongoing services to the Registrant, if the engagement relates directly to the operations and financial reporting of the Registrant. The committee will not delegate its responsibility to pre-approve these services to the investment adviser. The committee may delegate to one or more committee members the authority to review and pre-approve audit and permissible non-audit services. Actions taken under any such delegation will be reported to the full committee at its next meeting. The pre-approval requirement is waived with respect to non-audit services if certain conditions are met. The pre-approval requirement was not waived for any of the non-audit services listed above provided to the Registrant, adviser and affiliates. | |
| | | |
| | Aggregate non-audit fees paid to the Registrant’s auditors, including fees for all services billed to the Registrant, adviser and affiliates that provide ongoing services to the Registrant, were $2,812,000 for fiscal year 2022 and $2,001,000 for fiscal year 2023. The non-audit services represented by these amounts were brought to the attention of the committee and considered to be compatible with maintaining the auditors’ independence. | |
ITEM 5 – Audit Committee of Listed Registrants
Not applicable to this Registrant, insofar as the Registrant is not a listed issuer as defined in Rule 10A-3 under the Securities Exchange Act of 1934.
ITEM 6 – Schedule of Investments
Not applicable, insofar as the schedule is included as part of the report to shareholders filed under Item 1 of this Form.
ITEM 7 – Disclosure of Proxy Voting Policies and Procedures for Closed-End Management Investment Companies
Not applicable to this Registrant, insofar as the Registrant is not a closed-end management investment company.
ITEM 8 – Portfolio Managers of Closed-End Management Investment Companies
Not applicable to this Registrant, insofar as the Registrant is not a closed-end management investment company.
ITEM 9 – Purchases of Equity Securities by Closed-End Management Investment Company and Affiliated Purchasers
Not applicable to this Registrant, insofar as the Registrant is not a closed-end management investment company.
ITEM 10 – Submission of Matters to a Vote of Security Holders
There have been no material changes to the procedures by which shareholders may recommend nominees to the Registrant’s board of trustees since the Registrant last submitted a proxy statement to its shareholders. The procedures are as follows. The Registrant has a nominating and governance committee comprised solely of persons who are not considered ‘‘interested persons’’ of the Registrant within the meaning of the Investment Company Act of 1940, as amended. The committee periodically reviews such issues as the board’s composition, responsibilities, committees, compensation and other relevant issues, and recommends any appropriate changes to the full board of trustees. While the committee normally is able to identify from its own resources an ample number of qualified candidates, it will consider shareholder suggestions of persons to be considered as nominees to fill future vacancies on the board. Such suggestions must be sent in writing to the nominating and governance committee of the Registrant, c/o the Registrant’s Secretary, and must be accompanied by complete biographical and occupational data on the prospective nominee, along with a written consent of the prospective nominee for consideration of his or her name by the nominating and governance committee.
ITEM 11 – Controls and Procedures
| (a) | The Registrant’s Principal Executive Officer and Principal Financial Officer have concluded, based on their evaluation of the Registrant’s disclosure controls and procedures (as such term is defined in Rule 30a-3 under the Investment Company Act of 1940), that such controls and procedures are adequate and reasonably designed to achieve the purposes described in paragraph (c) of such rule. |
| | |
| (b) | There were no changes in the Registrant’s internal controls over financial reporting (as defined in Rule 30a-3(d) under the Investment Company Act of 1940) that occurred during the Registrant’s semi-annual period covered by this report that has materially affected, or is reasonably likely to materially affect, the Registrant’s internal control over financial reporting. |
ITEM 12 – Exhibits
| (a)(1) | The Code of Ethics that is the subject of the disclosure required by Item 2 is attached as an exhibit hereto. |
| | |
| (a)(2) | The certifications required by Rule 30a-2 of the Investment Company Act of 1940 and Sections 302 and 906 of the Sarbanes-Oxley Act of 2002 are attached as exhibits hereto. |
SIGNATURES
Pursuant to the requirements of the Securities Exchange Act of 1934 and the Investment Company Act of 1940, the Registrant has duly caused this report to be signed on its behalf by the undersigned, thereunto duly authorized.
| | THE BOND FUND OF AMERICA |
| | |
| | By __/s/ Kristine M. Nishiyama___________ |
| | Kristine M. Nishiyama, Principal Executive Officer |
| | |
| | Date: February 29, 2024 |
Pursuant to the requirements of the Securities Exchange Act of 1934 and the Investment Company Act of 1940, this report has been signed below by the following persons on behalf of the Registrant and in the capacities and on the dates indicated.
| By _ /s/ Kristine M. Nishiyama_____________ |
Kristine M. Nishiyama, Principal Executive Officer |
| |
| Date: February 29, 2024 |
| By ___/s/ Becky L. Park__________________ |
Becky L. Park, Treasurer and Principal Financial Officer |
| |
| Date: February 29, 2024 |