Exhibit 99.1
| April 5, 2013 Year-End 2012 Earnings Call & 2013 Guidance Capturing the Recovery Cycle: A Focus on Growth, A Commitment to Value Creation |
| 2 Forward-Looking Statements This presentation may contain forward-looking statements. Forward-looking statements are statements that are not historical, including statements regarding management's intentions, beliefs, expectations, representations, plans or predictions of the future, and are typically identified by such words as "believe," "expect," "anticipate," "intend," "estimate," "may," "will," "should" and "could." We intend that such forward-looking statements be subject to the safe harbor provisions created by Section 27A of the Securities Act of 1933 and Section 21E of the Securities Exchange Act of 1934. These forward-looking statements involve numerous risks and uncertainties that could cause actual results to be materially different from those set forth in the forward-looking statements. These risks are outlined more particularly in our annual report on Form 10-K for the year ended December 31, 2012 and any subsequent Quarterly Reports on Form 10-Q or current reports on Form 8-K to include but are not limited to: financial market disruptions current and future economic conditions could adversely affect our ability to refinance or secure additional debt financing at attractive terms as well as the values of our investments our ongoing strategy involves the disposition of properties; however, we may be unable to sell a property at acceptable terms and conditions, if at all. Our strategy also depends on future acquisitions, and we may not be successful in identifying and consummating these transactions. there is no assurance that we will be able to continue paying cash distributions or that distributions will increase over time an ongoing investigation by the SEC and the receipt of two related derivative demands by stockholders to conduct investigations and a lawsuit related to the derivative demands. The SEC’s investigation, the derivative demands, or both could have a material adverse impact on our business funding distributions from sources other than cash flow from operating activities may negatively impact our ability to sustain or pay distributions and will result in us having less cash available for other uses there is no established public market for our shares, and stockholders may not be able to sell their shares, including through our share repurchase program increasing vacancy rates for certain classes of real estate assets and possible disruption in the financial markets could adversely affect the value of our assets we may suffer adverse consequences due to the financial difficulties, bankruptcy or insolvency of our tenants our investments in equity and debt securities have materially impacted, and may in the future, materially impact our results our borrowings may reduce the funds available for distribution and increase the risk of loss since defaults may cause us to lose the properties securing the loans two tenants generated a significant portion of our revenue, and rental payment defaults by these significant tenants could adversely affect our results of operations we are subject to conflicts of interest with affiliates of our sponsor, which may affect our acquisition of properties and financial performance The estimated value of our common stock is based on a number of assumptions and estimates that may not be accurate or complete and is also subject to a number of limitations we rely on our business manager and property managers to manage our business and assets, and pay significant fees to these parties if we fail to qualify as a REIT, our operations and distributions to stockholders will be adversely affected This material is neither an offer to sell nor the solicitation of an offer to buy any security, which can be made only by the prospectus which has been filed or registered with appropriate state and federal regulatory agencies. No regulatory agency has passed on or endorsed the merits of this offering. Any representation to the contrary is unlawful. The companies depicted in the photographs herein may have proprietary interests in their trade names and trademarks and nothing herein shall be considered to be an endorsement, authorization or approval of Inland American by the companies. Furthermore, none of these companies are affiliated with Inland American in any manner. The Inland name and logo are registered trademarks being used under license. |
| 3 Welcome & Introductions Robert Parks Chairman of the Board Inland American |

| 4 Inland American’s Core Portfolio * As of 12/31/12 |
| 5 Same-Store NOI Growth Increase In $Ms $3.7 $10.7 $0.2 $1.1 $0.3 $3.6 $19.7 |
| 6 2013 Guidance 2012 FFO Results $477 million, or $0.54 per share. These results included certain one-time gains, which increased the result above our 2012 guidance of $0.50 to $0.51. Guidance assumptions Continued same store increases consistent with 2012 increases. Interest rates stay at current levels. Potential impacts to 2013 guidance Disposition activity could cause dilution to our operating performance as a period of time may exist between the disposition of properties and prior to the time we reinvest into other assets or repurchase shares. We could recognize defeasance costs on the extinguishment of debt related to dispositions, although we believe they will be more than offset by the overall gains on sale of the properties. 2013 FFO Guidance $0.50 to $0.52 per share |
| 7 Selected Balance Sheet Information In Millions In Millions 12/31/2012 12/31/2011 Total Assets $10,760 $10,919 Cash and restricted cash 325 317 Investment in marketable securities 328 289 Investment in unconsolidated entities 254 317 Mortgages, notes and margins payable 6,006 $ 5,903 $ Mortgages, notes and margins payable to total asset ratio 56% 54% average rate (per annum) Weighted interest 5.1% 5.2% 2012 FY Distributions Declared - $440.0 million ** $2.4 billion declared since inception |

| 8 Debt Maturities % of Total Debt as of 12/31/12 15.0% 11.4% 11.6% 13.3% 20.9% 27.8% * $250 million of total already refinanced through March 31, 2013 |
| 9 Long-Term Goals Sustainable stockholder distributions while maintaining capital preservation Tailoring our portfolio: Retail, Lodging and Student Housing Expand & perfect these growth portfolios Position for stockholder liquidity Multiple liquidity events **Our goals anticipate capturing the recovery cycle** |
| 10 Portfolio Evolution Approximate size of future portfolio and breakdown by asset class Current portfolio contains approximately $3 billion of triple-net properties These portfolios are mostly triple-net properties Apartments Student Housing Bank Branches (Triple-Net) |
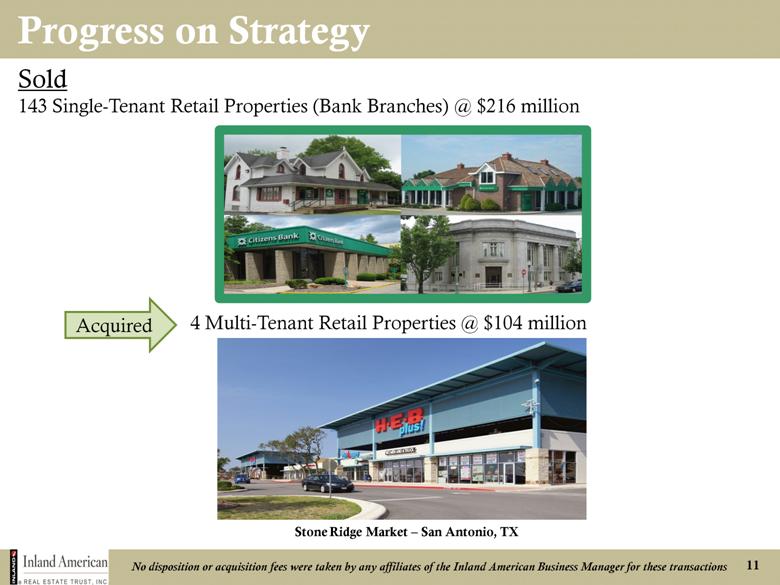
| 11 Progress on Strategy Sold 143 Single-Tenant Retail Properties (Bank Branches) @ $216 million Acquired 4 Multi-Tenant Retail Properties @ $104 million Stone Ridge Market – San Antonio, TX No disposition or acquisition fees were taken by any affiliates of the Inland American Business Manager for these transactions |
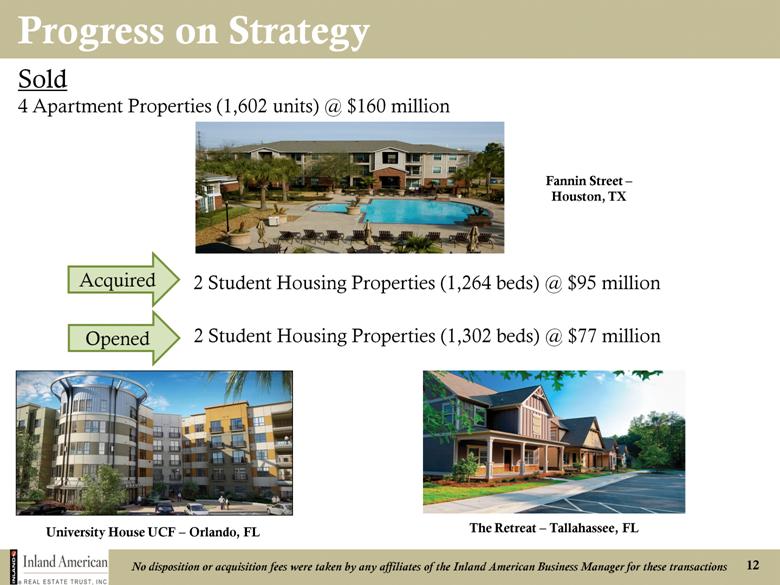
| 12 Progress on Strategy Sold 4 Apartment Properties (1,602 units) @ $160 million Opened 2 Student Housing Properties (1,302 beds) @ $77 million No disposition or acquisition fees were taken by any affiliates of the Inland American Business Manager for these transactions Acquired 2 Student Housing Properties (1,264 beds) @ $95 million University House UCF – Orlando, FL Fannin Street – Houston, TX The Retreat – Tallahassee, FL |
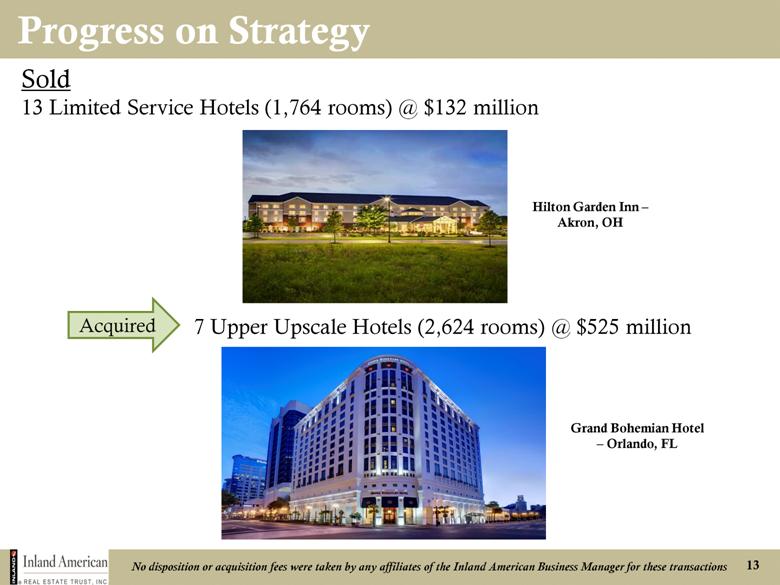
| 13 Progress on Strategy Sold 13 Limited Service Hotels (1,764 rooms) @ $132 million Acquired 7 Upper Upscale Hotels (2,624 rooms) @ $525 million No disposition or acquisition fees were taken by any affiliates of the Inland American Business Manager for these transactions Hilton Garden Inn – Akron, OH Grand Bohemian Hotel – Orlando, FL |
| 14 Why Student Housing? We believe there are few players with both our development and management expertise Fragmented nature of segment provides room for growth through acquisitions Name # of Beds Rent per Beds Occupancy % (as of 12/31/12) American Campus Communities 88,089 $619 96% Education Realty Trust 37,000 $545 92% Campus Crest Communities 16,936 $497 93% Inland American (end of 2013 w/current acquisition & development pipeline) 6,767 $724 96% |

| 15 Why Student Housing? Positive enrollment fundamentals key indicator Proved relatively recession resistant during credit crisis Enrollment in universities nationwide increased 12% over the last 10 years and is expected to grow about 13% by 2020. Universities are cash constrained Higher education spending in 2012 dropped 7.6% by states from 2011. 41 states cut funding. New student housing properties – low priority for universities. Average age of on-campus dorms over 20 years and growing. *Sources – IES - U.S. Dept. of Education & The College of 2020 Inland American Communities Group - http://www.inlandac.com |
| 16 Why Lodging? Current portfolio makes us comparable with other listed REITS *Chart does not include all public lodging companies Name # of Rooms Revenue / of Rooms Room Host Hotels 54,804 $96,453 Ashford Hospitality 25,573 $36,054 RLJ Lodging 21,600 $39,537 FelCor Lodging 18,822 $48,348 16,345 $42,852 Inland American DiamondRock 11,590 $69,198 Sunstone Hotels 11,632 $71,269 LaSalle Hotel 10,583 $81,924 Hersha Hospitality 9,129 $39,216 Ryman Hospitality 7,795 $126,491 |
| 17 Why Lodging? Revenue fundamentals continue to improve from industry lows in 2009 *Source STR & PKF |
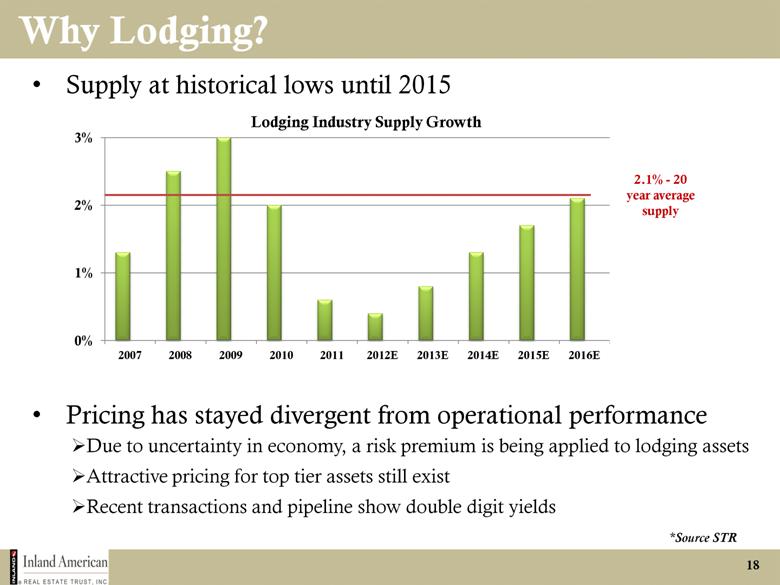
| 18 Why Lodging? Supply at historical lows until 2015 2.1% - 20 year average supply *Source STR Pricing has stayed divergent from operational performance Due to uncertainty in economy, a risk premium is being applied to lodging assets Attractive pricing for top tier assets still exist Recent transactions and pipeline show double digit yields |
| 19 Portfolio Transformation by Category Approximate size of future portfolio and breakdown by asset class Inland American Lodging Advisor - http://www.inlandamericanlodging.com |
| 20 Why Multi-Tenant Retail? Well-placed and high-traffic properties provide opportunities as economy improves to increase rents. Supply below 15-year average 1.7% -15 year average *Source Green Street **Strip Centers include necessity-based centers |
| 21 Why NOT Single Tenant? Interest rate risk As/when interest rates move up, the value of triple-net properties will decrease as this asset type trades closer to bond investments. Normalization of rates could be a big risk. Inflation risk Long-term leases provide limited ability to capture rent increases due to inflation. Governed by fixed rate contract increases, if any. Correlation of property value and length of lease. Shorter the lease, lesser the value of the property. |
| 22 Why NOT Office and Industrial? Office tenants continue to downsize Office space per employee* 2010 – ~225 sq. ft. 2012 – ~200 sq. ft. 2017 – ~150 sq. ft. Vacancy rates are high, especially in suburban markets with little demand in the near future. Increasing capital expenditures requirements. Demand for specialized space putting old product into obsolescence. Demand is not coming back. *Source Jones Lang LaSalle & CoreNet Global |
| 23 Key Points & Themes Solid 2012 financial results* $0.54 FFO per share (includes certain one-time gains) Same store NOI up 3.0% Distributions sustainable and stable from property operations 2013 FFO guidance – $0.50 to $0.52 per share Executing on our long-term goals Tailoring portfolio Preparing for multiple liquidity events in the future *Performance and estimated value per share may not always be in sync 1. 2. 3. |
| 24 Q&A Session Please submit your questions online now. We will do our best to answer as many questions in the time we have allowed today. If your exact question is not answered, a member of the Inland American team will contact you directly. |

| April 5, 2013 Year-End 2012 Earnings Call & 2013 Guidance Capturing the Recovery Cycle: A Focus on Growth, A Commitment to Value Creation |
| 26 GAAP Reconciliation Slide 12 Months Ended 12/31/12 12 Months Ended 12/31/11 Net income loss) attributable to Company $69,338) $316,253) Add: Depreciation and amortization related to investment properties and investment in unconsolidated entities 487,595 500,908 Provision for asset impairment reflected in continuing and discontinued 83,316 163,640 operations Impairment, Loss (Gain) of investment in unconsolidated entities, net 12,322 106,076 Impairment / (Gain) of investment property reflected in equity in earnings of unconsolidated entities, net (1,929) 5,598 Gain on sale of property reflected in net income attributed to noncontrolling 5,439 - interest Less: Gains from property sales and transfer of assets 40,691 16,510 Funds From Operations 476,714 443,459 |
| 27 Inland American Basics # of SF (000s)/Rooms 12/31/12 % of Segment Properties Units/Beds Occupancy NOI ($000s) NOI Retail 585 22,264 sf 93.0% $278,263 36.8% Bank Branches 435 2,352 sf 99.0% $57,287 7.6% Multi-tenant Retail 150 19,912 sf 92.0% $220,976 29.2% Lodging 88 16,345 rooms 73.0% $214,910 28.4% Office 42 10,227 sf 92.8% $132,229 17.5% Industrial 53 13,061 sf 97.0% $80,171 10.6% Distribution & Specialty Dist. Centers 43 12,282 sf 96.9% $61,144 8.1% Charter Schools/Correctional Facilities 10 779 sf 100.0% $19,027 2.5% Multi-family 26 10,523 units/beds 91.8% $50,814 6.7% Conventional 17 5,311 units 90.0% $32,883 4.3% Student Housing 9 5,212 beds 94.0% $17,931 2.4% Total 794 $756,387 100.0% |