Exhibit 99.3
| | |
| 2013 FOURTH QUARTER FLASH REPORT | | Data as of December 31, 2013 |
PORTFOLIO SUMMARY
| | |
Total Assets Undepreciated | | $11.4 billion |
Total Assets after Depreciation | | $9.7 billion |
Total Cash | | $319 million |
Same-Store NOI Increase over 2012 | | 2.2% |
Full Year FFO (a) | | $460 million |
Full Year FFO per share | | $0.51 |
Annualized Distribution Rate | | $0.50 a share |
Current Annualized Distribution Rate (b) | | 7.2% |
Declared Distributions Since Inception | | $2.8 billion |
Number of Properties | | 501 (including 224 held for sale) |
Debt | | $4.2 billion |
Leverage Ratio | | 47%* |
| * | Based on line of credit covenants. |
| (a) | FFO is a non-GAAP financial measure. Please review our recently filed 10K for a reconciliation of the most direct comparable GAAP measure. |
| (b) | Yield based on $6.94 estimated share price. |
LONG-TERM GOALS
| 1. | Provide our stockholders with a sustainable monthly distribution while maintaining capital preservation |
| 2. | Tailoring and expanding our portfolio in 3 asset classes—Retail, Lodging and Student Housing |
| 3. | Position our portfolio for optimal stockholder return |
2013 & 2014 YTD ACCOMPLISHMENTS
MAY—2013
| | • | | Announced a new credit facility in May, expanded in Nov. |
| | • | | 3-year $300 million unsecured revolving line of credit facility |
| | • | | 4-year, $200 million unsecured term loan |
| | • | | New $600 million joint venture with PGGM |
| | • | | One of the world’s largest and most respected pension funds |
| | • | | Majority equity stake in the entity & control of venture |
AUGUST—2013
| | • | | $460 million conventional apartment portfolio sale |
| | • | | Closed in August, we believe we sold at peak pricing |
| | • | | $2.1 billion net lease transaction |
| | • | | Will provide approximately $900 million in capital once the closings are completed |
| | • | | Potential use of the net proceeds: |
| | • | | Invest in high quality assets in our 3 targeted asset groups |
| | • | | Pay down and reduce debt |
DECEMBER—2013
| | • | | 2013 Acquisitions (as of 12/31/13) = $1.2 billion |
| | • | | 14 Lodging properties / 3,303 Rooms |
| | • | | 3 Student Housing properties / 1,409 Beds |
| | • | | 4 Retail properties / 483,753 Square Feet |
FEBRUARY—2014
| | • | | Proxy vote to approve charter changes |
MARCH—2014
| | • | | Eliminates the quarterly advisory fee paid by the REIT to its business manager |
| | • | | A lower property management fee for 2014 |
| | • | | No internalization or self-management fee in connection with the acquisition of its business manager and property managers |
| | • | | Announced $350 million modified “Dutch Auction” tender offer |
| | • | | The offer will expire at 5:00 PM ET on April 11, 2014, a time frame that may be extended. |
| * | Based on undepreciated (total investment) asset values |
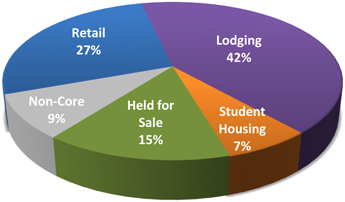
RETAIL PROPERTY OVERVIEW
119 PropertiesŸ 17.0 Million Square Feet
| | • | | Average lease rollover for next 10 years is about 9 percent annually |
| | • | | Economic occupancy equals 91% for the portfolio. |
| | • | | Top tenants include: Ross Dress for Less, Best Buy, Publix, Tom Thumb, Bed Bath & Beyond, and Petsmart. |
LODGING PROPERTY OVERVIEW
99 PropertiesŸ 19,337 Rooms
| | • | | Same-Store average daily rate increased to $136, up 3.8% over full year 2012. |
| | • | | Same-Store RevPAR up 5.3% over last year. |
| | • | | Occupancy for 2013 equaled 73%, which is above industry averages. |
STUDENT HOUSING PROPERTY OVERVIEW
14 PropertiesŸ 8,290 Beds
| | • | | Same-Store portfolio increased to 93% occupied. |
| | • | | Rent per bed for our entire student housing portfolio increased 8.1% to $724. |
| | • | | Top 10 student housing owner. |
NON-CORE PROPERTY OVERVIEW
45 PropertiesŸ 7.3 Million Square Feet
| | • | | Same-Store portfolio is 89% occupied. |
| | • | | Full year same-store revenue decreased 2.4% over full year 2012. |
Lodging Portfolio
Aston Waikiki Beach Hotel – Honolulu, Hawaii
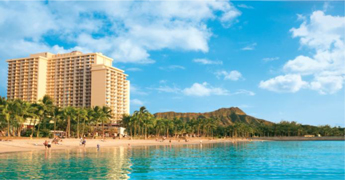
Acquired in February 2014 for approximately $183 million, the hotel is situated along the highly desirable Waikiki Beach with 645 guestrooms overlooking the beach.
Lodging Portfolio
Hyatt Key West Resort – Key West, Florida
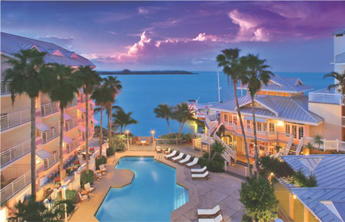
Acquired in November 2013 for about $76 million, the property contains 118 rooms with luxury amenities.
| | |
 | | CONTACT custserv@inland-investments.com 800.826.8228 www.inlandamerican.com |
This material is neither an offer to sell nor a solicitation of an offer to buy any security. Consult Inland American’s most recent Annual Report on Form 10-K and any subsequent Quarterly Reports on Form 10-Q for a discussion of the specific risks. The companies depicted in the photographs herein may have proprietary interests in their trade names and trademarks and nothing herein shall be considered to be an endorsement, authorization, or approval of Inland American by the companies. Further, none of these companies are affiliated with the Inland American in any manner. The Inland name and logo are registered trademarks being used under license.