Exhibit 99.1

| | |
2014 FIRST QUARTER FLASH REPORT | | Data as of March 31, 2014 |
PORTFOLIO SUMMARY
| | |
Total Assets Undepreciated | | $ 10.7 billion |
Total Assets after Depreciation | | $ 9.1 billion |
Total Cash | | $ 553 million |
1Q Same-Store NOI over 2013 | | up 3.5% |
1Q FFO (a) | | $ 112 million |
1Q FFO per share | | $ 0.12 |
Annualized Distribution Rate | | $ 0.50 a share |
Current Annualized Distribution Rate (b) | | 7.2% |
Number of Properties | | 281 (including 9 held for sale) |
Debt | | $ 4.2 billion |
Weighted Average Interest Rate | | 4.88% |
Leverage Ratio | | 43%* |
| * | Based on line of credit covenants. |
| (a) | FFO is a non-GAAP financial measure. Please review our recently filed 10Q for a reconciliation of the most direct comparable GAAP measure. |
| (b) | Yield based on $6.94 estimated share price. |
LONG-TERM GOALS
| 1. | Provide our stockholders with a sustainable monthly distribution while maintaining capital preservation. |
| 2. | Tailor and expand our portfolio in 3 asset classes - Retail, Lodging and Student Housing. |
| 3. | Position our portfolio for optimal stockholder return. |
2014 YTD ACCOMPLISHMENTS
| | • | | Our stockholders approved the proposed charter changes at our annual meeting. |
| • | | Self-Management Milestone Announced |
| | • | | The REIT and its business manager agreed to terminate the management agreement, and the REIT hired all of its business manager’s employees and acquired the assets of its business manager necessary to perform the REIT’s day-to-day operations. |
| | • | | Additionally, we hired certain employees of our property managers; assumed responsibility for performing certain of their significant functions. |
| | • | | We expect to hire the remaining employees of our property managers by December 31, 2014, thus becoming completely self-managed. |
| | • | | The property management fee was lowered for 2014. |
| | • | | No internalization or self-management fee was charged in connection with the acquisition of its business manager and property managers. |
| • | | Modified “Dutch Auction” Tender Offer |
| | • | | Offer was extended 10 business days and expired on April 25th at 5pm eastern. |
| | • | | Purchased approximately 61 million shares or 6.6% of the company’s shares outstanding. |
| | • | | All shares properly tendered were purchased at $6.50 for an aggregate cost of approximately $394 million. |
| • | | Completion of Net Lease Transaction |
| | • | | Final closing occurred on May 8th. |
| | • | | Net proceeds were used to pay down debt, purchase properties in our targeted asset classes and fund the tender offer. |
PORTFOLIO EVOLUTION

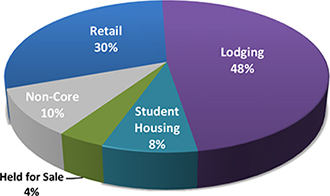
| * | Based on undepreciated (total investment) asset values |
RETAIL PROPERTY OVERVIEW
117 Properties . 16.9 Million Square Feet
| • | | 87 comparable leases commenced in 1Q ’14, 4.67% increase in rent over prior contract rent. |
| • | | Economic occupancy equals 91% for the portfolio. |
| • | | Same-store net operating income increased 0.2% over 1Q 2013. |
LODGING PROPERTY OVERVIEW
101 Properties . 20,093 Rooms
| • | | Same-Store average daily rate increased to $143, up 3.6% over first quarter of 2013. |
| • | | Same-Store RevPAR up 7.4% over 1Q 2013. |
| • | | Occupancy increased to 73%, up from 69% in March 2013. |
STUDENT HOUSING PROPERTY OVERVIEW
14 Properties . 8,286 Beds
| | • | | Rent per bed for our entire student housing portfolio increased 6.3% to $724. |
| | • | | We purchased three and placed one property in service in 2013. |
| | • | | Top-10 student housing owner. |
NON-CORE PROPERTY OVERVIEW
Retail Portfolio
Plantation Grove – Ocoee, FL (near Orlando)
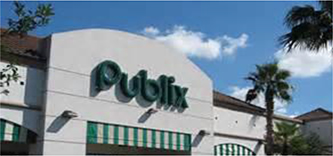
Acquired in February 2014 for approximately $12 million. 100% economic occupancy. Approximately 74,000 square feet of net rentable area.
Lodging Portfolio
Andaz San Diego – San Diego, CA
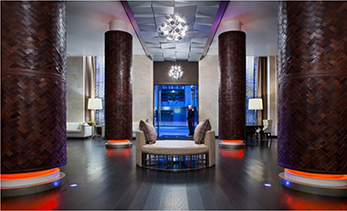
Acquired in 2013 for $53 million, the property contains 159 rooms with luxury amenities. This purchase aligns with our objective to acquire Luxury and Upper-Upscale hotels in the top 25 lodging markets.
| | |
| | CONTACT custserv@inland-investments.com 800.826.8228 www.inlandamerican.com |
This material is neither an offer to sell nor a solicitation of an offer to buy any security. Consult Inland American’s most recent Annual Report on Form 10-K and any subsequent Quarterly Reports on Form 10-Q for a discussion of the specific risks. The companies depicted in the photographs herein may have proprietary interests in their trade names and trademarks and nothing herein shall be considered to be an endorsement, authorization, or approval of Inland American by the companies. Further, none of these companies are affiliated with the Inland American in any manner. The Inland name and logo are registered trademarks being used under license.
40 Properties . 8.1 Million Square Feet
| • | | Same-Store portfolio is 92% occupied. |
| • | | Same-Store net operating income decreased 2.1% to $21.2 million over first quarter of 2013. |