|
Exhibit 99.1 
|
Investor Presentation
July 2015
Disclaimer
Forward-Looking Statements in this presentation, which are not historical facts, are forward-looking statements within the meaning of the Private Securities Litigation Reform Act of 1995. Forward-looking statements are statements that are not historical, including statements regarding management’s intentions, beliefs, expectations, representation, plans or predictions of the future and are typically identified by words such as “may,” “could,” “expect,” “intend,” “plan,” “seek,” “anticipate,” “believe,” “estimate,” “predict,” “potential,” “continue,” “likely,” “will,” “would” and variations of these terms and similar expressions, or the negative of these terms or similar expressions. Such forward-looking statements are necessarily based upon estimates and assumptions that, while considered reasonable by us and our management, are inherently uncertain. Factors that may cause actual results to differ materially from current expectations include, among others, our ability to execute on our strategy, our ability to return value to our stockholders and the availability of cash flow from operating activities to fund distributions. For further discussion of factors that could materially affect the outcome of our forward-looking statements and our future results and financial condition, see the Risk Factors included in InvenTrust’s most recent Annual Report on Form 10-K, as updated by any subsequent Quarterly Report on Form 10-Q, in each case as filed with the Securities and Exchange Commission. InvenTrust intends that such forward-looking statements be subject to the safe harbors created by Section 27A of the Securities Act of 1933, as amended, and Section 21E of the Securities Exchange Act of 1934, as amended, except as may be required by applicable law. We caution you not to place undue reliance on any forward-looking statements, which are made as of the date of this presentation. We undertake no obligation to update publicly any of these forward-looking statements to reflect actual results, new information or future events, changes in assumptions or changes in other factors affecting forward-looking statements, except to the extent required by applicable laws. If we update one or more forward-looking statements, no inference should be drawn that we will make additional updates with respect to those or other forward-looking statements.
This presentation includes certain non-GAAP financial measures. These non-GAAP financial measures are not measures of financial performance in accordance with GAAP and may exclude items that are significant in understanding and assessing our financial results. Therefore, these measures should not be considered in isolation or as an alternative to GAAP measures. You should be aware that our presentation of these measures may not be comparable to similarly-titled measures used by other companies. For reconciliations to GAAP measures, see the Appendix to this presentation.
1
InvenTrust Properties Overview
Tom McGuinness – CEO & President
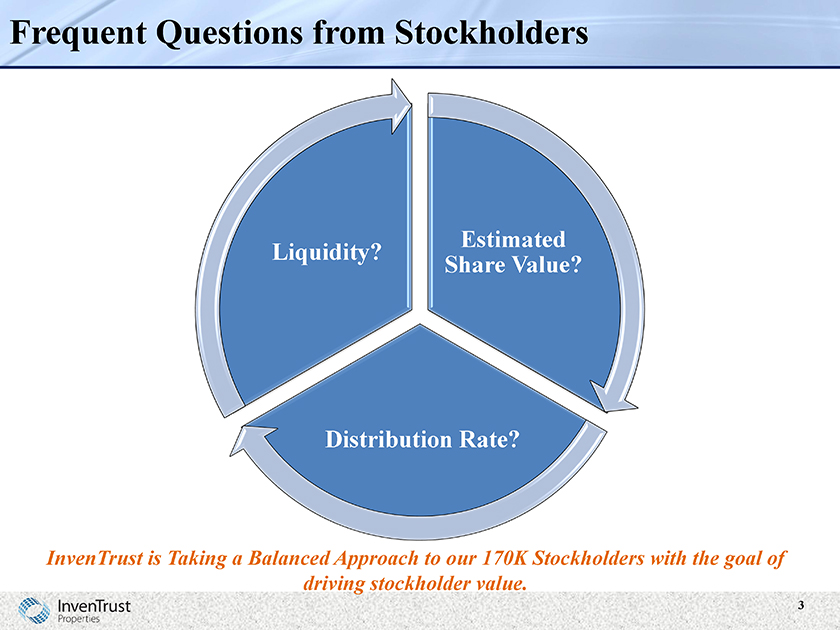
Frequent Questions from Stockholders
InvenTrust is Taking a Balanced Approach to our 170K Stockholders with the goal of driving stockholder value.
3
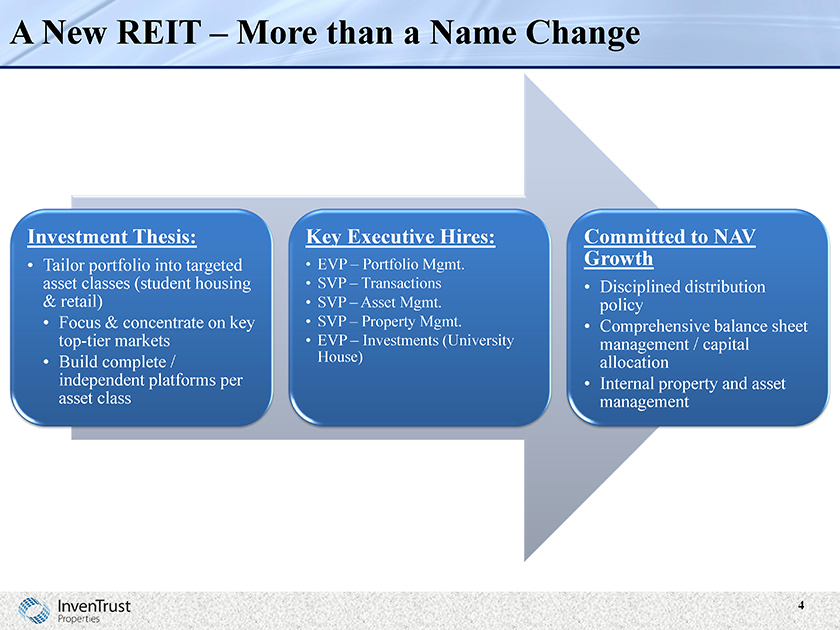
A New REIT – More than a Name Change
Investment Thesis:
Tailor portfolio into targeted asset classes (student housing & retail)
Focus & concentrate on key top-tier markets
Build complete / independent platforms per asset class
Key Executive Hires:
EVP – Portfolio Mgmt.
SVP – Transactions
SVP – Asset Mgmt.
SVP – Property Mgmt.
EVP – Investments (University House)
Committed to NAV Growth
Disciplined distribution policy
Comprehensive balance sheet management / capital allocation
Internal property and asset management
4
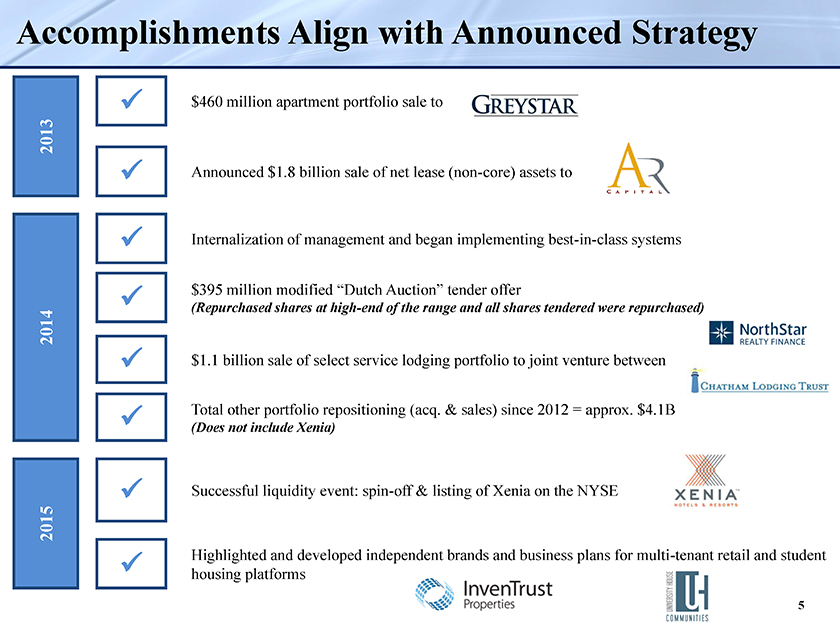
Accomplishments Align with Announced Strategy
2013
2014
2015
$460 million apartment portfolio sale
Announced $1.8 billion sale of net lease (non-core) a
Internalization of management and began implementing best-in-class systems
$395 million modified “Dutch Auction” tender offer
(Repurchased shares at high-end of the range and all shares tendered were repurchased)
$1.1 billion sale of select service lodging portfolio to joint venture between
Total other portfolio repositioning (acq. & sales) since 2012 = approx. $4.1B
(Does not include Xenia)
Successful liquidity event: spin-off & listing of Xenia on the NYSE
Highlighted and developed independent brands and business plans for multi-tenant retail and student housing platforms
5
Why Change the Name from Inland American to InvenTrust Properties?
Creates Clarity in the Market
Some vendors, tenants, lenders, and business partners assumed that Inland Group & Inland American were the same company
For example – tenant lease or property acquisition negotiations
Investors and/or FAs would contact the wrong company for information on Inland American
Further Demonstrates Independence after Self-Management
Next step in process
Management and Board of Directors are truly independent
Xenia Hotels & Resorts, Inc. (“Xenia”) received high marks from the investment community for having an independent brand from Inland American
InvenTrust has its own team of outstanding professionals to:
Source deals Manage our assets
Execute on a strategy to strictly benefit InvenTrust stockholders
6
What Did the Hotel Select Service Sale Provide Stockholders?
Select Service Transaction
Closed on the sale of 52 select service hotels for $1.1 billion in Q4 ‘14
Robust, competitive auction process
Net proceeds from the transaction = approximately $480 million Aligned with both Xenia’s and InvenTrust’s long-term strategy Positive outcome and pricing
Why Not Return Proceeds to Investors?
Xenia spin-off and listing required capital
$125 million went to fund Xenia’s “Dutch” tender offer
Approximately $150 million used to pay down Xenia’s debt and provide working capital upon Xenia’s spin-off
Student housing and retail portfolio acquisitions
Paid down debt
7
What Did the Xenia Hotels & Resorts Spin-Off Provide Stockholders?
Spin-off and listing of Xenia occurred in early Feb
Ticker symbol “XHR” on the New York Stock Exchange
Benefit to Stockholders
Meaningful liquidity option provided to stockholders Potential value appreciation
Xenia 3-month trading high (7/24/15) = $24.39
XHR has outperformed the lodging REIT sector since listing Recently added to MSCI US REIT Index Morgan Stanley recently picked up research coverage
Tax Consideration for Distribution (on a standalone basis)
The $2.76 Xenia distribution will be treated similar to other monthly/quarterly distributions $0.81 per InvenTrust share held would be taxable dividend income $1.95 per InvenTrust share would be a non-taxable return of capital and would reduce the tax basis of each share of InvenTrust held
** Please note that the taxability of the distribution of Xenia shares will not be determined on a stand-alone basis. Regardless of the above discussion, the determination of the taxable and non-taxable portions of the distribution will not be known until early 2016. For further information please review our Current Report on Form8 8-K filed on July 24, 2015.**
8
Moving Forward
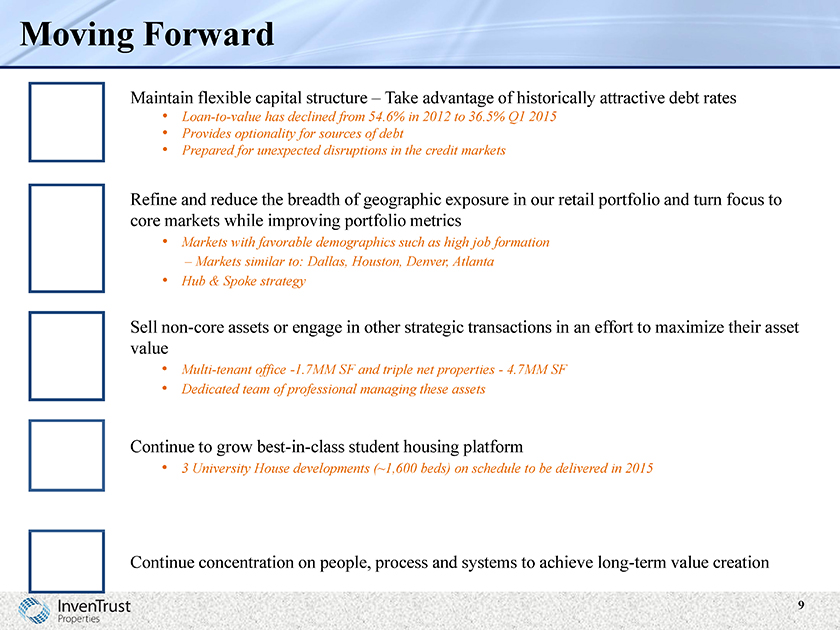
Maintain flexible capital structure – Take advantage of historically attractive debt rates
Loan-to-value has declined from 54.6% in 2012 to 36.5% Q1 2015
Provides optionality for sources of debt
Prepared for unexpected disruptions in the credit markets
Refine and reduce the breadth of geographic exposure in our retail portfolio and turn focus to core markets while improving portfolio metrics
Markets with favorable demographics such as high job formation
Markets similar to: Dallas, Houston, Denver, Atlanta
Hub & Spoke strategy
Sell non-core assets or engage in other strategic transactions in an effort to maximize their asset value
Multi-tenant office -1.7MM SF and triple net properties—4.7MM SF
Dedicated team of professional managing these assets
Continue to grow best-in-class student housing platform
3University House developments (~1,600 beds) on schedule to be delivered in 2015
Continue concentration on people, process and systems to achieve long-term value creation
9
InvenTrust at a Glance
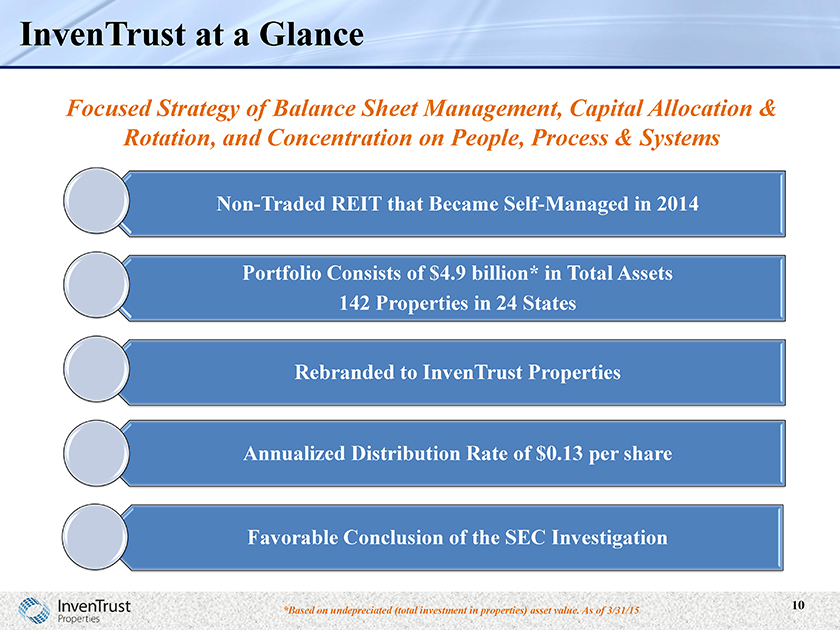
Focused Strategy of Balance Sheet Management, Capital Allocation & Rotation, and Concentration on People, Process & Systems
Non-Traded REIT that Became Self-Managed in 2014
Portfolio Consists of $4.9 billion* in Total Assets 142 Properties in 24 States
Rebranded to InvenTrust Properties Annualized Distribution Rate of $0.13 per share Favorable Conclusion of the SEC Investigation
*Based on undepreciated (total investment in properties) asset value. As of 3/31/15
10
Student Housing Platform
Travis Roberts—President
Overview of University House
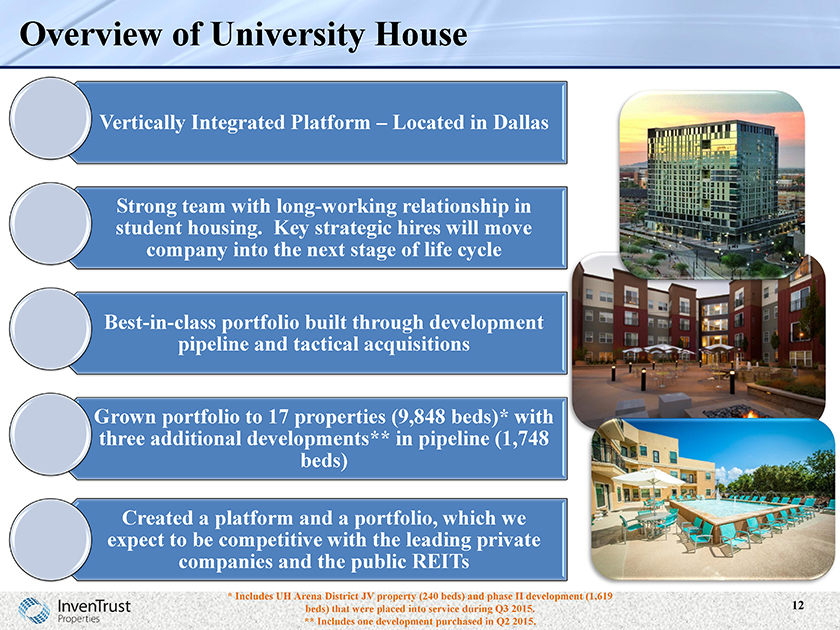
Vertically Integrated Platform – Located in Dallas
Strong team with long-working relationship in student housing. Key strategic hires will move company into the next stage of life cycle
Best-in-class portfolio built through development pipeline and tactical acquisitions
Grown portfolio to 17 properties (9,848 beds)* with three additional developments** in pipeline (1,748 beds)
Created a platform and a portfolio, which we expect to be competitive with the leading private companies and the public REITs
* Includes UH Arena District JV property (240 beds) and phase II development (1,619 beds) that were placed into service during Q3 2015.
** Includes one development purchased in Q2 2015.
12
University House Management Team
Travis Roberts
President
13 Years in Student Housing
Troy Manson
EVP
13 Years in Student Housing
David Pierce
SVP Development
10 Years in Student Housing
Carlie Cresse
SVP Operations
15 Years in Student Housing
Team previously managed the student housing investment and development business of First Worthing, prior to being acquired by InvenTrust Properties in 2007
13
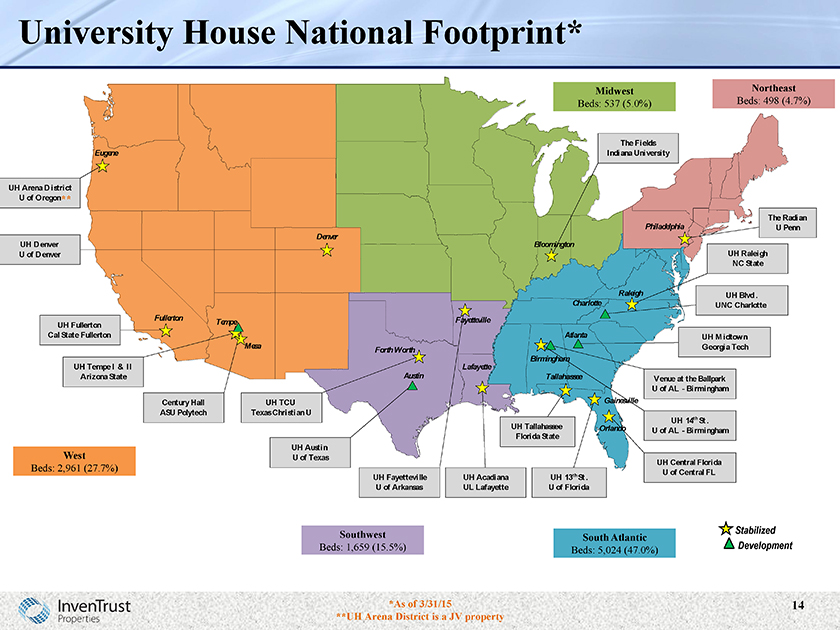
University House National Footprint*
*As of 3/31/15
**UH Arena District is a JV property
14
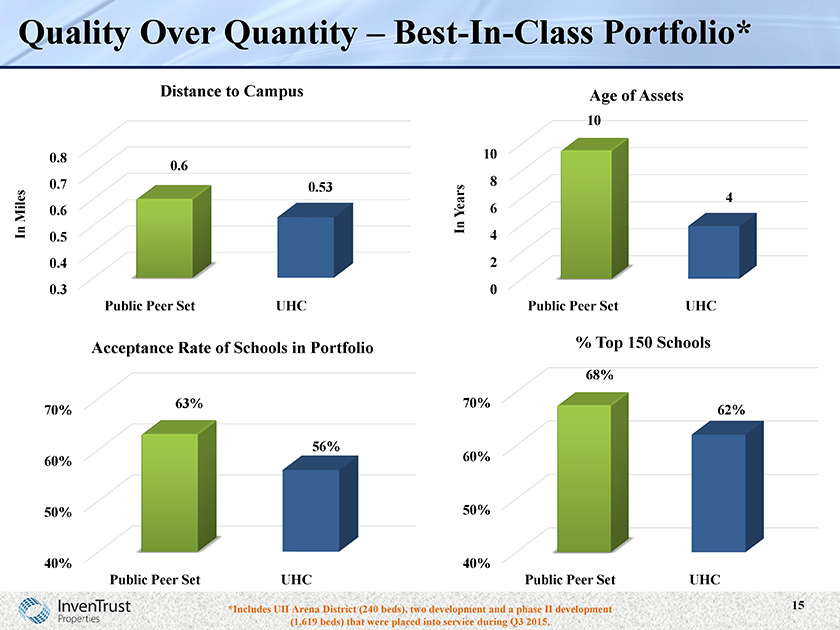
Quality Over Quantity – Best-In-Class Portfolio*
0.3
0.4
0.5
0.6
0.7
0.8
Public Peer Set
UHC
0.6
0.53
In Miles
Distance to Campus
0
10
Public Peer Set
UHC
10
In Years
Age of Assets
40%
50%
60%
70%
Public Peer Set
UHC
68%
62%
% Top 150 Schools
40%
50%
60%
70%
Public Peer Set
UHC
63%
56%
Acceptance Rate of Schools in Portfolio
*Includes UH Arena District (240 beds), two development and a phase II development (1,619 beds) that were placed into service during Q3 2015.
15
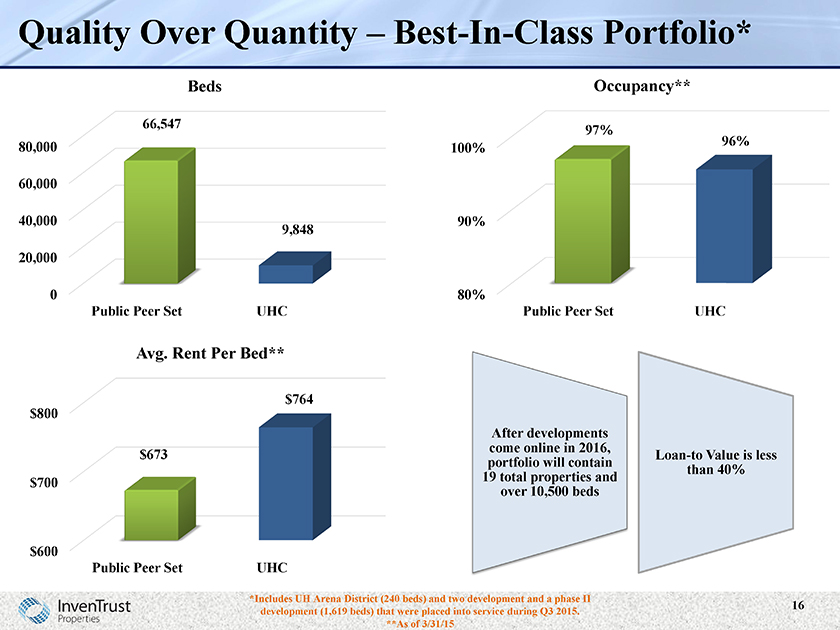
Quality Over Quantity – Best-In-Class Portfolio*
0
20,000
40,000
60,000
80,000
Public Peer Set
UHC
66,547
9,848
Beds
80%
90%
100%
Public Peer Set
UHC
97%
96%
Occupancy**
$600
$700
$800
Public Peer Set
UHC
$673
$764
Avg. Rent Per Bed**
After developments come online in 2016, portfolio will contain 19 total properties and over 10,500 beds
Loan-to Value is less than 40%
*Includes UH Arena District (240 beds) and two development and a phase II development (1,619 beds) that were placed into service during Q3 2015. **As of 3/31/15
16
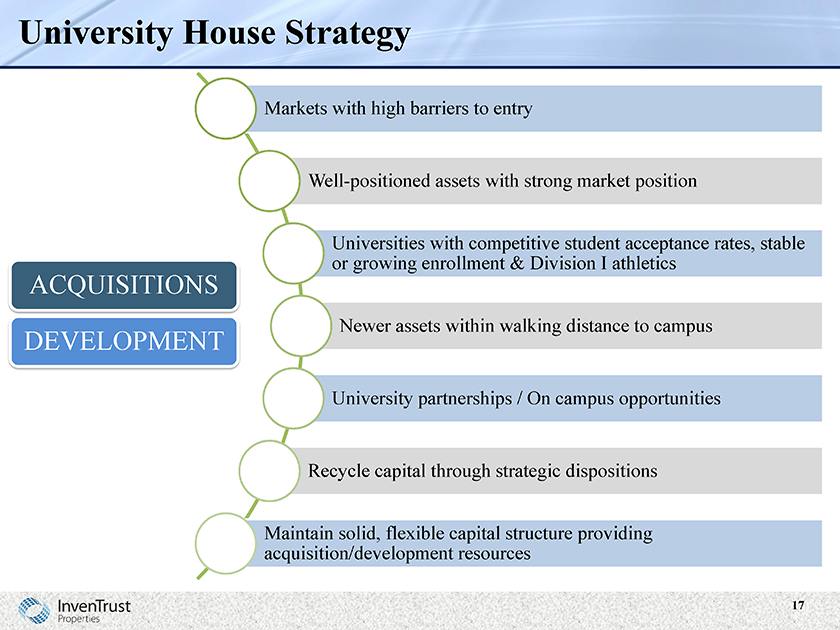
University House Strategy
ACQUISITIONS
DEVELOPMENT
Markets with high barriers to entry
Well-positioned assets with strong market position
Universities with competitive student acceptance rates, stable or growing enrollment & Division I athletics
Newer assets within walking distance to campus University partnerships / On campus opportunities Recycle capital through strategic dispositions
Maintain solid, flexible capital structure providing acquisition/development resources
17
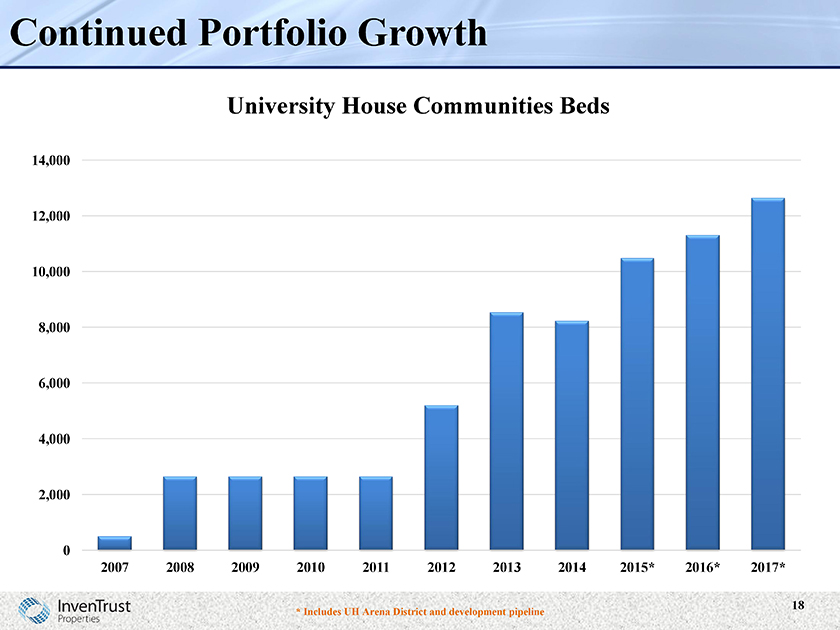
Continued Portfolio Growth
University House Communities Beds
14,000
12,000
10,000
8,000
6,000
4,000
2,000
0
2007 2008 2009 2010 2011 2012 2013 2014 2015* 2016* 2017*
* Includes UH Arena District and development pipeline
18
Development Properties – University of Texas
Located just one block west of the University of Texas in the popular West Campus neighborhood of Austin
Scheduled to open August of 2016
Property features premier amenities including amenity deck, sky lounge, fitness center, and study areas
19
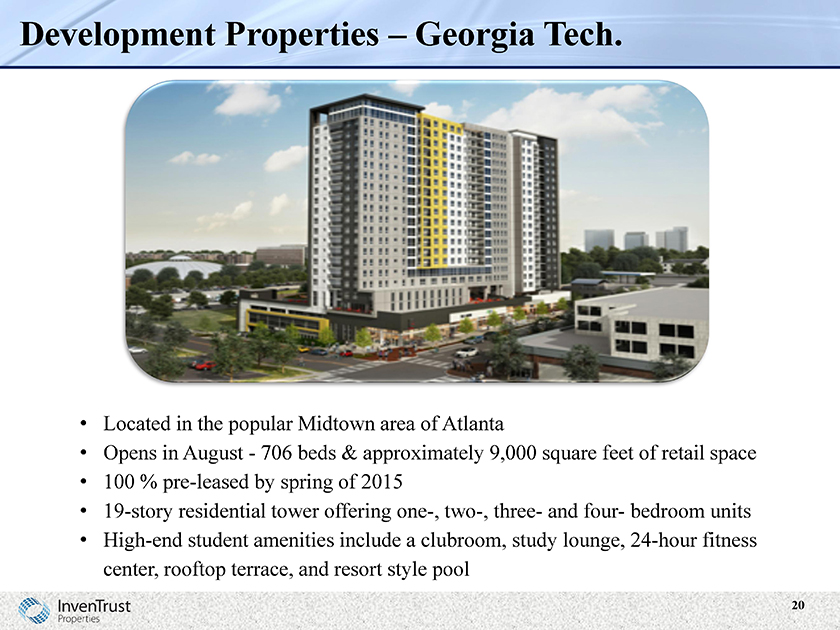
Development Properties – Georgia Tech.
Located in the popular Midtown area of Atlanta
Opens in August - 706 beds & approximately 9,000 square feet of retail space
100 % pre-leased by spring of 2015
19-story residential tower offering one-, two-, three- and four- bedroom units
High-end student amenities include a clubroom, study lounge, 24-hour fitness center, rooftop terrace, and resort style pool
20
How Does Student Investment Benefit Stockholders?
Potential Value Appreciation
New acquisitions & developments can bring increased value to platform
Development yields well above current cap rates providing strong value creation
Low leverage = Access to lower cost of debt
Recycle capital through targeted acquisitions/developments and strategic dispositions
Stable Asset Class
Student housing fundamentals remain solid as the value of an education remains high, especially at UHC’s targeted universities
New supply has slowed as developers have shifted to a limited number of pedestrian sites near the top universities
Sustainable Distribution
Investment strategy focused on premier, well-located assets provides high operating margins and stable cash flows Conservative debt profile further enhances cash flow stability
21
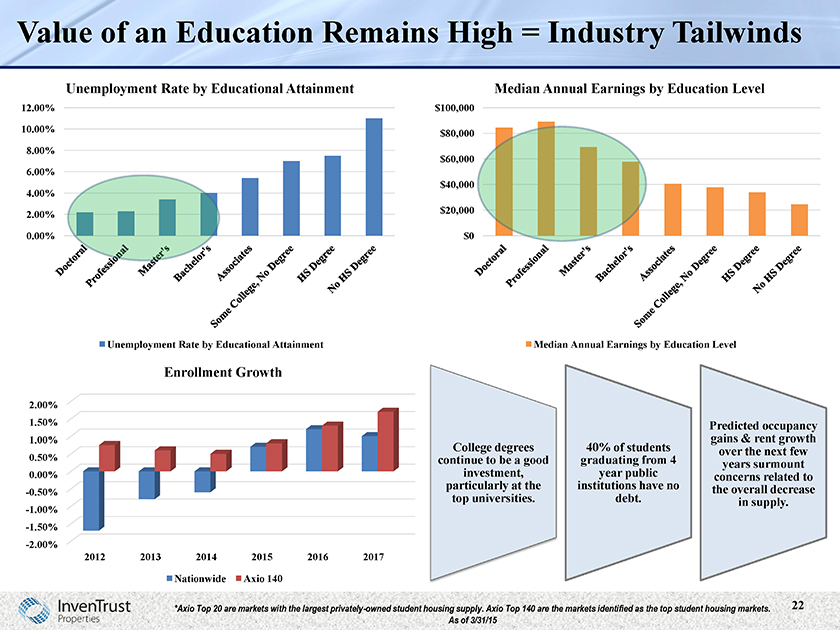
Value of an Education Remains High = Industry Tailwinds
Unemployment Rate by Educational Attainment
12.00%
10.00%
8.00%
6.00%
4.00%
2.00%
0.00%
Unemployment Rate by Educational Attainment
Median Annual Earnings by Education Level
$100,000
$80,000
$60,000
$40,000
$20,000
$0
Median Annual Earnings by Education Level
Enrollment Growth
2.00%
1.50%
1.00%
0.50%
0.00%
-0.50%
-1.00%
-1.50%
-2.00%
Nationwide Axio 140
College degrees continue to be a good investment, particularly at the top universities.
40% of students graduating from 4 year public institutions have no debt.
Predicted occupancy gains & rent growth over the next few years surmount concerns related to the overall decrease in supply.
*Axio Top 20 are markets with the largest privately-owned student housing supply. Axio Top 140 are the markets identified as the top student housing markets. As of 3/31/15
22
Multi-Tenant Retail Platform
David Collins – EVP of Portfolio Management
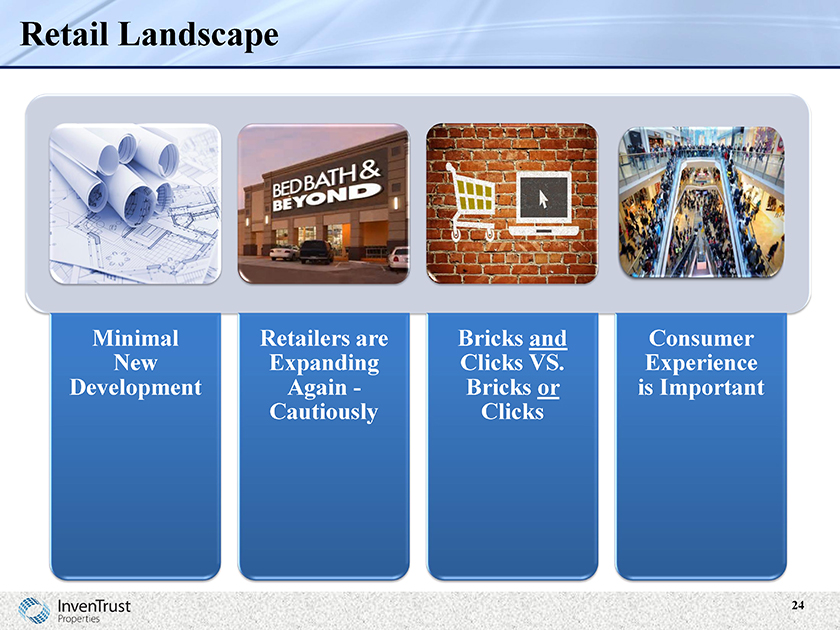
Retail Landscape
Minimal New Development
Retailers are Expanding Again—Cautiously
Bricks and Clicks VS. Bricks or Clicks
Consumer Experience is Important
24
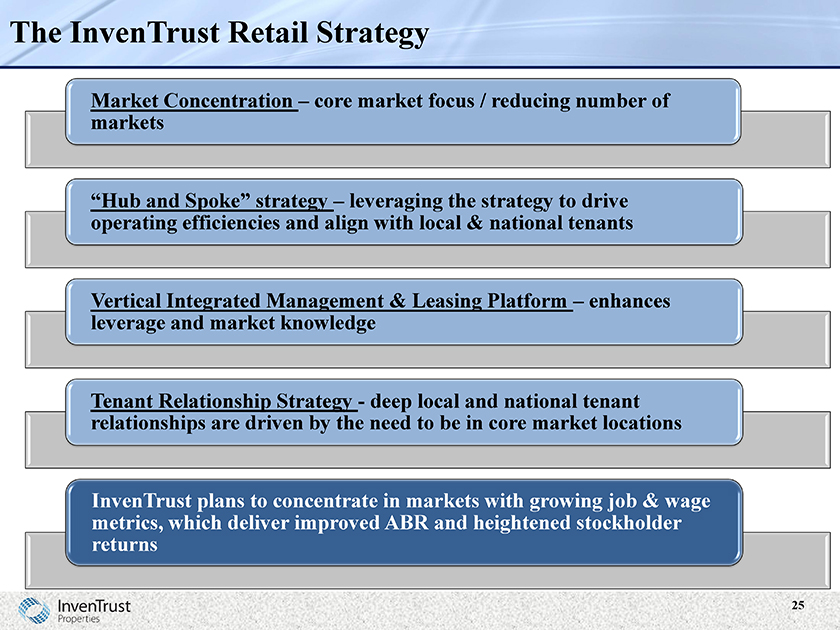
The InvenTrust Retail Strategy
Market Concentration – core market focus / reducing number of markets
“Hub and Spoke” strategy – leveraging the strategy to drive operating efficiencies and align with local & national tenants
Vertical Integrated Management & Leasing Platform – enhances leverage and market knowledge
Tenant Relationship Strategy—deep local and national tenant relationships are driven by the need to be in core market locations
InvenTrust plans to concentrate in markets with growing job & wage metrics, which deliver improved ABR and heightened stockholder returns
25
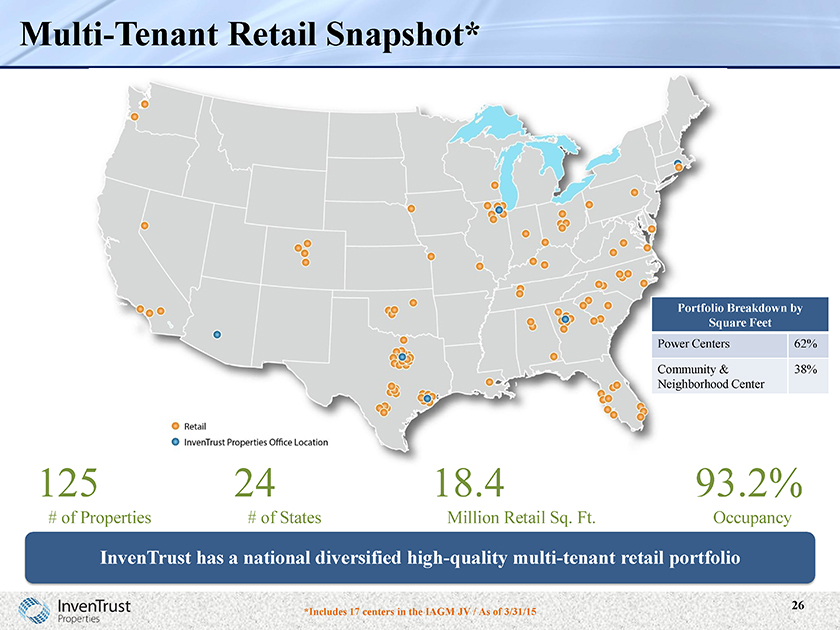
Multi-Tenant Retail Snapshot*
Portfolio Breakdown by Square Feet
Power Centers 62%
Community & 38%
Neighborhood Center
InvenTrust has a national diversified high-quality multi-tenant retail portfolio
*Includes 17 centers in the IAGM JV / As of 3/31/15
26
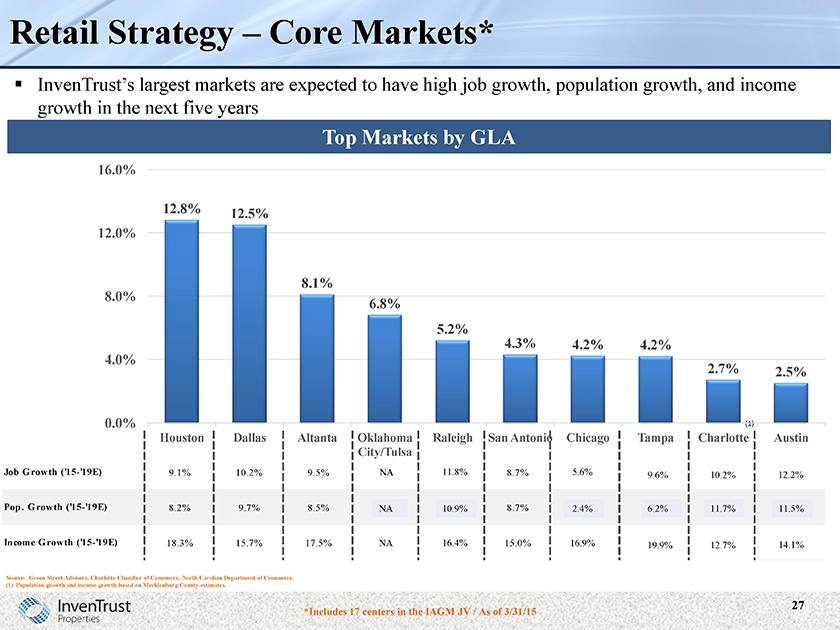
Retail Strategy – Core Markets*
InvenTrust’s largest markets are expected to have high job growth, population growth, and income growth in the next five years
Top Markets by GLA
16.0%
12.0%
8.0%
4.0%
0.0%
12.8% 12.5%
8.1%
6.8%
5.2%
4.3% 4.2% 4.2%
2.7% 2.5%
0.0% (1)
Houston Dallas Altanta Oklahoma Raleigh San Chicago Tampa Charlotte Austin
City/Tulsa Antonio
Job Growth (‘15-‘19E) 9.1% 10.2% 9.5% NA 11.8 8.7% 5.6%
9.6% 10.2 12.2
% % % Pop. Growth (‘15-‘19E) 8.2% 9.7% 8.5% NA 10.9 8.7% 2.4% 6.2% 11.7 11.5
% % %
Income Growth (‘15-‘19E) 18.3% 15.7% 17.5% NA 16.4 15.0% 16.9 14.1 19.9 12.7
% % % % %
Source: Green Street Advisors, Charlotte Chamber of Commerce, North Carolina Department of Commerce. (1) Population growth and income growth based on Mecklenburg County estimates.
*Includes 17 centers in the IAGM JV / As of 3/31/15
27
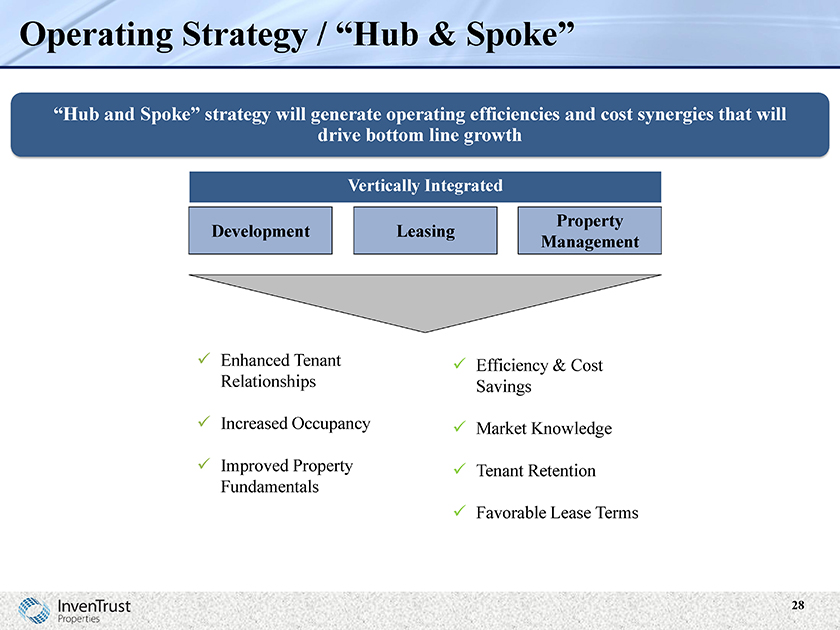
Operating Strategy / “Hub & Spoke”
“Hub and Spoke” strategy will generate operating efficiencies and cost synergies that will drive bottom line growth
Vertically Integrated
Development
Leasing
Property Management
Enhanced Tenant Relationships
Increased Occupancy
Improved Property Fundamentals
Efficiency & Cost Savings
Market Knowledge
Tenant Retention
Favorable Lease Terms
28
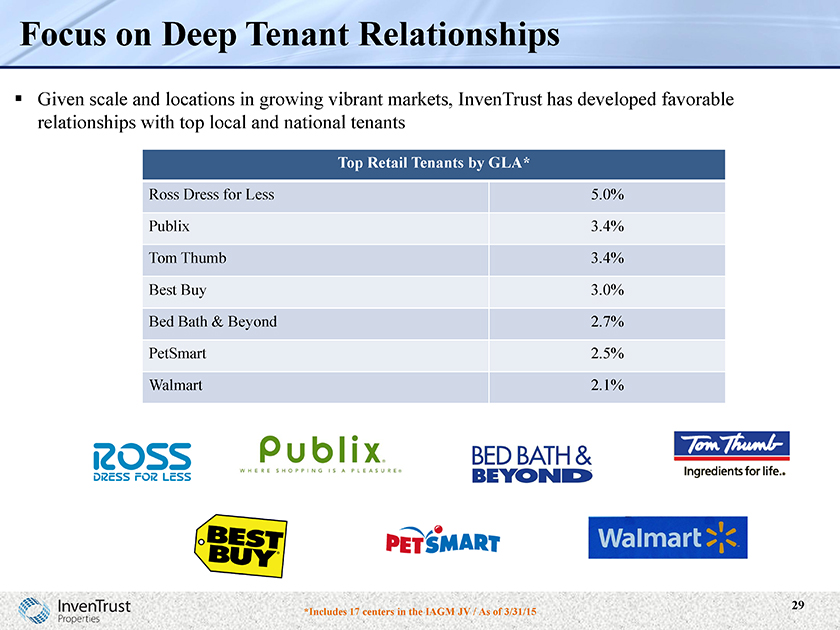
Focus on Deep Tenant Relationships
Given scale and locations in growing vibrant markets, InvenTrust has developed favorable relationships with top local and national tenants
Top Retail Tenants by GLA*
Ross Dress for Less
Publix
Tom Thumb
Best Buy
Bed Bath & Beyond
PetSmart
Walmart
5.0%
3.4%
3.4%
3.0%
2.7%
2.5%
2.1%
*Includes 17 centers in the IAGM JV / As of 3/31/15
29
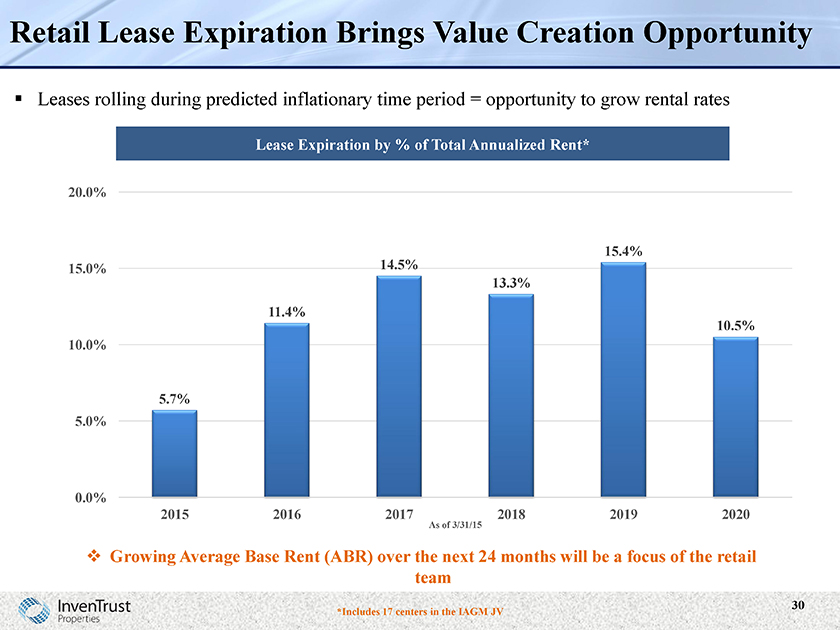
Retail Lease Expiration Brings Value Creation Opportunity
Leases rolling during predicted inflationary time period = opportunity to grow rental rates
Lease Expiration by % of Total Annualized Rent*
20.0%
15.0%
10.0%
5.0%
0.0%
15.4% 14.5% 13.3%
11.4%
10.5%
5.7%
2015 2016 2017 2018 2019 2020
As of 3/31/15
Growing Average Base Rent (ABR) over the next 24 months will be a focus of the retail team
*Includes 17 centers in the IAGM JV
30
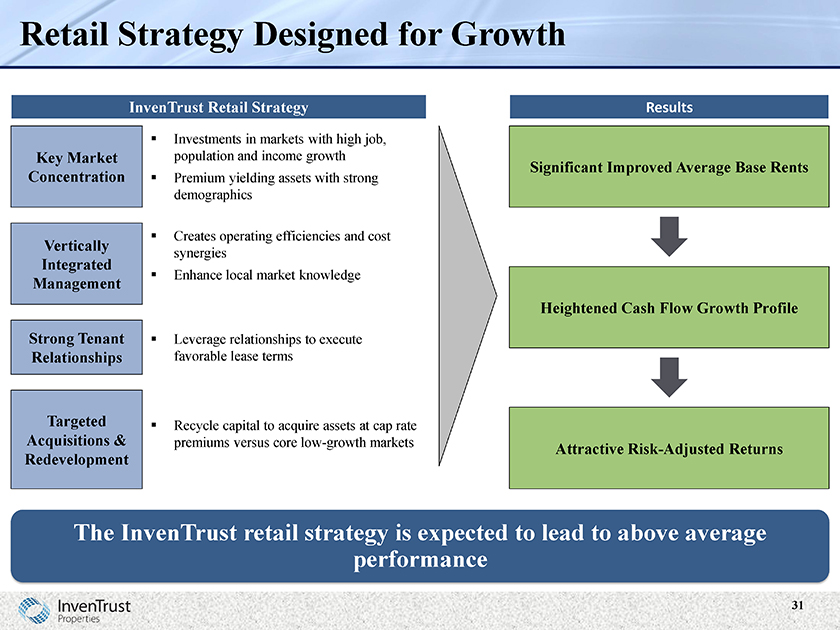
Retail Strategy Designed for Growth
InvenTrust Retail Strategy
Key Market Concentration
Vertically Integrated Management
Strong Tenant Relationships
Targeted Acquisitions & Redevelopment
Investments in markets with high job, population and income growth Premium yielding assets with strong demographics
Creates operating efficiencies and cost synergies Enhance local market knowledge
Leverage relationships to execute favorable lease terms
Recycle capital to acquire assets at cap rate premiums versus core low-growth markets
Results
Significant Improved Average Base Rents
Heightened Cash Flow Growth Profile
Attractive Risk-Adjusted Returns
The InvenTrust retail strategy is expected to lead to above average performance
31
Market Fundamentals / Capital Allocation / Acquisition & Disposition Strategies
Michael Podboy – CIO
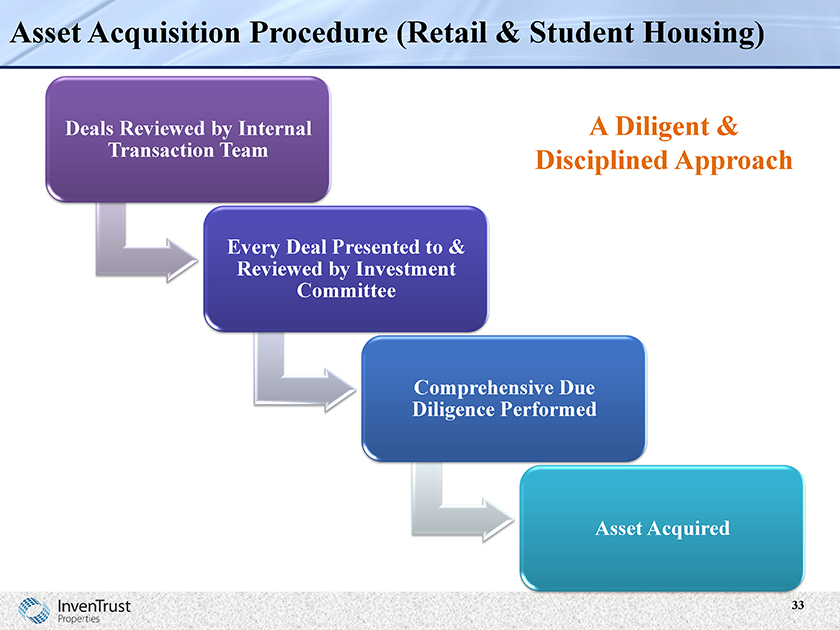
Asset Acquisition Procedure (Retail & Student Housing)
Deals Reviewed by Internal Transaction Team
Every Deal Presented to
& Reviewed by Investment Committee
Comprehensive Due Diligence Performed
Asset Acquired
A Diligent & Disciplined Approach
33
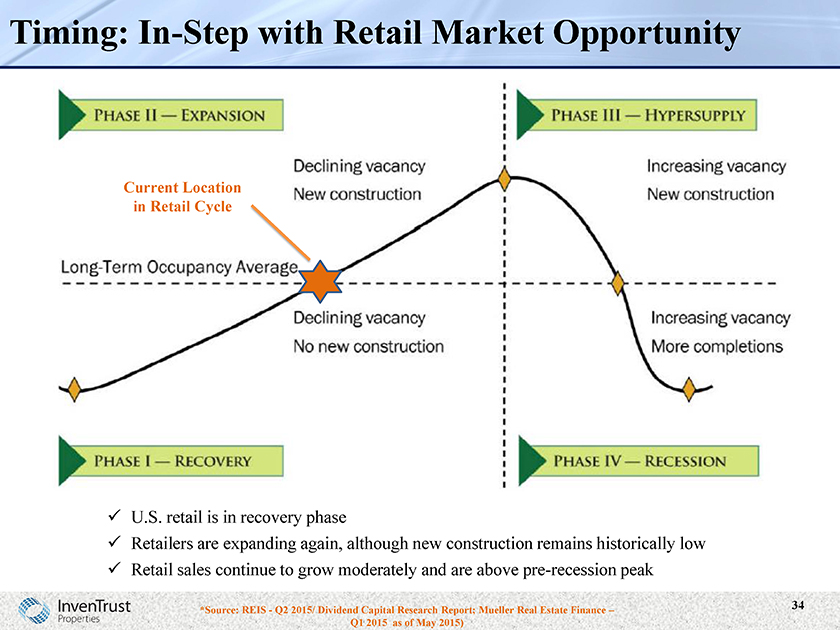
Timing: In-Step with Retail Market Opportunity
U.S. retail is in recovery phase
Retailers are expanding again, although new construction remains historically low Retail sales continue to grow moderately and are above pre-recession peak
*Source: REIS—Q2 2015/ Dividend Capital Research Report; Mueller Real Estate Finance – Q1 2015 as of May 2015)
34
Multi-Tenant Retail Acquisition Strategies
Open-Air Centers—grocery-anchored centers, necessity-based community centers and power centers
Location, Location, Location
Properties with strong demographics
Job & wage growth Population growth High education rate
Focus on key retail markets
With current competitive environment, we are being strategic and creative when sourcing deals
Investment opportunities do exist—retailers continue to place a premium on retail space at premier properties in key locations
35
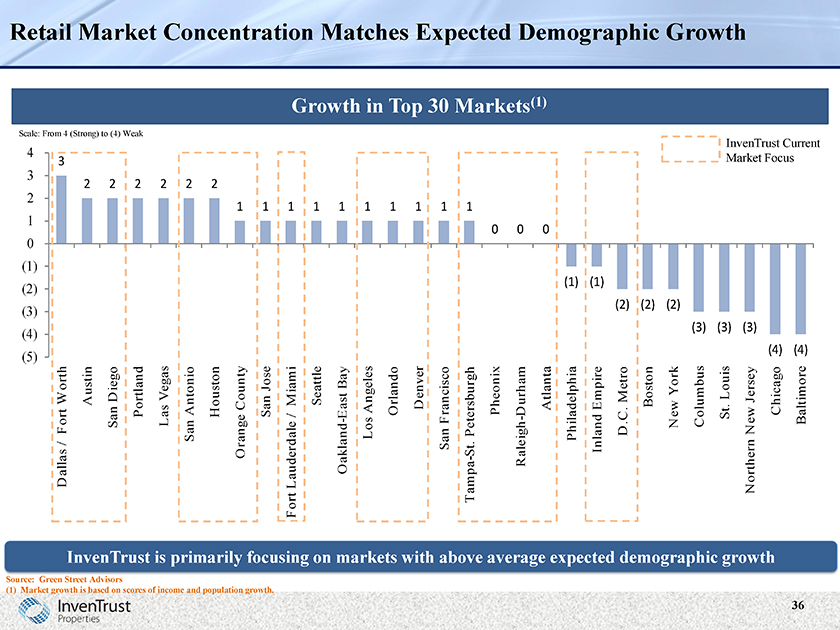
Retail Market Concentration Matches Expected Demographic Growth
Growth in Top 30 Markets(1)
Scale: From 4 (Strong) to (4) Weak
InvenTrust Current Market Focus
(5) | | (4) (3) (2) (1) 0 1 2 3 4 |
Dallas / Fort Worth 3
Austin2
San Diego2
Portland2
Las Vegas2
San Antonio2
Houston2
Orange County1
San Jose1
Fort Lauderdale / Miami 1
Seattle1
Oakland-East Bay1
Los Angeles1
Orlando1
Denver1
San Francisco1
Tampa-St. Petersburgh 1
Pheonix0
Raleigh-Durham 0
Atlanta0
Philadelphia (1)
Inland Empire (1)
D.C. Metro (2)
Boston (2)
New York (2)
Columbus (3)
St. Louis (3)
Northern New Jersey (3) Market
Chicago (4) InvenTrust
Baltimore Focus
Current
InvenTrust is primarily focusing on markets with above average expected demographic growth
Source: Green Street Advisors
(1) | | Market growth is based on scores of income and population growth. |
Recent Multi-Tenant Retail Acquisitions
The Highlands of Flower Mound
Outside Dallas
Acquired June 2015 as part of IAGM JV
Power Center
$45.8M
169K sq. ft.
3-mile Avg. HH Income—$144,000
3-mile Population – 65,000
Westpark Shopping Center
Richmond, VA
Acquired May 2015
Power Center
$33.8M
177K sq. ft.
3-mile Median HH Income—$62,000
3-mile Population – 89,000
The Shops at Walnut Creek
Outside Denver
Acquired April 2015
Power Center
$57.1M
216K sq. ft.
3-mile Avg. HH Income—$84,000
3-mile Population – 95,000
37
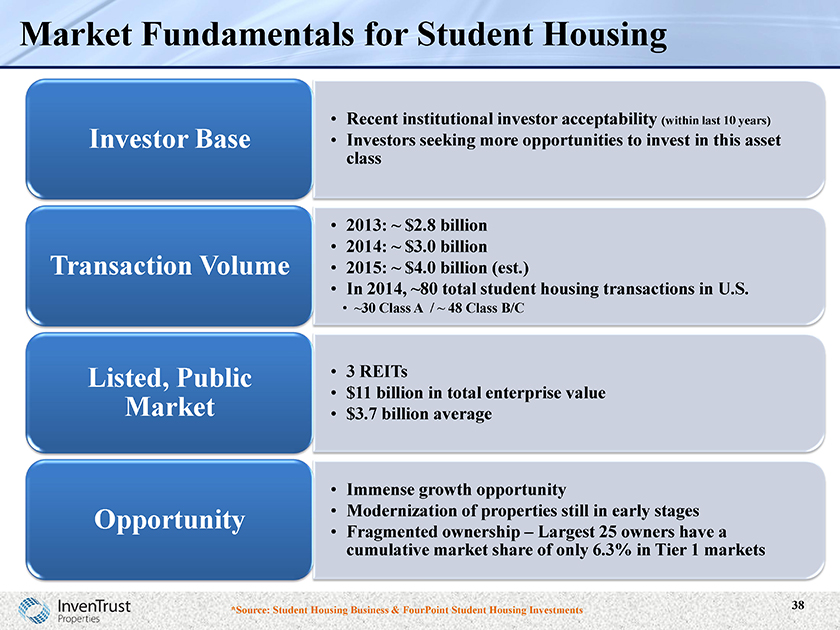
Market Fundamentals for Student Housing
Investor Base
Transaction Volume
Listed, Public Market
Opportunity
Recent institutional investor acceptability (within last 10
years)
Investors seeking more opportunities to invest in this asset class
2013: ~ $2.8 billion
2014: ~ $3.0 billion
2015: ~ $4.0 billion (est.)
In 2014, ~80 total student housing transactions in U.S.
~30 Class A / ~ 48 Class B/C
$11 billion in total enterprise value
$3.7 billion average
Immense growth opportunity
Modernization of properties still in early stages
Fragmented ownership – Largest 25 owners have a cumulative market share of only 6.3% in Tier 1 markets
*Source: Student Housing Business & FourPoint Student Housing Investments
38
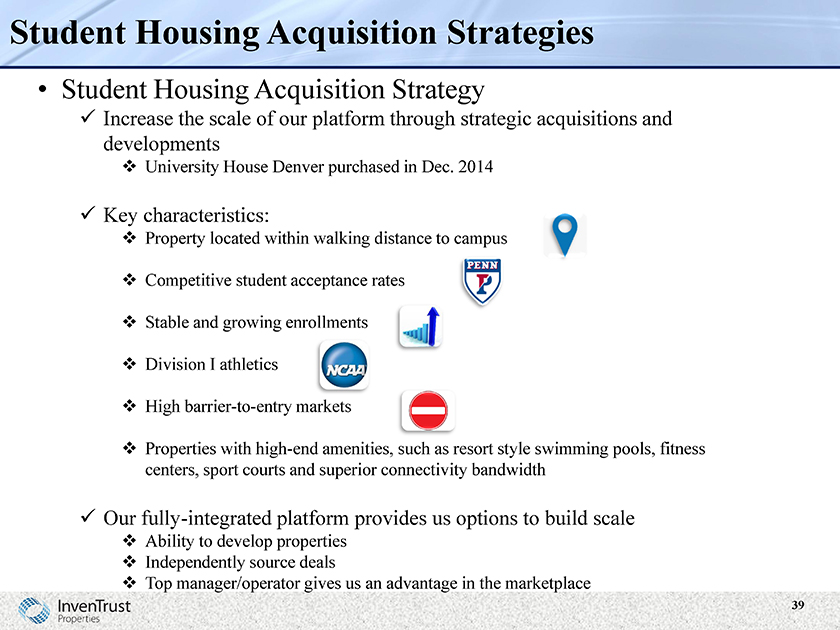
Student Housing Acquisition Strategies
Student Housing Acquisition Strategy
Increase the scale of our platform through strategic acquisitions and developments
University House Denver purchased in Dec. 2014
Key characteristics:
Property located within walking distance to Competitive student acceptance rate Stable and growing enrollmen Division I athletics High barrier-to-entry market
Properties with high-end amenities, such as resort style swimming pools, fitness centers, sport courts and superior connectivity bandwidth
Our fully-integrated platform provides us options to build scale
Ability to develop properties Independently source deals
Independently source deals
Top manager/operator gives us an advantage in the marketplace
39
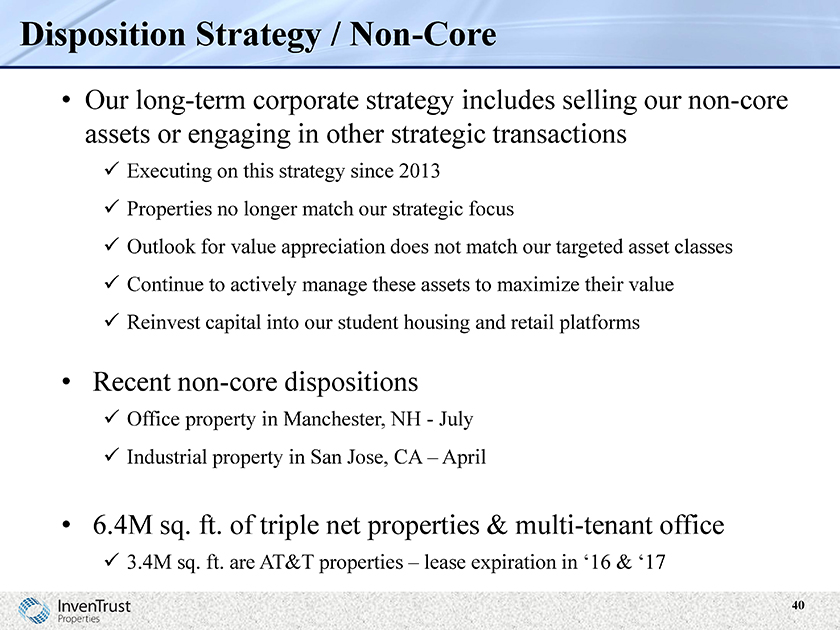
Disposition Strategy / Non-Core
Our long-term corporate strategy includes selling our non-core assets or engaging in other strategic transactions
Executing on this strategy since 2013
Properties no longer match our strategic focus
Outlook for value appreciation does not match our targeted asset classes
Continue to actively manage these assets to maximize their value
Reinvest capital into our student housing and retail platforms
Recent non-core dispositions
Office property in Manchester, NH—July
Industrial property in San Jose, CA – April
6.4M sq. ft. of triple net properties & multi-tenant office
3.4M sq. ft. are AT&T properties – lease expiration in ‘16 & ‘17
40
Financial Results & Balance Sheet Overview
Jack Potts – CFO
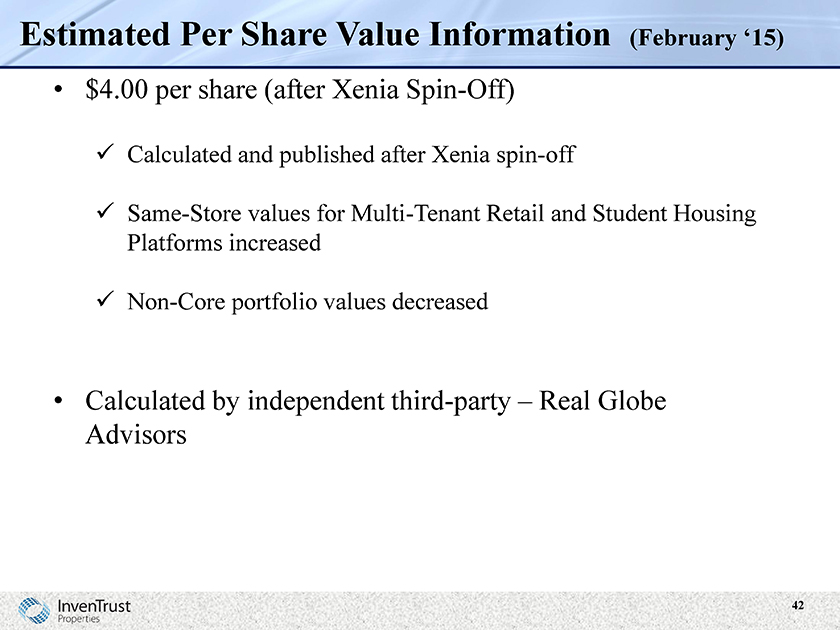
Estimated Per Share Value Information (February ‘15)
$4.00 per share (after Xenia Spin-Off)
Calculated and published after Xenia spin-off
Same-Store values for Multi-Tenant Retail and Student Housing Platforms increased
Non-Core portfolio values decreased
Calculated by independent third-party – Real Globe Advisors
42
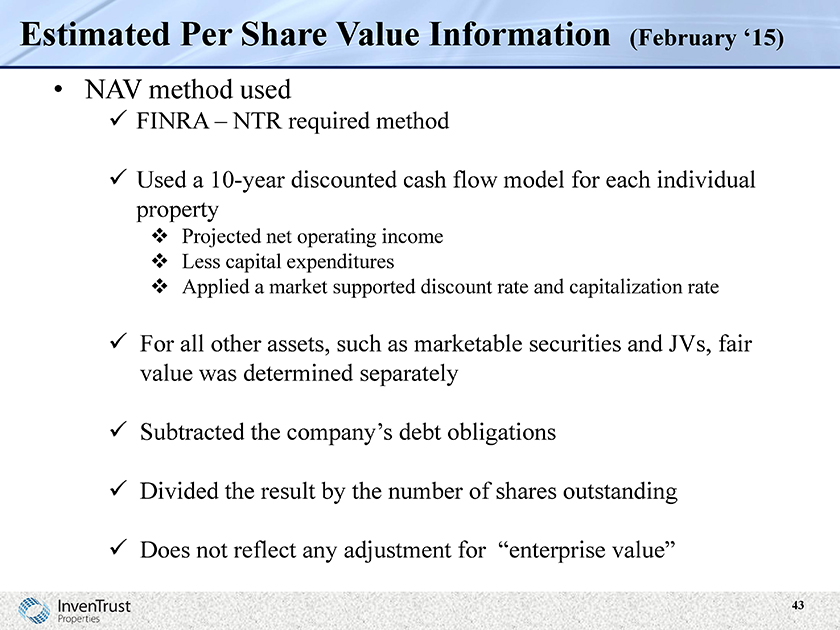
Estimated Per Share Value Information (February ‘15)
NAV method used
FINRA – NTR required method
Used a 10-year discounted cash flow model for each individual property
Projected net operating income
Less capital expenditures
Applied a market supported discount rate and capitalization rate
For all other assets, such as marketable securities and JVs, fair value was determined separately
Subtracted the company’s debt obligations
Divided the result by the number of shares outstanding
Does not reflect any adjustment for “enterprise value”
43
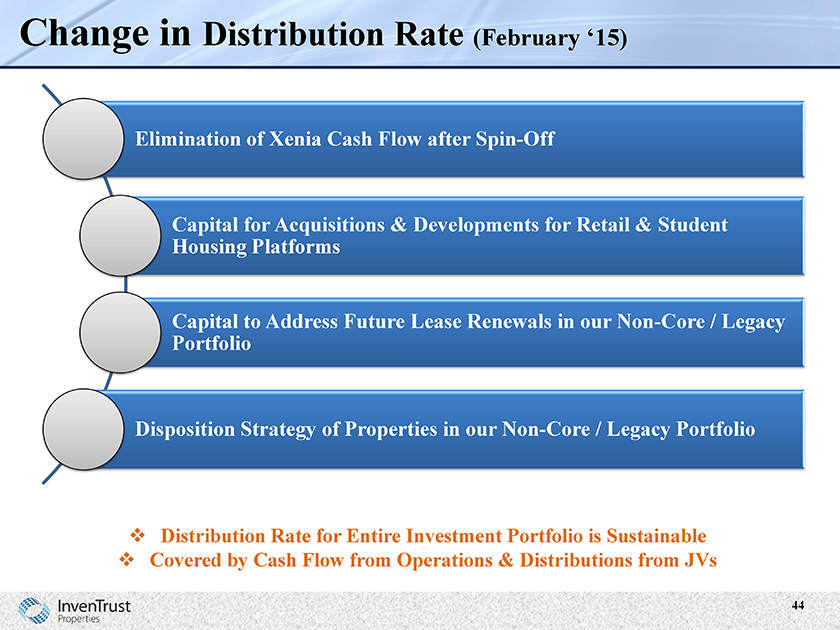
Change in Distribution Rate (February ‘15)
Elimination of Xenia Cash Flow after Spin-Off
Capital for Acquisitions & Developments for Retail & Student Housing Platforms
Capital to Address Future Lease Renewals in our Non-Core / Legacy Portfolio
Disposition Strategy of Properties in our Non-Core / Legacy Portfolio
Distribution Rate for Entire Investment Portfolio is Sustainable
Covered by Cash Flow from Operations & Distributions from JVs
44
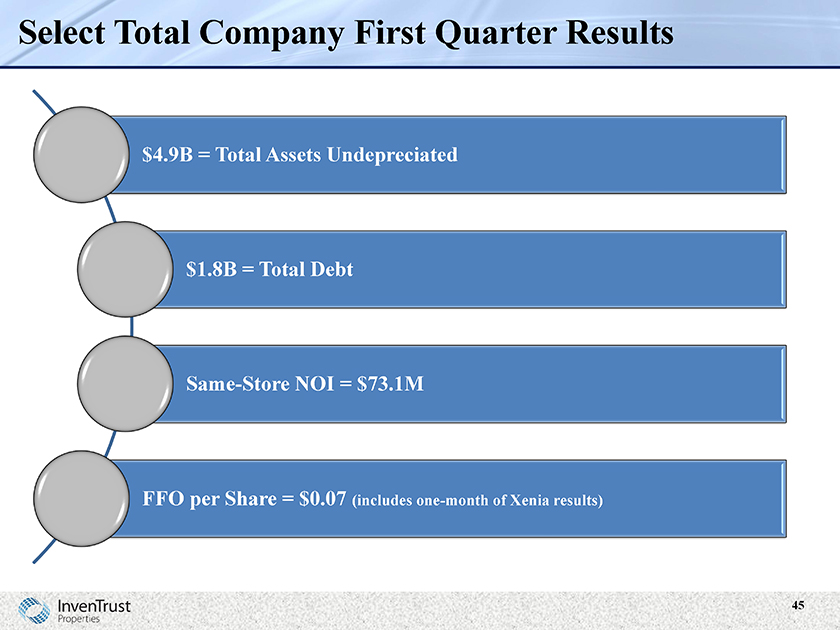
Select Total Company First Quarter Results
$4.9B = Total Assets Undepreciated
$1.8B = Total Debt
Same-Store NOI = $73.1M
FFO per Share = $0.07 (includes one-month of Xenia results)
45
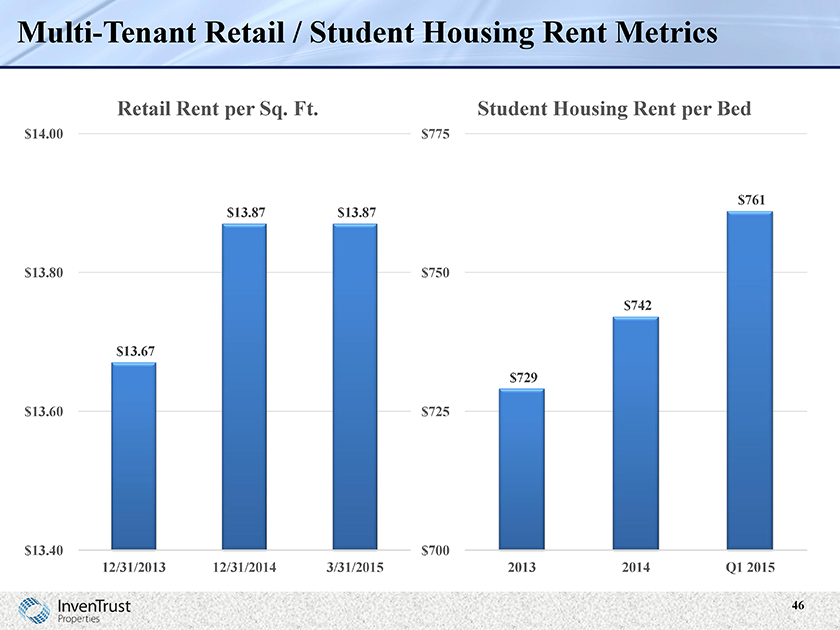
Multi-Tenant Retail / Student Housing Rent Metrics
Retail Rent per Sq. Ft. Student Housing Rent per Bed
$14.00 $775
$761
$13.87 $13.87
$13.80 $750
$742
$13.67
$729
$13.60 $725
$13.40 $700
12/31/2013 12/31/2014 3/31/2015 2013 2014 Q1 2015
46
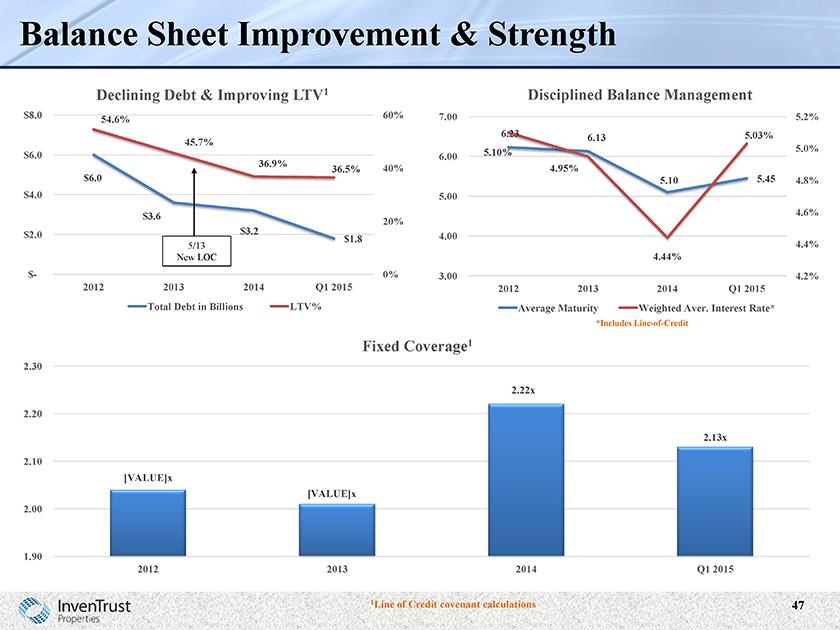
Balance Sheet Improvement & Strength
Declining Debt & Improving LTV1 Disciplined Balance Management
$8.0 60% 7.00 5.2%
54.6%
6.23 5.03%
6.13
45.7%
5.10% 5.0%
$6.0 6.00
36.9%
36.5% 40% 4.95%
$6.0 5.10 5.45 4.8%
$4.0 5.00
$3.6 4.6%
20%
$3.2
$2.0 4.00
$1.8
5/13 4.4%
New LOC 4.44%
$- 0% 3.00 4.2%
2012 2013 2014 Q1 2015 2012 2013 2014 Q1 2015
Total Debt in Billions LTV% Average Maturity Weighted Aver. Interest Rate*
*Includes Line-of-Credit
Fixed Coverage1
2.30
2.22x
2.20
2.13x
2.10
[VALUE]x
[VALUE]x
2.00
1.90
2012 2013 2014 Q1 2015
1Line of Credit covenant calculations 47
47
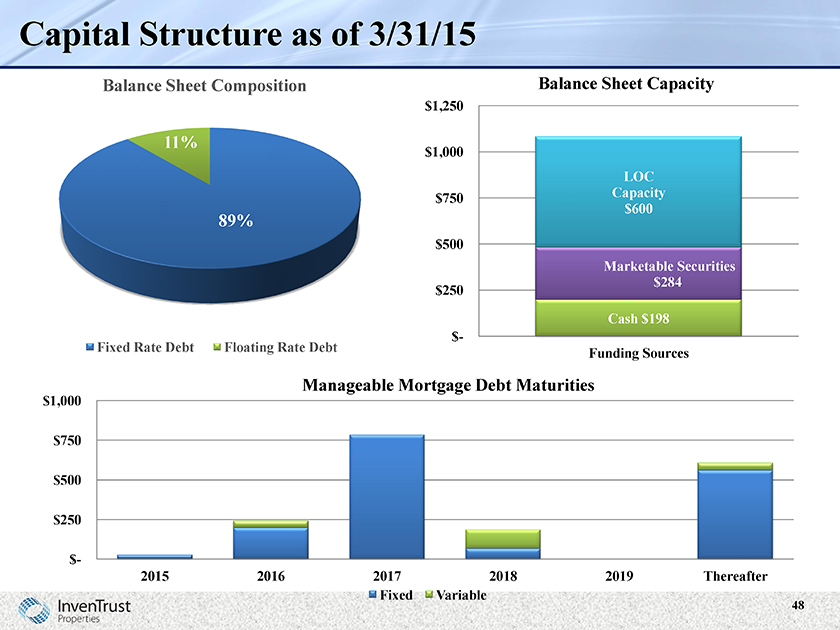
Capital Structure as of 3/31/15
Balance Sheet Composition Balance Sheet Capacity
$1,250
11%
$1,000
LOC
Capacity
$750 $600
89%
$500
Marketable Securities
$284
$250
Cash $198
$-
Fixed Rate Debt Floating Rate Debt Funding Sources
Manageable Mortgage Debt Maturities
$1,000
$750
$500
$250
$-
2015 2016 2017 2018 2019 Thereafter
Fixed Variable 48
48
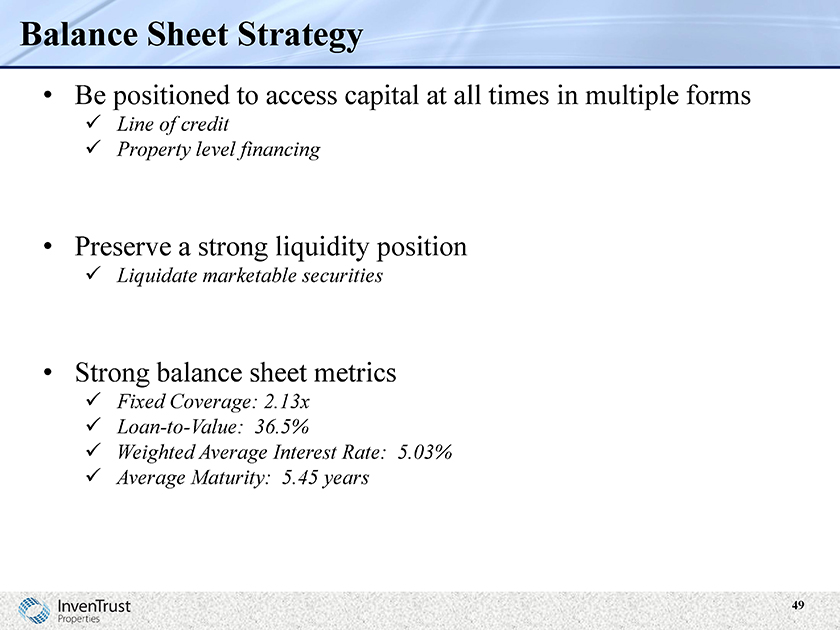
Balance Sheet Strategy
Be positioned to access capital at all times in multiple forms
Line of credit
Property level financing
Preserve a strong liquidity position
Liquidate marketable securities
Strong balance sheet metrics
Fixed Coverage: 2.13x Loan-to-Value: 36.5%
Weighted Average Interest Rate: 5.03% Average Maturity: 5.45 years
49
Q&A
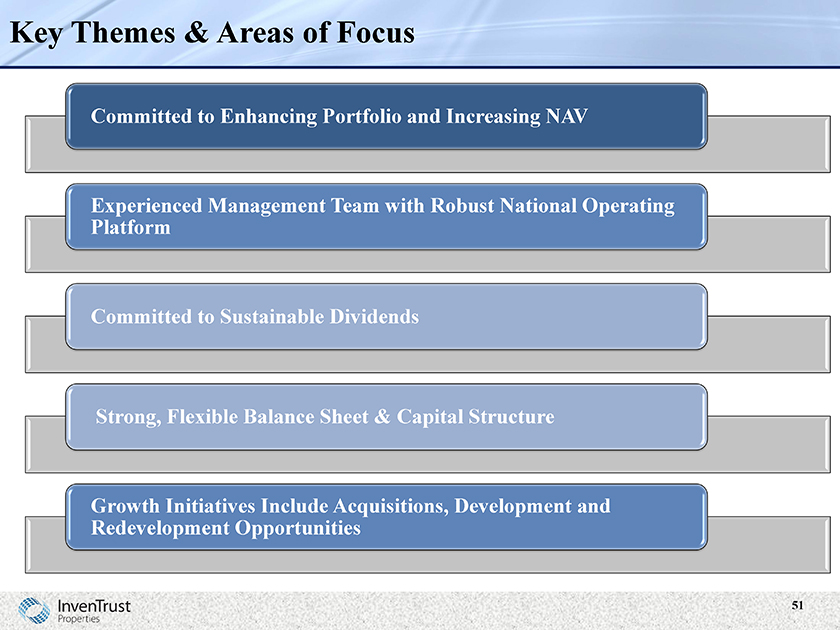
Key Themes & Areas of Focus
Committed to Enhancing Portfolio and Increasing NAV
Experienced Management Team with Robust National Operating Platform
Committed to Sustainable Dividends
Strong, Flexible Balance Sheet & Capital Structure
Growth Initiatives Include Acquisitions, Development and Redevelopment Opportunities
51
Appendix
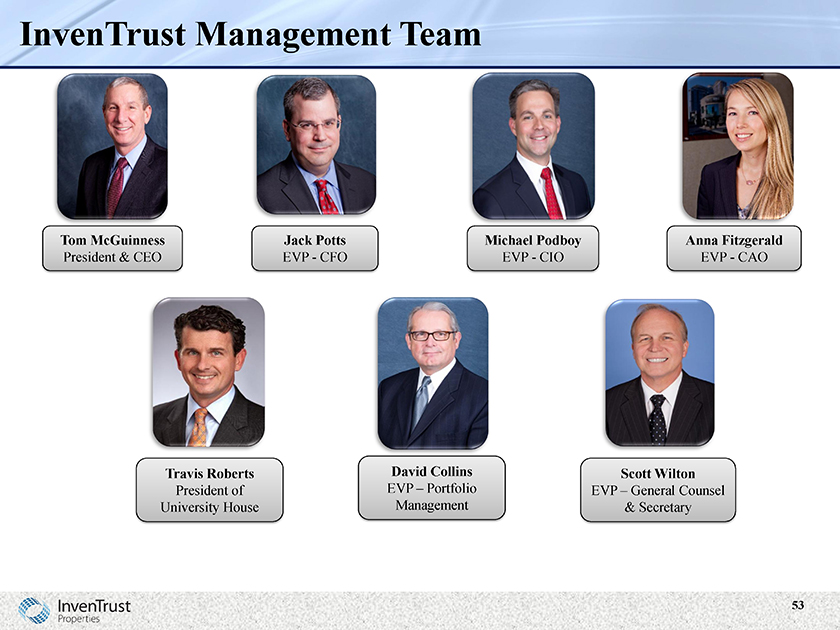
InvenTrust Management Team
Tom McGuinness Jack Potts Michael Podboy Anna Fitzgerald
President & CEO EVP—CFO EVP—CIO EVP—CAO
Travis Roberts David Collins Scott Wilton
President of EVP – Portfolio EVP – General
University House Management Counsel &
Secretary
53
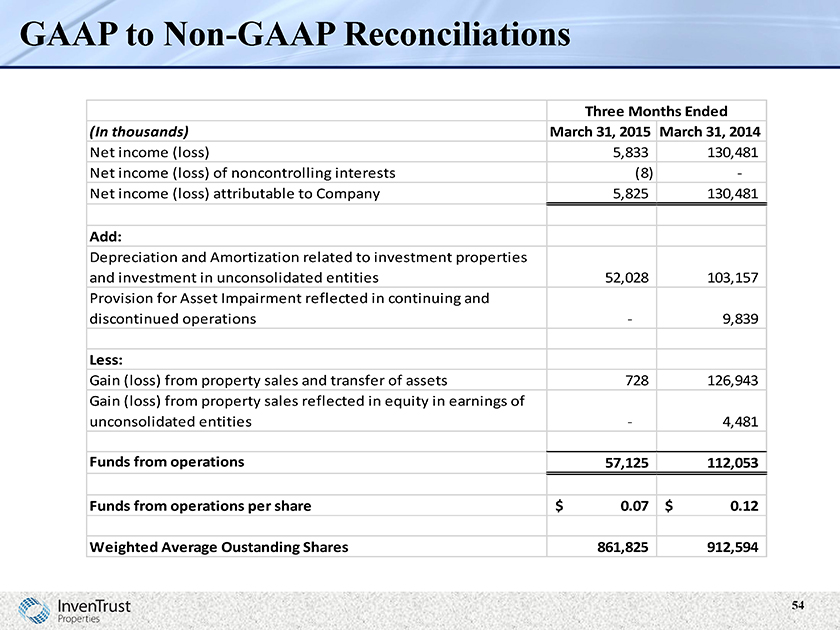
GAAP to Non-GAAP Reconciliations
(In thousands)
Net income (loss)
Net income (loss) of noncontrolling interests Net income (loss) attributable to Company
Add:
Depreciation and Amortization related to investment properties and investment in unconsolidated entities Provision for Asset Impairment reflected in continuing and discontinued operations
Less:
Gain (loss) from property sales and transfer of assets
Gain (loss) from property sales reflected in equity in earnings of unconsolidated entities
Funds from operations
Funds from operations per share
Weighted Average Oustanding Shares
Three Months Ended March 31, 2015 March 31, 2014
5,833
5,825
52,028
-
728
-
57,125
$ 0.07
861,825
130,481
-
130,481
103,157
9,839
126,943
4,481
112,053
$ 0.12
912,594
54