InvestorPresentation November 2021 Essential Retail. Smart Locations.® InvenTrust Properties

InvenTrust Properties Introductory Notes 2 Cautionary Note About Forward-Looking Statements This document has been prepared by InvenTrust Properties Corp. (the “Company,” “IVT” or “InvenTrust”) solely for informational purposes. This presentation contains “forward-looking statements” within the meaning of the Private Securities Litigation Reform Act of 1995. Forward-looking statements are statements that are not historical, including statements regarding management’s intentions, beliefs, expectations, representations, plans or predictions of the future and are typically identified by words such as “may,” “could,” “expect,” “intend,” “plan,” “seek,” “anticipate,” “believe,” “estimate,” “predict,” “potential,” “projections,” “guidance,” “outlook,” “continue,” “likely,” “will,” “should,” “would” and variations of these terms and similar expressions, or the negative of these terms or similar expressions. Such forward-looking statements are necessarily based upon estimates and assumptions that, while considered reasonable by us and our management, are inherently uncertain. The following factors, among others, could cause actual results and financial position and timing of certain events to differ materially from those described in the forward- looking statements: the effects and duration of the COVID-19 pandemic; interest rate movements; local, regional, national and global economic performance; competitive factors; the impact of e- commerce on the retail industry; future retailer store closings; retailer consolidation; retailers reducing store size; retailer bankruptcies; government policy changes; and any material market changes and trends that could affect the Company’s business strategy. For further discussion of factors that could materially affect the outcome of our forward-looking statements and our future results and financial condition, see the Risk Factors included in InvenTrust’s most recent Annual Report on Form 10-K, as updated by any subsequent Quarterly Report on Form 10-Q, in each case as filed with the SEC. InvenTrust intends that such forward-looking statements be subject to the safe harbors created by Section 27A of the Securities Act of 1933, as amended, and Section 21E of the Securities Exchange Act of 1934, as amended, except as may be required by applicable law. We caution you not to place undue reliance on any forward-looking statements, which are made as of the date of this investor presentation. We undertake no obligation to update publicly any of these forward-looking statements to reflect actual results, new information or future events, changes in assumptions or changes in other factors affecting forward-looking statements, except to the extent required by applicable laws. If we update one or more forward-looking statements, no inference should be drawn that we will make additional updates with respect to those or other forward-looking statements. Non-GAAP Measures This presentation contains non-GAAP financial measures such as NOI, EBITDA, Adjusted EBITDA, FFO, and Core FFO. These measures are not prepared in accordance with generally accepted accounting principles in the United States of America (“GAAP”) and have important limitations as analytical tools. Non-GAAP financial measures are supplemental, should only be used in conjunction with results presented in accordance with GAAP and should not be considered in isolation or as a substitute for such GAAP results. Reconciliations of our non-GAAP measures to the most directly comparable GAAP financial measures, together with definitions of the non-GAAP measures used in this presentation, are included in the appendix of this presentation. Joint Venture Partnership The Company owns a 55% interest in IAGM Retail Fund I, LLC (“IAGM” or “JV”), a joint venture partnership between the Company and PGGM Private Real Estate Fund (“PGGM”). IAGM was formed on April 17, 2013 for the purpose of acquiring, owning, managing, supervising and disposing of retail properties and sharing in the profits and losses from those retail properties and their activities. IAGM is the Company’s sole joint venture and is unconsolidated. Throughout this investor presentation disclosure, where indicated as “pro rata” the Company has included the results from its share of its JV properties when combined with the Company’s wholly-owned properties, with the exception of property count. Trademarks The companies depicted in the photographs herein, or any third-party trademarks, including names, logos and brands, referenced by the Company in this presentation, are the property of their respective owners. All references to third-party trademarks are for identification purposes only and nothing herein shall be considered to be an endorsement, authorization or approval of InvenTrust Properties Corp. by the companies. Further, none of these companies are affiliated with the Company in any manner. New York Stock Exchange Listing On October 12, 2021, the Company’s common stock began trading on the New York Stock Exchange under the ticker symbol “IVT”. Important Information regarding the Tender Offer The information in this investor presentation regarding the tender offer is for informational purposes only and is neither an offer to buy nor the solicitation of an offer to sell any securities of the Company. The full details of the tender offer, including complete instructions on how to tender shares, are included in the offer to purchase, the letter of transmittal, and other related materials, which we have distributed to stockholders and have filed with the SEC. Stockholders may obtain free copies of the offer to purchase, the letter of transmittal, and other related materials that the Company has filed with the SEC on the SEC’s website at www.sec.gov or by calling Georgeson LLC, the information agent for the tender offer at (888) 877-5360 (toll free).
Windward Commons MSA: Atlanta, GA Overview
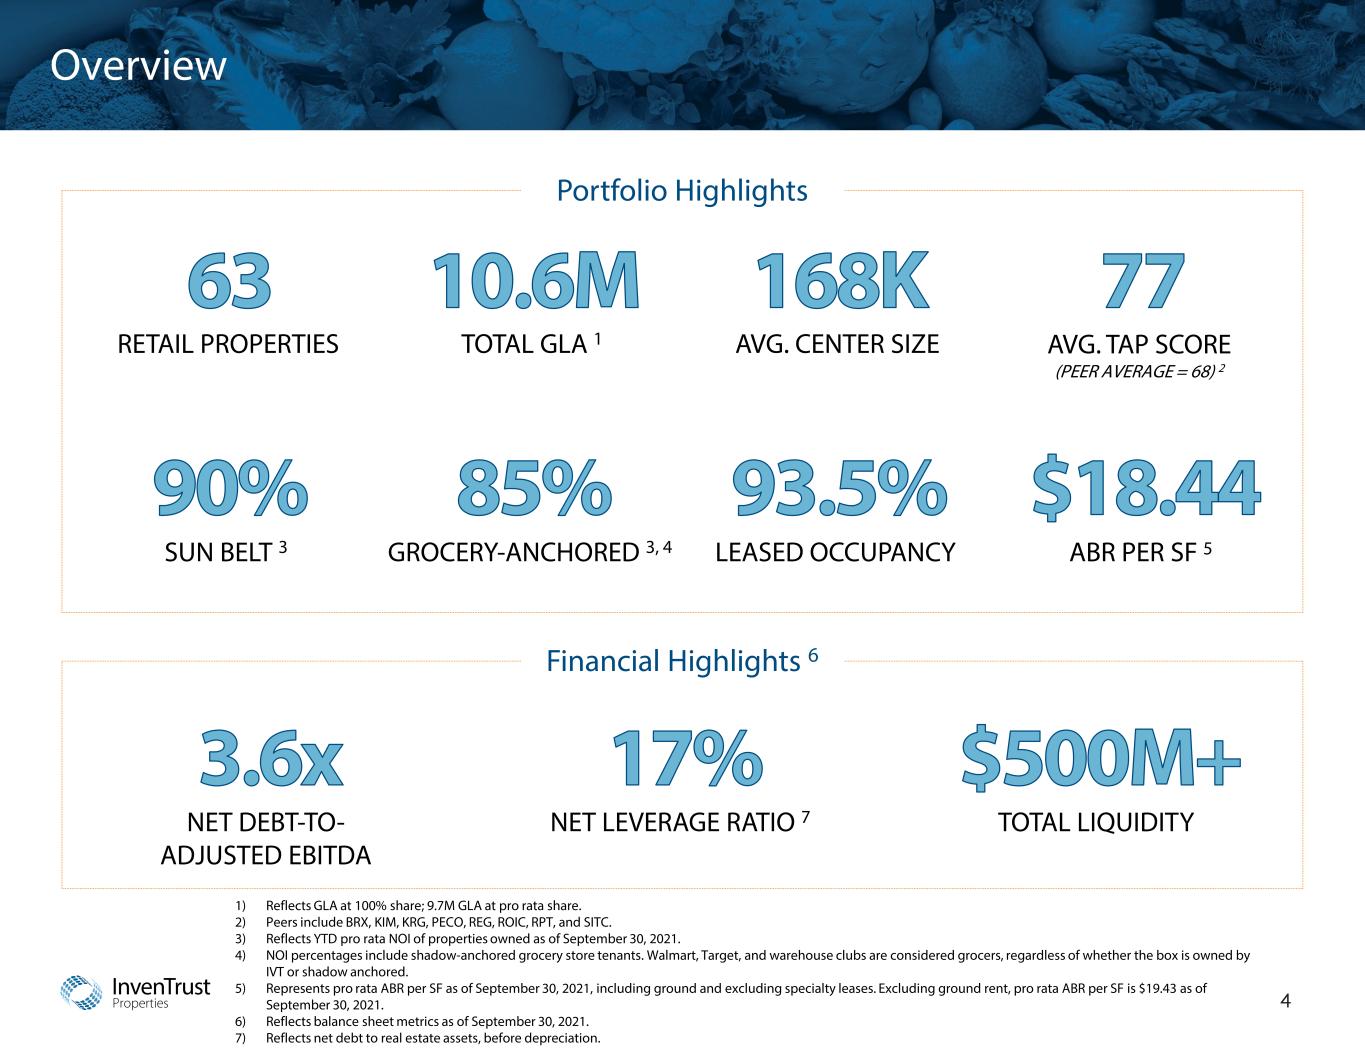
InvenTrust Properties Overview 4 1) Reflects GLA at 100% share; 9.7M GLA at pro rata share. 2) Peers include BRX, KIM, KRG, PECO, REG, ROIC, RPT, and SITC. 3) Reflects YTD pro rata NOI of properties owned as of September 30, 2021. 4) NOI percentages include shadow-anchored grocery store tenants. Walmart, Target, and warehouse clubs are considered grocers, regardless of whether the box is owned by IVT or shadow anchored. 5) Represents pro rata ABR per SF as of September 30, 2021, including ground and excluding specialty leases. Excluding ground rent, pro rata ABR per SF is $19.43 as of September 30, 2021. 6) Reflects balance sheet metrics as of September 30, 2021. 7) Reflects net debt to real estate assets, before depreciation. Portfolio Highlights Financial Highlights 6 TOTAL GLA 1 AVG. CENTER SIZE GROCERY-ANCHORED 3, 4SUN BELT 3 LEASED OCCUPANCY ABR PER SF 5 AVG. TAP SCORE (PEER AVERAGE = 68) 2 RETAIL PROPERTIES TOTAL LIQUIDITYNET DEBT-TO- ADJUSTED EBITDA NET LEVERAGE RATIO 7

InvenTrust Properties Simple & Focused Business Plan 5 Northcross Commons MSA: Charlotte, NC Strong Balance Sheet Ample liquidity, combined with sector-low leverage, provide unmatched strategic flexibility Favorable Demographics Continue to curate a Sun Belt- focused portfolio to capitalize on attractive demographic trends Organic / External Growth Local expertise and prudent acquisitions team enables both organic and external growth Cash Flow Stability Prioritize grocery-anchored properties as well as essential retail tenants to drive recurring foot traffic Essential Retail Smart Locations.®
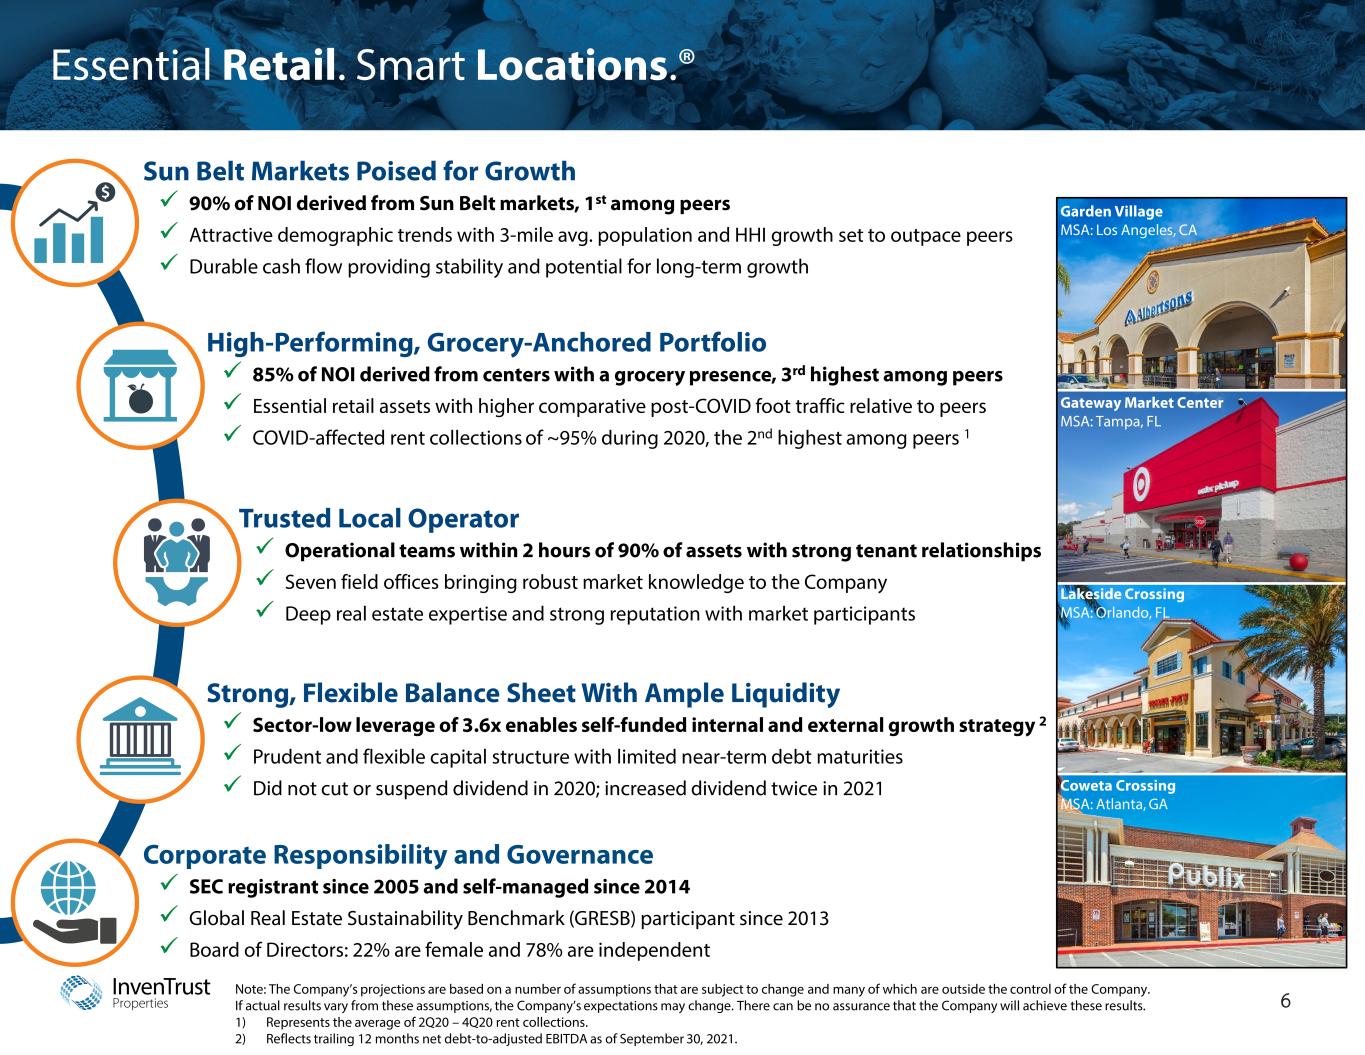
InvenTrust Properties Essential Retail. Smart Locations.® 6 Sun Belt Markets Poised for Growth 90% of NOI derived from Sun Belt markets, 1st among peers Attractive demographic trends with 3-mile avg. population and HHI growth set to outpace peers Durable cash flow providing stability and potential for long-term growth Strong, Flexible Balance Sheet With Ample Liquidity Sector-low leverage of 3.6x enables self-funded internal and external growth strategy 2 Prudent and flexible capital structure with limited near-term debt maturities Did not cut or suspend dividend in 2020; increased dividend twice in 2021 High-Performing, Grocery-Anchored Portfolio 85% of NOI derived from centers with a grocery presence, 3rd highest among peers Essential retail assets with higher comparative post-COVID foot traffic relative to peers COVID-affected rent collections of ~95% during 2020, the 2nd highest among peers 1 Trusted Local Operator Operational teams within 2 hours of 90% of assets with strong tenant relationships Seven field offices bringing robust market knowledge to the Company Deep real estate expertise and strong reputation with market participants Corporate Responsibility and Governance SEC registrant since 2005 and self-managed since 2014 Global Real Estate Sustainability Benchmark (GRESB) participant since 2013 Board of Directors: 22% are female and 78% are independent Garden Village MSA: Los Angeles, CA Gateway Market Center MSA: Tampa, FL Lakeside Crossing MSA: Orlando, FL Coweta Crossing MSA: Atlanta, GA Note: The Company’s projections are based on a number of assumptions that are subject to change and many of which are outside the control of the Company. If actual results vary from these assumptions, the Company’s expectations may change. There can be no assurance that the Company will achieve these results. 1) Represents the average of 2Q20 – 4Q20 rent collections. 2) Reflects trailing 12 months net debt-to-adjusted EBITDA as of September 30, 2021.

InvenTrust Properties 3.2% 3.0% Peers ¹ 1425017_1.wor DO NOT delete this tracker, it tells the graphic department how to locate the data for this map Sun Belt Sun Belt Focused: Near-Term Income Stability, Long-Term Value 7 Migration of people & jobs to Sun Belt markets is expected to accelerate the long-term growth potential for IVT centers MSA Median HHI Growth (’21E–’25E CAGR) IVT Properties Regional Offices Corporate HQ Source: Green Street. Note: The Company’s projections are based on a number of assumptions that are subject to change and many of which are outside the control of the Company. If actual results vary from these assumptions, the Company’s expectations may change. There can be no assurance that the Company will achieve these results. 1) Peers include BRX, KIM, KRG, PECO, REG, ROIC, RPT, and SITC. 2) Reflects YTD pro rata NOI of properties owned as of September 30, 2021. IVT Portfolio by % of NOI 2 Southern California 13% Denver 5% San Antonio 2% Austin 14% Dallas / Fort Worth / Arlington 10% Houston 8% Miami / Fort Lauderdale / West PalmBeach 10% Atlanta 11% Charlotte 4% Raleigh / Durham 8% DC Metro 5% Tampa / St. Petersburg 5% 1.2% 0.6% Peers ¹ Orlando 5% Austin Southern CA Atlanta Dallas Miami Top 5 % of Total 14% 13% 11% 10% 10% 58% Top 5 Markets by NOI 2 MSA Population Growth (’21E–’25E CAGR) InvenTrust Properties InvenTrust Properties
Portfolio The Pointe at Creedmoor MSA: Raleigh / Durham, NC

InvenTrust Properties 9 Our Differentiated Portfolio Gateway Market Center MSA: Tampa, FL Campus Marketplace MSA: San Diego, CA Portfolio Curation Parameters Large, Growing Workforce High Educational- Attainment Low Cost of Living Business-Friendly Grocery-Anchored / Necessity-Based Centers Above-Average Retail Sales Growth Forecast Superior Same Property NOI Growth Rate Focused on Sun Belt with favorable demographic trends Strategically focused in high growth markets predominantly across the Sun Belt Growth dynamics supported by highly-educated workforces comparable to those of coastal cities Low cost of living environments and favorable homebuilding outlooks further in-migration trends Product mix focused on necessity-based retail to meet consumer shift toward essentialism High Growth Sun Belt Demographics 1 38% of InvenTrust’s ABR is in the top 6 STEM markets 1 STEM-based companies seeking a business-friendly environment have a presence in markets we serve (e.g. Amazon, Apple, Dell, Facebook, Google, Samsung, and Tesla in Austin, TX – our #1 market by NOI) Local infrastructure and adjacency to institutions of higher education support growth of tech presence STEM-based professions add to portfolio resiliency and potential for increased HHI growth Strategically Located in Rising STEM Markets 2 Enhancing value by focusing on essential retail and the customer experience Outsized presence of grocers and other necessity-based tenants drive portfolio quality and resiliency Tenant collaboration to adapt and embrace brick & mortar as a last mile delivery solution New fulfillment methods such as curbside pickup create high-touch customer connections Small-format, localized centers enable use of outdoor common areas as a placemaking tool Customer- Focused Essential Retail 3 The Parke MSA: Austin, TX 1) Reflects ABR from Atlanta, Austin, D.C., and Raleigh markets. Top 6 STEM markets per WalletHub research, in descending order: Seattle, D.C., San Francisco, Austin, Raleigh, and Atlanta.
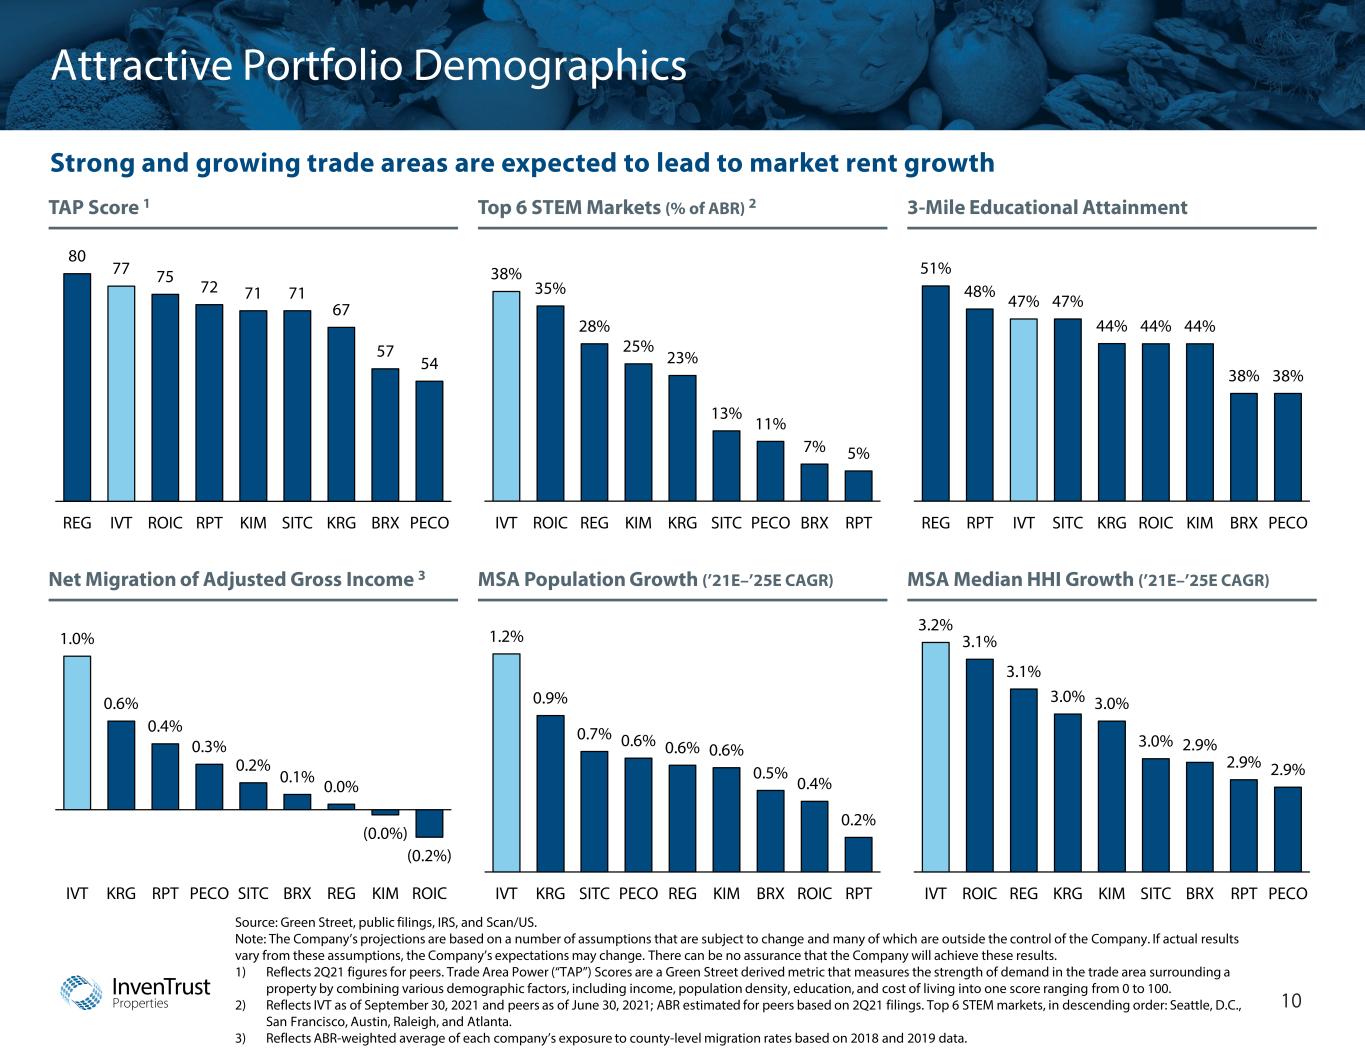
InvenTrust Properties Attractive Portfolio Demographics 10 Strong and growing trade areas are expected to lead to market rent growth TAP Score 1 Source: Green Street, public filings, IRS, and Scan/US. Note: The Company’s projections are based on a number of assumptions that are subject to change and many of which are outside the control of the Company. If actual results vary from these assumptions, the Company’s expectations may change. There can be no assurance that the Company will achieve these results. 1) Reflects 2Q21 figures for peers. Trade Area Power (“TAP”) Scores are a Green Street derived metric that measures the strength of demand in the trade area surrounding a property by combining various demographic factors, including income, population density, education, and cost of living into one score ranging from 0 to 100. 2) Reflects IVT as of September 30, 2021 and peers as of June 30, 2021; ABR estimated for peers based on 2Q21 filings. Top 6 STEM markets, in descending order: Seattle, D.C., San Francisco, Austin, Raleigh, and Atlanta. 3) Reflects ABR-weighted average of each company’s exposure to county-level migration rates based on 2018 and 2019 data. Net Migration of Adjusted Gross Income 3 Top 6 STEM Markets (% of ABR) 2 MSA Population Growth (’21E–’25E CAGR) 3-Mile Educational Attainment MSA Median HHI Growth (’21E–’25E CAGR) 80 77 75 72 71 71 67 57 54 REG IVT ROIC RPT KIM SITC KRG BRX PECO 51% 48% 47% 47% 44% 44% 44% 38% 38% REG RPT IVT SITC KRG ROIC KIM BRX PECO 38% 35% 28% 25% 23% 13% 11% 7% 5% IVT ROIC REG KIM KRG SITC PECO BRX RPT 1.0% 0.6% 0.4% 0.3% 0.2% 0.1% 0.0% (0.0%) (0.2%) IVT KRG RPT PECO SITC BRX REG KIM ROIC 3.2% 3.1% 3.1% 3.0% 3.0% 3.0% 2.9% 2.9% 2.9% IVT ROIC REG KRG KIM SITC BRX RPT PECO 1.2% 0.9% 0.7% 0.6% 0.6% 0.6% 0.5% 0.4% 0.2% IVT KRG SITC PECO REG KIM BRX ROIC RPT
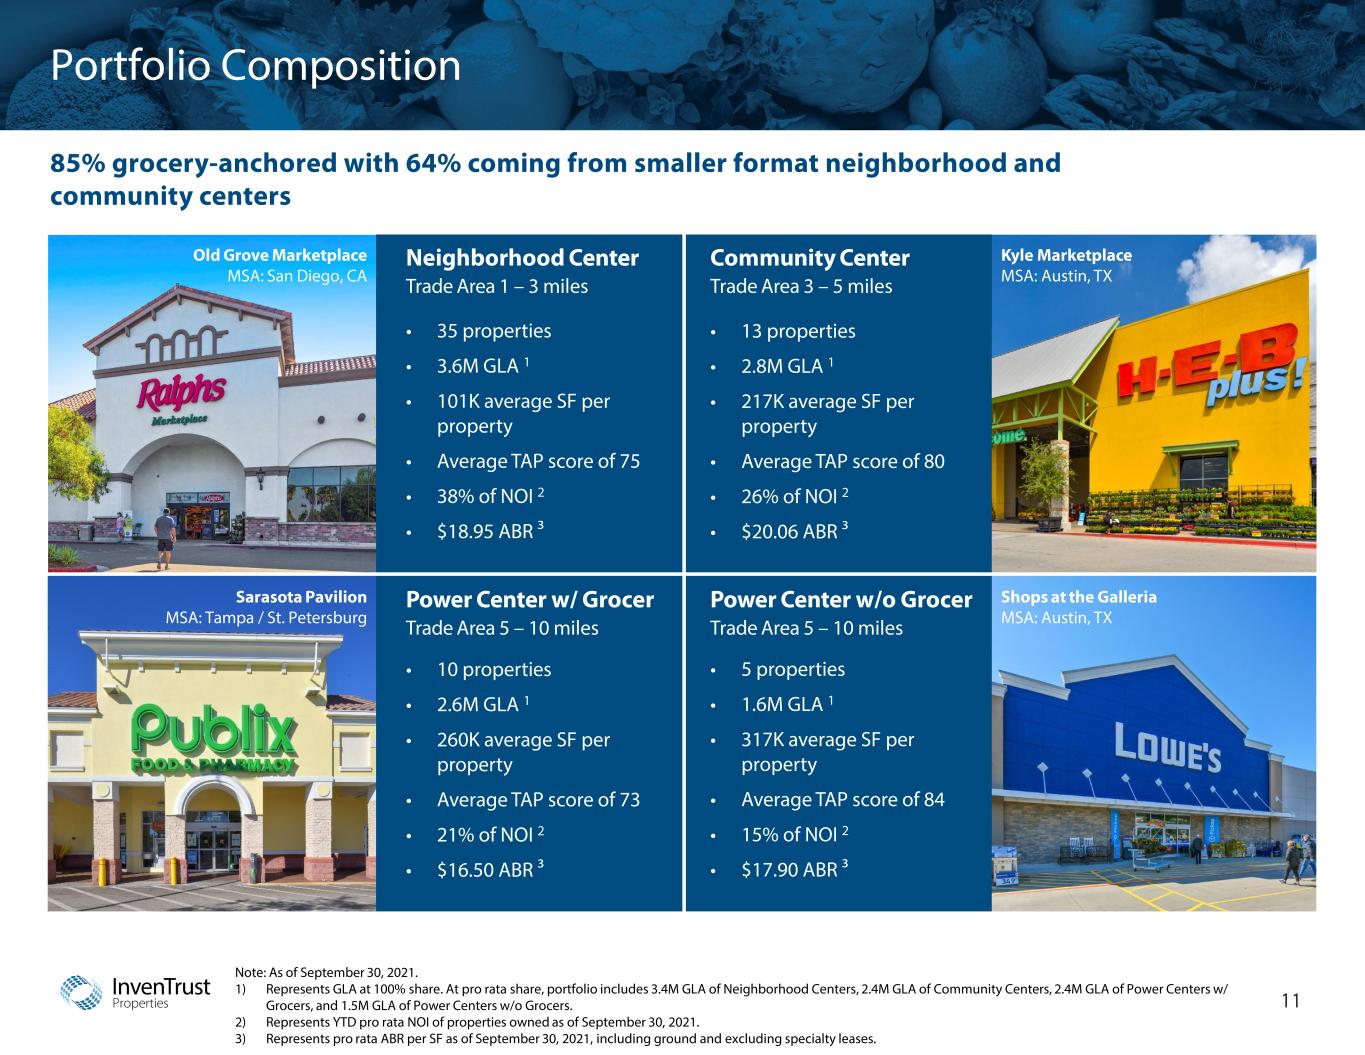
InvenTrust Properties Portfolio Composition 11 85% grocery-anchored with 64% coming from smaller format neighborhood and community centers Power Center w/ Grocer Trade Area 5 – 10 miles • 10 properties • 2.6M GLA 1 • 260K average SF per property • Average TAP score of 73 • 21% of NOI 2 • $16.50 ABR ³ Power Center w/o Grocer Trade Area 5 – 10 miles • 5 properties • 1.6M GLA 1 • 317K average SF per property • Average TAP score of 84 • 15% of NOI 2 • $17.90 ABR ³ Neighborhood Center Trade Area 1 – 3 miles • 35 properties • 3.6M GLA 1 • 101K average SF per property • Average TAP score of 75 • 38% of NOI 2 • $18.95 ABR ³ Community Center Trade Area 3 – 5 miles • 13 properties • 2.8M GLA 1 • 217K average SF per property • Average TAP score of 80 • 26% of NOI 2 • $20.06 ABR ³ Kyle Marketplace MSA: Austin, TX Shops at the Galleria MSA: Austin, TX Old Grove Marketplace MSA: San Diego, CA Sarasota Pavilion MSA: Tampa / St. Petersburg Note: As of September 30, 2021. 1) Represents GLA at 100% share. At pro rata share, portfolio includes 3.4M GLA of Neighborhood Centers, 2.4M GLA of Community Centers, 2.4M GLA of Power Centers w/ Grocers, and 1.5M GLA of Power Centers w/o Grocers. 2) Represents YTD pro rata NOI of properties owned as of September 30, 2021. 3) Represents pro rata ABR per SF as of September 30, 2021, including ground and excluding specialty leases.
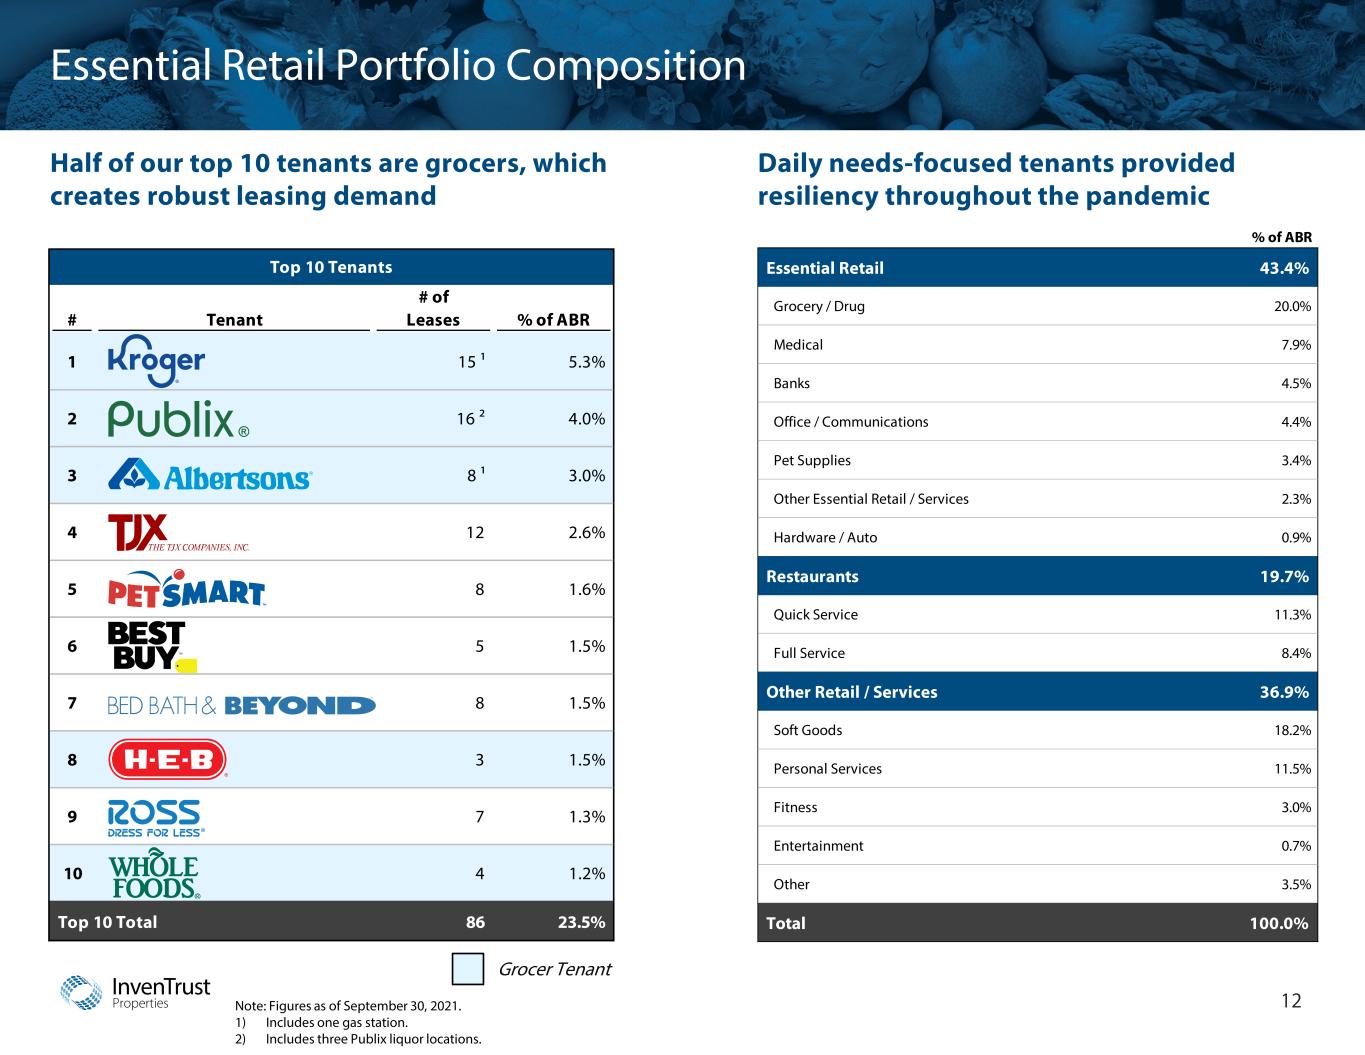
InvenTrust Properties Essential Retail Portfolio Composition 12 Half of our top 10 tenants are grocers, which creates robust leasing demand Grocer Tenant Top 10 Tenants # of # Tenant Leases % of ABR 1 15 ¹ 5.3% 2 16 ² 4.0% 3 8 ¹ 3.0% 4 12 2.6% 5 8 1.6% 6 5 1.5% 7 8 1.5% 8 3 1.5% 9 7 1.3% 10 4 1.2% Top 10 Total 86 23.5% % of ABR Essential Retail 43.4% Grocery / Drug 20.0% Medical 7.9% Banks 4.5% Office / Communications 4.4% Pet Supplies 3.4% Other Essential Retail / Services 2.3% Hardware / Auto 0.9% Restaurants 19.7% Quick Service 11.3% Full Service 8.4% Other Retail / Services 36.9% Soft Goods 18.2% Personal Services 11.5% Fitness 3.0% Entertainment 0.7% Other 3.5% Total 100.0% Daily needs-focused tenants provided resiliency throughout the pandemic Note: Figures as of September 30, 2021. 1) Includes one gas station. 2) Includes three Publix liquor locations.

InvenTrust Properties ~$730 ~$680 Peers ² Top Grocers Generate a Stable Income Stream 13 High productivity grocers drive traffic that benefits small shop tenants & leasing activity Average Grocer Sales ($ per SF) Source: Public filings and Green Street. 1) Reflects average grocer sales PSF for those that report for the 12 months ended September 30, 2021. 2) Peers that report average grocer sales include BRX, KIM, PECO, REG, and SITC. Peers 21InvenTrust Properties Kennesaw Marketplace MSA: Atlanta, GA

InvenTrust Properties Positive Leasing Momentum 14 Strong leasing momentum throughout 2021 3Q21 Leasing Overview Note: Data as of September 30, 2021. 1) Reflects pro rata combined retail portfolio for properties owned as of September 30, 2021. Executed Leases 1 (Thousands of SF) Historical Leased Occupancy 1 817 928 982 1,462 2018 2019 2020 YTD 2021 3-Year Average: 909 94% 95% 93% 94% 2018 2019 2020 YTD 2021 3-Year Average: 94% Comparable Re-Leasing Spread 1 (Blended) 8% 6% (0%) 3% 2018 2019 2020 YTD 2021 3-Year Average: 5% Q1 (2%) 5%5% Q2 Q3 • Strong leasing momentum in 3Q21: • 79 leases executed in 3Q21 • Leased GLA expiring in 2022 reduced from 1.1M SF in 2Q21 to 0.6M SF in 3Q21 • Expanded mix of retailers across the portfolio including grocers, essential retail and other retail / services Select Leases Executed in 2021
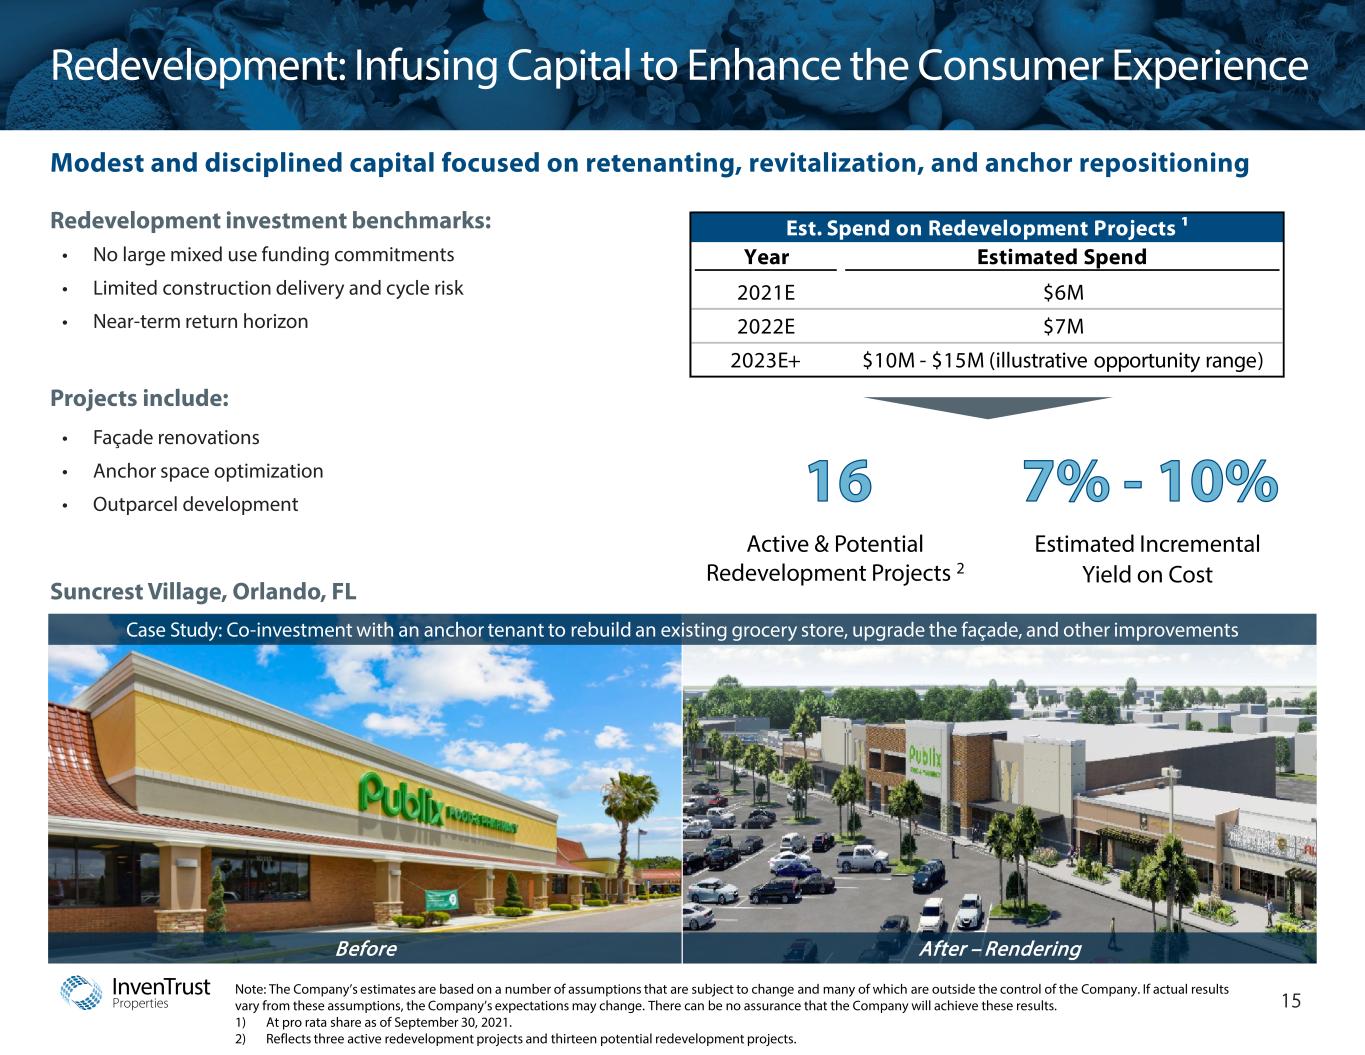
InvenTrust Properties Redevelopment: Infusing Capital to Enhance the Consumer Experience 15 Modest and disciplined capital focused on retenanting, revitalization, and anchor repositioning Redevelopment investment benchmarks: • No large mixed use funding commitments • Limited construction delivery and cycle risk • Near-term return horizon Projects include: • Façade renovations • Anchor space optimization • Outparcel development Note: The Company’s estimates are based on a number of assumptions that are subject to change and many of which are outside the control of the Company. If actual results vary from these assumptions, the Company’s expectations may change. There can be no assurance that the Company will achieve these results. 1) At pro rata share as of September 30, 2021. 2) Reflects three active redevelopment projects and thirteen potential redevelopment projects. Before After – Rendering Case Study: Co-investment with an anchor tenant to rebuild an existing grocery store, upgrade the façade, and other improvements Suncrest Village, Orlando, FL Active & Potential Redevelopment Projects 2 Estimated Incremental Yield on Cost Est. Spend on Redevelopment Projects ¹ Year Estimated Spend 2021E $6M 2022E $7M 2023E+ $10M - $15M (illustrative opportunity range)
Balance Sheet & Growth Potential PGA Plaza MSA: Miami, FL

InvenTrust Properties 17 InvenTrust primed for growth with sector-leading balance sheet Balance Sheet Highlights Debt Maturity Schedule ($M) Capital Structure (at share) • Balance sheet with investment grade-like characteristics • Over $500M liquidity • Liquidity includes $160M+ of cash and $350M remaining capacity on revolving credit facility • Below 20% net leverage with no near-term unsecured maturities • Debt composition of 81% fixed rate / 19% floating rate • Weighted average interest rate: 2.7% • Weighted average maturity: 4.3 years 1 $10 $200 – $23 $109 $16 $41 $210 $200 2021 2022 2023 2024 2025 2026 2027 Secured Unsecured 80% 13% 7% Equity (NAV) ³ Unsecured Debt Secured Debt Key Leverage Metrics Stabilized Leverage As of Long-Term Ratio Metric 9/30/2021 Debt Policy Net Debt-to- Adjusted EBITDA 3.6x 5.0x - 6.0x Net Leverage ² 17% 25% - 35% Note: Figures as of September 30, 2021 and reflect pro rata share of PGGM joint venture. The Company’s guidance is based on a number of assumptions that are subject to change and many of which are outside the control of the Company. If actual results vary from these assumptions, the Company’s expectations may change. There can be no assurance that the Company will achieve these results. 1) Excludes available extension options. 2) Reflects net debt to real estate assets, before depreciation. 3) Equity (NAV) represents the Green Street estimated Net Asset Value of the Company as of October 13, 2021 and includes subsequent events. Includes $100M of cash for a modified “Dutch Auction” tender offer commencing on October 12, 2021 and expiring on November 8, 2021. Flexible & Conservative Capital Structure
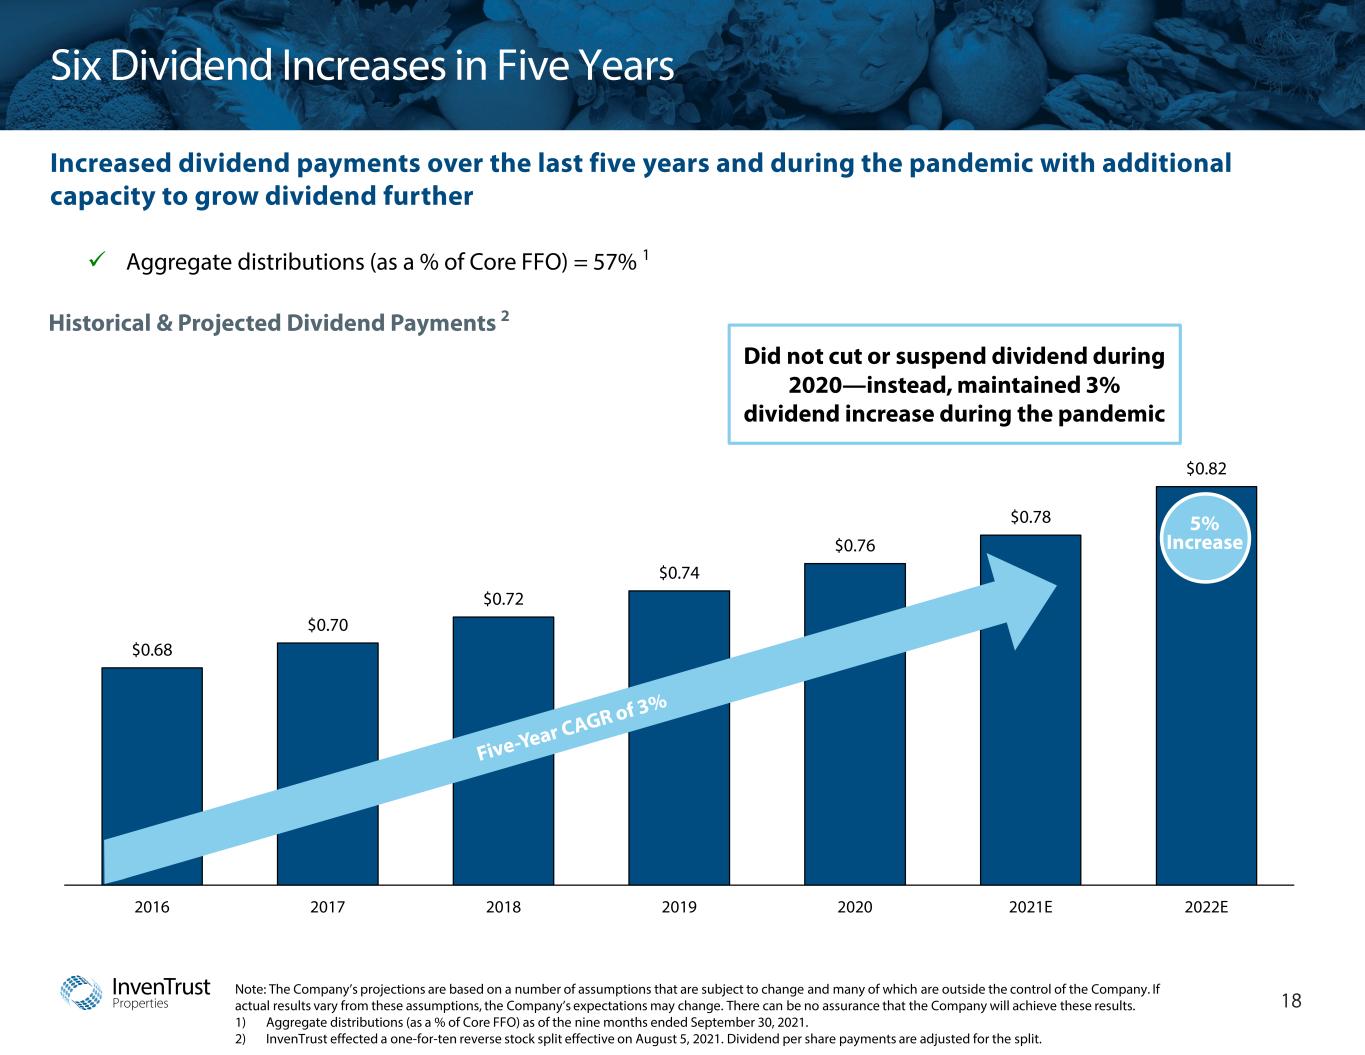
InvenTrust Properties $0.68 $0.70 $0.72 $0.74 $0.76 $0.78 $0.82 2016 2017 2018 2019 2020 2021E 2022E Six Dividend Increases in Five Years 18 Increased dividend payments over the last five years and during the pandemic with additional capacity to grow dividend further Note: The Company’s projections are based on a number of assumptions that are subject to change and many of which are outside the control of the Company. If actual results vary from these assumptions, the Company’s expectations may change. There can be no assurance that the Company will achieve these results. 1) Aggregate distributions (as a % of Core FFO) as of the nine months ended September 30, 2021. 2) InvenTrust effected a one-for-ten reverse stock split effective on August 5, 2021. Dividend per share payments are adjusted for the split. Aggregate distributions (as a % of Core FFO) = 57% 1 5% Increase Historical & Projected Dividend Payments 2 Did not cut or suspend dividend during 2020—instead, maintained 3% dividend increase during the pandemic

InvenTrust Properties Self Funded Growth Strategy 19 Flexible structure allows for various capital allocation levers to drive cash flow Net Leverage (Based on Green Street’s est. value for assets and liabilities) Net Debt-to-Adjusted EBITDA (Trailing 12 Months) 3.6x 5.5x 5.5x 6.0x 6.3x 6.4x 6.7x 6.9x 8.4x 17% 28% 30% 39% 42% 37% 43% 34% 43% Peer Average: 6.5xIllustrative Leverage Capacity Pre-Tender Post-Tender 4.5x ³ ⁴ InvenTrust 5 • Support a Dutch Auction tender up to $100M and repurchase shares accretive to NAV ¹ • External growth via acquisitions in Sun Belt markets with attractive growth profiles • Reinvest in assets through redevelopment pipeline Properties Source: Green Street and public filings. Note: Peers shown as of June 30, 2021 and adjusted for subsequent events. 1) Compared to Green Street published NAV per share of $32.75 as of October 13, 2021. 2) Assumes $100M cash expenditure for the tender offer. 3) Reflects net debt to real estate assets, before depreciation. 4) RPT net leverage based on 2Q21 EBITDA and EV as opposed to Green Street estimates. 5) Reflects balance sheet metrics as of September 30, 2021. 6) Net Debt-to-Adjusted EBITDA pro forma for the RPAI merger and realized synergies. 6

InvenTrust Properties Experienced Acquisitions Team 20 Best-in-class acquisitions platform with prudent approach and high volume capabilities Note: Includes all shopping center, pad acquisitions, and non-core dispositions at IVT share. Note: Average acquisitions and dispositions figures do not include figures for the nine months ended September 30, 2021. 1) Represents opportunities evaluated, LOIs issued, and acquisitions closed from January 1, 2015 to September 30, 2021. Historical Acquisitions Funnel ¹ 600+ Opportunities Evaluated 135+ LOIs Issued 49 Closed Total InvenTrust Acquisitions and Dispositions ($M) 2015 2016 2017 2018 2019 2020 2021 YTD Total Acquisitions 6 9 9 5 14 4 2 49 GLA 0.8M 1.5M 1.7M 0.5M 1.1M 0.2M 0.1M 5.9M Average GLA 128K 167K 187K 94K 79K 44K 56K 120K Dispositions 11 29 11 20 13 2 3 89 GLA 0.8M 3.3M 1.9M 3.8M 2.2M 0.2M 0.2M 12.4M Average GLA 69K 112K 171K 192K 172K 81K 69K 139K $191 $465 $633 $223 $392 $30 $26 $1,960 ($132) ($480) ($244) ($516) ($399) ($6) ($29) ($1,806) Average Annual Acquisitions: $322 Average Annual Dispositions: ($296)
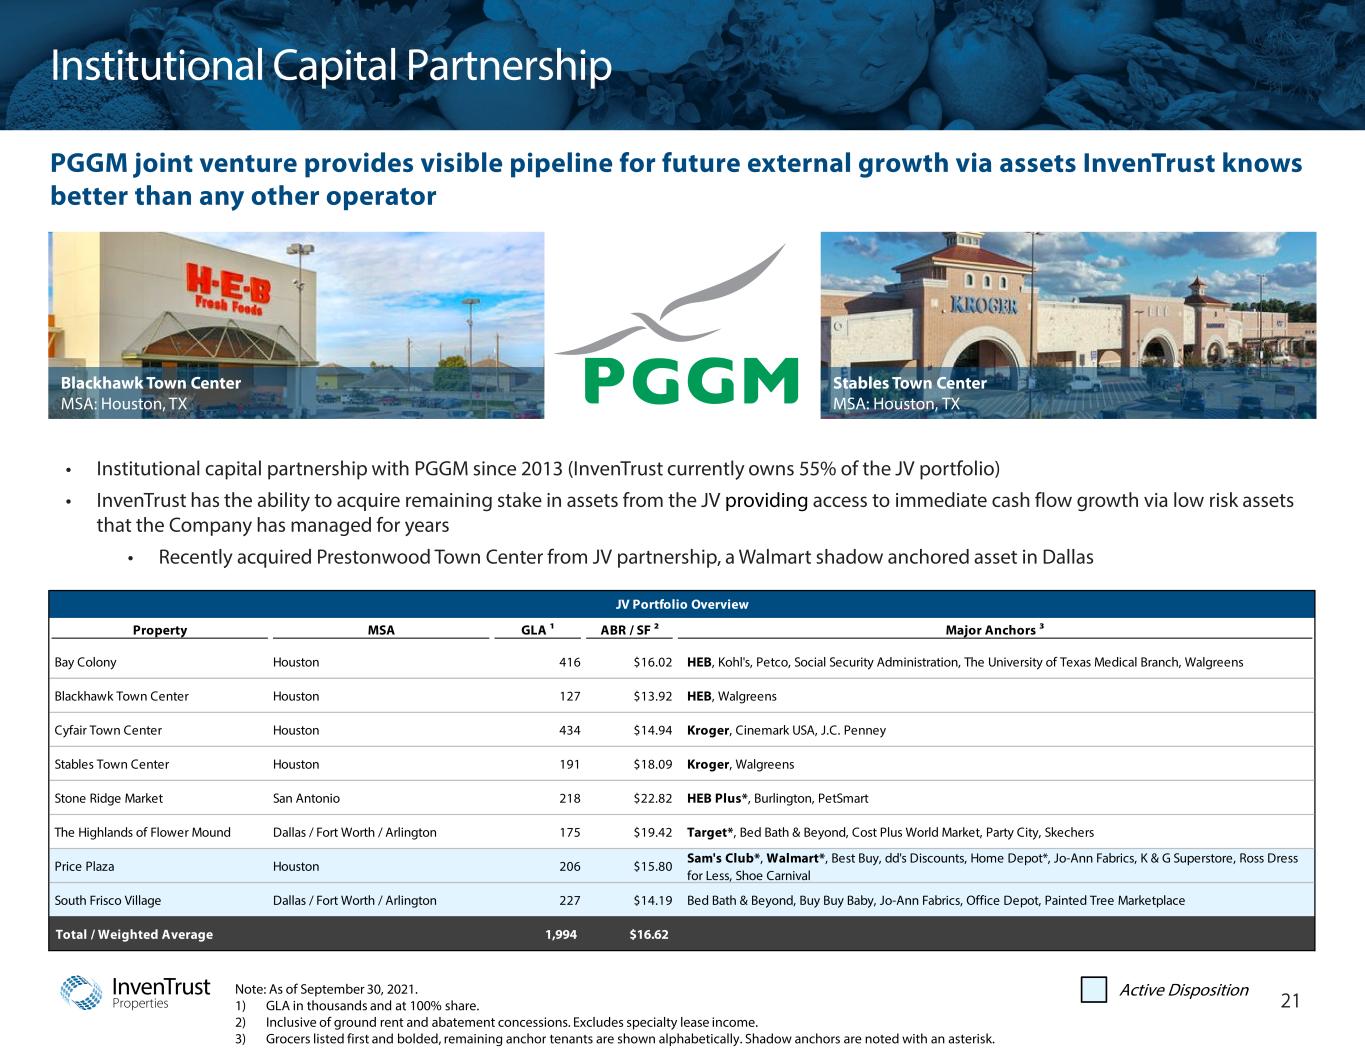
InvenTrust Properties Note: As of September 30, 2021. 1) GLA in thousands and at 100% share. 2) Inclusive of ground rent and abatement concessions. Excludes specialty lease income. 3) Grocers listed first and bolded, remaining anchor tenants are shown alphabetically. Shadow anchors are noted with an asterisk. Institutional Capital Partnership 21 PGGM joint venture provides visible pipeline for future external growth via assets InvenTrust knows better than any other operator • Institutional capital partnership with PGGM since 2013 (InvenTrust currently owns 55% of the JV portfolio) • InvenTrust has the ability to acquire remaining stake in assets from the JV providing access to immediate cash flow growth via low risk assets that the Company has managed for years • Recently acquired Prestonwood Town Center from JV partnership, a Walmart shadow anchored asset in Dallas Blackhawk Town Center MSA: Houston, TX Stables Town Center MSA: Houston, TX Active Disposition JV Portfolio Overview Property MSA GLA ¹ ABR / SF ² Major Anchors ³ Bay Colony Houston 416 $16.02 HEB, Kohl's, Petco, Social Security Administration, The University of Texas Medical Branch, Walgreens Blackhawk Town Center Houston 127 $13.92 HEB, Walgreens Cyfair Town Center Houston 434 $14.94 Kroger, Cinemark USA, J.C. Penney Stables Town Center Houston 191 $18.09 Kroger, Walgreens Stone Ridge Market San Antonio 218 $22.82 HEB Plus*, Burlington, PetSmart The Highlands of Flower Mound Dallas / Fort Worth / Arlington 175 $19.42 Target*, Bed Bath & Beyond, Cost Plus World Market, Party City, Skechers Price Plaza Houston 206 $15.80 Sam's Club*, Walmart*, Best Buy, dd's Discounts, Home Depot*, Jo-Ann Fabrics, K & G Superstore, Ross Dress for Less, Shoe Carnival South Frisco Village Dallas / Fort Worth / Arlington 227 $14.19 Bed Bath & Beyond, Buy Buy Baby, Jo-Ann Fabrics, Office Depot, Painted Tree Marketplace Total / Weighted Average 1,994 $16.62

Gateway Market Center MSA: Tampa, FL 2021 Outlook and Guidance

InvenTrust Properties 2021 Outlook and Guidance 23 Note: Acquisitions are not included in the 2021 Outlook and Guidance beyond what has been completed as of the date of this release. 2021 Outlook and Guidance does include two potential and pending dispositions that may be completed by the end of 2021. The Company’s 2021 Outlook and Guidance is based on a number of assumptions that are subject to change and may be outside the control of the Company. If actual results vary from these assumptions, the Company’s expectations may change. There can be no assurances that InvenTrust will achieve these results. 1) FFO as defined by NAREIT. 2) Estimated 2021 Core FFO per share, excludes, among other things, advisory fees associated with our NYSE direct listing. These advisory fees represent banker, legal and other advisor fees incurred in connection with our direct listing on October 12, 2021. Commons at University Place MSA: Raleigh—Durham, NC 2021 Outlook and Guidance Net Loss per diluted share $(0.20) to $(0.16) FFO per share ¹ $1.09 to $1.13 Core FFO per share ² $1.38 to $1.42 SPNOI Growth 3.25% to 4.75%
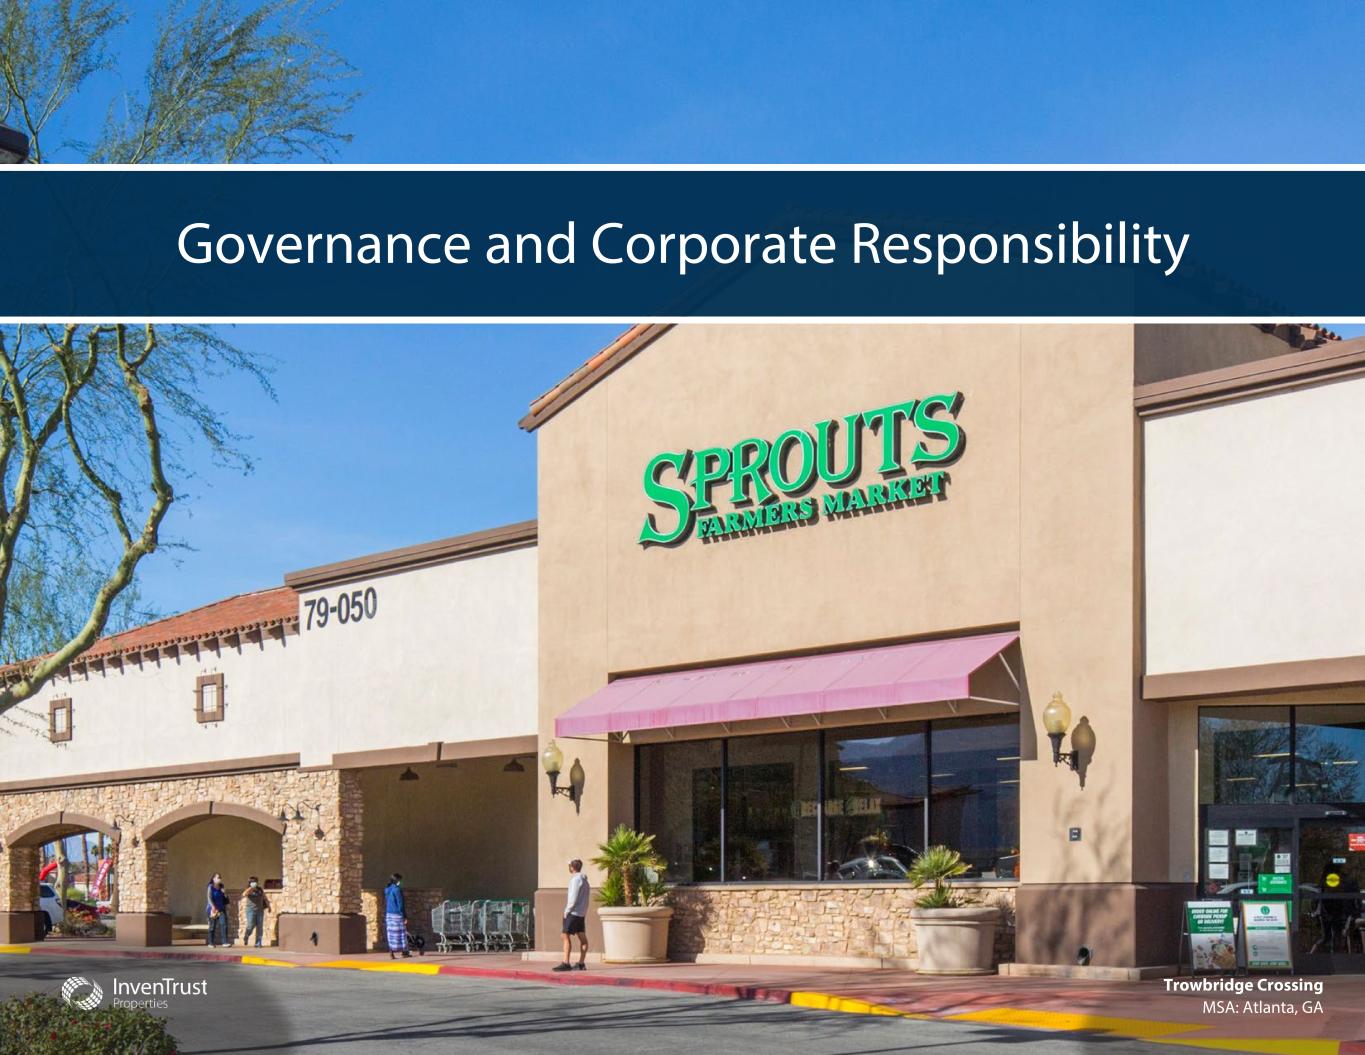
Governance and Corporate Responsibility Trowbridge Crossing MSA: Atlanta, GA

InvenTrust Properties Experienced Board of Directors with Strong Governance 25 Paula J. Saban (Chairperson since 2017 and Director since 2004) • Former Senior Vice President and Private Client Manager at Bank of America • Over 25 years of financial services and banking experience Stuart Aitken (Director since 2017) • Chief Merchant and Marketing Officer at The Kroger Co • Former Group Vice President of The Kroger Co. and CEO of 84.51°, a data analytics firm • Former CEO of dunnhumbyUSA and EVP & CMO of Michael’s Stores Amanda Black (Director since 2018) • Managing Director and Portfolio Manager of JLP Asset Management • Former Senior Vice President and Portfolio Manager at Ascent Investment Advisors • Over 20 years of experience in real estate investments Daniel J. (DJ) Busch (President, CEO, and Director since 2021) • Currently serving as President and CEO • Previously served as EVP, CFO, and Treasurer since 2019 • Former Managing Director, Retail at Green Street Advisors Thomas F. Glavin (Director since 2007) • Owner of Thomas F. Glavin & Associates, Inc., a certified public accounting firm • Former Partner at Gateway Homes and internal auditor at Vavrus & Associates Thomas P. McGuinness (Director since 2015) • Former CEO of the Company since 2014 post the Company’s self-management transactions • Prior to IVT’s self-management transactions, served as President of business manager • Previously President of the Company’s former property manager Michael A. Stein (Director since 2016) • Former Senior Vice President and CFO of ICOS Corp., a bio tech company acquired by Eli Lilly • Former EVP and CFO of Nordstrom, Inc. as well as EVP and CFO of Marriott International, Inc. • Former Partner at Arthur Andersen LLP Scott A. Nelson (Director since 2016) • Principal and Founder of SAN Prop Advisors, a real estate advisory firm • Former Senior Vice President at Target Corporation, overseeing various real estate groups • Former Director of Real Estate at Mervyn’s Board of Directors Julian E. Whitehurst (Director since 2016) • CEO and President of National Retail Properties, Inc. • Previously served as COO of National Retail Properties, Inc. from 2004 to 2017 • Practiced business and real estate law for 20 years at Lowndes, Drosdick, Doster, Kantor & Reed Board Governance Non-Staggered Board Yes Independent Board 78% Board Investment Yes Opt out of MUTA Yes Proxy Access Yes Anti-Takeover State Anti-Takeover Provisions Yes 1 Ownership Limits Yes 2 Shareholder Rights Plan No 3 Insider Block Power No 1) Board may opt back into statutes via resolution. IVT intends to propose at its next annual meeting that a shareholder vote would be required for IVT to opt back into statutes. 2) In order to meet REIT qualifications, ownership restrictions apply. 3) IVT currently does not have a rights plan, but could adopt one provided such plan is ratified by stockholders within 12 months of plan adoption.
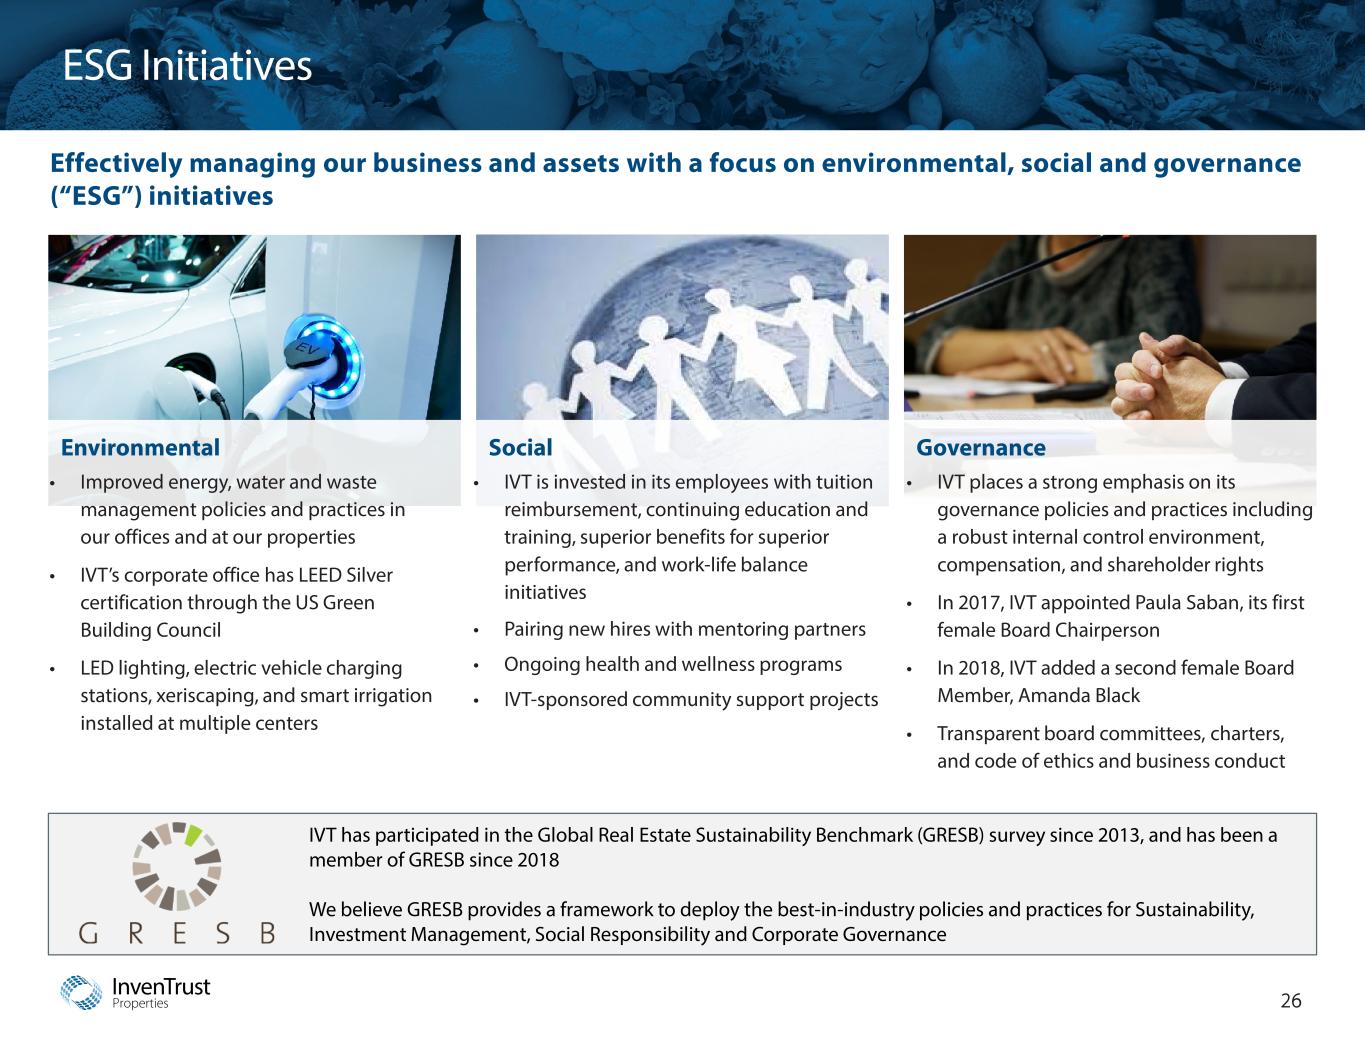
InvenTrust Properties IVT has participated in the Global Real Estate Sustainability Benchmark (GRESB) survey since 2013, and has been a member of GRESB since 2018 We believe GRESB provides a framework to deploy the best-in-industry policies and practices for Sustainability, Investment Management, Social Responsibility and Corporate Governance ESG Initiatives 26 Effectively managing our business and assets with a focus on environmental, social and governance (“ESG”) initiatives GovernanceEnvironmental • Improved energy, water and waste management policies and practices in our offices and at our properties • IVT’s corporate office has LEED Silver certification through the US Green Building Council • LED lighting, electric vehicle charging stations, xeriscaping, and smart irrigation installed at multiple centers Social • IVT is invested in its employees with tuition reimbursement, continuing education and training, superior benefits for superior performance, and work-life balance initiatives • Pairing new hires with mentoring partners • Ongoing health and wellness programs • IVT-sponsored community support projects • IVT places a strong emphasis on its governance policies and practices including a robust internal control environment, compensation, and shareholder rights • In 2017, IVT appointed Paula Saban, its first female Board Chairperson • In 2018, IVT added a second female Board Member, Amanda Black • Transparent board committees, charters, and code of ethics and business conduct

InvenTrust Properties 27

Appendix Plaza Midtown MSA: Atlanta, GA

InvenTrust Properties Non-GAAP Measures and Definition of Terms 29 General In addition to GAAP measures, this investor presentation contains and refers to certain non-GAAP measures. We do not consider our non-GAAP measures to be alternatives to measures required in accordance with GAAP. Certain non-GAAP measures should not be viewed as an alternative measure of our financial performance as they may not reflect the operations of our entire portfolio, and they may not reflect the impact of general and administrative expenses, depreciation and amortization, interest expense, other income (expense), or the level of capital expenditures and leasing costs necessary to maintain the operating performance of our properties that could materially impact our results from operations. Additionally, certain non-GAAP measures should not be considered as an indication of our liquidity, nor as an indication of funds available to cover our cash needs, including our ability to fund distributions, and may not be a useful measure of the impact of long-term operating performance on value if we do not continue to operate our business in the manner currently contemplated. Accordingly, non-GAAP measures should be reviewed in connection with other GAAP measurements and should not be viewed as more prominent measures of performance than net income (loss) or cash flows from operations prepared in accordance with GAAP. Other REITs may use different methodologies for calculating similar non-GAAP measures, and accordingly, our non-GAAP measures may not be comparable to other REITs. NOI NOI excludes general and administrative expenses, depreciation and amortization, provision for asset impairment, other income and expense, net, gains (losses) from sales of properties, gains (losses) on extinguishment of debt, interest expense, net, equity in (losses) earnings and (impairment), net, from unconsolidated entities, lease termination income and expense, and GAAP rent adjustments (such as straight-line rent, above/below market lease amortization and amortization of lease incentives). EBITDA Our non-GAAP measure of Earnings Before Interest, Taxes, Depreciation, and Amortization (EBITDA) is net income (or loss) in accordance with GAAP, plus federal and state tax expense, interest expense, and depreciation and amortization. Adjustments for our joint ventures are calculated to reflect our proportionate share of the joint venture's EBITDA on the same basis. Adjusted EBITDA Our non-GAAP measure of Adjusted EBITDA excludes gains (or losses) resulting from debt extinguishments, transaction expenses, straight-line rent adjustments, amortization of above and below market leases and lease inducements, and other unique revenue and expense items which are not pertinent to measuring our on-going operating performance. Adjustments for our joint ventures are calculated to reflect our proportionate share of the joint venture's Adjusted EBITDA on the same basis. Funds From Operations (FFO) and Core FFO Our non-GAAP measure of Funds from Operations ("FFO"), based on the National Association of Real Estate Investment Trusts ("NAREIT") definition, is net income (or loss) in accordance with GAAP, excluding gains (or losses) resulting from dispositions of properties, plus depreciation and amortization and impairment charges on depreciable real property. Adjustments for our joint ventures are calculated to reflect our proportionate share of the joint venture's FFO on the same basis. Core Funds From Operations is an additional supplemental non-GAAP financial measure of our operating performance. In particular, Core FFO provides an additional measure to compare the operating performance of different REITs without having to account for certain remaining amortization assumptions within FFO and other unique revenue and expense items which are not pertinent to measuring a particular company’s on-going operating performance. Pro Rata Where appropriate, the Company has included the results from its ownership share of its joint venture properties when combined with the Company's wholly-owned properties, defined as "Pro Rata," with the exception of property count. Same Property Information provided on a same property basis includes the results of properties that were owned and operated for the entirety of both periods presented.
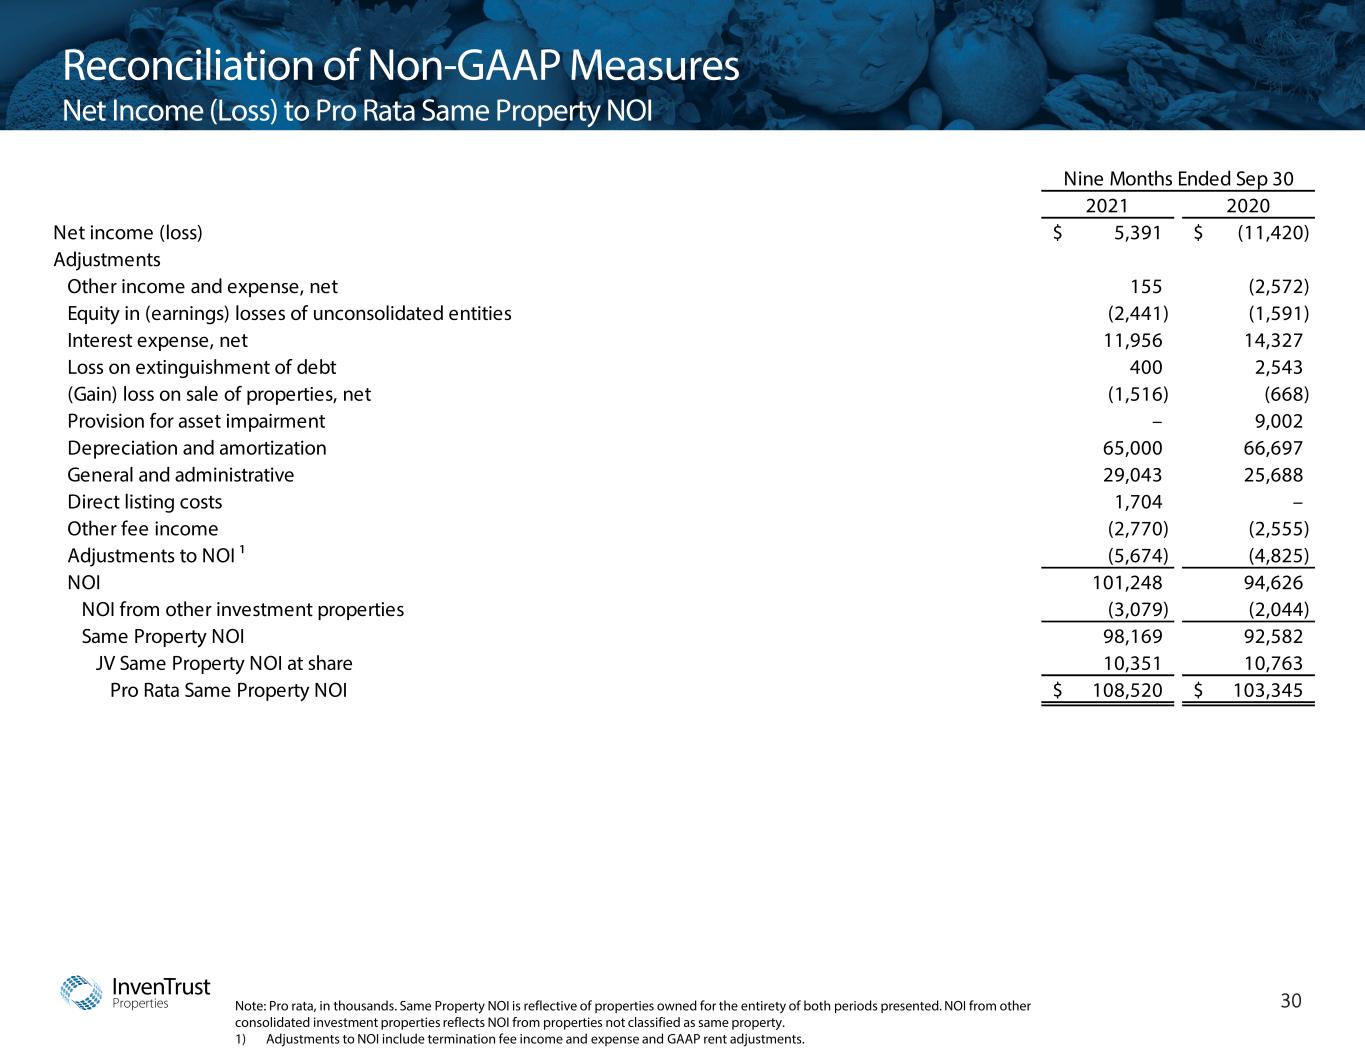
InvenTrust Properties 30 Reconciliation of Non-GAAP Measures Net Income (Loss) to Pro Rata Same Property NOI Note: Pro rata, in thousands. Same Property NOI is reflective of properties owned for the entirety of both periods presented. NOI from other consolidated investment properties reflects NOI from properties not classified as same property. 1) Adjustments to NOI include termination fee income and expense and GAAP rent adjustments. Nine Months Ended Sep 30 2021 2020 Net income (loss) 5,391$ (11,420)$ Adjustments Other income and expense, net 155 (2,572) Equity in (earnings) losses of unconsolidated entities (2,441) (1,591) Interest expense, net 11,956 14,327 Loss on extinguishment of debt 400 2,543 (Gain) loss on sale of properties, net (1,516) (668) Provision for asset impairment – 9,002 Depreciation and amortization 65,000 66,697 General and administrative 29,043 25,688 Direct listing costs 1,704 – Other fee income (2,770) (2,555) Adjustments to NOI ¹ (5,674) (4,825) NOI 101,248 94,626 NOI from other investment properties (3,079) (2,044) Same Property NOI 98,169 92,582 JV Same Property NOI at share 10,351 10,763 Pro Rata Same Property NOI 108,520$ 103,345$

InvenTrust Properties 31 Reconciliation of Non-GAAP Measures Net Income (Loss) to Pro Rata Same Property NOI (Cont’d) Year Ended December 31 2020 2019 Net income (loss) (10,174)$ 38,399$ Adjustments Net Loss from discontinued operations – 25,500 Other income and expense, net (3,326) (1,384) Equity in (earnings) losses of unconsolidated entities 3,141 (957) Interest expense, net 18,749 22,717 Loss on extinguishment of debt 2,543 2,901 (Gain) loss on sale of properties, net (1,752) (62,011) Provision for asset impairment 9,002 2,359 Depreciation and amortization 87,755 97,429 General and administrative 33,141 35,361 Other fee income (3,647) (3,856) Adjustments to NOI ¹ (7,249) (10,830) NOI from other consolidated investment properties (16,628) (27,844) Consolidated Same Property NOI 111,555$ 117,784$ Adjustments for Pro Rata Same Property NOI JV Same Property NOI at share 17,102 18,637 Pro Rata Same Property NOI 128,657$ 136,421$ Note: Pro rata, in thousands. Same Property NOI is reflective of properties owned for the entirety of both periods presented. NOI from other consolidated investment properties reflects NOI from properties not classified as same property. 1) Adjustments to NOI include termination fee income and expense and GAAP rent adjustments.
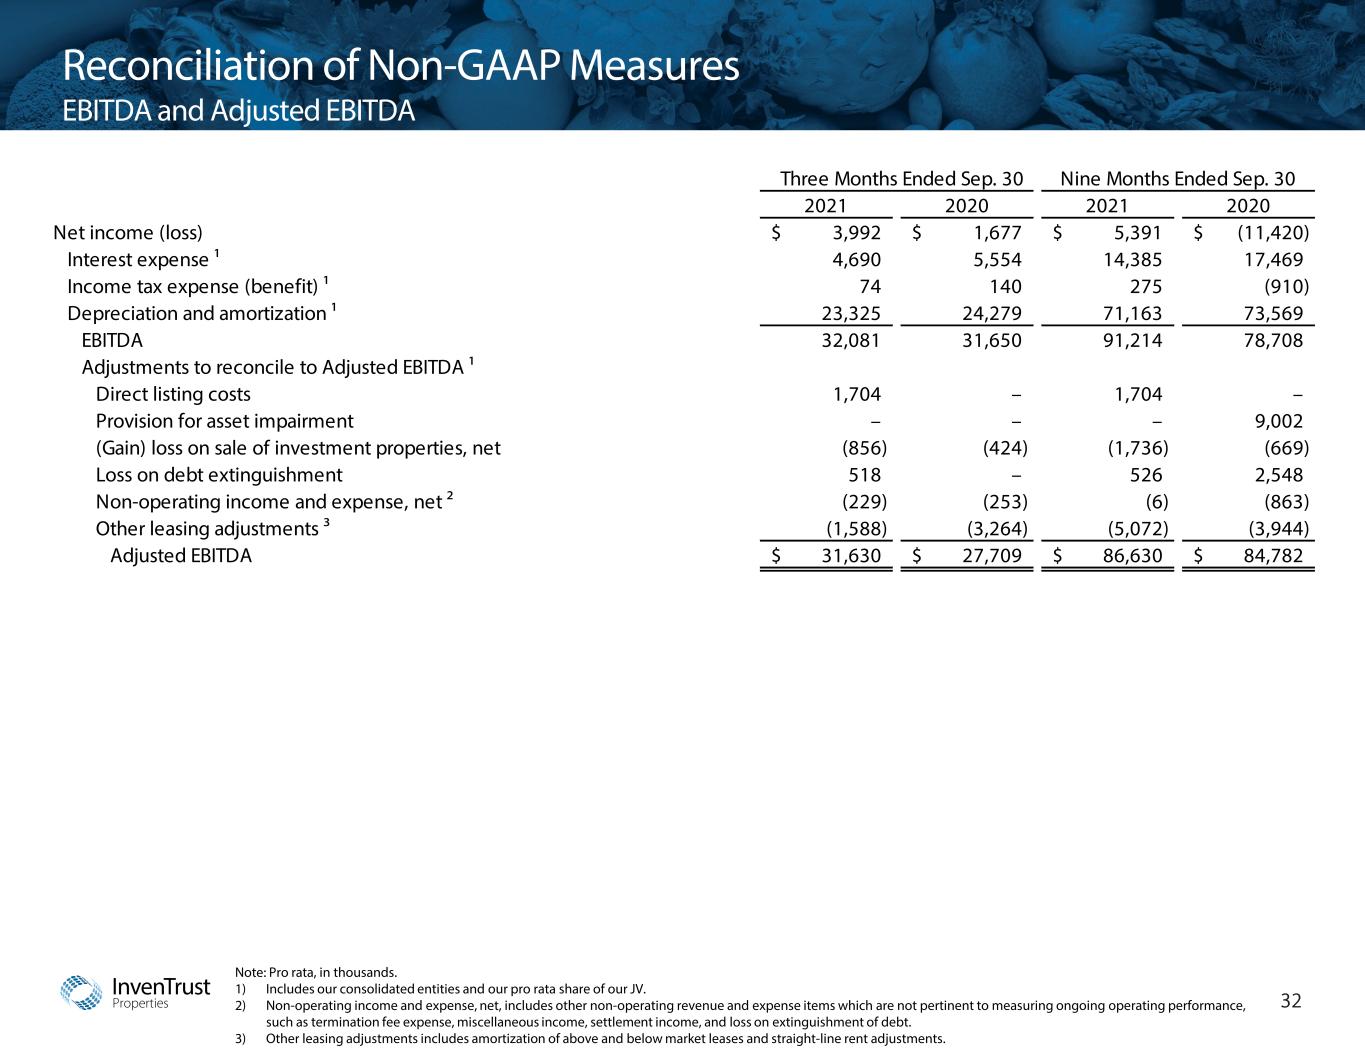
InvenTrust Properties 32 Note: Pro rata, in thousands. 1) Includes our consolidated entities and our pro rata share of our JV. 2) Non-operating income and expense, net, includes other non-operating revenue and expense items which are not pertinent to measuring ongoing operating performance, such as termination fee expense, miscellaneous income, settlement income, and loss on extinguishment of debt. 3) Other leasing adjustments includes amortization of above and below market leases and straight-line rent adjustments. Reconciliation of Non-GAAP Measures EBITDA and Adjusted EBITDA Three Months Ended Sep. 30 Nine Months Ended Sep. 30 2021 2020 2021 2020 Net income (loss) 3,992$ 1,677$ 5,391$ (11,420)$ Interest expense ¹ 4,690 5,554 14,385 17,469 Income tax expense (benefit) ¹ 74 140 275 (910) Depreciation and amortization ¹ 23,325 24,279 71,163 73,569 EBITDA 32,081 31,650 91,214 78,708 Adjustments to reconcile to Adjusted EBITDA ¹ Direct listing costs 1,704 – 1,704 – Provision for asset impairment – – – 9,002 (Gain) loss on sale of investment properties, net (856) (424) (1,736) (669) Loss on debt extinguishment 518 – 526 2,548 Non-operating income and expense, net ² (229) (253) (6) (863) Other leasing adjustments ³ (1,588) (3,264) (5,072) (3,944) Adjusted EBITDA 31,630$ 27,709$ 86,630$ 84,782$

InvenTrust Properties 33 Note: Pro rata, in thousands. 1) Includes our consolidated entities and our pro rata share of our JV. 2) Non-operating income and expense, net, includes other non-operating revenue and expense items which are not pertinent to measuring ongoing operating performance, such as termination fee expense, miscellaneous income, settlement income, and loss on extinguishment of debt. 3) Other leasing adjustments includes amortization of above and below market leases and straight-line rent adjustments. Reconciliation of Non-GAAP Measures EBITDA and Adjusted EBITDA (Cont’d) Year Ended Dec. 31, 2020 Net income (loss) (10,174)$ Interest expense ¹ 22,849 Income tax expense (benefit) ¹ (739) Depreciation and amortization ¹ 96,722 EBITDA 108,658 Adjustments to reconcile to Adjusted EBITDA ¹ Provision for asset impairment 15,060 (Gain) loss on sale of investment properties, net (2,709) Non-operating income and expense, net ² 939 Other leasing adjustments ³ (5,758) Adjusted EBITDA 116,190$
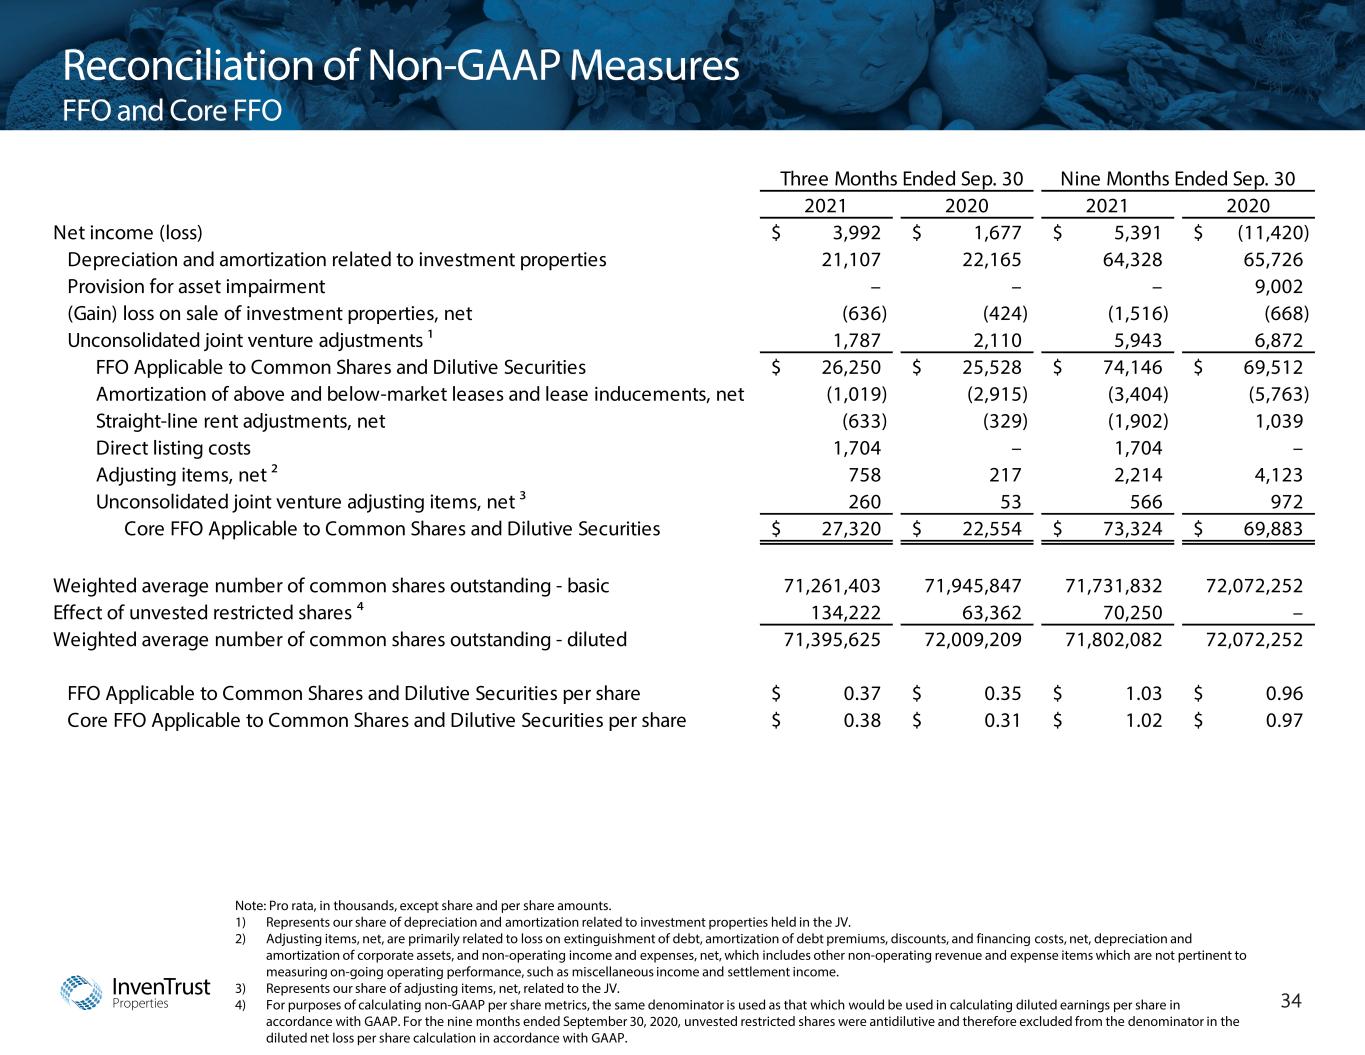
InvenTrust Properties 34 Note: Pro rata, in thousands, except share and per share amounts. 1) Represents our share of depreciation and amortization related to investment properties held in the JV. 2) Adjusting items, net, are primarily related to loss on extinguishment of debt, amortization of debt premiums, discounts, and financing costs, net, depreciation and amortization of corporate assets, and non-operating income and expenses, net, which includes other non-operating revenue and expense items which are not pertinent to measuring on-going operating performance, such as miscellaneous income and settlement income. 3) Represents our share of adjusting items, net, related to the JV. 4) For purposes of calculating non-GAAP per share metrics, the same denominator is used as that which would be used in calculating diluted earnings per share in accordance with GAAP. For the nine months ended September 30, 2020, unvested restricted shares were antidilutive and therefore excluded from the denominator in the diluted net loss per share calculation in accordance with GAAP. Reconciliation of Non-GAAP Measures FFO and Core FFO Three Months Ended Sep. 30 Nine Months Ended Sep. 30 2021 2020 2021 2020 Net income (loss) 3,992$ 1,677$ 5,391$ (11,420)$ Depreciation and amortization related to investment properties 21,107 22,165 64,328 65,726 Provision for asset impairment – – – 9,002 (Gain) loss on sale of investment properties, net (636) (424) (1,516) (668) Unconsolidated joint venture adjustments ¹ 1,787 2,110 5,943 6,872 FFO Applicable to Common Shares and Dilutive Securities 26,250$ 25,528$ 74,146$ 69,512$ Amortization of above and below-market leases and lease inducements, net (1,019) (2,915) (3,404) (5,763) Straight-line rent adjustments, net (633) (329) (1,902) 1,039 Direct listing costs 1,704 – 1,704 – Adjusting items, net ² 758 217 2,214 4,123 Unconsolidated joint venture adjusting items, net ³ 260 53 566 972 Core FFO Applicable to Common Shares and Dilutive Securities 27,320$ 22,554$ 73,324$ 69,883$ Weighted average number of common shares outstanding - basic 71,261,403 71,945,847 71,731,832 72,072,252 Effect of unvested restricted shares ⁴ 134,222 63,362 70,250 – Weighted average number of common shares outstanding - diluted 71,395,625 72,009,209 71,802,082 72,072,252 FFO Applicable to Common Shares and Dilutive Securities per share 0.37$ 0.35$ 1.03$ 0.96$ Core FFO Applicable to Common Shares and Dilutive Securities per share 0.38$ 0.31$ 1.02$ 0.97$

Corporate Office 3025 Highland Parkway Suite 350 Downers Grove, IL 60515 Investor Relations 630-570-0605 Investorrelations@inventrustproperties.com Transfer Agent Computershare 855.377.0510


