
INVESTOR PRESENTATION THIRD QUARTER 2024

Q3 2024 Investor Presentation 2 INTRODUCTORY NOTES Forward-Looking Statements Disclaimer Forward-Looking Statements in this presentation, which are not historical facts, are forward-looking statements within the meaning of the Private Securities Litigation Reform Act of 1995. These statements are based on the current beliefs and expectations of InvenTrust’s management and are subject to significant risks and uncertainties. Actual results may differ materially from those described in the forward-looking statements. Any statements made in this pre that are not statements of historical fact, including statements about our beliefs and expectations, are forward-looking statements. Forward-looking statements include information concerning possible or assumed future results of operations, including our guidance and descriptions of our business plans and strategies. These statements often include words such as “may,” “should,” “could,” “would,” “expect,” “intend,” “plan,” “seek,” “anticipate,” “believe,” “estimate,” “target,” “project,” “predict,” “potential,” “continue,” “likely,” “will,” “forecast,” “outlook,” “guidance,” “suggest,” and variations of these terms and similar expressions, or the negative of these terms or similar expressions. The following factors, among others, could cause actual results, financial position and timing of certain events to differ materially from those described in the forward-looking statements: interest rate movements; local, regional, national and global economic performance; the impact of inflation on the Company and on its tenants; competitive factors; the impact of e-commerce on the retail industry; future retailer store closings; retailer consolidation; retailers reducing store size; retailer bankruptcies; government policy changes; and any material market changes and trends that could affect the Company’s business strategy. For further discussion of factors that could materially affect the outcome of management’s forward-looking statements and IVT’s future results and financial condition, see the Risk Factors included in the Company’s most recent Annual Report on Form 10-K, as updated by any subsequent Quarterly Report on Form 10-Q, in each case as filed with the SEC. InvenTrust intends that such forward-looking statements be subject to the safe harbors created by Section 27A of the Securities Act of 1933, as amended, and Section 21E of the Securities Exchange Act of 1934, as amended, except as may be required by applicable law. IVT cautions you not to place undue reliance on any forward-looking statements, which are made as of the date of this press release. IVT undertakes no obligation to update publicly any of these forward-looking statements to reflect actual results, new information or future events, changes in assumptions or changes in other factors affecting forward-looking statements, except to the extent required by applicable laws. If IVT updates one or more forward-looking statements, no inference should be drawn that IVT will make additional updates with respect to those or other forward-looking statements. Trademarks The companies depicted in the photographs herein, or any third-party trademarks, including names, logos and brands, referenced by the Company in this presentation, are the property of their respective owners. All references to third-party trademarks are for identification purposes only and nothing herein shall be considered to be an endorsement, authorization or approval of InvenTrust Properties Corp. by the companies. Further, none of these companies are affiliated with the Company in any manner.
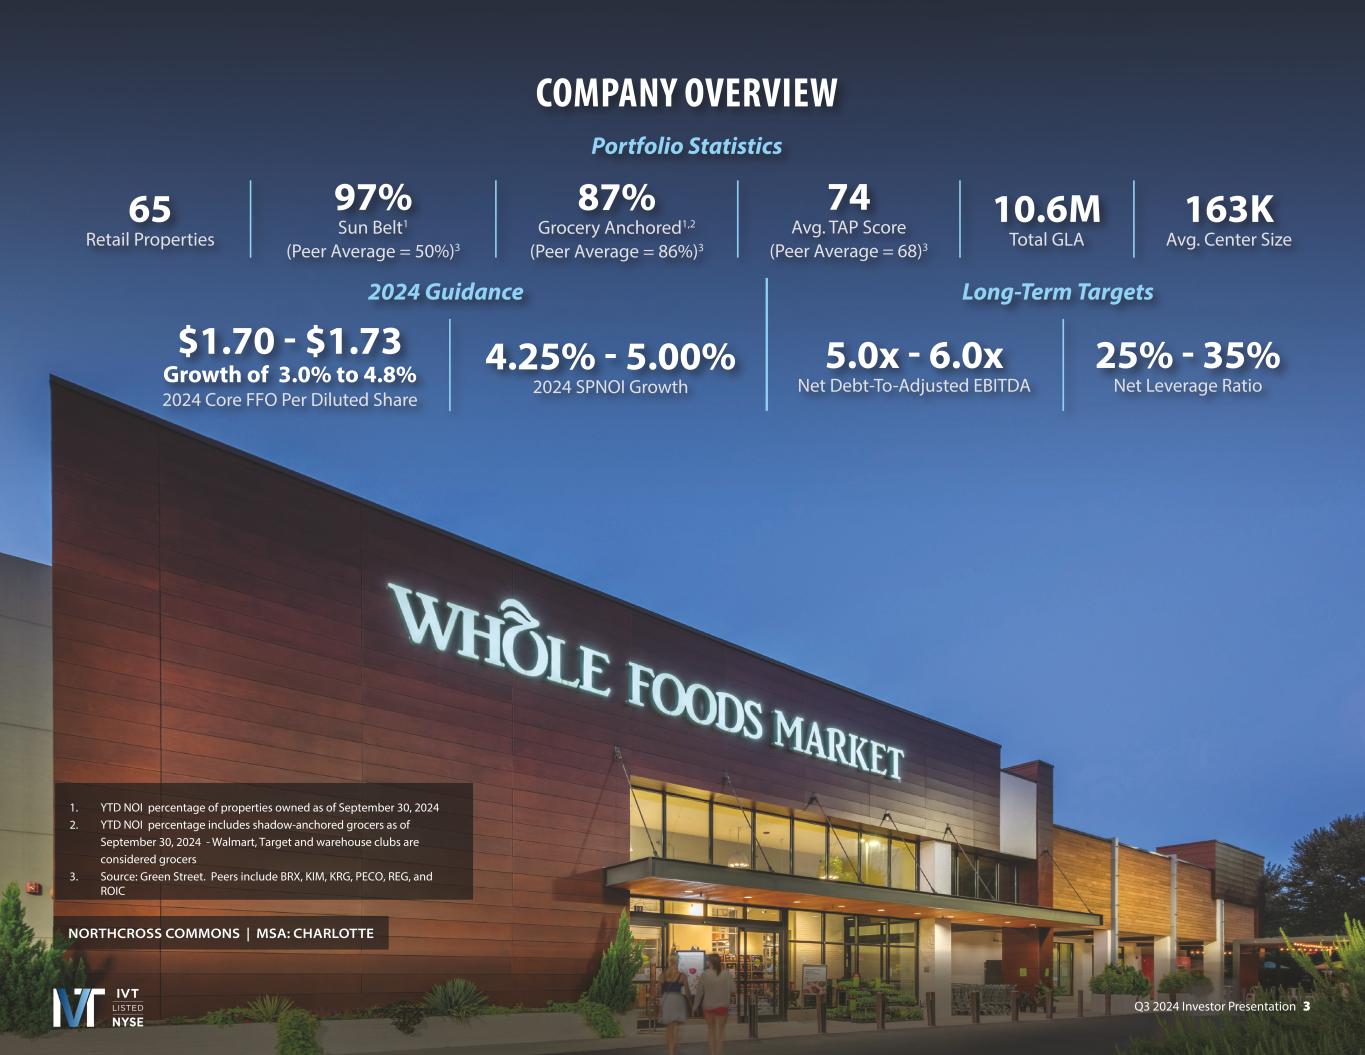
Q3 2024 Investor Presentation 3 NORTHCROSS COMMONS | MSA: CHARLOTTE COMPANY OVERVIEW 2024 Guidance $1.70 - $1.73 Growth of 3.0% to 4.8% 2024 Core FFO Per Diluted Share 4.25% - 5.00% 2024 SPNOI Growth Long-Term Targets 5.0x - 6.0x Net Debt-To-Adjusted EBITDA 25% - 35% Net Leverage Ratio Portfolio Statistics 87% Grocery Anchored1,2 (Peer Average = 86%)3 74 Avg. TAP Score (Peer Average = 68)3 65 Retail Properties 97% Sun Belt1 (Peer Average = 50%)3 10.6M Total GLA 163K Avg. Center Size YTD NOI percentage owned as of September 30, 2024 YTD NOI percentage includes shadow-anchored grocers as of September 30, 2024 - Walmart, Target and warehouse clubs are considered grocers Source: Green Street. Peers include BRX, KIM, KRG, PECO, REG, and ROIC
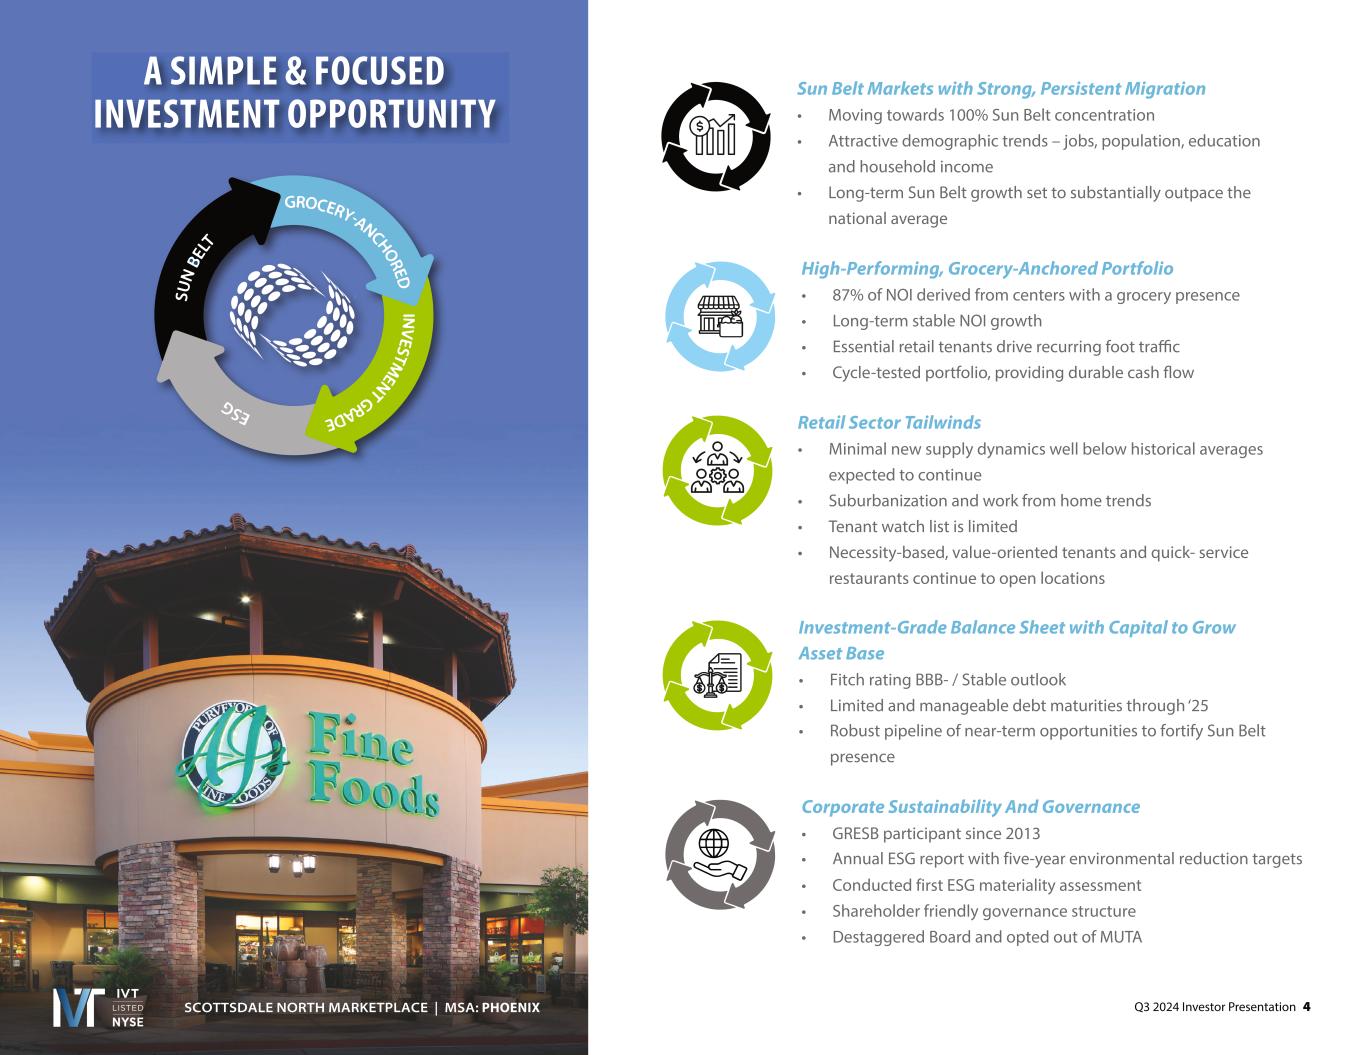
Q3 2024 Investor Presentation 4 Retail Sector Tailwinds • Minimal new supply dynamics well below historical averages expected to continue • Suburbanization and work from home trends • Tenant watch list is limited • Necessity-based, value-oriented tenants and quick- service restaurants continue to open locations SCOTTSDALE NORTH MARKETPLACE | MSA: A SIMPLE & FOCUSED INVESTMENT OPPORTUNITY High-Performing, Grocery-Anchored Portfolio • 87% of NOI derived from centers with a grocery presence • Long-term stable NOI growth • Essential retail tenants drive recurring foot traffic • Cycle-tested portfolio, providing durable cash flow Investment-Grade Balance Sheet with Capital to Grow Asset Base • Fitch rating BBB- / Stable outlook • Limited and manageable debt maturities through ‘2 • Robust pipeline of near-term opportunities to fortify Sun Belt presence Corporate Sustainability And Governance • GRESB participant since 2013 • Annual ESG report with five-year environmental reduction targets • Conducted first ESG materiality assessment • Shareholder friendly governance structure • Destaggered Board and opted out of MUTA Sun Belt Markets with Strong, Persistent Migration • Moving towards 100% Sun Belt concentration • Attractive demographic trends – jobs, population, education and household income • Long-term Sun Belt growth set to substantially outpace the national average
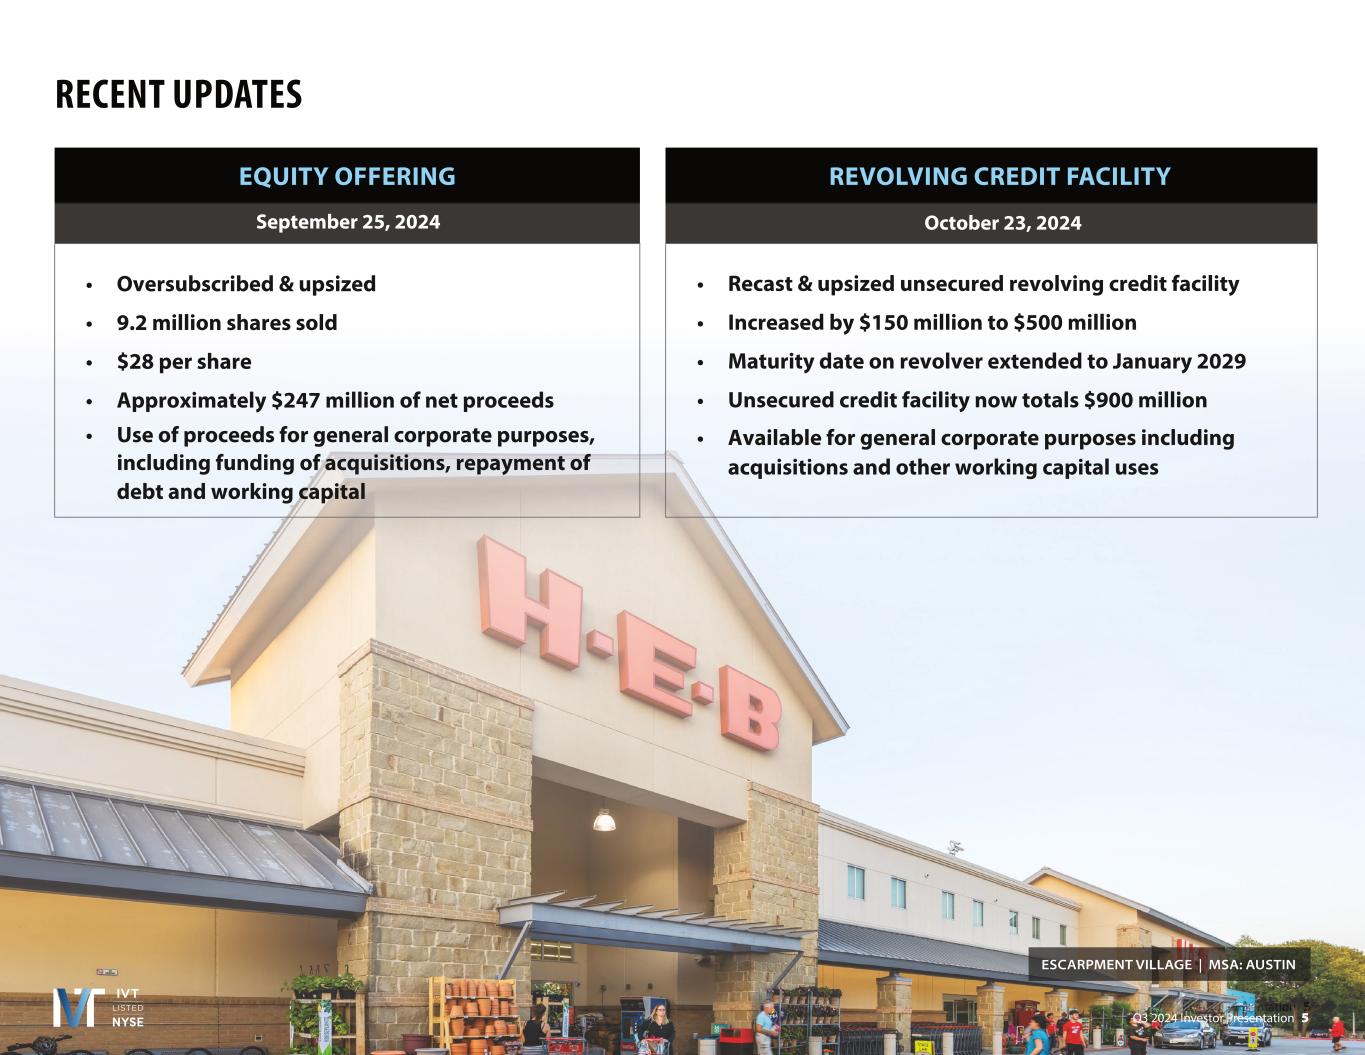
Q3 2024 Investor Presentation 5 RECENT UPDATES Q3 2024 Investor Presentation 5 ESCARPMENT VILLAGE | MSA: AUSTIN EQUITY OFFERING • • • • • REVOLVING CREDIT FACILITY • • • • •
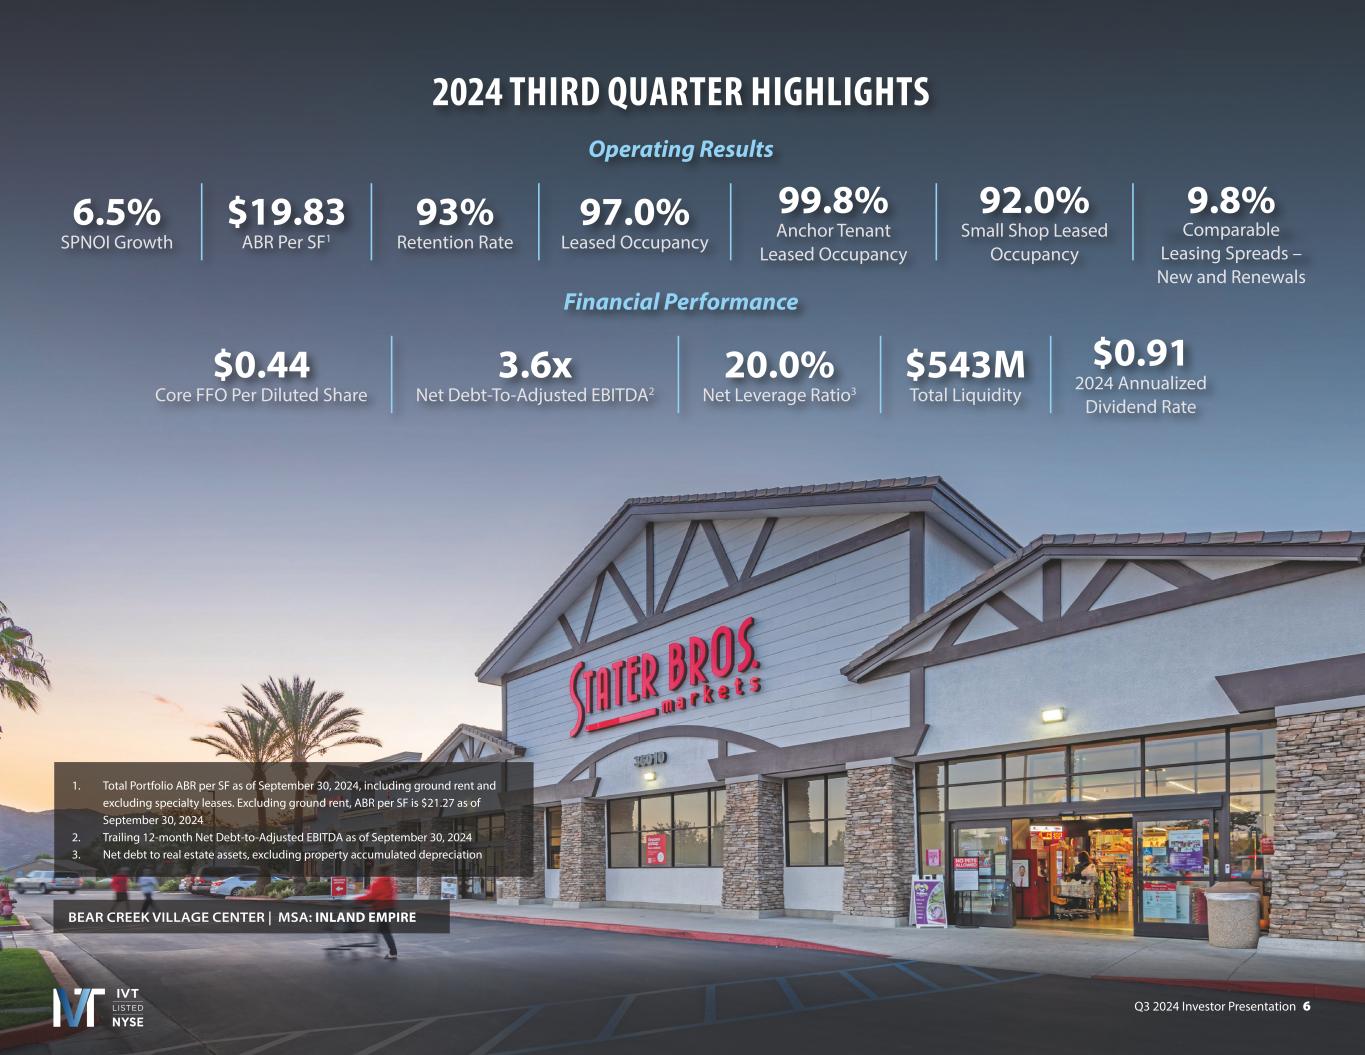
Q3 2024 Investor Presentation 6 BEAR CREEK VILLAGE CENTER | MSA: 2024 THIRD QUARTER HIGHLIGHTS Operating Results 93% Retention Rate 97.0% Leased Occupancy 6.5% SPNOI Growth $19.83 ABR Per SF1 99.8% Anchor Tenant Leased Occupancy 92.0% Small Shop Leased Occupancy 9.8% Leasing Spreads – New and Renewals Financial Performance $0.44 Core FFO Per Diluted Share 3.6x Net Debt-To-Adjusted EBITDA2 20.0% Net Leverage Ratio3 $543M Total Liquidity $0.91 2024 Annualized Dividend Rate 1. Total Portfolio ABR per SF as of September 30, 2024, including ground rent and excluding specialty leases. Excluding ground rent, ABR per SF is $21.27 as of September 30, 2024 2. Trailing 12-month Net Debt-to-Adjusted EBITDA as of September 30, 2024 3. Net debt to real estate assets, excluding property accumulated depreciation
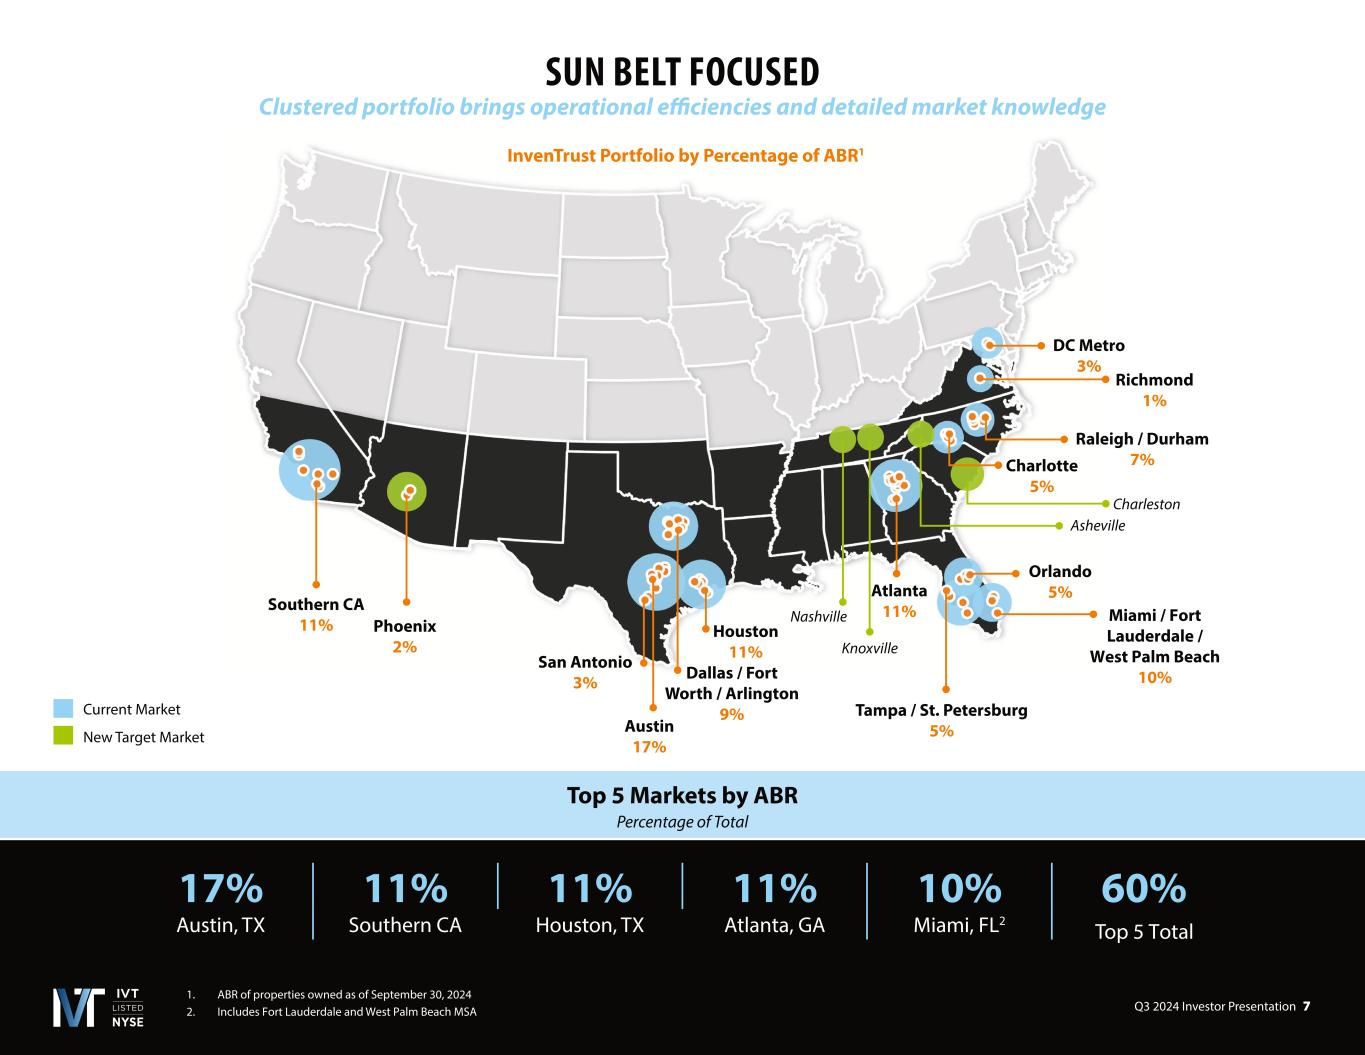
Q3 2024 Investor Presentation 7 Southern CA 11% Phoenix 2% San Antonio 3% Austin 17% Dallas / Fort Worth / Arlington 9% Houston 11% Tampa / St. Petersburg 5% Lauderdale / West Palm Beach 10% Orlando 5% Charlotte 5% Raleigh / Durham 7% Richmond 1% DC Metro 3% Charleston Asheville Atlanta 11% Knoxville Nashville SUN BELT FOCUSED Clustered portfolio brings operational efficiencies and detailed market knowledge ABR of properties owned as of September 30, 2024 Includes Fort Lauderdale and West Palm Beach MSA Top 5 Markets by ABR Percentage of Total InvenTrust Portfolio by Percentage of ABR1 17% 11% 11% 11% 10% 60% Austin, TX Southern CA Houston, TX Atlanta, GA Miami, FL2 Top 5 Current Market New Target Market
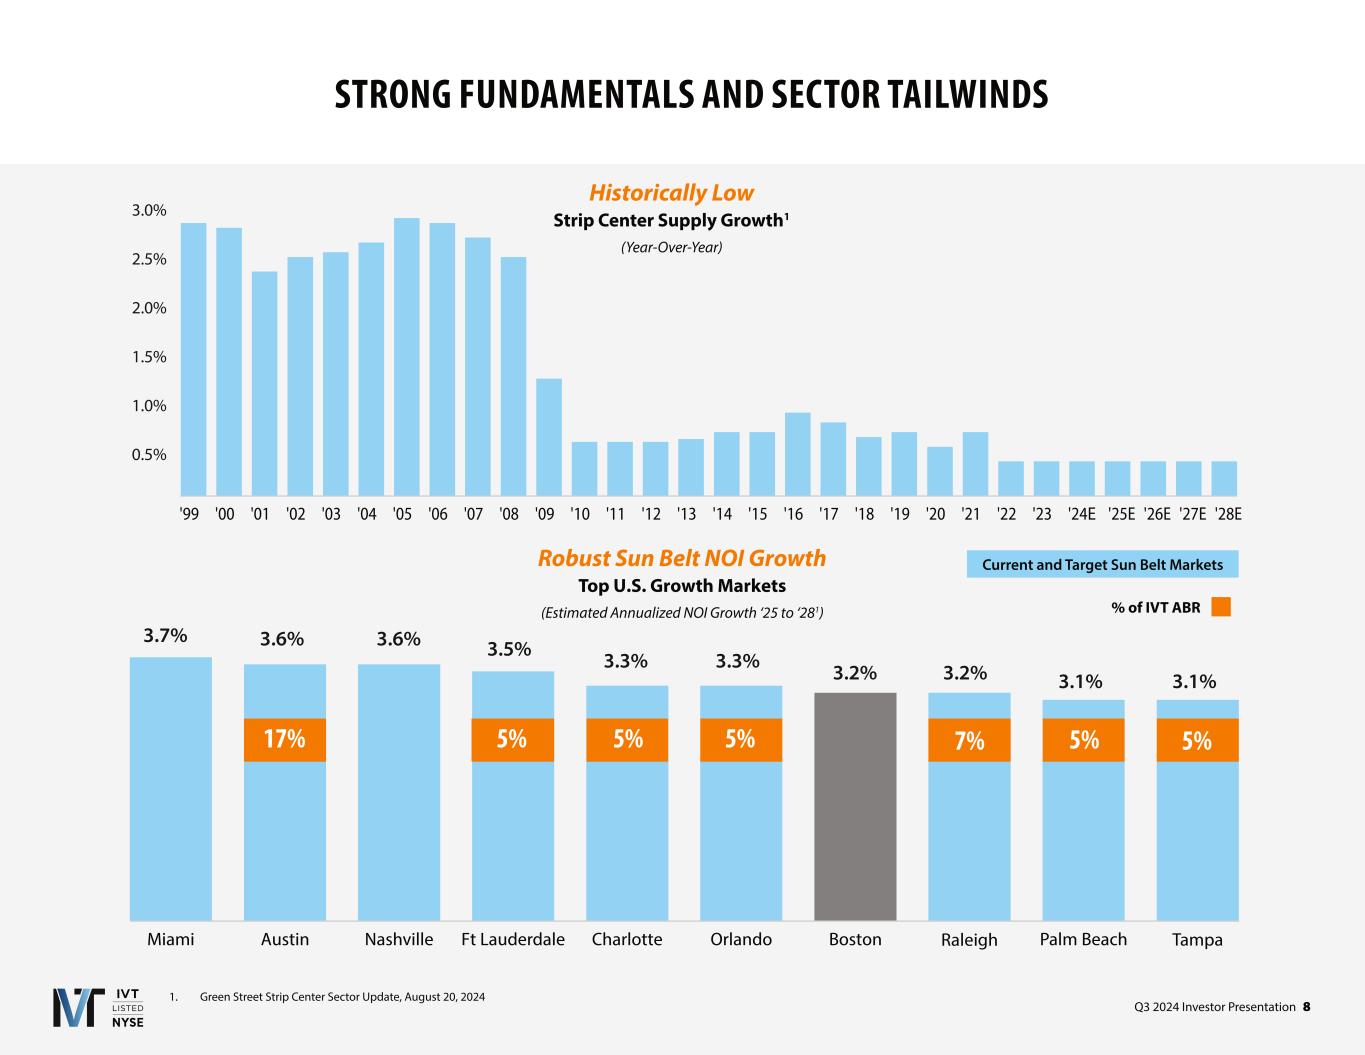
Q3 2024 Investor Presentation 8 TampaPalm BeachRaleighBostonOrlandoCharlotteFt LauderdaleNashvilleAustinMiami STRONG FUNDAMENTALS AND SECTOR TAILWINDS 1. Green Street Strip Center Sector Update, August 20, 2024 Historically Low Strip Center Supply Growth1 (Year-Over-Year) Robust Sun Belt NOI Growth Top U.S. Growth Markets (Estimated Annualized NOI Growth ‘2 to ‘281) 17% 5% 5% 5% 5%7% 5% Current and Target Sun Belt Markets % of IVT ABR 0.5% 1.0% 1.5% 2.0% 2.5% 3.0% 0.0% '99 '00 '01 '02 '03 '04 '05 '06 '07 '08 '09 '10 '11 '12 '13 '14 '15 '16 '17 '18 '19 '20 '21 '22 '23 '24 '25E '26E '27E '28E 0.5% 1.5% 2.5% 1.0% 2.0% 3.0% 3.7% 3.6% 3.6% 3.5% 3.3% 3.3% 3.2% 3.2% 3.1% 3.1%

Q3 2024 Investor Presentation 9 POWER CENTER W/ GROCER Trade Area 5-10 mi. • 4 properties • 1.4M GLA • 12% of NOI • $19.51 ABR1 POWER CENTER W/ GROCER Trade Area 5-10 mi. • 8 properties • 2.2M GLA • 18% of NOI • $17.62 ABR1 COMMUNITY CENTER Trade Area 3-5 mi. • 13 properties • 3.0M GLA • 30% of NOI • $20.08 ABR1 NEIGHBORHOOD CENTER Trade Area 1-3 mi. • 40 properties • 4.0M GLA • 40% of NOI • $20.88 ABR1 SHOPPES AT DAVIS LAKE | MSA: CHARLOTTE HIGH QUALITY ASSETS Established centers with necessity-based tenants drive performance in all economic conditions Note: As of September 30, 2024. 1. Includes ground rent and excludes specialty leases Note: As of September 30,2024. 1. Includes ground rent and excludes specialty leases Rio Pinar Plaza Orlando, FL Shops at Arbor Trails Austin, TX Sarasota Pavilion Tampa, FL
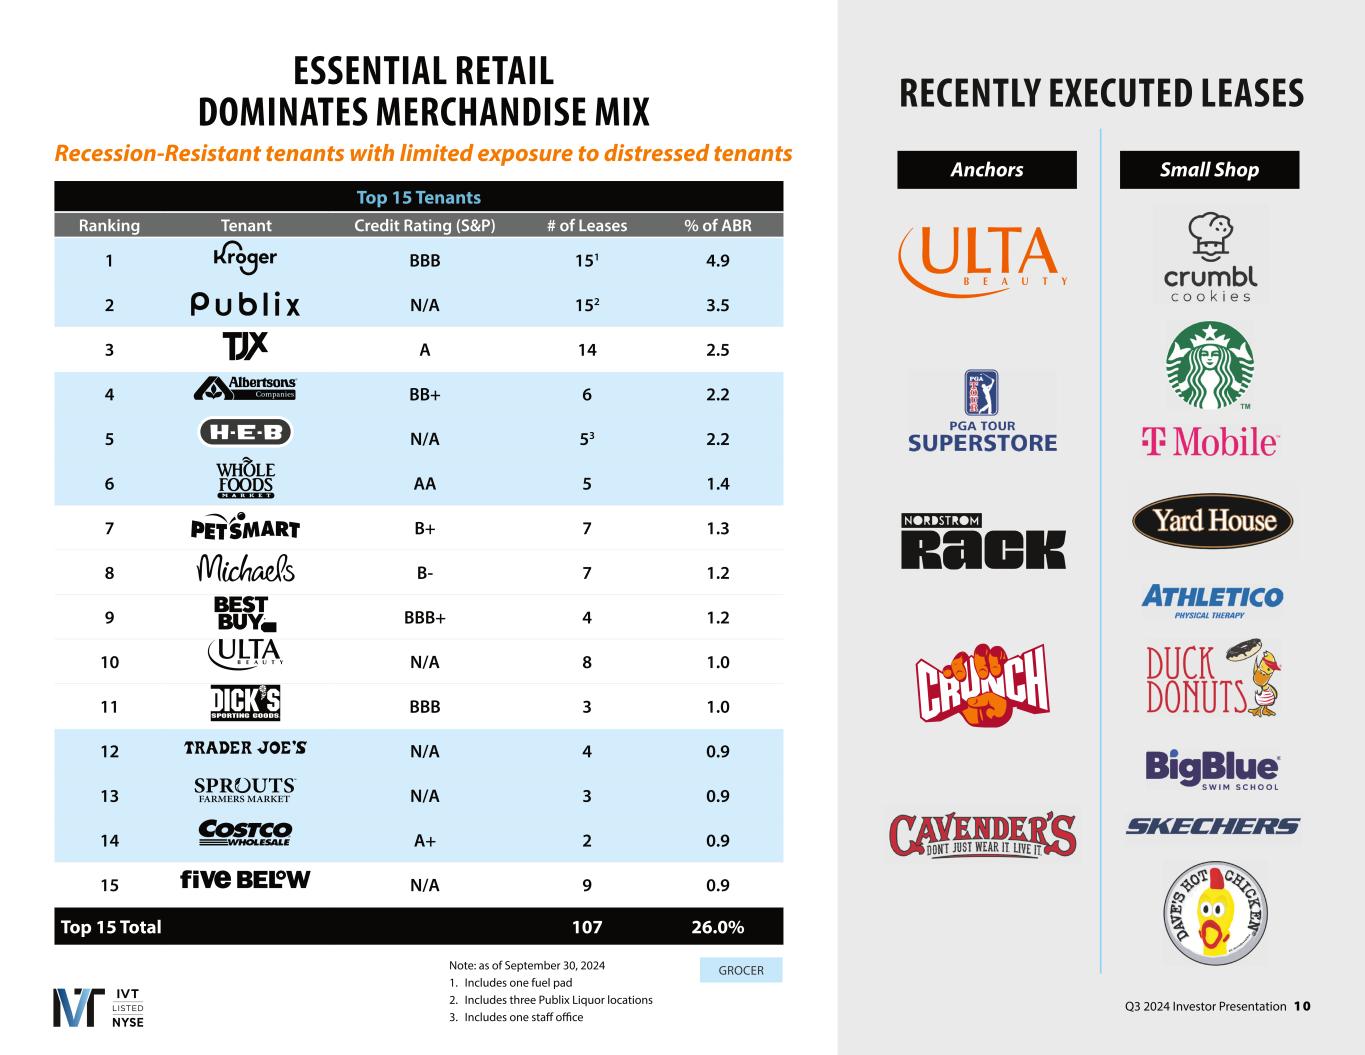
Q3 2024 Investor Presentation 1 0 Note: as of September 30, 2024 1. Includes one fuel pad 2. Includes three Publix Liquor locations 3. Includes one staff office Top 15 Tenants Ranking Tenant Credit Rating (S&P) # of Leases % of ABR 1 BBB 151 4.9 2 N/A 152 3.5 3 A 14 2.5 4 BB+ 6 2.2 5 N/A 53 2.2 6 AA 5 1.4 7 B+ 7 1.3 8 B- 7 1.2 9 BBB+ 4 1.2 10 N/A 8 1.0 11 BBB 3 1.0 12 N/A 4 0.9 13 N/A 3 0.9 14 A+ 2 0.9 15 N/A 9 0.9 Top 15 Total 107 26.0% GROCER ESSENTIAL RETAIL DOMINATES MERCHANDISE MIX Recession esistant tenants with limited exposure to distressed tenants RECENTLY EXECUTED LEASES Anchors Small Shop

Q3 2024 Investor Presentation 1 1 TENANT COMPOSITION Diverse and balanced tenant mix provides durable cash flows Other Retail / Services Restaurants Grocery / Essential Retail Anchor & Small Shop Composition % of ABR1 42% 58%Anchor Small Shop Total Portfolio Composition % of ABR1 17% 15% 68% Local Regional National Tenant Composition % of ABR Essential Retail Breakout 59% Grocery 18% Health & Beauty Services 11% Medical 9% Off Price 5% Banks 4% Pets 3% Office / Communications 3% Other Essential Retail / Services 3% Drug / Pharmacy 2% Hardware / Auto 1% RIVER OAKS | MSA: LOS ANGELES Note: As of September 30, 2024. 1. Includes ground rent and excludes specialty leases Tenant Composition % of ABR1 20% 21% 59%
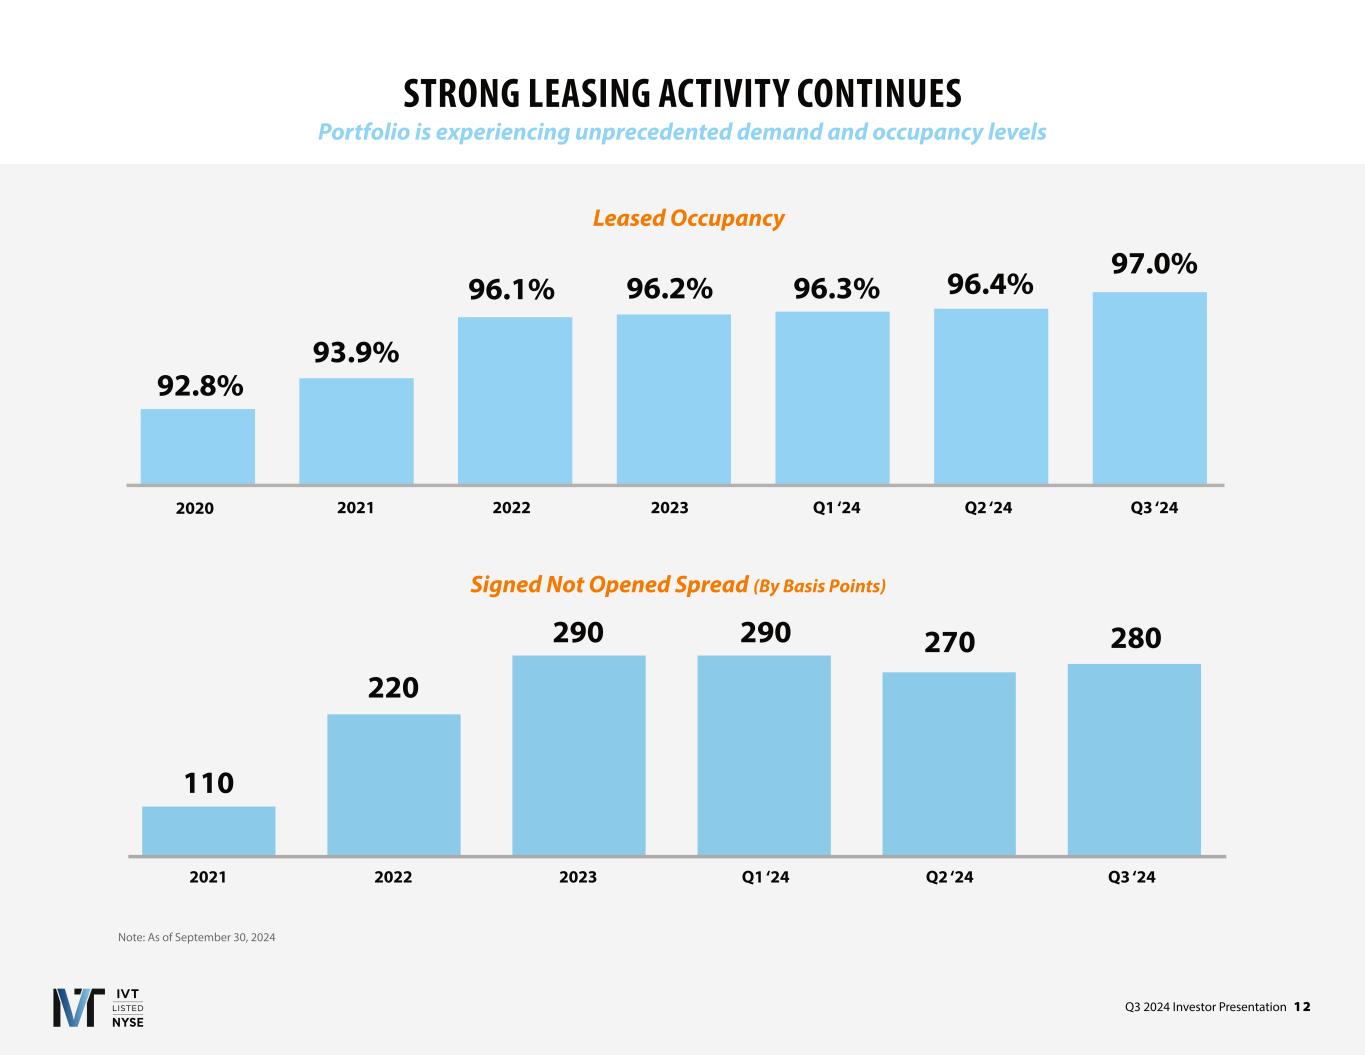
Q3 2024 Investor Presentation 1 2 STRONG LEASING ACTIVITY CONTINUES Portfolio is experiencing unprecedented demand and occupancy levels 92.8% 93.9% 96.1% 96.2% 96.3% 96.4% 2020 2021 2022 2023 Q1 ‘24 Leased Occupancy Signed Not Opened Spread By Basis Points 2021 2022 2023 Q1 ‘24 Q2 ‘24 110 220 290 290 270 Note: As of September 30, 2024 Q2 ‘24 Q3 ‘24 97.0% Q3 ‘24 280

Q3 2024 Investor Presentation 1 3 GROWING ASSET BASE THROUGH ACQUISITIONS Acquiring necessity-based retail assets in the Sun Belt AC T I V E LY P U R S U I N G : • • Predominantly grocer anchored • Markets include Charleston, West Florida and • Consists of a mix of open-air retail formats exclusively in current and target Sun Belt markets A C T I V E LY T R A C K I N G 1. make no assurance that will close on any of the transactions • Acquired Q 2024 • Year Built – 2016 • ABR PSF - $19.12 • Wegmans anchored • 100% leased occupancy • 3-mile Avg. HHI - $119,000 • 3-mile Population – 61,000 STONEHENGE VILLAGE MSA: Richmond, VA • Acquired Q3 2024 • Year Built – 2007 • ABR PSF - $21.97 • AJ’s Fine Foods anchored • 98% leased occupancy • 3-mile Avg. HHI - $228,000 • 3-mile Population – 24,000 SCOTTSDALE NORTH MARKETPLACE MSA: Phoenix, AZ I N V E S T M E N T H I G H L I G H T S : CLOSED: ~$ MILLION
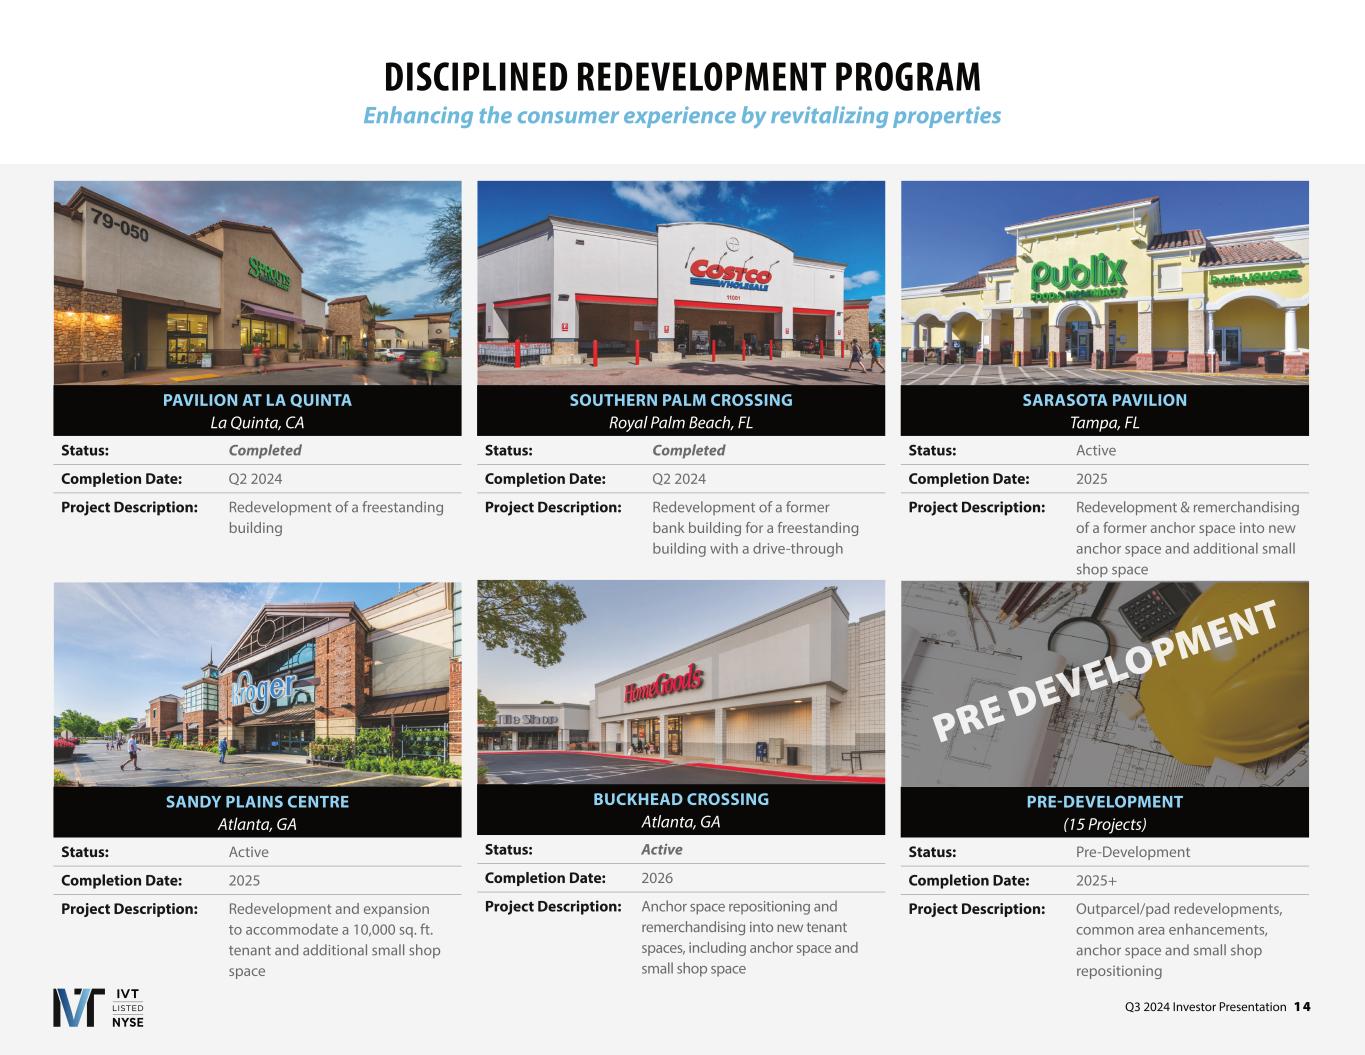
Q3 2024 Investor Presentation 1 4 SARASOTA PAVILION Tampa, FL Status: Active Completion Date: 2025 Project Description: Redevelopment & remerchandising of a former anchor space into new anchor space and additional small shop space DISCIPLINED REDEVELOPMENT PROGRAM Enhancing the consumer experience by revitalizing properties PAVILION AT LA QUINTA La Quinta, CA Status: Completed Completion Date: Q2 2024 Project Description: Redevelopment of a freestanding building SOUTHERN PALM CROSSING Royal Palm Beach, FL Status: Completed Completion Date: Q2 2024 Project Description: Redevelopment of a former bank building for a freestanding building with a drive-through BUCKHEAD CROSSING Atlanta, GA Status: Active Completion Date: 2026 Project Description: Anchor space repositioning and remerchandising into new tenant spaces, including anchor space and small shop space SANDY PLAINS CENTRE Atlanta, GA Status: Active Completion Date: 2025 Project Description: Redevelopment and expansion to accommodate a 10,000 sq. ft. tenant and additional small shop space PRE-DEVELOPMENT (15 Projects) Status: Pre-Development Completion Date: 2025+ Project Description: Outparcel/pad redevelopments, common area enhancements, anchor space and small shop repositioning PRE DEVELOPMENT
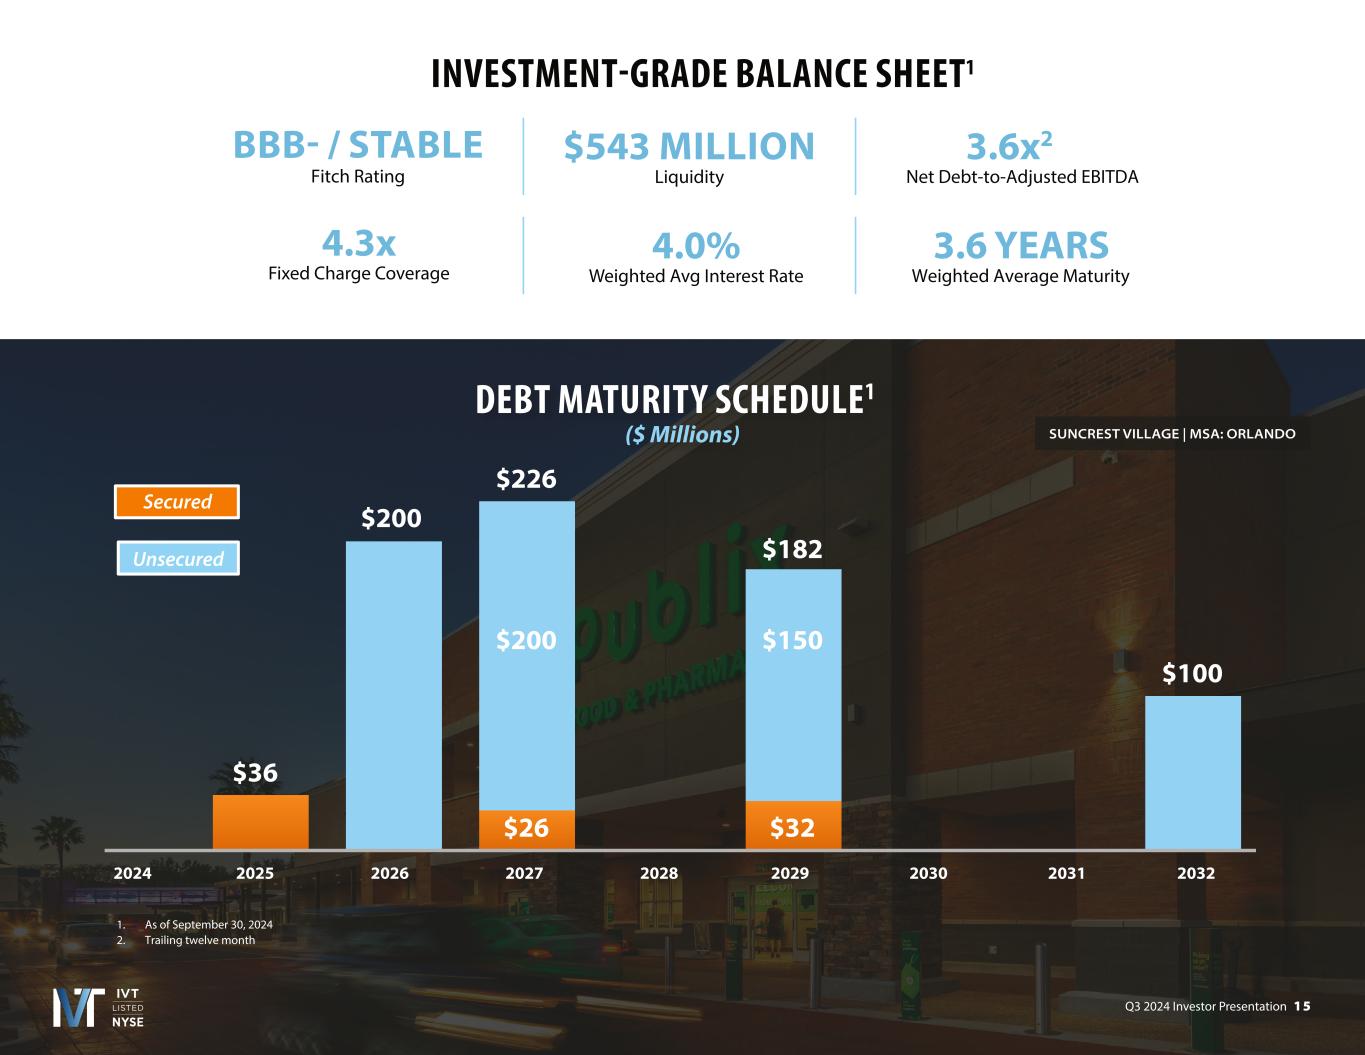
Q3 2024 Investor Presentation 1 5 SUNCREST VILLAGE | MSA: ORLANDO DEBT MATURITY SCHEDULE1 ($ Millions) As of September 30, 2024 Trailing twelve month 2024 2025 2026 2027 2028 2029 2030 2031 2032 Secured Unsecured INVESTMENT-GRADE BALANCE SHEET1 BBB- / STABLE Fitch $543 MILLION Liquidity 3.6x2 4.3x Fixed Charge Coverage 4.0% Weighted Avg Interest Rate Net Debt-to-Adjusted EBITDA 3.6 YEARS Weighted Average Maturity $36 $200 $226 $182 $200 $26 $150 $32 $100

Q3 2024 Investor Presentation 1 6 CONSERVATIVE BALANCE SHEET InvenTrust maintains a low leverage business model Net Debt-to-Adjusted EBITDA1 Net Leverage Ratio (Net Debt + Preferred As % of Gross Assets) 1 1. Forward metric provided by Green Street Strip Center Sector Update, , 2024. As of September 30, 2024, IVT’s TTM Net Debt-to-Adjusted EBITDA is 3.6x and Net Leverage is 20.0%. Peer Average: 5.6x 36% 39% 41% 32% 31% 29% 4.9x 4.8x 5.1x 5.1x 5.7x 5.9x 6.8x Peer Average: 36% 35%

Q3 2024 Investor Presentation 1 7 SUSTAINABLE DIVIDEND GROWTH Steady dividend increases with additional capacity to grow in the future 1. Aggregate distributions declared (as a % of Core FFO) for the nine months ended September 30, 2024 Historical and Projected Dividend Payments $0.78 $0.82 $0.86 $0.91 2021 2022 2023 Annualized Aggregate dividends declared as a percentage of Core FFO = 5 %1 PGA PLAZA | MSA: MIAMI
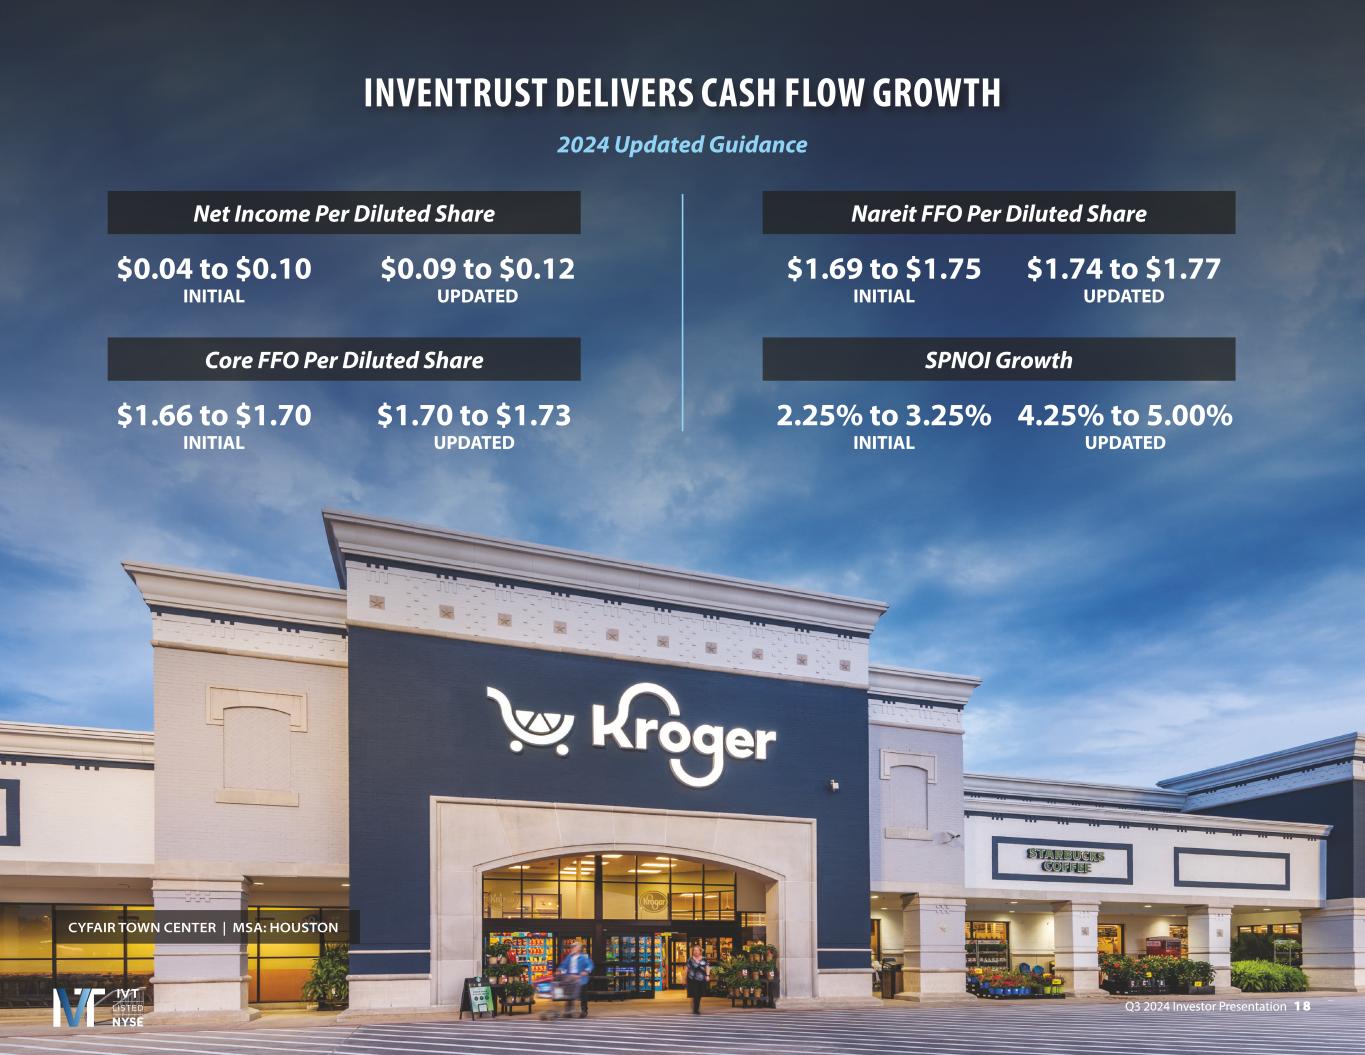
Q3 2024 Investor Presentation 1 8 INVENTRUST DELIVERS CASH FLOW GROWTH 2024 Updated Guidance $0.04 to $0.10 INITIAL CYFAIR TOWN CENTER | MSA: HOUSTON Net Income Per Diluted Share $0.09 to $0.12 UPDATED $1.69 to $1.75 INITIAL Nareit FFO Per Diluted Share $1.74 to $1.77 UPDATED $1.66 to $1.70 INITIAL Core FFO Per Diluted Share $1.70 to $1.73 UPDATED 2.25% to 3.25% INITIAL SPNOI Growth 4.25% to 5.00% UPDATED
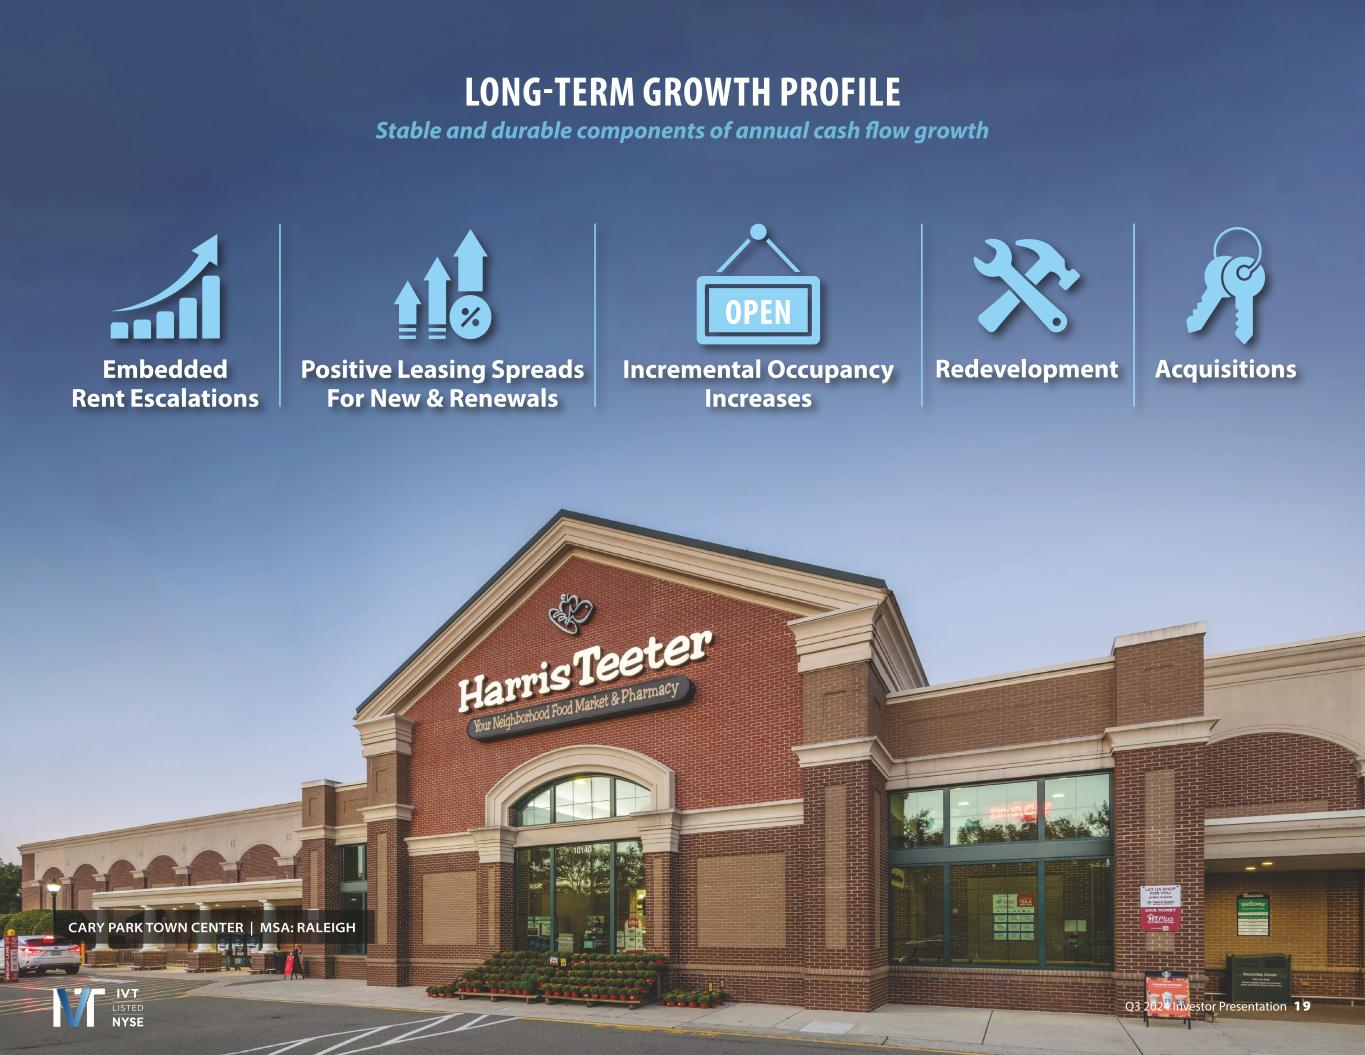
Q3 2024 Investor Presentation 1 9 LONG-TERM GROWTH PROFILE Stable and durable components of annual cash flow growth CARY PARK TOWN CENTER | MSA: RALEIGH Embedded Rent Escalations Positive Leasing Spreads For New & Renewals AcquisitionsRedevelopmentIncremental Occupancy Increases OPEN
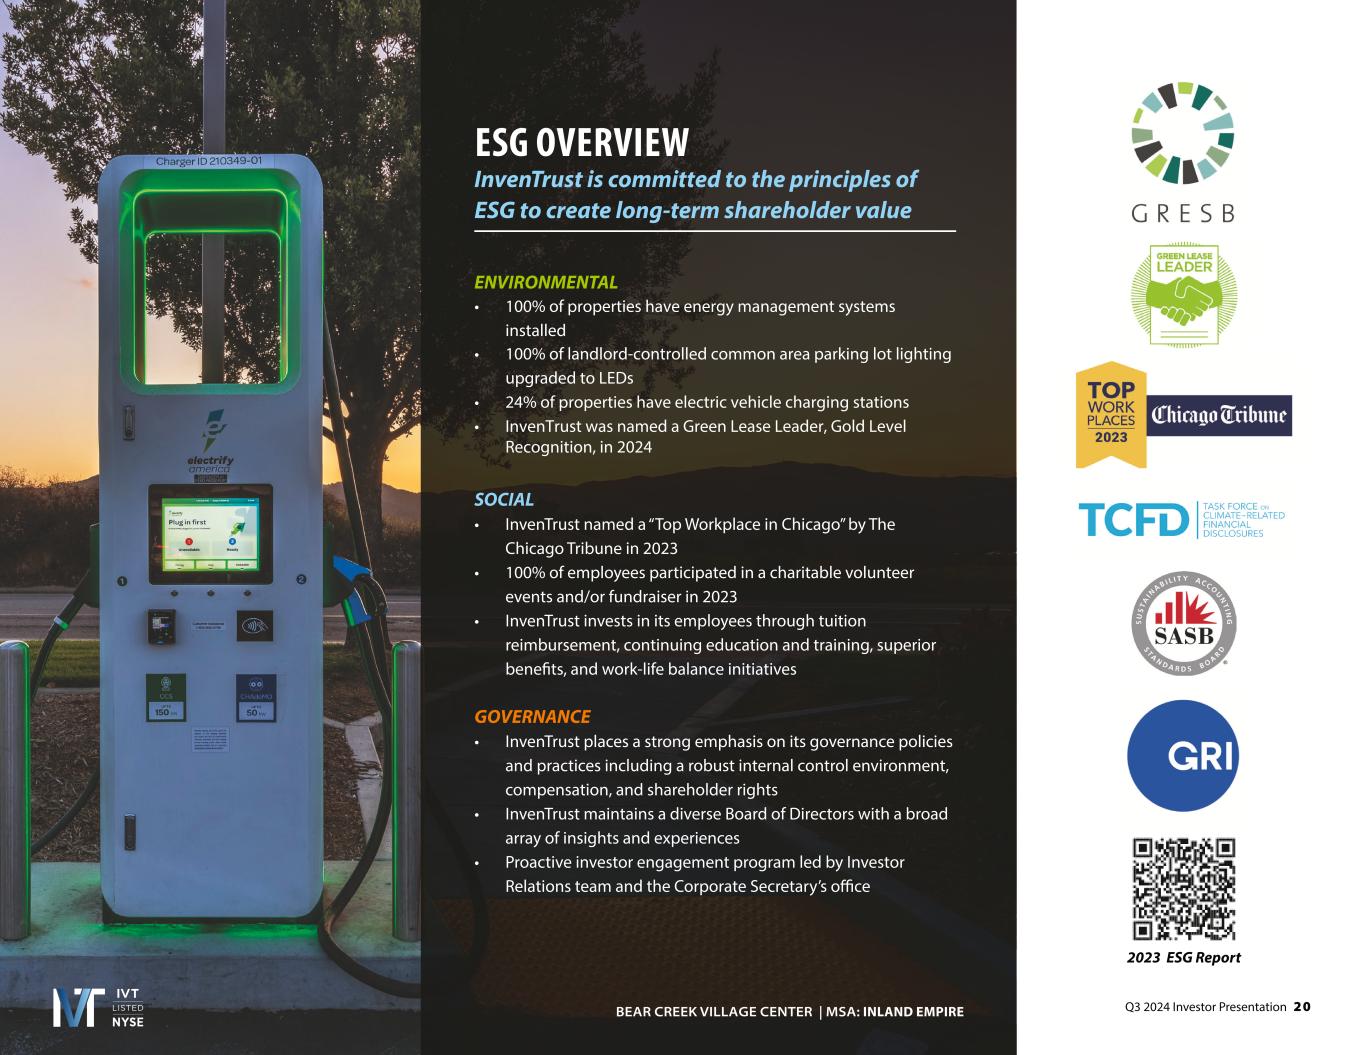
Q3 2024 Investor Presentation 2 0 ESG OVERVIEW InvenTrust is committed to the principles of ESG to create long-term shareholder value ENVIRONMENTAL • 100% of properties have energy management systems installed • 100% of landlord-controlled common area parking lot lighting upgraded to LEDs • 24% of properties have electric vehicle charging stations • InvenTrust was named a Green Lease Leader, Gold Level Recognition, in 2024 SOCIAL • InvenTrust named a “Top Workplace in Chicago” by The Chicago Tribune in 2023 • 100% of employees participated in a charitable volunteer events and/or fundraiser in 2023 • InvenTrust invests in its employees through tuition reimbursement, continuing education and training, superior benefits, and work-life balance initiatives GOVERNANCE • InvenTrust places a strong emphasis on its governance policies and practices including a robust internal control environment, compensation, and shareholder rights • InvenTrust maintains a diverse Board of Directors with a broad array of insights and experiences • Proactive investor engagement program led by Investor Relations team and the Corporate Secretary’s office BEAR CREEK VILLAGE CENTER | MSA: 2023 ESG Report
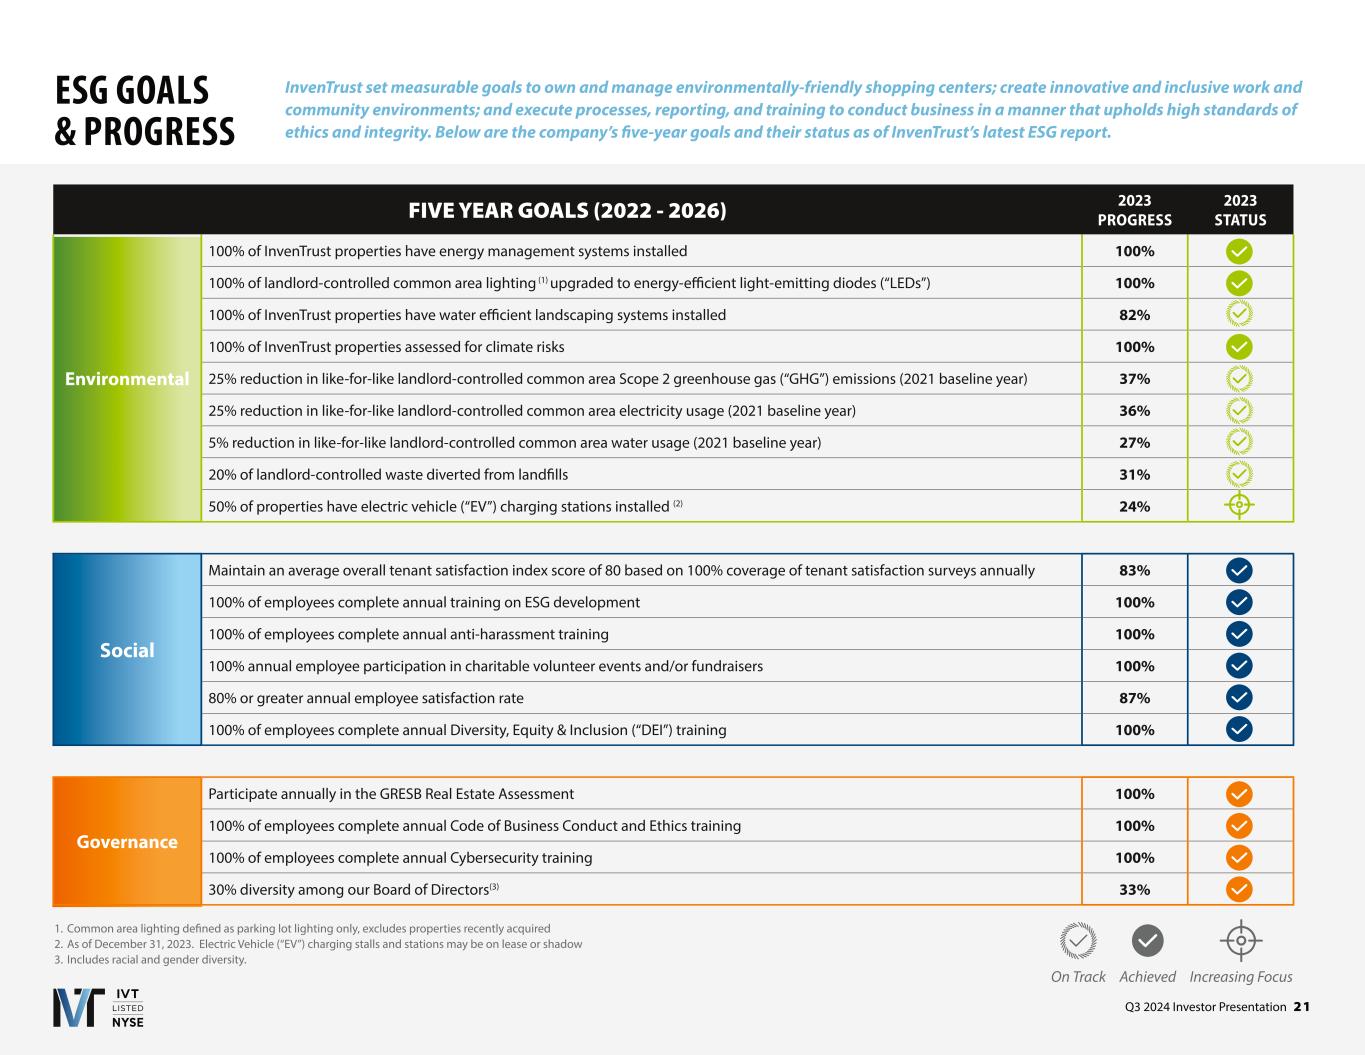
Q3 2024 Investor Presentation 2 1 ESG GOALS & PROGRESS InvenTrust set measurable goals to own and manage environmentally-friendly shopping centers; create innovative and inclusive work and community environments; and execute processes, reporting, and training to conduct business in a manner that upholds high standards of ethics and integrity. Below are the company’s five-year goals and their status as of InvenTrust’s latest ESG report. FIVE YEAR GOALS (2022 - 2026) 2023 PROGRESS 2023 STATUS Environmental 100% of InvenTrust properties have energy management systems installed 100% 100% of landlord-controlled common area lighting (1) upgraded to energy-efficient light-emitting diodes (“LEDs”) 100% 100% of InvenTrust properties have water efficient landscaping systems installed 82% 100% of InvenTrust properties assessed for climate risks 100% 25% reduction in like-for-like landlord-controlled common area Scope 2 greenhouse gas (“GHG”) emissions (2021 baseline year) 37% 25% reduction in like-for-like landlord-controlled common area electricity usage (2021 baseline year) 36% 5% reduction in like-for-like landlord-controlled common area water usage (2021 baseline year) 27% 20% of landlord-controlled waste diverted from landfills 31% 50% of properties have electric vehicle (“EV”) charging stations installed (2) 24% Social Maintain an average overall tenant satisfaction index score of 80 based on 100% coverage of tenant satisfaction surveys annually 83% 100% of employees complete annual training on ESG development 100% 100% of employees complete annual anti-harassment training 100% 100% annual employee participation in charitable volunteer events and/or fundraisers 100% 80% or greater annual employee satisfaction rate 87% 100% of employees complete annual Diversity, Equity & Inclusion (“DEI”) training 100% Governance Participate annually in the GRESB Real Estate Assessment 100% 100% of employees complete annual Code of Business Conduct and Ethics training 100% 100% of employees complete annual Cybersecurity training 100% 30% diversity among our Board of Directors(3) 33% On Track Achieved Increasing Focus 1. Common area lighting defined as parking lot lighting only, excludes properties recently acquired 2. As of December 31, 2023. Electric Vehicle (“EV”) charging stalls and stations may be on lease or shadow 3. Includes racial and gender diversity.
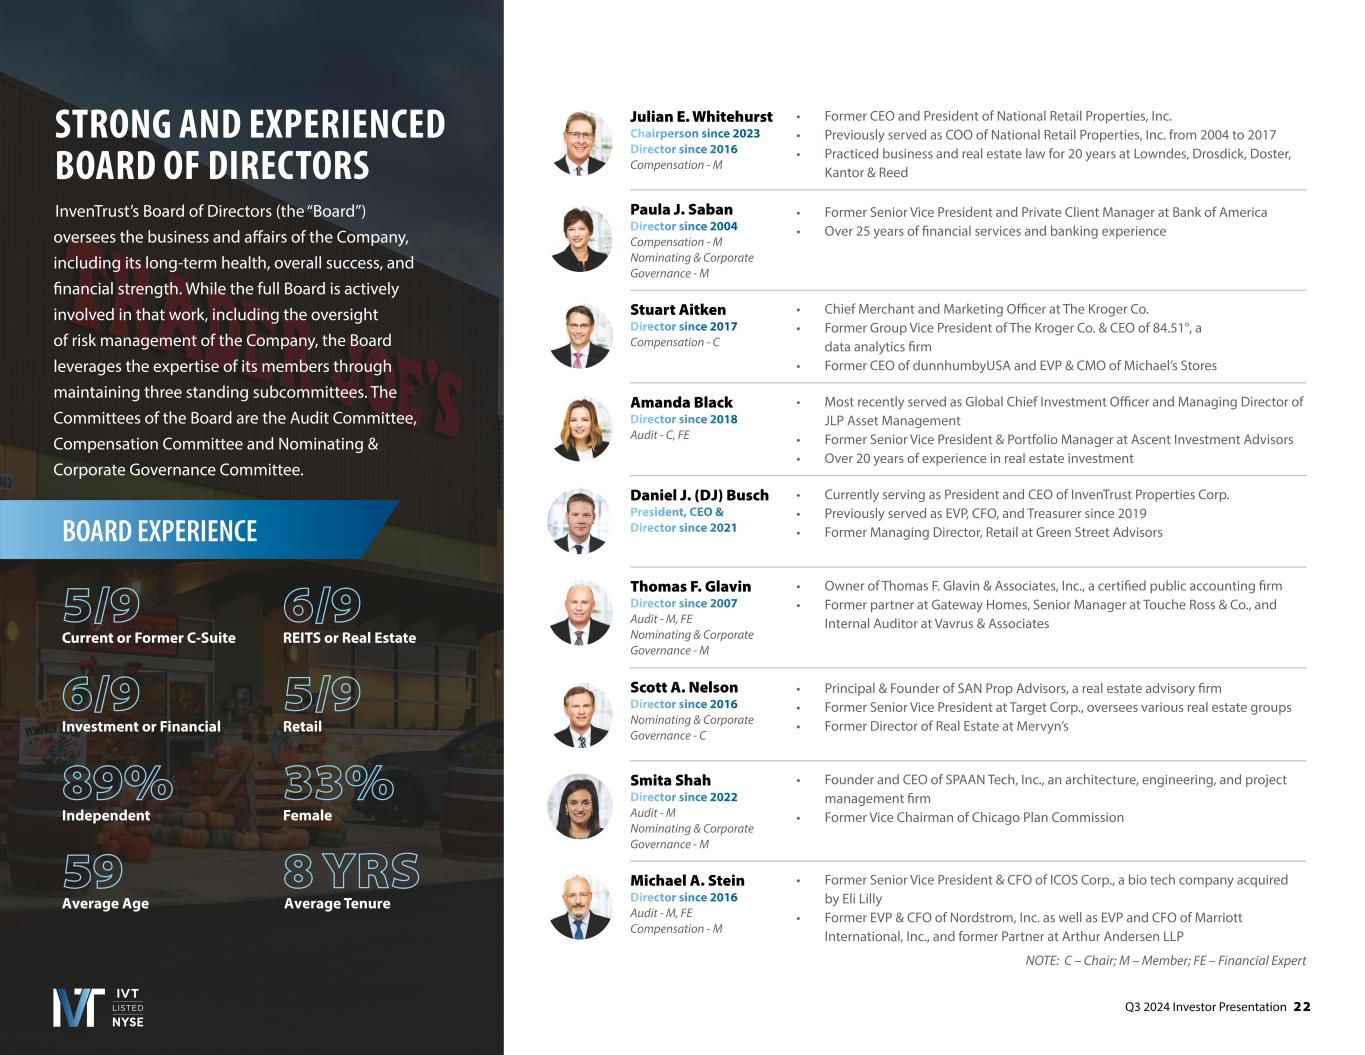
Q3 2024 Investor Presentation 2 2 Amanda Black Director since 2018 Audit - C, FE • Most recently served as Global Chief Investment Officer and Managing Director of JLP Asset Management • Former Senior Vice President & Portfolio Manager at Ascent Investment Advisors • Over 20 years of experience in real estate investment Stuart Aitken Director since 2017 Compensation - C • Chief Merchant and Marketing Officer at The Kroger Co. • Former Group Vice President of The Kroger Co. & CEO of 84.51°, a data analytics firm • Former CEO of dunnhumbyUSA and EVP & CMO of Michael’s Stores NOTE: C – Chair; M – Member; FE – Financial Expert Paula J. Saban Director since 2004 Compensation - M Nominating & Corporate Governance - M • Former Senior Vice President and Private Client Manager at Bank of America • Over 25 years of financial services and banking experience Thomas F. Glavin Director since 2007 Audit - M, FE Nominating & Corporate Governance - M • Owner of Thomas F. Glavin & Associates, Inc., a certified public accounting firm • Former partner at Gateway Homes, Senior Manager at Touche Ross & Co., and Internal Auditor at Vavrus & Associates Scott A. Nelson Director since 2016 Nominating & Corporate Governance - C • Principal & Founder of SAN Prop Advisors, a real estate advisory firm • Former Senior Vice President at Target Corp., oversees various real estate groups • Former Director of Real Estate at Mervyn’s Daniel J. (DJ) Busch President, CEO & Director since 2021 • Currently serving as President and CEO of InvenTrust Properties Corp. • Previously served as EVP, CFO, and Treasurer since 2019 • Former Managing Director, Retail at Green Street Advisors Julian E. Whitehurst Chairperson since 2023 Director since 2016 Compensation - M • Former CEO and President of National Retail Properties, Inc. • Previously served as COO of National Retail Properties, Inc. from 2004 to 2017 • Practiced business and real estate law for 20 years at Lowndes, Drosdick, Doster, Kantor & Reed Michael A. Stein Director since 2016 Audit - M, FE Compensation - M • Former Senior Vice President & CFO of ICOS Corp., a bio tech company acquired by Eli Lilly • Former EVP & CFO of Nordstrom, Inc. as well as EVP and CFO of Marriott International, Inc., and former Partner at Arthur Andersen LLP Smita Shah Director since 2022 Audit - M Nominating & Corporate Governance - M • Founder and CEO of SPAAN Tech, Inc., an architecture, engineering, and project management firm • Former Vice Chairman of Chicago Plan Commission InvenTrust’s Board of Directors (the “Board”) oversees the business and affairs of the Company, including its long-term health, overall success, and financial strength. While the full Board is actively involved in that work, including the oversight of risk management of the Company, the Board leverages the expertise of its members through maintaining three standing subcommittees. The Committees of the Board are the Audit Committee, Compensation Committee and Nominating & Corporate Governance Committee. BOARD EXPERIENCE 5/9 Current or Former C-Suite 89% Independent 6/9 Investment or Financial 59 5/9 Retail 6/9 REITS or Real Estate 33% Female 8 YRS STRONG AND EXPERIENCED BOARD OF DIRECTORS Average Age Average Tenure
Q3 2024 Investor Presentation 2 3 NON-GAAP MEASURES AND DEFINITION OF TERMS Adjusted EBITDA The Company’s non-GAAP measure of Adjusted EBITDA excludes gains (or losses) resulting from debt extinguishments, straight-line rent adjustments, amortization of above and below market leases and lease inducements, and other unique revenue and expense items which some may consider not pertinent to measuring a particular company’s on-going operating performance. Adjustments for the Company’s unconsolidated joint venture are calculated to reflect the Company’s proportionate share of the joint venture’s Adjusted EBITDA on the same basis. Nareit Funds From Operations (Nareit FFO) and Core FFO The Company’s non-GAAP measure of Nareit Funds from Operations (“Nareit FFO”), based on the National Association of Real Estate Investment Trusts (“Nareit”) definition, is net income (or loss) in accordance with GAAP, excluding gains (or losses) resulting from dispositions of properties, plus depreciation and amortization and impairment charges on depreciable real property. Adjustments for the Company’s unconsolidated joint venture are calculated to reflect the Company’s proportionate share of the joint venture’s Nareit FFO on the same basis. Core Funds From Operations (“Core FFO”) is an additional supplemental non-GAAP financial measure of the Company’s operating performance. In particular, Core FFO provides an additional measure to compare the operating performance of different REITs without having to account for certain remaining amortization assumptions within Nareit FFO and other unique revenue and expense items which some may consider not pertinent to measuring a particular company’s on-going operating performance. Net Debt-to-Adjusted EBITDA Net Debt-to-Adjusted EBITDA is Net Debt divided by trailing twelve month Adjusted EBITDA. Non-GAAP Financial Measures This Press Release includes certain financial measures and other terms that are not in accordance with U.S. Generally Accepted Accounting Principles (“GAAP”) that management believes are helpful in understanding the Company’s business. These measures should not be considered as alternatives to, or more meaningful than, net income (calculated in accordance with GAAP) or other GAAP financial measures, as an indicator of financial performance and are not alternatives to, or more meaningful than, cash flow from operating activities (calculated in accordance with GAAP) as a measure of liquidity. Non-GAAP performance measures have limitations as they do not include all items of income and expense that affect operations, and accordingly, should always be considered as supplemental financial results to those calculated in accordance with GAAP. The Company’s computation of these non-GAAP performance measures may differ in certain respects from the methodology utilized by other REITs and, therefore, may not be comparable to similarly titled measures presented by such other REITs. Investors are cautioned that items excluded from these non-GAAP performance measures are relevant to understanding and addressing financial performance. A reconciliation of the Company’s non-GAAP measures to the most directly comparable GAAP financials measures are included herein. Same Property NOI or SPNOI Information provided on a same property basis includes the results of properties that were owned and operated for the entirety of both periods presented. NOI excludes general and administrative expenses, depreciation and amortization, other income and expense, net, impairment of real estate assets, gains (losses) from sales of properties, gains (losses) on extinguishment of debt, interest expense, net, equity in earnings (losses) from unconsolidated entities, lease termination income and expense, and GAAP rent adjustments such as amortization of market lease intangibles, amortization of lease incentives, and straight-line rent adjustments (“GAAP Rent Adjustments”). The Company bifurcates NOI into Same Property NOI and NOI from other investment properties based on whether the retail properties meet the Company’s Same Property criteria. NOI from other investment properties includes adjustments for the Company’s captive insurance company.
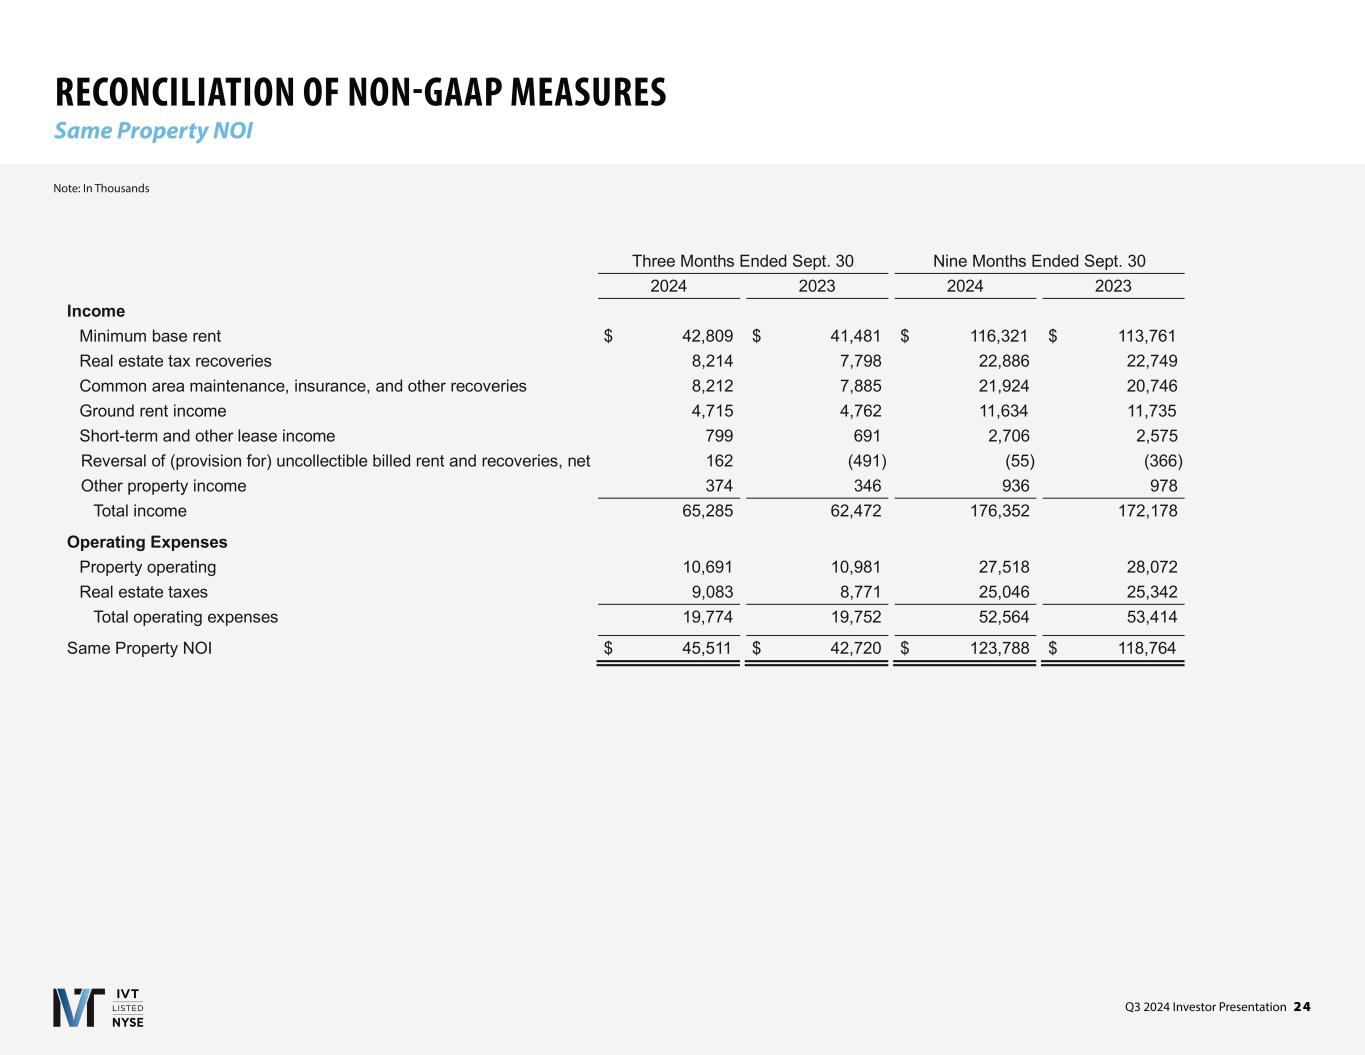
Q3 2024 Investor Presentation 2 4 RECONCILIATION OF NON-GAAP MEASURES Same Property NOI Note: In Thousands Three Months Ended Sept. 30 Nine Months Ended Sept. 30 2024 2023 2024 2023 Income Minimum base rent $ 42,809 $ 41,481 $ 116,321 $ 113,761 Real estate tax recoveries 8,214 7,798 22,886 22,749 Common area maintenance, insurance, and other recoveries 8,212 7,885 21,924 20,746 Ground rent income 4,715 4,762 11,634 11,735 Short-term and other lease income 799 691 2,706 2,575 Reversal of (provision for) uncollectible billed rent and recoveries, net 162 (491) (55) (366) Other property income 374 346 936 978 Total income 65,285 62,472 176,352 172,178 Operating Expenses Property operating 10,691 10,981 27,518 28,072 Real estate taxes 9,083 8,771 25,046 25,342 Total operating expenses 19,774 19,752 52,564 53,414 Same Property NOI $ 45,511 $ 42,720 $ 123,788 $ 118,764
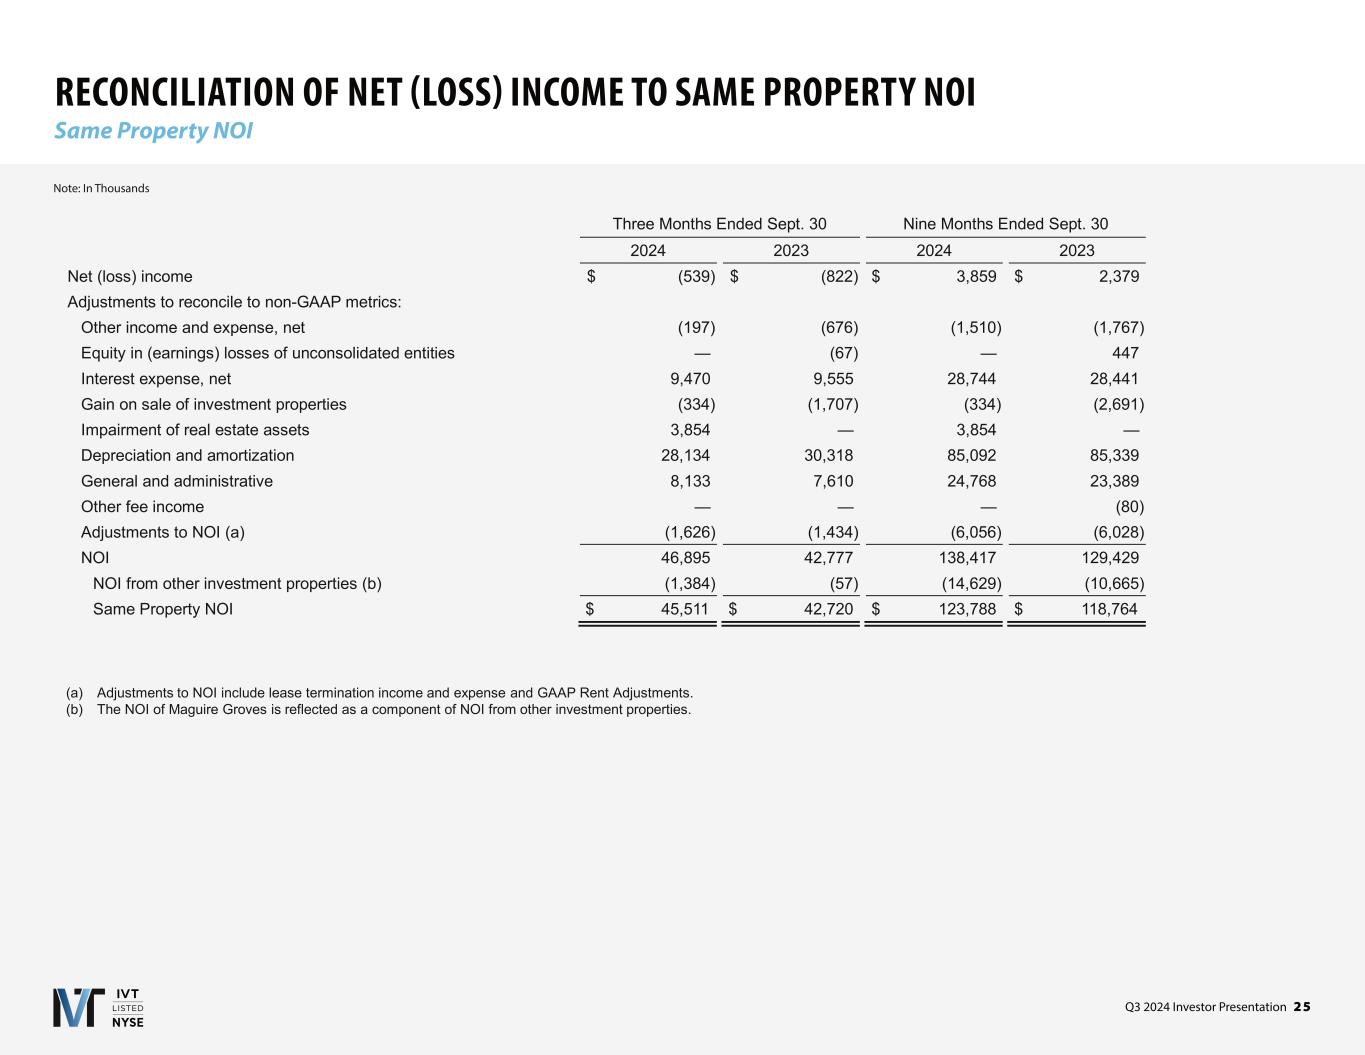
Q3 2024 Investor Presentation 2 5 RECONCILIATION OF NET (LOSS) INCOME TO SAME PROPERTY NOI Same Property NOI Note: In Thousands (a) Adjustments to NOI include lease termination income and expense and GAAP Rent Adjustments. (b) The NOI of Maguire Groves is reflected as a component of NOI from other investment properties. Three Months Ended Sept. 30 Nine Months Ended Sept. 30 2024 2023 2024 2023 Net (loss) income $ (539) $ (822) $ 3,859 $ 2,379 Adjustments to reconcile to non-GAAP metrics: Other income and expense, net (197) (676) (1,510) (1,767) Equity in (earnings) losses of unconsolidated entities — (67) — 447 Interest expense, net 9,470 9,555 28,744 28,441 Gain on sale of investment properties (334) (1,707) (334) (2,691) Impairment of real estate assets 3,854 — 3,854 — Depreciation and amortization 28,134 30,318 85,092 85,339 General and administrative 8,133 7,610 24,768 23,389 Other fee income — — — (80) Adjustments to NOI (a) (1,626) (1,434) (6,056) (6,028) NOI 46,895 42,777 138,417 129,429 NOI from other investment properties (b) (1,384) (57) (14,629) (10,665) Same Property NOI $ 45,511 $ 42,720 $ 123,788 $ 118,764
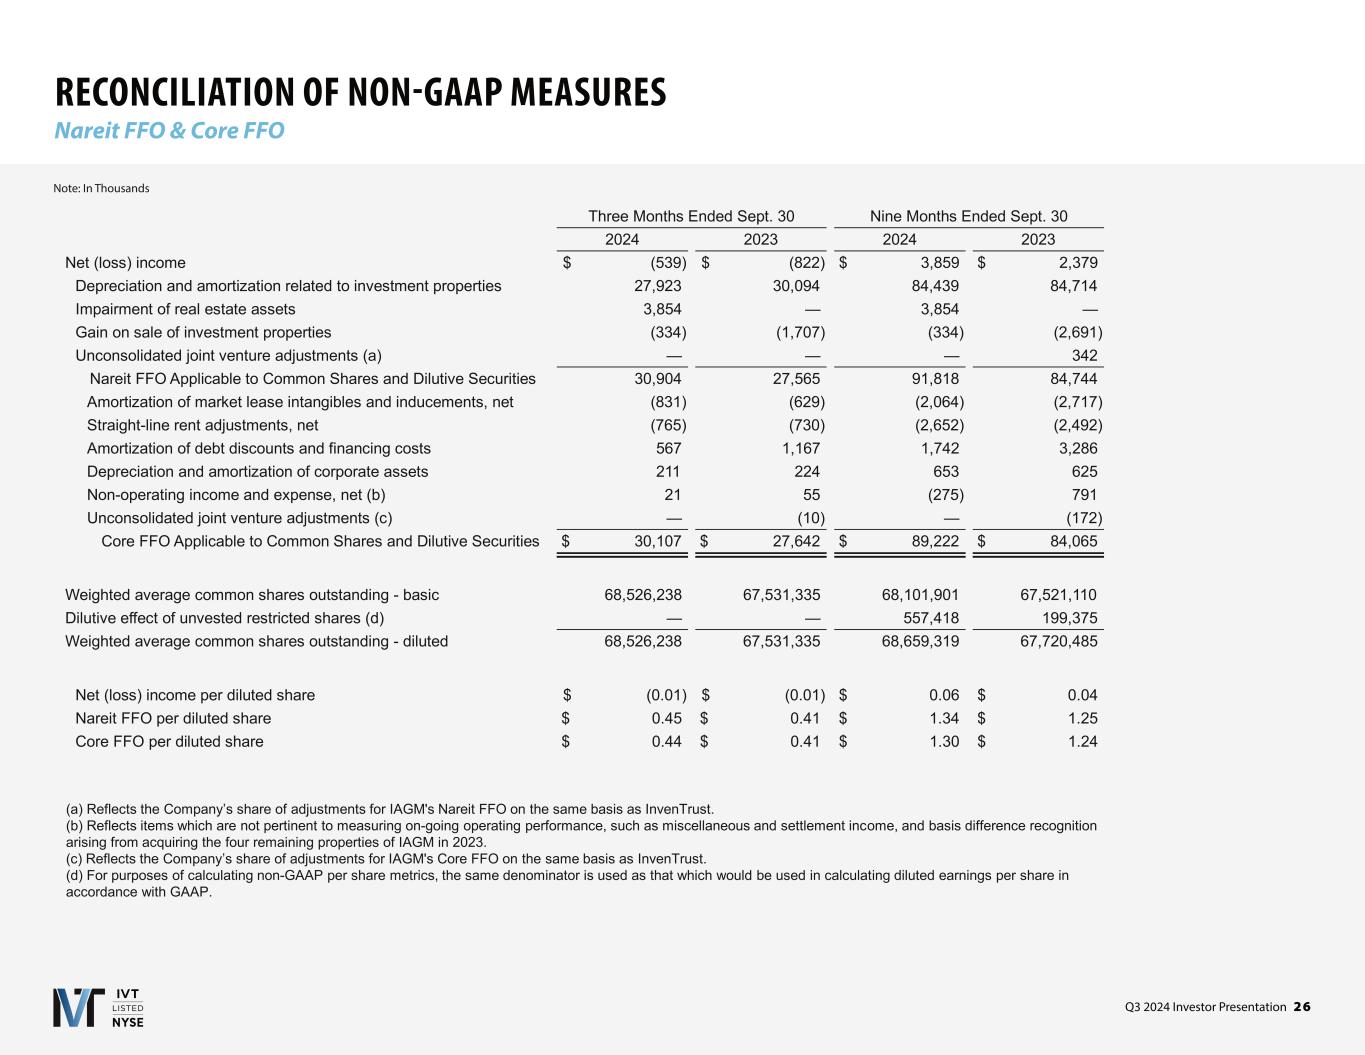
Q3 2024 Investor Presentation 2 6 RECONCILIATION OF NON-GAAP MEASURES Nareit FFO & Core FFO Note: In Thousands (a) Reflects the Company’s share of adjustments for IAGM's Nareit FFO on the same basis as InvenTrust. (b) Reflects items which are not pertinent to measuring on-going operating performance, such as miscellaneous and settlement income, and basis difference recognition arising from acquiring the four remaining properties of IAGM in 2023. (c) Reflects the Company’s share of adjustments for IAGM's Core FFO on the same basis as InvenTrust. (d) For purposes of calculating non-GAAP per share metrics, the same denominator is used as that which would be used in calculating diluted earnings per share in accordance with GAAP. Three Months Ended Sept. 30 Nine Months Ended Sept. 30 2024 2023 2024 2023 Net (loss) income $ (539) $ (822) $ 3,859 $ 2,379 Depreciation and amortization related to investment properties 27,923 30,094 84,439 84,714 Impairment of real estate assets 3,854 — 3,854 — Gain on sale of investment properties (334) (1,707) (334) (2,691) Unconsolidated joint venture adjustments (a) — — — 342 Nareit FFO Applicable to Common Shares and Dilutive Securities 30,904 27,565 91,818 84,744 Amortization of market lease intangibles and inducements, net (831) (629) (2,064) (2,717) Straight-line rent adjustments, net (765) (730) (2,652) (2,492) Amortization of debt discounts and financing costs 567 1,167 1,742 3,286 Depreciation and amortization of corporate assets 211 224 653 625 Non-operating income and expense, net (b) 21 55 (275) 791 Unconsolidated joint venture adjustments (c) — (10) — (172) Core FFO Applicable to Common Shares and Dilutive Securities $ 30,107 $ 27,642 $ 89,222 $ 84,065 Weighted average common shares outstanding - basic 68,526,238 67,531,335 68,101,901 67,521,110 Dilutive effect of unvested restricted shares (d) — — 557,418 199,375 Weighted average common shares outstanding - diluted 68,526,238 67,531,335 68,659,319 67,720,485 Net (loss) income per diluted share $ (0.01) $ (0.01) $ 0.06 $ 0.04 Nareit FFO per diluted share $ 0.45 $ 0.41 $ 1.34 $ 1.25 Core FFO per diluted share $ 0.44 $ 0.41 $ 1.30 $ 1.24
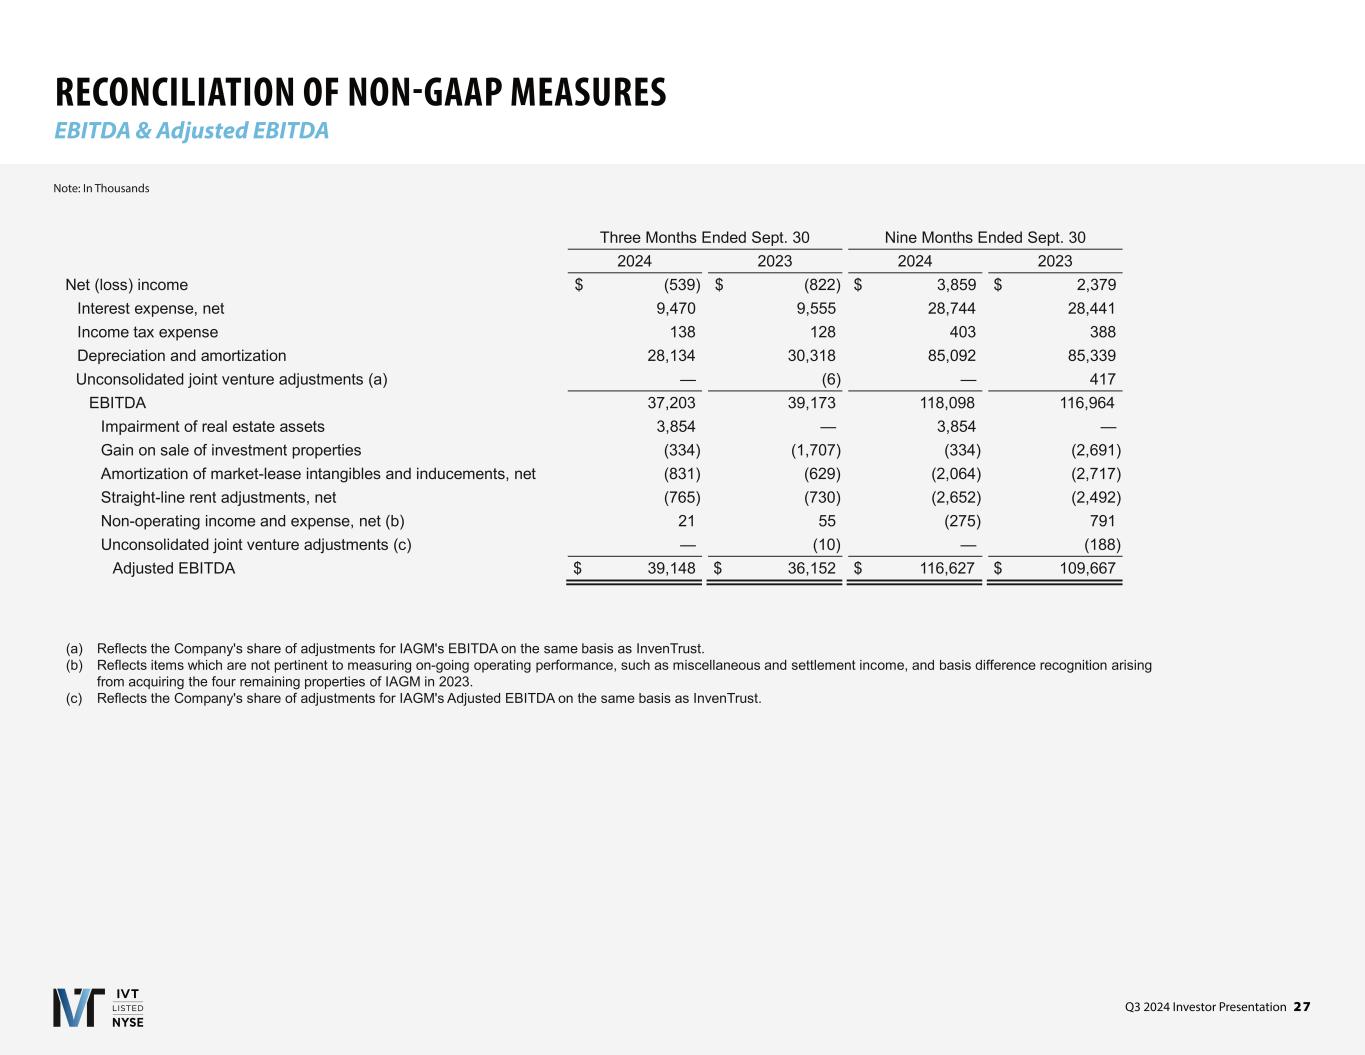
Q3 2024 Investor Presentation 2 7 RECONCILIATION OF NON-GAAP MEASURES EBITDA & Adjusted EBITDA Note: In Thousands (a) Reflects the Company's share of adjustments for IAGM's EBITDA on the same basis as InvenTrust. (b) Reflects items which are not pertinent to measuring on-going operating performance, such as miscellaneous and settlement income, and basis difference recognition arising from acquiring the four remaining properties of IAGM in 2023. (c) Reflects the Company's share of adjustments for IAGM's Adjusted EBITDA on the same basis as InvenTrust. Three Months Ended Sept. 30 Nine Months Ended Sept. 30 2024 2023 2024 2023 Net (loss) income $ (539) $ (822) $ 3,859 $ 2,379 Interest expense, net 9,470 9,555 28,744 28,441 Income tax expense 138 128 403 388 Depreciation and amortization 28,134 30,318 85,092 85,339 Unconsolidated joint venture adjustments (a) — (6) — 417 EBITDA 37,203 39,173 118,098 116,964 Impairment of real estate assets 3,854 — 3,854 — Gain on sale of investment properties (334) (1,707) (334) (2,691) Amortization of market-lease intangibles and inducements, net (831) (629) (2,064) (2,717) Straight-line rent adjustments, net (765) (730) (2,652) (2,492) Non-operating income and expense, net (b) 21 55 (275) 791 Unconsolidated joint venture adjustments (c) — (10) — (188) Adjusted EBITDA $ 39,148 $ 36,152 $ 116,627 $ 109,667
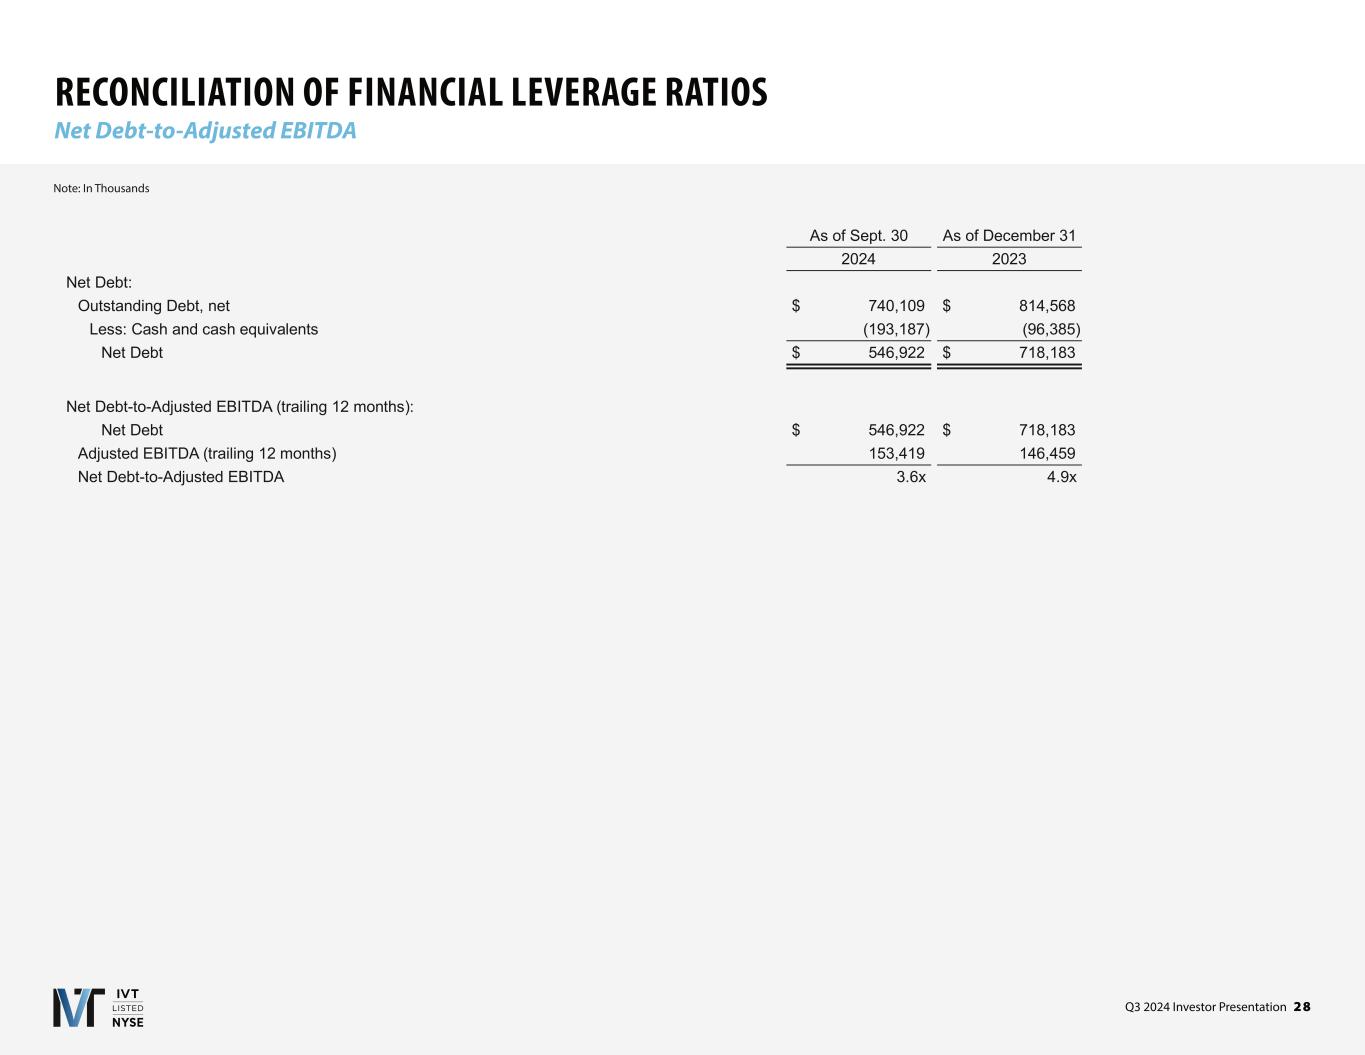
Q3 2024 Investor Presentation 2 8 RECONCILIATION OF FINANCIAL LEVERAGE RATIOS Net Debt-to-Adjusted EBITDA Note: In Thousands As of Sept. 30 As of December 31 2024 2023 Net Debt: Outstanding Debt, net $ 740,109 $ 814,568 Less: Cash and cash equivalents (193,187) (96,385) Net Debt $ 546,922 $ 718,183 Net Debt-to-Adjusted EBITDA (trailing 12 months): Net Debt $ 546,922 $ 718,183 Adjusted EBITDA (trailing 12 months) 153,419 146,459 Net Debt-to-Adjusted EBITDA 3.6x 4.9x
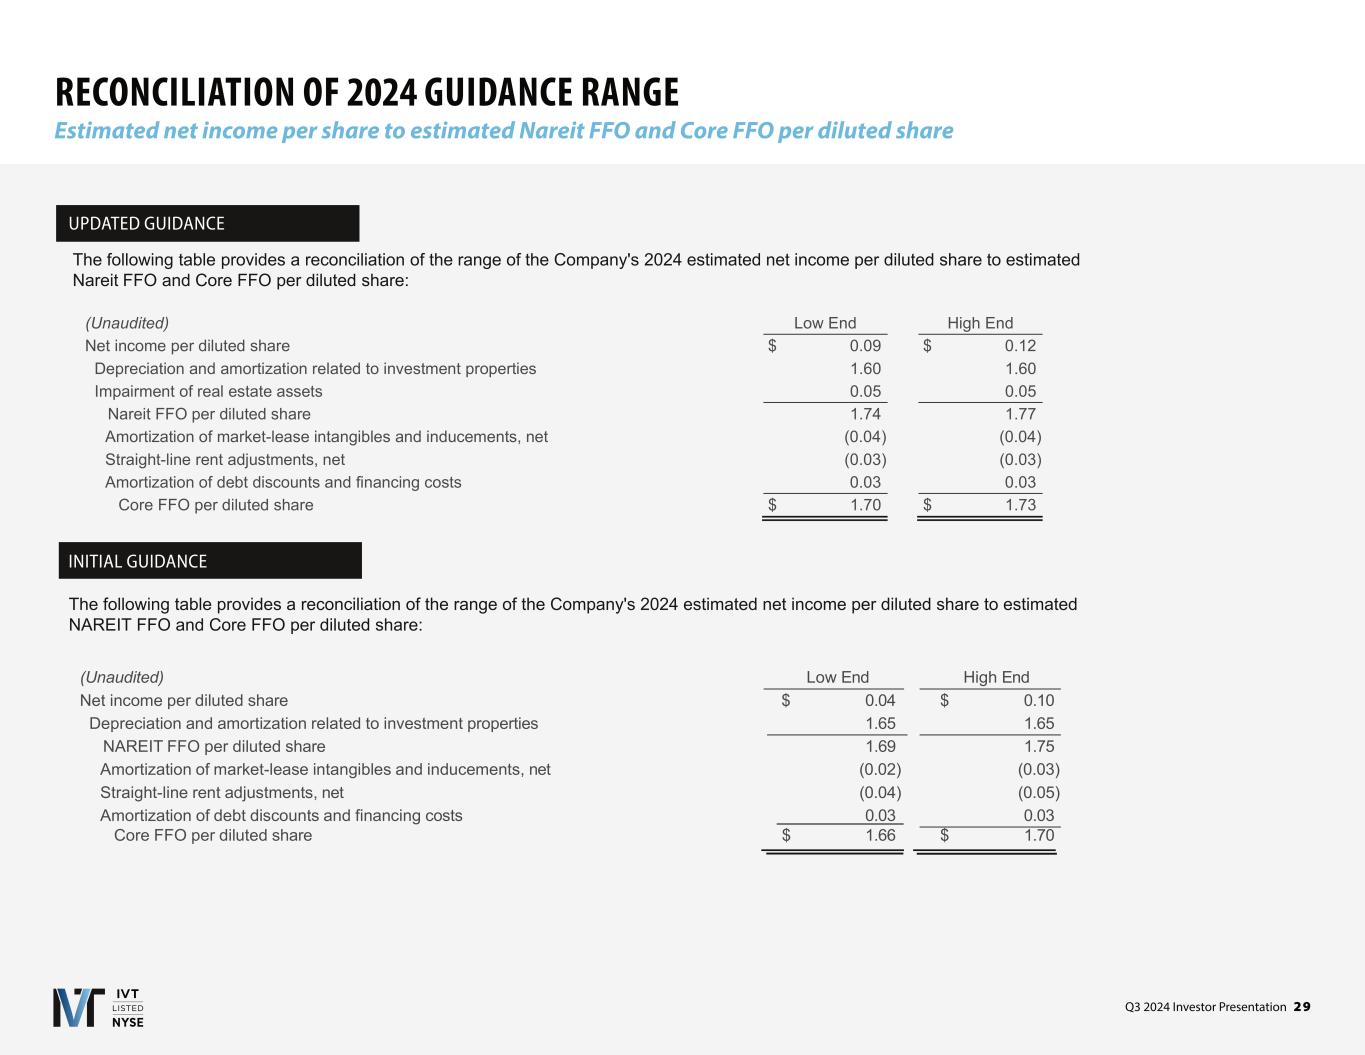
Q3 2024 Investor Presentation 2 9 RECONCILIATION OF 2024 GUIDANCE RANGE Estimated net income per share to estimated Nareit FFO and Core FFO per diluted share The following table provides a reconciliation of the range of the Company's 2024 estimated net income per diluted share to estimated Nareit FFO and Core FFO per diluted share: (Unaudited) Low End High End Net income per diluted share $ 0.09 $ 0.12 Depreciation and amortization related to investment properties 1.60 1.60 Impairment of real estate assets 0.05 0.05 Nareit FFO per diluted share 1.74 1.77 Amortization of market-lease intangibles and inducements, net (0.04) (0.04) Straight-line rent adjustments, net (0.03) (0.03) Amortization of debt discounts and financing costs 0.03 0.03 Core FFO per diluted share $ 1.70 $ 1.73 (Unaudited) Low End High End Net income per diluted share $ 0.04 $ 0.10 Depreciation and amortization related to investment properties 1.65 1.65 NAREIT FFO per diluted share 1.69 1.75 Amortization of market-lease intangibles and inducements, net (0.02) (0.03) Straight-line rent adjustments, net (0.04) (0.05) Amortization of debt discounts and financing costs 0.03 0.03 Core FFO per diluted share $ 1.66 $ 1.70 UPDATED GUIDANCE INITIAL GUIDANCE

Corporate Office 3025 Highland Parkway | Suite 350 Downers Grove, IL 60515 630.570.0700 info@InvenTrustProperties.com Investor Relations 630.570.0605 InvestorRelations@InvenTrustProperties.com Transfer Agent Computershare 855.377.0510 Investor Presentation Quarterly Earnings Materials 2023 ESG Report


