UNITED STATES
SECURITIES AND EXCHANGE COMMISSION
WASHINGTON, D.C. 20549
FORM N-CSR
CERTIFIED SHAREHOLDER REPORT OF REGISTERED
MANAGEMENT INVESTMENT COMPANIES
Investment Company Act file number: 811-21673
The AB Pooling Portfolios
(Exact name of registrant as specified in charter)
1345 Avenue of the Americas, New York, New York 10105
(Address of principal executive offices) (Zip code)
Joseph. J Mantineo
AllianceBernstein L.P.
1345 Avenue of the Americas
New York, New York 10105
(Name and address of agent for service)
Registrant’s telephone number, including area code: (800) 221-5672
Date of fiscal year end: August 31, 2015
Date of reporting period: August 31, 2015
| ITEM 1. | REPORTS TO STOCKHOLDERS. |
AUG 08.31.15

ANNUAL REPORT
AB POOLING PORTFOLIOS
| + | AB U.S. VALUE |
| + | AB U.S. LARGE CAP GROWTH |
| + | AB INTERNATIONAL VALUE |
| + | AB INTERNATIONAL GROWTH |
| + | AB SHORT DURATION BOND |
| + | AB GLOBAL CORE BOND |
| + | AB BOND INFLATION PROTECTION |
| + | AB HIGH-YIELD |
| + | AB SMALL-MID CAP VALUE |
| + | AB SMALL-MID CAP GROWTH |
| + | AB MULTI-ASSET REAL RETURN |
| + | AB VOLATILITY MANAGEMENT |
Investment Products Offered
• Are Not FDIC Insured • May Lose Value • Are Not Bank Guaranteed |
Investors should consider the investment objectives, risks, charges and expenses of the Fund carefully before investing. For copies of our prospectus or summary prospectus, which contain this and other information, visit us online at www.abglobal.com or contact your AB representative. Please read the prospectus and/or summary prospectus carefully before investing.
This shareholder report must be preceded or accompanied by the Fund’s prospectus for individuals who are not current shareholders of the Fund.
You may obtain a description of the Fund’s proxy voting policies and procedures, and information regarding how the Fund voted proxies relating to portfolio securities during the most recent 12-month period ended June 30, without charge. Simply visit AB’s website at www.abglobal.com, or go to the Securities and Exchange Commission’s (the “Commission”) website at www.sec.gov, or call AB at (800) 227-4618.
The Fund files its complete schedule of portfolio holdings with the Commission for the first and third quarters of each fiscal year on Form N-Q. The Fund’s Forms N-Q are available on the Commission’s website at www.sec.gov. The Fund’s Forms N-Q may also be reviewed and copied at the Commission’s Public Reference Room in Washington, DC; information on the operation of the Public Reference Room may be obtained by calling (800) SEC-0330. AB publishes full portfolio holdings for the Fund monthly at www.abglobal.com.
AllianceBernstein Investments, Inc. (ABI) is the distributor of the AB family of mutual funds. ABI is a member of FINRA and is an affiliate of AllianceBernstein L.P., the Adviser of the funds.
The [A/B] logo is service mark of AllianceBernstein and AllianceBernstein® is a registered trademark used by permission of the owner, AllianceBernstein L.P.
October 21, 2015
Annual Report
This report provides management’s discussion of fund performance for the AB Pooling Portfolios (collectively, the “Portfolios”; individually, the “Portfolio”) for the annual reporting period ended August 31, 2015. Effective January 20, 2015, the Registrant’s name changed from “AllianceBernstein Pooling Portfolios” to “AB Pooling Portfolios”, and the reference to “AllianceBernstein” in each Portfolio’s name changed to “AB”.
The tables on pages 20-31 show each Portfolio’s performance for the six- and 12-month periods ended August 31, 2015, compared to their respective benchmarks. Additional performance can be found on pages 32-35.
Market Review
Global stocks declined for the 12-month period ended August 31, 2015, while fixed-income markets were mixed. While capital markets overall were negatively affected by a sharp decline in oil and commodity prices, combined with events in Greece and China, suffered losses, US equity markets managed to post slight gains.
Global equities began the period under heavy pressure, driven by worries over economic weakness in China and Europe. Ongoing geopolitical turmoil in the Ukraine and elsewhere also played a role. Markets saw a slight respite after negotiations between Greece and its official creditors were resolved in July, but a sharp drop in the price of oil and volatile trading in China’s mainland stock markets prompted a global selloff in August.
Bond markets were volatile for the 12-month period as well. Markets remained preoccupied with central bank policies, which appeared to diverge. Speculation over the timing of an increase in US interest rates caused the US yield curve to flatten during the year. Meanwhile, central banks including Europe, Canada and China relaxed policy to offset weaker growth, sending government bond yields lower in those regions where central banks have adopted stimulus measures.
Disappointing economic data in China led authorities to devalue the yuan against the US dollar by the largest amount in decades. Although policymakers justified the move as an attempt to make the country’s exchange rate more responsive to market forces, investors interpreted it as a sign that China’s economic slowdown was worse than originally thought.
U.S. Value Portfolio
Investment Objective and Policies
The Portfolio seeks long-term growth of capital. The Portfolio invests primarily in a diversified portfolio of equity securities of US companies emphasizing investments in companies that AllianceBernstein L.P. (the “Adviser”) believes are undervalued. The Portfolio uses the fundamental value approach of the Adviser. This fundamental value approach seeks to identify investments that are considered to be undervalued because they are attractively priced relative to future earnings power and dividend-paying capability. The Adviser relies heavily on the fundamental analysis and research of the Adviser’s large internal research staff in making
| AB POOLING PORTFOLIOS • | 1 |
investment decisions for the Portfolio. These investment decisions are the result of the multi-step process described below. Under normal circumstances, the Portfolio invests at least 80% of its net assets in equity securities of US companies.
The Portfolio may enter into derivatives transactions, such as options, futures contracts, forwards, and swaps. The Portfolio may use options strategies involving the purchase and/or writing of various combinations of call and/or put options, including on individual securities and stock indices, futures contracts (including futures contracts on individual securities and stock indices) or shares of exchange-traded funds (“ETFs”). These transactions may be used, for example, in an effort to earn extra income, to adjust exposure to individual securities or markets, or to protect all or a portion of the Portfolio’s portfolio from a decline in value, sometimes within certain ranges.
The Portfolio may, at times, invest in shares of ETFs in lieu of making direct investments in securities. ETFs may provide more efficient and economical exposure to the types of companies and geographic locations in which the Portfolio seeks to invest than direct investments.
Investment Results
The Portfolio outperformed its benchmark, the Russell 1000 Value Index, for the six-month period and underperformed for the 12-month period ended August 31, 2015.
During the 12-month period, sector selection was the main source of underperformance, due to negative underweights in consumer growth and consumer staples, as well as a negative overweight in energy, relative to the benchmark. Security selection in the consumer cyclicals and services sectors, as well as an overweight in consumer cyclicals, helped to offset some of the losses. For the six-month period, security selection in the services, consumer cyclicals and financials sectors contributed most to performance. Security selection in the technology and consumer growth sectors, as well as an overweight in the consumer cyclicals sector, had a negative impact on returns.
The Portfolio did not utilize derivatives during the six- or 12-month periods.
U.S. Large Cap Growth Portfolio
Investment Objective and Policies
The Portfolio seeks long-term growth of capital. The Portfolio invests primarily in equity securities of a limited number of large, carefully selected, high quality US companies. The Portfolio invests primarily in the domestic equity securities of companies selected by the Adviser for their growth potential within various market sectors. The Portfolio emphasizes investments in large, seasoned companies. Under normal circumstances, the Portfolio invests at least 80% of its net assets in equity securities of large-capitalization US companies. For these purposes, “large-capitalization companies” are those that, at the time of investment, have market capitalizations within the
| 2 | • AB POOLING PORTFOLIOS |
range of market capitalizations of companies appearing in the Russell 1000 Growth Index. The Adviser expects that normally the Portfolio’s portfolio will tend to emphasize investments in securities issued by US companies, although it may invest in foreign securities.
The Portfolio may enter into derivatives transactions, such as options, futures contracts, forwards and swaps. The Portfolio may use options strategies involving the purchase and/or writing of various combinations of call and/or put options, including on individual securities and stock indices, futures contracts (including futures contracts on individual securities and stock indices) or shares of ETFs. These transactions may be used, for example, in an effort to earn extra income, to adjust exposure to individual securities or markets, or to protect all or a portion of the Portfolio from a decline in value, sometimes within certain ranges.
The Portfolio may, at times, invest in shares of ETFs in lieu of making direct investments in securities. ETFs may provide more efficient and economical exposure to the types of companies and geographic locations in which the Portfolio seeks to invest than direct investments.
Investment Results
The Portfolio outperformed its benchmark, the Russell 1000 Growth Index, for the six- and 12-month periods ended August 31, 2015.
During the 12-month period, security selection was the main source of
outperformance, as stock selection in the technology, consumer discretionary and industrials sectors contributed to returns, relative to the benchmark. Stock selection in the telecommunications and energy sectors had a negative impact on performance. Sector selection was positive, due to underweights in energy and materials, as well as an overweight in health care. For the six-month period, security selection was positive, as picks within the technology, industrials and consumer discretionary sectors contributed to performance. Security selection in the health care and consumer staples sectors had a negative impact on returns. Sector selection was positive, due to an underweight in materials and an overweight in health care.
The Portfolio did not utilize derivatives during the six- or 12-month periods.
International Value Portfolio
Investment Objective and Policies
The Portfolio seeks long-term growth of capital. The Portfolio invests primarily in a diversified portfolio of equity securities of established companies selected from more than 40 industries and from more than 40 developed and emerging market countries. These countries currently include the developed nations in Europe and the Far East, Canada, Australia and emerging market countries worldwide. Under normal market conditions, the Portfolio invests significantly (at least 40%, unless market conditions are not deemed favorable by the Adviser) in securities of non-US companies. In addition, the Portfolio invests, under normal market conditions, in companies in at least three countries other than the United States.
| AB POOLING PORTFOLIOS • | 3 |
The Portfolio invests in companies that the Adviser determines are undervalued, using a fundamental value approach. In selecting securities for the Portfolio, the Adviser uses its fundamental and quantitative research to identify companies whose stocks are priced low in relation to their perceived long-term earnings power.
Currencies can have a dramatic impact on equity returns, significantly adding to returns in some years and greatly diminishing them in others. The Adviser evaluates currency and equity positions separately and may seek to hedge the currency exposure resulting from securities positions when it finds the currency positions unattractive. To hedge a portion of its currency risk, the Portfolio may from time to time invest in currency-related derivatives, including forward currency exchange contracts, futures and options on futures, swaps and options. The Adviser may also seek investment opportunities by taking long or short positions in currencies through the use of currency-related derivatives.
The Portfolio may invest in depositary receipts, instruments of supranational entities denominated in the currency of any country, securities of multi-national companies and “semi-governmental securities”, and enter into forward commitments.
The Portfolio may enter into derivatives transactions, such as options, futures contracts, forwards and swaps. The Portfolio may use options strategies involving the purchase and/or writing of various combinations of call and/or put options, including on individual securities and stock indices, futures
contracts (including futures contracts on individual securities and stock indices) or shares of ETFs. These transactions may be used, for example, in an effort to earn extra income, to adjust exposure to individual securities or markets, or to protect all or a portion of the Portfolio’s portfolio from a decline in value, sometimes within certain ranges.
The Portfolio may, at times, invest in shares of ETFs in lieu of making direct investments in securities. ETFs may provide more efficient and economical exposure to the types of companies and geographic locations in which the Portfolio seeks to invest than direct investments.
Investment Results
The Portfolio outperformed its benchmark, the Morgan Stanley Capital International All Country World Index (“MSCI ACWI”) ex-US, for the six- and 12-month periods ended August 31, 2015.
During the 12-month period, security selection was positive within the industrial commodities, capital equipment and finance sectors. Security selection in the health care and technology/electronics sectors had a negative impact on returns, relative to the benchmark. Sector selection was negative due to underweights in consumer staples and health care. An overweight in telecommunications, as well as an underweight in industrial commodities, offset some of the losses. Country selection was positive, due mostly to an overweight in Japan. An overweight in France and an underweight in Canada also contributed to performance. In contrast, underweights
| 4 | • AB POOLING PORTFOLIOS |
in Sweden and Switzerland had a negative impact on returns. For the six-month period security selection was positive, while sector selection was negative. Security selection in the finance and industrial commodities sectors, as well as an underweight in industrial commodities, contributed most to performance. In contrast, security selection within the technology/electronics sector and an underweight in health care had a negative impact on returns. Country selection was positive, due mostly to an overweight in Japan. An underweight in Switzerland had a negative impact on returns.
The Portfolio utilized derivatives including Treasury futures for investment purposes and currency forwards for hedging and investment purposes, which added to returns during both periods, in absolute terms.
International Growth Portfolio
Investment Objective and Policies
The Portfolio seeks long-term growth of capital. The Portfolio invests primarily in an international portfolio of companies selected by the Adviser whose growth potential appears likely to outpace market expectations. The Adviser’s growth analysts use proprietary research to seek to identify companies that grow while creating a significant amount of “economic value”. These companies typically exhibit solid, durable growth; strong, sustainable competitive advantages; high return on invested capital and robust free cash flow.
The Portfolio invests, under normal circumstances, in the equity securities of companies located in at least three countries (and normally substantially
more) other than the United States. The Portfolio invests in securities of companies in both developed and emerging market countries. Geographic distribution of the Portfolio’s investments among countries or regions also will be a product of the stock selection process rather than a pre-determined allocation. The Portfolio may also invest in synthetic foreign equity securities, which are types of warrants used internationally that entitle a holder to buy or sell underlying securities. The Adviser expects that normally the Portfolio’s portfolio will tend to emphasize investments in larger capitalization companies.
Currencies can have a dramatic impact on equity returns, significantly adding to returns in some years and greatly diminishing them in others. Currency and equity positions are evaluated separately. The Adviser may seek to hedge the currency exposure resulting from securities positions when it finds the currency exposure unattractive. To hedge a portion of its currency risk, the Portfolio may from time to time invest in currency-related derivatives, including forward currency exchange contracts, futures, options on futures, swaps and options. The Adviser may also seek investment opportunities by taking long or short positions in currencies through the use of currency-related derivatives.
The Portfolio may enter into derivatives transactions, such as options, futures contracts, forwards and swaps. The Portfolio may use options strategies involving the purchase and/or writing of various combinations of call and/or put options, including on individual
| AB POOLING PORTFOLIOS • | 5 |
securities and stock indices, futures contracts (including futures contracts on individual securities and stock indices) or shares of ETFs. These transactions may be used, for example, in an effort to earn extra income, to adjust exposure to individual securities or markets, or to protect all or a portion of the Portfolio’s portfolio from a decline in value, sometimes within certain ranges.
The Portfolio may, at times, invest in shares of ETFs in lieu of making direct investments in securities. ETFs may provide more efficient and economical exposure to the types of companies and geographic locations in which the Portfolio seeks to invest than direct investments.
Investment Results
The Portfolio outperformed its benchmark, the MSCI ACWI ex-US, for the six- and 12-month periods ended August 31, 2015.
For the 12-month period, sector selection was positive due mostly to an underweight in energy and an overweight in consumer discretionary, relative to the benchmark. In contrast, security selection was negative, as positive stock selection within the health care and materials sectors was offset by negative stock selection in the consumer discretionary sector. Country selection was negative, as positive underweights in Canada and Korea were more than offset by a negative underweight in Japan and negative overweights in Brazil and India. During the six-month period, sector selection was positive due to underweights in energy and materials. Security selection
was also positive, particularly in the health care sector. Security selection within utilities offset some of these gains. Country selection was negative due to an overweight in India and an underweight in Japan. An underweight in Australia and an overweight in Denmark contributed to returns, offsetting some of the losses.
The Portfolio utilized derivatives in the form of currency forwards for hedging purposes, which detracted from returns during both periods, in absolute terms.
Short Duration Bond Portfolio
Investment Objective and Policies
The Portfolio seeks a moderate rate of income that is subject to taxes. The Portfolio may invest in many types of fixed-income securities, including corporate bonds, notes, US Government and agency securities, asset-backed securities, mortgage-related securities, and inflation-indexed securities, as well as other securities of US and non-US issuers. Under normal circumstances, the Portfolio invests at least 80% of its net assets in fixed-income securities. The Portfolio may also invest up to 20% of its total assets in debt securities denominated in currencies other than the US dollar. The Portfolio may also invest up to 20% of its assets in hybrid instruments, which have characteristics of futures, options, currencies and securities. The Portfolio seeks to maintain a relatively short duration of one to three years under normal market conditions. The Adviser may use interest-rate forecasting to determine the best level of interest-rate risk at a given time. The Adviser may moderately shorten the
| 6 | • AB POOLING PORTFOLIOS |
average duration of the Portfolio when it expects interest rates to rise and modestly lengthen the average duration when it anticipates that rates will fall.
The Portfolio may invest in investment grade quality securities rated A or Baa (including Baa1, Baa2 and Baa3) by Moody’s Investors Service (“Moody’s”), or A or BBB (including BBB+ and BBB-) by Standard & Poor’s Ratings Services (“S&P”) or Fitch Ratings (“Fitch”). The Portfolio may invest in variable, floating, and inverse floating rate investments. The Portfolio may also invest in zero-coupon and interest-only or principal-only securities. The Portfolio may enter into derivatives transactions, such as options, futures contracts, forwards and swaps.
Investment Results
The Portfolio outperformed its benchmark, the Bank of America Merrill Lynch (“BofA ML”) 1-3 Year US Treasury Index, for the six- and 12-month periods ended August 31, 2015.
Exposure to agencies, commercial mortgage obligations, asset-backed securities and investment-grade corporates contributed for both periods; an overweight to inflation-linked securities detracted from performance, relative to the benchmark. The Portfolio’s non-US holdings did not have a material impact on performance. Yield-curve positioning detracted for both periods, mainly from an underweight to the front end of the curve.
During both periods, the Portfolio utilized derivative instruments including Treasury futures and interest rate swaps
in order to manage duration and yield-curve positioning. Currency forwards were also utilized during both periods to hedge out non-dollar currency exposure. Cross currency swaps for hedging purposes had an immaterial impact during both periods, in absolute terms.
Global Core Bond Portfolio
Investment Objective and Policies
The Portfolio invests, under normal circumstances, at least 80% of its net assets in fixed-income securities. Fixed-income securities include, among other things, bonds. Under normal market conditions, the Portfolio invests at least 40% of its assets in fixed-income securities of non-US issuers. In addition, the Portfolio invests, under normal circumstances, in the fixed-income securities of issuers located in at least three countries.
The Portfolio may invest in medium-quality securities rated A or Baa (including Baa1, Baa2 and Baa3) by Moody’s, or A or BBB (including BBB+ and BBB-) by S&P or Fitch. The Portfolio may invest in mortgage-related and other asset-backed securities, loan participations, inflation-indexed securities, structured securities, variable, floating, and inverse floating rate instruments and preferred stock, and may use other investment techniques. To reduce volatility, the Adviser may hedge a significant portion of the currency exposure resulting from securities positions when it finds the currency exposure unattractive. To hedge its currency exposure, the Portfolio intends to use currency-related derivatives, including forward currency exchange contracts and futures. The Adviser may also seek
| AB POOLING PORTFOLIOS • | 7 |
investment opportunities by taking long or short positions in currencies through the use of currency-related derivatives. The Portfolio may also invest in other derivatives, including, without limitation, credit default swaps and interest rate swaps. The Portfolio may, among other things, enter into transactions such as reverse repurchase agreements and dollar rolls.
Investment Results
The Portfolio underperformed its benchmark, the Barclays Global Aggregate Bond Index (US dollar hedged), for the six- and 12-month periods ended August 31, 2015.
Security selection contributed for both periods, led by security selection within investment-grade corporates and commercial mortgage-backed securities, relative to the benchmark. Currency selection contributed for both periods, mainly from underweights to the Australian dollar, South Korean won and New Zealand dollar, as well as a long US dollar position. Country allocation detracted from returns for the six-month period, mainly from an overweight to Brazil as well as an underweight to Japan. However, for the 12-month period, country allocation contributed to returns, mainly from an overweight to the United Kingdom. Yield-curve positioning detracted for both periods, mainly from positioning on the long end of the euro and US yield curves.
During both periods, the Portfolio utilized derivatives including currency forwards for hedging and investment purposes, which added to returns in absolute terms; Treasury futures for
hedging purposes had an immaterial impact during the six-month period, and detracted for the 12-month period.
Bond Inflation Protection Portfolio
Investment Objective and Policies
The Portfolio pursues its objective by investing principally in Treasury Inflation Protected Securities (“TIPS”) directly or by gaining indirect exposure to TIPS through derivatives transactions such as Consumer Price Index (“CPI”) swaps and total return swaps linked to TIPS. In deciding whether to take direct or indirect exposure, the Adviser will consider the relative costs and efficiency of each method. In addition, in seeking to maximize real return, the Portfolio may invest in other fixed-income investments such as US and non-US government securities, corporate fixed-income securities and mortgage-related securities, as well as derivatives linked to such securities. Under normal circumstances, the Portfolio invests at least 80% of its net assets in fixed-income securities. While the Portfolio expects to invest principally in investment grade securities, it may invest up to 15% of its total assets in fixed-income securities rated BB or B or the equivalent by at least one national ratings agency (or deemed by the Adviser to be of comparable credit quality), which are not investment grade (“junk bonds”).
The Portfolio may also invest in other inflation-indexed securities, issued by both US and non-US issuers, and in derivative instruments linked to these securities, such as options, futures, forwards or swap agreements. The Portfolio intends to use leverage for investment purposes. The Portfolio
| 8 | • AB POOLING PORTFOLIOS |
may also invest in loan participations, structured securities, asset-backed securities, variable, floating, and inverse floating rate instruments, and preferred stock, and may use other investment techniques. The Portfolio may invest in fixed-income securities of any maturity and duration.
Investment Results
The Portfolio underperformed its benchmark, the Barclays 1-10 Year TIPS Index, for the six- and 12-month periods ended August 31, 2015.
During both periods, returns were negative due to an increase in TIPS yields across the curve. The continued downward pressure on oil prices as well as other commodity prices during both periods contributed to the negative performance, and also caused TIPS to underperform relative to US Treasuries. For the six-month period, sector allocation detracted from returns while currency allocation had an immaterial impact, relative to the benchmark; for the 12-month period, sector allocation detracted from performance, while currency selection contributed to returns. Regarding sector allocation, an allocation to corporates detracted for both periods. Within currency allocation, the Portfolio’s long US dollar position against its short euro, Australian dollar and Canadian dollar positions contributed to returns for the 12-month period; for the six-month period, the euro trade was immaterial with Australian dollar and Canadian dollar positions still contributing.
The Portfolio utilized derivatives including interest rate swaps and Treasury
futures during both periods to manage duration and yield-curve positioning. Overall duration and yield-curve positioning had a modest contribution to returns for the six- and 12-month periods in absolute terms. Credit default swaps and inflation swaps were utilized for hedging and investment purposes, which had an immaterial impact during both periods. Currency forwards were utilized to establish currency positioning. The Portfolio also utilized leverage through reverse repurchase agreements.
High-Yield Portfolio
Investment Objective and Policies
The Portfolio invests, under normal circumstances, at least 80% of its net assets in high-yield debt securities. The Portfolio invests in a diversified mix of high yield, below investment grade debt securities, known as “junk bonds”. These securities involve greater volatility of price and risk of principal and income than higher quality debt securities. The Portfolio is managed to maximize current income by taking advantage of market developments, yield disparities, and variations in the creditworthiness of issuers. The Portfolio uses various strategies in attempting to achieve its objective. The Portfolio may invest in debt securities with a range of maturities from short- to long-term. The Portfolio may invest in US dollar-denominated and non-US dollar-denominated foreign fixed-income securities. The Portfolio also may invest in mortgage-related and other asset-backed securities, loan participations, inflation-indexed securities, structured securities and preferred stocks. The Portfolio may use leverage for investment purposes by entering into transactions such as reverse repurchase agreements and dollar rolls.
| AB POOLING PORTFOLIOS • | 9 |
The Portfolio may invest in variable, floating, and inverse floating rate investments. The Portfolio may also invest in zero-coupon and interest-only or principal-only securities. The Portfolio may enter into derivatives transactions, such as options, futures contracts, forwards and swaps.
Investment Results
The Portfolio outperformed its benchmark, the Barclays US High Yield 2% Issuer Capped Index, for the six- and 12-month periods ended August 31, 2015.
For both periods, an underweight to the energy sector was a significant driver of outperformance, relative to the benchmark. An overweight to the banking sector, as well as an underweight to basic materials also contributed to performance for both periods. Security selection within communications/media contributed to performance for the 12-month period, yet detracted for the six-month period. Security selection within consumer non-cyclicals contributed for the six-month period yet detracted for the 12-month period. An underweight to CCC-rated bonds contributed to performance for both periods.
During both periods, the Portfolio utilized derivatives including currency forwards and credit default swaps for hedging and investment purposes, and written options and swaptions for hedging purposes, which added to performance in absolute terms; total return swaps for hedging and investment purposes, and purchased options for hedging purposes detracted. Treasury futures for hedging and investment purposes added during the six-month period and
detracted during the 12-month period; interest rate swaps for hedging purposes had an immaterial impact during both periods.
Small-Mid Cap Value Portfolio
Investment Objective and Policies
The Portfolio seeks long-term growth of capital. The Portfolio invests primarily in a diversified portfolio of equity securities of small- to mid-capitalization US companies. Under normal circumstances, the Portfolio invests at least 80% of its net assets in small- to mid-capitalization companies. For purposes of this policy, small- to mid-capitalization companies are those that, at the time of investment, fall within the capitalization range between the smallest company appearing in the Russell 2500 Value Index and the greater of $5 billion or the market capitalization of the largest company in the Russell 2500 Value Index. The Portfolio may invest in securities issued by non-US companies and enter into forward commitments.
The Portfolio may enter into derivatives transactions, such as options, futures contracts, forwards and swaps. The Portfolio may use options strategies involving the purchase and/or writing of various combinations of call and/or put options, including on individual securities and stock indices, futures contracts (including futures contracts on individual securities and stock indices) or shares of ETFs. These transactions may be used, for example, in an effort to earn extra income, to adjust exposure to individual securities or markets, or to protect all or a portion of the Portfolio’s portfolio from a decline in value, sometimes within certain ranges.
| 10 | • AB POOLING PORTFOLIOS |
The Portfolio may, at times, invest in shares of ETFs in lieu of making direct investments in securities. ETFs may provide more efficient and economical exposure to the types of companies and geographic locations in which the Portfolio seeks to invest than direct investments.
Investment Results
The Portfolio declined in absolute terms but outperformed its benchmark, the Russell 2500 Value Index, for the six- and 12-month periods ended August 31, 2015.
For the 12-month period, security selection drove the outperformance. Security selection was strongest in the financials sector, relative to the benchmark. Stock selection in the technology, consumer discretionary, materials and utilities sectors, as well as an underweight position in the energy sector, also significantly contributed to relative performance. The leading detractors from performance for the period were stock selection in the industrials and energy sectors and underweight positions in financials and health care. In the six-month period, security selection also drove the outperformance, particularly in the financials sector. Stock selection and an underweight position in the energy sector also contributed. Stock selection in the technology sector, as well as underweight positions in financials and health care, trimmed gains.
The Portfolio did not utilize derivatives during the six- or 12-month periods.
Small-Mid Cap Growth Portfolio
Investment Objective and Policies
The Portfolio seeks long-term growth of capital. The Portfolio invests primarily in a diversified portfolio of equity securities with relatively smaller capitalizations as compared to the overall market. Under normal circumstances, the Portfolio invests at least 80% of its net assets in the equity securities of small- and mid-capitalization US companies. For these purposes, “small- and mid-capitalization companies” are generally those companies that, at the time of investment, fall within the lowest 25% of the total US equity market capitalization (excluding, for purposes of this calculation, companies with market capitalizations of less than $10 million). In the future, the Portfolio may define small- and mid-capitalization companies using a different classification system.
The Portfolio may invest in any company and industry and in any type of equity security with potential for capital appreciation. It invests in well-known and established companies and in new and less-seasoned companies. The Portfolio’s investment policies emphasize investments in companies that are demonstrating improving financial results and a favorable earnings outlook. The Portfolio may invest in foreign securities. The Portfolio invests principally in equity securities but may also invest in other types of securities, such as preferred stocks. The Portfolio may also invest up to 20% of its total assets in rights and warrants.
The Portfolio may enter into derivatives transactions, such as options, futures contracts, forwards and swaps. The
| AB POOLING PORTFOLIOS • | 11 |
Portfolio may use options strategies involving the purchase and/or writing of various combinations of call and/or put options, including on individual securities and stock indices, futures contracts (including futures contracts on individual securities and stock indices) or shares of ETFs. These transactions may be used, for example, in an effort to earn extra income, to adjust exposure to individual securities or markets, or to protect all or a portion of the Portfolio’s portfolio from a decline in value, sometimes within certain ranges.
The Portfolio may, at times, invest in shares of ETFs in lieu of making direct investments in securities. ETFs may provide more efficient and economical exposure to the types of companies and geographic locations in which the Portfolio seeks to invest than direct investments.
Investment Results
The Portfolio outperformed its benchmark, the Russell 2500 Growth Index, for the six-month period yet underperformed for the 12-month period ended August 31, 2015.
Stock selection in the health care and industrials sectors contributed for the six-month period, while stock selection in technology and consumer/commercial staples sectors detracted, relative to the benchmark. For the 12-month period, stock selection detracted in the consumer/commercial services and industrials sectors, and contributed in the health care and technology sectors. Reflecting the Portfolio’s bottom-up investment process, the Small-Mid Cap Growth Investment Team continues to
find opportunities across most sectors. Given the increased uncertainty over global growth, however, there is an increased emphasis on secular growers and companies that have greater-than-normal control over future earnings growth (i.e., self-help opportunities).
The Portfolio did not utilize derivatives during the six- or 12-month periods.
Multi-Asset Real Return Portfolio
Investment Objective and Policies
The Portfolio seeks to maximize real return. Real return is the rate of total return (including income and capital appreciation) after adjusting for inflation. The Portfolio pursues an aggressive investment strategy involving a variety of asset classes. The Portfolio invests primarily in instruments that the Adviser expects to outperform broad equity indices during periods of rising inflation. Under normal circumstances, the Portfolio expects to invest its assets principally in the following instruments that, in the judgment of the Adviser, are affected directly or indirectly by the level and change in rate of inflation: inflation-indexed fixed-income securities, such as TIPS and similar bonds issued by governments outside of the United States, commodities, equity securities, such as commodity-related stocks, real estate securities, utility securities, infra-structure related securities, securities and derivatives linked to the price of other assets (such as commodities, stock indices and real estate), and currencies. The Portfolio expects its investments in fixed-income securities to have a broad range of any maturity and quality level.
| 12 | • AB POOLING PORTFOLIOS |
The Portfolio may invest in derivatives, such as options, futures, forwards, swap agreements or structured notes. The Portfolio intends to use leverage for investment purposes through the use of cash made available by derivatives transactions to make other investments in accordance with its investment policies.
The Portfolio may seek to gain exposure to physical commodities traded in the commodities markets through investments in a variety of derivative instruments, including investments in commodity index-linked notes. The Adviser expects that the Portfolio will seek to gain exposure to commodities and commodities-related instruments and derivatives primarily through investments in AllianceBernstein Cayman Inflation Pooling Subsidiary, Ltd., a wholly-owned subsidiary of the Portfolio organized under the laws of the Cayman Islands (the “Subsidiary”). The Subsidiary is advised by the Adviser and has the same investment objective and substantially similar investment policies and restrictions as the Portfolio. The Subsidiary, unlike the Portfolio, may invest, without limitation, in commodities and commodities-related instruments. The Portfolio will be subject to the risks associated with the commodities, derivatives and other instruments in which the Subsidiary invests, to the extent of its investment in the Subsidiary. The Portfolio limits its investment in the Subsidiary to no more than 25% of its net assets.
The Portfolio is non-diversified, which means that it may concentrate its assets in a smaller number of issuers than a diversified fund.
Investment Results
The Portfolio outperformed its primary benchmark, the MSCI AC World Commodity Producers Index, for the six- and 12-month periods ended August 31, 2015, and underperformed its secondary benchmark, the All Market Real Return Portfolio Benchmark, for both periods.
The outperformance during both periods versus the primary benchmark was driven by a strategic exposure to global real estate, which strongly outperformed the primary benchmark (which has no real estate exposure or commodity futures exposure, and has only commodity equity exposure); strategic allocation to commodity futures also boosted performance, although to a smaller degree. Further, overlay positions such as an overweight to the US dollar, CPI swaps, long term oil futures and security selection outperformed relative to the primary benchmark, which helped returns; precious metals stocks detracted for both periods. The underperformance versus the secondary benchmark during both periods was largely driven by exposure to commodity futures; security selection and top-down allocation in global real estate and natural resources added to returns, albeit to a smaller degree.
The Portfolio utilized derivatives in the form of futures, total return swaps, interest rate swaps and written options for hedging and investment purposes, which detracted from returns during both periods in absolute terms; currency forwards were utilized for hedging and investment purposes, which detracted during the six-month period and added
| AB POOLING PORTFOLIOS • | 13 |
during the 12-month period. Inflation swaps for hedging purposes and purchased options for hedging and investment purposes added to returns during both periods.
Volatility Management Portfolio
Investment Objective and Policies
The Portfolio is designed to reduce the overall portfolio volatility and the effects of adverse equity market conditions for a blended-style investor (an “investing Fund”). The Portfolio will not pursue its investment objective of long-term growth of capital and income in isolation, but always with the goal of reducing an investing Fund’s overall equity exposure when appropriate to mitigate equity risk. In other words, in making investment decisions for the Portfolio, the Adviser will consider the blended investing style of the investing Fund and not necessarily the goal of achieving the Portfolio’s investment objective.
The Portfolio will have the ability to invest in a wide array of asset classes, including US, non-US and emerging market equity and fixed-income securities, commodities, real estate investment trusts (“REITs”) and other real estate-related securities, currencies, and inflation-indexed securities. The Portfolio will invest directly in equity securities, but it will also be able to invest without limit in derivative instruments, including futures, forwards, options, swaps and other financially-linked investments.
To effectuate the Portfolio’s dynamic, opportunistic asset allocation approach, the Adviser may invest in derivatives or
ETFs rather than investing directly in equity securities. The Portfolio may use index futures or ETFs, for example, to gain broad exposure to a particular segment of the market, while buying representative equity securities to achieve exposure to another. The Adviser will choose investments, in each case, based on concerns of cost and efficiency of access. The Portfolio’s holdings may be frequently adjusted to reflect the Adviser’s assessment of changing risks. The Adviser believes that these adjustments can also frequently be made efficiently and economically through the use of derivatives strategies and/or ETFs. Similarly, when the Adviser decides to reduce (or eliminate) the Portfolio’s exposure to the equity markets, the Adviser may choose to gain this alternative exposure directly through securities purchases or indirectly through derivatives transactions and/or ETFs. The asset classes selected may or may not be represented by the holdings of other of the Pooling Portfolios, because investment decisions for the Portfolio will be driven by risk mitigation concerns that may be best facilitated through exposure to asset classes not represented elsewhere in the investing Fund’s overall exposure.
The Portfolio has the risk that it may not accomplish its purpose if the Adviser does not correctly assess the risk in equity markets and, consequently, its performance could be affected adversely.
Investment Results
The Portfolio’s long-term objective is to reduce overall volatility and the effects
| 14 | • AB POOLING PORTFOLIOS |
of adverse equity market conditions by reducing equity exposure during periods of high equity market volatility, or when the compensation for equity risk is poor. At such times, the Portfolio will move to underweight stocks relative to the primary benchmark and will seek to diversify across asset classes which are not represented in the benchmark including fixed-income securities and real estate.
During both periods, the Portfolio was fully allocated to growth-sensitive assets until late August, when the Portfolio moved to underweight equity and added to cash in response to rising volatility caused by Chinese currency devaluation and emerging market growth concerns. Throughout both periods, the Portfolio was more diversified than the benchmark through holdings of global REITs and made modest tilts across equity regions. In currency management, the Portfolio partially hedged some exposure back to the US dollar.
For both periods, the Portfolio outperformed its benchmark, the MSCI ACWI, driven by currency management (notably an underweight to the euro versus the US dollar) and regional shifts in equities (an overweight to Japan and decisions to overweight and underweight European exposure at different times in the year). Strategic allocation to REITs added to performance versus the benchmark over the 12-month period, and detracted from performance over the six-month period. The decision to underweight equities at the end of the 12-month period detracted from performance.
During both periods, the Portfolio had modestly higher overall Fund volatility than its primary benchmark.
The Portfolio utilized derivatives including currency forwards for hedging and investment purposes, which added to returns during both periods, in absolute terms; Treasury futures and total return swaps for hedging and investment purposes detracted during both periods.
| AB POOLING PORTFOLIOS • | 15 |
DISCLOSURES AND RISKS
Benchmark Disclosures
None of the indices listed below reflect fees and expenses associated with the active management of a mutual fund portfolio. The unmanaged Russell 1000® Value Index represents the performance of 1,000 large-cap value companies within the US. The unmanaged Russell 1000® Growth Index represents the performance of 1,000 large-cap growth companies within the US. The unmanaged MSCI ACWI ex-US (free float-adjusted, market capitalization weighted) represents the equity market performance of developed and emerging markets, excluding the United States. The unmanaged BofA ML® 1-3 Year US Treasury Index represents the performance of US dollar-denominated sovereign debt publicly issued by the US government in its domestic market with a remaining term to final maturity of one to three years. The unmanaged Barclays Global Aggregate Bond Index (US dollar hedged) represents the performance of the global investment-grade developed fixed-income markets. The unmanaged Barclays 1-10 Year TIPS Index represents the performance of inflation-protected securities issued by the US Treasury. The unmanaged Barclays US High Yield 2% Issuer Capped Index is the 2% issuer capped component of the US Corporate High Yield Index, which represents the performance of fixed-income securities having a maximum quality rating of Ba1, a minimum amount outstanding of $150 million, and at least one year to maturity. The unmanaged Russell 2500™ Value Index represents the performance of 2,500 small- to mid-cap value companies within the US. The unmanaged Russell 2500™ Growth Index represents the performance of 2,500 small- to mid-cap growth companies within the US. The All Market Real Return Portfolio Benchmark is an equally-weighted blend of the MSCI AC World Commodity Producers Index, the FTSE EPRA/NAREIT Global Index and the Dow Jones-UBS Commodity Index. The MSCI AC World Commodity Producers Index is a free float-adjusted, market capitalization index designed to track the performance of global listed commodity producers, including emerging markets. The FTSE EPRA/NAREIT Global Index (market-value-weighted index based upon the last closing price of the month) represents the performance of tax-qualified REITs listed on the NYSE, AMEX and the NASDAQ. The Dow Jones-UBS Commodity Index measures price movements of the commodities included in the appropriate sub index. It does not account for effects of rolling futures contracts or costs associated with holding the physical commodity. Commodities sectors include: energy, grains, industrial metals, petroleum, precious metals and softs. The unmanaged MSCI ACWI (free float-adjusted, market capitalization weighted) represents the equity market performance of developed and emerging markets. MSCI makes no express or implied warranties or representations, and shall have no liability whatsoever with respect to any MSCI data contained herein. The MSCI data may not be further redistributed or used as a basis for other indices, any securities or financial products. This report is not approved, reviewed or produced by MSCI. An investor cannot invest directly in an index, and its results are not indicative of the performance for any specific investment, including the Portfolios.
A Word About Risk
All Portfolios
While the equity Portfolios invest principally in common stocks and other equity securities and the fixed-income Portfolios invest principally in bonds and fixed-income securities, in order to achieve their investment objectives, the Portfolios may at times use certain types of investment derivatives, such as options, futures, forwards and swaps. These instruments involve risks different from, and in certain cases, greater than, the risks presented by more traditional investments. These risks are fully discussed in the Portfolios’ prospectus.
(Disclosures, Risks and Note about Historical Performance continued on next page)
| 16 | • AB POOLING PORTFOLIOS |
Disclosures and Risks
DISCLOSURES AND RISKS
(continued from previous page)
Market Risk: The value of the Portfolios’ assets will fluctuate as the stock or bond market fluctuates. The value of their investments may decline, sometimes rapidly and unpredictably, simply because of economic changes or other events that affect large portions of the market. It includes the risk that a particular style of investing, such as the Portfolios’ value approach, may be underperforming the market generally.
Derivatives Risk: Derivatives may be illiquid, difficult to price and leveraged so that small changes may produce disproportionate losses for the Portfolios, and may be subject to counterparty risk to a greater degree than more traditional investments.
Management Risk: The Portfolios are subject to management risk because they are actively managed investment funds. The Adviser will apply its investment techniques and risk analyses in making investment decisions for the Portfolios, but there is no guarantee that its techniques will produce the intended results.
U.S. Large Cap Growth Portfolio
Focused Portfolio Risk: This is the risk that investments in a limited number of companies may have more risk because changes in the value of a single security may have a more significant effect, either negative or positive, on the Portfolio’s net asset value (“NAV”).
International Value Portfolio, International Growth Portfolio, Short Duration Bond Portfolio, Global Core Bond Portfolio, Bond Inflation Protection Portfolio, High-Yield Portfolio, Small-Mid Cap Value Portfolio, Small-Mid Cap Growth Portfolio, Multi-Asset Real Return Portfolio, Volatility Management Portfolio
Foreign (Non-US) Risk: Investments in securities of non-US issuers may involve more risk than those of US issuers. These securities may fluctuate more widely in price and may be less liquid due to adverse market, economic, political, regulatory or other factors.
International Value Portfolio, International Growth Portfolio, Short Duration Bond Portfolio, Global Core Bond Portfolio, Bond Inflation Protection Portfolio, High-Yield Portfolio, Small-Mid Cap Value Portfolio, Multi-Asset Real Return Portfolio, Volatility Management Portfolio
Currency Risk: Fluctuations in currency exchange rates may negatively affect the value of the Portfolios’ investments or reduce their returns.
International Value Portfolio, International Growth Portfolio, Global Core Bond Portfolio, Volatility Management Portfolio
Emerging Market Risk: Investments in emerging market countries may have more risk because the markets are less developed and less liquid as well as being subject to increased economic, political, regulatory or other uncertainties.
Short Duration Bond Portfolio, Global Core Bond Portfolio, Bond Inflation Protection Portfolio, High-Yield Portfolio, Multi-Asset Real Return Portfolio, Volatility Management Portfolio
Interest Rate Risk: Changes in interest rates will affect the value of investments in fixed-income securities. When interest rates rise, the value of investments in fixed-income securities tends to fall and this decrease in value may not be offset by higher income from new investments. Interest rate risk is generally greater for fixed-income securities with longer maturities or durations.
Credit Risk: An issuer or guarantor of a fixed-income security, or the counterparty to a derivatives or other contract, may be unable or unwilling to make timely payments of interest or principal, or to otherwise honor its obligations. The issuer or
(Disclosures, Risks and Note about Historical Performance continued on next page)
| AB POOLING PORTFOLIOS • | 17 |
Disclosures and Risks
DISCLOSURES AND RISKS
(continued from previous page)
guarantor may default, causing a loss of the full principal amount of a security. The degree of risk for a particular security may be reflected in its credit rating. There is the possibility that the credit rating of a fixed-income security may be downgraded after purchase, which may adversely affect the value of the security. Investments in fixed-income securities with lower ratings tend to have a higher probability that an issuer will default or fail to meet its payment obligations.
Short Duration Bond Portfolio, Global Core Bond Portfolio, Bond Inflation Protection Portfolio, High-Yield Portfolio, Volatility Management Portfolio
Inflation Risk: This is the risk that the value of assets or income from investments will be less in the future as inflation decreases the value of money. As inflation increases, the value of each Portfolio’s assets can decline as can the value of the Portfolios’ distributions.
Short Duration Bond Portfolio, Global Core Bond Portfolio, Bond Inflation Protection Portfolio
Duration Risk: Duration is a measure that relates the expected price volatility of a fixed-income security to changes in interest rates. The duration of a fixed-income security may be shorter than or equal to full maturity of a fixed-income security. Fixed-income securities with longer durations have more risk and will decrease in price as interest rates rise. For example, a fixed-income security with a duration of three years will decrease in value by approximately 3% if interest rates increase by 1%.
Global Core Bond Portfolio, Bond Inflation Protection Portfolio, High-Yield Portfolio, Multi-Asset Real Return Portfolio
Leverage Risk: To the extent the Portfolios use leveraging techniques, their NAV may be more volatile because leverage tends to exaggerate the effect of changes in interest rates and any increase or decrease in the value of the Portfolios’ investments.
Bond Inflation Protection Portfolio, Multi-Asset Real Return Portfolio
Liquidity Risk: Liquidity risk exists when particular investments are difficult to purchase or sell, possibly preventing the Portfolios from selling out of these illiquid securities at an advantageous price. Derivatives and securities involving substantial market and credit risk tend to involve greater liquidity risk.
High-Yield Portfolio
Below Investment Grade Securities Risk: Investments in fixed-income securities with lower ratings (commonly known as “junk bonds”) tend to have a higher probability that an issuer will default or fail to meet its payment obligations. These securities may be subject to greater price volatility due to such factors as specific corporate developments, interest rate sensitivity, negative performance of the junk bond market generally and less secondary market liquidity.
Small-Mid Cap Value Portfolio, Small-Mid Cap Growth Portfolio
Capitalization Risk: Investments in small- and mid-capitalization companies may be more volatile than investments in large-capitalization companies. Investments in small-capitalization companies may have additional risks because these companies have limited product lines, markets or financial resources.
Multi-Asset Real Return Portfolio, Volatility Management Portfolio
Commodity Risk: Investments in commodities and commodity-linked derivative instruments, either directly or through the Subsidiary, may subject the Portfolio to greater volatility than investments in traditional securities. The value of commodity-linked
(Disclosures, Risks and Note about Historical Performance continued on next page)
| 18 | • AB POOLING PORTFOLIOS |
Disclosures and Risks
DISCLOSURES AND RISKS
(continued from previous page)
derivative instruments may be affected by changes in overall market movements, commodity index volatility, changes in interest rates, or factors affecting a particular industry or commodity, such as drought, floods, weather, livestock disease, embargoes, tariffs and international economic, political and regulatory developments.
Multi-Asset Real Return Portfolio
Subsidiary Risk: By investing in the Subsidiary, the Portfolio is indirectly exposed to the risks associated with the Subsidiary’s investments, including its investments in commodities. There is no guarantee that the investment objective of the Subsidiary will be achieved.
Real Estate Risk: The Portfolio’s investments in real estate securities have many of the same risks as direct ownership of real estate, including the risk that the value of real estate could decline due to a variety of factors that affect the real estate market generally. Investments in REITs may have additional risks. REITs are dependent on the capability of their managers, may have limited diversification, and could be significantly affected by changes in taxes.
Diversification Risk: The Portfolio may have more risk because it is “non-diversified”, meaning that it can invest more of its assets in a smaller number of issuers and that adverse changes in the value of one security could have a more significant effect on the Portfolio’s NAV.
An Important Note About Historical Performance
The investment return and principal value of an investment in the Portfolios will fluctuate, so that shares, when redeemed, may be worth more or less than their original cost. Performance shown on the following pages represents past performance and does not guarantee future results. Current performance may be lower or higher than the performance information shown. You may obtain performance information current to the most recent month-end by visiting www.abglobal.com.
Please note: Shares of the Portfolios are offered exclusively to mutual funds advised by, and certain institutional clients of, AB that seek a blend of asset classes for investment. These share classes are not currently offered for direct investment from the general public. The Pooling Portfolios can be purchased at the relevant NAV without a sales charge or other fee. However, there are sales charges in connection to purchases of other AB share classes invested in these Portfolios. For additional information regarding other retail share classes and their sales charges and fees, please visit www.abglobal.com. All fees and expenses related to the operation of the Portfolios have been deducted. Performance assumes reinvestment of distributions and does not account for taxes.
| AB POOLING PORTFOLIOS • | 19 |
Disclosures and Risks
HISTORICAL PERFORMANCE
THE PORTFOLIO VS. ITS BENCHMARK PERIOD ENDED AUGUST 31, 2015 (unaudited)
| Returns | ||||||||||
| U.S. VALUE PORTFOLIO | 6 Months | 12 Months | ||||||||
| AB U.S. Value Portfolio* | -6.25% | -4.21% | ||||||||
| ||||||||||
| Russell 1000 Value Index | -6.73% | -3.48% | ||||||||
| ||||||||||
* Includes the impact of proceeds received and credited to the Portfolio resulting from class-action settlements, which enhanced the performance of the Portfolio for the six- and 12-month periods ended August 31, 2015, by 0.29% and 0.34%, respectively. | ||||||||||
GROWTH OF A $10,000 INVESTMENT IN THE PORTFOLIO 8/31/05 TO 8/31/15 (unaudited)
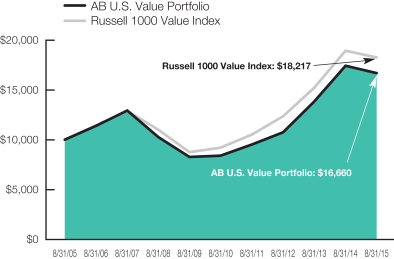
This chart illustrates the total value of an assumed $10,000 investment in AB U.S. Value Portfolio (from 8/31/05 to 8/31/15) as compared to the performance of the Portfolio’s benchmark. The chart assumes the reinvestment of dividends and capital gains distributions.
See Disclosures, Risks and Note about Historical Performance on pages 16-19.
(Historical Performance continued on next page)
| 20 | • AB POOLING PORTFOLIOS |
Historical Performance
HISTORICAL PERFORMANCE
(continued from previous page)
THE PORTFOLIO VS. ITS BENCHMARK PERIOD ENDED AUGUST 31, 2015 (unaudited)
| Returns | ||||||||||
| U.S. LARGE CAP GROWTH PORTFOLIO | 6 Months | 12 Months | ||||||||
| AB U.S. Large Cap Growth Portfolio* | -1.02% | 11.22% | ||||||||
| ||||||||||
| Russell 1000 Growth Index | -3.88% | 4.26% | ||||||||
| ||||||||||
* Includes the impact of proceeds received and credited to the Portfolio resulting from class-action settlements, which enhanced the performance of the Portfolio for the six- and 12-month periods ended August 31, 2015, by 0.00% and 0.01%, respectively. | ||||||||||
GROWTH OF A $10,000 INVESTMENT IN THE PORTFOLIO 8/31/05 TO 8/31/15 (unaudited)
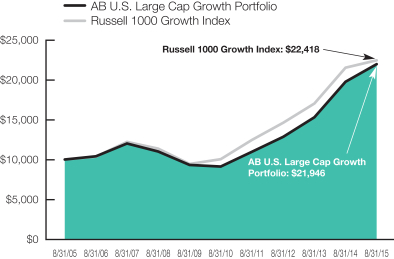
This chart illustrates the total value of an assumed $10,000 investment in AB U.S. Large Cap Growth Portfolio (from 8/31/05 to 8/31/15) as compared to the performance of the Portfolio’s benchmark. The chart assumes the reinvestment of dividends and capital gains distributions.
See Disclosures, Risks and Note about Historical Performance on pages 16-19.
(Historical Performance continued on next page)
| AB POOLING PORTFOLIOS • | 21 |
Historical Performance
HISTORICAL PERFORMANCE
(continued from previous page)
THE PORTFOLIO VS. ITS BENCHMARK PERIOD ENDED AUGUST 31, 2015 (unaudited)
| Returns | ||||||||||
| INTERNATIONAL VALUE PORTFOLIO | 6 Months | 12 Months | ||||||||
| AB International Value Portfolio | -7.96% | -8.59% | ||||||||
| ||||||||||
| MSCI ACWI ex-US | -8.91% | -12.35% | ||||||||
| ||||||||||
GROWTH OF A $10,000 INVESTMENT IN THE PORTFOLIO
8/31/05 TO 8/31/15 (unaudited)
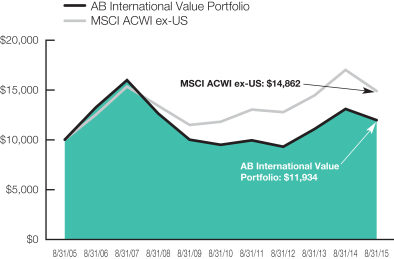
This chart illustrates the total value of an assumed $10,000 investment in AB International Value Portfolio (from 8/31/05 to 8/31/15) as compared to the performance of the Portfolio’s benchmark. The chart assumes the reinvestment of dividends and capital gains distributions.
See Disclosures, Risks and Note about Historical Performance on pages 16-19.
(Historical Performance continued on next page)
| 22 | • AB POOLING PORTFOLIOS |
Historical Performance
HISTORICAL PERFORMANCE
(continued from previous page)
THE PORTFOLIO VS. ITS BENCHMARK
PERIODS ENDED AUGUST 31, 2015 (unaudited)
| Returns | ||||||||||
| INTERNATIONAL GROWTH PORTFOLIO | 6 Months | 12 Months | ||||||||
| AB International Growth Portfolio | -7.44% | -10.86% | ||||||||
| ||||||||||
| MSCI ACWI ex-US | -8.91% | -12.35% | ||||||||
| ||||||||||
GROWTH OF A $10,000 INVESTMENT IN THE PORTFOLIO
8/31/05 TO 8/31/15 (unaudited)
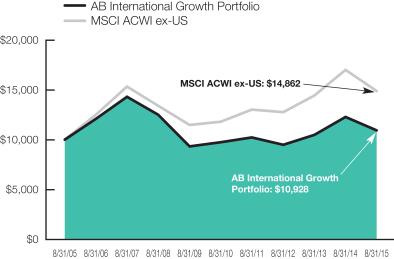
This chart illustrates the total value of an assumed $10,000 investment in AB International Growth Portfolio (from 8/31/05 to 8/31/15) as compared to the performance of the Portfolio’s benchmark. The chart assumes the reinvestment of dividends and capital gains distributions.
See Disclosures, Risks and Note about Historical Performance on pages 16-19.
(Historical Performance continued on next page)
| AB POOLING PORTFOLIOS • | 23 |
Historical Performance
HISTORICAL PERFORMANCE
(continued from previous page)
THE PORTFOLIO VS. ITS BENCHMARK
PERIODS ENDED AUGUST 31, 2015 (unaudited)
| Returns | ||||||||||
| SHORT DURATION BOND PORTFOLIO | 6 Months | 12 Months | ||||||||
| AB Short Duration Bond Portfolio | 0.48% | 0.90% | ||||||||
| ||||||||||
| BofA ML 1-3 Year US Treasury Index | 0.39% | 0.80% | ||||||||
| ||||||||||
GROWTH OF A $10,000 INVESTMENT IN THE PORTFOLIO
8/31/05 TO 8/31/15 (unaudited)
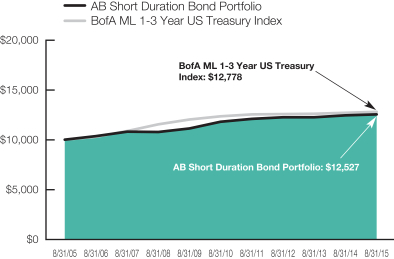
This chart illustrates the total value of an assumed $10,000 investment in AB Short Duration Bond Portfolio (from 8/31/05 to 8/31/15) as compared to the performance of the Portfolio’s benchmark. The chart assumes the reinvestment of dividends and capital gains distributions.
See Disclosures, Risks and Note about Historical Performance on pages 16-19.
(Historical Performance continued on next page)
| 24 | • AB POOLING PORTFOLIOS |
Historical Performance
HISTORICAL PERFORMANCE
(continued from previous page)
THE PORTFOLIO VS. ITS BENCHMARK
PERIODS ENDED AUGUST 31, 2015 (unaudited)
| Returns | ||||||||||
| GLOBAL CORE BOND PORTFOLIO | 6 Months | 12 Months | ||||||||
| AB Global Core Bond Portfolio | -1.03% | 2.15% | ||||||||
| ||||||||||
| Barclays Global Aggregate Bond Index (US dollar hedged) | -0.93% | 2.23% | ||||||||
| ||||||||||
GROWTH OF A $10,000 INVESTMENT IN THE PORTFOLIO
8/31/05 TO 8/31/15 (unaudited)
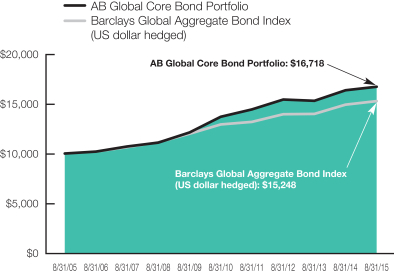
This chart illustrates the total value of an assumed $10,000 investment in AB Global Core Bond Portfolio (from 8/31/05 to 8/31/15) as compared to the performance of the Portfolio’s benchmark. The chart assumes the reinvestment of dividends and capital gains distributions.
See Disclosures, Risks and Note about Historical Performance on pages 16-19.
(Historical Performance continued on next page)
| AB POOLING PORTFOLIOS • | 25 |
Historical Performance
HISTORICAL PERFORMANCE
(continued from previous page)
THE PORTFOLIO VS. ITS BENCHMARK
PERIODS ENDED AUGUST 31, 2015 (unaudited)
| Returns | ||||||||||
| BOND INFLATION PROTECTION PORTFOLIO | 6 Months | 12 Months | ||||||||
| AB Bond Inflation Protection Portfolio | -1.63% | -2.73% | ||||||||
| ||||||||||
| Barclays 1-10 Year TIPS Index | -1.15% | -2.35% | ||||||||
| ||||||||||
GROWTH OF A $10,000 INVESTMENT IN THE PORTFOLIO
8/31/05 TO 8/31/15 (unaudited)
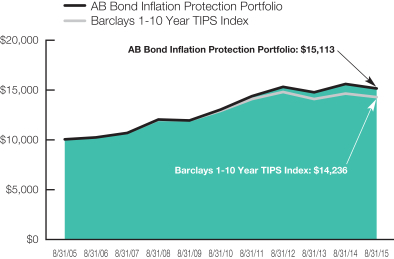
This chart illustrates the total value of an assumed $10,000 investment in AB Bond Inflation Protection Portfolio (from 8/31/05 to 8/31/15) as compared to the performance of the Portfolio’s benchmark. The chart assumes the reinvestment of dividends and capital gains distributions.
See Disclosures, Risks and Note about Historical Performance on pages 16-19.
(Historical Performance continued on next page)
| 26 | • AB POOLING PORTFOLIOS |
Historical Performance
HISTORICAL PERFORMANCE
(continued from previous page)
THE PORTFOLIO VS. ITS BENCHMARK
PERIODS ENDED AUGUST 31, 2015 (unaudited)
| Returns | ||||||||||
| HIGH-YIELD PORTFOLIO | 6 Months | 12 Months | ||||||||
| AB High-Yield Portfolio* | -2.23% | -2.27% | ||||||||
| ||||||||||
| Barclays US High Yield 2% Issuer Capped Index | -2.85% | -2.93% | ||||||||
| ||||||||||
* Includes the impact of proceeds received and credited to the Portfolio resulting from class-action settlements, which enhanced the performance of the Portfolio for the six- and 12-month periods ended August 31, 2015, by 0.05% and 0.09%, respectively.. | ||||||||||
GROWTH OF A $10,000 INVESTMENT IN THE PORTFOLIO
8/31/05 TO 8/31/15 (unaudited)
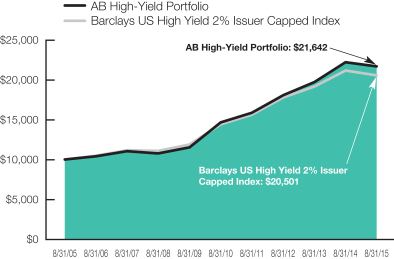
This chart illustrates the total value of an assumed $10,000 investment in AB High-Yield Portfolio (from 8/31/05 to 8/31/15) as compared to the performance of the Portfolio’s benchmark. The chart assumes the reinvestment of dividends and capital gains distributions.
See Disclosures, Risks and Note about Historical Performance on pages 16-19.
(Historical Performance continued on next page)
| AB POOLING PORTFOLIOS • | 27 |
Historical Performance
HISTORICAL PERFORMANCE
(continued from previous page)
THE PORTFOLIO VS. ITS BENCHMARK
PERIODS ENDED AUGUST 31, 2015 (unaudited)
| Returns | ||||||||||
| SMALL-MID CAP VALUE PORTFOLIO | 6 Months | 12 Months | ||||||||
| AB Small-Mid Cap Value Portfolio | -4.43% | -1.38% | ||||||||
| ||||||||||
| Russell 2500 Value Index | -6.52% | -4.77% | ||||||||
| ||||||||||
GROWTH OF A $10,000 INVESTMENT IN THE PORTFOLIO
8/31/05 TO 8/31/15 (unaudited)
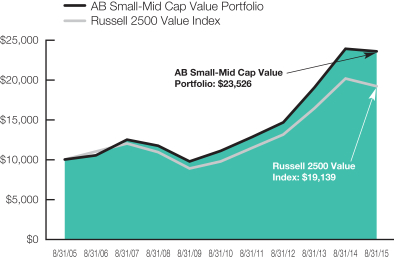
This chart illustrates the total value of an assumed $10,000 investment in AB Small-Mid Cap Value Portfolio (from 8/31/05 to 8/31/15) as compared to the performance of the Portfolio’s benchmark. The chart assumes the reinvestment of dividends and capital gains distributions.
See Disclosures, Risks and Note about Historical Performance on pages 16-19.
(Historical Performance continued on next page)
| 28 | • AB POOLING PORTFOLIOS |
Historical Performance
HISTORICAL PERFORMANCE
(continued from previous page)
THE PORTFOLIO VS. ITS BENCHMARK
PERIODS ENDED AUGUST 31, 2015 (unaudited)
| Returns | ||||||||||
| SMALL-MID CAP GROWTH PORTFOLIO | 6 Months | 12 Months | ||||||||
| AB Small-Mid Cap Growth Portfolio | -2.59% | 3.92% | ||||||||
| ||||||||||
| Russell 2500 Growth Index | -3.78% | 4.53% | ||||||||
| ||||||||||
GROWTH OF A $10,000 INVESTMENT IN THE PORTFOLIO
8/31/05 TO 8/31/15 (unaudited)
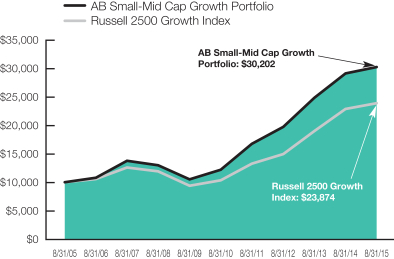
This chart illustrates the total value of an assumed $10,000 investment in AB Small-Mid Cap Growth Portfolio (from 8/31/05 to 8/31/15) as compared to the performance of the Portfolio’s benchmark. The chart assumes the reinvestment of dividends and capital gains distributions.
See Disclosures, Risks and Note about Historical Performance on pages 16-19.
(Historical Performance continued on next page)
| AB POOLING PORTFOLIOS • | 29 |
Historical Performance
HISTORICAL PERFORMANCE
(continued from previous page)
THE PORTFOLIO VS. ITS BENCHMARK
PERIODS ENDED AUGUST 31, 2015 (unaudited)
| Returns | ||||||||||
| MULTI-ASSET REAL RETURN PORTFOLIO | 6 Months | 12 Months | ||||||||
| AB Multi-Asset Real Return Portfolio | -14.23% | -27.40% | ||||||||
| ||||||||||
Primary Benchmark: MSCI AC World Commodity Producers Index | -20.00% | -35.80% | ||||||||
| ||||||||||
Secondary Benchmark: All Market Real Return Portfolio Benchmark | -13.87% | -23.86% | ||||||||
| ||||||||||
GROWTH OF A $10,000 INVESTMENT IN THE PORTFOLIO
8/31/05 TO 8/31/15 (unaudited)
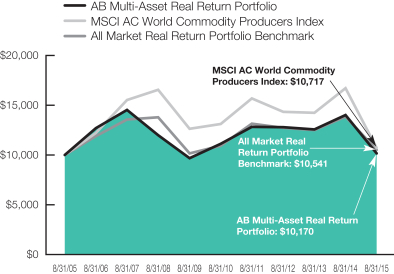
This chart illustrates the total value of an assumed $10,000 investment in AB Multi-Asset Real Return Portfolio (from 8/31/05 to 8/31/15) as compared to the performance of the Portfolio’s benchmark. The chart assumes the reinvestment of dividends and capital gains distributions.
See Disclosures, Risks and Note about Historical Performance on pages 16-19.
(Historical Performance continued on next page)
| 30 | • AB POOLING PORTFOLIOS |
Historical Performance
HISTORICAL PERFORMANCE
(continued from previous page)
THE PORTFOLIO VS. ITS BENCHMARK
PERIODS ENDED AUGUST 31, 2015 (unaudited)
| Returns | ||||||||||
| VOLATILITY MANAGEMENT PORTFOLIO | 6 Months | 12 Months | ||||||||
| AB Volatility Management Portfolio | -6.73% | -3.35% | ||||||||
| ||||||||||
MSCI ACWI | -7.18% | -6.29% | ||||||||
| ||||||||||
GROWTH OF A $10,000 INVESTMENT IN THE PORTFOLIO
4/16/10* TO 8/31/15 (unaudited)
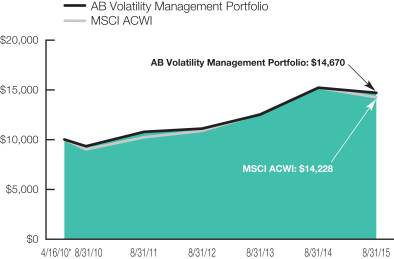
This chart illustrates the total value of an assumed $10,000 investment in AB Volatility Management Portfolio (from 4/16/10* to 8/31/15) as compared to the performance of the Portfolio’s benchmark. The chart assumes the reinvestment of dividends and capital gains distributions.
| * | Inception date: 4/16/2010. |
See Disclosures, Risks and Note about Historical Performance on pages 16-19.
(Historical Performance continued on next page)
| AB POOLING PORTFOLIOS • | 31 |
Historical Performance
HISTORICAL PERFORMANCE
(continued from previous page)
| AVERAGE ANNUAL RETURNS AS OF AUGUST 31, 2015 (unaudited) | ||||
| NAV/SEC Returns* | ||||
| AB U.S. Value Portfolio | ||||
1 Year | -4.21 | % | ||
5 Years | 14.68 | % | ||
10 Years | 5.24 | % | ||
| AB U.S. Large Cap Growth Portfolio | ||||
1 Year | 11.22 | % | ||
5 Years | 19.19 | % | ||
10 Years | 8.18 | % | ||
| AB International Value Portfolio | ||||
1 Year | -8.59 | % | ||
5 Years | 4.70 | % | ||
10 Years | 1.78 | % | ||
| AB International Growth Portfolio | ||||
1 Year | -10.86 | % | ||
5 Years | 2.37 | % | ||
10 Years | 0.89 | % | ||
| AB Short Duration Bond Portfolio | ||||
1 Year | 0.90 | % | ||
5 Years | 1.21 | % | ||
10 Years | 2.28 | % | ||
| AB Global Core Bond Portfolio | ||||
1 Year | 2.15 | % | ||
5 Years | 4.08 | % | ||
10 Years | 5.27 | % | ||
| AB Bond Inflation Protection Portfolio | ||||
1 Year | -2.73 | % | ||
5 Years | 3.07 | % | ||
10 Years | 4.22 | % | ||
| AB High-Yield Portfolio | ||||
1 Year | -2.27 | % | ||
5 Years | 8.13 | % | ||
10 Years | 8.03 | % | ||
| * | These Portfolios are offered at NAV, and their SEC returns are the same as their NAV returns. |
See Disclosures, Risks and Note about Historical Performance on pages 16-19.
(Historical Performance continued on next page)
| 32 | • AB POOLING PORTFOLIOS |
Historical Performance
HISTORICAL PERFORMANCE
(continued from previous page)
| AVERAGE ANNUAL RETURNS AS OF AUGUST 31, 2015 (unaudited) | ||||
| NAV/SEC Returns* | ||||
| AB Small-Mid Cap Value Portfolio | ||||
1 Year | -1.38 | % | ||
5 Years | 16.29 | % | ||
10 Years | 8.93 | % | ||
| AB Small-Mid Cap Growth Portfolio | ||||
1 Year | 3.92 | % | ||
5 Years | 19.87 | % | ||
10 Years | 11.69 | % | ||
| AB Multi-Asset Real Return Portfolio | ||||
1 Year | -27.40 | % | ||
5 Years | -1.78 | % | ||
10 Years | 0.17 | % | ||
| AB Volatility Management Portfolio | ||||
1 Year | -3.35 | % | ||
5 Years | 9.52 | % | ||
Since Inception† | 7.39 | % | ||
| * | These Portfolios are offered at NAV, and their SEC returns are the same as their NAV returns. |
| † | Inception date: 4/16/2010. |
See Disclosures, Risks and Note about Historical Performance on pages 16-19.
(Historical Performance continued on next page)
| AB POOLING PORTFOLIOS • | 33 |
Historical Performance
HISTORICAL PERFORMANCE
(continued from previous page)
SEC AVERAGE ANNUAL RETURNS AS OF THE MOST RECENT CALENDAR QUARTER-END SEPTEMBER 30, 2015 (unaudited) | ||||
| SEC Returns* | ||||
| AB U.S. Value Portfolio | ||||
1 Year | -5.07 | % | ||
5 Years | 12.15 | % | ||
10 Years | 4.78 | % | ||
| AB U.S. Large Cap Growth Portfolio | ||||
1 Year | 10.21 | % | ||
5 Years | 16.49 | % | ||
10 Years | 7.67 | % | ||
| AB International Value Portfolio | ||||
1 Year | -8.25 | % | ||
5 Years | 1.76 | % | ||
10 Years | 0.97 | % | ||
| AB International Growth Portfolio | ||||
1 Year | -7.15 | % | ||
5 Years | -0.11 | % | ||
10 Years | 0.20 | % | ||
| AB Short Duration Bond Portfolio | ||||
1 Year | 1.15 | % | ||
5 Years | 1.18 | % | ||
10 Years | 2.31 | % | ||
| AB Global Core Bond Portfolio | ||||
1 Year | 3.27 | % | ||
5 Years | 4.10 | % | ||
10 Years | 5.42 | % | ||
| AB Bond Inflation Protection Portfolio | ||||
1 Year | -1.30 | % | ||
5 Years | 2.70 | % | ||
10 Years | 4.16 | % | ||
| AB High-Yield Portfolio | ||||
1 Year | -3.73 | % | ||
5 Years | 6.75 | % | ||
10 Years | 7.78 | % | ||
| * | These Portfolios are offered at NAV, and their SEC returns are the same as their NAV returns. |
See Disclosures, Risks and Note about Historical Performance on pages 16-19.
(Historical Performance continued on next page)
| 34 | • AB POOLING PORTFOLIOS |
Historical Performance
HISTORICAL PERFORMANCE
(continued from previous page)
SEC AVERAGE ANNUAL RETURNS AS OF THE MOST RECENT CALENDAR QUARTER-END SEPTEMBER 30, 2015 (unaudited) | ||||
| SEC Returns* | ||||
| AB Small-Mid Cap Value Portfolio | ||||
1 Year | 0.77 | % | ||
5 Years | 12.77 | % | ||
10 Years | 8.63 | % | ||
| AB Small-Mid Cap Growth Portfolio | ||||
1 Year | 0.15 | % | ||
5 Years | 14.79 | % | ||
10 Years | 10.68 | % | ||
| AB Multi-Asset Real Return Portfolio | ||||
1 Year | -25.81 | % | ||
5 Years | -4.49 | % | ||
10 Years | -0.43 | % | ||
| AB Volatility Management Portfolio | ||||
1 Year | -2.68 | % | ||
5 Years | 7.34 | % | ||
Since Inception† | 6.73 | % | ||
| * | These Portfolios are offered at NAV, and their SEC returns are the same as their NAV returns. |
| † | Inception date: 4/16/2010. |
See Disclosures, Risks and Note about Historical Performance on pages 16-19.
| AB POOLING PORTFOLIOS • | 35 |
Historical Performance
EXPENSE EXAMPLE
(unaudited)
As a shareholder of the Fund, you incur two types of costs: (1) transaction costs, including sales charges (loads) on purchase payments, contingent deferred sales charges on redemptions and (2) ongoing costs, including management fees; distribution (12b-1) fees; and other Fund expenses. This example is intended to help you understand your ongoing costs (in dollars) of investing in the Fund and to compare these costs with the ongoing costs of investing in other mutual funds.
The Example is based on an investment of $1,000 invested at the beginning of the period and held for the entire period as indicated below.
Actual Expenses
The table below provides information about actual account values and actual expenses. You may use the information in this line, together with the amount you invested, to estimate the expenses that you paid over the period. Simply divide your account value by $1,000 (for example, an $8,600 account value divided by $1,000 = 8.6), then multiply the result by the number in the first line under the heading entitled “Expenses Paid During Period” to estimate the expenses you paid on your account during this period.
Hypothetical Example for Comparison Purposes
The table below provides information about hypothetical account values and hypothetical expenses based on the Fund’s actual expense ratio and an assumed annual rate of return of 5% before expenses, which is not the Fund’s actual return. The hypothetical account values and expenses may not be used to estimate the actual ending account balance or expenses you paid for the period. You may use this information to compare the ongoing costs of investing in the Fund and other funds by comparing this 5% hypothetical example with the 5% hypothetical examples that appear in the shareholder reports of other funds.
Please note that the expenses shown in the table are meant to highlight your ongoing costs only and do not reflect any transactional costs, such as sales charges (loads), or contingent deferred sales charges on redemptions. Therefore, the second line of the table is useful in comparing ongoing costs only, and will not help you determine the relative total costs of owning different funds. In addition, if these transactional costs were included, your costs would have been higher.
| Beginning Account Value March 1, 2015 | Ending Account Value August 31, 2015 | Expenses Paid During Period* | Annualized Expense Ratio* | |||||||||||||
| AB U.S. Value | ||||||||||||||||
Actual | $ | 1,000 | $ | 937.50 | $ | 0.29 | 0.06 | % | ||||||||
Hypothetical** | $ | 1,000 | $ | 1,024.90 | $ | 0.31 | 0.06 | % | ||||||||
| AB U.S. Large Cap Growth | ||||||||||||||||
Actual | $ | 1,000 | $ | 989.80 | $ | 0.30 | 0.06 | % | ||||||||
Hypothetical** | $ | 1,000 | $ | 1,024.90 | $ | 0.31 | 0.06 | % | ||||||||
| AB International Value | ||||||||||||||||
Actual | $ | 1,000 | $ | 920.40 | $ | 0.39 | 0.08 | % | ||||||||
Hypothetical** | $ | 1,000 | $ | 1,024.80 | $ | 0.41 | 0.08 | % | ||||||||
| AB International Growth | ||||||||||||||||
Actual | $ | 1,000 | $ | 925.60 | $ | 0.49 | 0.10 | % | ||||||||
Hypothetical** | $ | 1,000 | $ | 1,024.70 | $ | 0.51 | 0.10 | % | ||||||||
| 36 | • AB POOLING PORTFOLIOS |
Expense Example
EXPENSE EXAMPLE
(unaudited)
(continued from previous page)
| Beginning Account Value March 1, 2015 | Ending Account Value August 31, 2015 | Expenses Paid During Period* | Annualized Expense Ratio* | |||||||||||||
| AB Short Duration Bond | ||||||||||||||||
Actual | $ | 1,000 | $ | 1,004.80 | $ | 0.20 | 0.04 | % | ||||||||
Hypothetical** | $ | 1,000 | $ | 1,025.00 | $ | 0.20 | 0.04 | % | ||||||||
| AB Global Core Bond | ||||||||||||||||
Actual | $ | 1,000 | $ | 989.70 | $ | 0.25 | 0.05 | % | ||||||||
Hypothetical** | $ | 1,000 | $ | 1,024.95 | $ | 0.26 | 0.05 | % | ||||||||
| AB Bond Inflation Protection | ||||||||||||||||
Actual | $ | 1,000 | $ | 983.70 | $ | 0.75 | 0.15 | % | ||||||||
Hypothetical** | $ | 1,000 | $ | 1,024.45 | $ | 0.77 | 0.15 | % | ||||||||
| AB High-Yield | ||||||||||||||||
Actual | $ | 1,000 | $ | 977.70 | $ | 0.70 | 0.14 | % | ||||||||
Hypothetical** | $ | 1,000 | $ | 1,024.50 | $ | 0.71 | 0.14 | % | ||||||||
| AB Small-Mid Cap Value | ||||||||||||||||
Actual | $ | 1,000 | $ | 955.70 | $ | 0.44 | 0.09 | % | ||||||||
Hypothetical** | $ | 1,000 | $ | 1,024.75 | $ | 0.46 | 0.09 | % | ||||||||
| AB Small-Mid Cap Growth | ||||||||||||||||
Actual | $ | 1,000 | $ | 974.10 | $ | 0.50 | 0.10 | % | ||||||||
Hypothetical** | $ | 1,000 | $ | 1,024.70 | $ | 0.51 | 0.10 | % | ||||||||
| AB Multi-Asset Real Return*** | ||||||||||||||||
Actual | $ | 1,000 | $ | 857.70 | $ | 0.33 | 0.07 | % | ||||||||
Hypothetical** | $ | 1,000 | $ | 1,024.85 | $ | 0.36 | 0.07 | % | ||||||||
| AB Volatility Management | ||||||||||||||||
Actual | $ | 1,000 | $ | 932.70 | $ | 0.24 | 0.05 | % | ||||||||
Hypothetical** | $ | 1,000 | $ | 1,024.95 | $ | 0.26 | 0.05 | % | ||||||||
| * | Expenses are equal to the Portfolio’s annualized expense ratio, multiplied by the average account value over the period, multiplied by 184/365 (to reflect the one-half year period). |
| ** | Assumes 5% annual return before expenses. |
| *** | Consolidated (see Note A). |
| AB POOLING PORTFOLIOS • | 37 |
Expense Example
AB U.S. VALUE PORTFOLIO
PORTFOLIO SUMMARY
August 31, 2015 (unaudited)
PORTFOLIO STATISTICS
Net Assets ($mil): $449.5
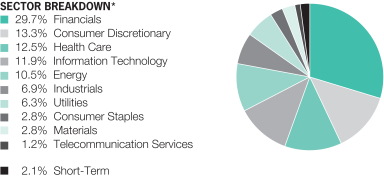
| * | All data are as of August 31, 2015. The Portfolio’s sector breakdown is expressed as a percentage of total investments (excluding security lending collateral) and may vary over time. |
| Please note: The sector classifications presented herein are based on the Global Industry Classification Standard (GICS) which was developed by Morgan Stanley Capital International and Standard & Poor’s. The components are divided into sector, industry group, and industry sub-indices as classified by the GICS for each of the market capitalization indices in the broad market. These sector classifications are broadly defined. The “Portfolio of Investments” section of the report reflects more specific industry information and is consistent with the investment restrictions discussed in the Portfolio’s prospectus. |
| 38 | • AB POOLING PORTFOLIOS |
Portfolio Summary
AB U.S. LARGE CAP GROWTH PORTFOLIO
PORTFOLIO SUMMARY
August 31, 2015 (unaudited)
PORTFOLIO STATISTICS
Net Assets ($mil): $453.6
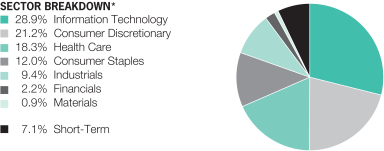
| * | All data are as of August 31, 2015. The Portfolio’s sector breakdown is expressed as a percentage of total investments (excluding security lending collateral) and may vary over time. |
| Please note: The sector classifications presented herein are based on the Global Industry Classification Standard (GICS) which was developed by Morgan Stanley Capital International and Standard & Poor’s. The components are divided into sector, industry group, and industry sub-indices as classified by the GICS for each of the market capitalization indices in the broad market. These sector classifications are broadly defined. The “Portfolio of Investments” section of the report reflects more specific industry information and is consistent with the investment restrictions discussed in the Portfolio’s prospectus. |
| AB POOLING PORTFOLIOS • | 39 |
Portfolio Summary
AB INTERNATIONAL VALUE PORTFOLIO
PORTFOLIO SUMMARY
August 31, 2015 (unaudited)
PORTFOLIO STATISTICS
Net Assets ($mil): $372.4
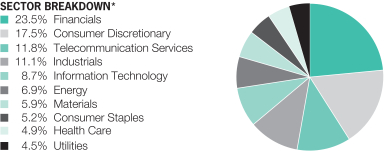
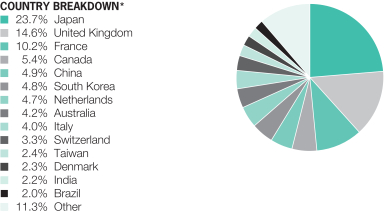
| * | All data are as of August 31, 2015. The Portfolio’s sector and country breakdowns are expressed as a percentage of total investments (excluding security lending collateral) and may vary over time. The Portfolio also enters into derivative transactions, which may be used for hedging or investment purposes (see “Portfolio of Investments” section of the report for additional details). “Other” country weightings represent 1.8% or less in the following countries: Argentina, Belgium, Germany, Hong Kong, Indonesia, Israel, Norway, Portugal, Russia, South Africa and Turkey. |
Please note: The sector classifications presented herein are based on the Global Industry Classification Standard (GICS) which was developed by Morgan Stanley Capital International and Standard & Poor’s. The components are divided into sector, industry group, and industry sub-indices as classified by the GICS for each of the market capitalization indices in the broad market. These sector classifications are broadly defined. The “Portfolio of Investments” section of the report reflects more specific industry information and is consistent with the investment restrictions discussed in the Portfolio’s prospectus.
| 40 | • AB POOLING PORTFOLIOS |
Portfolio Summary
AB INTERNATIONAL GROWTH PORTFOLIO
PORTFOLIO SUMMARY
August 31, 2015 (unaudited)
PORTFOLIO STATISTICS
Net Assets ($mil): $375.3
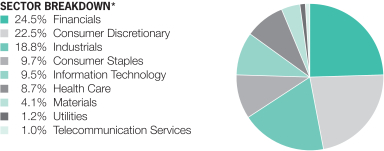
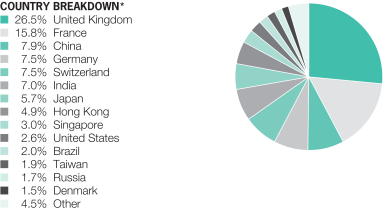
| * | All data are as of August 31, 2015. The Portfolio’s sector and country breakdowns are expressed as a percentage of total investments (excluding security lending collateral) and may vary over time. The Portfolio also enters into derivative transactions, which may be used for hedging or investment purposes (see “Portfolio of Investments” section of the report for additional details). “Other” country weightings represent 1.3% or less in the following countries: Indonesia, Luxembourg, Philippines, South Africa, Sweden and Thailand. |
Please note: The sector classifications presented herein are based on the Global Industry Classification Standard (GICS) which was developed by Morgan Stanley Capital International and Standard & Poor’s. The components are divided into sector, industry group, and industry sub-indices as classified by the GICS for each of the market capitalization indices in the broad market. These sector classifications are broadly defined. The “Portfolio of Investments” section of the report reflects more specific industry information and is consistent with the investment restrictions discussed in the Portfolio’s prospectus.
| AB POOLING PORTFOLIOS • | 41 |
Portfolio Summary
AB SHORT DURATION BOND PORTFOLIO
PORTFOLIO SUMMARY
August 31, 2015 (unaudited)
PORTFOLIO STATISTICS
Net Assets ($mil): $898.4
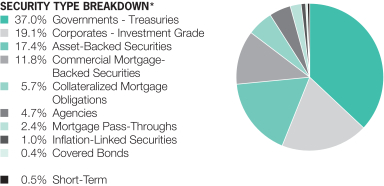
| * | All data are as of August 31, 2015. The Portfolio’s security type breakdown is expressed as a percentage of total investments and may vary over time. The Portfolio also enters into derivative transactions, which may be used for hedging or investment purposes (see “Portfolio of Investments” section of the report for additional details). |
| 42 | • AB POOLING PORTFOLIOS |
Portfolio Summary
AB GLOBAL CORE BOND PORTFOLIO
PORTFOLIO SUMMARY
August 31, 2015 (unaudited)
PORTFOLIO STATISTICS
Net Assets ($mil): $931.0
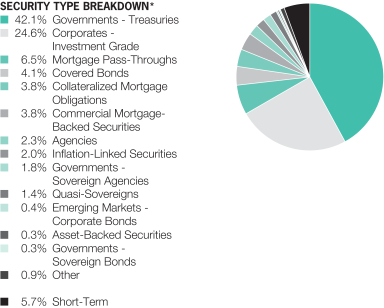
| * | All data are as of August 31, 2015. The Portfolio’s security type breakdown is expressed as a percentage of total investments and may vary over time. The Portfolio also enters into derivative transactions, which may be used for hedging or investment purposes (see “Portfolio of Investments” section of the report for additional details). “Other” security type weightings represent 0.3% or less in the following types: Corporates – Non-Investment Grade, Local Governments-Municipal Bonds, and Supranationals. |
| AB POOLING PORTFOLIOS • | 43 |
Portfolio Summary
AB GLOBAL CORE BOND PORTFOLIO
PORTFOLIO SUMMARY
August 31, 2015 (unaudited)
PORTFOLIO STATISTICS
Net Assets ($mil): $931.0
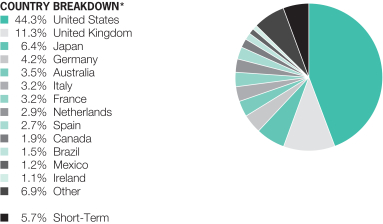
| * | All data are as of August 31, 2015. The Portfolio’s country breakdown is expressed as a percentage of total investments and may vary over time. The Portfolio also enters into derivative transactions, which may be used for hedging or investment purposes (see “Portfolio of Investments” section of the report for additional details). “Other” country weightings represent 1.0% or less in the following countries: Belgium, Chile, China, Colombia, Denmark, India, Indonesia, Malaysia, Morocco, Norway, Peru, Portugal, Qatar, Singapore, South Africa, Supranational, Sweden, Switzerland and United Arab Emirates. |
| 44 | • AB POOLING PORTFOLIOS |
Portfolio Summary
AB BOND INFLATION PROTECTION PORTFOLIO
PORTFOLIO SUMMARY
August 31, 2015 (unaudited)
PORTFOLIO STATISTICS
Net Assets ($mil): $717.0
Total Investments ($mil): $914.9
| INFLATION PROTECTION BREAKDOWN* | ||||
Inflation-Protected Exposure – U.S. | 99.5 | % | ||
Inflation-Protected Exposure – Non-U.S. | — | |||
Non-Inflation-Protected Exposure | 0.5 | % | ||
|
| |||
Total | 100 | % | ||
| SECTOR BREAKDOWN OF NET PORTFOLIO ASSETS, EXCLUDING TREASURY SECURITIES, TIPS, INTEREST RATE DERIVATIVES AND NET CASH EQUIVALENTS* | ||||
Corporates – Investment Grade | 15.7 | % | ||
Asset-Backed Securities | 11.1 | % | ||
Commercial Mortgage-Backed Securities | 9.9 | % | ||
Collateralized Mortgage Obligations | 2.4 | % | ||
Governments – Sovereign Agencies | 0.7 | % | ||
Quasi-Sovereigns | 0.6 | % | ||
Emerging Markets – Corporate Bonds | 0.2 | % | ||
Common Stocks | 0.2 | % | ||
Preferred Stocks | 0.1 | % | ||
Governments – Sovereign Bonds | 0.1 | % | ||
Corporates – Non-Investment Grade | (0.9 | )% | ||
| * | All data are as of August 31, 2015. The Portfolio’s sector and inflation protection exposure breakdowns are expressed as an approximate percentage of the Portfolio’s total net assets (and may vary over time) inclusive of derivative exposure except as noted, based on the Adviser’s internal classification. |
| AB POOLING PORTFOLIOS • | 45 |
Portfolio Summary
AB BOND INFLATION PROTECTION PORTFOLIO
PORTFOLIO SUMMARY
August 31, 2015 (unaudited)
PORTFOLIO STATISTICS
Net Assets ($mil): $717.0
Total Investments ($mil): $914.9
| SECTOR BREAKDOWN OF TOTAL PORTFOLIO INVESTMENTS, EXCLUDING DERIVATIVES* | ||||
Inflation-Linked Securities | 63.2 | % | ||
Corporates – Investment Grade | 14.4 | % | ||
Asset-Backed Securities | 8.7 | % | ||
Commercial Mortgage-Backed Securities | 7.7 | % | ||
Corporates – Non-Investment Grade | 2.0 | % | ||
Collateralized Mortgage Obligations | 1.9 | % | ||
Governments – Sovereign Agencies | 0.6 | % | ||
Quasi-Sovereigns | 0.5 | % | ||
Governments – Treasuries | 0.3 | % | ||
Emerging Markets – Corporate Bonds | 0.1 | % | ||
Common Stocks | 0.1 | % | ||
Preferred Stocks | 0.1 | % | ||
Short-Term | 0.4 | % | ||
| * | The Portfolio’s sector breakdown is expressed, based on the Adviser’s internal classification, as a percentage of total investments and may vary over time. The Portfolio also enters into derivative transactions (not reflected in the table), which may be used for hedging or investment purposes or to adjust the risk profile or exposures of the Portfolio (see “Portfolio of Investments” section of the report for additional details). Derivative transactions may result in a form of leverage for the Portfolio. The Portfolio uses leverage for investment purposes by entering into reverse repurchase agreements. As a result, the Portfolio’s total investments will generally exceed its net assets. |
| 46 | • AB POOLING PORTFOLIOS |
Portfolio Summary
AB HIGH-YIELD PORTFOLIO
PORTFOLIO SUMMARY
August 31, 2015 (unaudited)
PORTFOLIO STATISTICS
Net Assets ($mil): $322.8

| * | All data are as of August 31, 2015. The Portfolio’s security type breakdown is expressed as a percentage of total investments and may vary over time. The Portfolio also enters into derivative transactions, which may be used for hedging or investment purposes (see “Portfolio of Investments” section of the report for additional details). “Other” securities type weightings represent 0.1% or less in the following security types: Emerging Markets – Sovereigns, Options Purchased – Calls, Options Purchased – Puts, and Warrants. |
| AB POOLING PORTFOLIOS • | 47 |
Portfolio Summary
AB SMALL-MID CAP VALUE PORTFOLIO
PORTFOLIO SUMMARY
August 31, 2015 (unaudited)
PORTFOLIO STATISTICS
Net Assets ($mil): $281.7
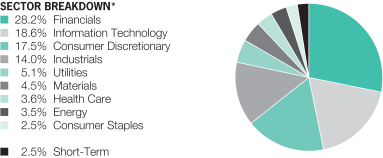
| * | All data are as of August 31, 2015. The Portfolio’s sector breakdown is expressed as a percentage of total investments (excluding security lending collateral) and may vary over time. |
Please note: The sector classifications presented herein are based on the Global Industry Classification Standard (GICS) which was developed by Morgan Stanley Capital International and Standard & Poor’s. The components are divided into sector, industry group, and industry sub-indices as classified by the GICS for each of the market capitalization indices in the broad market. These sector classifications are broadly defined. The “Portfolio of Investments” section of the report reflects more specific industry information and is consistent with the investment restrictions discussed in the Portfolio’s prospectus.
| 48 | • AB POOLING PORTFOLIOS |
Portfolio Summary
AB SMALL-MID CAP GROWTH PORTFOLIO
PORTFOLIO SUMMARY
August 31, 2015 (unaudited)
PORTFOLIO STATISTICS
Net Assets ($mil): $279.9
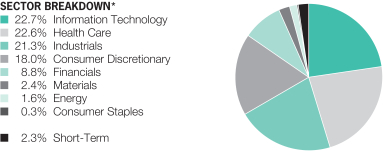
| * | All data are as of August 31, 2015. The Portfolio’s sector breakdown is expressed as a percentage of total investments (excluding security lending collateral) and may vary over time. |
Please note: The sector classifications presented herein are based on the Global Industry Classification Standard (GICS) which was developed by Morgan Stanley Capital International and Standard & Poor’s. The components are divided into sector, industry group, and industry sub-indices as classified by the GICS for each of the market capitalization indices in the broad market. These sector classifications are broadly defined. The “Portfolio of Investments” section of the report reflects more specific industry information and is consistent with the investment restrictions discussed in the Portfolio’s prospectus.
| AB POOLING PORTFOLIOS • | 49 |
Portfolio Summary
AB MULTI-ASSET REAL RETURN PORTFOLIO
PORTFOLIO SUMMARY
August 31, 2015 (unaudited)
PORTFOLIO STATISTICS
Net Assets ($mil): $832.8
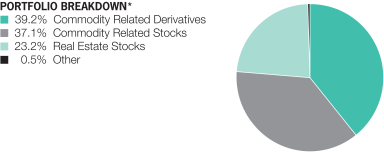
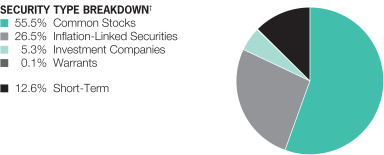
| * | All data are as of August 31, 2015. The Portfolio’s portfolio type breakdown is expressed as an approximate percentage of the Portfolio’s net assets inclusive of derivative exposure, based on the Adviser’s internal classification guidelines. |
| † | The Portfolio’s security type breakdown is expressed as a percentage of total investments (excluding security lending collateral) and may vary over time. The Portfolio also enters into derivative transactions, which may be used for hedging or investment purposes (see “Portfolio of Investments” section of the report for additional details). |
| 50 | • AB POOLING PORTFOLIOS |
Portfolio Summary
AB MULTI-ASSET REAL RETURN PORTFOLIO
PORTFOLIO SUMMARY
August 31, 2015 (unaudited)
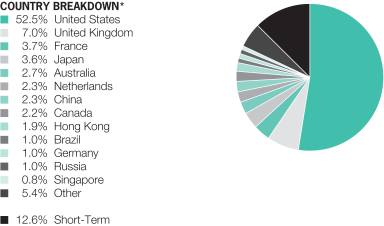
| * | All data are as of August 31, 2015. The Portfolio’s country breakdown is expressed as a percentage of total investments (excluding security lending collateral) and may vary over time. The Portfolio also enters into derivative transactions, which may be used for hedging or investment purposes (see “Portfolio of Investments” section of the report for additional details). “Other” country weightings represent 0.6% or less in the following countries: Austria, Belgium, Denmark, Finland, India, Indonesia, Ireland, Israel, Italy, Jersey (Channel Islands), Malaysia, Mexico, New Zealand, Norway, Philippines, Poland, Portugal, South Africa, South Korea, Spain, Sweden, Switzerland, Taiwan, Thailand, Turkey and United Arab Emirates. |
| AB POOLING PORTFOLIOS • | 51 |
Portfolio Summary
AB VOLATILITY MANAGEMENT
PORTFOLIO SUMMARY
August 31, 2015 (unaudited)
PORTFOLIO STATISTICS
Net Assets ($mil): $1,278.0
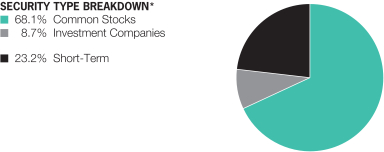
TEN LARGEST HOLDINGS†
August 31, 2015 (unaudited)
| Company | U.S. $ Value | Percent of Net Assets | ||||||
iShares Core MSCI Emerging Markets ETF | $ | 94,701,459 | 7.4 | % | ||||
Apple, Inc. | 18,245,695 | 1.4 | ||||||
Google, Inc. — Class A and Class C | 10,105,386 | 0.8 | ||||||
Microsoft Corp. | 9,938,662 | 0.8 | ||||||
Exxon Mobil Corp. | 8,788,258 | 0.7 | ||||||
Vanguard REIT ETF | 8,125,903 | 0.6 | ||||||
iShares International Developed Real Estate ETF | 8,111,629 | 0.6 | ||||||
Johnson & Johnson | 7,274,052 | 0.6 | ||||||
Wells Fargo & Co. | 6,962,231 | 0.6 | ||||||
General Electric Co. | 6,954,564 | 0.5 | ||||||
| $ | 179,207,839 | 14.0 | % | |||||
| * | All data are as of August 31, 2015. The Portfolio’s security type breakdown is expressed as a percentage of total investments (excluding security lending collateral) and may vary over time. The Portfolio also enters into derivative transactions, which may be used for hedging or investment purposes (see “Portfolio of Investments” section of the report for additional details). |
| † | Long-term investments. |
| 52 | • AB POOLING PORTFOLIOS |
Portfolio Summary and Ten Largest Holdings
AB U.S. VALUE PORTFOLIO
PORTFOLIO OF INVESTMENTS
August 31, 2015
| Company | Shares | U.S. $ Value | ||||||
| ||||||||
COMMON STOCKS – 98.2% | ||||||||
Financials – 29.8% | ||||||||
Banks – 14.6% | ||||||||
Bank of America Corp. | 898,126 | $ | 14,675,379 | |||||
Citigroup, Inc. | 149,506 | 7,995,581 | ||||||
Citizens Financial Group, Inc. | 297,840 | 7,392,389 | ||||||
Comerica, Inc. | 70,970 | 3,122,680 | ||||||
Fifth Third Bancorp | 55,790 | 1,111,337 | ||||||
JPMorgan Chase & Co. | 181,759 | 11,650,752 | ||||||
KeyCorp | 42,990 | 590,682 | ||||||
PNC Financial Services Group, Inc. (The) | 25,946 | 2,364,199 | ||||||
SunTrust Banks, Inc. | 17,243 | 696,100 | ||||||
Wells Fargo & Co. | 297,225 | 15,851,009 | ||||||
|
| |||||||
| 65,450,108 | ||||||||
|
| |||||||
Capital Markets – 2.4% | ||||||||
Bank of New York Mellon Corp. (The) | 59,200 | 2,356,160 | ||||||
Goldman Sachs Group, Inc. (The) | 22,008 | 4,150,709 | ||||||
Morgan Stanley | 75,873 | 2,613,825 | ||||||
State Street Corp. | 26,720 | 1,921,702 | ||||||
|
| |||||||
| 11,042,396 | ||||||||
|
| |||||||
Consumer Finance – 3.5% | ||||||||
Capital One Financial Corp. | 110,000 | 8,552,500 | ||||||
Discover Financial Services | 67,246 | 3,613,128 | ||||||
Springleaf Holdings, Inc.(a) | 76,853 | 3,439,940 | ||||||
|
| |||||||
| 15,605,568 | ||||||||
|
| |||||||
Diversified Financial Services – 2.1% | ||||||||
Berkshire Hathaway, Inc. – Class B(a) | 32,080 | 4,300,003 | ||||||
Voya Financial, Inc. | 117,644 | 5,068,104 | ||||||
|
| |||||||
| 9,368,107 | ||||||||
|
| |||||||
Insurance – 7.2% | ||||||||
ACE Ltd. | 16,404 | 1,675,833 | ||||||
Allstate Corp. (The) | 131,800 | 7,681,304 | ||||||
American Financial Group, Inc./OH | 75,140 | 5,189,168 | ||||||
American International Group, Inc. | 66,850 | 4,033,729 | ||||||
Aon PLC | 46,945 | 4,386,541 | ||||||
First American Financial Corp. | 35,936 | 1,396,473 | ||||||
Hanover Insurance Group, Inc. (The) | 37,403 | 2,951,097 | ||||||
MetLife, Inc. | 19,316 | 967,731 | ||||||
Travelers Cos., Inc. (The) | 35,680 | �� | 3,551,944 | |||||
Unum Group | 16,670 | 559,112 | ||||||
|
| |||||||
| 32,392,932 | ||||||||
|
| |||||||
| 133,859,111 | ||||||||
|
| |||||||
Consumer Discretionary – 13.3% | ||||||||
Auto Components – 2.0% | ||||||||
Lear Corp. | 44,952 | 4,620,616 | ||||||
Magna International, Inc. (New York) – Class A | 91,579 | 4,504,771 | ||||||
|
| |||||||
| 9,125,387 | ||||||||
|
| |||||||
| AB POOLING PORTFOLIOS • | 53 |
AB U.S. Value Portfolio—Portfolio of Investments
| Company | Shares | U.S. $ Value | ||||||
| ||||||||
Automobiles – 1.1% | ||||||||
Ford Motor Co. | 179,451 | $ | 2,488,985 | |||||
General Motors Co. | 79,874 | 2,351,491 | ||||||
|
| |||||||
| 4,840,476 | ||||||||
|
| |||||||
Hotels, Restaurants & Leisure – 0.2% | ||||||||
Carnival Corp. | 16,637 | 819,039 | ||||||
|
| |||||||
Media – 2.4% | ||||||||
Comcast Corp. – Class A | 68,913 | 3,881,869 | ||||||
Thomson Reuters Corp. | 17,294 | 671,353 | ||||||
Time Warner, Inc. | 77,181 | 5,487,569 | ||||||
Twenty-First Century Fox, Inc. – Class A | 19,319 | 529,148 | ||||||
|
| |||||||
| 10,569,939 | ||||||||
|
| |||||||
Multiline Retail – 3.5% | ||||||||
Dollar General Corp. | 57,720 | 4,299,563 | ||||||
Kohl’s Corp. | 96,583 | 4,928,630 | ||||||
Macy’s, Inc. | 36,485 | 2,138,386 | ||||||
Target Corp. | 57,593 | 4,475,552 | ||||||
|
| |||||||
| 15,842,131 | ||||||||
|
| |||||||
Specialty Retail – 4.1% | ||||||||
American Eagle Outfitters, Inc.(b) | 112,292 | 1,911,210 | ||||||
Foot Locker, Inc. | 52,869 | 3,742,597 | ||||||
GameStop Corp. – Class A(b) | 107,160 | 4,552,157 | ||||||
Office Depot, Inc.(a) | 394,765 | 3,130,486 | ||||||
Ross Stores, Inc. | 51,524 | 2,505,097 | ||||||
Staples, Inc. | 187,539 | 2,664,929 | ||||||
|
| |||||||
| 18,506,476 | ||||||||
|
| |||||||
| 59,703,448 | ||||||||
|
| |||||||
Health Care – 12.5% | ||||||||
Biotechnology – 1.0% | ||||||||
Gilead Sciences, Inc. | 42,773 | 4,494,159 | ||||||
|
| |||||||
Health Care Providers & Services – 4.2% | ||||||||
Aetna, Inc. | 68,171 | 7,806,943 | ||||||
Anthem, Inc. | 25,964 | 3,662,222 | ||||||
Quest Diagnostics, Inc. | 42,468 | 2,879,330 | ||||||
UnitedHealth Group, Inc. | 41,387 | 4,788,476 | ||||||
|
| |||||||
| 19,136,971 | ||||||||
|
| |||||||
Pharmaceuticals – 7.3% | ||||||||
Johnson & Johnson | 129,985 | 12,215,990 | ||||||
Merck & Co., Inc. | 125,173 | 6,740,566 | ||||||
Pfizer, Inc. | 425,906 | 13,722,692 | ||||||
|
| |||||||
| 32,679,248 | ||||||||
|
| |||||||
| 56,310,378 | ||||||||
|
| |||||||
| 54 | • AB POOLING PORTFOLIOS |
AB U.S. Value Portfolio—Portfolio of Investments
| Company | Shares | U.S. $ Value | ||||||
| ||||||||
Information Technology – 12.0% | ||||||||
Communications Equipment – 1.4% | ||||||||
Cisco Systems, Inc. | 249,322 | $ | 6,452,453 | |||||
|
| |||||||
Electronic Equipment, Instruments & Components – 0.9% | ||||||||
Keysight Technologies, Inc.(a) | 119,326 | 3,823,205 | ||||||
|
| |||||||
IT Services – 1.1% | ||||||||
Booz Allen Hamilton Holding Corp. | 54,590 | 1,457,553 | ||||||
Xerox Corp. | 355,753 | 3,618,008 | ||||||
|
| |||||||
| 5,075,561 | ||||||||
|
| |||||||
Semiconductors & Semiconductor Equipment – 2.6% | ||||||||
Applied Materials, Inc. | 304,518 | 4,898,172 | ||||||
Fairchild Semiconductor International, Inc.(a) | 50,490 | 686,664 | ||||||
Intel Corp. | 206,880 | 5,904,355 | ||||||
|
| |||||||
| 11,489,191 | ||||||||
|
| |||||||
Software – 4.0% | ||||||||
Electronic Arts, Inc.(a) | 33,776 | 2,234,283 | ||||||
Microsoft Corp. | 239,244 | 10,411,899 | ||||||
Oracle Corp. | 147,479 | 5,469,996 | ||||||
|
| |||||||
| 18,116,178 | ||||||||
|
| |||||||
Technology Hardware, Storage & Peripherals – 2.0% | ||||||||
Hewlett-Packard Co. | 315,865 | 8,863,172 | ||||||
|
| |||||||
| 53,819,760 | ||||||||
|
| |||||||
Energy – 10.5% | ||||||||
Oil, Gas & Consumable Fuels – 10.5% | ||||||||
Chevron Corp. | 6,913 | 559,884 | ||||||
EOG Resources, Inc. | 88,182 | 6,905,532 | ||||||
Exxon Mobil Corp. | 193,927 | 14,591,068 | ||||||
Hess Corp. | 93,134 | 5,536,816 | ||||||
Marathon Petroleum Corp. | 64,798 | 3,065,593 | ||||||
Murphy Oil Corp. | 119,935 | 3,717,985 | ||||||
Occidental Petroleum Corp. | 38,697 | 2,825,268 | ||||||
SM Energy Co. | 98,508 | 3,615,244 | ||||||
Valero Energy Corp. | 109,361 | 6,489,482 | ||||||
|
| |||||||
| 47,306,872 | ||||||||
|
| |||||||
Industrials – 6.9% | ||||||||
Aerospace & Defense – 1.7% | ||||||||
General Dynamics Corp. | 16,000 | 2,272,480 | ||||||
L-3 Communications Holdings, Inc. | 47,307 | 4,989,469 | ||||||
United Technologies Corp. | 4,646 | 425,620 | ||||||
|
| |||||||
| 7,687,569 | ||||||||
|
| |||||||
| AB POOLING PORTFOLIOS • | 55 |
AB U.S. Value Portfolio—Portfolio of Investments
| Company | Shares | U.S. $ Value | ||||||
| ||||||||
Airlines – 2.1% | ||||||||
Delta Air Lines, Inc. | 107,936 | $ | 4,725,438 | |||||
JetBlue Airways Corp.(a) | 207,547 | 4,632,449 | ||||||
|
| |||||||
| 9,357,887 | ||||||||
|
| |||||||
Electrical Equipment – 1.3% | ||||||||
Eaton Corp. PLC | 102,165 | 5,829,535 | ||||||
|
| |||||||
Industrial Conglomerates – 1.1% | ||||||||
General Electric Co. | 194,992 | 4,839,702 | ||||||
|
| |||||||
Machinery – 0.7% | ||||||||
ITT Corp. | 90,941 | 3,402,103 | ||||||
|
| |||||||
| 31,116,796 | ||||||||
|
| |||||||
Utilities – 6.4% | ||||||||
Electric Utilities – 2.9% | ||||||||
American Electric Power Co., Inc. | 70,800 | 3,843,732 | ||||||
Edison International | 99,202 | 5,801,333 | ||||||
FirstEnergy Corp. | 20,437 | 653,166 | ||||||
Westar Energy, Inc. | 75,700 | 2,766,835 | ||||||
|
| |||||||
| 13,065,066 | ||||||||
|
| |||||||
Gas Utilities – 0.8% | ||||||||
UGI Corp. | 105,533 | 3,596,565 | ||||||
|
| |||||||
Independent Power and Renewable Electricity Producers – 1.6% | ||||||||
AES Corp./VA | 202,906 | 2,434,872 | ||||||
Calpine Corp.(a) | 299,123 | 4,768,021 | ||||||
|
| |||||||
| 7,202,893 | ||||||||
|
| |||||||
Multi-Utilities – 1.1% | ||||||||
PG&E Corp. | 72,515 | 3,595,294 | ||||||
Public Service Enterprise Group, Inc. | 26,100 | 1,050,525 | ||||||
|
| |||||||
| 4,645,819 | ||||||||
|
| |||||||
| 28,510,343 | ||||||||
|
| |||||||
Consumer Staples – 2.8% | ||||||||
Food & Staples Retailing – 0.2% | ||||||||
Wal-Mart Stores, Inc. | 14,813 | 958,845 | ||||||
|
| |||||||
Food Products – 0.8% | ||||||||
Archer-Daniels-Midland Co. | 30,600 | 1,376,694 | ||||||
Bunge Ltd. | 7,309 | 529,537 | ||||||
Ingredion, Inc. | 19,632 | 1,695,027 | ||||||
|
| |||||||
| 3,601,258 | ||||||||
|
| |||||||
Household Products – 0.7% | ||||||||
Procter & Gamble Co. (The) | 46,918 | 3,315,695 | ||||||
|
| |||||||
| 56 | • AB POOLING PORTFOLIOS |
AB U.S. Value Portfolio—Portfolio of Investments
| Company | Shares | U.S. $ Value | ||||||
| ||||||||
Tobacco – 1.1% | ||||||||
Altria Group, Inc. | 90,241 | $ | 4,835,113 | |||||
|
| |||||||
| 12,710,911 | ||||||||
|
| |||||||
Materials – 2.8% | ||||||||
Chemicals – 2.7% | ||||||||
CF Industries Holdings, Inc. | 113,858 | 6,533,172 | ||||||
LyondellBasell Industries NV – Class A | 64,300 | 5,489,934 | ||||||
|
| |||||||
| 12,023,106 | ||||||||
|
| |||||||
Metals & Mining – 0.1% | ||||||||
Alcoa, Inc. | 62,500 | 590,625 | ||||||
|
| |||||||
| 12,613,731 | ||||||||
|
| |||||||
Telecommunication Services – 1.2% | ||||||||
Diversified Telecommunication Services – 0.3% | ||||||||
AT&T, Inc. | 45,850 | 1,522,220 | ||||||
|
| |||||||
Wireless Telecommunication Services – 0.9% | ||||||||
Vodafone Group PLC (Sponsored ADR) | 114,700 | 3,954,856 | ||||||
|
| |||||||
| 5,477,076 | ||||||||
|
| |||||||
Total Common Stocks | 441,428,426 | |||||||
|
| |||||||
SHORT-TERM INVESTMENTS – 2.1% | ||||||||
Investment Companies – 2.1% | ||||||||
AB Fixed-Income Shares, Inc. – | 9,312,738 | 9,312,738 | ||||||
|
| |||||||
Total Investments Before Security Lending Collateral for Securities Loaned – 100.3% | 450,741,164 | |||||||
|
| |||||||
INVESTMENTS OF CASH COLLATERAL FOR SECURITIES LOANED – 1.3% | ||||||||
Investment Companies – 1.3% | ||||||||
AB Exchange Reserves – Class I, | 6,081,135 | 6,081,135 | ||||||
|
| |||||||
Total Investments – 101.6% | 456,822,299 | |||||||
Other assets less liabilities – (1.6)% | (7,349,214 | ) | ||||||
|
| |||||||
Net Assets – 100.0% | $ | 449,473,085 | ||||||
|
| |||||||
| AB POOLING PORTFOLIOS • | 57 |
AB U.S. Value Portfolio—Portfolio of Investments
| (a) | Non-income producing security. |
| (b) | Represents entire or partial securities out on loan. See Note D for securities lending information. |
| (c) | To obtain a copy of the fund’s financial statements, please go to the Securities and Exchange Commission’s website at www.sec.gov, or call AB at (800) 227-4618. |
| (d) | Investment in affiliated money market mutual fund. The rate shown represents the 7-day yield as of period end. |
| Glossary: |
| ADR | – American Depositary Receipt |
See notes to financial statements.
| 58 | • AB POOLING PORTFOLIOS |
AB U.S. Value Portfolio—Portfolio of Investments
AB U.S. LARGE CAP GROWTH PORTFOLIO
PORTFOLIO OF INVESTMENTS
August 31, 2015
| Company | Shares | U.S. $ Value | ||||||
| ||||||||
COMMON STOCKS – 94.0% | ||||||||
Information Technology – 29.3% | ||||||||
Communications Equipment – 0.8% | ||||||||
F5 Networks, Inc.(a) | 28,890 | $ | 3,507,535 | |||||
|
| |||||||
Electronic Equipment, Instruments & Components – 1.6% | ||||||||
Amphenol Corp. – Class A | 140,521 | 7,357,679 | ||||||
|
| |||||||
Internet Software & Services – 10.7% | ||||||||
Facebook, Inc. – Class A(a) | 203,100 | 18,163,233 | ||||||
Google, Inc. – Class A(a) | 7,115 | 4,609,239 | ||||||
Google, Inc. – Class C(a) | 30,848 | 19,071,776 | ||||||
Twitter, Inc.(a) | 247,170 | 6,868,855 | ||||||
|
| |||||||
| 48,713,103 | ||||||||
|
| |||||||
IT Services – 4.9% | ||||||||
Cognizant Technology Solutions Corp. – Class A(a) | 41,956 | 2,640,711 | ||||||
Visa, Inc. – Class A | 271,258 | 19,340,695 | ||||||
|
| |||||||
| 21,981,406 | ||||||||
|
| |||||||
Semiconductors & Semiconductor Equipment – 2.1% | ||||||||
Altera Corp. | 32,340 | 1,570,107 | ||||||
NVIDIA Corp. | 352,962 | 7,934,586 | ||||||
|
| |||||||
| 9,504,693 | ||||||||
|
| |||||||
Software – 3.5% | ||||||||
Adobe Systems, Inc.(a) | 22,110 | 1,737,183 | ||||||
ANSYS, Inc.(a) | 64,420 | 5,707,612 | ||||||
Aspen Technology, Inc.(a) | 45,564 | 1,725,509 | ||||||
Mobileye NV(a)(b) | 64,947 | 3,673,402 | ||||||
ServiceNow, Inc.(a) | 44,508 | 3,158,287 | ||||||
|
| |||||||
| 16,001,993 | ||||||||
|
| |||||||
Technology Hardware, Storage & Peripherals – 5.7% | ||||||||
Apple, Inc. | 228,351 | 25,748,859 | ||||||
|
| |||||||
| 132,815,268 | ||||||||
|
| |||||||
Consumer Discretionary – 21.4% | ||||||||
Hotels, Restaurants & Leisure – 2.4% | ||||||||
Starbucks Corp. | 201,530 | 11,025,706 | ||||||
|
| |||||||
Internet & Catalog Retail – 2.5% | ||||||||
Priceline Group, Inc. (The)(a) | 8,080 | 10,089,011 | ||||||
TripAdvisor, Inc.(a) | 20,421 | 1,427,428 | ||||||
|
| |||||||
| 11,516,439 | ||||||||
|
| |||||||
| AB POOLING PORTFOLIOS • | 59 |
AB U.S. Large Cap Growth Portfolio—Portfolio of Investments
| Company | Shares | U.S. $ Value | ||||||
| ||||||||
Media – 6.7% | ||||||||
Comcast Corp. – Class A | 251,080 | $ | 14,143,336 | |||||
Walt Disney Co. (The) | 157,526 | 16,048,749 | ||||||
|
| |||||||
| 30,192,085 | ||||||||
|
| |||||||
Multiline Retail – 0.9% | ||||||||
Dollar Tree, Inc.(a) | 55,080 | 4,200,401 | ||||||
|
| |||||||
Specialty Retail – 5.7% | ||||||||
Home Depot, Inc. (The) | 159,111 | 18,530,067 | ||||||
O’Reilly Automotive, Inc.(a) | 15,690 | 3,766,698 | ||||||
Ulta Salon Cosmetics & Fragrance, Inc.(a) | 22,620 | 3,575,996 | ||||||
|
| |||||||
| 25,872,761 | ||||||||
|
| |||||||
Textiles, Apparel & Luxury Goods – 3.2% | ||||||||
NIKE, Inc. – Class B | 127,706 | 14,271,146 | ||||||
|
| |||||||
| 97,078,538 | ||||||||
|
| |||||||
Health Care – 18.5% | ||||||||
Biotechnology – 6.0% | ||||||||
Biogen, Inc.(a) | 59,334 | 17,639,998 | ||||||
Gilead Sciences, Inc.(a) | 92,010 | 9,667,491 | ||||||
|
| |||||||
| 27,307,489 | ||||||||
|
| |||||||
Health Care Equipment & Supplies – 4.5% | ||||||||
Align Technology, Inc.(a) | 69,229 | 3,918,361 | ||||||
Intuitive Surgical, Inc.(a) | 31,951 | 16,325,364 | ||||||
|
| |||||||
| 20,243,725 | ||||||||
|
| |||||||
Health Care Providers & Services – 5.1% | ||||||||
Premier, Inc. – Class A(a) | 115,238 | 4,108,235 | ||||||
UnitedHealth Group, Inc. | 164,695 | 19,055,211 | ||||||
|
| |||||||
| 23,163,446 | ||||||||
|
| |||||||
Life Sciences Tools & Services – 2.9% | ||||||||
Illumina, Inc.(a) | 27,417 | 5,417,873 | ||||||
Mettler-Toledo International, Inc.(a) | 13,163 | 3,903,488 | ||||||
Quintiles Transnational Holdings, Inc.(a) | 54,229 | 4,040,603 | ||||||
|
| |||||||
| 13,361,964 | ||||||||
|
| |||||||
| 84,076,624 | ||||||||
|
| |||||||
Consumer Staples – 12.2% | ||||||||
Beverages – 2.2% | ||||||||
Monster Beverage Corp.(a) | 70,708 | 9,790,230 | ||||||
|
| |||||||
Food & Staples Retailing – 5.9% | ||||||||
Costco Wholesale Corp. | 56,190 | 7,869,409 | ||||||
CVS Health Corp. | 186,720 | 19,120,128 | ||||||
|
| |||||||
| 26,989,537 | ||||||||
|
| |||||||
Personal Products – 1.6% | ||||||||
Estee Lauder Cos., Inc. (The) – Class A | 89,770 | 7,160,953 | ||||||
|
| |||||||
| 60 | • AB POOLING PORTFOLIOS |
AB U.S. Large Cap Growth Portfolio—Portfolio of Investments
| Company | Shares | U.S. $ Value | ||||||
| ||||||||
Tobacco – 2.5% | ||||||||
Philip Morris International, Inc. | 140,335 | $ | 11,198,733 | |||||
|
| |||||||
| 55,139,453 | ||||||||
|
| |||||||
Industrials – 9.5% | ||||||||
Aerospace & Defense – 1.9% | ||||||||
Rockwell Collins, Inc. | 106,650 | 8,729,302 | ||||||
|
| |||||||
Airlines – 0.8% | ||||||||
Alaska Air Group, Inc. | 46,775 | 3,501,576 | ||||||
|
| |||||||
Electrical Equipment – 2.5% | ||||||||
Acuity Brands, Inc. | 19,980 | 3,893,503 | ||||||
AMETEK, Inc. | 142,533 | 7,671,126 | ||||||
|
| |||||||
| 11,564,629 | ||||||||
|
| |||||||
Industrial Conglomerates – 1.9% | ||||||||
Danaher Corp. | 98,939 | 8,609,672 | ||||||
|
| |||||||
Machinery – 1.6% | ||||||||
Wabtec Corp./DE | 75,510 | 7,230,838 | ||||||
|
| |||||||
Professional Services – 0.8% | ||||||||
Robert Half International, Inc. | 69,540 | 3,548,626 | ||||||
|
| |||||||
| 43,184,643 | ||||||||
|
| |||||||
Financials – 2.2% | ||||||||
Capital Markets – 2.2% | ||||||||
Affiliated Managers Group, Inc.(a) | 32,370 | 6,035,063 | ||||||
BlackRock, Inc. – Class A | 13,330 | 4,031,925 | ||||||
|
| |||||||
| 10,066,988 | ||||||||
|
| |||||||
Materials – 0.9% | ||||||||
Chemicals – 0.9% | ||||||||
Monsanto Co. | 40,775 | 3,981,679 | ||||||
|
| |||||||
Total Common Stocks | 426,343,193 | |||||||
|
| |||||||
SHORT-TERM INVESTMENTS – 7.1% | ||||||||
Investment Companies – 7.1% | ||||||||
AB Fixed Income Shares, Inc. – | 32,430,239 | 32,430,239 | ||||||
|
| |||||||
Total Investments Before Security Lending Collateral for Securities | 458,773,432 | |||||||
|
| |||||||
| AB POOLING PORTFOLIOS • | 61 |
AB U.S. Large Cap Growth Portfolio—Portfolio of Investments
| Company | Shares | U.S. $ Value | ||||||
| ||||||||
INVESTMENTS OF CASH COLLATERAL FOR SECURITIES LOANED – 0.7% | ||||||||
Investment Companies – 0.7% | ||||||||
AB Exchange Reserves – Class I, | 2,930,293 | $ | 2,930,293 | |||||
|
| |||||||
Total Investments – 101.8% | 461,703,725 | |||||||
Other assets less liabilities – (1.8)% | (8,118,555 | ) | ||||||
|
| |||||||
Net Assets – 100.0% | $ | 453,585,170 | ||||||
|
| |||||||
| (a) | Non-income producing security. |
| (b) | Represents entire or partial securities out on loan. See Note D for securities lending information. |
| (c) | To obtain a copy of the fund’s financial statements, please go to the Securities and Exchange Commission’s website at www.sec.gov, or call AB at (800) 227-4618. |
| (d) | Investment in affiliated money market mutual fund. The rate shown represents the 7-day yield as of period end. |
See notes to financial statements.
| 62 | • AB POOLING PORTFOLIOS |
AB U.S. Large Cap Growth Portfolio—Portfolio of Investments
AB INTERNATIONAL VALUE PORTFOLIO
PORTFOLIO OF INVESTMENTS
August 31, 2015
| Company | Shares | U.S. $ Value | ||||||
| ||||||||
COMMON STOCKS – 98.4% | ||||||||
Financials – 23.1% | ||||||||
Banks – 16.4% | ||||||||
Banco Macro SA (ADR)(a) | 40,150 | $ | 1,797,114 | |||||
Bank Hapoalim BM | 497,353 | 2,522,497 | ||||||
Bank Mandiri Persero Tbk PT (ADR) | 197,290 | 1,246,873 | ||||||
Bank of Baroda | 863,880 | 2,396,461 | ||||||
Bank of China Ltd. – Class H | 8,577,000 | 3,906,537 | ||||||
Bank of Montreal | 29,660 | 1,600,684 | ||||||
Bank of Queensland Ltd. | 593,531 | 5,351,421 | ||||||
China Merchants Bank Co., Ltd. – Class H | 844,000 | 1,996,453 | ||||||
Danske Bank A/S | 217,470 | 6,725,888 | ||||||
ICICI Bank Ltd. | 330,960 | 1,392,089 | ||||||
ING Groep NV | 489,480 | 7,500,024 | ||||||
Intesa Sanpaolo SpA | 749,420 | 2,726,658 | ||||||
KB Financial Group, Inc. | 74,640 | 2,251,596 | ||||||
Mitsubishi UFJ Financial Group, Inc. | 1,566,600 | 10,333,577 | ||||||
Shinhan Financial Group Co., Ltd. | 69,730 | 2,338,299 | ||||||
Toronto-Dominion Bank (The) | 77,410 | 3,087,927 | ||||||
UniCredit SpA | 625,040 | 4,076,802 | ||||||
|
| |||||||
| 61,250,900 | ||||||||
|
| |||||||
Diversified Financial Services – 0.8% | ||||||||
Challenger Ltd./Australia | 548,460 | 2,786,569 | ||||||
|
| |||||||
Insurance – 4.3% | ||||||||
AIA Group Ltd. | 529,600 | 2,922,675 | ||||||
Assicurazioni Generali SpA | 307,617 | 5,626,104 | ||||||
Aviva PLC | 376,519 | 2,772,152 | ||||||
NN Group NV | 91,110 | 2,780,797 | ||||||
Suncorp Group Ltd. | 215,552 | 1,967,011 | ||||||
|
| |||||||
| 16,068,739 | ||||||||
|
| |||||||
Real Estate Investment Trusts | ||||||||
Emlak Konut Gayrimenkul Yatirim Ortakligi AS | 1,597,600 | 1,368,877 | ||||||
|
| |||||||
Real Estate Management & Development – 0.6% | ||||||||
Lend Lease Group | 239,183 | 2,366,679 | ||||||
|
| |||||||
Thrifts & Mortgage Finance – 0.6% | ||||||||
LIC Housing Finance Ltd. | 323,207 | 2,151,891 | ||||||
|
| |||||||
| 85,993,655 | ||||||||
|
| |||||||
Consumer Discretionary – 17.2% | ||||||||
Auto Components – 6.4% | ||||||||
Aisin Seiki Co., Ltd. | 118,800 | 4,271,757 | ||||||
Hankook Tire Co., Ltd. | 122,060 | 3,810,615 | ||||||
Magna International, Inc. (New York) – Class A | 90,470 | 4,450,219 | ||||||
| AB POOLING PORTFOLIOS • | 63 |
AB International Value Portfolio—Portfolio of Investments
| Company | Shares | U.S. $ Value | ||||||
| ||||||||
Plastic Omnium SA | 79,652 | $ | 2,056,320 | |||||
Sumitomo Electric Industries Ltd. | 391,100 | 5,351,835 | ||||||
Valeo SA | 30,110 | 3,770,616 | ||||||
|
| |||||||
| 23,711,362 | ||||||||
|
| |||||||
Automobiles – 5.7% | ||||||||
Chongqing Changan Automobile Co., Ltd. – Class B | 799,461 | 1,267,599 | ||||||
Great Wall Motor Co., Ltd. – Class H | 316,000 | 841,480 | ||||||
Honda Motor Co., Ltd. | 210,700 | 6,627,374 | ||||||
Hyundai Motor Co. | 12,460 | 1,568,135 | ||||||
Isuzu Motors Ltd. | 216,600 | 2,453,677 | ||||||
Peugeot SA(a) | 369,890 | 6,359,110 | ||||||
Tata Motors Ltd.(a) | 365,993 | 1,889,919 | ||||||
Tata Motors Ltd. – Class A(a) | 91,246 | 326,724 | ||||||
|
| |||||||
| 21,334,018 | ||||||||
|
| |||||||
Leisure Products – 0.8% | ||||||||
Bandai Namco Holdings, Inc. | 122,800 | 2,836,859 | ||||||
|
| |||||||
Media – 2.6% | ||||||||
Liberty Global PLC – Series C(a) | 130,345 | 5,848,580 | ||||||
Vivendi SA | 162,597 | 4,013,352 | ||||||
|
| |||||||
| 9,861,932 | ||||||||
|
| |||||||
Specialty Retail – 1.3% | ||||||||
Foschini Group Ltd. (The) | 249,400 | 2,817,575 | ||||||
Kingfisher PLC | 357,760 | 1,944,260 | ||||||
|
| |||||||
| 4,761,835 | ||||||||
|
| |||||||
Textiles, Apparel & Luxury Goods – 0.4% | ||||||||
Kering | 8,840 | 1,512,895 | ||||||
|
| |||||||
| 64,018,901 | ||||||||
|
| |||||||
Telecommunication Services – 11.6% | ||||||||
Diversified Telecommunication Services – 6.2% | ||||||||
Bezeq The Israeli Telecommunication Corp., Ltd. | 1,017,409 | 1,826,476 | ||||||
BT Group PLC | 816,040 | 5,443,953 | ||||||
China Telecom Corp., Ltd. – Class H | 7,002,000 | 3,662,845 | ||||||
Nippon Telegraph & Telephone Corp. | 226,400 | 8,635,380 | ||||||
Telefonica Brasil SA (Preference Shares) | 298,100 | 3,319,940 | ||||||
|
| |||||||
| 22,888,594 | ||||||||
|
| |||||||
Wireless Telecommunication | ||||||||
China Mobile Ltd. | 310,000 | 3,794,228 | ||||||
Rogers Communications, Inc. – Class B | 39,100 | 1,334,738 | ||||||
SK Telecom Co., Ltd. | 9,460 | 1,948,492 | ||||||
SoftBank Group Corp. | 37,300 | 2,170,237 | ||||||
| 64 | • AB POOLING PORTFOLIOS |
AB International Value Portfolio—Portfolio of Investments
| Company | Shares | U.S. $ Value | ||||||
| ||||||||
Sunrise Communications Group AG(a)(b) | 28,049 | $ | 1,822,249 | |||||
Turkcell Iletisim Hizmetleri AS | 634,690 | 2,485,716 | ||||||
Vodafone Group PLC | 1,949,042 | 6,711,409 | ||||||
|
| |||||||
| 20,267,069 | ||||||||
|
| |||||||
| 43,155,663 | ||||||||
|
| |||||||
Industrials – 10.9% | ||||||||
Aerospace & Defense – 2.0% | ||||||||
Airbus Group SE | 59,808 | 3,894,371 | ||||||
Safran SA | 46,059 | 3,593,526 | ||||||
|
| |||||||
| 7,487,897 | ||||||||
|
| |||||||
Airlines – 4.3% | ||||||||
Air Canada(a) | 184,020 | 1,570,800 | ||||||
International Consolidated Airlines Group SA(a) | 916,540 | 7,511,904 | ||||||
Japan Airlines Co., Ltd. | 109,000 | 3,868,378 | ||||||
Qantas Airways Ltd.(a) | 1,306,098 | 3,119,999 | ||||||
|
| |||||||
| 16,071,081 | ||||||||
|
| |||||||
Machinery – 1.0% | ||||||||
JTEKT Corp. | 260,600 | 3,658,568 | ||||||
|
| |||||||
Marine – 1.4% | ||||||||
AP Moeller – Maersk A/S – Class B | 937 | 1,595,773 | ||||||
Nippon Yusen KK | 1,430,000 | 3,749,606 | ||||||
|
| |||||||
| 5,345,379 | ||||||||
|
| |||||||
Road & Rail – 2.2% | ||||||||
Canadian National Railway Co. | 26,450 | 1,471,879 | ||||||
Central Japan Railway Co. | 40,200 | 6,581,767 | ||||||
|
| |||||||
| 8,053,646 | ||||||||
|
| |||||||
| 40,616,571 | ||||||||
|
| |||||||
Information Technology – 8.6% | ||||||||
Electronic Equipment, Instruments & Components – 0.6% | ||||||||
Largan Precision Co., Ltd. | 25,000 | 2,326,566 | ||||||
|
| |||||||
Semiconductors & Semiconductor Equipment – 5.1% | ||||||||
Advanced Semiconductor Engineering, Inc. | 1,731,000 | 1,747,492 | ||||||
Infineon Technologies AG | 290,400 | 3,168,608 | ||||||
Novatek Microelectronics Corp. | 778,000 | 2,610,774 | ||||||
SCREEN Holdings Co., Ltd. | 677,000 | 3,236,417 | ||||||
Sumco Corp. | 355,200 | 3,261,329 | ||||||
Tokyo Electron Ltd. | 94,200 | 4,956,287 | ||||||
|
| |||||||
| 18,980,907 | ||||||||
|
| |||||||
Software – 0.8% | ||||||||
Nintendo Co., Ltd. | 14,200 | 2,921,594 | ||||||
|
| |||||||
| AB POOLING PORTFOLIOS • | 65 |
AB International Value Portfolio—Portfolio of Investments
| Company | Shares | U.S. $ Value | ||||||
| ||||||||
Technology Hardware, Storage & Peripherals – 2.1% | ||||||||
Catcher Technology Co., Ltd. | 212,000 | $ | 2,167,222 | |||||
Samsung Electronics Co., Ltd. | 6,040 | 5,557,839 | ||||||
|
| |||||||
| 7,725,061 | ||||||||
|
| |||||||
| 31,954,128 | ||||||||
|
| |||||||
Energy – 6.8% | ||||||||
Energy Equipment & Services – 0.2% | ||||||||
Aker Solutions ASA(b) | 218,407 | 916,258 | ||||||
|
| |||||||
Oil, Gas & Consumable Fuels – 6.6% | ||||||||
BG Group PLC | 333,050 | 5,054,890 | ||||||
Canadian Natural Resources Ltd. | 71,310 | 1,607,131 | ||||||
JX Holdings, Inc. | 1,476,800 | 5,714,382 | ||||||
Lukoil PJSC (London) (Sponsored ADR) | 37,140 | 1,433,975 | ||||||
Petroleo Brasileiro SA (Sponsored ADR)(a) | 424,870 | 2,141,345 | ||||||
Royal Dutch Shell PLC (Euronext Amsterdam) – Class A | 131,552 | 3,453,261 | ||||||
TOTAL SA | 109,080 | 5,029,286 | ||||||
|
| |||||||
| 24,434,270 | ||||||||
|
| |||||||
| 25,350,528 | ||||||||
|
| |||||||
Materials – 5.8% | ||||||||
Chemicals – 3.8% | ||||||||
Agrium, Inc. (Toronto) | 21,690 | 2,252,258 | ||||||
Arkema SA | 53,052 | 3,737,161 | ||||||
JSR Corp. | 290,000 | 4,546,302 | ||||||
Koninklijke DSM NV | 64,989 | 3,413,729 | ||||||
|
| |||||||
| 13,949,450 | ||||||||
|
| |||||||
Metals & Mining – 1.0% | ||||||||
Goldcorp, Inc. | 166,180 | 2,305,248 | ||||||
Novolipetsk Steel OJSC (GDR)(b) | 126,010 | 1,500,894 | ||||||
|
| |||||||
| 3,806,142 | ||||||||
|
| |||||||
Paper & Forest Products – 1.0% | ||||||||
Mondi PLC | 167,724 | 3,769,384 | ||||||
|
| |||||||
| 21,524,976 | ||||||||
|
| |||||||
Consumer Staples – 5.1% | ||||||||
Beverages – 0.4% | ||||||||
Asahi Group Holdings Ltd. | 51,200 | 1,686,037 | ||||||
|
| |||||||
Food & Staples Retailing – 2.0% | ||||||||
Delhaize Group | 65,530 | 5,863,398 | ||||||
X5 Retail Group NV (GDR)(a)(b) | 98,645 | 1,617,778 | ||||||
|
| |||||||
| 7,481,176 | ||||||||
|
| |||||||
| 66 | • AB POOLING PORTFOLIOS |
AB International Value Portfolio—Portfolio of Investments
| Company | Shares | U.S. $ Value | ||||||
| ||||||||
Tobacco – 2.7% | ||||||||
British American Tobacco PLC | 144,890 | $ | 7,672,275 | |||||
Imperial Tobacco Group PLC | 49,870 | 2,400,437 | ||||||
|
| |||||||
| 10,072,712 | ||||||||
|
| |||||||
| 19,239,925 | ||||||||
|
| |||||||
Health Care – 4.9% | ||||||||
Pharmaceuticals – 4.9% | ||||||||
GlaxoSmithKline PLC | 392,670 | 8,017,384 | ||||||
Roche Holding AG | 37,390 | 10,178,470 | ||||||
|
| |||||||
| 18,195,854 | ||||||||
|
| |||||||
Utilities – 4.4% | ||||||||
Electric Utilities – 3.2% | ||||||||
EDP – Energias de Portugal SA(c) | 1,798,260 | 6,279,468 | ||||||
Electricite de France SA | 155,350 | 3,351,037 | ||||||
Enel SpA | 547,768 | 2,463,176 | ||||||
|
| |||||||
| 12,093,681 | ||||||||
|
| |||||||
Independent Power and Renewable Electricity Producers – 0.7% | ||||||||
Huadian Power International Corp., Ltd. – | 3,012,000 | 2,453,431 | ||||||
|
| |||||||
Water Utilities – 0.5% | ||||||||
Cia de Saneamento Basico do Estado de Sao Paulo | 419,400 | 1,819,080 | ||||||
|
| |||||||
| 16,366,192 | ||||||||
|
| |||||||
Total Common Stocks | 366,416,393 | |||||||
|
| |||||||
Total Investments Before Security Lending Collateral for Securities Loaned – 98.4% | 366,416,393 | |||||||
|
| |||||||
INVESTMENTS OF CASH COLLATERAL FOR SECURITIES LOANED – 0.1% | ||||||||
Investment Companies – 0.1% | ||||||||
AB Exchange Reserves – Class I, 0.11%(d)(e) | 210,915 | 210,915 | ||||||
|
| |||||||
Total Investments – 98.5% | 366,627,308 | |||||||
Other assets less liabilities – 1.5% | 5,761,968 | |||||||
|
| |||||||
Net Assets – 100.0% | $ | 372,389,276 | ||||||
|
| |||||||
| AB POOLING PORTFOLIOS • | 67 |
AB International Value Portfolio—Portfolio of Investments
FUTURES (see Note C)
| Type | Number of Contracts | Expiration Month | Original Value | Value at August 31, 2015 | Unrealized Appreciation/ (Depreciation) | |||||||||||||||
Purchased Contracts |
| |||||||||||||||||||
EURO STOXX 50 Index Futures | 66 | September 2015 | $ | 2,559,030 | $ | 2,421,085 | $ | (137,945 | ) | |||||||||||
FORWARD CURRENCY EXCHANGE CONTRACTS (see Note C)
| Counterparty | Contracts to Deliver (000) | In Exchange For (000) | Settlement Date | Unrealized Appreciation/ (Depreciation) | ||||||||||||||||||||
Barclays Bank PLC | TWD | 94,856 | USD | 2,993 | 11/13/15 | $ | 72,354 | |||||||||||||||||
Citibank | RUB | 90,831 | USD | 1,574 | 9/10/15 | 163,246 | ||||||||||||||||||
Citibank | USD | 9,048 | GBP | 5,797 | 11/13/15 | (156,043 | ) | |||||||||||||||||
Citibank | USD | 1,184 | HKD | 9,180 | 11/13/15 | 760 | ||||||||||||||||||
Credit Suisse International | KRW | 2,406,931 | USD | 2,038 | 11/13/15 | 7,168 | ||||||||||||||||||
Deutsche Bank AG | HKD | 9,180 | USD | 1,184 | 11/13/15 | (90 | ) | |||||||||||||||||
Goldman Sachs Bank USA | AUD | 3,323 | USD | 2,441 | 11/13/15 | 85,307 | ||||||||||||||||||
Goldman Sachs Bank USA | CAD | 2,064 | USD | 1,582 | 11/13/15 | 13,088 | ||||||||||||||||||
Goldman Sachs Bank USA | GBP | 3,974 | USD | 6,207 | 11/13/15 | 111,029 | ||||||||||||||||||
Goldman Sachs Bank USA | JPY | 843,770 | USD | 6,801 | 11/13/15 | (166,746 | ) | |||||||||||||||||
HSBC Bank USA | ILS | 12,510 | USD | 3,295 | 11/13/15 | 102,135 | ||||||||||||||||||
Morgan Stanley & Co., Inc. | SEK | 39,094 | USD | 4,614 | 11/13/15 | (12,358 | ) | |||||||||||||||||
Morgan Stanley & Co., Inc. | USD | 2,345 | EUR | 2,135 | 11/13/15 | 53,207 | ||||||||||||||||||
Royal Bank of Scotland PLC | CHF | 2,305 | USD | 2,371 | 11/13/15 | (19,733 | ) | |||||||||||||||||
Royal Bank of Scotland PLC | JPY | 568,614 | USD | 4,580 | 11/13/15 | (115,599 | ) | |||||||||||||||||
Royal Bank of Scotland PLC | KRW | 1,606,098 | USD | 1,363 | 11/13/15 | 7,785 | ||||||||||||||||||
Standard Chartered Bank | BRL | 11,366 | USD | 3,117 | 9/02/15 | (17,231 | ) | |||||||||||||||||
Standard Chartered Bank | USD | 3,192 | BRL | 11,366 | 9/02/15 | (57,778 | ) | |||||||||||||||||
Standard Chartered Bank | BRL | 11,366 | USD | 3,159 | 10/02/15 | 57,777 | ||||||||||||||||||
Standard Chartered Bank | AUD | 6,560 | USD | 4,809 | 11/13/15 | 157,608 | ||||||||||||||||||
Standard Chartered Bank | JPY | 1,440,936 | USD | 11,549 | 11/13/15 | (349,123 | ) | |||||||||||||||||
State Street Bank & Trust Co. | EUR | 6,235 | USD | 6,820 | 11/13/15 | (184,178 | ) | |||||||||||||||||
State Street Bank & Trust Co. | USD | 5,977 | CAD | 7,880 | 11/13/15 | 11,665 | ||||||||||||||||||
State Street Bank & Trust Co. | USD | 1,262 | CHF | 1,232 | 11/13/15 | 15,605 | ||||||||||||||||||
State Street Bank & Trust Co. | USD | 12,504 | SEK | 108,653 | 11/13/15 | 352,669 | ||||||||||||||||||
UBS AG | BRL | 11,366 | USD | 3,377 | 9/02/15 | 242,686 | ||||||||||||||||||
UBS AG | USD | 3,117 | BRL | 11,366 | 9/02/15 | 17,231 | ||||||||||||||||||
UBS AG | USD | 16,209 | EUR | 14,528 | 11/13/15 | 112,060 | ||||||||||||||||||
|
| |||||||||||||||||||||||
| $ | 504,501 | |||||||||||||||||||||||
|
| |||||||||||||||||||||||
| (a) | Non-income producing security. |
| (b) | Security is exempt from registration under Rule 144A of the Securities Act of 1933. These securities are considered liquid and may be resold in transactions exempt from registration, normally to qualified institutional buyers. At August 31, 2015, the aggregate market value of these securities amounted to $5,857,179 or 1.6% of net assets. |
| (c) | Represents entire or partial securities out on loan. See Note D for securities lending information. |
| (d) | To obtain a copy of the fund’s financial statements, please go to the Securities and Exchange Commission’s website at www.sec.gov, or call AB at (800) 227-4618. |
| (e) | Investment in affiliated money market mutual fund. The rate shown represents the 7-day yield as of period end. |
| 68 | • AB POOLING PORTFOLIOS |
AB International Value Portfolio—Portfolio of Investments
Currency Abbreviations:
| AUD | – Australian Dollar |
| BRL | – Brazilian Real |
| CAD | – Canadian Dollar |
| CHF | – Swiss Franc |
| EUR | – Euro |
| GBP | – Great British Pound |
| HKD | – Hong Kong Dollar |
| ILS | – Israeli Shekel |
| JPY | – Japanese Yen |
| KRW | – South Korean Won |
| RUB | – Russian Ruble |
| SEK | – Swedish Krona |
| TWD | – New Taiwan Dollar |
| USD | – United States Dollar |
Glossary:
| ADR | – American Depositary Receipt |
| GDR | – Global Depositary Receipt |
| OJSC | – Open Joint Stock Company |
| PJSC | – Public Joint Stock Company |
See notes to financial statements.
| AB POOLING PORTFOLIOS • | 69 |
AB International Value Portfolio—Portfolio of Investments
AB INTERNATIONAL GROWTH PORTFOLIO
PORTFOLIO OF INVESTMENTS
August 31, 2015
| Company | Shares | U.S. $ Value | ||||||
| ||||||||
COMMON STOCKS – 98.5% | ||||||||
Financials – 24.2% | ||||||||
Banks – 1.8% | ||||||||
Axis Bank Ltd. | 391,460 | $ | 2,989,657 | |||||
HDFC Bank Ltd. | 249,610 | 3,842,248 | ||||||
|
| |||||||
| 6,831,905 | ||||||||
|
| |||||||
Capital Markets – 5.5% | ||||||||
Credit Suisse Group AG (REG)(a) | 69,690 | 1,875,879 | ||||||
Partners Group Holding AG | 14,540 | 4,689,457 | ||||||
UBS Group AG | 677,303 | 14,010,442 | ||||||
|
| |||||||
| 20,575,778 | ||||||||
|
| |||||||
Consumer Finance – 0.6% | ||||||||
Shriram Transport Finance Co., Ltd. | 177,460 | 2,170,755 | ||||||
|
| |||||||
Diversified Financial Services – 0.3% | ||||||||
Grenkeleasing AG | 6,550 | 1,077,152 | ||||||
|
| |||||||
Insurance – 10.5% | ||||||||
Admiral Group PLC | 405,451 | 9,596,414 | ||||||
AIA Group Ltd. | 2,211,200 | 12,202,830 | ||||||
BB Seguridade Participacoes SA | 550,900 | 4,359,624 | ||||||
Prudential PLC | 607,250 | 13,105,870 | ||||||
|
| |||||||
| 39,264,738 | ||||||||
|
| |||||||
Real Estate Management & Development – 2.8% | ||||||||
Ayala Land, Inc. | 3,991,800 | 3,066,888 | ||||||
Global Logistic Properties Ltd.(b) | 4,756,000 | 7,487,887 | ||||||
|
| |||||||
| 10,554,775 | ||||||||
|
| |||||||
Thrifts & Mortgage Finance – 2.7% | ||||||||
Housing Development Finance Corp. Ltd. | 572,720 | 10,211,351 | ||||||
|
| |||||||
| 90,686,454 | ||||||||
|
| |||||||
Consumer Discretionary – 22.2% | ||||||||
Auto Components – 1.4% | ||||||||
Continental AG | 24,980 | 5,291,023 | ||||||
|
| |||||||
Automobiles – 2.6% | ||||||||
Toyota Motor Corp.(b) | 167,000 | 9,870,738 | ||||||
|
| |||||||
Diversified Consumer Services – 2.1% | ||||||||
Estacio Participacoes SA | 407,100 | 1,399,787 | ||||||
Kroton Educacional SA | 693,600 | 1,660,057 | ||||||
TAL Education Group (ADR)(a)(b) | 153,152 | 4,697,172 | ||||||
|
| |||||||
| 7,757,016 | ||||||||
|
| |||||||
Hotels, Restaurants & Leisure – 4.4% | ||||||||
Melco International Development Ltd.(b) | 2,358,000 | 3,668,455 | ||||||
Merlin Entertainments PLC(c) | 294,628 | 1,743,883 | ||||||
| 70 | • AB POOLING PORTFOLIOS |
AB International Growth Portfolio—Portfolio of Investments
| Company | Shares | U.S. $ Value | ||||||
| ||||||||
Sodexo SA | 104,026 | $ | 9,135,141 | |||||
Yum! Brands, Inc. | 23,860 | 1,903,312 | ||||||
|
| |||||||
| 16,450,791 | ||||||||
|
| |||||||
Internet & Catalog Retail – 1.0% | ||||||||
Vipshop Holdings Ltd. (ADR)(a) | 197,370 | 3,550,686 | ||||||
|
| |||||||
Media – 1.0% | ||||||||
CTS Eventim AG & Co. KGaA | 111,320 | 3,883,058 | ||||||
|
| |||||||
Multiline Retail – 1.3% | ||||||||
B&M European Value Retail SA | 938,797 | 4,660,290 | ||||||
|
| |||||||
Specialty Retail – 3.1% | ||||||||
L’Occitane International SA | 563,000 | 1,275,253 | ||||||
Sports Direct International PLC(a) | 855,008 | 10,343,415 | ||||||
|
| |||||||
| 11,618,668 | ||||||||
|
| |||||||
Textiles, Apparel & Luxury Goods – 5.3% | ||||||||
Cie Financiere Richemont SA | 93,994 | 7,022,986 | ||||||
Eclat Textile Co., Ltd. | 264,800 | 3,982,440 | ||||||
Global Brands Group Holding Ltd.(a) | 5,628,000 | 1,066,126 | ||||||
HUGO BOSS AG | 41,365 | 4,720,169 | ||||||
Samsonite International SA | 1,040,600 | 3,248,404 | ||||||
|
| |||||||
| 20,040,125 | ||||||||
|
| |||||||
| 83,122,395 | ||||||||
|
| |||||||
Industrials – 18.5% | ||||||||
Aerospace & Defense – 1.9% | ||||||||
Zodiac Aerospace | 237,990 | 7,231,490 | ||||||
|
| |||||||
Building Products – 0.6% | ||||||||
Assa Abloy AB – Class B | 108,480 | 2,073,079 | ||||||
|
| |||||||
Commercial Services & Supplies – 4.4% | ||||||||
APR Energy PLC(b) | 445,028 | 519,001 | ||||||
Babcock International Group PLC | 742,455 | 10,944,461 | ||||||
Regus PLC | 1,128,494 | 4,892,283 | ||||||
|
| |||||||
| 16,355,745 | ||||||||
|
| |||||||
Machinery – 1.6% | ||||||||
Hoshizaki Electric Co., Ltd. | 96,300 | 6,140,231 | ||||||
|
| |||||||
Professional Services – 7.8% | ||||||||
Bureau Veritas SA | 383,708 | 8,746,731 | ||||||
Capita PLC | 636,390 | 11,975,810 | ||||||
Teleperformance | 122,160 | 8,588,154 | ||||||
|
| |||||||
| 29,310,695 | ||||||||
|
| |||||||
Road & Rail – 0.3% | ||||||||
CAR, Inc.(a)(b) | 572,000 | 998,529 | ||||||
|
| |||||||
| AB POOLING PORTFOLIOS • | 71 |
AB International Growth Portfolio—Portfolio of Investments
| Company | Shares | U.S. $ Value | ||||||
| ||||||||
Trading Companies & Distributors – 1.9% | ||||||||
Brenntag AG | 39,410 | $ | 2,189,111 | |||||
Bunzl PLC | 189,660 | 5,018,475 | ||||||
|
| |||||||
| 7,207,586 | ||||||||
|
| |||||||
| 69,317,355 | ||||||||
|
| |||||||
Consumer Staples – 9.5% | ||||||||
Food & Staples Retailing – 3.2% | ||||||||
CP ALL PCL | 1,783,000 | 2,536,839 | ||||||
Lenta Ltd. (GDR)(a)(c) | 558,381 | 4,076,030 | ||||||
Magnit PJSC (Sponsored GDR)(c) | 42,200 | 2,109,789 | ||||||
Olam International Ltd.(b) | 2,358,370 | 3,459,861 | ||||||
|
| |||||||
| 12,182,519 | ||||||||
|
| |||||||
Food Products – 0.3% | ||||||||
Universal Robina Corp. | 238,190 | 986,566 | ||||||
|
| |||||||
Household Products – 0.5% | ||||||||
Henkel AG & Co. KGaA | 21,120 | 1,936,829 | ||||||
|
| |||||||
Personal Products – 0.8% | ||||||||
Hengan International Group Co. Ltd. | 75,000 | 740,348 | ||||||
L’Oreal SA | 10,900 | 1,864,101 | ||||||
Unilever PLC | 9,150 | 366,960 | ||||||
|
| |||||||
| 2,971,409 | ||||||||
|
| |||||||
Tobacco – 4.7% | ||||||||
British American Tobacco PLC | 273,459 | 14,480,314 | ||||||
Japan Tobacco, Inc. | 90,600 | 3,219,869 | ||||||
|
| |||||||
| 17,700,183 | ||||||||
|
| |||||||
| 35,777,506 | ||||||||
|
| |||||||
Information Technology – 9.4% | ||||||||
Electronic Equipment, Instruments & Components – 1.0% | ||||||||
China Railway Signal & Communication Corp., Ltd.(a)(c) | 5,042,450 | 3,910,313 | ||||||
|
| |||||||
Internet Software & Services – 4.1% | ||||||||
Baidu, Inc. (Sponsored ADR)(a) | 56,813 | 8,365,714 | ||||||
Tencent Holdings Ltd. | 414,800 | 6,946,661 | ||||||
|
| |||||||
| 15,312,375 | ||||||||
|
| |||||||
IT Services – 1.5% | ||||||||
Tata Consultancy Services Ltd. | 120,640 | 4,668,272 | ||||||
Wirecard AG | 22,930 | 951,616 | ||||||
|
| |||||||
| 5,619,888 | ||||||||
|
| |||||||
| 72 | • AB POOLING PORTFOLIOS |
AB International Growth Portfolio—Portfolio of Investments
| Company | Shares | U.S. $ Value | ||||||
| ||||||||
Semiconductors & Semiconductor Equipment – 0.8% | ||||||||
Taiwan Semiconductor Manufacturing Co., Ltd. | 800,000 | $ | 3,112,646 | |||||
|
| |||||||
Software – 2.0% | ||||||||
Dassault Systemes | 105,860 | 7,334,278 | ||||||
|
| |||||||
| 35,289,500 | ||||||||
|
| |||||||
Health Care – 8.6% | ||||||||
Health Care Equipment & Supplies – 2.5% | ||||||||
Essilor International SA | 16,260 | 1,935,624 | ||||||
Sartorius AG (Preference Shares) | 34,470 | 7,596,620 | ||||||
|
| |||||||
| 9,532,244 | ||||||||
|
| |||||||
Life Sciences Tools & Services – 3.6% | ||||||||
Eurofins Scientific SE | 40,499 | 13,537,961 | ||||||
|
| |||||||
Pharmaceuticals – 2.5% | ||||||||
Aspen Pharmacare Holdings Ltd.(a) | 67,780 | 1,747,312 | ||||||
Novo Nordisk A/S – Class B | 101,741 | 5,617,155 | ||||||
Sun Pharmaceutical Industries Ltd. | 141,187 | 1,882,210 | ||||||
|
| |||||||
| 9,246,677 | ||||||||
|
| |||||||
| 32,316,882 | ||||||||
|
| |||||||
Materials – 4.0% | ||||||||
Chemicals – 4.0% | ||||||||
Essentra PLC | 1,156,347 | 15,035,169 | ||||||
|
| |||||||
Utilities – 1.1% | ||||||||
Independent Power and Renewable Electricity Producers – 1.1% | ||||||||
TerraForm Global, Inc. – Class A(a)(b) | 438,847 | 4,274,371 | ||||||
|
| |||||||
Telecommunication Services – 1.0% | ||||||||
Wireless Telecommunication Services – 1.0% | ||||||||
SoftBank Group Corp. | 32,600 | 1,896,776 | ||||||
Tower Bersama Infrastructure Tbk PT(a) | 3,402,500 | 1,735,998 | ||||||
|
| |||||||
| 3,632,774 | ||||||||
|
| |||||||
Total Common Stocks | 369,452,406 | |||||||
|
| |||||||
Total Investments Before Security Lending Collateral for Securities Loaned – 98.5% | 369,452,406 | |||||||
|
| |||||||
INVESTMENTS OF CASH COLLATERAL FOR SECURITIES LOANED – 1.6% | ||||||||
Investment Companies – 1.6% | ||||||||
AB Exchange Reserves – Class I, 0.11%(d)(e) | 6,050,194 | 6,050,194 | ||||||
|
| |||||||
| AB POOLING PORTFOLIOS • | 73 |
AB International Growth Portfolio—Portfolio of Investments
| Company | Shares | U.S. $ Value | ||||
| ||||||
Total Investments – 100.1% | $ | 375,502,600 | ||||
Other assets less liabilities – (0.1)% | (252,426 | ) | ||||
|
| |||||
Net Assets – 100.0% | $ | 375,250,174 | ||||
|
| |||||
FORWARD CURRENCY EXCHANGE CONTRACTS (see Note C)
| Counterparty | Contracts to (000) | In Exchange For (000) | Settlement Date | Unrealized Appreciation/ (Depreciation) | ||||||||||||||||||||
Barclays Bank PLC | EUR | 23,415 | USD | 26,514 | 9/17/15 | $ | 233,384 | |||||||||||||||||
Barclays Bank PLC | USD | 4,152 | JPY | 509,033 | 9/17/15 | 47,988 | ||||||||||||||||||
Barclays Bank PLC | USD | 6,214 | SEK | 52,693 | 12/15/15 | 27,166 | ||||||||||||||||||
BNP Paribas SA | GBP | 4,773 | USD | 7,478 | 9/17/15 | 154,010 | ||||||||||||||||||
BNP Paribas SA | GBP | 1,009 | USD | 1,536 | 9/17/15 | (11,977 | ) | |||||||||||||||||
BNP Paribas SA | HKD | 138,964 | USD | 17,924 | 9/17/15 | (6,778 | ) | |||||||||||||||||
Deutsche Bank AG | SGD | 16,312 | USD | 11,636 | 9/17/15 | 84,351 | ||||||||||||||||||
Morgan Stanley & Co., Inc. | CAD | 16,131 | USD | 12,396 | 9/17/15 | 135,034 | ||||||||||||||||||
Morgan Stanley & Co., Inc. | USD | 2,007 | JPY | 249,096 | 12/15/15 | 51,518 | ||||||||||||||||||
Royal Bank of Scotland PLC | USD | 12,136 | SGD | 16,312 | 9/17/15 | (584,256 | ) | |||||||||||||||||
Royal Bank of Scotland PLC | CHF | 3,404 | USD | 3,500 | 12/15/15 | (34,553 | ) | |||||||||||||||||
Standard Chartered Bank | USD | 29,446 | CAD | 36,201 | 9/17/15 | (1,930,927 | ) | |||||||||||||||||
Standard Chartered Bank | USD | 3,747 | HKD | 29,053 | 9/17/15 | 1,746 | ||||||||||||||||||
State Street Bank & Trust Co. | EUR | 6,749 | USD | 7,605 | 9/17/15 | 30,217 | ||||||||||||||||||
State Street Bank & Trust Co. | EUR | 2,290 | USD | 2,547 | 9/17/15 | (23,296 | ) | |||||||||||||||||
State Street Bank & Trust Co. | GBP | 4,255 | USD | 6,634 | 9/17/15 | 104,868 | ||||||||||||||||||
UBS AG | GBP | 11,707 | USD | 18,177 | 9/17/15 | 214,425 | ||||||||||||||||||
UBS AG | USD | 14,409 | GBP | 9,231 | 9/17/15 | (245,184 | ) | |||||||||||||||||
|
| |||||||||||||||||||||||
| $ | (1,752,264 | ) | ||||||||||||||||||||||
|
| |||||||||||||||||||||||
| (a) | Non-income producing security. |
| (b) | Represents entire or partial securities out on loan. See Note D for securities lending information. |
| (c) | Security is exempt from registration under Rule 144A of the Securities Act of 1933. These securities are considered liquid and may be resold in transactions exempt from registration, normally to qualified institutional buyers. At August 31, 2015, the aggregate market value of these securities amounted to $11,840,015 or 3.2% of net assets. |
| (d) | To obtain a copy of the fund’s financial statements, please go to the Securities and Exchange Commission’s website at www.sec.gov, or call AB at (800) 227-4618. |
| (e) | Investment in affiliated money market mutual fund. The rate shown represents the 7-day yield as of period end. |
| 74 | • AB POOLING PORTFOLIOS |
AB International Growth Portfolio—Portfolio of Investments
Currency Abbreviations:
CAD – Canadian Dollar
CHF – Swiss Franc
EUR – Euro
GBP – Great British Pound
HKD – Hong Kong Dollar
JPY – Japanese Yen
SEK – Swedish Krona
SGD – Singapore Dollar
USD – United States Dollar
Glossary:
| ADR | – American Depositary Receipt |
| GDR | – Global Depositary Receipt |
| PJSC | – Public Joint Stock Company |
| REG | – Registered Shares |
See notes to financial statements.
| AB POOLING PORTFOLIOS • | 75 |
AB International Growth Portfolio—Portfolio of Investments
AB SHORT DURATION BOND PORTFOLIO
PORTFOLIO OF INVESTMENTS
August 31, 2015
| Principal Amount (000) | U.S. $ Value | |||||||||
| ||||||||||
GOVERNMENTS - TREASURIES – 36.9% | ||||||||||
United States – 36.9% | ||||||||||
U.S. Treasury Notes | U.S.$ | 119,328 | $ | 119,270,544 | ||||||
0.50%, 11/30/16-4/30/17 | 77,668 | 77,573,594 | ||||||||
0.625%, 5/31/17 | 33,394 | 33,357,033 | ||||||||
0.75%, 10/31/17 | 2,070 | 2,066,388 | ||||||||
1.375%, 6/30/18 | 63,207 | 63,805,317 | ||||||||
1.50%, 6/30/16 | 28,475 | 28,742,694 | ||||||||
1.625%, 6/30/20 | 6,779 | 6,808,129 | ||||||||
|
| |||||||||
Total Governments - Treasuries | 331,623,699 | |||||||||
|
| |||||||||
CORPORATES - INVESTMENT | ||||||||||
Financial Institutions – 14.2% | ||||||||||
Banking – 13.1% | ||||||||||
Abbey National Treasury Services | 3,145 | 3,208,916 | ||||||||
ABN AMRO Bank NV | 4,092 | 4,137,167 | ||||||||
American Express Credit Corp. | 3,340 | 3,350,448 | ||||||||
1.80%, 7/31/18 | 2,310 | 2,305,459 | ||||||||
Australia & New Zealand Banking Group | 3,300 | 3,305,815 | ||||||||
Bank of America Corp. | 3,220 | 3,223,986 | ||||||||
Bank of America NA | 2,340 | 2,328,595 | ||||||||
Bank of New York Mellon Corp. (The) | 3,330 | 3,330,879 | ||||||||
Barclays PLC | 2,320 | 2,309,263 | ||||||||
BNP Paribas SA | 4,084 | 4,132,792 | ||||||||
Capital One Bank USA NA | 3,355 | 3,338,574 | ||||||||
Citigroup, Inc. | 2,327 | 2,317,448 | ||||||||
1.029%, 11/24/17(b) | 2,374 | 2,362,023 | ||||||||
1.25%, 1/15/16 | 3,335 | 3,338,855 | ||||||||
Credit Agricole SA/London | 3,750 | 3,853,511 | ||||||||
| 76 | • AB POOLING PORTFOLIOS |
AB Short Duration Bond Portfolio—Portfolio of Investments
| Principal Amount (000) | U.S. $ Value | |||||||||
| ||||||||||
Credit Suisse/New York NY | U.S.$ | 3,267 | $ | 3,261,436 | ||||||
Danske Bank A/S | 1,612 | 1,640,700 | ||||||||
Fifth Third Bancorp | 3,175 | 3,209,007 | ||||||||
Goldman Sachs Group, Inc. (The) | 2,308 | 2,334,761 | ||||||||
3.625%, 2/07/16 | 3,080 | 3,115,121 | ||||||||
HSBC USA, Inc. | 2,336 | 2,323,360 | ||||||||
Huntington National Bank (The) | 3,355 | 3,347,847 | ||||||||
ING Bank NV | 3,310 | 3,318,076 | ||||||||
JPMorgan Chase & Co. | 2,340 | 2,324,586 | ||||||||
Series G | 3,290 | 3,292,310 | ||||||||
KeyBank NA/Cleveland OH | 3,690 | 3,675,716 | ||||||||
Lloyds Bank PLC | 4,203 | 4,181,258 | ||||||||
Mizuho Bank Ltd. | 4,785 | 4,768,123 | ||||||||
Morgan Stanley | 1,988 | 1,996,479 | ||||||||
1.875%, 1/05/18 | 2,378 | 2,378,257 | ||||||||
5.95%, 12/28/17 | 2,782 | 3,031,804 | ||||||||
PNC Funding Corp. | 3,130 | 3,173,689 | ||||||||
Royal Bank of Canada | 3,335 | 3,340,003 | ||||||||
Royal Bank of Scotland Group PLC | 3,280 | 3,281,853 | ||||||||
SunTrust Bank/Atlanta GA | 3,330 | 3,323,117 | ||||||||
UBS AG/Stamford CT | 3,747 | 3,734,249 | ||||||||
US Bank NA/Cincinnati OH | 1,851 | 1,840,179 | ||||||||
Wells Fargo & Co. | 3,907 | 3,904,394 | ||||||||
|
| |||||||||
| 117,640,056 | ||||||||||
|
| |||||||||
Insurance – 1.1% | ||||||||||
MetLife, Inc. | 3,400 | 3,416,874 | ||||||||
New York Life Global Funding | 3,315 | 3,318,541 | ||||||||
| AB POOLING PORTFOLIOS • | 77 |
AB Short Duration Bond Portfolio—Portfolio of Investments
| Principal Amount (000) | U.S. $ Value | |||||||||
| ||||||||||
Prudential Financial, Inc. | U.S.$ | 3,075 | $ | 3,078,173 | ||||||
|
| |||||||||
| 9,813,588 | ||||||||||
|
| |||||||||
| 127,453,644 | ||||||||||
|
| |||||||||
Industrial – 4.8% | ||||||||||
Basic – 0.4% | ||||||||||
Monsanto Co. | 3,355 | 3,338,769 | ||||||||
|
| |||||||||
Communications - Media – 0.4% | ||||||||||
NBCUniversal Enterprise, Inc. | 3,795 | 3,801,121 | ||||||||
|
| |||||||||
Communications - Telecommunications – 0.5% | ||||||||||
America Movil SAB de CV | 2,031 | 2,234,303 | ||||||||
AT&T, Inc. | 2,365 | 2,365,809 | ||||||||
|
| |||||||||
| 4,600,112 | ||||||||||
|
| |||||||||
Consumer Cyclical - Automotive – 1.4% | ||||||||||
Daimler Finance North America LLC | 4,430 | 4,436,370 | ||||||||
1.65%, 3/02/18(a) | 2,236 | 2,220,590 | ||||||||
Ford Motor Credit Co. LLC | 2,806 | 2,793,202 | ||||||||
Volkswagen International Finance NV | 3,350 | 3,345,732 | ||||||||
|
| |||||||||
| 12,795,894 | ||||||||||
|
| |||||||||
Consumer Cyclical - Retailers – 0.3% | ||||||||||
Wal-Mart Stores, Inc. | 2,375 | 2,376,187 | ||||||||
|
| |||||||||
Consumer Non-Cyclical – 1.2% | ||||||||||
AbbVie, Inc. | 3,280 | 3,277,232 | ||||||||
Gilead Sciences, Inc. | 3,085 | 3,161,095 | ||||||||
McKesson Corp. | 1,298 | 1,297,966 | ||||||||
PepsiCo, Inc. | 3,315 | 3,318,610 | ||||||||
|
| |||||||||
| 11,054,903 | ||||||||||
|
| |||||||||
Technology – 0.6% | ||||||||||
Cisco Systems, Inc. | 3,360 | 3,361,505 | ||||||||
| 78 | • AB POOLING PORTFOLIOS |
AB Short Duration Bond Portfolio—Portfolio of Investments
| Principal Amount (000) | U.S. $ Value | |||||||||
| ||||||||||
QUALCOMM, Inc. | U.S.$ | 2,355 | $ | 2,330,303 | ||||||
|
| |||||||||
| 5,691,808 | ||||||||||
|
| |||||||||
| 43,658,794 | ||||||||||
|
| |||||||||
Total Corporates - Investment Grade | 171,112,438 | |||||||||
|
| |||||||||
ASSET-BACKED SECURITIES – 17.4% | ||||||||||
Autos - Fixed Rate – 9.0% | ||||||||||
Ally Auto Receivables Trust | 2,415 | 2,438,832 | ||||||||
Ally Master Owner Trust | 3,398 | 3,392,124 | ||||||||
ARI Fleet Lease Trust | 42 | 42,012 | ||||||||
Series 2014-A, Class A2 | 660 | 659,496 | ||||||||
Avis Budget Rental Car Funding | 1,730 | 1,737,027 | ||||||||
Series 2013-2A, Class A | 4,101 | 4,206,200 | ||||||||
Bank of America Auto Trust | 2,960 | 2,975,055 | ||||||||
Bank of The West Auto Trust | 3,297 | 3,295,268 | ||||||||
California Republic Auto Receivables Trust | 1,507 | 1,505,920 | ||||||||
Chrysler Capital Auto Receivables Trust | 1,663 | 1,663,443 | ||||||||
Drive Auto Receivables Trust | 2,180 | 2,180,208 | ||||||||
Enterprise Fleet Financing LLC | 564 | 563,511 | ||||||||
Series 2014-2, Class A2 | 2,804 | 2,800,644 | ||||||||
Series 2015-1, Class A2 | 3,270 | 3,253,450 | ||||||||
| AB POOLING PORTFOLIOS • | 79 |
AB Short Duration Bond Portfolio—Portfolio of Investments
| Principal Amount (000) | U.S. $ Value | |||||||||
| ||||||||||
Fifth Third Auto Trust | U.S.$ | 2,965 | $ | 2,975,256 | ||||||
Ford Credit Auto Lease Trust | 1,753 | 1,751,824 | ||||||||
Ford Credit Auto Owner Trust | 3,468 | 3,488,602 | ||||||||
GM Financial Automobile Leasing Trust | 3,298 | 3,305,583 | ||||||||
Series 2015-2, Class A3 | 3,024 | 3,044,971 | ||||||||
GMF Floorplan Owner Revolving Trust | 1,367 | 1,358,352 | ||||||||
Harley-Davidson Motorcycle Trust | 3,870 | 3,868,854 | ||||||||
Series 2015-1, Class A3 | 1,413 | 1,412,373 | ||||||||
Hertz Vehicle Financing LLC | 4,270 | 4,237,529 | ||||||||
Hyundai Auto Lease Securitization Trust | 2,267 | 2,267,119 | ||||||||
Series 2015-B, Class A3 | 1,487 | 1,487,905 | ||||||||
Hyundai Auto Receivables Trust | 2,306 | 2,305,451 | ||||||||
Mercedes Benz Auto Lease Trust | 340 | 339,668 | ||||||||
Mercedes-Benz Master Owner Trust | 3,854 | 3,838,091 | ||||||||
Nissan Auto Lease Trust | 2,825 | 2,833,678 | ||||||||
Santander Drive Auto Receivables Trust | 602 | 602,270 | ||||||||
Series 2015-3, Class A2A | 1,615 | 1,615,039 | ||||||||
| 80 | • AB POOLING PORTFOLIOS |
AB Short Duration Bond Portfolio—Portfolio of Investments
| Principal Amount (000) | U.S. $ Value | |||||||||
| ||||||||||
Series 2015-4,Class A2A | U.S.$ | 1,549 | $ | 1,548,972 | ||||||
TCF Auto Receivables Owner Trust | 2,170 | 2,168,177 | ||||||||
Volkswagen Auto Loan Enhanced Trust | 2,971 | 2,964,958 | ||||||||
World Omni Auto Receivables Trust | 2,451 | 2,450,188 | ||||||||
|
| |||||||||
| 80,578,050 | ||||||||||
|
| |||||||||
Credit Cards - Fixed Rate – 2.3% | ||||||||||
American Express Credit Account Master Trust | 1,948 | 1,952,784 | ||||||||
Barclays Dryrock Issuance Trust | 2,074 | 2,119,329 | ||||||||
Capital One Multi-Asset Execution Trust | 2,091 | 2,094,782 | ||||||||
Citibank Credit Card Issuance Trust | 4,015 | 4,052,227 | ||||||||
Discover Card Execution Note Trust | 2,841 | 2,816,419 | ||||||||
Synchrony Credit Card Master Note Trust | 3,299 | 3,328,061 | ||||||||
World Financial Network Credit Card Master Trust | 1,540 | 1,552,226 | ||||||||
Series 2013-A, Class A | 950 | 950,871 | ||||||||
Series 2015-B,Class A | 2,193 | 2,192,646 | ||||||||
|
| |||||||||
| 21,059,345 | ||||||||||
|
| |||||||||
Credit Cards - Floating Rate – 2.2% | ||||||||||
Cabela’s Credit Card Master Note Trust | 3,365 | 3,375,251 | ||||||||
Series 2014-1, Class A | 1,200 | 1,193,095 | ||||||||
| AB POOLING PORTFOLIOS • | 81 |
AB Short Duration Bond Portfolio—Portfolio of Investments
| Principal Amount (000) | U.S. $ Value | |||||||||
| ||||||||||
Chase Issuance Trust | U.S.$ | 4,632 | $ | 4,637,877 | ||||||
Discover Card Execution Note Trust | 1,905 | 1,906,288 | ||||||||
Series 2015-A1, Class A1 | 2,907 | 2,904,837 | ||||||||
First National Master Note Trust | 2,006 | 2,008,617 | ||||||||
World Financial Network Credit Card Master Trust | 2,110 | 2,111,319 | ||||||||
Series 2015-A, Class A | 1,853 | 1,845,265 | ||||||||
|
| |||||||||
| 19,982,549 | ||||||||||
|
| |||||||||
Autos - Floating Rate – 2.0% | ||||||||||
BMW Floorplan Master Owner Trust | 1,413 | 1,413,085 | ||||||||
Series 2015-1A, Class A | 2,788 | 2,788,459 | ||||||||
Ford Credit Floorplan Master Owner Trust A | 2,635 | 2,625,837 | ||||||||
GE Dealer Floorplan Master Note Trust | 1,462 | 1,455,450 | ||||||||
Series 2015-1, Class A | 2,788 | 2,767,076 | ||||||||
Hertz Fleet Lease Funding LP | 2,027 | 2,029,426 | ||||||||
Series 2014-1, Class A | 2,815 | 2,817,260 | ||||||||
Navistar Financial Dealer Note Master Trust | 2,069 | 2,059,946 | ||||||||
|
| |||||||||
| 17,956,539 | ||||||||||
|
| |||||||||
Other ABS - Fixed Rate – 1.8% | ||||||||||
CIT Equipment Collateral | 2,315 | 2,314,919 | ||||||||
| 82 | • AB POOLING PORTFOLIOS |
AB Short Duration Bond Portfolio—Portfolio of Investments
| Principal Amount (000) | U.S. $ Value | |||||||||
| ||||||||||
CNH Equipment Trust | U.S.$ | 4,975 | $ | 4,969,125 | ||||||
Series 2014-B, Class A4 | 1,812 | 1,812,063 | ||||||||
Series 2015-A, Class A4 | 1,728 | 1,724,463 | ||||||||
Dell Equipment Finance Trust | 2,036 | 2,034,632 | ||||||||
Series 2015-1, Class A3 | 981 | 977,276 | ||||||||
GE Equipment Small Ticket LLC | 825 | 824,532 | ||||||||
Macquarie Equipment Funding Trust | 1,202 | 1,201,984 | ||||||||
|
| |||||||||
| 15,858,994 | ||||||||||
|
| |||||||||
Home Equity Loans - Fixed Rate – 0.1% | ||||||||||
Credit-Based Asset Servicing and Securitization LLC | 505 | 509,741 | ||||||||
Nationstar NIM Ltd. | 35 | – 0 | – | |||||||
|
| |||||||||
| 509,741 | ||||||||||
|
| |||||||||
Total Asset-Backed Securities | 155,945,218 | |||||||||
|
| |||||||||
COMMERCIAL MORTGAGE-BACKED SECURITIES – 11.8% | ||||||||||
Non-Agency Fixed Rate CMBS – 10.9% | ||||||||||
Banc of America Commercial Mortgage Trust | 3,958 | 4,208,728 | ||||||||
Citigroup Commercial Mortgage Trust | 618 | 627,841 | ||||||||
Series 2015-GC29, Class A2 | 2,900 | 2,946,256 | ||||||||
Commercial Mortgage Pass Through Certificates | 1,434 | 1,430,101 | ||||||||
| AB POOLING PORTFOLIOS • | 83 |
AB Short Duration Bond Portfolio—Portfolio of Investments
| Principal Amount (000) | U.S. $ Value | |||||||||
| ||||||||||
Series 2013-CR6, Class A1 | U.S.$ | 2,579 | $ | 2,556,436 | ||||||
Series 2013-LC6, Class A1 | 1,233 | 1,227,138 | ||||||||
Series 2014-CR16, Class A2 | 3,374 | 3,488,227 | ||||||||
Series 2014-CR19, Class A2 | 4,220 | 4,341,101 | ||||||||
Series 2015-DC1, Class A2 | 3,205 | 3,288,397 | ||||||||
Series 2015-LC21, Class A2 | 2,430 | 2,503,783 | ||||||||
Commercial Mortgage Trust | 3,071 | 3,186,795 | ||||||||
Series 2013-LC6, Class XA | 5,701 | 430,374 | ||||||||
DBUBS Mortgage Trust | 4,919 | 4,981,033 | ||||||||
GS Mortgage Securities Corp. II | 259 | 259,034 | ||||||||
Series 2015-GC30, Class A2 | 2,965 | 3,017,897 | ||||||||
GS Mortgage Securities Trust | 1,445 | 1,524,633 | ||||||||
Series 2013-GC14, Class A1 | 1,348 | 1,347,642 | ||||||||
JP Morgan Chase Commercial Mortgage Securities Corp. | 264 | 263,917 | ||||||||
JP Morgan Chase Commercial Mortgage Securities Trust | 658 | 656,498 | ||||||||
Series 2007-LDPX, Class A1A | 4,747 | 4,960,418 | ||||||||
Series 2010-C1, Class A1 | 140 | 139,600 | ||||||||
Series 2013-C10, Class A1 | 1,225 | 1,219,518 | ||||||||
Series 2013-C16, Class A2 | 4,682 | 4,834,218 | ||||||||
| 84 | • AB POOLING PORTFOLIOS |
AB Short Duration Bond Portfolio—Portfolio of Investments
| Principal Amount (000) | U.S. $ Value | |||||||||
| ||||||||||
JPMBB Commercial Mortgage Securities Trust | U.S.$ | 4,720 | $ | 4,865,909 | ||||||
Series 2015-C28, Class A2 | 3,659 | 3,723,014 | ||||||||
Series 2015-C29, Class A2 | 1,800 | 1,841,915 | ||||||||
LSTAR Commercial Mortgage Trust | 1,496 | 1,516,159 | ||||||||
Merrill Lynch Mortgage Trust | 1,469 | 1,511,443 | ||||||||
ML-CFC Commercial Mortgage Trust | 2,570 | 2,663,212 | ||||||||
Morgan Stanley Bank of America Merrill Lynch Trust | 2,480 | 2,464,807 | ||||||||
Series 2014-C17, Class A2 | 2,876 | 2,975,170 | ||||||||
Series 2015-C23, Class A2 | 2,960 | 3,040,056 | ||||||||
UBS-Barclays Commercial Mortgage Trust | 1,588 | 1,579,321 | ||||||||
Series 2013-C5, Class A1 | 2,543 | 2,525,838 | ||||||||
Wachovia Bank Commercial Mortgage Trust | 4,181 | 4,209,514 | ||||||||
Series 2006-C26, Class A1A | 1,101 | 1,130,483 | ||||||||
Wells Fargo Commercial Mortgage Trust | 2,039 | 2,032,048 | ||||||||
Series 2015-NXS1, Class A2 | 1,633 | 1,656,898 | ||||||||
WF-RBS Commercial Mortgage Trust | 4,892 | 431,936 | ||||||||
Series 2012-C6, Class XA | 3,315 | 311,313 | ||||||||
Series 2012-C9, Class A1 | 2,154 | 2,144,048 | ||||||||
Series 2013-C12, Class A1 | 1,823 | 1,813,069 | ||||||||
| AB POOLING PORTFOLIOS • | 85 |
AB Short Duration Bond Portfolio—Portfolio of Investments
| Principal Amount (000) | U.S. $ Value | |||||||||
| ||||||||||
Series 2014-C24, Class A2 | U.S.$ | 2,150 | $ | 2,201,566 | ||||||
|
| |||||||||
| 98,077,304 | ||||||||||
|
| |||||||||
Non-Agency Floating Rate CMBS – 0.9% | ||||||||||
Carefree Portfolio Trust | 1,340 | 1,333,276 | ||||||||
JP Morgan Chase Commercial Mortgage Securities Trust | 3,239 | 3,230,083 | ||||||||
PFP III Ltd. | 768 | 766,930 | ||||||||
Resource Capital Corp. Ltd. | 1,008 | 1,003,296 | ||||||||
Starwood Retail Property Trust | 1,625 | 1,617,741 | ||||||||
|
| |||||||||
| 7,951,326 | ||||||||||
|
| |||||||||
Total Commercial Mortgage-Backed Securities | 106,028,630 | |||||||||
|
| |||||||||
COLLATERALIZED MORTGAGE OBLIGATIONS – 5.7% | ||||||||||
Agency Floating Rate – 2.7% | ||||||||||
Federal Home Loan Mortgage Corp. | 2,872 | 2,892,331 | ||||||||
Series 4286, Class VF | 3,405 | 3,420,544 | ||||||||
Federal National Mortgage Association | 3,243 | 3,251,623 | ||||||||
Series 2014-49, Class AF | 6,051 | 6,082,598 | ||||||||
NCUA Guaranteed Notes Trust | 7,971 | 8,027,019 | ||||||||
|
| |||||||||
| 23,674,115 | ||||||||||
|
| |||||||||
Agency Fixed Rate – 1.4% | ||||||||||
Federal Home Loan Mortgage Corp. | 3,809 | 3,950,052 | ||||||||
Series 4461, Class EA | 2,956 | 2,978,500 | ||||||||
| 86 | • AB POOLING PORTFOLIOS |
AB Short Duration Bond Portfolio—Portfolio of Investments
| Principal Amount (000) | U.S. $ Value | |||||||||
| ||||||||||
Federal National Mortgage Association | U.S.$ | 1,349 | $ | 1,390,356 | ||||||
Series 2011-39, Class DA | 851 | 861,618 | ||||||||
Series 2014-54, Class LA | 3,590 | 3,697,883 | ||||||||
|
| |||||||||
| 12,878,409 | ||||||||||
|
| |||||||||
GSE Risk Share Floating Rate – 1.4% | ||||||||||
Federal Home Loan Mortgage Corp., Structured Agency Credit Risk Debt Notes | 1,697 | 1,693,072 | ||||||||
Series 2014-HQ1, Class M1 | 2,132 | 2,135,439 | ||||||||
Series 2014-HQ2, Class M1 | 1,244 | 1,246,225 | ||||||||
Series 2014-HQ3, Class M1 | 1,503 | 1,503,529 | ||||||||
Federal National Mortgage Association Connecticut Avenue Securities | 2,830 | 2,810,945 | ||||||||
Series 2014-C04, Class 2M1 | 1,947 | 1,957,960 | ||||||||
Series 2015-C01, Class 1M1 | 975 | 975,825 | ||||||||
|
| |||||||||
| 12,322,995 | ||||||||||
|
| |||||||||
Non-Agency Floating Rate – 0.2% | ||||||||||
Mortgage Equity Conversion Asset Trust | 2,280 | 1,952,305 | ||||||||
|
| |||||||||
Total Collateralized Mortgage Obligations | 50,827,824 | |||||||||
|
| |||||||||
AGENCIES – 4.7% | ||||||||||
Agency Callables – 4.7% | ||||||||||
Federal Home Loan Banks | 6,880 | 6,895,982 | ||||||||
Federal Home Loan Mortgage Corp. | 9,427 | 9,420,316 | ||||||||
1.95%, 5/28/20 | 7,070 | 7,076,193 | ||||||||
1.58%, 2/27/19 | 9,420 | 9,412,643 | ||||||||
Series 0000 | 9,410 | 9,402,500 | ||||||||
|
| |||||||||
Total Agencies | 42,207,634 | |||||||||
|
| |||||||||
| AB POOLING PORTFOLIOS • | 87 |
AB Short Duration Bond Portfolio—Portfolio of Investments
| Principal Amount (000) | U.S. $ Value | |||||||||
| ||||||||||
MORTGAGE PASS-THROUGHS – 2.4% | ||||||||||
Agency ARMs – 0.1% | ||||||||||
Federal National Mortgage Association | U.S.$ | 819 | $ | 852,595 | ||||||
|
| |||||||||
Agency Fixed Rate 15-Year – 0.2% | ||||||||||
Federal Home Loan Mortgage Corp. Gold | 1,151 | 1,244,399 | ||||||||
Federal National Mortgage Association | 14 | 14,284 | ||||||||
Series 2005 | 21 | 22,643 | ||||||||
Series 2006 | 729 | 793,194 | ||||||||
Series 2001 | 7 | 7,113 | ||||||||
Series 2007 | 222 | 242,517 | ||||||||
|
| |||||||||
| 2,324,150 | ||||||||||
|
| |||||||||
Agency Fixed Rate 30-Year – 1.3% | ||||||||||
Federal National Mortgage Association | 7,095 | 7,989,659 | ||||||||
Government National Mortgage Association | 3,393 | 3,814,857 | ||||||||
|
| |||||||||
| 11,804,516 | ||||||||||
|
| |||||||||
Other Agency Fixed Rate | ||||||||||
Federal National Mortgage Association | 6,868 | 7,023,887 | ||||||||
|
| |||||||||
Total Mortgage Pass-Throughs | 22,005,148 | |||||||||
|
| |||||||||
INFLATION-LINKED | ||||||||||
United States – 1.0% | ||||||||||
U.S. Treasury Inflation Index | 9,285 | 9,268,691 | ||||||||
|
| |||||||||
COVERED BONDS – 0.4% | ||||||||||
DNB Boligkreditt AS | 3,335 | 3,334,873 | ||||||||
|
| |||||||||
| 88 | • AB POOLING PORTFOLIOS |
AB Short Duration Bond Portfolio—Portfolio of Investments
| Company | Shares | U.S. $ Value | ||||||||
| ||||||||||
SHORT-TERM INVESTMENTS – 0.5% | ||||||||||
Investment Companies – 0.4% | ||||||||||
AB Fixed Income Shares, Inc. – | 3,756,308 | $ | 3,756,308 | |||||||
|
| |||||||||
| Principal Amount (000) | ||||||||||
Asset-Backed Securities – 0.1% | ||||||||||
AmeriCredit Automobile Receivables Trust | U.S.$ | 522 | 521,641 | |||||||
|
| |||||||||
Total Short-Term Investments | 4,277,949 | |||||||||
|
| |||||||||
Total Investments – 99.8% | 896,632,104 | |||||||||
Other assets less liabilities – 0.2% | 1,773,333 | |||||||||
|
| |||||||||
Net Assets – 100.0% | $ | 898,405,437 | ||||||||
|
| |||||||||
FUTURES (see Note C)
| Type | Number of Contracts | Expiration Month | Original Value | Value at August 31, 2015 | Unrealized Appreciation/ (Depreciation) | |||||||||||||||
Purchased Contracts |
| |||||||||||||||||||
U.S. T-Note 2 Yr (CBT) Futures | 1,171 | December 2015 | $ | 256,169,565 | $ | 255,826,906 | $ | (342,659 | ) | |||||||||||
Sold Contracts |
| |||||||||||||||||||
U.S. T-Note 5 Yr (CBT) Futures | 407 | December 2015 | 49,000,397 | 48,611,063 | 389,334 | |||||||||||||||
U.S. T-Note 10 Yr (CBT) Futures | 129 | December 2015 | 16,524,374 | 16,391,062 | 133,312 | |||||||||||||||
|
| |||||||||||||||||||
| $ | 179,987 | |||||||||||||||||||
|
| |||||||||||||||||||
CENTRALLY CLEARED INTEREST RATE SWAPS (see Note C)
| Rate Type | ||||||||||||||||||||
| Clearing Broker/ (Exchange) | Notional Amount (000) | Termination Date | Payments made by the Fund | Payments received by the Fund | Unrealized Appreciation/ (Depreciation) | |||||||||||||||
Morgan Stanley & Co., LLC/(CME Group) | NZD | 11,260 | 4/29/17 | 3 Month BKBM | 4.274% | $ | 266,617 | |||||||||||||
| AB POOLING PORTFOLIOS • | 89 |
AB Short Duration Bond Portfolio—Portfolio of Investments
| (a) | Security is exempt from registration under Rule 144A of the Securities Act of 1933. These securities are considered liquid and may be resold in transactions exempt from registration, normally to qualified institutional buyers. At August 31, 2015, the aggregate market value of these securities amounted to $114,656,576 or 12.8% of net assets. |
| (b) | Floating Rate Security. Stated interest rate was in effect at August 31, 2015. |
| (c) | Security is exempt from registration under Rule 144A of the Securities Act of 1933. This security, which represents 0.00% of net assets as of August 31, 2015, is considered illiquid and restricted. |
| Restricted Securities | Acquisition Date | Cost | Market Value | Percentage of Net Assets | ||||||||||||
Nationstar NIM Ltd. Series 2007-A, Class A | 04/04/07 | $ | 35,213 | $ | – 0 | – | 0.00 | % | ||||||||
| (d) | Fair valued by the Adviser. |
| (e) | IO – Interest Only |
| (f) | To obtain a copy of the fund’s financial statements, please go to the Securities and Exchange Commission’s website at www.sec.gov, or call AB at (800) 227-4618. |
| (g) | Investment in affiliated money market mutual fund. The rate shown represents the 7-day yield as of period end. |
Currency Abbreviations:
NZD – New Zealand Dollar
Glossary:
| ABS | – Asset-Backed Securities |
| BKBM | – Bank Bill Benchmark (New Zealand) |
| CBT | – Chicago Board of Trade |
| CFC | – Customer Facility Charge |
| CMBS | – Commercial Mortgage-Backed Securities |
| CME | – Chicago Mercantile Exchange |
| GSE | – Government-Sponsored Enterprise |
| NCUA | – National Credit Union Administration |
| TIPS | – Treasury Inflation Protected Security |
See notes to financial statements.
| 90 | • AB POOLING PORTFOLIOS |
AB Short Duration Bond Portfolio—Portfolio of Investments
AB GLOBAL CORE BOND PORTFOLIO
PORTFOLIO OF INVESTMENTS
August 31, 2015
| Principal Amount (000) | U.S. $ Value | |||||||||||
| ||||||||||||
GOVERNMENTS – TREASURIES – 44.1% | ||||||||||||
Australia – 2.9% | ||||||||||||
Australia Government Bond | AUD | 24,140 | $ | 19,201,744 | ||||||||
Series 139 | 5,680 | 4,237,773 | ||||||||||
Series 144 | 4,220 | 3,203,084 | ||||||||||
|
| |||||||||||
| 26,642,601 | ||||||||||||
|
| |||||||||||
Belgium – 0.8% | ||||||||||||
Belgium Government Bond | EUR | 3,605 | 5,964,242 | |||||||||
Series 75 | 1,755 | 1,780,249 | ||||||||||
|
| |||||||||||
| 7,744,491 | ||||||||||||
|
| |||||||||||
Brazil – 1.4% | ||||||||||||
Brazil Notas do Tesouro Nacional | BRL | 12,569 | 8,063,348 | |||||||||
Series B | 2,061 | 1,316,163 | ||||||||||
Series F | 12,725 | 3,339,141 | ||||||||||
|
| |||||||||||
| 12,718,652 | ||||||||||||
|
| |||||||||||
Denmark – 0.4% | ||||||||||||
Denmark Government Bond | DKK | 21,530 | 3,748,114 | |||||||||
|
| |||||||||||
France – 1.3% | ||||||||||||
France Government Bond OAT | ||||||||||||
0.50%, 5/25/25(a) | EUR | 2,398 | 2,533,639 | |||||||||
2.50%, 5/25/30(a) | 1,818 | 2,273,637 | ||||||||||
3.25%, 10/25/21-5/25/45(a) | 4,395 | 6,139,506 | ||||||||||
4.50%, 4/25/41(a) | 680 | 1,151,896 | ||||||||||
|
| |||||||||||
| 12,098,678 | ||||||||||||
|
| |||||||||||
Germany – 4.0% | ||||||||||||
Bundesrepublik Deutschland | 23,878 | 26,208,443 | ||||||||||
Series 00 | 5,660 | 10,732,867 | ||||||||||
|
| |||||||||||
| 36,941,310 | ||||||||||||
|
| |||||||||||
Ireland – 1.0% | ||||||||||||
Ireland Government Bond | ||||||||||||
3.40%, 3/18/24(a) | 3,820 | 5,027,599 | ||||||||||
5.40%, 3/13/25 | 2,527 | 3,829,436 | ||||||||||
|
| |||||||||||
| 8,857,035 | ||||||||||||
|
| |||||||||||
| AB POOLING PORTFOLIOS • | 91 |
AB Global Core Bond Portfolio—Portfolio of Investments
| Principal Amount (000) | U.S. $ Value | |||||||||
| ||||||||||
Italy – 3.2% | ||||||||||
Italy Buoni Poliennali Del Tesoro | EUR | 9,335 | $ | 10,437,355 | ||||||
3.75%, 3/01/21-5/01/21 | 5,702 | 7,289,171 | ||||||||
4.25%, 9/01/19 | 2,245 | 2,869,713 | ||||||||
4.50%, 5/01/23 | 4,895 | 6,603,888 | ||||||||
5.00%, 8/01/34(a) | 1,810 | 2,724,370 | ||||||||
|
| |||||||||
| 29,924,497 | ||||||||||
|
| |||||||||
Japan – 5.9% | ||||||||||
Japan Government Thirty Year Bond | JPY | 250,050 | 2,357,216 | |||||||
Series 44 | 179,500 | 1,582,446 | ||||||||
Japan Government Twenty Year Bond | 1,784,200 | 17,474,078 | ||||||||
Series 143 | 935,050 | 8,480,661 | ||||||||
Series 150 | 1,818,450 | 15,765,100 | ||||||||
Japan Government Two Year Bond | 1,165,900 | 9,630,227 | ||||||||
|
| |||||||||
| 55,289,728 | ||||||||||
|
| |||||||||
Mexico – 0.7% | ||||||||||
Mexican Bonos | MXN | 60,655 | 4,106,399 | |||||||
Series M 20 | 31,235 | 2,387,979 | ||||||||
|
| |||||||||
| 6,494,378 | ||||||||||
|
| |||||||||
Netherlands – 1.7% | ||||||||||
Netherlands Government Bond | EUR | 12,145 | 15,936,304 | |||||||
|
| |||||||||
Singapore – 0.1% | ||||||||||
Singapore Government Bond | SGD | 876 | 636,453 | |||||||
|
| |||||||||
South Africa – 0.1% | ||||||||||
South Africa Government Bond | ZAR | 21,030 | 1,349,172 | |||||||
|
| |||||||||
Spain – 2.5% | ||||||||||
Spain Government Bond | EUR | 5,230 | 5,400,513 | |||||||
| 92 | • AB POOLING PORTFOLIOS |
AB Global Core Bond Portfolio—Portfolio of Investments
| Principal Amount (000) | U.S. $ Value | |||||||||
| ||||||||||
4.20%, 1/31/37(a) | EUR | 3,455 | $ | 4,639,720 | ||||||
4.40%, 10/31/23(a) | 4,585 | 6,137,213 | ||||||||
4.70%, 7/30/41(a) | 5,021 | 7,221,742 | ||||||||
|
| |||||||||
| 23,399,188 | ||||||||||
|
| |||||||||
Sweden – 0.4% | ||||||||||
Sweden Government Bond | SEK | 24,950 | 3,573,632 | |||||||
|
| |||||||||
United Kingdom – 8.4% | ||||||||||
United Kingdom Gilt | GBP | 14,485 | 22,434,193 | |||||||
1.75%, 9/07/22(a) | 8,210 | 12,678,913 | ||||||||
4.25%, 12/07/40(a) | 1,005 | 2,032,892 | ||||||||
4.50%, 3/07/19-12/07/42(a) | 9,236 | 18,185,763 | ||||||||
4.75%, 12/07/30(a) | 5,269 | 10,648,477 | ||||||||
5.00%, 3/07/25(a) | 6,165 | 12,060,082 | ||||||||
|
| |||||||||
| 78,040,320 | ||||||||||
|
| |||||||||
United States – 9.3% | ||||||||||
U.S. Treasury Bonds | U.S.$ | 2,980 | 2,936,152 | |||||||
3.00%, 11/15/44 | 7,395 | 7,464,328 | ||||||||
4.50%, 2/15/36 | 3,530 | 4,559,355 | ||||||||
4.625%, 2/15/40 | 16,233 | 21,296,197 | ||||||||
U.S. Treasury Notes | 5,630 | 5,636,598 | ||||||||
1.25%, 1/31/20 | 14,030 | 13,902,299 | ||||||||
1.375%, 4/30/20 | 10,545 | 10,484,725 | ||||||||
1.50%, 2/28/19 | 15 | 14,722 | ||||||||
1.625%, 8/15/22 | 2,852 | 2,792,399 | ||||||||
2.50%, 5/15/24 | 11,115 | 11,431,378 | ||||||||
2.75%, 2/15/24 | 6,045 | 6,347,407 | ||||||||
|
| |||||||||
| 86,865,560 | ||||||||||
|
| |||||||||
Total Governments - Treasuries | 410,260,113 | |||||||||
|
| |||||||||
CORPORATES - INVESTMENT GRADE – 25.8% | ||||||||||
Industrial – 13.4% | ||||||||||
Basic – 1.2% | ||||||||||
Air Products & Chemicals, Inc. | 2,067 | 2,009,606 | ||||||||
Glencore Funding LLC | 1,257 | 1,195,921 | ||||||||
4.00%, 4/16/25(a) | 1,065 | 894,353 | ||||||||
4.125%, 5/30/23(a) | 561 | 504,695 | ||||||||
| AB POOLING PORTFOLIOS • | 93 |
AB Global Core Bond Portfolio—Portfolio of Investments
| Principal Amount (000) | U.S. $ Value | |||||||||
| ||||||||||
International Paper Co. | U.S.$ | 1,200 | $ | 1,173,716 | ||||||
5.15%, 5/15/46 | 122 | 117,607 | ||||||||
Minsur SA | 714 | 735,104 | ||||||||
Mosaic Co. (The) | 714 | 754,632 | ||||||||
Rio Tinto Finance USA Ltd. | 2,309 | 2,235,216 | ||||||||
Teck Resources Ltd. | 1,960 | 1,562,120 | ||||||||
|
| |||||||||
| 11,182,970 | ||||||||||
|
| |||||||||
Capital Goods – 0.4% | ||||||||||
DH Europe Finance SA | EUR | 1,152 | 1,306,530 | |||||||
Republic Services, Inc. | U.S.$ | 85 | 88,927 | |||||||
Yamana Gold, Inc. | 2,128 | 1,915,979 | ||||||||
|
| |||||||||
| 3,311,436 | ||||||||||
|
| |||||||||
Communications - Media – 1.7% | ||||||||||
21st Century Fox America, Inc. | 1,110 | 1,064,654 | ||||||||
6.55%, 3/15/33 | 268 | 321,283 | ||||||||
CBS Corp. | 2,110 | 2,001,398 | ||||||||
CCO Safari II LLC | 980 | 978,877 | ||||||||
4.908%, 7/23/25(a) | 980 | 970,684 | ||||||||
Comcast Corp. | 965 | 954,851 | ||||||||
Cox Communications, Inc. | 666 | 613,999 | ||||||||
Discovery Communications LLC | 1,001 | 923,265 | ||||||||
McGraw Hill Financial, Inc. | 1,677 | 1,667,802 | ||||||||
RELX Capital, Inc. | 2,109 | 2,501,869 | ||||||||
Time Warner, Inc. | 1,386 | 1,358,250 | ||||||||
3.60%, 7/15/25 | 990 | 958,146 | ||||||||
7.625%, 4/15/31 | 380 | 476,322 | ||||||||
Viacom, Inc. | 1,511 | 1,401,972 | ||||||||
|
| |||||||||
| 16,193,372 | ||||||||||
|
| |||||||||
| 94 | • AB POOLING PORTFOLIOS |
AB Global Core Bond Portfolio—Portfolio of Investments
| Principal Amount (000) | U.S. $ Value | |||||||||
| ||||||||||
Communications - Telecommunications – 1.9% | ||||||||||
America Movil SAB de CV | U.S.$ | 1,330 | $ | 1,304,265 | ||||||
American Tower Corp. | 2,750 | 2,973,262 | ||||||||
AT&T, Inc. | 2,235 | 2,129,926 | ||||||||
Bell Canada | CAD | 924 | 732,366 | |||||||
3.35%, 6/18/19 | 460 | 366,101 | ||||||||
4.70%, 9/11/23 | 625 | 527,364 | ||||||||
British Telecommunications PLC | U.S.$ | 534 | 778,483 | |||||||
Deutsche Telekom International Finance BV | 2,436 | 2,429,796 | ||||||||
DIRECTV Holdings LLC/DIRECTV Financing Co., Inc. | 1,517 | 1,470,909 | ||||||||
4.45%, 4/01/24 | 1,065 | 1,076,369 | ||||||||
Rogers Communications, Inc. | CAD | 1,100 | 887,918 | |||||||
Verizon Communications, Inc. | U.S.$ | 2,358 | 2,793,027 | |||||||
|
| |||||||||
| 17,469,786 | ||||||||||
|
| |||||||||
Consumer Cyclical - Automotive – 0.2% | ||||||||||
Ford Motor Credit Co., LLC | 2,126 | 2,092,990 | ||||||||
|
| |||||||||
Consumer Cyclical - Retailers – 0.7% | ||||||||||
CVS Health Corp. | 2,425 | 2,591,685 | ||||||||
Kohl’s Corp. | 1,401 | 1,363,925 | ||||||||
Walgreens Boots Alliance, Inc. | 2,151 | 2,129,869 | ||||||||
|
| |||||||||
| 6,085,479 | ||||||||||
|
| |||||||||
Consumer Non-Cyclical – 2.5% | ||||||||||
AbbVie, Inc. | 1,485 | 1,468,164 | ||||||||
3.60%, 5/14/25 | 1,942 | 1,911,845 | ||||||||
Actavis Funding SCS | 1,469 | 1,462,855 | ||||||||
3.80%, 3/15/25 | 1,305 | 1,262,953 | ||||||||
3.85%, 6/15/24 | 697 | 679,397 | ||||||||
Agilent Technologies, Inc. | 505 | 553,063 | ||||||||
| AB POOLING PORTFOLIOS • | 95 |
AB Global Core Bond Portfolio—Portfolio of Investments
| Principal Amount (000) | U.S. $ Value | |||||||||
| ||||||||||
Ahold Finance USA LLC | U.S.$ | 3,105 | $ | 3,825,177 | ||||||
Baxalta, Inc. | 980 | 985,623 | ||||||||
Becton Dickinson and Co. | 791 | 791,301 | ||||||||
3.734%, 12/15/24 | 552 | 550,407 | ||||||||
Celgene Corp. | 965 | 959,044 | ||||||||
Kraft Heinz Foods Co. | 1,465 | 1,464,081 | ||||||||
3.50%, 7/15/22(a) | 1,245 | 1,256,747 | ||||||||
Kroger Co. (The) | 242 | 244,593 | ||||||||
Perrigo Co. PLC | 275 | 272,509 | ||||||||
Perrigo Finance PLC | 262 | 255,728 | ||||||||
Reynolds American, Inc. | 1,269 | 1,235,115 | ||||||||
3.75%, 5/20/23(a) | 960 | 932,383 | ||||||||
4.45%, 6/12/25 | 1,955 | 2,008,950 | ||||||||
5.85%, 8/15/45 | 788 | 848,529 | ||||||||
Tyson Foods, Inc. | 493 | 492,108 | ||||||||
|
| |||||||||
| 23,460,572 | ||||||||||
|
| |||||||||
Energy – 2.7% | ||||||||||
Anadarko Petroleum Corp. | 735 | 766,945 | ||||||||
Devon Energy Corp. | 1,460 | 1,393,623 | ||||||||
Energy Transfer Partners LP | 972 | 1,066,258 | ||||||||
7.50%, 7/01/38 | 1,054 | 1,146,373 | ||||||||
EnLink Midstream Partners LP | 2,460 | 2,269,205 | ||||||||
Enterprise Products Operating LLC | 990 | 893,271 | ||||||||
Kinder Morgan Energy Partners LP | 183 | 178,651 | ||||||||
3.50%, 9/01/23 | 698 | 619,244 | ||||||||
3.95%, 9/01/22 | 495 | 461,560 | ||||||||
4.15%, 3/01/22 | 863 | 826,415 | ||||||||
Kinder Morgan, Inc./DE | 829 | 855,533 | ||||||||
Noble Energy, Inc. | 2,858 | 3,330,990 | ||||||||
| 96 | • AB POOLING PORTFOLIOS |
AB Global Core Bond Portfolio—Portfolio of Investments
| Principal Amount (000) | U.S. $ Value | |||||||||
| ||||||||||
ONEOK Partners LP | U.S.$ | 712 | $ | 709,975 | ||||||
Plains All American Pipeline LP/PAA Finance Corp. | 1,727 | 1,607,524 | ||||||||
Reliance Holding USA, Inc. | 2,345 | 2,545,125 | ||||||||
Southwestern Energy Co. | 823 | 747,765 | ||||||||
Sunoco Logistics Partners Operations LP | 1,055 | 893,731 | ||||||||
Weatherford International Ltd./Bermuda | 1,540 | 1,681,390 | ||||||||
Williams Partners LP | 943 | 838,718 | ||||||||
4.125%, 11/15/20 | 2,295 | 2,333,969 | ||||||||
4.50%, 11/15/23 | 425 | 412,394 | ||||||||
|
| |||||||||
| 25,578,659 | ||||||||||
|
| |||||||||
Technology – 1.2% | ||||||||||
Hewlett-Packard Co. | 215 | 216,505 | ||||||||
3.75%, 12/01/20 | 1,317 | 1,357,153 | ||||||||
4.375%, 9/15/21 | 181 | 188,227 | ||||||||
4.65%, 12/09/21 | 460 | 484,258 | ||||||||
KLA-Tencor Corp. | 1,582 | 1,555,867 | ||||||||
Motorola Solutions, Inc. | 859 | 758,135 | ||||||||
7.50%, 5/15/25 | 290 | 329,558 | ||||||||
QUALCOMM, Inc. | 2,455 | 2,384,787 | ||||||||
Seagate HDD Cayman | 1,234 | 1,173,883 | ||||||||
Tencent Holdings Ltd. | 1,483 | 1,501,047 | ||||||||
Total System Services, Inc. | 791 | 787,913 | ||||||||
|
| |||||||||
| 10,737,333 | ||||||||||
|
| |||||||||
Transportation - Airlines – 0.1% | ||||||||||
Southwest Airlines Co. | 1,115 | 1,178,205 | ||||||||
|
| |||||||||
Transportation - Services – 0.8% | ||||||||||
Asciano Finance Ltd. | 1,708 | 1,709,455 | ||||||||
5.00%, 4/07/18(a) | 1,675 | 1,777,187 | ||||||||
| AB POOLING PORTFOLIOS • | 97 |
AB Global Core Bond Portfolio—Portfolio of Investments
| Principal Amount (000) | U.S. $ Value | |||||||||
| ||||||||||
Penske Truck Leasing Co. LP / PTL Finance Corp. | U.S.$ | 2,485 | $ | 2,415,759 | ||||||
Ryder System, Inc. | 930 | 977,262 | ||||||||
7.20%, 9/01/15 | 908 | 908,000 | ||||||||
|
| |||||||||
| 7,787,663 | ||||||||||
|
| |||||||||
| 125,078,465 | ||||||||||
|
| |||||||||
Financial Institutions – 10.2% | ||||||||||
Banking – 7.0% | ||||||||||
ABN AMRO Bank NV | 1,312 | 1,317,071 | ||||||||
Bank of America Corp. | 1,340 | 1,329,146 | ||||||||
4.875%, 4/01/44 | 3,345 | 3,482,546 | ||||||||
Series L | 1,280 | 1,288,645 | ||||||||
Barclays Bank PLC | EUR | 1,003 | 1,398,540 | |||||||
Barclays PLC | U.S.$ | 920 | 873,908 | |||||||
BNP Paribas SA | 2,966 | 3,317,670 | ||||||||
BPCE SA | 540 | 571,633 | ||||||||
Compass Bank | 1,034 | 1,020,401 | ||||||||
5.50%, 4/01/20 | 4,989 | 5,433,625 | ||||||||
Cooperatieve Centrale Raiffeisen-Boerenleenbank BA/Netherlands | 1,486 | 1,482,457 | ||||||||
4.375%, 8/04/25 | 1,682 | 1,679,112 | ||||||||
Credit Suisse Group Funding Guernsey Ltd. | 2,680 | 2,665,222 | ||||||||
Fifth Third Bancorp | 1,132 | 1,132,137 | ||||||||
Goldman Sachs Group, Inc. (The) | 3,880 | 3,864,810 | ||||||||
Series D | 920 | 1,048,639 | ||||||||
Series G | 2,855 | 3,334,263 | ||||||||
ING Bank NV | 1,600 | 1,653,355 | ||||||||
ING Groep NV | 719 | 719,899 | ||||||||
Lloyds Bank PLC | 2,702 | 3,124,088 | ||||||||
| 98 | • AB POOLING PORTFOLIOS |
AB Global Core Bond Portfolio—Portfolio of Investments
| Principal Amount (000) | U.S. $ Value | |||||||||
| ||||||||||
Macquarie Bank Ltd. | U.S.$ | 651 | $ | 681,667 | ||||||
Mellon Capital III | GBP | 850 | 1,333,803 | |||||||
Mizuho Financial Group Cayman 3 Ltd. | U.S.$ | 2,266 | 2,317,273 | |||||||
Morgan Stanley | 2,640 | 2,681,973 | ||||||||
Series G | 1,666 | 1,700,363 | ||||||||
5.50%, 7/24/20 | 1,430 | 1,595,025 | ||||||||
Murray Street Investment Trust I | 272 | 283,364 | ||||||||
Nationwide Building Society | 3,415 | 3,979,612 | ||||||||
Nordea Bank AB | 2,990 | 3,069,594 | ||||||||
6.125%, 9/23/24(a)(b) | 385 | 381,150 | ||||||||
Rabobank Capital Funding Trust III | 605 | 611,806 | ||||||||
Rabobank Capital Funding Trust IV | GBP | 620 | 996,916 | |||||||
Santander UK PLC | U.S.$ | 925 | 959,638 | |||||||
Standard Chartered PLC | 2,214 | 2,250,354 | ||||||||
Sumitomo Mitsui Banking Corp. | 1,377 | 1,365,009 | ||||||||
|
| |||||||||
| 64,944,714 | ||||||||||
|
| |||||||||
Brokerage – 0.3% | ||||||||||
Nomura Holdings, Inc. | 2,586 | 2,603,068 | ||||||||
|
| |||||||||
Insurance – 2.2% | ||||||||||
Allied World Assurance Co. Holdings Ltd. | 1,820 | 1,917,030 | ||||||||
Dai-ichi Life Insurance Co., Ltd. (The) | 1,041 | 1,074,832 | ||||||||
Five Corners Funding Trust | 1,060 | 1,095,967 | ||||||||
Hartford Financial Services Group, Inc. (The) | 600 | 667,894 | ||||||||
5.50%, 3/30/20 | 922 | 1,032,279 | ||||||||
Humana, Inc. | 369 | 412,117 | ||||||||
7.20%, 6/15/18 | 610 | 692,268 | ||||||||
| AB POOLING PORTFOLIOS • | 99 |
AB Global Core Bond Portfolio—Portfolio of Investments
| Principal Amount (000) | U.S. $ Value | |||||||||
| ||||||||||
Lincoln National Corp. | U.S.$ | 791 | $ | 968,952 | ||||||
Markel Corp. | 1,105 | 1,294,878 | ||||||||
Massachusetts Mutual Life Insurance Co. | 815 | 1,221,377 | ||||||||
MetLife Capital Trust IV | 162 | 202,095 | ||||||||
MetLife, Inc. | 1,085 | 1,193,438 | ||||||||
7.717%, 2/15/19 | 1,159 | 1,365,800 | ||||||||
Muenchener Rueckversicherungs-Gesellschaft AG in Muenchen | EUR | 1,400 | 1,906,934 | |||||||
Nationwide Mutual Insurance Co. | U.S.$ | 740 | 1,101,962 | |||||||
Prudential Financial, Inc. | 2,045 | 2,099,192 | ||||||||
Swiss Re Solutions Holding Corp. | 1,295 | 1,665,137 | ||||||||
XLIT Ltd. | 530 | 493,001 | ||||||||
|
| |||||||||
| 20,405,153 | ||||||||||
|
| |||||||||
Other Finance – 0.1% | ||||||||||
SUAM Finance BV | 1,289 | 1,285,777 | ||||||||
|
| |||||||||
REITS – 0.6% | ||||||||||
HCP, Inc. | 2,195 | 2,321,741 | ||||||||
Health Care REIT, Inc. | 2,902 | 2,870,107 | ||||||||
Healthcare Trust of America Holdings LP | 568 | 563,407 | ||||||||
|
| |||||||||
| 5,755,255 | ||||||||||
|
| |||||||||
| 94,993,967 | ||||||||||
|
| |||||||||
Utility – 2.2% | ||||||||||
Electric – 1.0% | ||||||||||
Constellation Energy Group, Inc. | 504 | 551,568 | ||||||||
Entergy Corp. | 1,706 | 1,719,563 | ||||||||
Exelon Generation Co. LLC | 2,463 | 2,526,077 | ||||||||
Monongahela Power Co. | 1,059 | 1,086,578 | ||||||||
| 100 | • AB POOLING PORTFOLIOS |
AB Global Core Bond Portfolio—Portfolio of Investments
| Principal Amount (000) | U.S. $ Value | |||||||||
| ||||||||||
TECO Finance, Inc. | U.S.$ | 745 | $ | 756,123 | ||||||
5.15%, 3/15/20 | 915 | 999,647 | ||||||||
Trans-Allegheny Interstate Line Co. | 1,160 | 1,164,617 | ||||||||
Union Electric Co. | 315 | 362,652 | ||||||||
|
| |||||||||
| 9,166,825 | ||||||||||
|
| |||||||||
Natural Gas – 1.1% | ||||||||||
Centrica PLC | 1,865 | 1,875,918 | ||||||||
Empresa de Energia de Bogota SA ESP | 1,515 | 1,576,618 | ||||||||
NiSource Finance Corp. | 3,445 | 3,932,019 | ||||||||
Talent Yield Investments Ltd. | 2,400 | 2,474,976 | ||||||||
|
| |||||||||
| 9,859,531 | ||||||||||
|
| |||||||||
Other Utility – 0.1% | ||||||||||
Veolia Environnement SA | EUR | 640 | 1,038,158 | |||||||
|
| |||||||||
| 20,064,514 | ||||||||||
|
| |||||||||
Total Corporates - Investment Grade | 240,136,946 | |||||||||
|
| |||||||||
MORTGAGE PASS-THROUGHS – 6.8% | ||||||||||
Agency ARMs – 0.2% | ||||||||||
Federal Home Loan Mortgage Corp. | U.S.$ | 1,226 | 1,305,325 | |||||||
Federal National Mortgage Association | 639 | 680,634 | ||||||||
|
| |||||||||
| 1,985,959 | ||||||||||
|
| |||||||||
Agency Fixed Rate 30-Year – 6.6% | ||||||||||
Federal Home Loan Mortgage Corp. Gold | 746 | 835,502 | ||||||||
Federal National Mortgage Association | 9,828 | 9,879,444 | ||||||||
3.00%, 9/01/42-11/01/43 | 6,370 | 6,421,999 | ||||||||
4.00%, 9/15/45, TBA | 25,073 | 26,647,898 | ||||||||
Series 2003 | 625 | 701,316 | ||||||||
Series 2004 | 625 | 700,336 | ||||||||
| AB POOLING PORTFOLIOS • | 101 |
AB Global Core Bond Portfolio—Portfolio of Investments
| Principal Amount (000) | U.S. $ Value | |||||||||
| ||||||||||
Series 2005 | U.S.$ | 483 | $ | 541,620 | ||||||
Series 2006 | 1 | 1,403 | ||||||||
Government National Mortgage Association | 5,795 | 5,876,492 | ||||||||
3.50%, 9/01/45, TBA | 9,400 | 9,795,093 | ||||||||
|
| |||||||||
| 61,401,103 | ||||||||||
|
| |||||||||
Total Mortgage Pass-Throughs | 63,387,062 | |||||||||
|
| |||||||||
COVERED BONDS – 4.2% | ||||||||||
Abbey National Treasury Services PLC/London | EUR | 2,015 | 2,390,900 | |||||||
Aib Mortgage Bank | 665 | 809,586 | ||||||||
Bank of Ireland Mortgage Bank | 580 | 654,843 | ||||||||
Bank of Nova Scotia (The) | U.S.$ | 2,900 | 2,930,412 | |||||||
Bank of Scotland PLC | EUR | 3,180 | 4,520,487 | |||||||
BPCE SFH SA | 400 | 460,116 | ||||||||
Series E | 1,800 | 2,100,646 | ||||||||
Caisse Francaise de Financement Local | 883 | 1,026,754 | ||||||||
CaixaBank SA | 1,250 | 1,447,926 | ||||||||
Cie de Financement Foncier SA | 3,457 | 3,928,619 | ||||||||
Credit Suisse AG/Guernsey | 2,000 | 2,385,681 | ||||||||
Danske Bank A/S | 940 | 1,096,409 | ||||||||
DNB Boligkreditt AS | 1,778 | 2,372,850 | ||||||||
National Australia Bank Ltd. | U.S.$ | 3,190 | 3,216,892 | |||||||
| 102 | • AB POOLING PORTFOLIOS |
AB Global Core Bond Portfolio—Portfolio of Investments
| Principal Amount (000) | U.S. $ Value | |||||||||
| ||||||||||
Nationwide Building Society | EUR | 2,610 | $ | 3,029,834 | ||||||
Series E | 1,700 | 2,351,545 | ||||||||
Santander Consumer Finance SA | 1,300 | 1,488,911 | ||||||||
Societe Generale SFH SA | 900 | 1,034,886 | ||||||||
UBS AG/London | 2,040 | 2,393,856 | ||||||||
|
| |||||||||
Total Covered Bonds | 39,641,153 | |||||||||
|
| |||||||||
COLLATERALIZED MORTGAGE OBLIGATIONS – 4.0% | ||||||||||
GSE Risk Share Floating Rate – 3.9% | ||||||||||
Federal Home Loan Mortgage Corp. Structured Agency Credit Risk Debt Notes | U.S.$ | 2,195 | 2,201,392 | |||||||
Series 2014-DN3, Class M2 | 1,750 | 1,760,685 | ||||||||
Series 2014-HQ1, Class M2 | 2,555 | 2,597,914 | ||||||||
Series 2015-DNA1, Class M2 | 1,090 | 1,077,528 | ||||||||
Series 2015-DNA2, Class M2 | 3,290 | 3,310,080 | ||||||||
Series 2015-HQ1, Class M2 | 1,515 | 1,508,943 | ||||||||
Series 2015-HQ2, Class M1 | 1,241 | 1,236,379 | ||||||||
Federal Home Loan Mortgage Corp., Structured Agency Credit Risk Debt Notes | 3,090 | 3,095,747 | ||||||||
Series 2014-HQ3, Class M1 | 2,652 | 2,653,286 | ||||||||
Federal National Mortgage Association Connecticut Avenue Securities | 697 | 702,049 | ||||||||
Series 2014-C01, Class M1 | 1,897 | 1,900,313 | ||||||||
Series 2014-C04, Class 1M1 | 3,172 | 3,191,467 | ||||||||
| AB POOLING PORTFOLIOS • | 103 |
AB Global Core Bond Portfolio—Portfolio of Investments
| Principal Amount (000) | U.S. $ Value | |||||||||
| ||||||||||
Series 2014-C04, Class 2M1 | U.S.$ | 1,713 | $ | 1,722,595 | ||||||
Series 2015-C01, Class 1M1 | 1,034 | 1,034,974 | ||||||||
Series 2015-C01, Class 2M1 | 1,827 | 1,828,532 | ||||||||
Series 2015-C02, Class 2M1 | 2,414 | 2,402,441 | ||||||||
Series 2015-C03, Class 2M1 | 3,862 | 3,864,252 | ||||||||
|
| |||||||||
| 36,088,577 | ||||||||||
|
| |||||||||
Non-Agency Fixed Rate – 0.1% | ||||||||||
Citigroup Mortgage Loan Trust, Inc. | 853 | 830,496 | ||||||||
|
| |||||||||
Agency Fixed Rate – 0.0% | ||||||||||
Fannie Mae Grantor Trust | 392 | 357,464 | ||||||||
|
| |||||||||
Total Collateralized Mortgage Obligations | 37,276,537 | |||||||||
|
| |||||||||
COMMERCIAL MORTGAGE-BACKED SECURITIES – 4.0% | ||||||||||
Non-Agency Fixed Rate CMBS – 2.5% | ||||||||||
Banc of America Commercial Mortgage Trust | 4,373 | 4,649,212 | ||||||||
BHMS Mortgage Trust | 2,570 | 2,606,425 | ||||||||
Citigroup Commercial Mortgage Trust | 2,079 | 2,111,353 | ||||||||
Commercial Mortgage Loan Trust | 3,648 | 3,931,061 | ||||||||
Commercial Mortgage Trust | 5,420 | 5,460,650 | ||||||||
GS Mortgage Securities Trust | 1,424 | 1,394,828 | ||||||||
Series 2013-G1, Class A2 | 1,615 | 1,621,300 | ||||||||
| 104 | • AB POOLING PORTFOLIOS |
AB Global Core Bond Portfolio—Portfolio of Investments
| Principal Amount (000) | U.S. $ Value | |||||||||
| ||||||||||
ML-CFC Commercial Mortgage Trust | U.S.$ | 1,313 | $ | 1,360,789 | ||||||
|
| |||||||||
| 23,135,618 | ||||||||||
|
| |||||||||
Non-Agency Floating Rate CMBS – 1.0% | ||||||||||
Commercial Mortgage Pass Through Certificates | 2,026 | 2,020,636 | ||||||||
Series 2014-SAVA, Class A | 1,393 | 1,390,375 | ||||||||
JP Morgan Chase Commercial Mortgage Securities Trust | 2,672 | 2,664,644 | ||||||||
Resource Capital Corp. Ltd. | 1,108 | 1,102,332 | ||||||||
Starwood Retail Property Trust | 1,721 | 1,712,715 | ||||||||
|
| |||||||||
| 8,890,702 | ||||||||||
|
| |||||||||
Agency CMBS – 0.5% | ||||||||||
Federal Home Loan Mortgage Corp. Multifamily Structured Pass-Through Certificates | 4,653 | 4,967,121 | ||||||||
|
| |||||||||
Total Commercial Mortgage-Backed Securities | 36,993,441 | |||||||||
|
| |||||||||
AGENCIES – 2.4% | ||||||||||
United States – 2.4% | ||||||||||
Federal National Mortgage Association Zero Coupon, 10/09/19 | 2,180 | 2,006,801 | ||||||||
Residual Funding Corp. Principal Strip Zero Coupon, 7/15/20 | 22,014 | 20,069,437 | ||||||||
|
| |||||||||
Total Agencies | 22,076,238 | |||||||||
|
| |||||||||
| AB POOLING PORTFOLIOS • | 105 |
AB Global Core Bond Portfolio—Portfolio of Investments
| Principal Amount (000) | U.S. $ Value | |||||||||
| ||||||||||
INFLATION-LINKED SECURITIES – 2.1% | ||||||||||
United States – 2.1% | ||||||||||
U.S. Treasury Inflation Index | U.S.$ | 19,745 | $ | 19,709,806 | ||||||
|
| |||||||||
GOVERNMENTS - | ||||||||||
Canada – 1.0% | ||||||||||
Canada Housing Trust No 1 | CAD | 11,205 | 9,426,304 | |||||||
|
| |||||||||
Colombia – 0.2% | ||||||||||
Ecopetrol SA | U.S.$ | 737 | 596,970 | |||||||
7.375%, 9/18/43 | 730 | 714,305 | ||||||||
Oleoducto Central SA | 1,041 | 1,017,578 | ||||||||
|
| |||||||||
| 2,328,853 | ||||||||||
|
| |||||||||
France – 0.4% | ||||||||||
Dexia Credit Local SA/New York, NY | 1,383 | 1,386,769 | ||||||||
1.50%, 10/07/17(a) | 2,691 | 2,696,500 | ||||||||
|
| |||||||||
| 4,083,269 | ||||||||||
|
| |||||||||
Morocco – 0.1% | ||||||||||
OCP SA | 654 | 670,481 | ||||||||
|
| |||||||||
Qatar – 0.1% | ||||||||||
Ooredoo International Finance Ltd. | 647 | 618,636 | ||||||||
|
| |||||||||
United Arab Emirates – 0.1% | ||||||||||
Abu Dhabi National Energy Co. PJSC | 619 | 608,172 | ||||||||
|
| |||||||||
Total Governments - Sovereign Agencies | 17,735,715 | |||||||||
|
| |||||||||
QUASI-SOVEREIGNS – 1.5% | ||||||||||
Quasi-Sovereign Bonds – 1.5% | ||||||||||
Chile – 0.3% | ||||||||||
Empresa de Transporte de Pasajeros Metro SA | 2,595 | 2,684,032 | ||||||||
|
| |||||||||
Malaysia – 0.4% | ||||||||||
Petronas Capital Ltd. | 3,390 | 3,682,865 | ||||||||
|
| |||||||||
| 106 | • AB POOLING PORTFOLIOS |
AB Global Core Bond Portfolio—Portfolio of Investments
| Principal Amount (000) | U.S. $ Value | |||||||||
| ||||||||||
Mexico – 0.4% | ||||||||||
Petroleos Mexicanos | U.S.$ | 3,970 | $ | 3,771,698 | ||||||
|
| |||||||||
Peru – 0.1% | ||||||||||
Fondo MIVIVIENDA SA | 613 | 578,979 | ||||||||
|
| |||||||||
United Arab Emirates – 0.3% | ||||||||||
IPIC GMTN Ltd. | 3,300 | 3,403,125 | ||||||||
|
| |||||||||
Total Quasi-Sovereigns | 14,120,699 | |||||||||
|
| |||||||||
EMERGING MARKETS - | ||||||||||
Industrial – 0.4% | ||||||||||
Communications - Media – 0.2% | ||||||||||
Myriad International Holdings BV | 1,582 | 1,689,644 | ||||||||
|
| |||||||||
Consumer Non-Cyclical – 0.2% | ||||||||||
Raizen Energy Finance Ltd. | 1,885 | 1,953,803 | ||||||||
|
| |||||||||
Total Emerging Markets - Corporate Bonds | 3,643,447 | |||||||||
|
| |||||||||
ASSET-BACKED SECURITIES – 0.4% | ||||||||||
Other ABS - Fixed Rate – 0.4% | ||||||||||
SBA Tower Trust | 1,031 | 1,042,975 | ||||||||
Series 2014-1A, Class C | 1,248 | 1,241,826 | ||||||||
TAGUS-Sociedade de Titularizacao de Creditos SA/Volta II Electricity Receivables | EUR | 732 | 821,901 | |||||||
|
| |||||||||
| 3,106,702 | ||||||||||
|
| |||||||||
Home Equity Loans - Floating | ||||||||||
ABFC Trust | U.S.$ | 269 | 258,463 | |||||||
|
| |||||||||
Total Asset-Backed Securities | 3,365,165 | |||||||||
|
| |||||||||
| AB POOLING PORTFOLIOS • | 107 |
AB Global Core Bond Portfolio—Portfolio of Investments
| Principal Amount (000) | U.S. $ Value | |||||||||
| ||||||||||
GOVERNMENTS - | ||||||||||
Indonesia – 0.3% | ||||||||||
Indonesia Government International Bond | U.S.$ | 3,326 | $ | 3,076,550 | ||||||
|
| |||||||||
CORPORATES - | ||||||||||
Financial Institutions – 0.3% | ||||||||||
Banking – 0.3% | ||||||||||
Societe Generale SA | 1,515 | 1,556,662 | ||||||||
UniCredit Luxembourg Finance SA | 1,386 | 1,437,708 | ||||||||
|
| |||||||||
Total Corporates - Non-Investment Grade | 2,994,370 | |||||||||
|
| |||||||||
LOCAL GOVERNMENTS - MUNICIPAL BONDS – 0.3% | ||||||||||
United States – 0.3% | ||||||||||
State of California | 1,985 | 2,859,670 | ||||||||
|
| |||||||||
SUPRANATIONALS – 0.3% | ||||||||||
International Bank for Reconstruction & Development | 2,340 | 2,691,711 | ||||||||
|
| |||||||||
| Shares | ||||||||||
SHORT-TERM INVESTMENTS – 6.0% | ||||||||||
Investment Companies – 0.5% | ||||||||||
AB Fixed Income Shares, Inc. – Government STIF Portfolio, 0.13%(e)(f) | 4,458,849 | 4,458,849 | ||||||||
|
| |||||||||
| 108 | • AB POOLING PORTFOLIOS |
AB Global Core Bond Portfolio—Portfolio of Investments
| Principal Amount (000) | U.S. $ Value | |||||||||||
| ||||||||||||
U.S. Treasury Bills – 5.5% | ||||||||||||
U.S. Treasury Bill | U.S.$ | 51,020 | $ | 51,019,848 | ||||||||
|
| |||||||||||
Total Short-Term Investments | 55,478,697 | |||||||||||
|
| |||||||||||
Total Investments – 104.8% | 975,447,320 | |||||||||||
Other assets less liabilities – (4.8)% | (44,451,957 | ) | ||||||||||
|
| |||||||||||
Net Assets – 100.0% | $ | 930,995,363 | ||||||||||
|
| |||||||||||
FUTURES (see Note C)
Type | Number of Contracts | Expiration Month | Original Value | Value at August 31, 2015 | Unrealized Appreciation/ (Depreciation) | |||||||||||||||
Sold Contracts |
| |||||||||||||||||||
Euro BUXL 30 Yr Bond Futures | 7 | September 2015 | $ | 1,168,508 | $ | 1,190,669 | $ | (22,161 | ) | |||||||||||
Euro-BUND Futures | 103 | September 2015 | 17,599,188 | 17,694,373 | (95,185 | ) | ||||||||||||||
U.S. Long Bond (CBT) Futures | 131 | December 2015 | 20,464,692 | 20,255,875 | 208,817 | |||||||||||||||
U.S T-Note 5 Yr (CBT) Futures | 230 | December 2015 | 27,690,932 | 27,470,625 | 220,307 | |||||||||||||||
U.S. T-Note 10 Yr (CBT) Futures | 188 | December 2015 | 24,082,034 | 23,887,750 | 194,284 | |||||||||||||||
|
| |||||||||||||||||||
| $ | 506,062 | |||||||||||||||||||
|
| |||||||||||||||||||
FORWARD CURRENCY EXCHANGE CONTRACTS (see Note C)
| Counterparty | Contracts to Deliver (000) | In Exchange For (000) | Settlement Date | Unrealized Appreciation/ (Depreciation) | ||||||||||||||||||||
Barclays Bank PLC | SGD | 26,756 | USD | 19,048 | 9/18/15 | $ | 100,393 | |||||||||||||||||
Barclays Bank PLC | AUD | 12,661 | USD | 9,208 | 9/25/15 | 208,703 | ||||||||||||||||||
Barclays Bank PLC | TWD | 151,849 | USD | 4,685 | 10/16/15 | 10,562 | ||||||||||||||||||
BNP Paribas SA | SEK | 25,076 | USD | 2,950 | 9/17/15 | (13,257 | ) | |||||||||||||||||
BNP Paribas SA | SGD | 945 | USD | 691 | 9/18/15 | 22,178 | ||||||||||||||||||
BNP Paribas SA | AUD | 57,530 | USD | 42,176 | 9/25/15 | 1,283,227 | ||||||||||||||||||
BNP Paribas SA | NZD | 5,648 | USD | 3,732 | 10/09/15 | 162,637 | ||||||||||||||||||
Citibank | JPY | 1,321,033 | USD | 11,103 | 9/17/15 | 204,309 | ||||||||||||||||||
Citibank | JPY | 4,266,838 | USD | 34,400 | 9/17/15 | (801,801 | ) | |||||||||||||||||
Credit Suisse International | DKK | 23,949 | USD | 3,566 | 9/17/15 | (35,919 | ) | |||||||||||||||||
Credit Suisse International | EUR | 16,997 | SEK | 162,792 | 9/17/15 | 158,349 | ||||||||||||||||||
Goldman Sachs Bank USA | BRL | 49,537 | USD | 14,452 | 9/02/15 | 793,429 | ||||||||||||||||||
Goldman Sachs Bank USA | BRL | 16,534 | USD | 4,534 | 9/02/15 | (25,065 | ) | |||||||||||||||||
Goldman Sachs Bank USA | USD | 13,584 | BRL | 49,537 | 9/02/15 | 75,099 | ||||||||||||||||||
| AB POOLING PORTFOLIOS • | 109 |
AB Global Core Bond Portfolio—Portfolio of Investments
| Counterparty | Contracts to Deliver (000) | In Exchange For (000) | Settlement Date | Unrealized Appreciation/ (Depreciation) | ||||||||||||||||||||
Goldman Sachs Bank USA | USD | 4,702 | BRL | 16,534 | 9/02/15 | $ | (143,538 | ) | ||||||||||||||||
Goldman Sachs Bank USA | USD | 900 | EUR | 823 | 9/18/15 | 24,058 | ||||||||||||||||||
Goldman Sachs Bank USA | USD | 1,398 | EUR | 1,230 | 9/18/15 | (17,422 | ) | |||||||||||||||||
Goldman Sachs Bank USA | GBP | 51,990 | USD | 81,014 | 9/24/15 | 1,245,353 | ||||||||||||||||||
Goldman Sachs Bank USA | MXN | 107,471 | USD | 6,517 | 9/30/15 | 97,606 | ||||||||||||||||||
Goldman Sachs Bank USA | USD | 3,678 | NZD | 5,619 | 10/09/15 | (127,504 | ) | |||||||||||||||||
HSBC Bank USA | USD | 9,407 | KRW | 11,074,028 | 9/25/15 | (48,549 | ) | |||||||||||||||||
Morgan Stanley & Co., Inc. | EUR | 7,175 | SEK | 68,362 | 9/17/15 | 24,215 | ||||||||||||||||||
Morgan Stanley & Co., Inc. | EUR | 2,023 | USD | 2,267 | 9/18/15 | (4,275 | ) | |||||||||||||||||
Northern Trust Co. | GBP | 978 | USD | 1,524 | 9/24/15 | 24,371 | ||||||||||||||||||
Royal Bank of Scotland PLC | EUR | 191,230 | USD | 211,347 | 9/18/15 | (3,290,924 | ) | |||||||||||||||||
Royal Bank of Scotland PLC | KRW | 22,433,319 | USD | 19,283 | 9/25/15 | 325,278 | ||||||||||||||||||
Royal Bank of Scotland PLC | USD | 9,171 | IDR | 129,720,242 | 10/09/15 | (105,007 | ) | |||||||||||||||||
Standard Chartered Bank | BRL | 33,003 | USD | 9,050 | 9/02/15 | (50,034 | ) | |||||||||||||||||
Standard Chartered Bank | USD | 9,268 | BRL | 33,003 | 9/02/15 | (167,769 | ) | |||||||||||||||||
Standard Chartered Bank | BRL | 33,003 | USD | 9,171 | 10/02/15 | 167,766 | ||||||||||||||||||
Standard Chartered Bank | MYR | 37,027 | USD | 9,036 | 10/09/15 | 157,073 | ||||||||||||||||||
Standard Chartered Bank | USD | 8,776 | MYR | 37,138 | 10/09/15 | 130,506 | ||||||||||||||||||
State Street Bank & Trust Co. | USD | 1,298 | EUR | 1,163 | 9/18/15 | 6,508 | ||||||||||||||||||
State Street Bank & Trust Co. | USD | 2,605 | EUR | 2,283 | 9/18/15 | (43,359 | ) | |||||||||||||||||
State Street Bank & Trust Co. | ZAR | 18,442 | USD | 1,391 | 10/13/15 | 10,580 | ||||||||||||||||||
UBS AG | USD | 5,649 | EUR | �� | 5,084 | 9/18/15 | 57,393 | |||||||||||||||||
UBS AG | CAD | 15,803 | USD | 11,935 | 10/02/15 | (75,811 | ) | |||||||||||||||||
|
| |||||||||||||||||||||||
| $ | 339,359 | |||||||||||||||||||||||
|
| |||||||||||||||||||||||
| (a) | Security is exempt from registration under Rule 144A of the Securities Act of 1933. These securities are considered liquid and may be resold in transactions exempt from registration, normally to qualified institutional buyers. At August 31, 2015, the aggregate market value of these securities amounted to $345,792,400 or 37.1% of net assets. |
| (b) | Securities are perpetual and, thus, do not have a predetermined maturity date. The date shown, if applicable, reflects the next call date. |
| (c) | Variable rate coupon, rate shown as of August 31, 2015. |
| (d) | Floating Rate Security. Stated interest rate was in effect at August 31, 2015. |
| (e) | To obtain a copy of the fund’s financial statements, please go to the Securities and Exchange Commission’s website at www.sec.gov, or call AB at (800) 227-4618. |
| (f) | Investment in affiliated money market mutual fund. The rate shown represents the 7-day yield as of period end. |
Currency Abbreviations:
AUD – Australian Dollar
BRL – Brazilian Real
CAD – Canadian Dollar
DKK – Danish Krone
EUR – Euro
GBP – Great British Pound
IDR – Indonesian Rupiah
JPY – Japanese Yen
KRW – South Korean Won
MXN – Mexican Peso
MYR – Malaysian Ringgit
NZD – New Zealand Dollar
SEK – Swedish Krona
SGD – Singapore Dollar
TWD – New Taiwan Dollar
USD – United States Dollar
ZAR – South African Rand
| 110 | • AB POOLING PORTFOLIOS |
AB Global Core Bond Portfolio—Portfolio of Investments
Glossary:
ABS – Asset-Backed Securities
ARMs – Adjustable Rate Mortgages
CBT – Chicago Board of Trade
CFC – Customer Facility Charge
CMBS – Commercial Mortgage-Backed Securities
GMTN – Global Medium Term Note
GSE – Government-Sponsored Enterprise
OAT – Obligations Assimilables du Trésor
PJSC – Public Joint Stock Company
REIT – Real Estate Investment Trust
TBA – To Be Announced
TIPS – Treasury Inflation Protected Security
See notes to financial statements.
| AB POOLING PORTFOLIOS • | 111 |
AB Global Core Bond Portfolio—Portfolio of Investments
AB BOND INFLATION PROTECTION PORTFOLIO
PORTFOLIO OF INVESTMENTS
August 31, 2015
| Principal Amount (000) | U.S. $ Value | |||||||||
| ||||||||||
INFLATION-LINKED SECURITIES – 80.6% | ||||||||||
United States – 80.6% | ||||||||||
U.S. Treasury Inflation Index | ||||||||||
0.125%, 4/15/17-7/15/24 (TIPS)(a) | U.S.$ | 395,415 | $ | 390,315,946 | ||||||
0.125%, 1/15/22 (TIPS)(b) | 35,352 | 34,559,631 | ||||||||
0.25%, 1/15/25 (TIPS)(a) | 55,847 | 53,867,938 | ||||||||
0.375%, 7/15/23 (TIPS)(a) | 41,506 | 40,983,917 | ||||||||
0.375%, 7/15/25 (TIPS) | 24,613 | 24,144,641 | ||||||||
0.625%, 1/15/24 (TIPS) | 33,883 | 33,948,092 | ||||||||
|
| |||||||||
Total Inflation-Linked Securities (cost $591,686,803) | 577,820,165 | |||||||||
|
| |||||||||
CORPORATES - INVESTMENT GRADE – 18.4% | ||||||||||
Industrial – 11.5% | ||||||||||
Basic – 1.4% | ||||||||||
Barrick Gold Corp. | 306 | 270,588 | ||||||||
Dow Chemical Co. (The) | 637 | 769,425 | ||||||||
Eastman Chemical Co. | 630 | 617,739 | ||||||||
Freeport-McMoran Oil & Gas LLC/FCX Oil & Gas, Inc. | 257 | 239,652 | ||||||||
Glencore Funding LLC | 3,225 | 3,085,606 | ||||||||
International Paper Co. | 1,410 | 1,501,210 | ||||||||
LyondellBasell Industries NV | 1,087 | 1,217,921 | ||||||||
Minsur SA | 459 | 472,567 | ||||||||
Sociedad Quimica y Minera de Chile SA | 832 | 719,680 | ||||||||
Teck Resources Ltd. | 1,645 | 1,311,065 | ||||||||
|
| |||||||||
| 10,205,453 | ||||||||||
|
| |||||||||
Capital Goods – 0.3% | ||||||||||
Odebrecht Finance Ltd. | �� | 793 | 500,553 | |||||||
Yamana Gold, Inc. | 1,588 | 1,429,781 | ||||||||
|
| |||||||||
| 1,930,334 | ||||||||||
|
| |||||||||
| 112 | • AB POOLING PORTFOLIOS |
AB Bond Inflation Protection Portfolio—Portfolio of Investments
| Principal Amount (000) | U.S. $ Value | |||||||||
| ||||||||||
Communications - Media – 1.2% | ||||||||||
21st Century Fox America, Inc. | U.S.$ | 1,584 | $ | 1,769,436 | ||||||
CBS Corp. | 630 | 597,574 | ||||||||
5.75%, 4/15/20 | 1,625 | 1,813,937 | ||||||||
Cox Communications, Inc. | 348 | 320,828 | ||||||||
Discovery Communications LLC | 677 | 624,426 | ||||||||
McGraw Hill Financial, Inc. | 1,281 | 1,273,974 | ||||||||
NBCUniversal Enterprise, Inc. | 906 | 956,093 | ||||||||
Time Warner, Inc. | 1,124 | 1,101,495 | ||||||||
Viacom, Inc. | 635 | 589,181 | ||||||||
|
| |||||||||
| 9,046,944 | ||||||||||
|
| |||||||||
Communications - Telecommunications – 1.5% | ||||||||||
American Tower Corp. | 911 | 894,892 | ||||||||
5.05%, 9/01/20 | 1,355 | 1,465,007 | ||||||||
AT&T, Inc. | 1,715 | 1,634,373 | ||||||||
DIRECTV Holdings LLC/DIRECTV Financing Co., Inc. | 469 | 465,309 | ||||||||
4.45%, 4/01/24 | 620 | 626,618 | ||||||||
5.00%, 3/01/21 | 1,700 | 1,822,798 | ||||||||
Rogers Communications, Inc. | CAD | 150 | 121,080 | |||||||
Telefonica Emisiones SAU | U.S.$ | 835 | 933,661 | |||||||
Verizon Communications, Inc. | 2,262 | 2,031,749 | ||||||||
7.35%, 4/01/39 | 780 | 953,025 | ||||||||
|
| |||||||||
| 10,948,512 | ||||||||||
|
| |||||||||
Consumer Cyclical - Automotive – 0.5% | ||||||||||
Ford Motor Credit Co. LLC | 919 | 904,731 | ||||||||
5.00%, 5/15/18 | 337 | 358,796 | ||||||||
5.875%, 8/02/21 | 1,166 | 1,309,258 | ||||||||
General Motors Co. | 775 | 785,897 | ||||||||
|
| |||||||||
| 3,358,682 | ||||||||||
|
| |||||||||
| AB POOLING PORTFOLIOS • | 113 |
AB Bond Inflation Protection Portfolio—Portfolio of Investments
| Principal Amount (000) | U.S. $ Value | |||||||||
| ||||||||||
Consumer Cyclical - Retailers – 0.7% | ||||||||||
CVS Health Corp. | U.S.$ | 1,490 | $ | 1,525,281 | ||||||
Kohl’s Corp. | 1,870 | 1,820,514 | ||||||||
Walgreens Boots Alliance, Inc. | 1,910 | 1,868,127 | ||||||||
|
| |||||||||
| 5,213,922 | ||||||||||
|
| |||||||||
Consumer Non-Cyclical – 2.9% | ||||||||||
AbbVie, Inc. | 1,488 | 1,464,894 | ||||||||
Actavis Funding SCS | 1,664 | 1,610,386 | ||||||||
3.85%, 6/15/24 | 517 | 503,943 | ||||||||
Altria Group, Inc. | 1,915 | 1,913,102 | ||||||||
Baxalta, Inc. | 1,510 | 1,508,994 | ||||||||
Bayer US Finance LLC | 611 | 606,852 | ||||||||
Becton Dickinson and Co. | 832 | 829,600 | ||||||||
Bunge Ltd. Finance Corp. | 13 | 15,540 | ||||||||
Grupo Bimbo SAB de CV | 1,270 | 1,245,095 | ||||||||
Kraft Heinz Foods Co. | 750 | 749,530 | ||||||||
3.50%, 7/15/22(c) | 956 | 965,020 | ||||||||
Kroger Co. (The) | 1,324 | 1,338,187 | ||||||||
Laboratory Corp. of America Holdings | 575 | 550,704 | ||||||||
Medtronic, Inc. | 1,910 | 1,902,242 | ||||||||
Perrigo Finance PLC | 251 | 244,991 | ||||||||
3.90%, 12/15/24 | 650 | 630,357 | ||||||||
Reynolds American, Inc. | 899 | 874,995 | ||||||||
4.00%, 6/12/22 | 1,323 | 1,359,431 | ||||||||
Thermo Fisher Scientific, Inc. | 696 | 711,298 | ||||||||
Tyson Foods, Inc. | 367 | 366,336 | ||||||||
3.95%, 8/15/24 | 1,207 | 1,207,048 | ||||||||
|
| |||||||||
| 20,598,545 | ||||||||||
|
| |||||||||
| 114 | • AB POOLING PORTFOLIOS |
AB Bond Inflation Protection Portfolio—Portfolio of Investments
| Principal Amount (000) | U.S. $ Value | |||||||||
| ||||||||||
Energy – 2.1% | ||||||||||
Diamond Offshore Drilling, Inc. | U.S.$ | 654 | $ | 470,800 | ||||||
Energy Transfer Partners LP | 1,645 | 1,733,582 | ||||||||
EnLink Midstream Partners LP | 750 | 627,424 | ||||||||
Enterprise Products Operating LLC | 1,643 | 1,550,105 | ||||||||
5.20%, 9/01/20 | 720 | 791,147 | ||||||||
Kinder Morgan Energy Partners LP | 1,439 | 1,341,787 | ||||||||
4.15%, 3/01/22 | 625 | 598,504 | ||||||||
Marathon Petroleum Corp. | 590 | 642,286 | ||||||||
Noble Energy, Inc. | 996 | 940,941 | ||||||||
8.25%, 3/01/19 | 1,370 | 1,596,731 | ||||||||
Plains All American Pipeline LP/PAA Finance Corp. | 1,323 | 1,231,473 | ||||||||
Reliance Holding USA, Inc. | 2,065 | 2,241,229 | ||||||||
Spectra Energy Capital LLC | 450 | 525,831 | ||||||||
Valero Energy Corp. | 998 | 1,122,917 | ||||||||
|
| |||||||||
| 15,414,757 | ||||||||||
|
| |||||||||
Other Industrial – 0.1% | ||||||||||
Hutchison Whampoa International 14 Ltd. | 636 | 631,727 | ||||||||
|
| |||||||||
Technology – 0.8% | ||||||||||
KLA-Tencor Corp. | 1,321 | 1,299,178 | ||||||||
Motorola Solutions, Inc. | 1,540 | 1,750,065 | ||||||||
Seagate HDD Cayman | 740 | 703,950 | ||||||||
Tencent Holdings Ltd. | 1,230 | 1,244,968 | ||||||||
Total System Services, Inc. | 530 | 527,932 | ||||||||
|
| |||||||||
| 5,526,093 | ||||||||||
|
| |||||||||
| 82,874,969 | ||||||||||
|
| |||||||||
| AB POOLING PORTFOLIOS • | 115 |
AB Bond Inflation Protection Portfolio—Portfolio of Investments
| Principal Amount (000) | U.S. $ Value | |||||||||
| ||||||||||
Financial Institutions – 5.8% | ||||||||||
Banking – 3.7% | ||||||||||
ABN AMRO Bank NV | U.S.$ | 448 | $ | 449,732 | ||||||
Bank of America Corp. | EUR | 1,850 | 2,057,710 | |||||||
5.625%, 7/01/20 | U.S.$ | 705 | 791,874 | |||||||
Barclays Bank PLC | EUR | 459 | 640,010 | |||||||
Barclays PLC | U.S.$ | 475 | 451,203 | |||||||
BPCE SA | 397 | 420,256 | ||||||||
Citigroup, Inc. | 1,365 | 1,318,810 | ||||||||
Cooperatieve Centrale Raiffeisen-Boerenleenbank BA/Netherlands | 361 | 360,139 | ||||||||
4.375%, 8/04/25 | 977 | 975,322 | ||||||||
Credit Suisse Group Funding Guernsey Ltd. | 1,870 | 1,811,209 | ||||||||
Goldman Sachs Group, Inc. (The) | 1,550 | 1,572,956 | ||||||||
ING Bank NV | 1,995 | 1,996,538 | ||||||||
Mizuho Financial Group Cayman 3 Ltd. | 1,710 | 1,748,692 | ||||||||
Morgan Stanley | 348 | 386,979 | ||||||||
Series G | 1,397 | 1,567,965 | ||||||||
Murray Street Investment Trust I | 184 | 191,687 | ||||||||
Nordea Bank AB | 232 | 229,680 | ||||||||
PNC Bank NA | 1,930 | 1,972,215 | ||||||||
Rabobank Capital Funding Trust III | 735 | 743,269 | ||||||||
Santander Bank NA | 1,870 | 1,863,775 | ||||||||
Santander UK PLC | 1,050 | 1,089,318 | ||||||||
Standard Chartered PLC | 1,900 | 1,931,198 | ||||||||
UBS AG/Stamford CT | 655 | 678,902 | ||||||||
7.625%, 8/17/22 | 929 | 1,080,981 | ||||||||
|
| |||||||||
| 26,330,420 | ||||||||||
|
| |||||||||
| 116 | • AB POOLING PORTFOLIOS |
AB Bond Inflation Protection Portfolio—Portfolio of Investments
| Principal Amount (000) | U.S. $ Value | |||||||||
| ||||||||||
Insurance – 1.4% | ||||||||||
American International Group, Inc. | U.S.$ | 1,660 | $ | 1,944,984 | ||||||
Dai-ichi Life Insurance Co., Ltd. (The) | 804 | 830,130 | ||||||||
Hartford Financial Services Group, Inc. (The) | 1,330 | 1,480,499 | ||||||||
6.10%, 10/01/41 | 760 | 904,347 | ||||||||
Lincoln National Corp. | 550 | 673,734 | ||||||||
Nationwide Mutual Insurance Co. | 548 | 816,047 | ||||||||
Prudential Financial, Inc. | 940 | 964,910 | ||||||||
Swiss Re Capital I LP | 1,815 | 1,851,300 | ||||||||
XLIT Ltd. | 335 | 311,614 | ||||||||
|
| |||||||||
| 9,777,565 | ||||||||||
|
| |||||||||
REITS – 0.7% | ||||||||||
HCP, Inc. | 1,538 | 1,686,988 | ||||||||
Health Care REIT, Inc. | 1,945 | 2,115,495 | ||||||||
Host Hotels & Resorts LP | 23 | 22,213 | ||||||||
Trust F/1401 | 1,555 | 1,621,087 | ||||||||
|
| |||||||||
| 5,445,783 | ||||||||||
|
| |||||||||
| 41,553,768 | ||||||||||
|
| |||||||||
Utility – 1.1% | ||||||||||
Electric – 0.8% | ||||||||||
CMS Energy Corp. | 669 | 727,301 | ||||||||
Constellation Energy Group, Inc. | 263 | 287,822 | ||||||||
Entergy Corp. | 1,308 | 1,318,399 | ||||||||
Exelon Corp. | 2,470 | 2,465,722 | ||||||||
Exelon Generation Co. LLC | 763 | 782,540 | ||||||||
|
| |||||||||
| 5,581,784 | ||||||||||
|
| |||||||||
| AB POOLING PORTFOLIOS • | 117 |
AB Bond Inflation Protection Portfolio—Portfolio of Investments
| Principal Amount (000) | U.S. $ Value | |||||||||
| ||||||||||
Natural Gas – 0.3% | ||||||||||
Talent Yield Investments Ltd. | U.S.$ | 2,090 | $ | 2,155,291 | ||||||
|
| |||||||||
| 7,737,075 | ||||||||||
|
| |||||||||
Total Corporates - Investment Grade | 132,165,812 | |||||||||
|
| |||||||||
ASSET-BACKED SECURITIES – 11.1% | ||||||||||
Autos - Fixed Rate – 6.1% | ||||||||||
Ally Master Owner Trust | 1,572 | 1,569,282 | ||||||||
AmeriCredit Automobile Receivables Trust | 1,584 | 1,584,570 | ||||||||
Series 2013-4, Class A3 | 740 | 740,301 | ||||||||
ARI Fleet Lease Trust | 34 | 34,285 | ||||||||
Series 2014-A, Class A2 | 535 | 534,737 | ||||||||
Avis Budget Rental Car Funding AESOP LLC | 3,140 | 3,220,548 | ||||||||
Series 2014-1A, Class A | 1,591 | 1,602,982 | ||||||||
Bank of The West Auto Trust | 1,506 | 1,505,209 | ||||||||
California Republic Auto Receivables Trust | 1,585 | 1,591,652 | ||||||||
Series 2015-2, Class A3 | 1,210 | 1,209,133 | ||||||||
Capital Auto Receivables Asset Trust | 324 | 323,791 | ||||||||
Series 2014-1, Class B | 400 | 404,582 | ||||||||
CPS Auto Receivables Trust | 749 | 749,095 | ||||||||
Series 2014-B, Class A | 715 | 713,947 | ||||||||
| 118 | • AB POOLING PORTFOLIOS |
AB Bond Inflation Protection Portfolio—Portfolio of Investments
| Principal Amount (000) | U.S. $ Value | |||||||||
| ||||||||||
Drive Auto Receivables Trust | U.S.$ | 721 | $ | 720,784 | ||||||
Series 2015-CA, Class A2A | 854 | 853,771 | ||||||||
Enterprise Fleet Financing LLC | 474 | 473,054 | ||||||||
Series 2015-1, Class A2 | 1,491 | 1,483,454 | ||||||||
Exeter Automobile Receivables Trust | 46 | 46,462 | ||||||||
Series 2014-1A, Class A | 253 | 253,578 | ||||||||
Series 2014-2A, Class A | 287 | 286,657 | ||||||||
Flagship Credit Auto Trust | 133 | 133,028 | ||||||||
Ford Auto Securitization Trust | CAD | 68 | 51,948 | |||||||
Ford Credit Auto Owner Trust | U.S.$ | 645 | 643,433 | |||||||
Series 2014-2, Class A | 1,373 | 1,381,156 | ||||||||
GM Financial Automobile Leasing Trust | 1,476 | 1,479,283 | ||||||||
Series 2015-2, Class A3 | 1,723 | 1,734,949 | ||||||||
GMF Floorplan Owner Revolving Trust | 730 | 725,002 | ||||||||
Harley-Davidson Motorcycle Trust | 780 | 779,769 | ||||||||
Hertz Vehicle Financing LLC | 4,705 | 4,706,308 | ||||||||
Series 2013-1A, Class B2 | 853 | 839,111 | ||||||||
Hyundai Auto Lease Securitization Trust | 1,032 | 1,032,054 | ||||||||
| AB POOLING PORTFOLIOS • | 119 |
AB Bond Inflation Protection Portfolio—Portfolio of Investments
| Principal Amount (000) | U.S. $ Value | |||||||||
| ||||||||||
Series 2015-B, Class A3 | U.S.$ | 1,190 | $ | 1,190,724 | ||||||
Hyundai Auto Receivables Trust | 585 | 590,956 | ||||||||
Mercedes Benz Auto Lease Trust | 157 | 157,431 | ||||||||
Mercedes-Benz Master Owner Trust | 3,196 | 3,182,807 | ||||||||
Nissan Auto Lease Trust | 1,287 | 1,290,954 | ||||||||
Santander Drive Auto Receivables Trust | 477 | 477,506 | ||||||||
Series 2015-3, Class A2A | 1,298 | 1,298,031 | ||||||||
Series 2015-4,Class A2A | 704 | 703,987 | ||||||||
TCF Auto Receivables Owner Trust | 1,736 | 1,734,542 | ||||||||
|
| |||||||||
| 44,034,853 | ||||||||||
|
| |||||||||
Credit Cards - Fixed Rate – 1.8% | ||||||||||
American Express Credit Account Master Trust | 901 | 903,213 | ||||||||
Barclays Dryrock Issuance Trust | 1,685 | 1,721,827 | ||||||||
Capital One Multi-Asset Execution Trust | 1,487 | 1,489,690 | ||||||||
Citibank Credit Card Issuance Trust | 1,300 | 1,312,054 | ||||||||
Discover Card Execution Note Trust | 1,526 | 1,512,796 | ||||||||
Synchrony Credit Card Master Note Trust | 2,269 | 2,288,988 | ||||||||
World Financial Network Credit Card Master Trust | 1,310 | 1,320,400 | ||||||||
| 120 | • AB POOLING PORTFOLIOS |
AB Bond Inflation Protection Portfolio—Portfolio of Investments
| Principal Amount (000) | U.S. $ Value | |||||||||
| ||||||||||
Series 2013-A, Class A | U.S.$ | 809 | $ | 809,741 | ||||||
Series 2015-B,Class A | 1,163 | 1,162,812 | ||||||||
|
| |||||||||
| 12,521,521 | ||||||||||
|
| |||||||||
Autos - Floating Rate – 1.7% | ||||||||||
BMW Floorplan Master Owner Trust | 3,034 | 3,034,182 | ||||||||
Series 2015-1A, Class A | 2,227 | 2,227,366 | ||||||||
Ford Credit Floorplan Master Owner Trust A | 1,429 | 1,424,031 | ||||||||
GE Dealer Floorplan Master Note Trust | 996 | 991,538 | ||||||||
Series 2015-1, Class A | 1,290 | 1,280,319 | ||||||||
Hertz Fleet Lease Funding LP | 1,611 | 1,613,465 | ||||||||
Navistar Financial Dealer Note Master Trust | 1,301 | 1,295,306 | ||||||||
|
| |||||||||
| 11,866,207 | ||||||||||
|
| |||||||||
Credit Cards - Floating Rate – 0.8% | ||||||||||
Cabela’s Credit Card Master Note Trust | 600 | 596,548 | ||||||||
Discover Card Execution Note Trust | 1,228 | 1,227,086 | ||||||||
First National Master Note Trust | 1,619 | 1,621,113 | ||||||||
World Financial Network Credit Card Master Trust | 1,715 | 1,716,072 | ||||||||
Series 2015-A, Class A | 850 | 846,452 | ||||||||
|
| |||||||||
| 6,007,271 | ||||||||||
|
| |||||||||
Other ABS - Fixed Rate – 0.7% | ||||||||||
CIT Equipment Collateral | 1,911 | 1,910,933 | ||||||||
| AB POOLING PORTFOLIOS • | 121 |
AB Bond Inflation Protection Portfolio—Portfolio of Investments
| Principal Amount (000) | U.S. $ Value | |||||||||
| ||||||||||
CNH Equipment Trust | U.S.$ | 1,021 | $ | 1,018,722 | ||||||
GE Equipment Small Ticket LLC | 669 | 668,553 | ||||||||
SBA Tower Trust | 1,573 | 1,565,219 | ||||||||
|
| |||||||||
| 5,163,427 | ||||||||||
|
| |||||||||
Total Asset-Backed Securities | 79,593,279 | |||||||||
|
| |||||||||
COMMERCIAL MORTGAGE-BACKED SECURITIES – 9.8% | ||||||||||
Non-Agency Fixed Rate CMBS – 8.0% | ||||||||||
Banc of America Commercial Mortgage Trust | 3,213 | 3,416,492 | ||||||||
Series 2007-5, Class AM | 618 | 651,767 | ||||||||
Bear Stearns Commercial Mortgage Securities Trust | 1,182 | 1,197,467 | ||||||||
BHMS Mortgage Trust | 1,950 | 1,977,637 | ||||||||
CGRBS Commercial Mortgage Trust | 1,970 | 2,013,852 | ||||||||
Citigroup Commercial Mortgage Trust | 498 | 505,519 | ||||||||
Series 2015-GC27, Class A5 | 1,475 | 1,446,064 | ||||||||
COBALT CMBS Commercial Mortgage Trust | 1,965 | 2,089,448 | ||||||||
Commercial Mortgage Trust | 1,412 | 1,465,019 | ||||||||
Series 2007-GG9, Class A4 | 2,892 | 3,018,253 | ||||||||
Series 2007-GG9, Class AM | 1,282 | 1,328,247 | ||||||||
| 122 | • AB POOLING PORTFOLIOS |
AB Bond Inflation Protection Portfolio—Portfolio of Investments
| Principal Amount (000) | U.S. $ Value | |||||||||
| ||||||||||
Series 2013-SFS, Class A1 | U.S.$ | 806 | $ | 791,373 | ||||||
Credit Suisse Commercial Mortgage Trust | 947 | 972,880 | ||||||||
CSAIL Commercial Mortgage Trust | 1,346 | 1,381,511 | ||||||||
DBUBS Mortgage Trust | 763 | 823,799 | ||||||||
Extended Stay America Trust | 1,320 | 1,326,501 | ||||||||
GS Mortgage Securities Corp. II | 1,916 | 1,944,480 | ||||||||
GS Mortgage Securities Trust | 1,160 | 1,224,679 | ||||||||
Series 2013-G1, Class A1 | 1,522 | 1,490,589 | ||||||||
JP Morgan Chase Commercial Mortgage Securities Trust | 473 | 471,585 | ||||||||
Series 2006-CB15, Class A4 | 1,903 | 1,930,614 | ||||||||
Series 2006-LDP9, Class AM | 778 | 797,080 | ||||||||
Series 2007-CB19, Class AM | 700 | 737,215 | ||||||||
Series 2007-LD12, Class AM | 598 | 638,224 | ||||||||
Series 2007-LDPX, Class A1A | 3,844 | 4,016,791 | ||||||||
Series 2008-C2, Class A1A | 1,573 | 1,696,147 | ||||||||
Series 2010-C2, Class A1 | 657 | 664,757 | ||||||||
Series 2011-C5, Class D | 552 | 566,166 | ||||||||
JPMBB Commercial Mortgage Securities Trust | 1,273 | 1,308,758 | ||||||||
LB-UBS Commercial Mortgage Trust | 620 | 650,076 | ||||||||
| AB POOLING PORTFOLIOS • | 123 |
AB Bond Inflation Protection Portfolio—Portfolio of Investments
| Principal Amount (000) | U.S. $ Value | |||||||||
| ||||||||||
LSTAR Commercial Mortgage Trust | U.S.$ | 1,211 | $ | 1,226,836 | ||||||
Series 2015-3, Class A2 | 1,505 | 1,519,888 | ||||||||
Merrill Lynch Mortgage Trust | 1,182 | 1,216,901 | ||||||||
ML-CFC Commercial Mortgage Trust | 2,070 | 2,144,855 | ||||||||
UBS-Barclays Commercial Mortgage Trust | 317 | 317,976 | ||||||||
Series 2012-C4, Class A5 | 637 | 628,235 | ||||||||
Wachovia Bank Commercial Mortgage Trust | 3,694 | 3,719,193 | ||||||||
Series 2006-C26, Class A1A | 882 | 906,001 | ||||||||
WFRBS Commercial Mortgage Trust | 1,776 | 1,808,577 | ||||||||
Series 2014-C20, Class A2 | 1,218 | 1,256,460 | ||||||||
|
| |||||||||
| 57,287,912 | ||||||||||
|
| |||||||||
Non-Agency Floating Rate CMBS – 1.5% | ||||||||||
Carefree Portfolio Trust | 1,065 | 1,059,656 | ||||||||
Commercial Mortgage Pass Through Certificates | 1,490 | 1,486,359 | ||||||||
Series 2014-SAVA, Class A | 1,033 | 1,030,674 | ||||||||
H/2 Asset Funding NRE | 1,489 | 1,485,261 | ||||||||
JP Morgan Chase Commercial Mortgage Securities Trust | 1,987 | 1,981,530 | ||||||||
PFP III Ltd. | 616 | 615,408 | ||||||||
| 124 | • AB POOLING PORTFOLIOS |
AB Bond Inflation Protection Portfolio—Portfolio of Investments
| Principal Amount (000) | U.S. $ Value | |||||||||
| ||||||||||
Resource Capital Corp. Ltd. | U.S.$ | 827 | $ | 823,141 | ||||||
Starwood Retail Property Trust | 1,299 | 1,293,009 | ||||||||
Wells Fargo Commercial Mortgage Trust | 1,206 | 1,161,469 | ||||||||
|
| |||||||||
| 10,936,507 | ||||||||||
|
| |||||||||
Agency CMBS – 0.3% | ||||||||||
FHLMC Multifamily Structured Pass Through Certificates | 2,416 | 2,481,540 | ||||||||
|
| |||||||||
Total Commercial Mortgage-Backed Securities | 70,705,959 | |||||||||
|
| |||||||||
CORPORATES - NON-INVESTMENT GRADE – 2.6% | ||||||||||
Financial Institutions – 1.4% | ||||||||||
Banking – 1.2% | ||||||||||
Bank of America Corp. | 480 | 494,400 | ||||||||
Bank of Ireland | CAD | 1,060 | 781,544 | |||||||
Barclays Bank PLC | U.S.$ | 255 | 288,150 | |||||||
7.625%, 11/21/22 | 596 | 679,440 | ||||||||
7.75%, 4/10/23 | 686 | 740,880 | ||||||||
BNP Paribas SA | 530 | 542,720 | ||||||||
Credit Agricole SA | 368 | 376,280 | ||||||||
Credit Suisse Group AG | 305 | 323,300 | ||||||||
HBOS Capital Funding LP | EUR | 2,440 | 2,724,374 | |||||||
Intesa Sanpaolo SpA | U.S.$ | 1,365 | 1,334,211 | |||||||
Royal Bank of Scotland PLC (The) | 285 | 312,184 | ||||||||
Societe Generale SA | 230 | 236,325 | ||||||||
|
| |||||||||
| 8,833,808 | ||||||||||
|
| |||||||||
| AB POOLING PORTFOLIOS • | 125 |
AB Bond Inflation Protection Portfolio—Portfolio of Investments
| Principal Amount (000) | U.S. $ Value | |||||||||
| ||||||||||
Finance – 0.2% | ||||||||||
AerCap Aviation Solutions BV | U.S.$ | 453 | $ | 475,650 | ||||||
International Lease Finance Corp. | 539 | 573,362 | ||||||||
|
| |||||||||
| 1,049,012 | ||||||||||
|
| |||||||||
| 9,882,820 | ||||||||||
|
| |||||||||
Industrial – 1.0% | ||||||||||
Basic – 0.0% | ||||||||||
Novelis, Inc. | 166 | 166,207 | ||||||||
|
| |||||||||
Communications - Media – 0.0% | ||||||||||
CSC Holdings LLC | 268 | 301,500 | ||||||||
|
| |||||||||
Communications - Telecommunications – 0.5% | ||||||||||
Numericable-SFR SAS | EUR | 283 | 327,007 | |||||||
Sprint Capital Corp. | U.S.$ | 2,165 | 2,194,769 | |||||||
Sprint Corp. | 810 | 778,612 | ||||||||
|
| |||||||||
| 3,300,388 | ||||||||||
|
| |||||||||
Consumer Cyclical - Automotive – 0.1% | ||||||||||
Goodyear Tire & Rubber Co. (The) | 352 | 366,960 | ||||||||
|
| |||||||||
Consumer Cyclical - Other – 0.1% | ||||||||||
KB Home | 632 | 620,940 | ||||||||
MCE Finance Ltd. | 385 | 350,350 | ||||||||
|
| |||||||||
| 971,290 | ||||||||||
|
| |||||||||
Energy – 0.2% | ||||||||||
ONEOK, Inc. | 1,321 | 1,083,220 | ||||||||
SM Energy Co. | 74 | 71,151 | ||||||||
Transocean, Inc. | 785 | 646,644 | ||||||||
|
| |||||||||
| 1,801,015 | ||||||||||
|
| |||||||||
Technology – 0.1% | ||||||||||
Advanced Micro Devices, Inc. | 605 | 426,525 | ||||||||
|
| |||||||||
| 7,333,885 | ||||||||||
|
| |||||||||
| 126 | • AB POOLING PORTFOLIOS |
AB Bond Inflation Protection Portfolio—Portfolio of Investments
| Principal Amount (000) | U.S. $ Value | |||||||||
| ||||||||||
Utility – 0.2% | ||||||||||
Electric – 0.2% | ||||||||||
AES Corp./VA | U.S.$ | 700 | $ | 754,250 | ||||||
NRG Energy, Inc. | 532 | 505,400 | ||||||||
|
| |||||||||
| 1,259,650 | ||||||||||
|
| |||||||||
Total Corporates - Non-Investment Grade | 18,476,355 | |||||||||
|
| |||||||||
COLLATERALIZED MORTGAGE OBLIGATIONS – 2.4% | ||||||||||
GSE Risk Share Floating Rate – 2.3% | ||||||||||
Bellemeade Re Ltd. | 1,299 | 1,300,824 | ||||||||
Federal Home Loan Mortgage Corp. Structured Agency Credit Risk Debt Notes | 1,940 | 1,927,728 | ||||||||
Series 2014-DN2, Class M1 | 543 | 541,783 | ||||||||
Series 2014-DN3, Class M3 | 1,965 | 1,904,453 | ||||||||
Series 2014-DN4, Class M3 | 250 | 250,303 | ||||||||
Series 2014-HQ3, Class M3 | 1,210 | 1,213,936 | ||||||||
Series 2015-DNA1, Class M3 | 315 | 299,067 | ||||||||
Series 2015-DNA2, Class M2 | 2,560 | 2,575,625 | ||||||||
Series 2015-HQ1, Class M2 | 535 | 532,861 | ||||||||
Federal National Mortgage Association Connecticut Avenue Securities | 563 | 561,304 | ||||||||
Series 2014-C04, Class 1M2 | 1,111 | 1,115,884 | ||||||||
Series 2014-C04, Class 2M2 | 415 | 418,613 | ||||||||
Series 2015-C01, Class 1M2 | 835 | 812,980 | ||||||||
Series 2015-C01, Class 2M2 | 732 | 727,567 | ||||||||
| AB POOLING PORTFOLIOS • | 127 |
AB Bond Inflation Protection Portfolio—Portfolio of Investments
| Principal Amount (000) | U.S. $ Value | |||||||||
| ||||||||||
Series 2015-C02, Class 2M2 | U.S.$ | 895 | $ | 853,342 | ||||||
Series 2015-C03, Class 1M2 | 340 | 341,042 | ||||||||
Series 2015-C03, Class 2M2 | 1,095 | 1,092,985 | ||||||||
|
| |||||||||
| 16,470,297 | ||||||||||
|
| |||||||||
Agency Fixed Rate – 0.1% | ||||||||||
Federal National Mortgage Association REMICS | 4,759 | 473,768 | ||||||||
|
| |||||||||
Total Collateralized Mortgage Obligations | 16,944,065 | |||||||||
|
| |||||||||
GOVERNMENTS - | ||||||||||
Governments - Sovereign Agencies – 0.7% | ||||||||||
Brazil – 0.1% | ||||||||||
Petrobras Global Finance BV | 1,450 | 1,318,963 | ||||||||
|
| |||||||||
Canada – 0.1% | ||||||||||
NOVA Chemicals Corp. | 730 | 733,650 | ||||||||
|
| |||||||||
Colombia – 0.1% | ||||||||||
Ecopetrol SA | 547 | 443,070 | ||||||||
|
| |||||||||
Israel – 0.2% | ||||||||||
Israel Electric Corp. Ltd. | 1,380 | 1,425,402 | ||||||||
|
| |||||||||
Morocco – 0.1% | ||||||||||
OCP SA | 515 | 527,978 | ||||||||
|
| |||||||||
United Kingdom – 0.1% | ||||||||||
Royal Bank of Scotland Group PLC | 735 | 736,838 | ||||||||
|
| |||||||||
Total Governments - Sovereign Agencies | 5,185,901 | |||||||||
|
| |||||||||
| 128 | • AB POOLING PORTFOLIOS |
AB Bond Inflation Protection Portfolio—Portfolio of Investments
| Principal Amount (000) | U.S. $ Value | |||||||||
| ||||||||||
QUASI-SOVEREIGNS – 0.6% | ||||||||||
Quasi-Sovereign Bonds – 0.6% | ||||||||||
Chile – 0.1% | ||||||||||
Empresa de Transporte de Pasajeros Metro SA | U.S.$ | 586 | $ | 606,105 | ||||||
|
| |||||||||
Malaysia – 0.2% | ||||||||||
Petronas Capital Ltd. | 1,500 | 1,629,586 | ||||||||
|
| |||||||||
Mexico – 0.1% | ||||||||||
Petroleos Mexicanos | 526 | 535,994 | ||||||||
|
| |||||||||
United Arab Emirates – 0.2% | ||||||||||
IPIC GMTN Ltd. | 1,695 | 1,747,969 | ||||||||
|
| |||||||||
Total Quasi-Sovereigns | 4,519,654 | |||||||||
|
| |||||||||
GOVERNMENTS - TREASURIES – 0.4% | ||||||||||
Brazil – 0.4% | ||||||||||
Brazil Notas do Tesouro Nacional | BRL | 10,010 | 2,626,704 | |||||||
|
| |||||||||
EMERGING MARKETS - CORPORATE BONDS – 0.2% | ||||||||||
Industrial – 0.2% | ||||||||||
Communications - | ||||||||||
Comcel Trust via Comunicaciones Celulares SA | U.S.$ | 387 | 397,642 | |||||||
|
| |||||||||
Consumer Non-Cyclical – 0.1% | ||||||||||
Marfrig Overseas Ltd. | 760 | 768,550 | ||||||||
Virgolino de Oliveira Finance SA | 761 | 6,659 | ||||||||
11.75%, 2/09/22(i)(j) | 270 | 2,700 | ||||||||
|
| |||||||||
| 777,909 | ||||||||||
|
| |||||||||
Total Emerging Markets - Corporate Bonds | 1,175,551 | |||||||||
|
| |||||||||
| AB POOLING PORTFOLIOS • | 129 |
AB Bond Inflation Protection Portfolio—Portfolio of Investments
| Company | Shares | U.S. $ Value | ||||||||||
| ||||||||||||
COMMON STOCKS – 0.1% | ||||||||||||
Mt Logan Re Ltd. (Preference Shares)(k)(l) | 1,100 | $ | 1,139,080 | |||||||||
|
| |||||||||||
PREFERRED STOCKS – 0.1% | ||||||||||||
Insurance – 0.1% | ||||||||||||
Allstate Corp. (The) | 27,700 | 712,444 | ||||||||||
|
| |||||||||||
| Principal Amount (000) | ||||||||||||
GOVERNMENTS - SOVEREIGN |
| |||||||||||
Mexico – 0.1% | ||||||||||||
Mexico Government International Bond 5.95%, 3/19/19 | U.S.$ | 348 | 388,890 | |||||||||
|
| |||||||||||
| Shares | ||||||||||||
SHORT-TERM INVESTMENTS – 0.5% | ||||||||||||
Investment Companies – 0.5% | ||||||||||||
AB Fixed Income Shares, Inc. – Government STIF Portfolio, 0.13%(m)(n) | 3,467,407 | 3,467,407 | ||||||||||
|
| |||||||||||
Total Investments – 127.6% | 914,921,266 | |||||||||||
Other assets less liabilities – (27.6)% | (197,902,998 | ) | ||||||||||
|
| |||||||||||
Net Assets – 100.0% | $ | 717,018,268 | ||||||||||
|
| |||||||||||
FUTURES (see Note C)
| Type | Number of Contracts | Expiration Month | Original Value | Value at August 31, 2015 | Unrealized Appreciation/ (Depreciation) | |||||||||||||||
Purchased Contracts |
| |||||||||||||||||||
Canada 10 Yr Bond Future | 68 | December 2015 | $ | 7,415,708 | $ | 7,309,638 | $ | (106,070 | ) | |||||||||||
U.S. Ultra Bond (CBT) Futures | 43 | December 2015 | 7,058,394 | 6,811,469 | (246,925 | ) | ||||||||||||||
Sold Contracts | ||||||||||||||||||||
Euro-BOBL Futures | 192 | September 2015 | 28,031,052 | 28,015,342 | 15,710 | |||||||||||||||
U.S. Long Bond (CBT) Futures | 24 | December 2015 | 3,749,323 | 3,711,000 | 38,323 | |||||||||||||||
U.S. T-Note 10 Yr (CBT) Futures | 174 | December 2015 | 22,288,962 | 22,108,875 | 180,087 | |||||||||||||||
U.S. T-Note 2 Yr (CBT) Futures | 170 | December 2015 | 37,192,562 | 37,139,687 | 52,875 | |||||||||||||||
|
| |||||||||||||||||||
| $ | (66,000 | ) | ||||||||||||||||||
|
| |||||||||||||||||||
| 130 | • AB POOLING PORTFOLIOS |
AB Bond Inflation Protection Portfolio—Portfolio of Investments
FORWARD CURRENCY EXCHANGE CONTRACTS (see Note C)
| Counterparty | Contracts to Deliver (000) | In Exchange For (000) | Settlement Date | Unrealized Appreciation/ (Depreciation) | ||||||||||||||||||||
Bank of America, NA | EUR | 12,164 | USD | 13,449 | 9/18/15 | $ | (203,407 | ) | ||||||||||||||||
Deutsche Bank AG | BRL | 9,729 | USD | 2,668 | 9/02/15 | (14,750 | ) | |||||||||||||||||
Deutsche Bank AG | USD | 2,714 | BRL | 9,729 | 9/02/15 | (31,167 | ) | |||||||||||||||||
Deutsche Bank AG | BRL | 9,729 | USD | 2,686 | 10/02/15 | 31,655 | ||||||||||||||||||
Deutsche Bank AG | CAD | 798 | USD | 601 | 10/02/15 | (5,046 | ) | |||||||||||||||||
Goldman Sachs Bank USA | BRL | 10,218 | USD | 2,981 | 9/02/15 | 163,658 | ||||||||||||||||||
Goldman Sachs Bank USA | USD | 2,802 | BRL | 10,218 | 9/02/15 | 15,491 | ||||||||||||||||||
HSBC Bank USA | AUD | 7,080 | USD | 5,189 | 9/25/15 | 155,925 | ||||||||||||||||||
Morgan Stanley & Co., Inc. | SGD | 10,153 | USD | 7,185 | 9/18/15 | (5,172 | ) | |||||||||||||||||
State Street Bank & Trust Co. | USD | 140 | BRL | 489 | 9/02/15 | (4,955 | ) | |||||||||||||||||
UBS AG | GBP | 2,429 | USD | 3,778 | 9/24/15 | 51,827 | ||||||||||||||||||
|
| |||||||||||||||||||||||
| $ | 154,059 | |||||||||||||||||||||||
|
| |||||||||||||||||||||||
CENTRALLY CLEARED CREDIT DEFAULT SWAPS (see Note C)
| Clearing Broker/(Exchange) & Referenced Obligation | Fixed Rate (Pay) Receive | Implied Credit Spread at August 31, 2015 | Notional Amount (000) | Market Value | Unrealized Appreciation/ (Depreciation) | |||||||||||||||
Buy Contracts | ||||||||||||||||||||
Citigroup Global Markets, Inc./(INTRCONX): |
| |||||||||||||||||||
CDX-NAHY Series 21, 5 Year Index, 12/20/18* | (5.00 | )% | 2.97 | % | $ | 14,957 | $ | (1,079,792 | ) | $ | (378,360 | ) | ||||||||
Morgan Stanley & Co., |
| |||||||||||||||||||
CDX-NAHY Series 21, 5 Year Index, 12/20/18* | (5.00 | ) | 2.97 | 5,995 | (432,819 | ) | (273,300 | ) | ||||||||||||
CDX-NAIG Series 22, 5 Year Index, 6/20/19* | (1.00 | ) | 0.71 | 23,810 | (304,843 | ) | (48,812 | ) | ||||||||||||
|
|
|
| |||||||||||||||||
| $ | (1,817,454 | ) | $ | (700,472 | ) | |||||||||||||||
|
|
|
| |||||||||||||||||
| * | Termination Date |
CENTRALLY CLEARED INTEREST RATE SWAPS (see Note C)
| Rate Type | ||||||||||||||||
| Clearing Broker /(Exchange) | Notional Amount (000) | Termination Date | Payments made by the Fund | Payments received by the Fund | Unrealized Appreciation/ (Depreciation) | |||||||||||
Morgan Stanley & Co., LLC/(CME Group) | CAD | 35,660 | 3/10/17 | 0.973% | 3 Month CDOR | $ | (112,307 | ) | ||||||||
Morgan Stanley & Co., LLC/(CME Group) | AUD | 47,230 | 3/11/17 | 2.140% | 3 Month BBSW | (95,911 | ) | |||||||||
Morgan Stanley & Co., LLC/(CME Group) | CAD | 33,470 | 6/05/17 | 1.054% | 3 Month CDOR | (155,006 | ) | |||||||||
Morgan Stanley & Co., LLC/(CME Group) | NZD | 65,930 | 6/09/17 | 3.366% | 3 Month BKBM | (422,903 | ) | |||||||||
Morgan Stanley & Co., LLC/(CME Group) | AUD | 42,090 | 6/09/17 | 2.218% | 3 Month BBSW | (150,249 | ) | |||||||||
| AB POOLING PORTFOLIOS • | 131 |
AB Bond Inflation Protection Portfolio—Portfolio of Investments
| Rate Type | ||||||||||||||||
| Clearing Broker /(Exchange) | Notional Amount (000) | Termination Date | Payments made by the Fund | Payments received by the Fund | Unrealized Appreciation/ (Depreciation) | |||||||||||
Morgan Stanley & Co., LLC/(CME Group) | $ | 43,660 | 5/06/19 | 3 Month LIBOR | 1.751% | $ | 847,639 | |||||||||
Morgan Stanley & Co., LLC/(CME Group) | 8,240 | 7/02/19 | 3 Month LIBOR | 1.701% | 112,754 | |||||||||||
Morgan Stanley & Co., LLC/(CME Group) | 14,230 | 10/31/19 | 3 Month LIBOR | 1.747% | 241,311 | |||||||||||
Morgan Stanley & Co., LLC/(CME Group) | AUD | 14,575 | 5/18/20 | 3 Month LIBOR | 1.663% | 120,466 | ||||||||||
Morgan Stanley & Co., LLC/(CME Group) | GBP | 12,180 | 6/05/20 | 6 Month LIBOR | 1.651% | 105,260 | ||||||||||
Morgan Stanley & Co., LLC/(CME Group) | $ | 12,070 | 8/11/20 | 3 Month LIBOR | 1.712% | 56,941 | ||||||||||
Morgan Stanley & Co., LLC/(CME Group) | 4,910 | 1/14/24 | 2.980% | 3 Month LIBOR | (347,201 | ) | ||||||||||
Morgan Stanley & Co., LLC/(CME Group) | 4,330 | 2/14/24 | 2.889% | 3 Month LIBOR | (264,996 | ) | ||||||||||
Morgan Stanley & Co., LLC/(CME Group) | 6,120 | 4/28/24 | 2.817% | 3 Month LIBOR | (387,974 | ) | ||||||||||
Morgan Stanley & Co., LLC/(CME Group) | 4,360 | 5/06/24 | 2.736% | 3 Month LIBOR | (244,054 | ) | ||||||||||
Morgan Stanley & Co., LLC/(CME Group) | 3,520 | 5/29/24 | 3 Month LIBOR | 2.628% | 159,473 | |||||||||||
Morgan Stanley & Co., LLC/(CME Group) | 8,860 | 7/02/24 | 2.632% | 3 Month LIBOR | (375,055 | ) | ||||||||||
Morgan Stanley & Co., LLC/(CME Group) | 4,440 | 7/10/24 | 2.674% | 3 Month LIBOR | (201,008 | ) | ||||||||||
Morgan Stanley & Co., LLC/(CME Group) | 3,550 | 7/18/24 | 3 Month LIBOR | 2.668% | 156,410 | |||||||||||
Morgan Stanley & Co., LLC/(CME Group) | 5,140 | 9/24/24 | 3 Month LIBOR | 2.691% | 276,530 | |||||||||||
Morgan Stanley & Co., LLC/(CME Group) | AUD | 7,190 | 3/11/25 | 6 Month BBSW | 2.973% | 14,599 | ||||||||||
Morgan Stanley & Co., LLC/(CME Group) | $ | 4,250 | 4/21/25 | 1.991% | 3 Month LIBOR | 61,097 | ||||||||||
Morgan Stanley & Co., LLC/(CME Group) | NZD | 7,685 | 6/09/25 | 3 Month BKBM | 4.068% | 212,317 | ||||||||||
Morgan Stanley & Co., LLC/(CME Group) | AUD | 4,560 | 6/09/25 | 6 Month BBSW | 3.384% | 117,353 | ||||||||||
Morgan Stanley & Co., LLC/(CME Group) | $ | 2,500 | 6/09/25 | 2.488% | 3 Month LIBOR | (68,332 | ) | |||||||||
Morgan Stanley & Co., LLC/(CME Group) | 8,120 | 8/04/25 | 2.293% | 3 Month LIBOR | (42,929 | ) | ||||||||||
Morgan Stanley & Co., LLC/(CME Group) | GBP | 1,130 | 6/05/45 | 2.396% | 6 Month LIBOR | (77,799 | ) | |||||||||
Morgan Stanley & Co., LLC/(CME Group) | $ | 1,050 | 8/06/45 | 2.692% | 3 Month LIBOR | 2,709 | ||||||||||
|
| |||||||||||||||
| $ | (460,865 | ) | ||||||||||||||
|
| |||||||||||||||
| 132 | • AB POOLING PORTFOLIOS |
AB Bond Inflation Protection Portfolio—Portfolio of Investments
CREDIT DEFAULT SWAPS (see Note C)
| Swap Counterparty & Referenced Obligation | Fixed Rate (Pay) Receive | Implied Credit Spread at August 31, 2015 | Notional Amount (000) | Market Value | Upfront Premiums Paid (Received) | Unrealized Appreciation/ (Depreciation) | ||||||||||||||||||
Buy Contracts | ||||||||||||||||||||||||
Citibank, NA: |
| |||||||||||||||||||||||
Advanced Micro Devices, Inc., | (5.00 | )% | 13.59 | % | $ | 605 | $ | 130,936 | $ | 38,435 | $ | 92,501 | ||||||||||||
Sprint Communications, Inc., | (5.00 | ) | 3.60 | 1,009 | (57,082 | ) | (47,155 | ) | (9,927 | ) | ||||||||||||||
Sprint Communications, Inc., | (5.00 | ) | 3.60 | 1,156 | (65,399 | ) | (56,019 | ) | (9,380 | ) | ||||||||||||||
Sale Contracts | ||||||||||||||||||||||||
Bank of America, NA: |
| |||||||||||||||||||||||
Societe Generale, | 3.00 | 0.49 | EUR | 1,400 | 100,316 | 40,192 | 60,124 | |||||||||||||||||
Credit Suisse International: |
| |||||||||||||||||||||||
Anadarko Petroleum Corp., | 1.00 | 0.48 | $ | 2,140 | 27,110 | (30,933 | ) | 58,043 | ||||||||||||||||
Kohl’s Corp., | 1.00 | 0.87 | 227 | 1,260 | (2,332 | ) | 3,592 | |||||||||||||||||
Kohl’s Corp., | 1.00 | 0.87 | 134 | 747 | (1,239 | ) | 1,986 | |||||||||||||||||
Kohl’s Corp., | 1.00 | 0.87 | 92 | 513 | (949 | ) | 1,462 | |||||||||||||||||
Kohl’s Corp., | 1.00 | 0.87 | 92 | 510 | (944 | ) | 1,454 | |||||||||||||||||
|
|
|
|
|
| |||||||||||||||||||
| $ | 138,911 | $ | (60,944 | ) | $ | 199,855 | ||||||||||||||||||
|
|
|
|
|
| |||||||||||||||||||
| * | Termination Date |
| AB POOLING PORTFOLIOS • | 133 |
AB Bond Inflation Protection Portfolio—Portfolio of Investments
INFLATION (CPI) SWAPS (see Note C)
| Rate Type | ||||||||||||||||||
| Swap Counterparty | Notional Amount (000) | Termination Date | Payments by the | Payments received by the Fund | Unrealized Appreciation/ (Depreciation) | |||||||||||||
Barclays Bank PLC | $ | 15,500 | 1/15/16 | CPI# | 0.970 | % | $ | 172,829 | ||||||||||
Barclays Bank PLC | 2,520 | 7/15/19 | 1.370% | CPI | # | (2,508 | ) | |||||||||||
Barclays Bank PLC | 42,130 | 7/15/20 | 1.527% | CPI | # | (65,296 | ) | |||||||||||
Barclays Bank PLC | 14,120 | 1/15/21 | 1.490% | CPI | # | (22,479 | ) | |||||||||||
Citibank, NA | 15,500 | 1/15/16 | 0.945% | CPI | # | (168,438 | ) | |||||||||||
Deutsche Bank AG | 48,590 | 7/15/21 | 1.574% | CPI | # | (26,683 | ) | |||||||||||
JPMorgan Chase Bank, NA | 17,240 | 1/15/20 | 1.795% | CPI | # | (247,399 | ) | |||||||||||
Morgan Stanley Capital Services LLC | 10,900 | 7/15/17 | 1.955% | CPI | # | (398,547 | ) | |||||||||||
|
| |||||||||||||||||
| $ | (758,521 | ) | ||||||||||||||||
|
| |||||||||||||||||
| # | Variable interest rate based on the rate of inflation as determined by the Consumer Price Index (CPI). |
INTEREST RATE SWAPS (see Note C)
| Rate Type | ||||||||||||||||
Swap Counterparty | Notional Amount (000) | Termination Date | Payments by the | Payments received by the Fund | Unrealized Appreciation/ (Depreciation) | |||||||||||
Morgan Stanley Capital Services LLC | $ | 5,480 | 2/21/42 | 2.813% | 3 Month LIBOR | $ | (134,045 | ) | ||||||||
Morgan Stanley Capital Services LLC | 3,990 | 3/06/42 | 2.804% | 3 Month LIBOR | (140,178 | ) | ||||||||||
|
| |||||||||||||||
| $ | (274,223 | ) | ||||||||||||||
|
| |||||||||||||||
REVERSE REPURCHASE AGREEMENTS (see Note C)
| Broker | Interest Rate | Maturity | U.S. $ 2015 | |||||||||
Bank of America | 0.41 | % | 10/13/15 | $ | 25,095,689 | |||||||
Bank of America+ | 0.22 | % | — | 9,113,646 | ||||||||
Bank of America+ | 0.22 | % | — | 7,288,260 | ||||||||
Barclays Capital, Inc.+ | 0.27 | % | — | 9,929,888 | ||||||||
HSBC | 0.21 | % | 10/15/15 | 23,230,597 | ||||||||
HSBC | 0.21 | % | 10/22/15 | 15,098,555 | ||||||||
HSBC | 0.21 | % | 10/26/15 | 17,179,610 | ||||||||
HSBC | 0.21 | % | 10/28/15 | 19,775,509 | ||||||||
HSBC+ | 0.21 | % | — | 9,599,944 | ||||||||
HSBC+ | 0.21 | % | — | 7,160,011 | ||||||||
JPMorgan Chase | 0.31 | % | 10/22/15 | 49,543,736 | ||||||||
JPMorgan Chase | 0.34 | % | 11/09/15 | 56,629,471 | ||||||||
|
| |||||||||||
| $ | 249,644,916 | |||||||||||
|
| |||||||||||
| + | The reverse repurchase agreement matures on demand. Interest rate resets daily and the rate shown is the rate in effect on August 31, 2015 |
| (a) | Position, or a portion thereof, has been segregated to collateralize reverse repurchase agreements. |
| 134 | • AB POOLING PORTFOLIOS |
AB Bond Inflation Protection Portfolio—Portfolio of Investments
| (b) | Position, or a portion thereof, has been segregated to collateralize OTC derivatives outstanding. |
| (c) | Security is exempt from registration under Rule 144A of the Securities Act of 1933. These securities are considered liquid and may be resold in transactions exempt from registration, normally to qualified institutional buyers. At August 31, 2015, the aggregate market value of these securities amounted to $114,349,716 or 15.9% of net assets. |
| (d) | Securities are perpetual and, thus, do not have a predetermined maturity date. The date shown, if applicable, reflects the next call date. |
| (e) | Floating Rate Security. Stated interest rate was in effect at August 31, 2015. |
| (f) | Variable rate coupon, rate shown as of August 31, 2015. |
| (g) | Illiquid security. |
| (h) | IO – Interest Only |
| (i) | Security is in default and is non-income producing. |
| (j) | Security is exempt from registration under Rule 144A of the Securities Act of 1933. These securities, which represent 0.00% of net assets as of August 31, 2015, are considered illiquid and restricted. |
| Restricted Securities | Acquisition Date | Cost | Market Value | Percentage of Net Assets | ||||||||||||
Virgolino de Oliveira Finance SA | ||||||||||||||||
10.50%, 1/28/18 | 1/24/14 | $ | 420,913 | $ | 6,659 | 0.00 | % | |||||||||
Virgolino de Oliveira Finance SA | ||||||||||||||||
11.75%, 2/09/22 | 1/30/14 | 132,510 | 2,700 | 0.00 | % | |||||||||||
| (k) | The security is subject to a 12 month lock-up period, after which semi-annual redemptions are permitted. |
| (l) | Restricted and illiquid security. |
| Restricted Securities | Acquisition Date | Cost | Market Value | Percentage of Net Assets | ||||||||||||
Mt Logan Re Ltd. (Preference Shares) | 12/30/14 | $ | 1,100,000 | $ | 1,139,080 | 0.16 | % | |||||||||
| (m) | To obtain a copy of the fund’s financial statements, please go to the Securities and Exchange Commission’s website at www.sec.gov, or call AB at (800) 227-4618. |
| (n) | Investment in affiliated money market mutual fund. The rate shown represents the 7-day yield as of period end. |
Currency Abbreviations:
| AUD | – Australian Dollar |
| BRL | – Brazilian Real |
| CAD | – Canadian Dollar |
| EUR | – Euro |
| GBP | – Great British Pound |
| NZD | – New Zealand Dollar |
| SGD | – Singapore Dollar |
| USD | – United States Dollar |
Glossary:
| ABS | – Asset-Backed Securities |
| BA | – Banker’s Acceptance |
| BBSW | – Bank Bill Swap Reference Rate (Australia) |
| BKBM | – Bank Bill Benchmark (New Zealand) |
| CBT | – Chicago Board of Trade |
| CDOR | – Canadian Dealer Offered Rate |
| CDX-NAHY | – North American High Yield Credit Default Swap Index |
| CDX-NAIG | – North American Investment Grade Credit Default Swap Index |
| CFC | – Customer Facility Charge |
| CMBS | – Commercial Mortgage-Backed Securities |
| CME | – Chicago Mercantile Exchange |
| AB POOLING PORTFOLIOS • | 135 |
AB Bond Inflation Protection Portfolio—Portfolio of Investments
| CPI | – Consumer Price Index |
| FHLMC | – Federal Home Loan Mortgage Corporation |
| GMTN | – Global Medium Term Note |
| GSE | – Government-Sponsored Enterprise |
| INTRCONX | – Inter-Continental Exchange |
| LIBOR | – London Interbank Offered Rates |
| REIT | – Real Estate Investment Trust |
| REMICs | – Real Estate Mortgage Investment Conduits |
| TIPS | – Treasury Inflation Protected Security |
See notes to financial statements.
| 136 | • AB POOLING PORTFOLIOS |
AB Bond Inflation Protection Portfolio—Portfolio of Investments
AB HIGH-YIELD PORTFOLIO
PORTFOLIO OF INVESTMENTS
August 31, 2015
| Principal Amount (000) | U.S. $ Value | |||||||||
| ||||||||||
CORPORATES - NON-INVESTMENT | ||||||||||
Industrial – 60.6% | ||||||||||
Basic – 3.8% | ||||||||||
AK Steel Corp. | U.S.$ | 61 | $ | 39,955 | ||||||
8.75%, 12/01/18 | 130 | 130,000 | ||||||||
Aleris International, Inc. | 264 | 259,380 | ||||||||
7.875%, 11/01/20 | 230 | 222,525 | ||||||||
ArcelorMittal | 180 | 177,750 | ||||||||
6.125%, 6/01/18(a) | 1,330 | 1,383,200 | ||||||||
6.125%, 6/01/25 | 97 | 89,483 | ||||||||
6.25%, 3/01/21 | 249 | 245,576 | ||||||||
7.75%, 10/15/39 | 922 | 855,155 | ||||||||
Arch Coal, Inc. | 594 | 81,675 | ||||||||
Axalta Coating Systems US Holdings, Inc./Axalta Coating Systems Dutch Holding B | 275 | 294,222 | ||||||||
Axiall Corp. | 269 | 260,930 | ||||||||
Chemours Co. (The) | 262 | 224,010 | ||||||||
Cliffs Natural Resources, Inc. | 406 | 157,325 | ||||||||
8.25%, 3/31/20(b) | 323 | 293,930 | ||||||||
Commercial Metals Co. | 336 | 347,760 | ||||||||
Consolidated Energy Finance SA | 540 | 533,142 | ||||||||
Emeco Pty Ltd. | 481 | 312,650 | ||||||||
FMG Resources August 206 Pty Ltd. | 240 | 148,800 | ||||||||
9.75%, 3/01/22(b) | 131 | 119,701 | ||||||||
Hexion, Inc. | 102 | 88,740 | ||||||||
Huntsman International LLC | 680 | 646,000 | ||||||||
INEOS Group Holdings SA | 345 | 345,431 | ||||||||
Jefferson Smurfit Corp./US | 630 | 315 | ||||||||
JMC Steel Group, Inc. | 201 | 159,293 | ||||||||
| AB POOLING PORTFOLIOS • | 137 |
AB High-Yield Portfolio—Portfolio of Investments
| Principal Amount (000) | U.S. $ Value | |||||||||
| ||||||||||
Kerling PLC | EUR | 255 | $ | 291,494 | ||||||
Lundin Mining Corp. | U.S.$ | 244 | 240,950 | |||||||
7.875%, 11/01/22(b) | 236 | 232,460 | ||||||||
Magnetation LLC/Mag Finance Corp. | 645 | 96,750 | ||||||||
Momentive Performance Materials, Inc. | 461 | 393,291 | ||||||||
8.875%, 10/15/20(d)(g)(h) | 461 | – 0 | – | |||||||
Novelis, Inc. | 509 | 507,727 | ||||||||
Peabody Energy Corp. | 1,192 | 396,340 | ||||||||
Ryerson, Inc./Joseph T. Ryerson & Son, Inc. | 387 | 353,137 | ||||||||
Smurfit Kappa Acquisitions | 400 | 417,000 | ||||||||
Smurfit-Stone Container Enterprises, Inc. | 650 | 325 | ||||||||
Steel Dynamics, Inc. | 645 | 668,381 | ||||||||
Thompson Creek Metals Co., Inc. | 341 | 204,600 | ||||||||
9.75%, 12/01/17 | 470 | 430,050 | ||||||||
Univar USA, Inc. | 320 | 318,400 | ||||||||
WR Grace & Co.-Conn | 211 | 213,638 | ||||||||
|
| |||||||||
| 12,181,491 | ||||||||||
|
| |||||||||
Capital Goods – 4.7% | ||||||||||
Accudyne Industries Borrower/Accudyne Industries LLC | 328 | 285,360 | ||||||||
Apex Tool Group LLC | 368 | 309,120 | ||||||||
Ardagh Finance Holdings SA | 414 | 436,522 | ||||||||
Ardagh Packaging Finance PLC | EUR | 145 | 169,887 | |||||||
Ardagh Packaging Finance PLC/Ardagh Holdings USA, Inc. | U.S.$ | 570 | 565,611 | |||||||
Berry Plastics Corp. | 299 | 279,565 | ||||||||
Beverage Packaging Holdings Luxembourg II SA/Beverage Packaging Holdings II Issuer | 171 | 170,145 | ||||||||
| 138 | • AB POOLING PORTFOLIOS |
AB High-Yield Portfolio—Portfolio of Investments
| Principal Amount (000) | U.S. $ Value | |||||||||
| ||||||||||
Bombardier, Inc. | U.S.$ | 1,135 | $ | 851,250 | ||||||
6.125%, 1/15/23(b) | 1,023 | 762,135 | ||||||||
7.45%, 5/01/34(b) | 564 | 394,800 | ||||||||
7.50%, 3/15/25(b) | 268 | 203,010 | ||||||||
CNH Industrial Capital LLC | 285 | 277,163 | ||||||||
3.625%, 4/15/18 | 795 | 789,037 | ||||||||
EnerSys | 210 | 202,388 | ||||||||
EnPro Industries, Inc. | 266 | 267,330 | ||||||||
Gardner Denver, Inc. | 176 | 156,640 | ||||||||
KLX, Inc. | 238 | 233,240 | ||||||||
Manitowoc Co., Inc. (The) | 252 | 264,128 | ||||||||
Milacron LLC/Mcron Finance Corp. | 308 | 315,700 | ||||||||
Nuverra Environmental Solutions, Inc. | 70 | 45,500 | ||||||||
Owens-Brockway Glass Container, Inc. | 74 | 75,295 | ||||||||
Owens-Illinois, Inc. | 290 | 320,450 | ||||||||
Pactiv LLC | 597 | 576,105 | ||||||||
Reynolds Group Issuer, Inc./Reynolds Group Issuer LLC/Reynolds Group Issuer Lu | 1,309 | 1,346,634 | ||||||||
9.00%, 4/15/19 | 1,110 | 1,134,975 | ||||||||
9.875%, 8/15/19 | 400 | 420,500 | ||||||||
Sealed Air Corp. | 136 | 136,000 | ||||||||
6.875%, 7/15/33(b) | 1,181 | 1,189,857 | ||||||||
SIG Combibloc Holdings SCA | EUR | 147 | 170,251 | |||||||
SPX Corp. | U.S.$ | 300 | 319,500 | |||||||
Summit Materials LLC/Summit Materials Finance Corp. | 127 | 136,843 | ||||||||
TransDigm, Inc. | 530 | 522,129 | ||||||||
6.50%, 7/15/24 | 481 | 470,178 | ||||||||
| AB POOLING PORTFOLIOS • | 139 |
AB High-Yield Portfolio—Portfolio of Investments
| Principal Amount (000) | U.S. $ Value | |||||||||
| ||||||||||
United Rentals North America, Inc. | U.S.$ | 758 | $ | 731,470 | ||||||
5.75%, 11/15/24 | 586 | 577,210 | ||||||||
|
| |||||||||
| 15,105,928 | ||||||||||
|
| |||||||||
Communications - Media – 9.3% | ||||||||||
Altice Financing SA | 672 | 668,640 | ||||||||
Arqiva Broadcast Finance PLC | GBP | 555 | 925,301 | |||||||
CCO Holdings LLC/CCO Holdings Capital Corp. | U.S.$ | 785 | 783,037 | |||||||
5.875%, 5/01/27(b) | 334 | 327,320 | ||||||||
Cequel Communications Holdings I LLC/Cequel Capital Corp. | 855 | 783,394 | ||||||||
Clear Channel Worldwide Holdings, Inc. | 525 | 530,512 | ||||||||
Series A | 100 | 102,500 | ||||||||
Series B | 675 | 697,275 | ||||||||
CSC Holdings LLC | 362 | 335,936 | ||||||||
7.625%, 7/15/18 | 1,140 | 1,248,300 | ||||||||
DISH DBS Corp. | 550 | 485,722 | ||||||||
5.875%, 11/15/24 | 1,893 | 1,724,996 | ||||||||
Hughes Satellite Systems Corp. | 965 | 1,055,469 | ||||||||
iHeartCommunications, Inc. | 1,231 | 1,070,970 | ||||||||
9.00%, 12/15/19-9/15/22 | 1,180 | 1,084,669 | ||||||||
10.00%, 1/15/18 | 475 | 344,969 | ||||||||
Intelsat Jackson Holdings SA | 1,934 | 1,701,920 | ||||||||
7.25%, 10/15/20 | 1,153 | 1,108,321 | ||||||||
LGE HoldCo VI BV | EUR | 510 | 623,586 | |||||||
Mediacom Broadband LLC/Mediacom | U.S.$ | 350 | 348,250 | |||||||
Nielsen Finance LLC/Nielsen Finance Co. | 705 | 695,306 | ||||||||
Radio One, Inc. | 400 | 385,000 | ||||||||
9.25%, 2/15/20(b) | 511 | 454,790 | ||||||||
RR Donnelley & Sons Co. | 390 | 433,875 | ||||||||
| 140 | • AB POOLING PORTFOLIOS |
AB High-Yield Portfolio—Portfolio of Investments
| Principal Amount (000) | U.S. $ Value | |||||||||
| ||||||||||
Sinclair Television Group, Inc. | U.S.$ | 1,165 | $ | 1,108,206 | ||||||
6.125%, 10/01/22 | 539 | 541,695 | ||||||||
Sirius XM Radio, Inc. | 250 | 238,125 | ||||||||
5.375%, 4/15/25(b) | 700 | 693,000 | ||||||||
6.00%, 7/15/24(b) | 650 | 669,500 | ||||||||
Starz LLC/Starz Finance Corp. | 315 | 315,788 | ||||||||
TEGNA, Inc. | 455 | 449,313 | ||||||||
5.125%, 7/15/20 | 170 | 175,950 | ||||||||
5.50%, 9/15/24(b) | 114 | 112,860 | ||||||||
6.375%, 10/15/23 | 710 | 743,725 | ||||||||
Time, Inc. | 959 | 915,845 | ||||||||
Townsquare Media, Inc. | 346 | 333,890 | ||||||||
Unitymedia GmbH | 497 | 509,425 | ||||||||
Unitymedia Hessen GmbH & Co | 273 | 266,858 | ||||||||
Unitymedia Hessen GmbH & Co. | 580 | 595,950 | ||||||||
Univision Communications, Inc. | 1,914 | 1,858,815 | ||||||||
UPCB Finance IV Ltd. | 685 | 664,450 | ||||||||
Videotron Ltd. | 500 | 499,375 | ||||||||
Virgin Media Finance PLC | 208 | 194,480 | ||||||||
6.00%, 10/15/24(b) | 982 | 1,007,777 | ||||||||
Wave Holdco LLC/Wave Holdco Corp. | 152 | 150,480 | ||||||||
Ziggo Bond Finance BV | 262 | 252,830 | ||||||||
|
| |||||||||
| 30,218,395 | ||||||||||
|
| |||||||||
Communications - | ||||||||||
Altice Luxembourg SA | EUR | 520 | 586,436 | |||||||
7.625%, 2/15/25(b) | U.S.$ | 220 | 209,000 | |||||||
7.75%, 5/15/22(b) | 332 | 323,700 | ||||||||
| AB POOLING PORTFOLIOS • | 141 |
AB High-Yield Portfolio—Portfolio of Investments
| Principal Amount (000) | U.S. $ Value | |||||||||
| ||||||||||
Altice US Finance II Corp. | U.S.$ | 408 | $ | 397,800 | ||||||
CenturyLink, Inc. | 265 | 251,419 | ||||||||
Series U | 760 | 649,800 | ||||||||
Series W | 335 | 325,788 | ||||||||
Columbus International, Inc. | 829 | 866,305 | ||||||||
CommScope Technologies Finance LLC | 162 | 157,545 | ||||||||
CommScope, Inc. | 293 | 284,576 | ||||||||
Frontier Communications Corp. | 655 | 597,950 | ||||||||
7.125%, 3/15/19 | 350 | 358,750 | ||||||||
7.625%, 4/15/24 | 488 | 435,540 | ||||||||
7.875%, 1/15/27 | 127 | 112,395 | ||||||||
9.00%, 8/15/31 | 360 | 317,475 | ||||||||
Level 3 Financing, Inc. | 800 | 842,000 | ||||||||
Numericable-SFR SAS | 1,185 | 1,185,000 | ||||||||
6.25%, 5/15/24(b) | 783 | 782,757 | ||||||||
Sable International Finance Ltd. | 344 | 347,440 | ||||||||
Sprint Capital Corp. | 95 | 81,700 | ||||||||
8.75%, 3/15/32 | 1,310 | 1,239,587 | ||||||||
Sprint Communications, Inc. | 425 | 382,500 | ||||||||
9.00%, 11/15/18(b) | 945 | 1,052,494 | ||||||||
Sprint Corp. | 360 | 332,888 | ||||||||
7.25%, 9/15/21 | 520 | 505,700 | ||||||||
7.625%, 2/15/25 | 1,502 | 1,401,554 | ||||||||
7.875%, 9/15/23 | 1,583 | 1,521,659 | ||||||||
T-Mobile USA, Inc. | 900 | 929,520 | ||||||||
6.375%, 3/01/25 | 1,300 | 1,328,600 | ||||||||
6.50%, 1/15/24 | 715 | 734,663 | ||||||||
Telecom Italia Capital SA | 1,050 | 1,065,750 | ||||||||
7.721%, 6/04/38 | 360 | 410,400 | ||||||||
| 142 | • AB POOLING PORTFOLIOS |
AB High-Yield Portfolio—Portfolio of Investments
| Principal Amount (000) | U.S. $ Value | |||||||||
| ||||||||||
Wind Acquisition Finance SA | U.S.$ | 380 | $ | 382,850 | ||||||
6.50%, 4/30/20(b) | 510 | 536,775 | ||||||||
7.375%, 4/23/21(b) | 1,383 | 1,414,117 | ||||||||
Windstream Services LLC | 460 | 337,599 | ||||||||
7.50%, 4/01/23 | 340 | 266,053 | ||||||||
Zayo Group LLC/Zayo Capital, Inc. | 779 | 777,987 | ||||||||
|
| |||||||||
| 23,734,072 | ||||||||||
|
| |||||||||
Consumer Cyclical - Automotive – 2.2% | ||||||||||
Affinia Group, Inc. | 579 | 613,740 | ||||||||
Commercial Vehicle Group, Inc. | 427 | 439,810 | ||||||||
Exide Technologies | 978 | 836,563 | ||||||||
11.00%, 4/30/20(h)(i) | 1,326 | 1,100,856 | ||||||||
Gates Global LLC/Gates Global Co. | 515 | 419,777 | ||||||||
LKQ Corp. | 1,084 | 1,039,285 | ||||||||
Navistar International Corp. | 322 | 278,530 | ||||||||
Rhino Bondco SpA | EUR | 200 | 223,196 | |||||||
7.25%, 11/15/20(b) | 275 | 329,637 | ||||||||
Schaeffler Holding Finance BV | 544 | 632,396 | ||||||||
Titan International, Inc. | U.S.$ | 360 | 322,200 | |||||||
ZF North America Capital, Inc. | 332 | 331,950 | ||||||||
4.75%, 4/29/25(b) | 451 | 427,322 | ||||||||
|
| |||||||||
| 6,995,262 | ||||||||||
|
| |||||||||
Consumer Cyclical - Entertainment – 0.5% | ||||||||||
AMC Entertainment, Inc. | 324 | 322,380 | ||||||||
Carlson Travel Holdings, Inc. | 644 | 652,050 | ||||||||
Regal Entertainment Group | 645 | 645,129 | ||||||||
|
| |||||||||
| 1,619,559 | ||||||||||
|
| |||||||||
| AB POOLING PORTFOLIOS • | 143 |
AB High-Yield Portfolio—Portfolio of Investments
| Principal Amount (000) | U.S. $ Value | |||||||||||
| ||||||||||||
Consumer Cyclical - Other – 3.3% | ||||||||||||
Beazer Homes USA, Inc. | U.S.$ | 350 | $ | 336,875 | ||||||||
Boyd Gaming Corp. | 870 | 933,075 | ||||||||||
Caesars Entertainment Operating Co., Inc. | 145 | 124,338 | ||||||||||
10.00%, 12/15/18(e) | 825 | 257,812 | ||||||||||
Caesars Entertainment Resort Properties LLC/Caesars Entertainment Resort Prope | 350 | 345,625 | ||||||||||
Caesars Growth Properties Holdings LLC/Caesars Growth Properties Finance, Inc. | 380 | 318,250 | ||||||||||
DR Horton, Inc. | 500 | 502,500 | ||||||||||
Eldorado Resorts, Inc. | 229 | 227,283 | ||||||||||
International Game Technology PLC | 558 | 536,729 | ||||||||||
6.50%, 2/15/25(b) | 450 | 426,375 | ||||||||||
Isle of Capri Casinos, Inc. | 175 | 180,250 | ||||||||||
KB Home | 290 | 284,925 | ||||||||||
Lennar Corp. | 665 | 679,630 | ||||||||||
M/I Homes, Inc. | 790 | 816,662 | ||||||||||
MDC Holdings, Inc. | 54 | 54,270 | ||||||||||
6.00%, 1/15/43 | 172 | 146,200 | ||||||||||
Meritage Homes Corp. | 636 | 641,164 | ||||||||||
7.00%, 4/01/22 | 45 | 48,038 | ||||||||||
NAI Entertainment Holdings/NAI Entertainment Holdings Finance Corp. | 165 | 168,300 | ||||||||||
PulteGroup, Inc. | 555 | 545,287 | ||||||||||
6.375%, 5/15/33 | 86 | 89,440 | ||||||||||
7.875%, 6/15/32 | 31 | 35,883 | ||||||||||
Ryland Group, Inc. (The) | 335 | 366,825 | ||||||||||
Scientific Games International, Inc. | 306 | 312,885 | ||||||||||
| 144 | • AB POOLING PORTFOLIOS |
AB High-Yield Portfolio—Portfolio of Investments
| Principal Amount (000) | U.S. $ Value | |||||||||
| ||||||||||
Shea Homes LP/Shea Homes Funding Corp. | U.S.$ | 81 | $ | 82,823 | ||||||
6.125%, 4/01/25(b) | 624 | 638,040 | ||||||||
Standard Pacific Corp. | 100 | 102,500 | ||||||||
8.375%, 5/15/18 | 300 | 339,000 | ||||||||
Studio City Finance Ltd. | 325 | 318,500 | ||||||||
Taylor Morrison Communities, Inc./Monarch Communities, Inc. | 253 | 253,632 | ||||||||
Toll Brothers Finance Corp. | 157 | 160,140 | ||||||||
Wynn Las Vegas LLC/Wynn Las Vegas Capital Corp. | 228 | 210,900 | ||||||||
Wynn Macau Ltd. | 200 | 183,500 | ||||||||
|
| |||||||||
| 10,667,656 | ||||||||||
|
| |||||||||
Consumer Cyclical - Restaurants – 0.5% | ||||||||||
1011778 BC ULC/New Red Finance, Inc. | 324 | 325,620 | ||||||||
6.00%, 4/01/22(b) | 414 | 426,420 | ||||||||
Pizzaexpress Financing 1 PLC | GBP | 103 | 162,600 | |||||||
Pizzaexpress Financing 2 PLC | 107 | 167,966 | ||||||||
Stonegate Pub Co. Financing PLC | 330 | 509,550 | ||||||||
|
| |||||||||
| 1,592,156 | ||||||||||
|
| |||||||||
Consumer Cyclical - Retailers – 2.3% | ||||||||||
American Tire Distributors, Inc. | U.S.$ | 695 | 712,375 | |||||||
Argos Merger Sub, Inc. | 755 | 790,862 | ||||||||
Brighthouse Group PLC | GBP | 330 | 482,686 | |||||||
Cash America International, Inc. | U.S.$ | 544 | 541,280 | |||||||
Dollar Tree, Inc. | 734 | 768,865 | ||||||||
Group 1 Automotive, Inc. | 410 | 406,925 | ||||||||
L Brands, Inc. | 820 | 965,550 | ||||||||
Levi Strauss & Co. | 758 | 741,893 | ||||||||
| AB POOLING PORTFOLIOS • | 145 |
AB High-Yield Portfolio—Portfolio of Investments
| Principal Amount (000) | U.S. $ Value | |||||||||
| ||||||||||
Neiman Marcus Group Ltd. LLC | U.S.$ | 172 | $ | 184,040 | ||||||
Party City Holdings, Inc. | 302 | 304,076 | ||||||||
Rite Aid Corp. | 1,544 | 1,584,530 | ||||||||
|
| |||||||||
| 7,483,082 | ||||||||||
|
| |||||||||
Consumer Non-Cyclical – 11.5% | ||||||||||
Air Medical Merger Sub Corp. | 570 | 530,100 | ||||||||
Alere, Inc. | 76 | 77,900 | ||||||||
8.625%, 10/01/18 | 739 | 757,756 | ||||||||
AMAG Pharmaceuticals, Inc. | 162 | 165,848 | ||||||||
Amsurg Corp. | 408 | 416,417 | ||||||||
BI-LO LLC/BI-LO Finance Corp. | 374 | 344,080 | ||||||||
9.25%, 2/15/19(b) | 330 | 335,775 | ||||||||
Boparan Finance PLC | GBP | 121 | 178,452 | |||||||
5.50%, 7/15/21(b) | 225 | 314,516 | ||||||||
Capsugel SA | U.S.$ | 725 | 730,437 | |||||||
Care UK Health & Social Care PLC | GBP | 233 | 344,925 | |||||||
Cerberus Nightingale 1 SARL | EUR | 520 | 598,573 | |||||||
CHS/Community Health Systems, Inc. | U.S.$ | 2,246 | 2,387,071 | |||||||
Concordia Healthcare Corp. | 178 | 183,803 | ||||||||
Constellation Brands, Inc. | 840 | 847,350 | ||||||||
DaVita HealthCare Partners, Inc. | 698 | 684,040 | ||||||||
Endo Finance LLC | 225 | 230,062 | ||||||||
Endo Finance LLC/Endo Finco, Inc. | 93 | 99,278 | ||||||||
Endo Ltd./Endo Finance LLC/Endo Finco, Inc. | 1,450 | 1,497,962 | ||||||||
Envision Healthcare Corp. | 395 | 400,431 | ||||||||
| 146 | • AB POOLING PORTFOLIOS |
AB High-Yield Portfolio—Portfolio of Investments
| Principal Amount (000) | U.S. $ Value | |||||||||
| ||||||||||
Ephios Bondco PLC | EUR | 264 | $ | 299,655 | ||||||
First Quality Finance Co., Inc. | U.S.$ | 1,535 | 1,442,900 | |||||||
Galaxy Bidco Ltd. | GBP | 215 | 333,388 | |||||||
Grifols Worldwide Operations Ltd. | U.S.$ | 270 | 274,387 | |||||||
HCA, Inc. | 2,317 | 2,363,340 | ||||||||
5.375%, 2/01/25 | 467 | 474,005 | ||||||||
6.50%, 2/15/20 | 1,545 | 1,707,225 | ||||||||
Holding Medi-Partenaires SAS | EUR | 735 | 873,938 | |||||||
Horizon Pharma Financing, Inc. | U.S.$ | 500 | 516,250 | |||||||
HRG Group, Inc. | 254 | 267,335 | ||||||||
7.875%, 7/15/19 | 508 | 534,670 | ||||||||
Jaguar Holding Co. II/Pharmaceutical Product Development LLC | 233 | 230,903 | ||||||||
Kindred Healthcare, Inc. | 350 | 383,469 | ||||||||
Kinetic Concepts, Inc./KCI USA, Inc. | 1,015 | 1,070,825 | ||||||||
Mallinckrodt International Finance SA | 262 | 263,310 | ||||||||
Mallinckrodt International Finance SA/Mallinckrodt CB LLC | 228 | 226,290 | ||||||||
5.75%, 8/01/22(b) | 339 | 346,288 | ||||||||
MPH Acquisition Holdings LLC | 185 | 190,088 | ||||||||
Par Pharmaceutical Cos., Inc. | 360 | 382,680 | ||||||||
Post Holdings, Inc. | 752 | 770,800 | ||||||||
7.75%, 3/15/24(b) | 267 | 275,677 | ||||||||
8.00%, 7/15/25(b) | 244 | 251,930 | ||||||||
PRA Holdings, Inc. | 540 | 602,100 | ||||||||
Priory Group No 3 PLC | GBP | 282 | 445,100 | |||||||
Quintiles Transnational Corp. | U.S.$ | 337 | 343,740 | |||||||
R&R Ice Cream PLC | GBP | 358 | 559,020 | |||||||
| AB POOLING PORTFOLIOS • | 147 |
AB High-Yield Portfolio—Portfolio of Investments
| Principal Amount (000) | U.S. $ Value | |||||||||
| ||||||||||
RSI Home Products, Inc. | U.S.$ | 1,013 | $ | 1,033,260 | ||||||
Smithfield Foods, Inc. | 660 | 671,550 | ||||||||
5.875%, 8/01/21(b) | 220 | 228,250 | ||||||||
Spectrum Brands, Inc. | 276 | 284,280 | ||||||||
6.125%, 12/15/24(b) | 122 | 126,880 | ||||||||
Sterigenics-Nordion Holdings LLC | 75 | 76,499 | ||||||||
Sun Products Corp. (The) | 333 | 299,700 | ||||||||
Tenet Healthcare Corp. | 450 | 451,125 | ||||||||
6.875%, 11/15/31 | 1,343 | 1,242,275 | ||||||||
8.00%, 8/01/20 | 1,040 | 1,085,500 | ||||||||
8.125%, 4/01/22 | 446 | 493,945 | ||||||||
Valeant Pharmaceuticals International, Inc. | 697 | 706,584 | ||||||||
5.875%, 5/15/23(b) | 1,189 | 1,215,752 | ||||||||
6.125%, 4/15/25(b) | 2,316 | 2,391,270 | ||||||||
Voyage Care Bondco PLC | GBP | 100 | 157,938 | |||||||
|
| |||||||||
| 37,018,897 | ||||||||||
|
| |||||||||
Energy – 8.7% | ||||||||||
American Energy-Permian Basin LLC/AEPB Finance Corp. | U.S.$ | 235 | 118,675 | |||||||
Antero Resources Corp. | 830 | 751,324 | ||||||||
5.375%, 11/01/21 | 205 | 188,600 | ||||||||
5.625%, 6/01/23(b) | 218 | 198,380 | ||||||||
Approach Resources, Inc. | 190 | 127,300 | ||||||||
Baytex Energy Corp. | 360 | 300,427 | ||||||||
Berry Petroleum Co. LLC | 624 | 318,240 | ||||||||
Bonanza Creek Energy, Inc. | 34 | 23,120 | ||||||||
6.75%, 4/15/21 | 103 | 76,220 | ||||||||
BreitBurn Energy Partners LP/BreitBurn Finance Corp. | 447 | 189,975 | ||||||||
California Resources Corp. | 401 | 315,707 | ||||||||
5.50%, 9/15/21 | 286 | 221,759 | ||||||||
| 148 | • AB POOLING PORTFOLIOS |
AB High-Yield Portfolio—Portfolio of Investments
| Principal Amount (000) | U.S. $ Value | |||||||||
| ||||||||||
6.00%, 11/15/24 | U.S.$ | 114 | $ | 84,531 | ||||||
Carrizo Oil & Gas, Inc. | 48 | 45,360 | ||||||||
Chaparral Energy, Inc. | 393 | 168,990 | ||||||||
CHC Helicopter SA | 611 | 368,188 | ||||||||
Chesapeake Energy Corp. | 376 | 327,590 | ||||||||
3.539%, 4/15/19(k) | 209 | 155,705 | ||||||||
4.875%, 4/15/22 | 249 | 180,525 | ||||||||
6.875%, 11/15/20 | 877 | 703,792 | ||||||||
Cobalt International Energy, Inc. | 430 | 309,063 | ||||||||
Concho Resources, Inc. | 550 | 543,351 | ||||||||
Crestwood Midstream Partners LP/Crestwood Midstream Finance Corp. | 290 | 262,450 | ||||||||
DCP Midstream Operating LP | 253 | 207,017 | ||||||||
5.60%, 4/01/44 | 285 | 232,616 | ||||||||
Denbury Resources, Inc. | 1,330 | 891,100 | ||||||||
5.50%, 5/01/22 | 212 | 151,050 | ||||||||
Energy Transfer Equity LP | 406 | 391,790 | ||||||||
Energy XXI Gulf Coast, Inc. | 660 | 130,350 | ||||||||
7.75%, 6/15/19 | 135 | 29,025 | ||||||||
11.00%, 3/15/20(b) | 244 | 154,330 | ||||||||
EP Energy LLC/Everest Acquisition Finance, Inc. | 265 | 243,800 | ||||||||
9.375%, 5/01/20 | 312 | 302,172 | ||||||||
EXCO Resources, Inc. | 115 | 40,825 | ||||||||
8.50%, 4/15/22 | 125 | 35,000 | ||||||||
Global Partners LP/GLP Finance Corp. | 950 | 864,500 | ||||||||
7.00%, 6/15/23(b) | 125 | 116,250 | ||||||||
Gulfport Energy Corp. | 345 | 320,850 | ||||||||
Halcon Resources Corp. | 277 | 91,410 | ||||||||
9.75%, 7/15/20 | 138 | 50,370 | ||||||||
Hornbeck Offshore Services, Inc. | 543 | 431,685 | ||||||||
| AB POOLING PORTFOLIOS • | 149 |
AB High-Yield Portfolio—Portfolio of Investments
| Principal Amount (000) | U.S. $ Value | |||||||||
| ||||||||||
Jones Energy Holdings LLC/Jones Energy Finance Corp. | U.S.$ | 730 | $ | 620,500 | ||||||
Jupiter Resources, Inc. | 601 | 375,625 | ||||||||
Laredo Petroleum, Inc. | 89 | 86,775 | ||||||||
Legacy Reserves LP/Legacy Reserves Finance Corp. | 584 | 408,800 | ||||||||
8.00%, 12/01/20 | 205 | 155,800 | ||||||||
Linn Energy LLC/Linn Energy Finance Corp. | 1,098 | 428,220 | ||||||||
MarkWest Energy Partners LP/MarkWest Energy Finance Corp. | 1,220 | 1,128,500 | ||||||||
Memorial Resource Development Corp. | 359 | 326,690 | ||||||||
Midstates Petroleum Co., Inc./Midstates Petroleum Co. LLC | 365 | 102,200 | ||||||||
Newfield Exploration Co. | 400 | 372,000 | ||||||||
5.625%, 7/01/24 | 239 | 232,547 | ||||||||
Northern Blizzard Resources, Inc. | 726 | 595,320 | ||||||||
Oasis Petroleum, Inc. | 377 | 312,910 | ||||||||
Offshore Group Investment Ltd. | 483 | 224,595 | ||||||||
Pacific Drilling SA | 441 | 317,520 | ||||||||
Paragon Offshore PLC | 266 | 53,200 | ||||||||
7.25%, 8/15/24(b) | 873 | 174,600 | ||||||||
PHI, Inc. | 455 | 393,575 | ||||||||
Precision Drilling Corp. | 299 | 254,150 | ||||||||
QEP Resources, Inc. | 1,095 | 944,437 | ||||||||
Range Resources Corp. | 585 | 526,500 | ||||||||
Sabine Oil & Gas Corp. | 415 | 64,325 | ||||||||
Sabine Pass Liquefaction LLC | 1,000 | 985,000 | ||||||||
| 150 | • AB POOLING PORTFOLIOS |
AB High-Yield Portfolio—Portfolio of Investments
| Principal Amount (000) | U.S. $ Value | |||||||||
| ||||||||||
5.625%, 3/01/25(b) | U.S.$ | 275 | $ | 265,891 | ||||||
5.75%, 5/15/24 | 571 | 558,152 | ||||||||
6.25%, 3/15/22 | 565 | 567,825 | ||||||||
SandRidge Energy, Inc. | 315 | 90,956 | ||||||||
Seven Generations Energy Ltd. | 93 | 85,560 | ||||||||
8.25%, 5/15/20(b) | 554 | 551,230 | ||||||||
SM Energy Co. | 150 | 128,250 | ||||||||
5.625%, 6/01/25 | 514 | 456,175 | ||||||||
6.50%, 1/01/23 | 239 | 229,799 | ||||||||
Southern Star Central Corp. | 380 | 370,500 | ||||||||
Swift Energy Co. | 315 | 85,050 | ||||||||
Targa Resources Partners LP/Targa Resources Partners Finance Corp. | 1,075 | 940,625 | ||||||||
Tervita Corp. | 346 | 280,260 | ||||||||
10.875%, 2/15/18(b) | 332 | 192,560 | ||||||||
Transocean, Inc. | 750 | 690,000 | ||||||||
6.80%, 3/15/38 | 855 | 572,850 | ||||||||
Triangle USA Petroleum Corp. | 425 | 255,000 | ||||||||
Vanguard Natural Resources LLC/VNR Finance Corp. | 215 | 150,500 | ||||||||
W&T Offshore, Inc. | 290 | 136,300 | ||||||||
Whiting Petroleum Corp. | 299 | 267,605 | ||||||||
5.75%, 3/15/21 | 382 | 341,890 | ||||||||
6.25%, 4/01/23 | 707 | 622,160 | ||||||||
WPX Energy, Inc. | 280 | 236,600 | ||||||||
8.25%, 8/01/23 | 170 | 163,625 | ||||||||
|
| |||||||||
| 27,986,564 | ||||||||||
|
| |||||||||
Other Industrial – 1.4% | ||||||||||
Algeco Scotsman Global Finance PLC | 244 | 218,380 | ||||||||
10.75%, 10/15/19(b) | 745 | 439,550 | ||||||||
B456 Systems, Inc. | 270 | 11,475 | ||||||||
| AB POOLING PORTFOLIOS • | 151 |
AB High-Yield Portfolio—Portfolio of Investments
| Principal Amount (000) | U.S. $ Value | |||||||||
| ||||||||||
General Cable Corp. | U.S.$ | 387 | $ | 346,365 | ||||||
5.75%, 11/15/29(j)(m) | 319 | 226,091 | ||||||||
Hill-Rom Holdings, Inc. | 75 | 76,313 | ||||||||
Laureate Education, Inc. | 862 | 723,003 | ||||||||
Modular Space Corp. | 420 | 306,600 | ||||||||
NANA Development Corp. | 851 | 776,537 | ||||||||
New Enterprise Stone & Lime Co., Inc. | 537 | 467,190 | ||||||||
13.00% (6.00% Cash and 7.00% PIK), | 390 | 420,144 | ||||||||
Safway Group Holding LLC/Safway Finance Corp. | 422 | 430,394 | ||||||||
|
| |||||||||
| 4,442,042 | ||||||||||
|
| |||||||||
Services – 0.5% | ||||||||||
ADT Corp. (The) | 446 | 452,690 | ||||||||
6.25%, 10/15/21 | 270 | 278,775 | ||||||||
Cerved Group SpA | EUR | 135 | 163,231 | |||||||
Geo Debt Finance SCA | 180 | 185,856 | ||||||||
IHS, Inc. | U.S.$ | 237 | 239,666 | |||||||
Mobile Mini, Inc. | 309 | 322,133 | ||||||||
|
| |||||||||
| 1,642,351 | ||||||||||
|
| |||||||||
Technology – 3.9% | ||||||||||
Alcatel-Lucent USA, Inc. | 651 | 706,742 | ||||||||
Audatex North America, Inc. | 193 | 188,457 | ||||||||
6.125%, 11/01/23(b) | 694 | 687,851 | ||||||||
Avaya, Inc. | 102 | 91,545 | ||||||||
10.50%, 3/01/21(b) | 767 | 508,137 | ||||||||
Blackboard, Inc. | 155 | 138,725 | ||||||||
BMC Software Finance, Inc. | 939 | 767,632 | ||||||||
Brightstar Corp. | 883 | 891,830 | ||||||||
| 152 | • AB POOLING PORTFOLIOS |
AB High-Yield Portfolio—Portfolio of Investments
| Principal Amount (000) | U.S. $ Value | |||||||||
| ||||||||||
CDW LLC/CDW Finance Corp. | U.S.$ | 258 | $ | 254,775 | ||||||
5.50%, 12/01/24 | 577 | 571,230 | ||||||||
Ceridian HCM Holding, Inc. | 325 | 320,938 | ||||||||
CommScope Holding Co., Inc. | 170 | 176,588 | ||||||||
Dell, Inc. | 540 | 560,196 | ||||||||
6.50%, 4/15/38 | 610 | 539,850 | ||||||||
Energizer Holdings, Inc. | 223 | 217,146 | ||||||||
First Data Corp. | 358 | 403,287 | ||||||||
12.625%, 1/15/21 | 817 | 938,529 | ||||||||
Goodman Networks, Inc. | 775 | 294,500 | ||||||||
Infor Software Parent LLC/Infor Software Parent, Inc. | 319 | 289,094 | ||||||||
Infor US, Inc. | 208 | 208,520 | ||||||||
6.50%, 5/15/22(b) | 350 | 328,125 | ||||||||
Micron Technology, Inc. | 1,369 | 1,273,170 | ||||||||
MSCI, Inc. | 338 | 343,915 | ||||||||
5.75%, 8/15/25(b) | 166 | 169,320 | ||||||||
NXP BV/NXP Funding LLC | 515 | 519,506 | ||||||||
Open Text Corp. | 265 | 265,000 | ||||||||
Sabre GLBL, Inc. | 159 | 155,820 | ||||||||
Sanmina Corp. | 666 | 668,497 | ||||||||
|
| |||||||||
| 12,478,925 | ||||||||||
|
| |||||||||
Transportation - Airlines – 0.1% | ||||||||||
Air Canada | 150 | 158,250 | ||||||||
8.75%, 4/01/20(b) | 292 | 321,258 | ||||||||
|
| |||||||||
| 479,508 | ||||||||||
|
| |||||||||
Transportation - Services – 0.6% | ||||||||||
CEVA Group PLC | 150 | 135,750 | ||||||||
| AB POOLING PORTFOLIOS • | 153 |
AB High-Yield Portfolio—Portfolio of Investments
| Principal Amount (000) | U.S. $ Value | |||||||||
| ||||||||||
Hertz Corp. (The) | U.S.$ | 1,345 | $ | 1,358,934 | ||||||
LBC Tank Terminals Holding Netherlands BV | 200 | 206,000 | ||||||||
XPO Logistics, Inc. | 350 | 344,750 | ||||||||
|
| |||||||||
| 2,045,434 | ||||||||||
|
| |||||||||
| 195,691,322 | ||||||||||
|
| |||||||||
Financial Institutions – 11.2% | ||||||||||
Banking – 5.7% | ||||||||||
ABN AMRO Bank NV | EUR | 980 | 1,101,467 | |||||||
Ally Financial, Inc. | U.S.$ | 1,255 | 1,258,388 | |||||||
8.00%, 12/31/18-11/01/31 | 1,340 | 1,534,200 | ||||||||
Baggot Securities Ltd. | EUR | 169 | 193,624 | |||||||
Bank of America Corp. | U.S.$ | 206 | 201,108 | |||||||
Series Z | 251 | 258,530 | ||||||||
Bank of Ireland | CAD | 370 | 272,803 | |||||||
10.00%, 7/30/16(b) | EUR | 304 | 361,791 | |||||||
Barclays Bank PLC | U.S.$ | 75 | 84,750 | |||||||
7.625%, 11/21/22 | 200 | 228,000 | ||||||||
BBVA International Preferred SAU | EUR | 79 | 87,590 | |||||||
4.952%, 9/20/16(b)(n) | 550 | 621,045 | ||||||||
BNP Paribas SA | U.S.$ | 625 | 640,000 | |||||||
Citigroup, Inc. | 538 | 527,509 | ||||||||
Commerzbank AG | 342 | 400,568 | ||||||||
Countrywide Capital III | 600 | 746,357 | ||||||||
Credit Agricole SA | GBP | 450 | 752,672 | |||||||
7.875%, 1/23/24(b)(n) | U.S.$ | 587 | 600,207 | |||||||
Credit Suisse Group AG | 882 | 934,920 | ||||||||
Danske Bank A/S | GBP | 330 | 512,968 | |||||||
| 154 | • AB POOLING PORTFOLIOS |
AB High-Yield Portfolio—Portfolio of Investments
| Principal Amount (000) | U.S. $ Value | |||||||||
| ||||||||||
Equiniti Newco 2 PLC | GBP | 320 | $ | 501,499 | ||||||
HBOS Capital Funding LP | EUR | 217 | 242,291 | |||||||
HT1 Funding GmbH | 825 | 935,958 | ||||||||
ING Groep NV | U.S.$ | 219 | 215,715 | |||||||
6.50%, 4/16/25(n) | 234 | 226,980 | ||||||||
LBG Capital No.1 PLC | 148 | 168,720 | ||||||||
Lloyds Banking Group PLC | 517 | 576,455 | ||||||||
6.657%, 5/21/37(b)(n) | 152 | 170,240 | ||||||||
7.50%, 6/27/24(n) | 234 | 244,238 | ||||||||
Novo Banco SA | EUR | 200 | 217,710 | |||||||
RBS Capital Trust C | 1,325 | 1,482,240 | ||||||||
Royal Bank of Scotland Group PLC | U.S.$ | 800 | 847,000 | |||||||
Societe Generale SA | 432 | 443,880 | ||||||||
7.875%, 12/18/23(b)(n) | 321 | 321,000 | ||||||||
Zions Bancorporation | 145 | 149,713 | ||||||||
5.80%, 6/15/23(n) | 350 | 331,800 | ||||||||
|
| |||||||||
| 18,393,936 | ||||||||||
|
| |||||||||
Brokerage – 0.4% | ||||||||||
E*TRADE Financial Corp. | 705 | 705,000 | ||||||||
Lehman Brothers Holdings, Inc. | 5,500 | 594,000 | ||||||||
|
| |||||||||
| 1,299,000 | ||||||||||
|
| |||||||||
Finance – 3.7% | ||||||||||
AerCap Aviation Solutions BV | 300 | 315,000 | ||||||||
Artsonig Pty Ltd. | 423 | 84,610 | ||||||||
CIT Group, Inc. | 235 | 244,106 | ||||||||
5.50%, 2/15/19(b) | 2,740 | 2,880,425 | ||||||||
Creditcorp | 355 | 276,900 | ||||||||
| AB POOLING PORTFOLIOS • | 155 |
AB High-Yield Portfolio—Portfolio of Investments
| Principal Amount (000) | U.S. $ Value | |||||||||
| ||||||||||
Enova International, Inc. | U.S.$ | 720 | $ | 597,600 | ||||||
International Lease Finance Corp. | 1,200 | 1,276,500 | ||||||||
8.25%, 12/15/20 | 635 | 752,475 | ||||||||
8.75%, 3/15/17 | 143 | 155,084 | ||||||||
8.875%, 9/01/17 | 687 | 756,559 | ||||||||
Molycorp, Inc. | 385 | 3,850 | ||||||||
Navient Corp. | 470 | 466,475 | ||||||||
4.875%, 6/17/19 | 965 | 902,275 | ||||||||
5.00%, 10/26/20 | 500 | 445,000 | ||||||||
5.625%, 8/01/33 | 54 | 36,720 | ||||||||
5.875%, 10/25/24 | 20 | 16,900 | ||||||||
6.125%, 3/25/24 | 35 | 29,750 | ||||||||
7.25%, 1/25/22 | 37 | 34,873 | ||||||||
8.00%, 3/25/20 | 1,885 | 1,908,562 | ||||||||
TMX Finance LLC/TitleMax Finance Corp. | 997 | 808,816 | ||||||||
|
| |||||||||
| 11,992,480 | ||||||||||
|
| |||||||||
Insurance – 0.5% | ||||||||||
CNO Financial Group, Inc. | 216 | 222,750 | ||||||||
HUB International Ltd. | 365 | 364,088 | ||||||||
Liberty Mutual Group, Inc. | 715 | 832,975 | ||||||||
|
| |||||||||
| 1,419,813 | ||||||||||
|
| |||||||||
Other Finance – 0.5% | ||||||||||
ACE Cash Express, Inc. | 146 | 56,940 | ||||||||
CNG Holdings, Inc. | 843 | 484,725 | ||||||||
iPayment, Inc. | 17 | 16,137 | ||||||||
Series AI | 710 | 684,854 | ||||||||
Speedy Group Holdings Corp. | 519 | 425,580 | ||||||||
|
| |||||||||
| 1,668,236 | ||||||||||
|
| |||||||||
REITS – 0.4% | ||||||||||
Communications Sales & Leasing, Inc,/CSL Capital LLC | 388 | 364,720 | ||||||||
Communications Sales & Leasing, Inc./CSL Capital LLC | 656 | 596,960 | ||||||||
| 156 | • AB POOLING PORTFOLIOS |
AB High-Yield Portfolio—Portfolio of Investments
| Principal Amount (000) | U.S. $ Value | |||||||||
| ||||||||||
Felcor Lodging LP | U.S.$ | 294 | $ | 298,778 | ||||||
|
| |||||||||
| 1,260,458 | ||||||||||
|
| |||||||||
| 36,033,923 | ||||||||||
|
| |||||||||
Utility – 3.7% | ||||||||||
Electric – 3.7% | ||||||||||
AES Corp./VA | 628 | 584,040 | ||||||||
7.375%, 7/01/21 | 989 | 1,065,648 | ||||||||
Calpine Corp. | 1,607 | 1,556,781 | ||||||||
7.875%, 1/15/23(b) | 258 | 276,060 | ||||||||
DPL, Inc. | 250 | 261,250 | ||||||||
Dynegy, Inc. | 845 | 876,159 | ||||||||
7.375%, 11/01/22 | 615 | 636,525 | ||||||||
7.625%, 11/01/24 | 595 | 619,276 | ||||||||
FirstEnergy Corp. | 220 | 220,629 | ||||||||
Series C | 482 | 576,920 | ||||||||
GenOn Energy, Inc. | 840 | 802,200 | ||||||||
9.50%, 10/15/18 | 721 | 693,061 | ||||||||
NRG Energy, Inc. | 135 | 131,625 | ||||||||
7.875%, 5/15/21 | 716 | 739,270 | ||||||||
Series WI | 1,253 | 1,190,350 | ||||||||
Talen Energy Supply LLC | 726 | 629,805 | ||||||||
6.50%, 5/01/18 | 170 | 175,950 | ||||||||
TerraForm Power Operating LLC | 390 | 367,575 | ||||||||
Texas Competitive Electric Holdings Co. LLC/TCEH Finance, Inc. | 761 | 350,060 | ||||||||
Viridian Group FundCo II Ltd. | EUR | 314 | 348,832 | |||||||
|
| |||||||||
| 12,102,016 | ||||||||||
|
| |||||||||
Total Corporates - Non-Investment Grade | 243,827,261 | |||||||||
|
| |||||||||
| AB POOLING PORTFOLIOS • | 157 |
AB High-Yield Portfolio—Portfolio of Investments
| Principal Amount (000) | U.S. $ Value | |||||||||
| ||||||||||
CORPORATES - INVESTMENT | ||||||||||
Financial Institutions – 3.7% | ||||||||||
Banking – 2.0% | ||||||||||
BPCE SA | U.S.$ | 682 | $ | 721,952 | ||||||
Cooperatieve Centrale Raiffeisen-Boerenleenbank BA/Netherlands | 410 | 425,634 | ||||||||
8.40%, 6/29/17(b)(n) | 330 | 354,783 | ||||||||
HSBC Capital Funding LP/Jersey | 674 | 1,012,850 | ||||||||
JPMorgan Chase & Co. | 473 | 446,985 | ||||||||
Series R | 336 | 332,640 | ||||||||
Series S | 157 | 164,850 | ||||||||
Nationwide Building Society | GBP | 839 | 1,313,194 | |||||||
Nordea Bank AB | U.S.$ | 464 | 459,360 | |||||||
Santander UK PLC | 500 | 518,723 | ||||||||
Standard Chartered PLC | 549 | 567,678 | ||||||||
Wells Fargo & Co. | 127 | 127,476 | ||||||||
|
| |||||||||
| 6,446,125 | ||||||||||
|
| |||||||||
Brokerage – 0.1% | ||||||||||
GFI Group, Inc. | 374 | 411,400 | ||||||||
Finance – 0.3% | ||||||||||
General Electric Capital Corp. | ||||||||||
Series A | 400 | 461,480 | ||||||||
Series B | 400 | 433,000 | ||||||||
HSBC Finance Capital Trust IX | 200 | 200,750 | ||||||||
|
| |||||||||
| 1,095,230 | ||||||||||
|
| |||||||||
Insurance – 1.1% | ||||||||||
MetLife Capital Trust IV | 750 | 935,625 | ||||||||
| 158 | • AB POOLING PORTFOLIOS |
AB High-Yield Portfolio—Portfolio of Investments
| Principal Amount (000) | U.S. $ Value | |||||||||
| ||||||||||
MetLife, Inc. | ||||||||||
Series C | U.S.$ | 159 | $ | 158,205 | ||||||
Mitsui Sumitomo Insurance Co., Ltd. | 489 | 556,769 | ||||||||
Nationwide Mutual Insurance Co. | 325 | 483,970 | ||||||||
Progressive Corp. (The) | 500 | 507,500 | ||||||||
Prudential Financial, Inc. | 756 | 776,034 | ||||||||
|
| |||||||||
| 3,418,103 | ||||||||||
|
| |||||||||
REITS – 0.2% | ||||||||||
EPR Properties | 417 | 488,859 | ||||||||
|
| |||||||||
| 11,859,717 | ||||||||||
|
| |||||||||
Industrial – 1.7% | ||||||||||
Basic – 0.3% | ||||||||||
Braskem Finance Ltd. | 247 | 224,128 | ||||||||
Freeport-McMoRan, Inc. | 525 | 477,487 | ||||||||
Teck Resources Ltd. | 353 | 281,341 | ||||||||
5.40%, 2/01/43 | 90 | 58,605 | ||||||||
6.25%, 7/15/41 | 54 | 36,315 | ||||||||
|
| |||||||||
| 1,077,876 | ||||||||||
|
| |||||||||
Communications - Media – 0.3% | ||||||||||
CCO Safari II LLC | 345 | 341,720 | ||||||||
6.484%, 10/23/45(b) | 510 | 518,796 | ||||||||
|
| |||||||||
| 860,516 | ||||||||||
|
| |||||||||
Communications - | ||||||||||
Embarq Corp. | 272 | 287,640 | ||||||||
Qwest Corp. | 600 | 651,000 | ||||||||
6.875%, 9/15/33 | 720 | 703,915 | ||||||||
|
| |||||||||
| 1,642,555 | ||||||||||
|
| |||||||||
Consumer Cyclical - Other – 0.0% | ||||||||||
Seminole Tribe of Florida, Inc. | 94 | 99,170 | ||||||||
|
| |||||||||
Energy – 0.6% | ||||||||||
Cimarex Energy Co. | 215 | 206,837 | ||||||||
| AB POOLING PORTFOLIOS • | 159 |
AB High-Yield Portfolio—Portfolio of Investments
| Principal Amount (000) | U.S. $ Value | |||||||||||
| ||||||||||||
Kinder Morgan, Inc./DE | U.S.$ | 169 | $ | 183,709 | ||||||||
Noble Energy, Inc. | 611 | 631,407 | ||||||||||
Regency Energy Partners LP/Regency Energy Finance Corp. | 19 | 17,631 | ||||||||||
5.00%, 10/01/22 | 635 | 622,056 | ||||||||||
5.50%, 4/15/23 | 357 | 347,050 | ||||||||||
|
| |||||||||||
| 2,008,690 | ||||||||||||
|
| |||||||||||
| 5,688,807 | ||||||||||||
|
| |||||||||||
Utility – 0.4% | ||||||||||||
Electric – 0.3% | ||||||||||||
EDP Finance BV | 480 | 511,271 | ||||||||||
PPL Capital Funding, Inc. | 375 | 319,688 | ||||||||||
|
| |||||||||||
| 830,959 | ||||||||||||
|
| |||||||||||
Natural Gas – 0.1% | ||||||||||||
Empresa de Energia de Bogota SA ESP | 350 | 364,235 | ||||||||||
|
| |||||||||||
| 1,195,194 | ||||||||||||
|
| |||||||||||
Total Corporates - Investment Grade | 18,743,718 | |||||||||||
|
| |||||||||||
BANK LOANS – 4.4% | ||||||||||||
Industrial – 3.4% | ||||||||||||
Basic – 0.5% | ||||||||||||
FMG Resources (August 2006) Pty Ltd. | 588 | 474,370 | ||||||||||
Ineos US Finance LLC | 523 | 521,787 | ||||||||||
Magnetation LLC | 711 | 658,006 | ||||||||||
|
| |||||||||||
| 1,654,163 | ||||||||||||
|
| |||||||||||
Capital Goods – 0.2% | ||||||||||||
ClubCorp Club Operations, Inc. | 516 | 515,616 | ||||||||||
|
| |||||||||||
Communications - Media – 0.3% | ||||||||||||
Advantage Sales & Marketing, Inc. | 311 | 301,622 | ||||||||||
| 160 | • AB POOLING PORTFOLIOS |
AB High-Yield Portfolio—Portfolio of Investments
| Principal Amount (000) | U.S. $ Value | |||||||||
| ||||||||||
TWCC Holding Corp. | U.S.$ | 525 | $ | 492,518 | ||||||
|
| |||||||||
| 794,140 | ||||||||||
|
| |||||||||
Consumer Cyclical - Automotive – 0.2% | ||||||||||
CS Intermediate Holdco 2 LLC | 332 | 330,075 | ||||||||
Navistar, Inc. | 420 | 415,275 | ||||||||
|
| |||||||||
| 745,350 | ||||||||||
|
| |||||||||
Consumer Cyclical - | ||||||||||
NCL Corporation Ltd. | 70 | 69,621 | ||||||||
Station Casinos LLC | 341 | 339,934 | ||||||||
|
| |||||||||
| 409,555 | ||||||||||
|
| |||||||||
Consumer Cyclical - Other – 0.3% | ||||||||||
CityCenter Holdings LLC | 909 | 906,992 | ||||||||
La Quinta Intermediate Holdings LLC | 183 | 182,946 | ||||||||
|
| |||||||||
| 1,089,938 | ||||||||||
|
| |||||||||
Consumer Cyclical - Retailers – 0.4% | ||||||||||
Dollar Tree, Inc. | 18 | 17,898 | ||||||||
Harbor Freight Tools USA, Inc. | 469 | 470,011 | ||||||||
J. Crew Group, Inc. | 500 | 387,028 | ||||||||
Men’s Wearhouse, Inc. (The) | 141 | 141,482 | ||||||||
Michaels Stores, Inc. | 173 | 173,168 | ||||||||
|
| |||||||||
| 1,189,587 | ||||||||||
|
| |||||||||
Consumer Non-Cyclical – 0.4% | ||||||||||
Acadia Healthcare Co., Inc. | 26 | 26,271 | ||||||||
Air Medical Group Holdings, Inc. | 237 | 232,228 | ||||||||
Grifols Worldwide Operations Ltd. | 198 | 197,073 | ||||||||
Ortho-Clinical Diagnostics Holdings | 179 | 176,250 | ||||||||
| AB POOLING PORTFOLIOS • | 161 |
AB High-Yield Portfolio—Portfolio of Investments
| Principal Amount (000) | U.S. $ Value | |||||||||||
| ||||||||||||
Pharmedium Healthcare Corp. | U.S.$ | 780 | $ | 777,075 | ||||||||
|
| |||||||||||
| 1,408,897 | ||||||||||||
|
| |||||||||||
Other Industrial – 0.4% | ||||||||||||
Atkore International, Inc. | 490 | 451,413 | ||||||||||
Gardner Denver, Inc. | 295 | 280,855 | ||||||||||
Gates Global LLC | 203 | 194,196 | ||||||||||
Orbitz Worldwide, Inc. | 197 | 196,056 | ||||||||||
Unifrax Holding Co. | EUR | 242 | 270,467 | |||||||||
|
| |||||||||||
| 1,392,987 | ||||||||||||
|
| |||||||||||
Technology – 0.4% | ||||||||||||
Avaya, Inc. | U.S.$ | 257 | 238,327 | |||||||||
6.50%, 3/31/18(k) | 46 | 42,491 | ||||||||||
BMC Software Finance, Inc. | 365 | 335,019 | ||||||||||
First Data Corp. | 350 | 347,085 | ||||||||||
Smart Modular Technologies (Global), Inc. | 297 | 280,523 | ||||||||||
|
| |||||||||||
| 1,243,445 | ||||||||||||
|
| |||||||||||
Transportation - Airlines – 0.2% | ||||||||||||
Delos Finance S.à r.l. | 570 | 569,003 | ||||||||||
|
| |||||||||||
| 11,012,681 | ||||||||||||
|
| |||||||||||
Utility – 0.9% | ||||||||||||
Electric – 0.9% | ||||||||||||
Energy Future Intermediate Holding | 2,710 | 2,710,321 | ||||||||||
|
| |||||||||||
Financial Institutions – 0.1% | ||||||||||||
Other Finance – 0.1% | ||||||||||||
Travelport Finance (Luxembourg) S.à r.l. | 419 | 418,502 | ||||||||||
|
| |||||||||||
Total Bank Loans | 14,141,504 | |||||||||||
|
| |||||||||||
| 162 | • AB POOLING PORTFOLIOS |
AB High-Yield Portfolio—Portfolio of Investments
| Company | Shares | U.S. $ Value | ||||||||
| ||||||||||
PREFERRED STOCKS – 2.2% | ||||||||||
Financial Institutions – 2.0% | ||||||||||
Banking – 1.6% | ||||||||||
GMAC Capital Trust I | 37,000 | $ | 944,610 | |||||||
Goldman Sachs Group, Inc. (The) | 23,525 | 579,186 | ||||||||
Morgan Stanley | 20,825 | 564,149 | ||||||||
Royal Bank of Scotland Group PLC | 45,000 | 1,136,700 | ||||||||
US Bancorp | 35,000 | 1,002,750 | ||||||||
Wells Fargo & Co. | 2,300 | 58,880 | ||||||||
Wells Fargo & Co. | 28,225 | 778,445 | ||||||||
|
| |||||||||
| 5,064,720 | ||||||||||
|
| |||||||||
REITS – 0.4% | ||||||||||
Health Care REIT, Inc. | 8,525 | 225,913 | ||||||||
National Retail Properties, Inc. | �� | 6,300 | 154,539 | |||||||
Public Storage | 5,400 | 130,572 | ||||||||
Public Storage | 1,000 | 24,210 | ||||||||
Sovereign Real Estate Investment Trust | 624 | 823,680 | ||||||||
|
| |||||||||
| 1,358,914 | ||||||||||
|
| |||||||||
| 6,423,634 | ||||||||||
|
| |||||||||
Industrial – 0.2% | ||||||||||
Consumer Cyclical - Other – 0.0% | ||||||||||
Hovnanian Enterprises, Inc. | 5,130 | 20,571 | ||||||||
|
| |||||||||
Energy – 0.2% | ||||||||||
Energy XXI Ltd. | 3,250 | 74,750 | ||||||||
Halcon Resources Corp. | 635 | 116,045 | ||||||||
| AB POOLING PORTFOLIOS • | 163 |
AB High-Yield Portfolio—Portfolio of Investments
| Company | Shares | U.S. $ Value | ||||||||
| ||||||||||
Sanchez Energy Corp. | 10,350 | $ | 221,878 | |||||||
SandRidge Energy, Inc. | 4,500 | 60,750 | ||||||||
|
| |||||||||
| 473,423 | ||||||||||
|
| |||||||||
| 493,994 | ||||||||||
|
| |||||||||
Electric – 0.0% | ||||||||||
SCE Trust III | 5,525 | 149,838 | ||||||||
|
| |||||||||
Total Preferred Stocks | 7,067,466 | |||||||||
|
| |||||||||
COMMON STOCKS – 2.1% | ||||||||||
Amkor Technology, Inc.(g) | 37,000 | 199,800 | ||||||||
Clear Channel Outdoor Holdings, Inc. – Class A(g) | 32,000 | 261,120 | ||||||||
Crown Castle International Corp. | 9,194 | 766,688 | ||||||||
DISH Network Corp. – Class A(g) | 2,510 | 148,768 | ||||||||
Dynegy, Inc.(g) | 14,605 | 376,079 | ||||||||
eDreams ODIGEO SA(g) | 36,590 | 94,437 | ||||||||
Eldorado Resorts, Inc.(g) | 19,987 | 188,277 | ||||||||
Emeco Holdings Ltd.(g) | 1,050,000 | 44,834 | ||||||||
Exide Corp.(c)(d)(g) | 586,000 | 1 | ||||||||
Exide Technologies(d)(h) | 19,782 | 79,919 | ||||||||
General Motors Co. | 14,160 | 416,870 | ||||||||
International Game Technology PLC | 18,000 | 305,640 | ||||||||
iPayment, Inc.(g) | 44,784 | 190,332 | ||||||||
Jones Energy, Inc. – Class A(g) | 16,960 | 100,573 | ||||||||
Keystone Automotive Operations | 61,065 | – 0 | –^ | |||||||
Las Vegas Sands Corp. | 8,388 | 387,777 | ||||||||
LifePoint Health, Inc.(g) | 4,559 | 356,195 | ||||||||
LyondellBasell Industries NV – Class A | 1,996 | 170,418 | ||||||||
MDC Holdings, Inc. | 12,258 | 349,230 | ||||||||
Neenah Enterprises, Inc.(c)(d)(g) | 58,199 | 465,592 | ||||||||
Nortek, Inc.(g) | 5,410 | 442,592 | ||||||||
Nuverra Environmental Solutions, Inc.(g) | 11,810 | 35,430 | ||||||||
SBA Communications Corp. – Class A(g) | 4,879 | 576,698 | ||||||||
Townsquare Media, Inc. – Class A(g) | 26,530 | 304,830 | ||||||||
Travelport LLC(g) | 15,482 | 205,136 | ||||||||
Travelport Worldwide Ltd. | 2,580 | 34,185 | ||||||||
Triangle Petroleum Corp.(g) | 34,470 | 139,259 | ||||||||
|
| |||||||||
Total Common Stocks | 6,640,680 | |||||||||
|
| |||||||||
| 164 | • AB POOLING PORTFOLIOS |
AB High-Yield Portfolio—Portfolio of Investments
Principal Amount (000) | U.S. $ Value | |||||||||
| ||||||||||
EMERGING MARKETS - CORPORATE | ||||||||||
Industrial – 1.8% | ||||||||||
Basic – 0.3% | ||||||||||
Gold Fields Orogen Holdings BVI Ltd. | U.S.$ | 700 | $ | 595,000 | ||||||
Sappi Papier Holding GmbH | 200 | 214,000 | ||||||||
|
| |||||||||
| 809,000 | ||||||||||
|
| |||||||||
Capital Goods – 0.3% | ||||||||||
CEMEX Espana SA/Luxembourg | 172 | 187,222 | ||||||||
Cemex SAB de CV | 670 | 628,125 | ||||||||
|
| |||||||||
| 815,347 | ||||||||||
|
| |||||||||
Communications - | ||||||||||
Digicel Ltd. | 525 | 481,687 | ||||||||
|
| |||||||||
Consumer Cyclical - Retailers – 0.1% | ||||||||||
Edcon Ltd. | EUR | 381 | 299,312 | |||||||
9.50%, 3/01/18(b) | U.S.$ | 150 | 105,390 | |||||||
|
| |||||||||
| 404,702 | ||||||||||
|
| |||||||||
Consumer Non-Cyclical – 0.9% | ||||||||||
Arcelik AS | 498 | 459,405 | ||||||||
Cosan Luxembourg SA | 570 | 478,800 | ||||||||
Marfrig Holding Europe BV | 637 | 619,483 | ||||||||
Marfrig Overseas Ltd. | 240 | 242,700 | ||||||||
Minerva Luxembourg SA | 725 | 708,687 | ||||||||
Tonon Luxembourg SA | 420 | 143,216 | ||||||||
USJ Acucar e Alcool SA | 850 | 352,942 | ||||||||
Virgolino de Oliveira Finance SA | 930 | 8,138 | ||||||||
|
| |||||||||
| 3,013,371 | ||||||||||
|
| |||||||||
Transportation - Airlines – 0.1% | ||||||||||
Guanay Finance Ltd. | 283 | 284,415 | ||||||||
|
| |||||||||
| 5,808,522 | ||||||||||
|
| |||||||||
| AB POOLING PORTFOLIOS • | 165 |
AB High-Yield Portfolio—Portfolio of Investments
Principal Amount (000) | U.S. $ Value | |||||||||
| ||||||||||
Utility – 0.2% | ||||||||||
Electric – 0.2% | ||||||||||
ContourGlobal Power Holdings SA | U.S.$ | 760 | $ | 777,100 | ||||||
|
| |||||||||
Total Emerging Markets - Corporate Bonds | 6,585,622 | |||||||||
|
| |||||||||
COLLATERALIZED MORTGAGE | ||||||||||
Non-Agency Floating Rate – 0.6% | ||||||||||
HarborView Mortgage Loan Trust | 693 | 565,733 | ||||||||
Residential Accredit Loans, Inc., Trust | 1,307 | 1,091,389 | ||||||||
Structured Asset Mortgage Investments II Trust | 506 | 421,215 | ||||||||
|
| |||||||||
| 2,078,337 | ||||||||||
|
| |||||||||
GSE Risk Share Floating Rate – 0.5% | ||||||||||
Federal Home Loan Mortgage Corp. Structured Agency Credit Risk Debt Notes | 380 | 377,596 | ||||||||
Series 2014-DN1, Class M3 | 375 | 375,253 | ||||||||
Series 2014-HQ2, Class M3 | 435 | 409,744 | ||||||||
Federal National Mortgage Association Connecticut Avenue Securities | 333 | 334,598 | ||||||||
Series 2015-C03, Class 1M2 | 85 | 85,261 | ||||||||
Series 2015-C03, Class 2M2 | 30 | 29,945 | ||||||||
|
| |||||||||
| 1,612,397 | ||||||||||
|
| |||||||||
Non-Agency Fixed Rate – 0.4% | ||||||||||
CSMC Mortgage-Backed Trust | 268 | 234,002 | ||||||||
Residential Accredit Loans, Inc., Trust | 1,299 | 1,083,583 | ||||||||
|
| |||||||||
| 1,317,585 | ||||||||||
|
| |||||||||
Total Collateralized Mortgage Obligations | 5,008,319 | |||||||||
|
| |||||||||
| 166 | • AB POOLING PORTFOLIOS |
AB High-Yield Portfolio—Portfolio of Investments
Principal Amount (000) | U.S. $ Value | |||||||||
| ||||||||||
GOVERNMENTS - TREASURIES – 1.5% | ||||||||||
Brazil – 0.3% | ||||||||||
Brazil Notas do Tesouro Nacional | BRL | 600 | $ | 384,916 | ||||||
Series F | 2,360 | 619,283 | ||||||||
|
| |||||||||
| 1,004,199 | ||||||||||
|
| |||||||||
United States – 1.2% | ||||||||||
U.S. Treasury Bonds | U.S.$ | 1,755 | 1,827,279 | |||||||
U.S. Treasury Notes | 2,000 | 2,003,906 | ||||||||
|
| |||||||||
| 3,831,185 | ||||||||||
|
| |||||||||
Total Governments - Treasuries | 4,835,384 | |||||||||
|
| |||||||||
COMMERCIAL MORTGAGE-BACKED SECURITIES – 1.4% | ||||||||||
Non-Agency Fixed Rate CMBS – 1.4% | ||||||||||
Bear Stearns Commercial Mortgage Securities Trust | 167 | 169,727 | ||||||||
GS Mortgage Securities Trust | 1,000 | 1,008,585 | ||||||||
LB-UBS Commercial Mortgage Trust | 1,565 | 1,573,155 | ||||||||
Series 2007-C1, Class AJ | 1,380 | 1,420,956 | ||||||||
Merrill Lynch/Countrywide Commercial Mortgage Trust | 315 | 315,972 | ||||||||
|
| |||||||||
Total Commercial Mortgage-Backed Securities | 4,488,395 | |||||||||
|
| |||||||||
| AB POOLING PORTFOLIOS • | 167 |
AB High-Yield Portfolio—Portfolio of Investments
Principal Amount (000) | U.S. $ Value | |||||||||
| ||||||||||
GOVERNMENTS - SOVEREIGN AGENCIES – 0.7% | ||||||||||
Governments - Sovereign | ||||||||||
Brazil – 0.2% | ||||||||||
Petrobras Global Finance BV | ||||||||||
5.625%, 5/20/43 | U.S.$ | 423 | $ | 292,589 | ||||||
6.85%, 6/05/15 | 297 | 223,463 | ||||||||
|
| |||||||||
| 516,052 | ||||||||||
|
| |||||||||
Colombia – 0.0% | ||||||||||
Ecopetrol SA | 159 | 128,790 | ||||||||
|
| |||||||||
Dominican Republic – 0.1% | ||||||||||
Banco de Reservas de la Republica Dominicana | 460 | 459,262 | ||||||||
|
| |||||||||
Morocco – 0.1% | ||||||||||
OCP SA | 232 | 237,846 | ||||||||
|
| |||||||||
United Kingdom – 0.3% | ||||||||||
Royal Bank of Scotland Group PLC | 1,040 | 1,062,100 | ||||||||
|
| |||||||||
Total Governments - Sovereign Agencies | 2,404,050 | |||||||||
|
| |||||||||
ASSET-BACKED SECURITIES – 0.7% | ||||||||||
Home Equity Loans - Floating | ||||||||||
GSAA Home Equity Trust | 1,188 | 678,234 | ||||||||
Lehman XS Trust | 807 | 992,547 | ||||||||
|
| |||||||||
| 1,670,781 | ||||||||||
|
| |||||||||
Home Equity Loans - Fixed Rate – 0.2% | ||||||||||
CWABS Asset-Backed Certificates Trust | 737 | 732,950 | ||||||||
|
| |||||||||
Total Asset-Backed Securities | 2,403,731 | |||||||||
|
| |||||||||
| 168 | • AB POOLING PORTFOLIOS |
AB High-Yield Portfolio—Portfolio of Investments
Principal Amount (000) | U.S. $ Value | |||||||||
| ||||||||||
LOCAL GOVERNMENTS - MUNICIPAL BONDS – 0.6% | ||||||||||
United States – 0.6% | ||||||||||
Buckeye Tobacco Settlement Financing Authority | U.S.$ | 165 | $ | 132,183 | ||||||
Golden State Tobacco Securitization Corp. | 310 | 240,452 | ||||||||
State of California | 325 | 476,749 | ||||||||
7.95%, 3/01/36 | 700 | 840,420 | ||||||||
Tobacco Settlement Financing Corp./NJ | 165 | 124,435 | ||||||||
Tobacco Settlement Financing Corp./VA | 220 | 155,124 | ||||||||
|
| |||||||||
Total Local Governments - Municipal Bonds (cost $1,663,919) | 1,969,363 | |||||||||
|
| |||||||||
AGENCIES – 0.1% | ||||||||||
CITGO Petroleum Corp. | 484 | 469,480 | ||||||||
|
| |||||||||
| Contracts | ||||||||||
OPTIONS PURCHASED - PUTS – 0.1% | ||||||||||
Options on Funds and Investment Trusts – 0.1% | ||||||||||
SPDR S&P 500 ETF Trust | 150 | 53,625 | ||||||||
SPDR S&P 500 ETF Trust | 747 | 221,485 | ||||||||
|
| |||||||||
| 275,110 | ||||||||||
|
| |||||||||
Options on Equities – 0.0% | ||||||||||
iShares iBoxx High Yield Corp. | 172 | 12,900 | ||||||||
Boardwalk Real Estate Investment Trust | 24,741 | 28,250 | ||||||||
|
| |||||||||
| 41,150 | ||||||||||
|
| |||||||||
| AB POOLING PORTFOLIOS • | 169 |
AB High-Yield Portfolio—Portfolio of Investments
| Company | Notional Amount (000) | U.S. $ Value | ||||||||
| ||||||||||
Swaptions – 0.0% | ||||||||||
CDX NAHY.24 RTP, Citi Bank, NA (Buy Protection) | 1,810 | $ | 10,508 | |||||||
CDX NAHY.24 RTP, Bank of America, NA | 5,680 | 18,030 | ||||||||
|
| |||||||||
| 28,538 | ||||||||||
|
| |||||||||
| Contracts | |||||||||
Options on Indices – 0.0% | ||||||||||
Russell 2000 Index | 10 | 27,150 | ||||||||
|
| |||||||||
Total Options Purchased - Puts | 371,948 | |||||||||
|
| |||||||||
| Shares | ||||||||||
WARRANTS – 0.1% | ||||||||||
FairPoint Communications, Inc., | 12,643 | 379 | ||||||||
iPayment Holdings, Inc., | 234,094 | 187,275 | ||||||||
Talon Equity Co. NV, | 671 | – 0 | – | |||||||
|
| |||||||||
Total Warrants | 187,654 | |||||||||
|
| |||||||||
| Contracts | ||||||||||
OPTIONS PURCHASED - CALLS – 0.1% | ||||||||||
Options on Equities – 0.1% | ||||||||||
Ishares iBoxx High Yield Corp. | 1,941 | 76,669 | ||||||||
Diageo PLC | 436 | 22 | ||||||||
Diageo PLC | 22,122 | 1,109 | ||||||||
Beazer Homes USA, Inc. | 178 | 4,450 | ||||||||
Chesapeake Energy Corp. | 1,434 | 5,019 | ||||||||
|
| |||||||||
| 87,269 | ||||||||||
|
| |||||||||
| 170 | • AB POOLING PORTFOLIOS |
AB High-Yield Portfolio—Portfolio of Investments
| Company | Contracts | U.S. $ Value | ||||||||
| ||||||||||
Options on Funds and Investment | ||||||||||
SPDR S&P 500 ETF Trust | 524 | $ | 37,728 | |||||||
SPDR S&P 500 ETF Trust | 247 | 1,112 | ||||||||
SPDR S&P 500 ETF Trust | 169 | 14,703 | ||||||||
SPDR S&P 500 ETF Trust | 672 | 4,368 | ||||||||
SPDR S&P 500 ETF Trust | 683 | 11,611 | ||||||||
|
| |||||||||
| 69,522 | ||||||||||
|
| |||||||||
| Notional Amount (000) | ||||||||||
Swaptions – 0.0% | ||||||||||
CDX NAHY.24 RTR, Bank of America, NA (Sell Protection) | 8,250 | 23,329 | ||||||||
|
| |||||||||
| Contracts | ||||||||||
Options on Indices – 0.0% | ||||||||||
Euro STOXX 50 Index | 637 | 1,659 | ||||||||
DAX Index | 637 | 1,264 | ||||||||
|
| |||||||||
| 2,923 | ||||||||||
|
| |||||||||
Total Options Purchased - Calls | 183,043 | |||||||||
|
| |||||||||
| Notional Amount (000) | ||||||||||
EMERGING MARKETS - | ||||||||||
Venezuela – 0.1% | ||||||||||
Venezuela Government International Bond | U.S.$ | 430 | 180,170 | |||||||
|
| |||||||||
| AB POOLING PORTFOLIOS • | 171 |
AB High-Yield Portfolio—Portfolio of Investments
| Company | Shares | U.S. $ Value | ||||||||
| ||||||||||
SHORT-TERM INVESTMENTS – 1.9% | ||||||||||
Investment Companies – 1.9% | ||||||||||
AB Fixed Income Shares, Inc. – Government STIF Portfolio, 0.13%(s)(t) | 5,978,392 | $ | 5,978,392 | |||||||
|
| |||||||||
Total Investments – 100.8% | 325,486,180 | |||||||||
Other assets less liabilities – (0.8)% | (2,646,931 | ) | ||||||||
|
| |||||||||
Net Assets – 100.0% | $ | 322,839,249 | ||||||||
|
| |||||||||
FUTURES (see Note C)
| Type | Number of Contracts | Expiration Month | Original Value | Value at August 31, 2015 | Unrealized Appreciation/ (Depreciation) | |||||||||||||||
Purchased Contracts |
| |||||||||||||||||||
Russell 2000 Mini Futures | 8 | September 2015 | $ | 982,254 | $ | 926,000 | $ | (56,254 | ) | |||||||||||
Sold Contracts |
| |||||||||||||||||||
S&P 500 E-Mini Futures | 9 | September 2015 | 866,121 | 886,140 | (20,019 | ) | ||||||||||||||
|
| |||||||||||||||||||
| $ | (76,273 | ) | ||||||||||||||||||
|
| |||||||||||||||||||
FORWARD CURRENCY EXCHANGE CONTRACTS (see Note C)
| Counterparty | Contracts to Deliver (000) | In Exchange For (000) | Settlement Date | Unrealized Appreciation/ (Depreciation) | ||||||||||||||||||||
Barclays Bank PLC | USD | 1,303 | IDR | 18,417,739 | 10/09/15 | $ | (15,369 | ) | ||||||||||||||||
BNP Paribas SA | USD | 788 | EUR | 697 | 9/18/15 | (5,565 | ) | |||||||||||||||||
BNP Paribas SA | NZD | 1,555 | USD | 1,028 | 10/09/15 | 44,784 | ||||||||||||||||||
Deutsche Bank AG | USD | 830 | JPY | 102,948 | 9/17/15 | 19,074 | ||||||||||||||||||
Goldman Sachs Bank USA | BRL | 1,120 | USD | 327 | 9/02/15 | 17,947 | ||||||||||||||||||
Goldman Sachs Bank USA | BRL | 1,120 | USD | 307 | 9/02/15 | (1,699 | ) | |||||||||||||||||
Goldman Sachs Bank USA | USD | 307 | BRL | 1,120 | 9/02/15 | 1,699 | ||||||||||||||||||
Goldman Sachs Bank USA | USD | 315 | BRL | 1,120 | 9/02/15 | (6,422 | ) | |||||||||||||||||
Goldman Sachs Bank USA | USD | 474 | MXN | 7,816 | 9/30/15 | (7,099 | ) | |||||||||||||||||
Goldman Sachs Bank USA | BRL | 1,120 | USD | 312 | 10/02/15 | 6,398 | ||||||||||||||||||
Northern Trust Company | AUD | 1,738 | USD | 1,274 | 9/25/15 | 38,817 | ||||||||||||||||||
Royal Bank of Scotland PLC | USD | 839 | PEN | 2,718 | 9/14/15 | (3,276 | ) | |||||||||||||||||
Royal Bank of Scotland PLC | EUR | 12,823 | USD | 14,153 | 9/18/15 | (239,910 | ) | |||||||||||||||||
Royal Bank of Scotland PLC | KRW | 966,726 | USD | 831 | 9/25/15 | 14,017 | ||||||||||||||||||
State Street Bank & Trust Co. | USD | 728 | SEK | 6,198 | 9/17/15 | 3,979 | ||||||||||||||||||
State Street Bank & Trust Co. | EUR | 264 | USD | 289 | 9/18/15 | (6,728 | ) | |||||||||||||||||
State Street Bank & Trust Co. | USD | 270 | EUR | 246 | 9/18/15 | 6,254 | ||||||||||||||||||
State Street Bank & Trust Co. | USD | 335 | EUR | 298 | 9/18/15 | (647 | ) | |||||||||||||||||
State Street Bank & Trust Co. | USD | 30 | GBP | 19 | 9/24/15 | (669 | ) | |||||||||||||||||
| 172 | • AB POOLING PORTFOLIOS |
AB High-Yield Portfolio—Portfolio of Investments
| Counterparty | Contracts to Deliver (000) | In Exchange For (000) | Settlement Date | Unrealized Appreciation/ (Depreciation) | ||||||||||||||||||||
UBS AG | GBP | 5,965 | USD | 9,280 | 9/24/15 | $ | 127,296 | |||||||||||||||||
UBS AG | CAD | 362 | USD | 274 | 10/02/15 | (1,739 | ) | |||||||||||||||||
|
| |||||||||||||||||||||||
| $ | (8,858 | ) | ||||||||||||||||||||||
|
| |||||||||||||||||||||||
CALL OPTIONS WRITTEN (see Note C)
| Description | Contracts | Exercise Price | Expiration Month | Premiums Received | U.S. $ Value | |||||||||||||||
Chesapeake Energy Corp.(q) | 1,434 | $ | 16.00 | September 2015 | $ | 9,980 | $ | (2,868 | ) | |||||||||||
SPDR S&P 500 ETF Trust(q) | 524 | 210.00 | September 2015 | 10,303 | (8,122 | ) | ||||||||||||||
|
|
|
| |||||||||||||||||
| $ | 20,283 | $ | (10,990 | ) | ||||||||||||||||
|
|
|
| |||||||||||||||||
PUT OPTIONS WRITTEN (see Note C)
| Description | Contracts | Exercise Price | Expiration Month | Premiums Received | U.S. $ Value | |||||||||||||||
Ishares iBoxx High Yield Corp.(q) | 1,941 | $ | 76.00 | December 2015 | $ | 75,615 | $ | (121,312 | ) | |||||||||||
SPDR S&P 500 ETF Trust(q) | 897 | 181.00 | September 2015 | 318,872 | (94,185 | ) | ||||||||||||||
Taylor Morrison Home Corp.(q) | 153 | 22.50 | January 2016 | 41,015 | (52,020 | ) | ||||||||||||||
|
|
|
| |||||||||||||||||
| $ | 435,502 | $ | (267,517 | ) | ||||||||||||||||
|
|
|
| |||||||||||||||||
CREDIT DEFAULT SWAPTIONS WRITTEN (see Note C)
| Description | Counter- party | Buy/Sell Protection | Strike Rate | Expiration Date | Notional Amount (000) | Premiums Received | Market Value | |||||||||||||||||||||
CDX NAHY | | Bank of America, NA | | Sell | 100.00 | % | 9/16/15 | $ | 5,680 | $ | 7,310 | $ | (4,348 | ) | ||||||||||||||
CDX NAHY | | Bank of America, NA | | Sell | 100.00 | 10/21/15 | 8,250 | 40,021 | (35,444 | ) | ||||||||||||||||||
|
|
|
| |||||||||||||||||||||||||
| $ | 47,331 | $ | (39,792 | ) | ||||||||||||||||||||||||
|
|
|
| |||||||||||||||||||||||||
CENTRALLY CLEARED CREDIT DEFAULT SWAPS (see Note C)
| Clearing Broker/(Exchange) & Referenced Obligation | Fixed Rate (Pay) Receive | Implied Credit Spread at August 31, 2015 | Notional Amount (000) | Market Value | Unrealized Appreciation/ (Depreciation) | |||||||||||||||
Buy Contracts | ||||||||||||||||||||
Morgan Stanley & Co., LLC/(INTRCONX): |
| |||||||||||||||||||
CDX-NAHY Series 20, 5 Year Index, 6/20/18* | (5.00 | )% | 2.49 | % | $ | 10,230 | $ | (785,111 | ) | $ | (316,980 | ) | ||||||||
CDX-NAHY Series 23, 5 Year Index, 12/20/19* | (5.00 | ) | 3.40 | 2,037 | (145,077 | ) | (23,370 | ) | ||||||||||||
CDX-NAHY Series 24, 5 Year Index, 6/20/20* | (5.00 | ) | 3.91 | 5,198 | (286,379 | ) | 49,690 | |||||||||||||
CDX-NAHY Series 24, 5 Year Index, 6/20/20* | (5.00 | ) | 3.91 | 8,712 | (480,026 | ) | 125,228 | |||||||||||||
CDX-NAHY Series 24, 5 Year Index, 6/20/20* | (5.00 | ) | 3.91 | 3,445 | (189,828 | ) | 41,993 | |||||||||||||
| AB POOLING PORTFOLIOS • | 173 |
AB High-Yield Portfolio—Portfolio of Investments
| Clearing Broker/(Exchange) & Referenced Obligation | Fixed Rate (Pay) Receive | Implied Credit Spread at August 31, 2015 | Notional Amount (000) | Market Value | Unrealized Appreciation/ (Depreciation) | |||||||||||||||
CDX-NAHY Series 24, 5 Year Index, 6/20/20* | (5.00 | )% | 3.91 | % | $ | 967 | $ | (53,294 | ) | $ | 3,876 | |||||||||
CDX-NAHY Series 24, 5 Year Index, 6/20/20* | (5.00 | ) | 3.91 | 938 | (51,657 | ) | 5,862 | |||||||||||||
CDX-NAHY Series 24, 5 Year Index, 6/20/20* | (5.00 | ) | 3.91 | 1,001 | (55,148 | ) | 7,509 | |||||||||||||
CDX-NAHY Series 24, 5 Year Index, 6/20/20* | (5.00 | ) | 3.91 | 6,485 | (357,074 | ) | (64,678 | ) | ||||||||||||
CDX-NAHY Series 24, 5 Year Index, 6/20/20* | (5.00 | ) | 3.91 | 4,802 | (264,398 | ) | (93,932 | ) | ||||||||||||
CDX-NAIG Series 23, 5 Year Index, 12/20/19* | (1.00 | ) | 0.80 | 3,680 | (37,933 | ) | 14,998 | |||||||||||||
CDX-NAIG Series 23, 5 Year Index, 12/20/19* | (1.00 | ) | 0.80 | 8,730 | (89,990 | ) | 35,415 | |||||||||||||
iTraxx-XOVER Series 21, 5 Year Index, 6/20/19* | (5.00 | ) | 2.07 | EUR | – 0 | –^^ | (17 | ) | (42 | ) | ||||||||||
iTraxx-XOVER Series 23, 5 Year Index, 6/20/20* | (5.00 | ) | 3.24 | 3,070 | (292,053 | ) | 42,638 | |||||||||||||
iTraxx-XOVER Series 23, 5 Year Index, 6/20/20* | (5.00 | ) | 3.24 | 3,150 | (299,377 | ) | 45,949 | |||||||||||||
Sale Contracts | ||||||||||||||||||||
Morgan Stanley & Co., LLC/(INTRCONX): |
| |||||||||||||||||||
CDX-NAHY Series 24, 5 Year Index, 6/20/20* | 5.00 | 3.91 | $ | 2,624 | 144,553 | (32,668 | ) | |||||||||||||
CDX-NAHY Series 24, 5 Year Index, 6/20/20* | 5.00 | 3.91 | 1,385 | 76,313 | 688 | |||||||||||||||
CDX-NAHY Series 24, 5 Year Index, 6/20/20* | 5.00 | 3.91 | 3,462 | 190,757 | 1,719 | |||||||||||||||
CDX-NAHY Series 24, 5 Year Index, 6/20/20* | 5.00 | 3.91 | 5,425 | 298,743 | (41,467 | ) | ||||||||||||||
CDX-NAHY Series 24, 5 Year Index, 6/20/20* | 5.00 | 3.91 | 3,317 | 182,626 | (18,011 | ) | ||||||||||||||
CDX-NAHY Series 24, 5 Year Index, 6/20/20* | 5.00 | 3.91 | 1,634 | 89,950 | 6,935 | |||||||||||||||
CDX-NAHY Series 24, 5 Year Index, 6/20/20* | 5.00 | 3.91 | 812 | 44,703 | 6,909 | |||||||||||||||
CDX-NAHY Series 24, 5 Year Index, 6/20/20* | 5.00 | 3.91 | 4,802 | 264,398 | 70,011 | |||||||||||||||
CDX-NAIG Series 20, 5 Year Index, 6/20/18* | 1.00 | 0.50 | 5,980 | 94,336 | 61,381 | |||||||||||||||
|
|
|
| |||||||||||||||||
| $ | (2,000,983 | ) | $ | (70,347 | ) | |||||||||||||||
|
|
|
| |||||||||||||||||
| * | Termination date |
CENTRALLY CLEARED INTEREST RATE SWAPS (see Note C)
| Rate Type | ||||||||||||||||||||
| Clearing Broker /(Exchange) | Notional Amount (000) | Termination Date | Payments made by the Fund | Payments received by the Fund | Unrealized Appreciation/ (Depreciation) | |||||||||||||||
Morgan Stanley & Co. LLC/(CME) | $ | 17,030 | 9/02/25 | 2.248 | % | 3 Month LIBOR | $ | 14,330 | ||||||||||||
| 174 | • AB POOLING PORTFOLIOS |
AB High-Yield Portfolio—Portfolio of Investments
CREDIT DEFAULT SWAPS (see Note C)
| Swap Counterparty & Referenced Obligation | Fixed Rate (Pay) Receive | Implied Credit Spread at August 31, 2015 | Notional Amount (000) | Market Value | Upfront Premiums Paid (Received) | Unrealized Appreciation/ (Depreciation) | ||||||||||||||||||
Buy Contracts | ||||||||||||||||||||||||
Bank of America, NA: |
| |||||||||||||||||||||||
CDX-NAHY Series 20, 5 Year Index, 6/20/18* | (5.00 | )% | 2.49 | % | $ | 1,546 | $ | (118,621 | ) | $ | (25,705 | ) | $ | (92,916 | ) | |||||||||
Barclays Bank PLC: |
| |||||||||||||||||||||||
Beazer Homes USA, Inc., 9.125%, 6/15/18, 3/20/17* | (5.00 | ) | 1.56 | 1,085 | (64,807 | ) | (48,747 | ) | (16,060 | ) | ||||||||||||||
K. Hovnanian Enterprises, Inc., 8.625%, 1/15/17, 3/20/17* | (5.00 | ) | 14.16 | 1,018 | 121,915 | (32,690 | ) | 154,605 | ||||||||||||||||
Tenet Healthcare Corporation, 6.875%, 11/15/31, 6/20/17* | (5.00 | ) | 0.93 | 1,132 | (92,957 | ) | (68,279 | ) | (24,678 | ) | ||||||||||||||
Citibank, NA: | ||||||||||||||||||||||||
Bombardier Inc., 7.45%, 5/01/34, 3/20/17* | (5.00 | ) | 6.27 | 572 | 8,302 | (30,782 | ) | 39,084 | ||||||||||||||||
Bombardier Inc., 7.45%, 5/01/34, 3/20/17* | (5.00 | ) | 6.27 | 568 | 8,244 | (31,562 | ) | 39,806 | ||||||||||||||||
CDX-EMS Series 22, 5 Year Index, 12/20/19* | (1.00 | ) | 4.07 | 10,640 | 1,218,728 | 662,746 | 555,982 | |||||||||||||||||
United States Steel Corp., 6.65%, 6/01/37, 3/20/17* | (5.00 | ) | 2.39 | 1,052 | (44,413 | ) | (44,010 | ) | (403 | ) | ||||||||||||||
Credit Suisse International: |
| |||||||||||||||||||||||
Western Union Co., 3.65%, 8/22/18, 3/20/17* | (1.00 | ) | 0.27 | 570 | (7,184 | ) | (1,129 | ) | (6,055 | ) | ||||||||||||||
Western Union Co., 3.65% 8/22/18, 9/20/17* | (1.00 | ) | 0.39 | 550 | (8,031 | ) | (5,017 | ) | (3,014 | ) | ||||||||||||||
Deutsche Bank AG |
| |||||||||||||||||||||||
iHeartCommunications, Inc., 6.875%, 6/15/18, 6/20/18* | (5.00 | ) | 23.58 | 56 | 21,520 | 4,393 | 17,127 | |||||||||||||||||
Goldman Sachs Bank USA: |
| |||||||||||||||||||||||
Community Health Systems, Inc., 8.00%, 11/15/19, 3/20/17* | (5.00 | ) | 0.60 | 1,130 | (88,018 | ) | (56,527 | ) | (31,491 | ) | ||||||||||||||
Dell, Inc., 7.10%, 4/15/28, 3/20/17* | (1.00 | ) | 0.95 | 1,027 | (1,514 | ) | 12,672 | (14,186 | ) | |||||||||||||||
First Data Corp., 12.625%, 1/15/21, 3/20/17* | (5.00 | ) | 0.97 | 1,058 | (75,000 | ) | (41,146 | ) | (33,854 | ) | ||||||||||||||
| AB POOLING PORTFOLIOS • | 175 |
AB High-Yield Portfolio—Portfolio of Investments
| Swap Counterparty & Referenced Obligation | Fixed Rate (Pay) Receive | Implied Credit Spread at August 31, 2015 | Notional Amount (000) | Market Value | Upfront Premiums Paid (Received) | Unrealized Appreciation/ (Depreciation) | ||||||||||||||||||
Newmont Mining Corp., 5.875%, 4/01/35, 3/20/17* | (1.00 | )% | 0.47 | % | $ | 1,140 | $ | (9,879 | ) | $ | (3,303 | ) | $ | (6,576 | ) | |||||||||
Nine West Holdings, Inc., 6.875%, 3/15/19, 3/20/17* | (5.00 | ) | 19.46 | 1,050 | 236,562 | (47,299 | ) | 283,861 | ||||||||||||||||
Goldman Sachs International: |
| |||||||||||||||||||||||
British Telecommunications PLC, 5.75% 12/07/28, 6/20/20* | (1.00 | ) | 0.71 | EUR | 3,330 | (57,139 | ) | (85,708 | ) | 28,569 | ||||||||||||||
Morgan Stanley Capital Services LLC: |
| |||||||||||||||||||||||
CDX-NAIG Series 20, 5 Year Index, 6/20/18* | (1.00 | ) | 0.50 | $ | 6,840 | (107,904 | ) | (53,442 | ) | (54,462 | ) | |||||||||||||
Fiat Finance North America, Inc., 5.625%, 6/12/17, 3/20/19* | (5.00 | ) | 2.39 | EUR | 403 | (44,016 | ) | (30,897 | ) | (13,119 | ) | |||||||||||||
Fiat Finance North America, Inc., 5.625%, 6/12/17, 3/20/19* | (5.00 | ) | 2.39 | 427 | (46,637 | ) | (29,004 | ) | (17,633 | ) | ||||||||||||||
iHeartCommunications, Inc., 6.875%, 6/15/18, 6/20/18* | (5.00 | ) | 23.58 | $ | 64 | 24,213 | 4,943 | 19,270 | ||||||||||||||||
Sale Contracts |
| |||||||||||||||||||||||
Barclays Bank PLC: |
| |||||||||||||||||||||||
Beazer Homes USA, Inc., 9.125%, 6/15/18, 3/20/19* | 5.00 | 3.74 | 739 | 34,732 | 27,789 | 6,943 | ||||||||||||||||||
CCO Holdings, LLC, 7.250%, 10/30/17, 6/20/19* | 5.00 | 2.13 | 582 | 64,633 | 49,768 | 14,865 | ||||||||||||||||||
K. Hovnanian Enterprises, Inc., 8.625%, 1/15/17, 12/20/18* | 5.00 | 14.45 | 739 | (167,008 | ) | 12,234 | (179,242 | ) | ||||||||||||||||
K. Hovnanian Enterprises, Inc., 8.625%, 1/15/17, 9/20/20* | 5.00 | 14.09 | 443 | (128,423 | ) | (127,503 | ) | (920 | ) | |||||||||||||||
K. Hovnanian Enterprises, Inc., 8.625%, 1/15/17, 9/20/20* | 5.00 | 14.09 | 177 | (51,311 | ) | (51,026 | ) | (285 | ) | |||||||||||||||
MGM Resorts International, 7.625%, 1/15/17, 6/20/17* | 5.00 | 1.34 | 470 | 34,539 | (9,454 | ) | 43,993 | |||||||||||||||||
| 176 | • AB POOLING PORTFOLIOS |
AB High-Yield Portfolio—Portfolio of Investments
| Swap Counterparty & Referenced Obligation | Fixed Rate (Pay) Receive | Implied Credit Spread at August 31, 2015 | Notional Amount (000) | Market Value | Upfront Premiums Paid (Received) | Unrealized Appreciation/ (Depreciation) | ||||||||||||||||||
MGM Resorts International, 7.625%, 1/15/17, 6/20/18* | 5.00 | % | 1.83 | % | $ | 689 | $ | 65,464 | $ | 24,935 | $ | 40,529 | ||||||||||||
Tenet Healthcare Corporation, 6.875%, 11/15/31, 6/20/19* | 5.00 | 2.68 | 760 | 67,959 | 49,359 | 18,600 | ||||||||||||||||||
Citibank, NA: |
| |||||||||||||||||||||||
Bombardier Inc., 7.45%, 5/01/34, 3/20/19* | 5.00 | 9.89 | 380 | (48,750 | ) | 27,991 | (76,741 | ) | ||||||||||||||||
Bombardier Inc.,7.45%, 5/01/34, 3/20/19* | 5.00 | 9.89 | 380 | (48,750 | ) | 27,412 | (76,162 | ) | ||||||||||||||||
MGM Resorts International, 7.625%, 1/15/17, 6/20/18* | 5.00 | 1.83 | 909 | 86,367 | 33,833 | 52,534 | ||||||||||||||||||
United States Steel Corp., 6.650%, 6/01/37, 3/20/19* | 5.00 | 6.23 | 760 | (25,459 | ) | 17,970 | (43,429 | ) | ||||||||||||||||
Credit Suisse International: |
| |||||||||||||||||||||||
Dell, Inc., 7.10%, 4/15/28, 12/20/18* | 1.00 | 1.91 | 380 | (11,008 | ) | (33,359 | ) | 22,351 | ||||||||||||||||
MGM Resorts International, 7.625%, 1/15/17, 6/20/18* | 5.00 | 1.83 | 332 | 31,544 | 12,867 | 18,677 | ||||||||||||||||||
Western Union Co., 3.65%, 8/22/18, 3/2019* | 1.00 | 0.82 | 380 | 2,600 | (9,288 | ) | 11,888 | |||||||||||||||||
Western Union Co., 3.65% 8/22/18, 9/20/19* | 1.00 | 1.01 | 360 | 608 | (4,065 | ) | 4,673 | |||||||||||||||||
Goldman Sachs Bank USA: |
| |||||||||||||||||||||||
Community Health Systems, Inc., 8.00%, 11/15/19, 3/20/19* | 5.00 | 1.79 | 760 | 88,607 | 45,053 | 43,554 | ||||||||||||||||||
ConvaTec Healthcare E S.A., 10.875%, 12/15/18, 6/20/17* | 5.00 | 0.77 | EUR | 590 | 56,562 | (45,427 | ) | 101,989 | ||||||||||||||||
Dell, Inc., 7.10%, 4/15/28, 3/20/19* | 1.00 | 2.08 | $ | 760 | (28,395 | ) | (60,794 | ) | 32,399 | |||||||||||||||
First Data Corp., 12.625%, 1/15/21, 3/20/19* | 5.00 | 2.22 | 760 | 76,375 | 13,366 | 63,009 | ||||||||||||||||||
Newmont Mining Corp., 5.875%, 4/01/35, 3/20/19* | 1.00 | 1.35 | 760 | (9,584 | ) | (20,478 | ) | 10,894 | ||||||||||||||||
Nine West Holdings, Inc., 6.875%, 3/15/19, 3/20/19* | 5.00 | 29.70 | 760 | (377,194 | ) | 17,960 | (395,154 | ) | ||||||||||||||||
Morgan Stanley Capital Services LLC: |
| |||||||||||||||||||||||
AK Steel Corp., 7.625%, 5/15/20, 3/20/16* | 5.00 | 5.56 | 550 | 3,882 | 977 | 2,905 | ||||||||||||||||||
| AB POOLING PORTFOLIOS • | 177 |
AB High-Yield Portfolio—Portfolio of Investments
| Swap Counterparty & Referenced Obligation | Fixed Rate (Pay) Receive | Implied Credit Spread at August 31, 2015 | Notional Amount (000) | Market Value | Upfront Premiums Paid (Received) | Unrealized Appreciation/ (Depreciation) | ||||||||||||||||||
United States Steel Corp., 6.65%, 6/01/37, 9/20/19* | 5.00 | % | 7.00 | % | $ | 212 | $ | (12,391 | ) | $ | 9,749 | $ | (22,140 | ) | ||||||||||
United States Steel Corp., 6.65%, 6/01/37, 9/20/19* | 5.00 | 7.00 | 141 | (8,230 | ) | 6,124 | (14,354 | ) | ||||||||||||||||
|
|
|
|
|
| |||||||||||||||||||
| $ | 570,733 | $ | 65,500 | $ | 505,233 | |||||||||||||||||||
|
|
|
|
|
| |||||||||||||||||||
| * | Termination date |
TOTAL RETURN SWAPS (see Note C)
| Counterparty & Referenced Obligation | # of Shares or Units | Rate Paid/ Received | Notional Amount (000) | Maturity Date | Unrealized Appreciation/ (Depreciation) | |||||||||||||||
Receive Total Return on Reference Obligation |
| |||||||||||||||||||
Bank of America, NA |
| |||||||||||||||||||
iBoxx $ Liquid High Yield | 3,450,000 | LIBOR | $ | 3,450 | 9/21/15 | $ | (79,396 | ) | ||||||||||||
Goldman Sachs International |
| �� | ||||||||||||||||||
iBoxx $ Liquid High Yield | 3,440,000 | LIBOR | 3,440 | 9/21/15 | (77,591 | ) | ||||||||||||||
iBoxx $ Liquid High Yield | 1,827,000 | LIBOR | 1,827 | 12/21/15 | 22,594 | |||||||||||||||
iBoxx $ Liquid High Yield | 3,490,000 | LIBOR | 3,490 | 12/21/15 | 4,414 | |||||||||||||||
iBoxx $ Liquid High Yield | 1,752,000 | LIBOR | 1,752 | 12/21/15 | (4,980 | ) | ||||||||||||||
JPMorgan Chase Bank, NA |
| |||||||||||||||||||
iBoxx $ Liquid High Yield | 3,450,000 | LIBOR | 3,450 | 9/21/15 | (95,555 | ) | ||||||||||||||
Morgan Stanley Capital Services Llc |
| |||||||||||||||||||
iBoxx $ Liquid High Yield | 650,000 | LIBOR | 650 | 9/21/15 | (22,587 | ) | ||||||||||||||
iBoxx $ Liquid High Yield | 7,680,000 | LIBOR | 7,680 | 9/21/15 | (217,215 | ) | ||||||||||||||
iBoxx $ Liquid High Yield | 3,562,000 | LIBOR | 3,562 | 12/21/15 | 7,822 | |||||||||||||||
iBoxx $ Liquid High Yield | 3,551,000 | LIBOR | 3,551 | 12/21/15 | (8,531 | ) | ||||||||||||||
Pay Total Return on Reference Obligation |
| |||||||||||||||||||
Goldman Sachs International |
| |||||||||||||||||||
iBoxx $ Liquid High Yield | 1,752,000 | LIBOR | 1,752 | 9/21/15 | 3,191 | |||||||||||||||
iBoxx $ Liquid High Yield | 3,490,000 | LIBOR | 3,490 | 9/21/15 | (7,033 | ) | ||||||||||||||
iBoxx $ Liquid High Yield | 1,827,000 | LIBOR | 1,827 | 9/21/15 | (20,909 | ) | ||||||||||||||
Morgan Stanley Capital Services LLC |
| |||||||||||||||||||
iBoxx $ Liquid High Yield | 3,551,000 | LIBOR | 3,551 | 9/21/15 | 4,904 | |||||||||||||||
iBoxx $ Liquid High Yield | 3,563,000 | LIBOR | 3,563 | 9/21/15 | (10,694 | ) | ||||||||||||||
|
| |||||||||||||||||||
| $ | (501,566 | ) | ||||||||||||||||||
|
| |||||||||||||||||||
| 178 | • AB POOLING PORTFOLIOS |
AB High-Yield Portfolio—Portfolio of Investments
REVERSE REPURCHASE AGREEMENTS (see Note C)
| Broker | Interest Rate | Maturity | U.S. $ Value at August 31, 2015 | |||||||||
Barclays Capital, Inc.+ | (2.75 | )%* | — | $ | 438,907 | |||||||
Barclays Capital, Inc.+ | (2.00 | )%* | — | 188,537 | ||||||||
Credit Suisse Securities (USA) LLC+ | (4.00 | )%* | — | 140,147 | ||||||||
Credit Suisse Securities (USA) LLC+ | (1.00 | )%* | — | 187,193 | ||||||||
Credit Suisse Securities (USA) LLC+ | �� | 0.00 | % | — | 2,973,140 | |||||||
Credit Suisse Securities (USA) LLC+ | 0.01 | % | — | 2,589,194 | ||||||||
RBC Capital Markets+ | (0.25 | )%* | — | 594,713 | ||||||||
|
| |||||||||||
| $ | 7,111,831 | |||||||||||
|
| |||||||||||
| + | The reverse repurchase agreement matures on demand. Interest rate resets daily and the rate shown is the rate in effect on August 31, 2015 |
| * | Interest payment due from counterparty. |
| ^ | Less than $0.50. |
| ^^ | Notional Amount less than $500. |
| (a) | Position, or a portion thereof, has been segregated to collateralize reverse repurchase agreements. |
| (b) | Security is exempt from registration under Rule 144A of the Securities Act of 1933. These securities are considered liquid and may be resold in transactions exempt from registration, normally to qualified institutional buyers. At August 31, 2015, the aggregate market value of these securities amounted to $118,333,427 or 36.7% of net assets. |
| (c) | Illiquid security. |
| (d) | Fair valued by the Adviser. |
| (e) | Security is in default and is non-income producing. |
| (f) | Security is exempt from registration under Rule 144A of the Securities Act of 1933. These securities, which represent 0.03% of net assets as of August 31, 2015, are considered illiquid and restricted. |
| Restricted Securities | Acquisition Date | Cost | Market Value | Percentage of Net Assets | ||||||||||||
Magnetation LLC/Mag Finance Corp. | | 5/15/13-2/19/15 | | $ | 507,900 | $ | 96,750 | 0.03 | % | |||||||
Virgolino de Oliveira Finance SA | 2/13/13 | 956,442 | 8,138 | 0.00 | % | |||||||||||
| (g) | Non-income producing security. |
| (h) | Restricted and illiquid security. |
| Restricted Securities | Acquisition Date | Cost | Market Value | Percentage of Net Assets | ||||||||||||
Exide Technologies Series AI | 4/30/15 | $ | 1,223,054 | $ | 1,100,856 | 0.34 | % | |||||||||
Exide Technologies | 4/30/15 | 37,522 | 79,919 | 0.02 | % | |||||||||||
Momentive Performance Materials, Inc. | 10/24/14 | – 0 | – | – 0 | – | 0.00 | % | |||||||||
| (i) | Pay-In-Kind Payments (PIK). The issuer may pay cash interest and/or interest in additional debt securities. Rates shown are the rates in effect at August 31, 2015. |
| (j) | Convertible security. |
| (k) | Floating Rate Security. Stated interest rate was in effect at August 31, 2015. |
| (l) | Variable rate coupon, rate shown as of August 31, 2015. |
| AB POOLING PORTFOLIOS • | 179 |
AB High-Yield Portfolio—Portfolio of Investments
| (m) | Coupon rate adjusts periodically based upon a predetermined schedule. Stated interest rate in effect at August 31, 2015. |
| (n) | Securities are perpetual and, thus, do not have a predetermined maturity date. The date shown, if applicable, reflects the next call date. |
| (o) | Defaulted. |
| (p) | Position, or a portion thereof, has been segregated to collateralize OTC derivatives outstanding. |
| (q) | One contract relates to 100 shares. |
| (r) | One contract relates to 1 share. |
| (s) | To obtain a copy of the fund’s financial statements, please go to the Securities and Exchange Commission’s website at www.sec.gov, or call AB at (800) 227-4618. |
| (t) | Investment in affiliated money market mutual fund. The rate shown represents the 7-day yield as of period end. |
Currency Abbreviations:
AUD – Australian Dollar
BRL – Brazilian Real
CAD – Canadian Dollar
EUR – Euro
GBP – Great British Pound
IDR – Indonesian Rupiah
JPY – Japanese Yen
KRW – South Korean Won
MXN – Mexican Peso
NZD – New Zealand Dollar
PEN – Peruvian Nuevo Sol
SEK – Swedish Krona
USD – United States Dollar
Glossary:
CDX-EM – Emerging Market Credit Default Swap Index
CDX-NAHY – North American High Yield Credit Default Swap Index
CDX-NAIG – North American Investment Grade Credit Default Swap Index
CMBS – Commercial Mortgage-Backed Securities
CME – Chicago Mercantile Exchange
DAX – Deutscher Aktien Index (German Stock Index)
ETF – Exchange Traded Fund
GSE – Government-Sponsored Enterprise
INTRCONX – Inter-Continental Exchange
LIBOR – London Interbank Offered Rates
MSCI – Morgan Stanley Capital International
REIT – Real Estate Investment Trust
RTP – Right to Pay
RTR – Right To Receive
SPDR – Standard & Poor’s Depository Receipt
See notes to financial statements.
| 180 | • AB POOLING PORTFOLIOS |
AB High-Yield Portfolio—Portfolio of Investments
AB SMALL-MID CAP VALUE PORTFOLIO
PORTFOLIO OF INVESTMENTS
August 31, 2015
| Company |
Shares | U.S. $ Value | ||||||
| ||||||||
COMMON STOCKS – 96.8% | ||||||||
Financials – 28.0% | ||||||||
Banks – 9.3% | ||||||||
Associated Banc-Corp | 118,770 | $ | 2,180,617 | |||||
Comerica, Inc. | 93,150 | 4,098,600 | ||||||
First Niagara Financial Group, Inc. | 254,098 | 2,350,407 | ||||||
Fulton Financial Corp. | 172,960 | 2,103,194 | ||||||
Huntington Bancshares, Inc./OH | 339,630 | 3,705,363 | ||||||
Synovus Financial Corp. | 84,710 | 2,577,725 | ||||||
Texas Capital Bancshares, Inc.(a) | 46,140 | 2,485,100 | ||||||
Webster Financial Corp. | 69,770 | 2,468,463 | ||||||
Zions Bancorporation | 144,370 | 4,186,730 | ||||||
|
| |||||||
| 26,156,199 | ||||||||
|
| |||||||
Capital Markets – 1.0% | ||||||||
E*TRADE Financial Corp.(a) | 104,790 | 2,754,929 | ||||||
|
| |||||||
Consumer Finance – 0.9% | ||||||||
SLM Corp.(a) | 297,610 | 2,523,733 | ||||||
|
| |||||||
Insurance – 10.2% | ||||||||
American Financial Group, Inc./OH | 60,740 | 4,194,705 | ||||||
Aspen Insurance Holdings Ltd. | 88,480 | 4,062,117 | ||||||
CNO Financial Group, Inc. | 219,870 | 3,933,474 | ||||||
First American Financial Corp. | 105,390 | 4,095,455 | ||||||
Hanover Insurance Group, Inc. (The) | 50,840 | 4,011,276 | ||||||
StanCorp Financial Group, Inc. | 39,087 | 4,444,583 | ||||||
Validus Holdings Ltd. | 91,400 | 4,047,192 | ||||||
|
| |||||||
| 28,788,802 | ||||||||
|
| |||||||
Real Estate Investment Trusts (REITs) – 5.3% | ||||||||
DDR Corp. | 153,790 | 2,351,449 | ||||||
Gramercy Property Trust, Inc. | 109,130 | 2,412,864 | ||||||
LTC Properties, Inc. | 82,260 | 3,355,385 | ||||||
Mid-America Apartment Communities, Inc. | 33,000 | 2,593,470 | ||||||
RLJ Lodging Trust | 101,400 | 2,792,556 | ||||||
STAG Industrial, Inc. | 85,110 | 1,451,977 | ||||||
|
| |||||||
| 14,957,701 | ||||||||
|
| |||||||
Thrifts & Mortgage Finance – 1.3% | ||||||||
Essent Group Ltd.(a) | 136,940 | 3,668,623 | ||||||
|
| |||||||
| 78,849,987 | ||||||||
|
| |||||||
Information Technology – 18.4% | ||||||||
Communications Equipment – 2.8% | ||||||||
Brocade Communications Systems, Inc. | 212,590 | 2,264,084 | ||||||
Finisar Corp.(a) | 208,770 | 3,221,321 | ||||||
Polycom, Inc.(a) | 210,940 | 2,269,714 | ||||||
|
| |||||||
| 7,755,119 | ||||||||
|
| |||||||
| AB POOLING PORTFOLIOS • | 181 |
AB Small-Mid Cap Value Portfolio—Portfolio of Investments
| Company |
Shares | U.S. $ Value | ||||||
| ||||||||
Electronic Equipment, Instruments & Components – 7.8% | ||||||||
Arrow Electronics, Inc.(a) | 47,420 | $ | 2,651,726 | |||||
Avnet, Inc. | 101,220 | 4,291,728 | ||||||
CDW Corp./DE | 104,840 | 4,167,390 | ||||||
Celestica, Inc.(a) | 153,260 | 1,871,305 | ||||||
Insight Enterprises, Inc.(a) | 57,433 | 1,453,629 | ||||||
Keysight Technologies, Inc.(a) | 92,390 | 2,960,176 | ||||||
TTM Technologies, Inc.(a) | 206,758 | 1,410,089 | ||||||
Vishay Intertechnology, Inc. | 324,170 | 3,202,800 | ||||||
|
| |||||||
| 22,008,843 | ||||||||
|
| |||||||
IT Services – 3.4% | ||||||||
Amdocs Ltd. | 47,530 | 2,719,191 | ||||||
Booz Allen Hamilton Holding Corp. | 152,930 | 4,083,231 | ||||||
Genpact Ltd.(a) | 124,350 | 2,860,050 | ||||||
|
| |||||||
| 9,662,472 | ||||||||
|
| |||||||
Semiconductors & Semiconductor | ||||||||
Advanced Micro Devices, Inc.(a)(b) | 387,060 | 700,579 | ||||||
Fairchild Semiconductor International, Inc.(a) | 272,320 | 3,703,552 | ||||||
Lam Research Corp. | 28,600 | 2,081,222 | ||||||
|
| |||||||
| 6,485,353 | ||||||||
|
| |||||||
Software – 0.7% | ||||||||
Electronic Arts, Inc.(a) | 29,910 | 1,978,546 | ||||||
|
| |||||||
Technology Hardware, Storage & | ||||||||
NCR Corp.(a) | 159,910 | 4,012,142 | ||||||
|
| |||||||
| 51,902,475 | ||||||||
|
| |||||||
Consumer Discretionary – 17.4% | ||||||||
Auto Components – 3.0% | ||||||||
Dana Holding Corp. | 173,580 | 3,044,593 | ||||||
Lear Corp. | 29,270 | 3,008,663 | ||||||
Tenneco, Inc.(a) | 53,610 | 2,522,351 | ||||||
|
| |||||||
| 8,575,607 | ||||||||
|
| |||||||
Hotels, Restaurants & Leisure – 1.4% | ||||||||
Bloomin’ Brands, Inc. | 190,570 | 3,944,799 | ||||||
|
| |||||||
Household Durables – 3.1% | ||||||||
Helen of Troy Ltd.(a) | 28,780 | 2,450,329 | ||||||
Meritage Homes Corp.(a) | 83,120 | 3,502,677 | ||||||
PulteGroup, Inc. | 128,920 | 2,667,355 | ||||||
|
| |||||||
| 8,620,361 | ||||||||
|
| |||||||
Media – 1.3% | ||||||||
Cable One, Inc.(a) | 4,440 | 1,844,110 | ||||||
| 182 | • AB POOLING PORTFOLIOS |
AB Small-Mid Cap Value Portfolio—Portfolio of Investments
| Company |
Shares | U.S. $ Value | ||||||
| ||||||||
Scholastic Corp. | 41,350 | $ | 1,786,733 | |||||
|
| |||||||
| 3,630,843 | ||||||||
|
| |||||||
Multiline Retail – 2.3% | ||||||||
Big Lots, Inc. | 86,970 | 4,173,690 | ||||||
Dillard’s, Inc. – Class A | 25,150 | 2,326,627 | ||||||
|
| |||||||
| 6,500,317 | ||||||||
|
| |||||||
Specialty Retail – 4.9% | ||||||||
Caleres, Inc. | 74,673 | 2,486,611 | ||||||
Children’s Place, Inc. (The) | 56,950 | 3,412,444 | ||||||
GameStop Corp. – Class A(b) | 71,680 | 3,044,966 | ||||||
Office Depot, Inc.(a) | 372,030 | 2,950,198 | ||||||
Pier 1 Imports, Inc.(b) | 185,110 | 1,884,420 | ||||||
|
| |||||||
| 13,778,639 | ||||||||
|
| |||||||
Textiles, Apparel & Luxury Goods – 1.4% | ||||||||
Crocs, Inc.(a) | 270,480 | 3,984,170 | ||||||
|
| |||||||
| 49,034,736 | ||||||||
|
| |||||||
Industrials – 13.9% | ||||||||
Aerospace & Defense – 1.0% | ||||||||
Spirit AeroSystems Holdings, Inc. – Class A(a) | 56,360 | 2,880,560 | ||||||
|
| |||||||
Construction & Engineering – 4.5% | ||||||||
AECOM(a) | 120,594 | 3,316,335 | ||||||
EMCOR Group, Inc. | 84,740 | 3,905,667 | ||||||
Granite Construction, Inc. | 96,250 | 3,320,625 | ||||||
Tutor Perini Corp.(a) | 124,250 | 2,199,225 | ||||||
|
| |||||||
| 12,741,852 | ||||||||
|
| |||||||
Electrical Equipment – 1.8% | ||||||||
General Cable Corp. | 100,100 | 1,456,455 | ||||||
Regal Beloit Corp. | 55,210 | 3,680,851 | ||||||
|
| |||||||
| 5,137,306 | ||||||||
|
| |||||||
Machinery – 2.7% | ||||||||
ITT Corp. | 74,640 | 2,792,282 | ||||||
Oshkosh Corp. | 84,660 | 3,559,953 | ||||||
Terex Corp. | 51,943 | 1,211,830 | ||||||
|
| |||||||
| 7,564,065 | ||||||||
|
| |||||||
Road & Rail – 2.0% | ||||||||
Con-way, Inc. | 60,370 | 2,125,024 | ||||||
Ryder System, Inc. | 41,000 | 3,360,770 | ||||||
|
| |||||||
| 5,485,794 | ||||||||
|
| |||||||
Trading Companies & Distributors – 1.9% | ||||||||
MRC Global, Inc.(a) | 187,510 | 2,435,755 | ||||||
WESCO International, Inc.(a) | 53,260 | 2,980,962 | ||||||
|
| |||||||
| 5,416,717 | ||||||||
|
| |||||||
| 39,226,294 | ||||||||
|
| |||||||
| AB POOLING PORTFOLIOS • | 183 |
AB Small-Mid Cap Value Portfolio—Portfolio of Investments
| Company |
Shares | U.S. $ Value | ||||||
| ||||||||
Utilities – 5.1% | ||||||||
Electric Utilities – 2.4% | ||||||||
PNM Resources, Inc. | 138,840 | $ | 3,555,692 | |||||
Westar Energy, Inc. | 87,351 | 3,192,679 | ||||||
|
| |||||||
| 6,748,371 | ||||||||
|
| |||||||
Gas Utilities – 2.7% | ||||||||
Southwest Gas Corp. | 65,650 | 3,616,659 | ||||||
UGI Corp. | 115,615 | 3,940,159 | ||||||
|
| |||||||
| 7,556,818 | ||||||||
|
| |||||||
| 14,305,189 | ||||||||
|
| |||||||
Materials – 4.5% | ||||||||
Chemicals – 1.9% | ||||||||
A. Schulman, Inc. | 95,532 | 3,279,614 | ||||||
Huntsman Corp. | 117,640 | 1,944,589 | ||||||
|
| |||||||
| 5,224,203 | ||||||||
|
| |||||||
Containers & Packaging – 1.8% | ||||||||
Avery Dennison Corp. | 45,720 | 2,655,417 | ||||||
Graphic Packaging Holding Co. | 166,320 | 2,345,112 | ||||||
|
| |||||||
| 5,000,529 | ||||||||
|
| |||||||
Metals & Mining – 0.8% | ||||||||
Steel Dynamics, Inc. | 120,160 | 2,340,717 | ||||||
|
| |||||||
| 12,565,449 | ||||||||
|
| |||||||
Health Care – 3.6% | ||||||||
Health Care Providers & Services – 3.6% | ||||||||
LifePoint Health, Inc.(a) | 48,778 | 3,811,025 | ||||||
Molina Healthcare, Inc.(a) | 32,740 | 2,442,077 | ||||||
WellCare Health Plans, Inc.(a) | 42,970 | 3,896,090 | ||||||
|
| |||||||
| 10,149,192 | ||||||||
|
| |||||||
Energy – 3.5% | ||||||||
Oil, Gas & Consumable Fuels – 3.5% | ||||||||
Noble Energy, Inc. | 96,606 | 3,227,606 | ||||||
QEP Resources, Inc. | 198,370 | 2,785,115 | ||||||
SM Energy Co. | 102,180 | 3,750,006 | ||||||
|
| |||||||
| 9,762,727 | ||||||||
|
| |||||||
Consumer Staples – 2.4% | ||||||||
Food Products – 2.4% | ||||||||
Dean Foods Co. | 154,935 | 2,550,230 | ||||||
Ingredion, Inc. | 50,550 | 4,364,487 | ||||||
|
| |||||||
| 6,914,717 | ||||||||
|
| |||||||
Total Common Stocks | 272,710,766 | |||||||
|
| |||||||
| 184 | • AB POOLING PORTFOLIOS |
AB Small-Mid Cap Value Portfolio—Portfolio of Investments
| Company |
Shares | U.S. $ Value | ||||||
| ||||||||
SHORT-TERM INVESTMENTS – 2.4% | ||||||||
Investment Companies – 2.4% | ||||||||
AB Fixed Income Shares, Inc. – | 6,866,624 | $ | 6,866,624 | |||||
|
| |||||||
Total Investments Before Security Lending Collateral for Securities Loaned – 99.2% | 279,577,390 | |||||||
|
| |||||||
INVESTMENTS OF CASH COLLATERAL FOR SECURITIES LOANED – 2.3% | ||||||||
Investment Companies – 2.3% | ||||||||
AB Exchange Reserves – | 6,422,235 | 6,422,235 | ||||||
|
| |||||||
Total Investments – 101.5% | 285,999,625 | |||||||
Other assets less liabilities – (1.5)% | (4,275,853 | ) | ||||||
|
| |||||||
Net Assets – 100.0% | $ | 281,723,772 | ||||||
|
| |||||||
| (a) | Non-income producing security. |
| (b) | Represents entire or partial securities out on loan. See Note D for securities lending information. |
| (c) | To obtain a copy of the fund’s financial statements, please go to the Securities and Exchange Commission’s website at www.sec.gov, or call AB at (800) 227-4618. |
| (d) | Investment in affiliated money market mutual fund. The rate shown represents the 7-day yield as of period end. |
See notes to financial statements.
| AB POOLING PORTFOLIOS • | 185 |
AB Small-Mid Cap Value Portfolio—Portfolio of Investments
AB SMALL-MID CAP GROWTH PORTFOLIO
PORTFOLIO OF INVESTMENTS
August 31, 2015
| Company |
Shares | U.S. $ Value | ||||||
| ||||||||
COMMON STOCKS – 98.0% | ||||||||
Information Technology – 22.8% | ||||||||
Communications Equipment – 1.2% | ||||||||
Palo Alto Networks, Inc.(a) | 19,660 | $ | 3,228,565 | |||||
|
| |||||||
Electronic Equipment, Instruments & Components – 1.0% | ||||||||
Zebra Technologies Corp. – Class A(a) | 32,727 | 2,712,414 | ||||||
|
| |||||||
Internet Software & Services – 4.0% | ||||||||
CoStar Group, Inc.(a) | 28,938 | 5,123,183 | ||||||
GrubHub, Inc.(a) | 60,240 | 1,593,348 | ||||||
HomeAway, Inc.(a) | 85,184 | 2,443,929 | ||||||
Pandora Media, Inc.(a) | 110,533 | 1,982,962 | ||||||
|
| |||||||
| 11,143,422 | ||||||||
|
| |||||||
IT Services – 2.7% | ||||||||
Vantiv, Inc. – Class A(a) | 114,901 | 5,060,240 | ||||||
VeriFone Systems, Inc.(a) | 83,604 | 2,611,789 | ||||||
|
| |||||||
| 7,672,029 | ||||||||
|
| |||||||
Semiconductors & Semiconductor | ||||||||
Cavium, Inc.(a) | 33,096 | 2,251,190 | ||||||
Intersil Corp. – Class A | 74,524 | 785,483 | ||||||
Mellanox Technologies Ltd.(a) | 45,207 | 1,828,171 | ||||||
ON Semiconductor Corp.(a) | 317,849 | 3,037,047 | ||||||
|
| |||||||
| 7,901,891 | ||||||||
|
| |||||||
Software – 11.1% | ||||||||
Aspen Technology, Inc.(a) | 26,771 | 1,013,818 | ||||||
Barracuda Networks, Inc.(a)(b) | 40,466 | 1,063,851 | ||||||
Cadence Design Systems, Inc.(a) | 240,845 | 4,821,717 | ||||||
Guidewire Software, Inc.(a) | 62,875 | 3,515,341 | ||||||
NetSuite, Inc.(a) | 40,208 | 3,572,481 | ||||||
Qlik Technologies, Inc.(a) | 6,472 | 245,030 | ||||||
ServiceNow, Inc.(a) | 55,010 | 3,903,510 | ||||||
SolarWinds, Inc.(a) | 61,290 | 2,436,277 | ||||||
Tableau Software, Inc. – Class A(a) | 39,693 | 3,737,890 | ||||||
Take-Two Interactive Software, Inc.(a) | 91,328 | 2,660,385 | ||||||
Ultimate Software Group, Inc. (The)(a) | 23,875 | 4,206,536 | ||||||
|
| |||||||
| 31,176,836 | ||||||||
|
| |||||||
| 63,835,157 | ||||||||
|
| |||||||
Health Care – 22.6% | ||||||||
Biotechnology – 5.7% | ||||||||
Achillion Pharmaceuticals, Inc.(a) | 70,585 | 521,623 | ||||||
Agios Pharmaceuticals, Inc.(a)(b) | 12,888 | 1,113,523 | ||||||
Alder Biopharmaceuticals, Inc.(a) | 35,785 | 1,386,669 | ||||||
Anacor Pharmaceuticals, Inc.(a) | 14,690 | 1,915,723 | ||||||
| 186 | • AB POOLING PORTFOLIOS |
AB Small-Mid Cap Growth Portfolio—Portfolio of Investments
| Company |
Shares | U.S. $ Value | ||||||
| ||||||||
DBV Technologies SA (Sponsored ADR)(a) | 36,386 | $ | 1,420,146 | |||||
Dyax Corp.(a) | 83,700 | 1,926,774 | ||||||
Isis Pharmaceuticals, Inc.(a) | 32,781 | 1,644,951 | ||||||
Medivation, Inc.(a) | 30,271 | 2,665,664 | ||||||
PTC Therapeutics, Inc.(a) | 21,830 | 833,688 | ||||||
Sage Therapeutics, Inc.(a) | 26,855 | 1,450,438 | ||||||
TESARO, Inc.(a) | 22,072 | 1,136,267 | ||||||
|
| |||||||
| 16,015,466 | ||||||||
|
| |||||||
Health Care Equipment & Supplies – 7.3% | ||||||||
Align Technology, Inc.(a) | 72,395 | 4,097,557 | ||||||
DexCom, Inc.(a) | 68,994 | 6,495,095 | ||||||
HeartWare International, Inc.(a)(b) | 38,018 | 3,254,341 | ||||||
Nevro Corp.(a) | 60,098 | 2,706,213 | ||||||
Sirona Dental Systems, Inc.(a) | 39,806 | 3,796,696 | ||||||
|
| |||||||
| 20,349,902 | ||||||||
|
| |||||||
Health Care Providers & Services – 5.7% | ||||||||
Acadia Healthcare Co., Inc.(a) | 70,274 | 5,132,110 | ||||||
Diplomat Pharmacy, Inc.(a) | 91,501 | 3,613,374 | ||||||
Envision Healthcare Holdings, Inc.(a) | 94,750 | 3,881,908 | ||||||
Premier, Inc. – Class A(a) | 93,026 | 3,316,377 | ||||||
|
| |||||||
| 15,943,769 | ||||||||
|
| |||||||
Life Sciences Tools & Services – 1.5% | ||||||||
ICON PLC(a) | 55,226 | 4,252,402 | ||||||
|
| |||||||
Pharmaceuticals – 2.4% | ||||||||
Akorn, Inc.(a) | 39,845 | 1,585,432 | ||||||
GW Pharmaceuticals PLC (ADR)(a) | 12,876 | 1,369,363 | ||||||
Jazz Pharmaceuticals PLC(a) | 14,176 | 2,393,192 | ||||||
Tetraphase Pharmaceuticals, Inc.(a) | 32,770 | 1,422,546 | ||||||
|
| |||||||
| 6,770,533 | ||||||||
|
| |||||||
| 63,332,072 | ||||||||
|
| |||||||
Industrials – 21.3% | ||||||||
Aerospace & Defense – 3.5% | ||||||||
Hexcel Corp. | 109,187 | 5,269,365 | ||||||
TransDigm Group, Inc.(a) | 19,744 | 4,537,763 | ||||||
|
| |||||||
| 9,807,128 | ||||||||
|
| |||||||
Air Freight & Logistics – 1.3% | ||||||||
Expeditors International of Washington, Inc. | 73,027 | 3,576,132 | ||||||
|
| |||||||
Electrical Equipment – 1.2% | ||||||||
AMETEK, Inc. | 64,128 | 3,451,369 | ||||||
|
| |||||||
Industrial Conglomerates – 1.8% | ||||||||
Carlisle Cos., Inc. | 48,727 | 4,906,809 | ||||||
|
| |||||||
| AB POOLING PORTFOLIOS • | 187 |
AB Small-Mid Cap Growth Portfolio—Portfolio of Investments
| Company |
Shares | U.S. $ Value | ||||||
| ||||||||
Machinery – 6.7% | ||||||||
IDEX Corp. | 62,733 | $ | 4,506,111 | |||||
Lincoln Electric Holdings, Inc. | 60,431 | 3,544,278 | ||||||
Middleby Corp. (The)(a) | 49,910 | 5,417,731 | ||||||
Valmont Industries, Inc.(b) | 22,260 | 2,366,015 | ||||||
Wabtec Corp./DE | 30,860 | 2,955,154 | ||||||
|
| |||||||
| 18,789,289 | ||||||||
|
| |||||||
Marine – 1.3% | ||||||||
Kirby Corp.(a) | 50,328 | 3,549,634 | ||||||
|
| |||||||
Professional Services – 1.9% | ||||||||
Robert Half International, Inc. | 105,026 | 5,359,477 | ||||||
|
| |||||||
Road & Rail – 1.1% | ||||||||
Genesee & Wyoming, Inc. – Class A(a) | 45,564 | 3,115,666 | ||||||
|
| |||||||
Trading Companies & Distributors – 2.5% | ||||||||
United Rentals, Inc.(a) | 44,128 | 3,059,394 | ||||||
Watsco, Inc. | 33,240 | 4,070,571 | ||||||
|
| |||||||
| 7,129,965 | ||||||||
|
| |||||||
| 59,685,469 | ||||||||
|
| |||||||
Consumer Discretionary – 18.1% | ||||||||
Diversified Consumer Services – 2.9% | ||||||||
Bright Horizons Family Solutions, Inc.(a) | 76,419 | 4,670,729 | ||||||
Grand Canyon Education, Inc.(a) | 92,046 | 3,402,020 | ||||||
|
| |||||||
| 8,072,749 | ||||||||
|
| |||||||
Hotels, Restaurants & Leisure – 4.4% | ||||||||
Buffalo Wild Wings, Inc.(a) | 10,351 | 1,963,378 | ||||||
Habit Restaurants, Inc. (The)(a)(b) | 91,996 | 2,292,540 | ||||||
Norwegian Cruise Line Holdings Ltd.(a) | 69,717 | 4,015,699 | ||||||
Wyndham Worldwide Corp. | 52,603 | 4,023,078 | ||||||
|
| |||||||
| 12,294,695 | ||||||||
|
| |||||||
Household Durables – 1.8% | ||||||||
Tempur Sealy International, Inc.(a) | 66,757 | 4,874,596 | ||||||
|
| |||||||
Media – 1.1% | ||||||||
AMC Networks, Inc. – Class A(a) | 43,970 | 3,182,549 | ||||||
|
| |||||||
Specialty Retail – 7.0% | ||||||||
Five Below, Inc.(a) | 105,396 | 4,075,663 | ||||||
Lithia Motors, Inc. – Class A | 31,540 | 3,362,164 | ||||||
Select Comfort Corp.(a) | 135,801 | 3,306,754 | ||||||
Tractor Supply Co. | 48,218 | 4,113,478 | ||||||
Ulta Salon Cosmetics & Fragrance, Inc.(a) | 29,552 | 4,671,876 | ||||||
|
| |||||||
| 19,529,935 | ||||||||
|
| |||||||
| 188 | • AB POOLING PORTFOLIOS |
AB Small-Mid Cap Growth Portfolio—Portfolio of Investments
| Company |
Shares | U.S. $ Value | ||||||
| ||||||||
Textiles, Apparel & Luxury Goods – 0.9% | ||||||||
Under Armour, Inc. – Class A(a) | 27,131 | $ | 2,591,824 | |||||
|
| |||||||
| 50,546,348 | ||||||||
|
| |||||||
Financials – 8.8% | ||||||||
Banks – 5.2% | ||||||||
First Republic Bank/CA | 56,731 | 3,421,447 | ||||||
IBERIABANK Corp. | 46,554 | 2,835,138 | ||||||
Signature Bank/New York NY(a) | 31,951 | 4,265,139 | ||||||
SVB Financial Group(a) | 33,066 | 4,135,895 | ||||||
|
| |||||||
| 14,657,619 | ||||||||
|
| |||||||
Capital Markets – 3.6% | ||||||||
Affiliated Managers Group, Inc.(a) | 17,855 | 3,328,886 | ||||||
Lazard Ltd. – Class A | 82,584 | 4,106,902 | ||||||
Stifel Financial Corp.(a) | 55,879 | 2,603,962 | ||||||
|
| |||||||
| 10,039,750 | ||||||||
|
| |||||||
| 24,697,369 | ||||||||
|
| |||||||
Materials – 2.4% | ||||||||
Chemicals – 1.5% | ||||||||
PolyOne Corp. | 125,195 | 4,065,082 | ||||||
|
| |||||||
Construction Materials – 0.9% | ||||||||
Martin Marietta Materials, Inc. | 15,675 | 2,630,265 | ||||||
|
| |||||||
| 6,695,347 | ||||||||
|
| |||||||
Energy – 1.6% | ||||||||
Energy Equipment & Services – 0.9% | ||||||||
Oceaneering International, Inc. | 56,310 | 2,467,504 | ||||||
|
| |||||||
Oil, Gas & Consumable Fuels – 0.7% | ||||||||
Concho Resources, Inc.(a) | 19,374 | 2,095,492 | ||||||
|
| |||||||
| 4,562,996 | ||||||||
|
| |||||||
Consumer Staples – 0.4% | ||||||||
Food Products – 0.4% | ||||||||
Blue Buffalo Pet Products, Inc.(a) | 37,683 | 962,801 | ||||||
|
| |||||||
Total Common Stocks | 274,317,559 | |||||||
|
| |||||||
SHORT-TERM INVESTMENTS – 2.3% | ||||||||
Investment Companies – 2.3% | ||||||||
AB Fixed Income Shares, Inc. – | 6,308,128 | 6,308,128 | ||||||
|
| |||||||
Total Investments Before Security Lending Collateral for Securities Loaned – 100.3% | 280,625,687 | |||||||
|
| |||||||
| AB POOLING PORTFOLIOS • | 189 |
AB Small-Mid Cap Growth Portfolio—Portfolio of Investments
| Company |
Shares | U.S. $ Value | ||||||
| ||||||||
INVESTMENTS OF CASH COLLATERAL FOR SECURITIES LOANED – 2.8% | ||||||||
Investment Companies – 2.8% | ||||||||
AB Exchange Reserves – | 7,862,001 | $ | 7,862,001 | |||||
|
| |||||||
Total Investments – 103.1% | 288,487,688 | |||||||
Other assets less liabilities – (3.1)% | (8,614,552 | ) | ||||||
|
| |||||||
Net Assets – 100.0% | $ | 279,873,136 | ||||||
|
| |||||||
| (a) | Non-income producing security. |
| (b) | Represents entire or partial securities out on loan. See Note D for securities lending information. |
| (c) | To obtain a copy of the fund’s financial statements, please go to the Securities and Exchange Commission’s website at www.sec.gov, or call AB at (800) 227-4618. |
| (d) | Investment in affiliated money market mutual fund. The rate shown represents the 7-day yield as of period end. |
Glossary:
| ADR | – American Depositary Receipt |
See notes to financial statements.
| 190 | • AB POOLING PORTFOLIOS |
AB Small-Mid Cap Growth Portfolio—Portfolio of Investments
AB MULTI-ASSET REAL RETURN PORTFOLIO
PORTFOLIO OF INVESTMENTS
August 31, 2015
| Company | Shares | U.S. $ Value | ||||||
| ||||||||
COMMON STOCKS – 54.9% | ||||||||
Energy – 23.6% | ||||||||
Coal & Consumable Fuels – 0.1% | ||||||||
Cameco Corp. | 24,968 | $ | 351,290 | |||||
China Shenhua Energy Co., Ltd. – Class H | 215,570 | 373,573 | ||||||
Coal India Ltd. | 31,180 | 170,772 | ||||||
CONSOL Energy, Inc.(a) | 14,564 | 221,810 | ||||||
|
| |||||||
| 1,117,445 | ||||||||
|
| |||||||
Integrated Oil & Gas – 16.0% | ||||||||
BG Group PLC | 760,800 | 11,547,096 | ||||||
BP PLC | 2,130,336 | 11,807,952 | ||||||
Chevron Corp. | 223,268 | 18,082,475 | ||||||
China Petroleum & Chemical Corp. – Class H | 2,326,000 | 1,559,684 | ||||||
Exxon Mobil Corp. | 484,472 | 36,451,673 | ||||||
Galp Energia SGPS SA | 106,230 | 1,120,855 | ||||||
Gazprom PAO (Sponsored ADR)(a) | 87,300 | 394,596 | ||||||
Lukoil PJSC (London) (Sponsored ADR)(a) | 69,780 | 2,694,206 | ||||||
Petroleo Brasileiro SA (ADR)(a)(b) | 249,880 | 1,464,297 | ||||||
Petroleo Brasileiro SA (Sponsored ADR)(a)(b) | 794,458 | 4,004,068 | ||||||
Royal Dutch Shell PLC (Euronext Amsterdam) – Class A | 356,763 | 9,365,084 | ||||||
Royal Dutch Shell PLC – Class A | 273,825 | 7,133,765 | ||||||
Royal Dutch Shell PLC – Class B | 353,887 | 9,239,662 | ||||||
TOTAL SA | 400,687 | 18,474,234 | ||||||
|
| |||||||
| 133,339,647 | ||||||||
|
| |||||||
Oil & Gas Equipment & Services – 0.3% | ||||||||
Aker Solutions ASA(c) | 234,860 | 985,281 | ||||||
Deep Sea Supply PLC(a) | 1,185,286 | 315,050 | ||||||
Helix Energy Solutions Group, Inc.(b) | 62,480 | 434,236 | ||||||
Petroleum Geo-Services ASA(a) | 141,370 | 641,626 | ||||||
|
| |||||||
| 2,376,193 | ||||||||
|
| |||||||
Oil & Gas Exploration & Production – 6.8% | ||||||||
Anadarko Petroleum Corp. | 86,144 | 6,166,187 | ||||||
Apache Corp. | 26,555 | 1,201,348 | ||||||
Cabot Oil & Gas Corp. | 28,231 | 668,228 | ||||||
Canadian Natural Resources Ltd. | 236,499 | 5,330,036 | ||||||
CNOOC Ltd. | 3,775,800 | 4,732,836 | ||||||
Concho Resources, Inc.(b) | 8,088 | 874,798 | ||||||
ConocoPhillips | 147,372 | 7,243,334 | ||||||
Det Norske Oljeselskap ASA(a)(b) | 286,004 | 1,707,146 | ||||||
Devon Energy Corp. | 26,275 | 1,120,892 | ||||||
EOG Resources, Inc. | 95,100 | 7,447,280 | ||||||
EQT Corp. | 10,473 | 815,009 | ||||||
Hess Corp. | 76,740 | 4,562,193 | ||||||
Inpex Corp. | 154,900 | 1,570,095 | ||||||
Marathon Oil Corp. | 44,530 | 769,924 | ||||||
| AB POOLING PORTFOLIOS • | 191 |
AB Multi-Asset Real Return Portfolio—Portfolio of Investments
| Company | Shares | U.S. $ Value | ||||||
| ||||||||
Murphy Oil Corp. | 66,450 | $ | 2,059,950 | |||||
Noble Energy, Inc. | 30,211 | 1,009,350 | ||||||
Occidental Petroleum Corp. | 68,250 | 4,982,932 | ||||||
Pioneer Natural Resources Co. | 10,175 | 1,252,136 | ||||||
SM Energy Co. | 52,930 | 1,942,531 | ||||||
Whiting Petroleum Corp.(b) | 14,070 | 271,973 | ||||||
Woodside Petroleum Ltd. | 54,049 | 1,243,978 | ||||||
|
| |||||||
| 56,972,156 | ||||||||
|
| |||||||
Oil & Gas Refining & Marketing – 0.4% | ||||||||
JX Holdings, Inc. | 333,100 | 1,288,909 | ||||||
Marathon Petroleum Corp. | 15,140 | 716,273 | ||||||
Valero Energy Corp. | 17,590 | 1,043,791 | ||||||
|
| |||||||
| 3,048,973 | ||||||||
|
| |||||||
| 196,854,414 | ||||||||
|
| |||||||
Equity: Other – 9.8% | ||||||||
Diversified/Specialty – 8.7% | ||||||||
Alexandria Real Estate Equities, Inc. | 2,700 | 232,173 | ||||||
Ayala Land, Inc. | 1,487,782 | 1,143,059 | ||||||
Azrieli Group | 6,851 | 270,304 | ||||||
Bakrieland Development Tbk PT(b) | 3,227,600 | 11,486 | ||||||
Beni Stabili SpA SIIQ | 196,904 | 152,937 | ||||||
British Land Co. PLC (The) | 289,043 | 3,603,939 | ||||||
Bumi Serpong Damai Tbk PT | 1,450,000 | 165,669 | ||||||
CA Immobilien Anlagen AG(b) | 56,901 | 1,059,616 | ||||||
Canadian Real Estate Investment Trust | 2,725 | 84,923 | ||||||
CapitaLand Ltd.(a) | 477,900 | 957,789 | ||||||
CBRE Group, Inc. – Class A(b) | 17,840 | 571,237 | ||||||
Central Pattana PCL | 266,100 | 334,063 | ||||||
Cheung Kong Property Holdings Ltd.(b) | 87,500 | 616,297 | ||||||
Ciputra Development Tbk PT | 2,094,400 | 129,374 | ||||||
ClubCorp Holdings, Inc. | 28,264 | 636,223 | ||||||
Cofinimmo SA | 9,645 | 1,012,799 | ||||||
Country Garden Holdings Co., Ltd. | 1,426,000 | 499,459 | ||||||
CSR Ltd. | 85,980 | 189,917 | ||||||
Dalian Wanda Commercial Properties Co., Ltd. – Class H(c) | 71,500 | 440,978 | ||||||
Digital Realty Trust, Inc. | 5,115 | 323,882 | ||||||
Duke Realty Corp. | 54,860 | 990,771 | ||||||
East Japan Railway Co. | 5,600 | 517,378 | ||||||
Emira Property Fund Ltd. | 262,530 | 348,056 | ||||||
Evergrande Real Estate Group Ltd.(a) | 1,079,750 | 721,544 | ||||||
Fastighets AB Balder – Class B(b) | 17,367 | 303,635 | ||||||
Fibra Uno Administracion SA de CV | 477,188 | 1,025,621 | ||||||
Folkestone Education Trust | 136,750 | 205,487 | ||||||
Fonciere Des Regions | 6,743 | 562,266 | ||||||
Forest City Enterprises, Inc. – Class A(b) | 8,645 | 186,127 | ||||||
| 192 | • AB POOLING PORTFOLIOS |
AB Multi-Asset Real Return Portfolio—Portfolio of Investments
| Company | Shares | U.S. $ Value | ||||||
| ||||||||
Fukuoka REIT Corp.(a) | 113 | $ | 175,478 | |||||
Gecina SA | 6,450 | 814,065 | ||||||
Globe Trade Centre SA(b) | 50,597 | 79,059 | ||||||
GPT Group (The) | 422,787 | 1,351,174 | ||||||
Gramercy Property Trust, Inc. | 57,032 | 1,260,977 | ||||||
Great Portland Estates PLC | 64,788 | 817,148 | ||||||
Growthpoint Properties Ltd. | 492,118 | 970,820 | ||||||
H&R Real Estate Investment Trust | 10,347 | 162,409 | ||||||
Hemfosa Fastigheter AB | 65,166 | 715,788 | ||||||
Henderson Land Development Co., Ltd. | 192,920 | 1,192,047 | ||||||
Hufvudstaden AB – Class A | 20,892 | 267,978 | ||||||
Hulic Co., Ltd. | 66,350 | 609,079 | ||||||
Hung Poo Real Estate Development Corp. | 25,000 | 14,981 | ||||||
IMMOFINANZ AG(b) | 388,380 | 968,625 | ||||||
IOI Properties Group Bhd | 387,700 | 169,080 | ||||||
Kaisa Group Holdings Ltd.(a)(b)(d)(e) | 1,057,000 | 185,499 | ||||||
Kennedy Wilson Europe Real Estate PLC | 55,079 | 1,000,702 | ||||||
Kiwi Property Group Ltd. | 238,394 | 197,788 | ||||||
KLCCP Stapled Group | 89,100 | 148,500 | ||||||
Land Securities Group PLC | 148,203 | 2,830,952 | ||||||
Lend Lease Group | 73,639 | 728,647 | ||||||
Leopalace21 Corp.(b) | 47,700 | 231,876 | ||||||
Lippo Karawaci Tbk PT | 3,779,100 | 288,181 | ||||||
Longfor Properties Co., Ltd. | 286,950 | 348,704 | ||||||
Mah Sing Group Bhd | 307,575 | 101,629 | ||||||
Mapletree Greater China Commercial Trust(c) | 365,100 | 245,705 | ||||||
Merlin Properties Socimi SA(b) | 204,948 | 2,376,406 | ||||||
Mitsubishi Estate Co., Ltd. | 289,000 | 6,216,629 | ||||||
Mitsui Fudosan Co., Ltd. | 222,000 | 6,151,294 | ||||||
New World China Land Ltd. | 512,000 | 310,079 | ||||||
New World Development Co., Ltd. | 1,466,000 | 1,488,245 | ||||||
Nomura Real Estate Holdings, Inc. | 10,200 | 191,340 | ||||||
Oberoi Realty Ltd. | 15,540 | 52,026 | ||||||
Orix JREIT, Inc.(a) | 586 | 738,272 | ||||||
Pakuwon Jati Tbk PT | 4,561,000 | 123,667 | ||||||
Pruksa Real Estate PCL | 131,700 | 93,691 | ||||||
Quality Houses PCL | 490,583 | 32,299 | ||||||
Redefine Properties Ltd. | 820,082 | 710,606 | ||||||
Resilient Property Income Fund Ltd. | 48,104 | 405,268 | ||||||
SA Corporate Real Estate Fund Nominees Pty Ltd. | 422,900 | 162,652 | ||||||
SM Prime Holdings, Inc. | 1,538,450 | 641,244 | ||||||
SP Setia Bhd Group | 170,550 | 125,476 | ||||||
Spirit Realty Capital, Inc. | 115,886 | 1,112,506 | ||||||
Sponda Oyj | 45,324 | 182,308 | ||||||
Sumitomo Realty & Development Co., Ltd. | 119,000 | 4,018,199 | ||||||
Summarecon Agung Tbk PT | 2,134,900 | 245,752 | ||||||
Sun Hung Kai Properties Ltd. | 429,663 | 5,446,346 | ||||||
| AB POOLING PORTFOLIOS • | 193 |
AB Multi-Asset Real Return Portfolio—Portfolio of Investments
| Company | Shares | U.S. $ Value | ||||||
| ||||||||
Sunac China Holdings Ltd. | 355,400 | $ | 192,691 | |||||
Suntec Real Estate Investment Trust | 450,100 | 487,919 | ||||||
Supalai PCL | 117,200 | 54,930 | ||||||
Swiss Prime Site AG (REG)(b) | 11,941 | 937,401 | ||||||
Taiheiyo Cement Corp. | 52,000 | 175,687 | ||||||
United Urban Investment Corp. | 472 | 619,798 | ||||||
UOL Group Ltd.(a) | 301,148 | 1,335,419 | ||||||
VEREIT, Inc. | 68,275 | 555,759 | ||||||
Vornado Realty Trust | 10,204 | 889,687 | ||||||
Wallenstam AB – Class B | 37,238 | 283,889 | ||||||
West China Cement Ltd.(a) | 6,216,000 | 1,006,348 | ||||||
WHA Corp. PCL(b) | 678,000 | 65,445 | ||||||
Wharf Holdings Ltd. (The) | 257,000 | 1,449,842 | ||||||
WP Carey, Inc. | 3,322 | 190,915 | ||||||
|
| |||||||
| 72,243,935 | ||||||||
|
| |||||||
Health Care – 0.8% | ||||||||
Care Capital Properties, Inc.(b) | 6,643 | 211,181 | ||||||
Chartwell Retirement Residences | 54,350 | 481,697 | ||||||
HCP, Inc. | 56,570 | 2,096,485 | ||||||
Health Care REIT, Inc. | 23,680 | 1,500,128 | ||||||
LTC Properties, Inc. | 24,140 | 984,671 | ||||||
Omega Healthcare Investors, Inc. | 6,090 | 205,720 | ||||||
Ventas, Inc. | 25,112 | 1,381,662 | ||||||
|
| |||||||
| 6,861,544 | ||||||||
|
| |||||||
Triple Net – 0.3% | ||||||||
National Retail Properties, Inc. | 37,505 | 1,303,299 | ||||||
Realty Income Corp.(a) | 26,728 | 1,194,474 | ||||||
|
| |||||||
| 2,497,773 | ||||||||
|
| |||||||
| 81,603,252 | ||||||||
|
| |||||||
Materials – 7.5% | ||||||||
Aluminum – 0.1% | ||||||||
Alcoa, Inc. | 15,205 | 143,687 | ||||||
Norsk Hydro ASA | 211,219 | 727,364 | ||||||
|
| |||||||
| 871,051 | ||||||||
|
| |||||||
Commodity Chemicals – 0.3% | ||||||||
LyondellBasell Industries NV – Class A | 16,920 | 1,444,630 | ||||||
Westlake Chemical Corp. | 20,410 | 1,127,244 | ||||||
|
| |||||||
| 2,571,874 | ||||||||
|
| |||||||
Diversified Chemicals – 0.3% | ||||||||
Arkema SA | 24,196 | 1,704,447 | ||||||
Eastman Chemical Co. | 11,050 | 800,683 | ||||||
|
| |||||||
| 2,505,130 | ||||||||
|
| |||||||
Diversified Metals & Mining – 3.1% | ||||||||
Anglo American PLC | 16,191 | 181,435 | ||||||
Aurubis AG | 22,710 | 1,503,487 | ||||||
| 194 | • AB POOLING PORTFOLIOS |
AB Multi-Asset Real Return Portfolio—Portfolio of Investments
| Company | Shares | U.S. $ Value | ||||||
| ||||||||
BHP Billiton Ltd. | 220,938 | $ | 4,047,075 | |||||
BHP Billiton PLC | 24,483 | 430,420 | ||||||
Boliden AB | 91,840 | 1,511,707 | ||||||
First Quantum Minerals Ltd.(a) | 125,670 | 655,288 | ||||||
Freeport-McMoRan, Inc. | 73,560 | 782,678 | ||||||
Glencore PLC(b) | 1,682,257 | 3,797,295 | ||||||
Korea Zinc Co., Ltd. | 4,270 | 1,857,527 | ||||||
Lundin Mining Corp.(b) | 253,660 | 861,858 | ||||||
MMC Norilsk Nickel PJSC (ADR)(a) | 169,320 | 2,679,617 | ||||||
Rio Tinto Ltd. | 5,129 | 183,944 | ||||||
Rio Tinto PLC | 181,160 | 6,614,265 | ||||||
South32 Ltd.(b) | 339,000 | 365,930 | ||||||
|
| |||||||
| 25,472,526 | ||||||||
|
| |||||||
Fertilizers & Agricultural | ||||||||
CF Industries Holdings, Inc. | 45,291 | 2,598,798 | ||||||
Monsanto Co. | 41,119 | 4,015,271 | ||||||
Mosaic Co. (The) | 14,534 | 593,423 | ||||||
Potash Corp. of Saskatchewan, Inc. | 36,428 | 948,634 | ||||||
Syngenta AG (REG) | 4,080 | 1,367,863 | ||||||
UPL Ltd. | 208,160 | 1,579,151 | ||||||
|
| |||||||
| 11,103,140 | ||||||||
|
| |||||||
Forest Products – 0.0% | ||||||||
West Fraser Timber Co., Ltd. | 3,026 | 117,834 | ||||||
|
| |||||||
Gold – 1.0% | ||||||||
Agnico Eagle Mines Ltd.(a) | 84,805 | 2,076,936 | ||||||
Barrick Gold Corp. | 48,971 | 340,593 | ||||||
Franco-Nevada Corp. | 6,561 | 284,264 | ||||||
Goldcorp, Inc. | 206,617 | 2,866,190 | ||||||
Koza Altin Isletmeleri AS | 91,170 | 765,614 | ||||||
Newcrest Mining Ltd.(b) | 33,565 | 267,817 | ||||||
Newmont Mining Corp. | 22,268 | 380,115 | ||||||
Randgold Resources Ltd. | 23,802 | 1,439,439 | ||||||
Real Gold Mining Ltd.(b)(d)(e) | 686,500 | – 0 | –^ | |||||
|
| |||||||
| 8,420,968 | ||||||||
|
| |||||||
Paper Packaging – 0.2% | ||||||||
Smurfit Kappa Group PLC | 49,420 | 1,436,892 | ||||||
|
| |||||||
Paper Products – 0.3% | ||||||||
International Paper Co. | 17,625 | 760,343 | ||||||
Mondi PLC | 51,638 | 1,160,498 | ||||||
Stora Enso Oyj – Class R | 24,188 | 214,608 | ||||||
UPM-Kymmene Oyj | 23,454 | 389,869 | ||||||
|
| |||||||
| 2,525,318 | ||||||||
|
| |||||||
| AB POOLING PORTFOLIOS • | 195 |
AB Multi-Asset Real Return Portfolio—Portfolio of Investments
| Company | Shares | U.S. $ Value | ||||||
| ||||||||
Precious Metals & Minerals – 0.1% | ||||||||
Fresnillo PLC | 9,290 | $ | 88,046 | |||||
Industrias Penoles SAB de CV | 5,875 | 83,777 | ||||||
Silver Wheaton Corp. | 83,690 | 1,026,087 | ||||||
|
| |||||||
| 1,197,910 | ||||||||
|
| |||||||
Specialty Chemicals – 0.1% | ||||||||
Johnson Matthey PLC | 18,980 | 782,330 | ||||||
|
| |||||||
Steel – 0.7% | ||||||||
ArcelorMittal (Euronext Amsterdam) | 11,619 | 90,736 | ||||||
JFE Holdings, Inc. | 5,900 | 91,367 | ||||||
Nippon Steel & Sumitomo Metal Corp. | 89,920 | 184,392 | ||||||
Novolipetsk Steel OJSC (GDR)(c) | 104,480 | 1,244,452 | ||||||
Nucor Corp. | 3,705 | 160,390 | ||||||
POSCO | 810 | 130,427 | ||||||
Severstal PAO (GDR)(c) | 83,130 | 885,335 | ||||||
ThyssenKrupp AG | 4,262 | 92,129 | ||||||
Vale SA (Preference Shares) | 21,990 | 85,798 | ||||||
Vale SA (Sponsored ADR) (Local Preference Shares) | 486,490 | 1,887,581 | ||||||
voestalpine AG | 22,630 | 825,057 | ||||||
|
| |||||||
| 5,677,664 | ||||||||
|
| |||||||
| 62,682,637 | ||||||||
|
| |||||||
Retail – 5.1% | ||||||||
Regional Mall – 1.5% | ||||||||
BR Malls Participacoes SA | 85,310 | 263,459 | ||||||
CapitaLand Mall Trust | 488,400 | 663,539 | ||||||
General Growth Properties, Inc. | 33,325 | 845,788 | ||||||
Macerich Co. (The) | 5,969 | 454,719 | ||||||
Multiplan Empreendimentos Imobiliarios SA | 25,050 | 284,438 | ||||||
Pennsylvania Real Estate Investment Trust | 56,910 | 1,129,094 | ||||||
Simon Property Group, Inc. | 31,486 | 5,646,069 | ||||||
Taubman Centers, Inc. | 2,336 | 161,161 | ||||||
Westfield Corp. | 388,613 | 2,691,062 | ||||||
|
| |||||||
| 12,139,329 | ||||||||
|
| |||||||
Shopping Center/Other Retail – 3.6% | ||||||||
Capital & Counties Properties PLC | 136,885 | 924,489 | ||||||
CapitaMalls Malaysia Trust | 215,100 | 68,115 | ||||||
Citycon Oyj(b) | 73,772 | 185,200 | ||||||
DDR Corp. | 59,269 | 906,223 | ||||||
Federal Realty Investment Trust | 2,595 | 334,963 | ||||||
Federation Centres | 926,180 | 1,861,857 | ||||||
Fibra Shop Portafolios Inmobiliarios SAPI de CV | 462,864 | 454,338 | ||||||
Hammerson PLC | 195,745 | 1,871,730 | ||||||
Hyprop Investments Ltd. | 78,785 | 736,744 | ||||||
| 196 | • AB POOLING PORTFOLIOS |
AB Multi-Asset Real Return Portfolio—Portfolio of Investments
| Company | Shares | U.S. $ Value | ||||||
| ||||||||
IGB Real Estate Investment Trust | 327,600 | $ | 102,180 | |||||
Iguatemi Empresa de Shopping Centers SA | 11,700 | 66,458 | ||||||
Intu Properties PLC | 172,930 | 849,620 | ||||||
Japan Retail Fund Investment Corp.(a) | 695 | 1,277,600 | ||||||
JB Hi-Fi Ltd.(a) | 33,720 | 455,558 | ||||||
Kimco Realty Corp. | 15,534 | 358,059 | ||||||
Kite Realty Group Trust | 39,600 | 930,996 | ||||||
Klepierre | 54,868 | 2,414,685 | ||||||
Link REIT | 499,378 | 2,651,238 | ||||||
Mercialys SA | 32,170 | 724,356 | ||||||
Ramco-Gershenson Properties Trust | 57,554 | 892,087 | ||||||
Regency Centers Corp. | 3,524 | 209,008 | ||||||
Renhe Commercial Holdings Co., Ltd.(a)(b) | 3,130,000 | 177,816 | ||||||
Retail Opportunity Investments Corp. | 60,829 | 969,006 | ||||||
RioCan Real Estate Investment Trust (Toronto) | 11,984 | 221,444 | ||||||
Scentre Group | 1,403,967 | 3,802,944 | ||||||
Smart Real Estate Investment Trust | 4,188 | 93,176 | ||||||
Unibail-Rodamco SE | 22,864 | 5,935,989 | ||||||
Vastned Retail NV | 13,948 | 635,679 | ||||||
|
| |||||||
| 30,111,558 | ||||||||
|
| |||||||
| 42,250,887 | ||||||||
|
| |||||||
Residential – 4.0% | ||||||||
Multi-Family – 3.5% | ||||||||
Advance Residence Investment Corp. | 241 | 500,359 | ||||||
Apartment Investment & Management Co. – Class A | 5,906 | 212,793 | ||||||
AvalonBay Communities, Inc. | 12,858 | 2,122,341 | ||||||
Boardwalk Real Estate Investment Trust | 1,501 | 62,215 | ||||||
BUWOG AG(a)(b) | 9,570 | 201,823 | ||||||
Camden Property Trust | 3,265 | 235,178 | ||||||
Canadian Apartment Properties REIT | 4,460 | 94,922 | ||||||
China Overseas Land & Investment Ltd. | 758,650 | 2,222,098 | ||||||
China Resources Land Ltd. | 980,966 | 2,474,975 | ||||||
China Vanke Co., Ltd. – Class H(a) | 821,775 | 1,871,136 | ||||||
CIFI Holdings Group Co., Ltd. | 2,114,000 | 391,935 | ||||||
Corp. GEO SAB de CV Series B(b)(d)(e) | 108,590 | – 0 | –^ | |||||
Cyrela Brazil Realty SA Empreendimentos | 52,720 | 122,109 | ||||||
Desarrolladora Homex SAB de CV(a)(b)(d)(e) | 1,300 | 31 | ||||||
Deutsche Annington Immobilien SE | 97,974 | 3,211,225 | ||||||
Deutsche Wohnen AG | 63,801 | 1,678,802 | ||||||
Emlak Konut Gayrimenkul Yatirim Ortakligi AS | 830,383 | 711,499 | ||||||
Equity LifeStyle Properties, Inc. | 2,886 | 160,923 | ||||||
Equity Residential | 23,798 | 1,695,608 | ||||||
Essex Property Trust, Inc. | 8,190 | 1,757,738 | ||||||
| AB POOLING PORTFOLIOS • | 197 |
AB Multi-Asset Real Return Portfolio—Portfolio of Investments
| Company | Shares | U.S. $ Value | ||||||
| ||||||||
Ichigo Real Estate Investment Corp. | 510 | $ | 355,514 | |||||
Japan Rental Housing Investments, Inc. | 414 | 264,731 | ||||||
KWG Property Holding Ltd. | 882,500 | 558,521 | ||||||
Land & Houses PCL | 692,300 | 150,611 | ||||||
LEG Immobilien AG(b) | 10,768 | 807,245 | ||||||
LPN Development PCL | 113,600 | 49,476 | ||||||
Mid-America Apartment Communities, Inc. | 18,174 | 1,428,295 | ||||||
MRV Engenharia e Participacoes SA | 56,300 | 98,888 | ||||||
Shenzhen Investment Ltd. | 582,000 | 208,054 | ||||||
Shimao Property Holdings Ltd. | 246,000 | 344,286 | ||||||
Sino-Ocean Land Holdings Ltd. | 727,350 | 375,585 | ||||||
Stockland | 757,187 | 2,103,807 | ||||||
Sun Communities, Inc. | 12,171 | 793,671 | ||||||
UDR, Inc. | 9,787 | 316,120 | ||||||
UNITE Group PLC (The) | 42,130 | 416,434 | ||||||
Urbi Desarrollos Urbanos SAB de CV(a)(b)(d)(e) | 52,560 | – 0 | – | |||||
Wing Tai Holdings Ltd. | 634,000 | 739,920 | ||||||
Yuexiu Property Co., Ltd. | 1,238,000 | 195,592 | ||||||
|
| |||||||
| 28,934,460 | ||||||||
|
| |||||||
Self Storage – 0.5% | ||||||||
CubeSmart | 43,510 | 1,100,368 | ||||||
Extra Space Storage, Inc. | 19,404 | 1,425,806 | ||||||
National Storage Affiliates Trust | 54,771 | 708,737 | ||||||
Public Storage | 5,481 | 1,103,161 | ||||||
Safestore Holdings PLC | 94,810 | 424,427 | ||||||
|
| |||||||
| 4,762,499 | ||||||||
|
| |||||||
| 33,696,959 | ||||||||
|
| |||||||
Office – 2.1% | ||||||||
Office – 2.1% | ||||||||
Allied Properties Real Estate Investment Trust | 24,205 | 641,370 | ||||||
alstria office REIT-AG(a)(b) | 52,065 | 696,807 | ||||||
Ascendas India Trust | 136,400 | 85,713 | ||||||
Befimmo SA | 3,170 | 195,610 | ||||||
Boston Properties, Inc. | 9,191 | 1,042,075 | ||||||
Castellum AB | 30,897 | 437,252 | ||||||
Cominar Real Estate Investment Trust | 6,257 | 77,190 | ||||||
Cousins Properties, Inc. | 62,390 | 572,116 | ||||||
Derwent London PLC | 18,766 | 1,030,821 | ||||||
Dream Office Real Estate Investment Trust | 33,270 | 537,641 | ||||||
Entra ASA(c) | 61,950 | 521,696 | ||||||
Fabege AB | 76,109 | 1,075,751 | ||||||
Highwoods Properties, Inc. | 17,210 | 652,947 | ||||||
Hongkong Land Holdings Ltd. | 353,500 | 2,449,221 | ||||||
Hudson Pacific Properties, Inc. | 19,170 | 544,236 | ||||||
Inmobiliaria Colonial SA(b) | 315,792 | 221,327 | ||||||
| 198 | • AB POOLING PORTFOLIOS |
AB Multi-Asset Real Return Portfolio—Portfolio of Investments
| Company | Shares | U.S. $ Value | ||||||
| ||||||||
Investa Office Fund | 121,280 | $ | 331,594 | |||||
Japan Prime Realty Investment Corp. | 111 | 358,809 | ||||||
Japan Real Estate Investment Corp. | 236 | 989,278 | ||||||
Kenedix Office Investment Corp. – Class A | 158 | 702,622 | ||||||
Kilroy Realty Corp. | 5,868 | 380,598 | ||||||
Liberty Property Trust | 18,039 | 554,519 | ||||||
Nippon Building Fund, Inc. | 256 | 1,075,546 | ||||||
Norwegian Property ASA(b) | 46,499 | 55,030 | ||||||
PSP Swiss Property AG (REG)(b) | 7,492 | 648,956 | ||||||
SL Green Realty Corp. | 3,764 | 389,612 | ||||||
Tokyo Tatemono Co., Ltd. | 38,800 | 487,391 | ||||||
Workspace Group PLC | 34,180 | 469,910 | ||||||
|
| |||||||
| 17,225,638 | ||||||||
|
| |||||||
Industrials – 1.2% | ||||||||
Industrial Warehouse Distribution – 0.9% | ||||||||
Ascendas Real Estate Investment Trust | 370,600 | 584,890 | ||||||
DCT Industrial Trust, Inc. | 25,630 | 822,979 | ||||||
Global Logistic Properties Ltd. | 574,800 | 904,970 | ||||||
GLP J-Reit(a) | 317 | 296,782 | ||||||
Granite Real Estate Investment Trust | 27,959 | 789,842 | ||||||
Japan Logistics Fund, Inc. | 125 | 225,653 | ||||||
Mapletree Industrial Trust | 197,300 | 214,793 | ||||||
Mapletree Logistics Trust | 556,012 | 385,968 | ||||||
Mexico Real Estate Management SA de CV(b) | 431,300 | 588,567 | ||||||
Nippon Prologis REIT, Inc. | 131 | 237,124 | ||||||
PLA Administradora Industrial S de RL de CV(b) | 185,450 | 350,749 | ||||||
Prologis, Inc. | 19,804 | 752,552 | ||||||
Segro PLC | 139,725 | 890,679 | ||||||
Warehouses De Pauw CVA | 7,920 | 633,244 | ||||||
|
| |||||||
| 7,678,792 | ||||||||
|
| |||||||
Mixed Office Industrial – 0.3% | ||||||||
BR Properties SA | 36,820 | 102,541 | ||||||
Goodman Group | 484,823 | 2,095,362 | ||||||
Green REIT PLC | 124,390 | 209,501 | ||||||
Kungsleden AB | 34,286 | 229,180 | ||||||
|
| |||||||
| 2,636,584 | ||||||||
|
| |||||||
| 10,315,376 | ||||||||
|
| |||||||
Lodging – 0.7% | ||||||||
Lodging – 0.7% | ||||||||
Ashford Hospitality Trust, Inc. | 59,718 | 462,217 | ||||||
Host Hotels & Resorts, Inc. | 28,573 | 506,599 | ||||||
Japan Hotel REIT Investment Corp. | 609 | 375,418 | ||||||
Pebblebrook Hotel Trust | 30,350 | 1,155,121 | ||||||
RLJ Lodging Trust | 44,050 | 1,213,137 | ||||||
| AB POOLING PORTFOLIOS • | 199 |
AB Multi-Asset Real Return Portfolio—Portfolio of Investments
| Company | Shares | U.S. $ Value | ||||||
| ||||||||
Starwood Hotels & Resorts Worldwide, Inc. | 5,490 | $ | 392,370 | |||||
Summit Hotel Properties, Inc. | 71,900 | 872,147 | ||||||
Wyndham Worldwide Corp. | 13,780 | 1,053,895 | ||||||
|
| |||||||
| 6,030,904 | ||||||||
|
| |||||||
Food Beverage & Tobacco – 0.5% | ||||||||
Agricultural Products – 0.4% | ||||||||
Archer-Daniels-Midland Co. | 64,221 | 2,889,302 | ||||||
Bunge Ltd. | 6,384 | 462,521 | ||||||
|
| |||||||
| 3,351,823 | ||||||||
|
| |||||||
Packaged Foods & Meats – 0.1% | ||||||||
Tyson Foods, Inc. – Class A | 22,360 | 945,381 | ||||||
|
| |||||||
| 4,297,204 | ||||||||
|
| |||||||
Mortgage – 0.2% | ||||||||
Mortgage – 0.2% | ||||||||
Blackstone Mortgage Trust, Inc. – Class A | 15,230 | 421,719 | ||||||
Concentradora Hipotecaria SAPI de CV | 248,000 | 400,772 | ||||||
First American Financial Corp. | 13,040 | 506,734 | ||||||
|
| |||||||
| 1,329,225 | ||||||||
|
| |||||||
Financial: Other – 0.1% | ||||||||
Financial: Other – 0.1% | ||||||||
DLF Ltd. | 84,276 | 140,254 | ||||||
HFF, Inc. – Class A | 10,280 | 373,472 | ||||||
|
| |||||||
| 513,726 | ||||||||
|
| |||||||
Transportation – 0.1% | ||||||||
Airport Services – 0.1% | ||||||||
Kobenhavns Lufthavne | 924 | 496,358 | ||||||
|
| |||||||
Real Estate – 0.0% | ||||||||
Developers – 0.0% | ||||||||
Daelim Industrial Co., Ltd. | 3,780 | 214,861 | ||||||
|
| |||||||
Total Common Stocks | 457,511,441 | |||||||
|
| |||||||
| Principal Amount (000) | ||||||||
INFLATION-LINKED SECURITIES – 26.2% | ||||||||
United States – 26.2% | ||||||||
U.S. Treasury Inflation Index | ||||||||
0.125%, 4/15/16 (TIPS)(f)(g) | 214,053 | 211,998,793 | ||||||
0.625%, 7/15/21 (TIPS) | 5,863 | 5,956,851 | ||||||
|
| |||||||
Total Inflation-Linked Securities | 217,955,644 | |||||||
|
| |||||||
| 200 | • AB POOLING PORTFOLIOS |
AB Multi-Asset Real Return Portfolio—Portfolio of Investments
| Company | Shares | U.S. $ Value | ||||||
| ||||||||
INVESTMENT COMPANIES – 5.3% | ||||||||
Funds and Investment Trusts – 5.3% | ||||||||
iShares US Real Estate ETF(a) | 38,220 | $ | 2,693,746 | |||||
SPDR S&P Dividend ETF(a) | 336,100 | 24,757,126 | ||||||
Vanguard Dividend Appreciation ETF(a) | 216,100 | 16,330,677 | ||||||
|
| |||||||
Total Investment Companies | 43,781,549 | |||||||
|
| |||||||
WARRANTS – 0.1% | ||||||||
Equity: Other – 0.1% | ||||||||
Diversified/Specialty – 0.1% | ||||||||
Eastern & Oriental Bhd, expiring 7/21/19(b) | 17,110 | 835 | ||||||
Emaar Properties PJSC, Merrill Lynch Intl & Co., expiring 10/01/15(b) | 419,279 | 770,545 | ||||||
|
| |||||||
Total Warrants | 771,380 | |||||||
|
| |||||||
SHORT-TERM INVESTMENTS – 12.4% | ||||||||
Investment Companies – 12.4% | ||||||||
AB Fixed Income Shares, Inc. – Government STIF Portfolio, 0.13%(h)(i) | 103,524,528 | 103,524,528 | ||||||
|
| |||||||
Total Investments Before Security Lending Collateral for Securities Loaned – 98.9% | 823,544,542 | |||||||
|
| |||||||
INVESTMENTS OF CASH COLLATERAL FOR SECURITIES LOANED – 3.2% | ||||||||
Investment Companies – 3.2% | ||||||||
AB Exchange Reserves – Class I, 0.11%(h)(i) (cost $26,857,470) | 26,857,470 | 26,857,470 | ||||||
|
| |||||||
Total Investments – 102.1% | 850,402,012 | |||||||
Other assets less liabilities – (2.1)% | (17,575,380 | ) | ||||||
|
| |||||||
Net Assets – 100.0% | $ | 832,826,632 | ||||||
|
| |||||||
| AB POOLING PORTFOLIOS • | 201 |
AB Multi-Asset Real Return Portfolio—Portfolio of Investments
FUTURES (see Note C)
| Type | Number of Contracts | Expiration Month | Original Value | Value at August 31, 2015 | Unrealized Appreciation/ (Depreciation) | |||||||||||||||
Purchased Contracts |
| |||||||||||||||||||
Coffee ‘C’ Futures | 44 | December 2015 | $ | 2,101,414 | $ | 2,050,950 | $ | (50,464 | ) | |||||||||||
Gold 100 OZ Futures | 92 | December 2015 | 10,076,986 | 10,419,000 | 342,014 | |||||||||||||||
Lean Hogs Futures | 91 | October 2015 | 2,292,534 | 2,476,110 | 183,576 | |||||||||||||||
LME Lead Futures | 20 | September 2015 | 894,936 | 864,750 | (30,186 | ) | ||||||||||||||
LME Nickel Futures | 44 | September 2015 | 3,204,615 | 2,650,032 | (554,583 | ) | ||||||||||||||
LME Nickel Futures | 44 | October 2015 | 2,680,922 | 2,653,200 | (27,722 | ) | ||||||||||||||
LME PRI Aluminum Futures | 50 | September 2015 | 1,993,903 | 1,994,375 | 472 | |||||||||||||||
LME Zinc Futures | 7 | September 2015 | 357,809 | 316,706 | (41,103 | ) | ||||||||||||||
LME Zinc Futures | 7 | October 2015 | 320,269 | 316,750 | (3,519 | ) | ||||||||||||||
Palladium Futures | 44 | December 2015 | 2,632,415 | 2,649,900 | 17,485 | |||||||||||||||
Platinum Futures | 83 | October 2015 | 4,568,537 | 4,193,575 | (374,962 | ) | ||||||||||||||
Soybean Futures | 31 | November 2015 | 1,405,554 | 1,375,625 | (29,929 | ) | ||||||||||||||
Sugar 11 (World) Futures | 467 | October 2015 | 6,337,792 | 5,591,298 | (746,494 | ) | ||||||||||||||
WTI Crude Futures | 301 | November 2017 | 23,904,355 | 17,774,050 | (6,130,305 | ) | ||||||||||||||
WTI Crude Futures | 569 | November 2018 | 45,113,635 | 34,845,560 | (10,268,075 | ) | ||||||||||||||
WTI Crude Futures | 278 | November 2019 | 19,355,366 | 17,494,540 | (1,860,826 | ) | ||||||||||||||
Sold Contracts | ||||||||||||||||||||
Coff Robusta Futures | 126 | November 2015 | 2,168,582 | 2,029,860 | 138,722 | |||||||||||||||
Cotton No. 2 Futures | 22 | December 2015 | 712,561 | 693,000 | 19,561 | |||||||||||||||
KC HRW Wheat (CBT) Futures | 60 | December 2015 | 1,485,054 | 1,463,250 | 21,804 | |||||||||||||||
Live Cattle Futures | 38 | October 2015 | 2,274,303 | 2,176,640 | 97,663 | |||||||||||||||
LME Lead Futures | 20 | September 2015 | 858,197 | 864,750 | (6,553 | ) | ||||||||||||||
LME Nickel Futures | 44 | September 2015 | 2,677,353 | 2,650,032 | 27,321 | |||||||||||||||
LME PRI Aluminum Futures | 50 | September 2015 | 2,120,628 | 1,994,375 | 126,253 | |||||||||||||||
LME PRI Aluminum Futures | 123 | October 2015 | 4,923,440 | 4,965,356 | (41,916 | ) | ||||||||||||||
LME Zinc Futures | 7 | September 2015 | 320,231 | 316,706 | 3,525 | |||||||||||||||
|
| |||||||||||||||||||
| $ | (19,188,241 | ) | ||||||||||||||||||
|
| |||||||||||||||||||
| 202 | • AB POOLING PORTFOLIOS |
AB Multi-Asset Real Return Portfolio—Portfolio of Investments
FORWARD CURRENCY EXCHANGE CONTRACTS (see Note C)
| Counterparty | Contracts to Deliver (000) | In Exchange For (000) | Settlement Date | Unrealized Appreciation/ (Depreciation) | ||||||||||||||||||||
Bank of America | USD | 36,428 | NOK | 282,717 | 9/17/15 | $ | (2,261,905 | ) | ||||||||||||||||
Barclays Bank PLC | INR | 83,602 | USD | 1,287 | 9/16/15 | 30,296 | ||||||||||||||||||
Barclays Bank PLC | EUR | 70,553 | USD | 79,891 | 9/17/15 | 703,221 | ||||||||||||||||||
Barclays Bank PLC | JPY | 3,196,341 | USD | 26,069 | 9/17/15 | (301,328 | ) | |||||||||||||||||
Barclays Bank PLC | USD | 3,254 | CHF | 3,013 | 9/17/15 | (135,213 | ) | |||||||||||||||||
Barclays Bank PLC | USD | 1,507 | IDR | 20,453,303 | 9/17/15 | (64,262 | ) | |||||||||||||||||
BNP Paribas SA | USD | 4,258 | HKD | 33,011 | 9/17/15 | 1,610 | ||||||||||||||||||
Citibank | USD | 1,956 | RUB | 112,835 | 9/10/15 | (202,793 | ) | |||||||||||||||||
Citibank | USD | 5,869 | EUR | 5,150 | 9/17/15 | (88,638 | ) | |||||||||||||||||
Credit Suisse International | NOK | 293,125 | USD | 35,904 | 9/17/15 | 480,164 | ||||||||||||||||||
Deutsche Bank AG | AUD | 7,288 | USD | 5,345 | 12/15/15 | 185,631 | ||||||||||||||||||
Goldman Sachs Bank USA | BRL | 10,288 | USD | 2,821 | 9/02/15 | (15,597 | ) | |||||||||||||||||
Goldman Sachs Bank USA | USD | 2,877 | BRL | 10,288 | 9/02/15 | (39,778 | ) | |||||||||||||||||
Goldman Sachs Bank USA | RUB | 112,835 | USD | 1,713 | 9/10/15 | (39,498 | ) | |||||||||||||||||
Goldman Sachs Bank USA | CAD | 23,967 | USD | 18,888 | 9/17/15 | 671,646 | ||||||||||||||||||
Goldman Sachs Bank USA | USD | 5,201 | CNY | 32,004 | 9/17/15 | (206,448 | ) | |||||||||||||||||
Goldman Sachs Bank USA | USD | 2,560 | JPY | 306,820 | 9/17/15 | (28,841 | ) | |||||||||||||||||
Goldman Sachs Bank USA | USD | 4,029 | ZAR | 50,519 | 9/17/15 | (228,961 | ) | |||||||||||||||||
HSBC Bank USA | SGD | 2,830 | USD | 2,015 | 9/17/15 | 10,383 | ||||||||||||||||||
HSBC Bank USA | SGD | 481 | USD | 341 | 12/15/15 | 1,788 | ||||||||||||||||||
Morgan Stanley & Co., Inc. | USD | 1,717 | BRL | 6,164 | 9/17/15 | (26,226 | ) | |||||||||||||||||
Morgan Stanley & Co., Inc. | USD | 11,872 | JPY | 1,473,247 | 9/17/15 | 282,626 | ||||||||||||||||||
Morgan Stanley & Co., Inc. | GBP | 1,611 | USD | 2,470 | 12/15/15 | (832 | ) | |||||||||||||||||
Northern Trust Company | EUR | 1,990 | USD | 2,238 | 12/15/15 | 615 | ||||||||||||||||||
Royal Bank of Scotland PLC | BRL | 10,288 | USD | 3,163 | 9/02/15 | 325,939 | ||||||||||||||||||
Royal Bank of Scotland PLC | USD | 2,821 | BRL | 10,288 | 9/02/15 | 15,597 | ||||||||||||||||||
Royal Bank of Scotland PLC | AUD | 8,438 | USD | 6,505 | 9/17/15 | 505,051 | ||||||||||||||||||
Royal Bank of Scotland PLC | CNY | 32,004 | USD | 4,903 | 9/17/15 | (90,916 | ) | |||||||||||||||||
Royal Bank of Scotland PLC | USD | 10,215 | CAD | 13,354 | 9/17/15 | (64,825 | ) | |||||||||||||||||
Royal Bank of Scotland PLC | USD | 504 | MYR | 1,893 | 9/17/15 | (50,319 | ) | |||||||||||||||||
Royal Bank of Scotland PLC | USD | 2,106 | SGD | 2,830 | 9/17/15 | (101,364 | ) | |||||||||||||||||
Royal Bank of Scotland PLC | CNY | 108,774 | USD | 16,574 | 12/15/15 | (162,606 | ) | |||||||||||||||||
Royal Bank of Scotland PLC | NOK | 30,549 | USD | 3,703 | 12/15/15 | 15,461 | ||||||||||||||||||
Royal Bank of Scotland PLC | NZD | 26,579 | USD | 17,410 | 12/15/15 | 689,002 | ||||||||||||||||||
Royal Bank of Scotland PLC | RUB | 516,754 | USD | 7,590 | 12/15/15 | (182,957 | ) | |||||||||||||||||
Standard Chartered Bank | CAD | 13,887 | USD | 11,296 | 9/17/15 | 740,719 | ||||||||||||||||||
State Street Bank & Trust Co. | EUR | 1,314 | USD | 1,489 | 9/17/15 | 14,541 | ||||||||||||||||||
State Street Bank & Trust Co. | JPY | 52,947 | USD | 432 | 9/17/15 | (4,781 | ) | |||||||||||||||||
State Street Bank & Trust Co. | USD | 40,126 | EUR | 35,891 | 9/17/15 | 157,982 | ||||||||||||||||||
State Street Bank & Trust Co. | USD | 5,095 | EUR | 4,464 | 9/17/15 | (84,795 | ) | |||||||||||||||||
State Street Bank & Trust Co. | USD | 12,733 | GBP | 8,141 | 9/17/15 | (241,526 | ) | |||||||||||||||||
State Street Bank & Trust Co. | USD | 67 | SEK | 551 | 9/17/15 | (1,761 | ) | |||||||||||||||||
UBS AG | BRL | 14,375 | USD | 4,482 | 9/17/15 | 539,768 | ||||||||||||||||||
UBS AG | GBP | 20,851 | USD | 32,375 | 9/17/15 | 381,905 | ||||||||||||||||||
UBS AG | HKD | 25,515 | USD | 3,290 | 9/17/15 | (2,568 | ) | |||||||||||||||||
UBS AG | USD | 4,439 | GBP | 2,807 | 9/17/15 | (131,889 | ) | |||||||||||||||||
|
| |||||||||||||||||||||||
| $ | 993,318 | |||||||||||||||||||||||
|
| |||||||||||||||||||||||
PUT OPTIONS WRITTEN (see Note C)
| Description | Contracts | Exercise Price | Expiration Month | Premiums Received | U.S. $ Value | |||||||||||||||
Market Vectors Gold(j) | 4,100,180 | $ | 13.00 | September 2015 | $ | 2,848,805 | $ | (1,406,579 | ) | |||||||||||
United States Oil Fund(j) | 5,895,640 | 10.50 | September 2015 | 235,826 | (19,898 | ) | ||||||||||||||
United States Oil Fund LP(k) | 58,956 | 10.50 | September 2015 | 233,301 | (147,390 | ) | ||||||||||||||
|
|
|
| |||||||||||||||||
| $ | 3,317,932 | $ | (1,573,867 | ) | ||||||||||||||||
|
|
|
| |||||||||||||||||
| AB POOLING PORTFOLIOS • | 203 |
AB Multi-Asset Real Return Portfolio—Portfolio of Investments
INFLATION (CPI) SWAPS (see Note C)
| Rate Type | ||||||||||||||||||||
| Swap Counterparty | Notional Amount (000) | Termination Date | Payments made by the Fund | Payments received by the Fund | Unrealized Appreciation/ (Depreciation) | |||||||||||||||
Deutsche Bank AG | $ | 10,150 | 3/25/25 | 2.205 | % | CPI | # | $ | 11,526 | |||||||||||
Deutsche Bank AG | 59,114 | 3/25/25 | 2.205 | % | CPI | # | 67,126 | |||||||||||||
Deutsche Bank AG | 70,937 | 3/25/25 | 2.205 | % | CPI | # | 80,551 | |||||||||||||
Deutsche Bank AG | 28,794 | 3/26/25 | 2.195 | % | CPI | # | 45,936 | |||||||||||||
Deutsche Bank AG | 57,586 | 3/26/25 | 2.170 | % | CPI | # | 156,337 | |||||||||||||
Deutsche Bank AG | 102,000 | 7/30/25 | 2.278 | % | CPI | # | (97,323 | ) | ||||||||||||
JPMorgan Chase Bank, NA | 116,340 | 3/30/25 | 2.170 | % | CPI | # | 327,179 | |||||||||||||
JPMorgan Chase Bank, NA | 116,340 | 4/01/25 | 2.170 | % | CPI | # | 323,919 | |||||||||||||
|
| |||||||||||||||||||
| $ | 915,251 | |||||||||||||||||||
|
| |||||||||||||||||||
| # | Variable interest rate based on the rate of inflation as determined by the Consumer Price Index (CPI). |
TOTAL RETURN SWAPS (see Note C)
| Counterparty & Referenced Obligation | # of Shares or Units | Rate Paid/ Received | Notional Amount (000) | Maturity Date | Unrealized Appreciation/ (Depreciation) | |||||||||||||||
Receive Total Return on Reference Obligation |
| |||||||||||||||||||
Goldman Sachs International |
| |||||||||||||||||||
Bloomberg Commodity Index 2 Months Forwards | 190,126 | 0.11 | % | $ | 37,086 | 9/15/15 | $ | 448,291 | ||||||||||||
JPMorgan Chase Bank, NA |
| |||||||||||||||||||
Bloomberg Commodity Index 2 Months Forwards | 1,155,897 | 0.11 | % | 225,468 | 9/15/15 | 2,725,443 | ||||||||||||||
Bloomberg Commodity Index 2 Months Forwards | 50,727 | 0.11 | % | 9,895 | 9/15/15 | 119,680 | ||||||||||||||
Pay Total Return on Reference Obligation |
| |||||||||||||||||||
Morgan Stanley Capital Services LLC |
| |||||||||||||||||||
United States Oil Fund LP | 1,266,231 | LIBOR Minus 1.78 | % | 22,295 | 10/15/15 | 2,125,377 | ||||||||||||||
United States Oil Fund LP | 1,225,720 | LIBOR Minus 1.78 | % | 15,591 | 10/15/15 | (3,885,532 | ) | |||||||||||||
|
| |||||||||||||||||||
| $ | 1,533,259 | |||||||||||||||||||
|
| |||||||||||||||||||
| ^ | Less than $0.50 |
| (a) | Represents entire or partial securities out on loan. See Note D for securities lending information. |
| (b) | Non-income producing security. |
| (c) | Security is exempt from registration under Rule 144A of the Securities Act of 1933. These securities are considered liquid and may be resold in transactions exempt from registration, normally to qualified institutional buyers. At August 31, 2015, the aggregate market value of these securities amounted to $4,323,447 or 0.5% of net assets. |
| (d) | Fair valued by the Adviser. |
| (e) | Illiquid security. |
| (f) | Position, or a portion thereof, has been segregated to collateralize margin requirements for open futures contracts. |
| 204 | • AB POOLING PORTFOLIOS |
AB Multi-Asset Real Return Portfolio—Portfolio of Investments
| (g) | Position, or a portion thereof, has been segregated to collateralize OTC derivatives outstanding. |
| (h) | To obtain a copy of the fund’s financial statements, please go to the Securities and Exchange Commission’s website at www.sec.gov, or call AB at (800) 227-4618. |
| (i) | Investment in affiliated money market mutual fund. The rate shown represents the 7-day yield as of period end. |
| (j) | One contract relates to 1 share. |
| (k) | One contract relates to 100 shares. |
Currency Abbreviations:
AUD – Australian Dollar
BRL – Brazilian Real
CAD – Canadian Dollar
CHF – Swiss Franc
CNY – Chinese Yuan Renminbi
EUR – Euro
GBP – Great British Pound
HKD – Hong Kong Dollar
IDR – Indonesian Rupiah
INR – Indian Rupee
JPY – Japanese Yen
MYR – Malaysian Ringgit
NOK – Norwegian Krone
NZD – New Zealand Dollar
RUB – Russian Ruble
SEK – Swedish Krona
SGD – Singapore Dollar
USD – United States Dollar
ZAR – South African Rand
Glossary:
ADR – American Depositary Receipt
CBT – Chicago Board of Trade
CPI – Consumer Price Index
ETF – Exchange Traded Fund
GDR – Global Depositary Receipt
KC HRW – Kansas City Hard Red Winter
LIBOR – London Interbank Offered Rates
LME – London Metal Exchange
OJSC – Open Joint Stock Company
PJSC – Public Joint Stock Company
REG – Registered Shares
REIT – Real Estate Investment Trust
SPDR – Standard & Poor’s Depository Receipt
TIPS – Treasury Inflation Protected Security
WTI – West Texas Intermediate
See notes to financial statements.
| AB POOLING PORTFOLIOS • | 205 |
AB Multi-Asset Real Return Portfolio—Portfolio of Investments
AB VOLATILITY MANAGEMENT
PORTFOLIO OF INVESTMENTS
August 31, 2015
| Company | Shares | U.S. $ Value | ||||||
| ||||||||
COMMON STOCKS – 68.4% | ||||||||
Financials – 11.4% | ||||||||
Banks – 5.7% | ||||||||
Aozora Bank Ltd. | 30,000 | $ | 109,523 | |||||
Australia & New Zealand Banking Group Ltd. | 73,579 | 1,463,406 | ||||||
Banca Monte dei Paschi di Siena SpA(a) | 67,580 | 141,596 | ||||||
Banco Bilbao Vizcaya Argentaria SA | 167,958 | 1,553,744 | ||||||
Banco Comercial Portugues SA(a)(b) | 1,009,163 | 71,213 | ||||||
Banco de Sabadell SA(b) | 130,008 | 275,447 | ||||||
Banco Espirito Santo SA (REG)(a)(c)(d) | 54,936 | – 0 | –^ | |||||
Banco Popolare SC(a) | 9,614 | 164,796 | ||||||
Banco Popular Espanol SA | 45,119 | 192,126 | ||||||
Banco Santander SA | 382,164 | 2,332,952 | ||||||
Bank Hapoalim BM | 28,188 | 142,965 | ||||||
Bank Leumi Le-Israel BM(a) | 37,238 | 135,679 | ||||||
Bank of America Corp. | 292,802 | 4,784,385 | ||||||
Bank of East Asia Ltd. (The) | 31,200 | 107,780 | ||||||
Bank of Ireland(a) | 727,800 | 288,772 | ||||||
Bank of Kyoto Ltd. (The) | 9,000 | 97,577 | ||||||
Bank of Queensland Ltd. | 9,550 | 86,105 | ||||||
Bank of Yokohama Ltd. (The) | 30,000 | 183,188 | ||||||
Bankia SA | 119,352 | 143,471 | ||||||
Bankinter SA | 17,836 | 133,634 | ||||||
Barclays PLC | 438,987 | 1,744,450 | ||||||
BB&T Corp. | 20,000 | 738,400 | ||||||
Bendigo & Adelaide Bank Ltd. | 11,979 | 93,446 | ||||||
BNP Paribas SA | 28,178 | 1,774,949 | ||||||
BOC Hong Kong Holdings Ltd. | 98,000 | 331,160 | ||||||
CaixaBank SA | 60,810 | 261,713 | ||||||
Chiba Bank Ltd. (The) | 18,000 | 131,051 | ||||||
Chugoku Bank Ltd. (The) | 4,000 | 59,166 | ||||||
Citigroup, Inc. | 84,399 | 4,513,658 | ||||||
Comerica, Inc. | 4,950 | 217,800 | ||||||
Commerzbank AG(a)(b) | 28,317 | 316,343 | ||||||
Commonwealth Bank of Australia | 45,006 | 2,404,504 | ||||||
Credit Agricole SA | 27,265 | 368,589 | ||||||
Danske Bank A/S | 18,782 | 580,888 | ||||||
DBS Group Holdings Ltd. | 46,000 | 579,799 | ||||||
DNB ASA | 25,942 | 369,317 | ||||||
Erste Group Bank AG(a) | 7,416 | 219,454 | ||||||
Fifth Third Bancorp | 22,650 | 451,188 | ||||||
Fukuoka Financial Group, Inc. | 20,000 | 99,084 | ||||||
Gunma Bank Ltd. (The) | 10,000 | 66,650 | ||||||
Hachijuni Bank Ltd. (The) | 10,000 | 68,907 | ||||||
Hang Seng Bank Ltd. | 20,300 | 361,329 | ||||||
Hiroshima Bank Ltd. (The) | 13,000 | 73,255 | ||||||
Hokuhoku Financial Group, Inc. | 32,000 | 72,156 | ||||||
| 206 | • AB POOLING PORTFOLIOS |
AB Volatility Management—Portfolio of Investments
| Company | Shares | U.S. $ Value | ||||||
| ||||||||
HSBC Holdings PLC | 511,267 | $ | 4,040,883 | |||||
Huntington Bancshares, Inc./OH | 22,500 | 245,475 | ||||||
ING Groep NV | 102,638 | 1,572,664 | ||||||
Intesa Sanpaolo SpA | 337,224 | 1,226,942 | ||||||
Intesa Sanpaolo SpA – RSP | 24,805 | 81,874 | ||||||
Iyo Bank Ltd. (The) | 6,000 | 67,072 | ||||||
Joyo Bank Ltd. (The) | 16,000 | 85,460 | ||||||
JPMorgan Chase & Co. | 103,750 | 6,650,375 | ||||||
KBC Groep NV | 6,723 | 444,270 | ||||||
KeyCorp | 23,750 | 326,325 | ||||||
Lloyds Banking Group PLC | 1,518,919 | 1,790,315 | ||||||
M&T Bank Corp. | 3,750 | 443,400 | ||||||
Mitsubishi UFJ Financial Group, Inc. | 339,200 | 2,237,424 | ||||||
Mizrahi Tefahot Bank Ltd. | 3,655 | 42,502 | ||||||
Mizuho Financial Group, Inc.(b) | 618,400 | 1,266,463 | ||||||
National Australia Bank Ltd. | 69,557 | 1,542,322 | ||||||
Natixis SA | 24,606 | 156,250 | ||||||
Nordea Bank AB | 80,801 | 954,081 | ||||||
Oversea-Chinese Banking Corp., Ltd. | 79,000 | 500,270 | ||||||
People’s United Financial, Inc. | 8,550 | 132,525 | ||||||
PNC Financial Services Group, Inc. (The) | 14,500 | 1,321,240 | ||||||
Raiffeisen Bank International AG(a) | 3,111 | 41,747 | ||||||
Regions Financial Corp. | 37,300 | 357,707 | ||||||
Resona Holdings, Inc. | 58,700 | 295,866 | ||||||
Royal Bank of Scotland Group PLC(a) | 66,895 | 345,642 | ||||||
Seven Bank Ltd.(b) | 15,841 | 67,307 | ||||||
Shinsei Bank Ltd.(b) | 47,000 | 101,310 | ||||||
Shizuoka Bank Ltd. (The)(b) | 14,000 | 147,324 | ||||||
Skandinaviska Enskilda Banken AB – Class A | 40,323 | 468,557 | ||||||
Societe Generale SA | 19,293 | 937,413 | ||||||
Standard Chartered PLC | 65,777 | 766,333 | ||||||
Sumitomo Mitsui Financial Group, Inc. | 33,900 | 1,383,678 | ||||||
Sumitomo Mitsui Trust Holdings, Inc.(b) | 88,000 | 363,254 | ||||||
SunTrust Banks, Inc. | 14,550 | 587,383 | ||||||
Suruga Bank Ltd. | 5,152 | 98,409 | ||||||
Svenska Handelsbanken AB – Class A | 39,750 | 592,908 | ||||||
Swedbank AB – Class A | 24,040 | 548,381 | ||||||
UniCredit SpA | 127,274 | 830,140 | ||||||
Unione di Banche Italiane SCpA | 23,987 | 186,681 | ||||||
United Overseas Bank Ltd. | 34,000 | 467,453 | ||||||
US Bancorp | 49,550 | 2,098,442 | ||||||
Wells Fargo & Co. | 130,550 | 6,962,231 | ||||||
Westpac Banking Corp. | 83,002 | 1,843,091 | ||||||
Yamaguchi Financial Group, Inc. | 5,000 | 61,577 | ||||||
Zions Bancorporation | 5,600 | 162,400 | ||||||
|
| |||||||
| 73,148,981 | ||||||||
|
| |||||||
| AB POOLING PORTFOLIOS • | 207 |
AB Volatility Management—Portfolio of Investments
| Company | Shares | U.S. $ Value | ||||||
| ||||||||
Capital Markets – 1.4% | ||||||||
3i Group PLC | 25,868 | $ | 193,644 | |||||
Aberdeen Asset Management PLC | 24,311 | 118,006 | ||||||
Affiliated Managers Group, Inc.(a) | 1,587 | 295,880 | ||||||
Ameriprise Financial, Inc. | 5,100 | 574,617 | ||||||
Bank of New York Mellon Corp. (The) | 31,000 | 1,233,800 | ||||||
BlackRock, Inc. – Class A | 3,590 | 1,085,867 | ||||||
Charles Schwab Corp. (The) | 32,100 | 975,198 | ||||||
Credit Suisse Group AG (REG)(a) | 40,631 | 1,093,684 | ||||||
Daiwa Securities Group, Inc. | 44,000 | 304,136 | ||||||
Deutsche Bank AG (REG) | 36,691 | 1,078,036 | ||||||
E*TRADE Financial Corp.(a) | 7,950 | 209,006 | ||||||
Franklin Resources, Inc. | 10,850 | 440,293 | ||||||
Goldman Sachs Group, Inc. (The) | 11,300 | 2,131,180 | ||||||
Hargreaves Lansdown PLC | 6,940 | 118,785 | ||||||
ICAP PLC | 14,678 | 101,442 | ||||||
Invesco Ltd. | 11,850 | 404,204 | ||||||
Investec PLC | 14,543 | 118,310 | ||||||
Julius Baer Group Ltd.(a) | 5,941 | 288,763 | ||||||
Legg Mason, Inc. | 2,700 | 119,691 | ||||||
Macquarie Group Ltd. | 7,766 | 419,169 | ||||||
Mediobanca SpA | 14,934 | 149,281 | ||||||
Morgan Stanley | 42,850 | 1,476,183 | ||||||
Nomura Holdings, Inc.(b) | 96,600 | 605,992 | ||||||
Northern Trust Corp. | 6,050 | 422,532 | ||||||
Partners Group Holding AG | 427 | 137,717 | ||||||
Platinum Asset Management Ltd. | 6,174 | 29,729 | ||||||
SBI Holdings, Inc./Japan | 5,675 | 68,722 | ||||||
Schroders PLC | 3,300 | 142,428 | ||||||
State Street Corp. | 11,450 | 823,484 | ||||||
T Rowe Price Group, Inc. | 7,250 | 521,130 | ||||||
UBS Group AG | 97,147 | 2,009,547 | ||||||
|
| |||||||
| 17,690,456 | ||||||||
|
| |||||||
Consumer Finance – 0.3% | ||||||||
Acom Co., Ltd.(a)(b) | 10,610 | 47,802 | ||||||
AEON Financial Service Co., Ltd.(b) | 2,800 | 63,404 | ||||||
American Express Co. | 24,400 | 1,871,968 | ||||||
Capital One Financial Corp. | 15,385 | 1,196,184 | ||||||
Credit Saison Co., Ltd. | 3,900 | 77,929 | ||||||
Discover Financial Services | 12,450 | 668,938 | ||||||
Navient Corp. | 11,100 | 141,969 | ||||||
|
| |||||||
| 4,068,194 | ||||||||
|
| |||||||
Diversified Financial Services – 1.1% | ||||||||
ASX Ltd. | 5,139 | 144,139 | ||||||
Berkshire Hathaway, Inc. – Class B(a) | 50,800 | 6,809,232 | ||||||
CME Group, Inc./IL – Class A | 8,850 | 835,794 | ||||||
Deutsche Boerse AG | 5,187 | 463,348 | ||||||
| 208 | • AB POOLING PORTFOLIOS |
AB Volatility Management—Portfolio of Investments
| Company | Shares | U.S. $ Value | ||||||
| ||||||||
Eurazeo SA | 1,125 | $ | 73,023 | |||||
EXOR SpA | 2,615 | 120,006 | ||||||
First Pacific Co., Ltd./Hong Kong | 57,900 | 37,563 | ||||||
Groupe Bruxelles Lambert SA | 2,142 | 166,019 | ||||||
Hong Kong Exchanges and Clearing Ltd. | 29,600 | 696,107 | ||||||
Industrivarden AB – Class C | 4,334 | 78,811 | ||||||
Intercontinental Exchange, Inc. | 3,145 | 718,349 | ||||||
Investment AB Kinnevik – Class B | 6,249 | 176,337 | ||||||
Investor AB – Class B | 12,091 | 434,637 | ||||||
Japan Exchange Group, Inc. | 7,303 | 226,614 | ||||||
Leucadia National Corp. | 8,750 | 187,775 | ||||||
London Stock Exchange Group PLC | 8,307 | 318,388 | ||||||
McGraw Hill Financial, Inc. | 7,600 | 737,124 | ||||||
Mitsubishi UFJ Lease & Finance Co., Ltd. | 13,100 | 63,082 | ||||||
Moody’s Corp. | 4,950 | 506,435 | ||||||
NASDAQ OMX Group, Inc. (The) | 3,250 | 166,368 | ||||||
ORIX Corp. | 35,210 | 471,935 | ||||||
Pargesa Holding SA | 820 | 50,259 | ||||||
Singapore Exchange Ltd. | 21,000 | 108,140 | ||||||
Wendel SA | 763 | 97,792 | ||||||
|
| |||||||
| 13,687,277 | ||||||||
|
| |||||||
Insurance – 2.5% | ||||||||
ACE Ltd. | 9,100 | 929,656 | ||||||
Admiral Group PLC | 5,560 | 131,597 | ||||||
Aegon NV | 48,093 | 296,216 | ||||||
Aflac, Inc. | 12,150 | 711,990 | ||||||
Ageas | 5,531 | 225,795 | ||||||
AIA Group Ltd. | 320,400 | 1,768,174 | ||||||
Allianz SE (REG) | 12,157 | 1,937,009 | ||||||
Allstate Corp. (The) | 11,600 | 676,048 | ||||||
American International Group, Inc. | 38,140 | 2,301,368 | ||||||
AMP Ltd. | 78,680 | 332,813 | ||||||
Aon PLC | 7,800 | 728,832 | ||||||
Assicurazioni Generali SpA | 30,996 | 566,896 | ||||||
Assurant, Inc. | 1,900 | 141,265 | ||||||
Aviva PLC | 106,452 | 783,762 | ||||||
AXA SA | 51,975 | 1,309,199 | ||||||
Baloise Holding AG (REG) | 1,331 | 162,780 | ||||||
Chubb Corp. (The) | 6,400 | 773,184 | ||||||
Cincinnati Financial Corp. | 4,050 | 211,936 | ||||||
CNP Assurances | 4,557 | 70,274 | ||||||
Dai-ichi Life Insurance Co., Ltd. (The) | 28,657 | 520,675 | ||||||
Delta Lloyd NV | 5,833 | 61,934 | ||||||
Direct Line Insurance Group PLC | 36,576 | 197,152 | ||||||
Genworth Financial, Inc. – Class A(a) | 13,800 | 71,484 | ||||||
Gjensidige Forsikring ASA | 5,309 | 78,617 | ||||||
Hannover Rueck SE (REG) | 1,601 | 162,486 | ||||||
| AB POOLING PORTFOLIOS • | 209 |
AB Volatility Management—Portfolio of Investments
| Company | Shares | U.S. $ Value | ||||||
| ||||||||
Hartford Financial Services Group, Inc. (The) | 11,650 | $ | 535,317 | |||||
Insurance Australia Group Ltd. | 61,247 | 220,797 | ||||||
Legal & General Group PLC | 157,078 | 604,313 | ||||||
Lincoln National Corp. | 7,100 | 360,609 | ||||||
Loews Corp. | 8,250 | 300,712 | ||||||
Mapfre SA | 28,672 | 84,175 | ||||||
Marsh & McLennan Cos., Inc. | 15,000 | 805,950 | ||||||
Medibank Pvt Ltd.(a) | 73,152 | 121,297 | ||||||
MetLife, Inc. | 31,050 | 1,555,605 | ||||||
MS&AD Insurance Group Holdings, Inc. | 13,500 | 424,429 | ||||||
Muenchener Rueckversicherungs-Gesellschaft AG in Muenchen (REG) | 4,603 | 844,338 | ||||||
NN Group NV | 5,130 | 156,574 | ||||||
Old Mutual PLC | 131,038 | 398,794 | ||||||
Principal Financial Group, Inc. | 7,600 | 382,660 | ||||||
Progressive Corp. (The) | 14,900 | 446,404 | ||||||
Prudential Financial, Inc. | 12,600 | 1,016,820 | ||||||
Prudential PLC | 68,311 | 1,474,311 | ||||||
QBE Insurance Group Ltd. | 36,309 | 340,960 | ||||||
RSA Insurance Group PLC | 27,018 | 210,906 | ||||||
Sampo Oyj – Class A | 11,972 | 576,747 | ||||||
SCOR SE | 4,077 | 143,502 | ||||||
Sompo Japan Nipponkoa Holdings, Inc. | 9,000 | 297,249 | ||||||
Sony Financial Holdings, Inc.(b) | 4,629 | 86,578 | ||||||
Standard Life PLC | 51,619 | 326,680 | ||||||
Suncorp Group Ltd. | 34,153 | 311,662 | ||||||
Swiss Life Holding AG(a) | 873 | 204,320 | ||||||
Swiss Re AG | 9,405 | 806,278 | ||||||
T&D Holdings, Inc. | 15,400 | 206,738 | ||||||
Tokio Marine Holdings, Inc. | 18,411 | 737,010 | ||||||
Torchmark Corp. | 3,475 | 203,148 | ||||||
Travelers Cos., Inc. (The) | 8,900 | 885,995 | ||||||
Tryg A/S | 3,176 | 62,348 | ||||||
UnipolSai SpA | 21,187 | 48,533 | ||||||
Unum Group | 6,950 | 233,103 | ||||||
XL Group PLC | 8,400 | 313,236 | ||||||
Zurich Insurance Group AG(a) | 3,982 | 1,093,311 | ||||||
|
| |||||||
| 31,972,551 | ||||||||
|
| |||||||
Real Estate Investment Trusts (REITs) – 0.2% | ||||||||
American Tower Corp. | 11,720 | 1,080,467 | ||||||
Crown Castle International Corp. | 9,330 | 778,029 | ||||||
Equinix, Inc. | 1,630 | 439,725 | ||||||
Iron Mountain, Inc. | 5,180 | 146,801 | ||||||
Plum Creek Timber Co., Inc. | 4,850 | 186,676 | ||||||
Weyerhaeuser Co. | 14,550 | 406,527 | ||||||
|
| |||||||
| 3,038,225 | ||||||||
|
| |||||||
| 210 | • AB POOLING PORTFOLIOS |
AB Volatility Management—Portfolio of Investments
| Company | Shares | U.S. $ Value | ||||||
| ||||||||
Real Estate Management & Development – 0.2% | ||||||||
CBRE Group, Inc. – Class A(a) | 7,690 | $ | 246,234 | |||||
Cheung Kong Property Holdings Ltd.(a) | 75,304 | 530,395 | ||||||
City Developments Ltd. | 10,000 | 62,349 | ||||||
Daito Trust Construction Co., Ltd.(b) | 2,000 | 218,471 | ||||||
Daiwa House Industry Co., Ltd. | 16,000 | 392,262 | ||||||
Lend Lease Group | 14,543 | 143,901 | ||||||
Swire Pacific Ltd. – Class A | 15,500 | 170,526 | ||||||
Tokyu Fudosan Holdings Corp. | 13,637 | 93,699 | ||||||
Wheelock & Co., Ltd. | 24,000 | 109,419 | ||||||
|
| |||||||
| 1,967,256 | ||||||||
|
| |||||||
Thrifts & Mortgage Finance – 0.0% | ||||||||
Hudson City Bancorp, Inc. | 13,400 | 124,620 | ||||||
|
| |||||||
| 145,697,560 | ||||||||
|
| |||||||
Health Care – 8.9% | ||||||||
Biotechnology – 1.3% | ||||||||
Actelion Ltd. (REG)(a) | 2,759 | 374,577 | ||||||
Alexion Pharmaceuticals, Inc.(a) | 5,690 | 979,761 | ||||||
Amgen, Inc. | 21,100 | 3,202,558 | ||||||
Baxalta, Inc.(a) | 15,050 | 529,007 | ||||||
Biogen, Inc.(a) | 6,550 | 1,947,315 | ||||||
Celgene Corp.(a) | 22,250 | 2,627,280 | ||||||
CSL Ltd. | 12,628 | 823,037 | ||||||
Gilead Sciences, Inc. | 41,500 | 4,360,405 | ||||||
Grifols SA | 3,959 | 161,328 | ||||||
Regeneron Pharmaceuticals, Inc.(a) | 2,100 | 1,078,350 | ||||||
Vertex Pharmaceuticals, Inc.(a) | 6,705 | 855,022 | ||||||
|
| |||||||
| 16,938,640 | ||||||||
|
| |||||||
Health Care Equipment & Supplies – 1.1% | ||||||||
Abbott Laboratories | 42,000 | 1,902,180 | ||||||
Baxter International, Inc. | 15,050 | 578,672 | ||||||
Becton Dickinson and Co. | 5,878 | 828,916 | ||||||
Boston Scientific Corp.(a) | 37,000 | 619,380 | ||||||
Cochlear Ltd. | 1,515 | 91,398 | ||||||
Coloplast A/S – Class B | 2,950 | 200,578 | ||||||
CR Bard, Inc. | 2,100 | 406,959 | ||||||
DENTSPLY International, Inc. | 3,850 | 201,778 | ||||||
Edwards Lifesciences Corp.(a) | 3,000 | 422,640 | ||||||
Elekta AB – Class B(b) | 9,784 | 60,616 | ||||||
Essilor International SA | 5,456 | 649,494 | ||||||
Getinge AB – Class B | 5,313 | 117,850 | ||||||
Hoya Corp. | 11,400 | 444,775 | ||||||
Intuitive Surgical, Inc.(a) | 1,030 | 526,278 | ||||||
Medtronic PLC | 39,631 | 2,864,925 | ||||||
Olympus Corp.(b) | 6,900 | 250,687 | ||||||
| AB POOLING PORTFOLIOS • | 211 |
AB Volatility Management—Portfolio of Investments
| Company | Shares | U.S. $ Value | ||||||
| ||||||||
Smith & Nephew PLC | 23,727 | $ | 422,346 | |||||
Sonova Holding AG (REG) | 1,461 | 189,770 | ||||||
St Jude Medical, Inc. | 7,800 | 552,318 | ||||||
Stryker Corp. | 8,350 | 823,727 | ||||||
Sysmex Corp. | 3,900 | 235,425 | ||||||
Terumo Corp. | 8,100 | 220,929 | ||||||
Varian Medical Systems, Inc.(a) | 2,800 | 227,500 | ||||||
William Demant Holding A/S(a) | 679 | 55,360 | ||||||
Zimmer Biomet Holdings, Inc. | 4,700 | 486,732 | ||||||
|
| |||||||
| 13,381,233 | ||||||||
|
| |||||||
Health Care Providers & Services – 1.2% | ||||||||
Aetna, Inc. | 9,759 | 1,117,601 | ||||||
Alfresa Holdings Corp. | 4,700 | 85,803 | ||||||
AmerisourceBergen Corp. – Class A | 5,800 | 580,232 | ||||||
Anthem, Inc. | 7,450 | 1,050,822 | ||||||
Cardinal Health, Inc. | 9,150 | 752,770 | ||||||
Cigna Corp. | 7,200 | 1,013,688 | ||||||
DaVita HealthCare Partners, Inc.(a) | 4,800 | 363,072 | ||||||
Express Scripts Holding Co.(a) | 20,183 | 1,687,299 | ||||||
Fresenius Medical Care AG & Co. KGaA | 5,803 | 441,991 | ||||||
Fresenius SE & Co. KGaA | 10,105 | 712,878 | ||||||
HCA Holdings, Inc.(a) | 8,218 | 711,843 | ||||||
Healthscope Ltd. | 29,786 | 56,327 | ||||||
Henry Schein, Inc.(a) | 2,370 | 324,240 | ||||||
Humana, Inc. | 4,200 | 767,718 | ||||||
Laboratory Corp. of America Holdings(a) | 2,850 | 335,758 | ||||||
McKesson Corp. | 6,500 | 1,284,270 | ||||||
Medipal Holdings Corp. | 3,600 | 62,100 | ||||||
Miraca Holdings, Inc. | 1,500 | 64,163 | ||||||
Patterson Cos., Inc. | 2,300 | 105,409 | ||||||
Quest Diagnostics, Inc. | 4,050 | 274,590 | ||||||
Ramsay Health Care Ltd. | 3,763 | 166,821 | ||||||
Ryman Healthcare Ltd. | 9,906 | 48,074 | ||||||
Sonic Healthcare Ltd. | 10,107 | 148,847 | ||||||
Suzuken Co., Ltd./Aichi Japan | 2,100 | 71,963 | ||||||
Tenet Healthcare Corp.(a) | 2,700 | 132,921 | ||||||
UnitedHealth Group, Inc. | 26,600 | 3,077,620 | ||||||
Universal Health Services, Inc. – Class B | 2,500 | 342,850 | ||||||
|
| |||||||
| 15,781,670 | ||||||||
|
| |||||||
Health Care Technology – 0.1% | ||||||||
Cerner Corp.(a) | 8,500 | 524,960 | ||||||
M3, Inc.(b) | 5,162 | 119,437 | ||||||
|
| |||||||
| 644,397 | ||||||||
|
| |||||||
Life Sciences Tools & Services – 0.2% | ||||||||
Agilent Technologies, Inc. | 9,300 | 337,683 | ||||||
Lonza Group AG (REG)(a) | 1,441 | 196,766 | ||||||
| 212 | • AB POOLING PORTFOLIOS |
AB Volatility Management—Portfolio of Investments
| Company | Shares | U.S. $ Value | ||||||
| ||||||||
PerkinElmer, Inc. | 3,100 | $ | 150,908 | |||||
QIAGEN NV(a) | 5,864 | 154,124 | ||||||
Thermo Fisher Scientific, Inc. | 11,050 | 1,385,338 | ||||||
Waters Corp.(a) | 2,350 | 285,243 | ||||||
|
| |||||||
| 2,510,062 | ||||||||
|
| |||||||
Pharmaceuticals – 5.0% | ||||||||
AbbVie, Inc. | 47,907 | 2,989,876 | ||||||
Allergan PLC(a) | 10,900 | 3,310,766 | ||||||
Astellas Pharma, Inc. | 57,100 | 844,536 | ||||||
AstraZeneca PLC | 33,606 | 2,096,648 | ||||||
Bayer AG | 21,999 | 2,973,299 | ||||||
Bristol-Myers Squibb Co. | 46,300 | 2,753,461 | ||||||
Chugai Pharmaceutical Co., Ltd. | 6,000 | 223,711 | ||||||
Daiichi Sankyo Co., Ltd. | 17,000 | 327,180 | ||||||
Eisai Co., Ltd.(b) | 6,700 | 456,428 | ||||||
Eli Lilly & Co. | 27,200 | 2,239,920 | ||||||
Endo International PLC(a) | 5,626 | 433,202 | ||||||
GlaxoSmithKline PLC | 129,412 | 2,642,284 | ||||||
Hisamitsu Pharmaceutical Co., Inc.(b) | 1,500 | 52,110 | ||||||
Hospira, Inc.(a) | 5,650 | 508,330 | ||||||
Johnson & Johnson | 77,400 | 7,274,052 | ||||||
Kyowa Hakko Kirin Co., Ltd.(b) | 6,000 | 100,627 | ||||||
Mallinckrodt PLC(a) | 3,205 | 276,399 | ||||||
Merck & Co., Inc. | 78,950 | 4,251,457 | ||||||
Merck KGaA | 3,477 | 331,069 | ||||||
Mitsubishi Tanabe Pharma Corp. | 6,000 | 107,228 | ||||||
Mylan NV(a)(b) | 11,300 | 560,367 | ||||||
Novartis AG (REG) | 61,191 | 5,971,368 | ||||||
Novo Nordisk A/S – Class B | 50,578 | 2,792,429 | ||||||
Ono Pharmaceutical Co., Ltd.(b) | 2,200 | 279,753 | ||||||
Orion Oyj – Class B | 2,784 | 110,121 | ||||||
Otsuka Holdings Co., Ltd. | 10,366 | 353,721 | ||||||
Perrigo Co. PLC | 3,939 | 720,719 | ||||||
Pfizer, Inc. | 170,607 | 5,496,958 | ||||||
Roche Holding AG | 18,690 | 5,087,874 | ||||||
Sanofi | 31,588 | 3,107,050 | ||||||
Santen Pharmaceutical Co., Ltd. | 9,900 | 154,896 | ||||||
Shionogi & Co., Ltd. | 8,000 | 313,428 | ||||||
Shire PLC | 15,702 | 1,214,353 | ||||||
Sumitomo Dainippon Pharma Co., Ltd.(b) | 4,200 | 44,853 | ||||||
Taisho Pharmaceutical Holdings Co., Ltd.(b) | 838 | 54,214 | ||||||
Takeda Pharmaceutical Co., Ltd. | 21,000 | 1,030,147 | ||||||
Teva Pharmaceutical Industries Ltd. | 22,901 | 1,492,646 | ||||||
UCB SA | 3,418 | 257,932 | ||||||
Zoetis, Inc. | 13,864 | 622,078 | ||||||
|
| |||||||
| 63,857,490 | ||||||||
|
| |||||||
| 113,113,492 | ||||||||
|
| |||||||
| AB POOLING PORTFOLIOS • | 213 |
AB Volatility Management—Portfolio of Investments
| Company | Shares | U.S. $ Value | ||||||
| ||||||||
Information Technology – 8.8% | ||||||||
Communications Equipment – 0.7% | ||||||||
Alcatel-Lucent(a) | 74,071 | $ | 248,210 | |||||
Cisco Systems, Inc. | 142,090 | 3,677,289 | ||||||
F5 Networks, Inc.(a) | 1,990 | 241,606 | ||||||
Harris Corp. | 3,440 | 264,261 | ||||||
Juniper Networks, Inc. | 10,080 | 259,157 | ||||||
Motorola Solutions, Inc. | 5,240 | 339,657 | ||||||
Nokia Oyj | 97,844 | 613,870 | ||||||
QUALCOMM, Inc. | 45,860 | 2,594,759 | ||||||
Telefonaktiebolaget LM Ericsson – Class B(b) | 80,956 | 789,110 | ||||||
|
| |||||||
| 9,027,919 | ||||||||
|
| |||||||
Electronic Equipment, Instruments & Components – 0.4% | ||||||||
Amphenol Corp. – Class A | 8,620 | 451,343 | ||||||
Citizen Holdings Co., Ltd.(b) | 7,000 | 52,778 | ||||||
Corning, Inc. | 35,330 | 608,029 | ||||||
FLIR Systems, Inc. | 3,860 | 110,512 | ||||||
Hamamatsu Photonics KK(b) | 3,800 | 93,938 | ||||||
Hexagon AB – Class B(b) | 6,890 | 221,725 | ||||||
Hirose Electric Co., Ltd.(b) | 800 | 91,209 | ||||||
Hitachi High-Technologies Corp. | 1,800 | 40,334 | ||||||
Hitachi Ltd. | 128,000 | 717,695 | ||||||
Ibiden Co., Ltd.(b) | 3,200 | 45,153 | ||||||
Japan Display, Inc.(a) | 9,598 | 30,075 | ||||||
Keyence Corp. | 1,300 | 601,794 | ||||||
Kyocera Corp.(b) | 8,600 | 421,306 | ||||||
Murata Manufacturing Co., Ltd.(b) | 5,400 | 777,834 | ||||||
Nippon Electric Glass Co., Ltd.(b) | 10,000 | 44,044 | ||||||
Omron Corp.(b) | 5,200 | 194,846 | ||||||
Shimadzu Corp. | 6,000 | 87,939 | ||||||
TDK Corp.(b) | 3,300 | 204,743 | ||||||
TE Connectivity Ltd. | 11,250 | 667,012 | ||||||
Yaskawa Electric Corp.(b) | 6,000 | 68,300 | ||||||
Yokogawa Electric Corp. | 6,000 | 70,339 | ||||||
|
| |||||||
| 5,600,948 | ||||||||
|
| |||||||
Internet Software & Services – 1.4% | ||||||||
Akamai Technologies, Inc.(a) | 5,010 | 357,263 | ||||||
eBay, Inc.(a) | 30,630 | 830,379 | ||||||
Facebook, Inc. – Class A(a) | 58,412 | 5,223,785 | ||||||
Google, Inc. – Class A(a) | 7,969 | 5,162,477 | ||||||
Google, Inc. – Class C(a) | 7,995 | 4,942,909 | ||||||
Kakaku.com, Inc.(b) | 3,835 | 60,844 | ||||||
Mixi, Inc. | 1,108 | 38,013 | ||||||
United Internet AG | 3,255 | 157,375 | ||||||
VeriSign, Inc.(a)(b) | 2,890 | 199,237 | ||||||
| 214 | • AB POOLING PORTFOLIOS |
AB Volatility Management—Portfolio of Investments
| Company | Shares | U.S. $ Value | ||||||
| ||||||||
Yahoo Japan Corp.(b) | 37,873 | $ | 153,288 | |||||
Yahoo!, Inc.(a) | 24,150 | 778,596 | ||||||
|
| |||||||
| 17,904,166 | ||||||||
|
| |||||||
IT Services – 1.6% | ||||||||
Accenture PLC – Class A | 17,470 | 1,646,897 | ||||||
Alliance Data Systems Corp.(a) | 1,810 | 465,514 | ||||||
Amadeus IT Holding SA – Class A | 11,907 | 496,170 | ||||||
Atos | 2,292 | 173,633 | ||||||
Automatic Data Processing, Inc. | 13,200 | 1,020,624 | ||||||
Cap Gemini SA | 4,135 | 370,672 | ||||||
Cognizant Technology Solutions Corp. – Class A(a) | 16,970 | 1,068,092 | ||||||
Computer Sciences Corp. | 3,880 | 240,521 | ||||||
Computershare Ltd. | 12,550 | 88,350 | ||||||
Fidelity National Information Services, Inc. | 7,890 | 544,883 | ||||||
Fiserv, Inc.(a) | 6,600 | 562,782 | ||||||
Fujitsu Ltd. | 49,000 | 242,560 | ||||||
International Business Machines Corp. | 25,569 | 3,781,399 | ||||||
Itochu Techno-Solutions Corp.(b) | 1,300 | 28,606 | ||||||
MasterCard, Inc. – Class A | 27,150 | 2,507,846 | ||||||
Nomura Research Institute Ltd. | 3,000 | 121,505 | ||||||
NTT Data Corp. | 3,358 | 161,448 | ||||||
Otsuka Corp. | 1,400 | 73,562 | ||||||
Paychex, Inc. | 9,070 | 405,066 | ||||||
PayPal Holdings, Inc.(a) | 30,630 | 1,072,050 | ||||||
Teradata Corp.(a) | 4,020 | 117,505 | ||||||
Total System Services, Inc. | 4,530 | 207,610 | ||||||
Visa, Inc. – Class A | 53,980 | 3,848,774 | ||||||
Western Union Co. (The) – Class W(b) | 14,420 | 265,905 | ||||||
Xerox Corp. | 29,060 | 295,540 | ||||||
|
| |||||||
| 19,807,514 | ||||||||
|
| |||||||
Semiconductors & Semiconductor Equipment – 1.1% | ||||||||
Advantest Corp.(b) | 3,900 | 31,255 | ||||||
Altera Corp. | 8,300 | 402,965 | ||||||
Analog Devices, Inc. | 8,650 | 483,189 | ||||||
Applied Materials, Inc. | 34,200 | 550,107 | ||||||
ARM Holdings PLC | 37,547 | 537,976 | ||||||
ASM Pacific Technology Ltd. | 6,400 | 49,918 | ||||||
ASML Holding NV | 9,326 | 850,598 | ||||||
Avago Technologies Ltd. | 7,158 | 901,693 | ||||||
Broadcom Corp. – Class A | 15,100 | 780,217 | ||||||
Infineon Technologies AG | 29,929 | 326,561 | ||||||
Intel Corp. | 131,800 | 3,761,572 | ||||||
KLA-Tencor Corp. | 4,450 | 222,990 | ||||||
Lam Research Corp. | 4,438 | 322,953 | ||||||
Linear Technology Corp. | 6,600 | 265,848 | ||||||
| AB POOLING PORTFOLIOS • | 215 |
AB Volatility Management—Portfolio of Investments
| Company | Shares | U.S. $ Value | ||||||
| ||||||||
Microchip Technology, Inc.(b) | 5,550 | $ | 235,875 | |||||
Micron Technology, Inc.(a) | 29,950 | 491,479 | ||||||
NVIDIA Corp. | 14,300 | 321,464 | ||||||
Qorvo, Inc.(a) | 4,155 | 230,644 | ||||||
Rohm Co., Ltd. | 2,600 | 140,718 | ||||||
Skyworks Solutions, Inc. | 5,295 | 462,518 | ||||||
STMicroelectronics NV | 16,955 | 122,957 | ||||||
Texas Instruments, Inc. | 29,150 | 1,394,536 | ||||||
Tokyo Electron Ltd. | 4,600 | 242,027 | ||||||
Xilinx, Inc. | 7,200 | 301,608 | ||||||
|
| |||||||
| 13,431,668 | ||||||||
|
| |||||||
Software – 1.7% | ||||||||
Activision Blizzard, Inc. | 14,130 | 404,542 | ||||||
Adobe Systems, Inc.(a) | 13,220 | 1,038,695 | ||||||
Autodesk, Inc.(a) | 6,230 | 291,253 | ||||||
CA, Inc. | 8,870 | 242,062 | ||||||
Citrix Systems, Inc.(a) | 4,420 | 301,046 | ||||||
COLOPL, Inc.(b) | 1,308 | 23,552 | ||||||
Dassault Systemes | 3,426 | 237,363 | ||||||
Electronic Arts, Inc.(a) | 8,600 | 568,890 | ||||||
Gemalto NV | 2,160 | 155,280 | ||||||
GungHo Online Entertainment, Inc.(b) | 9,396 | 28,219 | ||||||
Intuit, Inc. | 7,660 | 656,845 | ||||||
Konami Corp.(b) | 2,500 | 54,865 | ||||||
Microsoft Corp. | 228,370 | 9,938,662 | ||||||
Nexon Co., Ltd. | 3,483 | 48,391 | ||||||
NICE-Systems Ltd. | 1,556 | 96,047 | ||||||
Nintendo Co., Ltd. | 2,900 | 596,664 | ||||||
Oracle Corp. | 89,180 | 3,307,686 | ||||||
Oracle Corp. Japan | 1,000 | 41,782 | ||||||
Red Hat, Inc.(a) | 5,070 | 366,105 | ||||||
Sage Group PLC (The) | 28,333 | 222,499 | ||||||
salesforce.com, Inc.(a) | 16,790 | 1,164,554 | ||||||
SAP SE | 26,144 | 1,753,477 | ||||||
Symantec Corp. | 18,920 | 387,671 | ||||||
Trend Micro, Inc./Japan(b) | 2,800 | 99,465 | ||||||
|
| |||||||
| 22,025,615 | ||||||||
|
| |||||||
Technology Hardware, Storage & Peripherals – 1.9% | ||||||||
Apple, Inc. | 161,810 | 18,245,695 | ||||||
Brother Industries Ltd.(b) | 6,300 | 85,690 | ||||||
Canon, Inc.(b) | 28,400 | 865,264 | ||||||
EMC Corp./MA | 55,290 | 1,375,062 | ||||||
FUJIFILM Holdings Corp. | 12,300 | 504,206 | ||||||
Hewlett-Packard Co. | 50,530 | 1,417,872 | ||||||
Konica Minolta, Inc.(b) | 12,000 | 131,393 | ||||||
NEC Corp. | 69,000 | 216,979 | ||||||
| 216 | • AB POOLING PORTFOLIOS |
AB Volatility Management—Portfolio of Investments
| Company | Shares | U.S. $ Value | ||||||
| ||||||||
NetApp, Inc. | 8,650 | $ | 276,454 | |||||
Ricoh Co., Ltd.(b) | 18,000 | 175,485 | ||||||
SanDisk Corp. | 5,870 | 320,267 | ||||||
Seagate Technology PLC(b) | 9,100 | 467,740 | ||||||
Seiko Epson Corp. | 7,400 | 119,664 | ||||||
Western Digital Corp. | 6,030 | 494,219 | ||||||
|
| |||||||
| 24,695,990 | ||||||||
|
| |||||||
| 112,493,820 | ||||||||
|
| |||||||
Consumer Discretionary – 8.3% | ||||||||
Auto Components – 0.5% | ||||||||
Aisin Seiki Co., Ltd. | 5,100 | 183,383 | ||||||
BorgWarner, Inc. | 6,300 | 274,932 | ||||||
Bridgestone Corp. | 17,300 | 578,471 | ||||||
Cie Generale des Etablissements Michelin – Class B | 4,977 | 480,580 | ||||||
Continental AG | 2,943 | 623,358 | ||||||
Delphi Automotive PLC | 8,071 | 609,522 | ||||||
Denso Corp. | 13,000 | 580,028 | ||||||
GKN PLC | 43,711 | 194,105 | ||||||
Goodyear Tire & Rubber Co. (The) | 7,450 | 221,786 | ||||||
Johnson Controls, Inc. | 18,300 | 752,862 | ||||||
Koito Manufacturing Co., Ltd. | 3,000 | 102,516 | ||||||
NGK Spark Plug Co., Ltd.(b) | 5,000 | 122,470 | ||||||
NHK Spring Co., Ltd. | 4,000 | 38,572 | ||||||
NOK Corp. | 2,600 | 63,912 | ||||||
Nokian Renkaat Oyj(b) | 3,009 | 81,100 | ||||||
Pirelli & C. SpA | 6,960 | 116,613 | ||||||
Stanley Electric Co., Ltd.(b) | 3,800 | 73,752 | ||||||
Sumitomo Electric Industries Ltd. | 20,100 | 275,050 | ||||||
Sumitomo Rubber Industries Ltd.(b) | 4,500 | 63,583 | ||||||
Toyoda Gosei Co., Ltd.(b) | 1,700 | 33,208 | ||||||
Toyota Industries Corp. | 4,400 | 217,649 | ||||||
Valeo SA | 2,114 | 264,732 | ||||||
Yokohama Rubber Co., Ltd. (The) | 2,500 | 48,990 | ||||||
|
| |||||||
| 6,001,174 | ||||||||
|
| |||||||
Automobiles – 1.3% | ||||||||
Bayerische Motoren Werke AG | 8,834 | 811,940 | ||||||
Bayerische Motoren Werke AG (Preference Shares) | 1,500 | 108,989 | ||||||
Daihatsu Motor Co., Ltd.(b) | 5,000 | 60,999 | ||||||
Daimler AG (REG) | 25,614 | 2,053,078 | ||||||
Fiat Chrysler Automobiles NV(a) | 23,926 | 335,448 | ||||||
Ford Motor Co. | 110,100 | 1,527,087 | ||||||
Fuji Heavy Industries Ltd. | 16,000 | 559,341 | ||||||
General Motors Co. | 37,565 | 1,105,914 | ||||||
Harley-Davidson, Inc. | 5,900 | 330,695 | ||||||
| AB POOLING PORTFOLIOS • | 217 |
AB Volatility Management—Portfolio of Investments
| Company | Shares | U.S. $ Value | ||||||
| ||||||||
Honda Motor Co., Ltd. | 43,400 | $ | 1,365,107 | |||||
Isuzu Motors Ltd. | 15,500 | 175,586 | ||||||
Mazda Motor Corp.(b) | 14,400 | 246,779 | ||||||
Mitsubishi Motors Corp. | 16,300 | 124,647 | ||||||
Nissan Motor Co., Ltd.(b) | 66,100 | 594,465 | ||||||
Peugeot SA(a) | 11,508 | 197,844 | ||||||
Porsche Automobil Holding SE (Preference Shares) | 4,120 | 286,108 | ||||||
Renault SA | 5,150 | 426,453 | ||||||
Suzuki Motor Corp.(b) | 9,700 | 329,377 | ||||||
Toyota Motor Corp. | 72,800 | 4,302,933 | ||||||
Volkswagen AG | 942 | 175,677 | ||||||
Volkswagen AG (Preference Shares) | 4,336 | 821,555 | ||||||
Yamaha Motor Co., Ltd.(b) | 7,000 | 134,756 | ||||||
|
| |||||||
| 16,074,778 | ||||||||
|
| |||||||
Distributors – 0.0% | ||||||||
Genuine Parts Co. | 4,240 | 353,998 | ||||||
Jardine Cycle & Carriage Ltd.(b) | 3,000 | 60,895 | ||||||
|
| |||||||
| 414,893 | ||||||||
|
| |||||||
Diversified Consumer Services – 0.0% | ||||||||
Benesse Holdings, Inc.(b) | 1,800 | 47,708 | ||||||
H&R Block, Inc. | 7,650 | 260,253 | ||||||
|
| |||||||
| 307,961 | ||||||||
|
| |||||||
Hotels, Restaurants & Leisure – 1.0% | ||||||||
Accor SA | 5,581 | 264,258 | ||||||
Aristocrat Leisure Ltd. | 14,331 | 85,887 | ||||||
Carnival Corp. | 12,450 | 612,913 | ||||||
Carnival PLC | 4,980 | 251,536 | ||||||
Chipotle Mexican Grill, Inc. – Class A(a) | 950 | 674,509 | ||||||
Compass Group PLC | 44,377 | 699,940 | ||||||
Crown Resorts Ltd. | 9,668 | 78,623 | ||||||
Darden Restaurants, Inc. | 3,450 | 234,634 | ||||||
Flight Centre Travel Group Ltd.(b) | 1,468 | 38,639 | ||||||
Galaxy Entertainment Group Ltd. | 61,700 | 198,067 | ||||||
Genting Singapore PLC | 160,000 | 87,614 | ||||||
InterContinental Hotels Group PLC | 6,337 | 237,256 | ||||||
Marriott International, Inc./MD – Class A | 5,750 | 406,295 | ||||||
McDonald’s Corp. | 26,750 | 2,541,785 | ||||||
McDonald’s Holdings Co. Japan Ltd.(b) | 1,800 | 39,629 | ||||||
Merlin Entertainments PLC(e) | 18,877 | 111,732 | ||||||
MGM China Holdings Ltd. | 23,500 | 39,172 | ||||||
Oriental Land Co., Ltd./Japan | 5,400 | 297,399 | ||||||
Royal Caribbean Cruises Ltd. | 4,624 | 407,652 | ||||||
Sands China Ltd. | 63,300 | 220,019 | ||||||
Shangri-La Asia Ltd. | 32,000 | 31,445 | ||||||
SJM Holdings Ltd. | 51,500 | 46,629 | ||||||
| 218 | • AB POOLING PORTFOLIOS |
AB Volatility Management—Portfolio of Investments
| Company | Shares | U.S. $ Value | ||||||
| ||||||||
Sodexo SA | 2,503 | $ | 219,803 | |||||
Starbucks Corp. | 41,700 | 2,281,407 | ||||||
Starwood Hotels & Resorts Worldwide, Inc. | 4,800 | 343,056 | ||||||
Tabcorp Holdings Ltd. | 21,691 | 71,542 | ||||||
Tatts Group Ltd. | 37,618 | 98,416 | ||||||
TUI AG | 12,089 | 212,759 | ||||||
Whitbread PLC | 4,880 | 356,383 | ||||||
William Hill PLC | 23,023 | 126,198 | ||||||
Wyndham Worldwide Corp. | 3,400 | 260,032 | ||||||
Wynn Macau Ltd.(b) | 39,800 | 61,840 | ||||||
Wynn Resorts Ltd. | 2,250 | 168,863 | ||||||
Yum! Brands, Inc. | 12,100 | 965,217 | ||||||
|
| |||||||
| 12,771,149 | ||||||||
|
| |||||||
Household Durables – 0.4% | ||||||||
Barratt Developments PLC | 26,388 | 256,894 | ||||||
Casio Computer Co., Ltd.(b) | 5,400 | 103,571 | ||||||
DR Horton, Inc. | 9,250 | 280,922 | ||||||
Electrolux AB – Class B | 6,386 | 179,863 | ||||||
Garmin Ltd.(b) | 3,280 | 123,361 | ||||||
Harman International Industries, Inc. | 1,900 | 185,706 | ||||||
Husqvarna AB – Class B | 10,962 | 71,101 | ||||||
Iida Group Holdings Co., Ltd. | 3,916 | 69,007 | ||||||
Leggett & Platt, Inc. | 3,800 | 168,796 | ||||||
Lennar Corp. – Class A | 4,950 | 251,955 | ||||||
Mohawk Industries, Inc.(a) | 1,800 | 354,546 | ||||||
Newell Rubbermaid, Inc. | 7,500 | 315,975 | ||||||
Nikon Corp.(b) | 9,000 | 115,042 | ||||||
Panasonic Corp. | 58,700 | 642,861 | ||||||
Persimmon PLC(a) | 8,256 | 264,132 | ||||||
PulteGroup, Inc. | 9,150 | 189,314 | ||||||
Rinnai Corp. | 1,000 | 74,815 | ||||||
Sekisui Chemical Co., Ltd. | 11,000 | 121,142 | ||||||
Sekisui House Ltd. | 16,000 | 238,492 | ||||||
Sharp Corp./Japan(a)(b) | 38,000 | 55,314 | ||||||
Sony Corp.(a) | 31,100 | 801,944 | ||||||
Taylor Wimpey PLC | 86,547 | 265,240 | ||||||
Techtronic Industries Co., Ltd. | 36,500 | 132,233 | ||||||
Whirlpool Corp. | 2,150 | 361,415 | ||||||
|
| |||||||
| 5,623,641 | ||||||||
|
| |||||||
Internet & Catalog Retail – 0.8% | ||||||||
Amazon.com, Inc.(a) | 10,670 | 5,472,536 | ||||||
Expedia, Inc. | 2,740 | 315,073 | ||||||
Netflix, Inc.(a) | 12,320 | 1,417,170 | ||||||
Priceline Group, Inc. (The)(a) | 1,510 | 1,885,446 | ||||||
Rakuten, Inc. | 21,208 | 302,391 | ||||||
TripAdvisor, Inc.(a) | 3,050 | 213,195 | ||||||
|
| |||||||
| 9,605,811 | ||||||||
|
| |||||||
| AB POOLING PORTFOLIOS • | 219 |
AB Volatility Management—Portfolio of Investments
| Company | Shares | U.S. $ Value | ||||||
| ||||||||
Leisure Products – 0.1% | ||||||||
Bandai Namco Holdings, Inc. | 4,700 | $ | 108,577 | |||||
Hasbro, Inc. | 3,050 | 227,499 | ||||||
Mattel, Inc.(b) | 9,350 | 219,071 | ||||||
Sankyo Co., Ltd.(b) | 1,300 | 50,029 | ||||||
Sega Sammy Holdings, Inc.(b) | 4,900 | 51,626 | ||||||
Shimano, Inc. | 2,100 | 282,136 | ||||||
Yamaha Corp. | 4,500 | 102,827 | ||||||
|
| |||||||
| 1,041,765 | ||||||||
|
| |||||||
Media – 1.7% | ||||||||
Altice NV – Class A(a) | 6,996 | 199,601 | ||||||
Altice NV – Class B(a) | 2,332 | 73,220 | ||||||
Axel Springer SE | 1,185 | 71,623 | ||||||
Cablevision Systems Corp. – Class A | 6,100 | 153,537 | ||||||
CBS Corp. – Class B | 12,700 | 574,548 | ||||||
Comcast Corp. – Class A | 70,750 | 3,985,347 | ||||||
Dentsu, Inc.(b) | 5,800 | 296,921 | ||||||
Discovery Communications, Inc. – Class A(a)(b) | 4,050 | 107,730 | ||||||
Discovery Communications, Inc. – Class C(a) | 7,500 | 190,200 | ||||||
Eutelsat Communications SA | 4,529 | 136,442 | ||||||
Hakuhodo DY Holdings, Inc. | 6,200 | 61,878 | ||||||
Interpublic Group of Cos., Inc. (The) | 11,450 | 216,176 | ||||||
ITV PLC | 101,892 | 388,035 | ||||||
JCDecaux SA | 2,085 | 74,745 | ||||||
Kabel Deutschland Holding AG(a) | 588 | 79,628 | ||||||
Lagardere SCA | 3,133 | 85,163 | ||||||
News Corp. – Class A(a) | 13,875 | 189,116 | ||||||
Numericable-SFR SAS(a) | 2,577 | 132,574 | ||||||
Omnicom Group, Inc. | 6,850 | 458,813 | ||||||
Pearson PLC | 21,742 | 376,932 | ||||||
ProSiebenSat.1 Media SE (REG) | 5,808 | 282,088 | ||||||
Publicis Groupe SA | 5,001 | 355,933 | ||||||
REA Group Ltd. | 1,399 | 40,970 | ||||||
RELX NV | 27,096 | 416,635 | ||||||
RELX PLC | 29,923 | 477,094 | ||||||
RTL Group SA (London)(a) | 1,028 | 89,732 | ||||||
Scripps Networks Interactive, Inc. – Class A(b) | 2,700 | 143,343 | ||||||
SES SA | 8,532 | 253,129 | ||||||
Singapore Press Holdings Ltd.(b) | 42,000 | 117,290 | ||||||
Sky PLC | 27,524 | 438,409 | ||||||
TEGNA, Inc. | 6,250 | 148,688 | ||||||
Telenet Group Holding NV(a) | 1,473 | 82,829 | ||||||
Time Warner Cable, Inc. – Class A | 7,800 | 1,450,956 | ||||||
Time Warner, Inc. | 23,100 | 1,642,410 | ||||||
Toho Co., Ltd./Tokyo | 3,000 | 67,585 | ||||||
Twenty-First Century Fox, Inc. – Class A | 50,900 | 1,394,151 | ||||||
Viacom, Inc. – Class B | 10,100 | 411,777 | ||||||
| 220 | • AB POOLING PORTFOLIOS |
AB Volatility Management—Portfolio of Investments
| Company | Shares | U.S. $ Value | ||||||
| ||||||||
Vivendi SA | 30,595 | $ | 755,171 | |||||
Walt Disney Co. (The) | 43,588 | 4,440,745 | ||||||
Wolters Kluwer NV | 8,014 | 253,550 | ||||||
WPP PLC | 34,858 | 717,561 | ||||||
|
| |||||||
| 21,832,275 | ||||||||
|
| |||||||
Multiline Retail – 0.4% | ||||||||
Dollar General Corp. | 8,430 | 627,951 | ||||||
Dollar Tree, Inc.(a) | 6,517 | 496,986 | ||||||
Don Quijote Holdings Co., Ltd. | 3,200 | 123,972 | ||||||
Harvey Norman Holdings Ltd. | 14,771 | 45,569 | ||||||
Isetan Mitsukoshi Holdings Ltd.(b) | 9,400 | 150,235 | ||||||
J Front Retailing Co., Ltd. | 6,000 | 97,283 | ||||||
Kohl’s Corp. | 5,560 | 283,727 | ||||||
Macy’s, Inc. | 9,460 | 554,450 | ||||||
Marks & Spencer Group PLC | 43,813 | 347,872 | ||||||
Marui Group Co., Ltd.(b) | 6,300 | 76,153 | ||||||
Next PLC | 3,864 | 467,855 | ||||||
Nordstrom, Inc. | 3,870 | 282,046 | ||||||
Takashimaya Co., Ltd. | 7,392 | 63,884 | ||||||
Target Corp. | 17,720 | 1,377,021 | ||||||
|
| |||||||
| 4,995,004 | ||||||||
|
| |||||||
Specialty Retail – 1.3% | ||||||||
ABC-Mart, Inc.(b) | 700 | 42,385 | ||||||
Advance Auto Parts, Inc. | 2,058 | 360,665 | ||||||
AutoNation, Inc.(a) | 2,030 | 121,475 | ||||||
AutoZone, Inc.(a) | 910 | 651,551 | ||||||
Bed Bath & Beyond, Inc.(a) | 4,800 | 298,128 | ||||||
Best Buy Co., Inc. | 8,040 | 295,390 | ||||||
CarMax, Inc.(a) | 5,870 | 358,070 | ||||||
Dixons Carphone PLC | 26,036 | 171,409 | ||||||
Dufry AG (REG)(a) | 1,163 | 156,146 | ||||||
Fast Retailing Co., Ltd. | 1,500 | 608,020 | ||||||
GameStop Corp. – Class A(b) | 2,960 | 125,741 | ||||||
Gap, Inc. (The) | 7,290 | 239,185 | ||||||
Hennes & Mauritz AB – Class B | 25,329 | 972,576 | ||||||
Hikari Tsushin, Inc. | 500 | 33,237 | ||||||
Home Depot, Inc. (The) | 36,740 | 4,278,741 | ||||||
Industria de Diseno Textil SA | 29,106 | 966,643 | ||||||
Kingfisher PLC | 62,036 | 337,137 | ||||||
L Brands, Inc. | 6,850 | 574,715 | ||||||
Lowe’s Cos., Inc. | 27,040 | 1,870,357 | ||||||
Nitori Holdings Co., Ltd. | 2,000 | 158,742 | ||||||
O’Reilly Automotive, Inc.(a) | 2,830 | 679,398 | ||||||
Ross Stores, Inc. | 14,120 | 686,514 | ||||||
Sanrio Co., Ltd.(b) | 1,300 | 42,865 | ||||||
Shimamura Co., Ltd. | 600 | 55,340 | ||||||
Signet Jewelers Ltd. | 2,256 | 311,328 | ||||||
| AB POOLING PORTFOLIOS • | 221 |
AB Volatility Management—Portfolio of Investments
| Company | Shares | U.S. $ Value | ||||||
| ||||||||
Sports Direct International PLC(a) | 7,149 | $ | 86,485 | |||||
Staples, Inc. | 17,740 | 252,085 | ||||||
Tiffany & Co. | 3,170 | 260,733 | ||||||
TJX Cos., Inc. (The) | 19,020 | 1,337,486 | ||||||
Tractor Supply Co. | 3,823 | 326,140 | ||||||
Urban Outfitters, Inc.(a) | 2,730 | 84,248 | ||||||
USS Co., Ltd. | 5,830 | 103,247 | ||||||
Yamada Denki Co., Ltd.(b) | 17,990 | 69,216 | ||||||
|
| |||||||
| 16,915,398 | ||||||||
|
| |||||||
Textiles, Apparel & Luxury Goods – 0.8% | ||||||||
adidas AG | 5,617 | 419,637 | ||||||
Asics Corp.(b) | 4,000 | 116,764 | ||||||
Burberry Group PLC | 11,776 | 253,074 | ||||||
Christian Dior SE | 1,473 | 272,679 | ||||||
Cie Financiere Richemont SA | 13,914 | 1,039,618 | ||||||
Coach, Inc. | 7,600 | 229,900 | ||||||
Fossil Group, Inc.(a)(b) | 1,179 | 72,603 | ||||||
Hanesbrands, Inc. | 11,095 | 334,070 | ||||||
Hermes International | 703 | 249,438 | ||||||
Hugo Boss AG | 1,780 | 203,116 | ||||||
Kering | 2,040 | 349,130 | ||||||
Li & Fung Ltd. | 154,000 | 101,446 | ||||||
Luxottica Group SpA | 4,513 | 305,625 | ||||||
LVMH Moet Hennessy Louis Vuitton SE | 7,440 | 1,238,313 | ||||||
Michael Kors Holdings Ltd.(a) | 5,510 | 239,465 | ||||||
NIKE, Inc. – Class B | 19,500 | 2,179,125 | ||||||
Pandora A/S | 3,111 | 359,603 | ||||||
PVH Corp. | 2,261 | 269,014 | ||||||
Ralph Lauren Corp. | 1,650 | 183,463 | ||||||
Swatch Group AG (The)(b) | 832 | 318,031 | ||||||
Swatch Group AG (The) (REG) | 1,318 | 97,502 | ||||||
Under Armour, Inc. – Class A(a) | 4,675 | 446,603 | ||||||
VF Corp. | 9,500 | 688,085 | ||||||
Yue Yuen Industrial Holdings Ltd. | 19,500 | 69,776 | ||||||
|
| |||||||
| 10,036,080 | ||||||||
|
| |||||||
| 105,619,929 | ||||||||
|
| |||||||
Industrials – 7.4% | ||||||||
Aerospace & Defense – 1.3% | ||||||||
Airbus Group SE | 15,665 | 1,020,019 | ||||||
BAE Systems PLC | 83,502 | 574,774 | ||||||
Boeing Co. (The) | 18,300 | 2,391,444 | ||||||
Cobham PLC | 30,287 | 129,790 | ||||||
Finmeccanica SpA(a) | 10,743 | 145,167 | ||||||
General Dynamics Corp. | 8,800 | 1,249,864 | ||||||
Honeywell International, Inc. | 21,750 | 2,159,122 | ||||||
L-3 Communications Holdings, Inc. | 2,300 | 242,581 | ||||||
| 222 | • AB POOLING PORTFOLIOS |
AB Volatility Management—Portfolio of Investments
| Company | Shares | U.S. $ Value | ||||||
| ||||||||
Lockheed Martin Corp. | 7,500 | $ | 1,508,850 | |||||
Meggitt PLC | 21,168 | 153,955 | ||||||
Northrop Grumman Corp. | 5,500 | 900,570 | ||||||
Precision Castparts Corp. | 3,950 | 909,488 | ||||||
Raytheon Co. | 8,550 | 876,888 | ||||||
Rockwell Collins, Inc. | 3,750 | 306,938 | ||||||
Rolls-Royce Holdings PLC(a) | 49,432 | 560,035 | ||||||
Safran SA | 7,766 | 605,904 | ||||||
Singapore Technologies Engineering Ltd. | 41,000 | 89,227 | ||||||
Textron, Inc. | 7,700 | 298,760 | ||||||
Thales SA | 2,751 | 189,513 | ||||||
United Technologies Corp. | 23,050 | 2,111,611 | ||||||
Zodiac Aerospace | 5,366 | 163,050 | ||||||
|
| |||||||
| 16,587,550 | ||||||||
|
| |||||||
Air Freight & Logistics – 0.4% | ||||||||
Bollore SA | 23,041 | 124,430 | ||||||
CH Robinson Worldwide, Inc. | 4,050 | 273,091 | ||||||
Deutsche Post AG (REG) | 25,833 | 709,696 | ||||||
Expeditors International of Washington, Inc. | 5,250 | 257,093 | ||||||
FedEx Corp. | 7,350 | 1,106,983 | ||||||
Kuehne & Nagel International AG (REG) | 1,470 | 195,680 | ||||||
Royal Mail PLC | 17,290 | 122,245 | ||||||
TNT Express NV | 13,124 | 110,856 | ||||||
United Parcel Service, Inc. – Class B | 19,400 | 1,894,410 | ||||||
Yamato Holdings Co., Ltd.(b) | 9,300 | 181,060 | ||||||
|
| |||||||
| 4,975,544 | ||||||||
|
| |||||||
Airlines – 0.3% | ||||||||
American Airlines Group, Inc. | 19,908 | 776,014 | ||||||
ANA Holdings, Inc. | 30,000 | 87,858 | ||||||
Cathay Pacific Airways Ltd. | 31,000 | 56,079 | ||||||
Delta Air Lines, Inc. | 22,883 | 1,001,818 | ||||||
Deutsche Lufthansa AG (REG)(a) | 6,120 | 74,260 | ||||||
easyJet PLC | 4,213 | 107,903 | ||||||
International Consolidated Airlines Group SA(a) | 21,707 | 180,004 | ||||||
Japan Airlines Co., Ltd. | 3,278 | 116,335 | ||||||
Qantas Airways Ltd.(a) | 14,527 | 34,702 | ||||||
Ryanair Holdings PLC (Sponsored ADR) | 820 | 59,819 | ||||||
Singapore Airlines Ltd. | 14,000 | 98,563 | ||||||
Southwest Airlines Co. | 18,750 | 688,125 | ||||||
|
| |||||||
| 3,281,480 | ||||||||
|
| |||||||
Building Products – 0.2% | ||||||||
Allegion PLC | 2,600 | 154,986 | ||||||
Asahi Glass Co., Ltd. | 25,000 | 148,103 | ||||||
Assa Abloy AB – Class B | 26,607 | 508,466 | ||||||
Cie de Saint-Gobain | 12,705 | 583,121 | ||||||
Daikin Industries Ltd. | 6,300 | 374,302 | ||||||
| AB POOLING PORTFOLIOS • | 223 |
AB Volatility Management—Portfolio of Investments
| Company | Shares | U.S. $ Value | ||||||
| ||||||||
Geberit AG (REG) | 1,018 | $ | 323,033 | |||||
LIXIL Group Corp.(b) | 7,100 | 146,264 | ||||||
Masco Corp. | 9,700 | 254,431 | ||||||
TOTO Ltd.(b) | 7,000 | 102,830 | ||||||
|
| |||||||
| 2,595,536 | ||||||||
|
| |||||||
Commercial Services & Supplies – 0.3% | ||||||||
ADT Corp. (The)(b) | 4,750 | 155,705 | ||||||
Aggreko PLC | 6,798 | 110,560 | ||||||
Babcock International Group PLC | 6,668 | 98,292 | ||||||
Brambles Ltd. | 41,665 | 291,640 | ||||||
Cintas Corp. | 2,750 | 233,722 | ||||||
Dai Nippon Printing Co., Ltd.(b) | 15,000 | 154,037 | ||||||
Edenred | 5,573 | 117,878 | ||||||
G4S PLC | 41,274 | 161,452 | ||||||
ISS A/S | 3,951 | 137,642 | ||||||
Park24 Co., Ltd. | 2,500 | 48,971 | ||||||
Pitney Bowes, Inc. | 5,550 | 109,945 | ||||||
Republic Services, Inc. – Class A | 6,900 | 282,762 | ||||||
Secom Co., Ltd. | 5,600 | 358,167 | ||||||
Securitas AB – Class B | 8,312 | 105,846 | ||||||
Societe BIC SA | 790 | 125,180 | ||||||
Stericycle, Inc.(a) | 2,350 | 331,679 | ||||||
Toppan Printing Co., Ltd. | 13,000 | 107,821 | ||||||
Tyco International PLC | 11,600 | 420,964 | ||||||
Waste Management, Inc. | 11,800 | 590,708 | ||||||
|
| |||||||
| 3,942,971 | ||||||||
|
| |||||||
Construction & Engineering – 0.2% | ||||||||
ACS Actividades de Construccion y Servicios SA | 5,023 | 162,370 | ||||||
Boskalis Westminster | 2,300 | 119,706 | ||||||
Bouygues SA | 5,365 | 204,306 | ||||||
Chiyoda Corp.(b) | 4,000 | 28,798 | ||||||
CIMIC Group Ltd.(b) | 2,696 | 44,859 | ||||||
Ferrovial SA | 11,867 | 282,932 | ||||||
Fluor Corp. | 4,100 | 187,042 | ||||||
Jacobs Engineering Group, Inc.(a) | 3,550 | 143,456 | ||||||
JGC Corp.(b) | 5,864 | 85,535 | ||||||
Kajima Corp. | 22,000 | 123,293 | ||||||
Obayashi Corp. | 17,000 | 146,782 | ||||||
Quanta Services, Inc.(a) | 5,800 | 140,592 | ||||||
Shimizu Corp. | 15,000 | 146,317 | ||||||
Skanska AB – Class B | 10,087 | 197,463 | ||||||
Taisei Corp. | 27,000 | 182,205 | ||||||
Vinci SA | 12,569 | 808,482 | ||||||
|
| |||||||
| 3,004,138 | ||||||||
|
| |||||||
| 224 | • AB POOLING PORTFOLIOS |
AB Volatility Management—Portfolio of Investments
| Company | Shares | U.S. $ Value | ||||||
| ||||||||
Electrical Equipment – 0.5% | ||||||||
ABB Ltd. (REG)(a) | 58,497 | $ | 1,129,704 | |||||
Alstom SA(a) | 5,736 | 177,774 | ||||||
AMETEK, Inc. | 6,639 | 357,311 | ||||||
Eaton Corp. PLC | 13,209 | 753,706 | ||||||
Emerson Electric Co. | 19,000 | 906,680 | ||||||
First Solar, Inc.(a) | 2,050 | 98,072 | ||||||
Fuji Electric Co., Ltd.(b) | 14,000 | 55,504 | ||||||
Legrand SA | 7,051 | 405,980 | ||||||
Mabuchi Motor Co., Ltd.(b) | 1,300 | 60,583 | ||||||
Mitsubishi Electric Corp. | 51,000 | 507,490 | ||||||
Nidec Corp. | 5,800 | 454,122 | ||||||
OSRAM Licht AG | 2,362 | 124,670 | ||||||
Prysmian SpA | 5,189 | 110,725 | ||||||
Rockwell Automation, Inc. | 3,750 | 419,362 | ||||||
Schneider Electric SE (Paris) | 14,772 | 931,092 | ||||||
Vestas Wind Systems A/S | 5,948 | 316,960 | ||||||
|
| |||||||
| 6,809,735 | ||||||||
|
| |||||||
Industrial Conglomerates – 1.3% | ||||||||
3M Co. | 17,650 | 2,508,771 | ||||||
CK Hutchison Holdings Ltd. | 75,304 | 1,002,015 | ||||||
Danaher Corp. | 17,050 | 1,483,691 | ||||||
General Electric Co. | 280,200 | 6,954,564 | ||||||
Keihan Electric Railway Co., Ltd. | 13,000 | 83,872 | ||||||
Keppel Corp., Ltd. | 38,000 | 184,985 | ||||||
Koninklijke Philips NV(b) | 24,868 | 639,070 | ||||||
NWS Holdings Ltd. | 39,000 | 49,156 | ||||||
Roper Technologies, Inc. | 2,800 | 453,852 | ||||||
Seibu Holdings, Inc. | 3,175 | 69,629 | ||||||
Sembcorp Industries Ltd.(b) | 26,000 | 63,218 | ||||||
Siemens AG (REG) | 21,093 | 2,090,802 | ||||||
Smiths Group PLC | 10,470 | 179,948 | ||||||
Toshiba Corp.(b) | 107,000 | 338,951 | ||||||
|
| |||||||
| 16,102,524 | ||||||||
|
| |||||||
Industrial Warehouse Distribution – 0.3% | ||||||||
Ascendas Real Estate Investment Trust | 153,350 | 242,021 | ||||||
Daiwa House REIT Investment Corp.(b) | 20 | 72,600 | ||||||
DCT Industrial Trust, Inc. | 4,440 | 142,568 | ||||||
EastGroup Properties, Inc. | 1,613 | 87,102 | ||||||
First Industrial Realty Trust, Inc. | 5,500 | 106,645 | ||||||
Global Logistic Properties Ltd. | 235,565 | 370,876 | ||||||
GLP J-Reit(b) | 52 | 48,684 | ||||||
Hansteen Holdings PLC | 34,463 | 60,816 | ||||||
Industrial & Infrastructure Fund Investment Corp.(b) | 23 | 95,411 | ||||||
Japan Logistics Fund, Inc. | 13 | 23,468 | ||||||
Mapletree Industrial Trust | 61,512 | 66,966 | ||||||
Mapletree Logistics Trust | 73,455 | 50,990 | ||||||
| AB POOLING PORTFOLIOS • | 225 |
AB Volatility Management—Portfolio of Investments
| Company | Shares | U.S. $ Value | ||||||
| ||||||||
Nippon Prologis REIT, Inc. | 113 | $ | 204,542 | |||||
Prologis, Inc. | 40,575 | 1,541,850 | ||||||
Pure Industrial Real Estate Trust | 9,500 | 33,072 | ||||||
Rexford Industrial Realty, Inc. | 2,700 | 34,884 | ||||||
Segro PLC | 57,022 | 363,487 | ||||||
STAG Industrial, Inc. | 3,235 | 55,189 | ||||||
Terreno Realty Corp. | 2,100 | 42,714 | ||||||
Tritax Big Box REIT PLC | 31,650 | 57,641 | ||||||
Warehouses De Pauw CVA | 711 | 56,848 | ||||||
|
| |||||||
| 3,758,374 | ||||||||
|
| |||||||
Machinery – 1.1% | ||||||||
Alfa Laval AB | 7,811 | 131,485 | ||||||
Amada Holdings Co., Ltd. | 9,000 | 78,657 | ||||||
ANDRITZ AG | 2,075 | 99,135 | ||||||
Atlas Copco AB – Class A | 17,826 | 448,840 | ||||||
Atlas Copco AB – Class B | 10,359 | 235,932 | ||||||
Caterpillar, Inc. | 16,850 | 1,288,014 | ||||||
CNH Industrial NV | 25,062 | 197,700 | ||||||
Cummins, Inc. | 4,750 | 578,312 | ||||||
Deere & Co. | 9,450 | 772,821 | ||||||
Dover Corp. | 4,500 | 278,775 | ||||||
FANUC Corp.(b) | 5,500 | 890,727 | ||||||
Flowserve Corp. | 3,700 | 166,981 | ||||||
GEA Group AG | 4,855 | 189,010 | ||||||
Hino Motors Ltd.(b) | 7,000 | 76,770 | ||||||
Hitachi Construction Machinery Co., Ltd. | 2,900 | 41,970 | ||||||
IHI Corp.(b) | 37,000 | 114,310 | ||||||
Illinois Tool Works, Inc. | 9,700 | 819,941 | ||||||
IMI PLC | 7,238 | 114,325 | ||||||
Ingersoll-Rand PLC | 7,300 | 403,617 | ||||||
Joy Global, Inc.(b) | 2,700 | 65,394 | ||||||
JTEKT Corp. | 5,500 | 77,215 | ||||||
Kawasaki Heavy Industries Ltd. | 37,000 | 139,642 | ||||||
Komatsu Ltd.(b) | 24,800 | 410,689 | ||||||
Kone Oyj – Class B | 8,416 | 332,213 | ||||||
Kubota Corp.(b) | 30,000 | 466,939 | ||||||
Kurita Water Industries Ltd. | 2,900 | 60,112 | ||||||
Makita Corp.(b) | 3,200 | 180,651 | ||||||
MAN SE | 936 | 98,138 | ||||||
Melrose Industries PLC | 26,474 | 107,618 | ||||||
Metso Oyj | 2,994 | 73,758 | ||||||
Minebea Co., Ltd.(b) | 8,000 | 95,479 | ||||||
Mitsubishi Heavy Industries Ltd. | 80,000 | 380,216 | ||||||
Nabtesco Corp.(b) | 3,000 | 59,713 | ||||||
NGK Insulators Ltd.(b) | 7,000 | 157,306 | ||||||
NSK Ltd.(b) | 12,000 | 147,268 | ||||||
PACCAR, Inc. | 9,850 | 580,854 | ||||||
| 226 | • AB POOLING PORTFOLIOS |
AB Volatility Management—Portfolio of Investments
| Company | Shares | U.S. $ Value | ||||||
| ||||||||
Parker-Hannifin Corp. | 4,000 | $ | 430,640 | |||||
Pentair PLC | 5,084 | 281,094 | ||||||
Sandvik AB | 28,303 | 273,130 | ||||||
Schindler Holding AG | 1,210 | 185,301 | ||||||
Schindler Holding AG (REG) | 565 | 87,927 | ||||||
Sembcorp Marine Ltd.(b) | 22,000 | 37,379 | ||||||
SKF AB – Class B | 10,511 | 200,488 | ||||||
SMC Corp./Japan | 1,500 | 363,046 | ||||||
Snap-on, Inc. | 1,650 | 263,620 | ||||||
Stanley Black & Decker, Inc. | 4,350 | 441,612 | ||||||
Sulzer AG | 637 | 64,942 | ||||||
Sumitomo Heavy Industries Ltd. | 14,000 | 60,502 | ||||||
THK Co., Ltd.(b) | 3,200 | 55,437 | ||||||
Vallourec SA | 2,892 | 36,921 | ||||||
Volvo AB – Class B | 40,579 | 440,657 | ||||||
Wartsila Oyj Abp | 3,927 | 162,440 | ||||||
Weir Group PLC (The) | 5,659 | 121,134 | ||||||
Xylem, Inc./NY | 5,050 | 163,873 | ||||||
Yangzijiang Shipbuilding Holdings Ltd. | 51,000 | 39,760 | ||||||
Zardoya Otis SA(b) | 4,618 | 49,243 | ||||||
|
| |||||||
| 14,119,673 | ||||||||
|
| |||||||
Marine – 0.1% | ||||||||
AP Moeller – Maersk A/S – Class A | 105 | 175,290 | ||||||
AP Moeller – Maersk A/S – Class B | 192 | 326,989 | ||||||
Mitsui OSK Lines Ltd.(b) | 30,000 | 84,389 | ||||||
Nippon Yusen KK | 42,000 | 110,128 | ||||||
|
| |||||||
| 696,796 | ||||||||
|
| |||||||
Mixed Office Industrial – 0.1% | ||||||||
Goodman Group | 134,085 | 579,504 | ||||||
Green REIT PLC | 33,200 | 55,916 | ||||||
Intervest Offices & Warehouses NV | 350 | 8,788 | ||||||
Kungsleden AB | 9,124 | 60,988 | ||||||
|
| |||||||
| 705,196 | ||||||||
|
| |||||||
Professional Services – 0.2% | ||||||||
Adecco SA (REG)(a) | 4,522 | 354,477 | ||||||
Bureau Veritas SA | 7,055 | 160,821 | ||||||
Capita PLC | 17,497 | 329,265 | ||||||
Dun & Bradstreet Corp. (The) | 1,050 | 111,269 | ||||||
Equifax, Inc. | 3,300 | 323,070 | ||||||
Experian PLC | 26,362 | 444,917 | ||||||
Intertek Group PLC | 4,284 | 165,709 | ||||||
Nielsen Holdings PLC | 10,238 | 463,065 | ||||||
Randstad Holding NV | 3,402 | 214,290 | ||||||
Recruit Holdings Co., Ltd.(b) | 3,821 | 117,328 | ||||||
Robert Half International, Inc. | 3,700 | 188,811 | ||||||
| AB POOLING PORTFOLIOS • | 227 |
AB Volatility Management—Portfolio of Investments
| Company | Shares | U.S. $ Value | ||||||
| ||||||||
Seek Ltd. | 8,583 | $ | 75,372 | |||||
SGS SA (REG) | 146 | 257,173 | ||||||
|
| |||||||
| 3,205,567 | ||||||||
|
| |||||||
Road & Rail – 0.6% | ||||||||
Asciano Ltd. | 25,946 | 156,555 | ||||||
Aurizon Holdings Ltd. | 55,491 | 195,753 | ||||||
Central Japan Railway Co. | 3,836 | 628,051 | ||||||
ComfortDelGro Corp., Ltd. | 56,000 | 111,717 | ||||||
CSX Corp. | 27,550 | 754,319 | ||||||
DSV A/S | 4,778 | 170,595 | ||||||
East Japan Railway Co. | 8,900 | 822,261 | ||||||
Hankyu Hanshin Holdings, Inc. | 30,000 | 179,917 | ||||||
JB Hunt Transport Services, Inc. | 2,582 | 187,918 | ||||||
Kansas City Southern | 3,100 | 287,494 | ||||||
Keikyu Corp.(b) | 12,000 | 96,346 | ||||||
Keio Corp.(b) | 15,000 | 112,489 | ||||||
Keisei Electric Railway Co., Ltd. | 7,000 | 74,669 | ||||||
Kintetsu Group Holdings Co., Ltd.(b) | 48,000 | 171,235 | ||||||
MTR Corp., Ltd. | 38,500 | 171,490 | ||||||
Nagoya Railroad Co., Ltd.(b) | 23,000 | 91,551 | ||||||
Nippon Express Co., Ltd. | 22,000 | 106,405 | ||||||
Norfolk Southern Corp. | 8,550 | 666,131 | ||||||
Odakyu Electric Railway Co., Ltd.(b) | 16,000 | 145,918 | ||||||
Ryder System, Inc. | 1,500 | 122,955 | ||||||
Tobu Railway Co., Ltd.(b) | 27,000 | 120,499 | ||||||
Tokyu Corp. | 29,000 | 205,583 | ||||||
Union Pacific Corp. | 24,550 | 2,104,917 | ||||||
West Japan Railway Co. | 4,381 | 295,682 | ||||||
|
| |||||||
| 7,980,450 | ||||||||
|
| |||||||
Trading Companies & Distributors – 0.4% | ||||||||
Ashtead Group PLC | 13,317 | 191,108 | ||||||
Brenntag AG | 4,102 | 227,854 | ||||||
Bunzl PLC | 8,855 | 234,307 | ||||||
Fastenal Co.(b) | 7,550 | 290,977 | ||||||
ITOCHU Corp. | 42,000 | 503,717 | ||||||
Marubeni Corp.(b) | 43,000 | 235,596 | ||||||
Mitsubishi Corp. | 36,700 | 681,818 | ||||||
Mitsui & Co., Ltd.(b) | 45,400 | 590,370 | ||||||
Noble Group Ltd.(b) | 125,000 | 48,339 | ||||||
Rexel SA | 7,767 | 118,984 | ||||||
Sumitomo Corp. | 29,900 | 317,130 | ||||||
Toyota Tsusho Corp.(b) | 5,700 | 131,147 | ||||||
Travis Perkins PLC | 6,701 | 208,993 | ||||||
United Rentals, Inc.(a) | 2,650 | 183,724 | ||||||
Wolseley PLC | 6,918 | 443,379 | ||||||
WW Grainger, Inc. | 1,750 | 391,020 | ||||||
|
| |||||||
| 4,798,463 | ||||||||
|
| |||||||
| 228 | • AB POOLING PORTFOLIOS |
AB Volatility Management—Portfolio of Investments
| Company | Shares | U.S. $ Value | ||||||
| ||||||||
Transportation Infrastructure – 0.1% | ||||||||
Abertis Infraestructuras SA(b) | 11,948 | $ | 197,274 | |||||
Aena SA(a)(e) | 1,796 | 205,633 | ||||||
Aeroports de Paris | 789 | 90,485 | ||||||
Atlantia SpA | 10,961 | 292,837 | ||||||
Auckland International Airport Ltd. | 25,335 | 79,687 | ||||||
Fraport AG Frankfurt Airport Services Worldwide | 1,106 | 66,711 | ||||||
Groupe Eurotunnel SE (REG) | 12,410 | 167,833 | ||||||
Hutchison Port Holdings Trust – Class U | 143,000 | 75,131 | ||||||
Japan Airport Terminal Co., Ltd.(b) | 1,200 | 53,477 | ||||||
Kamigumi Co., Ltd.(b) | 6,000 | 50,130 | ||||||
Mitsubishi Logistics Corp.(b) | 3,000 | 36,140 | ||||||
Sydney Airport | 28,887 | 118,103 | ||||||
Transurban Group | 50,927 | 350,611 | ||||||
|
| |||||||
| 1,784,052 | ||||||||
|
| |||||||
| 94,348,049 | ||||||||
|
| |||||||
Consumer Staples – 6.6% | ||||||||
Beverages – 1.5% | ||||||||
Anheuser-Busch InBev SA/NV | 21,391 | 2,333,089 | ||||||
Asahi Group Holdings Ltd. | 10,300 | 339,183 | ||||||
Brown-Forman Corp. – Class B | 4,300 | 421,830 | ||||||
Carlsberg A/S – Class B | 2,893 | 218,593 | ||||||
Coca-Cola Amatil Ltd. | 15,234 | 91,021 | ||||||
Coca-Cola Co. (The) | 109,400 | 4,301,608 | ||||||
Coca-Cola Enterprises, Inc. | 6,000 | 308,940 | ||||||
Coca-Cola HBC AG(a) | 5,318 | 108,309 | ||||||
Constellation Brands, Inc. – Class A | 4,650 | 595,200 | ||||||
Diageo PLC | 66,921 | 1,773,202 | ||||||
Dr Pepper Snapple Group, Inc. | 5,350 | 410,506 | ||||||
Heineken Holding NV | 2,676 | 186,593 | ||||||
Heineken NV | 6,180 | 488,440 | ||||||
Kirin Holdings Co., Ltd.(b) | 22,000 | 322,840 | ||||||
Molson Coors Brewing Co. – Class B | 4,450 | 303,001 | ||||||
Monster Beverage Corp.(a) | 4,060 | 562,148 | ||||||
PepsiCo, Inc. | 41,250 | 3,833,362 | ||||||
Pernod Ricard SA | 5,678 | 595,411 | ||||||
Remy Cointreau SA | 644 | 38,179 | ||||||
SABMiller PLC (London) | 25,789 | 1,199,629 | ||||||
Suntory Beverage & Food Ltd. | 3,691 | 155,833 | ||||||
Treasury Wine Estates Ltd. | 17,180 | 72,835 | ||||||
|
| |||||||
| 18,659,752 | ||||||||
|
| |||||||
Food & Staples Retailing – 1.3% | ||||||||
Aeon Co., Ltd.(b) | 17,400 | 260,965 | ||||||
Carrefour SA | 14,663 | 476,074 | ||||||
Casino Guichard Perrachon SA | 1,502 | 94,881 | ||||||
Colruyt SA(a) | 1,860 | 90,574 | ||||||
| AB POOLING PORTFOLIOS • | 229 |
AB Volatility Management—Portfolio of Investments
| Company | Shares | U.S. $ Value | ||||||
| ||||||||
Costco Wholesale Corp. | 12,250 | $ | 1,715,613 | |||||
CVS Health Corp. | 31,300 | 3,205,120 | ||||||
Delhaize Group | 2,776 | 248,387 | ||||||
Distribuidora Internacional de Alimentacion SA(a) | 16,453 | 98,671 | ||||||
FamilyMart Co., Ltd.(b) | 1,600 | 74,089 | ||||||
ICA Gruppen AB | 2,048 | 76,004 | ||||||
J Sainsbury PLC | 35,651 | 131,960 | ||||||
Jeronimo Martins SGPS SA | 6,682 | 92,436 | ||||||
Koninklijke Ahold NV | 23,907 | 471,509 | ||||||
Kroger Co. (The) | 27,300 | 941,850 | ||||||
Lawson, Inc. | 1,800 | 128,441 | ||||||
METRO AG | 4,302 | 125,082 | ||||||
Seven & i Holdings Co., Ltd.(b) | 20,100 | 874,043 | ||||||
Sysco Corp. | 16,450 | 655,862 | ||||||
Tesco PLC | 216,083 | 627,165 | ||||||
Wal-Mart Stores, Inc. | 43,950 | 2,844,883 | ||||||
Walgreens Boots Alliance, Inc. | 24,250 | 2,098,837 | ||||||
Wesfarmers Ltd. | 29,973 | 866,744 | ||||||
Whole Foods Market, Inc. | 9,950 | 325,962 | ||||||
WM Morrison Supermarkets PLC | 59,010 | 151,476 | ||||||
Woolworths Ltd. | 33,602 | 630,836 | ||||||
|
| |||||||
| 17,307,464 | ||||||||
|
| |||||||
Food Products – 1.5% | ||||||||
Ajinomoto Co., Inc. | 15,000 | 329,502 | ||||||
Archer-Daniels-Midland Co. | 17,600 | 791,824 | ||||||
Aryzta AG(a)(b) | 2,316 | 118,711 | ||||||
Associated British Foods PLC | 9,457 | 460,970 | ||||||
Barry Callebaut AG (REG)(a)(b) | 59 | 64,710 | ||||||
Calbee, Inc.(b) | 1,933 | 73,845 | ||||||
Campbell Soup Co. | 4,900 | 235,151 | ||||||
Chocoladefabriken Lindt & Spruengli AG | 26 | 146,563 | ||||||
Chocoladefabriken Lindt & Spruengli AG (REG) | 3 | 201,708 | ||||||
ConAgra Foods, Inc. | 11,800 | 491,824 | ||||||
Danone SA | 15,414 | 954,951 | ||||||
General Mills, Inc. | 16,800 | 953,568 | ||||||
Golden Agri-Resources Ltd.(b) | 187,000 | 41,768 | ||||||
Hershey Co. (The) | 4,150 | 371,508 | ||||||
Hormel Foods Corp. | 3,700 | 226,070 | ||||||
JM Smucker Co. (The) | 2,750 | 323,730 | ||||||
Kellogg Co. | 7,000 | 463,960 | ||||||
Kerry Group PLC – Class A | 4,267 | 317,791 | ||||||
Keurig Green Mountain, Inc. | 3,394 | 192,100 | ||||||
Kikkoman Corp.(b) | 4,000 | 128,463 | ||||||
Kraft Heinz Co. (The) | 16,400 | 1,191,624 | ||||||
McCormick & Co., Inc./MD | 3,550 | 281,444 | ||||||
Mead Johnson Nutrition Co. – Class A | 5,600 | 438,704 | ||||||
MEIJI Holdings Co., Ltd. | 1,700 | 276,422 | ||||||
| 230 | • AB POOLING PORTFOLIOS |
AB Volatility Management—Portfolio of Investments
| Company | Shares | U.S. $ Value | ||||||
| ||||||||
Mondelez International, Inc. – Class A | 45,850 | $ | 1,942,206 | |||||
Nestle SA (REG) | 85,785 | 6,319,513 | ||||||
NH Foods Ltd | 5,000 | 115,220 | ||||||
Nisshin Seifun Group, Inc. | 5,500 | 74,978 | ||||||
Nissin Foods Holdings Co., Ltd. | 1,700 | 80,602 | ||||||
Orkla ASA | 21,684 | 159,861 | ||||||
Tate & Lyle PLC | 12,363 | 101,737 | ||||||
Toyo Suisan Kaisha Ltd. | 3,000 | 112,317 | ||||||
Tyson Foods, Inc. – Class A | 8,050 | 340,354 | ||||||
WH Group Ltd.(a)(e) | 155,800 | 81,783 | ||||||
Wilmar International Ltd. | 51,000 | 103,036 | ||||||
Yakult Honsha Co., Ltd.(b) | 2,400 | 133,677 | ||||||
Yamazaki Baking Co., Ltd. | 3,000 | 50,392 | ||||||
|
| |||||||
| 18,692,587 | ||||||||
|
| |||||||
Household Products – 0.9% | ||||||||
Clorox Co. (The) | 3,650 | 405,770 | ||||||
Colgate-Palmolive Co. | 23,700 | 1,488,597 | ||||||
Henkel AG & Co. KGaA | 2,765 | 253,567 | ||||||
Henkel AG & Co. KGaA (Preference Shares) | 4,772 | 498,665 | ||||||
Kimberly-Clark Corp. | 10,200 | 1,086,606 | ||||||
Procter & Gamble Co. (The) | 75,200 | 5,314,384 | ||||||
Reckitt Benckiser Group PLC | 17,205 | 1,507,406 | ||||||
Svenska Cellulosa AB SCA – Class B | 15,764 | 448,366 | ||||||
Unicharm Corp. | 9,900 | 199,731 | ||||||
|
| |||||||
| 11,203,092 | ||||||||
|
| |||||||
Personal Products – 0.4% | ||||||||
Beiersdorf AG | 2,676 | 221,129 | ||||||
Estee Lauder Cos., Inc. (The) – Class A | 6,250 | 498,562 | ||||||
Kao Corp. | 13,400 | 612,019 | ||||||
L’Oreal SA | 6,719 | 1,149,073 | ||||||
Shiseido Co., Ltd.(b) | 9,600 | 200,800 | ||||||
Unilever NV | 43,334 | 1,736,590 | ||||||
Unilever PLC | 34,142 | 1,369,261 | ||||||
|
| |||||||
| 5,787,434 | ||||||||
|
| |||||||
Tobacco – 1.0% | ||||||||
Altria Group, Inc. | 54,750 | 2,933,505 | ||||||
British American Tobacco PLC | 49,589 | 2,625,857 | ||||||
Imperial Tobacco Group PLC | 25,460 | 1,225,488 | ||||||
Japan Tobacco, Inc. | 29,262 | 1,039,954 | ||||||
Philip Morris International, Inc. | 43,100 | 3,439,380 | ||||||
Reynolds American, Inc. | 12,069 | 1,010,779 | ||||||
Swedish Match AB | 5,362 | 158,353 | ||||||
|
| |||||||
| 12,433,316 | ||||||||
|
| |||||||
| 84,083,645 | ||||||||
|
| |||||||
| AB POOLING PORTFOLIOS • | 231 |
AB Volatility Management—Portfolio of Investments
| Company | Shares | U.S. $ Value | ||||||
| ||||||||
Energy – 4.0% | ||||||||
Energy Equipment & Services – 0.5% | ||||||||
Amec Foster Wheeler PLC | 10,254 | $ | 125,880 | |||||
Baker Hughes, Inc. | 14,650 | 820,400 | ||||||
Cameron International Corp.(a) | 5,350 | 357,166 | ||||||
Diamond Offshore Drilling, Inc.(b) | 1,850 | 43,864 | ||||||
Ensco PLC – Class A | 6,450 | 116,810 | ||||||
FMC Technologies, Inc.(a) | 6,400 | 222,592 | ||||||
Halliburton Co. | 23,650 | 930,627 | ||||||
Helmerich & Payne, Inc.(b) | 2,950 | 174,080 | ||||||
National Oilwell Varco, Inc. | 10,700 | 452,931 | ||||||
Petrofac Ltd. | 6,887 | 93,691 | ||||||
Saipem SpA(a)(b) | 7,029 | 67,582 | ||||||
Schlumberger Ltd. | 35,550 | 2,750,503 | ||||||
Seadrill Ltd.(b) | 9,831 | 76,031 | ||||||
Subsea 7 SA(a) | 6,999 | 60,204 | ||||||
Technip SA | 2,791 | 151,969 | ||||||
Tenaris SA | 12,535 | 164,895 | ||||||
Transocean Ltd.(b) | 9,465 | 134,687 | ||||||
Transocean Ltd. (Zurich)(b) | 9,584 | 131,685 | ||||||
WorleyParsons Ltd. | 5,494 | 29,348 | ||||||
|
| |||||||
| 6,904,945 | ||||||||
|
| |||||||
Oil, Gas & Consumable Fuels – 3.5% | ||||||||
Anadarko Petroleum Corp. | 14,050 | 1,005,699 | ||||||
Apache Corp. | 10,500 | 475,020 | ||||||
BG Group PLC | 90,828 | 1,378,548 | ||||||
BP PLC | 485,288 | 2,689,837 | ||||||
Cabot Oil & Gas Corp. | 11,450 | 271,022 | ||||||
Caltex Australia Ltd. | 7,183 | 162,938 | ||||||
Chesapeake Energy Corp.(b) | 14,350 | 112,074 | ||||||
Chevron Corp. | 52,350 | 4,239,826 | ||||||
Cimarex Energy Co. | 2,633 | 290,973 | ||||||
Columbia Pipeline Group, Inc. | 8,800 | 223,168 | ||||||
ConocoPhillips | 34,300 | 1,685,845 | ||||||
CONSOL Energy, Inc.(b) | 6,350 | 96,711 | ||||||
Delek Group Ltd. | 125 | 29,426 | ||||||
Devon Energy Corp. | 10,750 | 458,595 | ||||||
Eni SpA | 67,672 | 1,116,989 | ||||||
EOG Resources, Inc. | 15,250 | 1,194,227 | ||||||
EQT Corp. | 4,200 | 326,844 | ||||||
Exxon Mobil Corp. | 116,803 | 8,788,258 | ||||||
Galp Energia SGPS SA | 10,235 | 107,992 | ||||||
Hess Corp. | 6,700 | 398,315 | ||||||
Idemitsu Kosan Co., Ltd.(b) | 2,300 | 39,577 | ||||||
Inpex Corp.(b) | 25,285 | 256,293 | ||||||
JX Holdings, Inc. | 59,000 | 228,297 | ||||||
Kinder Morgan, Inc./DE | 47,413 | 1,536,655 | ||||||
| 232 | • AB POOLING PORTFOLIOS |
AB Volatility Management—Portfolio of Investments
| Company | Shares | U.S. $ Value | ||||||
| ||||||||
Koninklijke Vopak NV(b) | 1,867 | $ | 76,755 | |||||
Lundin Petroleum AB(a) | 5,907 | 77,194 | ||||||
Marathon Oil Corp. | 18,700 | 323,323 | ||||||
Marathon Petroleum Corp. | 15,300 | 723,843 | ||||||
Murphy Oil Corp. | 4,600 | 142,600 | ||||||
Neste Oyj | 3,403 | 87,242 | ||||||
Newfield Exploration Co.(a) | 4,400 | 146,564 | ||||||
Noble Energy, Inc. | 10,750 | 359,158 | ||||||
Occidental Petroleum Corp. | 21,450 | 1,566,064 | ||||||
OMV AG | 3,910 | 100,100 | ||||||
ONEOK, Inc. | 5,800 | 208,858 | ||||||
Origin Energy Ltd. | 29,232 | 171,507 | ||||||
Phillips 66 | 15,100 | 1,193,957 | ||||||
Pioneer Natural Resources Co. | 4,150 | 510,699 | ||||||
Range Resources Corp.(b) | 4,600 | 177,652 | ||||||
Repsol SA | 27,427 | 391,054 | ||||||
Royal Dutch Shell PLC – Class A | 103,602 | 2,699,068 | ||||||
Royal Dutch Shell PLC – Class B | 64,919 | 1,694,975 | ||||||
Santos Ltd.(b) | 25,806 | 94,722 | ||||||
Showa Shell Sekiyu KK | 5,000 | 42,819 | ||||||
Southwestern Energy Co.(a) | 10,650 | 172,956 | ||||||
Spectra Energy Corp. | 18,650 | 542,155 | ||||||
Statoil ASA | 29,626 | 451,529 | ||||||
Tesoro Corp. | 3,500 | 322,035 | ||||||
TonenGeneral Sekiyu KK(b) | 7,000 | 70,057 | ||||||
Total SA | 56,941 | 2,625,344 | ||||||
Tullow Oil PLC(a) | 23,528 | 80,196 | ||||||
Valero Energy Corp. | 14,350 | 851,529 | ||||||
Williams Cos., Inc. (The) | 18,650 | 898,930 | ||||||
Woodside Petroleum Ltd. | 19,796 | 455,620 | ||||||
|
| |||||||
| 44,371,634 | ||||||||
|
| |||||||
| 51,276,579 | ||||||||
|
| |||||||
Materials – 2.9% | ||||||||
Chemicals – 1.7% | ||||||||
Air Liquide SA | 9,177 | 1,098,267 | ||||||
Air Products & Chemicals, Inc. | 5,350 | 746,486 | ||||||
Air Water, Inc. | 4,000 | 63,693 | ||||||
Airgas, Inc. | 1,850 | 178,562 | ||||||
Akzo Nobel NV | 6,529 | 440,912 | ||||||
Arkema SA | 1,794 | 126,375 | ||||||
Asahi Kasei Corp. | 33,000 | 262,485 | ||||||
BASF SE | 24,433 | 1,963,115 | ||||||
CF Industries Holdings, Inc. | 7,000 | 401,660 | ||||||
Croda International PLC | 3,605 | 159,059 | ||||||
Daicel Corp. | 8,000 | 105,260 | ||||||
Dow Chemical Co. (The) | 30,300 | 1,325,928 | ||||||
Eastman Chemical Co. | 4,100 | 297,086 | ||||||
| AB POOLING PORTFOLIOS • | 233 |
AB Volatility Management—Portfolio of Investments
| Company | Shares | U.S. $ Value | ||||||
| ||||||||
Ecolab, Inc. | 7,500 | $ | 818,550 | |||||
EI du Pont de Nemours & Co. | 25,200 | 1,297,800 | ||||||
EMS-Chemie Holding AG (REG) | 218 | 98,168 | ||||||
Evonik Industries AG | 2,480 | 92,212 | ||||||
FMC Corp. | 3,700 | 156,547 | ||||||
Fuchs Petrolub SE (Preference Shares) | 1,884 | 81,076 | ||||||
Givaudan SA (REG)(a) | 246 | 422,926 | ||||||
Hitachi Chemical Co., Ltd. | 2,800 | 42,860 | ||||||
Incitec Pivot Ltd. | 43,665 | 108,858 | ||||||
International Flavors & Fragrances, Inc. | 2,250 | 246,488 | ||||||
Israel Chemicals Ltd. | 13,528 | 76,180 | ||||||
Israel Corp., Ltd. (The) | 87 | 26,381 | ||||||
Johnson Matthey PLC | 5,440 | 224,230 | ||||||
JSR Corp. | 5,100 | 79,952 | ||||||
K&S AG (REG) | 5,092 | 190,052 | ||||||
Kaneka Corp.(b) | 7,000 | 56,627 | ||||||
Kansai Paint Co., Ltd.(b) | 6,000 | 93,408 | ||||||
Koninklijke DSM NV | 4,827 | 253,552 | ||||||
Kuraray Co., Ltd.(b) | 9,000 | 106,108 | ||||||
Lanxess AG | 2,430 | 123,211 | ||||||
Linde AG | 4,955 | 859,899 | ||||||
LyondellBasell Industries NV – Class A | 11,040 | 942,595 | ||||||
Mitsubishi Chemical Holdings Corp. | 36,000 | 204,145 | ||||||
Mitsubishi Gas Chemical Co., Inc. | 10,000 | 48,579 | ||||||
Mitsui Chemicals, Inc.(b) | 21,000 | 70,827 | ||||||
Monsanto Co. | 13,450 | 1,313,392 | ||||||
Mosaic Co. (The) | 8,600 | 351,138 | ||||||
Nippon Paint Holdings Co., Ltd.(b) | 4,000 | 81,623 | ||||||
Nitto Denko Corp.(b) | 4,400 | 294,872 | ||||||
Novozymes A/S – Class B | 6,354 | 276,291 | ||||||
OCI NV(a)(b) | 2,238 | 65,834 | ||||||
Orica Ltd.(b) | 9,846 | 111,100 | ||||||
PPG Industries, Inc. | 7,700 | 733,733 | ||||||
Praxair, Inc. | 8,050 | 851,288 | ||||||
Sherwin-Williams Co. (The) | 2,300 | 588,363 | ||||||
Shin-Etsu Chemical Co., Ltd.(b) | 11,000 | 603,484 | ||||||
Sigma-Aldrich Corp. | 3,300 | 460,053 | ||||||
Sika AG | 58 | 191,794 | ||||||
Solvay SA | 1,610 | 188,926 | ||||||
Sumitomo Chemical Co., Ltd. | 39,000 | 193,604 | ||||||
Symrise AG | 3,342 | 201,188 | ||||||
Syngenta AG (REG) | 2,473 | 829,099 | ||||||
Taiyo Nippon Sanso Corp.(b) | 4,000 | 48,901 | ||||||
Teijin Ltd. | 24,000 | 76,255 | ||||||
Toray Industries, Inc.(b) | 39,000 | 343,390 | ||||||
Umicore SA | 2,533 | 101,076 | ||||||
Yara International ASA | 4,806 | 214,459 | ||||||
|
| |||||||
| 22,009,982 | ||||||||
|
| |||||||
| 234 | • AB POOLING PORTFOLIOS |
AB Volatility Management—Portfolio of Investments
| Company | Shares | U.S. $ Value | ||||||
| ||||||||
Construction Materials – 0.2% | ||||||||
Boral Ltd. | 20,672 | $ | 83,112 | |||||
CRH PLC | 21,681 | 648,031 | ||||||
Fletcher Building Ltd. | 17,504 | 79,780 | ||||||
HeidelbergCement AG | 3,803 | 286,808 | ||||||
Imerys SA | 911 | 62,659 | ||||||
James Hardie Industries PLC | 11,774 | 146,997 | ||||||
LafargeHolcim Ltd. (REG)(a) | 10,604 | 673,252 | ||||||
Martin Marietta Materials, Inc. | 1,698 | 284,924 | ||||||
Taiheiyo Cement Corp. | 31,000 | 104,737 | ||||||
Vulcan Materials Co. | 3,700 | 346,394 | ||||||
|
| |||||||
| 2,716,694 | ||||||||
|
| |||||||
Containers & Packaging – 0.2% | ||||||||
Amcor Ltd./Australia | 32,032 | 312,756 | ||||||
Avery Dennison Corp. | 2,450 | 142,296 | ||||||
Ball Corp. | 3,850 | 253,754 | ||||||
Owens-Illinois, Inc.(a) | 4,550 | 94,868 | ||||||
Rexam PLC | 18,752 | 153,835 | ||||||
Sealed Air Corp. | 5,800 | 298,410 | ||||||
Toyo Seikan Group Holdings Ltd.(b) | 4,300 | 70,467 | ||||||
WestRock Co. | 7,310 | 433,848 | ||||||
|
| |||||||
| 1,760,234 | ||||||||
|
| |||||||
Metals & Mining – 0.7% | ||||||||
Alcoa, Inc. | 34,000 | 321,300 | ||||||
Alumina Ltd. | 63,695 | 59,384 | ||||||
Anglo American PLC | 37,012 | 414,754 | ||||||
Antofagasta PLC | 10,468 | 97,024 | ||||||
ArcelorMittal (Euronext Amsterdam)(b) | 26,525 | 207,141 | ||||||
BHP Billiton Ltd. | 84,972 | 1,556,491 | ||||||
BHP Billiton PLC | 55,874 | 982,286 | ||||||
Boliden AB | 7,260 | 119,501 | ||||||
Fortescue Metals Group Ltd.(b) | 39,187 | 53,154 | ||||||
Freeport-McMoRan, Inc. | 28,950 | 308,028 | ||||||
Fresnillo PLC | 5,868 | 55,614 | ||||||
Glencore PLC(a) | 295,867 | 667,849 | ||||||
Hitachi Metals Ltd. | 6,000 | 75,875 | ||||||
Iluka Resources Ltd. | 11,138 | 58,830 | ||||||
JFE Holdings, Inc.(b) | 13,100 | 202,866 | ||||||
Kobe Steel Ltd. | 82,000 | 109,785 | ||||||
Maruichi Steel Tube Ltd. | 1,300 | 33,035 | ||||||
Mitsubishi Materials Corp. | 29,000 | 92,992 | ||||||
Newcrest Mining Ltd.(a) | 20,390 | 162,693 | ||||||
Newmont Mining Corp. | 13,850 | 236,420 | ||||||
Nippon Steel & Sumitomo Metal Corp.(b) | 202,000 | 414,226 | ||||||
Norsk Hydro ASA | 34,867 | 120,070 | ||||||
Nucor Corp. | 8,850 | 383,117 | ||||||
Randgold Resources Ltd. | 2,470 | 149,375 | ||||||
| AB POOLING PORTFOLIOS • | 235 |
AB Volatility Management—Portfolio of Investments
| Company | Shares | U.S. $ Value | ||||||
| ||||||||
Rio Tinto Ltd. | 11,568 | $ | 414,870 | |||||
Rio Tinto PLC | 33,849 | 1,235,848 | ||||||
South32 Ltd.(a) | 140,846 | 152,035 | ||||||
Sumitomo Metal Mining Co., Ltd.(b) | 13,000 | 165,023 | ||||||
ThyssenKrupp AG(b) | 9,786 | 211,539 | ||||||
voestalpine AG | 2,976 | 108,501 | ||||||
|
| |||||||
| 9,169,626 | ||||||||
|
| |||||||
Paper & Forest Products – 0.1% | ||||||||
International Paper Co. | 11,750 | 506,895 | ||||||
Mondi PLC | 9,769 | 219,546 | ||||||
Oji Holdings Corp.(b) | 21,000 | 96,937 | ||||||
Stora Enso Oyj – Class R | 14,610 | 129,627 | ||||||
UPM-Kymmene Oyj | 14,324 | 238,103 | ||||||
|
| |||||||
| 1,191,108 | ||||||||
|
| |||||||
| 36,847,644 | ||||||||
|
| |||||||
Equity: Other – 2.3% | ||||||||
Diversified/Specialty – 1.7% | ||||||||
Activia Properties, Inc. | 17 | 139,033 | ||||||
Aedifica SA | 627 | 37,220 | ||||||
Affine SA | 250 | 4,458 | ||||||
Alexander’s, Inc. | 105 | 38,115 | ||||||
Alexandria Real Estate Equities, Inc. | 3,610 | 310,424 | ||||||
American Assets Trust, Inc. | 1,900 | 73,188 | ||||||
American Homes 4 Rent – Class A | 7,565 | 120,889 | ||||||
ANF Immobilier | 322 | 7,443 | ||||||
Artis Real Estate Investment Trust | 6,800 | 63,369 | ||||||
Azrieli Group | 2,768 | 109,210 | ||||||
Beni Stabili SpA SIIQ | 53,607 | 41,637 | ||||||
BioMed Realty Trust, Inc. | 10,243 | 189,496 | ||||||
British Land Co. PLC (The) | 76,701 | 956,348 | ||||||
CA Immobilien Anlagen AG(a) | 3,653 | 68,027 | ||||||
Campus Crest Communities, Inc.(b) | 3,200 | 16,544 | ||||||
Canadian Real Estate Investment Trust | 3,650 | 113,750 | ||||||
CapitaLand Ltd. | 195,450 | 391,713 | ||||||
Chambers Street Properties | 11,900 | 80,563 | ||||||
Champion REIT | 118,800 | 59,056 | ||||||
Cofinimmo SA | 1,020 | 107,108 | ||||||
Conwert Immobilien Invest SE(a)(b) | 3,094 | 40,205 | ||||||
Daejan Holdings PLC | 255 | 22,969 | ||||||
Dexus Property Group | 73,857 | 386,530 | ||||||
DIC Asset AG | 1,700 | 15,431 | ||||||
Digital Realty Trust, Inc. | 6,810 | 431,209 | ||||||
Dios Fastigheter AB | 2,339 | 15,298 | ||||||
Duke Realty Corp. | 17,358 | 313,485 | ||||||
DuPont Fabros Technology, Inc. | 3,290 | 87,942 | ||||||
F&C Commercial Property Trust Ltd. | 26,533 | 58,418 | ||||||
| 236 | • AB POOLING PORTFOLIOS |
AB Volatility Management—Portfolio of Investments
| Company | Shares | U.S. $ Value | ||||||
| ||||||||
Fastighets AB Balder – Class B(a) | 4,650 | $ | 81,298 | |||||
Fonciere Des Regions | 2,584 | 215,467 | ||||||
Forest City Enterprises, Inc. – Class A(a) | 11,510 | 247,810 | ||||||
Fukuoka REIT Corp.(b) | 46 | 71,433 | ||||||
Gaming and Leisure Properties, Inc. | 4,400 | 136,136 | ||||||
Gecina SA | 2,653 | 334,840 | ||||||
GPT Group (The) | 135,863 | 434,201 | ||||||
Gramercy Property Trust, Inc. | 2,750 | 60,803 | ||||||
Granite Real Estate Investment Trust (Toronto) | 2,350 | 68,699 | ||||||
Great Portland Estates PLC | 17,281 | 217,959 | ||||||
Grivalia Properties REIC AE | 1,956 | 17,112 | ||||||
H&R Real Estate Investment Trust | 13,756 | 215,918 | ||||||
Hamborner REIT AG | 2,400 | 24,190 | ||||||
Hang Lung Properties Ltd. | 170,900 | 386,895 | ||||||
Helical Bar PLC | 4,950 | 32,282 | ||||||
Hemfosa Fastigheter AB | 3,968 | 43,585 | ||||||
Henderson Land Development Co., Ltd. | 88,902 | 549,323 | ||||||
Hispania Activos Inmobiliarios SA(a) | 3,400 | 51,556 | ||||||
Hufvudstaden AB – Class A | 5,580 | 71,574 | ||||||
Hulic Co., Ltd. | 25,567 | 234,700 | ||||||
Hysan Development Co., Ltd. | 47,250 | 189,727 | ||||||
Investors Real Estate Trust | 6,167 | 41,257 | ||||||
Kerry Properties Ltd. | 49,550 | 148,641 | ||||||
Kiwi Property Group Ltd. | 63,681 | 52,834 | ||||||
Klovern AB – Class B | 18,850 | 17,820 | ||||||
Land Securities Group PLC | 60,554 | 1,156,693 | ||||||
Lar Espana Real Estate Socimi SA(b) | 1,700 | 17,302 | ||||||
Lexington Realty Trust(b) | 11,830 | 95,468 | ||||||
Londonmetric Property PLC | 29,358 | 72,815 | ||||||
Mapletree Commercial Trust | 65,900 | 61,731 | ||||||
Merlin Properties Socimi SA(a) | 9,771 | 113,296 | ||||||
Mitsubishi Estate Co., Ltd. | 96,440 | 2,074,504 | ||||||
Mitsui Fudosan Co., Ltd. | 72,040 | 1,996,122 | ||||||
Mobimo Holding AG(a) | 326 | 67,416 | ||||||
Morguard Real Estate Investment Trust | 1,750 | 19,235 | ||||||
Mori Trust Sogo Reit, Inc.(b) | 50 | 86,121 | ||||||
New World Development Co., Ltd. | 409,200 | 415,409 | ||||||
Nomura Real Estate Holdings, Inc. | 9,330 | 175,020 | ||||||
Nomura Real Estate Master Fund, Inc. | 75 | 80,930 | ||||||
NSI NV | 6,512 | 27,473 | ||||||
Orix JREIT, Inc.(b) | 110 | 138,584 | ||||||
Premier Investment Corp.(b) | 16 | 80,186 | ||||||
QTS Realty Trust, Inc. – Class A | 1,500 | 60,285 | ||||||
Quintain Estates & Development PLC(a) | 24,612 | 49,097 | ||||||
Redefine International PLC/Isle of Man | 48,900 | 39,582 | ||||||
Schroder Real Estate Investment Trust Ltd. | 26,069 | 23,702 | ||||||
Select Income REIT | 3,355 | 62,235 | ||||||
| AB POOLING PORTFOLIOS • | 237 |
AB Volatility Management—Portfolio of Investments
| Company | Shares | U.S. $ Value | ||||||
| ||||||||
Silver Bay Realty Trust Corp. | 1,750 | $ | 27,405 | |||||
Sino Land Co., Ltd. | 232,810 | 348,560 | ||||||
Spirit Realty Capital, Inc. | 21,176 | 203,290 | ||||||
Sponda Oyj | 12,108 | 48,702 | ||||||
ST Modwen Properties PLC | 8,873 | 60,662 | ||||||
Starwood Waypoint Residential Trust | 1,900 | 45,771 | ||||||
Sumitomo Realty & Development Co., Ltd. | 30,990 | 1,046,420 | ||||||
Sun Hung Kai Properties Ltd. | 129,150 | 1,637,087 | ||||||
Suntec Real Estate Investment Trust | 183,500 | 198,918 | ||||||
Swire Properties Ltd. | 89,950 | 276,381 | ||||||
Swiss Prime Site AG(a) | 4,907 | 385,213 | ||||||
TLG Immobilien AG | 2,526 | 47,842 | ||||||
Tokyu REIT, Inc. | 19 | 22,211 | ||||||
Top REIT, Inc. | 13 | 50,902 | ||||||
United Urban Investment Corp. | 159 | 208,788 | ||||||
UOL Group Ltd. | 35,350 | 156,757 | ||||||
Vereit, Inc. | 45,500 | 370,370 | ||||||
Vornado Realty Trust | 13,410 | 1,169,218 | ||||||
Wallenstam AB – Class B | 9,950 | 75,855 | ||||||
Washington Real Estate Investment Trust(b) | 3,384 | 83,246 | ||||||
Wharf Holdings Ltd. (The) | 104,650 | 590,374 | ||||||
Wihlborgs Fastigheter AB | 3,320 | 57,923 | ||||||
Winthrop Realty Trust(a) | 1,600 | 22,912 | ||||||
WP Carey, Inc. | 4,409 | 253,385 | ||||||
|
| |||||||
| 22,546,536 | ||||||||
|
| |||||||
Health Care – 0.5% | ||||||||
Assura PLC | 50,650 | 39,638 | ||||||
Care Capital Properties, Inc.(a) | 4,167 | 132,461 | ||||||
Chartwell Retirement Residences | 8,650 | 76,664 | ||||||
Extendicare, Inc.(b) | 4,400 | 26,288 | ||||||
HCP, Inc. | 35,800 | 1,326,748 | ||||||
Health Care REIT, Inc.(b) | 27,370 | 1,733,889 | ||||||
Healthcare Realty Trust, Inc. | 5,010 | 114,729 | ||||||
Healthcare Trust of America, Inc. – Class A | 6,275 | 150,663 | ||||||
LTC Properties, Inc. | 1,800 | 73,422 | ||||||
Medical Properties Trust, Inc. | 10,450 | 121,952 | ||||||
National Health Investors, Inc. | 1,734 | 95,543 | ||||||
New Senior Investment Group, Inc. | 3,200 | 36,448 | ||||||
Omega Healthcare Investors, Inc. | 8,118 | 274,226 | ||||||
Physicians Realty Trust | 3,500 | 50,750 | ||||||
Primary Health Properties PLC | 5,295 | 33,415 | ||||||
Sabra Health Care REIT, Inc. | 2,950 | 70,712 | ||||||
Senior Housing Properties Trust | 11,780 | 184,946 | ||||||
Target Healthcare REIT Ltd. | 7,150 | 11,723 | ||||||
Universal Health Realty Income Trust | 679 | 31,234 | ||||||
Ventas, Inc. | 25,847 | 1,422,102 | ||||||
|
| |||||||
| 6,007,553 | ||||||||
|
| |||||||
| 238 | • AB POOLING PORTFOLIOS |
AB Volatility Management—Portfolio of Investments
| Company | Shares | U.S. $ Value | ||||||
| ||||||||
Triple Net – 0.1% | ||||||||
Agree Realty Corp. | 828 | $ | 23,556 | |||||
EPR Properties | 2,857 | 145,393 | ||||||
Getty Realty Corp. | 1,250 | 19,700 | ||||||
National Retail Properties, Inc. | 6,735 | 234,041 | ||||||
Realty Income Corp.(b) | 17,910 | 800,398 | ||||||
|
| |||||||
| 1,223,088 | ||||||||
|
| |||||||
| 29,777,177 | ||||||||
|
| |||||||
Telecommunication Services – 2.2% | ||||||||
Diversified Telecommunication Services – 1.7% | ||||||||
AT&T, Inc. | 170,892 | 5,673,614 | ||||||
Bezeq The Israeli Telecommunication Corp., Ltd. | 51,093 | 91,723 | ||||||
BT Group PLC | 222,634 | 1,485,232 | ||||||
CenturyLink, Inc. | 15,700 | 424,528 | ||||||
Deutsche Telekom AG (REG) | 84,457 | 1,440,712 | ||||||
Elisa Oyj | 3,776 | 125,649 | ||||||
Frontier Communications Corp.(b) | 32,040 | 162,443 | ||||||
HKT Trust & HKT Ltd. – Class SS | 68,200 | 79,039 | ||||||
Iliad SA | 714 | 161,285 | ||||||
Inmarsat PLC | 11,926 | 178,163 | ||||||
Koninklijke KPN NV(b) | 85,196 | 330,955 | ||||||
Level 3 Communications, Inc.(a) | 7,989 | 357,348 | ||||||
Nippon Telegraph & Telephone Corp. | 20,000 | 762,843 | ||||||
Orange SA | 49,173 | 777,684 | ||||||
PCCW Ltd. | 109,000 | 57,006 | ||||||
Proximus | 4,038 | 144,844 | ||||||
Singapore Telecommunications Ltd. | 212,000 | 565,782 | ||||||
Spark New Zealand Ltd | 46,441 | 99,344 | ||||||
Swisscom AG (REG) | 689 | 371,901 | ||||||
TDC A/S | 20,937 | 132,370 | ||||||
Telecom Italia SpA (ordinary shares)(a) | 267,121 | 324,189 | ||||||
Telecom Italia SpA (savings shares) | 160,303 | 160,650 | ||||||
Telefonica Deutschland Holding AG(b) | 15,739 | 95,419 | ||||||
Telefonica SA(a) | 118,428 | 1,668,943 | ||||||
Telenor ASA | 20,084 | 399,379 | ||||||
TeliaSonera AB | 69,112 | 389,303 | ||||||
Telstra Corp., Ltd. | 113,543 | 465,825 | ||||||
TPG Telecom Ltd. | 7,390 | 49,310 | ||||||
Verizon Communications, Inc. | 115,670 | 5,321,977 | ||||||
|
| |||||||
| 22,297,460 | ||||||||
|
| |||||||
Wireless Telecommunication Services – 0.5% | ||||||||
KDDI Corp. | 46,528 | 1,154,540 | ||||||
Millicom International Cellular SA | 1,756 | 116,998 | ||||||
NTT DOCOMO, Inc. | 40,640 | 852,373 | ||||||
SoftBank Group Corp. | 25,600 | 1,489,493 | ||||||
| AB POOLING PORTFOLIOS • | 239 |
AB Volatility Management—Portfolio of Investments
| Company | Shares | U.S. $ Value | ||||||
| ||||||||
StarHub Ltd.(b) | 16,000 | $ | 41,510 | |||||
Tele2 AB – Class B | 8,468 | 83,464 | ||||||
Vodafone Group PLC | 705,240 | 2,428,451 | ||||||
|
| |||||||
| 6,166,829 | ||||||||
|
| |||||||
| 28,464,289 | ||||||||
|
| |||||||
Utilities – 2.1% | ||||||||
Electric Utilities – 1.1% | ||||||||
American Electric Power Co., Inc. | 13,550 | 735,629 | ||||||
AusNet Services | 44,949 | 41,676 | ||||||
Cheung Kong Infrastructure Holdings Ltd. | 16,000 | 133,025 | ||||||
Chubu Electric Power Co., Inc. | 17,100 | 264,699 | ||||||
Chugoku Electric Power Co., Inc. (The)(b) | 7,900 | 115,450 | ||||||
CLP Holdings Ltd. | 50,000 | 414,799 | ||||||
Contact Energy Ltd. | 8,742 | 28,715 | ||||||
Duke Energy Corp. | 19,708 | 1,397,494 | ||||||
Edison International | 9,050 | 529,244 | ||||||
EDP – Energias de Portugal SA | 61,603 | 215,116 | ||||||
Electricite de France SA | 6,419 | 138,464 | ||||||
Endesa SA | 8,422 | 173,981 | ||||||
Enel SpA | 187,607 | 843,622 | ||||||
Entergy Corp. | 5,050 | 329,917 | ||||||
Eversource Energy | 8,800 | 415,712 | ||||||
Exelon Corp. | 23,932 | 736,148 | ||||||
FirstEnergy Corp. | 11,650 | 372,334 | ||||||
Fortum Oyj | 11,791 | 190,863 | ||||||
Hokuriku Electric Power Co. | 4,500 | 64,908 | ||||||
Iberdrola SA | 144,451 | 976,791 | ||||||
Kansai Electric Power Co., Inc. (The)(a) | 18,700 | 233,004 | ||||||
Kyushu Electric Power Co., Inc.(a)(b) | 11,300 | 134,617 | ||||||
Mighty River Power Ltd.(b) | 18,520 | 32,446 | ||||||
NextEra Energy, Inc. | 12,300 | 1,210,443 | ||||||
Pepco Holdings, Inc. | 6,950 | 159,711 | ||||||
Pinnacle West Capital Corp. | 3,000 | 178,590 | ||||||
Power Assets Holdings Ltd. | 36,500 | 314,424 | ||||||
PPL Corp. | 18,550 | 574,864 | ||||||
Red Electrica Corp. SA | 2,873 | 228,608 | ||||||
Shikoku Electric Power Co., Inc.(b) | 4,700 | 73,385 | ||||||
Southern Co. (The) | 25,250 | 1,096,102 | ||||||
SSE PLC | 26,274 | 588,778 | ||||||
Terna Rete Elettrica Nazionale SpA | 40,101 | 186,640 | ||||||
Tohoku Electric Power Co., Inc. | 12,000 | 164,490 | ||||||
Tokyo Electric Power Co., Inc.(a) | 38,400 | 262,951 | ||||||
Xcel Energy, Inc. | 14,000 | 472,220 | ||||||
|
| �� | ||||||
| 14,029,860 | ||||||||
|
| |||||||
Gas Utilities – 0.1% | ||||||||
AGL Resources, Inc. | 3,300 | 201,267 | ||||||
APA Group | 29,642 | 184,870 | ||||||
| 240 | • AB POOLING PORTFOLIOS |
AB Volatility Management—Portfolio of Investments
| Company | Shares | U.S. $ Value | ||||||
| ||||||||
Enagas SA | 5,716 | $ | 155,972 | |||||
Gas Natural SDG SA | 9,297 | 188,027 | ||||||
Hong Kong & China Gas Co., Ltd. | 183,898 | 346,590 | ||||||
Osaka Gas Co., Ltd. | 49,000 | 198,827 | ||||||
Snam SpA | 55,873 | 272,949 | ||||||
Toho Gas Co., Ltd. | 10,000 | 60,176 | ||||||
Tokyo Gas Co., Ltd. | 61,000 | 333,271 | ||||||
|
| |||||||
| 1,941,949 | ||||||||
|
| |||||||
Independent Power and Renewable Electricity Producers – 0.1% | ||||||||
AES Corp./VA | 19,000 | 228,000 | ||||||
Electric Power Development Co., Ltd. | 3,800 | 118,958 | ||||||
Enel Green Power SpA | 44,329 | 84,199 | ||||||
Meridian Energy Ltd. | 33,214 | 46,274 | ||||||
NRG Energy, Inc. | 9,350 | 186,252 | ||||||
|
| |||||||
| 663,683 | ||||||||
|
| |||||||
Multi-Utilities – 0.8% | ||||||||
AGL Energy Ltd. | 17,909 | 215,131 | ||||||
Ameren Corp. | 6,750 | 271,957 | ||||||
CenterPoint Energy, Inc. | 11,950 | 222,509 | ||||||
Centrica PLC | 131,613 | 487,328 | ||||||
CMS Energy Corp. | 7,650 | 250,767 | ||||||
Consolidated Edison, Inc. | 8,150 | 512,716 | ||||||
Dominion Resources, Inc./VA | 16,400 | 1,143,900 | ||||||
DTE Energy Co. | 4,950 | 386,397 | ||||||
E.ON SE | 53,230 | 601,544 | ||||||
Engie | 38,869 | 694,199 | ||||||
National Grid PLC | 99,421 | 1,309,934 | ||||||
NiSource, Inc. | 8,800 | 147,752 | ||||||
PG&E Corp. | 13,250 | 656,935 | ||||||
Public Service Enterprise Group, Inc. | 14,000 | 563,500 | ||||||
RWE AG | 12,991 | 194,513 | ||||||
SCANA Corp. | 3,950 | 208,916 | ||||||
Sempra Energy | 6,500 | 616,525 | ||||||
Suez Environnement Co. | 7,861 | 141,394 | ||||||
TECO Energy, Inc. | 6,500 | 136,955 | ||||||
United Utilities Group PLC | 18,101 | 236,131 | ||||||
Veolia Environnement SA | 11,967 | 261,359 | ||||||
WEC Energy Group, Inc. | 9,295 | 442,907 | ||||||
|
| |||||||
| 9,703,269 | ||||||||
|
| |||||||
Water Utilities – 0.0% | ||||||||
Severn Trent PLC | 6,343 | 201,162 | ||||||
|
| |||||||
| 26,539,923 | ||||||||
|
| |||||||
Retail – 1.5% | ||||||||
Regional Mall – 0.6% | ||||||||
CapitaLand Mall Trust | 194,550 | 264,315 | ||||||
CBL & Associates Properties, Inc. | 8,540 | 127,075 | ||||||
| AB POOLING PORTFOLIOS • | 241 |
AB Volatility Management—Portfolio of Investments
| Company | Shares | U.S. $ Value | ||||||
| ||||||||
General Growth Properties, Inc. | 42,770 | $ | 1,085,503 | |||||
Macerich Co. (The) | 11,890 | 905,781 | ||||||
Pennsylvania Real Estate Investment Trust(b) | 3,310 | 65,670 | ||||||
Rouse Properties, Inc.(b) | 1,800 | 27,972 | ||||||
Simon Property Group, Inc. | 24,303 | 4,358,014 | ||||||
Taubman Centers, Inc. | 3,100 | 213,869 | ||||||
Westfield Corp. | 149,781 | 1,037,201 | ||||||
WP GLIMCHER, Inc. | 9,258 | 112,114 | ||||||
|
| |||||||
| 8,197,514 | ||||||||
|
| |||||||
Shopping Center/Other Retail – 0.9% | ||||||||
Acadia Realty Trust | 3,390 | 100,174 | ||||||
Aeon Mall Co., Ltd. | 8,832 | 148,589 | ||||||
AEON REIT Investment Corp. | 50 | 55,963 | ||||||
Brixmor Property Group, Inc. | 8,777 | 200,291 | ||||||
BWP Trust | 24,558 | 55,163 | ||||||
Capital & Counties Properties PLC | 36,541 | 246,789 | ||||||
Cedar Realty Trust, Inc. | 4,200 | 26,292 | ||||||
Charter Hall Retail REIT | 16,080 | 45,880 | ||||||
Citycon Oyj(a) | 19,730 | 49,531 | ||||||
Crombie Real Estate Investment Trust | 3,850 | 37,985 | ||||||
DDR Corp. | 15,320 | 234,243 | ||||||
Deutsche Euroshop AG | 2,315 | 102,955 | ||||||
Development Securities PLC | 6,263 | 24,387 | ||||||
Equity One, Inc. | 3,256 | 76,549 | ||||||
Eurocommercial Properties NV | 2,298 | 101,872 | ||||||
Federal Realty Investment Trust | 3,473 | 448,295 | ||||||
Federation Centres | 300,882 | 604,849 | ||||||
First Capital Realty, Inc. | 4,430 | 58,557 | ||||||
Fortune Real Estate Investment Trust(b) | 66,200 | 65,075 | ||||||
Frontier Real Estate Investment Corp. | 24 | 96,121 | ||||||
Hammerson PLC | 60,227 | 575,896 | ||||||
Immobiliare Grande Distribuzione SIIQ SpA | 15,234 | 14,293 | ||||||
Inland Real Estate Corp. | 4,300 | 36,163 | ||||||
Intu Properties PLC | 70,464 | 346,196 | ||||||
Japan Retail Fund Investment Corp.(b) | 187 | 343,757 | ||||||
Kimco Realty Corp. | 32,056 | 738,891 | ||||||
Kite Realty Group Trust | 4,112 | 96,673 | ||||||
Klepierre | 13,397 | 589,588 | ||||||
Link REIT | 175,300 | 930,681 | ||||||
Mercialys SA | 2,040 | 45,934 | ||||||
Ramco-Gershenson Properties Trust | 3,929 | 60,899 | ||||||
Regency Centers Corp. | 4,712 | 279,469 | ||||||
Retail Opportunity Investments Corp. | 4,685 | 74,632 | ||||||
Retail Properties of America, Inc. – Class A | 11,900 | 162,435 | ||||||
RioCan Real Estate Investment Trust (Toronto) | 15,962 | 294,950 | ||||||
Saul Centers, Inc. | 697 | 34,390 | ||||||
Scentre Group | 398,840 | 1,080,343 | ||||||
| 242 | • AB POOLING PORTFOLIOS |
AB Volatility Management—Portfolio of Investments
| Company | Shares | U.S. $ Value | ||||||
| ||||||||
Shaftesbury PLC | 13,983 | $ | 191,960 | |||||
Shopping Centres Australasia Property Group | 34,300 | 48,053 | ||||||
Smart Real Estate Investment Trust | 5,600 | 124,591 | ||||||
Tanger Factory Outlet Centers, Inc. | 4,790 | 151,556 | ||||||
Unibail-Rodamco SE | 7,603 | 1,973,903 | ||||||
Urban Edge Properties | 4,460 | 93,259 | ||||||
Urstadt Biddle Properties, Inc. – Class A | 1,300 | 23,309 | ||||||
Vastned Retail NV | 910 | 41,473 | ||||||
Weingarten Realty Investors | 5,578 | 176,488 | ||||||
Wereldhave Belgium NV | 100 | 11,210 | ||||||
Wereldhave NV | 1,720 | 98,447 | ||||||
|
| |||||||
| 11,418,999 | ||||||||
|
| |||||||
| 19,616,513 | ||||||||
|
| |||||||
Residential – 1.1% | ||||||||
Multi-Family – 0.8% | ||||||||
ADLER Real Estate AG(a) | 850 | 12,635 | ||||||
Ado Properties SA(a)(e) | 1,178 | 25,711 | ||||||
Advance Residence Investment Corp. | 46 | 95,504 | ||||||
Apartment Investment & Management Co. – Class A | 12,120 | 436,683 | ||||||
AvalonBay Communities, Inc. | 10,331 | 1,705,235 | ||||||
Boardwalk Real Estate Investment Trust | 2,000 | 82,898 | ||||||
BUWOG AG(a)(b) | 2,558 | 53,946 | ||||||
Camden Property Trust | 4,350 | 313,331 | ||||||
Canadian Apartment Properties REIT | 5,950 | 126,634 | ||||||
Daiwa House Residential Investment Corp.(b) | 33 | 61,329 | ||||||
Deutsche Annington Immobilien SE | 34,743 | 1,138,747 | ||||||
Deutsche Wohnen AG | 24,787 | 652,223 | ||||||
Equity LifeStyle Properties, Inc. | 3,849 | 214,620 | ||||||
Equity Residential | 28,300 | 2,016,375 | ||||||
Essex Property Trust, Inc. | 5,198 | 1,115,595 | ||||||
Grainger PLC | 20,665 | 74,046 | ||||||
Grand City Properties SA(b) | 4,000 | 70,607 | ||||||
Home Properties, Inc. | 2,900 | 215,209 | ||||||
Killam Properties, Inc.(b) | 2,650 | 20,042 | ||||||
LEG Immobilien AG(a)(b) | 2,900 | 217,404 | ||||||
Mid-America Apartment Communities, Inc. | 3,812 | 299,585 | ||||||
Mirvac Group | 282,670 | 351,410 | ||||||
Nippon Accommodations Fund, Inc.(b) | 24 | 79,685 | ||||||
Northern Property Real Estate Investment Trust | 1,600 | 25,175 | ||||||
Post Properties, Inc. | 2,750 | 152,240 | ||||||
Stockland | 180,617 | 501,835 | ||||||
Sun Communities, Inc. | 2,586 | 168,633 | ||||||
TAG Immobilien AG(b) | 5,820 | 66,548 | ||||||
UDR, Inc. | 13,030 | 420,869 | ||||||
UNITE Group PLC (The) | 11,173 | 110,439 | ||||||
|
| |||||||
| 10,825,193 | ||||||||
|
| |||||||
| AB POOLING PORTFOLIOS • | 243 |
AB Volatility Management—Portfolio of Investments
| Company | Shares | U.S. $ Value | ||||||
| ||||||||
Self Storage – 0.3% | ||||||||
Big Yellow Group PLC | 7,154 | $ | 73,599 | |||||
CubeSmart | 8,328 | 210,615 | ||||||
Extra Space Storage, Inc. | 5,500 | 404,140 | ||||||
Public Storage | 11,405 | 2,295,484 | ||||||
Safestore Holdings PLC | 10,400 | 46,557 | ||||||
Sovran Self Storage, Inc. | 1,798 | 161,335 | ||||||
|
| |||||||
| 3,191,730 | ||||||||
|
| |||||||
Student Housing – 0.0% | ||||||||
American Campus Communities, Inc. | 5,670 | 194,198 | ||||||
Education Realty Trust, Inc. | 2,393 | 69,995 | ||||||
|
| |||||||
| 264,193 | ||||||||
|
| |||||||
| 14,281,116 | ||||||||
|
| |||||||
Office – 0.7% | ||||||||
Office – 0.7% | ||||||||
Allied Properties Real Estate Investment Trust | 3,887 | 102,995 | ||||||
Allreal Holding AG(a) | 480 | 64,950 | ||||||
alstria office REIT-AG(a)(b) | 4,120 | 55,140 | ||||||
Befimmo SA | 820 | 50,599 | ||||||
Boston Properties, Inc. | 12,000 | 1,360,560 | ||||||
Brandywine Realty Trust | 8,991 | 108,971 | ||||||
CapitaLand Commercial Trust Ltd | 154,050 | 145,090 | ||||||
Castellum AB | 8,260 | 116,895 | ||||||
Columbia Property Trust, Inc. | 6,250 | 133,625 | ||||||
Cominar Real Estate Investment Trust | 8,305 | 102,455 | ||||||
Corporate Office Properties Trust | 4,750 | 99,893 | ||||||
Cousins Properties, Inc. | 10,639 | 97,560 | ||||||
Cromwell Property Group | 73,426 | 53,489 | ||||||
Daiwa Office Investment Corp. | 19 | 89,108 | ||||||
Derwent London PLC | 5,020 | 275,750 | ||||||
DO Deutsche Office AG | 3,250 | 16,420 | ||||||
Douglas Emmett, Inc. | 6,830 | 188,713 | ||||||
Dream Global Real Estate Investment Trust | 4,750 | 32,747 | ||||||
Dream Office Real Estate Investment Trust | 5,450 | 88,072 | ||||||
Empire State Realty Trust, Inc. – Class A | 4,479 | 72,605 | ||||||
Entra ASA(e) | 3,118 | 26,257 | ||||||
Equity Commonwealth(a) | 6,474 | 166,317 | ||||||
Fabege AB | 6,690 | 94,559 | ||||||
First Potomac Realty Trust | 2,950 | 31,005 | ||||||
Franklin Street Properties Corp. | 4,420 | 46,012 | ||||||
Government Properties Income Trust(b) | 3,508 | 55,567 | ||||||
Highwoods Properties, Inc. | 4,730 | 179,456 | ||||||
Hongkong Land Holdings Ltd. | 58,750 | 407,049 | ||||||
Hudson Pacific Properties, Inc. | 3,650 | 103,624 | ||||||
ICADE | 2,685 | 192,379 | ||||||
| 244 | • AB POOLING PORTFOLIOS |
AB Volatility Management—Portfolio of Investments
| Company | Shares | U.S. $ Value | ||||||
| ||||||||
Inmobiliaria Colonial SA(a) | 84,309 | $ | 59,089 | |||||
Investa Office Fund | 28,410 | 77,676 | ||||||
Japan Excellent, Inc. | 32 | 34,480 | ||||||
Japan Prime Realty Investment Corp. | 61 | 197,184 | ||||||
Japan Real Estate Investment Corp. | 97 | 406,610 | ||||||
Kenedix Office Investment Corp. – Class A | 18 | 80,046 | ||||||
Keppel REIT | 92,700 | 64,354 | ||||||
Kilroy Realty Corp. | 4,454 | 288,886 | ||||||
Liberty Property Trust | 7,530 | 231,472 | ||||||
Mack-Cali Realty Corp. | 4,477 | 83,854 | ||||||
Mori Hills REIT Investment Corp. | 48 | 55,128 | ||||||
New York REIT, Inc. | 8,200 | 78,556 | ||||||
Nippon Building Fund, Inc.(b) | 106 | 445,343 | ||||||
Nomura Real Estate Office Fund, Inc. | 18 | 70,962 | ||||||
Norwegian Property ASA(a) | 12,417 | 14,695 | ||||||
NTT Urban Development Corp. | 8,527 | 79,392 | ||||||
Paramount Group, Inc. | 7,221 | 118,713 | ||||||
Parkway Properties Inc/Md | 4,000 | 63,360 | ||||||
Piedmont Office Realty Trust, Inc. – Class A | 7,750 | 131,440 | ||||||
PS Business Parks, Inc. | 1,040 | 75,878 | ||||||
PSP Swiss Property AG (REG)(a) | 1,980 | 171,507 | ||||||
SL Green Realty Corp. | 7,800 | 807,378 | ||||||
Technopolis Oyj | 4,777 | 18,931 | ||||||
Tokyo Tatemono Co., Ltd. | 15,100 | 189,680 | ||||||
Workspace Group PLC | 5,847 | 80,385 | ||||||
|
| |||||||
| 8,482,861 | ||||||||
|
| |||||||
Lodging – 0.2% | ||||||||
Lodging – 0.2% | ||||||||
Ashford Hospitality Trust, Inc. | 4,760 | 36,842 | ||||||
CDL Hospitality Trusts | 32,138 | 30,048 | ||||||
Chatham Lodging Trust | 1,850 | 42,458 | ||||||
Chesapeake Lodging Trust | 2,984 | 86,268 | ||||||
DiamondRock Hospitality Co. | 10,070 | 118,423 | ||||||
FelCor Lodging Trust, Inc. | 7,190 | 58,023 | ||||||
Hersha Hospitality Trust | 2,085 | 50,957 | ||||||
Hospitality Properties Trust | 7,510 | 193,157 | ||||||
Host Hotels & Resorts, Inc. | 59,090 | 1,047,665 | ||||||
InnVest Real Estate Investment Trust | 4,651 | 18,560 | ||||||
Japan Hotel REIT Investment Corp. | 110 | 67,810 | ||||||
LaSalle Hotel Properties | 5,650 | 177,749 | ||||||
Pandox AB(a) | 2,626 | 36,788 | ||||||
Pebblebrook Hotel Trust | 3,600 | 137,016 | ||||||
RLJ Lodging Trust | 6,650 | 183,141 | ||||||
Ryman Hospitality Properties, Inc. | 2,460 | 126,026 | ||||||
Strategic Hotels & Resorts, Inc.(a) | 13,808 | 186,270 | ||||||
Summit Hotel Properties, Inc. | 4,100 | 49,733 | ||||||
| AB POOLING PORTFOLIOS • | 245 |
AB Volatility Management—Portfolio of Investments
| Company | Shares | U.S. $ Value | ||||||
| ||||||||
Sunstone Hotel Investors, Inc. | 10,481 | $ | 144,952 | |||||
Xenia Hotels & Resorts, Inc.(b) | 5,700 | 105,450 | ||||||
|
| |||||||
| 2,897,336 | ||||||||
|
| |||||||
Total Common Stocks | 873,539,933 | |||||||
|
| |||||||
INVESTMENT COMPANIES – 8.7% | ||||||||
Funds and Investment Trusts – 8.7% | ||||||||
F&C UK Real Estate Investment Ltd. | 11,760 | 18,122 | ||||||
iShares Core MSCI Emerging Markets ETF(b) | 2,327,389 | 94,701,459 | ||||||
iShares International Developed Real Estate ETF(b) | 287,239 | 8,111,629 | ||||||
Medicx Fund Ltd. | 18,175 | 21,754 | ||||||
Picton Property Income Ltd. | 27,142 | 29,990 | ||||||
Standard Life Investment Property Income Trust PLC | 13,912 | 17,879 | ||||||
UK Commercial Property Trust Ltd. | 30,703 | 40,871 | ||||||
Vanguard REIT ETF(b) | 109,765 | 8,125,903 | ||||||
|
| |||||||
Total Investment Companies | 111,067,607 | |||||||
|
| |||||||
SHORT-TERM INVESTMENTS – 23.3% | ||||||||
Investment Companies – 20.3% | ||||||||
AB Fixed Income Shares, Inc. – Government STIF Portfolio, 0.13%(f)(g) | 258,901,017 | 258,901,017 | ||||||
|
| |||||||
| Principal Amount (000) | ||||||||
U.S. TREASURY BILLS – 3.0% | ||||||||
U.S. Treasury Bill | $ | 29,000 | 28,996,146 | |||||
Zero Coupon, 12/24/15(i) | 10,000 | 9,996,833 | ||||||
|
| |||||||
Total U.S. Treasury Bills | 38,992,979 | |||||||
|
| |||||||
Total Short-Term Investments | 297,893,996 | |||||||
|
| |||||||
Total Investments Before Security Lending Collateral for Securities Loaned – 100.4% | 1,282,501,536 | |||||||
|
| |||||||
| 246 | • AB POOLING PORTFOLIOS |
AB Volatility Management—Portfolio of Investments
| Company | Shares | U.S. $ Value | ||||||
| ||||||||
INVESTMENTS OF CASH COLLATERAL FOR SECURITIES LOANED – 9.7% | ||||||||
Investment Companies – 9.7% | ||||||||
AB Exchange Reserves – Class I, 0.11%(f)(g) | 124,645,745 | $ | 124,645,745 | |||||
|
| |||||||
Total Investments – 110.1% | 1,407,147,281 | |||||||
Other assets less liabilities – (10.1)% | (129,163,224 | ) | ||||||
|
| |||||||
Net Assets – 100.0% | $ | 1,277,984,057 | ||||||
|
| |||||||
FUTURES (see Note C)
| Type | Number of Contracts | Expiration Month | Original Value | Value at August 31, 2015 | Unrealized Appreciation/ (Depreciation) | |||||||||||||||
Purchased Contracts |
| |||||||||||||||||||
DAX Index Futures | 6 | September 2015 | $ | 1,858,714 | $ | 1,724,801 | $ | (133,913 | ) | |||||||||||
MSCI EAFE Mini Index Futures | 21 | September 2015 | 1,956,067 | 1,819,335 | (136,732 | ) | ||||||||||||||
S&P TSX 60 Index Futures | 185 | September 2015 | 22,132,250 | 22,895,789 | 763,539 | |||||||||||||||
TOPIX Index Futures | 623 | September 2015 | 85,474,357 | 78,803,192 | (6,671,165 | ) | ||||||||||||||
Sold Contracts |
| |||||||||||||||||||
EURO STOXX 50 Futures | 2,731 | September 2015 | 97,110,791 | 100,181,552 | (3,070,761 | ) | ||||||||||||||
FTSE 100 Index Futures | 682 | September 2015 | 63,022,804 | 65,062,715 | (2,039,911 | ) | ||||||||||||||
Hang Seng Index Futures | 18 | September 2015 | 2,477,957 | 2,492,578 | (14,621 | ) | ||||||||||||||
S&P 500 E-Mini Futures | 583 | September 2015 | 55,832,926 | 57,402,180 | (1,569,254 | ) | ||||||||||||||
SPI 200 Futures | 60 | September 2015 | 5,824,350 | 5,515,644 | 308,706 | |||||||||||||||
|
| |||||||||||||||||||
| $ | (12,564,112 | ) | ||||||||||||||||||
|
| |||||||||||||||||||
FORWARD CURRENCY EXCHANGE CONTRACTS (see Note C)
| Counterparty | Contracts to Deliver (000) | In Exchange For (000) | Settlement Date | Unrealized Appreciation/ (Depreciation) | ||||||||||||||||||||
Barclays Bank PLC | CHF | 1,624 | USD | 1,749 | 9/17/15 | $ | 68,606 | |||||||||||||||||
Barclays Bank PLC | EUR | 58,753 | USD | 66,530 | 9/17/15 | 585,607 | ||||||||||||||||||
Barclays Bank PLC | JPY | 290,148 | USD | 2,369 | 9/17/15 | (24,928 | ) | |||||||||||||||||
Barclays Bank PLC | USD | 3,402 | CHF | 3,174 | 9/17/15 | (116,582 | ) | |||||||||||||||||
Barclays Bank PLC | USD | 46,245 | JPY | 5,614,908 | 9/17/15 | 78,710 | ||||||||||||||||||
BNP Paribas SA | CAD | 38,076 | USD | 30,683 | 9/17/15 | 1,742,799 | ||||||||||||||||||
| AB POOLING PORTFOLIOS • | 247 |
AB Volatility Management—Portfolio of Investments
| Counterparty | Contracts to Deliver (000) | In Exchange For (000) | Settlement Date | Unrealized Appreciation/ (Depreciation) | ||||||||||||||||||||
BNP Paribas SA | EUR | 2,413 | USD | 2,637 | 9/17/15 | $ | (71,306 | ) | ||||||||||||||||
BNP Paribas SA | USD | 41,829 | JPY | 5,142,245 | 9/17/15 | 595,652 | ||||||||||||||||||
Brown Brothers Harriman & Co. | USD | 4,496 | AUD | 5,824 | 9/17/15 | (354,637 | ) | |||||||||||||||||
Citibank | AUD | 2,285 | USD | 1,762 | 9/17/15 | 137,471 | ||||||||||||||||||
Citibank | USD | 2,479 | AUD | 3,237 | 9/17/15 | (177,447 | ) | |||||||||||||||||
Citibank | USD | 1,403 | CAD | 1,762 | 9/17/15 | (63,727 | ) | |||||||||||||||||
Citibank | USD | 1,348 | EUR | 1,219 | 9/17/15 | 19,879 | ||||||||||||||||||
Citibank | USD | 1,712 | GBP | 1,088 | 9/17/15 | (42,463 | ) | |||||||||||||||||
Credit Suisse International | USD | 28,627 | AUD | 40,085 | 9/17/15 | (121,791 | ) | |||||||||||||||||
Credit Suisse International | USD | 19,482 | EUR | 16,962 | 9/17/15 | (443,561 | ) | |||||||||||||||||
Credit Suisse International | USD | 4,091 | AUD | 5,755 | 12/15/15 | (17,137 | ) | |||||||||||||||||
Deutsche Bank AG | USD | 4,969 | EUR | 4,469 | 9/17/15 | 46,646 | ||||||||||||||||||
Deutsche Bank AG | USD | 5,763 | GBP | 3,633 | 9/17/15 | (188,476 | ) | |||||||||||||||||
Deutsche Bank AG | USD | 1,922 | JPY | 238,179 | 9/17/15 | 42,750 | ||||||||||||||||||
Goldman Sachs Bank USA | CAD | 5,988 | USD | 4,719 | 9/17/15 | 167,806 | ||||||||||||||||||
Goldman Sachs Bank USA | JPY | 499,493 | USD | 4,034 | 9/17/15 | (86,948 | ) | |||||||||||||||||
Goldman Sachs Bank USA | USD | 1,646 | JPY | 196,772 | 9/17/15 | (22,135 | ) | |||||||||||||||||
HSBC Bank USA | USD | 3,297 | GBP | 2,114 | 9/17/15 | (53,556 | ) | |||||||||||||||||
HSBC Bank USA | USD | 21,060 | CAD | 28,070 | 12/15/15 | 271,478 | ||||||||||||||||||
JPMorgan Chase Bank | CHF | 1,550 | USD | 1,649 | 9/17/15 | 44,351 | ||||||||||||||||||
JPMorgan Chase Bank | CHF | 678 | USD | 723 | 12/15/15 | 19,428 | ||||||||||||||||||
Morgan Stanley & Co., Inc. | GBP | 4,153 | USD | 6,514 | 9/17/15 | 141,683 | ||||||||||||||||||
Morgan Stanley & Co., Inc. | JPY | 822,065 | USD | 6,633 | 9/17/15 | (148,991 | ) | |||||||||||||||||
Morgan Stanley & Co., Inc. | USD | 7,220 | EUR | 6,528 | 9/17/15 | 107,285 | ||||||||||||||||||
Morgan Stanley & Co., Inc. | GBP | 25,789 | USD | 40,429 | 12/15/15 | 877,264 | ||||||||||||||||||
Royal Bank of Scotland PLC | USD | 1,383 | AUD | 1,810 | 9/17/15 | (96,025 | ) | |||||||||||||||||
Royal Bank of Scotland PLC | USD | 2,023 | SEK | 16,693 | 9/17/15 | (50,945 | ) | |||||||||||||||||
Standard Chartered Bank | AUD | 48,671 | USD | 36,088 | 9/17/15 | 1,477,545 | ||||||||||||||||||
Standard Chartered Bank | GBP | 1,583 | USD | 2,434 | 9/17/15 | 5,526 | ||||||||||||||||||
Standard Chartered Bank | USD | 35,052 | CAD | 43,093 | 9/17/15 | (2,298,539 | ) | |||||||||||||||||
State Street Bank & Trust Co. | SEK | 16,693 | USD | 1,956 | 9/17/15 | (16,623 | ) | |||||||||||||||||
State Street Bank & Trust Co. | USD | 3,712 | EUR | 3,344 | 9/17/15 | 41,140 | ||||||||||||||||||
State Street Bank & Trust Co. | USD | 3,345 | JPY | 409,943 | 9/17/15 | 37,400 | ||||||||||||||||||
UBS AG | EUR | 11,733 | USD | 13,059 | 9/17/15 | (109,873 | ) | |||||||||||||||||
UBS AG | GBP | 3,630 | USD | 5,647 | 9/17/15 | 77,291 | ||||||||||||||||||
UBS AG | JPY | 300,009 | USD | 2,524 | 9/17/15 | 48,692 | ||||||||||||||||||
UBS AG | JPY | 706,456 | USD | 5,827 | 9/17/15 | (1,853 | ) | |||||||||||||||||
UBS AG | USD | 3,930 | GBP | 2,531 | 9/17/15 | (46,358 | ) | |||||||||||||||||
|
| |||||||||||||||||||||||
| $ | 2,081,108 | |||||||||||||||||||||||
|
| |||||||||||||||||||||||
| 248 | • AB POOLING PORTFOLIOS |
AB Volatility Management—Portfolio of Investments
TOTAL RETURN SWAPS (see Note C)
Counterparty & Obligation | # of Shares or Units | Rate Paid/ Received | Notional Amount (000) | Maturity Date | Unrealized Appreciation/ (Depreciation) | |||||||||||||||
Receive Total Return on Reference Obligation |
| |||||||||||||||||||
Bank of America, NA | ||||||||||||||||||||
Russell 2000 Total Return Index | 5,334 | | LIBOR Minus 0.30 | % | $ | 29,059 | 1/15/16 | $ | (1,648,772 | ) | ||||||||||
Citibank, NA | ||||||||||||||||||||
S&P Midcap 400 Index | 26,975 | | LIBOR Plus 0.07 | % | 55,871 | 2/3/16 | (3,720,143 | ) | ||||||||||||
Goldman Sachs International | ||||||||||||||||||||
Russell 2000 Total Return Index | 192 | | LIBOR Minus 0.57 | % | 1,125 | 4/15/16 | (93,915 | ) | ||||||||||||
Russell 2000 Total Return Index | 559 | | LIBOR Minus 0.49 | % | 3,374 | 4/15/16 | (273,744 | ) | ||||||||||||
UBS AG | ||||||||||||||||||||
Russell 2000 Total Return Index | 1,214 | | LIBOR Minus 0.60 | % | 6,123 | 10/15/15 | (374,548 | ) | ||||||||||||
|
| |||||||||||||||||||
| $ | (6,111,122 | ) | ||||||||||||||||||
|
| |||||||||||||||||||
| ^ | Less than $0.50. |
| (a) | Non-income producing security. |
| (b) | Represents entire or partial securities out on loan. See Note E for securities lending information. |
| (c) | Fair valued by the Adviser. |
| (d) | Illiquid security. |
| (e) | Security is exempt from registration under Rule 144A of the Securities Act of 1933. These securities are considered liquid and may be resold in transactions exempt from registration, normally to qualified institutional buyers. At August 31, 2015, the aggregate market value of these securities amounted to $451,116 or 0.0% of net assets. |
| (f) | To obtain a copy of the fund’s financial statements, please go to the Securities and Exchange Commission’s website at www.sec.gov, or call AB at (800) 227-4618. |
| (g) | Investment in affiliated money market mutual fund. The rate shown represents the 7-day yield as of period end. |
| (h) | Position, or a portion thereof, has been segregated to collateralize margin requirements for open futures contracts. |
| (i) | Position, or a portion thereof, has been segregated to collateralize OTC derivatives outstanding. |
Currency Abbreviations:
AUD – Australian Dollar
CAD – Canadian Dollar
CHF – Swiss Franc
EUR – Euro
GBP – Great British Pound
JPY – Japanese Yen
SEK – Swedish Krona
USD – United States Dollar
Glossary:
ADR – American Depositary Receipt
DAX – Deutscher Aktien Index (German Stock Index)
EAFE – Europe, Australia, and Far East
| AB POOLING PORTFOLIOS • | 249 |
AB Volatility Management—Portfolio of Investments
ETF – Exchange Traded Fund
FTSE – Financial Times Stock Exchange
LIBOR – London Interbank Offered Rates
MSCI – Morgan Stanley Capital International
REG – Registered Shares
REIT – Real Estate Investment Trust
SPI – Share Price Index
TOPIX – Tokyo Price Index
TSX – Toronto Stock Exchange
See notes to financial statements.
| 250 | • AB POOLING PORTFOLIOS |
AB Volatility Management—Portfolio of Investments
STATEMENT OF ASSETS & LIABILITIES
August 31, 2015
| AB U.S. Value | AB U.S. Large Cap Growth | AB International Value | ||||||||||
| Assets | ||||||||||||
Investments in securities, at value | ||||||||||||
Unaffiliated issuers (cost $394,170,775, $323,162,122 and $392,458,245, respectively)(a) | $ | 441,428,426 | $ | 426,343,193 | $ | 366,416,393 | ||||||
Affiliated issuers (cost $15,393,873, $35,360,532 and $210,915,—including investment of cash collateral for securities loaned of $6,081,135, $2,930,293 and $210,915, respectively) | 15,393,873 | 35,360,532 | 210,915 | |||||||||
Cash | 13,319 | – 0 | – | – 0 | – | |||||||
Cash collateral due from broker | – 0 | – | – 0 | – | 344,816 | |||||||
Foreign currencies, at value (cost $0, $0 and $2,273,843, respectively) | – 0 | – | – 0 | – | 2,224,445 | |||||||
Receivable for investment securities sold | 3,872,749 | – 0 | – | 2,866,266 | ||||||||
Dividends and interest receivable | 1,240,426 | 183,208 | 1,916,891 | |||||||||
Unrealized appreciation of forward currency exchange contracts | – 0 | – | – 0 | – | 1,583,380 | |||||||
Receivable for shares of beneficial interest sold | – 0 | – | – 0 | – | 10,845 | |||||||
|
|
|
|
|
| |||||||
Total assets | 461,948,793 | 461,886,933 | 375,573,951 | |||||||||
|
|
|
|
|
| |||||||
See notes to financial statements.
| AB POOLING PORTFOLIOS • | 251 |
Statement of Assets & Liabilities
| AB U.S. Value | AB U.S. Large Cap Growth | AB International Value | ||||||||||
| Liabilities | ||||||||||||
Due to custodian | $ | – 0 | – | $ | 15,257 | $ | 145,872 | |||||
Payable for investment securities purchased and foreign currency transactions | 6,247,991 | 5,007,767 | 1,555,599 | |||||||||
Payable for collateral received on securities loaned | 6,081,135 | 2,930,293 | 210,915 | |||||||||
Payable for shares of beneficial interest redeemed | 48,345 | 256,029 | 14,222 | |||||||||
Administrative fee payable | 8,139 | 8,139 | 7,297 | |||||||||
Unrealized depreciation of forward currency exchange contracts | – 0 | – | – 0 | – | 1,078,879 | |||||||
Payable for variation margin on exchange-traded derivatives | – 0 | – | – 0 | – | 7,796 | |||||||
Accrued expenses | 90,098 | 84,278 | 164,095 | |||||||||
|
|
|
|
|
| |||||||
Total liabilities | 12,475,708 | 8,301,763 | 3,184,675 | |||||||||
|
|
|
|
|
| |||||||
Net Assets | $ | 449,473,085 | $ | 453,585,170 | $ | 372,389,276 | ||||||
|
|
|
|
|
| |||||||
| Composition of Net Assets | ||||||||||||
Paid-in capital | $ | 705,653,227 | $ | 273,216,784 | $ | 813,546,440 | ||||||
Undistributed net investment income | 2,426,836 | 798,934 | 14,411,627 | |||||||||
Accumulated net realized gain (loss) on investment and foreign currency transactions | (305,864,629 | ) | 76,388,381 | (429,758,023 | ) | |||||||
Net unrealized appreciation / (depreciation) on investments and foreign currency denominated assets and liabilities | 47,257,651 | 103,181,071 | (25,810,768 | ) | ||||||||
|
|
|
|
|
| |||||||
Net Assets | $ | 449,473,085 | $ | 453,585,170 | $ | 372,389,276 | ||||||
|
|
|
|
|
| |||||||
Shares of beneficial interest outstanding—unlimited shares authorized, without par value | 35,591,264 | 36,034,881 | 52,852,506 | |||||||||
|
|
|
|
|
| |||||||
Net Asset Value | $ | 12.63 | $ | 12.59 | $ | 7.05 | ||||||
|
|
|
|
|
| |||||||
| (a) | Includes securities on loan with a value of $5,952,903, $2,869,911 and $199,056, respectively (see Note D). |
See notes to financial statements.
| 252 | • AB POOLING PORTFOLIOS |
Statement of Assets & Liabilities
| AB International Growth | AB Short Duration Bond | AB Global Core Bond | ||||||||||
| Assets | ||||||||||||
Investments in securities, at value | ||||||||||||
Unaffiliated issuers (cost $357,123,156, $894,667,433 and $986,410,715, respectively)(a) | $ | 369,452,406 | $ | 892,875,796 | $ | 970,988,471 | ||||||
Affiliated issuers (cost $6,050,194, $3,756,308 and $4,458,849,—including investment of cash collateral for securities loaned of $6,050,194, $0 and $0, respectively) | 6,050,194 | 3,756,308 | 4,458,849 | |||||||||
Cash collateral due from broker | – 0 | – | 385,413 | 1,566,125 | ||||||||
Foreign currencies, at value (cost $1,463,899, $0 and $548,300, respectively) | 1,454,499 | – 0 | – | 506,791 | ||||||||
Receivable for investment securities sold and foreign currency transactions | 6,972,228 | – 0 | – | 27,990 | ||||||||
Unrealized appreciation of forward currency exchange contracts | 1,084,707 | – 0 | – | 5,289,593 | ||||||||
Dividends and interest receivable | 885,148 | 2,086,677 | 7,598,370 | |||||||||
Receivable for shares of beneficial interest sold | 33,537 | 197,199 | 302,361 | |||||||||
Receivable for variation margin on exchange-traded derivatives | – 0 | – | 5,955 | 346,883 | ||||||||
|
|
|
|
|
| |||||||
Total assets | 385,932,719 | 899,307,348 | 991,085,433 | |||||||||
|
|
|
|
|
| |||||||
See notes to financial statements.
| AB POOLING PORTFOLIOS • | 253 |
Statement of Assets & Liabilities
| AB International Growth | AB Short Duration Bond | AB Global Core Bond | ||||||||||
| Liabilities | ||||||||||||
Due to custodian | $ | 796,001 | $ | 213,202 | $ | 518,569 | ||||||
Payable for collateral received on securities loaned | 6,050,194 | – 0 | – | – 0 | – | |||||||
Unrealized depreciation of forward currency exchange contracts | 2,836,971 | – 0 | – | 4,950,234 | ||||||||
Payable for investment securities purchased and foreign currency transactions | 799,161 | – 0 | – | 52,154,337 | ||||||||
Audit and tax fee payable | 55,511 | 48,833 | 55,866 | |||||||||
Payable for shares of beneficial interest redeemed | 47,065 | 531,054 | 2,351,228 | |||||||||
Administrative fee payable | 8,139 | 7,037 | 8,315 | |||||||||
Payable for variation margin on exchange-traded derivatives | – 0 | – | 54,523 | – 0 | – | |||||||
Accrued expenses and other liabilities | 89,503 | 47,262 | 51,521 | |||||||||
|
|
|
|
|
| |||||||
Total liabilities | 10,682,545 | 901,911 | 60,090,070 | |||||||||
|
|
|
|
|
| |||||||
Net Assets | $ | 375,250,174 | $ | 898,405,437 | $ | 930,995,363 | ||||||
|
|
|
|
|
| |||||||
| Composition of Net Assets | ||||||||||||
Paid-in capital | $ | 703,227,540 | $ | 970,486,415 | $ | 932,143,928 | ||||||
Undistributed net investment income | 4,482,624 | 422,524 | 19,753,680 | |||||||||
Accumulated net realized gain (loss) on investment and foreign currency transactions | (342,948,442 | ) | (71,150,749 | ) | (6,208,167 | ) | ||||||
Net unrealized appreciation / (depreciation) on investments and foreign currency denominated assets and liabilities | 10,488,452 | (1,352,753 | ) | (14,694,078 | ) | |||||||
|
|
|
|
|
| |||||||
Net Assets | $ | 375,250,174 | $ | 898,405,437 | $ | 930,995,363 | ||||||
|
|
|
|
|
| |||||||
Shares of beneficial interest outstanding—unlimited shares authorized, without par value | 45,066,519 | 95,281,668 | 92,688,649 | |||||||||
|
|
|
|
|
| |||||||
Net Asset Value | $ | 8.33 | $ | 9.43 | $ | 10.04 | ||||||
|
|
|
|
|
| |||||||
| (a) | Includes securities on loan with a value of $5,621,307 for the AB International Growth Portfolio (see Note D). |
See notes to financial statements.
| 254 | • AB POOLING PORTFOLIOS |
Statement of Assets & Liabilities
| AB Bond Inflation Protection | AB High-Yield | AB Small-Mid Cap Value | ||||||||||
| Assets | ||||||||||||
Investments in securities, at value | ||||||||||||
Unaffiliated issuers (cost $930,058,431, $334,872,930 and $241,521,904, respectively)(a) | $ | 911,453,859 | $ | 319,507,788 | $ | 272,710,766 | ||||||
Affiliated issuers (cost $3,467,407, $5,978,392 and $13,288,859,—including investment of cash collateral for securities loaned of $0, $0 and $6,422,235, respectively) | 3,467,407 | 5,978,392 | 13,288,859 | |||||||||
Cash collateral due from broker | 2,305,906 | 1,511,420 | – 0 | – | ||||||||
Receivable for investment securities sold | 66,578,155 | 487,723 | 2,413,818 | |||||||||
Dividends and interest receivable | 2,478,609 | 5,636,677 | 196,511 | |||||||||
Unrealized appreciation of forward currency exchange contracts | 418,556 | 280,265 | – 0 | – | ||||||||
Unrealized appreciation on credit default swaps | 219,162 | 1,628,107 | – 0 | – | ||||||||
Unrealized appreciation on inflation swaps | 172,829 | – 0 | – | – 0 | – | |||||||
Receivable for variation margin on exchange-traded derivatives | 138,479 | 61,867 | – 0 | – | ||||||||
Upfront premium paid on credit default swaps | 78,627 | 1,062,141 | – 0 | – | ||||||||
Receivable for shares of beneficial interest sold | 75,282 | 5,071 | 5,206 | |||||||||
Unrealized appreciation on total return swaps | – 0 | – | 42,925 | – 0 | – | |||||||
|
|
|
|
|
| |||||||
Total assets | 987,386,871 | 336,202,376 | 288,615,160 | |||||||||
|
|
|
|
|
| |||||||
See notes to financial statements.
| AB POOLING PORTFOLIOS • | 255 |
Statement of Assets & Liabilities
| AB Bond Inflation Protection | AB High-Yield | AB Small-Mid Cap Value | ||||||||||
| Liabilities | ||||||||||||
Due to custodian | $ | 1,010,808 | $ | 794,345 | $ | – 0 | – | |||||
Payable reverse repurchase agreements | 249,644,916 | 7,111,831 | – 0 | – | ||||||||
Payable for investment securities purchased and foreign currency transactions | 16,320,113 | 1,668,181 | 243,779 | |||||||||
Payable for shares of beneficial interest redeemed | 1,640,345 | 333,885 | 133,174 | |||||||||
Unrealized depreciation on inflation swaps | 931,350 | – 0 | – | – 0 | – | |||||||
Unrealized depreciation on interest rate swaps | 274,223 | – 0 | – | – 0 | – | |||||||
Unrealized depreciation of forward currency exchange contracts | 264,497 | 289,123 | – 0 | – | ||||||||
Upfront premium received on credit default swaps | 139,571 | 996,641 | – 0 | – | ||||||||
Unrealized depreciation on credit default swaps | 19,307 | 1,122,874 | – 0 | – | ||||||||
Administrative fee payable | 7,037 | 7,037 | 8,121 | |||||||||
Unrealized depreciation on total return swaps | – 0 | – | 544,491 | – 0 | – | |||||||
Options written, at value (premiums received $0, $455,785 and $0, respectively) | – 0 | – | 278,507 | – 0 | – | |||||||
Swaptions written, at value (premiums received $0, $47,331 and $0, respectively) | – 0 | – | 39,792 | – 0 | – | |||||||
Payable for collateral received on securities loaned | – 0 | – | – 0 | – | 6,422,235 | |||||||
Accrued expenses | 116,436 | 176,420 | 84,079 | |||||||||
|
|
|
|
|
| |||||||
Total liabilities | 270,368,603 | 13,363,127 | 6,891,388 | |||||||||
|
|
|
|
|
| |||||||
Net Assets | $ | 717,018,268 | $ | 322,839,249 | $ | 281,723,772 | ||||||
|
|
|
|
|
| |||||||
See notes to financial statements.
| 256 | • AB POOLING PORTFOLIOS |
Statement of Assets & Liabilities
| AB Bond Inflation Protection | AB High-Yield | AB Small-Mid Cap Value | ||||||||||
| Composition of Net Assets | ||||||||||||
Paid-in capital | $ | 728,528,976 | $ | 347,328,827 | $ | 223,530,283 | ||||||
Undistributed net investment income | 16,068,300 | 4,978,640 | 908,063 | |||||||||
Accumulated net realized gain (loss) on investment and foreign currency transactions | (7,056,497 | ) | (14,162,006 | ) | 26,096,564 | |||||||
Net unrealized appreciation / (depreciation) on investments and foreign currency denominated assets and liabilities | (20,522,511 | ) | (15,306,212 | ) | 31,188,862 | |||||||
|
|
|
|
|
| |||||||
Net Assets | $ | 717,018,268 | $ | 322,839,249 | $ | 281,723,772 | ||||||
|
|
|
|
|
| |||||||
Shares of beneficial interest outstanding—unlimited shares authorized, without par value | 74,344,450 | 32,549,814 | 24,992,510 | |||||||||
|
|
|
|
|
| |||||||
Net Asset Value | $ | 9.64 | $ | 9.92 | $ | 11.27 | ||||||
|
|
|
|
|
| |||||||
| (a) | Includes securities on loan with a value of $6,202,595 for the AB Small-Mid Cap Value Portfolio (see Note D). |
See notes to financial statements.
| AB POOLING PORTFOLIOS • | 257 |
Statement of Assets & Liabilities
| AB Small-Mid Cap Growth | AB Multi-Asset Real Return* | AB Volatility Management | ||||||||||
| Assets | ||||||||||||
Investments in securities, at value | ||||||||||||
Unaffiliated issuers (cost $209,844,596, $807,509,620 and $869,631,162, respectively)(a) | $ | 274,317,559 | $ | 720,020,014 | $ | 1,023,600,519 | ||||||
Affiliated issuers (cost $14,170,129, $130,381,998 and $383,546,762,—including investment of cash collateral for securities loaned of $7,862,001, $26,857,470 and $124,645,745, respectively) | 14,170,129 | 130,381,998 | 383,546,762 | |||||||||
Cash collateral due from broker | – 0 | – | 6,038,725 | 1,649,956 | ||||||||
Foreign currencies, at value (cost $0, $1,890,853 and $666,148, respectively) | – 0 | – | 1,876,610 | 657,006 | ||||||||
Receivable for investment securities sold and foreign currency transactions | 1,259,725 | 28,728 | – 0 | – | ||||||||
Dividends and interest receivable | 93,127 | 2,282,995 | 2,621,003 | |||||||||
Receivable for shares of beneficial interest sold | 11,309 | 49,157 | 888,442 | |||||||||
Unrealized appreciation of forward currency exchange contracts | – 0 | – | 5,753,945 | 6,635,009 | ||||||||
Unrealized appreciation on total return swaps | – 0 | – | 5,418,791 | – 0 | – | |||||||
Receivable for variation margin on exchange-traded derivatives | – 0 | – | 2,393,457 | 10,208 | ||||||||
Unrealized appreciation on inflation swaps | – 0 | – | 1,012,574 | – 0 | – | |||||||
Collateral due from Securities Lending Agent | – 0 | – | – 0 | – | 71,162 | |||||||
|
|
|
|
|
| |||||||
Total assets | 289,851,849 | 875,256,994 | 1,419,680,067 | |||||||||
|
|
|
|
|
| |||||||
See notes to financial statements.
| 258 | • AB POOLING PORTFOLIOS |
Statement of Assets & Liabilities
| AB Small-Mid Cap Growth | AB Multi-Asset Real Return* | AB Volatility Management | ||||||||||
| Liabilities | ||||||||||||
Due to custodian | $ | 2,347 | $ | 365,019 | $ | 4,392,271 | ||||||
Payable for collateral received on securities loaned | 7,862,001 | 26,857,470 | 124,716,907 | |||||||||
Payable for investment securities purchased and foreign currency transactions | 1,556,430 | 1,308,363 | 412,723 | |||||||||
Payable for shares of beneficial interest redeemed | 469,790 | 242,328 | 14,618 | |||||||||
Administrative fee payable | 8,122 | 8,215 | 7,294 | |||||||||
Unrealized depreciation of forward currency exchange contracts | – 0 | – | 4,760,627 | 4,553,901 | ||||||||
Unrealized depreciation on total return swaps | – 0 | – | 3,885,532 | 6,111,122 | ||||||||
Options written, at value (premiums received $0, $3,317,932 and $0, respectively) | – 0 | – | 1,573,867 | – 0 | – | |||||||
Cash collateral due to broker | – 0 | – | 3,110,000 | – 0 | – | |||||||
Unrealized depreciation on inflation swaps | – 0 | – | 97,323 | – 0 | – | |||||||
Transfer Agent fee payable | – 0 | – | 1,044 | – 0 | – | |||||||
Payable for terminated total return swaps | – 0 | – | – 0 | – | 1,196,861 | |||||||
Accrued expenses and other liabilities | 80,023 | 220,574 | 290,313 | |||||||||
|
|
|
|
|
| |||||||
Total liabilities | 9,978,713 | 42,430,362 | 141,696,010 | |||||||||
|
|
|
|
|
| |||||||
Net Assets | $ | 279,873,136 | $ | 832,826,632 | $ | 1,277,984,057 | ||||||
|
|
|
|
|
| |||||||
See notes to financial statements.
| AB POOLING PORTFOLIOS • | 259 |
Statement of Assets & Liabilities
| AB Small-Mid Cap Growth | AB Multi-Asset Real Return* | AB Volatility Management | ||||||||||
| Composition of Net Assets | ||||||||||||
Paid-in capital | $ | 184,050,647 | $ | 1,231,846,895 | $ | 1,072,605,104 | ||||||
Undistributed net investment income | 192,770 | 17,629,764 | 29,194,263 | |||||||||
Accumulated net realized gain (loss) on investment and foreign currency transactions | 31,156,756 | (315,129,152 | ) | 38,900,519 | ||||||||
Net unrealized appreciation / (depreciation) on investments and foreign currency denominated assets and liabilities | 64,472,963 | (101,520,875 | ) | 137,284,171 | ||||||||
|
|
|
|
|
| |||||||
Net Assets | $ | 279,873,136 | $ | 832,826,632 | $ | 1,277,984,057 | ||||||
|
|
|
|
|
| |||||||
Shares of beneficial interest outstanding—unlimited. shares authorized, without par value | 25,589,094 | 132,902,984 | 113,917,810 | |||||||||
|
|
|
|
|
| |||||||
Net Asset Value | $ | 10.94 | $ | 6.27 | $ | 11.22 | ||||||
|
|
|
|
|
| |||||||
| * | Consolidated (see Note A). |
| (a) | Includes securities on loan with a value of $7,537,578, $25,601,329 and 121,005,875, respectively (see Note D). |
See notes to financial statements.
| 260 | • AB POOLING PORTFOLIOS |
Statement of Assets & Liabilities
STATEMENT OF OPERATIONS
Year Ended August 31, 2015
| AB U.S. Value | AB U.S. Large Cap Growth | AB International Value | ||||||||||
| Investment Income | ||||||||||||
Dividends | ||||||||||||
Unaffiliated issuers (net of foreign taxes withheld of $11,147, 0 and $1,439,724, respectively) | $ | 10,466,899 | $ | 4,434,676 | $ | 11,038,286 | ||||||
Affiliated issuers | 9,035 | 28,608 | 11,536 | |||||||||
Securities lending income | 199,303 | 62,651 | 293,367 | |||||||||
|
|
|
|
|
| |||||||
Total income | 10,675,237 | 4,525,935 | 11,343,189 | |||||||||
|
|
|
|
|
| |||||||
| Expenses | ||||||||||||
Custodian | 108,250 | 110,433 | 156,369 | |||||||||
Audit and tax | 45,795 | 45,770 | 83,214 | |||||||||
Legal | 34,098 | 34,098 | 27,764 | |||||||||
Administrative | 30,205 | 30,205 | 28,234 | |||||||||
Trustees’ fees | 17,291 | 17,291 | 17,291 | |||||||||
Printing | 3,949 | 3,949 | 3,949 | |||||||||
Registration fees | 536 | 534 | 286 | |||||||||
Miscellaneous | 11,807 | 11,079 | 15,918 | |||||||||
|
|
|
|
|
| |||||||
Total expenses | 251,931 | 253,359 | 333,025 | |||||||||
|
|
|
|
|
| |||||||
Net investment income | 10,423,306 | 4,272,576 | 11,010,164 | |||||||||
|
|
|
|
|
| |||||||
| Realized and Unrealized Gain (Loss) on Investment and Foreign Currency Transactions | ||||||||||||
Net realized gain on: | ||||||||||||
Investment transactions | 64,316,719 | 95,323,469 | 24,453,703 | (a) | ||||||||
Futures | – 0 | – | – 0 | – | 158,021 | |||||||
Foreign currency transactions | – 0 | – | – 0 | – | 3,807,379 | |||||||
Net change in unrealized appreciation/depreciation of: | ||||||||||||
Investments | (93,484,850 | ) | (42,723,450 | ) | (74,317,511 | )(b) | ||||||
Futures | – 0 | – | – 0 | – | (47,642 | ) | ||||||
Foreign currency denominated assets and liabilities | – 0 | – | – 0 | – | (199,486 | ) | ||||||
|
|
|
|
|
| |||||||
Net gain (loss) on investment and foreign currency transactions | (29,168,131 | ) | 52,600,019 | (46,145,536 | ) | |||||||
|
|
|
|
|
| |||||||
Net Increase (Decrease) in Net Assets from Operations | $ | (18,744,825 | ) | $ | 56,872,595 | $ | (35,135,372 | ) | ||||
|
|
|
|
|
| |||||||
| (a) | Net of foreign capital gains taxes of $68,100. |
| (b) | Net of decrease in accrued foreign capital gains taxes of $68,769. |
See notes to financial statements.
| AB POOLING PORTFOLIOS • | 261 |
Statement of Operations
| AB International Growth | AB Short Duration Bond | AB Global Core Bond | ||||||||||
| Investment Income | ||||||||||||
Dividends | ||||||||||||
Unaffiliated issuers (net of foreign taxes withheld of $430,241, $0 and $0, respectively) | $ | 7,489,915 | $ | – 0 | – | $ | – 0 | – | ||||
Affiliated issuers | 9,209 | 21,966 | 28,180 | |||||||||
Interest | – 0 | – | 8,792,141 | 25,731,337 | ||||||||
Securities lending income | 125,231 | – 0 | – | – 0 | – | |||||||
Other income | – 0 | – | 5,338 | 1,728 | ||||||||
|
|
|
|
|
| |||||||
Total income | 7,624,355 | 8,819,445 | 25,761,245 | |||||||||
|
|
|
|
|
| |||||||
| Expenses | ||||||||||||
Custodian | 206,564 | 175,372 | 248,315 | |||||||||
Audit and tax | 69,355 | 51,693 | 58,729 | |||||||||
Legal | 32,764 | 33,926 | 33,926 | |||||||||
Administrative | 30,205 | 29,786 | 33,025 | |||||||||
Trustees’ fees | 17,289 | 17,124 | 17,103 | |||||||||
Printing | 3,948 | 5,333 | 6,715 | |||||||||
Registration fees | 534 | 534 | 1,158 | |||||||||
Miscellaneous | 20,577 | 23,266 | 16,547 | |||||||||
|
|
|
|
|
| |||||||
Total expenses | 381,236 | 337,034 | 415,518 | |||||||||
|
|
|
|
|
| |||||||
Net investment income | 7,243,119 | 8,482,411 | 25,345,727 | |||||||||
|
|
|
|
|
| |||||||
| Realized and Unrealized Gain (Loss) on Investment and Foreign Currency Transactions | ||||||||||||
Net realized gain (loss) on: | ||||||||||||
Investment transactions | 1,540,454 | (a) | (198,338 | ) | 14,794,437 | |||||||
Futures | – 0 | – | 576,608 | (4,496,254 | ) | |||||||
Swaps | – 0 | – | 83,007 | – 0 | – | |||||||
Foreign currency transactions | (1,228,840 | ) | (209,062 | ) | 30,509,320 | |||||||
Net change in unrealized appreciation/depreciation of: | ||||||||||||
Investments | (52,357,106 | )(b) | (1,051,915 | ) | (43,177,520 | ) | ||||||
Futures | – 0 | – | 140,240 | 1,031,735 | ||||||||
Swaps | – 0 | – | 98,693 | – 0 | – | |||||||
Foreign currency denominated assets and liabilities | (1,470,167 | ) | 174,096 | (2,626,095 | ) | |||||||
|
|
|
|
|
| |||||||
Net loss on investment and foreign currency transactions | (53,515,659 | ) | (386,671 | ) | (3,964,377 | ) | ||||||
|
|
|
|
|
| |||||||
Net Increase (Decrease) in Net Assets from Operations | $ | (46,272,540 | ) | $ | 8,095,740 | $ | 21,381,350 | |||||
|
|
|
|
|
| |||||||
| (a) | Net of foreign capital gains taxes of $66,649. |
| (b) | Net of increase in accrued foreign capital gains taxes of $25,008. |
See notes to financial statements.
| 262 | • AB POOLING PORTFOLIOS |
Statement of Operations
| AB Bond Inflation Protection | AB High-Yield | AB Small-Mid Cap Value | ||||||||||
| Investment Income | ||||||||||||
Interest | $ | 10,241,398 | $ | 21,896,899 | $ | – 0 | – | |||||
Dividends | ||||||||||||
Unaffiliated issuers | 35,318 | 962,665 | 3,857,281 | |||||||||
Affiliated issuers | 9,658 | 7,296 | 9,417 | |||||||||
Securities lending income | – 0 | – | – 0 | – | 166,148 | |||||||
Other income | 5,881 | 36,215 | – 0 | – | ||||||||
|
|
|
|
|
| |||||||
Total income | 10,292,255 | 22,903,075 | 4,032,846 | |||||||||
|
|
|
|
|
| |||||||
| Expenses | ||||||||||||
Custodian | 187,870 | 222,680 | 89,682 | |||||||||
Audit and tax | 75,433 | 135,241 | 56,381 | |||||||||
Legal | 33,224 | 33,224 | 33,926 | |||||||||
Administrative | 29,786 | 29,786 | 32,245 | |||||||||
Trustees’ fees | 16,964 | 17,146 | 17,249 | |||||||||
Printing | 6,385 | 6,091 | 5,451 | |||||||||
Registration fees | 1,158 | 1,158 | 1,535 | |||||||||
Miscellaneous | 11,696 | 7,600 | 3,316 | |||||||||
|
|
|
|
|
| |||||||
Total expenses before interest expense | 362,516 | 452,926 | 239,785 | |||||||||
Interest expense | 601,496 | – 0 | – | – 0 | – | |||||||
|
|
|
|
|
| |||||||
Total expenses | 964,012 | 452,926 | 239,785 | |||||||||
|
|
|
|
|
| |||||||
Net investment income | 9,328,243 | 22,450,149 | 3,793,061 | |||||||||
|
|
|
|
|
| |||||||
| Realized and Unrealized Gain (Loss) on Investment and Foreign Currency Transactions | ||||||||||||
Net realized gain (loss) on: | ||||||||||||
Investment transactions | 2,479,837 | (1,194,064 | ) | 31,868,252 | ||||||||
Securities sold short | 15,748 | – 0 | – | – 0 | – | |||||||
Futures | (3,992,622 | ) | (163,878 | ) | – 0 | – | ||||||
Options written | – 0 | – | 366,810 | – 0 | – | |||||||
Swaptions written | – 0 | – | 667,030 | – 0 | – | |||||||
Swaps | (1,677,798 | ) | 195,602 | – 0 | – | |||||||
Foreign currency transactions | 5,700,978 | 3,143,960 | – 0 | – | ||||||||
Net change in unrealized appreciation/depreciation of: | ||||||||||||
Investments | (32,193,031 | ) | (33,880,839 | ) | (38,624,613 | ) | ||||||
Futures | 344,542 | 38,600 | – 0 | – | ||||||||
Options written | – 0 | – | 214,048 | – 0 | – | |||||||
Swaptions written | – 0 | – | (152,048 | ) | – 0 | – | ||||||
Swaps | (494,792 | ) | 449,022 | – 0 | – | |||||||
Foreign currency denominated assets and liabilities | 12,880 | (127,001 | ) | – 0 | – | |||||||
|
|
|
|
|
| |||||||
Net loss on investment and foreign currency transactions | (29,804,258 | ) | (30,442,758 | ) | (6,756,361 | ) | ||||||
|
|
|
|
|
| |||||||
Net Decrease in Net Assets from Operations | $ | (20,476,015 | ) | $ | (7,992,609 | ) | $ | (2,963,300 | ) | |||
|
|
|
|
|
| |||||||
See notes to financial statements.
| AB POOLING PORTFOLIOS • | 263 |
Statement of Operations
| AB Small-Mid Cap Growth | AB Multi-Asset Real Return* | AB Volatility Management | ||||||||||
| Investment Income | ||||||||||||
Dividends | ||||||||||||
Unaffiliated issuers (net of foreign taxes withheld of $0, $1,386,287 and $1,003,850, respectively) | $ | 121,917 | $ | 19,515,036 | $ | 28,566,812 | ||||||
Affiliated issuers | 12,184 | 134,552 | 270,836 | |||||||||
Interest | – 0 | – | (705,465 | )** | – 0 | – | ||||||
Securities lending income | 158,635 | 512,533 | 683,056 | |||||||||
|
|
|
|
|
| |||||||
Total income | 292,736 | 19,456,656 | 29,520,704 | |||||||||
|
|
|
|
|
| |||||||
| Expenses | ||||||||||||
Custodian | 127,602 | 281,927 | 358,838 | |||||||||
Audit and tax | 46,135 | 113,924 | 109,162 | |||||||||
Legal | 33,926 | 33,926 | 34,098 | |||||||||
Administrative | 32,246 | 32,925 | 41,660 | |||||||||
Trustees’ fees | 17,092 | 17,161 | 17,291 | |||||||||
Printing | 7,839 | 7,208 | 6,579 | |||||||||
Registration fees | 1,155 | 534 | 1,234 | |||||||||
Transfer agency | – 0 | – | 12,041 | – 0 | – | |||||||
Miscellaneous | 3,535 | 91,055 | 193,865 | |||||||||
|
|
|
|
|
| |||||||
Total expenses | 269,530 | 590,701 | 762,727 | |||||||||
|
|
|
|
|
| |||||||
Net investment income | 23,206 | 18,865,955 | 28,757,977 | |||||||||
|
|
|
|
|
| |||||||
See notes to financial statements.
| 264 | • AB POOLING PORTFOLIOS |
Statement of Operations
| AB Small-Mid Cap Growth | AB Multi-Asset Real Return* | AB Volatility Management | ||||||||||
| Realized and Unrealized Gain (Loss) on Investment and Foreign Currency Transactions | ||||||||||||
Net realized gain (loss) on: | ||||||||||||
Investment transactions | $ | 40,108,039 | $ | (33,271,975 | )(a) | $ | 37,013,185 | |||||
Futures | – 0 | – | (13,122,486 | ) | 9,562,623 | |||||||
Options written | – 0 | – | (7,982,304 | ) | – 0 | – | ||||||
Swaps | – 0 | – | (111,593,319 | ) | 10,223,358 | |||||||
Foreign currency transactions | – 0 | – | 12,318,881 | 6,872,834 | ||||||||
Net change in unrealized appreciation/depreciation of: | ||||||||||||
Investments | (26,241,212 | ) | (121,647,370 | )(b) | (108,703,341 | ) | ||||||
Futures | – 0 | – | (16,363,637 | ) | (14,822,258 | ) | ||||||
Options written | – 0 | – | 1,744,065 | – 0 | – | |||||||
Swaps | – 0 | – | 1,420,320 | (10,718,188 | ) | |||||||
Foreign currency denominated assets and liabilities | – 0 | – | (591,683 | ) | 1,912,669 | |||||||
|
|
|
|
|
| |||||||
Net gain (loss) on investment and foreign currency transactions | 13,866,827 | (289,089,508 | ) | (68,659,118 | ) | |||||||
|
|
|
|
|
| |||||||
Contributions from Affiliates (see Note B) | – 0 | – | 394 | – 0 | – | |||||||
|
|
|
|
|
| |||||||
Net Increase (Decrease) in Net Assets from Operations | $ | 13,890,033 | $ | (270,223,159 | ) | $ | (39,901,141 | ) | ||||
|
|
|
|
|
| |||||||
| * | Consolidated (see Note A). |
| ** | The negative interest income reflects interest income adjusted for fluctuation in the inflation index related to TIPS and amortization of premiums. |
| (a) | Net of foreign capital gains taxes of $179,921. |
| (b) | Net of decrease in accrued foreign capital gains taxes of $41,590. |
See notes to financial statements.
| AB POOLING PORTFOLIOS • | 265 |
Statement of Operations
STATEMENT OF CHANGES IN NET ASSETS
| AB U.S. Value | ||||||||
| Year Ended August 31, 2015 | Year Ended August 31, 2014 | |||||||
| Increase (Decrease) in Net Assets from Operations | ||||||||
Net investment income | $ | 10,423,306 | $ | 23,805,901 | ||||
Net realized gain on investment transactions | 64,316,719 | 256,871,531 | ||||||
Net change in unrealized appreciation/depreciation of investments | (93,484,850 | ) | (61,923,216 | ) | ||||
|
|
|
| |||||
Net increase (decrease) in net assets from operations | (18,744,825 | ) | 218,754,216 | |||||
| Dividends to Shareholders from | ||||||||
Net investment income | (10,546,202 | ) | (27,508,781 | ) | ||||
| Transactions in Shares of Beneficial Interest | ||||||||
Net decrease | (59,954,975 | ) | (765,417,996 | ) | ||||
|
|
|
| |||||
Total decrease | (89,246,002 | ) | (574,172,561 | ) | ||||
| Net Assets | ||||||||
Beginning of period | 538,719,087 | 1,112,891,648 | ||||||
|
|
|
| |||||
End of period (including undistributed net investment income of $2,426,836 and $2,549,732, respectively) | $ | 449,473,085 | $ | 538,719,087 | ||||
|
|
|
| |||||
See notes to financial statements.
| 266 | • AB POOLING PORTFOLIOS |
Statement of Changes in Net Assets
| AB U.S. Large Cap Growth | ||||||||
| Year Ended August 31, 2015 | Year Ended August 31, 2014 | |||||||
| Increase (Decrease) in Net Assets from Operations | ||||||||
Net investment income | $ | 4,272,576 | $ | 7,103,994 | ||||
Net realized gain on investment transactions | 95,323,469 | 386,831,188 | ||||||
Net change in unrealized appreciation/depreciation of investments | (42,723,450 | ) | (145,435,595 | ) | ||||
|
|
|
| |||||
Net increase in net assets from operations | 56,872,595 | 248,499,587 | ||||||
| Dividends and Distributions to Shareholders from | ||||||||
Net investment income | (4,419,633 | ) | (8,750,536 | ) | ||||
Net realized gain on investment transactions | (164,984,584 | ) | (116,790,485 | ) | ||||
| Transactions in Shares of Beneficial Interest | ||||||||
Net increase (decrease) | 28,602,127 | (708,528,107 | ) | |||||
|
|
|
| |||||
Total decrease | (83,929,495 | ) | (585,569,541 | ) | ||||
| Net Assets | ||||||||
Beginning of period | 537,514,665 | 1,123,084,206 | ||||||
|
|
|
| |||||
End of period (including undistributed net investment income of $798,934 and $945,991, respectively) | $ | 453,585,170 | $ | 537,514,665 | ||||
|
|
|
| |||||
See notes to financial statements.
| AB POOLING PORTFOLIOS • | 267 |
Statement of Changes in Net Assets
| AB International Value | ||||||||
| Year Ended August 31, 2015 | Year Ended August 31, 2014 | |||||||
| Increase (Decrease) in Net Assets from Operations | ||||||||
Net investment income | $ | 11,010,164 | $ | 29,476,369 | ||||
Net realized gain on investment transactions and foreign currency transactions | 28,419,103 | 134,501,814 | ||||||
Net change in unrealized appreciation/depreciation of investments and foreign currency denominated assets and liabilities | (74,564,639 | ) | (29,011,781 | ) | ||||
|
|
|
| |||||
Net increase (decrease) in net assets from operations | (35,135,372 | ) | 134,966,402 | |||||
| Dividends to Shareholders from | ||||||||
Net investment income | (31,500,480 | ) | (56,058,549 | ) | ||||
| Transactions in Shares of Beneficial Interest | ||||||||
Net decrease | (10,898,240 | ) | (576,082,880 | ) | ||||
|
|
|
| |||||
Total decrease | (77,534,092 | ) | (497,175,027 | ) | ||||
| Net Assets | ||||||||
Beginning of period | 449,923,368 | 947,098,395 | ||||||
|
|
|
| |||||
End of period (including undistributed net investment income of $14,411,627 and $30,482,766, respectively) | $ | 372,389,276 | $ | 449,923,368 | ||||
|
|
|
| |||||
See notes to financial statements.
| 268 | • AB POOLING PORTFOLIOS |
Statement of Changes in Net Assets
| AB International Growth | ||||||||
| Year Ended August 31, 2015 | Year Ended August 31, 2014 | |||||||
| Increase (Decrease) in Net Assets from Operations | ||||||||
Net investment income | $ | 7,243,119 | $ | 16,238,482 | ||||
Net realized gain on investment transactions and foreign currency transactions | 311,614 | 101,893,093 | ||||||
Net change in unrealized appreciation/depreciation of investments and foreign currency denominated assets and liabilities | (53,827,273 | ) | (4,205,286 | ) | ||||
|
|
|
| |||||
Net increase (decrease) in net assets from operations | (46,272,540 | ) | 113,926,289 | |||||
| Dividends to Shareholders from | ||||||||
Net investment income | (6,877,393 | ) | (17,047,166 | ) | ||||
| Transactions in Shares of Beneficial Interest | ||||||||
Net decrease | (19,038,027 | ) | (590,188,934 | ) | ||||
|
|
|
| |||||
Total decrease | (72,187,960 | ) | (493,309,811 | ) | ||||
| Net Assets | ||||||||
Beginning of period | 447,438,134 | 940,747,945 | ||||||
|
|
|
| |||||
End of period (including undistributed net investment income of $4,482,624 and $5,412,387, respectively) | $ | 375,250,174 | $ | 447,438,134 | ||||
|
|
|
| |||||
See notes to financial statements.
| AB POOLING PORTFOLIOS • | 269 |
Statement of Changes in Net Assets
| AB Short Duration Bond | ||||||||
| Year Ended August 31, 2015 | Year Ended August 31, 2014 | |||||||
| Increase (Decrease) in Net Assets from Operations | ||||||||
Net investment income | $ | 8,482,411 | $ | 10,185,902 | ||||
Net realized gain (loss) on investment transactions and foreign currency transactions | 252,215 | (1,697,609 | ) | |||||
Net change in unrealized appreciation/depreciation of investments and foreign currency denominated assets and liabilities | (638,886 | ) | 5,791,195 | |||||
|
|
|
| |||||
Net increase in net assets from operations | 8,095,740 | 14,279,488 | ||||||
| Dividends to Shareholders from | ||||||||
Net investment income | (9,366,087 | ) | (11,673,217 | ) | ||||
Return of capital | – 0 | – | (44,216 | ) | ||||
| Transactions in Shares of Beneficial Interest | ||||||||
Net increase (decrease) | (62,286,298 | ) | 23,576,081 | |||||
|
|
|
| |||||
Total increase (decrease) | (63,556,645 | ) | 26,138,136 | |||||
| Net Assets | ||||||||
Beginning of period | 961,962,082 | 935,823,946 | ||||||
|
|
|
| |||||
End of period (including undistributed net investment income of $422,524 and $71,051, respectively) | $ | 898,405,437 | $ | 961,962,082 | ||||
|
|
|
| |||||
See notes to financial statements.
| 270 | • AB POOLING PORTFOLIOS |
Statement of Changes in Net Assets
| AB Global Core Bond | ||||||||
| Year Ended August 31, 2015 | Year Ended August 31, 2014 | |||||||
| Increase (Decrease) in Net Assets from Operations | ||||||||
Net investment income | $ | 25,345,727 | $ | 30,303,961 | ||||
Net realized gain on investment transactions and foreign currency transactions | 40,807,503 | 10,052,747 | ||||||
Net change in unrealized appreciation/depreciation of investments and foreign currency denominated assets and liabilities | (44,771,880 | ) | 32,377,399 | |||||
|
|
|
| |||||
Net increase in net assets from operations | 21,381,350 | 72,734,107 | ||||||
| Dividends and Distributions to Shareholders from | ||||||||
Net investment income | (49,923,999 | ) | (35,379,162 | ) | ||||
Net realized gain on investment transactions | (17,075,288 | ) | (1,832,618 | ) | ||||
| Transactions in Shares of Beneficial Interest | ||||||||
Net decrease | (55,051,244 | ) | (45,343,520 | ) | ||||
|
|
|
| |||||
Total decrease | (100,669,181 | ) | (9,821,193 | ) | ||||
| Net Assets | ||||||||
Beginning of period | 1,031,664,544 | 1,041,485,737 | ||||||
|
|
|
| |||||
End of period (including undistributed net investment income of $19,753,680 and $762,689, respectively) | $ | 930,995,363 | $ | 1,031,664,544 | ||||
|
|
|
| |||||
See notes to financial statements.
| AB POOLING PORTFOLIOS • | 271 |
Statement of Changes in Net Assets
| AB Bond Inflation Protection | ||||||||
| Year Ended August 31, 2015 | Year Ended August 31, 2014 | |||||||
| Increase (Decrease) in Net Assets from Operations | ||||||||
Net investment income | $ | 9,328,243 | $ | 25,103,709 | ||||
Net realized gain (loss) on investment transactions and foreign currency transactions | 2,526,143 | (3,274,013 | ) | |||||
Net change in unrealized appreciation/depreciation of investments and foreign currency denominated assets and liabilities | (32,330,401 | ) | 21,058,271 | |||||
|
|
|
| |||||
Net increase (decrease) in net assets from operations | (20,476,015 | ) | 42,887,967 | |||||
| Dividends and Distributions to Shareholders from | ||||||||
Net investment income | (25,002,844 | ) | (10,202,595 | ) | ||||
Net realized gain on investment transactions | – 0 | – | (23,713,121 | ) | ||||
| Transactions in Shares of Beneficial Interest | ||||||||
Net increase (decrease) | (13,881,235 | ) | 13,890,882 | |||||
|
|
|
| |||||
Total increase (decrease) | (59,360,094 | ) | 22,863,133 | |||||
| Net Assets | ||||||||
Beginning of period | 776,378,362 | 753,515,229 | ||||||
|
|
|
| |||||
End of period (including undistributed net investment income of $16,068,300 and $24,830,372, respectively) | $ | 717,018,268 | $ | 776,378,362 | ||||
|
|
|
| |||||
See notes to financial statements.
| 272 | • AB POOLING PORTFOLIOS |
Statement of Changes in Net Assets
| AB High-Yield | ||||||||
| Year Ended August 31, 2015 | Year Ended August 31, 2014 | |||||||
| Increase (Decrease) in Net Assets from Operations | ||||||||
Net investment income | $ | 22,450,149 | $ | 25,039,636 | ||||
Net realized gain on investment transactions and foreign currency transactions | 3,015,460 | 10,277,865 | ||||||
Net change in unrealized appreciation/depreciation of investments and foreign currency denominated assets and liabilities | (33,458,218 | ) | 8,437,946 | |||||
|
|
|
| |||||
Net increase (decrease) in net assets from operations | (7,992,609 | ) | 43,755,447 | |||||
| Dividends to Shareholders from | ||||||||
Net investment income | (24,694,123 | ) | (25,509,174 | ) | ||||
| Transactions in Shares of Beneficial Interest | ||||||||
Net decrease | (9,408,030 | ) | (19,865,226 | ) | ||||
|
|
|
| |||||
Total decrease | (42,094,762 | ) | (1,618,953 | ) | ||||
| Net Assets | ||||||||
Beginning of period | 364,934,011 | 366,552,964 | ||||||
|
|
|
| |||||
End of period (including undistributed net investment income of $4,978,640 and $4,668,304, respectively) | $ | 322,839,249 | $ | 364,934,011 | ||||
|
|
|
| |||||
See notes to financial statements.
| AB POOLING PORTFOLIOS • | 273 |
Statement of Changes in Net Assets
| AB Small-Mid Cap Value | ||||||||
| Year Ended August 31, 2015 | Year Ended August 31, 2014 | |||||||
| Increase (Decrease) in Net Assets from Operations | ||||||||
Net investment income | $ | 3,793,061 | $ | 5,357,389 | ||||
Net realized gain on investment transactions | 31,868,252 | 62,480,396 | ||||||
Net change in unrealized appreciation/depreciation of investments | (38,624,613 | ) | 7,035,554 | |||||
|
|
|
| |||||
Net increase (decrease) in net assets from operations | (2,963,300 | ) | 74,873,339 | |||||
| Dividends and Distributions to Shareholders from | ||||||||
Net investment income | (4,014,970 | ) | (4,865,731 | ) | ||||
Net realized gain on investment transactions | (59,227,347 | ) | (39,641,663 | ) | ||||
| Transactions in Shares of Beneficial Interest | ||||||||
Net increase (decrease) | 24,794,977 | (19,185,955 | ) | |||||
|
|
|
| |||||
Total increase (decrease) | (41,410,640 | ) | 11,179,990 | |||||
| Net Assets | ||||||||
Beginning of period | 323,134,412 | 311,954,422 | ||||||
|
|
|
| |||||
End of period (including undistributed net investment income of $908,063 and $1,129,972, respectively) | $ | 281,723,772 | $ | 323,134,412 | ||||
|
|
|
| |||||
See notes to financial statements.
| 274 | • AB POOLING PORTFOLIOS |
Statement of Changes in Net Assets
| AB Small-Mid Cap Growth | ||||||||
| Year Ended August 31, 2015 | Year Ended August 31, 2014 | |||||||
| Increase (Decrease) in Net Assets from Operations | ||||||||
Net investment income | $ | 23,206 | $ | 1,645,194 | ||||
Net realized gain on investment transactions | 40,108,039 | 54,451,375 | ||||||
Net change in unrealized appreciation/depreciation of investments | (26,241,212 | ) | (3,382,749 | ) | ||||
|
|
|
| |||||
Net increase in net assets from operations | 13,890,033 | 52,713,820 | ||||||
| Dividends and Distributions to Shareholders from | ||||||||
Net investment income | (1,742,103 | ) | (1,567,203 | ) | ||||
Net realized gain on investment transactions | (49,602,665 | ) | (60,177,985 | ) | ||||
| Transactions in Shares of Beneficial Interest | ||||||||
Net increase (decrease) | (4,871,959 | ) | 14,523,225 | |||||
|
|
|
| |||||
Total increase (decrease) | (42,326,694 | ) | 5,491,857 | |||||
| Net Assets | ||||||||
Beginning of period | 322,199,830 | 316,707,973 | ||||||
|
|
|
| |||||
End of period (including undistributed net investment income of $192,770 and $746,458, respectively) | $ | 279,873,136 | $ | 322,199,830 | ||||
|
|
|
| |||||
See notes to financial statements.
| AB POOLING PORTFOLIOS • | 275 |
Statement of Changes in Net Assets
| AB Multi-Asset Real Return* | ||||||||
| Year Ended August 31, 2015 | Year Ended August 31, 2014 | |||||||
| Increase (Decrease) in Net Assets from Operations | ||||||||
Net investment income | $ | 18,865,955 | $ | 17,030,017 | ||||
Net realized gain (loss) on investment transactions and foreign currency transactions | (153,651,203 | ) | 19,260,145 | |||||
Net change in unrealized appreciation/depreciation of investments and foreign currency denominated assets and liabilities | (135,438,305 | ) | 44,755,203 | |||||
Contributions from Affiliates (see Note B) | 394 | 29,301 | ||||||
|
|
|
| |||||
Net increase (decrease) in net assets from operations | (270,223,159 | ) | 81,074,666 | |||||
| Dividends to Shareholders from | ||||||||
Net investment income | (28,954,469 | ) | (22,422,067 | ) | ||||
| Transactions in Shares of Beneficial Interest | ||||||||
Net increase | 331,826,656 | 17,298,928 | ||||||
|
|
|
| |||||
Total increase | 32,649,028 | 75,951,527 | ||||||
| Net Assets | ||||||||
Beginning of period | 800,177,604 | 724,226,077 | ||||||
|
|
|
| |||||
End of period (including undistributed net investment income of $17,629,764 and $13,655,459, respectively) | $ | 832,826,632 | $ | 800,177,604 | ||||
|
|
|
| |||||
| * | Consolidated (see Note A). |
See notes to financial statements.
| 276 | • AB POOLING PORTFOLIOS |
Statement of Changes in Net Assets
| AB Volatility Management | ||||||||
| Year Ended August 31, 2015 | Year Ended August 31, 2014 | |||||||
| Increase (Decrease) in Net Assets from Operations | ||||||||
Net investment income | $ | 28,757,977 | $ | 33,949,223 | ||||
Net realized gain on investment transactions and foreign currency transactions | 63,672,000 | 124,161,184 | ||||||
Net change in unrealized appreciation/depreciation of investments and foreign currency denominated assets and liabilities | (132,331,118 | ) | 166,026,969 | |||||
|
|
|
| |||||
Net increase (decrease) in net assets from operations | (39,901,141 | ) | 324,137,376 | |||||
| Dividends and Distributions to Shareholders from | ||||||||
Net investment income | (42,440,599 | ) | (49,363,231 | ) | ||||
Net realized gain on investment transactions | (64,224,989 | ) | (110,825,292 | ) | ||||
| Transactions in Shares of Beneficial Interest | ||||||||
Net decrease | (69,727,247 | ) | (259,625,447 | ) | ||||
|
|
|
| |||||
Total decrease | (216,293,976 | ) | (95,676,594 | ) | ||||
| Net Assets | ||||||||
Beginning of period | 1,494,278,033 | 1,589,954,627 | ||||||
|
|
|
| |||||
End of period (including undistributed net investment income of $29,194,263 and $22,665,594, respectively) | $ | 1,277,984,057 | $ | 1,494,278,033 | ||||
|
|
|
| |||||
See notes to financial statements.
| AB POOLING PORTFOLIOS • | 277 |
Statement of Changes in Net Assets
STATEMENT OF CASH FLOWS
For the Year Ended August 31, 2015
| AB Bond Inflation Protection* | ||||||||
| Cash flows from operating activities | ||||||||
Net decrease in net assets from operations | $ | (20,476,015 | ) | |||||
|
| |||||||
| Reconciliation of Net Decrease in Net Assets from Operations to Net Increase in Cash from Operating Activities: | ||||||||
Decrease in interest and dividends receivable | $ | 354,947 | ||||||
Increase in receivable for investments sold | (22,999,612 | ) | ||||||
Net accretion of bond discount and amortization of bond premium | 5,322,089 | |||||||
Inflation index adjustment | (760,494 | ) | ||||||
Increase in payable for investments purchased | 7,942,496 | |||||||
Increase in accrued expenses | 16,165 | |||||||
Increase in cash collateral due from broker | (127,060 | ) | ||||||
Purchases of long-term investments | (583,761,630 | ) | ||||||
Purchases of short-term investments | (719,255,432 | ) | ||||||
Proceeds from disposition of long-term investments | 659,248,266 | |||||||
Proceeds from disposition of short-term investments | 765,878,410 | |||||||
Proceeds from short sales transactions, net | 15,748 | |||||||
Payments on swaps, net | (1,009,358 | ) | ||||||
Payments for exchange-traded derivatives settlements | (4,040,614 | ) | ||||||
Decrease in cash collateral due to broker | (1,300,000 | ) | ||||||
Net realized gain on investment transactions | (2,526,143 | ) | ||||||
Net change in unrealized appreciation/depreciation of investments and foreign currency denominated assets and liabilities | 32,330,401 | |||||||
|
| |||||||
Total adjustments | 135,328,179 | |||||||
|
| |||||||
| Net increase in cash from operating activities | $ | 114,852,164 | ||||||
|
| |||||||
| Financing Activities: | ||||||||
Redemptions of beneficial interest stock, net | (37,543,727 | ) | ||||||
Increase in due to custodian | 1,010,808 | |||||||
Cash dividends paid (net of dividend reinvestments)** | – 0 | – | ||||||
Decrease in reverse repurchase agreements | (84,009,185 | ) | ||||||
|
| |||||||
Net decrease in cash from financing activities | (120,542,104 | ) | ||||||
Effect of exchange rate on cash | 5,683,451 | |||||||
|
| |||||||
Net increase in cash | (6,489 | ) | ||||||
Net change in cash | ||||||||
Cash at beginning of year | 6,489 | |||||||
|
| |||||||
Cash at end of year | $ | – 0 | – | |||||
|
| |||||||
** Reinvestment of dividends | $ | 25,002,844 | ||||||
Supplemental disclosure of cash flow information: | ||||||||
Interest expense paid during the year | $ | 564,220 | ||||||
| * | In accordance with U.S. GAAP, the Portfolio has included a Statement of Cash Flows as a result of its significant investments in reverse repurchase agreements throughout the year. |
See notes to financial statements.
| 278 | • AB POOLING PORTFOLIOS |
Statement of Cash Flows
NOTES TO FINANCIAL STATEMENTS
August 31, 2015
NOTE A
Significant Accounting Policies
The AB Pooling Portfolios (the “Trust”) was organized as a Massachusetts business trust on November 11, 2004 and is registered under the Investment Company Act of 1940 as a diversified, open-end management investment company. Prior to January 20, 2015, the Trust was known as The AllianceBernstein Pooling Portfolios. The Trust is currently comprised of 12 separate series: AB U.S. Value Portfolio, AB U.S. Large Cap Growth Portfolio, AB International Value Portfolio, AB International Growth Portfolio, AB Short Duration Bond Portfolio, AB Global Core Bond Portfolio, AB Bond Inflation Protection Portfolio, AB High-Yield Portfolio, AB Small-Mid Cap Value Portfolio, AB Small-Mid Cap Growth Portfolio, AB Multi-Asset Real Return Portfolio and AB Volatility Management Portfolio (collectively, the “Portfolios”). Prior to January 20, 2015, the Portfolios were known as AllianceBernstein U.S. Value Portfolio, AllianceBernstein U.S. Large Cap Growth Portfolio, AllianceBernstein International Value Portfolio, AllianceBernstein International Growth Portfolio, AllianceBernstein Short Duration Bond Portfolio, AllianceBernstein Global Core Bond Portfolio, AllianceBernstein Bond Inflation Protection Portfolio, AllianceBernstein High-Yield Portfolio, AllianceBernstein Small-Mid Cap Value Portfolio, AllianceBernstein Small-Mid Cap Growth Portfolio, AllianceBernstein Multi-Asset Real Return Portfolio and AllianceBernstein Volatility Management Portfolio. As part of AB Multi-Asset Real Return Portfolio’s investment strategy, the Portfolio seeks to gain exposure to commodities and commodities-related instruments and derivatives primarily through investments in AllianceBernstein Cayman Inflation Pooling Subsidiary, Ltd., a wholly-owned subsidiary of the Portfolio organized under the laws of the Cayman Islands (the “Subsidiary”). The Subsidiary was incorporated and commenced operations on October 18, 2010. The AB Multi-Asset Real Return Portfolio is the sole shareholder of the Subsidiary and it is intended that the Portfolio will remain the sole shareholder and will continue to control the Subsidiary. Under the Articles of Association of the Subsidiary, shares issued by the Subsidiary confer upon a shareholder the right to receive notice of, to attend and to vote at general meetings of the Subsidiary and shall confer upon the shareholder rights in a winding-up or repayment of capital and the right to participate in the profits or assets of the Subsidiary. As of August 31, 2015, net assets of the AB Multi-Asset Real Return Portfolio amounted to $832,826,632, of which $141,490,055, or 17%, represented the Portfolio’s ownership of all issued shares and voting rights of the Subsidiary. This report presents the consolidated financial statements and consolidated portfolio of investments of AB Multi-Asset Real Return Portfolio and the Subsidiary. All intercompany transactions and balances have been eliminated in consolidation. Each Portfolio is considered to be a separate entity for financial reporting and tax purposes. Shares of the Portfolios are offered exclusively to mutual funds advised by and certain other institutional clients of AllianceBernstein L.P. (the “Adviser”). A Portfolio’s shares may be purchased at the relevant net asset value without a sales charge or other fee. The financial
| AB POOLING PORTFOLIOS • | 279 |
Notes to Financial Statements
statements have been prepared in conformity with U.S. generally accepted accounting principles (“U.S. GAAP”) which require management to make certain estimates and assumptions that affect the reported amounts of assets and liabilities in the financial statements and amounts of income and expenses during the reporting period. Actual results could differ from those estimates. The Trust is an investment company under U.S. GAAP and follows the accounting and reporting guidance applicable to investment companies. The following is a summary of significant accounting policies followed by the Portfolios.
1. Security Valuation
Portfolio securities are valued at their current market value determined on the basis of market quotations or, if market quotations are not readily available or are deemed unreliable, at “fair value” as determined in accordance with procedures established by and under the general supervision of the Trust’s Board of Trustees (the “Board”).
In general, the market values of securities which are readily available and deemed reliable are determined as follows: securities listed on a national securities exchange (other than securities listed on the NASDAQ Stock Market, Inc. (“NASDAQ”)) or on a foreign securities exchange are valued at the last sale price at the close of the exchange or foreign securities exchange. If there has been no sale on such day, the securities are valued at the last traded price from the previous day. Securities listed on more than one exchange are valued by reference to the principal exchange on which the securities are traded; securities listed only on NASDAQ are valued in accordance with the NASDAQ Official Closing Price; listed or over the counter (“OTC”) market put or call options are valued at the mid level between the current bid and ask prices. If either a current bid or current ask price is unavailable, the Adviser will have discretion to determine the best valuation (e.g. last trade price in the case of listed options); open futures are valued using the closing settlement price or, in the absence of such a price, the most recent quoted bid price. If there are no quotations available for the day of valuation, the last available closing settlement price is used; U.S. Government securities and any other debt instruments having 60 days or less remaining until maturity are generally valued at market by an independent pricing vendor, if a market price is available. If a market price is not available, the securities are valued at amortized cost. This methodology is commonly used for short term securities that have an original maturity of 60 days or less, as well as short term securities that had an original term to maturity that exceeded 60 days. In instances when amortized cost is utilized, the Valuation Committee (the “Committee”) must reasonably conclude that the utilization of amortized cost is approximately the same as the fair value of the security. Such factors the Committee will consider include, but are not limited to, an impairment of the creditworthiness of the issuer or material changes in interest rates. Fixed-income securities, including mortgage-backed and asset-backed securities, may be valued on the basis of prices provided by a pricing service or at a price obtained from
| 280 | • AB POOLING PORTFOLIOS |
Notes to Financial Statements
one or more of the major broker-dealers. In cases where broker-dealer quotes are obtained, the Adviser may establish procedures whereby changes in market yields or spreads are used to adjust, on a daily basis, a recently obtained quoted price on a security. Swaps and other derivatives are valued daily, primarily using independent pricing services, independent pricing models using market inputs, as well as third party broker-dealers or counterparties. Investment companies are valued at their net asset value each day.
Securities for which market quotations are not readily available (including restricted securities) or are deemed unreliable are valued at fair value. Factors considered in making this determination may include, but are not limited to, information obtained by contacting the issuer, analysts, analysis of the issuer’s financial statements or other available documents. In addition, the Portfolios may use fair value pricing for securities primarily traded in non-U.S. markets because most foreign markets close well before the Portfolios value their securities at 4:00 p.m., Eastern Time. The earlier close of these foreign markets gives rise to the possibility that significant events, including broad market moves, may have occurred in the interim and may materially affect the value of those securities. To account for this, the Portfolios may frequently value many of its foreign equity securities using fair value prices based on third party vendor modeling tools to the extent available.
2. Fair Value Measurements
In accordance with U.S. GAAP regarding fair value measurements, fair value is defined as the price that the Portfolios would receive to sell an asset or pay to transfer a liability in an orderly transaction between market participants at the measurement date. U.S. GAAP establishes a framework for measuring fair value, and a three-level hierarchy for fair value measurements based upon the transparency of inputs to the valuation of an asset or liability (including those valued based on their market values as described in Note A.1 above). Inputs may be observable or unobservable and refer broadly to the assumptions that market participants would use in pricing the asset or liability. Observable inputs reflect the assumptions market participants would use in pricing the asset or liability based on market data obtained from sources independent of the Portfolios. Unobservable inputs reflect the Portfolios’ own assumptions about the assumptions that market participants would use in pricing the asset or liability based on the best information available in the circumstances. Each investment is assigned a level based upon the observability of the inputs which are significant to the overall valuation. The three-tier hierarchy of inputs is summarized below.
| • | Level 1—quoted prices in active markets for identical investment |
| • | Level 2—other significant observable inputs (including quoted prices for similar investments, interest rates, prepayment speeds, credit risk, etc.) |
| • | Level 3—significant unobservable inputs (including the Portfolios’ own assumptions in determining the fair value of investments) |
| AB POOLING PORTFOLIOS • | 281 |
Notes to Financial Statements
The fair value of debt instruments, such as bonds, and over-the-counter derivatives is generally based on market price quotations, recently executed market transactions (where observable) or industry recognized modeling techniques and are generally classified as Level 2. Pricing vendor inputs to Level 2 valuations may include quoted prices for similar investments in active markets, interest rate curves, coupon rates, currency rates, yield curves, option adjusted spreads, default rates, credit spreads and other unique security features in order to estimate the relevant cash flows which are then discounted to calculate fair values. If these inputs are unobservable and significant to the fair value, these investments will be classified as Level 3. In addition, non-agency rated investments are classified as Level 3.
Where readily available market prices or relevant bid prices are not available for certain equity investments, such investments may be valued based on similar publicly traded investments, movements in relevant indices since last available prices or based upon underlying company fundamentals and comparable company data (such as multiples to earnings or other multiples to equity). Where an investment is valued using an observable input, such as another publicly traded security, the investment will be classified as Level 2. If management determines that an adjustment is appropriate based on restrictions on resale, illiquidity or uncertainty, and such adjustment is a significant component of the valuation, the investment will be classified as Level 3. An investment will also be classified as Level 3 where management uses company fundamentals and other significant inputs to determine the valuation.
Options are valued using market-based inputs to models, broker or dealer quotations, or alternative pricing sources with reasonable levels of price transparency, where such inputs and models are available. Alternatively the values may be obtained through unobservable management determined inputs and/or management’s proprietary models. Where models are used, the selection of a particular model to value an option depends upon the contractual terms of, and specific risks inherent in, the option as well as the availability of pricing information in the market. Valuation models require a variety of inputs, including contractual terms, market prices, measures of volatility and correlations of such inputs. Exchange traded options generally will be classified as Level 2. For options that do not trade on exchange but trade in liquid markets, inputs can generally be verified and model selection does not involve significant management judgment. Options are classified within Level 2 on the fair value hierarchy when all of the significant inputs can be corroborated to market evidence. Otherwise such instruments are classified as Level 3.
Valuations of mortgage-backed or other asset-backed securities, by pricing vendors, are based on both proprietary and industry recognized models and discounted cash flow techniques. Significant inputs to the valuation of these instruments are value of the collateral, the rates and timing of delinquencies, the
| 282 | • AB POOLING PORTFOLIOS |
Notes to Financial Statements
rates and timing of prepayments, and default and loss expectations, which are driven in part by housing prices for residential mortgages. Significant inputs are determined based on relative value analyses, which incorporate comparisons to instruments with similar collateral and risk profiles, including relevant indices. Mortgage and asset-backed securities for which management has collected current observable data through pricing services are generally categorized within Level 2. Those investments for which current observable data has not been provided are classified as Level 3.
Bank loan prices are provided by third party pricing services and consist of a composite of the quotes received by the vendor into a consensus price. Bank loans are classified as Level 3, as significant input used in the fair value measurement of these instruments is the market quotes that are received by the vendor and these inputs are not observable.
Other fixed income investments, including non-U.S. government and corporate debt, are generally valued using quoted market prices, if available, which are typically impacted by current interest rates, maturity dates and any perceived credit risk of the issuer. Additionally, in the absence of quoted market prices, these inputs are used by pricing vendors to derive a valuation based upon industry or proprietary models which incorporate issuer specific data with relevant yield/spread comparisons with more widely quoted bonds with similar key characteristics. Those investments for which there are observable inputs are classified as Level 2. Where the inputs are not observable, the investments are classified as Level 3.
The following table summarizes the valuation of the Portfolios’ investments by the above fair value hierarchy levels as of August 31, 2015:
| AB U.S. Value Portfolio | ||||||||||||||||
| Investments in Securities: | Level 1 | Level 2 | Level 3 | Total | ||||||||||||
Assets: | ||||||||||||||||
Common Stocks* | $ | 441,428,426 | $ | – 0 | – | $ | – 0 | – | $ | 441,428,426 | ||||||
Short-Term Investments | 9,312,738 | – 0 | – | – 0 | – | 9,312,738 | ||||||||||
Investments of Cash Collateral for Securities Loaned in Affiliated Money Market Fund | 6,081,135 | – 0 | – | – 0 | – | 6,081,135 | ||||||||||
|
|
|
|
|
|
|
| |||||||||
Total Investments in Securities | 456,822,299 | – 0 | – | – 0 | – | 456,822,299 | ||||||||||
Other Financial Instruments** | – 0 | – | – 0 | – | – 0 | – | – 0 | – | ||||||||
|
|
|
|
|
|
|
| |||||||||
Total++ | $ | 456,822,299 | $ | – 0 | – | $ | – 0 | – | $ | 456,822,299 | ||||||
|
|
|
|
|
|
|
| |||||||||
| AB U.S. Large Cap Growth Portfolio | ||||||||||||||||
| Investments in Securities: | Level 1 | Level 2 | Level 3 | Total | ||||||||||||
Assets: | ||||||||||||||||
Common Stocks* | $ | 426,343,193 | $ | – 0 | – | $ | – 0 | – | $ | 426,343,193 | ||||||
Short-Term Investments | 32,430,239 | – 0 | – | – 0 | – | 32,430,239 | ||||||||||
| AB POOLING PORTFOLIOS • | 283 |
Notes to Financial Statements
| Investments in Securities: | Level 1 | Level 2 | Level 3 | Total | ||||||||||||
Investments of Cash Collateral for Securities Loaned in Affiliated Money Market Fund | $ | 2,930,293 | $ | – 0 | – | $ | – 0 | – | $ | 2,930,293 | ||||||
|
|
|
|
|
|
|
| |||||||||
Total Investments in Securities | 461,703,725 | – 0 | – | – 0 | – | 461,703,725 | ||||||||||
Other Financial Instruments** | – 0 | – | – 0 | – | – 0 | – | – 0 | – | ||||||||
|
|
|
|
|
|
|
| |||||||||
Total++ | $ | 461,703,725 | $ | – 0 | – | $ | – 0 | – | $ | 461,703,725 | ||||||
|
|
|
|
|
|
|
| |||||||||
| AB International Value Portfolio | ||||||||||||||||
| Investments in Securities: | Level 1 | Level 2 | Level 3 | Total | ||||||||||||
Assets: | ||||||||||||||||
Common Stocks: | ||||||||||||||||
Financials | $ | 7,732,598 | $ | 78,261,057 | $ | – 0 | – | $ | 85,993,655 | |||||||
Consumer Discretionary | 10,298,799 | 53,720,102 | – 0 | – | 64,018,901 | |||||||||||
Telecommunication Services | 6,476,927 | 36,678,736 | – 0 | – | 43,155,663 | |||||||||||
Industrials | 3,042,679 | 37,573,892 | – 0 | – | 40,616,571 | |||||||||||
Information Technology | – 0 | – | 31,954,128 | – 0 | – | 31,954,128 | ||||||||||
Energy | 5,182,451 | 20,168,077 | – 0 | – | 25,350,528 | |||||||||||
Materials | 4,557,506 | 16,967,470 | – 0 | – | 21,524,976 | |||||||||||
Consumer Staples | 1,617,778 | 17,622,147 | – 0 | – | 19,239,925 | |||||||||||
Health Care | – 0 | – | 18,195,854 | – 0 | – | 18,195,854 | ||||||||||
Utilities | 1,819,080 | 14,547,112 | – 0 | – | 16,366,192 | |||||||||||
Investments of Cash Collateral for Securities Loaned in Affiliated Money Market Fund | 210,915 | – 0 | – | – 0 | – | 210,915 | ||||||||||
|
|
|
|
|
|
|
| |||||||||
Total Investments in Securities | 40,938,733 | 325,688,575 | + | – 0 | – | 366,627,308 | ||||||||||
Other Financial Instruments**: | ||||||||||||||||
Assets: | ||||||||||||||||
Forward Currency Exchange Contracts | – 0 | – | 1,583,380 | – 0 | – | 1,583,380 | ||||||||||
Liabilities: | ||||||||||||||||
Futures | – 0 | – | (137,945 | ) | – 0 | – | (137,945 | )# | ||||||||
Forward Currency Exchange Contracts | – 0 | – | (1,078,879 | ) | – 0 | – | (1,078,879 | ) | ||||||||
|
|
|
|
|
|
|
| |||||||||
Total++ | $ | 40,938,733 | $ | 326,055,131 | $ | – 0 | – | $ | 366,993,864 | |||||||
|
|
|
|
|
|
|
| |||||||||
| AB International Growth Portfolio | ||||||||||||||||
| Investments in Securities: | Level 1 | Level 2 | Level 3 | Total | ||||||||||||
Assets: | ||||||||||||||||
Common Stocks: | ||||||||||||||||
Financials | $ | 4,359,624 | $ | 86,326,830 | $ | – 0 | – | $ | 90,686,454 | |||||||
Consumer Discretionary | 17,871,304 | 65,251,091 | – 0 | – | 83,122,395 | |||||||||||
Industrials | 519,001 | 68,798,354 | – 0 | – | 69,317,355 | |||||||||||
Consumer Staples | 2,109,789 | 33,667,717 | – 0 | – | 35,777,506 | |||||||||||
Information Technology | 12,276,027 | 23,013,473 | – 0 | – | 35,289,500 | |||||||||||
Health Care | 1,882,210 | 30,434,672 | – 0 | – | 32,316,882 | |||||||||||
Materials | – 0 | – | 15,035,169 | – 0 | – | 15,035,169 | ||||||||||
Utilities | 4,274,371 | – 0 | – | – 0 | – | 4,274,371 | ||||||||||
Telecommunication Services | – 0 | – | 3,632,774 | – 0 | – | 3,632,774 | ||||||||||
| 284 | • AB POOLING PORTFOLIOS |
Notes to Financial Statements
| Investments in Securities: | Level 1 | Level 2 | Level 3 | Total | ||||||||||||
Investments of Cash Collateral for Securities Loaned in Affiliated Money Market Fund | $ | 6,050,194 | $ | – 0 | – | $ | – 0 | – | $ | 6,050,194 | ||||||
|
|
|
|
|
|
|
| |||||||||
Total Investments in Securities | 49,342,520 | 326,160,080 | + | – 0 | – | 375,502,600 | ||||||||||
Other Financial Instruments**: | ||||||||||||||||
Assets: | ||||||||||||||||
Forward Currency Exchange Contracts | – 0 | – | 1,084,707 | – 0 | – | 1,084,707 | ||||||||||
Liabilities: | ||||||||||||||||
Forward Currency Exchange Contracts | – 0 | – | (2,836,971 | ) | – 0 | – | (2,836,971 | ) | ||||||||
|
|
|
|
|
|
|
| |||||||||
Total##, ### | $ | 49,342,520 | $ | 324,407,816 | $ | – 0 | – | $ | 373,750,336 | |||||||
|
|
|
|
|
|
|
| |||||||||
| AB Short Duration Bond Portfolio | ||||||||||||||||
| Investments in Securities: | Level 1 | Level 2 | Level 3 | Total | ||||||||||||
Assets: | ||||||||||||||||
Governments – Treasuries | $ | – 0 | – | $ | 331,623,699 | $ | – 0 | – | $ | 331,623,699 | ||||||
Corporates – Investment Grade | – 0 | – | 171,112,438 | – 0 | – | 171,112,438 | ||||||||||
Asset-Backed Securities | – 0 | – | 139,576,483 | 16,368,735 | ^ | 155,945,218 | ||||||||||
Commercial Mortgage-Backed Securities | – 0 | – | 104,503,997 | 1,524,633 | 106,028,630 | |||||||||||
Collateralized Mortgage Obligations | – 0 | – | 36,552,524 | 14,275,300 | 50,827,824 | |||||||||||
Agencies | – 0 | – | 42,207,634 | – 0 | – | 42,207,634 | ||||||||||
Mortgage Pass-Throughs | – 0 | – | 22,005,148 | – 0 | – | 22,005,148 | ||||||||||
Inflation-Linked Securities | – 0 | – | 9,268,691 | – 0 | – | 9,268,691 | ||||||||||
Covered Bonds | – 0 | – | 3,334,873 | – 0 | – | 3,334,873 | ||||||||||
Short-Term Investments: | ||||||||||||||||
Investment Companies | 3,756,308 | – 0 | – | – 0 | – | 3,756,308 | ||||||||||
Asset-Backed Securities | – 0 | – | 521,641 | – 0 | – | 521,641 | ||||||||||
|
|
|
|
|
|
|
| |||||||||
Total Investments in Securities | 3,756,308 | 860,707,128 | 32,168,668 | 896,632,104 | ||||||||||||
Other Financial Instruments**: | ||||||||||||||||
Assets: | ||||||||||||||||
Futures | 522,646 | – 0 | – | – 0 | – | 522,646 | # | |||||||||
Centrally Cleared Interest Rate Swaps | – 0 | – | 266,617 | – 0 | – | 266,617 | # | |||||||||
Liabilities: | ||||||||||||||||
Futures | (342,659 | ) | – 0 | – | – 0 | – | (342,659 | )# | ||||||||
|
|
|
|
|
|
|
| |||||||||
Total^^^ | $ | 3,936,295 | $ | 860,973,745 | $ | 32,168,668 | $ | 897,078,708 | ||||||||
|
|
|
|
|
|
|
| |||||||||
| AB POOLING PORTFOLIOS • | 285 |
Notes to Financial Statements
| AB Global Core Bond Portfolio | ||||||||||||||||
| Investments in Securities: | Level 1 | Level 2 | Level 3 | Total | ||||||||||||
Assets: | ||||||||||||||||
Governments – Treasuries | $ | – 0 | – | $ | 410,260,113 | $ | – 0 | – | $ | 410,260,113 | ||||||
Corporates – Investment Grade | – 0 | – | 240,136,946 | – 0 | – | 240,136,946 | ||||||||||
Mortgage Pass-Throughs | – 0 | – | 63,387,062 | – 0 | – | 63,387,062 | ||||||||||
Covered Bonds | – 0 | – | 39,641,153 | – 0 | – | 39,641,153 | ||||||||||
Collateralized Mortgage Obligations | – 0 | – | 357,464 | 36,919,073 | 37,276,537 | |||||||||||
Commercial Mortgage-Backed Securities | – 0 | – | 33,062,380 | 3,931,061 | 36,993,441 | |||||||||||
Agencies | – 0 | – | 22,076,238 | – 0 | – | 22,076,238 | ||||||||||
Inflation-Linked Securities | – 0 | – | 19,709,806 | – 0 | – | 19,709,806 | ||||||||||
Governments – Sovereign Agencies | – 0 | – | 17,735,715 | – 0 | – | 17,735,715 | ||||||||||
Quasi-Sovereigns | – 0 | – | 14,120,699 | – 0 | – | 14,120,699 | ||||||||||
Emerging Markets – Corporate Bonds | – 0 | – | 3,643,447 | – 0 | – | 3,643,447 | ||||||||||
Asset-Backed Securities | – 0 | – | – 0 | – | 3,365,165 | 3,365,165 | ||||||||||
Governments – Sovereign Bonds | – 0 | – | 3,076,550 | – 0 | – | 3,076,550 | ||||||||||
Corporates – Non-Investment Grade | – 0 | – | 2,994,370 | – 0 | – | 2,994,370 | ||||||||||
Local Governments – Municipal Bonds | – 0 | – | 2,859,670 | – 0 | – | 2,859,670 | ||||||||||
Supranationals | – 0 | – | 2,691,711 | – 0 | – | 2,691,711 | ||||||||||
Short-Term Investments: | ||||||||||||||||
Investment Companies | 4,458,849 | – 0 | – | – 0 | – | 4,458,849 | ||||||||||
U.S. Treasury Bills | – 0 | – | 51,019,848 | – 0 | – | 51,019,848 | ||||||||||
|
|
|
|
|
|
|
| |||||||||
Total Investments in Securities | 4,458,849 | 926,773,172 | 44,215,299 | 975,447,320 | ||||||||||||
Other Financial Instruments**: | ||||||||||||||||
Assets: | ||||||||||||||||
Futures | 623,408 | – 0 | – | – 0 | – | 623,408 | # | |||||||||
Forward Currency Exchange Contracts | – 0 | – | 5,289,593 | – 0 | – | 5,289,593 | ||||||||||
Liabilities: | ||||||||||||||||
Futures | (117,346 | ) | – 0 | – | – 0 | – | (117,346 | )# | ||||||||
Forward Currency Exchange Contracts | – 0 | – | (4,950,234 | ) | – 0 | – | (4,950,234 | ) | ||||||||
|
|
|
|
|
|
|
| |||||||||
Total++ | $ | 4,964,911 | $ | 927,112,531 | $ | 44,215,299 | $ | 976,292,741 | ||||||||
|
|
|
|
|
|
|
| |||||||||
| AB Bond Inflation Protection Portfolio | ||||||||||||||||
| Investments in Securities: | Level 1 | Level 2 | Level 3 | Total | ||||||||||||
Assets: | ||||||||||||||||
Inflation-Linked Securities | $ | – 0 | – | $ | 577,820,165 | $ | – 0 | – | $ | 577,820,165 | ||||||
Corporates – Investment Grade | – 0 | – | 132,165,812 | – 0 | – | 132,165,812 | ||||||||||
| 286 | • AB POOLING PORTFOLIOS |
Notes to Financial Statements
| Investments in Securities: | Level 1 | Level 2 | Level 3 | Total | ||||||||||||
Asset-Backed Securities | $ | – 0 | – | $ | 74,429,852 | $ | 5,163,427 | $ | 79,593,279 | |||||||
Commercial Mortgage-Backed Securities | – 0 | – | 56,330,129 | 14,375,830 | 70,705,959 | |||||||||||
Corporates – Non-Investment Grade | – 0 | – | 18,476,355 | – 0 | – | 18,476,355 | ||||||||||
Collateralized Mortgage Obligations | – 0 | – | 473,768 | 16,470,297 | 16,944,065 | |||||||||||
Governments – Sovereign Agencies | – 0 | – | 5,185,901 | – 0 | – | 5,185,901 | ||||||||||
Quasi-Sovereigns | – 0 | – | 4,519,654 | – 0 | – | 4,519,654 | ||||||||||
Governments – Treasuries | – 0 | – | 2,626,704 | – 0 | – | 2,626,704 | ||||||||||
Emerging Markets – Corporate Bonds | – 0 | – | 1,175,551 | – 0 | – | 1,175,551 | ||||||||||
Common Stocks | – 0 | – | – 0 | – | 1,139,080 | 1,139,080 | ||||||||||
Preferred Stocks | 712,444 | – 0 | – | – 0 | – | 712,444 | ||||||||||
Governments – Sovereign Bonds | – 0 | – | 388,890 | – 0 | – | 388,890 | ||||||||||
Short-Term Investments | 3,467,407 | – 0 | – | – 0 | – | 3,467,407 | ||||||||||
|
|
|
|
|
|
|
| |||||||||
Total Investments in Securities | 4,179,851 | 873,592,781 | 37,148,634 | 914,921,266 | ||||||||||||
Other Financial Instruments**: | ||||||||||||||||
Assets: | ||||||||||||||||
Futures | 286,995 | – 0 | – | – 0 | – | 286,995 | # | |||||||||
Forward Currency Exchange Contracts | – 0 | – | 418,556 | – 0 | – | 418,556 | ||||||||||
Centrally Cleared Interest Rate Swaps | – 0 | – | 2,484,859 | – 0 | – | 2,484,859 | # | |||||||||
Credit Default Swaps | – 0 | – | 219,162 | – 0 | – | 219,162 | ||||||||||
Inflation (CPI) Swaps | – 0 | – | 172,829 | – 0 | – | 172,829 | ||||||||||
Liabilities: | ||||||||||||||||
Futures | (352,995 | ) | – 0 | – | – 0 | – | (352,995 | )# | ||||||||
Forward Currency Exchange Contracts | – 0 | – | (264,497 | ) | – 0 | – | (264,497 | ) | ||||||||
Centrally Cleared Credit Default Swaps | – 0 | – | (700,472 | ) | – 0 | – | (700,472 | )# | ||||||||
Centrally Cleared Interest Rate Swaps | – 0 | – | (2,945,724 | ) | – 0 | – | (2,945,724 | )# | ||||||||
Credit Default Swaps | – 0 | – | (19,307 | ) | – 0 | – | (19,307 | ) | ||||||||
Inflation (CPI) Swaps | – 0 | – | (931,350 | ) | – 0 | – | (931,350 | ) | ||||||||
Interest Rate Swaps | – 0 | – | (274,223 | ) | – 0 | – | (274,223 | ) | ||||||||
|
|
|
|
|
|
|
| |||||||||
Total^^^ | $ | 4,113,851 | $ | 871,752,614 | $ | 37,148,634 | $ | 913,015,099 | ||||||||
|
|
|
|
|
|
|
| |||||||||
| AB High-Yield Portfolio | ||||||||||||||||
| Investments in Securities: | Level 1 | Level 2 | Level 3 | Total | ||||||||||||
Assets: | ||||||||||||||||
Corporates – Non-Investment Grade | $ | – 0 | – | $ | 240,427,122 | $ | 3,400,139 | ^ | $ | 243,827,261 | ||||||
Corporates – Investment Grade | – 0 | – | 18,743,718 | – 0 | – | 18,743,718 | ||||||||||
Bank Loans | – 0 | – | – 0 | – | 14,141,504 | 14,141,504 | ||||||||||
Preferred Stocks | 5,770,363 | 1,297,103 | – 0 | – | 7,067,466 | |||||||||||
| AB POOLING PORTFOLIOS • | 287 |
Notes to Financial Statements
| Investments in Securities: | Level 1 | Level 2 | Level 3 | Total | ||||||||||||
Common Stocks | $ | 5,699,700 | $ | 670,728 | $ | 270,252 | $ | 6,640,680 | ||||||||
Emerging Markets – Corporate Bonds | – 0 | – | 6,585,622 | – 0 | – | 6,585,622 | ||||||||||
Collateralized Mortgage Obligations | – 0 | – | – 0 | – | 5,008,319 | 5,008,319 | ||||||||||
Governments – Treasuries | – 0 | – | 4,835,384 | – 0 | – | 4,835,384 | ||||||||||
Commercial Mortgage-Backed Securities | – 0 | – | – 0 | – | 4,488,395 | 4,488,395 | ||||||||||
Governments – Sovereign Agencies | – 0 | – | 2,404,050 | – 0 | – | 2,404,050 | ||||||||||
Asset-Backed Securities | – 0 | – | – 0 | – | 2,403,731 | 2,403,731 | ||||||||||
Local Governments – Municipal Bonds | – 0 | – | 1,969,363 | – 0 | – | 1,969,363 | ||||||||||
Agencies | – 0 | – | 469,480 | – 0 | – | 469,480 | ||||||||||
Options Purchased – Puts | – 0 | – | 371,948 | – 0 | – | 371,948 | ||||||||||
Warrants | 379 | – 0 | – | 187,275 | ^ | 187,654 | ||||||||||
Options Purchased – Calls | – 0 | – | 183,043 | – 0 | – | 183,043 | ||||||||||
Emerging Markets – Sovereigns | – 0 | – | 180,170 | – 0 | – | 180,170 | ||||||||||
Short-Term Investments | 5,978,392 | – 0 | – | – 0 | – | 5,978,392 | ||||||||||
|
|
|
|
|
|
|
| |||||||||
Total Investments in Securities | 17,448,834 | 278,137,731 | 29,899,615 | 325,486,180 | ||||||||||||
Other Financial Instruments**: | ||||||||||||||||
Assets: | ||||||||||||||||
Forward Currency Exchange Contracts | – 0 | – | 280,265 | – 0 | – | 280,265 | ||||||||||
Centrally Cleared Credit Default Swaps | – 0 | – | 520,801 | – 0 | – | 520,801 | # | |||||||||
Centrally Cleared Interest Rate Swaps | – 0 | – | 14,330 | – 0 | – | 14,330 | # | |||||||||
Credit Default Swaps | – 0 | – | 1,628,107 | – 0 | – | 1,628,107 | ||||||||||
Total Return Swaps | – 0 | – | 42,925 | – 0 | – | 42,925 | ||||||||||
Liabilities: | ||||||||||||||||
Futures | (76,273 | ) | – 0 | – | – 0 | – | (76,273 | )# | ||||||||
Forward Currency Exchange Contracts | – 0 | – | (289,123 | ) | – 0 | – | (289,123 | ) | ||||||||
Call Options Written | – 0 | – | (10,990 | ) | – 0 | – | (10,990 | ) | ||||||||
Put Options Written | – 0 | – | (267,517 | ) | – 0 | – | (267,517 | ) | ||||||||
Credit Default Swaptions Written | – 0 | – | (39,792 | ) | – 0 | – | (39,792 | ) | ||||||||
Centrally Cleared Credit Default Swaps | – 0 | – | (591,148 | ) | – 0 | – | (591,148 | )# | ||||||||
Credit Default Swaps | – 0 | – | (1,122,874 | ) | – 0 | – | (1,122,874 | ) | ||||||||
Total Return Swaps | – 0 | – | (544,491 | ) | – 0 | – | (544,491 | ) | ||||||||
|
|
|
|
|
|
|
| |||||||||
Total++ | $ | 17,372,561 | $ | 277,758,224 | $ | 29,899,615 | $ | 325,030,400 | ||||||||
|
|
|
|
|
|
|
| |||||||||
| 288 | • AB POOLING PORTFOLIOS |
Notes to Financial Statements
| AB Small-Mid Cap Value Portfolio | ||||||||||||||||
| Investments in Securities: | Level 1 | Level 2 | Level 3 | Total | ||||||||||||
Assets: | ||||||||||||||||
Common Stocks* | $ | 272,710,766 | $ | – 0 | – | $ | – 0 | – | $ | 272,710,766 | ||||||
Short-Term Investments | 6,866,624 | – 0 | – | – 0 | – | 6,866,624 | ||||||||||
Investments of Cash Collateral for Securities Loaned in Affiliated Money Market Fund | 6,422,235 | – 0 | – | – 0 | – | 6,422,235 | ||||||||||
|
|
|
|
|
|
|
| |||||||||
Total Investments in Securities | 285,999,625 | – 0 | – | – 0 | – | 285,999,625 | ||||||||||
Other Financial Instruments** | – 0 | – | – 0 | – | – 0 | – | – 0 | – | ||||||||
|
|
|
|
|
|
|
| |||||||||
Total++ | $ | 285,999,625 | $ | – 0 | – | $ | – 0 | – | $ | 285,999,625 | ||||||
|
|
|
|
|
|
|
| |||||||||
| AB Small-Mid Cap Growth Portfolio | ||||||||||||||||
| Investments in Securities: | Level 1 | Level 2 | Level 3 | Total | ||||||||||||
Assets: | ||||||||||||||||
Common Stocks* | $ | 274,317,559 | $ | – 0 | – | $ | – 0 | – | $ | 274,317,559 | ||||||
Short-Term Investments | 6,308,128 | – 0 | – | – 0 | – | 6,308,128 | ||||||||||
Investments of Cash Collateral for Securities Loaned in Affiliated Money Market Fund | 7,862,001 | – 0 | – | – 0 | – | 7,862,001 | ||||||||||
|
|
|
|
|
|
|
| |||||||||
Total Investments in Securities | 288,487,688 | – 0 | – | – 0 | – | 288,487,688 | ||||||||||
Other Financial Instruments** | – 0 | – | – 0 | – | – 0 | – | – 0 | – | ||||||||
|
|
|
|
|
|
|
| |||||||||
Total++ | $ | 288,487,688 | $ | – 0 | – | $ | – 0 | – | $ | 288,487,688 | ||||||
|
|
|
|
|
|
|
| |||||||||
| AB Multi-Asset Real Return Portfolio*** | ||||||||||||||||
| Investments in Securities: | Level 1 | Level 2 | Level 3 | Total | ||||||||||||
Assets: | ||||||||||||||||
Common Stocks: | ||||||||||||||||
Energy | $ | 113,576,816 | $ | 83,277,598 | $ | – 0 | – | $ | 196,854,414 | |||||||
Equity: Other | 20,518,074 | 60,899,679 | 185,499 | 81,603,252 | ||||||||||||
Materials | 27,358,743 | 35,323,894 | – 0 | –^^ | 62,682,637 | |||||||||||
Retail | 15,127,525 | 27,123,362 | – 0 | – | 42,250,887 | |||||||||||
Residential | 13,438,873 | 20,258,055 | 31 | 33,696,959 | ||||||||||||
Office | 5,447,334 | 11,778,304 | – 0 | – | 17,225,638 | |||||||||||
Industrials | 3,407,230 | 6,908,146 | – 0 | – | 10,315,376 | |||||||||||
Lodging | 5,655,486 | 375,418 | – 0 | – | 6,030,904 | |||||||||||
Food Beverage & Tobacco | 4,297,204 | – 0 | – | – 0 | – | 4,297,204 | ||||||||||
Mortgage | 1,329,225 | – 0 | – | – 0 | – | 1,329,225 | ||||||||||
Financial: Other | 373,472 | 140,254 | – 0 | – | 513,726 | |||||||||||
Transportation | 496,358 | – 0 | – | – 0 | – | 496,358 | ||||||||||
Real Estate | – 0 | – | 214,861 | – 0 | – | 214,861 | ||||||||||
Inflation-Linked Securities | – 0 | – | 217,955,644 | – 0 | – | 217,955,644 | ||||||||||
Investment Companies | 43,781,549 | – 0 | – | – 0 | – | 43,781,549 | ||||||||||
Warrants | 835 | 770,545 | – 0 | – | 771,380 | |||||||||||
Short-Term Investments | 103,524,528 | – 0 | – | – 0 | – | 103,524,528 | ||||||||||
| AB POOLING PORTFOLIOS • | 289 |
Notes to Financial Statements
| Investments in Securities: | Level 1 | Level 2 | Level 3 | Total | ||||||||||||
Investments of Cash Collateral for Securities Loaned in Affiliated Money Market Fund | $ | 26,857,470 | $ | – 0 | – | $ | – 0 | – | $ | 26,857,470 | ||||||
|
|
|
|
|
|
|
| |||||||||
Total Investments in Securities | 385,190,722 | 465,025,760 | 185,530 | 850,402,012 | ||||||||||||
Other Financial Instruments**: | ||||||||||||||||
Assets: | ||||||||||||||||
Futures | 978,396 | – 0 | – | – 0 | – | 978,396 | # | |||||||||
Forward Currency Exchange Contracts | – 0 | – | 5,753,945 | – 0 | – | 5,753,945 | ||||||||||
Inflation (CPI) Swaps | – 0 | – | 1,012,574 | – 0 | – | 1,012,574 | ||||||||||
Total Return Swaps | – 0 | – | 5,418,791 | – 0 | – | 5,418,791 | ||||||||||
Liabilities: | ||||||||||||||||
Futures | (20,166,637 | ) | – 0 | – | – 0 | – | (20,166,637 | )# | ||||||||
Forward Currency Exchange Contracts | – 0 | – | (4,760,627 | ) | – 0 | – | (4,760,627 | ) | ||||||||
Put Options Written | – 0 | – | (1,573,867 | ) | – 0 | – | (1,573,867 | ) | ||||||||
Inflation (CPI) Swaps | – 0 | – | (97,323 | ) | – 0 | – | (97,323 | ) | ||||||||
Total Return Swaps | – 0 | – | (3,885,532 | ) | – 0 | – | (3,885,532 | ) | ||||||||
|
|
|
|
|
|
|
| |||||||||
Total†,†† | $ | 366,002,481 | $ | 466,893,721 | $ | 185,530 | $ | 833,081,732 | ||||||||
|
|
|
|
|
|
|
| |||||||||
| AB Volatility Management Portfolio | ||||||||||||||||
| Investments in Securities: | Level 1 | Level 2 | Level 3 | Total | ||||||||||||
Assets: | ||||||||||||||||
Common Stocks: | ||||||||||||||||
Financials | $ | 71,661,833 | $ | 74,035,727 | $ | – 0 | –^^ | $ | 145,697,560 | |||||||
Health Care | 74,126,739 | 38,986,753 | – 0 | – | 113,113,492 | |||||||||||
Information Technology | 97,154,257 | 15,339,563 | – 0 | – | 112,493,820 | |||||||||||
Consumer Discretionary | 63,604,783 | 42,015,146 | – 0 | – | 105,619,929 | |||||||||||
Industrials | 50,671,528 | 43,676,521 | – 0 | – | 94,348,049 | |||||||||||
Consumer Staples | 46,946,372 | 37,137,273 | – 0 | – | 84,083,645 | |||||||||||
Energy | 35,247,215 | 16,029,364 | – 0 | – | 51,276,579 | |||||||||||
Materials | 14,319,923 | 22,527,721 | – 0 | – | 36,847,644 | |||||||||||
Equity: Other | 12,657,926 | 17,119,251 | – 0 | – | 29,777,177 | |||||||||||
Telecommunication Services | 12,101,195 | 16,363,094 | – 0 | – | 28,464,289 | |||||||||||
Utilities | 14,385,663 | 12,154,260 | – 0 | – | 26,539,923 | |||||||||||
Retail | 10,437,299 | 9,179,214 | – 0 | – | 19,616,513 | |||||||||||
Residential | 10,674,602 | 3,606,514 | – 0 | – | 14,281,116 | |||||||||||
Office | 5,121,739 | 3,361,122 | – 0 | – | 8,482,861 | |||||||||||
Lodging | 2,799,478 | 97,858 | – 0 | – | 2,897,336 | |||||||||||
Investment Companies | 111,019,495 | 48,112 | – 0 | – | 111,067,607 | |||||||||||
Short-Term Investments: | ||||||||||||||||
Investment Companies | 258,901,017 | – 0 | – | – 0 | – | 258,901,017 | ||||||||||
U.S. Treasury Bills | 38,992,979 | – 0 | – | 38,992,979 | ||||||||||||
Investments of Cash Collateral for Securities Loaned in Affiliated Money Market Fund | 124,645,745 | – 0 | – | – 0 | – | 124,645,745 | ||||||||||
|
|
|
|
|
|
|
| |||||||||
Total Investments in Securities | 1,016,476,809 | 390,670,472 | – 0 | –^^ | 1,407,147,281 | |||||||||||
| 290 | • AB POOLING PORTFOLIOS |
Notes to Financial Statements
| Investments in Securities: | Level 1 | Level 2 | Level 3 | Total | ||||||||||||
Other Financial Instruments**: | ||||||||||||||||
Assets: | ||||||||||||||||
Futures | $ | 763,539 | $ | 308,706 | $ | – 0 | – | $ | 1,072,245 | # | ||||||
Forward Currency Exchange Contracts | – 0 | – | 6,635,009 | – 0 | – | 6,635,009 | ||||||||||
Liabilities: | ||||||||||||||||
Futures | (1,839,899 | ) | (11,796,458 | ) | – 0 | – | (13,636,357 | )# | ||||||||
Forward Currency Exchange Contracts | – 0 | – | (4,553,901 | ) | – 0 | – | (4,553,901 | ) | ||||||||
Total Return Swaps | – 0 | – | (6,111,122 | ) | – 0 | – | (6,111,122 | ) | ||||||||
|
|
|
|
|
|
|
| |||||||||
Total+++ | $ | 1,015,400,449 | $ | 375,152,706 | $ | – 0 | –^^ | $ | 1,390,553,155 | |||||||
|
|
|
|
|
|
|
| |||||||||
| ^ | The Portfolio held securities with zero market value at period end. |
| ^^ | Amount less than $0.50. |
| ^^^ | There were no transfers between Level 1 and Level 2 during the reporting period. |
| * | See Portfolio of Investments for sector classifications. |
| ** | Other financial instruments are derivative instruments, such as futures, forwards and swaps, which are valued at the unrealized appreciation/depreciation on the instrument. Other financial instruments may also include options written and swaptions written which are valued at market value. |
| *** | Consolidated (see Note A). |
| + | A significant portion of the Portfolio’s foreign equity investments are categorized as Level 2 investments since they are valued using fair value prices based on third party vendor modeling tools to the extent available, see Note A.1. |
| ++ | There were no transfers between any levels during the reporting period. |
| +++ | There were de minimis transfers under 1% of net assets between Level 1 and Level 2 during the reporting period. |
| # | Only variation margin receivable/payable at period end is reported within the statement of assets and liabilities. This amount reflects cumulative appreciation/(depreciation) of exchange-traded derivatives as reported in the portfolio of investments. |
| ## | An amount of $9,094,964 was transferred from Level 1 to Level 2 due to the above mentioned foreign equity fair valuation using third party vendor modeling tools during the reporting period. |
| ### | An amount of $10,422,491 was transferred from Level 2 to Level 1 as the above mentioned foreign equity fair valuation by the third party vendor modeling tools was not applied during the reporting period. |
| † | There were de minimis transfers under 1% of net assets from Level 2 to Level 1 during the reporting period. |
| †† | An amount of $10,934,208 was transferred from Level 1 to Level 2 due to the above mentioned foreign equity fair valuation using third party vendor modeling tools during the reporting period. |
| AB POOLING PORTFOLIOS • | 291 |
Notes to Financial Statements
The Portfolios recognize all transfers between levels of the fair value hierarchy assuming the financial instruments were transferred at the beginning of the reporting period.
The following is a reconciliation of investments in which significant unobservable inputs (Level 3) were used in determining fair value.
AB Short Duration | Asset-Backed Securities^ | Commercial Mortgage-Backed Securities | Collateralized Mortgage Obligations | |||||||||
Balance as of 8/31/14 | $ | 21,992,589 | $ | 1,525,280 | $ | 5,634,559 | ||||||
Accrued discounts/(premiums) | 913 | (1,356 | ) | 6,155 | ||||||||
Realized gain (loss) | (195,949 | ) | (155 | ) | 15,885 | |||||||
Change in unrealized appreciation/depreciation | 53,981 | (17,614 | ) | 125,718 | ||||||||
Purchases/Payups | 5,024,043 | 1,558,726 | 14,828,875 | |||||||||
Sales/Paydowns | (7,581,160 | ) | (1,540,248 | ) | (6,335,892 | ) | ||||||
Settlements | – 0 | – | – 0 | – | – 0 | – | ||||||
Transfers in to Level 3 | – 0 | – | – 0 | – | – 0 | – | ||||||
Transfers out of Level 3 | (2,925,682 | ) | – 0 | – | – 0 | – | ||||||
|
|
|
|
|
| |||||||
Balance as of 8/31/15 | $ | 16,368,735 | $ | 1,524,633 | $ | 14,275,300 | ||||||
|
|
|
|
|
| |||||||
Net change in unrealized appreciation/depreciation from investments held as of 8/31/15* | $ | 24,724 | $ | (30,569 | ) | $ | 125,718 | |||||
|
|
|
|
|
| |||||||
| Cross Currency Swaps | Total | |||||||||||
Balance as of 8/31/14 | $ | 30,180 | $ | 29,182,608 | ||||||||
Accrued discounts/(premiums) | – 0 | – | 5,712 | |||||||||
Realized gain (loss) | 407,425 | 227,206 | ||||||||||
Change in unrealized appreciation/depreciation | (30,180 | ) | 131,905 | |||||||||
Purchases/Payups | – 0 | – | 21,411,644 | |||||||||
Sales/Paydowns | – 0 | – | (15,457,300 | ) | ||||||||
Settlements | (407,425 | ) | (407,425 | ) | ||||||||
Transfers in to Level 3 | – 0 | – | – 0 | – | ||||||||
Transfers out of Level 3 | – 0 | – | (2,925,682 | ) | ||||||||
|
|
|
| |||||||||
Balance as of 8/31/15 | $ | – 0 | – | $ | 32,168,668 | + | ||||||
|
|
|
| |||||||||
Net change in unrealized appreciation/depreciation from investments held as of 8/31/15* | $ | – 0 | – | $ | 119,873 | |||||||
|
|
|
| |||||||||
| 292 | • AB POOLING PORTFOLIOS |
Notes to Financial Statements
AB Global Core Bond | Collateralized Mortgage Obligations | Commercial Mortgage-Backed Securities | Asset-Backed Securities | |||||||||
Balance as of 8/31/14 | $ | 9,334,834 | $ | 4,102,183 | $ | 328,900 | ||||||
Accrued discounts/(premiums) | (1,756 | ) | (14,128 | ) | (1,651 | ) | ||||||
Realized gain (loss) | (11,696 | ) | (5,574 | ) | (3,024 | ) | ||||||
Change in unrealized appreciation/depreciation | (83,974 | ) | (109,884 | ) | (10,522 | ) | ||||||
Purchases/Payups | 39,464,758 | – 0 | – | 3,202,105 | ||||||||
Sales/Paydowns | (11,783,093 | ) | (41,536 | ) | (150,643 | ) | ||||||
Transfers in to Level 3 | – 0 | – | – 0 | – | – 0 | – | ||||||
Transfers out of Level 3 | – 0 | – | – 0 | – | – 0 | – | ||||||
|
|
|
|
|
| |||||||
Balance as of 8/31/15 | $ | 36,919,073 | $ | 3,931,061 | $ | 3,365,165 | ||||||
|
|
|
|
|
| |||||||
Net change in unrealized appreciation/depreciation from investments held as of 8/31/15* | $ | (83,974 | ) | $ | (109,884 | ) | $ | (10,522 | ) | |||
|
|
|
|
|
| |||||||
| Total | ||||||||||||
Balance as of 8/31/14 | $ | 13,765,917 | ||||||||||
Accrued discounts/(premiums) | (17,535 | ) | ||||||||||
Realized gain (loss) | (20,294 | ) | ||||||||||
Change in unrealized appreciation/depreciation | (204,380 | ) | ||||||||||
Purchases/Payups | 42,666,863 | |||||||||||
Sales/Paydowns | (11,975,272 | ) | ||||||||||
Transfers in to Level 3 | – 0 | – | ||||||||||
Transfers out of Level 3 | – 0 | – | ||||||||||
|
| |||||||||||
Balance as of 8/31/15 | $ | 44,215,299 | ||||||||||
|
| |||||||||||
Net change in unrealized appreciation/depreciation from investments held as of 8/31/15* | $ | (204,380 | ) | |||||||||
|
| |||||||||||
| AB POOLING PORTFOLIOS • | 293 |
Notes to Financial Statements
AB Bond Inflation | Asset-Backed Securities | Commercial Mortgage-Backed Securities | Collateralized Mortgage Obligations | |||||||||
Balance as of 8/31/14 | $ | 6,855,167 | $ | 7,281,022 | $ | 7,226,396 | ||||||
Accrued discounts/(premiums) | 89 | (34,149 | ) | (3,175 | ) | |||||||
Realized gain (loss) | 969 | (2,569 | ) | 40,539 | ||||||||
Change in unrealized appreciation/depreciation | (11,926 | ) | (365,400 | ) | (559,789 | ) | ||||||
Purchases/Payups | 4,504,831 | 7,554,255 | 13,044,510 | |||||||||
Sales/Paydowns | (4,192,239 | ) | (57,329 | ) | (3,278,184 | ) | ||||||
Transfers in to Level 3 | – 0 | – | – 0 | – | – 0 | – | ||||||
Transfers out of Level 3 | (1,993,464 | ) | – 0 | – | – 0 | – | ||||||
|
|
|
|
|
| |||||||
Balance as of 8/31/15 | $ | 5,163,427 | $ | 14,375,830 | $ | 16,470,297 | ||||||
|
|
|
|
|
| |||||||
Net change in unrealized appreciation/depreciation from investments held as of 8/31/15* | $ | (10,180 | ) | $ | (365,400 | ) | $ | (486,309 | ) | |||
|
|
|
|
|
| |||||||
| Common Stocks | Total | |||||||||||
Balance as of 8/31/14 | $ | – 0 | – | $ | 21,362,585 | |||||||
Accrued discounts/(premiums) | – 0 | – | (37,235 | ) | ||||||||
Realized gain (loss) | – 0 | – | 38,939 | |||||||||
Change in unrealized appreciation/depreciation | 39,080 | (898,035 | ) | |||||||||
Purchases/Payups | 1,100,000 | 26,203,596 | ||||||||||
Sales/Paydowns | – 0 | – | (7,527,752 | ) | ||||||||
Transfers in to Level 3 | – 0 | – | – 0 | – | ||||||||
Transfers out of Level 3 | – 0 | – | (1,993,464 | ) | ||||||||
|
|
|
| |||||||||
Balance as of 8/31/15 | $ | 1,139,080 | $ | 37,148,634 | + | |||||||
|
|
|
| |||||||||
Net change in unrealized appreciation/depreciation from investments held as of 8/31/15* | $ | 39,080 | $ | (822,809 | ) | |||||||
|
|
|
| |||||||||
| 294 | • AB POOLING PORTFOLIOS |
Notes to Financial Statements
AB High-Yield | Corporates - Non-Investment Grade^ | Corporates - Investment Grade | Bank Loans | |||||||||
Balance as of 8/31/14 | $ | 3,112,321 | $ | 240,755 | $ | 16,979,969 | ||||||
Accrued discounts/(premiums) | (41,610 | ) | – 0 | – | (35,714 | ) | ||||||
Realized gain (loss) | 14,367 | – 0 | – | (87,144 | ) | |||||||
Change in unrealized appreciation/depreciation | (847,410 | ) | – 0 | – | (338,552 | ) | ||||||
Purchases | 2,048,038 | – 0 | – | 3,435,439 | ||||||||
Sales | (1,126,322 | ) | – 0 | – | (5,812,494 | ) | ||||||
Transfers in to Level 3 | 240,755 | ** | – 0 | – | – 0 | – | ||||||
Transfers out of Level 3 | – 0 | – | (240,755 | )** | – 0 | – | ||||||
|
|
|
|
|
| |||||||
Balance as of 8/31/15 | $ | 3,400,139 | $ | – 0 | – | $ | 14,141,504 | |||||
|
|
|
|
|
| |||||||
Net change in unrealized appreciation/depreciation from investments held as of 8/31/15* | $ | (816,090 | ) | $ | – 0 | – | $ | (302,253 | ) | |||
|
|
|
|
|
| |||||||
| Common Stocks | Collateralized Mortgage Obligations | Commercial Mortgage-Backed Securities | ||||||||||
Balance as of 8/31/14 | $ | 564,622 | $ | 6,125,644 | $ | 4,557,567 | ||||||
Accrued discounts/(premiums) | – 0 | – | 42,311 | 6,644 | ||||||||
Realized gain (loss) | – 0 | – | 114,835 | – 0 | – | |||||||
Change in unrealized appreciation/depreciation | (122,908 | ) | (375,630 | ) | (75,816 | ) | ||||||
Purchases/Payups | 148,805 | 551,400 | – 0 | – | ||||||||
Sales/Paydowns | – 0 | – | (1,450,241 | ) | – 0 | – | ||||||
Transfers in to Level 3 | – 0 | – | – 0 | – | – 0 | – | ||||||
Transfers out of Level 3 | (320,267 | ) | – 0 | – | – 0 | – | ||||||
|
|
|
|
|
| |||||||
Balance as of 8/31/15 | $ | 270,252 | $ | 5,008,319 | $ | 4,488,395 | ||||||
|
|
|
|
|
| |||||||
Net change in unrealized appreciation/depreciation from investments held as of 8/31/15* | $ | 121,447 | $ | (294,467 | ) | $ | (75,816 | ) | ||||
|
|
|
|
|
| |||||||
| AB POOLING PORTFOLIOS • | 295 |
Notes to Financial Statements
| Asset-Backed Securities | Warrants^ | Total | ||||||||||
Balance as of 8/31/14 | $ | 2,674,264 | $ | – 0 | – | $ | 34,255,142 | |||||
Accrued discounts/(premiums) | 40,937 | – 0 | – | 12,568 | ||||||||
Realized gain (loss) | 141,317 | – 0 | – | 183,375 | ||||||||
Change in unrealized appreciation/depreciation | (95,111 | ) | 104,521 | (1,750,906 | ) | |||||||
Purchases/Payups | – 0 | – | 82,754 | 6,266,436 | ||||||||
Sales/Paydowns | (357,676 | ) | – 0 | – | (8,746,733 | ) | ||||||
Transfers in to Level 3 | – 0 | – | – 0 | – | 240,755 | |||||||
Transfers out of Level 3 | – 0 | – | – 0 | – | (561,022 | ) | ||||||
|
|
|
|
|
| |||||||
Balance as of 8/31/15 | $ | 2,403,731 | $ | 187,275 | $ | 29,899,615 | + | |||||
|
|
|
|
|
| |||||||
Net change in unrealized appreciation/depreciation from investments held as of 8/31/15* | $ | (95,111 | ) | $ | 104,521 | $ | (1,357,769 | ) | ||||
|
|
|
|
|
| |||||||
AB Multi-Asset Real Return | Common Stocks - Equity: Other | Common Stocks - Materials | Common Stocks - Residential | |||||||||
Balance as of 8/31/14 | $ | – 0 | – | $ | 9 | $ | 1,077 | |||||
Accrued discounts/(premiums) | – 0 | – | – 0 | – | – 0 | – | ||||||
Realized gain (loss) | – 0 | – | – 0 | – | – 0 | – | ||||||
Change in unrealized appreciation/depreciation | (224,076 | ) | (9 | ) | (1,046 | ) | ||||||
Purchases | 409,575 | – 0 | – | – 0 | – | |||||||
Sales | – 0 | – | – 0 | – | – 0 | – | ||||||
Transfers in to Level 3 | – 0 | – | – 0 | – | – 0 | – | ||||||
Transfers out of Level 3 | – 0 | – | – 0 | – | – 0 | – | ||||||
|
|
|
|
|
| |||||||
Balance as of 8/31/15 | $ | 185,499 | $ | – 0 | –^^ | $ | 31 | |||||
|
|
|
|
|
| |||||||
Net change in unrealized appreciation/depreciation from investments held as of 8/31/15* | $ | (224,076 | ) | $ | – 0 | – | $ | (201 | ) | |||
|
|
|
|
|
| |||||||
| Total | ||||||||||||
Balance as of 8/31/14 | $ | 1,086 | ||||||||||
Accrued discounts/(premiums) | – 0 | – | ||||||||||
Realized gain (loss) | – 0 | – | ||||||||||
Change in unrealized appreciation/depreciation | (225,131 | ) | ||||||||||
Purchases | 409,575 | |||||||||||
Sales | – 0 | – | ||||||||||
Transfers in to Level 3 | – 0 | – | ||||||||||
Transfers out of Level 3 | – 0 | – | ||||||||||
|
| |||||||||||
Balance as of 8/31/15 | $ | 185,530 | ||||||||||
|
| |||||||||||
Net change in unrealized appreciation/depreciation from investments held as of 8/31/15* | $ | (224,277 | ) | |||||||||
|
| |||||||||||
| 296 | • AB POOLING PORTFOLIOS |
Notes to Financial Statements
AB Volatility Management | Common Stocks - Financials | Rights | Total | |||||||||
Balance as of 8/31/14 | $ | – 0 | – | $ | 15,992 | $ | 15,992 | |||||
Accrued discounts/(premiums) | – 0 | – | – 0 | – | – 0 | – | ||||||
Realized gain (loss) | – 0 | – | 13,038 | 13,038 | ||||||||
Change in unrealized appreciation/depreciation | – 0 | –^^ | (15,992 | ) | (15,992 | ) | ||||||
Purchases | – 0 | – | – 0 | – | – 0 | – | ||||||
Sales | – 0 | – | (13,038 | ) | (13,038 | ) | ||||||
Transfers in to Level 3 | – 0 | – | – 0 | – | – 0 | – | ||||||
Transfers out of Level 3 | – 0 | – | – 0 | – | – 0 | – | ||||||
|
|
|
|
|
| |||||||
Balance as of 8/31/15 | $ | – 0 | –^^ | $ | – 0 | – | $ | – 0 | –^^ | |||
|
|
|
|
|
| |||||||
Net change in unrealized appreciation/depreciation from investments held as of 8/31/15* | $ | – 0 | –^^ | $ | – 0 | – | $ | – 0 | –^^ | |||
|
|
|
|
|
| |||||||
| ^ | The Portfolio held securities with zero market value at period end. |
| ^^ | Amount less than $0.50. |
| + | There were de minimis transfers under 1% of net assets during the reporting period. |
| * | The unrealized appreciation/depreciation is included in net change in unrealized appreciation/depreciation on investments and other financial instruments in the accompanying statement of operations. |
| ** | The Security Type has been changed during the reporting period. |
| *** | Consolidated (see Note A). |
The following presents information about significant unobservable inputs related to the Portfolio’s Level 3 investments at August 31, 2015. Securities priced by third party vendors or using prior transaction prices, which approximate fair value, are excluded from the following table.
AB Short Duration Bond Portfolio |
| |||||||||||
| Quantitative Information about Level 3 Fair Value Measurements | ||||||||||||
| Fair Value at 8/31/15 | Valuation Technique | Unobservable Input | Range/ Weighted Average | |||||||||
Asset-Backed Securities | | $– 0 | – | Qualitative Assessment | | $ 0.00/N/A | | |||||
AB High-Yield Portfolio |
| |||||||||||
| Quantitative Information about Level 3 Fair Value Measurements | ||||||||||||
| Fair Value at 8/31/15 | Valuation Technique | Unobservable Input | Range/ Weighted Average | |||||||||
Corporates – Non-Investment Grade | | $ 836,563 | | Market Approach | Implied Enterprise Value | | $521mil-$604mil/N/A | | ||||
| AB POOLING PORTFOLIOS • | 297 |
Notes to Financial Statements
| Fair Value at 8/31/15 | Valuation Technique | Unobservable Input | Range/ Weighted Average | |||||||||
Bank | $ 658,006 | Market Approach | EBITDA* EBITDA Multiple Scrap Value |
| $28mil-$70mil/N/A 6X $154mil/N/A |
| ||||||
Common | $79,919 | Option Pricing Model | Enterprise Value Exercise Price Years to Expiration EV Volatility % Risk Free Rate |
| $521mil-$604mil/N/A $730mil-$830mil/N/A 3yr-5yr/N/A 24.5%-27.7%/N/A 1.01%-1.57%/N/A |
| ||||||
| $0 | Qualitative Assessment | $0.00/N/A | ||||||||||
| * | Earnings Before Interest, Taxes, Depreciation and Amortization. |
The Adviser established the Committee to oversee the pricing and valuation of all securities held in the Portfolios. The Committee operates under pricing and valuation policies and procedures established by the Adviser and approved by the Board, including pricing policies which set forth the mechanisms and processes to be employed on a daily basis to implement these policies and procedures. In particular, the pricing policies describe how to determine market quotations for securities and other instruments. The Committee’s responsibilities include: 1) fair value and liquidity determinations (and oversight of any third parties to whom any responsibility for fair value and liquidity determinations is delegated), and 2) regular monitoring of the Adviser’s pricing and valuation policies and procedures and modification or enhancement of these policies and procedures (or recommendation of the modification of these policies and procedures) as the Committee believes appropriate.
The Committee is also responsible for monitoring the implementation of the pricing policies by the Adviser’s Pricing Group (the “Pricing Group”) and a third party which performs certain pricing functions in accordance with the pricing policies. The Pricing Group is responsible for the oversight of the third party on a day-to-day basis. The Committee and the Pricing Group perform a series of activities to provide reasonable assurance of the accuracy of prices including: 1) periodic vendor due diligence meetings, review of methodologies, new developments and processes at vendors, 2) daily comparison of security valuation versus prior day for all securities that exceeded established thresholds, and 3) daily review of unpriced, stale, and variance reports with exceptions reviewed by senior management and the Committee.
In addition, several processes outside of the pricing process are used to monitor valuation issues including: 1) performance and performance attribution reports are monitored for anomalous impacts based upon benchmark performance, and 2) portfolio managers review all portfolios for performance and analytics (which are generated using the Adviser’s prices).
| 298 | • AB POOLING PORTFOLIOS |
Notes to Financial Statements
3. Currency Translation
Assets and liabilities denominated in foreign currencies and commitments under forward currency exchange contracts are translated into U.S. dollars at the mean of the quoted bid and ask prices of such currencies against the U.S. dollar. Purchases and sales of portfolio securities are translated into U.S. dollars at the rates of exchange prevailing when such securities were acquired or sold. Income and expenses are translated into U.S. dollars at rates of exchange prevailing when accrued.
Net realized gain or loss on foreign currency transactions represents foreign exchange gains and losses from sales and maturities of foreign fixed income investments, foreign currency exchange contracts, holding of foreign currencies, currency gains or losses realized between the trade and settlement dates on foreign investment transactions, and the difference between the amounts of dividends, interest and foreign withholding taxes recorded on the Portfolios’ books and the U.S. dollar equivalent amounts actually received or paid. Net unrealized currency gains and losses from valuing foreign currency denominated assets and liabilities at period end exchange rates are reflected as a component of net unrealized appreciation or depreciation of foreign currency denominated assets and liabilities.
4. Taxes
It is each Portfolio’s policy to meet the requirements of the Internal Revenue Code applicable to regulated investment companies and to distribute all of its investment company taxable income and net realized gains, if any, to shareholders. Therefore, no provisions for federal income or excise taxes are required.
The Portfolios may be subject to taxes imposed by countries in which they invest. Such taxes are generally based on income and/or capital gains earned or repatriated. Taxes are accrued and applied to net investment income, net realized gains and net unrealized appreciation/depreciation as such income and/or gains are earned.
If, during a taxable year, the Subsidiary’s taxable losses (and other deductible items) exceed its income and gains, the net loss will not pass through to the Fund as a deductible amount for Federal income tax purposes. Note that the loss from the Subsidiary’s contemplated activities also cannot be carried forward to reduce future Subsidiary’s income in subsequent years. However, if the Subsidiary’s taxable gains exceed its losses and other deductible items during a taxable year, the net gain will pass through to the Fund as income for Federal income tax purposes.
In accordance with U.S. GAAP requirements regarding accounting for uncertainties in income taxes, management has analyzed the Portfolios’ tax positions taken or expected to be taken on federal and state income tax returns for
| AB POOLING PORTFOLIOS • | 299 |
Notes to Financial Statements
all open tax years (the current and the prior three tax years, as applicable) and has concluded that no provision for income tax is required in the Portfolios’ financial statements.
5. Investment Income and Investment Transactions
Dividend income is recorded on the ex-dividend date or as soon as a Portfolio is informed of the dividend. Interest income is accrued daily. Investment transactions are accounted for on the date the securities are purchased or sold. Investment gains or losses are determined on the identified cost basis. The Portfolios amortize premiums and accrete discounts as adjustments to interest income.
6. Expenses
Expenses of the Trust are charged proportionately to each Portfolio or based on other appropriate methods.
7. Dividends and Distributions
Dividends and distributions to shareholders, if any, are recorded on the ex-dividend date. Income dividends and capital gains distributions are determined in accordance with federal tax regulations and may differ from those determined in accordance with U.S. GAAP. To the extent these differences are permanent, such amounts are reclassified within the capital accounts based on their federal tax basis treatment; temporary differences do not require such reclassification.
NOTE B
Advisory Fee and Other Transactions With Affiliates
The Trust has entered into an advisory agreement (the “Advisory Agreement”) with the Adviser. Under the terms of the Advisory Agreement, the Portfolios pay no advisory fees to the Adviser. The Adviser serves as investment manager and adviser of each of the Portfolios and continuously furnishes an investment program for each Portfolio and manages, supervises and conducts the affairs of each Portfolio, subject to the supervision of the Trust’s Board of Trustees. The Advisory Agreement provides that the Adviser or an affiliate will furnish, or pay the expenses of the Trust for, office space, facilities and equipment, services of executive and other personnel of the Trust and certain administrative services. The Adviser has agreed to bear certain expenses to the extent necessary to limit the total operating expenses on an annual basis (the “Expense Cap”) to .15% of average daily net assets for the Volatility Management Portfolio. The Expense Cap may not be terminated before December 31, 2015 and then may be extended by the Adviser for additional one-year terms. For the year ended August 31, 2015, there was no such reimbursement.
The Subsidiary has entered into a separate agreement with the Adviser for the management of the Subsidiary’s portfolio. The Adviser receives no compensation from the Subsidiary for its services under the agreement.
| 300 | • AB POOLING PORTFOLIOS |
Notes to Financial Statements
The Adviser reimbursed the AB Multi-Asset Real Return Portfolio $394 and $29,301 for trading losses incurred due to a trade entry error for the years ended August 31, 2015 and August 31, 2014, respectively.
The Trust has entered into a distribution agreement (the “Distribution Agreement”) on behalf of each Portfolio with AllianceBernstein Investments, Inc., a wholly-owned subsidiary of the Adviser, the Portfolios’ principal underwriter (the “Underwriter”), to permit the Underwriter to distribute the Portfolios’ shares, which are sold at the net asset value without any sales charge.
Under the Distribution Agreement, the Trust is responsible for all expenses of the Portfolios, including, for example, certain administrative services, costs of printing Portfolio prospectuses and other reports to shareholders, any taxes levied against the Portfolios and brokerage fees and commissions in connection with the purchase and sale of portfolio securities, but not expenses incurred in promoting the sale of the Portfolios’ shares, which are borne by the Underwriter.
Effective January 1st, 2015, the Portfolios may reimburse the Adviser for certain legal and accounting services provided to the Portfolios by the Adviser. For the year ended August 31, 2015, such fees amounted to:
| Portfolio | Administrative Fees | |||
AB U.S. Value | $ | 30,205 | ||
AB U.S. Large Cap Growth | 30,205 | |||
AB International Value | 28,234 | |||
AB International Growth | 30,205 | |||
AB Short Duration Bond | 29,786 | |||
AB Global Core Bond | 33,025 | |||
AB Bond Inflation Protection | 29,786 | |||
AB High-Yield | 29,786 | |||
AB Small-Mid Cap Value | 32,245 | |||
AB Small-Mid Cap Growth | 32,246 | |||
AB Multi-Asset Real Return | 32,925 | |||
AB Volatility Management | 41,660 | |||
AllianceBernstein Investor Services, Inc. (“ABIS”), a wholly-owned subsidiary of the Adviser, acts as the Portfolios’ registrar, transfer agent and dividend-disbursing agent. ABIS did not receive any fees for such services.
The Portfolios may invest in the AB Fixed-Income Shares, Inc. – Government STIF Portfolio (“Government STIF Portfolio”), an open-end management investment company managed by the Adviser. The Government STIF Portfolio is offered as a cash management option to mutual funds and other institutional accounts of the Adviser, and is not available for direct purchase by members of the public. The Government STIF Portfolio pays no investment management
| AB POOLING PORTFOLIOS • | 301 |
Notes to Financial Statements
fees but does bear its own expenses. A summary of the Portfolios’ transactions in shares of the Government STIF Portfolio for the year ended August 31, 2015 is as follows:
| Portfolio | Market Value August 31, 2014 (000) | Purchases at Cost (000) | Sales Proceeds (000) | Market Value August 31, 2015 (000) | Dividend Income (000) | |||||||||||||||
AB U.S. Value | $ | 6,434 | $ | 173,106 | $ | 170,227 | $ | 9,313 | $ | 5 | ||||||||||
AB U.S. Large Cap Growth | 31,588 | 232,701 | 231,859 | 32,430 | 26 | |||||||||||||||
AB International Value | 3,754 | 105,293 | 109,047 | – 0 | – | 3 | ||||||||||||||
AB International Growth | 2,185 | 88,791 | 90,976 | – 0 | – | 2 | ||||||||||||||
AB Short Duration Bond | 23,536 | 363,334 | 383,114 | 3,756 | 22 | |||||||||||||||
AB Global Core Bond | 23,063 | 590,403 | 609,007 | 4,459 | 28 | |||||||||||||||
AB Bond Inflation Protection | 11,351 | 719,255 | 727,139 | 3,467 | 10 | |||||||||||||||
AB High-Yield | 1,498 | 136,741 | 132,261 | 5,978 | 7 | |||||||||||||||
AB Small-Mid Cap Value | 5,983 | 79,413 | 78,529 | 6,867 | 6 | |||||||||||||||
AB Small-Mid Cap Growth | 1,773 | 79,266 | 74,731 | 6,308 | 4 | |||||||||||||||
AB Multi-Asset Real Return | 122,853 | 679,578 | 698,906 | 103,525 | 117 | |||||||||||||||
AB Volatility Management | 237,629 | 447,122 | 425,850 | 258,901 | 215 | |||||||||||||||
Brokerage commissions paid on investment transactions and brokerage commissions paid to Sanford C. Bernstein & Co. LLC and Sanford C. Bernstein Limited, affiliates of the Adviser, for the year ended August 31, 2015 were as follows:
| Portfolio | Total Commissions | Sanford C. Bernstein & Co. LLC | Sanford C. Bernstein Limited | |||||||||
AB U.S. Value | $ | 388,146 | $ | – 0 | – | $ | – 0 | – | ||||
AB U.S. Large Cap Growth | 249,366 | – 0 | – | – 0 | – | |||||||
AB International Value | 647,326 | – 0 | – | – 0 | – | |||||||
AB International Growth | 467,787 | – 0 | – | – 0 | – | |||||||
AB Short Duration Bond | 30,125 | – 0 | – | – 0 | – | |||||||
AB Global Core Bond | 10,972 | – 0 | – | – 0 | – | |||||||
AB Bond Inflation Protection | 19,728 | – 0 | – | – 0 | – | |||||||
AB High-Yield | 201,416 | – 0 | – | – 0 | – | |||||||
AB Small-Mid Cap Value | 300,354 | – 0 | – | – 0 | – | |||||||
AB Small-Mid Cap Growth | 236,289 | 35 | – 0 | – | ||||||||
AB Multi-Asset Real Return | 693,747 | – 0 | – | – 0 | – | |||||||
AB Volatility Management | 179,860 | – 0 | – | – 0 | – | |||||||
| 302 | • AB POOLING PORTFOLIOS |
Notes to Financial Statements
NOTE C
Investment Transactions
Purchases and sales of investment securities (excluding U.S. government securities and short-term investments) for the year ended August 31, 2015, were as follows:
| Portfolio | Purchases | Sales | ||||||
AB U.S. Value | $ | 260,612,641 | $ | 322,507,697 | ||||
AB U.S. Large Cap Growth | 266,271,860 | 393,454,748 | ||||||
AB International Value | 288,444,716 | 313,535,998 | ||||||
AB International Growth | 216,926,496 | 240,595,161 | ||||||
AB Short Duration Bond | 233,160,791 | 102,782,296 | ||||||
AB Global Core Bond | 675,294,673 | 672,621,789 | ||||||
AB Bond Inflation Protection | 176,354,766 | 91,619,128 | ||||||
AB High-Yield | 171,747,488 | 173,593,744 | ||||||
AB Small-Mid Cap Value | 120,176,155 | 156,635,850 | ||||||
AB Small-Mid Cap Growth | 166,962,229 | 224,672,681 | ||||||
AB Multi-Asset Real Return | 446,300,124 | 347,238,979 | ||||||
AB Volatility Management | 155,214,532 | 340,314,372 | ||||||
Purchases and sales of U.S. government securities for the year ended August 31, 2015, were as follows:
| Portfolio | Purchases | Sales | ||||||
AB U.S. Value | $ | – 0 | – | $ | – 0 | – | ||
AB U.S. Large Cap Growth | – 0 | – | – 0 | – | ||||
AB International Value | – 0 | – | – 0 | – | ||||
AB International Growth | – 0 | – | – 0 | – | ||||
AB Short Duration Bond | 440,891,025 | 544,736,938 | ||||||
AB Global Core Bond | 779,935,905 | 765,496,887 | ||||||
AB Bond Inflation Protection | 407,406,864 | 535,440,935 | ||||||
AB High-Yield | – 0 | – | – 0 | – | ||||
AB Small-Mid Cap Value | – 0 | – | – 0 | – | ||||
AB Small-Mid Cap Growth | – 0 | – | – 0 | – | ||||
AB Multi-Asset Real Return | 133,053,693 | 13,737,188 | ||||||
AB Volatility Management | – 0 | – | – 0 | – | ||||
The cost of investments for federal income tax purposes, gross unrealized appreciation and unrealized depreciation (excluding futures, foreign currency, written options and swap transactions) are as follows:
Portfolio | Cost | Gross Unrealized | Net Unrealized Appreciation/ (Depreciation) | |||||||||||||
| Appreciation | (Depreciation) | |||||||||||||||
AB U.S. Value | $ | 410,540,705 | $ | 69,562,436 | $ | (23,280,842 | ) | $ | 46,281,594 | |||||||
AB U.S. Large Cap Growth | 358,854,366 | 109,013,553 | (6,164,194 | ) | 102,849,359 | |||||||||||
AB International Value | 394,250,015 | 23,907,808 | (51,530,515 | ) | (27,622,707 | ) | ||||||||||
AB International Growth | 364,166,790 | 44,621,022 | (33,285,212 | ) | 11,335,810 | |||||||||||
| AB POOLING PORTFOLIOS • | 303 |
Notes to Financial Statements
Portfolio | Cost | Gross Unrealized | Net Unrealized Appreciation/ (Depreciation) | |||||||||||||
| Appreciation | (Depreciation) | |||||||||||||||
AB Short Duration Bond | $ | 898,494,965 | $ | 1,630,044 | $ | (3,492,905 | ) | $ | (1,862,861 | ) | ||||||
AB Global Core Bond | 992,568,951 | 22,241,204 | (39,362,835 | ) | (17,121,631 | ) | ||||||||||
AB Bond Inflation Protection | 934,982,034 | 4,324,659 | (24,385,427 | ) | (20,060,768 | ) | ||||||||||
AB High-Yield | 340,940,623 | 9,600,223 | (25,054,666 | ) | (15,454,443 | ) | ||||||||||
AB Small-Mid Cap Value | 256,282,003 | 49,414,389 | (19,696,767 | ) | 29,717,622 | |||||||||||
AB Small-Mid Cap Growth | 226,692,097 | 71,655,228 | (9,859,637 | ) | 61,795,591 | |||||||||||
AB Multi-Asset Real Return | 1,146,223,442 | 10,870,503 | (301,441,221 | ) | (290,570,718 | ) | ||||||||||
AB Volatility Management | 1,258,120,602 | 228,431,960 | (79,405,281 | ) | 149,026,679 | |||||||||||
1. Derivative Financial Instruments
Certain Portfolios may use derivatives in an effort to earn income and enhance returns, to replace more traditional direct investments, to obtain exposure to otherwise inaccessible markets (collectively, “investment purposes”), or to hedge or adjust the risk profile of its portfolio.
The principal types of derivatives utilized by the Portfolios, as well as the methods in which they may be used are:
| • | Futures |
Certain Portfolios may buy or sell futures for investment purposes or for the purpose of hedging their Portfolios against adverse effects of potential movements in the market or for investment purposes. The Portfolio bears the market risk that arises from changes in the value of these instruments and the imperfect correlation between movements in the price of the futures and movements in the price of the assets, reference rates or indices which they are designed to track. Among other things, the Portfolio may purchase or sell futures for foreign currencies or options thereon for non-hedging purposes as a means of making direct investment in foreign currencies, as described below under “Currency Transactions”.
At the time the Portfolio enters into futures, the Portfolio deposits and maintains as collateral an initial margin with the broker, as required by the exchange on which the transaction is effected. Such amount is shown as cash collateral due from broker on the statement of assets and liabilities. Pursuant to the contract, the Portfolio agrees to receive from or pay to the broker an amount of cash equal to the daily fluctuation in the value of the contract. Such receipts or payments are known as variation margin and are recorded by the Portfolio as unrealized gains or losses. Risks may arise from the potential inability of a counterparty to meet the terms of the
| 304 | • AB POOLING PORTFOLIOS |
Notes to Financial Statements
contract. The credit/counterparty risk for exchange-traded futures is generally less than privately negotiated futures, since the clearinghouse, which is the issuer or counterparty to each exchange-traded future, has robust risk mitigation standards, including the requirement to provide initial and variation margin. When the contract is closed, the Portfolio records a realized gain or loss equal to the difference between the value of the contract at the time it was opened and the time it was closed.
Use of long futures subjects the Portfolio to risk of loss in excess of the amounts shown on the statement of assets and liabilities, up to the notional value of the futures. Use of short futures subjects the Portfolio to unlimited risk of loss. Under some circumstances, futures exchanges may establish daily limits on the amount that the price of futures can vary from the previous day’s settlement price, which could effectively prevent liquidation of unfavorable positions.
During the year ended August 31, 2015, AB Short Duration Bond Portfolio, AB Bond Inflation Protection Portfolio, High-Yield Portfolio, AB Multi-Asset Real Return Portfolio and AB Volatility Management Portfolio held futures for hedging and non-hedging purposes; the AB Global Core Bond Portfolio held futures for hedging purposes; the AB International Value Portfolio held futures for non-hedging purposes
| • | Forward Currency Exchange Contracts |
Certain Portfolios may enter into forward currency exchange contracts in order to hedge their exposure to changes in foreign currency exchange rates on their foreign portfolio holdings, to hedge certain firm purchase and sale commitments denominated in foreign currencies and for non-hedging purposes as a means of making direct investments in foreign currencies, as described below under “Currency Transactions”.
A forward currency exchange contract is a commitment to purchase or sell a foreign currency at a future date at a negotiated forward rate. The gain or loss arising from the difference between the original contract and the closing of such contract would be included in net realized gain or loss on foreign currency transactions. Fluctuations in the value of open forward currency exchange contracts are recorded for financial reporting purposes as unrealized appreciation and/or depreciation by the Portfolio. Risks may arise from the potential inability of a counterparty to meet the terms of a contract and from unanticipated movements in the value of a foreign currency relative to the U.S. dollar.
During the year ended August 31, 2015, the AB International Value Portfolio, AB Global Core Bond Portfolio, AB Bond Inflation Protection Portfolio, AB High-Yield Portfolio, AB Multi-Asset Real Return Portfolio and AB Volatility Management Portfolio held forward currency exchange contracts for hedging and non-hedging purposes; the AB Short Duration
| AB POOLING PORTFOLIOS • | 305 |
Notes to Financial Statements
Bond Portfolio and AB International Growth Portfolio held forward currency exchange contracts for hedging purposes.
| • | Option Transactions |
For hedging and investment purposes, certain Portfolios may purchase and write (sell) put and call options on U.S. and foreign securities, including government securities, and foreign currencies that are traded on U.S. and foreign securities exchanges and over-the-counter markets. Among other things, the Portfolio may use options transactions for non-hedging purposes as a means of making direct investments in foreign currencies, as described below under “Currency Transactions” and may use options strategies involving the purchase and/or writing of various combinations of call and/or put options, for hedging and investment purposes.
The risk associated with purchasing an option is that the Portfolio pays a premium whether or not the option is exercised. Additionally, the Portfolio bears the risk of loss of the premium and change in market value should the counterparty not perform under the contract. Put and call options purchased are accounted for in the same manner as portfolio securities. The cost of securities acquired through the exercise of call options is increased by premiums paid. The proceeds from securities sold through the exercise of put options are decreased by the premiums paid.
When the Portfolio writes an option, the premium received by the Portfolio is recorded as a liability and is subsequently adjusted to the current market value of the option written. Premiums received from written options which expire unexercised are recorded by the Portfolio on the expiration date as realized gains from options written. The difference between the premium received and the amount paid on effecting a closing purchase transaction, including brokerage commissions, is also treated as a realized gain, or if the premium received is less than the amount paid for the closing purchase transaction, as a realized loss. If a call option is exercised, the premium received is added to the proceeds from the sale of the underlying security or currency in determining whether the Portfolio has realized a gain or loss. If a put option is exercised, the premium received reduces the cost basis of the security or currency purchased by the Portfolio. In writing an option, the Portfolio bears the market risk of an unfavorable change in the price of the security or currency underlying the written option. Exercise of an option written by the Portfolio could result in the Portfolio selling or buying a security or currency at a price different from the current market value.
A Portfolio may also invest in options on swap agreements, also called “swaptions”. A swaption is an option that gives the buyer the right, but not the obligation, to enter into a swap on a future date in exchange for paying a market-based “premium”. A receiver swaption gives the owner the right to receive the total return of a specified asset, reference rate, or
| 306 | • AB POOLING PORTFOLIOS |
Notes to Financial Statements
index. A payer swaption gives the owner the right to pay the total return on a specified asset, reference rate, or index. Swaptions also include options that allow an existing swap to be terminated or extended by one of the counterparties.
During the year ended August 31, 2015, the AB High-Yield Portfolio held purchased options, written options and written swaptions for hedging purposes; the AB Multi-Asset Real Return Portfolio held purchased options and written options for hedging and non-hedging purposes.
For the year ended August 31, 2015, the Portfolios had the following transactions in written options:
| AB High-Yield Portfolio | Number of Contracts | Premiums Received | ||||||
Options written outstanding as of 08/31/14 | 796 | $ | 72,775 | |||||
Options written | 10,648,018 | 1,604,104 | ||||||
Options expired | (10,255 | ) | (710,151 | ) | ||||
Options bought back | (10,633,610 | ) | (510,943 | ) | ||||
Options exercised | – 0 | – | – 0 | – | ||||
|
|
|
| |||||
Options written outstanding as of 08/31/15 | 4,949 | $ | 455,785 | |||||
|
|
|
| |||||
| Notional Amount | Premiums Received | |||||||
Swaptions written outstanding as of 08/31/14 | 55,807,000 | $ | 173,869 | |||||
Swaptions written | 226,796,760 | 542,354 | ||||||
Swaptions expired | (231,056,760 | ) | (529,239 | ) | ||||
Swaptions bought back | (37,617,000 | ) | (139,653 | ) | ||||
Swaptions exercised | – 0 | – | – 0 | – | ||||
|
|
|
| |||||
Swaptions written outstanding as of 08/31/15 | 13,930,000 | $ | 47,331 | |||||
|
|
|
| |||||
| AB Multi-Asset Real Return Portfolio | Number of Contracts | Premiums Received | ||||||
Options written outstanding as of 08/31/14 | – 0 | – | $ | – 0 | – | |||
Options written | 29,429,202 | 9,137,184 | ||||||
Options expired | – 0 | – | – 0 | – | ||||
Options bought back | (19,374,426 | ) | (5,819,252 | ) | ||||
Options exercised | – 0 | – | – 0 | – | ||||
|
|
|
| |||||
Options written outstanding as of 08/31/15 | 10,054,776 | $ | 3,317,932 | |||||
|
|
|
| |||||
| • | Swaps |
Certain Portfolios may enter into swaps to hedge their exposure to interest rates, credit risk, equity markets, currencies or other underlying asset classes. The Portfolio may also enter into swaps for non-hedging purposes as a means of gaining market exposures, including by making direct investments in foreign currencies, as described below under “Currency Transactions” or in order to take a “long” or “short” position with respect to an underlying referenced asset described below under “Total Return Swaps”. A swap is an agreement that obligates two parties to exchange a
| AB POOLING PORTFOLIOS • | 307 |
Notes to Financial Statements
series of cash flows at specified intervals based upon or calculated by reference to changes in specified prices or rates for a specified amount of an underlying asset. The payment flows are usually netted against each other, with the difference being paid by one party to the other. In addition, collateral may be pledged or received by the Portfolio in accordance with the terms of the respective swaps to provide value and recourse to the Portfolio or its counterparties in the event of default, bankruptcy or insolvency by one of the parties to the swap.
Risks may arise as a result of the failure of the counterparty to the swap to comply with the terms of the swap. The loss incurred by the failure of a counterparty is generally limited to the net interim payment to be received by the Portfolio, and/or the termination value at the end of the contract. Therefore, the Portfolio considers the creditworthiness of each counterparty to a swap in evaluating potential counterparty risk. This risk is mitigated by having a netting arrangement between the Portfolio and the counterparty and by the posting of collateral by the counterparty to the Portfolio to cover the Portfolio’s exposure to the counterparty. Additionally, risks may arise from unanticipated movements in interest rates or in the value of the underlying securities. The Portfolio accrues for the interim payments on swaps on a daily basis, with the net amount recorded within unrealized appreciation/depreciation of swaps on the statement of assets and liabilities, where applicable. Once the interim payments are settled in cash, the net amount is recorded as realized gain/(loss) on swaps on the statement of operations, in addition to any realized gain/(loss) recorded upon the termination of swap. Upfront premiums paid or received are recognized as cost or proceeds on the statement of assets and liabilities and are amortized on a straight line basis over the life of the contract. Amortized upfront premiums are included in net realized gain/(loss) from swaps on the statement of operations. Fluctuations in the value of swaps are recorded as a component of net change in unrealized appreciation/depreciation of swaps on the statement of operations.
Certain standardized swaps, including certain interest rate swaps and credit default swaps, are (or soon will be) subject to mandatory central clearing. Cleared swaps are transacted through futures commission merchants (“FCMs”) that are members of central clearinghouses, with the clearinghouse serving as central counterparty, similar to transactions in futures contracts. Centralized clearing will be required for additional categories of swaps on a phased-in basis based on requirements published by the Securities and Exchange Commission and Commodity Futures Trading Commission.
At the time the Portfolio enters into a centrally cleared swap, the Portfolio deposits and maintains as collateral an initial margin with the broker, as required by the clearinghouse on which the transaction is effected. Such
| 308 | • AB POOLING PORTFOLIOS |
Notes to Financial Statements
amount is shown as cash collateral due from broker on the statement of assets and liabilities. Pursuant to the contract, the Portfolio agrees to receive from or pay to the broker an amount of cash equal to the daily fluctuation in the value of the contract. Such receipts or payments are known as variation margin and are recorded by the Portfolio as unrealized gains or losses. Risks may arise from the potential inability of a counterparty to meet the terms of the contract. The credit/counterparty risk for centrally cleared swaps is generally less than non-centrally cleared swaps, since the clearinghouse, which is the issuer or counterparty to each centrally cleared swap, has robust risk mitigation standards, including the requirement to provide initial and variation margin. When the contract is closed, the Portfolio records a realized gain or loss equal to the difference between the value of the contract at the time it was opened and the time it was closed.
Interest Rate Swaps:
The Portfolio is subject to interest rate risk exposure in the normal course of pursuing its investment objectives. Because the Portfolio holds fixed rate bonds, the value of these bonds may decrease if interest rates rise. To help hedge against this risk and to maintain its ability to generate income at prevailing market rates, the Portfolio may enter into interest rate swaps. Interest rate swaps are agreements between two parties to exchange cash flows based on a notional amount. The Portfolio may elect to pay a fixed rate and receive a floating rate, or, receive a fixed rate and pay a floating rate on a notional amount.
In addition, a Portfolio may also enter into interest rate swap transactions to preserve a return or spread on a particular investment or portion of its portfolio, or protecting against an increase in the price of securities the Portfolio anticipates purchasing at a later date. Interest rate swaps involve the exchange by a Portfolio with another party of their respective commitments to pay or receive interest (e.g., an exchange of floating rate payments for fixed rate payments) computed based on a contractually-based principal (or “notional”) amount. Interest rate swaps are entered into on a net basis (i.e., the two payment streams are netted out, with the Portfolio receiving or paying, as the case may be, only the net amount of the two payments).
During the year ended August 31, 2015, the AB Short Duration Bond Portfolio held interest rate swaps for non-hedging purposes; the AB Bond Inflation Protection Portfolio and the AB Multi-Asset Real Return Portfolio held interest rate swaps for hedging and non-hedging purposes; the AB High Yield Portfolio held interest rate swaps for hedging purposes.
Inflation (CPI) Swaps:
Inflation swap agreements are contracts in which one party agrees to pay the cumulative percentage increase in a price index (the Consumer Price Index with respect to CPI swaps) over the term of the swap (with some lag on the inflation index), and the other pays a compounded fixed rate.
| AB POOLING PORTFOLIOS • | 309 |
Notes to Financial Statements
Inflation swaps may be used to protect the net asset value, or NAV, of a Portfolio against an unexpected change in the rate of inflation measured by an inflation index since the value of these agreements is expected to increase if unexpected inflation increases.
During the year ended August 31, 2015, the AB Bond Inflation Protection Portfolio held inflation (CPI) swaps for hedging and non-hedging purposes; the AB Multi-Asset Real Return Portfolio held inflation (CPI) swaps for hedging purposes.
Currency Swaps:
The Portfolio may invest in currency swaps for hedging purposes to protect against adverse changes in exchange rates between the U.S. dollar and other currencies or for non-hedging purposes as a means of making direct investments in foreign currencies, as described below under “Currency Transactions”. Currency swaps involve the individually negotiated exchange by a Portfolio with another party of a series of payments in specified currencies. Actual principal amounts of currencies may be exchanged by the counterparties at the initiation, and again upon the termination, of the transaction. Therefore, the entire principal value of a currency swap is subject to the risk that the swap counterparty will default on its contractual delivery obligations.
During the year ended August 31, 2015, the AB Short Duration Bond Portfolio held currency swaps for hedging purposes.
Credit Default Swaps:
The Portfolio may enter into credit default swaps, including to manage its exposure to the market or certain sectors of the market, to reduce its risk exposure to defaults by corporate and sovereign issuers held by the Portfolio, or to create exposure to corporate or sovereign issuers to which it is not otherwise exposed. The Portfolio may purchase credit protection (“Buy Contract”) or provide credit protection (“Sale Contract”) on the referenced obligation of the credit default swap. During the term of the swap, the Portfolio receives/(pays) fixed payments from/(to) the respective counterparty, calculated at the agreed upon rate applied to the notional amount. If the Portfolio is a buyer/(seller) of protection and a credit event occurs, as defined under the terms of the swap, the Portfolio will either (i) receive from the seller/(pay to the buyer) of protection an amount equal to the notional amount of the swap (the “Maximum Payout Amount”) and deliver/(take delivery of) the referenced obligation or (ii) receive/(pay) a net settlement amount in the form of cash or securities equal to the notional amount of the swap less the recovery value of the referenced obligation.
In certain circumstances Maximum Payout Amounts may be partially offset by recovery values of the respective referenced obligations, upfront
| 310 | • AB POOLING PORTFOLIOS |
Notes to Financial Statements
premium received upon entering into the agreement, or net amounts received from settlement of buy protection credit default swaps entered into by the Portfolio for the same reference obligation with the same counterparty. As of August 31, 2015, the High-Yield Portfolio had Buy Contracts outstanding with respect to the same referenced obligation and counterparty as certain Sale Contracts which may partially offset the Maximum Payout Amount in the amount of $3,014,000.
Credit default swaps may involve greater risks than if a Portfolio had invested in the referenced obligation directly. Credit default swaps are subject to general market risk, liquidity risk, counterparty risk and credit risk. If the Portfolio is a buyer of protection and no credit event occurs, it will lose the payments it made to its counterparty. If the Portfolio is a seller of protection and a credit event occurs, the value of the referenced obligation received by the Portfolio coupled with the periodic payments previously received, may be less than the Maximum Payout Amount it pays to the buyer, resulting in a net loss to the Portfolio.
During the year ended August 31, 2015, the AB Bond Inflation Protection Portfolio and the AB High-Yield Portfolio held credit default swaps for hedging and non-hedging purposes.
Implied credit spreads over U.S. Treasuries of comparable maturity over U.S. Treasuries of comparable maturity utilized in determining the market value of credit default swaps on issuers as of period end are disclosed in the portfolio of investments. The implied spreads serve as an indicator of the current status of the payment/ performance risk and typically reflect the likelihood of default by the issuer of the referenced obligation. The implied credit spread of a particular reference obligation also reflects the cost of buying/selling protection and may reflect upfront payments required to be made to enter into the agreement. Widening credit spreads typically represent a deterioration of the referenced obligation’s credit soundness and greater likelihood of default or other credit event occurring as defined under the terms of the agreement. A credit spread identified as “Defaulted” indicates a credit event has occurred for the referenced obligation.
Total Return Swaps:
The Portfolio may enter into total return swaps in order to take a “long” or “short” position with respect to an underlying referenced asset. The Portfolio is subject to market price volatility of the underlying referenced asset. A total return swap involves commitments to pay interest in exchange for a market linked return based on a notional amount. To the extent that the total return of the security, group of securities or index underlying the transaction exceeds or falls short of the offsetting interest obligation, the Portfolio will receive a payment from or make a payment to the counterparty.
During the year ended August 31, 2015, the AB Multi-Asset Real Return Portfolio, the AB High-Yield Portfolio and the AB Volatility Management Portfolio held total return swaps for hedging and non-hedging purposes.
| AB POOLING PORTFOLIOS • | 311 |
Notes to Financial Statements
The Portfolios typically enter into International Swaps and Derivatives Association, Inc. Master Agreements (“ISDA Master Agreement”) or similar master agreements (collectively, “Master Agreements”) with its derivative contract counterparties in order to, among other things, reduce its credit risk to counterparties. ISDA Master Agreements include provisions for general obligations, representations, collateral and events of default or termination. Under an ISDA Master Agreement, the Portfolios typically may offset with the counterparty certain derivative financial instrument’s payables and/or receivables with collateral held and/or posted and create one single net payment (close-out netting) in the event of default or termination.
Various Master Agreements govern the terms of certain transactions with counterparties, including transactions such as derivative transactions, repurchase and reverse repurchase agreements. These Master Agreements typically attempt to reduce the counterparty risk associated with such transactions by specifying credit protection mechanisms and providing standardization that improves legal certainty. Cross-termination provisions under Master Agreements typically provide that a default in connection with one transaction between the Portfolio and a counterparty gives the non-defaulting party the right to terminate any other transactions in place with the defaulting party to create one single net payment due to/due from the defaulting party. In the event of a default by a Master Agreements counterparty, the return of collateral with market value in excess of the Portfolio’s net liability, held by the defaulting party, may be delayed or denied.
At August 31, 2015, the Portfolios had entered into the following derivatives:
| AB International Value Portfolio | ||||||||||||
Asset Derivatives | Liability Derivatives | |||||||||||
| Derivative Type | Statement of Assets and Liabilities Location | Fair Value | Statement of Assets and Liabilities Location | Fair Value | ||||||||
Equity contracts | Receivable/Payable for variation margin on exchange-traded derivatives | $ | 137,945 | * | ||||||||
Foreign exchange contracts | Unrealized appreciation on forward currency exchange contracts | $ | 1,583,380 |
| Unrealized depreciation on forward currency exchange contracts | | 1,078,879 | | ||||
|
|
|
| |||||||||
Total | $ | 1,583,380 | $ | 1,216,824 | ||||||||
|
|
|
| |||||||||
| * | Only variation margin receivable/payable at period end is reported within the statement of assets and liabilities. This amount reflects cumulative appreciation/(depreciation) of exchange-traded derivatives as reported in the portfolio of investments. |
| 312 | • AB POOLING PORTFOLIOS |
Notes to Financial Statements
The effect of derivative instruments on the statement of operations for the year ended August 31, 2015:
Derivative Type | Location of | Realized Gain or (Loss) on Derivatives | Change in Unrealized Appreciation or (Depreciation) | |||||||
Equity contracts | Net realized gain (loss) on futures; Net change in unrealized appreciation/depreciation of futures | $ | 158,021 | $ | (47,642 | ) | ||||
Foreign exchange contracts | Net realized gain (loss) on foreign currency transactions; Net change in unrealized appreciation/depreciation of foreign currency denominated assets and liabilities | 3,257,536 | (92,648 | ) | ||||||
|
|
|
| |||||||
Total | $ | 3,415,557 | $ | (140,290 | ) | |||||
|
|
|
| |||||||
| AB International Growth Portfolio | ||||||||||||
Asset Derivatives | Liability Derivatives | |||||||||||
| Derivative Type | Statement of Assets and Liabilities Location | Fair Value | Statement of Assets and Liabilities Location | Fair Value | ||||||||
Foreign exchange contracts | Unrealized appreciation on forward currency exchange contracts | $ | 1,084,707 |
| Unrealized depreciation on forward currency exchange contracts | $ | 2,836,971 |
| ||||
|
|
|
| |||||||||
Total | $ | 1,084,707 | $ | 2,836,971 | ||||||||
|
|
|
| |||||||||
The effect of derivative instruments on the statement of operations for the year ended August 31, 2015:
Derivative Type | Location of | Realized Gain or (Loss) on Derivatives | Change in Unrealized Appreciation or (Depreciation) | |||||||
Foreign exchange contracts | Net realized gain (loss) on foreign currency transactions; Net change in unrealized appreciation/depreciation of foreign currency denominated assets and liabilities | $ | 1,094,900 | $ | (1,408,395 | ) | ||||
|
|
|
| |||||||
Total | $ | 1,094,900 | $ | (1,408,395 | ) | |||||
|
|
|
| |||||||
| AB POOLING PORTFOLIOS • | 313 |
Notes to Financial Statements
| AB Short Duration Bond Portfolio | ||||||||||||
Asset Derivatives | Liability Derivatives | |||||||||||
| Derivative Type | Statement of Assets and Liabilities Location | Fair Value | Statement of Assets and Liabilities Location | Fair Value | ||||||||
Interest rate contracts | Receivable/Payable for variation margin on exchange-traded derivatives | $ | 789,263 | * | Receivable/Payable for variation margin on exchange-traded derivatives | $ | 342,659 | * | ||||
|
|
|
| |||||||||
Total | $ | 789,263 | $ | 342,659 | ||||||||
|
|
|
| |||||||||
| * | Only variation margin receivable/payable at period end is reported within the statement of assets and liabilities. This amount reflects cumulative appreciation/(depreciation) of exchange-traded derivatives as reported in the portfolio of investments. |
The effect of derivative instruments on the statement of operations for the year ended August 31, 2015:
Derivative Type | Location of | Realized Gain or (Loss) on Derivatives | Change in Unrealized Appreciation or (Depreciation) | |||||||
Interest rate contracts | Net realized gain (loss) on futures; Net change in unrealized appreciation/depreciation of futures | $ | 576,608 | $ | 140,240 | |||||
Foreign exchange contracts | Net realized gain (loss) on foreign currency transactions; Net change in unrealized appreciation/depreciation of foreign currency denominated assets and liabilities | (75,872 | ) | 179,991 | ||||||
Interest rate contracts | Net realized gain (loss) on swaps; Net change in unrealized appreciation/depreciation of swaps | 75,414 | 128,873 | |||||||
Foreign exchange contracts | Net realized gain (loss) on swaps; Net change in unrealized appreciation/depreciation of swaps | 7,593 | (30,180 | ) | ||||||
|
|
|
| |||||||
Total | $ | 583,743 | $ | 418,924 | ||||||
|
|
|
| |||||||
| 314 | • AB POOLING PORTFOLIOS |
Notes to Financial Statements
| AB Global Core Bond Portfolio | ||||||||||||
Asset Derivatives | Liability Derivatives | |||||||||||
| Derivative Type | Statement of Assets and Liabilities Location | Fair Value | Statement of Assets and Liabilities Location | Fair Value | ||||||||
Interest rate contracts | Receivable/Payable for variation margin on exchange-traded derivatives | $ | 623,408 | * | Receivable/Payable for variation margin on exchange-traded derivatives | $ | 117,346 | * | ||||
Foreign exchange contracts | Unrealized appreciation on forward currency exchange contracts |
| 5,289,593 |
| Unrealized depreciation on forward currency exchange contracts |
| 4,950,234 |
| ||||
|
|
|
| |||||||||
Total | $ | 5,913,001 | $ | 5,067,580 | ||||||||
|
|
|
| |||||||||
| * | Only variation margin receivable/payable at period end is reported within the statement of assets and liabilities. This amount reflects cumulative appreciation/(depreciation) of exchange-traded derivatives as reported in the portfolio of investments. |
The effect of derivative instruments on the statement of operations for the year ended August 31, 2015:
Derivative Type | Location of | Realized Gain or (Loss) on Derivatives | Change in Unrealized Appreciation or (Depreciation) | |||||||
Interest rate contracts | Net realized gain (loss) on futures; Net change in unrealized appreciation/depreciation of futures | $ | (4,496,254 | ) | $ | 1,031,735 | ||||
Foreign exchange contracts | Net realized gain (loss) on foreign currency transactions; Net change in unrealized appreciation/depreciation of foreign currency denominated assets and liabilities | 9,017,495 | (2,656,358 | ) | ||||||
|
|
|
| |||||||
Total | $ | 4,521,241 | $ | (1,624,623 | ) | |||||
|
|
|
| |||||||
| AB POOLING PORTFOLIOS • | 315 |
Notes to Financial Statements
| AB Bond Inflation Protection Portfolio | ||||||||||||
Asset Derivatives | Liability Derivatives | |||||||||||
| Derivative Type | Statement of Assets and Liabilities Location | Fair Value | Statement of Assets and Liabilities Location | Fair Value | ||||||||
Interest rate contracts | Receivable/Payable for variation margin on exchange-traded derivatives | $ | 2,771,854 | * | Receivable/Payable for variation margin on exchange-traded derivatives | $ | 3,298,719 | * | ||||
Credit contracts | Receivable/Payable for variation margin on exchange-traded derivatives | 700,472 | * | |||||||||
Foreign exchange contracts | Unrealized appreciation on forward currency exchange contracts |
| 418,556 |
| Unrealized depreciation on forward currency exchange contracts |
| 264,497 |
| ||||
Interest rate contracts | Unrealized depreciation on interest rate swaps | 274,223 | ||||||||||
Interest rate contracts | Unrealized appreciation on inflation swaps |
| 172,829 |
| Unrealized depreciation on inflation swaps |
| 931,350 |
| ||||
Credit contracts | Unrealized appreciation on credit default swaps | 219,162 | Unrealized depreciation on credit default swaps | 19,307 | ||||||||
|
|
|
| |||||||||
Total | $ | 3,582,401 | $ | 5,488,568 | ||||||||
|
|
|
| |||||||||
| * | Only variation margin receivable/payable at period end is reported within the statement of assets and liabilities. This amount reflects cumulative appreciation/(depreciation) of exchange-traded derivatives as reported in the portfolio of investments. |
The effect of derivative instruments on the statement of operations for the year ended August 31, 2015:
Derivative Type | Location of | Realized Gain or (Loss) on Derivatives | Change in Unrealized Appreciation or (Depreciation) | |||||||
Interest rate contracts | Net realized gain (loss) on futures; Net change in unrealized appreciation/depreciation of futures | $ | (3,992,622 | ) | $ | 344,542 | ||||
| 316 | • AB POOLING PORTFOLIOS |
Notes to Financial Statements
Derivative Type | Location of | Realized Gain or (Loss) on Derivatives | Change in Unrealized Appreciation or (Depreciation) | |||||||
Foreign exchange contracts | Net realized gain (loss) on foreign currency transactions; Net change in unrealized appreciation/depreciation of foreign currency denominated assets and liabilities | $ | 1,378,325 |
| $ | 17,527 |
| |||
Interest rate contracts | Net realized gain (loss) on swaps; Net change in unrealized appreciation/depreciation of swaps | (1,399,072 | ) | (887,107 | ) | |||||
Credit contracts | Net realized gain (loss) on swaps; Net change in unrealized appreciation/depreciation of swaps | (278,726 | ) | 392,315 | ||||||
|
|
|
| |||||||
Total | $ | (4,292,095 | ) | $ | (132,723 | ) | ||||
|
|
|
| |||||||
| AB High-Yield Portfolio | ||||||||||||
Asset Derivatives | Liability Derivatives | |||||||||||
| Derivative Type | Statement of Assets and Liabilities Location | Fair Value | Statement of Assets and Liabilities Location | Fair Value | ||||||||
Interest rate contracts | Receivable/Payable for variation margin on exchange-traded derivatives | $ | 14,330 | * | ||||||||
Credit contracts | Receivable/Payable for variation margin on exchange-traded derivatives | 520,801 | * | Receivable/Payable for variation margin on exchange-traded derivatives | $ | 591,148 | * | |||||
Equity contracts | Receivable/Payable for variation margin on exchange-traded derivatives | 76,273 | * | |||||||||
Foreign exchange contracts | Unrealized appreciation on forward currency exchange contracts |
| 280,265 |
| Unrealized depreciation on forward currency exchange contracts |
| 289,123 |
| ||||
Credit contracts | Investments in securities, at value | 51,867 | ||||||||||
| AB POOLING PORTFOLIOS • | 317 |
Notes to Financial Statements
Asset Derivatives | Liability Derivatives | |||||||||||
| Derivative Type | Statement of Assets and Liabilities Location | Fair Value | Statement of Assets and Liabilities Location | Fair Value | ||||||||
Equity contracts | Investments in securities, at value | $ | 503,124 | |||||||||
Credit contracts | Swaptions written, at value | $ | 39,792 | |||||||||
Equity contracts | Options written, at value | 278,507 | ||||||||||
Credit contracts | Unrealized appreciation on credit default swaps | 1,628,107 | Unrealized depreciation on credit default swaps | 1,122,874 | ||||||||
Equity contracts | Unrealized appreciation on total return swaps | 42,925 | Unrealized depreciation on total return swaps | 544,491 | ||||||||
|
|
|
| |||||||||
Total | $ | 3,041,419 | $ | 2,942,208 | ||||||||
|
|
|
| |||||||||
| * | Only variation margin receivable/payable at period end is reported within the statement of assets and liabilities. This amount reflects cumulative appreciation/(depreciation) of exchange-traded derivatives as reported in the portfolio of investments. |
The effect of derivative instruments on the statement of operations for the year ended August 31, 2015:
Derivative Type | Location of Gain | Realized Gain or (Loss) on Derivatives | Change in Unrealized Appreciation or (Depreciation) | |||||||
Interest rate contracts | Net realized gain (loss) on futures; Net change in unrealized appreciation/depreciation of futures | $ | (287,429 | ) | $ | 32,166 | ||||
Equity contracts | Net realized gain (loss) on futures; Net change in unrealized appreciation/depreciation of futures | 123,551 | 6,434 | |||||||
Foreign exchange contracts | Net realized gain (loss) on foreign currency transactions; Net change in unrealized appreciation/depreciation of foreign currency denominated assets and liabilities | 695,297 | (150,419 | ) | ||||||
| 318 | • AB POOLING PORTFOLIOS |
Notes to Financial Statements
Derivative Type | Location of Gain | Realized Gain or (Loss) on Derivatives | Change in Unrealized Appreciation or (Depreciation) | |||||||
Interest rate contracts | Net realized gain (loss) on investment transactions; Net change in unrealized appreciation/depreciation of investments | $ | (1,015,553 | ) | $ | 198,106 | ||||
Foreign exchange contracts | Net realized gain (loss) on investment transactions; Net change in unrealized appreciation/depreciation of investments | (63,337 | ) | 43,982 | ||||||
Equity contracts | Net realized gain (loss) on investment transactions; Net change in unrealized appreciation/depreciation of investments | (1,082,150 | ) | (105,012 | ) | |||||
Interest rate contracts | Net realized gain (loss) on swaptions written; Net change in unrealized appreciation/depreciation of swaptions written | 667,030 | (152,048 | ) | ||||||
Foreign exchange contracts | Net realized gain (loss) on options written; Net change in unrealized appreciation/depreciation of options written | 60,176 | – 0 | – | ||||||
Equity contracts | Net realized gain (loss) on options written; Net change in unrealized appreciation/depreciation of options written | 306,634 | 214,048 | |||||||
Interest rate contracts | Net realized gain (loss) on swaps; Net change in unrealized appreciation/depreciation of swaps | – 0 | – | 14,330 | ||||||
Credit contracts | Net realized gain (loss) on swaps; Net change in unrealized appreciation/depreciation of swaps | (69,728 | ) | 1,017,733 | ||||||
| AB POOLING PORTFOLIOS • | 319 |
Notes to Financial Statements
| Derivative Type | Location of Gain or (Loss) on Derivatives | Realized Gain or (Loss) on Derivatives | Change in Unrealized Appreciation or (Depreciation) | |||||||
Equity contracts | Net realized gain (loss) on swaps; Net change in unrealized appreciation/depreciation of swaps | 265,330 | (583,041 | ) | ||||||
|
|
|
| |||||||
Total | $ | (400,179 | ) | $ | 536,279 | |||||
|
|
|
| |||||||
| AB Multi-Asset Real Return Portfolio** | ||||||||||||
Asset Derivatives | Liability Derivatives | |||||||||||
| Derivative Type | Statement of Assets and Liabilities Location | Fair Value | Statement of Assets and Liabilities Location | Fair Value | ||||||||
Commodity contracts | Receivable/Payable for variation margin on exchange-traded derivatives | $ | 978,396 | * | Receivable/Payable for variation margin on exchange-traded derivatives | $ | 20,166,637 | * | ||||
Foreign exchange contracts | Unrealized appreciation on forward currency exchange contracts |
| 5,753,945 |
| Unrealized depreciation on forward currency exchange contracts |
| 4,760,627 |
| ||||
Equity contracts | Options written, at value | 1,573,867 | ||||||||||
Interest rate contracts | Unrealized appreciation on inflation swaps |
| 1,012,574 |
| Unrealized depreciation on inflation swaps |
| 97,323 |
| ||||
Equity contracts | Unrealized appreciation on total return swaps | 5,418,791 | Unrealized depreciation on total return swaps | 3,885,532 | ||||||||
|
|
|
| |||||||||
Total | $ | 13,163,706 | $ | 30,483,986 | ||||||||
|
|
|
| |||||||||
| * | Only variation margin receivable/payable at period end is reported within the consolidated statement of assets and liabilities. This amount reflects cumulative appreciation/(depreciation) of exchange-traded derivatives as reported in the consolidated portfolio of investments. |
| ** | Consolidated (see Note A). |
| 320 | • AB POOLING PORTFOLIOS |
Notes to Financial Statements
The effect of derivative instruments on the consolidated statement of operations for the year ended August 31, 2015:
Derivative Type | Location of | Realized Gain or (Loss) on Derivatives | Change in Unrealized Appreciation or (Depreciation) | |||||||
Equity contracts | Net realized gain (loss) on futures; Net change in unrealized appreciation/depreciation of futures | $ | (5,990,406 | ) | $ | 2,307,670 | ||||
Commodity contracts | Net realized gain (loss) on futures; Net change in unrealized appreciation/depreciation of futures | (7,132,080 | ) | (18,671,307 | ) | |||||
Foreign exchange contracts | Net realized gain (loss) on foreign currency transactions; Net change in unrealized appreciation/depreciation of foreign currency denominated assets and liabilities | 12,078,727 | (582,657 | ) | ||||||
Equity contracts | Net realized gain (loss) on investment transactions; Net change in unrealized appreciation/depreciation of investments | 3,779,812 | 1,132,854 | |||||||
Commodity contracts | Net realized gain (loss) on investment transactions; Net change in unrealized appreciation/depreciation of investments | 509,184 | – 0 | – | ||||||
Equity contracts | Net realized gain (loss) on options written; Net change in unrealized appreciation/depreciation of options written | (7,642,889 | ) | 1,744,065 | ||||||
Commodity contracts | Net realized gain (loss) on options written; Net change in unrealized appreciation/depreciation of options written | (339,415 | ) | – 0 | – | |||||
| AB POOLING PORTFOLIOS • | 321 |
Notes to Financial Statements
Derivative Type | Location of | Realized Gain or (Loss) on Derivatives | Change in Unrealized Appreciation or (Depreciation) | |||||||
Interest rate contracts | Net realized gain (loss) on swaps; Net change in unrealized appreciation/depreciation of swaps | $ | (18,127,515 | ) | $ | 1,382,992 | ||||
Equity contracts | Net realized gain (loss) on swaps; Net change in unrealized appreciation/depreciation of swaps | (93,465,804 | ) | 37,328 | ||||||
|
|
|
| |||||||
Total | $ | (116,330,386 | ) | $ | (12,649,055 | ) | ||||
|
|
|
| |||||||
| AB Volatility Management Portfolio | ||||||||||||
Asset Derivatives | Liability Derivatives | |||||||||||
| Derivative Type | Statement of Assets and Liabilities Location | Fair Value | Statement of Assets and Liabilities Location | Fair Value | ||||||||
Equity contracts | Receivable/Payable for variation margin on exchange-traded derivatives | $ | 1,072,245 | * | Receivable/Payable for variation margin on exchange-traded derivatives | $ | 13,636,357 | * | ||||
Foreign exchange contracts | Unrealized appreciation on forward currency exchange contracts |
| 6,635,009 |
| Unrealized depreciation on forward currency exchange contracts |
| 4,553,901 |
| ||||
Equity contracts | Unrealized depreciation on total return swaps | 6,111,122 | ||||||||||
|
|
|
| |||||||||
Total | $ | 7,707,254 | $ | 24,301,380 | ||||||||
|
|
|
| |||||||||
| * | Only variation margin receivable/payable at period end is reported within the statement of assets and liabilities. This amount reflects cumulative appreciation/(depreciation) of exchange-traded derivatives as reported in the portfolio of investments. |
The effect of derivative instruments on the statement of operations for the year ended August 31, 2015:
Derivative Type | Location of | Realized Gain or (Loss) on Derivatives | Change in Unrealized Appreciation or (Depreciation) | |||||||
Equity contracts | Net realized gain (loss) on futures; Net change in unrealized appreciation/depreciation of futures | $ | 9,562,623 | $ | (14,822,258 | ) | ||||
| 322 | • AB POOLING PORTFOLIOS |
Notes to Financial Statements
Derivative Type | Location of | Realized Gain or (Loss) on Derivatives | Change in Unrealized Appreciation or (Depreciation) | |||||||
Foreign exchange contracts | Net realized gain (loss) on foreign currency transactions; Net change in unrealized appreciation/depreciation of foreign currency denominated assets and liabilities | $ | 7,173,806 | $ | 1,936,621 | |||||
Equity contracts | Net realized gain (loss) on swaps; Net change in unrealized appreciation/depreciation of swaps | 10,223,358 | (10,718,188 | ) | ||||||
|
|
|
| |||||||
Total | $ | 26,959,787 | $ | (23,603,825 | ) | |||||
|
|
|
| |||||||
The following tables represent the average monthly volume of the Portfolio’s derivative transactions during the year ended August 31, 2015:
| AB International Value Portfolio | ||||
Futures: | ||||
Average original value of buy contracts | $ | 2,546,666 | ||
Forward Currency Exchange Contracts: | ||||
Average principal amount of buy contracts | $ | 122,565,709 | ||
Average principal amount of sale contracts | $ | 147,782,575 | ||
| AB International Growth Portfolio | ||||
Forward Currency Exchange Contracts: | ||||
Average principal amount of buy contracts | $ | 76,713,116 | ||
Average principal amount of sale contracts | $ | 105,110,695 | ||
| AB Short Duration Bond Portfolio | ||||
Futures: | ||||
Average original value of buy contracts | $ | 265,750,969 | ||
Average original value of sale contracts | $ | 56,933,008 | ||
Forward Currency Exchange Contracts: | ||||
Average principal amount of buy contracts | $ | 2,313,973 | (a) | |
Average principal amount of sale contracts | $ | 3,941,169 | (b) | |
Centrally Cleared Interest Rate Swaps: | ||||
Average notional amount | $ | 8,347,080 | ||
Cross Currency Swaps: | ||||
Average notional amount | $ | 1,309,680 | (c) | |
(a) Positions were open for eight months during the year. | ||||
(b) Positions were open for eleven months during the year. | ||||
(c) Positions were open for five months during the year. | ||||
| AB POOLING PORTFOLIOS • | 323 |
Notes to Financial Statements
| AB Global Core Bond Portfolio | ||||
Futures: | ||||
Average original value of sale contracts | $ | 105,998,680 | ||
Forward Currency Exchange Contracts: | ||||
Average principal amount of buy contracts | $ | 52,097,069 | ||
Average principal amount of sale contracts | $ | 541,645,460 | ||
| AB Bond Inflation Protection Portfolio | ||||
Futures: | ||||
Average original value of buy contracts | $ | 11,503,032 | ||
Average original value of sale contracts | $ | 180,587,799 | ||
Forward Currency Exchange Contracts: | ||||
Average principal amount of buy contracts | $ | 11,220,152 | ||
Average principal amount of sale contracts | $ | 45,385,753 | ||
Interest Rate Swaps: | ||||
Average notional amount | $ | 31,934,636 | ||
Inflation Swaps: | ||||
Average notional amount | $ | 61,790,769 | ||
Centrally Cleared Interest Rate Swaps: | ||||
Average notional amount | $ | 206,725,706 | ||
Credit Default Swaps: | ||||
Average notional amount of buy contracts | $ | 2,770,000 | (a) | |
Average notional amount of sale contracts | $ | 5,529,913 | ||
Centrally Cleared Credit Default Swaps: | ||||
Average notional amount of buy contracts | $ | 45,148,135 | ||
(a) Positions were open for three months during the year. | ||||
| AB High-Yield Portfolio | ||||
Futures: | ||||
Average original value of buy contracts | $ | 2,185,716 | ||
Average original value of sale contracts | $ | 13,550,878 | ||
Forward Currency Exchange Contracts: | ||||
Average principal amount of buy contracts | $ | 6,751,543 | ||
Average principal amount of sale contracts | $ | 38,786,238 | ||
Purchased Options: | ||||
Average monthly cost | $ | 730,164 | ||
Centrally Cleared Interest Rate Swaps: | ||||
Average notional amount | $ | 17,030,000 | (a) | |
Credit Default Swaps: | ||||
Average notional amount of buy contracts | $ | 40,292,197 | ||
Average notional amount of sale contracts | $ | 19,943,799 | ||
Centrally Cleared Credit Default Swaps: | ||||
Average notional amount of buy contracts | $ | 34,439,760 | ||
Average notional amount of sale contracts | $ | 11,827,243 | ||
Total Return Swaps: | ||||
Average notional amount | $ | 14,402,269 | ||
(a) Positions were open for one month during the year. | ||||
| 324 | • AB POOLING PORTFOLIOS |
Notes to Financial Statements
| AB Multi-Asset Real Return Portfolio* | ||||
Futures: | ||||
Average original value of buy contracts | $ | 121,950,102 | ||
Average original value of sale contracts | $ | 72,967,404 | ||
Forward Currency Exchange Contracts: | ||||
Average principal amount of buy contracts | $ | 76,168,848 | ||
Average principal amount of sale contracts | $ | 168,959,320 | ||
Purchased Options: | ||||
Average monthly cost | $ | 2,152,290 | (a) | |
Interest Rate Swaps: | ||||
Average notional amount | $ | 6,040,000 | (b) | |
Inflation Swaps: | ||||
Average notional amount | $ | 477,943,692 | ||
Total Return Swaps: | ||||
Average notional amount | $ | 299,112,719 | ||
* Consolidated (see Note A). | ||||
(a) Positions were open for six months during the year. | ||||
(b) Positions were open for eleven months during the year. | ||||
| AB Volatility Management Portfolio | ||||
Futures: | ||||
Average original value of buy contracts | $ | 255,818,314 | ||
Average original value of sale contracts | $ | 132,083,155 | (a) | |
Forward Currency Exchange Contracts: | ||||
Average principal amount of buy contracts | $ | 131,147,107 | ||
Average principal amount of sale contracts | $ | 162,149,254 | ||
Total Return Swaps: | ||||
Average notional amount | $ | 162,785,109 | ||
(a) Positions were open for seven months during the year. | ||||
For financial reporting purposes, the Portfolios do not offset derivative assets and derivative liabilities that are subject to netting arrangements in the statement of assets and liabilities.
All derivatives held at period end were subject to netting arrangements. The following tables present the Portfolios’ derivative assets and liabilities by
| AB POOLING PORTFOLIOS • | 325 |
Notes to Financial Statements
counterparty net of amounts available for offset under Master Agreements (“MA”) and net of the related collateral received/ pledged by the Portfolios as of August 31, 2015:
| AB International Value | ||||||||||||||||||||
| Counterparty | Derivative Assets Subject to a MA | Derivative Available for Offset | Cash Collateral Received | Security Collateral Received | Net Amount of Derivatives Assets | |||||||||||||||
OTC Derivatives: |
| |||||||||||||||||||
Barclays Bank PLC | $ | 72,354 | $ | – 0 | – | $ | – 0 | – | $ | – 0 | – | $ | 72,354 | |||||||
Citibank | 164,006 | (156,043 | ) | – 0 | – | – 0 | – | 7,963 | ||||||||||||
Credit Suisse International | 7,168 | – 0 | – | – 0 | – | – 0 | – | 7,168 | ||||||||||||
Goldman Sachs Bank USA | 209,424 | (166,746 | ) | – 0 | – | – 0 | – | 42,678 | ||||||||||||
HSBC Bank USA | 102,135 | – 0 | – | – 0 | – | – 0 | – | 102,135 | ||||||||||||
Morgan Stanley & Co., Inc. | 53,207 | (12,358 | ) | – 0 | – | – 0 | – | 40,849 | ||||||||||||
Royal Bank of Scotland PLC | 7,785 | (7,785 | ) | – 0 | – | – 0 | – | – 0 | – | |||||||||||
Standard Chartered Bank | 215,385 | (215,385 | ) | – 0 | – | – 0 | – | – 0 | – | |||||||||||
State Street Bank & Trust Co. | 379,939 | (184,178 | ) | – 0 | – | – 0 | – | 195,761 | ||||||||||||
UBS AG | 371,977 | – 0 | – | – 0 | – | – 0 | – | 371,977 | ||||||||||||
|
|
|
|
|
|
|
|
|
| |||||||||||
Total | $ | 1,583,380 | $ | (742,495 | ) | $ | – 0 | – | $ | – 0 | – | $ | 840,885 | ^ | ||||||
|
|
|
|
|
|
|
|
|
| |||||||||||
| Counterparty | Derivative Liabilities Subject to a MA | Derivative Available for Offset | Cash Collateral Pledged* | Security Collateral Pledged | Net Amount of Derivatives Liabilities | |||||||||||||||
Exchange-Traded Derivatives: |
| |||||||||||||||||||
Goldman Sachs & Co.** | $ | 7,796 | $ | – 0 | – | $ | (7,796 | ) | $ | – 0 | – | $ | – 0 | – | ||||||
|
|
|
|
|
|
|
|
|
| |||||||||||
Total | $ | 7,796 | $ | – 0 | – | $ | (7,796 | ) | $ | – 0 | – | $ | – 0 | – | ||||||
|
|
|
|
|
|
|
|
|
| |||||||||||
OTC Derivatives: | ||||||||||||||||||||
Citibank | $ | 156,043 | $ | (156,043 | ) | $ | – 0 | – | $ | – 0 | – | $ | – 0 | – | ||||||
Deutsche Bank AG | 90 | – 0 | – | – 0 | – | – 0 | – | 90 | ||||||||||||
Goldman Sachs Bank USA | 166,746 | (166,746 | ) | – 0 | – | – 0 | – | – 0 | – | |||||||||||
Morgan Stanley & Co., Inc. | 12,358 | (12,358 | ) | – 0 | – | – 0 | – | – 0 | – | |||||||||||
Royal Bank of Scotland PLC | 135,332 | (7,785 | ) | – 0 | – | – 0 | – | 127,547 | ||||||||||||
Standard Chartered Bank | 424,132 | (215,385 | ) | – 0 | – | – 0 | – | 208,747 | ||||||||||||
State Street Bank & Trust Co. | 184,178 | (184,178 | ) | – 0 | – | – 0 | – | – 0 | – | |||||||||||
|
|
|
|
|
|
|
|
|
| |||||||||||
Total | $ | 1,078,879 | $ | (742,495 | ) | $ | – 0 | – | $ | – 0 | – | $ | 336,384 | ^ | ||||||
|
|
|
|
|
|
|
|
|
| |||||||||||
| * | The actual collateral received/pledged may be more than the amount reported due to overcollateralization. |
| 326 | • AB POOLING PORTFOLIOS |
Notes to Financial Statements
| ** | Cash has been posted for initial margin requirements for exchange traded derivatives outstanding at August 31, 2015. |
| ^ | Net amount represents the net receivable/payable that would be due from/to the counterparty in the event of default or termination. The net amount from OTC financial derivative instruments can only be netted across transactions governed under the same master agreement with the same counterparty. |
| AB International Growth | ||||||||||||||||||||
| Counterparty | Derivative Assets Subject to a MA | Derivative Available for Offset | Cash Collateral Received | Security Collateral Received | Net Amount of Derivatives Assets | |||||||||||||||
OTC Derivatives: | ||||||||||||||||||||
Barclays Bank PLC | $ | 308,538 | $ | – 0 | – | $ | – 0 | – | $ | – 0 | – | $ | 308,538 | |||||||
BNP Paribas SA | 154,010 | (18,755 | ) | – 0 | – | – 0 | – | 135,255 | ||||||||||||
Deutsche Bank AG | 84,351 | – 0 | – | – 0 | – | – 0 | – | 84,351 | ||||||||||||
Morgan Stanley & Co., Inc. | 186,552 | – 0 | – | – 0 | – | – 0 | – | 186,552 | ||||||||||||
Standard Chartered Bank | 1,746 | (1,746 | ) | – 0 | – | – 0 | – | – 0 | – | |||||||||||
State Street Bank & Trust Co. | 135,085 | (23,296 | ) | – 0 | – | – 0 | – | 111,789 | ||||||||||||
UBS AG | 214,425 | (214,425 | ) | – 0 | – | – 0 | – | – 0 | – | |||||||||||
|
|
|
|
|
|
|
|
|
| |||||||||||
Total | $ | 1,084,707 | $ | (258,222 | ) | $ | – 0 | – | $ | – 0 | – | $ | 826,485 | ^ | ||||||
|
|
|
|
|
|
|
|
|
| |||||||||||
| Counterparty | Derivative Liabilities Subject to a MA | Derivative Available for Offset | Cash Collateral Pledged | Security Collateral Pledged | Net Amount of Derivatives Liabilities | |||||||||||||||
OTC Derivatives: | ||||||||||||||||||||
BNP Paribas SA | $ | 18,755 | $ | (18,755 | ) | $ | – 0 | – | $ | – 0 | – | $ | – 0 | – | ||||||
Royal Bank of Scotland PLC | 618,809 | – 0 | – | – 0 | – | – 0 | – | 618,809 | ||||||||||||
Standard Chartered Bank | 1,930,927 | (1,746 | ) | – 0 | – | – 0 | – | 1,929,181 | ||||||||||||
State Street Bank & Trust Co. | 23,296 | (23,296 | ) | – 0 | – | – 0 | – | – 0 | – | |||||||||||
UBS AG | 245,184 | (214,425 | ) | – 0 | – | – 0 | – | 30,759 | ||||||||||||
|
|
|
|
|
|
|
|
|
| |||||||||||
Total | $ | 2,836,971 | $ | (258,222 | ) | $ | – 0 | – | $ | – 0 | – | $ | 2,578,749 | ^ | ||||||
|
|
|
|
|
|
|
|
|
| |||||||||||
| ^ | Net amount represents the net receivable/payable that would be due from/to the counterparty in the event of default or termination. The net amount from OTC financial derivative instruments can only be netted across transactions governed under the same master agreement with the same counterparty. |
| AB Short Duration Bond | ||||||||||||||||||||
| Counterparty | Derivative Assets Subject to a MA | Derivative Available for Offset | Cash Collateral Received | Security Collateral Received | Net Amount of Derivatives Assets | |||||||||||||||
Exchange-Traded Derivatives: |
| |||||||||||||||||||
Morgan Stanley & Co., LLC** | $ | 5,955 | $ | (5,955 | ) | $ | – 0 | – | $ | – 0 | – | $ | – 0 | – | ||||||
|
|
|
|
|
|
|
|
|
| |||||||||||
Total | $ | 5,955 | $ | (5,955 | ) | $ | – 0 | – | $ | – 0 | – | $ | – 0 | – | ||||||
|
|
|
|
|
|
|
|
|
| |||||||||||
| AB POOLING PORTFOLIOS • | 327 |
Notes to Financial Statements
| Counterparty | Derivative Liabilities Subject to a MA | Derivative Available for Offset | Cash Collateral Pledged* | Security Collateral Pledged | Net Amount of Derivatives Liabilities | |||||||||||||||
Exchange-Traded Derivatives: |
| |||||||||||||||||||
Morgan Stanley & Co., LLC** | $ | 54,523 | $ | (5,955 | ) | $ | (48,568 | ) | $ | – 0 | – | $ | – 0 | – | ||||||
|
|
|
|
|
|
|
|
|
| |||||||||||
Total | $ | 54,523 | $ | (5,955 | ) | $ | (48,568 | ) | $ | – 0 | – | $ | – 0 | – | ||||||
|
|
|
|
|
|
|
|
|
| |||||||||||
| * | The actual collateral received/pledged may be more than the amount reported due to overcollateralization. |
| ** | Cash has been posted for initial margin requirements for exchange traded derivatives outstanding at August 31, 2015. |
| AB Global Core Bond | ||||||||||||||||||||
| Counterparty | Derivative Assets Subject to a MA | Derivative Available for Offset | Cash Collateral Received | Security Collateral Received | Net Amount of Derivatives Assets | |||||||||||||||
Exchange-Traded Derivatives: |
| |||||||||||||||||||
Morgan Stanley & Co., LLC** | $ | 346,883 | $ | – 0 | – | $ | – 0 | – | $ | – 0 | – | $ | 346,883 | |||||||
|
|
|
|
|
|
|
|
|
| |||||||||||
Total | $ | 346,883 | $ | – 0 | – | $ | – 0 | – | $ | – 0 | – | $ | 346,883 | |||||||
|
|
|
|
|
|
|
|
|
| |||||||||||
OTC Derivatives: |
| |||||||||||||||||||
Barclays Bank PLC | $ | 319,658 | $ | – 0 | – | $ | – 0 | – | $ | – 0 | – | $ | 319,658 | |||||||
BNP Paribas SA | 1,468,042 | (13,257 | ) | – 0 | – | – 0 | – | 1,454,785 | ||||||||||||
Citibank | 204,309 | (204,309 | ) | – 0 | – | – 0 | – | – 0 | – | |||||||||||
Credit Suisse International | 158,349 | (35,919 | ) | – 0 | – | – 0 | – | 122,430 | ||||||||||||
Goldman Sachs Bank USA | 2,235,545 | (313,529 | ) | – 0 | – | – 0 | – | 1,922,016 | ||||||||||||
Morgan Stanley & Co., Inc. | 24,215 | (4,275 | ) | – 0 | – | – 0 | – | 19,940 | ||||||||||||
Northern Trust Co. | 24,371 | – 0 | – | – 0 | – | – 0 | – | 24,371 | ||||||||||||
Royal Bank of Scotland PLC | 325,278 | (325,278 | ) | – 0 | – | – 0 | – | – 0 | – | |||||||||||
Standard Chartered Bank | 455,345 | (217,803 | ) | – 0 | – | – 0 | – | 237,542 | ||||||||||||
State Street Bank & Trust Co. | 17,088 | (17,088 | ) | – 0 | – | – 0 | – | – 0 | – | |||||||||||
UBS AG | 57,393 | (57,393 | ) | – 0 | – | – 0 | – | – 0 | – | |||||||||||
|
|
|
|
|
|
|
|
|
| |||||||||||
Total | $ | 5,289,593 | $ | (1,188,851 | ) | $ | – 0 | – | $ | – 0 | – | $ | 4,100,742 | ^ | ||||||
|
|
|
|
|
|
|
|
|
| |||||||||||
| 328 | • AB POOLING PORTFOLIOS |
Notes to Financial Statements
| Counterparty | Derivative Liabilities Subject to a MA | Derivative Available for Offset | Cash Collateral Pledged | Security Collateral Pledged | Net Amount of Derivatives Liabilities | |||||||||||||||
OTC Derivatives: |
| |||||||||||||||||||
BNP Paribas SA | $ | 13,257 | $ | (13,257 | ) | $ | – 0 | – | $ | – 0 | – | $ | – 0 | – | ||||||
Citibank | 801,801 | (204,309 | ) | – 0 | – | – 0 | – | 597,492 | ||||||||||||
Credit Suisse International | 35,919 | (35,919 | ) | – 0 | – | – 0 | – | – 0 | – | |||||||||||
Goldman Sachs Bank USA | 313,529 | (313,529 | ) | – 0 | – | – 0 | – | – 0 | – | |||||||||||
HSBC Bank USA | 48,549 | – 0 | – | – 0 | – | – 0 | – | 48,549 | ||||||||||||
Morgan Stanley & Co., Inc. | 4,275 | (4,275 | ) | – 0 | – | – 0 | – | – 0 | – | |||||||||||
Royal Bank of Scotland PLC | 3,395,931 | (325,278 | ) | – 0 | – | – 0 | – | 3,070,653 | ||||||||||||
Standard Chartered Bank | 217,803 | (217,803 | ) | – 0 | – | – 0 | – | – 0 | – | |||||||||||
State Street Bank & Trust Co. | 43,359 | (17,088 | ) | – 0 | – | – 0 | – | 26,271 | ||||||||||||
UBS AG | 75,811 | (57,393 | ) | – 0 | – | – 0 | – | 18,418 | ||||||||||||
|
|
|
|
|
|
|
|
|
| |||||||||||
Total | $ | 4,950,234 | $ | (1,188,851 | ) | $ | – 0 | – | $ | – 0 | – | $ | 3,761,383 | ^ | ||||||
|
|
|
|
|
|
|
|
|
| |||||||||||
| ** | Cash has been posted for initial margin requirements for exchange traded derivatives outstanding at August 31, 2015. |
| ^ | Net amount represents the net receivable/payable that would be due from/to the counterparty in the event of default or termination. The net amount from OTC financial derivative instruments can only be netted across transactions governed under the same master agreement with the same counterparty. |
| AB Bond Inflation Protection | ||||||||||||||||||||
| Counterparty | Derivative Assets Subject to a MA | Derivative Available for Offset | Cash Collateral Received | Security Collateral Received | Net Amount of Derivatives Assets | |||||||||||||||
Exchange-Traded Derivatives: |
| |||||||||||||||||||
Morgan Stanley & Co., LLC ** | $ | 138,479 | $ | – 0 | – | $ | – 0 | – | $ | – 0 | – | $ | 138,479 | |||||||
|
|
|
|
|
|
|
|
|
| |||||||||||
Total | $ | 138,479 | $ | – 0 | – | $ | – 0 | – | $ | – 0 | – | $ | 138,479 | |||||||
|
|
|
|
|
|
|
|
|
| |||||||||||
OTC Derivatives: |
| |||||||||||||||||||
Bank of America, NA | $ | 100,316 | $ | (100,316 | ) | $ | – 0 | – | $ | – 0 | – | $ | – 0 | – | ||||||
Barclays Bank PLC | 172,829 | (90,283 | ) | – 0 | – | – 0 | – | 82,546 | ||||||||||||
Citibank, NA | 130,936 | (130,936 | ) | – 0 | – | – 0 | – | – 0 | – | |||||||||||
Credit Suisse International | 30,140 | – 0 | – | – 0 | – | – 0 | – | 30,140 | ||||||||||||
Deutsche Bank AG | 31,655 | (31,655 | ) | – 0 | – | – 0 | – | – 0 | – | |||||||||||
Goldman Sachs Bank USA | 179,149 | – 0 | – | – 0 | – | – 0 | – | 179,149 | ||||||||||||
HSBC Bank USA | 155,925 | – 0 | – | – 0 | – | – 0 | – | 155,925 | ||||||||||||
UBS AG | 51,827 | – 0 | – | – 0 | – | – 0 | – | 51,827 | ||||||||||||
|
|
|
|
|
|
|
|
|
| |||||||||||
Total | $ | 852,777 | $ | (353,190 | ) | $ | – 0 | – | $ | – 0 | – | $ | 499,587 | ^ | ||||||
|
|
|
|
|
|
|
|
|
| |||||||||||
| AB POOLING PORTFOLIOS • | 329 |
Notes to Financial Statements
| Counterparty | Derivative Liabilities Subject to a MA | Derivative Available for Offset | Cash Collateral Pledged | Security Collateral Pledged* | Net Amount of Derivatives Liabilities | |||||||||||||||
OTC Derivatives: |
| |||||||||||||||||||
Bank of America, NA | $ | 203,407 | $ | (100,316 | ) | $ | – 0 | – | $ | – 0 | – | $ | 103,091 | |||||||
Barclays Bank PLC | 90,283 | (90,283 | ) | – 0 | – | – 0 | – | – 0 | – | |||||||||||
Citibank, NA | 290,919 | (130,936 | ) | – 0 | – | (159,983 | ) | – 0 | – | |||||||||||
Deutsche Bank AG | 77,646 | (31,655 | ) | – 0 | – | – 0 | – | 45,991 | ||||||||||||
JPMorgan Chase Bank, NA | 247,399 | – 0 | – | – 0 | – | (49,857 | ) | 197,542 | ||||||||||||
Morgan Stanley & Co., Inc./ Morgan Stanley Capital Services LLC | 677,942 | – 0 | – | – 0 | – | (498,278 | ) | 179,664 | ||||||||||||
State Street Bank & Trust Co. | 4,955 | – 0 | – | – 0 | – | – 0 | – | 4,955 | ||||||||||||
|
|
|
|
|
|
|
|
|
| |||||||||||
Total | $ | 1,592,551 | $ | (353,190 | ) | $ | – 0 | – | $ | (708,118 | ) | $ | 531,243 | ^ | ||||||
|
|
|
|
|
|
|
|
|
| |||||||||||
| * | The actual collateral received/pledged may be more than the amount reported due to overcollateralization. |
| ** | Cash has been posted for initial margin requirements for exchange traded derivatives outstanding at August 31, 2015. |
| ^ | Net amount represents the net receivable/payable that would be due from/to the counterparty in the event of default or termination. The net amount from OTC financial derivative instruments can only be netted across transactions governed under the same master agreement with the same counterparty. |
| AB High-Yield Portfolio | ||||||||||||||||||||
| Counterparty | Derivative Assets Subject to a MA | Derivative Available for Offset | Cash Collateral Received | Security Collateral Received* | Net Amount of Derivatives Assets | |||||||||||||||
Exchange-Traded Derivatives: |
| |||||||||||||||||||
Bank Of America, NA | $ | 41,359 | $ | (39,792 | ) | $ | – 0 | – | $ | – 0 | – | $ | 1,567 | |||||||
Citi Bank, NA | 10,508 | – 0 | – | – 0 | – | – 0 | – | 10,508 | ||||||||||||
Goldman Sachs & Co** | 4,025 | – 0 | – | – 0 | – | – 0 | – | 4,025 | ||||||||||||
Morgan Stanley & Co., LLC** | 528,663 | (278,507 | ) | – 0 | – | – 0 | – | 250,156 | ||||||||||||
|
|
|
|
|
|
|
|
|
| |||||||||||
Total | $ | 584,555 | $ | (318,299 | ) | $ | – 0 | – | $ | – 0 | – | $ | 266,256 | |||||||
|
|
|
|
|
|
|
|
|
| |||||||||||
OTC Derivatives: |
| |||||||||||||||||||
Barclays Bank PLC | $ | 389,242 | $ | (389,242 | ) | $ | – 0 | – | $ | – 0 | – | $ | – 0 | – | ||||||
BNP Paribas SA | 44,784 | (5,565 | ) | – 0 | – | – 0 | – | 39,219 | ||||||||||||
Citibank, NA | 1,321,641 | (167,372 | ) | – 0 | – | (1,154,269 | ) | – 0 | – | |||||||||||
Credit Suisse International | 34,752 | (26,223 | ) | – 0 | – | – 0 | – | 8,529 | ||||||||||||
Deutsche Bank AG | 71,767 | – 0 | – | – 0 | – | – 0 | – | 71,767 | ||||||||||||
Goldman Sachs Bank USA/ Goldman Sachs International | 515,480 | (515,480 | ) | – 0 | – | – 0 | – | – 0 | – | |||||||||||
| 330 | • AB POOLING PORTFOLIOS |
Notes to Financial Statements
| Counterparty | Derivative Assets Subject to a MA | Derivative Available for Offset | Cash Collateral Received | Security Collateral Received* | Net Amount of Derivatives Assets | |||||||||||||||
Morgan Stanley Capital Services LLC | $ | 40,821 | $ | (40,821 | ) | $ | – 0 | – | $ | – 0 | – | $ | – 0 | – | ||||||
Northern Trust Company | 38,817 | – 0 | – | – 0 | – | – 0 | – | 38,817 | ||||||||||||
Royal Bank of Scotland PLC | 14,017 | (14,017 | ) | – 0 | – | – 0 | – | – 0 | – | |||||||||||
State Street Bank & Trust Co. | 10,233 | (8,044 | ) | – 0 | – | – 0 | – | 2,189 | ||||||||||||
UBS AG | 127,296 | (1,739 | ) | – 0 | – | – 0 | – | 125,557 | ||||||||||||
|
|
|
|
|
|
|
|
|
| |||||||||||
Total | $ | 2,608,850 | $ | (1,168,503 | ) | $ | – 0 | – | $ | (1,154,269 | ) | $ | 286,078 | ^ | ||||||
|
|
|
|
|
|
|
|
|
| |||||||||||
| Counterparty | Derivative Liabilities Subject to a MA | Derivative Available for Offset | Cash Collateral Pledged | Security Collateral Pledged | Net Amount of Derivatives Liabilities | |||||||||||||||
Exchange-Traded Derivatives: |
| |||||||||||||||||||
Bank Of America, NA | $ | 39,792 | $ | (39,792 | ) | $ | – 0 | – | $ | – 0 | – | $ | – 0 | – | ||||||
Morgan Stanley & Co., LLC | 278,507 | (278,507 | ) | – 0 | – | – 0 | – | – 0 | – | |||||||||||
|
|
|
|
|
|
|
|
|
| |||||||||||
Total | $ | 318,299 | $ | (318,299 | ) | $ | – 0 | – | $ | – 0 | – | $ | – 0 | – | ||||||
|
|
|
|
|
|
|
|
|
| |||||||||||
OTC Derivatives: |
| |||||||||||||||||||
Bank of America, NA | $ | 198,017 | $ | – 0 | – | $ | – 0 | – | $ | (156,178 | ) | $ | 41,839 | |||||||
Barclays Bank PLC | 519,875 | (389,242 | ) | – 0 | – | – 0 | – | 130,633 | ||||||||||||
BNP Paribas SA | 5,565 | (5,565 | ) | – 0 | – | – 0 | – | – 0 | – | |||||||||||
Citibank, NA | 167,372 | (167,372 | ) | – 0 | – | – 0 | – | – 0 | – | |||||||||||
Credit Suisse International | 26,223 | (26,223 | ) | – 0 | – | – 0 | – | – 0 | – | |||||||||||
Goldman Sachs Bank USA/ Goldman Sachs International | 772,456 | (515,480 | ) | – 0 | – | – 0 | – | 256,976 | ||||||||||||
JPMorgan Chase Bank, NA | 95,555 | – 0 | – | – 0 | – | – 0 | – | 95,555 | ||||||||||||
Morgan Stanley Capital Services LLC | 478,205 | (40,821 | ) | – 0 | – | (257,069 | ) | 180,315 | ||||||||||||
Royal Bank of Scotland PLC | 243,186 | (14,017 | ) | – 0 | – | – 0 | – | 229,169 | ||||||||||||
State Street Bank & Trust Co. | 8,044 | (8,044 | ) | – 0 | – | – 0 | – | – 0 | – | |||||||||||
UBS AG | 1,739 | (1,739 | ) | – 0 | – | – 0 | – | – 0 | – | |||||||||||
|
|
|
|
|
|
|
|
|
| |||||||||||
Total | $ | 2,516,237 | $ | (1,168,503 | ) | $ | – 0 | – | $ | (413,247 | ) | $ | 934,487 | ^ | ||||||
|
|
|
|
|
|
|
|
|
| |||||||||||
| * | The actual collateral received/pledged may be more than the amount reported due to overcollateralization. |
| AB POOLING PORTFOLIOS • | 331 |
Notes to Financial Statements
| ** | Cash has been posted for initial margin requirements for exchange traded derivatives outstanding at August 31, 2015. |
| ^ | Net amount represents the net receivable/payable that would be due from/to the counterparty in the event of default or termination. The net amount from OTC financial derivative instruments can only be netted across transactions governed under the same master agreement with the same counterparty. |
| AB Multi-Asset Real Return Portfolio | ||||||||||||||||||||
| Counterparty | Derivative Assets Subject to a MA | Derivative Available for Offset | Cash Collateral Received | Security Collateral Received | Net Amount of Derivatives Assets | |||||||||||||||
OTC Derivatives: |
| |||||||||||||||||||
Barclays Bank PLC | $ | 733,517 | $ | (500,803 | ) | $ | – 0 | – | $ | – 0 | – | $ | 232,714 | |||||||
BNP Paribas SA | 1,610 | – 0 | – | – 0 | – | – 0 | – | 1,610 | ||||||||||||
Credit Suisse International | 480,164 | – 0 | – | – 0 | – | – 0 | – | 480,164 | ||||||||||||
Deutsche Bank AG | 547,107 | (97,323 | ) | – 0 | – | – 0 | – | 449,784 | ||||||||||||
Goldman Sachs Bank USA | 671,646 | (671,646 | ) | – 0 | – | – 0 | – | – 0 | – | |||||||||||
HSBC Bank USA | 12,171 | – 0 | – | – 0 | – | – 0 | – | 12,171 | ||||||||||||
JPMorgan Chase Bank, NA | 651,098 | – 0 | – | – 0 | – | – 0 | – | 651,098 | ||||||||||||
Morgan Stanley & Co., Inc. | 282,626 | (27,058 | ) | – 0 | – | – 0 | – | 255,568 | ||||||||||||
Northern Trust Company | 615 | – 0 | – | – 0 | – | – 0 | – | 615 | ||||||||||||
Royal Bank of Scotland PLC | 1,551,050 | (652,987 | ) | – 0 | – | – 0 | – | 898,063 | ||||||||||||
Standard Chartered Bank | 740,719 | – 0 | – | – 0 | – | – 0 | – | 740,719 | ||||||||||||
State Street Bank & Trust Co. | 157,982 | (157,982 | ) | – 0 | – | – 0 | – | – 0 | – | |||||||||||
UBS AG | 921,673 | (134,457 | ) | – 0 | – | – 0 | – | 787,216 | ||||||||||||
|
|
|
|
|
|
|
|
|
| |||||||||||
Total | $ | 6,751,978 | $ | (2,242,256 | ) | $ | – 0 | – | $ | – 0 | – | $ | 4,509,722 | ^ | ||||||
|
|
|
|
|
|
|
|
|
| |||||||||||
| 332 | • AB POOLING PORTFOLIOS |
Notes to Financial Statements
| Counterparty | Derivative Liabilities Subject to a MA | Derivative Available for Offset | Cash Collateral Pledged | Security Collateral Pledged* | Net Amount of Derivatives Liabilities | |||||||||||||||
OTC Derivatives: |
| |||||||||||||||||||
Bank of America | $ | 2,261,905 | $ | – 0 | – | $ | – 0 | – | $ | – 0 | – | $ | 2,261,905 | |||||||
Barclays Bank PLC | 500,803 | (500,803 | ) | – 0 | – | – 0 | – | – 0 | – | |||||||||||
Citibank | 291,431 | – 0 | – | – 0 | – | – 0 | – | 291,431 | ||||||||||||
Deutsche Bank AG | 97,323 | (97,323 | ) | – 0 | – | – 0 | – | – 0 | – | |||||||||||
Goldman Sachs Bank USA | 1,965,702 | (671,646 | ) | – 0 | – | (1,294,056 | ) | – 0 | – | |||||||||||
Morgan Stanley & Co., Inc. | 27,058 | (27,058 | ) | – 0 | – | – 0 | – | – 0 | – | |||||||||||
Royal Bank of Scotland PLC | 652,987 | (652,987 | ) | – 0 | – | – 0 | – | – 0 | – | |||||||||||
State Street Bank & Trust Co. | 328,082 | (157,982 | ) | – 0 | – | – 0 | – | 170,100 | ||||||||||||
UBS AG | 134,457 | (134,457 | ) | – 0 | – | – 0 | – | – 0 | – | |||||||||||
|
|
|
|
|
|
|
|
|
| |||||||||||
Total | $ | 6,259,748 | $ | (2,242,256 | ) | $ | – 0 | – | $ | (1,294,056 | ) | $ | 2,723,436 | ^ | ||||||
|
|
|
|
|
|
|
|
|
| |||||||||||
| * | The actual collateral received/pledged may be more than the amount reported due to overcollateralization. |
| ^ | Net amount represents the net receivable/payable that would be due from/to the counterparty in the event of default or termination. The net amount from OTC financial derivative instruments can only be netted across transactions governed under the same master agreement with the same counterparty. |
| AllianceBernstein Cayman Inflation Pooling Subsidiary, Ltd. | ||||||||||||||||||||
| Counterparty | Derivative Assets Subject to a MA | Derivative Available for Offset | Cash Collateral Received | Security Collateral Received | Net Amount of Derivatives Assets | |||||||||||||||
Exchange-Traded Derivatives: |
| |||||||||||||||||||
Morgan Stanley & Co., LLC** | $ | 2,393,457 | $ | (147,390 | ) | $ | – 0 | – | $ | – 0 | – | $ | 2,246,067 | |||||||
|
|
|
|
|
|
|
|
|
| |||||||||||
Total | $ | 2,393,457 | $ | (147,390 | ) | $ | – 0 | – | $ | – 0 | – | $ | 2,246,067 | |||||||
|
|
|
|
|
|
|
|
|
| |||||||||||
OTC Derivatives: |
| |||||||||||||||||||
Goldman Sachs International | $ | 448,291 | $ | – 0 | – | $ | – 0 | – | $ | – 0 | – | $ | 448,291 | |||||||
JPMorgan Chase Bank, NA | 2,845,123 | – 0 | – | – 0 | – | – 0 | – | 2,845,123 | ||||||||||||
Morgan Stanley Capital Services LLC | 2,125,377 | (2,125,377 | ) | – 0 | – | – 0 | – | – 0 | – | |||||||||||
State Street Bank & Trust Co. | 14,541 | (4,781 | ) | – 0 | – | – 0 | – | 9,760 | ||||||||||||
|
|
|
|
|
|
|
|
|
| |||||||||||
Total | $ | 5,433,332 | $ | (2,130,158 | ) | $ | – 0 | – | $ | – 0 | – | $ | 3,303,174 | ^ | ||||||
|
|
|
|
|
|
|
|
|
| |||||||||||
| AB POOLING PORTFOLIOS • | 333 |
Notes to Financial Statements
| Counterparty | Derivative Liabilities Subject to a MA | Derivative Available for Offset | Cash Collateral Pledged | Security Collateral Pledged* | Net Amount of Derivatives Liabilities | |||||||||||||||
Exchange-Traded Derivatives: | ||||||||||||||||||||
Morgan Stanley & Co., LLC** | $ | 147,390 | $ | (147,390 | ) | $ | – 0 | – | $ | – 0 | – | $ | – 0 | – | ||||||
|
|
|
|
|
|
|
|
|
| |||||||||||
Total | $ | 147,390 | $ | (147,390 | ) | $ | – 0 | – | $ | – 0 | – | $ | – 0 | – | ||||||
|
|
|
|
|
|
|
|
|
| |||||||||||
OTC Derivatives: | ||||||||||||||||||||
Morgan Stanley Capital Services LLC | $ | 3,905,430 | $ | (2,125,377 | ) | $ | – 0 | – | $ | (1,780,053 | ) | $ | – 0 | – | ||||||
State Street Bank & Trust Co. | 4,781 | (4,781 | ) | – 0 | – | – 0 | – | – 0 | – | |||||||||||
|
|
|
|
|
|
|
|
|
| |||||||||||
Total | $ | 3,910,211 | $ | (2,130,158 | ) | $ | – 0 | – | $ | (1,780,053 | ) | $ | – 0 | –^ | ||||||
|
|
|
|
|
|
|
|
|
| |||||||||||
| * | The actual collateral received/pledged may be more than the amount reported due to overcollateralization. |
| ** | Cash has been posted for initial margin requirements for exchange traded derivatives outstanding at August 31, 2015. |
| ^ | Net amount represents the net receivable/payable that would be due from/to the counterparty in the event of default or termination. The net amount from OTC financial derivative instruments can only be netted across transactions governed under the same master agreement with the same counterparty. |
| AB Volatility Management | ||||||||||||||||||||
| Counterparty | Derivative Assets Subject to a MA | Derivative Available for Offset | Cash Collateral Received | Security Collateral Received | Net Amount of Derivatives Assets | |||||||||||||||
Exchange-Traded Derivatives: |
| |||||||||||||||||||
Goldman Sachs & Co** | $ | 10,208 | $ | – 0 | – | $ | – 0 | – | $ | – 0 | – | $ | 10,208 | |||||||
|
|
|
|
|
|
|
|
|
| |||||||||||
Total | $ | 10,208 | $ | – 0 | – | $ | – 0 | – | $ | – 0 | – | $ | 10,208 | |||||||
|
|
|
|
|
|
|
|
|
| |||||||||||
OTC Derivatives: |
| |||||||||||||||||||
Barclays Bank PLC | $ | 732,923 | $ | (141,510 | ) | $ | – 0 | – | $ | – 0 | – | $ | 591,413 | |||||||
BNP Paribas SA | 2,338,451 | (71,306 | ) | – 0 | – | – 0 | – | 2,267,145 | ||||||||||||
Citibank/Citibank, NA | 157,350 | (157,350 | ) | – 0 | – | – 0 | – | – 0 | – | |||||||||||
Deutsche Bank AG | 89,396 | (89,396 | ) | – 0 | – | – 0 | – | – 0 | – | |||||||||||
Goldman Sachs Bank USA/ Goldman Sachs International | 167,806 | (167,806 | ) | – 0 | – | – 0 | – | – 0 | – | |||||||||||
HSBC Bank USA | 271,478 | (53,556 | ) | – 0 | – | – 0 | – | 217,922 | ||||||||||||
JPMorgan Chase Bank | 63,779 | — | – 0 | – | – 0 | – | 63,779 | |||||||||||||
Morgan Stanley & Co., Inc. | 1,126,232 | (148,991 | ) | – 0 | – | – 0 | – | 977,241 | ||||||||||||
Standard Chartered Bank | 1,483,071 | (1,483,071 | ) | – 0 | – | – 0 | – | – 0 | – | |||||||||||
State Street Bank & Trust Co. | 78,540 | (16,623 | ) | – 0 | – | – 0 | – | 61,917 | ||||||||||||
UBS AG | 125,983 | (125,983 | ) | – 0 | – | – 0 | – | – 0 | – | |||||||||||
|
|
|
|
|
|
|
|
|
| |||||||||||
Total | $ | 6,635,009 | $ | (2,455,592 | ) | $ | – 0 | – | $ | – 0 | – | $ | 4,179,417 | ^ | ||||||
|
|
|
|
|
|
|
|
|
| |||||||||||
| 334 | • AB POOLING PORTFOLIOS |
Notes to Financial Statements
| Counterparty | Derivative Liabilities Subject to a MA | Derivative Available for Offset | Cash Collateral Pledged* | Security Collateral Pledged* | Net Amount of Derivatives Liabilities | |||||||||||||||
OTC Derivatives: |
| |||||||||||||||||||
Bank of America, NA | $ | 1,648,772 | $ | – 0 | – | $ | – 0 | – | $ | (1,648,772 | ) | $ | – 0 | – | ||||||
Barclays Bank PLC | 141,510 | (141,510 | ) | – 0 | – | – 0 | – | – 0 | – | |||||||||||
BNP Paribas SA | 71,306 | (71,306 | ) | – 0 | – | – 0 | – | – 0 | – | |||||||||||
Brown Brothers Harriman & Co. | 354,637 | – 0 | – | – 0 | – | – 0 | – | 354,637 | ||||||||||||
Citibank/Citibank, NA | 4,003,780 | (157,350 | ) | – 0 | – | (3,846,430 | ) | – 0 | – | |||||||||||
Credit Suisse International | 582,489 | – 0 | – | – 0 | – | – 0 | – | 582,489 | ||||||||||||
Deutsche Bank AG | 188,476 | (89,396 | ) | – 0 | – | – 0 | – | 99,080 | ||||||||||||
Goldman Sachs Bank USA/ Goldman Sachs International | 476,742 | (167,806 | ) | — | (308,936 | ) | — | |||||||||||||
HSBC Bank USA | 53,556 | (53,556 | ) | — | — | — | ||||||||||||||
Morgan Stanley & Co., Inc. | 148,991 | (148,991 | ) | – 0 | – | – 0 | – | – 0 | – | |||||||||||
Royal Bank of Scotland PLC | 146,970 | – 0 | – | – 0 | – | – 0 | – | 146,970 | ||||||||||||
Standard Chartered Bank | 2,298,539 | (1,483,071 | ) | – 0 | – | – 0 | – | 815,468 | ||||||||||||
State Street Bank & Trust Co. | 16,623 | (16,623 | ) | – 0 | – | – 0 | – | – 0 | – | |||||||||||
UBS AG | 532,632 | (125,983 | ) | – 0 | – | (406,649 | ) | – 0 | – | |||||||||||
|
|
|
|
|
|
|
|
|
| |||||||||||
Total | $ | 10,665,023 | $ | (2,455,592 | ) | $ | – 0 | – | $ | (6,210,787 | ) | $ | 1,998,644 | ^ | ||||||
|
|
|
|
|
|
|
|
|
| |||||||||||
| * | The actual collateral received/pledged may be more than the amount reported due to overcollateralization. |
| ** | Cash has been posted for initial margin requirements for exchange traded derivatives outstanding at August 31, 2015. |
| ^ | Net amount represents the net receivable/payable that would be due from/to the counterparty in the event of default or termination. The net amount from OTC financial derivative instruments can only be netted across transactions governed under the same master agreement with the same counterparty. |
2. Currency Transactions
The Portfolios may invest in non-U.S. dollar securities on a currency hedged or unhedged basis. The Portfolios may seek investment opportunities by taking long or short positions in currencies through the use of currency-related derivatives, including forward currency exchange contracts, futures and options on futures, swaps, and other options. The Portfolios may enter into transactions for investment opportunities when it anticipates that a foreign currency will appreciate or depreciate in value but securities denominated in that currency are not held by the Portfolios and do not present attractive investment opportunities. Such transactions may also be used when the Adviser believes that it may be more efficient than a direct investment in a foreign currency-
| AB POOLING PORTFOLIOS • | 335 |
Notes to Financial Statements
denominated security. The Portfolios may also conduct currency exchange contracts on a spot basis (i.e., for cash at the spot rate prevailing in the currency exchange market for buying or selling currencies).
3. TBA and Dollar Rolls
The Portfolio may invest in TBA mortgage-backed securities. A TBA, or “To Be Announced”, trade represents a contract for the purchase or sale of mortgage-backed securities to be delivered at a future agree-upon date; however, the specific mortgage pool numbers or the number of pools that will be delivered to fulfill the trade obligation or terms of the contract are unknown at the time of the trade. Mortgage pools (including fixed-rate or variable-rate mortgages) guaranteed by the Government National Mortgage Association, or GNMA, the Federal National Mortgage Association, or FNMA, or the Federal Home Loan Mortgage Corporation, or FHLMC, are subsequently allocated to the TBA transactions.
Certain Portfolios may enter into dollar rolls. Dollar rolls involve sales by the Portfolio of securities for delivery in the current month and the Portfolio’s simultaneously contracting to repurchase substantially similar (same type and coupon) securities on a specified future date. During the roll period, the Portfolio forgoes principal and interest paid on the securities. The Portfolio is compensated by the difference between the current sales price and the lower forward price for the future purchase (often referred to as the “drop”) as well as by the interest earned on the cash proceeds of the initial sale. Dollar rolls involve the risk that the market value of the securities the Portfolio is obligated to repurchase under the agreement may decline below the repurchase price. Dollar rolls are speculative techniques. For the year ended August 31, 2015, the AB Global Core Bond Portfolio earned drop income of $1,257,888, which is included in interest income in the accompanying statement of operations.
4. Reverse Repurchase Agreements
The Portfolios may enter into reverse repurchase transactions (“RVP”) in accordance with the terms of a Master Repurchase Agreement (“MRA”), under which the Portfolio sells securities and agrees to repurchase them at a mutually agreed upon date and price. At the time the Portfolio enters into a reverse repurchase agreement, it will establish a segregated account with the custodian containing liquid assets having a value comparable to the repurchase price. Under the MRA and other Master Agreements, the Portfolio is permitted to offset payables and/or receivables with collateral held and/or posted to the counterparty and create one single net payment due to or from the Portfolio in the event of a default. In the event of a default by a MRA counterparty, the Portfolio may be considered an unsecured creditor with respect to any excess collateral (collateral with a market value in excess of the repurchase price) held by and/or posted to the counterparty, and as such the return of such excess collateral may be delayed or denied. For the year ended August 31, 2015, the average amount of reverse
| 336 | • AB POOLING PORTFOLIOS |
Notes to Financial Statements
repurchase agreements outstanding for AB Bond Inflation Protection Portfolio and AB High-Yield Portfolio were $299,020,963 and $7,441,943, respectively, and the daily weighted average interest rate were 0.20% and (0.38%), respectively. At August 31, 2015, the AB Bond Inflation Protection Portfolio and AB High-Yield Portfolio had reverse repurchase agreements outstanding in the amount of $249,644,916 and $7,111,831, respectively, as reported on the statements of assets and liabilities. During the year, the High-Yield Portfolio received net interest payments from counterparties.
The following table presents the Portfolio’s RVP liabilities by counterparty net of the related collateral pledged by the Portfolios as of August 31, 2015:
| Bond Inflation Protection Portfolio | ||||||||||||
| Counterparty | RVP Liabilities Subject to a MRA | Securities Collateral Pledged†* | Net Amount of RVP Liabilities | |||||||||
Bank of America | $ | 41,497,595 | $ | (41,497,595 | ) | $ | –0 | – | ||||
Barclays Capital, Inc. | 9,929,888 | (9,929,888 | ) | – 0 | – | |||||||
HSBC | 92,044,226 | (92,044,226 | ) | – 0 | – | |||||||
JPMorgan Chase | 106,173,207 | (106,173,207 | ) | – 0 | – | |||||||
|
|
|
|
|
| |||||||
Total | $ | 249,644,916 | $ | (249,644,916 | ) | $ | – 0 | – | ||||
|
|
|
|
|
| |||||||
| † | Including accrued interest. |
| * | The actual collateral pledged may be more than the amount reported due to overcollateralization. |
| AB High-Yield Portfolio | ||||||||||||
| Counterparty | RVP Liabilities Subject to a MRA | Securities Collateral Pledged†* | Net Amount of RVP Liabilities | |||||||||
Barclays Capital, Inc. | $ | 627,444 | $ | (626,579 | ) | $ | 865 | |||||
Credit Suisse Securities (USA) LLC | 5,889,674 | (5,889,674 | ) | – 0 | – | |||||||
RBC Capital Markets | 594,713 | (570,454 | ) | 24,259 | ||||||||
|
|
|
|
|
| |||||||
Total | $ | 7,111,831 | $ | (7,086,707 | ) | $ | 25,124 | |||||
|
|
|
|
|
| |||||||
| † | Including accrued interest. |
| * | The actual collateral pledged may be more than the amount reported due to overcollateralization. |
| AB POOLING PORTFOLIOS • | 337 |
Notes to Financial Statements
5. Loan Participations and Assignments
Certain Portfolios may invest in direct debt instruments which are interests in amounts owed to lenders or lending syndicates by corporate, governmental, or other borrowers, either in the form of participations at the time the loan is originated (“Participations”) or by buying an interest in the loan in the secondary market from a financial institution or institutional investor (“Assignments”). A loan is often administered by a bank or other financial institution (the “Lender”) that acts as agent for all holders. The agent administers the term of the loan as specified in the loan agreement. When investing in Participations, the Portfolio generally has no right to enforce compliance with the terms of the loan agreement with the borrower. In addition, when investing in Participations, the Portfolio has the right to receive payments of principal, interest and any fees to which it is entitled only from the Lender and only upon receipt of payments by the Lender from the borrower. As a result, the Portfolio may be subject to the credit risk of both the borrower and the Lender. When the Portfolio purchases Assignments from Lenders, it will typically acquire direct rights against the borrower on the loan. These loans may include participations in “bridge loans”, which are loans taken out by borrowers for a short period (typically less than six months) pending arrangement of more permanent financing through, for example, the issuance of bonds, frequently high-yield bonds issued for the purpose of acquisitions. The Portfolio may also participate in unfunded loan commitments, which are contractual obligations for investing in future Participations, and may receive a commitment fee based on the amount of the commitment. Under these arrangements, the Portfolio may receive a fixed rate commitment fee and, if the extent the borrower borrows under the facility, the Portfolio may receive an additional funding fee.
Unfunded loan commitments and funded loans are marked to market daily.
During the year ended August 31, 2015, the High-Yield Portfolio had no commitments outstanding and received commitment fees or additional funding fees during the year in the amount of $12,442.
NOTE D
Securities Lending
Certain Portfolio’s may enter into securities lending transactions. Under the Portfolio’s securities lending program, all loans of securities will be collateralized continually by cash. The Portfolio will be compensated for the loan from a portion of the net return from the income earned on cash collateral after a rebate is paid to the borrower (in some cases, this rebate may be a “negative rebate” or fee paid by the borrower to the Portfolio in connection with the loan), and payments are made for fees of the securities lending agent and for certain other administrative expenses. It is the policy of the Portfolio to receive collateral consisting of cash in an amount exceeding the value of the securities loaned. The Portfolio will have the right to call a loan and obtain the securities loaned at any
| 338 | • AB POOLING PORTFOLIOS |
Notes to Financial Statements
time on notice to the borrower within the normal and customary settlement time for the securities. While the securities are on loan, the borrower is obligated to pay the Portfolio amounts equal to any income or other distributions from the securities. The Portfolio will not have the right to vote on any securities during the existence of a loan, but will have the right to regain ownership of loaned securities in order to exercise voting or other ownership rights. The lending agent has agreed to indemnify the Portfolio in the case of default of any securities borrower. Collateral received and securities loaned are marked to market daily to ensure that the securities loaned are secured by collateral. The lending agent will invest the cash collateral received in AB Exchange Reserves, an eligible money market vehicle, in accordance with the investment restrictions of the Portfolio, and as approved by the Board. The collateral received on securities loaned is recorded as an asset as well as a corresponding liability in the statement of assets and liabilities. When the Portfolio lends securities, its investment performance will continue to reflect changes in the value of the securities loaned. As of August 31, 2015, the value of securities on loan and cash collateral received which has been invested into AB Exchange Reserves are as follows:
| Portfolio | Market Value of Securities on Loan | Market Value of Cash Collateral | ||||||
AB U.S. Value | $ | 5,952,903 | $ | 6,081,135 | ||||
AB U.S. Large Cap Growth | 2,869,911 | 2,930,293 | ||||||
AB International Value | 199,056 | 210,915 | ||||||
AB International Growth | 5,621,307 | 6,050,194 | ||||||
AB Small-Mid Cap Value | 6,202,595 | 6,422,235 | ||||||
AB Small-Mid Cap Growth | 7,537,578 | 7,862,001 | ||||||
AB Multi-Asset Real Return | 25,601,329 | 26,857,470 | ||||||
AB Volatility Management | 121,005,875 | 124,645,745 | ||||||
The cash collateral will be adjusted on the next business day to maintain the required collateral amount. The securities lending income earned for the year ended August 31, 2015 from the borrowers and AB Exchange Reserves are as follows:
| Portfolio | Borrowers | AB Exchange Reserves | ||||||
AB U.S. Value | $ | 199,303 | $ | 4,246 | ||||
AB U.S. Large Cap Growth | 62,651 | 2,742 | ||||||
AB International Value | 293,367 | 8,821 | ||||||
AB International Growth | 125,231 | 7,388 | ||||||
AB Small-Mid Cap Value | 166,148 | 3,878 | ||||||
AB Small-Mid Cap Growth | 158,635 | 7,892 | ||||||
AB Multi-Asset Real Return | 512,533 | 17,948 | ||||||
AB Volatility Management | 683,056 | 55,556 | ||||||
These amounts are reflected in the statement of operations. A principal risk of lending portfolio securities is that the borrower will fail to return the loaned securities upon termination of the loan and that the collateral will not be
| AB POOLING PORTFOLIOS • | 339 |
Notes to Financial Statements
sufficient to replace the loaned securities. A summary of the Portfolios’ transactions in shares of AB Exchange Reserves for the year ended August 31, 2015 are as follows:
| Portfolio | Market Value August 31, 2014 (000) | Purchases at Cost (000) | Sales Proceeds (000) | Market Value August 31, 2015 (000) | ||||||||||||
AB U.S. Value | $ | 494 | $ | 52,274 | $ | 46,687 | $ | 6,081 | ||||||||
AB U.S. Large Cap Growth | 1,101 | 63,774 | 61,945 | 2,930 | ||||||||||||
AB International Value | 13,033 | 253,736 | 266,558 | 211 | ||||||||||||
AB International Growth | 2,772 | 167,140 | 163,862 | 6,050 | ||||||||||||
AB Small-Mid Cap Value | 2,842 | 50,843 | 47,263 | 6,422 | ||||||||||||
AB Small-Mid Cap Growth | 12,333 | 116,765 | 121,236 | 7,862 | ||||||||||||
AB Multi-Asset Real Return | 12,119 | 485,835 | 471,097 | 26,857 | ||||||||||||
AB Volatility Management | 68,251 | 1,707,098 | 1,650,703 | 124,646 | ||||||||||||
NOTE E
Shares of Beneficial Interest
Transactions in shares of beneficial interest for each class were as follows:
| Shares | Amount | |||||||||||||||||||
| Year Ended August 31, 2015 | Year Ended August 31, 2014 | Year Ended August 31, 2015 | Year Ended August 31, 2014 | |||||||||||||||||
|
| |||||||||||||||||||
| AB U.S. Value | ||||||||||||||||||||
Shares sold | 899,902 | 1,256,504 | $ | 11,886,481 | $ | 14,990,228 | ||||||||||||||
| ||||||||||||||||||||
Shares issued in reinvestment of dividends | 787,294 | 2,290,586 | 10,546,202 | 27,508,781 | ||||||||||||||||
| ||||||||||||||||||||
Shares redeemed | (6,107,627 | ) | (65,036,472 | ) | (82,387,658 | ) | (807,917,005 | ) | ||||||||||||
| ||||||||||||||||||||
Net decrease | (4,420,431 | ) | (61,489,382 | ) | $ | (59,954,975 | ) | $ | (765,417,996 | ) | ||||||||||
| ||||||||||||||||||||
| AB U.S. Large Cap Growth | ||||||||||||||||||||
Shares sold | 569,773 | 972,739 | $ | 7,184,060 | $ | 15,016,834 | ||||||||||||||
| ||||||||||||||||||||
Shares issued in reinvestment of dividends and distributions | 14,104,875 | 8,354,810 | 169,404,217 | 125,541,021 | ||||||||||||||||
| ||||||||||||||||||||
Shares redeemed | (10,679,388 | ) | (54,570,581 | ) | (147,986,150 | ) | (849,085,962 | ) | ||||||||||||
| ||||||||||||||||||||
Net increase (decrease) | 3,995,260 | (45,243,032 | ) | $ | 28,602,127 | $ | (708,528,107 | ) | ||||||||||||
| ||||||||||||||||||||
| 340 | • AB POOLING PORTFOLIOS |
Notes to Financial Statements
| Shares | Amount | |||||||||||||||||||
| Year Ended August 31, 2015 | Year Ended August 31, 2014 | Year Ended August 31, 2015 | Year Ended August 31, 2014 | |||||||||||||||||
|
| |||||||||||||||||||
| AB International Value | ||||||||||||||||||||
Shares sold | 1,595,825 | 2,130,858 | $ | 12,087,012 | $ | 17,127,078 | ||||||||||||||
| ||||||||||||||||||||
Shares issued in reinvestment of dividends | 4,256,822 | 7,177,791 | 31,500,480 | 56,058,549 | ||||||||||||||||
| ||||||||||||||||||||
Shares redeemed | (7,057,663 | ) | (82,218,170 | ) | (54,485,732 | ) | (649,268,507 | ) | ||||||||||||
| ||||||||||||||||||||
Net decrease | (1,205,016 | ) | (72,909,521 | ) | $ | (10,898,240 | ) | $ | (576,082,880 | ) | ||||||||||
| ||||||||||||||||||||
| AB International Growth | ||||||||||||||||||||
Shares sold | 1,759,886 | 2,671,122 | $ | 15,676,225 | $ | 23,664,748 | ||||||||||||||
| ||||||||||||||||||||
Shares issued in reinvestment of dividends | 786,887 | 1,937,178 | 6,877,392 | 17,047,166 | ||||||||||||||||
| ||||||||||||||||||||
Shares redeemed | (4,603,483 | ) | (71,252,154 | ) | (41,591,644 | ) | (630,900,848 | ) | ||||||||||||
| ||||||||||||||||||||
Net decrease | (2,056,710 | ) | (66,643,854 | ) | $ | (19,038,027 | ) | $ | (590,188,934 | ) | ||||||||||
| ||||||||||||||||||||
| AB Short Duration Bond | ||||||||||||||||||||
Shares sold | 3,241,057 | 8,306,556 | $ | 30,610,385 | $ | 78,407,307 | ||||||||||||||
| ||||||||||||||||||||
Shares issued in reinvestment of dividends | 992,400 | 1,241,841 | 9,366,087 | 11,717,433 | ||||||||||||||||
| ||||||||||||||||||||
Shares redeemed | (10,835,547 | ) | (7,049,018 | ) | (102,262,770 | ) | (66,548,659 | ) | ||||||||||||
| ||||||||||||||||||||
Net increase (decrease) | (6,602,090 | ) | 2,499,379 | $ | (62,286,298 | ) | $ | 23,576,081 | ||||||||||||
| ||||||||||||||||||||
| AB Global Core Bond | ||||||||||||||||||||
Shares sold | 2,922,261 | 6,026,995 | $ | 29,955,764 | $ | 61,795,059 | ||||||||||||||
| ||||||||||||||||||||
Shares issued in reinvestment of dividends and distributions | 6,610,824 | 3,635,361 | 66,999,287 | 37,211,781 | ||||||||||||||||
| ||||||||||||||||||||
Shares redeemed | (14,877,837 | ) | (13,971,729 | ) | (152,006,295 | ) | (144,350,360 | ) | ||||||||||||
| ||||||||||||||||||||
Net decrease | (5,344,752 | ) | (4,309,373 | ) | $ | (55,051,244 | ) | $ | (45,343,520 | ) | ||||||||||
| ||||||||||||||||||||
| AB Bond Inflation Protection | ||||||||||||||||||||
Shares sold | 3,523,285 | 5,424,721 | $ | 34,639,427 | $ | 54,644,669 | ||||||||||||||
| ||||||||||||||||||||
Shares issued in reinvestment of dividends and distributions | 2,585,609 | 3,467,865 | 25,002,844 | 33,915,716 | ||||||||||||||||
| ||||||||||||||||||||
Shares redeemed | (7,526,367 | ) | (7,389,637 | ) | (73,523,506 | ) | (74,669,503 | ) | ||||||||||||
| ||||||||||||||||||||
Net increase (decrease) | (1,417,473 | ) | 1,502,949 | $ | (13,881,235 | ) | $ | 13,890,882 | ||||||||||||
| ||||||||||||||||||||
| AB POOLING PORTFOLIOS • | 341 |
Notes to Financial Statements
| Shares | Amount | |||||||||||||||||||
| Year Ended August 31, 2015 | Year Ended August 31, 2014 | Year Ended August 31, 2015 | Year Ended August 31, 2014 | |||||||||||||||||
|
| |||||||||||||||||||
| AB High-Yield | ||||||||||||||||||||
Shares sold | 611,033 | 1,051,044 | $ | 6,358,714 | $ | 11,224,827 | ||||||||||||||
| ||||||||||||||||||||
Shares issued in reinvestment of dividends | 2,387,311 | 2,392,415 | 24,694,123 | 25,509,174 | ||||||||||||||||
| ||||||||||||||||||||
Shares redeemed | (3,925,769 | ) | (5,276,819 | ) | (40,460,867 | ) | (56,599,227 | ) | ||||||||||||
| ||||||||||||||||||||
Net decrease | (927,425 | ) | (1,833,360 | ) | $ | (9,408,030 | ) | $ | (19,865,226 | ) | ||||||||||
| ||||||||||||||||||||
| AB Small-Mid Cap Value | ||||||||||||||||||||
Shares sold | 309,496 | 311,854 | $ | 3,728,621 | $ | 4,171,197 | ||||||||||||||
| ||||||||||||||||||||
Shares issued in reinvestment of dividends and distributions | 5,565,605 | 3,443,018 | 63,242,317 | 44,507,395 | ||||||||||||||||
| ||||||||||||||||||||
Shares redeemed | (3,504,600 | ) | (4,963,204 | ) | (42,175,961 | ) | (67,864,547 | ) | ||||||||||||
| ||||||||||||||||||||
Net increase (decrease) | 2,370,501 | (1,208,332 | ) | $ | 24,794,977 | $ | (19,185,955 | ) | ||||||||||||
| ||||||||||||||||||||
| AB Small-Mid Cap Growth | ||||||||||||||||||||
Shares sold | 252,091 | 1,195,831 | $ | 2,782,968 | $ | 14,454,274 | ||||||||||||||
| ||||||||||||||||||||
Shares issued in reinvestment of dividends and distributions | 4,851,374 | 5,178,738 | 51,344,768 | 61,745,187 | ||||||||||||||||
| ||||||||||||||||||||
Shares redeemed | (5,164,035 | ) | (4,795,852 | ) | (58,999,695 | ) | (61,676,236 | ) | ||||||||||||
| ||||||||||||||||||||
Net increase (decrease) | (60,570 | ) | 1,578,717 | $ | (4,871,959 | ) | $ | 14,523,225 | ||||||||||||
| ||||||||||||||||||||
| AB Multi-Asset Real Return* | ||||||||||||||||||||
Shares sold | 54,774,185 | 14,265,266 | $ | 423,029,389 | $ | 124,401,516 | ||||||||||||||
| ||||||||||||||||||||
Shares issued in reinvestment of dividends | 3,939,384 | 2,714,536 | 28,954,469 | 22,422,067 | ||||||||||||||||
| ||||||||||||||||||||
Shares redeemed | (15,265,478 | ) | (15,292,938 | ) | (120,157,202 | ) | (129,524,655 | ) | ||||||||||||
| ||||||||||||||||||||
Net increase | 43,448,091 | 1,686,864 | $ | 331,826,656 | $ | 17,298,928 | ||||||||||||||
| ||||||||||||||||||||
| AB Volatility Management | ||||||||||||||||||||
Shares sold | 2,677,728 | 4,093,947 | $ | 31,694,373 | $ | 48,340,621 | ||||||||||||||
| ||||||||||||||||||||
Shares issued in reinvestment of dividends and distributions | 9,227,127 | 14,138,440 | 106,665,587 | 160,188,523 | ||||||||||||||||
| ||||||||||||||||||||
Shares redeemed | (17,200,171 | ) | (38,792,782 | ) | (208,087,207 | ) | (468,154,591 | ) | ||||||||||||
| ||||||||||||||||||||
Net decrease | (5,295,316 | ) | (20,560,395 | ) | $ | (69,727,247 | ) | $ | (259,625,447 | ) | ||||||||||
| ||||||||||||||||||||
| * | Consolidated (see Note A). |
| 342 | • AB POOLING PORTFOLIOS |
Notes to Financial Statements
NOTE F
Risks Involved in Investing in the Portfolios
Interest Rate Risk and Credit Risk—Interest rate risk is the risk that changes in interest rates will affect the value of the Portfolios’ investments in fixed-income debt securities such as bonds or notes. Increases in interest rates may cause the value of the Portfolios’ investments to decline. Credit risk is the risk that the issuer or guarantor of a debt security, or the counterparty to a derivative contract, will be unable or unwilling to make timely principal and/or interest payments, or to otherwise honor its obligations. The degree of risk for a particular security may be reflected in its credit rating. Credit risk is greater for medium quality and lower-rated securities. Lower-rated debt securities and similar unrated securities (commonly known as “junk bonds”) have speculative elements or are predominantly speculative risks.
Duration Risk—Duration is the measure that relates the expected price volatility of a fixed-income security to changes in interest rates. The duration of a fixed-income security may be shorter than or equal to full maturity of a fixed-income security. Fixed-income securities with longer durations have more risk and will decrease in price as interest rates rise. For example, a fixed-income security with a duration of three years will decrease in value by approximately 3% if interest rates increase by 1%.
Inflation Risk—This is the risk that the value of assets or income from investments will be less in the future as inflation decreases the value of money. As inflation increases, the value of each Portfolios’ assets can decline as can the value of the Portfolios’ distributions.
Foreign (Non-U.S.) Risk—Investments in securities of non-U.S. issuers may involve more risk than those of U.S. issuers. These securities may fluctuate more widely in price and may be less liquid due to adverse market, economic, political, regulatory or other factors.
Currency Risk—Fluctuations in currency exchange rates may negatively affect the value of the Portfolios’ investments or reduce its returns.
Emerging Market Risk—Investments in emerging market countries may have more risk because the markets are less developed and less liquid, as well as being subject to increased economic, political, regulatory, or other uncertainties.
Derivatives Risk—The Portfolios may enter into derivative transactions such as forwards, options, futures and swaps. Derivatives may be illiquid, difficult to price, and leveraged so that small changes may produce disproportionate losses for the Portfolios, and subject to counterparty risk to a greater degree than more traditional investments. Derivatives may result in significant losses, including losses that are far greater than the value of the derivatives reflected in the statement of assets and liabilities.
| AB POOLING PORTFOLIOS • | 343 |
Notes to Financial Statements
Leverage Risk—When certain Portfolios borrow money or otherwise leverages its portfolios, it may be volatile because leverage tends to exaggerate the effect of any increase or decrease in the value of the Portfolio’s investments. The Portfolio may create leverage through the use of reverse repurchase arrangements, forward currency exchange contracts, forward commitments, dollar rolls or futures contracts or by borrowing money. The use of derivative instruments by the Portfolios, such as forwards, futures, options and swaps, may also result in a form of leverage. Leverage may result in higher returns to the Portfolios than if the Portfolios were not leveraged, but may also adversely affect returns, particularly if the market is declining.
Liquidity Risk—Liquidity risk exists when particular investments are difficult to purchase or sell, possibly preventing the Portfolio from selling out of these illiquid securities at an advantageous time or price. Derivatives and securities involving substantial market risk and credit risk tend to involve greater liquidity risk.
Capitalization Risk—Investments in small- and mid-capitalization companies may be more volatile than investments in large-capitalization companies. Investments in small-capitalization companies may have additional risks because these companies have limited product lines, markets or financial resources.
Commodity Risk—Investments in commodities and commodity-linked derivative instruments by AB Multi-Asset Real Return, either directly or through its Subsidiary, may subject the Portfolio to greater volatility than investments in traditional securities. The value of commodity-linked derivative instruments may be affected by changes in overall market movements, commodity index volatility, changes in interest rates, or factors affecting a particular industry or commodity, such as drought, floods, weather, livestock disease, embargoes, tariffs and international economic, political and regulatory developments.
Real Estate Risk—The Portfolio’s investments in the real estate market have many of the same risks as direct ownership of real estate, including the risk that the value of real estate could decline due to a variety of factors that affect the real estate market generally. Investments in REITs may have additional risks. REITs are dependent on the capability of their managers, may have limited diversification, and could be significantly affected by changes in taxes.
Subsidiary Risk—By investing in the Subsidiary, the Portfolio is indirectly exposed to the risks associated with the Subsidiary’s investments, including its investments in commodities. There is no guarantee that the investment objective of the Subsidiary will be achieved.
Indemnification Risk—In the ordinary course of business, the Portfolios enter into contracts that contain a variety of indemnifications. The Portfolio’s maximum exposure under these arrangements is unknown. However, the Portfolios
| 344 | • AB POOLING PORTFOLIOS |
Notes to Financial Statements
have not had prior claims or losses pursuant to these indemnification provisions and expect the risk of loss thereunder to be remote. Therefore, the Portfolios have not accrued any liability in connection with these indemnification provisions.
NOTE G
Distributions to Shareholders
The tax character of distributions paid during the fiscal years ended August 31, 2015 and August 31, 2014 were as follows:
| AB U.S. Value | 2015 | 2014 | ||||||
Distributions paid from: | ||||||||
Ordinary income | $ | 10,546,202 | $ | 27,508,781 | ||||
|
|
|
| |||||
Total distributions paid | $ | 10,546,202 | $ | 27,508,781 | ||||
|
|
|
| |||||
| AB U.S. Large Cap Growth | 2015 | 2014 | ||||||
Distributions paid from: | ||||||||
Ordinary income | $ | 14,782,301 | $ | 23,015,023 | ||||
Long-term capital gains | 154,621,916 | 102,525,998 | ||||||
|
|
|
| |||||
Total distributions paid | $ | 169,404,217 | $ | 125,541,021 | ||||
|
|
|
| |||||
| AB International Value | 2015 | 2014 | ||||||
Distributions paid from: | ||||||||
Ordinary income | $ | 31,500,480 | $ | 56,058,549 | ||||
|
|
|
| |||||
Total distributions paid | $ | 31,500,480 | $ | 56,058,549 | ||||
|
|
|
| |||||
| AB International Growth | 2015 | 2014 | ||||||
Distributions paid from: | ||||||||
Ordinary income | $ | 6,877,393 | $ | 17,047,166 | ||||
|
|
|
| |||||
Total distributions paid | $ | 6,877,393 | $ | 17,047,166 | ||||
|
|
|
| |||||
| AB Short Duration Bond | 2015 | 2014 | ||||||
Distributions paid from: | ||||||||
Ordinary income | $ | 9,366,087 | $ | 11,673,217 | ||||
Return of capital | – 0 | – | 44,216 | |||||
|
|
|
| |||||
Total distributions paid | $ | 9,366,087 | $ | 11,717,433 | ||||
|
|
|
| |||||
| AB Global Core Bond | 2015 | 2014 | ||||||
Distributions paid from: | ||||||||
Ordinary income | $ | 55,828,805 | $ | 35,379,162 | ||||
Long-term capital gains | 11,170,482 | 1,832,618 | ||||||
|
|
|
| |||||
Total distributions paid | $ | 66,999,287 | $ | 37,211,780 | ||||
|
|
|
| |||||
| AB Bond Inflation Protection | 2015 | 2014 | ||||||
Distributions paid from: | ||||||||
Ordinary income | $ | 25,002,844 | $ | 12,850,585 | ||||
Long-term capital gains | – 0 | – | 21,065,131 | |||||
|
|
|
| |||||
Total distributions paid | $ | 25,002,844 | $ | 33,915,716 | ||||
|
|
|
| |||||
| AB POOLING PORTFOLIOS • | 345 |
Notes to Financial Statements
| AB High-Yield | 2015 | 2014 | ||||||
Distributions paid from: | ||||||||
Ordinary income | $ | 24,694,123 | $ | 25,509,174 | ||||
|
|
|
| |||||
Total distributions paid | $ | 24,694,123 | $ | 25,509,174 | ||||
|
|
|
| |||||
| AB Small-Mid Cap Value | 2015 | 2014 | ||||||
Distributions paid from: | ||||||||
Ordinary income | $ | 11,292,081 | $ | 10,895,600 | ||||
Long-term capital gains | 51,950,236 | 33,611,794 | ||||||
|
|
|
| |||||
Total distributions paid | $ | 63,242,317 | $ | 44,507,394 | ||||
|
|
|
| |||||
| AB Small-Mid Cap Growth | 2015 | 2014 | ||||||
Distributions paid from: | ||||||||
Ordinary income | $ | 2,513,207 | $ | 1,668,154 | ||||
Long-term capital gains | 48,831,561 | 60,077,034 | ||||||
|
|
|
| |||||
Total distributions paid | $ | 51,344,768 | $ | 61,745,188 | ||||
|
|
|
| |||||
| AB Multi-Asset Real Return | 2015 | 2014 | ||||||
Distributions paid from: | ||||||||
Ordinary income | $ | 28,954,469 | $ | 22,422,067 | ||||
|
|
|
| |||||
Total distributions paid | $ | 28,954,469 | $ | 22,422,067 | ||||
|
|
|
| |||||
| AB Volatility Management | 2015 | 2014 | ||||||
Distributions paid from: | ||||||||
Ordinary income | $ | 69,377,411 | $ | 110,905,951 | ||||
Long-term capital gains | 37,288,177 | 49,282,572 | ||||||
|
|
|
| |||||
Total distributions paid | $ | 106,665,588 | $ | 160,188,523 | ||||
|
|
|
| |||||
As of August 31, 2015, the components of accumulated earnings/(deficit) on a tax basis were as follows:
| Portfolio | Undistributed Ordinary Income | Undistributed Long-Term Gains | Accumulated Losses(a) | Unrealized Appreciation/ (Depreciation)(b) | Total Accumulated Earnings/ (Deficit)(c) | |||||||||||||||
AB U.S. Value | $ | 2,426,834 | $ | – 0 | – | $ | (304,888,572 | ) | $ | 46,281,594 | $ | (256,180,144 | ) | |||||||
AB U.S. Large Cap Growth | 6,180,124 | 71,338,903 | – 0 | – | 102,849,359 | 180,368,386 | ||||||||||||||
AB International Value | 15,412,104 | – 0 | – | (428,884,112 | ) | (27,685,156 | ) | (441,157,164 | ) | |||||||||||
AB International Growth | 3,235,297 | – 0 | – | (341,955,002 | ) | 10,742,339 | (327,977,366 | ) | ||||||||||||
AB Short Duration Bond | 521,735 | – 0 | – | (70,905,940 | ) | (1,696,771 | ) | (72,080,976 | ) | |||||||||||
AB Global Core Bond | 23,844,568 | – 0 | – | (8,069,949 | ) | (16,923,180 | ) | (1,148,561 | ) | |||||||||||
AB Bond Inflation Protection | 16,323,558 | – 0 | – | (5,726,304 | ) | (21,974,710 | ) | (11,377,456 | ) | |||||||||||
AB High-Yield | 5,739,370 | – 0 | – | (14,148,980 | ) | (15,763,913 | ) | (24,173,523 | ) | |||||||||||
AB Small-Mid Cap Value | 1,007,473 | 27,468,395 | – 0 | – | 29,717,622 | 58,193,490 | ||||||||||||||
| 346 | • AB POOLING PORTFOLIOS |
Notes to Financial Statements
| Portfolio | Undistributed Ordinary Income | Undistributed Long-Term Gains | Accumulated Losses(a) | Unrealized Appreciation/ (Depreciation)(b) | Total Accumulated Earnings/ (Deficit)(c) | |||||||||||||||
AB Small-Mid Cap Growth | $ | 544,418 | $ | 33,482,473 | $ | – 0 | – | $ | 61,795,591 | $ | 95,822,482 | |||||||||
AB Multi-Asset Real Return | 21,129,639 | – 0 | – | (290,382,766 | ) | (288,507,806 | ) | (557,760,933 | ) | |||||||||||
AB Volatility Management | 35,186,722 | 26,870,152 | – 0 | – | 143,322,078 | 205,378,952 | ||||||||||||||
| (a) | As of August 31, 2015 certain Portfolios had capital loss carryforwards for federal income tax purposes. During the fiscal year ended August 31, 2015 AB U.S. Value Portfolio, AB International Value Portfolio, AB International Growth Portfolio and AB High Yield Portfolio utilized capital loss carryforwards of $66,186,422, $23,677,098, $5,938,664 and $2,129,413, respectively, to offset current year net realized gains. Additionally, AB Short Duration Bond Portfolio had $3,562,331 of capital loss carryforwards expire during the fiscal year. At August 31, 2015 AB Short Duration Bond Portfolio, AB Global Core Bond Portfolio, AB Bond Inflation Protection Portfolio, AB High-Yield Portfolio and AB Multi-Asset Real Return Portfolio deferred straddle losses of $610,095, $7,338,294, $6,484, $7,112 and $163,901, respectively. At August 31, 2015 AB U.S. Value Portfolio, AB International Growth Portfolio, AB Global Core Bond Portfolio and AB High-Yield Portfolio had post-October short-term capital loss deferrals of $1,088,105, $4,426,793, $731,655 and $1,651,360, respectively. These losses are deemed to arise on September 1, 2015. |
| (b) | The differences between book-basis and tax-basis unrealized appreciation/(depreciation) are attributable primarily to the tax deferral of losses on wash sales, the tax treatment of swaps and passive foreign investment companies (PFICs), the realization for tax purposes of gains/losses on certain derivative instruments, the tax treatment of partnership investments and Treasury inflation-protected securities, return of capital distributions received from underlying securities, the tax treatment of a restructured investment, and the tax treatment of earnings from a wholly-owned subsidiary. |
| (c) | The differences between book-basis and tax-basis components of accumulated earnings/(deficit) are attributable primarily to the tax treatment of defaulted securities and the tax treatment of earnings from a wholly-owned subsidiary.. |
For tax purposes, net capital losses may be carried over to offset future capital gains, if any. Funds are permitted to carry forward capital losses incurred in taxable years beginning after December 22, 2010 for an indefinite period. These post-December 22, 2010 capital losses must be utilized prior to the earlier capital losses, which are subject to expiration. Post-December 22, 2010 capital loss carryforwards will retain their character as either short-term or long-term capital losses rather than being considered short-term as under previous regulation.
As of August 31, 2015, the following Portfolios had net capital loss carryforwards which will expire as follows:
| Portfolio | Short-Term Amount | Long-Term Amount | Expiration | |||||||||
AB U.S. Value | $ | 303,800,467 | n/a | 2018 | ||||||||
AB International Value | 51,400,581 | n/a | 2017 | |||||||||
AB International Value | 325,801,637 | n/a | 2018 | |||||||||
| AB POOLING PORTFOLIOS • | 347 |
Notes to Financial Statements
| Portfolio | Short-Term Amount | Long-Term Amount | Expiration | |||||||||
AB International Value | $ | 25,033,617 | $ | 26,648,277 | No expiration | |||||||
AB International Growth | 34,597,465 | n/a | 2017 | |||||||||
AB International Growth | 302,930,744 | n/a | 2018 | |||||||||
AB Short Duration Bond | 1,756,801 | n/a | 2016 | |||||||||
AB Short Duration Bond | 19,308,695 | n/a | 2017 | |||||||||
AB Short Duration Bond | 11,669,892 | n/a | 2018 | |||||||||
AB Short Duration Bond | 8,417,896 | n/a | 2019 | |||||||||
AB Short Duration Bond | 3,740,656 | 25,401,905 | No expiration | |||||||||
AB Bond Inflation Protection | 5,719,820 | n/a | No expiration | |||||||||
AB High-Yield | 12,490,508 | n/a | 2018 | |||||||||
AB Multi-Asset Real Return | 232,200,875 | n/a | 2018 | |||||||||
AB Multi-Asset Real Return | 37,320,905 | 20,697,085 | No expiration | |||||||||
During the current fiscal year, most of the Portfolios had adjustments due to permanent differences. Permanent differences have no effect on net assets. The effect of such permanent differences on each Portfolio—primarily due to reclassifications of foreign currency and foreign capital gains tax, the tax treatment of passive foreign investment companies (PFICs) and Treasury inflation-protected securities, return of capital distributions received from underlying securities, the utilization of a net operating loss to offset capital gains, the tax treatment of swaps and partnership investments, paydown gain/loss reclassifications, the tax treatment of proceeds from the sale of restructured securities, the redesignation of dividends, the tax treatment of offering costs and clearing fees, the expiration of capital loss carryforwards, contributions from the Advisor, the tax treatment of gains from redemptions-in-kind, the utilization of earnings and profits distributed to shareholders on redemption of shares, and the tax treatment of earnings from a wholly-owned subsidiary—is reflected as an adjustment to the components of capital as of August 31, 2015 as shown below:
| Portfolio | Increase (Decrease) to Additional Paid-In Capital | Increase (Decrease) to Undistributed Net Investment Income (Loss) | Increase (Decrease) to Accumulated Net Realized Gain (Loss) on Investment and Foreign Currency Transactions | |||||||||
AB U.S. Value | $ | 1,717 | $ | –0 | – | $ | (1,717 | ) | ||||
AB U.S. Large Cap Growth | – 0 | – | – 0 | – | – 0 | – | ||||||
| 348 | • AB POOLING PORTFOLIOS |
Notes to Financial Statements
| Portfolio | Increase (Decrease) to Additional Paid-In Capital | Increase (Decrease) to Undistributed Net Investment Income (Loss) | Increase (Decrease) to Accumulated Net Realized Gain (Loss) on Investment and Foreign Currency Transactions | |||||||||
AB International Value | $ | – 0 | – | $ | 4,419,177 | $ | (4,419,177 | ) | ||||
AB International Growth | – 0 | – | (1,295,489 | ) | 1,295,489 | |||||||
AB Short Duration Bond | (3,562,331 | ) | 1,235,149 | 2,327,182 | ||||||||
AB Global Core Bond | – 0 | – | 43,569,263 | (43,569,263 | ) | |||||||
AB Bond Inflation Protection | – 0 | – | 6,912,529 | (6,912,529 | ) | |||||||
AB High-Yield | – 0 | – | 2,554,310 | (2,554,310 | ) | |||||||
AB Small-Mid Cap Value | – 0 | – | – 0 | – | – 0 | – | ||||||
AB Small-Mid Cap Growth | – 0 | – | 1,165,209 | (1,165,209 | ) | |||||||
AB Multi-Asset Real Return | (103,906,538 | ) | 14,062,819 | 89,843,719 | ||||||||
AB Volatility Management | 4,326,805 | 20,211,291 | (24,538,096 | ) | ||||||||
NOTE H
Subsequent Events
Management has evaluated subsequent events for possible recognition or disclosure in the financial statements through the date the financial statements are issued. Management has determined that there are no material events that would require disclosure in the Portfolios’ financial statements through this date.
| AB POOLING PORTFOLIOS • | 349 |
Notes to Financial Statements
FINANCIAL HIGHLIGHTS
Selected Data For A Share Of Beneficial Interest Outstanding Throughout Each Period
| AB U.S. Value | ||||||||||||||||||||
| Year Ended August 31, | ||||||||||||||||||||
| 2015 | 2014 | 2013 | 2012 | 2011 | ||||||||||||||||
|
| |||||||||||||||||||
Net asset value, beginning of period | $ 13.46 | $ 10.96 | $ 8.73 | $ 7.97 | $ 7.18 | |||||||||||||||
|
| |||||||||||||||||||
Income From Investment Operations | ||||||||||||||||||||
Net investment income(a) | .28 | .32 | .24 | .23 | .18 | |||||||||||||||
Net realized and unrealized gain (loss) on investment transactions | (.83 | ) | 2.50 | 2.23 | .76 | .77 | ||||||||||||||
|
| |||||||||||||||||||
Net increase (decrease) in net asset value from operations | (.55 | ) | 2.82 | 2.47 | .99 | .95 | ||||||||||||||
|
| |||||||||||||||||||
Less: Dividends | ||||||||||||||||||||
Dividends from net investment income | (.28 | ) | (.32 | ) | (.24 | ) | (.23 | ) | (.16 | ) | ||||||||||
|
| |||||||||||||||||||
Net asset value, end of period | $ 12.63 | $ 13.46 | $ 10.96 | $ 8.73 | $ 7.97 | |||||||||||||||
|
| |||||||||||||||||||
Total Return | ||||||||||||||||||||
Total investment return based on net asset value(b) | (4.21 | )%* | 26.10 | %* | 28.67 | %* | 12.75 | %* | 13.21 | % | ||||||||||
Ratios/Supplemental Data | ||||||||||||||||||||
Net assets, end of period (000,000’s omitted) | $449 | $539 | $1,113 | $1,173 | $1,943 | |||||||||||||||
Ratio to average net assets of: | ||||||||||||||||||||
Expenses | .05 | % | .03 | % | .02 | % | .02 | % | .01 | %+ | ||||||||||
Net investment income | 2.06 | % | 2.65 | % | 2.44 | % | 2.75 | % | 2.14 | %+ | ||||||||||
Portfolio turnover rate | 52 | % | 43 | % | 53 | % | 40 | % | 65 | % | ||||||||||
See footnote summary on page 362.
| 350 | • AB POOLING PORTFOLIOS |
Financial Highlights
Selected Data For A Share Of Beneficial Interest Outstanding Throughout Each Period
| AB U.S. Large Cap Growth | ||||||||||||||||||||
| Year Ended August 31, | ||||||||||||||||||||
| 2015 | 2014 | 2013 | 2012 | 2011 | ||||||||||||||||
|
| |||||||||||||||||||
Net asset value, beginning of period | $ 16.78 | $ 14.53 | $ 12.30 | $ 10.66 | $ 8.94 | |||||||||||||||
|
| |||||||||||||||||||
Income From Investment Operations | ||||||||||||||||||||
Net investment income(a) | .11 | .12 | .12 | .12 | .12 | |||||||||||||||
Net realized and unrealized gain on investment transactions | 1.46 | 3.91 | 2.20 | 1.67 | 1.70 | |||||||||||||||
|
| |||||||||||||||||||
Net increase in net asset value from operations | 1.57 | 4.03 | 2.32 | 1.79 | 1.82 | |||||||||||||||
|
| |||||||||||||||||||
Less: Dividends and Distributions | ||||||||||||||||||||
Dividends from net investment income | (.13 | ) | (.14 | ) | (.09 | ) | (.15 | ) | (.10 | ) | ||||||||||
Distributions from net realized gain on investment transactions | (5.63 | ) | (1.64 | ) | – 0 | – | – 0 | – | – 0 | – | ||||||||||
|
| |||||||||||||||||||
Total dividends and distributions | (5.76 | ) | (1.78 | ) | (.09 | ) | (.15 | ) | (.10 | ) | ||||||||||
|
| |||||||||||||||||||
Net asset value, end of period | $ 12.59 | $ 16.78 | $ 14.53 | $ 12.30 | $ 10.66 | |||||||||||||||
|
| |||||||||||||||||||
Total Return | ||||||||||||||||||||
Total investment return based on net asset value(b) | 11.22 | %* | 29.19 | % | 18.92 | % | 16.99 | %* | 20.35 | %* | ||||||||||
Ratios/Supplemental Data | ||||||||||||||||||||
Net assets, end of period (000,000’s omitted) | $454 | $538 | $1,123 | $1,173 | $1,953 | |||||||||||||||
Ratio to average net assets of: | ||||||||||||||||||||
Expenses | .05 | % | .03 | % | .02 | % | .02 | % | .02 | %+ | ||||||||||
Net investment income | .84 | % | .79 | % | .87 | % | 1.10 | % | 1.09 | %+ | ||||||||||
Portfolio turnover rate | 56 | % | 59 | % | 57 | % | 85 | % | 91 | % | ||||||||||
See footnote summary on page 362.
| AB POOLING PORTFOLIOS • | 351 |
Financial Highlights
Selected Data For A Share Of Beneficial Interest Outstanding Throughout Each Period
| AB International Value | ||||||||||||||||||||
| Year Ended August 31, | ||||||||||||||||||||
| 2015 | 2014 | 2013 | 2012 | 2011 | ||||||||||||||||
|
| |||||||||||||||||||
Net asset value, beginning of period | $ 8.32 | $ 7.46 | $ 6.39 | $ 6.98 | $ 6.93 | |||||||||||||||
|
| |||||||||||||||||||
Income From Investment Operations | ||||||||||||||||||||
Net investment income(a) | .20 | .31 | .23 | .23 | .24 | |||||||||||||||
Net realized and unrealized gain (loss) on investment and foreign currency transactions | (.89 | ) | 1.01 | .98 | (.70 | ) | .13 | |||||||||||||
|
| |||||||||||||||||||
Net increase (decrease) in net asset value from operations | (.69 | ) | 1.32 | 1.21 | (.47 | ) | .37 | |||||||||||||
|
| |||||||||||||||||||
Less: Dividends | ||||||||||||||||||||
Dividends from net investment income | (.58 | ) | (.46 | ) | (.14 | ) | (.12 | ) | (.32 | ) | ||||||||||
|
| |||||||||||||||||||
Net asset value, end of period | $ 7.05 | $ 8.32 | $ 7.46 | $ 6.39 | $ 6.98 | |||||||||||||||
|
| |||||||||||||||||||
Total Return | ||||||||||||||||||||
Total investment return based on net asset value(b) | (8.59 | )% | 18.14 | % | 19.15 | % | (6.69 | )% | 4.82 | % | ||||||||||
Ratios/Supplemental Data | ||||||||||||||||||||
Net assets, end of period (000,000’s omitted) | $372 | $450 | $947 | $986 | $984 | |||||||||||||||
Ratio to average net assets of: | ||||||||||||||||||||
Expenses(c) | .08 | % | .05 | % | .05 | % | .04 | % | .04 | %+ | ||||||||||
Net investment income | 2.60 | % | 3.84 | % | 3.16 | % | 3.56 | % | 3.00 | %+ | ||||||||||
Portfolio turnover rate | 69 | % | 65 | % | 58 | % | 61 | % | 58 | % | ||||||||||
See footnote summary on page 362.
| 352 | • AB POOLING PORTFOLIOS |
Financial Highlights
Selected Data For A Share Of Beneficial Interest Outstanding Throughout Each Period
| AB International Growth | ||||||||||||||||||||
| Year Ended August 31, | ||||||||||||||||||||
| 2015 | 2014 | 2013 | 2012 | 2011 | ||||||||||||||||
|
| |||||||||||||||||||
Net asset value, beginning of period | $ 9.50 | $ 8.27 | $ 7.54 | $ 8.27 | $ 8.18 | |||||||||||||||
|
| |||||||||||||||||||
Income From Investment Operations | ||||||||||||||||||||
Net investment income(a) | .15 | .19 | .20 | .18 | .19 | |||||||||||||||
Net realized and unrealized gain (loss) on investment and foreign currency transactions | (1.18 | ) | 1.19 | .59 | (.78 | ) | .26 | |||||||||||||
|
| |||||||||||||||||||
Net increase (decrease) in net asset value from operations | (1.03 | ) | 1.38 | .79 | (.60 | ) | .45 | |||||||||||||
|
| |||||||||||||||||||
Less: Dividends | ||||||||||||||||||||
Dividends from net investment income | (.14 | ) | (.15 | ) | (.06 | ) | (.13 | ) | (.36 | ) | ||||||||||
|
| |||||||||||||||||||
Net asset value, end of period | $ 8.33 | $ 9.50 | $ 8.27 | $ 7.54 | $ 8.27 | |||||||||||||||
|
| |||||||||||||||||||
Total Return | ||||||||||||||||||||
Total investment return based on net asset value(b) | (10.86 | )% | 16.89 | % | 10.53 | % | (7.19 | )% | 5.15 | % | ||||||||||
Ratios/Supplemental Data | ||||||||||||||||||||
Net assets, end of period (000,000’s omitted) | $375 | $447 | $941 | $999 | $1,022 | |||||||||||||||
Ratio to average net assets of: | ||||||||||||||||||||
Expenses | .09 | % | .05 | % | .04 | % | .04 | % | .04 | %+ | ||||||||||
Net investment income | 1.72 | % | 2.13 | % | 2.40 | % | 2.36 | % | 2.15 | %+ | ||||||||||
Portfolio turnover rate | 52 | % | 61 | % | 55 | % | 93 | % | 73 | % | ||||||||||
See footnote summary on page 362.
| AB POOLING PORTFOLIOS • | 353 |
Financial Highlights
Selected Data For A Share Of Beneficial Interest Outstanding Throughout Each Period
| AB Short Duration Bond | ||||||||||||||||||||
| Year Ended August 31, | ||||||||||||||||||||
| 2015 | 2014 | 2013 | 2012 | 2011 | ||||||||||||||||
|
| |||||||||||||||||||
Net asset value, beginning of period | $ 9.44 | $ 9.42 | $ 9.56 | $ 9.59 | $ 9.56 | |||||||||||||||
|
| |||||||||||||||||||
Income From Investment Operations | ||||||||||||||||||||
Net investment income(a) | .09 | .10 | .09 | .12 | .17 | |||||||||||||||
Net realized and unrealized gain (loss) on investment transactions | (.01 | ) | .04 | † | (.08 | ) | – 0 | – | .05 | |||||||||||
|
| |||||||||||||||||||
Net increase in net asset value from operations | .08 | .14 | .01 | .12 | .22 | |||||||||||||||
|
| |||||||||||||||||||
Less: Dividends and Distributions | ||||||||||||||||||||
Dividends from net investment income | (.09 | ) | (.12 | ) | (.15 | ) | (.15 | ) | (.19 | ) | ||||||||||
Tax return of capital | – 0 | – | (.00 | )(d) | – 0 | – | – 0 | – | – 0 | – | ||||||||||
|
| |||||||||||||||||||
Total dividends and distributions | (.09 | ) | (.12 | ) | (.15 | ) | (.15 | ) | (.19 | ) | ||||||||||
|
| |||||||||||||||||||
Net asset value, end of period | $ 9.43 | $ 9.44 | $ 9.42 | $ 9.56 | $ 9.59 | |||||||||||||||
|
| |||||||||||||||||||
Total Return | ||||||||||||||||||||
Total investment return based on net asset value(b) | .90 | % | 1.45 | % | .14 | %* | 1.24 | % | 2.36 | % | ||||||||||
Ratios/Supplemental Data | ||||||||||||||||||||
Net assets, end of period (000,000’s omitted) | $898 | $962 | $936 | $933 | $1,286 | |||||||||||||||
Ratio to average net assets of: | ||||||||||||||||||||
Expenses(c) | .04 | % | .03 | % | .03 | % | .03 | % | .05 | %+ | ||||||||||
Net investment income | .90 | % | 1.06 | % | .94 | % | 1.26 | % | 1.75 | %+ | ||||||||||
Portfolio turnover rate | 71 | % | 47 | % | 114 | % | 129 | % | 88 | % | ||||||||||
See footnote summary on page 362.
| 354 | • AB POOLING PORTFOLIOS |
Financial Highlights
Selected Data For A Share Of Beneficial Interest Outstanding Throughout Each Period
| AB Global Core Bond | ||||||||||||||||||||
| Year Ended August 31, | ||||||||||||||||||||
| 2015 | 2014 | 2013 | 2012 | 2011 | ||||||||||||||||
|
| |||||||||||||||||||
Net asset value, beginning of period | $ 10.52 | $ 10.18 | $ 11.00 | $ 10.88 | $ 10.78 | |||||||||||||||
|
| |||||||||||||||||||
Income From Investment Operations | ||||||||||||||||||||
Net investment income(a) | .26 | .29 | .29 | .33 | .41 | |||||||||||||||
Net realized and unrealized gain (loss) on investment and foreign currency transactions | (.04 | ) | .41 | (.38 | ) | .40 | .15 | |||||||||||||
|
| |||||||||||||||||||
Net increase (decrease) in net asset value from operations | .22 | .70 | (.09 | ) | .73 | .56 | ||||||||||||||
|
| |||||||||||||||||||
Less: Dividends and Distributions | ||||||||||||||||||||
Dividends from net investment income | (.52 | ) | (.34 | ) | (.37 | ) | (.34 | ) | (.43 | ) | ||||||||||
Distributions from net realized gain on investment transactions | (.18 | ) | (.02 | ) | (.36 | ) | (.27 | ) | (.03 | ) | ||||||||||
|
| |||||||||||||||||||
Total dividends and distributions | (.70 | ) | (.36 | ) | (.73 | ) | (.61 | ) | (.46 | ) | ||||||||||
|
| |||||||||||||||||||
Net asset value, end of period | $ 10.04 | $ 10.52 | $ 10.18 | $ 11.00 | $ 10.88 | |||||||||||||||
|
| |||||||||||||||||||
Total Return | ||||||||||||||||||||
Total investment return based on net asset value(b) | 2.15 | % | 7.05 | % | (.94 | )%* | 6.98 | %†† | 5.38 | % | ||||||||||
Ratios/Supplemental Data | ||||||||||||||||||||
Net assets, end of period (000,000’s omitted) | $931 | $1,032 | $1,041 | $1,124 | $1,307 | |||||||||||||||
Ratio to average net assets of: | ||||||||||||||||||||
Expenses(c) | .04 | % | .03 | % | .03 | % | .03 | % | .03 | %+ | ||||||||||
Net investment income | 2.56 | % | 2.86 | % | 2.77 | % | 2.99 | % | 3.87 | %+ | ||||||||||
Portfolio turnover rate | 150 | % | 169 | % | 116 | % | 163 | % | 114 | % | ||||||||||
See footnote summary on page 362.
| AB POOLING PORTFOLIOS • | 355 |
Financial Highlights
Selected Data For A Share Of Beneficial Interest Outstanding Throughout Each Period
| AB Bond Inflation Protection | ||||||||||||||||||||
| Year Ended August 31, | ||||||||||||||||||||
| 2015 | 2014 | 2013 | 2012 | 2011 | ||||||||||||||||
|
| |||||||||||||||||||
Net asset value, beginning of period | $ 10.25 | $ 10.15 | $ 11.22 | $ 11.46 | $ 10.70 | |||||||||||||||
|
| |||||||||||||||||||
Income From Investment Operations | ||||||||||||||||||||
Net investment income(a) | .12 | .33 | .32 | .38 | .68 | |||||||||||||||
Net realized and unrealized gain (loss) on investment and foreign currency transactions | (.40 | ) | .22 | (.69 | ) | .32 | .40 | |||||||||||||
|
| |||||||||||||||||||
Net increase (decrease) in net asset value from operations | (.28 | ) | .55 | (.37 | ) | .70 | 1.08 | |||||||||||||
|
| |||||||||||||||||||
Less: Dividends and Distributions | ||||||||||||||||||||
Dividends from net investment income | (.33 | ) | (.14 | ) | (.52 | ) | (.72 | ) | (.32 | ) | ||||||||||
Distributions from net realized gain on investment transactions | – 0 | – | (.31 | ) | (.18 | ) | (.22 | ) | – 0 | – | ||||||||||
|
| |||||||||||||||||||
Total dividends and distributions | (.33 | ) | (.45 | ) | (.70 | ) | (.94 | ) | (.32 | ) | ||||||||||
|
| |||||||||||||||||||
Net asset value, end of period | $ 9.64 | $ 10.25 | $ 10.15 | $ 11.22 | $ 11.46 | |||||||||||||||
|
| |||||||||||||||||||
Total Return | ||||||||||||||||||||
Total investment return based on net asset value(b) | (2.73 | )% | 5.63 | % | (3.70 | )% | 6.59 | % | 10.28 | % | ||||||||||
Ratios/Supplemental Data | ||||||||||||||||||||
Net assets, end of period (000’s omitted) | $717,018 | $776,378 | $753,515 | $792,721 | $712,731 | |||||||||||||||
Ratio to average net assets of: | ||||||||||||||||||||
Expenses(c) | .13 | % | .08 | % | .13 | % | .11 | % | .12 | %+ | ||||||||||
Net investment income | 1.24 | % | 3.22 | % | 3.00 | % | 3.44 | % | 6.21 | %+ | ||||||||||
Portfolio turnover rate | 56 | % | 72 | % | 49 | % | 52 | % | 39 | % | ||||||||||
See footnote summary on page 362.
| 356 | • AB POOLING PORTFOLIOS |
Financial Highlights
Selected Data For A Share Of Beneficial Interest Outstanding Throughout Each Period
| AB High-Yield | ||||||||||||||||||||
| Year Ended August 31, | ||||||||||||||||||||
| 2015 | 2014 | 2013 | 2012 | 2011 | ||||||||||||||||
|
| |||||||||||||||||||
Net asset value, beginning of period | $ 10.90 | $ 10.38 | $ 10.31 | $ 9.71 | $ 9.85 | |||||||||||||||
|
| |||||||||||||||||||
Income From Investment Operations | ||||||||||||||||||||
Net investment income(a) | .67 | .72 | .75 | .76 | .87 | |||||||||||||||
Net realized and unrealized gain (loss) on investment and foreign currency transactions | (.91 | ) | .53 | .18 | .53 | (.08 | ) | |||||||||||||
Contributions from Affiliates | – 0 | – | – 0 | – | .00 | – 0 | – | .00 | (d) | |||||||||||
|
| |||||||||||||||||||
Net increase (decrease) in net asset value from operations | (.24 | ) | 1.25 | .93 | 1.29 | .79 | ||||||||||||||
|
| |||||||||||||||||||
Less: Dividends | ||||||||||||||||||||
Dividends from net investment income | (.74 | ) | (.73 | ) | (.86 | ) | (.69 | ) | (.93 | ) | ||||||||||
|
| |||||||||||||||||||
Net asset value, end of period | $ 9.92 | $ 10.90 | $ 10.38 | $ 10.31 | $ 9.71 | |||||||||||||||
|
| |||||||||||||||||||
Total Return | ||||||||||||||||||||
Total investment return based on net asset value(b) | (2.27 | )%* | 12.44 | % | 9.24 | % | 13.95 | % | 8.07 | % | ||||||||||
Ratios/Supplemental Data | ||||||||||||||||||||
Net assets, end of period (000’s omitted) | $322,839 | $364,934 | $366,553 | $397,208 | $482,423 | |||||||||||||||
Ratio to average net assets of: | ||||||||||||||||||||
Expenses(c) | .13 | % | .11 | % | .09 | % | .07 | % | .07 | %+ | ||||||||||
Net investment income. | 6.45 | % | 6.68 | % | 7.15 | % | 7.87 | % | 8.53 | %+ | ||||||||||
Portfolio turnover rate | 51 | % | 54 | % | 63 | % | 57 | % | 55 | % | ||||||||||
See footnote summary on page 362.
| AB POOLING PORTFOLIOS • | 357 |
Financial Highlights
Selected Data For A Share Of Beneficial Interest Outstanding Throughout Each Period
| AB Small-Mid Cap Value | ||||||||||||||||||||
| Year Ended August 31, | ||||||||||||||||||||
| 2015 | 2014 | 2013 | 2012 | 2011 | ||||||||||||||||
|
| |||||||||||||||||||
Net asset value, beginning of period | $ 14.28 | $ 13.09 | $ 11.72 | $ 10.38 | $ 9.08 | |||||||||||||||
|
| |||||||||||||||||||
Income From Investment Operations | ||||||||||||||||||||
Net investment income(a) | .15 | .22 | .18 | .16 | .15 | |||||||||||||||
Net realized and unrealized gain (loss) on investment transactions | (.35 | ) | 2.89 | 2.94 | 1.30 | 1.30 | ||||||||||||||
|
| |||||||||||||||||||
Net increase (decrease) in net asset value from operations | (.20 | ) | 3.11 | 3.12 | 1.46 | 1.45 | ||||||||||||||
|
| |||||||||||||||||||
Less: Dividends and Distributions | ||||||||||||||||||||
Dividends from net investment income | (.17 | ) | (.20 | ) | (.26 | ) | (.12 | ) | (.15 | ) | ||||||||||
Distributions from net realized gain on investment transactions | (2.64 | ) | (1.72 | ) | (1.49 | ) | – 0 | – | – 0 | – | ||||||||||
|
| |||||||||||||||||||
Total dividends and distributions | (2.81 | ) | (1.92 | ) | (1.75 | ) | (.12 | ) | (.15 | ) | ||||||||||
|
| |||||||||||||||||||
Net asset value, end of period | $ 11.27 | $ 14.28 | $ 13.09 | $ 11.72 | $ 10.38 | |||||||||||||||
|
| |||||||||||||||||||
Total Return | ||||||||||||||||||||
Total investment return based on net asset value(b) | (1.38 | )% | 25.46 | %* | 29.94 | % | 14.21 | % | 15.84 | % | ||||||||||
Ratios/Supplemental Data | ||||||||||||||||||||
Net assets, end of period (000’s omitted) | $281,724 | $323,134 | $311,954 | $328,749 | $497,049 | |||||||||||||||
Ratio to average net assets of: | ||||||||||||||||||||
Expenses | .08 | % | .06 | % | .06 | % | .05 | % | .04 | %+ | ||||||||||
Net investment income | 1.23 | % | 1.62 | % | 1.48 | % | 1.47 | % | 1.36 | %+ | ||||||||||
Portfolio turnover rate | 40 | % | 50 | % | 49 | % | 52 | % | 65 | % | ||||||||||
See footnote summary on page 362.
| 358 | • AB POOLING PORTFOLIOS |
Financial Highlights
Selected Data For A Share Of Beneficial Interest Outstanding Throughout Each Period
| AB Small-Mid Cap Growth | ||||||||||||||||||||
| Year Ended August 31, | ||||||||||||||||||||
| 2015 | 2014 | 2013 | 2012 | 2011 | ||||||||||||||||
|
| |||||||||||||||||||
Net asset value, beginning of period | $ 12.56 | $ 13.16 | $ 13.23 | $ 16.09 | $ 11.77 | |||||||||||||||
|
| |||||||||||||||||||
Income From Investment Operations | ||||||||||||||||||||
Net investment income(a) | .00 | (d) | .06 | .09 | .08 | .07 | ||||||||||||||
Net realized and unrealized gain on investment transactions | .42 | 2.03 | 2.62 | 2.15 | 4.32 | |||||||||||||||
|
| |||||||||||||||||||
Net increase in net asset value from operations | .42 | 2.09 | 2.71 | 2.23 | 4.39 | |||||||||||||||
|
| |||||||||||||||||||
Less: Dividends and Distributions | ||||||||||||||||||||
Dividends from net investment income | (.07 | ) | (.07 | ) | (.09 | ) | (.09 | ) | (.07 | ) | ||||||||||
Distributions from net realized gain on investment transactions | (1.97 | ) | (2.62 | ) | (2.69 | ) | (5.00 | ) | – 0 | – | ||||||||||
|
| |||||||||||||||||||
Total dividends and distributions | (2.04 | ) | (2.69 | ) | (2.78 | ) | (5.09 | ) | (.07 | ) | ||||||||||
|
| |||||||||||||||||||
Net asset value, end of period | $ 10.94 | $ 12.56 | $ 13.16 | $ 13.23 | $ 16.09 | |||||||||||||||
|
| |||||||||||||||||||
Total Return | ||||||||||||||||||||
Total investment return based on net asset value(b) | 3.92 | % | 17.04 | %* | 25.85 | %* | 17.77 | %* | 37.31 | %* | ||||||||||
Ratios/Supplemental Data | ||||||||||||||||||||
Net assets, end of period (000’s omitted) | $279,873 | $322,200 | $316,708 | $328,634 | $504,936 | |||||||||||||||
Ratio to average net assets of: | ||||||||||||||||||||
Expenses | .09 | % | .07 | % | .06 | % | .06 | % | .04 | %+ | ||||||||||
Net investment income | .01 | % | .51 | % | .70 | % | .55 | % | .43 | %+ | ||||||||||
Portfolio turnover rate | 55 | % | 65 | % | 72 | % | 68 | % | 75 | % | ||||||||||
See footnote summary on page 362.
| AB POOLING PORTFOLIOS • | 359 |
Financial Highlights
Selected Data For A Share Of Beneficial Interest Outstanding Throughout Each Period
| AB Multi-Asset Real Return** | ||||||||||||||||||||
| Year Ended August 31, | ||||||||||||||||||||
| 2015 | 2014 | 2013 | 2012 | 2011 | ||||||||||||||||
|
| |||||||||||||||||||
Net asset value, beginning of period | $ 8.95 | $ 8.25 | $ 8.67 | $ 9.13 | $ 8.57 | |||||||||||||||
|
| |||||||||||||||||||
Income From Investment Operations | ||||||||||||||||||||
Net investment income(a) | .16 | .19 | .17 | .18 | .24 | |||||||||||||||
Net realized and unrealized gain (loss) on investment and foreign currency transactions | (2.58 | ) | .75 | (.31 | ) | (.25 | ) | 1.06 | ||||||||||||
Contributions from Affiliates | .00 | (d) | .00 | (d) | .00 | (d) | – 0 | – | – 0 | – | ||||||||||
|
| |||||||||||||||||||
Net increase (decrease) in net asset value from operations | (2.42 | ) | .94 | (.14 | ) | (.07 | ) | 1.30 | ||||||||||||
|
| |||||||||||||||||||
Less: Dividends | ||||||||||||||||||||
Dividends from net investment income | (.26 | ) | (.24 | ) | (.28 | ) | (.39 | ) | (.74 | ) | ||||||||||
|
| |||||||||||||||||||
Net asset value, end of period | $ 6.27 | $ 8.95 | $ 8.25 | $ 8.67 | $ 9.13 | |||||||||||||||
|
| |||||||||||||||||||
Total Return | ||||||||||||||||||||
Total investment return based on net asset value(b) | (27.40 | )% | 11.48 | % | (1.69 | )% | (.45 | )%* | 15.42 | % | ||||||||||
Ratios/Supplemental Data | ||||||||||||||||||||
Net assets, end of period (000’s omitted) | $832,827 | $800,178 | $724,226 | $547,929 | $937,281 | |||||||||||||||
Ratio to average net assets of: | ||||||||||||||||||||
Expenses | .07 | % | .07 | % | .06 | % | .06 | % | .05 | %+ | ||||||||||
Net investment income | 2.13 | % | 2.17 | % | 1.89 | % | 2.11 | % | 2.52 | %+ | ||||||||||
Portfolio turnover rate | 45 | % | 76 | % | 126 | % | 110 | % | 156 | % | ||||||||||
See footnote summary on page 362.
| 360 | • AB POOLING PORTFOLIOS |
Financial Highlights
Selected Data For A Share Of Beneficial Interest Outstanding Throughout Each Period
| AB Volatility Management | ||||||||||||||||||||
| Year Ended August 31, | ||||||||||||||||||||
| 2015 | 2014 | 2013 | 2012 | 2011 | ||||||||||||||||
|
| |||||||||||||||||||
Net asset value, beginning of period | $ 12.53 | $ 11.38 | $ 10.24 | $ 10.27 | $ 9.31 | |||||||||||||||
|
| |||||||||||||||||||
Income From Investment Operations | ||||||||||||||||||||
Net investment income(a) | .24 | .24 | .15 | .07 | .09 | (e) | ||||||||||||||
Net realized and unrealized gain (loss) on investment and foreign currency transactions | (.63 | ) | 2.10 | 1.11 | .24 | 1.36 | ||||||||||||||
|
| |||||||||||||||||||
Net increase (decrease) in net asset value from operations | (.39 | ) | 2.34 | 1.26 | .31 | 1.45 | ||||||||||||||
|
| |||||||||||||||||||
Less: Dividends and Distributions | ||||||||||||||||||||
Dividends from net investment income | (.37 | ) | (.37 | ) | (.12 | ) | (.06 | ) | (.08 | ) | ||||||||||
Distributions from net realized gain on investment transactions | (.55 | ) | (.82 | ) | – 0 | – | (.28 | ) | (.41 | ) | ||||||||||
|
| |||||||||||||||||||
Total dividends and distributions | (.92 | ) | (1.19 | ) | (.12 | ) | (.34 | ) | (.49 | ) | ||||||||||
|
| |||||||||||||||||||
Net asset value, end of period | $ 11.22 | $ 12.53 | $ 11.38 | $ 10.24 | $ 10.27 | |||||||||||||||
|
| |||||||||||||||||||
Total Return | ||||||||||||||||||||
Total investment return based on net asset value(b) | (3.35 | )% | 21.69 | % | 12.40 | % | 3.10 | % | 15.61 | % | ||||||||||
Ratios/Supplemental Data | ||||||||||||||||||||
Net assets, end of period (000,000’s omitted) | $1,278 | $1,494 | $1,590 | $1,688 | $284 | |||||||||||||||
Ratio to average net assets of: | ||||||||||||||||||||
Expenses, net of waivers/reimbursements | .05 | % | .05 | % | .05 | % | .04 | % | .15 | %+ | ||||||||||
Expenses, before waivers/reimbursements | .05 | % | .05 | % | .05 | % | .04 | % | .16 | %+ | ||||||||||
Net investment income | 2.01 | % | 2.04 | % | 1.40 | % | .68 | % | .88 | %+(e) | ||||||||||
Portfolio turnover rate | 13 | % | 41 | % | 80 | % | 130 | % | 81 | % | ||||||||||
See footnote summary on page 362.
| AB POOLING PORTFOLIOS • | 361 |
Financial Highlights
| (a) | Based on average shares outstanding. |
| (b) | Total investment return is calculated assuming an initial investment made at the net asset value at the beginning of the period, reinvestment of all dividends and distributions at net asset value during the period, and redemption on the last day of the period. Total return does not reflect the deduction of taxes that a shareholder would pay on fund distributions or the redemption of fund shares. Total investment return calculated for a period of less than one year is not annualized. |
| (c) | The expense ratios presented below exclude interest expense where applicable: |
| Year Ended August 31, | ||||||||||||||||||||
| 2015 | 2014 | 2013 | 2012 | 2011 | ||||||||||||||||
| AB International Value Portfolio | ||||||||||||||||||||
Expenses | N/A | .05 | % | N/A | N/A | N/A | ||||||||||||||
| AB Short Duration Bond Portfolio | ||||||||||||||||||||
Expenses | N/A | .03 | % | N/A | N/A | N/A | ||||||||||||||
| AB Global Core Bond Portfolio | ||||||||||||||||||||
Expenses | N/A | .03 | % | N/A | N/A | N/A | ||||||||||||||
| AB Bond Inflation Protection Portfolio | ||||||||||||||||||||
Expenses | .05 | % | .04 | % | .04 | % | .04 | % | .04 | %+ | ||||||||||
| AB High-Yield Portfolio | ||||||||||||||||||||
Expenses | N/A | N/A | .09 | % | N/A | N/A | + | |||||||||||||
| (d) | Amount is less than $0.005. |
| (e) | Net of fees and expenses waived/reimbursed by the Adviser. |
| * | Includes the impact of proceeds received and credited to the Portfolio resulting from the class action settlements, which enhanced the performance for the AB U.S. Value Portfolio for years ended August 31, 2015, August 31, 2014, August 31, 2013 and August 31, 2012 by 0.34%, 0.04%, 0.08% and 0.01%, respectively, AB U.S. Large Cap Growth Portfolio for the years ended August 31, 2015, August 31, 2012 and August 31, 2011 by 0.01%, 0.02% and 0.01%, respectively, AB Short Duration Bond Portfolio for the year ended August 31, 2013 by 0.02%, AB Global Core Bond for the year ended August 31, 2013 by 0.01%, AB Small-Mid Cap Value Portfolio for the year ended August 31, 2014 by 0.04%, AB Small-Mid Cap Growth Portfolio for the years ended August 31, 2014, August 31, 2013, August 31, 2012 and August 31, 2011 by 0.08%, 0.14%, 0.01% and 0.01%, respectively, AB High Yield Portfolio for the year ended August 31, 2015 by 0.09% and AB Multi-Asset Real Return Portfolio for the year ended August 31, 2012 by 0.01%. |
| ** | Consolidated (see Note A). |
| † | Due to timing of sales and repurchase of capital shares, the net realized and unrealized gain (loss) per share is not in accord with the Portfolio change in net realized and unrealized gain (loss) on investment transactions for the period. |
| †† | Includes the Adviser’s reimbursement in respect of the Lehman Bankruptcy Claim which contributed to the Portfolio’s performance by 0.09% for the year-ended August 31, 2012. |
| + | The ratio includes expenses attributable to costs of proxy solicitation. |
See notes to financial statements.
| 362 | • AB POOLING PORTFOLIOS |
Financial Highlights
REPORT OF INDEPENDENT REGISTERED PUBLIC ACCOUNTING FIRM
To the Board of Trustees and Shareholders of The AB Pooling Portfolios
We have audited the accompanying statements of assets and liabilities, including the portfolios of investments, of The AB Pooling Portfolios, formerly The AllianceBernstein Pooling Portfolios (comprising, respectively, the AB U.S. Value Portfolio, AB U.S. Large Cap Growth Portfolio, AB International Value Portfolio, AB International Growth Portfolio, AB Short Duration Bond Portfolio, AB Global Core Bond Portfolio, AB Bond Inflation Protection Portfolio, AB High-Yield Portfolio, AB Small-Mid Cap Value Portfolio, AB Small-Mid Cap Growth Portfolio, AB Multi-Asset Real Return Portfolio, and AB Volatility Management Portfolio, formerly the AllianceBernstein U.S. Value Portfolio, the AllianceBernstein U.S. Large Cap Growth Portfolio, AllianceBernstein International Value Portfolio, AllianceBernstein International Growth Portfolio, AllianceBernstein Short Duration Bond Portfolio, AllianceBernstein Global Core Bond Portfolio, AllianceBernstein Bond Inflation Protection Portfolio, AllianceBernstein High-Yield Portfolio, AllianceBernstein Small-Mid Cap Value Portfolio, AllianceBernstein Small-Mid Cap Growth Portfolio, AllianceBernstein Multi-Asset Real Return Portfolio, and AllianceBernstein Volatility Management Portfolio, respectively) (the “Fund”), as of August 31, 2015, and the related statements of operations for the year then ended, the statements of changes in net assets for each of the two years in the period then ended, the financial highlights for each of the five years in the period then ended, and the statement of cash flows for the year then ended for AB Bond Inflation Protection Portfolio. These financial statements and financial highlights are the responsibility of the Fund’s management. Our responsibility is to express an opinion on these financial statements and financial highlights based on our audits.
We conducted our audits in accordance with the standards of the Public Company Accounting Oversight Board (United States). Those standards require that we plan and perform the audit to obtain reasonable assurance about whether the financial statements and financial highlights are free of material misstatement. We were not engaged to perform an audit of the Fund’s internal control over financial reporting. Our audits included consideration of internal control over financial reporting as a basis for designing audit procedures that are appropriate in the circumstances, but not for the purpose of expressing an opinion on the effectiveness of the Fund’s internal control over financial reporting. Accordingly, we express no such opinion. An audit also includes examining, on a test basis, evidence supporting the amounts and disclosures in the financial statements and financial highlights, assessing the accounting principles used and significant estimates made by management, and evaluating the overall financial statement presentation. Our procedures included confirmation of securities owned as of August 31, 2015 by correspondence with the custodian and others, or by other appropriate auditing procedures where replies from others were not received. We believe that our audits provide a reasonable basis for our opinion.
| AB POOLING PORTFOLIOS • | 363 |
Report of Independent Registered Public Accounting Firm
In our opinion, the financial statements and financial highlights referred to above present fairly, in all material respects, the financial position of each of the respective portfolios constituting The AB Pooling Portfolios at August 31, 2015, the results of their operations for the year then ended, the changes in their net assets for each of the two years in the period then ended, the financial highlights for each of the five years in the period then ended, and the cash flows for AB Bond Inflation Protection Portfolio for the year then ended, in conformity with U.S. generally accepted accounting principles.

New York, New York
October 30, 2015
| 364 | • AB POOLING PORTFOLIOS |
Report of Independent Registered Public Accounting Firm
FEDERAL TAX INFORMATION
(unaudited)
For Federal income tax purposes, the following information is furnished with respect to the distributions paid by each applicable Portfolio during the taxable year ended August 31, 2015. For corporate shareholders, the following percentages of dividends paid by each Portfolio qualify for the dividends received deduction. Additionally, for foreign shareholders the following percentages of dividends paid by each Portfolio may be considered to be qualifying to be taxed as interest-related dividends.
| Portfolio | Dividends Received Deduction % (corporate shareholders) | % of Qualified Interest Income (foreign shareholders) | ||||||
AB U.S. Value | 85.95 | % | 0.00 | % | ||||
AB U.S. Large Cap Growth | 27.24 | % | 0.00 | % | ||||
AB International Value | 0.00 | % | 0.00 | % | ||||
AB International Growth | 0.00 | % | 0.00 | % | ||||
AB Short Duration Bond | 0.00 | % | 94.11 | % | ||||
AB Global Core Bond | 0.00 | % | 21.25 | % | ||||
AB Bond Inflation Protection | 0.00 | % | 86.88 | % | ||||
AB High-Yield | 3.33 | % | 55.14 | % | ||||
AB Small-Mid Cap Value | 42.64 | % | 0.00 | % | ||||
AB Small-Mid Cap Growth | 63.90 | % | 0.00 | % | ||||
AB Multi-Asset Real Return | 11.47 | % | 1.30 | % | ||||
AB Volatility Management | 12.88 | % | 0.00 | % | ||||
For the taxable year ended August 31, 2015, each Portfolio designates the following amounts as the maximum amount that may be considered qualified dividend income for individual shareholders:
| Portfolio | Qualified Dividend Income | |||
AB U.S. Value | $ | 10,125,216 | ||
AB U.S. Large Cap Growth | 4,290,924 | |||
AB International Value | 6,519,353 | |||
AB International Growth | 5,354,657 | |||
AB Short Duration Bond | – 0 | – | ||
AB Global Core Bond | – 0 | – | ||
AB Bond Inflation Protection | – 0 | – | ||
AB High-Yield | 822,836 | |||
AB Small-Mid Cap Value | 2,855,779 | |||
AB Small-Mid Cap Growth | 1,011,581 | |||
AB Multi-Asset Real Return | 9,652,588 | |||
AB Volatility Management | 18,967,869 | |||
Shareholders should not use the above information to prepare their income tax returns. The information necessary to complete your income tax returns will be included with your Form 1099-DIV which will be sent to you separately in January 2016.
| AB POOLING PORTFOLIOS • | 365 |
TRUSTEES
Marshall C. Turner, Jr.(1) , Chairman John H. Dobkin(1) Michael J. Downey(1) William H. Foulk, Jr.(1) D. James Guzy(1) | Nancy P. Jacklin(1) Robert M. Keith, President and Chief Executive Officer Garry L. Moody(1) Earl D. Weiner(1) | |
| OFFICERS(2) | ||
Philip L. Kirstein, Senior Vice President and Independent Compliance Officer Bruce K. Aronow, Vice President Takeo Aso, Vice President Frank V. Caruso, Vice President Vinod Chathlani, Vice President Sergey Davalchenko, Vice President Jon P. Denfeld, Vice President Paul J. DeNoon, Vice President Scott A. DiMaggio, Vice President Gershon M. Distenfeld, Vice President Vincent C. DuPont, Vice President John H. Fogarty, Vice President Rajen B. Jadav, Vice President Shawn E. Keegan, Vice President N. Kumar Kirpalani, Vice President Samantha S. Lau, Vice President Avi Lavi, Vice President Daniel J. Loewy, Vice President James W. MacGregor, Vice President | Alison M. Martier, Vice President Christopher W. Marx, Vice President Michael L. Mon, Vice President Joseph G. Paul, Vice President Douglas J. Peebles, Vice President Gregory L. Powell, Vice President Jonathan E. Ruff, Vice President Laurent Saltiel, Vice President Ashish C. Shah, Vice President Matthew S. Sheridan, Vice President Kevin F. Simms, Vice President Shri Singhvi, Vice President Wen-Tse Tseng, Vice President Greg J. Wilensky, Vice President Vadim Zlotnikov, Vice President Emilie D. Wrapp, Secretary Joseph J. Mantineo, Treasurer and Chief Financial Officer Phyllis J. Clarke, Controller Vincent S. Noto, Chief Compliance Officer | |
Custodian and Accounting Agent State Street Bank and Trust Company
Principal Underwriter AllianceBernstein Investments, Inc.
Transfer Agent AllianceBernstein Investor | Legal Counsel Seward & Kissel LLP
Independent Registered Public Ernst & Young LLP | |
| 366 | • AB POOLING PORTFOLIOS |
Trustees
| (1) | Member of the Audit Committee, the Governance and Nominating Committee and the Independent Directors Committee. |
| (2) | The management of, and investment decisions for, the AB Multi-Asset Real Return Portfolio are made by the Real Asset Strategy Team. Messrs. Loewy, Zlotnikov and Chathlani are the senior most members of the Investment Management Team. |
| The management of, and investment decisions for, the AB U.S. Value Portfolio are made by the U.S. Value Senior Investment Management Team. Mr. Joseph G. Paul, Mr. Christopher W. Marx and Mr. Gregory L. Powell are the senior most members of the Investment Management Team. |
| The management of, and investment decisions for, the AB Small-Mid Cap Value Portfolio are made by the Small-Mid Cap Value Senior Investment Management Team. Mr. Joseph G. Paul, Mr. James W. MacGregor and Mr. Shri Singhvi are the senior most members of the Investment Management Team. |
| The management of, and investment decisions for, the AB International Value Portfolio are made by the International Value Senior Investment Management Team. Mr. Takeo Aso, Mr. Avi Lavi and Mr. Kevin F. Simms are the senior most members of the Investment Management Team. |
| The management of, and investment decisions for, the AB U.S. Large Cap Growth Portfolio are made by the U.S. Large Cap Growth Team. Mr. Frank V. Caruso, Mr. Vincent C. DuPont and Mr. John H. Fogarty are the senior most members of the team. |
| The management of, and investment decisions for, the AB Small-Mid Cap Growth Portfolio are made by the Small/Mid Cap Growth Investment Team. Mr. Bruce K. Aronow, Mr. N. Kumar Kirpalani, Ms. Samantha S. Lau and Mr. Wen-Tse Tseng are the senior most members of the team. |
| The management of, and investment decisions for, the AB International Growth Portfolio are made by the International Growth Team. Mr. Sergey Davalchenko and Mr. Laurent Saltiel are the senior most members of the team. |
| The management of, and investment decisions for, the AB Short Duration Bond Portfolio are made by the U.S. Multi Sector Fixed Income Team. Mr. Jon P. Denfeld, Mr. Paul J. DeNoon, Mr. Shawn E. Keegan, Ms. Alison M. Martier, Mr. Douglas J. Peebles and Mr. Greg J. Wilensky are the senior most members of the team. |
| The management of, and investment decisions for, the AB Global Core Bond Portfolio are made by the U.S. Global Fixed Income Investment Team. Mr. Paul J. DeNoon, Mr. Scott A. DiMaggio, Mr. Michael L. Mon, Mr. Douglas J. Peebles and Mr. Matthew S. Sheridan are the senior most members of the team. |
| The management of, and investment decisions for, the AB High-Yield Portfolio are made by the Global Credit Investment Team. Mr. Gershon M. Distenfeld, Mr. Douglas J. Peebles and Mr. Ashish C. Shah are the senior most members of the team. |
| Mr. Rajen B. Jadav, Mr. Shawn E. Keegan and Mr. Greg J. Wilensky are primarily responsible for the day-to-day management of the AB Bond Inflation Protection Portfolio. |
| The day-to-day management of, and investment decisions for, the AB Volatility Management Portfolio are made by the Adviser’s Dynamic Asset Allocation Team. Mr. Daniel J. Loewy and Mr. Vadim Zlotnikov are primarily responsible for the day-to-day management of the Portfolio. |
| AB POOLING PORTFOLIOS • | 367 |
Trustees
MANAGEMENT OF THE FUND
Trustee Information
The business and affairs of the Trust are managed under the direction of the Trustees. Certain information concerning the Trustees of the Trust is set forth below.
| NAME, ADDRESS*, AGE, (YEAR FIRST ELECTED**) | PRINCIPAL OCCUPATION(S) DURING PAST FIVE YEARS AND OTHER RELEVANT QUALIFICATIONS*** | PORTFOLIOS IN FUND COMPLEX OVERSEEN BY DIRECTOR | OTHER PUBLIC COMPANY DIRECTORSHIPS CURRENTLY HELD BY DIRECTOR | |||||
| INTERESTED DIRECTOR | ||||||||
Robert M. Keith, # 1345 Avenue of the Americas New York, NY 10105 55 (2010) | Senior Vice President of AllianceBernstein L.P. (the “Adviser”) and the head of AllianceBernstein Investments, Inc. (“ABI”) since July 2008; Director of ABI and President of the AB Mutual Funds. Previously, he served as Executive Managing Director of ABI from December 2006 to June 2008. Prior to joining ABI in 2006, Executive Managing Director of Bernstein Global Wealth Management, and prior thereto, Senior Managing Director and Global Head of Client Service and Sales of the Adviser’s institutional investment management business since 2004. Prior thereto, he was Managing Director and Head of North American Client Service and Sales in the Adviser’s institutional investment management business, with which he had been associated since prior to 2004. | 121 | None | |||||
| 368 | • AB POOLING PORTFOLIOS |
Management of the Fund
| NAME, ADDRESS*, AGE, (YEAR FIRST ELECTED**) | PRINCIPAL OCCUPATION(S) DURING PAST FIVE YEARS AND OTHER RELEVANT QUALIFICATIONS*** | PORTFOLIOS IN FUND COMPLEX OVERSEEN BY DIRECTOR | OTHER PUBLIC COMPANY DIRECTORSHIPS CURRENTLY HELD BY DIRECTOR | |||||
| DISINTERESTED DIRECTORS | ||||||||
Marshall C. Turner, Jr., ## Chairman of the Board 74 (2005) | Private Investor since prior to 2010. Former Chairman and CEO of Dupont Photomasks, Inc. (components of semi-conductor manufacturing). He has extensive operating leadership and venture capital investing experience, including five interim or full-time CEO roles, and prior service as general partner of institutional venture capital partnerships. He also has extensive non-profit board leadership experience, and currently serves on the boards of two education and science-related non-profit organizations. He has served as a director of one AB fund since 1992, and director or trustee of multiple AB Funds since 2005. He has been Chairman of the AB Funds since January 2014, and the Chairman of the Independent Directors Committees of such Funds since February 2014. | 121 | Xilinx, Inc. (programmable logic semi-conductors) since 2007 | |||||
John H. Dobkin, ## 73 (2005) | Independent Consultant since prior to 2010. Formerly, President of Save Venice, Inc. (preservation organization) from 2001-2002; Senior Advisor from June 1999-June 2000 and President of Historic Hudson Valley (historic preservation) from December 1989-May 1999. Previously, Director of the National Academy of Design. He has served as a director or trustee of various AB Funds since 1992, and as Chairman of the Audit Committees of a number of such Funds from 2001-2008. | 121 | None | |||||
| AB POOLING PORTFOLIOS • | 369 |
Management of the Fund
| NAME, ADDRESS*, AGE, (YEAR FIRST ELECTED**) | PRINCIPAL OCCUPATION(S) DURING PAST FIVE YEARS AND OTHER RELEVANT QUALIFICATIONS*** | PORTFOLIOS IN FUND COMPLEX OVERSEEN BY DIRECTOR | OTHER PUBLIC COMPANY DIRECTORSHIPS CURRENTLY HELD BY DIRECTOR | |||||
DISINTERESTED DIRECTORS (continued) | ||||||||
Michael J. Downey, ## 71 (2005) | Private Investor since prior to 2010. Formerly, managing partner of Lexington Capital, LLC (investment advisory firm) from December 1997 until December 2003. He served as a Director of Prospect Acquisition Corp. (financial services) from 2007 until 2009. From 1987 until 1993, Chairman and CEO of Prudential Mutual Fund Management, director of the Prudential mutual funds, and member of the Executive Committee of Prudential Securities Inc. He has served as a director or trustee of the AB Funds since 2005 and is a director and Chairman of one other registered investment company. | 121 | Asia Pacific Fund, Inc. (registered investment company) since prior to 2010 | |||||
William H. Foulk, Jr., ## 83 (2005) | Investment Adviser and an Independent Consultant since prior to 2010. Previously, he was Senior Manager of Barrett Associates, Inc., a registered investment adviser. He was formerly Deputy Comptroller and Chief Investment Officer of the State of New York and, prior thereto, Chief Investment Officer of the New York Bank for Savings. He has served as a director or trustee of various AB Funds since 1983, and was Chairman of the Independent Directors Committees of the AB Funds from 2003 until early February 2014. He served as Chairman of such Funds from 2003 through December 2013. He is also active in a number of mutual fund related organizations and committees. | 121 | None | |||||
| 370 | • AB POOLING PORTFOLIOS |
Management of the Fund
| NAME, ADDRESS*, AGE, (YEAR FIRST ELECTED**) | PRINCIPAL OCCUPATION(S) DURING PAST FIVE YEARS AND OTHER RELEVANT QUALIFICATIONS*** | PORTFOLIOS IN FUND COMPLEX OVERSEEN BY DIRECTOR | OTHER PUBLIC COMPANY DIRECTORSHIPS CURRENTLY HELD BY DIRECTOR | |||||
DISINTERESTED DIRECTORS (continued) | ||||||||
D. James Guzy, ## 79 (2005) | Chairman of the Board of SRC Computers, Inc. (semi-conductors), with which he has been associated since prior to 2010. He served as Chairman of the Board of PLX Technology (semi-conductors) since prior to 2010 until November 2013. He was a director of Intel Corporation (semi-conductors) from 1969 until 2008, and served as Chairman of the Finance Committee of such company for several years until May 2008. He was a Director of Cirrus Logic Corporation (semi-conductors) from 1984 until July 2011. He has served as a director or trustee of one or more of the AB Funds since 1982. | 121 | None | |||||
Nancy P. Jacklin, ## 67 (2006) | Professorial Lecturer at the Johns Hopkins School of Advanced International Studies (2008-2015). U.S. Executive Director of the International Monetary Fund (which is responsible for ensuring the stability of the international monetary system), (December 2002-May 2006); Partner, Clifford Chance (1992-2002); Sector Counsel, International Banking and Finance, and Associate General Counsel, Citicorp (1985-1992); Assistant General Counsel (International), Federal Reserve Board of Governors (1982-1985); and Attorney Advisor, U.S. Department of the Treasury (1973-1982). Member of the Bar of the District of Columbia and of New York; and member of the Council on Foreign Relations. She has served as a director or trustee of the AB Funds since 2006 and has been Chairman of the Governance and Nominating Committees of the Funds since August 2014. | 121 | None | |||||
| AB POOLING PORTFOLIOS • | 371 |
Management of the Fund
| NAME, ADDRESS*, AGE, (YEAR FIRST ELECTED**) | PRINCIPAL OCCUPATION(S) DURING PAST FIVE YEARS AND OTHER RELEVANT QUALIFICATIONS*** | PORTFOLIOS IN FUND COMPLEX OVERSEEN BY DIRECTOR | OTHER PUBLIC COMPANY DIRECTORSHIPS CURRENTLY HELD BY DIRECTOR | |||||
DISINTERESTED DIRECTORS (continued) | ||||||||
Garry L. Moody, ## 63 (2008) | Independent Consultant. Formerly, Partner, Deloitte & Touche LLP (1995-2008) where he held a number of senior positions, including Vice Chairman, and U.S. and Global Investment Management Practice Managing Partner; President, Fidelity Accounting and Custody Services Company (1993-1995); and Partner, Ernst & Young LLP (1975-1993), where he served as the National Director of Mutual Fund Tax Services and Managing Partner of its Chicago Office Tax department. He is a member of both the Governing Council of the Independent Directors Council (IDC), an organization of independent directors of mutual funds, and the Trustee Advisory Board of BoardIQ, a biweekly publication focused on issues and news affecting directors of mutual funds. He has served as a director or trustee, and as Chairman of the Audit Committees, of the AB Funds since 2008. | 121 | None | |||||
Earl D. Weiner, ## 76 (2007) | Of Counsel, and Partner prior to January 2007, of the law firm Sullivan & Cromwell LLP and is a former member of the ABA Federal Regulation of Securities Committee Task Force to draft editions of the Fund Director’s Guidebook. He also serves as a director or trustee of various non-profit organizations and has served as Chairman or Vice Chairman of a number of them. He has served as a director or trustee of the AB Funds since 2007 and served as Chairman of the Governance and Nominating Committees of the AB Funds from 2007 until August 2014. | 121 | None | |||||
| 372 | • AB POOLING PORTFOLIOS |
Management of the Fund
| * | The address for each of the Fund’s disinterested Trustees is c/o AllianceBernstein L.P., Attention: Philip L. Kirstein, 1345 Avenue of the Americas, New York, NY 10105. |
| ** | There is no stated term of office for the Fund’s Trustees. |
| *** | The information above includes each Trustee’s principal occupation during the last five years and other information relating to the experience, attributes and skills relevant to each Trustee’s qualifications to serve as a Trustee, which led to the conclusion that each Trustee should serve as a Trustee for the Fund. |
| # | Mr. Keith is an “interested person” of the Fund, as defined in the 1940 Act, due to his position as a Senior Vice President of the Adviser. |
| ## | Member of the Audit Committee, the Governance and Nominating Committee and the Independent Directors Committee. |
| AB POOLING PORTFOLIOS • | 373 |
Management of the Fund
Officer Information
Certain information concerning the Fund’s Officers is listed below.
| NAME, ADDRESS* AND AGE | POSITION(S) HELD WITH TRUST | PRINCIPAL OCCUPATION DURING PAST FIVE YEARS | ||
Robert M. Keith 55 | President and Chief Executive Officer | See biography above. | ||
| Philip L. Kirstein 70 | Senior Vice President and Independent Compliance Officer | Senior Vice President and Independent Compliance Officer of the AB Funds, with which he has been associated since October 2004. Prior thereto, he was Of Counsel to Kirkpatrick & Lockhart, LLP from October 2003 to October 2004, and General Counsel of Merrill Lynch Investment Managers, L.P. since prior to March 2003. | ||
| Bruce K. Aronow 49 | Vice President | Senior Vice President of the Adviser,** with which he has been associated since prior to 2010. | ||
Takeo Aso 50 | Vice President | Senior Vice President of the Adviser,** with which he has been associated since prior to 2010. | ||
Frank V. Caruso 59 | Vice President | Senior Vice President of the Adviser,** with which he has been associated since prior to 2010. | ||
Sergey Davalchenko 40 | Vice President | Senior Vice President of the Adviser,** with which he has been associated since January 2011. In early 2012, he also became a Portfolio Manager for Emerging Markets Growth. Previously, he was a senior international analyst at Global Currents Investment Management, a subsidiary of Legg Mason from April 2008 to January 2011. Prior thereto, he was associated with Fenician Capital Management since prior to 2010. | ||
| Vinod S. Chathlani 32 | Vice President | Assistant Vice President of the Adviser** with which he has been associated since December 2013. Prior thereto, he was a risk analyst at Oppenheimer Funds and a corporate investment strategist at Reliance Communications (India) since prior to 2010. | ||
| Paul J. DeNoon 53 | Vice President | Senior Vice President of the Adviser,** with which he has been associated since prior to 2010. | ||
Jon P. Denfeld 45 | Vice President | Vice President of the Adviser,** with which he has been associated since prior to 2010. | ||
| 374 | • AB POOLING PORTFOLIOS |
Management of the Fund
| NAME, ADDRESS* AND AGE | POSITION(S) HELD WITH TRUST | PRINCIPAL OCCUPATION DURING PAST FIVE YEARS | ||
| Scott A. DiMaggio 44 | Vice President | Senior Vice President of the Adviser,** with which he has been associated since prior to 2010. | ||
| Gershon M. Distenfeld 39 | Vice President | Senior Vice President of the Adviser,** with which he has been associated since prior to 2010. | ||
| Vincent C. DuPont 53 | Vice President | Senior Vice President of the Adviser,** with which he has been associated since prior to 2010. | ||
| John H. Fogarty 45 | Vice President | Senior Vice President of the Adviser,** with which he has been associated since prior to 2010. | ||
| Rajen B. Jadav 40 | Vice President | Vice President of the Adviser,** with which he has been associated since prior to 2010. | ||
| Shawn E. Keegan 44 | Vice President | Senior Vice President of the Adviser,** with which he has been associated since prior to 2010. | ||
| N. Kumar Kirpalani 61 | Vice President | Senior Vice President of the Adviser,** with which he has been associated since prior to 2010. | ||
| Samantha S. Lau 43 | Vice President | Senior Vice President of the Adviser,** with which she has been associated since prior to 2010. | ||
| Avi Lavi 49 | Vice President | Senior Vice President of the Adviser,** with which he has been associated since prior to 2010. | ||
| Daniel J. Loewy 41 | Vice President | Senior Vice President of the Adviser,** with which he has been associated since prior to 2010. | ||
| James W. MacGregor 48 | Vice President | Senior Vice President of the Adviser,** with which he has been associated since prior to 2010. | ||
| Alison M. Martier 58 | Vice President | Senior Vice President of the Adviser,** with which she has been associated since prior to 2010. | ||
| Christopher W. Marx 48 | Vice President | Senior Vice President of the Adviser,** with which he has been associated since prior to 2010. | ||
| Michael L. Mon 46 | Vice President | Senior Vice President of the Adviser,** with which he has been associated since prior to 2010. | ||
| Joseph G. Paul 55 | Vice President | Senior Vice President of the Adviser,** with which he has been associated since prior to 2010. | ||
| AB POOLING PORTFOLIOS • | 375 |
Management of the Fund
| NAME, ADDRESS* AND AGE | POSITION(S) HELD WITH TRUST | PRINCIPAL OCCUPATION DURING PAST FIVE YEARS | ||
| Douglas J. Peebles 50 | Vice President | Senior Vice President of the Adviser,** with which he has been associated since prior to 2010. | ||
| Gregory L. Powell 56 | Vice President | Senior Vice President of the Adviser,** with which he has been associated since prior to 2010. | ||
Laurent Saltiel 45 | Vice President | Senior Vice President of the Adviser,** with which he has been associated since June 2010. Prior thereto, he had been associated with Janus Capital as an international portfolio manager. since prior to 2010. | ||
| Ashish C. Shah 45 | Vice President | Senior Vice President and Head of Global Credit of the Adviser** with which he has been associated since May 2010. Previously, he was a Managing Director and Head of Global Credit Strategy at Barclays Capital from September 2008 until May 2010. Prior thereto, he served as the Head of Credit Strategy at Lehman Brothers, heading the Structured Credit/CDO and Credit Strategy groups since prior to 2010. | ||
| Matthew S. Sheridan 40 | Vice President | Senior Vice President of the Adviser,** with which he has been associated since prior to 2010. | ||
Kevin F. Simms 49 | Vice President | Senior Vice President of the Adviser,** with which he has been associated since prior to 2010. | ||
Shri Singhvi 41 | Vice President | Senior Vice President of the Adviser,** with which he has been associated since prior to 2010. | ||
Wen-Tse Tseng 49 | Vice President | Senior Vice President of the Adviser,** with which he has been associated since prior to 2010. | ||
Greg J. Wilensky 48 | Vice President | Senior Vice President of the Adviser,** with which he has been associated since prior to 2010. | ||
Vadim Zlotnikov 53 | Vice President | Senior Vice President of the Adviser,** with which he has been associated since prior to 2010. | ||
Emilie D. Wrapp 59 | Secretary | Senior Vice President, Assistant General Counsel, and Assistant Secretary of ABI,** with which she has been associated since prior to 2010. | ||
Joseph J. Mantineo 56 | Treasurer and Chief Financial Officer | Senior Vice President of ABIS,** with which he has been associated since prior to 2010. | ||
| 376 | • AB POOLING PORTFOLIOS |
Management of the Fund
| NAME, ADDRESS* AND AGE | POSITION(S) HELD WITH TRUST | PRINCIPAL OCCUPATION DURING PAST FIVE YEARS | ||
Phyllis J. Clarke 54 | Controller | Vice President of ABIS,** with which she has been associated since prior to 2010. | ||
Vincent S. Noto 50 | Chief Compliance Officer | Senior Vice President since 2015 and Mutual Fund Chief Compliance Officer of the Adviser** since 2014. Prior thereto, he was Vice President and Director of Mutual Fund Compliance of the Adviser** since prior to 2010. |
| * | The address for each of the Trust’s Officers is 1345 Avenue of the Americas, New York, NY 10105. |
| ** | The Adviser, ABI and ABIS are affiliates of the Trust. |
| The Fund’s Statement of Additional Information (“SAI”) has additional information about the Fund’s Trustees and Officers and is available without charge upon request. Contact your financial representative or AB at 1-800-227-4618, or visit www.ABglobal.com, for a free prospectus or SAI. |
| AB POOLING PORTFOLIOS • | 377 |
Management of the Fund
Information Regarding the Review and Approval of the Advisory Agreement in Respect of Each Portfolio
The disinterested trustees (the “trustees”) of The AB Pooling Portfolios (the “Trust”) unanimously approved the continuance of the Trust’s Advisory Agreement with the Adviser in respect of each of the equity portfolios listed below (each, a “Portfolio” and collectively, the “Portfolios”) at a meeting held on May 4-7, 2015:
| • | AB U.S. Value Portfolio |
| • | AB U.S. Large Cap Growth Portfolio |
| • | AB Multi-Asset Real Return Portfolio (formerly named AB Global Real Estate Investment Portfolio) |
| • | AB International Value Portfolio |
| • | AB International Growth Portfolio |
| • | AB Small-Mid Cap Value Portfolio |
| • | AB Small-Mid Cap Growth Portfolio |
| • | AB Volatility Management Portfolio |
Prior to approval of the continuance of the Advisory Agreement in respect of each Portfolio, the trustees had requested from the Adviser, and received and evaluated, extensive materials. They reviewed the proposed continuance of the Advisory Agreement with the Adviser and with experienced counsel who are independent of the Adviser, who advised on the relevant legal standards. The trustees also reviewed an independent evaluation prepared by the Trust’s Senior Officer (who is also the Trust’s Independent Compliance Officer) of the reasonableness of the advisory fee in respect of each Portfolio, in which the Senior Officer concluded that the contractual fee (zero) for each Portfolio was reasonable. The trustees also discussed the proposed continuances in private sessions with counsel and the Trust’s Senior Officer.
The trustees noted that the Portfolios are designed as investment vehicles for registered investment companies sponsored by, and certain other institutional clients of, the Adviser that seek a blend of asset classes (the institutional clients, including the registered investment companies, are all referred to as the “Pooling Investors”). The trustees also noted that no advisory fee is payable by any of the Portfolios, although the Advisory Agreement provides that the Portfolios will reimburse the Adviser for the cost of certain clerical, accounting, administrative and other services provided to the Portfolios by employees of the Adviser or its affiliates, and that a similar reimbursement provision is included in the Adviser’s advisory agreements with most of the open-end AB Funds. The trustees further noted that the Trust acknowledges in the Advisory Agreement that the Adviser will receive compensation for its services to the Portfolios from third parties (e.g., the Pooling Investors). The trustees noted that the current Pooling Investors are certain registered investment companies sponsored by the Adviser and an unaffiliated institutional investor.
| 378 | • AB POOLING PORTFOLIOS |
The trustees considered their knowledge of the nature and quality of the services provided by the Adviser to the Portfolios gained from their experience as trustees or directors of most of the registered investment companies advised by the Adviser, their overall confidence in the Adviser’s integrity and competence they have gained from that experience, the Adviser’s initiative in identifying and raising potential issues with the trustees and its responsiveness, frankness and attention to concerns raised by the trustees in the past, including the Adviser’s willingness to consider and implement organizational and operational changes designed to improve investment results and the services provided to the AB Funds. The trustees noted that they have four regular meetings each year, at each of which they receive presentations from the Adviser on the investment results of the Portfolios and review extensive materials and information presented by the Adviser.
The trustees also considered all other factors they believed relevant, including the specific matters discussed below. In their deliberations, the trustees did not identify any particular information that was all-important or controlling, and different trustees may have attributed different weights to the various factors. The trustees determined that the selection of the Adviser to manage each Portfolio, and the overall arrangements between each Portfolio and the Adviser as provided in the Advisory Agreement, including the advisory fee, were fair and reasonable in light of the services performed, expenses incurred and such other matters as the trustees considered relevant in the exercise of their business judgment. The material factors and conclusions that formed the basis for the trustees’ determination included the following:
Nature, Extent and Quality of Services Provided
The trustees considered the scope and quality of services provided by the Adviser under the Advisory Agreement, including the quality of the investment research capabilities of the Adviser and the other resources it has dedicated to performing services for the Portfolios. They also noted the professional experience and qualifications of each Portfolio’s portfolio management team and other senior personnel of the Adviser. The trustees also considered that the Advisory Agreement provides that each Portfolio will reimburse the Adviser for the cost to it of providing certain clerical, accounting, administrative and other services to such Portfolio by employees of the Adviser or its affiliates. Requests for these reimbursements are made on a quarterly basis and subject to approval by the trustees. Reimbursements, to the extent requested and paid in respect of a Portfolio, result in some compensation from such Portfolio to the Adviser. The trustees noted that the methodology used to determine the reimbursement amounts had been reviewed by an independent consultant retained by the Trust’s Senior Officer. The trustees noted that, to date, they had approved reimbursements from AB Volatility Management Portfolio and had not approved requests for reimbursements in respect of the other Portfolios. The quality of administrative and other services, including the Adviser’s role in
| AB POOLING PORTFOLIOS • | 379 |
coordinating the activities of each Portfolio’s other service providers, also was considered. The trustees concluded that, overall, they were satisfied with the nature, extent and quality of services provided to each of the Portfolios under the Advisory Agreement.
Costs of Services Provided and Profitability
The trustees reviewed a schedule of the revenues, expenses and related notes indicating the profitability of each Portfolio (which, as noted above, pays no advisory fee to the Adviser but may reimburse expenses to the Adviser) to the Adviser for calendar years 2013 and 2014 that had been prepared with an expense allocation methodology arrived at in consultation with an independent consultant retained by the Trust’s Senior Officer. The trustees noted the assumptions and methods of allocation used by the Adviser in preparing fund-specific profitability data and understood that there are a number of potentially acceptable allocation methodologies for information of this type. The trustees noted that the methodology took into account that the Adviser was indirectly compensated for its services to the Portfolios by the Pooling Investors. The trustees also noted that the profitability information reflected all revenues and expenses of the Adviser’s relationships with the Portfolios, including those relating to its subsidiaries that provide transfer agency, distribution and brokerage services to the Portfolios, and that the profitability methodology attributed revenues and expenses to the Pooling Investors. The trustees recognized that it is difficult to make comparisons of the profitability of the advisory arrangements with the profitability of advisory contracts for unaffiliated funds because comparative information is not generally publicly available and is affected by numerous factors. The trustees focused on the profitability of the Adviser’s relationships with the Portfolios before taxes and distribution expenses. The trustees were satisfied that the Adviser’s level of profitability from its relationship with each Portfolio was not unreasonable.
Fall-Out Benefits
The trustees considered the other benefits to the Adviser and its affiliates from their relationships with the Portfolios, including, but not limited to, benefits relating to soft dollar arrangements (whereby the Adviser receives brokerage and research services from brokers that execute transactions for certain clients, including the Portfolios); 12b-1 fees and sales charges received by the Trust’s principal underwriter (which is a wholly owned subsidiary of the Adviser) in respect of certain classes of shares of the Pooling Investors that are registered investment companies; and brokerage commissions paid by the Portfolios to brokers affiliated with the Adviser. The trustees noted that while the Adviser’s affiliated transfer agent does not receive fees for providing services to the Portfolios (although it may be reimbursed for its out-of-pocket expenses), such affiliated transfer agent receives fees for providing services to the Pooling Investors. The trustees noted that the Adviser receives fees for advisory, distribution, recordkeeping and other services provided to the institutional Pooling Investor
| 380 | • AB POOLING PORTFOLIOS |
and is compensated by the other Pooling Investors for providing advisory services to them. The trustees recognized that the Adviser’s profitability would be lower without these benefits. The trustees understood that the Adviser also might derive reputational and other benefits from its association with the Portfolios.
Investment Results
In addition to the information reviewed by the trustees in connection with the meetings, the trustees receive detailed comparative performance information for each Portfolio at each regular Board meeting during the year. At the May 2015 meeting, the trustees reviewed information prepared by Lipper showing the performance of each Portfolio as compared with that of a group of similar funds selected by Lipper (the “Performance Group”) and as compared with that of a broader array of funds selected by Lipper (the “Performance Universe”), and information prepared by the Adviser showing performance of each Portfolio as compared with one or more securities indices, in each case for the 1-, 3- and 5-year periods, as applicable, ended February 28, 2015 and (in the case of comparisons with certain indices) the period since inception.
In reviewing the performance information the trustees noted that the Portfolios had a performance advantage in that the performance of virtually all of the Portfolios’ competitors was negatively affected by the fact they pay advisory fees whereas the Portfolios do not.
AB U.S. Value Portfolio
The trustees noted that the Portfolio (May 2005 inception) was in the 2nd quintile of the Performance Group and the Performance Universe for the 1-year period, in the 3rd quintile of the Performance Group and the Performance Universe for the 3-year period, and in the 5th quintile of the Performance Group and 4th quintile of the Performance Universe for the 5-year period. The Portfolio outperformed the Russell 1000 Value Index in the 3-year period and lagged it in all other periods. Based on their review, the trustees concluded that the Portfolio’s performance in recent years was satisfactory.
AB U.S. Large Cap Growth Portfolio
The trustees noted that the Portfolio (May 2005 inception) was in the 1st quintile of the Performance Group and the Performance Universe for the 1-year period, in the 2nd quintile of the Performance Group and 1st quintile of the Performance Universe for the 3-year period, and in the 4th quintile of the Performance Group and the Performance Universe for the 5-year period. The Portfolio outperformed the Russell 1000 Growth Index in the 1- and 3-year periods and lagged it in the 5-year period and the period since inception. Based on their review, the trustees concluded that the Portfolio’s performance in recent years was satisfactory.
| AB POOLING PORTFOLIOS • | 381 |
AB Multi-Asset Real Return Portfolio
The trustees noted that the Portfolio (May 2005 inception) was in the 5th quintile of the Performance Group and the Performance Universe for the 1-, 3- and 5-year periods. The Portfolio outperformed the Morgan Stanley Capital International (MSCI) All Country (AC) World Commodity Producers Index (the “MSCI AC World Commodity Index”) in all periods except the period since inception. It lagged the Financial Times Stock Exchange (FTSE) European Public Real Estate Association (EPRA)/National Association of Real Estate Investment Trusts (NAREIT) Global Real Estate Index on a gross return basis in all periods. The Portfolio outperformed the All Market Real Return Index in the 5-year period and lagged it in all other periods. The trustees also noted that at their September 2010 meeting they had approved modifications to the Portfolio’s investment strategy and policies, including a new benchmark, the MSCI AC World Commodity Index, and a name change to AllianceBernstein Multi-Asset Real Return Portfolio from AllianceBernstein Global Real Estate Investment Portfolio, effective December 31, 2010. As a result, the trustees gave less weight to the Portfolio’s investment performance prior to December 2010. Based on their review and their discussion with the Adviser of the reasons for the Portfolio’s performance and the appropriateness of the Portfolio’s primary benchmark, the trustees retained confidence in the Adviser’s ability to manage the Portfolio’s assets. The trustees determined to continue to monitor the Portfolio’s performance closely.
AB International Value Portfolio
The trustees noted that the Portfolio (May 2005 inception) was in the 1st quintile of the Performance Group and the Performance Universe for the 1-year period, and in the 5th quintile of the Performance Group and the Performance Universe for the 3- and 5-year periods. The Portfolio outperformed the Morgan Stanley Capital International (MSCI) All Country World Index ex-U.S. (Net) in the 1- and 3-year periods and lagged it in the 5-year period and the period since inception. The Portfolio outperformed the MSCI Europe, Australasia and Far East Index (Net) in the 1-year period and lagged it in all other periods. Based on their review, the trustees concluded that the Portfolio’s recent performance was acceptable.
AB International Growth Portfolio
The trustees noted that the Portfolio (May 2005 inception) was in the 2nd quintile of the Performance Group and the Performance Universe for the 1-year period, and in the 5th quintile of the Performance Group and the Performance Universe for the 3- and 5-year periods. The Portfolio lagged the Morgan Stanley Capital International (MSCI) All Country (AC) World Index ex U.S. (the Portfolio’s primary index since January 1, 2012) in all periods except in the one-year period; it lagged the MSCI AC World Index ex U.S. Growth (the Portfolio’s secondary index since January 1, 2012) in all periods; and it lagged the MSCI Europe, Australasia and Far East Index (Net), the Portfolio’s prior index,
| 382 | • AB POOLING PORTFOLIOS |
in all periods except in the one-year period. Based on their review, the trustees concluded that the Portfolio’s recent performance was acceptable. The trustees determined to continue to monitor the Portfolio’s performance closely.
AB Small-Mid Cap Value Portfolio
The trustees noted that the Portfolio (May 2005 inception) was in the 4th quintile of the Performance Group and the Performance Universe for the 1- and 5-year periods, and in the 3rd quintile of the Performance Group and the Performance Universe for the 3-year period. The Portfolio outperformed the Russell 2500 Value Index in all periods. Based on their review, the trustees concluded that the Portfolio’s performance was acceptable.
AB Small-Mid Cap Growth Portfolio
The trustees noted that the Portfolio (May 2005 inception) was in the 5th quintile of the Performance Group and the Performance Universe for the 1-year period, in the 4th quintile of the Performance Group and the Performance Universe for the 3-year period, and in the 1st quintile of the Performance Group and the Performance Universe for the 5-year period. The Portfolio lagged the Russell 2500 Growth Index in the 1- and 3-year periods and outperformed it in the 5-year period and the period since inception. Based on their review and their discussion with the Adviser of the reasons for the Portfolio’s recent performance, the trustees concluded that the Portfolio’s performance was acceptable.
AB Volatility Management Portfolio
The trustees noted that the Portfolio (April 2010 inception) was in the 2nd quintile of the Performance Group and 4th quintile of the Performance Universe for the 1-year period, and 2nd out of 4 of the Performance Group and in the 2nd quintile of the Performance Universe for the 3-year period. The Portfolio outperformed the Morgan Stanley Capital International All Country World Index in the 1-year period and the period since inception, and lagged it in the 3-year period. Based on their review, the trustees concluded that the Portfolio’s performance was satisfactory.
Advisory Fees and Other Expenses
The trustees considered the advisory fee rate paid by each Portfolio to the Adviser (zero) and information prepared by Lipper concerning advisory fee rates paid by other funds in the same Lipper category as such Portfolio at a common asset level. The trustees also reviewed certain information showing the advisory fees paid to the Adviser by the Pooling Investors. The trustees recognized that it is difficult to make comparisons of advisory fees because there are variations in the services that are included in the fees paid by other funds.
The trustees noted the unusual arrangements in the Advisory Agreement providing for no advisory fee but were cognizant that the Adviser is indirectly compensated by the Pooling Investors for its services to the Portfolios. While the fees
| AB POOLING PORTFOLIOS • | 383 |
paid by the Pooling Investors to the Adviser vary, the trustees acknowledged that a portion of those fees may reasonably be viewed as compensating the Adviser for advisory services it provides to each Portfolio (the “implied fee”) and that the Adviser had represented to the Securities and Exchange Commission’s staff and to the Trust’s former counsel that the implied fee rate is the same for all the Pooling Investors. The trustees also noted that the Adviser had undertaken to work with the trustees to develop procedures to enable the trustees to monitor the implied fee rates for the Portfolios and had provided the trustees with information concerning the fees paid by the Pooling Investors.
In considering the fee arrangements (including the payments to the Adviser by the Pooling Investors), the trustees took into account the complexity of investment management for the Portfolios relative to other types of funds, noting, in the case of AB Volatility Management Portfolio, that, in addition to requiring equity management capabilities, the Portfolio also required continual monitoring of the expected risk-return potential for equities and judgments about the timing and extent of defensive moves to fixed income.
Based on their review, the trustees concluded that the advisory arrangements for the Portfolios, including the zero fee aspect of the Advisory Agreement with the Adviser, were satisfactory.
The trustees also considered the Adviser’s fee schedule for non-fund clients pursuing a similar investment style. For this purpose, the trustees reviewed the relevant advisory fee information from the Adviser’s Form ADV and the evaluation from the Trust’s Senior Officer. The trustees recognized that this information was of limited utility in light of the Portfolios’ unusual fee arrangements. The trustees noted that the Adviser may, in some cases, agree to fee rates with large institutional clients that are lower than those on the schedules reviewed by the trustees and that they had previously discussed with the Adviser its policies in respect of such arrangements.
The Adviser reviewed with the trustees the significantly greater scope of the services it provides the Portfolios relative to institutional clients. The Adviser also noted that because mutual funds are constantly issuing and redeeming shares, they are more difficult to manage than an institutional account, where the assets tend to be relatively stable. In light of the substantial differences in services rendered by the Adviser to institutional clients as compared to funds such as the Portfolios, and the unusual fee structure for all the Portfolios, the trustees considered these fee comparisons inapt and did not place significant weight on them in their deliberations.
The trustees noted that each of AB Multi-Asset Real Return Portfolio and AB Volatility Management Portfolio may invest in shares of exchange-traded funds (“ETFs”), subject to the restrictions and limitations of the Investment Company Act of 1940 as these may be varied as a result of exemptive orders issued by the
| 384 | • AB POOLING PORTFOLIOS |
SEC. The trustees noted that ETFs pay advisory fees pursuant to their advisory contracts, and that the Adviser had provided, and they had reviewed, information about the expense ratios of the relevant ETFs. The trustees concluded, based on the Adviser’s explanation of how it may use ETFs when they are the most cost-effective way to obtain desired exposures for a fund or to temporarily “equitize” cash inflows pending purchases of underlying securities, that the advisory fee for each such Portfolio (zero) would be paid for services that would be in addition to, rather than duplicative of, the services to be provided under the advisory contracts of the ETFs.
The trustees also considered the total non-advisory expense ratio of each Portfolio in comparison to the non-advisory expenses of funds within two comparison groups created by Lipper: an Expense Group and an Expense Universe. Lipper described an Expense Group as a representative sample of funds similar to a Portfolio and an Expense Universe as a broader group, consisting of all funds in a Portfolio’s investment classification/objective. The non-advisory expense ratio of each Portfolio was based on the Portfolio’s latest fiscal year. The trustees noted that it was likely that the non-advisory expense ratios of some of the other funds in each Portfolio’s Lipper category were lowered by waivers or reimbursements by those funds’ investment advisers, which in some cases might be voluntary or temporary. The trustees view the non-advisory expense ratio information as relevant to their evaluation of the Adviser’s services because the Adviser is responsible for coordinating services provided to the Portfolios by others.
Economies of Scale
Since the Advisory Agreement does not provide for any compensation to be paid to the Adviser by the Portfolios, the trustees did not consider the extent to which fee levels in the Advisory Agreement reflect economies of scale. They did note, however, that the fee schedules for the Pooling Investors that are registered investment companies incorporate breakpoints.
AB U.S. Value Portfolio
AB U.S. Large Cap Growth Portfolio
AB Multi-Asset Real Return Portfolio
AB International Value Portfolio
AB International Growth Portfolio
The trustees noted that each Portfolio’s total non-advisory expense ratio was lower than the Expense Group and Expense Universe medians. The trustees concluded that each Portfolio’s non-advisory expense ratio was satisfactory.
AB Small-Mid Cap Value Portfolio
The trustees noted that the Portfolio’s total non-advisory expense ratio was lower than the Expense Group median and higher than the Expense Universe median. The trustees concluded that the Portfolio’s non-advisory expense ratio was satisfactory.
| AB POOLING PORTFOLIOS • | 385 |
AB Small-Mid Cap Growth Portfolio
The trustees concluded that the Portfolio’s total non-advisory expense ratio was acceptable, although they noted that it was higher than the Expense Group and Expense Universe medians.
AB Volatility Management Portfolio
The trustees noted that the Portfolio’s total non-advisory expense ratio, which had been capped by the Adviser (although the non-advisory expense ratio was currently lower than the cap), was lower than the Expense Group and Expense Universe medians. The trustees concluded that the Portfolio’s non-advisory expense ratio was satisfactory.
| 386 | • AB POOLING PORTFOLIOS |
THE FOLLOWING IS NOT PART OF THE SHAREHOLDER REPORT OR THE FINANCIAL STATEMENTS
SUMMARY OF SENIOR OFFICER’S EVALUATION OF INVESTMENT ADVISORY AGREEMENT1
The following is a summary of the evaluation of the Investment Advisory Agreement between AllianceBernstein L.P. (the “Adviser”) and AB Pooling Portfolios (the “Trust” or the “Pooling Portfolios”) in respect of the following Portfolios:2
U.S. Value Portfolio
U.S. Large Cap Growth Portfolio
Multi-Asset Real Return Portfolio3
International Value Portfolio
International Growth Portfolio
Small-Mid Cap Value Portfolio
Small-Mid Cap Growth Portfolio
Volatility Management Portfolio
The Trust, which is designed to facilitate a “blended style” investment approach, represents a variety of asset classes and investment styles, and is available for investment only to institutional clients of the Adviser, including both registered investment companies and large managed separate accounts.
The evaluation of the Investment Advisory Agreement was prepared by Philip L. Kirstein, the Senior Officer, for the Trustees of the Trust, as required by the September 1, 2004 Assurance of Discontinuance (“AoD”) between the Adviser and the New York State Attorney General (the “NYAG”). The Senior Officer’s evaluation of the Investment Advisory Agreement is not meant to diminish the responsibility or authority of the Board of Trustees of the Trust to perform its duties pursuant to Section 15 of the Investment Company Act of 1940 (the “40 Act”) and applicable state law. The purpose of the summary is to provide shareholders with a synopsis of the independent evaluation of the reasonableness of the advisory fees proposed to be paid by the Portfolios which was provided to
| 1 | The information in the fee summary was completed on April 23, 2015 and discussed with the Board of Trustees on May 5-7, 2015. |
| 2 | Future references to the Portfolios do not include “AB.” The other Portfolios of the Trust that are not discussed in this evaluation are the fixed-income Pooling Portfolios: Short Duration Bond Portfolio, Global Core Bond (formerly Intermediate Duration Bond Portfolio), Bond Inflation Protected Securities Portfolio (formerly Inflation Protected Securities Portfolio) and High Yield Portfolio. |
| 3 | Effective December 31, 2010, the Portfolio changed its name from Global Real Estate Investment Portfolio and eliminated its policy of investing at least 80% of its net assets in real estate related investments. Also at this time, the Portfolio’s management team changed. |
| AB POOLING PORTFOLIOS • | 387 |
the Trustees in connection with their review of the proposed approval of the continuance of the Investment Advisory Agreement. The Senior Officer’s evaluation considered the following factors:
| 1. | Advisory fees charged to institutional and other clients of the Adviser for like services; |
| 2. | Advisory fees charged by other mutual fund companies for like services; |
| 3. | Costs to the Adviser and its affiliates of supplying services pursuant to the advisory agreements, excluding any intra-corporate profit; |
| 4. | Profit margins of the Adviser and its affiliates from supplying such services; |
| 5. | Possible economies of scale as the Portfolios grow larger; and |
| 6. | Nature and quality of the Adviser’s services including the performance of the Portfolios. |
These factors, with the exception of the first factor, are generally referred to as the “Gartenberg factors,” which were articulated by the United States Court of Appeals for the Second Circuit in 1982. Gartenberg v. Merrill Lynch Asset Management, Inc., 694 F. 2d 923 (2d Cir. 1982). On March 30, 2010, the Supreme Court held the Gartenberg decision was correct in its basic formulation of what Section 36(b) requires: to face liability under Section 36(b), “an investment adviser must charge a fee that is so disproportionately large that it bears no reasonable relationship to the services rendered and could not have been the product of arm’s length bargaining”Jones v. Harris Associates L.P., 130 S. Ct. 1418 (2010). In Jones, the Court stated the Gartenberg approach fully incorporates the correct understanding of fiduciary duty within the context of Section 36(b) and noted with approval that “Gartenberg insists that all relevant circumstances be taken into account” and “uses the range of fees that might result from arm’s-length bargaining as the benchmark for reviewing challenged fees.”4
PORTFOLIO ADVISORY FEES, NET ASSETS, & EXPENSE RATIOS
Under the Investment Advisory Agreement, the Portfolios are not charged an advisory fee. The Portfolios’ Investment Advisory Agreement was amended to provide for reimbursements to the Adviser for providing certain clerical, legal, administrative, and other services; to date, other than Volatility Management Portfolio, the Trustees have not authorized reimbursements under these provisions, although the adviser proposed at the March 11, 2015 meeting that the trustees authorize such reimbursements going forward and presented information on the expense ratio impact of providing such authorization. During the most recently completed fiscal year, Volatility Management Portfolio reimbursed the Adviser in the amount of $47,037 (0.003% of the Portfolio average daily net assets) for providing such services.
| 4 | Jones v. Harris at 1427. |
| 388 | • AB POOLING PORTFOLIOS |
The Adviser is compensated by the institutional clients that invest in the Portfolios, which include AB Retirement Strategies (“Retirement Strategies”),5 AB Wealth Strategies (“Wealth Strategies”),6 Sanford C. Bernstein Fund, Inc.,—Overlay Portfolios (“SCB Overlay Portfolios”)7 and the Rhode Island Higher Education Savings Trust (referred to herein as “CollegeBoundfund”). Collectively, these shareholders (the “Institutional Clients”) own 100 percent of the Pooling Portfolios’ total outstanding shares. Set forth below are the advisory fee schedules of the Adviser’s Institutional Clients that invest in the Pooling Portfolios.
AB Blended Style Series, Inc.—AB Retirement Strategies
Each of the Retirement Strategies pays an advisory fee correlated to the percentage of equity investments held by the Retirement Strategy. This fee is discounted by a certain percentage depending on the asset level of the Retirement Strategy as indicated below:
| % Invested in Equity Investments | Advisory Fee | |
| Equal to or less than 60% | 0.55% | |
| Greater than 60% and less than 80% | 0.60% | |
| Equal to or greater than 80% | 0.65% |
| Net Asset Level | Discount | |||
| Assets equal to or less than $2.5 billion | n/a | |||
| Assets greater than $2.5 billion and less than $5 billion | 0.10 | % | ||
| Assets greater than $5 billion | 0.15 | % | ||
Accordingly, under the terms of the Investment Advisory Agreement, the Retirement Strategies will pay the Adviser at the following annual rates:
| Average Daily Net Assets | ||||||||||||
| Retirement Strategy | First $2.5 billion | Next $2.5 billion | In excess of $5 billion | |||||||||
Retirement Strategies: 2030, 2035, 2040, 2045, 2050, 2055 | 0.65 | % | 0.55 | % | 0.50 | % | ||||||
Retirement Strategies: 2015, 2020, 2025 | 0.60 | % | 0.50 | % | 0.45 | % | ||||||
Retirement Strategies: 2000, 2005, 2010 | 0.55 | % | 0.45 | % | 0.40 | % | ||||||
| 5 | Includes AB 2000 Retirement Strategy, AB 2005 Retirement Strategy, AB 2010 Retirement Strategy, AB 2015 Retirement Strategy, AB 2020 Retirement Strategy, AB 2025 Retirement Strategy, AB 2030 Retirement Strategy, AB 2035 Retirement Strategy, AB 2040 Retirement Strategy, AB 2045 Retirement Strategy, AB 2050 Retirement Strategy and AB 2055 Retirement Strategy. Future references to the Retirement Strategies do not include “AB.” |
| 6 | Includes AB Balanced Wealth Strategy, AB Wealth Appreciation Strategy, AB Conservative Wealth Strategy. Future references to the Wealth Strategies do not include “AB.” |
| 7 | Includes SCB Overlay A Portfolio, SCB Tax-Aware Overlay A Portfolio, SCB Overlay B Portfolio, SCB Tax-Aware Overlay B Portfolio, SCB Tax-Aware Overlay C Portfolio and SCB Tax-Aware Overlay N Portfolio. |
| AB POOLING PORTFOLIOS • | 389 |
AB Portfolios—AB Wealth Strategies
The Adviser charges the Wealth Strategies an advisory fee based on a percentage of each fund’s average daily net assets:8
| Fund | Advisory Fee Based on % of Average Daily Net Assets | |||||
| Tax-Managed Wealth Appreciation | First $2.5 billion | 0.65 | % | |||
| Strategy | Next $2.5 billion | 0.55 | % | |||
| Wealth Appreciation Strategy | Excess of $5 billion | 0.50 | % | |||
| Tax-Managed Balanced Wealth Strategy | First $2.5 billion | 0.55 | % | |||
| Tax-Managed Conservative | Next $2.5 billion | 0.45 | % | |||
Balanced Wealth Strategy Conservative Wealth Strategy | Excess of $5 billion | 0.40 | % | |||
Sanford C. Bernstein Fund, Inc.—SCB Overlay Portfolios
The SCB Overlay Portfolios invest in Multi-Asset Real Return Pooling Portfolio. The Adviser charges the SCB Overlay an advisory fee based on a percentage of each fund’s average daily net assets:9
| SCB Overlay Portfolios | Annual Percentage of Average Daily Net Assets | |
| Overlay A Portfolio | 0.90% | |
| Tax-Aware Overlay A Portfolio | 0.90% | |
| Overlay B Portfolio | 0.65% | |
| Tax-Aware Overlay B Portfolio | 0.65% | |
| Tax-Aware Overlay C Portfolio | 0.65% | |
| Tax-Aware Overlay N Portfolio | 0.65% |
Rhode Island Higher Education Savings Trust—CollegeBoundfund
The Adviser serves as the program manager of the CollegeBoundfund, a 529 college-savings plan. Services provided by the Adviser as program manager for CollegeBoundfund include managing the assets of each Education Strategy of the plan that may invest in a combination of the Pooling Portfolios (the “Underlying Portfolios”), performing administrative related functions, servicing shareholder accounts, providing customer service to participants, maintaining
| 8 | At the Board meetings on May 6-8, 2014, the Adviser proposed modifications to the Wealth Strategies to provide for the inclusion of AB Multi-Manager Alternative Strategies Fund as one of the underlying portfolios for each Wealth Strategy. At the time of the presentation, it was estimated that the loss of assets to the Pooling Portfolios in the aggregate would be $350-$400 million, with the largest transfers expected to come from U.S. Value Portfolio, U.S. Large Cap Growth Portfolio, International Value Portfolio and International Growth Portfolio. As of March 31, 2015, the market value of aggregate investment of the Wealth Strategies in the AB Multi-Manager Alternative Strategies Fund was $373.9 million. The difference in in the Pooling Portfolios’ net assets between March 31, 2015 and March 31, 2014, including the fixed income Pooling Portfolios that are not discussed in this evaluation, was $545.0 million in the aggregate. |
| 9 | The Board of Directors of the SCB Fund approved the renewal of the investment advisory agreement of the SCB Overlay Portfolios on October 23, 2014. |
| 390 | • AB POOLING PORTFOLIOS |
the program and developing/updating a website where participants can access their personal accounts.10 The shareholder servicing is provided by AllianceBernstein Investor Services (“ABIS”) and distribution by AllianceBernstein Investments, Inc. (“ABI”), both of which are affiliates of the Adviser. As program manager, the Adviser is paid a program management fee equal to the total expense ratio (fixed) of each Education Strategy minus the weighted average of the expenses of the Underlying Portfolios in which the Strategy is invested. The weighted average of the expenses of the Underlying Portfolios may fluctuate over time, resulting in an increase or decrease in the program management fee since the total expense ratio is constant. Set forth below is a table showing the total expense ratios of the Education Strategies as of December 31, 2014.11
| Portfolios | Total Expense Ratio12 | |||
| Age-Based Education Strategies | ||||
| Age-Based Aggressive Growth 2014-2016 | 0.94 | % | ||
| Age-Based Aggressive Growth 2011-2013 | 0.94 | % | ||
| Age-Based Aggressive Growth 2008-2010 | 0.90 | % | ||
| Age-Based Aggressive Growth 2005-2007 | 0.86 | % | ||
| Age-Based Aggressive Growth 2002-2004 | 0.82 | % | ||
| Age-Based Aggressive Growth 1999-2001 | 0.78 | % | ||
| Age-Based Aggressive Growth 1996-1998 | 0.74 | % | ||
| Age-Based Aggressive Growth 1993-1995 | 0.74 | % | ||
| Age-Based Aggressive Growth 1990-1992 | 0.74 | % | ||
| Age-Based Aggressive Growth 1987-1989 | 0.74 | % | ||
| Age-Based Aggressive Growth 1984-1986 | 0.74 | % | ||
| Age-Based Aggressive Growth Pre-1984 | 0.74 | % | ||
| Age-Based Moderate Growth 2014-201613 | 0.92 | % | ||
| Age-Based Moderate Growth 2011-2013 | 0.88 | % | ||
| Age-Based Moderate Growth 2008-2010 | 0.84 | % | ||
| Age-Based Moderate Growth 2005-2007 | 0.80 | % | ||
| Age-Based Moderate Growth 2002-2004 | 0.78 | % | ||
| Age-Based Moderate Growth 1999-2001 | 0.76 | % | ||
| Age-Based Moderate Growth 1996-1998 | 0.72 | % | ||
| 10 | On March 24, 2014 the CBF replaced U.S. Value Portfolio and U.S. Large Cap Portfolio with AB Growth and Income Fund, Inc., as well as International Value Portfolio and International Growth Portfolio with a separate account, managed by the Adviser, called AB International Factor. |
| 11 | For all Education Strategies that invest in the Pooling Portfolios held by Rhode Island resident accounts, which account for 5.47% of all accounts and 4.12% in terms of net assets as of March 31, 2015, the total expense ratio, which includes the blended underlying expense ratio related to the Pooling Portfolios, is capped at 0.20%. |
| 12 | The total expense ratios do not include an annual distribution fee of up to1.00% payable to ABI, the program distributor and an affiliate of the Adviser, which is applied only to certain accounts that are established with the involvement of a financial adviser (“FA”). This charge is to fund compensation payable in the same amount by ABI to the FA for the FA’s services after such account is open at least one year. |
| 13 | The Education Strategy commenced operations on February 4, 2014. |
| AB POOLING PORTFOLIOS • | 391 |
| Portfolios | Total Expense Ratio12 | |||
| Age-Based Moderate Growth 1993-1995 | 0.72 | % | ||
| Age-Based Moderate Growth 1990-1992 | 0.72 | % | ||
| Age-Based Moderate Growth 1987-1989 | 0.72 | % | ||
| Age-Based Moderate Growth 1984-1986 | 0.72 | % | ||
| Age-Based Moderate Growth Pre-1984 | 0.72 | % | ||
| Age-Based Conservative Growth 2014-201614 | 0.82 | % | ||
| Age-Based Conservative Growth 2011-2013 | 0.82 | % | ||
| Age-Based Conservative Growth 2008-2010 | 0.79 | % | ||
| Age-Based Conservative Growth 2005-2007 | 0.78 | % | ||
| Age-Based Conservative Growth 2002-2004 | 0.76 | % | ||
| Age-Based Conservative Growth 1999-2001 | 0.72 | % | ||
| Age-Based Conservative Growth 1996-1998 | 0.72 | % | ||
| Age-Based Conservative Growth Pre-1996 | 0.72 | % | ||
| Fixed Based Education Strategies | ||||
| Appreciation | 0.94 | % | ||
| Balanced | 0.80 | % | ||
| Conservative | 0.72 | % | ||
The Portfolios’ net assets as of March 31, 2015 are as follows:
| Portfolio | Net Assets 3/31/15 ($MM) | |||
| U.S. Value Portfolio | $ | 505.7 | ||
| U.S. Large Cap Growth Portfolio | $ | 506.7 | ||
| Multi-Asset Real Return Portfolio | $ | 916.9 | ||
| International Value Portfolio | $ | 425.1 | ||
| International Growth Portfolio | $ | 425.9 | ||
| Small-Mid Cap Value Portfolio | $ | 317.2 | ||
| Small-Mid Cap Growth Portfolio | $ | 317.0 | ||
| Volatility Management Portfolio | $ | 1,438.2 | ||
Set forth below are the most recently completed fiscal year total expense ratios of the Pooling Portfolios that do not have an Expense Limitation Undertaking:
| Portfolio | Fiscal Year End | Total Expense Ratio | ||||
| U.S. Value Portfolio | August 31 | 0.03 | % | |||
| U.S. Large Cap Growth Portfolio | August 31 | 0.03 | % | |||
| Multi-Asset Real Return Portfolio15,16 | August 31 | 0.07 | % | |||
| International Value Portfolio | August 31 | 0.05 | % | |||
| International Growth Portfolio | August 31 | 0.05 | % | |||
| Small-Mid Cap Value Portfolio | August 31 | 0.06 | % | |||
| Small-Mid Cap Growth Portfolio | August 31 | 0.07 | % | |||
| 14 | The Education Strategy commenced operations on April 21, 2014. |
| 15 | The Portfolio has exposure to exchange traded funds (“ETF”). Like any other mutual fund, ETFs bear fund expenses. Accordingly, if a Portfolio were to hold a long position in an ETF, the ETF’s expenses would detract from the Portfolio’s total return |
| 16 | The Portfolio’s current fiscal year exposure to ETFs is 0.32% of the Fund’s average net assets. The Portfolio’s underlying expense ratio related to the ETF holdings is 0.0015%. |
| 392 | • AB POOLING PORTFOLIOS |
With respect to Volatility Management Portfolio, the Adviser agreed to reimburse the Portfolio for that portion of the Portfolio’s total operating expenses to the degree necessary to limit the Portfolio’s expense ratio to the amount set forth below for the Portfolio’s current fiscal year. The terms of the expense limitation undertaking permit modification or termination by the Adviser upon 60 days’ notice prior to the Portfolios’ prospectus update. During the Portfolio’s most completed fiscal year, the Portfolio was operating below its expense cap. Accordingly, the expense limitation undertaking was of no effect during the period. Also set forth below is the Portfolio’s gross expense ratio:
| Fund | Expense Cap Pursuant to Expense Limitation Undertaking | Gross Expense Ratio | Fiscal Year End | |||||||
| Volatility Management Portfolio17 | 0.15 | % | 0.05 | % | August 31 | |||||
| I. | ADVISORY FEES CHARGED TO INSTITUTIONAL AND OTHER CLIENTS |
Although the Portfolios are not charged an advisory fee, their shareholders, which include other investment companies and large institutional clients managed by the Adviser, pay the Adviser an investment advisory fee for managing their assets. The advisory fees charged to investment companies that the Adviser manages and sponsors are normally higher than those charged to similar sized institutional accounts, including pension plans and sub-advised investment companies. The fee differential reflects, among other things, different services provided to such clients and different liabilities assumed. Services provided by the Adviser to the Portfolios that are not provided to non-investment company clients and sub-advised investment companies include providing office space and personnel to serve as Fund Officers, who among other responsibilities make the certifications required under the Sarbanes–Oxley Act of 2002, and coordinating with and monitoring third party service providers such as Fund counsel, auditors, custodians, transfer agents and pricing services. The accounting, administrative, legal and compliance requirements for the Portfolios are more costly than those for institutional accounts due to the greater complexities and time required for investment companies. While there are differences in the services provided to investment companies and institutional accounts, it is contemplated that the Adviser will recover some of the costs related to providing these administrative services by the reimbursements it receives from Volatility Management Portfolio and the Institutional Clients. In addition, managing the cash flow of an investment company may be more difficult than managing that of a stable pool of assets, such as an institutional account with little cash movement in either direction, particularly if the investment company experiences a net redemption and the Adviser is frequently forced to sell securities to raise cash for the redemption. However, managing an investment company with positive cash flow may be easier at times than managing a stable pool of assets. In recent years,
| 17 | The Portfolio’s current fiscal year exposure to ETFs is 16.85% of the Fund’s average net assets. The Portfolio’s underlying expense ratio related to the ETF holdings is 0.0254%. |
| AB POOLING PORTFOLIOS • | 393 |
investment advisers have been sued by institutional clients and have suffered reputational damage both by the attendant publicity and outcomes other than complete victories. Accordingly, the legal and reputational risks associated with institutional accounts are greater than previously thought, although arguably still not equal to those related to the mutual fund industry.
Notwithstanding the Adviser’s view that managing an investment company is not comparable to managing other institutional accounts because the services provided are different, the Supreme Court has indicated consideration should be given to the advisory fees charged to institutional accounts that have a substantially similar investment style as the Portfolio.18 In addition to the AB Institutional fee schedule, set forth below are what would have been the effective advisory fees of the Portfolios had the AB Institutional fee schedules been applicable to the Portfolios based on March 31, 2015 net assets, although the Portfolios are not charged an advisory fee by the Adviser.19
| Portfolio | Portfolio Net Assets ($MIL) | AB Institutional Fee Schedule | Effective Fee (%) | |||||
| U.S. Value Portfolio | $505.7 | U.S. Diversified Value 0.65% on 1st $25 million 0.50% on next $25 million 0.40% on next $50 million 0.30% on next $100 million 0.25% on the balance Minimum Account Size: $25 m | 0.307% | |||||
| U.S. Large Cap Growth Portfolio | $506.7 | U.S. Large Cap Growth 0.80% on 1st $25 million 0.50% on next $25 million 0.40% on next $50 million 0.30% on next $100 million 0.25% on the balance Minimum Account Size: $25 m | 0.314% | |||||
| Multi-Asset Real Return Portfolio | $916.9 | Real Asset Strategy 0.75% on 1st $150 million 0.60% on next $150 million 0.50% on the balance Minimum Account Size: $150 m | 0.557% | |||||
| 18 | The Supreme Court stated that “courts may give such comparisons the weights that they merit in light of the similarities and differences between the services that the clients in question require, but the courts must be wary of inapt comparisons.” Among the significant differences the Supreme Court noted that may exist between services provided to mutual funds and institutional accounts are “higher marketing costs.” Jones v. Harris at 1428. |
| 19 | The Adviser has indicated that with respect to institutional accounts with assets greater than $300 million, it will negotiate a fee schedule. Discounts that are negotiated vary based upon each client relationship. |
| 394 | • AB POOLING PORTFOLIOS |
| Portfolio | Portfolio Net Assets ($MIL) | AB Institutional Fee Schedule | Effective Fee (%) | |||
| International Value Portfolio | $425.1 | International Value 0.80% on 1st $25 million 0.60% on next $25 million 0.50% on next $50 million 0.40% on next the balance Minimum Account Size: $25 m | 0.447% | |||
| International Growth Portfolio | $425.9 | International Growth Trends 0.85% on 1st $25 million 0. % on next $25 million 0.55% on next $50 million 0.45% on the balance Minimum Account Size: $25 m | 0.497% | |||
| Small-Mid Cap Value Portfolio | $317.2 | Small & Mid Cap Value 0.95% on 1st $25 million 0.75% on next $25 million 0.65%on next $50 million 0.55% on the balance Minimum Account Size: $25 m | 0.613% | |||
| Small-Mid Cap Growth Portfolio | $317.0 | U.S. SMID Cap Growth 0.95% on 1st $25 million 0.75% on next $25 million 0.65% on next $50 million 0.55% on the balance Minimum Account Size: $25 m | 0.613% | |||
| Volatility Management Portfolio | $1,438.2 | Volatility Management20 0.60% on 1st $50 million 0.50% on next $100 million 0.45% on the balance Minimum Account Size: None | 0.459% |
The Adviser manages the AB Mutual Funds (“ABMF”), which are open-end investment companies, and AB Variable Products Series Fund, Inc. (“AVPS”), which offers variable annuity and variable life contract policyholders the option to utilize certain AVPS portfolios as the investment option underlying their insurance contracts. The advisory schedules of almost all of the ABMF and AVPS funds, implemented in January 2004 as the AoD between the NYAG and the Adviser, contemplates eight categories with almost all of the AB funds in each category having the same advisory fee schedule. In addition to the fee schedules of the ABMF and AVPS funds whose investment styles are similar to those of the Portfolios, set forth below are what would have been the effective advisory fees
| 20 | For stand-alone investment (Collective Investment Trust) only. |
| AB POOLING PORTFOLIOS • | 395 |
of the Portfolios had the fee schedules of the ABMF/AVPS funds been applicable to the Portfolios based on the Portfolios’ March 31, 2015 net assets:
| Portfolio | ABMF/AVPS Portfolio | Fee Schedule | ABMF/ AVPS Effective Fee (%) | |||||
| U.S. Value Portfolio | Value Fund AVPS Value Portfolio | 0.55% on first $2.5 billion 0.45% on next $2.5 billion 0.40% on the balance | 0.550% | |||||
| U.S. Large Cap Growth Portfolio | Large Cap Growth Fund, Inc.
AVPS Large Cap Growth Portfolio | 0.75% on first $2.5 billion 0.65% on next $2.5 billion 0.60% on the balance | 0.750% | |||||
| Multi-Asset Real Return Portfolio | AB Bond Fund, Inc. – Real Asset Strategy | 0.75% (flat fee) | 0.750% | |||||
| International Value Portfolio | International Value Fund, Inc.
AVPS International Value Portfolio | 0.75% on first $2.5 billion 0.65% on next $2.5 billion 0.60% on the balance | 0.750% | |||||
| International Growth Portfolio | International Growth Fund, Inc.
AVPS International Growth Portfolio | 0.75% on first $2.5 billion 0.65% on next $2.5 billion 0.60% on the balance | 0.750% | |||||
| Small-Mid Cap Value Portfolio | Discovery Value Fund
AVPS Small/Mid Cap Value Portfolio | 0.75% on first $2.5 billion 0.65% on next $2.5 billion 0.60% on the balance | 0.750% | |||||
| Small-Mid Cap Growth Portfolio | Discovery Growth Fund | 0.75% on first $500 million 0.65% on next $500 million 0.55% on the balance | 0.750% | |||||
The Adviser manages the International Portfolio of the Sanford C. Bernstein Fund, Inc. (“SCB Fund”), which has a blend investment strategy of International Value Portfolio and International Growth Portfolio. The advisory fee schedule of SCB Fund—International Portfolio is set forth in the table below.
| 396 | • AB POOLING PORTFOLIOS |
| Portfolio21 | SCB Fund Portfolio | Fee Schedule | SCB Fund Effective Fee (%) | |||||
International Value Portfolio/ International Growth Portfolio | International Portfolio | 0.925% on 1st $1 billion 0.850% on next $3 billion 0.800% on next $2 billion 0.750% on next $2 billion 0.650% thereafter The Adviser is waving 5 basis points in advisory fees effective through October 31, 2015. | 0.875%22 | |||||
The Adviser also manages and sponsors retail mutual funds, which are organized in jurisdictions outside the United States, generally Luxembourg and Japan, and sold to non-United States resident investors. The Adviser charges the fees set forth below for the Luxembourg funds that has a somewhat similar investment style as U.S. Large Cap Portfolio and Multi-Asset Real Return Portfolio.
| Portfolio | Luxembourg Fund | Fee23 | ||
| U.S. Large Cap Growth Portfolio | American Growth Portfolio Class A Class I | 1.50% 0.70% | ||
| Multi-Asset Real Return Portfolio | Real Asset Portfolio Class A Class I | 1.55% 0.75% |
The Adviser provides sub-advisory investment services to certain other investment companies managed by other fund families. The Adviser charges the fees set forth below for the following sub-advisory relationships that have a somewhat similar investment style as the Portfolios. In the table below are the advisory fee schedules of the sub-advised funds and the effective management fees of the sub-advisory relationships based on the Portfolios’ March 31, 2015 net assets.24
| 21 | investment guidelines of the Portfolios are more restrictive than the SCB Fund portfolio. The Portfolios invest primarily in either value or growth equity securities, in contrast to the SCB Fund portfolio, which invests in both value and growth equity securities. |
| 22 | The SCB Fund effective fee of 0.875% includes the five basis points advisory fee waiver. |
| 23 | Class A shares of the Luxembourg funds are charged an “all-in” fee, which includes investment advisory services and distribution related services, unlike Class I shares, whose fee is for investment advisory services only. |
| 24 | The Supreme Court cautioned against accepting mutual fund fee comparisons without careful scrutiny since “these comparisons are problematic because these fees, like those challenged, may not be the product of negotiations conducted at arm’s-length.” Jones v. Harris at 1429. |
| AB POOLING PORTFOLIOS • | 397 |
| Portfolio | Sub-advised Fund | Sub-advised Fund Fee Schedule | Sub-advised Fund Eff. Mgmt. Fee (%) | |||||
| U.S. Value Portfolio | Client #125,26 | AB Sub-Advisory Fee Schedule: 0.49% on the first $100 million 0.30% on the next $100 million 0.25% on the balance | 0.301% | |||||
| U.S. Large Cap Growth Portfolio | Client #2 | AB Sub-Advisory Fee Schedule: 0.35% on the first $50 million 0.30% on the next $1000 million 0.25% on the balance | 0.270% | |||||
| International Value Portfolio | Client #325,26 | AB Sub-Advisory Fee Schedule: 0.60% on the first $1 billion 0.55% on the next $500 million 0.50% on the next $500 million 0.45% on the next $500 million 0.40% on the balance | 0.600% | |||||
| Small/Mid Cap Value Portfolio | Client #4 | AB Sub-Advisory Fee Schedule: 0.50% on the first $250 million 0.40 % on the balance | 0.489% | |||||
| Client #5 | AB Sub-Advisory Fee Schedule: 0.61% on the first $150 million 0.50% on the balance | 0.552% | �� | |||||
| Client #6 | AB Sub-Advisory Fee Schedule: 0.95% on the first $10 million 0.75% on the next $40 million 0.65% on the next $50 million 0.55% on the balance | 0.604% | ||||||
| Volatility Management Portfolio | Client #7 | AB Sub-Advisory Fee Schedule: 0.18% on the first $500 million 0.15% on the next $1 billion 0.13% on the balance | 0.160% | |||||
The services the Adviser provides pursuant to sub-advisory agreements are generally confined to the services related to the investment process; in other words, they are not as comprehensive as the services provided to the Portfolios by the Adviser. In addition, to the extent that certain of these sub-advisory relationships are with affiliates of the Adviser, the fee schedules may not reflect arm’s-length bargaining or negotiations.
| 25 | The client is an affiliate of the Adviser. |
| 26 | Assets are aggregated with other client portfolios for purposes of calculating the advisory fee. |
| 398 | • AB POOLING PORTFOLIOS |
| II. | MANAGEMENT FEES CHARGED BY OTHER MUTUAL FUNDS COMPANIES FOR LIKE SERVICES. |
The Trustees previously received the Senior Officer’s Evaluation of the Investment Advisory Agreement (the “Senior Officer Fee Evaluation”) for the Retirement Strategies and the Wealth Strategies. The Senior Officer Fee Evaluation for the SCB Overlay Portfolios was reviewed by the SCB Fund Board of Directors.27 In those Senior Officer Fee Evaluations, the Senior Officer concluded that the investment advisory agreements for those funds were reasonable and within range of what would have been negotiated at arm’s-length.
The Pooling Portfolios are not charged an advisory fee. However, as previously mentioned, the Institutional Clients that invest in the Pooling Portfolios do pay an advisory fee pursuant to their advisory agreements with the Adviser. The Adviser believes that the fee paid by the Institutional Clients includes a portion, referred by the Adviser as the “Implied Advisory Fee,” that may be reasonably viewed as compensation for services that the Adviser provides to the Pooling Portfolios. The Adviser further believes that the rate of the Implied Advisory Fee is the same for each Institutional Client invested in a series of the Pooling Portfolios.
Because of the Pooling Portfolios’ limited availability for investment, open only to certain institutional clients of the Adviser, the Pooling Portfolios have zero transfer agent (with the exception of certain transfer agent out of pocket expenses) and distribution fees, in addition to zero advisory fees. Such expense structure is rare in the industry. The UBS Relationship Funds, an open-end investment company managed by UBS Global Asset Management (Americas) Inc., was the only other fund family that was determined by the Adviser, the Senior Officer and Lipper, Inc. (“Lipper”) to have an expense structure comparable to the Pooling Portfolios.
Since there are not many funds of other fund families that have a similar expense structure as the Portfolios, Lipper, an analytical service not affiliated with the Adviser, compared the total expense ratios of the Portfolios to that of funds of a similar investment classification/objective with institutional class shares; however, Lipper excluded management, transfer agent and distribution fees from the total expense ratios of the Portfolios’ peers.28,29 Lipper’s analysis included the
| 27 | The Senior Officer Fee Evaluation was dated July 24, 2014 for the Retirement Strategies and the Wealth Strategies. The Senior Officer Fee Evaluation for the SCB Overlays Portfolios was dated October 7, 2014. |
| 28 | Because the Portfolios are offered only to other investment companies and certain institutional clients managed by the Adviser, the Portfolios are not assessed a fee for transfer agent and distribution related services although it should be noted that the transfer agent of the Portfolios is reimbursed for out of pocket expenses. |
| 29 | As stated previously, comparisons with fees charged to mutual funds by other advisers may be “problematic” as the fees charged by other advisers may not be the product of negotiations conducted at arm’s-length. Jones v. Harris at 1429. |
| AB POOLING PORTFOLIOS • | 399 |
Portfolios’ rankings relative to their respective Lipper Expense Group (“EG”) and Lipper Expense Universe (“EU”).30,31
Lipper describes an EG as a representative sample of comparable funds. Lipper’s standard methodology for screening funds to be included in an EG entails the consideration of several fund criteria, including fund type, investment classification/objective, load type and similar 12b-1/non-12b-1 service fees, asset (size) comparability, expense components, operating structure, and expense attributes. An EG will typically consist of seven to twenty funds.
The original EGs of International Value Portfolio and Volatility Management Portfolio had an insufficient number of peers. Consequently, Lipper expanded the Portfolio’s EG to include peers that have a similar but not the same Lipper investment classification/objective. However, because Lipper had expanded the Portfolio’s EG to include peers that have a similar but not the same Lipper investment classification/objective, under Lipper’s standard guidelines, the Portfolio’s EU was also expanded to include the universes of those peers that have a
similar but not the same investment classification/objective and load type as the Portfolio. The result of Lipper’s analysis is set forth in the table below.32,33
| Portfolio | Expense Ratio (%) | Lipper EG Median (%) | Lipper EG Rank | Lipper Median (%) | Lipper Rank | |||||||||||
| U.S. Value Portfolio | 0.027 | 0.047 | 3/15 | 0.068 | 8/50 | |||||||||||
| U.S. Large Cap Growth Portfolio | 0.028 | 0.043 | 3/17 | 0.056 | 26/125 | |||||||||||
| Multi-Asset Real Return Portfolio | 0.069 | 0.085 | 7/17 | 0.113 | 20/58 | |||||||||||
| International Value Portfolio34 | 0.052 | 0.100 | 3/15 | 0.114 | 5/30 | |||||||||||
| International Growth Portfolio | 0.047 | 0.096 | 1/18 | 0.103 | 19/88 | |||||||||||
| Small-Mid Cap Value Portfolio | 0.064 | 0.086 | 6/16 | 0.060 | 18/30 | |||||||||||
| 30 | A ranking of “1” would mean that the Portfolio had the lowest total expense ratio in the Lipper peer group. |
| 31 | There are limitations in expense category data because different funds categorize expenses differently. |
| 32 | The total expense ratios shown below were estimated by Lipper using rounded Form-NSAR data. Accordingly, there may be slight differences in the total expense ratios estimated by Lipper and that of the Adviser. |
| 33 | Except for asset (size) comparability, Lipper uses the same criteria for selecting a Lipper EG when selecting a Lipper EU. Unlike the Lipper EG, the Lipper EU allows for the same adviser to be represented by more than just one fund. In addition, multiple institutional class shares for the Portfolios’ peers are included. |
| 34 | The Portfolio’s EG includes the Portfolio, nine other International Multi-Cap Value (“IMLV”) funds and five International Large-Cap Value (“ILCV”) funds. The Portfolio’s EU includes the Portfolio, EG and all other IMLV and ILCV funds, excluding outliers. |
| 400 | • AB POOLING PORTFOLIOS |
| Portfolio | Expense Ratio (%) | Lipper EG Median (%) | Lipper EG Rank | Lipper Median (%) | Lipper Rank | |||||||||||
| Small-Mid Cap Growth Portfolio | 0.074 | 0.067 | 12/20 | 0.064 | 51/88 | |||||||||||
| Volatility Management Portfolio35 | 0.046 | 0.128 | 1/9 | 0.246 | 2/18 | |||||||||||
Based on this analysis, except for Small-Mid Cap Growth Portfolio, whose total expense ratio is higher than its EG and EU medians, and Small-Mid Cap Growth Value Portfolio, whose total expense ratio is lower than the EG median but higher than the EU median, the total expense ratios of the Portfolios are lower than their respective EG and EU medians.
| III. | COSTS TO THE ADVISER AND ITS AFFILIATES OF SUPPLYING SERVICES PURSUANT TO THE ADVISORY FEE ARRANGEMENT, EXCLUDING ANY INTRA-CORPORATE PROFIT. |
The Adviser utilizes two profitability reporting systems, which operate independently but are aligned with each other, to estimate the Adviser’s profitability in connection with investment advisory services provided to the Portfolios. The Senior Officer has retained a consultant to provide independent advice regarding the alignment of the two profitability systems as well as the methodologies and allocations utilized by both profitability systems. See Section IV for additional discussion.
| IV. | PROFIT MARGINS OF THE ADVISER AND ITS AFFILIATES FOR SUPPLYING SUCH SERVICES. |
The Pooling Portfolios’ profitability information, prepared by the Adviser for the Board of Trustees, was reviewed by the Senior Officer and the consultant. The Adviser’s profitability from providing investment advisory services to each of the Pooling Portfolios decreased with the exception Small-Mid Cap Value Portfolio, Small-Mid Cap Growth Portfolio, and Volatility Management Portfolio during calendar year 2014, relative to 2013.
Multi-Asset Real Return, International Value Portfolio, and Small-Mid Cap Growth Portfolio effected brokerage transactions and paid commissions to the Adviser’s affiliate, Sanford C. Bernstein & Co. LLC, and/or its U.K. based affiliate, Sanford C. Bernstein Ltd., collectively “SCB,” during the Portfolios’ most recently completed fiscal year. The Adviser represented that SCB’s profitability from business conducted with the Portfolios is comparable to the profitability of SCB’s dealings with other similar third party clients. In the ordinary course of business, SCB receives and pays liquidity rebates from electronic communications networks (“ECNs”) derived from trading for its clients. These credits and charges are not being passed on to any SCB client.
| 35 | The Portfolio’s EG includes the Portfolio, four other Flexible Portfolio (“FX”) funds and four Alternative Global Macro (“AGM”) funds. The Portfolio’s EU includes the Portfolio, EG and all other FX and AGM funds, excluding outliers. |
| AB POOLING PORTFOLIOS • | 401 |
| V. | POSSIBLE ECONOMIES OF SCALE |
The Adviser has indicated that economies of scale are being shared with shareholders through pricing to scale, breakpoints, fee reductions/waivers and enhancement to services.
In May 2012, an independent consultant, retained by the Senior Officer, provided the Board of Trustees information on the Adviser’s firm-wide average costs from 2005 through 2011 and the potential economies of scale. The independent consultant noted that from 2005 through 2007 the Adviser experienced significant growth in assets under management (“AUM”). During this period, operating expenses increased, in part to keep up with growth, and in part reflecting market returns. However, from 2008 through the first quarter of 2009, AUM rapidly and significantly decreased due to declines in market value and client withdrawals. When AUM rapidly decreased, some operating expenses categories, including base compensation and office space, adjusted more slowly during this period, resulting in an increase in average costs. Since 2009, AUM has experienced less significant changes. The independent consultant noted that changes in operating expenses reflect changes in business composition and business practices in response to changes in financial markets. Finally, the independent consultant concluded that the increase in average cost and the decline in net operating margin across the Adviser since late 2008 are inconsistent with the view that there are currently reductions in average costs due to economies of scale that can be shared with the AB Mutual Funds managed by the Adviser through lower fees.
Previously, in February 2008, the independent consultant provided the Board of Trustees an update of the Deli36 study on advisory fees and various fund characteristics.37 The independent consultant first reiterated the results of his previous two dimensional comparison analysis (fund size and family size) with the Board of Trustees.38 The independent consultant then discussed the results of the regression model that was utilized to study the effects of various factors on advisory fees. The regression model output indicated that the bulk of the variation in fees predicted were explained by various factors, but substantially by fund AUM, family AUM, index fund indicator and investment style. The independent
| 36 | The Deli study, originally published in 2002 based on 1997 data and updated for the February 2008 Presentation, may be of diminished value due to the age of the data used in the presentation and the changes experienced in the industry over the last four years. |
| 37 | As mentioned previously, the Supreme Court cautioned against accepting mutual fund fee comparisons without careful scrutiny since the fees may not be the product of negotiations conducted at arm’s length. See Jones V. Harris at 1429. |
| 38 | The two dimensional analysis showed patterns of lower advisory fees for funds with larger asset sizes and funds from larger family sizes compared to funds with smaller asset sizes and funds from smaller family sizes, which according to the independent consultant is indicative of a sharing of economies of scale and scope. However, in less liquid and active markets, such is not the case, as the empirical analysis showed potential for diseconomies of scale in those markets. The empirical analysis also showed diminishing economies of scale and scope as funds surpassed a certain high level of assets. |
| 402 | • AB POOLING PORTFOLIOS |
consultant also compared the advisory fees of the AB Mutual Funds to similar funds managed by 19 other large asset managers, regardless of the fund size and each Adviser’s proportion of mutual fund assets to non-mutual fund assets.
| VI. | NATURE AND QUALITY OF THE ADVISER’S SERVICES INCLUDING THE PERFORMANCE OF THE PORTFOLIOS. |
With assets under management of $486 billion as of March 31, 2015, the Adviser has the investment experience to manage and provide non-investment services to the Portfolios.
The information in the table below shows the 1, 3 and 5 year (with respect to Volatility Management Portfolio, 1 and 3 year) gross performance returns and rankings of the Portfolios39 relative to their Lipper Performance Group (“PG”) and Lipper Performance Universe (“PU”)40 for the periods ended February 28, 2015.41,42
| Portfolio (%) | PG Median (%) | PU Median (%) | PG Rank | PU Rank | ||||||||||||||||
| U.S. Value Portfolio | ||||||||||||||||||||
1 year | 13.07 | 12.33 | 11.70 | 6/15 | 19/50 | |||||||||||||||
3 year | 18.49 | 18.49 | 18.39 | 8/15 | 21/47 | |||||||||||||||
5 year | 14.61 | 16.38 | 15.76 | 12/14 | 30/41 | |||||||||||||||
| U.S. Large Cap Growth Portfolio | ||||||||||||||||||||
1 year | 19.96 | 13.88 | 13.78 | 1/17 | 6/123 | |||||||||||||||
3 year | 20.64 | 19.74 | 18.65 | 6/17 | 15/113 | |||||||||||||||
5 year | 17.09 | 17.84 | 17.41 | 11/16 | 56/93 | |||||||||||||||
| Multi-Asset Real Return Portfolio43 | ||||||||||||||||||||
1 year | -10.96 | 7.49 | 5.57 | 16/17 | 55/56 | |||||||||||||||
3 year | -2.99 | 10.47 | 9.56 | 15/15 | 44/45 | |||||||||||||||
5 year | 2.77 | 10.16 | 10.09 | 12/12 | 27/27 | |||||||||||||||
| 39 | The performance returns of the Portfolios shown were provided by Lipper. |
| 40 | A Portfolio’s PG/PU may not be identical to its respective EG/EU as the criteria for including/excluding a fund in a PG/PU is somewhat different from that of an EG/EU. |
| 41 | The performance returns of the Portfolios’ peers are also adjusted for expenses (gross up). |
| 42 | The Lipper investment classification/objective dictates the PG/PU throughout the life of each Portfolio even if a Portfolio had a different investment classification/objective at a different point in time. |
| 43 | The Portfolio’s Lipper classification changed in 2011 from Global Real Estates to Global Flexible Funds as a result of changes to the Portfolio’s strategy. Subsequently, Lipper Classification changed in 2014 to Flexible Portfolios as a result of Lipper’s elimination of their Global Flexible Funds category in September 2014. See footnote 42 for information regarding Lipper classification changes. |
| AB POOLING PORTFOLIOS • | 403 |
| Portfolio (%) | PG Median (%) | PU Median (%) | PG Rank | PU Rank | ||||||||||||||||
| International Value Portfolio | ||||||||||||||||||||
1 year | 1.81 | -1.73 | -1.76 | 1/10 | 2/30 | |||||||||||||||
3 year | 7.41 | 9.20 | 9.14 | 9/10 | 22/25 | |||||||||||||||
5 year | 5.17 | 7.86 | 7.86 | 8/9 | 20/21 | |||||||||||||||
| International Growth Portfolio | ||||||||||||||||||||
1 year | 2.50 | 1.79 | 1.46 | 6/18 | 33/87 | |||||||||||||||
3 year | 5.37 | 10.51 | 9.55 | 15/15 | 72/76 | |||||||||||||||
5 year | 3.53 | 10.12 | 9.48 | 12/12 | 69/70 | |||||||||||||||
| Small-Mid Cap Value Portfolio | ||||||||||||||||||||
1 year | 11.09 | 11.63 | 13.15 | 11/15 | 22/29 | |||||||||||||||
3 year | 19.10 | 18.95 | 18.94 | 7/14 | 11/26 | |||||||||||||||
5 year | 16.29 | 16.94 | 17.08 | 7/10 | 13/21 | |||||||||||||||
| Small-Mid Cap Growth Portfolio | ||||||||||||||||||||
1 year | 3.32 | 10.07 | 10.05 | 17/19 | 80/87 | |||||||||||||||
3 year | 16.04 | 16.85 | 16.85 | 12/19 | 52/81 | |||||||||||||||
5 year | 21.30 | 18.10 | 17.79 | 2/17 | 3/73 | |||||||||||||||
| Volatility Management Portfolio | ||||||||||||||||||||
1 year | 10.74 | 3.41 | 10.83 | 2/5 | 5/8 | |||||||||||||||
3 year | 11.34 | 6.70 | 9.34 | 2/4 | 2/6 | |||||||||||||||
Set forth below are the 1, 3, 5 year and since inception net performance returns of the Portfolios (in bold) versus their benchmarks.44 Portfolio and benchmark volatility and reward-to-variability ratio (“Sharpe Ratio”) information is also shown.45
| 44 | The Adviser provided Portfolio and benchmark performance return information for periods through February 28, 2015. |
| 45 | Portfolio and benchmark volatility and Sharpe Ratio information was obtained through Lipper LANA, a database maintained by Lipper. Volatility is a statistical measure of the tendency of a market price or yield to vary over time. The Sharpe Ratio is a risk adjusted measure of return that divides a portfolio’s return in excess of the riskless return by the portfolio’s standard deviation. A portfolio with a greater volatility would be regarded as more risky than a portfolio with equivalent performance but lower volatility; for that reason, a greater return would be demanded for the more risky portfolio. A portfolio with a higher Sharpe Ratio would be regarded as better performing than a portfolio with a lower Sharpe Ratio. |
| 404 | • AB POOLING PORTFOLIOS |
Periods Ended February 28, 2015 Annualized Performance | ||||||||||||||||||||||||||||
Since Inception | Annualized | Risk Period (Year) | ||||||||||||||||||||||||||
1 Year (%) | 3 Year (%) | 5 Year (%) | Volatility (%) | Sharpe Ratio | ||||||||||||||||||||||||
| U.S. Value Portfolio | 13.05 | 18.47 | 14.59 | 6.44 | 14.44 | 1.01 | 5 | |||||||||||||||||||||
| Russell 1000 Value Index | 13.49 | 18.11 | 15.51 | 7.49 | 13.47 | 1.13 | 5 | |||||||||||||||||||||
| Inception Date: May 20, 2005 | ||||||||||||||||||||||||||||
| U.S. Large Cap Growth Portfolio | 19.93 | 20.62 | 17.07 | 9.28 | 15.58 | 1.09 | 5 | |||||||||||||||||||||
| Russell 1000 Growth Index | 16.24 | 18.05 | 17.21 | 9.38 | 13.37 | 1.24 | 5 | |||||||||||||||||||||
| Inception Date: May 20, 2005 | ||||||||||||||||||||||||||||
| Multi-Asset Real Return Portfolio | -11.39 | -3.21 | 2.61 | 2.54 | 15.40 | 0.24 | 5 | |||||||||||||||||||||
| MSCI AC World Commodity Producers Index | -12.41 | -6.47 | -0.60 | 5.01 | N/A | N/A | N/A | |||||||||||||||||||||
| FTSE EPRA/NAREIT Developed RE Index—Gross Return | 16.44 | 13.34 | 13.65 | 7.52 | N/A | N/A | N/A | |||||||||||||||||||||
| All Market Real Return Benchmark46 | -7.70 | -2.25 | 2.28 | 3.60 | 15.39 | 0.22 | 5 | |||||||||||||||||||||
| Inception Date: May 20, 2005 | ||||||||||||||||||||||||||||
| International Value Portfolio47 | 1.76 | 7.36 | 5.12 | 3.67 | 18.95 | 0.35 | 5 | |||||||||||||||||||||
| MSCI AC World Index ex U.S. | 0.87 | 6.49 | 6.55 | 6.03 | 16.35 | 0.46 | 5 | |||||||||||||||||||||
| MSCI EAFE Net Index | -0.03 | 9.41 | 7.78 | 5.50 | N/A | N/A | N/A | |||||||||||||||||||||
| Inception Date: May 20, 2005 | ||||||||||||||||||||||||||||
| International Growth Portfolio47 | 2.45 | 5.33 | 3.49 | 2.31 | 17.47 | 0.28 | 5 | |||||||||||||||||||||
| MSCI AC World Index ex U.S. | 0.87 | 6.49 | 6.55 | 6.03 | 16.35 | 0.46 | 5 | |||||||||||||||||||||
| MSCI AC World Index ex U.S. Growth | 2.88 | 7.24 | 7.40 | 6.41 | N/A | N/A | N/A | |||||||||||||||||||||
| MSCI EAFE Net Index | -0.03 | 9.41 | 7.78 | 5.50 | N/A | N/A | N/A | |||||||||||||||||||||
| Inception Date: May 20, 2005 | ||||||||||||||||||||||||||||
| 46 | Multi-Asset Real Return Benchmark comprises of equally-weighted blend of the MSCI ACWI Commodity Producers Index, the FTSE EPRA/NAREIT Global Index and the Dow Jones-UBS Commodity Index. Effective October 1, 2011 the Real Estate component changed from the FTSE EPRA/NAREIT Developed index to the FTSE EPRA/NAREIT Global Index. |
| 47 | On January 1, 2012, the Portfolio’s benchmark changed from MSCI EAFE Net Index to MSCI AC World Index ex U.S. |
| AB POOLING PORTFOLIOS • | 405 |
Periods Ended February 28, 2015 Annualized Performance | ||||||||||||||||||||||||||||
Since Inception | Annualized | Risk Period (Year) | ||||||||||||||||||||||||||
1 Year (%) | 3 Year (%) | 5 Year (%) | Volatility (%) | Sharpe Ratio | ||||||||||||||||||||||||
| Small-Mid Cap Value Portfolio | 11.02 | 19.03 | 16.24 | 10.38 | 18.10 | 0.92 | 5 | |||||||||||||||||||||
| Russell 2500 Value Index | 6.95 | 16.87 | 15.46 | 8.48 | 16.06 | 0.97 | 5 | |||||||||||||||||||||
| Inception Date: May 20, 2005 | ||||||||||||||||||||||||||||
| Small-Mid Cap Growth Portfolio | 3.25 | 15.97 | 21.23 | 13.37 | 17.77 | 1.17 | 5 | |||||||||||||||||||||
| Russell 2500 Growth Index | 9.62 | 17.94 | 18.40 | 10.71 | 17.26 | 1.06 | 5 | |||||||||||||||||||||
| Inception Date: May 20, 2005 | ||||||||||||||||||||||||||||
| Volatility Management Portfolio48 | 10.69 | 11.29 | N/A | 9.74 | 9.39 | 1.18 | 3 | |||||||||||||||||||||
| MSCI AC World Index | 7.55 | 11.57 | N/A | 9.14 | 10.32 | 1.10 | 3 | |||||||||||||||||||||
| Inception Date: April 16, 2010 | ||||||||||||||||||||||||||||
CONCLUSION:
The Senior Officer recommended that the Trustees consider discussing with the Adviser changing Multi-Asset Real Return Portfolio’s primary benchmark from the MSCI AC World Commodity Producers Index (NDR) to the All Market Real Return Index or to add the All Market Real Return Index as a secondary benchmark in the Portfolio’s prospectus.
Based on the factors discussed above, most notably the zero advisory fees and limited total expenses of the Portfolios as well as the reasonableness of the advisory fees paid by shareholders of the Institutional Clients that invest in the Portfolios, and the information provided by the Adviser and the memorandum from your independent counsel, including the legal analysis and factors you need to consider when approving the Investment Advisory Agreement for the Portfolios, my conclusion is that the Investment Advisory Agreement is reasonable and within the range of what would have been negotiated at arm’s-length in light of all the surrounding circumstances.
Dated: June 5, 2015
| 48 | The Portfolio’s benchmark changed from S&P 500 Index to MSCI AC World Index on January 1, 2012. |
| 406 | • AB POOLING PORTFOLIOS |
THIS PAGE IS NOT PART OF THE SHAREHOLDER REPORT OR THE FINANCIAL STATEMENTS
AB FAMILY OF FUNDS
US EQUITY
US Core
Core Opportunities Fund
Select US Equity Portfolio
US Growth
Concentrated Growth Fund
Discovery Growth Fund
Growth Fund
Large Cap Growth Fund
Small Cap Growth Portfolio
US Value
Discovery Value Fund
Equity Income Fund
Growth & Income Fund
Small Cap Value Portfolio
Value Fund
INTERNATIONAL/ GLOBAL EQUITY
International/Global Core
Global Core Equity Portfolio
Global Equity & Covered Call Strategy Fund
Global Thematic Growth Fund
International Portfolio
Tax-Managed International Portfolio
International/Global Growth
International Growth Fund
International/Global Value
International Value Fund
FIXED INCOME
Municipal
High Income Municipal Portfolio
Intermediate California Municipal Portfolio
Intermediate Diversified Municipal Portfolio
Intermediate New York Municipal Portfolio
Municipal Bond Inflation Strategy
Tax-Aware Fixed Income Portfolio
FIXED INCOME (continued)
National Portfolio
Arizona Portfolio
California Portfolio
Massachusetts Portfolio
Michigan Portfolio
Minnesota Portfolio
New Jersey Portfolio
New York Portfolio
Ohio Portfolio
Pennsylvania Portfolio
Virginia Portfolio
Taxable
Bond Inflation Strategy
Global Bond Fund
High Income Fund
High Yield Portfolio
Intermediate Bond Portfolio
Limited Duration High Income Portfolio
Short Duration Portfolio
ALTERNATIVES
All Market Real Return Portfolio*
Credit Long/Short Portfolio
Global Real Estate Investment Fund
Long/Short Multi-Manager Fund
Multi-Manager Alternative Strategies Fund
Select US Long/Short Portfolio
Unconstrained Bond Fund
MULTI-ASSET
All Market Growth Portfolio*
All Market Income Portfolio
Emerging Markets Multi-Asset Portfolio
Global Risk Allocation Fund
Target-Date
Multi-Manager Select Retirement Allocation Fund
Multi-Manager Select 2010 Fund
MULTI-ASSET (continued)
Multi-Manager Select 2015 Fund
Multi-Manager Select 2020 Fund
Multi-Manager Select 2025 Fund
Multi-Manager Select 2030 Fund
Multi-Manager Select 2035 Fund
Multi-Manager Select 2040 Fund
Multi-Manager Select 2045 Fund
Multi-Manager Select 2050 Fund
Multi-Manager Select 2055 Fund
Wealth Strategies
Balanced Wealth Strategy
Conservative Wealth Strategy
Wealth Appreciation Strategy
Tax-Managed Balanced Wealth Strategy
Tax-Managed Conservative Wealth Strategy
Tax-Managed Wealth Appreciation Strategy
CLOSED-END FUNDS
AB Multi-Manager Alternative Fund
Alliance California Municipal Income Fund
AllianceBernstein Global High Income Fund
AllianceBernstein Income Fund
AllianceBernstein National Municipal Income Fund
We also offer Exchange Reserves, which serves as the money market fund exchange vehicle for the AB mutual funds. An investment in Exchange Reserves is not a deposit in a bank and is not insured or guaranteed by the Federal Deposit Insurance Corporation or any other government agency. Although the Fund seeks to preserve the value of your investment at $1.00 per share, it is possible to lose money by investing in the Fund.
Investors should consider the investment objectives, risks, charges and expenses of the Fund carefully before investing. For copies of our prospectus or summary prospectus, which contain this and other information, visit us online at www.abglobal.com or contact your AB representative. Please read the prospectus and/or summary prospectus carefully before investing.
* Prior to December 15, 2014, All Market Growth Portfolio was named Dynamic All Market Fund; All Market Real Return Portfolio was named Real Asset Strategy.
| AB POOLING PORTFOLIOS • | 407 |
AB Family of Funds
NOTES
| 408 | • AB POOLING PORTFOLIOS |
AB POOLING PORTFOLIOS
1345 Avenue of the Americas
New York, NY 10105
800.221.5672
POOL-0151-0815 
| ITEM 2. | CODE OF ETHICS. |
(a) The registrant has adopted a code of ethics that applies to its principal executive officer, principal financial officer and principal accounting officer. A copy of the registrant’s code of ethics is filed herewith as Exhibit 12(a)(1).
(b) During the period covered by this report, no material amendments were made to the provisions of the code of ethics adopted in 2(a) above.
(c) During the period covered by this report, no implicit or explicit waivers to the provisions of the code of ethics adopted in 2(a) above were granted.
| ITEM 3. | AUDIT COMMITTEE FINANCIAL EXPERT. |
The registrant’s Board of Directors has determined that independent director. William H. Foulk, Jr., Garry L. Moody and Marshall C. Turner, Jr. qualify as audit committee financial experts.
| ITEM 4. | PRINCIPAL ACCOUNTANT FEES AND SERVICES. |
(a) - (c) The following table sets forth the aggregate fees billed by the independent registered public accounting firm Ernst & Young LLP for the Fund’s last two fiscal years, for professional services rendered for: (i) the audit of the Fund’s annual financial statements included in the Fund’s annual report to stockholders; (ii) assurance and related services that are reasonably related to the performance of the audit of the Fund’s financial statements and are not reported under (i), which include advice and education related to accounting and auditing issues, quarterly press release review (for those Funds that issue quarterly press releases), and preferred stock maintenance testing (for those Funds that issue preferred stock); and (iii) tax compliance, tax advice and tax return preparation.
| Audit Fees | Audit-Related Fees | Tax Fees | ||||||||||||||
AB U.S. Value Portfolio | 2014 | $ | 27,778 | $ | — | $ | 13,622 | |||||||||
| 2015 | $ | 28,620 | $ | — | $ | 16,888 | ||||||||||
AB U.S. Large Cap Growth Portfolio | 2014 | $ | 27,778 | $ | — | $ | 13,622 | |||||||||
| 2015 | $ | 28,620 | $ | — | $ | 16,863 | ||||||||||
AB Multi-Asset Real Return | 2014 | $ | 65,848 | $ | — | $ | 41,216 | |||||||||
| 2015 | $ | 67,844 | $ | — | $ | 26,338 | ||||||||||
AB International Value Portfolio | 2014 | $ | 39,021 | $ | — | $ | 33,539 | |||||||||
| 2015 | $ | 40,204 | $ | — | $ | 40,930 | ||||||||||
AB International Growth Portfolio | 2014 | $ | 39,021 | $ | — | $ | 26,689 | |||||||||
| 2015 | $ | 40,204 | $ | — | $ | 29,950 | ||||||||||
AB Short Duration Bond Portfolio | 2014 | $ | 35,119 | $ | — | $ | 12,309 | |||||||||
| 2015 | $ | 36,183 | $ | — | $ | 15,251 | ||||||||||
AB Global Core Bond Portfolio | 2014 | $ | 41,948 | $ | — | $ | 12,309 | |||||||||
| 2015 | $ | 43,219 | $ | — | $ | 12,647 | ||||||||||
AB Inflation Protected Securities Portfolio | 2014 | $ | 58,694 | $ | — | $ | 11,744 | |||||||||
| 2015 | $ | 60,473 | $ | — | $ | 14,703 | ||||||||||
AB High-Yield Portfolio | 2014 | $ | 107,552 | $ | — | $ | 20,565 | |||||||||
| 2015 | $ | 110,811 | $ | — | $ | 24,027 | ||||||||||
AB Small Mid-Cap Value Portfolio | 2014 | $ | 31,593 | $ | — | $ | 22,719 | |||||||||
| 2015 | $ | 32,551 | $ | — | $ | 13,976 | ||||||||||
AB Small Mid-Cap Growth Portfolio | 2014 | $ | 27,778 | $ | — | $ | 16,454 | |||||||||
| 2015 | $ | 28,620 | $ | — | $ | 13,976 | ||||||||||
AB Volatility Management | 2014 | $ | 66,499 | $ | — | $ | 30,161 | |||||||||
| 2015 | $ | 68,514 | $ | — | $ | 40,216 | ||||||||||
(d) Not applicable.
(e) (1) Beginning with audit and non-audit service contracts entered into on or after May 6, 2003, the Fund’s Audit Committee policies and procedures require the pre-approval of
all audit and non-audit services provided to the Fund by the Fund’s independent registered public accounting firm. The Fund’s Audit Committee policies and procedures also require pre-approval of all audit and non-audit services provided to the Adviser and Service Affiliates to the extent that these services are directly related to the operations or financial reporting of the Fund.
(e) (2) All of the amounts for Audit Fees, Audit-Related Fees and Tax Fees in the table under Item 4 (a) – (c) are for services pre-approved by the Fund’s Audit Committee.
(f) Not applicable.
(g) The following table sets forth the aggregate non-audit services provided to the Fund, the Fund’s Adviser and entities that control, are controlled by or under common control with the Adviser that provide ongoing services to the Fund:
| All Fees for Non-Audit Services Provided to the Portfolio, the Adviser and Service Affiliates | Total Amount of Foregoing Column Pre- approved by the Audit Committee (Portion Comprised of Audit Related Fees) (Portion Comprised of Tax Fees) | |||||||||||
AB U.S. Value Portfolio | 2014 | $ | 382,427 | $ $ $ | 13,622 — (13,622 |
) | ||||||
| 2015 | $ | 355,138 | $ $ $ | 16,888 — (16,888 |
) | |||||||
AB U.S. Large Cap Growth Portfolio | 2014 | $ | 382,427 | $ $ $ | 13,622 — (13,622 |
) | ||||||
| 2015 | $ | 355,113 | $ $ $ | 16,863 — (16,863 |
) | |||||||
AB Multi-Asset Real Return | 2014 | $ | 410,021 | $ $ $ | 41,216 — (41,216 |
) | ||||||
| 2015 | $ | 525,165 | $ $ $ | 26,338 — (26,338 |
) | |||||||
AB International Value Portfolio | 2014 | $ | 402,344 | $ $ $ | 33,539 — (33,539 |
) | ||||||
| 2015 | $ | 379,180 | $ $ $ | 40,930 — (40,930 |
) | |||||||
AB International Growth Portfolio | 2014 | $ | 395,494 | $ $ $ | 26,689 — (26,689 |
) | ||||||
| 2015 | $ | 368,200 | $ $ $ | 29,950 — (29,950 |
) | |||||||
AB Short Duration Bond Portfolio | 2014 | $ | 381,114 | $ $ $ | 12,309 — (12,309 |
) | ||||||
| 2015 | $ | 353,501 | $ $ $ | 15,251 — (15,251 |
) | |||||||
AB Global Core Bond Portfolio | 2014 | $ | 381,114 | $ $ $ | 12,309 — (12,309 |
) | ||||||
| 2015 | $ | 511,474 | $ $ $ | 12,647 — (12,647 |
) | |||||||
AB Inflation Protected Securities Portfolio | 2014 | $ | 380,549 | $ $ $ | 11,744 — (11,744 |
) | ||||||
| 2015 | $ | 352,953 | $ $ $ | 14,703 — (14,703 |
) | |||||||
AB High-Yield Portfolio | 2014 | $ | 389,370 | $ $ $ | 20,565 — (20,565 |
) | ||||||
| 2015 | $ | 362,277 | $ $ $ | 24,027 — (24,027 |
) | |||||||
AB Small Mid-Cap Value Portfolio | 2014 | $ | 391,524 | $ $ $ | 22,719 — (22,719 |
) | ||||||
| 2015 | $ | 484,851 | $ $ $ | (13,976 — 13,976 | )
| |||||||
AB Small Mid-Cap Growth Portfolio | 2014 | $ | 385,529 | $ $ $ | 16,454 — (16,454 |
) | ||||||
| 2015 | $ | 512,803 | $ $ $ | 13,976 — (13,976 |
) | |||||||
AB Volatility Management | 2014 | $ | 398,966 | $ $ $ | 30,161 — (30,161 |
) | ||||||
| 2015 | $ | 378,466 | $ $ $ | 40,216 — (40,216 |
) | |||||||
(h) The Audit Committee of the Fund has considered whether the provision of any non-audit services not pre-approved by the Audit Committee provided by the Fund’s independent registered public accounting firm to the Adviser and Service Affiliates is compatible with maintaining the auditor’s independence.
| ITEM 5. | AUDIT COMMITTEE OF LISTED REGISTRANTS. |
Not applicable to the registrant.
| ITEM 6. | SCHEDULE OF INVESTMENTS. |
Please see Schedule of Investments contained in the Report to Shareholders included under Item 1 of this Form N-CSR.
ITEM 7. DISCLOSURE OF PROXY VOTING POLICIES AND PROCEDURES FOR CLOSED-END MANAGEMENT INVESTMENT COMPANIES.
Not applicable to the registrant.
ITEM 8. PORTFOLIO MANAGERS OF CLOSED-END MANAGEMENT INVESTMENT COMPANIES.
Not applicable to the registrant.
ITEM 9. PURCHASES OF EQUITY SECURITIES BY CLOSED-END MANAGEMENT INVESTMENT COMPANY AND AFFILIATED PURCHASERS.
Not applicable to the registrant.
ITEM 10. SUBMISSION OF MATTERS TO A VOTE OF SECURITY HOLDERS.
There have been no material changes to the procedures by which shareholders may recommend nominees to the Fund’s Board of Directors since the Fund last provided disclosure in response to this item.
| ITEM 11. | CONTROLS AND PROCEDURES. |
(a) The registrant’s principal executive officer and principal financial officer have concluded that the registrant’s disclosure controls and procedures (as defined in Rule 30a-2(c) under the Investment Company Act of 1940, as amended) are effective at the reasonable assurance level based on their evaluation of these controls and procedures as of a date within 90 days of the filing date of this document.
(b) There were no significant changes in the registrant’s internal controls over financial reporting during the second fiscal quarter of the period that could significantly affect these controls subsequent to the date of their evaluation, including any corrective actions with regard to significant deficiencies and material weaknesses.
ITEM 12. EXHIBITS.
The following exhibits are attached to this Form N-CSR:
EXHIBIT | DESCRIPTION OF EXHIBIT | |
| 12 (a) (1) | Code of Ethics that is subject to the disclosure of Item 2 hereof | |
| 12 (b) (1) | Certification of Principal Executive Officer Pursuant to Section 302 of the Sarbanes-Oxley Act of 2002 | |
| 12 (b) (2) | Certification of Principal Financial Officer Pursuant to Section 302 of the Sarbanes-Oxley Act of 2002 | |
| 12 (c) | Certification of Principal Executive Officer and Principal Financial Officer Pursuant to Section 906 of the Sarbanes-Oxley Act of 2002 | |
SIGNATURES
Pursuant to the requirements of the Securities Exchange Act of 1934 and the Investment Company Act of 1940, the registrant has duly caused this report to be signed on its behalf by the undersigned, thereunto duly authorized.
| (Registrant): The AB Pooling Portfolios | ||
| By: | /s/ Robert M. Keith | |
| Robert M. Keith | ||
| President | ||
| Date: | October 20, 2015 | |
Pursuant to the requirements of the Securities Exchange Act of 1934 and the Investment Company Act of 1940, this report has been signed below by the following persons on behalf of the registrant and in the capacities and on the dates indicated.
| By: | /s./ Robert M. Keith | |
| Robert M. Keith | ||
| President | ||
| Date: | October 20, 2015 | |
| By: | /s/ Joseph J. Mantineo | |
| Joseph J. Mantineo | ||
| Treasurer and Chief Financial Officer | ||
| Date: | October 20, 2015 | |