 September 2013 Investor Presentation The New Spirit Exhibit 99.1 |
 FORWARD LOOKING STATEMENT: Statements contained in these slides and any accompanying oral presentation by Spirit Realty Capital, Inc. (the “Company”) that are not strictly historical are forward-looking statements under Federal securities laws, which should be regarded solely as reflections of our current operating plans and estimates and not guarantees of future performance. These forward-looking statements are subject to known and unknown risks and uncertainties that can cause actual results to differ materially from those currently anticipated, due to a number of factors which include, but are not limited to, our continued ability to source new investments, risks associated with using debt to fund the company’s business activities (including refinancing and interest rate risks, changes in interest rates and/or credit spreads, changes in the real estate markets), risks related to the Spirit-CCPT II merger and our ability to integrate the portfolios, disruption from the merger making it more difficult to maintain business and operational relationships, unknown liabilities acquired in connection with the acquired properties, portfolios of properties, or interests in real-estate related entities, effects of liquidity for former CCPT II shareholders and Spirit shareholders previously holding unregistered shares, and those discussed in the Company’s filings with the Securities and Exchange Commission from time to time, including the pre-merger companies’ Annual Reports on Form 10-K, as well as the Company’s press releases, which can be found on the Company’s website www.spiritrealty.com. The Company expressly disclaims any responsibility to update or revise forward-looking statements, whether as a result of new information, future events or otherwise, except as required by law. NOTICE REGARDING NON-GAAP FINANCIAL MEASURES: This presentation contains and may refer to certain non-GAAP financial measures. These non-GAAP financial measures should not be considered replacements for, and should be read together with, the most comparable GAAP financial measures. Explanations of these non-GAAP financial measures and reconciliations to the most directly comparable GAAP financial measures can be found in the Appendix at the end of this presentation. |
 Spirit Overview and Investment Highlights Section 1 |
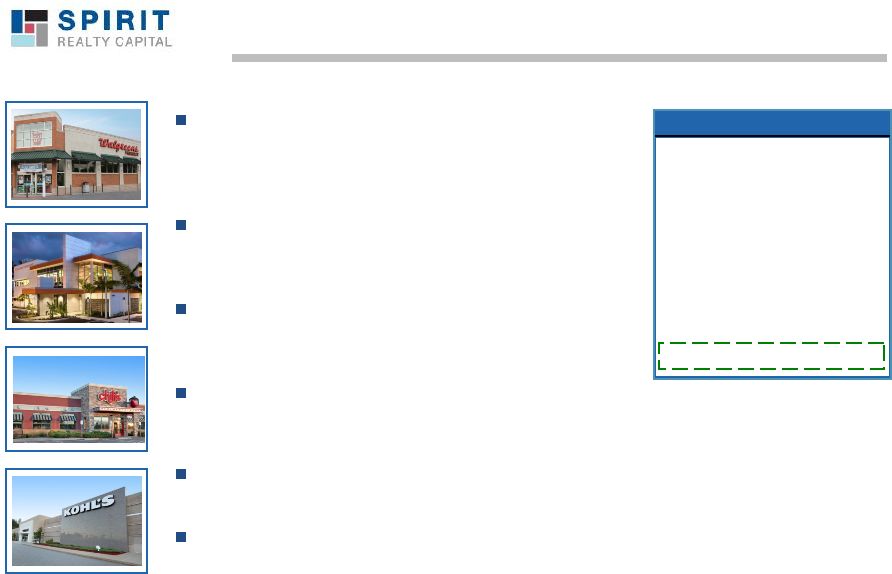 SRC Overview (1) NYSE Ticker SRC Enterprise Value $6.9 billion Market Capitalization $3.3 billion Current Annual Dividend $0.65625 Dividend Yield 7.3% Current Share Price $8.99 IPO Share Price $7.87 (2) Total Return Since IPO +20% 3 Spirit Overview and Investment Highlights Spirit, a single tenant, triple net REIT focused on operationally essential real estate, owns a real estate portfolio consisting of 2,046 properties (99% occupied with an average remaining lease term of 11 years) The portfolio is well-diversified by industry (19), tenants (231), and geography (49 states) and has 49% investment grade tenancy (3) In September 2012, Spirit was recapitalized through a $500 million IPO with an enterprise value of $3.2 billion and a market cap of $1.3 billion In July 2013, Spirit merged with Cole Credit Property Trust II, a $3.7 billion non-traded, public REIT and created a $7.1 billion enterprise value company Despite approximately 368 million shares becoming freely tradable over the past 12 months, Spirit shares have out performed its competitors and the market (4) Spirit is focused on generating and delivering sustainable and attractive returns for our shareholders Notes: (1) As of September 13, 2013 (2) $15.00 initial share price divided by the 1.9048 conversion ratio associated with Cole II merger (3) Based on annualized rental revenue from tenants with actual or implied credit ratings of BBB- or higher. Implied credit ratings determined using Moody’s KMV licensed software (4) Including ARCP, NNN, O, the S&P 500, and the RMS; based on total return since IPO, per Capital IQ |
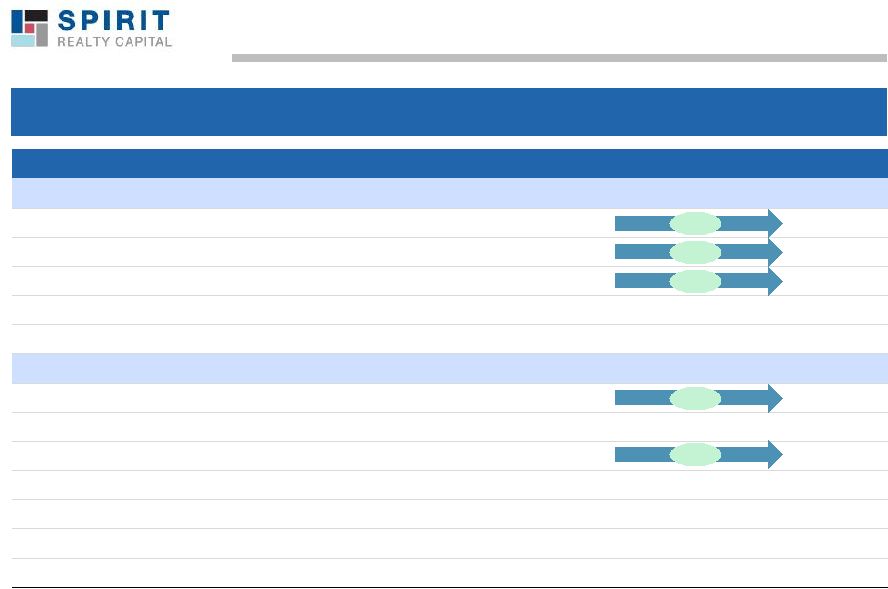 1 st Year’s Progress Management Has Made Material Progress Since the IPO 4 Criteria Sept. 2012 Jun. 2013 (1) Portfolio # of Properties 1,183 2,046 (5) % of Revenue from Investment Grade (2) 28% 49% % of Revenue from Top Tenant 30% 16% % of Revenue from Top 10 Tenants 52% 37% Avg. Remaining Lease Term 11 years 11 years Financial Enterprise Value (3) $3.2Bn $7.1Bn Market Capitalization (3) $1.3Bn $3.6Bn G&A (% of Revenue) 8.8% 7.3% Free Float 39% 99% EBITDA (3) $253MM $484MM Total Debt (4) $1.9Bn $3.6Bn Total Debt / EBITDA (3)(4) 7.6x 7.5x Notes: (1) Pro forma for Cole II merger which closed on July 17, 2013 (2) Based on annualized rental revenue from tenants with actual or implied credit ratings of BBB- or higher. Implied credit ratings determined using Moody’s KMV licensed software (3) Definition/ reconciliation in appendix (4) Represents debt principal balance outstanding (5) As of September 13, 2013 +863 +21% (14%) +$3.9Bn (1.5%) |
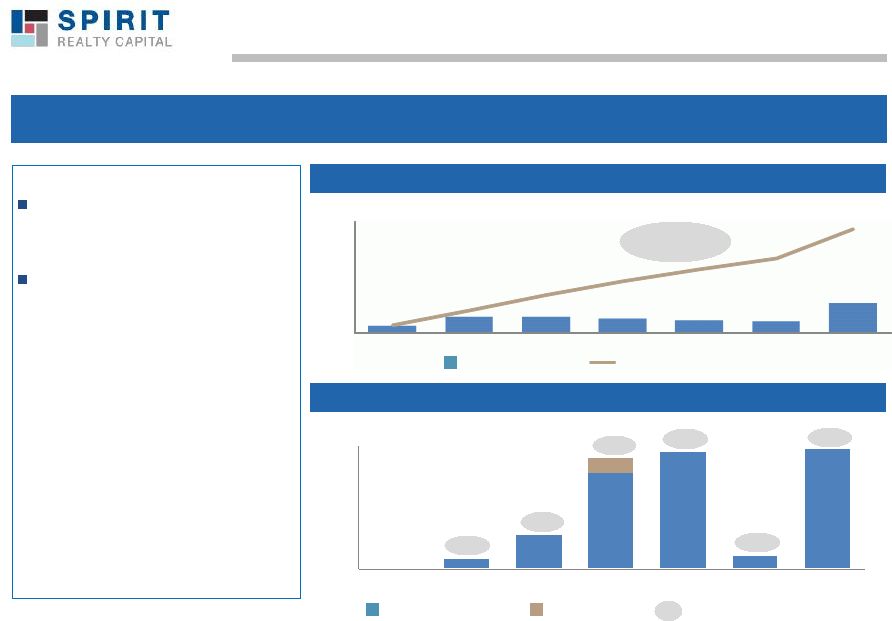
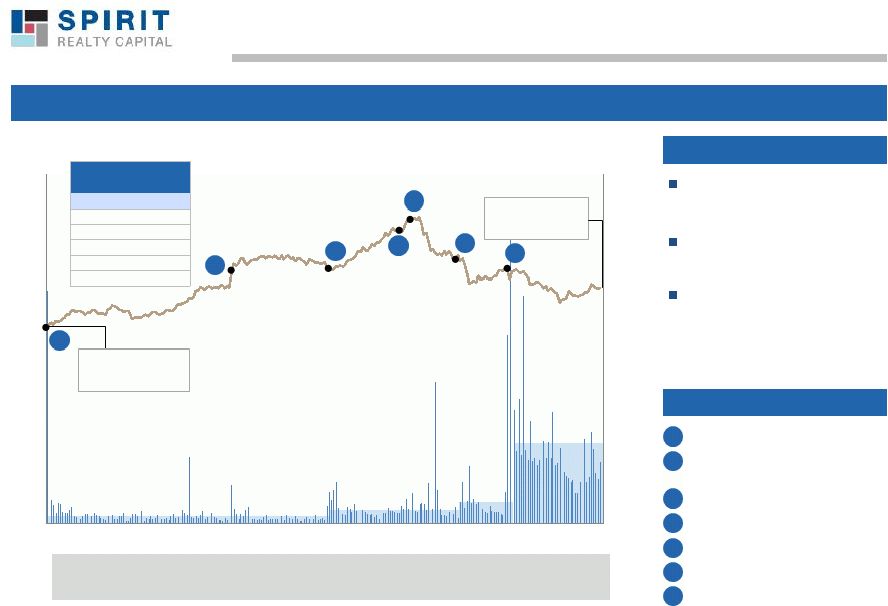 SRC prices IPO at $7.87 (2) / share Spirit announces plans to merge with Cole II TLC lockup expires Spirit announces 1 quarter results Spirit added to the RMZ Index Sponsor equity lockups expire Spirit completes $7.1Bn merger with Cole II Strong Performance Since IPO Demonstrated Public Company Track Record, Minimal Equity Overhang Total Return (%) Volume (MM) 5 Notes: (1) Implied cap rate calculation in appendix; FFO multiple is share price divided by consensus estimate (2) $15.00 initial share price divided by the 1.9048 conversion ratio associated with Cole II merger (3) Excludes first day of trading post-IPO Ample opportunity for legacy SRC equity and Cole retail to exit – Highly liquid stock Equity overhang is behind us with only execs and directors locked up Possible additional index demand – S&P Real Estate Indices and Dow Jones Real Estate Indices Observations Annotations Free Float: 40% Shares: 65.2mm ADTV: 0.5mm (3) Free Float: 69% Shares: 111.4mm ADTV: 1.2mm Free Float: 98% Shares: 159.0mm ADTV: 1.9mm Free Float: 99% Shares: 367.5mm ADTV: 5.7mm Source: SNL Financial, Capital IQ $2.0Bn of NTR equity becomes freely tradable 0 5 10 15 20 25 0 20 40 60 80 100 120 140 160 180 Sep-12 Oct-12 Nov-12 Dec-12 Jan-13 Feb-13 Mar-13 Apr-13 May-13 Jun-13 Jul-13 Sep-13 A B C D E F G Current Valuation of 7.8% cap rate and 12.2x 2014E FFO (1) IPO Valuation of 8.8% cap rate and 10.2x NTM FFO (1) Total Return Since SRC IPO SRC +20% S&P 500 +18% ARCP +11% NNN +5% RMS +4% O +0% G B A C D E F st |
 Operational Overview Section 2 |
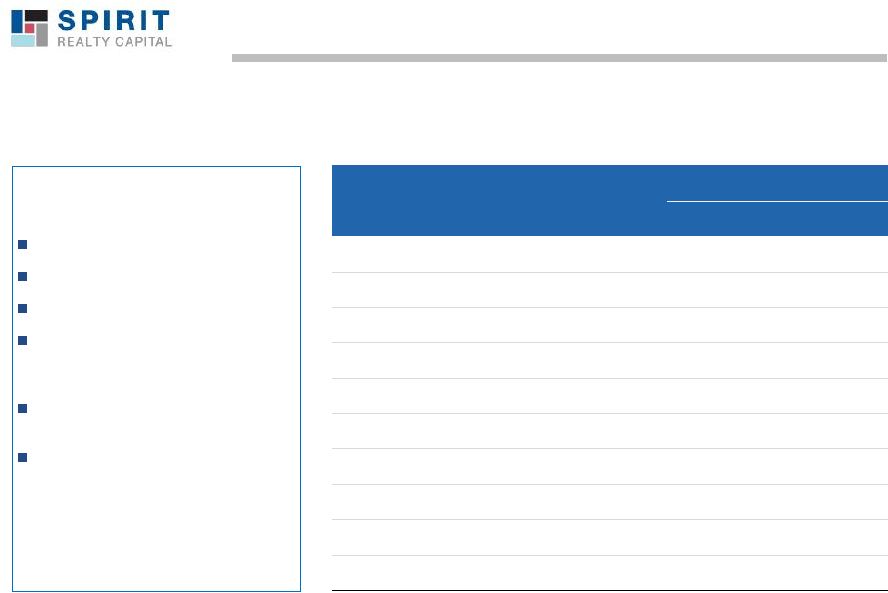
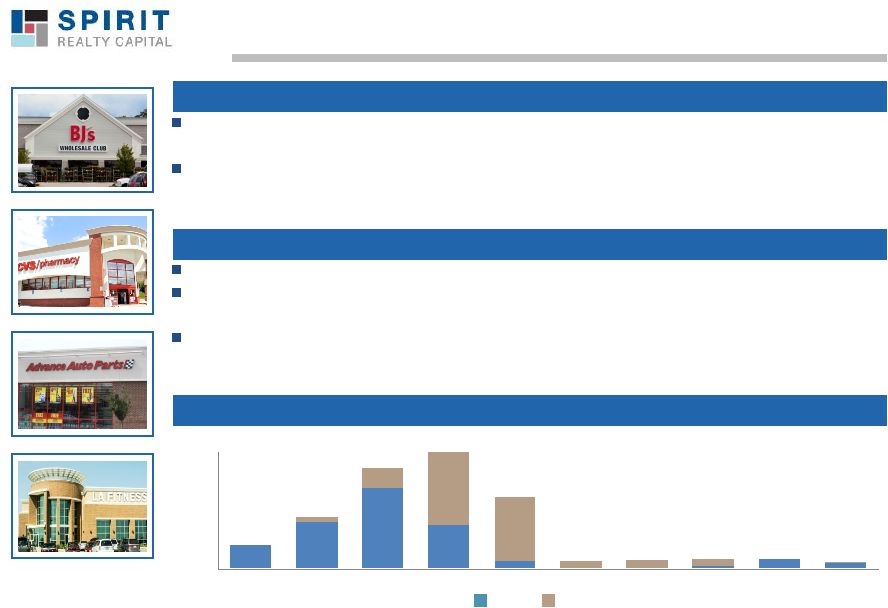 Notes: (1) Excludes mortgage notes receivables and vacant properties (2) Represents unit-level coverage ratio of EBITDAR to cash interest paid and rent expense; weighted by rent (3) Based on annualized rental revenue from tenants with actual or implied credit ratings of BBB- or higher. Implied credit ratings determined using Moody’s KMV licensed software 7 Operational Highlights Focus on retail real estate that is operationally essential to tenant profits – Including non-rated tenants with strong credits, but otherwise overlooked by traditional lenders Market segment allows for favorable lease structuring – 96% of portfolio has rent escalations – Approximately half of the portfolio under master lease Historical credit loss of only 3.6% in total across 10 years Portfolio occupancy rate has never been below 95% and 10 year average is greater than 99% – 80% historical lease renewal rate Market segment allows for favorable lease structuring – Weighted average EBITDAR coverage ratio of 2.58x (2) – 49% of tenants are investment grade (3) Differentiated Business Strategy Seasoned, Cycle-Tested Portfolio $412 $803 $1,375 $750 $133 $37 $164 $91 $81 $349 $1,243 $1,103 $124 $143 $121 $8 0 500 1,000 1,500 2,000 2004 2005 2006 2007 2008 2009 2010 2011 2012 1H13 Acquisition Vintage Amounts in Millions (1) Over 90% of the portfolio was acquired before 2009 SRC Cole |
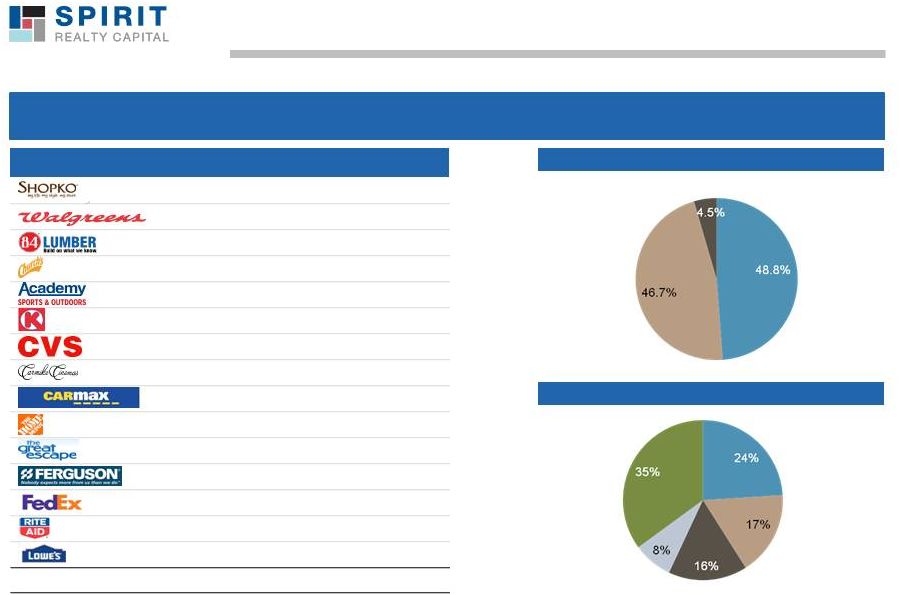 Large Diverse Portfolio Notes: (1) By rental revenue (2) Does not include investments of mortgage notes receivable and vacant properties Credit Diversity 8 Industry Diversity Investment Grade / Implied Investment Grade (2) Non-Investment Grade / Implied Non-Investment Grade Not Rated Specialty Retail Restaurants Department / Discount Drug Stores Other Top Tenants # of Prop. % of Portfolio (1) (S&P/Moody’s) 181 15.6% BB 70 4.3% A- 109 3.5% BB+ 201 2.4% BBB- 9 2.3% B+ 83 2.0% BBB 36 1.7% BBB 12 1.5% BB+ 8 1.5% A- 4 1.3% A- 14 1.2% BB 8 1.2% BBB+ 8 1.2% A 21 1.1% BB- 9 1.1% BBB Total Top 15 773 41.9% Spirit's Top Tenants Represent an Attractive Mix of Industries and Credits (1)(2) |
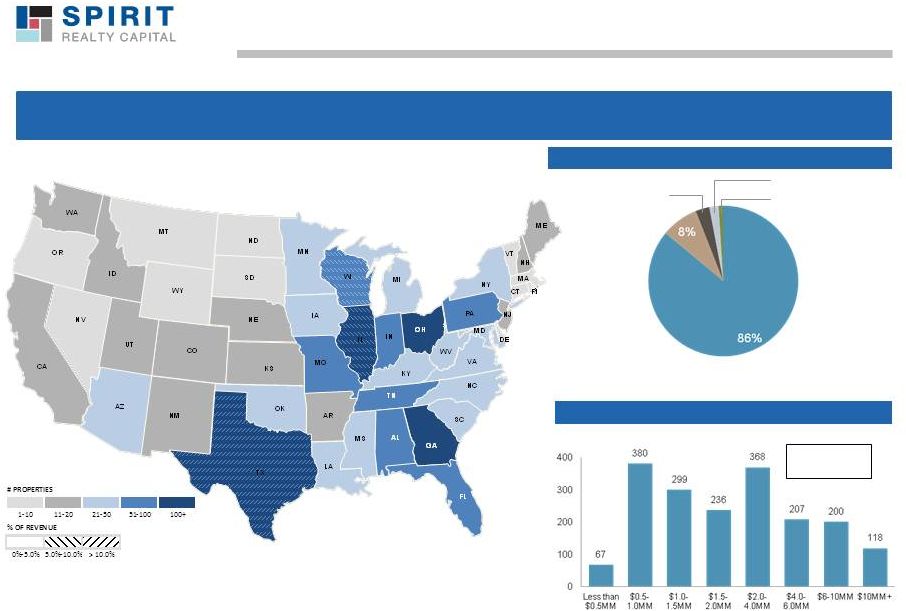 Large Diverse Portfolio Spirit’s Portfolio is Geographically Well-Diversified Retail Real Estate 9 Number of Properties Retail Industrial Office, 3% Distribution, 2% Service, 1% 70%+ Less Than $4.0MM Notes: (1) By rental revenue (2) Does not include investments of mortgage note portfolios and vacant properties Property Type Diversification Property Value Diversification (1)(2) |
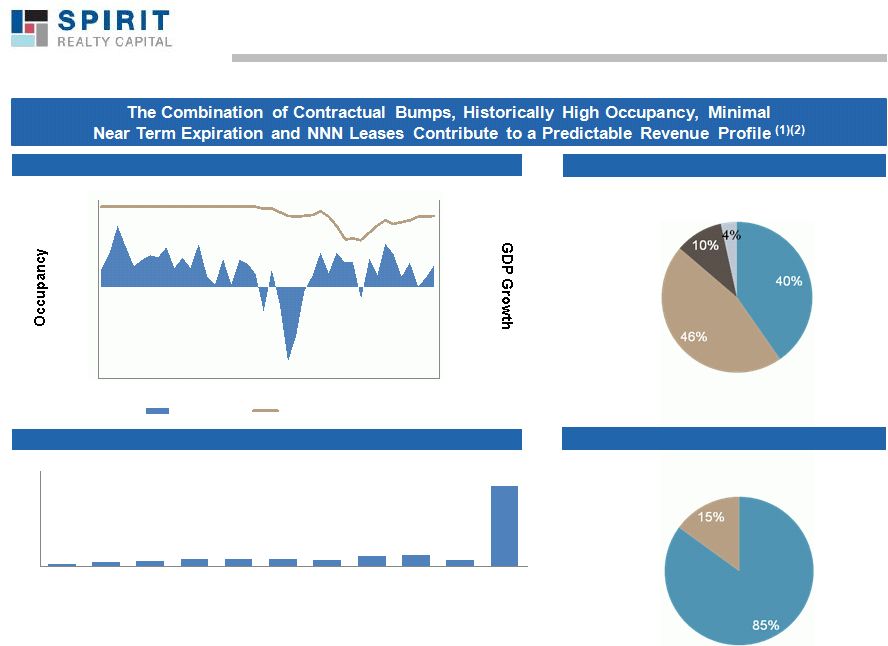 Lease Profile with Predictable Revenue Source: Company filings Occupancy Lease Expiration Lease Escalation (3) 0.8 2.3 2.8 4.1 4.3 4.5 3.7 6.9 7.8 3.9 58.8 0.0 10.0 20.0 30.0 40.0 50.0 60.0 70.0 2013 2014 2015 2016 2017 2018 2019 2020 2021 2022 2023 and thereafter (%) 10 Lease Structure (2) Notes: (1) By rental revenue (2) Does not include investments of mortgage notes receivable and vacant properties (3) Does not include investments in multi-tenant properties % Contractual Fixed % With Contractual CPI-Related % Flat % Other % NNN % NN (10.0%) (5.0%) 0.0% 5.0% 10.0% 80.0% 90.0% 100.0% 2003 2004 2005 2006 2007 2008 2009 2010 2011 2012 2013 GDP Growth Spirit Occupancy Rate |
 Financial Overview Section 3 |
 Balance Sheet Data SRC Has Long-Term Leases and Well-Laddered Debt Maturities Balance Sheet (1) $7.1 billion in total assets – Almost entirely owned real estate – Long-term leases $3.6 billion in debt principal balance outstanding – Only $141 million in short-term, variable facility – $925 million in Master Trust bonds; this facility (or similar structure) can be used to issue investment grade bonds – Remainder in laddered, property- level CMBS debt – Weighted average rate on debt outstanding is approximately 5.66% – No significant maturities until 2016 – Leverage is 7.5x (3) Scheduled Principal Amortization (2) Balloon Payments at Maturity (2) Notes: (1) Post-merger, pro forma as of June 30, 2013 (2) Post-merger, contractual debt maturities (July 1, 2013) (3) Debt / EBITDA, see appendix for EBITDA calculation / reconciliation (4) CMBS interest rate, contractual weighted average interest rate including revolver is 6.0% $MM Primarily CMBS Debt Revolver Debt Contractual Weighted Avg. Interest Rate 12 72 266 775 945 96 964 115 0 200 400 600 800 1,000 2H13 2014 2015 2016 2017 2018 Thereafter 4.3% 5.3% 6.3% 5.8% 5.7% 5.5% $225MM by 2017 (4) Annual Amortization Cumulative Amortization $MM 24 55 55 49 42 40 106 0 100 200 300 400 2H13 2014 2015 2016 2017 2018 Thereafter |
 Income Statement Data Note: (1) Continuing operations, excluding merger costs and impairments; calculation / reconciliation in appendix Income Statement Post-merger Pro Forma $546 million in annualized revenue $525 million in annualized NOI G&A is 7.3% of revenue A significant amount of property costs relate to remaining multi-tenant portfolio 1H13 pro forma annualized FFO was approximately $0.75 per share AFFO per share is estimated to be between $0.77 and $0.82 per share in 2014 13 Post-Merger Pro Forma ($000s) 2012 Annualized Revenues $ 530,227 $ 545,904 Property costs 24,441 21,234 Net operating income (“NOI”) (1) 505,786 524,670 General and administrative 32,762 39,868 Acquisition costs 1,054 436 EBITDA (1) 471,970 484,366 Interest 211,569 206,086 Income taxes 504 284 Funds from Operations (“FFO”) (1) $ 259,897 $ 277,996 1H13 |
 Market Overview Section 4 |
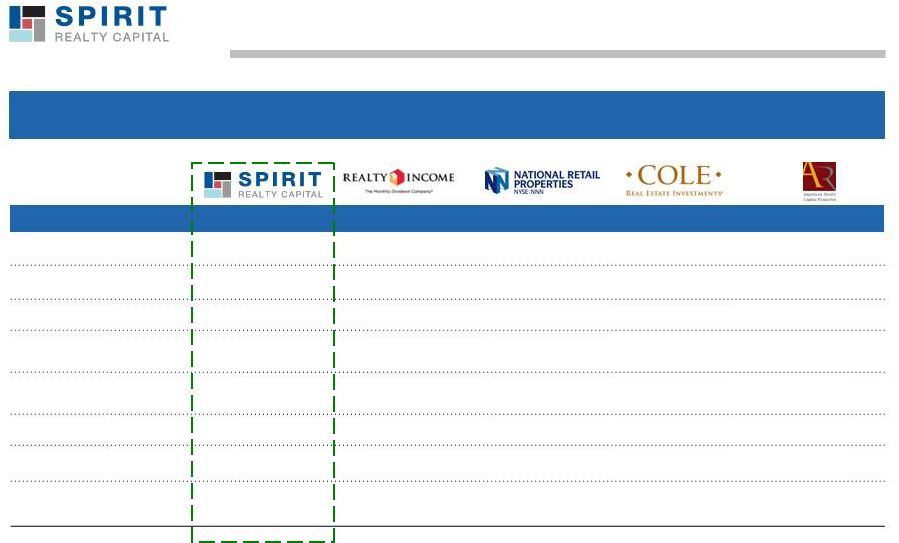 Benchmarking to Our Closest Comparables Operational Statistics (1) Number of Properties 2,046 3,681 1,838 1,014 2,574 Square Feet (MM) 54.3 58.3 20.2 44.0 43.4 Occupancy Rate 99% 98% 98% 99% 100% Average Remaining Lease Term 11 yrs 11 yrs 12 yrs 12 yrs 10 yrs % of Investment Grade Tenants 49% (2) 38% (3) Not Reported 55% (3) 53% (3) % Retail 77% 78% 100% 66% 58% Top 5 Tenants % Rent 28% 21% 23% 20% 21% Top 10 Tenants % Rent 37% 34% 39% 33% 30% Size, Occupancy, and Tenant Mix Similar to Sector-Leading Peers 15 Notes: (1) Sources: Company Filings; SRC statistics as of September 13, 2013; ARCP pro froma for ARCT IV and CapLease mergers (2) Based on annualized rental revenue from tenants with actual or implied credit ratings of BBB- or higher. Implied credit ratings determined using Moody’s KMV licensed software (3) Company reported |
 Benchmarking to Our Closest Comparables Notes: (1) Calculation / reconciliation in appendix (2) Per SNL (3) Principal value of debt + liquidation value of preferred equity / most recent quarter EBITDA annualized (COLE is “annualized normalized EBITDA”, ARCP prior to acquisition of CapLease and ARCT IV (4) Calculated by applying comps average multiple / yield to the respective SRC metric 16 Spirit Remains a Good Relative Valuation Opportunity Comps Average Implied SRC Share Price (4) Implied Cap Rate (1) 7.8% 5.9% 6.3% NA NA 6.1% $13.99 2014 AFFOx (2) 11.5x 15.8x 14.6x 12.2x 11.5x 13.5x $10.58 Dividend Yield (2) 7.3% 5.6% 5.3% 5.9% 7.1% 6.0% $11.00 AFFO Payout Ratio (2) 82% 93% 82% 88% 103% 92% NA Leverage (Debt + Preferred / EBITDA) (3) 7.5x 6.9x 7.1x 5.7x 6.3x 6.5x NA Sources: SNL, SEC filings |
 What's Next for SRC? Significantly reduced equity overhang Q4 2013 - our first full reporting period as a merged company Continued portfolio management and asset recycling Possible additional index inclusion – S&P Real Estate Indices and Dow Jones Real Estate Indices 2014 guidance – $0.77 to $0.82 of AFFO – Implied dividend coverage of 117% - 125% (1) Closing the valuation gap to peers through execution and investor education Continue to identify and close on accretive acquisitions as the market allows 17 Note: (1) Based on current annualized dividend of $0.65625 |
 Appendix & Financial Definitions Appendix |
 Financial Definitions 19 NOI from Continuing Operations – expenses, merger costs, real estate acquisition costs, interest expense, depreciation and amortization, impairments, Cole II portfolio gains on sale of real estate assets and property condemnations, and income tax expense (benefit). EBITDA from Continuing Operations, as Adjusted – discontinued operations, interest expense, depreciation and amortization, and income tax expense (benefit); as further adjusted to eliminate the impact of merger costs, impairments, and Cole II portfolio gains on sale of real estate assets and property condemnations. EBITDAR – depreciation and amortization, income tax expense (benefit), and rent. FFO from Continuing Operations, as Adjusted – real estate related depreciation and amortization, impairment charges, merger costs, and Cole II portfolio gains on sale of real estate assets and property condemnations. Enterprise Value – Adjusted Funds from Operations (AFFO) – REIT industry. It adjusts FFO (defined below) to eliminate the impact of non-recurring items that are not reflective of ongoing operations and certain non-cash items that reduce or increase net income in accordance with GAAP. Our computation of AFFO may differ from the methodology for calculating AFFO used by other equity REITs, and, therefore, many not be comparable to such other REITs. AFFO should not be considered as a substitute for net income determined in accordance with U.S. GAAP as measures of financial performance. Reconciliations from U.S. GAAP net income available to common stockholders to AFFO are included in financial statements filed by the Company with the Securities and Exchange Commission. Funds from Operations – estate-related depreciation and amortization, impairment charges and net losses (gains) on the disposition of real estate assets. Its calculation conforms to the standards established by the National Association of Real Estate Investment Trusts, or NAREIT. Market Capitalization – as of the date indicated. Represents net income (loss) (computed in accordance with GAAP), excluding general and administrative Represents net income (loss) before the cumulative effect of income (loss) from Represents net income (loss) before the cumulative effect of income (loss) from discontinued operations, interest expense, Represents net income (loss) from continuing operations, adjusted to eliminate the impact of Represents market capitalization plus the sum of long-term and short-term debt on the company's balance sheet less cash. AFFO is a non-GAAP financial measure of operating performance used by many companies in the Funds from Operations ("FFO") represents net income (loss) computed in accordance with GAAP, excluding real Calculated by multiplying the number of shares outstanding by the closing share price of the company's common stock |
 NOI Reconciliations 20 Net Operating Income from Continuing Operations Reconciliations Post-Merger Pro Forma 2012 1H13 Annualized (1) Income (Loss) from Continuing Operations $51,163 $70,970 Adjustments: General and Administrative Expense 32,762 39,868 Real Estate Acquisition Costs 1,054 436 Interest Expense 211,569 206,086 Depreciation and Amortization Expense 193,557 202,166 Impairments 15,816 5,506 Other Expense (Income) (2) (639) (646) Income Tax Expense (Benefit) 504 284 Net Operating Income from Continuing Operations $505,786 $524,670 Notes: (1) First half 2013 post-merger, pro forma results multiplied by 2 (2) Cole II portfolio gains on sale of real estate assets and property condemnations |
 EBITDA Reconciliations 21 EBITDA from Continuing Operations Excluding Merger Costs and Impairments Reconciliations Post-Merger Pro Forma 2012 1H13 Annualized (1) Income (Loss) from Continuing Operations $51,163 $70,970 Adjustments: Interest expense 211,569 206,086 Depreciation and amortization expense 193,557 202,166 Impairments 15,816 5,506 Other expense (income) (2) (639) (646) Income tax expense (benefit) 504 284 EBITDA, from Continuing Operations Excluding Merger Costs and Impairments $471,970 $484,366 Notes: (1) First half 2013 post-merger, pro forma results multiplied by 2 (2) Cole II portfolio gains on sale of real estate assets and property condemnations |
 FFO Reconciliations 22 FFO from Continuing Operations, as Adjusted Reconciliations Post-Merger Pro Forma 2012 1H13 Annualized (1) Income (Loss) from Continuing Operations $51,163 $70,970 Adjustments: Depreciation and amortization expense 193,557 202,166 Impairments 15,816 5,506 Other expense (income) (2) (639) (646) Funds from Operations, Continuing Operations Excluding Merger Costs and Impairments $259,897 $277,996 Weighted average common shares outstanding (diluted) 371,172 FFO from continuing operations, as Adjusted per share $0.75 Notes: (1) First half 2013 post-merger, pro forma results multiplied by 2 (2) Cole II portfolio gains on sale of real estate assets and property condemnations |
 Implied Cap Rate Reconciliation 23 $MM, unless otherwise noted Aggregate Value (1) 12,355 5,857 less: Loans Receivable, net (2) -- (40) less: Accounts Receivable, net (28) (3) less: Assets Held for Sale (17) (47) less: Other Assets (147) (101) plus: Accounts Payable & Accrued Expenses 77 17 plus: Distributions Payable 39 -- plus: Other Liabilities 29 88 plus: Minority Interest – – Implied Real Estate Value 12,309 5,770 Q2 2013 Real Estate NOI Annualized 721 363 Implied Cap Rate (3) 5.9% 6.3% Notes: (1) As of September 13, 2013 (2) For National Retail Properties, includes mortgages, notes, and commercial mortgage interests (3) Equals 2Q2013 real estate NOI annualized divided by implied real estate value Source: Most recent SEC filings |
 Implied Cap Rate Reconciliation 24 $MM, unless otherwise noted At IPO Current Aggregate Value (1) 3,180 6,905 less: Loans Receivable, net (61) (123) less: Accounts Receivable, net – – less: Assets Held for Sale (6) (43) less: Other Assets, net (35) (73) plus: Accounts Payable & Accrued Expenses 25 84 plus: Distributions Payable – – plus: Other Liabilities – – plus: Minority Interest – – Implied Real Estate Value 3,059 6,750 Real Estate NOI Annualized (2) 270 525 Implied Cap Rate (3) 8.8% 7.7% Source: SEC filings Notes: (1) “At IPO” as of pricing on September 19, 2012 (split adjusted share price of $7.87); “Current” as of September 13, 2013 (split adjusted share price of $8.99) (2) Annualized NOI; “At IPO” NOI research estimated forward NTM, “Current” as of 2Q 2013 (3) Equals real estate NOI annualized divided by implied real estate value |