Exhibit 99.3
Addendum to Supplemental Financial & Operating Information FOURTH QUARTER ENDED DECEMBER 31, 2017
TABLE OF CONTENTS Net Asset Value Components3 Top 100 Tenants4 Asset Type Diversification Portfolio Diversification6 Industry Diversification7 Asset Type Diversification—Retail9 Asset Type Diversification—Industrial10 Asset Type Diversification—Office11 Appendix12 Reporting Definitions and Explanations13 Forward-Looking Statements and Risk Factors15 Q4 2017ADDENDUM TO SUPPLEMENTAL FINANCIAL & OPERATING INFORMATION | As of December 31, 20172
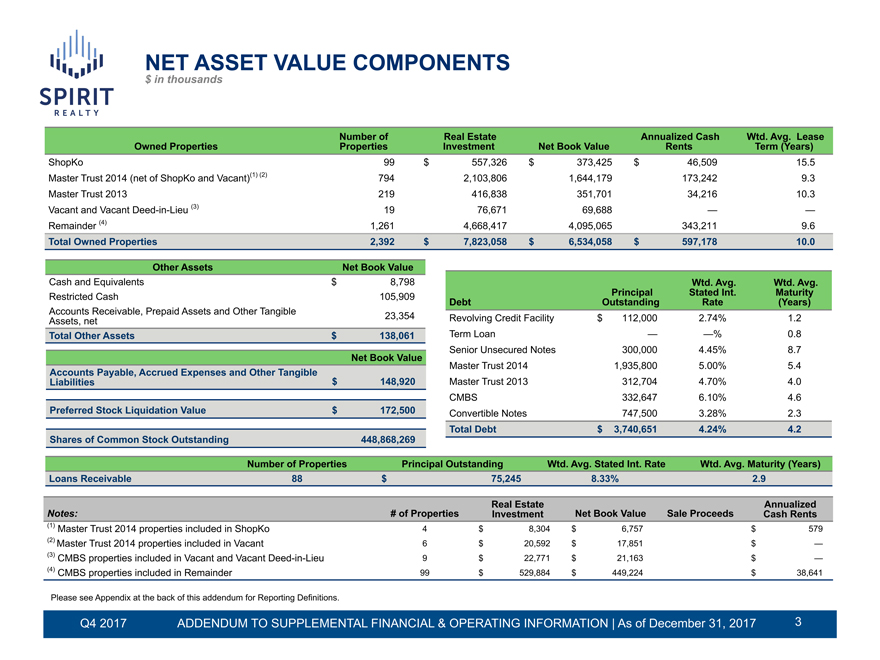
NET ASSET VALUE COMPONENTS $ in thousands Number of Real Estate Annualized CashWtd. Avg. Lease Owned PropertiesProperties InvestmentNet Book Value RentsTerm (Years) ShopKo 99$557,326$373,425$46,509 15.5 Master Trust 2014 (net of ShopKo and Vacant)(1) (2) 794 2,103,806 1,644,179 173,242 9.3 Master Trust 2013 219 416,838 351,701 34,216 10.3 Vacant and VacantDeed-in-Lieu (3) 19 76,671 69,688 — — Remainder (4) 1,261 4,668,417 4,095,065 343,211 9.6 Total Owned Properties 2,392$7,823,058$6,534,058$597,178 10.0 Other AssetsNet Book Value Cash and Equivalents $8,798 Wtd. Avg. Wtd. Avg. Restricted Cash 105,909 PrincipalStated Int. Maturity Debt OutstandingRate (Years) Accounts Receivable, Prepaid Assets and Other Tangible Assets, net 23,354 Revolving Credit Facility$112,0002.74% 1.2 Total Other Assets $138,061 Term Loan ——% 0.8 Senior Unsecured Notes 300,0004.45% 8.7 Net Book Value Master Trust 2014 1,935,8005.00% 5.4 Accounts Payable, Accrued Expenses and Other Tangible Liabilities $148,920 Master Trust 2013 312,7044.70% 4.0 CMBS 332,6476.10% 4.6 Preferred Stock Liquidation Value$172,500 Convertible Notes 747,5003.28% 2.3 Total Debt $3,740,6514.24% 4.2 Shares of Common Stock Outstanding 448,868,269 Number of PropertiesPrincipal OutstandingWtd. Avg. Stated Int. RateWtd. Avg. Maturity (Years) Loans Receivable88 $ 75,2458.33% 2.9 Real Estate Annualized Notes: # of PropertiesInvestmentNet Book ValueSale Proceeds Cash Rents (1) Master Trust 2014 properties included in ShopKo 4$8,304$6,757 $579 (2) Master Trust 2014 properties included in Vacant 6$20,592$17,851 $— (3) CMBS properties included in Vacant and VacantDeed-in-Lieu 9$22,771$21,163 $— (4) CMBS properties included in Remainder 99$529,884$449,224 $38,641 Please see Appendix at the back of this addendum for Reporting Definitions. Q4 2017ADDENDUM TO SUPPLEMENTAL FINANCIAL & OPERATING INFORMATION | As of December 31, 20173
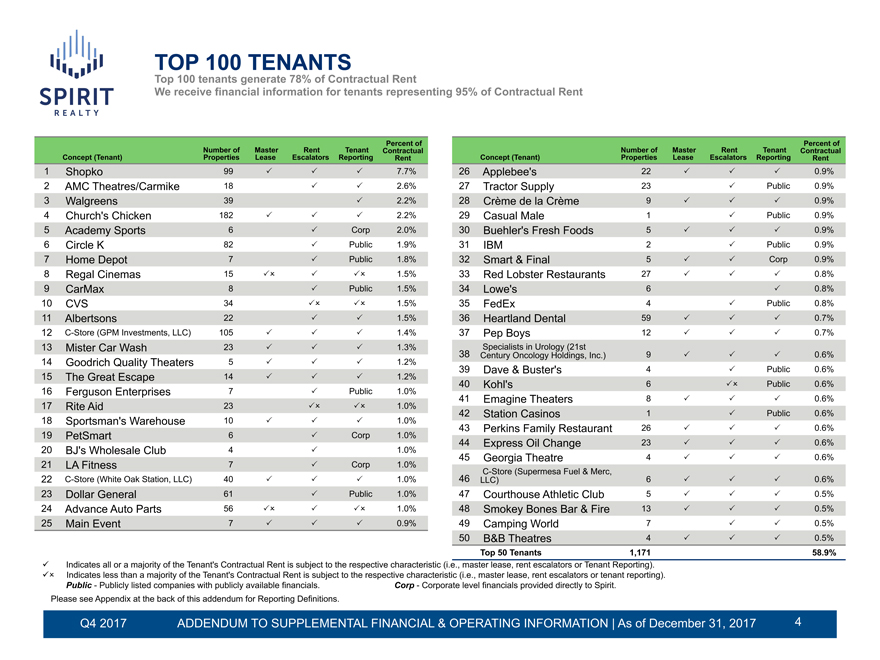
TOP 100 TENANTS Top 100 tenants generate 78% of Contractual Rent We receive financial information for tenants representing 95% of Contractual Rent Percent of Percent of Number of MasterRentTenant Contractual Number of MasterRentTenant Contractual Concept (Tenant) Properties Lease Escalators ReportingRent Concept (Tenant)Properties Lease Escalators ReportingRent 1Shopko 99PPP7.7%26Applebee’s22PPP0.9% 2AMC Theatres/Carmike18 PP2.6%27Tractor Supply23 PPublic0.9% 3Walgreens 39 P2.2%28Crème de la Crème9PPP0.9% 4Church’s Chicken 182PPP2.2%29Casual Male1 PPublic0.9% 5Academy Sports 6 PCorp2.0%30Buehler’s Fresh Foods5PPP0.9% 6Circle K 82 PPublic1.9%31IBM2 PPublic0.9% 7Home Depot 7 PPublic1.8%32Smart & Final5PPCorp0.9% 8Regal Cinemas 15POPPO1.5%33Red Lobster Restaurants27PPP0.8% 9CarMax 8 PPublic1.5%34Lowe’s6 P0.8% 10CVS 34 POPO1.5%35FedEx4 PPublic0.8% 11Albertsons 22 PP1.5%36Heartland Dental59PPP0.7%12C-Store (GPM Investments, LLC)105PPP1.4%37Pep Boys12PPP0.7% 13Mister Car Wash 23PPP1.3% Specialists in Urology (21st 38Century Oncology Holdings, Inc.)9PPP0.6% 14Goodrich Quality Theaters5PPP1.2% 39Dave & Buster’s4 PPublic0.6% 15The Great Escape14PPP1.2% 40Kohl’s6 POPublic0.6% 16Ferguson Enterprises7 PPublic1.0% 41Emagine Theaters8PPP0.6% 17Rite Aid 23 POPO1.0% 42Station Casinos1 PPublic0.6% 18Sportsman’s Warehouse10PPP1.0% 43Perkins Family Restaurant26PPP0.6% 19PetSmart 6 PCorp1.0% 44Express Oil Change23PPP0.6% 20BJ’s Wholesale Club4 P 1.0% 45Georgia Theatre4PPP0.6% 21LA Fitness 7 PCorp1.0%C-Store (Supermesa Fuel & Merc,22C-Store (White Oak Station, LLC)40PPP1.0%46LLC)6PPP0.6% 23Dollar General 61 PPublic1.0%47Courthouse Athletic Club5PPP0.5% 24Advance Auto Parts56POPPO1.0%48Smokey Bones Bar & Fire13PPP0.5% 25Main Event 7PPP0.9%49Camping World7 PP0.5% 50B&B Theatres4PPP0.5% Top 50 Tenants1,171 58.9% üIndicates all or a majority of the Tenant’s Contractual Rent is subject to the respective characteristic (i.e., master lease, rent escalators or Tenant Reporting). üOIndicates less than a majority of the Tenant’s Contractual Rent is subject to the respective characteristic (i.e., master lease, rent escalators or tenant reporting). Public—Publicly listed companies with publicly available financials. Corp—Corporate level financials provided directly to Spirit. Please see Appendix at the back of this addendum for Reporting Definitions. Q4 2017ADDENDUM TO SUPPLEMENTAL FINANCIAL & OPERATING INFORMATION | As of December 31, 2017 4
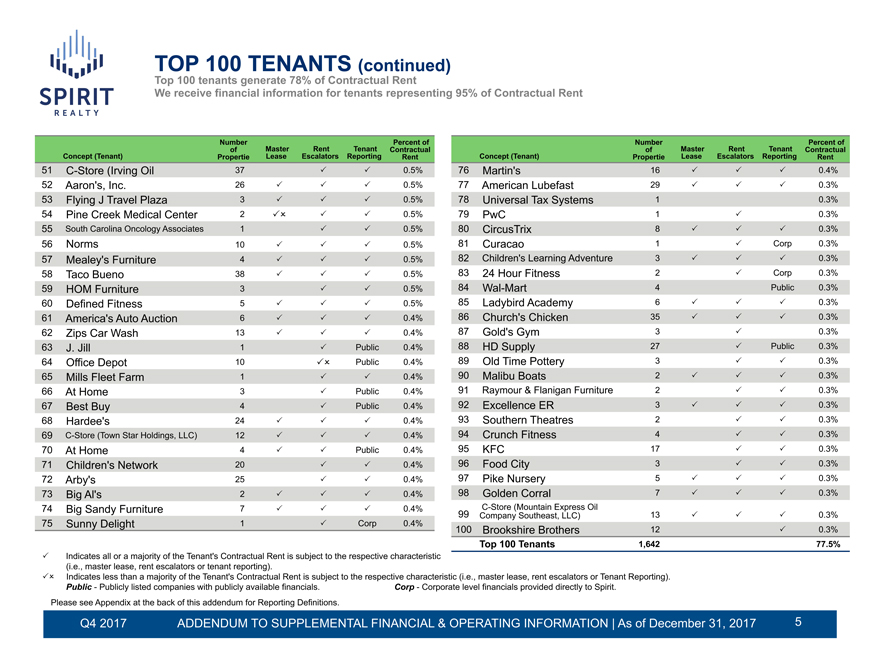
TOP 100 TENANTS (continued) Top 100 tenants generate 78% of Contractual Rent We receive financial information for tenants representing 95% of Contractual Rent Number Percent of Number Percent of ofMasterRentTenant Contractual ofMasterRentTenant Contractual Concept (Tenant) Propertie Lease Escalators ReportingRent Concept (Tenant)Propertie Lease Escalators ReportingRent51C-Store (Irving Oil 37 PP0.5%76Martin’s16PPP0.4% 52Aaron’s, Inc. 26PPP0.5%77American Lubefast29PPP0.3% 53Flying J Travel Plaza3PPP0.5%78Universal Tax Systems1 0.3% 54Pine Creek Medical Center2POPP0.5%79PwC1 P 0.3% 55South Carolina Oncology Associates1 PP0.5%80CircusTrix8PPP0.3% 56Norms 10PPP0.5%81Curacao1 PCorp0.3% 57Mealey’s Furniture4PPP0.5%82Children’s Learning Adventure3PPP0.3% 58Taco Bueno 38PPP0.5%8324 Hour Fitness2 PCorp0.3% 59HOM Furniture 3PP0.5%84Wal-Mart4 Public0.3% 60Defined Fitness 5PPP0.5%85Ladybird Academy6PPP0.3% 61America’s Auto Auction6PPP0.4%86Church’s Chicken35PPP0.3% 62Zips Car Wash 13PPP0.4%87Gold’s Gym3 P 0.3% 63J. Jill 1 PPublic0.4%88HD Supply27 PPublic0.3% 64Office Depot 10 POPublic0.4%89Old Time Pottery3 PP0.3% 65Mills Fleet Farm 1 PP0.4%90Malibu Boats2PPP0.3% 66At Home 3 PPublic0.4%91Raymour & Flanigan Furniture2 PP0.3% 67Best Buy 4 PPublic0.4%92Excellence ER3PPP0.3% 68Hardee’s 24PPP0.4%93Southern Theatres2 PP0.3%69C-Store (Town Star Holdings, LLC)12PPP0.4%94Crunch Fitness4 PP0.3% 70At Home 4PPPublic0.4%95KFC17 PP0.3% 71Children’s Network20 PP0.4%96Food City3 PP0.3% 72Arby’s 25 PP0.4%97Pike Nursery5PPP0.3% 73Big Al’s 2PPP0.4%98Golden Corral7PPP0.3% 74Big Sandy Furniture7PPP0.4%C-Store (Mountain Express Oil 99Company Southeast, LLC)13PPP0.3% 75Sunny Delight 1 PCorp0.4% 100Brookshire Brothers12 P0.3% Top 100 Tenants1,642 77.5% PIndicates all or a majority of the Tenant’s Contractual Rent is subject to the respective characteristic (i.e., master lease, rent escalators or tenant reporting). POIndicates less than a majority of the Tenant’s Contractual Rent is subject to the respective characteristic (i.e., master lease, rent escalators or Tenant Reporting). Public—Publicly listed companies with publicly available financials. Corp—Corporate level financials provided directly to Spirit. Please see Appendix at the back of this addendum for Reporting Definitions. Q4 2017ADDENDUM TO SUPPLEMENTAL FINANCIAL & OPERATING INFORMATION | As of December 31, 20175
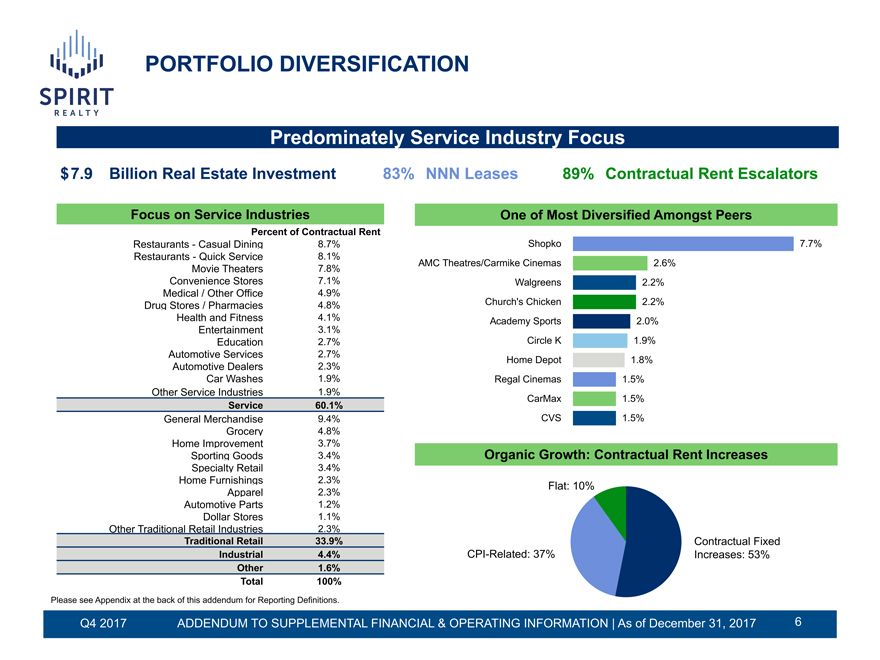
PORTFOLIO DIVERSIFICATION Predominately Service Industry Focus $ 7.9 Billion Real Estate Investment83%NNN Leases89%Contractual Rent Escalators Focus on Service Industries One of Most Diversified Amongst Peers Percent of Contractual Rent Restaurants—Casual Dining8.7% Shopko 7.7% Restaurants—Quick Service8.1% AMC Theatres/Carmike Cinemas2.6% Movie Theaters7.8% Convenience Stores7.1% Walgreens2.2% Medical / Other Office4.9% Drug Stores / Pharmacies4.8% Church’s Chicken2.2% Health and Fitness4.1% Academy Sports2.0% Entertainment3.1% Education2.7% Circle K1.9% Automotive Services2.7% Home Depot1.8% Automotive Dealers2.3% Car Washes1.9% Regal Cinemas1.5% Other Service Industries1.9% CarMax1.5% Service60.1% General Merchandise9.4% CVS1.5% Grocery4.8% Home Improvement3.7% Sporting Goods3.4% Organic Growth: Contractual Rent Increases Specialty Retail3.4% Home Furnishings2.3% Flat: 10% Apparel2.3% Automotive Parts1.2% Dollar Stores1.1% Other Traditional Retail Industries2.3% Traditional Retail33.9% Contractual Fixed Industrial4.4%CPI-Related: 37%Increases: 53% Other1.6% Total100% Please see Appendix at the back of this addendum for Reporting Definitions. Q4 2017ADDENDUM TO SUPPLEMENTAL FINANCIAL & OPERATING INFORMATION | As of December 31, 20176
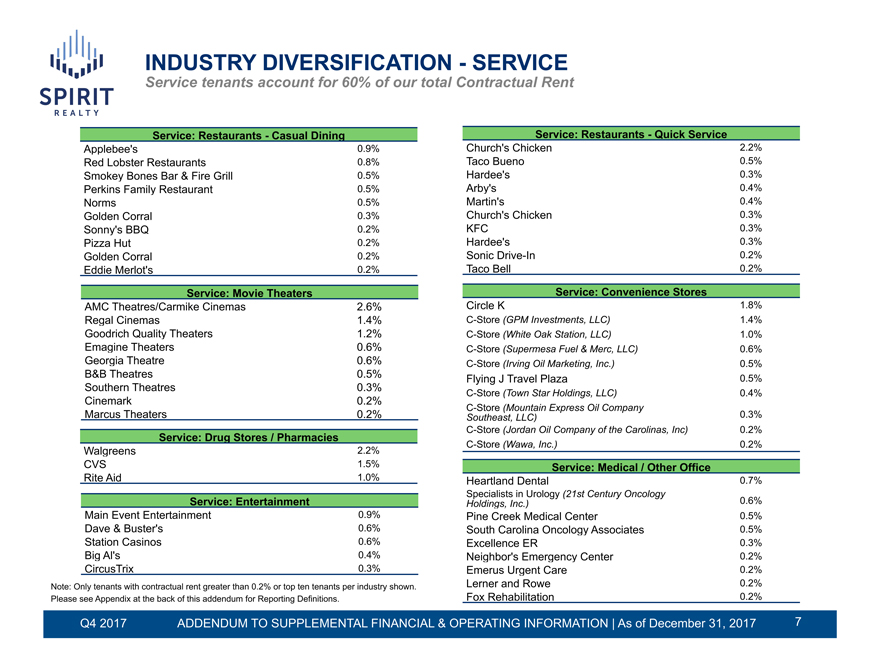
INDUSTRY DIVERSIFICATION—SERVICE Service tenants account for 60% of our total Contractual Rent Service: Restaurants—Casual Dining Service: Restaurants—Quick Service Applebee’s 0.9% Church’s Chicken 2.2% Red Lobster Restaurants0.8%Taco Bueno0.5% Smokey Bones Bar & Fire Grill0.5%Hardee’s0.3% Perkins Family Restaurant0.5%Arby’s0.4% Norms 0.5%Martin’s0.4% Golden Corral 0.3%Church’s Chicken0.3% Sonny’s BBQ 0.2%KFC0.3% Pizza Hut 0.2%Hardee’s0.3% Golden Corral 0.2%SonicDrive-In0.2% Eddie Merlot’s 0.2%Taco Bell0.2% Service: Movie Theaters Service: Convenience Stores AMC Theatres/Carmike Cinemas2.6%Circle K1.8% RegalCinemas1.4%C-Store (GPM Investments, LLC)1.4% Goodrich QualityTheaters1.2%C-Store (White Oak Station, LLC)1.0% EmagineTheaters0.6%C-Store (Supermesa Fuel & Merc, LLC)0.6% GeorgiaTheatre0.6%C-Store (Irving Oil Marketing, Inc.)0.5% B&B Theatres 0.5%Flying J Travel Plaza0.5% SouthernTheatres0.3%C-Store (Town Star Holdings, LLC)0.4% Cinemark 0.2%C-Store (Mountain Express Oil Company Marcus Theaters0.2%Southeast, LLC)0.3%C-Store (Jordan Oil Company of the Carolinas, Inc)0.2% Service: Drug Stores / PharmaciesC-Store (Wawa, Inc.)0.2% Walgreens 2.2% CVS 1.5%Service: Medical / Other Office Rite Aid 1.0%Heartland Dental0.7% Specialists in Urology (21st Century Oncology Service: Entertainment Holdings, Inc.)0.6% Main Event Entertainment0.9%Pine Creek Medical Center0.5% Dave & Buster’s0.6%South Carolina Oncology Associates0.5% Station Casinos0.6%Excellence ER0.3% Big Al’s 0.4%Neighbor’s Emergency Center0.2% CircusTrix 0.3%Emerus Urgent Care0.2% Note: Only tenants with contractual rent greater than 0.2% or top ten tenants per industry shown.Lerner and Rowe0.2% Please see Appendix at the back of this addendum for Reporting Definitions. Fox Rehabilitation0.2% Q4 2017ADDENDUM TO SUPPLEMENTAL FINANCIAL & OPERATING INFORMATION | As of December 31, 20177
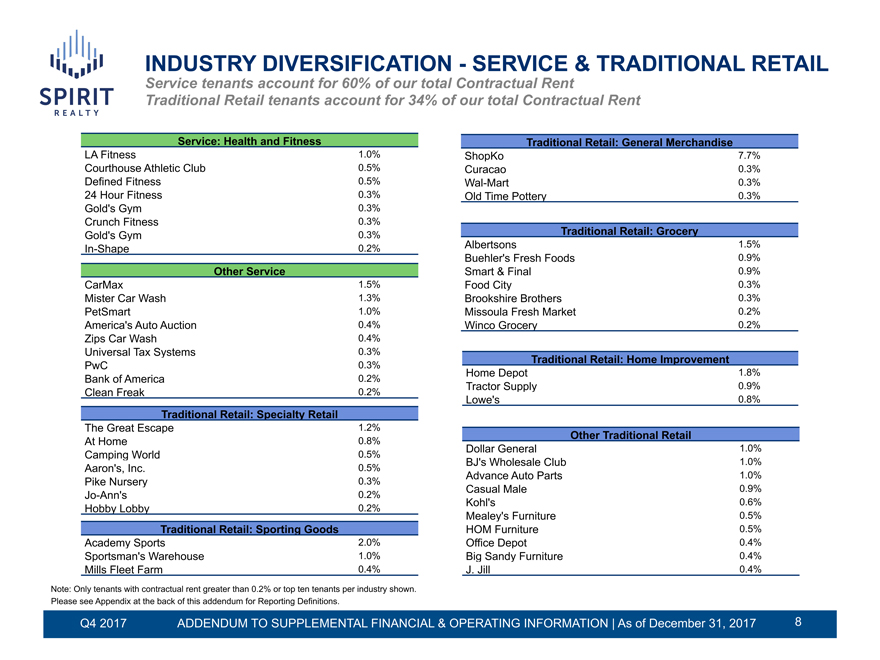
INDUSTRY DIVERSIFICATION—SERVICE & TRADITIONAL RETAIL Service tenants account for 60% of our total Contractual Rent Traditional Retail tenants account for 34% of our total Contractual Rent Service: Health and Fitness Traditional Retail: General Merchandise LA Fitness 1.0%ShopKo7.7% Courthouse Athletic Club0.5%Curacao0.3% DefinedFitness0.5%Wal-Mart0.3% 24 Hour Fitness0.3%Old Time Pottery0.3% Gold’s Gym 0.3% Crunch Fitness0.3% Gold’s Gym 0.3%Traditional Retail: GroceryIn-Shape 0.2%Albertsons1.5% Buehler’s Fresh Foods0.9% Other Service Smart & Final0.9% CarMax 1.5%Food City0.3% Mister Car Wash1.3%Brookshire Brothers0.3% PetSmart 1.0%Missoula Fresh Market0.2% America’s Auto Auction0.4%Winco Grocery0.2% Zips Car Wash0.4% Universal Tax Systems0.3% Traditional Retail: Home Improvement PwC 0.3% Home Depot1.8% Bank of America0.2% Tractor Supply0.9% Clean Freak 0.2% Lowe’s0.8% Traditional Retail: Specialty Retail The Great Escape1.2% Other Traditional Retail At Home 0.8% Dollar General1.0% Camping World0.5% BJ’s Wholesale Club1.0% Aaron’s, Inc.0.5% Advance Auto Parts1.0% Pike Nursery0.3% Casual Male0.9%Jo-Ann’s 0.2% Kohl’s0.6% Hobby Lobby0.2% Mealey’s Furniture0.5% Traditional Retail: Sporting Goods HOM Furniture0.5% Academy Sports2.0%Office Depot0.4% Sportsman’s Warehouse1.0%Big Sandy Furniture0.4% Mills Fleet Farm0.4%J. Jill0.4% Note: Only tenants with contractual rent greater than 0.2% or top ten tenants per industry shown. Please see Appendix at the back of this addendum for Reporting Definitions. Q4 2017ADDENDUM TO SUPPLEMENTAL FINANCIAL & OPERATING INFORMATION | As of December 31, 20178
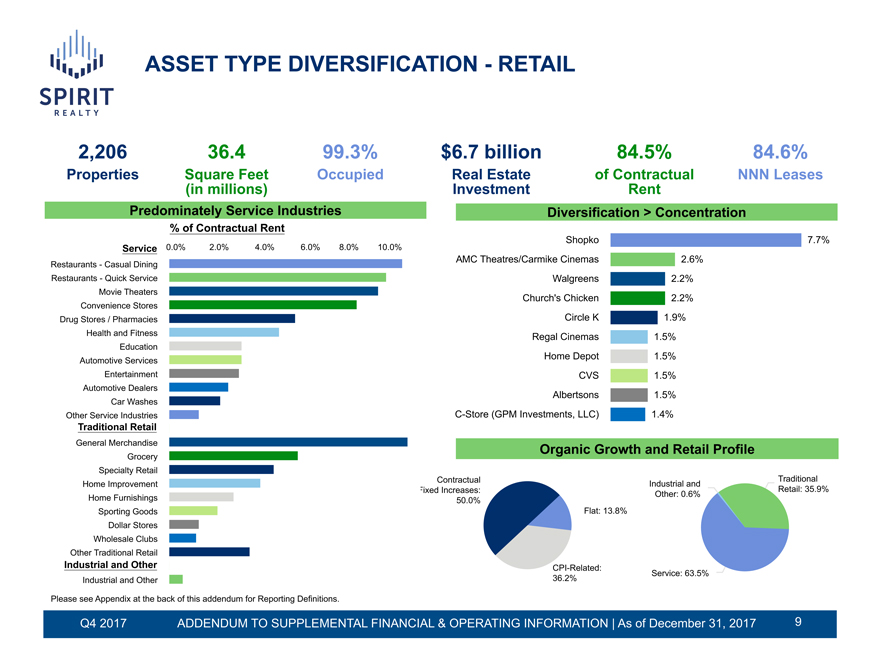
ASSET TYPE DIVERSIFICATION—RETAIL 2,206 36.4 99.3%$6.7 billion84.5%84.6% PropertiesSquare FeetOccupiedReal Estateof ContractualNNN Leases (in millions) Investment Rent Predominately Service Industries Diversification > Concentration % of Contractual Rent Shopko 7.7% Service0.0%2.0%4.0%6.0% 8.0% 10.0% AMC Theatres/Carmike Cinemas2.6% Restaurants—Casual Dining Restaurants—Quick Service Walgreens2.2% Movie Theaters Church’s Chicken2.2% Convenience Stores Drug Stores / Pharmacies Circle K1.9% Health and Fitness Regal Cinemas1.5% Education Automotive Services Home Depot1.5% Entertainment CVS1.5% Automotive Dealers Albertsons1.5% Car Washes Other Service IndustriesC-Store (GPM Investments, LLC)1.4% Traditional Retail General Merchandise Organic Growth and Retail Profile Grocery Specialty Retail Contractual Traditional Home Improvement Industrial and Fixed Increases: Retail: 35.9% Other: 0.6% Home Furnishings 50.0% Sporting Goods Flat: 13.8% Dollar Stores Wholesale Clubs Other Traditional Retail Industrial and OtherCPI-Related: Service: 63.5% Industrial and Other 36.2% Please see Appendix at the back of this addendum for Reporting Definitions. Q4 2017ADDENDUM TO SUPPLEMENTAL FINANCIAL & OPERATING INFORMATION | As of December 31, 20179
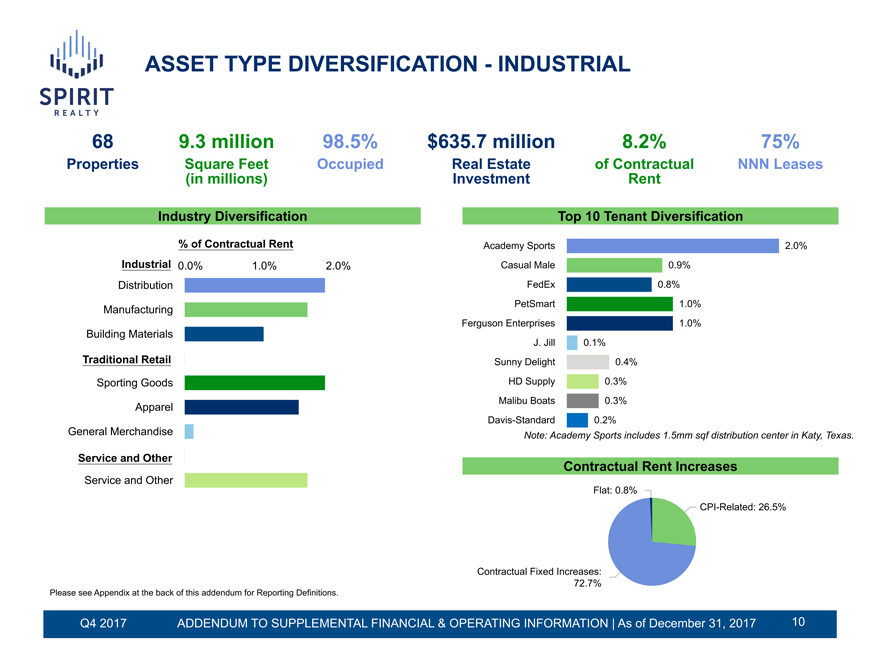
ASSET TYPE DIVERSIFICATION—INDUSTRIAL 68 9.3 million 98.5%$635.7 million8.2% 75% PropertiesSquare FeetOccupiedReal Estateof ContractualNNN Leases (in millions) InvestmentRent Industry Diversification Top 10 Tenant Diversification % of Contractual Rent Academy Sports 2.0% Industrial 0.0%1.0%2.0%Casual Male0.9% Distribution FedEx0.8% PetSmart1.0% Manufacturing Ferguson Enterprises1.0% Building Materials J. Jill0.1% Traditional Retail Sunny Delight0.4% Sporting Goods HD Supply0.3% Malibu Boats0.3% Apparel Davis-Standard0.2% General Merchandise Note: Academy Sports includes 1.5mm sqf distribution center in Katy, Service and Other Contractual Rent Increases Service and Other Flat: 0.8%CPI-Related: 26.5% Contractual Fixed Increases: 72.7% Please see Appendix at the back of this addendum for Reporting Definitions. Q4 2017ADDENDUM TO SUPPLEMENTAL FINANCIAL & OPERATING INFORMATION | As of December 31, 201710
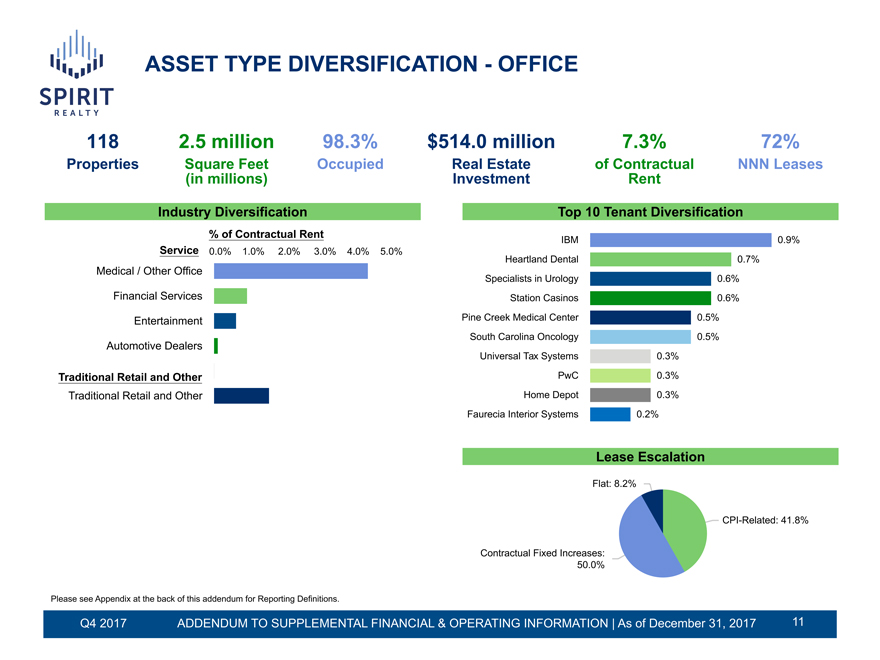
ASSET TYPE DIVERSIFICATION—OFFICE 118 2.5 million98.3%$514.0 million7.3% 72% PropertiesSquare FeetOccupiedReal Estateof ContractualNNN Leases (in millions) InvestmentRent Industry Diversification Top 10 Tenant Diversification % of Contractual RentIBM 0.9% Service 0.0% 1.0% 2.0%3.0% 4.0% 5.0% Heartland Dental 0.7% Medical / Other Office Specialists in Urology 0.6% Financial Services Station Casinos 0.6% Entertainment Pine Creek Medical Center 0.5% South Carolina Oncology 0.5% Automotive Dealers Universal Tax Systems0.3% Traditional Retail and Other PwC0.3% Traditional Retail and Other Home Depot0.3% Faurecia Interior Systems0.2% Lease Escalation Flat: 8.2%CPI-Related: 41.8% Contractual Fixed Increases: 50.0% Please see Appendix at the back of this addendum for Reporting Definitions. Q4 2017ADDENDUM TO SUPPLEMENTAL FINANCIAL & OPERATING INFORMATION | As of December 31, 201711
APPENDIX 12
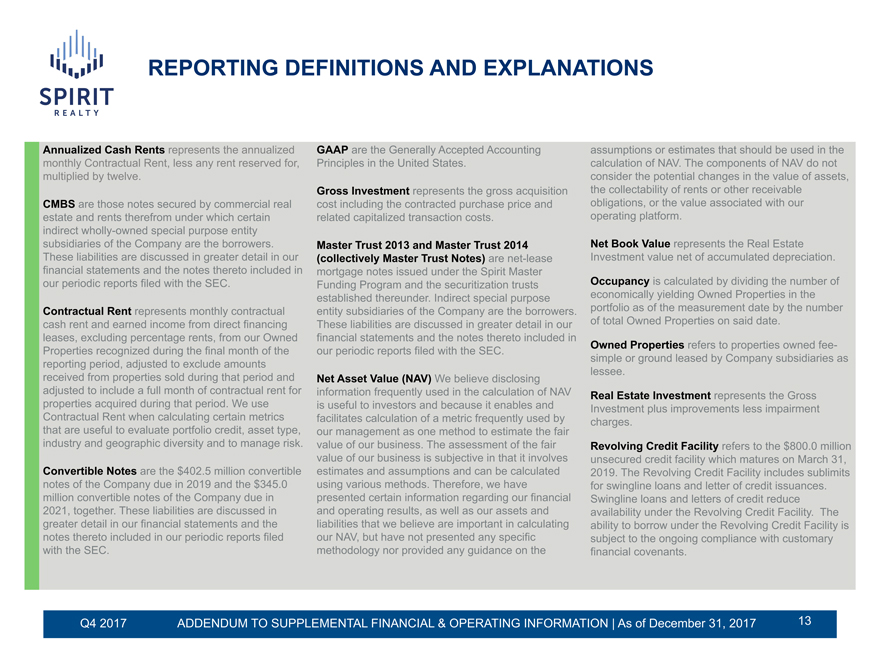
REPORTING DEFINITIONS AND EXPLANATIONS Annualized Cash Rents represents the annualized GAAP are the Generally Accepted Accountingassumptions or estimates that should be used in the monthly Contractual Rent, less any rent reserved for,Principles in the United States.calculation of NAV. The components of NAV do not multiplied by twelve. consider the potential changes in the value of assets, Gross Investment represents the gross acquisitionthe collectability of rents or other receivable CMBS are those notes secured by commercial realcost including the contracted purchase price andobligations, or the value associated with our estate and rents therefrom under which certainrelated capitalized transaction costs.operating platform. indirect wholly-owned special purpose entity subsidiaries of the Company are the borrowers.Master Trust 2013 and Master Trust 2014Net Book Value represents the Real Estate These liabilities are discussed in greater detail in our(collectively Master Trust Notes) arenet-leaseInvestment value net of accumulated depreciation. financial statements and the notes thereto included inmortgage notes issued under the Spirit Master our periodic reports filed with the SEC.Funding Program and the securitization trustsOccupancy is calculated by dividing the number of established thereunder. Indirect special purposeeconomically yielding Owned Properties in the Contractual Rent represents monthly contractualentity subsidiaries of the Company are the borrowers.portfolio as of the measurement date by the number cash rent and earned income from direct financingThese liabilities are discussed in greater detail in ourof total Owned Properties on said date. leases, excluding percentage rents, from our Ownedfinancial statements and the notes thereto included in Properties recognized during the final month of theour periodic reports filed with the SEC.Owned Properties refers to properties ownedfee- reporting period, adjusted to exclude amounts simple or ground leased by Company subsidiaries as lessee. received from properties sold during that period andNet Asset Value (NAV) We believe disclosing adjusted to include a full month of contractual rent forinformation frequently used in the calculation of NAVReal Estate Investment represents the Gross properties acquired during that period. We useis useful to investors and because it enables andInvestment plus improvements less impairment Contractual Rent when calculating certain metricsfacilitates calculation of a metric frequently used bycharges. that are useful to evaluate portfolio credit, asset type,our management as one method to estimate the fair industry and geographic diversity and to manage risk.value of our business. The assessment of the fairRevolving Credit Facility refers to the $800.0 million value of our business is subjective in that it involvesunsecured credit facility which matures on March 31, Convertible Notes are the $402.5 million convertibleestimates and assumptions and can be calculated2019. The Revolving Credit Facility includes sublimits notes of the Company due in 2019 and the $345.0using various methods. Therefore, we havefor swingline loans and letter of credit issuances. million convertible notes of the Company due inpresented certain information regarding our financialSwingline loans and letters of credit reduce 2021, together. These liabilities are discussed inand operating results, as well as our assets andavailability under the Revolving Credit Facility. The greater detail in our financial statements and theliabilities that we believe are important in calculatingability to borrow under the Revolving Credit Facility is notes thereto included in our periodic reports filedour NAV, but have not presented any specificsubject to the ongoing compliance with customary with the SEC. methodology nor provided any guidance on thefinancial covenants. Q4 2017ADDENDUM TO SUPPLEMENTAL FINANCIAL & OPERATING INFORMATION | As of December 31, 201713
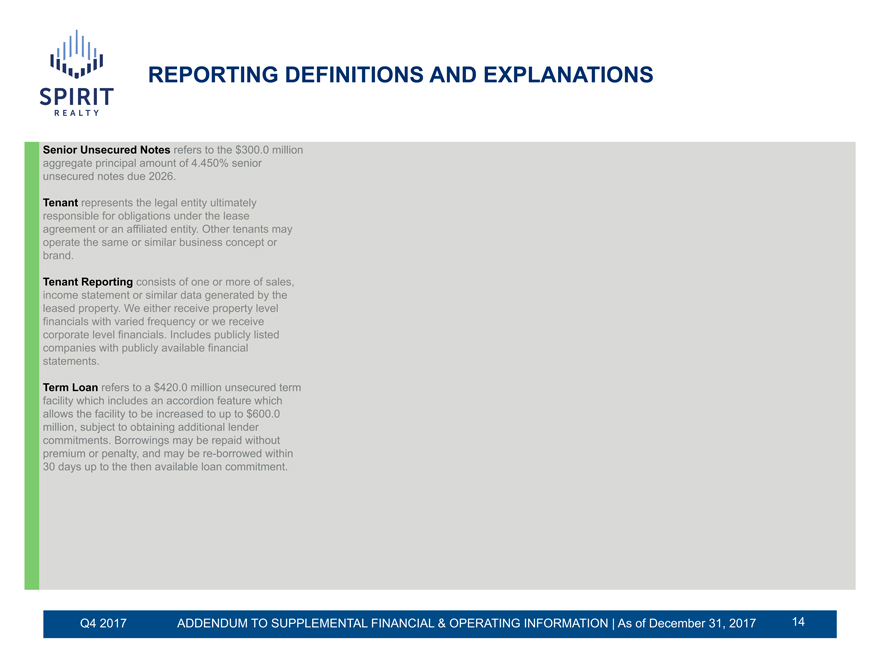
REPORTING DEFINITIONS AND EXPLANATIONS Senior Unsecured Notes refers to the $300.0 million aggregate principal amount of 4.450% senior unsecured notes due 2026. Tenant represents the legal entity ultimately responsible for obligations under the lease agreement or an affiliated entity. Other tenants may operate the same or similar business concept or brand. Tenant Reporting consists of one or more of sales, income statement or similar data generated by the leased property. We either receive property level financials with varied frequency or we receive corporate level financials. Includes publicly listed companies with publicly available financial statements. Term Loan refers to a $420.0 million unsecured term facility which includes an accordion feature which allows the facility to be increased to up to $600.0 million, subject to obtaining additional lender commitments. Borrowings may be repaid without premium or penalty, and may bere-borrowed within 30 days up to the then available loan commitment. Q4 2017 ADDENDUM TO SUPPLEMENTAL FINANCIAL & OPERATING INFORMATION | As of December 31, 2017 14

FORWARD-LOOKING STATEMENTS AND RISK FACTORS The information in this supplemental report should be read in conjunction with the accompanying earnings press release, as well as the Company’s Annual Report on Form10-K and other information filed with the Securities and Exchange Commission. This supplemental report is not incorporated into such filings. This document is not an offer to sell or a solicitation to buy securities of Spirit Realty Capital, Inc. Any offer or solicitation shall be made only by means of a prospectus approved for that purpose. Forward-Looking and Cautionary Statements This document contains forward-looking statements within the meaning of the Private Securities Litigation Reform Act of 1995 and other federal securities laws. These forward-looking statements can be identified by the use of words such as “expects,” “plans,” “estimates,” “projects,” “intends,” “believes,” “guidance,” and other similar expressions that do not relate to historical matters. These forward-looking statements are subject to known and unknown risks and uncertainties that can cause actual results to differ materially from those currently anticipated due to a number of factors, which include, but are not limited to, Spirit’s continued ability to source new investments, risks associated with using debt and equity financing to fund Spirit’s business activities (including refinancing and interest rate risks, changes in interest rates and/or credit spreads, changes in the price of our common stock, and conditions of the equity and debt capital markets, generally), unknown liabilities acquired in connection with acquired properties or interests in real-estate related entities, general risks affecting the real estate industry and local real estate markets (including, without limitation, the market value of our properties, the inability to enter into or renew leases at favorable rates, portfolio occupancy varying from our expectations, dependence on tenants’ financial condition and operating performance, and competition from other developers, owners and operators of real estate), the financial performance of our retail tenants and the demand for retail space, particularly with respect to challenges being experienced by general merchandise retailers, potential fluctuations in the consumer price index, risks associated with our failure to maintain our status as a REIT under the Internal Revenue Code of 1986, as amended, risks and uncertainties related to the completion and timing of Spirit’s proposedspin-off of properties leased to Shopko Retail Shops Holding Corp, and certain of its affiliates and assets that collateralize Master Trust 2014 and the impact of thespin-off on Spirit’s business, and other additional risks discussed in Spirit’s most recent filings with the Securities and Exchange Commission, including its Annual Report on Form10-K. Spirit expressly disclaims any responsibility to update or revise forward-looking statements, whether as a result of new information, future events or otherwise, except as required by law. Q4 2017 ADDENDUM TO SUPPLEMENTAL FINANCIAL & OPERATING INFORMATION | As of December 31, 2017 15