Exhibit 99.1

NAREIT Presentation New York, NY June 2018
Disclaimer This presentation contains forward-looking statements within the meaning of the Private Securities Litigation Reform Act of 1995 and other federal securities laws. These forward-looking statements can be identified by the use of words such as “expect,” “plan,” “will,” “estimate,” “project,” “intend,” “believe,” “guidance,” and other similar expressions that do not relate to historical matters. These forward-looking statements are subject to known and unknown risks and uncertainties that can cause actual results to differ materially from those currently anticipated due to a number of factors, which include, but are not limited to, our continued ability to source new investments, risks associated with using debt and equity financing to fund our business activities (including refinancing and interest rate risks, changes in interest rates and/or credit spreads, changes in the price of our common shares, and conditions of the equity and debt capital markets, generally), unknown liabilities acquired in connection with acquired properties or interests in real-estate related entities, general risks affecting the real estate industry and local real estate markets (including, without limitation, the market value of our properties, the inability to enter into or renew leases at favorable rates, portfolio occupancy varying from our expectations, dependence on tenants’ financial condition and operating performance, and competition from other developers, owners and operators of real estate), the financial performance of our retail tenants and the demand for retail space, particularly with respect to challenges being experienced by general merchandise retailers, potential fluctuations in the consumer price index, risks associated with our failure to maintain our status as a REIT under the Internal Revenue Code of 1986, as amended, and other additional risks discussed in our most recent filings with the Securities and Exchange Commission. We expressly disclaim any responsibility to update or revise forward-looking statements, whether as a result of new information, future events or otherwise, except as required by law. This presentation shall not constitute an offer to sell or the solicitation of an offer to buy securities nor shall there be any sale of any securities in any state in which such solicitation or sale would be unlawful prior to registration or qualification of these securities under the laws of any such state. Certain information contained herein is preliminary and subject to change and may be superseded in its entirety by further updated materials. We do not make any representation as to the accuracy or completeness of the information contained herein. Certain data set forth herein has been obtained from third parties, the accuracy of which we have not independently verified. This information is not intended to provide and should not be relied upon for accounting, legal or tax advice or investment recommendations. You should consult your own counsel, tax, accountant, regulatory and other advisors as to such matters.
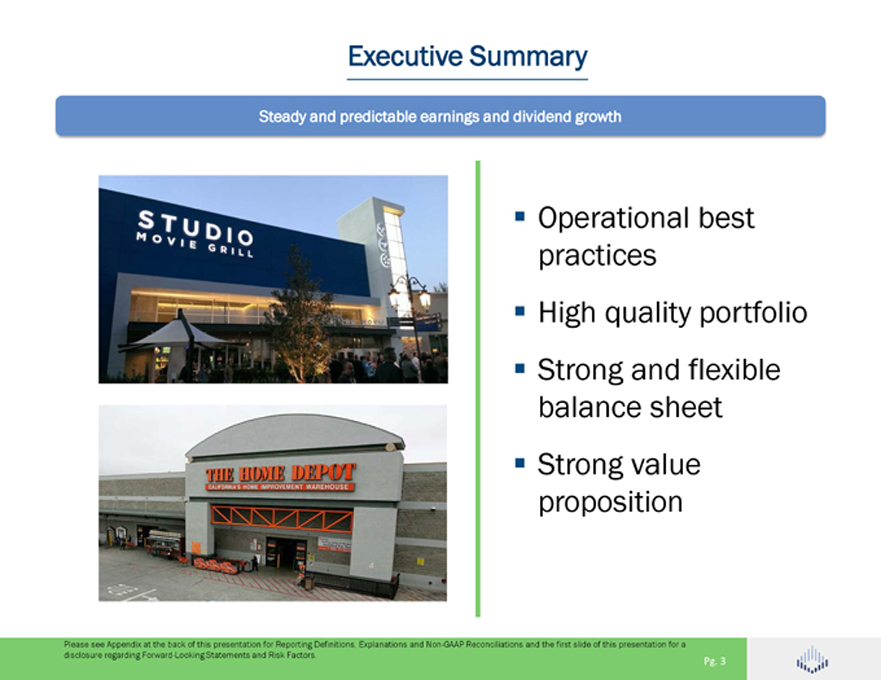
Executive Summary Steady and predictable earnings and dividend growth Operational best practices High quality portfolio Strong and flexible balance sheet Strong value proposition Please see Appendix at the back of this presentation for Reporting Definitions, Explanations and Non-GAAP Reconciliations and the first slide of this presentation for a disclosure regarding Forward-Looking Statements and Risk Factors. Pg. 3
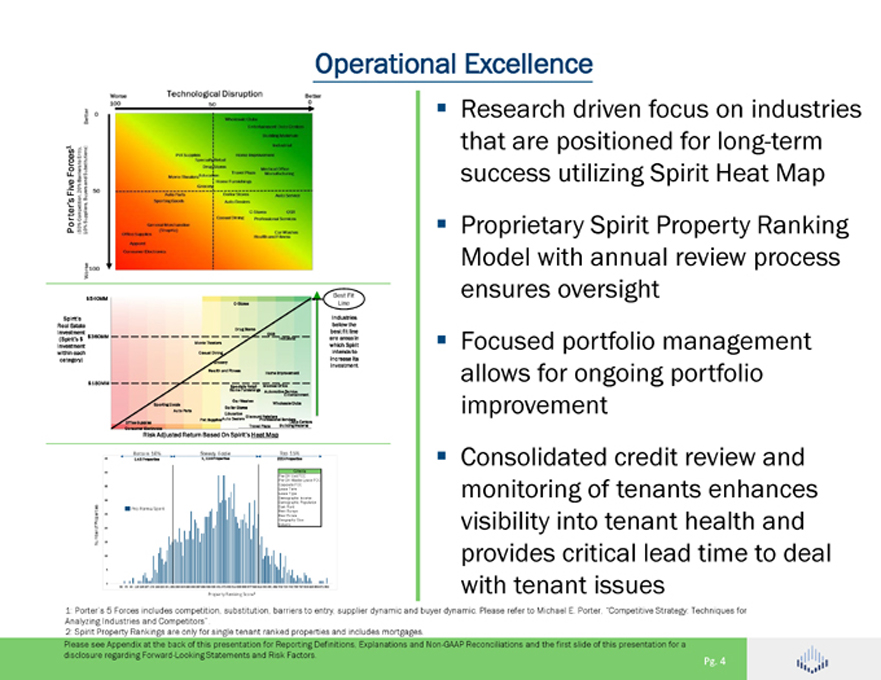
Operational Excellence Research driven focus on industries that are positioned for long-term success utilizing Spirit Heat Map Proprietary Spirit Property Ranking Model with annual review process ensures oversight Focused portfolio management allows for ongoing portfolio improvement Consolidated credit review and monitoring of tenants enhances visibility into tenant health and provides critical lead time to deal with tenant issues 1: Porter’s 5 Forces includes competition, substitution, barriers to entry, supplier dynamic and buyer dynamic. Please refer to Michael E. Porter, “Competitive Strategy: Techniques for Analyzing Industries and Competitors”. 2: Spirit Property Rankings are only for single tenant ranked properties and includes mortgages. Please see Appendix at the back of this presentation for Reporting Definitions, Explanations and Non-GAAP Reconciliations and the first slide of this presentation for a disclosure regarding Forward-Looking Statements and Risk Factors. Pg. 4
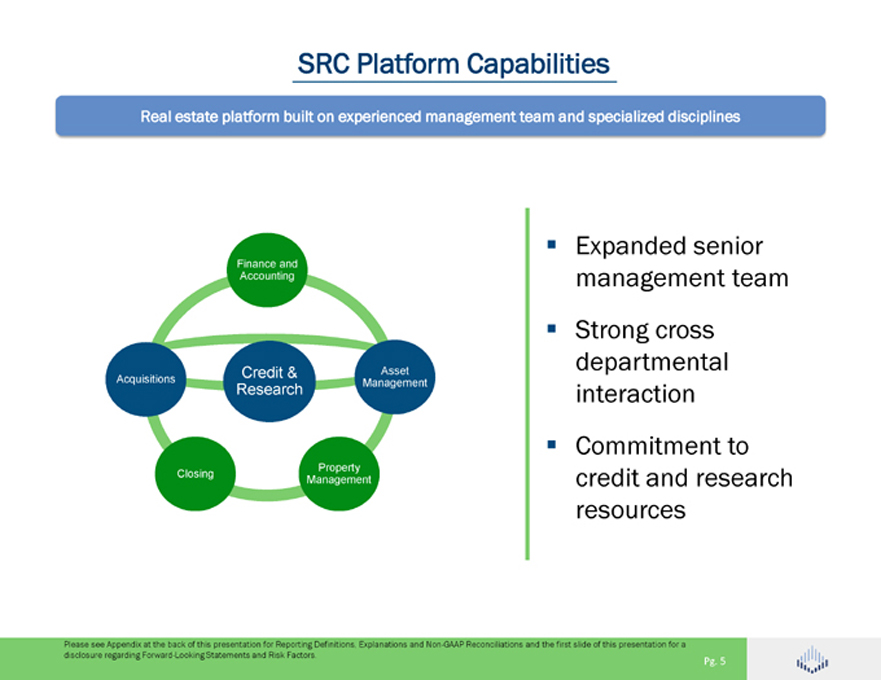
SRC Platform Capabilities Real estate platform built on experienced management team and specialized disciplines Finance Accounting and Credit & Asset Acquisitions Management Research Property Closing Management Expanded senior management team Strong cross departmental interaction Commitment to credit and research resources Please see Appendix at the back of this presentation for Reporting Definitions, Explanations and Non-GAAP Reconciliations and the first slide of this presentation for a disclosure regarding Forward-Looking Statements and Risk Factors. Pg. 5
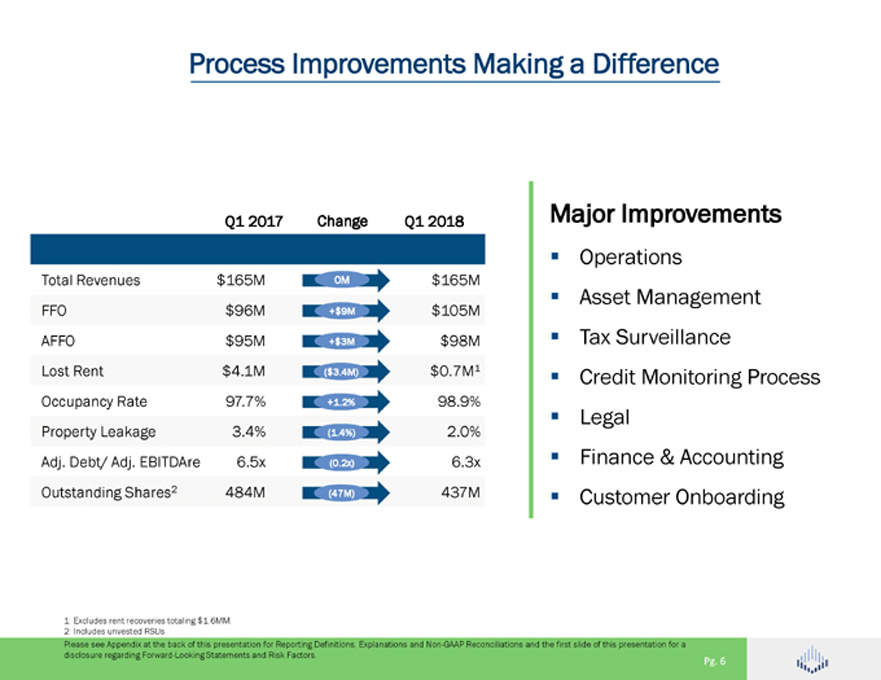
Process Improvements Making a Difference Q1 2017 Change Q1 2018 Total Revenues $165M 0M $165M FFO $96M +$9M $105M AFFO $95M +$3M $98M Lost Rent $4.1M ($3.4M) $0.7M1 Occupancy Rate 97.7% +1.2% 98.9% Property Leakage 3.4% (1.4%) 2.0% Adj. Debt/ Adj. EBITDAre 6.5x (0.2x) 6.3x Outstanding Shares2 484M (47M) 437M Major Improvements Operations Asset Management Tax Surveillance Credit Monitoring Process Legal Finance & Accounting Customer Onboarding 1: Excludes rent recoveries totaling $1.6MM. 2: Includes unvested RSUs. Please see Appendix at the back of this presentation for Reporting Definitions, Explanations and Non-GAAP Reconciliations and the first slide of this presentation for a disclosure regarding Forward-Looking Statements and Risk Factors. Pg. 6
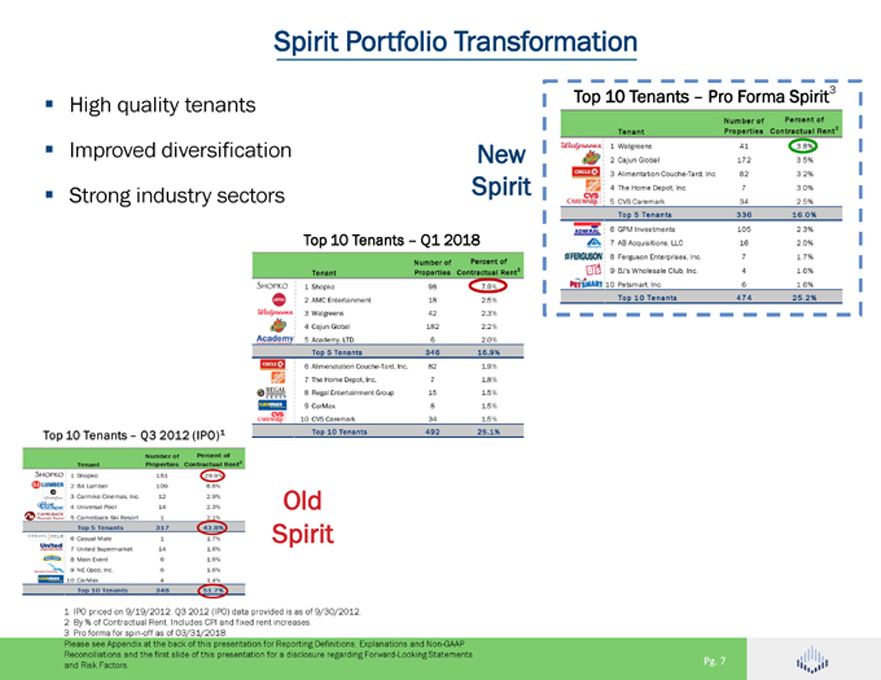
Spirit Portfolio Transformation High quality tenants Improved diversification Strong industry sectors New Spirit Top 10 Tenants – Pro Forma Spirit3 Number of Percent of Tenant Properties Contractual Rent2 1 Walgreens 41 3.8% 2 Cajun Global 172 3.5% 3 Alimentation Couche-Tard, Inc. 82 3.2% 4 The Home Depot, Inc. 7 3.0% 5 CVS Caremark 34 2.5% Top 5 Tenants 336 16.0% 6 GPM Investments 105 2.3% 7 AB Acquisitions, LLC 16 2.0% 8 Ferguson Enterprises, Inc. 7 1.7% 9 BJ’s Wholesale Club, Inc. 4 1.6% 10 Petsmart, Inc. 6 1.6% Top 10 Tenants 474 25.2% Top 10 Tenants – Q1 2018 Number of Percent of Tenant Properties Contractual Rent2 1 Shopko 98 7.9% 2 AMC Entertainment 18 2.5% 3 Walgreens 42 2.3% 4 Cajun Global 182 2.2% 5 Academy, LTD 6 2.0% Top 5 Tenants 346 16.9% 6 Alimenatation Couche-Tard, Inc. 82 1.9% 7 The Home Depot, Inc. 7 1.8% 8 Regal Entertainment Group 15 1.5% 9 CarMax 8 1.5% 10 CVS Caremark 34 1.5% Top 10 Tenants 492 25.1% Old Spirit 1: IPO priced on 9/19/2012. Q3 2012 (IPO) data provided is as of 9/30/2012. 2: By % of Contractual Rent. Includes CPI and fixed rent increases. 3: Pro forma for spin-off as of 03/31/2018. Please see Appendix at the back of this presentation for Reporting Definitions, Explanations and Non-GAAP Reconciliations and the first slide of this presentation for a disclosure regarding Forward-Looking Statements and Risk Factors. Pg. 7
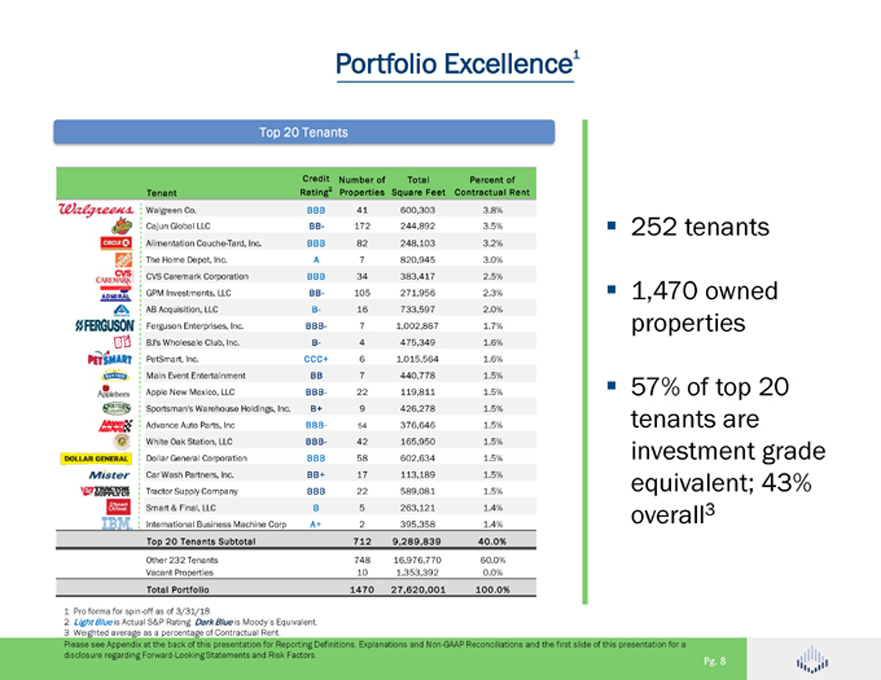
Portfolio Excellence1 Top 20 Tenants Credit Number of Total Percent of Tenant Rating2 Properties Square Feet Contractual Rent Walgreen Co. BBB 41 600,303 3.8% Cajun Global LLC BB- 172 244,892 3.5% Alimentation Couche-Tard, Inc. BBB 82 248,103 3.2% The Home Depot, Inc. A 7 820,945 3.0% CVS Caremark Corporation BBB 34 383,417 2.5% GPM Investments, LLC BB- 105 271,956 2.3% AB Acquisition, LLC B- 16 733,597 2.0% Ferguson Enterprises, Inc. BBB- 7 1,002,867 1.7% BJ’s Wholesale Club, Inc. B- 4 475,349 1.6% PetSmart, Inc. CCC+ 6 1,015,564 1.6% Main Event Entertainment BB 7 440,778 1.5% Apple New Mexico, LLC BBB- 22 119,811 1.5% Sportsman’s Warehouse Holdings, Inc. B+ 9 426,278 1.5% Advance Auto Parts, Inc BBB- 54 376,646 1.5% White Oak Station, LLC BBB- 42 165,950 1.5% Dollar General Corporation BBB 58 602,634 1.5% Car Wash Partners, Inc. BB+ 17 113,189 1.5% Tractor Supply Company BBB 22 589,081 1.5% Smart & Final, LLC B 5 263,121 1.4% International Business Machine Corp A+ 2 395,358 1.4% Top 20 Tenants Subtotal 712 9,289,839 40.0% Other 232 Tenants 748 16,976,770 60.0% Vacant Properties 10 1,353,392 0.0% Total Portfolio 1470 27,620,001 100.0% 252 tenants 1,470 owned properties 57% of top 20 tenants are investment grade equivalent; 43% overall3 1: Pro forma for spin-off as of 3/31/18. 2: Light Blue is Actual S&P Rating. Dark Blue is Moody’s Equivalent. 3: Weighted average as a percentage of Contractual Rent. . Please see Appendix at the back of this presentation for Reporting Definitions, Explanations and Non-GAAP Reconciliations and the first slide of this presentation for a disclosure regarding Forward-Looking Statements and Risk Factors. Pg. 8
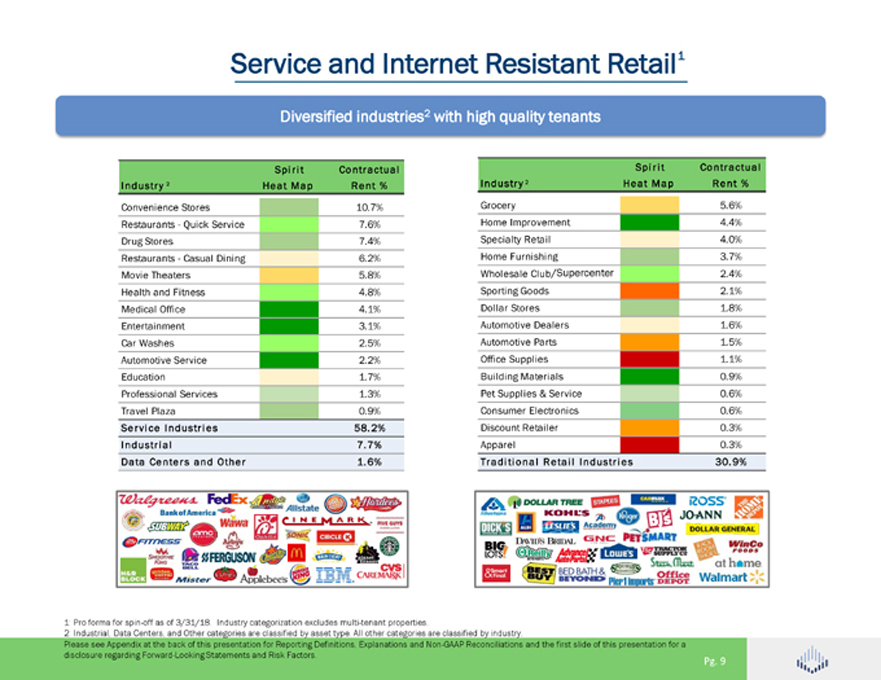
Service and Internet Resistant Retail1 Diversified industries2 with high quality tenants Spirit Contractual Industry 2 Heat Map Rent % Convenience Stores 10.7% Restaurants - Quick Service 7.6% Drug Stores 7.4% Restaurants - Casual Dining 6.2% Movie Theaters 5.8% Health and Fitness 4.8% Medical Office 4.1% Entertainment 3.1% Car Washes 2.5% Automotive Service 2.2% Education 1.7% Professional Services 1.3% Travel Plaza 0.9% Service Industries 58.2% Industrial 7.7% Data Centers and Other 1.6% Spirit Contractual Industry 2 Heat Map Rent % Grocery 5.6% Home Improvement 4.4% Specialty Retail 4.0% Home Furnishing 3.7% Wholesale Club/Supercenter 2.4% Sporting Goods 2.1% Dollar Stores 1.8% Automotive Dealers 1.6% Automotive Parts 1.5% Office Supplies 1.1% Building Materials 0.9% Pet Supplies & Service 0.6% Consumer Electronics 0.6% Discount Retailer 0.3% Apparel 0.3% Traditional Retail Industries 30.9% 1: Pro forma for spin-off as of 3/31/18. Industry categorization excludes multi-tenant properties. 2: Industrial, Data Centers, and Other categories are classified by asset type. All other categories are classified by industry. Please see Appendix at the back of this presentation for Reporting Definitions, Explanations and Non-GAAP Reconciliations and the first slide of this presentation for a disclosure regarding Forward-Looking Statements and Risk Factors. Pg. 9
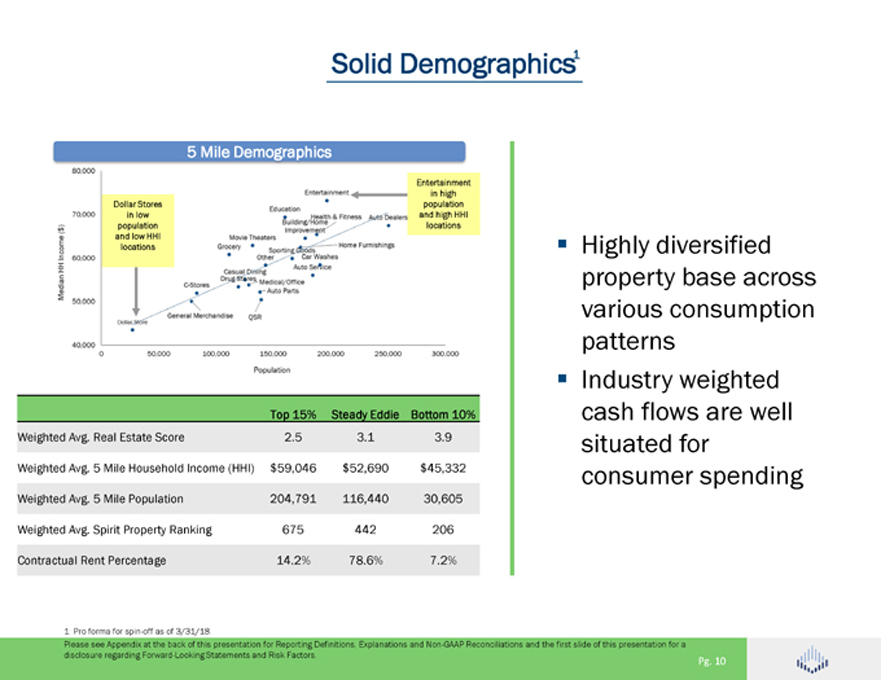
Solid Demographics1 5 Mile Demographics Entertainment in high Dollar Stores population in low and high HHI population locations and low HHI locations Top 15% Steady Eddie Bottom 10% Weighted Avg. Real Estate Score 2.5 3.1 3.9 Weighted Avg. 5 Mile Household Income (HHI) $59,046 $52,690 $45,332 Weighted Avg. 5 Mile Population 204,791 116,440 30,605 Weighted Avg. Spirit Property Ranking 675 442 206 Contractual Rent Percentage 14.2% 78.6% 7.2% Highly diversified property base across various consumption patterns Industry weighted cash flows are well situated for consumer spending 1: Pro forma for spin-off as of 3/31/18. Please see Appendix at the back of this presentation for Reporting Definitions, Explanations and Non-GAAP Reconciliations and the first slide of this presentation for a disclosure regarding Forward-Looking Statements and Risk Factors. Pg. 10
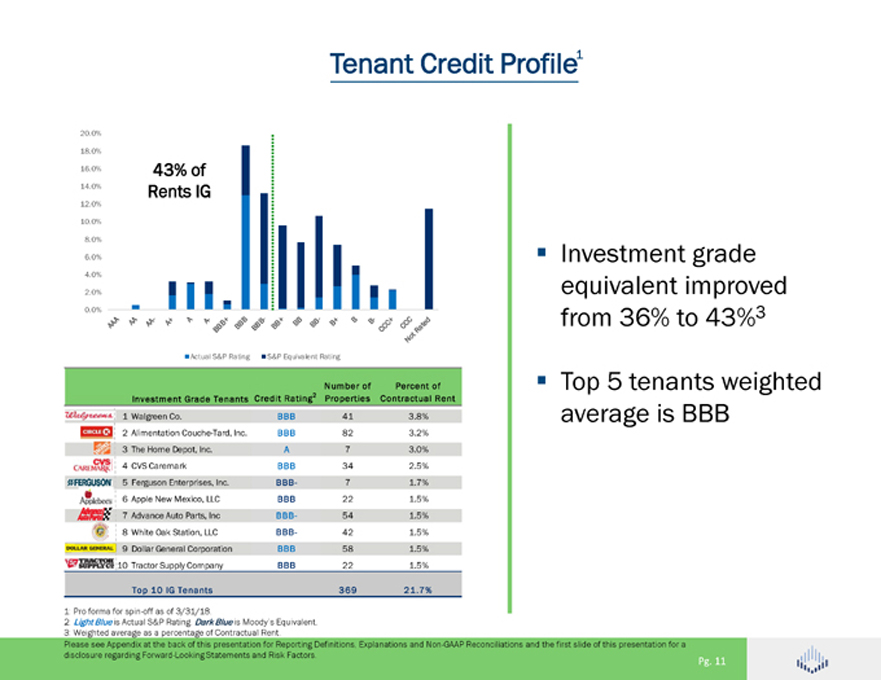
Tenant Credit Profile1 20.0% 18.0% 16.0% 43% of 14.0% Rents IG 12.0% 10.0% 8.0% 6.0% 4.0% 2.0% 0.0% Actual S&P Rating S&P Equivalent Rating Number of Percent of Investment Grade Tenants Credit Rating2 Properties Contractual Rent 1 Walgreen Co. BBB 41 3.8% 2 Alimentation Couche-Tard, Inc. BBB 82 3.2% 3 The Home Depot, Inc. A 7 3.0% 4 CVS Caremark BBB 34 2.5% 5 Ferguson Enterprises, Inc. BBB- 7 1.7% 6 Apple New Mexico, LLC BBB 22 1.5% 7 Advance Auto Parts, Inc BBB- 54 1.5% 8 White Oak Station, LLC BBB- 42 1.5% 9 Dollar General Corporation BBB 58 1.5% 10 Tractor Supply Company BBB 22 1.5% Top 10 IG Tenants 369 21.7% Investment grade equivalent improved from 36% to 43%3 Top 5 tenants weighted average is BBB 1: Pro forma for spin-off as of 3/31/18. 2: Light Blue is Actual S&P Rating. Dark Blue is Moody’s Equivalent. 3: Weighted average as a percentage of Contractual Rent. . Please see Appendix at the back of this presentation for Reporting Definitions, Explanations and Non-GAAP Reconciliations and the first slide of this presentation for a disclosure regarding Forward-Looking Statements and Risk Factors. Pg. 11
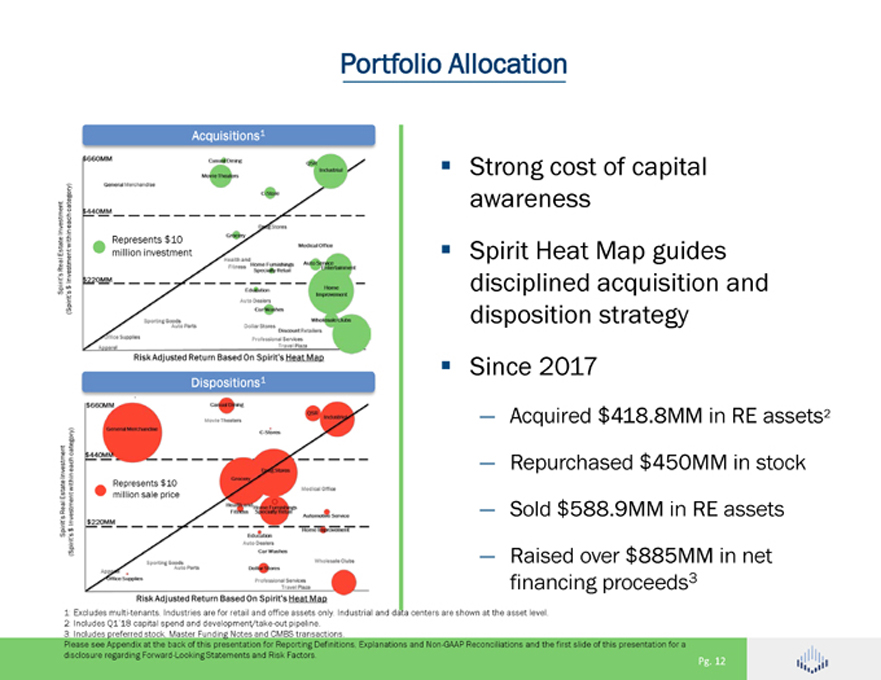
Portfolio Allocation Acquisitions1 Dispositions1 Strong cost of capital awareness Spirit Heat Map guides disciplined acquisition and disposition strategy Since 2017 — Acquired $418.8MM in RE assets2 — Repurchased $450MM in stock — Sold $588.9MM in RE assets — Raised over $885MM in net financing proceeds3 1: Excludes multi-tenants. Industries are for retail and office assets only. Industrial and data centers are shown at the asset level. 2: Includes Q1’18 capital spend and development/take-out pipeline. 3: Includes preferred stock, Master Funding Notes and CMBS transactions. Please see Appendix at the back of this presentation for Reporting Definitions, Explanations and Non-GAAP Reconciliations and the first slide of this presentation for a disclosure regarding Forward-Looking Statements and Risk Factors. Pg. 12
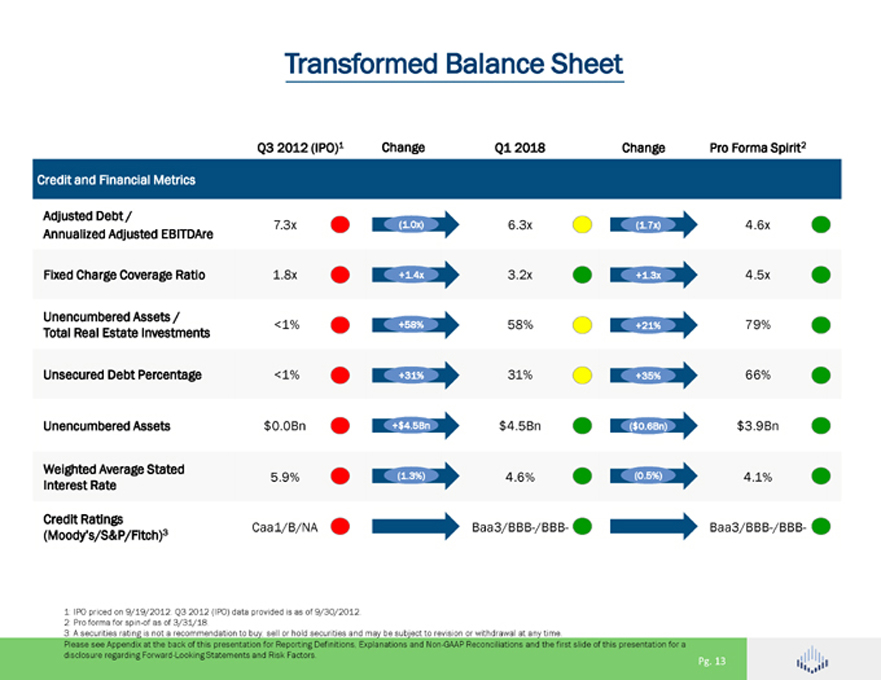
Transformed Balance Sheet Q3 2012 (IPO)1 Change Q1 2018 Change Pro Forma Spirit2 Credit and Financial Metrics Adjusted Debt / 7.3x (1.0x) 6.3x (1.7x) 4.6x Annualized Adjusted EBITDAre Fixed Charge Coverage Ratio 1.8x +1.4x 3.2x +1.3x 4.5x Unencumbered Assets / <1% +58% 58% +21% 79% Total Real Estate Investments Unsecured Debt Percentage <1% +31% 31% +35% 66% Unencumbered Assets $0.0Bn +$4.5Bn $4.5Bn ($0.6Bn) $3.9Bn Weighted Average Stated 5.9% (1.3%) 4.6% (0.5%) 4.1% Interest Rate Credit Ratings 3 Caa1/B/NA Baa3/BBB-/BBB- Baa3/BBB-/BBB- (Moody’s/S&P/Fitch) 1: IPO priced on 9/19/2012. Q3 2012 (IPO) data provided is as of 9/30/2012. 2: Pro forma for spin-of as of 3/31/18. 3: A securities rating is not a recommendation to buy, sell or hold securities and may be subject to revision or withdrawal at any time. . Please see Appendix at the back of this presentation for Reporting Definitions, Explanations and Non-GAAP Reconciliations and the first slide of this presentation for a disclosure regarding Forward-Looking Statements and Risk Factors. Pg. 13
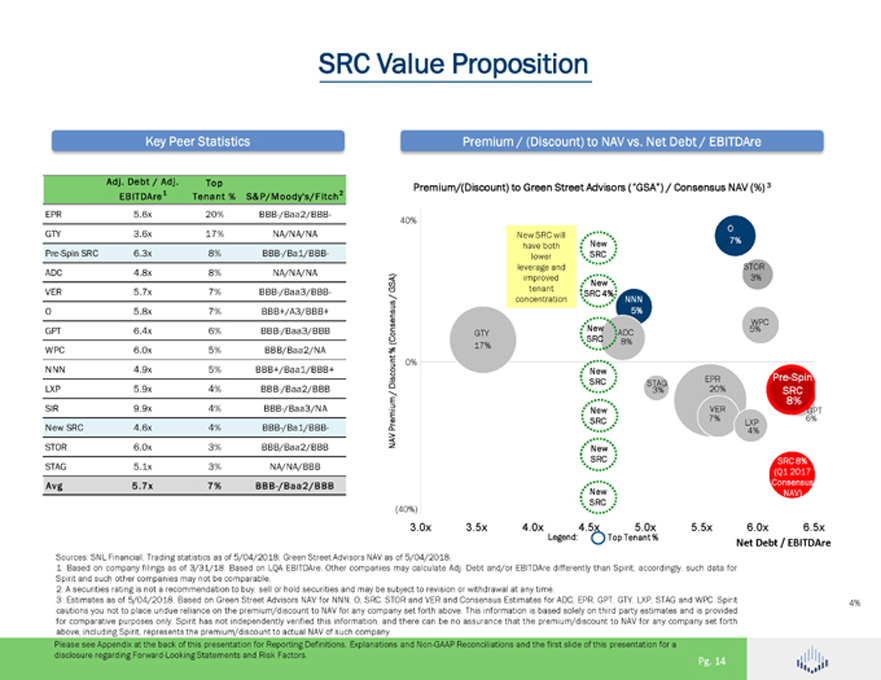
SRC Value Proposition Key Peer Statistics Adj. Debt / Adj. Top EBITDAre1 Tenant % S&P/Moody’s/Fitch2 EPR 5.6x 20% BBB-/Baa2/BBB- GTY 3.6x 17% NA/NA/NA Pre-Spin SRC 6.3x 8% BBB-/Ba1/BBB- ADC 4.8x 8% NA/NA/NA VER 5.7x 7% BBB-/Baa3/BBB- O 5.8x 7% BBB+/A3/BBB+ GPT 6.4x 6% BBB-/Baa3/BBB WPC 6.0x 5% BBB/Baa2/NA NNN 4.9x 5% BBB+/Baa1/BBB+ LXP 5.9x 4% BBB-/Baa2/BBB SIR 9.9x 4% BBB-/Baa3/NA New SRC 4.6x 4% BBB-/Ba1/BBB- STOR 6.0x 3% BBB/Baa2/BBB STAG 5.1x 3% NA/NA/BBB Avg 5.7x 7% BBB-/Baa2/BBB Premium / (Discount) to NAV vs. Net Debt / EBITDAre Premium/(Discount) to Green Street Advisors (“GSA”) / Consensus NAV (%) 3 40% O New SRC will % New 7% 7% have both SRC lower leverage and STOR improved 3% New GSA) tenant / SRC 4% concentration NNN 5% 5% 5% WPC New 5% GTY ADC (Consensus SRC 8% % 17% 0% New SRC EPR Pre-Spin Discount STAG / 67% 3% 20% SRC 8% New 7% VER 6% GPT Premium SRC LXP NAV 4% New SRC SRC 8% (Q1 2017 Consensus New NAV) SRC (40%) 3.0x 3.5x 4.0x Legend:4.5x 5.0x 5.5x 6.0x 6.5x Top Tenant % Net Debt / EBITDAre Sources: SNL Financial, Trading statistics as of 5/04/2018; Green Street Advisors NAV as of 5/04/2018. 1: Based on company filings as of 3/31/18. Based on LQA EBITDAre. Other companies may calculate Adj. Debt and/or EBITDAre differently than Spirit; accordingly, such data for Spirit and such other companies may not be comparable. 2: A securities rating is not a recommendation to buy, sell or hold securities and may be subject to revision or withdrawal at any time. 14 3: Estimates as of 5/04/2018. Based on Green Street Advisors NAV for NNN, O, SRC, STOR and VER and Consensus Estimates for ADC, EPR, GPT, GTY, LXP, STAG and WPC. Spirit 4% cautions you not to place undue reliance on the premium/discount to NAV for any company set forth above. This information is based solely on third party estimates and is provided for comparative purposes only. Spirit has not independently verified this information, and there can be no assurance that the premium/discount to NAV for any company set forth above, including Spirit, represents the premium/discount to actual NAV of such company. Please see Appendix at the back of this presentation for Reporting Definitions, Explanations and Non-GAAP Reconciliations and the first slide of this presentation for a disclosure regarding Forward-Looking Statements and Risk Factors. Pg. 14
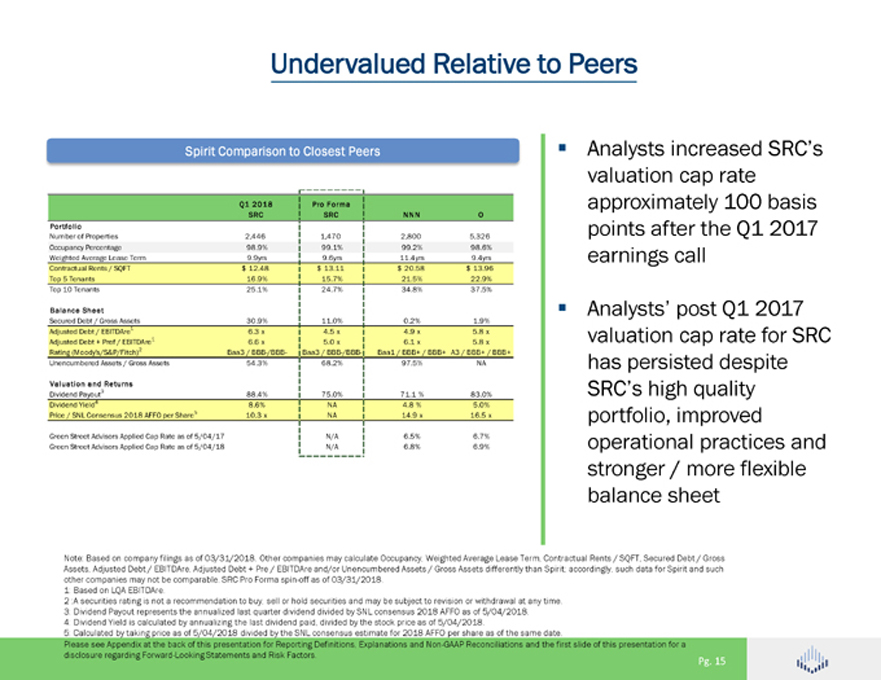
Undervalued Relative to Peers Spirit Comparison to Closest Peers Q1 2018 Pro Forma SRC SRC NNN O Portfolio Number of Properties 2,446 1,470 2,800 5,326 Occupancy Percentage 98.9% 99.1% 99.2% 98.6% Weighted Average Lease Term 9.9yrs 9.6yrs 11.4yrs 9.4yrs Contractual Rents / SQFT $ 12.48 $ 13.11 $ 20.58 $ 13.96 Top 5 Tenants 16.9% 15.7% 21.5% 22.9% Top 10 Tenants 25.1% 24.7% 34.8% 37.5% Balance Sheet Secured Debt / Gross Assets 30.9% 11.0% 0.2% 1.9% Adjusted Debt / EBITDAre1 6.3 x 4.5 x 4.9 x 5.8 x Adjusted Debt + Pref / EBITDAre1 6.6 x 5.0 x 6.1 x 5.8 x Rating (Moody’s/S&P/Fitch)2 Baa3 / BBB-/BBB- Baa3 / BBB-/BBB- Baa1 / BBB+ / BBB+ A3 / BBB+ / BBB+ Unencumbered Assets / Gross Assets 54.3% 68.2% 97.5% NA Valuation and Returns Dividend Payout3 88.4% 75.0% 71.1 % 83.0% Dividend Yield4 8.6% NA 4.8 % 5.0% Price / SNL Consensus 2018 AFFO per Share5 10.3 x NA 14.9 x 16.5 x Green Street Advisors Applied Cap Rate as of 5/04/17 N/A 6.5% 6.7% Green Street Advisors Applied Cap Rate as of 5/04/18 N/A 6.8% 6.9% Analysts increased SRC’s valuation cap rate approximately 100 basis points after the Q1 2017 earnings call Analysts’ post Q1 2017 valuation cap rate for SRC has persisted despite SRC’s high quality portfolio, improved operational practices and stronger / more flexible balance sheet Note: Based on company filings as of 03/31/2018. Other companies may calculate Occupancy, Weighted Average Lease Term, Contractual Rents / SQFT, Secured Debt / Gross Assets, Adjusted Debt / EBITDAre, Adjusted Debt + Pre / EBITDAre and/or Unencumbered Assets / Gross Assets differently than Spirit; accordingly, such data for Spirit and such other companies may not be comparable. SRC Pro Forma spin-off as of 03/31/2018. 1: Based on LQA EBITDAre. 2 :A securities rating is not a recommendation to buy, sell or hold securities and may be subject to revision or withdrawal at any time. 3: Dividend Payout represents the annualized last quarter dividend divided by SNL consensus 2018 AFFO as of 5/04/2018. 4: Dividend Yield is calculated by annualizing the last dividend paid, divided by the stock price as of 5/04/2018. 5: Calculated by taking price as of 5/04/2018 divided by the SNL consensus estimate for 2018 AFFO per share as of the same date. Please see Appendix at the back of this presentation for Reporting Definitions, Explanations and Non-GAAP Reconciliations and the first slide of this presentation for a disclosure regarding Forward-Looking Statements and Risk Factors. Pg. 15

Appendix Supplemental Information and Reporting Definitions
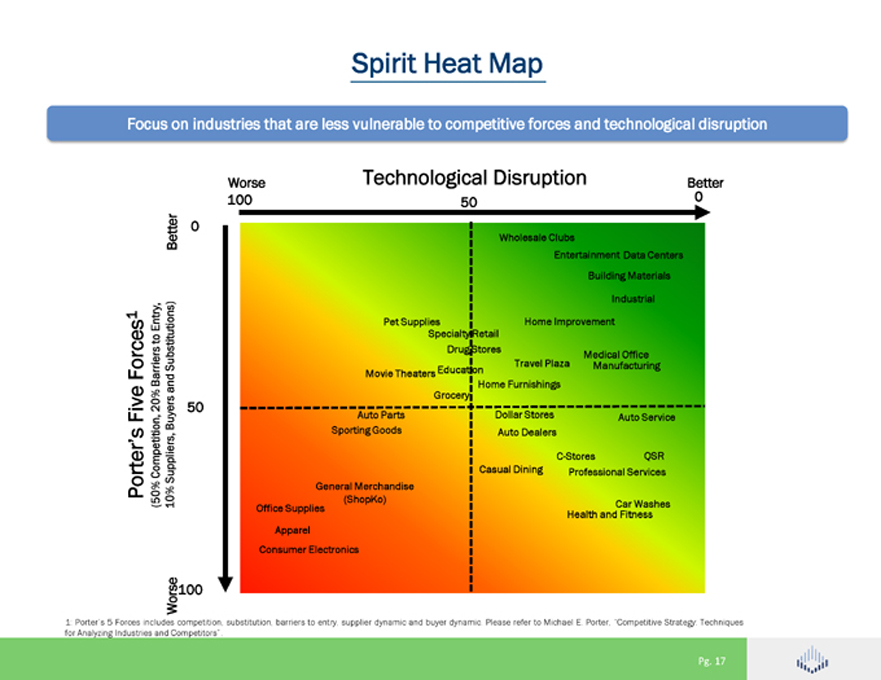
Spirit Heat Map Focus on industries that are less vulnerable to competitive forces and technological disruption Worse Technological Disruption Better 100 50 0 Better 0 Wholesale Clubs Entertainment Data Centers Building Materials Industrial 1 Entry, Pet Supplies Home Improvement to Specialty Retail Drug Stores Medical Office Substitutions) Travel Plaza Manufacturing Forces Movie Theaters Education Barriers Home Furnishings and Grocery 20% 50 Five Auto Parts Dollar Stores Auto Service Buyers Sporting Goods Auto Dealers C-Stores QSR Competition, Casual Dining Professional Services Suppliers, Porter’s General Merchandise (50% 10% (ShopKo) Car Washes Office Supplies Health and Fitness Apparel Consumer Electronics Worse100 1: Porter’s 5 Forces includes competition, substitution, barriers to entry, supplier dynamic and buyer dynamic. Please refer to Michael E. Porter, “Competitive Strategy: Techniques for Analyzing Industries and Competitors”. Pg. 17
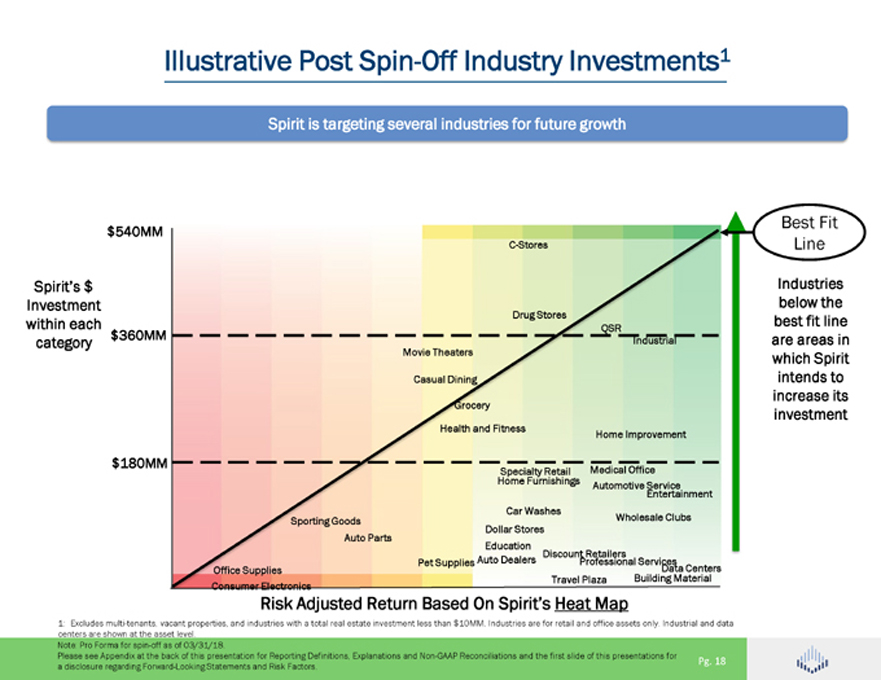
Illustrative Post Spin-Off Industry Investments1 Spirit is targeting several industries for future growth Best Fit $540MM C-Stores Line Spirit’s $ Industries Investment below the within each best fit line category $360MM Industrial are areas in which Spirit intends to increase its investment Home Improvement $180MM Specialty Retail Home Furnishings Entertainment Car Washes Sporting Goods Wholesale Clubs Dollar Stores Auto Parts Discount Retailers Pet Supplies Auto Dealers Professional Services Office Supplies Building Data Material Centers Travel Plaza Consumer Electronics Risk Adjusted Return Based On Spirit’s Heat Map 1: Excludes multi-tenants, vacant properties, and industries with a total real estate investment less than $10MM. Industries are for retail and office assets only. Industrial and data centers are shown at the asset level. Note: Pro Forma for spin-off as of 03/31/18. Please see Appendix at the back of this presentation for Reporting Definitions, Explanations and Non-GAAP Reconciliations and the first slide of this presentations for Pg. 18 a disclosure regarding Forward-Looking Statements and Risk Factors.
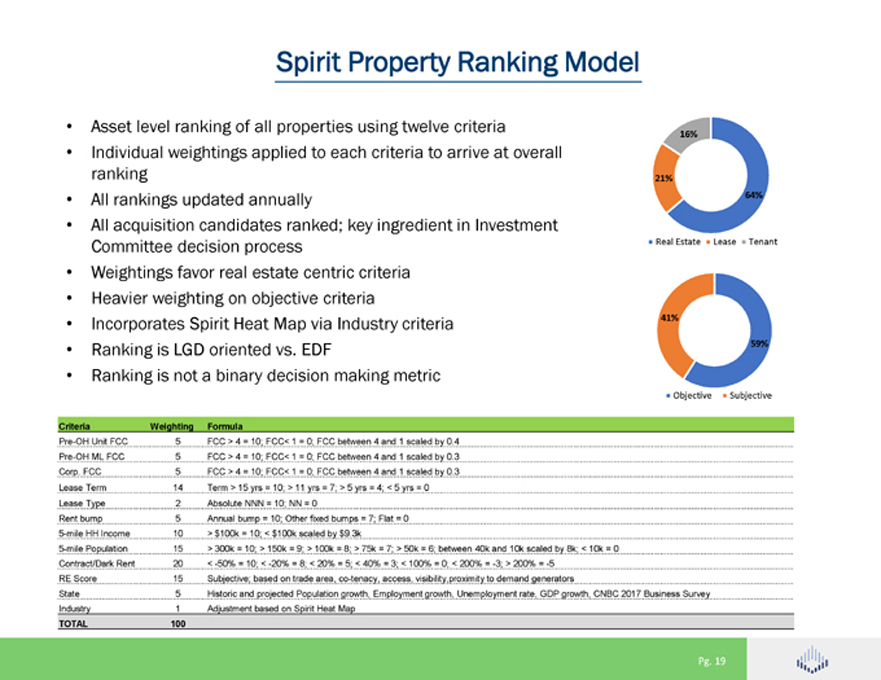
Spirit Property Ranking Model • Asset level ranking of all properties using twelve criteria 16% • Individual weightings applied to each criteria to arrive at overall ranking 21% • All rankings updated annually 64% • All acquisition candidates ranked; key ingredient in Investment Committee decision process Real Estate Lease Tenant • Weightings favor real estate centric criteria • Heavier weighting on objective criteria • Incorporates Spirit Heat Map via Industry criteria 41% • Ranking is LGD oriented vs. EDF 59% • Ranking is not a binary decision making metric Objective Subjective Criteria Weighting Formula Pre-OH Unit FCC 5 FCC > 4 = 10; FCC< 1 = 0; FCC between 4 and 1 scaled by 0.4 Pre-OH ML FCC 5 FCC > 4 = 10; FCC< 1 = 0; FCC between 4 and 1 scaled by 0.3 Corp. FCC 5 FCC > 4 = 10; FCC< 1 = 0; FCC between 4 and 1 scaled by 0.3 Lease Term 14 Term > 15 yrs = 10; > 11 yrs = 7; > 5 yrs = 4; < 5 yrs = 0 Lease Type 2 Absolute NNN = 10; NN = 0 Rent bump 5 Annual bump = 10; Other fixed bumps = 7; Flat = 0 5-mile HH Income 10 > $100k = 10; < $100k scaled by $9.3k 5-mile Population 15 > 300k = 10; > 150k = 9; > 100k = 8; > 75k = 7; > 50k = 6; between 40k and 10k scaled by 8k; < 10k = 0 Contract/Dark Rent 20 < -50% = 10; < -20% = 8; < 20% = 5; < 40% = 3; < 100% = 0; < 200% = -3; > 200% = -5 RE Score 15 Subjective; based on trade area, co-tenacy, access, visibility, proximity to demand generators State 5 Historic and projected Population growth, Employment growth, Unemployment rate, GDP growth, CNBC 2017 Business Survey Industry 1 Adjustment based on Spirit Heat Map TOTAL 100 Pg. 19
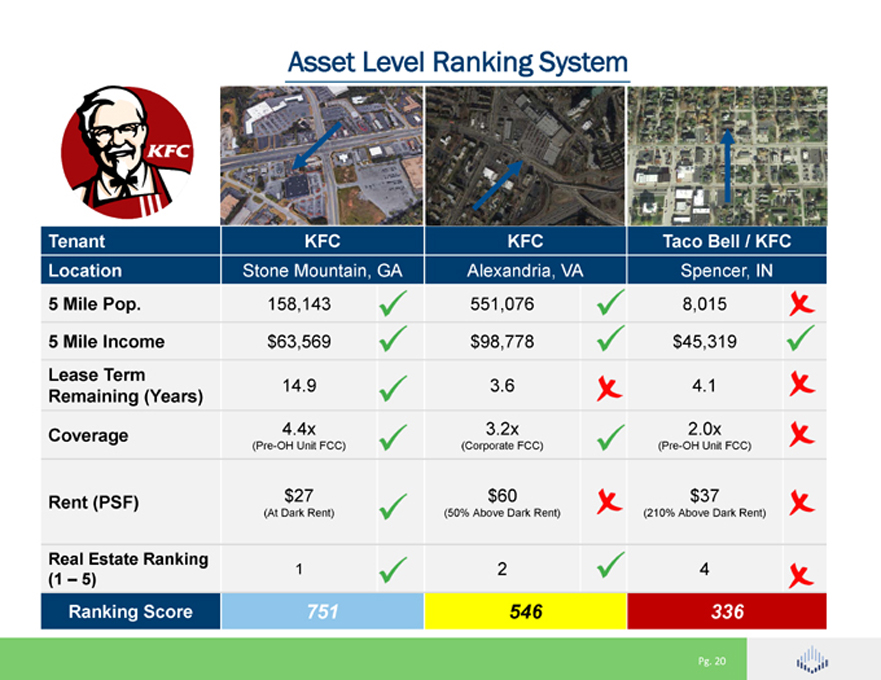
Asset Level Ranking System Tenant KFC KFC Taco Bell / KFC Location Stone Mountain, GA Alexandria, VA Spencer, IN 5 Mile Pop. 158,143 551,076 8,015 5 Mile Income $63,569 $98,778 $45,319 Lease Term 14.9 3.6 4.1 Remaining (Years) Coverage 4.4x 3.2x 2.0x (Pre-OH Unit FCC) (Corporate FCC) (Pre-OH Unit FCC) Rent (PSF) $27 $60 $37 (At Dark Rent) (50% Above Dark Rent) (210% Above Dark Rent) Real Estate Ranking 1 2 4 (1 – 5) Ranking Score 751 546 336 Pg. 20
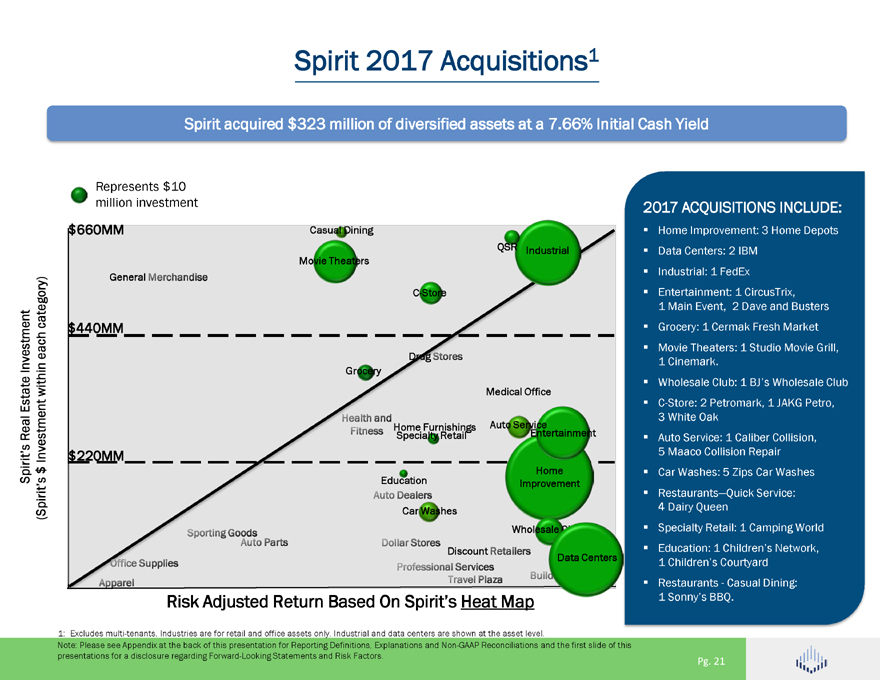
Spirit 2017 Acquisitions1 Spirit acquired $323 million of diversified assets at a 7.66% Initial Cash Yield Represents $10 million investment $660MM Casual Dining QSR Industrial Movie Theaters C-Store category) each $440MM Investment Grocery within Estate Home Furnishings Auto Service Real Specialty Retail Entertainment Investment $220MM $ Home Spirit’s Improvement (Spirit’s Car Washes Wholes Discount Data Centers Risk Adjusted Return Based On Spirit’s Heat Map 2017 ACQUISITIONS INCLUDE: Home Improvement: 3 Home Depots Data Centers: 2 IBM Industrial: 1 FedEx Entertainment: 1 CircusTrix, 1 Main Event, 2 Dave and Busters Grocery: 1 Cermak Fresh Market Movie Theaters: 1 Studio Movie Grill, 1 Cinemark. Wholesale Club: 1 BJ’s Wholesale Club C-Store: 2 Petromark, 1 JAKG Petro, 3 White Oak Auto Service: 1 Caliber Collision, 5 Maaco Collision Repair Car Washes: 5 Zips Car Washes Restaurants—Quick Service: 4 Dairy Queen Specialty Retail: 1 Camping World Education: 1 Children’s Network, 1 Children’s Courtyard Restaurants - Casual Dining: 1 Sonny’s BBQ. 1: Excludes multi-tenants. Industries are for retail and office assets only. Industrial and data centers are shown at the asset level. Note: Please see Appendix at the back of this presentation for Reporting Definitions, Explanations and Non-GAAP Reconciliations and the first slide of this presentations for a disclosure regarding Forward-Looking Statements and Risk Factors. Pg. 21
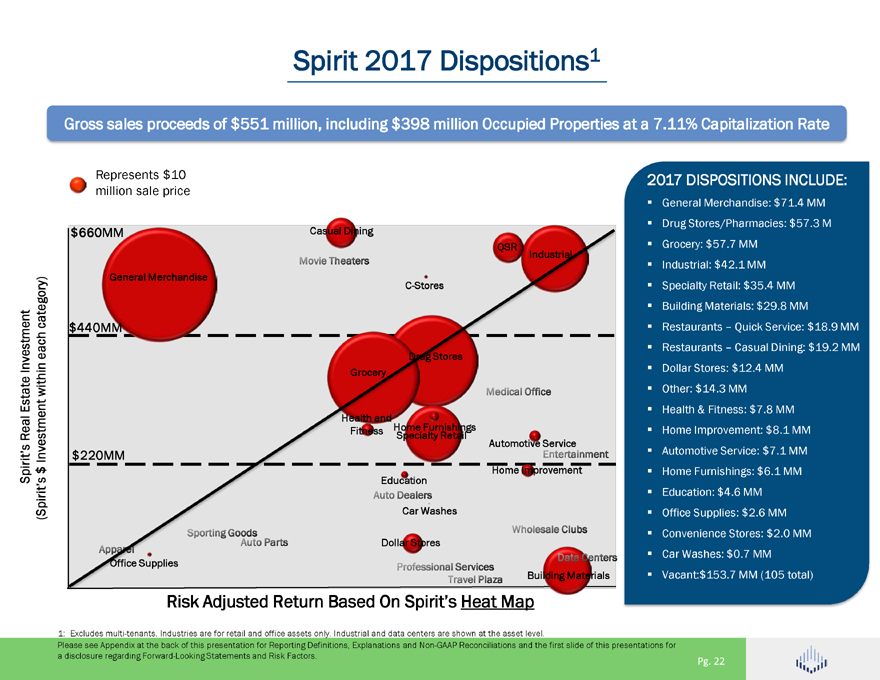
Spirit 2017 Dispositions1 Gross sales proceeds of $551 million, including $398 million Occupied Properties at a 7.11% Capitalization Rate Represents $10 million sale price Casual Dining QSR category) each $440MM Investment within Estate Health and Fitness Home Furnishings Real Specialty Retail Investment Automoti Service $ Home Improvement Spirit’s (Spirit’s Dollar Stores Building Materials Risk Adjusted Return Based On Spirit’s Heat Map 2017 DISPOSITIONS INCLUDE: General Merchandise: $71.4 MM Drug Stores/Pharmacies: $57.3 M Grocery: $57.7 MM Industrial: $42.1 MM Specialty Retail: $35.4 MM Building Materials: $29.8 MM Restaurants – Quick Service: $18.9 MM Restaurants – Casual Dining: $19.2 MM Dollar Stores: $12.4 MM Other: $14.3 MM Health & Fitness: $7.8 MM Home Improvement: $8.1 MM Automotive Service: $7.1 MM Home Furnishings: $6.1 MM Education: $4.6 MM Office Supplies: $2.6 MM Convenience Stores: $2.0 MM Car Washes: $0.7 MM Vacant:$153.7 MM (105 total) 1: Excludes multi-tenants. Industries are for retail and office assets only. Industrial and data centers are shown at the asset level. Please see Appendix at the back of this presentation for Reporting Definitions, Explanations and Non-GAAP Reconciliations and the first slide of this presentations for a disclosure regarding Forward-Looking Statements and Risk Factors. Pg. 22
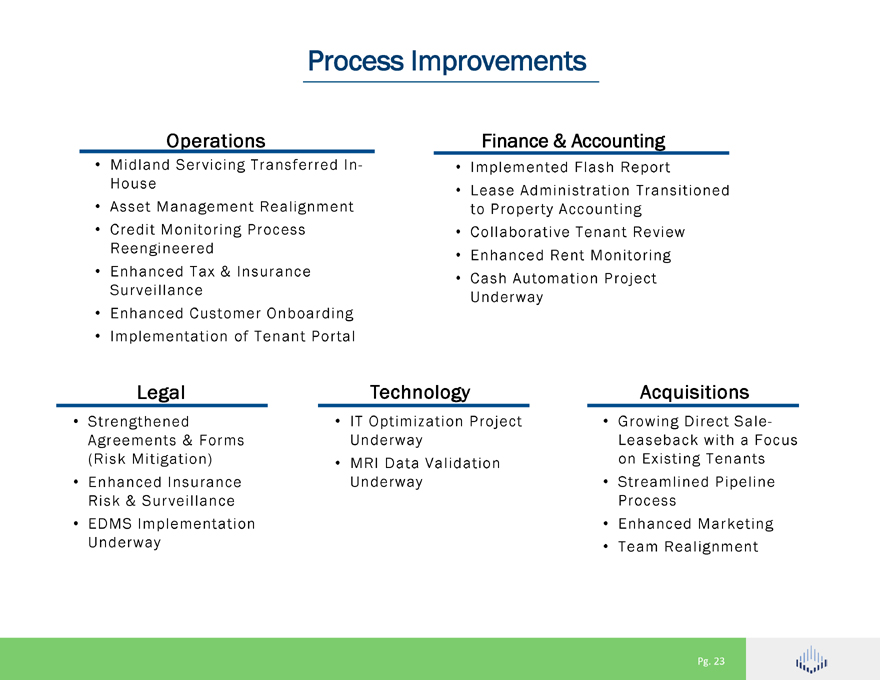
Process Improvements Operations • Midland Servicing Transferred In-House • Asset Management Realignment • Credit Monitoring Process Reengineered • Enhanced Tax & Insurance Surveillance • Enhanced Customer Onboarding • Implementation of Tenant Portal Finance & Accounting • Implemented Flash Report • Lease Administration Transitioned to Property Accounting • Collaborative Tenant Review • Enhanced Rent Monitoring • Cash Automation Project Underway Legal • Strengthened Agreements & Forms (Risk Mitigation) • Enhanced Insurance Risk & Surveillance • EDMS Implementation Underway Technology • IT Optimization Project Underway • MRI Data Validation Underway Acquisitions • Growing Direct Sale-Leaseback with a Focus on Existing Tenants • Streamlined Pipeline Process • Enhanced Marketing • Team Realignment Pg. 23
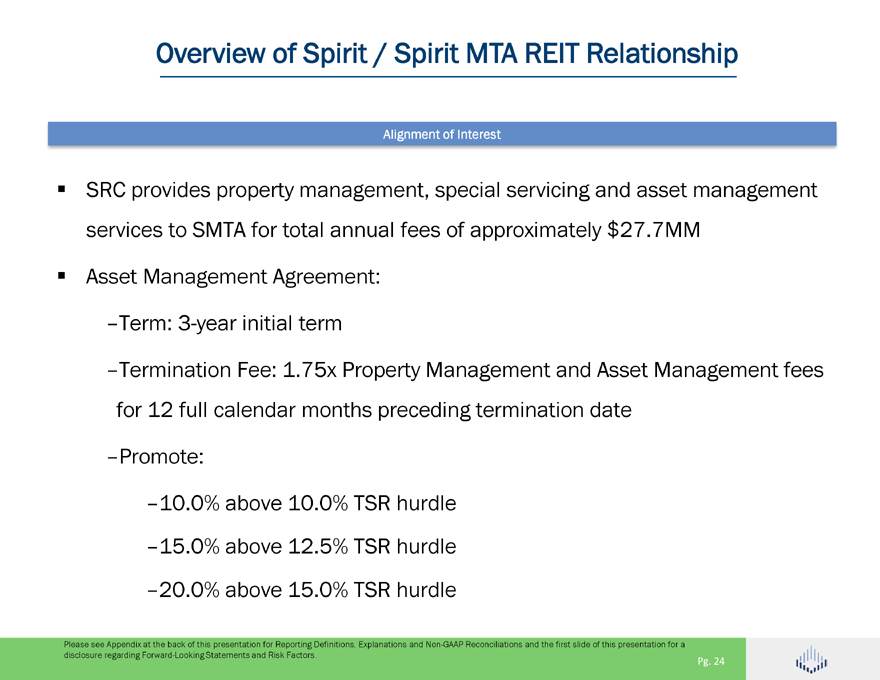
Overview of Spirit / Spirit MTA REIT Relationship Alignment of Interest SRC provides property management, special servicing and asset management services to SMTA for total annual fees of approximately $27.7MM Asset Management Agreement: –Term: 3-year initial term –Termination Fee: 1.75x Property Management and Asset Management fees for 12 full calendar months preceding termination date –Promote: –10.0% above 10.0% TSR hurdle –15.0% above 12.5% TSR hurdle –20.0% above 15.0% TSR hurdle Please see Appendix at the back of this presentation for Reporting Definitions, Explanations and Non-GAAP Reconciliations and the first slide of this presentation for a disclosure regarding Forward-Looking Statements and Risk Factors. Pg. 24
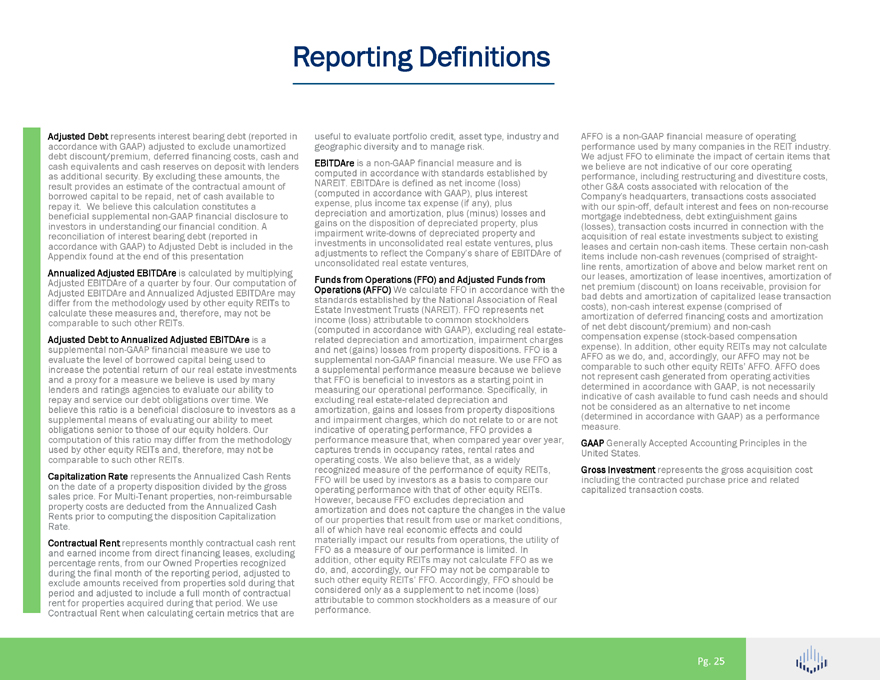
Reporting Definitions accordance Adjusted Debt with represents GAAP) adjusted interest to bearing exclude debt unamortized (reported in cash debt discount/premium, equivalents and cash deferred reserves financing on deposit costs, with cash lenders and result as additional provides security. an estimate By excluding of the contractual these amounts, amount the of borrowed repay it. We capital believe to be this repaid, calculation net of constitutes cash available a to investors beneficial in supplemental understanding non-GAAP our financial financial condition. disclosure A to accordance reconciliation with of interest GAAP) to bearing Adjusted debt Debt (reported is included in in the Appendix found at the end of this presentation Annualized Adjusted EBITDAre Adjusted of EBITDAre a quarteris by calculated four. Our computation by multiplying of differ Adjusted from EBITDAre the methodology and Annualized used by Adjusted other equity EBITDAre REITs may to comparable calculate these to such measures other REITs. and, therefore, may not be supplemental Adjusted Debt non-GAAP to Annualized financial Adjusted measure EBITDAre we use is a to evaluate increase the the potential level of borrowed return of capital our real being estate used investments to and lenders a proxy and for ratings a measure agencies we to believe evaluate is used our ability by many to believe repay and this service ratio is our a beneficial debt obligations disclosure over to time. investors We as a obligations supplemental senior means to those of evaluating of our equity our ability holders. to meet Our used computation by other of equity this ratio REITs may and, differ therefore, from the may methodology not be comparable to such other REITs. Capitalization on the date of Rate a property represents disposition the Annualized divided by Cash the gross Rents property sales price. costs For are Multi-Tenant deducted from properties, the Annualized non-reimbursable Cash Rents Rate. prior to computing the disposition Capitalization Contractual and earned income Rent represents from direct monthly financing contractual leases, excluding cash rent during percentage the final rents, month from of our the Owned reporting Properties period, recognized adjusted to period exclude and amounts adjusted received to include from a properties full month sold of contractual during that rent Contractual for properties Rent when acquired calculating during certain that period. metrics We that use are useful geographic to evaluate diversity portfolio and to credit, manage asset risk. type, industry and EBITDAre computed is in a accordance non-GAAP financial with standards measure established and is by NAREIT. (computed EBITDAre in accordance is defined with as GAAP), net income plus interest (loss) expense, depreciation plus and income amortization, tax expense plus (if (minus) any), plus losses and impairment gains on the write-downs disposition of of depreciated depreciated property, property and plus adjustments investments in to unconsolidated reflect the Company’s real estate share ventures, of EBITDAre plus of unconsolidated real estate ventures, Operations Funds from (AFFO) Operations We calculate (FFO) and FFO Adjusted in accordance Funds from with the standards Estate Investment established Trusts by (NAREIT) the National . FFO Association represents of net Real (computed income (loss) in accordance attributable with to common GAAP), stockholders excluding real estate-and related net depreciation (gains) losses and from amortization, property dispositions. impairment FFO charges is a a supplemental supplemental non-GAAP performance financial measure measure. because We use we believe FFO as that measuring FFO is our beneficial operational to investors performance. as a starting Specifically, point in in amortization, excluding real gains estate-related and losses depreciation from property and dispositions and indicative impairment of operating charges, performance, which do not FFO relate provides to or a are not performance captures trends measure in occupancy that, when rates, compared rental rates year and over year, operating recognized costs. measure We also of the believe performance that, as of a widely equity REITs, operating FFO will be performance used by investors with that as a of basis other to equity compare REITs. our amortization However, because and does FFO not excludes capture depreciation the changes and in the value of all our of which properties have that real economic result from effects use or and market could conditions, FFO materially as a measure impact our of our results performance from operations, is limited. the In utility of addition, do, and, accordingly, other equity our REITs FFO may may not not calculate be comparable FFO as we to such considered other equity only as REITs’ a supplement FFO. Accordingly, to net income FFO should (loss) be attributable performance. to common stockholders as a measure of our performance AFFO is a non-GAAP used by financial many companies measure of in operating the REIT industry. We we believe adjust FFO are not to eliminate indicative the of impact our core of operating certain items that other performance, G&A costs including associated restructuring with relocation and divestiture of the costs, with Company’s our spin-off, headquarters, default interest transactions and fees costs on associated non-recourse (losses), mortgage transaction indebtedness, costs debt incurred extinguishment in connection gains with the acquisition leases and certain of real estate non-cash investments items. These subject certain to existing non-cash line items rents, include amortization non-cash of revenues above and (comprised below market of straight- rent on our net premium leases, amortization (discount) on of loans lease receivable, incentives, amortization provision for of bad costs), debts non-cash and amortization interest expense of capitalized (comprised lease of transaction of amortization net debt discount/premium) of deferred financing and costs non-cash and amortization expense) compensation . In addition, expense other (stock-based equity REITs compensation may not calculate AFFO comparable as we do, to such and, other accordingly, equity REITs’ our AFFO AFFO. may AFFO not be does determined not represent in cash accordance generated with from GAAP, operating is not necessarily activities indicative not be considered of cash available as an alternative to fund cash to net needs income and should (determined measure. in accordance with GAAP) as a performance United GAAP Generally States. Accepted Accounting Principles in the Gross including Investment the contracted represents purchase the gross price acquisition and related cost capitalized transaction costs. Pg. 25
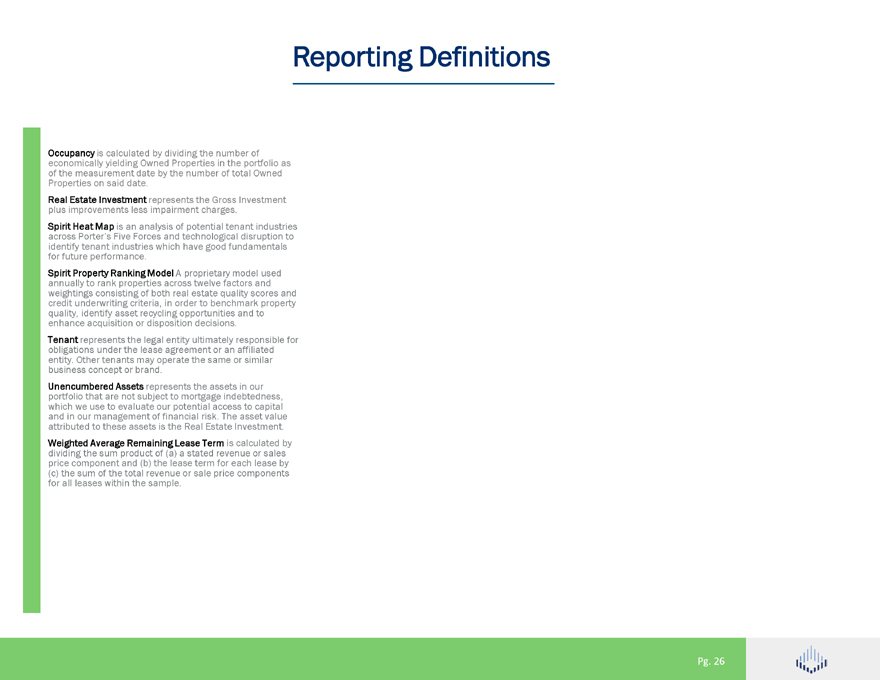
Reporting Definitions Occupancy economically is yielding calculated Owned by dividing Properties the number in the portfolio of as of Properties the measurement on said date. date by the number of total Owned plus Real improvements Estate Investment less represents impairment the charges. Gross Investment Spirit across Heat Porter’s Map Five is an Forces analysis and of technological potential tenant disruption industries to identify for future tenant performance. industries which have good fundamentals annually Spirit Property to rank Ranking properties Model across A proprietary twelve factors model and used credit weightings underwriting consisting criteria, of both in real order estate to benchmark quality scores property and enhance quality, identify acquisition asset or recycling disposition opportunities decisions. and to obligations Tenant represents under the the lease legal agreement entity ultimately or an responsible affiliated for entity. business Other concept tenants or brand. may operate the same or similar Unencumbered portfolio that are Assets not subject represents to mortgage the assets indebtedness, in our which and in we our use management to evaluate of our financial potential risk. access The asset to capital value attributed to these assets is the Real Estate Investment. Weighted dividing the Average sum product Remaining of (a) Lease a stated Term revenue is calculated or sales by price (c) the component sum of the and total (b) revenue the lease or sale term price for each components lease by for all leases within the sample. Pg. 26
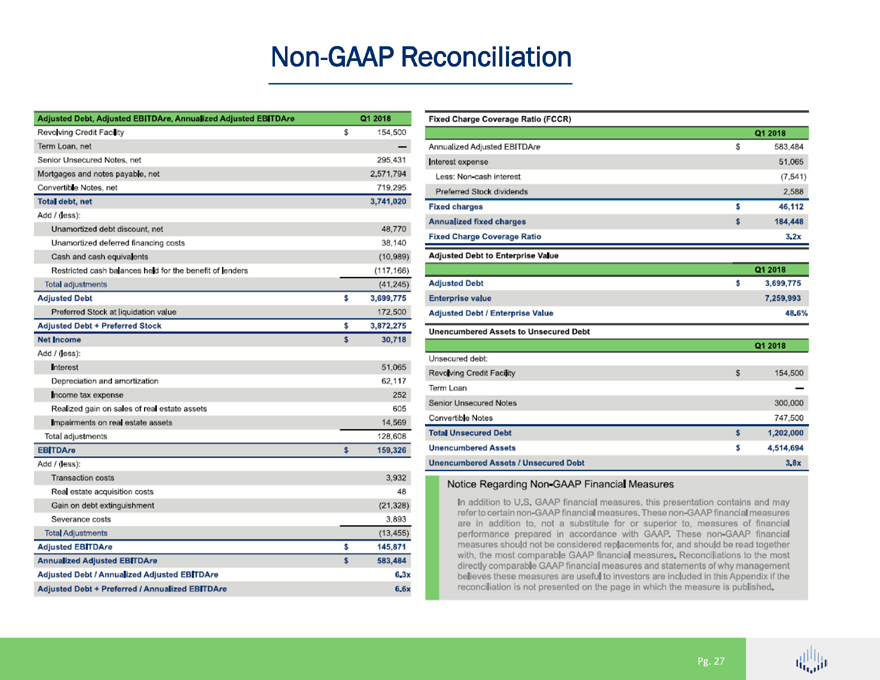
Non-GAAP Reconciliation Adjusted Debt, Adjusted EBITDAre, Annualized Adjusted EBITDAre Q1 2018 Revolving Credit Facility S 154,500 Term Loan, net Senior Unsecured Notes, net 295,431 Mortgages and notes payable, net 2,571,794 Convertible Notes, net 719,295 Total debt, net 3,741,020 Add / [less): Unamortized debt discount, net 48,770 Unamortized deferred financing costs 38,140 Cash and cash equivalents (10,989) Restricted cash balances held for the benefit of lenders (117,166) total adjustments (41,245) Adjusted Debt $ 3,699,775 Preferred Stock at liquidation value 172,500 Adjusted Debt * Preferred Stock S 3,872,275 Net Income $ 30,718 Add / (less): Interest 51.065 Depreciation and amortization 62,117 Income tax expense 252 Realized gain on sales of real estate assets 605 Impairments on real estate assets 14,569 Total adjustment 128,6C8 EBlTDAre $ 159,326 Add / [less): Transaction costs 3,932 Real estate acquisition costs 48 Gain on debt extinguishment (21,328) Severance costs 3,893 Total Adjustments (13,455) Adjusted EBITDAre S 145,371 Annualized Adjusted EBITDAre $ 583,484 Adjusted Debt / Annualized Adjusted EBITDAre 6.3x Adjusted Debt + Preferred I Annualized EBITDAre 6.6x Fixed Charge Coverage Ratio (FCCR) Q1 2018 Annualized Adjusted EBITDAre S 583,484 Interest expense 51.065 Less: Non-cash interest (7,541) Preferred Stock dividends 2,588 Fixed charges S 46,112 Annualized fixed charges $ 184,448 Fixed Charge Coverage Ratio 3.2x Adjusted Debt to Enterprise Value Q1 2018 Adjusted Debt S 3,699,775 Enterprise value 7,259,993 Adjusted Debt / Enterprise Value 48.6% Unencumbered Assets to Unsecured Debt Q1 2018 Unsecured debt: Revolving Credit Facility S 154,500 Term Loan Senior Unsecured Notes 300,000 Convertible Notes 747,500 Total Unsecured Debt $ 1,202,000 Unencumbered Assets S 4,514,694 Unencumbered Assets / Unsecured Debt 3.8x Notice Regarding Non-GAAP Financial Measures In addition to U.S. GAAP financial measures, this presentation contains and may refer to certain non-GAAP financial measures. These non-GAAP financial measures are in addition to, not a substitute for or superior to, measures of financial performance prepared in accordance with GAAP. These non-GAAP financial measures should not be considered replacements for, and should be read together with, the most comparable GAAP financial measures. Reconciliations to the most directly comparable GAAP financial measures and statements of why management believes these measures are useful to investors are included in this Appendix if the reconciliation is not presented on the page in which the measure is published. Pg. 27
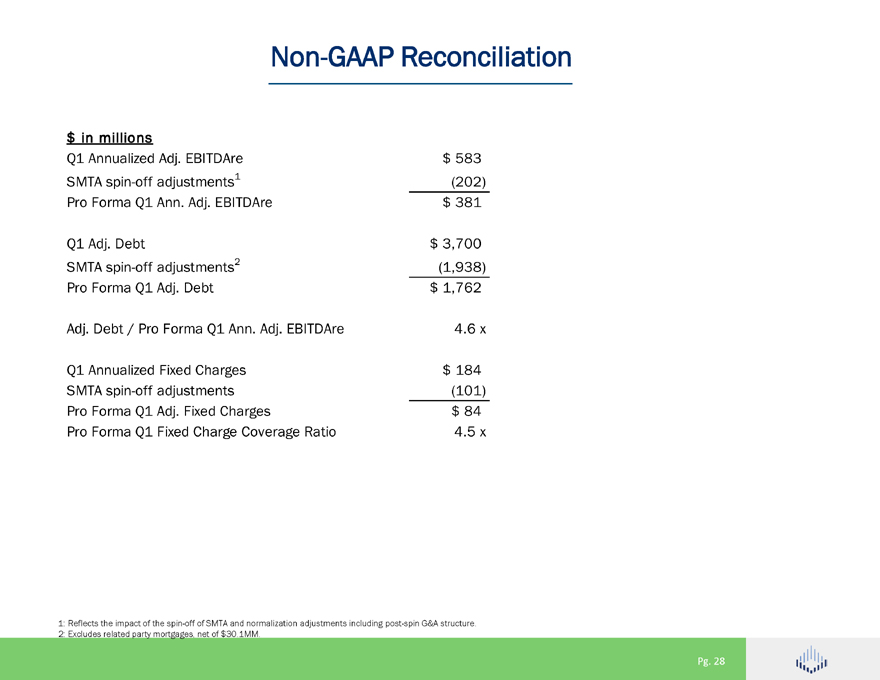
Non-GAAP Reconciliation $ in millions Q1 Annualized Adj. EBITDAre $ 583 SMTA spin-off adjustments1 (202) Pro Forma Q1 Ann. Adj. EBITDAre $ 381 Q1 Adj. Debt $ 3,700 SMTA spin-off adjustments2 (1,938) Pro Forma Q1 Adj. Debt $ 1,762 Adj. Debt / Pro Forma Q1 Ann. Adj. EBITDAre 4.6 x Q1 Annualized Fixed Charges $ 184 SMTA spin-off adjustments (101) Pro Forma Q1 Adj. Fixed Charges $ 84 Pro Forma Q1 Fixed Charge Coverage Ratio 4.5 x 1: Reflects the impact of the spin-off of SMTA and normalization adjustments including post-spin G&A structure. 2: Excludes related party mortgages, net of $30.1MM. Pg. 28