
Exhibit 99.2 Realty Income to Acquire Spirit Realty October 30, 2023

Disclaimer Cautionary Note Regarding Forward-Looking Statements This communication may contain forward-looking statements within the meaning of Section 27A of the Securities Act of 1933, as amended, Section 21E of the Securities Exchange Act of 1934, as amended, the Private Securities Litigation Reform Act of 1995 and other federal securities laws. These forward-looking statements can be identified by the use of words and phrases such as “preliminary,” “expect,” “plan,” “will,” “estimate,” “project,” “intend,” “believe,” “guidance,” “approximately,” “anticipate,” “may,” “should,” “seek,” or the negative of these words and phrases or similar words or phrases that are predictions of or indicate future events or trends and that do not relate to historical matters but are meant to identify forward-looking statements. You can also identify forward-looking statements by discussions of strategy, plans or intentions of management. These forward-looking statements are subject to known and unknown risks and uncertainties that you should not rely on as predictions of future events. Forward-looking statements depend on assumptions, data and/or methods which may be incorrect or imprecise, and Realty Income Corporation (“Realty Income”) may not be able to realize them. Realty Income does not guarantee that the events described will happen as described (or that they will happen at all). The following risks and uncertainties, among others, could cause actual results and future events to differ materially from those set forth or contemplated in the forward-looking statements: Realty Income’s continued qualification as a REIT under the Internal Revenue Code of 1986, as amended; general domestic and foreign business, industry, economic, or financial conditions; competition; fluctuating interest and currency rates; inflation, including potential fluctuations in the Consumer Price Index, access to debt and equity capital markets and other sources of funding, and fluctuations in the available terms thereof; continued volatility and uncertainty in the credit markets and broader financial markets; other risks inherent in the real estate business, including client defaults under leases, increased client bankruptcies, potential liability relating to environmental matters, illiquidity of real estate investments, re-leasing uncertainties, and potential damages from natural disasters; competition, impairments in the value of real estate assets; changes in domestic and foreign income tax laws and rates; Realty Income’s success in implementing its business strategy and its ability to identify, underwrite, finance, consummate, integrate and manage diversified acquisitions or investments; the impact of any financial, accounting, legal or regulatory issues or litigation that may affect Realty Income or its major tenants; risks that the proposed transaction (the Transaction”) between Realty Income and Spirit Realty Capital, Inc. (“Spirit”) disrupts current plans and operations; the outcome of any legal proceedings related to the Transaction; the ability of Realty Income and Spirit to consummate the Transaction on a timely basis or at all; the impacts of the announcement or consummation of the Transaction on business relationships of Realty Income or Spirit; the satisfaction of the conditions precedent to consummation of the Transaction, including the ability to secure regulatory approvals on the terms expected, at all or in a timely manner; the anticipated cost related to the Transactions; and the ability for the combined company to realize the anticipated synergies, or at all. These risks, as well as other risks related to the Transaction, will be included in the registration statement on Form S-4 and proxy statement/prospectus that will be filed with the Securities and Exchange Commission (“SEC”) in connection with the proposed transaction. While the list of factors presented here is, and the list of factors to be presented in the registration statement on Form S-4 are, considered representative, no such list should be considered to be a complete statement of all potential risks and uncertainties. For additional information about other factors that could cause actual results to differ materially from those described in the forward-looking statements, please refer to Spirit’s and Realty Income’s respective periodic reports and other filings with the SEC, including the risk factors identified in Realty Income’s and Spirit’s most recent Quarterly Reports on Form 10-Q and Annual Reports on Form 10-K. The forward-looking statements included in this communication are made only as of the date hereof. Neither Realty Income nor Spirit undertakes any obligation to update any forward-looking statements to reflect subsequent events or circumstances, except as required by law. Additional Information about the Proposed Transactions and Where to Find It In connection with the proposed transaction, Realty Income intends to file with the SEC a registration statement on Form S-4 that will include a proxy statement of Spirit that also constitutes a prospectus of Realty Income. Each of Spirit and Realty Income may also file other relevant documents with the SEC regarding the proposed transaction. This document is not a substitute for the proxy statement/prospectus or registration statement or any other document that Spirit or Realty Income may file with the SEC. The definitive proxy statement/prospectus (if and when available) will be mailed to stockholders of Spirit. INVESTORS AND SECURITY HOLDERS ARE URGED TO READ THE REGISTRATION STATEMENT, PROXY STATEMENT/PROSPECTUS AND ANY OTHER RELEVANT DOCUMENTS THAT MAY BE FILED WITH THE SEC, AS WELL AS ANY AMENDMENTS OR SUPPLEMENTS TO THESE DOCUMENTS, CAREFULLY AND IN THEIR ENTIRETY IF AND WHEN THEY BECOME AVAILABLE BECAUSE THEY CONTAIN OR WILL CONTAIN IMPORTANT INFORMATION ABOUT THE PROPOSED TRANSACTION. Investors and security holders will be able to obtain free copies of the registration statement and proxy statement/prospectus (if and when available) and other documents containing important information about Spirit, Realty Income and the proposed transaction, once such documents are filed with the SEC, through the website maintained by the SEC at http://www.sec.gov. Copies of the documents filed with the SEC by Realty Income will be available free of charge on Realty Income’ website at https://www.realtyincome.com/investors or by contacting Realty Income’ Investor Relations department at 877-924-6266.Copies of the documents filed with the SEC by Spirit will be available free of charge on Spirit’ website at https://investors.spiritrealty.com or by contacting Spirit’ Investor Relations department by mail at Investor Relations, 2727 North Harwood Street, Suite 300, Dallas, TX. 2 Note: All data as of 6/30/2023, unless otherwise noted.
Disclaimer, Continued Participants in the Solicitation Realty Income, Spirit and certain of their respective directors and executive officers may be deemed to be participants in the solicitation of proxies in respect of the proposed transaction. Information about the directors and executive officers of Realty Income, including a description of their direct or indirect interests, by security holdings or otherwise, is set forth in Realty Income’s proxy statement for its 2023 Annual Meeting of Stockholders, which was filed with the SEC on March 31, 2023, and Realty Income’s Annual Report on Form 10-K for the fiscal year ended December 31, 2022, which was filed with the SEC on February 22, 2023. Information about the directors and executive officers of Spirit, including a description of their direct or indirect interests, by security holdings or otherwise, is set forth in Spirit’s proxy statement for its 2023 Annual Meeting of Stockholders, which was filed with the SEC on March 23, 2023, and Spirit’s Annual Report on Form 10-K for the fiscal year ended December 31, 2022, which was filed with the SEC on February 28, 2023. Other information regarding the participants in the proxy solicitations and a description of their direct and indirect interests, by security holdings or otherwise, will be contained in the proxy statement/prospectus and other relevant materials to be filed with the SEC regarding the proposed transaction when such materials become available. Investors should read the proxy statement/prospectus carefully when it becomes available before making any voting or investment decisions. You may obtain free copies of these documents from Spirit or Realty Income using the sources indicated above. Non-GAAP Financial Measures This presentation includes non-GAAP financial measures, including the combined company's estimated net debt + preferred / Annualized Adjusted EBITDAre, Adjusted EBITDA, Adjusted EBITDA Margin and Adjusted Funds from Operations, and Realty Income's net debt + preferred / Annualized Adjusted EBITDAre, Adjusted EBITDA, EBITDA, Adjusted EBITDA Margin and Adjusted Funds From Operations. For information on Realty Income's presentation of such non-GAAP financial measures, see the Earnings Release and Supplemental Report available Realty Income's investor relations website at www.realtyincome.com. A quantitative reconciliation for the combined company's estimated net debt + preferred / Annualized Adjusted EBITDAre, Adjusted EBITDA, Adjusted EBITDA Margin and Adjusted Funds from to estimated consolidated net income after giving effect to the transaction is not available without unreasonable efforts due to the inherent variability in timing and/or amount of various items considered in Realty Income's underwriting of the transaction that could impact estimated consolidated net income. Such pro forma information was not derived from unaudited pro forma consolidated financial statements prepared in accordance with Article 11 of Regulation S-X. No assurance can be given that such pro forma information will not change in connection with the preparation of such unaudited pro forma consolidated financial statements. No Offer or Solicitation This communication and the information contained herein is not intended to and shall not constitute an offer to buy or sell or the solicitation of an offer to buy or sell any securities, or a solicitation of any vote or approval, nor shall there be any sale of securities in any jurisdiction in which such offer, solicitation or sale would be unlawful prior to registration or qualification under the securities laws of any such jurisdiction. No offering of securities shall be made, except by means of a prospectus meeting the requirements of Section 10 of the U.S. Securities Act of 1933, as amended. 3

Realty Income is the Global Leader in a Fragmented Net Lease Sector AT-A-GLANCE SIZE, SCALE AND QUALITY ü Broad growth opportunities across diverse property types and geographies ~$54B ~$3.8B A3 / A- ü Data-driven, calculated investment decisions enterprise annualized credit ratings by ü Superior financial and operational stability value base rent Moody’s & S&P ü Strong balance sheet and access to an attractive, diversified capital pool ü Superior real estate portfolio 54+ 13,118 ~40% ü Experienced consolidator; integrated VEREIT in a ~$17B merger in 2021, years of commercial real of rent from investment closed a $1.5 billion sale-leaseback transaction with EG Group and acquired (1) operating history estate properties grade clients a ~$900 million portfolio from CIM in 2023 DIVERSIFIED REAL ESTATE PORTFOLIO THE UNQUESTIONED LEADER IN NET LEASE (2) Total Enterprise Value Size Comparison Other 1,303 Non-retail 9% clients 2% ~91% 13% of total rent is Industrial 85 resilient to industries economic 76% downturns and/or Non-discretionary, Low Price Point isolated from and/or Service-oriented Retail 50 e-commerce pressures U.S. states and Puerto Rico, Ireland, Italy, Spain and the U.K. 4 Source: FactSet. Portfolio and balance sheet data per Realty Income filings as of 6/30/2023. (1) Clients and clients that are subsidiaries or affiliates of companies with a credit rating of Baa3/BBB- or higher from one of the three major rating agencies (Moody’s/S&P/Fitch). (2) Dollars in billions. Total enterprise value per FactSet as of 10/27/2023.

Transaction Overview • All-stock acquisition by Realty Income Corporation (“Realty Income”) of Spirit Realty Capital, Inc. (“Spirit”) • Spirit’s shareholders to receive 0.762 of a share of Realty Income for each Spirit common share Transaction Structure • Pro forma ownership of ~87% for Realty Income’s shareholders and ~13% for Spirit’s shareholders • Leverage-neutral transaction requiring no external capital to complete Management and • No anticipated changes to Realty Income’s executive management team or Board of Directors Board Anticipated • Anticipate approximately $50 million of G&A synergies, or approximately $30 million of synergies excluding stock-based compensation, representing approximately $0.03 per share Synergies and • Transaction expected to be over 2.5% accretive to Realty Income AFFO per share Earnings Impact (1) Continued • Realty Income does not intend to change its regular dividend as a result of the transaction Commitment to the • Realty Income, a member of the S&P 500 Dividend Aristocrats® index, remains committed to building upon its longstanding track record of delivering consistent monthly dividends and quarterly dividend increases to its shareholders Dividend • Transaction expected to close Q1 2024, subject to Spirit shareholder approval and other customary closing conditions Timing 5 5 (1) Future dividends remain at the discretion of the Realty Income Board of Directors.

Transaction Rationale Immediate AFFO Accretion and Meaningful Anticipated Annual Cost Synergies • Transaction expected to be over 2.5% accretive to Realty Income AFFO per share 1 • Expected annual synergies of approximately $50 million, or approximately $30 million excluding stock-based compensation Attractive Capital Stack Requires No New Capital Raise to Fund the Acquisition • No capital markets execution required to complete the transaction or achieve the expected accretion 2 (1) • Expect to benefit from Spirit’s $4.1 billion of debt with weighted average cost of 3.48% and term of 4.9 years and $173 million of freely-callable 6.00% preferred stock Complementary Portfolio Exposure Improves Diversification and Increases Investment Capacity Across Key Industries and Clients (2) • Spirit’s portfolio comprises 51% non-discretionary and service retail assets and 26% industrial (77% total) • 14 of top 20 clients overlap on a combined basis, allowing Realty Income to reinforce and deepen existing relationships with key clients 3 • Greater client and industry diversification allows Realty Income to extend its runway for growth in target areas and amplifies its competitive advantage when competing for large scale transactions Conservative Underwriting of Credit and Real Estate to Retain Upside • Granular, bottom-up portfolio underwriting to identify opportunities for potential upside 4 • Spirit’s unit and corporate reporting provides Realty Income with substantial visibility into portfolio health to evaluate and underwrite risk Preserves Best-in-Class Balance Sheet • Leverage-neutral transaction preserves Realty Income’s leading liquidity and access to capital 5 • Well-staggered combined debt maturity ladder with manageable near-term maturities Unparalleled Combined Portfolio Enhances the Benefits of Scale th (3) th • Realty Income becomes the 4 largest REIT and 150 largest company in the S&P 500 by total enterprise value, enhancing access to equity capital 6 (4) • Further boosts Realty Income’s position as one of the most liquid REIT stocks in the S&P 500 6 6 Source: FactSet. Market data as of 10/27/2023. (1) Includes additional $200 million term loan at fixed rate of 4.64% expected to be drawn in December 2023. (2) Percentages based on ABR. (3) Includes equity REITs listed in the RMZ; on a combined basis. Excludes tower and timber REITS. (4) By average daily trading volume.
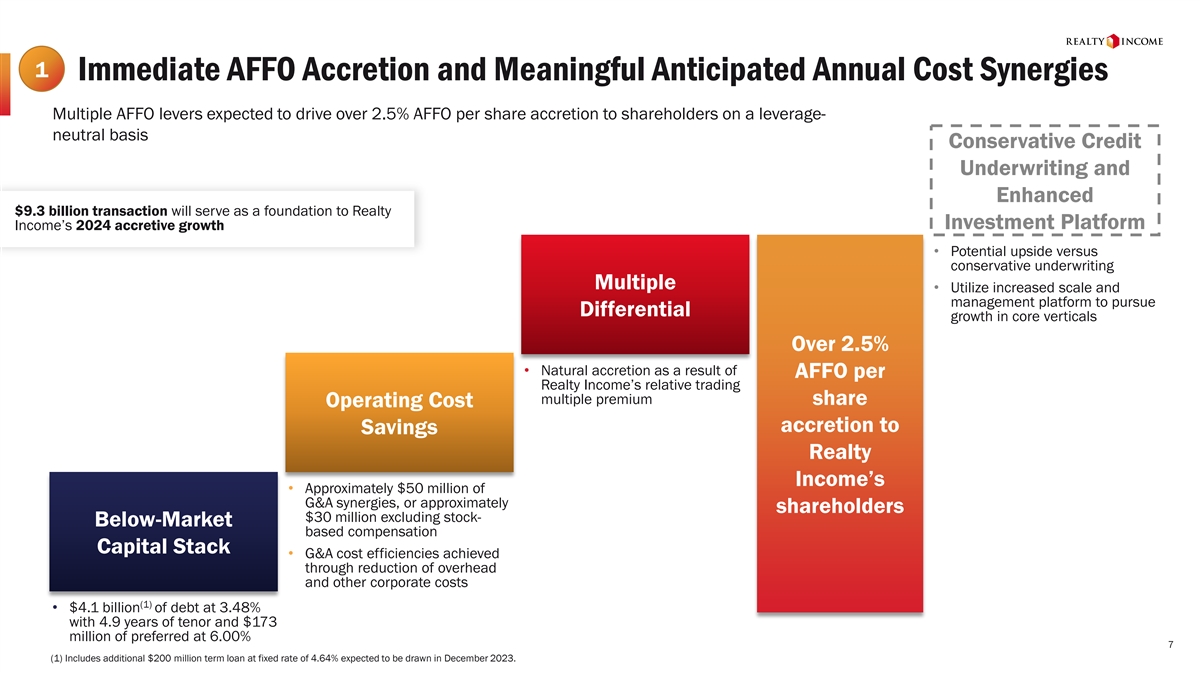
1 Immediate AFFO Accretion and Meaningful Anticipated Annual Cost Synergies Multiple AFFO levers expected to drive over 2.5% AFFO per share accretion to shareholders on a leverage- neutral basis Conservative Credit Underwriting and Enhanced $9.3 billion transaction will serve as a foundation to Realty Investment Platform Income’s 2024 accretive growth • Potential upside versus conservative underwriting Multiple • Utilize increased scale and management platform to pursue Differential growth in core verticals Over 2.5% • Natural accretion as a result of AFFO per Realty Income’s relative trading multiple premium share Operating Cost accretion to Savings Realty Income’s • Approximately $50 million of G&A synergies, or approximately shareholders $30 million excluding stock- Below-Market based compensation Capital Stack • G&A cost efficiencies achieved through reduction of overhead and other corporate costs (1) • $4.1 billion of debt at 3.48% with 4.9 years of tenor and $173 million of preferred at 6.00% 7 (1) Includes additional $200 million term loan at fixed rate of 4.64% expected to be drawn in December 2023.

2 Attractive Capital Stack Requires No New Capital Raise to Fund the Acquisition $4.1 billion debt capital stack with 4.9-year tenor and 3.48% weighted average interest rate and $173 million preferred with 6.00% dividend which Realty Income expects to benefit from on a leverage-neutral basis SPIRIT DEBT & PREFERRED EQUITY OVERVIEW Balance Outstanding Remaining Est. Market Refinance Estimated Interest Rate $ in millions Interest Rate (1) (2) ($mm) Term (Yrs) Rate Benefit (3) (4) Unsecured Term Loans (Including Swaps) $1,300 2.9 3.98% 6.31% 233 bps Senior Unsecured Notes 2,750 5.9 3.25% 6.60% 335 bps CMBS Mortgages 5 7.6 5.82% 6.85% 103 bps Series A Preferred Stock 173 Perpetual 6.00% 7.25% 125 bps Total $4,227 4.9 3.59% 6.54% 295 bps Sources: Commercial Real Estate Alert, Trepp. Note: Balance sheet data as of 6/30/2023. Market interest rate data as of 10/27/2023. The assumption of unsecured term loans, CMBS mortgages and swaps shall be subject to the applicable lenders’ and counterparties’ approval. (1) Weighted average tenor excludes Spirit’s freely-callable $173 million 6.00% perpetual preferred stock. (2) For term loans, represents the current interest rate excluding the impact of interest rate swaps. For unsecured notes, 8 represents estimated new issue pricing for Realty Income 10-year senior unsecured notes. For CMBS, represents estimated new issue pricing for retail assets. For Series A Preferred Stock, represents estimated new issue pricing for Realty Income preferred stock. (3) Includes additional $200 million term loan at fixed rate of 4.64% expected to be drawn in December 2023. (4) Includes the impact of interest rate swaps.
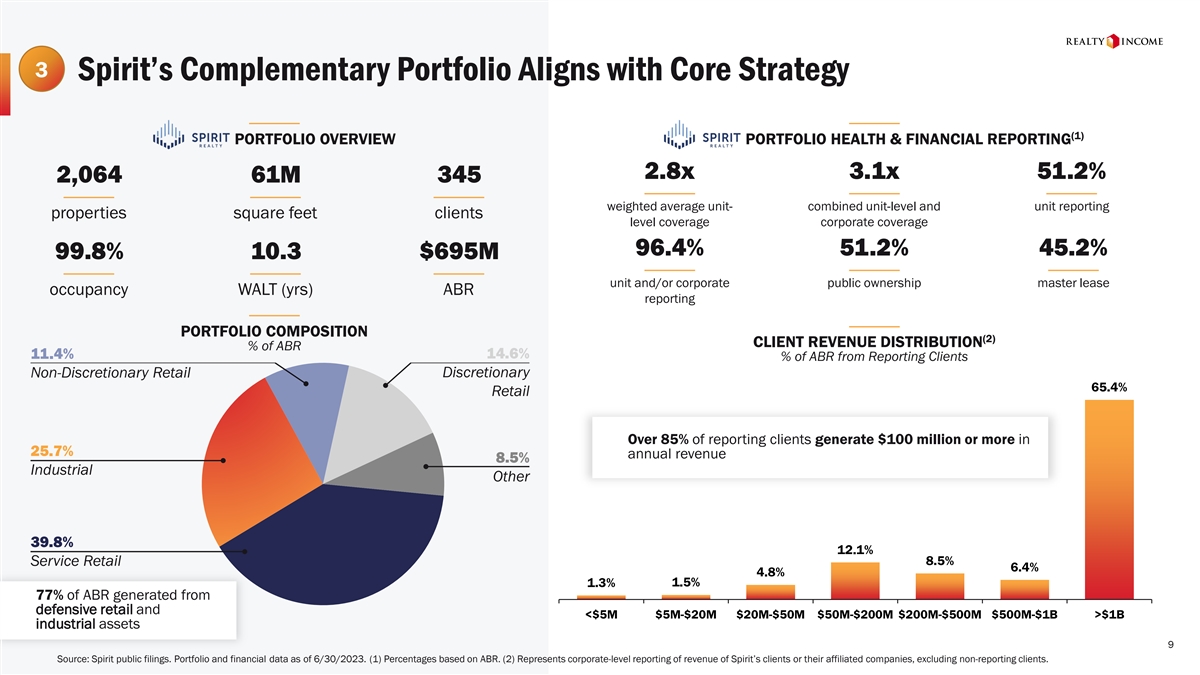
3 Spirit’s Complementary Portfolio Aligns with Core Strategy (1) PORTFOLIO OVERVIEW PORTFOLIO HEALTH & FINANCIAL REPORTING 2.8x 3.1x 51.2% 2,064 61M 345 weighted average unit- combined unit-level and unit reporting properties square feet clients level coverage corporate coverage 96.4% 51.2% 45.2% 99.8% 10.3 $695M unit and/or corporate public ownership master lease occupancy WALT (yrs) ABR reporting PORTFOLIO COMPOSITION (2) CLIENT REVENUE DISTRIBUTION % of ABR 11.4% 14.6% % of ABR from Reporting Clients Non-Discretionary Retail Discretionary 65.4% Retail Over 85% of reporting clients generate $100 million or more in 25.7% annual revenue 8.5% Industrial Other 39.8% 12.1% 8.5% Service Retail 6.4% 4.8% 1.5% 1.3% 77% of ABR generated from defensive retail and <$5M $5M-$20M $20M-$50M $50M-$200M $200M-$500M $500M-$1B >$1B industrial assets 9 Source: Spirit public filings. Portfolio and financial data as of 6/30/2023. (1) Percentages based on ABR. (2) Represents corporate-level reporting of revenue of Spirit’s clients or their affiliated companies, excluding non-reporting clients.

3 Spirit’s Standalone Portfolio Primarily Comprised of Resilient Retail & Industrial (1) (1) RESILIENT RETAIL PORTFOLIO INDUSTRIAL PORTFOLIO $2.5B $179M $6.1B $457M 7.3% 3.1% RE Investments ABR Industrial Outdoor RE Investments ABR Flex Storage 21.4% 12.4 $15.77 Discretionary WALT (yrs) Avg. Rent PSF 45.9% 43.9% 60.9% Distribution Manufacturing Service $6.23 9.5 17.7% Non-Discretionary Avg. Rent PSF WALT (yrs) 257 47.3% 1,741 54.4% Properties Publicly-Traded Publicly-Traded Properties REPRESENTATIVE CLIENTS REPRESENTATIVE CLIENTS 10 Source: Spirit public filings. Portfolio and financial data as of 6/30/2023. (1) Percentages based on real estate investment.
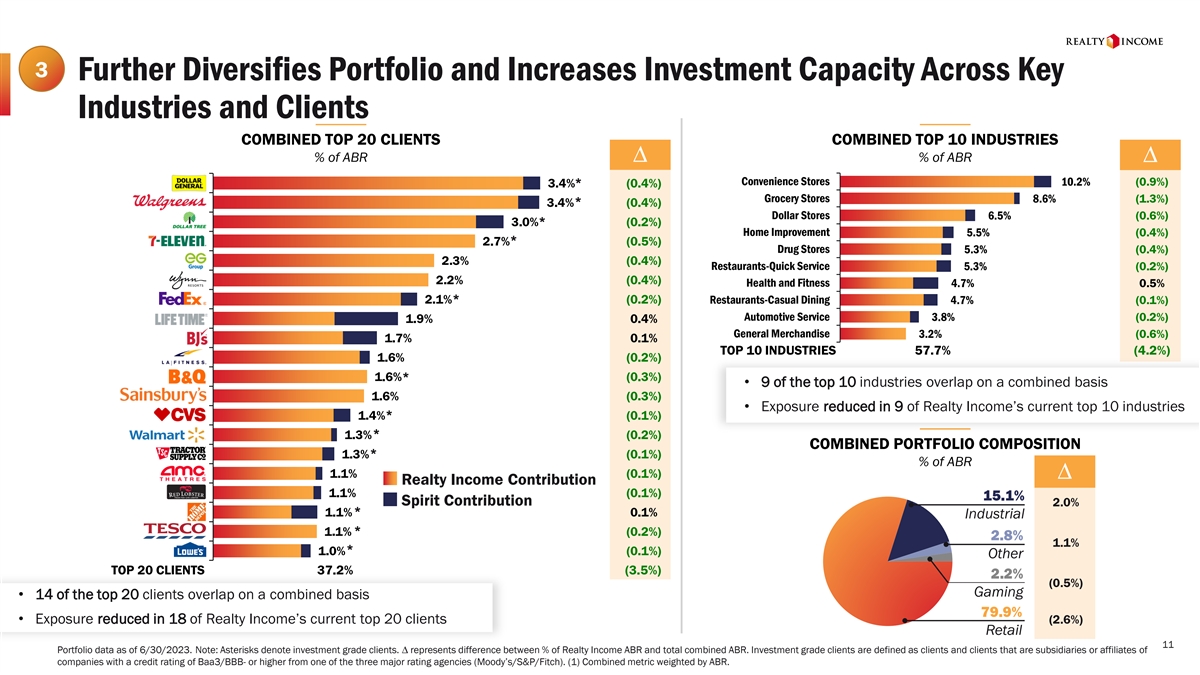
3 Further Diversifies Portfolio and Increases Investment Capacity Across Key Industries and Clients COMBINED TOP 20 CLIENTS COMBINED TOP 10 INDUSTRIES % of ABR ∆ % of ABR ∆ Convenience Stores * 10.2% (0.9%) 3.4% (0.4%) Grocery Stores 8.6% (1.3%) * 3.4% (0.4%) Dollar Stores 6.5% (0.6%) 3.0% * (0.2%) Home Improvement 5.5% (0.4%) * 2.7% (0.5%) Drug Stores 5.3% (0.4%) 2.3% (0.4%) Restaurants-Quick Service 5.3% (0.2%) 2.2% (0.4%) Health and Fitness 4.7% 0.5% * 2.1% (0.2%) Restaurants-Casual Dining 4.7% (0.1%) Automotive Service 3.8% (0.2%) 1.9% 0.4% General Merchandise 3.2% (0.6%) 1.7% 0.1% TOP 10 INDUSTRIES 57.7% (4.2%) 1.6% (0.2%) 1.6% * (0.3%) • 9 of the top 10 industries overlap on a combined basis 1.6% (0.3%) • Exposure reduced in 9 of Realty Income’s current top 10 industries * 1.4% (0.1%) * 1.3% (0.2%) COMBINED PORTFOLIO COMPOSITION * 1.3% (0.1%) % of ABR 1.1% (0.1%) ∆ Realty Income Contribution 1.1% (0.1%) 15.1% Spirit Contribution 2.0% * 1.1% 0.1% Industrial * 1.1% (0.2%) 2.8% 1.1% * 1.0% (0.1%) Other TOP 20 CLIENTS 37.2% (3.5%) 2.2% (0.5%) Gaming • 14 of the top 20 clients overlap on a combined basis 79.9% • Exposure reduced in 18 of Realty Income’s current top 20 clients (2.6%) Retail 11 Portfolio data as of 6/30/2023. Note: Asterisks denote investment grade clients. ∆ represents difference between % of Realty Income ABR and total combined ABR. Investment grade clients are defined as clients and clients that are subsidiaries or affiliates of companies with a credit rating of Baa3/BBB- or higher from one of the three major rating agencies (Moody’s/S&P/Fitch). (1) Combined metric weighted by ABR.

4 Bottom-Up Underwriting Gives Confidence in Portfolio’s Potential (1) Benchmarked assets with reported performance against Realty Income’s portfolio and historical outcomes 1 • Substantial visibility into property level financial performance and potential to benefit from Realty Income’s leading asset management capabilities • Spirit receives unit and/or corporate reporting for 96.4% of its portfolio, including 51.2% unit reporting Proprietary credit underwriting on overlapping clients 2 • Of the combined company’s top 20 clients, 14 are within Spirit’s portfolio, representing 18.2% of Spirit’s annual base rent Predictive analytics for assets utilizing database of historical outcomes 3 • Detailed asset-by-asset underwriting using proprietary predictive analytics tools (machine learning/AI) • Modeled results give further confidence in risk-adjusted return potential and broad fungibility of assets 12 Financial data per reported filings as of 6/30/2023. (1) Percentages based on ABR.

5 Maintains Best-In-Class Credit Profile and Balance Sheet Flexibility KEY CREDIT HIGHLIGHTS COMBINED CREDIT METRICS Estimated • Leverage-neutral transaction Combined • Net lease industry leading A3 Moody’s / A- S&P credit ratings and expected 5.4x leverage • One of only eight REITs with ‘A’ ratings from two major agencies Net Debt + Preferred / 5.4x 5.5x 5.4x Annualized Adjusted EBITDAre • Benefit from Spirit’s below-market debt with no maturities until 2025 Fixed Charge Coverage Ratio 4.6x 5.2x 4.6x (1)(2) COMBINED CAPITALIZATION % of Total Capitalization 1.3% 0.3% Secured Debt Unsecured Assets / Preferred Equity 2.6x 2.6x 2.6x Unsecured Debt 36.8% Unsecured Debt (3) Secured Debt / Gross Assets 1.8% 0.0% 1.5% $63 bn 61.7% Total Debt / Gross Assets 39.5% 39.0% 39.4% Total Capitalization Common Equity Source: FactSet. Market data as of 10/27/2023; foreign exchange rates, balance sheet and financial data per reported filings as of 6/30/2023, adjusted for €1.1 billion Euro bond issuance and additional $200 million term loan at fixed rate of 4.64% expected 13 to be drawn in December 2023. Note: Metrics include non-GAAP measures that could be calculated differently by each company. (1) Assumes proceeds of €1.1 billion unsecured notes issuance in July 2023 and $200 million term loan draw expected in December 2023 debited to cash. (2) Combined equity market capitalization based on 0.762x exchange ratio of Sprit fully diluted shares and units into Realty Income shares and units. (3) Spirit has $4.5 million of secured debt.
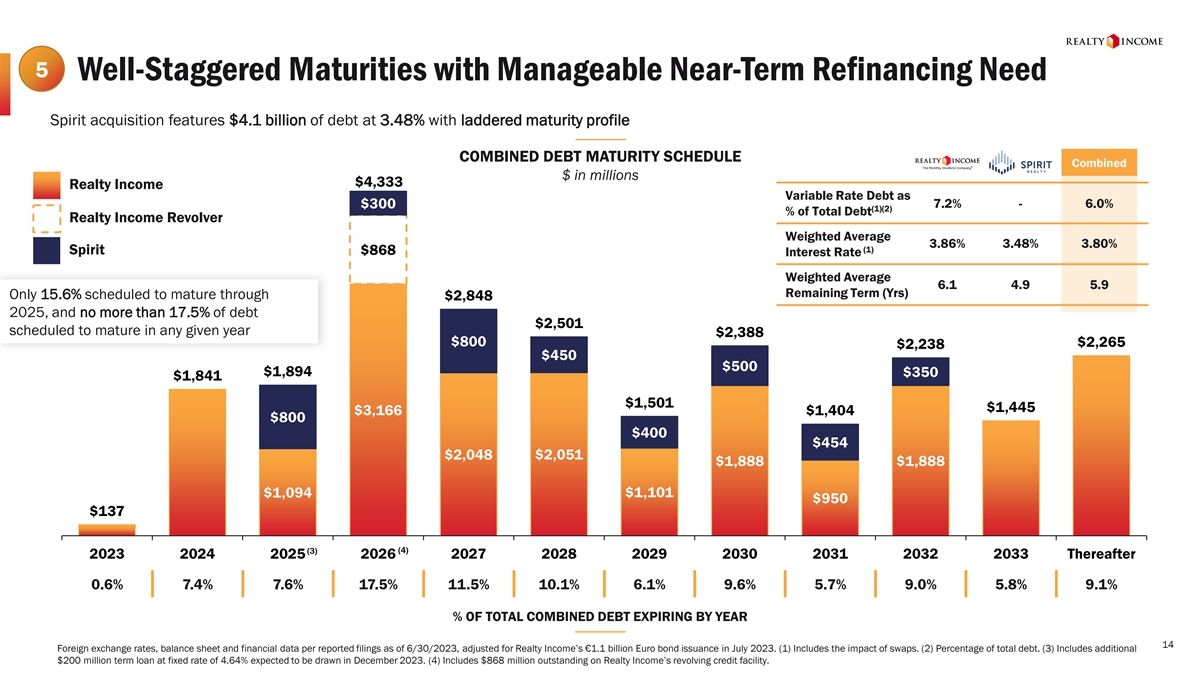
5 Well-Staggered Maturities with Manageable Near-Term Refinancing Need Spirit acquisition features $4.1 billion of debt at 3.48% with laddered maturity profile COMBINED DEBT MATURITY SCHEDULE Combined $ in millions $4,333 Realty Income Variable Rate Debt as 7.2% - 6.0% $300 (1)(2) % of Total Debt Realty Income Revolver Weighted Average 3.86% 3.48% 3.80% (1) Spirit $868 Interest Rate Weighted Average 6.1 4.9 5.9 Remaining Term (Yrs) Only 15.6% scheduled to mature through $2,848 2025, and no more than 17.5% of debt $2,501 scheduled to mature in any given year $2,388 $800 $2,265 $2,238 $450 $500 $1,894 $350 $1,841 $1,501 $1,445 $3,166 $1,404 $800 $400 $454 $2,048 $2,051 $1,888 $1,888 $1,094 $1,101 $950 $137 (3) (4) 2023 2024 2025 2026 2027 2028 2029 2030 2031 2032 2033 Thereafter 0.6% 7.4% 7.6% 17.5% 11.5% 10.1% 6.1% 9.6% 5.7% 9.0% 5.8% 9.1% % OF TOTAL COMBINED DEBT EXPIRING BY YEAR 14 Foreign exchange rates, balance sheet and financial data per reported filings as of 6/30/2023, adjusted for Realty Income’s €1.1 billion Euro bond issuance in July 2023. (1) Includes the impact of swaps. (2) Percentage of total debt. (3) Includes additional $200 million term loan at fixed rate of 4.64% expected to be drawn in December 2023. (4) Includes $868 million outstanding on Realty Income’s revolving credit facility.
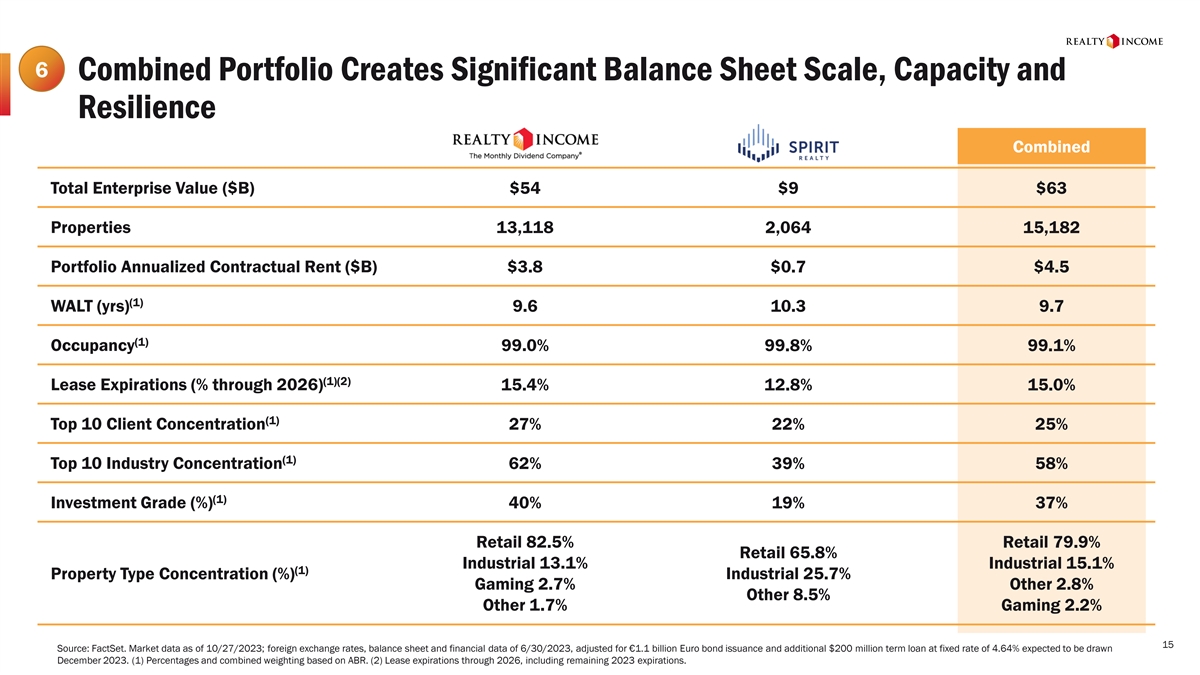
6 Combined Portfolio Creates Significant Balance Sheet Scale, Capacity and Resilience Combined Total Enterprise Value ($B) $54 $9 $63 Properties 13,118 2,064 15,182 Portfolio Annualized Contractual Rent ($B) $3.8 $0.7 $4.5 (1) WALT (yrs) 9.6 10.3 9.7 (1) Occupancy 99.0% 99.8% 99.1% (1)(2) Lease Expirations (% through 2026) 15.4% 12.8% 15.0% (1) Top 10 Client Concentration 27% 22% 25% (1) Top 10 Industry Concentration 62% 39% 58% (1) Investment Grade (%) 40% 19% 37% Retail 82.5% Retail 79.9% Retail 65.8% Industrial 13.1% Industrial 15.1% (1) Property Type Concentration (%) Industrial 25.7% Gaming 2.7% Other 2.8% Other 8.5% Other 1.7% Gaming 2.2% 15 Source: FactSet. Market data as of 10/27/2023; foreign exchange rates, balance sheet and financial data of 6/30/2023, adjusted for €1.1 billion Euro bond issuance and additional $200 million term loan at fixed rate of 4.64% expected to be drawn December 2023. (1) Percentages and combined weighting based on ABR. (2) Lease expirations through 2026, including remaining 2023 expirations.

6 Benefits of Scale and Size: Growth Optionality Unmatched capacity to buy large portfolios at “wholesale“ prices while maintaining diversification LARGER SIZE PROVIDES GROWTH FLEXIBILITY (1) TRANSACTION SIZE & IMPACT TO RENT CONCENTRATION TOTAL ABR $100 $200 $300 $400 $500 $1,000 $1,500 $200 3% 7% 10% 12% 15% 26% 34% Peers with smaller denominators lack ability $400 2% 3% 5% 7% 8% 15% 21% to buy in bulk without incurring material diversification risk $600 1% 2% 3% 4% 6% 10% 15% $700 1% 2% 3% 4% 5% 9% 13% $800 <1% 2% 3% 3% 4% 8% 12% $1,000 <1% 1% 2% 3% 3% 7% 10% $2,000 <0.5% <1% 1% 1% 2% 3% 5% $3,000 <0.5% <0.5% <1% <1% 1% 2% 3% $3,800 <0.5% <0.5% <1% <1% <1% 2% 3% Combined $4,500 <0.5% <0.5% <0.5% <1% <1% 2% 2% Increased scale post-transaction allows Realty Income to pursue even larger sale-leaseback transactions without compromising prudent client and industry diversification metrics 16 16 Financial data as of 6/30/2023. Dollars in millions. Note: Metrics include non-GAAP measures that could be calculated differently by each company. (1) Based on illustrative 7% acquisition cap rate.
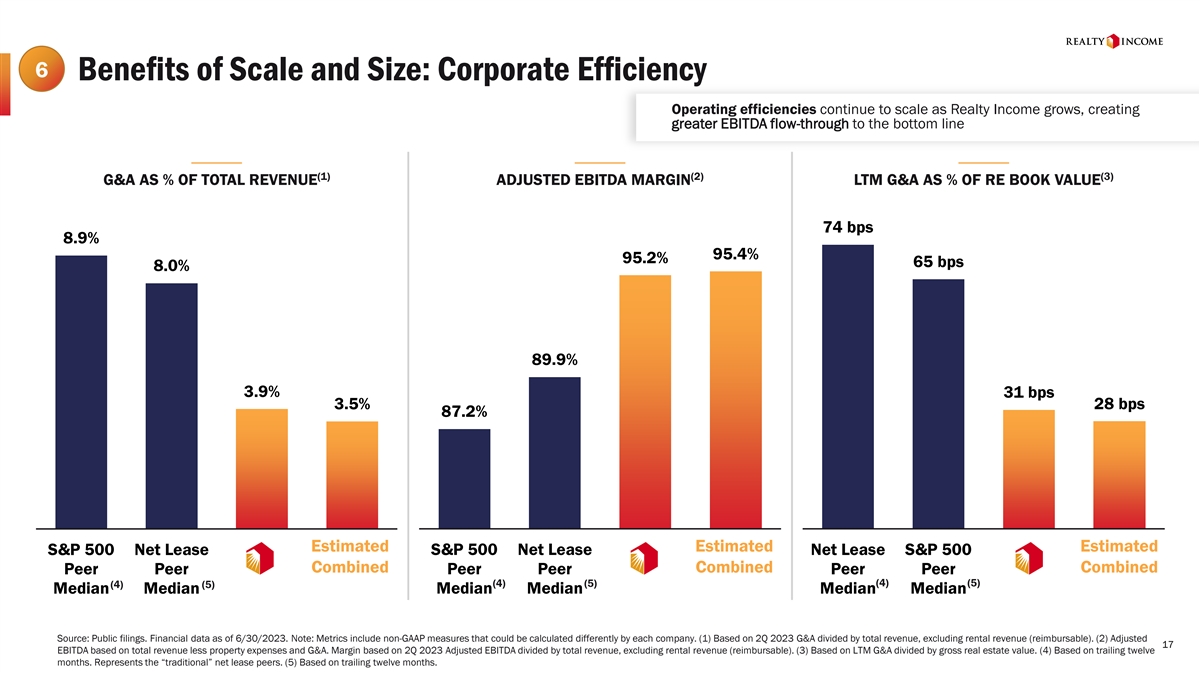
6 Benefits of Scale and Size: Corporate Efficiency Operating efficiencies continue to scale as Realty Income grows, creating greater EBITDA flow-through to the bottom line (1) (2) (3) G&A AS % OF TOTAL REVENUE ADJUSTED EBITDA MARGIN LTM G&A AS % OF RE BOOK VALUE 74 bps 8.9% 95.4% 95.2% 65 bps 8.0% 89.9% 3.9% 31 bps 3.5% 28 bps 87.2% Estimated Estimated Estimated S&P 500 Net Lease S&P 500 Net Lease Net Lease S&P 500 Combined Combined Combined Peer Peer Peer Peer Peer Peer (4) (5) (4) (5) (4) (5) Median Median Median Median Median Median Source: Public filings. Financial data as of 6/30/2023. Note: Metrics include non-GAAP measures that could be calculated differently by each company. (1) Based on 2Q 2023 G&A divided by total revenue, excluding rental revenue (reimbursable). (2) Adjusted 17 17 EBITDA based on total revenue less property expenses and G&A. Margin based on 2Q 2023 Adjusted EBITDA divided by total revenue, excluding rental revenue (reimbursable). (3) Based on LTM G&A divided by gross real estate value. (4) Based on trailing twelve months. Represents the “traditional” net lease peers. (5) Based on trailing twelve months.
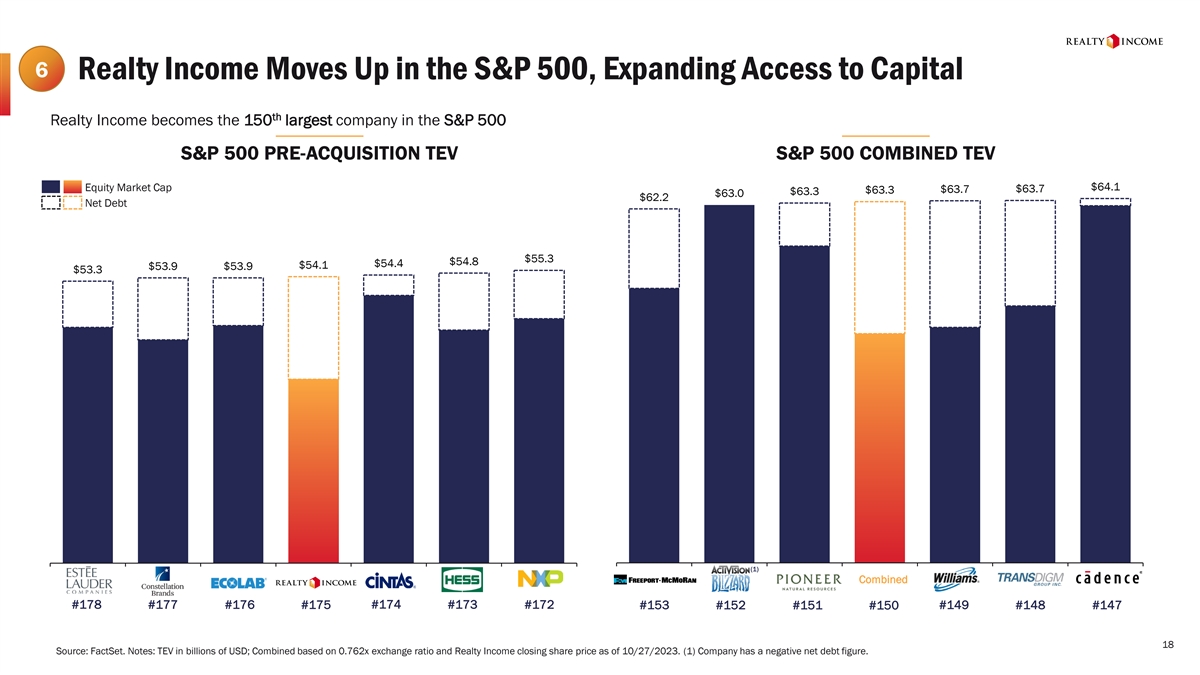
6 Realty Income Moves Up in the S&P 500, Expanding Access to Capital th Realty Income becomes the 150 largest company in the S&P 500 S&P 500 PRE-ACQUISITION TEV S&P 500 COMBINED TEV Equity Market Cap $64.1 $63.7 $63.7 $63.3 $63.3 $63.0 $62.2 Net Debt $55.3 $54.8 $54.4 $54.1 $53.9 $53.9 $53.3 (1) 153 152 150 151 149 148 147 178 177 176 175 174 173 172 Combined #178 #177 #176 #175 #174 #173 #172 #153 #149 #148 #152 #151 #150 #147 18 Source: FactSet. Notes: TEV in billions of USD; Combined based on 0.762x exchange ratio and Realty Income closing share price as of 10/27/2023. (1) Company has a negative net debt figure.

6 Realty Income Becomes One of the Largest REITs in the S&P 500 (1) LARGEST REITS IN THE S&P 500 BY TEV $124.2 Equity Market Cap th Net Debt Becomes the 4 largest REIT in the S&P 500 $82.8 $70.4 $63.3 $58.2 $56.9 $54.1 $51.6 5 9 8 4 6 10 3 1 Combined #8 #7 #6 #4 #3 #2 #1 #5 3-MONTH AVERAGE DAILY TRADING VOLUME OF THE LARGEST S&P 500 REITS Further enhances position as one of the most liquid REITs in the S&P 500 Index rebalancing creates additional $303.9 liquidity for the stock $266.4 $260.1 $261.9 $255.1 $191.7 $188.8 $154.3 (2) 10 9 8 7 6 5 4 2 Combined 19 Source: FactSet. Notes: TEV in billions of USD; volumes in millions of USD; Combined based on 0.762x exchange ratio and Realty Income closing share price as of 10/27/2023. (1) Includes equity REITs listed in the RMZ; Excludes tower and timber REITS. (2) Based on 0.762x exchange ratio, Realty Income closing share price as of 10/27/2023 and an estimated 3-month average daily trading volume of Spirit common stock of $32 million.
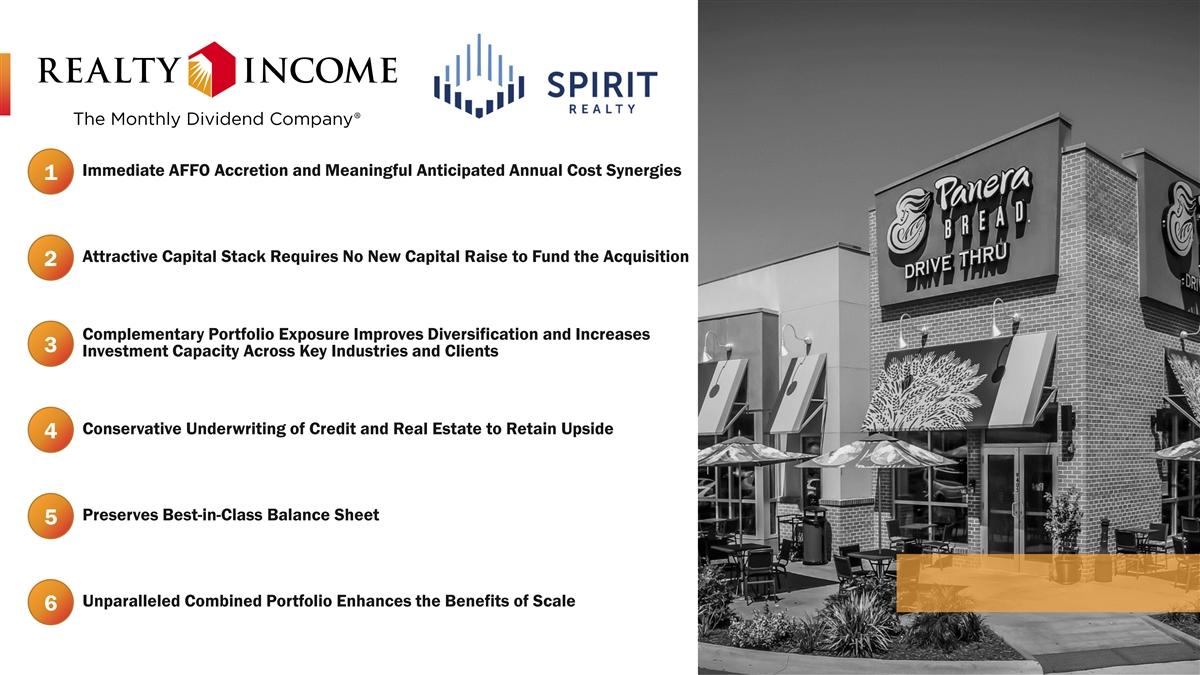
Immediate AFFO Accretion and Meaningful Anticipated Annual Cost Synergies 1 Attractive Capital Stack Requires No New Capital Raise to Fund the Acquisition 2 Complementary Portfolio Exposure Improves Diversification and Increases 3 Investment Capacity Across Key Industries and Clients Conservative Underwriting of Credit and Real Estate to Retain Upside 4 Preserves Best-in-Class Balance Sheet 5 Unparalleled Combined Portfolio Enhances the Benefits of Scale 6 20