


MEASURED AND INDICATED MINERAL RESOURCES
(with an effective date of December 31, 2018)
update prepared under the supervision of Ramon Mendoza Reyes, PEng, QP for First Majestic
| Mine/Project | Category | Mineral Type | | Tonnage | | | Grades | | | Metal Content | |
|
|
| |
kt | | | Ag
(g/t) | | | Au
(g/t) | | | Pb
(%) | | | Zn
(%) | | | Ag-Eq
(g/t) | | | Ag
(k Oz) | | | Au
(k Oz) | | | Ag-Eq
(k Oz) | |
| | | | | | | | | | | | | | | | | | | | | | | | | | | | | | |
| SAN DIMAS | Measured (UG) | Sulphides | | 1,412 | | | 505 | | | 7.33 | | | – | | | – | | | 1,059 | | | 22,930 | | | 332.7 | | | 48,080 | |
| | Indicated (UG) | Sulphides | | 3,193 | | | 427 | | | 4.93 | | | – | | | – | | | 800 | | | 43,840 | | | 505.7 | | | 82,080 | |
| Total Measuredand Indicated (UG) | Sulphides | | 4,604 | | | 451 | | | 5.66 | | | – | | | – | | | 879 | | | 66,770 | | | 838.4 | | | 130,160 | |
| | | | | | | | | | | | | | | | | | | | | | | | | | | | | | |
| SANTA ELENA | Measured Santa Elena (UG) | Sulphides | | 2,508 | | | 132 | | | 1.84 | | | – | | | – | | | 280 | | | 10,640 | | | 148.7 | | | 22,550 | |
| | Indicated Santa Elena (UG) | Sulphides | | 915 | | | 124 | | | 1.60 | | | – | | | – | | | 253 | | | 3,650 | | | 47.1 | | | 7,430 | |
| | Indicated Ermitano (UG) | Sulphides | | 704 | | | 65 | | | 4.05 | | | – | | | – | | | 389 | | | 1,460 | | | 91.7 | | | 8,810 | |
| | Indicated (Pad) | Oxides | | 1,179 | | | 39 | | | 1.04 | | | – | | | – | | | 122 | | | 1,480 | | | 39.3 | | | 4,630 | |
| Total Measuredand Indicated (UG+Pad) | Oxides + Sulphides | | 5,306 | | | 101 | | | 1.92 | | | – | | | – | | | 255 | | | 17,230 | | | 326.8 | | | 43,420 | |
| | | | | | | | | | | | | | | | | | | | | | | | | | | | | | |
| LA ENCANTADA | Indicated Veins Systems (UG) | Oxides | | 1,339 | | | 255 | | | – | | | – | | | – | | | 255 | | | 10,960 | | | – | | | 10,960 | |
| | Indicated Breccias (UG) | Oxides – Flotation | | 830 | | | 238 | | | – | | | 3.36 | | | – | | | 337 | | | 6,350 | | | 61.5 | | | 8,990 | |
| | Indicated (Tailings) | Oxides | | 4,200 | | | 110 | | | – | | | – | | | – | | | 110 | | | 14,850 | | | – | | | 14,850 | |
| | Total Indicated (UG) | Oxides + Tailings | | 6,370 | | | 157 | | | – | | | 0.44 | | | – | | | 170 | | | 32,160 | | | 62 | | | 34,800 | |
| | | | | | | | | | | | | | | | | | | | | | | | | | | | | | |
| LA PARRILLA | Indicated (UG) | Sulphides | | 999 | | | 184 | | | 0.06 | | | 2.01 | | | 1.78 | | | 318 | | | 5,910 | | | 44.3 | | | 10,230 | |
| | Indicated (UG) | Oxides | | 142 | | | 254 | | | 0.15 | | | – | | | – | | | 265 | | | 1,160 | | | – | | | 1,210 | |
| Total Measuredand Indicated (UG) | Oxides + Sulphides | | 1,142 | | | 193 | | | 0.07 | | | 1.76 | | | 1.55 | | | 312 | | | 7,070 | | | 44.3 | | | 11,440 | |
| | | | | | | | | | | | | | | | | | | | | | | | | | | | | | |
| SAN MART¥N | Measured (UG) | Oxides | | 112 | | | 268 | | | 0.46 | | | – | | | – | | | 302 | | | 960 | | | 1.7 | | | 1,090 | |
| | Indicated (UG) | Oxides | | 1,485 | | | 291 | | | 0.57 | | | – | | | – | | | 334 | | | 13,880 | | | 27.1 | | | 15,940 | |
| Total Measuredand Indicated (UG) | Oxides | | 1,597 | | | 289 | | | 0.56 | | | – | | | – | | | 332 | | | 14,840 | | | 28.8 | | | 17,030 | |
| | | | | | | | | | | | | | | | | | | | | | | | | | | | | | |
| DEL TORO | Measured (UG) | Transition + Sulphides | | 60 | | | 225 | | | 0.35 | | | 2.60 | | | 0.66 | | | 362 | | | 430 | | | 0.7 | | | 700 | |
| Indicated (UG) | Transition + Sulphides | | 896 | | | 218 | | | 0.30 | | | 4.47 | | | 3.98 | | | 477 | | | 6,290 | | | 8.7 | | | 13,760 | |
| Total Measuredand Indicated (UG) | Transition +Sulphides | | 956 | | | 219 | | | 0.31 | | | 4.35 | | | 3.77 | | | 470 | | | 6,720 | | | 9.4 | | | 14,460 | |
| | | | | | | | | | | | | | | | | | | | | | | | | | | | | | |
| LA GUITARRA | Measured (UG) | Sulphides | | 384 | | | 292 | | | 1.84 | | | – | | | – | | | 431 | | | 3,610 | | | 22.7 | | | 5,330 | |
| | Indicated (UG) | Sulphides | | 243 | | | 250 | | | 1.98 | | | – | | | – | | | 399 | | | 1,950 | | | 15.5 | | | 3,120 | |
| Total Measuredand Indicated (UG) | Sulphides | | 627 | | | 276 | | | 1.89 | | | – | | | – | | | 419 | | | 5,560 | | | 38.2 | | | 8,450 | |
| | | | | | | | | | | | | | | | | | | | | | | | | | | | | | |
| Total Measuredand Indicated | All mineral types | | 20,601 | | | 227 | | | 1.88 | | | 0.43 | | | 0.26 | | | 392 | | | 150,350 | | | 1,347.4 | | | 259,760 | |
| (1) | Mineral Resources have been classified in accordance with the Canadian Institute of Mining, Metallurgy and Petroleum (“CIM”) Definition Standards on Mineral Resources and Mineral Reserves, whose definitions are incorporated by reference into NI 43-101. |
| (2) | The Mineral Resources information provided above is based on internal estimates prepared as of December 31, 2018. The information provided was reviewed and compiled by Ramon Mendoza Reyes, PEng, QP for First Majestic, and is based on internal work prepared under the supervision of First Majestic internal QPs, who have the appropriate relevant qualifications, and experience in geology and resource estimation. |
| (3) | Metal prices considered for Mineral Resources estimates were $17.50/oz Ag, $1,300/oz Au, $1.00/lb Pb, and $1.20/lb Zn. |
| (4) | Silver-equivalent grade is estimated considering: metal price assumptions, metallurgical recovery for the corresponding mineral type/mineral process and the metal payable of the corresponding contract of each mine. Estimation details are listed in each mine section of the Annual Information Form (AIF). |
| (5) | The cut-off grades used to estimate Mineral Resources are different for all mines. The cut-off grades and factors are listed in the applicable section describing each mine section of the AIF. |
| (6) | Measured and Indicated Mineral Resources are reported inclusive of Mineral Reserves. |
| (7) | La Guitarra was placed in care and maintenance on August 3, 2018 and is no longer a material property. |
| FIRST MAJESTIC SILVER CORP. | 36 | Reserves and Resources |
INFERRED MINERAL RESOURCES
(with an effective date of December 31, 2018)
update prepared under the supervision of Ramon Mendoza Reyes, PEng, QP for First Majestic
| Mine/Project | Category | Mineral Type | | Tonnage | | | Grades | | | Metal Content | |
|
|
| |
kt | | | Ag
(g/t) | | | Au
(g/t) | | | Pb
(%) | | | Zn
(%) | | | Ag-Eq
(g/t) | | | Ag
(k Oz) | | | Au
(k Oz) | | | Ag-Eq
(k Oz) | |
| SAN DIMAS | Inferred Total (UG) | Sulphides | | 5,708 | | | 341 | | | 3.60 | | | – | | | – | | | 614 | | | 62,640 | | | 661.3 | | | 112,640 | |
| | Inferred Santa Elena Mine (UG) | Sulphides | | 931 | | | 90 | | | 1.09 | | | – | | | – | | | 177 | | | 2,700 | | | 32.7 | | | 5,310 | |
| SANTA ELENA | Inferred Ermitaño (UG) | Sulphides | | 4,637 | | | 59 | | | 3.36 | | | – | | | – | | | 329 | | | 8,820 | | | 501.5 | | | 48,980 | |
| | Inferred Total (UG) | Sulphides | | 5,568 | | | 64 | | | 2.98 | | | – | | | – | | | 303 | | | 11,520 | | | 534.2 | | | 54,290 | |
| LA ENCANTADA | Inferred Veins Systems (UG) | Oxides | | 608 | | | 234 | | | – | | | – | | | – | | | 234 | | | 4,580 | | | – | | | 4,580 | |
| | Inferred Breccias (UG) | Oxides | | 902 | | | 201 | | | – | | | – | | | – | | | 201 | | | 5,830 | | | – | | | 5,830 | |
| | Inferred Ojuelas (UG) | Oxides – Flotation | | 88 | | | lcr183 | | | – | | | 3.41 | | | – | | | 283 | | | 520 | | | 6.7 | | | 810 | |
| | Inferred Total (UG) | Oxides | | 1,598 | | | 213 | | | – | | | 0.19 | | | – | | | 218 | | | 10,930 | | | 6.7 | | | 11,220 | |
| LA PARRILLA | Inferred (UG) | Oxides | | 870 | | | 189 | | | 0.07 | | | 1.83 | | | 1.95 | | | 321 | | | 5,290 | | | 35.1 | | | 8,970 | |
| | Inferred (UG) | Sulphides | | 471 | | | 226 | | | 0.06 | | | – | | | – | | | 231 | | | 3,430 | | | – | | | 3,490 | |
| | Inferred Total (UG) | Oxides + Sulphides | | 1,341 | | | 202 | | | 0.06 | | | 1.19 | | | 1.27 | | | 289 | | | 8,720 | | | 35.1 | | | 12,460 | |
| SAN MARTIN | Inferred Total (UG) | Oxides | | 1,634 | | | 232 | | | 0.30 | | | – | | | – | | | 254 | | | 12,180 | | | 15.7 | | | 13,360 | |
| DEL TORO | Inferred Total (UG) | Transition + Sulphides | | 560 | | | 219 | | | 0.18 | | | 3.33 | | | 1.23 | | | 377 | | | 3,960 | | | 3.3 | | | 6,790 | |
| LA GUITARRA | Inferred Total (UG) | Sulphides | | 164 | | | 268 | | | 1.39 | | | – | | | – | | | 373 | | | 1,420 | | | 7.3 | | | 1,970 | |
| | Total Inferred | All mineral types | | 16,573 | | | 209 | | | 2.30 | | | 0.23 | | | 0.14 | | | 399 | | | 111,370 | | | 1,263.6 | | | 212,730 | |
| (1) | Mineral Resources have been classified in accordance with the Canadian Institute of Mining, Metallurgy and Petroleum (“CIM”) Definition Standards on Mineral Resources and Mineral Reserves, whose definitions are incorporated by reference into NI 43-101. |
| (2) | The Mineral Resources information provided above is based on internal estimates prepared as of December 31, 2018. The information provided was reviewed and compiled by Ramon Mendoza Reyes, PEng, QP for First Majestic, and is based on internal work prepared under the supervision of First Majestic internal QPs, who have the appropriate relevant qualifications, and experience in geology and resource estimation. |
| (3) | Metal prices considered for Mineral Resources estimates were $17.50/oz Ag, $1,300/oz Au, $1.00/lb Pb, and $1.20/lb Zn. |
| (4) | Silver-equivalent grade is estimated considering: metal price assumptions, metallurgical recovery for the corresponding mineral type/mineral process and the metal payable of the corresponding contract of each mine. Estimation details are listed in each mine section of the Annual Information Form (AIF). |
| (5) | The cut-off grades used to estimate Mineral Resources are different for all mines. The cut-off grades and factors are listed in the applicable section describing each mine section of the AIF. |
| (6) | La Guitarra was placed in care and maintenance on August 3, 2018 and is no longer a material property. |
PROVEN AND PROBABLE MINERAL RESERVES
(with an effective date of December 31, 2018)
update prepared under the supervision of Ramon Mendoza Reyes, PEng, QP for First Majestic
| Mine/Project | Category | Mineral Type | | Tonnage | | | Grades | | | Metal Content | |
|
|
| |
kt | | | Ag
(g/t) | | | Au
(g/t) | | | Pb
(%) | | | Zn
(%) | | | Ag-Eq
(g/t) | | | Ag
(k Oz) | | | Au
(k Oz) | | | Ag-Eq
(k Oz) | |
| SAN DIMAS | Proven (UG) | Sulphides | | 1,629 | | | 323 | | | 4.09 | | | – | | | – | | | 630 | | | 16,940 | | | 214.4 | | | 32,980 | |
| | Probable (UG) | Sulphides | | 3,794 | | | 303 | | | 3.34 | | | – | | | – | | | 553 | | | 36,980 | | | 407.1 | | | 67,450 | |
| | Total Proven and Probable (UG) Sulphides | | 5,423 | | | 309 | | | 3.56 | | | – | | | – | | | 576 | | | 53,920 | | | 621.5 | | | 100,430 | |
| SANTA ELENA | Proven (UG) | Sulphides | | 2,028 | | | 113 | | | 1.58 | | | – | | | – | | | 238 | | | 7,340 | | | 103.2 | | | 15,520 | |
| | Probable (UG) | Sulphides | | 576 | | | 102 | | | 1.28 | | | – | | | – | | | 202 | | | 1,880 | | | 23.6 | | | 3,740 | |
| | Probable (Pad) | Oxides | | 1,349 | | | 36 | | | 0.94 | | | – | | | – | | | 111 | | | 1,570 | | | 40.7 | | | 4,800 | |
| | Total Proven and Probable | | | | | | | | | | | | | | | | | | | | | | | | | | | | |
| | (UG+Pad) | Oxides + Sulphides | | 3,953 | | | 85 | | | 1.32 | | | – | | | – | | | 189 | | | 10,790 | | | 167.5 | | | 24,060 | |
| LA ENCANTADA | Probable (UG) | Oxides | | 1,311 | | | 189 | | | – | | | – | | | – | | | 189 | | | 7,950 | | | – | | | 7,950 | |
| | Probable (UG) | Oxides – Flotation | | 809 | | | 147 | | | – | | | 2.35 | | | – | | | 196 | | | 3,820 | | | – | | | 5,090 | |
| | Probable (Tailings) | Oxides | | 4,138 | | | 110 | | | – | | | – | | | – | | | 110 | | | 14,630 | | | – | | | 14,630 | |
| | Total Probable (UG) | Oxides + Tailings | | 6,257 | | | 131 | | | – | | | 0.30 | | | – | | | 138 | | | 26,400 | | | – | | | 27,670 | |
| LA PARRILLA | Probable (UG) | Oxides | | 70 | | | 233 | | | 0.17 | | | – | | | – | | | 247 | | | 520 | | | 0.4 | | | 560 | |
| | Probable (UG) | Sulphides | | 308 | | | 166 | | | 0.05 | | | 2.00 | | | 2.10 | | | 308 | | | 1,650 | | | 0.5 | | | 3,050 | |
| | Total Probable (UG) | Oxides | | 378 | | | 179 | | | 0.08 | | | 1.63 | | | 1.71 | | | 297 | | | 2,170 | | | 0.9 | | | 3,610 | |
| SAN MART¥N | Proven (UG) | Oxides | | 79 | | | 175 | | | 0.27 | | | – | | | – | | | 195 | | | 445 | | | 0.7 | | | 495 | |
| | Probable (UG) | Oxides | | 615 | | | 245 | | | 0.50 | | | – | | | – | | | 282 | | | 4,840 | | | 9.9 | | | 5,580 | |
| | Total Proven and Probable (UG) Oxides | | 694 | | | 237 | | | 0.47 | | | – | | | – | | | 272 | | | 5,285 | | | 10.6 | | | 6,075 | |
| DEL TORO | Proven (UG) | Transition + Sulphides | | 42 | | | 205 | | | 0.29 | | | 2.44 | | | 0.65 | | | 325 | | | 280 | | | 0.4 | | | 450 | |
| | Probable (UG) | Transition + Sulphides | | 639 | | | 200 | | | 0.28 | | | 4.41 | | | 4.08 | | | 419 | | | 4,110 | | | 5.7 | | | 8,620 | |
| | Total Proven and Probable (UG) | Transition + Sulphides | | 681 | | | 200 | | | 0.28 | | | 4.29 | | | 3.87 | | | 413 | | | 4,390 | | | 6.1 | | | 9,070 | |
| | Total Proven and Probable | All mineral types | | 17,387 | | | 184 | | | 1.44 | | | 0.31 | | | 0.19 | | | 306 | | | 102,955 | | | 806.6 | | | 170,915 | |
| (1) | Mineral Reserves have been classified in accordance with the Canadian Institute of Mining, Metallurgy and Petroleum (“CIM”) Definition Standards on Mineral Resources and Mineral Reserves, whose definitions are incorporated by reference into National Instrument 43-101 (NI43-101). |
| (2) | The Mineral Reserves statement provided in the table above is based on internal estimates prepared as of December 31, 2018. The information provided was reviewed and prepared under the supervision of Ramon Mendoza Reyes, PEng, and a Qualified Person (“QP”) for the purposes of NI43-101. |
| (3) | Silver-equivalent grade is estimated considering metal price assumptions, metallurgical recovery for the corresponding mineral type/mineral process and the metal payable of the corresponding contract of each mine. Estimation details are listed in each mine section of this AIF. |
| (4) | Metal prices considered for Mineral Reserves estimates were $17.00/oz Ag and $1,250/oz Au, $1.00/lb Pb, and $1.20/lb Zn. |
| (5) | A two-step constraining approach has been implemented to estimate reserves for each mining method in use: A General Cut-Off Grade (GC) was used to delimit new mining areas that will require development of access and infrastructure and all sustaining costs. A second Incremental Cut-Off Grade (IC) was considered to include adjacent mineralized material which recoverable value pays for all associated costs, including but not limited to the variable cost of mining and processing, indirect costs, treatment, administration costs and plant sustaining costs. The cut-off grades, metallurgical recoveries, payable terms and modifying factors used to convert Mineral Reserves from Mineral Resources are different for all mines. These cut-off grades and economic parameters are listed in the applicable section describing each mine below in this AIF. |
| (6) | Dilution for underground mining includes consideration for planned dilution due to geometric aspects of the designed stopes and economic zones, and additional dilution consideration due to material handling and other operating aspects. Dilution and mining recovery factors are listed in the applicable section describing each mine below in this AIF. |
| (7) | Tonnage is expressed in thousands of tonnes, metal content is expressed in thousands of ounces. |
| (8) | Totals may not add up due to rounding. |
| (9) | The technical reports from which the above-mentioned information is derived are cited under the heading “Current Technical Reports for Material Properties” of the AIF. |


REPORT OF INDEPENDENT REGISTERED PUBLIC ACCOUNTING FIRM
TO THE SHAREHOLDERS AND THE BOARD OF DIRECTORS OF FIRST MAJESTIC SILVER CORP.
OPINION ON THE FINANCIAL STATEMENTS
We have audited the accompanying consolidated statements of financial position of First Majestic Silver Corp. and subsidiaries (the “Company”) as of December 31, 2018 and 2017, the related consolidated statements of (loss) earnings, comprehensive (loss) income, changes in equity and cash flows, for each of the two years in the period ended December 31, 2018, and the related notes (collectively referred to as the “financial statements”). In our opinion, the financial statements present fairly, in all material respects, the financial position of the Company as of December 31, 2018 and 2017, and its financial performance and its cash flows for each of the two years in the period ended December 31, 2018, in conformity with International Financial Reporting Standards as issued by the International Accounting Standards Board.
We have also audited, in accordance with the standards of the Public Company Accounting Oversight Board (United States) (PCAOB), the Company’s internal control over financial reporting as of December 31, 2018, based on criteria established inInternal Control – Integrated Framework(2013) issued by the Committee of Sponsoring Organizations of the Treadway Commission and our report dated February 22, 2019, expressed an unqualified opinion on the Company’s internal control over financial reporting.
BASIS FOR OPINION
These financial statements are the responsibility of the Company’s management. Our responsibility is to express an opinion on the Company’s financial statements based on our audits. We are a public accounting firm registered with the PCAOB and are required to be independent with respect to the Company in accordance with the U.S. federal securities laws and the applicable rules and regulations of the Securities and Exchange Commission and the PCAOB.
We conducted our audits in accordance with the standards of the PCAOB. Those standards require that we plan and perform the audit to obtain reasonable assurance about whether the financial statements are free of material misstatement, whether due to error or fraud. Our audits included performing procedures to assess the risks of material misstatement of the financial statements, whether due to error or fraud, and performing procedures that respond to those risks. Such procedures included examining, on a test basis, evidence regarding the amounts and disclosures in the financial statements. Our audits also included evaluating the accounting principles used and significant estimates made by management, as well as evaluating the overall presentation of the financial statements. We believe that our audits provide a reasonable basis for our opinion.

Chartered Professional Accountants
Vancouver, Canada
February 22, 2019
We have served as the Company’s auditor since 2005.
| FIRST MAJESTIC SILVER CORP. | 40 | CONSOLIDATED FINANCIAL STATEMENTS |
REPORT OF INDEPENDENT REGISTERED PUBLIC ACCOUNTING FIRM
TO THE SHAREHOLDERS AND THE BOARD OF DIRECTORS OF FIRST MAJESTIC SILVER CORP.
OPINION ON INTERNAL CONTROL OVER FINANCIAL REPORTING
We have audited the internal control over financial reporting of First Majestic Silver Corp. and subsidiaries (the “Company”) as of December 31, 2018, based on criteria established inInternal Control – Integrated Framework(2013) issued by the Committee of Sponsoring Organizations of the Treadway Commission (COSO). In our opinion, the Company maintained, in all material respects, effective internal control over financial reporting as of December 31, 2018, based on criteria established inInternal Control – Integrated Framework(2013) issued by COSO.
We have also audited, in accordance with the standards of the Public Company Accounting Oversight Board (United States) (PCAOB), the consolidated financial statements as of and for the year ended December 31, 2018, of the Company and our report dated February 22, 2019, expressed an unqualified opinion on those financial statements.
As described in Management’s Report on Internal Control Over Financial Reporting, management excluded from its assessment the internal control over financial reporting at Primero Mining Corp., which was acquired on May 10, 2018 and whose financial statements constitute 53% and 39% of net and total assets, respectively, and 34% of revenues of the consolidated financial statement amounts as of and for the year ended December 31, 2018. Accordingly, our audit did not include the internal control over financial reporting at Primero Mining Corp.
BASIS FOR OPINION
The Company’s management is responsible for maintaining effective internal control over financial reporting and for its assessment of the effectiveness of internal control over financial reporting, included in the accompanying Management’s Report on Internal Control over Financial Reporting. Our responsibility is to express an opinion on the Company’s internal control over financial reporting based on our audit. We are a public accounting firm registered with the PCAOB and are required to be independent with respect to the Company in accordance with the U.S. federal securities laws and the applicable rules and regulations of the Securities and Exchange Commission and the PCAOB.
We conducted our audit in accordance with the standards of the PCAOB. Those standards require that we plan and perform the audit to obtain reasonable assurance about whether effective internal control over financial reporting was maintained in all material respects. Our audit included obtaining an understanding of internal control over financial reporting, assessing the risk that a material weakness exists, testing and evaluating the design and operating effectiveness of internal control based on the assessed risk, and performing such other procedures as we considered necessary in the circumstances. We believe that our audit provides a reasonable basis for our opinion.
DEFINITION AND LIMITATIONS OF INTERNAL CONTROL OVER FINANCIAL REPORTING
A company’s internal control over financial reporting is a process designed to provide reasonable assurance regarding the reliability of financial reporting and the preparation of financial statements for external purposes in accordance with generally accepted accounting principles. A company’s internal control over financial reporting includes those policies and procedures that (1) pertain to the maintenance of records that, in reasonable detail, accurately and fairly reflect the transactions and dispositions of the assets of the company; (2) provide reasonable assurance that transactions are recorded as necessary to permit preparation of financial statements in accordance with generally accepted accounting principles, and that receipts and expenditures of the company are being made only in accordance with authorizations of management and directors of the company; and (3) provide reasonable assurance regarding prevention or timely detection of unauthorized acquisition, use, or disposition of the company’s assets that could have a material effect on the financial statements.
Because of its inherent limitations, internal control over financial reporting may not prevent or detect misstatements. Also, projections of any evaluation of effectiveness to future periods are subject to the risk that controls may become inadequate because of changes in conditions, or that the degree of compliance with the policies or procedures may deteriorate.

Chartered Professional Accountants
Vancouver, Canada
February 22, 2019
| CONSOLIDATED FINANCIAL STATEMENTS | 41 | ANNUAL REPORT 2018 |
| CONSOLIDATED STATEMENTS OF (LOSS) EARNINGS |
| for the years ended December 31, 2018 and 2017 |
| (in thousands of US dollars, except share and per share amounts) |
The Consolidated Statements of (Loss) Earnings provide a summary of the Company’s financial performance and net earnings or loss over the reporting periods.
| | | | | | YEAR ENDED DECEMBER 31, | |
| | | Note | | | 2018 | | | 2017 | |
| REVENUES | | 6 | | $ | 300,929 | | $ | 252,288 | |
| Mine operating costs | | | | | | | | | |
| Cost of sales | | 7 | | | 219,162 | | | 159,265 | |
| Depletion, depreciation and amortization | | | | | 93,667 | | | 77,045 | |
| | | | | | 312,829 | | | 236,310 | |
| Mine operating (loss) earnings | | | | | (11,900 | ) | | 15,978 | |
| General and administrative expenses | | 8 | | | 21,428 | | | 17,493 | |
| Share-based payments | | | | | 7,375 | | | 8,295 | |
| Impairment of non-current assets | | 17 | | | 199,688 | | | 65,500 | |
| Mine care and maintenance costs | | 17 | | | 2,109 | | | — | |
| Acquisition costs | | 4 | | | 4,893 | | | — | |
| Foreign exchange loss (gain) | | | | | 1,874 | | | (4,314 | ) |
| Operating loss | | | | | (249,267 | ) | | (70,996 | ) |
| Investment and other loss | | 9 | | | (744 | ) | | (34 | ) |
| Finance costs | | 10 | | | (13,036 | ) | | (4,271 | ) |
| Loss before income taxes | | | | | (263,047 | ) | | (75,301 | ) |
| Income taxes | | | | | | | | | |
| Current income tax expense | | | | | 2,148 | | | 7,177 | |
| Deferred income tax recovery | | | | | (61,031 | ) | | (29,206 | ) |
| | | | | | (58,883 | ) | | (22,029 | ) |
| Net loss for the year | | | | $ | (204,164 | ) | $ | (53,272 | ) |
| Loss per common share | | | | | | | | | |
| Basic | | 11 | | | ($1.11 | ) | | ($0.32 | ) |
| Diluted | | 11 | | | ($1.11 | ) | | ($0.32 | ) |
| Weighted average shares outstanding | | | | | | | | | |
| Basic | | 11 | | | 183,650,405 | | | 165,293,893 | |
| Diluted | | 11 | | | 183,650,405 | | | 165,293,893 | |
Approved by the Board of Directors

The accompanying notes are an integral part of the audited consolidated financial statements.
| FIRST MAJESTIC SILVER CORP. | 42 | CONSOLIDATED FINANCIAL STATEMENTS |
CONSOLIDATED STATEMENTS OF COMPREHENSIVE (LOSS) INCOME
for the years ended December 31, 2018 and 2017
(in thousands of US dollars)
The Consolidated Statements of Comprehensive (Loss) Income provide a summary of total comprehensive earnings or loss and summarizes items recorded in other comprehensive income that may or may not be subsequently reclassified to profit or loss depending on future events.
| | | | | | YEAR ENDED DECEMBER 31, | |
| | | Note | | | 2018 | | | 2017 | |
| NET LOSS FOR THE YEAR | | | | $ | (204,164 | ) | $ | (53,272 | ) |
| Other comprehensive income (loss) | | | | | | | | | |
| Items that will not be subsequently reclassified to profit or loss: | | | | | | | | | |
| Unrealized loss on fair value of investments in marketable securities | | 14 | | | (510 | ) | | (479 | ) |
| Remeasurement of retirement benefit plan | | | | | 665 | | | — | |
| Other comprehensive income (loss) | | | | | 155 | | | (479 | ) |
| Total comprehensive loss | | | | $ | (204,009 | ) | $ | (53,751 | ) |
| CONSOLIDATED FINANCIAL STATEMENTS | 43 | ANNUAL REPORT 2018 |
CONSOLIDATED STATEMENTS OF CASH FLOWS
for the years ended December 31, 2018 and 2017
(in thousands of US dollars)
The Consolidated Statements of Cash Flows provide a summary of movements in cash and cash equivalents during the reporting periods by classifying them as operating, investing or financing activities.
| | | | | YEAR ENDED DECEMBER 31, | |
| | | Note | | 2018 | | | 2017 | |
| OPERATING ACTIVITIES | | | | | | | | |
| Net loss for the year | | | $ | (204,164 | ) | $ | (53,272 | ) |
| Adjustments for: | | | | | | | | |
| Depletion, depreciation and amortization | | | | 94,522 | | | 78,077 | |
| Share-based payments | | | | 7,375 | | | 8,295 | |
| Impairment of non-current assets | | 17 | | 199,688 | | | 65,500 | |
| Income tax recovery | | | | (58,883 | ) | | (22,028 | ) |
| Finance costs | | 10 | | 13,036 | | | 4,271 | |
| Acquisition costs | | 4 | | 4,893 | | | — | |
| Other | | 25 | | 5,094 | | | 143 | |
| Operating cash flows before movements in working capital and taxes | | | | 61,561 | | | 80,986 | |
| Net change in non-cash working capital items | | 25 | | (21,167 | ) | | (4,419 | ) |
| Income taxes paid | | | | (7,132 | ) | | (6,116 | ) |
| Cash generated by operating activities | | | | 33,262 | | | 70,451 | |
| INVESTING ACTIVITIES | | | | | | | | |
| Expenditures on mining interests | | | | (76,303 | ) | | (54,571 | ) |
| Acquisition of property, plant and equipment | | | | (35,005 | ) | | (20,941 | ) |
| Deposits paid for acquisition of non-current assets | | | | (2,942 | ) | | (416 | ) |
| Purchase of marketable securities and silver futures derivatives | | | | (720 | ) | | — | |
| Primero acquisition costs, net of cash acquired | | 4 | | (1,022 | ) | | — | |
| Cash spent on settlement of derivatives | | | | (1,049 | ) | | — | |
| Cash used in investing activities | | | | (117,041 | ) | | (75,928 | ) |
| FINANCING ACTIVITIES | | | | | | | | |
| Proceeds from exercise of stock options | | | | 3,943 | | | 5,740 | |
| Net proceeds from convertible debentures | | 19 (a) | | 151,079 | | | — | |
| Net proceeds from debt facilities | | 19 (b) | | 34,006 | | | — | |
| Repayment of debt facilities | | 19 (b) | | (16,000 | ) | | — | |
| Repayment of Scotia debt facilities | | 19 (c) | | (32,072 | ) | | (12,726 | ) |
| Repayment of Primero’s debt facilities | | 19 (d) | | (106,110 | ) | | — | |
| Proceeds from equipment financing obligations | | 20 (b) | | — | | | 7,894 | |
| Repayment of equipment financing obligations | | 20 (b) | | (3,546 | ) | | (6,781 | ) |
| Finance costs paid | | | | (4,471 | ) | | (2,779 | ) |
| Shares repurchased and cancelled | | 23 (d)(e) | | (1,386 | ) | | — | |
| Cash provided by (used in) financing activities | | | | 25,443 | | | (8,652 | ) |
| Effect of exchange rate on cash and cash equivalents held in foreign currencies | | | | (2,792 | ) | | 3,221 | |
| Decrease in cash and cash equivalents | | | | (58,336 | ) | | (14,129 | ) |
| Cash and cash equivalents, beginning of the year | | | | 118,141 | | | 129,049 | |
| Cash and cash equivalents, end of year | | | $ | 57,013 | | $ | 118,141 | |
| Cash | | | $ | 40,352 | | $ | 77,411 | |
| Short-term investments | | | | 16,661 | | | 40,730 | |
| Cash and cash equivalents, end of year | | | $ | 57,013 | | $ | 118,141 | |
| Supplemental cash flow information | | 25 | | | | | | |
The accompanying notes are an integral part of the audited consolidated financial statements.
| FIRST MAJESTIC SILVER CORP. | 44 | CONSOLIDATED FINANCIAL STATEMENTS |
CONSOLIDATED STATEMENTS OF FINANCIAL POSITION
as at December 31, 2018 and 2017
(in thousands of US dollars)
The Consolidated Statements of Financial Position provides a summary of assets, liabilities and equity, as well as their current versus non-current nature, as at the reporting date.
| | | Note | | December 31, 2018 | | | December 31, 2017 | |
| ASSETS | | | | | | | | |
| | | | | | | | | |
| Current assets | | | | | | | | |
| Cash and cash equivalents | | | $ | 57,013 | | $ | 118,141 | |
| Trade and other receivables | | 12 | | 5,599 | | | 5,378 | |
| Value added taxes receivable | | 24 (c) | | 59,665 | | | 14,984 | |
| Income taxes receivable | | | | 982 | | | 493 | |
| Inventories | | 13 | | 32,468 | | | 18,858 | |
| Other financial assets | | 14 | | 8,458 | | | 11,326 | |
| Prepaid expenses and other | | | | 2,089 | | | 1,478 | |
| Total current assets | | | | 166,274 | | | 170,658 | |
| Non-current assets | | | | | | | | |
| Mining interests | | 15 | | 435,613 | | | 374,146 | |
| Property, plant and equipment | | 16 | | 251,084 | | | 192,052 | |
| Deposits on non-current assets | | | | 3,464 | | | 869 | |
| Non-current income taxes receivable | | 26 | | 18,737 | | | — | |
| Deferred tax assets | | 22 | | 50,938 | | | 43,716 | |
| Total assets | | | $ | 926,110 | | $ | 781,441 | |
| LIABILITIES AND EQUITY | | | | | | | | |
| Current liabilities | | | | | | | | |
| Trade and other payables | | 18 | $ | 50,183 | | $ | 35,567 | |
| Unearned revenue | | 6 | | 3,769 | | | 2,190 | |
| Current portion of debt facilities | | 19 | | 1,281 | | | 12,464 | |
| Current portion of equipment financing obligations | | 20 | | 2,904 | | | 4,154 | |
| Total current liabilities | | | | 58,137 | | | 54,375 | |
| Non-current liabilities | | | | | | | | |
| Debt facilities | | 19 | | 148,231 | | | 19,305 | |
| Equipment financing obligations | | 20 | | 2,943 | | | 5,151 | |
| Decommissioning liabilities | | 21 | | 27,796 | | | 16,076 | |
| Other liabilities | | | | 3,787 | | | 655 | |
| Deferred tax liabilities | | 22 | | 90,643 | | | 103,394 | |
| Total liabilities | | | $ | 331,537 | | $ | 198,956 | |
| EQUITY | | | | | | | | |
| Share capital | | | | 827,622 | | | 636,672 | |
| Equity reserves | | | | 88,030 | | | 62,303 | |
| Accumulated deficit | | | | (321,079 | ) | | (116,490 | ) |
| Total equity | | | $ | 594,573 | | $ | 582,485 | |
| Total liabilities and equity | | | $ | 926,110 | | $ | 781,441 | |
Commitments (Note 15; Note 24(c)); Subsequent events (Note 29)
| CONSOLIDATED FINANCIAL STATEMENTS | 45 | ANNUAL REPORT 2018 |
CONSOLIDATED STATEMENTS OF CHANGES IN EQUITY
for the years ended December 31, 2018 and 2017
(in thousands of US dollars except share and per share amounts)
The Consolidated Statements of Changes in Equity summarizes movements in equity, including common shares, share capital, equity reserves and retained earnings or accumulated deficit.
| | | SHARE CAPITAL | | | EQUITY RESERVES | | | | | | | |
| | | | | | | | | | | | | | | | | | Equity | | | | | | | | | | |
| | | | | | | | | | | | Other | | | | | | component of | | | | | | | | | | |
| | | | | | | | | Share-based | | | comprehensive | | | Retirement | | | convertible | | | Total equity | | | Accumulated | | | | |
| | | Shares | | | Amount | | | payments(a) | | | income(b) | | | Benefit Plan(c) | | | debenture(d) | | | reserves | | | deficit | | | Total equity | |
| Balance atDecember 31, 2016 | | 164,461,567 | | $ | 628,565 | | $ | 58,879 | | $ | (2,525 | ) | $ | — | | $ | — | | $ | 56,354 | | $ | (63,218 | ) | $ | 621,701 | |
| Net loss for the year | | — | | | — | | | — | | | — | | | — | | | — | | | — | | | (53,272 | ) | | (53,272 | ) |
| Other comprehensive loss | | — | | | — | | | — | | | (479 | ) | | — | | | — | | | (479 | ) | | — | | | (479 | ) |
| Totalcomprehensive loss | | — | | | — | | | — | | | (479 | ) | | — | | | — | | | (479 | ) | | (53,272 | ) | | (53,751 | ) |
| Share-based payments | | — | | | — | | | 8,295 | | | — | | | — | | | — | | | 8,295 | | | — | | | 8,295 | |
| Shares issued for: | | | | | | | | | | | | | | | | | | | | | | | | | | | |
| Exercise of stock options (Note 23(b)) | | 1,292,206 | | | 7,607 | | | (1,867 | ) | | — | | | — | | | — | | | (1,867 | ) | | — | | | 5,740 | |
| Settlement of liabilities | | 70,391 | | | 500 | | | — | | | — | | | — | | | — | | | — | | | — | | | 500 | |
| Balance atDecember 31, 2017 | | 165,824,164 | | $ | 636,672 | | $ | 65,307 | | $ | (3,004 | ) | $ | — | | $ | — | | $ | 62,303 | | $ | (116,490 | ) | $ | 582,485 | |
| Net loss for the year | | — | | | — | | | — | | | — | | | — | | | — | | | — | | | (204,164 | ) | | (204,164 | ) |
| Other comprehensive income | | — | | | — | | | — | | | (510 | ) | | 665 | | | — | | | 155 | | | — | | | 155 | |
| Totalcomprehensive(loss) income | | — | | | — | | | — | | | (510 | ) | | 665 | | | — | | | 155 | | | (204,164 | ) | | (204,009 | ) |
| Share-based payments | | — | | | — | | | 7,375 | | | — | | | — | | | — | | | 7,375 | | | — | | | 7,375 | |
| Equity component of convertible debenture, net of tax (Note 19(c)) | | — | | | — | | | | | | — | | | — | | | 19,164 | | | 19,164 | | | — | | | 19,164 | |
| Shares issued for: | | | | | | | | | | | | | | | | | | | | | | | | | | | |
| Exercise of stock options (Note 23(b)) | | 973,948 | | | 4,910 | | | (967 | ) | | — | | | — | | | — | | | (967 | ) | | — | | | 3,943 | |
| Acquisition of Primero (Note 4) | | 27,333,184 | | | 186,959 | | | | | | — | | | — | | | — | | | — | | | — | | | 186,959 | |
| Settlement of liabilities | | 92,110 | | | 500 | | | — | | | — | | | — | | | — | | | — | | | — | | | 500 | |
| Shares cancelled | | (105,728 | ) | | (458 | ) | | — | | | — | | | — | | | — | | | — | | | — | | | (458 | ) |
| Shares repurchased and cancelled (Note 23(d)) | | (230,000 | ) | | (899 | ) | | | | | — | | | — | | | — | | | — | | | (390 | ) | | (1,289 | ) |
| Shares repurchased for delisting from Bolsa (Note 23(e)) | | (14,343 | ) | | (62 | ) | | | | | — | | | — | | | — | | | — | | | (35 | ) | | (97 | ) |
| Balance atDecember 31, 2018 | | 193,873,335 | | $ | 827,622 | | $ | 71,715 | | $ | (3,514 | ) | $ | 665 | | $ | 19,164 | | $ | 88,030 | | $ | (321,079 | ) | $ | 594,573 | |
| (a) | Share-based payments reserve records the cumulative amount recognized under IFRS 2 share-based payments in respect of options granted and shares purchase warrants issued but not exercised to acquire shares of the Company. |
| | |
| (b) | Other comprehensive income reserve principally records the unrealized fair value gains or losses related to fair value through other comprehensive income (“FVTOCI”) financial instruments. |
| | |
| (c) | Retirement benefit plan reserve records re-measurements arising from actuarial gains or losses and return on plan assets in relation to San Dimas’ retirement benefit plan. |
| | |
| (d) | Equity component of convertible debenture reserve represents the estimated fair value of its conversion option of $26.3 million, net of deferred tax effect of $7.1 million. This amount is not subsequently remeasured and will remain in equity until the conversion option is exercised, in which case, the balance recognized in equity will be transferred to share capital. Where the conversion option remains unexercised at the maturity date of the convertible note, the balance will remain in equity reserves. |
The accompanying notes are an integral part of the audited consolidated financial statements.
| FIRST MAJESTIC SILVER CORP. | 46 | CONSOLIDATED FINANCIAL STATEMENTS |
NOTES TO AUDITED CONSOLIDATED FINANCIAL STATEMENTS
(tabular amounts are expressed in thousands of US dollars)
| 1. | NATURE OF OPERATIONS |
| | |
| First Majestic Silver Corp. (the “Company” or “First Majestic”) is in the business of silver production, development, exploration, and acquisition of mineral properties with a focus on silver production in Mexico. |
| | |
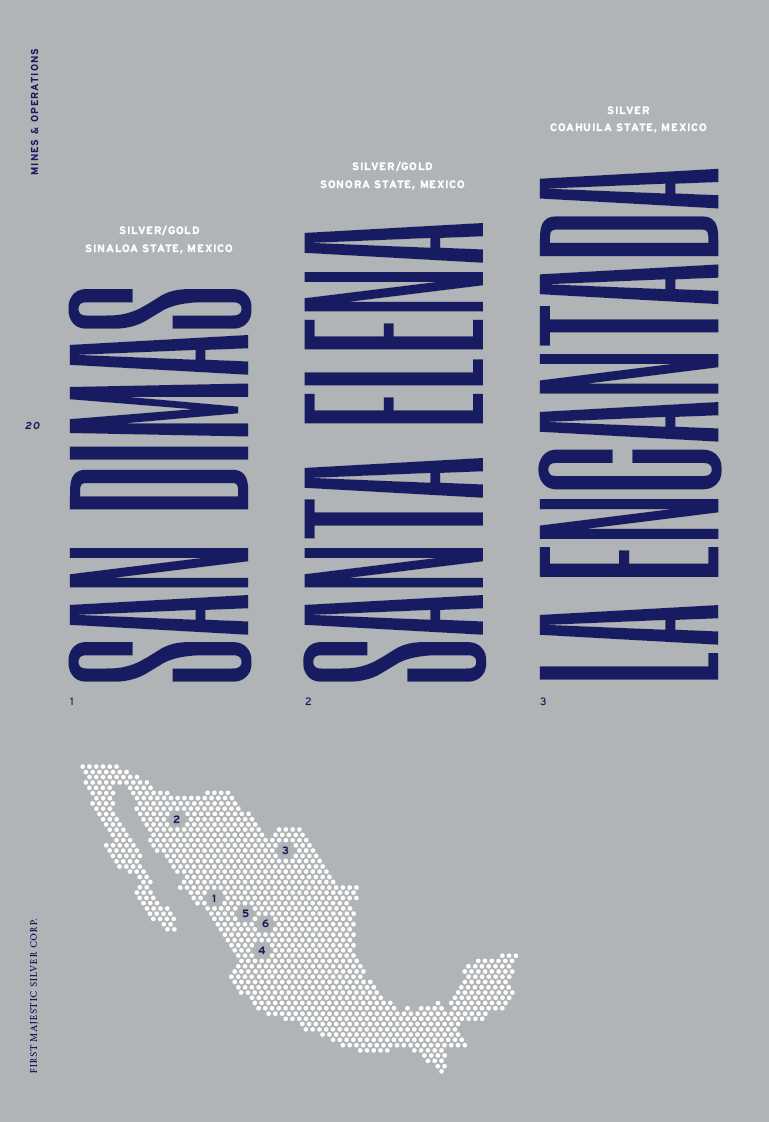
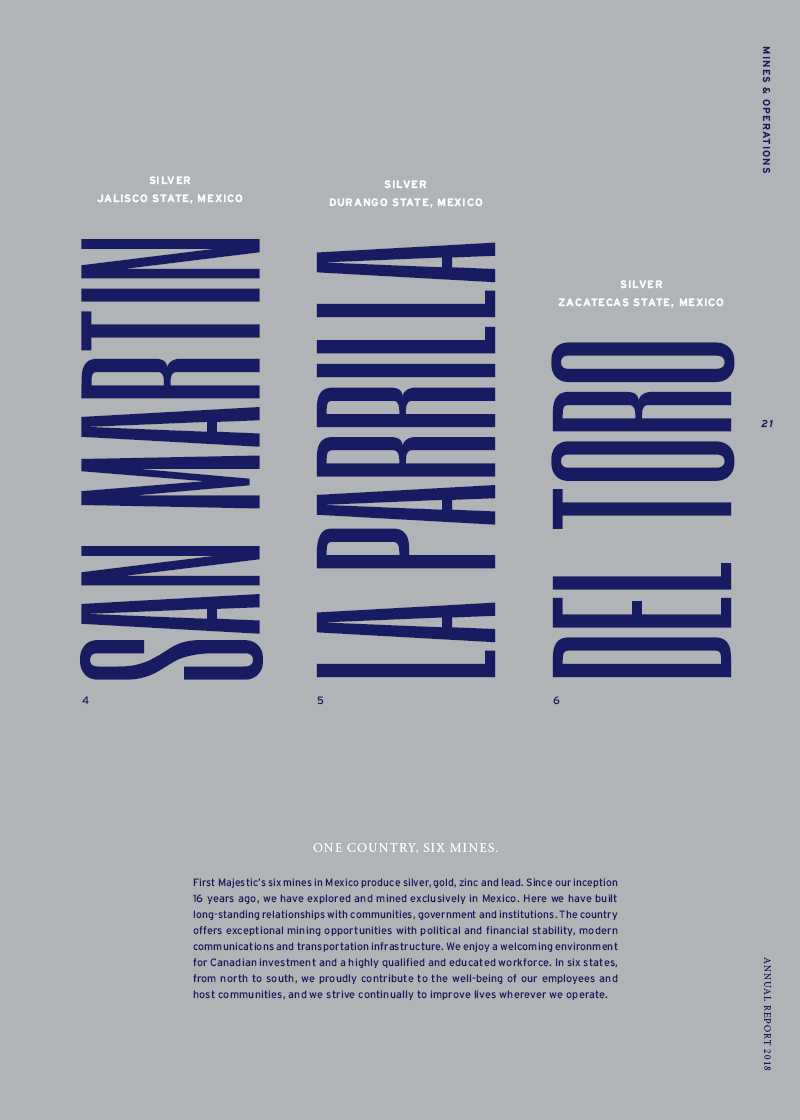
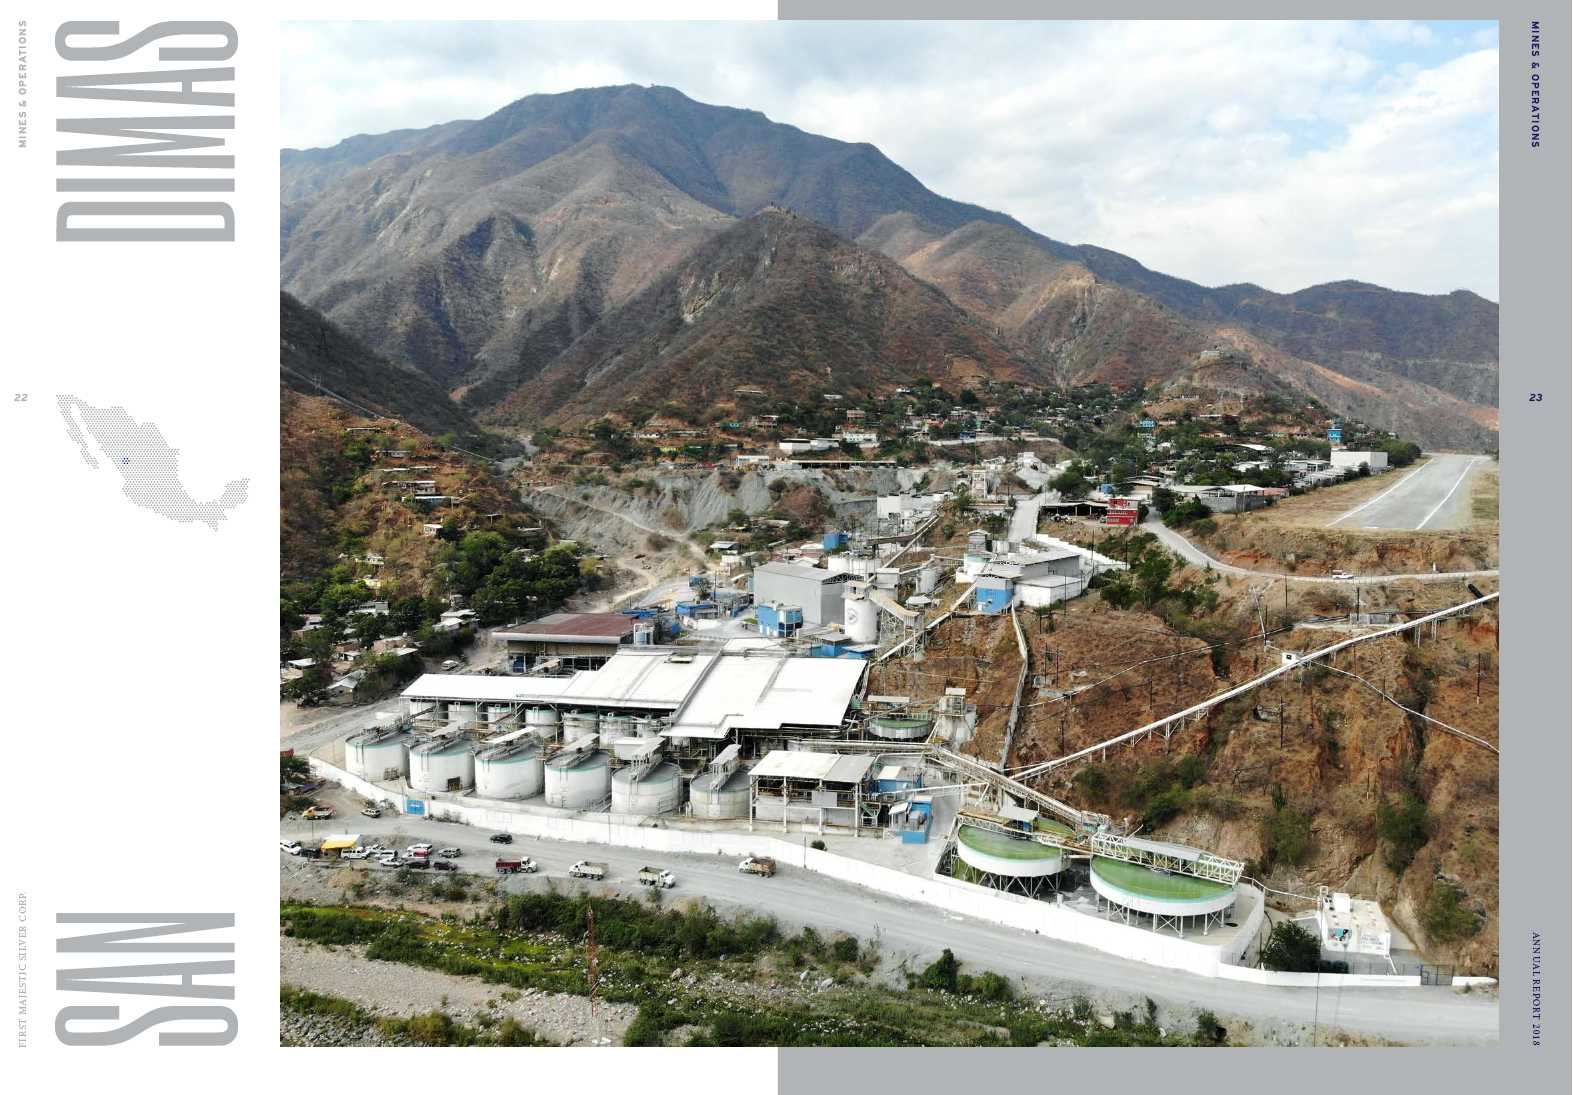
| With the addition of the San Dimas Silver/Gold Mine on May 10, 2018 (Note 4), the Company owns and operates six producing mines: the San Dimas Silver/Gold Mine, the Santa Elena Silver/ Gold Mine, the La Encantada Silver Mine, the San Martin Silver Mine, the La Parrilla Silver Mine and the Del Toro Silver Mine. |
| | |
| In August 2018, the Company placed the La Guitarra Silver Mine under care and maintenance and is currently reviewing strategic options including the potential sale of the operation. |
| | |
| First Majestic is incorporated in Canada with limited liability under the legislation of the Province of British Columbia and is publicly listed on the New York Stock Exchange under the symbol “AG”, on the Toronto Stock Exchange under the symbol “FR” and on the Frankfurt Stock Exchange under the symbol “FMV”. The Company’s head office and principal address is located at 925 West Georgia Street, Suite 1800, Vancouver, British Columbia, Canada, V6C 3L2. |
| | |
| 2. | BASIS OF PRESENTATION |
| | |
| These audited consolidated financial statements have been prepared in accordance with International Financial Reporting Standards as issued by the International Accounting Standards Board (“IFRS”). The significant accounting policies, estimates and judgments applied in preparing these consolidated financial statements are summarized in Note 3 of the consolidated financial statements and have been consistently applied throughout all periods presented. |
| | |
| These audited consolidated financial statements have been prepared on an historical cost basis except for certain items that are measured at fair value including derivative financial instruments (Note 24(a)) and other financial assets (Note 14). All dollar amounts presented are in thousands of United States dollars unless otherwise specified. |
| | |
| These audited consolidated financial statements incorporate the financial statements of the Company and its controlled subsidiaries. Control exists when the Company has the power, directly or indirectly, to govern the financial and operating policies of an entity so as to obtain benefits from its activities. The consolidated financial statements include the accounts of the Company and its subsidiaries (see Note 27). Intercompany balances, transactions, income and expenses are eliminated on consolidation. |
| | |
| These audited consolidated financial statements of First Majestic Silver Corp. for the years ended December 31, 2018 and 2017 were approved and authorized for issue by the Board of Directors on February 22, 2019. |
| 3. | SIGNIFICANT ACCOUNTING POLICIES, ESTIMATES AND JUDGMENTS |
| | |
| The preparation of audited consolidated financial statements in conformity with IFRS requires management to make judgments, estimates and assumptions about future events that affect the reported amounts of assets and liabilities at the date of the financial statements and the reported amounts of revenue and expenses during the reporting period. Although these estimates are based on management’s best knowledge of the amounts, events or actions, actual results may differ from these estimates. |
| | |
| New and amended IFRS standards that are effective for the current year |
| | |
| Financial Instruments |
| | |
| On January 1, 2018, the Company adopted IFRS 9 –Financial Instruments(“IFRS 9”) which replaced IAS 39 –Financial Instruments: Recognition and Measurement(“IAS 39”) using the modified retrospective approach. IFRS 9 is effective for annual periods beginning on or after January 1, 2018 and provides a revised model for recognition and measurement of financial instruments; a single, forward-looking expected loss impairment model; and includes significant changes to hedge accounting. IFRS 9 did not impact the Company’s classification and measurement of financial assets and liabilities except for equity securities as described below. The standard also had negligible impact on the carrying amounts of our financial instruments at the transition date. |
| | |
| The following summarizes the significant changes in IFRS 9 compared to the previous standard: |
| | • | IFRS 9 uses a single approach to determine whether a financial asset is classified and measured at amortized cost or fair value. The classification and measurement of financial assets is based on the Company’s business models for managing its financial assets and whether the contractual cash flows represent solely payments for principal and interest. Most of the requirements in IAS 39 for classification and measurement of financial liabilities were carried forward in IFRS 9. The change did not impact the carrying amounts of any of our financial assets on transition date. Upon adoption of IFRS 9, the Company designated its marketable securities previously designated as available- for-sale (“AFS”) as financial assets at fair value through other comprehensive income (“FVTOCI”), where they will be recorded initially at fair value. Subsequent changes in fair value will be recognized in other comprehensive income only and will not be transferred into earnings (loss) upon disposition. This did not impact the Company’s financial statements as at the date of adoption. However, as a result of this designation, the net change in fair value of the marketable securities classified at FVTOCI, including realized and unrealized gains and losses, if any, is now presented as an item that will not be reclassified subsequently to net earnings. The Company’s investments in marketable securities previously classified as held for trading continue to be measured at fair value with changes in fair value recognized in profit or loss (“FVTPL”). |
| CONSOLIDATED FINANCIAL STATEMENTS | 47 | ANNUAL REPORT 2018 |
NOTES TO AUDITED CONSOLIDATED FINANCIAL STATEMENTS
(tabular amounts are expressed in thousands of US dollars)
| 3. | SIGNIFICANT ACCOUNTING POLICIES, ESTIMATES AND JUDGMENTS(continued) |
| | |
| New and amended IFRS standards that are effective for the current year(continued) |
| | |
| Financial Instruments(continued) |
| | • | The adoption of the new “expected credit loss” impairment model under IFRS 9, as opposed to an incurred credit loss model under IAS 39, had a negligible impact on the carrying amounts of our financial assets on the transition date given the Company transacts exclusively with large international financial institutions and other organizations with strong credit ratings and the negligible historical level of customer default. |
| | | |
| | • | The new general hedge accounting requirements retain the three types of hedge accounting mechanisms previously available under IAS 39. Under IFRS 9 however, greater flexibility has been introduced to the types of transactions eligible for hedge accounting, specifically broadening the types of instruments that qualify for hedging instruments and the types of risk components of non-financial items that are eligible for hedge accounting. In addition, the effectiveness test has been replaced with the principle of an “economic relationship” and retrospective assessment of hedge effectiveness is no longer required. Enhanced disclosure requirements about an entity’s risk management activities have also been introduced. The Company did not have any hedges in place as at December 31, 2017 and has not designated any of its financial instruments as hedges upon adoption of IFRS 9. |
The Company has also adopted a narrow scope amendment to IFRS 7 –Financial Instruments – Disclosures.As a result of applying the amendment, the Company will add disclosure relating to its risk management strategies if hedge accounting is applied.
Revenue Recognition
On January 1, 2018, the Company adopted IFRS 15 –“Revenue from Contracts with Customers”(“IFRS 15”) which supersedes IAS 18 –“Revenue”(“IAS 18”). IFRS 15 establishes a single five-step model framework for determining the nature, amount, timing and uncertainty of revenue and cash flows arising from a contract with a customer. The standard is effective for annual periods beginning on or after January 1, 2018. The Company adopted the standard on January 1, 2018 using the full retrospective approach without applying any practical expedients.
IFRS 15 requires entities to recognize revenue when control of goods or services transfers to the customer whereas the previous standard, IAS 18, required entities to recognize revenue when the risks and rewards of the goods or services transfer to the customer. The Company concluded there is no change in the timing of revenue recognition of its doré and concentrate sales under IFRS 15 compared to the previous standard as the point of transfer of risks and rewards of goods and services and transfer of control occur at the same time. Therefore, no adjustment was required to the Company’s financial statements.
In addition, IFRS 15 requires entities to apportion the transaction price attributable to contracts from customers to distinct performance obligations on a relative standalone selling price basis. In accordance with the terms of some of the Company’s concentrate agreements, the Company must contract for and pay the shipping and insurance costs necessary to bring the goods to the named destination. Therefore a portion of the revenue earned under these contracts, representing the obligation to fulfill the shipping and insurance services that occur after the transfer of control, is deferred and recognized over time as the obligations are fulfilled. The impact of this change was insignificant to the Company’s financial statements.
IFRS 15 also requires that variable consideration should only be recognized to the extent that it is highly probable that a significant reversal in the amount of cumulative revenue recognized will not occur. The Company concluded that the adjustments relating to the final assay results for the quantity and quality of concentrate sold are not significant and does not constrain the recognition of revenue.
IFRS 15 contains presentation and disclosure requirements which are more detailed than the previous standards, including disclosures for each of the Company’s material revenue streams, the timing of completion of the Company’s performance obligations and the portion of revenue related to provisional pricing adjustments on concentrate sales. These disclosures were included in the revenue note disclosure (Note 6).
Other narrow scope amendments/interpretations
The Company has adopted narrow scope amendments/ interpretations to IFRIC 22 –Foreign Currency Transactions and Advance Consideration,IFRS 2 –Share-Based Paymentsand IAS 1 –Presentation of Financial Statements,which did not have an impact on the Company’s Consolidated Financial Statements.
In preparing the Company’s consolidated financial statements for the years ended December 31, 2018 and 2017, the Company applied the following significant accounting policies and associated significant estimates and critical judgments:
Business Combinations
ACCOUNTING POLICY:
Acquisitions of businesses are accounted for using the acquisition method. The consideration of each business combination is measured, at the date of the exchange, as the aggregate of the fair value of assets given, liabilities incurred or assumed and equity instruments issued by the Company to the former owners of the acquiree in exchange for control of the acquiree. Acquisition-related costs incurred for the business combination are expensed. The acquiree’s identifiable assets, liabilities and contingent liabilities are recognized at their fair value at the acquisition date.
Goodwill arising on acquisition is recognized as an asset and initially measured at cost, being the excess of the consideration of the acquisition over the Company’s interest in the fair value of the net identifiable assets, liabilities and contingent liabilities recognized. If the Company’s interest in the fair value of the acquiree’s net identifiable assets, liabilities and contingent liabilities exceeds the cost of the acquisition, the excess is recognized in earnings or loss immediately. Goodwill may also arise as a result of the requirement under IFRS to record a deferred tax liability on the excess of the fair value of the acquired assets over their corresponding tax bases, with the corresponding offset recorded as goodwill.
The accompanying notes are an integral part of the audited consolidated financial statements.
| FIRST MAJESTIC SILVER CORP. | 48 | CONSOLIDATED FINANCIAL STATEMENTS |
NOTES TO AUDITED CONSOLIDATED FINANCIAL STATEMENTS
(tabular amounts are expressed in thousands of US dollars)
| 3. | SIGNIFICANT ACCOUNTING POLICIES, ESTIMATES AND JUDGMENTS(continued) |
| | | |
| Business Combinations(continued) ACCOUNTING ESTIMATES AND JUDGMENTS: |
| Determination of a Business |
| | | |
| Determination of whether a set of assets acquired and liabilities assumed constitute a business may require the Company to make certain judgments, taking into account all facts and circumstances. A business consists of inputs, including non-current assets and processes, including operational processes, that when applied to those inputs have the ability to create outputs that provide a return to the Company and its shareholders. |
| | | |
| In 2018, the Company concluded that Primero Mining Corp. (“Primero”) met the definition of a business and, accordingly, the acquisition was accounted for as a business combination (Note 4). |
| | | |
| ACCOUNTING ESTIMATES AND JUDGMENTS: |
| Fair Value Estimates |
| | | |
| In business combinations, it generally requires time to obtain the information necessary to identify and measure the following as of the acquisition date: |
| | | |
| (i) | The identifiable assets acquired and liabilities assumed; |
| | | |
| (ii) | The consideration transferred in exchange for an interest in the acquiree; |
| | | |
| (iii) | The resulting goodwill. |
If the initial accounting for a business combination is incomplete by the end of the reporting period in which the combination occurs, the Company reports in its consolidated financial statements provisional amounts for the items for which the accounting is incomplete.
During the allowable measurement period, the Company will retrospectively adjust the provisional amounts recognized at the acquisition date to reflect new information obtained about facts and circumstances that existed as of the acquisition date and, if known, would have affected the measurement of the amounts recognized as of that date. The Company may also recognize additional assets or liabilities if new information is obtained about facts and circumstances that existed as of the acquisition date and, if known, would have resulted in the recognition of those assets and liabilities as of that date. The measurement period ends as soon as the Company receives the information it was seeking about facts and circumstances that existed as of the acquisition date or learns that more information is not obtainable and shall not exceed one year from the acquisition date.
As at December 31, 2018, the purchase consideration for the acquisition of Primero Mining Corp. (“Primero”) has been allocated on a preliminary basis based on management’s best estimates at the time these consolidated financial statements were prepared. The Company is continuing its review to determine the fair value of mining interests, the recoverability of value added tax receivables that are in arrears (see Note 24(c)) and the outcome of the APA Ruling (see Note 26) during the allowable measurement period, which shall not exceed one year from the acquisition date. Any future changes to the purchase price allocation may result in adjustments to recognized assets, acquired liabilities and/or goodwill.
ACCOUNTING ESTIMATES AND JUDGMENTS:
Consideration for the Acquisition of Primero
Acquisitions of businesses are accounted for using the acquisition method. The consideration of each business combination is measured, at the date of the exchange, as the aggregate of the fair value of assets given, liabilities incurred or assumed and equity instruments issued by the Company to the former owners of the acquiree in exchange for control of the acquiree.
In determining the total consideration for the acquisition of Primero, the Company included consideration issued to Wheaton Precious Metals Corp. (“WPM”) on the basis that WPM is, in substance, an owner of Primero given the following:
| | (i) | The requirement of consent by WPM to a change in control for Primero; |
| | | |
| | (ii) | WPM was a guarantor of certain of Primero’s debt facilities and also guarantees through the previous stream agreement which would have resulted in WPM having a significant interest in the residual assets of Primero in the event of a bankruptcy or default; and |
| | | |
| | (iii) | The plan of arrangement for the acquisition of Primero was contemplated together and neither transactions would have been economical without considering the other. |
Therefore, management included consideration issued to WPM for the restructuring of the New Stream as part of the consideration for the business combination.
Goodwill
ACCOUNTING POLICY:
Goodwill arising on the acquisition of a business is carried at cost as established at the date of the acquisition less accumulated impairment losses, if any. As at December 31, 2018, the Company had $nil goodwill (2017 – $nil).
Goodwill is allocated to each of the Company’s cash-generating units that is expected to benefit from the synergies of the acquisition. A cash-generating unit to which goodwill has been allocated is tested for impairment annually, or more frequently when there is an indication that the unit may be impaired. If the recoverable amount of the cash-generating unit is less than its carrying amount, the impairment loss is allocated first to reduce the carrying amount of any goodwill allocated to the unit and then to the other assets of the unit pro-rata based on the carrying amount of each asset in the unit. Any impairment loss for goodwill is recognized directly in profit or loss in the consolidated statements of earnings or loss. An impairment loss recognized for goodwill is not reversed in subsequent periods.
Foreign Currency
ACCOUNTING POLICY:
The consolidated financial statements are presented in U.S. dollars. The individual financial statements of each entity are presented in their functional currency, which is the currency of the primary economic environment in which the entity operates.
Transactions in foreign currencies are translated into the entities’ functional currencies at the exchange rates at the date of the transactions. Monetary assets and liabilities of the Company’s operations denominated in a currency other than the U.S. dollar are translated using exchange rates prevailing at the date of the statement of financial position.
| CONSOLIDATED FINANCIAL STATEMENTS | 49 | ANNUAL REPORT 2018 |
NOTES TO AUDITED CONSOLIDATED FINANCIAL STATEMENTS
(tabular amounts are expressed in thousands of US dollars)
| 3. | SIGNIFICANT ACCOUNTING POLICIES, ESTIMATES AND JUDGMENTS(continued) |
| | |
| Foreign Currency(continued) ACCOUNTING POLICY (continued) |
| | |
| Non-monetary items that are measured in terms of historical cost in a foreign currency are translated using the exchange rates on the dates of the transactions. Revenue and expense items are translated at the exchange rates in effect at the date of the underlying transaction, except for depletion and depreciation related to non-monetary assets, which are translated at historical exchange rates. Exchange differences are recognized in the statements of earnings or loss in the period in which they arise. |
| | |
| ACCOUNTING ESTIMATES AND JUDGMENTS: |
| | |
| Determination of Functional Currency |
| | |
| The functional currency for each of the Company’s subsidiaries is the currency of the primary economic environment in which the entity operates. The Company has determined that the functional currency of each entity is the U.S. dollar. Determination of functional currency may involve certain judgments to determine the primary economic environment and the Company reconsiders the functional currency of its entities if there is a change in events and conditions which determined the primary economic environment. |
| | |
| Revenue Recognition(Note 5) ACCOUNTING POLICY: |
| | |
| The Company’s primary product is silver. Other metals, such as gold, lead and zinc, produced as part of the extraction process are considered to be by-products arising from the production of silver. Smelting and refining charges are net against revenue from the sale of metals. |
| | |
| Revenue relating to the sale of metals is recognized when control of the metal or related services are transferred to the customer in an amount that reflects the consideration the Company expects to receive in exchange for the metals. |
| | |
| When considering whether the Company has satisfied its performance obligation, it considers the indicators of the transfer of control, which include, but are not limited to, whether: the Company has a present right to payment; the customer has legal title to the asset; the Company has transfered physical possession of the asset to the customer; and the customer has the significant risks and rewards of ownership of the asset. |
| | |
| Metals in doré sold are priced on date of transfer of control. Final weights and assays are adjusted on final settlement which is approximately one month after delivery. Metals in concentrate sold are provisionally priced at the date of transfer of control as the final selling price is subject to movements in the monthly average prices up to the final settlement date, typically one to three months after delivery to the customer. Upon transfer of control of the concentrate, the Company recognizes revenue on a provisional basis based on spot price and, at each period end, subsequently re-estimated by reference to forward market prices of the estimated month of settlement, with the impact of changes in the forward market prices recognized as revenue adjustments as they occur until final settlement. |
Revenue from the sale of coins, ingots and bullion is recorded when the products have been shipped and funds have been received. When cash was received from customers prior to shipping of the related finished goods, the amounts are recorded as unearned revenue until the products are shipped.
ACCOUNTING ESTIMATES AND JUDGMENTS:
Determination of Performance Obligations
The Company applied judgment to determine if a good or service that is promised to a customer is distinct based on whether the customer can benefit from the good or service on its own or together with other readily available resources and whether the good or service is separately identifiable.
Based on these criteria, the Company determined the primary performance obligation relating to its sales contracts is the delivery of the bullion, doré and concentrates. Shipping and insurance services arranged by the Company for its concentrate sales customers that occur after the transfer of control are also considered to be performance obligations.
ACCOUNTING ESTIMATES AND JUDGMENTS:
Variable Consideration
Variable consideration should only be recognized to the extent that it is highly probable that a significant reversal in the amount of cumulative revenue recognized will not occur.
The Company identified a variable component of its revenue for concentrate sales relating to adjustments to the final sales price based on differences between the original and final assay results relating to the quantity and quality of concentrate shipments. Based on the Company’s proficiency in its assaying process, evidenced by the insignificant amount of historical adjustments from the initial to final assays, the Company concluded the variability in consideration caused by assaying results was negligible. Therefore, the Company does not expect a significant amount of reversal in revenue related to assaying differences.
The Company applied judgment to determine the amount of variable consideration to be recognized during the period for which the likelihood of significant reversal is low.
Inventories(Note 13)
ACCOUNTING POLICY:
Mineral inventories, including stockpiled ore, work in process and finished goods, are valued at the lower of weighted average cost and estimated net realizable value. Cost includes all direct costs incurred in production including direct labour and materials, freight, depreciation and amortization and directly attributable overhead costs. Net realizable value is calculated as the estimated price at the time of sale based on prevailing and future metal prices less estimated future production costs to convert the inventories into saleable form.
Any write-downs of inventory to net realizable value are recorded as cost of sales. If there is a subsequent increase in the value of inventories, the previous write-downs to net realizable value are reversed to the extent that the related inventory has not been sold.
The accompanying notes are an integral part of the audited consolidated financial statements.
| FIRST MAJESTIC SILVER CORP. | 50 | CONSOLIDATED FINANCIAL STATEMENTS |
NOTES TO AUDITED CONSOLIDATED FINANCIAL STATEMENTS
(tabular amounts are expressed in thousands of US dollars)
| 3. | SIGNIFICANT ACCOUNTING POLICIES, ESTIMATES AND JUDGMENTS(continued) |
| | |
| Inventories (Note 13) (continued) ACCOUNTING POLICY(continued) |
| | |
| Stockpiled ore inventory represents ore that has been extracted from the mine and is available for further processing. Costs added to stockpiled ore inventory are valued based on current mining cost per tonne incurred up to the point of stockpiling the ore and are removed at the weighted average cost per tonne. Stockpiled ore tonnage is verified by periodic surveys and physical counts. |
| | |
| Work in process inventory includes precipitates, inventories in tanks and in the milling process. Finished goods inventory includes metals in their final stage of production prior to sale, including primarily doré and dried concentrates at our operations and finished goods in-transit. |
| | |
| Materials and supplies inventories are valued at the lower of weighted average cost and net realizable value. Costs include acquisition, freight and other directly attributable costs. |
| | |
| Exploration and Evaluation Expenditures (Note 15) ACCOUNTING POLICY: Exploration and evaluation activity involves the search for mineral resources, the determination of technical feasibility and the assessment of commercial viability of an identified resource. Exploration and evaluation activity includes: |
| | • | acquiring the rights to explore; |
| | | |
| | • | researching and analyzing historical exploration data; |
| | | |
| | • | gathering exploration data through topographical, geochemical and geophysical studies; |
| | | |
| | • | exploratory drilling, trenching and sampling; |
| | | |
| | • | determining and examining the volume and grade of the resource; |
| | | |
| | • | surveying transportation and infrastructure requirements; and |
| | | |
| | • | compiling pre-feasibility and feasibility studies. |
Capitalization of exploration and evaluation expenditures commences on acquisition of a beneficial interest or option in mineral rights. Capitalized costs are recorded as mining interests at cost less impairment charges, if applicable. No amortization is charged during the exploration and evaluation phase as the asset is not available for use.
The majority of the Company’s exploration and evaluation expenditures focus on mineral deposits in proximity to its existing mining operations. Where the Company is acquiring a new property, the Company makes a preliminary evaluation to determine that the property has significant potential to develop an economic ore body.
Exploration and evaluation expenditures are transferred to development or producing mining interests when technical feasibility and commercial viability of the mineral resource have been demonstrated. Factors taken into consideration include:
| | • | there is sufficient geological certainty of converting the mineral deposit into proven and probable reserves; |
| | | |
| | • | life of mine plan and economic modeling support the economic extraction of such reserves and resources; |
| | • | for new properties, a scoping study and/or feasibility study demonstrates that the additional reserves and resources will generate a positive economic outcome; and |
| | | |
| | • | operating and environmental permits exist or are reasonably assured as obtainable. |
Exploration and evaluation expenditures remain as exploration mining interests and do not qualify as producing mining interests until the aforementioned criteria are met. Exploration and evaluation expenditures are transferred to development or producing mining interests when the technical feasibility and commercial viability of a mineral resource has been demonstrated according to the above mentioned factors.
ACCOUNTING ESTIMATES AND JUDGMENTS:
Economic recoverability and probability of future economic benefits of exploration, evaluation and development costs
Management has determined that exploratory drilling, evaluation, development and related costs incurred which were capitalized have potential future economic benefits and are potentially economically recoverable, subject to impairment analysis. Management uses several criteria in its assessments of economic recoverability and probability of future economic benefit including geologic and metallurgic information, history of conversion of mineral deposits to proven and probable reserves, scoping and feasibility studies, accessible facilities, existing permits and life of mine plans.
Mining Interests (Note 15)
ACCOUNTING POLICY:
Exploration, development and field support costs directly related to mining interests are deferred until the property to which they directly relate is placed into production, sold, abandoned or subject to a condition of impairment. The deferred costs are amortized over the useful life of the ore body following commencement of production, or written off if the property is sold or abandoned. Administration costs and other exploration costs that do not relate to any specific property are expensed as incurred.
Upon commencement of commercial production, mining interests are depleted on a units-of-production basis over the estimated economic life of the mine. In applying the units of production method, depletion is determined using quantity of material extracted from the mine in the period as a portion of total quantity of material to be extracted in current and future periods based on reserves and resources considered to be highly probable to be economically extracted over the life of mine. If no published reserves and resources are available, the Company may rely on internal estimates of economically recoverable mineralized material, prepared on a basis consistent with that used for determining reserves and resources, for purpose of determining depletion.
From time to time, the Company acquires or disposes of properties pursuant to the terms of option agreements.
Options are exercisable entirely at the discretion of the optionee with no obligation or sale until exercised or expired and, accordingly, are recorded as mineral property costs or recoveries when the payments are made or received.
| CONSOLIDATED FINANCIAL STATEMENTS | 51 | ANNUAL REPORT 2018 |
NOTES TO AUDITED CONSOLIDATED FINANCIAL STATEMENTS
(tabular amounts are expressed in thousands of US dollars)
| 3. | SIGNIFICANT ACCOUNTING POLICIES, ESTIMATES AND JUDGMENTS(continued) |
| | |
| Mining Interests (Note 15)(continued) ACCOUNTING ESTIMATES AND JUDGMENTS: |
| | |
| Mineral Reserve and Resource Estimates |
| | |
| Mineral reserve and resource estimates affect the determination of recoverable value used in impairment assessments, the depletion and depreciation rates for non-current assets using the units of production method and the expected timing of reclamation and closure expenditures. |
| | |
| The figures for mineral reserves and mineral resources are determined in accordance with National Instrument 43-101 (“NI 43-101”) Technical Report standards. There are numerous uncertainties inherent in estimating mineral reserves and mineral resources, including many factors beyond the Company’s control. Such estimation is a subjective process and the accuracy of any mineral reserve or mineral resource estimate is a function of the quantity and quality of available data and of the assumptions made and judgments used in engineering and geological interpretation. Differences between management’s assumptions including economic assumptions such as metal prices and market conditions could have a material effect in the future on the Company’s financial position, results of operation and cash flows. |
| | |
| ACCOUNTING ESTIMATES AND JUDGMENTS: |
| | |
| Depletion Rate for Mining Interests |
| | |
| Depletion expenses are allocated based on estimated useful life of the asset. Should the expected asset life and associated depletion rate differ from the initial estimate, the change in estimate would be made prospectively in the consolidated statements of earnings or loss. |
| | |
| Property, Plant and Equipment (Note 16) ACCOUNTING POLICY: |
| | |
| Property, plant and equipment are recorded at cost less accumulated depreciation and accumulated impairment losses. The cost of an item of property, plant and equipment includes the purchase price or construction cost, any costs directly attributable to bringing the asset to the location and condition necessary for its intended use, an initial estimate of the costs of dismantling and removing the item and restoring the site on which it is located, and borrowing costs related to the acquisition or construction of qualifying assets. |
| | |
| Property, plant and equipment are depreciated using either the straight-line or units-of-production method over the shorter of the estimated useful life of the asset or the expected life of mine. Where an item of property, plant and equipment comprises of major components with different useful lives, the components are accounted for as separate items of property, plant and equipment. Assets under construction are recorded at cost and re-allocated to machinery and equipment when it becomes available for use. |
| | |
| Depreciation commences when the asset is in the condition and location necessary for it to operate in the manner intended by management. Depreciation charges on assets that are directly related to mineral properties are allocated to those mineral properties. |
The Company conducts an annual review of residual balances, useful lives and depreciation methods utilized for property, plant and equipment. Any changes in estimate that arise from this review are accounted for prospectively.
ACCOUNTING ESTIMATES AND JUDGMENTS:
Commencement of Commercial Production
Prior to reaching commercial production levels intended by management, costs incurred are capitalized as part of the related mine or mill and proceeds from mineral sales are offset against costs capitalized. Depletion of capitalized costs for mining properties and depreciation and amortization of property, plant and equipment begin when operating levels intended by management have been reached.
Determining when a mine or mill is in the condition necessary for it to be capable of operating in the manner intended by management is a matter of judgment dependent on the specific facts and circumstances. The following factors may indicate that commercial production has commenced:
| | • | substantially all major capital expenditures have been completed to bring the asset to the condition necessary to operate in the manner intended by management; |
| | | |
| | • | the mine or mill has reached a pre-determined percentage of design capacity; |
| | | |
| | • | the ability to sustain a pre-determined level of design capacity for a significant period of time (i.e. the ability to process ore continuously at a steady or increasing level); |
| | | |
| | • | the completion of a reasonable period of testing of the mine plant and equipment; |
| | | |
| | • | the ability to produce a saleable product (i.e. the ability to produce concentrate within required sellable specifications); |
| | | |
| | • | the mine or mill has been transferred to operating personnel from internal development groups or external contractors; and |
| | | |
| | • | mineral recoveries are at or near the expected production levels. |
ACCOUNTING ESTIMATES AND JUDGMENTS:
Depreciation and Amortization Rates for Property, Plant and Equipment
Depreciation and amortization expenses are allocated based on estimated useful life of the asset. Should the expected asset life and associated depreciation rates differ from the initial estimate, the change in estimate would be made prospectively in the consolidated statements of earnings or loss.
Borrowing Costs
ACCOUNTING POLICY:
Borrowing costs directly attributable to the acquisition, construction or production of a qualifying asset that takes a substantial period of time to get ready for its intended use are capitalized as part of the cost of the asset until the asset is substantially ready for its intended use. Other borrowing costs are recognized as an expense in the period incurred. As at December 31, 2018 and 2017, the Company does not have any qualifying assets under construction.
The accompanying notes are an integral part of the audited consolidated financial statements.
| FIRST MAJESTIC SILVER CORP. | 52 | CONSOLIDATED FINANCIAL STATEMENTS |
NOTES TO AUDITED CONSOLIDATED FINANCIAL STATEMENTS
(tabular amounts are expressed in thousands of US dollars)
| 3. | SIGNIFICANT ACCOUNTING POLICIES, ESTIMATES AND JUDGMENTS (continued) |
| | |
| Impairment of Non-Current Assets(Note 17) ACCOUNTING POLICY: |
| | |
| At each statement of financial position date, the Company reviews the carrying amounts of its non-current assets to determine whether there is any indication that those assets are impaired. If any such indication exists, the recoverable amount of the asset is estimated in order to determine the extent of the impairment, if any. Where the asset does not generate independent cash inflows, the Company estimates the recoverable amount of the cash generating unit (“CGU”) to which the asset belongs. |
| | |
| If the recoverable amount of the asset or CGU is determined to be less than its carrying amount, the carrying amount of the asset or CGU is reduced to its recoverable amount and an impairment loss is recognized as an expense in the consolidated statements of earnings or loss. Recoverable amount is the higher of fair value less costs of disposal (“FVLCD”) and value in use (“VIU”). |
| | |
| FVLCD is determined as the amount that would be obtained from the sale of the asset or CGU in an arm’s length transaction between knowledgeable and willing parties. The Company considers the use of a combination of its internal discounted cash flow economic models and in-situ value of reserves, resources and exploration potential of each CGU for estimation of its FVLCD. These cash flows are discounted by an appropriate post-tax discount rate to arrive at a net present value of the asset. VIU is determined as the present value of the estimated cash flows expected to arise from the continued use of the asset or CGU in its present form and its eventual disposal. VIU is determined by applying assumptions specific to the Company’s continued use and does not take into account future development. |
| | |
| Where an impairment loss subsequently reverses, the carrying amount of the asset or CGU is increased to the revised estimate of its recoverable amount, so that the increased carrying amount does not exceed the carrying amount that would have been determined had no impairment been recognized for the asset or CGU in prior periods, adjusted for additional amortization which would have been recorded had the asset or CGU not been impaired. A reversal of an impairment loss is recognized as a gain in the statements of earnings or loss. |
| | |
| ACCOUNTING ESTIMATES AND JUDGMENTS: |
| | |
| Indications of Impairment and Reversal of Impairment |
| | |
| Management considers both external and internal sources of information in assessing whether there are any indications that the Company’s property, plant and equipment and mining interests are impaired or previous impairments should be reversed. External sources of information management considers include changes in the market, economic and legal environment in which the Company operates that are not within its control and affect the recoverable amount of its property, plant and equipment and mining interests. Internal sources of information management consider include the manner in which mining properties and plant and equipment are being used or are expected to be used and indications of economic performance of the assets. |
For exploration and evaluation assets, indications include but are not limited to expiration of the right to explore, substantive expenditure in the specific area is neither budgeted nor planned, and if the entity has decided to discontinue exploration activity in the specific area.
Fair Value Estimates
In determining the recoverable amounts of the Company’s property, plant and equipment and mining interests, management makes estimates of the discounted future cash flows expected to be derived from the Company’s mining properties, costs of disposal of the mining properties and the appropriate discount rate. Reductions in metal price forecasts, increases in estimated future costs of production, increases in estimated future capital expenditures, reductions in the amount of recoverable reserves, resources, and exploration potential, and/or adverse current economics can result in an impairment of the carrying amounts of the Company’s non-current assets. Conversely, favourable changes to the aforementioned factors can result in a reversal of previous impairments.
Share-based Payment Transactions(Note 23(b))
ACCOUNTING POLICY:
Employees (including directors and officers) of the Company may receive a portion of their remuneration in the form of stock options which are share-based payment transactions (“share-based payments”). Stock options issued to employees are measured by reference to their fair value using the Black-Scholes model at the date on which they were granted. Forfeitures are estimated at grant date and adjusted prospectively based on actual forfeitures. Share-based payments expense, for stock options that are forfeited or cancelled prior to vesting, is reversed. The costs of share-based payments are recognized, together with a corresponding increase in the equity reserve, over the period in which the services and/or performance conditions are fulfilled, ending on the date on which the relevant employees become fully entitled to the award (“the vesting date”). On exercise by the employee, the associated option value in the equity reserve is reclassified to share capital.
In situations where equity instruments are issued to non-employees, the share-based payments are measured at the fair value of goods or services received. If some or all of the goods or services received by the Company as consideration cannot be specifically identified, they are measured at the fair value of the share-based payment.
ACCOUNTING ESTIMATES AND JUDGMENTS:
Valuation of Share-based Payments
The Company uses the Black-Scholes Option Pricing Model for valuation of share-based payments. Option pricing models require the input of subjective assumptions including expected price volatility, interest rate and forfeiture rate. Changes in the input assumptions can materially affect the fair value estimate and the Company’s earnings and equity reserves.
Taxation (Note 22)
ACCOUNTING POLICY:
Current and deferred tax are recognized in profit or loss, except when they relate to items that are recognized in other comprehensive income or directly in equity, in which case they are recognized in other comprehensive income or directly in equity.
| CONSOLIDATED FINANCIAL STATEMENTS | 53 | ANNUAL REPORT 2018 |
NOTES TO AUDITED CONSOLIDATED FINANCIAL STATEMENTS
(tabular amounts are expressed in thousands of US dollars)
| 3. | SIGNIFICANT ACCOUNTING POLICIES, ESTIMATES AND JUDGMENTS(continued) |
| | |
| Taxation (Note 22)(continued) ACCOUNTING POLICY(continued) |
| | |
| Current income tax is based on taxable earnings for the year. The tax rates and tax laws to compute the amount payable are those that are substantively enacted in each tax regime at the date of the statement of financial position. |
| | |
| Deferred income tax is recognized, using the liability method, on temporary differences between the carrying value of assets and liabilities in the statement of financial position, unused tax losses, unused tax credits and the corresponding tax bases used in the computation of taxable earnings, based on tax rates and tax laws that are substantively enacted at the date of the statement of financial position and are expected to apply when the related deferred tax asset is realized or the deferred tax liability is settled. |
| | |
| Deferred tax liabilities are recognized for taxable temporary differences associated with investments in subsidiaries, and interests in joint ventures, except where the timing of the reversal of the temporary difference is controlled by the Company and it is probable that the temporary difference will not reverse in the foreseeable future. |
| | |
| Deferred tax assets are recognized for all deductible temporary differences to the extent that the realization of the related tax benefit through future taxable earnings is probable. |
| | |
| Deferred tax assets and liabilities are offset when there is a legally enforceable right to offset the current tax assets against the current tax liabilities and when they relate to income taxes levied by the same taxation authority and the Company intends to settle its current tax assets and liabilities on a net basis. |
| | |
| ACCOUNTING ESTIMATES AND JUDGMENTS: |
| | |
| Recognition of Deferred Income Tax Assets |
| | |
| In assessing the probability of realizing income tax assets recognized, management makes estimates related to expectations of future taxable income, applicable tax opportunities, expected timing of reversals of existing temporary differences and the likelihood that tax positions taken will be sustained upon examination by applicable tax authorities. In making its assessments, management gives additional weight to positive and negative evidence that can be objectively verified. |
| | |
| Estimates of future taxable income are based on forecasted cash flows from operations and the application of existing tax laws in each jurisdiction. Forecasted cash flows from operations are based on life of mine projections internally developed, reviewed by management and are consistent with the forecasts utilized for business planning and impairment testing purposes. Weight is attached to tax planning opportunities that are within the Company’s control, and are feasible and implementable without significant obstacles. The likelihood that tax positions taken will be sustained upon examination by applicable tax authorities is assessed based on individual facts and circumstances of the relevant tax position evaluated in light of all available evidence. Where applicable tax laws and regulations are either unclear or subject to ongoing varying interpretations, it is reasonably possible that changes in these estimates can occur that materially affect the amounts of income tax assets recognized. At the end of each reporting period, the Company reassesses recognized and unrecognized income tax assets. |
ACCOUNTING ESTIMATES AND JUDGMENTS:
Tax Contingencies
The Company’s operations involve dealing with uncertainties and judgments in the application of tax regulations in multiple jurisdictions. The final taxes paid are dependent upon many factors, including negotiations with tax authorities in various jurisdictions and resolution of disputes arising from tax audits. The Company recognizes potential liabilities and records tax liabilities for anticipated tax audit issues based on its estimate of whether, and the extent to which, additional taxes will be due. The Company adjusts these liabilities in light of changing facts and circumstances; however, due to the complexity of some of these uncertainties, the ultimate resolution may result in a payment that is materially different from the Company’s current estimate of the tax liabilities. If the Company’s estimate of tax liabilities proves to be less than the ultimate assessment, an additional charge to expense would result. If the estimate of tax liabilities proves to be greater than the ultimate assessment, a tax benefit would result.
Finance Leases(Note 20)
ACCOUNTING POLICY:
Leases are classified as finance leases whenever the terms of the lease transfer substantially all the risks and rewards of ownership to the lessee. All other leases are classified as operating leases.
Assets held under finance leases are initially recognized as assets of the Company at their fair value at the inception of the lease or, if lower, at the present value of the minimum lease payments. The corresponding liability to the lessor is included in the consolidated statement of financial position as a finance lease obligation. Finance costs are recognized immediately in profit or loss, unless they are directly attributable to qualifying assets, in which case they are capitalized in accordance with the Company’s general policy on borrowing costs.
The Company will apply the new lease accounting standard, IFRS 16, on its effective date of January 1, 2019.
Cash and Cash Equivalents
ACCOUNTING POLICY:
Cash in the statement of financial position includes cash on hand and held at banks and cash equivalents include short-term guaranteed investment certificates redeemable within three months or less at the date of purchase.
Financial Instruments
ACCOUNTING POLICY:
Financial assets and financial liabilities are recognized when the Company becomes a party to the contractual provisions of the instrument. On initial recognition, all financial assets and financial liabilities are recorded at fair value, net of attributable transaction costs, except for financial assets and liabilities classified as at fair value through profit or loss (“FVTPL”). The directly attributable transaction costs of financial assets and liabilities classified as at FVTPL are expensed in the period in which they are incurred.
Subsequent measurement of financial assets and liabilities depends on the classifications of such assets and liabilities.
| FIRST MAJESTIC SILVER CORP. | 54 | CONSOLIDATED FINANCIAL STATEMENTS |
NOTES TO AUDITED CONSOLIDATED FINANCIAL STATEMENTS
(tabular amounts are expressed in thousands of US dollars)
| 3. | SIGNIFICANT ACCOUNTING POLICIES, ESTIMATES AND JUDGMENTS(continued) |
| | |
| Financial Instruments(continued) ACCOUNTING POLICY(continued) |
| | |
| Amortized cost |
| | |
| Financial assets that meet the following conditions are measured subsequently at amortized cost: |
| | • | the financial asset is held within a business model whose objective is to hold financial assets in order to collect contractual cash flows, and |
| | | |
| | • | the contractual terms of the financial asset give rise on specified dates to cash flows that are solely payments of principal and interest on the principal amount outstanding. |
The amortized cost of a financial asset is the amount at which the financial asset is measured at initial recognition minus the principal repayments, plus the cumulative amortization using effective interest method of any difference between that initial amount and the maturity amount, adjusted for any loss allowance. Interest income is recognized using the effective interest method.
The Company’s financial assets at amortized cost primarily include cash and cash equivalents, trade and other receivables and value added taxes receivable included in other current and non-current financial assets in the Consolidated Statement of Financial Position.
Fair value through other comprehensive income (“FVTOCI”)
Financial assets that meet the following conditions are measured at FVTOCI:
| | • | The financial asset is held within a business model whose objective is achieved by both collecting contractual cash flows and selling financial assets, and |
| | | |
| | • | The contractual terms of the financial asset give rise on specified dates to cash flows that are solely payments of principal and interest on the principal amount outstanding. |
The Company has designated certain investments in marketable securities that are not held for trading as FVTOCI (note 14).
On initial recognition, the Company may make an irrevocable election (on an instrument-by-instrument basis) to designate investments in equity instruments that would otherwise be measured at fair value through profit or loss to present subsequent changes in fair value in other comprehensive income.
Designation at FVTOCI is not permitted if the equity investment is held for trading or if it is contingent consideration recognized by an acquirer in a business combination. Investments in equity instruments at FVTOCI are initially measured at fair value plus transaction costs. Subsequently, they are measured at fair value with gains and losses arising from changes in fair value recognized in OCI. The cumulative gain or loss is not reclassified to profit or loss on disposal of the equity instrument, instead, it is transferred to retained earnings.
Financial assets measured subsequently at fair value through profit or loss (“FVTPL”)
By default, all other financial assets are measured subsequently at FVTPL.
The Company, at initial recognition, may also irrevocably designate a financial asset as measured at FVTPL if doing so eliminates or significantly reduces a measurement or recognition inconsistency that would otherwise arise from measuring assets or liabilities or recognizing the gains and losses on them on different bases.
Financial assets measured at FVTPL are measured at fair value at the end of each reporting period, with any fair value gains or losses recognized in profit or loss to the extent they are not part of a designated hedging relationship. Fair value is determined in the manner described in note 24. The Company’s financial assets at FVTPL include its account receivable arising from sales of metal contained in concentrates.
ACCOUNTING POLICY:
Financial liabilities and equity
Debt and equity instruments are classified as either financial liabilities or as equity in accordance with the substance of the contractual arrangements and the definitions of a financial liability and an equity instrument.
An equity instrument is any contract that evidences a residual interest in the assets of the Company after deducting all its liabilities. Equity instruments issued by the Company are recognized at the proceeds received, net of direct issue costs. Repurchase of the Company’s own equity instruments is recognized and deducted directly in equity. No gain or loss is recognized in profit or loss on the purchase, sale, issue or cancellation of the Company’s own equity instruments.
Financial liabilities that are not contingent consideration of an acquirer in a business combination, held for trading or designated as at FVTPL, are measured at amortized cost using effective interest method.
The Company’s financial liabilities at amortized cost primarily include trade and other payables, debt facilities (note 19) and equipment financing obligations (note 20).
Financial instruments designated as hedging instruments
The Company does not currently apply nor have a past practice of applying hedge accounting to financial instruments.
Impairment
The Company recognizes a loss allowance for expected credit losses on its financial assets. The amount of expected credit losses is updated at each reporting period to reflect changes in credit risk since initial recognition of the respective financial instruments.
| CONSOLIDATED FINANCIAL STATEMENTS | 55 | ANNUAL REPORT 2018 |
NOTES TO AUDITED CONSOLIDATED FINANCIAL STATEMENTS
(tabular amounts are expressed in thousands of US dollars)
| 3. | SIGNIFICANT ACCOUNTING POLICIES, ESTIMATES AND JUDGMENTS(continued) |
| | |
| Provisions(Note 21) ACCOUNTING POLICY: |
| | |
| Provisions are recognized when the Company has a present legal or constructive obligation as a result of a past event, it is probable that the Company will be required to settle the obligation, and a reliable estimate of the obligation can be made. The amount recognized as a provision is the present value of the expenditures expected to be required to settle the obligation using a pre-tax discount rate that reflects current market assessment of the time value of money and the risks specific to the obligation. The increase in the provision due to the passage of time is recognized as finance costs. |
| | |
| ACCOUNTING ESTIMATES AND JUDGMENTS: |
| | |
| Estimated Reclamation and Closure Costs |
| | |
| The Company’s provision for decommissioning liabilities represents management’s best estimate of the present value of the future cash outflows required to settle estimated reclamation and closure costs at the end of the mine’s life. The provision reflects estimates of future costs, inflation, movements in foreign exchange rates and assumptions of risks associated with the future cash outflows, and the applicable risk-free interest rates for discounting the future cash outflows. Changes in the above factors can result in a change to the provision recognized by the Company. |
| | |
| Changes to reclamation and closure cost obligations are recorded with a corresponding change to the carrying amounts of related mining properties. Adjustments to the carrying amounts of related mining properties can result in a change to future depletion expense. |
| | |
| Earnings or Loss per Share(Note 11) ACCOUNTING POLICY: |
| | |
| Basic earnings or loss per share for the period is calculated by dividing the earnings or loss attributable to equity holders of the Company by the weighted average number of shares outstanding during the reporting period. |
| | |
| Diluted earnings or loss per share is calculated by adjusting the weighted average number of shares outstanding to assume conversion of all potentially dilutive share equivalents, such as stock options and share purchase warrants, and assumes the receipt of proceeds upon exercise of the options to determine the number of shares assumed to be purchased at the average market price during the period. |
| | |
| Future Changes in Accounting Policies Not Yet Effective as at December 31, 2018 |
| | |
| Leases |
| | |
| In January 2016, the IASB published a new accounting standard, IFRS 16 –Leases(“IFRS 16”) which supersedes IAS 17 –Leases.IFRS 16 applies a control model to the identification of leases, distinguishing between a lease and a service contract on the basis of whether the customer controls the asset. Control is considered to exist if the customer has the right to obtain substantially all of the economic benefits from the use of an identified asset and the right to direct the use of that asset. For those assets determined to meet the definition of a lease, IFRS 16 introduces significant changes to the accounting by lessees, introducing a single, on-balance sheet accounting model that is similar to the current finance lease accounting, with limited exceptions for short-term leases or leases of low value assets. |
| The Company will adopt IFRS 16 on its effective date of January 1, 2019 retrospectively, with the cumulative effect of initially applying the standard as an adjustment to retained earnings and no restatement of comparative information. The Company has elected to measure its right of use assets at amounts equal to the associated lease liabilities. |
| | |
| The Company has also elected to apply the available exemptions as permitted by IFRS 16 to recognize a lease expense on a straight line basis for short-term leases (lease term of 12 months or less) and low-value assets. The Company has also elected to apply the practical expedient whereby leases whose term ends within 12 months of the date of initial application would be accounted for in the same way as short term leases. |
| | |
| Upon the adoption of IFRS 16, the Company expects to recognize additional right of use assets and lease liabilities related to the Company’s equipment and building rental, land leases and service contracts, including certain of the Company’s drilling and blasting contracts that contain embedded leases for property, plant and equipment. Due to the recognition of additional lease assets and liabilities, a higher amount of depreciation expense and interest expense on lease liabilities will be recorded under IFRS 16 compared to the current standard. Additionally, a corresponding reduction in production costs is expected. Lastly, the Company expects a positive impact on operating cash flows with a corresponding increase in financing cash outflows under IFRS 16. |
| | |
| 4. | ACQUISITION OF PRIMERO MINING CORP. |
| | |
| Description of the Transaction |
| | |
| On May 10, 2018, First Majestic completed the acquisition of all of the issued and outstanding common shares (the “Arrangement”) of Primero Mining Corp. pursuant to the terms and conditions of an arrangement agreement (the “Arrangement Agreement”) between First Majestic and Primero dated January 11, 2018. Under the terms of the Arrangement Agreement, First Majestic issued an aggregate of 6,418,594 common shares to Primero shareholders, on the basis of 0.03325 of a First Majestic common share for each Primero common share (the “Exchange Ratio”). |
| | |
| The Arrangement also provided for the issuance by First Majestic of an aggregate of 221,908 replacement stock options (the “Replacement Options”) to the holders of outstanding Primero stock options, at exercise prices adjusted by the Exchange Ratio. Under the Arrangement, all existing warrants of Primero also became exercisable to acquire First Majestic shares at exercise prices adjusted by the Exchange Ratio (“Replacement Warrants”). After the effective date of the Arrangement, such warrants are exercisable for an aggregate of 366,124 common shares of the Company. The fair value of the Replacement Options and Replacement Warrants, determined using a Black-Scholes valuation model, resulted in a nominal value as the exercise prices of the options and warrants are significantly out-of-the-money based on the Exchange Ratio and underlying share price. |
The accompanying notes are an integral part of the audited consolidated financial statements.
| FIRST MAJESTIC SILVER CORP. | 56 | CONSOLIDATED FINANCIAL STATEMENTS |
NOTES TO AUDITED CONSOLIDATED FINANCIAL STATEMENTS
(tabular amounts are expressed in thousands of US dollars)
| 4. | ACQUISITION OF PRIMERO MINING CORP. |
| (continued) |
| | |
| Description of the Transaction(continued) |
| | |
| With this transaction, First Majestic added the San Dimas Silver/Gold Mine which is located approximately 130 km northwest of Durango, Durango State, Mexico. The mine is accessible via a 40 minute flight from Durango to the mine’s airstrip. The operation consists of an underground mine and a mill with a 2,500 tpd capacity. |
| | |
| Concurrently and in connection and as part of the Arrangement, First Majestic terminated the pre-existing silver purchase agreement with Wheaton Precious Metals Corp. and its subsidiary, Wheaton Precious Metals International Ltd. (“WPMI”), relating to the San Dimas Mine and entered into a new precious metal purchase agreement (the “New Stream Agreement”) with WPMI and FM Metal Trading (Barbados) Inc., a wholly-owned subsidiary of First Majestic. Pursuant to the New Stream Agreement, WPMI is entitled to receive 25% of the gold equivalent production (based on a fixed exchange ratio of 70 silver ounces to 1 gold ounce) at San Dimas in exchange for ongoing payments equal to the lesser of $600 (subject to a 1% annual inflation adjustment) and the prevailing market price, for each gold ounce delivered under the New Stream Agreement. As part of the restructuring of the stream agreement, WPMI received 20,914,590 common shares of First Majestic with an aggregate fair market value of approximately $143.1 million based on the closing price of First Majestic common shares on May 9, 2018 of $6.84. The final common share purchase consideration was determined based on the closing market price of First Majestic’s common shares on the day before the closing date of the Arrangement. |
| | |
| Management has concluded that Primero constitutes a business and, therefore, the acquisition is accounted for in accordance with IFRS 3 – Business Combinations. For the purpose of these consolidated financial statements, the purchase consideration has been allocated on a preliminary basis based on management’s best estimates at the time these consolidated financial statements were prepared. The Company is continuing its review to determine the recoverability of value added tax receivables that are in arrears (see Note 12) and the outcome of the APA Ruling (see Note 26) during the allowable measurement period, which shall not exceed one year from the acquisition date. Any future changes to the purchase price allocation may also result in adjustments to mining interests and deferred income taxes. |
| | |
| Consideration and Purchase Price Allocation |
| | |
| Total consideration for the acquisition was valued at $187.0 million on the acquisition date. The preliminary purchase price allocation, which is subject to final adjustments, is estimated as follows: |
Total Consideration
| | 6,418,594 First Majestic shares to Primero shareholders at $6.84 (CAD$8.80) per share | $ | 43,903 | |
| | 20,914,590 First Majestic shares to WPM at $6.84 (CAD$8.80) per share | | 143,056 | |
| | | $ | 186,959 | |
| | Allocation of Purchase Price | | | |
| | Cash and cash equivalents | $ | 3,871 | |
| | Value added taxes receivable | | 27,508 | |
| | Inventories | | 15,628 | |
| | Mining interests | | 178,183 | |
| | Property, plant and equipment | | 122,815 | |
| | Deposit on non-current assets | | 60 | |
| | Non-current income taxes receivable | | 19,342 | |
| | Other working capital items | | (23,792 | ) |
| | Income taxes payable | | (2,888 | ) |
| | Debt facilities | | (106,110 | ) |
| | Decommissioning liabilities | | (4,095 | ) |
| | Other non-current liabilities | | (4,678 | ) |
| | Deferred tax liabilities | | (38,885 | ) |
| | Net assets acquired | $ | 186,959 | |
The fair value of acquired receivables is equal to their gross contractual amount at the acquisition date.
Total transaction costs of $4.9 million related to the acquisition were expensed during the year.
As at the acquisition date, Primero Empresa Minera S.A. de C.V. (“PEM”), the subsidiary that owns 100% of the San Dimas Silver/Gold Mine, has available non-capital tax loss carryforwards of $47.1 million.
Financial and operating results of Primero are included in the Company’s consolidated financial statements effective May 10, 2018. During the year ended December 31, 2018, the acquisition of Primero contributed $102.5 million of revenue and $7.5 million of net earnings to the Company since May 10, 2018.
Had the business combination been effected at January 1, 2018, pro forma revenues and net loss of the Company for the year ended December 31, 2018 would have been $374.7 million and $189.8 million, respectively.
| CONSOLIDATED FINANCIAL STATEMENTS | 57 | ANNUAL REPORT 2018 |
NOTES TO AUDITED CONSOLIDATED FINANCIAL STATEMENTS
(tabular amounts are expressed in thousands of US dollars)
| 5. | SEGMENTED INFORMATION |
| | |
| All of the Company’s operations are within the mining industry and its major products are precious metals doré and precious and base metals concentrates which are refined or smelted into pure silver, gold, lead and zinc and sold to global metal brokers. Transfer prices between reporting segments are set on an arms-length basis in a manner similar to transactions with third parties. Coins and bullion cost of sales are based on transfer prices. |
| | |
| A reporting segment is defined as a component of the Company that: |
| | • | engages in business activities from which it may earn revenues and incur expenses; |
| | | |
| | • | whose operating results are reviewed regularly by the entity’s chief operating decision maker; and |
| | | |
| | • | for which discrete financial information is available. |
For the year ended December 31, 2018, the Company’s reporting segments includes its seven operating mines in Mexico during the year, including the La Guitarra mine which was placed on care and maintenance on August 3, 2018.
The “others” category consists primarily of the Company’s corporate assets including cash and cash equivalents, other development and exploration properties (Note 15), debt facilities (Note 19), intercompany eliminations, and corporate expenses which are not allocated to operating segments.
Management evaluates segment performance based on mine operating earnings. Therefore, other income and expense items are not allocated to the segments.
| | | | YEAR ENDED DECEMBER 31, 2018 | | | AT DECEMBER 31, 2018 | |
| | | | | | | | | | Depletion, | | | | | | | | | | | | | |
| | | | | | | | | | depreciation, | | | | | | | | | | | | | |
| | | | | | | | | | and | | | Mine operating | | | Capital | | | | | | | |
| | | | Revenue | | | Cost of sales | | | amortization | | | earnings (loss) | | | expenditures | | | Total assets | | | Total liabilities | |
| | Mexico | | | | | | | | | | | | | | | | | | | | | |
| | San Dimas | $ | 102,515 | | $ | 60,762 | | $ | 19,052 | | $ | 22,701 | | $ | 20,485 | | $ | 368,460 | | $ | 59,990 | |
| | Santa Elena | | 83,116 | | | 52,154 | | | 12,352 | | | 18,610 | | | 18,908 | | | 104,955 | | | 16,753 | |
| | La Encantada | | 24,533 | | | 30,215 | | | 13,955 | | | (19,637 | ) | | 16,938 | | | 111,887 | | | 13,972 | |
| | San Martin | | 33,925 | | | 22,903 | | | 8,608 | | | 2,414 | | | 9,302 | | | 92,835 | | | 23,386 | |
| | La Parrilla | | 29,908 | | | 26,758 | | | 24,944 | | | (21,794 | ) | | 14,191 | | | 52,383 | | | 9,784 | |
| | Del Toro | | 17,923 | | | 19,170 | | | 8,612 | | | (9,859 | ) | | 11,620 | | | 36,760 | | | 7,624 | |
| | La Guitarra | | 9,285 | | | 7,344 | | | 5,264 | | | (3,323 | ) | | 5,319 | | | 34,925 | | | 4,310 | |
| | Others | | (276 | ) | | (144 | ) | | 880 | | | (1,012 | ) | | 10,424 | | | 123,905 | | | 195,718 | |
| | Consolidated | $ | 300,929 | | $ | 219,162 | | $ | 93,667 | | $ | (11,900 | ) | $ | 107,187 | | $ | 926,110 | | $ | 331,537 | |
| | | | YEAR ENDED DECEMBER 31, 2017 | | | AT DECEMBER 31, 2017 | |
| | | | | | | | | | Depletion, | | | | | | | | | | | | | |
| | | | | | | | | | depreciation, | | | | | | | | | | | | | |
| | | | | | | | | | and | | | Mine operating | | | Capital | | | | | | | |
| | | | Revenue | | | Cost of sales | | | amortization | | | earnings (loss) | | | expenditures | | | Total assets | | | Total liabilities | |
| | Mexico | | | | | | | | | | | | | | | | | | | | | |
| | Santa Elena | $ | 92,515 | | $ | 50,948 | | $ | 16,417 | | $ | 25,150 | | $ | 18,048 | | $ | 123,413 | | $ | 19,399 | |
| | La Encantada | | 37,557 | | | 29,827 | | | 12,944 | | | (5,214 | ) | | 12,498 | | | 96,626 | | | 13,254 | |
| | San Martin | | 39,709 | | | 20,954 | | | 6,654 | | | 12,101 | | | 10,835 | | | 92,819 | | | 26,617 | |
| | La Parrilla | | 36,301 | | | 26,739 | | | 19,379 | | | (9,817 | ) | | 15,323 | | | 171,695 | | | 40,387 | |
| | Del Toro | | 30,113 | | | 18,086 | | | 14,122 | | | (2,095 | ) | | 8,590 | | | 99,402 | | | 10,120 | |
| | La Guitarra | | 15,363 | | | 12,072 | | | 6,549 | | | (3,258 | ) | | 9,837 | | | 73,117 | | | 15,052 | |
| | Others | | 730 | | | 639 | | | 980 | | | (889 | ) | | 6,271 | | | 124,369 | | | 74,127 | |
| | Consolidated | $ | 252,288 | | $ | 159,265 | | $ | 77,045 | | $ | 15,978 | | $ | 81,402 | | $ | 781,441 | | $ | 198,956 | |
During the year ended December 31, 2018, the Company had eight (December 31, 2017 – six) customers that accounted for 100% of its doré and concentrate sales revenue, with one major customer accounting for 72% of total revenue (2017 – three major customers for 54%, 17% and 15%).
The accompanying notes are an integral part of the audited consolidated financial statements.
| FIRST MAJESTIC SILVER CORP. | 58 | CONSOLIDATED FINANCIAL STATEMENTS |
NOTES TO AUDITED CONSOLIDATED FINANCIAL STATEMENTS
(tabular amounts are expressed in thousands of US dollars)
| 6. | REVENUES |
| | |
| The Company sells metals in the form of doré and concentrates. The Company’s primary product is silver and other metals produced as part of the extraction process, such as gold, lead and zinc, are considered as by-products. Revenues from sale of metal, including by-products, are recorded net of smelting and refining costs. |
| | |
| Revenues for the year are summarized as follows: |
| | | | YEAR ENDED DECEMBER 31, | |
| | | | 2018 | | | 2017 | |
| | Gross revenue by material form: | | | | | | | | | | | | |
| | Doré | $ | 255,723 | | | 83% | | $ | 186,275 | | | 71% | |
| | Concentrate | | 52,697 | | | 27% | | | 77,431 | | | 29% | |
| | Gross revenue | $ | 308,420 | | | 100% | | $ | 263,706 | | | 100% | |
| | | | | | | | | | | | | | |
| | Gross revenue from payable metals: | | | | | | | | | | | | |
| | Silver | $ | 176,783 | | | 57% | | $ | 165,832 | | | 63% | |
| | Gold | | 111,058 | | | 36% | | | 69,608 | | | 26% | |
| | Lead | | 14,369 | | | 5% | | | 23,949 | | | 9% | |
| | Zinc | | 6,210 | | | 2% | | | 4,317 | | | 2% | |
| | Gross revenue | | 308,420 | | | 100% | | | 263,706 | | | 100% | |
| | Less: smelting and refining costs | | (7,491 | ) | | | | | (11,418 | ) | | | |
| | Revenues | $ | 300,929 | | | | | $ | 252,288 | | | | |
As at December 31, 2018, $3.8 million of revenues that have not satisfied performance obligations were recorded as unearned revenue (2017 – $2.2 million) and will be recorded as revenue in the subsequent period. During the year ended December 31, 2018, revenue related to provisional pricing adjustments on concentrate sales was $0.8 million (2017 – $0.5 million).
| | (a) | Gold Stream Agreement with Sandstorm Gold Ltd. |
| | | |
| | | The Santa Elena mine has a purchase agreement with Sandstorm Gold Ltd. (“Sandstorm”), which requires the Company to sell 20% of its gold production over the life of mine from its leach pad and a designated area of its underground operations. The selling price to Sandstorm is the lesser of the prevailing market price or $450 per ounce, subject to a 1% annual inflation. During the year ended December 31, 2018, the Company delivered 8,947 ounces of gold (2017 – 10,107 ounces) to Sandstorm at an average price of $453 per ounce (2017 – $388 per ounce). In September 2017, the Company exceeded 50,000 cumulative ounces delivered to Sandstorm which increased the base selling price from $350 per ounce to $450 per ounce. |
| | | |
| | (b) | Gold Stream Agreement with Wheaton Precious Metals Corporation |
| | | |
| | | The Company’s recently acquired San Dimas mine (see Note 4) has a purchase agreement with WPM, which entitles WPM to receive 25% of the gold equivalent production (based on a fixed exchange ratio of 70 silver ounces to 1 gold ounce) at San Dimas in exchange for ongoing payments equal to the lesser of $600 (subject to a 1% annual inflation adjustment) and the prevailing market price, for each gold equivalent ounce delivered under the New Stream Agreement. |
During the year ended December 31, 2018, the Company delivered 21,962 ounces of gold equivalent to WPM at $600 per ounce under the New Stream plus 452,197 ounces of silver at $4.30 per ounce, which were opening inventory acquired from Primero on the acquisition date which were covered under the old stream.
| 7. | COST OF SALES |
| | |
| Cost of sales excludes depletion, depreciation and amortization and are costs that are directly related to production and generation of revenues at the operating segments. Significant components of cost of sales are comprised of the following: |
| | | | YEAR ENDED DECEMBER 31, | |
| | | | 2018 | | | 2017 | |
| | Consumables and materials | $ | 49,750 | | $ | 33,179 | |
| | Labour costs | | 106,540 | | | 69,435 | |
| | Energy | | 35,366 | | | 30,738 | |
| | Other costs | | 13,300 | | | 16,072 | |
| | Production costs | $ | 204,956 | | $ | 149,424 | |
| | Transportation and other selling costs | | 3,399 | | | 3,267 | |
| | Workers participation costs | | 5,775 | | | 2,328 | |
| | Environmental duties and royalties | | 1,288 | | | 1,096 | |
| | Inventory changes | | (3,776 | ) | | 1,752 | |
| | Inventory loss due to Republic Metals Refining Corp. bankruptcy(1) | | 7,520 | | | — | |
| | Standby costs during stoppage at the La Encantada mine | | — | | | 1,398 | |
| | | $ | 219,162 | | $ | 159,265 | |
| | (1) | In November 2018, Republic Metals Refining Corp. (“Republic”), one of the three refineries used by the Company announced it filed for bankruptcy. At the time of the announcement, the Company had approximately 758,000 silver equivalent ounces of inventory that were in Republic’s possession for refining. The Company has been pursuing legal and insurance channels to recover this inventory, but there is no assurance that these inventory is recoverable. As a result, the Company has written off the cost of these inventories to cost of sales. |
| 8. | GENERAL AND ADMINISTRATIVE EXPENSES |
| | |
| General and administrative expenses are incurred to support the administration of the business that are not directly related to production. Significant components of general and administrative expenses are comprised of the following: |
| | | | YEAR ENDED DECEMBER 31, | |
| | | | 2018 | | | 2017 | |
| | Corporate administration | $ | 5,552 | | $ | 3,875 | |
| | Salaries and benefits | | 10,412 | | | 8,509 | |
| | Audit, legal and professional fees | | 3,421 | | | 2,822 | |
| | Filing and listing fees | | 449 | | | 506 | |
| | Directors fees and expenses | | 739 | | | 749 | |
| | Depreciation | | 855 | | | 1,032 | |
| | | $ | 21,428 | | $ | 17,493 | |
| CONSOLIDATED FINANCIAL STATEMENTS | 59 | ANNUAL REPORT 2018 |
NOTES TO AUDITED CONSOLIDATED FINANCIAL STATEMENTS
(tabular amounts are expressed in thousands of US dollars)
| 9. | INVESTMENT AND OTHER LOSS |
| | |
| The Company’s investment and other loss are comprised of the following: |
| | | | YEAR ENDED DECEMBER 31, | |
| | | | 2018 | | | 2017 | |
| | Interest income and other | $ | 3,691 | | $ | 1,360 | |
| | Loss from investment in marketable securities (Note 14) | | (4,704 | ) | | (2,600 | ) |
| | Gain from investment in silver futures derivatives | | 269 | | | 1,206 | |
| | | $ | (744 | ) | $ | (34 | ) |
| 10. | FINANCE COSTS |
| | |
| Finance costs are primarily related to interest and accretion expense on the Company’s debt facilities, equipment financing obligations and accretion of decommissioning liabilities. The Company’s finance costs in the year are summarized as follows: |
| | | | YEAR ENDED DECEMBER 31, | |
| | | | 2018 | | | 2017 | |
| | Debt facilities (Note 19) | $ | 10,389 | | $ | 2,254 | |
| | Equipment financing obligations (Note 20) | | 524 | | | 561 | |
| | Accretion of decommissioning liabilities | | 1,495 | | | 935 | |
| | Silver sales and other | | 628 | | | 521 | |
| | | $ | 13,036 | | $ | 4,271 | |
| 11. | LOSS PER SHARE |
| | |
| Basic net earnings (loss) per share is the net earnings (loss) available to common shareholders divided by the weighted average number of common shares outstanding during the period. Diluted net earnings (loss) per share adjusts basic net earnings per share for the effects of dilutive potential common shares. |
| | |
| The calculations of basic and diluted (loss) earnings per share for the years ended December 31, 2018 and 2017 are as follows: |
| | | | YEAR ENDED DECEMBER 31, | |
| | | | 2018 | | | 2017 | |
| | Net loss for the year | $ | (204,164 | ) | $ | (53,272 | ) |
| | Weighted average number of shares on issue – basic and diluted(1) | | 183,650,405 | | | 165,293,893 | |
| | Loss per share – basic | $ | (1.11 | ) | $ | (0.32 | ) |
| | Loss per share – diluted | $ | (1.11 | ) | $ | (0.32 | ) |
| | (1) | Diluted weighted average number of shares excluded 6,644,542 (2017 – 9,431,737) options and 16,327,598 common shares issuable under the convertible debentures (Note 19(a)) that were anti-dilutive for the year ended December 31, 2018. |
| 12. | TRADE AND OTHER RECEIVABLES |
| | |
| Trade and other receivables of the Company are comprised of: |
| | | | DECEMBER 31, | | | DECEMBER 31, | |
| | | | 2018 | | | 2017 | |
| | Trade receivables | $ | 4,671 | | $ | 4,038 | |
| | Other | | 928 | | | 1,340 | |
| | | $ | 5,599 | | $ | 5,378 | |
| 13. | INVENTORIES |
| | |
| Inventories consist primarily of materials and supplies and products of the Company’s operations, in varying stages of the production process, and are presented at the lower of weighted average cost or net realizable value. Inventories of the Company are comprised of: |
| | | | DECEMBER 31, | | | DECEMBER 31, | |
| | | | 2018 | | | 2017 | |
| | Finished goods – doré and concentrates | $ | 2,538 | | $ | 1,299 | |
| | Work-in-process | | 4,626 | | | 1,152 | |
| | Stockpile | | 1,257 | | | 217 | |
| | Silver coins and bullion | | 351 | | | 303 | |
| | Materials and supplies | | 23,696 | | | 15,887 | |
| | | $ | 32,468 | | $ | 18,858 | |
| The amount of inventories recognized as an expense during the year is equivalent to the total of cost of sales plus depletion, depreciation and amortization for the period. As at December 31, 2018, mineral inventories, which consist of stockpile, work-in-process and finished goods, includes a $7.5 million write-down of finished goods inventory as a result of Republic’s bankruptcy (Note 7) and a $3.0 million (December 31, 2017 – $0.7 million) net realizable value write- down, primarily at La Encantada, Del Toro and La Parrilla, which was recognized in cost of sales during the year ended December 31, 2018. |
| | |
| 14. | OTHER FINANCIAL ASSETS |
| | |
| As at December 31, 2018, other financial assets consists of the Company’s investment in marketable securities and foreign exchange derivatives comprised of the following: |
| | | | DECEMBER 31, | | | DECEMBER 31, | |
| | | | 2018 | | | 2017 | |
| | First Mining Gold Corp. (TSX: FF) | $ | 2,753 | | $ | 7,576 | |
| | Sprott Physical Silver Trust (NYSE: PSLV) | | 2,236 | | | 2,536 | |
| | FVTPL marketablesecurities | $ | 4,989 | | $ | 10,112 | |
| | FVTOCI marketable securities | | 1,431 | | | 1,214 | |
| | Total marketablesecurities | $ | 6,420 | | $ | 11,326 | |
| | Silver future derivatives | | 2,038 | | | — | |
| | Total otherfinancial assets | $ | 8,458 | | $ | 11,326 | |
| FIRST MAJESTIC SILVER CORP. | 60 | CONSOLIDATED FINANCIAL STATEMENTS |
NOTES TO AUDITED CONSOLIDATED FINANCIAL STATEMENTS
(tabular amounts are expressed in thousands of US dollars)
| 14. | OTHER FINANCIAL ASSETS(continued) |
| | (a) | Marketable Securities |
| | | |
| | | Changes in fair value of marketable securities designated as fair value through profit or loss (“FVTPL”) for the year ended December 31, 2018 totalling $4.7 million (2017 – $2.6 million) are recorded through profit or loss, while changes in fair value of marketable securities designated as fair value through other comprehensive income (“FVTOCI”) for the year ended December 31, 2018 totalling $0.5 million (2017 – $0.5 million) are recorded through other comprehensive income and will not be transferred into (loss) earnings upon disposition or impairment. |
| | | |
| | (b) | Silver Future Derivatives |
| | | |
| | | As at December 31, 2018, the Company carried a long position of 200 silver future contracts for 1,000,000 ounces of silver. The silver future derivatives balance of $2.0 million (December 31, 2017 – $nil) consisted of an unrealized gain of $1.3 million and $0.7 million in deposits. |
| 15. | MINING INTERESTS |
| | |
| Mining interests primarily consist of acquisition, development and exploration costs directly related to the Company’s operations and projects. Upon commencement of commercial production, mining interests for producing properties are depleted on a units-of- production basis over the estimated economic life of the mine. In applying the units of production method, depletion is determined using quantity of material extracted from the mine in the period as a portion of total quantity of material, based on reserves and resources, considered to be highly probable to be economically extracted over the life of mine plan. |
| | |
| The Company’s mining interests are comprised of the following: |
| | | | DECEMBER 31, | | | DECEMBER 31, | |
| | | | 2018 | | | 2017 | |
| | Producing properties | $ | 353,651 | | | 287,218 | |
| | Exploration properties (non-depletable) | | 81,962 | | | 86,928 | |
| | | $ | 435,613 | | $ | 374,146 | |
Producing properties are allocated as follows:
| | | | San | | | Santa | | | La | | | La | | | Del | | | San | | | La | | | | |
| | Producing properties | | Dimas | | | Elena | | | Encantada | | | Parrilla | | | Toro | | | Martin | | | Guitarra | | | Total | |
| | Cost | | | | | | | | | | | | | | | | | | | | | | | | |
| | At December 31, 2016 | $ | — | | $ | 27,629 | | $ | 85,829 | | $ | 146,189 | | $ | 99,678 | | $ | 86,314 | | $ | 101,000 | | $ | 546,639 | |
| | Additions | | — | | | 8,386 | | | 2,588 | | | 8,339 | | | 4,512 | | | 3,613 | | | 5,233 | | | 32,671 | |
| | Change in decommissioning liabilities | | — | | | 356 | | | 210 | | | 823 | | | 445 | | | 1,028 | | | 458 | | | 3,320 | |
| | At December 31, 2017 | $ | — | | $ | 36,371 | | $ | 88,627 | | $ | 155,351 | | $ | 104,635 | | $ | 90,955 | | $ | 106,691 | | $ | 582,630 | |
| | Additions | | 11,030 | | | 7,609 | | | 5,787 | | | 8,336 | | | 6,241 | | | 3,988 | | | 2,686 | | | 45,677 | |
| | Acquired from Primero (Note 4) | | 178,183 | | | — | | | — | | | — | | | — | | | — | | | — | | | 178,183 | |
| | Change in decommissioning liabilities | | 4,092 | | | (633 | ) | | 3,122 | | | — | | | — | | | — | | | — | | | 6,581 | |
| | Transfer from exploration properties | | — | | | 1,694 | | | 1,900 | | | — | | | — | | | — | | | — | | | 3,594 | |
| | At December 31, 2018 | $ | 193,305 | | $ | 45,041 | | $ | 99,436 | | $ | 163,687 | | $ | 110,876 | | $ | 94,943 | | $ | 109,377 | | $ | 816,665 | |
| | Accumulated depletion, amortization and impairment | | | | | | | | | | | | | | | | | | | | | | | | |
| | At December 31, 2016 | $ | — | | | ($3,404 | ) | $ | (51,399 | ) | $ | (48,975 | ) | $ | (27,274 | ) | $ | (37,354 | ) | $ | (59,020 | ) | $ | (227,426 | ) |
| | Depletion and amortization | | — | | | (4,235 | ) | | (4,165 | ) | | (13,169 | ) | | (5,480 | ) | | (2,963 | ) | | (3,574 | ) | | (33,586 | ) |
| | Impairment (Note 17) | | — | | | — | | | — | | | — | | | (34,400 | ) | | — | | | — | | | (34,400 | ) |
| | At December 31, 2017 | $ | — | | $ | (7,639 | ) | $ | (55,564 | ) | $ | (62,144 | ) | $ | (67,154 | ) | $ | (40,317 | ) | $ | (62,594 | ) | $ | (295,412 | ) |
| | Depletion and amortization | | (10,871 | ) | | (3,955 | ) | | (4,308 | ) | | (16,470 | ) | | (4,850 | ) | | (4,220 | ) | | (3,102 | ) | | (47,776 | ) |
| | Impairment (Note 17) | | — | | | — | | | — | | | (67,901 | ) | | (29,271 | ) | | — | | | (22,654 | ) | | (119,826 | ) |
| | At December 31, 2018 | $ | (10,871 | ) | $ | (11,594 | ) | $ | (59,872 | ) | $ | (146,515 | ) | $ | (101,275 | ) | $ | (44,537 | ) | $ | (88,350 | ) | $ | (463,014 | ) |
| | Carrying values | | | | | | | | | | | | | | | | | | | | | | | | |
| | At December 31, 2017 | $ | — | | $ | 28,732 | | $ | 33,063 | | $ | 93,207 | | $ | 37,481 | | $ | 50,638 | | $ | 44,097 | | $ | 287,218 | |
| | At December 31, 2018 | $ | 182,434 | | $ | 33,447 | | $ | 39,564 | | $ | 17,172 | | $ | 9,601 | | $ | 50,406 | | $ | 21,027 | | $ | 353,651 | |
| CONSOLIDATED FINANCIAL STATEMENTS | 61 | ANNUAL REPORT 2018 |
NOTES TO AUDITED CONSOLIDATED FINANCIAL STATEMENTS
(tabular amounts are expressed in thousands of US dollars)
| 15. | MINING INTERESTS(continued) Exploration properties are allocated as follows: |
| | | | San | | | Santa | | | La | | | La | | | Del | | | San | | | La | | | | | | | |
| | Exploration properties | | Dimas | | | Elena | | | Encantada | | | Parrilla | | | Toro | | | Martin | | | Guitarra | | | Other | | | Total | |
| | Cost | | | | | | | | | | | | | | | | | | | | | | | | | | | |
| | At December 31, 2016 | $ | — | | $ | 1,028 | | $ | 2,557 | | $ | 10,628 | | $ | 16,812 | | $ | 6,101 | | $ | 7,810 | | $ | 26,260 | | $ | 71,196 | |
| | Exploration and evaluation expenditures | | — | | | 6,749 | | | 2,664 | | | 3,354 | | | 2,605 | | | 3,498 | | | 2,575 | | | 3,587 | | | 25,032 | |
| | Impairment (Note 17) | | — | | | — | | | — | | | — | | | (9,300 | ) | | — | | | — | | | — | | | (9,300 | ) |
| | At December 31, 2017 | $ | — | | $ | 7,777 | | $ | 5,221 | | $ | 13,982 | | $ | 10,117 | | $ | 9,599 | | $ | 10,385 | | $ | 29,847 | | $ | 86,928 | |
| | Exploration and evaluation expenditures | | 3,705 | | | 8,233 | | | 2,339 | | | 3,291 | | | 2,363 | | | 2,939 | | | 1,337 | | | 3,593 | | | 27,800 | |
| | Impairment (Note 17) | | — | | | — | | | — | | | (13,787 | ) | | (9,398 | ) | | — | | | (5,987 | ) | | — | | | (29,172 | ) |
| | Transfer to producing properties | | — | | | (1,694 | ) | | (1,900 | ) | | — | | | — | | | — | | | — | | | — | | | (3,594 | ) |
| | At December 31, 2018 | $ | 3,705 | | $ | 14,316 | | $ | 5,660 | | $ | 3,486 | | $ | 3,082 | | $ | 12,538 | | $ | 5,735 | | $ | 33,440 | | $ | 81,962 | |
| | (a) | San Dimas Silver/Gold Mine, Durango State |
| | | |
| | | The San Dimas Mine has a gold and silver streaming agreement with WPMI which entitles WPMI to receive 25% of the gold equivalent production (based on a fixed exchange ratio of 70 silver ounces to 1 gold ounce) at San Dimas in exchange for ongoing payments equal to the lesser of $600 (subject to a 1% annual inflation adjustment) and the prevailing market price, for each gold equivalent ounce delivered under the New Stream Agreement. |
| | | |
| | (b) | Santa Elena Silver/Gold Mine, Sonora State |
| | | |
| | | The Santa Elena Mine has a gold streaming agreement with Sandstorm, which requires the mine to sell 20% of its life of mine gold production from its leach pad and a designated area of its underground operations to Sandstorm. The selling price to Sandstorm is the lesser of $450 per ounce, subject to a 1% annual inflation increase commencing in April 2018, and the prevailing market price. |
| | | |
| | | In December 2016, the Company entered into an option agreement with Compania Minera Dolores, S.A. de C.V., a subsidiary of Pan American Silver Corp., to acquire the Los Hernandez Property, consisting of 5,802 hectares of mining concessions north of the Santa Elena mine. In exchange, First Majestic has agreed to incur $1.6 million in exploration costs on the property over four years, grant a 2.5% NSR royalty on the related concessions, and to pay $1.4 million in option payments, of which $0.5 million has been paid, $0.2 million due in December 2019 and $0.7 million in December 2020. |
| | | |
| | (c) | Del Toro Silver Mine, Zacatecas State |
| | | |
| | | In September 2016, the Company entered into two agreements to acquire 1,223 hectares of mining concessions adjacent to the Del Toro Silver Mine. The total purchase price amounted to $3.6 million in cash, of which $3.2 million has been paid and $0.4 million is due in March 2019. |
| | | |
| | | In October 2016, the Company entered into an agreement to acquire 7,205 hectares of mining concessions adjacent to the Del Toro Silver Mine. The total purchase price amounted to $1.5 million, payable over six equal payments every six months. As at December 31, 2018, $1.2 million (December 31, 2017 – $0.9 million) has been paid. |
| 16. | PROPERTY, PLANT AND EQUIPMENT |
| | |
| The majority of the Company’s property, plant and equipment is used in the Company’s seven operating mine segments. Property, plant and equipment is depreciated using either the straight-line or units-of-production method over the shorter of the estimated useful life of the asset or the expected life of mine. Where an item of property, plant and equipment comprises of major components with different useful lives, the components are accounted for as separate items of property, plant and equipment. Assets under construction are recorded at cost and re-allocated to land and buildings, machinery and equipment or other when they become available for use. |
The accompanying notes are an integral part of the audited consolidated financial statements.
| FIRST MAJESTIC SILVER CORP. | 62 | CONSOLIDATED FINANCIAL STATEMENTS |
NOTES TO AUDITED CONSOLIDATED FINANCIAL STATEMENTS
(tabular amounts are expressed in thousands of US dollars)
| 16. | PROPERTY, PLANT AND EQUIPMENT(continued) Property, plant and equipment are comprised of the following: |
| | | | Land and | | | Machinery and | | | Assets under | | | | | | | |
| | | | Buildings(1) | | | Equipment | | | Construction | | | Other | | | Total | |
| | Cost | | | | | | | | | | | | | | | |
| | At December 31, 2016 | $ | 133,122 | | $ | 325,230 | | $ | 21,815 | | $ | 13,150 | | $ | 493,317 | |
| | Additions | | — | | | 6,295 | | | 17,281 | | | 123 | | | 23,699 | |
| | Transfers and disposals | | 1,276 | | | 10,374 | | | (17,147 | ) | | 1,438 | | | (4,059 | ) |
| | At December 31, 2017 | $ | 134,398 | | $ | 341,899 | | $ | 21,949 | | $ | 14,711 | | $ | 512,957 | |
| | Additions | | 9 | | | 4,411 | | | 28,669 | | | 621 | | | 33,710 | |
| | Acquired from Primero (Note 4) | | 40,404 | | | 70,064 | | | 7,169 | | | 5,178 | | | 122,815 | |
| | Transfers and disposals | | 3,053 | | | 14,488 | | | (22,114 | ) | | 2,900 | | | (1,673 | ) |
| | At December 31, 2018 | $ | 177,864 | | $ | 430,862 | | $ | 35,673 | | $ | 23,410 | | $ | 667,809 | |
| | Accumulated depreciation, amortization and impairment | | | | | | | | | | | | | | | |
| | At December 31, 2016 | $ | (65,982 | ) | $ | (180,362 | ) | $ | — | | $ | (9,335 | ) | $ | (255,679 | ) |
| | Depreciation and amortization | | (8,347 | ) | | (34,556 | ) | | — | | | (1,896 | ) | | (44,799 | ) |
| | Transfers and disposals | | 226 | | | 961 | | | — | | | 186 | | | 1,373 | |
| | Impairment (Note 17) | | (12,301 | ) | | (9,396 | ) | | — | | | (103 | ) | | (21,800 | ) |
| | At December 31, 2017 | $ | (86,404 | ) | $ | (223,353 | ) | $ | — | | $ | (11,148 | ) | $ | (320,905 | ) |
| | Depreciation and amortization | | (8,215 | ) | | (36,650 | ) | | — | | | (1,777 | ) | | (46,642 | ) |
| | Impairment (Note 17) | | (16,639 | ) | | (33,420 | ) | | — | | | (631 | ) | | (50,690 | ) |
| | Transfers and disposals | | — | | | 1,464 | | | — | | | 48 | | | 1,512 | |
| | At December 31, 2018 | $ | (111,258 | ) | $ | (291,959 | ) | $ | — | | $ | (13,508 | ) | $ | (416,725 | ) |
| | Carrying values | | | | | | | | | | | | | | | |
| | At December 31, 2017 | $ | 47,994 | | $ | 118,546 | | $ | 21,949 | | $ | 3,563 | | $ | 192,052 | |
| | At December 31, 2018 | $ | 66,606 | | $ | 138,903 | | $ | 35,673 | | $ | 9,902 | | $ | 251,084 | |
(1) Included in land and buildings is $11.5 million (December 31, 2017 – $5.9 million) of land which is not subject to depreciation.
Property, plant and equipment, including land and buildings, machinery and equipment, assets under construction and other assets above are allocated by mine as follow:
| | | | San | | | Santa | | | La | | | La | | | Del | | | San | | | La | | | | | | | |
| | | | Dimas | | | Elena | | | Encantada | | | Parrilla | | | Toro | | | Martin | | | Guitarra | | | Other | | | Total | |
| | Cost | | | | | | | | | | | | | | | | | | | | | | | | | | | |
| | At December 31, 2016 | $ | — | | $ | 69,370 | | $ | 116,923 | | $ | 94,693 | | $ | 117,128 | | $ | 45,879 | | $ | 25,751 | | $ | 23,573 | | $ | 493,317 | |
| | Additions | | — | | | 2,913 | | | 7,246 | | | 3,630 | | | 1,473 | | | 3,724 | | | 2,029 | | | 2,684 | | | 23,699 | |
| | Transfers and disposals | | — | | | 1,401 | | | 29 | | | (1,832 | ) | | (1,400 | ) | | (2,062 | ) | | 335 | | | (530 | ) | | (4,059 | ) |
| | At December 31, 2017 | $ | — | | $ | 73,684 | | $ | 124,198 | | $ | 96,491 | | $ | 117,201 | | $ | 47,541 | | $ | 28,115 | | $ | 25,727 | | $ | 512,957 | |
| | Additions | | 5,750 | | | 3,066 | | | 8,812 | | | 2,564 | | | 3,016 | | | 2,375 | | | 1,296 | | | 6,831 | | | 33,710 | |
| | Acquired from Primero (Note 4) | | 122,815 | | | — | | | — | | | — | | | — | | | — | | | — | | | — | | | 122,815 | |
| | Transfers and disposals | | (802 | ) | | (79 | ) | | (864 | ) | | (9 | ) | | 1,311 | | | 1,784 | | | (2,648 | ) | | (366 | ) | | (1,673 | ) |
| | At December 31, 2018 | $ | 127,763 | | $ | 76,671 | | $ | 132,146 | | $ | 99,046 | | $ | 121,528 | | $ | 51,700 | | $ | 26,763 | | $ | 32,192 | | $ | 667,809 | |
| | | | | | | | | | | | | | | | | | | | | | | | | | | | | |
| | Accumulated depreciation, amortization and impairment | | | | | | | | | | | | | | | | | | | | | | | | | | | |
| | At December 31, 2016 | $ | — | | $ | (15,870 | ) | $ | (72,013 | ) | $ | (46,566 | ) | $ | (63,234 | ) | $ | (25,782 | ) | $ | (18,347 | ) | $ | (13,867 | ) | $ | (255,679 | ) |
| | Depreciation and | | — | | | (12,181 | ) | | (8,779 | ) | | (6,585 | ) | | (8,580 | ) | | (3,691 | ) | | (2,974 | ) | | (2,009 | ) | | (44,799 | ) |
| | amortization | | | | | | | | | | | | | | | | | | | | | | | | | | | |
| | Transfers and disposals | | — | | | (847 | ) | | 523 | | | 167 | | | 35 | | | 1,684 | | | (333 | ) | | 144 | | | 1,373 | |
| | Impairment | | — | | | — | | | — | | | — | | | (21,800 | ) | | — | | | — | | | — | | | (21,800 | ) |
| | At December 31, 2017 | $ | — | | $ | (28,898 | ) | $ | (80,269 | ) | $ | (52,984 | ) | $ | (93,579 | ) | $ | (27,789 | ) | $ | (21,654 | ) | $ | (15,732 | ) | $ | (320,905 | ) |
| | Depreciation and | | (8,179 | ) | | (8,397 | ) | | (9,646 | ) | | (8,489 | ) | | (3,761 | ) | | (4,388 | ) | | (2,161 | ) | | (1,621 | ) | | (46,642 | ) |
| | amortization | | | | | | | | | | | | | | | | | | | | | | | | | | | |
| | Impairment (Note 17) | | — | | | — | | | — | | | (30,062 | ) | | (17,609 | ) | | — | | | (3,019 | ) | | — | | | (50,690 | ) |
| | Transfers and disposals | | 634 | | | 288 | | | 829 | | | 92 | | | (804 | ) | | (1,150 | ) | | 1,546 | | | 77 | | | 1,512 | |
| | At December 31, 2018 | $ | (7,545 | ) | $ | (37,007 | ) | $ | (89,086 | ) | $ | (91,443 | ) | $ | (115,753 | ) | $ | (33,327 | ) | $ | (25,288 | ) | $ | (17,276 | ) | $ | (416,725 | ) |
| | | | | | | | | | | | | | | | | | | | | | | | | | | | | |
| | Carrying values | | | | | | | | | | | | | | | | | | | | | | | | | | | |
| | At December 31, 2017 | $ | — | | $ | 44,786 | | $ | 43,929 | | $ | 43,507 | | $ | 23,622 | | $ | 19,752 | | $ | 6,461 | | $ | 9,995 | | $ | 192,052 | |
| | At December 31, 2018 | $ | 120,218 | | $ | 39,664 | | $ | 43,060 | | $ | 7,603 | | $ | 5,775 | | $ | 18,373 | | $ | 1,475 | | $ | 14,916 | | $ | 251,084 | |
| CONSOLIDATED FINANCIAL STATEMENTS | 63 | ANNUAL REPORT 2018 |
NOTES TO AUDITED CONSOLIDATED FINANCIAL STATEMENTS
(tabular amounts are expressed in thousands of US dollars)
| 17. | IMPAIRMENT OF NON-CURRENT ASSETS |
| | |
| During the years ended December 31, 2018 and 2017, the Company determined there were indicators of potential impairment on its non-current assets, including the following: |
| | • | La Parrilla – a decrease in Reserves and Resources due to a reduction in market consensus on silver, lead and zinc prices which diminished the profit margin on its concentrate producing operations; |
| | | |
| | • | Del Toro – a decrease in Reserves and Resources due to a reduction in market consensus on silver and lead prices, and the impact of the decision to reduce the mine’s throughput to 270 tpd in 2019 to focus on development and exploration; and |
| | | |
| | • | La Guitarra – management’s decision to place the mine on care and maintenance effective August 3, 2018 pursuant to decline in market consensus on long-term silver price forecasts. |
Based on the Company’s assessment, the Company concluded that the following mines and properties had estimated recoverable value, based on their FVLCD, below their carrying value and impairment charges were required:
| | | | DECEMBER 31, | | | DECEMBER 31, | |
| | | | 2018 | | | 2017 | |
| | La Parrilla Silver Mine | $ | 111,750 | | $ | — | |
| | DelToro Silver Mine | | 56,278 | | | 65,500 | |
| | La Guitarra Silver Mine | | 31,660 | | | — | |
| | Impairment ofnon-current assets | $ | 199,688 | | $ | 65,500 | |
| | Deferred income tax recovery | | (48,588 | ) | | (23,100 | ) |
| | Impairment ofnon-current assets,net of tax | $ | 151,100 | | $ | 42,400 | |
The impairment charge recognized for the year ended December 31, 2018 in respect of each CGU was as follows:
| | | | Mining interests | | | Property, | | | | |
| | | | | | | | | | plant and | | | | |
| | | | Producing | | | Exploration | | | equipment | | | Total | |
| | La Parrilla Silver Mine | $ | 67,901 | | $ | 13,787 | | $ | 30,062 | | $ | 111,750 | |
| | DelToro Silver Mine | | 29,271 | | | 9,398 | | | 17,609 | | | 56,278 | |
| | La Guitarra Silver Mine | | 22,654 | | | 5,987 | | | 3,019 | | | 31,660 | |
| | Impairmentofnon-currentassets | $ | 119,826 | | $ | 29,172 | | $ | 50,690 | | $ | 199,688 | |
Recoverable values are determined with internal discounted cash flow economic models projected using management’s best estimate of recoverable mineral reserves and resources, future operating costs and capital expenditures and long-term foreign exchange rates.
Metal price assumptions used to determine the recoverable amounts for the years ended December 31, 2018 and 2017 are summarized in the following table:
| | | | DECEMBER 31, 2018 | | | DECEMBER 31, 2017 | |
| | Commodity | | 2019-2022 | | | | | | 2018-2021 | | | | |
| | Prices | | Average | | | Long-term | | | Average | | | Long-term | |
| | Silver (per ounce) | | $ 17.23 | | | $ 18.50 | | | $ 19.38 | | | $ 20.00 | |
| | Gold (per ounce) | $ | 1,318 | | $ | 1,350 | | $ | 1,333 | | $ | 1,350 | |
| | Lead (per pound) | $ | 0.99 | | $ | 1.00 | | $ | 1.08 | | $ | 1.00 | |
| | Zinc (per pound) | $ | 1.19 | | $ | 1.19 | | $ | 1.36 | | $ | 1.16 | |
| A discount rate of 6.5% (2017 – 6.5%), equivalent to the Company’s weighted average cost of capital for the year ended December 31, 2018, was used to determine FVLCD based on internal discounted cash flow economic models for each CGU. |
| | |
| The internal discounted cash flow economic models used to determine FVLCD are significantly affected by changes in key assumptions for future metal prices, capital expenditures, production cost estimates and discount rates. Management’s estimate of FVLCD is classified as level 3 in the fair value hierarchy. There was no material change in the valuation techniques utilized to determine FVLCD in the year ended December 31, 2018. |
| | |
| 18. | TRADE AND OTHER PAYABLES |
| | |
| The Company’s trade and other payables are primarily comprised of amounts outstanding for purchases relating to mining operations, exploration and evaluation activities and corporate expenses. The normal credit period for these purchases is usually between 30 to 90 days. |
| | |
| Trade and other payables are comprised of the following items: |
| | | | DECEMBER 31, | | | DECEMBER 31, | |
| | | | 2018 | | | 2017 | |
| | Trade payables | $ | 26,420 | | $ | 18,281 | |
| | Trade related accruals | | 9,351 | | | 11,378 | |
| | Payroll and related benefits | | 11,255 | | | 4,028 | |
| | Environmental duty | | 1,536 | | | 1,047 | |
| | Other accrued liabilities | | 1,621 | | | 833 | |
| | | $ | 50,183 | | $ | 35,567 | |
The accompanying notes are an integral part of the audited consolidated financial statements.
| FIRST MAJESTIC SILVER CORP. | 64 | CONSOLIDATED FINANCIAL STATEMENTS |
NOTES TO AUDITED CONSOLIDATED FINANCIAL STATEMENTS
(tabular amounts are expressed in thousands of US dollars)
| 19. | DEBT FACILITIES |
| | |
| The movement in debt facilities during the years ended December 31, 2018 and December 31, 2017, respectively, are comprised of the following: |
| | | | Convertible | | | Revolving Credit | | | Scotia Debt | | | Primero Debt | | | | |
| | | | Debentures | | | Facility | | | Facility | | | Facilities | | | | |
| | | | (a) | | | (b) | | | (c) | | | (d) | | | Total | |
| | Balance at December 31, 2016 | $ | — | | $ | — | | $ | 43,938 | | $ | — | | $ | 43,938 | |
| | Interest and accretion expense | | — | | | — | | | 2,206 | | | — | | | 2,206 | |
| | Repayments of principal | | — | | | — | | | (12,726 | ) | | — | | | (12,726 | ) |
| | Repayments of finance costs | | — | | | — | | | (1,649 | ) | | — | | | (1,649 | ) |
| | Balance at December 31, 2017 | $ | — | | $ | — | | $ | 31,769 | | $ | — | | $ | 31,769 | |
| | Net proceeds from debt financing | | 151,079 | | | 34,006 | | | — | | | — | | | 185,085 | |
| | Acquired from Primero (Note 4) | | — | | | — | | | — | | | 106,111 | | | 106,111 | |
| | Portion allocated to equity reserves | | (26,252 | ) | | — | | | — | | | — | | | (26,252 | ) |
| | Finance costs | | | | | | | | | | | | | | | |
| | Interest expense | | 2,738 | | | 1,170 | | | 529 | | | — | | | 4,437 | |
| | Accretion | | 4,978 | | | 419 | | | 555 | | | — | | | 5,952 | |
| | Repayments of principal | | — | | | (16,000 | ) | | (32,072 | ) | | (106,111 | ) | | (154,183 | ) |
| | Repayments of finance costs | | (1,736 | ) | | (890 | ) | | (781 | ) | | — | | | (3,407 | ) |
| | Balance at December 31, 2018 | $ | 130,807 | | $ | 18,705 | | $ | — | | $ | — | | $ | 149,512 | |
| | | | | | | | | | | | | | | | | |
| | Statements of Financial Position Presentation | | | | | | | | | | | | | | | |
| | Current portion of debt facilities | $ | — | | $ | — | | $ | 12,464 | | $ | — | | $ | 12,464 | |
| | Non-current portion of debt facilities | | — | | | — | | | 19,305 | | | — | | | 19,305 | |
| | Balance at December 31, 2017 | $ | — | | $ | — | | $ | 31,769 | | $ | — | | $ | 31,769 | |
| | Current portion of debt facilities | $ | 1,002 | | $ | 279 | | $ | — | | $ | — | | $ | 1,281 | |
| | Non-current portion | | | | | | | | | | | | | | | |
| | of debt facilities | | 129,805 | | | 18,426 | | | — | | | — | | | 148,231 | |
| | Balance at December 31, 2018 | $ | 130,807 | | $ | 18,705 | | $ | — | | $ | — | | $ | 149,512 | |
| | (a) | Convertible Debentures |
| | | |
| | | During the first quarter of 2018, the Company issued $156.5 million of unsecured senior convertible debentures (the “Notes”). The Company received net proceeds of $151.1 million after transaction costs of $5.4 million. The Notes mature on March 1, 2023 and bear an interest rate of 1.875% per annum, payable semi-annually in arrears in March and September of each year. |
| | | |
| | | The Notes are convertible into common shares of the Company at any time prior to maturity at a conversion rate of 104.3297 common shares per $1,000 principal amount of Notes converted, representing an initial conversion price of $9.59 per common share, subject to certain anti-dilution adjustments. In addition, if certain fundamental changes occur, holders of the Notes may be entitled to an increased conversion rate. |
| | | |
| | | The Company may not redeem the Notes before March 6, 2021, except in the event of certain changes in Canadian tax law. At any time on or after March 6, 2021 and until maturity, the Company may redeem all or part of the Notes for cash if the last reported share price of the Company’s common shares for 20 or more trading days in a period of 30 consecutive trading days exceeds 130% of the conversion price. The redemption price will equal to the sum of: (i) 100% of the principal amount of the notes to be redeemed and (ii) accrued and unpaid interest, if any, to the redemption date. |
| | | |
| | | The Company is required to offer to purchase for cash all of the outstanding Notes upon a fundamental change, at a cash purchase price equal to 100% of the principal amount of the Notes to be purchased, plus accrued and unpaid interest, if any, to the fundamental change purchase date. |
| | | |
| | | The component parts of the convertible debentures, a compound instrument, are classified separately as financial liabilities and equity in accordance with the substance of the contractual arrangement and the definitions of a financial liability and an equity instrument. A conversion option that will be settled by the exchange of a fixed amount of cash or another financial asset for a fixed number of the Company’s own equity instrument is an equity instrument. |
| CONSOLIDATED FINANCIAL STATEMENTS | 65 | ANNUAL REPORT 2018 |
NOTES TO AUDITED CONSOLIDATED FINANCIAL STATEMENTS
(tabular amounts are expressed in thousands of US dollars)
| 19. | DEBT FACILITIES(continued) |
| | (a) | Convertible Debentures (continued) |
| | | |
| | | At initial recognition, net proceeds of $151.1 million from the Notes were allocated into its debt and equity components. The fair value of the debt portion was estimated at $124.8 million using a discounted cash flow model method with an expected life of five years and a discount rate of 6.14%. This amount is recorded as a financial liability on an amortized cost basis using the effective interest method using an effective interest rate of 6.47% until extinguished upon conversion or at its maturity date. |
| | | |
| | | The conversion option is classified as equity and was estimated based on the residual value of $26.3 million. This amount is not subsequently remeasured and will remain in equity until the conversion option is exercised, in which case, the balance recognized in equity will be transferred to share capital. Where the conversion option remains unexercised at the maturity date of the convertible note, the balance will remain in equity reserves. Deferred tax liability of $7.1 million related to taxable temporary difference arising from the equity portion of the convertible debenture was recognized in equity reserves. |
| | | |
| | | Transaction costs of $5.4 million that relate to the issuance of the convertible debentures were allocated to the liability and equity components in proportion to the allocation of the gross proceeds. Transaction costs relating to the equity component are recognized directly in equity. Transaction costs relating to the liability component are included in the carrying amount of the liability component and are amortized over the life of the convertible debentures using the effective interest method. |
| | | |
| | (b) | Revolving Credit Facility |
| | | |
| | | On May 10, 2018, the Company entered into a $75.0 million senior secured revolving credit facility (“Revolving Credit Facility”) with the Bank of Nova Scotia, Bank of Montreal and Investec Bank PLC, as lenders. The Revolving Credit Facility will mature on its third anniversary date. Interest on the drawn balance will accrue at LIBOR plus an applicable range of 2.25% to 3.5% while the undrawn portion is subject to a standby fee with an applicable range of 0.5625% to 0.875%, dependent on certain financial parameters of First Majestic. As at December 31, 2018, the applicable rates were 6.0% and 0.875%, respectively. |
| | | |
| | | Proceeds from the Revolving Credit Facility were used primarily to repay Scotia debt facilities (Note 19(c)) as well as a $30.2 million revolving credit facility assumed from the Primero acquisition. |
| | | |
| | | These debt facilities are guaranteed by certain subsidiaries of the Company and are also secured by a first priority charge against the assets of the Company, and a first priority pledge of shares of the Company’s subsidiaries. |
| | | The Revolving Credit Facility includes financial covenants, to be tested quarterly on a consolidated basis, requiring First Majestic to maintain the following: (a) a leverage ratio based on total debt to rolling four quarters adjusted EBITDA of not more than 3.00 to 1.00; (b) an interest coverage ratio, based on rolling four quarters adjusted EBITDA divided by interest payments, of not less than 4.00 to 1.00; and (c) tangible net worth of not less than $563.5 million plus 50% of its positive earnings subsequent to June 30, 2018. The debt facilities also provide for negative covenants customary for these types of facilities and allows the Company to enter into equipment financing obligations up to $30.0 million. As at December 31, 2018 and December 31, 2017, the Company was in compliance with these covenants. |
| | | |
| | (c) | Scotia Debt Facilities |
| | | |
| | | In February 2016, the Company entered into an agreement with The Bank of Nova Scotia and Investec Bank PLC for a senior secured debt facility consisting of a $35.0 million term loan and a $25.0 million revolving credit facility (together, “Scotia Debt Facilities”). |
| | | |
| | | The $35.0 million term loan was repayable in 11 equal quarterly instalments of $3.2 million in principal plus related interest, with the final instalment due in February 2019. The term loan bears an interest rate of LIBOR plus a range from 3.25% to 4.00%, depending on certain financial parameters of the Company. |
| | | |
| | | The $25.0 million revolving credit facility was to mature in three years on February 8, 2019 and bears the same interest rate as the term loan plus a relevant standby fee from 0.81% to 1.00% from the undrawn portion of the facility. |
| | | |
| | | In connection with the acquisition of Primero (Note 4), First Majestic restructured its debt by entering into a Revolving Credit Facility (Note 19(b)) which was used to repay the remaining balance of the Scotia Debt Facilities on May 10, 2018. |
| | | |
| | (d) | Primero Debt |
| | | |
| | | As part of the acquisition of Primero (Note 4), First Majestic assumed $106.1 million in outstanding debt facilities owed by Primero, consisting of $75.8 million in convertible debentures and a $30.2 million revolving credit facility (together, “Primero Debt Facilities”). |
| | | |
| | | In connection with the Plan of Arrangement for the acquisition of Primero (Note 4), in March 2018, the debentureholders of Primero’s $75.8 million convertible debentures voted to approve an amendment to the maturity date of the debentures from February 28, 2020 to the next business day following the closing date of the business combination with First Majestic. As a result, these convertible debentures were fully repaid by the Company on May 11, 2018. |
| | | |
| | | The $30.2 million revolving credit facility was fully repaid by the Company on May 10, 2018. |
The accompanying notes are an integral part of the audited consolidated financial statements.
| FIRST MAJESTIC SILVER CORP. | 66 | CONSOLIDATED FINANCIAL STATEMENTS |
NOTES TO AUDITED CONSOLIDATED FINANCIAL STATEMENTS
(tabular amounts are expressed in thousands of US dollars)
| 20. | EQUIPMENT FINANCING OBLIGATIONS |
| | |
| The Company has finance leases and equipment financing for various mine and plant equipment. Assets under finance leases and equipment financing are pledged as security against the obligations. |
| | |
| The movement in equipment financing obligations during the years ended December 31, 2018 and December 31, 2017, respectively, are comprised of the following: |
| | | | Finance | | | Equipment | | | | |
| | | | Leases | | | Financing | | | | |
| | | | (a) | | | (b) | | | Total | |
| | Balance at December 31, 2016 | $ | 8,186 | | $ | — | | $ | 8,186 | |
| | Net proceeds from equipment financing | | — | | | 7,894 | | | 7,894 | |
| | Finance costs | | 326 | | | 233 | | | 559 | |
| | Repayments of principal | | (6,083 | ) | | (698 | ) | | (6,781 | ) |
| | Repayments of finance costs | | (320 | ) | | (233 | ) | | (553 | ) |
| | Balance at December 31, 2017 | $ | 2,109 | | $ | 7,196 | | $ | 9,305 | |
| | Finance costs | | 80 | | | 444 | | | 524 | |
| | Repayments of principal | | (1,700 | ) | | (1,846 | ) | | (3,546 | ) |
| | Repayments of finance costs | | (80 | ) | | (356 | ) | | (436 | ) |
| | Balance at December 31, 2018 | $ | 409 | | $ | 5,438 | | $ | 5,847 | |
| | Statements of Financial Position Presentation | | | | | | | | | |
| | Current portion of equipment financing obligations | $ | 1,690 | | $ | 2,464 | | $ | 4,154 | |
| | Non-current portion of equipment financing obligations | | 419 | | | 4,732 | | | 5,151 | |
| | Balance at December 31, 2017 | $ | 2,109 | | $ | 7,196 | | $ | 9,305 | |
| | Current portion of equipment financing obligations | $ | 352 | | $ | 2,552 | | $ | 2,904 | |
| | Non-current portion of equipment financing obligations | | 57 | | | 2,886 | | | 2,943 | |
| | Balance at December 31, 2018 | $ | 409 | | $ | 5,438 | | $ | 5,847 | |
| | (a) | Finance Leases |
| | | |
| | | From time to time, the Company purchases equipment under finance leases, with terms ranging from 24 to 48 months with interest rates ranging from 6.9% to 7.5%. |
| | | |
| | | As at December 31, 2018, the net book value of property, plant and equipment includes $0.6 million (December 31, 2017 – $10.0 million) of equipment in property, plant and equipment pledged as security under finance leases. |
| | | |
| | (b) | Equipment Financing |
| | | |
| | | During 2017, the Company entered into a $7.9 million credit facility with repayment terms ranging from 12 to 16 equal quarterly instalments in principal plus related interest. The facility bears an interest rate of LIBOR plus 4.60%. Proceeds from the equipment financing were primarily used for the purchase and rehabilitation of property, plant and equipment. The equipment financing is secured by certain equipment of the Company and is subject to various covenants, including the requirement for First Majestic to maintain a leverage ratio based on total debt to rolling four quarters adjusted EBITDA. As at December 31, 2018 and December 31, 2017, the Company was in compliance with these covenants. |
| | | |
| | | As at December 31, 2018, the net book value of property, plant and equipment includes $4.6 million (December 31, 2017 – $6.9 million) of equipment pledged as security for the equipment financing. |
| CONSOLIDATED FINANCIAL STATEMENTS | 67 | ANNUAL REPORT 2018 |
NOTES TO AUDITED CONSOLIDATED FINANCIAL STATEMENTS
(tabular amounts are expressed in thousands of US dollars)
| 21. | DECOMMISSIONING LIABILITIES |
| | |
| The Company has an obligation to undertake decommissioning, restoration, rehabilitation and environmental work when environmental disturbance is caused by the development and ongoing production of a mining operation. Movements in decommissioning liabilities during the year ended December 31, 2018 and 2017 are allocated as follow: |
| | | | San | | | Santa | | | La | | | San | | | La | | | Del | | | La | | | La | | | | |
| | | | Dimas | | | Elena | | | Encantada | | | Martin | | | Parrilla | | | Toro | | | Guitarra | | | Luz | | | Total | |
| | Balance atDecember 31, 2016 | $ | — | | $ | 2,107 | | $ | 2,753 | | $ | 1,289 | | $ | 1,930 | | $ | 1,861 | | $ | 1,110 | | $ | 265 | | $ | 11,315 | |
| | Movements during the year: | | | | | | | | | | | | | | | | | | | | | | | | | | | |
| | Change in rehabilitation provision | | — | | | 356 | | | 210 | | | 1,028 | | | 823 | | | 445 | | | 458 | | | — | | | 3,320 | |
| | Interest or accretion expense | | — | | | 176 | | | 235 | | | 116 | | | 166 | | | 159 | | | 83 | | | — | | | 935 | |
| | Foreign exchange loss | | — | | | 91 | | | 119 | | | 55 | | | 83 | | | 80 | | | 41 | | | 37 | | | 506 | |
| | Balance atDecember 31, 2017 | $ | — | | $ | 2,730 | | $ | 3,317 | | $ | 2,488 | | $ | 3,002 | | $ | 2,545 | | $ | 1,692 | | $ | 302 | | $ | 16,076 | |
| | Movements during the year: | | | | | | | | | | | | | | | | | | | | | | | | | | | |
| | Acquired from Primero | | 4,095 | | | — | | | — | | | — | | | — | | | — | | | — | | | — | | | 4,095 | |
| | Change in rehabilitation provision | | 4,092 | | | (633 | ) | | 3,122 | | | — | | | — | | | — | | | — | | | — | | | 6,581 | |
| | Reclamation costs incurred | | — | | | — | | | — | | | — | | | (2 | ) | | (259 | ) | | (203 | ) | | — | | | (464 | ) |
| | Interest or accretion expense | | 225 | | | 221 | | | 269 | | | 204 | | | 243 | | | 208 | | | 125 | | | — | | | 1,495 | |
| | Foreign exchange loss | | — | | | 3 | | | 1 | | | 2 | | | 2 | | | 4 | | | 1 | | | — | | | 13 | |
| | Balance atDecember 31, 2018 | $ | 8,412 | | $ | 2,321 | | $ | 6,709 | | $ | 2,694 | | $ | 3,245 | | $ | 2,498 | | $ | 1,615 | | $ | 302 | | $ | 27,796 | |
| A provision for decommissioning liabilities is estimated based on management’s interpretation of current regulatory requirements and is recognized at the present value of such costs. The expected timing of cash flows in respect of the provision is based on the estimated life of the mining operations. The discount rate is a risk-free rate determined based on Mexican pesos default swap rates ranging between 8.6% to 9.3% (2017 – 7.8% to 8.2%) for the respective estimated life of the operations. |
| | |
| The inflation rate used is based on historical Mexican inflation rate of 3.8% (2017 – 3.8%). The present value of reclamation liabilities may be subject to change based on changes to cost estimates, remediation technologies or applicable laws and regulations. Changes in decommissioning liabilities are recorded against mining interests. |
| | |
| 22. | INCOME TAXES |
| | |
| The following is a reconciliation of income taxes calculated at the combined Canadian federal and provincial statutory tax rate to the income tax expense for the year ended December 31, 2018 and 2017: |
| | | | YEAR ENDED DECEMBER 31, | |
| | | | 2018 | | | 2017 | |
| | Loss before tax | $ | (263,047 | ) | $ | (75,301 | ) |
| | Combined statutory tax rate | | 27.00% | | | 26.00% | |
| | Income tax recovery computed at statutory tax rate | | (71,023 | ) | | (19,578 | ) |
| | Reconciling items: | | | | | | |
| | Effect of different foreign statutory tax rates on earnings of subsidiaries | | (15,309 | ) | | (6,476 | ) |
| | Impact of foreign exchange on deferred income tax assets and liabilities | | 13,807 | | | (3,153 | ) |
| | Change in unrecognized deferred income tax asset | | 39,765 | | | 15,549 | |
| | 7.5% mining royalty in Mexico | | (8,225 | ) | | (2,133 | ) |
| | Other non-deductible expenses | | 834 | | | 4,259 | |
| | Impact of inflationary adjustments | | 51 | | | (1,085 | ) |
| | Change in tax provision estimates | | 8,258 | | | (3,504 | ) |
| | Impact of post acquisition Primero restructure | | (20,024 | ) | | — | |
| | Other | | (7,017 | ) | | (5,908 | ) |
| | Income tax recovery | $ | (58,883 | ) | $ | (22,029 | ) |
| | | | | | | | |
| | Statements of (Loss) Earnings Presentation | | | | | | |
| | Current income tax expense | $ | 2,148 | | $ | 7,177 | |
| | Deferred income tax recovery | | (61,031 | ) | | (29,206 | ) |
| | Income tax recovery | $ | (58,883 | ) | $ | (22,029 | ) |
| | Effective tax rate | | 22% | | | 29% | |
| FIRST MAJESTIC SILVER CORP. | 68 | CONSOLIDATED FINANCIAL STATEMENTS |
NOTES TO AUDITED CONSOLIDATED FINANCIAL STATEMENTS
(tabular amounts are expressed in thousands of US dollars)
| 22. | INCOME TAXES(continued) |
| | |
| During the years ended December 31, 2018 and 2017, the movement in deferred tax assets and deferred tax liabilities is shown as follows: |
| | | | | | | | | | Deferred tax | | | | | | | |
| | | | | | | | | | asset not | | | | | | | |
| | Deferred tax assets | | Losses | | | Provisions | | | recognized | | | Other | | | Total | |
| | At December 31, 2016 | $ | 90,590 | | $ | 10,192 | | $ | (20,379 | ) | $ | 817 | | $ | 81,220 | |
| | (Expense) benefit to income statement | | (4,038 | ) | | (77 | ) | | (8,657 | ) | | (2 | ) | | (12,774 | ) |
| | At December 31, 2017 | $ | 86,552 | | $ | 10,115 | | $ | (29,036 | ) | $ | 815 | | $ | 68,446 | |
| | Benefit (expense) to income statement | | 17,702 | | | 6,393 | | | (39,312 | ) | | 2,741 | | | (12,476 | ) |
| | Acquired from Primero (Note 4) | | 14,139 | | | — | | | — | | | — | | | 14,139 | |
| | At December 31, 2018 | $ | 118,393 | | $ | 16,508 | | $ | (68,348 | ) | $ | 3,556 | | $ | 70,109 | |
| | | | Property, plant | | | | | | | | | | |
| | | | and equipment | | | Effect of | | | | | | | |
| | | | and mining | | | Mexican tax | | | | | | | |
| | Deferred tax liabilities | | interests | | | deconsolidation | | | Other | | | Total | |
| | At December 31, 2016 | $ | 131,672 | | $ | 12,167 | | $ | 27,413 | | $ | 171,252 | |
| | (Benefit) expense to income statement | | (35,976 | ) | | 47 | | | (4,529 | ) | | (40,458 | ) |
| | Reclassed to current income taxes payable | | — | | | (2,670 | ) | | — | | | (2,670 | ) |
| | At December 31, 2017 | $ | 95,696 | | $ | 9,544 | | $ | 22,884 | | $ | 128,124 | |
| | (Benefit) expense to income statement | | (63,314 | ) | | 488 | | | (12,325 | ) | | (75,151 | ) |
| | Acquired from Primero (Note 4) | | 33,000 | | | — | | | 20,024 | | | 53,024 | |
| | Charged to equity | | — | | | — | | | 7,105 | | | 7,105 | |
| | Reclassed to current income taxes payable | | — | | | (3,288 | ) | | — | | | (3,288 | ) |
| | At December 31, 2018 | $ | 65,382 | | $ | 6,744 | | $ | 37,688 | | $ | 109,814 | |
| | | | | | | | | | | | | | |
| | Statements of Financial Position Presentation | | | | | | | | | | | | |
| | Deferred tax assets | | | | | | | | | | $ | 43,716 | |
| | Deferred tax liabilities | | | | | | | | | | | 103,394 | |
| | At December 31, 2017 | | | | | | | | | | $ | 59,678 | |
| | Deferred tax assets | | | | | | | | | | $ | 50,938 | |
| | Deferred tax liabilities | | | | | | | | | | | 90,643 | |
| | At December 31, 2018 | | | | | | | | | | $ | 39,705 | |
At December 31, 2018, the Company recognized $50.9 million (2017 – $43.7 million) of net deferred tax assets in entities that have had a loss for tax purposes in either 2018 or 2017, or both. In evaluating whether it is probable that sufficient taxable income will be generated to realize the benefit of these deferred tax assets, the Company considered all available evidence, including approved budgets, forecasts and business plans and, in certain cases, tax planning opportunities.
The aggregate amount of taxable temporary differences associated with investments in subsidiaries for which deferred taxes have not been recognized, as at December 31, 2018 was $142.3 million (2017 – $228.0 million).
| CONSOLIDATED FINANCIAL STATEMENTS | 69 | ANNUAL REPORT 2018 |
NOTES TO AUDITED CONSOLIDATED FINANCIAL STATEMENTS
(tabular amounts are expressed in thousands of US dollars)
| 22. | INCOME TAXES(continued) |
| | |
| As at December 31, 2018 and 2017, the Company has available Canadian, Swiss and Mexican non-capital tax losses, which if not utilized will expire as follows: |
| | | | Canadian | | | Swiss | | | Mexican | | | December 31, | | | December 31, | |
| | Year of Expiry | | non-capital losses | | | non-capital losses | | | non-capital losses | | | 2018 | | | 2017 | |
| | 2018 | $ | — | | $ | — | | $ | — | | $ | — | | $ | 11,317 | |
| | 2019 | | — | | | — | | | 1,726 | | | 1,726 | | | 1,679 | |
| | 2020 | | — | | | — | | | 274 | | | 274 | | | 269 | |
| | 2021 | | — | | | 6,131 | | | 4,271 | | | 10,402 | | | 13,749 | |
| | 2022 | | — | | | — | | | 3,719 | | | 3,719 | | | 3,539 | |
| | 2023 | | — | | | — | | | 1,763 | | | 1,763 | | | 1,680 | |
| | 2024 | | — | | | — | | | 36,214 | | | 36,214 | | | 34,489 | |
| | 2025 | | — | | | — | | | 91,844 | | | 91,844 | | | 100,394 | |
| | 2026 | | — | | | — | | | 105,683 | | | 105,683 | | | 95,316 | |
| | 2027 | | — | | | — | | | 52,654 | | | 52,654 | | | 19,498 | |
| | 2028 and after | | 18,263 | | | — | | | 68,546 | | | 86,809 | | | 10,819 | |
| | Total | $ | 18,263 | | $ | 6,131 | | $ | 366,694 | | $ | 391,088 | | $ | 292,749 | |
| | Unrecognized losses | $ | — | | $ | — | | $ | 147,697 | | $ | 147,697 | | $ | 92,123 | |
| | (a) | Authorized and issued capital |
| | | |
| | | The Company has unlimited authorized common shares with no par value. The movement in the Company’s issued and outstanding capital during the year is summarized in the consolidated statements of changes in equity. |
| | | |
| | | In May 2018, the Company completed an arrangement agreement to acquire all of the issued and outstanding shares of Primero by issuing 27,333,363 common shares at a price of $6.84 (CAD$8.80) based on the Company’s quoted market price as at the acquisition date. See Note 4 for details. |
| | | |
| | (b) | Stock options |
| | | |
| | | Under the terms of the Company’s Stock Option Plan, the maximum number of shares reserved for issuance under the Plan is 10% of the issued shares on a rolling basis. Options may be exercisable over periods of up to ten years as determined by the Board of Directors of the Company and the exercise price shall not be less than the closing price of the shares on the day preceding the award date, subject to regulatory approval. All stock options granted are subject to vesting with 25% vesting on first anniversary from the date of grant, and 25% vesting each six months thereafter. |
| | | |
| | | The following table summarizes information about stock options outstanding as at December 31, 2018: |
| | | | Options Outstanding | | | Options Exercisable | |
| | | | | | | Weighted | | | Weighted | | | | | | Weighted | | | Weighted | |
| | | | | | | Average | | | Average | | | | | | Average | | | Average | |
| | Exercise prices | | Number of | | | Exercise Price | | | Remaining Life | | | Number of | | | Exercise Price | | | Remaining Life | |
| | (CAD$) | | Options | | | (CAD $/Share) | | | (Years) | | | Options | | | (CAD $/Share) | | | (Years | |
| | 2.01 – 5.00 | | 1,444,023 | | | 4.79 | | | 2.00 | | | 1,444,023 | | | 4.79 | | | 2.00 | |
| | 5.01 – 10.00 | | 3,573,421 | | | 7.75 | | | 6.18 | | | 1,312,533 | | | 6.21 | | | 1.61 | |
| | 10.01 – 15.00 | | 3,894,246 | | | 10.94 | | | 2.60 | | | 2,498,946 | | | 10.94 | | | 2.12 | |
| | 15.01 – 20.00 | | 125,000 | | | 16.36 | | | 2.62 | | | 93,750 | | | 16.36 | | | 2.62 | |
| | 20.01 – 250.00 | | 229,408 | | | 88.94 | | | 1.99 | | | 227,533 | | | 89.49 | | | 1.99 | |
| | | | 9,266,098 | | | 10.76 | | | 3.87 | | | 5,576,785 | | | 11.53 | | | 1.97 | |
The accompanying notes are an integral part of the audited consolidated financial statements.
| FIRST MAJESTIC SILVER CORP. | 70 | CONSOLIDATED FINANCIAL STATEMENTS |
NOTES TO AUDITED CONSOLIDATED FINANCIAL STATEMENTS
(tabular amounts are expressed in thousands of US dollars)
| 23. | SHARE CAPITAL(continued) |
| | (b) | Stock options(continued) |
| | | |
| | | The movements in stock options issued during the years ended December 31, 2018 and December 31, 2017 are summarized as follows: |
| | | | YEAR ENDED | | | YEAR ENDED | |
| | | | DECEMBER 31, 2018 | | | DECEMBER 31, 2017 | |
| | | | | | | Weighted Average | | | | | | Weighted Average | |
| | | | | | | Exercise Price | | | | | | Exercise Price | |
| | | | Number of Options | | | (CAD $/Share) | | | Number of Options | | �� | (CAD $/Share) | |
| | Balance, beginning of the year | | 9,431,737 | | | 9.35 | | | 9,599,270 | | | 9.76 | |
| | Granted(1) | | 2,552,796 | | | 15.95 | | | 3,205,137 | | | 10.48 | |
| | Exercised | | (973,948 | ) | | 5.28 | | | (1,292,206 | ) | | 5.76 | |
| | Cancelled or expired | | (1,744,487 | ) | | 13.78 | | | (2,080,464 | ) | | 15.21 | |
| | Balance, end of the year | | 9,266,098 | | | 10.76 | | | 9,431,737 | | | 9.35 | |
| | (1) | Includes 221,908 stock options issued to replace pre-existing stock options of Primero in accordance with the Primero arrangement (see Note 4) with a nominal fair value. |
During the year ended December 31, 2018, the aggregate fair value of stock options granted was $7.8 million (2017 – $10.1 million), or a weighted average fair value of $3.07 per stock option granted (2017 – $3.16) .
The following weighted average assumptions were used in estimating the fair value of stock options granted using the Black-Scholes Option Pricing Model:
| | | | YEAR ENDED | YEAR ENDED |
| | | | DECEMBER 31, | DECEMBER 31, |
| | Assumption | Based on | 2018 | 2017 |
| | Risk-free interest rate (%) | Yield curves on Canadian government zero-coupon bonds with a remaining term equal to the stock options’ expected life | 1.87 | 1.02 |
| | Expected life (years) | Average of the expected vesting term and expiry term of the option | 5.40 | 3.77 |
| | Expected volatility (%) | Historical and implied volatility of the precious metals mining sector | 58.70 | 52.00 |
| | Expected dividend yield (%) | Annualized dividend rate as of the date of grant | — | — |
| | | The weighted average closing share price at date of exercise for the year ended December 31, 2018 was CAD$8.86 (December 31, 2017 – CAD$11.06). |
| | | |
| | (c) | Warrants |
| | | |
| | | In connection with the Primero acquisition (see Note 4), First Majestic issued 366,124 warrants with an average exercise price of $100.75 and a nominal fair value based on the Black-Scholes Option Pricing Model. The warrants expired unexercised on June 25, 2018. |
| | | |
| | (d) | Share repurchase program |
| | | |
| | | The Company has a share repurchase program to repurchase up to 5% of the Company’s issued and outstanding common shares. The normal course issuer bids will be carried through facilities of the Toronto Stock Exchange. During the year ended December 31, 2018, the Company repurchased and cancelled 230,000 shares for total consideration of $1.3 million. No shares were repurchased during the year ended December 31, 2017. |
| | | |
| | (e) | Delisting from the Mexican Stock Exchange |
| | | |
| | | In the first quarter of 2018, the Company filed before the Mexican National Banking and Securities Commission for delisting from the Mexican Stock Exchange (“Bolsa”) due to low trading volumes and high costs associated with regulatory compliance. On February 21, 2018, the Company received authorization and has officially delisted. In connection with the delisting, during the year ended December 31, 2018, the Company has repurchased and cancelled 14,343 of the Company’s shares on Bolsa for total consideration of $0.1 million. |
| CONSOLIDATED FINANCIAL STATEMENTS | 71 | ANNUAL REPORT 2018 |
NOTES TO AUDITED CONSOLIDATED FINANCIAL STATEMENTS
(tabular amounts are expressed in thousands of US dollars)
| 24. | FINANCIAL INSTRUMENTS AND RELATED RISK MANAGEMENT |
| | |
| The Company’s financial instruments and related risk management objectives, policies, exposures and sensitivity related to financial risks are summarized below. |
| | (a) | Fair value and categories of financial instruments |
| | | |
| | | Financial instruments included in the consolidated statements of financial position are measured either at fair value or amortized cost. Estimated fair values for financial instruments are designed to approximate amounts for which the instruments could be exchanged in an arm’s-length transaction between knowledgeable and willing parties. |
| | | |
| | | The Company uses various valuation techniques in determining the fair value of financial assets and liabilities based on the extent to which the fair value is observable. The following fair value hierarchy is used to categorize and disclose the Company’s financial assets and liabilities held at fair value for which a valuation technique is used: |
| LEVEL 1: | Unadjusted quoted prices in active markets that are accessible at the measurement date for identical assets or liabilities. |
| | | |
| LEVEL 2: | All inputs which have a significant effect on the fair value are observable, either directly or indirectly, for substantially the full contractual term. |
| | | |
| | LEVEL 3: | Inputs which have a significant effect on the fair value are not based on observable market data. |
The table below summarizes the valuation methods used to determine the fair value of each financial instrument:
| FINANCIAL INSTRUMENTS MEASURED AT FAIR VALUE | | VALUATION METHOD |
| | | |
| Trade receivables (related to concentrate sales) | | Receivables that are subject to provisional pricing and final price adjustment at the end of the quotational period are estimated based on observable forward price of metal per London Metal Exchange (Level 2) |
| | | |
Marketable securities
Silver futures derivatives
Foreign exchange derivatives | | Based on quoted market prices for identical assets in an active market (Level 1) as at the date of statements of financial position |
| | | |
| FINANCIAL INSTRUMENTS MEASURED AT AMORTIZED COST | | VALUATION METHOD |
| | | |
Cash and cash equivalents
Trade and other receivables
Value added taxes receivable
Trade and other payables | | Approximated carrying value due to their short-term nature
|
| | | |
Debt facilities
Equipment financing obligations | | Assumed to approximate carrying value as discount rate on these instruments approximate the Company’s credit risk. |
The following table presents the Company’s fair value hierarchy for financial assets and financial liabilities that are measured at fair value:
| | | | DECEMBER 31, 2018 | | | DECEMBER 31, 2017 | |
| | | | | | | Fair value measurement | | | | | | Fair value measurement | |
| | | | Carrying value | | | Level 1 | | | Level 2 | | | Carrying value | | | Level 1 | | | Level 2 | |
| | Financial assets | | | | | | | | | | | | | | | | | | |
| | Trade receivables | $ | 2,559 | | $ | — | | $ | 2,559 | | $ | 1,847 | | $ | — | | $ | 1,847 | |
| | Marketable securities (Note 14) | | 6,420 | | | 6,420 | | | — | | | 11,326 | | | 11,326 | | | — | |
| | Silver futures derivatives (Note 14) | | 2,038 | | | 2,038 | | | — | | | — | | | — | | | — | |
There were no transfers between levels 1, 2 and 3 during the years ended December 31, 2018 and December 31, 2017.
The accompanying notes are an integral part of the audited consolidated financial statements.
| FIRST MAJESTIC SILVER CORP. | 72 | CONSOLIDATED FINANCIAL STATEMENTS |
NOTES TO AUDITED CONSOLIDATED FINANCIAL STATEMENTS
(tabular amounts are expressed in thousands of US dollars)
| 24. | FINANCIAL INSTRUMENTS AND RELATED RISK MANAGEMENT(continued) |
| | (b) | Capital risk management |
| | | |
| | | The Company’s objectives when managing capital are to maintain financial flexibility to continue as a going concern while optimizing growth and maximizing returns of investments from shareholders. |
| | | |
| | | The Company monitors its capital structure and, based on changes in operations and economic conditions, may adjust the structure by repurchasing shares, issuing new shares, issuing new debt or retiring existing debt. The Company prepares annual budget and quarterly forecasts to facilitate the management of its capital requirements. The annual budget is approved by the Company’s Board of Directors. |
| | | |
| | | The capital of the Company consists of equity (comprising of issued capital, equity reserves and retained earnings or accumulated deficit), debt facilities, equipment financing obligations, net of cash and cash equivalents as follows: |
| | | | DECEMBER 31, | | | DECEMBER 31, | |
| | | | 2018 | | | 2017 | |
| | Equity | $ | 594,573 | | $ | 582,485 | |
| | Debt facilities | | 149,512 | | | 31,769 | |
| | Equipment financing obligations | | 5,847 | | | 9,305 | |
| | Less: cash and cash equivalents | | (57,013 | ) | | (118,141 | ) |
| | | $ | 692,919 | | $ | 505,418 | |
| | | The Company’s investment policy is to invest its cash in highly liquid short-term investments with maturities of 90 days or less, selected with regards to the expected timing of expenditures from continuing operations. The Company expects that its available capital resources will be sufficient to carry out its development plans and operations for at least the next 12 months. |
| | | |
| | | The Company is not subject to any externally imposed capital requirements with the exception of complying with covenants under the debt facilities (Note 19) and equipment financing obligations (Note 20(b)). As at December 31, 2018 and December 31, 2017, the Company was in compliance with these covenants. |
| | | |
| | (c) | Financial risk management |
| | | |
| | | The Company thoroughly examines the various financial instruments and risks to which it is exposed and assesses the impact and likelihood of those risks. These risks may include credit risk, liquidity risk, currency risk, commodity price risk, and interest rate risk. Where material, these risks are reviewed and monitored by the Board of Directors. |
| | | |
| | | Credit Risk |
| | | |
| | | Credit risk is the risk of financial loss if a customer or counterparty fails to meet its contractual obligations. The Company’s credit risk relates primarily to trade receivables in the ordinary course of business, value added taxes receivable and other receivables. |
| | | |
| | | As at December 31, 2018, value added taxes receivable was $59.7 million (2017 – $15.0 million), including $33.0 million in PEM as part of the acquisition of Primero. The delay in recovery was primarily attributed to Primero being 18 months behind in its filings when First Majestic acquired the company. Since acquisition, the Company has accelerated its filings and, as at December 31, 2018, recovered $4.5 million of the outstanding amount. The Company continues supplying additional information requested by the Servicio de Administración Tributaria (“SAT”) as part of the review process and the Company expects the amounts to be refunded in the future. |
| | | |
| | | The Company sells and receives payment upon delivery of its silver doré and by-products primarily through three international customers. Silver-lead concentrates and related base metal by-products are sold primarily through three international customers. All of the Company’s customers have good ratings and payments of receivables are scheduled, routine and fully received within 60 days of submission; therefore, the balance of trade receivables owed to the Company in the ordinary course of business is not significant. |
| | | |
| | | The carrying amount of financial assets recorded in the consolidated financial statements represents the Company’s maximum exposure to credit risk. With the exception to the above, the Company believes it is not exposed to significant credit risk. |
| | | |
| | | Liquidity Risk |
| | | |
| | | Liquidity risk is the risk that the Company will not be able to meet its financial obligations as they arise. The Company has in place a planning and budgeting process to help determine the funds required to support the Company’s normal operating requirements and contractual obligations. |
| CONSOLIDATED FINANCIAL STATEMENTS | 73 | ANNUAL REPORT 2018 |
NOTES TO AUDITED CONSOLIDATED FINANCIAL STATEMENTS
(tabular amounts are expressed in thousands of US dollars)
| 24. | FINANCIAL INSTRUMENTS AND RELATED RISK MANAGEMENT(continued) |
| | (c) | Financial risk management(continued) |
| | | |
| | | Liquidity Riskcontinued) |
| | | |
| | | The following table summarizes the maturities of the Company’s financial liabilities as at December 31, 2018 based on the undiscounted contractual cash flows: |
| | | | Carrying | | | Contractual | | | Less than | | | 1 to 3 | | | 4 to 5 | | | After | |
| | | | Amount | | | Cash Flows | | | 1 year | | | years | | | years | | | 5 years | |
| | Trade and other payables | $ | 50,183 | | $ | 50,183 | | $ | 50,183 | | $ | — | | $ | — | | $ | — | |
| | Debt facilities | | 149,512 | | | 192,596 | | | 4,606 | | | 28,067 | | | 159,923 | | | — | |
| | Equipment financing | | | | | | | | | | | | | | | | | | |
| | obligations | | 5,847 | | | 6,251 | | | 3,145 | | | 2,499 | | | 607 | | | — | |
| | Other liabilities | | 3,787 | | | 3,787 | | | — | | | — | | | — | | | 3,787 | |
| | | $ | 209,329 | | $ | 252,817 | | $ | 57,934 | | $ | 30,566 | | $ | 160,530 | | $ | 3,787 | |
At December 31, 2018, the Company had working capital of $108.1 million (December 31, 2017 – $116.3 million). Total available liquidity at December 31, 2018 was $163.2 million, including $55.0 million of undrawn revolving credit facility. The Company believes it has sufficient cash on hand, combined with cash flows from operations, to meet operating requirements as they arise for at least the next 12 months.
Currency Risk
The Company is exposed to foreign exchange risk primarily relating to financial instruments that are denominated in Canadian dollars or Mexican pesos, which would impact the Company’s net earnings or loss. To manage foreign exchange risk, the Company may occasionally enter into short-term foreign currency derivatives. The foreign currency derivatives are not designated as hedging instruments for accounting purposes.
The sensitivity of the Company’s net earnings or loss and comprehensive income or loss due to changes in the exchange rate between the Canadian dollar and the Mexican peso against the U.S. dollar is included in the table below:
| | | | DECEMBER 31, 2018 | |
| | | | | | | | | | Value | | | | | | | | | | | | | | | | |
| | | | Cash | | | Trade | | | added | | | Other | | | Trade | | | Foreign | | | Net assets | | | Effect of +/- | |
| | | | and cash | | | and other | | | taxes | | | financial | | | and other | | | exchange | | | (liabilities) | | | 10% change | |
| | | | equivalents | | | receivables | | | receivable | | | assets | | | payables | | | derivative | | | exposure | | | in currency | |
| | Canadian dollar | $ | 22,968 | | $ | 45 | | $ | — | | $ | 2,753 | | ($ | 1,782 | ) | $ | — | | $ | 23,984 | | $ | 2,398 | |
| | Mexican peso | | 5,178 | | | — | | | 51,698 | | | — | | | (31,474 | ) | | 53,500 | | | 78,902 | | | 7,890 | |
| | | $ | 28,146 | | $ | 45 | | $ | 51,698 | | $ | 2,753 | | $ | (33,256 | ) | $ | 53,500 | | $ | 102,886 | | $ | 10,289 | |
Commodity Price Risk
The Company is exposed to commodity price risk on silver, gold, lead and zinc, which have a direct and immediate impact on the value of its related financial instruments and net earnings. The Company’s revenues are directly dependent on commodity prices that have shown volatility and are beyond the Company’s control. The Company does not use derivative instruments to hedge its commodity price risk to silver.
The following table summarizes the Company’s exposure to commodity price risk and their impact on net earnings:
| | | | DECEMBER 31, 2018 | |
| | | | Effect of +/- 10% change in metal prices | |
| | | | Silver | | | Gold | | | Lead | | | Zinc | | | Total | |
| | Metals subject to provisional price adjustments | $ | 136 | | $ | — | | $ | 85 | | $ | 125 | | $ | 346 | |
| | Metals in doré and concentrates inventory | | 127 | | | 146 | | | 37 | | | 12 | | | 322 | |
| | | $ | 263 | | $ | 146 | | $ | 122 | | $ | 137 | | $ | 668 | |
Interest Rate Risk
The Company is exposed to interest rate risk on its short-term investments, debt facilities and equipment financing obligations. The Company monitors its exposure to interest rates and has not entered into any derivative contracts to manage this risk. The Company’s interest bearing financial assets comprise of cash and cash equivalents which bear interest at a mixture of variable and fixed rates for pre-set periods of time.
As at December 31, 2018, the Company’s exposure to interest rate risk on interest-bearing liabilities is limited to its debt facilities and equipment financing obligations. The Company’s equipment leases bear interest at fixed rates.
Based on the Company’s interest rate exposure at December 31, 2018, a change of 25 basis points increase or decrease of market interest rate does not have a significant impact on net earnings or loss.
| FIRST MAJESTIC SILVER CORP. | 74 | CONSOLIDATED FINANCIAL STATEMENTS |
NOTES TO AUDITED CONSOLIDATED FINANCIAL STATEMENTS
(tabular amounts are expressed in thousands of US dollars)
| 25. | SUPPLEMENTAL CASH FLOW INFORMATION |
| | | | | | | YEAR ENDED DECEMBER 31, | |
| | | | Note | | | 2018 | | | 2017 | |
| | Adjustments to reconcile net earnings to operating cash flowsbefore movements in working capital: | | | | | | | | | |
| | Unrealized foreign exchange loss (gain) and other | | . | | $ | 659 | | $ | (2,457 | ) |
| | Unrealized loss from marketable securities and silver futures derivatives | | 14 | | | 4,435 | | | 2,600 | |
| | | | | | $ | 5,094 | | $ | 143 | |
| | Net change in non-cash working capital items: | | | | | | | | | |
| | Decrease in trade and other receivables | | | | $ | 771 | | $ | 1,616 | |
| | Increase in value added taxes receivable | | | | | (17,173 | ) | | (5,505 | ) |
| | Decrease in inventories | | | | | 2,015 | | | 2,646 | |
| | Decrease (increase) in prepaid expenses and other | | | | | 549 | | | (743 | ) |
| | Decrease in income taxes payable | | | | | (941 | ) | | (4,081 | ) |
| | (Decrease) increase in trade and other payables | | | | | (6,388 | ) | | 1,648 | |
| | | | | | $ | (21,167 | ) | $ | (4,419 | ) |
| | Non-cash investing and financing activities: | | | | | | | | | |
| | Transfer of share-based payments reserve upon exercise of options | | | | $ | 967 | | $ | 1,867 | |
| | Settlement of liabilities | | | | $ | (500 | ) | $ | (500 | ) |
| | | | | | $ | 467 | | $ | 1,367 | |
| 26. | CONTINGENCIES AND OTHER MATTERS |
| | |
| Due to the size, complexity and nature of the Company’s operations, various legal and tax matters arise in the ordinary course of business. The Company accrues for such items when a liability is probable and the amount can be reasonably estimated. In the opinion of management, these matters will not have a material effect on the consolidated financial statements of the Company. |
| | |
| Claims and Legal Proceedings Risks |
| | |
| The Company is subject to various claims and legal proceedings covering a wide range of matters that arise in the ordinary course of business activities. Many factors, both known and unknown, could cause actual results, performance or achievements to be materially different from the results, performance or achievements that are or may be expressed or implied by such forward-looking statements or information and the Company has made assumptions and estimates based on or related to many of these factors. Such factors include, without limitation: availability of time on court calendars in Canada and elsewhere; the recognition of Canadian judgments under Mexican law; the possibility of settlement discussions; the risk of appeal of judgment; and the insufficiency of the defendant’s assets to satisfy the judgment amount. Each of these matters is subject to various uncertainties and it is possible that some of these matters may be resolved unfavourably to the Company. First Majestic carries liability insurance coverage and establishes provisions for matters that are probable and can be reasonably estimated. In addition, the Company may be involved in disputes with other parties in the future which may result in a significant impact on our financial condition, cash flow and results of operations. |
| | |
| Although the Company has taken steps to verify ownership and legal title to mineral properties in which it has an interest, according to the usual industry standards for the stage of mining, development and exploration of such properties, these procedures do not guarantee the Company’s title. Such properties may be subject to prior agreements or transfers, and title may be affected by undetected defects. However, management is not aware of any such agreements, transfers or defects. |
| | |
| In April 2013, the Company received a positive judgment on the First Silver litigation from the Supreme Court of British Columbia (the “Court”), which awarded the sum of $93.8 million in favour of First Majestic against Hector Davila Santos (the “Defendant”). The Company received a sum of $14.1 million in June 2013 as partial payment of the judgment, leaving an unpaid amount of approximately $59.7 million (CAD$81.5 million). As part of the ruling, the Court granted orders restricting any transfer or encumbrance of the Bolaños Mine by the Defendant and limiting mining at the Bolaños Mine. The orders also require that the Defendant to preserve net cash flow from the Bolaños Mine in a holding account and periodically provide to the Company certain information regarding the Bolaños Mine. However, there can be no guarantee that the remainder of the judgment amount will be collected and it is likely that it will be necessary to take additional action in Mexico and/or elsewhere to recover the balance. Therefore, as at December 31, 2018, the Company has not accrued any of the remaining $59.7 million (CAD$81.5 million) unrecovered judgment in favour of the Company. |
The accompanying notes are an integral part of the audited consolidated financial statements.
| CONSOLIDATED FINANCIAL STATEMENTS | 75 | ANNUAL REPORT 2018 |
NOTES TO AUDITED CONSOLIDATED FINANCIAL STATEMENTS
(tabular amounts are expressed in thousands of US dollars)
| 26. | CONTINGENCIES AND OTHER MATTERS(continued) |
| | |
| Primero Tax Rulings |
| | |
| Since Primero acquired the San Dimas Mine in August 2010, it had a Silver Purchase Agreement (“Old Stream Agreement”) that required PEM to sell 100% of the silver produced from the San Dimas to WPMI, up to 6 million ounces and 50% of silver produced thereafter, at the lower of: (i) the spot market price and (ii) $4.04 per ounce plus an annual increase of 1%. |
| | |
| In order to reflect commercial realities and the effects of the Old Stream Agreement, for Mexican income tax purposes, PEM recognized the revenue on these silver sales based on its actual realized revenue (“PEM Realized Price”) instead of at spot market prices. |
| | |
| To obtain assurances that the SAT would accept the PEM Realized Price as the proper price to use to calculate Mexican income taxes, Primero applied for and received an Advanced Pricing Agreement (“APA”) from the SAT. The APA confirmed that the PEM Realized Price would be used as Primero’s basis for calculating taxes owed by Primero on the silver sold under the Old Stream Agreement. Primero believed that the function of an APA was to provide tax certainty and as a result made significant investments in Mexico based on that certainty. On October 4, 2012, Primero received the APA Ruling from SAT which confirmed the appropriate price for sales of silver under the Old Stream Agreement. Under Mexican tax law, an APA ruling is generally applicable for up to a five year period which made this ruling effective retrospectively from 2010 to 2014. |
| | |
| In February 2016, PEM received a legal claim from the SAT seeking to nullify the APA. The legal claim initiated does not identify any different basis for paying taxes, nor have any tax reassessments been received from SAT. The Company is continuing Primero’s effort to vigorously defend the validity of its APA. If the SAT is successful in retroactively nullifying the APA, the SAT may seek to audit and reassess PEM in respect of its sales of silver in connection with the Old Stream Agreement for 2010 through 2014. If the SAT is successful in retroactively nullifying the APA and issuing reassessments, it would likely have a material adverse effect on the Company’s results of operations, financial condition and cash flows. PEM would have rights of appeal in connection with any reassessments. |
| | |
| In June 2017 and October 2017, as part of the ongoing annual audits of the PEM tax returns, the SAT issued observations letters for the 2010 and 2011 tax years, respectively. Observations letters are issued to a taxpayer in advance of a reassessment being issued and provide an outline of the SAT’s position on matters under audit, and affords the taxpayer an opportunity to respond to such position in advance of the reassessment being issued. In the observations letters issued to PEM, the SAT made explicit its view that PEM should pay taxes based on the market price of silver. As the Company continues to defend the APA in the Mexican legal proceeding, the APA remains valid and the Company will vigorously dispute any reassessment that may be issued in the future on a basis that assesses taxes on PEM’s historical silver revenues that is inconsistent with the APA. The observations letter does not represent a tax reassessment and no liability has been recognized in the financial statements. Based on the Company’s assessments, the Company believes Primero’s filings were appropriate and continues to believe its tax filing position based upon the APA is correct. Should the Company ultimately be required to pay tax on its silver revenues based on market prices without any mitigating adjustments, the incremental income tax for the years 2010-2018 would be approximately $185 million, before interest or penalties. |
While the Company continues to vigorously defend the validity of the APA and its transfer pricing position, it is also engaging in dialogue with the SAT seeking to resolve matters and bring tax certainty through a negotiated solution. Since January 1, 2015, PEM has recorded its revenue from the sale of silver for purposes of Mexican tax accounting in a manner consistent with the APA, on the basis that the applicable facts and laws have not changed. The Company’s legal and financial advisors continue to believe that the Company has filed its tax returns compliant with applicable Mexican law. Due to the uncertainty in timing of resolution to this matter, which may take more than one year, the Company has classified its income taxes receivable of $18.7 million as non-current as at December 31, 2018 as SAT is not expected to pay PEM’s income tax refunds until the dispute is resolved.
To the extent the SAT determines that the appropriate price of silver sales under the Silver Purchase Agreement is significantly different from the realized price and while PEM would have rights of appeal in connection with any reassessments, it is likely to have a material effect on the Company’s business, financial position and results of operations.
Primero Class Action Suit
In July 2016, Primero and certain of its officers were served with a class action lawsuit that was filed in federal court in the State of California seeking to recover damages for investors in the Company’s common shares under the U.S. federal securities laws. Primero filed a motion to dismiss this action which was granted on January 30, 2017. The plaintiff’s claims were dismissed without prejudice and the plaintiffs filed an amended complaint on February 27, 2017. On July 14, 2017 the Company’s motion to dismiss the amended complaint was granted and the plaintiffs’ claims were dismissed without prejudice. Rather than amend the complaint again, the plaintiffs asked the federal court to enter final judgment and initiated an appeal of the dismissal to the Ninth Circuit Court of Appeals on September 8, 2017. The parties have filed their briefs in this appeal and a hearing on the appeal is expected sometime in the first half of 2019. The Company continues to vigorously defend this class action lawsuit on behalf of Primero and no liability has been recognized in the financial statements.
The accompanying notes are an integral part of the audited consolidated financial statements.
| FIRST MAJESTIC SILVER CORP. | 76 | CONSOLIDATED FINANCIAL STATEMENTS |
NOTES TO AUDITED CONSOLIDATED FINANCIAL STATEMENTS
(tabular amounts are expressed in thousands of US dollars)
| 27. | SUBSIDIARIES |
| | |
| The consolidated financial statements of the Company include the following significant subsidiaries as at December 31, 2018 and 2017 as follows: |
| | | | | 2018 | 2017 |
| | | | | % | % |
| | Name of subsidiary | Operations and Projects | Location | Ownership | Ownership |
| | First Majestic Silver Corp. | Parent company and bullion sales | Canada | 100% | 100% |
| | Corporación First Majestic, S.A. de C.V. | Holding company | Mexico | 100% | 100% |
| | Primero Empresa Minera, S.A de C.V. | San Dimas Silver/Gold Mine | Mexico | 100% | —% |
| | Nusantara de Mexico, S.A. de C.V. | Santa Elena Silver/Gold Mine | Mexico | 100% | 100% |
| | Minera La Encantada, S.A. de C.V. | La Encantada Silver Mine | Mexico | 100% | 100% |
| | La Encantada Procesadora de Minerales, S.A. de C.V. | La Encantada Silver Mine | Mexico | 100% | 100% |
| | First Majestic Plata, S.A. de C.V. | La Parrilla Silver Mine | Mexico | 100% | 100% |
| | Minera El Pilón, S.A. de C.V. | San Martin Silver Mine | Mexico | 100% | 100% |
| | First Majestic Del Toro, S.A. de C.V. | Del Toro Silver Mine | Mexico | 100% | 100% |
| | La Guitarra Compañia Minera, S.A. de C.V. | La Guitarra Silver Mine | Mexico | 100% | 100% |
| | Majestic Services, S.A. de C.V. | Service company | Mexico | 100% | 100% |
| | Santa Elena Oro y Plata, S.A. de C.V. | Service company | Mexico | 100% | 100% |
| | FM Metal Trading (Barbados) Ltd. | Metals trading company | Barbados | 100% | —% |
| | Silver Trading (Barbados) Ltd. | Metals trading company | Barbados | 100% | —% |
| | FMSTrading AG | Metals trading company | Switzerland | 100% | 100% |
| 28. | KEY MANAGEMENT COMPENSATION |
| | | | YEAR ENDED DECEMBER 31, | |
| | | | 2018 | | | 2017 | |
| | Salaries, bonuses, fees and benefits | | | | | | |
| | Independent members of the Board of Directors | $ | 702 | | $ | 730 | |
| | Other members of key management | | 3,212 | | | 2,201 | |
| | Share-based payments | | | | | | |
| | Independent members of the Board of Directors | | 306 | | | 396 | |
| | Other members of key management | | 2,587 | | | 3,211 | |
| | | $ | 6,807 | | $ | 6,538 | |
| 29. | SUBSEQUENT EVENTS |
| | |
| The following significant events occurred subsequent to December 31, 2018: |
| | |
| Sale of Common Shares |
| | |
| As previously announced on December 27, 2018, the Company filed a prospectus supplement to the short form base shelf prospectus dated November 5, 2018, pursuant to which the Company may, at its discretion and from time-to-time, sell common shares of the Company for aggregate gross proceeds of up to $50.0 million. The sale of common shares would be made through “at-the-market distributions” as defined in the Canadian Securities Administrators’ National Instrument 44-102 Shelf Distributions. Since January 1, 2019, First Majestic has sold 2,250,000 common shares of the Company directly on the New York Stock Exchange (the “NYSE”) for net proceeds of $13.2 million or $5.99 per share. |
| CONSOLIDATED FINANCIAL STATEMENTS | 77 | ANNUAL REPORT 2018 |
MANAGEMENT’S DISCUSSION AND ANALYSIS
OF RESULTS OF OPERATIONS AND FINANCIAL CONDITION
This Management’s Discussion and Analysis of Results of Operations and Financial Condition (“MD&A”) should be read in conjunction with the audited consolidated financial statements of First Majestic Silver Corp. (“First Majestic” or “the Company”) for the year ended December 31, 2018, which are prepared in accordance with International Financial Reporting Standards as issued by the International Accounting Standards Board (“IFRS”). All dollar amounts are expressed in United States (“US”) dollars and tabular amounts are expressed in thousands of US dollars, unless otherwise indicated. Certain amounts shown in this MD&A may not add exactly to total amounts due to rounding differences.
This MD&A contains “forward-looking statements” that are subject to risk factors set out in a cautionary note contained at the end of this MD&A. All information contained in this MD&A is current and has been approved by the Board of Directors of the Company as of February 22, 2019 unless otherwise stated.
COMPANY OVERVIEW
First Majestic is a multinational mining company headquartered in Vancouver, Canada, focused on primary silver production in México, pursuing the development of its existing mineral properties and acquiring new assets. The Company owns and operates six producing mines: the San Dimas Silver/Gold Mine, the Santa Elena Silver/Gold Mine, La Encantada Silver Mine, San Martin Silver Mine, La Parrilla Silver Mine, and the Del Toro Silver Mine.
In August 2018, the Company placed the La Guitarra Silver Mine under care and maintenance and is currently reviewing strategic options including the potential sale of the operation.
First Majestic is publicly listed on the New York Stock Exchange under the symbol “AG”, on the Toronto Stock Exchange under the symbol “FR” and on the Frankfurt Stock Exchange under the symbol “FMV”.
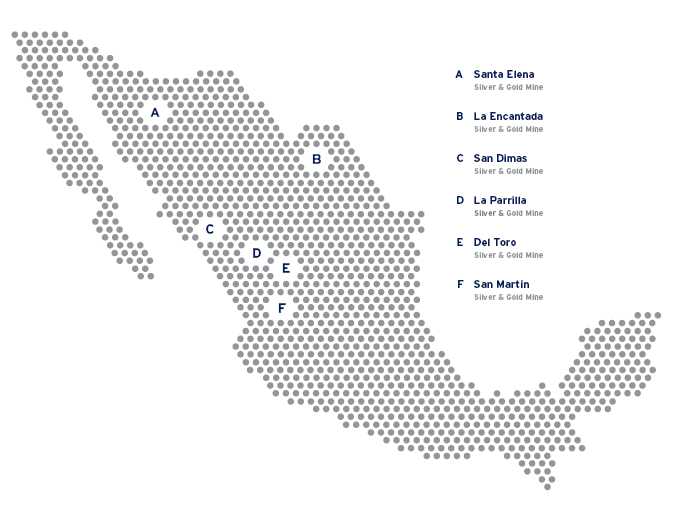
| FIRST MAJESTIC SILVER CORP. | 78 | MANAGEMENT DISCUSSION AND ANALYSIS |
MANAGEMENT’S DISCUSSION AND ANALYSIS
OF RESULTS OF OPERATIONS AND FINANCIAL CONDITION
2018 ANNUAL HIGHLIGHTS
| KEY PERFORMANCE METRICS | | 2018 | | | 2017 | | | 2016 | | | Change ‘18 vs ‘17 | |
| Operational | | | | | | | | | | | | |
| Ore Processed / Tonnes Milled | | 3,375,452 | | | 2,981,506 | | | 3,270,162 | | | 13% | |
| Silver Ounces Produced | | 11,679,452 | | | 9,749,591 | | | 11,853,438 | | | 20% | |
| Silver Equivalent Ounces Produced | | 22,243,071 | | | 16,207,905 | | | 18,669,800 | | | 37% | |
| Cash Costs per Ounce(1) | $ | 6.98 | | $ | 7.04 | | $ | 5.92 | | | (1% | ) |
| All-in Sustaining Cost per Ounce(1) | $ | 14.95 | | $ | 13.82 | | $ | 10.79 | | | 8% | |
| Total Production Cost per Tonne(1) | $ | 60.71 | | $ | 50.12 | | $ | 43.22 | | | 21% | |
| Average Realized Silver Price per Ounce(1) | $ | 15.53 | | $ | 17.12 | | $ | 17.16 | | | (9% | ) |
| | | | | | | | | | | | | |
| Financial (in $millions) | | | | | | | | | | | | |
| Revenues | $ | 300.9 | | $ | 252.3 | | $ | 278.1 | | | 19% | |
| Mine Operating (Loss) Earnings(2) | $ | (11.9 | ) | $ | 16.0 | | $ | 49.2 | | | (174% | ) |
| Impairment of non-current assets | $ | (199.7 | ) | $ | (65.5 | ) | $ | — | | | (205% | ) |
| (Loss) Earnings before Income Taxes | $ | (263.0 | ) | $ | (75.3 | ) | $ | 25.5 | | | (249% | ) |
| Net (Loss) Earnings | $ | (204.2 | ) | $ | (53.3 | ) | $ | 8.6 | | | (283% | ) |
| Operating Cash Flows before Working Capital and Taxes(2) | $ | 61.6 | | $ | 81.0 | | $ | 107.3 | | | (24% | ) |
| Cash and Cash Equivalents | $ | 57.0 | | $ | 118.1 | | $ | 129.0 | | | (52% | ) |
| Working Capital(1) | $ | 108.1 | | $ | 116.3 | | $ | 130.6 | | | (7% | ) |
| | | | | | | | | | | | | |
| Shareholders | | | | | | | | | | | | |
| (Loss) Earnings per Share (“EPS”) – Basic | $ | (1.11 | ) | $ | (0.32 | ) | $ | 0.05 | | | (247% | ) |
| Adjusted EPS(1) | $ | (0.21 | ) | $ | (0.04 | ) | $ | 0.12 | | | (427% | ) |
| Cash Flow per Share(1) | $ | 0.34 | | $ | 0.49 | | $ | 0.67 | | | (32% | ) |
| (1) | The Company reports non-GAAP measures which include cash costs per ounce produced, all-in sustaining cost per ounce, total production cost per tonne, average realized silver price per ounce sold, working capital, adjusted EPS and cash flow per share. These measures are widely used in the mining industry as a benchmark for performance, but do not have a standardized meaning and may differ from methods used by other companies with similar descriptions. See “Non-GAAP Measures” on pages 105 to 111 for a reconciliation of non-GAAP to GAAP measures. |
| | |
| (2) | The Company reports additional GAAP measures which include mine operating earnings and operating cash flows before working capital and taxes. These additional financial measures are intended to provide additional information and do not have a standardized meaning prescribed by IFRS. See “Additional GAAP Measures” on page 112. |

| MANAGEMENT DISCUSSION AND ANALYSIS | 79 | ANNUAL REPORT 2018 |
MANAGEMENT’S DISCUSSION AND ANALYSIS
OF RESULTS OF OPERATIONS AND FINANCIAL CONDITION
ACQUISITION OF PRIMERO
On May 10, 2018, First Majestic completed the acquisition of Primero Mining Corp. (“Primero”) and its world-class San Dimas Silver/ Gold Mine in Mexico to create one of the largest publicly traded silver companies in the world.
The 100%-owned San Dimas mine in Durango, Mexico, is a premier low-cost asset with more than 100 years of mine production history with more than 120 epithermal veins identified with exploration potential and over 76 million silver equivalent ounces in Proven and Probable Reserves and 248 million silver equivalent ounces in Measured, Indicated and Inferred Resources.
Together with First Majestic’s five other operating mines in Mexico, the acquisition significantly expands the Company’s projected annual silver equivalent production to 24.7 to 27.5 million silver equivalent ounces in 2019:
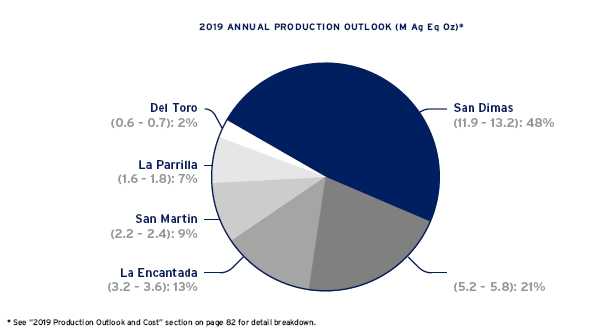
TRANSACTION DETAIL
On May 10, 2018, the Company acquired all of the issued and outstanding common shares of Primero for a total consideration of $187.0 million by issuing a total of 27,333,184 common shares of First Majestic, including 6,418,594 common shares to Primero shareholders and 20,914,590 common shares to Wheaton Precious Metals Corp. (“WPM”).
In connection with the plan of arrangement, the Company restructured its pre-existing silver purchase agreement with WPM. Pursuant to the New Stream Agreement, WPM is entitled to receive 25% of the gold equivalent production (based on a fixed exchange ratio of 70 silver ounces to 1 gold ounce) at San Dimas in exchange for ongoing payments equal to the lesser of US$600 (subject to a 1% annual inflation adjustment) and the prevailing market price, for each gold ounce delivered under the agreement (“New Stream Agreement”). The New Stream Agreement provides for a number of value creation opportunities with alignment between silver and gold production and increased post-stream cash flow at San Dimas. In addition, the maturity date of Primero’s $75 million 2020 convertible debentures (the “Primero Debentures”) was accelerated to May 11, 2018 and was paid in full.
To fund the repayment of the Primero Debentures, amounts outstanding under Primero’s existing revolving credit facility and other costs related to the closing of the Arrangement, the Company successfully raised and has committed cash through the following debt financing arrangements:
| • | Issuance of $156.5 million five year convertible debentures with a semi-annual interest of 1.875% per annum. The initial conversion rate for the convertible debentures will be 104.3297 common shares per $1,000 principal amount, equivalent to an initial conversion price of approximately $9.59 per share of First Majestic. The initial conversion rate represents a premium of approximately 35% relative to the Company’s closing share price on the day before the announcement and is subject to adjustment in certain events. Proceeds from the convertible debentures will be used primarily for repayment of Primero’s existing convertible debentures, other costs related to the closing of the Arrangement and general working capital purposes. |
| | |
| • | Entered into a new $75.0 million three-year revolving credit facility with a syndicate of lenders, led by Scotiabank, which bears an interest rate of LIBOR plus a range from 2.25% to 3.50% and a standby fee from 0.56% to 0.88% for the undrawn portion of the revolving credit facility, depending on certain financial parameters of the Company. |
| FIRST MAJESTIC SILVER CORP. | 80 | MANAGEMENT DISCUSSION AND ANALYSIS |
MANAGEMENT’S DISCUSSION AND ANALYSIS
OF RESULTS OF OPERATIONS AND FINANCIAL CONDITION
OPERATIONAL HIGHLIGHTS
| Annual Production | | San | | | Santa | | | La | | | San | | | La | | | Del | | | La | | | | |
| Summary | | Dimas(1) | | | Elena | | | Encantada | | | Martin | | | Parrilla | | | Toro | | | Guitarra | | | Consolidated | |
| Ore Processed / Tonnes Milled | | 435,289 | | | 899,370 | | | 916,894 | | | 284,656 | | | 491,637 | | | 267,170 | | | 80,435 | | | 3,375,452 | |
| Silver Ounces Produced | | 3,621,868 | | | 2,223,246 | | | 1,603,740 | | | 1,746,139 | | | 1,340,385 | | | 785,154 | | | 358,919 | | | 11,679,452 | |
| Silver Equivalent Ounces Produced | | 8,051,605 | | | 6,014,687 | | | 1,610,895 | | | 2,169,338 | | | 2,323,056 | | | 1,432,312 | | | 641,179 | | | 22,243,071 | |
| Cash Costs per Ounce | $ | 0.11 | | $ | 0.50 | | $ | 18.80 | | $ | 9.42 | | $ | 12.83 | | $ | 17.10 | | $ | 9.79 | | $ | 6.98 | |
| All-in Sustaining Cost per Ounce | $ | 5.92 | | $ | 4.54 | | $ | 23.82 | | $ | 12.28 | | $ | 19.57 | | $ | 27.49 | | $ | 16.13 | | $ | 14.95 | |
| Total Production Cost perTonne | $ | 117.46 | | $ | 57.01 | | $ | 32.28 | | $ | 77.66 | | $ | 51.88 | | $ | 70.20 | | $ | 81.91 | | $ | 60.71 | |
(1) San Dimas production was from the period May of 10, 2018 to December 31, 2018.
| • | Record Annual Silver Equivalent Production: Total production in 2018 reached an annual record of 22,243,071 silver equivalent ounces, representing an increase of 37% compared to the previous year and near the top end of the Company’s guidance of 20.5 to 22.6 million silver equivalent ounces. The increase in production was primarily attributed to the addition of the San Dimas mine, which contributed 8,051,605 silver equivalent ounces of production since being acquired on May 10, 2018. |
| | |
| • | Purest Silver Production: Production in 2018 comprised of 11,679,452 ounces of silver, 111,084 ounces of gold, 16,135,438 pounds of lead and 5,695,657 pounds of zinc. With the addition of San Dimas, First Majestic continues to be one of the purest silver producers with silver accounting for 57% of the Company’s 2018 consolidated revenue while gold accounted for 36%. |
| | |
| • | Cash cost per ounce: Cash cost per ounce in the year was $6.98, a decrease of $0.06 per ounce compared to the previous year and below the range of the Company’s 2018 guidance of $7.18 to $7.75 per ounce. The decrease in cash cost compared to the prior year was primarily due to the addition of San Dimas, which had a cash cost of $0.11 per ounce, partially offset by $2.1 million in severance costs incurred during the year as part of the Company’s cost reduction initiative and staff level optimization as well as increase in energy costs due to a 30% rate hike by Mexico’s Federal Electricity Commission and higher diesel costs. |
| | |
| • | Annual all-in sustaining cost (“AISC”): AISC per ounce in 2018 was $14.95, an increase of $1.13 per ounce compared to the previous year and within the annual guidance of $14.53 to $15.83 per ounce. The increase in AISC per ounce was attributed to higher sustaining capital expenditures as the Company began re-investing in development and exploration at each unit. |
FINANCIAL HIGHLIGHTS
| • | Healthy cash position and liquidity: Cash and cash equivalents at December 31, 2018 was $57.0 million compared to $118.1 million at the end of the previous year while working capital remained healthy at $108.1 million compared to $116.3 million. The decrease in cash and cash equivalents was primarily attributed to movements in working capital items in relation to the Primero acquisition, including a $6.4 million decrease in trade and other payables as First Majestic began paying down overdue liabilities assumed from the Primero acquisition and a $17.2 million increase in value added taxes receivable as a result of delays in recovery from the Mexican tax authority, the Servicio de Administración Tributaria (“SAT”), as Primero was 18 months behind on its filings when First Majestic acquired the San Dimas mine. Since acquisition, the Company has accelerated its filings and, as at December 31, 2018, recovered $4.5 million of the outstanding amount. The Company continues to be supplying additional information requested by the SAT as part of the review process and the Company expects the amounts outstanding to be refunded. |
| | |
| • | Record revenue: Despite a 9% decrease in average silver price in 2018, the Company generated revenues of $300.9 million compared to $252.3 million in 2017, an increase of 19% primarily due a 37% increase in production. With the expanded production from San Dimas, the Company is well positioned to further realize increased revenue with further metal prices appreciation. |
| | |
| • | Mine operating earnings: During the year, the Company recognized a mine operating loss of $11.9 million compared to mine operating earnings of $16.0 million in 2017. Mine operating loss in the year was attributed to taking a $7.5 million inventory loss due to the bankruptcy of Republic Metals Refining Corp. (“Republic”), one of three refineries used by the Company. At the time of the Chapter 11 announcement, the Company had approximately 758,000 silver equivalent ounces of inventory that were in Republic’s possession for refining. The Company has been pursuing legal and insurance channels to recover this inventory, but there is no assurance that some or any this inventory is recoverable. As a result, the Company has written off the cost of these inventories to cost of sales. The decrease in mine operating earnings was also affected by tighter margins as a result of an average of 9% decrease in silver price, higher production costs attributed to increases in energy costs, and $2.1 million in severance costs incurred during the year as part of the Company’s staff reduction initiative. |
| MANAGEMENT DISCUSSION AND ANALYSIS | 81 | ANNUAL REPORT 2018 |
MANAGEMENT’S DISCUSSION AND ANALYSIS
OF RESULTS OF OPERATIONS AND FINANCIAL CONDITION
| • | Impairment on non-current assets: During the year ended December 31, 2018, the Company recognized a total impairment charge of $199.7 million, or $151.1 million net of tax. Due to a reduction in estimated Reserves and Resources as a result of a decline in long-term metal price forecasts, a decrease of investment, and increase in operating costs, the Company was required to record an impairment charge of $111.8 million and $56.3 million on its two Concentrate producing mines, La Parrilla and Del Toro, respectively. In addition, the Company recognized an impairment charge of $31.7 million on La Guitarra in the second quarter as a result of management’s decision to place the La Guitarra Silver Mine on care and maintenance effective August 3, 2018. |
| | |
| • | Net loss: The Company recognized a net loss of $204.2 million (loss per share of $1.11) in 2018 compared to net loss of $53.3 million (loss per share of $0.32) in 2017 primarily due to the impairment on non-current assets. |
| | |
| • | Adjusted net loss: Adjusted net loss (see “non-GAAP measures”), normalized for non-cash or unusual items such as impairment of non-current assets, share-based payments and deferred income taxes for the year ended December 31, 2018 was a loss of $38.7 million $(0.21 per share), compared to a loss of $6.2 million $(0.04 per share) in 2017. |
| | |
| • | Cash flow from operations: During the year, cash flow from operations before changes in working capital and income taxes was $61.6 million $(0.34 per share) compared to $81.0 million $(0.49 per share) in 2017. The decrease was attributed to the decrease in mine operating earnings. |
2018 FOURTH QUARTER HIGHLIGHTS
| | | 2018 | | | 2018 | | | Change | | | 2017 | | | Change | |
| KEY PERFORMANCE METRICS | | Q4 | | | Q3 | | | Q4 vs Q3 | | | Q4 | | | Q4 vs Q4 | |
| Operational | | | | | | | | | | | | | | | |
| Ore Processed / Tonnes Milled | | 850,272 | | | 864,056 | | | (2% | ) | | 736,684 | | | 15% | |
| Silver Ounces Produced | | 3,250,816 | | | 3,505,344 | | | (7% | ) | | 2,337,463 | | | 39% | |
| Silver Equivalent Ounces Produced | | 6,485,761 | | | 6,740,315 | | | (4% | ) | | 4,065,337 | | | 60% | |
| Cash Costs per Ounce(1) | $ | 6.06 | | $ | 6.85 | | | (12% | ) | $ | 6.76 | | | (10% | ) |
| All-in Sustaining Cost per Ounce(1) | $ | 12.83 | | $ | 15.12 | | | (15% | ) | $ | 14.13 | | | (9% | ) |
| Total Production Cost per Tonne(1) | $ | 65.31 | | $ | 68.87 | | | (5% | ) | $ | 50.81 | | | 29% | |
| Average Realized Silver Price per Ounce(1) | $ | 14.47 | | $ | 14.66 | | | (1% | ) | $ | 16.61 | | | (13% | ) |
| | | | | | | | | | | | | | | | |
| Financial (in $millions) | | | | | | | | | | | | | | | |
| Revenues | $ | 74.1 | | $ | 88.5 | | | (16% | ) | $ | 61.2 | | | 21% | |
| Mine Operating (Loss) Earnings | $ | (9.0 | ) | $ | (0.1 | ) | | (6,083% | ) | $ | 1.4 | | | (744% | ) |
| Impairment of non-current assets | $ | (168.0 | ) | $ | — | | | (100% | ) | $ | (65.5 | ) | | (157% | ) |
| Net (Loss) Earnings | $ | (164.4 | ) | $ | 5.9 | | | (2,885% | ) | $ | (56.1 | ) | | (193% | ) |
| Operating Cash Flows before Working Capital and Taxes | $ | 11.0 | | $ | 20.7 | | | (47% | ) | $ | 18.7 | | | (41% | ) |
| Cash and Cash Equivalents | $ | 57.0 | | $ | 72.4 | | | (21% | ) | $ | 118.1 | | | (52% | ) |
| Working Capital(1) | $ | 108.1 | | $ | 127.8 | | | (15% | ) | $ | 116.3 | | | (7% | ) |
| | | | | | | | | | | | | | | | |
| Shareholders | | | | | | | | | | | | | | | |
| Earnings (Loss) per Share (“EPS”) – Basic | $ | (0.85 | ) | $ | 0.03 | | | (2,884% | ) | $ | (0.34 | ) | | (151% | ) |
| Adjusted EPS(1) | $ | (0.05 | ) | $ | (0.03 | ) | | (81% | ) | $ | (0.04 | ) | | (47% | ) |
| Cash Flow per Share(1) | $ | 0.06 | | $ | 0.11 | | | (47% | ) | $ | 0.11 | | | (50% | ) |
| (1) | The Company reports non-GAAP measures which include cash costs per ounce produced, all-in sustaining cost per ounce, total production cost per tonne, average realized silver price per ounce sold, working capital, adjusted EPS and cash flow per share. These measures are widely used in the mining industry as a benchmark for performance, but do not have a standardized meaning and may differ from methods used by other companies with similar descriptions. See “Non-GAAP Measures” on pages 105 to 111 for a reconciliation of non-GAAP to GAAP measures. |
| Fourth Quarter | | San | | | Santa | | | La | | | San | | | La | | | Del | | | | |
| Production Summary | | Dimas | | | Elena | | | Encantada | | | Martin | | | Parrilla | | | Toro | | | Consolidated | |
| Ore Processed / Tonnes Milled | | 172,641 | | | 221,945 | | | 206,812 | | | 66,924 | | | 125,751 | | | 56,200 | | | 850,272 | |
| Silver Ounces Produced | | 1,367,028 | | | 567,754 | | | 449,632 | | | 404,523 | | | 312,144 | | | 149,734 | | | 3,250,816 | |
| Silver Equivalent Ounces Produced | | 3,127,871 | | | 1,587,396 | | | 451,244 | | | 511,911 | | | 563,703 | | | 243,637 | | | 6,485,761 | |
| Cash Costs per Ounce | $ | 0.58 | | $ | (1.06 | ) | $ | 15.60 | | $ | 10.40 | | $ | 13.80 | | $ | 27.69 | | $ | 6.06 | |
| All-in Sustaining Cost per Ounce | $ | 5.35 | | $ | 2.18 | | $ | 18.70 | | $ | 13.60 | | $ | 21.18 | | $ | 37.83 | | $ | 12.83 | |
| Total Production Cost per Tonne | $ | 113.66 | | $ | 54.55 | | $ | 33.20 | | $ | 83.27 | | $ | 52.47 | | $ | 84.67 | | $ | 65.31 | |
| FIRST MAJESTIC SILVER CORP. | 82 | MANAGEMENT DISCUSSION AND ANALYSIS |
MANAGEMENT’S DISCUSSION AND ANALYSIS
OF RESULTS OF OPERATIONS AND FINANCIAL CONDITION
OPERATIONAL HIGHLIGHTS
| • | Total ore processed during the quarter at the Company’s silver mines amounted to 850,272 tonnes, representing a 2% decrease compared to the previous quarter. The slight decrease in tonnes processed compared to the prior quarter was primarily due to placing the La Guitarra mine in care and maintenance on August 3, 2018. |
| | |
| • | Total silver equivalents production decreased by 4% to 6,485,761 ounces and silver production decreased 7% to 3,250,816 ounces compared to the previous quarter. The decrease in production was primarily due to a 5% decrease in consolidated silver grade and 2% decrease in tonnes milled. |
| | |
| • | Total production consisted of 3.3 million ounces of silver, 34,487 ounces of gold, 3.3 million pounds of lead and 1.4 million pounds of zinc. |
| | |
| • | Cash cost per ounce in the quarter was $6.06, a decrease of 12% or $0.79 per ounce compared to the previous quarter. The decrease in cash cost per ounce was primarily attributed to an increase in by-product credits which was partially offset by a $1.0 million in severance costs incurred during the quarter as part of the Company’s cost reduction initiative. |
| | |
| • | All-in sustaining cost per ounce (“AISC”) in the fourth quarter was $12.83, a decrease of 15% or $2.29 per ounce compared to the previous quarter, primarily attributed to lower sustaining capital expenditures as the Company wound down its development and exploration projects near the end of the year after completing respective budget programs. |
FINANCIAL
| • | Generated revenues of $74.1 million in the quarter, an increase of 21% compared to $61.2 million in the fourth quarter of 2017 primarily due to a 40% increase in silver equivalent ounces sold, partially offset by a 13% decrease in average realized silver price compared to the same quarter of the prior year. |
| | |
| • | The Company recognized a mine operating loss of $9.0 million compared to mine operating earnings of $1.4 million in the fourth quarter of 2017. Mine operating loss in the quarter was attributed to recognizing a $7.5 million inventory loss due to the bankruptcy of Republic, one of three refineries used by the Company. At the time of the Chapter 11 announcement, the Company had approximately 758,000 silver equivalent ounces of inventory that were in Republic’s possession for refining. The Company has been pursuing legal and insurance channels to recover the value of this inventory, but there is no assurance that any or all of this inventory value is recoverable. As a result, the Company has written off the cost of these inventories to cost of sales. The decrease in mine operating earnings was also affected by tighter margins as a result of a 13% decrease in average silver price and $1.0 million in severance costs incurred during the quarter as part of the Company’s staff reduction initiative. |
| | |
| • | Despite the addition of San Dimas, which contributed $4.6 million in mine operating earnings from the fourth quarter of production, mine operating earnings were lower compared to the same quarter of the previous year due to a decline in production from La Parrilla, La Encantada, Del Toro and La Guitarra, relative to the previous year. |
| | |
| • | During the fourth quarter, the Company recognized a total impairment charge of $168.0 million, or $130.6 million net of tax, as a result of an impairment charge on the La Parrilla and Del Toro mine due to decrease in estimated Reserves and Resources amidst a decline in metal prices and increased operating costs. |
| | |
| • | The Company generated a net loss of $164.4 million (EPS of $(0.85)) compared to $56.1 million (EPS of $(0.34)) in the fourth quarter of 2017. Adjusted net loss for the quarter was $10.5 million (adjusted loss per share of $0.05), after excluding non-cash and non-recurring items including impairment of non-current assets, deferred income tax recovery, share-based payments, loss from marketable securities and acquisition costs (see “Adjusted EPS” on page 77). |
| | |
| • | Cash flow from operations before movements in working capital and income taxes in the quarter was $11.0 million $(0.06 per share) compared to $18.7 million $(0.11 per share) in the fourth quarter of 2017. |
| MANAGEMENT DISCUSSION AND ANALYSIS | 83 | ANNUAL REPORT 2018 |
MANAGEMENT’S DISCUSSION AND ANALYSIS
OF RESULTS OF OPERATIONS AND FINANCIAL CONDITION
2019 PRODUCTION OUTLOOK AND COST GUIDANCE UPDATE
This section provides management’s production outlook and cost guidance for 2019. These are forward-looking estimates and are subject to the cautionary note regarding the risks associated with relying on forward-looking statements at the end of this MD&A. Actual results may vary based on production throughputs, grades, recoveries and changes in economic circumstances.
The Company anticipates 2019 silver production will range between 14.2 to 15.8 million ounces with total silver equivalent production (including gold, lead and zinc by-products) between 24.7 to 27.5 million silver equivalent ounces. Based on the midpoint of the guidance range, the Company expects a 28% increase in silver production and an 18% increase in total production when compared to 2018. The increases are primarily due to consolidating a full year of production from San Dimas, as well as the start-up of the new roasting circuit at La Encantada but partially offset by lower production at Del Toro and La Parrilla.
A mine-by-mine breakdown of the 2019 production guidance is included in the table below. Cash cost and all-in sustaining cost per ounce (“AISC”) guidance is shown per payable silver ounce. Metal price and foreign currency assumptions for calculating equivalents are: silver: $15.00/oz, gold: $1,250/oz, lead: $1.00/lb, zinc: $1.10/lb, MXN:USD 19:1.
| Mine | Silver Oz (M) | Silver Eqv Oz (M) | Cash Costs ($) | AISC ($) |
| San Dimas | 5.5 – 6.1 | 11.9 – 13.2 | 0.89 – 1.81 | 7.58 – 9.27 |
| Santa Elena | 2.3 – 2.6 | 5.2 – 5.8 | 5.33 – 6.59 | 8.99 – 10.66 |
| La Encantada | 3.2 – 3.6 | 3.2 – 3.6 | 12.41 – 13.22 | 13.87 – 14.85 |
| San Martin | 1.9 – 2.1 | 2.2 – 2.4 | 9.81 – 10.60 | 12.39 – 13.47 |
| La Parrilla | 0.9 – 1.0 | 1.6 – 1.8 | 9.97 – 11.14 | 14.76 – 16.49 |
| DelToro | 0.4 – 0.4 | 0.6 – 0.7 | 17.43 – 19.51 | 23.87 – 26.69 |
| Consolidated | 14.2 – 15.8 | 24.7 – 27.5 | $6.39 – $7.37 | $12.55 – $14.23 |
* Consolidated AISC includes corporate general & administrative cost estimates and non-cash costs of $1.84 to $2.05 per payable silver ounce.
The Company is projecting its 2019 AISC, as defined by the World Gold Council, to be within a range of $12.55 to $14.23 on a per consolidated payable silver ounce basis. Excluding non-cash items, the Company anticipates its 2019 AISC to be within a range of $11.97 to $13.59 per payable silver ounce. An itemized AISC cost table is provided below:
| | FY 2019 |
| All-In Sustaining Cost Calculation(1) | ($/Ag oz) |
| Total Cash Costs per Payable Silver Ounce(2) | 6.39 – 7.37 |
| General and Administrative Costs | 1.26 – 1.40 |
| Sustaining Development Costs | 2.41 – 2.69 |
| Sustaining Property, Plant and Equipment Costs | 1.39 – 1.55 |
| Sustaining Exploration Costs | 0.06 – 0.07 |
| Profit Sharing | 0.46 – 0.51 |
| Share-based Payments (non-cash) | 0.48 – 0.54 |
| Accretion of Reclamation Costs (non-cash) | 0.09 – 0.11 |
| All-In Sustaining Costs: (WGC definition) | $12.55 – $14.23 |
| All-In Sustaining Costs: (WGC excluding non-cash items) | $11.97 – $13.59 |
| 1. | AISC is a non-GAAP measure and is calculated based on guidance provided by the World Gold Council (“WGC”) in June 2013. AISC is used as a comprehensive measure for the Company’s consolidated operating performance. WGC is a not a regulatory industry organization and does not have the authority to develop accounting standards for disclosure requirements. Other mining companies may calculate AISC differently as a result of differences in underlying accounting principles, the definition of “sustaining costs” and the distinction between sustaining and expansionary capital costs. |
| | |
| 2. | Total cash cost per payable silver ounce includes estimated royalties and 0.5% mining environmental fee of $0.11 per ounce. |
In 2019, the Company plans to invest a total of $137.4 million on capital expenditures consisting of $61.1 million of sustaining investments and $76.3 million of expansionary projects. This represents a 20% increase in capital expenditures compared to the revised 2018 capital budget, and is aligned with the Company’s future growth strategy. The Company plans to develop additional mine production at each of the Company’s operations, invest in high-intensity grinding and microbubble technologies, in addition to expanding exploration work at the Ermitaño West project in order to advance that project towards a production decision.
The 2019 annual budget includes total capital investments of $64.5 million on underground development, $23.8 million towards property, plant and equipment, $26.2 million on exploration and $22.9 million towards automation and efficiency projects. Management may revise the guidance and budget during the year to reflect actual and anticipated changes in metal prices or to the business.
The Company is planning to complete a total of 64,610 metres of underground development in 2019, representing a 5% decrease compared to 2018. In addition, the Company is planning to complete a total of 188,000 metres of exploration drilling in 2019, representing a 12% decrease compared to 2018.
| FIRST MAJESTIC SILVER CORP. | 84 | MANAGEMENT DISCUSSION AND ANALYSIS |
MANAGEMENT’S DISCUSSION AND ANALYSIS
OF RESULTS OF OPERATIONS AND FINANCIAL CONDITION
SAFETY, ENVIRONMENT AND SOCIAL MANAGEMENT
First Majestic is committed to continuously enhancing its sustainability practices. We use safety, environmental and social management systems and standards based on international best practices and the principle of risk management, identification of opportunities and continual improvement:
HEALTH & SAFETY
2018 Highlights
| • | Achieved a 18% reduction of the Total Reportable Injury Frequency Rate (TRIFR) and a 21% reduction of the Lost Time Injury Rate (LTIR); |
| | |
| • | Completed the standardization of Health and Safety Management System procedures across all operations; |
| | |
| • | Safety Fairs organized by our mines attracted over 5,000 attendees and engaged employees and their families, local community residents, schools, and local authorities on Health, Safety, Environment, and responsible mining practices; |
| | |
| • | The Del Toro mine received the second-highest level Occupational Health and Safety certification (Certificación Empresa Segura) from the Mexico Ministry of Labour and Social Welfare. |
2019 Goals
| • | Deploy a new Crisis Management Protocol across the Company; |
| | |
| • | Implement a safety leadership training program under the standard known as Visible Felt Leadership. |
ENVIRONMENT
2018 Highlights
| • | Reduced higher severity incidents by 40% over 2017 results; |
| | |
| • | The Del Toro mine achieved re-certification of the Clean Industry Certification (Certificación de Industria Limpia); |
| | |
| • | Completed commissioning of the tailings filtration system at the San Martin mine, reaching our target of 85% water reuse at the plant facility; |
| | |
| • | Advanced conservation work with the Environmental Management Unit (Unidad de Manejo Ambiental de Conservación de Biodiversidad) on our Cielo Norteño property at the La Encantada Mine. |
2019 Goals
| • | Continue to reduce the incidence of moderate or higher environmental incidents; |
| | |
| • | Review bonus calculation structure to optimize the use of our environmental management system. |
SOCIAL
2018 Highlights
| • | Continued the development and implementation of our Social Management System standards and procedures for stakeholder engagement and communication, risk management, grievance mechanism, local employment and procurement, and land access; |
| | |
| • | Established partnerships for key community infrastructure projects for water and sanitation systems funded by the Mexico Mining Tax Fund (Fondo Minero); |
| | |
| • | The La Parrilla mine and San Dimas mine were awarded the Corporate Social Responsibility award (Distintivo ESR) for the 11th and 8th consecutive year, respectively; |
| | |
| • | Implemented a participatory water monitoring program with local communities at the La Guitarra mine. |
2019 Goals
| • | Initiate a Sustainability Reporting process using the Global Reporting Initiative (GRI) Standards; |
| | |
| • | Implement the Local Content pilot program to support local participation in our workforce and supply chain. |
| MANAGEMENT DISCUSSION AND ANALYSIS | 85 | ANNUAL REPORT 2018 |
MANAGEMENT’S DISCUSSION AND ANALYSIS
OF RESULTS OF OPERATIONS AND FINANCIAL CONDITION
OVERVIEW OF OPERATING RESULTS
SELECTED PRODUCTION RESULTS FOR THE PAST EIGHT QUARTERS
| | | | | | 2018 | | | | | | | | | | | | 2017 | | | | | | | |
| PRODUCTION HIGHLIGHTS | | Q4 | | | Q3(2) | | | Q2(1) | | | Q1 | | | Q4 | | | Q3 | | | Q2 | | | Q1 | |
| Ore processed/tonnes milled | | | | | | | | | | | | | | | | | | | | | | | | |
| San Dimas | | 172,641 | | | 176,884 | | | 85,765 | | | — | | | — | | | — | | | — | | | — | |
| Santa Elena | | 221,945 | | | 225,873 | | | 228,054 | | | 223,498 | | | 232,575 | | | 232,662 | | | 232,451 | | | 230,050 | |
| La Encantada | | 206,812 | | | 196,030 | | | 237,862 | | | 276,191 | | | 198,845 | | | 212,092 | | | 148,039 | | | 266,510 | |
| San Martin | | 66,924 | | | 67,926 | | | 74,431 | | | 75,374 | | | 72,503 | | | 69,113 | | | 67,073 | | | 69,563 | |
| La Parrilla | | 125,751 | | | 117,130 | | | 123,642 | | | 125,114 | | | 138,124 | | | 132,389 | | | 132,880 | | | 140,592 | |
| DelToro | | 56,200 | | | 65,323 | | | 65,879 | | | 79,769 | | | 56,753 | | | 60,501 | | | 81,843 | | | 79,108 | |
| La Guitarra | | — | | | 14,891 | | | 35,715 | | | 29,829 | | | 37,885 | | | 23,896 | | | 29,547 | | | 36,514 | |
| Consolidated | | 850,272 | | | 864,056 | | | 851,349 | | | 809,775 | | | 736,684 | | | 730,652 | | | 691,833 | | | 822,336 | |
| Silver equivalent ounces produced | | | | | | | | | | | | | | | | | | | | | | | | |
| San Dimas | | 3,127,871 | | | 3,225,352 | | | 1,698,382 | | | — | | | — | | | — | | | — | | | — | |
| Santa Elena | | 1,587,396 | | | 1,475,635 | | | 1,407,880 | | | 1,543,776 | | | 1,653,941 | | | 1,503,376 | | | 1,399,940 | | | 1,369,875 | |
| La Encantada | | 451,244 | | | 379,773 | | | 327,458 | | | 452,420 | | | 489,071 | | | 610,307 | | | 375,563 | | | 708,959 | |
| San Martin | | 511,911 | | | 557,746 | | | 524,843 | | | 574,838 | | | 617,879 | | | 604,686 | | | 577,598 | | | 522,672 | |
| La Parrilla | | 563,703 | | | 537,986 | | | 605,826 | | | 615,541 | | | 643,799 | | | 612,116 | | | 593,852 | | | 667,431 | |
| DelToro | | 243,637 | | | 427,218 | | | 323,714 | | | 437,743 | | | 369,992 | | | 472,804 | | | 712,714 | | | 682,219 | |
| La Guitarra | | — | | | 136,605 | | | 249,214 | | | 255,359 | | | 290,654 | | | 182,986 | | | 229,276 | | | 316,195 | |
| Consolidated | | 6,485,761 | | | 6,740,315 | | | 5,137,318 | | | 3,879,678 | | | 4,065,336 | | | 3,986,274 | | | 3,888,944 | | | 4,267,350 | |
| Silver ounces produced | | | | | | | | | | | | | | | | | | | | | | | | |
| San Dimas | | 1,367,028 | | | 1,445,918 | | | 808,923 | | | — | | | — | | | — | | | — | | | — | |
| Santa Elena | | 567,754 | | | 598,693 | | | 535,015 | | | 521,784 | | | 582,789 | | | 560,054 | | | 557,914 | | | 581,425 | |
| La Encantada | | 449,632 | | | 378,983 | | | 325,603 | | | 449,522 | | | 486,514 | | | 609,138 | | | 374,901 | | | 707,479 | |
| San Martin | | 404,523 | | | 438,061 | | | 419,815 | | | 483,740 | | | 514,678 | | | 471,893 | | | 425,645 | | | 410,082 | |
| La Parrilla | | 312,144 | | | 330,047 | | | 360,862 | | | 337,332 | | | 401,090 | | | 424,358 | | | 425,060 | | | 479,875 | |
| DelToro | | 149,734 | | | 231,350 | | | 167,591 | | | 236,478 | | | 185,695 | | | 233,015 | | | 365,323 | | | 340,958 | |
| La Guitarra | | — | | | 82,292 | | | 138,454 | | | 138,173 | | | 166,698 | | | 117,504 | | | 138,345 | | | 189,159 | |
| Consolidated | | 3,250,816 | | | 3,505,344 | | | 2,756,263 | | | 2,167,030 | | | 2,337,463 | | | 2,415,962 | | | 2,287,188 | | | 2,708,978 | |
| Cash cost per ounce | | | | | | | | | | | | | | | | | | | | | | | | |
| San Dimas | $ | 0.58 | | $ | (0.40 | ) | $ | 0.24 | | | — | | | — | | | — | | | — | | | — | |
| Santa Elena | $ | (1.06 | ) | $ | 5.77 | | $ | 1.39 | | $ | (4.74 | ) | $ | (6.93 | ) | $ | (0.18 | ) | $ | 1.24 | | $ | (0.12 | ) |
| La Encantada | $ | 15.60 | | $ | 21.15 | | $ | 23.05 | | $ | 16.93 | | $ | 15.23 | | $ | 12.47 | | $ | 13.59 | | $ | 10.83 | |
| San Martin | $ | 10.40 | | $ | 9.78 | | $ | 9.68 | | $ | 8.04 | | $ | 7.55 | | $ | 7.11 | | $ | 5.43 | | $ | 6.42 | |
| La Parrilla | $ | 13.80 | | $ | 16.29 | | $ | 10.42 | | $ | 11.02 | | $ | 11.21 | | $ | 12.26 | | $ | 11.15 | | $ | 9.96 | |
| DelToro | $ | 27.69 | | $ | 13.07 | | $ | 18.01 | | $ | 13.66 | | $ | 12.53 | | $ | 6.41 | | $ | 3.99 | | $ | 2.64 | |
| La Guitarra | $ | — | | $ | 6.99 | | $ | 12.89 | | $ | 7.97 | | $ | 11.20 | | $ | 19.02 | | $ | 12.65 | | $ | 6.36 | |
| Consolidated | $ | 6.06 | | $ | 6.85 | | $ | 7.59 | | $ | 7.83 | | $ | 6.76 | | $ | 8.15 | | $ | 7.01 | | $ | 6.31 | |
| All-in sustaining cost per ounce | | | | | | | | | | | | | | | | | | | | | | | | |
| San Dimas | $ | 5.35 | | $ | 6.74 | | $ | 5.41 | | | — | | | — | | | — | | | — | | | — | |
| Santa Elena | $ | 2.18 | | $ | 9.03 | | $ | 6.60 | | $ | (0.17 | ) | $ | (2.01 | ) | $ | 3.08 | | $ | 5.02 | | $ | 2.95 | |
| La Encantada | $ | 18.70 | | $ | 27.25 | | $ | 30.81 | | $ | 20.97 | | $ | 19.20 | | $ | 14.98 | | $ | 17.95 | | $ | 12.07 | |
| San Martin | $ | 13.60 | | $ | 13.37 | | $ | 12.49 | | $ | 9.98 | | $ | 9.73 | | $ | 10.03 | | $ | 7.53 | | $ | 8.66 | |
| La Parrilla | $ | 21.18 | | $ | 23.34 | | $ | 16.39 | | $ | 17.66 | | $ | 15.28 | | $ | 18.85 | | $ | 17.12 | | $ | 13.86 | |
| DelToro | $ | 37.83 | | $ | 24.48 | | $ | 32.08 | | $ | 20.61 | | $ | 25.48 | | $ | 12.92 | | $ | 7.93 | | $ | 7.95 | |
| La Guitarra | $ | — | | $ | 12.30 | | $ | 18.11 | | $ | 15.76 | | $ | 17.77 | | $ | 31.55 | | $ | 19.51 | | $ | 11.83 | |
| Consolidated | $ | 12.83 | | $ | 15.12 | | $ | 16.43 | | $ | 16.01 | | $ | 14.13 | | $ | 15.36 | | $ | 14.17 | | $ | 11.85 | |
| Production cost per tonne | | | | | | | | | | | | | | | | | | | | | | | | |
| San Dimas | $ | 113.66 | | $ | 105.91 | | $ | 148.91 | | | — | | | — | | | — | | | — | | | — | |
| Santa Elena | $ | 54.55 | | $ | 63.15 | | $ | 55.97 | | $ | 54.31 | | $ | 47.13 | | $ | 55.65 | | $ | 54.44 | | $ | 52.90 | |
| La Encantada | $ | 33.20 | | $ | 40.20 | | $ | 31.09 | | $ | 27.00 | | $ | 36.42 | | $ | 34.77 | | $ | 33.65 | | $ | 27.92 | |
| San Martin | $ | 83.27 | | $ | 88.15 | | $ | 72.77 | | $ | 68.06 | | $ | 73.14 | | $ | 76.81 | | $ | 69.37 | | $ | 61.28 | |
| La Parrilla | $ | 52.47 | | $ | 58.18 | | $ | 49.10 | | $ | 48.12 | | $ | 48.00 | | $ | 50.75 | | $ | 44.54 | | $ | 43.22 | |
| DelToro | $ | 84.67 | | $ | 73.50 | | $ | 69.23 | | $ | 58.12 | | $ | 72.77 | | $ | 71.80 | | $ | 57.16 | | $ | 51.58 | |
| La Guitarra | $ | — | | $ | 68.47 | | $ | 83.68 | | $ | 86.50 | | $ | 83.61 | | $ | 120.09 | | $ | 93.49 | | $ | 75.33 | |
| Consolidated | $ | 65.31 | | $ | 68.87 | | $ | 61.04 | | $ | 46.88 | | $ | 50.81 | | $ | 54.15 | | $ | 51.53 | | $ | 44.72 | |
| (1) | San Dimas production was from the period May 10, 2018 to June 30, 2018, or 52 days in the second quarter of 2018. |
| | |
| (2) | La Guitarra was placed on care and maintenance on August 3, 2018. |
| FIRST MAJESTIC SILVER CORP. | 86 | MANAGEMENT DISCUSSION AND ANALYSIS |
MANAGEMENT’S DISCUSSION AND ANALYSIS
OF RESULTS OF OPERATIONS AND FINANCIAL CONDITION
OPERATING RESULTS – CONSOLIDATED OPERATIONS
| | | 2018 | | | 2018 | | | 2018 | | | 2018 | | | 2018 | | | 2017 | | | Change | | | Change | |
| CONSOLIDATED | | Q4 | | | Q3 | | | Q2 | | | Q1 | | | YTD | | | YTD | | | Q4 vs Q3 | | | ‘18 vs ‘17 | |
| | | | | | | | | | | | | | | | | | | | | | | | | |
| Ore processed/tonnes milled | | 850,272 | | | 864,056 | | | 851,349 | | | 809,775 | | | 3,375,452 | | | 2,981,506 | | | (2% | ) | | 13% | |
| Average silver grade (g/t) | | 144 | | | 152 | | | 127 | | | 111 | | | 134 | | | 131 | | | (5% | ) | | 2% | |
| Average gold grade (g/t) | | 1.31 | | | 1.33 | | | 0.99 | | | 0.66 | | | 1.08 | | | 0.71 | | | (2% | ) | | 52% | |
| Average lead grade (g/t) | | 1.98 | | | 2.07 | | | 1.61 | | | 1.77 | | | 1.84 | | | 2.25 | | | (4% | ) | | (18% | ) |
| Average zinc grade (g/t) | | 0.95 | | | 0.73 | | | 0.61 | | | 0.69 | | | 0.73 | | | 0.50 | | | 30% | | | 46% | |
| Silver recovery (%) | | 83% | | | 83% | | | 79% | | | 75% | | | 80% | | | 78% | | | 0% | | | 3% | |
| Gold recovery (%) | | 96% | | | 95% | | | 94% | | | 93% | | | 95% | | | 92% | | | 1% | | | 3% | |
| Lead recovery (%) | | 58% | | | 65% | | | 64% | | | 62% | | | 62% | | | 70% | | | (11% | ) | | (11% | ) |
| Zinc recovery (%) | | 53% | | | 51% | | | 60% | | | 57% | | | 55% | | | 50% | | | 4% | | | 10% | |
| | | | | | | | | | | | | | | | | | | | | | | | | |
| Production | | | | | | | | | | | | | | | | | | | | | | | | |
| Silver ounces produced | | 3,250,816 | | | 3,505,344 | | | 2,756,263 | | | 2,167,030 | | | 11,679,452 | | | 9,749,591 | | | (7% | ) | | 20% | |
| Gold ounces produced | | 34,487 | | | 35,260 | | | 25,449 | | | 15,887 | | | 111,084 | | | 62,991 | | | (2% | ) | | 76% | |
| Pounds of lead produced | | 3,294,360 | | | 4,443,290 | | | 3,949,410 | | | 4,448,378 | | | 16,135,438 | | | 24,522,803 | | | (26% | ) | | (34% | ) |
| Pounds of zinc produced | | 1,466,812 | | | 1,234,385 | | | 1,382,760 | | | 1,611,699 | | | 5,695,657 | | | 3,944,232 | | | 19% | | | 44% | |
| Total production – ounces silver equivalent | | 6,485,761 | | | 6,740,315 | | | 5,137,318 | | | 3,879,678 | | | 22,243,071 | | | 16,207,905 | | | (4% | ) | | 37% | |
| | | | | | | | | | | | | | | | | | | | | | | | | |
| Cost | | | | | | | | | | | | | | | | | | | | | | | | |
| Cash cost per ounce | $ | 6.06 | | $ | 6.85 | | $ | 7.59 | | $ | 7.83 | | $ | 6.98 | | $ | 7.04 | | | (12% | ) | | (1% | ) |
| All-In sustaining costs per ounce | $ | 12.83 | | $ | 15.12 | | $ | 16.43 | | $ | 16.01 | | $ | 14.95 | | $ | 13.82 | | | (15% | ) | | 8% | |
| Total production cost per tonne | $ | 65.31 | | $ | 68.87 | | $ | 61.04 | | $ | 46.88 | | $ | 60.71 | | $ | 50.12 | | | (5% | ) | | 21% | |
| | | | | | | | | | | | | | | | | | | | | | | | | |
| Underground development (m) | | 16,587 | | | 18,833 | | | 17,838 | | | 14,914 | | | 68,171 | | | 57,902 | | | (12% | ) | | 18% | |
| Diamond drilling (m) | | 32,532 | | | 60,439 | | | 73,899 | | | 44,827 | | | 211,695 | | | 156,540 | | | (46% | ) | | 35% | |
PRODUCTION
In 2018 the Company achieved a record production level of 22,243,071 silver equivalent ounces, an increase of 37% compared to the previous year. Silver production increased 20% to 11,679,452 ounces while gold production increased 76% to 111,084 ounces compared to 2017. Lead production for the year was 16,135,438 pounds, a decrease of 34% and zinc production was 5,695,657 pounds, an increase of 44% compared to the previous year. The increase in production was primarily attributed to the addition of the San Dimas mine, which contributed 8,051,605 silver equivalent ounces of production since being acquired on May 10, 2018.
Total ore processed increased 13% year over year to 3,375,452 tonnes while consolidated gold and silver recoveries improved to 80% and 95%, respectively.
In the fourth quarter, silver equivalent production decreased by 4% to 6,485,761 ounces and silver production decreased 7% to 3,250,816 ounces compared to the previous quarter. The decrease in production was primarily due to a 5% decrease in consolidated silver grade and 2% decrease in tonnes milled. Total production consisted of 3.3 million ounces of silver, 34,487 ounces of gold, 3.3 million pounds of lead and 1.4 million pounds of zinc. Typically production is lower in the fourth quarter due to Christmas holidays.
Total ore processed during the quarter amounted to 850,272 tonnes, representing a 2% decrease compared to the previous quarter. The decease in tonnes compared to the prior quarter was primarily due to a 14% decrease in tonnes processed at Del Toro, offset by a 7% increase in throughput processed at La Parrilla and a 6% increase at La Encantada.
Consolidated silver grades in the quarter averaged 144 g/t compared to 152 g/t in the previous quarter. This 5% decrease was primarily the result of lower grades at La Parrilla. Consolidated gold grades were relatively consistent in the quarter averaging 1.31 g/t compared to 1.33 g/t in the prior quarter.
Consolidated silver and gold recoveries averaged 83% and 96%, respectively, in the fourth quarter of 2018 and consistent with the previous quarter. The Company continues to expect further improvements in recoveries associated with the installation of the microbubble flotation columns and the High Intensity Grinding (“HIG”) mills. The microbubble column cells at La Parrilla are expected to be delivered in the first quarter and installed and commissioning to commercial production in the second quarter. In addition, the HIG mill at Santa Elena is expected to be delivered in the first quarter of 2019 followed by installation, commissioning and ramp up to commercial production in the second quarter. The Company has also redirected its second HIG mill purchase to La Encantada following very positive metallurgical results on mineral samples which concluded that grinding ore to sub-50 microns significantly improved silver recoveries even with the presence of high-grade manganese that has historically limited the recovery of silver in the cyanidation process. The La Encantada HIG mill is expected to be installed in the third quarter followed by commissioning in the fourth quarter of 2019. Regardless of the HIG mill, the roasting process is continuing its commissioning with full commissioning anticipated in the second quarter.
| MANAGEMENT DISCUSSION AND ANALYSIS | 87 | ANNUAL REPORT 2018 |
MANAGEMENT’S DISCUSSION AND ANALYSIS
OF RESULTS OF OPERATIONS AND FINANCIAL CONDITION
CASH COST PER OUNCE
Cash cost per ounce in the year was $6.98, a decrease of $0.06 per ounce compared to the previous year and below the range of the Company’s 2018 guidance of $7.18 to $7.75 per ounce. The decrease in cash cost compared to the prior year was primarily due to the addition of San Dimas, which had a cash cost of $0.11 per ounce, partially offset by $2.1 million in severance costs incurred during the year as part of the Company’s cost reduction initiative and staff level optimization, as well as increase in energy costs due to a 30% rate hike by Mexico’s Federal Electricity Commission and higher diesel costs.
Cash cost per ounce for the quarter was $6.06 per payable ounce of silver, a decrease of 12% from $6.85 per ounce in the third quarter of 2018. The decrease in cash cost per ounce was primarily attributed to an increase in by-product credits which was partially offset against a $1.0 million in severance costs incurred during the quarter as part of the Company’s cost reduction initiative.
ALL-IN SUSTAINING COST PER OUNCE
AISC per ounce in 2018 was $14.95, an increase of $1.13 per ounce compared to the previous year and within the annual guidance of $14.53 to $15.83 per ounce. The increase in AISC per ounce was attributed to higher sustaining capital expenditures as the Company began re-investing in development and exploration at each unit.
AISC in the fourth quarter was $12.83, a decrease of 15% or $2.29 per ounce compared to the previous quarter, primarily attributed to lower sustaining capital expenditures as the Company wound down its development and exploration projects near the end of the year.
DEVELOPMENT AND EXPLORATION
The Company completed 68,171 metres of underground development and 211,695 metres of diamond drilling in 2018, an increase of 18% and 35%, respectively, compared to the previous year.
The Company is planning to complete a total of 64,610 metres of underground development and 188,000 metres of exploration drilling in 2019. The 2019 drilling program will consist of approximately 11,600 metres of sustaining diamond drilling intended to increase the mineral confidence of Mineral Resources to Reserves at the six operating mines; approximately 168,000 metres of expansionary diamond drilling intended to convert Inferred Resources into Measured & Indicated as well as to add Resources from new exploration targets, with a focus on the Santa Elena Main Vein at depth, the Ermitaño West project near Santa Elena and the Central Block at San Dimas; and drill approximately 8,400 metres intended to test greenfield targets at Santa Elena and Del Toro.
SAN DIMAS SILVER/GOLD MINE, DURANGO, MÉXICO
The San Dimas Silver/Gold Mine is located approximately 130 km northwest of Durango, Durango State, Mexico and contains 71,867 hectares of mining claims located in the state of Durango, Mexico. San Dimas is one of the country’s most prominent silver and gold mines as well as the largest producing underground mine in the state of Durango, with over 250 years of operating history. First Majestic acquired the San Dimas mine in May 2018 with the acquisition of Primero Mining Corp. The San Dimas operation involves processing ore from an underground mine with a 2,500 tpd capacity milling operation. The mine is accessible via a 40 minute flight from Durango airport to the airstrip in the town of Tayoltita. The Company owns 100% of the San Dimas mine.
| | | 2018 | | | 2018 | | | 2018 | | | 2018 | | | Change | |
| SAN DIMAS | | Q4 | | | Q3 | | | Q2 | | | YTD | | | Q4 vs Q3 | |
| | | | | | | | | | | | | | | | |
| Total ore processed/tonnes milled | | 172,641 | | | 176,884 | | | 85,765 | | | 435,289 | | | (2% | ) |
| Average silver grade (g/t) | | 262 | | | 269 | | | 307 | | | 274 | | | (3% | ) |
| Average gold grade (g/t) | | 3.9 | | | 4.0 | | | 4.3 | | | 4.0 | | | (3% | ) |
| Silver recovery (%) | | 94% | | | 94% | | | 96% | | | 95% | | | 0% | |
| Gold recovery (%) | | 97% | | | 97% | | | 97% | | | 97% | | | 0% | |
| | | | | | | | | | | | | | | | |
| Production | | | | | | | | | | | | | | | |
| Silver ounces produced | | 1,367,028 | | | 1,445,918 | | | 808,923 | | | 3,621,868 | | | (5% | ) |
| Gold ounces produced | | 20,839 | | | 21,910 | | | 11,348 | | | 54,098 | | | (5% | ) |
| Total production – ounces silver equivalent | | 3,127,871 | | | 3,225,352 | | | 1,698,382 | | | 8,051,605 | | | (3% | ) |
| | | | | | | | | | | | | | | | |
| Cost | | | | | | | | | | | | | | | |
| Cash cost per ounce | $ | 0.58 | | $ | (0.40 | ) | $ | 0.24 | | $ | 0.11 | | | (245% | ) |
| All-In sustaining costs per ounce | $ | 5.35 | | $ | 6.74 | | $ | 5.41 | | $ | 5.92 | | | (21% | ) |
| Total production cost per tonne | $ | 113.66 | | $ | 105.91 | | $ | 148.91 | | $ | 117.46 | | | 7% | |
| | | | | | | | | | | | | | | | |
| Underground development (m) | | 5,321 | | | 5,260 | | | 2,481 | | | 13,063 | | | 1% | |
| Diamond drilling (m) | | 13,664 | | | 19,324 | | | 10,522 | | | 43,510 | | | (29% | ) |
| FIRST MAJESTIC SILVER CORP. | 88 | MANAGEMENT DISCUSSION AND ANALYSIS |
MANAGEMENT’S DISCUSSION AND ANALYSIS
OF RESULTS OF OPERATIONS AND FINANCIAL CONDITION
Since being acquired on May 10, 2018, the San Dimas mine produced 3,621,868 ounces of silver and 54,098 ounces of gold for a total production of 8,051,605 silver equivalent ounces. The mill processed a total of 435,289 tonnes with average silver grade of 274 g/t and average gold grade of 4.0 g/t.
During the fourth quarter, the San Dimas mine produced 1,367,028 ounces of silver and 20,839 ounces of gold for a total production of 3,127,871 silver equivalent ounces, a 3% decrease compared to the prior quarter primarily due to a 2% decrease in throughput. The mill processed a total of 172,641 tonnes with average silver and gold grades of 262 g/t and 3.9 g/t, respectively, during the quarter. The operation continued to process higher volumes from lower grade stopes left behind as they were deemed uneconomical under the old streaming agreement and have now become economical under the new streaming agreement.
During the year, cash cost per ounce for San Dimas averaged $0.11 per ounce and all-in sustaining cost per ounce averaged $5.92 per ounce.
In the fourth quarter, cash cost per ounce increased to $0.58 compared to $(0.40) in the prior quarter while AISC decreased to $5.35 per ounce compared to $6.74 per once in the prior quarter.
With the acquisition of Primero, First Majestic renegotiated San Dimas’ streaming agreement with Wheaton Precious Metals International Ltd. (“WPM”), is entitled to receive 25% of the gold equivalent production (based on a fixed exchange ratio of 70 silver ounces to 1 gold ounce) from San Dimas in exchange for ongoing payments equal to the lesser of $600 (subject to a 1% annual inflation adjustment) and the prevailing market price for each gold ounce delivered, with provisions to adjust the gold to silver ratio if the average gold to silver ratio moves above or below 90:1 or 50:1, respectively, for a period of six months.
The New Stream Agreement enables the operation to generate sufficient cash flows and First Majestic to deploy capital towards exploration and underground development in areas of the mine that were previously deemed uneconomic. During the year ended December 31, 2018, the Company delivered 21,960 ounces of gold to WPM at $600 per ounce under the New Stream.
A total of 5,321 metres of underground development was completed in the fourth quarter, a slight increase compared to the prior quarter.
Since the acquisition announcement in January 2018, First Majestic has been developing a long-term mine and mill automation plan for the future of the operation. The Company has identified numerous projects that will be implemented over the next two years, intended to reduce production costs at the mine and processing plant, including:
| 1) | Optimization of the mining sequence by cycling mining and backfilling areas to minimize the haulage of waste to surface |
| 2) | Improvement of grinding technologies |
| 3) | Lime automation and pH control |
| 4) | Upgrading the tailings filtration plant |
| 5) | Modernization of the Merrill-Crowe and smelting operations |
| 6) | Reduction in mining dilution |
| 7) | Pillar recoveries from Tayoltita, Santa Rita and Noche Buena mines |
| 8) | Detailed designs updates and permitting of a second hydro dam will be advanced in preparation for an investment decision later in the year |
| MANAGEMENT DISCUSSION AND ANALYSIS | 89 | ANNUAL REPORT 2018 |
MANAGEMENT’S DISCUSSION AND ANALYSIS
OF RESULTS OF OPERATIONS AND FINANCIAL CONDITION
SANTA ELENA SILVER/GOLD MINE, SONORA, MÉXICO
The Santa Elena Silver/Gold Mine is located approximately 150 kilometres northeast of the city of Hermosillo, Sonora, Mexico and owns mining concessions over a total of 101,772 hectares. The operating plan for Santa Elena involves the processing of ore in the 3,000 tpd cyanidation circuit from a combination of underground reserves and spent ore from the previous heap leach pad. The Company owns 100% of the Santa Elena mine.
| | | 2018 | | | 2018 | | | 2018 | | | 2018 | | | 2018 | | | 2017 | | | Change | | | Change | |
| SANTA ELENA | | Q4 | | | Q3 | | | Q2 | | | Q1 | | | YTD | | | YTD | | | Q4 vs Q3 | | | ‘18 vs ‘17 | |
| Total ore processed/tonnes milled | | 221,945 | | | 225,873 | | | 228,054 | | | 223,498 | | | 899,370 | | | 927,737 | | | (2% | ) | | (3% | ) |
| Underground tonnes | | | | | | | | | | | | | | | | | | | | | | | | |
| Tonnes milled | | 142,534 | | | 135,510 | | | 128,200 | | | 124,827 | | | 531,072 | | | 553,504 | | | 5% | | | (4% | ) |
| Average silver grade (g/t) | | 120 | | | 128 | | | 120 | | | 124 | | | 123 | | | 115 | | | (6% | ) | | 7% | |
| Average gold grade (g/t) | | 2.4 | | | 2.2 | | | 2.3 | | | 2.9 | | | 2.4 | | | 2.4 | | | 9% | | | 0% | |
| Heap leach tonnes | | | | | | | | | | | | | | | | | | | | | | | | |
| Tonnes milled | | 79,410 | | | 90,362 | | | 99,854 | | | 98,671 | | | 368,298 | | | 374,232 | | | (12% | ) | | (2% | ) |
| Average silver grade (g/t) | | 36 | | | 37 | | | 36 | | | 32 | | | 35 | | | 42 | | | (3% | ) | | (17% | ) |
| Average gold grade (g/t) | | 0.6 | | | 0.6 | | | 0.7 | | | 0.6 | | | 0.6 | | | 0.7 | | | 0% | | | (14% | ) |
| Silver recovery (%) | | 88% | | | 90% | | | 87% | | | 87% | | | 88% | | | 89% | | | (2% | ) | | (1% | ) |
| Gold recovery (%) | | 96% | | | 95% | | | 95% | | | 95% | | | 95% | | | 95% | | | 1% | | | 0% | |
| Production | | | | | | | | | | | | | | | | | | | | | | | | |
| Silver ounces produced | | 567,754 | | | 598,693 | | | 535,015 | | | 521,784 | | | 2,223,246 | | | 2,282,182 | | | (5% | ) | | (3% | ) |
| Gold ounces produced | | 12,081 | | | 10,848 | | | 11,040 | | | 12,887 | | | 46,856 | | | 49,211 | | | 11% | | | (5% | ) |
| Total production – ounces silver equivalent | | 1,587,396 | | | 1,475,635 | | | 1,407,880 | | | 1,543,776 | | | 6,014,687 | | | 5,927,132 | | | 8% | | | 1% | |
| Cost | | | | | | | | | | | | | | | | | | | | | | | | |
| Cash cost per ounce | $ | (1.06 | ) | $ | 5.77 | | $ | 1.39 | | $ | (4.74 | ) | $ | 0.50 | | $ | (1.54 | ) | | (118% | ) | | (132% | ) |
| All-In sustaining costs per ounce | $ | 2.18 | | $ | 9.03 | | $ | 6.60 | | $ | (0.17 | ) | $ | 4.54 | | $ | 2.22 | | | (76% | ) | | 105% | |
| Total production cost per tonne | $ | 54.55 | | $ | 63.15 | | $ | 55.97 | | $ | 54.31 | | $ | 57.01 | | $ | 52.53 | | | (14% | ) | | 9% | |
| Underground development (m) | | 2,585 | | | 2,326 | | | 2,926 | | | 3,030 | | | 10,866 | | | 10,892 | | | 11% | | | 0% | |
| Diamond drilling (m) | | 9,701 | | | 9,147 | | | 10,717 | | | 7,097 | | | 36,661 | | | 21,207 | | | 6% | | | 73% | |
In 2018, Santa Elena produced 2,223,246 ounces of silver and 46,856 ounces of gold for a total production of 6,014,687 equivalent silver ounces, a marginal increase compared to 5,927,132 equivalent silver ounces in 2017. The mill processed a total of 899,370 tonnes compared to 927,737 tonnes in the previous year. The strategic decrease in throughput to increase retention time was offset by a 7% increase in silver head grades from underground ore relative to 2017.
During the fourth quarter, Santa Elena produced 567,754 ounces of silver and 12,081 ounces of gold for a total production of 1,587,396 silver equivalent ounces, reflecting an increase of 8% compared to the prior quarter primarily due to 9% higher gold grades which resulted in an increase of 11% in gold production. The mill processed a total of 221,945 tonnes during the quarter, consisting of 142,534 tonnes of underground ore and 79,410 tonnes from the above ground heap leach pad.
Cash cost for the year was $0.50 per silver ounce compared to $(1.54) per silver ounce in 2017. AISC was $4.54 per ounce compared to $2.22 per ounce in the previous year. The increase in cash cost and AISC were primarily attributed to an increase in energy costs as well as a $1.6 million decrease in available diesel tax credits recognized year over year.
Cash cost in the fourth quarter decreased to $(1.06) per payable silver ounce compared to $5.77 per payable silver ounce in the previous quarter. AISC in the fourth quarter decreased to $2.18 per ounce compared to $9.03 per ounce in the previous quarter. Cash cost per ounce was lower primarily due to an increase in by-product credits as a result of an 11% increase in gold production, as well as recognition of $0.8 million in diesel tax credits, which was only available to the extent of income taxes payable to the Mexican tax authorities.
During the quarter, the Santa Elena mine completed a total of 9,701 metres of diamond drilling, consisting of 25 underground drill holes for 4,744 metres at Santa Elena and 13 surface holes for 4,402 metres at the Ermitaño-West project. Drilling at Santa Elena focused on exploring extensions of the Tortuga and America veins, and the Santa Elena Main Vein looking for extensions to the west and at depth. Drilling at the Ermitaño-West project focused on exploring the Ermitaño West to infill and potentially convert Inferred Resources into Indicated Resources, and the Aitana vein systems. In the first half of 2019, the Company will explore the Ermitaño West vein at shallow elevations, the objective is to investigate the continuity of mineralization at low depths to evaluate the feasibility of an eventual open pit extraction. If feasibility is confirmed, this could provide a faster way to process ore from this area.
| FIRST MAJESTIC SILVER CORP. | 90 | MANAGEMENT DISCUSSION AND ANALYSIS |
MANAGEMENT’S DISCUSSION AND ANALYSIS
OF RESULTS OF OPERATIONS AND FINANCIAL CONDITION
The Santa Elena mine has a gold streaming agreement with Sandstorm Gold Ltd. (“Sandstorm”), which requires the mine to sell 20% of its gold production from the leach pad and a designated area of its underground operations over the life of mine to Sandstorm. In September 2017, the Company exceeded 50,000 cumulative ounces delivered to Sandstorm which increased the base selling price from $350 per ounce to $450 per ounce. The selling price to Sandstorm is currently the lesser of $450 per ounce (subject to a 1% annual inflation increase commencing in April 2018) and the prevailing market price. During the quarter ended December 31, 2018 the Company delivered 1,887 ounces of gold to Sandstorm.
The Santa Elena mine is comprised of five major groups of concessions totalling 101,772 hectares, including Santa Elena, Ermitaño, Cumobabi, El Gachi and Los Hernandez.
As previously announced on September 10th, the Company exercised the Ermitaño and Cumobabi option agreements with Evrim Resources Corp. for a 100% earn-in on the mining concessions on both projects for $1.5 million. Evrim will retain a 2% net smelter royalty (“NSR”). The Company began a 4,400 metres infill exploration program on the Ermitaño West project in mid-September with the objective of upgrading a portion of the Inferred Resources to Indicated Resources.
In December 2016, the Company entered into an option agreement with Compañía Minera Dolores, S.A. de C.V., a subsidiary of Pan American Silver Corp., to acquire the Los Hernandez Property, consisting of 5,802 hectares of mining concessions to the north of the Santa Elena mine. In exchange, First Majestic has agreed: to incur $1.6 million in exploration costs on the property over four years, a 2.5% NSR on the related concessions, and to pay $1.4 million in cash, of which $0.5 million was paid, $0.3 million in is due in December 2019 and $0.6 million in December 2020, respectively.
LA ENCANTADA SILVER MINE, COAHUILA, MÉXICO
The La Encantada Silver Mine is an underground mine located in the northern México State of Coahuila, 708 kilometres northeast of Torreon. La Encantada has 4,076 hectares of mineral rights and surface land ownership of 1,343 hectares. La Encantada also has a 4,000 tpd cyanidation plant, a village with 180 houses as well as administrative offices, laboratory, general store, hospital, airstrip and the infrastructure required for such an operation. The mine is accessible via a 1.5 hour flight from Torreon, Coahuila to the mine’s private airstrip or via a mostly paved road from the closest town, Muzquiz, which is 225 kilometres away. The Company owns 100% of the La Encantada Silver Mine.
| | | 2018 | | | 2018 | | | 2018 | | | 2018 | | | 2018 | | | 2017 | | | Change | | | Change | |
| LA ENCANTADA | | Q4 | | | Q3 | | | Q2 | | | Q1 | | | YTD | | | YTD | | | Q4 vs Q3 | | | ‘18 vs ‘17 | |
| Ore processed/tonnes milled | | 206,812 | | | 196,030 | | | 237,862 | | | 276,191 | | | 916,894 | | | 825,486 | | | 6% | | | 11% | |
| Average silver grade (g/t) | | 110 | | | 107 | | | 83 | | | 85 | | | 95 | | | 127 | | | 3% | | | (25% | ) |
| Silver recovery (%) | | 61% | | | 56% | | | 51% | | | 60% | | | 57% | | | 64% | | | 9% | | | (11% | ) |
| Production | | | | | | | | | | | | | | | | | | | | | | | | |
| Silver ounces produced | | 449,632 | | | 378,983 | | | 325,603 | | | 449,522 | | | 1,603,740 | | | 2,178,032 | | | 19% | | | (26% | ) |
| Gold ounces produced | | 19 | | | 10 | | | 23 | | | 37 | | | 89 | | | 79 | | | 90% | | | 13% | |
| Total production – ounces silver equivalent | | 451,244 | | | 379,773 | | | 327,458 | | | 452,420 | | | 1,610,895 | | | 2,183,899 | | | 19% | | | (26% | ) |
| Cost | | | | | | | | | | | | | | | | | | | | | | | | |
| Cash cost per ounce | $ | 15.60 | | $ | 21.15 | | $ | 23.05 | | $ | 16.93 | | $ | 18.80 | | $ | 12.74 | | | (26% | ) | | 48% | |
| All-In sustaining costs per ounce | $ | 18.70 | | $ | 27.25 | | $ | 30.81 | | $ | 20.97 | | $ | 23.82 | | $ | 15.49 | | | (31% | ) | | 54% | |
| Total production cost per tonne | $ | 33.20 | | $ | 40.20 | | $ | 31.09 | | $ | 27.00 | | $ | 32.28 | | $ | 32.76 | | | (17% | ) | | (1% | ) |
| Underground development (m) | | 1,055 | | | 1,862 | | | 1,718 | | | 1,445 | | | 6,078 | | | 3,064 | | | (43% | ) | | 98% | |
| Diamond drilling (m) | | 1,449 | | | 6,419 | | | 7,020 | | | 4,574 | | | 19,461 | | | 15,370 | | | (77% | ) | | 27% | |
In 2018, La Encantada produced 1,603,740 ounces of silver and 89 ounces of gold for a total of 1,610,895 silver equivalent ounces, compared to 2,183,899 silver equivalent ounces in 2017. The decrease was primarily due to a 25% decrease in silver head grade and an 11% decrease in silver recovery, offset by an 11% increase in tonnes milled.
For the fourth quarter, total production was 451,244 silver equivalent ounces, representing a 19% increase from the previous quarter, primarily due to a 9% increase in silver recovery, 6% increase in tonnes milled and 3% increase in silver head grade. The increase in silver production was the result of higher tonnage from the San Javier breccia, where the implementation of the sublevel caving method has been successfully completed, which produced 104,651 tonnes with an average silver grade of 125 g/t. Implementation of sublevel caving was also completed in the La Prieta breccia which will allow the mine to produce continually at low cost, and to fulfill its production targets from underground extraction.
Despite stable production cost per tonne, cash cost and AISC per ounce both increased in 2018 to $18.80 and $23.82, respectively, compared to $12.74 and $15.49 per ounce in 2017. Cash cost and AISC per ounce were influenced by a 25% decrease in average silver grade, which also negatively affected silver recovery, and resulted in a 26% decrease in silver ounces produced.
| MANAGEMENT DISCUSSION AND ANALYSIS | 91 | ANNUAL REPORT 2018 |
MANAGEMENT’S DISCUSSION AND ANALYSIS
OF RESULTS OF OPERATIONS AND FINANCIAL CONDITION
Cash cost per ounce for the quarter improved to $15.60 per ounce, a decrease of 26% compared to $21.15 per ounce in the previous quarter, while AISC per ounce was $18.70 compared to $27.25 in the previous quarter. The decrease in cash cost and AISC per ounce was primarily attributed to a 19% increase in silver production attributed to increased throughput from the San Javier breccia.
Commissioning of the roaster continued throughout the quarter with the Company completing numerous production campaigns. In December, the furnace successfully completed all commissioning procedures having reached sustainable coal injection levels with the use of natural gas only during start-ups, as well as modifications to the dryer lift system to reduce the generation of material reporting to the dust collectors. The final stage of commissioning remains to streamline the roasted tailings slurry pumping system. The roaster is now expected to be operating at 2,000 tpd in the second quarter.
SAN MARTIN SILVER MINE, JALISCO, MÉXICO
The San Martin Silver Mine is an underground mine located near the town of San Martin de Bolaños in the Bolaños River valley, in the northern portion of the State of Jalisco, México. San Martin has 33 contiguous mining concessions in the San Martin de Bolaños mining district covering mineral rights for 37,902 hectares, including the application to acquire a new mining concession covering 24,723 hectares. In addition, the mine owns 160 hectares of surface land where the processing plant, camp, office facilities, maintenance shops, and tailings dams are located, and an additional 640 hectares of surface rights. The 1,300 tpd mill and processing plant consists of crushing, grinding and conventional cyanidation by agitation in tanks and a Merrill-Crowe doré production system. The mine can be accessed via small plane, 150 kilometres by air from Durango or 250 kilometres by paved road north of Guadalajara, Jalisco. The San Martin Silver Mine is 100% owned by the Company.
| | | 2018 | | | 2018 | | | 2018 | | | 2018 | | | 2018 | | | 2017 | | | Change | | | Change | |
| SAN MARTIN | | Q4 | | | Q3 | | | Q2 | | | Q1 | | | YTD | | | YTD | | | Q4 vs Q3 | | | ‘18 vs ‘17 | |
| Ore processed/tonnes milled | | 66,924 | | | 67,926 | | | 74,431 | | | 75,374 | | | 284,656 | | | 278,252 | | | (1% | ) | | 2% | |
| Average silver grade (g/t) | | 212 | | | 224 | | | 203 | | | 234 | | | 218 | | | 239 | | | (5% | ) | | (9% | ) |
| Average gold grade (g/t) | | 0.6 | | | 0.8 | | | 0.6 | | | 0.5 | | | 0.6 | | | 0.8 | | | (16% | ) | | (22% | ) |
| Silver recovery (%) | | 89% | | | 90% | | | 87% | | | 85% | | | 87% | | | 85% | | | (1% | ) | | 2% | |
| Gold recovery (%) | | 93% | | | 89% | | | 87% | | | 91% | | | 90% | | | 93% | | | 4% | | | (3% | ) |
| Production | | | | | | | | | | | | | | | | | | | | | | | | |
| Silver ounces produced | | 404,523 | | | 438,061 | | | 419,815 | | | 483,740 | | | 1,746,139 | | | 1,822,297 | | | (8% | ) | | (4% | ) |
| Gold ounces produced | | 1,272 | | | 1,475 | | | 1,331 | | | 1,148 | | | 5,226 | | | 6,797 | | | (14% | ) | | (23% | ) |
| Total production – ounces silver equivalent | | 511,911 | | | 557,746 | | | 524,843 | | | 574,838 | | | 2,169,338 | | | 2,322,835 | | | (8% | ) | | (7% | ) |
| Cost | | | | | | | | | | | | | | | | | | | | | | | | |
| Cash cost per ounce | $ | 10.40 | | $ | 9.78 | | $ | 9.68 | | $ | 8.04 | | $ | 9.42 | | $ | 6.69 | | | 6% | | | 41% | |
| All-In sustaining costs per ounce | $ | 13.60 | | $ | 13.37 | | $ | 12.49 | | $ | 9.98 | | $ | 12.28 | | $ | 9.06 | | | 2% | | | 36% | |
| Total production cost per tonne | $ | 83.27 | | $ | 88.15 | | $ | 72.77 | | $ | 68.06 | | $ | 77.66 | | $ | 70.18 | | | (6% | ) | | 11% | |
| Underground development (m) | | 2,866 | | | 2,934 | | | 2,957 | | | 2,966 | | | 11,722 | | | 11,344 | | | (2% | ) | | 3% | |
| Diamond drilling (m) | | 3,125 | | | 7,954 | | | 9,781 | | | 4,928 | | | 25,788 | | | 26,078 | | | (61% | ) | | (1% | ) |
In 2018, San Martin produced 1,746,139 silver ounces and 5,226 ounces of gold for a total production of 2,169,338 silver equivalent ounces. Total production decreased by 8% compared to the 2,322,835 silver equivalent ounces in the prior year primarily due to a 9% decrease in silver grades.
During the quarter, San Martin produced 404,523 silver ounces and 1,272 ounces of gold for a total production of 511,911 silver equivalent ounces, an 8% decrease compared to the prior quarter. The decrease in production was primarily attributed to a decrease in silver and gold grades of 5% and 16%, respectively.
Cash cost per ounce for the year was $9.42 compared to $6.69 per ounce in the prior year, primarily due to a decrease in gold byproduct credits as well as a decrease in silver production. AISC per ounce in the year increased to $12.28 compared to $9.06 in 2017, primarily due to higher cash costs and higher sustaining capital expenditures relating to equipment overhauls.
In the fourth quarter, cash cost per ounce increased by 6% to $10.40 compared to $9.78 in the previous quarter, primarily due to an 8% decrease in silver production. AISC in the quarter was $13.60 compared to $13.37 in the third quarter.
| FIRST MAJESTIC SILVER CORP. | 92 | MANAGEMENT DISCUSSION AND ANALYSIS |
MANAGEMENT’S DISCUSSION AND ANALYSIS
OF RESULTS OF OPERATIONS AND FINANCIAL CONDITION
LA PARRILLA SILVER MINE, DURANGO, MÉXICO
The La Parrilla Silver Mine, located approximately 65 kilometres southeast of the city of Durango in Durango State, México, is a complex of producing underground operations consisting of the Rosarios, La Blanca and San Marcos mines which are inter-connected through underground workings, and the Vacas and Quebradillas mines which are connected via above-ground gravel roads. The total mining concessions consist of 69,478 hectares. The Company owns 60 hectares and leases an additional 107 hectares of surface rights, for a total of 167 hectares of surface rights. La Parrilla includes a 2,000 tpd dual-circuit processing plant consisting of a 1,000 tpd cyanidation circuit and a 1,000 tpd flotation circuit, a central laboratory, buildings, offices and associated infrastructure. The Company owns 100% of the La Parrilla Silver Mine.
| | | 2018 | | | 2018 | | | 2018 | | | 2018 | | | 2018 | | | 2017 | | | Change | | | Change | |
| LA PARRILLA | | Q4 | | | Q3 | | | Q2 | | | Q1 | | | YTD | | | YTD | | | Q4 vs Q3 | | | ‘18 vs ‘17 | |
| Total ore processed/tonnes milled | | 125,751 | | | 117,130 | | | 123,642 | | | 125,114 | | | 491,637 | | | 543,985 | | | 7% | | | (10% | ) |
| Cyanidation | | | | | | | | | | | | | | | | | | | | | | | | |
| Tonnes milled | | 50,841 | | | 46,859 | | | 52,871 | | | 49,260 | | | 199,832 | | | 239,303 | | | 8% | | | (16% | ) |
| Average silver grade (g/t) | | 114 | | | 140 | | | 105 | | | 125 | | | 120 | | | 138 | | | (19% | ) | | (13% | ) |
| Average gold grade (g/t) | | 0.12 | | | 0.15 | | | 0.13 | | | 0.14 | | | 0.14 | | | 0.12 | | | (20% | ) | | 17% | |
| Silver recovery (%) | | 77% | | | 76% | | | 71% | | | 71% | | | 74% | | | 72% | | | 1% | | | 3% | |
| Gold recovery (%) | | 80% | | | 82% | | | 81% | | | 81% | | | 81% | | | 81% | | | (2% | ) | | 0% | |
| Flotation | | | | | | | | | | | | | | | | | | | | | | | | |
| Tonnes milled | | 74,910 | | | 70,271 | | | 70,771 | | | 75,854 | | | 291,806 | | | 304,682 | | | 7% | | | (4% | ) |
| Average silver grade (g/t) | | 94 | | | 102 | | | 131 | | | 105 | | | 108 | | | 123 | | | (8% | ) | | (12% | ) |
| Average lead grade (%) | | 1.5 | | | 1.3 | | | 1.4 | | | 1.3 | | | 1.4 | | | 1.3 | | | 15% | | | 8% | |
| Average zinc grade (%) | | 1.7 | | | 1.6 | | | 1.5 | | | 1.7 | | | 1.6 | | | 1.2 | | | 6% | | | 33% | |
| Silver recovery (%) | | 74% | | | 74% | | | 78% | | | 77% | | | 76% | | | 80% | | | 0% | | | (5% | ) |
| Lead recovery (%) | | 72% | | | 71% | | | 77% | | | 73% | | | 73% | | | 75% | | | 1% | | | (3% | ) |
| Zinc recovery (%) | | 53% | | | 51% | | | 60% | | | 57% | | | 55% | | | 50% | | | 4% | | | 10% | |
| Production | | | | | | | | | | | | | | | | | | | | | | | | |
| Silver ounces produced | | 312,144 | | | 330,047 | | | 360,862 | | | 337,332 | | | 1,340,385 | | | 1,730,383 | | | (5% | ) | | (23% | ) |
| Gold ounces produced | | 238 | | | 243 | | | 235 | | | 247 | | | 963 | | | 1,014 | | | (2% | ) | | (5% | ) |
| Pounds of lead produced | | 1,816,180 | | | 1,474,222 | | | 1,653,868 | | | 1,606,332 | | | 6,550,602 | | | 6,544,745 | | | 23% | | | 0% | |
| Pounds of zinc produced | | 1,466,812 | | | 1,234,385 | | | 1,382,760 | | | 1,611,699 | | | 5,695,657 | | | 3,944,232 | | | 19% | | | 44% | |
| Total production – ounces silver equivalent | | 563,703 | | | 537,986 | | | 605,826 | | | 615,541 | | | 2,323,056 | | | 2,517,199 | | | 5% | | | (8% | ) |
| Cost | | | | | | | | | | | | | | | | | | | | | | | | |
| Cash cost per ounce | $ | 13.80 | | $ | 16.29 | | $ | 10.42 | | $ | 11.02 | | $ | 12.83 | | $ | 11.11 | | | (15% | ) | | 15% | |
| All-In sustaining costs per ounce | $ | 21.18 | | $ | 23.34 | | $ | 16.39 | | $ | 17.66 | | $ | 19.57 | | $ | 16.22 | | | (9% | ) | | 21% | |
| Total production cost per tonne | $ | 52.47 | | $ | 58.18 | | $ | 49.10 | | $ | 48.12 | | $ | 51.88 | | $ | 46.59 | | | (10% | ) | | 11% | |
| Underground development (m) | | 2,936 | | | 2,492 | | | 2,761 | | | 3,254 | | | 11,443 | | | 12,313 | | | 18% | | | (7% | ) |
| Diamond drilling (m) | | 3,728 | | | 8,184 | | | 10,444 | | | 8,358 | | | 30,713 | | | 28,839 | | | (54% | ) | | 6% | |
Total production for 2018 was 2,323,056 silver equivalent ounces compared to 2,517,199 silver equivalent ounces in the previous year. During the year, the flotation circuit processed 291,806 tonnes (799 tpd) with an average silver grade of 108 g/t and a 76% recovery while the cyanidation circuit processed 199,832 tonnes (547 tpd) with an average silver grade of 120 g/t and a 74% recovery. Throughput and grades in the year were challenged by mine sequencing as development of the San Marcos area was delayed by additional shotcreting required to improve safety and ground stability associated with the poor ground conditions.
During the year, the lead circuit processed ore with an average lead grade of 1.4% with recoveries of 73% for a total lead production of 6,550,602 pounds, comparable to the previous year. The zinc circuit processed an average zinc grade of 1.6% with recoveries of 55% for a total zinc production of 5,695,657 pounds, representing a 44% increase compared to the previous year.
In the fourth quarter, total production from the La Parrilla mine was 563,703 silver equivalent ounces, an increase of 5% compared to 537,986 equivalent ounces of silver in the previous quarter. During the quarter, the flotation circuit processed 74,910 tonnes (814 tpd) with an average silver grade of 94 g/t and a 74% recovery while the cyanidation circuit processed 50,841 tonnes (553 tpd) with an average silver grade of 114 g/t and a 77% recovery.
During the quarter, the lead circuit processed ore with an average lead grade of 1.5% with recoveries of 72% for a total lead production of 1,816,180 pounds, representing a 23% increase compared to the previous quarter. The zinc circuit processed an average zinc grade of 1.7% with recoveries of 53% for a total zinc production of 1,466,812 pounds, representing a 19% increase compared to the previous quarter.
| MANAGEMENT DISCUSSION AND ANALYSIS | 93 | ANNUAL REPORT 2018 |
MANAGEMENT’S DISCUSSION AND ANALYSIS
OF RESULTS OF OPERATIONS AND FINANCIAL CONDITION
Cash cost in the year was $12.83 per ounce compared to $11.11 per ounce in 2017. The increase in cash costs was primarily attributed to a 23% decrease in silver production, partially offset by increase in lead and zinc by-product credits. AISC per ounce increased to $19.57 compared to $16.22 in the previous year.
Cash cost in the fourth quarter was $13.80 per ounce, a decrease of 15% compared to $16.29 per ounce in the previous quarter. AISC per ounce in the quarter was $21.18 compared to $23.34 in the previous quarter. The decreases in cash cost and AISC per ounce were primarily attributed to an increase in by-product credits, as lead and zinc production increased 23% and 19%, respectively, compared to the previous quarter.
Due to delays for adjustments in design and manufacturing changes, delivery of the microbubble cells to La Parrilla is expected in the first quarter of 2019 followed by installation, commissioning and ramp up to commercial production in the second quarter. By using microbubble technology, the Company expects to achieve higher metallurgical recoveries in the treatment of sulphide ore within the flotation circuit at La Parrilla.
DEL TORO SILVER MINE, ZACATECAS, MÉXICO
The Del Toro Silver Mine is located 60 kilometres to the southeast of the Company’s La Parrilla mine and consists of 2,132 hectares of mining claims and 219 hectares of surface rights. The Del Toro operation represents the consolidation of three historical silver mines, the Perseverancia, San Juan and Dolores mines, which are approximately one and three kilometres apart, respectively. Del Toro includes a 2,000 tpd flotation circuit and a 2,000 tpd cyanidation circuit which is currently in care and maintenance. First Majestic owns 100% of the Del Toro Silver Mine.
| | | 2018 | | | 2018 | | | 2018 | | | 2018 | | | 2018 | | | 2017 | | | Change | | | Change | |
| DEL TORO | | Q4 | | | Q3 | | | Q2 | | | Q1 | | | YTD | | | YTD | | | Q4 vs Q3 | | | ‘18 vs ‘17 | |
| Ore processed/tonnes milled | | 56,200 | | | 65,323 | | | 65,879 | | | 79,769 | | | 267,170 | | | 278,204 | | | (14% | ) | | (4% | ) |
| Average silver grade (g/t) | | 132 | | | 147 | | | 117 | | | 133 | | | 132 | | | 158 | | | (10% | ) | | (16% | ) |
| Average lead grade (%) | | 2.6 | | | 3.3 | | | 2.7 | | | 2.9 | | | 2.9 | | | 4.3 | | | (21% | ) | | (33% | ) |
| Silver recovery (%) | | 63% | | | 75% | | | 68% | | | 69% | | | 69% | | | 80% | | | (16% | ) | | (14% | ) |
| Lead recovery (%) | | 46% | | | 62% | | | 58% | | | 57% | | | 56% | | | 68% | | | (26% | ) | | (18% | ) |
| Production | | | | | | | | | | | | | | | | | | | | | | | | |
| Silver ounces produced | | 149,734 | | | 231,350 | | | 167,591 | | | 236,478 | | | 785,154 | | | 1,124,992 | | | (35% | ) | | (30% | ) |
| Pounds of lead produced | | 1,478,180 | | | 2,969,068 | | | 2,295,542 | | | 2,842,046 | | | 9,584,836 | | | 17,978,058 | | | (50% | ) | | (47% | ) |
| Total production – ounces silver equivalent | | 243,637 | | | 427,218 | | | 323,714 | | | 437,743 | | | 1,432,312 | | | 2,237,730 | | | (43% | ) | | (36% | ) |
| Cost | | | | | | | | | | | | | | | | | | | | | | | | |
| Cash cost per ounce | $ | 27.69 | | $ | 13.07 | | $ | 18.01 | | $ | 13.66 | | $ | 17.10 | | $ | 5.49 | | | 112% | | | 211% | |
| All-In sustaining costs per ounce | $ | 37.83 | | $ | 24.48 | | $ | 32.08 | | $ | 20.61 | | $ | 27.49 | | $ | 11.87 | | | 55% | | | 132% | |
| Total production cost per tonne | $ | 84.67 | | $ | 73.50 | | $ | 69.23 | | $ | 58.12 | | $ | 70.20 | | $ | 61.94 | | | 15% | | | 13% | |
| Underground development (m) | | 1,824 | | | 3,789 | | | 3,044 | | | 2,836 | | | 11,493 | | | 11,663 | | | (52% | ) | | (1% | ) |
| Diamond drilling (m) | | 865 | | | 5,472 | | | 9,145 | | | 5,824 | | | 21,305 | | | 19,555 | | | (84% | ) | | 9% | |
In 2018, Del Toro produced 785,154 ounces of silver and 9,584,836 pounds of lead for a total of 1,432,312 silver equivalent ounces, a decrease of 36% compared to 2,237,730 silver equivalent ounces produced in the previous year. The decrease in production was attributed to lower silver and lead head grades, which were 16% and 33% lower, respectively, as well as challenges in metallurgical recovery of transitional ore which caused a 14% decrease in silver recovery and 18% decrease in lead recovery.
During the fourth quarter, the Del Toro mine produced 149,734 ounces of silver and 1,478,180 pounds of lead for a total of 243,637 silver equivalent ounces, a 43% decrease compared to 427,218 ounces produced in the previous quarter. The decrease was primarily due to lower silver and lead recoveries due to processing higher volumes of low-grade transitional ore from the San Juan ore body.
Del Toro has planned to reduce mill throughputs in 2019 to 270 tpd in order to allow more time to test the mineral economics and to better realize the value of ore bodies to be mined. In addition, the installation of microbubbles columns has been postponed until flow charts and additional lab tests can be concluded, including the potential to economically recover zinc from the Cuerpo 3 Ore Body. The Company has also initiated a staff reduction of approximately 250 employees as a result of the decision to lower production rate as well as reduced plans for development.
Cash cost and AISC per ounce for the year was $17.10 and $27.49 respectively, compared to $5.49 and $11.87 per ounce in 2017.
Cash cost and AISC per ounce for the quarter were $27.69 and $37.83, respectively, compared to $13.07 and $24.48 per ounce in the previous quarter. The increase in cash cost and AISC per ounce was directly attributed to the 35% decrease in silver production, lower by-product credits from reduced lead production, as well as $0.4 million incurred for severance as part of the staff reduction plan.
| FIRST MAJESTIC SILVER CORP. | 94 | MANAGEMENT DISCUSSION AND ANALYSIS |
MANAGEMENT’S DISCUSSION AND ANALYSIS
OF RESULTS OF OPERATIONS AND FINANCIAL CONDITION
LA GUITARRA SILVER MINE, MÉXICO STATE, MÉXICO
The La Guitarra Silver Mine is located in the Temascaltepec Mining District in the State of México, México, approximately 130 kilometres southwest from México City. The La Guitarra mine covers 39,714 hectares of mining claims and has a 500 tpd flotation processing plant, buildings and related infrastructure. The Company owns 100% of the La Guitarra Silver Mine.
| | | 2018 | | | 2018 | | | 2018 | | | 2018 | | | 2018 | | | 2017 | | | Change ‘18 | |
| LA GUITARRA | | Q4 | | | Q3 | | | Q2 | | | Q1 | | | YTD | | | Q3 | | | vs ‘17 | |
| Ore processed/tonnes milled | | — | | | 14,891 | | | 35,715 | | | 29,829 | | | 80,435 | | | 127,842 | | | (37% | ) |
| Average silver grade (g/t) | | — | | | 214 | | | 154 | | | 187 | | | 177 | | | 189 | | | (6% | ) |
| Average gold grade (g/t) | | — | | | 1.8 | | | 1.5 | | | 1.9 | | | 1.7 | | | 1.8 | | | (6% | ) |
| Silver recovery (%) | | —% | | | 80% | | | 78% | | | 77% | | | 78% | | | 79% | | | (1% | ) |
| Gold recovery (%) | | —% | | | 78% | | | 79% | | | 80% | | | 79% | | | 76% | | | 4% | |
| Production | | | | | | | | | | | | | | | | | | | | | |
| Silver ounces produced | | — | | | 82,292 | | | 138,454 | | | 138,173 | | | 358,919 | | | 611,705 | | | (41% | ) |
| Gold ounces produced | | — | | | 688 | | | 1,399 | | | 1,477 | | | 3,564 | | | 5,553 | | | (36% | ) |
| Total production – ounces silver equivalent | | — | | | 136,605 | | | 249,214 | | | 255,359 | | | 641,179 | | | 1,019,111 | | | (37% | ) |
| Cost | | | | | | | | | | | | | | | | | | | | | |
| Cash cost per ounce | $ | — | | $ | 6.99 | | $ | 12.89 | | $ | 7.97 | | $ | 9.79 | | $ | 11.53 | | | (15% | ) |
| All-In sustaining costs per ounce | $ | — | | $ | 12.30 | | $ | 18.11 | | $ | 15.76 | | $ | 16.13 | | $ | 18.98 | | | (15% | ) |
| Total production cost per tonne | $ | — | | $ | 68.47 | | $ | 83.68 | | $ | 86.50 | | $ | 81.91 | | $ | 90.35 | | | (9% | ) |
| Underground development (m) | | — | | | 172 | | | 1,950 | | | 1,384 | | | 3,506 | | | 8,167 | | | (57% | ) |
| Diamond drilling (m) | | — | | | 1,119 | | | 7,613 | | | 5,806 | | | 14,539 | | | 27,883 | | | (48% | ) |
The La Guitarra milling and mining operations were placed under care and maintenance effective August 3, 2018 and the Company is currently reviewing strategic options including the potential sale of the operation. The Company will continue with current permitting activities and remediation programs to prepare the operation for a potential reopening in the future, subject to a sufficient improvement in the economic situation to justify a restart of the operation.
Ongoing care and maintenance activities include pumping and de-watering of the underground mine and treatment of the discharge water. Work also continues at the tailings dam to prepare for closure and water treatment. The surface facilities have all been secured and prepared for suspension of activities and some of the excess equipment not required for care and maintenance activities at La Guitarra have been relocated to the Company’s other mining operations. Future care and maintenance costs for the mine is expected to average approximately $0.8 million per quarter.
| MANAGEMENT DISCUSSION AND ANALYSIS | 95 | ANNUAL REPORT 2018 |
MANAGEMENT’S DISCUSSION AND ANALYSIS
OF RESULTS OF OPERATIONS AND FINANCIAL CONDITION
DEVELOPMENT AND EXPLORATION PROJECTS AND PROPERTIES
Plomosas Silver Project, Sinaloa, Mexico
The Plomosas Silver Project consists of 18 mining concessions covering 8,514 hectares, which includes the adjacent Rosario and San Juan historic mines located in Sinaloa State, México.
The two key areas of interest within the property’s boundaries are the historic operations of the Rosario and San Juan mines. Extensive facilities and infrastructure are in place on the property, including a fully functional mining camp facility for 120 persons, a 20-year surface rights agreement in good standing, a 30-year water use permit, a 60-kilometre 33-kilovolt power line, an infirmary, offices, shops and warehouses, and an assay lab. Extensive historical underground development at the Rosario and San Juan mines will allow for easy access to mineralized zones and to accelerate exploration and development in the future.
During 2018, three drill rigs were active on site and the Company completed 19,718 metres of diamond drilling at the Plomosas Silver Project, compared to 17,606 metres in the previous year. After reaching 19,718 metres drilled of the 22,000 budgeted metres in the third quarter, and due to security issues in the area, the Company decided to halt the drilling program and continue logging and sampling the data and continue building the geological model.
La Luz Silver Project, San Luis Potosi, México
The La Luz Silver Project is located 25 kilometres west of the town of Matehuala in San Luis Potosi State, México, near the village of Real de Catorce. The Company owns 100% of the La Luz project and all of the associated mining claims of what was historically known as the Santa Ana Mine and consists of 36 mining concessions covering 4,974 hectares, with estimated historical production of 230 million ounces of silver between 1773 and 1990. The total surface rights on different properties at La Luz amount to 26 hectares.
To date, the Company has completed a Baseline Study and the Geo-hydrologic Study. However, there has been opposition to mining in the La Luz area from certain indigenous people (Huicholes) and non-government organizations (“NGOs”) largely residing or based outside of San Luis Potosi State, who placed an injunction on the constitutionality of the concessions given that the claims overlay a traditional pilgrimage route. In a related matter, local Ejido members placed an injunction to defend against attempts to create a biosphere reserve by constitutional decree that includes some mining concession areas of the La Luz Project near Real de Catorce, as that would prohibit them from engaging in many livelihood activities including mining. The Company is currently addressing these constitutional legal matters in the Mexican courts. The Company is ready to submit the Environmental Impact Statement, the Risk Study and the Change of Use of Land Studies to government authorities once the courts resolve the outstanding constitutional matters. The Company is unable at this time to estimate when these legal constitutional matters will be resolved.
La Joya Silver Project, Durango, México
The Company owns 100% of the La Joya Silver Project which is located 75 kilometres southeast of the city of Durango, Mexico and consists of 15 mining concessions covering 4,646 hectares. A Preliminary Economic Assessment for La Joya was previously published by SilverCrest Mines Inc. with an effective date of October 21, 2013, and was amended March 4, 2014.
Jalisco Group of Properties, Jalisco, México
The Company owns 100% of a group of mining claims totalling 4,719 hectares located in various mining districts located in Jalisco State, México.
Jimenez del Teul Properties, Zacatecas, Mexico
The Company owns 100% of the Jimenez del Teul Properties which are located 30 kilometres south of the Del Toro Silver Mine, in the state of Zacatecas, Mexico. These properties consist of 12 mining concessions covering 12,420 hectares. Some of the prospects known as Las Minitas, El Triangulo, La Luz and Reyna Victoria host low-scale historic mining operations.
| FIRST MAJESTIC SILVER CORP. | 96 | MANAGEMENT DISCUSSION AND ANALYSIS |
MANAGEMENT’S DISCUSSION AND ANALYSIS
OF RESULTS OF OPERATIONS AND FINANCIAL CONDITION
OVERVIEW OF FINANCIAL PERFORMANCE
For the quarters ended December 31, 2018 and 2017 (in thousands of dollars, except for per share amounts):
| | | Fourth Quarter | | | Fourth Quarter | | | Variance | | |
| | | 2018 | | | 2017 | | | % | | |
| | | | | | | | | | | |
| Revenues | $ | 74,128 | | $ | 61,165 | | | 21% | | (1) |
| Mine operating costs | | | | | | | | | | |
| Cost of sales | | 56,230 | | | 39,309 | | | 43% | | (2) |
| Depletion, depreciation and amortization | | 26,925 | | | 20,454 | | | 32% | | (3) |
| | | 83,155 | | | 59,763 | | | 39% | | |
| | | | | | | | | | | |
| Mine operating (loss) earnings | | (9,027 | ) | | 1,402 | | | (744)% | | (4) |
| | | | | | | | | | | |
| General and administrative expenses | | 5,942 | | | 3,952 | | | 50% | | (5) |
| Share-based payments | | 943 | | | 1,850 | | | (49)% | | |
| Mine care and maintenance costs | | 636 | | | — | | | 100% | | (6) |
| Impairment of non-current assets | | 168,028 | | | 65,500 | | | 157% | | (7) |
| Acquisition costs | | 16 | | | — | | | 100% | | |
| Foreign exchange loss (gain) | | 1,684 | | | (807 | ) | | (309)% | | |
| Operating loss | | (186,276 | ) | | (69,093 | ) | | 170% | | |
| Investment and other income | | 1,095 | | | 265 | | | 313% | | |
| Finance costs | | (3,388 | ) | | (1,052 | ) | | 222% | | (8) |
| Loss before income taxes | | (188,569 | ) | | (69,880 | ) | | 170% | | |
| Current income tax expense | | 724 | | | 4,142 | | | (83)% | | |
| Deferred income tax recovery | | (24,850 | ) | | (17,938 | ) | | 39% | | |
| Income tax recovery | | (24,126 | ) | | (13,796 | ) | | 75% | | (9) |
| Net loss for the period | $ | (164,443 | ) | $ | (56,084 | ) | | 193% | | (10) |
| | | | | | | | | | | |
| Earnings (loss) per share (basic and diluted) | $ | (0.85 | ) | $ | (0.34 | ) | | 151% | | (10) |
| MANAGEMENT DISCUSSION AND ANALYSIS | 97 | ANNUAL REPORT 2018 |
MANAGEMENT’S DISCUSSION AND ANALYSIS
OF RESULTS OF OPERATIONS AND FINANCIAL CONDITION
| 1. | Revenues in the quarter increased 21% compared to the same quarter of the previous year primarily attributed to: |
| | • | a 40% increase insilver equivalent ouncessold compared to the fourth quarter of 2017 which contributed to an increase in revenues of $32.7 million, mainly due to the addition of the San Dimas mine; and |
| | • | smelting and refiningcosts decreased from $2.4 million $(1.06 per ounce) to $1.4 million $(0.43 per ounce). The savings in smelting and refining costs per ounce were primarily attributed to a higher volume of doré production at San Dimas, as well as lower smelting and refining rates renegotiated in July 2018; |
Partially offset by:
| | • | a 13% decrease inaverage realized silver priceof $14.47 per ounce compared to $16.61 per ounce in the same quarter of the prior year, which resulted in a decrease in revenues of $11.9 million. |
| 2. | Cost of sales in the quarter increased 43% or $16.9 million compared to the same quarter of the previous year as a result of the following factors: |
| | • | theaddition of the San Dimas minewhich incurred $20.0 million in cost of sales; |
| | • | increase in energy costsof $1.1 million in the current quarter compared to the fourth quarter of 2017, primarily due to a 30% rate hike by Mexico’s Federal Electricity Commission during the year as well as higher diesel costs; |
Partially offset by:
| | • | net increase in inventoryof $1.9 million, which was net of the inventory loss from the Republic Chapter 11 bankruptcyin November 2018 for approximately 758,000 silver equivalent ounces or $7.5 million of inventory that were in Republic’s possession for refining. |
| 3. | Depletion, depreciation and amortization in the quarter increased $6.5 million or 32% compared to the same quarter of the previous year primarily as a result of the addition of the San Dimas mine, which added $8.1 million of depletion, depreciation and amortization during the quarter compared to last year. |
| | |
| 4. | Mine operating earnings during the quarter decreased by $10.4 million to a mine operating loss of $9.0 million compared to the fourth quarter of 2017. During the quarter, the San Dimas mine generated mine operating earnings of $4.6 million; however, this was offset by $6.3 million decrease in mine operating earnings at La Parrilla, $5.4 million decrease in La Encantada and $3.8 million decrease at Del Toro, respectively, due to a combination of 13% lower average realized silver price and higher costs. |
| | |
| 5. | General and administrative expenses increased by $2.0 million or 50% during the quarter compared to the same quarter of 2017, primarily attributed to incremental general and administrative costs from the addition of Primero and numerous legal costs associated with the First Silver litigation and Republic Chapter 11 bankruptcy. |
| | |
| 6. | As previously announced, the Company placed the La Guitarra milling and mining operations under care and maintenance on August 3, 2018. Mine care and maintenance costs for the quarter were $0.6 million. |
| | |
| 7. | Impairment of non-current assets during the fourth quarter was $168.0 million, or $130.6 million net of tax, as a result of an impairment charge on the La Parrilla and Del Toro mine due to decrease in estimated Reserves and Resources amidst decline in metal prices and increased operating costs. |
| | |
| 8. | Finance costs increased by $2.3 million compared to the same quarter of the prior year, primarily attributed to interest expense of $2.1 million and accretion expense of $0.7 million related to the $156.5 million convertible debentures that the Company contracted in the first quarter of 2018. |
| | |
| 9. | During the quarter, the Company recorded a net income tax recovery of $24.1 million compared to an income tax recovery of $13.8 million in the fourth quarter of 2017. The increase in income tax recovery in the quarter was primarily driven by impairment on non-current assets, certain tax benefits realized from post-acquisition re-organization of Primero entities and foreign exchange impact on the Company’s Mexican Peso denominated tax balances, partially offset by an increase in unrecognized deferred income tax asset. |
| | |
| 10. | As a result of the foregoing, net loss for the quarter was $164.4 million (EPS of $(0.85)) compared to net loss of $56.1 million (EPS of $(0.34)) in the same quarter of the prior year. |
| FIRST MAJESTIC SILVER CORP. | 98 | MANAGEMENT DISCUSSION AND ANALYSIS |
MANAGEMENT’S DISCUSSION AND ANALYSIS
OF RESULTS OF OPERATIONS AND FINANCIAL CONDITION
For the year ended December 31, 2018 and 2017 (in thousands of dollars, except for per share amounts):
| | | | | | | | | | | | Variance % | | |
| | | Annual 2018 | | | Annual 2017 | | | Annual 2016 | | | ‘18 vs ‘17 | | |
| | | | | | | | | | | | | | |
| Revenues | $ | 300,929 | | $ | 252,288 | | $ | 278,077 | | | 19% | | (1) |
| Mine operating costs | | | | | | | | | | | | | |
| Cost of sales | | 219,162 | | | 159,265 | | | 149,281 | | | 38% | | (2) |
| Depletion, depreciation and amortization | | 93,667 | | | 77,045 | | | 79,593 | | | 22% | | (3) |
| | | 312,829 | | | 236,310 | | | 228,874 | | | 32% | | |
| | | | | | | | | | | | | | |
| Mine operating (loss) earnings | | (11,900 | ) | | 15,978 | | | 49,203 | | | (174)% | | (4) |
| | | | | | | | | | | | | | |
| General and administrative | | 21,428 | | | 17,493 | | | 17,747 | | | 22% | | (5) |
| Share-based payments | | 7,375 | | | 8,295 | | | 4,403 | | | (11)% | | |
| Impairment of non-current assets | | 199,688 | | | 65,500 | | | — | | | 33% | | (6) |
| Acquisition costs | | 4,893 | | | — | | | — | | | 100% | | (7) |
| Mine care and maintenance costs | | 2,109 | | | — | | | — | | | 100% | | (8) |
| Foreign exchange loss (gain) | | 1,874 | | | (4,314 | ) | | (1,192 | ) | | 143% | | (9) |
| Operating (loss) earnings | | (249,267 | ) | | (70,996 | ) | | 28,245 | | | 251% | | |
| Investment and other (loss) income | | (744 | ) | | (34 | ) | | 5,209 | | | 2,088% | | |
| Finance costs | | (13,036 | ) | | (4,271 | ) | | (7,963 | ) | | 205% | | (10) |
| (Loss) earnings before income taxes | | (263,047 | ) | | (75,301 | ) | | 25,491 | | | 249% | | |
| Current income tax expense | | 2,148 | | | 7,177 | | | 8,346 | | | (70)% | | |
| Deferred income tax (recovery) expense | | (61,031 | ) | | (29,206 | ) | | 8,544 | | | 109% | | |
| Income tax (recovery) expense | | (58,883 | ) | | (22,029 | ) | | 16,890 | | | 167% | | (11) |
| Net (loss) earnings for the year | $ | (204,164 | ) | $ | (53,272 | ) | $ | 8,601 | | | 283% | | (12) |
| | | | | | | | | | | | | | |
| (Loss) earnings per share (basic and diluted) | $ | (1.11 | ) | $ | (0.32 | ) | $ | 0.05 | | | 245% | | (12) |
| | | | | | | | | | | | | | |
| Cash and cash equivalents | $ | 57,013 | | $ | 118,141 | | $ | 129,049 | | | | | |
| Total assets | $ | 926,110 | | $ | 781,441 | | $ | 857,175 | | | | | |
| Non-current liabilities | $ | 273,400 | | $ | 144,581 | | $ | 185,902 | | | | | |
| MANAGEMENT DISCUSSION AND ANALYSIS | 99 | ANNUAL REPORT 2018 |
MANAGEMENT’S DISCUSSION AND ANALYSIS
OF RESULTS OF OPERATIONS AND FINANCIAL CONDITION
| 1. | Revenues in the year ended December 31, 2018 increased by 19% compared to the previous year due to the following significant contributors: |
| | • | Silver equivalent ouncessold increased by 34% compared to the previous year resulting in an increase in revenues of $84.1 million, primarily attributed to the additional production from San Dimas; and |
| | • | Smelting and refining costsdecreased from $11.4 million $(1.19 per ounce) to $7.5 million $(0.65 per ounce). The savings in smelting and refining costs per ounce were primarily attributed to a higher volume of doré production from San Dimas, as well as lower concentrate and treatment charges renegotiated in July 2018; |
Partially offset by:
| | • | a 9% decrease inaverage realized silver priceof $15.53 per ounce compared to $17.12 per ounce in the prior year, resulting in a decrease in revenues of $34.0 million. |
| 2. | Cost of sales in the year increased $59.9 million or 38% compared to 2017 as a result of the following factors: |
| | • | theaddition of the San Dimas mineon May 10, 2018, which incurred $60.8 million in cost of sales during the eight months of operations under First Majestic’s control; |
| | • | increase in energy costsof $4.6 million compared to 2017, primarily due to a 30% rate hike by Mexico’s Federal Electricity Commission since the beginning of the year as well as higher diesel costs; |
Partially offset by:
| | • | decrease in inventoryof $3.8 million, net of thewrite down of inventory from Republic Chapter 11 bankruptcyin November 2018, which related for approximately 758,000 silver equivalent ounces of inventory or $7.5 million that were in Republic’s possession for refining. |
| 3. | Depletion, depreciation and amortization in the year increased $16.6 million or 22% compared to the previous year primarily as a result of the addition of the San Dimas mine, which incurred $19.1 million of depletion, depreciation and amortization during the year. |
| | |
| 4. | Mine operating earnings during the year ended December 31, 2018 decreased $27.9 million compared to 2017. In the first eight months under the management of First Majestic, San Dimas generated mine operating earnings of $22.7 million. However, this was offset by $21.8 million decrease in mine operating earnings at La Parrilla, $19.6 million decrease in La Encantada, and $9.9 million decrease in Del Toro, respectively, due to a combination of lower production, 9% lower average realized silver price and higher costs. |
| | |
| 5. | General and administrative expenses increased $3.9 million or 22% during the year compared to 2017, primarily attributed to incremental general and administrative costs from the acquisition and integration of Primero, and numerous legal costs associated with the First Silver litigation and Republic Chapter 11 bankruptcy. |
| | |
| 6. | Impairment on non-current assets: During the year ended December 31, 2018, the Company recognized a total impairment charge of $199.7 million, or $151.1 million net of tax. Due to a reduction in estimated Reserves and Resources as a result of a decline in long-term metal price forecasts and increase in operating costs, the Company was required to record an impairment charge of $111.8 million and $56.3 million on its two concentrates producing mines, La Parrilla and Del Toro, respectively. In addition, the Company recognized an impairment charge of $31.7 million on La Guitarra in the second quarter as a result of management’s decision to place the La Guitarra Silver Mine on care and maintenance effective August 3, 2018. |
| | |
| 7. | Acquisition costs in the year were $4.9 million relating to due diligence costs and closing fees incurred in connection with the acquisition of Primero Mining Corp. which closed on May 10, 2018. |
| | |
| 8. | As previously announced, the Company placed the La Guitarra milling and mining operations under care and maintenance on August 3, 2018. Mine care and maintenance costs for the year was $2.1 million, including $0.6 million in severance costs for terminated employees and workers. Future care and maintenance costs for the mine is expected to be approximately $3.2 million per year. |
| | |
| 9. | Foreign exchange loss for the year was $1.9 million compared to a gain of $4.3 million in 2017. Foreign exchange loss in the year was primarily attributed to a 9% weaker Canadian dollar related to the Company’s Canadian denominated cash and cash equivalents, partially offset by $0.8 million gain on foreign exchange derivatives. The foreign exchange impact of the Mexican peso was negligible in 2018. |
| | |
| 10. | Finance costs increased $8.8 million during the year ended December 31, 2018 compared to the previous year, primarily due to $2.7 million in interest expense and $4.9 million in accretion expense related to the $156.5 million convertible debentures that the Company issued in the first quarter of 2018, as well as $0.5 million in accelerated accretion costs as a result of early termination of previous debt facilities. |
| | |
| 11. | During the year ended December 31, 2018, the Company recorded a net income tax recovery of $58.9 million, compared to an income tax recovery of $22.0 million in 2017. The increase in income tax recovery was primarily driven by deferred income tax effect of $48.6 million on the $199.7 million impairment charge on non-current assets, certain tax benefits realized from post- acquisition re-organization of Primero entities and foreign exchange impact on the Company’s Mexican Peso denominated tax balances, partially offset by an increase in unrecognized deferred income tax asset. |
| | |
| 12. | As a result of the foregoing, net loss for the year ended December 31, 2018 was $204.2 million (loss per share of $(1.11)), compared to loss of $53.3 million (EPS of $(0.32)) in the prior year. |
| FIRST MAJESTIC SILVER CORP. | 100 | MANAGEMENT DISCUSSION AND ANALYSIS |
MANAGEMENT’S DISCUSSION AND ANALYSIS
OF RESULTS OF OPERATIONS AND FINANCIAL CONDITION
SUMMARY OF QUARTERLY RESULTS
The following table presents selected financial information for each of the most recent eight quarters:
| | | 2018 | | | 2017 | |
| SELECTED FINANCIAL | | | | | | | | | | | | | | | | | | | | | | | | |
| INFORMATION | | Q4 | | | Q3 | | | Q2 | | | Q1 | | | Q4 | | | Q3 | | | Q2 | | | Q1 | |
| Revenue | $ | 74,128 | | $ | 88,521 | | $ | 79,687 | | $ | 58,593 | | $ | 61,165 | | $ | 61,901 | | $ | 60,116 | | $ | 69,106 | |
| Cost of sales | $ | 56,230 | | $ | 63,966 | | $ | 59,285 | | $ | 39,681 | | $ | 39,309 | | $ | 40,290 | | $ | 40,004 | | $ | 39,662 | |
| Depletion, depreciation and amortization | $ | 26,925 | | $ | 24,701 | | $ | 22,706 | | $ | 19,335 | | $ | 20,454 | | $ | 18,436 | | $ | 18,707 | | $ | 19,448 | |
| Mine operating (loss) earnings | $ | (9,027 | ) | $ | (146 | ) | $ | (2,304 | ) | $ | (423 | ) | $ | 1,402 | | $ | 3,175 | | $ | 1,405 | | $ | 9,996 | |
| Net (loss) earnings after tax | $ | (164,443 | ) | $ | 5,904 | | $ | (40,033 | ) | $ | (5,592 | ) | $ | (56,084 | ) | $ | (1,320 | ) | $ | 1,412 | | $ | 2,720 | |
| (Loss) earnings per share-basic | $ | (0.85 | ) | $ | 0.03 | | $ | (0.22 | ) | $ | (0.03 | ) | $ | (0.34 | ) | $ | (0.01 | ) | $ | 0.01 | | $ | 0.02 | |
| (Loss) earnings per share-diluted | $ | (0.85 | ) | $ | 0.03 | | $ | (0.22 | ) | $ | (0.03 | ) | $ | (0.34 | ) | $ | (0.01 | ) | $ | 0.01 | | $ | 0.02 | |
During the fourth quarter of 2018, mine operating loss was $9.0 million compared to a net loss of $0.1 million in the previous quarter. The increase in mine operating loss was primarily attributed to $7.5 million inventory loss due to Republic Chapter 11 bankruptcy. Net earnings after tax decreased $170.3 million compared to the previous quarter primarily due to an impairment charge of $168.0 million as well as a $2.5 million decrease in investment income.
OTHER DISCLOSURES
LIQUIDITY, CAPITAL RESOURCES AND CONTRACTUAL OBLIGATIONS
Liquidity
As at December 31, 2018, the Company had cash and cash equivalents of $57.0 million, a decrease of $61.1 million compared to $118.1 million at December 31, 2017. The Company’s cash and cash equivalents primarily comprised of cash held with reputable financial institutions and is invested in cash accounts and in highly liquid short-term investments with maturities of three months or less. The funds are not exposed to liquidity risk and there are no restrictions on the ability of the Company to use these funds to meet its obligations.
In connection with the Primero acquisition, First Majestic repaid all outstanding amounts of Primero’s $75.8 million convertible debentures as well as $30.2 million in Primero’s revolving credit facilities.
In February 2018, to fund these debt repayments and related costs for the acquisition, the Company issued $156.5 million of five year convertible debentures with a semi-annual interest of 1.875% per annum. The Notes are convertible into common shares of the Company at a conversion rate of 104.3297 common shares per $1,000 principal amount of Notes converted, representing an initial conversion price of $9.59 per common share, subject to certain anti-dilution adjustments.
In addition, the Company also restructured 100% of its bank debt in May 2018 by entering into a three year $75.0 million senior secured credit facility.
On December 27, 2018, the Company announced it has entered into an At The Market (“ATM”) equity distribution agreement pursuant to which the Company may, at its discretion and from time-to-time, sell through an agent, such number of common shares of the Company to an aggregate gross proceeds of up to US$50.0 million. The sale of these common shares will be made through “at-the-market distributions” as defined in the Canadian Securities Administrators’ National Instrument 44-102-Shelf Distributions, including sales made directly on the New York Stock Exchange (the “NYSE”), or any other recognized marketplace upon which the common shares are listed or quoted or where the common shares are traded in the United States. Since January 1, 2019, First Majestic has sold 2,250,000 common shares of the Company for net proceeds of $13.2 million or $5.99 per share.
| MANAGEMENT DISCUSSION AND ANALYSIS | 101 | ANNUAL REPORT 2018 |
MANAGEMENT’S DISCUSSION AND ANALYSIS
OF RESULTS OF OPERATIONS AND FINANCIAL CONDITION
The following table summarizes the Company’s cash flow activity during the year:
| | | YEAR ENDED DECEMBER 31, | |
| | | 2018 | | | 2017 | |
| Cash flow | | | | | | |
| Cash generated by operating activities | | 33,262 | | | 70,451 | |
| Cash used in investing activities | | (117,041 | ) | | (75,928 | ) |
| Cash generated by (used in) financing activities | | 25,443 | | | (8,652 | ) |
| Decrease in cash and cash equivalents | | (58,336 | ) | | (14,129 | ) |
| Effect of exchange rate on cash and cash equivalents held in foreign currencies | | (2,792 | ) | | 3,221 | |
| Cash and cash equivalents, beginning of the year | | 118,141 | | | 129,049 | |
| Cash and cash equivalents, end of year | $ | 57,013 | | $ | 118,141 | |
The Company’s cash flows from operating, investing and financing activities during the year ended December 31, 2018 are summarized as follows:
| • | | Cash provided from operating activities of $33.3 million, primarily due to: |
| | — | $61.6 million in operating cash flows from operating activities before movements in working capital and taxes; net of: |
| | — | a $17.2 million increase in value added taxes receivable as a result of delays in recovery from the Mexican tax authorities, primarily related to San Dimas which was 18 months behind on its filings when First Majestic acquired the mine. Since acquisition, the Company has accelerated its filings and, as at December 31, 2018, recovered $4.5 million of the outstanding amount. The Company continues to be supplying additional information requested by the SAT as part of the review process and the Company expects the amounts to be refunded in the future; and |
| | — | $6.4 million decrease in trade and other payables as First Majestic began paying down overdue liabilities assumed from the acquisition of Primero. |
| | | |
| • | | Cash used in investing activities of $117.0 million, primarily related to: |
| | — | $76.3 million spent on mine development and exploration activities; |
| | — | $35.0 million spent on purchase of property, plant and equipment; |
| | — | $2.9 million spent on deposits on non-current assets; and |
| | — | $1.0 million spent on the Primero acquisition. |
| | | |
| • | | Cash provided from financing activities of $25.4 million, primarily consists of the following: |
| | — | $151.1 million of net proceeds from the issuance of the convertible debentures; and |
| | — | $34.0 million of net proceeds from the revolving credit facility; net of: |
| | — | $106.1 million repayment on Primero debt facilities; |
| | — | $32.1 million on repayment of Scotia debt facilities; |
| | — | $16.0 million repayment of revolving credit facility; |
| | — | $4.5 million repayment of financing costs; |
| | — | $3.5 million on repayment of lease obligations; and |
| | — | $1.4 million on repurchase and cancellation of shares. |
Working capital as at December 31, 2018 was $108.1 million compared to $116.3 million at December 31, 2017. Total available liquidity at December 31, 2018 was $163.2 million (see page 111), including $55.0 million of undrawn revolving credit facility.
Capital Resources
The Company’s objective when managing capital is to maintain financial flexibility to continue as a going concern while optimizing growth and maximizing returns of investments from shareholders.
The Company monitors its capital structure and based on changes in operations and economic conditions, may adjust the structure by repurchasing shares, issuing new shares, issuing new debt or retiring existing debt. The Company prepares annual budget and quarterly forecasts to facilitate the management of its capital requirements. The annual budget is approved by the Company’s Board of Directors.
The Company is not subject to any externally imposed capital requirements with the exception of complying with banking covenants defined in its debt facilities. As at December 31, 2018 and December 31, 2017, the Company was fully in compliance with these covenants.
| FIRST MAJESTIC SILVER CORP. | 102 | MANAGEMENT DISCUSSION AND ANALYSIS |
MANAGEMENT’S DISCUSSION AND ANALYSIS
OF RESULTS OF OPERATIONS AND FINANCIAL CONDITION
Contractual Obligations and Commitments
As at December 31, 2018, the Company’s contractual obligations and commitments are summarized as follows:
| | | Contractual | | | Less than | | | 1 to 3 | | | 4 to 5 | | | After 5 | |
| | | Cash Flows | | | 1 year | | | years | | | years | | | years | |
| Trade and other payables | $ | 50,183 | | $ | 50,183 | | $ | — | | $ | — | | $ | — | |
| Debt facilities | | 192,596 | | | 4,606 | | | 28,067 | | | 159,923 | | | — | |
| Equipment financing obligations | | 6,251 | | | 3,145 | | | 2,499 | | | 607 | | | — | |
| Other liabilities | | 3,787 | | | — | | | — | | | — | | | 3,787 | |
| Purchase obligations and commitments | | 10,343 | | | 9,643 | | | 700 | | | — | | | — | |
| | $ | 263,160 | | $ | 67,577 | | $ | 31,266 | | $ | 160,530 | | $ | 3,787 | |
Management is of the view that the above contractual obligations and commitments will be sufficiently funded by current working capital, future operating cash flows, and available debt facilities as at the date of this MD&A.
MANAGEMENT OF RISKS AND UNCERTAINTIES
The Company thoroughly examines the various financial instruments and risks to which it is exposed and assesses the impact and likelihood of those risks. These risks may include credit risk, liquidity risk, currency risk, commodity price risk, and interest rate risk. Where material, these risks are reviewed and monitored by the Board of Directors.
Credit Risk
Credit risk is the risk of financial loss if a customer or counterparty fails to meet its contractual obligations. The Company’s credit risk relates primarily to trade receivables in the ordinary course of business, value added taxes receivable and other receivables.
As at December 31, 2018, value added taxes receivable was $59.7 million (2017 – $15.0 million), including $33.0 million in PEM as part of the acquisition of Primero. The delay in recovery was primarily attributed to Primero being 18 months behind in its filings when First Majestic acquired the company. Since acquisition, the Company has accelerated its filings and, as at December 31, 2018, recovered $4.5 million of the outstanding amount. The Company continues supplying additional information requested by the Servicio de Administración Tributaria (“SAT”) as part of the review process and the Company expects the amounts to be refunded in the future.
The Company sells and receives payment upon delivery of its silver doré and by-products primarily through three international customers. Silver-lead concentrates and related base metal by-products are sold primarily through three international customers. All of the Company’s customers have good ratings and payments of receivables are scheduled, routine and fully received within 60 days of submission; therefore, the balance of trade receivables owed to the Company in the ordinary course of business is not significant.
The carrying amount of financial assets recorded in the consolidated financial statements represents the Company’s maximum exposure to credit risk. With the exception to the above, the Company believes it is not exposed to significant credit risk.
Liquidity Risk
Liquidity risk is the risk that the Company will not be able to meet its financial obligations as they arise. The Company has in place a planning and budgeting process to help determine the funds required to support the Company’s normal operating requirements and contractual obligations.
Based on the Company’s current operating plan, the Company believes it has sufficient cash on hand, combined with cash flows from operations, to meet operating requirements as they arise for at least the next 12 months. If commodity prices in the metal markets were to decrease significantly, or the Company was to deviate significantly from its operating plan, the Company may need further injection of capital to address its cash flow requirements.
| MANAGEMENT DISCUSSION AND ANALYSIS | 103 | ANNUAL REPORT 2018 |
MANAGEMENT’S DISCUSSION AND ANALYSIS
OF RESULTS OF OPERATIONS AND FINANCIAL CONDITION
Currency Risk
The Company is exposed to foreign exchange risk primarily relating to financial instruments that are denominated in Canadian dollars or Mexican pesos, which would impact the Company’s net earnings or loss. To manage foreign exchange risk, the Company may occasionally enter into short-term foreign currency derivatives. The foreign currency derivatives are not designated as hedging instruments for accounting purposes.
The sensitivity of the Company’s net earnings or loss and comprehensive income or loss due to changes in the exchange rate between the Canadian dollar and the Mexican peso against the U.S. dollar is included in the table below:
| | | | | | | | | | | | | | | | | | | | | DECEMBER 31, 2018 | |
| | | Cash | | | Trade | | | Value | | | Other | | | Trade | | | Foreign | | | Net assets | | | Effect of +/- | |
| | | and cash | | | and other | | | added taxes | | | financial | | | and other | | | exchange | | | (liabilities) | | | 10% change | |
| | | equivalents | | | receivables | | | receivable | | | assets | | | payables | | | derivative | | | exposure | | | in currency | |
| Canadian dollar | $ | 22,968 | | $ | 45 | | $ | — | | $ | 2,753 | | $ | (1,782 | ) | $ | — | | $ | 23,984 | | $ | 2,398 | |
| Mexican peso | | 5,178 | | | — | | | 51,698 | | | — | | | (31,474 | ) | | 53,500 | | | 78,902 | | | 7,890 | |
| | $ | 28,146 | | $ | 45 | | $ | 51,698 | | $ | 2,753 | | $ | (33,256 | ) | $ | 53,500 | | $ | 102,886 | | $ | 10,289 | |
Commodity Price Risk
The Company is exposed to commodity price risk on silver, gold, lead and zinc, which have a direct and immediate impact on the value of its related financial instruments and net earnings. The Company’s revenues are directly dependent on commodity prices that have shown volatility and are beyond the Company’s control. The Company does not use derivative instruments to hedge its commodity price risk to silver.
The following table summarizes the Company’s exposure to commodity price risk and their impact on net earnings:
| | | | | | | | | DECEMBER 31, 2018 | |
| | | | | | Effect of +/- 10% change in metal prices | |
| | | Silver | | | Gold | | | Lead | | | Zinc | | | Total | |
| Metals subject to provisional price adjustments | $ | 136 | | $ | — | | $ | 85 | | $ | 125 | | $ | 346 | |
| Metals in doré and concentrates inventory | | 127 | | | 146 | | | 37 | | | 12 | | | 322 | |
| | $ | 263 | | $ | 146 | | $ | 122 | | $ | 137 | | $ | 668 | |
Political and Country Risk
First Majestic currently conducts foreign operations primarily in México, and as such the Company’s operations are exposed to various levels of political and economic risks by factors outside of the Company’s control. These potential factors include, but are not limited to: royalty and tax increases or claims by governmental bodies, expropriation or nationalization, foreign exchange controls, high rates of inflation, extreme fluctuations in foreign currency exchange rates, import and export tariffs and regulations, cancellation or renegotiation of contracts and environmental and permitting regulations. The Company currently has no political risk insurance coverage against these risks.
The Company is unable to determine the impact of these risks on its future financial position or results of operations. Changes, if any, in mining or investment policies or shifts in political attitude in foreign countries may substantively affect the Company’s exploration, development and production activities.
Uncertainty in the Calculation of Mineral Reserves, Resources and Silver Recovery
There is a degree of uncertainty attributable to the calculation of Mineral Reserves and Mineral Resources (as defined in NI 43-101). Until Mineral Reserves or Mineral Resources are actually mined, extracted and processed, the quantity of minerals and their grades must be considered estimates only. In addition, the quantity of Mineral Reserves and Mineral Resources may vary depending on, among other things, applicable metal prices. Any material change in the quantity of Mineral Reserves, Mineral Resources, grade or mining widths may affect the economic viability of some or all of the Company’s mineral properties and may have a material adverse effect on the Company’s operational results and financial condition. Mineral Reserves on the Company’s properties have been calculated on the basis of economic factors at the time of calculation; variations in such factors may have an impact on the amount of the Company’s Mineral Reserves. In addition, there can be no assurance that silver recoveries or other metal recoveries in small scale laboratory tests will be duplicated in larger scale tests under on-site conditions or during production, or that the existing known and experienced recoveries will continue.
| FIRST MAJESTIC SILVER CORP. | 104 | MANAGEMENT DISCUSSION AND ANALYSIS |
MANAGEMENT’S DISCUSSION AND ANALYSIS
OF RESULTS OF OPERATIONS AND FINANCIAL CONDITION
Environmental and Health and SafetyRisks
The Company’s activities are subject to extensive laws and regulations governing environmental protection and employee health and safety. Environmental laws and regulations are complex and have tended to become more stringent over time. The Company is required to obtain governmental permits and in some instances air, water quality, and mine reclamation rules and permits. The Company has complied with environmental taxes applied to the use of certain fossil fuels according to the Kyoto Protocol. Although the Company makes provisions for reclamation costs, it cannot be assured that these provisions will be adequate to discharge its future obligations for these costs. Failure to comply with applicable environmental and health and safety laws may result in injunctions, damages, suspension or revocation of permits and imposition of penalties. While the health and safety of our people and responsible environmental stewardship are our top priorities, there can be no assurance that First Majestic has been or will be at all times in complete compliance with such laws, regulations and permits, or that the costs of complying with current and future environmental and health and safety laws and permits will not materially and adversely affect the Company’s business, results of operations or financial condition.
Claims and Legal Proceedings Risks
The Company is subject to various claims and legal proceedings covering a wide range of matters that arise in the ordinary course of business activities. Many factors, both known and unknown, could cause actual results, performance or achievements to be materially different from the results, performance or achievements that are or may be expressed or implied by such forward-looking statements or information and the Company has made assumptions and estimates based on or related to many of these factors. Such factors include, without limitation: availability of time on court calendars in Canada and elsewhere; the recognition of Canadian judgments under Mexican law; the possibility of settlement discussions; the risk of appeal of judgment; and the insufficiency of the defendant’s assets to satisfy the judgment amount. Each of these matters is subject to various uncertainties and it is possible that some of these matters may be resolved unfavourably to the Company. First Majestic carries liability insurance coverage and establishes provisions for matters that are probable and can be reasonably estimated. In addition, the Company may be involved in disputes with other parties in the future which may result in a significant impact on our financial condition, cash flow and results of operations.
Although the Company has taken steps to verify ownership and legal title to mineral properties in which it has an interest, according to the usual industry standards for the stage of mining, development and exploration of such properties, these procedures do not guarantee the Company’s title. Such properties may be subject to prior agreements or transfers, and title may be affected by undetected defects. However, management is not aware of any such agreements, transfers or defects.
In April 2013, the Company received a positive judgment on the First Silver litigation from the Supreme Court of British Columbia (the “Court”), which awarded the sum of $93.8 million in favour of First Majestic against Hector Davila Santos (the “Defendant”).
The Company received a sum of $14.1 million in June 2013 as partial payment of the judgment, leaving an unpaid amount of approximately $59.7 million (CAD$81.5 million). As part of the ruling, the Court granted orders restricting any transfer or encumbrance of the Bolaños Mine by the Defendant and limiting mining at the Bolaños Mine. The orders also require that the Defendant to preserve net cash flow from the Bolaños Mine in a holding account and periodically provide to the Company certain information regarding the Bolaños Mine. However, there can be no guarantee that the remainder of the judgment amount will be collected and it is likely that it will be necessary and the Company is taking additional action in Mexico and/or elsewhere to attempt to recover the balance. Therefore, as at December 31, 2018, the Company has not accrued any of the remaining $59.7 million (CAD$81.5 million) unrecovered judgment in favour of the Company.
Primero Tax Rulings
Since Primero acquired the San Dimas Mine in August 2010, it has had a Silver Purchase Agreement (“Old Stream Agreement”) that required Primero Empresa Minera, S.A. de C.V. (“PEM”) to sell 100% of the silver produced from the San Dimas to WPMI, up to 6 million ounces and 50% of silver produced thereafter, at the lower of: (i) the spot market price and (ii) $4.04 per ounce plus an annual increase of 1%.
In order to reflect commercial realities and the effects of the Old Stream Agreement, for Mexican income tax purposes, PEM recognized the revenue on these silver sales based on its actual realized revenue (“PEM Realized Price”) instead of at spot market prices.
To obtain assurances that the Servicio de Administración Tributaria (“SAT”) would accept the PEM Realized Price as the proper price to use to calculate Mexican income taxes, Primero applied for and received an Advance Pricing Agreement (“APA”) from the SAT. The APA confirmed that the PEM Realized Price would be used as Primero’s basis for calculating taxes owed by Primero on the silver sold under the Old Stream Agreement. Primero believed that the function of an APA was to provide tax certainty and as a result made significant investments in Mexico based on that certainty. On October 4, 2012, Primero received the APA Ruling from SAT which confirmed the appropriate price for sales of silver under the Old Stream Agreement. Under Mexican tax law, an APA ruling is generally applicable for up to a five-year period which made this ruling effective retrospectively from 2010 to 2014.
In February 2016, PEM received a legal claim from the SAT seeking retroactively to nullify the APA. The legal claim initiated does not identify any different basis for paying taxes, nor have any tax reassessments been received from SAT. The Company intends to continue Primero’s effort to vigorously defend the validity of its APA. If the SAT were successful in retroactively nullifying the APA, the SAT may seek to audit and reassess Primero in respect of its sales of silver in connection with the Old Stream Agreement for 2010 through 2014. If the SAT is successful in retroactively nullifying the APA and issuing reassessments, it would likely have a material adverse effect on the Company’s results of operations, financial condition and cash flows. PEM would have rights of appeal in connection with any reassessments.
| MANAGEMENT DISCUSSION AND ANALYSIS | 105 | ANNUAL REPORT 2018 |
MANAGEMENT’S DISCUSSION AND ANALYSIS
OF RESULTS OF OPERATIONS AND FINANCIAL CONDITION
In June 2017 and October 2017, as part of the ongoing annual audits of the PEM tax returns, the SAT issued observations letters for the 2010 and 2011 tax years, respectively. Observations letters are issued to a taxpayer in advance of a reassessment being issued and provide an outline of the SAT’s position on matters under audit, and affords the taxpayer an opportunity to respond to such position in advance of the reassessment being issued. In the observations letters issued to PEM, the SAT made explicit its view that PEM should pay taxes based on the market price of silver. As the Company continues to defend the APA in the Mexican legal proceeding, the APA remains valid and the Company will vigorously dispute any reassessment that may be issued in the future on a basis that assesses taxes on PEM’s historical silver revenues that is inconsistent with the APA. The observations letter does not represent a tax reassessment and no liability has been recognized in the financial statements. Based on the Company’s assessments, the Company believes Primero’s filings were appropriate and continues to believe its tax filing position based upon the APA is correct. Should the Company ultimately be required to pay tax on its silver revenues based on market prices without any mitigating adjustments, the incremental income tax for the years 2010-2018 would be approximately $185 million, before interest or penalties.
While the Company continues to vigorously defend the validity of the APA and its transfer pricing position, it is also engaging in dialogue with the SAT seeking to resolve matters and bring tax certainty through a negotiated solution. Since January 1, 2015, PEM has recorded its revenue from the sale of silver for purposes of Mexican tax accounting in a manner consistent with the APA, on the basis that the applicable facts and laws have not changed. The Company’s legal and financial advisors continue to believe that the Company has filed its tax returns compliant with applicable Mexican law. Due to the uncertainty in timing of resolution to this matter, which may take more than one year, the Company has classified its income taxes receivable of $18.7 million as non-current as at December 31, 2018.
To the extent the SAT determines that the appropriate price of silver sales under the Silver Purchase Agreement is significantly different from the realized price and while PEM would have rights of appeal in connection with any reassessments, it is likely to have a material adverse effect on the Company’s business, financial position and results of operations.
Primero Class Action Suit
In July 2016, Primero and certain of its officers were served with a class action lawsuit that was filed in federal court in the State of California seeking to recover damages for investors in the Company’s common shares under the U.S. federal securities laws. Primero filed a motion to dismiss this action which was granted on January 30, 2017. The plaintiff’s claims were dismissed without prejudice and the plaintiffs filed an amended complaint on February 27, 2017. On July 14, 2017 the Company’s motion to dismiss the amended complaint was granted and the plaintiffs’ claims were dismissed without prejudice. Rather than amend the complaint again, the plaintiffs asked the federal court to enter final judgment and initiated an appeal of the dismissal to the Ninth Circuit Court of Appeals on September 8, 2017. The parties have filed their briefs in this appeal and a ruling on the appeal is expected sometime in the first half of 2019. The Company continues to vigorously defend this class action lawsuit on behalf of Primero and no liability has been recognized in the financial statements.
OTHER FINANCIAL INFORMATION
Share Repurchase Program
The Company has an ongoing share repurchase program to repurchase up to 5% of the Company’s issued and outstanding shares. The normal course issuer bids will be carried through the facilities of the Toronto Stock Exchange and alternative Canadian marketplaces.
During the year ended December 31, 2018, the Company repurchased and cancelled 230,000 common shares for a total consideration of $1.3 million through a normal course issuer bid in the open market as approved by the Toronto Stock Exchange. No shares were repurchased during the year ended December 31, 2018.
Delisting from the Mexican Stock Exchange
In the first quarter of 2018, the Company filed before the Mexican National Banking and Securities Commission for delisting from the Mexican Stock Exchange (“Bolsa”) due to low trading volumes and high costs associated with regulatory compliance. On February 21, 2018, the Company received authorization and has officially delisted. In connection with the delisting, during the year ended December 31, 2018, the Company has repurchased and cancelled 14,343 of the Company’s shares on Bolsa. The Company was required to offer to repurchase Bolsa shares until August 2018 through a trustee.
Off-Balance Sheet Arrangements
At December 31, 2018, the Company had no material off-balance sheet arrangements such as contingent interest in assets transferred to an entity, derivative instruments obligations or any obligations that generate financing, liquidity, market or credit risk to the Company, other than contingent liabilities and vendor liability and interest, as disclosed in this MD&A and the consolidated financial statements and the related notes.
Related Party Disclosures
Amounts paid to related parties were incurred in the normal course of business and measured at the exchange amount, which is the amount agreed upon by the transacting parties and on terms and conditions similar to non-related parties. There were no transactions with related parties outside of the ordinary course of business during the year ended December 31, 2018.
Outstanding Share Data
As at the date on which this MD&A was approved and authorized for issue by the Board of Directors, the Company has 196,166,046 common shares issued and outstanding.
| FIRST MAJESTIC SILVER CORP. | 106 | MANAGEMENT DISCUSSION AND ANALYSIS |
MANAGEMENT’S DISCUSSION AND ANALYSIS
OF RESULTS OF OPERATIONS AND FINANCIAL CONDITION
ACCOUNTING POLICIES, JUDGMENTS AND ESTIMATES
Critical Accounting Judgments and Estimates
The preparation of consolidated financial statements in conformity with IFRS as issued by IASB requires management to make judgments, estimates and assumptions about future events that affect the reported amounts of assets and liabilities at the date of the financial statements and the reported amounts of revenue and expenses during the reporting period. Although these estimates are based on management’s best knowledge of the amount, events or actions, actual results may differ from these estimates. With the exception of the adoption of IFRS 15 –“Revenue from Contracts with Customers”and IFRS 9 –“Financial Instruments”as outlined in Note 3 of the Company’s consolidated financial statements for the year ended December 31, 2018, there were no changes in critical accounting judgments and estimates that were significantly different from those disclosed in the Company’s annual MD&A as at and for the year ended December 31, 2017.
Future Changes in Accounting Policies Not Yet Effective as at December 31, 2018
Leases
In January 2016, the IASB published a new accounting standard, IFRS 16 – Leases (“IFRS 16”) which supersedes IAS 17 – Leases. IFRS 16 specifies how to recognize, measure, present and disclose leases. The standard provides a single lessee accounting model, requiring the recognition of assets and liabilities for all leases, unless the lease term is 12 months or less or the underlying asset has a low value. The standard is effective for annual periods beginning on or after January 1, 2019, with early adoption permitted if IFRS 15, has also been applied. Upon the adoption of IFRS 16, the Company expects to record a material balance of lease assets and associated lease liabilities related to leases with a term of 12 months or more previously classified as operating leases on the Consolidated Statements of Financial Position at January 1, 2019. Due to the recognition of additional lease assets and liabilities, a higher amount of depreciation expense and interest expense on lease liabilities will be recorded under IFRS 16 compared to the current standard. Additionally, a corresponding reduction in production costs is expected. Lastly, the Company expects a positive impact on operating cash flows with a corresponding increase in financing cash outflows under IFRS 16. The Company is currently reviewing the impact at this time.
NON-GAAP MEASURES
The Company has included certain non-GAAP measures including “Cash costs per ounce”, “Production cost per tonne”, “All-in sustaining costs per ounce”, “Average realized silver price”, “Adjusted earnings per share”, “Cash flow per share” and “Working capital” to supplement its consolidated financial statements, which are presented in accordance with IFRS. The terms IFRS and generally accepted accounting principles (“GAAP”) are used interchangeably throughout this MD&A.
The Company believes that these measures, together with measures determined in accordance with IFRS, provide investors with an improved ability to evaluate the underlying performance of the Company. Non-GAAP measures do not have any standardized meaning prescribed under IFRS, and therefore they may not be comparable to similar measures employed by other companies. The data is intended to provide additional information and should not be considered in isolation or as a substitute for measures of performance prepared in accordance with IFRS.
Cash Cost per Ounce, All-In Sustaining Cost per Ounce and Production Cost per Tonne
Cash costs per ounce and total production cost per tonne are non-GAAP measures used by the Company to manage and evaluate operating performance at each of the Company’s operating mining units, and are widely reported in the mining industry as benchmarks for performance, but do not have a standardized meaning and are disclosed in addition to IFRS measures.
All-in sustaining cost (“AISC”) is a non-GAAP measure and was calculated based on guidance provided by the World Gold Council (“WGC”) in June 2013. WGC is not a regulatory industry organization and does not have the authority to develop accounting standards for disclosure requirements. Other mining companies may calculate AISC differently as a result of differences in underlying accounting principles and policies applied, as well as differences in definitions of sustaining versus expansionary capital expenditures. AISC is a more comprehensive measure than cash cost per ounce for the Company’s consolidated operating performance by providing greater visibility, comparability and representation of the total costs associated with producing silver from its current operations.
The Company defines sustaining capital expenditures as,“costs incurred to sustain and maintain existing assets at current productive capacity and constant planned levels of productive output without resulting in an increase in the life of assets, future earnings, or improvements in recovery or grade. Sustaining capital includes costs required to improve/enhance assets to minimum standards for reliability, environmental or safety requirements. Sustaining capital expenditures excludes all expenditures at the Company’s new projects and certain expenditures at current operations which are deemed expansionary in nature.”
Expansionary capital expenditure is defined as,“costs incurred to extend existing assets beyond their current productive capacity and beyond their planned levels of productive output, resulting in an increase in the life of the assets, increasing their future earnings potential, or improving their recoveries or grades which would serve to increase the value of the assets over their useful lives”.Development and exploration work which moves inferred resources to measured or indicated resources and adds to the Net Present Value of the assets is considered expansionary in nature. Expansionary capital also includes costs required to improve/enhance assets beyond their minimum standard for reliability, environmental or safety requirements.
Consolidated AISC includes total production cash costs incurred at the Company’s mining operations, which forms the basis of the Company’s total cash costs. Additionally, the Company includes sustaining capital expenditures, corporate general and administrative expense, share-based payments and reclamation cost accretion. AISC by mine does not include certain corporate and non-cash items such as general and administrative expense and share-based payments. The Company believes this measure represents the total sustainable costs of producing silver from current operations, and provides additional information of the Company’s operational performance and ability to generate cash flows. As the measure seeks to reflect the full cost of silver production from current operations, new project and expansionary capital at current operations are not included. Certain other cash expenditures, including tax payments, dividends and financing costs are also not included.
| MANAGEMENT DISCUSSION AND ANALYSIS | 107 | ANNUAL REPORT 2018 |
MANAGEMENT’S DISCUSSION AND ANALYSIS
OF RESULTS OF OPERATIONS AND FINANCIAL CONDITION
The following tables provide detailed reconciliations of these measures to cost of sales, as reported in notes to our consolidated financial statements.
| | | THREE MONTHS ENDED DECEMBER 31, 2018 | |
| (expressed in thousands | | | | | | | | | | | | | | | | | | | | | |
| of U.S. dollars, except ounce | | San | | | Santa | | | La | | | La | | | Del | | | San | | | | |
| and per ounce amounts) | | Dimas | | | Elena | | | Encantada | | | Parrilla | | | Toro | | | Martin | | | Consolidated | |
| Mining cost | $ | 10,868 | | $ | 4,613 | | $ | 1,620 | | $ | 2,520 | | $ | 1,851 | | $ | 2,123 | | $ | 23,595 | |
| Milling cost | | 4,065 | | | 5,423 | | | 3,559 | | | 2,492 | | | 1,493 | | | 1,899 | | | 18,930 | |
| Indirect cost | | 4,691 | | | 2,074 | | | 1,690 | | | 1,587 | | | 1,415 | | | 1,551 | | | 13,007 | |
| Total production cost (A) | $ | 19,623 | | $ | 12,110 | | $ | 6,869 | | $ | 6,598 | | $ | 4,759 | | $ | 5,573 | | $ | 55,532 | |
| Add: transportation and other selling cost | | 221 | | | 95 | | | 35 | | | 176 | | | 57 | | | 50 | | | 684 | |
| Add: smelting and refining cost | | 308 | | | 131 | | | 89 | | | 556 | | | 188 | | | 107 | | | 1,373 | |
| Add: environmental duty and royalties cost | | 140 | | | 93 | | | 14 | | | 27 | | | 11 | | | 38 | | | 324 | |
| Total cash cost beforeby-product credits (B) | $ | 20,292 | | $ | 12,429 | | $ | 7,007 | | $ | 7,357 | | $ | 5,015 | | $ | 5,768 | | $ | 57,913 | |
| Deduct by-product credits attributed to: | | | | | | | | | | | | | | | | | | | | | |
| Gold by-product credits(1) | | (19,494 | ) | | (13,032 | ) | | (19 | ) | | (219 | ) | | — | | | (1,567 | ) | | (34,274 | ) |
| Lead by-product credits | | — | | | — | | | — | | | (1,601 | ) | | (1,075 | ) | | — | | | (2,676 | ) |
| Zinc by-product credits | | — | | | — | | | — | | | (1,414 | ) | | — | | | — | | | (1,414 | ) |
| Total by-product credits | $ | (19,494 | ) | $ | (13,032 | ) | $ | (19 | ) | $ | (3,234 | ) | $ | (1,075 | ) | $ | (1,567 | ) | $ | (38,364 | ) |
| Total cash cost (C) | $ | 798 | | $ | (603 | ) | $ | 6,988 | | $ | 4,123 | | $ | 3,940 | | $ | 4,201 | | $ | 19,549 | |
| Workers’ participation | | 941 | | | 64 | | | 324 | | | 75 | | | 67 | | | 62 | | | 1,532 | |
| General and administrative expenses | | — | | | — | | | — | | | — | | | — | | | — | | | 5,593 | |
| Share-based payments | | — | | | — | | | — | | | — | | | — | | | — | | | 943 | |
| Accretion of decommissioning liabilities | | 90 | | | 53 | | | 65 | | | 58 | | | 50 | | | 48 | | | 394 | |
| Sustaining capital expenditures | | 5,482 | | | 1,724 | | | 1,004 | | | 2,072 | | | 1,325 | | | 1,183 | | | 13,376 | |
| All-In Sustaining Costs (D) | $ | 7,311 | | $ | 1,238 | | $ | 8,381 | | $ | 6,328 | | $ | 5,382 | | $ | 5,494 | | $ | 41,387 | |
| Payable silver ounces produced (E) | | 1,365,661 | | | 567,186 | | | 447,833 | | | 298,821 | | | 142,248 | | | 404,119 | | | 3,225,868 | |
| Tonnes milled (F) | | 172,641 | | | 221,945 | | | 206,812 | | | 125,751 | | | 56,200 | | | 66,924 | | | 850,272 | |
| | | | | | | | | | | | | | | | | | | | | | |
| Total cash cost per ounce,before by-product credits (B/E) | $ | 14.86 | | $ | 21.91 | | $ | 15.64 | | $ | 24.62 | | $ | 35.25 | | $ | 14.27 | | $ | 17.95 | |
| Total cash cost per ounce (C/E) | $ | 0.58 | | $ | (1.06 | ) | $ | 15.60 | | $ | 13.80 | | $ | 27.69 | | $ | 10.40 | | $ | 6.06 | |
| All-in sustaining cost per ounce (D/E) | $ | 5.35 | | $ | 2.18 | | $ | 18.70 | | $ | 21.18 | | $ | 37.83 | | $ | 13.60 | | $ | 12.83 | |
| Production cost per tonne (A/F) | $ | 113.66 | | $ | 54.55 | | $ | 33.20 | | $ | 52.47 | | $ | 84.67 | | $ | 83.27 | | $ | 65.31 | |
(1) Gold by-product credits include gold inventory loss due to Republic’s Chapter 11 bankruptcy of $3.2 million at the San Dimas mine and $1.7 million at the Santa Elena mine.
| FIRST MAJESTIC SILVER CORP. | 108 | MANAGEMENT DISCUSSION AND ANALYSIS |
MANAGEMENT’S DISCUSSION AND ANALYSIS
OF RESULTS OF OPERATIONS AND FINANCIAL CONDITION
| | | THREE MONTHS ENDED DECEMBER 31, 2017 | |
| (expressed in thousands | | | | | | | | | | | | | | | | | | | | | |
| of U.S. dollars, except ounce | | Santa | | | La | | | San | | | La | | | Del | | | La | | | | |
| and per ounce amounts) | | Elena | | | Encantada | | | Martin | | | Parrilla | | | Toro | | | Guitarra | | | Consolidated | |
| Mining cost | $ | 4,339 | | $ | 1,337 | | $ | 1,903 | | $ | 2,709 | | $ | 1,362 | | $ | 1,203 | | $ | 12,853 | |
| Milling cost | | 4,626 | | | 3,981 | | | 1,947 | | | 2,276 | | | 1,390 | | | 770 | | | 14,990 | |
| Indirect cost | | 1,999 | | | 1,923 | | | 1,453 | | | 1,645 | | | 1,379 | | | 1,195 | | | 9,594 | |
| Total production cost (A) | $ | 10,965 | | $ | 7,241 | | $ | 5,302 | | $ | 6,630 | | $ | 4,131 | | $ | 3,168 | | $ | 37,437 | |
| Add: transportation and other selling cost | | 125 | | | 37 | | | 112 | | | 199 | | | 141 | | | 142 | | | 800 | |
| Add: smelting and refining cost | | 132 | | | 104 | | | 105 | | | 944 | | | 898 | | | 261 | | | 2,444 | |
| Add: environmental duty and royalties cost | | 140 | | | 18 | | | 60 | | | 38 | | | 17 | | | 22 | | | 295 | |
| Total cash cost beforeby-product credits (B) | $ | 11,362 | | $ | 7,400 | | $ | 5,579 | | $ | 7,811 | | $ | 5,187 | | $ | 3,593 | | $ | 40,976 | |
| Deduct by-product credits attributed to: | | | | | | | | | | | | | | | | | | | | | |
| Gold by-product credits | | (15,393 | ) | | (22 | ) | | (1,698 | ) | | (260 | ) | | — | | | (1,819 | ) | | (19,192 | ) |
| Lead by-product credits | | — | | | — | | | — | | | (1,748 | ) | | (2,980 | ) | | — | | | (4,728 | ) |
| Zinc by-product credits | | — | | | — | | | — | | | (1,542 | ) | | — | | | — | | | (1,542 | ) |
| Total by-product credits | $ | (15,393 | ) | $ | (22 | ) | $ | (1,698 | ) | $ | (3,550 | ) | $ | (2,980 | ) | $ | (1,819 | ) | $ | (25,462 | ) |
| Total cash cost (C) | $ | (4,031 | ) | $ | 7,378 | | $ | 3,881 | | $ | 4,261 | | $ | 2,207 | | $ | 1,774 | | $ | 15,514 | |
| Workers’ participation | | 78 | | | 110 | | | 185 | | | 122 | | | 217 | | | 60 | | | 772 | |
| General and administrative expenses | | — | | | — | | | — | | | — | | | — | | | — | | | 3,683 | |
| Share-based payments | | — | | | — | | | — | | | — | | | — | | | — | | | 1,850 | |
| Accretion of decommissioning liabilities | | 43 | | | 58 | | | 29 | | | 41 | | | 39 | | | 20 | | | 230 | |
| Sustaining capital expenditures | | 2,744 | | | 1,757 | | | 906 | | | 1,383 | | | 2,021 | | | 961 | | | 10,386 | |
| All-In Sustaining Costs (D) | $ | (1,166 | ) | $ | 9,303 | | $ | 5,001 | | $ | 5,807 | | $ | 4,484 | | $ | 2,815 | | $ | 32,435 | |
| Payable silver ounces produced (E) | | 582,206 | | | 484,568 | | | 514,163 | | | 380,084 | | | 175,881 | | | 158,363 | | | 2,295,265 | |
| Tonnes milled (F) | | 232,575 | | | 198,845 | | | 72,503 | | | 138,124 | | | 56,753 | | | 37,885 | | | 736,684 | |
| | | | | | | | | | | | | | | | | | | | | | |
| Total cash cost per ounce, before by-product credits (B/E) | $ | 19.51 | | $ | 15.27 | | $ | 10.86 | | $ | 20.55 | | $ | 29.47 | | $ | 22.69 | | $ | 17.85 | |
| Total cash cost per ounce (C/E) | $ | (6.93 | ) | $ | 15.23 | | $ | 7.55 | | $ | 11.21 | | $ | 12.54 | | $ | 11.21 | | $ | 6.76 | |
| All-in sustaining cost per ounce (D/E) | $ | (2.01 | ) | $ | 19.20 | | $ | 9.73 | | $ | 15.28 | | $ | 25.48 | | $ | 17.77 | | $ | 14.13 | |
| Production cost per tonne (A/F) | $ | 47.13 | | $ | 36.42 | | $ | 73.14 | | $ | 48.00 | | $ | 72.77 | | $ | 83.61 | | $ | 50.81 | |
| MANAGEMENT DISCUSSION AND ANALYSIS | 109 | ANNUAL REPORT 2018 |
MANAGEMENT’S DISCUSSION AND ANALYSIS
OF RESULTS OF OPERATIONS AND FINANCIAL CONDITION
| | | YEAR ENDED DECEMBER 31, 2018 | |
| (expressed in thousands | | | | | | | | | | | | | | | | | | | | | | | | |
| of U.S. dollars, except ounce | | San | | | Santa | | | La | | | San | | | La | | | Del | | | La | | | | |
| and per ounce amounts) | | Dimas | | | Elena | | | Encantada | | | Martin | | | Parrilla | | | Toro | | | Guitarra | | | Consolidated | |
| Mining cost | $ | 28,145 | | $ | 18,192 | | $ | 5,948 | | $ | 8,514 | | $ | 9,987 | | $ | 7,027 | | $ | 2,430 | | $ | 80,244 | |
| Milling cost | | 10,509 | | | 24,007 | | | 16,184 | | | 7,645 | | | 9,295 | | | 6,092 | | | 1,621 | | | 75,354 | |
| Indirect cost | | 12,474 | | | 9,078 | | | 7,467 | | | 5,948 | | | 6,223 | | | 5,637 | | | 2,537 | | | 49,364 | |
| Total production cost (A) | $ | 51,128 | | $ | 51,277 | | $ | 29,598 | | $ | 22,107 | | $ | 25,505 | | $ | 18,757 | | $ | 6,589 | | $ | 204,961 | |
| Add: transportation and other selling cost | | 528 | | | 525 | | | 167 | | | 353 | | | 802 | | | 456 | | | 368 | | | 3,399 | |
| Add: smelting and refining cost | | 773 | | | 506 | | | 336 | | | 396 | | | 2,903 | | | 1,942 | | | 636 | | | 7,492 | |
| Add: environmental duty and royalties cost | | 405 | | | 429 | | | 53 | | | 173 | | | 112 | | | 63 | | | 54 | | | 1,289 | |
| Total cash cost beforeby-product credits (B) | $ | 52,834 | | $ | 52,737 | | $ | 30,154 | | $ | 23,029 | | $ | 29,322 | | $ | 21,218 | | $ | 7,647 | | $ | 217,141 | |
| Deduct by-product credits attributed to: | | | | | | | | | | | | | | | | | | | | | | | | |
| Gold by-product credits(1) | | (52,418 | ) | | (51,617 | ) | | (130 | ) | | (6,599 | ) | | (930 | ) | | — | | | (4,307 | ) | | (116,001 | ) |
| Lead by-product credits | | — | | | — | | | — | | | — | | | (5,883 | ) | | (8,485 | ) | | — | | | (14,368 | ) |
| Zinc by-product credits | | — | | | — | | | — | | | — | | | (6,210 | ) | | — | | | — | | | (6,210 | ) |
| Total by-product credits | $ | (52,418 | ) | $ | (51,617 | ) | $ | (130 | ) | $ | (6,599 | ) | $ | (13,023 | ) | $ | (8,485 | ) | $ | (4,307 | ) | $ | (136,579 | ) |
| Total cash cost (C) | $ | 416 | | $ | 1,120 | | $ | 30,024 | | $ | 16,430 | | $ | 16,299 | | $ | 12,733 | | $ | 3,340 | | $ | 80,562 | |
| Workers’ participation | $ | 3,984 | | $ | 346 | | $ | 568 | | $ | 313 | | $ | 298 | | $ | 291 | | $ | (24 | ) | $ | 5,775 | |
| General and administrative expenses | | — | | | — | | | — | | | — | | | — | | | — | | | — | | | 20,573 | |
| Share-based payments | | — | | | — | | | — | | | — | | | — | | | — | | | — | | | 7,375 | |
| Accretion of decommissioning liabilities | | 225 | | | 221 | | | 270 | | | 203 | | | 242 | | | 208 | | | 125 | | | 1,494 | |
| Sustaining capital expenditures | | 16,793 | | | 8,387 | | | 7,183 | | | 4,467 | | | 8,020 | | | 7,239 | | | 2,060 | | | 56,731 | |
| All-In Sustaining Costs (D) | $ | 21,418 | | $ | 10,074 | | $ | 38,045 | | $ | 21,413 | | $ | 24,859 | | $ | 20,471 | | $ | 5,501 | | $ | 172,510 | |
| Payable silver ounces produced (E) | | 3,618,248 | | | 2,221,023 | | | 1,597,325 | | | 1,744,393 | | | 1,270,327 | | | 744,744 | | | 340,973 | | | 11,537,034 | |
| Tonnes milled (F) | | 435,289 | | | 899,370 | | | 916,894 | | | 284,656 | | | 491,637 | | | 267,170 | | | 80,435 | | | 3,375,452 | |
| | | | | | | | | | | | | | | | | | | | | | | | | |
| Total cash cost per ounce,before by-product credits(B/E) | $ | 14.60 | | $ | 23.74 | | $ | 18.88 | | $ | 13.20 | | $ | 23.08 | | $ | 28.49 | | $ | 22.42 | | $ | 18.82 | |
| Total cash cost per ounce(C/E) | $ | 0.11 | | $ | 0.50 | | $ | 18.80 | | $ | 9.42 | | $ | 12.83 | | $ | 17.10 | | $ | 9.79 | | $ | 6.98 | |
| All-in sustaining cost perounce (D/E) | $ | 5.92 | | $ | 4.54 | | $ | 23.82 | | $ | 12.28 | | $ | 19.57 | | $ | 27.49 | | $ | 16.13 | | $ | 14.95 | |
| Production cost per tonne(A/F) | $ | 117.46 | | $ | 57.01 | | $ | 32.28 | | $ | 77.66 | | $ | 51.88 | | $ | 70.20 | | $ | 81.91 | | $ | 60.71 | |
(1) Gold by-product credits include gold inventory loss due to Republic’s Chapter 11 bankruptcy of $3.2 million at the San Dimas mine and $1.7 million at the Santa Elena mine.
| FIRST MAJESTIC SILVER CORP. | 110 | MANAGEMENT DISCUSSION AND ANALYSIS |
MANAGEMENT’S DISCUSSION AND ANALYSIS
OF RESULTS OF OPERATIONS AND FINANCIAL CONDITION
| | | YEAR ENDED DECEMBER 31, 2017 | |
| (expressed in thousands | | | | | | | | | | | | | | | | | | | | | |
| of U.S. dollars, except ounce | | Santa | | | La | | | San | | | La | | | Del | | | La | | | | |
| and per ounce amounts) | | Elena | | | Encantada | | | Martin | | | Parrilla | | | Toro | | | Guitarra | | | Consolidated | |
| Mining cost | $ | 17,862 | | $ | 5,095 | | $ | 6,995 | | $ | 10,047 | | $ | 6,283 | | $ | 4,434 | | $ | 50,715 | |
| Milling cost | | 23,460 | | | 15,227 | | | 7,208 | | | 8,813 | | | 5,685 | | | 2,711 | | | 63,105 | |
| Indirect cost | | 7,410 | | | 6,718 | | | 5,323 | | | 6,484 | | | 5,265 | | | 4,405 | | | 35,605 | |
| Total production cost (A) | $ | 48,730 | | $ | 27,039 | | $ | 19,526 | | $ | 25,345 | | $ | 17,233 | | $ | 11,551 | | $ | 149,424 | |
| Add: transportation and other selling cost | | 500 | | | 121 | | | 408 | | | 697 | | | 821 | | | 548 | | | 3,267 | |
| Add: smelting and refining cost | | 550 | | | 485 | | | 383 | | | 3,927 | | | 5,122 | | | 951 | | | 11,418 | |
| Add: environmental duty and royalties cost | | 486 | | | 77 | | | 201 | | | 155 | | | 94 | | | 83 | | | 1,096 | |
| Total cash cost beforeby-product credits (B) | $ | 50,266 | | $ | 27,722 | | $ | 20,518 | | $ | 30,124 | | $ | 23,270 | | $ | 13,133 | | $ | 165,205 | |
| Deduct by-product credits attributed to: | | | | | | | | | | | | | | | | | | | | | |
| Gold by-product credits | | (53,784 | ) | | (76 | ) | | (8,333 | ) | | (986 | ) | | — | | | (6,429 | ) | | (69,608 | ) |
| Lead by-product credits | | — | | | — | | | — | | | (6,537 | ) | | (17,412 | ) | | — | | | (23,949 | ) |
| Zinc by-product credits | | — | | | — | | | — | | | (4,317 | ) | | — | | | — | | | (4,317 | ) |
| Total by-product credits | $ | (53,784 | ) | $ | (76 | ) | $ | (8,333 | ) | $ | (11,840 | ) | $ | (17,412 | ) | $ | (6,429 | ) | $ | (97,874 | ) |
| Total cash cost (C) | $ | (3,518 | ) | $ | 27,646 | | $ | 12,185 | | $ | 18,284 | | $ | 5,858 | | $ | 6,704 | | $ | 67,331 | |
| Workers’ participation | $ | 352 | | $ | 524 | | $ | 603 | | $ | 545 | | $ | 236 | | $ | 68 | | $ | 2,328 | |
| General and administrative expenses | | — | | | — | | | — | | | — | | | — | | | — | | | 16,461 | |
| Share-based payments | | — | | | — | | | — | | | — | | | — | | | — | | | 8,295 | |
| Accretion of decommissioning liabilities | | 176 | | | 235 | | | 116 | | | 166 | | | 159 | | | 83 | | | 935 | |
| Sustaining capital expenditures | | 8,045 | | | 5,194 | | | 3,589 | | | 7,698 | | | 6,403 | | | 4,174 | | | 36,778 | |
| All-In Sustaining Costs (D) | $ | 5,055 | | $ | 33,599 | | $ | 16,493 | | $ | 26,693 | | $ | 12,656 | | $ | 11,029 | | $ | 132,128 | |
| Payable silver ounces produced (E) | | 2,279,330 | | | 2,169,319 | | | 1,820,475 | | | 1,645,831 | | | 1,066,543 | | | 581,120 | | | 9,562,618 | |
| Tonnes milled (F) | | 927,737 | | | 825,486 | | | 278,252 | | | 543,985 | | | 278,204 | | | 127,842 | | | 2,981,506 | |
| Total cash cost per ounce, | | | | | | | | | | | | | | | | | | | | | |
| before by-product credits (B/E) | $ | 22.05 | | $ | 12.78 | | $ | 11.27 | | $ | 18.30 | | $ | 21.82 | | $ | 22.60 | | $ | 17.28 | |
| Total cash cost per ounce (C/E) | $ | (1.54 | ) | $ | 12.74 | | $ | 6.69 | | $ | 11.11 | | $ | 5.49 | | $ | 11.53 | | $ | 7.04 | |
| All-in sustaining cost per ounce (D/E) | $ | 2.22 | | $ | 15.49 | | $ | 9.06 | | $ | 16.22 | | $ | 11.87 | | $ | 18.98 | | $ | 13.82 | |
| Production cost per tonne (A/F) | $ | 52.53 | | $ | 32.76 | | $ | 70.18 | | $ | 46.59 | | $ | 61.94 | | $ | 90.35 | | $ | 50.12 | |
| MANAGEMENT DISCUSSION AND ANALYSIS | 111 | ANNUAL REPORT 2018 |
MANAGEMENT’S DISCUSSION AND ANALYSIS
OF RESULTS OF OPERATIONS AND FINANCIAL CONDITION
Average Realized Silver Price per Ounce
Revenues are presented as the net sum of invoiced revenues related to delivered shipments of silver doré bars and concentrates, including associated metal by-products of gold, lead and zinc after having deducted refining and smelting charges, and after elimination of intercompany shipments of silver, silver being minted into coins, ingots and bullion products.
The following is an analysis of the gross revenues prior to refining and smelting charges, and shows deducted smelting and refining charges to arrive at the net reportable revenue for the period per IFRS. Gross revenues are divided into payable equivalent silver ounces sold to calculate the average realized price per ounce of silver equivalents sold.
| | | THREE MONTHS ENDED | | | YEAR ENDED | |
| | | DECEMBER 31, | | | DECEMBER 31, | |
| | | 2018 | | | 2017 | | | 2018 | | | 2017 | |
| Revenues as reported | $ | 74,128 | | $ | 61,165 | | $ | 300,929 | | $ | 252,288 | |
| Add back: smelting and refining charges | | 1,371 | | | 2,444 | | | 7,491 | | | 11,418 | |
| Gross revenues | | 75,499 | | | 63,609 | | | 308,420 | | | 263,706 | |
| Less: Sandstorm gold revenues | | (855 | ) | | (1,171 | ) | | (4,051 | ) | | (3,917 | ) |
| Less: Wheaton gold revenues | | (5,071 | ) | | — | | | (13,176 | ) | | — | |
| Less: Wheaton silver revenues | | — | | | — | | | (1,953 | ) | | — | |
| Gross revenues, excluding Sandstorm, Wheaton (A) | $ | 69,573 | | $ | 62,438 | | $ | 289,240 | | $ | 259,789 | |
| | | | | | | | | | | | | |
| Payable equivalent silver ounces sold | | 5,558,896 | | | 3,958,721 | | | 21,341,692 | | | 15,924,461 | |
| Less: Payable equivalent silver ounces sold to Sandstorm | | (159,122 | ) | | (199,665 | ) | | (723,526 | ) | | (748,115 | ) |
| Less: Payable equivalent silver ounces sold to Wheaton | | (591,677 | ) | | — | | | (1,989,514 | ) | | — | |
| Payable equivalent silver ounces sold, excluding Sandstormand Wheaton (B) | | 4,808,097 | | | 3,759,056 | | | 18,628,652 | | | 15,176,346 | |
| | | | | | | | | | | | | |
| Average realized price per ounce of silver sold (A/B)(1) | $ | 14.47 | | $ | 16.61 | | $ | 15.53 | | $ | 17.12 | |
| Average market price per ounce of silver per COMEX | $ | 14.55 | | $ | 16.66 | | $ | 15.74 | | $ | 17.15 | |
(1) Average realized price per ounce of silver sold in each reporting period is affected by mark-to-market adjustments and final settlements on concentrate shipments in prior periods. Concentrates sold to third-party smelters are provisionally priced and the price is not settled until a predetermined future date, typically one month after delivery to the customer, based on the market price at that time. The mark-to-market adjustments do not apply to doré sales.
Cash Flow per Share
Cash Flow per Share is determined based on operating cash flows before movements in working capital and income taxes, as illustrated in the consolidated statements of cash flow, divided by the weighted average shares outstanding during the period.
| | | THREE MONTHS ENDED | | | YEAR ENDED | |
| | | DECEMBER 31, | | | DECEMBER 31, | |
| | | 2018 | | | 2017 | | | 2018 | | | 2017 | |
| Operating Cash Flows before Working Capital and Taxes | $ | 10,991 | | $ | 18,704 | | $ | 61,561 | | $ | 80,986 | |
| Weighted average number of shares on issue – basic | | 193,669,968 | | | 165,724,767 | | | 183,650,405 | | | 165,293,893 | |
| Cash Flow per Share | $ | 0.06 | | $ | 0.11 | | $ | 0.34 | | $ | 0.49 | |
| FIRST MAJESTIC SILVER CORP. | 112 | MANAGEMENT DISCUSSION AND ANALYSIS |
MANAGEMENT’S DISCUSSION AND ANALYSIS
OF RESULTS OF OPERATIONS AND FINANCIAL CONDITION
Adjusted Earnings per Share (“Adjusted EPS”)
The Company uses the financial measure “Adjusted EPS” to supplement information in its consolidated financial statements. The Company believes that, in addition to conventional measures prepared in accordance with IFRS, the Company and certain investors and analysts use this information to evaluate the Company’s performance. The Company excludes non-cash and unusual items from net earnings to provide a measure which allows the Company and investors to evaluate the operating results of the underlying core operations. The presentation of Adjusted EPS is not meant to be a substitute for EPS presented in accordance with IFRS, but rather should be evaluated in conjunction with such IFRS measure.
The following table provides a detailed reconciliation of net losses as reported in the Company’s consolidated financial statements to adjusted net earnings and Adjusted EPS:
| | | THREE MONTHS ENDED | | | YEAR ENDED | |
| | | DECEMBER 31, | | | DECEMBER 31, | |
| | | 2018 | | | 2017 | | | 2018 | | | 2017 | |
| Net loss as reported | $ | (164,443 | ) | $ | (56,084 | ) | $ | (204,164 | ) | $ | (53,272 | ) |
| Adjustments for non-cash or unusual items: | | | | | | | | | | | | |
| Impairment of non-current assets | | 168,028 | | | 65,500 | | | 199,688 | | | 65,500 | |
| Deferred income tax recovery | | (24,850 | ) | | (17,938 | ) | | (61,031 | ) | | (29,206 | ) |
| Share-based payments | | 943 | | | 1,850 | | | 7,375 | | | 8,295 | |
| Loss from investment in derivatives and marketable securities | | 925 | | | 604 | | | 4,704 | | | 2,600 | |
| Write-down (recovery) of mineral inventory | | 1,316 | | | (87 | ) | | 2,329 | | | (153 | ) |
| Inventory loss due to Republic Chapter 11 bankruptcy | | 7,520 | | | — | | | 7,520 | | | — | |
| Primero acquisition costs | | 16 | | | — | | | 4,893 | | | — | |
| Adjusted net loss | $ | (10,545 | ) | $ | (6,155 | ) | $ | (38,686 | ) | $ | (6,236 | ) |
| Weighted average number of shares on issue – basic | | 193,669,968 | | | 165,724,767 | | | 183,650,405 | | | 165,293,893 | |
| Adjusted EPS | $ | (0.05 | ) | $ | (0.04 | ) | $ | (0.21 | ) | $ | (0.04 | ) |
Working Capital and Available Liquidity
Working capital is determined based on current assets and current liabilities as reported in the Company’s consolidated financial statements. The Company uses working capital as a measure of the Company’s short-term financial health and operating efficiency. Available liquidity includes the Company’s working capital and undrawn revolving credit facility.
| | | DECEMBER 31, | | | DECEMBER 31, | |
| | | 2018 | | | 2017 | |
| Current Assets | $ | 166,274 | | $ | 170,658 | |
| Less: Current Liabilities | | (58,137 | ) | | (54,375 | ) |
| Working Capital | $ | 108,137 | | $ | 116,283 | |
| Available Undrawn Revolving Credit Facility | | 55,031 | | | 8,782 | |
| Available Liquidity | $ | 163,168 | | $ | 125,065 | |
| MANAGEMENT DISCUSSION AND ANALYSIS | 113 | ANNUAL REPORT 2018 |
MANAGEMENT’S DISCUSSION AND ANALYSIS
OF RESULTS OF OPERATIONS AND FINANCIAL CONDITION
ADDITIONAL GAAP MEASURES
The Company uses additional financial measures which should be evaluated in conjunction with IFRS. It is intended to provide additional information and should not be considered in isolation or as a substitute for measures prepared in accordance with IFRS. The following additional GAAP measures are used:
Mine Operating Earnings
Mine operating earnings represents the difference between revenue less mine operating costs. Management believes that mine operating earnings provides useful information to investors because mine operating earnings excludes expenses not directly associated with commercial production.
Operating Cash Flows before Working Capital and Taxes
Operating cash flows before working capital and taxes represents cash flows generated from operations before changes in working capital and income taxes paid. Management believes that this measure allows investors to evaluate the Company’s pre-tax cash flows generated from operations adjusted for fluctuations in non-cash working capital items due to timing issues and the Company’s ability to service its debt.
The terms described above do not have a standardized meaning prescribed by IFRS, therefore the Company’s definitions may not be comparable to similar measures presented by other companies.
MANAGEMENT’S REPORT ON INTERNAL CONTROL OVER FINANCIAL REPORTING
Disclosure Controls and Procedures
The Company’s management, with the participation of its President and Chief Executive Officer (“CEO”) and Chief Financial Officer (“CFO”), has evaluated the effectiveness of the Company’s disclosure controls and procedures. Based upon the results of that evaluation, the Company’s CEO and CFO have concluded that, as of December 31, 2018, the Company’s disclosure controls and procedures were effective to provide reasonable assurance that the information required to be disclosed by the Company in reports it files is recorded, processed, summarized and reported, within the appropriate time periods and is accumulated and communicated to management, including the CEO and CFO, as appropriate to allow timely decisions regarding required disclosure.
Internal Control over Financial Reporting
The Company’s management, with the participation of its CEO and CFO, is responsible for establishing and maintaining adequate internal control over financial reporting as such term is defined in the rules of the United States Securities and Exchange Commission and the Canadian Securities Administrators. The Company’s internal control over financial reporting is a process designed to provide reasonable assurance regarding the reliability of financial reporting and the preparation of financial statements for external purposes in accordance with IFRS as issued by the IASB. The Company’s internal control over financial reporting includes policies and procedures that:
| • | maintain records that accurately and fairly reflect, in reasonable detail, the transactions and dispositions of assets of the Company; |
| | |
| • | provide reasonable assurance that transactions are recorded as necessary for preparation of financial statements in accordance with IFRS as issued by IASB; |
| | |
| • | provide reasonable assurance that the Company’s receipts and expenditures are made only in accordance with authorizations of management and the Company’s Directors; and |
| | |
| • | provide reasonable assurance regarding prevention or timely detection of unauthorized acquisition, use, or disposition of the Company’s assets that could have a material effect on the Company’s consolidated financial statements. |
The Company’s internal control over financial reporting may not prevent or detect all misstatements because of inherent limitations. Additionally, projections of any evaluation of effectiveness for future periods are subject to the risk that controls may become inadequate because of changes in conditions or deterioration in the degree of compliance with the Company’s policies and procedures.
The Company’s management evaluated the effectiveness of our ICFR based upon the criteria set forth in Internal Control – Integrated Framework (2013) issued by the Committee of Sponsoring Organizations of the Treadway Commission. Based on management’s evaluation, our CEO and CFO concluded that our ICFR was effective as of December 31, 2018.
Management excluded from its assessment the internal controls, policies and procedures of Primero, which the Company acquired control on May 10, 2018. Primero’s total assets, net assets and total revenues on a combined basis constitute approximately 39%, 53%, and 34%, respectively, of the consolidated financial statement amounts as of December 31, 2018. This limitation of scope is in accordance with section 3.3(1)(b) of NI 52-109, which allows for an issuer to limit the design of DC&P or ICFR to exclude a business that the issuer acquired not more than 365 days before the end of the financial period to which the CEO’s and CFO’s certification of annual filings relates.
With the exception of the internal controls of Primero, there has been no change in the Company’s internal control over financial reporting during the year ended December 31, 2018 that has materially affected, or is reasonably likely to materially affect, the Company’s internal control over financial reporting.
The Company’s independent registered public accounting firm, Deloitte LLP, have audited these Consolidated Annual Financial Statements and have issued an attestation report dated February 22, 2019 on the Company’s internal control over financial reporting based on the criteria set forth in Internal Control – Integrated Framework (2013) issued by the Committee of Sponsoring Organizations of the Treadway Commission.
| FIRST MAJESTIC SILVER CORP. | 114 | MANAGEMENT DISCUSSION AND ANALYSIS |
Limitations of Controls and Procedures
The Company’s management, including the President and Chief Executive Officer and Chief Financial Officer, believes that any disclosure controls and procedures or internal control over financial reporting, no matter how well conceived and operated, may not prevent or detect all misstatements because of inherent limitations. Further, the design of a control system must reflect the fact that there are resource constraints, and the benefits of controls must be considered relative to their costs. Because of the inherent limitations in all control systems, they cannot provide absolute assurance that all control issues and instances of fraud, if any, within the Company have been prevented or detected. These inherent limitations include the realities that judgments in decision-making can be faulty, and that breakdowns can occur because of simple error or mistake. Additionally, controls can be circumvented by the individual acts of some persons, by collusion of two or more people, or by unauthorized override of the control. The design of any control system also is based in part upon certain assumptions about the likelihood of future events, and there can be no assurance that any design will succeed in achieving its stated goals under all potential future conditions. Accordingly, because of the inherent limitations in a cost effective control system, misstatements due to error or fraud may occur and not be detected.
CAUTIONARY STATEMENTS
Cautionary Note regarding Forward-Looking Statements
Certain information contained herein this MD&A constitutes forward-looking statements under applicable securities laws (collectively, “forward-looking statements”). These statements relate to future events or the Company’s future performance, business prospects or opportunities. Forward-looking statements include, but are not limited to: commercial mining operations; anticipated mineral recoveries; projected quantities of future mineral production; statements with respect to the Company’s business strategy; future planning processes; anticipated development, expansion, exploration activities and production rates; the completion of the acquisition of Primero; the restructuring of the streaming agreement at San Dimas; the estimated cost and timing of plant improvements at the Company’s operating mines and development of the Company’s development projects; the timing of completion of exploration programs and drilling programs; the repayment of the Debentures; statements with respect to the Company’s future financial position including operating efficiencies, cash flow, capital budgets, costs and expenditures; the preparation of technical reports and completion of preliminary economic assessments; the repurchase of the Company’s shares; the cancellation of shares purchased on the BMV; viability of the Company’s projects; potential metal recovery rates; the conversion of the Company’s securities; the debt financing with Scotiabank. All statements other than statements of historical fact may be forward-looking statements. Any statements that express or involve discussions with respect to predictions, expectations, beliefs, plans, projections, objectives, assumptions or future events or performance (often, but not always, using words or phrases such as “seek”, “anticipate”, “plan”, “continue”, “estimate”, “expect”, “may”, “will”, “project”, “predict”, “forecast”, “potential”, “targeting”, “intend”, “could”, “might”, “should”, “believe” and similar expressions) are not statements of historical fact and may be “forward-looking statements”.
Forward-looking statements are based on the opinions and estimates of management at the dates the statements are made, and are subject to a variety of risks and uncertainties and other factors that could cause actual events or results to differ materially from those projected in the forward-looking statements. These factors include, without limitation: the inherent risks involved in the mining, exploration and development of mineral properties, the uncertainties involved in interpreting drilling results and other geological data, fluctuating metal prices, the possibility of project delays or cost overruns or unanticipated excessive operating costs and expenses, uncertainties related to the necessity of financing, the availability of and costs of financing needed in the future, and other factors described in the Company’s Annual Information Form under the heading “Risk Factors”.
The Company believes that the expectations reflected in any such forward-looking statements are reasonable, but no assurance can be given that these expectations will prove to be correct and such forward-looking statements included herein this MD&A should not be unduly relied upon. These statements speak only as of the date of this MD&A. The Company does not intend, and does not assume any obligation, to update these forward-looking statements, except as required by applicable laws. Actual results may differ materially from those expressed or implied by such forward-looking statements.
Cautionary Note regarding Reserves and Resources
Mineral reserves and mineral resources are determined in accordance with National Instrument 43-101 (“NI 43-101”), issued by the Canadian Securities Administrators. This National Instrument lays out the standards of disclosure for mineral projects including rules relating to the determination of mineral reserves and mineral resources. This includes a requirement that a certified Qualified Person (“QP”) (as defined under the NI 43-101) supervises the preparation of the mineral reserves and mineral resources. Ramon Mendoza, P. Eng., Vice President of Technical Services is a certified QP for the Company and has reviewed this MD&A for QP technical disclosures. All NI 43-101 technical reports can be found on the Company’s website at www.firstmajestic.com or on SEDAR atwww.sedar.com.
| MANAGEMENT DISCUSSION AND ANALYSIS | 115 | ANNUAL REPORT 2018 |
MANAGEMENT’S DISCUSSION AND ANALYSIS
OF RESULTS OF OPERATIONS AND FINANCIAL CONDITION
Cautionary Note to United States Investors Concerning Estimates of Mineral Reserves and Resources
This Management’s Discussion and Analysis has been prepared in accordance with the requirements of the securities laws in effect in Canada, which differ in certain material respects from the disclosure requirements of United States securities laws. The terms “mineral reserve”, “proven mineral reserve” and “probable mineral reserve” are Canadian mining terms as defined in accordance with Canadian NI 43-101 Standards of Disclosure for Mineral Projects and the Canadian Institute of Mining, Metallurgy and Petroleum (the “CIM”) – CIM Definition Standards on Mineral Resources and Mineral Reserves, adopted by the CIM Council, as amended. These definitions differ from the definitions in the disclosure requirements promulgated by the Securities and Exchange Commission (the “Commission”) and contained in Industry Guide 7 (“Industry Guide 7”). Under Industry Guide 7 standards, a “final” or “bankable” feasibility study is required to report mineral reserves, the three-year historical average price is used in any mineral reserve or cash flow analysis to designate mineral reserves and the primary environmental analysis or report must be filed with the appropriate governmental authority.
In addition, the terms “mineral resource”, “measured mineral resource”, “indicated mineral resource” and “inferred mineral resource” are defined in and required to be disclosed by NI 43-101. However, these terms are not defined terms under Industry Guide 7 and are not permitted to be used in reports and registration statements of United States companies filed with the Commission. Investors are cautioned not to assume that any part or all of the mineral deposits in these categories will ever be converted into mineral reserves. “Inferred mineral resources” have a great amount of uncertainty as to their existence, and great uncertainty as to their economic and legal feasibility. It cannot be assumed that all or any part of an inferred mineral resource will ever be upgraded to a higher category. Under Canadian rules, estimates of inferred mineral resources may not form the basis of feasibility or pre-feasibility studies, except in rare cases. Investors are cautioned not to assume that all or any part of an inferred mineral resource exists or is economically or legally mineable. Disclosure of “contained ounces” in a mineral resource is permitted disclosure under Canadian regulations. In contrast, the Commission only permits U.S. companies to report mineralization that does not constitute “mineral reserves” by Commission standards as in place tonnage and grade without reference to unit measures.
Accordingly, information contained in this Management’s Discussion and Analysis may not be comparable to similar information made public by U.S. companies subject to the reporting and disclosure requirements under the United States federal securities laws and the rules and regulations of the Commission thereunder.
Additional Information
Additional information on the Company, including the Company’s Annual Information Form and the Company’s audited consolidated financial statements for the year ended December 31, 2018, is available on SEDAR at www.sedar.com and on the Company’s website at www.firstmajestic.com.
| FIRST MAJESTIC SILVER CORP. | 116 | MANAGEMENT DISCUSSION AND ANALYSIS |