MANAGEMENT’S DISCUSSION AND ANALYSIS
FOR THE QUARTER ENDED MARCH 31, 2019
|
| | |
| |
925 West Georgia Street, Suite 1800, Vancouver, B.C., Canada V6C 3L2 Phone: 604.688.3033 | Fax: 604.639.8873| Toll Free: 1.866.529.2807 | Email: info@firstmajestic.com www.firstmajestic.com |
|
| | |
| |
| | |
| |
| | |
| OVERVIEW OF OPERATING RESULTS | |
| | | |
| | | |
| | | |
| | | |
| | | |
| | | |
| | | |
| | | |
| | | |
| | | |
| OVERVIEW OF FINANCIAL PERFORMANCE | |
| | | |
| | | |
| | |
| OTHER DISCLOSURES | |
| | | |
| | | |
| | | |
| | | |
| | | |
| | | |
| | | |
| | | |
|
| | |
| |
| First Majestic Silver Corp. 2019 First Quarter Report | Page 2 |
MANAGEMENT’S DISCUSSION AND ANALYSIS OF RESULTS OF OPERATIONS AND FINANCIAL CONDITION
This Management’s Discussion and Analysis of Results of Operations and Financial Condition (“MD&A”) should be read in conjunction with the unaudited condensed interim consolidated financial statements of First Majestic Silver Corp. (“First Majestic” or “the Company”) for the three months ended March 31, 2019, and the audited consolidated financial statements for the year ended December 31, 2018, which are prepared in accordance with International Financial Reporting Standards as issued by the International Accounting Standards Board (“IFRS”). All dollar amounts are expressed in United States (“US”) dollars and tabular amounts are expressed in thousands of US dollars, unless otherwise indicated. Certain amounts shown in this MD&A may not add exactly to total amounts due to rounding differences.
This MD&A contains “forward-looking statements” that are subject to risk factors set out in a cautionary note contained at the end of this MD&A. All information contained in this MD&A is current and has been approved by the Board of Directors of the Company as of May 8, 2019 unless otherwise stated.
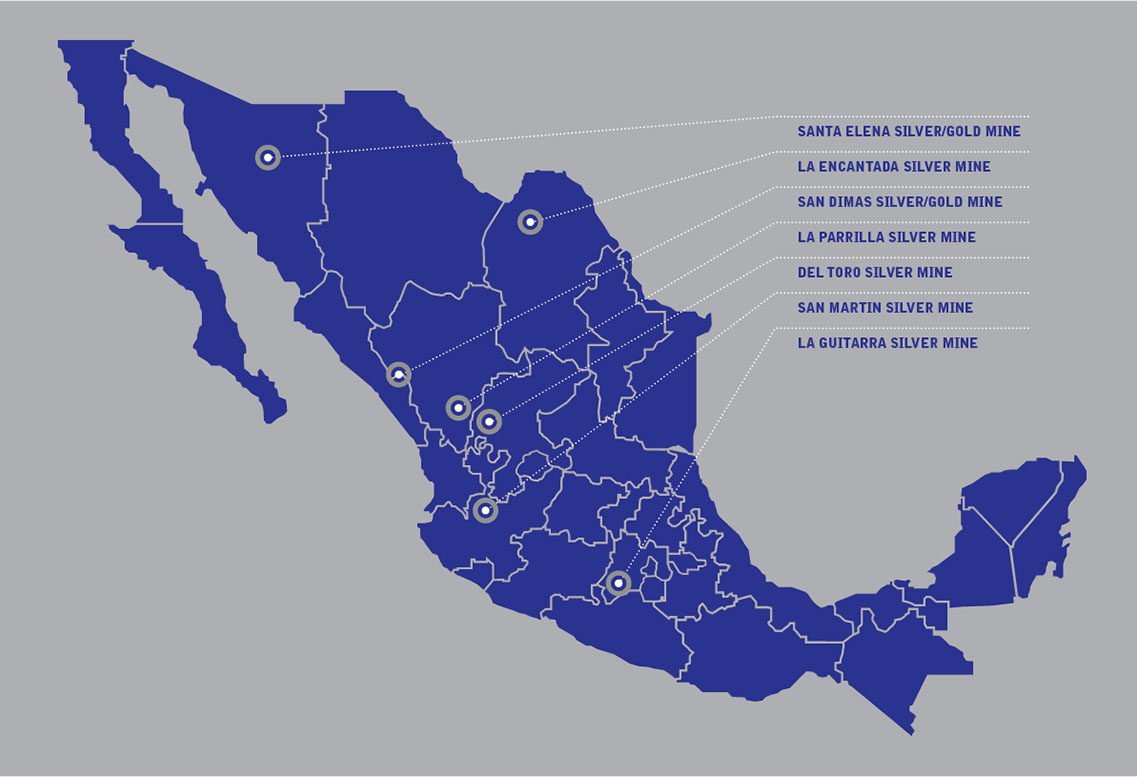
First Majestic is a multinational mining company headquartered in Vancouver, Canada, focused on primary silver production in México, pursuing the development of its existing mineral properties and acquiring new assets. The Company owns and operates six producing mines: the San Dimas Silver/Gold Mine, the Santa Elena Silver/Gold Mine, La Encantada Silver Mine, San Martin Silver Mine, La Parrilla Silver Mine, and the Del Toro Silver Mine.
First Majestic is publicly listed on the New York Stock Exchange under the symbol “AG”, on the Toronto Stock Exchange under the symbol “FR” and on the Frankfurt Stock Exchange under the symbol “FMV”.
|
| | |
| |
| First Majestic Silver Corp. 2019 First Quarter Report | Page 3 |
|
| |
| 2019 FIRST QUARTER HIGHLIGHTS |
|
| | | | | | | | | | | | | | | | |
| Key Performance Metrics | | 2019-Q1 | | 2018-Q4 | Change
Q1 vs Q4 | | 2018-Q1 | Change
Q1 vs Q1 |
| Operational | | | | | | | | |
| Ore Processed / Tonnes Milled | | 812,654 |
| | 850,272 |
| (4 | %) | | 809,775 |
| 0 | % |
| Silver Ounces Produced | | 3,331,388 |
| | 3,250,816 |
| 2 | % | | 2,167,030 |
| 54 | % |
| Silver Equivalent Ounces Produced | | 6,273,677 |
| | 6,485,761 |
| (3 | %) | | 3,879,678 |
| 62 | % |
Cash Costs per Ounce (1) | |
| $6.34 |
| |
| $6.06 |
| 5 | % | |
| $7.83 |
| (19 | %) |
All-in Sustaining Cost per Ounce (1) | |
| $12.91 |
| |
| $12.83 |
| 1 | % | |
| $16.01 |
| (19 | %) |
Total Production Cost per Tonne (1) | |
| $66.65 |
| |
| $65.31 |
| 2 | % | |
| $46.88 |
| 42 | % |
Average Realized Silver Price per Ounce (1) | |
| $15.73 |
| |
| $14.47 |
| 9 | % | |
| $16.76 |
| (6 | %) |
| | | | | | | | | |
| Financial (in $millions) | | | | | | | | |
| Revenues | |
| $86.8 |
| |
| $74.1 |
| 17 | % | |
| $58.6 |
| 48 | % |
| Mine Operating Earnings (Loss) | |
| $10.3 |
| |
| ($9.0 | ) | 214 | % | |
| ($0.4 | ) | 2,524 | % |
| Net Earnings (Loss) | |
| $2.9 |
| |
| ($164.4 | ) | 102 | % | |
| ($5.6 | ) | 152 | % |
Operating Cash Flows before Working Capital and Taxes | |
| $23.7 |
| |
| $11.0 |
| 115 | % | |
| $15.6 |
| 52 | % |
| Cash and Cash Equivalents | |
| $91.5 |
| |
| $57.0 |
| 61 | % | |
| $249.2 |
| (63 | %) |
Working Capital (1) | |
| $130.9 |
| |
| $108.1 |
| 21 | % | |
| $235.6 |
| (44 | %) |
| | | | | | | | | |
| Shareholders | | | | | | | | |
| Earnings (Loss) per Share ("EPS") - Basic | |
| $0.01 |
| |
| ($0.85 | ) | 102 | % | |
| ($0.03 | ) | 144 | % |
Adjusted EPS (1) | |
| ($0.01 | ) | |
| ($0.05 | ) | 70 | % | |
| ($0.06 | ) | 75 | % |
Cash Flow per Share (1) | |
| $0.12 |
| |
| $0.06 |
| 113 | % | |
| $0.09 |
| 28 | % |
| |
| (1) | The Company reports non-GAAP measures which include cash costs per ounce produced, all-in sustaining cost per ounce, total production cost per tonne, average realized silver price per ounce sold, working capital, adjusted EPS and cash flow per share. These measures are widely used in the mining industry as a benchmark for performance, but do not have a standardized meaning and may differ from methods used by other companies with similar descriptions. See “Non-GAAP Measures” on pages 25 to 30 for a reconciliation of non-GAAP to GAAP measures. |
|
| | | | | | | | | | | | | | | | | | | | | |
First Quarter
Production Summary | San Dimas | Santa Elena | La Encantada | San Martin | La Parrilla | Del Toro | Consolidated |
| Ore Processed / Tonnes Milled | 163,264 |
| 219,941 |
| 269,611 |
| 62,148 |
| 72,551 |
| 25,138 |
| 812,654 |
|
| Silver Ounces Produced | 1,404,454 |
| 587,195 |
| 720,959 |
| 331,539 |
| 219,485 |
| 67,757 |
| 3,331,388 |
|
| Silver Equivalent Ounces Produced | 3,172,270 |
| 1,403,364 |
| 723,699 |
| 421,091 |
| 441,095 |
| 112,158 |
| 6,273,677 |
|
| Cash Costs per Ounce |
| $0.93 |
|
| $2.81 |
|
| $12.60 |
|
| $11.35 |
|
| $16.58 |
|
| $27.20 |
|
| $6.34 |
|
| All-in Sustaining Cost per Ounce |
| $5.65 |
|
| $6.37 |
|
| $13.72 |
|
| $15.67 |
|
| $25.62 |
|
| $35.89 |
|
| $12.91 |
|
| Total Production Cost per Tonne |
| $122.17 |
|
| $56.53 |
|
| $32.71 |
|
| $80.39 |
|
| $76.78 |
|
| $95.06 |
|
| $66.65 |
|
Operational Highlights
| |
| • | Total production in the first quarter reached 6,273,677 silver equivalents ounces, consisting of 3.3 million ounces of silver, 32,037 ounces of gold, 2.7 million pounds lead and 1.3 million pounds of zinc. Total production decreased slightly by 3% due to lower throughput and production at the Del Toro and La Parrilla mines, partially offset by an increase in production from the La Encantada mine. Pure silver production increased 2% as a result of higher grades at the San Dimas and La Encantada mines. |
| |
| • | Total ore processed during the quarter at the Company's mines amounted to 812,654 tonnes, representing a 4% decrease compared to the previous quarter. The slight decrease in tonnes processed compared to the prior quarter was primarily due to the Company's decision to reduce throughput at its two concentrate plants, La Parrilla and Del Toro, offset by a 30% increase in tonnes milled at La Encantada. |
|
| | |
| |
| First Majestic Silver Corp. 2019 First Quarter Report | Page 4 |
| |
| • | Cash cost per ounce in the quarter was $6.34, an increase of 5% or $0.28 per ounce compared to the previous quarter. The increase in cash cost per ounce was primarily attributed to a decrease in by-product credits which was partially offset by lower mining contractor costs corresponding to planned reduction in throughputs at La Parrilla and Del Toro. |
| |
| • | All-in sustaining cost per ounce (“AISC”) in the first quarter was $12.91, comparable to $12.83 per ounce in the previous quarter. |
Financial
| |
| • | In the first quarter the Company generated revenues of $86.8 million, an increase of 48% compared to $58.6 million in the first quarter of 2018 primarily due to the acquisition of the San Dimas mine in the second quarter of 2018, which resulted in a 60% increase in silver equivalent ounces sold, partially offset by a 6% decrease in average realized silver price compared to the same quarter of the prior year. |
| |
| • | The Company recognized mine operating earnings of $10.3 million compared to a mine operating loss of $0.4 million in the first quarter of 2018. The increase in mine operating earnings in the quarter was attributed to the San Dimas and Santa Elena mines, which generated mine operating earnings of $11.2 million and $5.1 million, respectively, offset by small losses at other units due to scaled back production at Del Toro and La Parrilla mines. |
| |
| • | Net earnings for the quarter was $2.9 million (EPS of $0.01) compared to a net loss of $5.6 million (EPS of $(0.03)) in the first quarter of 2018. Adjusted net loss for the quarter was $2.9 million (adjusted loss per share of $(0.01)), after excluding non-cash and non-recurring items including deferred income tax recovery, share-based payments, gain from marketable securities and loss from silver futures derivatives (see "Adjusted EPS" on page 29). |
| |
| • | Cash flow from operations before movements in working capital and income taxes in the quarter was $23.7 million ($0.12 per share) compared to $15.6 million ($0.09 per share) in the first quarter of 2018. |
| |
| • | Cash and cash equivalents at March 31, 2019 was $91.5 million, an increase of $34.5 million compared to the previous quarter, while working capital increased to $130.9 million. The increase was primarily attributed to the sale of 5,250,000 common shares of the Company for net proceeds of $32.5 million through “at-the-market distributions” directly on the New York Stock Exchange as announced in December 2018. |
|
| | |
| |
| First Majestic Silver Corp. 2019 First Quarter Report | Page 5 |
|
| |
| OVERVIEW OF OPERATING RESULTS |
Selected Production Results for the Past Eight Quarters |
| | | | | | | | | | | | | | | | | | | | | | | | | | |
| | | 2019 | 2018 | | 2017 |
| PRODUCTION HIGHLIGHTS | | Q1 | Q4 | Q3(2) | Q2(1) | Q1 | | Q4 | Q3 | Q2 |
| Ore processed/tonnes milled | | | | | | | | | | |
| San Dimas | | 163,264 |
| 172,641 |
| 176,884 |
| 85,765 |
| — |
| | — |
| — |
| — |
|
| Santa Elena | | 219,941 |
| 221,945 |
| 225,873 |
| 228,054 |
| 223,498 |
| | 232,575 |
| 232,662 |
| 232,451 |
|
| La Encantada | | 269,611 |
| 206,812 |
| 196,030 |
| 237,862 |
| 276,191 |
| | 198,845 |
| 212,092 |
| 148,039 |
|
| San Martin | | 62,148 |
| 66,924 |
| 67,926 |
| 74,431 |
| 75,374 |
| | 72,503 |
| 69,113 |
| 67,073 |
|
| La Parrilla | | 72,551 |
| 125,751 |
| 117,130 |
| 123,642 |
| 125,114 |
| | 138,124 |
| 132,389 |
| 132,880 |
|
| Del Toro | | 25,138 |
| 56,200 |
| 65,323 |
| 65,879 |
| 79,769 |
| | 56,753 |
| 60,501 |
| 81,843 |
|
| La Guitarra | | — |
| — |
| 14,891 |
| 35,715 |
| 29,829 |
| | 37,885 |
| 23,896 |
| 29,547 |
|
| Consolidated | | 812,654 |
| 850,272 |
| 864,056 |
| 851,349 |
| 809,775 |
| | 736,684 |
| 730,652 |
| 691,833 |
|
| Silver equivalent ounces produced | | | | | | | | | | |
| San Dimas | | 3,172,270 |
| 3,127,871 |
| 3,225,352 |
| 1,698,382 |
| — |
| | — |
| — |
| — |
|
| Santa Elena | | 1,403,364 |
| 1,587,396 |
| 1,475,635 |
| 1,407,880 |
| 1,543,776 |
| | 1,653,941 |
| 1,503,376 |
| 1,399,940 |
|
| La Encantada | | 723,699 |
| 451,244 |
| 379,773 |
| 327,458 |
| 452,420 |
| | 489,071 |
| 610,307 |
| 375,563 |
|
| San Martin | | 421,091 |
| 511,911 |
| 557,746 |
| 524,843 |
| 574,838 |
| | 617,879 |
| 604,686 |
| 577,598 |
|
| La Parrilla | | 441,095 |
| 563,703 |
| 537,986 |
| 605,826 |
| 615,541 |
| | 643,799 |
| 612,116 |
| 593,852 |
|
| Del Toro | | 112,158 |
| 243,637 |
| 427,218 |
| 323,714 |
| 437,743 |
| | 369,992 |
| 472,804 |
| 712,714 |
|
| La Guitarra | | — |
| — |
| 136,605 |
| 249,214 |
| 255,359 |
| | 290,654 |
| 182,986 |
| 229,276 |
|
| Consolidated | | 6,273,677 |
| 6,485,761 |
| 6,740,315 |
| 5,137,318 |
| 3,879,678 |
| | 4,065,336 |
| 3,986,274 |
| 3,888,944 |
|
| Silver ounces produced | | | | | | | | | | |
| San Dimas | | 1,404,454 |
| 1,367,028 |
| 1,445,918 |
| 808,923 |
| — |
| | — |
| — |
| — |
|
| Santa Elena | | 587,195 |
| 567,754 |
| 598,693 |
| 535,015 |
| 521,784 |
| | 582,789 |
| 560,054 |
| 557,914 |
|
| La Encantada | | 720,959 |
| 449,632 |
| 378,983 |
| 325,603 |
| 449,522 |
| | 486,514 |
| 609,138 |
| 374,901 |
|
| San Martin | | 331,539 |
| 404,523 |
| 438,061 |
| 419,815 |
| 483,740 |
| | 514,678 |
| 471,893 |
| 425,645 |
|
| La Parrilla | | 219,485 |
| 312,144 |
| 330,047 |
| 360,862 |
| 337,332 |
| | 401,090 |
| 424,358 |
| 425,060 |
|
| Del Toro | | 67,757 |
| 149,734 |
| 231,350 |
| 167,591 |
| 236,478 |
| | 185,695 |
| 233,015 |
| 365,323 |
|
| La Guitarra | | — |
| — |
| 82,292 |
| 138,454 |
| 138,173 |
| | 166,698 |
| 117,504 |
| 138,345 |
|
| Consolidated | | 3,331,388 |
| 3,250,816 |
| 3,505,344 |
| 2,756,263 |
| 2,167,030 |
| | 2,337,463 |
| 2,415,962 |
| 2,287,188 |
|
| Cash cost per ounce | | | | | | | | | | |
| San Dimas | |
| $0.93 |
|
| $0.58 |
|
| ($0.40 | ) |
| $0.24 |
| — |
| | — |
| — |
| — |
|
| Santa Elena | |
| $2.81 |
|
| ($1.06 | ) |
| $5.77 |
|
| $1.39 |
|
| ($4.74 | ) | |
| ($6.93 | ) |
| ($0.18 | ) |
| $1.24 |
|
| La Encantada | |
| $12.60 |
|
| $15.60 |
|
| $21.15 |
|
| $23.05 |
|
| $16.93 |
| |
| $15.23 |
|
| $12.47 |
|
| $13.59 |
|
| San Martin | |
| $11.35 |
|
| $10.40 |
|
| $9.78 |
|
| $9.68 |
|
| $8.04 |
| |
| $7.55 |
|
| $7.11 |
|
| $5.43 |
|
| La Parrilla | |
| $16.58 |
|
| $13.80 |
|
| $16.29 |
|
| $10.42 |
|
| $11.02 |
| |
| $11.21 |
|
| $12.26 |
|
| $11.15 |
|
| Del Toro | |
| $27.20 |
|
| $27.69 |
|
| $13.07 |
|
| $18.01 |
|
| $13.66 |
| |
| $12.53 |
|
| $6.41 |
|
| $3.99 |
|
| La Guitarra | |
| $— |
|
| $— |
|
| $6.99 |
|
| $12.89 |
|
| $7.97 |
| |
| $11.20 |
|
| $19.02 |
|
| $12.65 |
|
| Consolidated | |
| $6.34 |
|
| $6.06 |
|
| $6.85 |
|
| $7.59 |
|
| $7.83 |
| |
| $6.76 |
|
| $8.15 |
|
| $7.01 |
|
| All-in sustaining cost per ounce | | | | | | | | | | |
| San Dimas | |
| $5.65 |
|
| $5.35 |
|
| $6.74 |
|
| $5.41 |
| — |
| | — |
| — |
| — |
|
| Santa Elena | |
| $6.37 |
|
| $2.18 |
|
| $9.03 |
|
| $6.60 |
|
| ($0.17 | ) | |
| ($2.01 | ) |
| $3.08 |
|
| $5.02 |
|
| La Encantada | |
| $13.72 |
|
| $18.70 |
|
| $27.25 |
|
| $30.81 |
|
| $20.97 |
| |
| $19.20 |
|
| $14.98 |
|
| $17.95 |
|
| San Martin | |
| $15.67 |
|
| $13.60 |
|
| $13.37 |
|
| $12.49 |
|
| $9.98 |
| |
| $9.73 |
|
| $10.03 |
|
| $7.53 |
|
| La Parrilla | |
| $25.62 |
|
| $21.18 |
|
| $23.34 |
|
| $16.39 |
|
| $17.66 |
| |
| $15.28 |
|
| $18.85 |
|
| $17.12 |
|
| Del Toro | |
| $35.89 |
|
| $37.83 |
|
| $24.48 |
|
| $32.08 |
|
| $20.61 |
| |
| $25.48 |
|
| $12.92 |
|
| $7.93 |
|
| La Guitarra | |
| $— |
|
| $— |
|
| $12.30 |
|
| $18.11 |
|
| $15.76 |
| |
| $17.77 |
|
| $31.55 |
|
| $19.51 |
|
| Consolidated | |
| $12.91 |
|
| $12.83 |
|
| $15.12 |
|
| $16.43 |
|
| $16.01 |
| |
| $14.13 |
|
| $15.36 |
|
| $14.17 |
|
| Production cost per tonne | | | | | | | | | | |
| San Dimas | |
| $122.17 |
|
| $113.66 |
|
| $105.91 |
|
| $148.91 |
| — |
| | — |
| — |
| — |
|
| Santa Elena | |
| $56.53 |
|
| $54.55 |
|
| $63.15 |
|
| $55.97 |
|
| $54.31 |
| |
| $47.13 |
|
| $55.65 |
|
| $54.44 |
|
| La Encantada | |
| $32.71 |
|
| $33.20 |
|
| $40.20 |
|
| $31.09 |
|
| $27.00 |
| |
| $36.42 |
|
| $34.77 |
|
| $33.65 |
|
| San Martin | |
| $80.39 |
|
| $83.27 |
|
| $88.15 |
|
| $72.77 |
|
| $68.06 |
| |
| $73.14 |
|
| $76.81 |
|
| $69.37 |
|
| La Parrilla | |
| $76.78 |
|
| $52.47 |
|
| $58.18 |
|
| $49.10 |
|
| $48.12 |
| |
| $48.00 |
|
| $50.75 |
|
| $44.54 |
|
| Del Toro | |
| $95.06 |
|
| $84.67 |
|
| $73.50 |
|
| $69.23 |
|
| $58.12 |
| |
| $72.77 |
|
| $71.80 |
|
| $57.16 |
|
| La Guitarra | |
| $— |
|
| $— |
|
| $68.47 |
|
| $83.68 |
|
| $86.50 |
| |
| $83.61 |
|
| $120.09 |
|
| $93.49 |
|
| Consolidated | |
| $66.65 |
|
| $65.31 |
|
| $68.87 |
|
| $61.04 |
|
| $46.88 |
| |
| $50.81 |
|
| $54.15 |
|
| $51.53 |
|
1) San Dimas production results in the second quarter of 2018 included 52 days from the period May 10, 2018 to June 30, 2018.
2) La Guitarra was placed on care and maintenance on August 3, 2018.
|
| | |
| |
| First Majestic Silver Corp. 2019 First Quarter Report | Page 6 |
Operating Results – Consolidated Operations
|
| | | | | | | | | | | | | | | | |
| CONSOLIDATED | | 2019-Q1 | 2018-Q4 | 2018-Q1 | | Change
Q1 vs Q4 | | Change
'19 vs '18 |
| | | | | | | | | |
| Ore processed/tonnes milled | | 812,654 |
| 850,272 |
| 809,775 |
| | (4 | %) | | 0 | % |
| Average silver grade (g/t) | | 153 |
| 144 |
| 111 |
| | 6 | % | | 38 | % |
| Average gold grade (g/t) | | 1.26 |
| 1.31 |
| 0.66 |
| | (4 | %) | | 91 | % |
| Average lead grade (g/t) | | 1.85 |
| 1.98 |
| 1.77 |
| | (7 | %) | | 5 | % |
| Average zinc grade (g/t) | | 1.22 |
| 0.95 |
| 0.69 |
| | 28 | % | | 77 | % |
| Silver recovery (%) | | 83 | % | 83 | % | 75 | % | | 0 | % | | 11 | % |
| Gold recovery (%) | | 96 | % | 96 | % | 93 | % | | 0 | % | | 3 | % |
| Lead recovery (%) | | 67 | % | 58 | % | 62 | % | | 16 | % | | 8 | % |
| Zinc recovery (%) | | 48 | % | 53 | % | 57 | % | | (9 | %) | | (16 | %) |
| | | | | | | | | |
| Production | | | | | | | | |
| Silver ounces produced | | 3,331,388 |
| 3,250,816 |
| 2,167,030 |
| | 2 | % | | 54 | % |
| Gold ounces produced | | 32,037 |
| 34,487 |
| 15,887 |
| | (7 | %) | | 102 | % |
| Pounds of lead produced | | 2,661,088 |
| 3,294,360 |
| 4,448,378 |
| | (19 | %) | | (40 | %) |
| Pounds of zinc produced | | 1,265,438 |
| 1,466,812 |
| 1,611,699 |
| | (14 | %) | | (21 | %) |
| Total production - ounces silver equivalent | | 6,273,677 |
| 6,485,761 |
| 3,879,678 |
| | (3 | %) | | 62 | % |
| | | | | | | | | |
| Cost | | | | | | | | |
| Cash cost per ounce | |
| $6.34 |
|
| $6.06 |
|
| $7.83 |
| | 5 | % | | (19 | %) |
| All-In sustaining costs per ounce | |
| $12.91 |
|
| $12.83 |
|
| $16.01 |
| | 1 | % | | (19 | %) |
| Total production cost per tonne | |
| $66.65 |
|
| $65.31 |
|
| $46.88 |
| | 2 | % | | 42 | % |
| | | | | | | | | |
| Underground development (m) | | 15,947 |
| 16,587 |
| 14,914 |
| | (4 | %) | | 7 | % |
| Diamond drilling (m) | | 37,716 |
| 32,532 |
| 44,827 |
| | 16 | % | | (16 | %) |
Production
Total production in the first quarter reached 6,273,677 silver equivalents ounces, consisting of 3.3 million ounces of silver, 32,037 ounces of gold, 2.7 million pounds lead and 1.3 million pounds of zinc. Total production decreased slightly by 3% due to scaled back throughput and production at the Del Toro and La Parrilla mines, partially offset by a significant increase in production from the La Encantada mine. Pure silver production increased 2% as a result of higher grades at the San Dimas and La Encantada mines.
The commissioning of the new La Encantada roaster advanced in the month of March but remained below expected throughput for the full quarter. Nevertheless, La Encantada recorded a significant 60% increase in silver production in the quarter due to higher grades and tonnes processed. Investments in new innovations, such as high-intensity grinding ("HIG") and microbubbles, are expected to begin to bear fruit in the second half of 2019 with higher recoveries and production at the Santa Elena and La Encantada operations.
Total ore processed during the quarter at the Company's mines amounted to 812,654 tonnes, representing a 4% decrease compared to the previous quarter. The slight decrease in tonnes processed compared to the prior quarter was primarily due to the Company’s decision to reduce throughput at its two concentrate plants, La Parrilla and Del Toro, offset by a 30% increase of tonnes processed at La Encantada.
Consolidated silver grades in the quarter averaged 153 g/t compared to 144 g/t in the previous quarter. The 6% increase was primarily the result of higher grades at San Dimas and La Encantada. Consolidated gold grades averaged 1.26 g/t compared to 1.31 g/t in the prior quarter representing a 4% decrease due to lower underground grades at Santa Elena.
Consolidated silver and gold recoveries averaged 83% and 96%, respectively, consistent with plans and the previous quarter. The Company continues to expect further improvements in recoveries associated with the installation of the microbubble flotation cells at La Parrilla and the HIG mills at Santa Elena and La Encantada in the second half of the year.
|
| | |
| |
| First Majestic Silver Corp. 2019 First Quarter Report | Page 7 |
Cash Cost and All-In Sustaining Cost per Ounce
Cash cost per ounce for the quarter was $6.34 per payable ounce of silver, an increase of 5% from $6.06 per ounce in the fourth quarter of 2018. The increase in cash cost per ounce was primarily attributed to a decrease in by-product credits which was partially offset by lower mining contractor costs corresponding to planned reduction in throughputs at La Parrilla and Del Toro.
All-in sustaining cost per ounce (“AISC”) in the first quarter was $12.91, comparable to $12.83 per ounce in the previous quarter.
Development and Exploration
During the first quarter, the Company completed 15,947 metres of underground development, representing a decrease of 4% compared to the previous quarter and 25% of the Company's planned 64,610 metres program for 2019.
The Company also completed a total of 37,716 metres of diamond drilling, an increase of 16% compared to the previous quarter and 20% of the planned 188,000 metres program for 2019. The 2019 drilling program will consist of approximately 11,600 metres of sustaining diamond drilling to support mining activities at the six operating mines; approximately 152,000 metres of expansionary diamond drilling intended to improve confidence and increase Mineral Resources with a focus on the Santa Elena Main Vein and the Central Block at San Dimas; 16,000 metres to infill and expand Mineral Resources at Ermitaño; and approximately 8,400 metres intended to test greenfield targets at Santa Elena and Del Toro.
|
| | |
| |
| First Majestic Silver Corp. 2019 First Quarter Report | Page 8 |
San Dimas Silver/Gold Mine, Durango, México
The San Dimas Silver/Gold Mine is located approximately 130 km northwest of Durango, Durango State, Mexico and contains 71,867 hectares of mining claims located in the states of Durango and Sinaloa, Mexico. San Dimas is one of the country’s most prominent silver mines as well as the largest producing underground mine in the state of Durango, with over 250 years of operating history. First Majestic acquired the San Dimas mine in May 2018 with the acquisition of Primero Mining Corp. The San Dimas operating plan involves processing ore from an underground mine with a 2,500 tpd capacity milling operation. The mine is accessible via a 40 minute flight from Durango airport to the airstrip in the town of Tayoltita. The Company owns 100% of the San Dimas mine.
|
| | | | | | | | | |
| San Dimas | 2019-Q1 | 2018-Q4 | | Change
Q1 vs Q4 |
| | | | | |
| Total ore processed/tonnes milled | 163,264 |
| 172,641 |
| | (5 | %) |
| Average silver grade (g/t) | 287 |
| 262 |
| | 10 | % |
| Average gold grade (g/t) | 4.18 |
| 3.88 |
| | 8 | % |
| Silver recovery (%) | 93 | % | 94 | % | | (1 | %) |
| Gold recovery (%) | 96 | % | 97 | % | | (1 | %) |
| | | | | |
| Production | | | | |
| Silver ounces produced | 1,404,454 |
| 1,367,028 |
| | 3 | % |
| Gold ounces produced | 21,095 |
| 20,839 |
| | 1 | % |
| Total production - ounces silver equivalent | 3,172,270 |
| 3,127,871 |
| | 1 | % |
| | | | | |
| Cost | | | | |
| Cash cost per ounce |
| $0.93 |
|
| $0.58 |
| | 60 | % |
| All-In sustaining costs per ounce |
| $5.65 |
|
| $5.35 |
| | 6 | % |
| Total production cost per tonne |
| $122.17 |
|
| $113.66 |
| | 7 | % |
| | | | | |
| Underground development (m) | 5,669 |
| 5,321 |
| | 7 | % |
| Diamond drilling (m) | 16,191 |
| 13,664 |
| | 18 | % |
During the first quarter, the San Dimas mine produced 1,404,454 ounces of silver and 21,095 ounces of gold for a total production of 3,172,270 silver equivalent ounces, a small increase compared to the prior quarter as a result of higher head grades.
During the quarter, the mill processed a total of 163,264 tonnes with average silver and gold grades of 287 g/t and 4.18 g/t, respectively. Silver and gold grades improved 10% and 8%, respectively, compared to the prior quarter due to higher grades in the Victoria and Jessica areas along with improvements in mine dilution controls.
In the first quarter, cash cost per ounce increased to $0.93 compared to $0.58 in the prior quarter and AISC increased to $5.65 per ounce compared to $5.35 per ounce in the prior quarter. The increase was primarily attributed to retroactive adjustments to workers' salaries and bonuses upon reaching a new collective bargaining agreement with the union, as well as higher contribution of energy costs from the national power grid as less energy is available from the hydroelectric dam prior to the return of the rainy season in July.
With the acquisition of Primero, First Majestic renegotiated San Dimas' streaming agreement with Wheaton Precious Metals International Ltd. (“WPM”), which is entitled to receive 25% of the gold equivalent production (based on a fixed exchange ratio of 70 silver ounces to 1 gold ounce) from San Dimas in exchange for ongoing payments equal to the lesser of $600 (subject to a 1% annual inflation adjustment) and the prevailing market price for each gold ounce delivered, with provisions to adjust the gold to silver ratio if the average gold to silver ratio moves above or below 90:1 or 50:1, respectively, for a period of six months. The New Stream Agreement enables the operation to generate sufficient cash flows and First Majestic to deploy capital towards exploration and underground development in areas of the mine that were previously deemed uneconomic. During the period ended March 31, 2019, the Company delivered 11,510 ounces of gold to WPM at $600 per ounce under the New Stream.
A total of 5,669 metres of underground development was completed in the first quarter, an increase of 7% compared to the prior quarter while diamond drilling increased 18% to 16,191 metres from 13,664 metres in the prior quarter. Six underground rigs were active during the quarter, completing 62 in-fill and step-out holes at the Santa Jessica, Santa Rita, Santa Gertrudis, San Jose, Victoria, and Pozolera veins.
|
| | |
| |
| First Majestic Silver Corp. 2019 First Quarter Report | Page 9 |
Santa Elena Silver/Gold Mine, Sonora, México
The Santa Elena Silver/Gold Mine is located approximately 150 kilometres northeast of the city of Hermosillo, Sonora, Mexico and owns mining concessions over a total of 101,772 hectares. The operating plan for Santa Elena involves the processing of ore in a 3,000 tpd cyanidation circuit from a combination of underground reserves and spent ore from the previous heap leach pad. The Company owns 100% of the Santa Elena mine.
|
| | | | | | | | | | | | | | | |
| SANTA ELENA | 2019-Q1 | 2018-Q4 | 2018-Q1 | | Change
Q1 vs Q4 | | Change
'19 vs '18 |
| | | | | | | |
| Total ore processed/tonnes milled | 219,941 |
| 221,945 |
| 223,498 |
| | (1 | %) | | (2 | %) |
| Underground tonnes | | | | | | | |
| Tonnes milled | 136,984 |
| 142,534 |
| 124,827 |
| | (4 | %) | | 10 | % |
| Average silver grade (g/t) | 121 |
| 120 |
| 124 |
| | 1 | % | | (2 | %) |
| Average gold grade (g/t) | 1.87 |
| 2.39 |
| 2.88 |
| | (22 | %) | | (35 | %) |
| Heap leach tonnes | | | | | | | |
| Tonnes milled | 82,957 |
| 79,410 |
| 98,671 |
| | 4 | % |
| (16 | %) |
| Average silver grade (g/t) | 47 |
| 36 |
| 32 |
| | 31 | % |
| 47 | % |
| Average gold grade (g/t) | 0.8 |
| 0.6 |
| 0.6 |
| | 33 | % |
| 33 | % |
| Silver recovery (%) | 89 | % | 88 | % | 87 | % | | 1 | % | | 2 | % |
| Gold recovery (%) | 95 | % | 96 | % | 95 | % | | (1 | %) | | 0 | % |
| | | | | | | | |
| Production | | | | | | | |
| Silver ounces produced | 587,195 |
| 567,754 |
| 521,784 |
| | 3 | % | | 13 | % |
| Gold ounces produced | 9,735 |
| 12,081 |
| 12,887 |
| | (19 | %) | | (24 | %) |
| Total production - ounces silver equivalent | 1,403,364 |
| 1,587,396 |
| 1,543,776 |
| | (12 | %) | | (9 | %) |
| | | | | | | | |
| Cost | | | | | | | |
| Cash cost per ounce |
| $2.81 |
|
| ($1.06 | ) |
| ($4.74 | ) | | (365 | %) | | (159 | %) |
| All-In sustaining costs per ounce |
| $6.37 |
|
| $2.18 |
|
| ($0.17 | ) | | 192 | % | | (3,847 | %) |
| Total production cost per tonne |
| $56.53 |
|
| $54.55 |
|
| $54.31 |
| | 4 | % | | 4 | % |
| | | | | | | | |
| Underground development (m) | 2,277 |
| 2,585 |
| 3,030 |
| | (12 | %) | | (25 | %) |
| Diamond drilling (m) | 11,291 |
| 9,701 |
| 7,097 |
| | 16 | % | | 59 | % |
During the first quarter, Santa Elena produced 587,195 ounces of silver and 9,735 ounces of gold for a total production of 1,403,364 silver equivalent ounces, a decrease of 12% compared to the prior quarter primarily due to a 22% decrease in underground gold grades which resulted in a 19% decrease in gold production.
The mill processed a total of 219,941 tonnes during the quarter, consisting of 136,984 tonnes of underground ore and 82,957 tonnes from the above ground heap leach pad. Silver and gold grades from underground ore averaged 121 g/t and 1.87 g/t, respectively. Silver and gold grades from the above ground heap leach pad averaged 47 g/t and 0.78 g/t, respectively.
Cash cost in the first quarter increased to $2.81 per payable silver ounce compared to ($1.06) per payable silver ounce in the previous quarter. AISC in the first quarter increased to $6.37 per ounce compared to $2.18 per ounce in the previous quarter. The increase in cash cost and AISC per ounce were primarily attributed to a decrease in by-product credits as a result of a 19% decrease in gold production. The Company is planning to convert Santa Elena from diesel power to liquid natural gas (“LNG”) generated power, which is expected to substantially reduce energy costs.
The installation of the HIG mill and related auxiliary facilities were approximately 70% complete at the end of March. Concrete foundations and buildings for the electrical control room and motor control center were completed during the quarter. The HIG mill motor and water flow meters were delivered to site and will be installed in April. The project remains on time with commissioning activities beginning in the second quarter and expected to complete by July.
In the first quarter, a total of 2,277 metres of underground development was completed compared to 2,585 metres in the previous quarter, while a total of 11,291 metres of diamond drilling was completed compared with 9,701 metres drilled in the
|
| | |
| |
| First Majestic Silver Corp. 2019 First Quarter Report | Page 10 |
previous quarter. During the quarter, three surface rigs drilled 24 in-fill and step-out holes at Ermitaño and two underground rigs drilled 13 step-out holes at the Santa Elena Main, America, and Alejandra veins.
The Santa Elena mine has a gold streaming agreement with Sandstorm Gold Ltd. (“Sandstorm”), which requires the mine to sell 20% of its gold production from the leach pad and a designated area of its underground operations over the life of mine to Sandstorm. The selling price to Sandstorm is currently the lesser of $450 per ounce (subject to a 1% annual inflation increase every April) and the prevailing market price. During the quarter ended March 31, 2019 the Company delivered 1,500 ounces of gold to Sandstorm.
|
| | |
| |
| First Majestic Silver Corp. 2019 First Quarter Report | Page 11 |
La Encantada Silver Mine, Coahuila, México
The La Encantada Silver Mine is an underground mine located in the northern México State of Coahuila, 708 kilometres northeast of Torreon. La Encantada has 4,076 hectares of mineral concessions and surface land ownership of 1,343 hectares. La Encantada also has a 4,000 tpd cyanidation plant, a village with 180 houses as well as administrative offices, laboratory, general store, hospital, airstrip and all infrastructure required for such an operation. The mine is accessible via a two hour flight from Durango, Durango State to the mine’s private airstrip, or via a mostly-paved road from the closest city, Muzquiz, which is 225 kilometres away. The Company owns 100% of the La Encantada Silver Mine.
|
| | | | | | | | | | | | | | | |
| LA ENCANTADA | 2019-Q1 | 2018-Q4 | 2018-Q1 | | Change
Q1 vs Q4 | | Change
'19 vs '18 |
| | | | | | | | |
| Ore processed/tonnes milled | 269,611 |
| 206,812 |
| 276,191 |
| | 30 | % | | (2 | %) |
| Average silver grade (g/t) | 126 |
| 110 |
| 85 |
| | 15 | % | | 48 | % |
| Silver recovery (%) | 66 | % | 61 | % | 60 | % | | 8 | % | | 10 | % |
| | | | | | | | |
| Production | | | | | | | |
| Silver ounces produced | 720,959 |
| 449,632 |
| 449,522 |
| | 60 | % | | 60 | % |
| Gold ounces produced | 33 |
| 19 |
| 37 |
| | 74 | % | | (11 | %) |
| Total production - ounces silver equivalent | 723,699 |
| 451,244 |
| 452,420 |
| | 60 | % | | 60 | % |
| | | | | | | | |
| Cost | | | | | | | |
| Cash cost per ounce |
| $12.60 |
|
| $15.60 |
|
| $16.93 |
| | (19 | %) | | (26 | %) |
| All-In sustaining costs per ounce |
| $13.72 |
|
| $18.70 |
|
| $20.97 |
| | (27 | %) | | (35 | %) |
| Total production cost per tonne |
| $32.71 |
|
| $33.20 |
|
| $27.00 |
| | (1 | %) | | 21 | % |
| | | | | | | | |
| Underground development (m) | 1,426 |
| 1,055 |
| 1,445 |
| | 35 | % | | (1 | %) |
| Diamond drilling (m) | 2,279 |
| 1,449 |
| 4,574 |
| | 57 | % | | (50 | %) |
Total production for the first quarter was 723,699 silver equivalent ounces, representing a 60% increase from the previous quarter, primarily due to a 30% increase in tonnes milled, a 15% increase in silver head grade, and an 8% increase in silver recovery. Production from the San Javier and La Prieta sub-level caving areas as well as the 660 area produced 118,043 tonnes with an average silver grade of 118 g/t, or approximately 44% of total quarterly production.
Silver grades and recoveries during the quarter averaged 126 g/t and 66%, respectively an increase of 15% and 8%, respectively, over the previous quarter primarily due higher grades obtained from the caving areas.
Cash cost per ounce for the quarter improved to $12.60 per ounce, a decrease of 19% compared to $15.60 per ounce in the previous quarter, while AISC per ounce was $13.72 compared to $18.70 in the previous quarter. The decrease in cash cost and AISC per ounce was primarily attributed to the 60% increase in silver production, partially offset by higher energy costs.
A total of 1,426 metres of underground development was completed in the first quarter compared to 1,055 metres in the fourth quarter of 2018. Access to La Prieta area has been completed and production from this area is in the ramp-up stage from several draw-points prepared in the quarter. Development and preparation of a lower production level in the San Javier caving area continued during the quarter and production from this level is expected in the second quarter of 2019.
A total of 2,279 metres of underground drilling was completed in the first quarter compared to 1,449 metres in the previous quarter. Two underground rigs were active during the quarter and completed 8 step-out holes at the Conejo and San Francisco veins.
Commissioning activities for the roaster continued throughout the first quarter with the circuit processing a total of 8,686 tonnes of tailings material (912 tonnes in January, 999 tonnes in February and 6,775 tonnes in March) in several production campaigns. Silver grades and recoveries averaged 100 g/t and 65%, respectively. Commissioning activities will continue throughout the second quarter with additional modifications to optimize the material discharge area and to control the amount of ultra-fine particles feeding the dust collectors. Throughput is expected to continue to ramp up as system modifications are completed.
|
| | |
| |
| First Majestic Silver Corp. 2019 First Quarter Report | Page 12 |
San Martin Silver Mine, Jalisco, México
The San Martin Silver Mine is an underground mine located near the town of San Martin de Bolaños in the Bolaños River valley, in the northern portion of the State of Jalisco, México. San Martin has 33 contiguous mining concessions in the San Martin de Bolaños mining district covering mineral rights for 37,902 hectares, including the application to acquire a new mining concession covering 24,723 hectares. In addition, the mine owns 160 hectares of surface land where the processing plant, camp, office facilities, maintenance shops, and tailings dams are located, and an additional 640 hectares of surface rights. The 1,300 tpd mill and processing plant consists of crushing, grinding and conventional cyanidation by agitation in tanks and a Merrill-Crowe doré production system. The mine can be accessed via small plane, 150 kilometres from Durango, or 250 kilometres by paved road north of Guadalajara, Jalisco. The San Martin Silver Mine is 100% owned by the Company.
|
| | | | | | | | | | | | | | | |
| SAN MARTIN | 2019-Q1 | 2018-Q4 | 2018-Q1 | | Change
Q1 vs Q4 | | Change
'19 vs '18 |
| | | | | | | | |
| Ore processed/tonnes milled | 62,148 |
| 66,924 |
| 75,374 |
| | (7 | %) | | (18 | %) |
| Average silver grade (g/t) | 187 |
| 212 |
| 234 |
| | (12 | %) | | (20 | %) |
| Average gold grade (g/t) | 0.60 |
| 0.64 |
| 0.52 |
| | (6 | %) | | 15 | % |
| Silver recovery (%) | 89 | % | 89 | % | 85 | % | | 0 | % | | 5 | % |
| Gold recovery (%) | 93 | % | 93 | % | 91 | % | | 0 | % | | 2 | % |
| | | | | | | | |
| Production | | | | | | | |
| Silver ounces produced | 331,539 |
| 404,523 |
| 483,740 |
| | (18 | %) | | (31 | %) |
| Gold ounces produced | 1,069 |
| 1,272 |
| 1,148 |
| | (16 | %) | | (7 | %) |
| Total production - ounces silver equivalent | 421,091 |
| 511,911 |
| 574,838 |
| | (18 | %) | | (27 | %) |
| | | | | | | | |
| Cost | | | | | | | |
| Cash cost per ounce |
| $11.35 |
|
| $10.40 |
|
| $8.04 |
| | 9 | % | | 41 | % |
| All-In sustaining costs per ounce |
| $15.67 |
|
| $13.60 |
|
| $9.98 |
| | 15 | % | | 57 | % |
| Total production cost per tonne |
| $80.39 |
|
| $83.27 |
|
| $68.06 |
| | (3 | %) | | 18 | % |
| | | | | | | | |
| Underground development (m) | 3,091 |
| 2,866 |
| 2,966 |
| | 8 | % | | 4 | % |
| Diamond drilling (m) | 4,863 |
| 3,125 |
| 4,928 |
| | 56 | % | | (1 | %) |
During the quarter, San Martin produced 331,539 silver ounces and 1,069 ounces of gold for a total production of 421,091 silver equivalent ounces, an 18% decrease compared to the prior quarter. The decrease in production was primarily attributed to lower throughput due to labour disruptions and lower silver grades.
Silver grades and recoveries averaged 187 g/t and 89%, respectively, during the quarter while gold grades and recoveries averaged 0.60 g/t and 93%, respectively. The decrease in silver grades was primarily due to resource variability and lower grade ore being sourced from the Rosario mine.
In the first quarter, cash cost per ounce increased by 9% to $11.35 compared to $10.40 in the previous quarter, primarily due to an 18% decrease in silver production. AISC in the quarter was $15.67 compared to $13.60 in the fourth quarter.
In the first quarter, a total of 3,091 metres of underground development was completed compared to 2,866 metres in the previous quarter and a total of 4,863 metres of diamond drilling was completed compared with 3,125 metres drilled in the previous quarter. During the quarter, three rigs were on site and drilled 25 holes in the Rosario, Hedionda and Intermedia veins.
|
| | |
| |
| First Majestic Silver Corp. 2019 First Quarter Report | Page 13 |
La Parrilla Silver Mine, Durango, México
The La Parrilla Silver Mine, located approximately 65 kilometres southeast of the city of Durango in Durango State, México, is a complex of producing underground operations consisting of the Rosarios, La Blanca and San Marcos mines which are inter-connected through underground workings, and the Vacas and Quebradillas mines which are connected via above-ground gravel roads. The total mining concessions consist of 69,478 hectares. The Company owns 60 hectares, and leases an additional 107 hectares of surface rights, for a total of 167 hectares of surface rights. La Parrilla includes a 2,000 tpd sequential processing plant which was recently reconfigured to move to cyanidation subsequent to flotation to process the tails of flotation consisting of a 1,000 tpd cyanidation circuit and a 1,000 tpd flotation circuit, an ISO certified central laboratory, buildings, offices and associated infrastructure. The Company owns 100% of the La Parrilla Silver Mine.
|
| | | | | | | | | | | | | | | |
| LA PARRILLA | 2019-Q1(1) | 2018-Q4 | 2018-Q1 | | Change
Q1 vs Q4 | | Change
'19 vs '18 |
| | | | | | | |
| Total ore processed/tonnes milled | 72,551 |
| 125,751 |
| 125,114 |
| | (42 | %) | | (42 | %) |
| Average silver grade (g/t) | 119 |
| 103 |
| 113 |
| | 16 | % | | 5 | % |
| Average lead grade (%) | 1.76 |
| 1.52 |
| 1.32 |
| | 16 | % | | 33 | % |
| Average zinc grade (%) | 1.64 |
| 1.67 |
| 1.68 |
| | (2 | %) | | (2 | %) |
| Silver recovery (%) | 79 | % | 75 | % | 74 | % | | 5 | % | | 7 | % |
| Lead recovery (%) | 69 | % | 72 | % | 73 | % | | (4 | %) | | (5 | %) |
| Zinc recovery (%) | 48 | % | 53 | % | 57 | % | | (9 | %) | | (16 | %) |
| | | | | | | | |
| Production | | | | | | | |
| Silver ounces produced | 219,485 |
| 312,144 |
| 337,332 |
| | (30 | %) | | (35 | %) |
| Gold ounces produced | 82 |
| 238 |
| 247 |
| | (66 | %) | | (67 | %) |
| Pounds of lead produced | 1,946,096 |
| 1,816,180 |
| 1,606,332 |
| | 7 | % | | 21 | % |
| Pounds of zinc produced | 1,265,438 |
| 1,466,812 |
| 1,611,699 |
| | (14 | %) | | (21 | %) |
| Total production - ounces silver equivalent | 441,095 |
| 563,703 |
| 615,541 |
| | (22 | %) | | (28 | %) |
| | | | | | | | |
| Cost | | | | | | | |
| Cash cost per ounce |
| $16.58 |
|
| $13.80 |
|
| $11.02 |
| | 20 | % | | 50 | % |
| All-In sustaining costs per ounce |
| $25.62 |
|
| $21.18 |
|
| $17.66 |
| | 21 | % | | 45 | % |
| Total production cost per tonne |
| $76.78 |
|
| $52.47 |
|
| $48.12 |
| | 46 | % | | 60 | % |
| | | | | | | | |
| Underground development (m) | 2,452 |
| 2,936 |
| 3,254 |
| | (16 | %) | | (25 | %) |
| Diamond drilling (m) | 2,100 |
| 3,728 |
| 8,358 |
| | (44 | %) | | (75 | %) |
(1) Due to low margins at current metal prices and limited underground oxide resources, the mine suspended oxide ore feed and the cyanidation circuit was reconfigured in January 2019 to reprocess the tailings from the flotation circuit as a means to improve overall silver recoveries.
In the first quarter, total production from the La Parrilla mine was 441,095 silver equivalent ounces, a decrease of 22% compared to 563,703 equivalent ounces of silver in the previous quarter.
During the quarter, the flotation circuit processed 72,551 tonnes (803 tpd) with an average silver grade of 119 g/t and a 79% recovery, which improved 5% from the previous quarter due to the cyanidation circuit reprocessing of flotation tails. The lead circuit processed ore with an average lead grade of 1.76% with recoveries of 69% for a total lead production of 1,946,096 pounds, representing a 7% increase compared to the previous quarter. The zinc circuit processed an average zinc grade of 1.64% with recoveries of 48% for a total zinc production of 1,265,438 pounds, representing a 14% decrease compared to the previous quarter.
Cash cost in the first quarter was $16.58 per ounce, an increase of 20% compared to $13.80 per ounce in the previous quarter. AISC per ounce in the quarter was $25.62 compared to $21.18 in the previous quarter. The increases in cash cost and AISC per ounce were primarily attributed to a 30% decrease in silver ounces produced compared to the previous quarter and severance payments of $0.2 million.
The microbubble flotation columns, which are designed to increase metallurgical recoveries, are expected to be delivered and installed during the second quarter followed by commissioning activities in the third quarter.
|
| | |
| |
| First Majestic Silver Corp. 2019 First Quarter Report | Page 14 |
A total of 2,452 metres of underground development and 2,100 metres of exploration drilling was completed in the quarter compared to 2,936 metres of development and 3,728 metres of diamond drilling in the fourth quarter of 2018. One drill rig was active during the quarter and completed seven in-fill holes focusing on the San Nicolas vein at the Quebradillas mine.
|
| | |
| |
| First Majestic Silver Corp. 2019 First Quarter Report | Page 15 |
Del Toro Silver Mine, Zacatecas, México
The Del Toro Silver Mine is located 60 kilometres to the southeast of the Company’s La Parrilla mine and consists of 2,132 hectares of mining concessions and 219 hectares of surface rights. The Del Toro operation represents the consolidation of three historical silver mines, the Perseverancia, San Juan and Dolores mines, which are approximately one and three kilometres apart, respectively. Del Toro includes a 2,000 tpd flotation circuit and a 2,000 tpd cyanidation circuit which is currently in care and maintenance. First Majestic owns 100% of the Del Toro Silver Mine.
|
| | | | | | | | | | | | | | | |
| DEL TORO | 2019-Q1 | 2018-Q4 | 2018-Q1 | | Change
Q1 vs Q4 | | Change
'19 vs '18 |
| | | | | | | | |
| Ore processed/tonnes milled | 25,138 |
| 56,200 |
| 79,769 |
| | (55 | %) | | (68 | %) |
| Average silver grade (g/t) | 114 |
| 132 |
| 133 |
| | (14 | %) | | (14 | %) |
| Average lead grade (%) | 2.12 |
| 2.59 |
| 2.85 |
| | (18 | %) | | (26 | %) |
| Silver recovery (%) | 74 | % | 63 | % | 69 | % | | 17 | % | | 7 | % |
| Lead recovery (%) | 61 | % | 46 | % | 57 | % | | 33 | % | | 7 | % |
| | | | | | | | |
| Production | | | | | | | |
| Silver ounces produced | 67,757 |
| 149,734 |
| 236,478 |
| | (55 | %) | | (71 | %) |
| Pounds of lead produced | 714,992 |
| 1,478,180 |
| 2,842,046 |
| | (52 | %) | | (75 | %) |
| Total production - ounces silver equivalent | 112,158 |
| 243,637 |
| 437,743 |
| | (54 | %) | | (74 | %) |
| | | | | | | | |
| Cost | | | | | | | |
| Cash cost per ounce |
| $27.20 |
|
| $27.69 |
|
| $13.66 |
| | (2 | %) | | 99 | % |
| All-In sustaining costs per ounce |
| $35.89 |
|
| $37.83 |
|
| $20.61 |
| | (5 | %) | | 74 | % |
| Total production cost per tonne |
| $95.06 |
|
| $84.67 |
|
| $58.12 |
| | 12 | % | | 64 | % |
| | | | | | | | |
| Underground development (m) | 1,032 |
| 1,824 |
| 2,836 |
| | (43 | %) | | (64 | %) |
| Diamond drilling (m) | 993 |
| 865 |
| 5,824 |
| | 15 | % | | (83 | %) |
During the first quarter, the Del Toro mine produced 67,757 ounces of silver and 714,992 pounds of lead for a total of 112,158 silver equivalent ounces, a 54% decrease compared to 243,637 ounces produced in the previous quarter. The decrease was primarily due to the Company’s decision to reduce mill throughput to approximately 270 tpd in order to give the Company time to drill, develop additional resources and re-engineer the mine plan throughout 2019. During the quarter, Del Toro production was sourced from the Dolores mine where the Santa Teresa and Purisima veins are being exploited with the objective of getting better recoveries from the sulphides of these areas.
Silver grades and recoveries during the quarter averaged 114 g/t and 74%, respectively. Lead grades and recoveries averaged 2.12% and 61%, respectively, producing a total of 0.7 million pounds of lead representing a 52% decrease compared to the previous quarter.
Cash cost and AISC per ounce for the quarter were $27.20 and $35.89, respectively, comparable to $27.69 and $37.83 per ounce in the previous quarter.
In the first quarter, a total of 1,032 metres of development were completed compared to 1,824 metres in the fourth quarter. Total exploration metres drilled in the quarter amounted to 993 metres compared to 865 metres of drilling in the previous quarter. One underground rig was active during the quarter and completed six holes in the Selma, Purisima, Pamela and Vania veins.
|
| | |
| |
| First Majestic Silver Corp. 2019 First Quarter Report | Page 16 |
La Guitarra Silver Mine, México State, México
The La Guitarra Silver Mine is located in the Temascaltepec Mining District in the State of México, México, approximately 130 kilometres southwest from México City. The La Guitarra mine covers 39,714 hectares of mining claims and has a 500 tpd flotation processing plant, buildings and related infrastructure. The Company owns 100% of the La Guitarra Silver Mine.
The La Guitarra milling and mining operations were placed under care and maintenance effective August 3, 2018 and the Company is currently reviewing strategic options including the potential sale of the operation. The Company will continue with current permitting activities and remediation programs to prepare the operation for a potential reopening in the future, subject to sufficient improvement in the economic situation to justify a restart of the operation.
Ongoing care and maintenance activities include pumping and de-watering of the underground mine, preparation for closure of tailings dam to prepare for closure and water treatment. Ongoing care and maintenance costs for the mine are expected to average approximately $0.8 million per quarter.
|
| |
| OVERVIEW OF FINANCIAL PERFORMANCE |
For the quarters ended March 31, 2019 and 2018 (in thousands of dollars, except for per share amounts):
|
| | | | | | | | | | | | |
| | | First Quarter | | First Quarter | | | |
| | | 2019 | | 2018 | | Variance % | |
| | | | | | | | |
| Revenues | |
| $86,810 |
| |
| $58,593 |
| | 48 | % | (1) |
| Mine operating costs | | | | | | | |
| Cost of sales | | 59,347 |
| | 39,681 |
| | 50 | % | (2) |
| Depletion, depreciation and amortization | | 17,210 |
| | 19,335 |
| | (11 | )% | (3) |
| | | 76,557 |
| | 59,016 |
| | 30 | % | |
| | | | | | | | |
| Mine operating earnings (loss) | | 10,253 |
| | (423 | ) | | (2,524 | )% | (4) |
| | | | | | | | |
| General and administrative expenses | | 6,500 |
| | 4,868 |
| | 34 | % | (5) |
| Share-based payments | | 2,075 |
| | 2,516 |
| | (18 | )% | |
| Mine care and maintenance costs | | 808 |
| | — |
| | 100 | % | |
| Foreign exchange (gain) loss | | (2,369 | ) | | 2,296 |
| | (203 | )% | (6) |
| Operating earnings (loss) | | 3,239 |
| | (10,103 | ) | | (132 | )% | |
| Investment and other income (loss) | | 2,018 |
| | (1,459 | ) | | (238 | )% | (7) |
| Finance costs | | (3,705 | ) | | (2,459 | ) | | 51 | % | (8) |
| Earnings (loss) before income taxes | | 1,552 |
| | (14,021 | ) | | (111 | )% | |
| Current income tax expense | | 3,464 |
| | 694 |
| | 399 | % | |
| Deferred income tax recovery | | (4,792 | ) | | (9,123 | ) | | (47 | )% | |
| Income tax recovery | | (1,328 | ) | | (8,429 | ) | | (84 | )% | (9) |
| Net earnings (loss) for the period | |
| $2,880 |
| |
| ($5,592 | ) | | (152 | )% | (10) |
| | | | | | | | |
| Earnings (loss) per share (basic and diluted) | |
| $0.01 |
| |
| ($0.03 | ) | | (144 | )% | (10) |
| |
| 1. | Revenues in the quarter increased 48% compared to the same quarter of the previous year primarily attributed to: |
| |
| • | a 60% increase in silver equivalent ounces sold compared to the first quarter of 2018, mainly due to the addition of the San Dimas mine in May 2018, which contributed to an increase of $35.6 million in revenues; and |
| |
| • | smelting and refining costs decreased from $2.7 million ($1.06 per ounce) to $1.5 million ($0.45 per ounce). The savings in smelting and refining costs per ounce were primarily attributed to a higher volume of doré production at San Dimas, as well as lower smelting and refining rates renegotiated in July 2018; |
Partially offset by:
|
| | |
| |
| First Majestic Silver Corp. 2019 First Quarter Report | Page 17 |
| |
| • | a 6% decrease in average realized silver price of $15.73 per ounce compared to $16.76 per ounce in the same quarter of the prior year, which resulted in a decrease in revenues of $6.2 million. |
| |
| 2. | Cost of sales in the quarter increased 50% or $19.7 million compared to the same quarter of the previous year as a result of the following factors: |
| |
| • | the addition of the San Dimas mine which incurred $23.4 million in cost of sales; |
Partially offset by:
| |
| • | a $2.9 million reduction in cost of sales pursuant to the La Guitarra mine being placed on care and maintenance effective August 3, 2018. |
| |
| 3. | Depletion, depreciation and amortization in the quarter decreased $2.1 million or 11% compared to the same quarter of the previous year primarily as a result of: |
| |
| • | a combined $6.8 million reduction at the Del Toro and La Parrilla mines primarily attributed to impairment recognized in the fourth quarter of 2018; and |
| |
| • | a $2.1 million reduction at the La Guitarra mine pursuant to the mine being placed on care and maintenance effective August 3, 2018; |
Partially offset by:
| |
| • | the addition of the San Dimas mine, which added $6.3 million of depletion, depreciation and amortization during the quarter. |
| |
| 4. | Mine operating earnings during the quarter increased by $10.7 million to a mine operating earnings of $10.3 million compared to a loss of $0.4 million in the first quarter of 2018. During the quarter, the San Dimas mine and the Santa Elena mine generated mine operating earnings of $11.2 million and $5.1 million, respectively, offset by small losses at other units due to scaled back production at Del Toro and La Parrilla mines. |
| |
| 5. | General and administrative expenses increased by $1.6 million or 34% during the quarter compared to the same quarter of 2018, primarily attributed to incremental general and administrative costs from the addition of Primero and numerous legal costs associated with the Republic Metals Chapter 11 bankruptcy, Primero APA litigation and regulatory filings. |
| |
| 6. | Foreign exchange gain for the quarter was $2.4 million compared to a loss of $2.3 million in the same quarter of 2018. Foreign exchange gain in the quarter was primarily attributed to a $1.4 million gain on foreign exchange derivatives as well as a 2% stronger Mexican peso related to the Company's peso denominated value added taxes receivable. |
| |
| 7. | Investment and other income in the quarter increased $3.5 million compared to the same quarter of the prior year and related to unrealized mark-to-market adjustment on investment in marketable securities of $1.2 million in the current quarter compared to an unrealized loss of $2.1 million in the same quarter of the prior year. |
| |
| 8. | Finance costs increased by $1.2 million compared to the same quarter of the prior year, primarily attributed to $0.8 million increase in finance costs related to convertible notes, which were issued at the end of January 2018 and incurred only two months of interest in the first quarter of 2018 compared to three full months in the current quarter. |
| |
| 9. | During the quarter, the Company recorded a net income tax recovery of $1.3 million compared to an income tax recovery of $8.4 million in the first quarter of 2018. The decrease in income tax recovery in the quarter was attributed primarily to a decrease in loss before income taxes, partially offset by foreign exchange impact on the Company's Mexican Peso denominated tax balances. |
| |
| 10. | As a result of the foregoing, net earnings for the quarter was $2.9 million (EPS of $0.01) compared to net loss of $5.6 million (EPS of ($0.03)) in the same quarter of the prior year. |
|
| | |
| |
| First Majestic Silver Corp. 2019 First Quarter Report | Page 18 |
|
| |
| SUMMARY OF QUARTERLY RESULTS |
The following table presents selected financial information for each of the most recent eight quarters:
|
| | | | | | | | | | | | | | | | | | | | | | | | | | | |
| | | 2019 | | 2018 | | 2017 |
| Selected Financial Information | | Q1 | | Q4 | Q3 | Q2 | Q1 | | Q4 | Q3 | Q2 |
| Revenue | |
| $86,810 |
| |
| $74,128 |
|
| $88,521 |
|
| $79,687 |
|
| $58,593 |
| |
| $61,165 |
|
| $61,901 |
|
| $60,116 |
|
| Cost of sales | |
| $59,347 |
| |
| $56,230 |
|
| $63,966 |
|
| $59,285 |
|
| $39,681 |
| |
| $39,309 |
|
| $40,290 |
|
| $40,004 |
|
| Depletion, depreciation and amortization | |
| $17,210 |
| |
| $26,925 |
|
| $24,701 |
|
| $22,706 |
|
| $19,335 |
| |
| $20,454 |
|
| $18,436 |
|
| $18,707 |
|
| Mine operating (loss) earnings | |
| $10,253 |
| |
| ($9,027 | ) |
| ($146 | ) |
| ($2,304 | ) |
| ($423 | ) | |
| $1,402 |
|
| $3,175 |
|
| $1,405 |
|
| Net earnings (loss) after tax | |
| $2,880 |
| |
| ($164,443 | ) |
| $5,904 |
|
| ($40,033 | ) |
| ($5,592 | ) | |
| ($56,084 | ) |
| ($1,320 | ) |
| $1,412 |
|
| Earnings (loss) per share - basic | |
| $0.01 |
| |
| ($0.85 | ) |
| $0.03 |
|
| ($0.22 | ) |
| ($0.03 | ) | |
| ($0.34 | ) |
| ($0.01 | ) |
| $0.01 |
|
| Earnings (loss) per share - diluted | |
| $0.01 |
| |
| ($0.85 | ) |
| $0.03 |
|
| ($0.22 | ) |
| ($0.03 | ) | |
| ($0.34 | ) |
| ($0.01 | ) |
| $0.01 |
|
During the first quarter of 2019, mine operating earnings was $10.3 million compared to a net loss of $9.0 million in the previous quarter. The increase in mine operating loss was primarily attributed to a 9% increase in average realized silver price, a decrease in depletion, depreciation and amortization costs, as well as a $7.5 million inventory loss recognized in the previous quarter due to Republic Metal Corp.'s Chapter 11 bankruptcy. Net earnings after tax increased $167.3 million compared to the previous quarter primarily due to an impairment charge of $168.0 million recognized in the fourth quarter of 2018.
|
| |
| LIQUIDITY, CAPITAL RESOURCES AND CONTRACTUAL OBLIGATIONS |
Liquidity
As at March 31, 2019, the Company had cash and cash equivalents of $91.5 million, an increase of $34.4 million during the quarter. The Company's cash and cash equivalents primarily comprised of cash held with reputable financial institutions and is invested in cash accounts and in highly liquid short-term investments with maturities of three months or less. The funds are not exposed to liquidity risk and there are no restrictions on the ability of the Company to use these funds to meet its obligations.
On December 27, 2018, the Company announced it has entered into an At The Market ("ATM") Equity Distribution Agreement pursuant to which the Company may, at its discretion and from time-to-time, sell through an agent, such number of common shares of the Company to an aggregate gross proceeds up to US$50.0 million. The sale of these common shares will be made through “at-the-market distributions” as defined in the Canadian Securities Administrators’ National Instrument 44-102-Shelf Distributions, including sales made directly on the New York Stock Exchange (the “NYSE”), or any other recognized marketplace upon which the common shares are listed or quoted or where the common shares are traded in the United States.
During the three months ended March 31, 2019, First Majestic sold 5,250,000 common shares of the Company under the ATM program at an average price of $6.34 per share for gross proceeds of $33.6 million, or net proceeds of $32.5 million after costs.
|
| | |
| |
| First Majestic Silver Corp. 2019 First Quarter Report | Page 19 |
The following table summarizes the Company's cash flow activity during the period:
|
| | | | | | | | |
| | | Three Months Ended March 31, |
| | | 2019 | | 2018 |
| Cash flow | | | | |
| Cash generated by operating activities | | 32,715 |
| | 9,871 |
|
| Cash used in investing activities | | (29,007 | ) | | (23,734 | ) |
| Cash generated by financing activities | | 30,305 |
| | 145,941 |
|
| Increase in cash and cash equivalents | | 34,013 |
| | 132,078 |
|
| Effect of exchange rate on cash and cash equivalents held in foreign currencies | | 431 |
| | (980 | ) |
| Cash and cash equivalents, beginning of the period | | 57,013 |
| | 118,141 |
|
| Cash and cash equivalents, end of period | |
| $91,457 |
| |
| $249,239 |
|
The Company’s cash flows from operating, investing and financing activities during the three months ended March 31, 2019 are summarized as follows:
| |
| • | Cash provided from operating activities of $32.7 million, primarily due to: |
| |
| • | $23.7 million in operating cash flows from operating activities before movements in working capital and taxes; and |
| |
| • | a $9.8 million decrease in value added taxes receivable as the Mexican tax authorities have made good progress in releasing payment for San Dimas filings that were in arrears. |
| |
| • | Cash used in investing activities of $29.0 million, primarily related to: |
| |
| • | $19.8 million spent on mine development and exploration activities; |
| |
| • | $10.1 million spent on purchase of property, plant and equipment; and |
| |
| • | $0.6 million spent on deposits on non-current assets; and |
| |
| • | Cash provided from financing activities of $30.3 million, primarily consists of the following: |
•$32.5 million of net proceeds from the issuance of the ATM;
•$1.2 million of net proceeds from the exercise of stock options;
net of:
•$2.3 million payment of financing costs; and
•$1.0 million on repayment of lease obligations.
Working capital as at March 31, 2019 was $130.9 million compared to $108.1 million at December 31, 2018. Total available liquidity at March 31, 2019 was $185.9 million (see page 30), including $55.0 million of undrawn revolving credit facility.
Capital Resources
The Company’s objective when managing capital is to maintain financial flexibility to continue as a going concern while optimizing growth and maximizing returns of investments from shareholders.
The Company monitors its capital structure and based on changes in operations and economic conditions, may adjust the structure by repurchasing shares, issuing new shares, issuing new debt or retiring existing debt. The Company prepares annual budget and quarterly forecasts to facilitate the management of its capital requirements. The annual budget is approved by the Company’s Board of Directors.
The Company is not subject to any externally imposed capital requirements with the exception of complying with banking covenants defined in its debt facilities. As at March 31, 2019 and December 31, 2018, the Company was fully in compliance with these covenants.
|
| | |
| |
| First Majestic Silver Corp. 2019 First Quarter Report | Page 20 |
Contractual Obligations and Commitments
As at March 31, 2019, the Company’s contractual obligations and commitments are summarized as follows:
|
| | | | | | | | | | | | | | | | | | | |
| | Contractual | | Less than | | 1 to 3 | | 4 to 5 | | After 5 |
| | Cash Flows | | 1 year | | years | | years | | years |
| Trade and other payables |
| $49,424 |
| |
| $49,424 |
| |
| $— |
| |
| $— |
| |
| $— |
|
| Debt facilities | 191,735 |
| | 4,628 |
| | 27,673 |
| | 159,434 |
| | — |
|
| Equipment financing obligations | 10,392 |
| | 4,552 |
| | 4,478 |
| | 1,362 |
| | — |
|
| Other liabilities | 3,985 |
| | — |
| | — |
| | — |
| | 3,985 |
|
| Purchase obligations and commitments | 14,209 |
| | 13,509 |
| | 700 |
| | — |
| | — |
|
| |
| $269,745 |
| |
| $72,113 |
| |
| $32,851 |
| |
| $160,796 |
| |
| $3,985 |
|
Management is of the view that the above contractual obligations and commitments will be sufficiently funded by current working capital, future operating cash flows, and available debt facilities as at the date of this MD&A.
|
| |
| MANAGEMENT OF RISKS AND UNCERTAINTIES |
|
|
| The Company thoroughly examines the various financial instruments and risks to which it is exposed and assesses the impact and likelihood of those risks. These risks may include credit risk, liquidity risk, currency risk, commodity price risk, and interest rate risk. Where material, these risks are reviewed and monitored by the Board of Directors. |
| |
| Credit Risk |
| |
| Credit risk is the risk of financial loss if a customer or counterparty fails to meet its contractual obligations. The Company’s credit risk relates primarily to trade receivables in the ordinary course of business, value added taxes receivable and other receivables. |
| |
| As at March 31, 2019, value added taxes receivable was $49.9 million (2018 - $59.7 million), majority of which relates to Primero Empresa Minera, S.A. de C.V. ("PEM") due to filings in arrears when First Majestic acquired the entity. Since acquisition, the Company has accelerated its filings and reduced PEM's VAT receivables from $33.0 million to $27.6 million. The Company continues supplying additional information requested by the Servicio de Administración Tributaria (“SAT”) in response to the review process and the Company fully expects the amounts to be refunded in the future. |
| |
| The Company sells and receives payment upon delivery of its silver doré and by-products primarily through three international customers. Silver-lead concentrates and related base metal by-products are sold primarily through three international customers. All of the Company's customers have good ratings and payments of receivables are scheduled, routine and fully received within 60 days of submission; therefore, the balance of trade receivables owed to the Company in the ordinary course of business is not significant. |
| |
| The carrying amount of financial assets recorded in the consolidated financial statements represents the Company’s maximum exposure to credit risk. With the exception to the above, the Company believes it is not exposed to significant credit risk. |
|
|
| Liquidity Risk |
| |
| Liquidity risk is the risk that the Company will not be able to meet its financial obligations as they arise. The Company has in place a planning and budgeting process to help determine the funds required to support the Company’s normal operating requirements and contractual obligations. |
|
| | | | |
| Based on the Company's current operating plan, the Company believes it has sufficient cash on hand, combined with cash flows from operations, to meet operating requirements as they arise for at least the next 12 months. If commodity prices in the metal markets were to decrease significantly, or the Company was to deviate significantly from its operating plan, the Company may need further injection of capital to address its cash flow requirements. |
|
| | |
| |
| First Majestic Silver Corp. 2019 First Quarter Report | Page 21 |
|
|
| Currency Risk |
| |
| The Company is exposed to foreign exchange risk primarily relating to financial instruments that are denominated in Canadian dollars or Mexican pesos, which would impact the Company’s net earnings or loss. To manage foreign exchange risk, the Company may occasionally enter into short-term foreign currency derivatives. The foreign currency derivatives are not designated as hedging instruments for accounting purposes. |
The sensitivity of the Company’s net earnings or loss and comprehensive income or loss due to changes in the exchange rate between the Canadian dollar and the Mexican peso against the U.S. dollar is included in the table below:
|
| | | | | | | | | | | | | | | | | | | | | | | | | | | | | | | |
| | March 31, 2019 | |
| | Cash and cash equivalents |
| | Trade and other receivables |
| | Value added taxes receivable |
| | Other financial assets |
| | Trade and other payables |
| | Foreign exchange derivative |
| | Net assets (liabilities) exposure |
| | Effect of +/- 10% change in currency |
|
| Canadian dollar |
| $8,204 |
| |
| $70 |
| |
| $— |
| |
| $3,958 |
| |
| ($2,098 | ) | |
| $— |
| |
| $10,134 |
| |
| $1,013 |
|
| Mexican peso | 8,172 |
| | — |
| | 42,853 |
| | — |
| | (29,949 | ) | | 35,500 |
| | 56,576 |
| | 5,658 |
|
| |
| $16,376 |
| |
| $70 |
| |
| $42,853 |
| |
| $3,958 |
| |
| ($32,047 | ) | |
| $35,500 |
| |
| $66,710 |
| |
| $6,671 |
|
Commodity Price Risk
|
|
| The Company is exposed to commodity price risk on silver, gold, lead and zinc, which have a direct and immediate impact on the value of its related financial instruments and net earnings. The Company’s revenues are directly dependent on commodity prices that have shown volatility and are beyond the Company’s control. The Company does not use derivative instruments to hedge its commodity price risk to silver. |
The following table summarizes the Company’s exposure to commodity price risk and their impact on net earnings:
|
| | | | | | | | | | | | | | | | | | | |
| | | | | | | | March 31, 2019 | |
| | Effect of +/- 10% change in metal prices | |
| | Silver |
| | Gold |
| | Lead |
| | Zinc |
| | Total |
|
| Metals subject to provisional price adjustments |
| $161 |
| |
| $— |
| |
| $84 |
| |
| $124 |
| |
| $369 |
|
| Metals in doré and concentrates inventory | 35 |
| | 143 |
| | 16 |
| | 25 |
| | 219 |
|
| |
| $196 |
| |
| $143 |
| |
| $100 |
| |
| $149 |
| |
| $588 |
|
Political and Country Risk
First Majestic currently conducts foreign operations primarily in México, and as such the Company’s operations are exposed to various levels of political and economic risks by factors outside of the Company’s control. These potential factors include, but are not limited to: royalty and tax increases or claims by governmental bodies, expropriation or nationalization, foreign exchange controls, high rates of inflation, extreme fluctuations in foreign currency exchange rates, import and export tariffs and regulations, cancellation or renegotiation of contracts and environmental and permitting regulations. The Company currently has no political risk insurance coverage against these risks.
The Company is unable to determine the impact of these risks on its future financial position or results of operations. Changes, if any, in mining or investment policies or shifts in political attitude in foreign countries may substantively affect the Company’s exploration, development and production activities.
Uncertainty in the Calculation of Mineral Reserves, Resources and Silver Recovery
There is a degree of uncertainty attributable to the calculation of Mineral Reserves and Mineral Resources (as defined in NI 43-101). Until Mineral Reserves or Mineral Resources are actually mined, extracted and processed, the quantity of minerals and their grades must be considered estimates only. In addition, the quantity of Mineral Reserves and Mineral Resources may vary depending on, among other things, applicable metal prices. Any material change in the quantity of Mineral Reserves, Mineral Resources, grade or mining widths may affect the economic viability of some or all of the Company’s mineral properties and may have a material adverse effect on the Company's operational results and financial condition. Mineral Reserves on the Company’s properties have been calculated on the basis of economic factors at the time of calculation; variations in such factors may have an impact on the amount of the Company’s Mineral Reserves. In addition, there can be no assurance that silver
|
| | |
| |
| First Majestic Silver Corp. 2019 First Quarter Report | Page 22 |
recoveries or other metal recoveries in small scale laboratory tests will be duplicated in larger scale tests under on-site conditions or during production, or that the existing known and experienced recoveries will continue.
Environmental and Health and Safety Risks
The Company’s activities are subject to extensive laws and regulations governing environmental protection and employee health and safety. Environmental laws and regulations are complex and have tended to become more stringent over time. The Company is required to obtain governmental permits and in some instances air, water quality, and mine reclamation rules and permits. The Company has complied with environmental taxes applied to the use of certain fossil fuels according to the Kyoto Protocol. Although the Company makes provisions for reclamation costs, it cannot be assured that these provisions will be adequate to discharge its future obligations for these costs. Failure to comply with applicable environmental and health and safety laws may result in injunctions, damages, suspension or revocation of permits and imposition of penalties. While the health and safety of our people and responsible environmental stewardship are our top priorities, there can be no assurance that First Majestic has been or will be at all times in complete compliance with such laws, regulations and permits, or that the costs of complying with current and future environmental and health and safety laws and permits will not materially and adversely affect the Company’s business, results of operations or financial condition.
Claims and Legal Proceedings Risks
The Company is subject to various claims and legal proceedings covering a wide range of matters that arise in the ordinary course of business activities. Many factors, both known and unknown, could cause actual results, performance or achievements to be materially different from the results, performance or achievements that are or may be expressed or implied by such forward-looking statements or information and the Company has made assumptions and estimates based on or related to many of these factors. Such factors include, without limitation: availability of time on court calendars in Canada and elsewhere; the recognition of Canadian judgments under Mexican law; the possibility of settlement discussions; the risk of appeal of judgment; and the insufficiency of the defendant’s assets to satisfy the judgment amount. Each of these matters is subject to various uncertainties and it is possible that some of these matters may be resolved unfavourably to the Company. First Majestic carries liability insurance coverage and establishes provisions for matters that are probable and can be reasonably estimated. In addition, the Company may be involved in disputes with other parties in the future which may result in a significant impact on our financial condition, cash flow and results of operations.
Although the Company has taken steps to verify ownership and legal title to mineral properties in which it has an interest, according to the usual industry standards for the stage of mining, development and exploration of such properties, these procedures do not guarantee the Company’s title. Such properties may be subject to prior agreements or transfers, and title may be affected by undetected defects. However, management is not aware of any such agreements, transfers or defects.
In April 2013, the Company received a positive judgment on the First Silver litigation from the Supreme Court of British Columbia (the “Court”), which awarded the sum of $93.8 million in favour of First Majestic against Hector Davila Santos (the “Defendant”). The Company received a sum of $14.1 million in June 2013 as partial payment of the judgment, leaving an unpaid amount of approximately $59.7 million (CAD$81.5 million). As part of the ruling, the Court granted orders restricting any transfer or encumbrance of the Bolaños Mine by the Defendant and limiting mining at the Bolaños Mine. The orders also require that the Defendant to preserve net cash flow from the Bolaños Mine in a holding account and periodically provide to the Company certain information regarding the Bolaños Mine. However, there can be no guarantee that the remainder of the judgment amount will be collected and it is likely that it will be necessary and the Company is taking additional action in Mexico and/or elsewhere to attempt to recover the balance. Therefore, as at March 31, 2019, the Company has not accrued any of the remaining $59.7 million (CAD$81.5 million) unrecovered judgment in favour of the Company.
Primero Tax Rulings
Since Primero acquired the San Dimas Mine in August 2010, it has had a Silver Purchase Agreement (“Old Stream Agreement”) that required Primero Empresa Minera, S.A. de C.V. ("PEM") to sell 100% of the silver produced from the San Dimas to WPMI, up to 6 million ounces and 50% of silver produced thereafter, at the lower of: (i) the spot market price and (ii) $4.04 per ounce plus an annual increase of 1%.
In order to reflect commercial realities and the effects of the Old Stream Agreement, for Mexican income tax purposes, PEM recognized the revenue on these silver sales based on its actual realized revenue (“PEM Realized Price”) instead of at spot market prices.
|
| | |
| |
| First Majestic Silver Corp. 2019 First Quarter Report | Page 23 |
To obtain assurances that the Servicio de Administración Tributaria (“SAT”) would accept the PEM Realized Price as the proper price to use to calculate Mexican income taxes, Primero applied for and received an Advance Pricing Agreement (“APA”) from the SAT. The APA confirmed that the PEM Realized Price would be used as Primero’s basis for calculating taxes owed by Primero on the silver sold under the Old Stream Agreement. Primero believed that the function of an APA was to provide tax certainty and as a result made significant investments in Mexico based on that certainty. On October 4, 2012, Primero received the APA Ruling from SAT which confirmed the appropriate price for sales of silver under the Old Stream Agreement. Under Mexican tax law, an APA ruling is generally applicable for up to a five year period which made this ruling effective retrospectively from 2010 to 2014.
In February 2016, PEM received a legal claim from the SAT seeking retroactively to nullify the APA. The legal claim initiated does not identify any different basis for paying taxes, nor have any tax reassessments been received from SAT. The Company intends to continue Primero's effort to vigorously defend the validity of its APA. If the SAT were successful in retroactively nullifying the APA, the SAT may seek to audit and reassess Primero in respect of its sales of silver in connection with the Old Stream Agreement for 2010 through 2014. If the SAT is successful in retroactively nullifying the APA and issuing reassessments, it would likely have a material adverse effect on the Company’s results of operations, financial condition and cash flows. PEM would have rights of appeal in connection with any reassessments.
In June 2017 and October 2017, as part of the ongoing annual audits of the PEM tax returns, the SAT issued observations letters for the 2010 and 2011 tax years, respectively. Observations letters are issued to a taxpayer in advance of a reassessment being issued and provide an outline of the SAT’s position on matters under audit, and affords the taxpayer an opportunity to respond to such position in advance of the reassessment being issued. In the observations letters issued to PEM, the SAT made explicit its view that PEM should pay taxes based on the market price of silver. As the Company continues to defend the APA in the Mexican legal proceeding, the APA remains valid and the Company will vigorously dispute any reassessment that may be issued in the future on a basis that assesses taxes on PEM’s historical silver revenues that is inconsistent with the APA. The observations letter does not represent a tax reassessment and no liability has been recognized in the financial statements. Based on the Company’s assessments, the Company believes Primero’s filings were appropriate and continues to believe its tax filing position based upon the APA is correct. Should the Company ultimately be required to pay tax on its silver revenues based on market prices without any mitigating adjustments, the incremental income tax for the years 2010-2018 would be approximately $185 million, before interest or penalties.
While the Company continues to vigorously defend the validity of the APA and its transfer pricing position, it is also engaging in dialogue with the SAT seeking to resolve matters and bring tax certainty through a negotiated solution. Since January 1, 2015, PEM has recorded its revenue from the sale of silver for purposes of Mexican tax accounting in a manner consistent with the APA, on the basis that the applicable facts and laws have not changed. The Company’s legal and financial advisors continue to believe that the Company has filed its tax returns compliant with applicable Mexican law. Due to the uncertainty in timing of resolution to this matter, which may take more than one year, the Company has classified its income taxes receivable of $19.0 million as non-current as at March 31, 2019.
To the extent the SAT determines that the appropriate price of silver sales under the Silver Purchase Agreement is significantly different from the realized price and while PEM would have rights of appeal in connection with any reassessments, it is likely to have a material adverse effect on the Company’s business, financial position and results of operations.
Primero Class Action Suit
In July 2016, Primero and certain of its officers were served with a class action lawsuit that was filed in federal court in the State of California seeking to recover damages for investors in the Company’s common shares under the U.S. federal securities laws. Primero filed a motion to dismiss this action which was granted on January 30, 2017. The plaintiff’s claims were dismissed without prejudice and the plaintiffs filed an amended complaint on February 27, 2017. On July 14, 2017 the Company’s motion to dismiss the amended complaint was granted and the plaintiffs’ claims were dismissed without prejudice. Rather than amend the complaint again, the plaintiffs asked the federal court to enter final judgment and initiated an appeal of the dismissal to the Ninth Circuit Court of Appeals on September 8, 2017 which was heard in appeals court on March 18, 2019. The parties have made their appearances, filed their briefs in this appeal, and a ruling on the appeal is expected sometime in the second or third quarter of 2019. The Company continues to vigorously defend this class action lawsuit on behalf of Primero and no liability has been recognized in the financial statements.
|
| | |
| |
| First Majestic Silver Corp. 2019 First Quarter Report | Page 24 |
|
| |
| OTHER FINANCIAL INFORMATION |
Share Repurchase Program
The Company has an ongoing share repurchase program to repurchase up to 5% of the Company’s issued and outstanding shares. The normal course issuer bids will be carried through the facilities of the Toronto Stock Exchange and alternative Canadian marketplaces.
During the year ended December 31, 2018, the Company repurchased and cancelled 230,000 common shares for a total consideration of $1.3 million through a normal course issuer bid in the open market as approved by the Toronto Stock Exchange. No shares were repurchased during the three months ended March 31, 2019
Off-Balance Sheet Arrangements
At March 31, 2019, the Company had no material off-balance sheet arrangements such as contingent interest in assets transferred to an entity, derivative instruments obligations or any obligations that generate financing, liquidity, market or credit risk to the Company, other than contingent liabilities and vendor liability and interest, as disclosed in this MD&A and the consolidated financial statements and the related notes.
Related Party Disclosures
Amounts paid to related parties were incurred in the normal course of business and measured at the exchange amount, which is the amount agreed upon by the transacting parties and on terms and conditions similar to non-related parties. There were no transactions with related parties outside of the ordinary course of business during the three months ended March 31, 2019.
Outstanding Share Data
As at the date on which this MD&A was approved and authorized for issue by the Board of Directors, the Company has 200,547,707 common shares issued and outstanding.
|
| |
| ACCOUNTING POLICIES, JUDGMENTS AND ESTIMATES |
Critical Accounting Judgments and Estimates
The preparation of consolidated financial statements in conformity with IFRS as issued by IASB requires management to make judgments, estimates and assumptions about future events that affect the reported amounts of assets and liabilities at the date of the financial statements and the reported amounts of revenue and expenses during the reporting period. Although these estimates are based on management’s best knowledge of the amount, events or actions, actual results may differ from these estimates. With the exception of the adoption of IFRS 16 - "Leases" as outlined in Note 2 and Note 3 of the Company's condensed interim consolidated financial statements for the three months ended March 31, 2019, there were no changes in critical accounting judgments and estimates that were significantly different from those disclosed in the Company’s annual MD&A as at and for the year ended December 31, 2018.
The Company has included certain non-GAAP measures including “Cash costs per ounce”, “Production cost per tonne”, “All-in sustaining costs per ounce”, “Average realized silver price”, “Adjusted earnings per share”, “Cash flow per share” and "Working capital” to supplement its consolidated financial statements, which are presented in accordance with IFRS. The terms IFRS and generally accepted accounting principles (“GAAP”) are used interchangeably throughout this MD&A.
The Company believes that these measures, together with measures determined in accordance with IFRS, provide investors with an improved ability to evaluate the underlying performance of the Company. Non-GAAP measures do not have any standardized meaning prescribed under IFRS, and therefore they may not be comparable to similar measures employed by other companies. The data is intended to provide additional information and should not be considered in isolation or as a substitute for measures of performance prepared in accordance with IFRS.
|
| | |
| |
| First Majestic Silver Corp. 2019 First Quarter Report | Page 25 |
Cash Cost per Ounce, All-In Sustaining Cost per Ounce and Production Cost per Tonne
Cash costs per ounce and total production cost per tonne are non-GAAP measures used by the Company to manage and evaluate operating performance at each of the Company’s operating mining units, and are widely reported in the mining industry as benchmarks for performance, but do not have a standardized meaning and are disclosed in addition to IFRS measures.
All-in sustaining cost (“AISC”) is a non-GAAP measure and was calculated based on guidance provided by the World Gold Council (“WGC”). WGC is not a regulatory industry organization and does not have the authority to develop accounting standards for disclosure requirements. Other mining companies may calculate AISC differently as a result of differences in underlying accounting principles and policies applied, as well as differences in definitions of sustaining versus expansionary capital expenditures. AISC is a more comprehensive measure than cash cost per ounce for the Company’s consolidated operating performance by providing greater visibility, comparability and representation of the total costs associated with producing silver from its current operations.
The Company defines sustaining capital expenditures as, “costs incurred to sustain and maintain existing assets at current productive capacity and constant planned levels of productive output without resulting in an increase in the life of assets, future earnings, or improvements in recovery or grade. Sustaining capital includes costs required to improve/enhance assets to minimum standards for reliability, environmental or safety requirements. Sustaining capital expenditures excludes all expenditures at the Company’s new projects and certain expenditures at current operations which are deemed expansionary in nature.”
Expansionary capital expenditure is defined as, "costs incurred to extend existing assets beyond their current productive capacity and beyond their planned levels of productive output, resulting in an increase in the life of the assets, increasing their future earnings potential, or improving their recoveries or grades which would serve to increase the value of the assets over their useful lives". Development and exploration work which moves inferred resources to measured or indicated resources and adds to the Net Present Value of the assets is considered expansionary in nature. Expansionary capital also includes costs required to improve/enhance assets beyond their minimum standard for reliability, environmental or safety requirements.
Consolidated AISC includes total production cash costs incurred at the Company’s mining operations, which forms the basis of the Company’s total cash costs. Additionally, the Company includes sustaining capital expenditures, corporate general and administrative expense, share-based payments, operating lease payments and reclamation cost accretion. AISC by mine does not include certain corporate and non-cash items such as general and administrative expense and share-based payments. The Company believes this measure represents the total sustainable costs of producing silver from current operations, and provides additional information of the Company’s operational performance and ability to generate cash flows. As the measure seeks to reflect the full cost of silver production from current operations, new project and expansionary capital at current operations are not included. Certain other cash expenditures, including tax payments, dividends and financing costs are also not included.
|
| | |
| |
| First Majestic Silver Corp. 2019 First Quarter Report | Page 26 |
The following tables provide detailed reconciliations of these measures to cost of sales, as reported in notes to our consolidated financial statements.
|
| | | | | | | | | | | | | | | | | | | | | |
| (expressed in thousands of U.S. dollars, | Three Months Ended March 31, 2019 |
| except ounce and per ounce amounts) | San Dimas | Santa Elena | La Encantada | La Parrilla | Del Toro | San Martin | Consolidated |
| Mining cost |
| $7,986 |
|
| $4,274 |
|
| $1,987 |
|
| $2,318 |
|
| $892 |
|
| $1,891 |
|
| $19,348 |
|
| Milling cost | 4,802 |
| 5,964 |
| 4,719 |
| 1,867 |
| 666 |
| 1,775 |
| 19,793 |
|
| Indirect cost | 7,159 |
| 2,196 |
| 2,114 |
| 1,386 |
| 832 |
| 1,329 |
| 15,017 |
|
| Total production cost (A) |
| $19,947 |
|
| $12,434 |
|
| $8,821 |
|
| $5,570 |
|
| $2,389 |
|
| $4,996 |
|
| $54,157 |
|
| Add: transportation and other selling cost | 317 |
| 76 |
| 68 |
| 190 |
| 50 |
| 53 |
| 807 |
|
| Add: smelting and refining cost | 349 |
| 153 |
| 163 |
| 588 |
| 136 |
| 85 |
| 1,474 |
|
| Add: environmental duty and royalties cost | 168 |
| 93 |
| 23 |
| 15 |
| 7 |
| 30 |
| 336 |
|
| Total cash cost before by-product credits (B) |
| $20,781 |
|
| $12,756 |
|
| $9,075 |
|
| $6,363 |
|
| $2,582 |
|
| $5,164 |
|
| $56,774 |
|
| Deduct by-product credits attributed to: | |
|
|
|
|
|
|
Gold by-product credits(1) | (19,469 | ) | (11,105 | ) | (25 | ) | (28 | ) | — |
| (1,404 | ) | (32,031 | ) |
| Lead by-product credits | — |
| — |
| — |
| (1,698 | ) | (831 | ) | — |
| (2,529 | ) |
| Zinc by-product credits | — |
| — |
| — |
| (1,235 | ) | — |
| — |
| (1,235 | ) |
| Total by-product credits |
| ($19,469 | ) |
| ($11,105 | ) |
| ($25 | ) |
| ($2,961 | ) |
| ($831 | ) |
| ($1,404 | ) |
| ($35,795 | ) |
| Total cash cost (C) |
| $1,312 |
|
| $1,651 |
|
| $9,050 |
|
| $3,402 |
|
| $1,751 |
|
| $3,760 |
|
| $20,979 |
|
| Workers’ participation | 1,226 |
| 66 |
| 78 |
| 75 |
| 68 |
| 81 |
| 1,595 |
|
| General and administrative expenses | — |
| — |
| — |
| — |
| — |
| — |
| 6,046 |
|
| Share-based payments | — |
| — |
| — |
| — |
| — |
| — |
| 2,075 |
|
| Accretion of decommissioning liabilities | 186 |
| 52 |
| 148 |
| 71 |
| 55 |
| 60 |
| 605 |
|
| Sustaining capital expenditures | 5,196 |
| 1,932 |
| 566 |
| 1,693 |
| 412 |
| 1,270 |
| 11,137 |
|
| Operating lease payments | 18 |
| 33 |
| 12 |
| 17 |
| 25 |
| 19 |
| 292 |
|
| All-In Sustaining Costs (D) |
| $7,938 |
|
| $3,734 |
|
| $9,854 |
|
| $5,258 |
|
| $2,311 |
|
| $5,190 |
|
| $42,729 |
|
| Payable silver ounces produced (E) | 1,403,752 |
| 586,608 |
| 718,075 |
| 205,228 |
| 64,369 |
| 331,207 |
| 3,309,239 |
|
| Tonnes milled (F) | 163,264 |
| 219,941 |
| 269,611 |
| 72,551 |
| 25,138 |
| 62,148 |
| 812,654 |
|
| | | | | | | | |
| Total cash cost per ounce, before by-product credits (B/E) |
| $14.80 |
|
| $21.74 |
|
| $12.64 |
|
| $31.01 |
|
| $40.12 |
|
| $15.59 |
|
| $17.16 |
|
| Total cash cost per ounce (C/E) |
| $0.93 |
|
| $2.81 |
|
| $12.60 |
|
| $16.58 |
|
| $27.20 |
|
| $11.35 |
|
| $6.34 |
|
| All-in sustaining cost per ounce (D/E) |
| $5.65 |
|
| $6.37 |
|
| $13.72 |
|
| $25.62 |
|
| $35.89 |
|
| $15.67 |
|
| $12.91 |
|
| Production cost per tonne (A/F) |
| $122.17 |
|
| $56.53 |
|
| $32.71 |
|
| $76.78 |
|
| $95.06 |
|
| $80.39 |
|
| $66.65 |
|
|
| |
| First Majestic Silver Corp. 2019 First Quarter Report | Page 27 |
|
| | | | | | | | | | | | | | | | | | | | | |
| (expressed in thousands of U.S. dollars, | Three Months Ended March 31, 2018 |
| except ounce and per ounce amounts) | Santa Elena | La Encantada | San Martin | La Parrilla | Del Toro | La Guitarra | Consolidated |
| Mining cost |
| $4,130 |
|
| $1,283 |
|
| $1,990 |
|
| $2,327 |
|
| $1,693 |
|
| $850 |
|
| $12,272 |
|
| Milling cost | 5,713 |
| 4,401 |
| 1,714 |
| 2,116 |
| 1,619 |
| 708 |
| 16,270 |
|
| Indirect cost | 2,296 |
| 1,774 |
| 1,425 |
| 1,578 |
| 1,324 |
| 1,022 |
| 9,420 |
|
| Total production cost (A) |
| $12,139 |
|
| $7,458 |
|
| $5,130 |
|
| $6,020 |
|
| $4,636 |
|
| $2,580 |
|
| $37,962 |
|
| Add: transportation and other selling cost | 136 |
| 43 |
| 114 |
| 266 |
| 153 |
| 139 |
| 902 |
|
| Add: smelting and refining cost | 121 |
| 96 |
| 101 |
| 1,043 |
| 1,075 |
| 224 |
| 2,660 |
|
| Add: environmental duty and royalties cost | 119 |
| 14 |
| 48 |
| 31 |
| 21 |
| 22 |
| 255 |
|
| Total cash cost before by-product credits (B) |
| $12,515 |
|
| $7,610 |
|
| $5,393 |
|
| $7,360 |
|
| $5,885 |
|
| $2,965 |
|
| $41,779 |
|
| Deduct by-product credits attributed to: | | | | | | | |
| Gold by-product credits | (14,986 | ) | (31 | ) | (1,505 | ) | (249 | ) | — |
| (1,919 | ) | (18,690 | ) |
| Lead by-product credits | — |
| — |
| — |
| (1,613 | ) | (2,824 | ) | — |
| (4,437 | ) |
| Zinc by-product credits | — |
| — |
| — |
| (2,019 | ) | — |
| — |
| (2,019 | ) |
| Total by-product credits |
| ($14,986 | ) |
| ($31 | ) |
| ($1,505 | ) |
| ($3,881 | ) |
| ($2,824 | ) |
| ($1,919 | ) |
| ($25,146 | ) |
| Total cash cost (C) |
| ($2,471 | ) |
| $7,579 |
|
| $3,888 |
|
| $3,479 |
|
| $3,061 |
|
| $1,046 |
|
| $16,633 |
|
| Workers’ participation | 44 |
| 80 |
| 39 |
| 81 |
| 76 |
| 21 |
| 341 |
|
| General and administrative expenses | — |
| — |
| — |
| — |
| — |
| — |
| 4,681 |
|
| Share-based payments | — |
| — |
| — |
| — |
| — |
| — |
| 2,516 |
|
| Accretion of decommissioning liabilities | 57 |
| 70 |
| 53 |
| 63 |
| 54 |
| 32 |
| 329 |
|
| Sustaining capital expenditures | 2,279 |
| 1,660 |
| 847 |
| 1,954 |
| 1,425 |
| 970 |
| 9,482 |
|
| All-In Sustaining Costs (D) |
| ($91 | ) |
| $9,389 |
|
| $4,827 |
|
| $5,577 |
|
| $4,616 |
|
| $2,069 |
|
| $33,982 |
|
| Payable silver ounces produced (E) | 521,262 |
| 447,724 |
| 483,256 |
| 315,745 |
| 223,981 |
| 131,264 |
| 2,123,233 |
|
| Tonnes milled (F) | 223,498 |
| 276,191 |
| 75,374 |
| 125,114 |
| 79,769 |
| 29,829 |
| 809,775 |
|
| | | | | | | | |
| Total cash cost per ounce, before by-product credits (B/E) |
| $24.01 |
|
| $17.00 |
|
| $11.16 |
|
| $23.31 |
|
| $26.27 |
|
| $22.60 |
|
| $19.68 |
|
| Total cash cost per ounce (C/E) |
| ($4.74 | ) |
| $16.93 |
|
| $8.04 |
|
| $11.02 |
|
| $13.66 |
|
| $7.97 |
|
| $7.83 |
|
| All-in sustaining cost per ounce (D/E) |
| ($0.17 | ) |
| $20.97 |
|
| $9.98 |
|
| $17.66 |
|
| $20.61 |
|
| $15.76 |
|
| $16.01 |
|
| Production cost per tonne (A/F) |
| $54.31 |
|
| $27.00 |
|
| $68.06 |
|
| $48.12 |
|
| $58.12 |
|
| $86.50 |
|
| $46.88 |
|
|
| |
| First Majestic Silver Corp. 2019 First Quarter Report | Page 28 |
Average Realized Silver Price per Ounce
Revenues are presented as the net sum of invoiced revenues related to delivered shipments of silver doré bars and concentrates, including associated metal by-products of gold, lead and zinc after having deducted refining and smelting charges, and after elimination of intercompany shipments of silver, silver being minted into coins, ingots and bullion products.
The following is an analysis of the gross revenues prior to refining and smelting charges, and shows deducted smelting and refining charges to arrive at the net reportable revenue for the period per IFRS. Gross revenues are divided into payable equivalent silver ounces sold to calculate the average realized price per ounce of silver equivalents sold.
|
| | | | | | | |
| | Three Months Ended March 31, |
| | 2019 | | 2018 |
| Revenues as reported |
| $86,810 |
| |
| $58,593 |
|
| Add back: smelting and refining charges | 1,473 |
| | 2,660 |
|
| Gross revenues | 88,283 |
| | 61,253 |
|
| Less: Sandstorm gold revenues | (682 | ) | | (1,222 | ) |
| Less: Wheaton gold revenues | (6,906 | ) | | — |
|
| Gross revenues, excluding Sandstorm, Wheaton (A) |
| $80,695 |
| |
| $60,031 |
|
| | | | |
| Payable equivalent silver ounces sold | 6,061,389 |
| | 3,798,412 |
|
| Less: Payable equivalent silver ounces sold to Sandstorm | (127,257 | ) | | (217,004 | ) |
| Less: Payable equivalent silver ounces sold to Wheaton | (805,727 | ) | | — |
|
Payable equivalent silver ounces sold, excluding Sandstorm and Wheaton (B) | 5,128,405 |
| | 3,581,408 |
|
| | | | |
Average realized price per ounce of silver sold (A/B)(1) |
| $15.73 |
| |
| $16.76 |
|
| Average market price per ounce of silver per COMEX |
| $15.55 |
| |
| $16.69 |
|
| |
| (1) | Average realized price per ounce of silver sold in each reporting period is affected by mark-to-market adjustments and final settlements on concentrate shipments in prior periods. Concentrates sold to third-party smelters are provisionally priced and the price is not settled until a predetermined future date, typically one month after delivery to the customer, based on the market price at that time. The mark-to-market adjustments do not apply to doré sales. |
Cash Flow per Share
Cash Flow per Share is determined based on operating cash flows before movements in working capital and income taxes, as illustrated in the consolidated statements of cash flow, divided by the weighted average shares outstanding during the period. |
| | | | | | | |
| | Three Months Ended March 31, |
| | 2019 | | 2018 |
| Operating Cash Flows before Working Capital and Taxes |
| $23,705 |
| |
| $15,641 |
|
| Weighted average number of shares on issue - basic | 195,832,712 |
| | 165,819,786 |
|
| Cash Flow per Share |
| $0.12 |
| |
| $0.09 |
|
Adjusted Earnings per Share (“Adjusted EPS”)
The Company uses the financial measure “Adjusted EPS” to supplement information in its consolidated financial statements. The Company believes that, in addition to conventional measures prepared in accordance with IFRS, the Company and certain investors and analysts use this information to evaluate the Company’s performance. The Company excludes non-cash and unusual items from net earnings to provide a measure which allows the Company and investors to evaluate the operating results of the underlying core operations. The presentation of Adjusted EPS is not meant to be a substitute for EPS presented in accordance with IFRS, but rather should be evaluated in conjunction with such IFRS measure.
|
| | |
| |
| First Majestic Silver Corp. 2019 First Quarter Report | Page 29 |
The following table provides a detailed reconciliation of net losses as reported in the Company’s consolidated financial statements to adjusted net earnings and Adjusted EPS:
|
| | | | | | | |
| | Three Months Ended March 31, |
| | 2019 | | 2018 |
| Net earnings (loss) as reported |
| $2,880 |
| |
| ($5,592 | ) |
| Adjustments for non-cash or unusual items: | | | |
| Deferred income tax recovery | (4,792 | ) | | (9,123 | ) |
| Share-based payments | 2,075 |
| | 2,516 |
|
| (Gain) loss from investment in derivatives and marketable securities | (617 | ) | | 2,149 |
|
| Recovery of mineral inventory | (2,481 | ) | | (87 | ) |
| Adjusted net loss |
| ($2,935 | ) | |
| ($10,137 | ) |
| Weighted average number of shares on issue - basic | 195,832,712 |
| | 165,819,786 |
|
| Adjusted EPS |
| ($0.01 | ) | |
| ($0.06 | ) |
Working Capital and Available Liquidity
Working capital is determined based on current assets and current liabilities as reported in the Company’s consolidated financial statements. The Company uses working capital as a measure of the Company’s short-term financial health and operating efficiency. Available liquidity includes the Company's working capital and undrawn revolving credit facility.
|
| | | | | | | |
| | March 31, 2019 | | December 31, 2018 |
| Current Assets |
| $189,183 |
| |
| $166,274 |
|
| Less: Current Liabilities | (58,305 | ) | | (58,137 | ) |
| Working Capital |
| $130,878 |
| |
| $108,137 |
|
| Available Undrawn Revolving Credit Facility | 55,031 |
| | 55,031 |
|
| Available Liquidity |
| $185,909 |
| |
| $163,168 |
|
The Company uses additional financial measures which should be evaluated in conjunction with IFRS. It is intended to provide additional information and should not be considered in isolation or as a substitute for measures prepared in accordance with IFRS. The following additional GAAP measures are used:
Mine Operating Earnings
Mine operating earnings represents the difference between revenue less mine operating costs. Management believes that mine operating earnings provides useful information to investors because mine operating earnings excludes expenses not directly associated with commercial production.
Operating Cash Flows before Working Capital and Taxes
Operating cash flows before working capital and taxes represents cash flows generated from operations before changes in working capital and income taxes paid. Management believes that this measure allows investors to evaluate the Company’s pre-tax cash flows generated from operations adjusted for fluctuations in non-cash working capital items due to timing issues and the Company’s ability to service its debt.
The terms described above do not have a standardized meaning prescribed by IFRS, therefore the Company’s definitions may not be comparable to similar measures presented by other companies.
|
| | |
| |
| First Majestic Silver Corp. 2019 First Quarter Report | Page 30 |
|
| |
| MANAGEMENT’S REPORT ON INTERNAL CONTROL OVER FINANCIAL REPORTING |
Disclosure Controls and Procedures
The Company’s management, with the participation of its President and Chief Executive Officer (“CEO”) and Chief Financial Officer (“CFO”), has evaluated the effectiveness of the Company’s disclosure controls and procedures. Based upon the results of that evaluation, the Company’s CEO and CFO have concluded that, as of March 31, 2019, the Company’s disclosure controls and procedures were effective to provide reasonable assurance that the information required to be disclosed by the Company in reports it files is recorded, processed, summarized and reported, within the appropriate time periods and is accumulated and communicated to management, including the CEO and CFO, as appropriate to allow timely decisions regarding required disclosure.
Internal Control over Financial Reporting
The Company’s management, with the participation of its CEO and CFO, is responsible for establishing and maintaining adequate internal control over financial reporting as such term is defined in the rules of the United States Securities and Exchange Commission and the Canadian Securities Administrators. The Company’s internal control over financial reporting is a process designed to provide reasonable assurance regarding the reliability of financial reporting and the preparation of financial statements for external purposes in accordance with IFRS as issued by the IASB. The Company’s internal control over financial reporting includes policies and procedures that:
| |
| • | maintain records that accurately and fairly reflect, in reasonable detail, the transactions and dispositions of assets of the Company; |
| |
| • | provide reasonable assurance that transactions are recorded as necessary for preparation of financial statements in accordance with IFRS as issued by IASB; |
| |
| • | provide reasonable assurance that the Company’s receipts and expenditures are made only in accordance with authorizations of management and the Company’s Directors; and |
| |
| • | provide reasonable assurance regarding prevention or timely detection of unauthorized acquisition, use, or disposition of the Company’s assets that could have a material effect on the Company’s consolidated financial statements. |
The Company’s internal control over financial reporting may not prevent or detect all misstatements because of inherent limitations. Additionally, projections of any evaluation of effectiveness for future periods are subject to the risk that controls may become inadequate because of changes in conditions or deterioration in the degree of compliance with the Company’s policies and procedures.
There has been no change in the Company's internal control over financial reporting during the three months ended March 31, 2019 that has materially affected, or is reasonably likely to materially affect, the Company's internal control over financial reporting.
Limitations of Controls and Procedures
The Company’s management, including the President and Chief Executive Officer and Chief Financial Officer, believes that any disclosure controls and procedures or internal control over financial reporting, no matter how well conceived and operated, may not prevent or detect all misstatements because of inherent limitations. Further, the design of a control system must reflect the fact that there are resource constraints, and the benefits of controls must be considered relative to their costs. Because of the inherent limitations in all control systems, they cannot provide absolute assurance that all control issues and instances of fraud, if any, within the Company have been prevented or detected. These inherent limitations include the realities that judgments in decision-making can be faulty, and that breakdowns can occur because of simple error or mistake. Additionally, controls can be circumvented by the individual acts of some persons, by collusion of two or more people, or by unauthorized override of the control. The design of any control system also is based in part upon certain assumptions about the likelihood of future events, and there can be no assurance that any design will succeed in achieving its stated goals under all potential future conditions. Accordingly, because of the inherent limitations in a cost effective control system, misstatements due to error or fraud may occur and not be detected.
|
| | |
| |
| First Majestic Silver Corp. 2019 First Quarter Report | Page 31 |
Cautionary Note regarding Forward-Looking Statements
Certain information contained herein this MD&A constitutes forward-looking statements under applicable securities laws (collectively, “forward-looking statements”). These statements relate to future events or the Company’s future performance, business prospects or opportunities. Forward-looking statements include, but are not limited to: commercial mining operations; anticipated mineral recoveries; projected quantities of future mineral production; statements with respect to the Company’s business strategy; future planning processes; anticipated development, expansion, exploration activities and production rates; the estimated cost and timing of plant improvements at the Company’s operating mines and development of the Company’s development projects; the timing of completion of exploration programs and drilling programs; the repayment of the Debentures; statements with respect to the Company’s future financial position including operating efficiencies, cash flow, capital budgets, costs and expenditures; the preparation of technical reports and completion of preliminary economic assessments; the repurchase of the Company’s shares; viability of the Company’s projects; potential metal recovery rates; the conversion of the Company’s securities. All statements other than statements of historical fact may be forward-looking statements. Any statements that express or involve discussions with respect to predictions, expectations, beliefs, plans, projections, objectives, assumptions or future events or performance (often, but not always, using words or phrases such as “seek”, “anticipate”, “plan”, “continue”, “estimate”, “expect”, “may”, “will”, “project”, “predict”, “forecast”, “potential”, “targeting”, “intend”, “could”, “might”, “should”, “believe” and similar expressions) are not statements of historical fact and may be “forward-looking statements”.
Forward-looking statements are based on the opinions and estimates of management at the dates the statements are made, and are subject to a variety of risks and uncertainties and other factors that could cause actual events or results to differ materially from those projected in the forward-looking statements. These factors include, without limitation: the inherent risks involved in the mining, exploration and development of mineral properties, the uncertainties involved in interpreting drilling results and other geological data, fluctuating metal prices, the possibility of project delays or cost overruns or unanticipated excessive operating costs and expenses, uncertainties related to the necessity of financing, the availability of and costs of financing needed in the future, and other factors described in the Company’s Annual Information Form under the heading “Risk Factors”.
The Company believes that the expectations reflected in any such forward-looking statements are reasonable, but no assurance can be given that these expectations will prove to be correct and such forward-looking statements included herein this MD&A should not be unduly relied upon. These statements speak only as of the date of this MD&A. The Company does not intend, and does not assume any obligation, to update these forward-looking statements, except as required by applicable laws. Actual results may differ materially from those expressed or implied by such forward-looking statements.
Cautionary Note regarding Reserves and Resources
Mineral reserves and mineral resources are determined in accordance with National Instrument 43-101 (“NI 43-101”), issued by the Canadian Securities Administrators. This National Instrument lays out the standards of disclosure for mineral projects including rules relating to the determination of mineral reserves and mineral resources. This includes a requirement that a certified Qualified Person (“QP”) (as defined under the NI 43-101) supervises the preparation of the mineral reserves and mineral resources. Ramon Mendoza, P. Eng., Vice President of Technical Services is a certified QP for the Company and has reviewed this MD&A for QP technical disclosures. All NI 43-101 technical reports can be found on the Company’s website at www.firstmajestic.com or on SEDAR at www.sedar.com.
Cautionary Note to United States Investors Concerning Estimates of Mineral Reserves and Resources
This Management’s Discussion and Analysis has been prepared in accordance with the requirements of the securities laws in effect in Canada, which differ in certain material respects from the disclosure requirements of United States securities laws. The terms “mineral reserve”, “proven mineral reserve” and “probable mineral reserve” are Canadian mining terms as defined in accordance with Canadian NI 43-101 Standards of Disclosure for Mineral Projects and the Canadian Institute of Mining, Metallurgy and Petroleum (the “CIM”) - CIM Definition Standards on Mineral Resources and Mineral Reserves, adopted by the CIM Council, as amended. These definitions differ from the definitions in the disclosure requirements promulgated by the Securities and Exchange Commission (the “Commission”) and contained in Industry Guide 7 (“Industry Guide 7”). Under Industry Guide 7 standards, a “final” or “bankable” feasibility study is required to report mineral reserves, the three-year historical average price is used in any mineral reserve or cash flow analysis to designate mineral reserves and the primary environmental analysis or report must be filed with the appropriate governmental authority.
|
| | |
| |
| First Majestic Silver Corp. 2019 First Quarter Report | Page 32 |
In addition, the terms “mineral resource”, “measured mineral resource”, “indicated mineral resource” and “inferred mineral resource” are defined in and required to be disclosed by NI 43-101. However, these terms are not defined terms under Industry Guide 7 and are not permitted to be used in reports and registration statements of United States companies filed with the Commission. Investors are cautioned not to assume that any part or all of the mineral deposits in these categories will ever be converted into mineral reserves. “Inferred mineral resources” have a great amount of uncertainty as to their existence, and great uncertainty as to their economic and legal feasibility. It cannot be assumed that all or any part of an inferred mineral resource will ever be upgraded to a higher category. Under Canadian rules, estimates of inferred mineral resources may not form the basis of feasibility or pre-feasibility studies, except in rare cases. Investors are cautioned not to assume that all or any part of an inferred mineral resource exists or is economically or legally mineable. Disclosure of “contained ounces” in a mineral resource is permitted disclosure under Canadian regulations. In contrast, the Commission only permits U.S. companies to report mineralization that does not constitute “mineral reserves” by Commission standards as in place tonnage and grade without reference to unit measures.
Accordingly, information contained in this Management’s Discussion and Analysis may not be comparable to similar information made public by U.S. companies subject to the reporting and disclosure requirements under the United States federal securities laws and the rules and regulations of the Commission thereunder.
Additional Information
Additional information on the Company, including the Company’s Annual Information Form and the Company’s audited consolidated financial statements for the year ended December 31, 2018, is available on SEDAR at www.sedar.com and on the Company’s website at www.firstmajestic.com.
|
| | |
| |
| First Majestic Silver Corp. 2019 First Quarter Report | Page 33 |