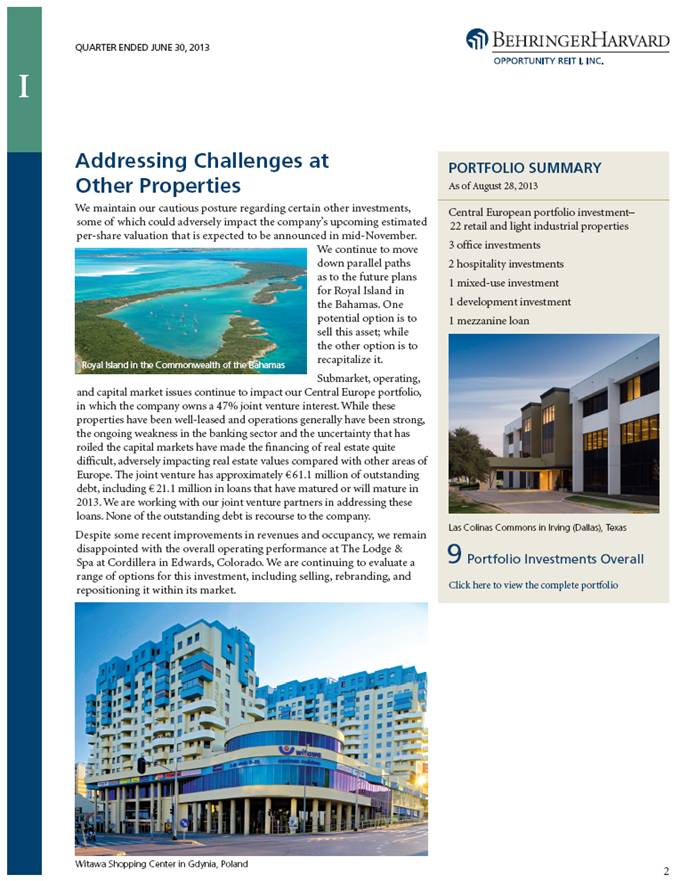
| I QUARTER ENDED JUNE 30, 2013 Conclusion The company remains committed to increasing value for shareholders and building additional value where possible. To help accomplish this, we are focusing on generating sufficient cash flow from existing portfolio properties to support operations and our value-creating initiatives. In addition, we are proactively managing assets in the portfolio to increase revenue and streamline expenses. We have made good progress in stabilizing much of our portfolio over the past year, but additional work remains to be done. ANNUAL MEETING OF SHAREHOLDERS October 9, 2013 at 12:00 p.m. at the company’s headquarters 15601 Dallas Parkway Addison, Texas 75001 Wednesday OCT 9 PLEASE VOTE Your vote is important, regardless of how many shares you own! If you have questions or would like to vote, please contact: Behringer Harvard Shareholder Services 866.655.3650 Proxy materials are available online at www.behringerharvard.com Financial Highlights (in thousands, except per share data) 3 mos. ended June 30, 2013 3 mos. ended June 30, 2012 6 mos. ended June 30, 2013 6 mos. ended June 30, 2012 FFO $ 1,123 $ (12,823) $ (1,752) $ (15,187) FFO per share $ 0.02 $ (0.23) $ (0.03) $ (0.27) Distributions declared $ – $ – $ – $ – Distributions per share $ – $ – $ – $ – (in thousands) As of June 30, 2013 As of Dec. 31, 2012 Total assets $ 334,894 $ 366,452 Total liabilities $ 165,906 $ 192,860 THIRD QUARTER UPDATE CALL We hope you will join us for the third quarter update call on November 22, 2013, at 1:00 p.m. Central Time. Friday Reconciliation of FFO to Net Loss (in thousands, except per share amounts) 3 mos. ended June 30, 2013 3 mos. ended June 30, 2012 6 mos. ended June 30, 2013 6 mos. ended June 30, 2012 Net loss $ (2,506) $ (13,925) $ (9,595) $ (21,804) Adjustments for1: Impairment charge2 - 698 244 1,114 Real estate depreciation and amortization3 3,724 4,530 7,694 9,629 Gain on sale of real estate (95) (4,126) (95) (4,126) FFO4 $ 1,123 $ (12,823) $ (1,752) $ (15,187) GAAP weighted average shares: Basic and diluted 56,500 56,500 56,500 56,500 FFO per share $ 0.02 $ (0.23) $ (0.03) $ (0.27) Net loss per share $ (0.05) $ (0.25) $ (0.17) $ (0.39) NOV 22 We will send further details about this call in your next quarterly statement. 1 Reflects the adjustments for continuing operations, as well as discontinued operations. 2 Includes impairment of our investments in unconsolidated entities which resulted from a measurable decrease in the fair value of the depreciable real estate held by the joint venture or partnership. 3 Real estate depreciation and amortization includes our consolidated real depreciation and amortization expense, as well as our pro rata share of those unconsolidated investments that we account for under the equity method of accounting and the noncontrolling interest adjustment for the third-party partners’ share of the real estate depreciation and amortization. 4 Funds from operations (FFO) is defined by the National Association of Real Estate Investment Trusts as net income (loss), computed in accordance with GAAP, excluding extraordinary items, as defined by GAAP, and gains (or losses) from sales of property, plus depreciation and amortization on real estate assets, and after adjustments for unconsolidated partnerships, joint ventures, and subsidiaries. FFO should not be considered as an alternative to net income (loss), or as indications of our liquidity, nor are they either indicative of funds available to fund our cash needs, including our ability to fund distributions. FFO should be reviewed in connection with other GAAP measurements. A reconciliation of FFO and FFO-per-share to net income can be found in our second quarter Form 10-Q on file with the SEC. Northborough Tower in Houston, Texas 3 |


