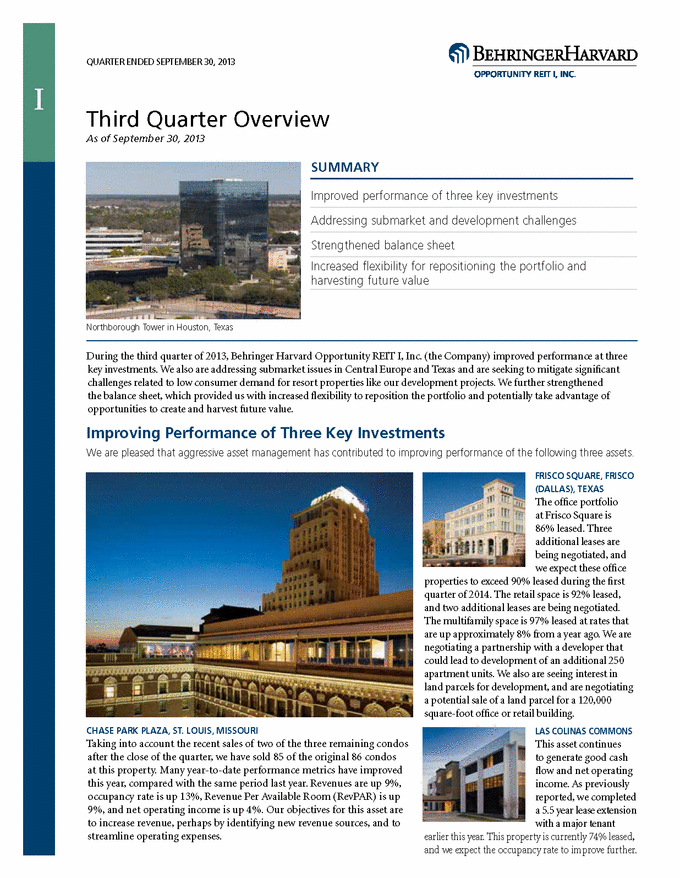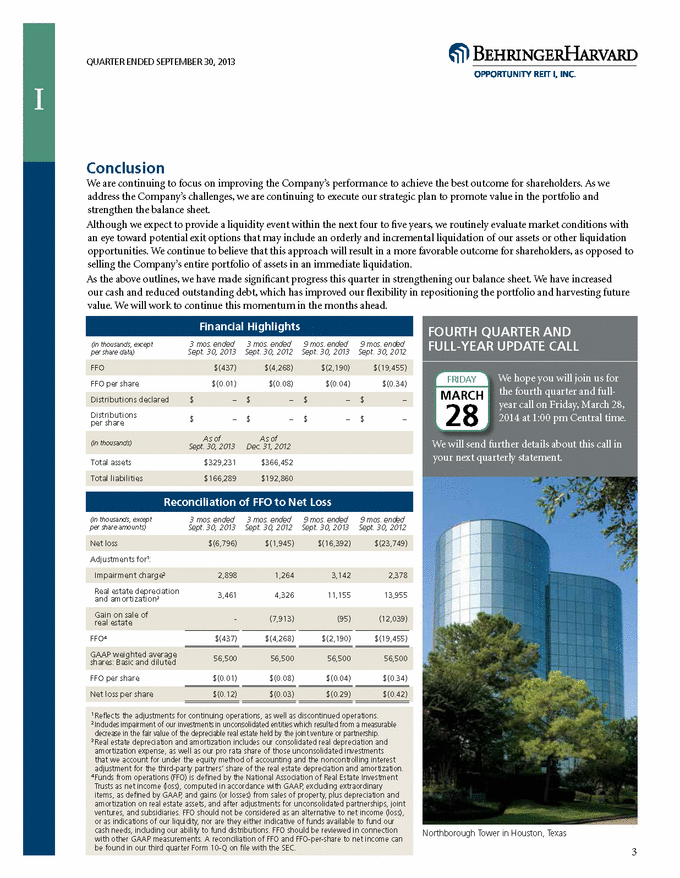
| Conclusion We are continuing to focus on improving the Company’s performance to achieve the best outcome for shareholders. As we address the Company’s challenges, we are continuing to execute our strategic plan to promote value in the portfolio and strengthen the balance sheet. Although we expect to provide a liquidity event within the next four to five years, we routinely evaluate market conditions with an eye toward potential exit options that may include an orderly and incremental liquidation of our assets or other liquidation opportunities. We continue to believe that this approach will result in a more favorable outcome for shareholders, as opposed to selling the Company’s entire portfolio of assets in an immediate liquidation. As the above outlines, we have made significant progress this quarter in strengthening our balance sheet. We have increased our cash and reduced outstanding debt, which has improved our flexibility in repositioning the portfolio and harvesting future value. We will work to continue this momentum in the months ahead. Financial Highlights (in thousands, except per share data) 3 mos. ended Sept. 30, 2013 3 mos. ended Sept. 30, 2012 9 mos. ended Sept. 30, 2013 9 mos. ended Sept. 30, 2012 FFO $ (437 ) $ (4,268 ) $ (2,190 ) $ (19,455 ) FFO per share $ (0.01 ) $ (0.08 ) $ (0.04 ) $ (0.34 ) Distributions declared $ — $ — $ — $ — Distributions per share $ — $ — $ — $ — (in thousands) As of Sept 30, 2013 As of Dec. 31, 2012 Total assets $ 329,231 $ 366,452 Total liabilities $ 166,289 $ 192,860 Reconciliation of FFO to Net Loss (in thousands, except per share amounts) 3 mos. ended Sept. 30, 2013 3 mos. ended Sept. 30, 2012 9 mos. ended Sept. 30, 2013 9 mos. ended Sept. 30, 2012 Net loss $ (6,796 ) $ (1,945 ) $ (16,392 ) $ (23,749 ) Adjustments for(1): Impairment charge(2) 2,898 1,264 3,142 2,378 Real estate depreciation and amortization(3) 3,461 4,326 11,155 13,955 Gain on sale of real estate — (7,913 ) (95 ) (12,039 ) FFO(4) $ (437 ) $ (4,268 ) $ (2,190 ) $ (19,455 ) GAAP weighted average shares: Basic and diluted 56,500 56,500 56,500 56,500 FFO per share $ (0.01 ) $ (0.08 ) $ (0.04 ) $ (0.34 ) Net loss per share $ (0.12 ) $ (0.03 ) $ (0.29 ) $ (0.42 ) (1) Reflects the adjustments for continuing operations, as well as discontinued operations. (2) Includes impairment of our investments in unconsolidated entities which resulted from a measurable decrease in the fair value of the depreciable real estate held by the joint venture or partnership. (3) Real estate depreciation and amortization includes our consolidated real depreciation and amortization expense, as well as our pro rata share of those unconsolidated investments that we account for under the equity method of accounting and the noncontrolling interest adjustment for the third-party partners’ share of the real estate depreciation and amortization. (4) Funds from operations (FFO) is defined by the National Association of Real Estate Investment Trusts as net income (loss), computed in accordance with GAAP, excluding extraordinary items, as defined by GAAP, and gains (or losses) from sales of property, plus depreciation and amortization on real estate assets, and after adjustments for unconsolidated partnerships, joint ventures, and subsidiaries. FFO should not be considered as an alternative to net income (loss), or as indications of our liquidity, nor are they either indicative of funds available to fund our cash needs, including our ability to fund distributions. FFO should be reviewed in connection with other GAAP measurements. A reconciliation of FFO and FFO-per-share to net income can be found in our third quarter Form 10-Q on file with the SEC. FOURTH QUARTER AND FULL-YEAR UPDATE CALL We hope you will join us for the fourth quarter and full- year call on Friday, March 28, 2014 at 1:00 pm Central time. We will send further details about this call in your next quarterly statement. Northborough Tower in Houston, Texas 3 |