Behringer Harvard Opportunity REIT I (BHOR) Inactive
Filed: 20 Nov 14, 12:00am
Exhibit 99.1
| I NOVEMBER 20, 2014 FAQs–Estimated Share Valuation 1. What is the estimated per-share valuation for Behringer Harvard Opportunity REIT I, Inc. (the Company)? On November 10, 2014, the Company’s board of directors established an estimated share valuation (ESV) of the Company’s stock as of October 31, 2014 of $3.58 per share— a 16% increase compared with the previous share valuation of $3.08. 2. Why are you providing the ESV? In accordance with the Company’s Amended and Restated Policy for Estimation of Common Share Value, the Company’s board of directors annually establishes an ESV. This ESV reflects the value of the Company’s assets and liabilities given market conditions at this current point in time. This estimate is provided solely to assist broker-dealers in connection with their obligations under applicable Financial Industry Regulatory Authority (FINRA) rules with respect to investor account statements. 3. What are the major reasons for the increase in the 2014 ESV compared with the 2013 valuation? The most significant contributor to the increase was the Chase Park Plaza Hotel in St. Louis, Missouri. Chase Park Plaza’s valuation increased $0.29 per share compared with the previous year’s valuation. The hotel’s operating performance improved compared with last year. In addition, the 2014 valuation included 100% of Chase Park Plaza, compared with 95% in last year’s valuation. Also, in 2015 Chase Park Plaza will begin a lobby and room improvement program and expand its retail space to take advantage of the vibrant retail activity in the Central West End area. Another significant contributor to the increase in the ESV was The Lodge & Spa at Cordillera in Edwards, Colorado, which saw a $0.07 per-share increase in its valuation compared with last year. This property is under contract for sale at a price greater than its valuation in the 2013 ESV. Frisco Square, including Construction in Progress, in Frisco, Texas, contributed $0.07 per share to the ESV increase. The Company’s mixed-use property and three office properties in Texas increased in value compared with last year. Royal Island and the Alexan Black Mountain mezzanine loan were not assigned any equity value in the ESV for 2014 or 2013. Royal Island is being marketed for sale. The Company’s cash balance (included in other assets and liabilities in the Allocation of Estimated Share Value table below) increased in the 2014 ESV compared with last year’s ESV, primarily due to the proceeds from the refinancing of the Chase Park Plaza in August 2014 and land sales. The increase in cash from these activities was partially offset by cash spent for capital improvements in certain real estate assets. 4. What were the primary negative contributors to the 2014 ESV? The positive contributions discussed above were partially offset by a $0.07 per share reduction in the value of the Company’s joint venture investment in Central Europe, primarily due to changes in currency exchange rates and continued challenging economic conditions in that region. 5. What was the allocation of the 2014 ESV across the Company’s various assets and liabilities? The table below provides a comparison of the allocations of the ESVs for 2014 and 2013. Behringer Harvard Opportunity REIT I, Inc. Allocation of Estimated Share Value (per-share data) Oct. 31, 2014 ESV Nov. 11, 2013 ESV Change Consolidated real estate properties $ 5.14 $4.60 $0.54 Unconsolidated joint venture 0.21 0.28 (0.07) Construction in Progress 0.12 - 0.12 Mezzanine loan investment - - - Mortgage debt (2.49) (2.25) (0.24) Other assets and liabilities 0.61 0.49 0.12 Noncontrolling interests (0.01) (0.04) 0.03 Estimated net asset value per share 3.58 3.08 0.50 Estimated enterprise value premium - - - Total estimated value per share $3.58 $3.08 $0.50 For Internal Use Only FOR BROKER- DEALER USE ONLY This material is intended for informational purposes only and is neither an offer to sell nor the solicitation of an offer to buy any security. Behringer Harvard Opportunity REIT I, Inc. is no longer in offering and is closed to new investments. |
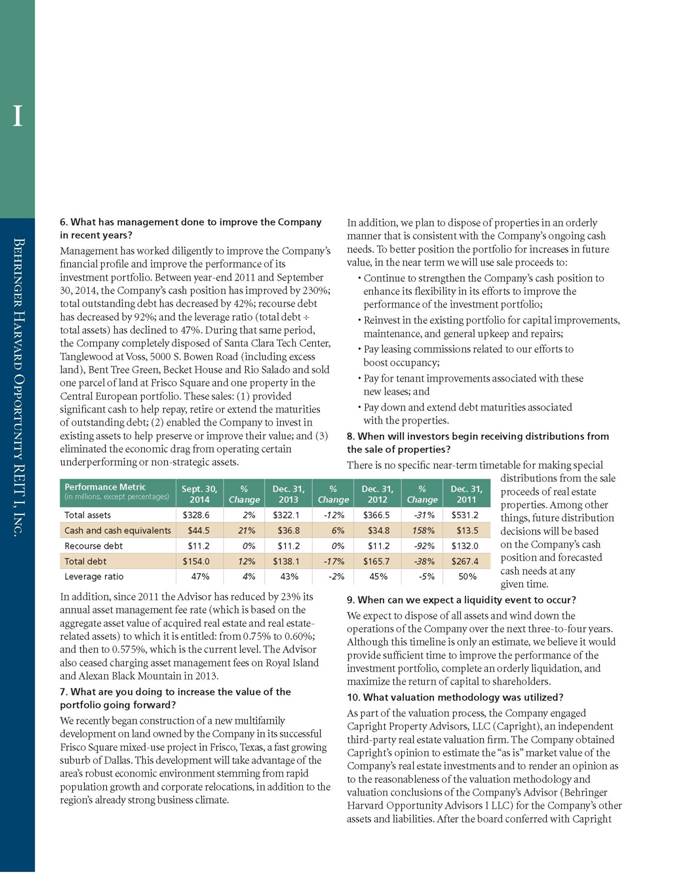
| 6. What has management done to improve the Company in recent years? Management has worked diligently to improve the Company’s financial profile and improve the performance of its investment portfolio. Between year-end 2011 and September 30, 2014, the Company’s cash position has improved by 230%; total outstanding debt has decreased by 42%; recourse debt has decreased by 92%; and the leverage ratio (total debt ÷ total assets) has declined to 47%. During that same period, the Company completely disposed of Santa Clara Tech Center, Tanglewood at Voss, 5000 S. Bowen Road (including excess land), Bent Tree Green, Becket House and Rio Salado and sold one parcel of land at Frisco Square and one property in the Central European portfolio. These sales: (1) provided significant cash to help repay, retire or extend the maturities of outstanding debt; (2) enabled the Company to invest in existing assets to help preserve or improve their value; and (3) eliminated the economic drag from operating certain underperforming or non-strategic assets. In addition, since 2011 the Advisor has reduced by 23% its annual asset management fee rate (which is based on the aggregate asset value of acquired real estate and real estate- related assets) to which it is entitled: from 0.75% to 0.60%; and then to 0.575%, which is the current level. The Advisor also ceased charging asset management fees on Royal Island and Alexan Black Mountain in 2013. 7. What are you doing to increase the value of the portfolio going forward? We recently began construction of a new multifamily development on land owned by the Company in its successful Frisco Square mixed-use project in Frisco, Texas, a fast growing suburb of Dallas. This development will take advantage of the area’s robust economic environment stemming from rapid population growth and corporate relocations, in addition to the region’s already strong business climate. In addition, we plan to dispose of properties in an orderly manner that is consistent with the Company’s ongoing cash needs. To better position the portfolio for increases in future value, in the near term we will use sale proceeds to: • Continue to strengthen the Company’s cash position to enhance its flexibility in its efforts to improve the performance of the investment portfolio; • Reinvest in the existing portfolio for capital improvements, maintenance, and general upkeep and repairs; • Pay leasing commissions related to our efforts to boost occupancy; • Pay for tenant improvements associated with these new leases; and • Pay down and extend debt maturities associated with the properties. 8. When will investors begin receiving distributions from the sale of properties? There is no specific near-term timetable for making special distributions from the sale proceeds of real estate properties. Among other things, future distribution decisions will be based on the Company’s cash position and forecasted cash needs at any given time. 9. When can we expect a liquidity event to occur? We expect to dispose of all assets and wind down the operations of the Company over the next three-to-four years. Although this timeline is only an estimate, we believe it would provide sufficient time to improve the performance of the investment portfolio, complete an orderly liquidation, and maximize the return of capital to shareholders. 10. What valuation methodology was utilized? As part of the valuation process, the Company engaged Capright Property Advisors, LLC (Capright), an independent third-party real estate valuation firm. The Company obtained Capright’s opinion to estimate the “as is” market value of the Company’s real estate investments and to render an opinion as to the reasonableness of the valuation methodology and valuation conclusions of the Company’s Advisor (Behringer Harvard Opportunity Advisors I LLC) for the Company’s other assets and liabilities. After the board conferred with Capright I Behringer Harvard Opportunity REIT I, Inc. Performance Metric (in millions, except percentages) Sept. 30, 2014 % Change Dec. 31, 2013 % Change Dec. 31, 2012 % Change Dec. 31, 2011 Total assets $328.6 2% $322.1 -12% $366.5 -31% $531.2 Cash and cash equivalents $44.5 21% $36.8 6% $34.8 158% $13.5 Recourse debt $11.2 0% $11.2 0% $11.2 -92% $132.0 Total debt $154.0 12% $138.1 -17% $165.7 -38% $267.4 Leverage ratio 47% 4% 43% -2% 45% -5% 50% FOR BROKER-DEALER USE ONLY Ameriprise Financial Use Only Registered Representatives Use Only |
| and the Company’s management and reviewed the methodologies and assumptions used, the board confirmed that the ESV of $3.58, as prepared by the Advisor, is reasonable and prepared in accordance with appropriate methods for valuing real estate. This ESV is the value of the Company’s assets given the current point-in-time market conditions of the various net assets. As noted in our estimated valuation policy, the ESV may not reflect the amount you would obtain if you were to sell your shares or if we liquidated our assets—the proceeds from such actions could possibly be higher or lower than this point-in- time ESV. For a detailed description of the valuation methodologies used by the Company and other limitations related to the estimated valuation, please refer to our Form 10-Q that was filed with the Securities and Exchange Commission on November 12, 2014, a copy of which is available without charge at sec.gov or at behringerinvestments.com. 11. How will the new ESV be communicated to shareholders? The new ESV will be immediately reflected in shareholders’ account value when they access their records online. It will also be reflected in the account value on the next investor statement and accompanying notification that will be mailed in January 2015. I Behringer Harvard Opportunity REIT I, Inc. FORWARD-LOOKING STATEMENTS This document contains forward-looking statements, including discussion and analysis of the financial condition of the Company and its subsidiaries and other matters. These forward-looking statements are not historical facts but are the intents, beliefs or current expectations of our management based on their knowledge and understanding of our business and industry. Words such as “may,” “anticipates,” “expects,” “intends,” “plans,” “believes,” “seeks,” “estimates,” “would,” “could,” “should” and variations of these words and similar expressions are intended to identify forward-looking statements. We intend that such forward-looking statements be subject to the safe harbor provisions created by Section 27A of the Securities Act of 1933 and Section 21E of the Securities Exchange Act of 1934. These statements are not guarantees of future performance and are subject to risks, uncertainties and other factors, some of which are beyond our control, are difficult to predict and could cause actual results to differ materially from those expressed or forecasted in the forward-looking statements. Forward-looking statements that were true at the time made may ultimately prove to be incorrect or false. We caution you not to place undue reliance on forward-looking statements, which reflect our management’s view only as of the date of this document. We undertake no obligation to update or revise forward-looking statements to reflect changed assumptions the occurrence of unanticipated events or changes to future operating results. IMPORTANT RISK FACTORS TO CONSIDER Factors that could cause actual results to differ materially from any forward-looking statements made in the document include, but are not limited to: market and economic challenges experienced by the U.S. and global economies or real estate industry as a whole and the local economic conditions in the markets in which our properties are located; the availability of cash flow from operating activities for capital expenditures; our ability to retain our executive officers and other key personnel of our Advisor, our property manager and their affiliates; conflicts of interest arising out of our relationships with our Advisor and its affiliates; our level of debt and the terms and limitations imposed on us by our debt agreements; the availability of credit generally, and any failure to refinance or extend our debt as it comes due or a failure to satisfy the conditions and requirements of that debt; the need to invest additional equity in connection with debt financings as a result of reduced asset values and requirements to reduce overall leverage; future increases in interest rates; our ability to raise capital in the future by issuing additional equity or debt securities, selling our assets or otherwise; impairment charges; unfavorable changes in laws or regulations impacting our business or our assets; and factors that could affect our ability to qualify as a real estate investment trust. The forward-looking statements should be read in light of these and other risk factors identified in the “Risk Factors” section of our Annual Report on Form 10-K for the year ended December 31, 2013, as filed with the Securities and Exchange Commission. 2714-1 © 2014 Behringer • Published 11/14 |