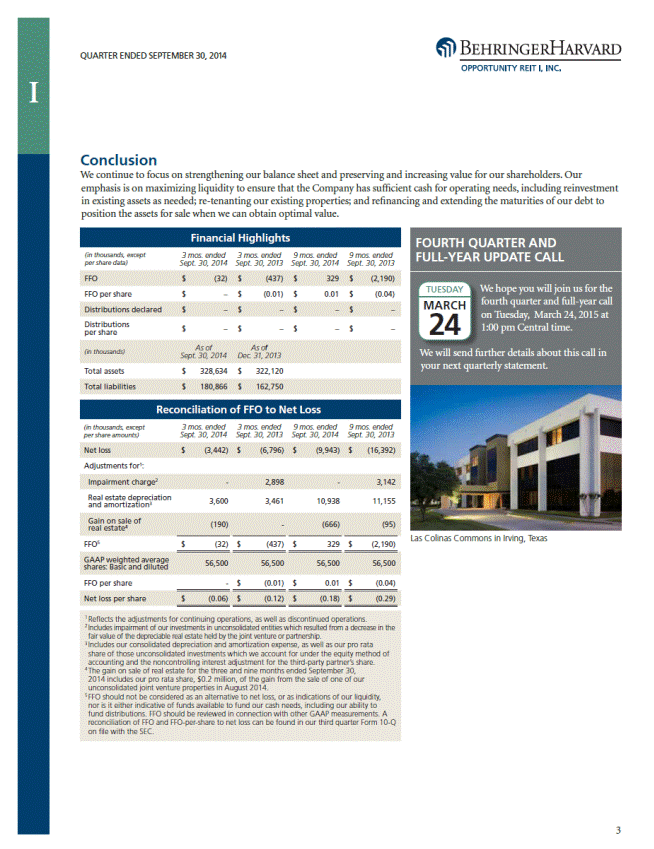
| QUARTER ENDED SEPTEMBER 30, 2014 Conclusion We continue to focus on strengthening our balance sheet and preserving and increasing value for our shareholders. Our emphasis is on maximizing liquidity to ensure that the Company has sufficient cash for operating needs, including reinvestment in existing assets as needed; re-tenanting our existing properties; and refinancing and extending the maturities of our debt to position the assets for sale when we can obtain optimal value. (in thousands, except per share data) 3 mos. ended Sept. 30, 2014 3 mos. ended Sept. 30, 2013 9 mos. ended Sept. 30, 2014 9 mos. ended Sept. 30, 2013 FFO per share $ – $ (0.01) $ 0.01 $ (0.04) Distributions per share $ – $ – $ – $ – Sept. 30, 2014 Dec. 31, 2013 Total assets $ 328,634 $ 322,120 (in thousands, except per share amounts) 3 mos. ended Sept. 30, 2014 3 mos. ended Sept. 30, 2013 9 mos. ended Sept. 30, 2014 9 mos. ended Sept. 30, 2013 Adjustments for1: Real estate depreciation and amortization3 3,600 3,461 10,938 11,155 (190) - (666) (95) real estate4 Las Colinas Commons in Irving, Texas FFO5 $ (32) $ (437) $ 329 $ (2,190) 56,500 56,500 56,500 56,500 shares: Basic and diluted FFO per share - $ (0.01) $ 0.01 $ (0.04) 3 1 Reflects the adjustments for continuing operations, as well as discontinued operations. 2 Includes impairment of our investments in unconsolidated entities which resulted from a decrease in the fair value of the depreciable real estate held by the joint venture or partnership. 3 Includes our consolidated depreciation and amortization expense, as well as our pro rata share of those unconsolidated investments which we account for under the equity method of accounting and the noncontrolling interest adjustment for the third-party partner’s share. 4 The gain on sale of real estate for the three and nine months ended September 30, 2014 includes our pro rata share, $0.2 million, of the gain from the sale of one of our unconsolidated joint venture properties in August 2014. 5 FFO should not be considered as an alternative to net loss, or as indications of our liquidity, nor is it either indicative of funds available to fund our cash needs, including our ability to fund distributions. FFO should be reviewed in connection with other GAAP measurements. A reconciliation of FFO and FFO-per-share to net loss can be found in our third quarter Form 10-Q on file with the SEC. Net loss per share$(0.06) $(0.12) $(0.18) $(0.29) GAAP weighted average Gain on sale of Impairment charge2 -2,898-3,142 Net loss$(3,442) $(6,796) $(9,943) $(16,392) Reconciliation of FFO to Net Loss Total liabilities$180,866 $162,750 (in thousands)As of As of Distributions declared $– $– $– $– FFO$(32) $(437) $329 $(2,190) FOURTH QUARTER AND FULL-YEAR UPDATE CALL We hope you will join us for the fourth quarter and full-year call on Tuesday, March 24, 2015 at 1:00 pm Central time. We will send further details about this call in your next quarterly statement. TUESDAY MARCH 24 Financial Highlights I |


