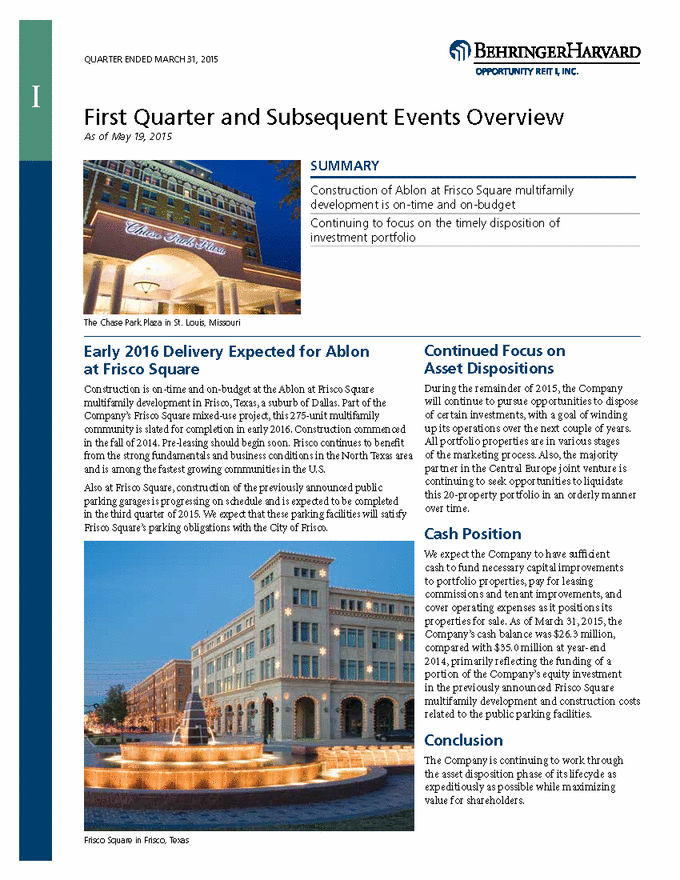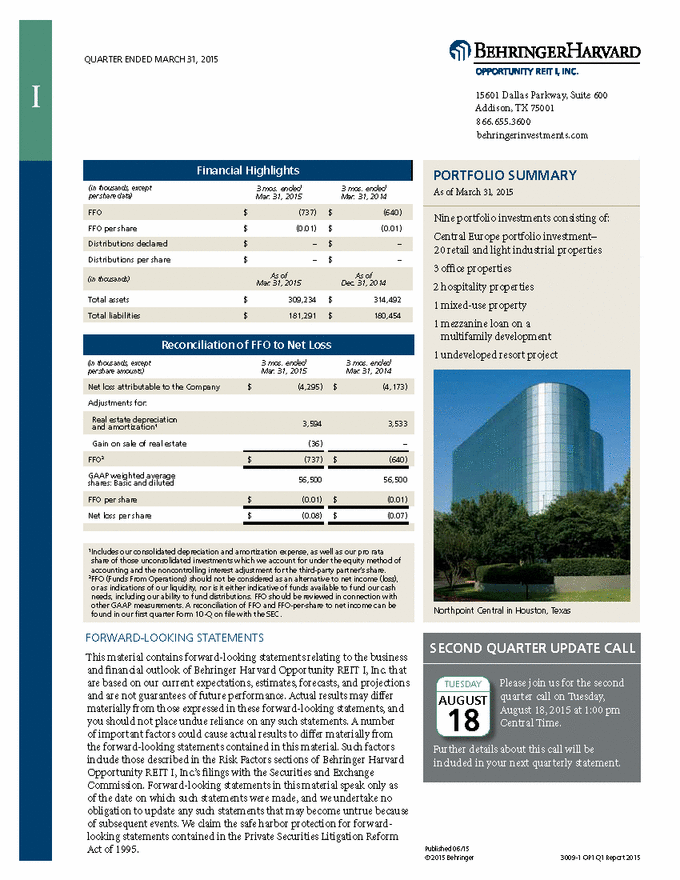
| QUARTER ENDED MARCH 31, 2015 15601 Dallas Parkway, Suite 600 Addison, TX 75001 866.655.3600 behringerinvestments.com 3 mos. ended Mar. 31, 2015 3 mos. ended Mar. 31, 2014 (in thousands, except per share data) FFO per share $ (0.01) $ (0.01) Distributions per share $ – $ – Mar. 31, 2015 Dec. 31, 2014 Total assets $ 309,234 $ 314,492 (in thousands, except per share amounts) 3 mos. ended Mar. 31, 2015 3 mos. ended Mar. 31, 2014 Adjustments for: 3,594 3,533 and amortization1 Gain on sale of real estate (36) – GAAP weighted average shares: Basic and diluted 56,500 56,500 Net loss per share $ (0.08) $ (0.07) found in our first quarter Form 10-Q on file with the SEC. FORWARD-LOOKING STATEMENTS This material contains forward-looking statements relating to the business and financial outlook of Behringer Harvard Opportunity REIT I, Inc. that are based on our current expectations, estimates, forecasts, and projections and are not guarantees of future performance. Actual results may differ materially from those expressed in these forward-looking statements, and you should not place undue reliance on any such statements. A number of important factors could cause actual results to differ materially from the forward-looking statements contained in this material. Such factors include those described in the Risk Factors sections of Behringer Harvard Opportunity REIT I, Inc.’s filings with the Securities and Exchange Commission. Forward-looking statements in this material speak only as of the date on which such statements were made, and we undertake no obligation to update any such statements that may become untrue because of subsequent events. We claim the safe harbor protection for forward-looking statements contained in the Private Securities Litigation Reform Act of 1995. Published 06/15 © 2015 Behringer 3009-1 OP1 Q1 Report 2015 SECOND QUARTER UPDATE CALL Please join us for the second quarter call on Tuesday, August 18, 2015 at 1:00 pm Central Time. Further details about this call will be included in your next quarterly statement. 2 TUESDAY AUGUST 18 1Includes our consolidated depreciation and amortization expense, as well as our pro rata share of those unconsolidated investments which we account for under the equity method of accounting and the noncontrolling interest adjustment for the third-party partner’s share. 2FFO (Funds From Operations) should not be considered as an alternative to net income (loss), or as indications of our liquidity, nor is it either indicative of funds available to fund our cash needs, including our ability to fund distributions. FFO should be reviewed in connection with other GAAP measurements. A reconciliation of FFO and FFO-per-share to net income can be FFO per share$(0.01) $(0.01) FFO2$(737) $(640) Real estate depreciation Net loss attributable to the Company $(4,295) $(4,173) Reconciliation of FFO to Net Loss Total liabilities$181,291$180,454 (in thousands)As of As of Distributions declared $–$– FFO$(737)$(640) PORTFOLIO SUMMARY As of March 31, 2015 Nine portfolio investments consisting of: Central Europe portfolio investment– 20 retail and light industrial properties 3 office properties 2 hospitality properties 1 mixed-use property 1 mezzanine loan on a multifamily development 1 undeveloped resort project Northpoint Central in Houston, Texas Financial Highlights I |