UNITED STATES
SECURITIES AND EXCHANGE COMMISSION
Washington, D.C. 20549
FORM N-CSR
CERTIFIED SHAREHOLDER REPORT OF REGISTERED
MANAGEMENT INVESTMENT COMPANIES
Investment Company Act file number | 811-21676 | ||||||||
| |||||||||
Eaton Vance Tax-Managed Buy-Write Income Fund | |||||||||
(Exact name of registrant as specified in charter) | |||||||||
| |||||||||
The Eaton Vance Building, 255 State Street, Boston, Massachusetts |
| 02109 | |||||||
(Address of principal executive offices) |
| (Zip code) | |||||||
| |||||||||
Alan R. Dynner | |||||||||
(Name and address of agent for service) | |||||||||
| |||||||||
Registrant’s telephone number, including area code: | (617) 482-8260 |
| |||||||
| |||||||||
Date of fiscal year end: | December 31 |
| |||||||
| |||||||||
Date of reporting period: | December 31, 2005 |
| |||||||
Item 1. Reports to Stockholders

Annual Report December 31, 2005


EATON VANCE
TAX-MANAGED
BUY-WRITE
INCOME
FUND
IMPORTANT NOTICES REGARDING PRIVACY,
DELIVERY OF SHAREHOLDER DOCUMENTS,
PORTFOLIO HOLDINGS, AND PROXY VOTING
Privacy. The Eaton Vance organization is committed to ensuring your financial privacy. Each of the financial institutions identified below has in effect the following policy ("Privacy Policy") with respect to nonpublic personal information about its customers:
• Only such information received from you, through application forms or otherwise, and information about your Eaton Vance fund transactions will be collected. This may include information such as name, address, social security number, tax status, account balances and transactions.
• None of such information about you (or former customers) will be disclosed to anyone, except as permitted by law (which includes disclosure to employees necessary to service your account). In the normal course of servicing a customer's account, Eaton Vance may share information with unaffiliated third parties that perform various required services such as transfer agents, custodians and broker/dealers.
• Policies and procedures (including physical, electronic and procedural safeguards) are in place that are designed to protect the confidentiality of such information.
• We reserve the right to change our Privacy Policy at any time upon proper notification to you. Customers may want to review our Policy periodically for changes by accessing the link on our homepage: www.eatonvance.com.
Our pledge of privacy applies to the following entities within the Eaton Vance organization: the Eaton Vance Family of Funds, Eaton Vance Management, Eaton Vance Investment Counsel, Boston Management and Research, and Eaton Vance Distributors, Inc.
In addition, our Privacy Policy only applies to those Eaton Vance customers who are individuals and who have a direct relationship with us. If a customer's account (i.e., fund shares) is held in the name of a third-party financial adviser/broker-dealer, it is likely that only such adviser's privacy policies apply to the customer. This notice supersedes all previously issued privacy disclosures.
For more information about Eaton Vance's Privacy Policy, please call 1-800-262-1122.
Delivery of Shareholder Documents. The Securities and Exchange Commission (the "SEC") permits funds to deliver only one copy of shareholder documents, including prospectuses, proxy statements and shareholder reports, to fund investors with multiple accounts at the same residential or post office box address. This practice is often called "householding" and it helps eliminate duplicate mailings to shareholders.
Eaton Vance, or your financial adviser, may household the mailing of your documents indefinitely unless you instruct Eaton Vance, or your financial adviser, otherwise.
If you would prefer that your Eaton Vance documents not be householded, please contact Eaton Vance at 1-800-262-1122, or contact your financial adviser.
Your instructions that householding not apply to delivery of your Eaton Vance documents will be effective within 30 days of receipt by Eaton Vance or your financial adviser.
Portfolio Holdings. Each Eaton Vance Fund and its underlying Portfolio (if applicable) will file a schedule of its portfolio holdings on Form N-Q with the SEC for the first and third quarters of each fiscal year. The Form N-Q will be available on the Eaton Vance website www.eatonvance.com, by calling Eaton Vance at 1-800-262-1122 or in the EDGAR database on the SEC's website at www.sec.gov. Form N-Q may also be reviewed and copied at the SEC's public reference room in Washington, D.C. (call 1-800-732-0330 for information on the operation of the public reference room).
Proxy Voting. From time to time, funds are required to vote proxies related to the securities held by the funds. The Eaton Vance Funds or their underlying Portfolios (if applicable) vote proxies according to a set of policies and procedures approved by the Funds' and Portfolios' Boards. You may obtain a description of these policies and procedures and information on how the Funds or Portfolios voted proxies relating to portfolio securities during the most recent 12 month period ended June 30, without charge, upon request, by calling 1-800-262-1122. This description is also available on the SEC's website at www.sec.gov.
Eaton Vance Tax-Managed Buy-Write Income Fund as of December 31, 2005
MANAGEMENT’S DISCUSSION OF FUND PERFORMANCE
|
|
Walter A. Row, CFA |
|
Eaton Vance |
|
Management |
|
|
|
|
|
Thomas Seto |
|
Parametric Portfolio |
|
Associates LLC |
|
|
|
|
|
David Stein, Ph.D. |
|
Parametric Portfolio |
|
Associates LLC |
|
|
|
|
|
Ronald M. Egalka |
|


The Fund
• Based on share price, the Fund had a total return of -0.45% for the period from inception on April 29, 2005 to December 31, 2005. This return resulted from a decrease in share price to $18.16 on December 31, 2005, from $19.10 (offering price of $20 per share, less all commissions) on April 29, 2005, and the reinvestment of $0.900 in quarterly distributions.(1)
• Based on net asset value (NAV), the Fund had a total return of 6.35% for the period from inception on April 29, 2005, to December 31, 2005. That return was the result of an increase in NAV per share to $19.40 on December 31, 2005, from $19.10(offering price of $20.00 per share, less all commissions) on April 29, 2005, and the reinvestment of $0.900 in quarterly distributions.(1)
• For comparison, the CBOE S&P 500 Buy Write Index – an unmanaged stock-plus-covered-call index created and maintained by the Chicago Board Options Exchange – had a return of 4.79% during the same period.(2) The S&P 500 Index – a broad-based, unmanaged, market index commonly used as a measure of overall U.S. stock market performance – had a total return of 9.41% during the same period.(2)
Management Discussion
• Eaton Vance Tax-Managed Buy-Write Income Fund (the Fund) is a diversified, closed-end investment company traded on the New York Stock Exchange under the symbol ETB. The Fund’s primary investment objective is to provide current income and gains, with a secondary objective of capital appreciation. In pursuing these objectives, the Fund invests in a diversified portfolio of common stocks that seeks to exceed the performance of the S&P 500 Index,(2) sells S&P 500 call options on a continuous basis and employs a number of tax-management strategies.
• The Fund’s overall strategy is overseen by Eaton Vance. With the assistance of Eaton Vance research and analysis, Parametric Portfolio Associates structures and manages the Fund’s common stock investments, including implementing tax-management strategies. Rampart Investment Management uses its option expertise and resources to implement continuous sales of S&P 500 Index options. These sales, and, to a lesser extent, common stock dividends, were the source for the Fund’s distributions during the period.• During its first eight months of operations, the Fund generated single-digit returns (at net asset value) that were ahead of the CBOE S&P 500 Buy Write Index, but below that of the S&P 500 index.(2) During the reporting period, the economy continued to grow, corporate earnings were impressive, unemployment declined and inflation remained low to moderate, despite high energy prices. In this environment, the stock market produced solid returns, despite continued short-term interest rate increases by the Federal Reserve.
• At December 31, 2005, the Fund held a diversified portfolio of stocks, representing a broad spectrum of the U.S. economy. Among the Fund’s common stock holdings, its largest sector weightings were financials, information technology, health care, and industrials stocks.
(1) Share price and net asset value on April 29, 2005 were calculated assuming a purchase price of $20.00 less the sales load of $0.90 per share paid by the shareholder.
(2) It is not possible to invest directly in an Index. The Index’s total return does not reflect commissions or expenses that would have been incurred if an investor individually purchased or sold the securities represented in the Index.
Past performance is no guarantee of future results. Returns are historical and are calculated by determining the percentage change in net asset value or share price (as applicable) with all distributions reinvested. The Fund has no current intention to utilize leverage, but may do so in the future through the issuance of preferred shares and/or borrowings, including the issuance of debt securities. Investment return and principal value will fluctuate so that shares, when sold, may be worth more or less than their original cost. Performance is for the stated time period only; due to market volatility, the Fund’s current performance may be lower or higher than quoted.
Fund shares are not insured by the FDIC and are not deposits or other obligations of, or guaranteed by, any depository institution. Shares are subject to investment risks, including possible loss of principal invested.
2
Eaton Vance Tax-Managed Buy-Write Income Fund as of December 31, 2005
FUND PERFORMANCE
• The Fund’s index option strategy is designed to produce current income from option premiums and to moderate volatility. The Fund writes (sells) index call options on substantially the full value of its common stock holdings. As the seller of S&P 500 call options, the Fund receives cash (premiums) from options purchasers, who then have the right to any appreciation in the value of the S&P over the exercise price as of a specified option valuation date. Writing covered call options involves a tradeoff between the options premiums received and reduced participation in potential stock price appreciation of the Fund’s portfolio of common stocks. Management believes that a strategy of owning a portfolio of common stocks in conjunction with writing index call options on the S&P 500 should generally underperform in strong up markets while seeking to outperform in modestly up, flat and down markets.
• Because taxes have a major impact on an investor’s after-tax returns, the Fund pursues a tax-managed investment strategy. The Fund employs a variety of techniques and strategies designed to provide favorable tax treatment. These strategies include harvesting capital losses that can be used to offset capital gains, allocating the Fund’s equity and options investments to a mix that management believes is advantageously taxed and managing the sale of appreciated stock positions so as to minimize short-term gains in excess of long-term capital losses.
• At the end of the period, management attempted to position the Fund for an expectation of continued growth in the U.S. economy in 2006. Of course, management will continue to monitor economic and market developments and make adjustments to the Fund that it deems necessary.
Performance
Average Annual Total Returns (by share price, New York Stock Exchange)
Life of Fund (4/29/05) |
| -0.45 | % |
Average Annual Total Returns (at net asset value)
Life of Fund (4/29/05) |
| 6.35 | % |
Past performance is no guarantee of future results. Returns are historical and are calculated by determining the percentage change in net asset value or share price (as applicable) with all distributions reinvested. The Fund’s performance at market share price will differ from its results at NAV. Although share price performance generally reflects investment results over time, during shorter periods, returns at share price can also be affected by factors such as changing perceptions about the Fund, market conditions, fluctuations in supply and demand for the Fund’s shares, or changes in Fund distributions. The Fund has no current intention to utilize leverage, but may do so in the future through the issuance of preferred shares and/or borrowings, including the issuance of debt securities. Investment return and principal value will fluctuate so that shares, when sold, may be worth more or less than their original cost. Performance is for the stated time period only; due to market volatility, the Fund’s current performance may be lower or higher than quoted.
Sector Weightings(1)
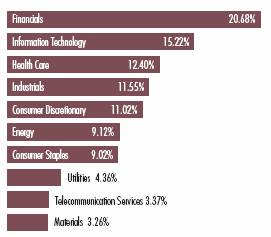
(1) Reflects the Fund’s total investments as of December 31, 2005. Fund information may not be representative of the Fund’s current or future investments and may change due to active management.
Top Ten Holdings(2)
By net assets |
|
|
|
General Electric Co. |
| 3.72 | % |
Exxon Mobil Corp. |
| 3.23 |
|
Citigroup, Inc. |
| 2.87 |
|
Microsoft Corp. |
| 2.73 |
|
Procter & Gamble Co. |
| 2.12 |
|
Bank of America Corp. |
| 2.00 |
|
Intel Corp. |
| 1.89 |
|
Pfizer Inc. |
| 1.84 |
|
Intl. Business Machines Corp. |
| 1.74 |
|
Chevron Corp. |
| 1.66 |
|
(2) Top Ten Holdings represented 23.8% of the Fund’s net assets as of 12/31/05. Fund information may not be representative of the Fund’s current or future investments and may change due to active management.
The views expressed throughout this report are those of the portfolio managers and are current only through the end of the period of the report as stated on the cover. These views are subject to change at any time based upon market or other conditions, and the investment adviser disclaims any responsibility to update such views. These views may not be relied on as investment advice and, because investment decisions for a fund are based on many factors, may not be relied on as an indication of trading intent on behalf of any Eaton Vance fund.
3
Eaton Vance Tax-Managed Buy-Write Income Fund as of December 31, 2005
PORTFOLIO OF INVESTMENTS
| Common Stocks — 100.0% | |||||||||||
| Security | Shares | Value | |||||||||
| Aerospace & Defense — 1.5% | |||||||||||
| General Dynamics Corp. | 4,038 | $ | 460,534 | ||||||||
| Northrop Grumman Corp. | 26,780 | 1,609,746 | |||||||||
| Rockwell Collins, Inc. | 7,248 | 336,815 | |||||||||
| United Technologies Corp. | 82,514 | 4,613,358 | |||||||||
| $ | 7,020,453 | ||||||||||
| Apparel — 0.9% | |||||||||||
| NIKE, Inc., Class B | 36,327 | $ | 3,152,820 | ||||||||
| Reebok International, Ltd. | 15,879 | 924,634 | |||||||||
| $ | 4,077,454 | ||||||||||
| Auto and Parts — 0.5% | |||||||||||
| BorgWarner, Inc. | 16,316 | $ | 989,239 | ||||||||
| Goodyear Tire & Rubber Co.(1) | 14,940 | 259,657 | |||||||||
| Johnson Controls, Inc. | 13,713 | 999,815 | |||||||||
| $ | 2,248,711 | ||||||||||
| Beverages — 2.9% | |||||||||||
| Anheuser-Busch Cos., Inc. | 79,253 | $ | 3,404,709 | ||||||||
| Coca-Cola Co. | 130,353 | 5,254,529 | |||||||||
| PepsiCo, Inc. | 86,754 | 5,125,426 | |||||||||
| $ | 13,784,664 | ||||||||||
| Biotechnology — 1.4% | |||||||||||
| Abgenix, Inc.(1) | 30,956 | $ | 665,864 | ||||||||
| Amgen, Inc.(1) | 57,391 | 4,525,854 | |||||||||
| Applera Corp.-Applied Biosystems Group | 10,719 | 284,697 | |||||||||
| Biogen Idec, Inc.(1) | 22,055 | 999,753 | |||||||||
| $ | 6,476,168 | ||||||||||
| Building and Construction — 0.1% | |||||||||||
| KB HOME | 8,156 | $ | 592,615 | ||||||||
| $ | 592,615 | ||||||||||
| Building Materials — 0.4% | |||||||||||
| Stanley Works | 29,637 | $ | 1,423,762 | ||||||||
| Vulcan Materials Co. | 4,180 | 283,195 | |||||||||
| $ | 1,706,957 | ||||||||||
| Security | Shares | Value | |||||||||
| Business Services — 0.5% | |||||||||||
| Cintas Corp. | 41,364 | $ | 1,703,370 | ||||||||
| Fluor Corp. | 8,580 | 662,891 | |||||||||
| $ | 2,366,261 | ||||||||||
| Chemicals and Plastics — 1.2% | |||||||||||
| Ashland, Inc. | 6,811 | $ | 394,357 | ||||||||
| Dow Chemical Co. | 79,461 | 3,481,981 | |||||||||
| Eastman Chemical Co. | 31,031 | 1,600,889 | |||||||||
| Rohm and Haas Co. | 7,911 | 383,051 | |||||||||
| $ | 5,860,278 | ||||||||||
| Commercial Banks — 6.5% | |||||||||||
| Bank of America Corp. | 205,052 | $ | 9,463,150 | ||||||||
| Bank of New York Co., Inc. | 117,692 | 3,748,490 | |||||||||
| Comerica, Inc. | 6,819 | 387,046 | |||||||||
| Commercial Capital Bancorp | 12,562 | 215,061 | |||||||||
| Compass Bancshares, Inc. | 5,081 | 245,362 | |||||||||
| First Horizon National Corp. | 5,141 | 197,620 | |||||||||
| Hanmi Financial Corp. | 13,864 | 247,611 | |||||||||
| Huntington Bancshares, Inc. | 9,423 | 223,796 | |||||||||
| Marshall & Ilsley Corp. | 8,458 | 364,032 | |||||||||
| National City Corp. | 94,603 | 3,175,823 | |||||||||
| North Fork Bancorp, Inc. | 76,283 | 2,087,103 | |||||||||
| PFF Bancorp, Inc. | 7,488 | 228,534 | |||||||||
| R&G Financial Corp., Class B | 9,175 | 121,110 | |||||||||
| Sterling Bancorp | 10,063 | 198,543 | |||||||||
| W Holding Co., Inc. | 21,120 | 173,818 | |||||||||
| Wachovia Corp. | 105,100 | 5,555,586 | |||||||||
| Wells Fargo & Co. | 69,164 | 4,345,574 | |||||||||
| $ | 30,978,259 | ||||||||||
| Commercial Services & Supplies — 0.8% | |||||||||||
| Acco Brands Corp.(1) | 4,260 | $ | 104,370 | ||||||||
| Avery Dennison Corp. | 13,376 | 739,292 | |||||||||
| Bemis Co., Inc. | 8,256 | 230,012 | |||||||||
| Waste Management, Inc. | 85,069 | 2,581,844 | |||||||||
| $ | 3,655,518 | ||||||||||
| Communications Equipment — 3.2% | |||||||||||
| Cisco Systems, Inc.(1) | 343,090 | $ | 5,873,701 | ||||||||
| Corning, Inc.(1) | 112,580 | 2,213,323 | |||||||||
| Juniper Networks, Inc.(1) | 9,251 | 206,297 | |||||||||
See notes to financial statements
4
Eaton Vance Tax-Managed Buy-Write Income Fund as of December 31, 2005
PORTFOLIO OF INVESTMENTS CONT'D
| Security | Shares | Value | |||||||||
| Communications Equipment (continued) | |||||||||||
| Motorola, Inc. | 116,382 | $ | 2,629,069 | ||||||||
| QUALCOMM, Inc. | 90,295 | 3,889,909 | |||||||||
| Research in Motion, Ltd.(1) | 5,364 | 354,078 | |||||||||
| $ | 15,166,377 | ||||||||||
| Computer Equipment — 0.1% | |||||||||||
| Network Appliance, Inc.(1) | 18,516 | $ | 499,932 | ||||||||
| $ | 499,932 | ||||||||||
| Computer Services — 0.1% | |||||||||||
| NCR Corp.(1) | 7,529 | $ | 255,534 | ||||||||
| Unisys Corp.(1) | 33,075 | 192,827 | |||||||||
| $ | 448,361 | ||||||||||
| Computer Software — 4.0% | |||||||||||
| Autodesk, Inc. | 5,062 | $ | 217,413 | ||||||||
| Automatic Data Processing, Inc. | 37,355 | 1,714,221 | |||||||||
| Intellisync Corp.(1) | 46,408 | 239,465 | |||||||||
| Microsoft Corp. | 496,588 | 12,985,776 | |||||||||
| Oracle Corp.(1) | 162,224 | 1,980,755 | |||||||||
| Quest Software, Inc.(1) | 17,700 | 258,243 | |||||||||
| Symantec Corp.(1) | 75,245 | 1,316,788 | |||||||||
| Wind River Systems, Inc.(1) | 15,557 | 229,777 | |||||||||
| $ | 18,942,438 | ||||||||||
| Computers & Peripherals — 2.9% | |||||||||||
| Dell, Inc.(1) | 92,890 | $ | 2,785,771 | ||||||||
| Hewlett-Packard Co. | 84,861 | 2,429,570 | |||||||||
| International Business Machines Corp. | 100,844 | 8,289,377 | |||||||||
| Palm, Inc.(1) | 9,328 | 296,630 | |||||||||
| $ | 13,801,348 | ||||||||||
| Consumer Services — 0.4% | |||||||||||
| Cendant Corp. | 107,820 | $ | 1,859,895 | ||||||||
| $ | 1,859,895 | ||||||||||
| Distributors — 0.1% | |||||||||||
| Genuine Parts Co. | 7,145 | $ | 313,808 | ||||||||
| $ | 313,808 | ||||||||||
| Security | Shares | Value | |||||||||
| Diversified Telecommunication Services — 3.6% | |||||||||||
| Alltel Corp. | 49,391 | $ | 3,116,572 | ||||||||
| AT&T, Inc. | 165,778 | 4,059,903 | |||||||||
| Citizens Communications Co. | 200,688 | 2,454,414 | |||||||||
| NTL, Inc.(1) | 17,324 | 1,179,418 | |||||||||
| Sprint Nextel Corp. | 34,516 | 806,294 | |||||||||
| Verizon Communications, Inc. | 185,478 | 5,586,597 | |||||||||
| $ | 17,203,198 | ||||||||||
| Electrical Equipment — 0.6% | |||||||||||
| Emerson Electric Co. | 38,120 | $ | 2,847,564 | ||||||||
| $ | 2,847,564 | ||||||||||
| Electronic Equipment & Instruments — 0.4% | |||||||||||
| Agilent Technologies, Inc.(1) | 35,133 | $ | 1,169,578 | ||||||||
| Fisher Scientific International, Inc.(1) | 12,780 | 790,571 | |||||||||
| Flextronics International, Ltd.(1) | 17,737 | 185,174 | |||||||||
| $ | 2,145,323 | ||||||||||
| Entertainment — 0.5% | |||||||||||
| Carnival Corp. | 45,019 | $ | 2,407,166 | ||||||||
| $ | 2,407,166 | ||||||||||
| Financial Services — 8.8% | |||||||||||
| American Express Co. | 47,841 | $ | 2,461,898 | ||||||||
| Ameriprise Financial, Inc. | 0 | 8 | |||||||||
| Citigroup, Inc. | 280,593 | 13,617,178 | |||||||||
| Countrywide Financial Corp. | 79,997 | 2,735,097 | |||||||||
| Euronet Worldwide, Inc.(1) | 7,444 | 206,943 | |||||||||
| Federated Investors, Inc. | 38,097 | 1,411,113 | |||||||||
| H&R Block, Inc. | 58,152 | 1,427,632 | |||||||||
| JPMorgan Chase & Co. | 144,915 | 5,751,676 | |||||||||
| Lehman Brothers Holdings, Inc. | 31,615 | 4,052,095 | |||||||||
| MBNA Corp. | 141,929 | 3,854,792 | |||||||||
| Merrill Lynch & Co., Inc. | 31,837 | 2,156,320 | |||||||||
| Morgan Stanley | 49,306 | 2,797,622 | |||||||||
| Paychex, Inc. | 41,448 | 1,579,998 | |||||||||
| $ | 42,052,372 | ||||||||||
| Food-Wholesale / Distribution — 0.1% | |||||||||||
| ConAgra Foods, Inc. | 24,975 | $ | 506,493 | ||||||||
| $ | 506,493 | ||||||||||
See notes to financial statements
5
Eaton Vance Tax-Managed Buy-Write Income Fund as of December 31, 2005
PORTFOLIO OF INVESTMENTS CONT'D
| Security | Shares | Value | |||||||||
| Health Services — 2.1% | |||||||||||
| Genesis HealthCare Corp.(1) | 9,286 | $ | 339,125 | ||||||||
| Health Management Associates, Inc., Class A | 10,012 | 219,864 | |||||||||
| Humana, Inc.(1) | 14,697 | 798,488 | |||||||||
| Laboratory Corporation of America Holdings(1) | 22,885 | 1,232,357 | |||||||||
| Manor Care, Inc. | 20,903 | 831,312 | |||||||||
| McKesson Corp. | 42,880 | 2,212,179 | |||||||||
| Quest Diagnostics, Inc. | 7,288 | 375,186 | |||||||||
| UnitedHealth Group, Inc. | 61,522 | 3,822,977 | |||||||||
| $ | 9,831,488 | ||||||||||
| Household Durables — 0.3% | |||||||||||
| Fortune Brands, Inc. | 18,128 | $ | 1,414,347 | ||||||||
| Whirlpool Corp. | 3,293 | 275,822 | |||||||||
| $ | 1,690,169 | ||||||||||
| Industrial Conglomerates — 8.3% | |||||||||||
| 3M Co. | 31,515 | $ | 2,442,413 | ||||||||
| Altria Group, Inc. | 97,480 | 7,283,706 | |||||||||
| Eaton Corp. | 41,406 | 2,777,929 | |||||||||
| General Electric Co. | 504,008 | 17,665,480 | |||||||||
| Honeywell International, Inc. | 64,761 | 2,412,347 | |||||||||
| Parker Hannifin Corp. | 15,868 | 1,046,653 | |||||||||
| Reynolds American, Inc. | 13,562 | 1,292,865 | |||||||||
| Trinity Industries, Inc. | 9,569 | 421,706 | |||||||||
| Tyco International, Ltd. | 96,017 | 2,771,051 | |||||||||
| UST, Inc. | 32,881 | 1,342,531 | |||||||||
| $ | 39,456,681 | ||||||||||
| Insurance — 5.8% | |||||||||||
| Allstate Corp. | 66,029 | $ | 3,570,188 | ||||||||
| American International Group, Inc. | 106,169 | 7,243,911 | |||||||||
| AON Corp. | 12,982 | 466,703 | |||||||||
| Lincoln National Corp. | 7,151 | 379,218 | |||||||||
| Marsh & McLennan Cos., Inc. | 106,798 | 3,391,904 | |||||||||
| MetLife, Inc. | 75,612 | 3,704,988 | |||||||||
| MGIC Investment Corp. | 30,567 | 2,011,920 | |||||||||
| Prudential Financial, Inc. | 59,022 | 4,319,820 | |||||||||
| UnumProvident Corp. | 13,120 | 298,480 | |||||||||
| WellPoint, Inc.(1) | 25,106 | 2,003,208 | |||||||||
| $ | 27,390,340 | ||||||||||
| Security | Shares | Value | |||||||||
| Internet Services — 1.2% | |||||||||||
| CheckFree Corp.(1) | 23,654 | $ | 1,085,719 | ||||||||
| eBay, Inc.(1) | 48,322 | 2,089,927 | |||||||||
| Google, Inc., Class A(1) | 5,538 | 2,297,495 | |||||||||
| Sapient Corp.(1) | 29,607 | 168,464 | |||||||||
| $ | 5,641,605 | ||||||||||
| Leisure Equipment & Products — 0.1% | |||||||||||
| Eastman Kodak Co. | 11,414 | $ | 267,088 | ||||||||
| $ | 267,088 | ||||||||||
| Lodging and Casinos — 0.7% | |||||||||||
| Harrah's Entertainment, Inc. | 25,739 | $ | 1,834,933 | ||||||||
| International Game Technology | 14,037 | 432,059 | |||||||||
| Starwood Hotels & Resorts Worldwide, Inc. | 17,410 | 1,111,803 | |||||||||
| $ | 3,378,795 | ||||||||||
| Machinery — 0.6% | |||||||||||
| Deere & Co. | 45,546 | $ | 3,102,138 | ||||||||
| $ | 3,102,138 | ||||||||||
| Media — 2.5% | |||||||||||
| CBS Corp.(1) | 49,989 | $ | 1,629,641 | ||||||||
| Comcast Corp., Class A(1) | 50,092 | 1,300,388 | |||||||||
| Cox Radio, Inc., Class A(1) | 13,580 | 191,206 | |||||||||
| Meredith Corp. | 4,689 | 245,422 | |||||||||
| Time Warner, Inc. | 256,667 | 4,476,273 | |||||||||
| Walt Disney Co. | 165,951 | 3,977,845 | |||||||||
| $ | 11,820,775 | ||||||||||
| Medical Products — 2.8% | |||||||||||
| Baxter International, Inc. | 58,113 | $ | 2,187,954 | ||||||||
| Johnson & Johnson Co. | 123,184 | 7,403,358 | |||||||||
| Medtronic, Inc. | 66,862 | 3,849,245 | |||||||||
| $ | 13,440,557 | ||||||||||
| Metals-Industrial — 1.5% | |||||||||||
| Alcan, Inc. | 19,051 | $ | 780,138 | ||||||||
| Alcoa, Inc. | 46,646 | 1,379,322 | |||||||||
| Freeport-McMoRan Copper & Gold, Inc., Class B | 61,009 | 3,282,284 | |||||||||
| Nucor Corp. | 23,121 | 1,542,633 | |||||||||
| $ | 6,984,377 | ||||||||||
See notes to financial statements
6
Eaton Vance Tax-Managed Buy-Write Income Fund as of December 31, 2005
PORTFOLIO OF INVESTMENTS CONT'D
| Security | Shares | Value | |||||||||
| Oil and Gas — 6.1% | |||||||||||
| Chevron Corp. | 139,315 | $ | 7,908,913 | ||||||||
| ConocoPhillips | 101,097 | 5,881,823 | |||||||||
| Exxon Mobil Corp. | 273,409 | 15,357,384 | |||||||||
| $ | 29,148,120 | ||||||||||
| Oil and Gas-Equipment and Services — 1.4% | |||||||||||
| BJ Services Co. | 14,716 | $ | 539,636 | ||||||||
| El Paso Corp. | 26,406 | 321,097 | |||||||||
| National-Oilwell Varco, Inc.(1) | 17,795 | 1,115,747 | |||||||||
| Noble Corp. | 42,818 | 3,020,382 | |||||||||
| Williams Co., Inc. | 78,113 | 1,809,878 | |||||||||
| $ | 6,806,740 | ||||||||||
| Oil and Gas-Exploration and Production — 1.5% | |||||||||||
| EOG Resources, Inc. | 32,118 | $ | 2,356,498 | ||||||||
| Halliburton Co. | 61,493 | 3,810,106 | |||||||||
| Kerr-McGee Corp. | 13,292 | 1,207,711 | |||||||||
| $ | 7,374,315 | ||||||||||
| Paper and Forest Products — 0.5% | |||||||||||
| Louisiana-Pacific Corp. | 8,955 | $ | 245,994 | ||||||||
| MeadWestvaco Corp. | 33,483 | 938,529 | |||||||||
| Plum Creek Timber Co., Inc. | 13,395 | 482,890 | |||||||||
| Temple-Inland, Inc. | 20,807 | 933,194 | |||||||||
| $ | 2,600,607 | ||||||||||
| Personal Products — 2.2% | |||||||||||
| Alberto-Culver Co. | 4,761 | $ | 217,816 | ||||||||
| Nu Skin Enterprises, Inc., Class A | 12,797 | 224,971 | |||||||||
| Procter & Gamble Co. | 173,748 | 10,056,534 | |||||||||
| $ | 10,499,321 | ||||||||||
| Pharmaceuticals — 5.5% | |||||||||||
| Abbott Laboratories | 71,142 | $ | 2,805,129 | ||||||||
| AmerisourceBergen Corp. | 8,636 | 357,530 | |||||||||
| Bristol-Myers Squibb Co. | 180,914 | 4,157,404 | |||||||||
| Eli Lilly & Co. | 46,180 | 2,613,326 | |||||||||
| Forest Laboratories, Inc.(1) | 21,447 | 872,464 | |||||||||
| King Pharmaceuticals, Inc.(1) | 27,784 | 470,105 | |||||||||
| Merck & Co., Inc. | 80,974 | 2,575,783 | |||||||||
| Pfizer, Inc. | 374,774 | 8,739,730 | |||||||||
| Security | Shares | Value | |||||||||
| Pharmaceuticals (continued) | |||||||||||
| Wyeth | 82,703 | $ | 3,810,127 | ||||||||
| $ | 26,401,598 | ||||||||||
| Publishing — 0.9% | |||||||||||
| Dow Jones & Co., Inc. | 67,688 | $ | 2,402,247 | ||||||||
| R.R. Donnelley & Sons Co. | 57,895 | 1,980,588 | |||||||||
| $ | 4,382,835 | ||||||||||
| REITs — 0.6% | |||||||||||
| Simon Property Group, Inc. | 38,407 | $ | 2,943,128 | ||||||||
| $ | 2,943,128 | ||||||||||
| Restaurants — 0.5% | |||||||||||
| Darden Restaurants, Inc. | 32,472 | $ | 1,262,511 | ||||||||
| Yum! Brands, Inc. | 19,547 | 916,363 | |||||||||
| $ | 2,178,874 | ||||||||||
| Retail-Food and Drug — 0.1% | |||||||||||
| CVS Corp. | 9,000 | $ | 237,780 | ||||||||
| SUPERVALU, Inc. | 6,564 | 213,199 | |||||||||
| $ | 450,979 | ||||||||||
| Retail-General — 2.6% | |||||||||||
| Best Buy Co., Inc. | 15,110 | $ | 656,983 | ||||||||
| Dollar General Corp. | 103,376 | 1,971,380 | |||||||||
| Federated Department Stores, Inc. | 20,961 | 1,390,343 | |||||||||
| Sears Holdings Corp.(1) | 7,626 | 881,032 | |||||||||
| Wal-Mart Stores, Inc. | 164,273 | 7,687,976 | |||||||||
| $ | 12,587,714 | ||||||||||
| Retail-Specialty and Apparel — 2.1% | |||||||||||
| Bed Bath and Beyond, Inc.(1) | 29,749 | $ | 1,075,426 | ||||||||
| Home Depot, Inc. | 123,241 | 4,988,796 | |||||||||
| Linens 'N Things, Inc.(1) | 13,723 | 365,032 | |||||||||
| Nordstrom, Inc. | 44,718 | 1,672,453 | |||||||||
| Office Depot, Inc.(1) | 12,839 | 403,145 | |||||||||
| Polo Ralph Lauren Corp. | 11,758 | 660,094 | |||||||||
| Sherwin-Williams Co. | 5,094 | 231,370 | |||||||||
| Tiffany & Co. | 14,641 | 560,604 | |||||||||
| $ | 9,956,920 | ||||||||||
See notes to financial statements
7
Eaton Vance Tax-Managed Buy-Write Income Fund as of December 31, 2005
PORTFOLIO OF INVESTMENTS CONT'D
| Security | Shares | Value | |||||||||
| Semiconductors & Semiconductor Equipment — 3.6% | |||||||||||
| Analog Devices, Inc. | 31,200 | $ | 1,119,144 | ||||||||
| Applied Materials, Inc. | 104,209 | 1,869,509 | |||||||||
| ASML Holding N.V.(1) | 13,738 | 275,859 | |||||||||
| Broadcom Corp., Class A(1) | 11,850 | 558,728 | |||||||||
| Cymer, Inc.(1) | 8,406 | 298,497 | |||||||||
| Intel Corp. | 360,053 | 8,986,923 | |||||||||
| KLA-Tencor Corp. | 23,763 | 1,172,229 | |||||||||
| Maxim Integrated Products, Inc. | 35,056 | 1,270,429 | |||||||||
| PMC-Sierra, Inc.(1) | 25,020 | 192,904 | |||||||||
| STMicroelectronics N.V. | 69,724 | 1,255,032 | |||||||||
| $ | 16,999,254 | ||||||||||
| Transport-Services — 0.6% | |||||||||||
| United Parcel Service, Inc., Class B | 36,301 | $ | 2,728,020 | ||||||||
| $ | 2,728,020 | ||||||||||
| Utilities-Electric and Gas — 4.4% | |||||||||||
| Ameren Corp. | 53,912 | $ | 2,762,451 | ||||||||
| CenterPoint Energy, Inc. | 17,504 | 224,926 | |||||||||
| Cinergy Corp. | 63,535 | 2,697,696 | |||||||||
| CMS Energy Corp.(1) | 34,209 | 496,373 | |||||||||
| Consolidated Edison, Inc. | 18,179 | 842,233 | |||||||||
| DTE Energy Co. | 4,649 | 200,790 | |||||||||
| Nicor, Inc. | 16,441 | 646,296 | |||||||||
| NiSource, Inc. | 111,431 | 2,324,451 | |||||||||
| NorthWestern Corp. | 25,000 | 776,750 | |||||||||
| Peoples Energy Corp. | 5,183 | 181,768 | |||||||||
| PPL Corp. | 46,448 | 1,365,571 | |||||||||
| Progress Energy, Inc. | 67,182 | 2,950,633 | |||||||||
| Public Service Enterprise Group, Inc. | 51,991 | 3,377,855 | |||||||||
| TECO Energy, Inc. | 13,039 | 224,010 | |||||||||
| TXU Corp. | 28,608 | 1,435,836 | |||||||||
| Xcel Energy, Inc. | 12,009 | 221,686 | |||||||||
| $ | 20,729,325 | ||||||||||
| Total Common Stocks (identified cost $443,411,544) | $ | 475,753,376 | |||||||||
| Total Investments — 100.0% (identified cost $443,411,544) | $ | 475,753,376 | |||||||||
| Covered Call Options Written — (0.2)% | |||||||||||||||
| Number of Contracts | Premium Received | Value | |||||||||||||
| S & P 500 Index, Expires 1/21/06, Strike 1,265.00 | 257 | $ | 436,386 | $ | (128,500 | ) | |||||||||
| S & P 500 Index, Expires 1/21/06, Strike 1,270.00 | 1,110 | 1,944,380 | (377,400 | ) | |||||||||||
| S & P 500 Index, Expires 1/21/06, Strike 1,275.00 | 1,101 | 1,898,498 | (275,250 | ) | |||||||||||
| S & P 500 Index, Expires 1/21/06, Strike 1,280.00 | 1,345 | 1,807,610 | (248,825 | ) | |||||||||||
| Total Call Options Written (premiums received $6,086,874) | $ | (1,029,975 | ) | ||||
| Other Assets, Less Liabilities — 0.2% | $ | 1,092,873 | |||||
| Net Assets — 100.0% | $ | 475,816,274 | |||||
REITs - Real Estate Investment Trusts
(1) Non-income producing security.
See notes to financial statements
8
Eaton Vance Tax-Managed Buy-Write Income Fund as of December 31, 2005
FINANCIAL STATEMENTS
Statement of Assets and Liabilities
As of December 31, 2005
| Assets | |||||||
| Investments, at value (identified cost, $443,411,544) | $ | 475,753,376 | |||||
| Cash | 894,616 | ||||||
| Receivable from the Investment Adviser | 15,000 | ||||||
| Dividends and interest receivable | 833,842 | ||||||
| Tax reclaim receivable | 837 | ||||||
| Total assets | $ | 477,497,671 | |||||
| Liabilities | |||||||
| Written options outstanding, at value (premiums received $6,086,874) | $ | 1,029,975 | |||||
| Payable to affiliate for Trustees' fees | 32,144 | ||||||
| Payable to affiliate for investment advisory fees | 406,915 | ||||||
| Accrued expenses | 212,363 | ||||||
| Total liabilities | $ | 1,681,397 | |||||
| Net assets applicable to common shares | $ | 475,816,274 | |||||
| Sources of Net Assets | |||||||
| Common Shares, $0.01 par value, unlimited number of shares authorized, 24,526,684 shares issued and outstanding | $ | 245,267 | |||||
| Additional paid-in capital | 452,162,682 | ||||||
| Accumulated net realized loss (computed on the basis of identified cost) | (13,990,406 | ) | |||||
| Net unrealized appreciation (computed on the basis of identified cost) | 37,398,731 | ||||||
| Net assets applicable to common shares | $ | 475,816,274 | |||||
| Net Asset Value Per Common Share | |||||||
| ($475,816,274 ÷ 24,526,684 common shares issued and outstanding) | $ | 19.40 | |||||
Statement of Operations
For the Period Ended
December 31, 2005(1)
| Investment Income | |||||||
| Dividends (net of foreign taxes, $2,971) | $ | 6,832,922 | |||||
| Interest | 101,835 | ||||||
| Total investment income | $ | 6,934,757 | |||||
| Expenses | |||||||
| Investment adviser fee | $ | 3,179,664 | |||||
| Trustees' fees and expenses | 32,144 | ||||||
| Custodian fee | 145,117 | ||||||
| Legal and accounting services | 62,059 | ||||||
| Transfer and dividend disbursing agent fees | 46,034 | ||||||
| Printing and postage | 33,521 | ||||||
| Organization expenses | 15,000 | ||||||
| Miscellaneous | 46,202 | ||||||
| Total expenses | $ | 3,559,741 | |||||
| Deduct — Expense reimbursement | $ | 15,000 | |||||
| Total expense reductions | $ | 15,000 | |||||
| Net expenses | $ | 3,544,741 | |||||
| Net investment income | $ | 3,390,016 | |||||
| Realized and Unrealized Gain (Loss) | |||||||
| Net realized gain (loss) — Investment transactions (identified cost basis) | $ | 1,508,831 | |||||
| Written options | (12,108,539 | ) | |||||
| Net realized loss | $ | (10,599,708 | ) | ||||
| Change in unrealized appreciation — Investments (identified cost basis) | $ | 32,341,832 | |||||
| Written options | 5,056,899 | ||||||
| Net change in unrealized appreciation | $ | 37,398,731 | |||||
| Net realized and unrealized gain | $ | 26,799,023 | |||||
| Net increase in net assets from operations | $ | 30,189,039 | |||||
(1) For the period from the start of business, April 29, 2005, to December 31, 2005.
See notes to financial statements
9
Eaton Vance Tax-Managed Buy-Write Income Fund as of December 31, 2005
FINANCIAL STATEMENTS CONT'D
Statement of Changes in Net Assets
| Increase (Decrease) in Net Assets | Period Ended December 31, 2005(1) | ||||||
| From operations — Net investment income | $ | 3,390,016 | |||||
| Net realized loss from investment transactions and written options | (10,599,708 | ) | |||||
| Net change in unrealized appreciation from investments and written options | 37,398,731 | ||||||
| Net increase in net assets from operations | $ | 30,189,039 | |||||
| Distributions to common shareholders — From net investment income | $ | (3,390,016 | ) | ||||
| From net realized gain | (3,390,698 | ) | |||||
| Tax return of capital | (15,277,905 | ) | |||||
| Total distributions to common shareholders | $ | (22,058,619 | ) | ||||
| Capital share transactions — Proceeds from sale of common shares(2) | $ | 467,837,500 | |||||
| Reinvestment of distributions to common shareholders | 418,869 | ||||||
| Offering costs | (670,515 | ) | |||||
| Net increase in net assets from capital share transactions | $ | 467,585,854 | |||||
| Net increase in net assets | $ | 475,716,274 | |||||
| Net Assets Applicable to Common Shares | |||||||
| At beginning of period | $ | 100,000 | |||||
| At end of period | $ | 475,816,274 | |||||
(1) For the period from the start of business, April 29, 2005, to December 31, 2005.
(2) Proceeds from sales of shares net of sales load paid of $22,162,500.
See notes to financial statements
10
Eaton Vance Tax-Managed Buy-Write Income Fund as of December 31, 2005
FINANCIAL STATEMENTS CONT'D
Financial Highlights
| Selected data for a common share outstanding during the period stated | |||||||
| Period Ended December 31, 2005(1)(2) | |||||||
| Net asset value — Beginning of period(3) | $ | 19.100 | |||||
| Income from operations | |||||||
| Net investment income | $ | 0.140 | |||||
| Net realized and unrealized gain | 1.088 | ||||||
| Total income from operations | $ | 1.228 | |||||
| Less distributions | |||||||
| From net investment income | $ | (0.138 | ) | ||||
| From net realized gain | (0.138 | ) | |||||
| From tax return of capital | (0.624 | ) | |||||
| Total distributions to common shareholders | $ | (0.900 | ) | ||||
| Common shares offering costs charged to paid-in capital | $ | (0.028 | ) | ||||
| Net asset value — End of period | $ | 19.400 | |||||
| Market value — End of period | $ | 18.160 | |||||
| Total Investment Return on Net Asset Value(4) | 6.35 | % | |||||
| Total Investment Return on Market Value(4) | (0.45 | )% | |||||
| Ratios/Supplemental Data† | |||||||
| Net assets applicable to common shares, end of period (000's omitted) | $ | 475,816 | |||||
| Ratios (As a percentage of average net assets): | |||||||
| Net expenses | 1.11 | %(5) | |||||
| Net investment income | 1.06 | %(5) | |||||
| Portfolio Turnover | 10 | % | |||||
† The operating expenses of the Fund reflect reimbursement of organization expenses by the Advisor. Had such action not been taken, the ratios and net investment income per share
would have been as follows:
| Ratios (As a percentage of average net assets): | |||||||
| Expenses | 1.12 | %(5) | |||||
| Net investment income | 1.06 | %(5) | |||||
| Net investment income per share | $ | 0.140 | |||||
(1) For the period from the start of business, April 29, 2005, to December 31, 2005.
(2) Computed using average common shares outstanding.
(3) Net Asset Value at beginning of period reflects the deduction of the sales load of $0.90 per share paid by the shareholder from the $20.00 offering price.
(4) Total investment return on net asset value is calculated assuming a purchase at the offering price of $20.00 less the sales load of $0.90 per share paid by the shareholder on the first day and a sale at the net asset value on the last day of the period reported. Total investment return on market value is calculated assuming a purchase at the offering price of $20.00 less the sales load of $0.90 per share paid by the shareholder on the first day and a sale at the current market price on the last day of the period reported. Total investment return on net asset value and total return on market value are not computed on an annualized basis.
(5) Annualized.
See notes to financial statements
11
Eaton Vance Tax-Managed Buy-Write Income Fund as of December 31, 2005
NOTES TO FINANCIAL STATEMENTS
1 Significant Accounting Policies
Eaton Vance Tax-Managed Buy-Write Income Fund (the Fund) is registered under the Investment Company Act of 1940, as amended, as a diversified, closed-end management investment company. The Fund was organized under the laws of the Commonwealth of Massachusetts by an Agreement and Declaration of Trust dated November 17, 2004. The Fund's primary investment objective is to provide current income and gains, with a secondary objective of capital appreciation. The Fund will pursue its investment objectives by investing primarily in a diversified portfolio of common stocks that seeks to exceed the total return performance of the S & P 500. Under normal market conditions, the Fund will seek to generate current earnings in part by writing index call options on the S & P 500. The following is a summary of significant accounting policies of the Fund. The policies are in conformity with accounting principles generally accepted in the United States of America.
A Investment Valuation — Securities listed on a U.S. securities exchange generally are valued at the last sale price on the day of valuation or, if no sales took place on such date, at the mean between the closing bid and asked prices on the exchange where such securities are principally traded. Equity securities listed on the NASDAQ National Market System generally are valued at the official NASDAQ closing price. Unlisted or listed securities for which closing sales prices or closing quotations are not available are valued at the mean between the latest available bid and asked prices or, in the case of preferred equity securities that are not listed or traded in the over-the-counter market, by an independent pricing service. Exchange-traded options are valued at the last sale price for the day of valuation as quoted on the principal exchange or board of trade on which the options are traded or, in the absence of sales on such date, at the mean between the latest bid and asked prices. Futures positions on securities and currencies generally are valued at closing settlement prices. Short-term debt securities with a remaining maturity of 60 days or less are valued at amortized cost. If short-term debt securities were acquired with a remaining maturity of more than 60 days, their amortized cost value will be based on their value on the sixty-first day prior to maturity. Other fixed income and debt securities, including listed securities and securities for which price quotations are available, will normally be valued on the basis of valuations furnished by a pricing service. Foreign securities and currencies are valued in U.S. dollars, based on foreign currency exchange rate quotations supplied by an independent quotation service. The daily valuation of exchange-traded foreign s ecurities generally is determined as of the close of trading on the principal exchange on which such securities trade. Events occurring after the close of trading on foreign exchanges may result in adjustments to the valuation of foreign securities to more accurately reflect their fair value as of the close of regular trading on the New York Stock Exchange. When valuing foreign equity securities that meet certain criteria, the Trustees have approved the use of a fair value service that values such securities to reflect market trading that occurs after the close of the applicable foreign markets of comparable securities or other instruments that have a strong correlation to the fair-valued securities. Investments held by the Fund for which valuations or market quotations are unavailable, and investments for which the price of the security is not believed to represent its fair market value, are valued at fair value using methods determined in good faith by or at the direction of the Trustees of the Fund considering relevant factors, data and information including the market value of freely tradable securities of the same class in the principal market on which such securities are normally traded.
B Income — Dividend income is recorded on the ex-dividend date for dividends received in cash and/or securities. However, if the ex-dividend date has passed, certain dividends from foreign securities are recorded as the Fund is informed of the ex-dividend date. Interest income is recorded on the accrual basis.
C Federal Taxes — The Fund's policy is to comply with the provisions of the Internal Revenue Code applicable to regulated investment companies and to distribute to shareholders each year substantially all of its taxable income, including any net realized capital gain on investments. Accordingly, no provision for federal income or excise tax is necessary.
At December 31, 2005, net capital losses of $8,933,506 attributable to security transactions incurred after October 31, 2005 are treated as arising on the first day of the Fund's taxable year ending December 31, 2006.
D Written Options — Upon the writing of a call option, an amount equal to the premium received by the Fund is included in the Statement of Assets and Liabilities as a liability. The amount of the liability is subsequently marked-to-market to reflect the current value of the option written in accordance with the Fund's policies on investment valuations discussed above. Premiums received from writing options which expire are treated as realized gains. Premiums received from writing options which are exercised or are closed are added to or offset against the
12
Eaton Vance Tax-Managed Buy-Write Income Fund as of December 31, 2005
NOTES TO FINANCIAL STATEMENTS CONT'D
proceeds or amount paid on the transaction to determine the realized gain or loss. If a put option is exercised, the premium reduces the cost basis of the securities purchased by the Fund. The Fund, as writer of an option, may have no control over whether the underlying securities may be sold (call) or purchased (put), and as a result, bears the market risk of an unfavorable change in the price of the securities underlying the written option.
E Offering Costs — Costs incurred by the Fund in connection with the offering of the common shares were recorded as a reduction of capital paid in excess of par applicable to common shares.
F Use of Estimates — The preparation of the financial statements in conformity with accounting principles generally accepted in the United States of America requires management to make estimates and assumptions that affect the reported amounts of assets and liabilities at the date of the financial statements and the reported amounts of income and expense during the reporting period. Actual results could differ from those estimates.
G Indemnifications — Under the Fund's organizational documents, its officers and Trustees may be indemnified against certain liabilities and expenses arising out of the performance of their duties to the Fund and shareholders are indemnified against personal liability for obligations of the Fund. Additionally, in the normal course of business, the Fund enters into agreements with service providers that may contain indemnification clauses. The Fund's maximum exposure under these arrangements is unknown as this would involve future claims that may be made against the Fund that have not yet occurred.
H Other — Investment transactions are accounted for on a trade date basis. Realized gains and losses are computed on the specific identification of the securities sold.
I Expense Reduction — Investors Bank & Trust Company (IBT) serves as custodian of the Fund. Pursuant to the custodian agreement, IBT receives a fee reduced by credits which are determined based on the average daily cash balance the Fund maintains with IBT. All credit balances used to reduce the Fund's custodian fees are reported as a reduction of total expenses in the Statement of Operations. For the period from the start of business, April 29, 2005 to December 31, 2005, there were no credit balances used to reduce the Fund's custodian fee.
2 Distribution to Shareholders
The Fund intends to make quarterly distributions of net investment income and short-term gains in excess of long-term capital losses. At least annually the Fund intends to distribute all or substantially all of its net realized capital gains, if any. Distributions are recorded on the ex-dividend date. The Fund distinguishes between distributions on a tax basis and a financial reporting basis. Accounting principles generally accepted in the United States of America require that only distributions in excess of tax basis earnings and profits be reported in the financial statements as a return of capital. Permanent differences between book and tax accounting relating to distributions are reclassified to paid-in capital.
The tax character of distributions paid for the period from the start of business, April 29, 2005 to December 31, 2005 was as follows:
| Period Ended December 31, 2005 | |||||||
| Distributions declared from: | |||||||
| Ordinary Income | $ | 4,956,045 | |||||
| Long-term Capital Gain | $ | 1,824,669 | |||||
| Return of Capital | $ | 15,277,905 | |||||
During the period from the start of business, April 29,2005 to December 31, 2005, accumulated net realized loss was increased by $3,390,698, distributions in excess of net investment income was decreased by $18,668,603 and paid-in capital was decreased by $15,277,905 primarily due to differences between book and tax accounting. This change had no effect on the net assets or the net asset value per share.
As of December 31, 2005, the components of distributable earnings (accumulated losses) on a tax basis were as follows:
| Other temporary differences | $ | (8,933,506 | ) | ||||
| Unrealized gain | $ | 32,341,831 | |||||
3 Investment Adviser Fee and Other Transactions with Affiliates
The investment adviser fee is earned by Eaton Vance Management (EVM), as compensation for management and investment advisory services rendered to the Fund. Under the advisory agreement, EVM receives a monthly advisory fee in the amount of 1.00% annually of average
13
Eaton Vance Tax-Managed Buy-Write Income Fund as of December 31, 2005
NOTES TO FINANCIAL STATEMENTS CONT'D
daily gross assets of the Fund. For the period from the start of business, April 29, 2005 to December 31, 2005, the advisory fee amounted to $3,179,664. Pursuant to sub-advisory agreements, EVM has delegated a portion of the investment management to Parametric Portfolio Associates, LLC (Parametric), an affiliate, and EVM has delegated the investment management of the Fund's option strategy to Rampart Investment Management Company (Rampart). EVM pays Parametric and Rampart a portion of the advisory fee for sub-advisory services provided to the Fund.
EVM has agreed to reimburse the Fund for costs incurred in the Fund's organization. For the period from the start of business, April 29, 2005, to December 31, 2005 EVM will reimburse the Fund $15,000 in organization expenses.
Trustees of the Fund who are not affiliated with EVM may elect to defer receipt of all or a percentage of their annual fees in accordance with the terms of the Trustees Deferred Compensation Plan. For the period from the start of business, April 29, 2005, to December 31, 2005, no significant amounts have been deferred.
Certain officers and Trustees of the Fund are officers of the above organization.
4 Purchases and Sales of Investments
Purchases and sales of investments, other than short-term obligations, aggregated $486,147,389 and $44,244,677 respectively, for the period from the start of business, April 29, 2005, to December 31, 2005.
5 Federal Income Tax Basis of Unrealized Appreciation (Depreciation)
The cost and unrealized appreciation (depreciation) in value of investments owned by the Fund at December 31, 2005, as computed on a federal income tax basis, were as follows:
| Aggregate cost | $ | 443,411,545 | |||||
| Gross unrealized appreciation | $ | 42,926,742 | |||||
| Gross unrealized depreciation | (10,584,911 | ) | |||||
| Net unrealized appreciation | $ | 32,341,831 | |||||
6 Common Shares of Beneficial Interest
The Declaration of Trust permits the Fund to issue an unlimited number of full and fractional $0.01 par value common shares of beneficial interest. Transactions in common shares were as follows:
| Period Ended December 31, 2005(1) | |||||||
| Sales | 24,505,000 | ||||||
| Issued to shareholders electing to receive payments of distributions in Fund shares | 21,684 | ||||||
| Net increase | 24,526,684 | ||||||
(1) For the period from the start of business, April 29, 2005, to December 31, 2005.
7 Financial Instruments
The Fund may trade in financial instruments with off-balance sheet risk in the normal course of its investing activities to assist in managing exposure to various market risks. These financial instruments include written options, forward foreign currency exchange contracts and financial futures contracts and may involve, to a varying degree, elements of risk in excess of the amounts recognized for financial statement purposes. The notional or contractual amounts of these instruments represent the investment the Fund has in particular classes of financial instruments and does not necessarily represent the amounts potentially subject to risk. The measurement of the risks associated with these instruments is meaningful only when all related and offsetting transactions are considered. A summary of obligations under these financial instruments at December 31, 2005 is included in the Portfolio of Investments.
Written call options activity for the period ended December 31, 2005 was as follows:
| Number of Contracts | Premiums Received | ||||||||||
| Outstanding, beginning of period | — | — | |||||||||
| Options written | 35,010 | $ | 53,409,603 | ||||||||
| Options terminated in closing purchase transactions | (31,197 | ) | (47,322,729 | ) | |||||||
| Outstanding, end of period | 3,813 | $ | 6,086,874 | ||||||||
All of the assets of the Fund are subject to segregation to satisfy the requirements of the escrow agent. At December 31, 2005, the Fund had sufficient cash and/or securities to cover commitments under these contracts.
14
Eaton Vance Tax-Managed Buy-Write Income Fund as of December 31, 2005
REPORT OF INDEPENDENT REGISTERED PUBLIC ACCOUNTING FIRM
To the Trustees and Shareholders
of Eaton Vance Tax-Managed Buy-Write Income Fund:
We have audited the accompanying statement of assets and liabilities of Eaton Vance Tax-Managed Buy-Write Income Fund (the "Fund"), including the portfolio of investments as of December 31, 2005, the related statements of operations, and changes in net assets, and the financial highlights for the period from the start of business, April 29, 2005, to December 31, 2005. These financial statements and financial highlights are the responsibility of the Fund's management. Our responsibility is to express an opinion on these financial statements and financial highlights based on our audit.
We conducted our audit in accordance with the standards of the Public Company Accounting Oversight Board (United States). Those standards require that we plan and perform the audit to obtain reasonable assurance about whether the financial statements and financial highlights are free of material misstatement. The Fund is not required to have, nor were we engaged to perform, an audit of its internal control over financial reporting. Our audit included consideration of internal control over financial reporting as a basis for designing audit procedures that are appropriate in the circumstances, but not for the purpose of expressing an opinion on the effectiveness of the Fund's internal control over financial reporting. Accordingly, we express no such opinion. An audit also includes examining, on a test basis, evidence supporting the amounts and disclosures in the financial statements, assessing the accounting principles used and si gnificant estimates made by management, as well as evaluating the overall financial statement presentation. Our procedures included confirmation of securities owned as of December 31, 2005 by correspondence with the custodian and brokers; where replies were not received from brokers, we performed other auditing procedures. We believe that our audit provides a reasonable basis for our opinion.
In our opinion, the financial statements and financial highlights referred to above present fairly, in all material respects, the financial position of the Eaton Vance Tax-Managed Buy-Write Income Fund as of December 31, 2005, the results of its operations, the changes in its net assets and its financial highlights for the period from the start of business, April 29, 2005 to December 31, 2005, in conformity with accounting principles generally accepted in the United States of America.
DELOITTE & TOUCHE LLP
Boston, Massachusetts
February 17, 2006
15
Eaton Vance Tax-Managed Buy-Write Income Fund as of December 31, 2005
FEDERAL TAX INFORMATION (Unaudited)
The Form 1099-DIV received in January 2006 showed the tax status of all distributions paid to your account in calendar 2005. Shareholders are advised to consult their own tax adviser with respect to the tax consequences of their investment in the Fund. As required by the Internal Revenue Code regulations, shareholders must be notified within 60 days of the Fund's fiscal year end regarding the status of qualified dividend income for individuals and the dividends received deduction for corporations.
Qualified Dividend Income. The Fund designates approximately $6,436,206, or up to the maximum amount of such dividends allowable pursuant to the Internal Revenue Code, as qualified dividend income eligible for the reduced tax rate of 15%.
Dividends Received Deduction. Corporate shareholders are generally entitled to take the dividends received deduction on the portion of the Fund's dividend distribution that qualifies under tax law. For the Fund's fiscal 2005 ordinary income dividends, 100% qualifies for the corporate dividends received deduction.
Capital Gains Dividends. The Fund designates $1,824,669 as a capital gain dividend.
16
Eaton Vance Tax-Managed Buy-Write Income Fund
DIVIDEND REINVESTMENT PLAN
The Fund offers a dividend reinvestment plan (the Plan) pursuant to which shareholders may elect to have dividends and capital gains distributions reinvested in common shares (the Shares) of the Fund. You may elect to participate in the Plan by completing the Dividend Reinvestment Plan Application Form. If you do not participate, you will receive all distributions in cash paid by check mailed directly to you by PFPC Inc. as dividend paying agent. On the distribution payment date, if the net asset value per Share is equal to or less than the market price per Share plus estimated brokerage commissions then new Shares will be issued. The number of Shares shall be determined by the greater of the net asset value per Share or 95% of the market price. Otherwise, Shares generally will be purchased on the open market by the Plan Agent. Distributions subject to income tax (if any) are taxable whether or not shares are reinvested.
If your shares are in the name of a brokerage firm, bank, or other nominee, you can ask the firm or nominee to participate in the Plan on your behalf. If the nominee does not offer the Plan, you will need to request that your shares be re-registered in your name with the Fund's transfer agent, PFPC Inc. or you will not be able to participate.
The Plan Agent's service fee for handling distributions will be paid by the Fund. Each participant will be charged their pro rata share of brokerage commissions on all open-market purchases.
Plan participants may withdraw from the Plan at any time by writing to the Plan Agent at the address noted on the following page. If you withdraw, you will receive shares in your name for all Shares credited to your account under the Plan. If a participant elects by written notice to the Plan Agent to have the Plan Agent sell part or all of his or her Shares and remit the proceeds, the Plan Agent is authorized to deduct a $5.00 fee plus brokerage commissions from the proceeds.
If you wish to participate in the Plan and your shares are held in your own name, you may complete the form on the following page and deliver it to the Plan Agent.
Any inquires regarding the Plan can be directed to the Plan Agent, PFPC Inc., at 1-800-331-1710.
17
Eaton Vance Tax-Managed Buy-Write Income Fund
APPLICATION FOR PARTICIPATION IN DIVIDEND REINVESTMENT PLAN
This form is for shareholders who hold their common shares in their own names. If your common shares are held in the name of a brokerage firm, bank, or other nominee, you should contact your nominee to see if it will participate in the Plan on your behalf. If you wish to participate in the Plan, but your brokerage firm, bank, or nominee is unable to participate on your behalf, you should request that your common shares be re-registered in your own name which will enable your participation in the Plan.
The following authorization and appointment is given with the understanding that I may terminate it at any time by terminating my participation in the Plan as provided in the terms and conditions of the Plan.
Please print exact name on account
Shareholder signature Date
Shareholder signature Date
Please sign exactly as your common shares are registered. All persons whose names appear on the share certificate must sign.
YOU SHOULD NOT RETURN THIS FORM IF YOU WISH TO RECEIVE YOUR DIVIDENDS AND DISTRIBUTIONS IN CASH. THIS IS NOT A PROXY.
This authorization form, when signed, should be mailed to the following address:
Eaton Vance Tax-Managed Buy-Write Income Fund
c/o PFPC Inc.
P.O. Box 43027
Providence, RI 02940-3027
800-331-1710
Number of Employees
The Fund is organized as a Massachusetts business trust and is registered under the Investment Company Act of 1940, as amended, as a diversified, closed-end management investment company and has no employees.
Number of Shareholders
As of December 31, 2005, our records indicate that there are 20 registered shareholders and 18,753 shareholders owning the Fund shares in street name, such as through brokers, banks, and financial intermediaries.
If you are a street name shareholder and wish to receive our reports directly, which contain important information about the Fund, please write or call:
Eaton Vance Distributors, Inc.
The Eaton Vance Building
255 State Street
Boston, MA 02109
1-800-225-6265
New York Stock Exchange symbol
| The New York Stock Exchange symbol is ETB. | |||
18
Eaton Vance Tax-Managed Buy-Write Income Fund
BOARD OF TRUSTEES' APPROVAL OF THE INVESTMENT ADVISORY AGREEMENTS
Prior to approving the (a) investment advisory agreement (the "Advisory Agreement") between Eaton Vance Tax-Managed Buy-Write Income Fund (the "Fund") and the investment adviser, Eaton Vance Management ("Eaton Vance" or the "Adviser") and (b) investment sub-advisory agreements (the "Sub-Advisory Agreements") between the Fund and Parametric Portfolio Associates ("Parametric") and the Fund and Rampart Investment Management Company, Inc. ("Rampart", and together with Parametric, the "Sub-Advisers"), the Special Committee of the Fund's Board of Trustees considered, among other things, the following:
• A report comparing the fees and expenses of the Fund and certain profitability analyses prepared by Eaton Vance, Rampart and Parametric;
• Information on the relevant peer group(s) of funds;
• The economic outlook and the general investment outlook in the relevant investment markets;
• Eaton Vance's and Parametric's results and financial condition and the overall organization of the Adviser and the Sub-Adviser;
• Eaton Vance's and Rampart's results and financial condition and the overall organization of the Adviser and the Sub-Adviser;
• Arrangements regarding the distribution of Fund shares;
• The procedures used to determine the fair value of the Fund's assets;
• The allocation of brokerage and the benefits received by the Adviser and the Sub-Advisers as the result of brokerage allocation, including allocations to soft dollar brokerage and allocations to firms that sell Eaton Vance fund shares;
• Eaton Vance's management of the relationship with the custodian, subcustodians and fund accountants;
• The resources devoted to Eaton Vance's compliance efforts undertaken on behalf of the funds it manages and the record of compliance with the investment policies and restrictions and with policies on personal securities transactions;
• Parametric's compliance efforts with respect to the accounts it manages;
• Rampart's compliance efforts with respect to the accounts it manages;
• The quality, nature, cost and character of the administrative and other non-investment management services provided by Eaton Vance and its affiliates and by Parametric and Rampart;
• The terms of the Advisory Agreement and the Sub-Advisory Agreements, and the reasonableness and appropriateness of the particular fee paid by the Fund for the services described therein;
• Operating expenses (including transfer agency expenses) to be paid to third parties; and
• Information to be provided to investors, including the Fund's shareholders.
In evaluating the Advisory Agreement between the Fund and Eaton Vance, the Sub-Advisory Agreement between the Adviser and Parametric, and the Sub-Advisory Agreement between the Adviser and Rampart, the Special Committee reviewed material furnished by Eaton Vance, Rampart and Parametric at the initial Board meeting held on February 7, 2005, including the above referenced considerations and information relating to the education, experience and number of investment professionals and other personnel who would provide services under the Advisory Agreement and under the Sub-Advisory Agreements. The Special Committee also took into account the time and attention to be devoted by senior management to the Fund and the other funds in the complex. The Special Committee evaluated the level of skill required to manage
19
Eaton Vance Tax-Managed Buy-Write Income Fund
BOARD OF TRUSTEES' APPROVAL OF THE INVESTMENT ADVISORY AGREEMENTS CONT'D
the Fund and concluded that the human resources available at Eaton Vance were appropriate to fulfill effectively the duties of the Adviser on behalf of the Fund. The Special Committee also considered the business reputation of the Adviser, its financial resources and professional liability insurance coverage and concluded that Eaton Vance would be able to meet any reasonably foreseeable obligations under the Advisory Agreement. The Special Committee also considered the business reputations of Parametric and Rampart, Parametric's and Rampart's respective investment strategies and their past experience in implementing these strategies.
The Special Committee received information concerning the investment philosophy and investment process to be applied by Eaton Vance, Rampart and Parametric in managing the Fund. In this regard, the Special Committee considered Eaton Vance's in-house research capabilities as well as other resources available to Eaton Vance personnel, including research services that may be available to Eaton Vance as a result of securities transactions effected for the Fund and other investment advisory clients. The Special Committee concluded that Eaton Vance's, Parametric's and Rampart's investment process, research capabilities and philosophy were well suited to the Fund, given the Fund's investment objective and policies.
In addition to the factors mentioned above, the Special Committee also reviewed the level of the Adviser's profits in respect of the management of the Eaton Vance funds, including the Fund. The Special Committee considered the other profits realized by Eaton Vance and its affiliates in connection with the operation of the Fund. The Special Committee also considered profit margins of Eaton Vance in comparison with available industry data. In addition, the Special Committee considered the fiduciary duty assumed by the Adviser in connection with the service rendered to the Fund and the business reputation of the Adviser, its financial resources and its professional liability insurance coverage. In evaluating the fees to be paid to Parametric and Rampart, the Special Committee considered and discussed fees paid to other investment sub-advisers in similar circumstances, as well as fees charged by Parametric and Rampart to their other clients.
The Special Committee did not consider any single factor as controlling in determining whether or not to approve the Advisory Agreement and the Sub-Advisory Agreements. Nor are the items described herein all encompassing of the matters considered by the Special Committee. In assessing the information provided by Eaton Vance, Parametric, Rampart and their affiliates, the Special Committee also took into consideration the benefits to shareholders of investing in a fund that is part of a large family of funds which provides a large variety of shareholder services.
Based on its consideration of all factors that it deemed material and assisted by the advice of its independent counsel, the Special Committee concluded that the approval of the Advisory Agreement and the Sub-Advisory Agreements, including the fee structure, is in the interests of shareholders. The Special Committee also considered that the Adviser would enter into a Structuring Fee Agreement with Citigroup Global Markets Inc., whereby the Adviser (and not the Fund) would pay Citigroup Global Markets Inc. to provide upon request certain market data and reports to support shareholder services pursuant to the agreement.
20
Eaton Vance Tax-Managed Buy-Write Income Fund
MANAGEMENT AND ORGANIZATION
Fund Management. The Trustees of Eaton Vance Tax Managed Buy-Write Income Fund (the Fund) are responsible for the overall management and supervision of the Fund's affairs. The Trustees and officers of the Fund are listed below. Except as indicated, each individual has held the office shown or other offices in the same company for the last five years. Trustees and officers of the Fund hold indefinite terms of office. The "noninterested Trustees" consist of those Trustees who are not "interested persons" of the Fund, as that term is defined under the 1940 Act. The business address of each Trustee and officer is The Eaton Vance Building, 255 State Street, Boston, Massachusetts 02109. As used below, "EVC" refers to Eaton Vance Corp., "EV" refers to Eaton Vance, Inc., "EVM" refers to Eaton Vance Management, "BMR" refers to Boston Management and Research and "EVD" refers to Eaton Vance Distributors, Inc. EVC and EV are the corporate parent and trustee, respectively, of EVM and BMR. Each officer affiliated with Eaton Vance may hold a position with other Eaton Vance affiliates that is comparable to his or her position with EVM listed below.
| Name and Date of Birth | Position with the Fund | Term of Office and Length of Service | Principal Occupation(s) During Past Five Years | Number of Portfolios in Fund Complex Overseen By Trustee(1) | Other Directorships Held | ||||||||||||||||||
| Interested Trustee | |||||||||||||||||||||||
| James B. Hawkes 11/9/41 | Trustee and Vice President | Until 2006. 3 years. Since 2005 | Chairman, President and Chief Executive Officer of BMR, EVC, EVM and EV; Chairman and Chief Executive Officer of EVC; Director of EV; Vice President and Director of EVD. Trustee and/or officer of 161 registered investment companies in the Eaton Vance Fund Complex. Mr. Hawkes is an interested person because of his positions with BMR, EVM, EVC and EV, which are affiliates of the Fund. | 161 | Director of EVC | ||||||||||||||||||
| Noninterested Trustee(s) | |||||||||||||||||||||||
| Benjamin C. Esty 1/2/63 | Trustee | Until 2006. 3 years. Since 2005 | Roy and Elizabeth Simmons Professor of Business Administration , Harvard University Graduate School of Business Administration (since 2003). Formerly, Associate Professor, Harvard University Graduate School of Business Administration (2000-2003). | 152 | None | ||||||||||||||||||
| Samuel L. Hayes, III 2/23/35 | Trustee and Chairman of the Board | Until 2006. 3 years. Since 2005 | Jacob H. Schiff Professor of Investment Banking Emeritus, Harvard University Graduate School of Business Administration. Director of Yakima Products, Inc. (manufacturer of automotive accessories) (since 2001) and Director of Telect, Inc. (telecommunications services company) (since 2000). | 161 | Director of Tiffany & Co. (specialty retailer) | ||||||||||||||||||
| William H. Park 9/19/47 | Trustee | Until 2007. 3 years. Since 2005 | Vice Chairman, Commercial Industrial Finance Corp. (specialty finance company) (since 2005). Formerly, President and Chief Executive Officer, Prizm Capital Management, LLC (investment management firm) (2002-2005). Formerly, Executive Vice President and Chief Financial Officer, United Asset Management Corporation (a holding company owning institutional investment management firms) (1982-2001). | 161 | None | ||||||||||||||||||
| Ronald A. Pearlman 7/10/40 | Trustee | Until 2007. 3 years. Since 2005 | Professor of Law, Georgetown University Law Center (since 1999). Formerly, Tax Partner, Covington & Burling, Washington, DC (1991-2000). | 161 | None | ||||||||||||||||||
21
Eaton Vance Tax-Managed Buy-Write Income Fund
MANAGEMENT AND ORGANIZATION CONT'D
| Name and Date of Birth | Position with the Fund | Term of Office and Length of Service | Principal Occupation(s) During Past Five Years | Number of Portfolios in Fund Complex Overseen By Trustee(1) | Other Directorships Held | ||||||||||||||||||
| Noninterested Trustee(s) (continued) | |||||||||||||||||||||||
| Norton H. Reamer 9/21/35 | Trustee | Until 2008. 3 years. Since 2005 | President, Chief Executive Officer and a Director of Asset Management Finance Corp. (a specialty finance company serving the investment management industry) (since October 2003). President, Unicorn Corporation (an investment and financial advisory services company) (since September 2000). Formerly, Chairman and Chief Operating Officer, Hellman, Jordan Management Co., Inc. (an investment management company) (2000-2003). Formerly, Advisory Director of Berkshire Capital Corporation (investment banking firm) (2002-2003). Formerly, Chairman of the Board, United Asset Management Corporation (a holding company owning institutional investment management firms) and Chairman, President and Director, UAM Funds (mutual funds) (1980-2000). | 161 | None | ||||||||||||||||||
| Lynn A. Stout 9/14/57 | Trustee | Until 2008. 3 years. Since 2005 | Professor of Law, University of California at Los Angeles School of Law (since July 2001). Formerly, Professor of Law, Georgetown University Law Center. | 161 | None | ||||||||||||||||||
| Ralph F. Verni 1/26/43 | Trustee | Until 2008. 3 years. Since 2005 | Consultant and private investor (since 2000). Formerly, President and Chief Executive Officer, Redwood Investment Systems, Inc. (software developer) (2000). Formerly, President and Chief Executive Officer, State Street Research & Management (investment advisor), SSRM Holdings (parent of State Street Research & Management), and SSR Realty (institutional realty manager) (1992-2000). | 152 | Director of W.P. Carey & Company LLC (manager of real estate investment trusts) | ||||||||||||||||||
| Principal Officers who are not Trustees | |||||||||||||||
| Name and Date of Birth | Position with the Fund | Term of Office and Length of Service | Principal Occupation(s) During Past Five Years | ||||||||||||
| Duncan W. Richardson 10/26/57 | President | Since 2005 | Senior Vice President and Chief Equity Investment Officer of EVM and BMR and Executive Vice President of EVC. Officer of 51 registered investment companies managed by EVM or BMR. | ||||||||||||
| Thomas E. Faust Jr. 5/31/58 | Vice President | Since 2005 | Executive Vice President of EVM, BMR and EV; Chief Investment Officer of EVM and BMR and President and Director of EVC. Chief Executive Officer of Belair Capital Fund LLC, Belcrest Capital Fund LLC, Belmar Capital Fund LLC, Belport Capital Fund LLC and Belrose Capital Fund LLC (private investment companies sponsored by EVM). Officer of 65 registered investment companies managed by EVM or BMR. | ||||||||||||
| Michael R. Mach 7/15/47 | Vice President | Since 2005 | Vice President of EVM and BMR. Officer of 32 registered investment companies managed by EVM or BMR. | ||||||||||||
| Cliff Quisenberry, Jr. 1/1/65 | Vice President | Since 2005 | Vice President and Global Portfolio Manager of Parametric Portfolio Associates ("Parametric"). Officer of 5 registered investment companies managed by EVM or BMR. | ||||||||||||
| Judith A. Saryan 8/21/54 | Vice President | Since 2005 | Vice President of EVM and BMR. Officer of 33 registered investment companies managed by EVM or BMR. | ||||||||||||
| Barbara E. Campbell 6/19/57 | Treasurer | Since 2005 | Vice President of EVM and BMR. Officer of 161 registered investment companies managed by EVM or BMR. | ||||||||||||
22
Eaton Vance Tax-Managed Buy-Write Income Fund
MANAGEMENT AND ORGANIZATION CONT'D
| Principal Officers who are not Trustees (continued) | |||||||||||||||
| Name and Date of Birth | Position with the Fund | Term of Office and Length of Service | Principal Occupation(s) During Past Five Years | ||||||||||||
| Alan R. Dynner 10/10/40 | Secretary | Since 2005 | Vice President, Secretary and Chief Legal Officer of BMR, EVM, EVD, EV and EVC. Officer of 161 registered investment companies managed by EVM or BMR. | ||||||||||||
| Paul M. O'Neil 7/11/53 | Chief Compliance Officer | Since 2005 | Vice President of EVM and BMR. Officer of 161 registered investment companies managed by EVM or BMR. | ||||||||||||
(1) Includes both master and feeder funds in a master-feeder structure.
In accordance with Section 303A.12 (a) of the New York Stock Exchange Listed Company Manual, the Fund's Annual CEO Certification certifying as to compliance with NYSE's Corporate Governance Listing Standards was submitted to the Exchange on September 13, 2005. The Fund has also filed its CEO and CFO certifications required by Section 302 of the Sarbanes-Oxley Act with the SEC as an exhibit to its most recent Form N-CSR.
Portfolio Management. EVM is investment adviser to the Fund. EVM has engaged its affiliate, Parametric Portfolio Associates LLC ("Parametric"), as a sub-adviser to the Fund responsible for structuring and managing the Fund's common stock portfolio, including tax-loss harvesting and other tax-management techniques. In addition, EVM has engaged Rampart Investment Management Company, Inc. ("Rampart") to serve as a sub-adviser to the Fund to provide advice on and execution of the Fund's options strategy.
Walter A. Row and other EVM investment professionals comprise the investment team responsible for managing the Fund's overall investment program, providing the sub-advisers with research support and supervising the performance of the sub-advisers. Mr. Row is the portfolio manager responsible for the day-to-day management of EVM's responsibilities with respect to the Fund's investment portfolio. Mr. Row is a Vice President and the Director of Equity Research at EVM. Mr. Row has been a member of EVM's research team since 1996.
David Stein, Ph.D., and Thomas Seto are the Parametric portfolio managers responsible for the day-to-day management of the Fund's common stock portfolio. Mr. Stein is Managing Director and Chief Investment Officer at Parametric, where he leads the investment, research and technology activities. Prior to joining Parametric, Mr. Stein held senior research, development and portfolio management positions at GTE Investment Management Corp, the Vanguard Group and IBM Retirement Funds. Mr. Seto is a Vice President and the Director of Portfolio Management at Parametric where he is responsible for all portfolio management, including taxable, tax-exempt, quantitative-active and international strategies. Prior to joining Parametric, Mr. Seto served as the Head of U.S. Equity Index Investments at Barclays Global Investors.
Ronald M. Egalka is responsible for the development and implementation of Rampart's options strategy utilized in managing the Fund. Mr. Egalka has been with Rampart since 1983 and is its President and CEO.
The following tables show, as of the Fund's most recent fiscal year end, the number of accounts each portfolio manager managed in each of the listed categories and the total assets in the accounts managed within each category. The table also shows the number of accounts with respect to which the advisory fee is based on the performance of the account, if any, and the total assets in those accounts.
| Number of All Accounts | Total Assets of All Accounts* | Number of Accounts Paying a Performance Fee | Total Assets of Accounts Paying a Performance Fee* | ||||||||||||||||
| Walter A. Row | |||||||||||||||||||
| Registered Investment Companies | 6 | $ | 5,342.7 | 0 | $ | 0 | |||||||||||||
| Other Pooled Investment Vehicles | 0 | $ | 0 | 0 | $ | 0 | |||||||||||||
| Other Accounts | 0 | $ | 0 | 0 | $ | 0 | |||||||||||||
| David Stein | |||||||||||||||||||
| Registered Investment Companies | 3 | $ | 3,635.0 | 0 | $ | 0 | |||||||||||||
| Other Pooled Investment Vehicles | 9 | $ | 1,324.0 | 0 | $ | 0 | |||||||||||||
| Other Accounts | 6,924 | $ | 10,875.0 | 0 | $ | 0 | |||||||||||||
23
Eaton Vance Tax-Managed Buy-Write Income Fund
MANAGEMENT AND ORGANIZATION CONT'D
| Number of All Accounts | Total Assets of All Accounts* | Number of Accounts Paying a Performance Fee | Total Assets of Accounts Paying a Performance Fee* | ||||||||||||||||
| Thomas Seto | |||||||||||||||||||
| Registered Investment Companies | 3 | $ | 3,635.0 | 0 | $ | 0 | |||||||||||||
| Other Pooled Investment Vehicles | 9 | $ | 1,324.0 | 0 | $ | 0 | |||||||||||||
| Other Accounts | 6,924 | $ | 10,875.0 | 0 | $ | 0 | |||||||||||||
| Ronald M. Egalka | |||||||||||||||||||
| Registered Investment Companies | 5 | $ | 5,340.8 | 0 | $ | 0 | |||||||||||||
| Other Pooled Investment Vehicles | 0 | $ | 0 | 0 | $ | 0 | |||||||||||||
| Other Accounts | 447 | $ | 1,342.3 | 0 | $ | 0 | |||||||||||||
*In millions of dollars. For registered investment companies, assets represent net assets of all open-end investment companies and gross assets of all closed-end investment companies.
The following table shows the dollar range of Fund shares beneficially by each portfolio manager as of the Fund's most recent fiscal year end.
| Portfolio Manager | Dollar Range of Equity Securities Owned in the Fund | ||||||
| Walter A. Row | $10,001 - $50,000 | ||||||
| David Stein | None | ||||||
| Thomas Seto | None | ||||||
| Ronald M. Egalka | $10,001 - $50,000 | ||||||
Potential for Conflicts of Interest
The portfolio managers manage multiple investment portfolios. Conflicts of interest may arise between a portfolio manager's management of the Fund and his management of these other investment portfolios. Potential areas of conflict may include allocation of a portfolio manager's time, investment opportunities and trades among investment portfolios, including the Fund, personal securities transactions and use of Fund portfolio holdings information. In addition, some investment portfolios may compensate the investment adviser or sub-adviser based on the performance of the securities held by that account. The existence of such a performance based fee may create additional conflicts of interest for a portfolio manager in the allocation of management time and investment opportunities. EVM and each sub-adviser have adopted policies and procedures that they believe are reasonably designed to address these conflicts. There is no guarant ee that such policies and procedures will be effective or that all potential conflicts will be anticipated.
Portfolio Manager Compensation Structure
EVM. Compensation of EVM's portfolio managers and other investment professionals has three primary components: (1) a base salary, (2) an annual cash bonus, and (3) annual stock-based compensation consisting of options to purchase shares of EVC's nonvoting common stock and/or restricted shares of EVC's nonvoting common stock. EVM's investment professionals also receive certain retirement, insurance and other benefits that are broadly available to all EVM's employees. Compensation of EVM's investment professionals is reviewed primarily on an annual basis. Cash bonuses, stock-based compensation awards, and adjustments in base salary are typically paid or put into effect at or shortly after the October 31st fiscal year end of EVC.
Method to Determine Compensation. EVM compensates its portfolio managers based primarily on the scale and complexity of their portfolio responsibilities and the total return performance of managed funds and accounts versus appropriate peer groups or benchmarks. Performance is normally based on periods ending on the September 30th preceding fiscal year end. Fund performance is evaluated primarily versus peer groups of funds as determined by Lipper Inc. and/or Morningstar, Inc. In evaluating the performance of a fund and its manager, primary emphasis is normally placed on three-year performance, with secondary consideration of performance over longer and shorter periods. For funds that are tax-managed or otherwise have an objective of after-tax returns, performance is measured net of taxes. For other funds, performance is evaluated on a pre-tax basis. In addit ion to rankings within peer groups of funds on the basis of absolute performance, consideration may also be given to risk-adjusted performance. For funds with an
24
Eaton Vance Tax-Managed Buy-Write Income Fund
MANAGEMENT AND ORGANIZATION CONT'D
investment objective other than total return (such as current income), consideration will also be given to the fund's success in achieving its objective. For managers responsible for multiple funds and accounts, investment performance is evaluated on an aggregate basis, based on averages or weighted averages among managed funds and accounts. Funds and accounts that have performance-based advisory fees are not accorded disproportionate weightings in measuring aggregate portfolio manager performance.
The compensation of portfolio managers with other job responsibilities (such as heading an investment group or providing analytical support to other portfolios) will include consideration of the scope of such responsibilities and the managers' performance in meeting them.
EVM seeks to compensate portfolio managers commensurate with their responsibilities and performance, and competitive with other firms within the investment management industry. EVM participates in investment-industry compensation surveys and utilizes survey data as a factor in determining salary, bonus and stock-based compensation levels for portfolio managers and other investment professionals. Salaries, bonuses and stock-based compensation are also influenced by the operating performance of EVM and its parent company. The overall annual cash bonus pool is based on a substantially fixed percentage of pre-bonus operating income. While the salaries of EVM's portfolio managers are comparatively fixed, cash bonuses and stock-based compensation may fluctuate significantly from year to year, based on changes in manager performance and other factors as described herein. For a high performing portfolio manager, cash bonuses and stock-b ased compensation may represent a substantial portion of total compensation.
Parametric
Compensation of Parametric portfolio managers and other investment professional has three primary components: (1) a base salary, (2) a quarterly cash bonus, and (3) annual stock-based compensation consisting of options to purchase shares of EVC's nonvoting common stock. Parametric investment professionals also receive certain retirement, insurance and other benefits that are broadly available to Parametric employees. Compensation of Parametric investment professionals is reviewed primarily on an annual basis. Stock-based compensation awards and adjustments in base salary and bonus are typically paid and/or put into effect at or shortly after calendar year-end.
Method Parametric uses to Determine Compensation. Parametric seeks to compensate portfolio managers commensurate with their responsibilities and performance, and competitive with other firms within the investment management industry. The performance of portfolio managers is evaluated primarily based on success in achieving portfolio objectives for managed funds and accounts. The compensation of portfolio managers with other job responsibilities (such as product development) will include consideration of the scope of such responsibilities and the managers' performance in meeting them.
Salaries, bonuses and stock-based compensation are also influenced by the operating performance of Parametric and EVC, its parent company. Cash bonuses are determined based on a target percentage of Parametric profits. While the salaries of Parametric portfolio managers are comparatively fixed, cash bonuses and stock-based compensation may fluctuate substantially from year to year, based on changes in financial performance and other factors.
Rampart. The identified Rampart portfolio manager is a founding shareholder of Rampart. The compensation of the portfolio manager has two primary components: (1) a base salary, and (2) an annual cash bonus. There are also certain retirement, insurance and other benefits that are broadly available to all Rampart employees. Compensation of Rampart investment professionals is reviewed primarily on an annual basis. Cash bonuses and adjustments in base salary are typically paid or put into effect at or shortly after the June 30 fiscal year-end of Rampart.
Rampart compensates its founding shareholders, including the identified portfolio manager, based primarily on the scale and complexity of their responsibilities. The performance of portfolio managers is evaluated primarily based on success in achieving portfolio objectives for managed funds and accounts. Rampart seeks to compensate all portfolio managers commensurate with their responsibilities and performance, and competitive with other firms within the investment management industry. This is reflected in the founding shareholders/identified portfolio manager's salaries.
Salaries and profit participations are also influenced by the operating performance of Rampart. While the salaries of Rampart's founding shareholders/identified portfolio manager are comparatively fixed, profit participations may fluctuate substantially from year to year, based on changes in financial performance.
25
Investment Adviser of Eaton Vance Tax-Managed Buy-Write Income Fund
Eaton Vance Management
The Eaton Vance Building
255 State Street
Boston, MA 02109
Sub-Advisers of Eaton Vance Tax-Managed Buy-Write Income Fund
Parametric Portfolio Associates
1151 Fairview Avenue N.
Seattle, WA 98109
Rampart Investment Management Company, Inc.
One International Place
Boston, MA 02110
Administrator of Eaton Vance Tax-Managed Buy-Write Income Fund
Eaton Vance Management
The Eaton Vance Building
255 State Street
Boston, MA 02109
Custodian
Investors Bank & Trust Company
200 Clarendon Street
Boston, MA 02116
Transfer Agent
PFPC Inc.
Attn: Eaton Vance Funds
P.O. Box 43027
Providence, RI 02940-3027
(800) 262-1122
Independent Registered Public Accounting Firm
Deloitte & Touche LLP
200 Berkeley Street
Boston, MA 02116-5022
Eaton Vance Tax-Managed Buy-Write Income Fund
The Eaton Vance Building
255 State Street
Boston, MA 02109
2427-2/06 CE-TMBWISRC
Item 2. Code of Ethics
The registrant has adopted a code of ethics applicable to its Principal Executive Officer, Principal Financial Officer and Principal Accounting Officer. The registrant undertakes to provide a copy of such code of ethics to any person upon request, without charge, by calling 1-800-262-1122.
Item 3. Audit Committee Financial Expert
The registrant’s Board has designated William H. Park, Samuel L. Hayes, III and Norton H. Reamer, each an independent trustee, as its audit committee financial experts. Mr. Park is a certified public accountant who is the President and Chief Executive Officer of Prizm Capital Management, LLC (investment management firm). Previously, he served as Executive Vice President and Chief Financial Officer of United Asset Management Corporation (“UAM”) (a holding company owning institutional investment management firms). Mr. Hayes is the Jacob H. Schiff Professor of Investment Banking Emeritus of the Harvard University Graduate School of Business Administration. Mr. Reamer is the President, Chief Executive Officer and a Director of Asset Management Finance Corp. (a specialty finance company serving the investment management industry) and is President of Unicorn Corporation (an investment and financial advisory services company). Formerly, Mr. Reamer was Chairman of Hellman, Jordan Management Co., Inc. (an investment management company) and Advisory Director of Berkshire Capital Corporation (an investment banking firm), Chairman of the Board of UAM and Chairman, President and Director of the UAM Funds (mutual funds).
Item 4. Principal Accountant Fees and Services
(a) –(d)
The following table presents the aggregate fees billed to the registrant for the registrant’s initial fiscal period from April 29, 2005 until December 31, 2005 by the Fund’s principal accountant for professional services rendered for the audit of the registrant’s annual financial statements and fees billed for other services rendered by the principal accountant during such period.
Fiscal Years Ended |
| 12/31/05 |
| |
|
|
|
| |
Audit Fees |
| $ | 31,540 |
|
|
|
|
| |
Audit-Related Fees(1) |
| $ | 15,000 |
|
|
|
|
| |
Tax Fees(2) |
| $ | 6,405 |
|
|
|
|
| |
All Other Fees(3) |
|
|
| |
|
|
|
| |
Total |
| $ | 52,945 |
|
(1) Audit-related fees consist of the aggregate fees billed for assurance and related services that are reasonably related to the performance of the audit of the registrant’s financial statements and are not reported under the category of audit fees and specifically include fees for the performance of certain agreed-upon procedures relating to the registrant’s auction preferred shares.
(2) Tax fees consist of the aggregate fees billed for professional services rendered by the principal accountant relating to tax compliance, tax advice, and tax planning and specifically include fees for tax return preparation and other tax related compliance/planning matters.
(3) All other fees consist of the aggregate fees billed for products and services provided by the registrant’s principal accountant other than audit, audit-related, and tax services.
(e)(1) The registrant’s audit committee has adopted policies and procedures relating to the pre-approval of services provided by the registrant’s principal accountant (the “Pre-Approval Policies”). The Pre-Approval Policies establish a framework intended to assist the audit committee in the proper discharge of its pre-approval responsibilities. As a general matter, the Pre-Approval Policies (i) specify certain types of audit, audit-related, tax, and other services determined to be pre-approved by the audit committee; and (ii) delineate specific procedures governing the mechanics of the pre-approval process, including the approval and monitoring of audit and non-audit service fees. Unless a service is specifically pre-approved under the Pre-Approval Policies, it must be separately pre-approved by the audit committee.
The Pre-Approval Policies and the types of audit and non-audit services pre-approved therein must be reviewed and ratified by the registrant’s audit committee at least annually. The registrant’s audit committee maintains full responsibility for the appointment, compensation, and oversight of the work of the registrant’s principal accountant.
(e)(2) No services described in paragraphs (b)-(d) above were approved by the registrant’s audit committee pursuant to the “de minimis exception” set forth in Rule 2-01(c)(7)(i)(C) of Regulation S-X.
(f) Not applicable.
(g) The following table presents (i) the aggregate non-audit fees (i.e., fees for audit-related, tax, and other services) billed to the registrant by the registrant’s principal accountant for the registrant’s initial fiscal period ended December 31, 2005; and (ii) the aggregate non-audit fees (i.e., fees for audit-related, tax, and other services) billed for services rendered to the Eaton Vance organization for the registrant’s principal accountant for the same time period.
Fiscal Years Ended |
| 12/31/05 |
| |
|
|
|
| |
Registrant |
| $ | 21,405 |
|
|
|
|
| |
Eaton Vance(1) |
| $ | 179,500 |
|
(1) Eaton Vance Management, a subsidiary of Eaton Vance Corp., acts as the registrant’s investment adviser and administrator.
(h) The registrant’s audit committee has considered whether the provision by the registrant’s principal accountant of non-audit services to the registrant’s investment adviser and any entity controlling, controlled by, or under common control with the adviser that provides ongoing services to the registrant that were not pre-approved pursuant to Rule 2-01(c)(7)(ii) of Regulation S-X is compatible with maintaining the principal accountant’s independence.
Item 5. Audit Committee of Listed registrants
The registrant has a separately-designated standing audit committee established in accordance with Section 3(a)(58)(A) of the Securities and Exchange Act of 1934, as amended. Norton H. Reamer (Chair), Samuel L. Hayes, III, William H. Park, Lynn A. Stout and Ralph E. Verni are the members of the registrant’s audit committee.
Item 6. Schedule of Investments
Please see schedule of investments contained in the Report to Stockholders included under Item 1 of this Form N-CSR.
Item 7. Disclosure of Proxy Voting Policies and Procedures for Closed-End Management Investment Companies
The Board of Trustees of the Trust has adopted a proxy voting policy and procedure (the “Fund Policy”), pursuant to which the Trustees have delegated proxy voting responsibility to the Fund’s investment adviser and adopted the investment adviser’s proxy voting policies and procedures (the “Policies”) which are described below. The Trustees will review the Fund’s proxy voting records from time to time and will annually consider approving the Policies for the upcoming year. In the event that a conflict of interest arises between the Fund’s shareholders and the investment adviser, the administrator, or any of their affiliates or any affiliate of the Fund, the investment adviser will generally refrain from voting the proxies related to the companies giving rise to such conflict until it consults with the Board’s Special Committee except as contemplated under the Fund Policy. The Board’s Special Committee will instruct the investment adviser on the appropriate course of action.
The Policies are designed to promote accountability of a company’s management to its shareholders and to align the interests of management with those shareholders. The investment adviser will generally support company management on proposals relating to environmental and social policy issues, on matters regarding the state of organization of the company and routine matters related to corporate administration which are not expected to have a significant economic impact on the company or its shareholders. On all other matters, the investment adviser will review each matter on a case-by-case basis and reserves the right to deviate from the Policies’ guidelines when it believes the situation warrants such a deviation. The Policies include voting guidelines for matters relating to, among other things, the election of directors, approval of independent auditors, executive compensation, corporate structure and anti-takeover defenses. The investment adviser may abstain from voting from time to time where it determines that the costs associated with voting a proxy outweighs the benefits derived from exercising the right to vote.
In addition, the investment adviser will monitor situations that may result in a conflict of interest between the Fund’s shareholders and the investment adviser, the administrator, or any of their affiliates or any affiliate of the Fund by maintaining a list of significant existing and prospective corporate clients. The investment adviser’s personnel responsible for reviewing and voting proxies on behalf of the Fund will report any proxy received or expected to be received from a company included on that list to members of senior management of the investment adviser identified in the Policies. Such members of senior management will determine if a conflict exists. If a conflict does exist, the investment adviser will seek instruction on how to vote from the Special Committee.
Information on how the Fund voted proxies relating to portfolio securities during the most recent 12 month period ended June 30 is available (1) without charge, upon request, by calling 1-800-262-1122, and (2) on the Securities and Exchange Commission’s website at http://www.sec.gov.
Item 8. Portfolio Managers of Closed-End Management Investment Companies
Portfolio Management
EVM is investment adviser to the Fund. EVM has engaged its affiliate, Parametric Portfolio Associates LLC (“Parametric”), as a sub-adviser to the Fund responsible for structuring and managing the Fund’s common stock portfolio, including tax-loss harvesting and other tax-management techniques. In addition, EVM has engaged Rampart Investment Management Company, Inc. (“Rampart”) to serve as a sub-adviser to the Fund to provide advice on and execution of the Fund’s options strategy.
Walter A. Row and other EVM investment professionals comprise the investment team responsible for managing the Fund’s overall investment program, providing the sub-advisers with research support and supervising the performance of the sub-advisers. Mr. Row is the portfolio manager responsible for the day-to-day management of EVM’s responsibilities with respect to the Fund’s investment portfolio. Mr. Row is a Vice President and the Director of Equity Research at EVM. Mr. Row has been a member of EVM’s research team since 1996. This information is provided as of the date of filing of this report.
David Stein, Ph.D., and Thomas Seto are the Parametric portfolio managers responsible for the day-to-day management of the Fund’s common stock portfolio. Mr. Stein is Managing Director and Chief Investment Officer at Parametric, where he leads the investment, research and technology activities. Prior to joining Parametric, Mr. Stein held senior research, development and portfolio management positions at GTE Investment Management Corp, the Vanguard Group and IBM Retirement Funds. Mr. Seto is a Vice President and the Director of Portfolio Management at Parametric where he is responsible for all portfolio management, including taxable, tax-exempt, quantitative-active and international strategies. Prior to joining Parametric, Mr. Seto served as the Head of U.S. Equity Index Investments at Barclays Global Investors. This information is provided as of the date of filing of this report.
Ronald M. Egalka is responsible for the development and implementation of Rampart’s options strategy utilized in managing the Fund. Mr. Egalka has been with Rampart since 1983 and is its President and CEO. This information is provided as of the date of filing of this report.
The following tables show, as of the Fund’s most recent fiscal year end, the number of accounts each portfolio manager managed in each of the listed categories and the total assets in the accounts managed within each category. The table also shows the number of accounts with respect to which the advisory fee is based on the performance of the account, if any, and the total assets in those accounts.
|
| Number |
| Total Assets of |
| Number of |
| Total Assets of |
| ||
Walter A. Row |
|
|
|
|
|
|
|
|
| ||
Registered Investment Companies |
| 6 |
| $ | 5,342.7 |
| 0 |
| $ | 0 |
|
Other Pooled Investment Vehicles |
| 0 |
| $ | 0 |
| 0 |
| $ | 0 |
|
Other Accounts |
| 0 |
| $ | 0 |
| 0 |
| $ | 0 |
|
David Stein |
|
|
|
|
|
|
|
|
| ||
Registered Investment Companies |
| 3 |
| $ | 3,635.0 |
| 0 |
| $ | 0 |
|
Other Pooled Investment Vehicles |
| 9 |
| $ | 1,324.0 |
| 0 |
| $ | 0 |
|
Other Accounts |
| 6,924 |
| $ | 10,875.0 |
| 0 |
| $ | 0 |
|
Thomas Seto |
|
|
|
|
|
|
|
|
| ||
Registered Investment Companies |
| 3 |
| $ | 3,635.0 |
| 0 |
| $ | 0 |
|
Other Pooled Investment Vehicles |
| 9 |
| $ | 1,324.0 |
| 0 |
| $ | 0 |
|
Other Accounts |
| 6,924 |
| $ | 10,875.0 |
| 0 |
| $ | 0 |
|
Ronald M. Egalka |
|
|
|
|
|
|
|
|
| ||
Registered Investment Companies |
| 5 |
| $ | 5,340.8 |
| 0 |
| $ | 0 |
|
Other Pooled Investment Vehicles |
| 0 |
| $ | 0 |
| 0 |
| $ | 0 |
|
Other Accounts |
| 447 |
| $ | 1,342.3 |
| 0 |
| $ | 0 |
|
*In millions of dollars. For registered investment companies, assets represent net assets of all open-end investment companies and gross assets of all closed-end investment companies.
The following table shows the dollar range of Fund shares beneficially by each portfolio manager as of the Fund’s most recent fiscal year end.
Portfolio Manager |
| Dollar Range of |
| |
Walter A. Row |
| $ | 10,001 - $50,000 |
|
David Stein |
| None |
| |
Thomas Seto |
| None |
| |
Ronald M. Egalka |
| $ | 10,001 - $50,000 |
|
Potential for Conflicts of Interest. The portfolio managers manage multiple investment portfolios. Conflicts of interest may arise between a portfolio manager’s management of the Fund and his management of these other investment portfolios. Potential areas of conflict may include allocation of a portfolio manager’s time, investment opportunities and trades among investment portfolios, including the Fund, personal securities transactions and use of Fund portfolio holdings information. In addition, some investment portfolios may compensate the investment adviser or sub-adviser based on the performance of the securities held by that account. The existence of such a performance based fee may create additional conflicts of interest for a portfolio manager in the allocation of management time and investment opportunities. EVM and each sub-adviser have adopted policies and procedures that they
believe are reasonably designed to address these conflicts. There is no guarantee that such policies and procedures will be effective or that all potential conflicts will be anticipated.
Portfolio Manager Compensation Structure
EVM
Compensation of EVM’s portfolio managers and other investment professionals has three primary components: (1) a base salary, (2) an annual cash bonus, and (3) annual stock-based compensation consisting of options to purchase shares of EVC’s nonvoting common stock and/or restricted shares of EVC’s nonvoting common stock. EVM’s investment professionals also receive certain retirement, insurance and other benefits that are broadly available to all EVM’s employees. Compensation of EVM’s investment professionals is reviewed primarily on an annual basis. Cash bonuses, stock-based compensation awards, and adjustments in base salary are typically paid or put into effect at or shortly after the October 31st fiscal year end of EVC.
Method to Determine Compensation. EVM compensates its portfolio managers based primarily on the scale and complexity of their portfolio responsibilities and the total return performance of managed funds and accounts versus appropriate peer groups or benchmarks. Performance is normally based on periods ending on the September 30th preceding fiscal year end. Fund performance is evaluated primarily versus peer groups of funds as determined by Lipper Inc. and/or Morningstar, Inc. In evaluating the performance of a fund and its manager, primary emphasis is normally placed on three-year performance, with secondary consideration of performance over longer and shorter periods. For funds that are tax-managed or otherwise have an objective of after-tax returns, performance is measured net of taxes. For other funds, performance is evaluated on a pre-tax basis. In addition to rankings within peer groups of funds on the basis of absolute performance, consideration may also be given to risk-adjusted performance. For funds with an investment objective other than total return (such as current income), consideration will also be given to the fund’s success in achieving its objective. For managers responsible for multiple funds and accounts, investment performance is evaluated on an aggregate basis, based on averages or weighted averages among managed funds and accounts. Funds and accounts that have performance-based advisory fees are not accorded disproportionate weightings in measuring aggregate portfolio manager performance.
The compensation of portfolio managers with other job responsibilities (such as heading an investment group or providing analytical support to other portfolios) will include consideration of the scope of such responsibilities and the managers’ performance in meeting them.
EVM seeks to compensate portfolio managers commensurate with their responsibilities and performance, and competitive with other firms within the investment management industry. EVM participates in investment-industry compensation surveys and utilizes survey data as a factor in determining salary, bonus and stock-based compensation levels for portfolio managers and other investment professionals. Salaries, bonuses and stock-based compensation are also influenced by the operating performance of EVM and its parent company. The overall annual cash bonus pool is based on a substantially fixed percentage of pre-bonus operating income. While the salaries of EVM’s portfolio managers are comparatively fixed, cash bonuses and stock-based compensation may fluctuate significantly from year to year, based on changes in manager performance and other factors as described herein. For a high performing portfolio manager, cash bonuses and stock-based compensation may represent a substantial portion of total compensation.
Parametric
Compensation of Parametric portfolio managers and other investment professional has three primary components: (1) a base salary, (2) a quarterly cash bonus, and (3) annual stock-based compensation consisting of options to purchase shares of EVC’s nonvoting common stock. Parametric investment professionals also receive certain retirement, insurance and other benefits that are broadly available to Parametric employees. Compensation of Parametric investment professionals is reviewed primarily on an annual basis. Stock-based compensation awards and adjustments in base salary and bonus are typically paid and/or put into effect at or shortly after calendar year-end.
Method Parametric uses to Determine Compensation. Parametric seeks to compensate portfolio managers commensurate with their responsibilities and performance, and competitive with other firms within the investment management industry. The performance of portfolio managers is evaluated primarily based on success in achieving portfolio objectives for managed funds and accounts. The compensation of portfolio managers with other job responsibilities (such as product development) will include consideration of the scope of such responsibilities and the managers’ performance in meeting them.
Salaries, bonuses and stock-based compensation are also influenced by the operating performance of Parametric and EVC, its parent company. Cash bonuses are determined based on a target percentage of Parametric profits. While the salaries of Parametric portfolio managers are comparatively fixed, cash bonuses and stock-based compensation may fluctuate substantially from year to year, based on changes in financial performance and other factors.
Rampart
The identified Rampart portfolio manager is a founding shareholder of Rampart. The compensation of the portfolio manager has two primary components: (1) a base salary, and (2) an annual cash bonus. There are also certain retirement, insurance and other benefits that are broadly available to all Rampart employees. Compensation of Rampart investment professionals is reviewed primarily on an annual basis. Cash bonuses and adjustments in base salary are typically paid or put into effect at or shortly after the June 30 fiscal year-end of Rampart.
Rampart compensates its founding shareholders, including the identified portfolio manager, based primarily on the scale and complexity of their responsibilities. The performance of portfolio managers is evaluated primarily based on success in achieving portfolio objectives for managed funds and accounts. Rampart seeks to compensate all portfolio managers commensurate with their responsibilities and performance, and competitive with other firms within the investment management industry. This is reflected in the founding shareholders/identified portfolio manager’s salaries.
Salaries and profit participations are also influenced by the operating performance of Rampart. While the salaries of Rampart’s founding shareholders/identified portfolio manager are comparatively fixed, profit participations may fluctuate substantially from year to year, based on changes in financial performance.
Item 9. Purchase of Equity Securities by Closed-End Management Investment Company and Affiliated Purchases.
Not required in this filing.
Item 10. Submission of Matters to a Vote of Security Holders.
Effective February 7, 2005, the Governance Committee of the Board of Trustees revised the procedures by which a Fund’s shareholders may recommend nominees to the registrant’s Board of Trustees to add the following (highlighted):
The Governance Committee shall, when identifying candidates for the position of Independent Trustee, consider any such candidate recommended by a shareholder of a Fund if such recommendation contains (i)sufficient background information concerning the candidate, including evidence the candidate is willing to serve as an Independent Trustee if selected for the position; and (ii) is received in a sufficiently timely manner (and in any event no later than the date specified for receipt of shareholder proposals in any applicable proxy statement with respect to a Fund). Shareholders shall be directed to address any such recommendations in writing to the attention of the Governance Committee, c/o the Secretary of the Fund. The Secretary shall retain copies of any shareholder recommendations which meet the foregoing requirements for a period of not more than 12 months following receipt. The Secretary shall have no obligation to acknowledge receipt of any shareholder recommendations.
Item 11. Controls and Procedures
(a) It is the conclusion of the registrant’s principal executive officer and principal financial officer that the effectiveness of the registrant’s current disclosure controls and procedures (such disclosure controls and procedures having been evaluated within 90 days of the date of this filing) provide reasonable assurance that the information required to be disclosed by the registrant has been recorded, processed, summarized and reported within the time period specified in the Commission’s rules and forms and that the information required to be disclosed by the registrant has been accumulated and communicated to the registrant’s principal executive officer and principal financial officer in order to allow timely decisions regarding required disclosure.
(b) There have been no changes in the registrant’s internal controls over financial reporting during the second fiscal quarter of the period covered by this report that has materially affected, or is reasonably likely to materially affect the registrant’s internal control over financial reporting.
Item 12. Exhibits
(a)(1) |
| Registrant’s Code of Ethics – Not applicable (please see Item 2). |
(a)(2)(i) |
| Treasurer’s Section 302 certification. |
(a)(2)(ii) |
| President’s Section 302 certification. |
(b) |
| Combined Section 906 certification. |
Signatures
Pursuant to the requirements of the Securities Exchange Act of 1934 and the Investment Company Act of 1940, the registrant has duly caused this report to be signed on its behalf by the undersigned, thereunto duly authorized.
Eaton Vance Tax-Managed Buy-Write Income Fund |
| ||
|
| ||
|
| ||
By: | /s/ Duncan W. Richardson |
|
|
| Duncan W. Richardson |
| |
| President |
| |
|
| ||
|
| ||
Date: | February 16, 2006 |
| |
Pursuant to the requirements of the Securities Exchange Act of 1934 and the Investment Company Act of 1940, this report has been signed below by the following persons on behalf of the registrant and in the capacities and on the dates indicated.
By: | /s/ Barbara E. Campbell |
|
|
| Barbara E. Campbell |
| |
| Treasurer |
| |
|
| ||
|
| ||
Date: | February 16, 2006 |
| |
By: | /s/ Duncan W. Richardson |
|
|
| Duncan W. Richardson |
| |
| President |
| |
|
| ||
|
| ||
Date: | February 16, 2006 |
| |