Exhibit 99.1 |

WEX Fourth Quarter 2019 Earnings February 13, 2020
WEX Forward-Looking Statements These earnings materials contain forward-looking statements, including statements regarding: financial guidance; assumptions underlying the Company's financial guidance; future growth opportunities and expectations; expectations for the macro environment; and, anticipated volumes. Any statements that are not statements of historical facts may be deemed to be forward-looking statements. When used in these earnings materials, the words “anticipate,” “believe,” “continue,” “could,” “estimate,” “expect,” “intend,” “may,” “plan,” “project” and similar expressions are intended to identify forward-looking statements, although not all forward-looking statements contain such words. These forward-looking statements are subject to a number of risks and uncertainties that could cause actual results to differ materially, including: the effects of general economic conditions on fueling patterns as well as payment and transaction processing activity; the impact of foreign currency exchange rates on the Company’s operations, revenue and income; changes in interest rates; the impact of fluctuations in fuel prices; the effects of the Company’s business expansion and acquisition efforts; potential adverse changes to business or employee relationships, including those resulting from the completion of an acquisition; competitive responses to any acquisitions; uncertainty of the expected financial performance of the combined operations following completion of an acquisition; the failure to successfully integrate the Company's acquisitions; the ability to realize anticipated synergies and cost savings; unexpected costs, charges or expenses resulting from an acquisition; the Company's ability to successfully acquire, integrate, operate and expand commercial fuel card programs; the failure of corporate investments to result in anticipated strategic value; the impact and size of credit losses; the impact of changes to the Company's credit standards; breaches of the Company’s technology systems or those of the Company's third-party service providers and any resulting negative impact on the Company's reputation, liabilities or relationships with customers or merchants; the Company’s failure to maintain or renew key commercial agreements; failure to expand the Company’s technological capabilities and service offerings as rapidly as the Company’s competitors; failure to successfully implement the Company's information technology strategies and capabilities in connection with its technology outsourcing and insourcing arrangements and any resulting cost associated with that failure; the actions of regulatory bodies, including banking and securities regulators, or possible changes in banking or financial regulations impacting the Company’s industrial bank, the Company as the corporate parent or other subsidiaries or affiliates; the impact of the material weaknesses first disclosed in Item 9A of the Company's Annual Report on Form 10-K for the year ended December 31, 2018 filed on Form 10-K with the Securities and Exchange Commission on March 18, 2019 and the effects of the Company's investigation and remediation efforts in connection with certain immaterial errors in the financial statements of our Brazilian subsidiary; the impact of the Company’s outstanding notes on its operations; the impact of increased leverage on the Company's operations, results or borrowing capacity generally, and as a result of acquisitions specifically; the incurrence of impairment charges if our assessment of the fair value of certain of our reporting units changes; the uncertainties of litigation; as well as other risks and uncertainties identified in Item 1A of our Annual Report for the year ended December 31, 2018 filed on Form 10-K with the Securities and Exchange Commission on March 18, 2019. The Company's forward-looking statements do not reflect the potential future impact of any alliance, merger, acquisition, disposition or stock repurchases. The forward-looking statements speak only as of the date of these earnings materials and undue reliance should not be placed on these statements. The Company disclaims any obligation to update any forward-looking statements as a result of new information, future events or otherwise.Non-GAAP Information:For additional important information and disclosure regarding our use of non-GAAP metrics, specifically adjusted net income, please see our most recent earnings release, issued on February 13, 2020. See the Appendix to this presentation for an explanation and reconciliation of non-GAAP adjusted net income attributable to shareholders (or "adjusted net income" or “ANI”) to GAAP net income attributable to shareholders, ANI per diluted share to GAAP net income per diluted share, adjusted operating income to GAAP operating income and adjusted operating margin to GAAP operating margin.Note: The Company rounds amounts in the consolidated financial statements to thousands and calculates all percentages and per-share data from underlying whole-dollar amounts. Thus, certain amounts may not foot, crossfoot, or recalculate exactly based on reported numbers due to rounding.
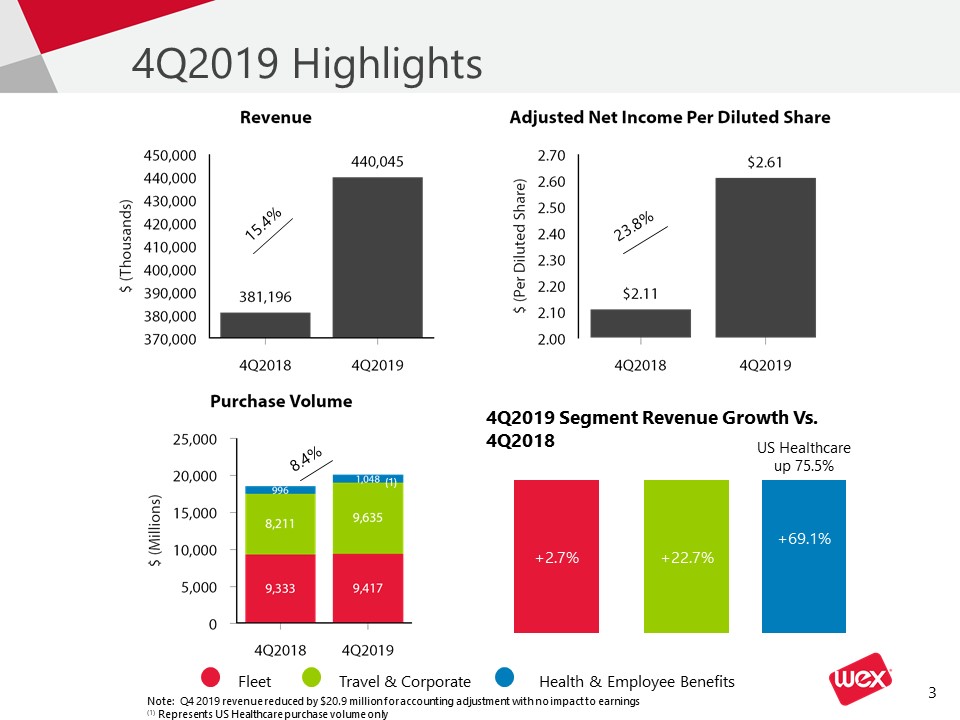
4Q2019 Highlights Fleet Travel & Corporate Health & Employee Benefits 15.4% 23.8% 8.4% 4Q2019 Segment Revenue Growth Vs. 4Q2018 +69.1% +22.7% +2.7% US Healthcare up 75.5% Note: Q4 2019 revenue reduced by $20.9 million for accounting adjustment with no impact to earnings(1) Represents US Healthcare purchase volume only (1)
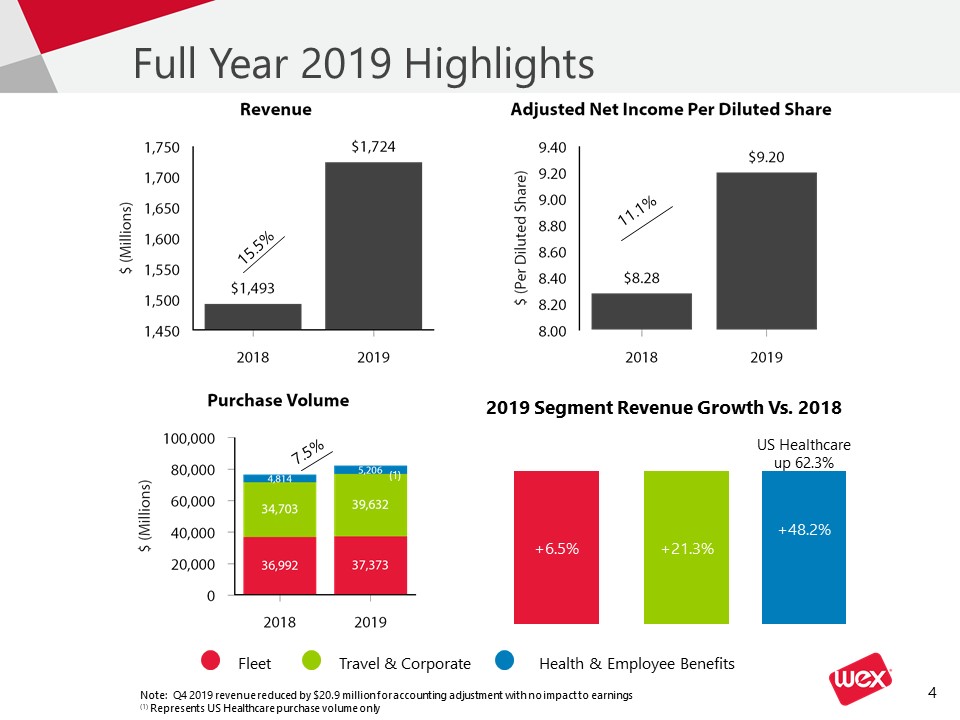
Full Year 2019 Highlights Fleet Travel & Corporate Health & Employee Benefits 15.5% 7.5% 2019 Segment Revenue Growth Vs. 2018 +48.2% +21.3% +6.5% US Healthcare up 62.3% 11.1% Note: Q4 2019 revenue reduced by $20.9 million for accounting adjustment with no impact to earnings(1) Represents US Healthcare purchase volume only (1)

Strategic Pillars 2019 HIGHLIGHTS Another record year for Revenue and Adjusted Net IncomeContinued to experience strong organic revenue growth, driven primarily by volumeSuccessful implementation and execution of Shell and Chevron portfoliosCloud migration of North American fleet business with minimal disruption Another positive enrollment season for US Health business and better than expected performance by Discovery Benefits business Continued execution of M&A strategy for Discovery Benefits complementing the Health business, Go Fuel Card expanding our European Fleet card business, and Noventis adding corporate payments functionalityRecently announced eNett and Optal acquisition will expand travel presence in EMEA and APAC regionsGreat Place To Work certified for third consecutive year
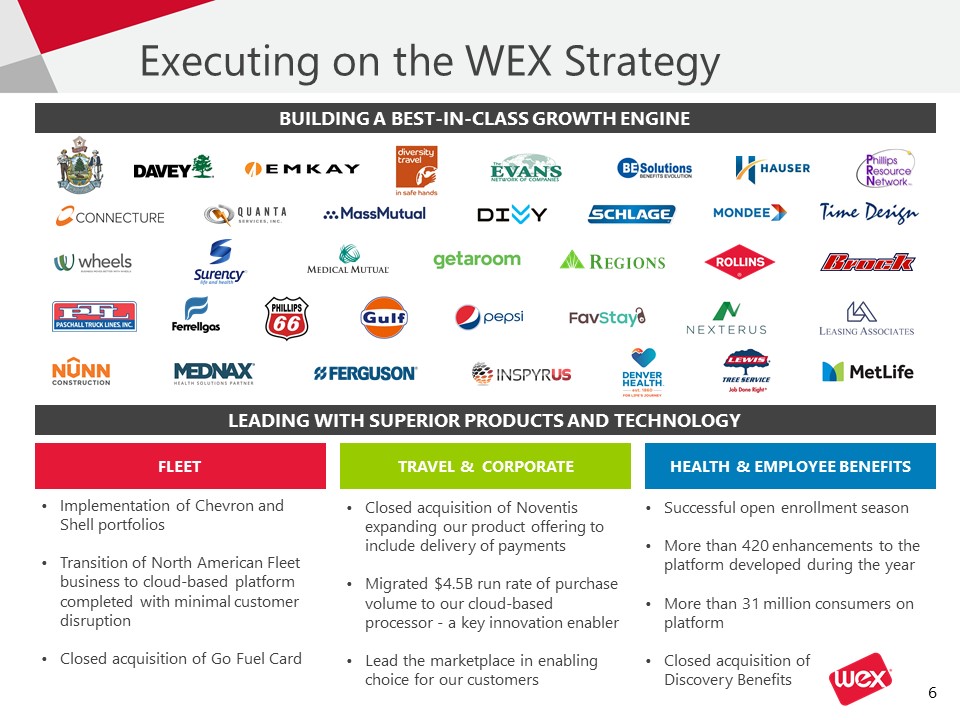
Executing on the WEX Strategy LEADING WITH SUPERIOR PRODUCTS AND TECHNOLOGY BUILDING A BEST-IN-CLASS GROWTH ENGINE FLEET TRAVEL & CORPORATE HEALTH & EMPLOYEE BENEFITS Implementation of Chevron and Shell portfoliosTransition of North American Fleet business to cloud-based platform completed with minimal customer disruptionClosed acquisition of Go Fuel Card Closed acquisition of Noventis expanding our product offering to include delivery of paymentsMigrated $4.5B run rate of purchase volume to our cloud-based processor - a key innovation enablerLead the marketplace in enabling choice for our customers Successful open enrollment season More than 420 enhancements to the platform developed during the yearMore than 31 million consumers on platformClosed acquisition of Discovery Benefits

WEX Full Year and Fourth Quarter 2019 Financial Results
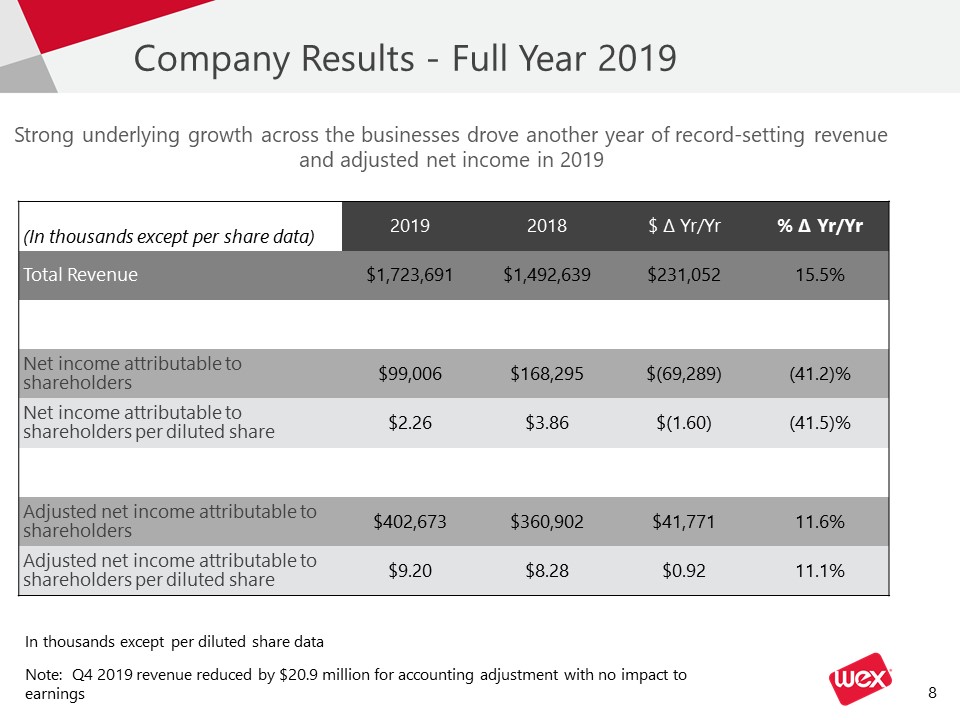
Company Results - Full Year 2019 (In thousands except per share data) 2019 2018 $ ∆ Yr/Yr % ∆ Yr/Yr Total Revenue $1,723,691 $1,492,639 $231,052 15.5% Net income attributable to shareholders $99,006 $168,295 $(69,289) (41.2)% Net income attributable to shareholders per diluted share $2.26 $3.86 $(1.60) (41.5)% Adjusted net income attributable to shareholders $402,673 $360,902 $41,771 11.6% Adjusted net income attributable to shareholders per diluted share $9.20 $8.28 $0.92 11.1% Strong underlying growth across the businesses drove another year of record-setting revenue and adjusted net income in 2019 In thousands except per diluted share data Note: Q4 2019 revenue reduced by $20.9 million for accounting adjustment with no impact to earnings

Company Results - 4Q 2019 (In thousands except per share data) 4Q19 4Q18 $ ∆ Yr/Yr % ∆ Yr/Yr Total Revenue $440,045 $381,196 $58,849 15.4% Net income attributable to shareholders $54,446 $21,257 $33,189 156.1% Net income attributable to WEX Inc. per diluted share $1.24 $0.49 $0.75 153.1% Adjusted net income attributable to shareholders $114,722 $91,807 $22,915 25.0% Adjusted net income attributable to shareholders per diluted share $2.61 $2.11 $0.50 23.7% Continued strong growth yielded positive results In thousands except per diluted share data Note: Q4 2019 revenue reduced by $20.9 million for accounting adjustment with no impact to earnings
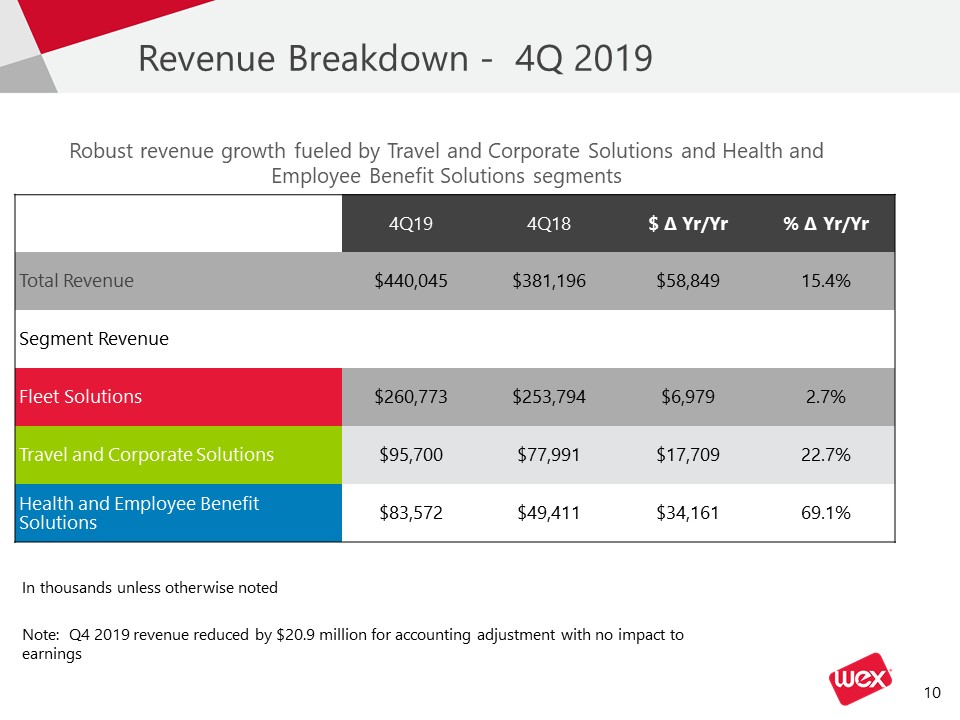
Revenue Breakdown - 4Q 2019 4Q19 4Q18 $ ∆ Yr/Yr % ∆ Yr/Yr Total Revenue $440,045 $381,196 $58,849 15.4% Segment Revenue Fleet Solutions $260,773 $253,794 $6,979 2.7% Travel and Corporate Solutions $95,700 $77,991 $17,709 22.7% Health and Employee Benefit Solutions $83,572 $49,411 $34,161 69.1% Robust revenue growth fueled by Travel and Corporate Solutions and Health and Employee Benefit Solutions segments In thousands unless otherwise noted Note: Q4 2019 revenue reduced by $20.9 million for accounting adjustment with no impact to earnings
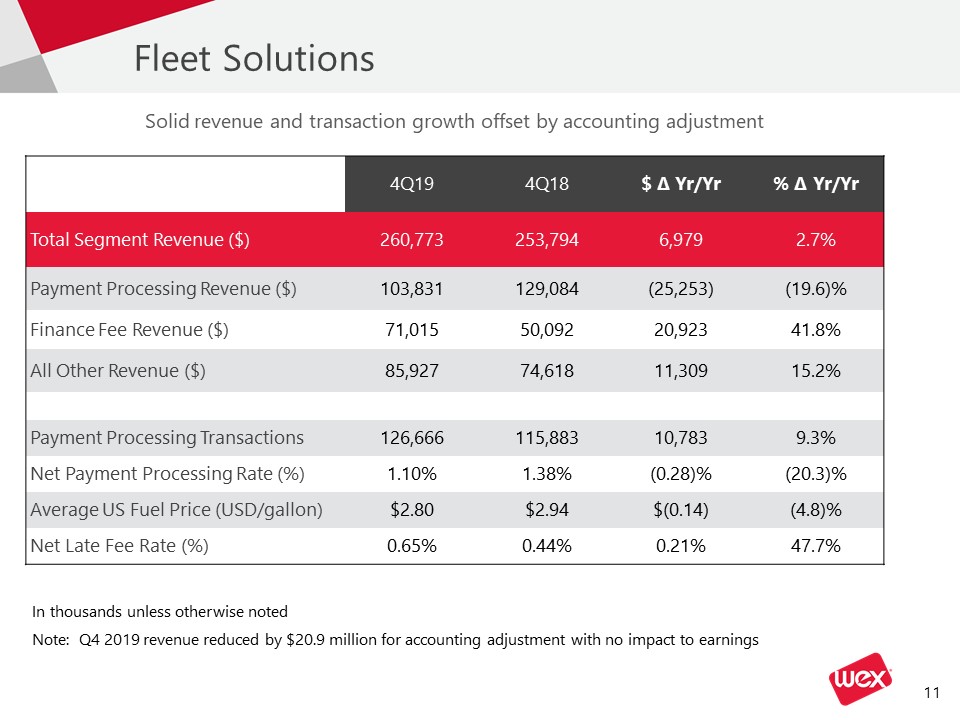
Fleet Solutions 4Q19 4Q18 $ ∆ Yr/Yr % ∆ Yr/Yr Total Segment Revenue ($) 260,773 253,794 6,979 2.7% Payment Processing Revenue ($) 103,831 129,084 (25,253) (19.6)% Finance Fee Revenue ($) 71,015 50,092 20,923 41.8% All Other Revenue ($) 85,927 74,618 11,309 15.2% Payment Processing Transactions 126,666 115,883 10,783 9.3% Net Payment Processing Rate (%) 1.10% 1.38% (0.28)% (20.3)% Average US Fuel Price (USD/gallon) $2.80 $2.94 $(0.14) (4.8)% Net Late Fee Rate (%) 0.65% 0.44% 0.21% 47.7% Solid revenue and transaction growth offset by accounting adjustment In thousands unless otherwise noted Note: Q4 2019 revenue reduced by $20.9 million for accounting adjustment with no impact to earnings
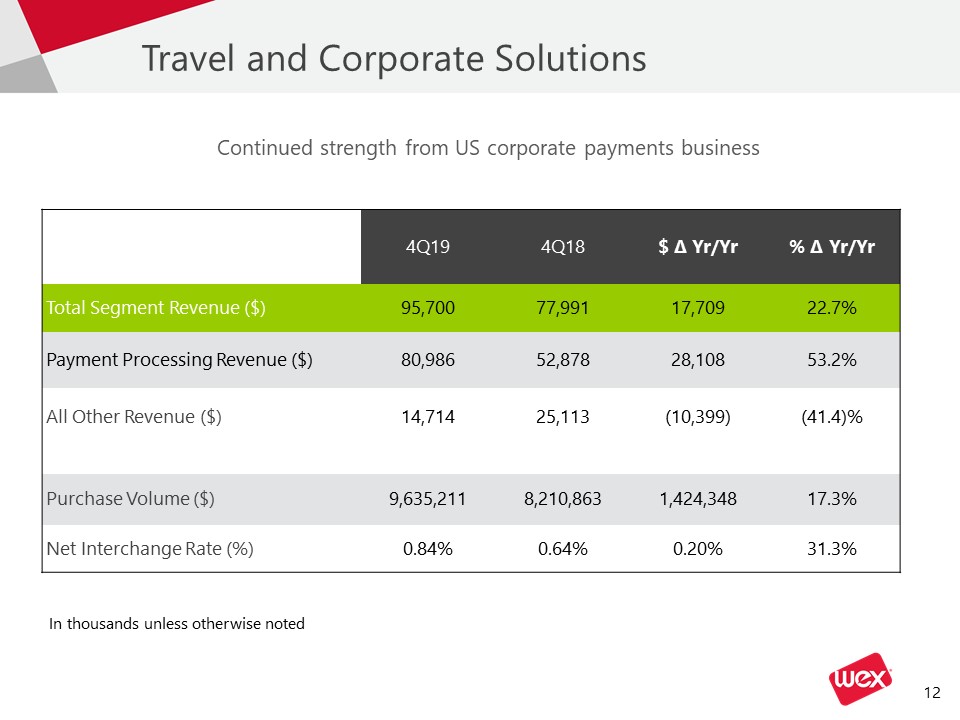
Travel and Corporate Solutions 4Q19 4Q18 $ ∆ Yr/Yr % ∆ Yr/Yr Total Segment Revenue ($) 95,700 77,991 17,709 22.7% Payment Processing Revenue ($) 80,986 52,878 28,108 53.2% All Other Revenue ($) 14,714 25,113 (10,399) (41.4)% Purchase Volume ($) 9,635,211 8,210,863 1,424,348 17.3% Net Interchange Rate (%) 0.84% 0.64% 0.20% 31.3% Continued strength from US corporate payments business In thousands unless otherwise noted
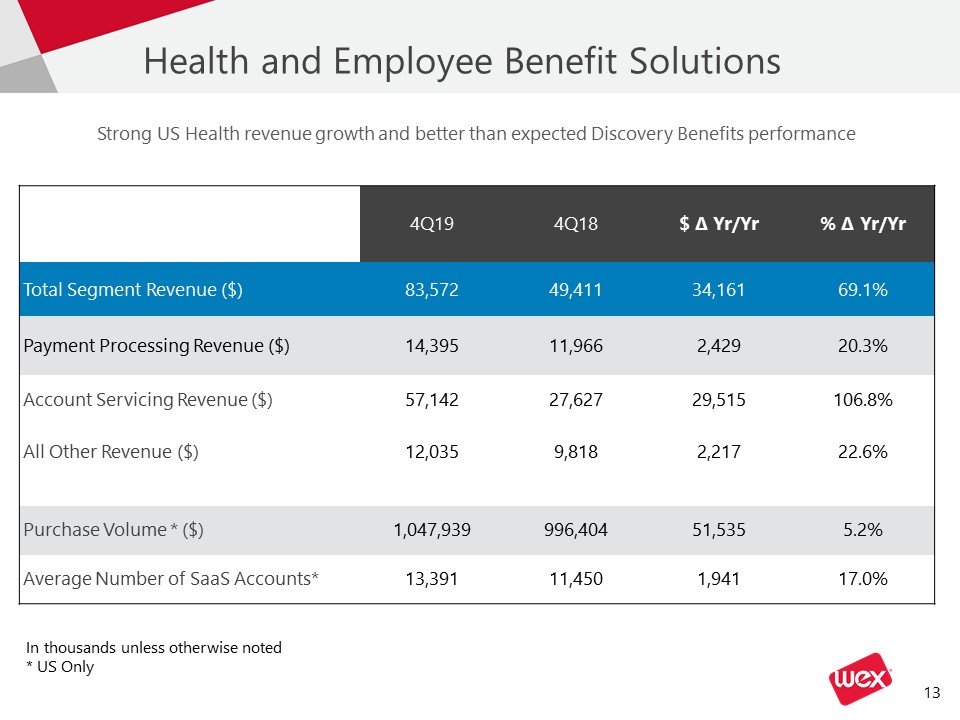
Health and Employee Benefit Solutions 4Q19 4Q18 $ ∆ Yr/Yr % ∆ Yr/Yr Total Segment Revenue ($) 83,572 49,411 34,161 69.1% Payment Processing Revenue ($) 14,395 11,966 2,429 20.3% Account Servicing Revenue ($) 57,142 27,627 29,515 106.8% All Other Revenue ($) 12,035 9,818 2,217 22.6% Purchase Volume * ($) 1,047,939 996,404 51,535 5.2% Average Number of SaaS Accounts* 13,391 11,450 1,941 17.0% Strong US Health revenue growth and better than expected Discovery Benefits performance In thousands unless otherwise noted* US Only
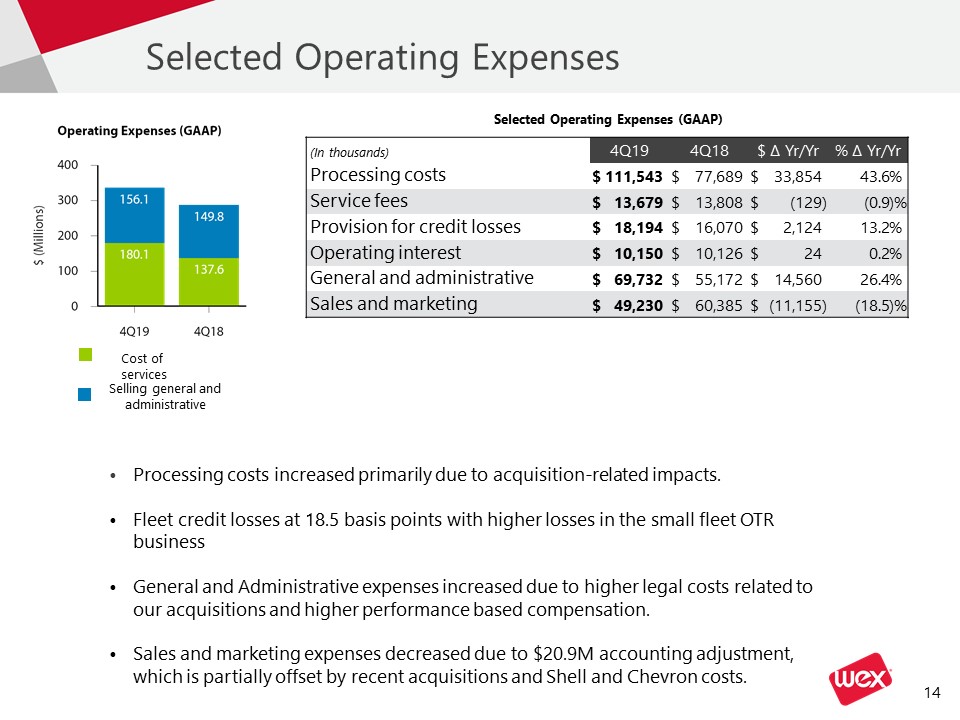
Selected Operating Expenses Processing costs increased primarily due to acquisition-related impacts.Fleet credit losses at 18.5 basis points with higher losses in the small fleet OTR business General and Administrative expenses increased due to higher legal costs related to our acquisitions and higher performance based compensation. Sales and marketing expenses decreased due to $20.9M accounting adjustment, which is partially offset by recent acquisitions and Shell and Chevron costs. (In thousands) 4Q19 4Q19 4Q18 4Q18 $ ∆ Yr/Yr $ ∆ Yr/Yr % ∆ Yr/Yr Processing costs $ 111,543 $ 77,689 $ 33,854 43.6 % Service fees $ 13,679 $ 13,808 $ (129 ) (0.9 )% Provision for credit losses $ 18,194 $ 16,070 $ 2,124 13.2 % Operating interest $ 10,150 $ 10,126 $ 24 0.2 % General and administrative $ 69,732 $ 55,172 $ 14,560 26.4 % Sales and marketing $ 49,230 $ 60,385 $ (11,155 ) (18.5 )% Cost of services Selling general and administrative Selected Operating Expenses (GAAP)
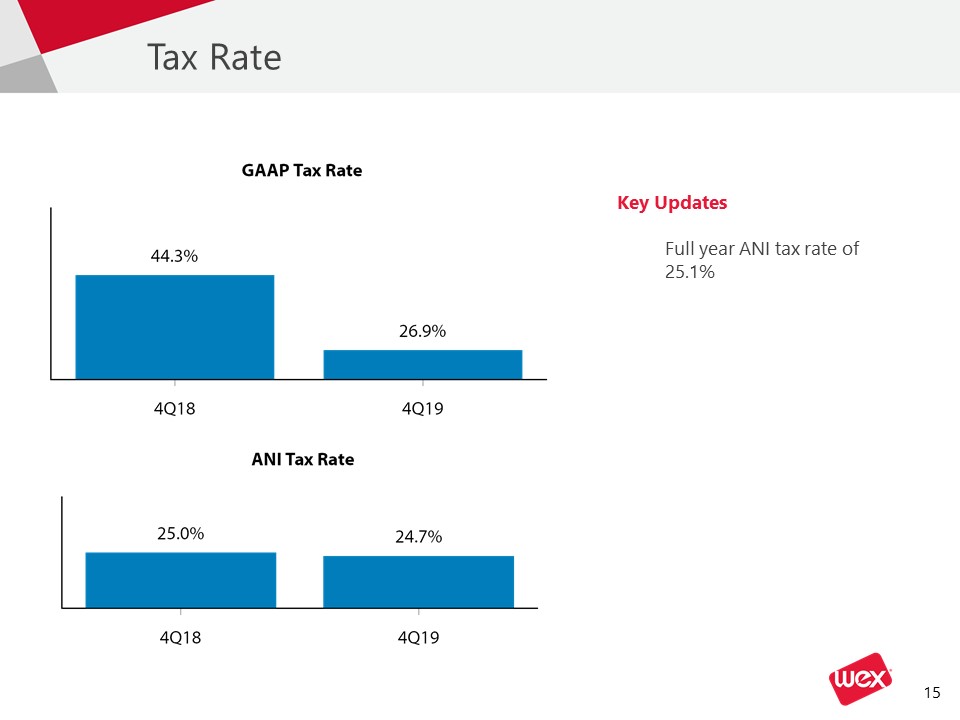
Tax Rate Key Updates Full year ANI tax rate of 25.1%
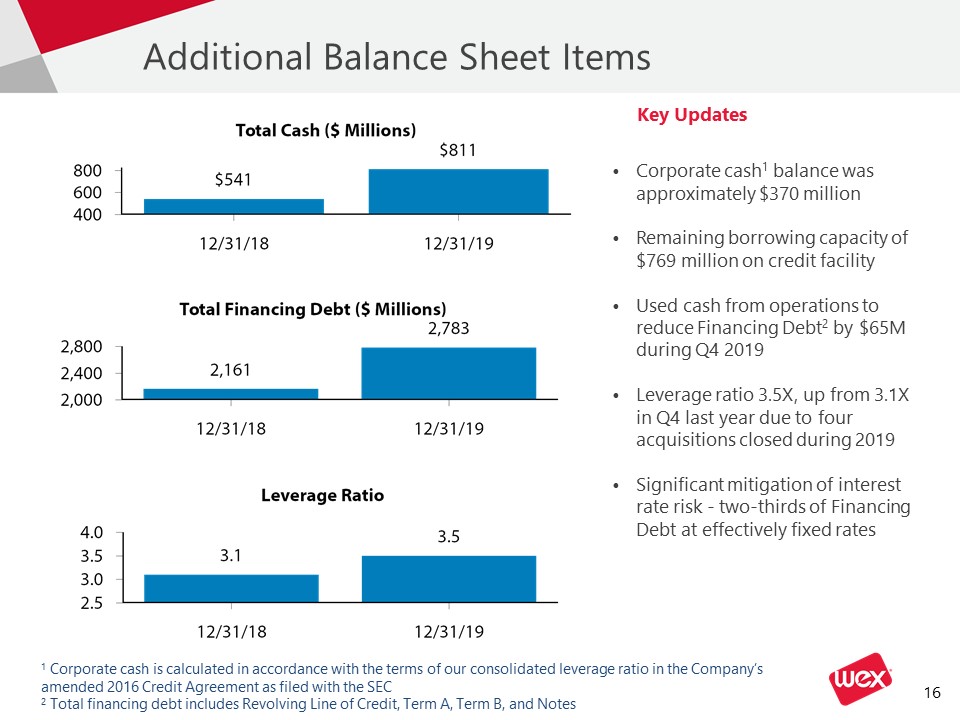
Additional Balance Sheet Items Key Updates Corporate cash1 balance was approximately $370 millionRemaining borrowing capacity of $769 million on credit facilityUsed cash from operations to reduce Financing Debt2 by $65M during Q4 2019Leverage ratio 3.5X, up from 3.1X in Q4 last year due to four acquisitions closed during 2019Significant mitigation of interest rate risk - two-thirds of Financing Debt at effectively fixed rates 1 Corporate cash is calculated in accordance with the terms of our consolidated leverage ratio in the Company’s amended 2016 Credit Agreement as filed with the SEC2 Total financing debt includes Revolving Line of Credit, Term A, Term B, and Notes
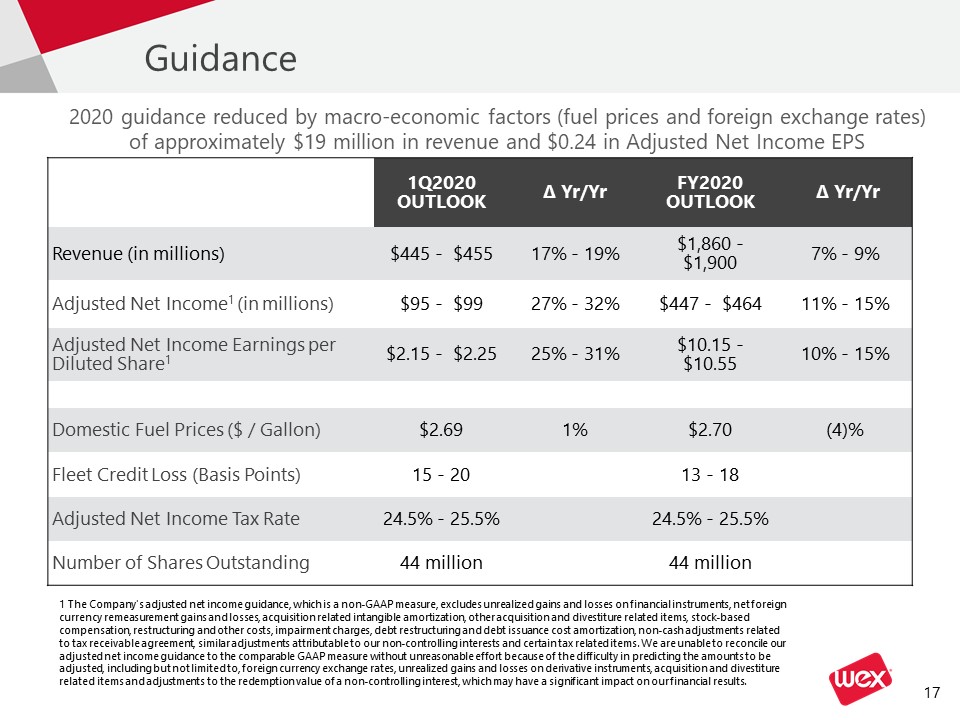
Guidance 1Q2020 OUTLOOK ∆ Yr/Yr FY2020 OUTLOOK ∆ Yr/Yr Revenue (in millions) $445 - $455 17% - 19% $1,860 - $1,900 7% - 9% Adjusted Net Income1 (in millions) $95 - $99 27% - 32% $447 - $464 11% - 15% Adjusted Net Income Earnings per Diluted Share1 $2.15 - $2.25 25% - 31% $10.15 - $10.55 10% - 15% Domestic Fuel Prices ($ / Gallon) $2.69 1% $2.70 (4)% Fleet Credit Loss (Basis Points) 15 - 20 13 - 18 Adjusted Net Income Tax Rate 24.5% - 25.5% 24.5% - 25.5% Number of Shares Outstanding 44 million 44 million 1 The Company's adjusted net income guidance, which is a non-GAAP measure, excludes unrealized gains and losses on financial instruments, net foreign currency remeasurement gains and losses, acquisition related intangible amortization, other acquisition and divestiture related items, stock-based compensation, restructuring and other costs, impairment charges, debt restructuring and debt issuance cost amortization, non-cash adjustments related to tax receivable agreement, similar adjustments attributable to our non-controlling interests and certain tax related items. We are unable to reconcile our adjusted net income guidance to the comparable GAAP measure without unreasonable effort because of the difficulty in predicting the amounts to be adjusted, including but not limited to, foreign currency exchange rates, unrealized gains and losses on derivative instruments, acquisition and divestiture related items and adjustments to the redemption value of a non-controlling interest, which may have a significant impact on our financial results. 2020 guidance reduced by macro-economic factors (fuel prices and foreign exchange rates) of approximately $19 million in revenue and $0.24 in Adjusted Net Income EPS
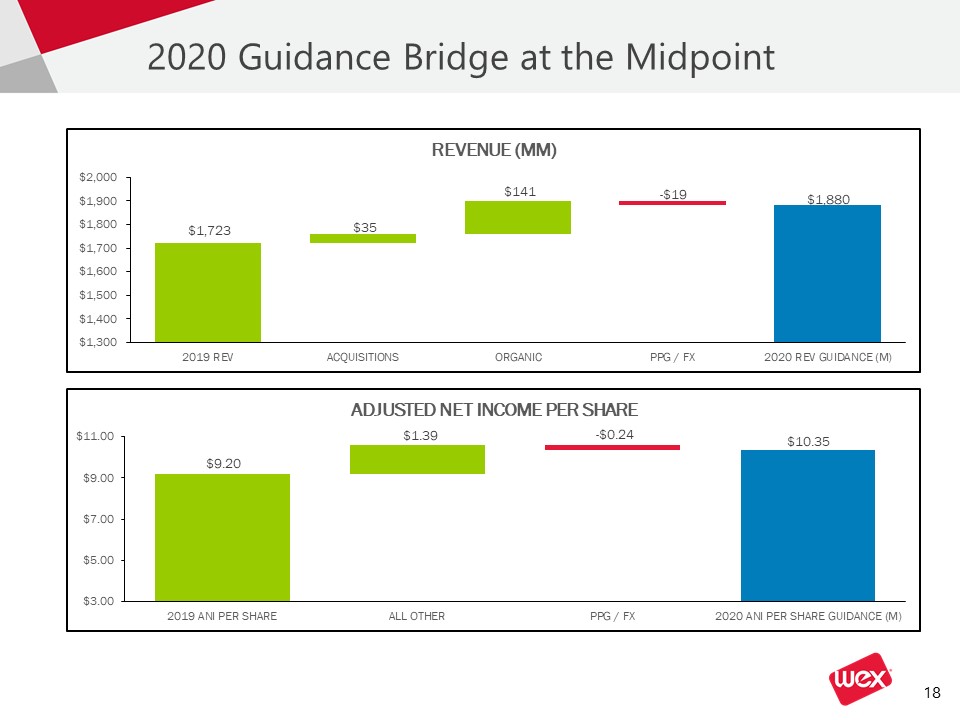
2020 Guidance Bridge at the Midpoint
Appendix
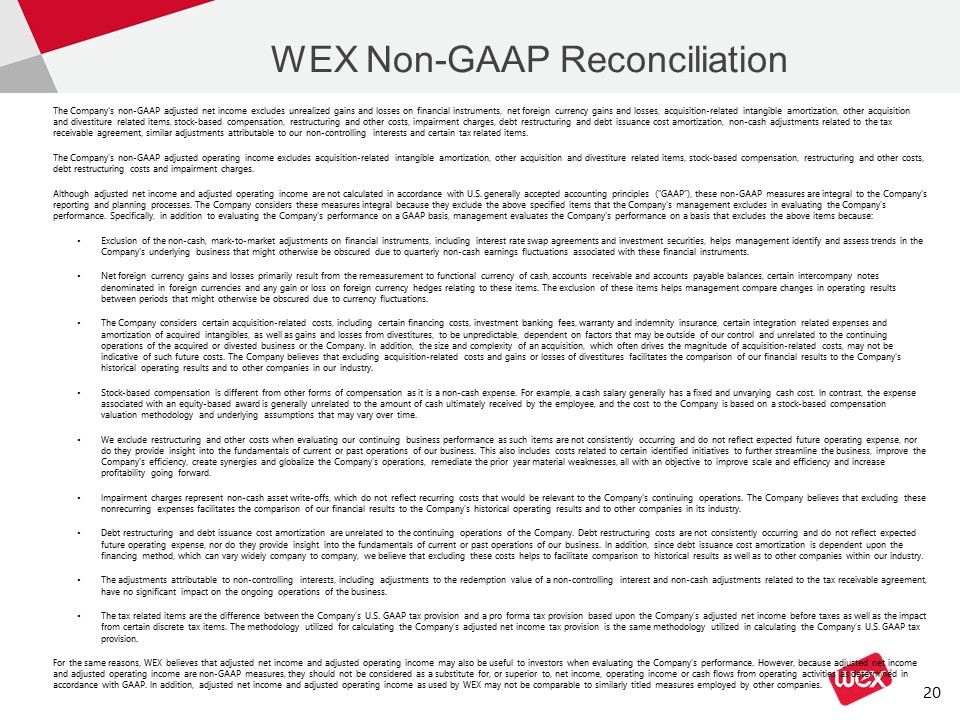
WEX Non-GAAP Reconciliation The Company's non-GAAP adjusted net income excludes unrealized gains and losses on financial instruments, net foreign currency gains and losses, acquisition-related intangible amortization, other acquisition and divestiture related items, stock-based compensation, restructuring and other costs, impairment charges, debt restructuring and debt issuance cost amortization, non-cash adjustments related to the tax receivable agreement, similar adjustments attributable to our non-controlling interests and certain tax related items. The Company's non-GAAP adjusted operating income excludes acquisition-related intangible amortization, other acquisition and divestiture related items, stock-based compensation, restructuring and other costs, debt restructuring costs and impairment charges. Although adjusted net income and adjusted operating income are not calculated in accordance with U.S. generally accepted accounting principles (“GAAP”), these non-GAAP measures are integral to the Company's reporting and planning processes. The Company considers these measures integral because they exclude the above specified items that the Company's management excludes in evaluating the Company's performance. Specifically, in addition to evaluating the Company's performance on a GAAP basis, management evaluates the Company's performance on a basis that excludes the above items because: Exclusion of the non-cash, mark-to-market adjustments on financial instruments, including interest rate swap agreements and investment securities, helps management identify and assess trends in the Company's underlying business that might otherwise be obscured due to quarterly non-cash earnings fluctuations associated with these financial instruments. Net foreign currency gains and losses primarily result from the remeasurement to functional currency of cash, accounts receivable and accounts payable balances, certain intercompany notes denominated in foreign currencies and any gain or loss on foreign currency hedges relating to these items. The exclusion of these items helps management compare changes in operating results between periods that might otherwise be obscured due to currency fluctuations. The Company considers certain acquisition-related costs, including certain financing costs, investment banking fees, warranty and indemnity insurance, certain integration related expenses and amortization of acquired intangibles, as well as gains and losses from divestitures, to be unpredictable, dependent on factors that may be outside of our control and unrelated to the continuing operations of the acquired or divested business or the Company. In addition, the size and complexity of an acquisition, which often drives the magnitude of acquisition-related costs, may not be indicative of such future costs. The Company believes that excluding acquisition-related costs and gains or losses of divestitures facilitates the comparison of our financial results to the Company's historical operating results and to other companies in our industry. Stock-based compensation is different from other forms of compensation as it is a non-cash expense. For example, a cash salary generally has a fixed and unvarying cash cost. In contrast, the expense associated with an equity-based award is generally unrelated to the amount of cash ultimately received by the employee, and the cost to the Company is based on a stock-based compensation valuation methodology and underlying assumptions that may vary over time.We exclude restructuring and other costs when evaluating our continuing business performance as such items are not consistently occurring and do not reflect expected future operating expense, nor do they provide insight into the fundamentals of current or past operations of our business. This also includes costs related to certain identified initiatives to further streamline the business, improve the Company's efficiency, create synergies and globalize the Company's operations, remediate the prior year material weaknesses, all with an objective to improve scale and efficiency and increase profitability going forward. Impairment charges represent non-cash asset write-offs, which do not reflect recurring costs that would be relevant to the Company's continuing operations. The Company believes that excluding these nonrecurring expenses facilitates the comparison of our financial results to the Company's historical operating results and to other companies in its industry. Debt restructuring and debt issuance cost amortization are unrelated to the continuing operations of the Company. Debt restructuring costs are not consistently occurring and do not reflect expected future operating expense, nor do they provide insight into the fundamentals of current or past operations of our business. In addition, since debt issuance cost amortization is dependent upon the financing method, which can vary widely company to company, we believe that excluding these costs helps to facilitate comparison to historical results as well as to other companies within our industry.The adjustments attributable to non-controlling interests, including adjustments to the redemption value of a non-controlling interest and non-cash adjustments related to the tax receivable agreement, have no significant impact on the ongoing operations of the business. The tax related items are the difference between the Company’s U.S. GAAP tax provision and a pro forma tax provision based upon the Company’s adjusted net income before taxes as well as the impact from certain discrete tax items. The methodology utilized for calculating the Company’s adjusted net income tax provision is the same methodology utilized in calculating the Company’s U.S. GAAP tax provision. For the same reasons, WEX believes that adjusted net income and adjusted operating income may also be useful to investors when evaluating the Company's performance. However, because adjusted net income and adjusted operating income are non-GAAP measures, they should not be considered as a substitute for, or superior to, net income, operating income or cash flows from operating activities as determined in accordance with GAAP. In addition, adjusted net income and adjusted operating income as used by WEX may not be comparable to similarly titled measures employed by other companies.
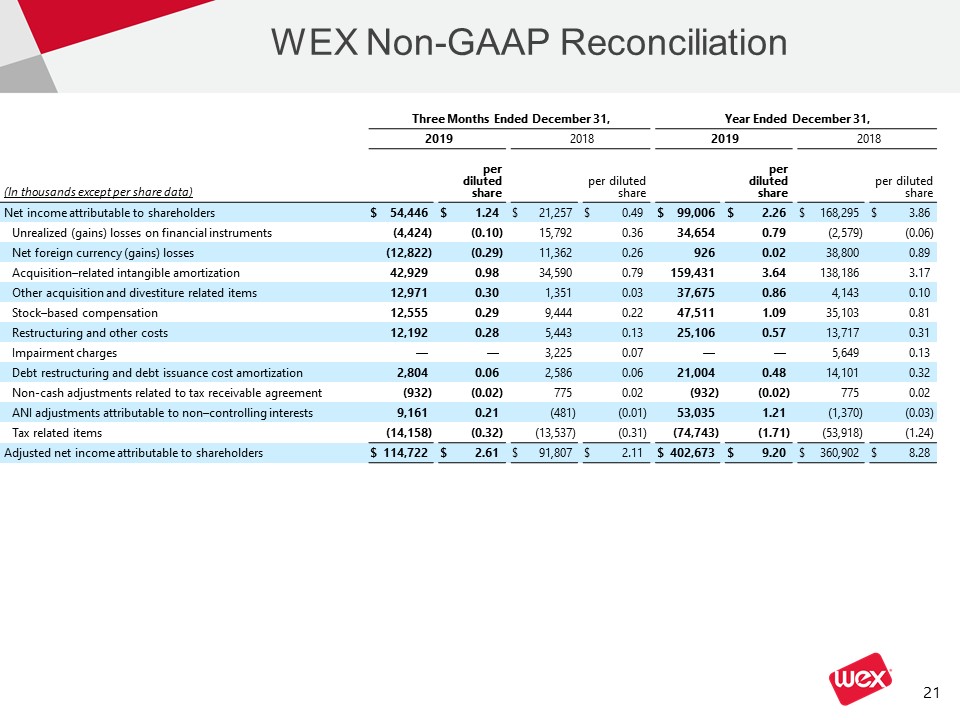
WEX Non-GAAP Reconciliation Three Months Ended December 31, Three Months Ended December 31, Year Ended December 31, Year Ended December 31, 2019 2019 2018 2018 2019 2019 2018 2018 (In thousands except per share data) per diluted share per diluted share per dilutedshare per dilutedshare per diluted share per diluted share per dilutedshare per dilutedshare Net income attributable to shareholders $ 54,446 $ 1.24 $ 21,257 $ 0.49 $ 99,006 $ 2.26 $ 168,295 $ 3.86 Unrealized (gains) losses on financial instruments (4,424 ) (0.10 ) 15,792 0.36 34,654 �� 0.79 (2,579 ) (0.06 ) Net foreign currency (gains) losses (12,822 ) (0.29 ) 11,362 0.26 926 0.02 38,800 0.89 Acquisition–related intangible amortization 42,929 0.98 34,590 0.79 159,431 3.64 138,186 3.17 Other acquisition and divestiture related items 12,971 0.30 1,351 0.03 37,675 0.86 4,143 0.10 Stock–based compensation 12,555 0.29 9,444 0.22 47,511 1.09 35,103 0.81 Restructuring and other costs 12,192 0.28 5,443 0.13 25,106 0.57 13,717 0.31 Impairment charges — — 3,225 0.07 — — 5,649 0.13 Debt restructuring and debt issuance cost amortization 2,804 0.06 2,586 0.06 21,004 0.48 14,101 0.32 Non-cash adjustments related to tax receivable agreement (932 ) (0.02 ) 775 0.02 (932 ) (0.02 ) 775 0.02 ANI adjustments attributable to non–controlling interests 9,161 0.21 (481 ) (0.01 ) 53,035 1.21 (1,370 ) (0.03 ) Tax related items (14,158 ) (0.32 ) (13,537 ) (0.31 ) (74,743 ) (1.71 ) (53,918 ) (1.24 ) Adjusted net income attributable to shareholders $ 114,722 $ 2.61 $ 91,807 $ 2.11 $ 402,673 $ 9.20 $ 360,902 $ 8.28