Table of Contents
Index to Financial Statements
Filed pursuant to Rule 424(B)(3)
Registration No: 333-122533
THE MONEY TREE INC.
$35,000,000 Subordinated Demand Notes
We are offering up to $35,000,000 in aggregate principal amount of our Subordinated Demand Notes on a continuous basis. A minimum initial investment of $100 is required.
We will issue the Demand Notes in denominations of at least $1, subject to the initial minimum investment requirement of $100. The Demand Notes shall have no stated maturity and shall be payable or redeemable, in whole or in part, at any time at your option, subject to the subordination provisions. The Demand Notes shall bear interest at a variable rate (compounded daily based upon a 365-day year) which will vary depending upon the daily average balance held by you ranging from $1.00 to $9,999.99; $10,000.00 to $49,999.99; $50,000.00 to $99,999.99; and $100,000.00 and over. When we set interest rates for each range of balances, such rates become effective for and applied to all Demand Notes with a daily average balance within that range, whether existing or newly issued. These interest rates may be the same or different for each range of balances and we may increase or decrease the rate for any range independently of the other ranges without advance notice to you after the date of purchase. We will only pay interest on a Demand Note when you make a demand for payment of principal of the Demand Note.
You may obtain the current interest rates payable on the Demand Notes by calling our executive offices in Bainbridge, Georgia at (877) 468-7878 (toll free) or (229) 248-0990 or by visiting our web site at www.themoneytreeinc.com. We will file a Rule 424(b)(2) prospectus supplement setting forth the current interest rates with the Securities and Exchange Commission upon any change in the interest rates.
We are offering the Demand Notes through our executive officers without an underwriter and on a continuous basis. We do not have to sell any minimum amount of Demand Notes to accept and use the proceeds of this offering. We cannot assure you that all or any portion of the Demand Notes we are offering will be sold. We have not made any arrangement to place any of the proceeds from this offering in an escrow, trust or similar account. Therefore, you will not be entitled to the return of your investment. The Demand Notes are not listed on any securities exchange and there is no public trading market for the Demand Notes. We have the right to reject any subscription, in whole or in part, for any reason.
We may at our option redeem at any time the Demand Notes (1) upon at least 30 days written notice to you, or (2) if the principal balance falls below $25, for a redemption price equal to the principal amount plus any unpaid interest thereon to the date of redemption.
You should read this prospectus and any applicable prospectus supplement carefully before you invest in the Demand Notes. These Demand Notes are our general unsecured obligations and are subordinated in right of payment to all of our present and future senior debt. As of June 25, 2005, we had $80,582,977 of debt outstanding that ranks equal with or senior to the Demand Notes offered pursuant to this prospectus. We expect to incur additional debt in the future, including without limitation the Demand Notes offered pursuant to this prospectus.
The Demand Notes are not certificates of deposit or similar obligations guaranteed by any depository institution, and they are not insured by the Federal Deposit Insurance Corporation (FDIC) or any governmental or private insurance fund, or any other entity. We do not contribute funds to a separate account such as a sinking fund to use to repay the Demand Notes.
See “Risk Factors” beginning on page 10 for certain factors you should consider before buying the Demand Notes.
These securities have not been approved or disapproved by the Securities and Exchange Commission or any state securities commission nor has the Securities and Exchange Commission or any state securities commission passed upon the accuracy or adequacy of this prospectus. Any representation to the contrary is a criminal offense.
| Price to Public | Underwriting Discount And Commission | Proceeds to Company | ||||||||
Per Demand Note | 100 | % | None | 100 | % | |||||
Total | $ | 35,000,000 | None | $ | 35,000,000 | (1) | ||||
| (1) | We will receive all of the net proceeds from the sale of the Demand Notes, which, if we sell all of the Demand Notes covered by this prospectus, we estimate will total approximately $34,385,000 after expenses. |
The date of this prospectus is November 4, 2005.
Table of Contents
Index to Financial Statements
| 1 | ||
| 6 | ||
| 6 | ||
| 6 | ||
| 7 | ||
| 8 | ||
| 10 | ||
| 15 | ||
| 15 | ||
| 16 | ||
| MANAGEMENT’S DISCUSSION AND ANALYSIS OF FINANCIAL CONDITION AND RESULTS OF OPERATIONS | 18 | |
| 18 | ||
| 21 | ||
| 21 | ||
| 23 | ||
| 24 | ||
| 24 | ||
| 24 | ||
| 27 | ||
| 31 | ||
| 34 | ||
| 34 | ||
| 34 | ||
| 36 | ||
| 37 | ||
| 37 | ||
| 38 | ||
| 38 | ||
| 38 | ||
| 42 | ||
| 43 | ||
| 44 | ||
| 45 | ||
| 46 | ||
i
Table of Contents
Index to Financial Statements
| 46 | ||
| 49 | ||
| 50 | ||
| 50 | ||
| 50 | ||
| 50 | ||
| 53 | ||
| 53 | ||
| 53 | ||
| 54 | ||
| 55 | ||
| 55 | ||
| 55 | ||
| 56 | ||
| 56 | ||
| 57 | ||
| 57 | ||
| 57 | ||
| 57 | ||
| 57 | ||
| 58 | ||
| 58 | ||
| 58 | ||
| 58 | ||
| 59 | ||
| 59 | ||
| 60 | ||
| 60 | ||
| 60 | ||
| 60 | ||
| 61 | ||
| 61 | ||
| 61 | ||
| F-1 | ||
ii
Table of Contents
Index to Financial Statements
You should rely only upon the information contained in this prospectus. We have not authorized anyone to provide you with information different from that contained in this prospectus. We are offering to sell Demand Notes only in jurisdictions where offers and sales are permitted.
iii
Table of Contents
Index to Financial Statements
Below we have provided some of the more frequently asked questions and answers relating to the offering of the Demand Notes. Please see the “Prospectus Summary” and the remainder of the prospectus for more information about the offering of the Demand Notes.
| Q: | Who is The Money Tree Inc.? |
| A: | We are a consumer finance company operating since our inception in 1987 through our branch offices in 103 locations throughout Georgia, Alabama, Louisiana and Florida. |
| Q: | What are your primary business activities? |
| A: | We primarily make, purchase and service direct consumer loans, consumer sales finance contracts and motor vehicle installment sales contracts. Direct consumer loans are direct loans to customers for general use, which are collateralized by existing automobiles or consumer goods, or are unsecured. Consumer sales finance contracts consist of retail installment sales contracts for purchases of specific consumer goods by customers either from one of our branch locations or from a retail store and are collateralized by such consumer goods. Motor vehicle installment sales contracts are initiated by us or purchased from automobile dealers subject to our credit approval. We originate direct consumer loans and consumer sales finance contracts primarily in our branch office locations. At June 25, 2005, direct consumer loans comprised 54.5%, motor vehicle sales contracts comprised 34.4% and consumer sales finance contracts comprised 11.1% of the gross amount of our outstanding loans and contracts. Most of our customers have “subprime” credit ratings and are considered higher than average credit risks. We sell retail merchandise, principally furniture, appliances and electronics, at certain of our branch office locations and operate three used automobile dealerships in the State of Georgia. We also offer, among other products and services, credit and non-credit insurance products, prepaid phone services and automobile club memberships to our loan customers. Insurance products include credit life, credit accident and sickness and collateral protection, which are issued by a non-affiliated insurance company. |
| Q: | What kind of offering is this? |
| A: | We are offering up to $35,000,000 of Subordinated Demand Notes to residents of the States of Georgia, Florida and Louisiana. |
1
Table of Contents
Index to Financial Statements
| Q: | What is a Subordinated Demand Note? |
| A: | A Demand Note is our promise to repay your principal investment on demand by you plus interest earned to that date. The Demand Notes are our general unsecured obligations and are subordinated in right of payment to all of our present and future senior debt. Subordinated means that if we are unable to pay our debts as they come due, the senior debt would all be paid first before any payment would be made on the Demand Notes. As of June 25, 2005, we had the following debt outstanding that ranks equal with or senior to the Demand Notes: |
Senior debt | $ | 1,305,741 | |
Debentures* | $ | 66,879,555 | |
Demand notes* | $ | 12,397,681 | |
Total | $ | 80,582,977 | |
| * | Issued by our subsidiary, The Money Tree of Georgia Inc. |
We expect to incur additional debt in the future, including without limitation the Demand Notes offered pursuant to this prospectus.
| Q: | Is my investment in the Demand Notes insured? |
| A: | No. The Demand Notes are not certificates of deposit or similar obligations or guaranteed by any depository institution, and they are not insured by the FDIC or any governmental or private insurance fund, or any other entity. They are backed only by the faith and credit of our company and our operations. |
| Q: | How is the interest rate determined? |
| A: | The interest rate offered on the Demand Notes varies depending on the average daily balances in the following ranges: $1.00 to $9,999.99; $10,000.00 to $49,999.99; $50,000.00 to $99,999.99; and $100,000.00 and over. When we establish an interest rate for each range of balances, it becomes effective for and applied to all Demand Notes with a daily balance within that range, whether existing or newly issued. If your average daily balance changes at any time during which you hold Demand Notes, your interest rate will change accordingly. |
2
Table of Contents
Index to Financial Statements
| Q: | How is interest calculated and paid to me? |
| A: | The interest rate is a variable rate and interest is compounded daily (based on a 365-day year). The interest rate may be the same or different for each range of balances and we may increase or decrease the rate for any range independently of the others without notice to you after the date of purchase. In other words, we can change the interest rate payable to you at any time in our discretion. Interest is only payable when you make a demand for payment of principal of the Demand Note. |
| Q: | Do the Demand Notes have a maturity date? |
| A: | No. A Demand Note is payable to you on your demand. |
| Q: | When may I redeem the Demand Note? |
| A: | Subject to the subordination provisions, you may redeem or demand payment on the Demand Note at any time. In such event, we will pay you the outstanding principal balance plus interest earned to the date of redemption. |
| Q: | Can you force me to redeem my Demand Note? |
| A: | Yes, we may call your Demand Note for redemption at any time upon 30 to 60 days notice. We may, in our sole discretion, redeem any Demand Note in full if the principal balance falls below $25 at any time. Any such redemptions by us will be for a price equal to the principal amount plus accrued interest to the date of redemption. |
| Q: | How are the Demand Notes sold? |
| A: | The Demand Notes are offered by our executive officers without an underwriter. We intend to market the offering primarily by placing advertisements in local newspapers, purchasing roadway sign advertisements and placing signs in our branch office locations in States in which we have properly registered the offerings or qualified for an exemption from registration. |
| Q: | What will you do with the proceeds raised from this offering? |
| A: | If all the Demand Notes offered by this prospectus are sold, we expect to receive approximately $34,385,000 in net proceeds after deducting all costs and expenses |
3
Table of Contents
Index to Financial Statements
associated with this offering. We intend to use substantially all of the net cash proceeds from this offering in the following order of priority: |
| • | to redeem debentures and demand notes of our subsidiary, The Money Tree of Georgia Inc.; |
| • | to redeem Demand Notes issued by us; |
| • | to make interest payments to holders of all of our debentures and demand notes; |
| • | to the extent we have remaining net proceeds and we have adequate cash on hand, to fund the following activities: |
| • | to make additional consumer loans; |
| • | to fund the purchase of inventory of used cars; |
| • | to open new branch office locations; |
| • | to acquire loan receivables from competitors; and |
| • | for working capital and other general corporate purposes. |
| Q: | What are the most significant risks of my investment in the Demand Notes? |
| A: | You should carefully read and consider all risk factors beginning on page 10 of the prospectus prior to investing. Below is a summary of the most significant risks of an investment in the Demand Notes: |
| • | the Demand Notes are risky and speculative investments for suitable investors only; |
| • | we may be unable to meet our debenture and demand note redemption obligations which could force us to sell off our loan receivables and other operating assets or cease our operations; |
| • | If we or our operations suffer from severe negative publicity, we could be faced with significantly greater payment or redemption obligations from holders of the Demand Notes than we have cash available for such payments or redemptions; |
| • | the Demand Notes are not insured or guaranteed by any third party so you are dependent upon our ability to manage our business and generate adequate cash flows; |
4
Table of Contents
Index to Financial Statements
| • | payment on the Demand Notes is subordinate to the payment of all of our present and future outstanding senior debt, and the indenture does not limit the amount of senior debt we may incur; |
| • | payment of interest and principal on the Demand Notes is effectively subordinate to the payment of the secured and unsecured creditors of our subsidiaries, including holders of debentures and demand notes issued by The Money Tree of Georgia Inc.; |
| • | the indenture does not contain covenants restricting us from taking certain actions and, therefore, the indenture provides very little protection of your investment; |
| • | our lack of a significant line of credit could affect our liquidity in the future; |
| • | we can provide no assurance that any Demand Notes will be sold or that we will raise sufficient proceeds to carry out our business plans; and |
| • | we are controlled by a single shareholder and do not have any independent board members overseeing our operations. |
| Q: | Who may I contact for more information? |
| A: | While our branch office personnel would be happy to provide you with a prospectus and may accept your investment check and documentation, they are not allowed to answer any substantive questions about your investment. If you have questions about the offering of the Debentures or need additional information, please call our executive office at (877) 468-7878 (toll free) or (229) 248-0990 (in Georgia). |
5
Table of Contents
Index to Financial Statements
This summary highlights selected information most of which was not otherwise addressed in the “Questions and Answers” section of this prospectus. You should carefully read the entire prospectus, including the section entitled “Risk Factors,” any related prospectus supplement and the documents we have referred you to in “Where You Can Find More Information” on page 61 for information about us.
We were incorporated in Georgia in 1987, and our principal corporate office is located at 114 South Broad Street, Bainbridge, Georgia 39817. Our general telephone number is (229) 246-6536. Information about us can be found at www.themoneytreeinc.com. The information contained on this website is not part of this prospectus.
| Securities Offered | We are offering up to $35,000,000 in aggregate principal amount of our Demand Notes. The Demand Notes are governed by an indenture between us and U.S. Bank National Association, as trustee. The Demand Notes do not have the benefit of a sinking fund. See “Description of Demand Notes – General.” | |
| Denominations | Increments of at least $1. | |
| Minimum Investment | A minimum initial investment of $100 is required. | |
| Form of Investment | Investments in Demand Notes may be made by check or by automatic debit of your bank account. | |
| Interest Rate | Variable interest rate, compounded daily based on a 365-day year, which will vary depending upon the average daily balances in the following ranges: $1.00 to $9,999.99; $10,000.00 to $49,999.99; $50,000.00 to $99,999.99; and $100,000.00 and over. | |
| Payment of Interest | Interest is payable only when you make a demand for payment of principal of the Demand Note. | |
| No Maturity | Demand Notes shall have no stated maturity. | |
| Payment/Redemption | Demand Notes shall be payable or redeemable, in whole or in part, at your option at any time, subject to subordination. | |
6
Table of Contents
Index to Financial Statements
| Redemption by Us | We may redeem the Demand Note at any time upon 30 to 60 days written notice to you for a price equal to principal plus interest accrued to the date of redemption. | |
Redemption if Balance Falls Below $25 | We may, at our sole option, redeem any Demand Note in full if the principal balance of such Demand Note falls below $25 at any time for a price equal to principal plus interest accrued to the date of redemption. | |
| Subordination | Demand Notes are subordinated, in all rights to payment and in all other respects, to all of our debt except debt that by its terms expressly provides that such debt is not senior in right to payment of the Demand Notes. Senior debt includes, without limitation, all of our bank and finance company debt and any line of credit we may obtain in the future. This means that if we are unable to pay our debts when due, the senior debt would all be paid first before any payment would be made on the Demand Notes. | |
| Event of Default | Under the indenture, an event of default is generally defined as a default in the payment of principal and interest on the Demand Notes which is not cured for 30 days, our becoming subject to certain events of bankruptcy or insolvency, or our failure to comply with provisions of the Demand Notes or the indenture which failure is not cured or waived within 60 days after receipt of a specific notice. | |
| Transfer Restrictions | Transfer of a Debenture is effective only upon the receipt of valid transfer instructions by the registrar from the Debenture holder of record. | |
| Trustee | U.S. Bank National Association, a national banking association. | |
| Risk Factors | See “Risk Factors” beginning on page 10 and other information included in this prospectus and any prospectus supplement for a discussion of factors you should carefully consider before investing in the Demand Notes. | |
In late August and September 2005, Hurricanes Katrina and Rita struck the Gulf Coast areas of Texas, Louisiana, Mississippi and Alabama. We operate several offices along the Alabama and Louisiana coastal area including three within the City of New Orleans. A total of 12 offices were affected by these storms. Nine offices were closed for periods ranging from three days to two weeks primarily because of the loss of electrical power. These offices are now open and fully operational. However, because of the flooding problem in New Orleans, those three offices remain closed. One office is currently under repair from the flood damage and we plan to consolidate all New Orleans operations into this office upon completion of these repairs, which we estimate will occur in November 2005. Although the damage to our properties caused by these events was minor, we cannot at this point predict what the effects to our results of operations might be. We may suffer increased loan losses resulting from loss of collateral securing the loans or other negative effects to our customers, such as loss of residence and/or employment or relocation to other parts of the United States. Please see the “Recent Developments” section of “Management’s Discussion and Analysis of Financial Condition and Results of Operations.”
7
Table of Contents
Index to Financial Statements
Summary Consolidated Financial Data
The following table summarizes certain financial data of our business. You should read this summary together with “Selected Consolidated Financial Data,” “Management’s Discussion and Analysis of Financial Condition and Results of Operations” and our audited and unaudited consolidated financial statements and related notes included elsewhere in this prospectus. Our summary balance sheet data, as of September 25, 2004 and 2003, and summary income statement data, for the fiscal years ended September 25, 2004, 2003 and 2002, have been derived from our audited consolidated financial statements and related notes included in this prospectus. The summary balance sheet data, as of September 25, 2002, 2001 and 2000, and the summary income statement data, for the fiscal years ended September 25, 2001 and 2000, have been derived from our audited financial statements that are not included in this prospectus. Our summary balance sheet data, as of June 25, 2005, and summary income statement data, for the nine months ended June 25, 2005 and 2004, have been derived from our unaudited consolidated financial statements and related notes included in this prospectus. Our summary balance sheet data, as of June 25, 2004, have been derived from our unaudited consolidated financial statements that are not included in this prospectus.
8
Table of Contents
Index to Financial Statements
| As of, and for, the Nine Months Ended June 25, | As of, and for, the Fiscal Year Ended September 25, | |||||||||||||||||||||||||||
| 2005 | 2004 | 2004 | 2003 | 2002 | 2001 | 2000 | ||||||||||||||||||||||
| (in thousands except ratios) | ||||||||||||||||||||||||||||
Consolidated income statement data: | ||||||||||||||||||||||||||||
Net interest income(1) | $ | 7,864 | $ | 7,344 | $ | 9,084 | $ | 7,099 | $ | 5,607 | $ | 4,982 | $ | 4,383 | ||||||||||||||
Insurance commissions | 7,501 | 5,134 | 6,477 | 6,177 | 4,893 | 4,652 | 3,321 | |||||||||||||||||||||
Other income(2) | 3,300 | 3,157 | 4,529 | 3,595 | 4,594 | 3,465 | 3,511 | |||||||||||||||||||||
Net revenues before retail sales | 18,665 | 15,635 | 20,090 | 16,871 | 15,094 | 13,099 | 11,215 | |||||||||||||||||||||
Gross margin on retail sales | 3,999 | 3,696 | 4,959 | 5,733 | 4,050 | 1,823 | 969 | |||||||||||||||||||||
Net revenues | 22,664 | 19,331 | 25,049 | 22,604 | 19,144 | 14,922 | 12,184 | |||||||||||||||||||||
Operating expenses | (22,051 | ) | (18,167 | ) | (24,854 | ) | (21,728 | ) | (18,990 | ) | (15,352 | ) | (14,483 | ) | ||||||||||||||
Net operating profit (loss) | 613 | 1,164 | 195 | 876 | 154 | (430 | ) | (2,299 | ) | |||||||||||||||||||
Gain (loss) on sale of assets | 34 | (1 | ) | (31 | ) | (20 | ) | (17 | ) | (7 | ) | 131 | ||||||||||||||||
Income (loss) before income taxes | 647 | 1,163 | 164 | 856 | 137 | (437 | ) | (2,168 | ) | |||||||||||||||||||
Income tax expense | (284 | ) | (454 | ) | (95 | ) | (339 | ) | (42 | ) | (117 | ) | 865 | |||||||||||||||
Net income (loss) | $ | 363 | $ | 709 | $ | 69 | $ | 517 | $ | 95 | $ | (554 | ) | $ | (1,303 | ) | ||||||||||||
Ratio of earnings to fixed charges(3) | 1.12 | 1.24 | 1.02 | 1.15 | 1.03 | (4 | ) | (4 | ) | |||||||||||||||||||
Consolidated balance sheet data: | ||||||||||||||||||||||||||||
Cash and cash equivalents | $ | 8,613 | $ | 9,072 | $ | 8,373 | $ | 8,749 | $ | 6,085 | $ | 5,084 | $ | 2,110 | ||||||||||||||
Finance receivables, net(5) | 72,703 | 59,320 | 65,100 | 57,705 | 39,901 | 27,306 | 21,546 | |||||||||||||||||||||
Other receivables | 2,428 | 9,602 | 4,904 | 2,074 | 2,142 | 2,643 | 463 | |||||||||||||||||||||
Inventory | 3,152 | 2,333 | 2,293 | 3,009 | 2,957 | 491 | 157 | |||||||||||||||||||||
Property and equipment, net | 4,993 | 4,375 | 4,657 | 3,272 | 3,346 | 2,434 | 2,250 | |||||||||||||||||||||
Total assets | 96,330 | 87,978 | 88,764 | 77,674 | 57,366 | 41,000 | 29,486 | |||||||||||||||||||||
Senior debt | 1,306 | 2,970 | 2,062 | 888 | 6,232 | 9,963 | 14,114 | |||||||||||||||||||||
Senior subordinated debt | — | 1,000 | 700 | 3,900 | 2,400 | 2,400 | 2,400 | |||||||||||||||||||||
Debentures(6) | 66,880 | 60,385 | 61,582 | 52,701 | 36,820 | 23,563 | 9,097 | |||||||||||||||||||||
Demand notes(6) | 12,398 | 11,569 | 11,702 | 10,277 | 6,192 | 593 | 308 | |||||||||||||||||||||
Shareholder’s equity (deficit) | $ | 768 | $ | 1,044 | $ | 405 | $ | 335 | $ | (182 | ) | $ | (276 | ) | $ | 277 | ||||||||||||
| (1) | Net of interest expense and provision for credit losses. |
| (2) | Includes commissions from motor club memberships received from Interstate Motor Club, Inc., an affiliated entity, and income from income tax return preparation services received from Cash Check Inc. of Ga., an affiliated entity. |
| (3) | The ratio of earnings to fixed charges represents the number of times fixed charges are covered by earnings. For purposes of this ratio, “earnings” is determined by adding pre-tax income to “fixed charges,” which consists of interest on all indebtedness and an interest factor attributable to rent expense. |
| (4) | Calculation results in a deficiency in the ratio (i.e., less than one-to-one coverage). The deficiency in earnings to cover fixed charges was $436,540 and $2,168,006 for the years ended September 25, 2001 and 2000, respectively. |
| (5) | Net of unearned insurance commissions, unearned finance charges, unearned discounts and allowance for credit losses. |
| (6) | Issued by our subsidiary, The Money Tree of Georgia Inc. |
9
Table of Contents
Index to Financial Statements
Our operations and your investment in the Demand Notes are subject to a number of risks. You should carefully read and consider these risks, together with all other information in this prospectus, before you decide to buy the Demand Notes. If any of the following risks actually occur, our business, financial condition or operating results and our ability to repay the Demand Notes could be materially adversely affected.
The Demand Notes are risky and speculative investments for suitable investors only.
You should be aware that the Demand Notes are risky and speculative investments suitable only for investors of adequate financial means. If you cannot afford to lose your entire investment, you should not invest in the Demand Notes. Potential investors are required to complete a purchaser suitability questionnaire to assist our executive officers in determining whether an investment in the Demand Notes is a suitable investment, and such executive officers have the right to reject any potential investor. If we accept an investment, you should not assume that the Demand Notes are a suitable and appropriate investment for you.
We may be unable to meet our debenture and demand note redemption obligations which could force us to sell off our loan receivables and other operating assets or cease our operations.
In addition to the Demand Notes we issue pursuant to this prospectus, we may issue Debentures or similar debt instruments to investors in order to raise funds for our operations. In addition, our subsidiary, The Money Tree of Georgia Inc., has issued debentures and demand notes to Georgia residents over the past several years, including $66,879,555 of debentures and $12,397,681 of demand notes outstanding as of June 25, 2005, which demand notes may be redeemed by our investors at any time. While the maturing debentures of our subsidiary are subject to early redemption and automatic four-year extension provisions, we cannot predict with any accuracy the number of debenture holders who will elect to redeem such debentures at or prior to maturity. We intend to pay these and any other redemption obligations using our normal cash sources, such as collections on finance receivables and used car sales, as well as proceeds from the sale of the Demand Notes and Debentures. We are substantially reliant upon the net offering proceeds we receive from the sale of the Debentures and Demand Notes. However, our operations and other sources of funds may not provide sufficient available cash flow to meet our redemption obligations, especially if the amount of redemptions at any given time is significantly greater than anticipated or if cash on hand is less than expected due to losses or other circumstances. If we are unable to repay or redeem the principal amount of debentures or demand notes when due, and we are unable to obtain additional financing or other sources of capital, we may be forced to sell off our loan receivables and other operating assets or we might be forced to cease our operations and you could lose some or all of your investment.
10
Table of Contents
Index to Financial Statements
If we or our operations suffer from severe negative publicity, we could be faced with significantly greater payment or redemption obligations from holders of the Demand Notes than we have cash available for such payments or redemptions.
Since the Demand Notes are payable or redeemable at any time by holders, we cannot control the amount or timing of such payments or redemptions. If we or our operations suffer from severe negative publicity, we may receive significantly greater payment or redemption requests in a short time period than we have cash available to fund such payments or redemptions. In such event, we could be declared in default on the Demand Notes and other debt instruments. If we are unable to cure such default or otherwise meet our payment or redemption obligations, you could lose your entire investment.
An increase in market interest rates may result in a reduction in our liquidity and profitability and impair our ability to pay interest and principal on the Demand Notes.
Interest rates are currently at or near historic lows. Sustained, significant increases in interest rates could unfavorably impact our liquidity and profitability by reducing the interest rate spread between the rate of interest we receive on loans and interest rates we must pay under our Demand Notes and Debentures and any bank debt we incur. Any reduction in our liquidity and profitability would diminish our ability to pay principal and interest on the Demand Notes.
Our Demand Notes are not insured or guaranteed by any third party so you are dependent upon our ability to manage our business and generate adequate cash flows.
Our Demand Notes are not insured or guaranteed by the FDIC, any governmental agency or any other public or private entity as are certificates of deposit or other accounts offered by banks, savings and loan associations or credit unions. You are dependent upon our ability to effectively manage our business to generate sufficient cash flow, including cash flow from our financing activities, for the repayment of principal and interest on the Demand Notes. If these sources are inadequate, you could lose your entire investment.
Payment on the Demand Notes is subordinate to the payment of all outstanding senior debt, and the indenture does not limit the amount of senior debt we may incur.
The Demand Notes are subordinate and junior to any and all senior debt. There are no restrictions in the indenture regarding the amount of senior debt or other indebtedness that we or our subsidiaries may incur. Upon the maturity of our senior debt, by lapse of time, acceleration or otherwise, the holders of our senior debt have first right to receive payment in full prior to any payments being made to you as a Demand Note holder. Therefore, you would only be repaid if funds remain after the repayment of our senior debt. As of June 25, 2005, we had $1,305,741 of senior debt outstanding.
Payment of interest and principal on the Demand Notes is effectively subordinate to the payment of the secured and unsecured creditors of our subsidiaries, including holders of debentures and demand notes issued by The Money Tree of Georgia Inc.
Substantially all of our assets and operations are conducted through our subsidiaries. As a result, all the creditors of our subsidiaries, including the holders of the debentures and demand
11
Table of Contents
Index to Financial Statements
notes issued by The Money Tree of Georgia Inc., would be paid prior to our subsidiaries being allowed to distribute any amounts to us. As of June 25, 2005, $66,879,555 of debentures and $12,397,681 of demand notes issued by The Money Tree of Georgia Inc. were outstanding. If our subsidiaries did not have sufficient funds to pay their debts, our ability to pay principal and interest on the Demand Notes would be impaired.
Our operations are not subject to the stringent banking regulatory requirements designed to protect investors so your investment is completely dependent upon our successful operation of our business.
Our operations are not subject to the stringent regulatory requirements imposed upon the operations of commercial banks, savings banks and thrift institutions and are not subject to periodic compliance examinations by federal banking regulators. Therefore, an investment in our Demand Notes does not have the regulatory protections that the holder of a demand account or a certificate of deposit at a bank does. The return on your investment is completely dependent upon our successful operation of our business. To the extent that we do not successfully operate our business, our ability to repay the principal and interest on the Demand Notes will be impaired.
The indenture does not contain covenants restricting us from taking certain actions and, therefore, the indenture provides very little protection of your investment.
The Demand Notes do not have the benefit of extensive covenants. The covenants in the indenture are not designed to protect your investment if there is a material adverse change in our financial condition or results of operations. For example, the indenture does not contain any restrictions on our ability to create or incur senior debt or other debt or to pay dividends or any financial covenants (such as a fixed charge coverage or minimum net worth covenants) to help ensure our ability to repay the principal and interest on the Demand Notes. In addition, the indenture does not contain covenants specifically designed to protect you if we engage in a highly leveraged transaction. Therefore, the indenture provides very little protection of your investment.
We are subject to many laws and governmental regulations, and any changes in these laws or regulations may materially adversely affect our financial condition and business operations.
Our operations are subject to regulation by federal authorities and state banking, finance, consumer protection and insurance authorities and are subject to various laws and judicial and administrative decisions imposing various requirements and restrictions on our operations which, among other things, require that we obtain and maintain certain licenses and qualifications, and limit the interest rates, fees and other charges we may impose in our consumer finance business. Although we believe we are in compliance in all material respects with applicable laws, rules and regulations, we cannot assure you that we are or that any change in such laws, or in the interpretations thereof, will not make our compliance with such laws more difficult or expensive or otherwise adversely affect our financial condition or business operations.
12
Table of Contents
Index to Financial Statements
Our lack of a significant line of credit could affect our liquidity in the future.
We have operated without a significant line of credit for the past two years. We are currently seeking a line of credit as an additional source of long-term financing. If we fail to obtain a line of credit, we will be more dependent on the proceeds from the Demand Notes and Debentures for our continued liquidity. If the sale of the Demand Notes and Debentures is significantly curtailed for any reason or we fail to obtain a line of credit, our ability to meet our obligations, including our obligations with respect to the Demand Notes offered hereby, could be materially adversely affected.
There is no sinking fund to ensure repayment of the Demand Notes so you are totally reliant upon our ability to generate adequate cash flows.
We do not contribute funds to a separate account, commonly known as a sinking fund, to repay the Demand Notes. Because funds are not set aside periodically for the repayment of the Demand Notes, you must rely on our cash flow from operations and other sources of financing for repayment, such as funds from the sale of the Demand Notes and Debentures and credit facilities, if any. To the extent cash flow from operations and other sources are not sufficient to repay the Demand Notes, you may lose all or a part of your investment.
The collectability of our finance receivables may be affected by general economic conditions and we may not be able to recover the full amount of delinquent accounts by resorting to sale of collateral or receipt of non-file insurance proceeds.
Our liquidity is dependent on, among other things, the collection of our finance receivables. We continually monitor the delinquency status of our finance receivables and promptly institute collection efforts on delinquent accounts. Collections of our consumer finance receivables are likely to be affected by general economic conditions. Although current economic conditions have not had a material adverse effect on our ability to collect such finance receivables, we can make no assurances regarding future economic conditions or their effect on our ability to collect our receivables. Furthermore, since we do not ordinarily perfect our security interest in collateral for loans, we may not be able to recover the full amount of outstanding receivables by resorting to the sale of collateral or receipt of non-file insurance proceeds.
We could suffer increased credit losses if there is a continued downtown in the economy.
Because our business consists mainly of the making of loans to individuals who depend on their earnings to make their repayments, our ability to operate on a profitable basis will depend to a large extent on the continued employment of those individuals and their ability to meet their financial obligations as they become due. In the event of a sustained recession or a continued downturn in the U.S. and local economies in which we operate, with resulting unemployment and increases in the number of personal bankruptcies, we could experience increased credit losses and our collection ratios and profitability could be materially and adversely affected.
Hurricanes or other adverse weather events could negatively affect our local economies or cause disruption to our branch office locations, which could have an adverse effect on our business or results of operations.
Our operations are conducted in the States of Georgia, Florida, Alabama and Louisiana, including areas susceptible to hurricanes or tropical storms. See our locations map on page 39 of the prospectus showing that there are several branch office locations in or near coastal towns. Such weather events can disrupt our operations, result in damage to our branch office locations and negatively affect the local economies in which we operate. In late August 2005, Hurricane Katrina devastated parts of the Gulf Coast of Louisiana and Alabama causing substantial damage to residences and businesses in these areas, including our three branch office locations in New Orleans. In September 2005, Hurricane Rita struck the Gulf Coast of Louisiana and Texas resulting in temporary closure of our Lake Charles, Louisiana branch office location. We cannot predict whether or to what extent damage caused by Hurricanes Katrina and Rita or damage that may be caused by future hurricanes will affect our operations or the economies in our market areas, but such weather events could result in a decline in loan originations and an increase in the risk of delinquencies, foreclosures or loan losses. Our business or results of operations may be adversely affected by these and other negative effects of Hurricanes Katrina and Rita or future hurricanes.
13
Table of Contents
Index to Financial Statements
Our typical customer base has “subprime” credit ratings and are higher than average credit risks which could result in increased risk of loan defaults.
We typically lend money to individuals who have difficulty receiving loans from banks and other financial institutions because of credit problems or other adverse financial circumstances. Therefore, we may have a higher risk of loan default among our customers than other lending companies. If we suffer increased loan defaults in any given period, our operations could be materially adversely affected and we may have difficulty making our principal and interest payments on the Demand Notes.
Additional competition may decrease our liquidity and profitability, which would adversely affect our ability to repay the Demand Notes.
We compete for business with a number of large national companies and banks that have substantially greater resources, lower cost of funds, and a more established market presence than we have. If these companies increase their marketing efforts to include our market niche of borrowers, or if additional competitors enter our markets, we may be forced to reduce our interest rates and fees in order to maintain or expand our market share. Any reduction in our interest rates or fees could have an adverse impact on our liquidity and profitability and our ability to repay the Demand Notes.
If we redeem the Demand Notes, you may not be able to reinvest the proceeds at comparable rates.
We may, at our option, redeem at any time the Demand Notes (1) upon at least 30 days written notice, or (2) if the principal balance falls below $25. In the event we redeem your Demand Note, you would have the risk of reinvesting the proceeds at the then-current market rates which may be higher or lower.
We can provide no assurance that any Demand Notes will be sold or that we will raise sufficient proceeds to carry out our business plans.
We are offering the Demand Notes through our executive officers without a firm underwriting commitment. While we intend to sell up to $35,000,000 in principal amount of Demand Notes, there is no minimum amount of proceeds that must be received from the sale of Demand Notes in order to accept proceeds from Demand Notes actually sold. Accordingly, we can provide no assurance as to the total principal amount of Demand Notes that will be sold. Therefore, we cannot assure you that we will raise sufficient proceeds to carry out our business plans.
We are controlled by a single shareholder and don’t have any independent board members overseeing our operations.
Our President, Vance R. Martin, controls all of the outstanding shares of our voting capital stock. In addition, we do not have any independent directors on our board. Accordingly, Mr. Martin will be able to exercise significant control over our affairs, including, without limitation, the election of officers and directors, operational decisions and decisions regarding
14
Table of Contents
Index to Financial Statements
the Demand Notes. In addition, there are no contractual or regulatory limits on the amounts we can pay to Mr. Martin or other affiliates.
This prospectus contains forward-looking statements within the meaning of federal securities law. Words such as “may,” “will,” “expect,” “anticipate,” “believe,” “estimate,” “continue,” “predict,” or other similar words, identify forward-looking statements. Forward-looking statements appear in a number of places in this prospectus, including, without limitation, the “Use of Proceeds” and “Management’s Discussion and Analysis of Financial Condition and Results of Operations” sections, and include statements regarding our intent, belief or current expectation about, among other things, trends affecting the markets in which we operate, our business, financial condition and growth strategies. Although we believe that the expectations reflected in these forward-looking statements are based on reasonable assumptions, forward-looking statements are not guarantees of future performance and involve risks and uncertainties. Actual results may differ materially from those predicted in the forward-looking statements as a result of various factors, including those set forth in the “Risk Factors” section of this prospectus. If any of the events described in “Risk Factors” occur, they could have an adverse effect on our business, financial condition and results of operations. When considering forward-looking statements, you should keep these risk factors in mind as well as the other cautionary statements in this prospectus. You should not place undue reliance on any forward-looking statement. We are not obligated to update forward-looking statements.
If we sell all of the Demand Notes offered by this prospectus, we estimate that the net proceeds will be approximately $34,385,000 after deduction of estimated offering expenses of $615,000. We will pay all of the expenses related to this offering.
We will receive cash proceeds in varying amounts from time to time as the Demand Notes are sold. Due to our inability to predict with any certainty whatsoever when holders of Demand Notes will redeem or which holders of Debentures will redeem at or prior to maturity, we cannot provide any specific allocation of proceeds we will use for any particular purpose. However, we intend to use substantially all of the net offering proceeds in the following order of priority:
| • | to redeem debentures and demand notes of our subsidiary, The Money Tree of Georgia Inc.; |
| • | to redeem Demand Notes issued by us; |
| • | to make interest payments to holders of all of our debentures and demand notes; |
| • | to the extent that net proceeds remain and we have adequate cash on hand, to fund the following company activities: |
15
Table of Contents
Index to Financial Statements
| • | to make additional consumer loans; |
| • | to fund the purchase of inventory of used cars; |
| • | to open new branch office locations; |
| • | to acquire loan receivables from competitors; and |
| • | for working capital and other general corporate purposes. |
There is no minimum number or amount of Demand Notes that we must sell to receive and use the proceeds from the sale of Demand Notes, and we cannot assure you that all or any portion of the Demand Notes will be sold. In the event that we do not raise sufficient proceeds from our offerings of Debentures and Demand Notes to adequately fund our operations, we could curtail the amount of funds we loan to our customers and focus on cash collections to increase cash flow. Please see “Management’s Discussion and Analysis of Financial Condition and Results of Operations – Liquidity and Capital Resources.”
SELECTED CONSOLIDATED FINANCIAL DATA
The following selected consolidated financial data should be read in conjunction with “Management’s Discussion and Analysis of Financial Condition and Results of Operations” and our audited and unaudited consolidated financial statements and related notes included elsewhere in this prospectus. The selected consolidated balance sheet data, as of September 25, 2004 and 2003, and the selected consolidated income statement data, for the fiscal years ended September 25, 2004, 2003 and 2002, have been derived from our audited consolidated financial statements and related notes included in this prospectus. The selected consolidated balance sheet data, as of September 25, 2002, 2001 and 2000, and the selected consolidated income statement data, for the fiscal years ended September 25, 2001 and 2000, have been derived from our audited financial statements that are not included in this prospectus. The selected consolidated balance sheet data, as of June 25, 2005, and the selected consolidated income statement data, for the nine months ended June 25, 2005 and 2004, have been derived from our unaudited consolidated financial statements and related notes included in this prospectus. The selected consolidated balance sheet data, as of June 25, 2004, have been derived from our unaudited consolidated financial statements that are not included in this prospectus.
The unaudited financial statements include, in the opinion of management, all adjustments, consisting only of normal, recurring adjustments, that management considers necessary for a fair statement of the results for those aforementioned periods. The historical results are not necessarily indicative of results to be expected in any future period, and the results for the nine months ended June 25, 2005 should not be considered indicative of results expected for the full fiscal year.
16
Table of Contents
Index to Financial Statements
| As of, and for, the Nine Months Ended June 25, | As of, and for, the Fiscal Year Ended September 25, | |||||||||||||||||||||||||||
| 2005 | 2004 | 2004 | 2003 | 2002 | 2001 | 2000 | ||||||||||||||||||||||
| (in thousands except ratios) | ||||||||||||||||||||||||||||
Selected consolidated income statement data: | ||||||||||||||||||||||||||||
Interest income | $ | 14,066 | $ | 12,973 | $ | 17,855 | $ | 14,001 | $ | 10,640 | $ | 8,004 | $ | 7,359 | ||||||||||||||
Interest expense | (4,867 | ) | (4,334 | ) | (5,848 | ) | (4,919 | ) | (3,973 | ) | (3,237 | ) | (2,358 | ) | ||||||||||||||
Net interest income before provision for credit losses | 9,379 | 8,639 | 12,007 | 9,082 | 6,667 | 4,767 | 5,001 | |||||||||||||||||||||
Provision for credit losses | (1,515 | ) | (1,295 | ) | (2,923 | ) | (1,983 | ) | (1,060 | ) | 215 | (618 | ) | |||||||||||||||
Net interest income after provision for credit losses | 7,864 | 7,344 | 9,084 | 7,099 | 5,607 | 4,982 | 4,383 | |||||||||||||||||||||
Insurance commissions | 7,501 | 5,134 | 6,477 | 6,177 | 4,893 | 4,652 | 3,321 | |||||||||||||||||||||
Commissions from motor club memberships(1) | 1,253 | 1,410 | 1,995 | 1,612 | 2,460 | 2,007 | 2,940 | |||||||||||||||||||||
Income tax service income(2) | 162 | 400 | 400 | 452 | 529 | 572 | 513 | |||||||||||||||||||||
Other income | 1,885 | 1,347 | 2,134 | 1,531 | 1,605 | 886 | 58 | |||||||||||||||||||||
Net revenues before retail sales | 18,665 | 15,635 | 20,090 | 16,871 | 15,094 | 13,099 | 11,215 | |||||||||||||||||||||
Retail sales | 11,967 | 11,699 | 15,428 | 22,781 | 14,992 | 3,711 | 2,217 | |||||||||||||||||||||
Cost of sales | (7,968 | ) | (8,003 | ) | (10,469 | ) | (17,048 | ) | (10,942 | ) | (1,888 | ) | (1,248 | ) | ||||||||||||||
Gross margin on retail sales | 3,999 | 3,696 | 4,959 | 5,733 | 4,050 | 1,823 | 969 | |||||||||||||||||||||
Net revenues | 22,664 | 19,331 | 25,049 | 22,604 | 19,144 | 14,922 | 12,184 | |||||||||||||||||||||
Operating expenses | (22,051 | ) | (18,167 | ) | (24,854 | ) | (21,728 | ) | (18,990 | ) | (15,352 | ) | (14,483 | ) | ||||||||||||||
Net operating profit (loss) | 613 | 1,164 | 195 | 876 | 154 | (430 | ) | (2,299 | ) | |||||||||||||||||||
Gain (loss) on sale of assets | 34 | (1 | ) | (31 | ) | (20 | ) | (17 | ) | (7 | ) | 131 | ||||||||||||||||
Income (loss) before income taxes | 647 | 1,163 | 164 | 856 | 137 | (437 | ) | (2,168 | ) | |||||||||||||||||||
Income tax expense | (284 | ) | (454 | ) | (95 | ) | (339 | ) | (42 | ) | (117 | ) | 865 | |||||||||||||||
Net income (loss) | 363 | 709 | $ | 69 | $ | 517 | $ | 95 | $ | (554 | ) | $ | (1,303 | ) | ||||||||||||||
Ratio of earnings to fixed charges(3) | 1.12 | 1.24 | 1.02 | 1.15 | 1.03 | (4 | ) | (4 | ) | |||||||||||||||||||
Selected consolidated balance sheet data: | ||||||||||||||||||||||||||||
Cash and cash equivalents | $ | 8,613 | $ | 9,072 | $ | 8,373 | $ | 8,749 | $ | 6,085 | $ | 5,084 | $ | 2,110 | ||||||||||||||
Finance receivables(5) | 74,964 | 61,207 | 67,156 | 59,410 | 41,096 | 28,048 | 22,916 | |||||||||||||||||||||
Allowance for credit losses | (2,261 | ) | (1,887 | ) | (2,056 | ) | (1,705 | ) | (1,195 | ) | (742 | ) | (1,370 | ) | ||||||||||||||
Finance receivables, net | 72,703 | 59,320 | 65,100 | 57,705 | 39,901 | 27,306 | 21,546 | |||||||||||||||||||||
Other receivables | 2,428 | 9,602 | 4,904 | 2,074 | 2,142 | 2,643 | 463 | |||||||||||||||||||||
Inventory | 3,151 | 2,333 | 2,293 | 3,009 | 2,957 | 491 | 157 | |||||||||||||||||||||
Property and equipment, net | 4,993 | 4,375 | 4,657 | 3,272 | 3,346 | 2,434 | 2,250 | |||||||||||||||||||||
Total assets | 96,330 | 87,978 | 88,764 | 77,674 | 57,366 | 41,000 | 29,486 | |||||||||||||||||||||
Senior debt | 1,306 | 2,970 | 2,062 | 888 | 6,232 | 9,963 | 14,114 | |||||||||||||||||||||
Senior subordinated debt | — | 1,000 | 700 | 3,900 | 2,400 | 2,400 | 2,400 | |||||||||||||||||||||
Subordinated debt, related parties | 800 | 300 | 800 | 271 | 346 | 565 | 515 | |||||||||||||||||||||
Debentures(6) | 66,880 | 60,385 | 61,582 | 52,701 | 36,820 | 23,563 | 9,097 | |||||||||||||||||||||
Demand notes(6) | 12,398 | 11,569 | 11,702 | 10,277 | 6,192 | 593 | 308 | |||||||||||||||||||||
Shareholder’s equity (deficit) | $ | 768 | $ | 1,044 | $ | 405 | $ | 335 | $ | (182 | ) | $ | (276 | ) | $ | 277 | ||||||||||||
| (1) | Received from Interstate Motor Club, Inc., an affiliated entity. |
| (2) | Received from Cash Check Inc. of Ga., an affiliated entity. |
| (3) | The ratio of earnings to fixed charges represents the number of times fixed charges are covered by earnings. For purposes of this ratio, “earnings” is determined by adding pre-tax income to “fixed charges,” which consists of interest on all indebtedness and an interest factor attributable to rent expense. |
| (4) | Calculation results in a deficiency in the ratio (i.e., less than one-to-one coverage). The deficiency in earnings to cover fixed charges was $436,540 and $2,168,006 for the years ended September 25, 2001 and 2000, respectively. |
| (5) | Net of unearned insurance commissions, unearned finance charges and unearned discounts. |
| (6) | Issued by our subsidiary, The Money Tree of Georgia Inc. |
17
Table of Contents
Index to Financial Statements
MANAGEMENT’S DISCUSSION AND ANALYSIS OF FINANCIAL CONDITION AND
RESULTS OF OPERATIONS
The following discussion should be read in conjunction with the information under “Selected Consolidated Financial Data” and our audited and unaudited consolidated financial statements and related notes and other financial data included elsewhere in this prospectus.
We make consumer finance loans and provide other financial products and services through our branch offices in Georgia, Alabama, Louisiana and Florida. We sell retail merchandise, principally furniture, appliances and electronics, at certain of our branch office locations and operate four used automobile dealerships in the State of Georgia. We also offer insurance products, prepaid phone services and automobile club memberships to our loan customers.
We fund our consumer loan demand through a combination of cash collections from our consumer loans, proceeds raised from the sale of debentures and demand notes and loans from various banks and other financial institutions. Our consumer loan business consists of making, purchasing and servicing direct consumer loans, consumer sales finance contracts and motor vehicle installment sales contracts. Direct consumer loans generally serve individuals with limited access to other sources of consumer credit, such as banks, savings and loans, other consumer finance businesses and credit cards. Direct consumer loans are general loans made typically to people who need money for some unusual or unforeseen expense, for the purpose of paying off an accumulation of small debts or for the purchase of furniture and appliances. Please see “Business – General” for a more detailed discussion of the various types of loans we make to our customers. The following table sets forth certain information about the components of our finance receivables:
Description of Loans and Contracts
| As of, or for, the Nine Months Ended June 25, | As of, or for, the Year Ended September 25, | |||||||||||||||||||
| 2005 | 2004 | 2004 | 2003 | 2002 | ||||||||||||||||
Direct Consumer Loans: | ||||||||||||||||||||
Number of Loans Made to New Borrowers | 18,981 | 12,754 | 18,601 | 14,245 | 16,080 | |||||||||||||||
Number of Loans Made to Former Borrowers | 38,159 | 34,210 | 46,109 | 41,442 | 46,041 | |||||||||||||||
Number of Loans Made to Existing Borrowers | 72,932 | 62,380 | 84,987 | 74,647 | 71,903 | |||||||||||||||
Total Number of Loans Made | 130,072 | 109,344 | 149,697 | 130,334 | 134,024 | |||||||||||||||
Total Volume of Loans Made | $ | 64,914,687 | $ | 50,497,227 | $ | 68,593,531 | $ | 64,417,672 | $ | 54,126,157 | ||||||||||
Average Size of Loans Made | $ | 499 | $ | 462 | $ | 458 | $ | 494 | $ | 404 | ||||||||||
Number of Loans Outstanding | 70,019 | 52,880 | 57,986 | 52,757 | 50,646 | |||||||||||||||
Total of Loans Outstanding | $ | 46,103,780 | $ | 33,439,943 | $ | 38,281,888 | $ | 33,215,821 | $ | 25,616,555 | ||||||||||
Percent of Loans Outstanding | 54.5 | % | 47.1 | % | 50.3 | % | 48.6 | % | 55.1 | % | ||||||||||
Average Balance on Outstanding Loans | $ | 658 | $ | 632 | $ | 660 | $ | 630 | $ | 506 | ||||||||||
Number of Contracts Purchased | — | 12,630 | 15,014 | 1,200 | 763 | |||||||||||||||
Total Volume of Contracts Purchased | $ | — | $ | 4,641,489 | $ | 5,428,391 | $ | 491,049 | $ | 363,240 | ||||||||||
Average Size of Contracts Purchased | $ | — | $ | 367 | $ | 362 | $ | 409 | $ | 476 | ||||||||||
18
Table of Contents
Index to Financial Statements
Description of Loans and Contracts
| As of, or for, the Nine Months Ended June 25, | As of, or for, the Year Ended September 25, | |||||||||||||||||||
| 2005 | 2004 | 2004 | 2003 | 2002 | ||||||||||||||||
Motor Vehicle Installment Sales Contracts: |
| |||||||||||||||||||
Total Number of Contracts Made | 602 | 710 | 892 | 1,084 | 749 | |||||||||||||||
Total Volume of Contracts Made | $ | 9,726,568 | $ | 14,003,943 | $ | 17,043,881 | $ | 21,667,826 | $ | 14,408,125 | ||||||||||
Average Size of Contracts Made | $ | 16,157 | $ | 19,724 | $ | 19,107 | $ | 19,989 | $ | 19,236 | ||||||||||
Number of Contracts Outstanding | 2,322 | 2,133 | 2,160 | 1,855 | 1,263 | |||||||||||||||
Total of Contracts Outstanding | $ | 29,155,062 | $ | 30,990,634 | $ | 30,557,683 | $ | 28,820,071 | $ | 16,219,115 | ||||||||||
Percent of Total Loans and Contracts | 34.4 | % | 43.6 | % | 40.2 | % | 42.2 | % | 34.9 | % | ||||||||||
Average Balance on Outstanding Contracts | $ | 12,556 | $ | 14,529 | $ | 14,147 | $ | 15,536 | $ | 12,842 | ||||||||||
Number of Contracts Purchased | — | — | — | — | 88 | |||||||||||||||
Total Volume of Contracts Purchased | $ | — | $ | — | $ | — | $ | — | $ | 346,539 | ||||||||||
Average Size of Contracts Purchased | $ | — | $ | — | $ | — | $ | — | $ | 3,938 | ||||||||||
Consumer Sales Finance Contracts: |
| |||||||||||||||||||
Number of Contracts Made to New Customers | 270 | 310 | 419 | 542 | 591 | |||||||||||||||
Number of Loans Made to Former Customers | 3,197 | 2,994 | 3,471 | 3,613 | 4,200 | |||||||||||||||
Number of Loans Made to Existing Customers | 1,772 | 2,291 | 2,643 | 3,499 | 2,554 | |||||||||||||||
Total Contracts Made | 5,239 | 5,595 | 6,533 | 7,654 | 7,345 | |||||||||||||||
Total Volume of Contracts Made | $ | 8,336,718 | $ | 5,541,429 | $ | 7,063,894 | $ | 8,124,364 | $ | 6,106,937 | ||||||||||
Number of Contracts Outstanding | 5,334 | 5,349 | 5,551 | 5,737 | 5,349 | |||||||||||||||
Total of Contracts Outstanding | $ | 9,410,055 | $ | 6,637,608 | $ | 7,240,653 | $ | 6,260,905 | $ | 4,619,579 | ||||||||||
Percent of Total Loans and Contracts | 11.1 | % | 9.3 | % | 9.5 | % | 9.2 | % | 9.9 | % | ||||||||||
Average Balance of Outstanding Contracts | $ | 1,764 | $ | 1,241 | $ | 1,304 | $ | 1,091 | $ | 864 | ||||||||||
Number of Contracts Purchased | — | — | — | — | — | |||||||||||||||
Total Volume of Contracts Purchased | $ | — | $ | — | $ | — | $ | — | $ | — | ||||||||||
Average Size of Contracts Purchased | $ | — | $ | — | $ | — | $ | — | $ | — | ||||||||||
| * | Contracts outstanding are exclusive of the following aggregate amounts of bankrupt accounts: $4,498,016 for the nine months ended June 25, 2005; $2,931,520 for the nine months ended June 25, 2004; $3,531,667 for the year ended September 25, 2004; $3,710,099 for the year ended September 25, 2003; and $2,906,125 for the year ended September 25, 2002. |
Below is a table showing our total gross outstanding finance receivables and bankrupt accounts:
Nine Months June 25, | Nine Months June 25, | Fiscal Year September 25, | Fiscal Year September 25, | Fiscal Year September 25, | |||||||||||
Total Loans and Contracts Outstanding (gross): | |||||||||||||||
Direct Consumer Loans | $ | 46,103,780 | $ | 33,439,943 | $ | 38,281,888 | $ | 33,215,821 | $ | 25,616,555 | |||||
Motor Vehicle Installment | 29,155,062 | 30,990,634 | 30,557,683 | 28,820,071 | 16,219,115 | ||||||||||
Consumer Sales Finance | 9,410,055 | 6,637,608 | 7,240,653 | 6,260,905 | 4,619,579 | ||||||||||
Bankrupt Accounts | 4,498,016 | 2,931,520 | 3,531,667 | 3,710,099 | 2,906,125 | ||||||||||
Total Gross Outstanding | $ | 89,166,913 | $ | 73,999,705 | $ | 79,611,891 | $ | 72,006,896 | $ | 49,361,374 | |||||
19
Table of Contents
Index to Financial Statements
Below is a roll-forward of the balance of each category of our outstanding finance receivables. Loans originated reflect the gross amount of loans made or purchased during the period presented inclusive of pre-computed interest, fees and insurance premiums. Collections represent cash receipts in the form of repayments made on our loans as reflected in our Consolidated Statements of Cash Flows. Refinancings represent the amount of the pay off of loans refinanced. Charge offs represent the gross amount of loans charged off as uncollectible (charge offs are shown net of non-file insurance receipts in our Allowance for Credit Losses). Rebates represent reductions to gross loan amounts of precomputed interest and insurance premiums resulting from loans refinanced and other loans paid off before maturity. See page F-9 (Summary of Significant Accounting Policies – Income Recognition) for further discussion related to rebates of interest. Other adjustments primarily represent accounts transferred to and from the department that administers bankrupt accounts.
| Nine Months Ended June 25, 2005 | Nine Months Ended June 25, 2004 | Fiscal Year Ended September 25, 2004 | Fiscal Year Ended September 25, 2003 | Fiscal Year Ended September 25, 2002 | ||||||||||||||||
Direct Consumer Loans: |
| |||||||||||||||||||
Balance – beginning | $ | 38,281,888 | $ | 33,215,821 | $ | 33,215,821 | $ | 25,616,555 | $ | 21,182,147 | ||||||||||
Loans originated | 64,914,687 | 55,138,717 | 74,021,922 | 64,908,722 | 54,489,398 | |||||||||||||||
Collections | (40,349,982 | ) | (35,761,807 | ) | (46,735,923 | ) | (39,155,436 | ) | (36,184,667 | ) | ||||||||||
Refinancings | (11,696,705 | ) | (9,685,836 | ) | (13,327,472 | ) | (12,461,275 | ) | (9,728,931 | ) | ||||||||||
Charge offs | (2,125,669 | ) | (6,448,085 | ) | (5,593,831 | ) | (1,368,678 | ) | (1,243,433 | ) | ||||||||||
Rebates/other adjustments | (2,920,440 | ) | (3,018,867 | ) | (3,298,629 | ) | (4,324,066 | ) | (2,897,959 | ) | ||||||||||
Balance – end | $ | 46,103,780 | $ | 33,439,943 | $ | 38,281,888 | $ | 33,215,821 | $ | 25,616,555 | ||||||||||
Consumer Sales Finance Contracts: |
| |||||||||||||||||||
Balance – beginning | $ | 7,240,653 | $ | 6,260,905 | $ | 6,260,905 | $ | 4,619,579 | $ | 3,509,847 | ||||||||||
Loans originated | 8,336,718 | 5,541,429 | 7,063,894 | 8,124,364 | 6,106,937 | |||||||||||||||
Collections | (2,855,278 | ) | (2,478,902 | ) | (3,262,061 | ) | (2,854,941 | ) | (2,451,000 | ) | ||||||||||
Refinancings | (2,082,967 | ) | (1,670,652 | ) | (2,248,381 | ) | (2,446,595 | ) | (1,784,885 | ) | ||||||||||
Charge offs | (332,772 | ) | (255,204 | ) | (199,915 | ) | (273,818 | ) | (173,111 | ) | ||||||||||
Rebates/other adjustments | (896,299 | ) | (759,968 | ) | (373,789 | ) | (907,684 | ) | (588,209 | ) | ||||||||||
Balance – end | $ | 9,410,055 | $ | 6,637,608 | $ | 7,240,653 | $ | 6,260,905 | $ | 4,619,579 | ||||||||||
Motor Vehicle Installment Sales Contracts: |
| |||||||||||||||||||
Balance – beginning | $ | 30,557,683 | $ | 28,820,071 | $ | 28,820,071 | $ | 16,219,115 | $ | 5,861,176 | ||||||||||
Loans originated | 9,726,568 | 14,003,943 | 17,043,881 | 21,667,826 | 14,754,664 | |||||||||||||||
Collections | (9,253,772 | ) | (8,221,909 | ) | (11,115,383 | ) | (12,222,839 | ) | (4,380,159 | ) | ||||||||||
Refinancings | — | — | — | — | — | |||||||||||||||
Charge offs | (1,007,365 | ) | (964,162 | ) | (1,379,734 | ) | (580,151 | ) | (212,334 | ) | ||||||||||
Rebates/other adjustments | (868,052 | ) | (2,647,309 | ) | (2,811,152 | ) | 3,736,120 | 195,767 | ||||||||||||
Balance – end | $ | 29,155,062 | $ | 30,990,634 | $ | 30,557,683 | $ | 28,820,071 | $ | 16,219,115 | ||||||||||
Total Active Accounts: |
| |||||||||||||||||||
Balance – beginning | $ | 76,080,224 | $ | 68,296,797 | $ | 68,296,797 | $ | 46,455,249 | $ | 30,553,170 | ||||||||||
Loans originated | 82,977,973 | 74,684,089 | 98,129,697 | 94,700,912 | 75,350,999 | |||||||||||||||
Collections | (52,459,032 | ) | (46,462,618 | ) | (61,113,367 | ) | (54,233,216 | ) | (43,015,826 | ) | ||||||||||
Refinancings | (13,779,672 | ) | (11,356,489 | ) | (15,575,853 | ) | (14,907,871 | ) | (11,513,817 | ) | ||||||||||
Charge offs | (3,465,806 | ) | (7,667,450 | ) | (7,173,480 | ) | (2,222,647 | ) | (1,628,878 | ) | ||||||||||
Rebates/other adjustments | (4,684,790 | ) | (6,426,144 | ) | (6,483,570 | ) | (1,495,630 | ) | (3,290,401 | ) | ||||||||||
Balance – end | $ | 84,668,897 | $ | 71,068,185 | $ | 76,080,224 | $ | 68,296,797 | $ | 46,455,249 | ||||||||||
Total Bankrupt Accounts: |
| |||||||||||||||||||
Balance – beginning | $ | 3,531,667 | $ | 3,710,099 | $ | 3,710,099 | $ | 2,906,125 | 2,313,593 | |||||||||||
Charge offs | (225,997 | ) | (1,271,247 | ) | (1,377,211 | ) | (511,908 | ) | (226,116 | ) | ||||||||||
Adjustments | 2,237,596 | 492,668 | 1,198,779 | 1,315,882 | 818,648 | |||||||||||||||
Balance – end | $ | 4,498,016 | $ | 2,931,520 | $ | 3,531,667 | $ | 3,710,099 | 2,906,125 | |||||||||||
Total Gross O/S Receivables | $ | 89,166,913 | $ | 73,999,705 | $ | 79,611,891 | $ | 72,006,896 | $ | 49,361,374 | ||||||||||
20
Table of Contents
Index to Financial Statements
Below is a reconciliation of the amounts of the loans originated and repaid (collections) from the receivable roll-forward to the amounts shown in our Consolidated Statements of Cash Flows.
Nine Months June 25, 2005 | Nine Months June 25, 2004 | Fiscal Year September 25, | Fiscal Year September 25, | Fiscal Year September 25, | ||||||||||||||||
Loans Originated: | ||||||||||||||||||||
Direct consumer loans | $ | 64,914,687 | $ | 55,138,717 | $ | 74,021,922 | $ | 64,908,722 | $ | 54,489,398 | ||||||||||
Consumer sales finance | 8,336,718 | 5,541,429 | 7,063,894 | 8,124,364 | 6,106,937 | |||||||||||||||
Motor vehicle installment sales | 9,726,568 | 14,003,943 | 17,043,881 | 21,667,826 | 14,754,664 | |||||||||||||||
Total gross loans originated | 82,977,973 | 74,684,089 | 98,129,697 | 94,700,912 | 75,350,999 | |||||||||||||||
Gross receivables purchased | — | (4,641,489 | ) | (5,428,391 | ) | (491,049 | ) | (709,779 | ) | |||||||||||
Non-cash items included in gross loans* | (21,401,208 | ) | (23,435,208 | ) | (24,785,406 | ) | (20,595,148 | ) | (18,442,653 | ) | ||||||||||
Loans originated – cash flows | $ | 61,576,765 | $ | 46,607,392 | $ | 67,915,900 | $ | 73,614,715 | $ | 56,198,567 | ||||||||||
Loans Repaid: |
| |||||||||||||||||||
Collections | ||||||||||||||||||||
Direct consumer loans | $ | 40,349,982 | $ | 35,761,807 | $ | 46,735,923 | $ | 39,155,436 | $ | 36,184,667 | ||||||||||
Consumer sales finance | 2,855,278 | 2,478,902 | 3,262,061 | 2,854,941 | 2,451,000 | |||||||||||||||
Motor vehicle installment sales | 9,253,772 | 8,221,909 | 11,115,383 | 12,222,839 | 4,380,159 | |||||||||||||||
Loans repaid – cash flows | $ | 52,459,032 | $ | 46,462,618 | $ | 61,113,367 | $ | 54,233,216 | $ | 43,015,826 | ||||||||||
| * | Includes precomputed interest and fees (since these amounts are included in the gross amount of loans originated but are not advanced in the form of cash to customers) and refinanced loan balances (since there is no cash generated from the repayment of original loans refinanced). |
| ** | Includes amounts advanced to customers in conjunction with refinancings, which were $10,423,617 for the nine months ended June 25, 2005; $6,525,035 for the nine months ended June 25, 2004; $9,328,161 for the fiscal year ended September 25, 2004; $8,402,623 for the fiscal year ended September 25, 2003; and $6,667,175 for the fiscal year ended September 25, 2002. |
We segment our business operations into the following two segments:
| • | consumer finance and sales; and |
| • | automotive finance and sales. |
The consumer finance and sales segment is comprised primarily of small consumer loans and sales of consumer goods such as furniture, appliances and electronics. We typically experience our strongest financial performance for the consumer finance and sales segment during the holiday season, which is our first fiscal quarter ending December 25.
The automotive finance and sales segment is comprised exclusively of used vehicle sales and their related financing. We typically experience our strongest financial performance for the automotive finance and sales segment during our second fiscal quarter ending March 25 when used car sales are the highest. Please refer to Note 18 in the “Notes to Consolidated Financial Statements” for a breakdown of our operations by segment.
Further improvement of our profitability is dependent in large part upon the growth in our outstanding finance receivables and the maintenance of loan quality, acceptable levels of borrowing costs and operating expenses and the ongoing introduction of new products and services to our customers. Since September 25, 2002, finance receivables have increased at a 32% average annual rate. We anticipate that our finance receivables will continue to grow (though to a lesser extent) as our loan originations grow through existing and planned new branch office locations.
21
Table of Contents
Index to Financial Statements
During 2000, we began implementing our long-range business plan primarily in the State of Georgia of expanding the loan base of existing branch offices, the addition of new branches and the opening of several used car lots. The following table highlights our growth in the past three fiscal years:
| Fiscal Years Ended September 25, | ||||||||||||
| 2004 | 2003 | 2002 | ||||||||||
Branch offices: | 95 | 72 | 68 | |||||||||
Finance receivables | ||||||||||||
Gross | $ | 79,611,891 | $ | 72,006,896 | $ | 49,361,374 | ||||||
Unearned revenues | (12,456,133 | ) | (12,597,280 | ) | (8,265,652 | ) | ||||||
Net finance receivables before allowance for credit losses | $ | 67,155,758 | $ | 59,409,616 | $ | 41,095,722 | ||||||
Net interest income after provision for credit losses | $ | 9,083,485 | $ | 7,098,793 | $ | 5,607,233 | ||||||
Car lots: | 3 | 3 | 2 | |||||||||
Car lots & retail sales | ||||||||||||
Retail sales | $ | 15,427,538 | $ | 22,781,327 | $ | 14,991,527 | ||||||
Cost of sales | (10,468,840 | ) | (17,048,272 | ) | (10,941,055 | ) | ||||||
Gross margin on retail sales | $ | 4,958,698 | $ | 5,733,055 | $ | 4,050,472 | ||||||
Net income | $ | 69,343 | $ | 517,352 | $ | 95,367 | ||||||
We incurred significant costs, during fiscal years 2002 and 2003, in pursuit of the expansion of our loan base and the opening of new branches in Georgia. Interest income from finance contracts and commissions from the insurance policies are recognized over the terms of their respective contracts. However, the expenses of these new locations are recognized as incurred. As new loans are made and the related insurance polices are written, we accumulate unearned revenues that become the branch’s future earnings stream. Historically, the branch needs to build its loan receivables prior to recognizing significant earnings. The maturation of the branches opened in the preceding two fiscal years contributed significantly to the improvement of our profitability.
During fiscal year 2004, we expanded our presence in the State of Louisiana by acquiring assets from two competitors. We purchased gross finance receivables of over $5.4 million as well as other assets in 22 locations for an investment of approximately $4.0 million. These purchases allowed us to enter new markets at a discounted price and provided us access to an established customer base from which we can grow our business. Purchases of this magnitude were a departure from our normal expansion efforts which typically involves the purchase of small finance company offices or opening start-up offices in selected markets.
We believe that continued growth of existing branches can be achieved through direct mail solicitation to prospective customers, solicitation of existing and former customers from the branch locations and through the payment of referral fees to existing customers. We will continue our past practice of establishing branch offices that are convenient for customers and that seek to provide quality service to such customers. We plan to expand our consumer loan business in the States of Alabama, Louisiana and Florida.
Management’s decision to open, during fiscal year ended September 25, 2002, the first two “buy here pay here” used car lots was based primarily on our experience in the collections and administration of the retail finance receivables generated from the sale of the automobiles.
22
Table of Contents
Index to Financial Statements
We also opened a third car lot in January 2003. During the fiscal years ended September 25, 2004 and 2003, the operations of the car lots and the related loan receivables had a significant impact on our profitability despite the significant decline in retail sales during 2004. See Note 18 in the “Notes to Consolidated Financial Statements” for segment financial reporting.
A principal component of our profitability is our net interest margin, which is the difference between the interest that we earn on finance receivables and the interest that we pay on borrowed funds. In some states, statutes regulate the interest rates that we may charge our customers, while, in other locations, competitive market conditions establish interest rates that we may charge. Differences also exist in the interest rates that we earn on the various components of our finance receivable portfolio.
Unlike our interest income, our interest expense is sensitive to general market interest rate fluctuations. These general market fluctuations directly impact our cost of funds. Our general limited ability to increase the interest rates earned on new and existing finance receivables restricts our ability to react to increases in our cost of funds. Accordingly, increases in market interest rates generally will narrow our interest rate spread and lower our profitability, while decreases in market interest rates generally will widen our interest rate spread and increase our profitability. Significant increases in market interest rates will likely result in a reduction in our liquidity and profitability and impair our ability to pay interest and principal on the Debentures. See “Quantitative and Qualitative Disclosures About Market Risk” below.
The following table presents important data relating to our net interest margin:
| As of, or for, the Nine Months Ended June 25, | As of, or for, the Year Ended September 25, | |||||||||||||||||||
| 2005 | 2004 | 2004 | 2003 | 2002 | ||||||||||||||||
Average net finance receivables(1) | $ | 70,289,300 | $ | 61,168,097 | $ | 64,411,401 | $ | 51,669,508 | $ | 34,892,667 | ||||||||||
Average notes payable (2) | $ | 79,243,887 | $ | 71,860,245 | $ | 73,452,571 | $ | 60,519,922 | $ | 46,236,050 | ||||||||||
Interest income | $ | 10,903,336 | $ | 10,760,249 | $ | 14,663,613 | $ | 11,535,880 | $ | 8,375,138 | ||||||||||
Loan fee income | $ | 3,162,424 | $ | 2,213,253 | $ | 3,191,393 | $ | 2,465,096 | $ | 2,265,063 | ||||||||||
Total interest and fee income | $ | 14,065,760 | $ | 12,973,502 | $ | 17,855,006 | $ | 14,000,976 | $ | 10,640,201 | ||||||||||
Interest expense | $ | 4,686,549 | $ | 4,334,527 | $ | 5,848,428 | $ | 4,919,059 | $ | 3,972,801 | ||||||||||
Net interest income before provision for credit losses | $ | 9,379,211 | $ | 8,638,975 | $ | 12,006,578 | $ | 9,081,917 | $ | 6,667,400 | ||||||||||
Average interest rate earned | 20.0 | % | 21.2 | % | 27.7 | % | 27.1 | % | 30.5 | % | ||||||||||
Average interest rate paid | 5.9 | % | 6.0 | % | 8.0 | % | 8.1 | % | 8.6 | % | ||||||||||
Net interest rate spread | 14.1 | % | 15.2 | % | 19.7 | % | 19.0 | % | 21.9 | % | ||||||||||
Net interest margin(3) | 13.3 | % | 14.1 | % | 18.6 | % | 17.6 | % | 19.1 | % | ||||||||||
| (1) | Averages are computed using month-end balances of finance receivables (net of unearned interest/fees, insurance commissions, and unearned discounts) during the year presented.Net finance receivables for this purpose includes all outstanding finance receivables, including accounts in bankruptcy and non-accrual status. |
| (2) | Averages are computed using month-end balances of interest bearing debt (including senior debt, senior subordinated debt, subordinated debt to related parties, debentures and demand notes) during the year presented. |
| (3) | Net interest margin represents net interest income (net of the provision for credit losses) divided by average net finance receivables. |
23
Table of Contents
Index to Financial Statements
The following table sets forth the effects of changing rates and volumes on our net interest income. Information is provided with respect to (i) effects of interest income attributable to changes in volume (changes in volume multiplied by prior rate), (ii) effects on interest income attributable to changes in rate (changes in rate multiplied by prior volume), and (iii) changes in rate/volume (change in rate multiplied by change in volume).
| Increase (Decrease) Due to | ||||||||||||||||||||||||
| Volume | Rate | Rate/Volume | Total net increase (decrease) | |||||||||||||||||||||
| 9/25/04 | 9/25/03 | 9/25/04 | 9/25/03 | 9/25/04 | 9/25/03 | 9/25/04 | 9/25/03 | |||||||||||||||||
Earning assets: | ||||||||||||||||||||||||
Interest income on finance receivables: | 1,870,102 | 6,136,295 | 442,494 | (2,446,014 | ) | 41,434 | (329,507 | ) | 2,354,030 | (1) | 3,360,775 | |||||||||||||
Interest bearing liabilities: | ||||||||||||||||||||||||
Debentures & demand notes | (35,320 | ) | (546,389 | ) | 11,773 | (84,960 | ) | (1,273 | ) | 51,224 | (24,820 | ) | (580,125 | ) | ||||||||||
Other debt | 1,024,298 | 1,583,155 | (56,771 | ) | (36,796 | ) | (13,338 | ) | (19,975 | ) | 954,189 | 1,526,383 | ||||||||||||
Total interest expense | 988,979 | 1,036,765 | (44,998 | ) | (121,756 | ) | (14,611 | ) | 31,249 | 929,369 | 946,258 | |||||||||||||
Net interest income | 881,123 | 5,099,531 | 487,492 | (2,324,258 | ) | 56,046 | (360,756 | ) | 1,424,661 | 2,414,517 | ||||||||||||||
| (1) | Excludes approximately $1,500,000 of interest income earned as a result of purchasing finance receivables at a discount. |
Below is a table showing certain performance ratios for the fiscal years ended September 25, 2004 and 2003. These ratios are typically reported by financial institutions in connection with their annual financial performance.
Performance Ratios(1) | 2004 | 2003 | ||||
Return on average assets(2) | 0.1 | % | 0.7 | % | ||
Return on average shareholder’s equity(3) | 13.1 | % | 425.3 | % | ||
Average equity to average assets ratio(4) | 0.6 | % | 0.2 | % |
| (1) | Averages are computed using quarter end balances. |
| (2) | Calculated as net income divided by average total assets during the fiscal year. |
| (3) | Calculated as net income divided by average shareholder’s equity during the fiscal year. |
| (4) | Calculated as average shareholder’s equity divided by average total assets during the fiscal year. |
Analysis of Allowance for Credit Losses
An allowance for credit losses is maintained primarily to account for loans that are delinquent. The allowance is calculated based upon management’s estimate of the expected collectability of loans outstanding based upon a variety of factors, including, without limitation, periodic analysis of the loan portfolio, historic loan loss experience, borrowers’ ability to repay and collateral considerations. We maintain an allowance for credit losses at a level that we consider adequate to provide for potential losses based on historical ratios of charge-offs to average notes receivable.
24
Table of Contents
Index to Financial Statements
The following table shows these ratios of charge offs to average notes receivable for the categories of our finance receivables. The average net finance receivables are computed using monthly balances, net of unearned interest, unearned insurance commissions and unearned discounts. Charge offs are shown at gross amounts as presented in the receivable roll-forward on page 20. Recoveries represent receipts from non-file insurance claims and cash recoveries.
| As of, or for, the Fiscal Year Ended September 25, | ||||||||||||
| 2004 | 2003 | 2002 | ||||||||||
Direct Consumer Loans and Consumer Sales Finance Contracts: | ||||||||||||
Average net finance receivables | $ | 39,503,251 | $ | 33,455,826 | $ | 26,848,207 | ||||||
Charge offs – direct consumer | $ | 5,593,831 | $ | 1,368,678 | $ | 1,243,433 | ||||||
Charge offs – consumer sales finance | $ | 199,915 | $ | 273,818 | $ | 173,111 | ||||||
Charge offs – bankruptcy | $ | 1,377,211 | $ | 511,908 | $ | 226,116 | ||||||
Total gross charge offs | $ | 7,170,957 | $ | 2,154,404 | $ | 1,642,660 | ||||||
Recoveries (all direct consumer)* | $ | (7,003,370 | ) | $ | (1,247,970 | ) | $ | (1,237,321 | ) | |||
Charge offs, net | $ | 167,587 | $ | 906,434 | $ | 405,339 | ||||||
Percent of net charge offs to average receivables | 0.4 | % | 2.7 | % | 1.5 | % | ||||||
Motor Vehicle Installment Sales Contracts: | ||||||||||||
Average net finance receivables | $ | 24,908,150 | $ | 18,213,682 | $ | 8,044,460 | ||||||
Charge offs, gross | $ | 1,379,734 | $ | 580,151 | $ | 212,334 | ||||||
Recoveries | $ | — | $ | — | $ | — | ||||||
Charge offs, net | $ | 1,379,734 | $ | 580,151 | $ | 212,334 | ||||||
Percent of net charge offs to average receivables | 5.5 | % | 3.2 | % | 2.6 | % | ||||||
Total Receivables: | ||||||||||||
Average net finance receivables | $ | 64,411,401 | $ | 51,669,508 | $ | 34,892,667 | ||||||
Charge offs, gross | $ | 8,550,691 | $ | 2,734,555 | $ | 1,854,994 | ||||||
Recoveries (all direct consumer)* | $ | (7,003,370 | ) | $ | (1,247,970 | ) | $ | (1,237,321 | ) | |||
Charge offs, net | $ | 1,547,321 | $ | 1,486,585 | $ | 617,673 | ||||||
Percent of net charge offs to average receivables | 2.4 | % | 2.9 | % | 1.8 | % | ||||||
| * | Recoveries for fiscal year ended September 25, 2004 were adjusted for the approximately $1.1 million contingent legal fees related to recoveries from our former insurance carrier. |
The significant increase in gross charge offs of direct consumer loans during fiscal year 2004 over 2003 was primarily the result of the termination of the relationship with our former non-file insurance carrier. During this transition, we reviewed our non-file insurance contract and discovered that all contracts which we deemed uncollectible upon which a non-file insurance premium had been paid were eligible for recovery. In the past, we believed that the amount of non-file insurance claims we could collect was limited by virtue of monthly reports provided to us by the carrier and, accordingly, we limited the monthly amount of claims filed. We were also concerned that claims filed by us in periods beyond the end of the relationship would be denied by the carrier. As a result, we thoroughly reviewed our loan portfolio for qualifying loans that were eligible for non-file insurance claims, charged off those accounts that we deemed uncollectible (our non-file insurance agreement states that a loss must have occurred) and filed the claims. We also discovered eligible charge offs from prior months that a claim had not been filed. This process resulted in a significant increase in gross charge offs and non-file claims during 2004. A business decision was made to take this approach to resolve these accounts during this time period rather than waiting for the customary approach of filing the claims, which would have resulted in us filing claims with our insurance carrier after the termination of the relationship making recovery much more difficult.
25
Table of Contents
Index to Financial Statements
Our concerns were founded when the insurance carrier indeed began to deny claims that ultimately led to the dispute and eventual settlement of these claims. We determined that it takes up to 180 days to fully exhaust all collection efforts. Only after these collection efforts had been exhausted would a claim be filed with the non-file insurance carrier. The circumstance of changing our carrier was the determining factor in our departure from our customary practice. Since the start of our relationship with our new non-file carrier we have been following the normal course of filing non-file claims. Our normal policy is that, when we deem the account uncollectible, the account is charged off and then a non-file claim is made within 30 days. We have been following the normal process of charge-off and non-file claims since signing on with a new carrier, we believe the amount of charge offs and non-file claims will return to historical levels.
We also experienced increases in charge offs related to our auto sales finance contracts during fiscal year 2004. Our lending policy had allowed late model vehicles to be financed up to 60 months. As the defaults on these longer term contracts occurred, we noted an increase in charge offs. A charge off occurs when the sales proceeds of the repossessed vehicle is not sufficient to payoff the customer’s loan balance. We noted that the deficiencies thus resulting in a larger charge off were generally greater with longer term contracts than with shorter-term contracts. During fiscal 2004, we began to significantly curtail the number of 60 month contracts. The average loan terms have decreased from 51 months for loans originating in earlier 2004 to 43 months for loans originating in the last six months of the current fiscal year. In implementing this change, we believe the amount of charge offs should return to historical levels.
As of September 25, 2004 and 2003, our allowance for credit losses was $2.1 million and $1.7 million, respectively. The growth in outstanding finance receivables resulting from the opening of 23 new finance offices in 2004 caused the increase in our allowance for credit losses. While the amount of the allowance for credit losses increased, the percentage remained consistent at approximately 3% of such period’s outstanding receivables.
Delinquency Information
Our delinquency levels reflect, among other factors, changes in the mix of loans in the portfolio, the quality of receivables, the success of collection efforts, bankruptcy trends and general economic conditions. The delinquency information in the following tables is computed on the basis of the amount past due in accordance with the original payment terms of the loan (contractual method). We use the contractual method for all external reporting purposes. Management closely monitors delinquency using this method to measure the quality of our loan portfolio and the probability of credit loss. We also use other tools, such as a recency report, which shows the date of the last full contractual payment received on the loan, to determine a particular customer’s willingness to pay. For example, if a delinquent customer has made a recent payment, we may decide to delay more serious collection measures, such as repossession of collateral. However, such a payment will not change the non-accrual status of the account until all of the principal and interest amounts contractually due are brought current (we receive one or more full contractual payments and the account is less than 60 days contractually delinquent), at which time we believe future payments are reasonably assured. Our gross finance receivables on non-accrual status, including bankruptcy accounts, totaled $10,953,155 and $11,590,533 for the fiscal years ended September 25, 2004 and 2003, respectively. Suspended interest as a result of these non-accrual accounts totaled $532,540, $343,419 and $219,671 for the fiscal years ended September 25, 2004, 2003 and 2002, respectively. Generally, we do not refinance delinquent accounts. However, on occasion, a past due account will qualify for refinancing. We use the following criteria for determining whether a delinquent account qualifies for refinancing: (1) a re-evaluation of the customer’s creditworthiness is performed to ensure additional credit is warranted; and (2) a payment must have been received on the account within the last 10 days. Since we refinance delinquent
26
Table of Contents
Index to Financial Statements
loans on such an infrequent basis, we do not maintain any statistics relating to this type of refinancing. Below is certain information relating to the delinquency status of each category of our receivables for the years ended September 25, 2004 and 2003:
| As of September 25, 2004 | ||||||||||||||||||||
| Direct Consumer Sales | Consumer Sales Finance Contracts | Motor Vehicle Installment Sales Contracts | Bankrupt Accounts | Total | ||||||||||||||||
Gross Loans and Contracts Receivable | $ | 38,281,888 | $ | 7,240,653 | $ | 30,557,683 | $ | 3,531,667 | $ | 79,611,891 | ||||||||||
Loans and Contracts 60-90 days past due | $ | 1,735,649 | $ | 277,978 | $ | 50,101 | $ | 236,868 | $ | 2,300,596 | ||||||||||
Percentage of Outstanding | 4.53 | % | 3.84 | % | 0.16 | % | 6.71 | % | 2.89 | % | ||||||||||
Loans and Contracts greater than 90 days past due | $ | 5,520,969 | $ | 1,900,519 | $ | 48,765 | $ | 1,253,541 | $ | 8,723,794 | ||||||||||
Percentage of Outstanding | 14.42 | % | 26.25 | % | 0.16 | % | 35.49 | % | 10.96 | % | ||||||||||
Loans and Contracts greater than 60 days past due | $ | 7,256,618 | $ | 2,178,497 | $ | 98,866 | $ | 1,760,408 | $ | 11,294,389 | ||||||||||
Percentage of Outstanding | 18.96 | % | 30.09 | % | 0.32 | % | 49.85 | % | 14.19 | % | ||||||||||
| As of September 25, 2003 | ||||||||||||||||||||
| Direct Consumer Sales | Consumer Sales Finance Contracts | Motor Vehicle Installment Sales Contracts | Bankrupt Accounts | Total | ||||||||||||||||
Gross Loans and Contracts Receivable | $ | 33,215,821 | $ | 6,260,905 | $ | 28,820,071 | $ | 3,710,099 | $ | 72,006,896 | ||||||||||
Loans and Contracts 60-90 days past due | $ | 1,020,342 | $ | 164,253 | $ | 772,905 | $ | 162,528 | $ | 2,120,028 | ||||||||||
Percentage of Outstanding | 3.07 | % | 2.62 | % | 2.68 | % | 4.38 | % | 2.94 | % | ||||||||||
Loans and Contracts greater than 90 days past due | $ | 6,702,215 | $ | 1,178,218 | $ | 50,171 | $ | 1,978,108 | $ | 9,908,712 | ||||||||||
Percentage of Outstanding | 20.18 | % | 18.82 | % | 0.17 | % | 53.32 | % | 13.76 | % | ||||||||||
Loans and Contracts greater than 60 days past due | $ | 7,722,557 | $ | 1,342,471 | $ | 823,076 | $ | 2,140,636 | $ | 12,028,740 | ||||||||||
Percentage of Outstanding | 23.25 | % | 21.44 | % | 2.86 | % | 57.70 | % | 16.70 | % | ||||||||||
Comparison of Fiscal Years Ended September 25, 2004 and 2003
Net Revenues
Net revenues were $25.0 million and $22.6 million for the fiscal years ended September 25, 2004 and 2003, respectively. Growth in net revenues generally was the result of the maturation of new offices opened during the past few years and the corresponding increases in interest, fees and related charges earned on customers’ loans, as well as the sale of various ancillary products to such customers, as described in more detail below.
Net Interest Income Before Provision for Credit Losses
Net interest income before provision for credit losses was $12.0 million and $9.1 million for fiscal years ended September 25, 2004 and 2003, respectively. The increase was due to the increase in loans made and, to a greater extent, loans purchased at a discount by us during 2004. Interest expense was $5.8 million in 2004 and $4.9 million in 2003. The increase in interest expense was due to the additional borrowings required to fund the higher levels of lending to our customers. During fiscal year 2004, gross interest income increased $3.9 million, of which $0.7 million represented increases in loan fees and $1.5 million represented increases in amortization of discounts.
27
Table of Contents
Index to Financial Statements
Provision for Credit Losses
Provision for credit losses was $2.9 million and $2.0 million for fiscal years ended September 25, 2004 and 2003, respectively. The provision for credit losses increased significantly during 2004 primarily as a result of approximately $0.9 million in legal fees associated with a settlement with our former non-file insurance carrier which offset higher than anticipated loan recoveries resulting from the settlement. Please see the “Business – Provision for Credit Losses” section of this prospectus for a detailed discussion of our policies for provision for credit losses and Note 3 in the “Notes to Consolidated Financial Statements.”
Insurance and Other Products
Income from commissions on insurance products and motor club memberships increased from $7.8 million in 2003 to $8.5 million in 2004. This increase is consistent with our overall increase in income during 2004. During 2004, commissions on credit insurance products were $4.8 million and non-credit insurance products and motor club memberships were $3.7 million. Approximately 79.4% of our loans during this period included one or more of our insurance products or motor club memberships. Other income was $2.1 million and $1.5 million for fiscal years ended September 25, 2004 and 2003, respectively. This increase was primarily due to the increase in our loan portfolio resulting in increases in late fees and other miscellaneous charges and products included in other income.
Gross Margin on Retail Sales
Gross margin on retail sales were $5.0 million and $5.7 million for fiscal years ended September 25, 2004 and 2003, respectively. Sales of used vehicles, as well as furniture and electronics, were down in 2004 as a result of the uncertainty in the regional economy in which we operate, which downturn was consistent with the sale of durable goods in general. While retail sales fell $7.4 million during 2004, mostly as a result of decreased sales of used vehicles, gross margin on retail sales only fell $0.7 million as a result of our monitoring of costs and margins associated with such sales.
Operating Expenses
Operating expenses were $24.9 million and $21.7 million for fiscal years ended September 25, 2004 and 2003, respectively. The increase in operating expenses was due in large part to the increased personnel expenses and other operating expenses associated with the opening of 23 new finance offices in 2004, including the finance offices acquired in Louisiana. Such expenses include additional infrastructure to support such growth, such as additional personnel for regional management and corporate office support with their associated costs, such as hiring, benefits, health insurance, and the cost of expanding the corporate training program, including travel, meals and lodging.
Comparison of Fiscal Years Ended September 25, 2003 and 2002
Net Revenues
Net revenues were $22.6 million and $19.1 million for the fiscal years ended September 25, 2003 and 2002, respectively. Growth in net revenues generally was the result of the maturation of new offices opened during the past few years and the opening of the third new used car lot in January 2003 resulting in corresponding increases in interest, fees and related charges and products, as described in more detail below.
28
Table of Contents
Index to Financial Statements
Net Interest Income Before Provision for Credit Losses
Net interest income before provision for credit losses was $9.1 million and $6.7 million for fiscal years ended September 25, 2003 and 2002, respectively. The increase was due primarily to the increase in loans made by us during 2003. Interest expense was $4.9 million in 2003 and $4.0 million in 2002. The increase in interest expense was due to the additional borrowings required to fund the higher levels of lending to our customers. During fiscal year 2003, gross interest income increased $3.4 million, of which $0.2 million represented increases in loan fees and $0.1 million represented increases in amortization of discounts.
Provision for Credit Losses
Provision for credit losses was $2.0 million and $1.0 million for fiscal years ended September 25, 2003 and 2002, respectively. The significant increase in the provision for credit losses was due primarily to the increased loan activity during 2003 with relatively stable loan recoveries. Please see the “Business – Provision for Credit Losses” section of this prospectus for a detailed discussion of our policies for provision for credit losses and Note 3 in the “Notes to Consolidated Financial Statements.”
Gross Margin on Retail Sales
Gross margin on retail sales were $5.7 million and $4.1 million for fiscal years ended September 25, 2003 and 2002, respectively. The opening of the third car lot in January 2003 contributed significantly to the increase of retail sales and cost of sales associated therewith during 2003.
Insurance and Other Products
While the overall income we received from our insurance and other products and services was relatively stable during 2003, there were fairly significant fluctuations within sales of these products and services. Insurance commissions were $6.2 million in 2003 and $4.9 million in 2002. Commissions from motor club memberships received from Interstate Motor Club, Inc., an affiliated entity, were $1.6 million in 2003 compared to $2.5 million in 2002. During 2003, we trained our personnel to focus on selling certain insurance products to our customers, which resulted in increased insurance commissions. We also applied more stringent guidelines in our sale of motor club memberships, which resulted in a decline in revenues associated with this product. During 2003, commissions on credit insurance products were $4.8 million and non-credit insurance products and motor club memberships were $3.0 million. Approximately 78.8% of our loans during this period included one or more of our insurance products or motor club memberships.
Operating Expenses
Operating expenses were $21.7 million and $19.0 million for fiscal years ended September 25, 2003 and 2002, respectively. The increase in operating expenses was due in large part to the increased personnel expenses and other operating expenses associated with the opening of four new finance offices and the third new used car lot in 2003. Such expenses include additional infrastructure to support such growth, such as additional personnel for regional management and corporate office support with their associated costs, such as hiring, benefits, health insurance, and the cost of expanding the corporate training program, including travel, meals and lodging.
29
Table of Contents
Index to Financial Statements
Comparison of Nine Months Ended June 25, 2005 and 2004
Net Revenues
Net revenues were $22.7 million and $19.3 million for the nine months ended June 25, 2005 and 2004, respectively. The increase was due generally to the revenues generated by the additional offices we were operating over the same period last year.
Net Interest Income Before Provision for Credit Losses
Net interest income before provision for credit losses was $9.4 million and $8.6 million for the nine months ended June 25, 2005 and 2004, respectively. The increase in net interest income before provision for credit losses of $0.8 million was due primarily to the increased volume of loans originated over the same period of 2004. Discounts earned, which are included in interest income, in 2005 from the business acquisitions in 2004 were down approximately $1.1 million. Interest expense was $4.7 million and $4.3 million for the nine months ended June 25, 2005 and 2004, respectively.
Provision for Credit Losses
Provision for credit losses was $1.5 million and $1.3 million for the nine months ended June 25, 2005 and 2004, respectively. We maintain an allowance for credit losses that we believe is sufficient to cover credit losses inherent in our finance receivable portfolio as of June 25, 2005. Increases in the provision for credit losses were generally a result of increases required to the allowance to keep pace with the overall growth in outstanding finance receivables.
Gross Margin on Retail Sales
Gross margin on retail sales were $4.0 million and $3.7 million for the nine months ended June 25, 2005 and 2004, respectively. Sales and gross margins overall were slightly higher for the comparable period. The consumer segment experienced increases sales and margins while the automotive segment’s sales were down over 10% from the same period in 2004. The opening of a fourth used car lot in June 2005 should contribute to increased sales for this segment in the future. Our management of cost margins contributed to minimizing the decrease in the gross margin in the automotive segment.
Insurance and Other Products
Insurance commissions were $7.5 million and $5.1 million for the nine months ended June 25, 2005 and 2004, respectively. Commissions earned from the sale of insurance products were significantly higher for the period in 2005 due primarily to the increased number of offices offering these products in connection with our loan originations. Commissions on the sale of motor club memberships were down slightly from the previous period’s levels, while service agreement income from Cash Check Inc. of Ga. were less than half of the income earned in the same period in 2004. Less emphasis was directed to our income tax preparation services offered to customers due to the significant cash funding requirements associated with advancing income tax refunds. Other income was $1.9 million and $1.3 million for the nine months ended June 25, 2005 and 2004, respectively. The significant increase was due to increases in late fees earned.
30
Table of Contents
Index to Financial Statements
Operating Expenses
Operating expenses were $22.1 million and $18.2 million for the nine months ended June 25, 2005 and 2004, respectively. The substantial increase in operating expenses was due primarily to the level of expense required for the additional offices purchased or opened during 2004 and the associated corporate office costs to support these offices.
Liquidity and Capital Resources
General
Liquidity is our ability to meet short-term financial obligations whether through collection of receivables, sales of Demand Notes and Debentures or by generating additional funds through sales of assets to our competitors (such as our finance receivables or vehicle inventory). Continued liquidity is, therefore, largely dependent on the collection of our receivables and the sale of debt securities that meet the investment requirements of the public. We believe the cash flow from our operations coupled with sales of the Demand Notes and Debentures will be sufficient to cover our liquidity needs and cash flow requirements during 2005.
Liquidity management refers to our ability to generate sufficient cash to fund the following primary uses of cash:
| • | meet all of our debenture and demand note redemption obligations; |
| • | pay interest on all of our debentures and demand notes; |
| • | pay operating expenses; and |
| • | fund consumer finance loan demand and used automobile vehicle inventory. |
The primary objective for liquidity management is to ensure that at all times we can meet the redemption obligations of our note holders. A secondary purpose of liquidity management is profit management. Because profit and liquidity are often conflicting objectives, we attempt to maximize our net interest margin by making adequate, but not excessive, liquidity provisions. To the extent we have adequate cash to meet our redemption obligations and pay interest to our note holders, we will use remaining cash to make consumer finance loans, purchase used automobile vehicle inventory and invest in other sources of potential revenues.
Changes in our liquidity position result from operating, investing and financing activities. Cash flows from operating activities are generally the cash effects of transactions and other events that enter into the determination of our net income, including without limitation purchases of used automobiles, electronics, furnishings and other consumer goods for resale to our customers. The primary investing activities include consumer loan originations and purchases and collections on such consumer loans. Our financing activities focus almost entirely on the sale of Demand Notes and Debentures.
Cash and cash equivalents decreased by approximately $0.4 million during fiscal year 2004 from a balance of $8.8 million at September 25, 2003 to $8.4 million at September 25, 2004 as compared to an approximately $2.7 million increase during fiscal year 2003 from a
31
Table of Contents
Index to Financial Statements
balance of $6.1 million at September 25, 2002 to $8.8 million at September 25, 2003. During 2004, the primary sources of cash were loan repayments from customers and proceeds net of redemptions from sales of demand notes and debentures by our subsidiary, The Money Tree of Georgia. During 2004, the primary uses of cash were loan originations to customers and redemptions of such demand notes and debentures.
During 2004, our investing activities were generally funded by the $8.3 million of net cash provided by financing activities and $4.1 million of net cash provided by operating activities. Below is a table showing the net effect of our cash flows from financial activities for our fiscal years ended September 25, 2004 and 2003:
| 2004 | 2003 | |||||||
Senior debt – borrowing | $ | 5,573,954 | $ | 2,290,198 | ||||
Senior debt – repayments | $ | (4,401,432 | ) | $ | (7,636,182 | ) | ||
Net | $ | 1,174,527 | $ | (5,343,982 | ) | |||
Senior subordinated debt – borrowing | $ | 300,000 | $ | 1,500,000 | ||||
Senior subordinated debt – repayments | $ | (3,500,000 | ) | — | ||||
Net | $ | (3,200,000 | ) | $ | 1,500,000 | |||
Junior subordinated debt – borrowing | $ | 943,465 | $ | 59,539 | ||||
Junior subordinated debt – repayments | $ | (905,434 | ) | $ | (224,780 | ) | ||
Net | $ | 38,031 | $ | (165,241 | ) | |||
Demand notes – borrowing | $ | 9,294,854 | $ | 10,556,876 | ||||
Demand notes – repayments | $ | (7,870,105 | ) | $ | (6,472,078 | ) | ||
Net | $ | 1,424,749 | $ | 4,084,798 | ||||
Debentures – borrowing | $ | 20,034,837 | $ | 21,135,619 | ||||
Debentures – repayments | $ | (11,153,648 | ) | $ | (5,254,343 | ) | ||
Net | $ | 8,881,189 | $ | 15,881,276 | ||||
Cash payments for interest for the fiscal years ended September 25, 2004 and 2003 were as follows:
| 2004 | 2003 | |||||
Senior debt | $ | 145,142 | $ | 326,848 | ||
Senior subordinated debt | $ | 116,383 | $ | 192,000 | ||
Junior subordinated debt, including related parties | $ | 46,448 | $ | 12,633 | ||
Debentures and demand notes | $ | 3,491,223 | $ | 1,780,794 | ||
Total interest payments | $ | 3,799,196 | $ | 2,312,275 | ||
During 2004, we used a net of $12.8 million for investing activities. We received $61.1 million in loan repayments from our customers. However, we originated $67.9 million in new loans to customers, acquired $4.0 million of new customer loans from our competitors and purchased $2.1 million worth of property and equipment.
During 2005, we expect to continue to use a significant amount of net offering proceeds we raise from the sale of Demand Notes and Debentures to fund redemption obligations and pay interest on our securities. During the nine months ended June 25, 2005, we redeemed $6.2 million of demand notes and $8.0 million of debentures issued by The Money Tree of Georgia. We will use any remaining net offering proceeds to fund our consumer loan demand, purchase
32
Table of Contents
Index to Financial Statements
used automobiles, open new branch office locations and to fund the other company activities described in “Use of Proceeds.”
Demand Notes and Debentures
During the fiscal year ended September 25, 2004, our subsidiary, The Money Tree of Georgia Inc., (1) received gross proceeds of $9.3 million from the sale of demand notes and $20.0 million from the sale of debentures, and (2) paid $7.9 million for redemptions of demand notes and $11.2 million for redemption of debentures. As of June 25, 2005, this subsidiary had $12.4 million of demand notes and $66.9 million of debentures outstanding compared to $11.7 million of demand notes and $61.6 million of debentures outstanding, as of September 25, 2004.
As described in more detail in “Description of Demand Notes,” the Demand Notes may be redeemed at any time. Debentures may be redeemed by holders at the end of the interest adjustment period they select (one years, two years or four years) or at maturity. We intend to meet our obligation to repay such debt with cash generated from sales of the Demand Notes and Debentures, cash on hand, income from operations, or working capital.
Pursuant to this prospectus, we are offering up to $35.0 million of Demand Notes for sale to the public. In addition, pursuant to a separate registration statement filed with the SEC (Commission Registration No. 333-122531), we are offering up to $75.0 million of Debentures for sale to the public. Currently, we are substantially reliant upon the net offering proceeds to be raised from these offerings to meet our redemption obligations and for our other short and long-term liquidity needs. See “Lack of a Significant Line of Credit” below.
Lack of a Significant Line of Credit
In December 2003, we borrowed $2.4 million from Finova Capital Corporation (Finova) to fund the acquisition of 16 new branches in Louisiana purchased from our bankrupt competitor, Stewart Finance Company. This loan was subsequently paid in full.
Although we have been without a significant line of credit for the past two years, we have not experienced any material cash flow problems and do not expect any cash flow problems during the next 12 months. This is due in part to the following factors:
| • | During the period of September 26, 2003 through September 25, 2004, The Money Tree of Georgia Inc. averaged over $2.4 million per month in sales of new debentures and demand notes; |
| • | We had an average cash equivalents balance during fiscal year 2004 of $7.7 million; |
| • | Cash collections increased over 23% in fiscal year 2004 to approximately $61.6 million. This represents approximately 81% of our average gross outstanding finance receivables during the period; and |
| • | The average term of our direct consumer loans is less than seven months and, therefore, if we anticipate having short term cash flow problems, we could curtail the amount of funds we loan to our customers and focus on collections to increase cash flow. |
33
Table of Contents
Index to Financial Statements
We are, however, currently seeking a line of credit for our long-term financing needs. If we fail to secure a line of credit, we will continue to be heavily reliant upon our ability to sell the Demand Notes and Debentures for our liquidity. If the sale of Demand Notes and Debentures is curtailed for any reason and we fail to obtain a line of credit, our ability to meet our obligations, including our redemption obligations with respect to the demand notes and debentures, could be materially and adversely affected. Please see “Risk Factors – We may be unable to meet our debenture and demand note redemption obligations which could force us to sell off our loan receivables and other operating assets or cease our operations.”
In late August 2005, Hurricane Katrina struck the Gulf Coast areas of Louisiana, Mississippi and Alabama. We operate several offices along the Alabama and Louisiana costal area including three within the city of New Orleans. A total of 11 offices were affected by this event. Eight offices were closed for periods ranging from three days to two weeks primarily because of loss of electrical power. These offices are now open and fully operational. However, because of the flooding problem in New Orleans, those three offices remain closed. One office is currently under repair from the flood damage and we plan to consolidate all New Orleans operations into this office upon completion of these repairs, which we estimate will occur in November 2005. Losses related to this event are currently being assessed, however, loss of furniture and equipment in the three New Orleans offices are the only losses that can be determined at this point.
In late September 2005, Hurricane Rita hit the Louisiana/Texas border of the Gulf Coast. We operate several offices in western Louisiana, but only one was directly affected by this storm. Our office in Lake Charles was closed for several days but has since reopened.
Although the damage to our properties caused by these events was minor, we cannot at this point predict what the effects to our results of operations might be. Potential for increases in loan losses might be expected because of the potential loss of collateral securing some of our loans and other negative effects to our customers, such as loss of residence and/or employment or relocation to other parts of the United States. However, these losses may be offset by proceeds from insurance coverage on this collateral or non-file insurance coverage on unsecured loans. Lending and collection activities were down in the affected offices during the periods of closure that may have a minor impact on our future earnings.
From June 26, 2005 to August 25, 2005, we had raised $0.9 million in debentures net of redemptions and we had redeemed $0.7 million more demand notes than we had sold through our subsidiary, The Money Tree of Georgia Inc.
On August 5, 2005, we borrowed $1.0 million from Life of the South Corporation (LOTS), our insurance carrier for credit related insurance products, pursuant to a purchase agreement and senior subordinated note. The maturity date of the note is August 5, 2007 and bears interest at the prime rate announced by Columbus Bank and Trust Company in Columbus, Georgia plus 1.0% per annum. For so long as the note is outstanding we are required to underwrite all of our credit related insurance products through LOTS.
Recent Accounting Pronouncements
Set forth below are recent accounting pronouncements that may have a future effect on operations.
34
Table of Contents
Index to Financial Statements
Statement of Financial Accounting Standards No. 142, Goodwill and Other Intangible Assets, establishes financial accounting and reporting for acquired goodwill and other intangible assets and supersedes Accounting Principles Board Opinion No. 17, “Intangible Assets.” Under SFAS No. 142, goodwill and indefinite-lived intangible assets are no longer amortized but are reviewed at least annually for impairment.
In the past and possibly in the future, we may acquire existing finance offices in selected markets where, in management’s opinion, improvement in our profits could be achieved more effectively than through the start up of a new office. In some instances, the purchase price negotiated for these acquisitions were higher than the net book value of the assets, thereby creating goodwill. The above pronouncements affected business combinations completed after June 30, 2001 and, in essence, state that instead of the periodic amortization of goodwill, that annual testing for the determination of the impairment of goodwill should occur. This affects our operations by virtue of a reduction of the amortization of goodwill expense related to these acquisitions and possibly on decisions on future acquisitions. Prior to the pronouncement, goodwill was periodically charged to operating expenses over a seven-year period. Beginning in 2003 and going forward, we have made and will make a determination if the amount of goodwill has been impaired. We believe that the effect of these pronouncements on our operating expenses, and the effect on investors, will be immaterial.
In November 2002, the FASB issued Interpretation No. 45, “Guarantor’s Accounting and Disclosure Requirements for Guarantees, Including Indirect Guarantees of Indebtedness of Others.” FIN 45 requires certain guarantees to be recorded at fair value. In general, FIN 45 applies to contracts or indemnification agreements that contingently require the guarantor to make payments to the guaranteed party based on changes in an underlying obligation that is related to an asset, liability, or an equity security of the guaranteed party. The initial recognition and measurement provisions of FIN 45 are applicable on a prospective basis to guarantees issued or modified after December 31, 2002. FIN 45 also requires new disclosures, even when the likelihood of making any payments under the guarantee is remote. These disclosure requirements are effective for financial statements of interim or annual periods ending after December 15, 2002. We adopted the disclosure provisions of FIN 45 in the first fiscal quarter of 2003. In accordance with the interpretation, we adopted the remaining provisions of FIN 45 effective January 1, 2003. The adoption of FIN 45 did not have a material effect on our financial position or results of operations.
In January 2003, the FASB issued FASB Interpretation No. 46, “Consolidation of Variable Interest Entities, an interpretation of ARB No. 51.” The interpretation requires the consolidation of entities in which an enterprise absorbs a majority of the entity’s expected losses, receives a majority of the entity’s expected residual returns, or both, as a result of ownership, contractual or other financial interests in the entity. FIN 46 was revised in December 2003 to make certain technical corrections and address certain implementation issues that have arisen. The adoption date for FIN 46, as revised, was postponed until the first interim or annual period ending after March 15, 2004. On October 8, 2003, the FASB deferred the effective date of the consolidation provisions of FIN 46 until the quarter ended December 31, 2003, for entities formed prior to February 1, 2003. FIN 46, as revised, was adopted by us in the quarter ended March 25, 2004 and did not have a significant impact on our financial statements.
In May 2003, the FASB issued SFAS No. 150, Accounting for Certain Financial Instruments with Characteristics of Both Liabilities and Equity, which specifies that instruments within its scope are obligations of the issuer and, therefore, the issuer must classify them as liabilities. Financial instruments within the scope of the pronouncement include mandatorily redeemable financial instruments, obligations to repurchase the issuer’s equity shares by transferring assets, and certain obligations to issue a variable number of shares. SFAS No. 150 is effective for all financial instruments entered into or modified after May 31, 2003. However, on October 29, 2003, the FASB indefinitely deferred the provisions of paragraph 9 and 10 of SFAS No. 150 related to noncontrolling interests in limited-life subsidiaries. We adopted SFAS No. 150 in 2003 and it did not have an impact on our financial statements.
35
Table of Contents
Index to Financial Statements
In December 2003, the Accounting Standards Executive Committee of the AICPA issued Statement of Position 03-3,Accounting for Certain Loans or Debt Securities Acquired in a Transfer. Statement of Position 03-3 addresses accounting for differences between contractual cash flows and cash flows expected to be collected from an investor’s initial investment in loans or debt securities acquired in a transfer if those differences are attributable, at least in part, to credit quality. It includes such loans acquired in purchase business combinations and applies to all nongovernmental entities, including not-for-profit organizations. This SOP does not apply to loans originated by the entity. This SOP limits the yield that may be accreted to the excess of the investor’s estimate of undiscounted expected principal, interest, and other cash flows (cash flows expected at acquisition to be collected) over the investor’s initial investment in the loan. This SOP requires that the excess of contractual cash flows over cash flows expected to be collected not be recognized as an adjustment of yield loss accrual, or valuation allowance. This SOP prohibits “carrying over” or creation of valuation allowances in the initial accounting of all loans acquired in a transfer that are within the scope of this SOP. The prohibition of the valuation allowance carryover applies to the purchase of an individual loan, a pool of loans, a group of loans, and loans acquired in a purchase business combination. This SOP is effective for loans acquired in fiscal years beginning after December 15, 2004. We are currently evaluating the impact, if any, that SOP 03-3 will have on our financial position or operating results.
Our accounting and reporting policies conform with accounting principles generally accepted in the United States of America (GAAP) and predominant practice within the financial services industry. The preparation of financial statements in conformity with GAAP requires management to make estimates and assumptions that affect the amounts reported in the financial statements and the accompanying notes. Actual results could differ from those estimates.
We believe that the determination of our allowance for credit losses involves a higher degree of judgment and complexity than our other significant accounting policies. The Allowance for Credit Losses is calculated with the objective of maintaining a reserve level believed by management to be sufficient to absorb estimated credit losses. Management’s determination of the adequacy of the allowance is based on periodic evaluations of the loan portfolio and other relevant factors. However, this evaluation is inherently subjective as it requires material estimates, including, among others, expected default probabilities, loss given default, the amounts and timing of expected future cash flows on impaired loans, and general amounts for historical loss experience. We also consider economic conditions, uncertainties in estimating losses and inherent risks in the loan portfolio. All of these factors may be susceptible to significant change. To the extent actual outcomes differ from management’s estimates, additional provisions for credit losses may be required that would adversely impact earnings in future periods.
Finance receivables are considered impaired, i.e. income recognition ceases, as a result of past-due status or a judgment by management that, although payments are current, such action is prudent. Finance receivables on which payments are past due 90 days or more are considered impaired unless they are well-secured and in the process of collection or renewal. Any losses incurred from finance receivables that are impaired are charged off at 180 days past due. Related accrued interest and fees are reversed against current period income.
36
Table of Contents
Index to Financial Statements
When a loan is impaired, interest accrued but uncollected is generally reversed against interest income. Cash receipts on impaired loans are generally applied to reduce the unpaid principal balance.
We recognize deferred tax assets and liabilities for the future tax effects of temporary differences, net operating loss carry-forwards and tax credits. Deferred tax assets are subject to management’s judgment based upon available evidence that future realization is more likely than not. If management determines that we may be unable to realize all or part of net deferred tax assets in the future, a direct charge to income tax expense may be required to reduce the recorded value of the net deferred tax asset to the expected realizable amount.
We have not substantially changed any aspect of our overall approach in the application of the foregoing policies. There have been no material changes in assumptions or estimation techniques utilized as compared to previous years. Please refer to Note 2 in the notes to our audited consolidated financial statements for details regarding our summary of significant accounting policies.
Impact of Inflation and General Economic Conditions
Although inflation has not had a material adverse effect on our financial condition or results of operations, increases in the inflation rate are generally associated with increased interest rates. A significant and sustained increase in the interest rates would likely unfavorably impact our profitability by reducing the interest rate spread between the rate of interest we receive on our customer loans and interest rates we pay to our note holders, banks and finance companies. Inflation may also negatively affect our operating expenses.
Contractual Commitments and Contingencies
Our operations are carried on in branch office locations which we occupy pursuant to lease agreements. The leases typically provide for a lease term of five years. Please see Notes 12 and 15 in the notes to our audited consolidated financial statements for details relating to our rental commitments and contingent liabilities, respectively. Please also see “Business – Properties” and “Certain Relationships and Related Transactions” for further discussion of our leases. Below is a table showing our contractual obligations under current debt financing and leasing arrangements as of September 25, 2004:
Contractual Obligations
Payments Due by Period (in thousands)
| Total | Less than 1 year | 1 – 3 years | 3 – 5 years | More than 5 years | |||||||||||
Long term debt | $ | 76,847 | $ | 25,726 | $ | 26,568 | $ | 24,359 | $ | 194 | |||||
Operating leases | 5,536 | 2,091 | 2,837 | 553 | 55 | ||||||||||
Total obligations | $ | 82,383 | $ | 27,817 | $ | 29,405 | $ | 24,912 | 249 | ||||||
37
Table of Contents
Index to Financial Statements
Quantitative and Qualitative Disclosures About Market Risk
Our profitability and financial performance are sensitive to changes in the U.S. Treasury yields and the spread between the effective rate of interest we receive on customer loans and the interest rates we pay on our borrowings. Our finance income is generally not sensitive to fluctuations in market interest rates. The primary exposure that we face is changes in interest rates on our borrowings. A substantial and sustained increase in market interest rates would likely adversely affect our growth and profitability since we will be required to increase the interest rates we pay to holders of Debentures at the end of each interest adjustment period. We would also face pressure to increase interest rates on our demand notes to stay competitive. The overall objective of our interest rate risk management strategy is to mitigate the effects of changing interest rates on our interest expense through the utilization of short-term variable rate debt and medium and long term fixed rate debt. We have not entered into any derivative instruments to manage our interest rate risk. Please see Note 8 in the notes to our audited consolidated financial statements for information on our debt, including maturities and interest rates.
We originally incorporated in the State of Georgia in 1987 under the name The Money Tree Inc. Then, in 1995, pursuant to a corporate reorganization, we changed the name of the company to The Money Tree of Georgia Inc. and formed a new parent company called The Money Tree Inc. We have been engaged in the consumer finance business since our inception, primarily making, purchasing and servicing direct consumer loans, consumer sales finance contracts and motor vehicle installment sales contracts. Direct consumer loans are direct loans to customers for general use, which are collateralized by existing automobiles or consumer goods, or are unsecured. Consumer sales finance contracts consist of retail installment sales contracts for purchases of specific consumer goods by customers either from our branch locations or from a retail store and are collateralized by such consumer goods. Motor vehicle installment sales contracts are initiated by us or purchased from automobile dealers subject to our credit approval. Direct consumer loans and consumer sales finance contracts originate primarily in our branch office locations. As of June 25, 2005, direct consumer loans comprised 54.5%, motor vehicle installment sales contracts comprised 34.4%, and consumer sales finance contracts comprised 11.1% of the gross amount of our outstanding loans and contracts.
As of the date of this prospectus, we operate 103 consumer finance branch offices in cities located throughout Georgia, Florida, Alabama and Louisiana and four used car lots in Georgia.
We operate our business through the following wholly-owned subsidiaries: The Money Tree of Georgia Inc.; Money to Lend of Louisiana, Inc.; The Money Tree of Florida Inc.; Small Loans, Inc.; and Home Furniture Mart Inc. Please see the detailed chart on page 41 below for a brief description of our subsidiaries. Below is a map showing our branch office locations:
38
Table of Contents
Index to Financial Statements
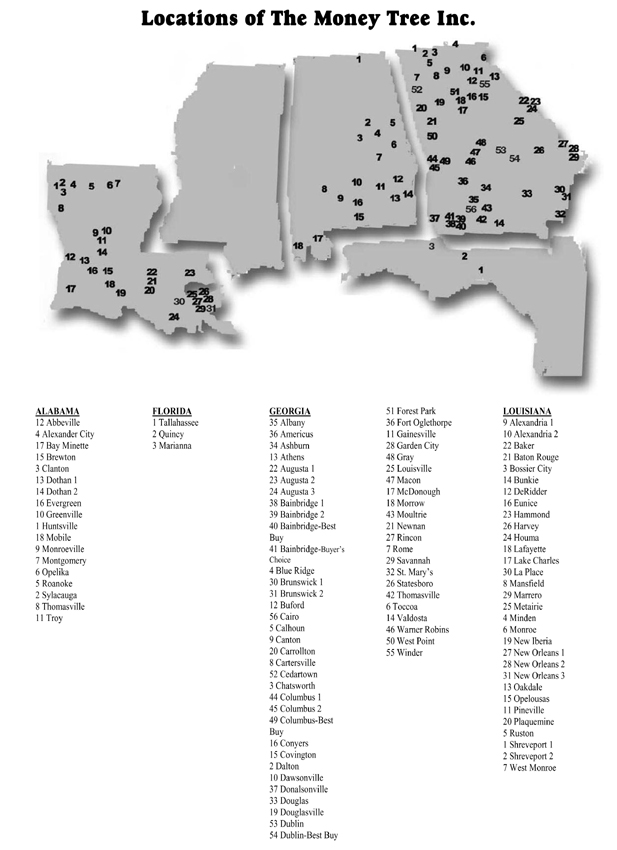
39
Table of Contents
Index to Financial Statements
We fund our loan demand through a combination of cash collections from our loans, proceeds raised from the sale of debentures and demand notes and loans from various banks and other financial institutions.
Our direct consumer loans generally serve individuals with limited access to other sources of consumer credit such as banks, savings and loans, other consumer finance businesses and credit cards. Direct consumer loans are general loans made to people who need money typically for the following purposes:
| • | paying some unusual or unforeseen expense; |
| • | paying off an accumulation of small debts; or |
| • | purchasing furniture and appliances. |
To the extent they are secured at all, direct consumer loans are generally secured by personal property and/or motor vehicles already owned by our customers. Automobile sales finance loans are made primarily in the Bainbridge, Columbus and Dublin, Georgia locations. They are typically made in amounts from $3,000 to $30,000 on maturities of 24 to 56 months. Consumer sales finance contracts consist of retail installment sales contracts for purchases of specific consumer goods by customers either at our branch locations or at a retail store. The consumer goods purchased by the customer serve as collateral for these loans. We originate consumer sales finance contracts at our branch offices and sometimes purchase such contracts from retail dealers. These loans have maturities that typically range from three to 36 months and generally do not individually exceed $4,000 in principal amount. We generally charge the maximum interest rates allowed under applicable federal and state laws for our loans.
Prior to the making of a loan or purchasing a consumer sales finance contract or a motor vehicle installment sales contract, we undertake a credit investigation to determine the income, existing indebtedness, length and stability of employment, and other relevant information concerning the customer. When a loan is made, if it is secured at all, we are granted a security interest in personal property or automobiles of the borrower. In making direct consumer loans, we place emphasis upon the customer’s ability to repay rather than upon the potential resale value of the underlying collateral. In making motor vehicle installment sales and consumer sales finance contracts, however, we place increased emphasis upon the marketability and value of the underlying collateral.
Our business consists mainly of the making of loans to salaried people and wage earners who depend on their earnings to make their repayments. Our ability to operate on a profitable basis, therefore, depends to a large extent on the continued employment of these people and their ability to meet their obligations as they become due. In the event of a sustained recession or a continued downturn in the U.S. and local economies in which we operate with resulting unemployment and continued increases in the number of personal bankruptcies, our collection ratios and profitability would be detrimentally affected. See “Risk Factors – We could suffer increased credit losses if there is a continued downturn in the economy.”
40
Table of Contents
Index to Financial Statements
Below is a chart detailing the relationships of our subsidiaries and other related entities: |
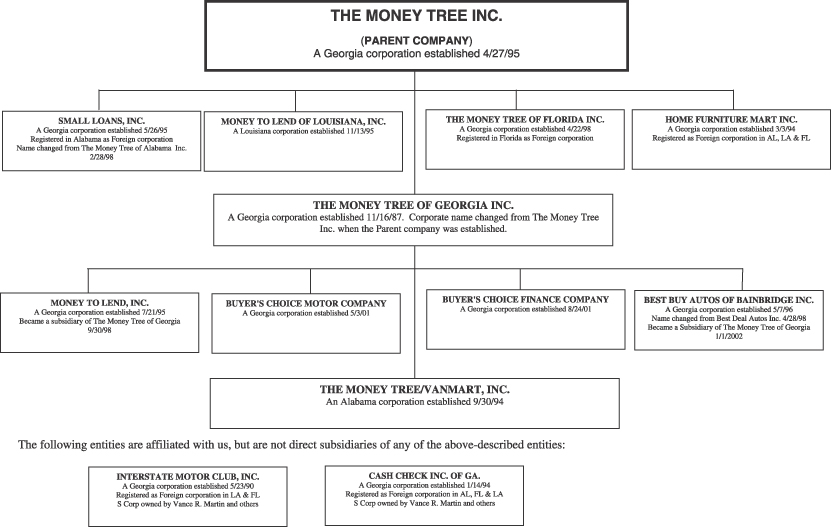
41
Table of Contents
Index to Financial Statements
Lending and Collection Operations
We seek to provide short-term loans to the segment of the population that has limited access to other sources of credit and are considered higher credit risks. See “Risk Factors – Our typical customer base has “subprime” credit ratings and are higher than average credit risks which could result in increased risk of loan defaults.” In evaluating the creditworthiness of potential customers, we primarily examine the individual’s discretionary income, length of current employment, duration of residence and prior credit experience. We make loans to individuals on the basis of the customer’s discretionary income and other factors and are limited to amounts that we believe the customer can reasonably be expected to repay from that income. All of our new customers are required to complete standardized credit applications in person or by telephone at our local offices. We equip each of our local offices to perform immediate background, employment and credit checks. Generally, we perform loan approval at our headquarters; however, some branch managers have limited authority to approve loans up to certain amounts. When initiating a loan for a new customer, our employees verify the applicant’s employment and credit histories through telephone checks with employers or other employment references and a variety of credit services. We require substantially all new customers to submit a listing of personal property that will be pledged as collateral to secure the loan, but we do not rely on the value of such collateral in the loan approval process and generally do not perfect our security interest in that collateral. Accordingly, if the customer were to default in the repayment of the loan, we may not be able to recover the outstanding loan balance by resorting to the sale of collateral.
We believe that the development and continual reinforcement of personal relationships with customers improve our ability to monitor their creditworthiness, reduce credit risk and generate repeat loans. It is not unusual for us to have made a number of loans to the same customer over the course of several years, many of which were refinanced with a new loan after two or three payments. In determining whether to refinance existing loans, we typically require loans to be current in their payments, and repeat customers are generally required to complete a new credit application if they have not completed one within the prior two years.
In the fiscal year ended September 25, 2004, approximately 35.3% of the total number of loans we made resulted from refinancing of existing loans. Refinancings accounted for approximately 46.9% of the total volume of loans we made during that period. In the fiscal year ended September 25, 2003, approximately 37.2% of the total number of loans and 40.7% of the total volume of loans we made resulted from refinancing of existing loans. A refinancing represents a new loan transaction with an existing customer in which a portion of the new loan is used to repay the balance of an existing loan and the remaining portion is advanced to the customer. We actively market the opportunity to refinance existing loans prior to maturity due to the established credit of these customers. The refinancings result in increased amounts borrowed by the customer and additional fees and income realized by us.
We typically do not perfect our security interest in collateral securing our loans by filing Uniform Commercial Code financing statements. We usually charge a non-file or non-recording insurance fee in connection with our direct consumer loans. These fees are equal in aggregate amount to the premiums paid by us to purchase non-file insurance coverage from an unaffiliated insurance company. Under our non-file insurance coverage, we are reimbursed for losses on
42
Table of Contents
Index to Financial Statements
direct consumer loans resulting from our policy of not perfecting our security interest in collateral pledged to secure the loans. Non-file insurance is not available for motor vehicle installment sales contracts and consumer sales finance contracts. We must rely on the collateral securing the loan for these two products, and any recovery on such collateral is very uncertain. See “Risk Factors – The collectability of our finance receivables may be affected by general economic conditions and we may not be able to recover the full amount of delinquent accounts by resorting to sale of collateral or receipt of non-file insurance proceeds.”
We compete with several national and regional finance companies, as well as a variety of local finance companies, in the communities in which we operate. We believe that we compete effectively in the marketplace primarily based on our emphasis on customer service and the variety of services we provide.
Customer Service Training. We believe intensive training for all employees is integral to the success of our customer service emphasis. Our branch structure includes three positions at each branch office: customer service representative; manager trainee; and branch manager. Customer service representatives meet customers, take payments and input loans. In addition, customer service representatives are responsible for soliciting additional business from existing customers when they visit a branch through the refinancing of current loans. Manager trainees collect past due loans and solicit loans. Branch managers oversee branch operations and the loan making process. When an employee is hired, he or she is required to successfully complete a one to two-week training course in our headquarters for the position. Branch managers attend both the customer service representative and collection training classes as well as a one-week manager training class (for a total of three weeks of training). Branch managers are also trained on location in their respective branch by one of our traveling trainers and by a regional manager. Designated employees in our headquarters also provide answers to questions by telephone that arise during the course of dealing with customers at the branch offices.
Additional Services to Customers. In addition to the loan services we provide, we offer certain services typically provided by banks or other institutions to consumers who do not have relationships with commercial banks or such other institutions. Please see the “Certain Relationships and Related Transactions” section for a discussion of conflicts issues arising from various relationships between us, our executive officers and our affiliates. We believe that our ability to service our customers’ needs distinguishes us from most of our competitors that solely offer loan services. Listed below are a number of services offered by us in this capacity.
| • | Direct Deposit. We (working in conjunction with our bank) are an approved “Authorized Payment Agent” for Social Security, Veterans Administration (VA), Military and retirement benefits. We (working in conjunction with our bank) also accept direct deposit of employee payroll checks for our customers. This service allows customers to elect to receive their benefits or payroll checks at a local branch office. |
| • | Preparation of Federal and State Income Tax Returns. We offer preparation of federal and state income tax returns for those customers who |
43
Table of Contents
Index to Financial Statements
elect to electronically file their income tax returns. The tax preparation and filing services are offered pursuant to a service agreement with our affiliate, Cash Check Inc. of Ga. (Cash Check). See “Certain Relationships and Related Transactions” for additional information on Cash Check. We also offer refund anticipation loans to customers meeting certain eligibility requirements. |
| • | Money Orders. We sell money orders to customers and other consumers seeking this service. We receive a fee for all money orders we issue. |
| • | Sale and Financing of Certain Consumer Goods. In each branch office location (or, right next door to the branch office in the State of Louisiana), we offer for sale certain furniture, appliances, electronics and other household items. See “Regulation and Supervision – State Laws.” We receive a mark-up for each of the products sold. In addition, we offer financing to eligible consumers desiring to finance the purchase of these consumer goods. |
| • | Motor Club Memberships. We offer motor club membership from Interstate Motor Club, Inc. to all customers possessing a valid driver’s license. Reimbursement benefits to membership include: bail bond; emergency road service; wrecker service; emergency ambulance expense; lock and key service; emergency travel expense; and legal fees. We receive a commission on sales of motor club memberships. Interstate Motor Club, Inc. is owned by our President and his three children. See “Certain Relationships and Related Transactions.” |
| • | Prepaid Telephone Service. We offer prepaid telephone services to all of our customers. We receive a commission for each customer who signs up for the service as well as a commission for each monthly payment collected. These telephone services are provided through Budget Phone, Inc., an unaffiliated entity. |
| • | Bank Draft. We offer bank draft services to all of our customers whereby amounts owed to us are automatically debited from the customer’s bank account and paid to us on a regular periodic basis. This results in ease of payment for the customer and, we believe, reduced collections costs and added predictability of cash flow. |
We offer various credit and non-credit insurance products in connection with our loans. We sell insurance products as a licensed agent for a non-affiliated insurance company pursuant to certain underwriting guidelines set by the insurance company. During our fiscal year ended September 25, 2004, we earned $6.5 million in commissions from the sale of insurance products.
We offer credit life insurance, credit accident and sickness insurance and collateral protection insurance. Credit life insurance is elected by those customers who prefer to have their
44
Table of Contents
Index to Financial Statements
indebtedness covered in the event of death. Credit accident and sickness insurance is available to customers who are gainfully employed for a minimum of 30 hours per week, and provides coverage in the form of continued payments on the loan made by us in the event the customer is unable to work for a period of time. Collateral protection insurance is written to protect our security interest in certain collateral. Examples of covered collateral are automobiles, trucks, travel trailers and certain boats. When a claim is made, the insurance proceeds are payable to us and any excess is payable to the customer. This insurance pays for partial losses as well as total losses of the collateral.
We also offer non-credit accidental death and dismemberment insurance to customers. This type of insurance may have a term shorter or longer than the term of the loan and coverage may exceed the principal amount of the loan. Proceeds of claims are payable to the customers and/or their beneficiaries. Customers are not required to purchase these insurance products from us in order to obtain any other product or service provided by us. See “Regulation and Supervision – State Laws.”
Provision for credit losses (sometimes otherwise known as bad debt expense) is charged against income in amounts sufficient, in the opinion of senior management, to maintain an allowance for credit losses at a level considered adequate to cover the probable losses inherent in our finance receivable portfolio. Credit loss experience, contractual delinquency of finance receivables, the value of underlying collateral and management’s judgment are all factors used in assessing the overall adequacy of the allowance and the resulting provision for credit losses. Charge-offs are typically determined in one of two ways. First, an account that is at least 180 days past due with no payments made within the last 180 days may be charged-off. Second, an account may be determined by senior management to be uncollectible under certain circumstances, as in the event of death of the customer who did not elect to purchase credit life insurance for his loan contract or in situations when repossession and sale of collateral occurs on consumer sales finance and motor vehicle installment sales contracts and the balance is not recoverable through legal process or other methods. In addition to these general means of designating an account to be charged-off, branch managers may encounter other situations when charge-off is appropriate. We require that a supervisor visit each branch to review all of their accounts that are potential charge-off accounts on a monthly basis. Then each supervisor meets with the operations manager for a final review. Prior to these visits, the branch manager is responsible for ensuring that all phases of the collection process have been followed. A comprehensive charge-off checklist has been developed to help the branch manager verify that all collection activity and procedures have been followed in order to have that account charged-off. Senior management reviews the charge-off checklist to determine whether an account should be charged-off or whether the branch manager should undertake further collection measures for the particular account. Direct consumer loans are charged off net of proceeds from non-filing insurance. We purchase non-file insurance on certain direct consumer loans in lieu of filing a Uniform Commercial Code financing statement. Premiums collected are remitted to the insurance company to cover possible losses from charge offs as a result of not recording. Should we ever discontinue our practice of purchasing non-file insurance, the proceeds from these claims would not be available to us to offset future credit losses and additional provisions for credit losses would be required. For consumer sales finance and motor vehicle installment sales contracts, we are granted a security interest in the collateral for which the loan was made. In the event of default, the collateral on such contracts may be repossessed at 31 to 60 days delinquency
45
Table of Contents
Index to Financial Statements
(roughly two payments). After repossession, the collateral is sold (typically within 30 days) according to UCC-9 disposition of collateral rules and the proceeds of the sale are applied to the customer’s account. If the likelihood of collection on a judgment is favorable, a suit is filed for the deficiency balance remaining and, if granted, garnishment and/or execution follows for collection of the balance. If the collateral is not conducive for repossession because of it being in unmarketable condition, judgment is sought without repossession and sale of collateral. If collection on a judgment is not favorable, the balance of the account is charged off. For fiscal years ended September 25, 2004 and 2003, our charge-offs net of recoveries were $2.6 million and $1.5 million, respectively.
The allowance for credit losses (a deduction from finance receivables reported on our Consolidated Balance Sheet and sometimes otherwise known as bad debt reserves) is determined by several factors. Historical loss experience is the primary factor in the determination of the allowance for credit losses. An evaluation is performed to compare the amount of accounts charged off, net of recoveries of such accounts, in relation to the average net outstanding finance receivables for the period being reviewed. For the fiscal years ended September 25, 2004 and 2003, the charge offs, net of recoveries were $1.6 million and $1.5 million, respectively. These amounts represent 2.4% and 2.9% of the respective year’s net average outstanding receivables. Management has found that this methodology has provided an adequate benchmark for determining the allowance due to our loan portfolio consisting primarily of a large number of smaller balance homogeneous loans. A review is also performed of loans with somewhat higher balances, primarily collateralized with vehicles, to determine if the allowance should be adjusted based possible exposure related to collectibility of these loans. In accordance with the auto sales contract, we may repossess the collateralized vehicle after 30 days without payment to protect the vehicle’s integrity and to minimize our loss. Management routinely evaluates the inherent risks and change in the composition of our loan portfolio based on its extensive experience in the consumer finance industry in consideration of estimating the adequacy of the allowance. Also considered are delinquency trends, economic conditions, and industry factors. Based on these factors, management increased the allowance by an additional 0.6% and 0.1% for the respective years over the aforementioned benchmark percentages. The balance of the allowance for credit losses at September 25, 2004 and 2003 was $2.1 million and $1.7 million, respectively.
Federal Laws
Our lending operations are subject to extensive federal regulation, including the Truth in Lending Act, the Equal Credit Opportunity Act and the Fair Credit Reporting Act. These laws generally require us to provide certain disclosures to prospective borrowers and protect against discriminatory lending practices and unfair credit practices.
The Truth in Lending Act requires us to make certain disclosures to our customers, including the terms of repayment, the total finance charge, the annual percentage rate charged and other information relating to the loan.
46
Table of Contents
Index to Financial Statements
The Equal Credit Opportunity Act prohibits us from discriminating against loan applicants based on race, color, sex, age or marital status. Pursuant to Regulation B promulgated under the Equal Credit Opportunity Act, we are required to make certain disclosures regarding consumer rights and advise consumers whose credit applications are not approved of the reasons for the rejection.
The Fair Credit Reporting Act requires us to provide certain information to consumers whose credit applications are not approved on the basis of a report obtained from a consumer reporting agency. On December 4, 2003, President Bush signed into law the Fair and Accurate Credit Transaction Act. The FACT Act reauthorizes and amends the Fair Credit Reporting Act and permanently extends the state preemption provisions of the Fair Credit Reporting Act. The FACT Act also creates new provisions to strengthen consumer rights by addressing the problem of identity theft, as well as limit the disclosure of medical information for credit purposes.
A Federal Trade Commission ruling prevents us and other consumer lenders from using certain household goods as collateral on direct cash loans. We collateralize such loans with non-household goods such as automobiles, boats, mobile homes, and other exempt items.
We are subject to the consumer privacy provisions of the Gramm-Leach-Bliley Act and, as such, are regulated by the Federal Trade Commission (FTC). The GLB Act restricts or prohibits our ability to offer non-affiliated third parties access to nonpublic personal information generated by our business. While we do not currently share any such nonpublic personal information with non-affiliated third parties, we may do so in the future. Required compliance with the GLB Act and these rules, or our failure to comply with them, may increase the overall cost to us in providing our products and services and may limit potential future revenue opportunities. In addition, the GLB Act allows states to enact consumer privacy laws that may be more burdensome or restrictive than the GLB Act, the rules promulgated thereunder and other existing federal laws. The GLB Act, the FTC’s rules, or the adoption of other consumer privacy laws or regulations could have a material adverse effect on our business, financial condition and operating results.
We are subject to the USA PATRIOT Act of 2001, including Section 352 of the Money Laundering Abatement Act, reasonably expected to detect and cause the reporting of suspicious transactions in connection with the sale of debentures and demand notes by us, direct deposits made by customers and the issuance of money orders to customers. In addition to other procedures, for investments or other cash receipts greater than $10,000, we obtain a copy of a valid driver’s license or picture identification and complete the required IRS Form 8300.
State Laws
General
State laws require that each office in which a small loan business is conducted be licensed by the state and that the business be conducted according to the applicable statutes and regulations. The granting of a license depends on the financial responsibility, character and fitness of the applicant, and, where applicable, the applicant must show finding of a need through convenience and advantage documentation. As a condition to obtaining such license, the
47
Table of Contents
Index to Financial Statements
applicant must consent to state regulation and examination and to the making of periodic reports to the appropriate governing agencies. Licenses are revocable for cause, and their continuance depends upon compliance with the law and regulations issued pursuant thereto. We have never had any of our small loan business licenses revoked.
We are also subject to state regulations governing insurance agents. State insurance regulations require that insurance agents be licensed and limit the premium amount charged for such insurance.
Georgia Laws
Direct consumer loans we make in Georgia are subject to the Georgia Industrial Loan Act. GILA governs loans of $3,000 or less and requires that lenders, like us, who are subject to GILA, not loan funds for more than 36 months and 15 days. GILA provides for a maximum rate of interest and specifies permitted additional fees that can be charged for a loan, including loan fees, maintenance fees and late fees. Under GILA, a lender may also sell certain types of insurance. GILA permits us to charge and collect from our customers premiums actually paid for insurance obtained for the customer, provided, that the insurance is reasonably related to the type and value of the property issued and the amount and term of the loan and, further provided, that the insurance is obtained through an insurance company authorized to do business in Georgia and through a regular insurance agent licensed by the insurance commissioner.
We also make a comparatively small number of direct consumer loans for amounts greater than $3,000 and for a longer period than 36 months and 15 days. These loans are not subject to GILA restrictions, but are made at an open, negotiated rate which, along with other terms of the loan, are subject only to the general Georgia usury laws.
In connection with the sale and financing of motor vehicles, we are generally subject to the Georgia Motor Vehicle Sales Financing Act. MVSFA requires, among other things, that certain content and notices be present in contracts and regulates the specific manner of execution and delivery of contracts. MVSFA also regulates related insurance purchased, the amount of certain finance charges, the treatment of prepayment and recovery of deficiencies in repossession cases.
Louisiana Laws
We are registered as a non-depository licensed lender in Louisiana. Direct consumer loans and sales finance loans we make in Louisiana are governed by the Louisiana Consumer Credit Law. The Louisiana Office of Financial Institutions regulates the Louisiana Consumer Credit Law. The Louisiana Consumer Credit Law generally regulates consumer loans made in Louisiana and provides for maximum rates of interest that may be charged based upon outstanding loan balance (the higher the loan balance the less the interest rate allowed to be charged). The Louisiana Consumer Credit Law specifies the permitted additional fees that may be charged in connection with a loan, including loan fees, maintenance fees and late fees. The Louisiana Consumer Credit Law allows us to request or require our customers to provide insurance in connection with consumer credit transactions. However, the maximum rates to be charged for such insurance are set by statute. The Louisiana Consumer Credit Law prevents us
48
Table of Contents
Index to Financial Statements
from displaying or selling merchandise at our branch office locations and requires that the space in which we make our consumer loans be separated from any location in which we display or sell merchandise by walls that may be broken only by a passageway in which the public does not have access.
Alabama Laws
Direct consumer loans and sales finance loans we make in Alabama are governed by the Alabama Consumer Credit Act and the Regulations promulgated thereunder, also referred to as the Mini-Code. The Alabama State Banking Department, Bureau of Loans regulates the Mini-Code. The Mini-Code governs loans of $2,000 or less and provides for maximum finance charges depending on the loan balance and specifies permitted additional fees that may be charged for a loan, including loan fees, maintenance fees and late fees. Furthermore, the Mini-Code requires that we refund or credit certain unearned finance charges when a customer renews or extends a loan. The Mini-Code also requires that loans of less than $1,000 be repaid in substantially equal installments at periodic intervals over a period of not more than 36 months and 15 days for amounts financed more than $300 and 24 months and 15 days for amounts financed of $300 or less. The Mini-Code permits us to charge and collect insurance premiums from our customers so long as the insurance is offered and written by a licensed insurance company authorized to do business in Alabama. However, the maximum rates to be charged for such insurance are set by statute. The Mini-Code also requires us to obtain the prior written approval of the State Banking Department prior to conducting any other business on the premises.
We also make a small number of consumer loans for amounts greater than $2,000 in Alabama. Such loans are not subject to the Mini-Code, but are made at an open, negotiated rate which, along with other terms of the loan, are subject only to the general Alabama usury laws.
Florida Laws
Direct consumer loans and sales finance loans we make in Florida are governed by the Florida Consumer Finance Act and are regulated by the Florida Department of Banking and Finance. The Florida Consumer Finance Act generally governs loans of less than $25,000 and provides for maximum rates of interest depending upon the loan balance and specifies permitted additional fees that may be charged for a loan, including loan fees, maintenance fees and late fees. The Florida Consumer Finance Act permits us to charge and collect insurance premiums from our customers so long as they are provided under a group or individual insurance policy which complies with the insurance laws of the State of Florida.
As of the date of this prospectus, we lease all 103 of our branch office locations, the four used car lots and our corporate headquarters in Bainbridge, Georgia. Vance R. Martin, our President and sole director, owns and leases to us the real estate for 12 of these branch office locations, three used car lots and our corporate headquarters. In addition, Mr. Martin leases from the owners, and subleases to us, 53 of these branch office locations and one used car lot. See “Certain Relationships and Related Transactions.”
49
Table of Contents
Index to Financial Statements
As of the date of this prospectus, neither we nor any of our officers or our sole director is a party to, and none of our property is presently the subject of, any pending or threatened legal proceeding or proceeding by a governmental authority that could have a material adverse effect on our business. We are party to litigation and other contingent assets and liabilities arising in the normal course of business.
As of September 25, 2004, we had 417 full-time employees and eight part-time employees.We do not have employment agreements with any of our employees.
The following individuals are our officers and sole director. All officers and the sole director may be contacted at our address and telephone number. Their positions and business experience are described below:
Name | Age | Position | ||
Vance R. Martin | 63 | President and Sole Director | ||
Steven P. Morrison | 47 | Controller | ||
W. Derek Martin | 34 | Vice President – Administration | ||
Bradley D. Bellville | 39 | Vice President – Operations | ||
Marvin E. Hall | 69 | Vice President – Investments | ||
Clayton Penhallegon | 69 | Second Vice President – Investments | ||
Dellhia “Cissie” Franklin | 48 | Vice President – Customer Service | ||
Beverly A. Cross | 36 | Corporate Secretary | ||
Karen V. Harrell | 45 | Assistant Corporate Secretary | ||
Jennifer L. Ard | 28 | Vice President – IRAs | ||
J. Hope McDonald | 22 | Assistant Vice President – Customer Service |
Vance R. Martin has served as our President since our inception in 1987. Mr. Martin is our sole director. Mr. Martin has been in the consumer finance business for 40 years, and during 31 of which he has owned his own business. Mr. Martin is a shareholder of Bainbridge Bancshares, Inc., which is the sole shareholder of First National Bank of Decatur County, a national bank in Bainbridge, Georgia. Mr. Martin serves on the Board of Directors of the Georgia Independent Auto Dealers Association. He previously served on the Board of Directors of the Georgia Industrial Loan Association for 18 years. He is a member of the Board of Directors of the Decatur County Unit of the American Cancer Society. He also previously served as a member of the Board of Directors of the Bainbridge-Decatur County YMCA. Mr. Martin received an Associate degree in Liberal Arts from Columbus College in 1964.
50
Table of Contents
Index to Financial Statements
Steven P. Morrison became our Controller in 2000. From 1997 to 2000, Mr. Morrison served as Atlanta Area Controller of Loomis, Fargo & Co., a national armored car service company, where his duties included management of the accounting functions and supervision of the accounting staff for the Atlanta service area. Mr. Morrison received a Bachelor of Business Administration degree from Georgia State University in 1983.
W. Derek Martin has been Vice President – Administration since 1997. His duties include oversight of the entire loan department, including all four states. Prior to 1997, Mr. Martin was a loan approver in our centralized loan approval department. He is the son of Mr. Vance R. Martin. Mr. Martin serves as a director of the Board of Trustees of Bainbridge College. Mr. Martin received a Bachelor of Arts degree in English from Florida State University in 1993.
Bradley D. Bellville became Vice President – Operations in 1997. Mr. Bellville’s duties include oversight of operations for all company locations, including collections for all branches. He also manages the tax program operations conducted with Cash Check. For the six years prior to 1997, Mr. Bellville held the positions of regional manager, trainer, collector, and branch manager with us. Mr. Bellville received a Bachelor of Business Administration degree in Marketing from Valdosta State University in 1990.
Marvin E. Hall became Vice President – Investments in 1999. Mr. Hall’s duties include oversight of our entire investment program. Mr. Hall was in retirement for seven years prior to his employment with us. Prior to retirement, Mr. Hall served as a District Manager with Georgia Power Company for the Bainbridge District from 1977 to 1992. His duties with Georgia Power included oversight of the entire Southwest Georgia area. Mr. Hall is a Past President of the Bainbridge Rotary Club and Bainbridge Chamber of Commerce. He is also a Past Chairman of the Bainbridge College Foundation, the Decatur County Industrial Development Authority, and the United Way. Mr. Hall received a Bachelor of Business Administration from Georgia State University in 1972. Mr. Hall also received an International Correspondence School certificate in Electrical Engineering in 1969.
Clayton Penhallegon became Second Vice President – Investments in 2002. Mr. Penhallegon’s duties include traveling to each branch to ensure compliance with company policy regarding the investment program. Mr. Penhallegon began serving as the Executive Director of the Decatur County United Way in 2001. Mr. Penhallegon was in retirement for the two years prior to his becoming Executive Director of the United Way. From 1972 to 1999, Mr. Penhallegon was Executive Director of Georgia Industries For The Blind in Bainbridge, Georgia for the State of Georgia Department of Human Resources and has served on the Board of the National Industries For The Blind. Mr. Penhallegon received a Bachelor degree in Industrial Engineering from Auburn University in 1959 and a Master degree in Business Administration from the University of Georgia in 1972. Mr. Penhallegon also holds a Certified Public Manager certificate from the University of Georgia Institute of Government. Mr. Penhallegon is a Past President of the Bainbridge-Decatur County Chamber of Commerce, Bainbridge Rotary Club, Georgia Society of Certified Public Managers and Past Chairman of the Board of the Georgia Society of Certified Public Managers.
51
Table of Contents
Index to Financial Statements
Dellhia “Cissie” Franklin became Vice President – Customer Service in 2002. Her duties include responsibility for all investor contacts and questions, coordination of branch personnel training for investments and oversight of all company advertising. Ms. Franklin previously held the positions of Assistant Vice President - Investments, Loan Approver Assistant and Collector. Her past duties with us have included collections and follow-up of approved loan customers. Ms. Franklin is a Past Assistant Vice President of the Bainbridge Junior Woman’s Club and a past scout leader.
Beverly A. Cross became our Corporate Secretary in 1997. Her duties include oversight of company-wide computer software and support and supervision of the branch support department. From 1993 to 1997, Ms. Cross was our Automated Clearing House (ACH) Coordinator and Purchasing Director where her duties included oversight of our ACH transactions and purchasing.
Karen V. Harrell was appointed Assistant Corporate Secretary in 2001. Her duties included oversight of the securities software and administration of securities. Ms. Harrell also serves as our Lease Administrator. From 1992 to 2001, Ms. Harrell served as Executive Secretary to the President and Assistant Treasurer. From 1982 to 1991, Ms. Harrell served as Textile Manager’s Secretary, Industrial Engineering Secretary and Plant Manager’s Secretary at Amoco Fabrics and Fibers Company in Bainbridge. During her employment with Amoco, she served as an officer for the Credit Union Board of Directors for two years.
Jennifer L. Ard was appointed to Vice President – Individual Retirement Accounts in 2004. Ms. Ard’s duties include oversight of our Individual Retirement Account department. Ms. Ard previously held the position of Treasurer with us from 2001 to 2004. In 2000, Ms. Ard served as Assistant Treasurer. She has been employed by us since 1999 and prior to that time was primarily a college student. Ms. Ard received a Bachelor of Business Administration degree in Management from Valdosta State University in 1999.
J. Hope McDonald became our Assistant Vice President – Customer Service in 2005. Her duties include follow-up with potential investors and assistance with investor contacts and questions. She is also responsible for creating, scheduling and follow-up of company-wide advertising, including investment advertising, finance company advertising and car lot advertising covering four states. Prior to become Assistant Vice President, Ms. McDonald held the position of office assistant with Thomasville Travel Center in Thomasville, Georgia, South Georgia Tractor and Gainous Agricultural Services in Cairo, Georgia from 1999 to 2002. Her duties included clerical responsibilities. Ms. McDonald attended Southwest Georgia Technical College. She is currently enrolled with Professional Career Development Institute studying for a degree in small business management.
The term of office of each officer expires when a successor is elected and qualified. There is no arrangement or understanding between any officer and any other person pursuant to which the officer was selected. Our sole director is not compensated by us in his capacity as director. Each of the above officers also serves on our Policy Board which meets quarterly and creates and implements our policies and procedures and growth plans.
52
Table of Contents
Index to Financial Statements
We pay the salaries of each of our officers, except for Bradley D. Bellville who is partially compensated by Cash Check and W. Derek Martin whose compensation is paid by Interstate Motor Club, Inc.
The following are the total remuneration paid to each of our three highest paid officers for the years ended September 25, 2004, 2003 and 2002:
Summary Compensation Table
| Annual Compensation | ||||||||
Name and Principal Position | Year | Salary ($) | Bonus ($) | |||||
Vance R. Martin, President | 2004 2003 2002 | $ $ $ | 414,528 414,528 414,528 | $ $ $ | 1,250 1,250 1,250 | |||
W. Derek Martin(1), Vice President - Administration | 2004 2003 2002 | $ $ $ | 114,108 108,324 102,342 | $ $ $ | 4,124 4,269 5,386 | |||
Bradley D. Bellville(2), Vice President - Operations | 2004 2003 2002 | $ $ $ | 73,440 68,316 62,238 | $ $ $ | 16,183 13,425 15,060 | |||
| (1) | All compensation to Derek Martin was paid by Interstate Motor Club, Inc. See “Certain Relationships and Related Transactions.” |
| (2) | Mr. Bellville was paid $38,490 in 2004; $26,465 in 2003; and $29,161 in 2002 of such compensation by Cash Check. See “Certain Relationships and Related Transactions.” |
Pursuant to our Articles of Incorporation and the authority granted in Section 14-2-851 of the Official Code of Georgia Annotated, we have agreed to indemnify our officers and sole director against any expenses (including attorneys’ fees), judgments, fines and amounts paid in settlement actually or reasonably incurred by them in any action, suit or proceeding brought or threatened to be brought against them by reason of the fact that they were our officer or director if they acted in a manner they reasonably believed to be in or not opposed to our best interests, and, with respect to any criminal action or proceeding, had no reasonable cause to believe their conduct was unlawful.
Vance R. Martin, our President, owns 100% of our outstanding voting and non-voting common stock. See “Certain Relationships and Related Transactions” and “Risk Factors – We are controlled by a single shareholder and don’t have any independent board members overseeing our operations.”
53
Table of Contents
Index to Financial Statements
CERTAIN RELATIONSHIPS AND RELATED TRANSACTIONS
Our officers also serve as the officers of various of our subsidiaries. Mr. Martin is our sole director and sole director of each of our subsidiaries. We may be subject to various conflicts of interest in our relationship with Mr. Martin and his other business enterprises. The following is a description of transactions and relationships between us, our executive officers and our sole director and each of their affiliates.
Mr. Martin owns 40% of the outstanding stock of Interstate Motor Club, Inc. and each of his three children, including W. Derek Martin, our Vice President - Administration, owns 20%. Interstate Motor Club, Inc. pays us a commission for each membership sold pursuant to an Agency Sales Agreement. During fiscal year ended September 25, 2004, we received $2.0 million in commissions pursuant to the Agency Sales Agreement.
Mr. Martin owns the real estate for 12 of our branch office locations, three used car lots and our principal executive offices. We have entered into lease agreements with Mr. Martin whereby rent is paid monthly for use of these locations. In addition, Mr. Martin leases from the owners, and then subleases to us, another 53 branch office locations and one used car lot for a greater amount than he pays under the underlying leases. Some of this spread covers costs for leasehold improvements and property operating costs paid directly by Mr. Martin. Management believes that these leases are at rates which are comparable to those obtainable from independent third parties. During fiscal year ended September 25, 2004, we paid total lease payments of $1.7 million to Mr. Martin.
Cash Check is a company owned by Mr. Martin (50%), Bradley Bellville, our Vice President – Operations (25%), and Beverly A. Cross, our Corporate Secretary (25%). Cash Check prepares and files income tax returns to our customers and other consumers. Pursuant to a service agreement, Cash Check prepares and files income tax returns for our customers. We provide substantially all expenses related to customer service, including personnel, facilities and equipment for Cash Check and receive approximately 90% of the net income resulting from income tax returns filed by Cash Check. The service agreement states that the following services be provided to Cash Check: (1) assisting customers in preparing tax returns; (2) handling the in-office preparation and processing of tax returns; (3) maintaining a supply of forms and documents related to the preparation and electronic filing of tax returns; and (4) doing such other acts as are necessary or desirable in connection with preparing and electronically filing tax returns for customers. During fiscal year ended September 25, 2004, we received $0.4 million pursuant to the service agreement.
Mr. Martin has loaned our subsidiary, Money To Lend of Louisiana, Inc., an aggregate of approximately $0.8 million evidenced by two promissory notes. The first note for $0.3 million is dated December 19, 2003, matures on November 20, 2006 and bears interest at a rate of 8% per annum payable to Mr. Martin on a monthly basis. The second note for $0.5 million is dated July 14, 2004, matures on June 28, 2008 and bears interest at a rate of 8% per annum payable to Mr. Martin on a monthly basis.
54
Table of Contents
Index to Financial Statements
The Demand Notes will be issued under an indenture dated as of April 27, 2005 between us and U.S. Bank National Association, as trustee. We do not have any previous relationship with the trustee. The indenture has been filed as an exhibit to the registration statement. You can also obtain a copy of the indenture from us. We have summarized certain parts of the indenture. The summary is not complete and you should read the indenture for provisions that may be important to you. Capitalized terms used in the summary have the meanings specified in the indenture.
The Demand Notes are registered and issued without coupons in series form. Any amount of any series may be issued. There is no limit on the principal amount of Demand Notes of any series. We may change the interest rates of the Demand Notes and of any prior or subsequent series that may be offered, provided that no such change shall affect any Demand Note of any series issued prior to the date of change.
The Demand Notes are our direct obligations, but are not secured. Principal and interest are payable at our executive offices in Bainbridge, Georgia. The Demand Notes are executed by us and authenticated and delivered to the purchaser by us.
The total aggregate maximum principal amount of the Demand Notes offered under this prospectus is $35,000,000. A minimum initial investment of $100 is required.
The Demand Notes are sold for an initial principal amount set by us, currently not less than $100 and for additional amounts not less than $1, dated the date of purchase and transferable only on our books. We may, in our discretion, limit the maximum amount any investor or related investors may maintain in outstanding Demand Notes at any one time.
Investments by Check
Your initial investment in Demand Notes (personal checks only) must be accompanied by properly completed investment documentation. Your check should be made payable to “The Money Tree Inc.” and may be (1) hand delivered or mailed to our headquarters at 114 South Broad Street, Bainbridge, Georgia 39817, or (2) hand delivered to one of our branch office locations in which case our branch manager will mail your check to our headquarters within two business days of receipt at such branch office location. Your investment by check will begin to accrue interest on the date that we deposit such check into our account.
Automatic Deposit
After your initial investment by check, you may elect to authorize us to make an automatic monthly charge from your personal bank account. Upon receipt of proper written authorization, we will prepare an electronic transfer drawn against your bank account for the amount authorized on either the 5th or 20th of each month as selected by you. Your investment
55
Table of Contents
Index to Financial Statements
begins to accrue interest on the same business day that we receive the electronic transfer. You may change the amount or day of transfer of your automatic monthly investment or terminate your automatic monthly investment at any time by providing written notice to us at our headquarters at 114 South Broad Street, Bainbridge, Georgia 39817. Please be aware that there is at least a 10 business day set up period each time you add, change or terminate the banking instructions for your automatic monthly investment.
Payroll Deduction for Money Tree Employees
Our employees who are investing in Demand Notes and who have completed the proper authorization may have a fixed amount deducted from their payroll checks on the 15th and 31st of every month. Interest begins to accrue on these investments on the same business day that we deduct funds from your payroll check. Employees may change the amount of the payroll deduction or terminate participation in the payroll deduction at any time by providing us with written notification and such change or termination will become effective within two business days of receipt of such notice.
The interest rate payable on any Demand Note is a variable rate, compounded daily. Interest on a Demand Note is paid only when you make a demand for payment of the principal amount of a Demand Note. We will establish, in our discretion, from time to time, separate interest rates for Demand Notes with a daily balance ranging from $1.00 to $9,999.99; $10,000.00 to $49,999.99; $50,000.00 to $99,999.99; and $100,000.00 and over. When an interest rate is established for each range of balances, it becomes effective for and applied to all Demand Notes with a daily balance within that range, whether existing or newly issued. These interest rates may be the same or different for each range of balances and we may increase or decrease the rate for any range independently of the others without notice to you after the date of purchase. The interest rate on a Demand Note may also change if the daily balance of the Demand Note changes to a different range of balances.
You will not be notified of changes from time to time in the interest rates. The interest rates being paid at any given time on the Demand Notes may be obtained by calling our executive offices in Bainbridge, Georgia at (877) 468-7878 (toll free) or (229) 248-0990 (in Georgia) or by visiting our website at www.themoneytreeinc.com. Demand Notes begin to accrue interest as of the effective date of purchase. See “Plan of Distribution.”
Payment or Redemption by Holders of the Demand Notes
Subject to the subordination provisions, we will pay or redeem any Demand Note on demand by you for the outstanding principal balance plus any unpaid interest at the time of redemption. We may also make partial redemptions as long as the balance remaining is at least $25. All payments or redemptions must be made either in person or by mail at our executive offices in Bainbridge, Georgia.
56
Table of Contents
Index to Financial Statements
Subject to the subordination provisions, we may call the Demand Notes as a whole, or individually, for redemption at any time at a price equal to the principal amount plus any unpaid interest thereon at the time of redemption. Notice of such redemption will be given by mail to you not less than 30 nor more than 60 days prior to the date fixed for redemption.
Redemption if Balance Falls Below $25
We may, in our sole discretion, redeem any Demand Note in full if the principal balance of such Demand Note falls below $25 at any time for a price equal to the principal amount plus accrued interest to the date of redemption. In such event, our redemption right is automatic and no advance notice to you is required.
The Demand Notes have the same priority as all of our other subordinated unsecured general obligations, including the Debentures. We may at any time borrow money from a lending institution on a secured or unsecured basis that would have priority over the Demand Notes.
We will mail to you on a monthly basis a statement showing your Demand Note balance as it appears on our books as of the end of each month.
Our obligation to repay the principal and interest on the Demand Notes is subordinate in right of payment to all senior debt. This means that if we are unable to pay our debts, when due, the senior debt would all be paid first before any payment of principal and interest would be made on the Demand Notes.
The term “Senior Debt” means all of our debt created, incurred, assumed or guaranteed by us, except debt that by its terms expressly provides that such debt is not senior in right of payment to the Demand Notes. Debt is generally any indebtedness, contingent or otherwise, in respect of borrowed money, or evidenced by bonds, notes, debentures or similar instruments or letters of credit, and shall include any guarantee of any such indebtedness. Senior debt includes, without limitation, all of our bank and finance company debt and any line of credit we may obtain in the future. Neither the Demand Notes nor the Debentures are senior debt. Any intercompany debt that may be owed by us to any affiliate or subsidiary shall not be considered senior debt. Since The Money Tree of Georgia Inc. is one of our subsidiaries, the Demand Notes are effectively subordinate to the debentures and demand notes previously issued by this subsidiary. See “Risk Factors – Payment of interest and principal on the Demand Notes is effectively subordinate to the payment of the secured and unsecured creditors of our subsidiaries, including holders of debentures and demand notes issued by The Money Tree of Georgia Inc.”
57
Table of Contents
Index to Financial Statements
No Restrictions on Additional Debt or Business
The indenture does not restrict us from issuing additional securities or incurring additional debt including senior debt or other secured or unsecured obligations or the manner in which we conduct our business.
We, together with the trustee, may modify the indenture at any time with the consent of the holders of not less than a majority in principal amount of the Demand Notes that are then outstanding. However, we and the trustee may not modify the indenture without the consent of each holder affected if the modification:
| • | reduces the principal or rate of interest, or changes the demand nature or waives any payment of principal and interest on any Demand Note; |
| • | reduces the percentage of Demand Note holders whose consent to a waiver or modification is required; |
| • | affects the subordination provisions of the indenture in a manner that adversely affects the rights of any holder; or |
| • | waives any event of default in the payment of principal or interest on any Demand Note. |
Without action by you, we and the trustee may amend the indenture or enter into supplemental indentures to clarify any ambiguity, defect or inconsistency in the indenture, to provide for the assumption of the Demand Notes by any successor to us, to make any change to the indenture that does not adversely affect the legal rights of any Demand Note holders, or to comply with the requirements of the Trust Indenture Act of 1939. We will give written notice to you of any amendment or supplement to the indenture or Demand Notes.
Place, Method and Time of Payment
We will pay principal and interest on the Demand Notes at our principal executive offices, or at such other place as we may designate for that purpose; provided, however, that if we make payments by check, they will be mailed to you at your address appearing in the Demand Note register maintained by the registrar. Any payment of principal and interest which is due on a nonbusiness day will be payable by us on the next business day immediately following that nonbusiness day.
An event of default is defined in the indenture as follows:
| • | a default in payment of principal and interest on the Demand Notes when presented for payment or redemption which default has not been cured for 30 days; |
58
Table of Contents
Index to Financial Statements
| • | our becoming subject to certain events of bankruptcy or insolvency; or |
| • | our failure to comply with any agreements or covenants in or provisions of the Demand Notes or the indenture which failure is not cured or waived within 60 days after we have received notice of such failure from the trustee or from the holders of at least a majority in principal amount of the outstanding Demand Notes. |
If an event of default occurs and is continuing, the trustee or the holders of at least 25% in principal amount of the then-outstanding Demand Notes may declare the principal and accrued interest on all outstanding Demand Notes due and payable. If such a declaration is made we are required to pay the principal and interest on all outstanding Demand Notes immediately, so long as the senior debt has not matured by lapse of time, acceleration or otherwise. We are required to file annually with the trustee an officer’s certificate that certifies the absence of defaults under the terms of the indenture. We are also required to file with the trustee and the paying agent prompt notice of an event of default under the indenture and any default related to any senior debt.
The indenture provides that the holders of a majority of the aggregate principal amount of the Demand Notes at the time outstanding may, on behalf of all holders, waive any existing event of default or compliance with any provision of the indenture or the Demand Notes, except a default in payment of principal and interest on the Demand Notes or an event of default with respect to a provision that cannot be amended without the consent of each affected holder. In addition, the trustee may waive an existing event of default or compliance with any provision of the indenture or Demand Notes, except in payments of principal and interest on the Demand Notes, if the trustee in good faith determines that a waiver or consent is in the best interests of the holders of the Demand Notes.
If an event of default occurs and is continuing, the trustee is required to exercise the rights and duties vested in it by the indenture and to use the same degree of care and skill as a prudent person would exercise under the circumstances in the conduct of his or her affairs. The trustee however, is under no obligation to perform any duty or exercise any right under the indenture at the request, order or direction of Demand Note holders unless the trustee receives indemnity satisfactory to it against any loss, liability or expense. Subject to such provisions for the indemnification of the trustee, the holders of a majority in principal amount of the Demand Notes at the time outstanding have the right to direct the time, method and place of conducting any proceeding for any remedy available to the trustee. The indenture effectively limits the right of an individual Demand Note holder to institute legal proceedings in the event of our default.
Satisfaction and Discharge of Indenture
The indenture may be discharged upon the payment of all Demand Notes outstanding thereunder or upon deposit in trust of funds sufficient for such payment and compliance with certain formal procedures set forth in the indenture.
We plan to file annual reports containing audited financial statements and quarterly reports containing unaudited financial information for the first three fiscal quarters of each fiscal
59
Table of Contents
Index to Financial Statements
year with the Securities and Exchange Commission while the registration statement containing this prospectus is effective and as long thereafter as we are required to do so. Copies of such reports will be sent to any Demand Note holder upon written request.
We reserve the right to assess service charges and fees for issuing Demand Notes to replace lost or stolen Demand Notes or to transfer a Demand Note.
You may not transfer any Demand Note until the registrar has received, among other things, appropriate endorsements and transfer documents and any taxes and fees required by law or permitted by the indenture. The registrar is not required to transfer any Demand Note for a period beginning 15 days before the date notice is mailed of the redemption of such Demand Note and ending on the date of redemption of such Demand Note.
The indenture contains certain limitations on the right of the trustee, should it become one of our creditors, to obtain payment of claims in certain cases, or to realize on certain property with respect to any such claim as security or otherwise. The trustee will be permitted to engage in other transactions; however, if it acquires certain conflicting interests and if any of the indenture securities are in default, it must eliminate such conflict or resign.
We are offering up to $35,000,000 in aggregate principal amount of the Demand Notes. We will offer the Demand Notes through our executive officers directly without an underwriter or agent and on a continuous basis.
We intend to market the offering primarily by placing advertisements in local newspapers, purchasing roadway sign advertisements and placing signs in our branch office locations in States in which we have properly registered the offerings or qualified for an exemption from registration. We may also make oral solicitations in limited circumstances and use other methods of marketing the offering, all in compliance with applicable laws and regulations, including securities laws. We also intend to have certain information relating to our offerings available on our website at www.themoneytreeinc.com. However, the information contained on this website is not part of this prospectus. While branch office personnel would be happy to provide you with a prospectus and may accept your investment check and documentation, they are not allowed to answer any substantive questions about your investment. If you have any questions about the offering of the Demand Notes or this prospectus or need additional information, please call our executive office at (877) 468-7878 (toll free) or (229) 248-0990 (in Georgia). Our executive officers will not receive any additional compensation or commissions for their selling efforts. We will otherwise offer the Demand Notes through our executive officers in accordance with Rule 3a4-1 under the Securities Exchange Act of 1934 and all applicable state securities laws.
60
Table of Contents
Index to Financial Statements
Prospective investors will be required to complete an application and purchaser suitability questionnaire prior to investing in the Demand Notes. We reserve the right to reject any subscription. If we accept an investment, you should not assume that the Demand Notes are a suitable and appropriate investment for you.
You will not know at the time of investment whether we will be successful in completing the sale of any or all of the Demand Notes. We reserve the right to withdraw or cancel the offering at any time. In the event of a withdrawal or cancellation, investments previously received will be irrevocable and no funds will be refunded.
The Demand Notes are not listed on any securities exchange and there is no established trading market for the Demand Notes.
The validity of the Demand Notes being offered by this prospectus will be passed upon for us by Schiff Hardin LLP, Atlanta, Georgia.
The consolidated financial statements of The Money Tree Inc. and subsidiaries, as of September 25, 2004 and 2003, and for each of the three fiscal years in the period ended September 25, 2004, included in this prospectus and in the registration statement have been audited by Carr, Riggs & Ingram, LLC, independent registered public accounting firm, as set forth in their report appearing elsewhere herein and in the registration statement, and are included in reliance upon such report given upon the authority of said firm as experts in auditing and accounting.
The consolidated financial statements of The Money Tree Inc. and subsidiaries, as of March 25, 2005, and for the six months ended March 25, 2005 and 2004, included in this prospectus and in the registration statement, have not been audited by Carr, Riggs & Ingram, LLC.
WHERE YOU CAN FIND MORE INFORMATION
We have filed with the Securities and Exchange Commission (SEC), Washington, D.C., a registration statement on Form S-1 under the Securities Act of 1933, as amended, with respect to the Demand Notes offered by this prospectus. This prospectus does not contain all of the information set forth in the registration statement and the exhibits and schedules thereto. Certain items are omitted in accordance with the rules and regulations of the SEC. For further information about us and our Demand Notes sold in this offering, refer to the registration statement and the exhibits and schedules filed therewith. Statements contained in this prospectus as to the contents of any contract or other document referred to are not necessarily complete and in each instance, if such contract or document is filed as an exhibit, reference is made to the copy of such contract or other documents filed as an exhibit to the registration statement.
A copy of the registration statement, including the exhibits and schedules thereto, may be read and copied at the SEC’s Public Reference Room at 450 Fifth Street, N.W., Washington,
61
Table of Contents
Index to Financial Statements
D.C. 20549. Information on the operation of the Public Reference Room may be obtained by calling the SEC at 1-800-SEC-0330. In addition, the SEC maintains an Internet site at www.sec.gov, from which interested persons can electronically access the registration statement, including the exhibits and schedules thereto.
As a result of the offering, we will become subject to the full informational requirements of the Securities Exchange Act of 1934. We will fulfill our obligations with respect to such requirements by filing periodic reports and other information with the SEC.
62
Table of Contents
Index to Financial Statements
F-1
Table of Contents
Index to Financial Statements
Report of Independent Registered Public Accounting Firm
To the Board of Directors of
The Money Tree Inc. and subsidiaries
We have audited the accompanying consolidated balance sheets of The Money Tree Inc. and subsidiaries (the “Company”) as of September 25, 2004 and 2003, and the related consolidated statements of income, shareholder’s equity, and cash flows for each of the three years in the period ended September 25, 2004. These financial statements are the responsibility of the Company’s management. Our responsibility is to express an opinion on these financial statements based on our audits.
We conducted our audits in accordance with standards of the Public Company Accounting Oversight Board (United States). Those standards require that we plan and perform the audit to obtain reasonable assurance about whether the financial statements are free of material misstatement. An audit includes examining, on a test basis, evidence supporting the amounts and disclosures in the financial statements. An audit also includes assessing the accounting principles used and significant estimates made by management, as well as evaluating the overall financial statement presentation. We believe that our audits provide a reasonable basis for our opinion.
In our opinion, the consolidated financial statements referred to above present fairly, in all material respects, the financial position of The Money Tree Inc. and subsidiaries as of September 25, 2004 and 2003, and the results of their operations and their cash flows for each of the three years in the period ended September 25, 2004, in conformity with accounting principles generally accepted in the United States of America.
/s/ Carr, Riggs & Ingram, LLC
Tallahassee, Florida
November 22, 2004
F-2
Table of Contents
Index to Financial Statements
The Money Tree Inc. and Subsidiaries
Consolidated Balance Sheets
September 25, | 2004 | 2003 | ||||||
Assets | ||||||||
Cash and cash equivalents | $ | 8,373,114 | $ | 8,749,412 | ||||
Finance receivables, net | 65,100,356 | 57,704,982 | ||||||
Other receivables | 4,904,088 | 2,073,658 | ||||||
Employee receivables | 18,027 | 17,227 | ||||||
Inventory | 2,292,869 | 3,009,217 | ||||||
Property and equipment, net | 4,657,439 | 3,272,240 | ||||||
Deferred income taxes | 1,260,000 | 1,129,000 | ||||||
Intangible assets | 1,388,210 | 1,216,401 | ||||||
Other assets | 769,878 | 501,520 | ||||||
Total assets | $ | 88,763,981 | $ | 77,673,657 | ||||
Liabilities and Shareholder’s Equity | ||||||||
Liabilities | ||||||||
Accounts payable and other accrued liabilities | $ | 3,669,133 | $ | 2,911,515 | ||||
Accrued interest payable | 7,843,615 | 5,898,748 | ||||||
Senior debt | 2,062,244 | 887,717 | ||||||
Senior subordinated debt | 700,000 | 3,900,000 | ||||||
Variable rate subordinated debentures | 61,582,281 | 52,701,092 | ||||||
Demand notes | 11,701,979 | 10,277,230 | ||||||
Junior subordinated debt, related parties | 800,000 | 270,928 | ||||||
Junior subordinated debt | — | 491,041 | ||||||
Total liabilities | 88,359,252 | 77,338,271 | ||||||
Shareholder’s equity | ||||||||
Common stock: | ||||||||
Class A voting, no par value; 500,000 shares authorized 2,686 shares issued and outstanding | 1,677,647 | 1,677,647 | ||||||
Class B non-voting, no par value; 1,500,000 shares authorized, 26,860 shares issued and outstanding | — | — | ||||||
Retained earnings (deficit) | (1,272,918 | ) | (1,342,261 | ) | ||||
Total shareholder’s equity | 404,729 | 335,386 | ||||||
Total liabilities and shareholder’s equity | $ | 88,763,981 | $ | 77,673,657 | ||||
See accompanying notes to the consolidated financial statements.
F-3
Table of Contents
Index to Financial Statements
The Money Tree Inc. and Subsidiaries
Consolidated Statements of Income
Years ended September 25, | 2004 | 2003 | 2002 | |||||||||
Interest income | $ | 17,855,006 | $ | 14,000,976 | $ | 10,640,201 | ||||||
Interest expense | (5,848,428 | ) | (4,919,059 | ) | (3,972,801 | ) | ||||||
Net interest income before provision for credit losses | 12,006,578 | 9,081,917 | 6,667,400 | |||||||||
Provision for credit losses | (2,923,093 | ) | (1,983,124 | ) | (1,060,167 | ) | ||||||
Net interest income after provision for credit losses | 9,083,485 | 7,098,793 | 5,607,233 | |||||||||
Insurance commissions | 6,477,309 | 6,177,042 | 4,892,885 | |||||||||
Commissions from motor club memberships from company owned by related parties | 1,995,389 | 1,612,109 | 2,459,536 | |||||||||
Income tax service agreement income from company owned by related parties | 400,173 | 452,173 | 528,637 | |||||||||
Other income | 2,133,687 | 1,530,934 | 1,605,484 | |||||||||
Net revenue before retail sales | 20,090,043 | 16,871,051 | 15,093,775 | |||||||||
Retail sales | 15,427,538 | 22,781,327 | 14,991,527 | |||||||||
Cost of sales | (10,468,840 | ) | (17,048,272 | ) | (10,941,055 | ) | ||||||
Gross margin on retail sales | 4,958,698 | 5,733,055 | 4,050,472 | |||||||||
Net revenues | 25,048,741 | 22,604,106 | 19,144,247 | |||||||||
Operating expenses | ||||||||||||
Personnel expense | (12,749,664 | ) | (10,976,068 | ) | (9,319,960 | ) | ||||||
Facilities expense | (2,970,349 | ) | (2,369,717 | ) | (1,850,224 | ) | ||||||
General and administrative expenses | (3,060,458 | ) | (2,997,277 | ) | (2,536,759 | ) | ||||||
Other operating expenses | (6,073,721 | ) | (5,385,353 | ) | (5,283,056 | ) | ||||||
Total operating expenses | (24,854,192 | ) | (21,728,415 | ) | (18,989,999 | ) | ||||||
Net operating profit | 194,549 | 875,691 | 154,248 | |||||||||
(Loss) on sale of assets | (30,349 | ) | (19,764 | ) | (16,532 | ) | ||||||
Income before income taxes | 164,200 | 855,927 | 137,716 | |||||||||
Income tax (expense) | (94,857 | ) | (338,575 | ) | (42,349 | ) | ||||||
Net income | $ | 69,343 | $ | 517,352 | $ | 95,367 | ||||||
Net income per common share, basic and diluted | $ | 2.35 | $ | 17.51 | $ | 3.23 | ||||||
See accompanying notes to the consolidated financial statements.
F-4
Table of Contents
Index to Financial Statements
The Money Tree Inc. and Subsidiaries
Consolidated Statements of Shareholder’s Equity
| Common Stock | Retained Earnings (Deficit) | Total Shareholder’s Equity (Deficit) | ||||||||||||||||
| Class A Voting | Class B Non-voting | |||||||||||||||||
| Shares | Stated Value | Shares | Stated Value | |||||||||||||||
Balance at September 25, 2001 | 2,686 | $ | 1,677,647 | — | $ | — | $ | (1,954,980 | ) | $ | (277,333 | ) | ||||||
Net income | — | — | 95,367 | $ | 95,367 | |||||||||||||
Balance at September 25, 2002 | 2,686 | 1,677,647 | — | — | (1,859,613 | ) | (181,966 | ) | ||||||||||
Net income | — | — | 517,352 | 517,352 | ||||||||||||||
Balance at September 25, 2003 | 2,686 | 1,677,647 | — | — | (1,342,261 | ) | 335,386 | |||||||||||
Stock issued to Class A shareholder | 26,860 | — | — | — | ||||||||||||||
Net income | 69,343 | 69,343 | ||||||||||||||||
Balance at September 25, 2004 | 2,686 | $ | 1,677,647 | 26,860 | $ | — | $ | (1,272,918 | ) | $ | 404,729 | |||||||
See accompanying notes to the consolidated financial statements.
F-5
Table of Contents
Index to Financial Statements
The Money Tree Inc. and Subsidiaries
Consolidated Statements of Cash Flows
Years ended September 25, | 2004 | 2003 | 2002 | |||||||||
Cash flows from operating activities | ||||||||||||
Net income | $ | 69,343 | $ | 517,352 | $ | 95,367 | ||||||
Adjustments to reconcile net income to net cash provided by operating activities: | ||||||||||||
Provision for credit losses | 2,923,093 | 1,983,124 | 1,060,167 | |||||||||
Depreciation | 817,789 | 718,380 | 649,170 | |||||||||
Amortization | 11,266 | 92,486 | 325,804 | |||||||||
Deferred income taxes | (131,000 | ) | 236,000 | (7,000 | ) | |||||||
Loss on sale of property and equipment | 30,349 | 19,764 | 16,532 | |||||||||
Change in assets and liabilities, net of effect of acquisitions: | ||||||||||||
Other receivables | (2,830,429 | ) | (1,035 | ) | 388,117 | |||||||
Employee receivables | (800 | ) | 21,830 | 15,600 | ||||||||
Inventory | 716,348 | (51,845 | ) | (2,466,193 | ) | |||||||
Other assets | (211,236 | ) | (25,060 | ) | 95,500 | |||||||
Accounts payable and other accrued liabilities | 803,712 | 1,196,523 | (527,378 | ) | ||||||||
Accrued interest payable | 1,944,868 | 2,606,784 | 1,892,943 | |||||||||
Income taxes payable | (82,987 | ) | 40,382 | (103,002 | ) | |||||||
Net cash provided by operating activities | 4,060,316 | 7,354,685 | 1,435,627 | |||||||||
Cash flows from investing activities, net of effect of acquisitions | ||||||||||||
Loans originated | (67,915,900 | ) | (73,614,715 | ) | (56,198,567 | ) | ||||||
Loans repaid | 61,113,367 | 54,233,216 | 43,015,826 | |||||||||
Purchase of property and equipment | (2,055,382 | ) | (821,028 | ) | (1,578,016 | ) | ||||||
Proceeds from sale of property and equipment | 74,045 | 156,622 | — | |||||||||
Acquisition of businesses, net of cash acquired | (3,971,240 | ) | (601,526 | ) | (672,901 | ) | ||||||
Net cash used in investing activities | (12,755,110 | ) | (20,647,431 | ) | (15,433,658 | ) | ||||||
Cash flows from financing activities | ||||||||||||
Net proceeds (repayments) on: | ||||||||||||
Senior debt | 1,174,527 | (5,343,982 | ) | (3,730,943 | ) | |||||||
Senior subordinated debt | (3,200,000 | ) | 1,500,000 | — | ||||||||
Junior subordinated debt and related parties | 38,031 | (165,241 | ) | (125,895 | ) | |||||||
Demand notes | 1,424,749 | 4,084,798 | 5,598,941 | |||||||||
Proceeds-variable rate subordinated debentures | 20,034,837 | 21,135,619 | 17,435,784 | |||||||||
Payments-variable rate subordinated debentures | (11,153,648 | ) | (5,254,343 | ) | (4,178,607 | ) | ||||||
Net cash provided by financing activities | 8,318,496 | 15,956,851 | 14,999,280 | |||||||||
Net change in cash and cash equivalents | (376,298 | ) | 2,664,105 | 1,001,249 | ||||||||
Cash and cash equivalents, beginning of year | 8,749,412 | 6,085,307 | 5,084,058 | |||||||||
Cash and cash equivalents, end of year | $ | 8,373,114 | $ | 8,749,412 | $ | 6,085,307 | ||||||
See accompanying notes to the consolidated financial statements.
F-6
Table of Contents
Index to Financial Statements
The Money Tree Inc. and Subsidiaries
Consolidated Statements of Cash Flows (continued)
Years ended September 25, | 2004 | 2003 | 2002 | ||||||
SUPPLEMENTAL DISCLOSURE OF CASH FLOW INFORMATION: | |||||||||
Cash paid during the year for: | |||||||||
Interest | $ | 3,799,196 | $ | 2,312,275 | $ | 2,079,858 | |||
Income taxes | $ | 265,344 | $ | 62,193 | $ | 78,709 | |||
See accompanying notes to the consolidated financial statements.
F-7
Table of Contents
Index to Financial Statements
The Money Tree Inc. and Subsidiaries
Notes to Consolidated Financial Statements
NOTE 1 – NATURE OF BUSINESS
The Company’s business consists of the operation of finance company offices in 95 locations throughout Georgia, Alabama, Louisiana and Florida; sales of retail merchandise (principally furniture, appliances, and electronics) at certain finance company locations; and the operation of three used automobile dealerships in the state of Georgia. The Company also earns revenues from commissions on premiums written for certain insurance products, when requested by loan customers, as an agent for a non-affiliated insurance company. Revenues are also generated from commissions on the sales of prepaid phone service and automobile club memberships.
The Company’s loan portfolio consists of sales finance loan receivables and direct consumer loan receivables. Sales finance loan receivables consist principally of retail installment sale contracts collateralized by used automobiles and consumer goods which are initiated by automobile and consumer good dealerships, subject to credit approval, in the locations where the Company operates offices. Direct loan receivables are loans originated directly to customers.
NOTE 2 – SUMMARY OF SIGNIFICANT ACCOUNTING POLICIES
Use of Estimates
In preparing the financial statements in conformity with accounting principles generally accepted in the United States, management is required to make estimates and assumptions that affect the reported amounts of assets and liabilities and disclosure of contingent assets and liabilities as of the date of the balance sheet and the reported amounts of revenues and expenses for the reporting period. Actual results could vary from those estimates.
Principles of Consolidation
The consolidated financial statements include the accounts of the Company and its subsidiaries, all of which are wholly owned. All significant intercompany accounts and transactions are eliminated in consolidation.
Cash and Cash Equivalents
Cash equivalents are short-term, highly liquid investments with original maturities of three months or less when purchased.
Finance Receivables
Finance receivables are stated at the amount of unpaid principal and accrued interest on certain loans where interest is recognized on an interest accrual basis. Finance receivables with precomputed finance charges are stated at the gross amount reduced by unearned interest, unearned insurance commissions and unearned discounts. In addition to these reductions, all finance receivables are stated net of the allowance for credit losses.
F-8
Table of Contents
Index to Financial Statements
The Money Tree Inc. and Subsidiaries
Notes to Consolidated Financial Statements
NOTE 2 – SUMMARY OF SIGNIFICANT ACCOUNTING POLICIES (CONTINUED)
Finance Receivables (continued)
For loans acquired at a discount, the initial investment, which is accounted for in the aggregate, includes the amount paid to the seller plus any fees paid or less any fees received. The initial investment frequently differs from the related loan’s principal amount at the date of purchase. This difference is recognized as an adjustment of yield over the life of the loan. All other costs incurred in connection with acquiring loans, or committing to purchase loans are charged to expense as incurred.
Collectibility of the acquired loans is continually evaluated throughout the life of the acquired loan. If upon subsequent evaluation:
| • | the estimate of the total probable collections is more favorable, the amount of the discount to be amortized is adjusted accordingly. |
| • | the estimate of amounts probable of collection is less favorable, the loans may be considered to be impaired. |
| • | it is not possible to estimate the amount and timing of collection, then amortization ceases, and the cost-recovery method is implemented, which requires that all payments be applied to the principal amount of loan first and when that is reduced to zero, any additional amounts are recognized as income. |
Income Recognition
Accounting principles generally accepted in the United States require that an interest yield method be used to calculate income recognized on accounts which have precomputed finance charges. Recognition of interest income is suspended on accounts with precomputed interest charges when the account becomes more than 90 days delinquent. An interest yield method is used by the Company on each individual precomputed account to calculate income for on-going accounts, however, state regulations often allow interest refunds to be made according to the Rule of 78’s method for payoffs and renewals when customers take such actions on their accounts. Since the majority of the Company’s precomputed accounts are paid off or renewed prior to maturity, the result is that the precomputed accounts effectively yield on a Rule of 78’s basis. Renewals and refinancings require that the borrower meet the underwriting guidelines similar to a new customer and, as a result, the interest rate and effective yield, as well as the other terms of the refinanced loans are at least as favorable to the lender as comparable loans with customers with similar risks who are not refinancing; therefore, all renewals and refinancings are treated as new loans. Further any unamortized net fees or costs and any prepayment penalties from the original loan are recognized in interest income when the new loan is granted. Rebates of interest, if applicable, are charged to interest income at the time of the new loan. The new loan is originated utilizing a portion of the proceeds to pay off the existing loan and the remaining portion advanced to the customer. The difference between income previously recognized under the interest yield method and the Rule of 78s method is recognized as an adjustment to interest income at the time of the rebate. Adjustments to interest income for the fiscal years ended September 25, 2004, 2003, and 2002 were $1,901,153, $2,280,812 and $1,239,786, respectively.
F-9
Table of Contents
Index to Financial Statements
The Money Tree Inc. and Subsidiaries
Notes to Consolidated Financial Statements
NOTE 2 – SUMMARY OF SIGNIFICANT ACCOUNTING POLICIES (CONTINUED)
Income Recognition (continued)
Accrual of interest income on interest-bearing finance receivables is suspended when no payment has been made on an account for 60 days or more on a contractual basis. The loan is returned to active status and accrual of income is resumed when all of the principal and interest amounts contractually due are brought current (one or more full contractual monthly payments are received and the account is less than 60 days contractually delinquent), at which time management believes future payments are reasonably assured. Interest accrued on loans charged off is reversed against interest income in the current period. Any amounts charged off that related to prior periods are not material for any period presented.
For loans acquired at a discount, the initial investment, which is accounted for in the aggregate, includes the amount paid to the seller plus any fees paid or less any fees received. The initial investment frequently differs from the related loan’s principal amount at the date of purchase. This difference is recognized as an adjustment of yield over the life of the loan. All other costs incurred in connection with acquiring loans, or committing to purchase loans are charged to expense as incurred. The discount on an acquired loan is amortized over the period in which the payments are probable of collection. Discounts are amortized using the interest method.
The Company receives commissions from independent insurers for policies issued to finance customers. These insurance commissions are deferred and systematically amortized to income over the life of the related insurance contract since the insurance and lending activities are integral parts of the same transaction. Commissions for credit and non-credit insurance products are recognized over the risk period based on the method applicable to the insurance coverage’s risk exposure, which generally coincides with the term of the related loan contract. Insurance commissions for products that have constant risk exposure are earned using the straight-line method. Insurance commissions for insurance products with declining risk exposure or coverage are recognized using the Rule of 78s method that approximates the interest method. The auto and accidental death and dismemberment policies are earned over the policy’s predetermined schedule of coverage. The Company retains advance commissions that vary by products at time the policies are written. Retrospective commissions are paid to the Company on an earned premium basis, net of claims and other expenses. Contingencies exist only to the extent of refunds due on early termination of policies that exceed the amount of advanced commissions retained. These refunds are netted against the gross amount of premiums written.
Commissions earned on the sale of motor club memberships are recognized at the time the membership is sold. The Company has no obligations related to refund of membership fees on cancellations. Claims filed by members are the responsibility of the issuer of the membership.
Retail sales include sales of used automobiles, home furnishings, electronic equipment, and appliances. Warranties on selected used vehicles are available as an add-on item through an unaffiliated warranty company. Home furnishings, electronic equipment and appliances carry their own manufacturer’s warranties. Retail sales revenues are recognized at the time of sale when title and risk of loss is transferred to the customer. Warranty revenues are recognized at the time of sale.
F-10
Table of Contents
Index to Financial Statements
The Money Tree Inc. and Subsidiaries
Notes to Consolidated Financial Statements
NOTE 2 – SUMMARY OF SIGNIFICANT ACCOUNTING POLICIES (CONTINUED)
Income Recognition (continued)
Income pursuant to a service agreement with Cash Check Inc. is earned in the period in which additional expenses are incurred in support of the service provided by Cash Check for the Company’s customers. These expenses are reported in the operating expenses of the Company incrementally as the level of service increases.
Loan Origination Fees and Costs
Non-refundable loan origination fees and certain direct origination costs are deferred and recognized as an adjustment of the loan yield over the contractual life of the related loan. Unamortized amounts are recognized in income at the time loans are renewed or paid in full.
Credit Losses
The Allowance for Credit Losses is determined by several factors. Historical loss experience is the primary factor in the determination of the allowance for credit losses. An evaluation is performed to compare the amount of accounts charged off, net of recoveries of such accounts, in relation to the average net outstanding finance receivables for the period being reviewed. Historically, management has found that this methodology has provided an adequate allowance due to the company’s loan portfolio consisting of a large number of smaller balance homogeneous loans. Also, a review of loans with higher balances, primarily collateralized with vehicles, is performed monthly to determine if the allowance should be adjusted based possible exposure related to collectibility of these loans. In accordance with the auto sales contract, the company may repossess the collateralized vehicle after 30 days without payment to protect the vehicle’s integrity and to minimize the company’s loss. Management routinely evaluates the inherent risks and change in the composition of our loan portfolio based on its extensive experience in the consumer finance industry in consideration of estimating the adequacy of the allowance. Also considered are delinquency trends, economic conditions, and industry factors. In most instances, an insurance product is purchased in conjunction with the loan. In the event of the death or injury of the customer or damage to pledged collateral, the proceeds from the claims would generally pay off or continue payments on the loan, thereby negating any consideration in the allowance determination. In other instances, a non-file or non-recording insurance policy is made in conjunction with the loan. (See description of non-file insurance below.) Proceeds from these claims are netted against charge offs as recoveries in the determination of the allowance. Provisions for credit losses are charged to income in amounts sufficient to maintain an allowance for credit losses at a level considered adequate to cover the probable loss inherent in our finance receivable portfolio. Each month, regional management reviews potential accounts for charge off with local branch management. A comprehensive charge off checklist is utilized to assist management in verifying that all collection activity and procedures have been followed. Once completed, it is submitted to senior management for final review.
F-11
Table of Contents
Index to Financial Statements
The Money Tree Inc. and Subsidiaries
Notes to Consolidated Financial Statements
NOTE 2 – SUMMARY OF SIGNIFICANT ACCOUNTING POLICIES (CONTINUED)
Credit Losses (continued)
The Company’s charge-off policy requires that balances be charged off when they are 180 days since last payment, unless upon review by management, the balance is deemed collectible by garnishment of wages, bankruptcy proceedings or other collection methods. Also, an account may be charged-off if it is determined by senior management that the account is uncollectible due to certain circumstances, as in the death of the customer who did not elect to purchase credit life insurance for the loan contract or in situations when repossession and sale of collateral occurs and the balance is not recoverable through the legal process or other methods. Loan balances charged off exclude accrued interest, which is charged against interest income. Accounts that are to be disbursed under a plan of bankruptcy are monitored separately from other accounts. The charge-off policy generally coincides with the bankruptcy plan period while payments are scheduled under the loan. Direct consumer loans are charged off net of proceeds from non-filing insurance (see discussion below). For consumer sales finance and motor vehicle installment sales contracts, the Company is granted a security interest in the collateral for which the loan was made. In the event of default, the collateral on such contracts may be repossessed at 31 to 60 days delinquency (roughly two payments). After repossession, the collateral is sold according to UCC-9 disposition of collateral rules and the proceeds of the sale are applied to the customer’s account. If the likelihood of collection on a judgment is favorable, a suit is filed for the deficiency balance remaining and, if granted, garnishment and/or execution follows for collection of the balance. If the collateral is not conducive for repossession because of it being in unmarketable condition, judgment is sought without repossession and sale of collateral. If collection on a judgment is not favorable, the balance of the account is charged off.
The Company accounts for its impaired loans in accordance with Statement of Financial Accounting Standards (SFAS) No. 114,Accounting by Creditors for Impairment of a Loan, as amended by SFAS No. 118, Accounting by Creditors for Impairment of a Loan - Income Recognition and Disclosures. This standard requires that a creditor measure impairment based on the present value of expected future cash flows discounted at the loan’s effective interest rate, except that as a practical expedient, a creditor may measure impairment based on a loan’s observable market price, or the fair value of the collateral if the loan is collateral dependent. Regardless of the measurement method, a creditor must measure impairment based on the fair value of the collateral when the creditor determines that foreclosure is probable.
Non-file insurance
Non-file premiums are charged on direct consumer loans at inception and renewal in lieu of recording and perfecting the Company’s security interest in the assets pledged on such loans and are remitted to a third-party insurance company for non-file insurance coverage. Non-file insurance is not available for motor vehicle installment sales contracts and consumer sales finance contracts. Certain losses related to such direct consumer loans, which are not recoverable through life, accident and health, property, or unemployment insurance claims, are reimbursed through non-file insurance claims subject to policy limitations. These limitations include: no loans may exceed $5,000 to any one customer; no loans may exceed 36 months in term; and no fraudulent loans. When accounts covered by non-file insurance are deemed uncollectible, they are charged off and the claim filed with the insurance carrier, usually within 30 days. Proof of coverage and documentation of collection activity are submitted with the claim. Recoveries from non-file insurance are reflected in the accompanying consolidated financial statements as a reduction in credit losses and receivables related to such claim recoveries are included in other receivables (see Note 3).
Inventory
Inventory is valued at the lower of cost (first-in, first-out basis) or market. Inventory generally consists of home furnishings, electronics and used automobiles.
F-12
Table of Contents
Index to Financial Statements
The Money Tree Inc. and Subsidiaries
Notes to Consolidated Financial Statements
NOTE 2 – SUMMARY OF SIGNIFICANT ACCOUNTING POLICIES (CONTINUED)
Property and equipment, net
Property and equipment are recorded at cost. Depreciation is provided by the straight-line method over the estimated useful lives of the assets ranging from 5 to 10 years. Leasehold improvements are recorded at cost and amortized using the straight-line method over the shorter of the estimated useful life of the assets or the lease term. Such amortization is included in depreciation expense in the accompanying consolidated statements of cash flows.
Goodwill and Other Intangible Assets
Prior to July 1, 2001, intangible assets acquired in business combinations accounted for by the purchase method of accounting were capitalized and amortized over their expected useful life. Acquisitions after June 30, 2001 are accounted for under SFAS No.141, “Business Combinations” and SFAS No. 142, “Goodwill and Other Intangible Assets.” Those standards require that certain identifiable intangible assets be amortized over their expected useful lives. Under the new standards, the portion of the purchase price allocated to goodwill is not amortized but is subject to impairment testing at least annually. Amounts paid for covenants not to compete are amortized on a straight-line basis over a period of seven years.
Impairment of Long-Lived Assets
The Company periodically evaluates whether events or circumstances have occurred that indicate the carrying amount of long-lived assets and certain identifiable intangible assets may warrant revision or may not be recoverable. When factors indicate that these long-lived assets and certain identifiable intangible assets should be evaluated for possible impairment, the Company assesses the recoverability by determining whether the carrying value of such assets will be recovered through the future undiscounted cash flows expected from the use of the asset and its eventual disposition. In Management’s opinion, there has been no impairment of value of long-lived assets and certain identifiable intangible assets at September 25, 2004 and 2003.
Income Taxes
The Company provides for income taxes under the asset and liability method. Under this method, deferred income taxes are recognized for expected future tax consequences of temporary differences between financial statement carrying amounts and the tax bases of existing assets and liabilities using tax rates expected in the years in which those temporary differences are expected to be recovered or settled. Valuation allowances are established, when necessary, to reduce deferred tax assets to the amount expected to be realized.
Governmental Regulation
The Company is subject to various state and federal laws and regulations which, among other things, impose limits on interest rates, other charges, insurance premiums, and require licensing and qualification.
Fair Values of Financial Instruments
The following methods and assumptions are used by the Company in estimating fair values for financial instruments:
Cash and cash equivalents. Cash consists of cash on hand and with banks, either in commercial accounts, or money market accounts.
F-13
Table of Contents
Index to Financial Statements
The Money Tree Inc. and Subsidiaries
Notes to Consolidated Financial Statements
NOTE 2 – SUMMARY OF SIGNIFICANT ACCOUNTING POLICIES (CONTINUED)
Fair Values of Financial Instruments (continued)
Finance receivables. Finance receivables are reported net of unearned interest, insurance commissions, discounts and allowances for credit losses, which are considered short-term because the average life is approximately five months, assuming prepayments. The discounted cash flow of the loans approximate the net finance receivables.
Subordinated debentures. The carrying value approximates fair value due to rights to redeem the debenture for a price equal to 100% of the principal on demand. The debenture holder also may redeem the debenture for 100% of the principal on demand subject to a 90-day interest penalty.
Senior debt. The carrying value of the Company’s senior debt approximates fair value due to the relatively short period of time from origination of the instruments and their expected payment.
Advertising Costs
Advertising costs are expensed as incurred. Advertising expenses totaled $713,681, $1,162,937, and $937,604 for the years ended September 25, 2004, 2003, and 2002, respectively.
Allocation of Expenses to Related Party
The salary of one of the Company’s officers has been allocated to Interstate Motor Club, an affiliate of the Company. The basis for this allocation is that several of the employees of the Money Tree Inc. perform services in support of Interstate Motor Club’s operations. In the past, the portion of the salaries that would have been allocated to Interstate Motor Club approximated the officer’s salary. The Company believes that the officer’s salary continues to approximate the costs of operations being supported by the Money Tree Inc. and has therefore allocated the officer’s salary to Interstate Motor Club, accordingly.
Net Income Per Common Share
Net income per share is computed based upon weighted–average common shares outstanding. The basic weighted-average shares have been restated for a stock split affected in the form of a stock dividend for the years ended September 25, 2004, 2003, and 2002 (see Note 9). There are no potentially dilutive securities issued or outstanding.
Reclassification
Certain 2003 and 2002 amounts have been reclassified in the accompanying consolidated financial statements to conform with the 2004 presentation.
Recent Accounting Pronouncements
In May 2003, the FASB issued SFAS No. 150, “Accounting for Certain Financial Instruments with Characteristics of Both Liabilities and Equity”(SFAS 150), which specifies that instruments within its scope are obligations of the issuer and, therefore, the issuer must classify them as liabilities. Financial instruments within the scope of the pronouncement include mandatorily redeemable financial instruments, obligations to repurchase the issuer’s equity shares by transferring assets, and certain obligations to issue a variable number of shares. SFAS 150 is effective for all financial instruments entered into or modified after May 31, 2003. However, on October 29, 2003, the FASB indefinitely deferred the provisions of paragraph 9 and 10 of SFAS 150 related to noncontrolling interests in limited-life subsidiaries. The Company adopted SFAS 150 in 2003 and it did not have an impact on our financial statements.
F-14
Table of Contents
Index to Financial Statements
The Money Tree Inc. and Subsidiaries
Notes to Consolidated Financial Statements
NOTE 2 – SUMMARY OF SIGNIFICANT ACCOUNTING POLICIES (CONTINUED)
Recent Accounting Pronouncements (continued)
In November 2002, the FASB issued Interpretation No. 45, “Guarantor’s Accounting and Disclosure Requirements for Guarantees, Including Indirect Guarantees of Indebtedness of Others” (FIN 45). FIN 45 requires certain guarantees to be recorded at fair value. In general, FIN 45 applies to contracts or indemnification agreements that contingently require the guarantor to make payments to the guaranteed party based on changes in an underlying obligation that is related to an asset, liability, or an equity security of the guaranteed party. The initial recognition and measurement provisions of FIN 45 are applicable on a prospective basis to guarantees issued or modified after December 31, 2002. FIN 45 also requires new disclosures, even when the likelihood of making any payments under the guarantee is remote.
These disclosure requirements are effective for financial statements of interim or annual periods ending after December 15, 2002. We adopted the disclosure provisions of FIN 45 in the first fiscal quarter of 2003. In accordance with the interpretation, we adopted the remaining provisions of FIN 45 effective January 1, 2003. The adoption of FIN 45 did not have a material effect on our financial position or results of operations.
In January 2003, the FASB issued FASB Interpretation No. 46, “Consolidation of Variable Interest Entities, an interpretation of ARB No. 51” (FIN 46). The interpretation requires the consolidation of entities in which an enterprise absorbs a majority of the entity’s expected losses, receives a majority of the entity’s expected residual returns, or both, as a result of ownership, contractual or other financial interests in the entity. FIN 46 was revised in December 2003 to make certain technical corrections and address certain implementation issues that have arisen. The adoption date for FIN 46, as revised, was postponed until the first interim or annual period ending after March 15, 2004. On October 8, 2003, the FASB deferred the effective date of the consolidation provisions of FIN 46 until the quarter ended December 31, 2003, for entities formed prior to February 1, 2003. FIN 46, as revised, was adopted by us in the quarter ended March 25, 2004 and did not have a significant impact on our financial statements.
In December 2003, the Accounting Standards Executive Committee of the AICPA issued Statement of Position 03-3 (SOP),Accounting for Certain Loans or Debt Securities Acquired in a Transfer. Statement of Position 03-3 addresses accounting for differences between contractual cash flows and cash flows expected to be collected from an investor’s initial investment in loans or debt securities (loans) acquired in a transfer if those differences are attributable, at least in part, to credit quality. It includes such loans acquired in purchase business combinations and applies to all nongovernmental entities, including not-for-profit organizations. This SOP does not apply to loans originated by the entity. This SOP limits the yield that may be accreted (accretable yield) to the excess of the investor’s estimate of undiscounted expected principal, interest, and other cash flows (cash flows expected at acquisition to be collected) over the investor’s initial investment in the loan. This SOP requires that the excess of contractual cash flows over cash flows expected to be collected (nonaccretable difference) not be recognized as an adjustment of yield loss accrual, or valuation allowance. This SOP prohibits “carrying over” or creation of valuation allowances in the initial accounting of all loans acquired in a transfer that are within the scope of this SOP. The prohibition of the valuation allowance carryover applies to the purchase of an individual loan, a pool of loans, a group of loans, and loans acquired in a purchase business combination. This SOP is effective for loans acquired in fiscal years beginning after December 15, 2004. The Company is currently evaluating the impact, if any, that SOP 03-3 will have on its financial position or operating results.
F-15
Table of Contents
Index to Financial Statements
The Money Tree Inc. and Subsidiaries
Notes to Consolidated Financial Statements
NOTE 2 – SUMMARY OF SIGNIFICANT ACCOUNTING POLICIES (CONTINUED)
Recent Accounting Pronouncements (continued)
In July 2001, the FASB issued SFAS No. 142 “Goodwill and Other Intangible Assets.” SFAS 142 requires that goodwill and intangible assets with indefinite useful lives no longer be amortized, but instead tested for impairment at least annually. SFAS 142 requires that intangible assets with estimable useful lives be amortized over their respective estimated useful lives to their estimated residual values. The Company adopted SFAS 142 effective September 26, 2001. Upon adoption, the Company tested goodwill for impairment according to the provisions of SFAS 142, which resulted in no impairment required as a cumulative effect of an accounting change.
NOTE 3 – FINANCE RECEIVABLES AND ALLOWANCE FOR CREDIT LOSSES
Finance receivables consisted of the following:
September 25, | 2004 | 2003 | ||||||
Finance receivables, direct consumer | $ | 41,813,555 | $ | 36,925,920 | ||||
Finance receivables, consumer sales finance | 7,240,653 | 6,260,905 | ||||||
Finance receivables, auto sales finance | 30,557,683 | 28,820,071 | ||||||
Total gross finance receivables | 79,611,891 | 72,006,896 | ||||||
Unearned insurance commissions | (3,269,252 | ) | (2,755,550 | ) | ||||
Unearned finance charges | (9,824,824 | ) | (10,885,020 | ) | ||||
Accrued interest receivable | 1,044,936 | 1,081,425 | ||||||
Unearned discounts | (406,993 | ) | (38,135 | ) | ||||
Finance receivables, before allowance for credit losses | 67,155,758 | 59,409,616 | ||||||
Allowance for credit losses | (2,055,402 | ) | (1,704,634 | ) | ||||
Finance receivables, net | $ | 65,100,356 | $ | 57,704,982 | ||||
An analysis of the allowance for credit losses is as follows:
Years ended September 25, | 2004 | 2003 | 2002 | |||||||||
Beginning balance | $ | 1,704,634 | $ | 1,194,817 | $ | 742,274 | ||||||
Provisions for credit losses | 2,923,093 | 1,983,124 | 1,060,167 | |||||||||
Charge-offs | (2,686,875 | ) | (1,519,461 | ) | (639,243 | ) | ||||||
Recoveries | 39,554 | 32,876 | 21,570 | |||||||||
Other | 74,996 | 13,278 | 10,049 | |||||||||
Ending balance | $ | 2,055,402 | $ | 1,704,634 | $ | 1,194,817 | ||||||
It is the Company’s experience that a substantial portion of the loan portfolio generally is renewed or repaid before contractual maturity dates. During the years ended September 25, 2004, 2003, and 2002, cash collections of principal amounts of receivables (including renewals and finance charges since finance receivables are recorded and tracked at their gross precomputed amount) totaled $76,689,220, $69,141,086, and $54,529,641, respectively, and these cash collections were 101%, 118%, and 132% of average gross finance receivable balances, respectively.
F-16
Table of Contents
Index to Financial Statements
The Money Tree Inc. and Subsidiaries
Notes to Consolidated Financial Statements
NOTE 3 – FINANCE RECEIVABLES AND ALLOWANCE FOR CREDIT LOSSES (CONTINUED)
Finance receivables in a non-accrual status, including accounts in bankruptcy, totaled $10,953,155, $11,590,533, and $8,943,423 at September 25, 2004, 2003 and 2002, respectively. Because of their delinquency status, the Company considers these loans to be impaired. Consequently, the amount of loans in non-accrual status represents the Company’s investment in impaired loans. Since the Company’s portfolio of finance receivables is comprised primarily of small balance, homogenous loans, individual impairment is not performed, but rather evaluated as a group. The allowance for credit losses related to these impaired loans was $2,055,402, $1,704,634 and $1,194,817 at September 25, 2004, 2003 and 2002, respectively. Impaired loans with no related allowance for credit losses were $8,897,753, $9,885,899, and $7,748,606 at September 25, 2004, 2003 and 2002 respectively.
The Company ceases the accrual of interest income on interest-bearing finance receivables when no payment has been made for 60 days or more. Recognition of interest income suspends at 90 days contractual delinquency on accounts with precomputed interest charges. Suspended interest totaled $532,540, $343,419, and $219,671 for the years ended September 25, 2004, 2003, and 2002, respectively.
Finance receivables charged off are net of proceeds from non-filing insurance. The Company purchases non-file insurance on certain loans in lieu of filing a Uniform Commercial Code lien. Premiums collected are remitted to the insurance company to cover possible losses from charge offs as a result of not recording these liens. Amounts recoverable from non-file insurance claims totaled $5,863,816, $1,215,094, and $1,215,751 for the years ended September 25, 2004, 2003, and 2002, respectively. (The 2004 recoveries are net of $1,025,000 contingent legal fees resulting from the settlement of the payment of claims.) If this insurance product was discontinued, these proceeds would not be available to offset future credit losses and additional provisions for credit losses would be required. Amounts receivable from the insurance company related to non-file insurance claims were $3,105,530 and $101,181 at September 25, 2004 and 2003, respectively, and are included in other receivables in the accompanying consolidated balance sheets.
NOTE 4 – INVENTORY
Inventory consisted of the following:
September 25, | 2004 | 2003 | ||||
Used automobiles | $ | 1,838,035 | $ | 2,460,651 | ||
Home furnishings and electronics | 454,834 | 548,566 | ||||
Total inventory | $ | 2,292,869 | $ | 3,009,217 | ||
F-17
Table of Contents
Index to Financial Statements
The Money Tree Inc. and Subsidiaries
Notes to Consolidated Financial Statements
NOTE 5 – PROPERTY AND EQUIPMENT, NET
Property and equipment consisted of the following:
September 25, | 2004 | 2003 | ||||||
Furniture and equipment | $ | 4,651,208 | $ | 4,829,502 | ||||
Automotive equipment | 1,516,351 | 947,926 | ||||||
Leasehold improvements | 2,093,978 | 1,421,790 | ||||||
| 8,261,537 | 7,199,218 | |||||||
Accumulated depreciation | (3,604,098 | ) | (3,926,978 | ) | ||||
Total property and equipment | $ | 4,657,439 | $ | 3,272,240 | ||||
Depreciation expense totaled $817,789, $718,380 and $649,170 for the years ended September 25, 2004, 2003 and 2002, respectively.
NOTE 6 – INTANGIBLE ASSETS
In June 2001, the FASB issued Statement No. 141,”Business Combinations” (“SFAS 141”), and Statement No. 142, “Goodwill and Other Intangible Assets” (“SFAS 142”). SFAS 141 required the purchase method of accounting be used for all business combinations initiated after June 30, 2001. SFAS 141 also provided new criteria to determine whether an acquired intangible asset should be recognized separately from goodwill. Under the provisions of SFAS 142, upon adoption, amortization of existing goodwill ceases and the remaining book value is to be tested for impairment at least annually. In connection with SFAS 142’s transitional goodwill impairment evaluation, the Statement required the Company to perform an assessment of whether there is an indication that goodwill is impaired as of the date of adoption, September 26, 2001. The Company performed such assessment which resulted in no impairment. During the years ended September 25, 2004 and 2003, respectively, the Company tested goodwill for impairment according to the provisions of SFAS 142, which resulted in no impairment. Future impairment tests will be performed annually in the fourth fiscal quarter. Tests will be performed between annual tests if an event occurs or circumstances change that would indicate the carrying amount may be impaired.
Intangible assets consisted of the following:
September 25, | 2004 | 2003 | ||||
Goodwill, net of accumulated amortization of $520,825 and $520,825, respectively | $ | 1,357,067 | $ | 1,177,067 | ||
Covenants not to compete, net of accumulated amortization of $26,193, and $18,002, respectively | 31,143 | 39,334 | ||||
Total intangible assets | $ | 1,388,210 | $ | 1,216,401 | ||
Amortization of covenants not to compete totaled $8,191, $7,937, and $10,775 for the years ended September 25, 2004, 2003, and 2002, respectively.
F-18
Table of Contents
Index to Financial Statements
The Money Tree Inc. and Subsidiaries
Notes to Consolidated Financial Statements
NOTE 6 – INTANGIBLE ASSETS (CONTINUED)
The estimated amortization expense of covenants not to compete for the next five succeeding years is as follows:
Year ended September 25, | |||
2005 | $ | 8,191 | |
2006 | 6,823 | ||
2007 | 5,714 | ||
2008 | 5,714 | ||
2009 | 4,701 | ||
| $ | 31,143 | ||
NOTE 7 – ACCOUNTS PAYABLE AND OTHER ACCRUED LIABILITIES
Accounts payable and other accrued liabilities consisted of the following:
September 25, | 2004 | 2003 | ||||
Accounts payable | $ | 501,204 | $ | 514,004 | ||
Insurance payable, loan related | 667,165 | 859,334 | ||||
Accrued payroll | 485,219 | 373,436 | ||||
Accrued payroll taxes | 39,574 | 26,729 | ||||
Money orders | 794,704 | 471,195 | ||||
Sales tax payable | 895,440 | 575,575 | ||||
Other liabilities | 285,827 | 91,242 | ||||
Total accounts payable and other accrued liabilities | $ | 3,669,133 | $ | 2,911,515 | ||
F-19
Table of Contents
Index to Financial Statements
The Money Tree Inc. and Subsidiaries
Notes to Consolidated Financial Statements
NOTE 8 – DEBT
Debt consisted of the following:
September 25, | 2004 | 2003 | ||||
| Senior debt: due to commercial finance company, collateralized by finance receivables, interest at prime rate (4.5% at September 25, 2004) plus 4%, due February 1, 2005. The aggregate carrying value of collateral at September 25, 2004 was $65,100,356. | $ | 871,575 | $ | — | ||
| Senior debt: due to banks and commercial finance companies, collateralized by inventory and certain automotive equipment, and certain notes include personal guarantees of the stockholder, interest at 5.5% to 8.00% (some variable), due 2004 to 2019. The carrying value of the collateral at September 25, 2004 and 2003 were $3,283,024 and $3,423,929 respectively. | 1,190,669 | 887,717 | ||||
Total senior debt | 2,062,244 | 887,717 | ||||
F-20
Table of Contents
Index to Financial Statements
The Money Tree Inc. and Subsidiaries
Notes to Consolidated Financial Statements
NOTE 8 – DEBT (CONTINUED)
September 25, | 2004 | 2003 | ||
| Senior subordinated debt: due to credit insurance company, unsecured, guaranteed by Company’s stockholder, interest at prime plus 2% (8% floor, 12% ceiling), interest only payable quarterly, principal due November 8, 2005. The balance was paid in October 2003. | — | 2,400,000 | ||
| Senior subordinated debt due to an investment company, unsecured, guaranteed by Company’s stockholder and subsidiaries, interest at prime (4.5% and 4.0% at September 25, 2004 and 2003 respectively) plus 1% (8% floor, 12% ceiling), interest payable monthly, principal due September 1, 2006. | 700,000 | 750,000 | ||
| Senior subordinated debt: due to a finance company, unsecured, guaranteed by Company’s stockholder and subsidiaries, interest at prime (4.0% at September 25, 2003) plus 1% (8% floor, 12% ceiling), interest payable monthly, principal due September 1, 2006. The balance was paid in May 2004. | — | 750,000 | ||
Total senior subordinated debt | 700,000 | 3,900,000 | ||
| Variable rate subordinated debentures: due to individuals, unsecured, interest at 4.25% to 9.6%, due at various dates through 2008. | 61,582,281 | 52,701,092 | ||
| Demand notes: due to individuals, unsecured, interest at 4.25% to 5.0%, due on demand. | 11,701,979 | 10,277,230 | ||
| Junior subordinated debt, related parties: due to principal shareholder, interest rate at 8%, due November 20, 2006. | 300,000 | — | ||
| Junior subordinated debt, related parties: due to principal shareholder, interest rate at 8% due June 28, 2008. | 500,000 | — | ||
F-21
Table of Contents
Index to Financial Statements
The Money Tree Inc. and Subsidiaries
Notes to Consolidated Financial Statements
NOTE 8 – DEBT (CONTINUED)
September 25, | 2004 | 2003 | ||||
| Junior subordinated debt, related parties: unsecured, interest ranging from 9% to 11%, due on demand through 2007. The balance was paid in April 2004. | — | 270,928 | ||||
Total junior subordinated debt, related parties | 800,000 | 270,928 | ||||
| Junior subordianted debt, due to an individual, unsecured, interest at 10.5% to 12%, due March 2004. The balance was paid in March 2004. | — | 300,000 | ||||
| Junior subordianted debt, due to individuals, unsecured, interest at 7.00% to 11%, due on demand through 2007. The balance was paid in April 2004. | — | 191,041 | ||||
Total junior subordinated debt | — | 491,041 | ||||
Total debt | $ | 76,846,504 | $ | 68,528,008 | ||
The senior debt loan agreement contains various restrictions, including maintenance of certain financial ratios and amounts, and certain other restrictions. The Company is in compliance with these covenants and restrictions.
The senior subordinated debt, due to an investment company, was obtained in 2003 as the Company began the process of changing the entity from which it obtains its lending insurance. The loan agreements contain various restrictions, including minimum liquid net worth maintenance, limitations on certain indebtedness, and certain other restrictions. The Company is in compliance with these covenants and restrictions.
There are no pre-payment penalties on the senior debt or senior subordinated debt. At the Company’s discretion, these debt obligations could be satisfied by paying the outstanding principal balance plus accrued interest.
During fiscal 1999, the Company’s wholly owned subsidiary, The Money Tree of Georgia Inc., established an investment program under which the Company issues subordinated debentures with maturities of four years (subject to an automatic extension of another four years) and subordinated demand notes. The Company uses the net proceeds for the redemption of senior demand notes and subordinated debentures as such debtholders request redemption. Any proceeds not used for the redemptions may be used to repay bank borrowings, make additional finance loans and auto loans, and for general operating purposes. These securities are issued by The Money Tree of Georgia Inc., a wholly owned subsidiary of the Company, and are available to Georgia residents only, subject to the terms of registration statements filed with the State of Georgia.
Interest on the debentures is earned daily and is payable at any time upon request of the holder. Interest on the demand notes is payable only at the time demand is made by the holder for repayment of the note.
F-22
Table of Contents
Index to Financial Statements
The Money Tree Inc. and Subsidiaries
Notes to Consolidated Financial Statements
NOTE 8 – DEBT (CONTINUED)
The debentures may be redeemed at the holder’s option at the end of the interest adjustment period selected (one years, two years or four years) or at maturity. Demand Notes may be redeemed by holders at any time. The Company intends to meet its obligation to repay such debt with cash generated from sales of the debentures and demand notes, cash on hand, income from operations or working capital.
There are no covenants or other special conditions with respect to the Company’s junior subordinated debt.
Aggregate debt maturities at September 25, 2004 are as follows:
| 2005 | 2006 | 2007 | 2008 | 2009 | Thereafter | Total | |||||||||||||||
Senior debt, banks and finance companies | $ | 1,598,180 | $ | 129,486 | $ | 62,844 | $ | 38,864 | $ | 38,864 | $ | 194,006 | $ | 2,062,244 | |||||||
Senior subordinated debt, finance and investment companies | — | 700,000 | — | — | — | — | 700,000 | ||||||||||||||
Variable rate subordinated debentures | 12,425,929 | 11,350,991 | 14,024,413 | 20,800,194 | 2,980,754 | — | 61,582,281 | ||||||||||||||
Demand notes | 11,701,979 | — | — | — | — | — | 11,701,979 | ||||||||||||||
Subordinated debt-related parties | — | — | 300,000 | 500,000 | — | — | 800,000 | ||||||||||||||
| $ | 25,726,088 | $ | 12,180,477 | $ | 14,387,257 | $ | 21,339,058 | $ | 3,019,618 | $ | 194,006 | $ | 76,846,504 | ||||||||
Interest expense totaled $5,848,428, $4,919,059 and $3,972,801 for the years ended September 25, 2004, 2003 and 2002, respectively.
NOTE 9 – COMMON STOCK
The common stock of the Company is comprised of the following: Class A voting shares; no par value; 500,000 authorized; 2,686 shares issued and outstanding. Class B non-voting shares; no par value; 1,500,000 authorized; 26,860 shares issued and outstanding.
On December 10, 2003, the Company’s Board of Directors amended the by-laws to give it authorization to issue 500,000 shares of Class A voting stock, having no par value and 1,500,000 shares of Class B non-voting common stock, having no par value. On December 15, 2003, the Company’s Board of Directors authorized a 10-for-1 stock split to be affected in the form of a stock dividend. In connection with this split, holders of the Class A voting shares received ten shares of Class B non-voting common stock. All earnings per share figures for periods prior to the stock split have been restated to reflect the effect of the stock split.
NOTE 10 – INCOME TAXES
The Company accounts for income taxes in accordance with Statement of Financial Accounting Statement No. 109 (FAS 109); accordingly deferred income taxes are provided at the enacted marginal rates on the difference between the financial statement and income taxes bases of assets and liabilities. Deferred income tax provisions or benefits are based on the change in the deferred tax assets and liabilities from period to period.
F-23
Table of Contents
Index to Financial Statements
The Money Tree Inc. and Subsidiaries
Notes to Consolidated Financial Statements
NOTE 10 – INCOME TAXES (CONTINUED)
The provision for income taxes for the years ended 2004, 2003, and 2002 consisted of the following:
September 25, | 2004 | 2003 | 2002 | |||||||||
Current tax expense (benefit) | ||||||||||||
Federal | $ | 175,731 | $ | 39,123 | $ | (23,397 | ) | |||||
State | 50,126 | 63,452 | 72,746 | |||||||||
Total | 225,857 | 102,575 | 49,349 | |||||||||
Deferred income tax expense (benefit) | ||||||||||||
Federal | (109,000 | ) | 246,000 | (28,000 | ) | |||||||
State | (22,000 | ) | (10,000 | ) | 21,000 | |||||||
Total | (131,000 | ) | 236,000 | (7,000 | ) | |||||||
| $ | 94,857 | $ | 338,575 | $ | 42,349 | |||||||
The income tax provision differs from the amount of income tax determined by applying the U.S. federal rate to pretax income for the years ended September 25, 2004, 2003 and 2002 due to the following:
| 2004 | 2003 | 2002 | ||||||||||
Income tax expense at Federal statutory income tax rates | $ | 55,828 | $ | 291,015 | $ | 46,823 | ||||||
Increase (decrease) in income taxes resulting from: | ||||||||||||
State income taxes, net of federal tax benefit | 18,563 | 35,278 | 61,872 | |||||||||
Non-deductible expenses | 32,177 | 19,849 | 19,992 | |||||||||
Decrease in valuation allowance | — | — | (33,000 | ) | ||||||||
Other | (11,711 | ) | (7,567 | ) | (53,338 | ) | ||||||
| $ | 94,857 | $ | 338,575 | $ | 42,349 | |||||||
Net deferred tax assets consist of the following components:
September 25, | 2004 | 2003 | ||||||
Deferred tax liability: | ||||||||
Property and equipment | $ | 568,000 | $ | 269,000 | ||||
Deferred tax assets: | ||||||||
Allowance for credit losses | 822,000 | 682,000 | ||||||
Federal and state net operating loss carryforwards | 353,000 | 346,000 | ||||||
Interest income | 148,000 | 133,000 | ||||||
Insurance commissions | 595,000 | 377,000 | ||||||
Goodwill/noncompete | 120,000 | 179,000 | ||||||
Other | 138,000 | 29,000 | ||||||
| 2,176,000 | 1,746,000 | |||||||
Net deferred tax asset | 1,608,000 | 1,477,000 | ||||||
Valuation allowance | (348,000 | ) | (348,000 | ) | ||||
Net deferred tax assets, less valuation allowance | $ | 1,260,000 | $ | 1,129,000 | ||||
F-24
Table of Contents
Index to Financial Statements
The Money Tree Inc. and Subsidiaries
Notes to Consolidated Financial Statements
NOTE 10 – INCOME TAXES (CONTINUED)
The Company’s valuation allowance for deferred tax assets relates to federal and state net operating loss carryforwards. In assessing the realizability of deferred tax assets, management considers whether it is more likely than not that some portion or all of the deferred tax assets will not be realized. The ultimate realization of deferred tax assets is dependent upon the generation of future taxable income and tax planning strategies in making this assessment. In order to fully realize the deferred tax asset, the Company will need to generate future taxable income prior to the expiration of the deferred tax assets governed by the tax code. Based upon the level of historical taxable income and projections for future taxable income over the periods during which the deferred tax assets are deductible, management believes it is more likely than not that the Company will realize the benefits of these deductible differences, net of the existing valuation allowances at September 25, 2004. The amount of the deferred tax asset considered realizable, however, could be reduced in the near term if estimates of future taxable income during the carryforward period are reduced.
The company has available at September 25, 2004, unused state operating loss and charitable carryforwards of $5,706,827 that expire in various amounts in years from 2005 through 2024.
NOTE 11 – RELATED PARTY TRANSACTIONS
Related party transactions and balances consisted of the following:
September 25, | 2004 | 2003 | 2002 | ||||||
Interest expense, junior subordinated debt, related parties | $ | 28,143 | $ | 14,710 | $ | 58,336 | |||
Rent expense, principal shareholder | 1,727,304 | 1,301,469 | 921,476 | ||||||
Motor club commissions earned by The Money Tree Inc. and Subsidiaries represents sales of motor club memberships with the Company acting as agent for an affiliate owned by the shareholder and other related parties. | 1,995,389 | 1,612,109 | 2,459,536 | ||||||
Income tax service agreement income from affiliated company owned by shareholder and other related parties | 400,173 | 452,173 | 528,637 | ||||||
Advances to companies affiliated through common ownership | 5,779 | 158,775 | 164,506 | ||||||
Advances to shareholder | — | — | 495,500 | ||||||
Loans from shareholder | 800,000 | — | — | ||||||
F-25
Table of Contents
Index to Financial Statements
The Money Tree Inc. and Subsidiaries
Notes to Consolidated Financial Statements
NOTE 11 – RELATED PARTY TRANSACTIONS (CONTINUED)
The shareholder of the Company and certain family members held junior subordinated debt of the company in varying amounts during the fiscal years 2004, 2003, and 2002. The interest paid on this debt is included in the interest expense on the Consolidated Statements of Income.
The Principal shareholder owns the real estate of twelve branch offices, three used car lots, and the Company’s principal executive offices. The Company has entered into lease agreements where by rent is paid monthly for use of these locations. In addition, the principal shareholder leases, and then subleases to the Company, another 49 branch office locations for amounts greater than are paid in the underlying leases. This spread is generally to cover property operating cost or improvements made directly by the principal shareholder. In the opinion of Management, rates paid for these are comparable to those obtained from third parties. Total rents paid are included in operating expense on the Consolidated Statement of Income.
The Company receives commissions from sales of motor club memberships from an entity, owned by the principal shareholder and his three children, pursuant to an Agency Sales Agreement.
The Company receives income tax service agreement income, pursuant to a service agreement, from an entity owned by the principal shareholder and two other officers of the Company.
At various times in fiscal years 2004, 2003, and 2002, the Company or its subsidiaries advanced loans to the stockholder and companies affiliated through common ownership. These were evidenced by promissory notes and accrued interest at rates prevailing at the time of the advance. During 2004, the Company’s subsidiary, Money To Lend of Louisiana Inc., received loans from the principal shareholder totaling $800,000 (see Note 8).
NOTE 12 – OPERATING LEASES
The Company leases office locations under various non-cancelable agreements that require various minimum annual rentals.
Future minimum rental commitments at September 25, 2004 were as follows:
Year Ending September 25 | Shareholder | Other | Total | ||||||
2005 | $ | 1,587,782 | $ | 503,404 | $ | 2,091,186 | |||
2006 | 1,271,084 | 413,484 | 1,684,568 | ||||||
2007 | 859,974 | 292,655 | 1,152,629 | ||||||
2008 | 154,224 | 184,708 | 338,932 | ||||||
2009 | 77,022 | 136,725 | 213,747 | ||||||
Thereafter | 16,500 | 38,783 | 55,283 | ||||||
| $ | 3,966,586 | $ | 1,569,759 | $ | 5,536,345 | ||||
Substantially all of the lease agreements are for a five year term with one or more renewal options at end of the initial term. Rental expense totaled $2,260,344, $1,795,580, and $1,360,395 for the years ended September 25, 2004, 2003, and 2002, respectively.
F-26
Table of Contents
Index to Financial Statements
The Money Tree Inc. and Subsidiaries
Notes to Consolidated Financial Statements
NOTE 13 – CONCENTRATION OF CREDIT RISK
The Company’s portfolio of finance receivables is with consumers living throughout Georgia, Louisiana, Alabama and Florida, and consequently such consumers’ ability to honor their installment contracts may be affected by economic conditions in these areas. On sales finance contracts and certain other loans, the Company has access to any collateral on supporting these receivables through repossession. Finance receivables are collateralized by personal property, automobiles, real property and mobile homes. On unsecured loans, a non-filing insurance policy is generally obtained so that in the event of default, a claim can be filed in order to recover the unpaid balance.
The Company maintains demand deposits with financial institutions. The Company’s policy is to maintain its cash balances at reputable financial institutions insured by the Federal Deposit Insurance Corporation (FDIC), which provides $100,000 of insurance coverage on each customer’s cash balances. At times during the years ended September 25, 2004 and 2003 the Company’s cash balances exceeded the FDIC insured coverage of $100,000 by approximately $5,700,000. Management believes that this policy will not cause any adverse effect.
NOTE 14 – RETIREMENT PLAN
The Company has a 401(k) profit-sharing plan and trust. The plan covers substantially all employees, subject to attaining age 21 and completing 1 year of service with the Company. Employees may contribute 15 percent of their compensation, with the Company matching 25 percent of these contributions up to a maximum of 6 percent of the employees’ compensation.
Profit-sharing expense totaled $35,707, $22,930, and $6,683 for the years ended September 25, 2004, 2003, and 2002, respectively.
NOTE 15 – CONTINGENT LIABILITIES
The Company is a party to litigation arising in the normal course of business. With respect to all such lawsuits, claims, and proceedings, the Company accrues reserves when it is probable a liability has been incurred and the amount can reasonably be estimated. In the opinion of management, the resolution of such matters will not have a material effect on the financial statements.
NOTE 16 – DISCRETIONARY BONUSES
From time to time, the Company pays discretionary bonuses to its employees. The amount of these bonuses charged to operating expenses was $1,375,046, $1,350,836, and $1,220,252 for the years ended September 25, 2004, 2003, and 2002, respectively.
F-27
Table of Contents
Index to Financial Statements
The Money Tree Inc. and Subsidiaries
Notes to Consolidated Financial Statements
NOTE 17 – ACQUISITIONS
During fiscal year 2004, the Company completed two acquisitions in exchange for cash consideration of $3,971,240. The transactions consist of the following:
| • | On December 10, 2003, our wholly owned subsidiary, Money To Lend of Louisiana Inc., purchased the assets of the Louisiana offices of Stewart Finance Company in bankruptcy proceedings for aggregate cash consideration of $3,194,037. |
| • | On June 28, 2004, our wholly owned subsidiary, Money To Lend of Louisiana Inc., purchased the assets of the offices in Louisiana of Titan Financial Louisiana LLC for aggregate cash consideration of $777,203. |
At various points in fiscal year 2003, our wholly owned subsidiary, The Money Tree of Georgia Inc., purchased the assets of four individual competitors in selected markets for combined aggregate cash consideration of $601,526.
At various points in fiscal year 2002, our wholly owned subsidiary, The Money Tree of Georgia Inc., purchased the assets of four individual competitors in selected markets for combined aggregate cash consideration of $671,678.
The Company’s acquisitions during fiscal years 2004, 2003 and 2002 were accounted for under the purchase method of accounting. Under the purchase method of accounting, the results of operations of the acquired businesses are included in the accompanying consolidated financial statements as of their respective acquisition dates. The identifiable assets and liabilities of acquired businesses are recorded at their estimated fair values with the excess of the purchase price over such identifiable net assets allocated to goodwill.
The following schedule summarizes the acquisitions during fiscal years 2004, 2003, and 2002 that are included in the consolidated statement of cash flows:
September 25, | 2004 | 2003 | 2002 | |||||||||
Fair value of assets acquired: | ||||||||||||
Finance receivables acquired, gross | $ | 5,428,291 | $ | 491,049 | $ | 709,779 | ||||||
Unearned discounts, interest, fees | (1,912,357 | ) | (85,347 | ) | (236,037 | ) | ||||||
Finance receivables, net | 3,515,934 | 405,702 | 473,742 | |||||||||
Property, equipment/other assets | 275,306 | — | — | |||||||||
Non-compete agreements | — | 10,000 | 30,000 | |||||||||
Goodwill acquired | 180,000 | 185,824 | 169,159 | |||||||||
Cash paid for acquisitions, net of cash acquired | $ | 3,971,240 | $ | 601,526 | $ | 672,901 | ||||||
All of the total goodwill recorded in connection with the Company’s acquisitions during fiscal years 2004, 2003 and 2002 is expected to be deductible for income tax purposes. The weighted average useful life for all intangible assets subject to amortization is seven years.
Pro forma operating results for the Company’s acquisitions during fiscal 2004, 2003 and 2002 have not been presented as they are not significantly different than reported amounts.
F-28
Table of Contents
Index to Financial Statements
The Money Tree Inc. and Subsidiaries
Notes to Consolidated Financial Statements
NOTE 18 – SEGMENT FINANCIAL INFORMATION
Statement of Financial Accounting Standards No. 131, “Disclosure about Segments of an Enterprise and Related Information” (SFAS 131), requires companies to determine segments based on how management makes decisions about allocating resources to segments and measuring their performance.
The Company has two reportable segments: Consumer Finance and Sales and Automotive Finance and Sales.
Consumer finance and sales segment
This segment is comprised of original core operations of the Company: the small consumer loan business in the four states in which the Company operates. The 95 offices that make up this segment are similar in size and in the market is serves. All, with few exceptions, offer consumer goods for sale acting as an agent for another subsidiary of the Company, Home Furniture Mart Inc., which is aggregated in this segment since its sales are generated through these finance offices. This segment is structured with branch management reporting through a regional management level to an operational manager and ultimately to the chief operating decision maker.
Automotive finance and sales segment
This segment is comprised of three used automobile sales locations and offers financing in conjunction with these sales. These locations target similar customers in the Bainbridge, GA and Columbus, GA markets and surrounding areas who generally cannot qualify for traditional financing. The sales and the financing organizations are aggregated in the segment. A general manager is responsible for sales and finance administration at each of the locations and reports to an operational manager and ultimately to the chief operating decision maker.
Accounting policies of the segments are the same as those described in the summary of significant accounting policies. Performance is measured by various factors such as segment profit, loan volumes and delinquency and loss management. All corporate expenses are allocated to the segments. Provision for income taxes are not allocated to segments.
F-29
Table of Contents
Index to Financial Statements
The Money Tree Inc. and Subsidiaries
Notes to Consolidated Financial Statements
Year ended September 25, 2004 | Consumer Finance & Sales Segment | Automotive Finance & Sales Segment | Total Segments | |||||||||
| In Thousands | ||||||||||||
Interest income | 13,584 | 4,271 | 17,855 | |||||||||
Interest expense | (4,045 | ) | (1,803 | ) | (5,848 | ) | ||||||
Net interest income before provision for credit losses | $ | 9,539 | $ | 2,468 | $ | 12,007 | ||||||
Provision for credit losses | (1,345 | ) | (1,578 | ) | (2,923 | ) | ||||||
Net interest income after provision for credit losses | 8,194 | 890 | 9,084 | |||||||||
Insurance commissions | 6,248 | 229 | 6,477 | |||||||||
Commissions from sale of motor club memberships from affiliated company | 1,995 | — | 1,995 | |||||||||
Income tax service agreement from affiliated company | 400 | — | 400 | |||||||||
Other income | 2,023 | 111 | 2,134 | |||||||||
Net revenues before retail sales | 18,860 | 1,230 | 20,090 | |||||||||
Gross margin on retail sales | 1,470 | 3,489 | 4,959 | |||||||||
Segment operating expenses | (20,960 | ) | (3,894 | ) | (24,854 | ) | ||||||
Segment operating profit (loss) | $ | (630 | ) | $ | 825 | $ | 195 | |||||
Depreciation and amortization | 399 | 76 | 475 | |||||||||
| 52,186 | 28,130 | 80,316 | ||||||||||
Capital expenditures | 695 | 436 | 1,131 | |||||||||
RECONCILIATION: | 2004 | |||||||||||
Depreciation and amortization: | ||||||||||||
Segment depreciation and amortization | $ | 475 | ||||||||||
Depreciation and amortization at corporate level | 343 | |||||||||||
Total depreciation and amortization | $ | 818 | ||||||||||
Assets: | ||||||||||||
Total assets for reportable segments | $ | 80,316 | ||||||||||
Cash and cash equivalents at corporate level | 60 | |||||||||||
Other receivables at corporate level | 4,904 | |||||||||||
Employee receivables at corporate level | 18 | |||||||||||
Property and equipment, net at corporate level | 1,436 | |||||||||||
Prepaid income taxes | 53 | |||||||||||
Deferred income taxes at corporate level | 1,260 | |||||||||||
Other assets at corporate level | 717 | |||||||||||
Consolidated total assets | $ | 88,764 | ||||||||||
Total capital expenditures for reportable segments | $ | 1,131 | ||||||||||
Capital expenditures at corporate level | 924 | |||||||||||
Total capital expenditures | $ | 2,055 | ||||||||||
F-30
Table of Contents
Index to Financial Statements
The Money Tree Inc. and Subsidiaries
Notes to Consolidated Financial Statements
Year ended September 25, 2003 | Consumer Finance & Sales Segment | Automotive Finance & Sales Segment | Total Segments | |||||||||
| In Thousands | ||||||||||||
Interest income | 10,031 | 3,970 | 14,001 | |||||||||
Interest expense | (3,273 | ) | (1,646 | ) | (4,919 | ) | ||||||
Net interest income before provision for credit losses | $ | 6,758 | $ | 2,324 | $ | 9,082 | ||||||
Provision for credit losses | (1,139 | ) | (844 | ) | (1,983 | ) | ||||||
Net interest income after provision for credit losses | 5,619 | 1,480 | 7,099 | |||||||||
Insurance commissions | 5,976 | 201 | 6,177 | |||||||||
Commissions from sale of motor club memberships from affiliated company | 1,612 | — | 1,612 | |||||||||
Income tax service agreement from affiliated company | 452 | — | 452 | |||||||||
Other income | 1,477 | 54 | 1,531 | |||||||||
Net revenues before retail sales | 15,136 | 1,735 | 16,871 | |||||||||
Gross margin on retail sales | 2,117 | 3,616 | 5,733 | |||||||||
Segment operating expenses | (18,307 | ) | (3,421 | ) | (21,728 | ) | ||||||
Segment operating profit (loss) | $ | (1,054 | ) | $ | 1,930 | $ | 876 | |||||
Depreciation and amortization | 317 | 68 | 385 | |||||||||
Total segment assets | 47,198 | 25,714 | 72,912 | |||||||||
Capital expenditures | 408 | 115 | 523 | |||||||||
RECONCILIATION: | 2003 | |||||||||||
Depreciation and amortization: | ||||||||||||
Segment depreciation and amortization | $ | 385 | ||||||||||
Depreciation and amortization at corporate level | 333 | |||||||||||
Total depreciation and amortization | $ | 718 | ||||||||||
Assets: | ||||||||||||
Total assets for reportable segments | $ | 72,912 | ||||||||||
Cash and cash equivalents at corporate level | 98 | |||||||||||
Other receivables at corporate level | 2,074 | |||||||||||
Employee receivables at corporate level | 17 | |||||||||||
Property and equipment, net at corporate level | 942 | |||||||||||
Deferred income taxes at corporate level | 1,129 | |||||||||||
Other assets at corporate level | 502 | |||||||||||
Consolidated total assets | $ | 77,674 | ||||||||||
Total capital expenditures for reportable segments | $ | 523 | ||||||||||
Capital expenditures at corporate level | 298 | |||||||||||
Total capital expenditures | $ | 821 | ||||||||||
F-31
Table of Contents
Index to Financial Statements
The Money Tree Inc. and Subsidiaries
Notes to Consolidated Financial Statements
Year ended September 25, 2002 | Consumer Finance & Sales Segment | Automotive Finance & Sales Segment | Total Segments | |||||||||
| In Thousands | ||||||||||||
Interest income | 8,666 | 1,974 | 10,640 | |||||||||
Interest expense | (2,686 | ) | (1,287 | ) | (3,973 | ) | ||||||
Net interest income before provision for credit losses | $ | 5,980 | $ | 687 | $ | 6,667 | ||||||
Provision for credit losses | (753 | ) | (307 | ) | (1,060 | ) | ||||||
Net interest income after provision for credit losses | 5,227 | 380 | 5,607 | |||||||||
Insurance commissions | 4,808 | 85 | 4,893 | |||||||||
Commissions from sale of motor club memberships from affiliated company | 2,459 | — | 2,459 | |||||||||
Income tax service agreement from affiliated company | 529 | — | 529 | |||||||||
Other income | 1,604 | 1 | 1,605 | |||||||||
Net revenues before retail sales | 14,627 | 466 | 15,093 | |||||||||
Gross margin on retail sales | 1,799 | 2,251 | 4,050 | |||||||||
Segment operating expenses | (16,951 | ) | (2,038 | ) | (18,989 | ) | ||||||
Segment operating profit (loss) | $ | (525 | ) | $ | 679 | $ | 154 | |||||
Depreciation and amortization | 262 | 50 | 312 | |||||||||
Total segment assets | 37,121 | 15,038 | 52,159 | |||||||||
Capital expenditures | 751 | 499 | 1,250 | |||||||||
RECONCILIATION: | 2002 | |||||||||||
Depreciation and amortization: | ||||||||||||
Segment depreciation and amortization | $ | 312 | ||||||||||
Depreciation and amortization at corporate level | 337 | |||||||||||
Total depreciation and amortization | $ | 649 | ||||||||||
Assets: | ||||||||||||
Total assets for reportable segments | $ | 52,159 | ||||||||||
Cash and cash equivalents at corporate level | 44 | |||||||||||
Other receivables at corporate level | 2,103 | |||||||||||
Employee receivables at corporate level | 39 | |||||||||||
Property and equipment, net at corporate level | 1,135 | |||||||||||
Deferred income taxes at corporate level | 1,365 | |||||||||||
Other assets at corporate level | 521 | |||||||||||
Consolidated total assets | $ | 57,366 | ||||||||||
Total capital expenditures for reportable segments | $ | 1,250 | ||||||||||
Capital expenditures at corporate level | 328 | |||||||||||
Total capital expenditures | $ | 1,578 | ||||||||||
F-32
Table of Contents
Index to Financial Statements
The Money Tree Inc. and Subsidiaries
Consolidated Balance Sheets
| June 25, 2005 | September 25, 2004 | |||||||
| (Unaudited) | ||||||||
Assets | ||||||||
Cash and cash equivalents | $ | 8,612,546 | $ | 8,373,114 | ||||
Finance receivables, net | 72,703,358 | 65,100,356 | ||||||
Other receivables | 2,428,019 | 4,904,088 | ||||||
Employee receivables | 7,592 | 18,027 | ||||||
Inventory | 3,151,598 | 2,292,869 | ||||||
Property and equipment, net | 4,992,794 | 4,657,439 | ||||||
Deferred income taxes | 1,842,000 | 1,260,000 | ||||||
Intangible assets | 1,382,067 | 1,388,210 | ||||||
Other assets | 1,209,687 | 769,878 | ||||||
Total assets | $ | 96,329,661 | $ | 88,763,981 | ||||
Liabilities and Shareholder’s Equity | ||||||||
Liabilities | ||||||||
Accounts payable and other accrued liabilities | $ | 5,044,715 | $ | 3,669,133 | ||||
Accrued interest payable | 9,133,980 | 7,843,615 | ||||||
Senior debt | 1,305,741 | 2,062,244 | ||||||
Senior subordinated debt | — | 700,000 | ||||||
Variable rate subordinated debentures | 66,879,555 | 61,582,281 | ||||||
Demand notes | 12,397,681 | 11,701,979 | ||||||
Junior subordinated debt, related parties | 800,000 | 800,000 | ||||||
Total liabilities | 95,561,672 | 88,359,252 | ||||||
Shareholder’s equity | ||||||||
Common stock: | ||||||||
Class A voting, no par value; 500,000 shares authorized 2,686 shares issued and outstanding | 1,677,647 | 1,677,647 | ||||||
Class B voting, no par value; 1,500,000 shares authorized, 26,860 shares issued and outstanding | — | — | ||||||
Retained earnings (deficit) | (909,658 | ) | (1,272,918 | ) | ||||
Total shareholder’s equity | 767,989 | 404,729 | ||||||
Total liabilities and shareholder’s equity | $ | 96,329,661 | $ | 88,763,981 | ||||
See accompanying notes to the consolidated financial statements.
F-33
Table of Contents
Index to Financial Statements
The Money Tree Inc. and Subsidiaries
Consolidated Statements of Income
Nine months ended June 25, | 2005 | 2004 | ||||||
| (Unaudited) | ||||||||
Interest income | $ | 14,065,760 | $ | 12,973,502 | ||||
Interest expense | (4,686,549 | ) | (4,334,527 | ) | ||||
Net interest income before provision for credit losses | 9,379,211 | 8,638,975 | ||||||
Provision for credit losses | (1,514,731 | ) | (1,294,938 | ) | ||||
Net interest income after provision for credit losses | 7,864,480 | 7,344,037 | ||||||
Insurance commissions | 7,500,474 | 5,134,204 | ||||||
Commissions from motor club memberships from company owned by related parties | 1,253,074 | 1,409,400 | ||||||
Income tax service agreement income from company owned by related parties | 161,739 | 400,173 | ||||||
Other income | 1,885,249 | 1,347,395 | ||||||
Net revenue before retail sales | 18,665,016 | 15,635,209 | ||||||
Retail sales | 11,966,526 | 11,699,387 | ||||||
Cost of sales | (7,967,775 | ) | (8,003,411 | ) | ||||
Gross margin on retail sales | 3,998,751 | 3,695,976 | ||||||
Net revenues | 22,663,767 | 19,331,185 | ||||||
Operating expenses | ||||||||
Personnel expense | (11,489,573 | ) | (9,575,421 | ) | ||||
Facilities expense | (3,128,068 | ) | (2,544,121 | ) | ||||
General and administrative expenses | (3,847,884 | ) | (2,065,313 | ) | ||||
Other operating expenses | (3,585,713 | ) | (3,982,216 | ) | ||||
Total operating expenses | (22,051,238 | ) | (18,167,071 | ) | ||||
Net operating profit | 612,529 | 1,164,114 | ||||||
Gain (loss) on sale of assets | 34,583 | (663 | ) | |||||
Income before income taxes | 647,112 | 1,163,451 | ||||||
Income tax (expense) | (283,853 | ) | (454,420 | ) | ||||
Net income | $ | 363,259 | $ | 709,031 | ||||
Net income per common share, basic and diluted | $ | 12.29 | $ | 24.00 | ||||
See accompanying notes to the consolidated financial statements.
F-34
Table of Contents
Index to Financial Statements
The Money Tree Inc. and Subsidiaries
Consolidated Statements of Cash Flows
Nine months ended June 25, | 2005 | 2004 | ||||||
| (Unaudited) | ||||||||
Cash flows from operating activities | ||||||||
Net income | $ | 363,259 | $ | 709,031 | ||||
Adjustments to reconcile net income to net cash provided by operating activities: | ||||||||
Provision for credit losses | 1,514,731 | 1,294,938 | ||||||
Depreciation | 666,641 | 597,001 | ||||||
Amortization | 6,143 | 6,144 | ||||||
Deferred income taxes | (582,000 | ) | — | |||||
Gain on sale of property and equipment | (34,583 | ) | 663 | |||||
Change in assets and liabilities, net of effect of acquisitions: | ||||||||
Other receivables | 2,476,069 | (7,227,845 | ) | |||||
Employee receivables | 10,435 | 4,343 | ||||||
Inventory | (858,729 | ) | 676,162 | |||||
Other assets | (439,809 | ) | (415,875 | ) | ||||
Accounts payable and other accrued liabilities | 1,375,583 | 448,042 | ||||||
Accrued interest payable | 1,290,365 | 1,450,858 | ||||||
Net cash provided by (used in) operating activities | 5,788,105 | (2,456,538 | ) | |||||
Cash flows from investing activities, net of effect of acquisitions | ||||||||
Loans originated | (61,576,765 | ) | (46,607,392 | ) | ||||
Loans repaid | 52,459,032 | 46,462,618 | ||||||
Purchase of property and equipment | (1,023,143 | ) | (1,512,659 | ) | ||||
Proceeds from sale of property and equipment | 55,730 | 52,296 | ||||||
Acquisition of businesses, net of cash acquired | — | (3,012,673 | ) | |||||
Net cash used in investing activities | (10,085,146 | ) | (4,617,810 | ) | ||||
Cash flows from financing activities | ||||||||
Net proceeds (repayments) on: | ||||||||
Senior debt | (756,503 | ) | 2,082,566 | |||||
Senior subordinated debt | (700,000 | ) | (2,900,000 | ) | ||||
Junior subordinated debt, related parties | — | (761,969 | ) | |||||
Demand notes | 695,703 | 1,292,048 | ||||||
Proceeds-variable rate subordinated debentures | 13,293,672 | 16,926,604 | ||||||
Payments-variable rate subordinated debentures | (7,996,399 | ) | (9,242,530 | ) | ||||
Net cash provided by financing activities | 4,536,473 | 7,396,719 | ||||||
Net change in cash and cash equivalents | 239,432 | 322,371 | ||||||
Cash and cash equivalents, beginning of period | 8,373,114 | 8,749,412 | ||||||
Cash and cash equivalents, end of period | $ | 8,612,546 | $ | 9,071,783 | ||||
See accompanying notes to the consolidated financial statements.
F-35
Table of Contents
Index to Financial Statements
The Money Tree Inc. and Subsidiaries
Consolidated Statements of Cash Flows (continued)
Nine months ended June 25, | 2005 | 2004 | ||||
| (Unaudited) | ||||||
SUPPLEMENTAL DISCLOSURE OF CASH FLOW INFORMATION: | ||||||
Cash paid during the period for: | ||||||
Interest | $ | 3,396,184 | $ | 2,883,669 | ||
Income taxes | $ | 356,560 | $ | 258,425 | ||
See accompanying notes to the consolidated financial statements.
F-36
Table of Contents
Index to Financial Statements
The Money Tree Inc. and Subsidiaries
Notes to Unaudited Consolidated Financial Statements
NOTE 1 – BASIS OF PRESENTATION
The consolidated financial statements of The Money Tree Inc., a Georgia corporation (the “Parent”) and subsidiaries (collectively with the Parent, the “Company”) included herein have been prepared by the Company without audit, pursuant to the rules and regulations of the United States Securities and Exchange Commission. Certain information and footnote disclosure normally included in financial statements prepared in accordance with accounting principles generally accepted in the United States have been omitted.
The consolidated financial statements include the accounts of the Company and all of its subsidiaries after eliminating all significant intercompany transactions and reflect all normal, recurring adjustments which are, in the opinion of management, necessary to present a fair statement of the results of operations of the Company in conformity with accounting principles generally accepted in the United States for the interim periods reported. The results of operations for the nine months ended June 25, 2005 are not necessarily indicative of the results for the full fiscal year.
NOTE 2 – NATURE OF BUSINESS
The Company’s business consists of: the operation of finance company offices in 100 locations throughout Georgia, Alabama, Louisiana and Florida; sales of retail merchandise (principally furniture, appliances, and electronics) at certain finance company locations; and the operation of four used automobile dealerships in the state of Georgia. The Company also earns revenues from commissions on premiums written for certain insurance products, when requested by loan customers, as an agent for a non-affiliated insurance company. Revenues are also generated from commissions on the sales of prepaid phone service and automobile club memberships.
The Company’s loan portfolio consists of sales finance loan receivables and direct consumer loan receivables. Sales finance loan receivables consist principally of retail installment sale contracts collateralized by used automobiles and consumer goods which are initiated by automobile and consumer good dealerships, subject to credit approval, in the locations where the Company operates offices. Direct loan receivables are loans originated directly to customers.
F-37
Table of Contents
Index to Financial Statements
The Money Tree Inc. and Subsidiaries
Notes to Unaudited Consolidated Financial Statements
NOTE 3 – RECENT ACCOUNTING PRONOUNCEMENTS
In December 2003, the Accounting Standards Executive Committee of the AICPA issued Statement of Position 03-3 (SOP 03-3),Accounting for Certain Loans or Debt Securities Acquired in a Transfer. SOP 03-3 addresses accounting for differences between contractual cash flows and cash flows expected to be collected from an investor’s initial investment in loans or debt securities (loans) acquired in a transfer if those differences are attributable, at least in part, to credit quality. It includes such loans acquired in purchase business combinations and applies to all nongovernmental entities, including not-for-profit organizations. This SOP does not apply to loans originated by the entity. This SOP limits the yield that may be accreted (accretable yield) to the excess of the investor’s estimate of undiscounted expected principal, interest, and other cash flows (cash flows expected at acquisition to be collected) over the investor’s initial investment in the loan. This SOP requires that the excess of contractual cash flows over cash flows expected to be collected (nonaccretable difference) not be recognized as an adjustment of yield loss accrual, or valuation allowance. This SOP prohibits “carrying over” or creation of valuation allowances in the initial accounting of all loans acquired in a transfer that are within the scope of this SOP. The prohibition of the valuation allowance carryover applies to the purchase of an individual loan, a pool of loans, a group of loans, and loans acquired in a purchase business combination. This SOP is effective for loans acquired in fiscal years beginning after December 15, 2004. The Company is currently evaluating the impact, if any, that SOP 03-3 will have on its financial position or operating results.
NOTE 4 – FINANCE RECEIVABLES AND ALLOWANCE FOR CREDIT LOSSES
Finance receivables consisted of the following:
| June 25, 2005 | September 25, 2004 | |||||||
| (Unaudited) | ||||||||
Finance receivables, direct consumer | $ | 50,601,796 | $ | 41,813,555 | ||||
Finance receivables, consumer sales finance | 9,410,055 | 7,240,653 | ||||||
Finance receivables, auto sales finance | 29,155,062 | 30,557,683 | ||||||
Total gross finance receivables | 89,166,913 | 79,611,891 | ||||||
Unearned insurance commissions | (4,747,267 | ) | (3,269,252 | ) | ||||
Unearned finance charges | (10,359,777 | ) | (9,824,824 | ) | ||||
Accrued interest receivable | 1,144,294 | 1,044,936 | ||||||
Unearned discounts | (239,694 | ) | (406,993 | ) | ||||
Finance receivables, before allowance for credit losses | 74,964,469 | 67,155,758 | ||||||
Allowance for credit losses | (2,261,111 | ) | (2,055,402 | ) | ||||
Finance receivables, net | $ | 72,703,358 | $ | 65,100,356 | ||||
F-38
Table of Contents
Index to Financial Statements
The Money Tree Inc. and Subsidiaries
Notes to Unaudited Consolidated Financial Statements
NOTE 4 – FINANCE RECEIVABLES AND ALLOWANCE FOR CREDIT LOSSES (Continued)
An analysis of the allowance for credit losses is as follows:
| As of and for the nine months ended June 25, 2005 | As of and for the year ended September 25, 2004 | |||||||
| (Unaudited) | ||||||||
Beginning balance | $ | 2,055,402 | $ | 1,704,634 | ||||
Provisions for credit losses | 1,514,731 | 2,923,093 | ||||||
Charge-offs | (1,463,630 | ) | (2,686,875 | ) | ||||
Recoveries | 24,378 | 39,554 | ||||||
Other | 130,230 | 74,996 | ||||||
Ending balance | $ | 2,261,111 | $ | 2,055,402 | ||||
NOTE 5 – OTHER RECEIVABLES
Other receivables consisted of the following
| June 25, 2005 | September 25, 2004 | |||||
| (Unaudited) | ||||||
Insurance receivable - non file | $ | 652,454 | $ | 3,105,530 | ||
Insurance commissions | 1,741,742 | 1,781,190 | ||||
Other | 33,823 | 17,368 | ||||
Total other receivables | $ | 2,428,019 | $ | 4,904,088 | ||
NOTE 6 – INVENTORY
Inventory consisted of the following:
| June 25, 2005 | September 25, 2004 | |||||
| (Unaudited) | ||||||
Used automobiles | $ | 2,476,332 | $ | 1,838,035 | ||
Home furnishings and electronics | 675,266 | 454,834 | ||||
Total inventory | $ | 3,151,598 | $ | 2,292,869 | ||
F-39
Table of Contents
Index to Financial Statements
The Money Tree Inc. and Subsidiaries
Notes to Unaudited Consolidated Financial Statements
NOTE 7 – ACCOUNTS PAYABLE AND OTHER ACCRUED LIABILITIES
Accounts payable and other accrued liabilities consisted of the following:
| June 25, 2005 | September 25, 2004 | |||||
| (Unaudited) | ||||||
Accounts payable | $ | 994,560 | $ | 501,204 | ||
Insurance payable, loan related | 861,597 | 667,165 | ||||
Accrued payroll | 554,595 | 485,219 | ||||
Accrued payroll taxes | 42,872 | 39,574 | ||||
Money orders | 986,464 | 794,704 | ||||
Sales tax payable | 1,041,651 | 895,440 | ||||
Other liabilities | 562,976 | 285,827 | ||||
Total accounts payable and other accrued liabilities | $ | 5,044,715 | $ | 3,669,133 | ||
NOTE 8 – DEBT
Debt consisted of the following:
| June 25, 2005 | September 25, 2004 | |||||
| (Unaudited) | ||||||
| Senior debt: due to commercial finance company, collateralized by finance receivables, interest at prime rate (4.5% at September 25, 2004) plus 4%, due February 1, 2005. The aggregate carrying value of collateral at September 25, 2004 was $65,100,356. | $ | — | $ | 871,575 | ||
| Senior debt: due to banks and commercial finance companies, collateralized by inventory and certain automotive equipment, and certain notes include personal guarantees of the stockholder, interest at 5.5% to 8.00% (some variable), due 2004 to 2019. The carrying value of the collateral at June 25, 2005 and September 25, 2004 were $2,334,432 and $3,283,024, respectively. | 1,305,741 | 1,190,669 | ||||
Total senior debt | 1,305,741 | 2,062,244 | ||||
F-40
Table of Contents
Index to Financial Statements
The Money Tree Inc. and Subsidiaries
Notes to Unaudited Consolidated Financial Statements
| June 25, 2005 | September 25, 2004 | |||||
| (Unaudited) | ||||||
| Senior subordinated debt due to an investment company, unsecured, guaranteed by Company’s stockholder and subsidiaries, interest at prime (4.5% at September 25, 2004 plus 1 % (8% floor, 12% ceiling), interest payable monthly. The balance due was paid on April 1, 2005. | — | 700,000 | ||||
Total senior subordinated debt | — | 700,000 | ||||
| Variable rate subordinated debentures: due to individuals, unsecured, interest at 4.25% to 9.6%, due at various dates through 2008. | 66,879,555 | 61,582,281 | ||||
| Demand notes: due to individuals, unsecured, interest at 4.25% to 5.0%, due on demand. | 12,397,681 | 11,701,979 | ||||
| Junior subordinated debt, related parties: due to principal shareholder, interest rate at 8%, due November 20, 2006. | 300,000 | 300,000 | ||||
| Junior subordinated debt, related parties: due to principal shareholder, interest rate at 8% due June 28, 2008. | 500,000 | 500,000 | ||||
Total junior subordinated debt, related parties | 800,000 | 800,000 | ||||
Total debt | $ | 81,382,977 | $ | 76,846,504 | ||
NOTE 9 – INCOME TAXES
The Company accounts for income taxes in accordance with Statement of Financial Accounting Statement No. 109 (FAS 109); accordingly deferred income taxes are provided at the enacted marginal rates on the difference between the financial statement and income taxes bases of assets and liabilities. Deferred income tax provisions or benefits are based on the change in the deferred tax assets and liabilities from period to period.
F-41
Table of Contents
Index to Financial Statements
The Money Tree Inc. and Subsidiaries
Notes to Unaudited Consolidated Financial Statements
NOTE 10 – RELATED PARTY TRANSACTIONS
The Principal shareholder owns the real estate of twelve branch offices, three used car lots, and the Company’s principal executive offices. The Company has entered into lease agreements where by rent is paid monthly for use of these locations. In addition, the principal shareholder leases, and then subleases to the Company, another 56 branch office locations for amounts greater than are paid in the underlying leases. This spread is generally to cover property operating cost or improvements made directly by the principal shareholder. In the opinion of Management, rates paid for these are comparable to those obtained from third parties. Total rents paid were $1,566,019 and $1,279,075 for the nine months ended June 25, 2005 and 2004, respectively and are included in operating expense on the Accompanying Unaudited Consolidated Statement of Income.
The Company receives commissions from sales of motor club memberships from an entity, owned by the principal shareholder and his three children, pursuant to an Agency Sales Agreement. Commissions earned on the sale of these memberships were $1,253,074 and $1,409,400 for the nine months ended June 25, 2005 and 2004 respectively.
The Company also engages from time to time in other transactions with related parties. Refer to the “Related Party Transactions” disclosure in the notes to the Company’s Consolidated Financial Statements as of and for the year ended September 25, 2004.
NOTE 11 – CONTINGENT LIABILITIES
The Company is a party to litigation arising in the normal course of business. With respect to all such lawsuits, claims, and proceedings, the Company accrues reserves when it is probable a liability has been incurred and the amount can reasonably be estimated. In the opinion of management, the resolution of such matters will not have a material effect on the financial statements.
NOTE 12 – DISCRETIONARY BONUSES
From time to time, the Company pays discretionary bonuses to its employees. The amount of these bonuses charged to operating expenses was $1,438,439 and $1,062,280 for the nine months ended June 25, 2005 and 2004, respectively.
F-42
Table of Contents
Index to Financial Statements
The Money Tree Inc. and Subsidiaries
Notes to Unaudited Consolidated Financial Statements
NOTE 13 – NET INCOME PER COMMON SHARE
Net income per share is computed based upon weighted-average common shares outstanding. The basic weighted-average shares have been restated for stock splits affected in the form of stock dividends for the nine months ended June 25, 2005 and 2004. There are no potentially dilutive securities issued or outstanding.
NOTE 14 – SEGMENT FINANCIAL INFORMATION
Statement of Financial Accounting Standards No. 131, “Disclosure about Segments of an Enterprise and Related Information” (SFAS 131), requires companies to determine segments based on how management makes decisions about allocating resources to segments and measuring their performance.
The Company has two reportable segments: Consumer Finance and Sales and Automotive Finance and Sales.
Consumer finance and sales segment
This segment is comprised of original core operations of the Company: the small consumer loan business in the four states in which the Company operates. The 100 offices that make up this segment are similar in size and in the market is serves. All, with few exceptions, offer consumer goods for sale acting as an agent for another subsidiary of the Company, Home Furniture Mart Inc., which is aggregated in this segment since its sales are generated through these finance offices. This segment is structured with branch management reporting through a regional management level to an operational manager and ultimately to the chief operating decision maker.
Automotive finance and sales segment
This segment is comprised of four used automobile sales locations and offers financing in conjunction with these sales. These locations target similar customers in the Bainbridge, GA, Columbus, GA and Dublin, GA markets and surrounding areas who generally cannot qualify for traditional financing. The sales and the financing organizations are aggregated in the segment. A general manager is responsible for sales and finance administration at each of the locations and reports to an operational manager and ultimately to the chief operating decision maker.
Accounting policies of the segments are the same as those described in the summary of significant accounting policies. Performance is measured by various factors such as segment profit, loan volumes and delinquency and loss management. All corporate expenses are allocated to the segments. Provision for income taxes are not allocated to segments.
F-43
Table of Contents
Index to Financial Statements
The Money Tree Inc. and Subsidiaries
Notes to Unaudited Consolidated Financial Statements
Nine months ended June 25, 2005 | Consumer Finance & Sales Division | Automotive Finance & Sales Division | Total Segments | |||||||||
| In Thousands | (Unaudited) | |||||||||||
Net revenues before retail sales | $ | 17,866 | $ | 800 | $ | 18,666 | ||||||
Net margin on retail sales | 1,869 | 2,129 | 3,998 | |||||||||
Segment operating expenses | (19,053 | ) | (2,998 | ) | (22,051 | ) | ||||||
Segment operating profit (loss) | $ | 682 | $ | (69 | ) | $ | 613 | |||||
June 25, 2005 | ||||||||||||
| In Thousands | ||||||||||||
Assets | ||||||||||||
Total segment assets | $ | 60,545 | $ | 28,856 | $ | 89,401 | ||||||
RECONCILIATION: | 6/25/2005 | |||||||||||
| (Thousands) | ||||||||||||
Assets: | ||||||||||||
Total assets for reportable segments | $ | 89,401 | ||||||||||
Cash and cash equivalents at corporate level | 68 | |||||||||||
Other receivables at corporate level | 2,428 | |||||||||||
Employee receivables at corporate level | 8 | |||||||||||
Property and equipment, net at corporate level | 1,374 | |||||||||||
Deferred income taxes at corporate level | 1,842 | |||||||||||
Other assets at corporate level | 1,209 | |||||||||||
Consolidated Assets | $ | 96,330 | ||||||||||
F-44
Table of Contents
Index to Financial Statements
The Money Tree Inc. and Subsidiaries
Notes to Unaudited Consolidated Financial Statements
Nine months ended June 25, 2004 | Consumer Finance & Sales Division | Automotive Finance & Sales Division | Total Segments | |||||||||
| In Thousands | (Unaudited) | |||||||||||
Net revenues before retail sales | $ | 14,654 | $ | 981 | $ | 15,635 | ||||||
Net margin on retail sales | 1,023 | 2,673 | 3,696 | |||||||||
Segment operating expenses | (15,388 | ) | (2,779 | ) | (18,167 | ) | ||||||
Segment operating profit | $ | 289 | $ | 875 | $ | 1,164 | ||||||
June 25, 2004 | ||||||||||||
| In Thousands | ||||||||||||
Assets | ||||||||||||
Total segment assets | $ | 46,685 | $ | 28,189 | $ | 74,874 | ||||||
RECONCILIATION: | 6/25/2004 | |||||||||||
| (Thousands) | ||||||||||||
Assets: | ||||||||||||
Total assets for reportable segments | $ | 74,874 | ||||||||||
Cash and cash equivalents at corporate level | 142 | |||||||||||
Other receivables at corporate level | 9,602 | |||||||||||
Employee receivables at corporate level | 12 | |||||||||||
Property and equipment, net at corporate level | 1,294 | |||||||||||
Deferred income taxes at corporate level | 1,129 | |||||||||||
Other assets at corporate level | 925 | |||||||||||
Consolidated Assets | $ | 87,978 | ||||||||||
NOTE 15 – SUBSEQUENT EVENTS
On August 5, 2005, the Company borrowed $1.0 million from Life of the South Corporation (LOTS), the Company’s insurance carrier for credit related insurance products, pursuant to a purchase agreement and senior subordinated note. The maturity date of the note is August 5, 2007 and bears interest at the prime rate announced by Columbus Bank and Trust Company in Columbus, Georgia plus 1.0% per annum. For so long as the note is outstanding the Company is required to underwrite all of its credit related insurance products through LOTS.
F-45
Table of Contents
Index to Financial Statements
THE MONEY TREE INC.
$35,000,000 Subordinated Demand Notes
PROSPECTUS
November 4, 2005