UNITED STATES
SECURITIES AND EXCHANGE COMMISSION
Washington, D.C. 20549
FORM N-CSR
CERTIFIED SHAREHOLDER REPORT OF REGISTERED
MANAGEMENT INVESTMENT COMPANIES
Investment Company Act file number | 811-21677 |
|
Cohen & Steers International Realty Fund, Inc. |
(Exact name of registrant as specified in charter) |
|
280 Park Avenue, New York, NY | | 10017 |
(Address of principal executive offices) | | (Zip code) |
|
Adam M. Derechin Cohen & Steers Capital Management, Inc. 280 Park Avenue New York, New York 10017 |
(Name and address of agent for service) |
|
Registrant’s telephone number, including area code: | (212) 832-3232 | |
|
Date of fiscal year end: | December 31 | |
|
Date of reporting period: | June 30, 2006 | |
| | | | | | | | |
Item 1. Reports to Stockholders.
COHEN & STEERS INTERNATIONAL REALTY FUND, INC.
August 9, 2006
To Our Shareholders:
We are pleased to submit to you our report for the six months ended June 30, 2006. The net asset values per share at that date were $15.09 and $15.08 for Class A and Class C shares, respectively. Class I shares had a net asset value of $15.10. In addition, a dividend was declared for shareholders of record on June 22, 2006 and paid on June 23, 2006 to all three classes of shares. The dividends were as follows: Class A—$0.088 per share, Class C—$0.04 per share and Class I—$0.114 per share.a
The total return, including income and change in net asset value, for Cohen & Steers International Realty Fund and the comparative benchmarks were:
| | | Six Months Ended
6/30/06 | |
| Cohen & Steers International Realty Fund—Class A | | | 14.33 | % | |
| Cohen & Steers International Realty Fund—Class C | | | 14.04 | % | |
| Cohen & Steers International Realty Fund—Class I | | | 14.61 | % | |
| S&P/ Citigroup BMI World Property Index (ex. U.S.)b | | | 12.24 | % | |
| S&P 500 Indexb | | | 2.71 | % | |
The performance data quoted represent past performance. Past performance is no guarantee of future results. The investment return and the principal value of an investment will fluctuate and shares, if redeemed, may be worth more or less than their original cost. Current performance may be lower or higher than the performance data quoted. Total returns of the fund current to the most recent month-end can be obtained by visiting our Web site at cohenandsteers.com.
Investment Review
Strong fundamentals drove international real estate stocks to new highs in the first quarter, easily outpacing the broader markets. However, concerns about inflation, accelerating interest rates and decelerating economic growth spooked investors across most markets early in the second quarter and international REITs gave back some of their gains. By June 30, the continued drumbeat of positive developments in fundamentals for real estate drove international real estate securities back to within a couple of percentage points of their first-quarter closing levels. Many central banks around the world, including the European Central Bank and, most recently, the Bank of Japan, have increased interest rates, attempting to slow economic growth. While many financial pundits spent the first half
a Please note that distributions paid by the fund to shareholders are subject to recharacterization for tax purposes. The final tax treatment of these distributions is reported to shareholders after the close of each fiscal year.
b The S&P/Citigroup World Property Index (excluding U.S.) is an unmanaged portfolio of approximately 269 constituents from 20 countries. The S&P 500 Index is an unmanaged index of common stocks that is frequently used as a general measure of stock market performance.
1
COHEN & STEERS INTERNATIONAL REALTY FUND, INC.
of the year focused on the potential difficulty that rising interest rates may pose for real estate securities, we believe the markets rewarded factors that today are much more important, such as improving rental income and declining cap rates (high valuations).
Also of note in the first half of the year is that the volume of international equity issuance, particularly initial public offerings (IPOs), accelerated. While we had forecasted a considerable volume of IPOs in Asia, we have been somewhat surprised by the pace of activity in Europe, considering that the United Kingdom and Germany have yet to formalize their REIT structures. This high level of equity issuance was a major factor driving the market volatility during the second quarter. Not only was the pipeline of primary and secondary issuance large, but many of the IPOs were poorly structured companies, often with external management, or in a "blind pool," where capital is raised before any portfolio is assembled. Several of these companies were successfully brought public earlier in the year, but investor discipline was highlighted throughout much of the second quarter, as numerous IPOs had to be restructured, postponed or cancelled. While the new equity overhang pressured the markets initially, we believe that the longer-term consequences are more important, as investors clearly stepped up to fund the expansion plans of certain companies with attractive structures and uses of proceeds, but carefully rejected others with suboptimal structures or business plans.
We participated in several IPOs during the first half of 2006, including the €350m IPO of Patrizia Immobilien in Germany. This offering allowed us to invest in what we believe is the improving German residential market through a company that has successfully operated there for twenty years. We continue to expect a considerable pipeline of new equity issuance during the next several years as companies take advantage of strong real estate fundamentals, investment opportunities and the spread of REIT legislation to new markets such as the United Kingdom and Germany, and we believe that the structures and valuations are now more likely to benefit the new shareholders.
During the six-month period, real estate securities in most major countries generated solid returns. We believe it is notable that, despite most countries being in negative territory for the second quarter, nearly every major country reported a positive total return year-to-date. Continental Europe was the best-performing region for the first half of the year, driven by its major outperformance in the first quarter. Real estate securities in Spain generated the highest total return with the country index rising 40.9%, followed by Germany, returning 23.4% and France, up 20.1%.1 Conditions in Spain remained very strong, spurred by negative real interest rates, strong local economic growth as well as considerable corporate M&A activity. The United Kingdom delivered a total return of 12.3%, performing in line with the international benchmark despite making considerable progress towards the creation of REITs for January 2007.
Most of the Asia Pacific region also turned in solid returns, with Singapore capturing the lead, gaining 19.8% year-to-date. Hong Kong slightly underperformed the international benchmark, but was still up 10.5%, while Australia and Japan returned 6.0% and –0.2%, respectively. While we believe that Hong Kong's modest
1 Country returns are in local currency.
2
COHEN & STEERS INTERNATIONAL REALTY FUND, INC.
underperformance was just a pause in what we think will be a multi-year period of strong performance, the mature Australian market may have more of a challenge making up the ground lost over the first half of the year, as we believe valuations are less attractive than in other countries. Japanese returns were relatively weak in the first half, as prices of real estate securities in Japan paused after delivering 74.3% in 2005—the best performance in the group.
The chart below ranks total returns by country, highest to lowest, in local currency and U.S. dollars.
Real Estate Securites Total Returns
YTD 2006
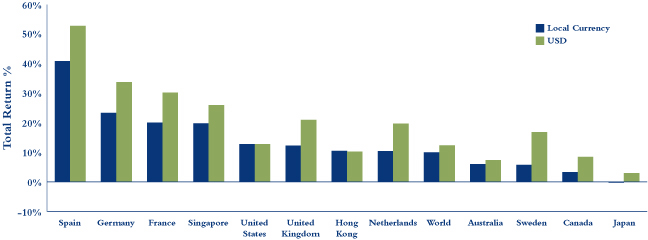
Source: S&P/Citigroup. Past performance is no guarantee of future results. Index performance is not representative of the performance of any Cohen & Steers account and no such account will seek to replicate an index. You cannot invest directly in an index.
During the first half of the year, the fund's performance benefited from its overweight positions in continental Europe's best-performing markets, including Germany (23.4%), France (20.1%), and The Netherlands (which was up 10.4%). France benefited from improving fundamentals, especially in Paris, and our large weight in industry leader Unibail (23.1%)2 aided performance relative to the benchmark. In our view, Germany and The Netherlands are only seeing the earliest stages of fundamental improvements, but even these signs pushed stocks higher, given what we see as attractive valuations and growing expectations of the creation of a German REIT structure and potential improvements in the Dutch REIT structure.
2 Global real estate security returns are in local currency.
3
COHEN & STEERS INTERNATIONAL REALTY FUND, INC.
We also benefited from our underweight positions in Japan and Australia, which lagged during the period, in line with our belief that both markets were less attractively valued. In particular, our stock selection in Japan helped us to avoid some of the worst-performing securities in the international index, such as Tokyu Land (–24.1%). Among the best performers for the six-month period were German real estate securities, IVG Immobilien AG (35.5%) and Deutsche Wohnen (31.4%), with Inmobiliaria Urbis (Spain, 33.5%) rounding out the top three.
Our underweight position in Spain, however, detracted from our relative performance, as Spanish stocks moved to even higher valuations driven by several corporate acquisitions. We did not own Metrovacesa (39.6%) in the period, which benefited significantly from two investors launching tender offers for large portions of the company. Our overweight position in Sweden (5.8%) also impacted performance negatively during the period; the stocks underperformed on interest-rate concerns despite what we believe to be attractive valuations.
Investment Outlook
Despite the volatility of the first half of 2006, we believe that the outlook for international real estate and real estate stocks is attractive. Looking forward to the second half of 2006 and beyond, we continue to expect moderate, albeit slower, economic growth through much of the world. While economic growth and the demand side of fundamentals always command a majority of the press reports regarding real estate conditions, our positive outlook for the sector is actually more driven by our view on the low level of new supply that is being delivered in most developed markets. The case for low supply is especially true in markets where geographic boundaries or government regulations structurally limit new supply over the long term, such as Hong Kong, London and Paris.
We also have a more constructive view on the equity issuance pipeline through the rest of the year, as investors appear to have regained the leverage from issuers with respect to structures and pricing that can create strong companies. Among what we view as the more appealing IPOs that we are beginning to learn about are several multi-billion dollar potential transactions in Europe. If successful, we believe these offerings will increase the universe of attractive companies in two key property types—pan-European industrial and German apartments—where, in our view, there are currently few focused ways to participate.
Our view on real estate fundamentals impacts our net asset value and dividend estimates and therefore valuation and dividend yields; and, as a result, has a heavy influence on where our investments are focused. We remain overweight in Hong Kong, believing that attractive fundamentals and valuations are likely to drive relative outperformance. We have also increased our overweight position in the United Kingdom, as the stocks lagged somewhat in the second quarter despite what we view as good valuations, and as the formal creation of the REIT structure is only six months away.
We remain underweight in Japan, but have been increasing our weights in certain Japanese real estate securities as valuations have returned to more appealing levels. We also continue to underweight Australia, given valuations that, we believe, more than fully reflect the strong fundamentals and business models in this market. Generally, we favor office and residential (for rent) real estate over retail. We believe that the relative valuations for
4
COHEN & STEERS INTERNATIONAL REALTY FUND, INC.
office companies will be driven by the shift in economic fundamentals to those that favor the corporate sector from those that favored the consumer several years ago.
During the second quarter, as it became apparent that rising inflation was going to require a slowing of growth by global central banks, the specter of "stagflation" reared its ugly head in the financial press for the first time since the 1970s. Indeed, recent days have marked the first time the market has had to face the combination of accelerating inflation and a potentially slower economy since that economically notorious decade. What might this imply for real estate stocks?
Land, the primary component of real estate that is responsible for the differentiated return series that real estate provides, is a unique asset class. Habitable urban land commands an economic rental payment that is based primarily on the proximity that it provides its occupants to other economic activity—that is, its location. Unlike capital and labor—the other two inputs to economic production, whose pricing power erodes further into an economic cycle as excess capacity is created to accommodate expanding demand—land's value has typically continued to increase when the surrounding economic activity has increased, regardless of what happened to the monetary price level. In other words, inflation historically has not harmed land values the way it can harm financial assets like bonds and (other) stocks. Historically, landowners have enjoyed inflationary times.
As a result, we believe that a modest reflation is a net positive for real estate securities relative to most other financial assets. This is particularly likely given the imbalances that exist in many of the markets where our investments are concentrated—those markets where demand continues to outstrip new supply. From a real estate standpoint, neither slightly higher inflation nor slightly lower economic growth should, in our view, derail the steady real estate recovery that has, thus far, driven growth in cash flows, net asset values, and dividends. From a real estate securities perspective, we believe valuations are attractive relative to private market values, and continued momentum towards tax-efficient REIT structures continues to provide support for attractive returns.
5
COHEN & STEERS INTERNATIONAL REALTY FUND, INC.
Sincerely,
 | |  | |
|
| MARTIN COHEN | | ROBERT H. STEERS | |
|
| Co-chairman | | Co-chairman | |
|
 | |  | |
|
| JOSEPH M. HARVEY | | JAMES S. CORL | |
|
| Portfolio Manager | | Portfolio Manager | |
|
 | |  | |
|
| W. JOSEPH HOULIHAN | | GERIOS J.M. ROVERS | |
|
| Portfolio Manager | | Portfolio Manager | |
|
| | |  | |
|
| | | DAVID J. OAKES | |
|
| | | Portfolio Manager | |
|
The views and opinions in the preceding commentary are as of the date stated and are subject to change. This material represents an assessment of the market environment at a specific point in time, should not be relied upon as investment advice and is not intended to predict or depict performance of any investment.
Visit Cohen & Steers online at cohenandsteers.com
For more information about any of our funds, visit cohenandsteers.com, where you'll find daily net asset values, fund fact sheets and portfolio highlights. You can also access newsletters, education tools and market updates covering REIT, utility and preferred securities sectors.
In addition, our Web site contains comprehensive information about our firm, including our most recent press releases, profiles of our senior investment professionals, and an overview of our investment approach.
6
COHEN & STEERS INTERNATIONAL REALTY FUND, INC.
Performance Review
Periods Ending June 30, 2006
| | | Class A Shares | | Class C Shares | | Class I Shares | |
| 1 Year (with sales charge) | | | 23.93 | %a | | | 28.06 | %b | | | — | | |
| 1 Year (without sales charge) | | | 29.77 | % | | | 29.06 | % | | | 30.28 | % | |
| Since Inceptionc (with sales charge) | | | 21.49 | %a | | | 25.35 | % | | | — | | |
| Since Inceptionc (without sales charge) | | | 26.03 | % | | | 25.35 | % | | | 28.65 | % | |
The performance data quoted represent past performance. Past performance is no guarantee of future results. The investment return and principal value of an investment will fluctuate and shares, when redeemed, may be worth more or less than their original cost. Current performance may be lower or higher than the performance data quoted. Performance information current to the most recent month-end can be obtained by visiting our Web site at cohenandsteers.com. The performance table does not reflect the deduction of taxes that a shareholder would pay on fund distributions or the redemption of fund shares.
Through December 31, 2006, the fund's advisor has contractually agreed to waive certain fees and/or reimburse the fund for expenses. Absent such arrangements, returns would have been lower.
a Reflects a 4.50% front-end sales charge.
b Reflects a contingent deferred sales charge of 1%.
c Inception date of March 31, 2005.
7
COHEN & STEERS INTERNATIONAL REALTY FUND, INC.
Expense Example (Unaudited)
As a shareholder of the fund, you incur two types of costs: (1) transaction costs, including sales charges (loads) on purchase payments and redemption fees; and (2) ongoing costs including management fees; distribution and/or service (12b-1) fees; and other fund expenses. This example is intended to help you understand your ongoing costs (in dollars) of investing in the fund and to compare these costs with the ongoing costs of investing in other mutual funds.
The example is based on an investment of $1,000 invested at the beginning of the period and held for the entire period 01/01/06—06/30/06.
Actual Expenses
The first line of the table below provides information about actual account values and expenses. You may use the information in this line, together with the amount you invested, to estimate the expenses that you paid over the period. Simply divide your account value by $1,000 (for example, an $8,600 account value divided by $1,000 = 8.6), then multiply the result by the number in the first line under the heading entitled "Expenses Paid During Period" to estimate the expenses you paid on your account during this period.
Hypothetical Example for Comparison Purposes
The second line of the table below provides information about hypothetical account values and hypothetical expenses based on the fund's actual expense ratio and an assumed rate of return of 5% per year before expenses, which is not the fund's actual return. The hypothetical account values and expenses may not be used to estimate the actual ending account balance or expenses you paid for the period. You may use this information to compare the ongoing cost of investing in the fund and other funds. To do so, compare this 5% hypothetical example with the 5% hypothetical examples that appear in the shareholder reports of the other funds.
Please note that the expenses shown in the table are meant to highlight your ongoing costs only and do not reflect any transactional costs, such as sales charges (loads) and redemption fees. Therefore, the second line of the table is useful in comparing ongoing costs only, and will not help you determine the relative total costs of owning different funds. In addition, if these transactional costs were included, your costs would have been higher.
8
COHEN & STEERS INTERNATIONAL REALTY FUND, INC.
Expense Example (Unaudited)—(Continued)
| | | Beginning
Account Value
January 01, 2006 | | Ending
Account Value
June 30, 2006 | | Expenses Paid
During Period*
January 01, 2006—
June 30, 2006 | |
| Class A | |
| Actual (14.33% return) | | $ | 1,000.00 | | | $ | 1,143.30 | | | $ | 8.29 | | |
| Hypothetical (5% annual return before expenses) | | $ | 1,000.00 | | | $ | 1,017.06 | | | $ | 7.80 | | |
| Class C | |
| Actual (14.04% return) | | $ | 1,000.00 | | | $ | 1,140.40 | | | $ | 11.78 | | |
| Hypothetical (5% annual return before expenses) | | $ | 1,000.00 | | | $ | 1,013.79 | | | $ | 11.08 | | |
| Class I | |
| Actual (14.61% return) | | $ | 1,000.00 | | | $ | 1,146.10 | | | $ | 6.44 | | |
| Hypothetical (5% annual return before expenses) | | $ | 1,000.00 | | | $ | 1,018.79 | | | $ | 6.06 | | |
* Expenses are equal to the fund's Class A, Class C and Class I annualized expense ratio of 1.56%, 2.22% and 1.21%, respectively, multiplied by the average account value over the period, multiplied by 181/365 (to reflect the one-half year period). If the fund had borne all of its expenses that were assumed by the advisor, the annualized expense ratios would have been 1.61%, 2.27% and 1.25%, respectively.
9
COHEN & STEERS INTERNATIONAL REALTY FUND, INC.
JUNE 30, 2006
Top Ten Holdings
(Unaudited)
| Security | | Market
Value | | % of
Net Assets | |
| 1. Mitsubishi Estate Co., Ltd. | | $ | 62,183,284 | | | | 6.5 | % | |
| 2. Westfield Group | | | 52,172,326 | | | | 5.5 | | |
| 3. Mitsui Fudosan Co., Ltd. | | | 48,184,332 | | | | 5.1 | | |
| 4. Cheung Kong Holdings Ltd. | | | 41,716,745 | | | | 4.4 | | |
| 5. Sun Hung Kai Properties Ltd. | | | 35,404,071 | | | | 3.7 | | |
| 6. Land Securities Group PLC | | | 35,138,579 | | | | 3.7 | | |
| 7. British Land Co., PLC | | | 30,070,304 | | | | 3.2 | | |
| 8. Hongkong Land Holdings Ltd. | | | 28,195,802 | | | | 3.0 | | |
| 9. Henderson Land Development Company Ltd. | | | 27,464,970 | | | | 2.9 | | |
| 10. Slough Estates PLC | | | 26,800,785 | | | | 2.8 | | |
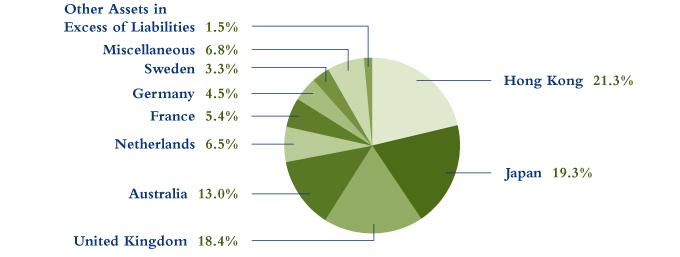
Country Breakdown
(Based on Net Assets)
(Unaudited)
10
COHEN & STEERS INTERNATIONAL REALTY FUND, INC.
SCHEDULE OF INVESTMENTS
June 30, 2006 (Unaudited)
| | | | | Number
of Shares | | Value | |
| COMMON STOCK | | | 98.5 | % | | | | | | | | | |
| AUSTRALIA | | | 13.0 | % | | | | | | | | | |
| DIVERSIFIED | | | 4.4 | % | | | | | | | | | |
| GPT Group | | | | | | | 6,185,600 | | | $ | 19,948,893 | | |
| Mirvac Group | | | | | | | 2,544,300 | | | | 8,224,411 | | |
| Stockland | | | | | | | 2,612,241 | | | | 13,626,916 | | |
| | | | | | | | 41,800,220 | | |
| INDUSTRIAL | | | 1.5 | % | | | | | | | | | |
| ING Industrial Fund | | | | | | | 5,749,925 | | | | 9,528,275 | | |
| Macquarie Goodman Group | | | | | | | 991,600 | | | | 4,421,147 | | |
| | | | | | | | 13,949,422 | | |
| OFFICE | | | 1.6 | % | | | | | | | | | |
| Investa Property Group | | | | | | | 5,205,165 | | | | 8,470,828 | | |
| Tishman Speyer Office Fund | | | | | | | 4,230,900 | | | | 6,885,319 | | |
| | | | | | | | 15,356,147 | | |
| SHOPPING CENTER | | | 5.5 | % | | | | | | | | | |
| Westfield Group | | | | | | | 4,051,300 | | | | 52,172,326 | | |
| TOTAL AUSTRALIA | | | | | | | | | | | 123,278,115 | | |
| AUSTRIA | | | 0.6 | % | | | | | | | | | |
| DIVERSIFIED | | | 0.6 | % | | | | | | | | | |
| Immofinanz Immobilien Anlagen AG | | | | | | | 501,731 | | | | 5,570,297 | | |
| CANADA | | | 1.2 | % | | | | | | | | | |
| OFFICE | | | 0.6 | % | | | | | | | | | |
| Brookfield Properties Corp. | | | | | | | 181,119 | | | | 5,826,598 | | |
| SHOPPING CENTER | | | 0.6 | % | | | | | | | | | |
| Primaris Retail REIT | | | | | | | 369,000 | | | | 5,371,540 | | |
| TOTAL CANADA | | | | | | | | | | | 11,198,138 | | |
See accompanying notes to financial statements.
11
COHEN & STEERS INTERNATIONAL REALTY FUND, INC.
SCHEDULE OF INVESTMENTS—(Continued)
June 30, 2006 (Unaudited)
| | | | | Number
of Shares | | Value | |
| FINLAND | | | 0.9 | % | | | | | | | | | |
| DIVERSIFIED | | | 0.9 | % | | | | | | | | | |
| Citycon Oyj | | | | | | | 906,710 | | | $ | 4,186,617 | | |
| Sponda Oyj | | | | | | | 453,593 | | | | 4,641,347 | | |
| TOTAL FINLAND | | | | | | | | | | | 8,827,964 | | |
| FRANCE | | | 5.4 | % | | | | | | | | | |
| DIVERSIFIED | | | 3.9 | % | | | | | | | | | |
| Klepierre | | | | | | | 71,290 | | | | 8,256,667 | | |
Societe Immobiliere de Location pour L'Industrie et le
Commerce (Silic) | | | | | | | 24,943 | | | | 2,780,377 | | |
| Unibail | | | | | | | 147,771 | | | | 25,704,892 | | |
| | | | | | | | 36,741,936 | | |
| OFFICE | | | 0.7 | % | | | | | | | | | |
| Fonciere des Regions | | | | | | | 52,788 | | | | 6,839,625 | | |
| SHOPPING CENTER | | | 0.8 | % | | | | | | | | | |
| Mercialys Promesse | | | | | | | 266,702 | | | | 7,948,220 | | |
| TOTAL FRANCE | | | | | | | | | | | 51,529,781 | | |
| GERMANY | | | 4.5 | % | | | | | | | | | |
| APARTMENT | | | 2.2 | % | | | | | | | | | |
| Deutsche Wohnen AG | | | | | | | 23,929 | | | | 7,344,005 | | |
| Patrizia Immobilien AG | | | | | | | 572,828 | | | | 14,023,417 | | |
| | | | | | | | 21,367,422 | | |
| DIVERSIFIED | | | 2.0 | % | | | | | | | | | |
| DIC Asset AG | | | | | | | 50,981 | | | | 1,304,145 | | |
| IFM Immobilien AG | | | | | | | 17,176 | | | | 224,084 | | |
| IVG Immobilien AG | | | | | | | 560,420 | | | | 16,930,945 | | |
| | | | | | | | 18,459,174 | | |
| SHOPPING CENTER | | | 0.3 | % | | | | | | | | | |
| Deutsche Euroshop AG | | | | | | | 39,136 | | | | 2,723,096 | | |
| TOTAL GERMANY | | | | | | | | | | | 42,549,692 | | |
See accompanying notes to financial statements.
12
COHEN & STEERS INTERNATIONAL REALTY FUND, INC.
SCHEDULE OF INVESTMENTS—(Continued)
June 30, 2006 (Unaudited)
| | | | | Number
of Shares | | Value | |
| HONG KONG | | | 21.3 | % | | | | | | | | | |
| DIVERSIFIED | | | 16.5 | % | | | | | | | | | |
| Cheung Kong Holdings Ltd. | | | | | | | 3,847,800 | | | $ | 41,716,745 | | |
| Great Eagle Holdings Ltd. | | | | | | | 5,679,400 | | | | 19,452,254 | | |
| Henderson Land Development Company Ltd. | | | | | | | 5,306,000 | | | | 27,464,970 | | |
| Hysan Development Company Ltd. | | | | | | | 8,298,500 | | | | 23,507,591 | | |
| Sun Hung Kai Properties Ltd. | | | | | | | 3,471,700 | | | | 35,404,071 | | |
| Wharf Holdings Ltd. | | | | | | | 2,639,500 | | | | 9,380,297 | | |
| | | | | | | | 156,925,928 | | |
| OFFICE | | | 3.2 | % | | | | | | | | | |
| Champion REIT | | | | | | | 3,545,100 | | | | 1,768,830 | | |
| Hongkong Land Holdings Ltd. (USD) | | | | | | | 7,703,771 | | | | 28,195,802 | | |
| | | | | | | | 29,964,632 | | |
| REAL ESTATE OPERATIONS/DEVELOPMENT | | | 0.9 | % | | | | | | | | | |
| Hang Lung Properties Ltd. | | | | | | | 4,591,609 | | | | 8,306,672 | | |
| SHOPPING CENTER | | | 0.7 | % | | | | | | | | | |
| Link REIT | | | | | | | 3,415,000 | | | | 6,837,651 | | |
| TOTAL HONG KONG | | | | | | | | | | | 202,034,883 | | |
| JAPAN | | | 19.3 | % | | | | | | | | | |
| DIVERSIFIED | | | 17.5 | % | | | | | | | | | |
| Kenedix Realty Investment Corp. | | | | | | | 921 | | | | 4,716,061 | | |
| Mitsubishi Estate Co., Ltd. | | | | | | | 2,928,500 | | | | 62,183,284 | | |
| Mitsui Fudosan Co., Ltd. | | | | | | | 2,219,000 | | | | 48,184,332 | | |
| NTT Urban Development Corp. | | | | | | | 2,534 | | | | 19,751,206 | | |
| Sumitomo Realty & Development Co., Ltd. | | | | | | | 700,000 | | | | 17,249,213 | | |
| TOC Co., Ltd. | | | | | | | 1,275,000 | | | | 6,751,573 | | |
| Tokyo Tatemono Co., Ltd. | | | | | | | 684,000 | | | | 7,327,718 | | |
| | | | | | | | 166,163,387 | | |
| OFFICE | | | 0.3 | % | | | | | | | | | |
| Japan Real Estate Investment Corp. | | | | | | | 343 | | | | 3,057,148 | | |
See accompanying notes to financial statements.
13
COHEN & STEERS INTERNATIONAL REALTY FUND, INC.
SCHEDULE OF INVESTMENTS—(Continued)
June 30, 2006 (Unaudited)
| | | | | Number
of Shares | | Value | |
| SHOPPING CENTER | | | 1.5 | % | | | | | | | | | |
| AEON Mall Co., Ltd. | | | | | | | 155,400 | | | $ | 6,531,580 | | |
| Japan Retail Fund Investment Corp. | | | | | | | 960 | | | | 7,549,808 | | |
| | | | | | | | 14,081,388 | | |
| TOTAL JAPAN | | | | | | | | | | | 183,301,923 | | |
| NETHERLANDS | | | 6.5 | % | | | | | | | | | |
| DIVERSIFIED | | | 2.8 | % | | | | | | | | | |
| Corio NV | | | | | | | 336,244 | | | | 20,914,452 | | |
| Wereldhave NV | | | | | | | 54,625 | | | | 5,313,471 | | |
| | | | | | | | 26,227,923 | | |
| INVESTMENT COMPANY | | | 0.5 | % | | | | | | | | | |
| Eurocastle Investment Ltd. | | | | | | | 124,976 | | | | 4,475,817 | | |
| OFFICE | | | 0.5 | % | | | | | | | | | |
| VastNed Offices/Industrial NV | | | | | | | 143,020 | | | | 5,030,569 | | |
| SHOPPING CENTER | | | 2.7 | % | | | | | | | | | |
| Rodamco Europe NV | | | | | | | 210,361 | | | | 20,623,627 | | |
| VastNed Retail NV | | | | | | | 67,344 | | | | 5,469,660 | | |
| | | | | | | | 26,093,287 | | |
| TOTAL NETHERLANDS | | | | | | | | | | | 61,827,596 | | |
| SINGAPORE | | | 2.2 | % | | | | | | | | | |
| DIVERSIFIED | | | 1.9 | % | | | | | | | | | |
| CapitaLand Ltd. | | | | | | | 3,195,900 | | | | 9,085,858 | | |
| City Development Ltd. | | | | | | | 498,900 | | | | 2,947,035 | | |
| Singapore Land Ltd. | | | | | | | 1,392,000 | | | | 5,540,386 | | |
| | | | | | | | 17,573,279 | | |
| INDUSTRIAL | | | 0.3 | % | | | | | | | | | |
| Ascendas REIT | | | | | | | 2,458,900 | | | | 2,982,651 | | |
| TOTAL SINGAPORE | | | | | | | | | | | 20,555,930 | | |
See accompanying notes to financial statements.
14
COHEN & STEERS INTERNATIONAL REALTY FUND, INC.
SCHEDULE OF INVESTMENTS—(Continued)
June 30, 2006 (Unaudited)
| | | | | Number
of Shares | | Value | |
| SPAIN | | | 0.8 | % | | | | | | | | | |
| DIVERSIFIED | | | 0.8 | % | | | | | | | | | |
| Inmobiliaria Urbis SA | | | | | | | 179,634 | | | $ | 4,675,635 | | |
| Parquesol Inmobiliaria SA | | | | | | | 116,727 | | | | 2,751,594 | | |
| TOTAL SPAIN | | | | | | | | | | | 7,427,229 | | |
| SWEDEN | | | 3.3 | % | | | | | | | | | |
| DIVERSIFIED | | | 3.3 | % | | | | | | | | | |
| Castellum AB | | | | | | | 677,448 | | | | 6,942,271 | | |
| Fabege AB | | | | | | | 925,251 | | | | 17,227,725 | | |
| Kungsleden AB | | | | | | | 624,015 | | | | 7,326,817 | | |
| TOTAL SWEDEN | | | | | | | | | | | 31,496,813 | | |
| SWITZERLAND | | | 1.1 | % | | | | | | | | | |
| DIVERSIFIED | | | 1.1 | % | | | | | | | | | |
| PSP Swiss Property AG | | | | | | | 202,064 | | | | 10,445,744 | | |
| UNITED KINGDOM | | | 18.4 | % | | | | | | | | | |
| DIVERSIFIED | | | 11.9 | % | | | | | | | | | |
| British Land Co., PLC | | | | | | | 1,287,509 | | | | 30,070,304 | | |
| Development Securities PLC | | | | | | | 564,316 | | | | 5,739,437 | | |
| Hammerson PLC | | | | | | | 1,049,381 | | | | 22,975,718 | | |
| Helical Bar PLC | | | | | | | 1,196,427 | | | | 8,296,629 | | |
| Land Securities Group PLC | | | | | | | 1,059,199 | | | | 35,138,579 | | |
| Quintain Estates & Development PLC | | | | | | | 955,457 | | | | 11,413,737 | | |
| | | | | | | | 113,634,404 | | |
| INDUSTRIAL | | | 2.8 | % | | | | | | | | | |
| Slough Estates PLC | | | | | | | 2,370,101 | | | | 26,800,785 | | |
| INVESTMENT COMPANY | | | 0.2 | % | | | | | | | | | |
| Dawnay Day Treveria PLC | | | | | | | 1,514,928 | | | | 2,131,436 | | |
| OFFICE | | | 1.8 | % | | | | | | | | | |
| Great Portland Estates PLC | | | | | | | 1,427,620 | | | | 13,199,784 | | |
| Mapeley UK Co., Ltd. | | | | | | | 62,646 | | | | 3,535,592 | | |
| | | | | | | | 16,735,376 | | |
See accompanying notes to financial statements.
15
COHEN & STEERS INTERNATIONAL REALTY FUND, INC.
SCHEDULE OF INVESTMENTS—(Continued)
June 30, 2006 (Unaudited)
| | | | | Number
of Shares | | Value | |
| SHOPPING CENTER | | | 1.7 | % | | | | | | | |
| Liberty International PLC | | | | | | | 815,768 | | | $ | 16,065,730 | | |
| TOTAL UNITED KINGDOM | | | | | | | | | 175,367,731 | | |
| TOTAL COMMON STOCK (Identified cost—$861,056,272) | | | | | | | | | 935,411,836 | | |
| | | | | Principal
Amount | | | |
| COMMERCIAL PAPER | | | 0.7 | % | | | | | | | |
Citigroup Funding, 4.15%, due 07/03/06
(Identified cost—$6,231,563) | | | | | | $ | 6,233,000 | | | | 6,231,563 | | |
| TOTAL INVESTMENTS (Identified cost—$867,287,835) | | | 99.2 | % | | | | | 941,643,399 | | |
| OTHER ASSETS IN EXCESS OF LIABILITIES | | | 0.8 | % | | | | | 7,990,385 | | |
| NET ASSETS | | | 100.0 | % | | | | $ | 949,633,784 | | |
Glossary of Portfolio Abbreviations
REIT Real Estate Investment Trust
USD United States Dollar
Note: Percentages indicated are based on the net assets of the fund.
See accompanying notes to financial statements.
16
COHEN & STEERS INTERNATIONAL REALTY FUND, INC.
STATEMENT OF ASSETS AND LIABILITIES
June 30, 2006 (Unaudited)
| ASSETS: | |
| Investments in securities, at value (Identified cost—$867,287,835) | | $ | 941,643,399 | | |
| Foreign currency (Identified cost—$7,635,809) | | | 7,763,268 | | |
| Receivable for fund shares sold | | | 11,556,127 | | |
| Receivable for investment securities sold | | | 4,112,439 | | |
| Dividends and interest receivable | | | 2,205,576 | | |
| Other assets | | | 21,301 | | |
| Total Assets | | | 967,302,110 | | |
| LIABILITIES: | |
| Payable for investment securities purchased | | | 15,805,522 | | |
| Payable for fund shares redeemed | | | 788,308 | | |
| Payable to investment advisor | | | 535,501 | | |
| Payable for distribution fees | | | 225,567 | | |
| Payable for shareholder servicing fees | | | 79,523 | | |
| Payable to administrator | | | 43,056 | | |
| Payable for directors' fees | | | 2,893 | | |
| Other liabilities | | | 187,956 | | |
| Total Liabilities | | | 17,668,326 | | |
| NET ASSETS | | $ | 949,633,784 | | |
| NET ASSETS consist of: | |
| Paid-in capital | | $ | 875,363,466 | | |
| Dividends in excess of net investment income | | | (466,061 | ) | |
| Accumulated undistributed net realized gain | | | 309,820 | | |
| Net unrealized appreciation | | | 74,426,559 | | |
| | | $ | 949,633,784 | | |
See accompanying notes to financial statements.
17
COHEN & STEERS INTERNATIONAL REALTY FUND, INC.
STATEMENT OF ASSETS AND LIABILITIES—(Continued)
June 30, 2006 (Unaudited)
| CLASS A SHARES: | |
| NET ASSETS | | $ | 346,652,026 | | |
| Shares issued and outstanding ($0.001 par value common stock outstanding) | | | 22,967,136 | | |
| Net asset value and redemption price per share | | $ | 15.09 | | |
| Maximum offering price per share ($15.09 ÷ 0.955)a | | $ | 15.80 | | |
| CLASS C SHARES: | |
| NET ASSETS | | $ | 281,287,289 | | |
| Shares issued and outstanding ($0.001 par value common stock outstanding) | | | 18,658,565 | | |
| Net asset value and offering price per shareb | | $ | 15.08 | | |
| CLASS I SHARES: | |
| NET ASSETS | | $ | 321,694,469 | | |
| Shares issued and outstanding ($0.001 par value common stock outstanding) | | | 21,306,089 | | |
| Net asset value, offering and redemption price per share | | $ | 15.10 | | |
a On investments of $100,000 or more, the offering price is reduced.
b Redemption price per share is equal to the net asset value per share less any applicable deferred sales charge which varies with the length of time shares are held.
See accompanying notes to financial statements.
18
COHEN & STEERS INTERNATIONAL REALTY FUND, INC.
STATEMENT OF OPERATIONS
For the Six Months Ended June 30, 2006 (Unaudited)
| Investment Income: | |
| Dividend income (net of $1,347,059 of foreign withholding tax) | | $ | 10,142,918 | | |
| Interest income | | | 242,080 | | |
| Total Income | | | 10,384,998 | | |
| Expenses: | |
| Investment advisory fees | | | 2,890,041 | | |
| Distribution fees—Class A | | | 265,561 | | |
| Distribution fees—Class C | | | 625,523 | | |
| Shareholder servicing fees—Class A | | | 106,224 | | |
| Shareholder servicing fees—Class C | | | 208,508 | | |
| Custodian fees and expenses | | | 239,946 | | |
| Administration fees | | | 234,211 | | |
| Registration and filing fees | | | 153,860 | | |
| Transfer agent fees | | | 137,543 | | |
| Professional fees | | | 64,798 | | |
| Shareholder reporting expenses | | | 30,227 | | |
| Directors' fees and expenses | | | 26,426 | | |
| Line of credit fees | | | 13,630 | | |
| Miscellaneous | | | 39,422 | | |
| Total Expenses | | | 5,035,920 | | |
| Reduction of Expenses | | | (146,218 | ) | |
| Net Expenses | | | 4,889,702 | | |
| Net Investment Income | | | 5,495,296 | | |
| Net Realized and Unrealized Gain (Loss) on Investments: | |
| Net realized loss on: | |
| Investments | | | (43,741 | ) | |
| Foreign currency transactions | | | (70,995 | ) | |
| Net realized loss | | | (114,736 | ) | |
| Net change in unrealized appreciation on: | |
| Investments | | | 51,251,565 | | |
| Foreign currency translations | | | 72,138 | | |
| Net change in unrealized appreciation | | | 51,323,703 | | |
| Total net realized and unrealized gain on investments | | | 51,208,967 | | |
| Net Increase in Net Assets Resulting from Operations | | $ | 56,704,263 | | |
See accompanying notes to financial statements.
19
COHEN & STEERS INTERNATIONAL REALTY FUND, INC.
STATEMENT OF CHANGES IN NET ASSETS (Unaudited)
| | | For the
Six Months Ended
June 30, 2006 | | For the Period
March 31, 2005a
through
December 31, 2005 | |
| Change in Net Assets: | |
| From Operations: | |
| Net investment income | | $ | 5,495,296 | | | $ | 693,890 | | |
| Net realized gain (loss) | | | (114,736 | ) | | | 1,027,992 | | |
| Net change in unrealized appreciation | | | 51,323,703 | | | | 23,102,856 | | |
| Net increase in net assets resulting from operations | | | 56,704,263 | | | | 24,824,738 | | |
| Dividends and Distributions to Shareholders from: | |
| Net investment income: | |
| Class A | | | (1,967,459 | ) | | | (323,527 | ) | |
| Class C | | | (734,470 | ) | | | (64,631 | ) | |
| Class I | | | (2,386,540 | ) | | | (752,226 | ) | |
| Net realized gain on investments: | |
| Class A | | | — | | | | (316,743 | ) | |
| Class C | | | — | | | | (210,681 | ) | |
| Class I | | | — | | | | (508,917 | ) | |
| Total dividends and distributions to shareholders | | | (5,088,469 | ) | | | (2,176,725 | ) | |
| Capital Stock Transactions: | |
| Increase in net assets from fund share transactions | | | 594,887,997 | | | | 280,381,705 | | |
| Total increase in net assets | | | 646,503,791 | | | | 303,029,718 | | |
| Net Assets: | |
| Beginning of period | | | 303,129,993 | | | | 100,275 | | |
| End of periodb | | $ | 949,633,784 | | | $ | 303,129,993 | | |
a Commencement of operations.
b Includes dividends in excess net investment income of $466,061 and $872,888, respectively.
See accompanying notes to financial statements.
20
COHEN & STEERS INTERNATIONAL REALTY FUND, INC.
FINANCIAL HIGHLIGHTS (Unaudited)
The following table includes selected data for a share outstanding throughout each period and other performance information derived from the financial statements. It should be read in conjunction with the financial statements and notes thereto.
| | | Class A | |
| Per Share Operating Performance | | For the
Six Months Ended
June 30, 2006 | | For the Period
March 31, 2005a
through
December 31, 2005 | |
| Net asset value, beginning of period | | $ | 13.28 | | | $ | 11.46 | | |
| Income from investment operations: | |
| Net investment incomeb | | | 0.14 | | | | 0.07 | | |
| Net realized and unrealized gain on investments | | | 1.76 | | | | 1.86 | | |
| Total from investment operations | | | 1.90 | | | | 1.93 | | |
| Less dividends and distributions to shareholders from: | |
| Net investment income | | | (0.09 | ) | | | (0.06 | ) | |
| Net realized gain on investments | | | — | | | | (0.05 | ) | |
| Total dividends and distributions to shareholders | | | (0.09 | ) | | | (0.11 | ) | |
| Redemption fees retained by the fund | | | 0.00 | c | | | 0.00 | c | |
| Net increase in net asset value | | | 1.81 | | | | 1.82 | | |
| Net asset value, end of period | | $ | 15.09 | | | $ | 13.28 | | |
| Total investment returnd,f | | | 14.33 | % | | | 16.88 | % | |
| Ratios/Supplemental Data | |
| Net assets, end of period (in millions) | | $ | 346.7 | | | $ | 91.6 | | |
| Ratio of expenses to average daily net assets (before expense reduction)e | | | 1.61 | % | | | 1.86 | % | |
| Ratio of expenses to average daily net assets (net of expense reduction)e | | | 1.56 | % | | | 1.70 | % | |
| Ratio of net investment income to average daily net assets (before expense reduction)e | | | 1.91 | % | | | 0.56 | % | |
| Ratio of net investment income to average daily net assets (net of expense reduction)e | | | 1.96 | % | | | 0.72 | % | |
| Portfolio turnover ratef | | | 13 | % | | | 35 | % | |
a Commencement of operations.
b Calculated based on the average shares outstanding during the period.
c Less than $0.005 per share.
d Does not reflect sales charges, which would reduce return.
e Annualized
f Not annualized
See accompanying notes to financial statements.
21
COHEN & STEERS INTERNATIONAL REALTY FUND, INC.
FINANCIAL HIGHLIGHTS (Unaudited)—(Continued)
| | | Class C | |
| Per Share Operating Performance | | For the
Six Months Ended
June 30, 2006 | | For the Period
March 31, 2005a
through
December 31, 2005 | |
| Net asset value, beginning of period | | $ | 13.26 | | | $ | 11.46 | | |
| Income from investment operations: | |
| Net investment incomeb | | | 0.10 | | | | 0.01 | | |
| Net realized and unrealized gain on investments | | | 1.76 | | | | 1.87 | | |
| Total from investment operations | | | 1.86 | | | | 1.88 | | |
| Less dividends and distributions to shareholders from: | |
| Net investment income | | | (0.04 | ) | | | (0.03 | ) | |
| Net realized gain on investments | | | — | | | | (0.05 | ) | |
| Total dividends and distributions to shareholders | | | (0.04 | ) | | | (0.08 | ) | |
| Redemption fees retained by the fund | | | 0.00 | c | | | 0.00 | c | |
| Net increase in net asset value | | | 1.82 | | | | 1.80 | | |
| Net asset value, end of period | | $ | 15.08 | | | $ | 13.26 | | |
| Total investment returnd,f | | | 14.04 | % | | | 16.37 | % | |
| Ratios/Supplemental Data | |
| Net assets, end of period (in millions) | | $ | 281.3 | | | $ | 61.4 | | |
| Ratio of expenses to average daily net assets (before expense reduction)e | | | 2.27 | % | | | 2.50 | % | |
| Ratio of expenses to average daily net assets (net of expense reduction)e | | | 2.22 | % | | | 2.35 | % | |
| Ratio of net investment income (loss) to average daily net assets (before expense reduction)e | | | 1.30 | % | | | (0.09 | )% | |
| Ratio of net investment income to average daily net assets (net of expense reduction)e | | | 1.36 | % | | | 0.07 | % | |
| Portfolio turnover ratef | | | 13 | % | | | 35 | % | |
a Commencement of operations.
b Calculated based on the average shares outstanding during the period.
c Less than $0.005 per share.
d Does not reflect sales charges, which would reduce return.
e Annualized
f Not annualized
See accompanying notes to financial statements.
22
COHEN & STEERS INTERNATIONAL REALTY FUND, INC.
FINANCIAL HIGHLIGHTS (Unaudited)—(Continued)
| | | Class I | |
| Per Share Operating Performance | | For the
Six Months Ended
June 30, 2006 | | For the Period
March 31, 2005a
through
December 31, 2005 | |
| Net asset value, beginning of period | | $ | 13.28 | | | $ | 11.46 | | |
| Income from investment operations: | |
| Net investment incomeb | | | 0.15 | | | | 0.11 | | |
| Net realized and unrealized gain on investments | | | 1.78 | | | | 1.85 | | |
| Total from investment operations | | | 1.93 | | | | 1.96 | | |
| Less dividends and distributions to shareholders from: | |
| Net investment income | | | (0.11 | ) | | | (0.09 | ) | |
| Net realized gain on investments | | | — | | | | (0.05 | ) | |
| Total dividends and distributions to shareholders | | | (0.11 | ) | | | (0.14 | ) | |
| Redemption fees retained by the fund | | | 0.00 | c | | | 0.00 | c | |
| Net increase in net asset value | | | 1.82 | | | | 1.82 | | |
| Net asset value, end of period | | $ | 15.10 | | | $ | 13.28 | | |
| Total investment returne | | | 14.61 | % | | | 17.14 | % | |
| Ratios/Supplemental Data | |
| Net assets, end of period (in millions) | | $ | 321.7 | | | $ | 150.2 | | |
| Ratio of expenses to average daily net assets (before expense reduction)d | | | 1.25 | % | | | 1.57 | % | |
| Ratio of expenses to average daily net assets (net of expense reduction)d | | | 1.21 | % | | | 1.35 | % | |
| Ratio of net investment income to average daily net assets (before expense reduction)d | | | 2.08 | % | | | 1.00 | % | |
| Ratio of net investment income to average daily net assets (net of expense reduction)d | | | 2.12 | % | | | 1.22 | % | |
| Portfolio turnover ratee | | | 13 | % | | | 35 | % | |
a Commencement of operations.
b Calculated based on the average shares outstanding during the period.
c Less than $0.005 per share.
d Annualized
e Not annualized
See accompanying notes to financial statements.
23
COHEN & STEERS INTERNATIONAL REALTY FUND, INC.
NOTES TO FINANCIAL STATEMENTS (Unaudited)
Note 1. Significant Accounting Policies
Cohen & Steers International Realty Fund, Inc. (the fund) was incorporated under the laws of the State of Maryland on November 23, 2004 and is registered under the Investment Company Act of 1940, as amended, as a nondiversified, open-end management investment company. The fund's investment objective is total return. The fund had no operations until January 11, 2005 when it sold 10 shares each of Class A, B, C, and 8,720 shares of Class I for $100,275 to Cohen & Steers Capital Management, Inc. (The Class B shares were subsequently transferred to Class I and Class B shares are presently not offered). Investment operations commenced on March 31, 2005. The authorized shares of the fund are divided into three classes designated Class A, C, and I shares. Each of the fund's shares has equal dividend, liquidation and voting rights (except for matters relating to distributions and shareholder servicing of such shares).
The following is a summary of significant accounting policies consistently followed by the fund in the preparation of its financial statements. The policies are in conformity with accounting principles generally accepted in the United States of America (GAAP). The preparation of the financial statements in accordance with GAAP requires management to make estimates and assumptions that affect the reported amounts of assets and liabilities at the date of the financial statements and the reported amounts of income and expenses during the reporting period. Actual results could differ from those estimates.
Portfolio Valuation: Investments in securities that are listed on the New York Stock Exchange are valued, except as indicated below, at the last sale price reflected at the close of the New York Stock Exchange on the business day as of which such value is being determined. If there has been no sale on such day, the securities are valued at the mean of the closing bid and asked prices for the day or, if no asked price is available, at the bid price.
Securities not listed on the New York Stock Exchange (NYSE) but listed on other domestic or foreign securities exchanges or admitted to trading on the National Association of Securities Dealers Automated Quotations, Inc. (Nasdaq) national market system are valued in a similar manner. Securities traded on more than one securities exchange are valued at the last sale price on the business day as of which such value is being determined as reflected on the tape at the close of the exchange representing the principal market for such securities.
Readily marketable securities traded in the over-the-counter market, including listed securities whose primary market is believed by Cohen & Steers Capital Management, Inc. to be over-the-counter, but excluding securities admitted to trading on the Nasdaq National List, are valued at the official closing prices as reported by Nasdaq, the National Quotation Bureau, or such other comparable sources as the Board of Directors deem appropriate to reflect their fair market value. If there has been no sale on such day, the securities are valued at the mean of the closing bid and asked prices for the day, or if no asked price is available, at the bid price. However, certain fixed-income securities may be valued on the basis of prices provided by a pricing service when such prices are believed by the Board of Directors to reflect the fair market value of such securities. Where securities are traded on more than one
24
COHEN & STEERS INTERNATIONAL REALTY FUND, INC.
NOTES TO FINANCIAL STATEMENTS (Unaudited)—(Continued)
exchange and also over-the-counter, the securities will generally be valued using the quotations the Board of Directors believes most closely reflect the value of such securities.
Portfolio securities primarily traded on foreign markets are generally valued at the preceding closing values of such securities on their respective exchanges or if after the close of the foreign markets, but prior to the close of business on the day the securities are being valued, market conditions change significantly, certain foreign securities may be fair valued pursuant to procedures established by the Board of Directors.
Securities for which market prices are unavailable, or securities for which the advisor determines that bid and/or asked price does not reflect market value, will be valued at fair value pursuant to procedures approved by the fund's Board of Directors. Circumstances in which market prices may be unavailable include, but are not limited to, when trading in a security is suspended, the exchange on which the security is traded is subject to an unscheduled close or disruption or material events occur after the close of the exchange on which the security is principally traded. In these circumstances, the fund determines fair value in a manner that fairly reflects the market value of the security on the valuation date based on consideration of any information or factors it deems appropriate. These may include recent transactions in comparable securities, information relating to the specific security and developments in the markets. In particular, portfolio securities primarily traded on foreign markets are generally valued at the preceding closing values of such securities on their respective exchanges or if after the close of the foreign markets, but prior to the close of trading on the NYSE on the day the securities are being valued, developments occur that are expected to materially affect the value of such securities, such values may be adjusted to reflect the estimated fair value of such securities as of the close of trading on the NYSE using a pricing service and/or procedures approved by the fund's Board of Directors.
The fund's use of fair value pricing may cause the net asset value of fund shares to differ from the net asset value that would be calculated using market quotations. Fair value pricing involves subjective judgments and it is possible that the fair value determined for a security may be materially different than the value that could be realized upon the sale of that security.
Short-term debt securities, which have a maturity date of 60 days or less, are valued at amortized cost, which approximates value.
Security Transactions and Investment Income: Security transactions are recorded on trade date. Realized gains and losses on investments sold are recorded on the basis of identified cost. Interest income is recorded on the accrual basis. Discounts are accreted and premiums are amortized over the life of the respective securities. Dividend income is recorded on the ex-dividend date. The fund records distributions received in excess of income from underlying investments as a reduction of cost of investments and/or realized gain. Such amounts are based on estimates if actual amounts are not available, and actual amounts of income, realized gain and return of capital may differ from the estimated amounts. The fund adjusts the estimated amounts of the components of distributions
25
COHEN & STEERS INTERNATIONAL REALTY FUND, INC.
NOTES TO FINANCIAL STATEMENTS (Unaudited)—(Continued)
(and consequently its net investment income) as an increase to unrealized appreciation/(depreciation) and realized gain/(loss) on investments as necessary once the issuers provide information about the actual composition of the distributions. Income, expenses (other than expenses attributable to a specific class), and realized and unrealized gains or losses on investments are allocated to each class of shares based on its relative net assets.
Foreign Currency Translation and Forward Foreign Currency Contracts: The books and records of the fund are maintained in U.S. dollars as follows: (1) the foreign currency market value of investment securities, other assets and liabilities and forward foreign currency contracts (forward contracts) are translated at the exchange rates prevailing at the end of the period; and (2) purchases, sales, income and expenses are translated at the exchange rates prevailing on the respective dates of such transactions. The resultant exchange gains and losses are recorded as realized and unrealized gain/loss on foreign exchange transactions. Pursuant to U.S. federal income tax regulations, certain foreign exchange gains/losses included in realized and unrealized gain/loss are included in or are a reduction of ordinary income for federal income tax purposes. The fund does not is olate that portion of the results of operations arising as a result of changes in the foreign exchange rates from the changes in the market prices of the securities. Forward contracts are valued daily at the appropriate exchange rates. The resultant unrealized exchange gains and losses are recorded as unrealized foreign currency gain or loss. The fund records realized gains or losses on delivery of the currency or at the time the forward contract is extinguished (compensated) by entering into a closing transaction prior to delivery.
Foreign Securities: The fund may directly purchase securities of foreign issuers. Investing in securities of foreign issuers involves special risks not typically associated with investing in securities of U.S. issuers. The risks include possible revaluation of currencies, the ability to repatriate funds, less complete financial information about companies and possible future adverse political and economic developments. Moreover, securities of many foreign issuers and their markets may be less liquid and their prices more volatile than those of securities of comparable U.S. issuers.
Dividends and Distributions to Shareholders: Dividends from net investment income and capital gain distributions are determined in accordance with U.S. federal income tax regulations, which may differ from GAAP. Dividends from net investment income are declared and paid semi-annually. Net realized capital gains, unless offset by any available capital loss carryforward, are distributed to shareholders annually. Dividends and distributions to shareholders are recorded on the ex-dividend date and are automatically reinvested in full and fractional shares of the fund based on the net asset value per share at the close of business on the ex-dividend date unless the shareholder has elected to have them paid in cash.
Distributions paid by the fund are subject to recharacterization for tax purposes. Based upon the results of operations for the six months ended June 30, 2006, the advisor considers it likely that a portion of the dividends will be reclassified to return of capital and distributions of net realized capital gains upon the final determination of the fund's taxable income for the year.
26
COHEN & STEERS INTERNATIONAL REALTY FUND, INC.
NOTES TO FINANCIAL STATEMENTS (Unaudited)—(Continued)
Federal Income Taxes: It is the policy of the fund to continue to qualify as a regulated investment company, if such qualification is in the best interest of the shareholders, by complying with the requirements of Subchapter M of the Internal Revenue Code applicable to regulated investment companies, and by distributing substantially all of its taxable earnings to its shareholders. Accordingly, no provision for federal income or excise tax is necessary.
Note 2. Investment Advisory and Administration Fees and Other Transactions with Affiliates
Investment Advisory Fees: Cohen & Steers Capital Management, Inc. (the advisor) serves as the fund's investment advisor pursuant to an investment advisory agreement (the advisory agreement). Under the terms of the advisory agreement, the advisor provides the fund with the day-to-day investment decisions and generally manages the fund's investments in accordance with the stated policies of the fund, subject to the supervision of the fund's Board of Directors. For the services provided to the fund, the advisor receives a monthly fee, accrued daily and paid monthly, at the annual rate of 0.95% of the average daily net assets of the fund up to and including $1.5 billion and 0.85% of the average daily net asset above $1.5 billion.
For the six months ended June 30, 2006 and through December 31, 2006, the advisor has contractually agreed to waive its fee and/or reimburse the fund for expenses incurred to the extent necessary to maintain the fund's operating expenses at 1.70% for the Class A shares, 2.35% for the Class C shares and 1.35% for the Class I shares.
Under a subadvisory agreement between the advisor and Houlihan Rovers S.A. (the subadvisor), an affiliate of the advisor, the subadvisor is responsible for managing the fund's investments in certain non-U.S. real estate securities. For its services provided under the subadvisory agreement, the advisor (not the fund) pays the subadvisor a monthly fee at the annual rate of 0.30% of the average daily net assets of the fund. For the six months ended June 30, 2006, the advisor paid the subadvisor $912,645.
Administration Fees: The fund has entered into an administration agreement with the advisor under which the advisor performs certain administrative functions for the fund and receives a fee, accrued daily and paid monthly, at the annual rate of 0.06% of the fund's average daily net assets. For the six months ended June 30, 2006, the fund paid the advisor $182,529 in fees under this administration agreement. Additionally, the fund has retained State Street Bank and Trust Company as sub-administrator under a fund accounting and administration agreement.
Distribution Fees: Shares of the fund are distributed by Cohen & Steers Securities, LLC (the distributor), an affiliated entity of the advisor. The fund has adopted a distribution plan (the plan) pursuant to Rule 12b-1 under the Investment Company Act of 1940. The plan provides that the fund will pay the distributor a fee at an annual rate of up to 0.25% of the average daily net assets attributable to the Class A shares and up to 0.75% of the average daily net assets attributable to the Class C shares.
27
COHEN & STEERS INTERNATIONAL REALTY FUND, INC.
NOTES TO FINANCIAL STATEMENTS (Unaudited)—(Continued)
For the six months ended June 30, 2006, the fund has been advised that the distributor received $345,123 in sales commissions from the sale of Class A shares and that the distributor also received $37,427 of contingent deferred sales charges relating to redemptions of Class C shares. The distributor has advised the fund that proceeds from the contingent deferred sales charge on the Class C shares are paid to the distributor and are used by the distributor to defray its expenses related to providing distribution-related services to the fund in connection with the sale of the Class C shares, including payments to dealers and other financial intermediaries for selling Class C shares and interest and other financing costs associated with Class C shares.
Shareholder Servicing Fees: The fund has adopted a shareholder services plan which provides that the fund may obtain the services of qualified financial institutions to act as shareholder servicing agents for their customers. For these services, the fund may pay the shareholder servicing agent a fee, accrued daily and paid monthly, at an annual rate of up to 0.10% of the average daily net asset value of the fund's Class A shares and up to 0.25% of the average daily net asset value of the fund's Class C shares.
Directors' and Officers' Fees: Certain directors and officers of the fund are also directors, officers, and/or employees of the advisor. The fund does not pay compensation to any affiliated directors and officers except for the Chief Compliance Officer, who received $4,623 from the fund for the six months ended June 30, 2006.
Note 3. Purchases and Sales of Securities
Purchases and sales of securities, excluding short-term investments, for the six months ended June 30, 2006 totaled $673,823,889 and $82,098,495 respectively.
Note 4. Income Tax Information
As of June 30, 2006, the federal tax cost and net unrealized appreciation were as follows:
| Cost for federal income tax purposes | | $ | 867,287,835 | | |
| Gross unrealized appreciation | | $ | 77,851,263 | | |
| Gross unrealized depreciation | | | (3,424,704 | ) | |
| Net unrealized appreciation | | $ | 74,426,559 | | |
Note 5. Capital Stock
The fund is authorized to issue 200 million shares of capital stock, at a par value of $0.001 per share. The Board of Directors of the fund may increase or decrease the aggregate number of shares of common stock that the
28
COHEN & STEERS INTERNATIONAL REALTY FUND, INC.
NOTES TO FINANCIAL STATEMENTS (Unaudited)—(Continued)
fund has authority to issue. At June 30, 2006, Cohen & Steers Capital Management Inc. owned 224,959 shares of Class I, or 0.4% of the fund. Transactions in fund shares were as follows:
| | | For the
Six Months Ended
June 30, 2006 | | For the Period
March 31, 2005a
through
December 31, 2005 | |
| | | Shares | | Amount | | Shares | | Amount | |
| CLASS A: | |
| Sold | | | 17,755,606 | | | $ | 264,740,523 | | | | 7,009,246 | | | $ | 85,114,447 | | |
Issued as reinvestment of
dividends | | | 75,641 | | | | 1,086,208 | | | | 29,652 | | | | 387,984 | | |
| Redeemed | | | (1,762,534 | ) | | | (26,276,440 | ) | | | (140,485 | ) | | | (1,753,046 | ) | |
Redemption fees retained
by the fundb | | | — | | | | 22,846 | | | | — | | | | 1,824 | | |
| Net increase | | | 16,068,713 | | | $ | 239,573,137 | | | | 6,898,413 | | | $ | 83,751,209 | | |
| CLASS C: | |
| Sold | | | 14,433,325 | | | $ | 214,316,214 | | | | 4,671,986 | | | $ | 57,212,816 | | |
Issued as reinvestment of
dividends | | | 20,339 | | | | 291,854 | | | | 6,732 | | | | 88,101 | | |
| Redeemed | | | (422,258 | ) | | | (6,225,442 | ) | | | (51,569 | ) | | | (639,735 | ) | |
Redemption fees retained
by the Fundb | | | — | | | | 15,568 | | | | — | | | | 857 | | |
| Net increase | | | 14,031,406 | | | $ | 208,398,194 | | | | 4,627,149 | | | $ | 56,662,039 | | |
| CLASS I: | |
| Sold | | | 10,676,042 | | | $ | 156,816,154 | | | | 11,330,663 | | | $ | 140,337,487 | | |
Issued as reinvestment of
dividends | | | 156,114 | | | | 2,243,361 | | | | 95,403 | | | | 1,247,618 | | |
| Redeemed | | | (833,220 | ) | | | (12,161,433 | ) | | | (127,633 | ) | | | (1,618,220 | ) | |
Redemption fees retained
by the fundb | | | — | | | | 18,584 | | | | — | | | | 1,572 | | |
| Net increase | | | 9,998,936 | | | $ | 146,916,666 | | | | 11,298,433 | | | $ | 139,968,457 | | |
a Commencement of operations
b The fund may charge a 1% redemption fee on shares sold within six months of the time of purchase.
29
COHEN & STEERS INTERNATIONAL REALTY FUND, INC.
NOTES TO FINANCIAL STATEMENTS (Unaudited)—(Continued)
Note 6. Borrowings
The fund, in conjunction with other Cohen & Steers funds, is a party to a $150,000,000 syndicated credit agreement (the credit agreement) with State Street Bank and Trust Company, as administrative agent and operations agent, and the lenders identified in the credit agreement, which expires December 2006. The fund pays a commitment fee of 0.125% per annum on its proportionate share of the unused portion of the credit agreement.
During the six months ended June 30, 2006, the fund did not utilize the line of credit.
Note 7. Other
In the normal course of business, the fund enters into contracts that provide general indemnifications. The fund's maximum exposure under these arrangements is dependent on claims that may be made against the fund in the future and, therefore, cannot be estimated; however, based on experience, the risk of material loss from such claims is considered remote.
In July 2006, the Financial Accounting Standards Board (FASB) issued Interpretation 48, Accounting for Uncertainty in Income Taxes—an interpretation of FASB Statement 109 (FIN 48). FIN 48 clarifies the accounting for income taxes by prescribing the minimum recognition threshold a tax position must meet before being recognized in the financial statements. FIN 48 is effective for fiscal years beginning after December 15, 2006. The fund will adopt FIN 48 during 2007 and the impact to the fund's financial statements, if any, is currently being assessed.
30
COHEN & STEERS INTERNATIONAL REALTY FUND, INC.
OTHER INFORMATION
A description of the policies and procedures that the fund uses to determine how to vote proxies relating to portfolio securities is available (i) without charge, upon request, by calling 800-330-7348, (ii) on our Web site at cohenandsteers.com or (iii) on the Securities and Exchange Commission's Web site at http://www.sec.gov. In addition, the fund's proxy voting record for the most recent 12-month period ended June 30 is available (i) without charge, upon request, by calling 800-330-7348 or (ii) on the SEC's Web site at http://www.sec.gov.
The fund files its complete schedule of portfolio holdings with the SEC for the first and third quarters of each fiscal year on Form N-Q. The fund's Forms N-Q are available (i) without charge, upon request by calling 800-330-7348, or (ii) on the SEC's Web site at http://www.sec.gov. In addition, the Forms N-Q may be reviewed and copied at the SEC's Public Reference Room in Washington, DC. Information on the operation of the Public Reference Room may be obtained by calling 800-SEC-0330.
Please note that the distributions paid by the fund to shareholders are subject to recharacterization for tax purposes. The fund may also pay distributions in excess of the fund's net investment company taxable income and this excess would be a tax-free return of capital distributed from the fund's assets. To the extent this occurs, the fund's shareholders of record will be notified of the estimated amount of capital returned to shareholders for each such distribution and this information will also be available at cohenandsteers.com. The final tax treatment of all distributions is reported to shareholders on their 1099-DIV forms, which are mailed after the close of each calendar year. Distributions of capital decrease the fund's total assets and, therefore, could have the effect of increasing the fund's expense ratio. In addition, in order to make these distributions, the fund may have to sell portfolio securities at a less than opportune ti me.
APPROVAL OF INVESTMENT ADVISORY AGREEMENT AND HOULIHAN ROVERS, S.A.
SUBADVISORY AGREEMENT
The board of directors of the fund, including a majority of the directors who are not parties to the fund's investment advisory agreement or subadvisory agreements, or interested persons of any such party ("Independent Directors"), has the responsibility under the 1940 Act to approve these agreements for initial two year terms and their continuation annually thereafter at a meeting of the board called for the purpose of voting on the approvals or continuations.
At a meeting held in person on June 6, 2006, the fund's Investment Advisory Agreement and the Subadvisory Agreement with Houlihan Rovers, S.A. (the "Houlihan Subadvisory Agreement") were discussed and were each unanimously continued for a one-year term by the fund's board, including the Independent Directors. The Independent Directors were represented by independent counsel who assisted them in their deliberations during the board meeting and executive session.
In considering whether to continue the Investment Advisory Agreement, the board reviewed materials provided by the fund's investment advisor (the "Advisor"), Houlihan Rovers, S.A. ("Houlihan Rovers") and fund counsel
31
COHEN & STEERS INTERNATIONAL REALTY FUND, INC.
which included, among other things, fee, expense and performance information compared to peer funds prepared by Morningstar Associates LLC ("Morningstar"), supplemental performance and summary information prepared by the Advisor, sales and redemption data for the fund and memoranda outlining the legal duties of the board. The board also spoke directly with representatives of Morningstar and met with investment advisory personnel from the Advisor. The board considered factors relating to both the selection of the Advisor and Houlihan Rovers and the approval of the advisory fee and the sub-advisory fee when reviewing the Investment Advisory Agreement and the Houlihan Subadvisory Agreement. In particular, the board considered the following:
(i) The nature, extent and quality of services to be provided by the Advisor and Houlihan Rovers: The directors reviewed the services that the Advisor provides to the fund, including, but not limited to, generally managing the fund's investments in accordance with the stated policies of the fund. The directors reviewed the services that Houlihan Rovers currently provides to the fund, including selecting portfolio securities and providing a continuous investment program for the fund with respect to investments in Europe; providing investment research and management; purchasing, retaining and selling securities for the fund; and placing orders for the execution of the fund's portfolio transactions. The directors also discussed with officers and portfolio managers of the fund the amount of time the Advisor and Houlihan Rovers dedicate to the fund and the types of transactions that were being done on behalf of the fund. The directors then consid ered the allocation of responsibilities between the Advisor and Houlihan Rovers, noting that the Advisor oversees the entire operations of the fund and has responsibility for investments in the U.S., Asia and Canada and overall regional and country allocation of the fund's portfolio. The directors also considered a presentation by the Advisor on its investment philosophy with respect to, and the investment outlook for, the fund. Additionally, the directors took into account the services provided by the Advisor to its other funds, including those that invest substantially in real estate securities and have investment objectives and strategies similar to the fund.
In addition, the board considered the education, background and experience of the Advisor's and Houlihan Rovers' personnel. The directors also took into consideration the favorable history and reputation of the portfolio managers for the fund, finding that this has had, and would likely continue to have, a favorable impact on the success of the fund. The board noted that the Advisor's experience in investing in real estate securities, and Houlihan Rovers' experience in investment in international real estate securities, generally helped further the fund's objectives. Lastly, the directors noted the Advisor's ability to attract quality and experienced personnel. The directors concluded that the nature, quality and extent of services provided by the Advisor, including compliance with investment restrictions and tax reporting requirements, and the services provided by Houlihan Rovers are adequate and appropriate.
(ii) Investment performance of the fund and the Advisor and Houlihan Rovers: The directors reviewed the past investment performance of the fund, as well as the past investment performance of the fund's peer group. In particular, they focused on materials provided by Morningstar. The directors noted that the fund's performance was at the median of its peer group funds in the specialty-real estate category. The directors gave consideration to the fact that Morningstar had a limited universe of international real estate funds to include in the peer group and the
32
COHEN & STEERS INTERNATIONAL REALTY FUND, INC.
relatively short one-year period of the performance comparison. The directors also noted that the fund was currently outperforming its blended benchmark.
The directors reviewed the Advisor's performance for other open- and closed-end real estate funds and Houlihan Rovers' performance for another open-end fund. In particular, the directors noted that the Advisor managed other real estate funds, in addition to the fund, that were outperforming their benchmark indices and their peer groups and that Houlihan Rovers managed another real estate fund that was performing similarly to the fund. The directors determined that the Advisor would continue to be an appropriate investment adviser for the fund and that Houlihan Rovers would continue to be an appropriate subadvisor for the fund and that the fund's performance was satisfactory.
(iii) Cost of the services to be provided and profits to be realized by the Advisor from the relationship with the fund: Next, the directors considered the cost of the services provided by the Advisor, noting that Houlihan Rovers' fees under the Houlihan Subadvisory Agreement are paid by the Advisor (not the fund). As part of their analysis, the directors gave substantial consideration to the fee and expense ratio analyses provided by Morningstar and comparisons to peer group funds selected by Morningstar. The directors noted that under the Investment Advisory Agreement, the fund pays the Advisor a monthly investment advisory fee computed at the annual rate of 0.95% of the average daily net assets of the fund. The directors noted, however, that the Advisor had waived a portion of its fees during the reporting period, resulting in a net advisory fee of 0.76% and a net management fee (including both advisory and affiliated administrative fees) of 0.82%.
In reviewing the investment advisory fee, the directors considered the investment advisory fees of the peer group and noted that the fund's contractual fee was at the peer group median (though, after the Advisor's waiver, the fee was substantially below the peer group median). The fund's total expense ratio was above the peer group median (though after the Advisor's waiver, the expense ratio was at the peer group median). It was noted that the Advisor expects the expense ratio would decline with additional assets. The directors concluded that the fund's expense structure is competitive in the peer group.
The directors also reviewed information regarding the profitability to the Advisor of its relationship with the fund. The board considered the level of the Advisor's profits and whether the profits were reasonable for the Advisor. The directors noted that the Advisor was currently waiving fees and/or reimbursing expenses for the fund and that the Advisor (and not the fund) pays Houlihan Rovers. The directors took into consideration other benefits to be derived by the Advisor and Houlihan Rovers in connection with the Investment Advisory Agreement and Houlihan Subadvisory Agreement, respectively, noting particularly the research and related services, within the meaning of Section 28(e) of the Securities Exchange Act of 1934, as amended (the "Exchange Act"), that the Advisor and Houlihan Rovers receive by allocating the fund's brokerage transactions. The directors also considered the fees received by the Advisor under the Administration Agreem ent, and noted the significant services received, such as operational services and furnishing office space and facilities for the fund, and providing persons satisfactory to the board to serve as officers of the fund, and that these services were beneficial to the fund. The directors concluded
33
COHEN & STEERS INTERNATIONAL REALTY FUND, INC.
that the profits realized by the Advisor from its relationship with the fund were reasonable and consistent with fiduciary duties.
(iv) The extent to which economies of scale would be realized as the fund grows and whether fee levels would reflect such economies of scale: The directors noted that the fund's advisory fee schedule does not contain any breakpoints. The directors considered the fund's asset size and determined that there were not at this time significant economies of scale that were not being shared with shareholders.
(v) Comparison of services rendered and fees paid to those under other investment advisory contracts, such as contracts of the same and other investment advisers or other clients: As discussed above in (i) and (iii), the directors compared both the services rendered and the fees paid under the Investment Advisory Agreement to those under other investment advisory contracts of other investment advisers managing peer group funds. The directors compared both the services rendered and the fees paid under the Investment Advisory Agreement and the Houlihan Subadvisory Agreement to their other advisory contracts with institutional and other clients. The directors acknowledged that differences in fees paid by other clients seemed to be consistent with the differences in services provided and determined that on a comparative basis the fees under the Investment Advisory Agreement and the Houlihan Subadvisory Agreement were reasonable in relation to th e services provided.
No single factor was cited as determinative to the decision of the board. Rather, after weighing all of the considerations and conclusions discussed above, the board, including the Independent Directors, unanimously approved the continuation of the Investment Advisory Agreement and the Houlihan Subadvisory Agreement.
34
COHEN & STEERS INTERNATIONAL REALTY FUND, INC.
Meet the Cohen & Steers family of open-end funds:

• Designed for investors seeking maximum total return, investing primarily in REITs
• Symbol: CSRSX

• Designed for institutional investors seeking maximum total return, investing primarily in REITs
• Symbol: CSRIX

• Designed for investors seeking high current income, investing primarily in REITs
• Symbols: CSEIX, CSBIX, CSCIX, CSDIX

• Designed for investors seeking maximum capital appreciation, investing in a limited number of REITs and other real estate securities
• Symbols: CSFAX, CSFBX, CSFCX, CSSPX

• Designed for investors seeking maximum total return, investing primarily in international real estate securities
• Symbols: IRFAX, IRFCX, IRFIX

• Designed for investors seeking maximum total return, investing primarily in utilities
• Symbols: CSUAX, CSUBX, CSUCX, CSUIX

• Designed for investors seeking high current income and long-term growth of income and capital appreciation, investing primarily in dividend paying common stocks and preferred stocks.
• Symbols: DVFAX, DVFCX, DVFIX

• Designed for investors seeking maximum total return, investing primarily in real estate securities located in the Asia Pacific region
• Symbols: APFAX, APFCX, APFIX
Please consider the investment objectives, risks, charges and expenses of the fund carefully before investing. A prospectus containing this and other information can be obtained by calling 800-330-7348 or by visiting cohenandsteers.com. Please read the prospectus carefully before investing.
Cohen & Steers Securities, LLC, Distributor
35
COHEN & STEERS INTERNATIONAL REALTY FUND, INC.
OFFICERS AND DIRECTORS
Robert H. Steers
Director and co-chairman
Martin Cohen
Director and co-chairman
Bonnie Cohen
Director
George Grossman
Director
Richard E. Kroon
Director
Richard J. Norman
Director
Frank K. Ross
Director
Willard H. Smith Jr.
Director
C. Edward Ward, Jr.
Director
Adam M. Derechin
President and chief executive officer
Joseph M. Harvey
Vice president
James S. Corl
Vice president
David J. Oakes
Vice president
Lawrence B. Stoller
Secretary
Jay J. Chen
Treasurer and chief financial officer
Lisa D. Phelan
Chief compliance officer
John E. McLean
Assistant secretary
KEY INFORMATION
Investment Advisor
Cohen & Steers Capital Management, Inc.
280 Park Avenue
New York, NY 10017
(212) 832-3232
Subadvisor
Houlihan Rovers SA
166 Choussee de la Hulpe
1170 Brussels, Belgium
Fund Subadministrator and Custodian
State Street Bank and Trust Company
225 Franklin Street
Boston, MA 02110
Transfer Agent
Boston Financial Data Services, Inc.
2 Heritage Drive
North Quincy, MA 02171
(800) 437-9912
Legal Counsel
Stroock & Stroock & Lavan LLP
180 Maiden Lane
New York, NY 10038
Distributor
Cohen & Steers Securities, LLC
280 Park Avenue
New York, NY 10017
Nasdaq Symbol: Class A—IRFAX
C—IRFCX
I— IRFIX
Web site: cohenandsteers.com
This report is authorized for delivery only to shareholders of Cohen & Steers International Realty Fund, Inc. unless accompanied or preceded by the delivery of a currently effective prospectus setting forth details of the fund. Past performance is of course no guarantee of future results and your investment may be worth more or less at the time you sell.
36
COHEN & STEERS
INTERNATIONAL REALTY FUND
280 PARK AVENUE
NEW YORK, NY 10017

SEMIANNUAL REPORT
JUNE 30, 2006
Item 2. Code of Ethics.
Not applicable.
Item 3. Audit Committee Financial Expert.
Not applicable.
Item 4. Principal Accountant Fees and Services.
Not applicable.
Item 5. Audit Committee of Listed Registrants.
Not applicable.
Item 6. Schedule of Investments.
Included in Item 1 above.
Item 7. Disclosure of Proxy Voting Policies and Procedures for Closed-End Management Investment Companies.
Not applicable.
Item 8. Portfolio Managers of Closed-End Management Investment Companies.
Not applicable.
Item 9. Purchases of Equity Securities by Closed-End Management Investment Company and Affiliated Purchasers.
Not applicable.
Item 10. Submission of Matters to a Vote of Security Holders.
None.
Item 11. Controls and Procedures.
(a) The registrant’s principal executive officer and principal financial officer have concluded, based upon their evaluation of the registrant’s disclosure controls and procedures as conducted
within 90 days of the filing date of this report, that these disclosure controls and procedures provide reasonable assurance that material information required to be disclosed by the registrant in the report it files or submits on Form N-CSR is recorded, processed, summarized and reported within the time periods specified in the Securities and Exchange Commission’s rules and forms and that such material information is accumulated and communicated to the registrant’s management, including its principal executive officer and principal financial officer, as appropriate, in order to allow timely decisions regarding required disclosure.
(b) There were no changes in the registrant’s internal control over financial reporting that occurred during the second fiscal quarter of the period covered by this report that have materially affected, or are reasonably likely to materially affect, the registrant’s internal control over financial reporting.
Item 12. Exhibits.
(a)(1) Not applicable.
(a) (2) Certifications of principal executive officer and principal financial officer as required by Rule 30a-2(a) under the Investment Company Act of 1940.
(a)(3) Not applicable.
(b) Certifications of principal exe cutive officer and principal financial officer as required by Rule 30a- 2(b) under the Investment Company Act of 1940.
SIGNATURES
Pursuant to the requirements of the Securities Exchange Act of 1934 and the Investment Company Act of 1940, the registrant has duly caused this report to be signed on its behalf by the undersigned, thereunto duly authorized.
COHEN & STEERS INTERNATIONAL REALTY FUND, INC.
| | | |
| By: | /s/ Adam M. Derechin | |
| | Name: Adam M. Derechin |
| | Title: President and Chief Executive Officer |
| | |
| Date: August 28, 2006 |
Pursuant to the requirements of the Securities Exchange Act of 1934 and the Investment Company Act of 1940, this report has been signed below by the following persons on behalf of the registrant and in the capacities and on the dates indicated.
| | | |
| By: | /s/ Adam M. Derechin | |
| | Name: | Adam M. Derechin |
| | Title: | President and Chief Executive Officer
(principal executive officer) |
| | | |
| By: | /s/ Jay J. Chen | |
| | Name: | Jay J. Chen |
| | Title: | Treasurer
(principal financial officer) |
| | | |
| | | |
| Date: August 28, 2006 |
| | | | |