Exhibit 99.(c)(2)
Privileged & Confidential Restricted Use: For Members of the Board of Directors of World Focus September 15, 2006 PRESENTATION MATERIALS FOR: The Board of Directors of World Focus |
Introduction Overview of Engagement Background Aegis Communications Group, Inc. Operating Overview Public Market Overview Selected Operating Data Historical Balance Sheet Analysis Stock Price Performance Valuation Analysis Summary Valuation Analysis Comparable Company Analysis Comparable Transaction Analysis Discounted Cash Flow Analysis Leveraged Buyout Analysis Premiums Paid Analysis – Going Private Transactions Addendum Comparable Company Descriptions Table of Contents |

I. Introduction |
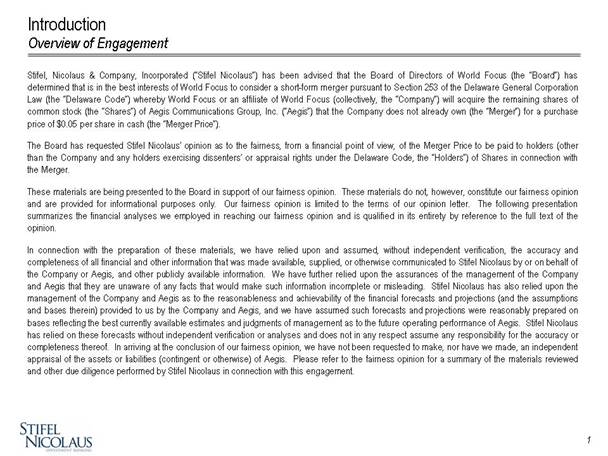
Stifel, Nicolaus & Company, Incorporated (“Stifel Nicolaus”) has been advised that the Board of Directors of World Focus (the “Board”) has determined that is in the best interests of World Focus to consider a short-form merger pursuant to Section 253 of the Delaware General Corporation Law (the “Delaware Code”) whereby World Focus or an affiliate of World Focus (collectively, the “Company”) will acquire the remaining shares of common stock (the “Shares”) of Aegis Communications Group, Inc. (“Aegis”) that the Company does not already own (the “Merger”) for a purchase price of $0.05 per share in cash (the “Merger Price”). The Board has requested Stifel Nicolaus’ opinion as to the fairness, from a financial point of view, of the Merger Price to be paid to holders (other than the Company and any holders exercising dissenters’ or appraisal rights under the Delaware Code, the “Holders”) of Shares in connection with the Merger. These materials are being presented to the Board in support of our fairness opinion. These materials do not, however, constitute our fairness opinion and are provided for informational purposes only. Our fairness opinion is limited to the terms of our opinion letter. The following presentation summarizes the financial analyses we employed in reaching our fairness opinion and is qualified in its entirety by reference to the full text of the opinion. In connection with the preparation of these materials, we have relied upon and assumed, without independent verification, the accuracy and completeness of all financial and other information that was made available, supplied, or otherwise communicated to Stifel Nicolaus by or on behalf of the Company or Aegis, and other publicly available information. We have further relied upon the assurances of the management of the Company and Aegis that they are unaware of any facts that would make such information incomplete or misleading. Stifel Nicolaus has also relied upon the management of the Company and Aegis as to the reasonableness and achievability of the financial forecasts and projections (and the assumptions and bases therein) provided to us by the Company and Aegis, and we have assumed such forecasts and projections were reasonably prepared on bases reflecting the best currently available estimates and judgments of management as to the future operating performance of Aegis. Stifel Nicolaus has relied on these forecasts without independent verification or analyses and does not in any respect assume any responsibility for the accuracy or completeness thereof. In arriving at the conclusion of our fairness opinion, we have not been requested to make, nor have we made, an independent appraisal of the assets or liabilities (contingent or otherwise) of Aegis. Please refer to the fairness opinion for a summary of the materials reviewed and other due diligence performed by Stifel Nicolaus in connection with this engagement. Introduction Overview of Engagement |

We believe that our analysis should be considered as a whole, and that selecting portions of our analysis and the factors we considered, without considering all analyses and factors, could be misleading. The preparation of a fairness opinion is a complex process and, as a result, fairness opinions are not necessarily susceptible to partial analysis or summary description. Our fairness opinion is necessarily based upon economic, market, financial and other conditions as they exist on, and on the information made available to us as of, the date of the opinion. It should be understood that, although subsequent developments may affect the fairness opinion or the analyses or information set forth in these materials, we do not have any obligation to update, revise or reaffirm our fairness opinion. It is understood that these materials are solely for the information of, and directed to, the Board in its evaluation of the Merger. Our opinion does not constitute a recommendation to the Board or the Board of Directors of ACG Acquisition, Inc. (the “ACG Board” and collectively with the Board, the “Boards”) as to how the Boards should vote on the Merger or to any shareholder of the Company or Aegis as to how to vote at any shareholders’ meeting at which the Merger is considered or whether or not to exercise any appraisal or dissenters’ rights available to such shareholder. Additionally, our opinion does not compare the relative merits of the Merger with those of any other transaction or business strategy which may have been available to or considered by the Company as alternatives to the Merger and does not address the underlying business decision of the Boards or the Company to proceed with or effect the Merger. We have not been involved in structuring or negotiating the Merger and were not requested to explore alternatives to the Merger or solicit the interest of any other parties in pursuing transactions with the Company or Aegis. In addition, our opinion does not consider, address or include: (i) the tax consequences of the Merger on the Holders of Shares; (ii) any other securities of Aegis or the holders thereof, including without limitation Aegis’ Series B Preferred Stock; or (iii) the stock purchase agreement between World Focus and Questor Partners Fund II, L.P. and certain affiliated entities, including without limitation the purchase price paid by World Focus to such Questor entities for shares of Aegis’ common stock pursuant thereto. These materials are not to be quoted or referred to, in whole or in part, in any registration statement, prospectus or proxy statement, or in any other document used in connection with the offering or sale of securities or to seek approval for the Merger, nor shall this presentation be used for any other purposes, without the prior written consent of Stifel Nicolaus. We have acted as financial advisor to the Board and will receive a fee upon the delivery of our fairness opinion that is not contingent upon consummation of the Merger. In addition, the Company has agreed to indemnify us for certain liabilities arising out of our engagement. In the past, the prior owner of part of the Stifel Nicolaus Capital Markets business provided investment banking services to Aegis and received customary fees for its services. In the ordinary course of our business, we may actively trade securities of Aegis for our own account and for the accounts of our customers and, accordingly, may at any time hold a long or short position in such securities. Introduction Overview of Engagement (cont.) |
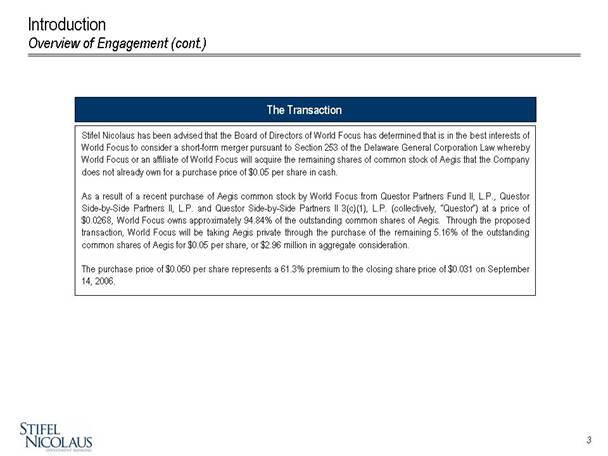
Introduction Stifel Nicolaus has been advised that the Board of Directors of World Focus has determined that is in the best interests of World Focus to consider a short-form merger pursuant to Section 253 of the Delaware General Corporation Law whereby World Focus or an affiliate of World Focus will acquire the remaining shares of common stock of Aegis that the Company does not already own for a purchase price of $0.05 per share in cash. As a result of a recent purchase of Aegis common stock by World Focus from Questor Partners Fund II, L.P., Questor Side-by-Side Partners II, L.P. and Questor Side-by-Side Partners II 3(c)(1), L.P. (collectively, “Questor”) at a price of $0.0268, World Focus owns approximately 94.84% of the outstanding common shares of Aegis. Through the proposed transaction, World Focus will be taking Aegis private through the purchase of the remaining 5.16% of the outstanding common shares of Aegis for $0.05 per share, or $2.96 million in aggregate consideration. The purchase price of $0.050 per share represents a 61.3% premium to the closing share price of $0.031 on September 14, 2006. The Transaction Overview of Engagement (cont.) |
II. Aegis Communications Group, Inc. Operating Overview |
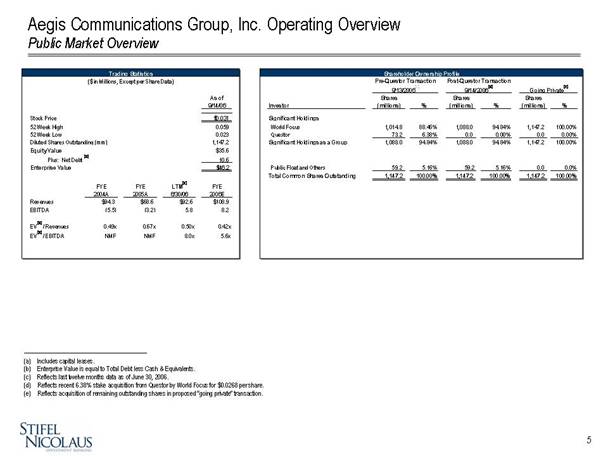
Aegis Communications Group, Inc. Operating Overview Public Market Overview ________ (a) Includes capital leases. (b) Enterprise Value is equal to Total Debt less Cash & Equivalents. (c) Reflects last twelve months data as of June 30, 2006. (d) Reflects recent 6.38% stake acquisition from Questor by World Focus for $0.0268 per share. (e) Reflects acquisition of remaining outstanding shares in proposed “going private” transaction. Going Private (e) As of Shares Shares Shares 9/14/06 Investor (millions) % (millions) % (millions) % Stock Price $0.031 Significant Holdings 52 Week High 0.059 World Focus 1,014.8 88.46% 1,088.0 94.84% 1,147.2 100.00% 52 Week Low 0.023 Questor 73.2 6.38% 0.0 0.00% 0.0 0.00% Diluted Shares Outstanding (mm) 1,147.2 Significant Holdings as a Group 1,088.0 94.84% 1,088.0 94.84% 1,147.2 100.00% Equity Value $35.6 Plus: Net Debt (a) 10.6 Enterprise Value $46.2 Public Float and Others 59.2 5.16% 59.2 5.16% 0.0 0.0% Total Common Shares Outstanding 1,147.2 100.00% 1,147.2 100.00% 1,147.2 100.00% FYE FYE LTM (c) FYE 2004A 2005A 6/30/06 2006E 1147.2171 Revenues $94.3 $68.6 $92.6 $108.9 EBITDA (5.5) (3.2) 5.8 8.2 EV (b) / Revenues 0.49x 0.67x 0.50x 0.42x EV (b) / EBITDA NMF NMF 8.0x 5.6x Post-Questor Transaction 9/14/2006 (d) ($ in Millions, Except per Share Data) Trading Statistics Pre-Questor Transaction 9/13/2006 (a) Shareholder Ownership Profile |
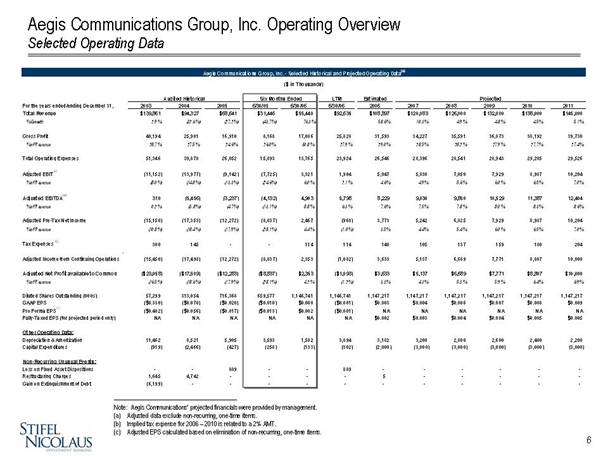
Aegis Communications Group, Inc. Operating Overview Selected Operating Data ________________ Note: Aegis Communications’ projected financials were provided by management. (a) Adjusted data exclude non-recurring, one-time items. (b) Implied tax expense for 2006 – 2010 is related to a 2% AMT. (c) Adjusted EPS calculated based on elimination of non-recurring, one-time items. Aegis Communications Group, Inc. - Selected Historical and Projected Operating Data (a) ($ in Thousands) Audited Historical Six Months Ended LTM Estimated Projected For the years ended/ending December 31, 2003 2004 2005 6/30/05 6/30/06 6/30/06 2006 2007 2008 2009 2010 2011 Total Revenue $139,861 $94,327 $68,641 $31,446 $55,440 $92,635 $108,897 $120,083 $126,000 $132,000 $138,000 $145,000 % Growth 2.9% (32.6%) (27.2%) (43.7%) 76.3% 58.6% 10.3% 4.9% 4.8% 4.5% 5.1% Gross Profit 40,194 25,901 16,910 8,168 17,086 25,828 31,593 34,227 35,591 36,873 38,192 39,730 % of Revenue 28.7% 27.5% 24.6% 26.0% 30.8% 27.9% 29.0% 28.5% 28.2% 27.9% 27.7% 27.4% Total Operating Expenses 51,346 39,878 26,052 15,893 13,765 23,924 26,546 28,396 28,541 28,943 29,205 29,526 Adjusted EBIT (a) (11,152) (13,977) (9,142) (7,725) 3,321 1,904 5,047 5,830 7,050 7,929 8,987 10,204 % of Revenue (8.0%) (14.8%) (13.3%) (24.6%) 6.0% 2.1% 4.6% 4.9% 5.6% 6.0% 6.5% 7.0% Adjusted EBITDA (a) 310 (5,456) (3,237) (4,132) 4,903 5,798 8,229 9,030 9,850 10,529 11,387 12,404 % of Revenue 0.2% (5.8%) (4.7%) (13.1%) 8.8% 6.3% 7.6% 7.5% 7.8% 8.0% 8.3% 8.6% Adjusted Pre-Tax Net Income (15,150) (17,353) (12,272) (8,837) 2,467 (968) 3,773 5,242 6,825 7,929 8,987 10,204 % of Revenue (10.8%) (18.4%) (17.9%) (28.1%) 4.4% (1.0%) 3.5% 4.4% 5.4% 6.0% 6.5% 7.0% Tax Expenses (b) 300 145 - - 114 114 140 105 137 159 180 204 . Adjusted Income from Continuing Operations (15,450) (17,498) (12,272) (8,837) 2,353 (1,082) 3,633 5,137 6,689 7,771 8,807 10,000 Adjusted Net Profit available to Common ($23,058) ($17,509) ($12,283) ($8,837) $2,353 ($1,093) $3,633 $5,137 $6,689 $7,771 $8,807 $10,000 % of Revenue (16.5%) (18.6%) (17.9%) (28.1%) 4.2% (1.2%) 3.3% 4.3% 5.3% 5.9% 6.4% 6.9% Diluted Shares Outstanding (000s) 57,299 313,054 716,368 659,577 1,146,741 1,146,741 1,147,217 1,147,217 1,147,217 1,147,217 1,147,217 1,147,217 GAAP EPS ($0.330) ($0.070) ($0.020) ($0.010) $0.000 ($0.001) $0.003 $0.004 $0.006 $0.007 $0.008 $0.009 Pro Forma EPS (c) ($0.402) ($0.056) ($0.017) ($0.013) $0.002 ($0.001) NA NA NA NA NA NA Fully-Taxed EPS (for projected period only) NA NA NA NA NA NA $0.002 $0.003 $0.004 $0.004 $0.005 $0.005 Other Operating Data: Depreciation & Amortization 11,462 8,521 5,905 3,593 1,582 3,894 3,182 3,200 2,800 2,600 2,400 2,200 Capital Expenditures (919) (2,466) (427) (258) (133) (302) (2,000) (3,000) (3,000) (3,000) (3,000) (3,000) Non-Recurring Unusual Events: Loss on Fixed Asset Dispositions - - 889 - - 889 - - - - - - Restructuring Charges 1,645 4,742 - - - - 5 - - - - - Gain on Extinguishment of Debt (6,199) - - - - - - - - - - - |
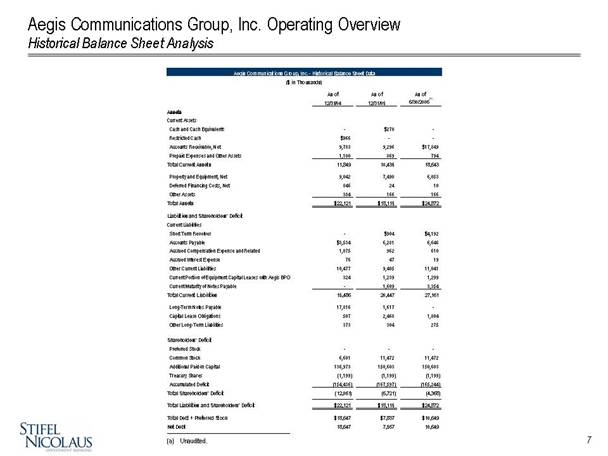
Aegis Communications Group, Inc. Operating Overview Historical Balance Sheet Analysis ________________ (a) Unaudited. As of As of As of 12/31/04 12/31/05 6/30/2006 (a) Assets Current Assets Cash and Cash Equivalents - $270 - Restricted Cash $966 - - Accounts Receivable, Net 9,783 9,296 $17,849 Prepaid Expenses and Other Assets 1,100 869 794 Total Current Assets 11,849 10,435 18,643 Property and Equipment, Net 9,042 7,490 6,053 Deferred Financing Costs, Net 846 24 10 Other Assets 384 166 166 Total Assets $22,121 $18,115 $24,872 Liabilities and Shareholders’ Deficit Current Liabilities Short Term Revolver - $904 $4,192 Accounts Payable $3,534 6,281 6,646 Accrued Compensation Expense and Related 1,075 962 610 Accrued Interest Expense 76 47 19 Other Current Liabilities 10,477 9,405 11,041 Current Portion of Equipment Capital Leases with Aegis BPO 324 1,239 1,299 Current Maturity of Notes Payable - 1,609 3,354 Total Current Liabilities 15,486 20,447 27,161 Long-Term Notes Payable 17,816 1,617 - Capital Lease Obligations 507 2,468 1,804 Other Long-Term Liabilities 373 304 275 Shareholders’ Deficit Preferred Stock - - - Common Stock 6,601 11,472 11,472 Additional Paid-In Capital 136,973 150,603 150,603 Treasury Shares (1,199) (1,199) (1,199) Accumulated Deficit (154,436) (167,597) (165,244) Total Shareholders’ Deficit (12,061) (6,721) (4,368) Total Liabilities and Shareholders’ Deficit $22,121 $18,115 $24,872 Total Debt + Preferred Stock $18,647 $7,837 $10,649 Net Debt 18,647 7,567 10,649 Aegis Communications Group, Inc. - Historical Balance Sheet Data ($ in Thousands) |
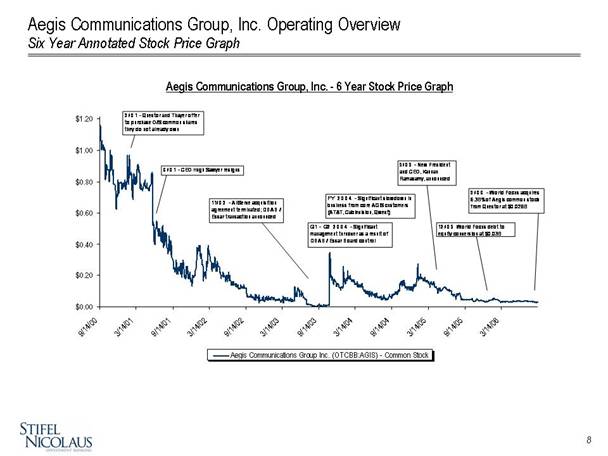
Aegis Communications Group, Inc. Operating Overview Six Year Annotated Stock Price Graph Aegis Communications Group, Inc. - 6 Year Stock Price Graph $0.00 $0.20 $0.40 $0.60 $0.80 $1.00 $1.20 9/14/00 3/14/01 9/14/01 3/14/02 9/14/02 3/14/03 9/14/03 3/14/04 9/14/04 3/14/05 9/14/05 3/14/06 Aegis Communications Group Inc. (OTCBB:AGIS) - Common Stock 3/01 - Questor and Thayer offer to purchase O/S common shares they do not already own 6/01 - CEO Hugh Sawyer resigns 11/03 - AllServe acquisition agreement terminated; DBAB / Essar transaction announced Q1 - Q2 2004 - Significant management turnover as a result of DBAB / Essar Board control FY 2004 - Significant slowdown in business from core AGIS customers (AT&T, Cablevision, Qwest) 5/05 - New President and CEO, Kannan Ramasamy, announced 12/05 World Focus debt to equity conversion at $0.038 9/06 - World Focus acquires 6.38% of Aegis common stock from Questor at $0.0268 |
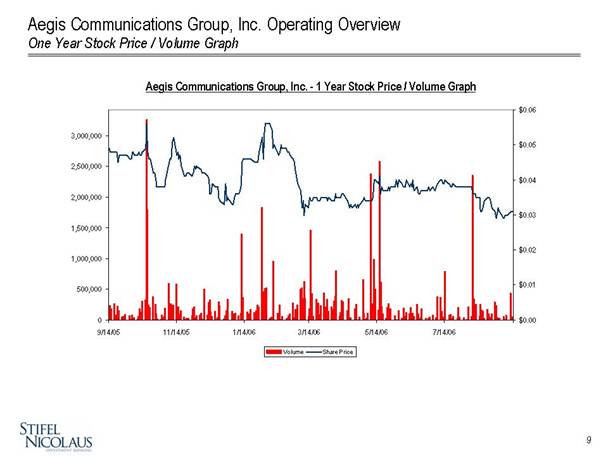
Aegis Communications Group, Inc. Operating Overview One Year Stock Price / Volume Graph Aegis Communications Group, Inc. - 1 Year Stock Price / Volume Graph 0 500,000 1,000,000 1,500,000 2,000,000 2,500,000 3,000,000 9/14/05 11/14/05 1/14/06 3/14/06 5/14/06 7/14/06 $0.00 $0.01 $0.02 $0.03 $0.04 $0.05 $0.06 Volume Share Price |
III. Valuation Analysis |
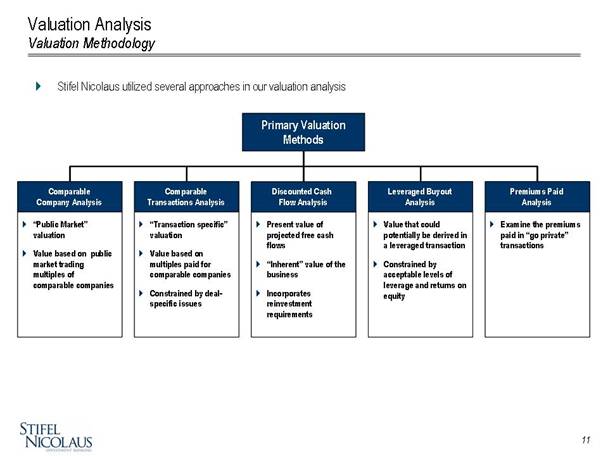
Valuation Analysis Valuation Methodology Stifel Nicolaus utilized several approaches in our valuation analysis } “Public Market” valuation } Value based on public market trading multiples of comparable companies Comparable Company Analysis } “Transaction specific” valuation } Value based on multiples paid for comparable companies } Constrained by deal - specific issues Comparable Transactions Analysis } Value that could potentially be derived in a leveraged transaction } Constrained by acceptable levels of leverage and returns on equity Leveraged Buyout Analysis Primary Valuation Methods } Present value of projected free cash flows } “Inherent” value of the business } Incorporates reinvestment requirements Discounted Cash Flow Analysis } Examine the premiums paid in “go private” transactions Premiums Paid Analysis } “Public Market” valuation } Value based on public market trading multiples of comparable companies Comparable Company Analysis } “Transaction specific” valuation } Value based on multiples paid for comparable companies } Constrained by deal - specific issues Comparable Transactions Analysis } Value that could potentially be derived in a leveraged transaction } Constrained by acceptable levels of leverage and returns on equity Leveraged Buyout Analysis Primary Valuation Methods } Present value of projected free cash flows } “Inherent” value of the business } Incorporates reinvestment requirements Discounted Cash Flow Analysis } Examine the premiums paid in “go private” transactions Premiums Paid Analysis |
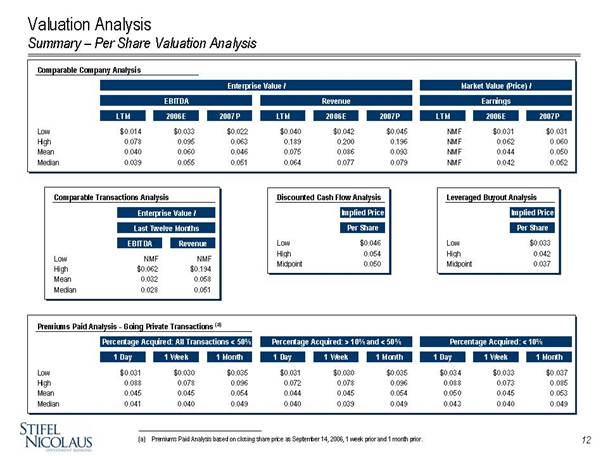
Valuation Analysis Summary – Per Share Valuation Analysis ________________________________________ (a) Premiums Paid Analysis based on closing share price as September 14, 2006, 1 week prior and 1 month prior. Premiums Paid Analysis - Going Private Transactions (a) Percentage Acquired: All Transactions < 50% Percentage Acquired: > 10% and < 50% Percentage Acquired: < 10% 1 Day 1 Week 1 Month 1 Day 1 Week 1 Month 1 Day 1 Week 1 Month Low $0.031 $0.030 $0.035 $0.031 $0.030 $0.035 $0.034 $0.033 $0.037 High 0.088 0.078 0.096 0.072 0.078 0.096 0.088 0.073 0.085 Mean 0.045 0.045 0.054 0.044 0.045 0.054 0.050 0.045 0.053 Median 0.041 0.040 0.049 0.040 0.039 0.049 0.043 0.040 0.049 Comparable Company Analysis Enterprise Value / Market Value (Price) / EBITDA Revenue Earnings LTM 2006E 2007P LTM 2006E 2007P LTM 2006E 2007P Low $0.014 $0.033 $0.022 $0.040 $0.042 $0.045 NMF $0.031 $0.031 High 0.078 0.095 0.063 0.189 0.200 0.196 NMF 0.062 0.060 Mean 0.040 0.060 0.046 0.075 0.086 0.093 NMF 0.044 0.050 Median 0.039 0.055 0.051 0.064 0.077 0.079 NMF 0.042 0.052 Discounted Cash Flow Analysis Implied Price Per Share Low $0.046 High 0.054 Midpoint 0.050 Comparable Transactions Analysis Enterprise Value/ Last Twelve Months EBITDA Revenue Low High Mean Median NMF NMF $0.062 $0.194 0.032 0.058 0.028 0.051 Leveraged Buyout Analysis Implied Price Per Share Low High Midpoint $0.033 0.042 0.037 |
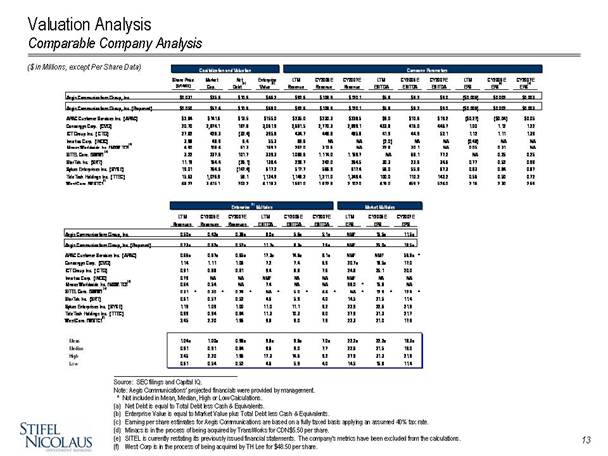
Valuation Analysis Comparable Company Analysis ($ in Millions, except Per Share Data) _____________________________________________________ Source: SEC filings and Capital IQ. Note: Aegis Communications’ projected financials were provided by management. * Not included in Mean, Median, High or Low Calculations. (a) Net Debt is equal to Total Debt less Cash & Equivalents. (b) Enterprise Value is equal to Market Value plus Total Debt less Cash & Equivalents. (c) Earning per share estimates for Aegis Communications are based on a fully taxed basis applying an assumed 40% tax rate. (d) Minacs is in the process of being acquired by TransWorks for CDN$5.50 per share. (e) SITEL is currently restating its previously issued financial statements. The company’s metrics have been excluded from the calculations. (f) West Corp is in the process of being acquired by TH Lee for $48.50 per share. Enterprise (b) Multiples Market Multiples Enterprise Value (b) as Multiple of: LTM CY2006E CY2007E LTM CY2006E CY2007E LTM CY2006E CY2007E Revenues Revenues Revenues EBITDA EBITDA EBITDA EPS EPS EPS Aegis Communications Group, Inc. 0.50x 0.42x 0.38x 8.0x 5.6x 5.1x NMF 15.5x 11.5x Aegis Communications Group, Inc. (Proposed) 0.73x 0.62x 0.57x 11.7x 8.3x 7.6x NMF 25.0x 18.5x APAC Customer Services Inc. (APAC) 0.66x 0.67x 0.65x 17.3x 14.6x 8.1x NMF NMF 56.8x * Convergys Corp. (CVG) 1.14 1.11 1.06 7.2 7.4 6.9 20.7x 18.5x 17.0 ICT Group Inc. (ICTG) 0.91 0.88 0.81 9.4 8.8 7.6 24.8 25.1 20.0 Innotrac Corp. (INOC) 0.79 NA NA NMF NA NA NMF NA NA Minacs Worldwide Inc. (MXW.TO) (d) 0.64 0.54 NA 7.4 NA NA 98.0 * 15.8 NA SITEL Corp. (SWW) (e) 0.31 * 0.30 * 0.29 * NA * 5.0 * 4.4 * NA * 12.9 * 12.9 * StarTek Inc. (SRT) 0.61 0.57 0.52 4.6 5.9 4.0 14.5 21.5 11.4 Sykes Enterprises Inc. (SYKE) 1.19 1.09 1.00 11.0 11.1 9.2 22.9 22.6 21.9 TeleTech Holdings Inc. (TTEC) 0.99 0.94 0.84 11.3 10.3 8.0 27.9 31.3 21.7 West Corp. (WSTC) (f) 2.45 2.20 1.96 9.8 9.0 7.9 22.3 21.0 17.9 Mean 1.04x 1.00x 0.98x 9.8x 9.6x 7.0x 22.2x 22.2x 18.3x Median 0.91 0.91 0.84 9.6 9.0 7.7 22.6 21.5 19.0 High 2.45 2.20 1.96 17.3 14.6 9.2 27.9 31.3 21.9 Low 0.61 0.54 0.52 4.6 5.9 4.0 14.5 15.8 11.4 Capitalization and Valueation Company Parameters Share Price (9/14/06) Market Cap. Net Debt(a) Enterprise Value (b) LTM Revenue CY2006E Revenue CY2007E Revenue LTM EBITDA CY2006E EBITDA CY2007E EBITDA LTM EPS CY2006E EPS (c) CY2007E EPS(c) APAC Customer Services Inc., (Proposed) Convergys Corp. (CVG) ICT Group Inc. Innotrac Corp. Minacs Worldwide Inc. (MXW.TO) SITEL Corp. (SWW)(a) Star Tek Inc. (SRT) Sykes Enterprises Inc. (SYKE) Tele Tech Holdings Inc. (TTEC) West Corp. (WSTC) $0.031 $0.050 $2.84 20.70 27.82 3.98 4.90 3.22 11.19 19.01 15.63 48.27 $35.6 $57.4 $141.6 2,874.1 428.3 48.9 108.4 237.6 164.4 764.6 1,076.9 3,415.1 $10.6 $10.6 $13.5 187.8 (32.4) 6.4 61.3 101.7 (26.1) (147.4) 58.1 703.2 $46.2 $68.0 $155.0 3,061.9 395.8 55.3 169.7 339.3 138.4 617.2 1,134.9 4,118.3 $92.6 $92.6 $235.0 2,681.5 434.7 69.8 267.0 89.8 267.0 1,088.6 228.7 517.7 1,1492 1,681.0 $108.9 $108.9 $230.3 2,770.3 448.8 NA 313.5 1,114.0 242.0 566.9 1,211.0 1,872.8 $120.1 $120.1 $238.5 2,899.1 484.8 NA NA 1,169.7 264.5 617.4 1,349.4 2,102.0 $5.8 $5.8 $9.0 423.8 41.9 (2.0) 22.8 NA 30.3 56.0 100.0 419.0 $8.2 $8.2 $10.36 416.0 44.9 NA 30.1 68.1 23.6 55.8 110.2 459.7 $9.0 $9.0 $19.2 446.7 52.1 NA NA 77.2 34.6 67.3 142.2 524.0 ($0.006) ($0.006) ($0.27) 1.00 1.12 (0.48) 0.05 NA 0.77 0.83 0.56 2.16 $0.002 $0.002 ($0.04) 1.12 1.11 NA 0.31 0.25 0.52 0.84 0.50 2.30 $0.003 $0.003 $0.06 1.22 1.39 NA NA 0.25 0.98 0.87 0.72 2.69 |
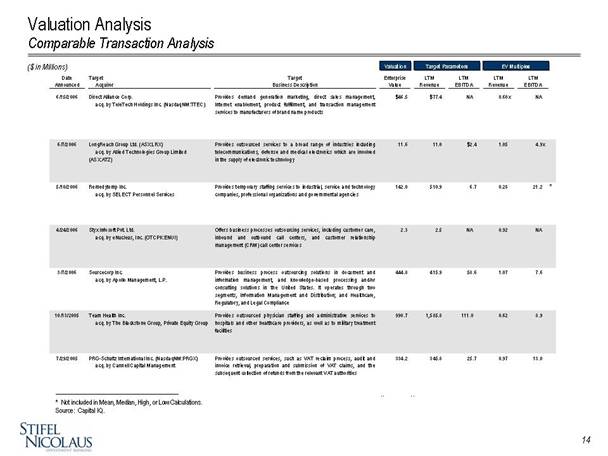
Valuation Analysis Comparable Transaction Analysis ($ in Millions) ________________________________________ * Not included in Mean, Median, High, or Low Calculations. Source: Capital IQ. Valuation Target Parameters EV Multiples Date Target Target Enterprise LTM LTM LTM LTM Announced Acquiror Business Description Value Revenue EBITDA Revenue EBITDA 6/15/2006 Direct Alliance Corp. acq. by TeleTech Holdings Inc. (NasdaqNM:TTEC) Provides demand generation marketing, direct sales management, Internet enablement, product fulfillment, and transaction management services to manufacturers of brand name products $46.5 $77.4 NA 0.60x NA 6/7/2006 LongReach Group Ltd. (ASX:LRX) acq. by Allied Technologies Group Limited (ASX:ATZ) Provides outsourced services to a broad range of industries including telecommunications, defense and medical electronics which are involved in the supply of electronic technology 11.6 11.0 $2.4 1.05 4.9x 5/10/2006 Remedytemp Inc. acq. by SELECT Personnel Services Provides temporary staffing services to industrial, service and technology companies, professional organizations and governmental agencies 142.0 510.9 6.7 0.28 21.2 * 4/24/2006 Styx Infosoft Pvt. Ltd. acq. by eNucleus, Inc. (OTCPK:ENUI) Offers business processes outsourcing services, including customer care, inbound and outbound call centers, and customer relationship management (CRM) call center services 2.3 2.5 NA 0.92 NA 3/7/2006 Sourcecorp Inc. acq. by Apollo Management, L.P. Provides business process outsourcing solutions in document and information management, and knowledge-based processing and/or consulting solutions in the United States. It operates through two segments, Information Management and Distribution; and Healthcare, Regulatory, and Legal Compliance 444.8 415.9 58.6 1.07 7.6 10/13/2005 Team Health Inc. acq. by The Blackstone Group, Private Equity Group Provides outsourced physician staffing and administrative services to hospitals and other healthcare providers, as well as to military treatment facilities 990.7 1,585.8 111.0 0.62 8.9 7/29/2005 PRG-Schultz International Inc. (NasdaqNM:PRGX) acq. by Cannell Capital Management Provides outsourced services, such as VAT reclaim process, audit and invoice retrieval, preparation and submission of VAT claims, and the subsequent collection of refunds from the relevant VAT authorities 334.2 345.8 25.7 0.97 13.0 (a) (a) |
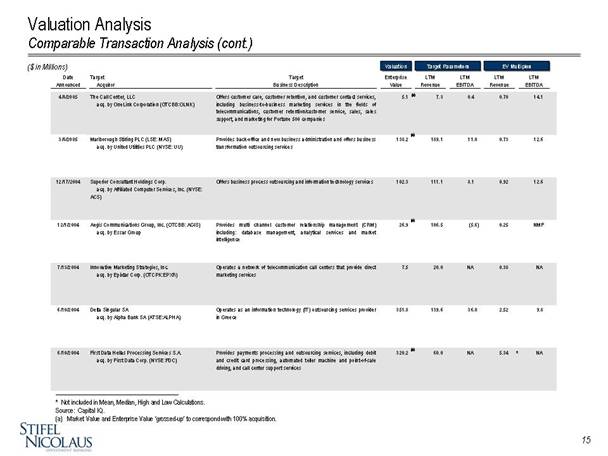
Valuation Analysis Comparable Transaction Analysis (cont.) ________________________________________ * Not included in Mean, Median, High and Low Calculations. Source: Capital IQ. (a) Market Value and Enterprise Value ‘grossed-up’ to correspond with 100% acquisition. ($ in Millions) Valuation Target Parameters EV Multiples Date Target Target Enterprise LTM LTM LTM LTM Announced Acquiror Business Description Value Revenue EBITDA Revenue EBITDA 4/8/2005 The Call Center, LLC acq. by OneLink Corporation (OTCBB:OLNK) Offers customer care, customer retention, and customer contact services, including business-to-business marketing services in the fields of telecommunications, customer retention/customer service, sales, sales support, and marketing for Fortune 500 companies 5.1 7.3 0.4 0.70 14.1 3/8/2005 Marlborough Stirling PLC (LSE: MAS) acq. by United Utilities PLC (NYSE: UU) Provides back-office and new business administration and offers business transformation outsourcing services 138.2 189.1 11.0 0.73 12.6 12/17/2004 Superior Consultant Holdings Corp. acq. by Affiliated Computer Services, Inc. (NYSE: ACS) Offers business process outsourcing and information technology services 102.3 111.1 8.1 0.92 12.6 12/1/2004 Aegis Communications Group, Inc. (OTCBB: AGIS) acq. by Essar Group Provides multi channel customer relationship management (CRM) including: database management, analytical services and market intelligence 26.9 106.5 (5.6) 0.25 NMF 7/13/2004 Innovative Marketing Strategies, Inc. acq. by Epixtar Corp. (OTCPK:EPXR) Operates a network of telecommunication call centers that provide direct marketing services 7.5 20.0 NA 0.38 NA 6/10/2004 Delta Singular SA acq. by Alpha Bank SA (ATSE:ALPHA) Operates as an information technology (IT) outsourcing services provider in Greece 351.8 139.6 36.0 2.52 9.8 6/10/2004 First Data Hellas Processing Services S.A. acq. by First Data Corp. (NYSE:FDC) Provides payments processing and outsourcing services, including debit and credit card processing, automated teller machine and point-of-sale driving, and call center support services 320.2 60.0 NA 5.34 * NA (a) (a) (a) (a) (a) (a) (a) (a) |
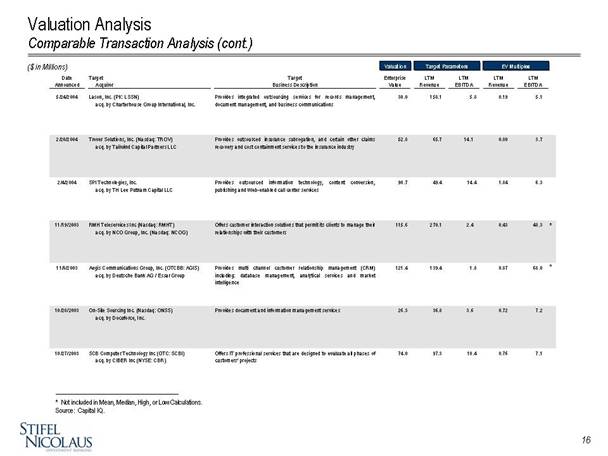
Valuation Analysis Comparable Transaction Analysis (cont.) ($ in Millions) ________________________________________ * Not included in Mean, Median, High, or Low Calculations. Source: Capital IQ. Valuation Target Parameters EV Multiples Date Target Target Enterprise LTM LTM LTM LTM Announced Acquiror Business Description Value Revenue EBITDA Revenue EBITDA 5/24/2004 Lason, Inc. (PK: LSSN) acq. by Charterhouse Group International, Inc. Provides integrated outsourcing services for records management, document management, and business communications 30.0 158.1 5.8 0.19 5.1 2/20/2004 Trover Solutions, Inc. (Nasdaq: TROV) acq. by Tailwind Capital Partners LLC Provides outsourced insurance subrogation, and certain other claims recovery and cost containment services to the insurance industry 52.8 65.7 14.1 0.80 3.7 2/4/2004 SPI Technologies, Inc. acq. by TH Lee Putnam Capital LLC Provides outsourced information technology, content conversion, publishing and Web-enabled call center services 90.7 49.4 14.4 1.84 6.3 11/19/2003 RMH Teleservices Inc (Nasdaq: RMHT) acq. by NCO Group, Inc. (Nasdaq: NCOG) Offers customer interaction solutions that permit its clients to manage their relationships with their customers 115.6 270.1 2.4 0.43 48.3 * 11/8/2003 Aegis Communications Group, Inc. (OTCBB: AGIS) acq. by Deutsche Bank AG / Essar Group Provides multi channel customer relationship management (CRM) including: database management, analytical services and market intelligence 121.4 139.4 1.8 0.87 68.0 * 10/28/2003 On-Site Sourcing Inc. (Nasdaq: ONSS) acq. by Docuforce, Inc. Provides document and information management services 26.3 36.8 3.6 0.72 7.2 10/27/2003 SCB Computer Technology Inc (OTC: SCBI) acq. by CIBER Inc (NYSE: CBR) Offers IT professional services that are designed to evaluate all phases of customers’ projects 74.0 97.3 10.4 0.76 7.1 |
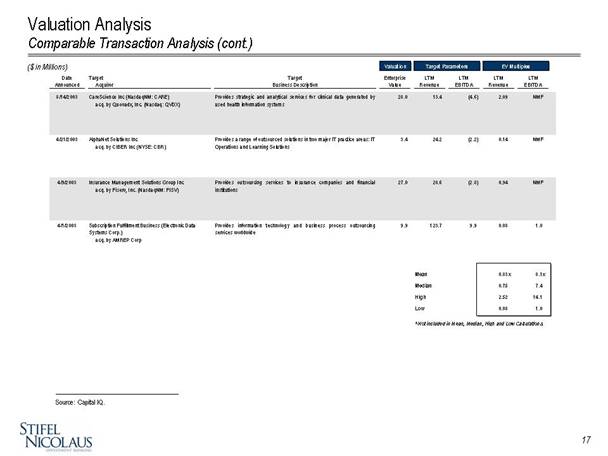
Valuation Analysis Comparable Transaction Analysis (cont.) ($ in Millions) ________________________________________ Source: Capital IQ. Valuation Target Parameters EV Multiples Date Target Target Enterprise LTM LTM LTM LTM Announced Acquiror Business Description Value Revenue EBITDA Revenue EBITDA 8/14/2003 CareScience Inc (NasdaqNM: CARE) acq. by Quovadx, Inc. (Nasdaq: QVDX) Provides strategic and analytical services for clinical data generated by used health information systems 28.0 13.4 (4.6) 2.09 NMF 4/21/2003 AlphaNet Solutions Inc acq. by CIBER Inc (NYSE: CBR) Provides a range of outsourced solutions in two major IT practice areas: IT Operations and Learning Solutions 3.4 24.2 (2.2) 0.14 NMF 4/9/2003 Insurance Management Solutions Group Inc acq. by Fiserv, Inc. (NasdaqNM: FISV) Provides outsourcing services to insurance companies and financial institutions 27.0 28.6 (2.8) 0.94 NMF 4/1/2003 Subscription Fulfillment Business (Electronic Data Systems Corp.) acq. by AMREP Corp Provides information technology and business process outsourcing services worldwide 9.9 123.7 9.9 0.08 1.0 Mean 0.83x 8.1x Median 0.75 7.4 High 2.52 14.1 Low 0.08 1.0 * Not included in Mean, Median, High and Low Calculations. |
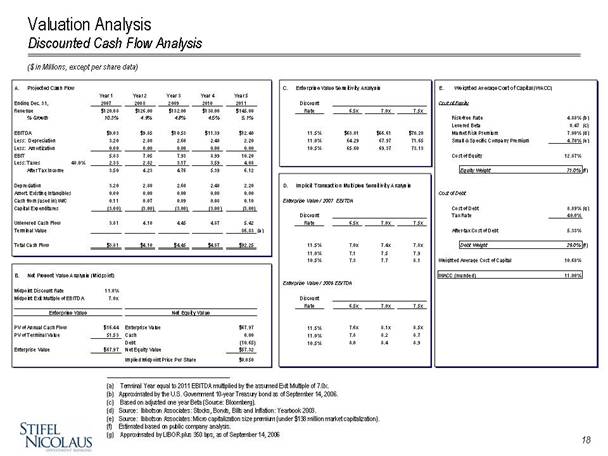
Valuation Analysis Discounted Cash Flow Analysis ________________________________________ (a) Terminal Year equal to 2011 EBITDA multiplied by the assumed Exit Multiple of 7.0x. (b) Approximated by the U.S. Government 10-year Treasury bond as of September 14, 2006. (c) Based on adjusted one year Beta (Source: Bloomberg). (d) Source: Ibbotson Associates: Stocks, Bonds, Bills and Inflation: Yearbook 2003. (e) Source: Ibbotson Associates: Micro capitalization size premium (under $138 million market capitalization). (f) Estimated based on public company analysis. (g) Approximated by LIBOR plus 350 bps, as of September 14, 2006 ($ in Millions, except per share data) A. Projected Cash Flow C. Enterprise Value Sensitivity Analysis E. Weighted Average Cost of Capital (WACC) Year 1 Year 2 Year 3 Year 4 Year 5 Ending Dec. 31, 2007 2008 2009 2010 2011 Discount Cost of Equity Revenue $120.08 $126.00 $132.00 $138.00 $145.00 Rate 6.5x 7.0x 7.5x % Growth 10.3% 4.9% 4.8% 4.5% 5.1% Risk-free Rate 4.88% (b) 12.0% $61.76 $65.28 $68.80 Levered Beta 0.47 (c) EBITDA $9.03 $9.85 $10.53 $11.39 $12.40 11.5% $63.01 $66.61 $70.20 Market Risk Premium 7.00% (d) Less: Depreciation 3.20 2.80 2.60 2.40 2.20 11.0% 64.29 67.97 71.65 Small & Specific Company Premium 4.70% (e) Less: Amortization 0.00 0.00 0.00 0.00 0.00 10.5% 65.60 69.37 73.13 EBIT 5.83 7.05 7.93 8.99 10.20 10.0% 66.95 70.80 74.65 Cost of Equity 12.87% Less: Taxes 40.0% 2.33 2.82 3.17 3.59 4.08 After Tax Income 3.50 4.23 4.76 5.39 6.12 Equity Weight 71.0% (f) Depreciation 3.20 2.80 2.60 2.40 2.20 D. Implicit Transaction Multiples Sensitivity Analysis Amort. Existing Intangibles 0.00 0.00 0.00 0.00 0.00 Cost of Debt Cash from (used in) W/C 0.11 0.07 0.09 0.08 0.10 Enterprise Value / 2007 EBITDA Capital Expenditures (3.00) (3.00) (3.00) (3.00) (3.00) Cost of Debt 8.89% (g) Discount Tax Rate 40.0% Unlevered Cash Flow 3.81 4.10 4.45 4.87 5.42 Rate 6.5x 7.0x 7.5x Terminal Value 86.83 (a) After-tax Cost of Debt 5.33% 12.0% 6.8x 7.2x 7.6x Total Cash Flow $3.81 $4.10 $4.45 $4.87 $92.25 11.5% 7.0x 7.4x 7.8x Debt Weight 29.0% (f) 11.0% 7.1 7.5 7.9 10.5% 7.3 7.7 8.1 Weighted Average Cost of Capital 10.68% 10.0% 7.4 7.8 8.3 B. Net Present Value Analysis (Midpoint) WACC (rounded) 11.00% Enterprise Value / 2006 EBITDA Midpoint Discount Rate 11.0% Midpoint Exit Multiple of EBITDA 7.0x Discount Rate 6.5x 7.0x 7.5x Enterprise Value Net Equity Value 12.0% 7.5x 7.9x 8.3x PV of Annual Cash Flow $16.44 Enterprise Value $67.97 11.5% 7.6x 8.1x 8.5x PV of Terminal Value 51.53 Cash 0.00 11.0% 7.8 8.2 8.7 Debt (10.65) 10.5% 8.0 8.4 8.9 Enterprise Value $67.97 Net Equity Value $57.32 10.0% 8.1 8.6 9.1 Implied Midpoint Price Per Share $0.050 |
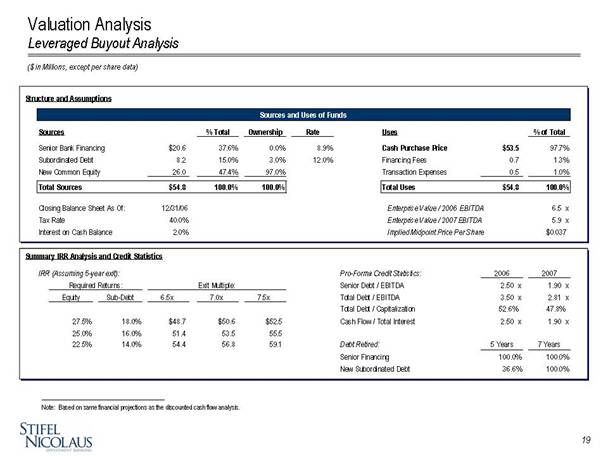
Valuation Analysis Leveraged Buyout Analysis ($ in Millions, except per share data) ________________________________________ Note: Based on same financial projections as the discounted cash flow analysis. Structure and Assumptions Sources and Uses of Funds Sources % Total Ownership Rate Uses % of Total Senior Bank Financing $20.6 37.6% 0.0% 8.9% Cash Purchase Price $53.5 97.7% Subordinated Debt 8.2 15.0% 3.0% 12.0% Financing Fees 0.7 1.3% New Common Equity 26.0 47.4% 97.0% Transaction Expenses 0.5 1.0% Total Sources $54.8 100.0% 100.0% Total Uses $54.8 100.0% Closing Balance Sheet As Of: 12/31/06 Enterprise Value / 2006 EBITDA 6.5 x Tax Rate 40.0% Enterprise Value / 2007 EBITDA 5.9 x Interest on Cash Balance 2.0% Implied Midpoint Price Per Share $0.037 Summary IRR Analysis and Credit Statistics IRR (Assuming 5-year exit): Pro-Forma Credit Statistics: 2006 2007 Required Returns: Exit Multiple: Senior Debt / EBITDA 2.50 x 1.90 x Equity Sub-Debt 6.5x 7.0x 7.5x Total Debt / EBITDA 3.50 x 2.81 x Total Debt / Capitalization 52.6% 47.8% 27.5% 18.0% $48.7 $50.6 $52.5 Cash Flow / Total Interest 2.50 x 1.90 x 25.0% 16.0% 51.4 53.5 55.5 22.5% 14.0% 54.4 56.8 59.1 Debt Retired: 5 Years 7 Years Senior Financing 100.0% 100.0% New Subordinated Debt 36.6% 100.0% |
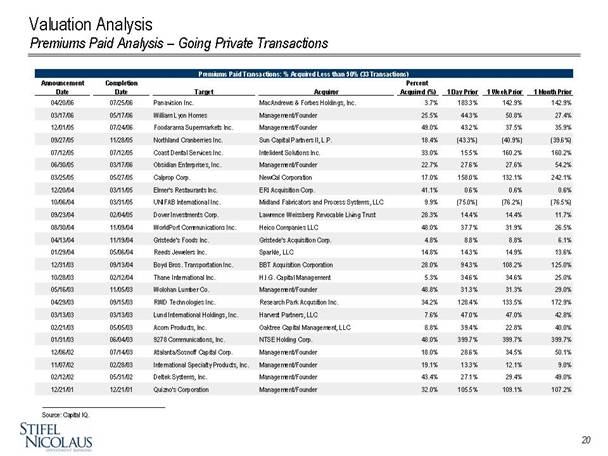
Valuation Analysis Premiums Paid Analysis – Going Private Transactions ________________________________________ Source: Capital IQ. Premiums Paid Transactions: % Acquired Less than 50% (33 Transactions) Announcement Completion Percent Date Date Target Acquiror Acquired (%) 1 Day Prior 1 Week Prior 1 Month Prior 04/20/06 07/25/06 Panavision Inc. MacAndrews & Forbes Holdings, Inc. 3.7% 183.3% 142.9% 142.9% 03/17/06 05/17/06 William Lyon Homes Management/Founder 25.5% 44.3% 50.8% 27.4% 12/01/05 07/24/06 Foodarama Supermarkets Inc. Management/Founder 49.0% 43.2% 37.5% 35.9% 09/27/05 11/28/05 Northland Cranberries Inc. Sun Capital Partners II, L.P. 18.4% (43.3%) (40.9%) (39.6%) 07/12/05 07/12/05 Coast Dental Services Inc. Intelident Solutions Inc. 33.0% 15.5% 160.2% 160.2% 06/30/05 03/17/06 Obsidian Enterprises, Inc. Management/Founder 22.7% 27.6% 27.6% 54.2% 03/25/05 05/27/05 Calprop Corp. NewCal Corporation 17.0% 158.0% 132.1% 242.1% 12/20/04 03/11/05 Elmer’s Restaurants Inc. ERI Acquisition Corp. 41.1% 0.6% 0.6% 0.6% 10/06/04 03/31/05 UNIFAB International Inc. Midland Fabricators and Process Systems, LLC 9.9% (75.0%) (76.2%) (76.5%) 09/23/04 02/04/05 Dover Investments Corp. Lawrence Weissberg Revocable Living Trust 28.3% 14.4% 14.4% 11.7% 08/30/04 11/09/04 WorldPort Communications Inc. Heico Companies LLC 48.0% 37.7% 31.9% 26.5% 04/13/04 11/19/04 Gristede’s Foods Inc. Gristede’s Acquisition Corp. 4.8% 8.8% 8.8% 6.1% 01/29/04 05/06/04 Reeds Jewelers Inc. Sparkle, LLC 14.8% 14.3% 14.9% 13.6% 12/31/03 09/13/04 Boyd Bros. Transportation Inc. BBT Acquisition Corporation 28.0% 94.3% 108.2% 125.0% 10/28/03 02/12/04 Thane International Inc. H.I.G. Capital Management 5.3% 34.6% 34.6% 25.0% 05/16/03 11/05/03 Wolohan Lumber Co. Management/Founder 48.8% 31.3% 31.3% 29.0% 04/29/03 09/15/03 RWD Technologies Inc. Research Park Acqusition Inc. 34.2% 128.4% 133.5% 172.9% 03/13/03 03/13/03 Lund International Holdings, Inc. Harvest Partners, LLC 7.6% 47.0% 47.0% 42.8% 02/21/03 05/05/03 Acorn Products, Inc. Oaktree Capital Management, LLC 8.8% 39.4% 22.8% 40.0% 01/31/03 06/04/03 9278 Communications, Inc. NTSE Holding Corp. 48.0% 399.7% 399.7% 399.7% 12/06/02 07/14/03 Atalanta/Sosnoff Capital Corp. Management/Founder 18.0% 28.6% 34.5% 50.1% 11/07/02 02/28/03 International Specialty Products, Inc. Management/Founder 19.1% 13.3% 12.1% 9.0% 02/12/02 05/31/02 Deltek Systems, Inc. Management/Founder 43.4% 27.1% 29.4% 49.0% 12/21/01 12/21/01 Quizno’s Corporation Management/Founder 32.0% 105.5% 109.1% 107.2% |
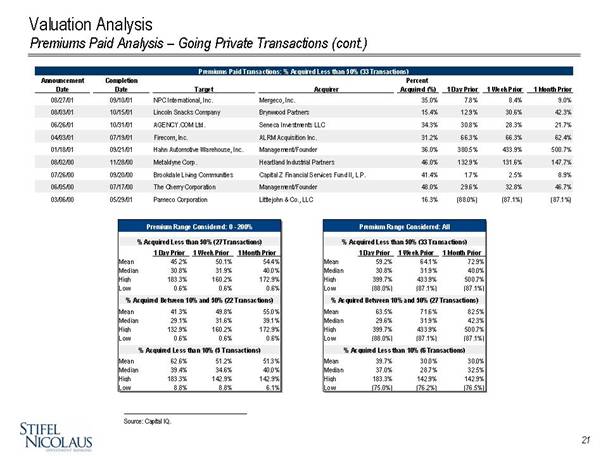
Valuation Analysis Premiums Paid Analysis – Going Private Transactions (cont.) ________________________________________ Source: Capital IQ. Premium Range Considered: 0 - 200% Premium Range Considered: All % Acquired Less than 50% (33 Transactions) 1 Day Prior 1 Week Prior 1 Month Prior 1 Day Prior 1 Week Prior 1 Month Prior Mean 45.2% 50.1% 54.4% Mean 59.2% 64.1% 72.9% Median 30.8% 31.9% 40.0% Median 30.8% 31.9% 40.0% High 183.3% 160.2% 172.9% High 399.7% 433.9% 500.7% Low 0.6% 0.6% 0.6% Low (88.0%) (87.1%) (87.1%) % Acquired Between 10% and 50% (22 Transactions) % Acquired Between 10% and 50% (27 Transactions) Mean 41.3% 49.8% 55.0% Mean 63.5% 71.6% 82.5% Median 29.1% 31.6% 39.1% Median 29.6% 31.9% 42.3% High 132.9% 160.2% 172.9% High 399.7% 433.9% 500.7% Low 0.6% 0.6% 0.6% Low (88.0%) (87.1%) (87.1%) % Acquired Less than 10% (5 Transactions) % Acquired Less than 10% (6 Transactions) Mean 62.6% 51.2% 51.3% Mean 39.7% 30.0% 30.0% Median 39.4% 34.6% 40.0% Median 37.0% 28.7% 32.5% High 183.3% 142.9% 142.9% High 183.3% 142.9% 142.9% Low 8.8% 8.8% 6.1% Low (75.0%) (76.2%) (76.5%) % Acquired Less than 50% (27 Transactions) |
Addendum Comparable Company Descriptions |
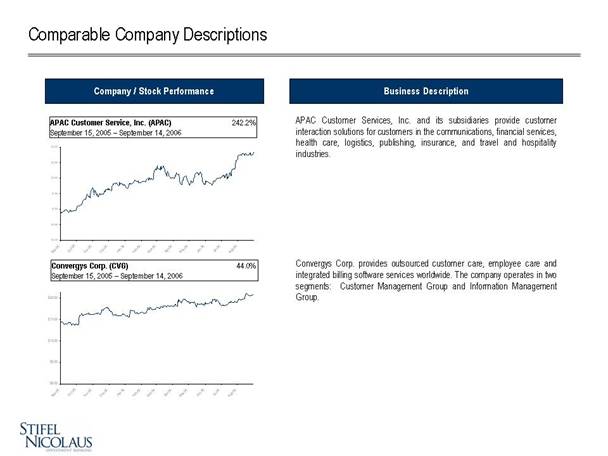
Comparable Company Descriptions APAC Customer Services, Inc. and its subsidiaries provide customer interaction solutions for customers in the communications, financial services, health care, logistics, publishing, insurance, and travel and hospitality industries. Convergys Corp. provides outsourced customer care, employee care and integrated billing software services worldwide. The company operates in two segments: Customer Management Group and Information Management Group. Business Description Company / Stock Performance APAC Customer Service, Inc. (APAC) 242.2% September 15, 2005 – September 14, 2006 Convergys Corp. (CVG) 44.0% September 15, 2005 – September 14, 2006 $0.00 $0.50 $1.00 $1.50 $2.00 $2.50 $3.00 Sep-05 Oct-05 Nov-05 Dec-05 Jan-06 Feb-06 Mar-06 Apr-06 May-06 Jun-06 Jul-06 Aug-06 |
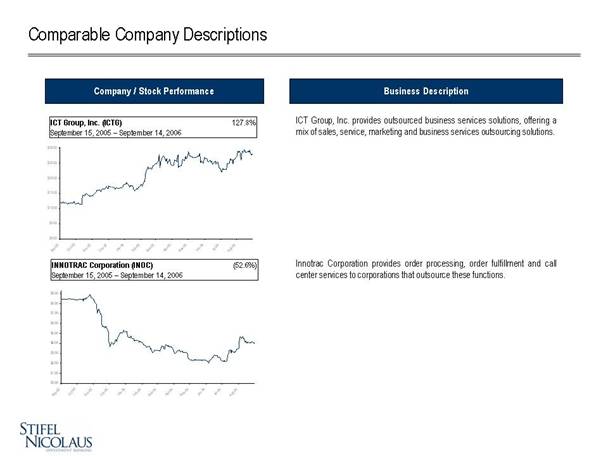
Comparable Company Descriptions ICT Group, Inc. provides outsourced business services solutions, offering a mix of sales, service, marketing and business services outsourcing solutions. Innotrac Corporation provides order processing, order fulfillment and call center services to corporations that outsource these functions. Business Description Company / Stock Performance ICT Group, Inc. (ICTG) 127.8% September 15, 2005 – September 14, 2006 INNOTRAC Corporation (INOC) (52.6%) September 15, 2005 – September 14, 2006 $0.00 $1.00 $2.00 $3.00 $4.00 $5.00 $6.00 $7.00 $8.00 $9.00 Sep-05 Oct-05 Nov-05 Dec-05 Jan-06 Feb-06 Mar-06 Apr-06 May-06 Jun-06 Jul-06 Aug-06 |
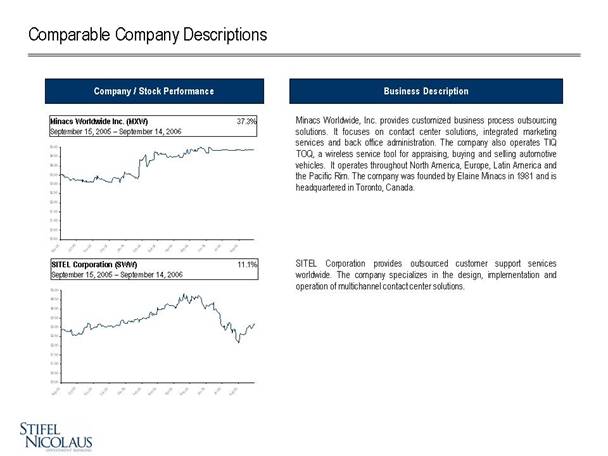
Comparable Company Descriptions SITEL Corporation provides outsourced customer support services worldwide. The company specializes in the design, implementation and operation of multichannel contact center solutions. Business Description Minacs Worldwide, Inc. provides customized business process outsourcing solutions. It focuses on contact center solutions, integrated marketing services and back office administration. The company also operates TIQ TOQ, a wireless service tool for appraising, buying and selling automotive vehicles. It operates throughout North America, Europe, Latin America and the Pacific Rim. The company was founded by Elaine Minacs in 1981 and is headquartered in Toronto, Canada. Company / Stock Performance Minacs Worldwide Inc. (MXW) 37.3% September 15, 2005 – September 14, 2006 SITEL Corporation (SWW) 11.1% September 15, 2005 – September 14, 2006 $0.00 $0.50 $1.00 $1.50 $2.00 $2.50 $3.00 $3.50 $4.00 $4.50 $5.00 Sep-05 Oct-05 Nov-05 Dec-05 Jan-06 Feb-06 Mar-06 Apr-06 May-06 Jun-06 Jul-06 Aug-06 |
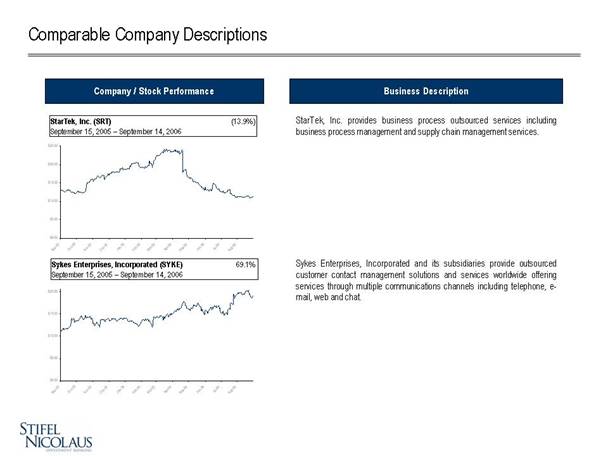
Comparable Company Descriptions Sykes Enterprises, Incorporated and its subsidiaries provide outsourced customer contact management solutions and services worldwide offering services through multiple communications channels including telephone, e-mail, web and chat. Business Description StarTek, Inc. provides business process outsourced services including business process management and supply chain management services. Company / Stock Performance StarTek, Inc. (SRT) (13.9%) September 15, 2005 – September 14, 2006 Sykes Enterprises, Incorporated (SYKE) 69.1% September 15, 2005 – September 14, 2006 $0.00 $5.00 $10.00 $15.00 $20.00 $25.00 Sep-05 Oct-05 Nov-05 Dec-05 Jan-06 Feb-06 Mar-06 Apr-06 May-06 Jun-06 Jul-06 Aug-06 |
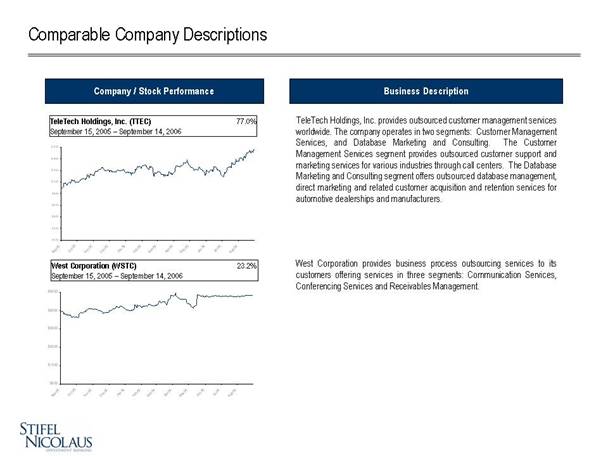
Comparable Company Descriptions West Corporation provides business process outsourcing services to its customers offering services in three segments: Communication Services, Conferencing Services and Receivables Management. Business Description TeleTech Holdings, Inc. provides outsourced customer management services worldwide. The company operates in two segments: Customer Management Services, and Database Marketing and Consulting. The Customer Management Services segment provides outsourced customer support and marketing services for various industries through call centers. The Database Marketing and Consulting segment offers outsourced database management, direct marketing and related customer acquisition and retention services for automotive dealerships and manufacturers. Company / Stock Performance TeleTech Holdings, Inc. (TTEC) 77.0% September 15, 2005 – September 14, 2006 West Corporation (WSTC) 23.2% September 15, 2005 – September 14, 2006 $0.00 $2.00 $4.00 $6.00 $8.00 $10.00 $12.00 $14.00 $16.00 Sep-05 Oct-05 Nov-05 Dec-05 Jan-06 Feb-06 Mar-06 Apr-06 May-06 Jun-06 Jul-06 Aug-06 |