 | MANAGEMENT’S DISCUSSION AND ANALYSIS |
MANAGEMENT’S DISCUSSION AND ANALYSIS
This Management’s Discussion and Analysis (“MD&A”) should be read in conjunction with the audited consolidated financial statements of Harvest Operations Corp. for the year ended December 31, 2010. The financial information contained in this MD&A has been prepared under Canadian Generally Accepted Accounting Principals (“GAAP”) unless otherwise noted. The information and opinions concerning our future outlook are based on information available at February 25, 2011.
In this MD&A, reference to "Harvest", “Company”, "we", "us" or "our" refers to Harvest Operations Corp. and all of its controlled entities on a consolidated basis. All references are to Canadian dollars unless otherwise indicated. Tabular amounts are in thousands of dollars, except where noted. Natural gas volumes are converted to barrels of oil equivalent (“boe”) using the ratio of six thousand cubic feet (“mcf”) of natural gas to one barrel of oil (“bbl”). Boes may be misleading, particularly if used in isolation. A boe conversion ratio of 6 mcf to 1 bbl is based on an energy equivalent conversion method primarily applicable at the burner tip and does not represent a value equivalent at the wellhead. In accordance with Canadian practice, petroleum and natural gas revenues are reported on a gross basis before deduction of Crown and other royalties. In addition to disclosing reserves under the requirements of National Instrument (NI) 51-101, we also disclose our reserves on a company interest basis which is not a term defined under NI 51-101. This information may not be comparable to similar measures by other issuers.
On December 22, 2009, KNOC Canada Ltd. (“KNOC Canada”), a wholly owned subsidiary of Korea National Oil Corporation (“KNOC”), purchased all of the issued and outstanding trust units of Harvest Energy Trust (the “Trust”). The acquisition of all the issued and outstanding trust units of the Trust resulted in a change of control in which KNOC Canada became the sole unitholder of the Trust.
On May 1, 2010, an internal reorganization was completed pursuant to which the Trust was dissolved and the Trust’s wholly owned subsidiary and manager of the Trust, Harvest Operations Corp., was amalgamated into KNOC Canada to continue as one corporation under the name Harvest Operations Corp. The carrying values of Harvest’s assets and liabilities were determined from the existing carrying values of KNOC Canada’s assets and liabilities and therefore reflect the fair values established through the purchase.
KNOC Canada was incorporated on October 9, 2009 and did not have any results from operations or cash flows in the period from October 9, 2009 to December 31, 2009 aside from capital injections from Korea National Oil Corporation to finance the purchase of the Trust. As such, the Company’s financial statements for the year ended December 31, 2010 do not include prior year comparative information. Unaudited pro forma consolidated results of operations have been included in this MD&A to reflect the impact of the acquisition of the Trust, as if the acquisition occurred on January 1, 2009. This pro forma financial information is included for information purpose only and is not necessarily indicative of the results of future operations that would have been achieved had the KNOC’s acquisition of the Trust taken place at the beginning of 2009.
NON-GAAP MEASURES
Throughout this MD&A we have referred to certain measures of financial performance that are not specifically defined under Canadian GAAP, such as “operating netbacks”, “gross margin”, “net revenue”, “earnings from operations”, “cash contributions from operations”, “cash from operations”, “total debt”, “total capitalization” and “EBITDA”. “Operating netbacks” are always reported on a per boe basis and used extensively in the Canadian energy sector for comparative purposes. “Operating netbacks” include “net revenue”, operating expenses, and transportation and marketing expenses. “Net revenues” includes revenue and royalties. “Gross margin” is commonly used in the refining industry to reflect the net funds received from the sale of refined products after considering the cost to purchase the feedstock and is calculated by deducting purchased products for resale and processing from total revenue. “Earnings from operations”, “cash contributions from operations” and “cash from operations” are commonly used for comparative purposes in the petroleum and natural gas and refining industries to reflect operating results before items not directly related to operations. “Total debt”, “total capitalization” and “EBITDA” are used to assist management in assessing liquidity and the Company’s ability to meet financial obligations. The non-GAAP measures may not be comparable to similar measures by other issuers.
1
| | MANAGEMENT’S DISCUSSION AND ANALYSIS |
FORWARD-LOOKING INFORMATION
This MD&A highlights significant business results and statistics from our consolidated financial statements for the year ended December 31, 2010 and the accompanying notes thereto. In the interest of providing our lenders and potential lenders with information regarding Harvest, including our assessment of our future plans and operations, this MD&A contains forward-looking statements that involve risks and uncertainties. Such risks and uncertainties include, but are not limited to: risks associated with conventional petroleum and natural gas operations; risks associated with refining and marketing operations; risks associated with the construction of the oil sands project; the volatility in commodity prices, interest rates and currency exchange rates; risks associated with realizing the value of acquisitions; general economic, market and business conditions; changes in environmental legislation and regulations; the availability of sufficient capital from internal and external sources; and such other risks and uncertainties described from time to time in our regulatory reports and filings made with securities regulators.
Forward-looking statements in this MD&A include, but are not limited to, the forward looking statements made in the “Outlook” section as well as statements made throughout with reference to production volumes, refinery throughput volumes, royalty rates, operating costs, commodity prices, administrative costs, price risk management activities, acquisitions and dispositions, capital spending, reserve estimates, access to credit facilities, income taxes, cash from operating activities, and regulatory changes. For this purpose, any statements that are contained herein that are not statements of historical fact may be deemed to be forward-looking statements. Forward-looking statements often contain terms such as “may”, “will”, “should”, “anticipate”, “expects”, and similar expressions.
Readers are cautioned not to place undue reliance on forward-looking statements as there can be no assurance that the plans, intentions or expectations upon which they are based will occur. Although we consider such information reasonable at the time of preparation, it may prove to be incorrect and actual results may differ materially from those anticipated. We assume no obligation to update forward-looking statements should circumstances, estimates or opinions change, except as required by law. Forward-looking statements contained in this MD&A are expressly qualified by this cautionary statement.
2
| | MANAGEMENT’S DISCUSSION AND ANALYSIS |
SELECTED INFORMATION
The table below provides a summary of our financial and operating results for the three months and year ended December 31, 2010.
| | | December 31, 2010 | |
| | | Three Months Ended | | | Year Ended | |
| FINANCIAL | | | | | | |
| Revenue, net(1) | | 1,255,785 | | | 3,802,178 | |
| Cash from operating activities | | 132,074 | | | 430,254 | |
| Net loss(2) | | (1,446 | ) | | (44,561 | ) |
| | | | | | | |
| Bank debt | | 11,379 | | | 11,379 | |
| 67/8% senior notes | | 482,389 | | | 482,389 | |
| Convertible debentures | | 745,257 | | | 745,257 | |
| Total financial debt | | 1,239,025 | | | 1,239,025 | |
| | | | | | | |
| Total assets | | 5,367,227 | | | 5,367,227 | |
| | | | | | | |
| UPSTREAM OPERATIONS | | | | | | |
| Daily sales volumes (boe/day) | | 50,054 | | | 49,397 | |
| Average realized price | | | | | | |
| Oil and NGLs ($/bbl) | $ | 68.67 | | $ | 67.34 | |
| Gas ($/mcf) | $ | 3.81 | | $ | 4.21 | |
| Operating netback ($/boe) | $ | 32.07 | | $ | 32.02 | |
| | | | | | | |
| Capital asset additions (excluding acquisitions) | | 147,904 | | | 404,015 | |
| Property and business acquisitions (dispositions), net | | (481 | ) | | 176,261 | |
| Abandonment and reclamation expenditures | | 6,444 | | | 20,257 | |
| Net wells drilled | | 41.6 | | | 141.4 | |
| Net undeveloped land acquired (acres) | | 104,081 | | | 175,436 | |
| | | | | | | |
| DOWNSTREAM OPERATIONS | | | | | | |
| Average daily throughput (bbl/d) | | 111,317 | | | 86,142 | |
| Average refining margin (US$/bbl) | | 6.13 | | | 5.13 | |
| | | | | | | |
| Capital asset additions | | 32,591 | | | 71,234 | |
| (1) | Revenues are net of royalties. |
| (2) | Net loss includes a future income tax recovery of $2.3 million and $39.9 million for the three months and year ended December 31, 2010 respectively and net unrealized gains from risk management activities of $1.1 million and $2.4 million for the three months and year ended December 31, 2010 |
3
| | MANAGEMENT’S DISCUSSION AND ANALYSIS |
REVIEW OF OVERALL PERFORMANCE
Harvest is an integrated energy company with our petroleum and natural gas business focused on the safe operation and development of assets in western Canada (our “upstream operations”) and our refining and marketing business focused on the safe operation of a medium gravity sour crude oil hydrocracking refinery and a retail and wholesale petroleum marketing business both located in the Province of Newfoundland and Labrador (our “downstream operations”). Our earnings and cash flow from operating activities are largely determined by the realized prices for our crude oil and natural gas production as well as refined product crack spreads.
Overview
Consolidated cash flow from operating activities was $430.3 million and net loss was $44.6 million for the year ended December 31, 2010. The net loss was primarily due to lower market crack spreads and unit outages experienced in the first and third quarters of 2010 at the refinery.
Upstream Operations
The cash contribution from the upstream operations for the year ended December 31, 2010 was $532.4 million. First quarter 2010 cash contribution of $151.2 million was the highest quarterly contribution in 2010 due to relatively high commodity prices and strong volumes at an average of 50,178 bbl/d. Harvest’s sales volumes averaged 49,397 bbl/d for the year ended December 31, 2010. The acquisition of the Red Earth assets allowed Harvest to offset natural declines from existing properties and increase sales volumes in the fourth quarter. Harvest’s operating netback was strong in the first quarter of 2010 at $36.20/boe due to a higher average realized price at $60.17/boe. As a result of lower commodity prices during the second and third quarters, Harvest’s operating netback fell to $29.68/boe and $30.05/boe respectively. However, in the fourth quarter, Harvest’s operating netback increased to $32.07/boe, reflecting the rebound in oil prices.
Capital expenditures (excluding acquisitions) for the year ended December 31, 2010 totaled $404.0 million, which includes the drilling of 171 (141.4 net) wells with a 99% success rate. The largest component of our activity was in the Slave Point formation in the Red Earth area. Harvest had an active drilling program throughout 2010 due to strengthening oil prices and increased access to capital following the KNOC acquisition. During 2010, Harvest acquired $176.3 million of upstream properties (net of dispositions), including a package of petroleum and natural gas assets purchased together with the remaining 40% interest in Red Earth Partnership for $161.3 million. In August 2010, Harvest issued $374.2 million of shares to KNOC in exchange for KNOC’s BlackGold oil sands project assets. Subsequent to the acquisition, Harvest issued an additional $85.7 million of shares to KNOC to fund BlackGold capital expenditures.
Downstream Operations
The negative cash contributions from the downstream operations of $12.6 million for the year ended December 31, 2010 is a consequence of low global refinery margins as well as unplanned shutdowns of refinery process units. The unplanned shutdowns during the first and third quarters, reduced the year’s average throughput to 86,142 bbl/day, which reflects an average gross margin of US$5.13/bbl. Throughput levels climbed back to 111,317 bbl/day during the fourth quarter, reflecting a gross margin of US$6.13/bbl. Operating expenses were $220.8 million for the year ended December 31, 2010 comprising $199.2 million of refinery operating expenses or $6.34/bbl of throughput and $21.6 million of marketing division costs.
Capital spending for year ended December 31, 2010 totaled $71.2 million relating to various capital improvement projects including $38.1 million of expenditures for the debottlenecking project.
4
| | MANAGEMENT’S DISCUSSION AND ANALYSIS |
Corporate
In 2010, Harvest successfully extended its credit facility. The credit facility maturity was extended to April 30, 2013 and reduced from $600 million to $500 million as Harvest intends to place less reliance on bank debt as a source of financing in the future. To provide flexibility to Harvest’s borrowing base, the lending capacity of the credit facility may be increased up to the greater of 15% of total assets and $1 billion. As at December 31, 2010, our bank borrowings totaled $14.0 million with $486 million of undrawn credit facility available.
In January 2010, Harvest received a capital injection from KNOC totaling $465.7 million which was used to fund the repayment of $240.2 million of bank debt, $42.3 million of senior notes and $156.4 million of convertible debentures. In October 2010, Harvest created a Global Technology and Research Centre (“GTRC”), which has been funded by a capital injection of $7.1 million from KNOC.
On October 4, 2010, Harvest completed its offering of US$500 million 67/8% senior notes, maturing in 2017. Of the US$484.6 million net proceeds, US$210.2 million was used to redeem the outstanding 77/8% senior notes and premium.
Harvest’s corporate ratings have been upgraded to Ba2 by Moody’s Investor Services and BB- by Standard and Poor’s.
5
| | MANAGEMENT’S DISCUSSION AND ANALYSIS |
UPSTREAM OPERATIONS
Summary of Financial and Operating Results
| | | | | | | | | December 31, 2010 | | | | | | | |
| | | Three Months Ended | | | Year Ended | |
| | | | | | 2009 | | | | | | | | | 2009 | | | | |
| | | 2010 | | | (pro forma)(2) | | | Change | | | 2010 | | | (pro forma)(2) | | | Change | |
| FINANCIAL | | | | | | | | | | | | | | | | | | |
| Revenues | | 258,013 | | | 254,353 | | | 1% | | | 1,007,005 | | | 886,308 | | | 14% | |
| Royalties | | (38,102 | ) | | (40,338 | ) | | (6% | ) | | (154,757 | ) | | (128,860 | ) | | 20% | |
| Net revenues(1) | | 219,911 | | | 214,015 | | | 3% | | | 852,248 | | | 757,448 | | | 13% | |
| | | | | | | | | | | | | | | | | | | |
| Operating | | 69,649 | | | 61,693 | | | 13% | | | 265,593 | | | 258,675 | | | 3% | |
| General and administrative | | 11,111 | | | 10,178 | | | 9% | | | 44,974 | | | 36,452 | | | 23% | |
| Transportation and marketing | | 2,634 | | | 3,142 | | | (16% | ) | | 9,394 | | | 14,228 | | | (34% | ) |
| Depreciation, depletion and accretion | | 114,177 | | | 110,653 | | | 3% | | | 448,091 | | | 463,333 | | | (3% | ) |
| Earnings from operations(1) | | 22,340 | | | 28,349 | | | (21% | ) | | 84,196 | | | (15,240 | ) | | (652% | ) |
| | | | | | | | | | | | | | | | | | | |
| Capital asset additions (excluding acquisitions) | | 147,904 | | | 31,720 | | | 366% | | | 404,015 | | | 186,276 | | | 117% | |
| Property and business acquisitions (dispositions), net | | (481 | ) | | (623 | ) | | (23% | ) | | 176,261 | | | (62,116 | ) | | (384% | ) |
| Abandonment and reclamation expenditures | | 6,444 | | | 5,598 | | | 15% | | | 20,257 | | | 14,270 | | | 42% | |
| | | | | | | | | | | | | | | | | | | |
| OPERATING | | | | | | | | | | | | | | | | | | |
| Daily sales volumes | | | | | | | | | | | | | | | | | | |
| Light / medium oil (bbl/d) | | 24,079 | | | 23,281 | | | 3% | | | 24,077 | | | 23,651 | | | 2% | |
| Heavy oil (bbl/d) | | 9,433 | | | 9,491 | | | (1% | ) | | 9,253 | | | 10,261 | | | (10% | ) |
| Natural gas liquids (bbl/d) | | 2,736 | | | 2,714 | | | 1% | | | 2,587 | | | 2,718 | | | (5% | ) |
| Natural gas (mcf/d) | | 82,837 | | | 83,610 | | | (1% | ) | | 80,881 | | | 90,097 | | | (10% | ) |
| Total (boe/d) | | 50,054 | | | 49,421 | | | 1% | | | 49,397 | | | 51,646 | | | (4% | ) |
| (1) | These are non-GAAP measures; please refer to "Non-GAAP Measures" in this MD&A. |
| (2) | The pro forma consolidated results of operations have been prepared as if the acquisition of the Trust and the subsequent reorganization occurred on January 1, 2009. For a summary of the pro forma adjustments, see note 1 to the December 31, 2010 consolidated financial statements. |
Earnings from operations for the year ended December 31, 2010 were significantly higher than the December 31, 2009 pro forma results primarily due to the higher commodity prices in 2010, despite the higher average sales volumes in 2009. The rebounding oil prices in 2010 resulted in Harvest’s realized prices for light/medium oil in 2010 increasing by 22%, heavy oil by 13% and NGL’s by 31% from 2009. Earnings from operations for the three months ended December 31, 2010 were comparable to the pro forma results.
Capital asset additions in 2010 were more than double the asset additions in 2009. This is due to Harvest’s shift to a growth focused strategy and our improved access to capital with the financial backing of KNOC. Additionally, the rebounding commodity price environment in 2010 provided attractive netbacks, resulting in more drilling activities during 2010.
Sales volumes for the fourth quarter increased marginally by 1% compared to the fourth quarter of 2009. This increase is due to the acquisition during the third quarter of 2010, which allowed Harvest to offset natural declines and increase sales volumes.
6
| | MANAGEMENT’S DISCUSSION AND ANALYSIS |
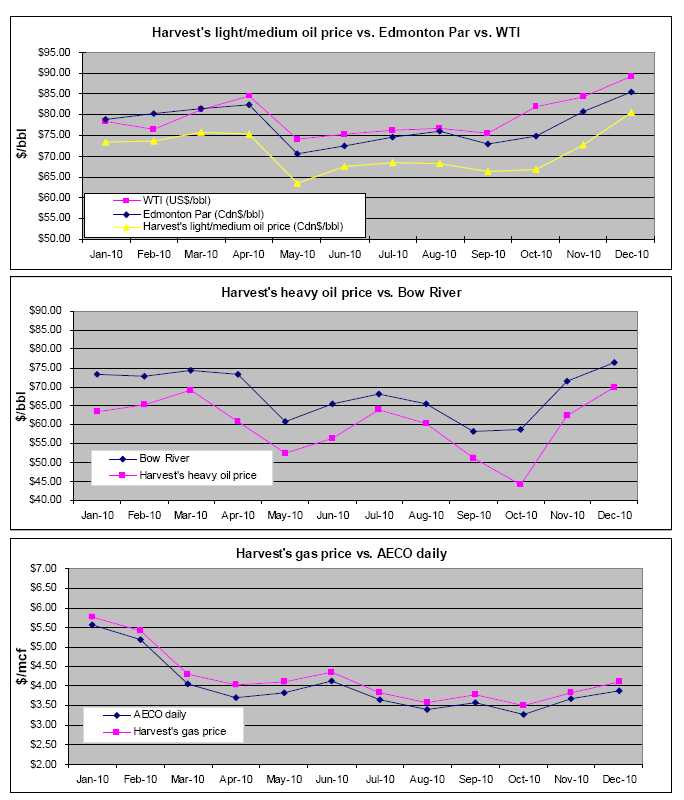
Commodity Price Environment
| | | December 31, 2010 | |
| Benchmarks | | Three Months Ended | | | Year Ended | |
| | | | | | | |
| West Texas Intermediate crude oil (WTI) (US$/bbl) | | 85.17 | | | 79.53 | |
| Edmonton light crude oil ($/bbl) | | 80.40 | | | 77.58 | |
| Bow River blend crude oil ($/bbl) | | 68.90 | | | 68.25 | |
| AECO natural gas daily ($/mcf) | | 3.62 | | | 4.00 | |
| | | | | | | |
| Canadian / U.S. dollar exchange rate | | 0.987 | | | 0.971 | |
| | | 2010 | |
| Differential Benchmarks | | Q4 | | | Q3 | | | Q2 | | | Q1 | |
| Bow River Blend differential to Edmonton Par ($/bbl) | | 11.50 | | | 10.55 | | | 8.58 | | | 6.72 | |
| Bow River Blend differential as a % of Edmonton Par | | 14.3% | | | 14.2% | | | 11.0% | | | 8.4% | |
While the Bow River price trend in 2010 was similar to the WTI trend, the heavy oil differential relative to Edmonton Par also increased. Heavy oil differentials fluctuate based on a combination of factors including the level of heavy oil inventories, pipeline capacity to deliver heavy crude to the U.S. markets and the seasonal demand for heavy oil.
Realized Commodity Prices(1)
The following table summarizes our average realized price by product for the three months and year ended December 31, 2010:
| | | December 31, 2010 | |
| | | Three Months Ended | | | Year Ended | |
| Light to medium oil ($/bbl) | | 73.44 | | | 71.09 | |
| Heavy oil ($/bbl) | | 58.82 | | | 59.94 | |
| Natural gas liquids ($/bbl) | | 60.69 | | | 58.83 | |
| Natural gas ($/mcf) | | 3.81 | | | 4.21 | |
| Average realized price ($/boe) | | 56.03 | | | 55.85 | |
(1) Realized commodity prices exclude the impact of price risk management activities.
Harvest’s monthly average realized price fluctuated between $49.11/boe and $62.51/boe during 2010 with the higher prices realized during the first and fourth quarters. Harvest’s realized oil prices peaked in December 2010, consistent with the global oil prices recovery. Harvest’s realized gas prices were higher at the beginning of 2010 and dropped in March 2010 and remained between $3.50/mcf and $4.10/mcf for the rest of 2010.
7
| | MANAGEMENT’S DISCUSSION AND ANALYSIS |
The trend in Harvest’s average realized price throughout the year is consistent with the trend in benchmark prices for 2010.
8
| | MANAGEMENT’S DISCUSSION AND ANALYSIS |
Harvest’s realized price for light to medium oil increased by 8% to $73.44/bbl in the fourth quarter of 2010 as compared to $67.71/bbl in the third quarter, reflecting the 8% increase in Edmonton Par. Despite the 8% increase in the Bow River benchmark from the third to fourth quarter of 2010, Harvest’s average realized price of heavy oil increased marginally by 1% from $58.52/bbl in the prior quarter to $58.82/bbl in the fourth quarter of 2010, partially due to a prior year price correction from one of our purchasers in the fourth quarter. The increase in the average realized price for gas of 2% for the fourth quarter of 2010 from $3.74/mcf in the third quarter of 2010 is consistent with the 2% increase in the AECO benchmark price.
Sales Volumes
The average daily sales volumes by product were as follows:
| | | December 31, 2010 | |
| | | Three Months Ended | | | Year Ended | |
| | | Volume | | | Weighting | | | Volume | | | Weighting | |
| Light / medium oil (bbl/d)(1) | | 24,079 | | | 48% | | | 24,077 | | | 49% | |
| Heavy oil (bbl/d) | | 9,433 | | | 19% | | | 9,253 | | | 19% | |
| Natural gas liquids (bbl/d) | | 2,736 | | | 5% | | | 2,587 | | | 5% | |
| Total liquids (bbl/d) | | 36,248 | | | 72% | | | 35,917 | | | 73% | |
| Natural gas (mcf/d) | | 82,837 | | | 28% | | | 80,881 | | | 27% | |
| Total oil equivalent (boe/d) | | 50,054 | | | 100% | | | 49,397 | | | 100% | |
| (1) | Harvest classifies our oil production, except that produced from Hay River, as light, medium and heavy according to NI 51-101 guidance. The oil produced from Hay River has an average API of 24° (medium grade), however, it benefits from a heavy oil royalty regime and therefore would be classified as heavy oil according to NI 51-101. |
Harvest’s sales volumes improved to 50,054 boe/d in the fourth quarter (5% increase from 47,777 boe/d in the third quarter) due to the acquisition at the end of the third quarter. Production was highest in the first quarter at 50,178 boe/d and lowest in the third quarter due to power outages and third party infrastructure constraints.
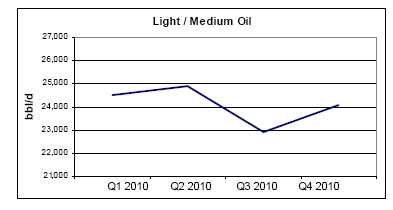 |
In the fourth quarter of 2010, Harvest’s average daily sales of light/medium oil was 24,079 bbl/d compared to prior quarter of 22,886 bbl/d resulting in an increase of 1,193 bbl/d. This increase is mainly attributable to the third quarter acquisition. |
9
| | MANAGEMENT’S DISCUSSION AND ANALYSIS |
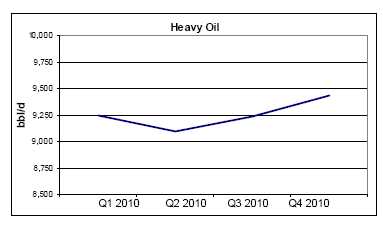 |
Harvest’s heavy oil sales increased to 9,433 bbl/d from 9,235 bbl/d in the prior quarter reflecting additional wells that were brought online between September and December 2010 in Metiskow, Murray Lake and Suffield. |
 |
Natural gas sales averaged 82,837 mcf/d in the fourth quarter of 2010 compared to prior quarter of 79,147 mcf/d as a result of an acquisition in the third quarter and the recovery from third party facility turnarounds in the prior quarter. |
Revenues
| | | December 31, 2010 | |
| | | Three Months Ended | | | Year Ended | |
| Light / medium oil sales | $ | 162,685 | | $ | 624,778 | |
| Heavy oil sales | | 51,048 | | | 202,445 | |
| Natural gas sales | | 29,003 | | | 124,226 | |
| Natural gas liquids sales and other | | 15,277 | | | 55,556 | |
| Total sales revenue | | 258,013 | | | 1,007,005 | |
| Royalties | | (38,102 | ) | | (154,757 | ) |
| Net revenues | $ | 219,911 | | $ | 852,248 | |
Harvest’s sales revenue in 2010 has decreased since the first quarter with a total of $271.7 and climbed back to $258.0 million in the fourth quarter. The decrease was mainly due to the decrease in sales volumes and the decrease in Harvest’s realized price of light to medium, heavy oil and natural gas. Sales volumes decreased from an average of 50,178 bbl/d in the first quarter to 47,777 bbl/d in the third quarter and climbed back to 50,054 bbl/d in the fourth quarter of 2010. Harvest’s average realized price fell from $60.17/bbl in the first quarter of 2010 and rebounded back to $56.03/bbl in the fourth quarter.
Harvest’s revenue is impacted by changes to sales volumes, commodity prices and currency exchange rates. The upstream operation’s total sales revenue for the three months ended December 31, 2010 was $258.0 million, $26.3 million higher than the prior quarter total sales revenue of $231.7 million. The 11% increase is attributable to higher realized commodity prices and sales volumes, partially offset by the strengthening of the Canadian dollar against the US dollar.
10
| | MANAGEMENT’S DISCUSSION AND ANALYSIS |
Royalties
Harvest pays Crown, freehold and overriding royalties to the owners of mineral rights from which production is generated. These royalties vary for each property and product and our Crown royalties are based on a sliding scale dependent on production volumes and commodity prices.
Royalties for the fourth and third quarter of 2010 were $38.1 million and $33.7 million respectively. Royalties as a percentage of gross revenue were relatively consistent for the fourth quarter of 2010 at 14.8% as compared to 14.5% in the third quarter of 2010. The year-to-date royalties were $154.8 million, or 15.4% .
Operating Expenses
| | | December 31, 2010 | |
| | | Three Months Ended | | | Year Ended | |
| | | Total | | | Per boe | | | Total | | | Per boe | |
| Operating expense | | | | | | | | | | | | |
| Power and fuel | $ | 15,412 | | $ | 3.35 | | $ | 59,106 | | $ | 3.28 | |
| Well servicing | | 13,366 | | | 2.90 | | | 50,427 | | | 2.80 | |
| Repairs and maintenance | | 10,932 | | | 2.37 | | | 43,720 | | | 2.42 | |
| Lease rentals and property tax | | 7,233 | | | 1.57 | | | 30,637 | | | 1.70 | |
| Labour - internal | | 5,419 | | | 1.18 | | | 22,641 | | | 1.26 | |
| Labour - contract | | 4,146 | | | 0.90 | | | 15,966 | | | 0.89 | |
| Processing and other fees | | 2,902 | | | 0.63 | | | 13,538 | | | 0.75 | |
| Chemicals | | 2,636 | | | 0.57 | | | 12,981 | | | 0.72 | |
| Trucking | | 2,535 | | | 0.55 | | | 9,645 | | | 0.53 | |
| Other | | 5,068 | | | 1.10 | | | 6,932 | | | 0.38 | |
| Total operating expenses | $ | 69,649 | | $ | 15.12 | | $ | 265,593 | | $ | 14.73 | |
| Transportation and marketing expense | $ | 2,634 | | $ | 0.57 | | $ | 9,394 | | $ | 0.52 | |
Operating expenses have been relatively consistent throughout 2010, at an average of $66.4 million per quarter. Fourth quarter operating expenses were the highest during 2010 mainly due to the additional costs related to the acquisition in the third quarter. Second quarter operating expenses were higher than the first and third quarters due to the Alberta Power Pool electricity price peak of $80.56/MWh for the second quarter of 2010, resulting in high power and fuel costs.
Fourth quarter 2010 operating costs totaled $69.6 million, an increase of $6.2 million as compared to the prior quarter operating costs of $63.4 million. The increase in operating costs is due to higher power and fuel costs, increased well servicing costs and incrementally higher operating costs related to the acquisition at the end of the third quarter. On a per barrel basis, operating costs have increased to $15.12/boe in the fourth quarter of 2010 as compared to $14.42/boe in the third quarter of 2010. The 5% increase is substantially attributed to higher power and fuel costs due to the increase in the average Alberta Power Pool electricity price from $35.69/MWh in the third quarter of 2010 to $45.97/MWh for the fourth quarter of 2010.
| | | December 31, 2010 | |
| ($ per boe) | | Three Months Ended | | | Year Ended | |
| Electric power and fuel costs | $ | 3.35 | | $ | 3.28 | |
| Realized losses on electricity risk management contracts | | 0.16 | | | 0.10 | |
| Net electric power and fuel costs | $ | 3.51 | | $ | 3.38 | |
| Alberta Power Pool electricity price ($ per MWh) | $ | 45.97 | | $ | 50.78 | |
11
| | MANAGEMENT’S DISCUSSION AND ANALYSIS |
Fourth quarter 2010 transportation and marketing expense was relatively consistent at $2.6 million ($0.57/boe) as compared to $2.5 million ($0.57/boe) in the third quarter of 2010. Throughout 2010, transportation and marketing expenses were relatively consistent at an average of $2.3 million ($0.52/boe) per quarter. These costs relate primarily to delivery of natural gas to Alberta’s natural gas sales hub, the AECO Storage Hub, and Harvest’s cost of trucking clean crude oil to pipeline receipt points. As a result, the total dollar amount of costs fluctuates in relation with Harvest’s production volumes while the cost per boe typically remains relatively constant.
Operating Netback
| | | December 31, 2010 | |
| ($ per boe) | | Three Months Ended | | | Year Ended | |
| Revenues | $ | 56.03 | | $ | 55.85 | |
| Royalties | | (8.27 | ) | | (8.58 | ) |
| Operating expense | | (15.12 | ) | | (14.73 | ) |
| Transportation expense | | (0.57 | ) | | (0.52 | ) |
| Operating netback(1) | $ | 32.07 | | $ | 32.02 | |
(1) This is a non-GAAP measure; please refer to “Non-GAAP Measures” in this MD&A.
Harvest’s operating netback represents the net amount realized on a per boe basis after deducting directly related costs. The 2010 operating netback was strongest at $36.20/bbl in the first quarter and weakest in the second quarter at $29.68/bbl. The trend in the operating netback closely follows that in the average realized prices.
In the fourth quarter of 2010, our operating netback increased by $2.02/boe from $30.05/boe in the prior quarter. The increase is due to a higher average realized price in the fourth quarter, partially offset by higher royalties and operating costs.
General and Administrative (“G&A”) Expense
| | | December 31, 2010 | |
| | | Three Months Ended | | | Year Ended | |
| Total G&A | $ | 11,111 | | $ | 44,974 | |
| G&A per boe ($/boe) | | 2.41 | | | 2.49 | |
For the three months ended December 31, 2010, G&A expense increased nominally by $1.4 million from $9.7 million in the third quarter of 2010. The increase in G&A is primarily due to increased consulting expenses and payroll taxes related to KNOC employees seconded to Harvest. Approximately 80% of the G&A expenses are related to salaries and other employee related costs.
Depletion, Depreciation, Amortization and Accretion Expense (“DDA&A”)
| | | December 31, 2010 | |
| | | Three Months Ended | | | Year Ended | |
| Depletion and depreciation | $ | 99,251 | | $ | 387,462 | |
| Depletion of capitalized asset retirement costs | | 8,469 | | | 35,388 | |
| Accretion on asset retirement obligation | | 6,457 | | | 25,241 | |
| Total depletion, depreciation and accretion | $ | 114,177 | | $ | 448,091 | |
| Per boe ($/boe) | $ | 24.79 | | $ | 24.85 | |
Harvest’s DDA&A is closely aligned with the sales volume and is impacted by our asset base which has slightly increased during the fourth quarter of 2010 due to acquisitions and higher drilling activities throughout the period.
12
| | MANAGEMENT’S DISCUSSION AND ANALYSIS |
Harvest’s DDA&A expense for the three months ended December 31, 2010 was marginally higher by $1.9 million than the prior quarter expense of $112.3 million.
Capital Expenditures
| | | December 31, 2010 | |
| | | Three Months Ended | | | Year Ended | |
| Drilling and completion | $ | 82,428 | | $ | 223,543 | |
| Well equipment, pipelines and facilities | | 35,756 | | | 107,933 | |
| Land and undeveloped lease rentals | | 6,954 | | | 23,803 | |
| Capitalized G&A expenses | | 2,944 | | | 13,027 | |
| Geological and geophysical | | 874 | | | 12,719 | |
| Furniture, leaseholds and office equipment | | 1,508 | | | 1,934 | |
| Total conventional oil and gas capital expenditures | | 130,464 | | | 382,959 | |
| Oil sands | | | | | | |
| BlackGold oil sands | | 17,440 | | | 21,056 | |
| Total development capital expenditures excluding acquisitions | $ | 147,904 | | $ | 404,015 | |
Conventional Oil and Gas
In 2010, approximately 58% of our conventional development capital expenditures were incurred to drill 171 gross wells with a success rate of 99%. Harvest had an active drilling program in 2010 due to strengthening oil prices and increased access to capital following the KNOC acquisition in 2009. Our 2010 drilling activity focused primarily on our oil properties where attractive netbacks generated positive economic returns. At Red Earth we drilled 36 gross (30.5 net) wells and completed infrastructure upgrades for a total cost of $85.4 million. The majority of our activity was in the Slave Point formation where we are drilling horizontal wells and applying multi-staged fracturing technology. At Hay River BC, we drilled 10 gross (10 net) including 5 water injection wells to continue our Enhanced Oil Recovery efforts in the Bluesky formation, for a total expenditure of $36.2 million. In SE Saskatchewan we drilled 20 gross (19.5 net) wells for a total expenditure of $27.0 million. At SE Saskatchewan, Harvest produces light oil from the Tilston, Souris Valley and Bakken formations. Heavy oil prices in 2010 were very attractive and Harvest drilled 6 gross (6 net) wells at Suffield and 29 gross (26.8 net) wells in our Lloydminster area for a total expenditure of $43.6 million. In our Markerville/Rimbey area, Harvest drilled 26 gross (15.4 net) wells and invested in infrastructure upgrades for a total expenditure of $52.2 million. Targeted formations include the Cardium and Ellerslie (light oil) as well as the Ostracod (liquids rich natural gas). At Kindersley, Sasktachewan, we drilled 13 gross (10.2 net) horizontal wells with multi-staged fracture completions targeting light oil in the Viking formation.
During the three months and the year ended December 31, 2010 the Harvest invested $107.9 million and $35.8 million, respectively in well equipment, pipelines and facilities relating to drilling and production optimization projects.
In 2010, Harvest invested $23.8 million to acquire additional mineral rights on approximately 175,436 net acres of undeveloped land that will provide additional drilling opportunities in the future.
Capital expenditures for the fourth quarter increased as Harvest was able to accelerate the winter drilling programs at Red Earth. At Red Earth, Harvest further delineated and continued the development of our Slave Point light oil resources play by drilling 18 gross (15.8 net) wells in the fourth quarter, the majority of which were multi-stage fractured horizontal wells, for a total expenditure of $30.3 million. Similarly at Kindersley, Saskatchewan, Harvest drilled 7 gross (5.5 net) multi-stage fractured horizontal wells in our Viking light oil resource play for a total expenditure of $6.4 million. At Rimbey/Markerville we drilled 11 gross (6.9 net) wells for a total expenditure of $36.2 million with 7 gross horizontal wells targeting the Cardium light oil formation. Additional drilling focused on attractive heavy oil netbacks in Lloydminster (4 gross; 3.8 net wells) and light oil netbacks in SE Saskatchewan (4 gross; 4 net wells) for a total expenditure of $12.2 million.
13
| | MANAGEMENT’S DISCUSSION AND ANALYSIS |
During the fourth quarter of 2010 Harvest continued to add to our undeveloped land base and invested $7.0 million in undeveloped land opportunities in various areas to be used for future exploration and development.
The following summarizes Harvest’s participation in gross and net wells drilled during the three and year ending December 31, 2010:
| | | December 31, 2010 | |
| | | Three Months Ended | | | Year Ended | |
| Area | | Gross | | | Net | | | Gross | | | Net | |
| Hay River | | 2.0 | | | 2.0 | | | 10.0 | | | 10.0 | |
| SE Alberta | | 2.0 | | | 2.0 | | | 20.0 | | | 15.4 | |
| Rimbey/Markerville | | 11.0 | | | 6.9 | | | 26.0 | | | 15.4 | |
| SE Saskatchewan | | 4.0 | | | 4.0 | | | 20.0 | | | 19.5 | |
| Red Earth | | 18.0 | | | 15.8 | | | 36.0 | | | 30.5 | |
| Suffield | | 0.0 | | | 0.0 | | | 6.0 | | | 6.0 | |
| Lloydminster Heavy Oil | | 4.0 | | | 3.8 | | | 29.0 | | | 26.8 | |
| Crossfield | | 1.0 | | | 0.6 | | | 4.0 | | | 3.5 | |
| Kindersley | | 7.0 | | | 5.5 | | | 13.0 | | | 10.2 | |
| Other Areas | | 2.0 | | | 1.0 | | | 7.0 | | | 4.0 | |
| Total | | 51.0 | | | 41.6 | | | 171.0 | | | 141.4 | |
Oil sands
On August 6, 2010, Harvest acquired the BlackGold oil sands project assets (“BlackGold”) from KNOC for $374 million of Harvest’s shares. As KNOC is the sole shareholder of Harvest, these assets were recorded at the existing carrying values as previously recorded by KNOC.
BlackGold is located in northeastern Alberta and has existing Energy Resources Conservation Board (“ERCB”) approval for phase 1 project of 10,000 bbl/d and an application has been made for a phase 2 project that is targeted to increase production to 30,000 bbl/d. Approval for phase 2 of the project is expected from the ERCB in 2012. The project will utilize steam assisted gravity drainage; a proven technology that uses innovation in horizontal drilling, with the first oil expected in early 2013 at an estimated production of 10,000 bbl/d.
During 2010, Harvest signed an engineering, procurement and construction (“EPC”) lump sum contract with a third party to build a central processing facility for BlackGold for an aggregate of $311 million. A 10% deposit of $31.1 million was paid in 2010. Year-to-date capital expenditures were $21.1 million, relating to engineering and site preparation work for the main facility and production pad sites. The remaining $289.9 million of the EPC contracted cost is expected to be incurred in 2011 and 2012
14
| | MANAGEMENT’S DISCUSSION AND ANALYSIS |
Asset Retirement Obligations (“ARO”)
Harvest’s upstream asset retirement obligations result from its net ownership interest in petroleum and natural gas assets including well sites, gathering systems and processing facilities and the estimated costs and timing to reclaim and abandon them. In connection with property acquisitions and development expenditures, Harvest records the fair value of the ARO as a liability in the same year the expenditures occur. The associated asset retirement costs are capitalized as part of the carrying amount of the assets and are depleted and depreciated over our estimated net proved reserves. Once the initial ARO is measured, it is adjusted at the end of each period to reflect the passage of time as well as changes in the estimated future cash flows of the underlying obligation. At December 31, 2010, Harvest estimates the total undiscounted amount of cash flows required to settle its upstream asset retirement obligations to be approximately $1,227 million which will be incurred between 2011 and 2070. A credit-adjusted risk-free discount rate of 8% - 10% and inflation rate of approximately 2% were used to calculate the fair value of the asset retirement obligations. Our asset retirement obligation increased by $18.0 million during 2010 as a result of accretion expense of $25.2 million, new liabilities recorded at $11.4 million and revision of estimates of $1.7 million, offset by $20.3 million of asset retirement liabilities settled.
Goodwill
Goodwill is recorded when the purchase price of an acquired business exceeds the fair value of the net identifiable assets and liabilities of that acquired business. At December 31, 2010, Harvest had $404.9 million of goodwill on the balance sheet related to the upstream segment. The goodwill balance is assessed annually for impairment or more frequently if events or changes in circumstances occur that would reasonably be expected to reduce the fair value of the acquired business to a level below its carrying amount.
15
| | MANAGEMENT’S DISCUSSION AND ANALYSIS |
DOWNSTREAM OPERATIONS
Summary of Financial and Operational Results
| | | Three Months Ended December 31 | | | Year Ended December 31 | |
| | | | | | 2009 | | | | | | | | | 2009 | | | | |
| | | 2010 | | | (pro forma)(5) | | | Change | | | 2010 | | | (pro forma)(5) | | | Change | |
| FINANCIAL | | | | | | | | | | | | | | | | | | |
| Revenues | | 1,035,874 | | | 639,123 | | | 62% | | | 2,949,930 | | | 2,381,637 | | | 24% | |
| Purchased feedstock for processing and products purchased for resale(4) | | 958,845 | | | 579,108 | | | 66% | | | 2,733,019 | | | 2,015,671 | | | 36% | |
| Gross margin(1) | | 77,029 | | | 60,015 | | | 28% | | | 216,911 | | | 365,966 | | | (41% | ) |
| | | | | | | | | | | | | | | | | | | |
| Costs and expenses | | | | | | | | | | | | | | | | | | |
| Operating expense | | 28,980 | | | 28,265 | | | 3% | | | 114,697 | | | 102,556 | | | 12% | |
| Purchased energy expense | | 40,504 | | | 33,715 | | | 20% | | | 106,126 | | | 91,868 | | | 16% | |
| Marketing expense | | 1,544 | | | 2,291 | | | (33% | ) | | 6,366 | | | 12,009 | | | (47% | ) |
| General and administrative expense | | 441 | | | 228 | | | 93% | | | 1,764 | | | 1,593 | | | 11% | |
| Depreciation and amortization expense | | 20,553 | | | 20,708 | | | (1% | ) | | 83,091 | | | 89,238 | | | (7% | ) |
| Earnings (Loss) from operations(1) | | (14,993 | ) | | (25,192 | ) | | 40% | | | (95,133 | ) | | 68,702 | | | (238% | ) |
| | | | | | | | | | | | | | | | | | | |
| Capital expenditures | | 32,591 | | | 9,964 | | | 227% | | | 71,234 | | | 91,362 | | | (22% | ) |
| | | | | | | | | | | | | | | | | | | |
| OPERATING | | | | | | | | | | | | | | | | | | |
| Feedstock volume (bbl/day)(2) | | 111,317 | | | 75,814 | | | 47% | | | 86,142 | | | 83,939 | | | 3% | |
| | | | | | | | | | | | | | | | | | | |
| Yield (000’s barrels) | | | | | | | | | | | | | | | | | | |
| Gasoline and related products | | 3,575 | | | 2,488 | | | 44% | | | 9,877 | | | 10,499 | | | (6% | ) |
| Ultra low sulphur diesel and jet fuel | | 3,988 | | | 2,930 | | | 36% | | | 11,339 | | | 12,196 | | | (7% | ) |
| High sulphur fuel oil | | 2,674 | | | 1,598 | | | 67% | | | 9,657 | | | 7,538 | | | 28% | |
| Total | | 10,237 | | | 7,016 | | | 46% | | | 30,873 | | | 30,233 | | | 2% | |
| | | | | | | | | | | | | | | | | | | |
| Average refining gross margin (US$/bbl)(3) | | 6.13 | | | 6.55 | | | (6% | ) | | 5.13 | | | 9.12 | | | (44% | ) |
| (1) | These are non-GAAP measures; please refer to “Non-GAAP Measures” in this MD&A. |
| (2) | Barrels per day are calculated using total barrels of crude oil feedstock and vacuum gas oil. |
| (3) | Average refining gross margin is calculated based on per barrel of feedstock throughput. |
| (4) | Purchased feedstock for processing and products purchased for resale includes inventory write-downs, net of reversals, of ($0.1) million and $2.4 million for the three months and year ended December 31, 2010, respectively. |
| (5) | The pro forma consolidated results of operations have been prepared as if the acquisition of the Trust and the subsequent reorganization occurred on January 1, 2009. For a summary of the pro forma adjustments, see note 1 to the December 31, 2010 consolidate financial statements. |
Despite the increase in revenues in 2010, the year to date gross margin is 41% lower than the 2009 pro forma results and a loss has resulted from operations compared to earnings from operations in 2009. This is largely due to the shutdowns that occurred during the first and third quarters of 2010. The low throughput volumes during those quarters had a negative impact on earnings from operations. Costs relating to the repairs and maintenance during the shutdowns in the first and third quarters were included in operating expenses, therefore increasing the loss from operations for the year ended December 31, 2010. The gross margin for the year ended December 31, 2010 of $5.13 was significantly lower than the 2009 pro forma gross margin of $9.12 as a result of lower crack spreads during 2010.
Capital expenditures in 2010 were 22% lower than the 2009 pro form capital expenditures primarily due to the turnaround and catalyst works performed during 2009.
16
| | MANAGEMENT’S DISCUSSION AND ANALYSIS |
Our downstream operations, North Atlantic Refining (“North Atlantic”) consists of a 115,000 bbl/d medium gravity sour crude oil hydrocracking refinery and a retail and wholesale petroleum marketing business both located in the Province of Newfoundland and Labrador. Our petroleum marketing business is composed of branded and unbranded retail and wholesale distribution and sales of gasoline, diesel, jet and other transportation fuels, as well as home heating fuels and the revenues from our marine services businesses.
Our refining gross margin is a function of the sales value of the refined products produced and the cost of crude oil and other feedstocks purchased as well as the yield of refined products from various feedstocks. We continuously evaluate the market and relative refinery values of several different crude oils and vacuum gas oils (“VGO”) to determine the optimal feedstock mix. We analyze the refining gross margin for our sales revenue relative to refined product benchmark prices and the WTI benchmark prices. With respect to feedstock costs, we analyze our price discounts relative to the WTI benchmark prices and segregate crude oil sources by country of origin for reporting.
In 2010, we purchased substantially all of our refinery feedstock and sold our distillates, gasoline products and our high sulphur fuel oil (“HSFO”) to Vitol Refining S.A. (“Vitol”) pursuant to the supply and offtake agreement (“SOA”), with the exception of products sold in Newfoundland through our petroleum marketing division and spot sales of HSFO products sold to various credit approved customers.
The SOA with Vitol contains pricing terms that reflect market prices based on an average ten-day delay which results in our purchases from, and sales to, Vitol being priced on future prices as compared to pricing at the time of the delivery. Refined product sales to customers other than Vitol are sold at prices that reflect market prices at the time that the product is delivered to the purchaser.
Refining Benchmark Prices
The following average benchmark prices and currency exchange rates are the reference points from which we discuss our refinery’s financial performance:
| | | December 31, 2010 | |
| | | Three Months Ended | | | Year Ended | |
| WTI crude oil (US$/bbl) | | 85.17 | | | 79.53 | |
| Brent crude oil (US$/bbl) | | 87.32 | | | 80.29 | |
| RBOB gasoline (US$/bbl) | | 93.17 | | | 89.11 | |
| RBOB gasoline crack spread (US$/bbl) | | 8.00 | | | 9.58 | |
| Heating oil (US$/bbl) | | 99.15 | | | 90.03 | |
| Heating oil crack spread (US$/bbl) | | 13.98 | | | 10.50 | |
| High Sulphur Fuel Oil (US$/bbl) | | 73.92 | | | 70.57 | |
| High Sulphur Fuel Oil discount | | (11.25 | ) | | (8.96 | ) |
| Canadian / U.S. dollar exchange rate | | 0.987 | | | 0.971 | |
17
| | MANAGEMENT’S DISCUSSION AND ANALYSIS |
The following graph summarizes the WTI crack spreads for the respective benchmark product prices for the year ended December 31, 2010:
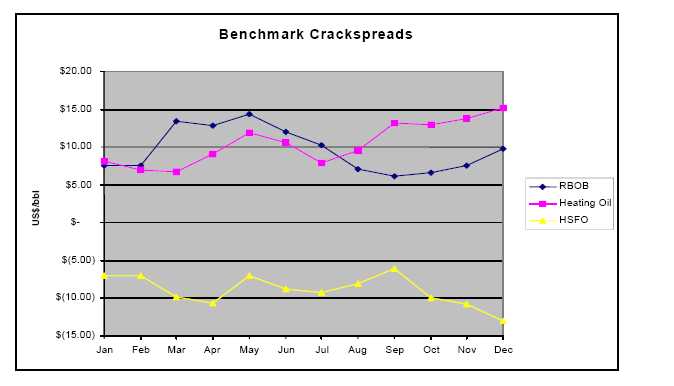
The following table details the refinery’s products average crack spread over WTI as compared to the benchmark crack spreads:
| | | December 31, 2010 | |
| | | Three Months Ended | | | Twelve Months Ended | |
| (US $ per bbl) | | Refinery | | | Benchmark | | | Refinery | | | Benchmark | |
| Gasoline and related products | | 8.78 | | | 8.00 | | | 8.78 | | | 9.58 | |
| Distillates | | 14.32 | | | 13.98 | | | 12.69 | | | 10.50 | |
| High sulphur fuel oil | | (12.57 | ) | | (11.25 | ) | | (8.59 | ) | | (8.96 | ) |
The average crack spread of our refinery products differs from the benchmark crack spreads as a result of timing of sales under the SOA, transportation costs, location differentials, quality differentials and variability in our throughput volume over a given period of time.
18
| | MANAGEMENT’S DISCUSSION AND ANALYSIS |
The following chart summarizes our refined products average crack spread by quarter in 2010:
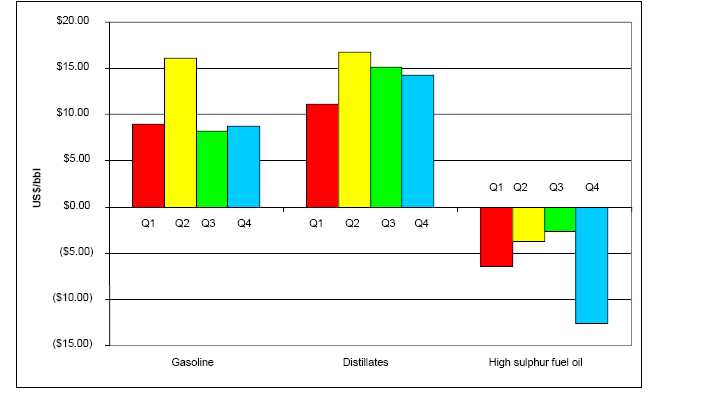
Summary of Gross Margin
The following table summarizes our downstream gross margin for the three months and year ended December 31, 2010 segregated between refining activities and petroleum marketing and other related businesses.
| | | | | | | | | December 31, 2010 | | | | | | | |
| | | Three Months Ended | | | | | | Year Ended | | | | |
| | | Refining | | | Marketing | | | Total | | | Refining | | | Marketing | | | Total | |
| | | | | | | | | | | | | | | | | | | |
| Sales revenue(1) | | 1,001,948 | | | 152,577 | | | 1,035,874 | | | 2,824,154 | | | 569,345 | | | 2,949,930 | |
| Cost of feedstock for processing and products for resale(1) | | 938,365 | | | 139,131 | | | 958,845 | | | 2,658,059 | | | 518,529 | | | 2,733,019 | |
| Gross margin(2) | | 63,583 | | | 13,446 | | | 77,029 | | | 166,095 | | | 50,816 | | | 216,911 | |
(1) Downstream sales revenue and cost of products for processing and resale are net of intra-segment sales of $118.7 million and $443.6 million for the three months and year ended December 31, 2010, respectively, reflecting the refined products produced by the refinery and sold by the Marketing Division.
(2) This is a non-GAAP measure; please refer to “Non-GAAP Measures” in this MD&A.
As a consequence of a fire in early January of 2010, the refinery units were shut down for part of the first quarter, which resulted in a negative impact on revenues and operations for the year ended December 31, 2010. An insurance claim has been submitted relating to the cost of the business interruption loss. The net proceeds will be recorded as income in the period in which there is agreement on the amount to be received under the insurance coverage. The average daily throughput was 86,142 bbl/d for the year ended December 31, 2010. Fourth quarter daily average throughput increased by 15% compared to the average daily throughput of 96,514 bbl/d in the prior quarter. The 14,803 bbl/d increase reflects the normal operations of the units following an unplanned maintenance and catalyst change-out in the hydrogen unit in the third quarter.
19
| | MANAGEMENT’S DISCUSSION AND ANALYSIS |
For the three months ended December 31, 2010, our refining gross margin increased 128% to $63.6 million from the prior quarter of $27.9 million. The increase reflects the return to normal operations in the fourth quarter. The gross margins from the marketing operations in the fourth quarter are only slightly lower than the prior quarter gross margin of $14.0 million. The strengthening of the Canadian dollar in the fourth quarter of 2010 has slightly offset the contribution from our downstream operations as substantially all of its gross margin, cost of purchased energy and marketing expense are denominated in U.S. dollars.
Refinery Sales Revenue
A comparison of our refinery yield, product pricing and revenue for the three months and year ended December 31, 2010 is presented below:
| | | | | | | | | December 31, 2010 | | | | | | | |
| | | Three Months Ended | | | | | | | | | Year Ended | | | | |
| | | Refinery | | | Volume | | | Sales | | | Refinery | | | Volume | | | Sales | |
| | | Revenues | | | | | | Price | | | Revenues | | | | | | Price | |
| | | | | | (000s of bbls) | | | (US$ per bbl) | | | | | | (000s of bbls) | | | (US$ per bbl) | |
| | | | | | | | | | | | | | | | | | | |
| Gasoline products | | 384,268 | | | 4,037 | | | 93.95 | | | 985,737 | | | 10,838 | | | 88.31 | |
| Distillates | | 397,447 | | | 3,943 | | | 99.49 | | | 1,114,963 | | | 11,740 | | | 92.22 | |
| High sulphur fuel oil | | 220,233 | | | 2,994 | | | 72.60 | | | 723,454 | | | 9,902 | | | 70.94 | |
| | | 1,001,948 | | | 10,974 | | | 90.12 | | | 2,824,154 | | | 32,480 | | | 84.43 | |
| Inventory adjustment | | | | | (737 | ) | | | | | | | | (1,607 | ) | | | |
| Total production | | | | | 10,237 | | | | | | | | | 30,873 | | | | |
| Yield (as a % of Feedstock)(1) | | | 100% | | | | | | | | | 98% | | | | |
(1)Based on production volumes after adjusting for changes in inventory held for resale.
The table below details the refinery’s product yields for the three months and year ended December 31, 2010:
| | | December 31, 2010 | |
| | | Three Months Ended | | | Twelve Months Ended | |
| Gasoline and related products | | 35% | | | 32% | |
| Distillates | | 39% | | | 37% | |
| High sulphur fuel oil(1) | | 26% | | | 31% | |
(1) Includes 1.2 million bbls of produced VGO for the year ended December 31, 2010
The refinery yields for the year ended December 31, 2010 are impacted by the unplanned shutdowns in the first and third quarters of the year. Fourth quarter yields are reflective of normal operations with an increase in yields of gasoline products and distillates and a decrease in the yield of HSFO as compared to the prior quarter yields of 28% gasoline products, 32% distillates and 40% HSFO. The third quarter yields are a consequence of the unplanned maintenance and catalyst change-out in the hydrogen unit that resulted in a decrease in the production of gasoline and distillates and an increase in the production of HSFO and VGO.
20
| | MANAGEMENT’S DISCUSSION AND ANALYSIS |
Refinery Feedstock
A comparison of crude oil and VGO feedstock processed for the three months and year ended December 31, 2010 is presented below:
| | | | | | | | | December 31, 2010 | | | | | | | |
| | | Three Months Ended | | | | | | Twelve Months Ended | | | | |
| | | Cost of | | | Volume | | | Cost per | | | Cost of | | | Volume | | | Cost per | |
| | | Feedstock | | | | | | Barrel(1) | | | Feedstock | | | | | | Barrel(1) | |
| | | | | | (000s of bbls) | | | (US$/bbl) | | | | | | (000s of bbls) | | | (US$/bbl) | |
| | | | | | | | | | | | | | | | | | | |
| Middle Eastern | | 607,721 | | | 7,019 | | | 85.46 | | | 1,713,780 | | | 21,456 | | | 77.56 | |
| Russian | | 211,780 | | | 2,453 | | | 85.21 | | | 485,884 | | | 5,884 | | | 80.18 | |
| South American | | 33,867 | | | 423 | | | 79.02 | | | 211,318 | | | 2,978 | | | 68.90 | |
| Crude Oil Feedstock | | 853,368 | | | 9,895 | | | 85.12 | | | 2,410,982 | | | 30,318 | | | 77.22 | |
| Vacuum Gas Oil | | 31,367 | | | 347 | | | 89.22 | | | 95,519 | | | 1,124 | | | 82.52 | |
| | | 884,735 | | | 10,242 | | | 85.26 | | | 2,506,501 | | | 31,442 | | | 77.41 | |
| | | | | | | | | | | | | | | | | | | |
| Net inventory adjustment(2) | | 20,505 | | | | | | | | | 9,427 | | | | | | | |
| Additives and blendstocks | | 33,224 | | | | | | | | | 139,742 | | | | | | | |
| Inventory write-down (recovery)(3) | | (99 | ) | | | | | | | | 2,389 | | | | | | | |
| | | 938,365 | | | | | | | | | 2,658,059 | | | | | | | |
| (1) | Cost of feedstock includes all costs of transporting the crude oil to the refinery in Newfoundland. |
| (2) | Inventories are determined using the weighted average cost method. |
| (3) | Inventory write-downs are calculated on a product by product basis using the lower of cost or net realizable value. |
The volatility of WTI prices from month to month makes it difficult to compare the financial impact of specific crude types when our consumption of crude types varies over the period. Further, our refinery competes for international waterborne crude oil and VGO’s and the WTI benchmark price reflects a land-locked North American price with limited access to the international markets.
The cost of our feedstock reflects numerous factors beyond WTI prices, including the quality of the crude oil processed, the mix of crude oil types, the costs of transporting the crude oil to our refinery, the operational hedging of the WTI component of our feedstock costs through the SOA, the ten day delay in pricing pursuant to the SOA and for Middle Eastern crude oil purchased, the OSP and the carrying costs of inventories due to shutdowns.
As is normal business practice, the WTI component of our feedstock cost is operationally hedged under the SOA with Vitol. When we commit to crude oil purchases, Vitol sells a forward WTI price contract for the next contract month, which results in price fluctuations subsequent to our purchase commitment being offset by the price volatility of the forward price curve. If the timing between processing the crude oil and the expiration of the forward contract are not aligned, the volume of the forward contract relating to unprocessed crude oil is rolled to the next contract month. This practice results in better matching of our refined product sales prices with our cost of feedstock. The persistent contango shape of the NYMEX WTI futures results in operational hedging gains from the rolling forward of these price contracts, which reduce our feedstock costs in the month the feedstock is processed.
21
| | MANAGEMENT’S DISCUSSION AND ANALYSIS |
The following table details the differential of our feedstock pricing to the benchmark WTI for the three months and year ended December 31, 2010:
| | | December 31, 2010 | |
| | | Three Months Ended | | | Year Ended | |
| (US $ per bbl) | | Crude | | | VGO | | | Crude | | | VGO | |
| Quality discount | | (0.50 | ) | | 5.83 | | | (1.78 | ) | | 5.56 | |
| Operational hedging gain | | (0.43 | ) | | (1.81 | ) | | (0.96 | ) | | (2.02 | ) |
| Timing under the SOA | | 0.88 | | | 0.03 | | | 0.43 | | | (0.55 | ) |
| Total | | (0.05 | ) | | 4.05 | | | (2.31 | ) | | 2.99 | |
Included in the additives and blendstocks for the three months and year ended December 31, 2010 is the cost of a gasoline blendstock which is blended with summer RBOB gasoline and the cost of products purchased for resale to the local market.
Operating Expenses
The following summarizes the operating expenses of the refinery and marketing divisions for the three months and year ended December 31, 2010:
| | | December 31, 2010 | |
| | | Three Months Ended | | | Year Ended | |
| | | Refining | | | Marketing | | | Total | | | Refining | | | Marketing | | | Total | |
| | | | | | | | | | | | | | | | | | | |
| Operating cost | | 23,387 | | | 5,593 | | | 28,980 | | | 93,078 | | | 21,619 | | | 114,697 | |
| Purchased energy | | 40,504 | | | - | | | 40,504 | | | 106,126 | | | - | | | 106,126 | |
| | | 63,891 | | | 5,593 | | | 69,484 | | | 199,204 | | | 21,619 | | | 220,823 | |
| (Per barrel of feedstock throughput) | | | | | | | | | | | | | | | | |
| Operating cost | | 2.28 | | | - | | | - | | | 2.96 | | | - | | | - | |
| Purchased energy | | 3.96 | | | - | | | - | | | 3.38 | | | - | | | - | |
| | | 6.24 | | | - | | | - | | | 6.34 | | | - | | | - | |
During the three months ended December 31, 2010, refining operating costs per barrel of feedstock throughput was comparable to the operating cost of $2.26/bbl of feedstock throughput in the prior quarter and is lower than the $2.96/bbl for the year ended December 31, 2010. The higher cost per barrel for the year reflects higher maintenance costs and lower average daily throughput as a result of the shutdowns in the first and third quarters of 2010.
Purchased energy, consisting of low sulphur fuel oil (“LSFO”) and electricity, is required to provide heat and power to refinery operations. The 52% increase in purchase energy costs from $2.61/bbl in the third quarter is due to a volume variance of $15.0 million combined with a price variance of $2.0 million.
Operating costs for the domestic marketing division are fairly consistent quarter over quarter with the fourth quarter operating costs comparable to the third quarter operating cost of $5.6 million.
Marketing Expense and Other
During the three months and year ended December 31, 2010, marketing expense was $0.2 million and $0.8 million respectively and a time value of money (TVM) charge of $1.3 million and $5.6 million respectively both pursuant to the terms of the SOA. The marketing fees and TVM charges are comparable to the $0.2 million and $1.3 million costs respectively in the third quarter.
22
| | MANAGEMENT’S DISCUSSION AND ANALYSIS |
Capital Expenditures
Capital spending for the three months and year ended December 31, 2010 totaled $32.6 million and $71.2 million, respectively, relating to various capital improvement projects including $16.2 million and $38.1 million of expenditures, respectively related to the debottlenecking projects which are intended to raise the refinery’s capacity to 130,000 bbl/d, provide enhanced yields and reduce expenses.
Depreciation and Amortization Expense
The following summarizes the depreciation and amortization expense for the three months and year ended December 31, 2010:
| | | December 31, 2010 | |
| | | Three Months Ended | | | Twelve Months Ended | |
| ($000’s of Canadian dollars) | | Refining | | | Marketing | | | Total | | | Refining | | | Marketing | | | Total | |
| | | | | | | | | | | | | | | | | | | |
| Tangible assets | | 19,674 | | | 879 | | | 20,553 | | | 79,615 | | | 3,476 | | | 83,091 | |
The process units are amortized over an average useful life of 20 to 30 years.
Environmental Contingencies
North Atlantic has been named a defendant in one of more than 100 methyl tertiary butyl ether U.S. product liability litigation cases that have been consolidated for pre-trial purposes in this matter. The plaintiffs seek relief for alleged contamination of ground water from the various defendants' use of the gasoline additives. Although the plaintiffs have not made a particular monetary demand, they are asserting collective and joint liability against all defendants. The evaluation of the risk of liability to the Company is not determinable at this time and no amounts are accrued in the consolidated financial statements in respect of this matter. Harvest is indemnified by Vitol Group B.V. in respect of this contingent liability.
Asset Retirement Obligations
Harvest’s downstream asset retirement obligations result from its ownership of the refinery and marketing assets. Harvest has a legal obligation to reclaim and abandon these assets. At December 31, 2010, Harvest estimates the total undiscounted amount of cash flows required to settle its downstream asset retirement obligations to be approximately $14.9 million which will be incurred beyond 2070. This obligation was not recorded in Harvest’s total ARO as the fair value can not be determined because the timing of the assets retirement is uncertain.
23
| | MANAGEMENT’S DISCUSSION AND ANALYSIS |
CORPORATE
Cash Flow Risk Management
Harvest periodically enters into derivatives contracts such as forwards, futures, swaps, options and costless collars to hedge against the potential adverse impact of changes in market prices due to changes in the underlying indices. The following is a summary of Harvest’s risk management contracts outstanding at December 31, 2010:
| Contracts not Designated as Hedges | | | |
| Contract Quantity | Type of Contract | Term | Contract Price | Fair value |
| 30 MWh | Electricity price swap contracts | Jan - Dec 2011 | Cdn $46.87 | 1,007 |
| Contracts Designated as Hedges | | | |
| Contract quantity | Type of Contract | Term | Contract Price | Fair value |
| 8200 bbl/day | Crude oil price swap contract | Jan - Dec 2011 | US $91.23/bbl | (7,553) |
Harvest uses electricity price swap contracts to manage some of its electricity price risk exposures relating to its electricity consumption. For the year ended December 31, 2010, the total realized loss and unrealized gain recognized in the consolidated statement of income relating to the electricity price swap contracts was $1.8 million and $3.1 million respectively ($0.7 million and $1.9 million respectively for the three months ended December 31, 2010).
Harvest’s strategic crude oil hedging program is subject to periodic management reviews to determine appropriate hedge requirements in light of the Company’s tolerance for exposure to market volatility, as well as the need for stable cash flow to finance future growth. The Company may be exposed to certain losses in the event that the counterparties to derivative financial instruments are unable to meet their obligations to Harvest. This risk is minimized by entering into agreements with investment grade counterparties and counterparties that are lenders in Harvest’s syndicated credit facilities. During the fourth quarter, Harvest entered into crude oil swap contracts to reduce the volatility of cash flows from a portion of its forecasted sales. The swaps were designated as cash flow hedges and are entered into for the periods consistent with forecasted petroleum sales. The effective portion of the unrealized loss of $5.0 million (net of deferred tax asset of $1.8 million) was included in other comprehensive income for the three months and year ended December 31, 2010. The ineffective portion of the unrealized loss of $0.7 million was recorded to net income for the three months and year ended December 31, 2010.
Interest Expense
| | | December 31, 2010 | |
| | | Three Months Ended | | | Year Ended | |
| Interest on short term debt | | | | | | |
| Bank loan | $ | - | | $ | 1,370 | |
| Convertible debentures | | 302 | | | 703 | |
| Senior notes | | - | | | 30 | |
| Total interest on short term debt | | 302 | | | 2,103 | |
| | | | | | | |
| Interest on long term debt | | | | | | |
| Bank loan | | 984 | | | 4,326 | |
| Convertible debentures | | 12,102 | | | 50,827 | |
| Senior notes | | 8,520 | | | 20,867 | |
| Total interest expense on long term debt | $ | 21,606 | | $ | 76,020 | |
| Total interest expense(1) | $ | 21,908 | | $ | 78,123 | |
(1) Net of capitalized borrowing cost of $0.4 million relating to BlackGold oil sands project
24
| | MANAGEMENT’S DISCUSSION AND ANALYSIS |
The bank loan, convertible debentures and 77/8% senior notes are recorded at amortized cost and as such interest is calculated using the effective interest method. Therefore, total interest includes non-cash interest income of $1.4 million and $7.0 million for the three months and year ended December 31, 2010 relating to the amortization of the premium on the convertible debentures and 77/8% senior notes and the fees incurred on the credit facility.
Total interest expense for the fourth and third quarter of 2010, including the amortization of related financing costs, was $21.9 million and $18.7 million, respectively. This increase is mainly attributed to a $4.5 million increase in senior note interest expense due to the higher borrowing balance relating to Harvest’s 67/8% senior notes and premium paid on the existing 77/8% senior notes for early redemption.
Interest expense on our bank loan was $1.0 million for the fourth quarter of 2010 compared to $1.8 million in the prior quarter. The decrease is attributed to the decrease in bank debt from $288.7 million at September 30, 2010 to $14.0 million at December 31, 2010. Interest expense for the fourth quarter of 2010 on our convertible debentures remained consistent with prior quarter.
Currency Exchange
Currency exchange gains and losses are attributed to the changes in the value of the Canadian dollar relative to the U.S. dollar on our U.S. dollar denominated debt as well as any other U.S. dollar working capital balances. At December 31, 2010 the Canadian dollar has strengthened compared to September 30, 2010 and December 31, 2009 resulting in an unrealized foreign exchange gain of $3.7 million and $2.3 million for the three months and year ended December 31, 2010, respectively. Realized foreign exchange gains were $6.8 million and $1.5 million for the three months and year ended December 31, 2010 respectively, resulting from the redemption of the 77/8% senior notes and settlement of U.S. dollar denominated transactions.
Our downstream operations use U.S. dollar as their functional currency. The foreign exchange gains and losses incurred by our downstream operations relate to Canadian dollar transactions converted to U.S. dollars as their functional currency is U.S. dollars. The cumulative translation adjustment recognized in other comprehensive income represents the translation of our downstream operation’s U.S. dollar functional currency financial statements to Canadian dollars using the current rate method. During the three months and year ended December 31, 2010, net cumulative translation losses were $32.4 million and $46.4 million respectively. Losses resulted due to the strengthening of the Canadian dollar against the U.S. dollar at December 31, 2010 compared to September 30, 2010 and December 31, 2009, reflecting a decrease in the relative value of the net assets in our downstream operations.
Future Income Tax
As a result of the reorganization in the second quarter of 2010, Harvest now is a taxable corporate structure, with the effective corporate rate applicable to all entities. At December 31, 2010, Harvest recognized $42.5 million of investment tax credits relating to downstream operations. As a result of the restructuring of intercompany debt, downstream operations are expected to be taxable in the future and will be able to utilize these credits.
At December 31, 2010, Harvest had a net future income tax (FIT) liability of $177.2 million (2009 – $211.2 million), comprised of $80 million (2009 – $112.5 million) for the downstream corporate entities and $97.2 million (2009 – $98.7 million) for the upstream corporate entities.
As a result of KNOC Canada’s acquisition of the Trust, the opening FIT liability of $211.2 million was reflected as part of the purchase price allocation recorded at that date. The change in the FIT liability between December 31, 2010 and December 31, 2009 was $34 million and resulted from a FIT recovery of $39.9 million recognized in net loss for the year, a FIT recovery of $1.8 million recognized in other comprehensive income relating to the effective portion of hedge contracts, and offset by the FIT liability associated with the Red Earth Partnership acquisition of $7.7 million.
25
| | MANAGEMENT’S DISCUSSION AND ANALYSIS |
At December 31, 2010, we estimated our unclaimed capital expenditures to be:
| Tax classification | | Upstream | | | Downstream | | | Total | |
| Canadian development & exploration expenditures | $ | 593,124 | | $ | - | | $ | 593,124 | |
| Canadian oil & gas property expenditures | | 852,862 | | | - | | | 852,862 | |
| Unclaimed capital cost | | 400,223 | | | 307,314 | | | 707,537 | |
| Non-capital losses and other | | 1,033,918 | | | 343,431 | | | 1,377,349 | |
| | $ | 2,880,127 | | $ | 650,745 | | $ | 3,530,872 | |
Income Tax Assessment
In January 2009 Canada Revenue Agency issued a Notice of Reassessment to Harvest Energy Trust in respect of its 2002 through 2004 taxation years claiming past taxes, interest and penalties totaling $6.2 million. The CRA adjusted Harvest Energy Trust’s taxable income to include their net profits interest royalty income on an accrual basis whereas the tax returns had reported this revenue on a cash basis. A Notice of Objection was filed with CRA requesting the adjustments to an accrual basis be reversed. On January 25, 2011, CRA indicated that they will not pursue the matter.
Contractual Obligations and Commitments
We have contractual obligations and commitments entered into in the normal course of operations including the purchase of assets and services, operating agreements, transportation commitments, sales commitments, royalty obligations, and land lease obligations. These obligations are of a recurring and consistent nature and impact cash flow in an ongoing manner.
As at December 31, 2010, we also have contractual obligations and commitments that are of a less routine nature as disclosed in the following table:
| | | | | | | | | Maturity | | | | | | | |
| | | Total | | | Less than 1 year | | | 1-3 years | | | 4-5 years | | | After 5 years | |
| Long-term debt(1) | $ | 1,245,273 | | $ | - | | $ | 451,344 | | $ | 296,629 | | $ | 497,300 | |
| Interest on long-term debt(1) | | 401,952 | | | 87,200 | | | 160,754 | | | 94,167 | | | 59,831 | |
| Operating and premise leases | | 28,751 | | | 7,514 | | | 13,355 | | | 7,602 | | | 280 | |
| Purchase commitments(2) | | 806,193 | | | 694,651 | | | 111,542 | | | - | | | - | |
| Asset retirement obligations(3) | | 1,242,033 | | | 16,148 | | | 30,756 | | | 34,185 | | | 1,160,944 | |
| Transportation(4) | | 4,259 | | | 3,253 | | | 1,006 | | | - | | | - | |
| Pension contributions(5) | | 24,783 | | | 5,318 | | | 7,590 | | | 7,850 | | | 4,025 | |
| Feedstock commitments(6) | | 900,131 | | | 900,131 | | | - | | | - | | | - | |
| Total | $ | 4,653,375 | | $ | 1,714,215 | | $ | 776,347 | | $ | 440,433 | | $ | 1,722,380 | |
| (1) | Assumes constant foreign exchange rate. |
| (2) | Relates to drilling commitments, AFE commitments, BlackGold oil sands project commitment, Hunt’s assets purchase agreement and downstream purchase commitments. |
| (3) | Represents the undiscounted obligation by period. |
| (4) | Relates to firm transportation commitment on the Nova pipeline. |
| (5) | Relates to the expected contributions for employee benefit plans. |
| (6) | Relates to feedstock commitments under the supply and offtake agreement and others |
Off Balance Sheet Arrangement
As of December 31, 2010, we have no off balance sheet arrangements in place.
26
| | MANAGEMENT’S DISCUSSION AND ANALYSIS |
LIQUIDITY
Harvest manages its cash requirements by optimizing the capital structure of the Company and maintaining sufficient liquid financial resources to fund obligations as they come due in the most cost effective manner. The Company’s liquidity needs are met through the following sources: cash generated from operations, borrowings under our long-term credit facility, long-term debt issuances and equity injections by KNOC. Harvest’s primary uses of funds are operating expenses, capital expenditures, and interest and principal payments on debt instruments.
For the year ended December 31, 2010, cash flow from operating activities was $430.3 million including $22.6 million provided by a reduction in non-cash working capital and $20.3 million used in the settlement of asset retirement obligations. At December 31, 2010, Harvest’s financing activities provided $212.5 million of cash, including $558.5 million capital injections from KNOC and the issue of $495.9 million 67/8% senior notes, which was used to fund the repayment of $406.7 million of bank debt, the redemption of $256.9 million of 77/8% senior notes and the redemption of $180.2 million of convertible debentures. Harvest funded $651.5 million of capital expenditures and net asset acquisition activity during 2010 with cash generated from operating activities and financing activities.
Harvest had working capital of $2.0 million at December 31, 2010, as compared to a deficiency of $589.2 million at December 31, 2009. The negative working capital in 2009 was primarily related to the $428 million of bank loan and the classification of $182.8 million and $42.9 million of convertible debentures and senior notes, respectively as current liabilities. A portion of the bank loan and convertible debentures were repaid during 2010 with capital injections from KNOC. The Company’s working capital is expected to fluctuate from time to time, and will be funded from cash flows from operations and borrowings from Harvest’s credit facility, as required.
As well as future petroleum and natural gas prices, our upstream operations rely on the successful exploitation of our existing reserves, future development activities and strategic acquisitions to replace existing production and add additional reserves. With a prudent maintenance program, our downstream assets are expected to have a long life with additional growth in profitability available by upgrading the HSFO currently produced and/or expanding our refining throughput capacity. Future development activities and acquisitions in our upstream business as well as the maintenance program in our downstream business will likely be funded from cash flow from operating activities, while we will generally rely on funding more significant acquisitions and growth initiatives from some combination of cash flow from operating activities, issuances of incremental debt and capital injections from KNOC. Should incremental debt not be available to us through debt capital markets, our ability to make the necessary expenditures to enhance or expand our assets may be impaired. Harvest’s liquidity is closely related to its ability to generate cash from operating activities, which is affected by changes in commodity prices, market demands for petroleum and natural gas products and the operating performances of both our upstream and downstream assets. Harvest enters into risk management contracts (refer to the “Financial Instrument” section of this MD&A) to protect the Company from cash flow fluctuations due to commodity price changes.
Through a combination of cash available at December 31, 2010, cash from operating activities, available undrawn credit capacity and the working capital provided by the supply and offtake agreement with Vitol, as further discussed below, it is anticipated that Harvest will have adequate liquidity to fund future operations, debt repayments and forecasted capital expenditures (excluding major acquisitions). Refer to the “Contractual Obligations and Commitments”section above for Harvest’s future commitments and the discussion below on certain significant items.
Hunt Acquisition
On December 14, 2010 Harvest signed an agreement to purchase the assets of Hunt Oil Company of Canada, Inc. and Hunt Oil Alberta, Inc. (collectively “Hunt”) for an initial purchase price of $525 million. The transaction is expected to close on February 28, 2011. Upon signing the agreement Harvest provided a $40 million deposit which is held in trust. The agreement contains a mechanism that allows for a subsequent $25 million payment to Hunt in the event that Canadian natural gas prices exceed certain pre-determined levels over the next 2 years. The Hunt assets include working interests in a third-party operated gas plant that is currently experiencing an outage, which results in reduced production in certain oil and gas properties. Hunt has agreed to reimburse Harvest for costs associated with restoring production as well as the lost production between October 1, 2010 and the earlier of (i) the date when production is resumed, and (ii) October 31, 2011. Subsequent to December 31, 2010, KNOC has provided $505 million of equity to fund the acquisition.
27
| | MANAGEMENT’S DISCUSSION AND ANALYSIS |
BlackGold Oil Sands Project
In August 2010, Harvest issued $374 million of shares to KNOC in exchange for the BlackGold assets. Subsequently, Harvest issued $85.7 million of shares to KNOC for funding the BlackGold’s initial capital expenditures. In August 2010, Harvest entered into two EPC contracts relating to the BlackGold production and processing facilities. The contracted cost is $311 million of which $43.5 million, including the $31.1 million deposit, was paid in 2010 and the remaining balance will be paid in 2011 and 2012. The development of the BlackGold assets is expected to be completed by the fourth quarter of 2012. Harvest expects to fund the future capital expenditures with the $85.7 million capital injection already funded by KNOC, future cash flow from operating activities and the undrawn credit facility.
Global Technology and Research Centre (“GTRC”)
On October 4, 2010, 0.7 million shares were issued to KNOC for total consideration of $7.1 million to provide funding for the initial set up and operation of the KNOC GTRC that will be owned and operated by Harvest. During 2010, $1.2 million capital spending was incurred relating to the GTRC.
Supply and Offtake Agreement
Concurrent with the acquisition of North Atlantic by Harvest in 2006, North Atlantic entered into a supply and offtake agreement (the “SOA”) with Vitol Refining S.A. ("Vitol"), and this agreement was amended and extended on November 1, 2009. The SOA is effective until November 1, 2011 and may be terminated by either party at any time thereafter by providing notice of termination no later than six months prior to the desired termination date or if the refinery is sold in an arm’s length transaction, upon 30 days notice prior to the desired termination date. Further, the SOA may be terminated upon the continuation for more than 180 days of a delay in performance due to force majeure but prior to the recommencing of performance.
The SOA provides that the ownership of substantially all crude oil and other feed stocks and refined product inventories at the refinery be retained by Vitol and that Vitol be granted the exclusive right and obligation to provide crude oil feedstock and other feed stocks for delivery to the refinery as well as the exclusive right and obligation to purchase virtually all refined products produced by the refinery for export. The SOA requires that Vitol purchase and lift all refined products, within specified quality, produced by the refinery, except for certain excluded refined products to be marketed by North Atlantic in the local Newfoundland market, and provides a product purchase pricing formula. North Atlantic is required to purchase the related feed stocks and refined product inventories at the prevailing market prices.
This arrangement provides working capital financing for its inventories of crude oil and substantially all refined products held for sale. The amendments made in 2009 to the SOA increased the amount of working capital financing available, reduced the cost of financing inventory and other working capital, and increased the prices realized for product sales. Pursuant to the SOA, we estimate that Vitol held inventories of VGO and crude oil feedstock (both delivered and in-transit) valued at approximately $774.7 million at December 31, 2010 (as compared to $582.1 million at December 31, 2009), which would have otherwise been assets of Harvest.
28
| | MANAGEMENT’S DISCUSSION AND ANALYSIS |
CAPITAL RESOURCES
The following table summarizes the Company’s capital structure as at December 31, 2010 and 2009 and provides the key financial ratios contained in the Company’s revolving credit facility. For a complete description of the revolving credit facility, 77/8% senior notes, 67/8% senior note and convertible debentures, see notes 9, 10 and 11, respectively, to Harvest’s consolidated financial statements for the year ended December 31, 2010.
| | | December 31, 2010 | | | December 31, 2009 | |
| Debts | | | | | | |
| Revolving credit facility(1) | $ | 14,000 | | $ | 428,017 | |
| 77/8% senior notes, at principal amount (US$209.6 million)(2) | | - | | | 262,750 | |
| 67/8% senior notes, at principal amount (US$500 million)(2) | | 497,300 | | | - | |
| Convertible debentures, at principal amount | | 733,973 | | | 914,166 | |
| Total Debt | | 1,245,273 | | | 1,604,933 | |
| | | | | | | |
| Shareholder’s Equity | | | | | | |
| 330,953,567 issued at December 31, 2010 | | 3,250,942 | | | - | |
| 242,268,802 issued at December 31, 2009 | | - | | | 2,422,688 | |
| | | | | | | |
| Total Capitalization | $ | 4,496,215 | | $ | 4,027,621 | |
| | | | | | | |
| Financial Ratios(3) | | | | | | |
| Secured Debt to Annualized EBITDA(4) (5) | | 0.1 | | | 0.7 | |
| Total Debt to Annualized EBITDA(4) (6) | | 2.4 | | | 2.7 | |
| Senior Debt to Total Capitalization(5) (7) | | 1% | | | 11% | |
| Total Debt to Total Capitalization(6) (7) | | 31% | | | 40% | |
| (1) | Net of transaction costs – $11.4 million |
| (2) | Principal amount converted at the period end exchange rate. |
| (3) | Calculated based on Harvest’s credit facility covenant requirements (see note 9 of the December 31, 2010 financial statements) |
| (4) | Annualized Earnings Before Interest, Taxes, Depreciation and Amortization based on twelve month rolling average. |
| (5) | “Senior Debt” includes letter of credit, bank debt and guarantees |
| (6) | “Total Debt” includes the secured debt, convertible debentures and notes |
| (7) | “Total Capitalization” includes total debt and shareholder’s equity |
During 2010, the improvement in global economic condition resulted in an increase in oil prices by the end of the year. During the second quarter of 2010, Harvest’s balance sheet improvement together with the improvement in global economic recovery, supported the renewal of Harvest’s revolving credit facility. The improvement of Harvest’s financial and business risks backstopped by the support from KNOC resulting in a stronger balance sheet that led to Standard and Poor’s Ratings Services (“S&P”) and Moody’s Investors Service upgrading Harvest’s corporate ratings to “BB-” and “Ba2”, respectively and the 67/8% senior notes rating to “BB-” and “Ba1” in 2010.
Credit Facility
On April 30, 2010, Harvest entered into a syndicated credit agreement establishing a $500 million three year extendible revolving credit facility (“the Facility”), maturing on April 30, 2013 unless extended. Harvest has the option to increase the capacity limit from $500 million to $1.0 billion, without lender consents, by utilizing the accordion feature and securing additional capacity from an existing or new lender(s). In addition, the capacity under the Facility (as long as it is fully secured) is limited to the greater of $1 billion or 15% of total assets as outlined in the limitations on liens covenant of the 67/8% senior notes described in the “Senior Note” section below. At December 31, 2010, Harvest had $486 million of unutilized borrowing capacity under the Facility. The unused borrowing capacity and the option to increase the capacity limit provide Harvest the flexibility to manage fluctuations in its liquidity needs.
29
| | MANAGEMENT’S DISCUSSION AND ANALYSIS |
The Facility is fully secured by a first floating charge over all of the assets of Harvest's operating subsidiaries (except the BlackGold assets) plus a first mortgage security interest on the downstream operation’s refinery assets. The most restrictive covenants of the Facility include an aggregate limitation of $25 million on financial assistance and/or capital contributions to parties other than those included in the first floating charge, a limitation to carrying on business in countries that are not members of the Organization of Economic Co-operation and Development and a limitation on the payment of distributions to shareholders of an amount greater than EBITDA minus capital expenditures by Harvest and its subsidiaries. Harvest did not pay any dividend to its shareholder during 2010. The Facility is subject to the following covenant ratios:
| Senior debt to EBITDA | 3.0 to 1.0 or less |
| Total debt to EBITDA | 3.5 to 1.0 or less |
| Senior debt to Capitalization | 50% or less |
| Total debt to Capitalization | 55% or less |
Convertible Debentures
At December 31, 2010, Harvest had $734 million of principal amount of convertible debentures issued in four series with the earliest maturity date of October 31, 2012. As a result of the Trust’s acquisition, the debentures are no longer convertible into units but debenture holders would receive $10.00 for each unit notionally received based on each series’ conversion rate. Because every series of debentures carry a conversion price that exceeds $10.00 per unit, it is assumed that no investor would exercise their conversion option.
The debentures may be redeemed by Harvest at its option in whole or in part prior to their respective redemption dates. The redemption price for the first redemption period is at a price equal to $1,050 per debenture and at $1,025 per debenture during the second redemption period. Harvest may redeem the debentures at par after the second redemption period. Any redemption will include accrued and unpaid interest at such time.
Senior Notes
On October 4, 2010, Harvest completed an offering of US$500 million principal amount of unsecured 67/8% senior notes for net cash proceeds of US$484.6 million of which US$210.2 million was used to redeem the outstanding principal amount of the existing 77/8% senior notes and premium. These notes are guaranteed by all of Harvest’s existing and future restricted subsidiaries that guarantee the Facility and future restricted subsidiary that guarantees certain debt. Prior to maturity, redemptions are permitted in whole or in part, at any time at a redemption price equal to the greater of 100% of the principal amount redeemed and the make-whole redemption premium plus any unpaid interest to the redemption date. Harvest may also redeem all of the notes at any time in the event that certain changes affecting Canadian withholding taxes occur.
The covenants of the senior notes will, among other things, restrict the sale of assets, restrict Harvest’s ability to enter into certain types of transactions with affiliates and restrict Harvest’s ability to pay dividends or make other restricted payments should the consolidated leverage ratio be greater than 2.50 to 1. It also restricts the incurrence of additional indebtedness if such issuance would result in an interest coverage ratio as defined of less than 2.0 to 1. Notwithstanding the interest coverage ratio limitation, the incurrence of additional secured indebtedness under the Facilities may be limited to the greater of $1.0 billion and 15% of total assets.
30
| | MANAGEMENT’S DISCUSSION AND ANALYSIS |
SUMMARY OF QUARTERLY RESULTS
The following table and discussion highlights our quarterly results for 2010:
| | | | | | 2010 | | | | |
| | | Q4 | | | Q3 | | | Q2 | | | Q1 | |
| | | | | | | | | | | | | |
| Revenue, net of royalties(1) | $ | 1,255,785 | | $ | 951,735 | | $ | 1,024,896 | | $ | 569,762 | |
| Net income (loss) | | (1,446 | ) | | (22,079 | ) | | 18,203 | | | (39,239 | ) |
| Cash from operating activities | | 132,074 | | | 97,711 | | | 122,335 | | | 78,134 | |
| Total long term debt | | 1,239,025 | | | 1,275,551 | | | 1,177,945 | | | 1,174,375 | |
| | | | | | | | | | | | | |
| Total assets | $ | 5,367,227 | | $ | 5,262,694 | | $ | 4,758,472 | | $ | 4,765,580 | |
| | | | | | | | | | | | | |
| Upstream daily sales volume (boe/d) | | 50,054 | | | 47,777 | | | 49,597 | | | 50,178 | |
| Upstream realized price ($/boe) | $ | 56.03 | | $ | 52.71 | | $ | 54.41 | | $ | 60.17 | |
| Downstream daily throughput volume | | 111,317 | | | 96,514 | | | 94,833 | | | 41,016 | |
| Downstream gross margin (US$/bbl) | $ | 6.13 | | $ | 3.02 | | $ | 8.56 | | $ | 0.54 | |
(8) Revenues are comprised of revenues net of royalties from upstream operations as well as sales of refined products from downstream operations.
The quarterly revenues and cash from operating activities are impacted by the upstream sales volume and realized prices and downstream throughput volume and gross margin. Significant items that impacted Harvest’s quarterly revenues include:
Revenues were the lowest in the first quarter of 2010. This was primarily due to the shutdown of the refinery units and scheduled maintenance in the first quarter in the downstream operations.
Revenues recovered in the second quarter and were the highest in the fourth quarter of 2010 due to increased throughput volumes from the downstream operations and increased sales volumes and commodity prices in the upstream operations.
The higher upstream sales volumes in the fourth quarter are attributable to the acquisition of certain oil and gas assets on September 30, 2010.
Net income (loss) reflects both cash and non-cash items. Changes in non-cash items including future income tax, DDA&A expense, unrealized foreign exchange gains and losses and unrealized gains on risk management contracts impact net income from period to period. For these reasons, our net income (loss) may not necessarily reflect the same trends as net revenues or cash from operating activities, nor is it expected to.
Total assets have significantly increased from the second quarter to the third quarter due to the acquisition of the BlackGold assets in August and certain oil and gas assets in September. The increase in total assets from the third quarter to the fourth quarter was due to the acceleration of Harvest’s winter drilling programs at Red Earth and increased capital expenditures in the fourth quarter relating to site engineering and preparation work for the main facility and production pad sites for the BlackGold project.
31
| | MANAGEMENT’S DISCUSSION AND ANALYSIS |
OUTLOOK
As we start 2011, we are optimistic about the ongoing global economic recovery and the continuing increase in global demand for crude oil and refined products. While natural gas prices are relatively weak and may be for some months until supply/demand imbalances are corrected, we are well-positioned at Harvest with our oil-weighted asset base. We continue to focus on exploiting oil or liquids-rich natural gas opportunities, as we have little dry gas assets in our portfolio. The improving economic climate bodes well for Harvest and our planned 2011 capital expenditures reflect this growing sense of optimism, as well as our sound financial backing from KNOC.
The majority of 2011’s $1.4 billion capital budget will be spent on our upstream operations. Our approved upstream spending plan will allot $525 million to acquire Hunt Oil Company of Canada’s producing and undeveloped assets in Western Canada. The transaction is expected to close on February 28, 2011.
An additional $450 million of upstream capital spending is intended to facilitate our active drilling program and continue our investment in longer term Enhanced Oil Recovery (EOR) projects. The majority of this capital will be spent during the first quarter, when we target our Hay River and Red Earth areas. We plan to drill 34 horizontal wells in the Hay River area and approximately 37 wells in Red Earth’s promising Slave Point light oil resource play. In addition to this, we plan to be active in the Viking, Cardium, and Ellerslie light oil plays, bringing our total forecasted wells drilled to over 200. With the strength in oil prices, we remain fully confident in pushing ahead with this active start to the year.
Rounding out our upstream capital spending is the $240 million we plan to invest in our BlackGold oil sands project. Of this cost, $190 million will be allocated to the construction and design of the BlackGold facility and $50 million will be spent drilling 10 production well pairs, 12 observation wells, as well as developing other capital growth opportunities. 2011 is slated to be an important year for this project, as a substantial portion of the detailed engineering, procurement and construction will take place in the coming months. We anticipate first oil in 2013.
With the delay in closing the Hunt transaction, our expectation for 2011 upstream production is approximately 59,000 boe/d, consisting of 41,300 bbls/d of liquids and 106 mmscf/d of natural gas (55% of this production will consist of light and medium gravity oil (including natural gas liquids), 15% will consist of heavy oil, and 30% will consist of natural gas). The acquisition will increase Harvest’s upstream asset base by $525 million and is expected to increase cash contribution from upstream operations in 2011. We will continue to focus on cost-effective methods of operating and expect our operating costs to average approximately $14.00/boe in 2011.
In our downstream operations, we plan to spend approximately $190 million on capital projects in 2011. This includes $69 million intended for a planned refinery turnaround, $62 million allotted to refinery debottleneck projects, $50 million intended for ongoing capital expenditures, and $9 million assigned to our retail marketing assets. 2011 full-year refinery throughput is forecasted to average 98,500 bbl/d of feedstock, with operating and purchased energy costs aggregating to approximately $6.64/bbl.
From a financial standpoint, we will continue to leverage on our convertible debentures, 67/8% senior notes, and extendible revolving credit facility, balanced with KNOC-held equity. Our exposure to interest rate fluctuations will continue to be managed by maintaining a mix of short and long term financing that carries both floating and fixed interest rates. Our long term debt, which is comprised of our senior notes and convertible debentures, will continue to pay fixed and stable interest rates on a semi-annual basis. Conversely, our short-term revolving credit facility, which had $14 million drawn against its $500 million facility at December 31, 2010, requires payments that are subject to floating rates. We are anticipating the average amount drawn on the Facility to climb to approximately $250 million in 2011, which subjects approximately 16% of our interest rate exposure to floating rates.
32
| | MANAGEMENT’S DISCUSSION AND ANALYSIS |
While we do not forecast commodity prices or refining margins, we do enter into price risk management contracts to mitigate price volatility and stabilize cash flow from operating activities. In the first quarter of 2011, we held hedging contracts on 16,400 bbl/d of crude oil for the remainder of 2011. The following table reflects the sensitivity of our 2011 operations to changes in the following key areas of our business:
| | | | | | | | | Annual Impact | |
| | | | | | | | | on Cash Flow | |
| | | Assumption | | | Change | | | ($ millions) | |
| WTI oil price (US$/bbl) | $ | 83.00 | | $ | 5.00 | | $ | 49 | |
| CAD/USD exchange rate | $ | 0.96 | | $ | 0.05 | | $ | 51 | |
| AECO daily natural gas price | $ | 4.19 | | $ | 1.00 | | $ | 36 | |
| Refinery crack spread (US$/bbl) | $ | 8.93 | | $ | 1.00 | | $ | 36 | |
| Upstream Operating Expenses (per boe) | $ | 13.54 | | $ | 1.00 | | $ | 22 | |
CRITICAL ACCOUNTING ESTIMATES
There are a number of critical estimates underlying the accounting policies applied when preparing the consolidated financial statements due to timing differences between when certain activities are settled and when these activities are recognized for accounting purposes. Changes in these estimates could have a material impact on our reported results.
Reserves
The process of estimating reserves impacts the upstream operations and is complex. It requires significant judgments and decisions based on available geological, geophysical, engineering and economic data. In the process of estimating the economically recoverable oil and natural gas reserves and related future net cash flows, we incorporate many factors and assumptions, such as:
- Expected reservoir characteristics based on geological, geophysical and engineering assessments;
- Future production rates based on historical performance and expected future operating and investment activities;
- Future oil and gas prices and quality differentials; and
- Future development costs.
We follow the full cost method of accounting for our oil and natural gas activities. All costs of acquiring oil and natural gas properties and related exploration and development costs, including overhead charges directly related to these activities, are capitalized and accumulated in one cost centre. Maintenance and repairs are charged against income, and renewals and enhancements that extend the economic life of the capital assets are capitalized. The provision for depletion and depreciation of petroleum and natural gas assets is calculated on the unit-of-production method based on proved reserves as estimated by independent petroleum engineers. Reserve estimates impact net income through depletion, the determination of asset retirement obligations and the application of an impairment test. Revisions or changes in the reserve estimates can have either a positive or a negative impact on net income, property, plant and equipment and asset retirement obligations.
Asset Retirement Obligations
Harvest recognizes ARO on its upstream operations. In the determination of our ARO, management is required to make a significant number of estimates and assumptions with respect to activities that will occur in many years to come including the ultimate settlement amounts, inflation factors, credit adjusted risk free discount rates, timing of settlement and expected changes in legal, regulatory, environmental and political environments. The ARO also results in an increase to the carrying cost of capital assets. The obligation accretes to a higher amount with the passage of time as it is determined using discounted present values. A change in any one of the assumptions could impact the estimated future obligation and in return, net income. It is difficult to determine the impact of a change in any one of our assumptions. As a result, a reasonable sensitivity analysis cannot be performed.
33
| | MANAGEMENT’S DISCUSSION AND ANALYSIS |
Impairment of Property, Plant and Equipment (“PP&E”)
Numerous estimates and judgments are involved in determining any potential impairment of PP&E. The most significant assumptions in determining future cash flows are future prices and reserves for our upstream operations and expected future refining margins and capital spending plans for our downstream operations.
The estimates of future prices and refining margins require significant judgments about highly uncertain future events. Historically, oil, natural gas and refined product prices have exhibited significant volatility from time to time. The prices used in carrying out our impairment tests for each operating segment are based on prices derived from a consensus of future price forecasts among industry analysts. Given the number of significant assumptions required and the possibility that actual conditions will differ, we consider the assessment of impairment to be a critical accounting estimate.
If forecast WTI crude oil prices were to fall by 40%, the initial assessment of impairment of our upstream assets would not change; however, below that level, we would likely experience an impairment. Although oil and natural gas prices fluctuate a great deal in the short-term, they are typically stable over a longer time horizon. This mitigates potential for impairment. Similarly, for our downstream operations, if forecast refining margins were to fall by more than 15%, it is likely that our downstream assets would experience an impairment.
Reductions in estimated future prices may also have an impact on estimates of economically recoverable proved reserves. It is difficult to determine and assess the impact of a decrease in our proved reserves on our impairment tests. The relationship between the reserve estimate and the estimated undiscounted cash flows is complex. As a result, we are unable to provide a reasonable sensitivity analysis of the impact that a reserve estimate decrease would have on our assessment of impairment.
Carrying Value of Goodwill
Goodwill is tested for impairment, at least annually, using the fair value of the upstream reporting unit. Impairment is assessed based on the difference between the fair value of the reporting unit and its carrying value, including goodwill. Any excess of the carrying value of the reporting unit over the fair value is charged to earnings. The process of assessing goodwill for impairment requires estimates of fair values including various assumptions and judgments such as reserve estimates, future commodity prices, future cash flows of the reporting unit and discount rates.
Employee Future Benefits
We maintain a defined benefit pension plan for the employees of North Atlantic. Obligations under employee future benefit plans are recorded net of plan assets where applicable. An independent actuary determines the costs of our employee future benefit programs using the projected benefit method. The determination of these costs requires management to estimate or make assumptions regarding the expected plan investment performance, salary escalation, retirement ages of employees, expected health care costs, employee turnover, discount rates and return on plan assets. The obligation and expense recorded related to our employee future benefit plans could increase or decrease if there were to be a change in these estimates. Pension expense represented less than 0.5% of our total expenses for the year ended December 31, 2010.
Purchase Price Allocations
Business acquisitions are accounted for by the purchase method of accounting. Under this method, the purchase price is allocated to the assets acquired and the liabilities assumed based on the fair values at the time of the acquisition. The excess of the purchase price over the assigned fair values of the identifiable assets and liabilities is allocated to goodwill. In determining the fair value of the assets and liabilities we are often required to make assumptions and estimates about future events, such as future oil and gas prices, refining margins and discount rates. Changes in any of these assumptions would impact amounts assigned to assets and liabilities and goodwill in the purchase price allocation and as a result, future net earnings.
34
| | MANAGEMENT’S DISCUSSION AND ANALYSIS |
Risk Management Contracts
Derivative risk management contracts are valued using valuation techniques with market observable inputs. The most frequently applied valuation techniques include forward pricing and swap models, using present value calculations. The models incorporate various inputs including the credit quality of counterparties, foreign exchange spot and forward rates, interest rate curves and forward rate curves of the underlying commodity. Changes in any of these assumptions would impact fair value of the risk management contracts and as a result, future net earnings and other comprehensive income. For risk management contracts designated as hedges, changes in the abovementioned assumptions may impact hedge effectiveness assessment and Harvest’s ability to continue applying hedge accounting.
RECENT CANADIAN ACCOUNTING AND RELATED PRONOUNCEMENTS
The CICA Handbook Section 1582 ‘‘Business Combinations’’ is effective for business combinations with an acquisition date after January 1, 2011. This standard was amended to require additional use of fair value measurements, recognition of additional assets and liabilities, and increased disclosure. Adopting the standard is expected to have a material effect on the way the Company accounts for future business combinations. Entities adopting Section 1582 will also be required to adopt CICA Handbook Sections 1601 ‘‘Consolidated Financial Statements’’ and 1602 ‘‘Non-Controlling Interests’’. These standards require non-controlling interests to be presented as part of Shareholder’s Equity on the balance sheet. In addition, the income statement of the controlling parent will include 100 per cent of the subsidiary’s results and present the allocation between the controlling and non-controlling interests. These standards will be effective January 1, 2011, with early adoption permitted. The changes resulting from adopting Section 1582 will be applied prospectively and the changes from adopting Sections 1601 and 1602 will be applied retrospectively. Harvest has not elected to early adopt these standards.
International Financial Reporting Standards
In February 2008, the CICA Accounting Standards Board (“AcSB”) announced that Canadian public reporting issuers will be required to report under International Financial Reporting Standards (“IFRS”) commencing January 1, 2011, including comparatives for 2010 and an opening balance sheet at January 1, 2010 showing the changes from Canadian GAAP to IFRS.
Harvest has an IFRS conversion plan and staffed a project team with regular reporting to our senior management team and to the Audit Committee of the Board of Directors to ensure Harvest will meet the IFRS transition requirements for 2011.
IFRS Project Status
Harvest is carrying out the final phase of the IFRS conversion project and has substantially completed the IFRS opening balance sheet and has identified adjustments to PP&E, exploration and evaluation (“E&E”) expenditures, asset retirement obligations and an offsetting adjustment to retained earnings. The KNOC acquisition of Harvest has minimized the IFRS transitional adjustments due to the fair values assigned to the Company’s assets and liabilities from the KNOC purchase price allocation. The Company is in the process of finalizing accounting policy changes and implementing and testing data, process, system and control changes.
Potential Impacts of IFRS Adoption
Significant differences that have been identified between Canadian GAAP and IFRS that will impact Harvest are: accounting for capital assets including exploration costs, depletion and depreciation, impairment testing, asset retirement obligations, employee benefits and an increased level of disclosure requirements. These differences have been identified based on the current IFRS standards issued and expected to be in effect on the date of transition. Current IFRS standards may be modified, and as a result, the impact may be different than Harvest’s current expectations; as such, Harvest cannot guarantee that the following information will not change as the date of transition approaches. Harvest will continue to communicate information in relation to its conversion process as it becomes available.
35
| | MANAGEMENT’S DISCUSSION AND ANALYSIS |
First Time Adoption of IFRS
IFRS 1, “First Time Adoption of International Financial Reporting Standards” (“IFRS 1”) prescribes requirements for preparing IFRS-compliant financial statements in the first reporting period after the changeover date. IFRS 1 requires retrospective application of IFRS as if they were always in effect. IFRS 1 also provides entities adopting IFRS for the first time with a number of mandatory exceptions and optional exemptions from retrospective application of IFRS to ease the transition to IFRS in the transition year. Harvest will apply the IFRS 1 exemptions associated with business combinations and arrangements containing a lease which will not have any impact to the opening balance on transition date. Harvest will also apply the IFRS 1 exemptions associated with ARO (refer to the ARO section below for detail).
Property, Plant and Equipment
IFRS requires costs recognized as PP&E to be allocated to the significant parts of the asset and to depreciate each significant component separately which is different from Harvest upstream’s current depreciation and depletion calculations under Canadian GAAP. The adoption of IFRS will increase the number of components to be amortized separately for the upstream segment and will have an impact on the amount of depreciation/depletion expense recognized. The amortization for downstream segment will not change as it has already been componentized and amortized separately under Canadian GAAP.
For the upstream assets, the net book value of PP&E excluding E&E expenditures as at December 31, 2009 will be the opening cost of the upstream PP&E balance at January 1, 2010. This amount will be allocated, based on reserve value, to depletable units which consolidate into cash generating units for impairment purposes. IFRS provides the option to calculate depletion using a reserve base of proved reserves or both proved plus probable reserves, as compared to the Canadian GAAP method of calculating depletion using proved reserves only. In aligning with KNOC’s IFRS accounting policies, Harvest plans to determine its depletion expense using proved developed reserves as its depletion base. This change in the depletion base will result in a higher depletion expenses and lower net income under IFRS.
Exploration and Evaluation Expenditures
Oil and gas companies are required to account for E&E expenditures in accordance with IFRS 6 “Exploration for and Evaluation of Mineral Resources”. This standard addresses the recognition, measurement, presentation and disclosure requirements for costs incurred in the exploration phase. IFRS requires the identification and presentation of E&E expenditures to be separated from those expenditures incurred on developed and producing properties. E&E expenditures are transferred to PP&E when technical feasibility and commercial viability has been proved. An impairment test is required to be performed on E&E expenditures when they are transferred to PP&E. Harvest will re-classify all E&E expenditures that are currently included in the PP&E balance and will consist of the book value of E&E land costs, and related drilling costs and seismic costs. E&E assets will not be depleted and will be assessed for impairment when indicators suggest the possibility of impairment. The reclassification of E&E expenditures will not have any impact to Harvest’s opening balance on transition; however, it will result in lower depletion, depreciation and amortization (“DD&A”) expense and higher net income as E&E assets are excluded from the DD&A calculation.
Impairment of Assets
Under IFRS, impairment of PP&E will be calculated at a more granular level than what is currently required under Canadian GAAP as impairment will be calculated at the cash generating unit (“CGU”) level. In addition, IAS 36 “Impairment of Assets” uses a one-step approach for testing and measuring asset impairments, with asset carrying values being compared to the higher of value in use and fair value less costs to sell. Under IAS 36 impairment losses previously recognized may be reversed where circumstances change. Due to the one-step approach for impairment testing, the likelihood of recognizing an impairment loss is higher under IFRS.
36
| | MANAGEMENT’S DISCUSSION AND ANALYSIS |
Asset Retirement Obligations
Under IFRS, the decommissioning liability is required to be remeasured at each reporting date using the current liability specific discount rate, which requires retroactive adjustment to the estimated liability, whereas under Canadian GAAP, ARO adjustments are made on a prospective basis. Under Canadian GAAP, Harvest uses a credit-adjusted interest rate. Harvest has made a preliminary decision to apply the risk free interest rate to measure the obligation. The lower discount rate will increase the ARO liability by approximately $264 million on transition date with the offset recorded in retained earnings as allowed under the IFRS 1. The will result in lower future accretion expenses on opening ARO liability. In addition, the recognition criteria under IFRS are more stringent which will result in an additional recognition of $9.4 million ARO liability relating to downstream assets on transition date with the offset recorded in retained earnings. Going forward, the lower discount rate will cause new ARO assets and liabilities to be recorded at higher amounts. This in turn will result in higher future DD&A expenses and lower accretion expenses.
Employee Benefits
Under IFRS and Canadian GAAP, actuarial gains and losses arising from defined benefit plans can be recognized into earnings through various appropriate methods. Canadian GAAP does not permit actuarial gains and losses to be recognized directly in equity whereas IAS 19 “Employee Benefits” provides an additional accounting policy option to recognize actuarial gains and losses directly in other comprehensive income (“OCI”) in the period in which they occur. Harvest has decided to recognize the full amount of gains or losses in OCI at the time it incurred. There will not be any impact on the opening balance at transition date as the full benefit obligation has already been recognized in KNOC’s purchase price allocation at acquisition date. However, going forward, this accounting policy will impact the OCI and net income as the full amount of gains or losses will be recognized in OCI instead of an amortized amount being recognized in net income.
Deferred Income Taxes
IAS 12 requires recognizing of the FIT that arises on the difference between historical and current exchange rates on the translation of non-monetary assets, whereas Canadian GAAP does not. This difference, however, does not impact the FIT balance on transition date as the cumulative translation adjustments balance at transition date was zero as a result of the KNOC acquisition. Any future fluctuation in the US dollar over the Canadian dollar will impact the FIT liability and the Company future net income. In addition, the FIT liability will decrease by approximately $70 million on the transition date as a result of the ARO opening balance adjustment.
Internal Controls over Financial Reporting (“ICFR”) and Disclosure
As the IFRS accounting policies are finalized, an assessment will be made to determine changes required for ICFR. This will be an ongoing process throughout 2011 to ensure that all changes in accounting policies include the appropriate additional controls and procedures for future IFRS reporting requirements. Harvest has established internal controls associated with the IFRS transition which include approvals at various stages of the project and the involvement of its auditors and other external advisors. Throughout the transition process, Harvest will be assessing stakeholders’ information requirements and will ensure that adequate and timely information is provided so all stakeholders are informed of the transition progress.
IT Systems
The conversion to IFRS will have an impact on the company’s IT system requirements. Harvest has modified its IT system to accommodate the requirement to track PP&E costs and E&E costs separately as well as the tracking of costs at a more granular level of detail for IFRS reporting.
37
| | MANAGEMENT’S DISCUSSION AND ANALYSIS |
OPERATIONAL AND OTHER BUSINESS RISKS
Both Harvest’s upstream operations and its downstream operations are conducted in the same business environment as most other operators in the respective businesses and the business risks are very similar. Harvest has a risk management committee that meets on a regular basis to assess and manage operational and business risks and has a corporate Environment, Health and Safety (“EH&S”) policy. We intend to continue executing our business plan to create value. The following summarizes the more significant risks:
Upstream Operations
- Prices received for petroleum and natural gas have fluctuated widely in recent years and are also impacted by the volatility in the Canadian/US currency exchange rate. The differential between light oil and heavy oil compounds the fluctuations in the benchmark oil prices.
- The operation of petroleum and natural gas properties involves a number of operating and natural hazards which may result in blowouts, environmental damage and other unexpected and/or dangerous conditions. Harvest’s corporate EH&S manual has a number of specific policies to minimize the risk of environmental contamination, including emergency response should an incident occur. If areas of higher risk are identified, Harvest will undertake to analyze and recommend changes to reduce the risk including replacement of specific infrastructure.
- The production of petroleum and natural gas may involve a significant use of electrical power and since de- regulation of the electric system in Alberta, electrical power prices in Alberta have been volatile.
- The markets for petroleum and natural gas produced in western Canada depend upon available capacity to refine crude oil and process natural gas as well as pipeline capacity to transport the products to consumers.
- The reservoir and recovery information in reserve reports are estimates and actual production and recovery rates may vary from the estimates and the variations may be significant.
- Absent capital reinvestment, production levels from petroleum and natural gas properties will decline over time and absent commodity price increases, cash generated from operating these assets will also decline.
- Prices paid for acquisitions are based in part on reserve report estimates and the assumptions made preparing the reserve reports are subject to change as well as geological and engineering uncertainty.
- The operation of petroleum and natural gas properties is subject to environmental regulation pursuant to local, provincial and federal legislation and a breach of such legislation may result in the imposition of fines as well as higher operating standards that may increase costs.
- The BlackGold oil sands project is exposed to the risks associated with major construction projects. These risks include the possibility that the project will not be completed on budget, on time and/or will not achieve the design objectives. This would have a significant impact on the financial results of the project.
- The oil sands project is subject to government regulations. Phase 2 of the BlackGold oil sands project is subject to approval by the ERCB and the delay of approval could impact Harvest’s ability and/or timing of reaching the targeted production of 30,000 bbl/d.
Downstream Operations
- The market prices for crude oil and refined products have fluctuated significantly, the direction of the fluctuations may be inversely related and the relative magnitude may be different resulting in volatile refining margins.
- The prices for crude oil and refined products are generally based in US dollars while our operating costs are denominated in Canadian dollars which introduces currency exchange rate exposure.
- Crude oil feedstock is delivered to our refinery via waterborne vessels which could experience delays in transporting supplies due to weather, accidents, government regulations or third party actions.
38
| | MANAGEMENT’S DISCUSSION AND ANALYSIS |
- We are relying on the creditworthiness of Vitol for our purchase of feedstock and should their creditworthiness deteriorate, crude oil suppliers may restrict the sale of crude oil to Vitol.
- Our refinery is a single train integrated interdependent facility which could experience a major accident, be damaged by severe weather or otherwise be forced to shutdown which may reduce or eliminate our cash flow.
- Our refining operations which include the transportation and storage of a significant amount of crude oil and refined products are adjacent to environmentally sensitive coastal waters, and are subject to hazards and similar risks such as fires, explosions, spills and mechanical failures, any of which may result in personal injury, damage to our property and/or the property of others along with significant other liabilities in connection with a discharge of materials. We regularly perform stack sampling, soil, vegetation, and fresh and ocean water tests, and we have monitoring stations to record the air quality in three adjacent communities, as well as at the refinery perimeter.
- The production of aviation fuels subjects us to liability should contaminants in the fuel result in aircraft engines being damaged and/or aircraft crashes.
- Collective agreements with our employees and the United Steel Workers of America may not prevent a strike or work stoppage and future agreements may result in an increase in operating costs.
- Refinery operations are subject to environmental regulation pursuant to local, provincial and federal legislation and a breach of such legislation may result in the imposition of fines as well as higher operating standards that may increase costs.
- The refinery operates under permits issued by the federal and provincial governments and these permits must be renewed periodically. The federal and provincial governments may make operating requirements more stringent which may require additional spending.
General Business Risks
- The loss of a member of our senior management team and/or key technical operations employee could result in a disruption to either our upstream or downstream operations.
- Variations in interest rates on our current and/or future financing arrangements may result in significant increases in our borrowing costs.
- Our crude oil sales and refining margins are denominated in US dollars while we incur costs in Canadian dollars which results in a currency exchange exposure.
- Changes in tax and other laws may affect shareholders. Income tax laws, other laws or government incentive programs relating to the oil and gas industry, may in the future be changed or interpreted in a manner that affects Harvest or its stakeholders.
- Although the Company monitors the credit worthiness of third parties it contracts with through a formal risk management policy, there can be no assurance that the Company will not experience a loss for non-performance by any counterparty with whom it has a commercial relationship. Such events may result in material adverse consequences on the business of the Company.
- Harvest is required to comply with covenants under the Facility and the senior notes. In the event that the Company does not comply with the covenants, its access to capital may be restricted or repayment may be required.
CHANGES IN REGULATORY ENVIRONMENT
Alberta
On October 25, 2007, the Government of Alberta released its New Royalty Framework (the “NRF”) outlining changes that increase the royalty rates on conventional oil and gas, oil sands and coal bed methane using a price-sensitive and volume-sensitive sliding rate formula for both conventional oil and natural gas. These proposals were given Royal Assent on December 2, 2008 and became effective January 1, 2009. Prior to the NRF, the amount of royalties payable was influenced by the oil price, oil production, density of oil and the vintage of the oil with the rate ranging from 10% to 35% and with respect to natural gas production, the royalty reserved was between 15% to 35% depending on the a prescribed or corporate average reference price and subject to various incentive programs.
39
| | MANAGEMENT’S DISCUSSION AND ANALYSIS |
The NRF sets royalty rates for conventional oil by a single sliding rate formula which is applied monthly and increases the range of royalty rates to up to 50% and with rate caps once the price of conventional oil reaches $120 per barrel. With respect to natural gas production, the royalties outlined in the NRF are set by a single sliding rate formula ranging from 5% to 50% with a rate cap once the price of natural gas reaches $16.59 per GJ.
The NRF also includes a policy of “shallow rights reversion.” The shallow rights reversion policy affects all petroleum and natural gas agreements, however, the timing of the reversion will differ depending on whether the leases and licenses were acquired prior to or subsequent to January 1, 2009. Leases granted after January 1, 2009 will be subject to shallow rights reversion at the expiry of the primary term, and in the event of a license, the policy will apply after the expiry of the intermediate term. Holders of leases and licenses that have been continued indefinitely prior to January 1, 2009 will receive a notice regarding the reversion of the shallow rights which will be implemented three years from the date of the notice. The lease or license holder can make a request to extend this period. The Government intends this policy to maximize the development of currently undeveloped resources by having the mineral rights to shallow gas geological formations that are not being developed revert back to the Government and be made available for resale.
On April 10, 2008, the Government of Alberta introduced two new royalty programs for the development of deep oil and natural gas reserves. A five-year oil program for exploratory wells over 2,000 meters will provide royalty adjustments up to $1 million or 12 months of royalty offsets whichever comes first while a natural gas deep drilling program for wells deeper than 2,500 meters will create a sliding scale of royalty credit according to depth of up to $3,750/meter.
On November 19, 2008, the Government of Alberta announced the introduction of a five year program of Transitional Royalty Plan (the “TRP”) which effective January 1, 2009, offers companies drilling new natural gas or conventional deep oil wells (between 1,000 and 3,500 meters) a one-time option, on a well-by-well basis, to reduced royalty rates for new wells for a maximum period of five years to December 31, 2013 after which all wells convert to the NRF. To qualify for this program, wells must be drilled between November 19, 2008 and December 31, 2013.
On March 3, 2009, the Government of Alberta announced a new three-point stimulus plan, and extended the plan to two years on June 25, 2009. The drilling royalty credit for new conventional oil and natural gas wells is a two-year program effective for wells spud on or after April 1, 2009, and will provide a $200 per-metre-drilled royalty credit, with the maximum credit determined on a sliding scale based on the individual company’s total Alberta-based 2008 Crown oil and gas production. The royalty rate cap is also effective April 1, 2009 for new conventional oil and natural gas wells and will provide a maximum 5% royalty rate for the first 12 months of production, to a maximum of 50,000 barrels of oil or 500 million cubic feet of natural gas per well, to all new wells that begin producing conventional oil or natural gas between April 1, 2009 and March 31, 2011. The third point is an abandonment and reclamation fund which will provide $30 million to be invested by the Orphan Well Association to abandon and reclaim old well sites where there is no legally responsible or financially able party available.
On May 27, 2010, in connection with its competitiveness review, the province amended the maximum royalty rates and royalty curves applicable to the NRF and amended the new well incentive program that applied to wells commencing production of conventional oil or natural gas on or after April 1, 2009 that was scheduled to expire on March 31, 2011 so that the program was permanent. The incentive provides for a maximum 5% royalty rate for the first 18 to 48 months of production, to a maximum of 50,000 to 100,000 barrels of oil equivalent depending on the depth of the well. The Province will review this program in 2014 and committed to provide three years notice prior to eliminating it.
40
| | MANAGEMENT’S DISCUSSION AND ANALYSIS |
On January 28, 2011, the Minister of Energy, Ron Liepert, announced that the Alberta Government had accepted the recommendations of the Regulatory Enhancement Task Force, including the proposal to consolidate a variety of upstream oil and gas regulatory functions into the authority of a single regulator. These changes are intended to streamline the approval process for projects, resulting in more consistency, less duplication and greater certainty to the regulatory regime in Alberta.
Saskatchewan
In Saskatchewan, the amount payable as a Crown royalty or freehold production tax in respect of crude oil depends on the type, value, quantity produced in a month and vintage. Crude oil type classifications are “heavy oil”, “southwest designated oil” or “non-heavy oil other than southwest designated oil”. Vintage categories applicable to each of the three crude oil types are old, new, third tier and fourth tier. Crude oil rates are also price sensitive and vary between the base royalty rates of 5% for all fourth tier oil to 20% for old oil. Marginal royalty rates, applied to the portion of the price that is above the base price, are 30% for all fourth tier oil to 45% for old oil.
The royalty payable on natural gas is determined by a sliding scale based on a reference price, which is the greater of the amount obtained by the producer and a prescribed minimum price. As an incentive for the marketing of natural gas produced in association with oil, a lower royalty rate is assessed than the royalty payable on non-associated natural gas. The rates and vintage categories of natural gas are similar to oil.
Saskatchewan has introduced a new orphan oil and gas well and facility program, solely funded by oil and gas companies to cover the cost of cleaning up abandoned wells and facilities where the owner cannot be located or has gone out of business. The program is composed of a security deposit, based upon a formula considering assets of the well and the facility licensee against the estimated cost of decommissioning the well and facility once it is no longer producing, and an annual levy assessed to each licensee.
On May 27, 2010, the Government of Saskatchewan announced an incentive to encourage increased natural gas exploration and production in the province. The volume-based incentive establishes a maximum Crown royalty rate of 2.5 per cent and a freehold production tax rate of zero per cent on the first 25 million cubic metres of natural gas produced from every horizontal gas well drilled between June 1, 2010 and March 31, 2013.
British Columbia
The British Columbia royalty regime for oil is dependent on age and production. Oil is classified as "old", "new" or "third tier" and a separate formula is used to determine the royalty rate depending on the classification. The rates are further varied depending on production. Lower royalty rates apply to low productivity wells and third tier oil to reflect the increased cost of exploration and extraction. There is no minimum royalty rate for oil.
The British Columbia natural gas royalty regime is price-sensitive, using a "select price" as a parameter in the royalty rate formula. When the reference price, being the greater of the producer price or the Crown set posted minimum price ("PMP"), is below the select price, the royalty rate is fixed. The rate increases as prices increase above the select price. The Government of British Columbia determines the producer prices by averaging the actual selling prices for gas sales with shared characteristics for each company minus applicable costs. If this price is below the PMP, the PMP will be the price of the gas for royalty purposes.
41
| | MANAGEMENT’S DISCUSSION AND ANALYSIS |
Natural gas is classified as either "conservation gas" or "non-conservation gas". There are three royalty categories applicable to non-conservation gas, which are dependent on the date on which title was acquired from the Crown and on the date on which the well was drilled. The base royalty rate for non-conservation gas ranges from 9% to 15%. A lower base royalty rate of 8% is applied to conservation gas. However, the royalty rate may be reduced for low productivity wells.
In May 2008, the Government of British Columbia introduced the Net Profit Royalty Program to stimulate development of high risk and high cost natural gas and oil resources in British Columbia that are not economic under other royalty programs. The program allows for the calculation of royalties based on the net profits of a particular project and is governed under the Net Profit Royalty Regulation, which came into effect in May 2008.
On August 6, 2009, the Province of British Columbia announced an Oil and Gas Stimulus package providing for:
- A one-year, two per cent royalty rate for all natural gas wells drilled in a 10 month window (September 2009 - June 2010).
- An increase of 15 per cent in the existing royalty deductions for natural gas deep drilling.
- Qualification of horizontal wells drilled between 1,900 and 2,300 metres into the Deep Royalty Credit Program.
An additional $50 million was allocated in the fall of 2009 for the Infrastructure Royalty Credit Program to stimulate investment in oil and gas roads and pipelines.
Environmental Regulation
In 2007, the Government of Alberta introduced the Climate Change and Emissions Management Amendment Act which intends to reduce greenhouse gas emissions intensity from large emitting facilities. On January 24, 2008, the Government of Alberta announced their plan to reduce projected emissions in the province by 50% under the new climate change plan by 2050. This will result in real reductions of 14% below 2005 levels. The Government of Alberta stated they will form a government-industry council to determine a go-forward plan for implementing technologies, which will significantly reduce greenhouse gas emissions by capturing air emissions from industrial sources and locking them permanently underground in deep rock formations.
The Canadian Government has indicated its commitment to reduce greenhouse gas emissions and will be making changes to environmental legislation for criteria air contaminants and renewable fuels but has provided no specific target guidelines or policies that relate to the oil and gas industry. Such legislation could have potentially adverse effects on both Harvest’s upstream and downstream financial results. Harvest will participate in the discussion of any initiatives whether at a Federal or Provincial government level, and will be able to determine if there is any financial impact once guidelines are established. On an ongoing basis, Harvest continues to undertake projects that reduce emission of greenhouse gases, such as evaluating the injection of carbon dioxide into oil reservoirs and the further capture of fugitive emissions in our field operations as part of our annual capital program.
In 2002, the Government of Canada ratified the Kyoto Protocol which calls for Canada to reduce its greenhouse gas emissions to specified levels. On April 26, 2007, the Government of Canada released its Action Plan to Reduce Greenhouse Gases and Air Pollution (the “Action Plan”) which includes a regulatory framework for air emissions. This Action Plan is to regulate the fuel efficiency of vehicles and the strengthening of energy standards for a number of energy-using products. On March 10, 2008, the Government of Canada released “Turning the Corner” outlining additional details to implement their April 2007 commitment to cut greenhouse gas emissions by an absolute 20% by 2020. “Turning the Corner” sets out a framework to establish a market price for carbon emissions and sets up a carbon emission trading market to provide incentives for Canadians to reduce their greenhouse gas emissions. In addition, the regulations include new measures for oil sands developers that require an 18% reduction from 2006 levels by 2010 for existing operations and for oil sands operations commencing in 2012, a carbon capture and storage capability. There is no mention of targeting reductions for unintentional fugitive emissions for conventional producers. Companies will be able to choose the most cost effective way to meet their emissions reduction targets from in-house reductions, contributions to time-limited technology funds, domestic emissions trading and the United Nations’ Clean Development Mechanism. Companies that have already reduced their greenhouse gas emissions prior to 2006 will have access to a limited one-time credit for early adoption. Giving the evolving nature of the debate related to climate change and the control of greenhouse gases and resulting requirements, and the lack of detail in the Government of Canada’s announcement, it is not possible to assess the impact of the requirements on our operations and financial performance.
42
| | MANAGEMENT’S DISCUSSION AND ANALYSIS |
DISCLOSURE CONTROLS AND PROCEDURES
As part of the corporate reorganization and dissolution of the Trust on May 1, 2010, the newly reorganized company, Harvest will continue to assume the disclosure controls and procedures. Under the supervision of the Chief Executive Officer and Chief Financial Officer, the Company has evaluated the effectiveness of its disclosure controls and procedures as of December 31, 2010 as defined under the rules adopted by the Canadian securities regulatory authorities and the U.S. Securities and Exchange Commission. Based on this evaluation, the Chief Executive Officer and Chief Financial Officer have concluded that as of December 31, 2010, the disclosure controls and procedures were effective to ensure that information required to be disclosed by Harvest in reports it files or submits to Canadian and U.S. securities authorities was recorded, processed, summarized and reported within the time period specified in Canadian and U.S. securities laws and was accumulated and communicated to management, including its Chief Executive Officer and Chief Financial Officer, to allow timely decisions regarding required disclosures.
INTERNAL CONTROL OVER FINANCIAL REPORTING
Management is responsible for establishing and maintaining internal control over our financial reporting. Our internal control is designed to provide reasonable assurance regarding the reliability of financial reporting and preparation of financial statements for external purposes in accordance with Canadian Generally Accepted Accounting Principles. Management, with the participation of our Chief Executive Officer and Chief Financial Officer, has evaluated the effectiveness of our internal control over financial reporting as of December 31, 2010. The evaluation was based on the Internal Control – Integrated Framework issued by the Committee of Sponsoring Organizations of the Treadway Commission. Based on that evaluation, management has concluded that as of December 31, 2010, the design and operation of internal controls were effective.
During the year ended December 31, 2010, there were no changes in our internal control over financial reporting that have materially affected, or are reasonably likely to materially affect, our internal control over financial reporting.
Based on their inherent limitations, disclosure controls and procedures and internal control over financial reporting may not prevent or detect misstatements, errors or fraud. Control systems, no matter how well conceived or operated, can provide only reasonable, but not absolute, assurance that the objectives of the control systems are met.
ADDITIONAL INFORMATION
Further information about us can be accessed under our public filings found on SEDAR atwww.sedar.com or atwww.harvestenergy.ca. Information can also be found by contacting our Investor Relations department at (403) 265-1178 or at 1-866-666-1178.
43