 | MANAGEMENT’S DISCUSSION AND ANALYSIS |
MANAGEMENT’S DISCUSSION AND ANALYSIS
This Management’s Discussion and Analysis (“MD&A”) should be read in conjunction with the unaudited interim consolidated financial statements of Harvest Operations Corp. (“Harvest”, “we”, “us”, “our” or the “Company”) for the three and nine months ended September 30, 2012 and the audited consolidated financial statements and MD&A for the year ended December 31, 2011. The information and opinions concerning our future outlook are based on information available at November 14, 2012.
In this MD&A, all dollar amounts are expressed in Canadian dollars unless otherwise indicated. Tabular amounts are in thousands of dollars, except where noted.
Natural gas volumes are converted to barrels of oil equivalent (“boe”) using the ratio of six thousand cubic feet (“mcf”) of natural gas to one barrel of oil (“bbl”). Boes may be misleading, particularly if used in isolation. A boe conversion ratio of 6 mcf to 1 bbl is based on an energy equivalent conversion method primarily applicable at the burner tip and does not represent a value equivalent at the wellhead. In accordance with Canadian practice, petroleum and natural gas revenues are reported on a gross basis before deduction of Crown and other royalties. In addition to disclosing reserves under the requirements of National Instrument (“NI”) 51-101, Harvest also discloses our reserves on a company interest basis which is not a term defined under NI 51-101. This information may not be comparable to similar measures by other issuers.
Additional information concerning Harvest, including its Annual Information Form (“AIF”) can be found on SEDAR atwww.sedar.com.
ADVISORY
This MD&A contains non-GAAP measures and forward-looking information about our current expectations, estimates and projections. Readers are cautioned that the MD&A should be read in conjunction with the “Non-GAAP Measures” and “Forward-Looking Information” sections at the end of this MD&A.
1
| MANAGEMENT’S DISCUSSION AND ANALYSIS |
SELECTED INFORMATION
The table below provides a summary of Harvest’s financial and operating results for the three and nine months ended September 30, 2012 and 2011.
| Three Months Ended | Nine Months Ended | |||||||||||
| September 30 | September 30 | |||||||||||
| 2012 | 2011 | 2012 | 2011 | |||||||||
FINANCIAL | ||||||||||||
Revenues(1) | 1,275,117 | 848,239 | 4,235,065 | 2,923,854 | ||||||||
Cash from operating activities | 153,895 | 161,499 | 309,855 | 415,862 | ||||||||
Net loss | (38,309 | ) | (49,204 | ) | (183,683 | ) | (30,768 | ) | ||||
| ||||||||||||
Bank loan | 570,413 | 256,463 | 570,413 | 256,463 | ||||||||
Convertible debentures | 632,695 | 510,420 | 632,695 | 510,420 | ||||||||
Senior notes | 480,319 | 742,890 | 480,319 | 742,890 | ||||||||
Related party loan | 168,109 | – | 168,109 | – | ||||||||
Total financial debt(2) | 1,851,536 | 1,509,773 | 1,851,536 | 1,509,773 | ||||||||
| ||||||||||||
Total assets | 6,162,913 | 6,483,568 | 6,162,913 | 6,483,568 | ||||||||
| ||||||||||||
UPSTREAM OPERATIONS | ||||||||||||
Daily sales volumes (boe/d) | 57,686 | 58,548 | 59,696 | 55,758 | ||||||||
Average realized price | ||||||||||||
Oil and NGLs ($/bbl)(3) | 70.71 | 74.49 | 73.66 | 77.67 | ||||||||
Gas ($/mcf) | 2.52 | 3.97 | 2.30 | 3.98 | ||||||||
Operating netback prior to hedging ($/boe)(2) | 26.55 | 30.96 | 27.75 | 33.79 | ||||||||
Operating income (loss) | (11,394 | ) | 24,232 | (48,862 | ) | 74,184 | ||||||
| ||||||||||||
Cash contribution from operations(2) | 133,294 | 161,372 | 421,316 | 467,187 | ||||||||
Capital asset additions (excluding acquisitions) | 113,912 | 190,597 | 477,139 | 553,747 | ||||||||
Property and business acquisitions (dispositions), net | (8,082 | ) | (2,582 | ) | (8,835 | ) | 513,327 | |||||
Decommissioning and environmental remediation expenditures | 6,119 | 5,923 | 16,079 | 12,172 | ||||||||
| ||||||||||||
Net wells drilled | 32.8 | 55.6 | 114.1 | 174.9 | ||||||||
Net undeveloped land additions (acres)(4) | 36,765 | 36,760 | 91,852 | 368,205 | ||||||||
| ||||||||||||
DOWNSTREAM OPERATIONS | ||||||||||||
Average daily throughput (bbl/d) | 84,889 | 43,357 | 99,760 | 60,826 | ||||||||
Average refining gross margin (US$/bbl)(2) | 6.03 | 10.06 | 4.28 | 9.93 | ||||||||
Operating loss | (21,882 | ) | (20,331 | ) | (113,287 | ) | (15,768 | ) | ||||
| ||||||||||||
Cash contribution (deficiency) from operations(2) | 213 | 2,035 | (38,598 | ) | 48,363 | |||||||
Capital asset additions | 12,886 | 100,132 | 32,686 | 244,752 | ||||||||
| (1) | Revenues are net of royalties and the effective portion of Harvest’s realized crude oil hedges. |
| (2) | This is a non-GAAP measure; please refer to “Non-GAAP Measures” in this MD&A. |
| (3) | Excludes the effect of risk management contracts designated as hedges. |
| (4) | Includes lands acquired in business combinations. |
2
| MANAGEMENT’S DISCUSSION AND ANALYSIS |
REVIEW OF OVERALL PERFORMANCE
Upstream
Sales volumes decreased 862 boe/d to 57,686 boe/d from the third quarter of 2011 primarily due to the extended turnaround of a third party natural gas plant.
Operating netback per boe was $26.55 prior to hedging for the third quarter of 2012, a decrease of 14% from the same quarter in 2011, reflecting lower realized prices and higher operating costs, partially offset by lower royalties and transportation costs.
Operating loss was $11.4 million for the third quarter of 2012 as compared to operating income of $24.2 million for the third quarter of 2011. The decrease in operating income is mainly attributable to the lower operating netback per boe, lower volumes, increased depreciation, depletion and amortization, and increased exploration and evaluation costs.
Cash contribution from operations was $133.3 million for the third quarter of 2012, a $28.1 million decrease from the same quarter in the prior year which was driven by the lower operating netback.
Capital spending of $113.9 million includes the drilling of 29 gross conventional wells and 7 gross SAGD wells.
Downstream
Throughput volume averaged 84,889 bbl/d, an increase of 96% as compared to a throughput volume of 43,357 bbl/d in the third quarter of 2011 due to the planned turnaround maintenance that occurred in 2011.
Refining gross margin per bbl averaged US$6.03 in the third quarter of 2012, a decrease of US$4.03 from the same quarter in 2011 mainly due to lower product crack spreads, increased feedstock costs per bbl and lower refinery yields. The higher throughput volume in the third quarter of 2012 compensated for the decrease in refining gross margin per bbl, which resulted in higher gross margin when compared to the same period in 2011.
Operating loss totaled $21.9 million for the three months ended September 30, 2012 as compared to an operating loss of $20.3 million in the same period in 2011. The increase in operating loss reflects the decrease in refining gross margin per bbl, increases in operating expense, depreciation and purchased energy expense, partially offset by higher throughput volume.
Cash contribution from operations was $0.2 million for the third quarter of 2012, a $1.8 million decrease from the same quarter in the prior year mainly due to higher operating and purchased energy expenses, partially offset by a higher gross margin.
Capital spending was $12.9 million for the quarter and mostly related to feedstock and product tank recertification, reliability improvements, and the expansion of our retail gasoline operation.
3
| MANAGEMENT’S DISCUSSION AND ANALYSIS |
Corporate
On July 31, 2012, Harvest agreed with its lenders to extend the credit facility agreement by one year to April 30, 2016.
On August 1, 2012, Harvest completed its offer to exchange US$500 million in aggregate principal amount of its 67/8% Senior Notes due 2017 that had been registered under the United States Securities Act of 1933, as amended (“the Act”), for the same principal amount of outstanding unregistered 67/8% Senior Notes due 2017 with 100% of the notes being exchanged. The terms of the exchanged notes are substantially identical but with the new notes having greater transferability.
On August 16, 2012, Harvest entered into a subordinated loan agreement with ANKOR to borrow US$170 million at a fixed interest rate of 4.62% per annum. No payments of principal or interest are required before maturity on October 2, 2017.
On September 19, 2012, Harvest redeemed $106.8 million of the outstanding 6.40% series of convertible debentures at an amount of $1,024.90 per $1,000 principal amount. The redemption resulted in a nominal gain.
4
| | MANAGEMENT’S DISCUSSION AND ANALYSIS |
UPSTREAM OPERATIONS
Summary of Financial and Operating Results
| Three Months Ended | Nine Months Ended | |||||||||||
| September 30 | September 30 | |||||||||||
| 2012 | 2011 | 2012 | 2011 | |||||||||
FINANCIAL | ||||||||||||
Petroleum and natural gas sales(1) | 285,666 | 318,731 | 902,194 | 923,238 | ||||||||
Royalties | (36,710 | ) | (46,996 | ) | (128,917 | ) | (139,415 | ) | ||||
Revenues | 248,956 | 271,735 | 773,277 | 783,823 | ||||||||
| ||||||||||||
Expenses | ||||||||||||
Operating | 93,163 | 88,121 | 281,674 | 254,031 | ||||||||
Transportation and marketing | 5,287 | 9,758 | 16,354 | 23,886 | ||||||||
Realized (gains) losses on risk management contracts(2) | 850 | (1,707 | ) | 1,024 | (3,915 | ) | ||||||
Operating netback after hedging(3) | 149,656 | 175,563 | 474,225 | 509,821 | ||||||||
| ||||||||||||
General and administrative | 16,677 | 14,621 | 46,792 | 42,960 | ||||||||
Depreciation, depletion and amortization | 142,648 | 137,070 | 434,189 | 386,348 | ||||||||
Exploration and evaluation | 5,618 | 831 | 24,702 | 11,286 | ||||||||
Impairment of property, plant and equipment | – | – | 21,843 | – | ||||||||
Unrealized (gains) losses on risk management contracts(4) | 988 | (1,126 | ) | 911 | (4,212 | ) | ||||||
Gains on disposition of property, plant and equipment | (4,881 | ) | (65 | ) | (5,350 | ) | (745 | ) | ||||
Operating income (loss) | (11,394 | ) | 24,232 | (48,862 | ) | 74,184 | ||||||
| ||||||||||||
Capital asset additions (excluding acquisitions) | 113,912 | 190,597 | 477,139 | 553,747 | ||||||||
Property and business acquisitions (dispositions), net | (8,082 | ) | (2,582 | ) | (8,835 | ) | 513,327 | |||||
Decommissioning and environmental remediation expenditures | 6,119 | 5,923 | 16,079 | 12,172 | ||||||||
| ||||||||||||
OPERATING | ||||||||||||
Light / medium oil (bbl/d) | 24,438 | 23,621 | 24,995 | 23,805 | ||||||||
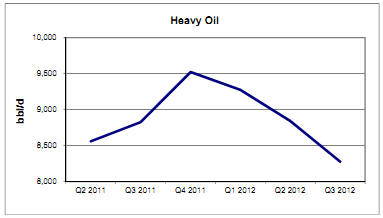
Heavy oil (bbl/d) | 8,275 | 8,825 | 8,794 | 8,807 | ||||||||
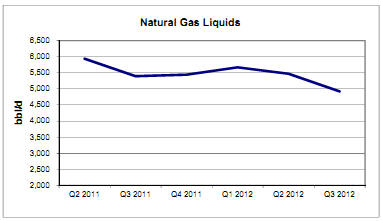
Natural gas liquids (bbl/d) | 4,920 | 5,392 | 5,351 | 4,935 | ||||||||
Natural gas (mcf/d) | 120,315 | 124,259 | 123,336 | 109,265 | ||||||||
Total (boe/d) | 57,686 | 58,548 | 59,696 | 55,758 | ||||||||
| (1) | Including the effective portion of Harvest’s realized crude oil hedges. |
| (2) | Realized (gains) losses on risk management contracts include the settlement amounts for power, crude oil and foreign exchange derivative contracts, excluding the effective portion of realized (gains) losses from Harvest’s previously designated crude oil hedges. See “Risk Management, Financing and Other” section of this MD&A for details. |
| (3) | This is a non-GAAP measure; please refer to “Non-GAAP Measures” in this MD&A. |
| (4) | Unrealized (gains) losses on risk management contracts reflect the change in fair value of the power derivative contracts, the ineffective portion of previously designated crude oil hedges and the change in fair value of the crude and foreign exchange derivative contracts subsequent to the discontinuation of hedge accounting. See “Risk Management, Financing and Other” section of this MD&A for details. |
5
| MANAGEMENT’S DISCUSSION AND ANALYSIS |
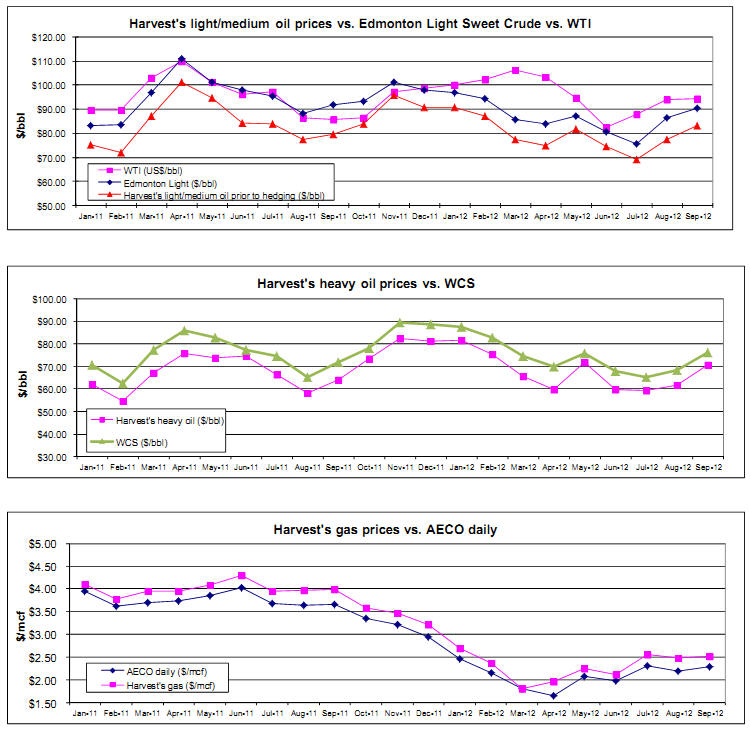
| Commodity Price Environment | ||||||||||||||||||
| Three Months Ended | Nine Months Ended | |||||||||||||||||
| September 30 | September 30 | |||||||||||||||||
| 2012 | 2011 | Change | 2012 | 2011 | Change | |||||||||||||
West Texas Intermediate (“WTI”) crude oil (US$/bbl) | 92.22 | 89.76 | 3% | 96.21 | 95.48 | 1% | ||||||||||||
West Texas Intermediate (“WTI”) crude oil ($/bbl) | 91.70 | 87.91 | 4% | 96.35 | 93.29 | 3% | ||||||||||||
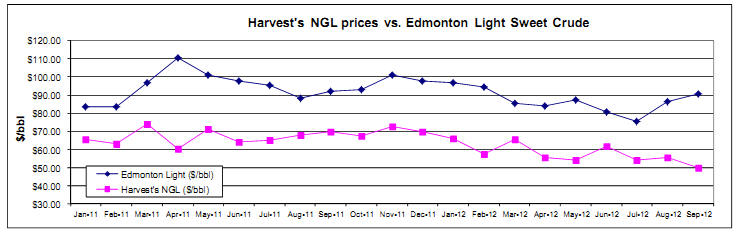
Edmonton light sweet crude oil ($/bbl) | 84.26 | 91.90 | (8% | ) | 86.87 | 94.40 | (8% | ) | ||||||||||
Western Canadian Select (“WCS”) crude oil ($/bbl) | 70.02 | 70.63 | (1% | ) | 74.30 | 74.30 | – | |||||||||||
AECO natural gas daily ($/mcf) | 2.27 | 3.66 | (38% | ) | 2.11 | 3.76 | (44% | ) | ||||||||||
U.S. / Canadian dollar exchange rate | 1.005 | 1.020 | (1% | ) | 0.998 | 1.023 | (2% | ) | ||||||||||
| ||||||||||||||||||
Differential Benchmarks | ||||||||||||||||||
WCS differential to WTI ($/bbl) | 21.68 | 17.28 | 25% | 22.05 | 18.99 | 16% | ||||||||||||
WCS differential as a % of WTI | 23.6% | 19.6% | 20% | 22.8% | 20.3% | 12% | ||||||||||||
The average WTI benchmark price in the third quarter of 2012 was 3% higher than the third quarter of 2011 and is 1% higher for the nine months ended September 30, 2012. The average Edmonton light sweet crude oil price (“Edmonton Light”) decreased 8% in both the third quarter of 2012 and for the nine months ended September 2012 as compared to the same periods in 2011 despite the increase in WTI, due to the widening of the light sweet differential.
Heavy oil differentials fluctuate based on a combination of factors including the level of heavy oil inventories, pipeline capacity to deliver heavy crude to U.S. markets and the seasonal demand for heavy oil. For the three and nine months ended September 30, 2012, the WCS price was comparable to the same periods in 2011, as the WTI price increase was offset by the widening of the WCS differential relative to WTI in both instances.
6
| MANAGEMENT’S DISCUSSION AND ANALYSIS |
Realized Commodity Prices
| Three Months Ended | Nine Months Ended | |||||||||||||||||
| September 30 | September 30 | |||||||||||||||||
| 2012 | 2011 | Change | 2012 | 2011 | Change | ||||||||||||
Light to medium oil prior to hedging ($/bbl) | 76.61 | 80.43 | (5% | ) | 79.20 | 84.08 | (6% | ) | ||||||||||
Heavy oil ($/bbl) | 63.81 | 62.84 | 2% | 67.55 | 66.28 | 2% | ||||||||||||
Natural gas liquids ($/bbl) | 53.01 | 67.51 | (21% | ) | 57.87 | 67.10 | (14% | ) | ||||||||||
Natural gas ($/mcf) | 2.52 | 3.97 | (37% | ) | 2.30 | 3.98 | (42% | ) | ||||||||||
Average realized price prior to hedging ($/boe)(1) | 52.02 | 57.85 | (10% | ) | 53.85 | 61.21 | (12% | ) | ||||||||||
| ||||||||||||||||||
Light to medium oil after hedging ($/bbl)(2) | 80.89 | 83.71 | (3% | ) | 82.31 | 82.77 | (1% | ) | ||||||||||
Average realized price after hedging ($boe)(1) (2) | 53.83 | 59.17 | (9% | ) | 55.16 | 60.65 | (9% | ) | ||||||||||
| (1) | Inclusive of sulphur revenue. |
| (2) | Inclusive of the effective portion of the realized gains (losses) from crude oil derivative contracts previously designated as hedges. |
Prior to hedging activities, our realized price for light to medium oil for the three and nine months ended September 30, 2012 decreased by 5% and 6%, respectively, compared to the same periods in 2011. This decrease is consistent with the downward movement in Edmonton Light prices during the three and nine months ended September 30, 2012.
In order to mitigate the risk of fluctuating cash flows due to crude oil price volatility, Harvest has entered into fixed-for-floating swaps which expire in December 2012. The impact of this hedging activity resulted in an increase of $4.28/bbl (2011 – increase of $3.28/bbl) in Harvest’s realized light to medium oil price for the three months ended September 30, 2012 and an increase of $3.11/bbl (2011 – decrease of $1.31/bbl) for the nine months ended September 30, 2012. With respect to our cash flow risk management program, see “Cash Flow Risk Management” in this MD&A.
Harvest’s realized heavy oil prices for both the three months and nine months ended September 30, 2012 increased by 2% as compared to the same periods in 2011, which is slightly above the changes in the WCS benchmark for the same reference periods.
The realized prices for NGLs decreased 21% and 14% for the three months and nine months ended September 30, 2012 reflecting the decrease in natural gas liquids commodity prices.
The average realized price for Harvest’s natural gas sales decreased by 37% for the three months ended September 30, 2012 and 42% for the nine months ended September 30, 2012 as compared to the same periods in 2011, reflecting the decrease in the AECO benchmark price.
7
| MANAGEMENT’S DISCUSSION AND ANALYSIS |
8
| MANAGEMENT’S DISCUSSION AND ANALYSIS |
Sales Volumes
| Three Months Ended September 30 | |||||||||||||||
| 2012 | 2011 | ||||||||||||||
| Volume | Weighting | Volume | Weighting | % Volume | |||||||||||
| Change | |||||||||||||||
Light to medium oil (bbl/d)(1) | 24,438 | 42% | 23,621 | 40% | 3% | ||||||||||
Heavy oil (bbl/d) | 8,275 | 14% | 8,825 | 15% | (6% | ) | |||||||||
Natural gas liquids (bbl/d) | 4,920 | 9% | 5,392 | 9% | (9% | ) | |||||||||
Total liquids (bbl/d) | 37,633 | 65% | 37,838 | 64% | (1% | ) | |||||||||
Natural gas (mcf/d) | 120,315 | 35% | 124,260 | 36% | (3% | ) | |||||||||
Total oil equivalent (boe/d) | 57,686 | 100% | 58,548 | 100% | (1% | ) | |||||||||
| Nine Months Ended September 30 | ||||||||||||||
| 2012 | 2011 | |||||||||||||
| Volume | Weighting | Volume | Weighting | % Volume | ||||||||||
| Change | ||||||||||||||
Light to medium oil (bbl/d)(1) | 24,995 | 42% | 23,805 | 43% | 5% | ||||||||||
Heavy oil (bbl/d) | 8,794 | 15% | 8,807 | 16% | – | ||||||||||
Natural gas liquids (bbl/d) | 5,351 | 9% | 4,935 | 9% | 8% | ||||||||||
Total liquids (bbl/d) | 39,140 | 66% | 37,547 | 68% | 4% | ||||||||||
Natural gas (mcf/d) | 123,336 | 34% | 109,265 | 32% | 13% | ||||||||||
Total oil equivalent (boe/d) | 59,696 | 100% | 55,758 | 100% | 7% | ||||||||||
| (1) | Harvest classifies all oil production, except that produced from Hay River, as light to medium and heavy according to NI 51-101 guidance. The oil produced from Hay River has an average API of 24o(medium grade) and is classified as a light to medium oil; notwithstanding that, it benefits from a heavy oil royalty regime and therefore would be classified as heavy oil according to NI 51-101. |
Harvest’s sales volumes were 57,686 boe/d for the third quarter of 2012 and 59,696 boe/d for the first nine months of 2012, a decrease of 1% and an increase of 7% respectively, as compared to the same periods in 2011. The decrease in the third quarter reflects the extended turnaround of a third party natural gas plant in our Caroline area. The increase in the first nine months of 2012 reflects the full period benefit of the assets acquired from Hunt at the end of February 2011, the impact of the Plains Rainbow Pipeline outage in 2011, and production increases resulting from Harvest’s capital program, partially offset by the turnaround of the Caroline plant.
9
| MANAGEMENT’S DISCUSSION AND ANALYSIS |
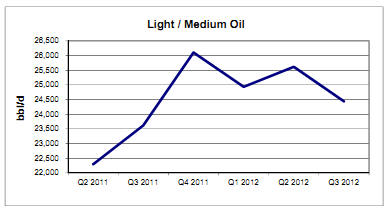 | Harvest’s average light/medium oil sales were 24,438 bbl/d and 24,995 bbl/d for the three and nine months ended September 30, 2012, a 3% and 5% increase, respectively, from the same periods in 2011. The increases are mainly due to the Plains Rainbow Pipeline outage from May to August of 2011. |
Heavy oil sales decreased by 6% for the third quarter of 2012 but remained consistent with the nine month period ended September 30 2012, as compared to the same periods in 2011. The decrease in the third quarter is a result of natural production declines. | |
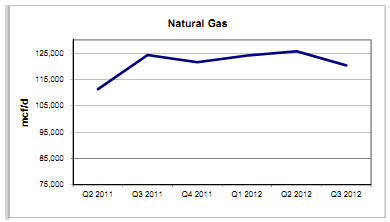 | Natural gas sales decreased by 3% in the third quarter of 2012 compared to the third quarter of 2011 mainly due to the extended turnaround of a third-party natural gas plant in our Caroline area. Natural gas sales increased 13% in the first nine months of 2012, as compared to the same period in 2011 mainly due to the full period production from the assets acquired from Hunt in 2011 and the results of 2011 drilling in Willesden Green and Deep Basin, partially offset by the Caroline plant outage. |
10
| MANAGEMENT’S DISCUSSION AND ANALYSIS |
Natural gas liquids sales decreased by 9% in the third quarter of 2012 but increased by 8% for the nine months ended September 30, 2012, as compared to the same periods in 2011, for reasons consistent with those describing our natural gas results. |
|
Revenues
| Three Months Ended September 30 | Nine Months Ended September 30 | |||||||||||||||||
| 2012 | 2011 | Change | 2012 | 2011 | Change | |||||||||||||
Light / medium oil sales after hedging(1) | 181,860 | 181,913 | – | 563,694 | 537,903 | 5% | ||||||||||||
Heavy oil sales | 48,583 | 51,025 | (5% | ) | 162,781 | 159,350 | 2% | |||||||||||
Natural gas sales | 27,840 | 45,333 | (39% | ) | 77,889 | 118,716 | (34% | ) | ||||||||||
Natural gas liquids sales | 23,995 | 33,492 | (28% | ) | 84,839 | 90,404 | (6% | ) | ||||||||||
Other(2) | 3,388 | 6,968 | (51% | ) | 12,991 | 16,865 | (23% | ) | ||||||||||
Petroleum and natural gas sales | 285,666 | 318,731 | (10% | ) | 902,194 | 923,238 | (2% | ) | ||||||||||
Royalties | (36,710 | ) | (46,996 | ) | (22% | ) | (128,917 | ) | (139,415 | ) | (8% | ) | ||||||
Revenues | 248,956 | 271,735 | (8% | ) | 773,277 | 783,823 | (1% | ) | ||||||||||
| (1) | Including the effective portion of realized gains (losses) from crude oil contracts designated as hedges. |
| (2) | Including sulphur revenue and miscellaneous income. |
Harvest’s revenue is subject to changes in sales volumes, commodity prices and currency exchange rates. In the third quarter of 2012, total petroleum and natural gas sales decreased by $33.1 million, mainly due to the 9% decrease in realized prices after hedging activities and the 1% decrease in sales volumes. For the first nine months of 2012, total petroleum and natural gas sales decreased by $21.0 million, mainly due the 9% decrease in realized prices after hedging activities, partially offset by the 7% increase in sales volumes. Sulphur revenue represented $2.5 million (2011 - $7.5 million) of the total in other revenues for the third quarter of 2012 and $11.9 million (2011 - $15.3 million) for the first nine months of 2012, with the decreases mainly resulting from the extended turnaround of a third-party natural gas plant in our Caroline area.
Royalties
Harvest pays Crown, freehold and overriding royalties to the owners of mineral rights from which production is generated. These royalties vary for each property and product and our Crown royalties are based on various sliding scales dependent on incentives, production volumes and commodity prices.
For the third quarter of 2012, royalties as a percentage of gross revenue averaged 12.9% (2011 – 14.7%) . The lower royalty rate is mainly due to higher Alberta Crown gas cost allowance credits in 2012 combined with lower gas and natural gas liquid royalties in the third quarter of 2012 due to the extended turnaround of the Caroline gas plant. For the nine months ended September 30, 2012, royalties as a percentage of gross revenue averaged 14.3% (2011 – 15.1%) .
11
| MANAGEMENT’S DISCUSSION AND ANALYSIS |
Operating and Transportation Expenses
| Three Months Ended September 30 | |||||||||||||||
| $/boe | |||||||||||||||
| 2012 | $/boe | 2011 | $/boe | Change | |||||||||||
Power and purchased energy | 20,600 | 3.88 | 22,854 | 4.24 | (0.36 | ) | |||||||||
Well servicing | 14,589 | 2.75 | 10,797 | 2.00 | 0.75 | ||||||||||
Repairs and maintenance | 17,727 | 3.34 | 16,113 | 2.99 | 0.35 | ||||||||||
Lease rentals and property tax | 8,781 | 1.65 | 9,280 | 1.72 | (0.07 | ) | |||||||||
Labor - internal | 7,569 | 1.43 | 7,551 | 1.40 | 0.03 | ||||||||||
Labor - contract | 4,807 | 0.91 | 5,085 | 0.95 | (0.04 | ) | |||||||||
Chemicals | 4,818 | 0.91 | 3,446 | 0.65 | 0.26 | ||||||||||
Trucking | 4,191 | 0.79 | 3,512 | 0.65 | 0.14 | ||||||||||
Processing and other fees | 8,836 | 1.66 | 6,692 | 1.24 | 0.42 | ||||||||||
Other | 1,245 | 0.23 | 2,791 | 0.52 | (0.29 | ) | |||||||||
Total operating expenses | 93,163 | 17.55 | 88,121 | 16.36 | 1.19 | ||||||||||
Transportation and marketing | 5,287 | 1.00 | 9,758 | 1.81 | (0.81 | ) | |||||||||
| Nine Months Ended September 30 | |||||||||||||||
| $/boe | |||||||||||||||
| 2012 | $/boe | 2011 | $/boe | Change | |||||||||||
Power and purchased energy | 57,861 | 3.54 | 61,005 | 4.01 | (0.47 | ) | |||||||||
Well servicing | 48,305 | 2.95 | 43,986 | 2.89 | 0.06 | ||||||||||
Repairs and maintenance | 49,913 | 3.05 | 42,562 | 2.80 | 0.25 | ||||||||||
Lease rentals and property tax | 27,310 | 1.67 | 25,025 | 1.65 | 0.02 | ||||||||||
Labor - internal | 24,327 | 1.49 | 21,294 | 1.40 | 0.09 | ||||||||||
Labor - contract | 14,698 | 0.90 | 14,205 | 0.93 | (0.03 | ) | |||||||||
Chemicals | 13,961 | 0.85 | 11,419 | 0.75 | 0.10 | ||||||||||
Trucking | 12,867 | 0.78 | 9,467 | 0.62 | 0.16 | ||||||||||
Processing and other fees | 26,074 | 1.59 | 12,819 | 0.84 | 0.75 | ||||||||||
Other | 6,358 | 0.39 | 12,249 | 0.80 | (0.41 | ) | |||||||||
Total operating expenses | 281,674 | 17.22 | 254,031 | 16.69 | 0.53 | ||||||||||
Transportation and marketing | 16,354 | 1.00 | 23,886 | 1.57 | (0.57 | ) | |||||||||
Operating costs for the third quarter of 2012 totaled $93.2 million, an increase of $5.0 million compared to the same period in 2011. Operating costs on a per barrel basis have increased by 7% to $17.55/boe. The increased operating costs are mainly attributable to the increase in well servicing, repairs and maintenance, and processing and other fees.
On a year-to-date basis, operating costs for 2012 totaled $281.7 million, an increase of $27.6 million when compared to the same period in 2011 mainly due to increased production. On a per barrel basis, year-to-date operating costs increased by $0.53/boe which is mainly attributable to higher processing and other fees, partially offset by lower power and purchased energy costs.
12
| MANAGEMENT’S DISCUSSION AND ANALYSIS |
| Three Months Ended | Nine Months Ended | |||||||||||||||||
| September 30 | September 30 | |||||||||||||||||
($ per boe) | 2012 | 2011 | Change | 2012 | 2011 | Change | ||||||||||||
Power and purchased energy costs | 3.88 | 4.24 | (0.36 | ) | 3.54 | 4.01 | (0.47 | ) | ||||||||||
Realized gains on electricity risk management contracts | – | (0.59 | ) | 0.59 | – | (0.38 | ) | 0.38 | ||||||||||
Net power and purchased energy costs | 3.88 | 3.65 | 0.23 | 3.54 | 3.63 | (0.09 | ) | |||||||||||
Alberta Power Pool electricity price ($ /MWh) | 78.44 | 94.71 | (16.27 | ) | 59.45 | 76.72 | (17.27 | ) | ||||||||||
Power and purchased energy costs per boe, comprised primarily of electric power costs, decreased for the three months and nine months ended September 30, 2012 as compared to the same periods in the prior year, reflecting the decline in the average Alberta electricity price. During the first nine months of 2012, Harvest did not have any risk management contracts relating to electricity.
Transportation and marketing costs relate primarily to delivery of natural gas to Alberta’s natural gas sales hub, the AECO Storage Hub, and the cost of trucking clean crude oil to pipeline receipt points. As a result, the total dollar amount of costs generally fluctuates in relation to our sales volumes. Transportation and marketing expenses decreased by $0.81/boe in the third quarter of 2012 compared to the third quarter of 2011 and by $0.57/boe year-to-date. The primary reason for the decreases is due to reduced oil trucking costs at Hay River and Red Earth after the outage of the Plains Rainbow Pipeline from May to August of 2011.
Operating Netback(1)
| Three Months Ended | Nine Months Ended | |||||||||||||||||
| September 30 | September 30 | |||||||||||||||||
| $/boe | $/boe | ||||||||||||||||
($ per boe) | 2012 | 2011 | Change | 2012 | 2011 | Change | ||||||||||||
Petroleum and natural gas sales prior to hedging | 52.02 | 57.85 | (5.83 | ) | 53.85 | 61.21 | (7.36 | ) | ||||||||||
Royalties | (6.92 | ) | (8.72 | ) | 1.80 | (7.88 | ) | (9.16 | ) | 1.28 | ||||||||
Operating expenses | (17.55 | ) | (16.36 | ) | (1.19 | ) | (17.22 | ) | (16.69 | ) | (0.53 | ) | ||||||
Transportation expenses | (1.00 | ) | (1.81 | ) | 0.81 | (1.00 | ) | (1.57 | ) | 0.57 | ||||||||
Operating netback prior to hedging(1) | 26.55 | 30.96 | (4.41 | ) | 27.75 | 33.79 | (6.04 | ) | ||||||||||
Hedging gains (losses)(2) | 1.60 | 1.64 | (0.04 | ) | 1.22 | (0.30 | ) | 1.52 | ||||||||||
Operating netback after hedging(1) | 28.15 | 32.60 | (4.45 | ) | 28.97 | 33.49 | (4.52 | ) | ||||||||||
| (1) | This is a non-GAAP measure; please refer to “Non-GAAP Measures” in this MD&A. |
| (2) | Hedging gains (losses) includes the settlement amounts for crude oil, foreign exchange and power contracts. |
Harvest’s operating netback represents the net amount realized on a per boe basis after deducting directly related costs. In the third quarter of 2012, operating netback prior to hedging decreased by 14% compared to the third quarter of 2011. For year-to-date 2012, operating netback prior to hedging decreased by 18% when compared to the same period in 2011. The decrease is primarily attributable to decreases in realized commodity prices and increased operating expenses, partially offset by decreases in royalties and transportation costs.
13
| MANAGEMENT’S DISCUSSION AND ANALYSIS |
General and Administrative (“G&A”) Expenses
| Three Months Ended | Nine Months Ended | |||||||||||
| September 30 | September 30 | |||||||||||
| 2012 | 2011 | 2012 | 2011 | |||||||||
| G&A | 16,677 | 14,621 | 46,792 | 42,960 | ||||||||
| G&A ($/boe ) | 3.14 | 2.71 | 2.86 | 2.82 | ||||||||
For the third quarter of 2012, G&A expenses increased by $2.1 million compared to the third quarter of 2011 mainly due to increases in salaries and consulting fees. For the first nine months of 2012, G&A expense totaled $46.8 million, an increase of approximately $3.8 million when compared to the same period in 2011 mainly due to the increase in salaries and consulting fees partially offset by the reversal of a provision for a potential renunciation shortfall on a series of flow through shares that was no longer required. G&A expenses are mainly comprised of salaries and other employee related costs. Harvest does not have a stock option program, however there is a long-term cash incentive program.
Depletion, Depreciation and Amortization (“DD&A”) Expenses
| Three Months Ended | Nine Months Ended | |||||||||||
| September 30 | September 30 | |||||||||||
| 2012 | 2011 | 2012 | 2011 | |||||||||
| DD&A | 142,648 | 137,070 | 434,189 | 386,348 | ||||||||
| DD&A ($/boe) | 26.88 | 25.45 | 26.55 | 25.38 | ||||||||
DD&A expenses for the three months and nine months ended September 30, 2012 increased by $5.6million and $47.8 million respectively, as compared to the same periods in 2011, mainly due to a lower depletable proved developed reserve base.
Impairment
In the first quarter of 2012, Harvest recorded a pre-tax impairment charge of $21.8 million (2011 – $ nil) against the South Alberta Gas cash generating unit, as a result of the declining forecasted natural gas prices during the quarter. The fair value was determined based on the total proved plus probable reserves estimated by our independent reserves evaluators using the April 1, 2012 commodity price forecast discounted at a pre-tax discount rate of 10%. No impairment was recognized in the third quarters of 2012 and 2011.
14
| MANAGEMENT’S DISCUSSION AND ANALYSIS |
Capital Asset Additions
| Three Months Ended | Nine Months Ended | |||||||||||
| September 30 | September 30 | |||||||||||
| 2012 | 2011 | 2012 | 2011 | |||||||||
Drilling and completion | 44,541 | 100,607 | 191,122 | 287,845 | ||||||||
Well equipment, pipelines and facilities | 21,823 | 50,998 | 126,192 | 149,059 | ||||||||
Geological and geophysical | – | 1,282 | 9,115 | 15,214 | ||||||||
Land and undeveloped lease rentals | 5,687 | 7,107 | 16,784 | 17,208 | ||||||||
Corporate | 730 | 1,010 | 1,269 | 2,059 | ||||||||
Other | 4,697 | 1,029 | 12,953 | 11,922 | ||||||||
Total additions before BlackGold | 77,478 | 162,033 | 357,435 | 483,307 | ||||||||
| ||||||||||||
BlackGold oil sands (“BlackGold”) | ||||||||||||
Drilling and completion | 14,221 | 9,979 | 51,065 | 15,249 | ||||||||
Well equipment, pipelines and facilities | 18,036 | 16,402 | 57,167 | 50,509 | ||||||||
Geological and geophysical | 75 | – | 1,009 | 158 | ||||||||
Other | 4,102 | 2,183 | 10,463 | 4,524 | ||||||||
Total BlackGold additions | 36,434 | 28,564 | 119,704 | 70,440 | ||||||||
Total additions excluding acquisitions | 113,912 | 190,597 | 477,139 | 553,747 | ||||||||
The total capital additions before BlackGold are lower for the three and nine months of 2012 as compared to the same periods in 2011 due to a lower capital budget of $411 million for the current year. As a result our drilling and completion expenditures decreased to $191.1 million (2011 - $287.8 million) for the nine months ended September 30, 2012. However, well equipment, pipelines and facilities expenditures did not decrease to the same degree because costs were incurred in the first and second quarters of 2012 for equipping and tying-in wells that had been drilled in late 2011.
The following table summarizes the wells drilled by Harvest and the related drilling and completion costs incurred in the period. A well is recorded in the table after it has been rig-released, however related drilling costs may be incurred in a period before a well has been rig-released and related completion costs may be incurred in a period afterwards.
| Three Months Ended | Nine Months Ended | |||||||||||||||||
| September 30, 2012 | September 30, 2012 | |||||||||||||||||
| Area | Gross | Net | Gross | Net | ||||||||||||||
| Hay River | – | – | $ | – | 27.0 | 27.0 | $ | 42,234 | ||||||||||
| Heavy Oil | 16.0 | 16.0 | 12,713 | 22.0 | 20.1 | 16,534 | ||||||||||||
| Red Earth | 1.0 | 0.2 | 3,039 | 12.0 | 10.5 | 45,845 | ||||||||||||
| Kindersley | 5.0 | 4.1 | 5,343 | 10.0 | 8.1 | 6,589 | ||||||||||||
| SE Saskatchewan | 1.0 | 1.0 | 1,799 | 9.0 | 9.0 | 11,312 | ||||||||||||
| Western Alberta | 3.0 | 1.5 | 5,055 | 10.0 | 5.4 | 17,877 | ||||||||||||
| Deep Basin | – | – | 10,635 | 3.0 | 2.3 | 29,126 | ||||||||||||
| Other areas | 3.0 | 3.0 | 5,957 | 9.0 | 5.8 | 21,605 | ||||||||||||
| Total before BlackGold | 29.0 | 25.8 | $ | 44,541 | 102.0 | 88.1 | $ | 191,122 | ||||||||||
| BlackGold | 7.0 | 7.0 | 14,221 | 26.0 | 26.0 | 51,065 | ||||||||||||
| Total | 36.0 | 32.8 | $ | 58,762 | 128.0 | 114.1 | $ | 242,187 | ||||||||||
15
| MANAGEMENT’S DISCUSSION AND ANALYSIS |
During the third quarter of 2012, Harvest drilled 29 gross (25.8 net) wells (2011 – 69 gross; 55.6 net) in areas other than BlackGold and had an overall drilling success rate of 97%.
For the third quarter of 2012, Harvest’s drilling activities were focused exclusively on oil development and 28 of the 29 wells were horizontal drills with the most active areas being Heavy Oil and Kindersley.
BlackGold oil sands
During the third quarter of 2012, Harvest continued drilling both pads of steam assisted gravity drainage (“SAGD”) producer and injector wells and spent $14.2 million drilling 7 gross wells. Harvest invested $18.0 million on the engineering, procurement and construction (“EPC”) of the central processing facility. During the first nine months of 2012, Harvest spent $51.1 million drilling 26 gross SAGD producer and injector wells and spent $58.3 million on the engineering, procurement and construction of the central processing facility, including the use of the $24.4 million construction deposit against the costs incurred by the EPC contractor as a result of the EPC contract amendment. As at September 30, 2012, the engineering and procurement portion of the contract relating to the central processing facility is approximately 60% complete and the facility construction portion of the contract is approximately 25% complete. Please see the “Liquidity” section of this MD&A for discussion of the EPC contract amendment and its financial impact.
Decommissioning and Environmental Remediation Liabilities
Harvest’s Upstream decommissioning and environmental remediation liabilities at September 30, 2012 were $679.6 million (December 31, 2011 - $672.7 million) for future remediation, abandonment, and reclamation of Harvest’s oil and gas properties. The increase of $6.9 million during the first nine months of 2012 was mostly a result of new liabilities incurred on new wells and the BlackGold facility of $14.2 million, plus accretion of $15.0 million, partially offset by $14.9 million of settlement expenditures and a $7.5 million change in estimate. Please refer to note 7 of our unaudited interim consolidated financial statements for the three and nine months ended September 30, 2012 for a continuity table of these liabilities. The total of our decommissioning and environmental remediation liabilities are based on management’s best estimate of costs to remediate, abandon and reclaim our wells, pipelines and facilities. The costs will be incurred over the operating lives of the assets with the majority being at or after the end of reserve life. Please refer to the “Contractual Obligations and Commitments” section of this MD&A for the payments expected for each of the next five years and thereafter in respect of these liabilities.
16
| MANAGEMENT’S DISCUSSION AND ANALYSIS |
DOWNSTREAM OPERATIONS
| Three Months Ended | Nine Months Ended | |||||||||||
| September 30 | September 30 | |||||||||||
| 2012 | 2011 | 2012 | 2011 | |||||||||
| FINANCIAL | ||||||||||||
Refined products sales(1) | 1,026,161 | 576,504 | 3,461,788 | 2,140,031 | ||||||||
Purchased products for processing and resale(1) | 968,620 | 527,722 | 3,309,139 | 1,941,396 | ||||||||
Gross margin(2) | 57,541 | 48,782 | 152,649 | 198,635 | ||||||||
Expenses | ||||||||||||
Operating | 31,416 | 24,077 | 89,085 | 75,883 | ||||||||
Power and purchased energy | 21,918 | 19,768 | 94,801 | 67,760 | ||||||||
Marketing | 757 | 2,295 | 3,111 | 5,229 | ||||||||
General and administrative | 150 | 441 | 450 | 1,323 | ||||||||
Depreciation and amortization | 25,182 | 22,532 | 78,489 | 64,208 | ||||||||
Operating loss | (21,882 | ) | (20,331 | ) | (113,287 | ) | (15,768 | ) | ||||
| ||||||||||||
Capital asset additions | 12,886 | 100,132 | 32,686 | 244,752 | ||||||||
OPERATING | ||||||||||||
Feedstock volume (bbl/d)(3) | 84,889 | 43,357 | 99,760 | 60,826 | ||||||||
Yield (% of throughput volume)(4) | ||||||||||||
Gasoline and related products | 26% | 30% | 29% | 31% | ||||||||
Ultra low sulphur diesel and jet fuel | 37% | 45% | 41% | 38% | ||||||||
High sulphur fuel oil | 32% | 23% | 26% | 29% | ||||||||
Total | 95% | 98% | 96% | 98% | ||||||||
Average refining gross margin (US$/bbl)(5) | 6.03 | 10.06 | 4.28 | 9.93 | ||||||||
| (1) | Refined product sales and purchased products for processing and resale are net of intra-segment sales of $134.6 million and $447.8 million for the three and nine months ended September 30, 2012 respectively (2011 - $122.2 million and $363.0 million), reflecting the refined products produced by the refinery and sold by the marketing division. |
| (2) | These are non-GAAP measures; please refer to “Non-GAAP Measures” in this MD&A. |
| (3) | Barrels per day are calculated using total barrels of crude oil feedstock and vacuum gas oil. |
| (4) | Based on production volumes after adjusting for changes in inventory held for resale. |
| (5) | Average refining gross margin is calculated based on per barrel of feedstock throughput. |
Refining Benchmark Prices
| Three Months Ended | Nine Months Ended | |||||||||||||||||
| September 30 | September 30 | |||||||||||||||||
| 2012 | 2011 | Change | 2012 | 2011 | Change | ||||||||||||
WTI crude oil (US$/bbl) | 92.22 | 89.76 | 3% | 96.21 | 95.48 | 1% | ||||||||||||
Brent crude oil (US$/bbl) | 109.43 | 112.29 | (3% | ) | 112.24 | 111.49 | 1% | |||||||||||
Argus Sour Crude Index (“ASCI”) (US$/bbl) | 104.19 | 109.49 | (5% | ) | 107.78 | 107.52 | - | |||||||||||
Brent – WTI differential (US$/bbl) | 17.21 | 22.53 | (24% | ) | 16.03 | 16.01 | - | |||||||||||
Brent – ASCI differential (US$/bbl) | 5.24 | 2.80 | 87% | 4.46 | 3.97 | 12% | ||||||||||||
Refined product prices | ||||||||||||||||||
RBOB(1)(US$/bbl) | 123.86 | 121.72 | 2% | 125.31 | 121.34 | 3% | ||||||||||||
Heating Oil(1)(US$/bbl) | 126.18 | 125.46 | 1% | 126.79 | 123.86 | 2% | ||||||||||||
High Sulphur Fuel Oil(2)(US$/bbl) | 97.77 | 99.34 | (2% | ) | 101.62 | 96.30 | 6% | |||||||||||
U.S. / Canadian dollar exchange rate | 1.005 | 1.020 | (1% | ) | 0.998 | 1.023 | (2% | ) | ||||||||||
| (1) | Market prices sourced from NYMEX. |
| (2) | Market price sourced from Platts. |
17
| MANAGEMENT’S DISCUSSION AND ANALYSIS |
Summary of Gross Margins
| Three Months Ended September 30 | ||||||||||||||||||
| 2012 | 2011 | |||||||||||||||||
| Volumes(4) | (US$/bbl)(5) | Volumes(4) | (US$/bbl)(5) | |||||||||||||||
Refinery | ||||||||||||||||||
Sales | ||||||||||||||||||
Gasoline products | 329,173 | 2,686 | 123.16 | 201,584 | 1,763 | 116.63 | ||||||||||||
Distillates | 417,521 | 3,196 | 131.29 | 269,242 | 2,184 | 125.74 | ||||||||||||
High sulphur fuel oil | 246,987 | 2,529 | 98.15 | 64,943 | 643 | 103.02 | ||||||||||||
Total sales | 993,681 | 8,411 | 118.73 | 535,769 | 4,590 | 119.06 | ||||||||||||
Feedstocks(1) | ||||||||||||||||||
Crude oil | 799,800 | 7,493 | 107.27 | 324,134 | 3,370 | 98.11 | ||||||||||||
Vacuum gas oil (“VGO”) | 35,298 | 317 | 111.91 | 66,025 | 619 | 108.80 | ||||||||||||
Total feedstocks | 835,098 | 7,810 | 107.46 | 390,159 | 3,989 | 99.76 | ||||||||||||
Other(2) | 111,687 | 106,274 | ||||||||||||||||
Purchased products for processing and resale | 946,785 | 496,433 | ||||||||||||||||
Refinery gross margin(3) | 46,896 | 6.03 | 39,336 | 10.06 | ||||||||||||||
| ||||||||||||||||||
Marketing | ||||||||||||||||||
Sales | 167,113 | 162,968 | ||||||||||||||||
Cost of products sold | 156,468 | 153,522 | ||||||||||||||||
Marketing gross margin(3) | 10,645 | 9,446 | ||||||||||||||||
| ||||||||||||||||||
Total gross margin(3) | 57,541 | 48,782 | ||||||||||||||||
| (1) | Cost of feedstock includes all costs of transporting the crude oil to the refinery in Newfoundland. |
| (2) | Includes inventory adjustments, additives and blendstocks. |
| (3) | This is a non-GAAP measure; please refer to “Non-GAAP Measures” in this MD&A. Per barrel amount is determined using throughput volume. |
| (4) | Volumes are in 000’s bbls. Sales volumes represent the quantity of refined products sold, whereas feedstock volumes reflect our throughput. |
| (5) | Translated using using the average US/Canadian exchange rate for each period. |
18
| MANAGEMENT’S DISCUSSION AND ANALYSIS |
| Nine Months Ended September 30 | ||||||||||||||||||
| 2012 | 2011 | |||||||||||||||||
| Volumes(4) | (US$/bbl)(5) | Volumes(4) | (US$/bbl)(5) | |||||||||||||||
Refinery | ||||||||||||||||||
Sales(1) | ||||||||||||||||||
Gasoline products | 1,093,469 | 8,938 | 122.09 | 699,192 | 6,150 | 116.30 | ||||||||||||
Distillates | 1,527,392 | 11,828 | 128.88 | 885,425 | 7,205 | 125.72 | ||||||||||||
High sulphur fuel oil | 749,978 | 7,541 | 99.25 | 433,020 | 4,710 | 94.05 | ||||||||||||
Total sales | 3,370,839 | 28,307 | 118.84 | 2,017,637 | 18,065 | 114.26 | ||||||||||||
Feedstocks(1) | ||||||||||||||||||
Crude oil | 2,815,466 | 25,644 | 109.57 | 1,472,843 | 15,175 | 99.29 | ||||||||||||
Vacuum gas oil (“VGO”) | 199,663 | 1,690 | 117.91 | 153,668 | 1,430 | 109.93 | ||||||||||||
Total feedstocks | 3,015,129 | 27,334 | 110.09 | 1,626,511 | 16,605 | 100.21 | ||||||||||||
Other(2) | 238,592 | 229,903 | ||||||||||||||||
Purchased products for processing and resale | 3,253,721 | 1,856,414 | ||||||||||||||||
Refinery gross margin(3) | 117,118 | 4.28 | 161,223 | 9.93 | ||||||||||||||
| ||||||||||||||||||
Marketing | ||||||||||||||||||
Sales | 538,776 | 485,370 | ||||||||||||||||
Cost of products sold | 503,245 | 447,958 | ||||||||||||||||
Marketing gross margin(3) | 35,531 | 37,412 | ||||||||||||||||
| ||||||||||||||||||
Total gross margin(3) | 152,649 | 198,635 | ||||||||||||||||
| (1) | Cost of feedstock includes all costs of transporting the crude oil to the refinery in Newfoundland. |
| (2) | Includes inventory adjustments, additives and blendstocks. |
| (3) | This is a non-GAAP measure; please refer to “Non-GAAP Measures” in this MD&A. Per barrel amount is determined using throughput volume. |
| (4) | Volumes are in 000’s bbls. Sales volumes represent the quantity of refined products sold, whereas feedstock volumes reflect our throughput. |
| (5) | Translated using using the average US/Canadian exchange rate for each period. |
Feedstock throughput averaged 84,889 bbl/d in the third quarter of 2012, an increase of 96% from 43,357 bbl/d average daily throughput in the third quarter of the prior year. The feedstock throughput for the nine months ended September 30, 2012 was 99,760 bbl/d, an increase of 64% from an average daily throughput of 60,826 bbl/d for the same period in the prior year. The third quarter of 2012 average daily rate is less than the nameplate capacity of 115,000 bbl/d as a consequence of an exchanger leak on the amine unit resulting in an outage of the amine, sulphur recovery and hydrocracker units and reduction in crude rate throughput to approximately 80,000 bbl/day for two weeks combined with an operational issue with the sulphur recovery unit resulting in an unplanned outage of all refinery units for approximately three weeks. As a consequence of these two outages, our refinery has a higher yield in high sulphur fuel oil and lower yields in the other products. The prior year reflects the impact of the planned shutdown of the refinery units for turnaround work for approximately two months in the third quarter of 2011 and for three months during the first nine months of 2011.
19
| MANAGEMENT’S DISCUSSION AND ANALYSIS |
The two tables below provide a comparison between the product crack spread realized by our refinery and the benchmark crack spread for the three and nine months ended September 30, 2012 with both crack spreads referring to the price of Brent crude oil.
| Three Months Ended September 30 | ||||||||||||||||||
| 2012 | 2011 | |||||||||||||||||
| Refinery | Benchmark | Difference | Refinery | Benchmark | Difference | |||||||||||||
| Gasoline products (US$/bbl) | 15.70 | 14.43 | (1) | 1.27 | 16.87 | 9.43 | (1) | 7.44 | ||||||||||
| Distillates (US$/bbl) | 23.83 | 16.75 | (2) | 7.08 | 25.98 | 13.17 | (2) | 12.81 | ||||||||||
| High Sulphur Fuel Oil (US$/bbl) | (9.31 | ) | (11.66 | )(3) | 2.35 | 3.26 | (12.95 | )(3) | 16.21 | |||||||||
| (1) | RBOB benchmark market price sourced from NYMEX. |
| (2) | Heating Oil benchmark market price sourced from NYMEX. Our distillate products are mainly comprised of ultra-low sulphur diesel which is a higher quality product and sells at a premium to the heating oil benchmark. |
| (3) | High Sulphur Fuel Oil benchmark market price sourced from Platts. Our high sulphur fuel oil normally contains a higher sulphur content than the 3% content reflected in the benchmark price. |
| Nine Months Ended September 30 | ||||||||||||||||||
| 2012 | 2011 | |||||||||||||||||
| Refinery | Benchmark | Difference | Refinery | Benchmark | Difference | |||||||||||||
| Gasoline products (US$/bbl) | 12.00 | 13.07 | (1) | (1.07 | ) | 16.09 | 9.85 | (1) | 6.24 | |||||||||
| Distillates (US$/bbl) | 18.79 | 14.55 | (2) | 4.24 | 25.51 | 12.37 | (2) | 13.14 | ||||||||||
| High Sulphur Fuel Oil (US$/bbl) | (10.84 | ) | (10.62 | )(3) | (0.22 | ) | (6.16 | ) | (15.19 | )(3) | 9.03 | |||||||
| (1) | RBOB benchmark market price sourced from NYMEX. |
| (2) | Heating Oil benchmark market price sourced from NYMEX. Our distillate products are mainly comprised of ultra-low sulphur diesel which is a higher quality product and sells at a premium to the heating oil benchmark. |
| (3) | High Sulphur Fuel Oil benchmark market price sourced from Platts. Our high sulphur fuel oil normally contains a higher sulphur content than the 3% content reflected in the benchmark price. |
Our product crack spreads are different from the benchmarks due to several factors including timing of actual sales and feedstock purchases differing from the calendar month benchmarks, transportation costs, sour crude differentials, quality differentials and variability in our throughput volume over a given period of time. Our refinery sales also include products for which market prices are not reflected in the benchmarks (such as hydrocracker bottoms that sell at spot market prices with a premium to the high sulphur fuel oil benchmark).
Our overall gross margin is also impacted by the purchasing of blendstocks to meet summer gasolines specifications, additives to meet product specifications, and inventory write-downs and reversals. These costs are included in “other” in the Summary of Gross Margin Table above.
The gross margin per bbl decreased from the prior year for both the three months and nine months ended September 30, 2012 mainly due to increased feedstock costs. During the first nine months of 2011, our refinery benefited from lower priced crude feedstock as our feedstock price was linked to WTI – Brent differentials. As the differentials widened in 2011, our feedstock prices decreased. A similar benefit did not exist in 2012 as we no longer include the WTI – Brent differentials in our feedstock pricing. Therefore, despite the decreases in Brent prices and the increases in Brent – Argus differentials in the three ended September 30, 2012, and the nominal changes in these benchmarks in the nine months ended September 30, 2012, our feedstock price increased from the same periods in 2011.
During the three months ended September 30, 2012, the increases in our feedstock prices have been partially offset by improved product prices resulting in the reversal of previously recorded inventory impairments of $4.2 million. The impact of changes in our inventory value is reflected in the “other” category of the feedstock costs.
20
| MANAGEMENT’S DISCUSSION AND ANALYSIS |
During the three and nine months ended September 30, 2012, the Canadian dollar strengthened as compared to the US dollar. The stronger Canadian dollar in 2012 has had a negative impact to the contribution from our refinery operations relative to the prior year as substantially all of our gross margin, cost of purchased energy and marketing expense are denominated in U.S. dollars.
Operating Expenses
| Three Months Ended September 30 | ||||||||||||||||||
| 2012 | 2011 | |||||||||||||||||
| Refining | Marketing | Total | Refining | Marketing | Total | |||||||||||||
Operating cost | 26,445 | 4,971 | 31,416 | 19,292 | 4,785 | 24,077 | ||||||||||||
Power and purchased energy | 21,918 | – | 21,918 | 19,768 | – | 19,768 | ||||||||||||
| 48,363 | 4,971 | 53,334 | 39,060 | 4,785 | 43,845 | ||||||||||||
($/bbl of feedstock throughput) | ||||||||||||||||||
Operating cost | 3.38 | – | – | 4.83 | – | – | ||||||||||||
Power and purchased energy | 2.81 | – | – | 4.96 | – | – | ||||||||||||
| 6.19 | – | – | 9.79 | – | – | ||||||||||||
| Nine Months Ended September 30 | ||||||||||||||||||
| 2012 | 2011 | |||||||||||||||||
| Refining | Marketing | Total | Refining | Marketing | Total | |||||||||||||
Operating cost | 74,266 | 14,819 | 89,085 | 61,790 | 14,093 | 75,883 | ||||||||||||
Power and purchased energy | 94,801 | – | 94,801 | 67,760 | – | 67,760 | ||||||||||||
| 169,067 | 14,819 | 183,886 | 129,550 | 14,093 | 143,643 | ||||||||||||
($/bbl of feedstock throughput) | ||||||||||||||||||
Operating cost | 2.72 | – | – | 3.72 | – | – | ||||||||||||
Power and purchased energy | 3.47 | – | – | 4.08 | – | – | ||||||||||||
| 6.19 | – | – | 7.80 | – | – | ||||||||||||
During the three and nine months ended September 30, 2012, refining operating costs were higher than the prior year, yet the costs per barrel of feedstock throughput decreased 30% and 27% respectively. 2011 results reflect lower operating costs and lower throughput volumes and higher cost per barrel of throughput due to the planned shutdown of the units for major maintenance work.
Purchased energy, consisting of low sulphur fuel oil (“LSFO”) and electricity, is required to provide heat and power to refinery operations. Purchased energy costs in the third quarter of 2012 are slightly higher than the costs in the third quarter of 2011, reflecting higher LSFO prices of $5.0 million and higher electricity consumption of $0.6 million offset by lower consumption of LSFO of $3.4 million. The $27.0 million higher energy costs for the nine months ended September 30, 2012 is a result of higher LSFO prices of $17.1 million combined with higher electricity consumption of $1.5 million and higher consumption of LSFO of $8.4 million. The consumption of purchased energy is impacted by unit outages and availability of internally produced fuels.
21
| MANAGEMENT’S DISCUSSION AND ANALYSIS |
Capital Asset Additions
Capital spending for the three and nine months ended September 30, 2012 totaled $12.9 million and $32.7 million respectively (2011 - $100.1 million and $244.8 million respectively) relating to various capital improvement projects. Prior year capital expenditures included significant costs related to the turnaround, replacement of catalysts and addition of the packinox and naphtha hydrotreater heat exchangers.
Depreciation and Amortization Expense
| Three Months Ended | Nine Months Ended | |||||||||||
| September 30 | September 30 | |||||||||||
| 2012 | 2011 | 2012 | 2011 | |||||||||
| Refining | 24,324 | 21,566 | 75,762 | 61,394 | ||||||||
| Marketing | 858 | 966 | 2,727 | 2,814 | ||||||||
| Total depreciation and amortization | 25,182 | 22,532 | 78,489 | 64,208 | ||||||||
The process units are amortized over an average useful life of 20 to 30 years and turnaround costs are amortized over 2 to 4 years. Total depreciation and amortization expense for the three and nine months ended September 30, 2012 increased by $2.7 million and $14.3 million respectively, as compared to the same periods in 2011, mainly due to the amortization of the turnaround and other capital costs that were completed in 2011.
RISK MANAGEMENT, FINANCING AND OTHER
Cash Flow Risk Management
The Company enters into crude oil and foreign exchange contracts to reduce the volatility of cash flows from some of its forecast sales. The following is a summary of Harvest’s risk management contracts outstanding at September 30, 2012:
| Contracts Not Designated as Hedges | ||||||||||||
| Contract Quantity | Type of Contract | Term | Contract Price | Fair Value | ||||||||
| 4,200 bbls/day | Crude oil price swap | Oct – Dec 2012 | US $111.37/bbl | $ | 6,939 | |||||||
| US $468/day | Foreign exchange swap | Oct – Dec 2012 | $ | 1.0236 Cdn/US | 1,692 | |||||||
| $ | 8,631 | |||||||||||
Effective July 31, 2012, the Company discontinued hedge accounting for its crude oil and foreign exchange derivative contracts that had been previously designated as cash flow hedges as the hedges were no longer considered highly effective. Though the hedges no longer meet the criteria for hedge accounting, the hedged forecast crude sales are still expected to occur. As such, the cumulative gains or losses that had been recognized in OCI during the period when the hedges were effective remain in AOCI until the hedged transactions occur. Changes in the fair value of these derivative contracts subsequent to July 31, 2012 have been recognized in “risk management contracts gains or losses” within the consolidated statements of comprehensive income. As at September 30, 2012, $6.7 million of gains remained in AOCI related to the effective cash flow hedges prior to the discontinuation of hedge accounting and are expected to be released to revenues within the next three months when the hedged sales affect earnings.
22
| MANAGEMENT’S DISCUSSION AND ANALYSIS |
The following is a summary of Harvest’s realized and unrealized (gains) losses on risk management contracts:
| Three Months Ended September 30 | ||||||||||||||||||
| 2012 | 2011 | |||||||||||||||||
Contracts not designated as hedges | Crude Oil | Currency | Total | Power | Currency | Total | ||||||||||||
Realized (gains) losses | 753 | 143 | 896 | (3,178 | ) | – | (3,178 | ) | ||||||||||
Unrealized (gains) losses | 874 | 2 | 876 | 1,507 | (163 | ) | 1,344 | |||||||||||
(Gains) losses recognized in net income | 1,627 | 145 | 1,772 | (1,671 | ) | (163 | ) | (1,834 | ) | |||||||||
| ||||||||||||||||||
Contracts designated as hedges | Crude Oil | Crude Oil | ||||||||||||||||
Realized (gains) losses | ||||||||||||||||||
Reclassified from other comprehensive income (“OCI”) to revenues, before tax | (9,610 | ) | (7,128 | ) | ||||||||||||||
Ineffective portion recognized in net income | (46 | ) | 1,471 | |||||||||||||||
| (9,656 | ) | (5,657 | ) | ||||||||||||||
Unrealized (gains) losses | ||||||||||||||||||
Recognized in OCI, net of tax | 426 | (48,290 | ) | |||||||||||||||
Ineffective portion recognized in net income | 112 | (2,470 | ) | |||||||||||||||
| 538 | (50,760 | ) | |||||||||||||||
| ||||||||||||||||||
Total (gains) losses from all risk management contracts | ||||||||||||||||||
Recognized in OCI, net of tax | 7,382 | (42,930 | ) | |||||||||||||||
Recognized in revenues | (9,610 | ) | (7,128 | ) | ||||||||||||||
Recognized in net income outside of revenues | 1,838 | (2,833 | ) | |||||||||||||||
| Nine Months Ended September 30 | ||||||||||||||||||
| 2012 | 2011 | ||||||||||||||||
Contracts not designated as hedges | Crude Oil | Currency | Total | Power | Currency | Total | ||||||||||||
Realized (gains) losses | 753 | 299 | 1,052 | (5,794 | ) | – | (5,794 | ) | ||||||||||
Unrealized (gains) losses | 874 | 2 | 876 | (1,453 | ) | (163 | ) | (1,616 | ) | |||||||||
(Gains) losses recognized in net income | 1,627 | 301 | 1,928 | (7,247 | ) | (163 | ) | (7,410 | ) | |||||||||
| ||||||||||||||||||
Contracts designated as hedges | Crude Oil | Crude Oil | ||||||||||||||||
Realized (gains) losses | ||||||||||||||||||
Reclassified from other comprehensive income (“OCI”) to revenues, before tax | (21,306 | ) | 8,508 | |||||||||||||||
Ineffective portion recognized in net income | (28 | ) | 1,879 | |||||||||||||||
| (21,334 | ) | 10,387 | |||||||||||||||
Unrealized (gains) losses | ||||||||||||||||||
Recognized in OCI, net of tax | (7,735 | ) | (47,154 | ) | ||||||||||||||
Ineffective portion recognized in net income | 35 | (2,596 | ) | |||||||||||||||
| (7,700 | ) | (49,750 | ) | ||||||||||||||
| ||||||||||||||||||
Total (gains) losses from all risk management contracts | ||||||||||||||||||
Recognized in OCI, net of tax | 7,688 | (53,518 | ) | |||||||||||||||
Recognized in revenues | (21,306 | ) | 8,508 | |||||||||||||||
Recognized in net income outside of revenues | 1,935 | (8,127 | ) | |||||||||||||||
23
| MANAGEMENT’S DISCUSSION AND ANALYSIS |
Financing Costs
| Three Months Ended | Nine Months Ended | |||||||||||
| September 30 | September 30 | |||||||||||
| 2012 | 2011 | 2012 | 2011 | |||||||||
Bank loan | 3,783 | 1,979 | 11,325 | 5,026 | ||||||||
Convertible debentures | 12,222 | 12,471 | 36,884 | 37,250 | ||||||||
Senior notes | 9,082 | 8,913 | 27,173 | 26,391 | ||||||||
Related party loan | 965 | – | 965 | – | ||||||||
Amortization of deferred finance charges | 223 | 130 | 733 | 667 | ||||||||
Interest and other financing charges | 26,275 | 23,493 | 77,080 | 69,334 | ||||||||
Capitalized interest | (3,878 | ) | (2,611 | ) | (10,125 | ) | (5,894 | ) | ||||
Gain on redemption of convertible debentures | (48 | ) | – | (48 | ) | – | ||||||
| 22,349 | 20,882 | 66,907 | 63,440 | ||||||||
Accretion of decommissioning liabilities and environmental remediation liabilities | 5,158 | 5,819 | 15,488 | 17,662 | ||||||||
Total finance costs | 27,507 | 26,701 | 82,395 | 81,102 | ||||||||
Interest and other financing charges for the three and nine months ended September 30, 2012, including the amortization of deferred finance charges, increased by $2.8 million and $7.7 million, respectively, compared to the same periods in 2011. These increases are mainly as a result of the increased amount of bank loan outstanding as well as interest accrued on the related party loan (see the “Related Party Transactions” section of this MD&A for discussion of the related party loan). For the three months and nine months ended September 30, 2012, interest charges on our bank loan reflected an effective interest rate of 3.14% and 4.42%, respectively (2011 – 2.98% for both periods).
Currency Exchange
Currency exchange gains and losses are attributed to the changes in the value of the Canadian dollar relative to the U.S. dollar on our U.S. dollar denominated 67/8% senior notes, related party loan and on any other U.S. dollar denominated monetary assets or liabilities. At September 30, 2012, the Canadian dollar relative to the U.S. dollar strengthened compared to the exchange rate as at both June 30, 2012 and December 31, 2011, resulting in an unrealized foreign exchange gain of $5.8 million (2011 - $21.2 million loss) and $5.0 million (2011 - $10.1 million loss) for the three and nine months ended September 30, 2012, respectively. Harvest recognized a realized foreign exchange loss of $1.5 million (2011 - $ 9.0 million gain) and a $0.8 million loss (2011 - $9.2 million gain) for the three and nine months ended September 30, 2012, respectively, as a result of the settlement of U.S. dollar denominated transactions.
The cumulative translation adjustment recognized in other comprehensive income results from the translation of the Downstream operation’s U.S. dollar functional currency financial statements to Canadian dollars. During the third quarter of 2012, Downstream recognized a net cumulative translation loss of $26.2 million (2011 - $79.3 million gain), which resulted from the strengthening of the Canadian dollar relative to the U.S. dollar at September 30, 2012 as compared to June 30, 2012. During the first nine months of 2012, Downstream recognized a net cumulative translation loss of $26.2 million (2011 - $50.3 million gain), as the value of the Canadian dollar strengthened relative to the U.S. dollar at September 30, 2012 as compared to December 31, 2011. As Downstream’s functional currency is U.S. dollars, the weakening of the U.S. dollar would result in losses from decommissioning liabilities, pension obligations, accounts payable and other balances that are denominated in Canadian dollars, which partially offset the unrealized gains recognized on the senior notes and Upstream U.S. dollar denominated monetary items.
24
| MANAGEMENT’S DISCUSSION AND ANALYSIS |
Deferred Income Taxes
For the three and nine months ended September 30, 2012, Harvest recorded a deferred income tax recovery of $18.2 million (2011 – $14.2 million expense) and $56.7 million (2011 - $7.1 million expense) respectively. Our deferred income tax assets and liabilities will fluctuate during each accounting period to reflect changes in the respective temporary differences between the book value and tax basis of our assets and liabilities, non-capital losses and legislative tax rates. Currently the principal source of our temporary differences is the net book value of the Company’s property, plant and equipment and the unclaimed tax pools, which include non-capital losses.
LIQUIDITY
Cash from operating activities for the three and nine months ended September 30, 2012 was $153.9 million and $309.9 million respectively, compared to $161.5 million and $415.9 million for the same periods in 2011. For the third quarter of 2012, the change in non-cash working capital was a surplus of $50.6 million (2011 – contribution of $16.2 million) and $6.1 million (2011 – $5.9 million) was incurred in the settlement of decommissioning liabilities and environmental provision. For the first nine months of 2012, the change in non-cash working capital was a contribution of $11.4 million (2011 – deficit of $32.8 million) and $16.1 million (2011 – $12.2 million) was incurred in the settlement of decommissioning liabilities and environmental provision.
The cash contribution from Harvest’s Upstream operations was $133.3 million in the third quarter of 2012, a decrease of $28.1 million as compared to the same quarter in 2011 mainly due to lower operating netback. The cash contribution from Harvest’s Downstream operations was $0.2 million in the third quarter of 2012, a decrease of $1.8 million as compared to the same quarter in 2011 as a result of higher operating and purchased energy expenses, partially offset by higher gross margin.
For the nine months ended September 30, 2012, the cash contribution from Harvest’s Upstream operations was $421.3 million, a decrease of $45.9 million as compared to the same period in 2011 mainly due to lower operating netback. The cash deficiency from Harvest’s Downstream operations was $38.6 million in the first nine months of 2012, an decrease of $87.0 million as compared to the same period in 2011 as a result of a lower gross margin and higher operating and purchased energy expenses.
For the third quarter of 2012, Harvest’s financing activities repaid $68.8 million (2011 - $83.9 million borrowed) of cash to the credit facility and also fully redeemed the remaining 6.4% convertible debentures at a cost of $106.8 million. Harvest funded the repayment of our credit facility and redemption of the 6.4% convertible debentures through the borrowing of USD $170 million from a related party (see the “Related Party Transactions” section of this MD&A for discussion of the related party loan). For the nine months ended September 30 2012, $215.3 million (2011 - $244.2 million) of net cash was borrowed under the credit facility. During the first nine months of the prior year, $505.4 million of cash was invested into Harvest by our sole shareholder, Korea National Oil Corporation (“KNOC”) to fund the acquisition of the Hunt assets.
For the three and nine months ended September 30, 2012, Harvest funded $121.9 million (2011 - $295.6 million) and $504.2 million (2011 – $809.6 million), respectively, of capital expenditures and net asset acquisition activity with cash generated from operating activities and financing activities.
25
| MANAGEMENT’S DISCUSSION AND ANALYSIS |
Harvest had a working capital deficiency of $415.6 million at September 30, 2012, as compared to a $265.6 million deficiency at December 31, 2011. The increase in our working capital deficiency at September 30, 2012 compared to December 31, 2011 is primarily due to an additional net $225.0 million of the Company’s convertible debentures coming due within the next twelve months. The Company’s working capital is expected to fluctuate from time to time, and may be funded from cash flows from operations, borrowings from Harvest’s credit facility, equity from KNOC, bank debt, and long-term debt as required.
Through a combination of cash available at September 30, 2012, cash from operating activities and the available undrawn amount from the credit facility, it is anticipated that Harvest will have adequate liquidity to fund future operations and the majority of its forecasted capital expenditures (excluding major acquisitions). Harvest regularly monitors its capital structure, liquidity and payment obligations. The Company has the ability to adjust its capital spending programs and issue replacement debt, new debt or equity as may be needed. Refer to the “Contractual Obligations and Commitments”section below for Harvest’s future commitments and discussion on certain significant items.
BlackGold Oil Sands Project
On May 30, 2012, Harvest amended certain aspects of its BlackGold oil sands project engineering, procurement and construction (“EPC”) contract, including revising the compensation terms from a lump sum price to a cost reimbursable price and confirming greater Harvest control over project execution. The cost pressures and resultant contract changes are expected to increase the net EPC costs to approximately $520 million from $311 million, after allowing for certain costs which are not reimbursable to the EPC contractor. Harvest and the EPC contractor also agreed to apply the cumulative progress payments made under the lump sum contract and the remaining deposit of $24.4 million as at May 30, 2012 towards costs incurred to date.
Under the amended EPC contract, a maximum of approximately $101 million of the EPC costs will be paid in equal installments, without interest, over 10 years commencing on the completion of the EPC work in 2014. The liability is considered a financial liability and is initially recorded at fair value, which is estimated as the present value of all future cash payments discounted using the prevailing market rate of interest for similar instruments. As at September 30, 2012, Harvest recognized a liability of $3.3 million using a discount rate of 4.50% .
The Company has designed Phase 1 with 30 SAGD wells (15 well pairs) of which 26 have been drilled to the end of the third quarter of 2012. The remaining 4 wells were drilled subsequent to the third quarter in October 2012. Engineering of the project is now approximately 80% complete and the site has been cleared and graded and now piling and foundation work is underway. Other near-term activities include completion of the detailed engineering work, delivery of equipment and modules to the site and the site construction. Phase 2 of the project, which is targeted to increase production capacity to 30,000 bbl/d, is in the regulatory approval process and approval is now anticipated in 2013.
Harvest had originally budgeted 2012 capital spending of $215 million for the BlackGold oil sands project which has now been reduced to approximately $160 million. Activities that will be deferred are primarily related to facility construction. Harvest plans to fund the capital expenditures with cash flows from operating activities and the undrawn amount from the credit facility. As of September 30, 2012, Harvest has spent $120.9 million (including the $31.1 million deposit) on the EPC contract and has invested $243.2 million in the entire project since acquiring the BlackGold assets in 2010.
26
| MANAGEMENT’S DISCUSSION AND ANALYSIS |
Contractual Obligations and Commitments
Harvest has contractual obligations and commitments entered into in the normal course of operations including the purchase of assets and services, operating agreements, transportation commitments, purchase commitments, royalty obligations, and land lease obligations. These obligations are of a recurring and consistent nature and impact cash flow in an ongoing manner. As at September 30, 2012, Harvest has the following significant contractual commitments:
| Maturity | |||||||||||||||
| 1 year | 2-3 years | 4-5 years | After 5 years | Total | |||||||||||
Debt repayments(1) | 330,548 | 296,629 | 573,495 | 658,744 | 1,859,416 | ||||||||||
Debt interest payments(1) | 98,690 | 136,643 | 89,606 | – | 324,939 | ||||||||||
Purchase commitments(2) | 259,836 | 83,663 | 20,000 | 60,000 | 423,499 | ||||||||||
Operating leases | 11,928 | 16,814 | 6,645 | 786 | 36,173 | ||||||||||
Transportation agreements(3) | 9,659 | 12,714 | 2,790 | 218 | 25,381 | ||||||||||
Feedstock & other purchase commitments(4) | 842,509 | – | – | – | 842,509 | ||||||||||
Employee benefits(5) | 10,730 | 15,787 | 9,351 | 236 | 36,104 | ||||||||||
Decommissioning and environmental remediation liabilities(6) | 22,664 | 37,865 | 34,256 | 1,372,370 | 1,467,155 | ||||||||||
Total | 1,586,564 | 600,115 | 736,143 | 2,092,354 | 5,015,176 | ||||||||||
| (1) | Assumes constant period end foreign exchange rate. |
| (2) | Relates to the BlackGold oil sands project commitment, drilling commitments, and Downstream capital commitments. |
| (3) | Relates to firm transportation commitments. |
| (4) | Includes commitments to purchase refinery crude stock under the supply and offtake agreement, purchased fuel and other additives. |
| (5) | Relates to the expected contributions to employee benefit plans and long-term incentive plan payments. |
| (6) | Represents the undiscounted obligation by period. |
27
| MANAGEMENT’S DISCUSSION AND ANALYSIS |
CAPITAL RESOURCES
The following table summarizes our capital structure as at September 30, 2012 and December 31, 2011 and provides the key financial ratios defined in Harvest’s credit facility agreement.
| September 30, 2012 | December 31, 2011 | |||||
| Debts | ||||||
| Bank loan(1) | 573,495 | 358,885 | ||||
| Senior notes, at principal amount (US$500 million)(2) | 491,600 | 508,500 | ||||
| Related party loan (US$170 million)(2) | 167,144 | – | ||||
| Convertible debentures, at principal amount | 627,177 | 733,973 | ||||
| 1,859,416 | 1,601,358 | |||||
| Shareholder’s Equity | ||||||
| 386,078,649 common shares issued(3) | 3,228,092 | 3,453,644 | ||||
| 5,087,508 | 5,055,002 | |||||
| Financial Ratios(4)(5) | ||||||
| Senior Debt to Annualized EBITDA(6) | 1.38 | 0.73 | ||||
| Total Debt to Annualized EBITDA(7) | 3.73 | 2.72 | ||||
| Senior Debt to Total Capitalization(6) (8) | 14% | 10% | ||||
| Total Debt to Total Capitalization(7) (8) | 38% | 36% |
| (1) | The bank loan net of deferred financing costs is $570.4 million (2011 - $355.6 million). |
| (2) | Principal amount converted at the period end exchange rate. |
| (3) | As at November 14, 2012, the number of common shares issued is 386,078,649. |
| (4) | Calculated based on Harvest’s credit facility covenant requirements (see note 11 of the September 30, 2012 financial statements). |
| (5) | The financial ratios and their components are non-GAAP measures; please refer to the “Non-GAAP Measures” section of this MD&A. |
| (6) | Senior debt consists of letters of credit of $8.1 million (2011 – $8.7 million), bank loan of $570.4 million (2011 - $355.6 million) and guarantees of $75.8 million (2011 - $92.1 million) at September 30, 2012. |
| (7) | Total debt includes the senior debt, convertible debentures of $632.7 million (2011 - $742.1 million) and senior notes of $480.3 million (2011 - $495.7 million) at September 30, 2012. |
| (8) | Total capitalization includes total debt, related party loan of $167.1 million (2011 – $ nil) and shareholder’s equity less equity attributed to BlackGold of $458.8 million at September 30, 2012 (2011 - $459.9 million). |
Under the credit facility agreement, Harvest is required to maintain certain financial ratios. On June 29, 2012, the credit facility agreement was amended to revise the maximum allowable total debt to annualized EBITDA ratio from 3.5:1 to the following:
| Twelve months ending | Total Debt to Annualized EBITDA |
| June 30, 2012 | 4.25:1.0 or less |
| September 30, 2012 | 4.25:1.0 or less |
| December 31, 2012 | 4.00:1.0 or less |
| March 31, 2013 | 3.75:1.0 or less |
| June 30, 2013 and thereafter | 3.50:1.0 or less |
In July 2012, Harvest agreed with its lenders to extend the credit facility agreement by one year to April 30, 2016.
Except for the above amendments, all other terms to the credit facility agreement remain unchanged.
28
| MANAGEMENT’S DISCUSSION AND ANALYSIS |
OFF BALANCE SHEET ARRANGEMENTS
As of September 30, 2012, there were no off balance sheet arrangements in place.
RELATED PARTY TRANSACTIONS
For the three and nine months ended September 30, 2012, Harvest billed KNOC and certain KNOC subsidiaries for a total of $0.9 million and $1.7 million, respectively (2011 - $0.2 million and $0.5 million) primarily related to technical services provided by Harvest’s Global Technology and Research Centre (“GTRC”). As at September 30, 2012, $0.8 million (2011 - $1.1 million) remained outstanding from KNOC in accounts receivable. KNOC billed Harvest $0.1 million for the nine months ended September 30, 2012 (2011 – $ nil) for reimbursement to KNOC for secondee salaries. As at September 30, 2012, $0.2 million (2011 - $0.6 million) remains outstanding in accounts payable.
KNOC Trading Corporation (“KNOC Trading”) is a wholly owned subsidiary of North Atlantic. On a monthly basis, KNOC Trading receives revenue from ANKOR E&P Holdings Corp. (“ANKOR”) and Dana Petroleum plc (“Dana”), both of which are wholly owned U.S. subsidiaries of KNOC, by providing oil marketing service such as the sale of products on behalf of ANKOR and Dana. For the three and nine months ended September 30, 2012, all of KNOC Trading’s revenue of $0.3 million and $0.6 million respectively (2011 - $nil) were derived from ANKOR and Dana.
On August 16, 2012, Harvest entered into a subordinated loan agreement with ANKOR to borrow USD $170 million at a fixed interest rate of 4.62% per annum. The principal balance outstanding and accrued interest is revalued using the exchange rate at the end of each reporting period. At September 30, 2012, $167.1 million of principal and $1.0 million of accrued interest remained outstanding. Interest expenses were $1.0 million for the three and nine months ended September 30, 2012. Harvest may, at its sole discretion, repay the principal in whole or in part without premium or penalty, together with all accrued interest at any time during the term of the agreement. No payments of principal or interest are required before the maturity of the loan on October 2, 2017. The loan is unsecured and the loan agreement contains no restrictive covenants. For purposes of Harvest’s bank loan covenant requirements, the loan is excluded from the ‘total debt’ amount but included in the ‘total capitalization’ amount.
29
| MANAGEMENT’S DISCUSSION AND ANALYSIS |
SUMMARY OF QUARTERLY RESULTS
The following table and discussion highlights our third quarter of 2012 results relative to the preceding 7 quarters:
| 2012 | 2011 | 2010 | ||||||||||||||||||||||
| Q3 | Q2 | Q1 | Q4 | Q3 | Q2 | Q1 | Q4 | |||||||||||||||||
FINANCIAL | ||||||||||||||||||||||||
Revenues | 1,275,117 | 1,533,808 | 1,426,140 | 1,469,918 | 848,241 | 786,733 | 1,288,882 | 1,301,348 | ||||||||||||||||
Net income (loss) | (38,309 | ) | (73,293 | ) | (72,081 | ) | (73,885 | ) | (49,204 | ) | (19,529 | ) | 37,961 | (12,333 | ) | |||||||||
Cash from operating activities | 153,895 | 70,850 | 85,110 | 144,625 | 161,499 | 107,536 | 146,828 | 142,134 | ||||||||||||||||
Total long-term financial debt | 1,519,352 | 1,770,748 | 1,652,424 | 1,486,170 | 1,509,773 | 1,384,862 | 1,244,825 | 1,239,024 | ||||||||||||||||
Total assets | 6,162,913 | 6,277,496 | 6,322,250 | 6,284,370 | 6,483,568 | 6,121,547 | 6,041,118 | 5,388,740 | ||||||||||||||||
| ||||||||||||||||||||||||
| ||||||||||||||||||||||||
OPERATIONS | ||||||||||||||||||||||||
Upstream | ||||||||||||||||||||||||
Daily sales volumes (boe/d) | 57,686 | 60,874 | 60,550 | 61,324 | 58,548 | 55,338 | 53,331 | 50,054 | ||||||||||||||||
Realized price prior to hedges ($/boe) | 52.02 | 51.42 | 58.07 | 64.61 | 57.85 | 66.73 | 59.19 | 56.03 | ||||||||||||||||
Downstream | ||||||||||||||||||||||||
Average daily throughput (bbl/d) | 84,889 | 114,552 | 100,000 | 89,468 | 43,357 | 38,749 | 101,007 | 111,317 | ||||||||||||||||
Average refining gross margin (loss) ($US/bbl) | 6.03 | 2.71 | 4.58 | (4.11 | ) | 10.06 | 7.94 | 10.57 | 6.13 | |||||||||||||||
The quarterly revenues and cash from operating activities are mainly impacted by the Upstream sales volumes, realized prices and operating expenses and Downstream throughput volumes, cost of feedstock and realized prices. Significant items that impacted Harvest’s quarterly revenues include:
Revenues were highest in the second quarter of 2012 as a result of the refinery operating at near capacity. Revenues were second highest during the fourth quarter of 2011, reflecting higher commodity prices and stronger sales volumes in the Upstream operations.
The lower revenue in the second and third quarters of 2011 was due to lower Downstream sales as a result of a planned shutdown, partially offset by increased Upstream sales from the assets acquired from Hunt in the first quarter 2011 and higher commodity prices.
The increasing Upstream sales volumes since the fourth quarter of 2010 were mainly attributable to the acquisition of oil and gas assets in the third quarter of 2010 and first quarter of 2011, combined with our active drilling programs. The decrease in the third quarter of 2012 was mainly due to the impact of natural declines and facility turnarounds which more than offset the increases from our drilling program.
Downstream’s refining margin/bbl increased in the first and third quarter of 2011, reflecting the higher global refining crack spreads during these periods. However the weaker margins experienced in the four most recent quarters reflect the decrease in the sour-crude differential from the Brent benchmark price for crude oil.
Downstream’s average daily throughput was lower in the third quarter of 2012 as compared to the three previous quarters due to a two-week partial outage of some process units and a three-week unplanned shutdown of all process units while repairs were completed to the sulphur recovery unit. The average daily throughput was significantly lower than the 115,000bbl/d nameplate capacity of the refinery for the second and third quarters of 2011 due to a planned turnaround.
30
| MANAGEMENT’S DISCUSSION AND ANALYSIS |
Net income (loss) reflects both cash and non-cash items. Changes in non-cash items including deferred income tax, DD&A expense, accretion of decommissioning and environmental remediation liabilities, impairment of long-lived assets, unrealized foreign exchange gains and losses, and unrealized gains and losses on risk management contracts impact net income (loss) from period to period. For these reasons, the net income (loss) may not necessarily reflect the same trends as revenues or cash from operating activities, nor is it expected to.
The significant increase in total assets in the first quarter of 2011 was due to the February 2011 acquisition of oil and gas properties from Hunt while the increases in other quarters are mainly attributable to organic additions from Harvest’s capital program.
OUTLOOK
Guidance for 2013 relating to both our Upstream and Downstream operations will be provided in early 2013 after the Board of Directors approves the capital budget in mid-December.
Upstream
The Upstream capital spending estimate for 2012 has been increased $30 million for a total of $441 million. The capital spending in the fourth quarter will primarily be for the completion and tie-in of the remaining wells drilled during our 2012 summer and fall drilling program. The additional $30 million of capital spending will be used in the fourth quarter for our winter drilling programs to ensure completion and tie-in of wells prior to 2013 spring break up.
Harvest’s 2012 fourth quarter production is expected to average approximately 57,000 boe/d with full year production averaging 59,000 boe/d. There is no change in royalty guidance of 16% of revenue, and average general & administrative costs of $2.80/boe. Based on the actual operating costs incurred to date in 2012, guidance to operating costs has been revised to average approximately $17.00/boe.
The BlackGold oil sands project capital budget remains at $160 million for 2012. First oil production from Phase 1 is expected in 2014. ERCB approval for Phase 2 is anticipated in early 2013.
As part of our continuous asset review process Harvest is divesting selected non-core assets comprised of less than 3% of production in an effort to high-grade our asset base and enhance our financial flexibility. Proceeds from our divestitures will be used to reduce bank debt in the short term.
Downstream
The 2012 capital spend for Downstream will be approximately $71 million. Most of the capital spending during the fourth quarter will be allocated to sustaining and maintenance projects focused on compressor replacement, catalyst change out in the isomax unit and decoking of the visbreaker.
Throughput volume is expected to average between 100,000 to 105,000 bbl/d in 2012, with operating costs and purchased energy costs aggregating to approximately $6.50/bbl.
31
| MANAGEMENT’S DISCUSSION AND ANALYSIS |
ACCOUNTING POLICIES AND CRITICAL ACCOUNTING ESTIMATES
The preparation of Harvest’s financial and operating results requires management to make judgments, estimates and assumptions in the application of accounting policies that could have a significant impact on our results. Actual results may differ from those estimates. Estimates and underlying assumptions are reviewed on an ongoing basis. Further information on the basis of presentation and our significant accounting policies and estimates can be found in the notes to the audited consolidated financial statements for the year ended December 31, 2011. There have been no changes to our critical accounting policies and estimates in the third quarter of 2012.
RECENT PRONOUNCEMENTS
There have been no updates during the third quarter of 2012 to the future accounting policies that were described in the annual MD&A for the year ended December 31, 2011. Harvest is currently assessing the potential impact from the adoption of those new standards.
OPERATIONAL AND OTHER BUSINESS RISKS
Harvest’s operational and other business risks remain substantially unchanged from those discussed in our annual MD&A for the year ended December 31, 2011 as filed on SEDAR atwww.sedar.com, except for the following additional risk relating to our Downstream operations:
- Greater competition now exists in Newfoundland for business resources such as qualified personnel, materials, and equipment. There is a risk that we may have difficulty sourcing such resources which could lead to disruptions in operations and increased operating and capital costs.
CHANGES IN REGULATORY ENVIRONMENT
Harvest’s regulatory environment remains unchanged from those discussed in our annual MD&A for the year ended December 31, 2011 as filed on SEDAR atwww.sedar.com.
INTERNAL CONTROL OVER FINANCIAL REPORTING
During the interim period ended September 30, 2012, there were no significant changes in internal controls over financial reporting that have materially affected, or are reasonably likely to materially affect our internal controls over financial reporting.
ADDITIONAL GAAP MEASURE
Harvest uses “operating income (loss)”, an additional GAAP measure that is not defined under International Financial Reporting Standards (“IFRS”) hereinafter also referred to as “GAAP”. The measure is commonly used for comparative purposes in the petroleum and natural gas and refining industries to reflect operating results before items not directly related to operations. Harvest uses this measure to assess and compare the performance of its two operating segments.
NON-GAAP MEASURES
Throughout this MD&A, the Company has referred to certain measures of financial performance that are not specifically defined under GAAP such as “operating netbacks”, “operating netback prior to/after hedging”, “gross margin (loss)”, “cash contribution (deficiency) from operations”, “total debt”, “total financial debt”, “total capitalization”, “Annualized EBITDA”, “senior debt to Annualized EBITDA”, “total debt to Annualized EBITDA”, “senior debt to total capitalization”, and “total debt to total capitalization”.
32
| MANAGEMENT’S DISCUSSION AND ANALYSIS |
“Operating netbacks” are reported on a per boe basis and used extensively in the Canadian energy sector for comparative purposes. “Operating netbacks” include revenues, operating expenses, transportation and marketing expenses, and realized gains or losses on risk management contracts. “Gross margin (loss)” is commonly used in the refining industry to reflect the net funds received from the sale of refined products after considering the cost to purchase the feedstock and is calculated by deducting purchased products for resale and processing from total revenue. “Cash contribution (deficiency) from operations” is calculated as operating income (loss) adjusted for non-cash items. The measure demonstrates the ability of the each segment of Harvest to generate the cash from our operations necessary to repay debt, make capital investments, and fund the settlement of decommissioning and environmental remediation liabilities. “Total debt”, “total financial debt”, “total capitalization”, and “Annualized EBITDA” are used to assist management in assessing liquidity and the Company’s ability to meet financial obligations. “Senior debt to Annualized EBITDA”, “total debt to Annualized EBITDA”, “senior debt to total capitalization” and “total debt to total capitalization” are terms defined in Harvest’s credit facility agreement for the purpose of calculation of our financial covenants. The non-GAAP measures do not have any standardized meaning prescribed by GAAP and may not be comparable to similar measures used by other issuers. The determination of the non-GAAP measures have been illustrated throughout this MD&A, with reconciliations to IFRS measures and/or account balances, except for Annualized EBITDA and cash contribution (deficiency) which are shown below.
Annualized EBITDA
Annualized EBITDA is defined in Harvest’s credit facility agreement as earnings before finance costs, income tax expense or recovery, DD&A, exploration and evaluation costs, impairment of assets, unrealized gains or losses on risk management contracts, unrealized gains or losses on foreign exchange, gains or losses on disposition of assets and other non-cash items. The following is a reconciliation of Annualized EBITDA to the nearest GAAP measure net loss:
| Twelve months rolling: | September 30, 2012 | December 31, 2011 | ||||
| Net loss | (257,568 | ) | (104,657 | ) | ||
| DD&A | 688,821 | 626,698 | ||||
| Finance costs | 110,420 | 109,127 | ||||
| Income tax recovery | (93,660 | ) | (29,827 | ) | ||
| EBITDA | 448,013 | 601,341 | ||||
| Unrealized (gains) losses on risk management contracts | 4,376 | (746 | ) | |||
| Unrealized (gains) losses on foreign exchange | (12,572 | ) | 2,555 | |||
| Unsuccessful exploration and evaluation costs | 28,744 | 17,757 | ||||
| Impairment of PP&E | 21,843 | – | ||||
| Gains on disposition of PP&E | (12,488 | ) | (7,883 | ) | ||
| Other non-cash items | (2,992 | ) | 4,795 | |||
| Adjustments on acquisitions and dispositions(1) | – | 6,481 | ||||
| Less earnings from non-restricted subsidiaries(1) | (1,568 | ) | (1,516 | ) | ||
| Annualized EBITDA(1) | 473,356 | 622,784 |
| (1) | As stipulated by the credit facility agreement, Annualized EBITDA is a twelve month rolling measure which includes the net income impact from acquisitions or dispositions as if the transaction had been effected at the beginning of the period and excludes earnings attributable to the BlackGold assets and non-restricted subsidiaries. |
| 33 | |
| MANAGEMENT’S DISCUSSION AND ANALYSIS |
Cash Contribution (Deficiency) from Operations
Cash contribution (deficiency) from operations represents operating income (loss) adjusted for non-cash expense items within: general and administrative, exploration and evaluation, depletion, depreciation and amortization, gains on disposition of PP&E, risk management contracts gains or losses, impairment on PP&E, and the inclusion of cash interest, realized foreign exchange gains or losses and other cash items not included in operating income (loss). The measure demonstrates the ability of each segment of Harvest to generate cash from its operations. The most directly comparable additional GAAP measure is operating income (loss). Operating income (loss) as presented in the notes to Harvest’s consolidated financial statements is reconciled to cash contribution (deficiency) from operations below:
| Three Months Ended September 30 | ||||||||||||||||||
| Downstream | Upstream | Total | ||||||||||||||||
| 2012 | 2011 | 2012 | 2011 | 2012 | 2011 | |||||||||||||
Operating income (loss) | (21,882 | ) | (20,331 | ) | (11,394 | ) | 24,232 | (33,276 | ) | 3,901 | ||||||||
Adjustments: | ||||||||||||||||||
Operating | (3,087 | ) | (166 | ) | 523 | – | (2,564 | ) | (166 | ) | ||||||||
General and administrative | – | – | (58 | ) | 548 | (58 | ) | 548 | ||||||||||
Exploration and evaluation | – | – | 5,468 | 713 | 5,468 | 713 | ||||||||||||
Depletion, depreciation and amortization | 25,182 | 22,532 | 142,648 | 137,070 | 167,830 | 159,602 | ||||||||||||
(Gains) losses on disposition of PP&E | – | – | (4,881 | ) | (65 | ) | (4,881 | ) | (65 | ) | ||||||||
Unrealized (gains) losses on risk management contracts | – | – | 988 | (1,126 | ) | 988 | (1,126 | ) | ||||||||||
Cash contribution from operations | 213 | 2,035 | 133,294 | 161,372 | 133,507 | 163,407 | ||||||||||||
Inclusion of items not attributable to segments: | ||||||||||||||||||
Net cash interest paid | 22,568 | 21,142 | ||||||||||||||||
Realized foreign exchange (gains) losses | 1,515 | (9,029 | ) | |||||||||||||||
Consolidated cash contribution from operations | 109,424 | 151,294 | ||||||||||||||||
| Nine Months Ended September 30 | ||||||||||||||||||
| Downstream | Upstream | Total | ||||||||||||||||
| 2012 | 2011 | 2012 | 2011 | 2012 | 2011 | ||||||||||||
Operating income (loss) | (113,287 | ) | (15,768 | ) | (48,862 | ) | 74,184 | (162,149 | ) | 58,416 | ||||||||
Adjustments: | ||||||||||||||||||
Operating | (3,800 | ) | (77 | ) | (3,100 | ) | – | (6,900 | ) | (77 | ) | |||||||
General and administrative | – | – | (255 | ) | 660 | (255 | ) | 660 | ||||||||||
Exploration and evaluation | – | – | 21,940 | 10,952 | 21,940 | 10,952 | ||||||||||||
Depletion, depreciation and amortization | 78,489 | 64,208 | 434,189 | 386,348 | 512,678 | 450,556 | ||||||||||||
(Gains) losses on disposition of PP&E | – | – | (5,350 | ) | (745 | ) | (5,350 | ) | (745 | ) | ||||||||
Unrealized (gains) losses on risk management contracts | – | – | 911 | (4,212 | ) | 911 | (4,212 | ) | ||||||||||
Impairment on PP&E | – | – | 21,843 | – | 21,843 | – | ||||||||||||
| ||||||||||||||||||
Cash contribution (deficiency) fromoperations | (38,598 | ) | 48,363 | 421,316 | 467,187 | 382,718 | 515,550 | |||||||||||
Inclusion of items not attributable to segments: | ||||||||||||||||||
Net cash interest paid | 67,389 | 63,931 | ||||||||||||||||
Realized foreign exchange (gains) losses | 823 | (9,195 | ) | |||||||||||||||
Consolidated cash contribution from operations | 314,506 | 460,814 | ||||||||||||||||
34
| MANAGEMENT’S DISCUSSION AND ANALYSIS |
FORWARD-LOOKING INFORMATION
This MD&A highlights significant business results and statistics from our unaudited consolidated financial statements for the three and nine months ended September 30, 2012 and the accompanying notes thereto. In the interest of providing our lenders and potential lenders with information regarding Harvest, including our assessment of our future plans and operations, this MD&A contains forward-looking statements that involve risks and uncertainties.
Such risks and uncertainties include, but are not limited to: risks associated with conventional petroleum and natural gas operations; risks associated with refining and marketing operations; risks associated with the construction of the oil sands project; the volatility in commodity prices, interest rates and currency exchange rates; risks associated with realizing the value of acquisitions; general economic, market and business conditions; changes in environmental legislation and regulations; the availability of sufficient capital from internal and external sources; and, such other risks and uncertainties described from time to time in our regulatory reports and filings made with securities regulators.
Forward-looking statements in this MD&A include, but are not limited to, the forward looking statements made in the “Outlook” section as well as statements made throughout with reference to production volumes, refinery throughput volumes, royalty rates, operating costs, commodity prices, administrative costs, price risk management activities, acquisitions and dispositions, capital spending, reserve estimates, access to credit facilities, income taxes, cash from operating activities, and regulatory changes. For this purpose, any statements that are contained herein that are not statements of historical fact may be deemed to be forward-looking statements. Forward-looking statements often contain terms such as “may”, “will”, “should”, “anticipate”, “expect”, “target”, “plan”, “potential”, “intend”, and similar expressions.
Readers are cautioned not to place undue reliance on forward-looking statements as there can be no assurance that the plans, intentions or expectations upon which they are based will occur. Although we consider such information reasonable at the time of preparation, it may prove to be incorrect and actual results may differ materially from those anticipated. Harvest assumes no obligation to update forward-looking statements should circumstances, estimates or opinions change, except as required by law. Forward-looking statements contained in this MD&A are expressly qualified by this cautionary statement.
ADDITIONAL INFORMATION
Further information about us can be accessed under our public filings found on SEDAR atwww.sedar.com or atwww.harvestenergy.ca. Information can also be found by contacting our Investor Relations department at (403) 265-1178 or at 1-866-666-1178.
35