 | MANAGEMENT’S DISCUSSION AND ANALYSIS |
MANAGEMENT’S DISCUSSION AND ANALYSIS
This Management’s Discussion and Analysis (“MD&A”) should be read in conjunction with the audited annual consolidated financial statements of Harvest Operations Corp. (“Harvest”, “we”, “us”, “our” or the “Company”) for the year ended December 31, 2012, together with the accompanying notes. The information and opinions concerning our future outlook are based on information available at February 28, 2013.
In this MD&A, all dollar amounts are expressed in Canadian dollars unless otherwise indicated. Tabular amounts are in millions of dollars, except where noted. All financial data has been prepared in accordance with International Financial Reporting Standards (“IFRS”) as issued by the International Accounting Standards Board except where otherwise noted.
Natural gas volumes are converted to barrels of oil equivalent (“boe”) using the ratio of six thousand cubic feet (“mcf”) of natural gas to one barrel of oil (“bbl”). Boes may be misleading, particularly if used in isolation. A boe conversion ratio of 6 mcf to 1 bbl is based on an energy equivalent conversion method primarily applicable at the burner tip and does not represent a value equivalent at the wellhead. In accordance with Canadian practice, petroleum and natural gas revenues are reported on a gross basis before deduction of Crown and other royalties.
Additional information concerning Harvest, including its audited annual consolidated financial statements and Annual Information Form (“AIF”) can be found on SEDAR atwww.sedar.com.
ADVISORY
This MD&A contains non-GAAP measures and forward-looking information about our current expectations, estimates and projections. Readers are cautioned that the MD&A should be read in conjunction with the “Non-GAAP Measures” and “Forward-Looking Information” sections at the end of this MD&A.
Effective October 1, 2012, Harvest reclassified certain properties that were previously reported as light to medium oil to heavy oil as classified under National Instrument 51-101. Tabular amounts have been updated for this reclassification. See the “Reclassification of Heavy Oil and Light to Medium Oil Volumes” section of this MD&A.
1
| MANAGEMENT’S DISCUSSION AND ANALYSIS |
FINANCIAL AND OPERATING HIGHLIGHTS
| Three Months Ended | Year Ended | |||||||||||
| December 31 | December 31 | |||||||||||
| 2012 | 2011 | 2012 | 2011 | |||||||||
| UPSTREAM OPERATIONS | ||||||||||||
| Daily sales volumes (boe/d) | 58,228 | 61,324 | 59,327 | 57,161 | ||||||||
| Average realized price | ||||||||||||
| Oil and NGLs ($/bbl)(2) | 68.50 | 84.82 | 72.39 | 79.60 | ||||||||
| Gas ($/mcf) | 3.44 | 3.42 | 2.58 | 3.83 | ||||||||
| Operating netback prior to hedging ($/boe)(1) | 30.61 | 36.57 | 28.46 | 34.54 | ||||||||
| Operating income (loss) | 36.1 | 37.0 | (12.7 | ) | 111.2 | |||||||
| Cash contribution from operations(1) | 160.4 | 193.7 | 581.9 | 661.0 | ||||||||
| Capital asset additions (excluding acquisitions) | 87.8 | 148.8 | 445.2 | 632.2 | ||||||||
| Property and business acquisitions (dispositions), net | (78.4 | ) | (8.0 | ) | (87.2 | ) | 505.3 | |||||
| Net wells drilled | 12.8 | 39.4 | 100.9 | 202.3 | ||||||||
| Net undeveloped land additions (acres)(3) | 39,543 | 19,549 | 131,394 | 387,754 | ||||||||
| BLACKGOLD OIL SANDS | ||||||||||||
| Capital asset additions | 44.4 | 30.8 | 164.1 | 101.2 | ||||||||
| Net wells drilled | 4.0 | – | 30.0 | 12.0 | ||||||||
| DOWNSTREAM OPERATIONS | ||||||||||||
| Average daily throughput (bbl/d) | 114,065 | 89,468 | 103,355 | 68,046 | ||||||||
| Average refining margin (loss) (US$/bbl)(1) | 6.43 | (4.11 | ) | 4.87 | 5.15 | |||||||
| Operating loss | (593.4 | ) | (124.7 | ) | (706.8 | ) | (140.6 | ) | ||||
| Cash deficiency from operations(1) | (3.0 | ) | (97.9 | ) | (41.7 | ) | (49.7 | ) | ||||
| Capital asset additions | 21.5 | 37.5 | 54.2 | 284.2 | ||||||||
| (1) | This is a non-GAAP measure; please refer to “Non-GAAP Measures” in this MD&A. |
| (2) | Excludes the effect of risk management contracts designated as hedges. |
| (3) | Includes lands acquired in business combinations. |
REVIEW OF OVERALL PERFORMANCE
Harvest is an integrated energy company with a petroleum and natural gas business focused on the exploration, development and production of assets in western Canada (“Upstream”), an oil sands project under construction and development in northern Alberta (“BlackGold”), and a refining and marketing business focused on the operation of a medium gravity sour crude oil hydrocracking refinery and a retail and wholesale petroleum marketing business both located in the Province of Newfoundland and Labrador (“Downstream”). Harvest is a wholly owned subsidiary of Korea National Oil Corporation (“KNOC”). Our earnings and cash flow from operating activities are largely determined by the realized prices for our crude oil and natural gas production as well as refined product crack spreads.
Harvest completed 2012 with actual results comparable to most of the previously disclosed guidance. Noticeable differences include Upstream fourth quarter production and royalties as a percentage of revenue. Upstream fourth quarter production exceeded guidance by 1,228 boe/day due to late closing of certain dispositions. Royalties came to 13.8% of revenue, lower than guidance of 16%, due to lower commodity prices especially in the fourth quarter, and higher Alberta Crown gas cost allowance credits in 2012.
2
| MANAGEMENT’S DISCUSSION AND ANALYSIS |
Upstream
Sales volumes for the fourth quarter of 2012 decreased by 3,096 boe/d compared to 2011 primarily due to natural declines, a smaller 2012 capital drilling program and dispositions of certain non-core producing properties in 2012. Sales volumes for the year ended December 31, 2012 increased by 2,166 boe/d compared to 2011 primarily due to the results of a very active capital program in the prior year, reduced production in 2011 from the Plains Rainbow Pipeline outage and an extra two months of production in 2012 from the Hunt assets acquired in February 2011.
Operating netback prior to hedging for the fourth quarter and year ended December 31, 2012 were $30.61/boe (2011 – $36.57/boe) and $28.46/boe (2011 – $34.54/boe), respectively, decreases of $5.96/boe and $6.08/boe from 2011, mainly due to lower realized prices.
Operating income was $36.1 million (2011 - $37.0 million) for the fourth quarter of 2012. The slight decrease in operating income is mainly attributable to the lower realized prices, largely offset by decreased operating expense and $25.0 million of gains on disposition of non-core assets. The annual operating loss was $12.7 million for 2012 as compared to operating income of $111.2 million for 2011. The decrease in operating income is attributable to the lower realized prices, increased depreciation, depletion and amortization and the recognition of a $21.8 million impairment loss, partially offset by $30.3 million of gains on disposition.
Cash contribution from operations was $160.4 million for the fourth quarter of 2012, a $33.3 million decrease from the prior period driven by lower realized prices, partially offset by a decrease in operating expenses. Cash contribution from operations was $581.9 million for the year ended December 31, 2012, a $79.1 million decrease from the prior year driven by lower realized prices.
Capital asset additions of $87.8 million during the fourth quarter 2012 includes the drilling of 14 gross (12.8 net) wells with a success rate of 100%. Capital asset additions of $445.2 million during the year 2012 includes the drilling of 116 gross (100.9 net) wells with a success rate of approximately 99%.
BlackGold
Capital asset additions of $44.4 million for the fourth quarter and $164.1 million for the year 2012 include the drilling of 4 and 30 SAGD wells, respectively, and construction of the processing facility.
The engineering, procurement and construction (“EPC”) contract was amended such that the net costs are now expected to be $520 million.
The engineering, procurement and construction portion of the EPC contract relating to the central processing facility is approximately 83% complete. The facility construction portion of the contract is approximately 43% complete. Production is expected to start in 2014.
Downstream
Throughput volume averaged 114,065 bbl/d for the fourth quarter of 2012, an increase of 24,597 bbl/d as compared to 2011 mainly due to reduced throughput rates in 2011 as a result of declining refining margins. Refining gross margin averaged US$6.43/bbl for fourth quarter of 2012, an improvement of US$10.54/bbl from 2011. The annual throughput volume averaged 103,355 bbl/d for the year ended December 31, 2012, an increase of 35,309 bbl/d as compared to 2011 mainly due to the planned maintenance of the refinery units which occurred in the prior year. Refining gross margin averaged $4.87/bbl for the year ended 2012, a slight decrease of $0.28/bbl from 2011.
3
| MANAGEMENT’S DISCUSSION AND ANALYSIS |
Operating losses totaled $593.4 million and $706.8 million for the fourth quarter and year ended December 31, 2012, respectively, as compared to operating losses of $124.7 million and $140.6 million for the same periods in 2011. The increase in operating losses is primarily due to an impairment charge of $563.2 million on the refining assets.
Cash deficiency from operations was $3.0 million for the fourth quarter of 2012, a $94.9 million improvement from the prior year mainly due to higher daily throughput and a higher average refining margin per bbl as compared to 2011. Cash deficiency from operations was $41.7 million for the year ended December 31, 2012, an $8.0 million improvement from the prior year mainly due to higher daily throughput, partially offset by lower average refining margin per bbl and increased operating and purchased energy expense.
Capital asset additions of $21.5 million (2011 - $37.5 million) and $54.2 million (2011 - $284.2 million) for the fourth quarter and year ended December 31, 2012, respectively, include turnaround costs and various capital improvement projects. Capital asset additions decreased from 2011 as a result of a lower capital budget and less intensive turnaround in 2012.
Corporate
On July 31, 2012, Harvest agreed with its lenders to extend the credit facility agreement by one year to April 30, 2016.
On August 1, 2012, Harvest completed its offer to exchange US$500 million in aggregate principal amount of its 6ì% Senior Notes that had been registered under the United States Securities Act of 1933, as amended, for the same principal amount of outstanding unregistered 6ì% Senior Notes with 100% of the notes being exchanged. The terms of the exchanged notes are substantially identical but with the new notes having greater transferability.
On August 16, 2012, Harvest entered into a subordinated loan agreement with ANKOR, a subsidiary of KNOC, to borrow US$170 million at a fixed interest rate of 4.62% per annum. No payments of principal or interest are required before maturity on October 2, 2017.
On September 19, 2012, Harvest redeemed the outstanding 6.40% series of convertible debentures for $106.8 million.
4
| MANAGEMENT’S DISCUSSION AND ANALYSIS |
UPSTREAM OPERATIONS
Summary of Financial and Operating Results
| Three Months Ended | Year Ended December 31 | |||||||||||
| December 31 | ||||||||||||
| 2012 | 2011 | 2012 | 2011 | |||||||||
| FINANCIAL | ||||||||||||
| Petroleum and natural gas sales(1) | 291.3 | 363.6 | 1,193.5 | 1,286.9 | ||||||||
| Royalties | (35.7 | ) | (56.0 | ) | (164.6 | ) | (195.5 | ) | ||||
| Revenues | 255.6 | 307.6 | 1,028.9 | 1,091.4 | ||||||||
| Expenses | ||||||||||||
| Operating | 77.4 | 96.4 | 359.0 | 350.4 | ||||||||
| Transportation and marketing | 5.9 | 5.7 | 22.2 | 29.6 | ||||||||
| Realized (gains) losses on risk management contracts(2) | (2.6 | ) | (2.1 | ) | (1.6 | ) | (6.0 | ) | ||||
| Operating netback after hedging(3) | 174.9 | 207.6 | 649.3 | 717.4 | ||||||||
| General and administrative | 18.2 | 17.8 | 65.0 | 60.8 | ||||||||
| Depreciation, depletion and amortization | 145.3 | 149.4 | 579.5 | 535.7 | ||||||||
| Exploration and evaluation | 0.2 | 7.0 | 24.9 | 18.3 | ||||||||
| Impairment of property, plant and equipment | – | – | 21.8 | – | ||||||||
| Unrealized (gains) losses on risk management contracts(4) | 0.1 | 3.5 | 1.1 | (0.7 | ) | |||||||
| Gains on disposition of property, plant and equipment | (25.0 | ) | (7.1 | ) | (30.3 | ) | (7.9 | ) | ||||
| Operating income (loss) | 36.1 | 37.0 | (12.7 | ) | 111.2 | |||||||
| Capital asset additions (excluding acquisitions) | 87.8 | 148.8 | 445.2 | 632.2 | ||||||||
| Property and business acquisitions (dispositions), net | (78.4 | ) | (8.0 | ) | (87.2 | ) | 505.3 | |||||
| Decommissioning and environmental remediation expenditures | 4.3 | 9.9 | 20.2 | 21.5 | ||||||||
| OPERATING | ||||||||||||
| Light / medium oil (bbl/d)(5) | 13,817 | 15,161 | 13,889 | 14,376 | ||||||||
| Heavy oil (bbl/d)(5) | 18,402 | 20,465 | 19,506 | 18,995 | ||||||||
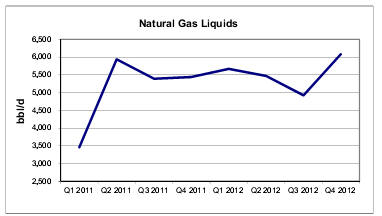
| Natural gas liquids (bbl/d) | 6,084 | 5,440 | 5,535 | 5,062 | ||||||||
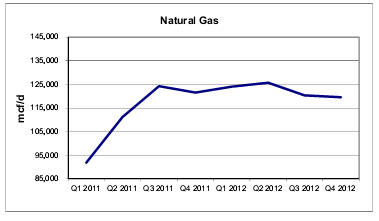
| Natural gas (mcf/d) | 119,554 | 121,547 | 122,385 | 112,360 | ||||||||
| Total (boe/d) | 58,228 | 61,324 | 59,327 | 57,161 | ||||||||
| (1) | Includes the effective portion of Harvest’s realized crude oil hedges. |
| (2) | Realized (gains) losses on risk management contracts include the settlement amounts for power, crude oil and foreign exchange derivative contracts, excluding the effective portion of realized (gains) losses from Harvest’s previously designated crude oil hedges. See “Risk Management, Financing and Other” section of this MD&A for details. |
| (3) | This is a non-GAAP measure; please refer to “Non-GAAP Measures” in this MD&A. |
| (4) | Unrealized (gains) losses on risk management contracts reflect the change in fair value of the power derivative contracts, the ineffective portion of previously designated crude oil hedges and the change in fair value of the crude and foreign exchange derivative contracts subsequent to the discontinuation of hedge accounting. See “Risk Management, Financing and Other” section of this MD&A for details. |
| (5) | Effective October 1, 2012, Harvest reclassified certain properties that were previously reported as light to medium oil to heavy oil as classified under National Instrument 51-101. See the “Reclassification of Heavy Oil and Light to Medium Oil Volumes” section of this MD&A. |
5
| MANAGEMENT’S DISCUSSION AND ANALYSIS |
Commodity Price Environment
| Three Months Ended | Year Ended | |||||||||||||||||
| December 31 | December 31 | |||||||||||||||||
| 2012 | 2011 | Change | 2012 | 2011 | Change | |||||||||||||
| West Texas Intermediate (“WTI”) crude oil (US$/bbl) | 88.18 | 94.06 | (6% | ) | 94.21 | 95.12 | (1% | ) | ||||||||||
| West Texas Intermediate (“WTI”) crude oil ($/bbl) | 87.42 | 96.25 | (9% | ) | 94.12 | 94.03 | – | |||||||||||
| Edmonton light sweet crude oil ($/bbl) | 83.98 | 97.51 | (14% | ) | 86.15 | 95.18 | (9% | ) | ||||||||||
| Western Canadian Select (“WCS”) crude oil ($/bbl) | 69.43 | 85.48 | (19% | ) | 73.09 | 77.10 | (5% | ) | ||||||||||
| AECO natural gas daily ($/mcf) | 3.21 | 3.17 | 1% | 2.39 | 3.62 | (34% | ) | |||||||||||
| U.S. / Canadian dollar exchange rate | 1.009 | 0.977 | 3% | 1.001 | 1.011 | (1% | ) | |||||||||||
| Differential Benchmarks | ||||||||||||||||||
| WCS differential to WTI ($/bbl) | 17.99 | 10.77 | 67% | 21.03 | 16.93 | 24% | ||||||||||||
| WCS differential as a % of WTI | 20.6% | 11.2% | 84% | 22.3% | 18.0% | 24% | ||||||||||||
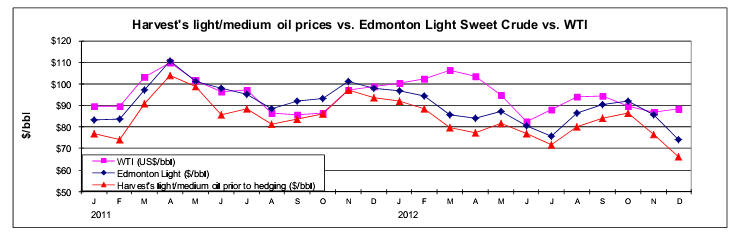
The average WTI benchmark price for the three months and year ended December 31, 2012 was 6% and 1% lower than the same periods in 2011, respectively. The average Edmonton light sweet crude oil price (“Edmonton Light”) decreased 14% in the fourth quarter as well as 9% for the year ended December 31, 2012 mainly due to the lower WTI prices and widening of the light sweet differential.
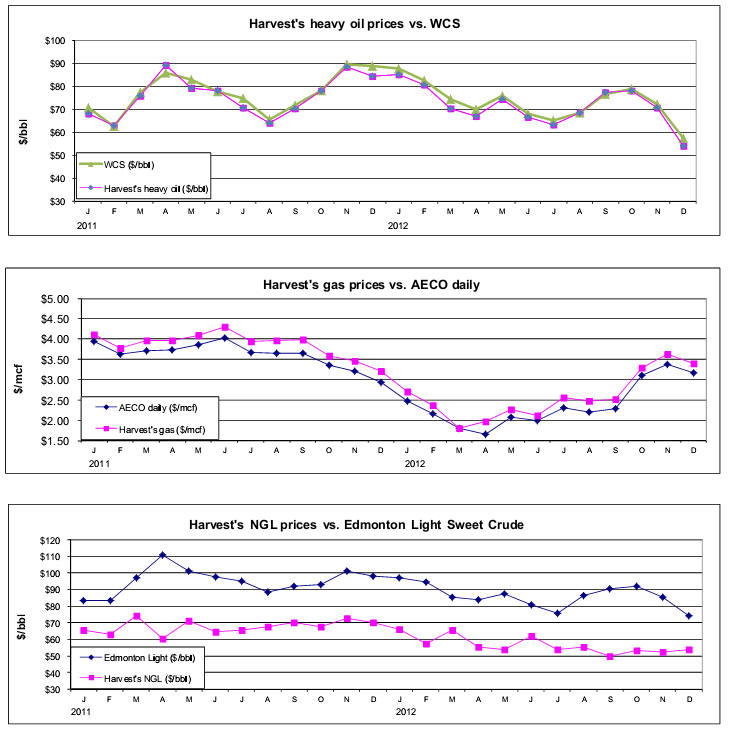
Heavy oil differentials fluctuate based on a combination of factors including the level of heavy oil inventories, pipeline capacity to deliver heavy crude to U.S. markets and the seasonal demand for heavy oil. For the three months ended December 31, 2012, the WCS price decreased 19% as compared to the same period in 2011 as a result of the WTI price decrease and the widening of the WCS differential to WTI. For the year ended December 31, 2012, the WCS price decreased 5% as compared to the same period in 2011 mainly as a result of the widening of the WCS differential to WTI.
Realized Commodity Prices
| Three Months Ended | Year Ended | |||||||||||||||||
| December 31 | December 31 | |||||||||||||||||
| 2012 | 2011 | Change | 2012 | 2011 | Change | |||||||||||||
| Light to medium oil prior to hedging ($/bbl)(1) | 76.42 | 92.01 | (17% | ) | 80.17 | 88.37 | (9% | ) | ||||||||||
| Heavy oil ($/bbl)(1) | 67.66 | 83.40 | (19% | ) | 71.35 | 76.07 | (6% | ) | ||||||||||
| Natural gas liquids ($/bbl) | 53.06 | 70.14 | (24% | ) | 56.54 | 67.93 | (17% | ) | ||||||||||
| Natural gas ($/mcf) | 3.44 | 3.42 | 1% | 2.58 | 3.83 | (33% | ) | |||||||||||
| Average realized price prior to hedging ($/boe)(2) | 52.82 | 64.61 | (18% | ) | 53.60 | 62.13 | (14% | ) | ||||||||||
| Light to medium oil after hedging ($/bbl)(1)(3) | 82.96 | 91.35 | (9% | ) | 86.00 | 86.58 | (1% | ) | ||||||||||
| Average realized price after hedging ($boe)(2)(3) | 54.38 | 64.45 | (16% | ) | 54.97 | 61.68 | (11% | ) | ||||||||||
| (1) | Effective October 1, 2012, Harvest reclassified certain properties that were previously reported as light to medium oil to heavy oil as classified under National Instrument 51-101. See the “Reclassification of Heavy Oil and Light to Medium Oil Volumes” section of this MD&A. |
| (2) | Inclusive of sulphur revenue. |
| (3) | Inclusive of the realized gains (losses) from crude oil contracts designated as hedges. Foreign exchange swaps and power contracts are excluded from the realized price. |
6
| MANAGEMENT’S DISCUSSION AND ANALYSIS |
Prior to hedging activities, our realized prices for light to medium oil for the three months and year ended December 31, 2012 decreased by 17% and 9%, respectively, compared to the same periods in 2011. This is consistent with the downward movement in Edmonton Light prices in 2012.
In order to mitigate the risk of fluctuating cash flows due to crude oil price volatility, Harvest entered into fixed-for-floating swaps which settled during 2012. The impact of this hedging activity resulted in an increase of $6.54/bbl (2011 – $0.66/bbl decrease) in Harvest’s realized light to medium oil price in the fourth quarter of 2012, and an increase of $5.83/bbl (2011 - $1.79/bbl decrease) for the year ended December 31, 2012. Please see “Cash Flow Risk Management” section in this MD&A for further discussion with respect to our cash flow risk management program.
Harvest’s realized heavy oil prices for the three months and year ended December 31, 2012 decreased by 19% and 6%, respectively, mainly due to the decrease in the WCS benchmark prices.
For the three months and year ended December 31, 2012, our realized prices for natural gas liquids decreased by 24% and 17%, respectively, reflecting the decrease in natural gas liquids commodity prices.
The realized prices for Harvest’s natural gas increased by 1% in the fourth quarter of 2012 and decreased 33% for the year of 2012, reflecting the movement in AECO benchmark prices.
7
| MANAGEMENT’S DISCUSSION AND ANALYSIS |
8
| MANAGEMENT’S DISCUSSION AND ANALYSIS |
Sales Volumes
| Three months Ended December 31 | |||||||||||||||
| 2012 | 2011 | ||||||||||||||
| Volume | Weighting | Volume | Weighting | % Volume | |||||||||||
| Change | |||||||||||||||
| Light to medium oil (bbl/d)(1) | 13,817 | 24% | 15,161 | 25% | (9% | ) | |||||||||
| Heavy oil (bbl/d)(1) | 18,402 | 32% | 20,465 | 33% | (10% | ) | |||||||||
| Natural gas liquids (bbl/d) | 6,084 | 10% | 5,440 | 9% | 12% | ||||||||||
| Total liquids (bbl/d) | 38,303 | 66% | 41,066 | 67% | (7% | ) | |||||||||
| Natural gas (mcf/d) | 119,554 | 34% | 121,547 | 33% | (2% | ) | |||||||||
| Total oil equivalent (boe/d) | 58,228 | 100% | 61,324 | 100% | (5% | ) | |||||||||
| Year Ended December 31 | |||||||||||||||
| 2012 | 2011 | ||||||||||||||
| Volume | Weighting | Volume | Weighting | % Volume | |||||||||||
| Change | |||||||||||||||
| Light to medium oil (bbl/d)(1) | 13,889 | 23% | 14,376 | 25% | (3% | ) | |||||||||
| Heavy oil (bbl/d)(1) | 19,506 | 33% | 18,995 | 33% | 3% | ||||||||||
| Natural gas liquids (bbl/d) | 5,535 | 9% | 5,062 | 9% | 9% | ||||||||||
| Total liquids (bbl/d) | 38,930 | 65% | 38,433 | 67% | 1% | ||||||||||
| Natural gas (mcf/d) | 122,385 | 35% | 112,360 | 33% | 9% | ||||||||||
| Total oil equivalent (boe/d) | 59,327 | 100% | 57,161 | 100% | 4% | ||||||||||
| (1) | Effective October 1, 2012, Harvest reclassified certain properties that were previously reported as light to medium oil to heavy oil as classified under National Instrument 51-101. See the “Reclassification of Heavy Oil and Light to Medium Oil Volumes” section of this MD&A. |
Total sales volumes were 58,228 boe/d for the fourth quarter of 2012 and 59,327 boe/d for the year ended December 31, 2012, a decrease of 5% and an increase of 4% respectively, compared to the same periods in 2011. The fourth quarter decrease in sales is mainly due to the impact of lower drilling activity in 2012 combined with the disposition of certain non-core producing properties in the fourth quarter of 2012. The year-over year increase in sales reflects the results of drilling in the liquids rich Deep Basin area, the full year benefit from the assets acquired from Hunt at the end of February 2011 and the current year production recovery from the Plains Rainbow Pipeline outage during the summer of 2011, partially offset by the extended turnaround of a third-party natural gas plant in the Caroline area, generally lower drilling activity in 2012 and the disposition of certain non-core producing properties in the fourth quarter.
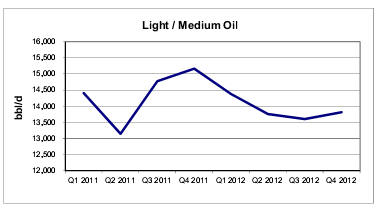
In the fourth quarter of 2012, Harvest’s average daily sales of light/medium oil were 13,817 bbl/d, reflecting a decrease of 9% from the same quarter in 2011. The decrease is due to a lower level of drilling activity in 2012 as well as miscellaneous operational issues and the disposition of non-core properties.
Harvest’s year-to-date light/medium oil sales decreased by 3% from 2011 to 13,889 bbl/d. The decrease is mainly a result of the lower level of drilling activity in 2012 and an extended pipeline outage in the Bashaw area.
9
| MANAGEMENT’S DISCUSSION AND ANALYSIS |
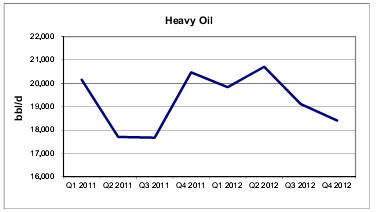
Heavy oil sales for the fourth quarter of 2012 decreased 10% from the same period in 2011, mainly due to the impact of lower drilling activity and natural declines. Heavy oil sales increased by 3% for the year ended December 31, 2012 compared to 2011, mainly due to sales recovering from the Plains Rainbow pipeline outage in 2011.
Natural gas sales averaged 119,554 mcf/d during the fourth quarter of 2012 reflecting a 2% decrease from the fourth quarter of 2011. For the year ended December 31, 2012, natural gas sales increased by 9%, due to the full year from the assets acquired from Hunt in 2011 and the results of development drilling in Willesden Green and the liquids rich Deep Basin area, partially offset by the extended Caroline plant turnaround in the summer of 2012.
Natural gas liquids sales for the three months ended December 31, 2012 increased by 12% mainly as a result of successful liquids rich drilling in the Deep Basin area. Natural gas liquids sales for the year ended December 31, 2012 increased 9% compared to 2011 for reasons consistent with those describing our natural gas results.
10
| MANAGEMENT’S DISCUSSION AND ANALYSIS |
Revenues
| Three Months Ended December 31 | Year Ended December 31 | |||||||||||||||||
| 2012 | 2011 | Change | 2012 | 2011 | Change | |||||||||||||
| Light / medium oil sales after hedging(1)(2) | 105.5 | 127.4 | (17% | ) | 437.1 | 454.3 | (4% | ) | ||||||||||
| Heavy oil sales(1) | 114.6 | 157.0 | (27% | ) | 509.4 | 527.4 | (3% | ) | ||||||||||
| Natural gas sales | 37.9 | 38.2 | (1% | ) | 115.7 | 156.9 | (26% | ) | ||||||||||
| Natural gas liquids sales | 29.7 | 35.1 | (15% | ) | 114.5 | 125.5 | (9% | ) | ||||||||||
| Other(3) | 3.7 | 5.9 | (37% | ) | 16.8 | 22.8 | (26% | ) | ||||||||||
| Petroleum and natural gas sales | 291.4 | 363.6 | (20% | ) | 1,193.5 | 1,286.9 | (7% | ) | ||||||||||
| Royalties | (35.7 | ) | (56.0 | ) | (36% | ) | (164.6 | ) | (195.5 | ) | (16% | ) | ||||||
| Revenues | 255.7 | 307.6 | (17% | ) | 1,028.9 | 1,091.4 | (6% | ) | ||||||||||
| (1) | Effective October 1, 2012, Harvest reclassified certain properties that were previously reported as light to medium oil to heavy oil as classified under National Instrument 51-101. See the “Reclassification of Heavy Oil and Light to Medium Oil Volumes” section of this MD&A. |
| (2) | Inclusive of the effective portion of realized gains (losses) from crude oil contracts designated as hedges. |
| (3) | Inclusive of sulphur revenue and miscellaneous income. |
Harvest’s revenue is subject to changes in sales volumes, commodity prices and currency exchange rates. In the fourth quarter of 2012, total petroleum and natural gas sales decreased by $72.2 million, mainly due to the 16% decrease in realized prices after hedging activities and the 5% decrease in sales volumes. For the year ended December 31, 2012, total petroleum and natural gas sales decreased by $93.4 million, mainly due to the 11% decrease in realized prices after hedging activities and partially offset by the 4% increase in sales volumes.
Sulphur revenue represented $5.0 million (2011 - $6.0 million) of the total in other revenues for the fourth quarter of 2012 and $16.9 million (2011 - $21.3 million) for the year ended December 31, 2012, with the decrease in the annual amount mainly resulting from the extended turnaround of a third-party natural gas plant in the Caroline area.
Royalties
Harvest pays Crown, freehold and overriding royalties to the owners of mineral rights from which production is generated. These royalties vary for each property and product and our Crown royalties are based on various sliding scales dependent on incentives, production volumes and commodity prices.
For the fourth quarter and year ended December 31, 2012, royalties as a percentage of gross revenue averaged 12.3% (2011 – 15.4%) and 13.8% (2011 – 15.2%), respectively. The lower royalty rates in 2012 are mainly due to lower commodity prices and higher Alberta Crown gas cost allowance credits in 2012. The extended turnaround of the Caroline plant further attributed to the lower natural gas and natural gas liquids royalties for the year.
11
| MANAGEMENT’S DISCUSSION AND ANALYSIS |
Operating and Transportation Expenses
| Three Months Ended December 31 | |||||||||||||||
| $/boe | |||||||||||||||
| 2012 | $/boe | 2011 | $/boe | Change | |||||||||||
| Power and purchased energy | 21.7 | 4.06 | 22.1 | 3.91 | 0.15 | ||||||||||
| Well servicing | 7.7 | 1.43 | 17.6 | 3.12 | (1.69 | ) | |||||||||
| Repairs and maintenance | 7.1 | 1.33 | 17.5 | 3.10 | (1.77 | ) | |||||||||
| Lease rentals and property tax | 11.0 | 2.05 | 9.7 | 1.72 | 0.33 | ||||||||||
| Labor - internal | 7.2 | 1.35 | 6.8 | 1.21 | 0.14 | ||||||||||
| Labor - contract | 4.6 | 0.85 | 5.2 | 0.92 | (0.07 | ) | |||||||||
| Chemicals | 4.1 | 0.76 | 3.9 | 0.70 | 0.06 | ||||||||||
| Trucking | 3.4 | 0.63 | 3.8 | 0.67 | (0.04 | ) | |||||||||
| Processing and other fees | 7.4 | 1.37 | 9.8 | 1.74 | (0.37 | ) | |||||||||
| Other | 3.2 | 0.62 | – | – | 0.62 | ||||||||||
| Total operating expenses | 77.4 | 14.45 | 96.4 | 17.09 | (2.64 | ) | |||||||||
| Transportation and marketing | 5.9 | 1.10 | 5.7 | 1.02 | 0.08 | ||||||||||
| Year Ended December 31 | |||||||||||||||
| $/boe | |||||||||||||||
| 2012 | $/boe | 2011 | $/boe | Change | |||||||||||
| Power and purchased energy | 79.6 | 3.67 | 83.1 | 3.98 | (0.31 | ) | |||||||||
| Well servicing | 56.0 | 2.58 | 61.6 | 2.95 | (0.37 | ) | |||||||||
| Repairs and maintenance | 57.0 | 2.63 | 60.0 | 2.88 | (0.25 | ) | |||||||||
| Lease rentals and property tax | 38.3 | 1.76 | 34.7 | 1.66 | 0.10 | ||||||||||
| Labor - internal | 31.5 | 1.45 | 28.1 | 1.35 | 0.10 | ||||||||||
| Labor - contract | 19.3 | 0.89 | 19.4 | 0.93 | (0.04 | ) | |||||||||
| Chemicals | 18.0 | 0.83 | 15.4 | 0.74 | 0.09 | ||||||||||
| Trucking | 16.3 | 0.74 | 13.3 | 0.64 | 0.10 | ||||||||||
| Processing and other fees | 33.4 | 1.54 | 22.6 | 1.09 | 0.45 | ||||||||||
| Other | 9.6 | 0.45 | 12.2 | 0.58 | (0.13 | ) | |||||||||
| Total operating expenses | 359.0 | 16.54 | 350.4 | 16.80 | (0.26 | ) | |||||||||
| Transportation and marketing | 22.2 | 1.02 | 29.6 | 1.42 | (0.4 | ) | |||||||||
Operating expenses for the fourth quarter of 2012 totaled $77.4 million, a decrease of $19.0 million, or $2.64/boe, compared to the same quarter in 2011. The lower operating expenses are mainly attributable to the decrease in well servicing and repairs and maintenance activities.
On a year-to-date basis, operating expenses for 2012 totaled $359.0 million, an increase of $8.7 million when compared to 2011, mainly due to the increase in processing and other fees and increased production. On a per barrel basis, year-to-date operating expenses decreased by $0.26/boe or 2% which is mainly attributable to lower well servicing, repairs and maintenance and power and purchased energy costs, partially offset by higher processing and other fees.
12
| MANAGEMENT’S DISCUSSION AND ANALYSIS |
| Three Months Ended | Year Ended | |||||||||||||||||
| December 31 | December 31 | |||||||||||||||||
| ($/boe) | 2012 | 2011 | Change | 2012 | 2011 | Change | ||||||||||||
| Power and purchased energy costs | 4.06 | 3.91 | 0.15 | 3.67 | 3.98 | (0.31 | ) | |||||||||||
| Realized (gains) losses on electricity risk management contracts | – | (0.34 | ) | 0.34 | – | (0.37 | ) | 0.37 | ||||||||||
| Net power and purchased energy costs | 4.06 | 3.57 | 0.49 | 3.67 | 3.61 | 0.06 | ||||||||||||
| Alberta Power Pool electricity price ($/MWh) | 78.80 | 76.42 | 2.38 | 64.29 | 76.65 | (12.36 | ) | |||||||||||
Power and purchased energy costs, comprised primarily of electric power costs, represented approximately 22% (2011 – 24%) of our total operating expenses for the year ended December 31, 2012. The power and purchased energy costs for the year ended December 31, 2012 totaled $79.6 million, a decrease of 4% compared to 2011, mainly attributable to the lower average Alberta electricity price and partially offset by higher average power consumption. During 2012, Harvest did not have any risk management contracts relating to electricity.
Transportation and marketing expenses relate primarily to delivery of natural gas to Alberta’s natural gas sales hub, the AECO Storage Hub, and the cost of trucking clean crude oil to pipeline receipt points. As a result, the total dollar amount of costs generally fluctuates in relation to our sales volumes. Transportation and marketing expenses had a modest increase of $0.08/boe or $0.2 million in the fourth quarter of 2012 as compared to the fourth quarter of 2011. The $0.40/boe or $7.4 million year-to-date decrease is mainly due to the higher oil trucking costs at Hay River and Red Earth that Harvest incurred in response to the outage of the Plains Rainbow Pipeline during the summer of 2011.
Operating Netback(1)
| Three Months Ended | Year Ended | |||||||||||||||||
| December 31 | December 31 | |||||||||||||||||
| $/boe | $/boe | |||||||||||||||||
| ($/boe) | 2012 | 2011 | Change | 2012 | 2011 | Change | ||||||||||||
| Petroleum and natural gas sales prior to hedging | 52.82 | 64.61 | (11.79 | ) | 53.60 | 62.13 | (8.53 | ) | ||||||||||
| Royalties | (6.66 | ) | (9.93 | ) | 3.27 | (7.58 | ) | (9.37 | ) | 1.79 | ||||||||
| Operating expenses | (14.45 | ) | (17.09 | ) | 2.64 | (16.54 | ) | (16.80 | ) | 0.26 | ||||||||
| Transportation expenses | (1.10 | ) | (1.02 | ) | (0.08 | ) | (1.02 | ) | (1.42 | ) | 0.40 | |||||||
| Operating netback prior to hedging(1) | 30.61 | 36.57 | (5.96 | ) | 28.46 | 34.54 | (6.08 | ) | ||||||||||
| Hedging gains (losses)(2) | 1.87 | 0.21 | 1.66 | 1.38 | (0.16 | ) | 1.54 | |||||||||||
| Operating netback after hedging(1) | 32.48 | 36.78 | (4.30 | ) | 29.84 | 34.38 | (4.54 | ) | ||||||||||
| (1) | This is a non-GAAP measure; please refer to “Non-GAAP Measures” in this MD&A. |
| (2) | Hedging gains (losses) include the settlement amounts for crude oil and power contracts. |
Harvest’s operating netback represents the net amount realized on a per boe basis after deducting directly related costs. In the fourth quarter of 2012, our operating netback prior to hedging decreased by $5.96/boe or 16% compared to 2011. On an annual basis, our 2012 operating netback prior to hedging decreased by $6.08/boe or 18% from 2011. The decreases are primarily attributable lower realized commodity prices, partially offset by decreases in royalties and operating expenses.
13
| MANAGEMENT’S DISCUSSION AND ANALYSIS |
General and Administrative (“G&A”) Expenses
| Three Months Ended | Year Ended | |||||||||||
| December 31 | December 31 | |||||||||||
| 2012 | 2011 | 2012 | 2011 | |||||||||
| G&A | 18.2 | 17.8 | 65.0 | 60.8 | ||||||||
| G&A ($/boe ) | 3.40 | 3.16 | 2.99 | 2.91 | ||||||||
For the fourth quarter of 2012, G&A expenses increased by $0.4 million or 2% compared to the same period in the prior year. On a year-over-year basis, G&A expenses increased by $4.2 million or 7% in 2012 primarily due to increased salary expenses and consulting fees. Approximately 90% of the G&A expenses are related to salaries and other employee related costs. Harvest does not have a stock option program, however there is a long-term incentive program, which is a cash settled plan that has been included in the G&A expense.
Depletion, Depreciation and Amortization (“DD&A”) Expenses
| Three Months Ended | Year Ended | |||||||||||
| December 31 | December 31 | |||||||||||
| 2012 | 2011 | 2012 | 2011 | |||||||||
| DD&A | 145.3 | 149.3 | 579.5 | 535.7 | ||||||||
| DD&A ($/boe) | 27.12 | 26.47 | 26.69 | 25.68 | ||||||||
DD&A expenses for the three months ended December 31, 2012 decreased by $4.0 million as compared to the same period in 2011, mainly due to lower sales volumes. DD&A expenses for the year ended 2012 increased by $43.8 million as compared to 2011 mainly due to a lower depletable proved developed reserve base and higher sales volumes.
Impairment
In the first quarter of 2012, Harvest recorded a pre-tax impairment charge of $21.8 million (2011 – $ nil) against the South Alberta Gas cash generating unit, as a result of the declining forecasted natural gas prices during the quarter. The fair value was determined based on the total proved plus probable reserves estimated by our independent reserves evaluators using the April 1, 2012 commodity price forecast discounted at a pre-tax discount rate of 10%. No impairment was recognized in the fourth quarters of 2012 and 2011.
Property Dispositions
During the fourth quarter of 2012, Harvest disposed of certain non-core producing properties in Alberta and Saskatchewan for proceeds of $88.5 million. The transactions resulted in a gain of $30.3 million, which has been recognized in the consolidated statements of comprehensive loss.
Harvest is in the process of marketing certain non-core properties for sale, to high-grade its asset portfolio and to monetize some of its assets. At December 31, 2012, properties with a net book value of $5.0 million were considered assets held for sale for accounting purposes. These properties were subsequently sold for $9.0 million in February 2013. Harvest continues to review and select non-core properties for disposition. The impact to future production from the future dispositions is difficult to predict, given the occurrence and the timing of the transactions cannot be determined with a high level of certainty. The proceeds from any dispositions would be used to manage Harvest’s liquidity and future developments of core assets.
14
| MANAGEMENT’S DISCUSSION AND ANALYSIS |
Capital Asset Additions
| Three Months Ended | Year Ended | |||||||||||
| December 31 | December 31 | |||||||||||
| 2012 | 2011 | 2012 | 2011 | |||||||||
| Drilling and completion | 45.5 | 98.6 | 236.6 | 386.4 | ||||||||
| Well equipment, pipelines and facilities | 32.9 | 46.0 | 159.1 | 195.1 | ||||||||
| Geological and geophysical | 0.9 | 0.5 | 9.7 | 15.7 | ||||||||
| Land and undeveloped lease rentals | 5.1 | 0.7 | 21.8 | 18.0 | ||||||||
| Corporate | 0.2 | 0.2 | 1.5 | 2.2 | ||||||||
| Other | 3.2 | 2.8 | 16.5 | 14.8 | ||||||||
| Total additions excluding acquisitions | 87.8 | 148.8 | 445.2 | 632.2 | ||||||||
Total capital additions are lower for the three months and year ended December 31, 2012 as compared to the same periods in 2011 due to a lower capital budget for the current year. As a result, the annual drilling and completion expenditures decreased to $236.6 million (2011 - $386.4 million) for the year 2012. However, well equipment, pipelines and facilities expenditures did not decrease to the same degree because costs were incurred in the first and second quarters of 2012 for equipping and tying-in wells that had been drilled in late 2011.
The following table summarizes the wells drilled by Harvest and the related drilling and completion costs incurred in the period. A well is recorded in the table as having being drilled after it has been rig-released, however related drilling costs may be incurred in a period before a well has been rig-released and related completion costs may be incurred in a period afterwards.
| Three Months Ended | Year Ended | |||||||||||||||||
| December 31, 2012 | December 31, 2012 | |||||||||||||||||
| Area | Gross | Net | Gross | Net | ||||||||||||||
| Hay River | 4.0 | 4.0 | $ | 11.4 | 31.0 | 31.0 | $ | 51.3 | ||||||||||
| Heavy Oil | 3.0 | 2.4 | 5.4 | 25.0 | 22.5 | 21.9 | ||||||||||||
| Red Earth | 1.0 | 1.0 | 2.8 | 13.0 | 11.5 | 48.7 | ||||||||||||
| Kindersley | – | – | 0.1 | 10.0 | 8.0 | 6.7 | ||||||||||||
| SE Saskatchewan | 2.0 | 1.8 | 2.9 | 11.0 | 10.8 | 14.2 | ||||||||||||
| Western Alberta | 1.0 | 1.0 | 6.5 | 11.0 | 6.4 | 24.4 | ||||||||||||
| Deep Basin | 2.0 | 1.6 | 13.0 | 5.0 | 3.9 | 42.1 | ||||||||||||
| Other areas | 1.0 | 1.0 | 3.4 | 10.0 | 6.8 | 27.3 | ||||||||||||
| Total | 14.0 | 12.8 | $ | 45.5 | 116.0 | 100.9 | $ | 236.6 | ||||||||||
During 2012, Harvest’s Upstream segment drilled or participated in a total of 116 gross (100.9 net) wells (2011 – 239 gross; 202.3 net wells) with an overall success ratio of 99%. Of the total wells drilled in 2012, Harvest drilled 96 gross (85.0 net) oil wells, 9 gross (5.1 net) gas wells, 10 gross (9.8 net) service wells and 1 gross (1.0 net) dry and abandoned well.
In Hay River, Harvest drilled 31 gross (31.0 net) wells pursuing heavy gravity oil in the Bluesky formation, including 22 producing, 8 injection and 1 source water wells. The Company’s remaining heavy oil drilling program included 25 gross (22.5 net) wells in our Heavy Oil and Provost areas which include Lloydminster,
15
| MANAGEMENT’S DISCUSSION AND ANALYSIS |
Wildmere, Maidstone and Consort as well as 3 gross (2.0 net) wells in Delbonita and Suffield. At Red Earth, Harvest drilled 13 gross (11.5 net) wells into the Slave Point and Gilwood light oil formations which were generally completed using multi-stage fracturing technology. At the Peace Arch and Cecil Areas, Harvest drilled 6 gross (4.5 net) oil wells in the Charlie Lake formation. Other active oil drilling areas included Kindersley (Eagle Lake) and southeast Saskatchewan where 21 gross (18.8 net) wells were drilled. In Garrington, Wilson Creek, Willesden Green, St. Anne, Rosevear and Waskahigan, Harvest drilled or participated in 11 gross (6.4 net) wells pursuing a variety of formations and well types. Harvest also drilled 5 gross (3.9 net) deep, multi-stage fractured, liquids rich gas wells in the Falher formations in the Deep Basin area and participated in one gas well near Retlaw.
During the fourth quarter of 2012, Harvest drilled or participated in 14 gross (12.8 net) horizontal and vertical wells with an overall success ratio of 100%. Of the wells drilled in the fourth quarter, Harvest drilled 8 gross (8.0 net) oil wells, 2 gross (1.6 net) gas wells and 3 gross (2.8 net) service wells. Harvest also participated in one partner-operated heavy oil well with a 40% working interest in Provost. Harvest was most active in Hay River where 4 gross horizontal wells (3 injectors and 1 producer) were drilled. In the Heavy Oil area 3 gross operated oil wells were drilled and Harvest participated in a fourth, partner-operated well. Harvest also drilled 2 gross (1.6 net) liquids rich gas wells in the Deep Basin area during the fourth quarter of 2012.
Decommissioning Liabilities
Harvest’s Upstream decommissioning liabilities at December 31, 2012 were $709.3 million (2011 - $664.4 million) for future remediation, abandonment, and reclamation of Harvest’s oil and gas properties. Please see note 9 of the audited annual consolidated financial statements for further discussion of decommissioning liabilities. The total of our decommissioning liabilities are based on management’s best estimate of costs to remediate, reclaim, and abandon our wells and facilities. The costs will be incurred over the operating lives of the assets with the majority being at or after the end of reserve life. Please refer to the “Risks Associated with Environment, Health & Safety” section of this MD&A for discussion of risks related to decommissioning liabilities “Contractual Obligations and Commitments” section of this MD&A for the payments expected for each of the next five years and thereafter in respect of the decommissioning liabilities.
Goodwill
Goodwill is recorded when the purchase price of an acquired business exceeds the fair value of the net identifiable assets and liabilities of that acquired business. At December 31, 2012, Harvest had $391.8 million (2011 - $404.9 million) of goodwill on the balance sheet related to the Upstream segment. The $13.1 million reduction of goodwill is a result of the disposition of certain groups of non-core assets to third parties as well as recognizing some assets as held for sale (see note 8 of the audited annual consolidated financial statements). The goodwill balance is assessed annually for impairment or more frequently if events or changes in circumstances occur that would reasonably be expected to reduce the fair value of the acquired business to a level below its carrying amount. Management has assessed goodwill for impairment and determined that there is no impairment at December 31, 2012.
16
| MANAGEMENT’S DISCUSSION AND ANALYSIS |
BLACKGOLD OIL SANDS
Capital Asset Additions
| Three Months Ended | Year Ended | |||||||||||
| December 31 | December 31 | |||||||||||
| 2012 | 2011 | 2012 | 2011 | |||||||||
| Drilling and completion | 5.5 | 8.2 | 56.6 | 23.5 | ||||||||
| Well equipment, pipelines and facilities | 34.7 | 19.6 | 93.1 | 70.1 | ||||||||
| Geological and geophysical | 0.1 | – | 1.1 | 0.1 | ||||||||
| Other | 4.1 | 3.0 | 13.3 | 7.5 | ||||||||
| Total BlackGold additions | 44.4 | 30.8 | 164.1 | 101.2 | ||||||||
Below is a summary of the BlackGold wells drilled by Harvest and the related drilling and completion expenditures in 2012.
| Three Months Ended | Year Ended | |||||||||||||||||
| December 31, 2012 | December 31, 2012 | |||||||||||||||||
| Area | Gross | Net | Gross | Net | ||||||||||||||
| BlackGold oil sands | 4.0 | 4.0 $ | 5.5 | 30.0 | 30.0 | $ | 56.6 | |||||||||||
During the fourth quarter of 2012, Harvest completed drilling both pads of steam assisted gravity drainage (“SAGD”) producer and injector wells and spent $5.5 million drilling 4 gross wells. Harvest invested $34.7 million on the engineering, procurement and construction (“EPC”) of the central processing facility. For the year ended December 31, 2012, Harvest spent $56.6 million drilling 30 gross SAGD producer and injector wells (15 well pairs) and spent $93.1 million on the engineering, procurement and construction of the central processing facility, including the use of the $24.4 million construction deposit against the costs incurred by the EPC contractor as a result of the EPC contract amendment. As at December 31, 2012, the engineering and procurement portion of the contract relating to the central processing facility is approximately 83% complete and the facility construction portion of the contract is approximately 43% complete. Please see the “Liquidity” section of this MD&A for discussion of the EPC contract amendment and its financial impact.
Oil Sands Project Development
On May 30, 2012, Harvest amended certain aspects of its BlackGold oil sands project engineering, procurement and construction (“EPC”) contract, including revising the compensation terms from a lump sum price to a cost reimbursable price and confirming greater Harvest control over project execution. The cost pressures and resultant contract changes are expected to increase the net EPC costs to approximately $520 million from $311 million, after allowing for certain costs which are not reimbursable to the EPC contractor. Harvest and the EPC contractor also agreed to apply the cumulative progress payments made under the lump sum contract and the remaining deposit of $24.4 million as at May 30, 2012 towards costs incurred to date.
Under the amended EPC contract, a maximum of approximately $101 million of the EPC costs will be paid in equal installments, without interest, over 10 years commencing on the completion of the EPC work in 2014. The liability is considered a financial liability and is initially recorded at fair value, which is estimated as the present value of all future cash payments discounted using the prevailing market rate of interest for similar instruments. As at December 31, 2012, Harvest recognized a liability of $4.7 million (2011 - $nil) using a discount rate of 4.50% (2011 - $nil).
17
| MANAGEMENT’S DISCUSSION AND ANALYSIS |
The Company has designed Phase 1 with 30 SAGD wells (15 well pairs) of which all have been drilled by the end of the fourth quarter of 2012. Engineering of the project is now approximately 85% complete and the site has been cleared and graded and now piling, foundation, and pipe rack module installation work is underway. Other near-term activities include completion of the detailed engineering work, delivery of equipment and modules to the site and the site construction. Phase 2 of the project, which is targeted to increase production capacity to 30,000 bbl/d, is in the regulatory approval process and approval is now anticipated in 2013.
Harvest had originally budgeted 2012 capital spending of $215 million for the BlackGold oil sands project but actual spending was reduced to $164.1 million. Activities that were deferred are primarily related to facility construction. As at December 31, 2012, Harvest has spent $157.5 million (including the $31.1 million deposit) on the EPC contract and has invested $286.4 million in the entire project since acquiring the BlackGold assets in 2010.
The BlackGold project faces similar cost and schedule pressures as other oil sand projects, including shortage of skilled labor, rising costs, and logistics issues surrounding module transportation; phase 1 production is expected to start in 2014.
Decommissioning Liabilities
Harvest’s BlackGold decommissioning liabilities at December 31, 2012 were $19.8 million (2011 - $1.5 million) relating to the future remediation, abandonment, and reclamation of the SAGD wells and central processing facilities. Please see note 9 of the audited annual consolidated financial statements for further discussion of decommissioning liabilities, “Risks Associated with Environment, Health & Safety” section of this MD&A for discussion of risks related to decommissioning liabilities and “Contractual Obligations and Commitments” section of this MD&A for the payments expected for each of the next five years and thereafter in respect of the decommissioning liabilities.
18
| MANAGEMENT’S DISCUSSION AND ANALYSIS |
DOWNSTREAM OPERATIONS
Summary of Financial and Operating Results
| Three Months Ended | Year Ended | |||||||||||
| December 31 | December 31 | |||||||||||
| 2012 | 2011 | 2012 | 2011 | |||||||||
| FINANCIAL | ||||||||||||
| Refined products sales(1) | 1,290.3 | 1,162.3 | 4,752.1 | 3,302.3 | ||||||||
| Purchased products for processing and resale(1) | 1,211.1 | 1,176.7 | 4,520.3 | 3,118.1 | ||||||||
| Gross margin (loss)(2) | 79.2 | (14.4 | ) | 231.8 | 184.2 | |||||||
| Operating expense | 31.7 | 32.5 | 120.8 | 108.4 | ||||||||
| Purchased energy expense | 45.9 | 49.5 | 140.7 | 117.3 | ||||||||
| Marketing expense | 1.3 | 1.1 | 4.4 | 6.3 | ||||||||
| General and administrative | 0.1 | 0.4 | 0.6 | 1.8 | ||||||||
| Depreciation and amortization | 30.4 | 26.8 | 108.9 | 91.0 | ||||||||
| Impairment of property, plant and equipment | 563.2 | – | 563.2 | – | ||||||||
| Operating loss(2) | (593.4 | ) | (124.7 | ) | (706.8 | ) | (140.6 | ) | ||||
| Capital expenditures | 21.5 | 37.5 | 54.2 | 284.2 | ||||||||
| OPERATING | ||||||||||||
| Feedstock volume (bbl/d)(3) | 114,065 | 89,468 | 103,355 | 68,046 | ||||||||
| Yield (% of throughput volume)(4) | ||||||||||||
| Gasoline and related products | 32% | 33% | 30% | 32% | ||||||||
| Ultra low sulphur diesel and jet fuel | 40% | 44% | 40% | 40% | ||||||||
| High sulphur fuel oil | 27% | 23% | 27% | 27% | ||||||||
| Total | 99% | 100% | 97% | 99% | ||||||||
| Average refining gross margin (loss) (US$/bbl)(5) | 6.43 | (4.11 | ) | 4.87 | 5.15 | |||||||
| (1) | Refined product sales and purchased products for processing and resale are net of intra-segment sales of $121.8 million and $569.6 million for the three and twelve months ended December 31, 2012, respectively (2011 - $144.8 million and $507.8 million), reflecting the refined products produced by the refinery and sold by the marketing division. |
| (2) | These are non-GAAP measures; please refer to “Non-GAAP Measures” in this MD&A. |
| (3) | Barrels per day are calculated using total barrels of crude oil feedstock and vacuum gas oil. |
| (4) | Based on production volumes after adjusting for changes in inventory held for resale. |
| (5) | Average refining gross margin is calculated based on per barrel of feedstock throughput. |
19
| MANAGEMENT’S DISCUSSION AND ANALYSIS |
Refining Benchmark Prices
| Three Months Ended | Year Ended | |||||||||||||||||
| December 31 | December 31 | |||||||||||||||||
| 2012 | 2011 | Change | 2012 | 2011 | Change | |||||||||||||
| WTI crude oil (US$/bbl) | 88.18 | 94.06 | (6% | ) | 94.21 | 95.12 | (1% | ) | ||||||||||
| Brent crude oil (US$/bbl) | 109.98 | 109.08 | 1% | 111.67 | 110.89 | 1% | ||||||||||||
| Argus sour crude index (“ASCI”) (US$/bbl) | 103.58 | 106.83 | (3% | ) | 106.73 | 107.35 | (1% | ) | ||||||||||
| Brent – WTI differential (US$/bbl) | 21.80 | 15.02 | 45% | 17.46 | 15.77 | 11% | ||||||||||||
| Brent – ASCI differential (US$/bbl) | 6.40 | 2.25 | 184% | 4.94 | 3.54 | 40% | ||||||||||||
| Refined product prices | ||||||||||||||||||
| RBOB (US$/bbl) | 114.74 | 110.08 | 4% | 122.66 | 118.52 | 3% | ||||||||||||
| Heating Oil (US$/bbl) | 128.07 | 125.01 | 2% | 127.11 | 124.15 | 2% | ||||||||||||
| High Sulphur Fuel Oil (US$/bbl) | 93.67 | 98.58 | (5% | ) | 99.64 | 96.87 | 3% | |||||||||||
| U.S. / Canadian dollar exchange rate | 1.009 | 0.977 | 3% | 1.001 | 1.011 | (1% | ) | |||||||||||
Summary of Gross Margins
| Three Months Ended December 31 | ||||||||||||||||||
| 2012 | 2011 | |||||||||||||||||
| Volumes | Volumes | |||||||||||||||||
| (bbls) | (US$/bbl) | (bbls) | (US$/bbl) | |||||||||||||||
| Refinery | ||||||||||||||||||
| Sales | ||||||||||||||||||
| Gasoline products | 435.8 | 3.9 | 113.33 | 355.8 | 3.1 | 110.02 | ||||||||||||
| Distillates | 556.3 | 4.3 | 130.21 | 500.6 | 3.9 | 126.43 | ||||||||||||
| High sulphur fuel oil | 265.8 | 2.9 | 92.63 | 258.4 | 2.6 | 98.50 | ||||||||||||
| Total sales | 1,257.9 | 11.1 | 114.49 | 1,114.8 | 9.6 | 113.56 | ||||||||||||
| Feedstock(1) | ||||||||||||||||||
| Crude oil | 1,042.9 | 9.9 | 106.76 | 878.0 | 7.2 | 118.76 | ||||||||||||
| Vacuum Gas Oil (“VGO”) | 74.6 | 0.6 | 117.99 | 132.8 | 1.0 | 128.74 | ||||||||||||
| Total feedstock | 1,117.5 | 10.5 | 107.45 | 1,010.8 | 8.2 | 119.98 | ||||||||||||
| Other(2) | 73.6 | 138.7 | ||||||||||||||||
| Total feedstock and other costs | 1,191.1 | 1,149.5 | ||||||||||||||||
| Refinery gross margin (loss)(3) | 66.8 | 6.43 | (34.7 | ) | (4.11 | ) | ||||||||||||
| Marketing | ||||||||||||||||||
| Sales | 154.3 | 192.4 | ||||||||||||||||
| Cost of products sold | 141.9 | 172.1 | ||||||||||||||||
| Marketing gross margin(3) | 12.4 | 20.3 | ||||||||||||||||
| Total gross margin (loss)(3) | 79.2 | (14.4 | ) | |||||||||||||||
| (1) | Cost of feedstock includes all costs of transporting the crude oil to the refinery in Newfoundland. |
| (2) | Includes inventory adjustments and additives and blendstocks |
| (3) | This is a non-GAAP measure; please refer to “Non-GAAP Measures” in this MD&A. |
20
| MANAGEMENT’S DISCUSSION AND ANALYSIS |
| Year Ended December 31 | ||||||||||||||||||
| 2012 | 2011 | |||||||||||||||||
| Volumes | Volumes | |||||||||||||||||
| (bbls) | (US$/bbl) | (bbls) | (US$/bbl) | |||||||||||||||
| Refinery | ||||||||||||||||||
| Sales | ||||||||||||||||||
| Gasoline products | 1,529.2 | 12.8 | 119.42 | 1,055.1 | 9.3 | 114.57 | ||||||||||||
| Distillates | 2,083.7 | 16.1 | 129.24 | 1,386.0 | 11.1 | 126.54 | ||||||||||||
| High sulphur fuel oil | 1,015.8 | 10.5 | 97.43 | 691.4 | 7.3 | 96.11 | ||||||||||||
| Total sales | 4,628.7 | 39.4 | 117.62 | 3,132.5 | 27.7 | 114.51 | ||||||||||||
| Feedstock(1) | ||||||||||||||||||
| Crude oil | 3,858.3 | 35.5 | 108.79 | 2,350.8 | 22.4 | 106.11 | ||||||||||||
| Vacuum Gas Oil (“VGO”) | 274.3 | 2.3 | 117.93 | 286.5 | 2.4 | 118.80 | ||||||||||||
| Total feedstock | 4,132.6 | 37.8 | 109.36 | 2,637.3 | 24.8 | 107.36 | ||||||||||||
| Other(2) | 312.1 | 368.6 | ||||||||||||||||
| Total feedstock and other costs | 4,444.7 | 3,005.9 | ||||||||||||||||
| Refinery gross margin(3) | 184.0 | 4.87 | 126.6 | 5.15 | ||||||||||||||
| Marketing | ||||||||||||||||||
| Sales | 693.0 | 677.7 | ||||||||||||||||
| Cost of products sold | 645.2 | 620.1 | ||||||||||||||||
| Marketing gross margin(3) | 47.8 | 57.6 | ||||||||||||||||
| Total gross margin(3) | 231.8 | 184.2 | ||||||||||||||||
| (1) | Cost of feedstock includes all costs of transporting the crude oil to the refinery in Newfoundland. |
| (2) | Includes inventory adjustments, additives and blendstocks and purchase of product for local sales |
| (3) | This is a non-GAAP measure; please refer to “Non-GAAP Measures” in this MD&A. |
Feedstock throughput averaged 114,065 bbl/d in the fourth quarter of 2012, an increase of 27% from 89,468 bbl/d in the fourth quarter of the prior year, reflecting almost full utilization of the refinery units as compared to the reduced throughput rates in 2011 in light of declining refining margins. The average throughput rate of 103,355 bbl/d for the year ended December 31, 2012 is 52% higher than the prior year. The lower daily average throughput rate for 2011 is a consequence of an extended planned maintenance shutdown during the year combined with the reduction in throughput rates in the fourth quarter of 2011. The average daily rate for 2012 is less than the nameplate capacity as a consequence of an exchanger leak on the amine unit resulting in an outage of the amine, sulphur recovery and hydrocracker units and reduction in crude rate throughput to approximately 80,000 bbls/day for two weeks combined with an operational issue with the sulphur recovery unit resulting in an unplanned outage of all refinery units for approximately three weeks.
The two tables below provide a comparison between the product crack spread realized by our refinery and the benchmark crack spread for the three and twelve months ended December 31, 2012, with both crack spreads referring to the price of Brent crude oil.
21
| MANAGEMENT’S DISCUSSION AND ANALYSIS |
| Three Months Ended December 31 | ||||||||||||||||||
| 2012 | 2011 | |||||||||||||||||
| Refinery | Benchmark(1) | Difference | Refinery | Benchmark (1) | Difference | |||||||||||||
| Gasoline products (US$/bbl) | 5.88 | 4.76 | (2) | 1.12 | (9.96 | ) | 1.00 | (2) | (10.96 | ) | ||||||||
| Distillates (US$/bbl) | 22.76 | 18.09 | (3) | 4.67 | 6.45 | 15.93 | (3) | (9.48 | ) | |||||||||
| High Sulphur Fuel Oil (US$/bbl) | (14.82 | ) | (16.31 | )(4) | 1.49 | (21.48 | ) | (10.50 | )(4) | (10.98 | ) | |||||||
| (1) | Benchmark product crack is relative to Brent crude oil. |
| (2) | RBOB benchmark market price sourced from NYMEX. |
| (3) | Heating Oil benchmark market price sourced from NYMEX. Downstream’s distillate products are mainly comprised of ultra-low sulphur diesel which is a higher quality product and sells at a premium to the heating oil benchmark. |
| (4) | High Sulphur Fuel Oil benchmark market price sourced from Platts. Our high sulphur fuel oil normally contains a higher sulphur content than the 3% content reflected in the benchmark price. |
| Year Ended December 31 | ||||||||||||||||||
| 2012 | 2011 | |||||||||||||||||
| Refinery | Benchmark(1) | Difference | Refinery | Benchmark (1) | Difference | |||||||||||||
| Gasoline products (US$/bbl) | 10.06 | 10.99 | (2) | (0.93 | ) | 7.21 | 7.63 | (2) | (0.42 | ) | ||||||||
| Distillates (US$/bbl) | 19.88 | 15.44 | (3) | 4.44 | 19.18 | 13.26 | (3) | 5.92 | ||||||||||
| High Sulphur Fuel Oil (US$/bbl) | (11.93 | ) | (12.03 | )(4) | 0.10 | (11.25 | ) | (14.02 | )(4) | 2.77 | ||||||||
| (1) | Benchmark product crack is relative to Brent crude oil. |
| (2) | RBOB benchmark market price sourced from NYMEX. |
| (3) | Heating Oil benchmark market price sourced from NYMEX. Downstream’s distillate products are mainly comprised of ultra-low sulphur diesel which is a higher quality product and sells at a premium to the heating oil benchmark. |
| (4) | High Sulphur Fuel Oil benchmark market price sourced from Platts. Our high sulphur fuel oil normally contains a higher sulphur content than the 3% content reflected in the benchmark price. |
Downstream’s product crack spreads are different from the benchmarks due to several factors including timing of actual sales and feedstock purchases differing from the calendar month benchmarks, transportation costs, sour crude differentials, quality differentials and variability in the throughput volume over a given period of time. The refinery sales also include products for which market prices are not reflected in the benchmarks (such as hydrocracker bottoms that sell at spot market prices with a premium to the high sulphur fuel oil benchmark).
The overall gross margin is also impacted by the purchasing of blendstocks to meet summer gasolines specifications, additives to meet product specifications, the build of unfinished saleable products which are recorded at a value lower than cost, and inventory write-downs and reversals. These costs are included in “other costs” in the Summary of Gross Margin Table above.
The refining gross margin per barrel for the three months ended December 31, 2012 improved significantly by US$10.54/bbl from the prior year mainly due to decreased feedstock costs. The cost of Downstream’s feedstock in the fourth quarter of 2012 was a US$2.53/bbl discount to the benchmark Brent crude oil as compared to a premium of US$10.90/bbl in the same period of the prior year. The refining gross margin for the fiscal year 2012 decreased slightly by US$0.28/bbl from 2011 mainly due to reduced sour crude differential, offset by increased product prices.
22
| MANAGEMENT’S DISCUSSION AND ANALYSIS |
The negative refining gross margin in the fourth quarter of 2011 was the result of processing high-cost crude oil when product prices were falling. Generally, the crude feedstock prices are closely linked to Brent prices with a sour crude differential. The sour crude differential includes transportation costs and the impact of timing of purchases of feedstock under the supply and offtake agreement with Macquarie Energy (the “SOA”). Prior to 2012, through a pricing mechanism in the SOA, the crude feedstock prices also included an adjustment factor that was tied to the WTI prices with the objective to provide a better match against the product prices. This adjustment factor created increased volatility to the feedstock prices as the WTI-Brent differentials fluctuated. In the fourth quarter of 2011, a significant premium to the feedstock cost was resulted as the WTI-Brent differential sharply tightened at the beginning of the quarter. In light of the volatility and the growing disconnect of the product prices from the WTI prices, the Downstream removed the adjustment factor in 2012.
The gross margin per barrel for the three months ended December 31, 2012 improved significantly from the prior year mainly as a result of decreased feedstock costs. The negative gross margin in the fourth quarter of 2011 was the result of processing high-cost crude oil when product prices were falling. During the first nine months of 2011, the refinery benefited from lower priced crude feedstock as the feedstock price was linked to WTI-Brent differentials. As the differentials widened in the first nine months of 2011 the feedstock prices decreased. In the fourth quarter of 2011, the decrease in the WTI-Brent differential increased the feedstock costs significantly. In 2012, Downstream no longer linked feedstock costs to the WTI-Brent differential, however, reduced sour crude differentials in 2012 had a negative impact on the overall refinery gross margin.
The sour crude differential includes transportation costs and the impact of timing of purchases of feedstock under the supply and offtake agreement with Macquarie Energy (the “SOA”) that may cause significant variances when measured against a given benchmark.
The cost of Downstream’s feedstock in the fourth quarter of 2012 was a US$2.53/bbl discount to the benchmark Brent crude oil as compared to a premium of US$10.90/bbl in the same period of the prior year. Similarly, the cost of feedstock for the year ended December 31, 2012 was a US$2.31/bbl discount to the benchmark Brent crude oil as compared to a discount of US$3.53/bbl in 2011.
The gross margin from the marketing operations is comprised of the margin from both the retail and wholesale distribution of gasoline and home heating fuels as well as the revenues from marine services including tugboat revenues, and for 2011, the inclusion of the US$10 million settlement from the business interruption claim relating to the fire in the first quarter of 2010.
During the three months ended December 31, 2012, the Canadian dollar strengthened as compared to the US dollar. The stronger Canadian dollar in the fourth quarter of 2012 has had a negative impact to the contribution from the refinery operations relative to the prior year as substantially all of its gross margin, cost of purchased energy and marketing expense are denominated in U.S. dollars. For the year ended December 31, 2012, the Canadian dollar had a negligible change from the US dollar.
23
| MANAGEMENT’S DISCUSSION AND ANALYSIS |
Operating Expenses
| Three Months Ended December 31 | ||||||||||||||||||
| 2012 | 2011 | |||||||||||||||||
| Refining | Marketing | Total | Refining | Marketing | Total | |||||||||||||
| Operating cost | 26.3 | 5.4 | 31.7 | 26.6 | 5.9 | 32.5 | ||||||||||||
| Purchased energy | 45.9 | – | 45.9 | 49.5 | – | 49.5 | ||||||||||||
| 72.2 | 5.4 | 77.6 | 76.1 | 5.9 | 82.0 | |||||||||||||
| ($/bbl of feedstock throughput) | ||||||||||||||||||
| Operating cost | 2.51 | – | – | 3.24 | – | – | ||||||||||||
| Purchased energy | 4.37 | – | – | 6.01 | – | – | ||||||||||||
| 6.88 | – | – | 9.25 | – | – | |||||||||||||
| Year Ended December 31 | ||||||||||||||||||
| 2012 | 2011 | |||||||||||||||||
| Refining | Marketing | Total | Refining | Marketing | Total | |||||||||||||
| Operating cost | 100.6 | 20.2 | 120.8 | 88.4 | 20.0 | 108.4 | ||||||||||||
| Purchased energy | 140.7 | – | 140.7 | 117.3 | – | 117.3 | ||||||||||||
| 241.3 | 20.2 | 261.5 | 205.7 | 20.0 | 225.7 | |||||||||||||
| ($/bbl of feedstock throughput) | ||||||||||||||||||
| Operating cost | 2.66 | – | – | 3.56 | – | – | ||||||||||||
| Purchased energy | 3.72 | – | – | 4.72 | – | – | ||||||||||||
| 6.38 | – | – | 8.28 | – | – | |||||||||||||
The refining operating cost per barrel of feedstock throughput decreased by 23% and 25% for the three months and year ended December 31, 2012 respectively, as compared to the same periods in the prior year, reflecting higher throughput volumes in 2012.
Purchased energy, consisting of low sulphur fuel oil (“LSFO”) and electricity, is required to provide heat and power to refinery operations. The purchased energy cost per barrel of feedstock throughput in 2012 decreased by 27% and 21% for the three months and year ended December 31, 2012 respectively, as compared to the same periods in the prior year. The decrease in the cost per barrel is mainly the result of higher feedstock throughput volumes in 2012.
Capital Assets Additions
Capital asset additions for the three months and year ended December 31, 2012 totaled $21.5 million and $54.2 million, respectively (2011 - $37.5 million and $284.2 million), relating to various capital projects including $6.1 million and $10.0 million respectively for turnaround costs (2011 - $3.9 million and $102.4 million respectively).
24
| MANAGEMENT’S DISCUSSION AND ANALYSIS |
Depreciation and Amortization Expense
| Three Months Ended | Year Ended | |||||||||||
| December 31 | December 31 | |||||||||||
| 2012 | 2011 | 2012 | 2011 | |||||||||
| Refining | 29.5 | 26.0 | 105.3 | 87.3 | ||||||||
| Marketing | 0.9 | 0.8 | 3.6 | 3.7 | ||||||||
| Total depreciation and amortization | 30.4 | 26.8 | 108.9 | 91.0 | ||||||||
The process units are amortized over an average useful life of 20 to 30 years and turnaround costs are amortized to the next scheduled turnaround. The increase in refining depreciation in 2012 as compared to 2011 is a consequence of the additional annual depreciation and amortization resulting from the capital and turnaround expenditures completed during 2011.
Decommissioning Liabilities
Harvest’s Downstream decommissioning liabilities result from the ownership of the refinery and marketing assets. At December 31, 2012, Downstream’s decommissioning liabilities were $16.2 million (2011 – $14.6 million) relating to the reclamation and abandonment of these assets with an expected abandonment date of 2069. Please see note 9 of the audited annual consolidated financial statements for further discussion of decommissioning liabilities, “Risks Associated with Environment, Health & Safety” section of this MD&A for discussion of risks related to decommissioning liabilities and “Contractual Obligations and Commitments” section of this MD&A for the payments expected for each of the next five years and thereafter in respect of the decommissioning liabilities.
Impairment of Property, Plant and Equipment
During the year ended December 31, 2012, Harvest recorded a pre-tax impairment of $563.2 million on its refinery CGU relating to the property, plant and equipment to reflect the excess of the carrying value over the assessed recoverable amount. The recoverable amount was based on the assets’ value-in-use, estimated using the net present value of future cash flows and a pre-tax discount rate of 16%. The value-in-use model did not include any expected cash flows from capital enhancement projects. The pre-tax discount rate of 16% incorporated the various risks inherent in the industry and in forecasting uncertainties.
RISK MANAGEMENT, FINANCING AND OTHER
Cash Flow Risk Management
The Company at times enters into natural gas, crude oil, electricity and foreign exchange contracts to reduce the volatility of cash flows from some of its forecast sales and purchases, and when allowable, will designate these contracts as cash flow hedges. Please refer to note 22 of the audited annual consolidated financial statements for discussion regarding our risk management contracts, the underlying risk management objectives and strategies, any significant assumptions made in determining the fair value of those contracts and sensitivity analysis on Harvest’s exposure to commodity price risks from these contracts.
During 2011, Harvest entered into crude oil and foreign exchange derivative contracts and designated them as cash flow hedges. Effective July 31, 2012, Harvest discontinued the hedge designation as the hedges were no longer highly effective. Subsequent to the discontinuation of hedge accounting, all changes in the fair value of these derivative contracts were recognized in the consolidated income statement.
25
| MANAGEMENT’S DISCUSSION AND ANALYSIS |
Risk management contracts (gains) losses recorded to income include the ineffective portion of the gains or losses on the derivative contracts designated as cash flow hedges, the gains or losses on the derivatives that were not designated as hedges and the gains or losses subsequent to the discontinuation of hedge accounting on the previously designated derivatives.
The following is a summary of Harvest’s risk management contracts outstanding at December 31, 2012:
| Contracts Designated as Hedges | ||||
| Contract Quantity | Type of Contract | Term | Contract Price | Fair Value |
| 10,800 GJs/day | Natural gas swap | Jan – Dec 2013 | $3.42/GJ | 1.8 |
The following is a summary of Harvest’s realized and unrealized (gains) losses on risk management contracts:
| Three Months Ended December 31 | ||||||||||||||||||
| 2012 | 2011 | |||||||||||||||||
| Contracts not designated as hedges | Crude | Currency | Total | Power | Currency | Total | ||||||||||||
| Realized (gains) losses | (2.8 | ) | 0.2 | (2.6 | ) | (1.9 | ) | – | (1.9 | ) | ||||||||
| Unrealized (gains) losses | 0.2 | (0.1 | ) | 0.1 | 2.5 | 0.2 | 2.7 | |||||||||||
| (Gains) losses recognized in net income | (2.6 | ) | 0.1 | (2.5 | ) | 0.6 | 0.2 | 0.8 | ||||||||||
| Contracts designated as hedges | Crude Oil | Crude Oil | ||||||||||||||||
| Realized (gains) losses | ||||||||||||||||||
| Reclassified from other comprehensive income (“OCI”) to revenues, before tax | (8.3 | ) | 0.9 | |||||||||||||||
| Ineffective portion recognized in net income | – | (0.2 | ) | |||||||||||||||
| (8.3 | ) | 0.7 | ||||||||||||||||
| Unrealized (gains) losses | ||||||||||||||||||
| Recognized in OCI, net of tax | (1.5 | ) | 34.8 | |||||||||||||||
| Ineffective portion recognized in net income | – | 0.8 | ||||||||||||||||
| (1.5 | ) | 35.6 | ||||||||||||||||
| Total (gains) losses from all risk management contracts | ||||||||||||||||||
| Recognized in OCI, net of tax | 5.5 | 34.1 | ||||||||||||||||
| Recognized in revenues | (8.3 | ) | 0.9 | |||||||||||||||
| Recognized in net income outside of revenues | (2.5 | ) | 1.4 | |||||||||||||||
26
| MANAGEMENT’S DISCUSSION AND ANALYSIS |
| Year Ended December 31 | ||||||||||||||||||
| 2012 | 2011 | |||||||||||||||||
| Contracts not designated as hedges | Crude | Currency | Total | Power | Currency | Total | ||||||||||||
| Realized (gains) losses | (2.1 | ) | 0.5 | (1.6 | ) | (7.7 | ) | – | (7.7 | ) | ||||||||
| Unrealized (gains) losses | 1.1 | – | 1.1 | 1.0 | – | 1.0 | ||||||||||||
| (Gains) losses recognized in net income | (1.0 | ) | 0.5 | (0.5 | ) | (6.7 | ) | – | (6.7 | ) | ||||||||
| Contracts designated as hedges | Crude Oil | Crude Oil | ||||||||||||||||
| Realized (gains) losses | ||||||||||||||||||
| Reclassified from OCI to revenues, before tax | (29.6 | ) | 9.4 | |||||||||||||||
| Ineffective portion recognized in net income | – | 1.7 | ||||||||||||||||
| (29.6 | ) | 11.1 | ||||||||||||||||
| Unrealized (gains) losses | ||||||||||||||||||
| Recognized in OCI, net of tax | (9.2 | ) | (12.3 | ) | ||||||||||||||
| Ineffective portion recognized in net income | – | (1.7 | ) | |||||||||||||||
| (9.2 | ) | (14.0 | ) | |||||||||||||||
| Total (gains) losses from all risk management contracts | ||||||||||||||||||
| Recognized in OCI, net of tax | 13.2 | (19.4 | ) | |||||||||||||||
| Recognized in revenues | (29.6 | ) | 9.4 | |||||||||||||||
| Recognized in net income outside of revenues | (0.5 | ) | (6.7 | ) | ||||||||||||||
Financing Costs
| Three Months Ended | Year Ended | |||||||||||
| December 31 | December 31 | |||||||||||
| 2012 | 2011 | 2012 | 2011 | |||||||||
| Bank loan | 4.8 | 2.9 | 16.1 | 7.9 | ||||||||
| Convertible debentures | 10.8 | 12.5 | 47.7 | 49.6 | ||||||||
| Senior notes | 9.0 | 9.3 | 36.2 | 35.7 | ||||||||
| Related party loan | 1.9 | – | 2.9 | – | ||||||||
| Amortization of deferred finance charges | 0.2 | 0.2 | 0.9 | 0.9 | ||||||||
| Interest and other financing charges | 26.7 | 24.9 | 103.8 | 94.1 | ||||||||
| Capitalized interest | (3.3 | ) | (2.7 | ) | (13.5 | ) | (8.6 | ) | ||||
| 23.4 | 22.2 | 90.3 | 85.5 | |||||||||
| Accretion of decommissioning liabilities | 5.2 | 5.9 | 20.7 | 23.6 | ||||||||
| Total finance costs | 28.6 | 28.1 | 111.0 | 109.1 | ||||||||
Interest and other financing charges for the three months and year ended December 31, 2012, including the amortization of related financing costs, increased by $1.8 million (7%) and $9.7 million (10%), respectively, compared to 2011.
Interest expense on Harvest’s bank loan for the three and twelve months ended December 31, 2012 increased by $1.9 million and $8.2 million, respectively, due to the higher amount of loan principal outstanding. The effective interest rate for interest charges on our bank loan for the three months and year ended December 31, 2012 was 3.0% and 3.0%, respectively, compared to 3.1% and 3.0% in 2011.
27
| MANAGEMENT’S DISCUSSION AND ANALYSIS |
Interest expense on the senior notes was relatively consistent for the three and twelve months ended December 31, 2012, compared to 2011.
Interest expense on the related party loan was $1.9 million and $2.9 million for the three months and year ended December 31, 2012, respectively (2011 – $nil). See the “Related Party Transactions” section of this MD&A for discussion of the related party loan.
During the three months and year ended December 31, 2012, interest expense of $3.3 million and $13.5 million, respectively, was capitalized to BlackGold and the Downstream debottlenecking project (2011 - $2.7 million and $8.6 million). The increase in capitalized interest for the year ended December 31, 2012 is primarily due to increased capital expenditures for the BlackGold project.
Please refer to note 22 of the audited annual consolidated financial statements for sensitivity analysis on Harvest’s exposure to interest rates.
Currency Exchange
Currency exchange gains and losses are attributed to the changes in the value of the Canadian dollar relative to the U.S. dollar on our U.S. dollar denominated 6ì% Senior Notes, the related party loan and on any U.S. dollar denominated monetary assets or liabilities. At December 31, 2012, the Canadian dollar had weakened compared to September 30, 2012, resulting in an unrealized foreign exchange loss of $3.8 million (2011 - $7.6 million gain) for the fourth quarter of 2012. For the year 2012, Harvest recognized an unrealized foreign exchange gain of $1.2 million (2011 - $2.6 million loss) as a result of the strengthening of the Canadian dollar relative to the U.S. dollar from $1.02 Cdn/U.S. at December 31, 2011 to $0.99 Cdn/U.S. at December 31, 2012. Harvest recognized a realized foreign exchange gain of $1.0 million (2011 - $2.7 million loss) and a gain of $0.1 million (2011 - $6.6 million gain) for the three months and year ended December 31, 2012, as a result of the settlement of U.S. dollar denominated transactions.
The cumulative translation adjustment recognized in other comprehensive income represents the translation of the Downstream operations’ U.S. dollar functional currency financial statements to Canadian dollars. During the three months and year ended December 31, 2012, Downstream operations recognized a net cumulative translation gain of $8.5 million and loss of $17.7 million, respectively (2011 – loss of $28.8 million and a gain of $21.5 million). The net cumulative translation gain in the fourth quarter of 2012 resulted from the weakening of the Canadian dollar relative to the U.S. dollar at December 31, 2012 compared to September 30, 2012. Conversely, the Canadian dollar relative to the U.S. dollar strengthened at December 31, 2012 compared to December 31, 2011, resulting in a net cumulative translation loss for the year of 2012. As Downstream operations’ functional currency is denominated in U.S. dollars, the strengthening (weakening) of the U.S. dollar would result in gains (losses) from decommissioning liabilities, pension obligations, accounts payable and other balances that are denominated in Canadian dollars, which partially offset the unrealized losses (gains) recognized on the senior notes and Upstream U.S. dollar denominated monetary items.
28
| MANAGEMENT’S DISCUSSION AND ANALYSIS |
Please refer to note 22 of the audited annual consolidated financial statements for sensitivity analysis on Harvest’s exposure to foreign exchange rates.
Deferred Income Taxes
For the three months and year ended December 31, 2012, Harvest recorded a deferred income tax recovery of $52.4 million and $109.1 million, respectively (2011 – recovery of $37.0 million and $29.9 million). Our deferred income tax asset (liability) will fluctuate during each accounting period to reflect changes in the temporary differences between the book value and tax basis of assets as well as legislative tax rate changes. Currently, the principal sources of our temporary differences relate to the Company’s property, plant and equipment, decommissioning liabilities and the unclaimed tax pools.
Related Party Transactions
The following provides a summary of the related party transactions between Harvest and KNOC in 2011 and 2012:
KNOC Trading Corporation (“KNOC Trading”) is a wholly owned subsidiary of North Atlantic. KNOC Trading bills KNOC, Ankor E&P Holdings Corp. (“ANKOR”) and Dana Petroleum plc (“Dana”) for oil marketing services, such as the sale of products, performed on behalf of KNOC, ANKOR and Dana. Both ANKOR and Dana are wholly owned subsidiaries of KNOC. For the year ended December 31, 2012, all of KNOC Trading’s revenue of $0.9 million (2011 - $nil) was derived from KNOC, ANKOR and Dana. As at December 31, 2012, $0.1 million (2011 - $nil) remains outstanding in accounts receivable. As well, for the year ended December 31, 2012 ANKOR billed KNOC Trading Corporation a total of $0.4 million (2011 and 2010 - $nil) for office rent and salaries and benefits. As at December 31, 2012, $0.3 million (2011 - $nil) remains outstanding in accounts payable.
On August 16, 2012, Harvest entered into a subordinated loan agreement with ANKOR to borrow US $170 million at a fixed interest rate of 4.62% per annum. The principal balance outstanding and accrued interest is revalued using the exchange rate at the end of each reporting period. At December 31, 2012, $169.1 million (2011 - $nil) of principal and $3.0 million (2011 - $nil) of accrued interest remained outstanding. Interest expense was $3.0 million for the year ended December 31, 2012 (2011 and 2010 - $nil). Harvest may, at its sole discretion, repay the principal in whole or in part without premium or penalty, together with all accrued interest at any time during the term of the agreement. There are no scheduled payments of principal or interest under the agreement prior to the maturity of the loan on October 2, 2017. The loan is unsecured and the loan agreement contains no restrictive covenants. For purposes of Harvest’s bank loan covenant requirements, the loan is excluded from the ‘total debt’ amount but included in the ‘total capitalization’ amount. Harvest entered into the loan agreement in order to redeem the remaining 6.4% convertible debentures and reduce the Company’s interest costs.
Harvest has a Global Technology and Research Centre (“GTRC”), which is used as a training and research facility for KNOC. For the year ended December 31, 2012, Harvest billed KNOC and certain subsidiaries of KNOC for a total of $5.8 million (2011 - $1.6 million) primarily related to technical services provided by Harvest’s GTRC. As at December 31, 2012, $1.6 million (2011 - $1.1 million) remains outstanding from KNOC in accounts receivable. The terms of these transactions are governed by a service contract.
For the year ended December 31, 2012, amounts billed by KNOC to Harvest totaled $0.2 million (2011 - $0.6 million). The amounts billed were mainly related to reimbursement to KNOC for secondee salaries paid by KNOC on behalf of Harvest. As at December 31, 2012, $nil (2011 - $0.6 million) remains outstanding in accounts payable.
29
| MANAGEMENT’S DISCUSSION AND ANALYSIS |
The Company identifies its related party transactions by: making inquiries of management and the Board of Directors; reviewing KNOC’s subsidiaries and associates; and performing a comprehensive search of transactions recorded in the accounting system. Material related party transactions require the Board of Directors’ approval.
CAPITAL RESOURCES
The following table summarizes our capital structure as at December 31, 2012 and December 31, 2011 and provides the key financial ratios defined in Harvest’s credit facility agreement.
| December 31, 2012 | December 31, 2011 | |||||
| Debts | ||||||
| Bank loan(1) | 494.2 | 358.9 | ||||
| Senior notes, at principal amount (US$500 million)(2) | 497.5 | 508.5 | ||||
| Related party loan (US$170 million)(2) | 169.1 | – | ||||
| Convertible debentures, at principal amount | 627.2 | 734.0 | ||||
| 1,788.0 | 1,601.4 | |||||
| Shareholder’s Equity | ||||||
| 386,078,649 common shares issued(3) | 2,691.9 | 3,453.7 | ||||
| 4,479.9 | 5,055.1 | |||||
| Financial Ratios (4) (5) | ||||||
| Senior Debt to Annualized EBITDA(6) | 1.10 | 0.73 | ||||
| Total Debt to Annualized EBITDA(7) | 3.22 | 2.72 | ||||
| Senior Debt to Total Capitalization(6) (8) | 14% | 10% | ||||
| Total Debt to Total Capitalization(7) (8) | 41% | 36% |
| (1) | The bank loan net of deferred financing costs is $491.3 million (2011 - $355.6 million). |
| (2) | Principal amount converted at the period end exchange rate. |
| (3) | As at February 28, 2013, the number of common shares issued is 386,078,649. |
| (4) | Calculated based on Harvest’s credit facility covenant requirements (see note 10 of the December 31, 2012 financial statements). |
| (5) | The financial ratios and their components are non-GAAP measures; please refer to the “Non-GAAP Measures” section of this MD&A. |
| (6) | Senior debt consists of letters of credit of $8.2 million (2011 – $8.7 million), bank loan of $491.3 million (2011 - $355.6 million) and guarantees of $76.6 million (2011 - $92.1 million) at December 31, 2012. |
| (7) | Total debt includes the senior debt, convertible debentures of $632.0 million (2011 - $742.0 million) and senior notes of $486.4 million (2011 - $495.7 million) at December 31, 2012. |
| (8) | Total capitalization includes total debt, related party loan of $169.1 million (2011 – $ nil) and shareholder’s equity less equity attributed to BlackGold of $458.6 million at December 31, 2012 (2011 - $459.9 million). |
30
| MANAGEMENT’S DISCUSSION AND ANALYSIS |
During 2012, Harvest was assigned a corporate credit rating of BB- (Negative outlook) and Ba2 (Stable outlook) from Standard and Poor’s Rating Services (“S&P”) and Moody’s Investors Service (“Moody’s”) respectively. The credit rating for the 6ì% senior notes from S&P and Moody’s was “BB-“ and “Ba2”.
Bank Loan
During 2012, the credit facility agreement was amended to revise the maximum allowable total debt to annualized EBITDA ratio (see note 10 of the audited annual consolidated financial statements) and on July 31, 2012 the agreement was extended one year to April 30, 2016. At December 31, 2012, Harvest is in compliance with all covenants under the credit facility.
As at December 31, 2012, Harvest had $305.8 million of unutilized borrowing capacity under the credit facility. The unused borrowing capacity and the option to increase the capacity limit to $1.0 billion provide Harvest the flexibility to manage fluctuations in its liquidity needs.
Senior Notes
Harvest had $497.5 million (2011 - $508.5 million) of principal amount of U.S. dollar denominated senior notes outstanding at December 31, 2012. The senior notes are unsecured with interest payable semi-annually on April 1 and October 1 and mature on October 1, 2017. The senior notes have a face value of US$500 million and are unconditionally guaranteed by Harvest and all of its wholly-owned subsidiaries that guarantee the revolving credit facility and every future restricted subsidiary that guarantees certain debt. The notes are redeemable at a redemption price equal to 100% of the principal amount of the notes being redeemed plus a make-whole redemption premium, plus accrued and unpaid interest to the redemption date. Harvest may also redeem the notes at any time in the event that certain changes affecting Canadian withholding taxes occur.
There are covenants restricting, among other things, the sale of assets and the incurrence of additional indebtedness if such issuance would result in an interest coverage ratio, as defined, of less than 2.0 to 1. Notwithstanding the interest coverage ratio limitation, the incurrence of additional indebtedness may be permitted under certain incurrence tests. One provision allows Harvest’s incurrence of indebtedness under the credit facility or other future bank debt in an aggregate principal amount not to exceed the greater of $1.0 billion and 15% of total assets. In addition, the covenants of the senior notes restrict the amount of dividends Harvest can pay to shareholders; no dividends have been paid during the year ended December 31, 2012. At December 31, 2012, Harvest is in compliance with all covenants under the senior notes. Interest coverage ratio is a defined term within the senior notes agreement and is considered a non-GAAP measure which may not be comparable with similar non-GAAP measures used by other entities. Please refer to the “Non-GAAP measures” section of this MD&A.
Convertible Debentures
At December 31, 2012, Harvest had $627.2 million (2011 - $734.0 million) of principal amount of convertible debentures issued in three series with the earliest maturity date in 2013. On September 19, 2012, Harvest redeemed its 6.40% or D series of convertible debentures for a total of $106.8 million.
The debentures may be redeemed by Harvest at its option in whole or in part prior to their respective redemption dates. The redemption price for the first redemption period is at a price equal to $1,050 per debenture and at $1,025 per debenture during the second redemption period. After the second redemption period, the debentures are redeemable at par. Any redemption will include accrued and unpaid interest at such time. Please refer to note 10 of the December 31, 2012, audited consolidated financial statements for details of the redemption periods.
31
| MANAGEMENT’S DISCUSSION AND ANALYSIS |
The 7.25% E series convertible debentures with a face value of $330.5 million will be maturing on September 30, 2013.
LIQUIDITY
The Company’s liquidity needs are met through the following sources: cash generated from operations, proceeds from asset dispositions, borrowings under our long-term credit facility, long-term debt issuances and capital injections by KNOC. Harvest’s primary uses of funds are operating expenses, capital expenditures, and interest and principal payments on debt instruments.
Cash flow from operating activities for the year ended December 31, 2012 was $442.8 million, compared to $560.5 million in 2011. The decrease was primarily due to lower cash contribution from Upstream. For the year ended December 31, 2012, the change in non-cash working capital relating to operating activities was a surplus of $11.0 million (2011 – surplus of $51.1 million), and $20.4 million (2011 - $22.1 million) was incurred in the settlement of decommissioning and environmental liabilities.
The cash contribution from Harvest’s Upstream operations was $581.9 million for the year ended December 31, 2012 (2011 – $661.0 million), a decrease of $79.1 million as compared to the prior year mainly due to lower operating netback. The cash deficiency from Harvest’s Downstream operations was $41.7 million in 2012 (2011 - $49.7 million deficiency), an improvement of $8.0 million as compared to the prior year as a result of a higher throughput volume, partially offset by lower average refining margin per bbl and higher operating and purchased energy expenses.
For the year ended December 31 2012, Harvest received $135.1 million (2011 - $343.3 million) from net borrowings under the credit facility. Harvest fully redeemed the remaining 6.4% convertible debentures at a cost of $106.8 million and funded the redemption through the borrowing of US$170 million from a related party (see the “Related Party Transactions” section of this MD&A for discussion of the related party loan). During the prior year, $505.4 million of cash was invested into Harvest by our sole shareholder KNOC to fund the acquisition of the Hunt assets.
Harvest funded $663.5 million of capital additions in 2012 (2011 – $1,017.6 million) with cash generated from operating activities and borrowings under the credit facility.
Harvest had a working capital deficiency of $444.9 million as at December 31, 2012, as compared to a $269.7 million deficiency at December 31, 2011. The negative working capital in 2012 is primarily related to the current liability classification of $331.8 million of convertible debentures which matures on September 30, 2013. Harvest intends to refinance these debentures and several financing options are being evaluated by management. The objectives of the refinancing are to i) extend the debt repayment horizon ii) reduce interest expenses and iii) possibly expand Harvest’s access to capital markets. The Company’s working capital is expected to fluctuate from time to time, and will be funded from cash flows from operations and borrowings from the credit facility, as required.
32
| MANAGEMENT’S DISCUSSION AND ANALYSIS |
Future development activities and acquisitions in our Upstream business as well as the sustaining and maintenance program in our Downstream business will likely be funded from cash flow from operating activities and proceeds from asset sales, while we will generally rely on funding more significant acquisitions and growth initiatives from some combination of cash flow from operating activities, issuances of incremental debt and capital injections from KNOC. Should incremental debt not be available to us through debt capital markets, our ability to make expenditures to enhance or expand our assets may be constrained. Harvest’s liquidity is closely related to its ability to generate cash from operating activities, which is affected by changes in commodity prices, market demands for petroleum and natural gas products and the operating performances of both our Upstream and Downstream assets. Harvest at times enters into risk management contracts (refer to the “Cash Flow Risk Management” section of this MD&A) to protect the Company from cash flow fluctuations due to changes in commodity prices.
Through a combination of cash available at December 31, 2012, cash from operating activities, proceeds from asset sales, issuance of new debt and available undrawn credit facility, it is anticipated that Harvest will have adequate liquidity to fund future operations, debt repayments and forecasted capital expenditures (excluding any major acquisitions). Our 2013 capital program, excluding acquisitions, for Upstream, BlackGold and Downstream is budgeted to be $733 million. Harvest regularly monitors its capital structure, liquidity and payment obligations. The Company has the ability to adjust its capital spending programs and issue replacement debt, new debt or equity through KNOC as may be needed. Refer to the “Contractual Obligations and Commitments” section of this MD&A for Harvest’s future commitments and the discussion below on certain significant items.
For 2013, $315 million of the capital expenditure program is allocated to the continued development of BlackGold. Harvest plans to fund the capital expenditures with cash flows from operating activities and drawings from the credit facility.
33
| MANAGEMENT’S DISCUSSION AND ANALYSIS |
Contractual Obligations and Commitments
Harvest has recurring and ongoing contractual obligations and commitments entered into in the normal course of operations including the purchase of assets and services, operating agreements, transportation commitments, sales commitments, royalty obligations, and land lease obligations. As described in note 11 of the audited annual consolidated financial statements, the BlackGold EPC contract now bears a cost reimbursable price. The expected cost outlays, including the $101 million of installment payments are included in the contractual obligation and commitment table below. Under the SOA, as at December 31, 2012, Downstream had commitments totaling approximately $1.1 billion (2011 - $776.1 million) in respect of future crude oil feedstock purchases from Macquarie. As at the end of December 31, 2012, Harvest has the following significant contractual commitments:
| Payments Due by Period | |||||||||||||||
| 1 year | 2-3 years | 4-5 years | After 5 years | Total | |||||||||||
| Debt repayments(1) | 330.5 | 296.6 | 1,160.8 | – | 1,787.9 | ||||||||||
| Debt interest payments(1) (2) | 88.2 | 122.2 | 101.7 | – | 312.1 | ||||||||||
| Purchase commitments(3) | 252.0 | 48.1 | 20.0 | 60.0 | 380.1 | ||||||||||
| Operating leases | 11.9 | 15.2 | 6.4 | 3.2 | 36.7 | ||||||||||
| Transportation agreements(4) | 9.4 | 13.1 | 1.9 | 0.5 | 24.9 | ||||||||||
| Feedstock and other purchase commitments(5) | 1,110.7 | – | – | – | 1,110.7 | ||||||||||
| Employee benefits(6) | 11.8 | 20.7 | 4.3 | – | 36.8 | ||||||||||
| Decommissioning and environmental liabilities(7) | 24.6 | 57.6 | 48.2 | 1,659.7 | 1,790.1 | ||||||||||
| Total | 1,839.1 | 573.5 | 1,343.3 | 1,723.4 | 5,479.3 | ||||||||||
| (1) | Assumes constant foreign exchange rate. |
| (2) | Assumes interest rates as at December 31, 2012 will be applicable to future interest payments. |
| (3) | Relates to drilling commitments, AFE commitments, BlackGold oil sands project commitment and Downstream capital commitments. |
| (4) | Relates to firm transportation commitments. |
| (5) | Includes commitments to purchase refinery crude stock and refined products for resale under the SOA with Macquarie. |
| (6) | Relates to the expected contributions to employee benefit plans and long-term incentive plan payments. |
| (7) | Represents the undiscounted obligation by period. |
Off Balance Sheet Arrangements
As at December 31, 2012, Harvest has no off balance sheet arrangements in place.
34
| MANAGEMENT’S DISCUSSION AND ANALYSIS |
SUMMARY OF QUARTERLY RESULTS
The following table and discussion highlights our fourth quarter of 2012 results relative to the preceding 7 quarters:
| 2012 | 2011 | |||||||||||||||||||||||
| Q4 | Q3 | Q2 | Q1 | Q4 | Q3 | Q2 | Q1 | |||||||||||||||||
| FINANCIAL | ||||||||||||||||||||||||
| Revenues | 1,546.0 | 1,275.1 | 1,533.8 | 1,426.1 | 1,469.9 | 848.2 | 786.7 | 1,288.9 | ||||||||||||||||
| Net income (loss) | (536.4 | ) | (38.3 | ) | (73.3 | ) | (72.1 | ) | (73.9 | ) | (49.2 | ) | (19.5 | ) | 37.9 | |||||||||
| Cash from operating activities | 133.0 | 153.9 | 70.8 | 85.1 | 144.6 | 161.5 | 107.6 | 146.8 | ||||||||||||||||
| Total long-term financial debt | 1,450.0 | 1,519.4 | 1,770.7 | 1,652.4 | 1,486.2 | 1,509.8 | 1,384.9 | 1,244.8 | ||||||||||||||||
| Total assets | 5,654.6 | 6,162.9 | 6,277.5 | 6,322.3 | 6,284.4 | 6,483.6 | 6,121.5 | 6,041.1 | ||||||||||||||||
| OPERATIONS | ||||||||||||||||||||||||
| Upstream | ||||||||||||||||||||||||
| Daily sales volumes (boe/d) | 58,228 | 57,686 | 60,874 | 60,550 | 61,324 | 58,548 | 55,338 | 53,331 | ||||||||||||||||
| Realized price prior to hedges ($/boe) | 52.82 | 52.02 | 51.42 | 58.07 | 64.61 | 57.85 | 66.73 | 59.19 | ||||||||||||||||
| Downstream | ||||||||||||||||||||||||
| Average daily throughput (bbl/d) | 114,065 | 84,889 | 114,552 | 100,000 | 89,468 | 43,357 | 38,749 | 101,007 | ||||||||||||||||
| Average refining gross margin (loss) (US$/bbl) | 6.43 | 6.03 | 2.71 | 4.58 | (4.11 | ) | 10.06 | 7.94 | 10.57 | |||||||||||||||
The quarterly revenues and cash from operating activities are mainly impacted by the Upstream sales volumes, realized prices and operating expenses and Downstream throughput volumes, cost of feedstock and realized prices. Significant items that impacted Harvest’s quarterly revenues include:
Revenues were highest in the fourth and second quarters of 2012, as a result of the refinery operating at near capacity during those periods.
The lower revenue in the second and third quarters of 2011 was due to lower Downstream sales as a result of a planned shutdown, partially offset by increased Upstream sales from the assets acquired from Hunt in the first quarter 2011 and higher commodity prices.
The increasing Upstream sales volumes since the first quarter of 2011 were mainly attributable to the acquisition of oil and gas assets in the third quarter of 2010 and first quarter of 2011, combined with a very active drilling program in 2011. The decrease in the third quarter of 2012 was mainly due to natural declines and facility turnarounds which more than offset the increases from the 2012 drilling program.
Downstream’s refining margin/bbl increased in the first and third quarter of 2011, reflecting the higher global refining crack spreads during these periods. However the weaker margins experienced in the five most recent quarters reflect the decrease in the sour-crude differential from the Brent benchmark price for crude oil.
Downstream’s average daily throughput was lower in the third quarter of 2012 as compared to the other quarters of 2012 due to a two-week partial outage of some process units and a three-week unplanned shutdown of all process units while repairs were completed to the sulphur recovery unit. The average daily throughput was significantly lower than the 115,000bbl/d nameplate capacity of the refinery for the second and third quarters of 2011 due to a planned turnaround.
35
| MANAGEMENT’S DISCUSSION AND ANALYSIS |
Net income (loss) reflects both cash and non-cash items. Changes in non-cash items including deferred income tax, DD&A expense, accretion of decommissioning and environmental remediation liabilities, impairment of long-lived assets, unrealized foreign exchange gains and losses, and unrealized gains and losses on risk management contracts impact net income (loss) from period to period. For these reasons, the net income (loss) may not necessarily reflect the same trends as revenues or cash from operating activities, nor is it expected to. Net loss in the fourth quarter of 2012 is mainly due to the $563.2 million impairment of Downstream PP&E.
The increases in total assets which occurred in 2011 and early 2012 are mainly attributable to organic additions from Harvest’s capital program. The significant decrease in total assets in the fourth quarter of 2012 was mainly due to the $563.2 million impairment of Downstream PP&E.
SELECTED ANNUAL INFORMATION
| Year Ended | |||||||||
| December 31 | |||||||||
| 2012 | 2011 | 2010 | |||||||
| FINANCIAL | |||||||||
| Revenues(1) | 5,781.0 | 4,393.7 | 4,045.5 | ||||||
| Cash from operating activities | 442.8 | 560.5 | 439.2 | ||||||
| Net loss | (720.1 | ) | (104.7 | ) | (81.2 | ) | |||
| Bank loan | 491.3 | 355.6 | 11.4 | ||||||
| Convertible debentures | 632.0 | 742.0 | 745.2 | ||||||
| Senior notes | 486.4 | 495.7 | 482.4 | ||||||
| Related party loan | 172.1 | – | – | ||||||
| Total financial debt(2) | 1,781.8 | 1,593.3 | 1,239.0 | ||||||
| Total assets | 5,654.6 | 6,284.4 | 5,388.7 | ||||||
| (1) | Revenues are net of royalties and the effective portion of Harvest’s realized crude oil hedges. |
| (2) | This is a non-GAAP measure; please refer to “Non-GAAP Measures” in this MD&A. |
OUTLOOK
The following information is provided with the objective to share with stakeholders management’s expectations for 2013 operating levels and key expenses in the Upstream and Downstream segments, and major cash outflows in 2013. The guidance information provided is consistent with the Company’s current budget information. Readers are cautioned that the Outlook information may not be appropriate for other purposes and the actual results may differ materially from those anticipated.
Harvest has established a capital expenditure budget of $733 million for 2013 comprised of $300 million for Upstream oil & gas operations, $315 million for development of the BlackGold oil sands project, and $118 million for the Downstream refining and marketing business.
36
| MANAGEMENT’S DISCUSSION AND ANALYSIS |
Upstream
Approximately 61% of Upstream’s $300 million capital budget is allocated to drilling activities. Harvest plans to drill 75 gross wells in 2013 of which 10 gross wells were drilled as part of its capital acceleration program in late 2012. The 2013 drilling program will mainly focus on crude oil opportunities in Western Canada, complemented with the liquids rich natural gas wells in the Deep Basin area.
Full Year production is expected to average 53,500 boe/d reflecting recent asset dispositions and reduction in capital spending from 2012. Upstream’s reduced capital budget in 2013 allows Harvest supply greater resources to the BlackGold project. Operating costs for 2013 are anticipated to average $17.00/boe.
BlackGold
The BlackGold 2013 capital budget is $315 million of which 73% is allocated to the construction of the 10,000 bbl/d Phase 1 central processing facility. First steam and oil production from BlackGold is expected in 2014. ERCB approval for an additional 20,000 bbl/d Phase 2 of the project is anticipated in 2013.
Downstream
The 2013 capital budget for the Downstream operations is $118 million. A scheduled refinery turnaround in the second half of 2013 will utilize 68% of the budget with the remainder allocated to sustaining and reliability improvement projects.
Including the scheduled turnaround days, 2013 throughput volume is anticipated to average 93,600 bbl/d, with operating costs and purchased energy costs aggregating to approximately $7.00/bbl.
Corporate
On September 30, 2013, Harvest’s 7.25% convertible debentures (TSX: HTE.DB.E) will mature in the amount of $330.5 million. Harvest anticipates refinancing the debentures with the objectives of extending the debt repayment horizon and to lower future interest expenses.
From time-to-time Harvest will enter into risk management contracts with the objective of stabilizing our cash flow from operating activities. Please refer to the Risk Management, Financing and Other section of the MD&A.
CRITICAL ACCOUNTING ESTIMATES
The preparation of financial statements in conformity with IFRS requires management to make judgments, estimates and assumptions that affect the application of accounting policies and the reported amounts of assets, liabilities, income and expenses. Actual results may differ from these estimates. Estimates and underlying assumptions are reviewed on an ongoing basis. Revisions to accounting estimates are recognized in the period in which the estimates are revised and in any future periods affected. Significant estimates and judgments made by management in the preparation of these consolidated financial statements are outlined below:
37
| MANAGEMENT’S DISCUSSION AND ANALYSIS |
Reserves
The provision for depletion and depreciation of Upstream assets is calculated on the unit-of-production method based on proved developed reserves. As well, reserve estimates impact net income through the application of impairment tests. Revisions or changes in the reserve estimates can have either a positive or a negative impact on net income and property, plant and equipment ("PP&E").
The process of estimating reserves is complex and requires significant judgments based on available geological, geophysical, engineering and economic data. In the process of estimating the recoverable oil and natural gas reserves and related future net cash flows, Harvest incorporates many factors and assumptions, such as:
expected reservoir characteristics based on geological, geophysical and engineering assessments;
future production rates based on historical performance and expected future operating and investment activities;
future commodity prices and quality differentials;
discount rates; and
future development costs.
On an annual basis, the Company engages qualified, independent reserve evaluators to evaluate Harvest's reserve data.
Impairment of long-lived assets
Long-lived assets (goodwill, PP&E and exploration and evaluation assets) are aggregated into cash-generating units ("CGUs") based on their ability to generate largely independent cash flows and are used for impairment testing. The determination of the Company's CGUs is subject to significant judgment; product type, internal operational teams, geology and geography were key factors considered when grouping Harvest's oil and gas assets into the CGUs.
PP&E is tested for impairment when indications of impairment exist. PP&E impairment indicators include declines in commodity prices, production, reserves and operating results, cost overruns and construction delays. E&E impairment indicators include expiration of the right to explore and cessation of exploration in specific areas, lack of potential for commercial viability and technical feasibility and when E&E costs are not expected to be recovered from successful development of an area. The determination of whether such indicators exist requires significant judgment.
The recoverable amounts of CGUs and individual assets are determined based on the higher of value-in-use calculations and estimated fair values less costs to sell. To determine the recoverable amounts, Harvest uses reserve estimates for both the Upstream and BlackGold operating segments and expected future cash flows for the Downstream operations. The estimates of reserves, future commodity prices, refining margins, discount rates, operating expenses and sustaining capital expenditures require significant judgments.
During the year ended December 31, 2012, Harvest recorded impairment losses of $563.2 million (2011 - $nil) against the Downstream refinery CGU’s PP&E (Please see note 7 of the audited annual consolidated financial statements for further impairment discussion). An increase of 100 bps in the pre-tax discount rate in the Downstream impairment calculation would result in an additional impairment of $45.8 million, while a 10% decrease in gross margin would result in an additional impairment of $292.3 million in the Downstream refinery CGU. Harvest also recorded a $21.8 million impairment on its Upstream’s South Alberta gas CGU’s PP&E during 2012. A 100 bps increase in the discount rate in the Upstream impairment calculation would result in an additional impairment of approximately $34.6 million while a 10% decrease in the forward gas price estimate would result in an additional impairment of approximately $42.1 million.
38
| MANAGEMENT’S DISCUSSION AND ANALYSIS |
Provisions
In the determination of provisions, management is required to make a significant number of estimates and assumptions with respect to activities that will occur in the future including the ultimate amounts and timing of settlements, inflation factors, risk-free discount rates, emergence of new restoration techniques and expected changes in legal, regulatory, environmental and political environments. A change in any one of the assumptions could impact the estimated future obligation and in return, net income and in the case of decommissioning liabilities, PP&E.
Employee benefits
Harvest’s Downstream operations maintains a defined benefit pension plan and provides certain post-retirement health care benefits, which cover the majority of its Downstream employees and their surviving spouses. An independent actuary determines the costs of the Company’s employee future benefit programs using certain management assumptions and estimates such as, the expected plan investment performance, salary escalation, retirement ages of employees, expected health care costs, employee turnover, discount rates and return on plan assets. The obligation and expense recorded related to Harvest’s employee future benefit plans could increase or decrease if there were to be a change in these estimates.
The Company also maintains a long-term incentive plan which is a performance-based program. As a result, the compensation costs accrued for the plan are subject to the estimation of what the ultimate payout will be and are subject to management’s judgment as to whether or not the performance criteria will be met.
Consideration transferred
Business acquisitions for all operating segments are accounted for using the acquisition method. Under this method, the consideration transferred is allocated to the assets acquired and the liabilities assumed based on the fair values at the time of the acquisition. In determining the fair value of the assets and liabilities, Harvest is often required to make assumptions and estimates, such as reserves, future commodity prices, fair value of undeveloped land, discount rates, decommissioning liabilities and possible outcome of any assumed contingencies. Changes in any of these assumptions would impact amounts assigned to assets and liabilities and goodwill in the consideration transferred allocation and as a result, future net income.
Risk management contracts
Derivative risk management contracts in the Upstream segment are valued using valuation techniques with market observable inputs. The most frequently applied valuation techniques include forward pricing and swap models, using present value calculations. The models incorporate various inputs including the credit quality of counterparties, foreign exchange spot and forward rates, interest rate curves and forward rate curves of the underlying commodity. Changes in any of these assumptions would impact fair value of the risk management contracts and as a result, future net income and other comprehensive income. For risk management contracts designated as hedges, changes in the above mentioned assumptions may impact hedge effectiveness assessment and Harvest’s ability to continue applying hedge accounting.
39
| MANAGEMENT’S DISCUSSION AND ANALYSIS |
Income taxes
Tax interpretations, regulations and legislation in the various jurisdictions in which Harvest and its subsidiaries operate are subject to change. The Company is also subject to income tax audits and reassessments which may change its provision for income taxes. Therefore, the determination of income taxes is by nature complex, and requires making certain estimates and assumptions.
Harvest recognizes the net deferred tax benefit related to deferred tax assets to the extent that it is probable that the deductible temporary differences will reverse in the foreseeable future. Assessing the recoverability of deferred tax assets requires the Company to make significant estimates related to expectations of future taxable income. Estimates of future taxable income are based on forecast cash flows from operations and the application of existing tax laws in each jurisdiction. To the extent that future cash flows and taxable income differ significantly from estimates, the ability of the Company to realize the net deferred tax assets recorded at the reporting date could be impacted.
Contingencies
Contingencies will only be resolved when one or more future events occur or fail to occur. The assessment of contingencies inherently involves the exercise of significant judgment and estimates of the outcome of future events.
RECENT PRONOUNCEMENTS
The Company has reviewed new and revised accounting pronouncements that have been issued but are not yet effective and determined that the following may have an impact on the Company.
In May 2011, the IASB issued the following new standards, which are effective for annual periods beginning on or after January 1, 2013:
IFRS 10, "Consolidated Financial Statements", replaces the consolidation requirements in SIC-12, "Consolidation - Special Purpose Entities" and a portion of IAS 27. IFRS 10 builds on existing principles by identifying the concept of control as the determining factor in whether an entity should be included within the consolidated financial statements of the parent company and provides additional guidance to assist in the determination of control where this is difficult to assess. IFRS 10 requires retrospective application and early adoption is permitted.
IFRS 11, "Joint Arrangements", focuses on the rights and obligations of the joint arrangement, rather than its legal form (as is currently the case) and requires a single method to account for interests in jointly controlled entities (equity method). This standard requires retrospective application and early adoption is permitted.
IFRS 12, "Disclosure of Interest in Other Entities", is a comprehensive standard on disclosure requirements for all forms of interests in other entities, including joint arrangements, associates, structure entities and other off balance sheet interests. IFRS 12 requires retrospective application and early adoption is permitted.
40
| MANAGEMENT’S DISCUSSION AND ANALYSIS |
| IFRS 13, "Fair Value Measurement", provides a consistent definition of fair value, establishes a single framework for determining fair value and introduces requirements for disclosures related to fair value measurement. IFRS 13 applies prospectively from the beginning of the annual period in which the standard is adopted. Early adoption is permitted. |
Harvest does not expect the adoption of these standards to have any material impact on its consolidated financial statements.
On June 16, 2011, the IASB issued an amendment to IAS 19, "Employee Benefits", which changes the recognition and measurement of defined benefit pension expense and termination benefits and expands disclosure requirements for all employee benefit plans. The new standard is required to be adopted for periods beginning on or after January 1, 2013. The adoption of this standard is not expected to have a material impact on Harvest's financial statements.
The IASB issued an amendment to IAS 1, “Presentation of Financial Statements” on June 16, 2011, which requires separating items presented in other comprehensive income between those that are recycled to income and those that are not. The standard is required to be adopted for periods beginning on or after July 1, 2012. The adoption of this standard should not have any impact on the Company’s consolidated financial statements as Harvest already complied with the standard with its existing disclosures.
In December 2011, the IASB issued amendments to IFRS 7 "Financial Instruments: Disclosures" and IAS 32, "Financial Instruments: Presentation" to clarify the current offsetting model and develop common disclosure requirements. Amendments to IFRS 7 are effective for annual periods beginning on or after January 1, 2013. Retrospective application is required and early adoption is permitted. Amendments to IAS 32 are effective for annual periods beginning on or after January 1, 2014. Retrospective application is required. Harvest does not expect material impact to its consolidated financial statements from the amendments.
On January 1, 2015, Harvest will be required to adopt IFRS 9, “Financial Instruments”, which is the result of the first phase of the IASB’s project to replace IAS 39, “Financial Instruments: Recognition and Measurement”. The new standard replaces the current multiple classification and measurement models for financial assets and liabilities with a single model that has only two classification categories: amortized cost and fair value. Restatement of comparative period financial statements is not required upon initial application; however, modified disclosures on transition from the classification and measurement requirements of IAS 39 to IFRS 9 are required. As the remaining phases of this standard are still in development, the full impact of this standard on Harvest’s consolidated financial statements will not be known until the project is complete. Harvest will continue to monitor the changes to this standard as they arise and will assess the impact accordingly.
OPERATIONAL AND OTHER BUSINESS RISKS
Harvest’s Upstream, BlackGold and Downstream operations are conducted in the same business environment as most other operators in the respective businesses and the business risks are very similar.
41
| MANAGEMENT’S DISCUSSION AND ANALYSIS |
Harvest has a risk management committee that meets on a regular basis to assess and manage operational and business risks and has a corporate Environment, Health and Safety (“EH&S”) policy. The following summarizes the significant risks:
Risks Associated with Commodity Prices
Upstream
- Prices received for petroleum and natural gas have fluctuated widely in recent years. Natural gas prices have continued to experience significant declines since 2010. Crude oil differentials continue to be volatile and are currently at wide levels. Decreases in commodity prices could reduce Harvest’s earnings and cash flow and have resulted in shut-in of certain natural gas properties. Low commodity prices may also result in asset impairment. Harvest manages commodity price risks by entering into various commodity price risk management contracts. Refer to the “Cash Flow Risk Management” section of this MD&A for further information.
Downstream
- The market prices for crude oil feedstock and refined products have fluctuated significantly, the direction of the fluctuations may not match and the relative magnitude may be different resulting in volatile refining margins.
Risks Associated with Operations
Upstream
The markets for petroleum and natural gas produced in western Canada are dependent upon available capacity to refine crude oil and process natural gas as well as pipeline or other methods to transport the products to consumers.
Pipeline capacity and natural gas liquids fractionation capacity in Alberta has not kept pace with the drilling of liquid rich gas properties in some areas of the province which may limit production periodically.
The production of petroleum and natural gas may involve a significant use of electrical power and since deregulation of the electric system in Alberta, electrical power prices in Alberta have been volatile. Increases in power prices could reduce our cash flow and earnings. From time to time, Harvest may enter into electricity price swaps to manage our exposure to power price volatility.
Downstream
Fluctuations in global demand and supply for crude oil and refined products could impact the Company’s margins.
Crude oil feedstock is delivered to the refinery via waterborne vessels which could experience delays due to weather, accidents, government regulations or third party actions.
Downstream’s refinery is a single train, integrated, interdependent facility which could experience a major interruption caused by an accident or severe weather damage. These potential interruptions may reduce or eliminate our cash flow.
The refinery utilizes a SOA to facilitate the supply of crude feedstock to the refinery and the offtake of refined products. This agreement has termination rights and replacement arrangements may not be as favorable and may result in an increase in costs.
There are risks and uncertainties affecting construction or planned maintenance schedules and costs, including the availability of materials, equipment, qualified personnel, impacts of competing projects drawing on the same resources during the same time period; and the potential for disruptions to operations and construction projects. Accordingly, actual costs can be materially different from estimates and could have a material adverse effect on our costs, results of operations and cash flows. In addition, maintenance activities may not improve operational performance or the outputs of related facilities and construction projects may not deliver anticipated results.
42
| MANAGEMENT’S DISCUSSION AND ANALYSIS |
- Collective agreements with the employees and the United Steel Workers of America may not prevent a strike or work stoppage and future agreements may result in an increase in operating costs.
Risks Associated with Reserve Estimates
The reservoir and recovery information in reserve reports prepared by independent reserve evaluators are estimates and actual production and recovery rates may vary from the estimates and the variations may be significant.
Prices paid for acquisitions are based in part on reserve report estimates and the assumptions made preparing the reserve reports are subject to change as well as geological and engineering uncertainty. The actual reserves acquired may be lower than expected, which could adversely impact our cash flow and earnings.
Risks Associated with the Oil Sands Project
The BlackGold oil sands project is exposed to the risks associated with major construction projects. These risks include the possibility that the project will not be completed on budget, on time and/or will not achieve the design objectives. This would have a significant impact on the financial results of the project.
The oil sands project is subject to government regulations. Phase 2 of the BlackGold oil sands project is subject to approval by the regulatory bodies and the delay of approval could impact Harvest’s ability and/or timing of reaching the targeted production of 30,000 bbl/d as well as the financial results of the project.
Risks Associated with Environment, Health & Safety (“EH&S”)
The operations of petroleum and natural gas properties involves a number of operating and natural hazards which may result in blowouts, environmental damage and other unexpected and/or dangerous conditions.
Decommissioning liabilities are calculated using estimated costs and timelines based upon current operational plans, technology and reclamation practices, and environmental regulations. These factors are subject to change and such changes may impact the actual timing and amount of Harvest’s decommissioning costs.
The operations of petroleum and natural gas properties as well as the refinery are subject to environmental regulation pursuant to local, provincial and federal legislation. Changes in these regulations could have a material adverse effect as regards to operating costs and capital costs. A breach of such legislation may result in the imposition of fines as well as higher operating standards that may increase costs.
The production of aviation fuels in the Downstream operations subjects us to liability should contaminants in the fuel result in aircraft engines being damaged and/or aircraft crashes.
Downstream’s refining operations, which include the transportation and storage of a significant amount of crude oil and refined products, are adjacent to environmentally sensitive coastal waters, and are subject to hazards such as fires, explosions, spills and mechanical failures, any of which may result in personal injury, damage to Downstream’s property and/or the property of others along with significant other liabilities in connection with a discharge of materials. Harvest regularly performs stack sampling, soil, vegetation, and fresh and ocean water tests, and we have monitoring stations to record the air quality in three adjacent communities, as well as at the refinery perimeter.
43
| MANAGEMENT’S DISCUSSION AND ANALYSIS |
Harvest’s corporate EH&S manual has a number of specific policies to minimize the risk of environmental contamination, including emergency response should an incident occur. If areas of higher risk are identified, Harvest will undertake to analyze and recommend changes to reduce the risk including replacement of specific infrastructure. In addition, our business units conduct emergency response training on a regular basis in all of our operating fields to ensure a high level of response capability when placed in a challenging situation. Harvest also performs safety and environmental audits of our operating facilities. In addition to the above, Harvest maintains business interruption insurance, commercial general liability insurance as well as specific environmental liability insurance, in amounts consistent with industry standards.
Risks Associated with Liquidity
Absent capital reinvestment or acquisition, Harvest’s reserves and production levels from petroleum and natural gas properties will decline over time as a result of natural declines. As a result, cash generated from operating these properties may decline.
Fluctuations in interest rates on our current and/or future financing arrangements may result in significant increases in our borrowing costs.
Harvest is required to comply with covenants under the credit facility and the senior notes. In the event that the Company does not comply with the covenants, its access to capital may be restricted or repayment may be required.
Although the Company monitors the credit worthiness of third parties it contracts with through a formal risk management policy, there can be no assurance that the Company will not experience a loss for nonperformance by any counterparty with whom it has a commercial relationship. Such events may result in material adverse consequences on the business of the Company.
Downstream operations are relying on the creditworthiness of Macquarie for the purchase of feedstock and should their creditworthiness deteriorate, crude oil suppliers may restrict the sale of crude oil to Macquarie.
Harvest’s ability to make scheduled repayments or refinance its debt obligations will depend upon its financial and operating performance and continued support from KNOC, which in turn will partially depend upon prevailing industry and general economic conditions which are beyond Harvest’s control. There can be no assurance that our operating performance, cash flow and capital resources will be sufficient to service and/or repay the Company’s debt in the future, in which case the Company may be required to sell assets, defer capital expenditures or raise additional equity from KNOC, to the extent available.
Harvest monitors its cash flow projections and covenants on a routine basis and will adjust its development plans accordingly in response to changes in commodity prices and cash flows.
44
| MANAGEMENT’S DISCUSSION AND ANALYSIS |
General Business Risks
The operation of petroleum and natural gas properties as well as the refinery requires physical access for people and equipment on a regular basis which could be affected by weather, accidents, government regulations or third party actions.
Skilled labor is necessary to run operations (both those employed directly by Harvest and by our contractors) and there is a risk that we may have difficulty in sourcing skilled labor which could lead to increased operating and capital costs.
The loss of a member of our senior management team and/or key technical operations employee could result in a disruption to either our Upstream or Downstream operations.
Upstream’s crude oil sales, a large portion of Harvest’s long-term debt and refining margins are denominated in US dollars while the Company incurs costs in Canadian dollars which results in a currency exchange exposure.
The operations of Harvest, including the refinery, operate under permits issued by the federal and provincial governments and these permits must be renewed periodically. The federal and provincial governments may make operating requirements more stringent which may require additional spending.
Income tax laws, other laws or government incentive programs relating to the oil and gas industry, may in the future be changed or interpreted in a manner that affects Harvest or its stakeholders.
CHANGES IN REGULATORY ENVIRONMENT
The oil and gas industry is subject to extensive regulations imposed by many levels of government in Canada. Harvest currently operates in Alberta, British Columbia, Saskatchewan, and Newfoundland, all of which have different legislations and royalty programs which may be amended from time to time. A change in the royalty programs or legislations may have adverse impacts on Harvest’s future earnings and cash flows.
The following summarizes some of the changes to Harvest’s regulatory environment during 2012:
Alberta
The Government of Alberta has approved the Lower Athabasca Regional Plan (“LARP”), the first of seven regional areas developed as part of the land-use framework under the Alberta Land Stewardship Act on August 22, 2012 and effective September 1, 2012. The LARP outlines management frameworks for protecting, monitoring, evaluating and reporting air, surface water and groundwater quality by setting strict environmental limits. Based on a preliminary assessment, the proposed new conservation areas do not appear to affect Harvest. The second plan now underway is the South Saskatchewan Region which completed the first two phases of consultation on December 12, 2012. The remaining two phases of consultation among the Alberta Government, the public, stakeholders and municipalities has will commence in the near future. Based on the preliminary assessment, the proposed new conservation area appears to have minimal to no effect on Harvest.
The Alberta Government is also in the process of re-vamping its regulatory framework developing a single regulatory body. This body will encompass responsibilities that are currently divided between Alberta Environment (“AENV”), Alberta Sustainable Resources Development (“SRD”) and the Energy Resources Conservation Board (“ERCB”). There will be changes in the process for Crown applications starting June 1, 2013. Final changes in the regulatory process will cause companies to apply for applications in one Department commonly referred to as the “Super Board” and is planned for June 1, 2014.
45
| MANAGEMENT’S DISCUSSION AND ANALYSIS |
DISCLOSURE CONTROLS AND PROCEDURES
Under the supervision of the Chief Executive Officer and Chief Financial Officer, the Company has evaluated the effectiveness of its disclosure controls and procedures as of December 31, 2012 as defined under the rules adopted by the Canadian securities regulatory authorities and the U.S. Securities and Exchange Commission. Based on this evaluation, the Chief Executive Officer and Chief Financial Officer have concluded that as of December 31, 2012, the disclosure controls and procedures were effective to ensure that information required to be disclosed by Harvest in reports that it files or submits to Canadian and U.S. securities authorities was recorded, processed, summarized and reported within the time period specified in Canadian and U.S. securities laws and was accumulated and communicated to management, including its Chief Executive Officer and Chief Financial Officer, to allow timely decisions regarding required disclosures.
INTERNAL CONTROL OVER FINANCIAL REPORTING
The Company’s Chief Executive Officer (“CEO”) and Chief Financial Officer (“CFO”) are responsible for establishing and maintaining disclosure controls and procedures (“DC&P”) and internal control over financial reporting (“ICFR”) as defined under National Instrument 52-109 – Certification of Disclosure in Issuers’ Annual and Interim Filings. The Company’s DC&P are designed to provide reasonable assurance that (i) material information relating to the Company is made known to management by others, particularly during the period in which the annual filings are being prepared; and (ii) information required to be disclosed by the Company in its annual filings, interim filings or other reports filed or submitted by it under securities legislation is recorded, processed, summarized and reported within the time periods specified in securities legislation. The Company’s ICFR are designed to provide reasonable assurance regarding the reliability of financial reporting and preparation of financial statements for external purposes in accordance with IFRS as issued by IASB. The Company’s CEO and CFO have evaluated, or caused to be evaluated under their supervision, the design and operation of the Company’s DC&P and ICFR as of December 31, 2012. The evaluation was based on the Internal Control – Integrated Framework issued by the Committee of Sponsoring Organizations of the Treadway Commission. Based on the evaluation, the CEO and CFO concluded that the Company’s internal control over financial reporting was effective as of December 31, 2012.
There were no significant changes in internal controls over financial reporting for the year ended December 31, 2012 that have materially affected, or are reasonably likely to materially affect, our internal controls over financial reporting.
Because of its inherent limitations, disclosure controls and procedures and internal control over financial reporting may not prevent or detect misstatements, errors or fraud. Control systems, no matter how well conceived or operated, can provide only reasonable, but not absolute, assurance that the objectives of the control systems are met.
46
| MANAGEMENT’S DISCUSSION AND ANALYSIS |
RECLASSIFICATION OF HEAVY OIL AND LIGHT TO MEDIUM OIL VOLUMES
Effective October 1, 2012, Harvest reclassified certain properties that were previously reported as light to medium oil to heavy oil as classified under National Instrument 51-101. As a result, volumes, revenues and realized prices for light to medium oil and heavy oil have been adjusted to reflect the reclassification. The reclassification did not result in any changes to the total volumes, revenues or to the total average realized prices prior to and after hedging previously reported by the Company. The following tables illustrate the changes resulting from the reclassification for the last seven quarters ended September 30, 2012:
Sales Volumes
| 2012 | 2011 | ||||||||||||||||||||
| Q3 | Q2 | Q1 | Q4 | Q3 | Q2 | Q1 | |||||||||||||||
| Revised Classification | |||||||||||||||||||||
| Light to medium oil (bbl/d) | 13,603 | 13,758 | 14,380 | 15,161 | 14,777 | 13,147 | 14,408 | ||||||||||||||
| % of total sales volumes | 24% | 23% | 24% | 25% | 25% | 24% | 27% | ||||||||||||||
| Heavy oil (bbl/d) | 19,110 | 20,701 | 19,828 | 20,466 | 17,669 | 17,706 | 20,153 | ||||||||||||||
| % of total sales volumes | 32% | 34% | 32% | 34% | 30% | 31% | 38% | ||||||||||||||
| Previously Reported | |||||||||||||||||||||
| Light to medium oil (bbl/d) | 24,438 | 25,617 | 24,936 | 26,106 | 23,621 | 22,294 | 25,523 | ||||||||||||||
| % of total sales volumes | 42% | 42% | 41% | 43% | 40% | 40% | 48% | ||||||||||||||
| Heavy oil (bbl/d) | 8,275 | 8,842 | 9,272 | 9,521 | 8,825 | 8,559 | 9,038 | ||||||||||||||
| % of total sales volumes | 14% | 15% | 15% | 16% | 15% | 15% | 17% | ||||||||||||||
| Revenues | |||||||||||||||||||||
| 2012 | 2011 | ||||||||||||||||||||
| Q3 | Q2 | Q1 | Q4 | Q3 | Q2 | Q1 | |||||||||||||||
| Revised Classification | |||||||||||||||||||||
| Light to medium oil sales after hedging | 108.1 | 106.0 | 117.5 | 127.4 | 122.0 | 102.9 | 102.0 | ||||||||||||||
| Heavy oil sales | 122.3 | 130.6 | 141.9 | 157.0 | 110.9 | 133.7 | 125.7 | ||||||||||||||
| Previously Reported | |||||||||||||||||||||
| Light to medium oil sales after hedging | 181.9 | 185.1 | 196.8 | 215.0 | 181.9 | 178.3 | 177.7 | ||||||||||||||
| Heavy oil sales | 48.5 | 51.5 | 62.6 | 69.4 | 51.0 | 58.3 | 50.0 | ||||||||||||||
47
| MANAGEMENT’S DISCUSSION AND ANALYSIS |
Realized Commodity Prices
| 2012 | 2011 | ||||||||||||||||||||
| Q3 | Q2 | Q1 | Q4 | Q3 | Q2 | Q1 | |||||||||||||||
| Revised Classification | |||||||||||||||||||||
| Light to medium oil prior to hedging ($/bbl) | 78.72 | 78.68 | 86.62 | 92.01 | 84.49 | 96.54 | 81.00 | ||||||||||||||
| Light to medium oil after hedging ($/bbl) | 86.40 | 84.68 | 89.82 | 91.35 | 89.73 | 86.00 | 78.66 | ||||||||||||||
| Heavy oil ($/bbl) | 69.57 | 69.33 | 78.64 | 83.40 | 68.25 | 82.96 | 69.34 | ||||||||||||||
| Previously Reported | |||||||||||||||||||||
| Light to medium oil prior to hedging ($/bbl) | 76.61 | 76.18 | 84.88 | 89.90 | 80.43 | 94.08 | 78.69 | ||||||||||||||
| Light to medium oil after hedging ($/bbl) | 80.89 | 79.41 | 86.72 | 89.52 | 83.71 | 87.87 | 77.37 | ||||||||||||||
| Heavy oil ($/bbl) | 63.81 | 64.02 | 74.24 | 79.28 | 62.84 | 74.84 | 61.51 | ||||||||||||||
ADDITIONAL GAAP MEASURE
Harvest uses “operating income (loss)”, an additional GAAP measure that is not defined under International Financial Reporting Standards (“IFRS”) hereinafter also referred to as “GAAP”. The measure is commonly used for comparative purposes in the petroleum and natural gas and refining industries to reflect operating results before items not directly related to operations. Harvest uses this measure to assess and compare the performance of its operating segments.
NON-GAAP MEASURES
Throughout this MD&A, the Company has referred to certain measures of financial performance that are not specifically defined under GAAP such as “operating netbacks”, “operating netback prior to/after hedging”, “gross margin (loss)”, “cash contribution (deficiency) from operations”, “total debt”, “total financial debt”, “total capitalization”, “Annualized EBITDA”, “senior debt to Annualized EBITDA”, “total debt to Annualized EBITDA”, “senior debt to total capitalization”, and “total debt to total capitalization”.
“Operating netbacks” are reported on a per boe basis and used extensively in the Canadian energy sector for comparative purposes. “Operating netbacks” include revenues, operating expenses, transportation and marketing expenses, and realized gains or losses on risk management contracts. “Gross margin (loss)” is commonly used in the refining industry to reflect the net funds received from the sale of refined products after considering the cost to purchase the feedstock and is calculated by deducting purchased products for resale and processing from total revenue. “Cash contribution (deficiency) from operations” is calculated as operating income (loss) adjusted for non-cash items. The measure demonstrates the ability of the each segment of Harvest to generate the cash from our operations necessary to repay debt, make capital investments, and fund the settlement of decommissioning and environmental remediation liabilities. “Total debt”, “total financial debt”, “total capitalization”, and “Annualized EBITDA” are used to assist management in assessing liquidity and the Company’s ability to meet financial obligations. “Senior debt to Annualized EBITDA”, “total debt to Annualized EBITDA”, “senior debt to total capitalization” and “total debt to total capitalization” are terms defined in Harvest’s credit facility agreement for the purpose of calculation of our financial covenants. The non-GAAP measures do not have any standardized meaning prescribed by GAAP and may not be comparable to similar measures used by other issuers. The determination of the non-GAAP measures have been illustrated throughout this MD&A, with reconciliations to IFRS measures and/or account balances, except for Annualized EBITDA and cash contribution (deficiency) which are shown below.
48
| MANAGEMENT’S DISCUSSION AND ANALYSIS |
Annualized EBITDA
Annualized EBITDA is defined in Harvest’s credit facility agreement as earnings before finance costs, income tax expense or recovery, DD&A, exploration and evaluation costs, impairment of assets, unrealized gains or losses on risk management contracts, unrealized gains or losses on foreign exchange, gains or losses on disposition of assets and other non-cash items. The following is a reconciliation of Annualized EBITDA to the nearest GAAP measure net loss:
| Twelve months rolling: | December 31, 2012 | December 31, 2011 | ||||
| Net loss | (720.1 | ) | (104.7 | ) | ||
| DD&A | 688.4 | 626.7 | ||||
| Finance costs | 111.0 | 109.1 | ||||
| Income tax recovery | (109.1 | ) | (29.8 | ) | ||
| EBITDA | (29.8 | ) | 601.3 | |||
| Unrealized (gains) losses on risk management contracts | 1.1 | (0.7 | ) | |||
| Unrealized (gains) losses on foreign exchange | (1.2 | ) | 2.6 | |||
| Unsuccessful exploration and evaluation costs | 22.0 | 17.8 | ||||
| Impairment of PP&E | 585.0 | – | ||||
| Gains on disposition of PP&E | (30.3 | ) | (7.9 | ) | ||
| Other non-cash items | (6.7 | ) | 4.7 | |||
| Adjustments on acquisitions and dispositions(1) | (13.4 | ) | 6.5 | |||
| Less earnings from non-restricted subsidiaries(1) | (0.8 | ) | (1.5 | ) | ||
| Annualized EBITDA(1) | 525.9 | 622.8 |
| (1) | As stipulated by the credit facility agreement, Annualized EBITDA is a twelve month rolling measure which includes the net income impact from acquisitions or dispositions as if the transaction had been effected at the beginning of the period and excludes earnings attributable to the BlackGold assets and non-restricted subsidiaries. |
49
| MANAGEMENT’S DISCUSSION AND ANALYSIS |
Cash Contribution (Deficiency) from Operations
Cash contribution (deficiency) from operations represents operating income (loss) adjusted for non-cash expense items within: general and administrative, exploration and evaluation, depletion, depreciation and amortization, gains on disposition of PP&E, risk management contracts gains or losses, impairment on PP&E, and the inclusion of cash interest, realized foreign exchange gains or losses and other cash items not included in operating income (loss). The measure demonstrates the ability of the Upstream and Downstream segments of Harvest to generate cash from its operations. There are no operating activities to report for the BlackGold segment as it is under development. The most directly comparable additional GAAP measure is operating income (loss). Operating income (loss) as presented in the notes to Harvest’s consolidated financial statements is reconciled to cash contribution (deficiency) from operations below:
Three Months Ended December 31 | ||||||||||||||||||
| Downstream | Upstream | Total | ||||||||||||||||
| 2012 | 2011 | 2012 | 2011 | 2012 | 2011 | |||||||||||||
| Operating income (loss) | (593.4 | ) | (124.7 | ) | 36.1 | 37.0 | (557.3 | ) | (87.7 | ) | ||||||||
| Adjustments: | ||||||||||||||||||
| Operating | (3.2 | ) | – | 0.4 | – | (2.8 | ) | – | ||||||||||
| General and administrative | – | – | 3.4 | 4.2 | 3.4 | 4.2 | ||||||||||||
| Exploration and evaluation | – | – | 0.1 | 6.8 | 0.1 | 6.8 | ||||||||||||
| Depletion, depreciation and amortization | 30.4 | 26.8 | 145.3 | 149.3 | 175.7 | 176.1 | ||||||||||||
| Gains on disposition of PP&E | – | – | (25.0 | ) | (7.1 | ) | (25.0 | ) | (7.1 | ) | ||||||||
| Unrealized losses on risk management contracts | – | – | 0.1 | 3.5 | 0.1 | 3.5 | ||||||||||||
| Impairment on PP&E | 563.2 | – | – | – | 563.2 | – | ||||||||||||
| Cash contribution (deficiency) fromoperations | (3.0 | ) | (97.9 | ) | 160.4 | 193.7 | 157.5 | 95.8 | ||||||||||
| Inclusion of items not attributable to segments: | ||||||||||||||||||
| Net cash interest paid | 20.6 | 22.3 | ||||||||||||||||
| Realized foreign exchange (gains) losses | (1.0 | ) | 2.7 | |||||||||||||||
| Consolidated cash contribution from operations | 137.8 | 70.8 | ||||||||||||||||
50
| MANAGEMENT’S DISCUSSION AND ANALYSIS |
Year Ended December 31 | ||||||||||||||||||
| Downstream | Upstream | Total | ||||||||||||||||
| 2012 | 2011 | 2012 | 2011 | 2012 | 2011 | |||||||||||||
| Operating income (loss) | (706.8 | ) | (140.6 | ) | (12.7 | ) | 111.2 | (719.5 | ) | (29.4 | ) | |||||||
| Adjustments: | – | – | – | – | – | – | ||||||||||||
| Operating | (7.0 | ) | (0.1 | ) | 1.6 | – | (5.4 | ) | (0.1 | ) | ||||||||
| General and administrative | – | – | (1.1 | ) | 4.9 | (1.1 | ) | 4.9 | ||||||||||
| Exploration and evaluation | – | – | 22.0 | 17.8 | 22.0 | 17.8 | ||||||||||||
| Depletion, depreciation and amortization | 108.9 | 91.0 | 579.5 | 535.7 | 688.4 | 626.7 | ||||||||||||
| Gains on disposition of PP&E | – | – | (30.3 | ) | (7.9 | ) | (30.3 | ) | (7.9 | ) | ||||||||
| Unrealized (gains) losses on risk management contracts | – | – | 1.1 | (0.7 | ) | 1.1 | (0.7 | ) | ||||||||||
| Impairment on PP&E | 563.2 | – | 21.8 | – | 585.0 | – | ||||||||||||
| Cash contribution (deficiency) fromoperations | (41.7 | ) | (49.7 | ) | 581.9 | 661.0 | 540.2 | 611.3 | ||||||||||
| Inclusion of items not attributable to segments: | ||||||||||||||||||
| Net cash interest paid | 87.9 | 86.2 | ||||||||||||||||
| Realized foreign exchange gains | (0.1 | ) | (6.6 | ) | ||||||||||||||
| Consolidated cash contribution from operations | 452.4 | 531.7 | ||||||||||||||||
FORWARD-LOOKING INFORMATION
This MD&A highlights significant business results and statistics from our consolidated financial statements for the year ended December 31, 2012 and the accompanying notes thereto. In the interest of providing our lenders and potential lenders with information regarding Harvest, including our assessment of our future plans and operations, this MD&A contains forward-looking statements that involve risks and uncertainties.
Such risks and uncertainties include, but are not limited to: risks associated with conventional petroleum and natural gas operations; risks associated with refining and marketing operations; risks associated with the construction of the oil sands project; the volatility in commodity prices, interest rates and currency exchange rates; risks associated with realizing the value of acquisitions; general economic, market and business conditions; changes in environmental legislation and regulations; the availability of sufficient capital from internal and external sources; and, such other risks and uncertainties described from time to time in our regulatory reports and filings made with securities regulators. The impact of any one risk, uncertainty or factor on a particular forward-looking statement is not determinable with certainty as these factors are interdependent, and management’s future course of action would depend on our assessment of all information at that time. Please also refer to “Operational and Other Business Risks” in this MD&A and “Risk Factors” in the Annual Information Form for detailed discussion on these risks.
Forward-looking statements in this MD&A include, but are not limited to, the forward looking statements made in the “Outlook” section as well as statements made throughout with reference to the following items to future periods: production volumes, refinery throughput volumes, royalty rates, operating costs, commodity prices, general and administrative costs, price risk management activities, acquisitions and dispositions, capital spending and allocation of such to various projects, reserve estimates and ultimate recovery of reserves, potential timing and commerciality of Harvest’s capital projects, the extent and success rate of Upstream and BlackGold drilling programs, the ability to achieve the maximum capacity from the BlackGold central processing facilities, refinery utilization and reliability rates, availability of the credit facility, access and ability to raise capital, ability to maintain debt covenants, debt levels, recovery of long-lived assets, the timing and amount of decommission and environmental related costs, income taxes, cash from operating activities, regulatory approval of development projects and regulatory changes. For this purpose, any statements that are contained herein that are not statements of historical fact may be deemed to be forward-looking statements. Forward-looking statements often contain terms such as “may”, “will”, “should”, “anticipate”, “expect”, “target”, “plan”, “potential”, “intend”, and similar expressions.
51
| MANAGEMENT’S DISCUSSION AND ANALYSIS |
All of the forward-looking statements in this MD&A are qualified by the assumptions that are stated or inherent in such forward-looking statements. Although Harvest believes that these assumptions are reasonable based on the information available to us on the date such assumptions were made, this list is not exhaustive of the factors that may affect any of the forward-looking statements and the reader should not place an undue reliance on these assumptions and such forward-looking statements. The key assumptions that have been made in connection with the forward-looking statements include the following: that the Company will conduct its operations and achieve results of operations as anticipated; that its development plans and sustaining maintenance programs will achieve the expected results; the general continuance of current or, where applicable, assumed industry conditions; the continuation of assumed tax, royalty and regulatory regimes; the accuracy of the estimates of the Company’s reserve volumes; commodity price, operation level, and cost assumptions; the continued availability of adequate cash flow and debt and/or equity financing to fund the Company’s capital and operating requirements as needed; and the extent of Harvest’s liabilities. Harvest believes the material factors, expectations and assumptions reflected in the forward-looking statements are reasonable, but no assurance can be given that these factors, expectations and assumptions will prove to be correct.
Although management believes that the forward-looking information is reasonable based on information available on the date such forward-looking statements were made, no assurances can be given as to future results, levels of activity and achievements. Therefore, readers are cautioned not to place undue reliance on forward-looking statements as the plans, intentions or expectations upon which the forward-looking information is based might not occur. Forward-looking statements contained in this MD&A are expressly qualified by this cautionary statement.
ADDITIONAL INFORMATION
Further information about us can be accessed under our public filings found on SEDAR atwww.sedar.com or atwww.harvestenergy.ca. Information can also be found by contacting our Investor Relations department at (403) 265-1178 or at 1-866-666-1178.
52