UNITED STATES
SECURITIES AND EXCHANGE COMMISSION
Washington, D.C. 20549
FORM 20-F
(Mark One)
[ ] REGISTRATION STATEMENT PURSUANT TO SECTION 12(b) OR (g) OF THE SECURITIES EXCHANGE ACT OF 1934
OR
[X] ANNUAL REPORT PURSUANT TO SECTION 13 OR 15(d) OF THE SECURITIES EXCHANGE ACT OF 1934
For the fiscal year ended:DECEMBER 31, 2012
OR
[ ] TRANSITION REPORT PURSUANT TO SECTION 13 OR 15(d) OF THE SECURITIES EXCHANGE ACT OF 1934 OR
[ ] SHELL COMPANY REPORT PURSUANT TO SECTION 13 OR 15(d) OF THE SECURITIES EXCHANGE ACT OF 1934
For the transition period from n/a to n/a
Commission file number333-121620
HARVEST OPERATIONS CORP.
(Exact name of Registrant as specified in its charter)
HARVEST OPERATIONS CORP.
(Translation of Registrant’s name into English)
ALBERTA, CANADA
(Jurisdiction of incorporation or organization)
2100, 330 - 5th Ave. SW Calgary, Alberta, Canada T2P 0L4
(Address of principal executive offices)
Mr. Myunghuhn Yi, President & CEO
2100, 330 - 5th Ave. SW Calgary, Alberta, Canada T2P 0L4
myunghuhn.yi@harvestenergy.ca
403-268-3189
(Name, Telephone, E-mail and/or Facsimile number and Address of Company Contact Person)
Securities registered or to be registered pursuant to Section 12(b) of the Act.
(none)
Securities registered or to be registered pursuant to Section 12(g) of the Act.
(none)
Securities for which there is a reporting obligation pursuant to Section 15(d) of the Act.
(none)
1
Indicate the number of outstanding shares of each of the issuer’s classes of capital or common stock as of the close of the period covered by the annual report.
Common shares as of December 31, 2012: 386,078,649
Indicate by check mark if the registrant is a well-known seasoned issuer, as defined in Rule 405 of the Securities Act.
[ ] Yes [X] No
If this report is an annual or transition report, indicate by check mark if the registrant is not required to file reports pursuant to Section 13 or 15(d) of the Securities Exchange Act of 1934.
[ ] Yes [X] No
Note – Checking the box above will not relieve any registrant required to file reports pursuant to Section 13 or 15(d) of the Securities Exchange Act of 1934 from their obligations under those Sections.
Indicate by check mark whether the registrant (1) has filed all reports required to be filed by Section 13 or 15(d) of the Securities Exchange Act of 1934 during the preceding 12 months (or for such shorter period that the registrant was required to file such reports), and (2) has been subject to such filing requirements for the past 90 days.
[X] Yes [ ] No
Indicate by check mark whether the registrant has submitted electronically and posted on its corporate Web site, if any, every Interactive Data File required to be submitted and posted pursuant to Rule 405 of Regulation S-T (§232.405 of this chapter) during the preceding 12 months (or for such shorter period that the registrant was required to submit and post such files).
[ ]Yes [ ] No
Indicate by check mark whether the registrant is a large accelerated filer, an accelerated filer, or a non-accelerated filer. See definition of “accelerated filer and large accelerated filer” in Rule 12b-2 of the Exchange Act. (Check one):
[ ] Large accelerated filer [ ] Accelerated filer [X] Non-accelerated filer
Indicate by check mark which basis of accounting the registrant has used to prepare the financial statements included in this filing:
[ ] U.S. GAAP
[X] International Financial Reporting Standards as issued by the International Accounting Standards Board
[ ] Other
If “Other” has been checked in response to the previous question, indicate by check mark which financial statement item the registrant has elected to follow.
[ ]Item 17 [ ] Item 18
If this is an annual report, indicate by check mark whether the registrant is a shell company (as defined in Rule 12b-2 of the Exchange Act).
[ ] Yes [X] No
2
Table of Contents
GLOSSARY OF TERMS
In this annual report, the following terms shall have the meanings set forth below, unless otherwise indicated.
Certain other terms used herein but not defined herein are defined in SEC regulations and, unless the context otherwise requires, shall have the same meanings herein as in SEC regulations.
“6.40% Debentures Due 2012” means the 6.40% convertible unsecured subordinated debentures of the Corporation due October 31, 2012, which were assumed by the Corporation from VERT on February 3, 2006 pursuant to the plan of arrangement under the ABCA by which the Corporation merged with VERT.
“7.25% Debentures Due 2013” means the 7.25% convertible unsecured subordinated debentures of the Corporation due September 30, 2013.
“7.25% Debentures Due 2014” means the 7.25% convertible unsecured subordinated debentures of the Corporation due February 28, 2014.
“7.50% Debentures Due 2015” means the 7.50% convertible unsecured subordinated debentures of the Corporation due May 31, 2015.
“67/8% Senior Notes” and Senior Notes mean the Corporation’s 67/8% Senior Notes due October 1, 2017.
“77/8% Senior Notes” means the Corporation’s 77/8% Senior Notes due October 15, 2011.
“ABCA” means theBusiness Corporations Act (Alberta), together with any or all regulations promulgated thereunder, as amended from time to time.
“APEGA” means the Association of Professional Engineers and Geoscientists of Alberta.
“BlackGold” means the BlackGold operating segment, with a core focus on the exploration and development of the BlackGold oil sands assets acquired from KNOC on August 6, 2010.
“Breeze Trust No. 1” means Harvest Breeze Trust No. 1, a trust established under the laws of the Province of Alberta, wholly owned by the Corporation.
“Breeze Trust No. 2” means Harvest Breeze Trust No. 2, a trust established under the laws of the Province of Alberta, wholly owned by the Corporation.
“Canadian GAAP” means accounting principles generally accepted in Canada.
“COGE Handbook” means the Canadian Oil and Gas Evaluation Handbook prepared jointly by the Society of Petroleum Evaluation Engineers (Calgary chapter) and the Canadian Institute of Mining, Metallurgy & Petroleum.
“Corporation” means Harvest Operations Corp.
“Credit Facility” means the $800 million revolving credit facility, as amended, provided by a syndicate of lenders to Harvest Operations as more fully described in Item 10C “Material Contracts” and in note 10 of the Corporation’s audited consolidated financial statements for the year ended December 31, 2012 under Item 18 in this annual report.
“Debentures” means, collectively, the 6.40% Debentures Due 2012, the 7.25% Debentures Due 2013, the 7.25% Debentures Due 2014 and the 7.50% Debentures Due 2015.
“Debenture Indenture” means (i) the trust indenture dated January 29, 2004 among Harvest Operations and Valiant Trust Company, as trustee, providing for the issue of debentures, as supplemented by the third supplemental indenture dated November 22, 2006 in respect of the 7.25% Debentures Due 2013, in respect of the fourth supplemental indenture dated February 1, 2007 in respect of the 7.25% Debentures Due 2014 and in respect of the fifth supplemental indenture dated April 25, 2008 in respect of the 7.50% Debentures Due 2015 and (ii) the trust indenture dated January 15, 2003 between VERT and Computershare Trust Company of Canada as trustee, providing for the issue of debentures, as supplemented by the first supplemental indenture dated October 20, 2005 in respect of the 6.40% Debentures Due 2012.
“Downstream”means the Corporation’s petroleum refining and marketing segment operating under the North Atlantic trade name, comprised of a medium gravity sour crude hydrocracking refinery with a 115,000 bbls/d nameplate capacity and a marketing division with 52 gasoline outlets, 3 commercial cardlock locations, a retail heating fuels business and a commercial and wholesale petroleum products business, all located in the Province of Newfoundland and Labrador.
“EPC”means engineering, procurement and construction.
“Farmout”means an agreement whereby a third party agrees to pay for all or a portion of the drilling of a well on one or more of the Properties in order to earn an interest therein, with an Operating Subsidiary retaining a residual interest in such Properties.
1
“Future Net Revenue”means the estimated net amount to be received with respect to the development and production of reserves computed by deducting, from estimated future revenues, estimated future royalty obligations, costs related to the development and production of reserves and abandonment and reclamation costs (corporate general and administrative expenses and financing costs are not deducted).
“GLJ” means GLJ Petroleum Consultants Ltd., independent oil and natural gas reserves evaluators of Calgary, Alberta.
“GAAP” means generally accepted accounting principles.
“Gross” means:
| | (a) | in relation to Harvest and the Operating Subsidiaries' interest in production and reserves, its "Corporation gross reserves", which are Harvest and the Operating Subsidiaries' interest (operating and non-operating) share before deduction of royalties and without including any royalty interest of Harvest and the Operating Subsidiaries; |
| | | |
| | (b) | in relation to wells, the total number of wells in which Harvest and the Operating Subsidiaries have an interest; and |
| | | |
| | (c) | in relation to properties, the total area of properties in which Harvest and the Operating Subsidiaries have an interest. |
“Harvest Board” means the board of directors of Harvest Operations.
“Harvest” and“Harvest Operations”means Harvest Operations Corp., a corporation amalgamated under the laws of the Province of Alberta.
“Independent Reserves Evaluators” means McDaniel and GLJ, who evaluated the crude oil, natural gas liquids and natural gas reserves of Harvest and the Operating Subsidiaries as at December 31, 2012, in accordance with the standards contained in Rule 4–10 of Regulation S–X.
“IFRS” means International Financial Reporting Standards as issued by the International Accounting Standards Board.
“KNOC” means Korea National Oil Corporation.
“KNOC Acquisition” means the purchase by KNOC Canada of all of the issued and outstanding Trust Units of the Trust for total consideration of approximately $1.8 billion and the assumption of approximately $2.3 billion of debt.
“KNOC Arrangement” means the plan of arrangement for the KNOC Acquisition implemented pursuant to Section 193 of the ABCA involving, among others, the Trust, Harvest Operations, KNOC Canada, KNOC and the holders of Trust Units, which became effective on December 22, 2009.
“KNOC Canada” means KNOC Canada Ltd., a corporation incorporated under the laws of the Province of Alberta.
“McDaniel” means McDaniel & Associates Consultants Ltd., independent oil and natural gas reserves evaluators of Calgary, Alberta.
“MEC” means Macquarie Energy Canada Ltd.
“Net” means:
| | (a) | in relation to Harvest and the Operating Subsidiaries' interest in production and reserves, Harvest and the Operating Subsidiaries' interest (operating and non-operating) share after deduction of royalties obligations, plus Harvest and the Operating Subsidiaries' royalty interest in production or reserves; |
| | | |
| | (b) | in relation to wells, the number of wells obtained by aggregating Harvest and the Operating Subsidiaries' working interest in each of its gross wells; and |
| | | |
| | (c) | in relation to Harvest and the Operating Subsidiaries' interest in a property, the total area in which Harvest and the Operating Subsidiaries have an interest multiplied by the working interest owned by Harvest and the Operating Subsidiaries. |
“NI 51-101” means National Instrument 51-101 Standards of Disclosure for Oil and Gas Activities.
“North Atlantic” means North Atlantic Refining Limited, a private company, and all wholly owned subsidiaries of North Atlantic Refining Limited.
“Note Indenture” means the trust indenture made as of October 4, 2010 between U.S. Bank National Association as trustee thereunder and Harvest Operations, providing for the issuance of the 67/8% Senior Notes.
“NYSE”means the New York Stock Exchange.
“Operating Subsidiaries” means Redearth Partnership (prior to September 30, 2010), Breeze Resource Partnership, Breeze Trust No. 1, Breeze Trust No. 2, and Hay River Partnership, each (other than Redearth Partnership with respect to which the Corporation held a 60% interest prior to its dissolution) a direct or indirect wholly-owned subsidiary of the Corporation, and "Operating Subsidiary" means any of them.
2
“Person” includes an individual, a body corporate, a trust, a union, a pension fund, a government and a governmental agency.
“Production” means, with respect to the Upstream operations the produced petroleum, natural gas and natural gas liquids attributed to the Properties and with respect to the Downstream operations, the production of refined petroleum products at the Refinery.
“Properties” means the working, royalty or other interests of Harvest and the Operating Subsidiaries in any petroleum and natural gas rights, tangibles and miscellaneous interests, including properties which may be acquired by Harvest and the Operating Subsidiaries from time to time.
“Purchase and Sale Agreement” means the purchase and sale agreement dated August 22, 2006 between the Corporation and Vitol Refining Group B.V. providing for the purchase of the outstanding shares of North Atlantic and the entering into of the Supply and Offtake Agreement.
“Redearth Partnership”means the general partnership formed on August 23, 2002 under the laws of the Province of Alberta. In September 2010 Harvest acquired 100% ownership interest, thereafter, Redearth Partnership was dissolved and Harvest Operations became the owner of all the assets and assumed all of the liabilities of the Redearth Partnership. “Refinery”means the 115,000 barrel per day medium gravity sour crude hydrocracking refinery located in the Province of Newfoundland and Labrador, owned by North Atlantic.
“Related Party Loan” means the subordinated loan agreement with Ankor E&P Holdings Corp., a 100% owned subsidiary of KNOC, entered into on August 16, 2012 with a maximum borrowing limit of US$170 million at a fixed interest rate of 4.62% per annum.
“Reserves Report” means, collectively, the reports prepared by the Independent Reserve Evaluators evaluating the crude oil, natural gas liquids and natural gas reserves of Harvest and the Operating Subsidiaries as at December 31, 2011, in accordance with the standards contained in the COGE Handbook and the reserve definitions and other requirements contained in NI 51-101 and SEC regulations.
“SEC” means the United States Securities and Exchange Commission.
“Security Acts” means the United States Securities Act of 1933, as amended.
“Senior Unsecured Credit Facility” has the meaning ascribed thereto under the heading “Senior Unsecured Credit Facility” in Item 10C “Material Contracts”.
“Supply and Offtake Agreement”or“SOA”means the supply and offtake agreement dated October 19, 2006 and as amended October 12, 2009 entered into between North Atlantic and Vitol Refining, S.A. (“Vitol”).
“Supply and Offtake Agreement (2011)”or “SOA (2011)”means the supply and offtake agreement dated October 11, 2011 and as amended on December 19, 2011, April 19, 2012 and July 23, 2012 entered into between North Atlantic and MEC the terms of which are summarized under Item 10C "Material Contracts".
“Trust” means Harvest Energy Trust.
“Trust Indenture” means the fifth amended and restated trust indenture dated May 20, 2008 between the Trustee and Harvest Operations, as amended on December 22, 2009 pursuant to the KNOC Arrangement.
“Trust Unit” means a trust unit of the Trust and unless the context otherwise requires means ordinary Trust Units of the Trust.
“Trustee” means 1496965 Alberta Ltd in its capacity as trustee of the Trust.
“TSX” means the Toronto Stock Exchange.
“Upstream”means Harvest’s petroleum and natural gas segment, consisting of the exploitation, production and subsequent sale of petroleum, natural gas and natural gas liquids in Alberta, Saskatchewan and British Columbia.
“U.S. GAAP”means accounting principles generally accepted in the United States.
“VERT”means Viking Energy Royalty Trust, a trust established under the laws of the Province of Alberta, wholly owned by the Trust.
“Viking” means Viking Holdings Inc., a corporation incorporated under the laws of the Province of Alberta that formerly acted as administrator of VERT, which amalgamated with Harvest Operations on July 1, 2006.
“Working Interest” means an undivided interest held by a party in an oil and/or natural gas or mineral lease granted by a Crown or freehold mineral owner, which interest gives the holder the right to "work" the property (lease) to explore for, develop, produce and market the lease substances but does not include, among other things, a royalty, overriding royalty, gross overriding royalty, net profits interest or other interest that entitles the holder thereof to a share of production or proceeds of sale of production without a corresponding right or obligation to "work" the property.
3
ABBREVIATIONS AND CONVERSIONS
In this annual report, the following abbreviations have the meanings set forth below:
| /d | Per day |
| 3-D | Three dimensional |
| AECO | AECO “C” hub price index for Alberta natural gas |
| oAPI | The measure of the density or gravity of liquid petroleum products |
| boe(1) | Barrel of oil equivalent on the conversion factor of 6 mcf of natural gas to one bbl of oil |
| bbl | Barrel |
| bbls | Barrels |
| EOR | Enhanced oil recovery |
| GHG | Greenhouse gas |
| GJ | Gigajoule |
| H2S | Hydrogen sulfide gas |
| Mbbls | Thousand barrels |
| Mboe | Thousand barrels of oil equivalent |
| mcf | Thousand cubic feet |
| MMboe | Million barrels of oil equivalent |
| MMcf | Million cubic feet |
| NGLs | Natural gas liquids |
| NOx | The general oxides of nitrogen (NO, NO2, N2O2, etc.) |
| SAGD | Steam-assisted gravity drainage is an enhanced oil recovery technology for producing heavy crude oil and bitumen |
| SOx | The general oxides of sulfur (SO2, SO3, etc.) |
| WTI | West Texas Intermediate, the reference price in U.S. dollars at Cushing, Oklahoma for crude oil of standard grade |
| $000 | Thousands of dollars |
| $millions | Millions of dollars |
| (1) | Boes may be misleading, particularly if used in isolation. A boe conversion ratio of 6 mcf:1 bbl is based on an energy equivalency conversion method primarily applicable at the burner tip and does not represent a value equivalency at the wellhead. |
The following table sets forth certain conversions between Standard Imperial Units and the International System of Units (or metric units):
| To Convert From | To | Multiply By |
| mcf | cubic metres | 28.174 |
| cubic metres | cubic feet | 35.494 |
| bbls | cubic metres | 0.159 |
| feet | metres | 0.305 |
| metres | feet | 3.281 |
| miles | kilometres | 1.609 |
| kilometres | miles | 0.621 |
| acres | hectares | 0.405 |
| hectares | acres | 2.471 |
SPECIAL NOTE REGARDING FORWARD-LOOKING STATEMENTS
Certain statements contained in this annual report and documents incorporated by reference herein, constitute forward-looking statements. These statements relate to future events and future performance. All statements other than statements of historical fact may be forward-looking statements. Forward-looking statements are subject to certain risks and uncertainties that could cause actual results to differ materially from those included in the forward-looking statements. Forward-looking statements are often, but not always, identified by the use of words such as: “budget”, “outlook”, “forecast”, "seek", "anticipate", "plan", "continue", "estimate", "expect", "may", "will", "project", "predict", "potential", "targeting", "intend", "could", "might", "should", "believe" and similar expressions. Harvest believes the expectations reflected in these forward-looking statements are reasonable but no assurance can be given that these expectations will prove to be correct and such forward-looking statements included in, or incorporated by reference into, this annual report should not be unduly relied upon. These statements speak only as of the date of this annual report or as of the date specified in the documents incorporated by reference into this annual report, as the case may be.
4
In particular, this annual report, and the documents incorporated by reference herein, contains forward-looking statements pertaining to:
- expected financial and operational performance in future periods, including but not limited to, production volumes, refinery throughput volumes, royalty rates, operating costs, commodity prices, general and administrative costs, refinery utilization rates and results from its price risk management activities;
- expected increases in revenue, net income and cash flows attributable to development and production activities;
- expectations regarding the development and production potential of Upstream and BlackGold properties;
- reserves estimates, ultimate recoverability of reserves and estimates of the present value of Harvest’s future net cash flows;
- estimated capital expenditures,
- factors upon which to decide whether or not to undertake a capital project;
- future sources of funding, debt levels and availability of committed credit facilities;
- future allocation of funding to various activities;
- plans to make acquisitions and dispositions, and expected synergies from acquisitions made;
- possible financial and operational impact from planned dispositions;
- possible commerciality of exploration and development projects;
- the ability to achieve the maximum capacity from the BlackGold central processing facilities;
- expected timing, cost and associated impact of facility turnaround and maintenance;
- treatment under government regulatory regimes including without limitation, royalty, environmental and tax regulations;
- ultimate recoverability of the Harvest’s assets;
- competitive advantages and ability to compete successfully; and
- global demand and supply of crude oil, natural gas, bitumen, refined products and other related products.
With respect to forward-looking statements contained in this annual report and the documents incorporated by reference herein, Harvest has made assumptions regarding, among other things:
- future oil and natural gas prices and differentials among light, medium and heavy oil prices;
- Harvest’s ability to conduct its operations and achieve results of operations as anticipated;
- Harvest’s ability to achieve the expected results from its development plans and sustaining maintenance programs;
- the continued availability of adequate cash flow and debt and/or equity financing to fund Harvest’s capital and operating requirements as needed;
- Harvest’s ability to obtain financing with favorable terms;
- the general continuance of current or, where applicable, assumed industry conditions;
- the general continuation of assumed tax, royalty and regulatory regimes;
- the accuracy of the Corporation’s reserves;
- the ability to obtain equipment in a timely manner to carry out development and other capital activities;
- the ability to market oil and natural gas successfully to current and new customers;
- the cost of expanding Harvest's property holdings;
- the impact of increasing competition;
- the ability to add production and reserves through development and exploitation activities; and
- the ability to produce gasoline, low sulphur diesel, jet fuel, furnace oil, and other refined products that meet customer specifications.
5
Some of the significant risks and uncertainties that could affect Harvest's future results and could cause results to differ materially from those expressed in forward-looking statements include but is not limited to:
- volatility of commodity prices, especially the price differentials between light oil and heavy oil and the refining margins;
- uncertainties in the estimation of reserves;
- costs associated with developing and producing Upstream and BlackGold reserves, and operating Downstream business;
- outages and disruptions to Harvest’s operations due to operational issues, severe weather conditions, accidents or natural hazards;
- difficulties encountered in delivering Upstream and Downstream products to commercial markets;
- difficulties encountered during the drilling for and production of crude oil, natural gas, bitumen and other related products;
- difficulties encountered in the integration of acquisitions;
- uncertainties around realizing the value of acquisitions;
- uncertainties around Harvest's ability to attract capital;
- interest rate and foreign currency fluctuations;
- non-performance risks associated with Harvest’s counterparties;
- changes in, or the introduction of, new government laws and regulations relating to the crude oil and natural gas business including without limitation, tax, royalty and environmental law and regulation;
- the extent and timing of decommissioning liabilities and environmental remediation obligations;
- liabilities stemming from accidental damage to the environment;
- adverse changes in the economy generally, such as global demand and supply for commodities;
- the impact of technology on operations and developments of Harvest’s assets;
- loss of the services of any of Harvest's senior management or directors;
- the impact of competition; and
- labour and material shortages.
Statements relating to "reserves" are deemed to be forward-looking statements, as they involve the implied assessment, based on certain estimates and assumptions, that the resources and reserves described can be profitably produced in the future. Readers are cautioned that the foregoing lists of assumptions and factors are not exhaustive. The forward-looking statements contained in this annual report and the documents incorporated by reference herein are expressly qualified by this cautionary statement. Except as required by law, Harvest Operations does not undertake any obligation to publicly update or revise any forward-looking statements and readers should also carefully consider the matters discussed under Item 3D “Risk Factors".
NON-GAAP MEASURES
Throughout this annual report, Harvest has referred to certain measures of financial performance that are not specifically defined under the U.S. GAAP or IFRS such as “operating netbacks”, “operating netback prior to/after hedging”, “gross margin (loss)”, “cash contribution (deficiency) from operations”, “total debt”, “total financial debt”, “total capitalization”, “Annualized EBITDA”, “senior debt to Annualized EBITDA”, “total debt to Annualized EBITDA”, “senior debt to total capitalization”, and “total debt to total capitalization”.
“Operating netbacks” are reported on a per boe basis and used extensively in the Canadian energy sector for comparative purposes. “Operating netbacks” include revenues, operating expenses, transportation and marketing expenses, and realized gains or losses on risk management contracts. “Gross margin (loss)” is commonly used in the refining industry to reflect the net funds received from the sale of refined products after considering the cost to purchase the feedstock and is calculated by deducting purchased products for resale and processing from total revenue. “Cash contribution (deficiency) from operations” is calculated as operating income (loss) adjusted for non-cash items. This measure demonstrates the ability of the each segment of Harvest to generate cash from our operations necessary to repay debt, make capital investments, and fund the settlement of decommissioning and environmental remediation liabilities. “Total debt”, “total financial debt”, “total capitalization”, and “Annualized EBITDA” are used to assist management in assessing liquidity and Harvest’s ability to meet financial obligations. “Senior debt to Annualized EBITDA”, “total debt to Annualized EBITDA”, “senior debt to total capitalization” and “total debt to total capitalization” are terms corresponding to defined terms in the Credit Facility agreement for the purpose of calculation of our financial covenants. These non-GAAP measures do not have any standardized meaning prescribed by GAAP and may not be comparable to similar measures used by other issuers. The determination of these non-GAAP measures have been illustrated throughout this annual report, with reconciliations to IFRS measures and/or account balances, except for Annualized EBITDA and cash contribution (deficiency) which are shown below.
6
Annualized EBITDA
The measure of Consolidated EBITDA (hereinafter referred to as “Annualized EBITDA”) used in the Credit Facility agreement is defined as earnings before finance costs, income tax expense or recovery, DD&A, exploration and evaluation costs, impairment of assets, unrealized gains or losses on risk management contracts, unrealized gains or losses on foreign exchange, gains or losses on disposition of assets and other non-cash items. The following is a reconciliation of Annualized EBITDA to the nearest GAAP measure, net loss:
| | | December 31, 2012 | | | December 31, 2011 | |
| Net loss | | (720.1 | ) | | (104.7 | ) |
| DD&A | | 688.4 | | | 626.7 | |
| Finance costs | | 111.0 | | | 109.1 | |
| Income tax recovery | | (109.1 | ) | | (29.8 | ) |
| EBITDA | | (29.8 | ) | | 601.3 | |
| Unrealized (gains) losses on risk management contracts | | 1.1 | | | (0.7 | ) |
| Unrealized (gains) losses on foreign exchange | | (1.2 | ) | | 2.6 | |
| Unsuccessful exploration and evaluation costs | | 22.0 | | | 17.8 | |
| Impairment of PP&E | | 585.0 | | | – | |
| Gains on disposition of PP&E | | (30.3 | ) | | (7.9 | ) |
| Other non-cash items | | (6.7 | ) | | 4.7 | |
| Adjustments on acquisitions and dispositions(1) | | (13.4 | ) | | 6.5 | |
| Less earnings from non-restricted subsidiaries(1) | | (0.8 | ) | | (1.5 | ) |
| Annualized EBITDA(1) | | 525.9 | | | 622.8 | |
| (1) | Annualized EBITDA is on a consolidated basis for any period, the aggregate of the last four quarters of the earnings (calculated in accordance with GAAP) and accordingly is a twelve month rolling measure which, as well, is required to be adjusted to the net income impact from acquisitions or dispositions (with net proceeds over $20 million) as if the transaction had been effected at the beginning of the period and excludes earnings attributable to the BlackGold assets and non-restricted subsidiaries. |
Cash Contribution (Deficiency) from Operations
Cash contribution (deficiency) from operations represents operating income (loss) adjusted for non-cash expense items within: general and administrative, exploration and evaluation, DD&A, gains on disposition of PP&E, risk management contracts gains or losses, impairment on PP&E, and the inclusion of cash interest, realized foreign exchange gains or losses and other cash items not included in operating income (loss). The measure demonstrates the ability of Harvest's Upstream and Downstream segments to generate cash from its operations. There are no operating activities to report for the BlackGold segment as it is under development. The most directly comparable GAAP measure to cash contribution (deficiency) from operations is operating income (loss). Operating income (loss) as presented in the notes to Harvest’s consolidated financial statements is reconciled to cash contribution (deficiency) from operations below:
7
| | | Year Ended December 31 | |
| | | Downstream | | | Upstream | | | Total | |
| | | 2012 | | | 2011 | | | 2010 | | | 2012 | | | 2011 | | | 2010 | | | 2012 | | | 2011 | | | 2010 | |
| Operating income (loss) | | (706.8 | ) | | (140.6 | ) | | (94.7 | ) | | (12.7 | ) | | 111.2 | | | 45.6 | | | (719.5 | ) | | (29.4 | ) | | (49.1 | ) |
| Adjustments: | | | | | | | | | | | | | | | | | | | | | | | | | | | |
| Operating | | (7.0 | ) | | (0.1 | ) | | (1.0 | ) | | 1.6 | | | – | | | – | | | (5.4 | ) | | (0.1 | ) | | (1.0 | ) |
| General and administrative | | – | | | – | | | – | | | (1.1 | ) | | 4.9 | | | (0.1 | ) | | (1.1 | ) | | 4.9 | | | (0.1 | ) |
| Exploration and evaluation | | – | | | – | | | – | | | 22.0 | | | 17.8 | | | 2.9 | | | 22.0 | | | 17.8 | | | 2.9 | |
| Depletion, depreciation and amortization | | 108.9 | | | 91.0 | | | 83.1 | | | 579.5 | | | 535.7 | | | 470.6 | | | 688.4 | | | 626.7 | | | 553.7 | |
| Gains on disposition of PP&E | | – | | | – | | | – | | | (30.3 | ) | | (7.9 | ) | | (0.7 | ) | | (30.3 | ) | | (7.9 | ) | | (0.7 | ) |
| Unrealized (gains) losses on risk management contracts | | – | | | – | | | – | | | 1.1 | | | (0.7 | ) | | (2.4 | ) | | 1.1 | | | (0.7 | ) | | (2.4 | ) |
| Impairment on PP&E | | 563.2 | | | – | | | – | | | 21.8 | | | – | | | 13.7 | | | 585.0 | | | – | | | 13.7 | |
| | | | | | | | | | | | | | | | | | | | | | | | | | | | |
| Cash contribution (deficiency) fromoperations | | (41.7 | ) | | (49.7 | ) | | (12.6 | ) | | 581.9 | | | 661.0 | | | 529.6 | | | 540.2 | | | 611.3 | | | 517.0 | |
| Inclusion of items not attributable to segments: | | | | | | | | | | | | | | | | | | | | | | | | | | | |
| Net cash interest paid | | | | | | | | | | | | | | | | | | | | 87.9 | | | 86.2 | | | 85.2 | |
| Realized foreign exchange gains | | | | | | | | | | | | | | | | | | | | (0.1 | ) | | (6.6 | ) | | (6.6 | ) |
| Consolidated cash contribution from operations | | | | | | | | | | | | | | | | | | | | 452.4 | | | 531.7 | | | 438.4 | |
PREDECESSOR PRESENTATION
On December 22, 2009, KNOC Canada purchased all of the issued and outstanding Trust Units of Harvest Energy Trust. The acquisition of all the issued and outstanding Trust Units of the Trust resulted in a change of control in which KNOC Canada became the sole unit holder of the Trust. On May 1, 2010, an internal reorganization was completed pursuant to which the Trust was dissolved and the Trust’s wholly owned subsidiary and the manager of the Trust, Harvest Operations Corp., was amalgamated into KNOC Canada to continue as one corporation under the name Harvest Operations Corp. The carrying values of Harvest’s assets and liabilities were determined from the existing carrying values of KNOC Canada’s assets and liabilities and therefore reflect the fair values established through the purchase.
The Trust meets the definition of a predecessor as described in Exchange Act Rule 12b-2 and Securities Act Rule 405; therefore, certain historical financial information related to the Trust is included in this annual report. Accordingly, the financial information presented in this annual report for the year ended and as at December 31, 2012, 2011 and 2010 is that of Harvest Operations Corp. (the successor company) while any comparative periods represent the financial information of Harvest Energy Trust (the predecessor company). As at December 31, 2009 the internal reorganization had not yet taken place; therefore, both Harvest Energy Trust and KNOC Canada existed at this date. However, KNOC Canada was incorporated on October 9, 2009 and did not have any results of operations or cash flows between October 9, 2009 and December 31, 2009, aside from capital contributions from KNOC to finance the KNOC Acquisition and cash used in the KNOC Acquisition; as such, the financial information presented for the year ended and as at December 31, 2009 is that of the Trust, unless otherwise stated, as this provides more relevant information in comparing the results of operations.
ITEM 1. IDENTITY OF DIRECTORS, SENIOR MANAGEMENT AND ADVISERS
Not applicable.
ITEM 2. OFFER STATISTICS AND EXPECTED TIMETABLE
Not applicable.
8
ITEM 3. KEY INFORMATION
A. Selected Financial Information
The financial data presented below for Harvest Operations and Harvest Energy Trust is derived from the audited consolidated financial statements. Harvest adopted IFRS with a transition date of January 1, 2010. As such, the consolidated financial statements of Harvest Operations for 2012, 2011 and 2010 have been prepared in accordance with IFRS, and the consolidated financial statements of Harvest Energy Trust for 2009 and 2008 were prepared in accordance with Canadian GAAP. The selected historical consolidated financial information presented below is condensed and may not contain all of the information that readers should consider. This selected financial data should be read in conjunction with the annual audited consolidated financial statements, the notes thereto and the section entitled “Item 5 Operating and Financial Review and Prospects”. The amounts presented below for the years 2009 and 2008, reflect the adjustments made to conform to U.S. GAAP.
| In accordance with IFRS | | | | | | | | | |
| (millions of Canadian dollars, except for per share amounts) | | 2012 | | | 2011 | | | 2010 | |
| Income statement data | | | | | | | | | |
| Net revenues | | | | | | | | | |
| Upstream | $ | 1,028.9 | | $ | 1,091.4 | | $ | 852.2 | |
| Downstream | | 4,752.1 | | | 3,302.3 | | | 3,193.3 | |
| Total | $ | 5,781.0 | | $ | 4,393.7 | | $ | 4,045.5 | |
| | | | | | | | | | |
| Operating loss | $ | (719.5 | ) | $ | (29.4 | ) | $ | (49.1 | ) |
| Net loss | $ | (720.1 | ) | $ | (104.7 | ) | $ | (81.2 | ) |
| Net loss per common share | | | | | | | | | |
| Basic and diluted | $ | (1.87 | ) | $ | (0.28 | ) | $ | (0.27 | ) |
| | | | | | | | | | |
| Distributions/dividends declared | $ | - | | $ | - | | $ | - | |
| Distributions/dividends declared - U.S. dollars(1) | $ | - | | $ | - | | $ | - | |
| Distributions declared, per common share | $ | - | | $ | - | | $ | - | |
| | | | | | | | | | |
| | | | | | | | | | |
| Balance sheet data | | | | | | | | | |
| Total assets | $ | 5,654.6 | | $ | 6,284.4 | | $ | 5,388.7 | |
| Net assets | $ | 2,691.9 | | $ | 3,453.7 | | $ | 3,017.0 | |
| Shareholder’s capital | $ | 3,860.8 | | $ | 3,860.8 | | $ | 3,355.4 | |
| Temporary equity | $ | - | | $ | - | | $ | - | |
| | | | | | | | | | |
| Capital expenditures (including acquisitions, net of dispositions) | | | | | | | | | |
| Upstream | $ | 360.4 | | $ | 1,144.9 | | $ | 932.9 | |
| Downstream | | 54.2 | | | 284.2 | | | 71.2 | |
| BlackGold | | 164.1 | | | 101.2 | | | 20.8 | |
| Total | $ | 578.7 | | $ | 1,530.3 | | $ | 1,024.9 | |
| | | | | | | | | | |
| Share data | | | | | | | | | |
| Weighted average common shares outstanding | | | | | | | | | |
| Basic and diluted | | 386,078,649 | | | 377,908,587 | | | 303,005,645 | |
(1) Translated using the average noon buying rate as disclosed in “Exchange Rate Information” under Item 3A below
9
| In accordance with US GAAP | | | | | | |
| (millions of Canadian dollars, except for per Trust | | 2009 | | | 2008 | |
| Unit amounts) | | | | | | |
| Income statement data | | | | | | |
| Net revenues | | | | | | |
| Upstream | $ | 757.4 | | $ | 1,294.8 | |
| Downstream | | 2,381.6 | | | 4,194.6 | |
| Total | $ | 3,139.0 | | $ | 5,489.4 | |
| | | | | | | |
| Operating income (loss) | $ | (603.8 | ) | $ | 550.7 | |
| Net loss | $ | (641.9 | ) | $ | (1,343.3 | ) |
| Net loss per Trust Unit | | | | | | |
| Basic and diluted | $ | (3.69 | ) | $ | (8.79 | ) |
| | | | | | | |
| Distributions/dividends declared | $ | 164.8 | | $ | 551.3 | |
| Distributions/dividends declared - U.S. dollars(1) | $ | 144.3 | | $ | 517.2 | |
| Distributions declared, per Trust Unit | $ | 1.00 | | $ | 3.60 | |
| | | | | | | |
| Balance sheet data | | | | | | |
| Total assets | $ | 2,476.4 | | $ | 3,561.5 | |
| Net assets | $ | (2,073.8 | ) | $ | (997.7 | ) |
| Shareholder’s capital | $ | - | | $ | - | |
| Temporary equity | $ | 2,422.1 | | $ | 1,562.8 | |
| | | | | | | |
| Capital expenditures | | | | | | |
| Upstream | $ | 124.2 | | $ | 400.0 | |
| Downstream | | 43.8 | | | 56.2 | |
| Total | $ | 168.0 | | $ | 456.2 | |
| | | | | | | |
| Share data | | | | | | |
| Weighted average Trust Units outstanding | | | | | | |
| Basic and diluted | | 173,785,806 | | | 152,836,717 | |
(1) Translated using the average noon buying rate as disclosed in “Exchange Rate Information” under Item 3A below
EXCHANGE RATE INFORMATION
All dollar amounts set forth in this annual report are expressed in Canadian dollars, except where otherwise indicated. References to Canadian dollars, Cdn$, C$ or $ are to the currency of Canada and references to U.S. dollars or US$ are to the currency of the United States.
The exchange rate information presented below is based on the Bank of Canada noon rates. Such rates are set forth as U.S. dollars per $1.00.
The exchange rate between the Canadian dollar and the U.S. dollar on April 26, 2013 was US$0.9833.
The high and low exchange rates between the Canadian dollar and the U.S. dollar for each month during the previous six months are as follows:
10
| | High | | Low |
| March 2013 | 0.9846 | | 0.9696 |
| February 2013 | 1.0040 | | 0.9723 |
| January 2013 | 1.0164 | | 0.9923 |
| December 2012 | 1.0162 | | 1.0048 |
| November 2012 | 1.0074 | | 0.9972 |
| October 2012 | 1.0243 | | 0.9996 |
The average exchange rates between the Canadian dollar and the U.S. dollar for the five most recent financial years calculated by using the average of the exchange rate on the last day of each month during the period are as follows:
| | Average |
| 2012 | 1.0004 |
| 2011 | 1.0110 |
| 2010 | 0.9709 |
| 2009 | 0.8757 |
| 2008 | 0.9381 |
B. Capitalization and Indebtedness
Not applicable.
C. Reasons for the Offer and Use of Proceeds
Not applicable.
D. Risk Factors
Harvest’s Upstream, BlackGold and Downstream operations are conducted in the same business environment as most other operators in the respective businesses. The risk factors set forth below have been separated into those applicable to each of the segments and those applicable to Harvest’s structure.
RISKS ASSOCIATED WITH COMMODITY PRICES
Prices received for Upstream production are volatile. The widening oil price differentials compound the commodity price risk.
The Upstream segment is more sensitive to crude oil prices given its oil-weighted portfolio of assets. Similar to other western North American oil producers, Harvest has been negatively impacted by the discounted WTI prices. The discounted WTI prices in relation to other international benchmarks, such as Brent, were caused by transportation constraints and the inability to bring crude oil production to other international markets. It is uncertain when the transportation issues will be resolved and the impact to the future oil prices.
In addition to the discounted WTI prices, Harvest has been facing a widening light oil and heavy oil price differential. Heavy oil generally receives lower market prices than light crude due to quality differences. However, the light oil and heavy oil price differential widened significantly in the past 12 months, primarily due to supply and demand imbalances caused by pipeline constraints between Canada and the U.S. The magnitudes of the future differentials are uncertain. As 55%-65% of Upstream’s crude oil production is in heavy oil, continued widening of these differentials could have a significant negative impact on Harvest.
Certain prices Harvest receives for its Upstream production are referenced to U.S. dollar benchmark prices, though Harvest receives revenues in Canadian dollars. As such, Harvest’s Upstream revenue is impacted by changes in the Canadian/U.S. currency exchange rates. The strengthening of the Canadian dollar could have a material adverse effect on the Corporation’s revenue and cash from operating activities.
11
Any prolonged period of low commodity prices, especially oil prices, could result in deterioration of Harvest’s liquidity and profitability, which may lead to a decision by the Corporation to suspend production and/or to curtail development projects. Suspension of production could result in a corresponding substantial decrease in revenues and earnings, which in turn could materially impact Harvest’s liquidity. The Corporation could also be exposed to significant additional expense as a result of failure to meet certain commitments relating to development and production activities. Furthermore, low commodity prices could also lead to reserve write-downs and impairment of Upstream’s assets.
The Downstream refining margins fluctuate significantly, reflecting the volatility experienced in both the feedstock costs and refined products prices.
The Downstream earnings and cash flows from refining and wholesale and retail marketing operations are dependent on a number of factors including fixed and variable expenses (including the cost of crude oil and other feedstocks) and the prices at which Harvest is able to sell refined products. In recent years, the market prices for crude oil and refined products have fluctuated substantially. These prices depend on a number of factors beyond Harvest’s control, including the supply and demand for crude oil and refined products, which are subject to, among other things:
- changes in the global demand for crude oil and refined products;
- the level of foreign and domestic production of crude oil and refined products and their price;
- threatened or actual terrorist incidents, acts of war, and other worldwide political conditions in both crude oil producing and refined product consuming regions;
- the availability of crude oil and refined products and the infrastructure to transport crude oil and refined products;
- supply and operational disruptions including accidents, weather conditions, hurricanes or other natural disasters;
- actions of other crude oil producing regions, such as OPEC;
- government regulations including changes in fuel specifications required by environmental and other laws;
- local factors including market conditions and the operations of other refineries in the markets in which Harvest competes; and
- the development and marketing of competitive alternative fuels.
Generally, fluctuations in the price of gasoline and other refined products are correlated with fluctuations in the price of crude oil; however, the prices for crude oil and prices for refined products can fluctuate in different directions as a result of worldwide market conditions. Further, the timing of the relative movement in prices as well as the magnitude of the change could significantly influence refining margins as could price changes occurring during the period between purchasing crude oil feedstock and selling the respective refined products. The Refinery purchases all of its crude oil feedstock at prices that fluctuate with worldwide market conditions and this could significantly impact Harvest’s earnings and cash flows. Harvest also purchases refined products from third parties for sale to its customers and price changes during the period between purchasing and selling these products could also have a material adverse effect on Harvest’s business and results of operations, as well as its financial condition and cash from operating activities.
It can be reasonably expected that Downstream results will fluctuate over time and from period to period. Any prolonged period of low refining margins could result in deterioration of Harvest’s liquidity and profitability, which may lead to a decision by the Corporation to suspend refinery operation and/or to curtail development projects. Suspension of operation could result in a corresponding substantial decrease in revenues and earnings, which in turn could materially impact Harvest’s liquidity. Declining refining margins could also lead to impairment of Harvest’s Downstream assets and the Corporation’s earnings could be adversely impacted (such as the impairment charge recorded in 2012 for Harvest’s Downstream assets). There can be no assurance that further decline in refined product margins will not result in additional impairment charges at some future dates.
Power expenses form a significant portion of Harvest’s operating costs. Harvest is subject to risks associated with changes in electricity prices.
As a result of the deregulation of the electrical power system in Alberta, electrical power prices have been set by the market based on supply and demand and electrical power prices in Alberta have been volatile. To mitigate the Corporation’s exposure to the volatility in electrical power prices, it may enter into fixed priced forward purchase contracts for a portion of the Corporation’s electrical power consumption in Alberta. In respect of the operations in British Columbia, Saskatchewan, Newfoundland and Labrador, the power systems are regulated and as such, electrical power costs are not subject to significant volatility. However, there can be no certainty that these power systems will not deregulate in the future.
12
Electricity prices have been and will continue to be affected by supply and demand for service in both local and regional markets and continued price increases could also have a material adverse effect on Harvest’s business and results of operations, as well as its financial condition and the cash from operating activities.
RISKS ASSOCIATED WITH UPSTREAM OPERATIONS
The Upstream operations are subject to a number of operational risks and natural hazards.
The Upstream business includes the drilling and completion of wells, the construction of associated infrastructures, the operations of crude oil and natural gas wells, equipment and facilities, the transportation, processing and storing of petroleum products, and the reclamation and abandonment of properties. These activities are subject to operational and natural hazards such as blowouts, explosions, fire, flooding, gaseous leaks, equipment failures, migration of harmful substances, spills, adverse weather conditions, environmental damage, trespass, malicious acts, unexpected accidents, natural disasters and other dangerous conditions. These incidents could result in damage to Harvest’s assets, operational interruptions, suspension of development activities, personal injury or death.
Harvest’s corporate environmental health and safety manual has a number of specific policies to minimize the occurrence of incidents, including emergency response should an incident occur. If areas of higher risk are identified, Harvest will undertake to analyze and recommend changes to reduce the risk including replacement of specific infrastructure; however, there can be no assurance that such measures will prevent against harmful incidents. Harvest employs prudent risk management practices and maintains liability insurance in amounts consistent with industry standards. In addition, business interruption insurance has been purchased for selected facilities. The Corporation may become liable for damages arising from such events against which it cannot insure, which it may elect not to insure or that may result in damages in excess of existing insurance coverage. Costs incurred to repair such damage or pay such liabilities would reduce Harvest’s cash flow. The occurrence of a significant event against which the Corporation is not fully insured could have a material adverse effect on Harvest’s financial position, operating results and cash flows.
The Upstream’s exploration and development activities may not yield anticipated production, and the associated cost outlay may not be recovered.
The Upstream’s exploration and development activities may not yield the intended production or the associated costs to meet production targets may exceed the cash flows from such production. Either case could result in adverse impact to Harvest’s future financial condition, cash flows and operating results. There are risks and uncertainties around the ability to commercially produce oil or gas reserves, to meet target production levels, and to complete the activities on schedule and on budget. Seismic data and other exploration technologies Harvest uses do not provide conclusive proof prior to drilling a well that crude oil or natural gas is present or may be produced economically. Even if production is present, Harvest may not be able to achieve or sustain production targets should reservoir production decline sooner than expected. The costs of drilling, completing and tie-in wells are often uncertain, and drilling activities may be extended, delayed or cancelled due to many factors, including but not limited to:
- inability to access drilling locations;
- failure to secure materials, equipment and qualified personnel to perform the activities;
- increased costs of oilfield services;
- delay caused by extreme weather conditions;
- changes in economic conditions, such as commodity prices;
- encountering unexpected formations or pressures;
- blowouts, wellbore collapse, equipment failures and other accidents;
- craterings and sour gas releases;
- accidents and equipment failures;
- uncontrollable flows of oil, natural gas or well fluids; and
- environmental risks.
13
The markets for crude oil, natural gas and related products depend upon available capacity to refine crude oil and process natural gas, pipeline capacity to transport the products to customers, and other factors beyond the Corporation’s control.
Harvest’s ability to market its production depends upon numerous factors beyond the Corporation’s control, including:
- the availability of capacity to refine crude oil;
- the availability of natural gas processing, including liquids fractionation, capacity;
- the availability of pipeline capacity;
- the availability of diluents to blend with heavy oil to enable pipeline transportation; and
- the effects of inclement weather.
Because of these factors, Harvest may be unable to market all of the crude oil, natural gas and related products it is capable of producing or to obtain favorable prices for its production.
Absent capital reinvestment or acquisition and development, production levels and cash flows from crude oil and natural gas properties will decline over time.
Harvest’s cash from operating activities, absent commodity price increases or cost effective acquisition and development activities of properties, will decline over time in a manner consistent with declining production from typical crude oil and natural gas reserves. Accordingly, absent additional capital investment from other sources, production levels and reserves attributable to Harvest’s properties will decline.
Harvest’s future reserves and production, and therefore Harvest’s cash flows, will be highly dependent on the Corporation’s success in exploiting its resource base and acquiring additional reserves. Without reserves additions through acquisition or exploration and development activities, Harvest’s reserves and production will decline over time as reserves are produced. There can be no assurance that Harvest will be successful in exploring for developing or acquiring additional reserves on terms that meet its investment objectives.
If the operators of Harvest’s joint venture properties fail to perform their duties properly, production may be reduced and proceeds from the sale of production may be negatively impacted.
Continuing production from a property and, to a certain extent, the marketing of production are largely dependent upon the capabilities of the operator of the property. To the extent the operator fails to perform its duties properly, production may be reduced and proceeds from the sale of production from properties operated by third parties may be negatively impacted. Although Harvest maintains operative control over the majority of its properties, there is no guarantee that the Corporation will remain the operator of such properties or that the Corporation will operate other properties that it may acquire.
Defects in title may defeat Harvest’s claims to certain properties.
Although title reviews will generally be conducted on the properties in accordance with industry standards, such reviews do not guarantee or certify that a defect in title may not arise to defeat Harvest’s claim to certain properties. If Harvest claims to certain properties are defeated, Harvest’s entitlement to the production and reserves associated with such properties could be jeopardized, which could have a material adverse effect on the Corporation’s financial condition and results of operations.
Harvest’s properties may be subject to aboriginal claims and treaty rights.
In Western Canada, aboriginal groups have filed claims in respect of aboriginal title and rights in certain areas against the Governments of Canada, Alberta and British Columbia, and certain government bodies. No certainty exists that any lands currently unaffected by claims brought by aboriginal groups will remain unaffected by future claims; if a claim arose and was successful, such claim may affect the ability to obtain approvals on a timely basis, or at all, and dependent on the nature of the claim, cause a material adverse effect on Harvest’s business, financial condition and results of operations. In addition, due to traditional lands claims and and treaty rights, aboriginal consultation on surface activities is required and may result in timing uncertainties or delays of future development activities, which, if significant, could have a material material adverse effect on the development of Harvest’s affected properties.
14
RISKS ASSOCIATED WITH RESERVES ESTIMATES
The reservoir and recovery information in reserves reports are estimates and actual production and recovery rates may vary from the estimates and the variations may be significant.
The reserves and recovery information contained in the Reserves Report prepared by the Independent Reserves Evaluators are complex estimates and the actual production and ultimate reserves recovered from the Corporation’s properties may differ. There are numerous uncertainties inherent in estimating quantities of crude oil and natural gas reserves, including many factors beyond the Corporation’s control. The reserves data, as disclosed in the “Reserves and Other Oil and Gas Information” section of Item 4B, represents estimates only. In general, crude oil and natural gas reserves and the future net cash flows are based upon a number of variable factors and assumptions, such as commodity prices, future operating and capital costs, historical production from the properties and the assumed effects of regulation by governmental agencies (including regulations related to royalty payments), all of which may vary considerably from actual results. All such estimates are to some degree uncertain, and classifications of reserves are only attempts to define the degree of uncertainty involved. For these reasons, estimates of the economically recoverable crude oil and natural gas reserves attributable to any particular group of properties, classification of such reserves based on risk of recovery and estimates of future net revenues expected there from, prepared by different evaluators or by the same evaluators at different times, may vary substantially. Harvest’s actual production, revenues, royalties, taxes, operating expenditures, abandonment costs and development costs with respect to the Corporation’s reserves may vary from such estimates, and such variances could be material.
Harvest’s proved reverses and probable reserves include undeveloped reserves that require additional capital to bring them on stream, see Item 5B in this annual report. Reserves may be recognized when plans are in place to make the required investments to convert these undeveloped reserves to producing. Circumstances such as a prolonged decline in commodity prices or poorer than expected results from initial drilling activities could cause a change in the development plans, which could lead to a material change in the reserve estimates.
Estimates with respect to reserves and resources that may be developed and produced in the future are often based upon volumetric calculations, probabilistic methods and upon analogy to similar types of reserves or resources, rather than upon actual production history. Estimates based on these methods generally are less reliable than those based on actual production history. Subsequent evaluation of the same reserves or resources based upon production history will result in variations, which may be material, in the estimated reserves or resources.
The Reserve value of Harvest’s Properties as estimated by Independent Reserves Evaluators is based in part on cash flows to be generated in future years as a result of future capital expenditures. The reserves value of the properties as estimated by the Independent Reserves Evaluators may not be realized to the extent that such capital expenditures on the properties do not achieve the level of success assumed in such engineering reports.
Prices paid for acquisitions are based in part on reserves report estimates and the assumptions made in preparing the reserves report are subject to change as well as geological and engineering uncertainty.
The prices paid for acquisitions are based, in part, on engineering and economic assessments made by the independent reserves evaluators in the related reserves report. These assessments include a number of material assumptions regarding such factors as recoverability and marketability of crude oil, natural gas and natural gas liquids, future commodity prices, operating costs, future capital expenditures and royalties and other government levies which will be imposed over the producing life of the reserves. Many of these factors are subject to change and are beyond Harvest’s control. In particular, the prices of and markets for crude oil and natural gas may change from those anticipated at the time of making such acquisitions. In addition, all engineering assessments involve a measure of geological and engineering uncertainty which could result in lower production and reserves than those currently attributed to Harvest’s properties.
RISKS ASSOCIATED WITH DOWNSTREAM OPERATIONS
The Refinery is a single train integrated interdependent facility which could experience a major shutdown caused by an accident or by severe weather. These potential disruptions may reduce or eliminate Harvest’s cash flow.
The Refinery is a single train integrated and interdependent facility which could be forced to shut down, partially or in full, by an accident in one of the units, fire, leakages, spills, extreme weather conditions, other natural disaster, or other unplanned incidents. A shutdown of one part of the Refinery could significantly impact the production of refined products and may reduce, and even eliminate, cash flow. Any one or more of the Refinery’s processing units may encounter unexpected or extended downtime for maintenance or repair for damages caused by the event or identified during the outage. The time required to complete the work may extend the duration of the outage or take longer than anticipated, and the restoration of operations may otherwise involve unanticipated delay. There are no assurances that the Refinery will produce refined products in the quantities or at the cost anticipated, or that it will not cease production entirely in certain circumstances, which could have a material adverse effect on Harvest’s business and results of operations, as well as its financial condition and cash from operating activities.
15
Harvest’s Downstream operations are subject to hazards which may result in personal injury, damage to Harvest’s property and/or the property of others along with significant liabilities.
Harvest’s Downtream operations, including the operation of the refinery, terminals, marine division, pipelines, storage tanks, and other distribution facilities and service stations, are subject to hazards and inherent risks such as fires, natural disasters, explosions, spills and mechanical failure of the equipment or third-party facilities, any of which can result in personal injury claims as well as damage to Harvest’s properties and the properties of others. While Harvest carries property, casualty and business interruption insurance, the Corporation does not maintain insurance coverage against all potential losses, and could suffer losses for uninsurable or uninsured risks or in amounts in excess of existing insurance coverage. The occurrence of an event that is not fully covered by insurance could have a material adverse effect on Harvest’s business and results of operations, as well as its financial condition and cash from operating activities, as the Corporation could be liable for all costs and penalties associated with their remediation under federal, provincial and local environmental laws or common law, and could be liable for property damage to third parties. In addition, unanticipated costs or reduced operating income may be resulted from any of these incidents, which may further impact Harvest’s profitability and liquidity.
Downstream operates in environmentally sensitive coastal waters where tanker operations are closely regulated by federal, provincial and local agencies and monitored by environmental interest groups. Transportation of crude oil and refined products over water involves inherent risk and subjects North Atlantic to the provisions of Canadian federal laws and the laws of the Province of Newfoundland and Labrador. Among other things, these laws require North Atlantic to demonstrate its capacity to respond to a “worst case discharge” to a maximum 10,000 metric tonne oil spill. Downstream’s marine division manages vessel traffic to the Refinery and works with regulatory authorities on measures to prevent and mitigate the risk of oil spills and other marine related matters. The marine division has two tugboats to assist in berthing and unberthing tankers at Harvest’s dock with one tugboat equipped with firefighting capability. The tugboat operations have a safety management system certified under the International Safety Management Code and are also certified under the International Ship and Port Security Code. In addition, Harvest has contracted the Eastern Canada Response Corporation to supplement Harvest’s resources. However, there may be accidents involving tankers transporting crude oil or refined products, and response services may not respond in a manner to adequately contain a discharge and Harvest may be subject to a significant liability in connection with a discharge.
Harvest has in the past operated service stations with underground storage tanks and currently operates 52 retail gasoline stations and three commercial cardlock locations with underground storage tanks in the Province of Newfoundland and Labrador. Harvest is required to comply with provincial regulations governing such storage tanks in the Province of Newfoundland and Labrador and compliance with these requirements can be costly. The operation of underground storage tanks also poses certain other risks, including damages associated with soil and groundwater contamination. Leaks from underground storage tanks which may occur at one or more of Harvest’s service stations, or which may have occurred at previously operated service stations, may impact soil or groundwater and could result in fines or civil liability. While Harvest maintains insurance in respect of such risks, there are no assurances that such insurance will be adequate to fully compensate for any liability Harvest may incur if such risks were to occur.
The Refinery is subject to regular major maintenance or turnarounds, where a significant portion or the entire Refinery may be shut down. Similar to any large scale maintenance projects, the project may not complete on time or on budget, which may materially impact Harvest’s cash flows and operating results.
The Refinery carries out various scales of major maintenance and turnarounds, some of which require complete shut-down. While Harvest makes every effort to properly plan and execute the scheduled maintenance, the possibility remains that capital cost overruns or schedule delays will occur as a result of fluctuating market conditions and unexpected challenges, including the availability, scheduling and costs of materials and qualified personnel; the complexities around the integration and management of contractors, subcontractors, staff and supplies; competing projects that require the same resources during the same time period; and severe weather conditions. The Refinery is a complicated facility with many integrated and interdependent components. As such, unforeseeable complications may occur or additional work may be identified during major maintenance projects that require more time and effort to complete than anticipated. Any cost overruns, schedule delays and resulting additional down days may cause material adverse effect to Harvest’s cash flows and operating results. As with unplanned outages, scheduled outages could significantly impact the production of refined products and may reduce, and even eliminate, cash flow
16
Crude oil feedstock is delivered to the Refinery via waterborne vessels which could experience delays in transporting supplies due to weather, accidents, government regulations or third party actions.
The Refinery receives all of its crude oil and other feedstocks and its customers lift approximately 90% of its refined products via water borne vessels including very large crude carriers. In addition to environmental risks of handling such vessels discussed above, Harvest could experience a disruption in the supply of crude oil because of accidents, extreme weather conditions, governmental regulation or third party actions. A prolonged disruption in the availability of vessels to deliver crude oil to the Refinery and/or to deliver refined products to market would have a material adverse effect on Harvest’s business and results of operations, as well as the financial condition and cash from operating activities.
Since Harvest’s acquisition of North Atlantic, approximately 71% of its crude oil feedstock has been from sources in the Middle East. The Corporation does not maintain long term supply commitments with any of its crude oil producers. To the extent that crude oil producers reduce the volume of crude oil produced as a result of declining production or competition or otherwise, the business, financial condition and results of operations may be adversely affected to the extent that the Corporation is not able to find a substantial amount and similar type of crude oil. Further, the Corporation has no control over the level of development in the fields that currently produce the crude oil it process at the Refinery nor the amount of reserves underlying such fields, the rate at which production will decline or the production decisions of the producers which are affected by, among other things, prevailing and projected crude oil prices, demand for crude oil, geological considerations, government regulation and the availability and cost of capital.
If MEC terminates the SOA (2011), Harvest’s business could be adversely affected.
Under the SOA (2011), MEC sells all of the Refinery’s feedstock and purchases almost all of the refined products produced. If MEC terminates the SOA (2011), Harvest would seek to enter into a similar agreement with another party that has a similar credit profile and expertise to that of MEC’s. If Harvest were unable to enter into such a replacement agreement, it would be required to enter into separate agreements for the supply and financing of feedstock to the Refinery and the sale of the Refinery’s refined products. No assurance can be given that Harvest will be able either to enter into an agreement similar to the SOA (2011) with another party or to enter into agreements with a number of different parties to replicate the economics of the SOA (2011). If the SOA (2011) were terminated and Harvest was unable to enter into replacement agreements, working capital requirements would likely increase and revenues and cash flows from the Refinery would likely decrease, which could have a material adverse effect on Harvest’s business.
Harvest is relying on the creditworthiness of MEC for Harvest’s purchase of feedstock and should their creditworthiness deteriorate, crude oil suppliers may restrict the sale of crude oil to MEC.
MEC purchases crude oil feedstock from third parties to supply North Atlantic pursuant to the SOA (2011). Should the creditworthiness of MEC deteriorate third party crude oil suppliers may reduce the sale volume to MEC, shorten the payment terms or require additional credit support. MEC may pass on additional costs to Harvest, which then may increase Downstream’s feedstock costs. If MEC fails to secure sufficient amount of feedstock supplies, the Refinery operations may be disrupted. Due to the large dollar amount of credit associated with the volume of crude oil purchases, any imposition of more burdensome payment terms may have a material adverse effect on Harvest’s financial liquidity which could hinder its ability to purchase sufficient quantities of crude oil to operate the Refinery at full capacity. A failure to operate the Refinery at full capacity could have a material adverse effect on its business and results of operations, as well as its financial condition and cash from operating activities.
17
The production of aviation fuels subjects us to liability should contaminants in the fuel result in aircraft engines being damaged and/or aircraft accidents.
The Refinery produces aviation fuels, which involves inherent risks and subjects it to the provisions of Canadian federal laws. Harvest’s product quality assurance programs are extensive; however, these procedures may not be sufficient to detect and prevent contaminants from entering into the aviation fuels which could result in aircraft engines being damaged and/or aircraft accidents. While the Corporation maintains insurance in respect of such risks, there are no assurances that such insurance will be adequate to fully compensate for any liability the Corporation may incur if such risks were to occur.
Collective bargaining agreements with North Atlantic’s employees and the United Steel Workers of America with respect to the Downstream operations may not prevent a strike or work stoppage and future agreements may result in an increase in operating costs.
As of December 31, 2012, 66% full-time employees and 100% of part-time employees in the Downstream operations are represented by the United Steel Workers of America pursuant to collective bargaining agreements. Upon the expiry of existing collective agreements, the Corporation may not be able to renegotiate future collective agreements on satisfactory terms, or at all, which may result in an increase in operating costs. In addition, the existing collective agreements may not prevent a strike or work stoppage in the future, and any such work stoppage could have a material adverse effect on the Downstream business and Harvest’s results of operations as well as the financial condition and cash from operating activities.
RISKS ASSOCIATED WITH BLACKGOLD OIL SANDS PROJECT
Harvest is subject to certain risks associated with the project execution and the commissioning of the SAGD operations.
Each stage of the BlackGold EPC project is subject to execution risks that are inherent in similar projects, such as failure to properly design the project scope and engineering details, difficulties around the procurement and fabrication of key modules and components, failure to carry out construction as planned, and inability to meet performance targets upon commissioning and project start-up.
The development of the BlackGold assets requires substantial capital investment. While Harvest makes every effort to properly and accurately forecast capital and operating expenditures, the possibility remains that capital cost overruns or schedule delays will occur as a result of fluctuating market conditions and unexpected challenges, including but not limited to:
- The availability, scheduling and costs of materials and qualified personnel;
- The complexities around the integration and management of contractors, subcontractors, staff and supplies;
- The ability to obtain the necessary regulatory approvals in various stages of the project;
- Logistic issues relating to the transportation of modules across great distances;
- The availability of auxiliary infrastructures in place to support the project;
- The impact from changing government regulations and public scrutiny over oil sands development; and
- Severe weather conditions.
In May 2012, Harvest amended certain aspects of its BlackGold EPC contract, including revising the compensation terms from a lump sum price to a cost reimbursable price. As such, any cost overruns and schedule delays could have the potential to affect the Corporation’s future financial position and cash flows.
BlackGold is subject to government regulation. The initial phase of the project, targeting production of 10,000 bbl/d, has been approved by provincial regulators. The proposed expansion phase of the BlackGold project is in the application stage and remains subject to approval by provincial regulators. The delay of such approval could impact Harvest’s ability and/or timing of reaching the targeted production of 30,000 bbl/d.
Harvest’s estimates of performance and recoverable volumes from this project are based primarily on sample reservoir data, the results of core drilling and industry performance from other SAGD operations in similar reservoirs. Actual performance and operating results may be different as there can be no certainty that the existing and future SAGD wells will achieve or maintain the planned production rates or steam-to-oil ratio. The inability to achieve anticipated results could be due to one or all of design, facility or reservoir performance, or the presence of problematic geological features. As such, additional drilling, construction of new facilities, modification of existing facilities and additional operating expenses may be required to maintain optimal production levels. Harvest may encounter operational issues unanticipated thus far as BlackGold is Harvest’s first SAGD project. Failure to meet performance targets may adversely impact Harvest’s financial conditions, operating results, cash flows and ultimate recoverability of the project.
18
RISKS ASSOCIATED WITH HARVEST’S CAPITAL RESOURCES
Harvest must meet certain ongoing financial and operating covenants; failure to do so may result in debt repayment and consequently adverse effect on Harvest’s cash flows.
Under the Credit Facility, Harvest and certain subsidiaries of Harvest Operations (designated as restricted subsidiaries) have provided the lenders security over all of the assets of Harvest Operations and of the restricted subsidiaries, excluding the BlackGold assets. If an event of default (as defined under the Credit Facility) has occurred the lenders may demand repayment and exercise rights under the security, including sale of the secured assets. Certain payments by Harvest or the restricted subsidiaries are prohibited upon an event of default. Any indebtedness of Harvest or of restricted subsidiaries which is owed to a restricted subsidiary is subordinate to payments to lenders pursuant to the Credit Facility, under subordination agreements between the lenders and the restricted subsidiaries.
Harvest must meet certain ongoing financial and other covenants under each of the Credit Facility and the Note Indenture (respecting the 67/8% Senior Notes). The covenants include customary provisions and restrictions related to Harvest Operations and the restricted subsidiaries' operations and activities, and are described further for each of the Credit Facility and the Note Indenture in Item 10C “Material Contract” of this annual report. Harvest reviews the covenants regularly based on historical financial results. If the Corporate does not comply with the covenants, repayments could be required. There is no assurance that Harvest will be able to meet such repayment requirements to or refinance such obligations. This could result in adverse effect on Harvest’s financial condition and liquidity.
Harvest may not be able to execute its capital investment projects as planned due to financial constraints.
Harvest has ongoing capital investment projects and planned projects for the future periods in all three segments. These projects compete for cash flows against each other and Harvest’s other cash commitments. Harvest may not have sufficient capital resources to finance all its projects and may delay or curtail certain development projects. Any changes to Harvest’s capital investment plans may further impair its ability to grow or to sustain its current operating levels, which may negatively impact Harvest’s future operating results, financial position and cash flows.
Harvest current debt level and financial commitments may negatively impact the business.
Harvest’s current debt levels and financial commitments may limit its financial and operating flexibility, which could have significant and adverse consequences to the business, including:
- an increased sensitivity to adverse economic and industry conditions;
- a limited ability to fund future working capital and capital expenditures, engage in future acquisitions or development activities, or to otherwise fully realize the value of assets or opportunities, because a substantial portion of the cash flows are required to service debt and other obligations;
- a limited ability to plan for, or react to, industry trends; and
- an uncompetitive position relative to Harvest’s competitors whose debt and financial commitment levels are lower.
Harvest’s ability to raise capital resources is subject to various risks. Failure to access future financing may result in severe liquidity issues.
Harvest’s ability to raise capital resources is subject to certain risks, including disruptions in international credit markets, collapses of sovereign financial systems, global economy downturns, overall oil and gas industry conditions, credit rating downgrades, and intense competition from other debt/equity issuers. To the extent that new sources of financing becomes limited, unavailable or available on unfavorable terms, the Corporation’s ability to make capital investments, maintain existing assets, meet financing commitments, repay debt may be constrained, and, as a result Harvest’s business, operating results and financial conditions may be materially impacted.
19
Harvest is exposed to exchange rate risks from its U.S dollar denominated debts and to interest rate risks from its floating-rate debts.
Harvest’s borrowings under its senior notes, Related Party Loan and LIBOR based loans and the related interests are denominated in U.S. dollars. As such, material adverse changes to the exchange rates between Canadian dollar and the U.S. dollar could negatively impact Harvest’s financial conditions, cash flows and operating results.
Harvest is also exposed to interest rate risks on its bank borrowings as interest rates are determined in relation to floating market rates. Furthermore, the Corporation is exposed to interest rate risk when maturing debt is refinanced, or when new debt capital is raised. Significant increase to interest rates could result in reduced future profitability and liquidity. Increased interest rates could also cause capital projects to become uneconomical and might lead to suspension of such projects. Ultimate recoverability of capital assets may be impaired from higher interest rates.
Harvest engages in various risk management activities using derivative instruments, which inherently are subject to risks and uncertainties.
The Corporation monitors its exposure to commodity prices, interest rates and foreign exchange rates and, where deemed appropriate, utilizes derivative financial instruments and physical delivery contracts to help mitigate such risks. The utilization of derivative financial instruments may introduce significant volatility into Harvest’s reported net earnings, comprehensive income and cash flows. The terms of our various hedging agreements may limit the benefit to the Corporation of commodity price increases or changes in interest rates and foreign exchange rates. The Corporation may also suffer financial loss because of hedging arrangements if:
- Harvest is unable to produce crude oil, natural gas or refined products to fulfill delivery obligations;
- Harvest is required to pay royalties based on market or reference prices that are higher than hedged prices; or
- Counterparties to the hedging agreements are unable to fulfill their obligations under the hedging agreements.
RISKS ASSOCIATED WITH GENERAL BUSINESS
Harvest may be adversely affected by changes in laws and regulations relating to the crude oil and natural gas industry.
Harvest’s Upstream could be impacted by changes in federal, provincial and municipal laws and regulations relating to the crude oil and natural gas industry, including but not limiting to, royalty regimes, income and capital tax laws, land tenure, government incentive programs, production rates controls, safety programs and environmental acts. Changes in laws, regulations and policies could lead to direct reduction in revenue and cash flows, and/or additional compliance costs. Significant adverse changes could also result in suspension of Harvest’s exploration, development and production of its oil and gas reserves. Government laws and regulations could be complex and subject to misinterpretation. Noncompliance may lead to significant penalties and fines, loss of licenses and permits or legal claims, all could have material effect to Harvest’s financial condition, results of operations and cash flows.
Harvest’s operations are subject to environmental regulation pursuant to local, provincial and federal legislation and require us to obtain and maintain regulatory approvals. A breach of such legislation may subject us to substantial liability and result in the imposition of fines as well as higher operating standards that may increase costs.
Harvest’s operations and related properties are subject to extensive federal, provincial and local environmental and health and safety regulations governing, among other things, the production, processing, storage, handling, use and transportation of petroleum and hazardous substances, the emission and discharge of materials into the environment, waste management and characteristics and composition of gasoline and diesel fuels. If the Corporation fails to comply with these regulations, it may be subject to administrative, civil and criminal proceedings by governmental authorities as well as civil proceedings by environmental groups and other entities and individuals. A failure to comply, and any related proceedings, including lawsuits, could result in significant costs and liabilities, penalties, judgments against us or governmental or court orders that could alter, limit or stop the operations.
Consistent with the experience of other Canadian oil and gas businesses, environmental laws and regulations have raised operating costs and at times required significant capital investments in our assets. Harvest believes that its operations are materially compliant with existing laws and regulatory requirements. However, material expenditures could be required in the future to comply with evolving environmental, health and safety laws, regulations or requirements that may be adopted or imposed in the future.
20
Harvest operates under permits issued by the federal and provincial governments and these permits may be renewed periodically. The federal and provincial governments may make operating requirements more stringent which may require additional spending. To the extent that the costs associated with meeting any of these requirements are substantial and not adequately provided for, there could be a material adverse effect on Harvest’s business and results of operations as well as its financial condition and cash from operating activities.
Harvest’s abandonment and reclamation obligations may increase due to changes in environmental laws and regulations.
Harvest is responsible for compliance with terms and conditions of environmental and regulatory approvals and all laws and regulations regarding the abandonment and reclamation of the surface leases, wells, facilities and pipelines at the end of their economic life as well as those for any future expansions. A breach of such legislation and/or regulations may result in the imposition of fines and penalties, including an order for cessation of operations at the site until satisfactory remedies are made. It is not possible to accurately predict the timing and the amount of the abandonment and reclamation costs due to uncertainties around numerous factors, such as regulatory requirements at the time, future labor and material costs, the extent of contamination at the site, future technology and the value of the salvaged equipment. Any adverse changes to any of these factors could result in additional costs to Harvest, which could impact Harvest’s cash flows and financial conditions. In addition, in the future Harvest may determine it prudent or may be required by applicable laws, regulations or regulatory approvals to establish and fund one or more reclamation funds to provide for payment of future abandonment and reclamation costs.
Harvest is subject to income tax assessments and re-assessment, which may result in unfavorable tax consequences.
From time to time, Harvest Operations may take steps to organize its affairs in a manner that minimizes taxes and other expenses payable with respect to the operation of the Corporation and the Operating Subsidiaries. Harvest’s prior years’ income tax and royalty filings are subject to reassessment by government entities. The reassessment of previous filings may result in additional income tax expenses, royalties, interest and penalties which may adversely affect the Corporation’s cash flows, results from operation and financial position.
Harvest faces strong competition in various aspects of its operations, which may create constraints and negative impact to Harvest’s operations.
There is strong competition relating to all aspects of the crude oil and natural gas industry. Harvest actively competes for capital, skilled personnel, new sources of crude oil and natural gas reserves, access to drilling rigs, service rigs and other equipment, access to processing facilities and pipeline and refining capacity, new customers or marketing channels, and access to lower priced feedstocks for the Refinery with a substantial number of other crude oil and natural gas organizations, many of which may have greater technical and financial resources than us. In areas where access and operations can only be conducted during limited times of the year due to weather or government regulations, the competition for resources is even more intense. Constraints resulted from such competition may lead to increased cost outlay and suspension of operational and development activities, which could negatively impact Harvest’s financial conditions, operating results and cash flows.
Harvest’s operations and performances are heavily reliant on key personnel.
Holders of securities of Harvest will be dependent on the management of Harvest in respect of the administration and management of all matters relating to Harvest and the Operating Subsidiaries and the properties. Investors who are not willing to rely on the management of Harvest should not invest in the Corporation. In addition, the loss of key management could have an adverse effect on the Corporation. The competition for qualified personnel in Alberta and Newfoundland is intense, and there can be no assurance that Harvest will be able to continue to retain or attract the necessary personnel for the continuance of development and operation of the Corporation’s business.
Harvest is subject to credit risks in its normal course of business.
Harvest enters into contractual relationships with various counterparties, the majority of which are from the oil and gas industry. If such counterparties do not fulfill their contractual obligations or settle their liabilities to the Corporation, the Corporation may suffer losses, may have to proceed on a sole risk basis, may have to forgo opportunities or may have to relinquish leases. While the Corporation maintains a risk management system that limits exposures to any one counterparty, losses due to the failure by counterparties to fulfill their contractual obligations may adversely affect Harvest’s financial condition and liquidity.
21
ITEM 4. INFORMATION ON THE COMPANY
A. History and Development of the Company
Harvest Operations Corp. was incorporated under the ABCA on May 14, 2002. All of the issued and outstanding common shares of Harvest Operations are owned by KNOC. Established in 1979, KNOC is a leading international oil and gas exploration and production company wholly owned by the Government of Korea. KNOC’s founding principle is to secure oil supplies for the nation of Korea by exploring for and developing oilfields and holding petroleum reserves. As at December 31, 2012, Harvest’s net proved reserves represented approximately 34% of KNOC’s consolidated crude oil and natural gas reserves and resources. Additionally, Harvest’s crude oil and natural gas production represented 27% of KNOC’s consolidated 2012 petroleum and natural gas production.
Harvest Operations manages the affairs of the Operating Subsidiaries and North Atlantic, and is responsible for providing all of the technical, engineering, geological, land management, financial, administrative and commodity marketing services relating to Harvest's Upstream and BlackGold operations.
The head and principal office of Harvest is located at Suite 2100, 330 - 5th Avenue S.W., Calgary, Alberta T2P 0L4 and the telephone number is (403) 265-1178. The registered office of Harvest is located at Suite 4500, Bankers Hall East 855 – 2nd Street S.W., Calgary, Alberta T2P 4K7.
RECENT DEVELOPMENTS
On May 30, 2012, Harvest amended certain aspects of its BlackGold oil sands project EPC contract, including revising the compensation terms from a lump sum price to a cost reimbursable price and conferring greater control over project execution. The cost pressures and resulting contract changes are expected to increase the net EPC costs to approximately $520 million from $311 million, after allowing for certain costs which are not reimbursable to the EPC contractor. Production is expected to start in 2014.
On July 31, 2012, Harvest extended the Credit Facility by one year to April 30, 2016.
On August 1, 2012, Harvest completed the exchange offer of up to US$500 million in aggregate principal amount of 67/8% Senior Notes due 2017 registered under the Securities Act for the same aggregate principal amount of its outstanding original 67/8% Senior Notes due 2017, and 100% of the original notes were tendered.
On August 16, 2012, Harvest entered into a subordinated loan agreement with Ankor E&P Holdings Corp. (“ANKOR”), a 100% owned subsidiary of KNOC, to borrow US$170 million at a fixed interest rate of 4.62% per annum.
On September 19, 2012, Harvest redeemed the outstanding 6.40% Debentures Due 2012 for $106.8 million.
During 2012 Harvest recognized impairment charges of $563.2 million and $21.8 million against its Downstream and Upstream assets, respectively, due to unfavourable refining margins and natural gas prices.
On February 1, 2013, Harvest sold certain non-core oil and gas assets in Alberta for net proceeds of approximately $9 million.
Two series of Harvest’s convertible unsecured subordinated debentures, the 7.25% Debentures Due 2013 and 7.25% Debentures Due 2014, were early redeemed on April 15, 2013 and April 2, 2013, respectively. Both series of debentures were redeemed at par with the total redemption payment, including all accrued and unpaid interest up to the respective redemption dates being $1,002.9794 per $1,000 principal amount for the 7.25% Debentures Due 2013 and $1,006.5547 per $1,000 principal amount for the 7.25% Debentures Due 2014. The redemptions were financed by draws under the Senior Unsecured Credit Facility.
22
CAPITAL EXPENDITURES
The following table provides a summary of Harvest’s capital expenditures in accordance with IFRS for the last three years ended December 31:
| ($ millions) | | 2012 | | | 2011 | | | 2010 | |
| Upstream capital expenditures | $ | 445.2 | | $ | 632.2 | | $ | 383.1 | |
| BlackGold capital expenditures | | 164.1 | | | 101.2 | | | 20.8 | |
| Downstream capital expenditures | | 54.2 | | | 284.2 | | | 71.2 | |
| Total capital expenditures | | 663.5 | | | 1,017.6 | | | 475.1 | |
| Acquisitions | | | | | | | | | |
| Business | | - | | | 509.8 | | | 145.1 | |
| Property | | 1.3 | | | 4.2 | | | 405.7 | |
| Divestitures | | | | | | | | | |
| Property | | (88.5 | ) | | (8.7 | ) | | (1.0 | ) |
| Net acquisition and divestiture activities | | (87.2 | ) | | 505.3 | | | 549.8 | |
| Addition to other long term assets | | 2.4 | | | 7.4 | | | - | |
| Net capital investment | $ | 578.7 | | $ | 1,530.3 | | $ | 1,024.9 | |
During 2012, Harvest disposed of certain non-core producing properties in Alberta and Saskatchewan for proceeds of $88.5 million. These transactions resulted in a gain of $30.3 million, which has been recognized in the consolidated statements of comprehensive loss.
On February 28, 2011, Harvest closed the acquisition of assets from Hunt Oil Company of Canada, Inc. and Hunt Oil Alberta Inc. (collectively, “Hunt”) for cash consideration of $511.0 million. KNOC provided $505.4 million of equity to fund the acquisition. An additional $25 million was payable to Hunt in the event that Canadian natural gas prices exceed certain pre-determined levels in 2012. Based on 2012 gas prices, no further consideration was paid. Assets acquired include approximately 377,000 net acres of undeveloped land, with complementary land positions in Willesden Green, the Peace River Arch and Southern Alberta. This acquisition includes access to resource plays in the Willesden Green area of Alberta and the Horn River basin of British Columbia.
In 2010, Harvest Operations acquired the remaining 40% interest in Redearth Partnership and other petroleum and natural gas properties for cash consideration of $145.2 million. This amount was finalized during 2011 and the total cash consideration was revised to $144.2 million as a result of adjustments made during the measurement period.
On August 6, 2010, Harvest completed the acquisition of the BlackGold oil sands project from KNOC for $374 million. Harvest signed an EPC contract in 2010 for phase 1 of BlackGold, under which $181.5 million (including a $31.1 million deposit) has been paid up to the end of 2012. Between project inception and December 31, 2012, Harvest has capitalized $286.4 million of expenditures relating to the EPC activities and the drilling and completion of 15 SAGD well pairs in 2012 and 12 observation wells in 2011. For further information on the BlackGold project, refer to Item 4B “Business Overview” and Item 4D “Property, Plant and Equipment” of this annual report.
Please refer to Item 4D “Property, Plant and Equipment” for details regarding the Corporation’s 2013 capital expenditure plan and Harvest’s material properties.
B. Business Overview
Harvest is a significant operator in Canada’s energy industry with three operating segments: Upstream, BlackGold and Downstream. Harvest’s Upstream and BlackGold oil and gas business is complemented by its long-life refining business that focuses on the safe and efficient operation of a medium gravity sour-crude refinery located in the Province of Newfoundland and Labrador and the associated retail and marketing operations.
23
UPSTREAM
In the Upstream operations, Harvest employs a disciplined approach to acquiring, developing and operating large resource-in-place producing properties using best-in-class technologies. Harvest’s Upstream operations are principally located in the Western Canadian sedimentary basin and material properties are described in Item 4D “Property, Plant and Equipment”. Harvest has a high degree of operational control as it is the operator on properties that generate the majority of Harvest’s production. The Corporation believes that this “hands on” approach allows it to better manage capital expenditures and accumulate institutional expertise in its operating regions.
IMPACT OF VOLATILITY IN COMMODITY PRICES
Harvest's operational results and financial condition will be dependent on the prices received for petroleum and natural gas production. Petroleum and natural gas prices have fluctuated widely during recent years and are determined by supply and demand factors, which are influenced by transportation constraints, weather, geopolitical and general economic conditions. Any decline in petroleum and natural gas prices could have an adverse effect on Harvest's financial condition. More details discussion on commodity price risks is included in Item 3D “Risk Factors”. Harvest mitigates such price risk through closely monitoring the various commodity markets and establishing commodity price risk management programs, as deemed necessary, to provide stability to its cash flows.
A summary of financial and physical contracts in respect of price risk management activities can be found in Note 22 of the consolidated financial statements for the year ended December 31, 2012 included in Item 18 of this annual report.
MARKETING CHANNELS
Crude Oil and NGLs
Harvest's crude oil and NGL production is marketed to a diverse portfolio of intermediaries and end users with the majority of the oil contracts existing on a 30-day continuously renewing basis and the NGL contracts on one-year terms. These commodities typically receive the prevailing monthly market prices. Harvest has a small number of condensate purchase contracts required for blending heavy oil to meet pipeline specifications. These are a combination of one year and monthly spot contracts, both at the prevailing monthly prices.
Natural Gas
Approximately 90% of Harvest's natural gas production is currently being sold at the prevailing daily spot market prices in Western Canada. A vast majority of the remaining 10% of production receives Chicago-based prices via two transportation contracts under which gas is shipped to the United States. A marginal 0.1% of production is dedicated to aggregator contracts, which are reflective of market prices and are under contract until 2015.
The following is Harvest’s Upstream sales by product for each of the three years ended December 31:
| ($ millions) | | 2012 | | | 2011 | | | 2010 | |
| Light / medium oil sales after hedging(1)(2)(3) | $ | 437.1 | | $ | 454.3 | | $ | 326.7 | |
| Heavy oil sales(2)(3) | | 509.4 | | | 527.4 | | | 500.5 | |
| Natural gas sales(4) | | 115.7 | | | 156.9 | | | 124.2 | |
| Natural gas liquids sales(2) | | 114.5 | | | 125.5 | | | 55.4 | |
| Other(5) | | 16.8 | | | 22.8 | | | 0.2 | |
| Petroleum and natural gas sales | $ | 1,193.5 | | $ | 1,286.9 | | $ | 1,007.0 | |
| Royalties | | (164.6 | ) | | (195.5 | ) | | (154.8 | ) |
| Revenues | $ | 1,028.9 | | $ | 1,091.4 | | $ | 852.2 | |
| | (1) | Inclusive of the effective portion of realized gains (losses) from crude oil contracts designated as hedges. |
| | (2) | All of Harvest’s crude oil and NGLs are sold in Canada. |
| | (3) | Effective October 1, 2012, Harvest reclassified certain properties that were previously reported as light to medium oil to heavy oil as classified under NI 51-101. Prior year amounts have been restated to reflect the reclassification. The reclassification did not result in any changes to the total petroleum and natural gas sales. |
| | (4) | In 2012, 10% of natural gas was delivered to a pipeline that ships to the United States (2011 – 9%; 2010 – nil). |
| | (5) | Inclusive of sulphur revenue and miscellaneous income. |
24
PIPELINE CAPACITY
Pipeline capacity is an important consideration and may significantly impact the oil and natural gas industry if a considerable imbalance exists between pipeline capacity and export nominations. If there is a significant shortfall of export capacity, it will result in oil and gas being unable to get to market which will result in discounted pricing and/or shut-in production. Conversely, if the basin has a significant amount of excess export capacity it can make transportation more expensive, which will also have a negative effect to the netback.
COMPETITIVE CONDITIONS, SEASONALITY, AND TRENDS
Competitive conditions are included in the description of Harvest’s risk factors in Item 3D of this annual report. The exploitation and development of petroleum and natural gas reserves is dependent on physical access to production areas. Seasonal weather conditions, including freeze-up and break-up, affect such access. The seasonal accessibility increases competition for equipment and human resources during those periods.
ENVIRONMENT, HEALTH AND SAFETY (“EH&S”) POLICIES AND PRACTICES
Harvest commits to conducting its operations in a manner that protects the health and safety of employees, contractors and the public, and minimizing environmental impact. Harvest’s EH&S policy is designed with a primary objective to comply with industry regulatory requirements. There are various components in the EH&S policies, with the core environmental components focused on prevention, remediation and reclamation of environmental impact to land, water and air. See “Environmental Regulation” section of this annual report for discussion of specific regulatory requirement.
Harvest takes an active role in the Canadian Association of Petroleum Producers (“CAPP”) Responsible Canadian Energy (“RCE”) program. The RCE is an association-wide performance reporting program designed to track progress of the CAPP membership in environmental, health, safety, and social performance. In particular, it is a commitment by Harvest to continuously improve on parameters such as reducing injuries, decreasing air emissions, re-using and recycling of water, and minimizing our environmental footprint and impact on the land. Harvest, in comparison to other upstream producers are below industry average on Total Recordable Injury Frequency, NOx and SOx emissions, and gas venting per BOE produced. Harvest is working towards improving the Corporation’s performance on water usage and decreasing our spill frequency for 2013. These improvement efforts are not expected to materially impact Harvest’s operations or operating results.
The majority of Harvest environmental expenditures relate to site remediation and asset retirement from its land use. In 2012, Harvest spent $20.4 million on the management and retirement of environmental obligations which included retirement of wells and facilities, restoration of spill sites, remediation of sites with historical contamination, and the reclamation of abandoned well sites and access roads. In 2012, Harvest had 310 active (operated) reclamation sites with 30 of these sites being submitted to regulators for reclamation certification. In addition, Harvest completed 57 surface well abandonments which will add to the number of active reclamation sites in 2013. Efforts towards other aspects of environmental protection and controls, such as water usage, waste management, air monitoring and emission reporting are not material.
In 2012, Harvest continued to take steps to build on its existing EH&S management systems using the RCE framework for continuous improvement. This included formalizing the environment and regulatory components of the EH&S management system. It is expected that in 2013 all components of the environment and regulatory portions of the EH&S management system will be formalized which will improve overall environmental performance. The costs associated with this initiative are not expected to be material.
In 2012, the health and safety program at Harvest had undergone and successfully completed a Certificate of Recognition (COR) audit that was conducted by a third party auditor in accordance with the Alberta Government’s COR program. As a result Harvest has been awarded and will be receiving a Certificate of Recognition endorsement and certification from Alberta Occupational Health and Safety. Finally, emergency response plans underwent the required annual review which included revising critical information within the plans and the ongoing training to key response personnel at Harvest.
Harvest met all regulatory compliance obligations in 2012 including the submission of the annual National Pollutant Release Inventory, the BC Greenhouse Gas Inventory, the annual Facility Approval summary reports, the inventory of all benzene emissions from Glycol Dehydrators, the annual Caribou Protection Plans and completion of all Indian and Oil and Gas required environmental audits. In addition, Harvest continued to be diligent with its Fugitive Emission Management Program, with leak detection testing conducted at all required facilities. All repairable emission sources detected were repaired representing a reduction in GHG emissions and savings in fuel gas usage. Harvest has incurred immaterial compliance costs associated with these various programs and regulations.
25
CONTROLS AND REGULATIONS
The petroleum and natural gas exploration and production industry is subject to extensive controls and regulations governing its operations (including land tenure, exploration, development, production, emissions, transportation and marketing) imposed by legislation enacted by various levels of government and with respect to pricing and taxation of petroleum and natural gas by agreements among the governments of Canada, Alberta, British Columbia and Saskatchewan. It is not expected that any of these controls or regulations will affect Harvest's operations in a manner materially different than they would affect other petroleum and natural gas entities of similar size. All current legislation is a matter of public record and Harvest is unable to predict what additional legislation or amendments may be enacted. Outlined below are some of the principal aspects of legislation, regulations and agreements governing the petroleum and natural gas industry.
Pricing and Marketing – Petroleum, Natural Gas and Associated Products
In the provinces of Alberta, British Columbia and Saskatchewan, petroleum, natural gas and associated products are generally sold at market index based prices. It is common to sell on an index, which is published on a daily and/or monthly basis. These indices are generated from calculations that consider volume-weighted-industry-reported purchase and sales transactions. They are generated at various sales points and are reflective of the current value of the specific commodity, adjusted for quality and location differentials. While these indices tend to directionally track benchmark prices (i.e. WTI crude oil at Cushing, Oklahoma or natural gas at Henry Hub, Louisiana), some variances can occur due to specific market imbalances. These relationships to industry reference prices can change on a monthly or daily basis depending on the supply-demand fundamentals at each location as well as other non-related market changes such as the value of the Canadian dollar.
Although the market ultimately determines the price of crude oil and natural gas, producers are entitled to negotiate sales contracts directly with purchasers. Crude oil prices are primarily based on worldwide supply and demand. The specific price depends in part on quality, prices of competing fuels, distance to market, the value of refined products, the supply/demand balance and other contractual terms. Crude oil exporters are also entitled to enter into export contracts with terms not exceeding one year in the case of light crude oil and two years in the case of heavy crude oil, provided that an order approving such exports has been obtained from the National Energy Board of Canada (the "NEB"). Any crude oil export to be made pursuant to a contract of longer duration (to a maximum of 25 years) requires an exporter to obtain an export license from the NEB and the issuance of such license requires the approval of the Governor in Council.
Natural gas exported from Canada is subject to regulation by the NEB and the Government of Canada. Exporters are free to negotiate prices and other terms with purchasers, provided that the export contracts must continue to meet certain other criteria prescribed by the NEB and the Government of Canada. Natural gas exports for a term of less than 2 years or for a term of 2 to 20 years (in quantities of not more than 30,000 cubic meters per day) must be made pursuant to an NEB order. Any natural gas export to be made pursuant to a contract of longer duration (to a maximum of 25 years) or a larger quantity requires an exporter to obtain an export license from the NEB and the issuance of such license requires the approval of the Governor in Council.
The governments of Alberta, British Columbia and Saskatchewan also regulate the volume of natural gas that may be removed from those provinces for consumption elsewhere based on such factors as reserve availability, transportation arrangements and market considerations.
Provincial Royalties and Incentives
In addition to federal regulation, each province has legislation and regulations which govern land tenure, royalties, production rates, environmental protection and other matters. The royalty regime is a significant factor in the profitability of crude oil, natural gas liquids, sulphur and natural gas production. Royalties payable on production from lands other than Crown lands are determined by negotiations between the mineral owner and the lessee, although production from such lands is also subject to certain provincial taxes and royalties. Crown royalties are determined by governmental regulation and are generally calculated as a percentage of the value of the gross production. The rate of royalties payable generally depends in part on prescribed reference prices, well productivity, geographical location, field discovery date, method of recovery and the type or quality of the petroleum product produced. Other royalties and royalty-like interests are from time to time carved out of the Working Interest owner's interest through non-public transactions. These are often referred to as overriding royalties, gross overriding royalties, net profits interests or net carried interests.
26
From time to time, the federal and provincial governments in Canada have established incentive programs which have included royalty rate reductions (including for specific wells), royalty holidays and tax credits for the purpose of encouraging oil and natural gas exploration or enhanced planning projects. However, the trend in recent years has been to eliminate these types of programs in favour of long-term programs which enhance predictability for producers. If applicable, oil and natural gas royalty holidays and reductions would reduce the amount of Crown royalties paid by oil and gas producers to the provincial governments.
Alberta
The Government of Alberta (the “Government”) implemented its New Royalty Framework (the “NRF”) effective January 1, 2009. Royalty rates for conventional oil and natural gas under the NRF are determined based on a sliding scale incorporating separate variables to account for production volumes and market prices. Effective January 1, 2011, the maximum royalty payable was set at 40% for conventional oil and 36% for natural gas. Oil sands base royalty rates start at 1%, of gross revenue, and increase for every dollar when oil is priced above $55 per barrel to a maximum of 9% when oil prices reach Cdn$120per barrel. Once the oil sands project has recovered specified allowed costs, the royalty rate will range from 25% to 40% of net operating income. The NRF has retained the Natural Gas Deep Drilling Program and the Deep Oil Exploration Program, which are five year programs, both of which commenced in 2008, with the intention to encourage the development of deeper, higher cost oil and gas reserves by offering royalty relief or credits to qualifying wells.
In November 2008, the Government announced the introduction of a five year program, the Transitional Royalty Plan (the “TRP”), which offers companies drilling new natural gas or conventional deep oil wells (between 1,000 and 3,500 meters) a one-time option, on a well-by-well basis, to reduced royalty rates for new wells for a maximum period of five years to December 31, 2013 after which all wells convert to the NRF. To qualify for this program, wells must be drilled between November 19, 2008 and December 31, 2013. This program was amended on May 27, 2010 such that no new wells will be allowed to select transitional royalty rates effective January 1, 2011 and wells that have selected the transitional royalty rates will have the option to switch to the new rates effective January 1, 2011.
On March 17, 2011, the Government approved the New Well Royalty Regulation providing the permanent implementation of a formerly temporary royalty program which provides for a maximum 5% royalty rate for eligible new wells for the first 12 production months or until the regulated volume cap is reached. In addition, the Government implemented certain initiatives intended to stimulate investment in emerging resources and technologies. In particular, the Government implemented the Horizontal Oil and Gas New Well Royalty Rates, retroactive to wells that commence drilling on or after May 1, 2010, to provide upfront royalty adjustments to new horizontal wells. Qualifying oil wells will receive a maximum royalty rate of 5 percent for all products with volume and production month limits set according to the depth of the well. Qualifying gas wells will also receive a maximum royalty rate of 5 percent for all products for 18 producing months, with a volume limit of 500 million cubic feet of gas equivalent production.
The Alberta Government is also in the process of re-vamping its regulatory framework developing a single regulatory body. This body will encompass responsibilities that are currently divided between Alberta Environment (“AENV”), Alberta Sustainable Resources Development (“SRD”) and the Energy Resources Conservation Board (“ERCB”). There will be changes in the process for Crown applications starting June 1, 2013. Final changes in the regulatory process will cause companies to apply for applications in one Department commonly referred to as the “Super Board” and is planned for June 1, 2014.
Saskatchewan
In Saskatchewan, the amount payable as a Crown royalty or freehold production tax in respect of crude oil depends on the type, value, quantity produced in a month and vintage. Crude oil type classifications are “heavy oil”, “southwest designated oil” or “non-heavy oil other than southwest designated oil”. Vintage categories applicable to each of the three crude oil types are old, new, third tier and fourth tier. Crude oil rates are also price sensitive and vary between the base royalty rates of 5% for all fourth tier oil to 20% for old oil. Marginal royalty rates, applied to the portion of the price that is above the base price, are 30% for all fourth tier oil to 45% for old oil.
27
The royalty payable on natural gas is determined by a sliding scale based on the vintage of the gas, type of gas production, quantity of gas produced in a month, and the provincial average gas price for the month. As an incentive for the marketing of natural gas produced in association with oil, a lower royalty rate is assessed than the royalty payable on non-associated natural gas. The rates and vintage categories of natural gas are similar to oil.
On May 27, 2010, the Government of Saskatchewan announced an incentive to encourage increased natural gas exploration and production in the province. The volume-based incentive establishes a maximum Crown royalty rate of 2.5 per cent and a freehold production tax rate of zero per cent on the first 25 million cubic metres of natural gas produced from every horizontal gas well drilled between June 1, 2010 and March 31, 2013.
British Columbia
The British Columbia royalty regime for oil is dependent on age and production. Oil is classified as "old", "new" or "third tier" and a separate formula is used to determine the royalty rate depending on the classification. The rates are further varied depending on production. Lower royalty rates apply to low productivity wells and third tier oil to reflect the increased cost of exploration and extraction. There is no minimum royalty rate for oil.
The British Columbia natural gas royalty regime is determined by a sliding scale formula based on a reference price, which is the greater of the average net price obtained by the producer and a posted minimum price. Natural gas is classified as either "conservation gas" or "non-conservation gas". For non-conservation gas, the royalty rate is dependent on the date on which title was acquired from the Crown and on the date on which the well was drilled and may also be impacted by the select price, a parameter used in the royalty rate formula to account for inflation. The base royalty rate for non-conservation gas ranges from 9% to 15%. A lower base royalty rate of 8% is applied to conservation gas. However, the royalty rate may be reduced for low productivity wells.
The Government of British Columbia also maintains a number of royalty programs such as the Summer Royalty Credit Program, Deep Royalty Credit Program, Net Profit Royalty Program, and the Infrastructure Royalty Credit Program. These programs offer either royalty credit or royalty reduction and are intended to stimulate development of British Columbia’s natural gas low productivity wells.
Land Tenure
Crude oil and natural gas located in western Canada is owned predominantly by the respective provincial governments. Provincial governments grant rights to explore for and produce oil and natural gas pursuant to leases, licences and permits for varying terms and on conditions set forth in provincial legislation including requirements to perform specific work or make payments. Oil and natural gas located in such provinces can also be privately owned and rights to explore for and produce such oil and natural gas are granted by lease on such terms and conditions as may be negotiated.
BLACKGOLD
The BlackGold segment focuses on the exploration, development and ultimately the production of in-situ oil sands located near Conklin, Alberta. BlackGold uses SAGD technology that utilizes horizontal drilling and thermal stimulation to maximize energy efficiency and minimized land disturbance. Phase 1 of the project is anticipated to produce 10,000 bbl/day with first oil expected in 2014. The scope of Phase 1 includes the drilling of 77 SAGD injector-producer well pairs and the construction of a central processing facility. Phase 2 of the project is targeted to expand processing capacity and increase output to 30,000 bbl/d and is currently pending regulatory approval.
BlackGold has now completed drilling of the initial 15 SAGD well pairs. Construction of the central processing facilities is well underway, where 83% of the engineering and procurement work and 43% of the construction work were complete at the end of 2012. For annual capital expenditures over the last three fiscal years, refer to Item 4A “History and Development of the Company”. Commissioning is targeted for the first half of 2014. Steam injection and thermal stimulation will typically take several months before production begins. In 2013, BlackGold will focus on the completion of the EPC work, including module fabrication, material and module transportation, construction of various infrastructures, installation of electrical, piping and piling components, preparing for commissioning and recruiting for operations team.
28
On May 30, 2012, Harvest amended certain aspects of its BlackGold oil sands project EPC contract, including revising the compensation terms from a lump sum price to a cost reimbursable price and conferring greater Harvest control over project execution. The cost pressures and resultant contract changes are expected to increase the net EPC costs to approximately $520 million from $311 million, after allowing for certain costs which are not reimbursable to the EPC contractor. Harvest and the EPC contractor also agreed to apply the cumulative progress payments made under the lump sum contract and the remaining deposit of $24.4 million as at May 30, 2012 towards costs incurred to date. Under the amended EPC contract, a maximum of approximately $101 million of the EPC costs will be paid in equal installments, without interest, over 10 years commencing on the completion of the EPC work in 2014. See Item 3D “Risk Factors” for detail discussion on the uncertainties around the project development costs and timing.
BlackGold operates in the same business environment as Harvest’s Upstream segment, please see Item 4B “Business Overview – Upstream” for details regarding pipelines, competitive conditions, EH&S and controls and regulations.
RESERVES AND OTHER OIL AND GAS INFORMATION
Harvest retained qualified Independent Reserves Evaluators to evaluate and prepare reports on 100% of Harvest’s crude oil and natural gas proved and 100% of Harvest’s crude oil and natural gas probable reserves as of December 31, 2012. Harvest’s reserves were evaluated by McDaniel (who evaluated approximately 22% of Harvest’s total proved reserves and 9% of Harvest’s total probable reserves), and GLJ (who evaluated approximately 78% of Harvest’s total proved reserves and 91% of Harvest’s total probable reserves). All of Harvest’s reserves were evaluated using the cost assumptions as at December 31, 2012 and the average first-day-of-the-month prices for the period ended December 31, 2012. All of Harvest’s reserves are in Canada and, specifically, in the provinces of Alberta, British Columbia and Saskatchewan. See Exhibit 15.1 and Exhibit 15.2 of this annual report for Independent Reserve Evaluators’ reports on evaluation methodology.
Disclosure provided herein in respect of boes may be misleading, particularly if used in isolation. A boe conversion ratio of 6 Mcf:1 bbl is based on an energy equivalency conversion method primarily applicable at the burner tip and does not represent a value equivalency at the wellhead.
Description of Harvest’s Internal Controls Used in Reserve Estimation
The key technical person primarily responsible for overseeing the preparation of the year-end reserves evaluation is the Vice President (“VP”), Engineering, Doug Walker who has been with Harvest since August 2010. Mr. Walker has a degree in Chemical Engineering from the University of Calgary and is a registered Professional Engineer with APEGA. He has over 30 years of technical and business experience in operations, production, facilities, completions, drilling, reservoir engineering, business development and frontier projects. The VP, Engineering reports to the Deputy Chief Operating Officer (“Deputy COO”), Yongseok Kim, who is ultimately responsible for Harvest’s reserve estimates.
Independent Reserves Evaluators are selected and appointed by the Upstream Reserves, Safety and Environment Committee (“Reserves Committee”), with assistance from the VP, Engineering. Each evaluator’s qualifications, industry experience and experience with Harvest’s assets are reviewed to enable the Reserves Committee to approve the selection of Independent Reserves Evaluator(s). In 2012, two Independent Reserves Evaluators were used. The allocation of assets to be reviewed by each Independent Reserves Evaluator is based on the evaluator’s expertise, information databases and past experience in evaluating the relevant properties. The allocations are reviewed by the VP, Engineering to ensure that there is no duplication of areas or gaps in reserves coverage.
For 2012, Harvest engaged GLJ and McDaniel to undertake the year-end evaluation. Harvest supplied accounting data (including production, revenue and operating costs), land data and well files for any new drills to the Independent Reserves Evaluators to ensure they had accurate and adequate data for their review process. Harvest also conducted technical review meetings on major properties to highlight activity that was undertaken through the course of the year. The Independent Reserves Evaluators use Harvest and industry data and their expertise in each area with reserves evaluation and prepared draft reserves reports for review with Harvest’s Exploitation Engineers for each property. Reports were logged by Harvest’s Reserves Coordinator to ensure accurate tracking and then forwarded to the appropriate Exploitation Engineers for detailed review. The Exploitation Engineers reviewed the draft reports to ensure all major developments in the previous year have been reflected in the report and to address any questions raised by the Independent Reserves Evaluators. This process continued until the final reports were received.
29
The VP, Engineering reviewed the final reports, ensuring that they were consistent with the previous reports and that appropriate changes (such as asset purchases or sales, revisions and drilling activities) have been made. After completing the review, the VP, Engineering presented the reports to the Deputy COO and the Reserves Committee together with a memo highlighting the significant changes from the prior year, including a reconciliation to gain an understanding of the additions, deletions and revisions made since the previous report. This memo was reviewed in detail by the VP, Engineering with the Reserves Committee to describe the key properties and major changes from the previous year. Significant differences between management and the Independent Reserves Evaluators, if any, were also discussed in this review.
A due diligence checklist was used by the Reserves Committee in reviewing the process to ensure comfort over the use of definitions, independence and qualifications. In addition, the Independent Reserves Evaluators attest to the Reserves Committee that the Reserves Report satisfied the NI 51-101 and SEC requirements, that the Independent Reserve Evaluators made their own independent assessments and that they were not pressured into any of their results or conclusions.
Net Reserves (Harvest’s Share after Royalties)
The following table sets forth a summary of oil and natural gas reserves prepared by Harvest using constant pricing in accordance with the SEC’s guidelines as of December 31, 2012. The year-end numbers represent estimates derived from the Reserve Reports. The recovery and reserve estimates of Harvest’s crude oil, natural gas liquids and natural gas reserves provided herein are estimates only and there is no guarantee that the estimated reserves will be recovered. Actual crude oil, natural gas and natural gas liquid reserves may be greater than or less than the estimates provided herein. Refer to Item 3D “Risk Factors” of this annual report for discussion on the uncertainties involved in estimating our reserves.
The crude oil, natural gas liquids and natural gas reserve estimates presented are based on the definitions provided in the SEC’s regulations. A summary of these definitions are set forth below:
| | (a) | Net reservesare the remaining reserves of Harvest, after deduction of estimated royalties and including royalty interests. |
| | | |
| | (b) | Proved reservesare the estimated quantities of crude oil, natural gas and NGLs which geological and engineering data demonstrate with reasonable certainty to be recoverable in future years from known reservoirs under existing economic and operating conditions, i.e., prices and costs as of the date the estimate is made. If deterministic methods are used, reasonable certainty means a high degree of confidence that the quantities will be recovered. If probabilistic methods are used, there should be at least a 90% probability that the quantities actually recovered will equal or exceed the estimate. |
| | | |
| | (c) | Probable reservesestimates are provided as optional disclosure under the SEC regulations. Probable reserves are those additional reserves that are less certain to be recovered than proved, however, together with proved are as likely as not to be recovered. When deterministic methods are used, it is as likely as not that actual remaining quantities recovered will exceed the sum of estimated proved plus probable reserves. When probabilistic methods are used, there should be at least a 50% probability that the actual quantities recovered will equal or exceed the proved plus probable reserves estimates. |
Each of the reserve categories (proved and probable) may be divided into developed and undeveloped categories:
| | (a) | Developedreserves are reserves that can be expected to be recovered through existing wells with existing equipment and operating methods. |
| | | |
| | (b) | Undevelopedreserves are reserves that are expected to be recovered from new wells on undrilled acreage, or from existing wells where a relatively major expenditure is required for recompletion. |
Estimates of total net proved crude oil or natural gas reserves are not filed with any U.S. federal authority or agency other than the SEC.
30
| | | Reserves | |
| | | | | | | | | | | | | | | | | | | |
| | | Light and Medium Oil | | | Heavy Oil | | | Bitumen | |
| | | Gross | | | Net | | | Gross | | | Net | | | Gross | | | Net | |
| | | (MMbbls) | | | (MMbbls) | | | (MMbbls) | | | (MMbbls) | | | (MMbbls) | | | (MMbbls) | |
| | | | | | | | | | | | | | | | | | | |
| Proved | | | | | | | | | | | | | | | | | | |
| Developed producing | | 34.2 | | | 30.6 | | | 41.5 | | | 37.6 | | | - | | | - | |
| Developed non-producing | | 2.0 | | | 1.7 | | | 1.3 | | | 1.1 | | | - | | | - | |
| Undeveloped | | 2.4 | | | 2.2 | | | 7.2 | | | 5.9 | | | 94.0 | | | 84.9 | |
| | | 38.6 | | | 34.5 | | | 50.0 | | | 44.6 | | | 94.0 | | | 84.9 | |
| | | | | | | | | | | | | | | | | | | |
| Probable | | | | | | | | | | | | | | | | | | |
| Developed | | 9.6 | | | 8.5 | | | 13.9 | | | 12.4 | | | - | | | - | |
| Undeveloped | | 9.7 | | | 8.6 | | | 8.8 | | | 7.3 | | | 165.1 | | | 137.8 | |
| Total probable | | 19.3 | | | 17.1 | | | 22.7 | | | 19.7 | | | 165.1 | | | 137.8 | |
| | | Reserves | |
| | | Natural Gas | | | Natural Gas Liquids | | | Total Oil Equivalent | |
| | | Gross | | | Net | | | Gross | | | Net | | | Gross | | | Net | |
| | | (Bcf) | | | (Bcf) | | | (MMbbls) | | | (MMbbls) | | | (MMboe) | | | (MMboe) | |
| | | | | | | | | | | | | | | | | | | |
| Proved | | | | | | | | | | | | | | | | | | |
| Developed producing | | 176.3 | | | 160.9 | | | 9.5 | | | 7.1 | | | 114.6 | | | 102.0 | |
| Developed non-producing | | 8.5 | | | 8.0 | | | 0.3 | | | 0.2 | | | 5.0 | | | 4.3 | |
| Undeveloped | | 46.6 | | | 43.8 | | | 2.6 | | | 2.2 | | | 114.0 | | | 102.5 | |
| Total proved | | 231.4 | | | 212.7 | | | 12.4 | | | 9.5 | | | 233.6 | | | 208.8 | |
| | | | | | | | | | | | | | | | | | | |
| Probable | | | | | | | | | | | | | | | | | | |
| Developed | | 61.6 | | | 56.0 | | | 3.2 | | | 2.4 | | | 37.0 | | | 32.6 | |
| Undeveloped | | 65.5 | | | 59.9 | | | 5.3 | | | 4.1 | | | 199.8 | | | 167.7 | |
| Total probable | | 127.1 | | | 115.9 | | | 8.5 | | | 6.5 | | | 236.9 | | | 200.3 | |
Undeveloped Reserves
As at December 31, 2012, Harvest has a total of 119.0 MMboe of gross reserves that are classified as proved non-producing, and of these non-producing reserves approximately 96% are undeveloped reserves. The balance are developed non-producing reserves which would be wells that are not currently producing and are eligible to be brought on production given economics and production information as at December 31, 2012. Substantially all of the undeveloped reserves are based on Harvest’s then current 2013 budget and long range development plans for the major assets noted elsewhere in this document.
Conventional
Approximately 18% of Harvest’s proved undeveloped reserves relate to the conventional oil and gas reserves. Of the conventional undeveloped reserves, approximately 37% are expected to be developed within the next two years. The remaining conventional undeveloped reserves are expected be developed within the next five years.
During 2012, Harvest drilled a gross total of 116 wells (100.9 net) with the vast majority of the development taking place in the following areas: Hay River, East Central Alberta and West Central Saskatchewan (heavy oil prospects), Red Earth, Kindersley, SE Saskatchewan and West Alberta. The bulk of the wells drilled had been previously assigned proved undeveloped (PUD) reserves and therefore these reserves were converted to proved developed. Total PUD reserves converted during 2012 were gross 6.0 MMboe (2011 – 11.1 MMboe; 2010 – 4.6 MMboe) with related capital expenditures of approximately $213 million. This translates to a conversion rate of approximately 24% of the conventional oil and gas PUD reserves that existed at the end of 2011 (2011 – 58%; 2010 – 28%).
31
New PUD reserves were also assigned during the 2012 year-end evaluation recognizing the ongoing development of Harvest’s properties. Total gross PUD reserves added for the 2012 year-end evaluation were 3.8 MMboe.
There are no material amounts of conventional oil and gas PUD reserves that have remained undeveloped for five years or more after their initial disclosure as proved undeveloped reserves.
BlackGold Bitumen
Approximately 82% of Harvest’s proved undeveloped reserves are located on Harvest’s BlackGold oil sands property. At the end of 2012, Harvest’s BlackGold oil sands project had gross proved undeveloped bitumen reserves of 94.0 MMboe. The evaluation of these reserves anticipates they will be recovered using SAGD technologies over the next 25 years. As at December 31, 2012, 15 initial well pairs have been drilled with related capital expenditures of approximately $56.6 million. BlackGold’s well pair completion program is currently underway and expected to be complete by end of 2013. First steam is expected in 2014 upon the completion of the central processing facility, followed by bitumen production a few months afterwards.
The BlackGold project requires the construction of steam generation, gathering systems and central processing facilities that service and support SAGD well pairs. The central processing facility is designed for 25 years of useful life (with up to approximately 35 to 40 years of useful life based on adequate maintenance) while the SAGD well pairs are designed to have individual useful lives of 7 – 13 years on a declining production basis. Therefore, to build a central facility that would process the entire field simultaneously would be neither economic nor environmentally efficient. Due to the high capital and operating costs associated with SAGD development and production, greater economic value and environmental efficiency are achieved by building a central facility with optimal capacity that provides for a set of SAGD well pairs to be drilled and produced over the life of the central processing facility. As the central processing facility has a long life relative to SAGD well pairs, in the early stages of a SAGD project, only a small portion of proved reserves will be developed as the number of well pairs drilled will be limited by the available steam and processing capacity. Once the initial 15 well pairs start producing in 2014, the first 30 MMboe of proved undeveloped reserves are expected to convert to proved developed reserves. The remaining PUD reserves will convert to proved developed reserves as Harvest drill additional SAGD wells to offset declines from the initial 15 wells. The specific timing of the conversion of those remaining PUD reserves from undeveloped to developed after SAGD start-up will depend on when the well pair targeting those reserves is scheduled for drilling during the life of the central processing facility and steam generator. Development of the proved undeveloped reserves will take place in an orderly manner as additional well pairs are drilled to utilize the available steam and processing capacity when the SAGD reservoir of the initial well pairs is gradually depleted.
Harvest has delineated BlackGold bitumen reserves to a high degree of certainty through seismic data and core hole drilling, consistent with COGE Handbook guidelines. In most cases, proved reserves have been drilled to a density of 16 wells per section, which is in excess of the eight wells per section required for regulatory approval. In order to determine the economic cut-offs of undeveloped reserves, geological information is tested against existing production analogues that use SAGD process. Recognition of probable reserves requires sufficient drilling of stratigraphic wells to establish reservoir suitability for SAGD. Reserves will be classified as probable if the number of wells drilled falls between the stratigraphic well requirements for proved reserves and for probable reserves, or if the reserves are not located within an approved development plan area. The Independent Reserve Evaluator’s standard for probable reserves is a minimum of four to eight stratigraphic wells per section, depending on the depositional environment. If reserves lie outside the approved development area, approval to include those reserves in the development plan area must be obtained before reserves can be classified as proved.
Production Volumes
| | | Production Volumes — 2012 | |
| | | Year | | | Q4 | | | Q3 | | | Q2 | | | Q1 | |
| | | | | | | | | | | | | | | | |
| | | | | | | | | | | | | | | | |
| Natural Gas(mcf/d) | | 122,385 | | | 119,554 | | | 120,315 | | | 125,680 | | | 124,045 | |
| | | | | | | | | | | | | | | | |
| Oil and Natural Gas Liquids(bbls/d) | | | | | | | | | | | | | | | |
| Light and Medium Oil | | 13,889 | | | 13,817 | | | 13,603 | | | 13,758 | | | 14,380 | |
| Heavy Oil | | 19,506 | | | 18,402 | | | 19,110 | | | 20,701 | | | 19,828 | |
| Natural Gas Liquids | | 5,535 | | | 6,084 | | | 4,920 | | | 5,468 | | | 5,668 | |
32
| | | Production Volumes — 2012 | |
| | | Year | | | Q4 | | | Q3 | | | Q2 | | | Q1 | |
| | | | | | | | | | | | | | | | |
| Total Oil and Natural Gas Liquids | | 38,929 | | | 38,302 | | | 37,633 | | | 39,928 | | | 39,876 | |
| Total (boe/d) | | 59,327 | | | 58,228 | | | 57,686 | | | 60,874 | | | 60,550 | |
| | | Production Volumes — 2011 | |
| | | Year | | | Q4 | | | Q3 | | | Q2 | | | Q1 | |
| | | | | | | | | | | | | | | | |
| Natural Gas(Mcf/d) | | 112,360 | | | 121,547 | | | 124,259 | | | 111,291 | | | 91,888 | |
| Oil and Natural Gas Liquids(bbls/d) | | | | | | | | | | | | | | | |
| Light and Medium Oil(1) | | 14,376 | | | 15,161 | | | 14,777 | | | 13,147 | | | 14,408 | |
| Heavy Oil(1) | | 18,996 | | | 20,466 | | | 17,669 | | | 17,706 | | | 20,153 | |
| Natural Gas Liquids | | 5,062 | | | 5,440 | | | 5,392 | | | 5,937 | | | 3,455 | |
| Total Oil and Natural Gas Liquids | | 38,434 | | | 41,067 | | | 37,838 | | | 36,790 | | | 38,016 | |
| Total (boe/d) | | 57,161 | | | 61,324 | | | 58,548 | | | 55,338 | | | 53,331 | |
| | | Production Volumes — 2010 | |
| | | Year | | | Q4 | | | Q3 | | | Q2 | | | Q1 | |
| | | | | | | | | | | | | | | | |
| Natural Gas(Mcf/d) | | 80,881 | | | 82,837 | | | 79,147 | | | 79,797 | | | 81,752 | |
| Oil and Natural Gas Liquids(bbls/d) | | | | | | | | | | | | | | | |
| Light and Medium Oil(1) | | 12,319 | | | 13,533 | | | 11,515 | | | 12,382 | | | 11,835 | |
| Heavy Oil(1) | | 21,011 | | | 19,979 | | | 20,606 | | | 21,582 | | | 21,902 | |
| Natural Gas Liquids | | 2,587 | | | 2,736 | | | 2,465 | | | 2,334 | | | 2,816 | |
| Total Oil and Natural Gas Liquids | | 35,917 | | | 36,248 | | | 34,586 | | | 36,298 | | | 36,553 | |
| Total (boe/d) | | 49,397 | | | 50,054 | | | 47,777 | | | 49,597 | | | 50,178 | |
Per-Unit Results
| | | Per-Unit Results — 2012 | |
| | | Year | | | Q4 | | | Q3 | | | Q2 | | | Q1 | |
| Natural Gas ($/boe) | | | | | | | | | | | | | | | |
| Average sales price(2) | | 15.50 | | | 20.65 | | | 15.09 | | | 12.68 | | | 13.75 | |
| Royalties | | 0.99 | | | 1.07 | | | 0.63 | | | 0.47 | | | 1.74 | |
| Operating expenses | | 11.68 | | | 9.34 | | | 12.52 | | | 11.98 | | | 12.89 | |
| Netback(3) | | 2.83 | | | 10.24 | | | 1.94 | | | 0.23 | | | (0.88 | ) |
| Crude Oil — Light and Medium ($/bbl) | | | | | | | | | | | | | | | |
| Average sales price(2) | | 80.17 | | | 76.42 | | | 78.72 | | | 78.68 | | | 86.62 | |
| Royalties | | 11.36 | | | 10.17 | | | 11.28 | | | 12.80 | | | 13.05 | |
| Operating expenses | | 21.97 | | | 18.14 | | | 25.71 | | | 23.74 | | | 24.26 | |
| Netback(3) | | 46.84 | | | 48.11 | | | 41.73 | | | 42.14 | | | 49.31 | |
| Crude Oil — Heavy ($/bbl) | | | | | | | | | | | | | | | |
| Average sales price | | 71.35 | | | 67.66 | | | 69.57 | | | 69.33 | | | 78.64 | |
| Royalties | | 11.93 | | | 10.18 | | | 11.98 | | | 11.43 | | | 14.07 | |
| Operating expenses | | 19.16 | | | 19.06 | | | 19.62 | | | 17.20 | | | 20.86 | |
| Netback(3) | | 40.26 | | | 38.42 | | | 37.97 | | | 40.70 | | | 43.71 | |
| Crude Oil — Total ($/bbl) | | | | | | | | | | | | | | | |
| Average sales price(2) | | 75.01 | | | 71.42 | | | 70.76 | | | 70.55 | | | 81.99 | |
| Royalties | | 11.69 | | | 10.17 | | | 11.31 | | | 11.57 | | | 13.64 | |
| Operating expenses | | 20.33 | | | 18.67 | | | 21.30 | | | 19.05 | | | 22.29 | |
| Netback(3) | | 42.99 | | | 42.58 | | | 38.15 | | | 39.93 | | | 46.06 | |
| Natural Gas Liquids ($/bbl) | | | | | | | | | | | | | | | |
| Average sales price | | 56.54 | | | 53.06 | | | 53.01 | | | 56.77 | | | 63.20 | |
| Royalties | | 7.04 | | | 6.36 | | | 3.08 | | | 3.48 | | | 14.69 | |
33
| | | Per-Unit Results — 2012 | |
| | | Year | | | Q4 | | | Q3 | | | Q2 | | | Q1 | |
| Operating expenses | | 11.52 | | | 8.68 | | | 12.97 | | | 11.98 | | | 12.69 | |
| Netback(3) | | 37.98 | | | 38.02 | | | 36.96 | | | 41.31 | | | 35.82 | |
| Total ($/boe) | | | | | | | | | | | | | | | |
| Average sales price(2) | | 53.60 | | | 52.82 | | | 52.02 | | | 51.42 | | | 58.07 | |
| Royalties | | 7.58 | | | 6.66 | | | 6.92 | | | 7.00 | | | 9.69 | |
| Operating expenses | | 16.54 | | | 14.45 | | | 17.55 | | | 15.98 | | | 18.14 | |
| Netback(3) | | 29.48 | | | 31.71 | | | 27.55 | | | 28.44 | | | 30.24 | |
| | | Per-Unit Results — 2011 | |
| | | Year | | | Q4 | | | Q3 | | | Q2 | | | Q1 | |
| Natural Gas ($/boe) | | | | | | | | | | | | | | | |
| Average sales price(2) | | 22.96 | | | 20.51 | | | 23.79 | | | 24.71 | | | 22.98 | |
| Royalties | | 2.05 | | | 2.22 | | | 1.76 | | | 3.76 | | | 0.12 | |
| Operating expenses | | 11.66 | | | 12.01 | | | 10.99 | | | 11.27 | | | 12.57 | |
| Netback(3) | | 9.25 | | | 6.28 | | | 11.04 | | | 9.68 | | | 10.29 | |
| Crude Oil — Light and Medium(1)($/bbl) | | | | | | | | | | | | | | | |
| Average sales price(2) | | 88.37 | | | 92.01 | | | 84.49 | | | 96.54 | | | 81.00 | |
| Royalties | | 13.72 | | | 14.69 | | | 15.95 | | | 13.80 | | | 10.29 | |
| Operating expenses | | 22.28 | | | 22.85 | | | 21.90 | | | 23.68 | | | 20.80 | |
| Netback(3) | | 52.37 | | | 54.47 | | | 46.64 | | | 59.06 | | | 49.91 | |
| Crude Oil — Heavy(1)($/bbl) | | | | | | | | | | | | | | | |
| Average sales price | | 76.07 | | | 83.40 | | | 68.25 | | | 82.96 | | | 69.34 | |
| Royalties | | 12.07 | | | 12.69 | | | 10.24 | | | 14.13 | | | 11.22 | |
| Operating expenses | | 19.41 | | | 19.20 | | | 19.16 | | | 17.84 | | | 21.22 | |
| Netback(3) | | 44.59 | | | 51.51 | | | 38.85 | | | 50.99 | | | 36.90 | |
| Crude Oil — Total ($/bbl) | | | | | | | | | | | | | | | |
| Average sales price(2) | | 81.37 | | | 87.06 | | | 75.65 | | | 88.74 | | | 74.20 | |
| Royalties | | 12.78 | | | 13.54 | | | 12.84 | | | 13.99 | | | 10.83 | |
| Operating expenses | | 20.65 | | | 20.76 | | | 20.41 | | | 20.33 | | | 21.05 | |
| Netback(3) | | 47.94 | | | 52.76 | | | 42.40 | | | 54.42 | | | 42.32 | |
| Natural Gas Liquids ($/bbl) | | | | | | | | | | | | | | | |
| Average sales price | | 67.92 | | | 70.14 | | | 67.51 | | | 79.87 | | | 69.32 | |
| Royalties | | 13.94 | | | 15.02 | | | 10.69 | | | 20.24 | | | 6.43 | |
| Operating expenses | | 10.44 | | | 12.01 | | | 12.60 | | | 11.51 | | | 2.60 | |
| Netback(3) | | 43.54 | | | 43.11 | | | 44.22 | | | 48.12 | | | 60.29 | |
| Total ($/boe) | | | | | | | | | | | | | | | |
| Average sales price(2) | | 62.13 | | | 64.61 | | | 57.85 | | | 66.73 | | | 59.19 | |
| Royalties | | 9.37 | | | 9.93 | | | 8.72 | | | 11.23 | | | 7.47 | |
| Operating expenses | | 16.80 | | | 17.09 | | | 16.36 | | | 16.35 | | | 17.42 | |
| Netback(3) | | 35.96 | | | 37.59 | | | 32.77 | | | 39.15 | | | 34.30 | |
| | | Per-Unit Results — 2010 | |
| | | Year | | | Q4 | | | Q3 | | | Q2 | | | Q1 | |
| Natural Gas ($/boe) | | | | | | | | | | | | | | | |
| Average sales price(2) | | 25.25 | | | 22.83 | | | 22.42 | | | 25.00 | | | 30.80 | |
| Royalties | | 2.75 | | | 1.58 | | | 0.96 | | | 1.91 | | | 6.57 | |
| Operating expenses | | 11.29 | | | 11.07 | | | 11.57 | | | 11.97 | | | 10.58 | |
| Netback(3) | | 11.20 | | | 10.18 | | | 9.89 | | | 11.11 | | | 13.65 | |
| Crude Oil — Light and Medium(1)($/bbl) | | | | | | | | | | | | | | | |
| Average sales price(2) | | 72.65 | | | 75.08 | | | 69.05 | | | 70.18 | | | 76.00 | |
| Royalties | | 8.51 | | | 9.10 | | | 8.09 | | | 10.51 | | | 6.11 | |
| Operating expenses | | 18.93 | | | 19.10 | | | 17.79 | | | 19.26 | | | 19.50 | |
| Netback(3) | | 45.22 | | | 46.88 | | | 43.17 | | | 40.42 | | | 50.39 | |
| Crude Oil — Heavy(1)($/bbl) | | | | | | | | | | | | | | | |
| Average sales price | | 65.27 | | | 65.43 | | | 62.84 | | | 62.80 | | | 69.93 | |
| Royalties | | 11.60 | | | 11.95 | | | 10.99 | | | 11.82 | | | 11.66 | |
34
| | | Per-Unit Results — 2010 | |
| | | Year | | | Q4 | | | Q3 | | | Q2 | | | Q1 | |
| Operating expenses | | 15.00 | | | 16.11 | | | 14.49 | | | 15.11 | | | 14.35 | |
| Netback(3) | | 38.67 | | | 37.36 | | | 37.36 | | | 35.88 | | | 43.92 | |
| Crude Oil — Total ($/bbl) | | | | | | | | | | | | | | | |
| Average sales price(2) | | 68.00 | | | 69.33 | | | 65.07 | | | 65.49 | | | 72.06 | |
| Royalties | | 10.46 | | | 10.80 | | | 9.95 | | | 11.34 | | | 9.71 | |
| Operating expenses | | 16.45 | | | 17.32 | | | 15.68 | | | 16.62 | | | 16.16 | |
| Netback(3) | | 41.09 | | | 41.21 | | | 39.44 | | | 37.53 | | | 46.19 | |
| Natural Gas Liquids ($/bbl) | | | | | | | | | | | | | | | |
| Average sales price | | 58.83 | | | 60.69 | | | 53.85 | | | 60.68 | | | 59.89 | |
| Royalties | | 14.79 | | | 11.09 | | | 13.83 | | | 18.02 | | | 16.61 | |
| Operating expenses | | 10.48 | | | 8.73 | | | 13.24 | | | 11.63 | | | 8.79 | |
| Netback(3) | | 33.56 | | | 40.87 | | | 26.79 | | | 31.02 | | | 34.49 | |
| Total ($/boe) | | | | | | | | | | | | | | | |
| Average sales price(2) | | 55.85 | | | 56.03 | | | 52.71 | | | 54.41 | | | 60.17 | |
| Royalties | | 8.58 | | | 8.27 | | | 7.67 | | | 9.13 | | | 9.25 | |
| Operating expenses | | 14.73 | | | 15.12 | | | 14.42 | | | 15.14 | | | 14.23 | |
| Netback(3) | | 32.54 | | | 32.64 | | | 30.62 | | | 30.14 | | | 36.69 | |
| (1) | Effective October 1, 2012, Harvest reclassified certain properties that were previously reported as light to medium oil to heavy oil as classified under NI 51-101. Prior year amounts have been restated to reflect the reclassification. The reclassification did not result in any changes to the total average sales price, royalties, operating expenses or netback. |
| (2) | Before gains or losses on commodity derivatives. |
| (3) | This is a non-GAAP measure. Please see “Non-GAAP Measures” in this annual report. Netbacks are calculated by subtracting royalties and operating expenses before gains or losses on commodity derivatives and transportation expenses. |
Drilling Activity
The following tables summarize Harvest’s gross and net interest in wells drilled for the periods indicated.
| | | 2012 | |
| | | Exploratory Wells | | | Development Wells | |
| | | Gross | | | Net | | | Gross | | | Net | |
| Oil Wells | | 6.0 | | | 4.4 | | | 105.0 | | | 95.6 | |
| Gas Wells | | 2.0 | | | 1.8 | | | 7.0 | | | 3.3 | |
| Service Wells | | - | | | - | | | 25.0 | | | 24.8 | |
| Dry Holes | | - | | | - | | | 1.0 | | | 1.0 | |
| Total Wells | | 8.0 | | | 6.2 | | | 138.0 | | | 124.7 | |
| | | 2011 | |
| | | Exploratory Wells | | | Development Wells | |
| | | Gross | | | Net | | | Gross | | | Net | |
| Oil Wells | | 15 | | | 14.0 | | | 163 | | | 145.0 | |
| Gas Wells | | 1 | | | 1.0 | | | 37 | | | 20.8 | |
| Service Wells | | 3 | | | 3.0 | | | 25 | | | 25.0 | |
| Dry Holes | | 7 | | | 5.5 | | | - | | | - | |
| Total Wells | | 26 | | | 23.5 | | | 225 | | | 190.8 | |
| | | 2010 | |
| | | Exploratory Wells | | | Development Wells | |
| | | Gross | | | Net | | | Gross | | | Net | |
| Oil Wells | | 12 | | | 10.6 | | | 139 | | | 118.1 | |
| Gas Wells | | 5 | | | 4.4 | | | 9 | | | 3.2 | |
| Service Wells | | - | | | - | | | 5 | | | 5.0 | |
| Dry Holes | | 1 | | | 0.1 | | | - | | | - | |
| Total Wells | | 18 | | | 15.1 | | | 153 | | | 126.3 | |
Present Activities
35
Conventional
At December 31, 2012, Harvest was in the process of drilling or participating in a gross total of 19 wells (18.58 net) which were part of the 2013 capital program (total 2013 capital budget of $300 million, with an oil and liquids rich gas focused drilling program of $182 million).
Of those 19 wells, one was a partner-operated (Harvest WI of 58%) Kakwa Falher liquids-rich gas well, one was a Montney oil well in Waskahigan (also known as Ante Creek), one was a Glauconite oil well in Suffield and one was a Slave Point oil well in Nipisi.
The remaining 15 wells were Bluesky oil wells and injectors at Hay. Harvest’s drilling practices at Hay involve drilling several wells from one pad and drilling all the surface portions of a pad’s wells first, before returning and drilling the remainder of the wells. This is done to achieve cost reduction benefits from grouping similar drilling activities together, which was why Harvest had 15 wells with 2012 spud dates but 2013 rig release dates, with 3 drilling rigs.
In addition to our oil and liquids-rich gas focused drilling program, Harvest is also continuing with its ongoing enhanced oil recovery projects in the large oil reservoirs at Hay River, Wainwright and Suffield.
Oil Sands
At the end of 2012 Harvest had completed the drilling operations of the 15 SAGD well pairs that form the initial drilling development of Phase 1 (10,000 bpd) of Harvest’s BlackGold oil sands project. Detailed engineering, procurement and construction of the facilities for the BlackGold oil sands project are ongoing. Several process modules are being fabricated and transported to site for civil, mechanical, electrical and instrumentation construction throughout 2013. Site construction is expected to continue throughout 2013 with start-up scheduled for 2014.
Location of Wells
The following table summarizes Harvest’s interests in producing wells and wells capable of producing as at December 31, 2012.
| | | Gas | | | Oil | | | Total(1)(2) | |
| | | Gross | | | Net | | | Gross | | | Net | | | Gross | | | Net | |
| Alberta | | 2,850 | | | 1,009 | | | 4,416 | | | 3,270 | | | 7,266 | | | 4,279 | |
| British Columbia | | 174 | | | 62 | | | 681 | | | 440 | | | 855 | | | 502 | |
| Saskatchewan | | 62 | | | 49 | | | 1,561 | | | 1,239 | | | 1,623 | | | 1,288 | |
| Total | | 3,086 | | | 1,120 | | | 6,658 | | | 4,949 | | | 9,744 | | | 6,068 | |
| (1) | Harvest has varying royalty interests in 911 natural gas wells and 436 crude oil wells which are producing or capable of producing. |
| | |
| (2) | Includes wells containing multiple completions as follows: 917 gross natural gas wells and 1,034 gross crude oil wells. |
Developed and Undeveloped Acreage
The following table summarizes Harvest’s developed, undeveloped and total landholdings as at December 31, 2012.
| | | Developed(1) | | | | | | Undeveloped(2) | | | | | | Total | | | | |
| (thousands of acres) | | Gross | | | Net | | | Gross | | | Net | | | Gross | | | Net | |
| Alberta | | 1,267 | | | 709 | | | 778 | | | 563 | | | 2,045 | | | 1,272 | |
| British Colombia | | 141 | | | 79 | | | 294 | | | 178 | | | 435 | | | 257 | |
| Saskatchewan | | 83 | | | 76 | | | 72 | | | 63 | | | 155 | | | 139 | |
| Total | | 1,491 | | | 864 | | | 1,144 | | | 804 | | | 2,635 | | | 1,668 | |
The following table summarizes Harvest’s developed and undeveloped land holdings, expiring within one year from December 31, 2012.
| | | Developed(1) | | | Undeveloped(2) | | | Total | |
| (thousands of acres) | | Gross | | | Net | | | Gross | | | Net | | | Gross | | | Net | |
| Alberta | | 19 | | | 12 | | | 74 | | | 61 | | | 93 | | | 73 | |
| British Colombia | | 5 | | | 5 | | | 55 | | | 42 | | | 60 | | | 47 | |
| Saskatchewan | | 1 | | | 1 | | | 11 | | | 11 | | | 12 | | | 12 | |
36
| | | Developed(1) | | | Undeveloped(2) | | | Total | |
| (thousands of acres) | | Gross | | | Net | | | Gross | | | Net | | | Gross | | | Net | |
| Total | | 25 | | | 180 | | | 140 | | | 114 | | | 165 | | | 132 | |
| (1) | Developed acreage is acreage assignable to productive wells; productive wells include producing wells and wells mechanically capable of producing. |
| (2) | Undeveloped acreage encompasses those leased acres on which wells have not been drilled or completed to a point that would permit the production of economic quantities of oil or gas regardless of whether such acreage contains proved reserves. Users of this information should not confuse undeveloped acreage with undrilled acreage held by production under the terms of the lease. |
Harvest’s lease holdings comprise a large portfolio of leases in western Canada (with no single lease accounting for material acreage). There are a wide range of expiry dates for Harvest’s leases with no material number of leases or material amount of acreage holdings due to expire at a particular date. Harvest conducts ongoing development activity to retain land that would otherwise expire. As a result of this activity, the actual land holdings that will expire within one year may be less than indicated above.
Delivery Commitments
Harvest does not have any material delivery commitments; commitments relating to transportation agreements have been disclosed in the “transportation agreements” under Item 5F “Tabular Disclosure of Contractual Obligations”.
DOWNSTREAM
Harvest’s Downstream business, operating under the North Atlantic trade name, is comprised of a medium gravity sour crude oil hydrocracking refinery with an 115,000 barrels per stream day nameplate capacity and a petroleum marketing business (the "Marketing Division") that is composed of five businesses. Downstream operations are predominantly located in the Province of Newfoundland and Labrador.
Refining is primarily a margin based business in which the feedstocks and the refined products are commodities. Both crude oil and refined products in each regional market react to a different set of supply/demand and transportation pressures and refiners must balance a number of competing factors in deciding what type of crude oil to process, what kind of equipment to invest in and what range of products to manufacture. As most refinery operating costs are relatively fixed, the goal is to maximize the yield of high value refined products and to minimize crude oil and other feedstock costs. The value and yield of refined products are a function of the refinery equipment and the characteristics of the crude oil feedstock, while the cost of feedstock depends on the type of crude oil. The refining industry depends on its ability to earn an acceptable rate of return in its marketplace where prices are set by international as well as local markets.
PRODUCTS AND MARKETS
Refining Business
An oil refinery is a manufacturing facility that uses crude oil and other feedstocks as raw materials and produces a variety of refined products. The actual mix of refined products from a particular refinery varies according to the refinery's processing units, the specific refining process utilized and the nature of the feedstocks. The refinery processing units generally perform one of three functions: separating different types of hydrocarbons in crude oil, converting the separated hydrocarbons into more desirable or higher value products or chemically treating the products to remove unwanted elements and components such as sulphur, nitrogen and metals. Refined products are typically differing grades of gasoline, diesel fuel, jet fuel, furnace oil and heavier fuel oil.
37
The Refinery produces high quality gasoline, ultra low sulphur diesel, jet fuel, furnace oil, and High Sulphur Fuel Oil (“HSFO”). Approximately 10-15% of North Atlantic’s refined products are sold in the Province of Newfoundland and Labrador while approximately 85%-90% is export cargos sold to MEC under the SOA (2011). Such cargos are shipped by MEC to U.S. east coast markets such as Boston, New York City and in Europe, or farther abroad, when economics justify the increased shipping charge. During 2011, North Atlantic sold the majority of its distillates, gasoline products and HSFO to Vitol pursuant to the SOA and to MEC pursuant to the SOA (2011), with the remaining products sold in Newfoundland through the petroleum marketing division. Please refer to Item 10C “Material Contracts” for further information regarding the SOA (2011). North Atlantic’s business and operating results are dependent on the SOA (2011) and the SOA partner, further discussion can be found at Item 3D “Risk Factors” of this annual report.
The following table shows the Refinery's sales by product for the years ended December 31:
| ($ millions) | | 2012 | | | 2011 | | | 2010 | |
| Gasoline products | $ | 1,529.2 | | $ | 1,055.1 | | $ | 985.7 | |
| Distillates | | 2,083.7 | | | 1,386.0 | | | 1,251.2 | |
| High sulphur fuel oil | | 1,015.8 | | | 691.4 | | | 832.0 | |
| Total sales | $ | 4,628.7 | | $ | 3,132.5 | | $ | 3,068.9 | |
The following table provides the total amount of Downstream’s export sales for the years ended December 31:
| | | 2012 | | | 2011 | | | 2010 | |
| Total export sales ($ millions)(1) | $ | 3,820.3 | | $ | 2,349.5 | | $ | 2,328.7 | |
| Export sales as a percentage of total Downstream sales | | 80% | | | 71% | | | 73% | |
(1)Export sales in 2012 consisted of approximately 60% to the U.S. market and 40% to the European market. Export sales for 2011 and 2010 were primarily to the U.S. market with only an immaterial amount exported to Europe.
FEEDSTOCK
The Refinery's crude oil and other feedstocks are waterborne cargos originating primarily from Iraq, Russia and South America. North Atlantic purchases substantially all of its refinery feedstock from MEC pursuant to the SOA (2011). Typically, there are approximately 20 days of crude oil feedstock in tankage at the Refinery to mitigate the effects of any supply disruptions. A discussion on the volatility of feedstock prices is included in Item 3D “Risk Factors” of this annual report. During the last two years, the country of origin of the feedstock has been as follows:
| | | 2012 | | | 2011 | | | 2010 | |
| | | (Mbbls) | | | (Mbbls) | | | (Mbbls) | |
| Iraq | | 33,571 | | | 20,938 | | | 21,456 | |
| South America | | 480 | | | - | | | 2,978 | |
| Russia | | 1,449 | | | 1,460 | | | 5,884 | |
| Other | | 2,328 | | | 2,438 | | | 2,176 | |
| Total Feedstock | | 37,828 | | | 24,836 | | | 32,494 | |
TRANSPORTATION
The Refinery enjoys a significant transportation advantage as a result of its ice-free, deep water docking facility and it has approximately seven million barrels of tankage, including six 575,000 barrel crude tanks. This enables the receipt of crude oil transported on very large crude carriers which typically result in significantly lower per barrel transportation charges. North Atlantic’s dock facilities are used for off-loading refinery feedstocks and for loading refined products. The dock facilities handle approximately 220 vessels each year, with North Atlantic owning and operating two tugboats to assist with berthing and unberthing tankers.
GROSS MARGIN
38
Refining gross margin is a function of the sales value of the refined products produced and the cost of crude oil and other feedstocks purchased as well as the yield of refined products from various feedstocks. North Atlantic continuously evaluates the market and relative refinery values of several different crude oils and vacuum gas oils (“VGO”) to determine the optimal feedstock mix. North Atlantic also analyzes the refining gross margin for its sales revenue relative to refined product benchmark prices and the Brent benchmark prices. With respect to feedstock costs, North Atlantic analyzes price discounts relative to the Brent benchmark prices and segregate crude oil sources by country of origin for reporting. See the Downstream risk factors included in Item 3D of this annual report for a discussion on the volatility of refining margins due to fluctuations in market prices for crude oil feedstocks and refined products.
Marketing Division
North Atlantic’s marketing division (the "Marketing Division") is headquartered in St. John's, Newfoundland and is composed of five businesses: retail gasoline (with 52 retail stations, including 39 locations branded as "North Atlantic", 9 locations branded as "Home Town" and 4 unbranded locations, and 3 commercial cardlock locations), retail heating fuels, commercial, wholesale and bunkers. Most retail locations include a convenience store which is independently operated, except for 10 branded locations, which are fully operated by North Atlantic and 2 franchise locations which are referred to as “Orange Store.” In 2012, the volume of gasoline sold at these retail locations represented a market share of approximately 24% of the Newfoundland market. The 2012 daily sales volume of North Atlantic’s marketing division averaged over 12,000 barrels of refined products, including gasoline, furnace oil, heating oil, propane, jet fuel, and bunker fuel. Customers include both wholesalers and end-users. The major competitors in the Newfoundland market are Irving Oil, Imperial Oil and Ultramar.
ENVIRONMENT, HEALTH AND SAFETY POLICIES AND PRACTICES
Downstream’s EH&S policy is to comply with, or exceed, regulations relevant to the industry and to fully cooperate with the regulatory bodies. Downstream operations have an active and comprehensive Integrated Management System to promote the integration of safety, health and environmental awareness into the Refinery and related businesses. The key components of the system are core elements applicable to most large industries, and include safety, process safety, environmental and health. It also includes a Continuous Improvement Management System that guides the development and improvement of these elements. The system has assisted in reducing the refinery injury rate. In 2012 the refinery achieved a Lost Time Injury Frequency of 0.20 compared to an Industry Achieved of 0.40, as published by Bureau of Labour Statistics 2011.
In May 2012, Downstream experienced a leak in one of the product tanks resulting in a spill of approximately 50,000 barrels of high sulphur fuel oil. The soil surrounding the tank was contaminated but the majority of the product was contained in the impounding basin. All clean-up and removal of contaminated soil has been completed and the product that was contained in the basin has been recovered. Although the Provincial Department of Environment is reviewing the events of the spill, there is no indication that a regulatory claim will be filed. As a result of the tank leak, Downstream has re-visited the tank inspection and recertification program with the intention of completing the tank recertification in order of priority based on a risk assessment of each tank. In addition, quarterly performance metrics with respect to the tank inspection program, the installation of alarms in the tank areas, and other industry best practices are all under review as part of the ongoing improvements under the EH&S program. Downstream has included tank recertification and inspection costs in its operating and capital plans. Re-prioritizing the order of tanks to be recertified may increase or accelerate the relating costs to the nearer future. Downstream cannot reasonably forecast the incremental costs, as it depends on the condition of the tanks as a portion of them could only be assessed via full inspection. Improvements to tank monitoring controls are not expected to have material effect to Downstream’s operating results.
CONTROLS AND REGULATIONS
The petroleum refining industry is subject to extensive controls and regulations governing its operations (including marine transportation, refined product specifications, emissions and marketing) imposed by legislation enacted by various levels of government all of which should be carefully considered by investors. It is not expected that any of these controls or regulations will affect the Downstream operations in a manner materially different than they would affect other petroleum refining entities of similar size. All current legislation is a matter of public record and Harvest is unable to predict what additional legislation or amendments may be enacted.
39
Pricing (Marketing Division)
Since 2001, the sales price of residential home heating fuels and automotive gasoline and diesel fuel sold for consumption within the Province of Newfoundland and Labrador is subject to regulation under the Petroleum Products Act (Newfoundland), administered by the Public Utilities Board of Newfoundland and Labrador. Under this act, the Pricing Commissioner has the authority to set the maximum wholesale and retail prices that a wholesaler and a retailer may charge and to determine the minimum and maximum mark-up between the wholesale price to the retailer and the retail price to the consumer in the Province of Newfoundland and Labrador. The wholesale and retail prices of petroleum products are adjusted weekly based on the New York Harbour benchmark price for these products.
ENVIRONMENTAL REGULATION
The oil and natural gas industry is subject to environmental regulations pursuant to a variety of provincial and federal legislation. Such legislation provides for restrictions and prohibitions on the release or emission of various substances produced in association with certain oil and gas industry operations. Environmental assessments and approvals are required before initiating most new larger projects or changes to existing operations. In addition, such legislation requires that well and facility sites are abandoned and reclaimed to the satisfaction of provincial authorities, and in most instances, any liability associated with the sites remains with the company. Compliance with such legislation can require significant expenditures and a breach of such requirements may result in suspension or revocation of necessary licenses and authorizations, civil liability for pollution damage and the imposition of material fines and penalties. It is expected that future changes to environmental regulations, including air pollutants and GHG, water usage and land use planning, will impose further requirements on companies operating in the energy industry. As such, Harvest expects that its future capital and operating costs for environmental protection and controls will likely increase. Harvest cannot predict the changes that could be made to environmental regulations and the resulting financial impact. Given any future regulations will be imposed to the industry as a whole, Harvest believes that any cost increases relating to environmental protection or compliance will not materially impact Harvest’s competitive position. Harvest has assessed the impact from the existing environmental laws and regulations of jurisdictions in which Harvest operates, and provides a summary on the significant ones below.
Climate Change
Federal
In December 2011, the Canadian Federal government announced that it would not commit to the requirements set by the Kyoto Protocol. Instead the government has endorsed the Durban Platform which sets forth a process for negotiating a new climate change treaty that would create binding commitments for all major GHG emitters. The government is hopeful that a new treaty can be reached by 2015. The impact of Canada’s withdrawal from the Kyoto Protocol is uncertain.
In March 2008, the federal government released an updated regulatory framework for air emissions entitled Turning the Corner: Regulatory Framework for Industrial Greenhouse Gas Emissions. On January 30th, 2010, the government announced a new GHG emission target to 17% below 2005 levels by 2020. This framework proposes mandatory emission intensity reduction obligations on a sector by sector basis. To date, only transportation and coal-fired electricity sector regulations have been developed. It is uncertain as to when the oil and gas industry sector targets will be developed. Harvest will continue to monitor the Federal GHG regulatory changes and will be able to determine if there is any financial impact once guidelines are established. On an ongoing basis, Harvest continues to undertake projects that reduce emission of GHGs such as evaluating the injection of carbon dioxide into oil reservoirs and the further capture of fugitive emissions in our field operations as part of our annual capital program.
Alberta
In 2007, the Government of Alberta introduced the Climate Change and Emissions Management Amendment Act which provides a framework for managing GHG emissions by reducing specified gas emissions to an amount that is equal to or less than 50% of 1990 levels by December 31, 2020. The regulations include the Specified Gas Emitter Regulations (“SGER’) and the Specified Gas Reporting Regulation (“SGRR”) which imposes GHG limits and emission reporting requirements. The SGER applies to facilities in Alberta that have produced 100,000 or more tonnes of GHG emissions in 2003 or any subsequent year and requires emission intensity (i.e. quantity of GHG emissions per unit of production) reductions from intensity baselines. The SGRR imposes GHG emission reporting requirements on facilities that have GHG emissions of 50,000 tonnes or more in a year. Harvest currently does not have any facilities exceeding these thresholds. However, with the commissioning of the BlackGold SAGD facility in 2014, it is expected this facility will trigger the requirements of both the SGRR and the SGER. For new facilities, the required reduction from its baseline is phased in by annual 2% increments beginning in the fourth year of commercial operation until an annual 12% reduction requirement is reached, and once reached such 12% reduction must be maintained over time.
40
There are three methods for companies to comply with the emission intensity reduction requirements: 1) improve emission intensity at the facility; 2) purchase emission offset credits in the open market; and/or 3) purchase fund credits by contributing to the Alberta Climate Change and Emission Management Fund run by the Alberta government. Historically the cost for 1 tonne of CO2e (carbon dioxide equivalent) is set at $15/tonne. Once BlackGold is in operation, Harvest can determine the baseline emission intensity and the consequent financial compliance requirements.
British Columbia
The Province of British Columbia intends to reduce its GHG emissions to 33% below 2007 levels by 2020 and has set interim targets of 6% below 2007 levels by 2012 and 18% below 2007 levels by 2016 and, accordingly, has implemented the Greenhouse Gas Reduction Targets Act. The British Columbia Crown is obligated to report every second year on the amount of reductions achieved in the province, although there is no mechanism in place to measure compliance nor is there any consequence for failing to reach the target. A carbon tax was implemented on the purchase or use of fossil fuels within the Province of British Columbia, starting at $10/ton on July 1, 2008 and rising by $5 per year to $30/ton in 2012. Fuel sellers are required to pay a security equal to the tax payable on the final sale to end purchasers and end purchasers are required to pay the tax. Fuel sellers collect carbon tax at the time fuel is sold at retail to the end purchaser. Carbon capture and storage is required for all new coal-fired electricity generation facilities and a 0.4% levy tax has been implemented at the consumer level on electricity, natural gas, grid propane and heating oil that goes towards establishing the Innovative Clean Energy Fund. In 2012, the cost to Harvest to comply with the new Greenhouse Gas Reduction Target Act was approximately $75,000 which included the GHG inventory and third party verification as required by the regulation. It is expected this will be an annual cost to comply with this regulation, however, there may be additional costs required to meet future reduction targets which have not been yet set by the Province of British Columbia.
Saskatchewan
The Management and Reduction of Greenhouse Gases Act received Royal Assent in Saskatchewan in May, 2010, however is still waiting final proclamation. The legislation will establish a provincial plan for reducing GHG emissions to meet provincial targets. The Province has also indicated that it intends to enter into an equivalency agreement with the federal government to achieve equivalent environmental outcomes with respect to GHG compliance. Harvest will continue to monitor the GHG regulatory requirements in Saskatchewan and meet all regulatory compliance expectations.Newfoundland The Federal Renewable Fuel Regulations were published in the Canada Gazette, April 10, 2010. At that time an exemption was provided for the addition of ethanol to gasoline sold in Newfoundland and Labrador and on June 20, 2011 a further exemption was provided for the requirements for renewable content in diesel fuel and heating distillate oil sold in Newfoundland and Labrador. These exemptions benefit our Downstream operations by providing relief from the Federal Renewable Fuel Regulations.
In 2011, the Government of Newfoundland and Labrador published its Climate Change Action Plan. The Province, in collaboration with the Conference of New England Governors and Eastern Canadian Premiers, has committed to reduce regional GHG emissions to 1990 levels by 2010, to reduce regional GHG emissions to 10% below 1990 levels by 2020; and to reduce regional GHG emissions to 75-85% below 2001 levels by 2050. The province has not established any regulations pertaining to the Climate Change Action Plan; hence, Harvest is unable to determine the impact to the Refinery business.
Land Use
In response to Alberta’s growth over the past 10 years, the government commenced a comprehensive initiative to develop a new land-use system for the province. The government released the Land-use Framework for Alberta in December 2008. This Land-use Framework called for the development of seven regional plans which will become the governing land-use policy for each region. In August 2012, the Government of Alberta approved the Lower Athabasca Regional Plan (“LARP”). The LARP outlines management frameworks for protecting, monitoring, evaluating and reporting air, surface water and groundwater quality by setting strict environmental limits. In addition, conservation areas will increase by approximately 16% to a total of 22% of the region’s land base. The proposed new conservation areas do not appear to affect Harvest. Harvest will comply with all regulatory requirements associated with the LARP framework in which it operates and meet the requirements outlined in the LARP- Related Application requirements set out recently by the Energy Resource Conservation Board (“ERCB”).
41
The second plan now underway is the South Saskatchewan Regional Plan (“SSRP”) which completed the first two phases of consultation on December 12, 2012. The remaining two phases of consultation among the Alberta Government, the public, stakeholders and municipalities has will commence in the near future. It is expected that the plan will focus on water supply, economic development and conservation needs. Based on the preliminary assessment, the proposed new conservation area appears to have minimal to no effect on Harvest.
Hydraulic Fracturing
In early 2012, the Canadian Association of Petroleum Producers (“CAPP”) announced new Canada-wide hydraulic fracture stimulation operating practices. These practices were already in place and being followed by reputable service companies and these procedures essentially summarized those best practices for industry.
Hydraulic fracturing is the process of pumping a liquid or gas under pressure down a wellbore, to the targeted producible formation, to cause the specific formation connected to the wellbore to crack or “fracture”, thereby enabling the hydrocarbons within the formation to flow more easily into the wellbore.
Harvest uses hydraulic fracturing in some of its well completion practices. This completion technique is a well-established procedure, with over 2 million such stimulations performed globally to date and when conducted using current technology and best practices pose insignificant environmental risk. These stimulations are typically performed on reservoirs several thousands of feet deep. Ground water aquifers are, in turn, tens to hundreds of feet deep and separated from the fractured zones by thousands of feet of overburden and one or more layers of steel pipe cemented in place within the wellbore itself.
Fracture stimulations are designed to treat only the hydrocarbon bearing formation. During the operation, pressures and injection rates are monitored live on site, and in the service company’s headquarters and Harvest’s offices. Injection rates and pressures are adjusted in real time to keep the fracturing within design parameters based on the observed rate and pressure information as the fracture stimulation is underway.
Harvest only selects contractors to conduct its field operations which adhere to Industry best practices. Those practices include engineered and documented stimulation design, live monitoring and control of rates, pressures and proppant concentrations throughout the operation to keep the operation within design parameters, isolation of any or all groundwater or aquifers through cemented casing and a large vertical separation between the aquifers and the zones being stimulated, and safe fluid transport, handling, storage and disposal. The produced frac fluids are recovered on surface and either reused in subsequent stimulations on other wells or disposed of in licensed disposal facilities.
Harvest is not aware of any negative or adverse consequences to date from any of Harvest’s historic fracture stimulation operations.
Harvest plans on drilling about 85 to 90 gross wells in 2013, of which 12 to 15 will be stimulated using hydraulic fractures. Approximately $25 to $30 million of Harvest’s 2013 capital budget will be allocated to fracture stimulation operations.
Species at Risk Act
In April 2012, Environment Canada announced that it will be adding 18 species to the Species at Risk Act (“SARA”) due to increased pressure and threats that put these species at risk of extirpation or extinction. It is expected the impacts of the addition of these species to Harvest’s operation to be low given the relatively small portion of species range covered in the area of application. Harvest will continue to assess and monitor wildlife impacts for existing and new operations and ensure it meets the setback requirements as outlined in SARA for each individual species.
Water Supply
In October 2012, the Saskatchewan government released their 25 Year Saskatchewan Water Security Plan. The intent of the plan is to ensure the sustainability and quality of Saskatchewan surface and groundwater supplies while protecting drinking water supplies from the source to the tap. The plan outlines seven goals: Sustainable Supplies, Drinking Water Safety, Protection of Water Resources, Safe and Sustainable Dams, Flood and Drought Damage Reduction, Adequate Data, Information and Knowledge and Effective Governance and Engagement. Alberta government also has the Water for Life initiative since 2003 which goals are to ensure safe and secure drinking water, healthy aquatic ecosystems and reliable quality water supplies for a sustainable economy. However, no regulations pertaining to the water usage have been established under these initiatives yet. Harvest will continue to monitor these plans as new acts and regulations are developed as a result of these overall plans.
42
Abandonment and Reclamation
In Alberta, the ERCB maintains a Licensee Liability Rating (“LLR”) program to ensure abandonment and reclamation cost of oil and gas wells, facilities and pipelines are covered by the industry. The ERCB requires oil and gas operators to post financial security deposits to cover the abandonment and reclamation costs in the event a licensee defaults on its obligations. In March 2013, the ERCB updated the LLR program to address concerns that the previous LLR program significantly underestimated abandonment and reclamation liabilities of ERCB licensees. Effective May 1, 2013, the ERCB increased the security deposit and will require 248 licensees to post financial security of $297 million over a three year period. Harvest does not expect to be subject to a security deposit.
On June 19, 2007, a new orphan oil and gas well and facility program was introduced in Saskatchewan, solely funded by oil and gas companies to cover the cost of cleaning up abandoned wells and facilities where the owner cannot be located or has gone out of business. The program is composed of a security deposit, based upon a formula considering assets of the well and the facility licensee against the estimated cost of decommissioning the well and facility once it is no longer producing, and an annual levy assessed to each licensee.
C. Organizational Structure
Harvest is a wholly-owned subsidiary of KNOC. Each of the subsidiary entities identified below is a direct or indirect wholly-owned subsidiary of Harvest Operations.
Harvest Breeze Trust No. 1, a commercial trust
Breeze Trust No. 1 is an unincorporated commercial trust established under the laws of the Province of Alberta on July 8, 2004. Breeze Trust No. 1 is wholly owned by Harvest Operations Corp. and its assets consist of the intangible portion of direct ownership interests in petroleum and natural gas properties purchased from the Breeze Resources Partnership and the Hay River Partnership. Breeze Trust No. 1 has a 99% interest in each of the Breeze Resources Partnership and the Hay River Partnership.
Harvest Breeze Trust. No. 2, a commercial trust
Breeze Trust No. 2 is an unincorporated commercial trust established under the laws of the Province of Alberta on July 8, 2004. Breeze Trust No. 2 is wholly-owned by Harvest Operations Corp. and its assets consist of a 1% interest in each of the Breeze Resources Partnership and the Hay River Partnership.
Breeze Resources Partnership, a general partnership
Breeze Resources Partnership (indirectly wholly owned by the Harvest Operations) is a general partnership formed on June 30, 2004 under the laws of the Province of Alberta. Breeze Resources Partnership was acquired in September 2004. Its assets consist of the tangible portion of direct ownership interest in petroleum and natural gas properties located in east central Alberta and southern Alberta.
Hay River Partnership, a general partnership
Hay River Partnership (indirectly wholly-owned by Harvest Operations) is a general partnership formed on December 20, 2004 under the laws of the Province of Alberta. Hay River Partnership was acquired in August 2005. Its assets consist of the tangible portion of direct ownership interests in petroleum and natural gas properties located in northeastern British Columbia.
43
North Atlantic Refining Limited, a taxable Canadian corporation
North Atlantic Refining Limited is a wholly owned subsidiary of Harvest Operations. North Atlantic’s assets consist of the Refinery and related retail marketing assets. North Atlantic is responsible for providing the engineering, operations and administrative services related to Harvest's Downstream operations.
The corporate structure including significant subsidiaries is set forth below. Harvest’s remaining subsidiaries and partnerships did not have assets or sales and operating revenues which, in the aggregate, exceeded 20 percent of the total consolidated assets or total consolidated sales and operating revenues of Harvest as at and for the year ended December 31, 2012:
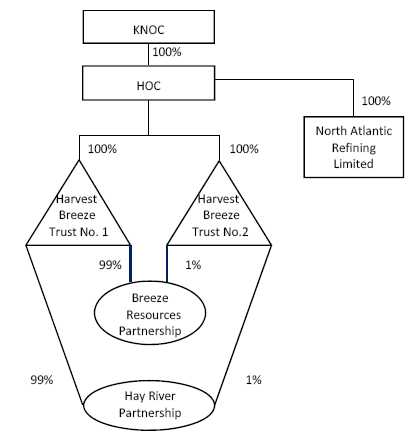
D. Property, Plant and Equipment
UPSTREAM & BLACKGOLD
MATERIAL PROPERTIES
In general, the material properties include major oil accumulations which benefit from active pressure support due to an underlying regional aquifer. Generally, the Properties have predictable decline rates with costs of production and oil price key to determining the economic limits of production. Harvest Operations is actively engaged in cost reduction, production and reserve replacement optimization efforts directed at reserves addition through extending the economic life of these producing properties beyond the limits used by the Independent Reserves Evaluators. The estimates of reserves and future net revenue for individual properties may not reflect the same confidence levels as estimates of reserves and future net revenue for all properties, due to the effects of aggregation.
44
2012 Historical Production by Material Property
| | | Light & Medium | | | Heavy Oil | | | Natural Gas | | | NGLs | | | Average Daily | |
| | | Crude Oil | | | | | | | | | | | | Production | |
| Material Property | | bbl/d | | | bbl/d | | | mcf/d | | | bbl/d | | | boe/d | |
| Hay River | | - | | | 5,867 | | | 1,595 | | | 16 | | | 6,149 | |
| Red Earth | | 4,047 | | | - | | | 189 | | | 71 | | | 4,149 | |
| West Central Alberta | | 1,390 | | | 344 | | | 63,099 | | | 4,229 | | | 16,480 | |
| East Central Alberta | | 2,883 | | | 3,894 | | | 4,599 | | | 127 | | | 7,671 | |
| Deep Basin | | 18 | | | - | | | 27,114 | | | 775 | | | 5,312 | |
| Heavy Oil | | - | | | 7,668 | | | 1,749 | | | 31 | | | 7,990 | |
| Saskatchewan Light Oil | | 4,102 | | | - | | | 978 | | | 24 | | | 4,288 | |
| Other | | 1,449 | | | 1,733 | | | 23,062 | | | 262 | | | 7,288 | |
| TOTAL | | 13,889 | | | 19,506 | | | 122,385 | | | 5,535 | | | 59,327 | |
Hay River
Hay River was acquired by Harvest on August 2, 2005 and is located approximately 125 miles north west of Grande Prairie in north-eastern British Columbia. In 2012, Hay River produced 6,149 boe/day (including a trace – 13 barrels per day – of condensate) of 24o API crude oil from the Bluesky formation located at a depth of approximately 350 metres. Natural gas produced from this formation, along with produced water, were re-injected for pressure support. Produced emulsion is processed at the central emulsion processing facility with the clean oil transported via pipeline to sales points.
Hay River is a winter-only access area in that drilling operations can only be reasonably undertaken when the ground is frozen (typically between late November and mid-March). The Hay River medium gravity oil production is priced at a discount to the Edmonton Light oil benchmark, contributing to stronger netbacks when compared to other similar gravity crudes. Harvest has a 100% Working Interest in this operated property. In 2012, Harvest drilled 31 gross 100% Working Interest wells, including 22 horizontal producing wells, 8 water injection wells and 1 water source well, and established new infrastructure with a total capital expenditure of $79 million.
Since 2007, Harvest has focused on increasing water injection into the producing Bluesky formation to improve overall pressure support, production and recovery of oil from the reservoir. The reinjection of produced water is now being augmented with additional make-up water from the Gething formation. A gas plant constructed in 2007 was commissioned in the spring of 2008 to eliminate flaring at the site and to manage production of associated gas. Connection of commercial power to the site was also completed in 2008 which allowed for optimization of the production in the field.
Red Earth
Red Earth is located 300 miles north west of Edmonton, Alberta. Production in 2012 from Red Earth averaged 4,149 boe/d (98% oil), with an average oil quality of 37° to 39° API from the Slave Point, Granite Wash and Gilwood Formations. Harvest increased its Working Interest in this area to over 90% following the acquisition of the remaining 40% interest in the Red Earth Partnership in the fall of 2010 and has been actively adding to its land base through Crown land sales, including a partnership with the Loon Lake First Nations for an option on up to 26 sections of land in 2012, on which drilling will commence in Q3 2013.
In 2012, Harvest drilled 13 gross wells with total capital expenditures, including roads and pipelines, of $73 million. A majority of the drilling was made up of horizontal wells in the Slave Point Formation using multi-staged fractured completions. Harvest has an extensive seismic database in the Red Earth area that was instrumental in the discovery of new Gilwood and Granite Wash oil pools in the area and placement of Slave Point horizontal wells. Two of the 13 wells drilled in 2012 were for the Gilwood formation.
West Central Alberta
West Central Alberta is comprised of properties west of Highway 2, south of Edmonton and north of Calgary. This is primarily a liquids-rich natural gas producing area for the Corporation with some oil production. Properties for this area were added through acquisition over the last several years with the most recent major acquisition being the Hunt assets in 2011. Production in 2012 for the area increased by 8% from 2011 to 16,480 boe/d (64% gas).
45
Major properties in this area include Caroline (Beaverhill Lake liquids rich 50% H2S gas), Crossfield (Ellerslie oil and Basal Quartz gas), Markerville (Pekisko, Edmonton Sands, Cardium and Glauconite and Ellerslie) and Rimbey (Glauconite, Ostracod, Notikewin and Cardium). All new liquids-rich gas production and oil production are from stage stimulated horizontal wells except for a highly prolific vertical gas play in the Glauconite.
In 2012, Harvest participated in 11 gross wells (7 oil, 3 gas and 1 injection well) for a total capital expenditure $46 million, including $10 million in capital upgrades at Shell’s Caroline Gas Plant in which Harvest is an 8.2% Working Interest owner.
East Central Alberta
This area mainly encompasses legacy oil properties from the Saskatchewan / Alberta border to Alberta Highway 2 and between the cities of Edmonton and Calgary. Working interest in these properties is over 90%. In 2012, the average production was 7,671 boe/d (88% oil) and is primarily heavy and medium oil from 18oto 32o API. The Corporation’s largest polymer flood in Wainwright is in this group along with large legacy properties such as Bellshill, Provost and Bashaw. This area remains largely focusses on EOR and optimization of current wells and facilities. In 2012, Harvest participated in 6 gross wells, all of which were successful, for a total capital expenditure of approximate $6 million.
Deep Basin
The Deep Basin was acquired from Hunt in early 2011 and has been an area of strong drilling results and reserves success. The Deep Basin is located to the south of the city of Grande Prairie in northwest Alberta.
Production in 2012 grew 44% over 2011 volumes to 5,312 boe/d (85% gas). Legacy production is from vertical wells completed in multiple zones (Falher, Cardium, Cadotte, Cadomin, Bluesky, Dunvegan, and Gething) and comingled together. 2011 and 2012 drilling activities have been focused on drilling high rate 5 to 15 mmcf/d, stage-stimulated horizontal wells in the Falher formations (Falher C, F and G), which has liquids content between 50 and 100 barrels per mmcf. In 2012, Harvest participated in 5 gross wells and added to our land base and expanded our gathering system infrastructure for a net cost of $57 million.
Heavy Oil
Harvest has various Working Interests in this area, which is located near the town of Lloydminster on both the Alberta and Saskatchewan side of the border and down into Southern Alberta near the city of Medicine Hat. Major properties in this group include Suffield (Glauconite), Maidstone (Sparky and Waseca), Lloyd (Lloydminster), and Hayter (Dina/Cummings and Sparky).
Production is 12° to 15° API heavy crude oil from Cretaceous aged sandstone formations within the Mannville group. Production averaged 7,990 boe/d (96% oil) in 2012. Harvest drilled 25 gross wells in 2012 with total net capital expenditures of $38 million. The majority of the wells drilled were horizontal in the Lloydminster formation or the Glauconite.
Production in each of these areas wells generally goes to central processing facilities with solution gas conservation and oil trucked to third party sales points, except for Hayter and Suffield which are pipeline connected. Future plans include downspacing pools with additional horizontal wells and assessing the potential impact of water injection for pressure maintenance and enhanced recovery.
This area also contains EOR potential. By increasing injection and using chemical enhancements such as polymers, Harvest believes the ultimate recovery of oil can be further increased. Pool optimization and EOR projects will target increased water injection into under-injected reservoirs that have not received adequate pressure maintenance as well as the expansion of the existing Suffield polymer flood to further enhance sweep efficiencies.
Saskatchewan Light Oil
This area includes Harvest’s assets in southeast Saskatchewan towards the Manitoba border as well as production near the City of Kindersley in western Saskatchewan, near the Alberta border. The Kindersley assets are produced from stage-fractured horizontal wells in the Viking formation. The SE Saskatchewan properties are located approximately 110 miles southeast of Regina with production from the non-stage stimulated horizontal wells in Tilston and Souris Valley formations of Mississippian age. Both of these properties contain high netback light 34° to 39° API oil.
46
Production in 2012 was 4,288 boe/d (96% oil). In 2012, Harvest participated in 21 gross wells (11 in SE Saskatchewan and 10 in Kindersley) with a total net capital expenditure of $42 million.
BlackGold
Harvest acquired a 100% Working Interest of BlackGold in 2010 from KNOC. The area is located in northeast Alberta near Conklin and is in close proximity to a number of major oil sands developments.
The BlackGold oil sands project continued to progress through 2012 with the drilling of 15 SAGD injection – producer well pairs. In 2012, detailed engineering, procurement and fabrication of several modules for the central processing facilities and well pads continued, with construction of the facilities the primary focus in 2013 as the project prepares for Phase 1 start-up in 2014. Phase 1 will inject steam for several months and then begin oil production, with a targeted rate of 10,000 boe/d. Regulatory work on Harvest’s expansion plan to 30,000 boe/d continued throughout 2012 and regulatory approval of Phase 2 is expected sometime in 2013. After that approval, detailed engineering and expansion planning will begin.
BlackGold’s capital program in 2012 was $164 million and was applied to the drilling of the 15 well pairs and detailed engineering and equipment procurement and fabrication.
For further details regarding the BlackGold project, please refer to Item 4B “Business Overview”.
2013 CAPITAL EXPENDITURE PLAN
Harvest’s expected total capital spending on its oil and natural gas properties for 2013 is expected to be approximately $615 million. Harvest plans to fund future capital expenditures through borrowings from the Credit Facility and cash from operating activities. For further discussion regarding Harvest’s liquidity and capital resources, please refer to Item 5B. The primary areas of focus for Harvest’s Upstream and BlackGold capital program during 2013 are the following:
| | • | BlackGold – Expenditures of approximately $315 million to fund module assembly, transportation to site and on- site facility construction; |
| | • | Hay River – Drill 25 gross producing multi-leg horizontal oil wells and water injection wells (13 producers, 12 injectors) and pipeline infrastructure expansion for a total expenditure of $39 million; |
| | • | Red Earth – Drill 9 gross light oil wells, primarily at Loon Lake, but also in Gift, Evi and Golden areas, for a net expenditure of $36 million; |
| | • | West Central/Rimbey – Drill 5 gross wells targeting the Cardium oil/gas/NGL stage stimulated horizontal wells, Ellerslie light oil vertical wells and Glauconitic (liquids-rich natural gas) stage stimulated horizontal wells for an expenditure of $19 million; |
| | • | Kindersley, Saskatchewan – Drill 10 gross horizontal wells into the Viking Formation for a total expenditure of $12 million; |
| | • | Deep Basin Area – Drill 4 gross Falher horizontal stage-fractured liquids-rich natural gas for a total expenditure of $21 million; |
| | • | Cecil – Drill 4 Charlie Lake horizontal, unstimulated oil wells for $8 million; |
| | • | Southeast Saskatchewan Area – Drill 4 gross horizontal light oil wells into the Souris Valley and Tilston formations and build an oil battery for a total expenditure of $8 million; |
| | • | Suffield and Wainwright – Drill 5 wells and expand and continue to inject polymer into the two existing EOR floods for a total expenditure of $16 million; and |
| | • | Various Areas |
| | | o | Expenditures of approximately $12 to $15 million to exploration projects which includes drilling, seismic and land purchases; |
| | | o | Expenditures of $31 million to optimize existing producing wells and facilities and $20 million to high- grade or replace existing production infrastructure; and |
| | | o | Expenditures of $26 million for land and seismic to set up future development opportunities, and $13 to $14 million each to abandon wells, maintain or enhance EOR schemes and for corporate capital. |
Incremental Exploitation and Development Potential
Management of Harvest Operations has identified numerous development opportunities, many of which provide the potential for capital investment and incremental production beyond that identified in the Reserves Reports. These opportunities include:
47
- Implementation or optimization of enhanced water floods beyond the two polymer floods previously mentioned in selected pools such as Suffield, Hay River, Red Earth, Cecil and Kindersley resulting in increased production and recovery;
- Increasing water handling and water disposal capacity at key fields such as Hayter, Suffield and Bellshill Lake to add incremental oil volumes. This includes additional use of free water knock-outs and additional disposal wells;
- De-bottlenecking existing fluid handling facilities and surface infrastructure;
- Uphole completions of bypassed or untested reserves in existing wellbores, including recompletion of existing shut-in wells to access undrained reserves;
- Selected infill and step-out development drilling opportunities for various proven targets generally defined by 3-D seismic;
- Numerous exploratory opportunities defined by seismic from which value might be extracted by sale, Farmout or joint venture;
- Management of dry gas portfolio to shut-in wells currently with low gas netbacks due to falling gas prices to preserve reserves to be produced at a time when gas prices improve; and
- Utilizing multistage fracturing technology in horizontal wells to increase oil recovery from tight oil and gas formations at Red Earth (Slave Point Formation), Crossfield (Basal Quartz and Ellerslie Formations), Kindersley (Viking Formation), Deep Basin (Falher Formation) and Rimbey/West Central Area (Cardium, Glauconite, Viking, Ostracod, Notikewin, Wilrich Formations).
DOWNSTREAM
In the Downstream operations the only material asset is the Refinery. While the nameplate capacity is 115,000 bbl/d, the average daily throughput was 103,355 bbl/d for the year ended December 31, 2012 due to an exchanger leak on the amine unit resulting in an outage of the amine, sulphur recovery and hydrocracker units and reduction in crude rate throughput to approximately 80,000 bbl/d for two weeks combined with an operational issue with the sulphur recovery unit resulting in an unplanned outage of all refinery units for approximately three weeks. For further discussion, refer to Item 5A “Operating Results”.
OTHER
For further information on environmental issues that may affect the utilization of the Upstream and Downstream assets, please see Item 3D “Risk Factors’’ and Item 4B “Business Overview - Environmental Regulations”. The Corporation’s Credit Facility is secured by a first floating charge over all of the assets (excluding BlackGold assets) of Harvest’s Operating Subsidiaries plus a first mortgage security interest on the Downstream operation’s refinery assets. For further information, please see Item 10C “Material Contracts”.
ITEM 4A. UNRESOLVED STAFF COMMENTS
Not applicable.
ITEM 5. OPERATING AND FINANCIAL REVIEW AND PROSPECTS
The information presented has been prepared in accordance with IFRS and should be read in conjunction with Item 3 “Key Information”, and our consolidated financial statements and related notes for the years ended December 31, 2012 as set out in this annual report under Item 18.
A. Operating Results
UPSTREAM OPERATIONS
Summary of Financial and Operating Results
| | | Year Ended December 31 | |
| (in millions except where noted) | | 2012 | | | 2011 | | | 2010 | |
48
| FINANCIAL | | | | | | | | | |
| Petroleum and natural gas sales(1) | $ | 1,193.5 | | $ | 1,286.9 | | $ | 1,007.0 | |
| Royalties | | (164.6 | ) | | (195.5 | ) | | (154.8 | ) |
| Revenues | | 1,028.9 | | | 1,091.4 | | | 852.2 | |
| | | | | | | | | | |
| Expenses | | | | | | | | | |
| Operating | | 359.0 | | | 350.4 | | | 265.6 | |
| Transportation and marketing | | 22.2 | | | 29.6 | | | 9.4 | |
| Realized (gains) losses on risk management contracts(2) | | (1.6 | ) | | (6.0 | ) | | 1.8 | |
| Operating netback after hedging(3) | | 649.3 | | | 717.4 | | | 575.4 | |
| | | | | | | | | | |
| General and administrative | | 65.0 | | | 60.8 | | | 45.3 | |
| Depreciation, depletion and amortization | | 579.5 | | | 535.7 | | | 470.6 | |
| Exploration and evaluation | | 24.9 | | | 18.3 | | | 3.3 | |
| Impairment of property, plant and equipment | | 21.8 | | | – | | | 13.7 | |
| Unrealized (gains) losses on risk management contracts(4) | | 1.1 | | | (0.7 | ) | | (2.4 | ) |
| Gains on disposition of property, plant and equipment | | (30.3 | ) | | (7.9 | ) | | (0.7 | ) |
| | $ | (12.7 | ) | $ | 111.2 | | $ | 45.6 | |
| | | | | | | | | | |
| Capital asset additions (excluding acquisitions) | $ | 445.2 | | $ | 632.2 | | $ | 383.1 | |
| Property and business acquisitions (dispositions), net | $ | (87.2 | ) | $ | 505.3 | | $ | 175.6 | |
| Abandonment and reclamation expenditures | $ | 20.2 | | $ | 21.5 | | $ | 20.3 | |
| | | | | | | | | | |
| OPERATING | | | | | | | | | |
| Light / medium oil (bbl/d)(5) | | 13,889 | | | 14,376 | | | 12,319 | |
| Heavy oil (bbl/d)(5) | | 19,506 | | | 18,995 | | | 21,011 | |
| Natural gas liquids (bbl/d) | | 5,535 | | | 5,062 | | | 2,587 | |
| Natural gas (mcf/d) | | 122,385 | | | 112,360 | | | 80,881 | |
| Total (boe/d) | | 59,327 | | | 57,161 | | | 49,397 | |
| (1) | Includes the effective portion of Harvest’s realized crude oil hedges. |
| (2) | Realized (gains) losses on risk management contracts include the settlement amounts for power, crude oil and foreign exchange derivative contracts, excluding the effective portion of realized (gains) losses from Harvest’s previously designated crude oil hedges. |
| (3) | This is a non-GAAP measure; please refer to “Non-GAAP Measures” in this annual report. |
| (4) | Unrealized (gains) losses on risk management contracts reflect the change in fair value of the power derivative contracts, the ineffective portion of previously designated crude oil hedges and the change in fair value of the crude and foreign exchange derivative contracts subsequent to the discontinuation of hedge accounting. |
| (5) | Effective October 1, 2012, Harvest reclassified certain properties that were previously reported as light to medium oil to heavy oil as classified under National Instrument 51-101. |
Commodity Price Environment
| | | Year Ended December 31 | |
| | | 2012 | | | 2011 | | | 2010 | |
| West Texas Intermediate crude oil (US$/bbl) | | 94.21 | | | 95.12 | | | 79.53 | |
| Edmonton light sweet crude oil ($/bbl) | | 86.15 | | | 95.18 | | | 77.58 | |
| Western Canadian Select (“WCS”) crude oil ($/bbl) | | 73.09 | | | 77.10 | | | 67.23 | |
| AECO natural gas daily ($/mcf) | | 2.39 | | | 3.62 | | | 4.00 | |
| U.S. / Canadian dollar exchange rate | | 1.001 | | | 1.011 | | | 0.971 | |
| | | | | | | | | | |
| Differential Benchmarks | | | | | | | | | |
| WCS differential to WTI ($/bbl) | | 21.03 | | | 16.93 | | | 14.66 | |
| WCS differential as a % of WTI | | 22.3% | | | 18.0% | | | 17.9% | |
The average WTI benchmark price for the year ended December 31, 2012 was 1% lower than the same period in 2011. The average Edmonton light sweet crude oil price (“Edmonton Light”) decreased 9% for the year ended December 31, 2012 mainly due to the lower WTI prices and widening of the light sweet differential. The average WTI benchmark price for the year ended December 31, 2011 was 20% higher than the same period in 2010. The average Edmonton Light increased 23% for the year ended December 31, 2011 due to the higher WTI prices and improvement of the light sweet differential, partially offset by the strengthening of the Canadian dollar on an annual average basis.
49
Heavy oil differentials fluctuate based on a combination of factors including the level of heavy oil inventories, pipeline capacity to deliver heavy crude to U.S. markets and the seasonal demand for heavy oil. For the year ended December 31, 2012, the WCS price decreased 5% as compared to the same period in 2011 mainly as a result of the widening of the WCS differential to WTI. The WCS price increased 15% in 2011 as compared to 2010 with the higher WTI prices, partially offset by the stronger Canadian dollar and wider WCS differential.
Realized Commodity Prices
| | | Year Ended December 31 | |
| | | 2012 | | | 2011 | | | 2010 | |
| Light to medium oil prior to hedging ($/bbl)(1) | | 80.17 | | | 88.37 | | | 72.65 | |
| Heavy oil ($/bbl)(1) | | 71.35 | | | 76.07 | | | 65.27 | |
| Natural gas liquids ($/bbl) | | 56.54 | | | 67.93 | | | 58.83 | |
| Natural gas ($/mcf) | | 2.58 | | | 3.83 | | | 4.21 | |
| Average realized price prior to hedging ($/boe)(2) | | 53.60 | | | 62.13 | | | 55.85 | |
| | | | | | | | | | |
| Light to medium oil after hedging ($/bbl)(3) | | 86.00 | | | 86.58 | | | 72.65 | |
| Average realized price after hedging ($/boe)(2)(3) | | 54.97 | | | 61.68 | | | 55.85 | |
| (1) | Effective October 1, 2012, Harvest reclassified certain properties that were previously reported as light to medium oil to heavy oil as classified under National Instrument 51-101. |
| (2) | Inclusive of sulphur revenue. |
| (3) | Inclusive of the realized gains (losses) from crude oil contracts designated as hedges. Foreign exchange swaps and power contracts are excluded from the realized price. |
Prior to hedging activities, the realized prices for light to medium oil for the year ended December 31, 2012 decreased by 9%, compared to the same period in 2011. This is consistent with the downward movement in Edmonton light price in 2012. The realized price for light to medium oil for the year ended December 31, 2011 increased by 22% compared to the same period in 2010, consistent with the upward movement in Edmonton light price in 2011.
In order to mitigate the risk of fluctuating cash flows due to crude oil price volatility, Harvest entered into fixed-for-floating swaps which settled during 2012. The impact of this hedging activity resulted in an increase in average light to medium oil realized price of $5.83/bbl (2011 - $1.79/bbl decrease, 2010 - $nil) for the year ended December 31, 2012. Please see “Cash Flow Risk Management” section of this item for further discussion with respect to our cash flow risk management program.
Harvest realized heavy oil price for the year ended December 31, 2012 decreased by 6% from the same period in 2011, mainly due to the decrease in the WCS benchmark price. Harvest’s realized heavy oil price for the year ended December 31, 2011 increased by 17% from the same period in 2010, mainly due to the increase in the WCS benchmark price.
Harvest’s realized prices for natural gas liquids decreased by 17% in 2012 compared to 2011 and increased by 15% when comparing 2011 against 2010. These movements reflected the changes in natural gas liquids commodity prices.
The realized prices for Harvest’s natural gas decreased 33% for 2012 as compared to 2011 and 10% for 2011 as compared to 2010, reflecting the downward movements in AECO benchmark prices.
Sales Volumes
| | | Year Ended December 31 | |
| | | 2012 | | | 2011 | | | 2010 | |
| | | Volume | | | Weighting | | | Volume | | | Weighting | | | Volume | | | Weighting | |
| Light to medium oil (bbl/d)(1) | | 13,889 | | | 23% | | | 14,376 | | | 25% | | | 12,319 | | | 25% | |
| Heavy oil (bbl/d)(1) | | 19,506 | | | 33% | | | 18,995 | | | 33% | | | 21,011 | | | 43% | |
| Natural gas liquids (bbl/d) | | 5,535 | | | 9% | | | 5,062 | | | 9% | | | 2,587 | | | 5% | |
| Total liquids (bbl/d) | | 38,930 | | | 65% | | | 38,433 | | | 67% | | | 35,917 | | | 73% | |
| Natural gas (mcf/d) | | 122,385 | | | 35% | | | 112,360 | | | 33% | | | 80,881 | | | 27% | |
| Total oil equivalent (boe/d) | | 59,327 | | | 100% | | | 57,161 | | | 100% | | | 49,397 | | | 100% | |
(1) Effective October 1, 2012, Harvest reclassified certain properties that were previously reported as light to medium oil to heavy oil as classified under National Instrument 51-101.
50
2012-2011
Total sales volumes were 59,327 boe/d for the year ended December 31, 2012, an increase of 4% compared to the same period in 2011. The year-over-year increase in sales reflects the results of drilling in the liquids rich Deep Basin area, the full year benefit from the assets acquired from Hunt at the end of February 2011 and the current year production recovery from the Plains Rainbow Pipeline outage during the summer of 2011, partially offset by the extended turnaround of a third-party natural gas plant in the Caroline area, generally lower drilling activity in 2012 and the disposition of certain non-core producing properties in the fourth quarter of 2012.
Harvest’s 2012 light/medium oil sales decreased by 3% from 2011 to 13,889 bbl/d. The decrease is mainly a result of the lower level of drilling activity in 2012 and an extended pipeline outage in the Bashaw area despite the production recovery from the Plains Rainbow Pipeline outage, fires at Red Earth and flooding in in southeast Saskatchewan which all occurred in the prior year.
Heavy oil sales increased by 3% for the year ended December 31, 2012 compared to 2011, mainly due to sales recovering from the Plains Rainbow pipeline outage in 2011.
For the year ended December 31, 2012, natural gas sales increased by 9%, due to the full year production from the assets acquired from Hunt in 2011 and the results of development drilling in Willesden Green and the liquids-rich Deep Basin area, partially offset by the extended Caroline plant turnaround in the summer of 2012.
Natural gas liquids sales for the year ended December 31, 2012 increased 9% compared to 2011 for reasons consistent with those describing the natural gas results.
2011-2010
Total sales volumes were 57,161 boe/d for the year ended December 31, 2011, an increase of 16% compared to the same period in 2010. The increase was primarily attributable to the acquisition of the Hunt assets at the end of February 2011.
Harvest’s 2011 light/medium oil sales increased by 16% from 2010 to 14,376 bbl/d. The increase reflects a full year production from assets acquired in the third quarter of 2010 as well as ten months of production from assets acquired from Hunt in 2011. Sales in 2011 were negatively impacted by the Plains Rainbow Pipeline outage, fires at Red Earth and flooding in southeast Saskatchewan during the summer of 2011.
Heavy oil sales decreased by 10% for the year ended December 31, 2011 compared to 2010. The decrease was primarily due to the Plains Rainbow Pipeline outage as well as natural declines and minor production interruptions during the first and second quarter of 2011, partially offset by production increases resulting from Harvest’s capital program.
For the year ended December 31, 2011, natural gas sales increased by 39%, compared to 2010. The increase was mainly due to the acquisition of the Hunt assets at the end of February 2011.
Natural gas liquids sales for the year ended December 31, 2011 increased by 96% compared to the same period in 2010. Similar to the increase in natural gas sales volumes, these increases were mainly due to the acquisition of the Hunt assets at the end of February 2011.
Revenues
| | | Year Ended December 31 | |
| ($ millions) | | 2012 | | | 2011 | | | 2010 | |
| Light / medium oil sales after hedging(1)(2) | | 437.1 | | | 454.3 | | | 326.7 | |
| Heavy oil sales(1) | | 509.4 | | | 527.4 | | | 500.5 | |
| Natural gas sales | | 115.7 | | | 156.9 | | | 124.2 | |
| Natural gas liquids sales | | 114.5 | | | 125.5 | | | 55.4 | |
| Other(3) | | 16.8 | | | 22.8 | | | 0.2 | |
| Petroleum and natural gas sales | | 1,193.5 | | | 1,286.9 | | | 1,007.0 | |
| Royalties | | (164.6 | ) | | (195.5 | ) | | (154.8 | ) |
| Revenues | | 1,028.9 | | | 1,091.4 | | | 852.2 | |
| (1) | Effective October 1, 2012, Harvest reclassified certain properties that were previously reported as light to medium oil to heavy oil as classified under National Instrument 51-101. |
| (2) | Inclusive of the effective portion of realized gains (losses) from crude oil contracts designated as hedges. |
51
| (3) | Inclusive of sulphur revenue and miscellaneous income. |
Harvest’s revenue is subject to changes in sales volumes, commodity prices and currency exchange rates. For the year ended December 31, 2012, total petroleum and natural gas sales decreased by $93.4 million from the prior year, mainly due to the 11% decrease in realized prices after hedging activities and partially offset by the 4% increase in sales volumes. For the year ended December 31, 2011, total petroleum and natural gas sales increased by $279.9 million from the year 2010. The 28% increase in annual revenues is attributable to the 10% increase in realized prices after hedging activities, the 16% increase in sales volumes and the increase in sulphur revenue from the acquired Hunt assets. Sulphur revenue represented $16.9 million (2011 - $21.3 million, 2010 - $0.2 million) of the total in other revenues for the year ended December 31, 2012.
Royalties
Harvest pays Crown, freehold and overriding royalties to the owners of mineral rights from which production is generated. These royalties vary for each property and product and our Crown royalties are based on a sliding scale dependent on production volumes and commodity prices. For the year ended December 31, 2012, royalties as a percentage of gross revenue averaged 13.8% (2011 – 15.2%, 2010 – 15.4%) . The lower royalty rates in 2012 are mainly due to lower commodity prices and higher Alberta Crown gas cost allowance credits in 2012. The extended turnaround of the Caroline plant further attributed to the lower natural gas and natural gas liquids royalties for the year.
Operating and Transportation Expenses
| | Year Ended December 31 |
| ($ millions) | 2012 | $/boe | 2011 | $/boe | 2010 | $/boe |
| Power and purchased energy | 79.6 | 3.67 | 83.1 | 3.98 | 59.1 | 3.28 |
| Well servicing | 56.0 | 2.58 | 61.6 | 2.95 | 50.4 | 2.80 |
| Repairs and maintenance | 57.0 | 2.63 | 60.0 | 2.88 | 43.7 | 2.42 |
| Lease rentals and property tax | 38.3 | 1.76 | 34.7 | 1.66 | 30.6 | 1.70 |
| Labor - internal | 31.5 | 1.45 | 28.1 | 1.35 | 22.6 | 1.26 |
| Labor - contract | 19.3 | 0.89 | 19.4 | 0.93 | 16.0 | 0.89 |
| Chemicals | 18.0 | 0.83 | 15.4 | 0.74 | 13.0 | 0.72 |
| Trucking | 16.3 | 0.74 | 13.3 | 0.64 | 9.6 | 0.53 |
| Processing and other fees | 33.4 | 1.54 | 22.6 | 1.09 | 13.5 | 0.75 |
| Other | 9.6 | 0.45 | 12.2 | 0.58 | 7.1 | 0.38 |
| Total operating expenses | 359.0 | 16.54 | 350.4 | 16.80 | 265.6 | 14.73 |
| Transportation and marketing | 22.2 | 1.02 | 29.6 | 1.42 | 9.4 | 0.52 |
Operating expenses for 2012 totaled $359.0 million, an increase of $8.6 million when compared to 2011, mainly due to the increase in processing and other fees and increased production. On a per barrel basis, operating expenses decreased by $0.26/boe or 2% which is mainly attributable to lower well servicing, repairs and maintenance and power and purchased energy costs, partially offset by higher processing and other fees.
For 2011, operating expenses totaled $350.4 million, an increase of $84.8 million when compared to 2010, mainly due to acquisition of assets in 2011 and higher power and purchased energy, repairs and maintenance, and well servicing costs. On a per barrel basis, year-to-date operating expenses increased by $2.07/boe (14%) compared to 2010 which is mainly attributable to higher power and purchased energy, repairs and maintenance, and processing costs.
Transportation and marketing expenses relate primarily to delivery of natural gas to Alberta’s natural gas sales hub, the AECO Storage Hub, and the cost of trucking clean crude oil to pipeline receipt points. As a result, the total dollar amount of costs generally fluctuates in relation to our sales volumes. In 2011, Harvest incurred higher oil trucking costs at Hay River and Red Earth in response to the outage of the Plains Rainbow Pipeline during the summer of 2011 combined with the 2011 acquisition of Hunt assets which generally incur higher transportation costs.
| | | Year Ended December 31 | |
| ($/boe) | | 2012 | | | 2011 | | | 2010 | |
| Power and purchased energy costs | | 3.67 | | | 3.98 | | | 3.28 | |
| Realized (gains) losses on electricity risk management contracts | | – | | | (0.37 | ) | | 0.10 | |
| Net power and purchased energy costs | | 3.67 | | | 3.61 | | | 3.38 | |
| Alberta Power Pool electricity price ($/MWh) | | 64.29 | | | 76.65 | | | 50.78 | |
52
Power and purchased energy costs, comprised primarily of electric power costs, represented approximately 22% (2011 – 24%, 2010 – 22%) of Harvest’s total operating expenses for the year ended December 31, 2012. The power and purchased energy costs for the year ended December 31, 2012 totaled $79.6 million, a decrease of 4% compared to 2011, mainly attributable to the lower average Alberta electricity price and partially offset by higher average power consumption. During 2012, Harvest did not have any risk management contracts relating to electricity. The power and purchased energy costs for the year ended December 31, 2011 totaled $83.1 million, an increase of 41% compared to 2010, mainly attributable to the higher average Alberta electricity price. In both 2011 and 2010 Harvest entered into electricity risk management contracts to reduce the volatility of power and purchased energy costs. See the “Cash Flow Risk Management” section within Item 5 for further discussion of risk management contracts.
Operating Netback(1)
| | | Year Ended December 31 | |
| ($/boe) | | 2012 | | | 2011 | | | 2010 | |
| Petroleum and natural gas sales prior to hedging | | 53.60 | | | 62.13 | | | 55.85 | |
| Royalties | | (7.58 | ) | | (9.37 | ) | | (8.58 | ) |
| Operating expenses | | (16.54 | ) | | (16.80 | ) | | (14.73 | ) |
| Transportation expenses | | (1.02 | ) | | (1.42 | ) | | (0.52 | ) |
| Operating netback prior to hedging(1) | | 28.46 | | | 34.54 | | | 32.02 | |
| Hedging gains (losses)(2) | | 1.38 | | | (0.16 | ) | | (0.10 | ) |
| Operating netback after hedging(1) | | 29.84 | | | 34.38 | | | 31.92 | |
| (1) | This is a non-GAAP measure; please refer to “Non-GAAP Measures” in this annual report. |
| (2) | Hedging gains (losses) include the settlement amounts for crude oil and power contracts. |
Harvest’s operating netback represents the net amount realized on a per boe basis after deducting directly related costs. For the year 2012, the operating netback prior to hedging decreased by $6.08/boe or 18% from 2011. The decrease was primarily attributable to lower realized commodity prices, partially offset by decreases in royalties and operating expenses. For the year 2011, Harvest’s operating netback prior to hedging increased by $2.52/boe or 8% from 2010. The increase was primarily due to increases in realized commodity prices, partially offset by increases in royalties, operating expenses and transportation expenses.
General and Administrative (“G&A”) Expense
| | | Year Ended December 31 | |
| | | 2012 | | | 2011 | | | 2010 | |
| G&A($ millions) | | 65.0 | | | 60.8 | | | 45.3 | |
| G&A($/boe ) | | 2.99 | | | 2.91 | | | 2.51 | |
For the year 2012, G&A expenses increased by $4.2 million or 7% compared to 2011 primarily due to increased salary expenses and consulting fees. For the year 2011, G&A expenses increased by 34% compared to 2010. The increase in G&A is primarily due to increased salary expense, partially resulting from the acquisition of assets in 2011. Approximately 90% of the G&A expenses are related to salaries and other employee related costs. Harvest does not have a stock option program, however there is a long-term incentive program, which is a cash settled plan that has been included in the G&A expense.
Depletion, Depreciation and Amortization (“DD&A”)
| | | Year Ended December 31 | |
| | | 2012 | | | 2011 | | | 2010 | |
| DD&A($ millions) | | 579.5 | | | 535.7 | | | 470.6 | |
| DD&A($/boe) | | 26.69 | | | 25.68 | | | 26.10 | |
DD&A expenses for the year ended 2012 increased by $43.8 million as compared to 2011 mainly due to a lower depletable proved developed reserve base and higher sales volumes. DD&A expenses for year ended December 31, 2011 increased by $65.1 million compared to 2010, mainly due to higher sales volumes.
Impairment
In 2012, Harvest recorded a pre-tax impairment charge of $21.8 million (2011 - $nil, 2010 - $13.7 million) against the South Alberta Gas cash generating unit, as a result of the declining forecasted natural gas prices during the quarter. The fair value was determined based on the total proved plus probable reserves estimated by Harvest’s independent reserves evaluators using the April 1, 2012 commodity price forecast discounted at a pre-tax discount rate of 10%. Please see note 7 of the audited annual consolidated financial statements under Item 18 of this annual report for further discussion of impairment.
53
Property Dispositions
During the 2012, Harvest disposed of certain non-core producing properties in Alberta and Saskatchewan for proceeds of $88.5 million (2011 - $8.7 million, 2010 - $1.0 million). The transactions resulted in a gain of $30.3 million, which has been recognized in the consolidated statements of comprehensive loss.
Harvest is in the process of marketing certain non-core properties for sale, to high-grade its asset portfolio and to monetize some of its assets. At December 31, 2012, properties with a net book value of $5.0 million (2011 & 2010 - $nil) were considered assets held for sale for accounting purposes. These properties were subsequently sold for $9.0 million in February 2013. Harvest continues to review and select non-core properties for disposition. The impact to future production from the future dispositions is difficult to predict, given the occurrence and the timing of the transactions cannot be determined with a high level of certainty. The proceeds from any dispositions would be used to manage Harvest’s liquidity and future developments of core assets.
Capital Asset Additions
| | | Year Ended December 31 | |
| ($ millions) | | 2012 | | | 2011 | | | 2010 | |
| Drilling and completion | | 236.6 | | | 386.4 | | | 223.0 | |
| Well equipment, pipelines and facilities | | 159.1 | | | 195.1 | | | 107.9 | |
| Geological and geophysical | | 9.7 | | | 15.7 | | | 12.7 | |
| Land and undeveloped lease rentals | | 21.8 | | | 18.0 | | | 23.4 | |
| Corporate | | 1.5 | | | 2.2 | | | 1.9 | |
| Other | | 16.5 | | | 14.8 | | | 14.2 | |
| Total additions excluding acquisitions | | 445.2 | | | 632.2 | | | 383.1 | |
Total capital additions were lower for the year ended December 31, 2012 as compared to 2011 due to a lower capital budget for the current year. As a result, the annual drilling and completion expenditures decreased to $236.6 million (2011 - $386.4 million, 2010 - $223.0 million) for the year 2012. However, well equipment, pipelines and facilities expenditures did not decrease to the same degree because costs were incurred in the first and second quarters of 2012 for equipping and tying-in wells that had been drilled in late 2011. The increase in capital asset additions in 2011 compared to 2010 is mainly due to a larger budget and a more active drilling program in the Harvest’s large resource oil pools as well as drilling on new lands acquired from Hunt in 2011.
The following tables summarize the wells drilled by Harvest and the related drilling and completion costs incurred in the year. A well is recorded in the table as having being drilled after it has been rig-released, however related drilling costs may be incurred in a period before a well has been rig-released and related completion costs may be incurred in a period afterwards.
| | | Year Ended | |
| ($ millions) | | December 31, 2012 | |
| Area | | Gross | | | Net | | | | |
| Hay River | | 31.0 | | | 31.0 | | $ | 51.3 | |
| Heavy Oil | | 25.0 | | | 22.5 | | | 21.9 | |
| Red Earth | | 13.0 | | | 11.5 | | | 48.7 | |
| Kindersley | | 10.0 | | | 8.0 | | | 6.7 | |
| SE Saskatchewan | | 11.0 | | | 10.8 | | | 14.2 | |
| Western Alberta | | 11.0 | | | 6.4 | | | 24.4 | |
| Deep Basin | | 5.0 | | | 3.9 | | | 42.1 | |
| Other areas | | 10.0 | | | 6.8 | | | 27.3 | |
| Total | | 116.0 | | | 100.9 | | $ | 236.6 | |
| | Year Ended |
| | December 31, 2011 |
54
| Area | | Gross | | | Net | | | | |
| Hay River | | 44.0 | | | 44.0 | | $ | 55.7 | |
| Red Earth | | 38.0 | | | 34.8 | | | 98.6 | |
| Rimbey/Markerville/West Central | | 39.0 | | | 21.5 | | | 74.1 | |
| Lloydminster Heavy Oil/ Hayter/ | | | | | | | | | |
| Murray Lake | | 35.0 | | | 32.5 | | | 23.2 | |
| Kindersley | | 30.0 | | | 28.1 | | | 39.1 | |
| SE Saskatchewan | | 13.0 | | | 13.0 | | | 17.1 | |
| Suffield | | 9.0 | | | 9.0 | | | 9.6 | |
| Peace Arch | | 8.0 | | | 3.1 | | | 7.3 | |
| Deep Basin | | 5.0 | | | 3.0 | | | 26.7 | |
| Other areas | | 18.0 | | | 13.3 | | | 35.1 | |
| Total | | 239.0 | | | 202.3 | | $ | 386.5 | |
| | | Year Ended | |
| | | December 31, 2010 | |
| Area | | Gross | | | Net | | | | |
| Hay River | | 10.0 | | | 10.0 | | $ | 17.4 | |
| SE Alberta | | 20.0 | | | 15.4 | | | 7.9 | |
| Rimbey/Markerville/West Central | | 26.0 | | | 15.4 | | | 49.2 | |
| SE Saskatchewan | | 20.0 | | | 19.5 | | | 20.1 | |
| Red Earth | | 36.0 | | | 30.5 | | | 54.3 | |
| Suffield | | 6.0 | | | 6.0 | | | 5.2 | |
| Lloydminster Heavy Oil/ Hayter/ | | 29.0 | | | 26.8 | | | 22.7 | |
| Murray Lake | | | | | | | | | |
| Crossfield | | 4.0 | | | 3.5 | | | 20.5 | |
| Kindersley | | 13.0 | | | 10.2 | | | 10.8 | |
| Other areas | | 7.0 | | | 4.1 | | | 14.9 | |
| Total | | 171.0 | | | 141.4 | | $ | 223.0 | |
During 2012, Harvest’s Upstream segment drilled or participated in a total of 116 gross (100.9 net) wells (2011 – 239 gross; 202.3 net wells, 2010 – 171 gross; 141.4 net wells) with an overall success ratio of 99%. Of the total wells drilled in 2012, Harvest drilled 96 gross (85.0 net) oil wells, 9 gross (5.1 net) gas wells, 10 gross (9.8 net) service wells and 1 gross (1.0 net) dry and abandoned well.
2012
In Hay River, Harvest drilled 31 gross (31.0 net) wells pursuing heavy gravity oil in the Bluesky formation, including 22 producing, 8 injection and 1 source water wells. Harvest’s remaining heavy oil drilling program included 25 gross (22.5 net) wells in our Heavy Oil and Provost areas which include Lloydminster, Wildmere, Maidstone and Consort as well as 3 gross (2.0 net) wells in Delbonita and Suffield. At Red Earth, Harvest drilled 13 gross (11.5 net) wells into the Slave Point and Gilwood light oil formations which were generally completed using multi-stage fracturing technology. At the Peace Arch and Cecil Areas, Harvest drilled 6 gross (4.5 net) oil wells in the Charlie Lake formation. Other active oil drilling areas included Kindersley (Eagle Lake) and Southeast Saskatchewan where 21 gross (18.8 net) wells were drilled. In Garrington, Wilson Creek, Willesden Green, St. Anne, Rosevear and Waskahigan, Harvest drilled or participated in 11 gross (6.4 net) wells pursuing a variety of formations and well types. Harvest also drilled 5 gross (3.9 net) deep, multi-stage fractured, liquids rich gas wells in the Falher formations in the Deep Basin area and participated in one gas well near Retlaw.
Please refer to Item 4D “Property, Plant and Equipment – Upstream Material Properties” for discussion of Harvest’s drilling activities in 2012 by material properties. For information on significant developments in 2012, please see Item 4A “Recent Developments”.
2011
In Hay River, Harvest drilled 44 gross (44.0 net) wells pursuing medium gravity oil in the Bluesky formation. At Red Earth, Harvest drilled 38 gross (34.8 net) wells including 30 gross horizontal wells into the Slave Point light oil formation using multi-stage fracturing technology. Other active oil drilling areas included Kindersley and Southeast Saskatchewan where 43 (41.1 net) gross wells were drilled. In the Peace Arch area, Harvest drilled 8 (3.1 net) gross wells mainly targeting the oil bearing formation with stage stimulated horizontal wells. Harvest’s heavy oil drilling program included 44 gross (41.5 net) wells in the Lloydminster, Suffield, Hayter and Murray Lake areas. Harvest also drilled 5 gross (3.0 net) liquids rich gas wells in the Falher formation in the Deep Basin area. In Rimbey, Markerville and West Central, Harvest drilled 39 gross (21.5) gas wells pursuing a variety of formations with the Glauconitic formation in the Hoadley trend being the most dominated play. Harvest also invested in EOR projects using polymer flooding technology during the year with focus in the Wainwright and Suffield areas.
55
2010
At Red Earth Harvest drilled 36 gross (30.5 net) wells and completed infrastructure upgrades. The majority of Harvest’s activity was in the Slave Point formation where we are drilling horizontal wells and applying multi-staged fracturing technology. At Hay River, Harvest drilled 10 gross (10.0 net) including 5 water injection wells to continue Harvest’s Enhanced Oil Recovery efforts in the Bluesky formation. At Southeast Saskatchewan, Harvest produces light oil from the Tilston, Souris Valley and Bakken formations and in 2010 drilled 20 gross (19.5 net) wells. Harvest drilled 6 gross (6.0 net) wells at Suffield and 29 gross (26.8 net) wells in Harvest’s Lloydminster area. In Harvest’s Markerville/Rimbey area, Harvest drilled 26 gross (15.4 net) wells and invested in infrastructure upgrades. Targeted formations include the Cardium and Ellerslie (light oil) as well as the Ostracod (liquids rich natural gas). At Kindersley, Saskatchewan, Harvest drilled 13 gross (10.2 net) horizontal wells with multi-staged fracture completions targeting light oil in the Viking formation.
Decommissioning Liabilities
Harvest’s Upstream decommissioning liabilities at December 31, 2012 were $709.3 million (2011 - $664.4 million) for future remediation, abandonment, and reclamation of Harvest’s oil and gas properties. Please see note 9 of the audited annual consolidated financial statements under Item 18 of this annual report for further discussion of decommissioning liabilities. The total of our decommissioning liabilities are based on management’s best estimate of costs to remediate, reclaim, and abandon our wells and facilities. The costs will be incurred over the operating lives of the assets with the majority being at or after the end of reserve life. Please refer to Item 5F “Tabular Disclosure f Contractual Obligations” for the payments due for each of the next five years and thereafter in respect of our decommissioning liabilities.
Goodwill
Goodwill is recorded when the purchase price of an acquired business exceeds the fair value of the net identifiable assets and liabilities of that acquired business. At December 31, 2012, Harvest had $391.8 million (2011 - $404.9 million) of goodwill on the balance sheet related to the Upstream segment. The $13.1 million reduction of goodwill is a result of the disposition of certain groups of non-core assets to third parties as well as recognizing some assets as held for sale (see note 8 of the audited annual consolidated financial statements under Item 18 of this annual report). The goodwill balance is assessed annually for impairment or more frequently if events or changes in circumstances occur that would reasonably be expected to reduce the fair value of the acquired business to a level below its carrying amount. Management has assessed goodwill for impairment and determined that there is no impairment at December 31, 2012.
BLACKGOLD OILSANDS
Capital Asset Additions
| ($ millions) | | Year Ended December 31 | |
| | | 2012 | | | 2011 | | | 2010 | |
| Drilling and completion | | 56.6 | | | 23.5 | | | – | |
| Well equipment, pipelines and facilities | | 93.1 | | | 70.1 | | | 18.3 | |
| Geological and geophysical | | 1.1 | | | 0.1 | | | 0.5 | |
| Other | | 13.3 | | | 7.5 | | | 2.3 | |
| Total BlackGold additions | | 164.1 | | | 101.2 | | | 21.1 | |
For the year ended December 31, 2012, Harvest spent $56.6 million drilling 30 gross SAGD producer and injector wells (15 well pairs) and spent $93.1 million on the engineering, procurement and construction of the central processing facility, including the use of the $24.4 million construction deposit against the costs incurred by the EPC contractor as a result of the EPC contract amendment. As at December 31, 2012, the engineering and procurement portion of the contract relating to the central processing facility is approximately 83% complete and the facility construction portion of the contract is approximately 43% complete. In 2011, Harvest invested a total of $101.2 million in the BlackGold oil sands project for engineering and procurement and drilling of 12 observation wells as well as the construction of the central processing facility and well pads. In 2010, $21.1 million was spent on engineering and site preparation work for the main facility and production pad sites.
56
Oil Sands Project Development
On May 30, 2012, Harvest amended certain aspects of its BlackGold EPC contract, including revising the compensation terms from a lump sum price to a cost reimbursable price and confirming greater Harvest control over project execution. The cost pressures and resultant contract changes are expected to increase the net EPC costs to approximately $520 million from $311 million, after allowing for certain costs which are not reimbursable to the EPC contractor. Harvest and the EPC contractor also agreed to apply the cumulative progress payments made under the lump sum contract and the remaining deposit of $24.4 million as at May 30, 2012 towards costs incurred to date.
Under the amended EPC contract, a maximum of approximately $101 million of the EPC costs will be paid in equal installments, without interest, over 10 years commencing on the completion of the EPC work in 2014. The liability is considered a financial liability and is initially recorded at fair value, which is estimated as the present value of all future cash payments discounted using the prevailing market rate of interest for similar instruments. As at December 31, 2012, Harvest recognized a liability of $4.7 million (2011- $nil) using a discount rate of 4.50% (2011 - nil).
Harvest has designed Phase 1 with 30 SAGD wells (15 well pairs) of which all have been drilled by the end of the fourth quarter of 2012. Engineering of the project is now approximately 85% complete and the site has been cleared and graded and now piling, foundation, and pipe rack module installation work is underway. Other near-term activities include completion of the detailed engineering work, delivery of equipment and modules to the site and the site construction. Phase 2 of the project, which is targeted to increase production capacity to 30,000 bbl/d, is in the regulatory approval process and approval is now anticipated in 2013.
Harvest had originally budgeted 2012 capital spending of $215 million for the BlackGold oil sands project but actual spending was reduced to $164.1 million. Activities that were deferred are primarily related to facility construction. As at December 31, 2012, Harvest has spent $157.5 million (including the $31.1 million deposit) on the EPC contract and has invested $286.4 million in the entire project since acquiring the BlackGold assets in 2010.
The BlackGold project faces similar cost and schedule pressures as other oil sand projects, including shortage of skilled labor, rising costs, and logistics issues surrounding module transportation; phase 1 production is expected to start in 2014. Please refer to Item 3D “Risk Factors” for further discussion of risks related to the BlackGold project.
Decommissioning Liabilities
Harvest’s BlackGold decommissioning liabilities at December 31, 2012 were $19.8 million (2011 - $1.5 million) relating to the future remediation, abandonment, and reclamation of the SAGD wells and central processing facilities. Please see note 9 of the audited annual consolidated financial statements under Item 18 of this annual report for further discussion of decommissioning liabilities. The total of our decommissioning liabilities are based on management’s best estimate of costs to remediate, reclaim, and abandon our wells and facilities. The costs will be incurred over the operating lives of the assets with the majority being at or after the end of reserve life. Please refer to the “Contractual Obligations and Commitments” under Item 5F for the payments due for each of the next five years and thereafter in respect of our decommissioning liabilities.
DOWNSTREAM OPERATIONS
Summary of Financial and Operational Results
| | | Year Ended December 31 | |
| (in $ millions except where noted) | | 2012 | | | 2011 | | | 2010 | |
| FINANCIAL | | | | | | | | | |
| Refined products sales(1) | | 4,752.1 | | | 3,302.3 | | | 3,193.3 | |
| Purchased products for processing and resale(1) | | 4,520.3 | | | 3,118.1 | | | 2,981.2 | |
| Gross margin(2) | | 231.8 | | | 184.2 | | | 212.1 | |
57
| Expenses | | | | | | | | | |
| Operating | | 120.8 | | | 108.4 | | | 109.5 | |
| Power and purchased energy | | 140.7 | | | 117.3 | | | 106.1 | |
| Marketing | | 4.4 | | | 6.3 | | | 6.3 | |
| General and administrative | | 0.6 | | | 1.8 | | | 1.8 | |
| Depreciation and amortization | | 108.9 | | | 91.0 | | | 83.1 | |
| Impairment of property, plant and equipment | | 563.2 | | | – | | | – | |
| Operating loss(2) | | (706.8 | ) | | (140.6 | ) | | (94.7 | ) |
| | | | | | | | | | |
| Capital asset additions | | 54.2 | | | 284.2 | | | 71.2 | |
| | | | | | | | | | |
| OPERATING | | | | | | | | | |
| Feedstock volume (bbl/d)(3) | | 103,355 | | | 68,046 | | | 89,025 | |
| | | | | | | | | | |
| Yield (% of throughput volume)(4) | | | | | | | | | |
| Gasoline and related products | | 30% | | | 32% | | | 31% | |
| Ultra low sulphur diesel and jet fuel | | 40% | | | 40% | | | 36% | |
| High sulphur fuel oil | | 27% | | | 27% | | | 31% | |
| Total | | 97% | | | 99% | | | 98% | |
| | | | | | | | | | |
| Average refining gross margin (US$/bbl)(5) | | 4.87 | | | 5.15 | | | 4.96 | |
| (1) | Refined product sales and purchased products for processing and resale are net of intra-segment sales of $569.6 million for the twelve months ended December 31, 2012 (2011 - $507.8 million, 2010 - $443.6 million), reflecting the refined products produced by the refinery and sold by the marketing division. |
| (2) | These are non-GAAP measures; please refer to “Non-GAAP Measures” in this annual report. |
| (3) | Barrels per day are calculated using total barrels of crude oil feedstock and vacuum gas oil. |
| (4) | Based on production volumes after adjusting for changes in inventory held for resale. |
| (5) | Average refining gross margin is calculated based on per barrel of feedstock throughput. |
Refining Benchmark Prices
| | | Year Ended December 31 | |
| | | 2012 | | | 2011 | | | 2010 | |
| WTI crude oil (US$/bbl) | | 94.21 | | | 95.12 | | | 79.53 | |
| Brent crude oil (US$/bbl) | | 111.67 | | | 110.89 | | | 80.40 | |
| Argus sour crude index (“ASCI”) (US$/bbl) | | 106.73 | | | 107.35 | | | 77.87 | |
| Brent – WTI differential (US$/bbl) | | 17.46 | | | 15.77 | | | 0.87 | |
| Brent – ASCI differential (US$/bbl) | | 4.94 | | | 3.54 | | | 2.53 | |
| Refined product prices | | | | | | | | | |
| RBOB (US$/bbl) | | 122.66 | | | 118.52 | | | 89.11 | |
| Heating Oil (US$/bbl) | | 127.11 | | | 124.15 | | | 90.03 | |
| High Sulphur Fuel Oil (US$/bbl) | | 99.64 | | | 96.87 | | | 70.57 | |
| U.S. / Canadian dollar exchange rate | | 1.001 | | | 1.011 | | | 0.971 | |
| Summary of Gross Margin | | | | | | | | | | | | | | | | | | | | | | | | | | | |
| | | Year Ended December 31 | |
| | | | | | 2012 | | | | | | | | | 2011 | | | | | | | | | 2010 | | | | |
| | | | | | Volumes | | | | | | | | | Volumes | | | | | | | | | Volumes | | | | |
| (in $ millions except | | | | | (million | | | (US$/ | | | | | | (million | | | (US$/ | | | | | | (million | | | (US$/ | |
| where noted) | | | | | bbls) | | | bbl) | | | | | | bbls) | | | bbl) | | | | | | bbls) | | | bbl) | |
| Refinery | | | | | | | | | | | | | | | | | | | | | | | | | | | |
| Sales | | | | | | | | | | | | | | | | | | | | | | | | | | | |
| | | | | | | | | | | | | | | | | | | | | | | | | | | | |
| Gasoline products | | 1,529.2 | | | 12.8 | | | 119.42 | | | 1,055.1 | | | 9.3 | | | 114.57 | | | 985.7 | | | 10.8 | | | 88.31 | |
| | | | | | | | | | | | | | | | | | | | | | | | | | | | |
| Distillates | | 2,083.7 | | | 16.1 | | | 129.24 | | �� | 1,386.0 | | | 11.1 | | | 126.54 | | | 1,251.2 | | | 13.2 | | | 92.12 | |
| High sulphur fuel oil | | | | | 10.5 | | | | | | | | | 7.3 | | | | | | 832.0 | | | 11.3 | | | | |
58
| | | 1,015.8 | | | | | | 97.43 | | | 691.4 | | | | | | 96.11 | | | | | | | | | 71.83 | |
| Total sales | | 4,628.7 | | | 39.4 | | | 117.62 | | | 3,132.5 | | | 27.7 | | | 114.51 | | | 3,068.9 | | | 35.3 | | | 84.48 | |
| Feedstock(1) | | | | | | | | | | | | | | | | | | | | | | | | | | | |
| | | | | | | | | | | | | | | | | | | | | | | | | | | | |
| Crude oil | | 3,858.3 | | | 35.5 | | | 108.79 | | | 2,350.8 | | | 22.4 | | | 106.11 | | | 2,411.0 | | | 30.3 | | | 77.22 | |
| Vacuum Gas Oil (“VGO”) | | 274.3 | | | 2.3 | | | 117.93 | | | 286.5 | | | 2.4 | | | 118.80 | | | 180.8 | | | 2.2 | | | 80.70 | |
| Total feedstock | | 4,132.6 | | | 37.8 | | | 109.36 | | | 2,637.3 | | | 24.8 | | | 107.36 | | | 2,591.8 | | | 32.5 | | | 77.45 | |
| Other(2) | | 312.1 | | | | | | | | | 368.6 | | | | | | | | | 311.0 | | | | | | | |
| Total feedstock and other costs | | 4,444.7 | | | | | | | | | 3,005.9 | | | | | | | | | 2,902.8 | | | | | | | |
| Refinery grossmargin(3) | | 184.0 | | | | | | 4.87 | | | 126.6 | | | | | | 5.15 | | | 166.1 | | | | | | 4.96 | |
| | | | | | | | | | | | | | | | | | | | | | | | | | | | |
| Marketing | | | | | | | | | | | | | | | | | | | | | | | | | | | |
| Sales | | 693.0 | | | | | | | | | 677.7 | | | | | | | | | 568.0 | | | | | | | |
| Cost of products sold | | 645.2 | | | | | | | | | 620.1 | | | | | | | | | 522.0 | | | | | | | |
| Marketing grossmargin(3) | | 47.8 | | | | | | | | | 57.6 | | | | | | | | | 46.0 | | | | | | | |
| | | | | | | | | | | | | | | | | | | | | | | | | | | | |
| Total gross margin(3) | | 231.8 | | | | | | | | | 184.2 | | | | | | | | | 212.1 | | | | | | | |
| (1) | Cost of feedstock includes all costs of transporting the crude oil to the refinery in Newfoundland. |
| (2) | Includes inventory adjustments, additives and blendstocks and purchase of product for local sales |
| (3) | This is a non-GAAP measure; please refer to “Non-GAAP Measures” in this annual report. |
2012-2011
Feedstock throughput of 103,355 bbl/d for the year ended December 31, 2012 is 52% higher than the prior year. The lower daily average throughput rate for 2011 is a consequence of an extended planned maintenance shutdown during the year combined with the reduction in throughput rates in the fourth quarter of 2011. The average daily rate for 2012 is less than the nameplate capacity of 115,000 bbl/d as a consequence of an exchanger leak on the amine unit resulting in an outage of the amine, sulphur recovery and hydrocracker units and reduction in crude rate throughput to approximately 80,000 bbls/day for two weeks combined with an operational issue with the sulphur recovery unit resulting in an unplanned outage of all refinery units for approximately three weeks.
2011-2010
The daily average throughput rate for the year ended December 31, 2011 of 68,046 bbl/d was 24% lower than the prior year as a consequence of an extended planned maintenance shutdown in 2011, the pre-start-up and commissioning of the new heat exchangers for the platformer and naphtha hydrotreater units and a reduction in throughput rates in the fourth quarter of 2011 due to declining refining margins.
The table below provides a comparison between the product crack spread realized by our refinery and the benchmark crack spread for the years ended December 31, 2012, 2011, and 2010, with both crack spreads referring to the price of Brent crude oil.
| | Year Ended December 31 |
| | | 2012 | | | 2011 | | | 2010 | |
| | Refinery | Benchmark(1) | Difference | Refinery | Benchmark(1) | Difference | Refinery | Benchmark(1) | Difference |
Gasoline products
(US$/bbl) | 10.06 | 10.99(2) | (0.93) | 7.21 | 7.63(2) | (0.42) | 10.86 | 8.71(2) | 2.15 |
| Distillates (US$/bbl) | 19.88 | 15.44(3) | 4.44 | 19.18 | 13.26(3) | 5.92 | 14.67 | 9.63(3) | 5.04 |
High Sulphur Fuel
Oil (US$/bbl) | (11.93) | (12.03)(4) | 0.10 | (11.25) | (14.02)(4) | 2.77 | (5.62) | (9.83)(4) | 4.21 |
| (1) | Benchmark product crack is relative to Brent crude oil. |
| (2) | RBOB benchmark market price sourced from NYMEX. |
| (3) | Heating Oil benchmark market price sourced from NYMEX. Downstream’s distillate products are mainly comprised of ultra-low sulphur diesel which is a higher quality product and sells at a premium to the heating oil benchmark. |
59
| (4) | High Sulphur Fuel Oil benchmark market price sourced from Platts. Our high sulphur fuel oil normally contains a higher sulphur content than the 3% content reflected in the benchmark price. |
Downstream’s product crack spreads are different from the benchmarks due to several factors including timing of actual sales and feedstock purchases differing from the calendar month benchmarks, transportation costs, sour crude differentials, quality differentials and variability in the throughput volume over a given period of time. The refinery sales also include products for which market prices are not reflected in the benchmarks (such as hydrocracker bottoms that sell at spot market prices with a premium to the high sulphur fuel oil benchmark). Product pricing under the SOA (2011) and SOA is based primarily on New York Harbour reference prices whereas feedstock costs are determined by crude oil reference prices and feedstock crude quality.
The overall gross margin is also impacted by the purchasing of blendstocks to meet summer gasolines specifications, additives to meet product specifications, the build of unfinished saleable products which are recorded at a value lower than cost, and inventory write-downs and reversals. These costs are included in “other costs” in the Summary of Gross Margin Table above.
2012-2011
The refining gross margin for the fiscal year 2012 decreased slightly by US$0.28/bbl from 2011 mainly due to reduced sour crude differential, offset by increased product prices.
The sour crude differential includes transportation costs and the impact of timing of purchases of feedstock under the SOA (2011) that may cause significant variances when measured against a given benchmark. The reduced sour crude differential in 2012 had a negative impact on the overall refinery gross margin. The cost of feedstock for the year ended December 31, 2012 was a US$2.31/bbl discount to the benchmark Brent crude oil as compared to a discount of US$3.53/bbl in 2011.
The gross margin from the marketing operations is comprised of the margin from both the retail and wholesale distribution of gasoline and home heating fuels as well as the revenues from marine services including tugboat revenues, and for 2011, the inclusion of the US$10 million settlement from the business interruption claim relating to the fire in the first quarter of 2010. For the year ended December 31, 2012, the Canadian dollar had a negligible change from the US dollar.
2011-2010
The refining gross margin decreased by US$0.19/bbl from 2010 mainly due to much lower margins in gasoline products and HSFO, despite the increased margins from distillates. Combined with lower throughput volume, 2011 gross margin was $39.5 million lower than 2011.
The cost of feedstock for the year ended December 31, 2011 was at US$3.53/bbl discount to the benchmark Brent crude as compared to a discount of US$2.95/bbl in 2010. The improvement in sour crude differential was not sufficient to offset the tighter margins from gasoline and HSFO. The relatively strong Canadian dollar in 2011 also reduced the contribution from Harvest’s refinery operations as compared to the prior year as substantially all of the gross margin, cost of purchased energy and marketing expense are transacted in U.S. dollars.
The gross margin from the marketing operations improved from 2010 mainly due to the inclusion of the US$10 million settlement from the business interruption claim relating to the fire in the first quarter of 2010.
Operating Expenses
| | | Year Ended December 31 | |
| | | | | | 2012 | | | | | | | | | 2011 | | | | | | | | | 2010 | | | | |
| ($ millions) | | Refining | | | Marketing | | | Total | | | Refining | | | Marketing | | | Total | | | Refining | | | Marketing | | | Total | |
| Operating cost | | 100.6 | | | 20.2 | | | 120.8 | | | 88.4 | | | 20.0 | | | 108.4 | | | 92.7 | | | 16.9 | | | 109.5 | |
| Power and purchased energy | | 140.7 | | | – | | | 140.7 | | | 117.3 | | | – | | | 117.3 | | | 106.1 | | | – | | | 106.1 | |
| | | 241.3 | | | 20.2 | | | 261.5 | | | 205.7 | | | 20.0 | | | 225.7 | | | 198.8 | | | 16.9 | | | 215.6 | |
| ($/bbl of feedstock throughput) | | | | | | | | | | | | | | | | | | | | | | | | | | | |
| Operating cost | | 2.66 | | | – | | | – | | | 3.56 | | | – | | | – | | | 2.85 | | | – | | | – | |
| Power and purchased energy | | 3.72 | | | – | | | – | | | 4.72 | | | – | | | – | | | 3.27 | | | – | | | – | |
| | | 6.38 | | | – | | | – | | | 8.28 | | | – | | | – | | | 6.12 | | | – | | | – | |
60
In 2012 the refining operating cost per barrel of feedstock throughput decreased by 25% as compared to the year 2011, reflecting higher throughput volumes in 2012. In 2011 the refining operating cost per barrel of feedstock throughput increased by 25% as compared to the year 2010, reflecting lower throughput volumes in 2011.
Power and purchased energy, consisting of low sulphur fuel oil (“LSFO”) and electricity, is required to provide heat and power to refinery operations. The purchased energy cost per barrel of feedstock throughput in 2012 decreased by 21% as compared to the prior year, mainly as the result of higher feedstock throughput volumes in the current year. In 2011, the power and purchased energy cost per barrel of feedstock throughput increased by 44% from the year 2010, mainly as the result of higher prices in 2011.
Capital Asset Additions
Capital asset additions for the year ended December 31, 2012 totaled $54.2 million (2011 - $284.2 million, 2010 - $71.2 million), relating to various capital improvement projects including $5.3 million (2011 - $62.6 million, 2010 - $38.1 million), for the debottlenecking project. The capital additions in 2011 were much higher than 2010 mainly due to the extended planned turnaround, which cost $102.4 million. Other capital additions in 2011 included catalyst replacement of $32.2 million, tubing and piping replacement of $26.0 million and other significant capital work completed during the turnaround period.
Depreciation and Amortization Expense
| | | Year Ended December 31 | |
| ($ millions) | | 2012 | | | 2011 | | | 2010 | |
| Refining | | 105.3 | | | 87.3 | | | 79.6 | |
| Marketing | | 3.6 | | | 3.7 | | | 3.5 | |
| Total depreciation and amortization | | 108.9 | | | 91.0 | | | 83.1 | |
The process units are amortized over an average useful life of 20 to 30 years and turnaround costs are amortized to the next scheduled turnaround. The increasing refining depreciation noted in the table is a consequence of the increased capital and turnaround expenditures completed during 2011.
Decommissioning Liabilities
Harvest’s Downstream decommissioning liabilities result from the ownership of the refinery and marketing assets. At December 31, 2012, Harvest’s Downstream decommissioning liabilities were $16.2 million (2011 - $14.6 million), relating to the reclamation and abandonment of these assets with an expected abandonment date of 2069. Please see note 9 of the audited annual consolidated financial statements under Item 18 of this annual report for further discussion of decommissioning liabilities. Please refer to Item 5F “Tabular Disclosure of Contractual Obligations” for the payments due for each of the next five years and thereafter in respect of our decommissioning liabilities.
Impairment of Property, Plant and Equipment
During the year ended December 31, 2012, Harvest recorded a pre-tax impairment of $563.2 million (2011 & 2010 - $nil) on its refinery CGU relating to the property, plant and equipment to reflect the excess of the carrying value over the assessed recoverable amount. The recoverable amount was based on the assets’ value-in-use, estimated using the net present value of future cash flows and a pre-tax discount rate of 16%. The value-in-use model did not include any expected cash flows from capital enhancement projects. The pre-tax discount rate of 16% incorporated the various risks inherent in the industry and in forecasting uncertainties. Included in the Downstream impairment amount of $563.2 million is the write-down of $27.7 million of investment tax credits (“ITC”). The ITCs were originally recorded as a reduction in the cost of PP&E. Based on the review of the forecasted future cash flows for Downstream, management concluded that a portion of the ITCs would not be utilized in the near term and therefore no longer met the recognition criteria. As a result, Harvest reversed $27.7 million of previously recorded ITCs through PP&E, which were immediately written down. Please see note 7 of the audited annual consolidated financial statements under Item 18 of this annual report for further discussion of impairment, including the key assumptions used and the sensitivity analysis performed on the key assumption.
CORPORATE
Cash Flow Risk Management
61
Harvest at times enters into natural gas, crude oil, electricity and foreign exchange contracts to reduce the volatility of cash flows from some of its forecast sales and purchases, and when allowable, will designate these contracts as cash flow hedges. Please refer to note 22 of the audited annual consolidated financial statements under Item 18 for discussion regarding our risk management contracts, the underlying risk management objectives and strategies, any significant assumptions made in determining the fair value of those contracts and sensitivity analysis on Harvest’s exposure to commodity price risks from these contracts.
During 2011, Harvest entered into crude oil and foreign exchange derivative contracts and designated them as cash flow hedges. Effective July 31, 2012, Harvest discontinued the hedge designation as the hedges were no longer highly effective. Subsequent to the discontinuation of hedge accounting, all changes in the fair value of these derivative contracts were recognized in the consolidated income statement.
Risk management contracts (gains) losses recorded to income include the ineffective portion of the gains or losses on the derivative contracts designated as cash flow hedges, the gains or losses on the derivatives that were not designated as hedges and the gains or losses subsequent to the discontinuation of hedge accounting on the previously designated derivatives.
The following is a summary of Harvest’s risk management contracts outstanding at December 31,:
2012
| Contracts Designated as Hedges(fair value in $ millions) | |
| Contract Quantity | Type of Contract | Term | Contract Price | Fair Value |
| 10,800 GJs/day | Natural gas swap | Jan – Dec 2013 | $3.42/GJ | $1.8 |
2011
| Contracts Designated as Hedges(fair value in $ millions) | |
| Contract Quantity | Type of Contract | Term | Contract Price | Fair Value |
| 4,200 bbls/day | Crude oil price swap | Jan – Dec 2012 | US $111.37/bbl | $19.7 |
| US $468,000/day | Foreign exchange swap | Jan – Dec 2012 | $1.0236 Cdn/US | 0.5 |
| | | | Total | $20.2 |
2010
| Contracts Designated as Hedges(fair value in $ millions) | |
| Contract Quantity | Type of Contract | Term | Contract Price | Fair Value |
| 30 MWh | Electricity price swap contracts | Jan - Dec 2011 | Cdn $46.87 | $1.0 |
| 8,200 bbl/day | Crude oil price swap contract | Jan - Dec 2011 | US $91.23/bbl | (7.6) |
| | | | Total | $(6.6) |
The following is a summary of Harvest’s realized and unrealized (gains) losses on risk management contracts:
| | | Year Ended December 31 | |
| ($ millions) | | | | | 2012 | | | | | | 2011 | | | 2010 | |
| Contracts not designated as hedges | | Crude | | | Currency | | | Total | | | Power | | | Power | |
| Realized (gains) losses | | (2.1 | ) | | 0.5 | | | (1.6 | ) | | (7.7 | ) | | 1.8 | |
| Unrealized (gains) losses | | 1.1 | | | – | | | 1.1 | | | 1.0 | | | (3.1 | ) |
| (Gains) losses recognized in net income | | (1.0 | ) | | 0.5 | | | (0.5 | ) | | (6.7 | ) | | (1.3 | ) |
| Contracts designated as hedges | | Crude Oil | | | Crude Oil | | | Crude Oil | |
| Realized (gains) losses | | | | | | | | | |
| Reclassified from OCI to revenues, before tax | | (29.6 | ) | | 9.4 | | | – | |
| Ineffective portion recognized in net income | | – | | | 1.7 | | | – | |
| | | (29.6 | ) | | 11.1 | | | – | |
| Unrealized (gains) losses | | | | | | | | | |
| Recognized in OCI, net of tax | | (9.2 | ) | | (12.3 | ) | | 5.0 | |
| Ineffective portion recognized in net income | | – | | | (1.7 | ) | | 0.7 | |
| | | (9.2 | ) | | (14.0 | ) | | 5.7 | |
62
| Total (gains) losses from all risk management contracts | | | | | | | | | |
| Recognized in OCI, net of tax | | 13.2 | | | (19.4 | ) | | 5.0 | |
| Recognized in revenues | | (29.6 | ) | | 9.4 | | | – | |
| Recognized in net income outside of revenues | | (0.5 | ) | | (6.7 | ) | | (0.6 | ) |
| Financing Costs | | | | | | | | | |
| | | Year Ended December 31 | |
| ($ millions) | | 2012 | | | 2011 | | | 2010 | |
| Credit Facility | | 16.1 | | | 7.9 | | | 4.9 | |
| Convertible debentures | | 47.7 | | | 49.6 | | | 51.9 | |
| Senior notes | | 36.2 | | | 35.7 | | | 20.9 | |
| Related Party Loan | | 2.9 | | | – | | | – | |
| Amortization of deferred finance charges | | 0.9 | | | 0.9 | | | 0.8 | |
| Interest and other financing charges | | 103.8 | | | 94.1 | | | 78.5 | |
| Capitalized interest | | (13.5 | ) | | (8.6 | ) | | (0.4 | ) |
| | | 90.3 | | | 85.5 | | | 78.1 | |
| Accretion of decommissioning liabilities | | 20.7 | | | 23.6 | | | 22.7 | |
| Total finance costs | | 111.0 | | | 109.1 | | | 100.8 | |
Interest and other financing charges for the year ended December 31, 2012, including the amortization of related financing costs, increased by $9.7 million (10%) compared to 2011. Interest and other financing charges for the year ended December 31, 2011, including the amortization of related financing costs, increased by $15.7 million (20%) compared to 2010. Interest expense on Harvest’s Credit Facility for the year ended December 31, 2012 increased by $8.2 million due to the higher amount of loan principal outstanding as compared to 2011. The 2011 interest expense increased $3.0 million as compared to 2010 also due to the higher amount of loan principal outstanding in 2011 as compared to the prior year. The effective interest rate for interest charges on our Credit Facility for the year ended December 31, 2012 was 3.0% (2011 – 3.0%, 2010 – 3.7%) .
Interest expense on the senior notes was relatively consistent for the year ended December 31, 2012, compared to 2011. Interest expense on senior notes increased by 71% for the year ended December 31, 2011 compared to 2010. The increase is due to the higher principal balance of the 67/8% Senior Notes issued in the fourth quarter of 2010, as compared to the 77/8% Senior Notes for which amounts outstanding were fully paid by the end of 2010, pursuant to repurchases under the tender offer made in September of 2010 and redemption thereafter of the remaining notes not tendered.
Interest expense on the Related Party Loan was $2.9 million for the year ended December 31, 2012 (2011 & 2010 – $nil). In 2011 and 2010 there was no Related Party Loan outstanding.
During the year ended December 31, 2012, interest expense of $13.5 million was capitalized to BlackGold and the Downstream debottlenecking project (2011 - $8.6 million, 2010 - $0.4 million). The increase in capitalized interest for both 2012 and 2011 is primarily due to increased capital expenditures for the BlackGold project, while the increase in 2011 is due to capital expenditures on both BlackGold and the Downstream debottlenecking project.
Please refer to note 22 of the audited annual consolidated financial statements under Item 18 for sensitivity analysis on Harvest’s exposure to interest rates.
Currency Exchange
Currency exchange gains and losses are attributed to the changes in the value of the Canadian dollar relative to the U.S. dollar on the U.S. dollar denominated 67/8% Senior Notes, the Related Party Loan and on any U.S. dollar denominated monetary assets or liabilities. For the year 2012, Harvest recognized an unrealized foreign exchange gain of $1.2 million (2011 - $2.6 million loss, 2010 - $1.9 million gain) as a result of the changes in value of the Canadian dollar relative to the U.S. dollar. Harvest recognized a realized foreign exchange gain of $0.1 million (2011 - $6.6 million, 2010 - $1.5 million) for the year ended December 31, 2012, as a result of the settlement of U.S. dollar denominated transactions.
63
The cumulative translation adjustment recognized in other comprehensive income represents the translation of the Downstream operations’ U.S. dollar functional currency financial statements to Canadian dollars. During the year ended December 31, 2012, Downstream operations recognized a net cumulative translation loss of $17.7 million (2011 – gain of $21.5 million, 2010 – loss of $45.9 million). As Downstream operations’ functional currency is denominated in U.S. dollars, the strengthening (weakening) of the U.S. dollar would result in gains (losses) from decommissioning liabilities, pension obligations, accounts payable and other balances that are denominated in Canadian dollars, which partially offset the unrealized losses (gains) recognized on the senior notes and Upstream U.S. dollar denominated monetary items.
Please refer to note 22 of the audited annual consolidated financial statements under Item 18 for sensitivity analysis on Harvest’s exposure to foreign exchange rates.
Deferred Income Taxes
For the year ended December 31, 2012, Harvest recorded a deferred income tax recovery of $109.1 million (2011 – recovery of $29.9 million, 2010 – recovery of $65.1 million). At December 31, 2012, Harvest recognized deferred income tax assets of $61.1 million (2011 – deferred tax liabilities of $54.9 million). For further discussion, see note 19 of the audited consolidated financial statements for the year ended December 31, 2012 under item 18 of this annual report.
Harvest’s deferred income tax asset (liability) will fluctuate during each accounting period to reflect changes in the temporary differences between the book value and tax basis of assets as well as legislative tax rate changes. Currently, the principal sources of our temporary differences relate to Harvest’s property, plant and equipment, decommissioning liabilities and unclaimed tax pools. Deferred income tax assets are recognized to the extent that it is probable that taxable profit will be available against which the deductible temporary differences and the carry-forward of unused tax losses can be utilized. Harvest has not recognized any deferred income tax assets on the basis that certain tax planning strategies would be implemented. For December 31, 2012, the same future cash flow forecasts used for Upstream reserve estimates and Downstream impairment test were used for determining future taxable income. Uncertainties and implications of the key assumptions, mainly commodity prices and refined margins, are discussed in the notes 7 and 8 to the 2012 audited consolidated financial statements. The realization of the deferred tax asset will be dependent on Harvest’s ability to generate sufficient future taxable income. Taxable income is subject to many uncertainties, such as Harvest’s operating results, future tax planning strategies and changes in tax laws and regulations, which may or may not be under Harvest’s control. The reserve estimate process also has inherent risks, see item 3D “Risk Factors” for further discussion.
OUTLOOK
The following information is provided with the objective to share with stakeholders management’s expectations for 2013 operating levels and key expenses in the Upstream and Downstream segments, and major cash outflows in 2013. The guidance information provided is consistent with Harvest’s current budget information. Readers are cautioned that the Outlook information may not be appropriate for other purposes and the actual results may differ materially from those anticipated.
Harvest has established a capital expenditure budget of $733 million for 2013 comprised of $300 million for Upstream oil & gas operations, $315 million for development of the BlackGold oil sands project, and $118 million for the Downstream refining and marketing business.
Upstream
Approximately 61% of Upstream’s $300 million capital budget is allocated to drilling activities. Harvest plans to drill 76 gross wells in 2013. An additional 12 wells were drilled in November and December 2012 as the start of our winter drilling program and their results are included in our 2012 report.
The 2013 drilling program will mainly focus on crude oil opportunities in Western Canada, complemented with the liquids rich natural gas wells in the Deep Basin area.
Full year production is expected to average 53,500 boe/d reflecting recent asset dispositions and reduction in capital spending from 2012. Upstream’s reduced capital budget in 2013 allows Harvest supply greater resources to the BlackGold project. Operating costs for 2013 are anticipated to average $17.00/boe.
64
BlackGold
The BlackGold 2013 capital budget is $315 million of which 73% is allocated to the construction of the 10,000 bbl/d Phase 1 central processing facility. First steam and oil production from BlackGold is expected in 2014. ERCB approval for an additional 20,000 bbl/d Phase 2 of the project is anticipated in 2013.
Downstream
The 2013 capital forecast for the Downstream operations is approximately $118 million. The current plan is to defer a previously scheduled refinery turnaround in the second half of 2013 to 2014 with capital spending in 2013 focused on sustaining and reliability improvement projects.
2013 throughput volume is anticipated to average 99,000 bbl/d, with operating costs and purchased energy costs aggregating to approximately $7.00/bbl.
See Item 4B “Controls and Regulations” and Item 4C “Environmental Regulations” in this annual report for policies that could affect Harvest’s operations.
B. Liquidity and Capital Resources
LIQUIDITY
Cash Flow Analysis
Harvest’s liquidity needs are met through the following sources: cash generated from operations, proceeds from asset dispositions, borrowings under our Credit Facility, long-term debt issuances and capital injections by KNOC. Harvest’s primary uses of funds are operating expenses, capital expenditures, and interest and principal payments on debt instruments. Cash flow from operating activities for the year ended December 31, 2012 was $442.8 million, compared to $560.5 million in 2011 and $439.2 million in 2010. The decrease in cash flow from operating activities in 2012 from 2011 was primarily due to lower cash contribution from Upstream, while the increase in 2011 as compared to 2010 was due to a higher cash contribution from Upstream. For the year ended December 31, 2012, the change in non-cash working capital relating to operating activities was a surplus of $11.0 million (2011 - $51.1 million, 2010 - $32.3 million), and $20.4 million (2011 - $22.1 million, 2010 - $20.3 million) was incurred in the settlement of decommissioning and environmental liabilities.
The cash contribution from Harvest’s Upstream operations was $581.9 million for the year ended December 31, 2012 (2011 – $661.0 million, 2010 - $529.6 million). The decreased amount of cash contribution of $79.1 million between the years of 2012 and 2011 and the increased cash contribution of $131.4 million between the years of 2011 and 2010 were a result of changes in operating netback (please see Item 5A “Operating Netback” for further discussion).
The cash deficiency from Harvest’s Downstream operations was $41.7 million in 2012 (2011 - $49.7 million deficiency, 2010 - $12.6 million deficiency). In 2012, the $8.0 million improvement in the cash deficiency as compared to the prior year is a result of a higher throughput volume, partially offset by lower average refining margin per bbl and higher operating and purchased energy expenses. In 2011, the $37.1 million increase in the cash deficiency as compared to 2010 is mainly the result of a poorer gross margin.
For the year ended December 31 2012, Harvest received $135.1 million (2011 - $343.3 million) from net borrowings under the Credit Facility. Harvest fully redeemed the remaining 6.40% Debentures Due 2012 at a cost of $106.8 million and funded the redemption through the borrowing of US$170 Related Party Loan. During 2011, $505.4 million of cash was invested into Harvest by our sole shareholder KNOC to fund the acquisition of the Hunt assets. In 2010, Harvest received $558.5 million of capital injections from KNOC and issued $495.9 million 67/8% Senior Notes. These funds were then used to repay $416.7 million of bank debt, redeem $256.9 million of 77/8% Senior Notes and redeem of $180.2 million of convertible debentures in 2010.
Harvest funded $663.5 million (2011 - $1,017.6 million, 2010 - $475.1 million) of capital additions in 2012 with cash generated from operating activities and borrowings under the Credit Facility. The acquisition of the Hunt assets in 2011 was funded primarily by the capital injection from KNOC. In 2010, Harvest funded $145.1 million of net asset acquisition activity with cash generated from operating activities and financing activities
65
Liquidity Analysis
Harvest had a working capital deficiency of $444.9 million as at December 31, 2012. The negative working capital in 2012 is primarily related to the current liability classification of $331.8 million of convertible debentures which matures on September 30, 2013. On March 15, 2012, Harvest entered into the Senior Unsecured Credit Facility. Draws under the Senior Unsecured Credit Facility were made on April 2 and April 12, 2013, for an aggregate amount of US$390 million to fund early redemption of the 7.25% Debentures Due 2013 and the 7.25% Debentures Due 2014 (see Item 4A “Recent Developments”). As of April 30, 2013, the total amount outstanding under the facility, including accrued interest was US$406.9 million. The Senior Unsecured Credit Facility will terminate on October 2, 2013, which Harvest plans to refinance in the near future. The objectives of the refinancing are to i) extend the debt repayment horizon ii) reduce interest expenses and iii) possibly expand Harvest’s access to capital markets. Harvest’s working capital is expected to fluctuate from time to time, and will be funded from cash flows from operations and borrowings from the Credit Facility, as required.
Future development activities and acquisitions in our Upstream business as well as the sustaining and maintenance program in the Downstream business will likely be funded from cash flow from operating activities and proceeds from asset sales, while Harvest will generally rely on funding more significant acquisitions and growth initiatives from some combination of issuances of incremental debt and capital injections from KNOC. Should incremental debt or capital injections not be available to Harvest, the ability to make expenditures to enhance or expand assets may be constrained. Harvest’s liquidity is closely related to its ability to generate cash from operating activities, which is affected by changes in commodity prices, market demands for petroleum and natural gas products and the operating performances of both the Upstream and Downstream assets. Please refer to Item 3D “Risk Factors” for more full discussion. Harvest at times enters into risk management contracts to protect the Corporation from cash flow fluctuations due to changes in commodity prices.
Through a combination of cash from operating activities, proceeds from asset sales, issuance of new debt and available undrawn Credit Facility, it is anticipated that Harvest will have adequate liquidity to fund future operations, interest payments and debt repayments (see Item 5F “Tabular Disclosure of Contractual Obligations” for Harvest’s future commitments at December 31, 2012). The 2013 capital program, excluding acquisitions, is budgeted to be $733 million, with $315 million of the capital expenditure program allocated to the continued development of BlackGold. Harvest regularly monitors its capital structure, liquidity and payment obligations. Harvest has the ability to adjust its capital spending programs, such as deferral or curtailment of certain projects, issue replacement debt or new debt or request for equity injection from KNOC as may be needed. However, Harvest’s ability to raise capital is subject to various risks (see Item 3D “Risk Factors”).
CAPITAL RESOURCES
The following table summarizes the Corporation’s capital structure as at December 31, 2012 and 2011:
| | | December 31, | | | December 31, | |
| (in $ millions except where noted) | | 2012 | | | 2011 | |
| Debts | | | | | | |
| Credit Facility(1) | | 494.2 | | | 358.9 | |
| Senior notes, at principal amount (US$500 million)(2) | | 497.5 | | | 508.5 | |
| Related Party Loan (US$170 million)(2) | | 169.1 | | | – | |
| Convertible debentures, at principal amount | | 627.2 | | | 734.0 | |
| | | 1,788.0 | | | 1,601.4 | |
| Shareholder’s Equity | | | | | | |
| 386,078,649 common shares issued at December 31, 2012, 2011(3) | | 2,691.9 | | | 3,453.7 | |
| | | 4,479.9 | | | 5,055.1 | |
| | | | | | | |
| Financial Ratios(4)(5) | | | | | | |
| Senior Debt to Annualized EBITDA(6) | | 1.10 | | | 0.73 | |
| Total Debt to Annualized EBITDA(7) | | 3.22 | | | 2.72 | |
| Senior Debt to Total Capitalization(6)(8) | | 14% | | | 10% | |
| Total Debt to Total Capitalization(7)(8) | | 41% | | | 36% | |
| (1) | The Credit Facility net of deferred financing costs is $491.3 million (2011 - $355.6 million, 2010 - $11.4 million). |
| (2) | Principal amount converted at the period end exchange rate. |
66
| (3) | As at April 29, 2013, the number of common shares issued is 386,078,649. |
| (4) | Calculated based on Harvest’s Credit Facility covenant requirements (see note 10 of the December 31, 2012 financial statements). |
| (5) | The financial ratios and their components are non-GAAP measures; please refer to the “Non-GAAP Measures” section of this annual report. |
| (6) | Senior debt consists of letters of credit of $8.2 million (2011 – $8.7 million, 2010 - $15.1 million), Credit Facility of $491.3 million (2011 - $355.6 million, 2010 - $2.5 million) and guarantees of $76.6 million (2011 - $92.1 million, 2010 - $15.1 million) at December 31, 2012. |
| (7) | Total debt includes the senior debt, convertible debentures of $632.0 million (2011 - $742.0 million, 2010 - $745.3 million) and senior notes of $486.4 million (2011 - $495.7 million, 2010 – $482.4 million) at December 31, 2012. |
| (8) | Total capitalization includes total debt, Related Party Loan of $169.1 million (2011 & 2010 – $ nil) and shareholder’s equity less equity attributed to BlackGold of $458.6 million at December 31, 2012 (2011 & 2010- $459.9 million). |
The outstanding securities of Harvest consist of the common shares, senior notes and convertible debentures. The authorized capital consists of an unlimited number of common shares. All of the outstanding common shares are held by KNOC.
The most significant restrictions on dividends which can be paid by Harvest exist under the Credit Facility pursuant to provisions restricting Distributions (as defined thereunder). Distributions include dividends on Harvest shares. Under those restrictions, a dividend can be paid as follows:
| | 1. | Debt/Annualized EBITDA basis: if the Total Debt to Annualized EBITDA Ratio after such dividend will not exceed 2.5:1 (including for the purposes of calculations for the ratio, any debt to fund the dividend); Annualized EBITDA shall be calculated as at the end of the most recent fiscal quarter prior to the dividend; |
| | 2. | Cash flow basis: if the aggregate amount of that dividend and any other Distributions previously paid is less than the amount of Annualized EBITDA in excess of aggregate capital expenditures. The aggregate Distributions and aggregate capital expenditures are calculated with respect to a period including the current and three prior fiscal quarters and Annualized EBITDA is calculated for the four most recent fiscal quarters; and |
| | 3. | Stipulated amount basis: on the basis of an aggregate amount of Distributions since April 29, 2011 not to exceed $150 million. This basis for dividends is further subject to compliance with certain ratios after cumulative Distributions of $100 million. |
For the purposes of these calculations, all Distributions by Harvest and restricted subsidiaries are included, and similarly capital expenditures are those of Harvest and restricted subsidiaries.
As of December 31, 2012, the Debt/Annualized EBITDA restriction and the cash flow restriction as described above resulted in no amount of allowed dividends payable by Harvest. However, on the stipulated amount basis, Harvest would be permitted to pay dividends up to $150 million, since no Distribution has been made since April 29, 2011.
Credit Facility
During 2012, the Credit Facility was amended to revise the maximum allowable total debt to Annualized EBITDA ratio (see note 10 of the audited annual consolidated financial statements under Item 18) and on July 31, 2012 the Credit Facility was extended one year to April 30, 2016. At December 31, 2012, Harvest was in compliance with all covenants under the Credit Facility.
As at December 31, 2012, Harvest had $305.8 million (2011 - $441.1 million) of unutilized borrowing capacity under the Credit Facility. The unused borrowing capacity and the option to increase the capacity limit to $1.0 billion provide Harvest the flexibility to manage fluctuations in its liquidity needs. The Credit Facility is secured by a first floating charge over all of the assets of Harvest and its restricted subsidiaries plus a first mortgage security interest on the Downstream refinery assets, with a further provision which allows Harvest to obtain a release of such security over certain of its oil sands assets. The most restrictive covenants under Harvest’s Credit Facility includes an aggregate limitation of $25 million on financial assistance and/or capital contributions to parties other than Harvest or its restricted subsidiaries. The Credit Facility requires standby fees on undrawn amounts and interest on amounts borrowed at varying rates depending on Harvest's Senior debt to Annualized EBITDA ratio. See Item 10C “Material Contracts” for a summary of the terms of the Credit Facility.
Senior Notes
Harvest had $497.5 million (2011 - $508.5 million) of principal amount of US$500 million its 67/8% Senior Notes outstanding at December 31, 2012. The 67/8% Senior Notes are unsecured with interest payable semi-annually on April 1 and October 1 and mature on October 1, 2017. The 67/8% Senior Notes are unconditionally guaranteed by Harvest and all of its wholly-owned subsidiaries that guarantee the revolving Credit Facility and every future restricted subsidiary that guarantee certain debt. The 67/8% Senior Notes are redeemable at a redemption price equal to the greater of 100% of the principal amount of the 67/8% Senior Notes being redeemed and a make-whole redemption amount calculated using a discount rate of 50 basis points over the reference treasury rate, plus a make-whole redemption premium, plus accrued and unpaid interest to the redemption date. Harvest may also redeem the notes at any time in the event that certain changes affecting Canadian withholding taxes occur.
67
There are covenants restricting, among other things, the sale of assets and the incurrence of additional indebtedness if such issuance would result in an interest coverage ratio, as defined, of less than 2.0 to 1. Notwithstanding the interest coverage ratio limitation, the incurrence of additional indebtedness may be permitted under certain incurrence tests. One provision allows Harvest’s incurrence of indebtedness under the Credit Facility or other future bank debt in an aggregate principal amount not to exceed the greater of $1.0 billion and 15% of total assets. In addition, the covenants of the senior notes restrict the amount of dividends Harvest can pay to shareholders; no dividends have been paid during the year ended December 31, 2012. At December 31, 2012, Harvest was in compliance with all covenants under the senior notes.
Convertible Debentures
At December 31, 2012, Harvest had $627.2 million (2011 - $734.0 million) of principal amount of convertible debentures issued in three series with the earliest maturity date in 2013. On September 19, 2012, Harvest redeemed its 6.40% Debentures Due 2012 for a total of $106.8 million.
The debentures may be redeemed by Harvest at its option in whole or in part prior to their respective redemption dates. The redemption price for the first redemption period is at a price equal to $1,050 per debenture and at $1,025 per debenture during the second redemption period. After the second redemption period, the debentures are redeemable at par. Any redemption will include accrued and unpaid interest at such time. Please refer to note 10 of the December 31, 2012, audited consolidated financial statements under Item 18 for details of the redemption periods.
The outstanding 7.25% Debentures Due 2013 and 7.25% Debentures Due 2014 were early redeemed on April 15, 2013 and April 2, 2013, respectively (see Item 4A “Recent Developments”).
C. Research and Development
Not applicable.
D. Trend Information
Harvest continues to be subject to variations in energy commodity prices. Prices for natural gas have increased since the end of 2012 due to colder than normal weather in key natural gas consuming areas in North America. The forward markets indicate fairly stable natural gas prices over the next several years; actual prices will depend on the usual factors such as weather, demand, supply and several other issues, all of which are beyond Harvest’s control. Pricing for natural gas liquids have softened compared to 2012 as the continued focus on the development of liquids-rich natural gas plays has resulted in some capacity restrictions to third party gas liquids pipelines, gas plants and fractionation facilities. Harvest continues to work with third party pipeline and gas plant operators but expects some periodic interruption of natural gas and natural gas liquid production over the next few years until new capacity is brought online.
Crude oil differentials are expected to remain volatile in the short to mid -term reflecting the lag between the addition of new crude oil production, especially from the oil sands and resources plays such the Bakken, and the addition of incremental refining and rail/pipeline take-away capacity to the Gulf Coast, East Coast or West Coast of North America. Harvest and third party infrastructure, particularly pipelines, require ongoing maintenance and replacement due to corrosion and age. Harvest will continue to invest capital in these projects to support base production in our more mature fields.
Demand for refined oil products has shifted as the Downstream segment, pace of economic recovery in the United States and Europe has been uneven compared to Asian economies. Demand in Asia, led by China and India, shows the most robust growth. Gasoline demand in the United States continues to be weak while gasoline demand is rising in Latin America, most notably Mexico and Brazil. Demand for diesel has been supportive in the United States and Europe and rising across Asia and Latin America.
68
Global investment in refining capacity has been more significant in the Far East as weak refining margins in the United States and Europe have not supported investments to expand capacity. The effects of refinery margins closures in Europe and the United States Atlantic Coast are expected to be tight as feedstock acquisition costs remain high due to their reference to global benchmark.
Strong global benchmark demand for refined products and tight supplies of crude oil have increased prices, while product prices, particularly gasoline, reflect a more North American significantly and encouraged oil production. Advances in production techniques, which resulted in more natural gas and light sweet crude oil, combined with lagging pipeline capacity to take Canadian crude oil to market, have created pricing benchmark disparities in the market crudes. Social unrest and political tensions in the Middle East add more uncertainty. The result is narrowing quality differentials for sour crudes as the emerging Asian economies fulfill their requirements.
The above trend information is based on assumptions that management believes to be reasonable in the light of the group’s operational and financial experience. However, no assurance can be given that the above trends will be realized. You should not rely on past performance as an indicator of future performance. You are urged to read the risks associated with Harvest refer to Item 3D “Risk Factors”.
E. Off-Balance Sheet Arrangements
None
F. Tabular Disclosure of Contractual Obligations.
Harvest has recurring and ongoing contractual obligations and commitments entered into in the normal course of operations including the purchase of assets and services, operating agreements, transportation commitments, sales commitments, royalty obligations, and land lease obligations. As at the end of December 31, 2012, Harvest has the following significant contractual commitments:
| | | Payments Due by Period | |
| (millions of Canadian dollar) | | 1 year | | | 2-3 years | | | 4-5 years | | | After 5 years | | | Total | |
| Debt repayments(1) | $ | 330.5 | | $ | 296.6 | | $ | 1,160.8 | | $ | - | | $ | 1,787.9 | |
| Debt interest payments(1)(2) | | 88.2 | | | 122.2 | | | 101.7 | | | - | | | 312.1 | |
| Purchase commitments(3) | | 252.0 | | | 48.1 | | | 20.0 | | | 60.0 | | | 380.1 | |
| Operating leases | | 11.9 | | | 15.2 | | | 6.4 | | | 3.2 | | | 36.7 | |
| Transportation agreements(4) | | 9.4 | | | 13.1 | | | 1.9 | | | 0.5 | | | 24.9 | |
| Feedstock and other purchase commitments(5) | | 1,110.7 | | | - | | | - | | | - | | | 1,110.7 | |
| Employee benefits(6) | | 11.8 | | | 20.7 | | | 4.3 | | | - | | | 36.8 | |
| Decommissioning liabilities and environmental liabilities(7) | | 24.6 | | | 57.6 | | | 48.2 | | | 1,659.7 | | | 1,790.1 | |
| Total | $ | 1,839.1 | | $ | 573.5 | | $ | 1,343.3 | | $ | 1,723.4 | | $ | 5,479.3 | |
| (1) | Assumes constant foreign exchange rate. |
| (2) | Calculated using interest rate as at December 31, 2012. |
| (3) | Relates to drilling commitments, AFE commitments, BlackGold capital commitment and Downstream capital commitments. |
| (4) | Relates to firm transportation commitments. |
| (5) | Includes commitments to purchase refinery crude stock and refined products for resale under the SOA with MEC. |
| (6) | Relates to the expected contributions to employee benefit plans and employee long-term incentive plan payments. |
| (7) | Represents the undiscounted obligation by period. |
G. Safe Harbor
See “SPECIAL NOTE REGARDING FORWARD-LOOKING STATEMENTS.”
ITEM 6. DIRECTORS, SENIOR MANAGEMENT AND EMPLOYEES
A. Directors and Senior Management
The names, jurisdiction of residence, present positions and offices with Harvest and principal occupations during the past five years of the directors and executive officers of Harvest Operations as at the December 31, 2012 are set out in the table below.
69
| Name and Jurisdiction | | Position with Harvest | | |
| of Residence | | Operations | | Principal Occupation(s)(3)and Other Relevant Experience |
| | | | | |
| | | | | |
Hong Geun Im
Seoul, South Korea | | Director from December 2009 to December 2010; reappointed as Director and Chairman of the Board in November 2012 | | Mr. Im has been a Senior Executive Vice President of KNOC since November 2012, and he was an Executive Vice President of KNOC from September 2009. He has also been a Director of KNOC since September 2009. Before becoming a Director of KNOC and Executive Vice President of KNOC, Mr. Im has led KNOC Canada office since 2008. Mr. Im has been with KNOC since 1982 and has held various positions overseeing the exploration and development of oil and gas assets in both Korea and foreign countries. |
| | | | | |
William A. Friley Jr.(2)
Alberta, Canada | | Director from 2006 to 2009; reappointed in January 2010 | | Mr. Friley is the President and Chief Executive Officer of Telluride Oil and Gas Ltd., and is President of Skyeland Oils Ltd. He is also a Director of OSUM Oil Sands Corp., Advanced Flow Technologies Inc. and Titan Energy Services Ltd. Mr. Friley is a past Director of TimberRock Energy Corp. and SilverStar Energy Services. |
| | | | |
Chang-Seok Jeong
Seoul, South Korea | | Director since January 2012 | | Mr. Jeong has been Executive Vice President of Production Group at KNOC since January 2012. Mr. Jeong worked in the Vietnam Office, Asia & Europe Production Department and the Overseas Exploration and Production Department as a General Manager & Managing Director from 2009 to 2011 and New Venture Team Senior Manager from 2008 to 2009. Mr. Jeong has 26 years of experience in the oil and gas exploration and production business at KNOC. |
| | | | | |
Chang-Koo Kang
Alberta, Canada | | Director since January 2010; Chief Financial Officer since January 2012 | | Mr. Kang was the Vice President of KNOC's Finance Management Department from January 2010 to December 2011. Prior to this, he held the position of Finance Team Senior Manager at KNOC from 2007. Mr. Kang led the financings for the merger and acquisition of PetroTech Peruana S.A., Peru, Harvest Operations Corp., Sumble JSC, Kazakhstan and Dana Petroleum, England, and has worked for KNOC since 1990. |
| | | | | |
Brant Sangster
Alberta, Calgary | | Director since November 2010 | | Mr. Sangster is a director of Canadian Oil Sands Limited, Inter Pipeline Fund, and Titanium Corporation. Mr. Sangster enjoyed a 25-year career with Petro-Canada. In his most recent role as Senior Vice President, Oil Sands for Petro-Canada, Mr. Sangster was responsible for the company’s oil sands production and development. Mr. Sangster is also the former chairman of the Canadian Petroleum Products Institute. |
70
| Name and Jurisdiction | | Position with Harvest | | |
| of Residence | | Operations | | Principal Occupation(s)(3)and Other Relevant Experience |
| | | | | |
| | | | | |
Kang Hyun Shin
Seoul, South Korea | | Director from November 2010 to February 2013 | | Mr. Shin has been KNOC's Vice President of Petroleum Marketing since September 2009. Prior to this he acted as the Senior Manager for KNOC’s Legal Team as well as the Senior Manager for the KNOC’s Management Planning Team and the Senior Manager for the Strategic Planning Team from 2005. |
| | | | | |
Kyungluck Sohn
Seoul, South Korea | | Director since November 2010; Chief Financial Officer until January 2012 | | Mr. Sohn is the Vice President, Finance Management Department at KNOC. He was the Chief Financial Officer of Harvest from February 16, 2010 to January 13, 2012. Mr. Sohn served as a Vice President of KNOC's Finance Management department in 2009, and in the Offshore Rig Operations department from May 2006 to December 2008. |
| | | | | |
Myunghuhn Yi
Alberta, Canada | | Director since December 2010; President & Chief Executive Officer since January 2012 | | Mr. Yi was the Executive Vice President for the Americas Group, as well as President of ANKOR E&P Holdings Corporation in the USA from May 2008 to January 2012. Mr. Yi has 23 years of experience at KNOC and has worked in Domestic Continental Shelf Development, the Overseas E&P Department, and the Ulsan Branch of the Petroleum Stockpile Department. |
| | | | | |
Les Hogan(1)
Alberta, Canada | | Vice President, Land from 2007 to November 2012; Acting Chief Operating Officer since November 2012 | | Previous to his appointment as Chief Operating Officer in November 2012, Mr. Hogan was Harvest's Vice President, Land since December 2007. |
| | | | | |
Yongseok Kim(1)
Seoul, South Korea | | Acting Deputy Chief Operating Officer since December 2012 | | Mr. Kim held the position of General Manager, Operations Excellence Team from March 2012 to December 2012. Before joining Harvest, he held senior positions in KNOC and its subsidiaries, including the position of VP Engineering at Ankor USA from 2008 to February 2012 and Project Manager from 2007 to 2008. |
| | | | | |
Jongwoo Kim
Alberta, Canada | | Chief Strategy Officer & Corporate Secretary since January 2010 | | Mr. Jongwoo Kim was the Vice President, Business Planning and Corporate Secretary at Harvest since January 2010. Before joining Harvest, he was acting as the Merger and Acquisition Team Lead for KNOC from July 2007 to December 2009. |
| | | | | |
Patrick BH An
Alberta, Canada | | Vice President, BlackGold since December 2011 | | Prior to joining Harvest Mr. An was Senior Manager of Production Assets in the Middle East and the Commonwealth of Independent States from 2009 to 2011 and BlackGold project from 2007 to 2008 in KNOC. |
71
| Name and Jurisdiction | | Position with Harvest | | |
| of Residence | | Operations | | Principal Occupation(s)(3)and Other Relevant Experience |
| | | | | |
| | | | | |
Brian Kwak
Seoul, South Korea | | Vice President, Global Technology Research Centre (“GTRC”) from December 2011 to January 2013 | | Mr. Kwak was VP, Oilsands between January 2010 and December 2011, and also Deputy Chief Operating Officer between January 2010 and December 2012. Prior to joining Harvest, Mr. Kwak was a manager, Subsurface of KNOC Canada from November 2006 and from August 2005 to November 2006 he was a manager, Offshore Drilling Rig of KNOC. Prior to this he acted as the Deputy Manager, Exploration of Cuulong Joint Operating Company in Vietnam. |
| | | | |
Gary Boukall
Alberta, Canada | | Vice President, Geosciences since 2007 | | From December 2002 to March 2007, Mr. Boukall held various positions with Harvest Operations including Chief Geologist, Manager of Geology and Manager of Geosciences. |
| | | | | |
Phil Reist
Alberta, Canada | | Vice President, Controller since 2007 | | Mr. Reist was Controller of Harvest Operations from February 2006 to March 2007. |
| | | | | |
Doug Reynolds(1)
Alberta, Canada | | Acting Vice President, Land since November 2012 | | Mr. Reynolds joined Harvest Operations in April 2011 as Manager, Land Negotiations. Before joining Harvest, he held various senior level managerial positions, including President of his own land consulting company from October 2010 to March 2011. Mr. Reynolds was also Founder, President & CEO and Board Member of his own private oil and gas company, Northern Hunter Energy Inc. from September 2006 to April 2010. Prior thereto, Mr. Reynolds was the Vice President Land and New Ventures for Vermilion Energy Trust. |
| | | | | |
Richard Suffron(1)
Alberta, Canada | | Acting Vice President, Operations since November 2012 | | Mr. Suffron joined Harvest Operations in 2007 as the Production Engineering Manager. Prior thereto, he held senior management and executive positions with PrimeWest Energy, including Southern Area Engineering Manager, Northern Business Unit Manager and Engineering Operations Manager, and Cork Exploration, where he was the Vice President of Operations. |
| | | | | |
Grant Ukrainetz
Alberta, Canada | | Treasurer since August 2012 | | Prior to joining Harvest in 2012, Mr. Ukrainetz was Treasurer then VP Corporate Development at Connacher Oil and Gas Limited from 2006 to 2012. |
72
| Name and Jurisdiction | | Position with Harvest | | |
| of Residence | | Operations | | Principal Occupation(s)(3)and Other Relevant Experience |
| | | | | |
| | | | | |
Doug Walker(1)
Alberta, Canada | | Acting Vice President, Engineering since November 2012 | | Mr. Walker joined Harvest in August 2010 as Area Manager, Peace River Arch and SE Saskatchewan. Prior to joining Harvest, Mr. Walker was the North West and West Central Alberta Team Leader at Provident Energy from 2007 to 2010. Mr. Walker’s prior industry experience includes technical, business and senior management positions with Noise Solutions, Stellarton Energy, Jordan Petroleum and Gulf Canada Resources. |
| (1) | At December 31, 2012, these individuals held the applicable offices on an interim basis to fill vacancies in such offices. In February 2013, they were appointed to hold the offices on a non-interim basis. |
| (2) | Mr. Friley was a director of Harvest Energy Trust, the predecessor of Harvest Operations Corp., from 2006-2009. |
| (3) | Unless otherwise noted, the directors or officers have held their current positions as their principal occupations for the last 5 years. |
As at December 31, 2012, none of the directors and executive officers of Harvest Operations and their associates and affiliates, directly or indirectly, beneficially owned, controlled or directed any of the outstanding shares of Harvest Operations. Directors and officers of Harvest Operations may, from to time, be involved with the business and operations of other oil and gas issuers, in which case a conflict may arise. Properties will not be acquired from officers or directors of Harvest Operations or persons not at arm's length with such persons at prices which are greater than fair market value, nor will properties be sold to officers or directors of Harvest Operations or persons not at arm's length with such persons at prices which are less than fair market value in each case as established by an opinion of an independent financial advisor and approved by the independent members of the Harvest Board. Any such conflicts shall be resolved in accordance with the procedures and requirements of the relevant provisions of the ABCA, including the duty of such directors and officers to act honestly and in good faith with a view to the best interests of Harvest.
Committees of the Board of Directors
| | | Upstream Reserves, | Downstream | Compensation and |
| | | Safety & | Operations, Safety & | Corporate |
| | | Environment | Environment | Governance |
| Name of Director | Audit Committee | Committee | Committee | Committee |
| Hong Geun Im | | | | Chair |
| William A. Friley | | X | | X |
| Chang-Seok Jeong | | | | X |
| Chang-Koo Kang | X | | X | |
| Brant Sangster | X | X | Chair | |
| Kang Hyun Shin | | | X | |
| Kyungluck Sohn | | | | X |
| Myunghuhn Yi | | X | X | |
Notes:
- As of January 13, 2012, Mr. Myunghuhn Yi was appointed to the Upstream, Reserves, Safety and Environment Committee, replacing Mr. John Zahary.
- As of January 13, 2012, Mr. Chang-Koo Kang and Mr. Myunghuhn Yi were appointed to the Downstream Operations, Safety and Environment Committee, replacing Mr. Kyungluck Sohn and Mr. John Zahary.
- As of January 13, 2012, Mr. Chang-Seok Jeong and Mr. Kyungluck Sohn were appointed to the Compensation and Corporate Governance Committee, replacing Mr. Myunghuhn Yi and Mr. Chang-Koo Kang.
- On September 10, 2012, Mr. John Zahary resigned as a director.
- On September 30, 2012, Mr. J. Richard Harris resigned from Harvest’s Board of Director and committees.
73
- On November 6, 2012 Mr. Hong Geun Im was appointed Chairman of the Board and chair of the Compensation and Corporate Governance Committee, replacing Dr. Seong-Hoon Kim.
- On November 6, 2012, Mr. Brant Sangster was appointed to the Upstream, Reserves, Safety and Environment Committee, and Mr. Chang-Koo Kang was appointed to the Audit Committee, replacing Mr. J. Richard Harris on an interim basis.
- As of November 21, 2012, Mr. William Robertson resigned from Harvest’s Board of Director and committees.
- On January 25, 2013, Mr. William A. Friley was appointed to the Audit Committee and became chair of the Upstream, Reserves, Safety and Environment Committee.
- In January 7, 2013, Mr. Brant Sangster accepted the offer to be the chair of the Audit Committee, replacing Mr. William Robertson.
- On February 28, 2013, Mr. Kang Hyun Shin resigned from Harvest’s Board of Director and committees.
- On April 5, 2013, Mr. Brant Sangster resigned from Harvest’s Board of Director and committees.
- On April 17, 2013, Mr. William A. Friley resigned from Harvest’s Board of Director and committees.
- On April 24, 2013, Mr. Les Hogan and Mr. Mark Tysowski were appointed to the Board of Directors.
B. Compensation
COMPENSATION COMMITTEE AND CORPORATE GOVERNANCE COMMITTEE
At December 31, 2012, the Compensation and Corporate Governance Committee is comprised of Dr. Seong-Hoon Kim, Kyungluck Sohn, Chang-Seok Jeong and William A. Friley Jr. The Compensation and Corporate Governance Committee (“CCGC”) is responsible for establishing and overseeing the administration of Harvest’s compensation program. The members of the CCGC have the skills and knowledge required to make decisions on the suitability of the Corporation’s compensation policies and practices by virtue of their experience as senior officers or directors of public and private companies. The CCGC approves and makes recommendations to Harvest Board in respect of compensation and human resources issues relating to directors, executive officers and employees of Harvest as well as senior officer succession and development. Specific responsibilities of the CCGC relating to executive compensation are documented in the CCGC Mandate and listed below:
- to review the compensation philosophy and remuneration policy for employees of Harvest and to recommend to the Harvest Board changes to improve Harvest's ability to recruit, retain and motivate employees;
- to establish the goals and objectives of the CEO and annually review the performance of the CEO relative to the corporate goals and objectives for the purpose of determining the compensation of the CEO and evaluate the CEO’s performance in light of those corporate goals and objectives.
- to annually review and approve the recommendations of the CEO concerning overall compensation and other conditions of employment of the Corporation’s officers and employees, satisfy itself that the overall compensation is in accordance with the business plans of the Corporation and with generally accepted compensation levels with comparable companies. The committee may recommend approval to the Boards based on the committee’s discretion; and to assist the Board in connection with issues relating to succession planning, including appointing, training and monitoring the development and performance of the senior officers of Harvest.
The CCGC, when making compensation determinations, takes into consideration the compensation amount, elements and structure paid to executives of other similarly sized oil and gas companies with a view to ensuring that Harvest’s overall compensation packages are competitive. The CCGC utilizes compensation information from annual participation in the Mercer Total Compensation Survey (“MTCS”) for the Energy Sector (Canada) published by Mercer Canada (“Mercer”). The MTCS provides a comprehensive perspective on the energy industry reward levels in Canada for any size of organization in any sector of the industry. Mercer, and its parent organization Mercer Global, are leaders in consulting in the area of human resources. Please see appendix C for the peer groups that participated in the MTCS.
COMPENSATION DISCUSSION AND ANALYSIS
Compensation of Officers and Management
74
ELEMENT OF COMPENSATION
The discussion in this section is applicable to all Harvest executives except for the CEO and the CFO. For information regarding the CEO’s and the CFO’s compensation, see “Compensation Summary” sections herein. The incentive programs (short-term and long-term) are available to all permanent employees of the Upstream and BlackGold segments, except for KNOC secondees, and the following discussion of incentives describes the programs generally and with the respect to the executives specifically, as applicable.
Base Salaries
Base salaries for the executives are determined with reference to comparable marketplace salaries, as published by Mercer. To be competitive with peer companies, Harvest sets base salary levels at the median of the MTCS for the relevant roles and responsibilities. In addition to the information published by Mercer, base salaries are further adjusted based on an overall determination of Harvest’s and the individual's performance. The individual’s skill set, experience and expertise are also considered. The CCGC has not established additional strict predetermined quantitative performance criteria linked to the setting of salary levels.
Short-term Incentive Program
At the end of each year, a short-term incentive pool is established by the CCGC after careful consideration of the corporate performance, market information from the MTCS and other qualitative factors. To assess corporate performance, comparisons are made to performance metrics specific to corporate operational goals and relative to industry comparison. The annual pool is shared by all eligible employees, including the executives. Individuals’ performances are factored into the allocation process.
Executives’ performance is evaluated annually by the CEO, CFO or COO, depending on the direct reporting relationships, based on subjective goals and measures. Recommendations on executives’ salary adjustments and short-term incentives are presented to the CCGC, together with their performance evaluations. The CCGC reviews such recommendations and makes compensation decisions accordingly. The CCGC has not established strict predetermined quantitative performance criteria linked to the value of short-term incentives. Bonuses for individuals are also compared with the MTCS information, to ensure the awards are competitive with Harvest’s peers.
Long-term Incentive Program
Each eligible employee is granted an annual long-term incentive payment target, expressed as a percentage of base salary. The target set for each employee reflects the individual’s roles, responsibilities, skill sets, expertise, relevant experience and past performance. The executives’ targets are set at higher levels so that a larger portion of their compensation is performance-based, compared to that for employees. The CCGC determines an annual adjustment factor up to a maximum of 100%, which is applied to every employee’s target to calculate the long-term incentive awards. The awards vest over three years, with one-third of the award vesting on the grant date and each of the next two anniversaries of the grant date. Effective for the 2012 year, the long-term incentive program was modified, such that awards will have a grant date of March 1st. The vesting date for the remaining portions of the 2010 and 2011 awards remains January 1st. The modification provides the CCGC with a longer period between the year-end and the grant date so that the CCGC has more complete information to assess corporate performance.
The CCGC considers, among many things, the achievement of certain performance metrics, when making decisions about the adjustment factor. The performance metrics are selected to align with the goals and objectives approved by the shareholder and are subject to change year over year. For 2012, Harvest assesses the following performance metrics as part of the corporate performance review: Upstream production, reserves, finding, development and acquisition costs on a per boe basis (“F&D costs”), Upstream EBITDA, Upstream operating and transportation costs on a per boe basis, and Upstream safety (lost time injury frequency). For 2013, the new metrics that have been approved by the shareholder include Upstream revenue, seismic findings, and operating income, while F&D costs and Upstream EBITDA will no longer be considered as key metrics. In addition to corporate performance, the CCGC also takes into consideration the competitive industry environment, peers’ compensation information from the MTCS, historical corporate performance of Harvest, achievements of other financial and business strategies, and other relevant qualitative factors. The CCGC has not established any formulae to link the performance metrics to the annual adjustment factor, which therefore is subject to the CCGC’s discretion.
75
COMPENSATION SUMMARY
The following table sets forth for the year ended December 31, 2012 information concerning the compensation paid to Harvest’s executive officers and senior management.
| | | | Non-Equity Incentive | | |
| | | | Plan Compensation ($) | | |
| | | | Annual | Long-term | | Total |
| Name and Principal | | Salary | Incentive | Incentive | All Other | Compensation |
| Position | Year | ($) | Plans(1) | Plans(4) | Compensation(2) | ($) |
| Myunghuhn Yi | 2012 | 205,956 | Nil(7) | Nil | 44,398 | 250,354 |
| Chief Executive | 2011 | Nil | Nil | Nil | Nil | Nil |
| Officer(3) | 2010 | Nil | Nil | Nil | Nil | Nil |
| | | | | | | |
| Chang-Koo Kang | 2012 | 50,768 | 7,966 | Nil | 337,122 | 395,856 |
| Chief Financial | 2011 | Nil | Nil | Nil | Nil | Nil |
| Officer(3)(5) | 2010 | Nil | Nil | Nil | Nil | Nil |
| | | | | | | |
| Brian Kwak | 2012 | 61,677 | 9,286 | Nil | 349,927 | 420,890 |
| Vice President, | 2011 | 62,276 | 12,581 | Nil | 203,469 | 278,326 |
| GTRC(5) | 2010 | 35,527 | 11,517 | Nil | 155,525 | 202,569 |
| | | | | | | |
| Jongwoo Kim | | | | | | |
| Chief Strategy Officer | 2012 | 53,554 | 8,254 | Nil | 302,137 | 363,945 |
| & Corporate | 2011 | 54,336 | 12,660 | Nil | 224,827 | 291,823 |
| Secretary(5) | 2010 | 49,433 | 11,576 | Nil | 242,205 | 303,214 |
| Les Hogan(6) | 2012 | 236,329 | 61,800 | Nil(8) | 38,372 | 336,501 |
| Chief Operating | 2011 | 223,840 | 55,000 | 114,521 | 39,742 | 433,103 |
| Officer | 2010 | 219,451 | 57,057 | 111,061 | 31,623 | 419,192 |
| (1) | The above amounts were paid during the year, except for Mr. Hogan’s annual incentive plan, which was paid shortly after the end of the fiscal year. |
| (2) | Includes taxable benefits like living allowances, vehicles and rent and payments relating to taxes, except for Mr. Hogan’s other compensation, which includes the contributions to a savings plan (equal to 10% of salary) and other taxable benefits. |
| (3) | Mr. Yi and Mr. Kang are directors of Harvest Operations, but did not receive compensation for their services as directors. |
| (4) | Mr. Hogan is the only NEO that participates in Harvest’s long-term incentive program. One third of the compensation for the 2011 long-term incentive plan was paid in 2012; one third will be paid in 2013, with the remainder to be paid in 2014. Half of the compensation for the 2010 long-term incentive plan was paid in 2011, with the remainder paid in 2012. |
| (5) | Messrs. Kang, Kwak and Kim participate in the KNOC employee compensation program but as secondees do not participate in Harvest’s incentive programs. Harvest pays the secondees the required compensation determined in accordance with KNOC’s compensation program. |
| (6) | Les Hogan was appointed as Chief Operating Officer in November 2012. |
| (7) | Mr. Yi’s 2012 annual incentive award of $156,070 was communicated and paid subsequent to December 31, 2012. |
| (8) | Due to the change in the long-term incentive program for 2012, discussed in the “Long-Term Incentive Program” section above, Mr. Hogan was granted long-term incentives of $115,573 subsequent to December 31, 2012. One third of these amounts will be paid in 2013; one third will be paid in 2014, with the remainder to be paid in 2015. |
Compensation of Directors
The independent directors of Harvest Operations Corp. were paid an annual retainer of $32,000. Effective May 15, 2012, committee chairmen were paid an annual retainer of $35,000, except for the Audit Committee chairman who was paid $37,000. In addition, the independent directors were paid $1,000 for each board meeting attended and $1,000 for each committee meeting attended. If an independent director attended two meetings on the same date, the independent director received $500 for the second meeting. The committee chairmen were paid $1,500 for each committee meeting attended. Independent directors are also eligible to receive an annual cash bonus of $10,000, which is not performance-based. Each such director was entitled to reimbursement for expenses incurred in carrying out his duties as director.
The following table sets forth all compensation provided to the independent directors of Harvest Operations for the most recently completed financial year ended December 31, 2012. The non-independent directors received no compensation for carrying out their duties as directors with the exception of John Zahary.
76
| William A. Friley | 53,500 |
| J. Richard Harris | 39,702 |
| William Robertson | 47,254 |
| Brant Sangster | 63,500 |
| John Zahary | 29,207 |
TERMINATION BENEFITS
Harvest has entered into an executive employment agreement with Mr. Yi, CEO. The agreement provides that, in the event of termination during the first year of employment, other than in the case of disability, but including for cause termination or resignation of Mr. Yi, he shall be entitled to a cash payment equal to one week of his base salary, plus a further cash payment equal to the his average annual bonus divided by twelve. Following the completion of the first year of employment, the agreed cash payment equals the sum of his monthly base salary and 1/12 of his average annual bonus, multiplied by the number of completed years of employment. Under this agreement, completed years of employment are calculated to include fractional years.
The estimated termination payment for Mr. Yi at December 31, 2012 was $4,808.
If the employment of Mr. Yi is terminated due to a permanent disability (within the meaning of the employment agreement), he shall be entitled to receive payment of any earned but unpaid base salary, but shall not be entitled to receive any bonus, severance or termination pay or any other form of compensation for loss of employment.
Harvest has also entered into an executive employment agreement with Mr. Hogan, COO, effective November 8, 2012. The agreement provides that, in the event of termination of employment without cause, Mr. Hogan shall be entitled to receive a cash payment equal to a multiple of his total monthly compensation, where total monthly compensation is calculated as 1/12 of the aggregate of (i) his then annual base salary, (ii) an amount equal to 20% of annual base salary for loss of benefits and contribution to the savings plan and (iii) an amount equal to the average annual bonus payments made in the two prior years (or the last annual bonus or a reasonable estimate thereof if only one bonus year or no bonus year has been completed, as the case may be), plus the amount Mr. Hogan’s long-term incentive plan related to prior years and unpaid as of the date of the termination, which are vest upon termination on the last day actively work. During the first year of employment under this agreement, the agreed multiple is calculated as 15 divided by 12 and multiplied by the number of months between the effective date and the executive’s last day actively at work. Following completion of one year of employment under this agreement, the agreed multiple is 15 with an increment of one for each full or partial year of service under the agreement to a maximum of 18.
The estimated termination payment for Mr. Hogan at December 31, 2012 without cause was $276,000.
If the employment of Mr. Hogan is terminated for cause or in the event of permanent disability (within the meaning of the employment agreement), or if he voluntarily resigns his employment, he would be entitled to receive payment of any earned but unpaid base salary and accrued vacation, but would not be entitled to receive any bonus, severance or termination pay or any other payment for loss of employment.
There are no agreements providing for benefits upon termination of employment/service for any other employees or directors.
C. Board Practices
TERM OF OFFICE
Directors are elected or appointed yearly at the annual meeting and the terms of office of all directors expire at the following annual meeting; see Item 6A above for the period that each Director has served in their current term of office.
77
AUDIT COMMITTEE
At December 31, 2012 the members of the Audit Committee were Brant Sangster and Chang-Koo Kang. On January 25, 2013 Mr. William A. Friley was appointed to the Audit Committee. In April 2013, Mr. Brant Sangster and Mr. William A. Friley resigned as directors. The appointment of Chang-Koo Kang to the Audit Committee was made in November with such appointment to expire March 31, 2013. No replacement appointments to the Audit Committee have been made to fill these vacancies and accordingly, the Audit Committee as of the filing date of this annual report has no members.
Name
(Director Since) | Principal Occupation & Biography |
Mr. Brant Sangster
(January 2010)
Other Canadian Public Board of Director
Memberships
Canadian Oil Sands Ltd.
Inter Pipeline Fund
Titanium Corporation Inc. | Mr. Sangster is currently a director of Canadian Oil Sands Limited, Inter Pipeline Fund, and Titanium Corporation. He also a member of the Audit Committee at Interpipline Fund. Mr. Sangster enjoyed a 25-year career as a senior executive with Petro-Canada, where he was responsible for managing the corporation’s oil sands businesses. Prior to this, Mr. Sangster held various strategic planning and operating positions with Imperial Oil Ltd. Both Petro-Canada and Imperial Oil Ltd. are publicly traded integrated oil and gas companies. |
Mr. Chang-Koo Kang
(January 2010)
Other Canadian Public Board of Director
Memberships
N/A
| Mr. Kang is a corporate financial specialist and currently the Chief Financial Officer at Harvest. Prior thereto, he was the Vice President of KNOC's Finance Management Department and he held the position of Finance Team Senior Manager at KNOC. Mr. Kang has led the financings for the merger and acquisition of PetroTech Peruana S.A., Peru, Harvest Operations Corp., Sumble JSC, Kazakhstan and Dana Petroleum, England. He holds a Bachelor's degree in accounting from the Pusan National University and graduated with a Master of Business Administration from Sogang Business School, Sogang University, Korea. |
Mr. William A. Friley(1)
(Director from 2006 to 2009; reappointed in January 2010)
Other Canadian Public Board of Director
Memberships
OSUM Oil Sands Corp.
Advanced Flow Technologies Inc.
Titan Energy Services Ltd. | Mr. Friley is President and CEO of Telluride Oil and Gas Ltd., and is the President of Skyeland Oil and Gas Ltd., both of Calgary, Alberta. He is also a director of OSUM Oil Sands Corp., Silverstar Well Servicing Ltd., Advanced Flow Technology Inc. and Titan Energy Services Ltd., all based in Calgary. Mr. Friley is a past Director of TimberRock Energy Corp. and Silver Star Energy Services. |
| (9) | Mr. Friley was a director of Harvest Energy Trust, the predecessor of Harvest Operations Corp., from 2006-2009. |
The mandate and terms of reference under which the Audit Committee operates are as follows:ROLE AND OBJECTIVE
The Audit Committee is a committee of the board of directors (the "Board") of Harvest Operations Corp. (“HOC”) to which the Board has delegated its responsibility for oversight of the nature and scope of the annual audit, management’s reporting on internal accounting standards and practices, financial information and accounting systems and procedures, financial reporting and statements and recommending, for approval of the Board, the audited financial statements, interim financial statements and other mandatory disclosure releases containing financial information. The primary objectives of the Audit Committee with respect to HOC and its subsidiaries, (hereinafter collectively referred to as “Harvest”) are as follows:
| 1. | to assist directors meet their responsibilities (especially for accountability) in respect of the preparation and disclosure of the financial statements of Harvest and related matters; |
| | |
| 2. | to ensure that Harvest complies with all applicable laws, regulations, rules, policies and other requirements of governments, regulatory agencies and stock exchanges relating to financial reporting and disclosure; |
78
| 3. | to enhance that Harvest’s accounting functions are performed in accordance with a system of internal controls designed to capture and record properly and accurately all of the financial transactions; |
| | |
| 4. | to provide better communication between directors and external auditor(s); |
| | |
| 5. | to enhance the external auditor’s independence; |
| | |
| 6. | to increase the credibility and objectivity of financial reports; including that such reports are accurate within a reasonable level of materiality and present fairly Harvest’s financial position and performance in accordance with generally accepted accounting principles consistently applied; and |
| | |
| 7. | to strengthen the role of the outside directors by facilitating in depth discussions between directors on the Audit Committee, management and external auditor(s). |
MEMBERSHIP OF COMMITTEE
| 1. | The Audit Committee shall be comprised of at least three (3) directors of Harvest Operations, none of whom are members of management of Harvest Operations and all of whom are "unrelated directors" (as such term is used in the Report of the Toronto Stock Exchange on Corporate Governance in Canada) and "independent" (as such term is used in Multilateral Instrument 52-110 – Audit Committees ("MI 52-110") unless the Board shall have determined that the exemption contained in Section 3.6 of MI 52-110 is available and has determined to rely thereon. |
| | |
| 2. | All of the members of the Audit Committee shall be "financially literate" (as defined in MI 52-110) unless the Board shall determine that an exemption under MI 52-110 from such requirement in respect of any particular member is available and has determined to rely thereon in accordance with the provisions of MI 52-110. |
| | |
| 3. | Unless otherwise designated by the Board, the members of the Audit Committee shall elect a Chairman from among the members and the Chair shall preside at all meetings of the Audit Committee. |
MANDATE AND RESPONSIBILITIES OF AUDIT COMMITTE
| 1. | It is the responsibility of the Audit Committee to oversee the work of the external auditor(s), including resolution of disagreements between management and the external auditor(s) regarding financial reporting. |
| | |
| 2. | It is the responsibility of the Audit Committee to satisfy itself on behalf of the Board with respect to Harvest's Internal Control Systems: |
| | |
| • | identifying, monitoring and mitigating business risks; and |
| • | ensuring compliance with legal, ethical and regulatory requirements. |
| | | |
| 3. | It is a primary responsibility of the Audit Committee to review the annual and interim financial statements of Harvest and related management's discussion and analysis ("MD&A") prior to their submission to the Board for approval. The process should include but not be limited to: |
| | |
| • | reviewing changes in accounting principles and policies, or in their application, which may have a material impact on the current or future years’ financial statements; |
| • | reviewing significant accruals, reserves or other estimates such as the ceiling test calculation; |
| • | reviewing accounting treatment of unusual or non-recurring transactions; |
| • | ascertaining compliance with covenants under loan agreements; |
| • | reviewing disclosure requirements for commitments and contingencies; |
| • | reviewing adjustments raised by the external auditor(s), whether or not included in the financial statements; |
| • | reviewing unresolved differences between management and the external auditor(s); and |
| • | obtain explanations of significant variances with comparative reporting periods. |
| | | |
| 4. | The Audit Committee is to review the financial statements, prospectuses, MD&A, annual information forms and all public disclosure containing audited or unaudited financial information (including, without limitation, annual and interim press releases and any other press releases disclosing earnings or financial results) before release and prior to Board approval. The Audit Committee must be satisfied that adequate procedures are in place for the review of Harvest's disclosure of all other financial information and shall periodically access the accuracy of those procedures. |
| | |
| 5. | With respect to the appointment of external auditor(s) by the Board, the Audit Committee shall: |
79
| | • | recommend to the Board the external auditor(s) to be nominated; |
| | • | recommend to the Board the terms of engagement of the external auditor(s), including the compensation of the auditor(s) and a confirmation that the external auditor(s) shall report directly to the Audit Committee; |
| | • | on an annual basis, review and discuss with the external auditor(s) all significant relationships such auditor(s) have with the Harvest to determine the auditor(s)' independence; |
| | • | when there is to be a change in auditor(s), review the issues related to the change and the information to be included in the required notice to securities regulators of such change; and |
| | • | review and pre-approve any non-audit services to be provided to Harvest by the external auditor(s) and consider the impact on the independence of such auditor(s). The Audit Committee may delegate to one or more independent members the authority to pre–approve non–audit services, provided that the member report to the Audit Committee at the next scheduled meeting such pre–approval and the member comply with such other procedures as may be established by the Audit Committee from time to time. |
| 6. | Review with external auditor(s) (and internal auditor if one is appointed by Harvest) their assessment of the internal controls of Harvest, their written reports containing recommendations for improvement, and management’s response and follow-up to any identified weaknesses. The Audit Committee shall also review annually with the external auditor(s) their plan for their audit and, upon completion of the audit, their reports upon the financial statements of Harvest and its subsidiaries. |
| | | |
| 7. | The Audit Committee shall review risk management policies and procedures of Harvest (i.e. hedging, litigation and insurance). |
| | | |
| 8. | The Audit Committee shall establish a procedure for: |
| | | |
| • | the receipt, retention and treatment of complaints received by Harvest regarding accounting, internal accounting controls or auditing matters; and |
| • | the confidential, anonymous submission by employees of Harvest of concerns regarding questionable accounting or auditing matters. |
| | | |
| 9. | The Audit Committee shall review and approve Harvest's hiring policies regarding partners and employees and former partners and employees of the present and former external auditor(s) of Harvest. |
| | | |
| 10. | The Audit Committee shall have the authority to investigate any financial activity of Harvest. All employees of Harvest are to cooperate as requested by the Audit Committee. |
| | | |
| 11. | The Audit Committee may retain persons having special expertise and/or obtain independent professional advice to assist in filling their responsibilities at the expense of Harvest without any further approval of the Board. |
| | | |
| 12. | The Audit Committee shall review the Audit Committee mandate and subsequent revisions periodically, and recommend to the Board for approval. |
MEETINGS AND ADMINISTRATIVE MATTERS
| 1. | At all meetings of the Audit Committee every question shall be decided by a majority of the votes cast. In case of an equality of votes, the Chairman of the meeting shall not be entitled to a second or casting vote. |
| | |
| 2. | The Chair shall preside at all meetings of the Audit Committee, unless the Chair is not present, in which case the members of the Audit Committee present shall designate from among the members present the Chair for purposes of the meeting. |
| | |
| 3. | A quorum for meetings of the Audit Committee shall be a majority of its members, and the rules for calling, holding, conducting and adjourning meetings of the Audit Committee shall be the same as those governing the Board unless otherwise determined by the Audit Committee or the Board. |
| | |
| 4. | Meetings of the Audit Committee should be scheduled to take place at least four times per year and at such other times as the Chair of the Audit Committee may determine necessary. Minutes of all meetings of the Audit Committee shall be taken. The Chief Financial Officer shall attend meetings of the Audit Committee, unless otherwise excused from all or part of any such meeting by the Chairman. |
80
| 5. | The Audit Committee shall meet with the external auditor(s) at least once per year (in connection with the preparation of the year-end financial statements) and at such other times as the external auditor(s) and the Audit Committee consider appropriate. |
| | |
| 6. | Agendas, approved by the Chair, shall be circulated to Audit Committee members along with background information on a timely basis prior to the Audit Committee meetings. |
| | |
| 7. | The Audit Committee may invite such officers, directors and employees of the Corporation as it may see fit from time to time to attend at meetings of the Audit Committee and assist thereat in the discussion and consideration of the matters being considered by the Audit Committee. |
| | |
| 8. | At the discretion of the Audit Committee, the members of the Audit Committee shall meet in private session (in camera) with the external auditor(s), management and with Audit Committee members as required. |
| | |
| 9. | Following each meeting, the Audit Committee will report to the Board. Upon request, copies of the materials of such Audit Committee meeting should be provided at the next Board meeting after a meeting is held (these may still be in draft form). |
| | |
| 10. | Minutes of the Audit Committee will be recorded and maintained and circulated to directors who are not members of the Audit Committee or otherwise made available at a subsequent meeting of the Board upon request. |
| | |
| 11. | The Audit Committee may retain persons having special expertise and/or obtain independent professional advice to assist in fulfilling its responsibilities at the expense of Harvest. |
| | |
| 12. | Any members of the Audit Committee may be removed or replaced at any time by the Board and shall cease to be a member of the Audit Committee as soon as such member ceases to be a director. The Board may fill vacancies on the Audit Committee by appointment from among its members. If and whenever a vacancy shall exist on the Audit Committee, the remaining members may exercise all its powers so long as a quorum remains. Subject to the foregoing, each member of the Audit Committee shall hold such office until the Audit Committee is reconstituted by the Board. |
| | |
| 13. | Any issues arising from these meetings that bear on the relationship between the Board and management should be communicated to the Chairman of the Board by the Audit Committee Chair. |
See Item 6B “Compensation Committee and Corporate Governance Committee” in this annual report for a discussion of the compensation committee.
D. Employees
The number of full-time and part-time employees as at December 31 for each of the past three financial years was as follows:
| | Upstream | BlackGold | Downstream | Total |
| | Corporate | Field | | | |
| 2012 | 350 | 154 | 15 | 468 | 987 |
| 2011 | 363 | 149 | 13 | 474 | 999 |
| 2010 | 278 | 128 | 8 | 481 | 895 |
In the Downstream operations approximately 66% of the full-time employees and 100% of the part-time employees are unionized and represented by the United Steel Workers of America in four collective bargaining agreements. North Atlantic has had a history of good relations with its union, which is evidenced by the lack of any work stoppage at the Refinery. One of the collective bargaining agreements expires December 31, 2014, two collective agreements expire March 31, 2015 and the fourth collective agreement expired March 31, 2013, which is under negotiation at the time of this annual report.
E. Share Ownership
None of the individuals listed in Item 6B own shares of Harvest as 100% of the issued and outstanding shares of the Corporation are owned by KNOC.
81
ITEM 7. MAJOR SHAREHOLDERS AND RELATED PARTY TRANSACTIONS
A. Major Shareholders
KNOC owns 100% of the 386,078,649 issued and outstanding common shares of Harvest at December 31, 2012 (see Item 4A of this annual report for more information on KNOC); this information remains unchanged as at the date of this annual report. KNOC is a leading international oil and gas exploration and production company wholly owned by the Government of Korea. The Trust Units of the predecessor company, Harvest Energy Trust, were widely held up until the date of the KNOC Acquisition on December 22, 2009.
B. Related Party Transactions
Other than as disclosed in Note 25 of the consolidated financial statements contained in Item 18 of this annual report and the guarantee provided by KNOC of Harvest’s obligations under the Senior Unsecured Credit Facility (see Items 4A “Recent Developments” and 10C “Material Contracts”) and the agreement with respect to such guarantee between KNOC and Harvest as to fees, reimbursement and related matters, there have been no material related party transactions from the commencement of the 2011 fiscal year to the date of this annual report.
C. Interests of Experts
Not applicable.
ITEM 8. FINANCIAL INFORMATION
A. Consolidated Statements and Other Financial Information
FINANCIAL STATEMENTS
See Item 18 “Financial Statements” of this annual report for the audited consolidated financial statements. For information regarding the Corporation’s export sales, please see Item 4B “Business Overview”.
LEGAL PROCEEDINGS
There are no legal proceedings which the Corporation or any subsidiary of the Corporation is or was a party to, or that any of their property is or was the subject of during the year ended December 31, 2012, nor are there any proceedings known to Harvest to be contemplated that involve a claim for damages exceeding ten per cent of Harvest’s current assets.
North Atlantic remained a party to a claim for an unspecified amount of damages for part of the first quarter of 2012. In the proceeding The State of New Hampshire v. Amerada Hess Corp. et al, Docket No. 03-C-0550 (Merrimack County) the State of New Hampshire brought a claim related to alleged contamination of ground water from the use of the gasoline additive methyl tertiary butyl ether against numerous defendants, including North Atlantic, and asserted collective and joint liability against all defendants. The New Hampshire Superior Court on March 2, 2012 rendered a decision which granted summary judgment in favour of North Atlantic and the judgment dismissed all claims against North Atlantic because of lack of personal jurisdiction over North Atlantic. The order for judgment of the New Hampshire Superior Court became final on expiry of the appeal period since no appeal to the New Hampshire Supreme Court (the sole level of appeal) was filed by the plaintiff. As a result, the claim has been fully dismissed against North Atlantic. No amounts had been accrued in the consolidated financial statements in respect of this matter and the Trust had received an indemnity from Vitol in respect of this contingent liability under the Purchase and Sale Agreement.
There were no penalties or sanctions imposed against the Corporation or any subsidiary of the Corporation by a court relating to securities legislation or by a securities regulatory authority during the year ended December 31, 2012 or any other penalties or sanctions imposed by a court or regulatory body against the Corporation or any subsidiary of the Corporation that would likely be considered important to a reasonable investor in making an investment decision. No settlement agreements were entered into by the Corporation or any subsidiary of the Corporation with a court relating to securities legislation or with a securities regulatory authority during the year ended December 31, 2012.
82
DIVIDEND POLICY
The Corporation does not currently distribute dividends.
B. Significant Changes
Except as otherwise disclosed in this annual report, there have been no material changes in our financial position, operations or cash flows since December 31, 2012.
ITEM 9. THE OFFER AND LISTING
Not applicable. The Corporation’s shares are not traded on any exchanges or other regulated markets (only common shares have been issued and all of these are held by the Corporation’s sole shareholder, KNOC).
ITEM 10. ADDITIONAL INFORMATION
A. Share Capital
Not applicable.
B. Memorandum and Articles of Association
Given that the information required under this Item 10B is primarily the listed matters as they are dealt with by or contained in a corporation’s articles and bylaws, the following discussion is not, except to the extent applicable and specifically required under this Item (or as necessary for clarity) intended to compare the provisions of Harvest’s bylaws and articles to the provisions of the ABCA. In some areas the Harvest bylaws and articles reflect or repeat the ABCA provisions, and in others, where and to the extent permitted by the ABCA, statutory provisions are added to or varied. Some description of the provisions of the ABCA may be made in the following explanations for context or for completeness to describe the relevant matters where the Articles or Bylaws do not have corresponding provisions. However, in any case where provisions of the ABCA are described, reference should be made to the actual statute for a complete understanding of the applicable law. In addition, in certain cases, the establishment of rights or restrictions under the Harvest articles and bylaws is subject to or restricted by the provisions of the ABCA, and the following does describe those aspects of the ABCA to the extent required for clear disclosure to meet the requirements of this Item 10B. The Harvest articles and bylaws have been developed to be in compliance with the ABCA requirements.
REGISTRATION AND POWERS
The Corporation is registered under Corporate Access Number 2015335496 and is the result of an amalgamation filed May 1, 2010 under the ABCA. The amalgamating corporations were KNOC Canada Ltd., Harvest Operations Corp. and 12065892 Alberta ULC. Companies incorporated or amalgamated under the ABCA have the capacity and, subject to the ABCA, the rights, powers and privileges of a natural person. Under the ABCA no bylaws are required to confer any particular power on a corporation or its directors, but if there are restrictions in its articles on the business carried on or exercised, the corporation shall not carry on or exercise such business. Harvest has no such restrictions in its articles of amalgamation (“Articles.”).There are no stated objects or purposes as would be applicable in a memorandum of association jurisdiction. References to “Bylaws” in the following shall mean the bylaws of Harvest, Bylaw No.1 and Bylaw No. 2.
DIRECTORS
Material contracts: A director who is party to a material contract or proposed material contract (or material transaction) has to disclose the nature and extent of the director’s interest therein in accordance with the ABCA. Such director is unable to vote on any resolution to approve such contract except as permitted by the ABCA, but is not excluded in determining the quorum. Certain exceptions to the inability to vote are provided for under the ABCA, and in particular an exception is made for contracts relating primarily to the director’s remuneration as a director, officer, employee or agent of the Corporation or an affiliate. Accordingly, the directors do have power in the absence of an independent forum to vote directors’ compensation. The compensation of the directors is decided by the directors unless the board of directors requests approval of compensation from the shareholders, which would be required to be by ordinary resolution (passed by a majority of the votes cast by the shareholders who voted on the resolution, or signed by all the shareholders entitled to vote on that resolution.)
83
Borrowing powers:There are no limitations created either by the Bylaws or Articles on borrowing powers of Harvest exercisable by the directors.
Retirement or non-retirement:There are no provisions for retirement or non-retirement of directors under an age limit.
Qualifying number of shares: There are no requirements for director share ownership provided under the Articles and Bylaws.
CLASSES OF SHARES AND SHARE RIGHTS
The Articles provide for two classes of shares (common shares and preferred shares), and for the issuance of an unlimited number of common share and the issuance in series of preferred shares, in unlimited number
Common shares
Under the Articles the common shares have the right to vote at all meetings of shareholders, except meetings which have voting restricted to holders of a specified class of shares, and under the ABCA ( a provision not varied by the Articles) each share entitles the holder to one vote at a meeting of shareholders. There is no provision under the Bylaws or Articles for directors to stand for reelection at staggered intervals or for cumulative voting. The common shares have the right to receive the remaining property and assets of the Corporation on dissolution, subject to the prior rights and privileges applicable to any other class of shares. With respect to the common shares under the Articles or Bylaws, there are no redemption provisions, sinking fund provisions, provisions imposing liability for further capital calls, or any provision discriminating against any existing or prospective holder of the common shares as a result of such shareholder owning a substantial number of shares.
Preferred shares
The preferred shares may be issued from time to time in one or more series with the number of shares in any such series determined by resolution of the directors prior to such issue. Under the Articles, each issued series of preferred shares shall have the rights, privileges, restrictions and conditions attaching to such series as are approved by resolution of the directors before the issue of such series.
Dividends
The common shares have the right to receive any dividend declared by Harvest subject to prior rights and privileges applicable to any other class of shares. The preferred shares’ rights to dividends may be established, as with any other rights, by resolution of directors as described above. Under the ABCA (and expressly included in the Bylaws) there is a solvency test and a liquidity test restricting the declaration and payment of dividends. There is no provision in the Articles or Bylaws for a lapse in dividend entitlement, based on time limits or otherwise.
Rights to change share rights
The necessary action to change the rights of holders of an Alberta corporation’s stock is set out under the ABCA. Under the ABCA in order to add, change or remove any rights, privileges, restrictions and conditions applicable to all or any of Harvest’s shares, the articles may be amended by special resolution. A special resolution is a resolution passed by a majority of not less than 2/3 of the votes cast by the shareholders who voted in respect of that resolution, or signed by all the shareholders entitled to vote on that resolution. The ability to amend or remove any of the foregoing includes rights to accrued dividends and can apply to shares whether issued or unissued. The Bylaws or Articles do not vary this provision of the ABCA and accordingly conditions for change of rights of Harvest shareholders are not more significant than required by law. Classes or series of shares are entitled to be dealt with in this regard by a vote separately by class or series, subject to the provisions of the ABCA. Articles of amendment must be filed after amendments are adopted by resolution.
84
MEETINGS
Annual meetings are provided under the Articles to be held in accordance with the requirements of the ABCA, and held at the registered office of the Corporation or elsewhere as determined by the directors. Special meetings may be called at any time and held on the dates and at the locations determined by the directors. Written notice to the shareholders is required (at least 21 days and not more than 50 days in advance of the meeting), including, if applicable details of special business to be transacted and the text of any special resolution to be tabled at the meeting. The notice is to be sent to each shareholder entitled to vote at the meeting, and the shareholders entitled to vote are those who on the record date are registered on the records of the Corporation (or if applicable, the transfer agent). Under the ABCA a written resolution signed by all shareholders entitled to vote on it is as valid as though passed at a meeting and such a resolution satisfies statutory meeting requirements. Accordingly in the case of a sole shareholder corporation, such as Harvest it can be practical to address annual meeting requirements and to deal with the business to be transacted at the annual meeting by written resolutions.
SHARE (SECURITIES) OWNERSHIP
The number of direct or indirect beneficial owners of securities of the Corporation under the Articles is limited to not more than fifty (securities in this context does not include non-convertible debt securities) and any invitation to the public to subscribe for securities is prohibited. With respect to the rights to acquire securities, the Articles provide that directors’ approval is required to transfer securities to a person who is not already a security holder. There are no limitations under the Articles and Bylaws on the rights of non-resident shareholders to hold securities or to exercise voting rights on securities which are held nor are there any such limitations pursuant to provisions of the ABCA.
OTHER PROVISIONS
There are no provisions of the Articles or Bylaws that would have the effect of delaying, deferring or preventing a change in control of Harvest and that would operate only with respect to a merger, acquisition or corporate restructuring involving Harvest or any subsidiaries. There are no provisions in the Bylaws governing the ownership threshold above which shareholder ownership must be disclosed. There are no provisions in the Articles or Bylaws governing changes in capital, and accordingly no conditions on changes in capital of Harvest under the Articles or Bylaws.
C. Material Contracts
SENIOR UNSECURED CREDIT FACILITY
An agreement for a US$400 million unsecured non-revolving credit facility (the “Senior Unsecured Credit Facility”), irrevocably and unconditionally guaranteed by KNOC, was entered into effective March 14, 2013 by Harvest with a syndicate of four financial institutions. Proceeds of borrowings under the Senior Unsecured Credit Facility are restricted to being used, directly or indirectly, to fund early redemption of the 7.25% Debentures Due 2013 and the 7.25% Debentures Due 2014 (see Item 4A “Recent Developments”). Draws under the Senior Unsecured Credit Facility were made on April 2 and April 12, 2013, for an aggregate amount of $US 390 million. The Senior Unsecured Credit Facility has a termination date six months from the date of the initial drawdown, and accordingly will terminate October 2, 2013. The Senior Unsecured Credit Facility contains no financial compliance covenants. Borrowings under the Senior Unsecured Credit Facility can be made as variable rate Libor Based or US Base Rate loans, with LIBOR Based loans bearing interest at LIBOR plus a margin, and US Base Rate loans bearing interest at the US Base Rate. The total amount outstanding under the Senior Unsecured Credit Facility as of April 30, 2013, including accrued interest is US$ 390.2 million.
67/8% SENIOR NOTES AND THE NOTE INDENTURE
The following is a summary of the material attributes and characteristics of the Note Indenture (and references below to “Notes” refer to the 67/8% Senior Notes):
PAYMENT UPON REDEMPTION
85
The Notes mature on October 1, 2017. Prior to maturity, the Notes are redeemable at a redemption price equal to 100% of the principal amount of the Notes being redeemed plus a make-whole redemption premium and accrued and unpaid interest to the redemption date. Harvest may also redeem the Notes at any time in the event that certain changes affecting Canadian withholding taxes occur.
COVENANTS
There are covenants restricting, among other things, the sale of assets and the incurrence of additional indebtedness if such issuance would result in an interest coverage ratio, as defined in the Note Indenture, of less than 2.0 to 1. In addition to debt permitted under the interest coverage ratio limitation, the incurrence of additional indebtedness may be permitted under other incurrence tests or baskets. One provision allows Harvest’s incurrence of indebtedness under the Credit Facility or other future bank debt in an aggregate principal amount not to exceed the greater of $1.0 billion and 15% of total assets. In addition, the covenants under the Note Indenture limit the amount of restricted payments, including dividends to Harvest’s shareholders.
REGISTRATION
On August 1, 2012 the Corporation completed the exchange of its initial unregistered Notes for Notes that have been registered under the Securities Act, as amended.
CREDIT FACILITY
The Credit Facility is a secured covenant-based $800 million revolving credit facility with a syndicate of ten financial institutions and includes an accordion feature that permits the Corporation to increase the size of the facility to $1.0 billion without lender consent if the Corporation is able to secure additional capacity from an existing or new lender(s).
Harvest continues to pay a floating interest rate plus a margin that changes based on the ratio of the Corporation’s drawn amount of debt to Annualized EBITDA (Annualized EBITDA as more fully discussed below and as defined in “Non-GAAP Measures” in this annual report). As at December 31, 2012, $494.2 million was drawn on the Credit Facility plus $8.2 million of letters of credit.
In addition to the standard representations, warrants and covenants commonly contained in a credit facility, the Credit Facility agreement contains the following covenants, among others:
| | (a) | An aggregate limitation of $25 million on financial assistance and/or capital contributions to parties other than those included in the first floating security interest; |
| | | | | |
| | (b) | A limitation on carrying on business in countries that are not members of the Organization for Economic Cooperation and Development; |
| | | | | |
| | (c) | A limitation on the payment of distributions to shareholders except for permitted distributions. The bases for permitted distributions include allowed distributions based on the Total Debt to Annualized EBITDA ratio not exceeding 2.5:1 after any such distribution, and allowed aggregate distributions for the most recent fiscal quarters (including the amount of the proposed distribution) in amounts less than Annualized EBITDA minus capital expenditures during the most recent four fiscal quarters by Harvest and its restricted subsidiaries. As well there is a provision for other allowed distributions provided that the aggregate of distributions made thereunder since April 29, 2011 is not to exceed $150 million; this basis for distribution is further subject to compliance with certain ratios after cumulative distributions of $100 million; and |
| | | | | |
| | (d) | Financial compliance covenants are as follows (compliance is certified quarterly for the relevant quarter or the fiscal year, as applicable): |
| | | | | |
| | | (1) | Total Debt to Annualized EBITDA for the twelve months ending |
| | | | | |
| | | | a. | June 30, 2012 of 4.25 to 1.0 or less; |
| | | | b. | Sept. 30, 2012 of 4.25 to 1.0 or less; |
| | | | c. | Dec. 31, 2012 of 4.00 to 1.0 or less; |
| | | | d. | March 31, 2013 of 3.75 to 1.0 or less; |
| | | | e. | June 30, 2013 and thereafter of 3.50 to 1.0 or less |
86
| | (2) | Senior Debt to Annualized EBITDA of 3.0 to 1.0 or less; |
| | (3) | Senior Debt to Capitalization of 50% or less; and |
| | (4) | Total Debt to Capitalization of 55% or less. |
Note: in the above, “Senior Debt” includes letters of credit, bank debt and guarantees and “Total Debt”consists of Senior Debt, the Notes and the Debentures.
For purposes of determining the financial covenants, the following terms are defined in the Credit Facility agreement:
| | (a) | Annualized EBITDA is the aggregate of the past four quarters Net Earnings plus: |
| | | |
| | | (1) | interest and financing charges; |
| | | (2) | future income tax expense; |
| | | (3) | depletion, depreciation and amortization; |
| | | (4) | unrealized gains/losses on risk management contracts; |
| | | (5) | unrealized currency exchange gains/losses; and |
| | | (6) | other non-cash items. |
| | | | |
| | (b) | Capitalization is the aggregate of the amounts of Total Debt, Related Party Loan and shareholders’ equity, all as reported in Harvest’s consolidated balance sheet in accordance with IFRS, less equity for the BlackGold project. |
With respect to these financial covenants, Harvest’s December 31, 2012 financial ratios were as follows:
- Secured Debt to Annualized EBITDA of 1.10 to 1.0;
- Total Debt to Annualized EBITDA of 3.22 to 1.0;
- Secured Debt to Capitalization of 14%; and
- Total Debt to Capitalization of 41%.
SUPPLY AND OFFTAKE AGREEMENT
SOA (2011)
North Atlantic entered into the SOA (2011) on October 11, 2011 upon the termination of the SOA. The SOA (2011) provides that the ownership of substantially all crude oil and other feedstocks and refined product inventories at the Refinery be retained by MEC and that MEC be granted the exclusive right and obligation to provide crude oil feedstock and other feedstocks for delivery to the Refinery as well as the exclusive right and obligation to purchase virtually all refined products produced by the Refinery for export. The SOA (2011) also provides that MEC will receive a time value of money ("TVM") amount associated with the purchase of crude oil and other feedstocks and sale of refined products as the SOA (2011) requires that MEC retain ownership of the crude oil and other feedstocks until delivered through the inlet flange to the Refinery as well as immediately take title to the refined products as they are delivered by the Refinery through the inlet flange to designated storage tanks. Further, the SOA (2011) provides North Atlantic with the opportunity to share the incremental profits and losses resulting from the sale of products beyond the U.S. east coast markets.
Pursuant to the SOA (2011), North Atlantic, in consultation with MEC, requests a certain slate of crude oil and other feedstocks and MEC is obligated to provide the feedstocks in accordance with the request and the other provisions of the SOA (2011). The SOA (2011) includes a feedstock transfer pricing formula that aggregates the pricing for the feedstocks purchased as correlated to published future contract settlement prices, the cost of transportation from the source of supply to the Refinery and the settlement cost or proceeds for related operational price risk management contracts. The purpose of these operational price risk management contracts is to convert the fixed price of crude oil and other feedstock purchases to floating prices for the period from the purchase date through to the date the refined products are sold to North Atlantic to allow "matching" of feedstock purchases to refined product sales.
The SOA (2011) requires that MEC purchase and lift all refined products produced by the Refinery, except for certain excluded refined products to be marketed by North Atlantic in the local Newfoundland market, and provides a product purchase pricing formula that aggregates a price based on the current Boston and New York City markets, less the costs of transportation, insurance, port fees, inspection charges and similar costs incurred by MEC, plus the TVM component.
The SOA (2011) is a successive one-year term agreement with an initial one-year term and may be terminated by either party at any time thereafter by providing notice of termination no later than six months prior to the desired termination date, or if the Refinery is sold in an arm’s length transaction, upon 30 days notice prior to the desired termination date. Further, the SOA (2011) may be terminated upon the continuation for more than 180 days of a delay in performance due to force majeure but prior to the recommencing of performance. Upon termination of the agreement or the right and obligation to provide feedstocks, North Atlantic has the option to purchase or arrange for another feedstock supplier to purchase the feedstocks and refined product inventories in designated tanks at the prevailing prices as stipulated under the SOA (2011).
87
On April 19, 2012 and subsequently on July 23, 2012 the SOA (2011) was amended to allow the Refinery to purchase from MEC certain additional petroleum products, additives and feedstock that was not previously included in the SOA (2011), to permit delivery method of feedstock and feedstock additives in addition to ex-ship delivery and to amend the Annex B “Designated Tank”.
D. Exchange Controls
There are no governmental laws, decrees, regulations or legislation of Canada or restrictions under the constating documents of Harvest that affect the import or export of capital or the remittance of dividends, interest or other payments to non-resident security holders.
E. Taxation
Not applicable.
F. Dividends and Paying Agents
Not applicable.
G. Statements by Experts
Not applicable.
H. Documents on Display
Documents concerning the Corporation which are referred to in this annual report may be inspected at Harvest’s head office, Suite 2100, 330 - 5th Avenue S.W., Calgary, Alberta T2P 0L4. In addition, all of the SEC filings made electronically by Harvest are available to the public on the SEC website atwww.sec.gov.
I. Subsidiary Information
Not applicable.
ITEM 11. QUANTITATIVE AND QUALITATIVE DISCLOSURES ABOUT MARKET RISK
Quantitative and qualitative disclosures of market risk as at December 31, 2012 can be found in Note 22 of the Corporation’s December 31, 2012 consolidated financial statements included under Item 18 of this annual report. All market risk sensitive instruments are entered into for purposes other than trading.
ITEM 12. DESCRIPTION OF SECURITIES OTHER THAN EQUITY SECURITIES
Not applicable.
ITEM 13. DEFAULTS, DIVIDEND ARREARAGES AND DELINQUENCIES
Not applicable.
ITEM 14. MATERIAL MODIFICATIONS TO THE RIGHTS OF SECURITY HOLDERS AND USE OF PROCEEDS
Not applicable.
88
ITEM 15. CONTROLS AND PROCEDURES
DISCLOSURE CONTROLS AND PROCEDURES
Under the supervision of the Chief Executive Officer and Chief Financial Officer, the Corporation has evaluated the effectiveness of its disclosure controls and procedures as of December 31, 2012 as defined under the rules adopted by the U.S. Securities and Exchange Commission. Based on this evaluation, the Chief Executive Officer and Chief Financial Officer have concluded that as of December 31, 2012, the disclosure controls and procedures were effective to ensure that information required to be disclosed by Harvest in reports it files or submits to U.S. securities authorities was recorded, processed, summarized and reported within the time period specified in U.S. securities laws and was accumulated and communicated to management, including its Chief Executive Officer and Chief Financial Officer, to allow timely decisions regarding required disclosures.
INTERNAL CONTROL OVER FINANCIAL REPORTING
Management is responsible for establishing and maintaining internal control over our financial reporting. Our internal control over financial reporting is designed to provide reasonable assurance regarding the reliability of financial reporting and preparation of financial statements for external purposes. Management, with the participation of our Chief Executive Officer and Chief Financial Officer, has evaluated the effectiveness of our internal control over financial reporting as of December 31, 2012. The evaluation was based on the Internal Control – Integrated Framework issued by the Audit Committee of Sponsoring Organizations of the Treadway Commission. Based on our evaluation, management concluded that our internal control over financial reporting was effective as of December 31, 2012.
Because of its inherent limitations, disclosure controls and procedures and internal control over financial reporting may not prevent or detect misstatements, errors or fraud. Control systems, no matter how well conceived or operated, can provide only reasonable, but not absolute, assurance that the objectives of the control systems are met.
CHANGES IN CONTROL OVER FINANCIAL REPORTING
There were not any significant changes in internal controls over financial reporting for the period ended December 31, 2012 that have materially affected, or are reasonably likely to materially affect, our internal controls over financial reporting.
ITEM 16A. AUDIT COMMITTEE FINANCIAL EXPERT
As discussed in Item 6C “Board Practice” given the recent resignation of Brant Sangster and Bill Friley, and the expiry of ChangKoo Kang’s term on the Audit Committee, the Audit Committee has no members. Accordingly, the Audit Committee currently does not have a financial expert. Until his resignation from the Harvest Board on November 21, 2012, Bill Robertson, Chair of the Audit Committee, was determined by the Board as the Audit Committee Financial Expert, as defined in Item 16A of Form 20-F. Mr. Robertson was independent within the meaning of the definition of audit committee member independence applicable under the Corporate Governance Standards of the New York Stock Exchange. Mr. Kang was determined to be the audit committee financial expert during the term of his appointment to the Audit Committee based on have held various positions within the meaning of Item 16(c)(4). Refer to Item 6A for additional information on Mr. Kang’s relevant education and experience.
ITEM 16B. CODE OF ETHICS
Harvest has adopted a Code of Ethics that applies to its principal executive, financial and accounting officers, and other members of senior management. Specifically, this code applies to the Registrant’s President and Chief Executive Officer, Chief Financial Officer, and Chief Operating Officer. The Code of Ethics can be found on Harvest’s Corporate Governance website athttp://www.harvestenergy.ca/corporate-overview/corporate-governance.html. There were no waivers or amendments to the Code of Ethics in 2012.
89
ITEM 16C. PRINCIPAL ACCOUNTANT FEES AND SERVICES
Ernst & Young LLP, Chartered Accountants (“E&Y”) have been appointed auditor of Harvest for the fiscal year 2011 and 2012. Prior to August 11, 2011, KPMG LLP Chartered Accountants (“KPMG”) was the auditor of the Corporation. For more information, please see section “Change in Registrant’s Certifying Accountant” under Item 16F of the annual report for Harvest on Form 20-F for the year ended December 31, 2011.
The aggregate fees billed by Harvest’s external auditor in the last two fiscal years for audit services are as follows:
| | | E&Y | | | KPMG(1) | | | E&Y(2) | | | Total | |
| For the year ended December 31 | | 2012 | | | 2011 | | | 2011 | | | 2011 | |
| Audit Fees(3) | | 682,000 | | | 337,000 | | | 561,500 | | | 898,500 | |
| Audit-Related Fees(4) | | 105,000 | | | 137,000 | | | 71,000 | | | 208,000 | |
| Tax Fees(5) | | 54,225 | | | 5,100 | | | 41,073 | | | 46,173 | |
| Executive Compensation – Related Fee(6) | | 41,074 | | | | | | | | | | |
| All Other Fees(7) | | 3,395 | | | - | | | 795 | | | 795 | |
| Total | | 885,694 | | | 479,100 | | | 674,368 | | | 1,153,468 | |
| (1) | Includes fees billed by KPMG for the fiscal year ended December 31, 2011 up to the appointment of E&Y on August 11, 2011. |
| (2) | Includes fees billed by E&Y for the fiscal year ended December 31, 2011 beginning after the appointment of E&Y on August 11, 2011. |
| (3) | Represents the aggregate fees of the Corporation’s auditors for audit services in respect of the financial year. |
| (4) | Represents the aggregate fees billed for assurance and related services by the Corporation’s auditors that are related to the performance of audit or review of the Corporation’s financial statements and are not included under “Audit Fees” and are primarily composed of services related to the Corporation’s interim financial statements and debt offerings in 2010. |
| (5) | Represents the aggregate fees billed for tax compliance, tax advice and tax planning in respect of the financial year. |
| (6) | Please see Compensation Consultant section in Item 6B of this annual report. |
| (7) | Represents the aggregate fees bill for online subscription and software implementation fees. |
The Audit Committee must first approve all non-audit or special services performed by any independent accountants. All remuneration provided to the Corporation's auditor and any independent accountants are also approved by the Audit Committee. The Corporation’s auditor meets with the Audit Committee, without management present, at least annually and more often at the request of either the Audit Committee or the auditor. The Audit Committee approved all services included in the table above. See Item 6C “Board Practice” for Harvest’s pre-approval process.
ITEM 16D. EXEMPTIONS FROM THE LISTING STANDARDS FOR AUDIT COMMITTEES
Not applicable.
ITEM 16E. PURCHASE OF EQUITY SECURITIES BY THE ISSUER AND AFFILIATED PURCHASERS
Not applicable.
ITEM 16F. CHANGE IN REGISTRANT’S CERTIFYING ACCOUNTANT
Not applicable (the disclosure called for by paragraph (a) has been reported in the annual report for the Corporation on Form 20-F for the 2011 fiscal year and paragraph (b) disclosure is not required since, as previously disclosed, there were no disagreements of the type described in paragraph (a)(1)(iv) or reportable events as described in paragraph (a)(1)(v) of Item 16. F.)
90
ITEM 16G. CORPORATE GOVERNANCE
Not applicable.
ITEM 16H. MINE SAFETY DISCLOSURE
Not applicable.
ITEM 17. FINANCIAL STATEMENTS
Not applicable.
ITEM 18. FINANCIAL STATEMENTS
See F-pages following Item 19.
91
| ITEM 19. | EXHIBITS |
| | |
| 1 | Harvest's Articles of Amalgamation and Bylaws |
| | |
| 2.1 | 67/8% Senior Notes Indenture, dated October 4, 2010(1) |
| | |
| 2.2 | Senior Unsecured Credit Facility Agreement, dated March 14, 2013 Supply and Offtake Agreement between North Atlantic and Macquarie Energy Canada Ltd. dated October 1, 2011(3)and First Amendment to Supply and Offtake Agreement between North Atlantic and Macquarie Energy |
| | |
| 4.1 | Canada Ltd dated December 19, 2011(2) Second and Third Amendments to Supply and Offtake Agreement between North Atlantic and Macquarie Energy |
| | |
| 4.2 | Canada Ltd dated April 19, 2012 and July 23, 2012 respectively(3) |
| | |
| 4.3 | Amended and Restated Credit Facility dated April 30, 2010(4) |
| | |
| 4.4 | First Amending Agreement (Credit Facility) dated December 17, 2010(1) |
| | |
| 4.5 | Second Amending Agreement (Credit Facility) dated April 29, 2011(1) |
| | |
| 4.6 | Third Amending Agreement (Credit Facility) dated December 16, 2011(5) |
| | |
| 4.7 | Fourth Amending Agreement (Credit Facility) dated June 29, 2012(6) |
| | |
| 4.8 | Fifth Amending Agreement (Credit Facility) dated July 31, 2012(7) |
| | |
| 4.9 | 67/8% Senior Notes Indenture, dated October 4, 2010(1) |
| | |
| 4.10 | Harvest's Articles of Amalgamation and Bylaws incorporated by reference to Item 19.1 of this annual report. |
| | |
| 4.11 | Senior Unsecured Credit Facility Agreement, dated March 14, 2013 incorporated by reference to Item 19.2.2 of this annual report |
| | |
| 8 | Refer to Item 4C “Organization Structure” of this annual report. |
| | |
| 12.1 | Chief Executive Officer Certification required by Rule 13a-14(a) or 15d-14(a) |
| | |
| 12.2 | Chief Financial Officer Certification required by Rule 13a-14(a) or 15d-14(a) |
| | |
| 13.1 | Chief Executive Officer Certification required by Rule 13a-14(b) or 15d-14(b) |
| | |
| 13.2 | Chief Financial Officer Certification required by Rule 13a-14(b) or 15d-14(b) |
| | |
| 15.1 | McDaniel’s consent and Reserve Evaluation Methodology Report covering letter |
| | |
| 15.2 | GLJ’s consent and Reserve Evaluation Procedure Report covering letter |
| | |
| (1) | Incorporated by reference to Form 6-K filed on June 20, 2011. |
| | |
| (2) | Incorporated by reference to Form 6-K filed on April 16, 2012. |
| | |
| (3) | Incorporated by reference to Form 6-K filed on July 30, 2012. |
| | |
| (4) | Incorporated by reference to Form 6-K filed on May 17, 2010. |
| | |
| (5) | Incorporated by reference to Form 6-K filed on April 2, 2012. |
| | |
| (6) | Incorporated by reference to Form 6-K filed on July 3, 2012. |
| | |
| (7) | Incorporated by reference to Form 6-K filed on July 31, 2012. |
92
SIGNATURES
The registrant hereby certifies that it meets all of the requirements for filing on Form 20-F and that it has duly caused and authorized the undersigned to sign this annual report on its behalf.
Harvest Operations Corp.
/s/ Chang-Koo Kang
Chang-Koo Kang
Chief Financial Officer
Dated: April 30, 2013
93
INDEX
F - 1
MANAGEMENT’S REPORT
In management’s opinion, the accompanying consolidated financial statements of Harvest Operations Corp. (the “Company”) have been prepared within reasonable limits of materiality and in accordance with International Financial Reporting Standards (“IFRS”) as issued by the International Accounting Standards Board (“IASB”). Since a precise determination of many assets and liabilities is dependent on future events, the preparation of financial statements necessarily involves the use of estimates and approximations. These have been made using careful judgment and with all information available up to February 28, 2013. Management is responsible for the consistency, therewith, of all other financial and operating data presented in Management’s Discussion and Analysis for the year ended December 31, 2012.
To meet our responsibility for reliable and accurate financial statements, management has developed and maintains internal controls, which are designed to provide reasonable assurance that financial information is relevant, reliable and accurate, and that assets are safeguarded and transactions are executed in accordance with management’s authorization.
Under the supervision of our Chief Executive Officer and our Chief Financial Officer, we have conducted an evaluation of the effectiveness of our internal control over financial reporting based on theInternal Control - Integrated Frameworkissued by the Committee of Sponsoring Organizations of the Treadway Commission. We have concluded that as of December 31, 2012, our internal controls over financial reporting were effective.
Because of inherent limitations, internal control over financial reporting may not prevent or detect misstatements and even those systems determined to be effective can provide only reasonable assurance with respect to the financial statement preparation and presentation.
The consolidated financial statements have been examined by our auditors, Ernst & Young LLP. Their responsibility is to express a professional opinion on the fair presentation of the consolidated financial statements prepared in accordance with IFRS as issued by the IASB. The Auditors’ Report outlines the scope of their examination and sets forth their opinion on our consolidated financial statements.
The Board of Directors is responsible for approving the consolidated financial statements. The Board fulfills its responsibilities related to financial reporting mainly through the Audit Committee. The Audit Committee currently consists of two independent directors and the Chief Financial Officer (“CFO”) of the Company. The CFO was appointed to the Audit Committee to temporarily fill a vacancy, resulting from a recent resignation of an audit committee member. The Company is exempted from the requirements in subsections 3.1(3) and 3.1(4) of National Instrument 52-110 (“NI 52-110”) for up to six months from the day the vacancy was created pursuant to section 3.5 of NI 52-110. The Board of Directors has determined that the reliance on the exemption will not materially adversely affect the ability of the audit committee to act independently and to satisfy the other requirements of NI 52-110. The Audit Committee meets regularly with management and the external auditors to discuss reporting and governance issues and ensures each party is discharging its responsibilities. The Audit Committee has reviewed these financial statements with management and the auditors and has recommended their approval to the Board of Directors. The Board of Directors has approved the consolidated financial statements of the Company.
| (signed) | (signed) |
| | |
| Myunghuhn Yi | Chang-Koo Kang |
| President and Chief Executive Officer | Chief Financial Officer |
| | |
| | |
| Calgary, Alberta | |
| February 28, 2013 | |
F - 2

INDEPENDENT AUDITORS’ REPORT
To the Shareholder of Harvest Operations Corp.
We have audited the accompanying comparative information of Harvest Operations Corp., which comprise the consolidated statements of financial position as at December 31, 2010 and January 1, 2010, the consolidated statements of comprehensive loss, changes in shareholders’ equity and cash flows for the year ended December 31, 2010, and notes, comprising a summary of significant accounting policies and other explanatory information
Management’s Responsibility for the Consolidated Financial Statements
Management is responsible for the preparation and fair presentation of these consolidated financial statements in accordance with International Financial Reporting Standards as issued by the International Accounting Standards Board, and for such internal control as management determines is necessary to enable the preparation of consolidated financial statements that are free from material misstatement, whether due to fraud or error.
Auditors’ Responsibility
Our responsibility is to express an opinion on these consolidated financial statements based on our audit. We conducted our audit in accordance with Canadian generally accepted auditing standards and the standards of the Public Company Accounting Oversight Board (United States). Those standards require that we comply with ethical requirements and plan and perform the audit to obtain reasonable assurance about whether the consolidated financial statements are free from material misstatement.
An audit involves performing procedures to obtain audit evidence about the amounts and disclosures in the consolidated financial statements. The procedures selected depend on our judgment, including the assessment of the risks of material misstatement of the consolidated financial statements, whether due to fraud or error. In making those risk assessments, we consider internal control relevant to the entity’s preparation and fair presentation of the consolidated financial statements in order to design audit procedures that are appropriate in the circumstances, but not for the purpose of expressing an opinion on the effectiveness of the entity’s internal control. An audit also includes evaluating the appropriateness of accounting policies used and the reasonableness of accounting estimates made by management, as well as evaluating the overall presentation of the consolidated financial statements.
We believe that the audit evidence we have obtained is sufficient and appropriate to provide a basis for our audit opinion.
Opinion
In our opinion, the comparative information in these consolidated financial statements present fairly, in all material respects, the consolidated financial positions of Harvest Operations Corp. as at December 31, 2010 and January 1, 2010, and its consolidated financial performance and its consolidated cash flows for the year ended December 31, 2010 in accordance with International Financial Reporting Standards as issued by the International Accounting Standards Board.
The consolidated statement of financial position as at December 31, 2011, the consolidated statements of comprehensive loss, changes in shareholders’ equity and cash flows for the year ended December 31, 2011 and notes, comprising a summary of significant accounting policies and other explanatory information, are audited by another auditor who expressed an unmodified opinion on February 29, 2012.

Chartered Accountants
F - 3

Calgary, Canada
June 14, 2012
F - 4
INDEPENDENT AUDITORS’ REPORT OF REGISTERED PUBLIC ACCOUNTING FIRM
To the Directors and the Shareholder of Harvest Operations Corp.:
We have audited the accompanying consolidated financial statements of Harvest Operations Corp., which comprise of the consolidated statement of financial position as at December 31, 2012 and 2011, and the consolidated statements of comprehensive loss, statement of changes in shareholder’s equity and cash flow statement for the years then ended, and a summary of significant accounting policies and other explanatory information.
Management’s responsibility for the consolidated financial statements
Management is responsible for the preparation and fair presentation of these consolidated financial statements in accordance with International Financial Reporting Standards as issued by the International Accounting Standards Board, and for such internal control as management determines is necessary to enable the preparation of consolidated financial statements that are free from material misstatement, whether due to fraud or error.
Auditors’ responsibility
Our responsibility is to express an opinion on these consolidated financial statements based on our audits. We conducted our audits in accordance with Canadian generally accepted auditing standards and the standards of the Public Company Accounting Oversight Board (United States). Those standards require that we comply with ethical requirements and plan and perform the audit to obtain reasonable assurance about whether the consolidated financial statements are free from material misstatement. We were not engaged to perform an audit of the Company’s internal control over financial reporting. Our audits included consideration of internal control over financial reporting as a basis for designing audit procedures that are appropriate in the circumstances, but not for the purpose of expressing an opinion on the effectiveness of the Company’s internal control over financial reporting. Accordingly, we express no such opinion.
An audit involves performing procedures to obtain audit evidence about the amounts and disclosures in the consolidated financial statements. The procedures selected depend on the auditor’s judgment, including the assessment of the risks of material misstatement of the consolidated financial statements, whether due to fraud or error. An audit also includes examining, on a test basis, evidence supporting the amounts and disclosures in the consolidated financial statements, evaluating the appropriateness of accounting policies used and the reasonableness of accounting estimates made by management, as well as evaluating the overall presentation of the consolidated financial statements.
We believe that the audit evidence we have obtained is sufficient and appropriate to provide a basis for our audit opinion.
Opinion
In our opinion, the consolidated financial statements present fairly, in all material respects, the financial position of Harvest Operations Corp. as at December 31, 2012 and 2011 and of its financial performance and its cash flows for the years then ended in accordance with International Financial Reporting Standards as issued by the International Accounting Standards Board
Other matter
The consolidated financial statements of Harvest Operations Corp. for the year ended December 31, 2010, were audited by another auditor who expressed an unmodified opinion on those statements on June 14, 2012.

Chartered Accountants
Calgary, Canada
February 28, 2013
F - 5
CONSOLIDATED STATEMENTS OF FINANCIAL POSITION
| | | | | | As at December 31, | |
| (millions of Canadian dollars) | | Notes | | | 2012 | | | 2011 | |
| Assets | | | | | | | | | |
| Current assets | | | | | | | | | |
| Cash | | 22 | | $ | 7.6 | | $ | 6.6 | |
| Accounts receivable and other | | 22 | | | 175.6 | | | 212.3 | |
| Inventories | | 4 | | | 80.8 | | | 61.0 | |
| Prepaid expenses | | | | | 20.2 | | | 18.5 | |
| Risk management contracts | | 22 | | | 1.8 | | | 20.2 | |
| Assets held for sale | | 5 | | | 16.9 | | | - | |
| | | | | | 302.9 | | | 318.6 | |
| Non-current assets | | | | | | | | | |
| Long-term deposit | | | | | 5.0 | | | 24.9 | |
| Investment tax credits and other | | 7 | | | 28.5 | | | 54.0 | |
| Deferred income tax asset | | 19 | | | 61.1 | | | - | |
| Exploration and evaluation assets | | 6 | | | 73.4 | | | 74.5 | |
| Property, plant and equipment | | 7 | | | 4,783.3 | | | 5,400.4 | |
| Other long-term asset | | | | | 8.6 | | | 7.1 | |
| Goodwill | | 8 | | | 391.8 | | | 404.9 | |
| | | | | | 5,351.7 | | | 5,965.8 | |
| Total assets | | | | $ | 5,654.6 | | $ | 6,284.4 | |
| | | | | | | | | | |
| Liabilities | | | | | | | | | |
| Current liabilities | | | | | | | | | |
| Accounts payable and accrued liabilities | | 22 | | $ | 376.0 | | $ | 464.1 | |
| Current portion of long-term debt | | 10, 22 | | | 331.8 | | | 107.1 | |
| Current portion of long-term provisions | | 9 | | | 28.1 | | | 17.1 | |
| Liabilities associated with assets held for sale | | 5 | | | 11.9 | | | - | |
| | | | | | 747.8 | | | 588.3 | |
| Non-current liabilities | | | | | | | | | |
| Long-term debt | | 10, 22 | | | 1,277.9 | | | 1,486.2 | |
| Related party loan | | 22, 25 | | | 172.1 | | | - | |
| Long-term liability and other | | 11, 22 | | | 5.2 | | | 0.8 | |
| Long-term provisions | | 9 | | | 727.3 | | | 674.5 | |
| Post-employment benefit obligations | | 20 | | | 32.4 | | | 26.0 | |
| Deferred income tax liability | | 19 | | | - | | | 54.9 | |
| | | | | | 2,214.9 | | | 2,242.4 | |
| Total liabilities | | | | $ | 2,962.7 | | $ | 2,830.7 | |
| | | | | | | | | | |
| Shareholder’s equity | | | | | | | | | |
| Shareholder’s capital | | 12 | | | 3,860.8 | | | 3,860.8 | |
| Deficit | | | | | (1,109.1 | ) | | (389.0 | ) |
| Accumulated other comprehensive loss | | 21 | | | (59.8 | ) | | (18.1 | ) |
| Total shareholder’s equity | | | | | 2,691.9 | | | 3,453.7 | |
| Total liabilities and shareholder's equity | | | | $ | 5,654.6 | | $ | 6,284.4 | |
| Commitments and contingencies[note 24] | | | | | | | | | |
The accompanying notes are an integral part of these consolidated financial statements.
| On behalf of the Board of Directors: | (signed) | | (signed) |
| | Brant Sangster, Director | | Myunghuhn Yi, Director |
F - 6
CONSOLIDATED STATEMENTS OF COMPREHENSIVE LOSS
For the years ended December 31,
| (millions of Canadian dollars) | | Notes | | | 2012 | | | 2011 | | | 2010 | |
| | | | | | | | | | | | | |
| Petroleum, natural gas, and refined products sales | | | | $ | 5,945.6 | | $ | 4,589.2 | | $ | 4,200.3 | |
| Royalties | | | | | (164.6 | ) | | (195.5 | ) | | (154.8 | ) |
| Revenues | | 14 | | | 5,781.0 | | | 4,393.7 | | | 4,045.5 | |
| | | | | | | | | | | | | |
| Expenses | | | | | | | | | | | | |
| Purchased products for processing and resale | | | | | 4,520.3 | | | 3,118.1 | | | 2,981.2 | |
| Operating | | 15 | | | 620.5 | | | 576.1 | | | 481.2 | |
| Transportation and marketing | | | | | 26.6 | | | 35.9 | | | 15.7 | |
| General and administrative | | 15 | | | 65.6 | | | 62.6 | | | 47.1 | |
| Depletion, depreciation and amortization | | 7 | | | 688.4 | | | 626.7 | | | 553.7 | |
| Exploration and evaluation | | 6 | | | 24.9 | | | 18.3 | | | 3.3 | |
| Gains on disposition of property, plant and equipment | | 7 | | | (30.3 | ) | | (7.9 | ) | | (0.7 | ) |
| Finance costs | | 16 | | | 111.0 | | | 109.1 | | | 100.8 | |
| Risk management contracts gains | | 22 | | | (0.5 | ) | | (6.7 | ) | | (0.6 | ) |
| Foreign exchange gains | | 17 | | | (1.3 | ) | | (4.0 | ) | | (3.4 | ) |
| Impairment on property, plant and equipment | | 7 | | | 585.0 | | | - | | | 13.7 | |
| Loss before income tax | | | | | (829.2 | ) | | (134.5 | ) | | (146.5 | ) |
| | | | | | | | | | | | | |
| Income tax recovery | | 19 | | | (109.1 | ) | | (29.8 | ) | | (65.3 | ) |
| Net loss | | | | $ | (720.1 | ) | $ | (104.7 | ) | $ | (81.2 | ) |
| | | | | | | | | | | | | |
| Other comprehensive loss | | | | | | | | | | | | |
| Gains (losses) on derivatives designated as cash flow hedges, net of tax | | 21, 22 | | | (13.2 | ) | | 19.4 | | | (5.0 | ) |
| Gains (losses) on foreign currency translation | | 21 | | | (17.7 | ) | | 21.5 | | | (45.9 | ) |
| Actuarial loss, net of tax | | 20, 21 | | | (10.8 | ) | | (4.9 | ) | | (3.2 | ) |
| Comprehensive loss | | | | $ | (761.8 | ) | $ | (68.7 | ) | $ | $ (135.3 | ) |
The accompanying notes are an integral part of these consolidated financial statements.
F - 7
CONSOLIDATED STATEMENTS OF CHANGES IN SHAREHOLDER’S EQUITY
| | | | | | | | | | | | Accumulated | | | | |
| | | | | | | | | | | | Other | | | Total | |
| | | | | | Shareholder’s | | | | | | Comprehensive | | | Shareholder’s | |
| (millions of Canadian dollars) | | Notes | | | Capital | | | Deficit | | | Loss | | | Equity | |
| Balance at December 31, 2011 | | | | $ | 3,860.8 | | $ | (389.0 | ) | $ | (18.1 | ) | $ | 3,453.7 | |
| Losses on derivatives designated as cash flow hedges, net of tax | | 21 | | | - | | | - | | | (13.2 | ) | | (13.2 | ) |
| Losses on foreign currency translation | | 21 | | | - | | | - | | | (17.7 | ) | | (17.7 | ) |
| Actuarial loss, net of tax | | 20, 21 | | | - | | | - | | | (10.8 | ) | | (10.8 | ) |
| Net loss | | | | | - | | | (720.1 | ) | | - | | | (720.1 | ) |
| Balance at December 31, 2012 | | | | $ | 3,860.8 | | $ | (1,109.1 | ) | $ | (59.8 | ) | $ | 2,691.9 | |
| | | | | | | | | | | | | | | | |
| | | | | | | | | | | | | | | | |
| Balance at December 31, 2010 | | | | $ | 3,355.4 | | $ | (284.3 | ) | $ | (54.1 | ) | $ | 3,017.0 | |
| Issue of share capital | | 3, 12 | | | 505.4 | | | - | | | - | | | 505.4 | |
| Gains on derivatives designated as cash flow hedges, net of tax | | 21 | | | - | | | - | | | 19.4 | | | 19.4 | |
| Gains on foreign currency translation | | 21 | | | - | | | - | | | 21.5 | | | 21.5 | |
| Actuarial loss, net of tax | | 20, 21 | | | - | | | - | | | (4.9 | ) | | (4.9 | ) |
| Net loss | | | | | - | | | (104.7 | ) | | - | | | (104.7 | ) |
| Balance at December 31, 2011 | | | | $ | 3,860.8 | | $ | (389.0 | ) | $ | (18.1 | ) | $ | 3,453.7 | |
| | | | | | | | | | | | | | | | |
| Balance at January 1, 2010 | | | | $ | 2,422.7 | | $ | (203.1 | ) | $ | - | | $ | 2,219.6 | |
| Issue of share capital | | 12 | | | 932.7 | | | - | | | - | | | 932.7 | |
| Losses on derivatives designated as cash flow hedges, net of tax | | 21 | | | - | | | - | | | (5.0 | ) | | (5.0 | ) |
| Losses on foreign currency translation | | 21 | | | - | | | - | | | (45.9 | ) | | (45.9 | ) |
| Actuarial loss, net of tax | | 20, 21 | | | - | | | - | | | (3.2 | ) | | (3.2 | ) |
| Net loss | | | | | - | | | (81.2 | ) | | - | | | (81.2 | ) |
| Balance at December 31, 2010 | | | | $ | 3,355.4 | | $ | (284.3 | ) | $ | (54.1 | ) | $ | 3,017.0 | |
The accompanying notes are an integral part of these consolidated financial statements.
F - 8
CONSOLIDATED STATEMENTS OF CASH FLOWS
For the years ended December 31,
| (millions of Canadian dollars) | | Notes | | | 2012 | | | 2011 | | | 2010 | |
| Cash provided by (used in) | | | | | | | | | | | | |
| Operating Activities | | | | | | | | | | | | |
| Net loss | | | | $ | (720.1 | ) | $ | (104.7 | ) | $ | (81.2 | ) |
| Items not requiring cash | | | | | | | | | | | | |
| Depletion, depreciation and amortization | | | | | 688.4 | | | 626.7 | | | 553.7 | |
| Accretion of decommissioning and environmental remediation liabilities | | 9, 16 | | | 20.7 | | | 23.6 | | | 22.7 | |
| Unrealized (gains) losses on risk management contracts | | 22 | | | 1.1 | | | (0.7 | ) | | (2.4 | ) |
| Unrealized (gains) losses on foreign exchange | | 17 | | | (1.2 | ) | | 2.6 | | | (1.9 | ) |
| Non-cash interest (income) expense | | | | | 2.4 | | | (0.7 | ) | | (7.0 | ) |
| Unsuccessful exploration and evaluation costs | | 6 | | | 22.0 | | | 17.8 | | | 2.9 | |
| Impairment on property, plant and equipment | | 7 | | | 585.0 | | | - | | | 13.7 | |
| Gains on disposition of property, plant and equipment | | 7 | | | (30.3 | ) | | (7.9 | ) | | (0.7 | ) |
| Deferred income tax recovery | | 19 | | | (109.1 | ) | | (29.9 | ) | | (65.1 | ) |
| Other non-cash items | | | | | (6.7 | ) | | 4.7 | | | (1.1 | ) |
| Realized foreign exchange gain on senior note redemptions | | | | | - | | | - | | | (6.4 | ) |
| Settlement of decommissioning and environmental | | 9 | | | (20.4 | ) | | (22.1 | ) | | (20.3 | ) |
| remediation liabilities | | | | | | | | | | | | |
| Change in non-cash working capital | | 18 | | | 11.0 | | | 51.1 | | | 32.3 | |
| | | | | $ | 442.8 | | $ | 560.5 | | $ | 439.2 | |
| | | | | | | | | | | | | |
| Financing Activities | | | | | | | | | | | | |
| Issue of common shares, net of issue costs | | 3, 12 | | | - | | | 505.4 | | | 558.5 | |
| Bank borrowing (repayments), net | | 10 | | | 135.1 | | | 343.3 | | | (416.7 | ) |
| Borrowings from related party loan | | 25 | | | 168.0 | | | - | | | - | |
| Issue of seniors notes, net of issue costs | | 10 | | | - | | | - | | | 495.9 | |
| Redemption of senior notes | | 10 | | | - | | | - | | | (256.9 | ) |
| Redemption of convertible debentures | | 10 | | | (106.8 | ) | | - | | | (180.2 | ) |
| Other cash items | | | | | (0.3 | ) | | - | | | - | |
| Change in non-cash working capital | | 18 | | | - | | | - | | | 1.9 | |
| | | | | $ | 196.0 | | $ | 848.7 | | $ | 202.5 | |
| | | | | | | | | | | | | |
| Investing Activities | | | | | | | | | | | | |
| Business acquisitions | | 3 | | | - | | | (509.8 | ) | | (145.1 | ) |
| Additions to property, plant and equipment | | 7 | | | (622.4 | ) | | (966.7 | ) | | (428.1 | ) |
| Additions to exploration and evaluation assets | | 6 | | | (41.1 | ) | | (50.9 | ) | | (47.0 | ) |
| Additions to other long-term assets | | | | | (2.4 | ) | | (7.4 | ) | | - | |
| Property dispositions (acquisitions), net | | | | | 87.2 | | | 4.5 | | | (30.5 | ) |
| Change in long-term liability | | 11 | | | 4.7 | | | - | | | - | |
| Change in non-cash working capital | | 18 | | | (63.8 | ) | | 108.7 | | | 22.5 | |
| | | | | $ | (637.8 | ) | $ | (1,421.6 | ) | $ | (628.2 | ) |
| | | | | | | | | | | | | |
| Change in cash | | | | | 1.0 | | | (12.4 | ) | | 13.5 | |
| Effect of exchange rate changes on cash | | | | | - | | | 0.1 | | | 5.4 | |
| Cash, beginning of period | | | | | 6.6 | | | 18.9 | | | - | |
| Cash, end of period | | | | $ | 7.6 | | $ | 6.6 | | $ | 18.9 | |
| | | | | | | | | | | | | |
| Interest paid | | | | $ | 83.9 | | $ | 75.9 | | $ | 66.9 | |
| Income tax paid | | | | $ | - | | $ | 0.1 | | $ | (0.2 | ) |
The accompanying notes are an integral part of these consolidated financial statements.
F - 9
NOTES TO THE CONSOLIDATED FINANCIAL STATEMENTS
Years ended December 31, 2012, 2011 and 2010
(amounts in millions of Canadian dollars unless otherwise indicated)
| 1. | Nature of Operations and Structure of the Company |
| | | |
| Harvest Operations Corp. (“Harvest” or the “Company”) is an energy company in the business of the exploration, development, and production of crude oil, bitumen, natural gas and natural gas liquids in western Canada with a petroleum refining and marketing business located in the Province of Newfoundland and Labrador. Harvest has three reportable segments: Upstream, BlackGold oil sands (“BlackGold”) and Downstream. For further information regarding these reportable segments, see note 23. |
| | | |
| Harvest is a wholly owned subsidiary of Korea National Oil Corporation (“KNOC”). The Company is incorporated and domiciled in Canada. Harvest’s principal place of business is located at 2100, 330 – 5thAvenue SW, Calgary, Alberta, Canada T2P 0L4. |
| | | |
| 2. | Basis of Presentation and Significant Accounting Policies |
| | | |
| These consolidated financial statements have been prepared in accordance with International Financial Reporting Standards (“IFRS”) as issued by the International Accounting Standards Board (“IASB”). The comparative consolidated financial statements have been reclassified from statements previously presented to conform to the presentation of the current year consolidated financial statements. |
| | | |
| These consolidated financial statements were approved and authorized for issue by the Board of Directors on February 28, 2013. |
| | | |
| Basis of Measurement |
| The consolidated financial statements have been prepared on the historical cost basis except for held for trading financial assets and derivative financial instruments, which are measured at fair value. |
| | | |
| Functional and Presentation Currency |
| In these consolidated financial statements, unless otherwise indicated, all dollar amounts are expressed in Canadian dollars, which is the Company’s functional currency. All references to US$ are to United States dollars. |
| | | |
| Significant Accounting Policies |
| | | |
| (a) | Consolidation |
| | These consolidated financial statements include the accounts of Harvest and its subsidiaries. All inter-entity transactions and balances have been eliminated upon consolidation. Subsidiaries are fully consolidated from the date of acquisition, being the date on which Harvest obtains control, and continue to be consolidated until the date that such control ceases. The financial statements of the subsidiaries are prepared for the same reporting period as Harvest, using consistent accounting policies. |
| | | |
| | Harvest conducts substantially all of its Upstream petroleum and natural gas production activities through jointly controlled assets. The consolidated financial statements reflect only Harvest’s proportionate interest in such activities. |
| | | |
| (b) | Revenue Recognition |
| | Revenues associated with the sale of crude oil, natural gas, natural gas liquids and refined products are recognized when title passes to customers and payment has either been received or collection is reasonably certain. Revenues for retail services are recorded when the services are provided. Revenues are measured at the fair value of the consideration received or receivable. |
| | | |
| | The sales price of residential home heating fuels and automotive gasoline and diesel within the Province of Newfoundland and Labrador is subject to regulation under the Petroleum Products Act. The Petroleum Products Pricing Commissioner sets the maximum wholesale and retail prices that a wholesaler and a retailer may charge and sets the maximum mark-up between the wholesale price to the retailer and the retail price to the consumer. Prices are set biweekly using a price adjustment formula based on an allowable premium above the New York Harbour price of the products that are regulated. The full effect of the regulation is reflected in the product sales revenue. |
| | | |
| (c) | Inventories |
| | Inventories are carried at the lower of cost or net realizable value. The costs of petroleum product inventory are determined using the weighted average cost method in Downstream and the first in, first out method in Upstream. Inventory costs include the cost of purchased crude oil and other feedstocks, purchased products for resale, purchased blendstocks and additives to meet product specifications and other related operating costs. The valuation of inventory is reviewed at the end of each month. When the circumstances that previously caused inventories to be written down below cost no longer exist or when there is clear evidence of an increase in net realizable value because of changed economic circumstances, the amount of the write-down is reversed. The reversal is limited to the amount of the original write-down. The costs of parts and supplies inventories are determined under the average cost method. |
F - 10
| | (d) | Property, Plant, and Equipment (“PP&E”) and Exploration and Evaluation (“E&E”) Assets |
| | | (i) | Upstream and BlackGold |
| | | | Exploration and evaluation expenditures |
| | | | Prior to acquiring the legal rights to explore an area, all costs are charged directly to the statement of comprehensive loss as E&E expense. |
| | | | |
| | | | Once the legal rights to explore are acquired, all costs directly associated with the E&E are capitalized. E&E costs are those expenditures incurred for identifying, exploring and evaluating new pools including acquisition of land and mineral leases, geological and geophysical costs, decommissioning costs, E&E drilling, sampling, appraisals and directly attributable general and administrative costs. All such costs are subject to technical, commercial and management review to confirm the continued intent to develop. When this is no longer the case, the costs are charged to net income as E&E expense. When technical feasibility and commercial viability are established, the relevant expenditure is transferred to PP&E after impairment is assessed and any resulting impairment loss is recognized. |
| | | | |
| | | | E&E assets are not amortized but are assessed for impairment if (i) sufficient data exists to determine technical feasibility and commercial viability, and (ii) facts and circumstances suggest that the carrying amount exceeds the recoverable amount. For purposes of impairment testing, E&E assets are allocated to cash generating units (“CGUs”). The impairment of E&E assets, and any eventual reversal thereof, is recognized as E&E expense in the statement of comprehensive loss. |
| | | | |
| | | | Development and production costs |
| | | | The Upstream and BlackGold PP&E generally represent costs incurred in acquiring and developing proved and/or probable reserves, and bringing in or enhancing production from such reserves. Development costs include the initial purchase price and directly attributable costs relating to land and mineral leases, geological and seismic studies, property acquisitions, development drilling, construction of gathering systems and infrastructure, decommissioning costs and transfers from E&E assets. These costs are accumulated on a field or an area basis (major components). |
| | | | |
| | | | Major capital maintenance projects such as well work-overs, major overhauls and turnarounds are capitalized but general maintenance and repair costs are charged against income. Where a major part of an asset is replaced, it is capitalized within PP&E and the carrying amount of the replaced component is derecognized immediately. The capitalized major capital maintenance projects and replacement parts are amortized as separate components if their useful lives are different from the associated assets. The costs of the day-to-day servicing of PP&E are recognized in net income as incurred. |
| | | | |
| | | | Depletion, Depreciation and Amortization |
| | | | Costs accumulated within PP&E are depleted generally using the unit-of-production method by reference to the ratio of production in the period to the related proved developed reserves. Certain major components within PP&E such as capitalized maintenance and replacement parts are amortized over their respective useful lives on a straight-line basis. Costs of major development projects under construction are excluded from the costs subject to depletion until they are available for use. |
| | | | |
| | | | Corporate and administrative assets are depreciated on a straight-line basis over the individual assets’ useful lives. |
| | | | |
| | | | Disposal of assets |
| | | | Gains and losses on disposal of an item of PP&E are determined by comparing the proceeds from disposal with the carrying amount of PP&E and are recognized in the period of disposal. |
| | | | |
| | | | For exchanges that involve only unproven properties, the exchange is accounted for at cost. Exchanges of development and production assets are measured at fair value unless the exchange transaction lacks commercial substance or if neither the fair value of the assets given up nor the assets received can be reliably estimated. Any gains or losses on de-recognition of the asset given up is included in net income. |
F - 11
| | (ii) | Downstream |
| | | PP&E related to the refining assets are recorded at cost. General maintenance and repair costs are expensed as incurred. Major replacements and capital maintenance projects such as turnaround costs are capitalized. Improvements that increase or prolong the service life or capacity of an asset are capitalized. Any gains or losses on disposal of individual assets are recognized in the year of disposal. |
| | | |
| | | Depreciation |
| | | When significant parts of an item of PP&E have different useful lives, they are accounted for as separate items (major components). Depreciation of recorded cost less the residual value is provided on a straight-line basis over the estimated useful life of the major components as set out below. |
| Asset | Period |
| Refining and production plant: | |
| Processing equipment | 5 – 35 years |
| Structures | 15 – 20 years |
| Catalysts and turnarounds | 2 – 8 years |
| Tugs | 25 years |
| Vehicles | 2 – 7 years |
| Office and computer equipment | 3 – 5 years |
| | (iii) | Impairment of Property, Plant and Equipment and Exploration and Evaluation Assets |
| | | Harvest assesses, at each reporting date, whether there is an indication that an asset may be impaired. If any indication exists, Harvest estimates the asset’s recoverable amount. An asset’s recoverable amount is the higher of an asset’s fair value less costs to sell and its value-in-use. The recoverable amount is determined for an individual asset, unless the asset does not generate cash inflows that are largely independent of those from other assets or groups of assets. In such case, an impairment test is performed at the CGUs level. A CGU is a group of assets that Harvest aggregates based on their ability to generate largely independent cash flows. |
| | | |
| | | Where the carrying amount of an asset or CGU exceeds its recoverable amount, the asset is considered impaired and is written down to its recoverable amount. To determine value-in-use, the Company estimates the present value of the future net cash flows expected to derive from the continued use of the asset or CGU. Discount rates that reflect the market assessments of the time value of money and the risks specific to the asset or CGU are used. In determining fair value less costs to sell, discounted cash flows and recent market transactions are taken into account, if available. These calculations are corroborated by valuation multiples or other available fair value indicators. |
| | | |
| | | Impairment losses are recognized in those expense categories consistent with the function of the impaired asset. Impairment losses recognized in respect of a CGU are allocated to reduce the carrying amount of the assets in the unit on a pro rata basis. |
| | | |
| | | For assets excluding goodwill, an assessment is made at each reporting date as to whether there is any indication that previously recognized impairment losses may no longer exist or may have decreased. If such indication exists, the previously recognized impairment loss is reversed. The reversal is limited so that the carrying amount of the asset does not exceed its recoverable amount, nor exceed the carrying amount that would have been determined, net of depreciation, had no impairment loss been recognized for the asset in prior periods. Such reversal is recognized in the net income. |
| (e) | Capitalized Interest |
| | | Interest on major development projects is capitalized until the project is complete using the weighted-average interest rate on Harvest’s general borrowings. In situations where Harvest borrows funds specifically to acquire a qualifying asset or project, interests on these funds are also capitalized. Capitalized interest is limited to the actual interest incurred. |
| | | |
| (f) | Assets Held for Sale |
| | | Non-current assets are classified as held for sale if their carrying amounts will be recovered through a sale transaction rather than through continuing use. This condition is met when the sale is highly probable and the asset is available for immediate sale in its present condition. |
| | | |
| | | The assets or disposal groups classified as held for sale are measured at the lower of the carrying amount and fair value less costs to sell, with impairments recognized in the consolidated statement of comprehensive loss. Non-current assets held for sale are presented in current assets and liabilities within the consolidated statement of financial positions. Assets held for sale are not depreciated, depleted or amortized. |
F - 12
| | (g) | Business Combinations and Goodwill |
| | | Business combinations are accounted for using the acquisition method. The cost of an acquisition including any contingent consideration is measured as the aggregate of the consideration transferred at acquisition date fair value. The acquired identifiable net assets are measured at their fair value at the date of acquisition. Any excess of the consideration transferred over the fair value of the net assets acquired is recognized as goodwill. Any deficiency of the consideration transferred below the fair value of the net assets acquired is recorded as a gain in net income. Associated transaction costs are expensed when incurred. |
| | | | |
| | | Those petroleum reserves and resources that are able to be reliably valued are recognized in the assessment of fair values on acquisition. The fair value of oil and natural gas interests is estimated with reference to the discounted cash flows expected to be derived from oil and natural gas production based on reserve estimates. The risk-adjusted discount rate is specific to the asset with reference to general market conditions. |
| | | | |
| | | For the purpose of impairment testing, goodwill acquired in a business combination is, from the acquisition date, allocated to groups of CGUs that are expected to benefit from the combination. Goodwill is carried at cost less impairment and is not amortized. |
| | | | |
| | | An impairment loss in respect of goodwill is not reversed. Goodwill is assessed for impairment annually at year- end or more frequently if events occur that could result in impairment. The recoverable amount is determined by calculating the recoverable amount of the group of CGUs goodwill has been allocated to. The excess of the carrying value of goodwill over the recoverable amount is then recognized as impairment and charged to income in the period in which it occurs. |
| | | | |
| | (h) | Provisions |
| | (i) | General |
| | | | Provisions are recognized when the Company has a present obligation (legal or constructive) as a result of a past event, it is probable that an outflow of resources embodying economic benefits will be required to settle the obligation and a reliable estimate can be made of the amount of the obligation. Where the Company expects some or all of a provision to be reimbursed, for example, under an insurance contract, the reimbursement is recognized as a separate asset but only when the reimbursement is virtually certain. The expenses relating to provisions are generally presented in the income statement net of any reimbursement except for decommissioning liabilities. If the effect of the time value of money is material, provisions are discounted using a current discount rate that reflects, where appropriate, the risks specific to the liability. Where discounting is used, the increase in the provision due to the passage of time is recognized as a finance cost. |
| | | | |
| | (ii) | Decommissioning Liabilities |
| | | | Harvest recognizes the present value of any decommissioning liabilities as a liability in the period in which it incurs a legal obligation associated with the retirement of tangible long-lived assets that result from the acquisition, construction, development, and normal use of the assets. Harvest uses a risk-free rate to estimate the present value of the expenditure required to settle the present obligation at the reporting date. The associated decommissioning costs are capitalized as part of the carrying amount of the related asset and the obligation is adjusted at the end of each period to reflect the passage of time and changes in the estimated future cash flows underlying the obligation. The increase in the provision due to the passage of time is recognized as finance costs whereas changes in the estimated future cash flows are capitalized. Actual costs incurred upon settlement of the decommissioning obligation are charged against the decommissioning liabilities. |
| | | | |
| | (iii) | Environmental Liabilities |
| | | | Environmental expenditures related to conditions caused by operations that generate current or future revenues are expensed. Environmental liabilities are recognized when a clean-up is probable and the associated costs can be reliably estimated. The amount recognized is the best estimate of the expenditure required. When the liability will not be settled for a number of years, the amount recognized is the present value of the estimated future expenditure. |
| | | | |
| | | (iv) | Contingencies |
| | | | |
| | | | A contingency is disclosed where the existence of an obligation will only be confirmed by future events, or where the amount of a present obligation cannot be measured reliably or will likely not result in an economic outflow. Contingent assets are only disclosed when the inflow of economic benefits is probable. |
| | | | |
| | (i) | Income Taxes |
| | | Income tax expense comprises current and deferred tax. Income tax expense is recognized in net income except to the extent that it relates to items recognized directly in equity, in which case it is recognized in equity. |
F - 13
Current tax is the expected tax payable on the taxable income for the year, using tax rates enacted or substantively enacted at the reporting date, and any adjustment to tax payable in respect of previous years.
Deferred tax is recognized for temporary differences between the carrying amounts of assets and liabilities for financial reporting purposes and the amounts used for taxation purposes. Deferred income tax liabilities and assets are generally not recognized for temporary differences arising on:
| | • | investments in subsidiaries and associates and interests in joint ventures; |
| | • | the initial recognition of goodwill; or |
| | • | the initial recognition of an asset or liability in a transaction which is not a business combination. |
| | | Deferred tax is measured at the tax rates that are expected to be applied to temporary differences when they reverse, based on the laws that have been enacted or substantively enacted by the reporting date. Deferred tax assets and liabilities are offset if there is a legally enforceable right to offset, and they relate to income taxes levied by the same tax authority on the same taxable entity, or on different tax entities, and Harvest intends to settle current tax liabilities and assets on a net basis. |
| | | |
| | | A deferred tax asset is recognized to the extent that it is probable that future taxable profits will be available against which the temporary difference can be utilized. Deferred tax assets are reviewed at each reporting date and are reduced to the extent that it is no longer probable that the related tax benefit will be realized. |
| | | |
| (j) | Post-Employment Benefits |
| | | Harvest’s Downstream operations maintains a defined benefit plan and provides certain post-retirement health care benefits, which cover the majority of its employees and their surviving spouses. The cost of providing the defined pension benefits and other post-retirement benefits is actuarially determined using the projected unit credit method reflecting management’s best estimates of discount rates, rate of return on plan assets, rate of compensation increase, retirement ages of employees, and expected health care costs. Post-employment benefit expense includes the cost of benefits earned during the current year, the interest cost on the obligations and the expected return on plan assets. |
| | | |
| | | Pension plan assets are measured at fair values with the difference between the fair value of the plan assets and the total employee benefit obligation recorded on the balance sheet. Actuarial gains or losses are recognized in other comprehensive income immediately. |
| | | |
| (k) | Currency Translation |
| | | Foreign currency-denominated transactions are translated to the respective functional currencies of Harvest’s entities at exchange rates at the date of the transactions. Non-monetary items measured at historical cost are not subsequently re-translated. Monetary assets and liabilities denominated in foreign currencies are converted into Harvest’s functional currencies at the exchange rate at the reporting date. Conversion gains and losses on monetary items are included in net income in the period in which they arise. |
| | | |
| | | Harvest’s Downstream operations’ functional currency is the U.S. dollar, while Harvest’s presentation currency is the Canadian dollar. Therefore, the Downstream operations’ assets and liabilities are translated at the period-end exchange rates, while revenues and expenses are translated using monthly average rates. Translation gains and losses relating to the foreign operations are included in accumulated other comprehensive income as a separate component of shareholder’s equity. |
| | | |
| (l) | Financial Instruments |
| | | Harvest recognizes financial assets and financial liabilities, including derivatives, on the consolidated statements of financial position when the Company becomes a party to the contract. Financial liabilities are removed from the consolidated financial statements when the liability is extinguished either through settlement of or release from the obligation of the underlying liability. Financial assets are derecognised when (1) the rights to receive cash flows from the assets have expired or (2) the Company has transferred its rights to receive cash flows from the assets or has assumed an obligation to pay the received cash flows in full without material delay to a third party under a ‘pass-through’ arrangement; and either (a) the Company has transferred substantially all the risks and rewards of the assets, or (b) the Company has neither transferred nor retained substantially all the risks and rewards of the assets, but has transferred control of the asset. |
| | | |
| | | The Company initially measures all financial instruments at fair value. Subsequent measurement of the financial instruments is based on their classification. Financial assets are classified into the following categories: held for trading, available for sale, held-to-maturity investments and loans and receivables. Financial liabilities are classified as held for trading or other financial liabilities. |
F - 14
| | | Financial assets and financial liabilities classified as held for trading are measured at fair value with changes in those fair values recognized in net income. Financial assets classified as either held-to-maturity or loans and receivables, and other financial liabilities are measured at amortized cost using the effective interest method of amortization. Financial assets classified as available-for-sale are measured at fair values with changes in those fair values recognized in other comprehensive income. |
| | | |
| | | Transaction costs relating to financial instruments classified as held for trading are expensed in net income in the period that they are incurred. For transaction costs that are directly attributable to the acquisition or issuance of financial instruments not classified as held for trading, they are included in the costs of the financial instruments upon initial recognition. |
| | | |
| | | Harvest assesses at each reporting date whether there is any objective evidence that a financial asset or a group of financial assets is impaired, as a result of one or more events that has occurred after the initial recognition of the asset (an incurred ‘loss event’) and that loss event has an impact on the estimated future cash flows of the financial asset or the group of financial assets that can be reliably estimated. |
| | | |
| (m) | Hedges |
| | | Harvest uses derivative financial instruments such as foreign currency contracts and financial commodity contracts to hedge its foreign currency risks and commodity price risks. Such derivative financial instruments are initially recognized at fair value on the date on which a derivative contract is entered into and are subsequently remeasured at fair value. Derivatives are carried as financial assets when the fair value is positive and as financial liabilities when the fair value is negative. Any gains or losses arising from changes in the fair value of derivatives are recorded in net income, except for the effective portion of cash flow hedges, which is recognized in other comprehensive income. |
| | | |
| | | At the inception of a hedge relationship, Harvest formally designates and documents the hedge relationship to which the Company intends to apply hedge accounting. The designation document includes the risk management objective and strategy for undertaking the hedge, the identification of the hedging instrument, the hedged item or transaction, the nature of the risk being hedged and how the Company will assess the hedge effectiveness. Upon designation and at each reporting date, Harvest assesses hedge effectiveness by performing regression analysis to assess the relationship between the hedged item and hedging instrument. Only if such hedges are highly effective in achieving offsetting changes in fair value or cash flows will Harvest continue to apply hedge accounting. |
| | | |
| | | The effective portion of the gain or loss on the hedging instrument is recognized directly in other comprehensive income, while any ineffective portion is recognized immediately in net income. Amounts recognized in other comprehensive income are transferred to the statement of comprehensive loss when the hedged transaction affects net income, such as when the hedged forecasted transaction occurs. Where the hedged item is the cost of a non-financial asset or non-financial liability, the amounts recognized in other comprehensive income are transferred to the initial carrying amount of the non-financial asset or liability. |
| | | |
| | | If the forecast transaction is no longer expected to occur, the cumulative gain or loss previously recognized in other comprehensive income is transferred to net income. If the hedging instrument expires or is sold, terminated or exercised without replacement or rollover, or if its designation as a hedge is revoked, any cumulative gains or losses previously recognized in other comprehensive income remain in other comprehensive income until the forecast transaction affects net income. |
| | | |
| (n) | Investment Tax Credits |
| | | Harvest is entitled to certain investment tax credits on qualifying manufacturing capital expenditures relating to its Downstream operations. These credits are recorded as a reduction of the cost of the related asset. The benefits are recognized when the Company has complied with the terms and conditions of applicable tax legislation provided there is reasonable assurance of realization. At each period end, Harvest reviews and if appropriate reduces the balance to the extent that it is no longer probable that the investment tax credit will be realized. |
| | | |
| (o) | Leases |
| | | Leases or other arrangements entered into for the use of an asset are classified as either finance or operating leases. Finance leases transfer to the Company substantially all of the risks and benefits incidental to ownership of the leased item. Finance leases are capitalized at the commencement of the lease term at the lower of the fair value of the leased asset or the present value of the minimum lease payments. Capitalized leased assets are amortized over the shorter of the estimated useful life of the assets and the lease term. Operating lease payments are recognized as an expense in the income statement on a straight line basis over the lease term. |
F - 15
| | (p) | Recent Pronouncements |
| | | The Company has reviewed new and revised accounting pronouncements that have been issued but are not yet effective and determined that the following may have an impact on the Company. |
| | • | In May 2011, the IASB issued the following new standards, which are effective for annual periods beginning on or after January 1, 2013: |
| | | | |
| | | o | IFRS 10, “Consolidated Financial Statements”, replaces the consolidation requirements in SIC- 12, “Consolidation – Special Purpose Entities” and a portion of IAS 27. IFRS 10 builds on existing principles by identifying the concept of control as the determining factor in whether an entity should be included within the consolidated financial statements of the parent company and provides additional guidance to assist in the determination of control where this is difficult to assess. IFRS 10 requires retrospective application and early adoption is permitted. |
| | | | |
| | | o | IFRS 11, “Joint Arrangements”, focuses on the rights and obligations of the joint arrangement, rather than its legal form (as is currently the case) and requires a single method to account for interests in jointly controlled entities (equity method). This standard requires retrospective application and early adoption is permitted. |
| | | | |
| | | o | IFRS 12, “Disclosure of Interest in Other Entities”, is a comprehensive standard on disclosure requirements for all forms of interests in other entities, including joint arrangements, associates, structure entities and other off balance sheet interests. IFRS 12 requires retrospective application and early adoption is permitted. |
| | | | |
| | | o | IFRS 13, “Fair Value Measurement”, provides a consistent definition of fair value, establishes a single framework for determining fair value and introduces requirements for disclosures related to fair value measurement. IFRS 13 applies prospectively from the beginning of the annual period in which the standard is adopted. Early adoption is permitted. |
| | | | |
| | | o | Harvest does not expect the adoption of these standards to have any material impact on its consolidated financial statements. |
| | | | |
| | • | On June 16, 2011, the IASB issued an amendment to IAS 19, “Employee Benefits”, which changes the recognition and measurement of defined benefit pension expense and termination benefits and expands disclosure requirements for all employee benefit plans. The new standard is required to be adopted for periods beginning on or after January 1, 2013. The adoption of this standard is not expected to have a material impact on Harvest’s consolidated financial statements. |
| | | | |
| | • | The IASB issued an amendment to IAS 1, “Presentation of Financial Statements” on June 16, 2011, which requires separating items presented in other comprehensive income between those that are recycled to income and those that are not. The standard is required to be adopted for periods beginning on or after July 1, 2012. The adoption of this standard should not have any impact on the Company’s consolidated financial statements as Harvest already complied with the standard with its existing disclosures. |
| | | | |
| | • | In December 2011, the IASB issued amendments to IFRS 7 “Financial Instruments: Disclosures” and IAS 32, “Financial Instruments: Presentation” to clarify the current offsetting model and develop common disclosure requirements. Amendments to IFRS 7 are effective for annual periods beginning on or after January 1, 2013. Retrospective application is required and early adoption is permitted. Amendments to IAS 32 are effective for annual periods beginning on or after January 1, 2014. Retrospective application is required. Harvest does not expect material impact to its consolidated financial statements from the amendments. |
| | | | |
| | • | On January 1, 2015, Harvest will be required to adopt IFRS 9, “Financial Instruments”, which is the result of the first phase of the IASB’s project to replace IAS 39, “Financial Instruments: Recognition and Measurement”. The new standard replaces the current multiple classification and measurement models for financial assets and liabilities with a single model that has only two classification categories: amortized cost and fair value. Restatement of comparative period financial statements is not required upon initial application; however, modified disclosures on transition from the classification and measurement requirements of IAS 39 to IFRS 9 are required. As the remaining phases of this standard are still under development by the IASB, the full impact of this standard on Harvest’s consolidated financial statements will not be known until the project is complete. Harvest will continue to monitor the changes to this standard as they arise and will assess the impact accordingly. |
F - 16
Use of Estimates and Judgments
The preparation of financial statements in conformity with IFRS requires management to make judgments, estimates and assumptions that affect the application of accounting policies and the reported amounts of assets, liabilities, income and expenses. Actual results may differ from these estimates. Estimates and underlying assumptions are reviewed on an ongoing basis. Revisions to accounting estimates are recognized in the period in which the estimates are revised and in any future periods affected. Significant estimates and judgments made by management in the preparation of these consolidated financial statements are outlined below:
| | (a) | Reserves |
| | | The provision for depletion and depreciation of Upstream assets is calculated on the unit-of-production method based on proved developed reserves. As well, reserve estimates impact net income through the application of impairment tests. Revisions or changes in the reserve estimates can have either a positive or a negative impact on net income and PP&E. |
| | | | |
| | | The process of estimating reserves is complex and requires significant judgments based on available geological, geophysical, engineering and economic data. In the process of estimating the recoverable oil and natural gas reserves and related future net cash flows, Harvest incorporates many factors and assumptions, such as: |
| | | | |
| | | • | expected reservoir characteristics based on geological, geophysical and engineering assessments; |
| | | • | future production rates based on historical performance and expected future operating and investment activities; |
| | | • | future commodity prices and quality differentials; |
| | | • | discount rates; and |
| | | • | future development costs. |
| | | On an annual basis, the Company engages qualified, independent reserves evaluators to evaluate Harvest’s reserves data. |
| | | |
| (b) | Impairment of long-lived assets |
| | | Long-lived assets (goodwill, PP&E and E&E assets) are aggregated into CGUs based on their ability to generate largely independent cash inflows and are used for impairment testing. The determination of the Company's CGUs is subject to significant judgment; product type, internal operational teams, geology and geography were key factors considered when grouping Harvest’s oil and gas assets into the CGUs. |
| | | |
| | | PP&E is tested for impairment when indications of impairment exist. PP&E impairment indicators include declines in commodity prices, production, reserves and operating results, cost overruns and construction delays. E&E impairment indicators include expiration of the right to explore and cessation of exploration in specific areas, lack of potential for commercial viability and technical feasibility and when E&E costs are not expected to be recovered from successful development of an area. The determination of whether such indicators exist requires significant judgment. |
| | | |
| | | The recoverable amounts of CGUs and individual assets are determined based on the higher of value-in-use calculations and estimated fair values less costs to sell. To determine the recoverable amounts, Harvest uses reserve estimates for both the Upstream and BlackGold operating segments and expected future cash flows for the Downstream operations. The estimates of reserves, future commodity prices, refining margins, forecast refinery utilization and yields, discount rates, operating expenses and sustaining capital expenditures require significant judgments. |
| | | |
| (c) | Provisions |
| | | In the determination of provisions, management is required to make a significant number of estimates and assumptions with respect to activities that will occur in the future including the ultimate amounts and timing of settlements, inflation factors, risk-free discount rates, emergence of new restoration techniques and expected changes in legal, regulatory, environmental and political environments. A change in any one of the assumptions could impact the estimated future obligation and in return, net income and in the case of decommissioning liabilities, PP&E. |
| | | |
| (d) | Employee benefits |
| | | Harvest’s Downstream operations maintains a defined benefit pension plan and provides certain post- retirement health care benefits, which cover the majority of its Downstream employees and their surviving spouses. An independent actuary determines the costs of the Company’s employee future benefit programs using certain management assumptions and estimates such as, the expected plan investment performance, salary escalation, retirement ages of employees, expected health care costs, employee turnover, discount rates and return on plan assets. The obligation and expense recorded related to Harvest’s employee future benefit plans could increase or decrease if there were to be a change in these estimates. |
F - 17
| | | The Company also maintains a long-term incentive plan which is a performance-based program. As a result, the compensation costs accrued for the plan are subject to the estimation of what the ultimate payout will be and are subject to management’s judgment as to whether or not the performance criteria will be met. |
| | | |
| (e) | Consideration transferred |
| | | Business acquisitions are accounted for using the acquisition method. Under this method, the consideration transferred is allocated to the assets acquired and the liabilities assumed based on the fair values at the time of the acquisition. In determining the fair value of the assets and liabilities, Harvest is often required to make assumptions and estimates, such as reserves, future commodity prices, fair value of undeveloped land, discount rates, decommissioning liabilities and possible outcome of any assumed contingencies. Changes in any of these assumptions would impact amounts assigned to assets and liabilities and goodwill in the consideration transferred allocation and as a result, future net income. |
| | | |
| (f) | Risk management contracts |
| | | Derivative risk management contracts are valued using valuation techniques with market observable inputs. The most frequently applied valuation techniques include forward pricing and swap models, using present value calculations. The models incorporate various inputs including the credit quality of counterparties, foreign exchange spot and forward rates, interest rate curves and forward rate curves of the underlying commodity. Changes in any of these assumptions would impact fair value of the risk management contracts and as a result, future net income and other comprehensive income. For risk management contracts designated as hedges, changes in the above mentioned assumptions may impact hedge effectiveness assessment and Harvest’s ability to continue applying hedge accounting. |
| | | |
| (g) | Income taxes |
| | | Tax interpretations, regulations and legislation in the various jurisdictions in which Harvest and its subsidiaries operate are subject to change. The Company is also subject to income tax audits and reassessments which may change its provision for income taxes. Therefore, the determination of income taxes is by nature complex, and requires making certain estimates and assumptions. |
| | | |
| | | Harvest recognizes the net deferred tax benefit related to deferred tax assets to the extent that it is probable that the deductible temporary differences will reverse in the foreseeable future. Assessing the recoverability of deferred tax assets requires the Company to make significant estimates related to expectations of future taxable income. Estimates of future taxable income are based on forecast cash flows from operations and the application of existing tax laws in each jurisdiction. To the extent that future cash flows and taxable income differ significantly from estimates, the ability of the Company to realize the net deferred tax assets recorded at the reporting date could be impacted. |
| | | |
| (h) | Contingencies |
| | | Contingencies will only be resolved when one or more future events occur or fail to occur. The assessment of contingencies inherently involves the exercise of significant judgment and estimates of the outcome of future events. |
F - 18
| 3. | Business Combination |
| | |
| a) Hunt Acquisition |
| | |
| On February 28, 2011, Harvest acquired certain petroleum and natural gas assets of Hunt Oil Company of Canada, Inc. and Hunt Oil Alberta, Inc. (collectively “Hunt”) for total cash consideration of $511.0 million. KNOC provided $505.4 million of equity to fund the acquisition and acquisition costs were $1.3 million (2010 - $0.1 million) for the year ended December 31, 2011. An additional $25 million was payable to Hunt in the event that Canadian natural gas prices exceed certain pre-determined levels in 2012. Based on 2012 gas prices, no further consideration was paid. |
| | |
| Hunt reimbursed Harvest for costs associated with restoring production as well as the lost revenues net of operating costs relating to certain properties between October 1, 2010 and April 3, 2011, when production was resumed. A portion of the reimbursement could have reverted to Hunt if the future net revenue earned by Harvest during the six months after April 3, 2011 exceeded the reimbursed amount. Subsequent to the six-month period, it was agreed that no refund of the reimbursement was necessary. |
| | |
| The acquisition was accounted for as a business combination. The fair values of identifiable assets and liabilities, including interim adjustments as at the date of acquisition were: |
| Property, plant and equipment | $ | 530.9 | |
| Evaluation and exploration assets | | 18.6 | |
| Decommissioning and environmental remediation liabilities | | (38.0 | ) |
| Other liabilities | | (0.5 | ) |
| Cash consideration | $ | 511.0 | |
The final review of the fair value of the purchase price allocation was completed at December 31, 2011.
These consolidated financial statements incorporate the results of operations of Hunt from February 28, 2011. For the year ended December 31, 2011, the Hunt assets have contributed $133.0 million of revenue and $96.6 million to Harvest’s earnings before depletion and income tax. If the acquisition had been completed on the first day of 2011, Harvest’s revenues for the year ended December 31, 2011 would have been $14.6 million higher and the earnings before depletion and income tax would have been $7.4 million higher.
b) Petroleum and Natural Gas Assets
On September 30, 2010, Harvest acquired certain petroleum and natural gas assets including the remaining 40% interest in an operating partnership for total cash consideration of $144.2 million. The acquisition was accounted for as a business combination and acquisition costs were $0.2 million for the year ended December 31, 2011 (2010 - $0.3 million).
| | | Year Ended December 31 | |
| | | 2012 | | | 2011 | |
| Petroleum products | | | | | | |
| Upstream – pipeline fill | $ | 0.9 | | $ | 1.4 | |
| Downstream | | 75.5 | | | 56.3 | |
| Total petroleum product inventory | | 76.4 | | | 57.7 | |
| Parts and supplies | | 4.4 | | | 3.3 | |
| | $ | 80.8 | | $ | 61.0 | |
The amount of Downstream petroleum products inventory recognized as an expense during the year is equal to the “purchased products for processing and resale” expense in the consolidated statements of comprehensive loss prior to any inventory write-downs or reversals of write-downs. For the year ended December 31, 2012, Harvest recognized inventory impairments of $14.8 million (2011 – $9.7 million; 2010 - $9.5 million) in its Downstream operations. Downstream inventory impairment reversals during 2012 amounted to $8.4 million (2011 - $7.2 million; 2010 - $7.1 million) due to improvement in market prices.
F - 19
| 5. | Assets Held For Sale |
| | |
| The following assets and liabilities were classified as held for sale as at December 31, 2012: |
| Assets held for sale | | | |
| Exploration and evaluation (see note 6) | $ | 0.4 | |
| Property, plant and equipment, net (see note 7) | | 13.8 | |
| Goodwill (see note 8) | | 2.7 | |
| | $ | 16.9 | |
| | | | |
| Liabilities associated with assets held for sale | | | |
| Decommissioning liabilities (see note 9) | $ | 11.9 | |
| Management committed to a plan to divest selected non-core oil and gas properties as of December 31, 2012. Accordingly, the carrying amount of the assets and liabilities relating to these disposal groups were classified as held for sale on December 31, 2012. In February 2013, Harvest completed the sale of these assets to a third party for net proceeds of approximately $9.0 million. |
| | |
| 6. | Exploration and Evaluation Assets (“E&E”) |
| As at December 31, 2010 | $ | 59.6 | |
| Additions | | 50.9 | |
| Acquisition | | 18.6 | |
| Dispositions | | (0.7 | ) |
| Unsuccessful exploration & evaluation costs | | (17.8 | ) |
| Transfer to property, plant & equipment | | (36.1 | ) |
| As at December 31, 2011 | $ | 74.5 | |
| Additions | | 41.1 | |
| Dispositions | | (0.6 | ) |
| Unsuccessful exploration and evaluation costs | | (22.0 | ) |
| Transfer to property, plant and equipment | | (19.2 | ) |
| Transfer to assets held for sale | | (0.4 | ) |
| As at December 31, 2012 | $ | 73.4 | |
Harvest determined certain E&E costs to be unsuccessful and not recoverable, which were expensed as follows, together with pre-licensing expenses:
| | | Year Ended December 31 | |
| | | 2012 | | | 2011 | | | 2010 | |
| Pre-licensing costs | $ | 2.9 | | $ | 0.5 | | $ | 0.4 | |
| Unsuccessful E&E costs | | 22.0 | | | 17.8 | | | 2.9 | |
| E&E expense | $ | 24.9 | | $ | 18.3 | | $ | 3.3 | |
F - 20
| 7. | Property, Plant and Equipment (“PP&E”) |
| | | | Upstream | | | BlackGold | | | Downstream | | | Total | |
| | Cost: | | | | | | | | | | | | |
| | As at December 31, 2010 | $ | 3,570.3 | | $ | 393.9 | | $ | 1,081.9 | | $ | 5,046.1 | |
| | Additions | | 581.3 | | | 101.2 | | | 284.2 | | | 966.7 | |
| | Acquisitions | | 533.9 | | | - | | | - | | | 533.9 | |
| | Change in decommissioning liabilities | | (20.4 | ) | | 2.2 | | | 3.8 | | | (14.4 | ) |
| | Transfers from E&E | | 36.1 | | | - | | | - | | | 36.1 | |
| | Disposals | | (0.9 | ) | | - | | | (18.0 | ) | | (18.9 | ) |
| | Exchange adjustment | | - | | | - | | | 36.9 | | | 36.9 | |
| | Investment tax credits | | - | | | - | | | (10.2 | ) | | (10.2 | ) |
| | As at December 31, 2011 | $ | 4,700.3 | | $ | 497.3 | | $ | 1,378.6 | | $ | 6,576.2 | |
| | Additions | | 404.1 | | | 164.1 | | | 54.2 | | | 622.4 | |
| | Acquisitions | | 1.3 | | | - | | | - | | | 1.3 | |
| | Change in decommissioning liabilities | | 82.7 | | | 18.4 | | | 1.2 | | | 102.3 | |
| | Transfers from E&E | | 19.2 | | | - | | | - | | | 19.2 | |
| | Disposals | | (108.8 | ) | | - | | | (11.5 | ) | | (120.3 | ) |
| | Exchange adjustment | | - | | | - | | | (29.5 | ) | | (29.5 | ) |
| | Investment tax credits reversal | | - | | | - | | | 25.0 | | | 25.0 | |
| | Transfers to assets held for sale | | (23.0 | ) | | - | | | - | | | (23.0 | ) |
| | As at December 31, 2012 | $ | 5,075.8 | | $ | 679.8 | | $ | 1,418.0 | | $ | 7,173.6 | |
| | | | | | | | | | | | | | |
| | Accumulated depletion, amortization, depreciation and impairment losses: | | | | | | | | | | | | |
| | As at December 31, 2010 | $ | 484.3 | | $ | - | | $ | 78.5 | | $ | 562.8 | |
| | Depreciation, depletion and amortization | | 535.4 | | | - | | | 91.0 | | | 626.4 | |
| | Disposals | | - | | | - | | | (18.0 | ) | | (18.0 | ) |
| | Exchange adjustment | | - | | | - | | | 4.6 | | | 4.6 | |
| | As at December 31, 2011 | $ | 1,019.7 | | $ | - | | $ | 156.1 | | $ | 1,175.8 | |
| | Depreciation, depletion and amortization | | 578.7 | | | - | | | 108.9 | | | 687.6 | |
| | Disposals | | (34.2 | ) | | - | | | (11.5 | ) | | (45.7 | ) |
| | Impairment | | 21.8 | | | - | | | 563.2 | | | 585.0 | |
| | Exchange adjustment | | - | | | - | | | (3.2 | ) | | (3.2 | ) |
| | Transfers to assets held for sale | | (9.2 | ) | | - | | | - | | | (9.2 | ) |
| | As at December 31, 2012 | $ | 1,576.8 | | $ | - | | $ | 813.5 | | $ | 2,390.3 | |
| | | | | | | | | | | | | | |
| | Net Book Value: | | | | | | | | | | | | |
| | As at December 31, 2012 | $ | 3,499.0 | | $ | 679.8 | | $ | 604.5 | | $ | 4,783.3 | |
| | As at December 31, 2011 | $ | 3,680.6 | | $ | 497.3 | | $ | 1,222.5 | | $ | 5,400.4 | |
General and administrative costs directly attributable to PP&E addition activities of $21.6 million have been capitalized for the year ended December 31, 2012 (2011 – $21.4 million; 2010 - $13.6 million). Borrowing costs relating to the development of BlackGold assets and the Downstream debottlenecking project have been capitalized within PP&E for the year ended December 31, 2012 in the amounts of $10.8 million and $2.7 million (2011 – $4.5 million and $4.1 million; 2010 - $0.4 million and $nil, respectively), at a weighted average interest rate of 5.7% (2011 – 6.7%; 2010 – 6.5%) .
At December 31, 2012 the following costs were excluded from the asset base subject to depreciation, depletion and amortization: BlackGold oil sands assets of $679.8 million (2011 - $497.3 million), Downstream assets under construction of $42.4 million (2011 - $102.5 million), and Downstream major parts inventory of $7.4 million (2011 - $7.5 million).
During 2012, Harvest recognized an impairment loss of $21.8 million before tax (2011 - $nil; 2010 - $13.7 million) against its Upstream PP&E relating to certain gas properties in the South Alberta CGU to reflect lower forecasted gas prices, which resulted in lower estimated future cash flows. The recoverable amount was based on the assets’ value-in-use, estimated using the net present value of proved plus probable reserves discounted at a pre-tax rate of 10%. A 100 bps increase in the discount rate would result in an additional impairment for the South Alberta CGU of approximately $34.6 million while a 10% decrease in the forward gas price estimate would result in an additional impairment of approximately $42.1 million.
F - 21
| During the fourth quarter of 2012, Downstream recorded an impairment of $563.2 million (2011 and 2010 - $nil) on its refinery CGU relating to the property, plant and equipment to reflect the excess of the carrying value over the assessed recoverable amount. The recoverable amount was based on the assets’ value-in-use, estimated using the net present value of future cash flows and using a pre-tax discount rate of 16%. The value-in-use model did not include any expected cash flows from capital enhancement projects. The pre-tax discount rate of 16% incorporated the various risks inherent in the industry and in forecasting uncertainties. An increase of 100 bps in the pre-tax discount rate would result in an additional impairment of $45.8 million, while a 10% decrease in gross margin would result in an additional impairment of $292.3 million. |
| | |
| Included in the Downstream impairment amount of $563.2 million is the write-down of $27.7 million of investment tax credits (“ITC”). The ITCs were originally recorded as a reduction in the cost of PP&E. Based on the review of the forecasted future cash flows for Downstream, management concluded that a portion of the ITCs would not be utilized in the near term and therefore no longer meet the recognition criteria. As a result, Harvest reversed $27.7 million of previously recorded ITCs through PP&E, which were immediately written down. |
| | |
| For the year ended December 31, 2012, Harvest disposed of certain non-core producing properties in Alberta and Saskatchewan with a carrying value of $74.6 million (2011 - $0.9 million). The transactions resulted in a gain of $30.3 million, which has been recognized in the consolidated statements of comprehensive loss (2011 - $7.9 million). |
| | |
| 8. | Goodwill |
| As at December 31, 2010 and 2011 | $ | 404.9 | |
| Disposals | | (10.4 | ) |
| Transfers to assets held for sale | | (2.7 | ) |
| As at December 31, 2012 | $ | 391.8 | |
Goodwill of $391.8 million (2011 - $404.9 million) has been allocated to the Upstream operating segment. In assessing whether goodwill has been impaired, the carrying amount of the Upstream operating segment (including goodwill) is compared with the recoverable amount of the Upstream operating segment. The estimated recoverable amount was based on the Upstream operating segment’s value in use, calculated using the estimated discounted future cash flows from the proved plus probable reserves evaluated by Harvest’s independent reserves evaluators. The key assumptions required to estimate the recoverable amount are the oil and natural gas prices, reserve estimates and the discount rate (see note 2). The values assigned to the key assumptions represent management’s assessment of future trends in the oil and gas industry based on both external and internal sources. A pre-tax discount rate of 10% and the following forward commodity price estimates were used in the goodwill impairment calculation at December 31, 2012:
| | | Edmonton Light | | |
| | WTI Crude Oil | Crude Oil | AECO Gas | US$/Cdn$ |
| Year | ($US/bbl) | ($Cdn/bbl) | ($Cdn/Mmbtu) | Exchange Rate |
| 2013 | 92.50 | 87.50 | 3.35 | 1.00 |
| 2014 | 92.50 | 90.50 | 3.85 | 1.00 |
| 2015 | 93.60 | 92.60 | 4.35 | 1.00 |
| 2016 | 95.50 | 94.50 | 4.70 | 1.00 |
| 2017 | 97.40 | 96.40 | 5.10 | 1.00 |
| Thereafter(1) | +2%/year | +2%/year | +2%/year | 1.00 |
| | (1) | Represents the average escalation percentage in each year after 2017 to the end of reserve life. |
Based on the calculation performed using the above assumptions, management did not identify impairment to the Upstream operating segment and the associated goodwill for the year ended December 31, 2012 (2011 and 2010 - $nil). A 200 bps increase in the discount rate would result in a goodwill impairment of approximately $24.9 million, while a 10% decrease in the forward oil price estimates would result in a goodwill impairment of approximately $252.0 million. A 10% decrease in the forward gas or NGL price estimates would not result in any goodwill impairment.
F - 22
| | | | Upstream | | | BlackGold | | | Downstream | | | Total | |
| | Decommissioning liabilities at December 31, 2010 | $ | 648.7 | | $ | 0.4 | | $ | 10.4 | | $ | 659.5 | |
| | Liabilities assumed on acquisitions | | 36.3 | | | - | | | - | | | 36.3 | |
| | Liabilities incurred | | 26.4 | | | 0.6 | | | - | | | 27.0 | |
| | Settled during the period | | (21.0 | ) | | (1.1 | ) | | - | | | (22.1 | ) |
| | Revisions (change in estimate) | | (48.2 | ) | | 1.6 | | | 3.8 | | | (42.8 | ) |
| | Disposals | | (0.7 | ) | | - | | | - | | | (0.7 | ) |
| | Accretion | | 22.9 | | | - | | | 0.4 | | | 23.3 | |
| | Decommissioning liabilities at December 31, 2011 | $ | 664.4 | | $ | 1.5 | | $ | 14.6 | | $ | 680.5 | |
| | Environmental remediation at December 31, 2011 | | 6.8 | | | - | | | - | | | 6.8 | |
| | Other provisions at December 31, 2011 | | 4.3 | | | - | | | - | | | 4.3 | |
| | Balance at December 31, 2011 | $ | 675.5 | | $ | 1.5 | | $ | 14.6 | | $ | 691.6 | |
| | | | | | | | | | | | | | |
| | Decommissioning liabilities at December 31, 2011 | $ | 664.4 | | $ | 1.5 | | $ | 14.6 | | $ | 680.5 | |
| | Liabilities incurred | | 9.9 | | | 15.8 | | | - | | | 25.7 | |
| | Settled during the period | | (18.4 | ) | | (0.2 | ) | | - | | | (18.6 | ) |
| | Revisions (change in estimated timing and costs) | | 72.8 | | | 2.6 | | | 1.2 | | | 76.6 | |
| | Disposals | | (27.4 | ) | | - | | | - | | | (27.4 | ) |
| | Accretion | | 19.9 | | | 0.1 | | | 0.4 | | | 20.4 | |
| | Transfers to assets held for sale | | (11.9 | ) | | - | | | - | | | (11.9 | ) |
| | Decommissioning liabilities at December 31, 2012 | $ | 709.3 | | $ | 19.8 | | $ | 16.2 | | $ | 745.3 | |
| | Environmental remediation at December 31, 2012 | | 6.6 | | | - | | | - | | | 6.6 | |
| | Other provisions at December 31, 2012 | | 3.5 | | | - | | | - | | | 3.5 | |
| | Balance at December 31, 2012 | $ | 719.4 | | $ | 19.8 | | $ | 16.2 | | $ | 755.4 | |
| | | | | | | | | | | | | | |
| | Current portion | $ | 28.1 | | $ | - | | $ | - | | $ | 28.1 | |
| | Non-current portion | | 691.3 | | | 19.8 | | | 16.2 | | | 727.3 | |
| | Balance at December 31, 2012 | $ | 719.4 | | $ | 19.8 | | $ | 16.2 | | $ | 755.4 | |
Harvest’s decommissioning and environmental remediation liabilities arise from its net ownership interests in petroleum and natural gas assets including well sites, gathering systems, pipeline, processing facilities and Downstream refining and marketing assets and its legal obligations to remediate, retire and reclaim them. Harvest estimates the total undiscounted amount of cash flows required to settle its decommissioning and environmental remediation liabilities to be approximately $1.8 billion at December 31, 2012 (2011 - $1.4 billion), which will be incurred between 2013 and 2074. A risk-free discount rate of 3.0% (2011 - 3.0%) and inflation rate of 1.7% (2011 - 1.7%) were used to calculate the present value of the decommissioning and environmental remediation liabilities. The actual decommissioning and environmental remediation costs will ultimately depend upon future market prices for the necessary decommissioning and remediation work required, which will reflect market conditions at the relevant time. Furthermore, the timing of decommissioning is likely to depend on when the fields cease to produce at economically viable rates. This in turn will depend upon future oil and gas prices, which are inherently uncertain.
Harvest’s other provisions relates to legal claims against Harvest and their estimated settlement amounts. In addition to these claims, Harvest is defendant and plaintiff in a number of other legal actions that arise in the normal course of business and the company believes that any liabilities that might arise pertaining to such matters would not have a material effect on its consolidated financial statements.
F - 23
| | | | December 31, 2012 | | | December 31, 2011 | |
| | Bank loan | $ | 491.3 | | $ | 355.6 | |
| | 67/8% senior notes (US$500 million) | | 486.4 | | | 495.7 | |
| | 6.40% debentures due 2012 (series D) | | – | | | 107.1 | |
| | 7.25% debentures due 2013 (series E) | | 331.8 | | | 333.3 | |
| | 7.25% debentures due 2014 (series F) | | 60.4 | | | 60.6 | |
| | 7.50% debentures due 2015 (series G) | | 239.8 | | | 241.0 | |
| | Long-term debt outstanding | | 1,609.7 | | | 1,593.3 | |
| | Less current portion | | (331.8 | ) | | (107.1 | ) |
| | Long-term debt | $ | 1,277.9 | | $ | 1,486.2 | |
a) Bank Loan
Borrowings under the credit facility are available by way of bankers’ acceptances, Canadian prime rate loans, LIBOR based loans, or U.S. base rate loans. At December 31, 2012, Harvest had $494.2 million (2011 - $358.9 million) drawn from the $800 million available under the credit facility, of which US$90 million were LIBOR based loans (2011 - $nil) with the remaining in Canadian bankers’ acceptances. The carrying value of the bank loan includes $2.9 million of deferred financial charges at December 31, 2012 (2011 - $3.3 million). For the year ended December 31, 2012 interest charges on the bank loan aggregated to $17.2 million (2011 - $5.7 million; 2010 - $5.7 million) reflecting an effective interest rate of 3.0% (2011 – 3.0%; 2010 – 3.7%) .
On July 31, 2012, Harvest extended the credit facility agreement by one year to April 30, 2016.
Under the credit facility agreement, Harvest is required to maintain certain financial ratios. On June 29, 2012, the credit facility agreement was amended to revise the maximum allowable total debt to annualized EBITDA ratio from 3.5:1 to the following:
| Twelve months ending | Total debt to annualized EBITDA |
| December 31, 2012 | 4.00:1.0 or less |
| March 31, 2013 | 3.75:1.0 or less |
| June 30, 2013 and thereafter | 3.50:1.0 or less |
Except for the above amendments, all other terms to the credit facility agreement remain unchanged.
The credit facility is secured by a first floating charge over all of the assets of Harvest and its restricted subsidiaries plus a first mortgage security interest on the Downstream operation’s refinery assets. The most restrictive covenants of Harvest’s credit facility include an aggregate limitation of $25 million on financial assistance and/or capital contributions to parties other than Harvest or its restricted subsidiaries, a limitation to carrying on business in countries that are not members of the Organization of Economic Co-operation and Development and a limitation on the payment of distributions to the shareholder in certain circumstances such as an event of default. The credit facility requires standby fees on undrawn amounts and interest on amounts borrowed at varying rates depending on Harvest's ratio of senior debt to its annualized EBITDA. Availability under this facility is subject to the following quarterly financial covenants as defined in the credit facility agreement:
| | | Covenant | December 31, 2012 | December 31, 2011 |
| | Senior debt(1)to Annualized EBITDA(3) | 3.00 to 1.0 or less | 1.10 | 0.73 |
| | Total debt(2)to Annualized EBITDA(3) | 4.00 to 1.0(4)or less | 3.22 | 2.72 |
| | Senior debt(1)to Capitalization(5) | 50% or less | 14% | 10% |
| | Total debt(2)to Capitalization(5) | 55% or less | 41% | 36% |
| | (1) | Senior debt consists of letters of credit of $8.2 million (December 31, 2011 – $8.7 million), bank loan of $491.3 million (December 31, 2011 - $355.6 million) and guarantees of $76.6 million (December 31, 2011 - $92.1 million) at December 31, 2012. |
| | (2) | Total debt consists of senior debt, convertible debentures and senior notes. |
| | (3) | Annualized EBITDA is defined in Harvest’s credit facility agreement as earnings before finance costs, income tax expense or recovery, depletion, depreciation and amortization, exploration and evaluation costs, impairment of assets, unrealized gains or losses on risk management contracts, unrealized gains or losses on foreign exchange, gains or losses on disposition of assets and other non-cash items. |
| | (4) | The covenant ratio was changed from 3.5 to 1.0 to 4.00 to 1.0 on June 29, 2012. |
| | (5) | Capitalization consists of total debt, related party loan and shareholder’s equity less equity for BlackGold of $458.6 million at December 31, 2012 (December 31, 2011 - $459.9 million). |
F - 24
b) Senior Notes
On October 4, 2010, Harvest issued US$500 million of 67/8% senior notes for net cash proceeds of US$484.6 million. The senior notes are unsecured with interest payable semi-annually on April 1 and October 1 and mature on October 1, 2017. The senior notes are unconditionally guaranteed by Harvest and all of its wholly-owned subsidiaries that guarantee the revolving credit facility and every future restricted subsidiary that guarantees certain debt. The notes are redeemable at a redemption price equal to 100% of the principal amount of the notes being redeemed plus a make-whole redemption premium, plus accrued and unpaid interest to the redemption date. Harvest may also redeem the notes at any time in the event that certain changes affecting Canadian withholding taxes occur.
There are covenants restricting, among other things, the sale of assets and the incurrence of additional indebtedness if such issuance would result in an interest coverage ratio, as defined, of less than 2.0 to 1. Notwithstanding the interest coverage ratio limitation, the incurrence of additional indebtedness may be permitted under certain incurrence tests. One provision allows Harvest’s incurrence of indebtedness under the credit facility or other future bank debt in an aggregate principal amount not to exceed the greater of $1.0 billion and 15% of total assets. In addition, the covenants of the senior notes restrict the amount of dividends Harvest can pay to shareholders; no dividends have been paid during the year ended December 31, 2012.
In 2010, Harvest redeemed the US$250 million of 77/8% senior notes for total consideration of $256.9 million.
c) Convertible Debentures
On September 19, 2012, Harvest redeemed its 6.40% or D series of convertible debentures at a redemption price of $1,024.90 per $1,000 principal amount for a total amount of $106.8 million. The redemption price was equal to the principal plus all accrued and unpaid interest thereon. Harvest recognized a nominal gain on the redemption, which has been included in “finance costs” in the consolidated statements of comprehensive income.
As a result of KNOC’S acquisition of Harvest Energy Trust, in 2009, the debentures are no longer convertible into units but investors would receive $10.00 for each unit notionally received based on each series conversion rate. Because every series of debentures carry a conversion price that exceeds $10.00 per unit, it is assumed that no investor would exercise their conversion option.
The debentures may be redeemed by Harvest at its option in whole or in part prior to their respective redemption dates. The redemption price for the first redemption period is at a price equal to $1,050 per debenture and at $1,025 per debenture during the second redemption period. After the second redemption period, the debentures are redeemable at par. Any redemption will include accrued and unpaid interest at such time.
The following is a summary of the three series of convertible debentures that are outstanding at December 31, 2012:
| | Interest | Conversion | | | Second redemption |
| Series | Rate | price / share | Maturity | First redemption period | period |
| E | 7.25% | $ 32.20 | Sept. 30, 2013 | Oct. 1/09-Sept. 30/10 | Oct. 1/10-Sept. 30/11 |
| F | 7.25% | $ 27.25 | Feb. 28, 2014 | Mar. 1/10-Feb. 28/11 | Mar. 1/11-Feb. 29/12 |
| G | 7.50% | $ 27.40 | May 31, 2015 | Jun. 1/11-May 31/12 | Jun. 1/12-May 31/13 |
The following table summarizes the face value, carrying amount and fair value of the convertible debentures:
| | | December 31, 2012 | | | December 31, 2011 | |
| | | Face | | | Carrying | | | | | | Face | | | Carrying | | | | |
| Series | | Value | | | Amount | | | Fair Value | | | Value | | | Amount | | | Fair Value | |
| D | $ | - | | $ | - | | $ | - | | $ | 106.8 | | $ | 107.1 | | $ | 108.2 | |
| E | | 330.5 | | | 331.8 | | | 335.5 | | | 330.5 | | | 333.3 | | | 337.2 | |
| F | | 60.1 | | | 60.4 | | | 61.5 | | | 60.1 | | | 60.6 | | | 61.6 | |
| G | | 236.6 | | | 239.8 | | | 247.0 | | | 236.6 | | | 241.0 | | | 245.5 | |
| | $ | 627.2 | | $ | 632.0 | | $ | 644.0 | | $ | 734.0 | | $ | 742.0 | | $ | 752.5 | |
The KNOC acquisition of the Trust triggered the “change of control” provision included within the convertible debentures’ indentures, which required Harvest to make an offer to purchase 100% of the outstanding convertible debentures for cash consideration of 101% of the principal amount thereof plus accrued and unpaid interest.
F - 25
Harvest made these offers on January 20, 2010 and by March 4, 2010 all of the offers had expired. The following redemptions were made:
| | • | Series B – $13.3 million principal amount tendered, with the remaining principal balance of $23.8 million maturing on December 31, 2010 |
| | • | Series D – $67.8 million principal amount tendered leaving a principal balance of $106.8 million outstanding |
| | • | Series E – $48.7 million principal amount tendered leaving a principal balance of $330.5 million outstanding |
| | • | Series F – $13.2 million principal amount tendered leaving a principal balance of $60.1 million outstanding |
| | • | Series G – $13.4 million principal amount tendered leaving a principal balance of $236.6 million outstanding |
| 11. | Long-Term Liability and Other |
| | | |
| On May 30, 2012, Harvest amended certain aspects of its BlackGold oil sands project engineering, procurement and construction (“EPC”) contract, including revising the compensation terms from a lump sum price to a cost reimbursable price and confirming greater Harvest control over project execution. The cost pressures and resulting contract changes are expected to increase the net EPC costs to approximately $520 million from $311 million, after allowing for certain costs which are not reimbursable to the EPC contractor. Harvest and the EPC contractor also agreed to apply the cumulative progress payments made under the lump sum contract and the remaining deposit of $24.4 million as at May 30, 2012 towards costs incurred to that date. |
| | | |
| Under the amended EPC contract, a maximum of approximately $101 million of the EPC costs will be paid in equal installments, without interest, over 10 years commencing on the completion of the EPC work in 2014. The liability is considered a financial liability and is initially recorded at fair value, which is estimated as the present value of all future cash payments discounted using the prevailing market rate of interest for similar instruments. As at December 31, 2012, Harvest recognized a long-term liability of $4.7 million (2011 - $nil) using a discount rate of 4.5% (2011 - nil). |
| | | |
| Also included in long-term liability and other is deferred credits of $0.5 million (2011 - $0.8 million). |
| | | |
| 12. | Shareholder’s Capital |
| | | |
| (a) | Authorized |
| | | |
| The authorized capital consists of an unlimited number of common shares with no par value and an unlimited number of preferred shares issuable in series. |
| | | |
| (b) | Number of Common Shares Issued |
| | Outstanding at January 1, 2010 | | 242,268,802 | |
| | Issued to KNOC at $10.00 per share to fund debt repayment | | 46,567,852 | |
| | Issued to KNOC at $10.00 per share for BlackGold consideration | | 37,416,913 | |
| | Issued to KNOC at $10.00 per share for BlackGold project development | | 4,700,000 | |
| | Issued to KNOC at $10.00 per share for BlackGold project development | | 3,868,600 | |
| | Issued to KNOC at $10.00 per share for KNOC Global Technology and Research Centre | | 712,880 | |
| | Outstanding at December 31, 2010 | | 335,535,047 | |
| | Issued to KNOC at $10.00 per share for Hunt acquisition | | 50,543,602 | |
| | Outstanding at December 31, 2011 and 2012 | | 386,078,649 | |
F - 26
| 13. | Capital Structure |
| | |
| Harvest considers its capital structure to include its credit facility, senior notes, related party loan, convertible debentures and shareholder’s equity. |
| | | | December 31, 2012 | | | December 31, 2011 | |
| | Bank loan(1) | $ | 494.2 | | $ | 358.9 | |
| | 67/8% senior notes (US$500 million)(1)(2) | | 497.5 | | | 508.5 | |
| | Related party loan (US$170 million)(2) | | 169.1 | | | – | |
| | Principal amount of convertible debentures | | 627.2 | | | 734.0 | |
| | | | 1,788.0 | | | 1,601.4 | |
| | Shareholder’s equity | | 2,691.9 | | | 3,453.7 | |
| | | $ | 4,479.9 | | $ | 5,055.1 | |
| | (1) | Excludes deferred financing fees. |
| | (2) | Principal amount converted at the period end exchange rate. |
| Harvest’s primary objective in its management of capital resources is to have access to capital to fund its financial obligations as well as future growth. Harvest monitors its capital structure and makes adjustments according to market conditions to remain flexible while meeting these objectives. Accordingly, Harvest may adjust its capital spending programs, issue equity, issue new debt or repay existing debt. |
| | |
| Harvest evaluates its capital structure using the same financial covenant ratios as the ones externally imposed under the Company’s credit facility and senior notes. Harvest was in compliance with all debt covenants at December 31, 2012. |
| | |
| 14. | Revenues |
| | | | Year Ended December 31 | |
| | | | 2012 | | | 2011 | | | 2010 | |
| | Petroleum and natural gas sales, net of royalty | $ | 999.3 | | $ | 1,100.8 | | $ | 852.2 | |
| | Refined products sales | | 4,752.1 | | | 3,302.3 | | | 3,193.3 | |
| | Effective portion of realized crude oil hedges | | 29.6 | | | (9.4 | ) | | - | |
| | | $ | 5,781.0 | | $ | 4,393.7 | | $ | 4,045.5 | |
| 15. | Operating and General and Administrative (“G&A”) Expenses |
| | | | Year Ended December 31 | |
| | | | | | | Upstream | | | | | | | | | Downstream | | | | | | | | | Total | | | | |
| | Operating expenses | | 2012 | | | 2011 | | | 2010 | | | 2012 | | | 2011 | | | 2010 | | | 2012 | | | 2011 | | | 2010 | |
| | Power and purchased energy | $ | 79.6 | | $ | 83.1 | | $ | 59.1 | | $ | 140.7 | | $ | 117.3 | | $ | 106.1 | | $ | 220.3 | | $ | 200.4 | | $ | 165.2 | |
| | Well servicing | | 56.0 | | | 61.6 | | | 50.4 | | | - | | | - | | | - | | | 56.0 | | | 61.6 | | | 50.4 | |
| | Repairs and maintenance | | 57.0 | | | 60.0 | | | 43.7 | | | 26.4 | | | 20.4 | | | 22.3 | | | 83.4 | | | 80.4 | | | 66.0 | |
| | Lease rentals and property taxes | | 38.3 | | | 34.7 | | | 30.6 | | | - | | | - | | | - | | | 38.3 | | | 34.7 | | | 30.6 | |
| | Salaries and benefits | | 31.5 | | | 28.1 | | | 22.6 | | | 66.5 | | | 58.9 | | | 61.0 | | | 98.0 | | | 87.0 | | | 83.6 | |
| | Professional and consultation fees | | 19.3 | | | 19.4 | | | 16.0 | | | 5.7 | | | 4.5 | | | 3.8 | | | 25.0 | | | 23.9 | | | 19.8 | |
| | Chemicals | | 18.0 | | | 15.4 | | | 13.0 | | | - | | | - | | | - | | | 18.0 | | | 15.4 | | | 13.0 | |
| | Processing fees | | 33.4 | | | 22.6 | | | 13.5 | | | - | | | - | | | - | | | 33.4 | | | 22.6 | | | 13.5 | |
| | Trucking | | 16.3 | | | 13.3 | | | 9.6 | | | - | | | - | | | - | | | 16.3 | | | 13.3 | | | 9.6 | |
| | Other | | 9.6 | | | 12.2 | | | 7.1 | | | 22.2 | | | 24.6 | | | 22.4 | | | 31.8 | | | 36.8 | | | 29.5 | |
| | | $ | 359.0 | | $ | 350.4 | | $ | 265.6 | | $ | 261.5 | | $ | 225.7 | | $ | 215.6 | | $ | 620.5 | | $ | 576.1 | | $ | 481.2 | |
F - 27
| | | | Year Ended December 31 | |
| | General and administrative expenses | | 2012 | | | 2011 | | | 2010 | |
| | Salaries and benefits | $ | 64.8 | | $ | 59.5 | | $ | 44.5 | |
| | Professional and consultation fees | | 10.8 | | | 7.9 | | | 8.4 | |
| | Other | | 13.3 | | | 18.6 | | | 9.4 | |
| | G&A capitalized and recovery | | (23.3 | ) | | (23.4 | ) | | (15.2 | ) |
| | | $ | 65.6 | | $ | 62.6 | | $ | 47.1 | |
| | | | Year Ended December 31 | |
| | | | 2012 | | | 2011 | | | 2010 | |
| | Interest and other finance charges | $ | 103.8 | | $ | 94.1 | | $ | 78.5 | |
| | Accretion of decommissioning and environmental remediation liabilities | | 20.7 | | | 23.6 | | | 22.7 | |
| | Less: capitalized interest | | (13.5 | ) | | (8.6 | ) | | (0.4 | ) |
| | | $ | 111.0 | | $ | 109.1 | | $ | 100.8 | |
| | | | Year Ended December 31 | |
| | | | 2012 | | | 2011 | | | 2010 | |
| | Realized gains on foreign exchange | $ | (0.1 | ) | $ | (6.6 | ) | $ | (1.5 | ) |
| | Unrealized (gains) losses on foreign exchange | | (1.2 | ) | | 2.6 | | | (1.9 | ) |
| | | $ | (1.3 | ) | $ | (4.0 | ) | $ | (3.4 | ) |
| 18. | Supplemental Cash Flow Information |
| | | | Year Ended December 31 | |
| | | | 2012 | | | 2011 | | | 2010 | |
| | Source (use) of cash: | | | | | | | | | |
| | Accounts receivable and other | $ | 36.7 | | $ | 1.7 | | $ | (35.3 | ) |
| | Prepaid expenses (including long-term deposit) | | 18.2 | | | 42.2 | | | (70.1 | ) |
| | Inventories | | (19.8 | ) | | 14.5 | | | 11.3 | |
| | Accounts payable | | (88.1 | ) | | 103.7 | | | 155.1 | |
| | Net changes in non-cash working capital | | (53.0 | ) | | 162.1 | | | 61.0 | |
| | Changes relating to operating activities | | 11.0 | | | 51.1 | | | 32.3 | |
| | Changes relating to financing activities | | - | | | - | | | 1.9 | |
| | Changes relating to investing activities | | (63.8 | ) | | 108.7 | | | 22.5 | |
| | Add: Non-cash changes | | (0.2 | ) | | 2.3 | | | 4.3 | |
| | | $ | (53.0 | ) | $ | 162.1 | | $ | 61.0 | |
F - 28
| | | | Year Ended December 31 | |
| | | | 2012 | | | 2011 | | | 2010 | |
| | Current income tax expense (recovery) | $ | – | | $ | 0.1 | | $ | (0.2 | ) |
| | Deferred income tax (“DIT”) recovery | | (109.1 | ) | | (29.9 | ) | | (65.1 | ) |
| | | $ | (109.1 | ) | $ | (29.8 | ) | $ | (65.3 | ) |
The income tax recovery varies from the amount that would be computed by applying the relevant Canadian income tax rates to reported losses before taxes as follows:
| | | | Year Ended December 31 | |
| | | | 2012 | | | 2011 | | | 2010 | |
| | Loss before income tax | $ | (829.2 | ) | $ | (134.5 | ) | $ | (146.5 | ) |
| | Combined Canadian federal and provincial statutory income tax rate | | 27.65% | | | 28.08% | | | 28.25% | |
| | Computed income tax recovery at statutory rates | | (229.3 | ) | | (37.8 | ) | | (41.4 | ) |
| | Increased expense (recovery) resulting from the following: | | | | | | | | | |
| | Difference between current and expected tax rates | | 56.3 | | | 13.9 | | | (12.9 | ) |
| | Foreign exchange impact not recognized in income | | (6.7 | ) | | 7.8 | | | (10.9 | ) |
| | Amended returns and pool balances | | 6.1 | | | 4.9 | | | – | |
| | Reversal of previously recognized temporary differences | | 60.0 | | | (12.7 | ) | | – | |
| | Non-deductible expenses (recoveries) | | 4.6 | | | (3.5 | ) | | (2.4 | ) |
| | Other | | (0.1 | ) | | (2.4 | ) | | (0.2 | ) |
| | Non-taxable portion of capital loss | | – | | | – | | | 2.5 | |
| | Income tax recovery | $ | (109.1 | ) | $ | (29.8 | ) | $ | (65.3 | ) |
The change in the applicable tax rate for the year ended December 31, 2012 from the previous year is due to a reduction in the federal component of the tax rate.
Movements in the DIT asset (liability) are as follows:
| | | | | | | Decommissioning | | | Non-capital | | | | | | Total deferred | |
| | | | PP&E | | | liabilities | | | tax losses | | | Other | | | asset (liability) | |
| | At December 31, 2010 | $ | (556.5 | ) | $ | 168.5 | | $ | 303.1 | | $ | 5.4 | | $ | (79.5 | )(1) |
| | Recognized in profit or loss | | (48.8 | ) | | 3.9 | | | 71.9 | | | 2.9 | | | 29.9 | |
| | Recognized in other comprehensive loss | | - | | | - | | | - | | | (5.3 | ) | | (5.3 | ) |
| | At December 31, 2011 | $ | (605.3 | ) | $ | 172.4 | | $ | 375.0 | | $ | 3.0 | | $ | (54.9 | ) |
| | Recognized in profit or loss | | 282.3 | | | 19.2 | | | (184.1 | ) | | (8.3 | ) | | 109.1 | |
| | Recognized in other comprehensive loss | | - | | | - | | | - | | | 6.9 | | | 6.9 | |
| | At December 31, 2012 | $ | (323.0 | ) | $ | 191.6 | | $ | 190.9 | | $ | 1.6 | | $ | 61.1 | |
| | (1) | The net DIT liability at December 31, 2010 consists of a $1.6 million DIT asset and an $81.1 million DIT liability. |
DIT assets are recognized to the extent that it is probable that taxable profit will be available against which the deductible temporary differences and the carry-forward of unused tax losses can be utilized. As at December 31, 2012, Harvest had approximately $1.1 billion (2011 - $1.6 billion) of carry-forward tax losses that would be available to offset against future taxable profit. These carry-forward losses will expire between the years 2023 and 2032.Based on management’s best estimate of the forecasted future taxable profit of the Company, management believes that there is sufficient evidence to recognize a DIT asset on $800 million (2011 - $1.6 billion) of the carry-forward losses as at December 31, 2012. A DIT asset of $60 million (2011 - $nil) was not recognized in respect to $300 million (2011 - $nil) of the Downstream carry-forward tax losses as it is not probable that sufficient future taxable profit will be available to utilize these losses. These carry-forward tax losses will expire between the years 2026 to 2031.
As at December 31, 2012, Harvest had a contingent liability relating to an unsettled dispute with the Canada Revenue Agency. This contingent liability has not been provided for in the consolidated statement of financial position as the Company has assessed that it is possible but not probable that a payment will be necessary. The range of possible payment is estimated to be between $3.6 million to $7.1 million.
F - 29
| 20. | Post-Employment Benefits |
| | |
| The measurement of the accrued benefit obligation and annual expense for the defined benefit plans requires actuarial calculations and the following key assumptions. |
| | | December 31, 2012 | December 31, 2011 |
| | | | Other | | Other |
| | | Pension | Benefit | Pension | Benefit |
| | | Plans | Plans | Plans | Plans |
| | | | | | |
| | Discount rate | 4.0% | 4.0% | 5.0% | 5.0% |
| | Expected long-term rate of return on plan assets – bonds/fixed income securities | 5.0% | - | 5.0% | - |
| | Expected long-term rate of return on plan assets – equity securities | 8.0% | - | 8.0% | - |
| | Rate of compensation increase | 3.5% | - | 3.5% | - |
| | Employee contribution of pensionable income | 6.0% | - | 6.0% | - |
| | Annual rate of increase in covered health care benefits | - | 8.0% | - | 8.0% |
The discount rates are determined with reference to market yields on high quality corporate bonds with similar duration to the benefit obligations at the end of the reporting period.
The expected long-term rate of return is based on the portfolio as a whole and not necessarily on the sum of the returns on individual asset categories and is calculated using the projected rates of return of the plan investment portfolio, including the expected forecast for inflation, risk premiums for each class of asset, and current and future financial market conditions.
The defined benefit pension plan asset mix is as follows:
| | | December 31, 2012 | December 31, 2011 |
| | Bonds/fixed income securities | 31% | 30% |
| | Equity securities | 69% | 70% |
The primary investment strategy is the security and long-term stability of plan assets, combined with moderate growth that corresponds to the participants’ anticipated retirement dates. The investment policy is reviewed from time to time to ensure consistency with the plan objectives. The Company in conjunction with the plan asset investment managers manages the inherent risks of various asset classes by investing in a diversified portfolio. The plan assets are primarily invested in domestic and foreign equity funds and in domestic bonds. The target asset allocation for equity securities is approximately 70% (and within a range of 50% to 90%) and the target asset allocation for debt securities is approximately 30% (and within a range of 10% to 50%). From time to time, the actual asset allocations for equity securities and debt securities may vary slightly from the target allocation, while staying within the target range, as a result of market conditions, however, management reviews the investments on a regular basis to ensure they continue to meet the plans’ investment strategy.
Total cash payments for employee future benefits, consisting of cash contributed by Harvest to the pension plans and other benefit plans was $10.1 million for the year ended December 31, 2012 (2011 - $3.6 million; 2010 - $3.9 million); the expected contribution for the pension plans and other benefit plans in 2013 is $9.4 million.
Actuarial valuations are completed annually for the defined benefit plans and post-retirement benefit plan.
F - 30
| | | | December 31, 2012 | | | December 31, 2011 | |
| | | | | | | Other | | | | | | | | | Other | | | | |
| | | | Pension | | | Benefit | | | | | | Pension | | | Benefit | | | | |
| | | | Plans | | | Plans | | | Total | | | Plans | | | Plans | | | Total | |
| | Employee benefit obligation, beginning of period | $ | 70.8 | | $ | 8.2 | | $ | 79.0 | | $ | 63.8 | | $ | 7.9 | | $ | 71.7 | |
| | Current service costs | | 2.6 | | | 0.3 | | | 2.9 | | | 2.5 | | | 0.3 | | | 2.8 | |
| | Interest costs | | 3.7 | | | 0.4 | | | 4.1 | | | 3.5 | | | 0.4 | | | 3.9 | |
| | Employee contributions | | 1.8 | | | 0.2 | | | 2.0 | | | 1.6 | | | 0.2 | | | 1.8 | |
| | Actuarial (gain) loss | | 14.4 | | | 0.7 | | | 15.1 | | | 1.5 | | | (0.1 | ) | | 1.4 | |
| | Benefits paid | | (2.7 | ) | | (0.5 | ) | | (3.2 | ) | | (2.1 | ) | | (0.5 | ) | | (2.6 | ) |
| | Employee benefit obligation, end of period | $ | 90.6 | | $ | 9.3 | | $ | 99.9 | | $ | 70.8 | | $ | 8.2 | | $ | 79.0 | |
| | | | | | | | | | | | | | | | | | | | |
| | Fair value of plan assets, beginning of period | $ | 53.0 | | $ | - | | $ | 53.0 | | $ | 51.3 | | $ | - | | $ | 51.3 | |
| | Expected return on plan assets | | 4.0 | | | - | | | 4.0 | | | 3.6 | | | - | | | 3.6 | |
| | Actuarial gain (loss) | | 1.6 | | | - | | | 1.6 | | | (4.7 | ) | | - | | | (4.7 | ) |
| | Employer contributions | | 9.8 | | | 0.3 | | | 10.1 | | | 3.3 | | | 0.3 | | | 3.6 | |
| | Employee contributions | | 1.8 | | | 0.2 | | | 2.0 | | | 1.6 | | | 0.2 | | | 1.8 | |
| | Benefits paid | | (2.7 | ) | | (0.5 | ) | | (3.2 | ) | | (2.1 | ) | | (0.5 | ) | | (2.6 | ) |
| | Fair value of plan assets, end of period | $ | 67.5 | | $ | - | | $ | 67.5 | | $ | 53.0 | | $ | - | | $ | 53.0 | |
| | Funded status – surplus (deficit) | $ | (23.1 | ) | $ | (9.3 | ) | $ | (32.4 | ) | $ | (17.8 | ) | $ | (8.2 | ) | $ | (26.0 | ) |
The following is a history of the Company’s experience adjustments:
| | | | Year Ended December 31 | |
| | | | Pension Plans | | | Other Benefit Plans | |
| | | | 2012 | | | 2011 | | | 2010 | | | 2012 | | | 2011 | | | 2010 | |
| | Experience gains (losses) as a percentage of plan assets | | (18.4 | )% | | (6.8 | )% | | - | | | - | | | - | | | - | |
| | Experience gains (losses) as a percentage of plan liabilities | | (13.8 | )% | | (5.5 | )% | | - | | | (3.5 | )% | | (5.4 | )% | | - | |
The table below shows the components of the net benefit plan expense:
| | | | Year Ended December 31 | |
| | | | | | | 2012 | | | | | | | | | 2011 | | | | | | | | | 2010 | | | | |
| | | | | | | Other | | | | | | | | | Other | | | | | | | | | Other | | | | |
| | | | Pension | | | Benefit | | | | | | Pension | | | Benefit | | | | | | Pension | | | Benefit | | | | |
| | | | Plans | | | Plans | | | Total | | | Plans | | | Plans | | | Total | | | Plans | | | Plans | | | Total | |
| | | | | | | | | | | | | | | | | | | | | | | | | | | | | |
| | Current service cost | $ | 2.6 | | $ | 0.3 | | $ | 2.9 | | $ | 2.5 | | $ | 0.3 | | $ | 2.8 | | $ | 2.2 | | $ | 0.3 | | $ | 2.5 | |
| | Interest costs | | 3.7 | | | 0.4 | | | 4.1 | | | 3.5 | | | 0.4 | | | 3.9 | | | 3.3 | | | 0.4 | | | 3.7 | |
| | Expected return on assets | | (4.0 | ) | | - | | | (4.0 | ) | | (3.6 | ) | | - | | | (3.6 | ) | | (3.3 | ) | | - | | | (3.3 | ) |
| | Net benefit plan expense | $ | 2.3 | | $ | 0.7 | | $ | 3.0 | | $ | 2.4 | | $ | 0.7 | | $ | 3.1 | | $ | 2.2 | | $ | 0.7 | | $ | 2.9 | |
The actual return on plan assets for the year ended December 31, 2012 was $5.6 million (2011 - a loss of $1.1 million; 2010 – a return of $2.0 million).
For the year ended December 31, 2012 the net benefit plan expense of $3.0 million (2011 - $3.1 million; 2010 – $2.9 million) has been included in operating expenses in the consolidated statements of comprehensive loss. An actuarial loss of $10.8 million, after tax of $2.7 million (2011 - $4.9 million, after tax of $1.2 million; 2010 - $3.2 million, after tax of $0.7 million) has been included in other comprehensive income. The cumulative amount of actuarial loss included in accumulated other comprehensive loss as at December 31, 2012 was $18.9 million, after tax of $4.6 million (2011 - $8.1 million, after tax of $1.9 million).
Under the pension regulations, Downstream is required to fund its defined benefit pension plan obligation within 5 to 15 years. The funding requirements are included in note 24.
F - 31
| A 1% change in the expected health care cost trend rate would have an insignificant impact on the post retirement benefit expense and projected benefit obligations at December 31, 2012. |
| | |
| 21. | Other Comprehensive Income (“OCI”) and Accumulated Other Comprehensive Income (“AOCI”) |
| | | | Foreign | | | Designated | | | | | | | |
| | | | Currency | | | Cash Flow | | | Actuarial | | | | |
| | | | Translation | | | Hedges, Net | | | Loss, Net of | | | | |
| | | | Adjustment | | | of Tax | | | Tax | | | Total | |
| | AOCI at January 1, 2010 | $ | - | | $ | - | | $ | - | | $ | - | |
| | Losses on derivatives designated as cash flow hedges | | - | | | (5.0 | ) | | - | | | (5.0 | ) |
| | Actuarial loss | | - | | | - | | | (3.2 | ) | | (3.2 | ) |
| | Losses on foreign currency translation | | (45.9 | ) | | - | | | - | | | (45.9 | ) |
| | AOCI at December 31, 2010 | $ | (45.9 | ) | $ | (5.0 | ) | $ | (3.2 | ) | $ | (54.1 | ) |
| | Reclassification to net income of losses on cash flow hedges | | - | | | 7.1 | | | - | | | 7.1 | |
| | Gains on derivatives designated as cash flow hedges | | - | | | 12.3 | | | - | | | 12.3 | |
| | Actuarial loss | | - | | | - | | | (4.9 | ) | | (4.9 | ) |
| | Gains on foreign currency translation | | 21.5 | | | - | | | - | | | 21.5 | |
| | AOCI at December 31, 2011 | $ | (24.4 | ) | $ | 14.4 | | $ | (8.1 | ) | $ | (18.1 | ) |
| | Reclassification to net income of gains on cash flow hedges | | - | | | (22.4 | ) | | - | | | (22.4 | ) |
| | Gains on derivatives designated as cash flow hedges | | - | | | 9.2 | | | - | | | 9.2 | |
| | Actuarial loss | | - | | | - | | | (10.8 | ) | | (10.8 | ) |
| | Losses on foreign currency translation | | (17.7 | ) | | - | | | - | | | (17.7 | ) |
| | AOCI at December 31, 2012 | $ | (42.1 | ) | $ | 1.2 | | $ | (18.9 | ) | $ | (59.8 | ) |
The following table summarizes the impacts of the cash flow hedges on the OCI:
| | | | Year Ended December 31 | |
| | | | | | | After - tax | | | | | | | | | Pre - tax | | | | |
| | | | 2012 | | | 2011 | | | 2010 | | | 2012 | | | 2011 | | | 2010 | |
| | (Gains) losses reclassified from OCI to revenues | $ | (22.4 | ) | $ | 7.1 | | $ | - | | $ | (29.6 | ) | $ | 9.4 | | $ | - | |
| | Gains (losses) recognized in OCI | $ | 9.2 | | $ | 12.3 | | $ | (5.0 | ) | $ | 12.2 | | $ | 16.5 | | $ | (6.8 | ) |
| | Total | $ | (13.2 | ) | $ | 19.4 | | $ | (5.0 | ) | $ | (17.4 | ) | $ | 25.9 | | $ | (6.8 | ) |
Effective July 31, 2012, the Company discontinued hedge accounting for its crude oil and foreign exchange derivative contracts that had been previously designated as cash flow hedges as the hedges were no longer considered highly effective. Though the hedges no longer meet the criteria for hedge accounting, the hedged forecast crude sales are still expected to occur. As such, the cumulative gains or losses that had been recognized in OCI during the period when the hedges were effective remain in AOCI until the hedged transactions occur. Changes in the fair value of these derivative contracts subsequent to July 31, 2012 have been recognized in “risk management contracts gains or losses” within the consolidated statements of comprehensive income (see note 22). As at December 31, 2012, all remaining amounts in AOCI related to the effective crude oil and foreign exchange cash flow hedges prior to the discontinuation of hedge accounting have been reclassified to net income.
On November 14, 2012, Harvest entered into natural gas derivative contracts and designated them as cash flow hedges. The Company expects the $1.2 million gain reported in AOCI related to the natural gas cash flow hedges to be released to net income within the next twelve months.
F - 32
| 22. | Financial Instruments |
| | |
| (a) Fair Values |
| The carrying value and fair value of these financial instruments are disclosed below by financial instrument category: |
| | | | December 31, 2012 | | | December 31, 2011 | |
| | | | Carrying | | | | | | Carrying | | | | |
| | | | Value | | | Fair Value | | | Value | | | Fair Value | |
| | Financial assets | | | | | | | | | | | | |
| | Loans and Receivables | | | | | | | | | | | | |
| | Accounts receivable and other | $ | 175.6 | | $ | 175.6 | | $ | 212.3 | | $ | 212.3 | |
| | Held for Trading | | | | | | | | | | | | |
| | Cash | | 7.6 | | | 7.6 | | | 6.6 | | | 6.6 | |
| | Risk management contracts | | 1.8 | | | 1.8 | | | 20.2 | | | 20.2 | |
| | Total Financial Assets | $ | 185.0 | | $ | 185.0 | | $ | 239.1 | | $ | 239.1 | |
| | Financial Liabilities | | | | | | | | | | | | |
| | Measured at Amortized Cost | | | | | | | | | | | | |
| | Accounts payable and accrued liabilities | | 376.0 | | | 376.0 | | | 464.1 | | | 464.1 | |
| | Bank loan | | 491.3 | | | 494.2 | | | 355.6 | | | 358.9 | |
| | Senior notes | | 486.4 | | | 555.3 | | | 495.7 | | | 523.1 | |
| | Convertible debentures | | 632.0 | | | 644.0 | | | 742.0 | | | 752.5 | |
| | Related party loan | | 172.1 | | | 172.1 | | | – | | | – | |
| | Long-term liability | | 4.7 | | | 4.7 | | | – | | | – | |
| | Total Financial Liabilities | $ | 2,162.5 | | $ | 2,246.3 | | $ | 2,057.4 | | $ | 2,098.6 | |
Harvest’s financial assets and liabilities carried at fair value have been classified according to the following hierarchy based on the significance of observable inputs used to value the instrument:
| | Level 1: | quoted (unadjusted) prices in active markets for identical assets or liabilities. Active markets are those in which transactions occur in sufficient frequency and volume to provide pricing information on an ongoing basis. |
| | Level 2: | other techniques for which all inputs which have a significant effect on the recorded fair value are observable, either directly or indirectly. |
| | Level 3: | techniques which use inputs that have a significant effect on the recorded fair value that are not based on observable market data. |
Harvest’s cash and risk management contracts have been assessed on the fair value hierarchy described above. Cash is classified as Level 1 and risk management contracts as Level 2. During the year ended December 31, 2012, there were no transfers among Levels 1, 2 and 3.
Non-derivative financial instruments
Due to the short term maturities of accounts receivable and accounts payable and accrued liabilities, their carrying values approximate their fair values.
The bank loan bears floating market rate, thus, the fair value approximates the carrying value (excluding deferred financing charges). The carrying value of the bank loan includes $2.9 million of deferred financing charges at December 31, 2012 (2011 - $3.3 million).
The fair values of the convertible debentures and the senior notes are based on quoted market prices as at December 31, 2012.
The fair values of the related party loan and long-term liability are estimated by discounting the future interest and principal payments using the current market interest rates of instruments with similar terms. At December 31, 2012, the fair values of the related party loan and long-term liability approximate their carrying value.
Derivative financial instruments
Harvest enters into risk management contracts with various counterparties, principally financial institutions with investment grade credit ratings. The fair values of the risk management contracts are determined based on the quoted forward prices of similar transactions observable in active markets as at December 31, 2012. The fair values
F - 33
of the risk management contracts are net of a credit valuation adjustment attributable to derivative counterparty default risk or the Company’s own default risk. The changes in counterparty credit risk had no material effect on the hedge effectiveness assessment for derivatives designated in the hedging relationship and other financial instruments recognized at fair value.
Derivative financial instruments carried at fair value are as follows:
| | | December 31, 2012 | | | December 31, 2011 | |
| Natural gas swap | $ | 1.8 | | $ | – | |
| Crude oil price swap | | – | | | 19.7 | |
| Foreign exchange swap | | – | | | 0.5 | |
| | $ | 1.8 | | $ | 20.2 | |
(b) Risk Management Contracts
The Company at times enters into natural gas, crude oil, electricity and foreign exchange contracts to reduce the volatility of cash flows from some of its forecast sales and purchases, and when allowable, will designate these contracts as cash flow hedges. These derivative contracts are entered for periods consistent with the underlying hedged transactions. Under hedge accounting, the effective portion of the unrealized gains and losses is included in OCI. The effective portion of the realized gains and losses is removed from AOCI and included in petroleum, natural gas, and refined product sales (see note 21). The ineffective portion of the unrealized and realized gains and losses are recognized in the consolidated income statement.
During 2011, Harvest entered into crude oil and foreign exchange derivative contracts and designated them as cash flow hedges. Effective July 31, 2012, Harvest discontinued the hedge designation as the hedges were no longer highly effective. Subsequent to the discontinuation of hedge accounting, all changes in the fair value of these derivative contracts were recognized in the consolidated income statement. The cumulative gains or losses that had been recognized in OCI during the period when the hedges were effective remained in AOCI given the hedged forecast sales were probable of occurring. The remaining AOCI was reclassified into net income as these derivative contracts settled in 2012 (see note 21).
Risk management contracts (gains) losses recorded to income include the ineffective portion of the gains or losses on the derivative contracts designated as cash flow hedges, the gains or losses on the derivatives that were not designated as hedges and the gains or losses subsequent to the discontinuation of hedge accounting on the previously designated derivatives:
| | | Year Ended December 31 | |
| | | Realized (gains) losses | | | Unrealized (gains) losses | | | Total | |
| | | 2012 | | | 2011 | | | 2010 | | | 2012 | | | 2011 | | | 2010 | | | 2012 | | | 2011 | | | 2010 | |
| Crude Oil | $ | (2.1 | ) | $ | 1.7 | | $ | - | | $ | 1.1 | | $ | (1.7 | ) | $ | 0.7 | | $ | (1.0 | ) | $ | - | | $ | 0.7 | |
| Natural Gas | | - | | | - | | | - | | | - | | | - | | | - | | | - | | | - | | | - | |
| Power | | - | | | (7.7 | ) | | 1.8 | | | - | | | 1.0 | | | (3.1 | ) | | - | | | (6.7 | ) | | (1.3 | ) |
| Currency | | 0.5 | | | - | | | - | | | - | | | - | | | - | | | 0.5 | | | - | | | - | |
| | $ | (1.6 | ) | $ | (6.0 | ) | $ | 1.8 | | $ | 1.1 | | $ | (0.7 | ) | $ | (2.4 | ) | $ | (0.5 | ) | $ | (6.7 | ) | $ | (0.6 | ) |
The following is a summary of Harvest’s risk management contracts outstanding at December 31, 2012:
| Contracts Designated as Hedges | | | |
| Contract Quantity | Type of Contract | Term | Contract Price | Fair Value |
| 10,800 GJ/day | Natural gas swap | Jan – Dec 2013 | $3.42/GJ | $ 1.8 |
(c) Risk Exposure
Harvest is exposed to market risks resulting from fluctuations in commodity prices, currency exchange rates and interest rates in the normal course of operations. Harvest is also exposed, to a lesser extent, to credit risk on accounts receivable, counterparty risk from price risk management contracts and to liquidity risk relating to the Company’s debt.
| | (i.) | Credit Risk |
| | | Upstream Accounts Receivable |
| | Accounts receivable in Harvest’s Upstream operations are due from crude oil and natural gas purchasers as well as joint venture partners in the petroleum and natural gas industry and are subject to normal industry credit risks. Concentration of credit risk is mitigated by having a broad customer base, which includes a significant number of companies engaged in joint operations with Harvest. Harvest periodically assesses the financial strength of its crude oil and natural gas purchasers and will adjust its marketing plan to mitigate credit risks. This assessment involves a review of external credit ratings; however, if external ratings are not available, Harvest requests a guarantee from the parent company that does have a credit rating. If this is not possible, Harvest performs an internal credit review based on the purchaser’s past financial performance. The credit risk associated with joint venture partners is mitigated by reviewing the credit history of partners and requiring some partners to provide cash prior to incurring significant capital costs on their behalf. Additionally, most agreements have a provision enabling Harvest to use the proceeds from the sale of production that would otherwise be taken in kind by the partner to offset amounts owing from the partner that is in default. Generally, the only instances of impairment are when a purchaser or partner is facing bankruptcy or extreme financial distress. |
F - 34
Risk Management Contract Counterparties
Harvest is exposed to credit risk from the counterparties to its risk management contracts. This risk is managed by diversifying Harvest’s risk management portfolio among a number of counterparties limited to lenders in its syndicated credit facilities; Harvest has no history of losses with these counterparties.
Downstream Accounts Receivable
The supply and off take agreement (“SOA”) exposes Harvest to the credit risk of Macquarie Energy Canada Ltd. (“Macquarie”) as all feedstock purchases and the majority of product sales are made with Macquarie. This credit risk is mitigated by the amounts owing to Macquarie for feedstock purchases that are offset against amounts receivable from Macquarie for product sales with the balance being net settled. The SOA also requires both Harvest and Maquarie’s parent, Macquarie Bank Ltd, to provide reciprocal guarantees of US$75 million to each other in order to mitigate the risk of either counter party being unable to settle a net payable amount. At December 31, 2012, Harvest is in a net payable position with Macquarie and the outstanding balance is included in current trade accounts payable in the liability liquidity table.
Harvest’s maximum exposure to credit risk relating to the above classes of financial assets at December 31, 2012 and 2011 is the carrying value of accounts receivable. The tables below provide an analysis of Harvest’s current and past due but not impaired receivables.
| | | | December 31, 2012 | |
| | | | | | | | | | Overdue AR | | | | | | | |
| | | | | | | | | | > 30 days, | | | > 60 days, | | | | |
| | | | Current AR | | | <30 days | | | <60 days | | | <90 days | | | > 90 days | |
| | Upstream accounts receivable | $ | 114.9 | | $ | 0.7 | | $ | 0.4 | | $ | 0.5 | | $ | 5.5 | |
| | Downstream accounts receivable | | 44.2 | | | – | | | 7.0 | | | 1.5 | | | 0.9 | |
| | | $ | 159.1 | | $ | 0.7 | | $ | 7.4 | | $ | 2.0 | | $ | 6.4 | (1) |
| | (1) | Net of $4.0 million of allowance for doubtful accounts. |
| | | | December 31, 2011 | |
| | | | | | | | | | Overdue AR | | | | | | | |
| | | | | | | | | | > 30 days, | | | > 60 days, | | | | |
| | | | Current AR | | | <30 days | | | <60 days | | | <90 days | | | > 90 days | |
| | Upstream accounts receivable | $ | 146.1 | | $ | 1.3 | | $ | 0.6 | | $ | 1.2 | | $ | 4.0 | |
| | Downstream accounts receivable | | 50.7 | | | 6.1 | | | 1.7 | | | 0.2 | | | 0.4 | |
| | | $ | 196.8 | | $ | 7.4 | | $ | 2.3 | | $ | 1.4 | | $ | 4.4 | (1) |
| | (1) | Net of $3.3 million of allowance for doubtful accounts. |
| | (ii.) | Liquidity Risk |
| | Harvest is exposed to liquidity risk due to the Company’s accounts payables and accrued liabilities, borrowings under its credit facility, convertible debentures, 67/8% senior notes and related party loan. This risk is mitigated by managing the maturity dates on the Company’s obligations, utilizing the undrawn borrowing capacity in the credit facility, complying with covenants and managing the Company’s cash flow by entering into price risk management contracts. Additionally, when Harvest enters into price risk management contracts it selects counterparties that are also lenders in its syndicated credit facility thereby using the security provided in the credit agreement and eliminating the requirement for margin calls and the pledging of collateral. Majority of the financial liabilities are an integral part of Harvest’s capital structure which is monitored and managed as discussed in note 13. |
| | | |
| | In addition to the guarantee provided to Macquarie at December 31, 2012, Harvest has also provided guarantees of $2.0 million for Downstream product purchases (2011 - $15.8 million). |
F - 35
The following table provides an analysis of Harvest’s financial liability maturities based on the remaining terms of its liabilities as at December 31, 2012 and 2011 and includes the related interest charges:
| | | | December 31, 2012 | |
| | | | | | | >1 year | | | >3 years | | | | | | | |
| | | | <1 year | | | <3 years | | | <5 years | | | >5 years | | | Total | |
| | Accounts payable and accrued liabilities | $ | 376.0 | | $ | - | | $ | - | | $ | - | | $ | 376.0 | |
| | Bank loan and interest | | 13.9 | | | 27.9 | | | 498.8 | | | - | | | 540.6 | |
| | Convertible debentures and interest | | 370.6 | | | 322.5 | | | - | | | - | | | 693.1 | |
| | 67/8% senior notes and interest | | 34.2 | | | 68.4 | | | 557.3 | | | - | | | 659.9 | |
| | Related party loan and interest | | - | | | - | | | 206.4 | | | - | | | 206.4 | |
| | Long-term liability | | - | | | 0.9 | | | 0.9 | | | 2.9 | | | 4.7 | |
| | Guarantees(1) | | 45.0 | | | - | | | - | | | - | | | 45.0 | |
| | | $ | 839.7 | | $ | 419.7 | | $ | 1,263.4 | | $ | 2.9 | | $ | 2,525.7 | |
| | (1) | Amounts are net of the related payables and receivables to and from counterparties. |
| | | | December 31, 2011 | |
| | | | | | | >1 year | | | >3 years | | | | | | | |
| | | | <1 year | | | <3 years | | | <5 years | | | >5 years | | | Total | |
| | Accounts payable and accrued liabilities | $ | 464.1 | | $ | - | | $ | - | | $ | - | | $ | 464.1 | |
| | Bank loan and interest | | 5.6 | | | 11.3 | | | 360.7 | | | - | | | 377.6 | |
| | Convertible debentures and interest | | 158.6 | | | 449.1 | | | 244.0 | | | - | | | 851.7 | |
| | 67/8% senior notes and interest | | 35.0 | | | 69.9 | | | 69.9 | | | 534.7 | | | 709.5 | |
| | Guarantees(1) | | 47.0 | | | - | | | - | | | - | | | 47.0 | |
| | | $ | 710.3 | | $ | 530.3 | | $ | 674.6 | | $ | 534.7 | | $ | 2,449.9 | |
| | (1) | Amounts are net of the related payables and receivables to and from counterparties. |
| | (iii.) | Market Risks and Sensitivity Analysis |
| | | Harvest is exposed to three types of market risks: interest rate risk, currency exchange rate risk and commodity price risk. Sensitivity analysis on these risks has been calculated below by increasing or decreasing commodity prices, interest rates or foreign currency exchange rates as appropriate with all other variables held constant. |
| | | |
| | | Interest rate risk |
| | | Harvest is exposed to interest rate risk on its bank borrowings as interest rates are determined in relation to floating market rates plus an incremental charge based on the Company’s senior debt to annualized EBITDA. Harvest’s convertible debentures, 67/8% senior notes and related party loans have fixed interest rates and therefore do not have any additional interest rate risk. Harvest manages its interest rate risk by targeting appropriate levels of debt relative to its expected cash flow from operations. |
| | | |
| | | If the interest rate applicable to Harvest’s bank borrowings at December 31, 2012 increased or decreased by 30 basis points with all other variables held constant, after-tax net income for the year would change by $1.4 million (2011 – $1.0 million) as a result of change in interest expense on variable rate borrowing. |
| | | |
| | | Currency exchange rate risk |
| | | Harvest is exposed to the risk of changes in the U.S. dollar exchange rate on its U.S. dollar denominated revenues as well as Canadian dollar revenues that are based on a U.S. dollar commodity price. In addition, Harvest’s 67/8% senior notes, related party loan and LIBOR based loans are denominated in U.S. dollars (US$500 million, US$170 million and US$90 million, respectively). Interest on the senior notes, related party loan and LIBOR based loans is payable in U.S. dollars and accordingly, the principal and accrued interest at the balance sheet date will be subject to currency exchange rate risk. Harvest’s Downstream operations operate with a U.S. dollar functional currency which gives rise to currency exchange rate risk on the Company’s Canadian dollar denominated monetary assets and liabilities such as Canadian dollar bank accounts and accounts receivable and payable. Harvest is also exposed to currency exchange rate risk on its net investment in its Downstream operations. Harvest manages these exchange rate risks by occasionally entering into fixed rate currency exchange contracts on future U.S. dollar payments and U.S. dollar sales receipts. |
F - 36
If the U.S. dollar strengthened or weakened by 10% relative to the Canadian dollar, the impact on net income and other comprehensive income due to the translation of monetary financial instruments held at December 31 would be as follows:
| | | | December 31, 2012 | | | December 31, 2011 | |
| | | | | | | | | | | | | | |
| | | | | | | | | | | | | | |
| | | | Increase | | | | | | Increase | | | | |
| | | | (decrease) | | | Increase | | | (decrease) | | | Increase | |
| | | | in Net | | | (decrease) | | | in Net | | | (decrease) | |
| | | | Income | | | in OCI | | | Income | | | in OCI | |
| | U.S. Dollar Exchange Rate - 10% increase | $ | (1.2 | ) | $ | (46.5 | ) | $ | (19.9 | ) | $ | (34.8 | ) |
| | U.S. Dollar Exchange Rate - 10% decrease | $ | 1.2 | | $ | 46.5 | | $ | 19.9 | | $ | 34.8 | |
| | (1) | The sensitivity to net income and other comprehensive income is done independently. |
Commodity Price Risk
Harvest is exposed to natural gas and crude oil price movements as part of its normal business operations. The Company uses price risk management contracts to protect a portion of the Company’s future cash flows and net income against unfavorable movements in commodity prices. These contracts are recorded on the consolidated statement of financial position at their fair value as of the reporting date. These fair values are generally determined as the difference between the stated fixed price of the contract and an expected future price of natural gas and oil. Variances in expected future prices expose Harvest to commodity price risk as changes will result in a gain or loss that Harvest will realize on settlement of these contracts. This risk is mitigated by continuously monitoring the effectiveness of these contracts.
If the following changes in expected forward prices were applied to the fair value of risk management contracts in place at December 31, 2012 and 2011, the pre-tax impact would be as follows:
| | | | December 31, 2012 | |
| | | | Increase (decrease) in | | | Increase (decrease) in | |
| | | | Net Income | | | OCI | |
| | Forward price of natural gas – 10% increase | $ | – | | $ | (1.2 | ) |
| | Forward price of natural gas – 10% decrease | $ | – | | $ | 1.2 | |
| | | | December 31, 2011 | |
| | | | Increase (decrease) in | | | Increase (decrease) in | |
| | | | Net Income | | | OCI | |
| | Forward price of crude oil – 10% increase | $ | (1.0 | ) | $ | (18.5 | ) |
| | Forward price of crude oil – 10% decrease | $ | 0.6 | | $ | 11.4 | |
F - 37
| 23. | Segment Information |
| | | |
| Harvest’s operating segments are determined based on the nature of the products and services. Effective October 1, 2012, Harvest established a new segment to reflect changes in how management evaluates and reports the activities related to the BlackGold oil sands project. Previously, the activities related to BlackGold were reported under the Upstream segment. Prior year results have been revised to reflect the change in presentation made in the current year. |
| | | |
| The following summary describes the operations in each of the segments: |
| | | |
| • | Upstream operations consist of exploration, development, production and subsequent sale of petroleum, natural gas and natural gas liquids in western Canada. |
| | | |
| • | The BlackGold Oil sands project is located near Conklin, Alberta and is currently under construction and development. Once Phase 1 of the project is complete, it is anticipated to produce 10,000 barrels of bitumen per day using steam assisted gravity drainage technology. |
| | | |
| • | Downstream operations include the purchase and refining of crude oil at a medium gravity sour crude oil hydrocracking refinery, and the sale of the refined products to commercial, wholesale and retail customers. The Downstream business operates under Harvest’s wholly owned subsidiary, North Atlantic Refining Limited (“North Atlantic”) located in the Province of Newfoundland and Labrador. |
| | | Year Ended December 31(3) | |
| | | | | | Downstream(2) | | | | | | | | | Upstream(2) | | | | | | | | | Total | | | | |
| | | 2012 | | | 2011 | | | 2010 | | | 2012 | | | 2011 | | | 2010 | | | 2012 | | | 2011 | | | 2010 | |
| Petroleum, natural gas and refined products sales(1) | $ | 4,752.1 | | $ | 3,302.3 | | $ | 3,193.3 | | $ | 1,193.5 | | $ | 1,286.9 | | $ | 1,007.0 | | $ | 5,945.6 | | $ | 4,589.2 | | $ | 4,200.3 | |
| Royalties | | - | | | - | | | - | | | (164.6 | ) | | (195.5 | ) | | (154.8 | ) | | (164.6 | ) | | (195.5 | ) | | (154.8 | ) |
| Revenues | $ | 4,752.1 | | $ | 3,302.3 | | $ | 3,193.3 | | $ | 1,028.9 | | $ | 1,091.4 | | $ | 852.2 | | $ | 5,781.0 | | $ | 4,393.7 | | $ | 4,045.5 | |
| Expenses | | | | | | | | | | | | | | | | | | | | | | | | | | | |
| Purchased products for resale and processing | | 4,520.3 | | | 3,118.1 | | | 2,981.2 | | | - | | | - | | | - | | | 4,520.3 | | | 3,118.1 | | | 2,981.2 | |
| Operating | | 261.5 | | | 225.7 | | | 215.6 | | | 359.0 | | | 350.4 | | | 265.6 | | | 620.5 | | | 576.1 | | | 481.2 | |
| Transportation and marketing | | 4.4 | | | 6.3 | | | 6.3 | | | 22.2 | | | 29.6 | | | 9.4 | | | 26.6 | | | 35.9 | | | 15.7 | |
| General and administrative | | 0.6 | | | 1.8 | | | 1.8 | | | 65.0 | | | 60.8 | | | 45.3 | | | 65.6 | | | 62.6 | | | 47.1 | |
| Depletion, depreciation and amortization | | 108.9 | | | 91.0 | | | 83.1 | | | 579.5 | | | 535.7 | | | 470.6 | | | 688.4 | | | 626.7 | | | 553.7 | |
| Exploration and evaluation | | - | | | - | | | - | | | 24.9 | | | 18.3 | | | 3.3 | | | 24.9 | | | 18.3 | | | 3.3 | |
| Gains on disposition of PP&E | | - | | | - | | | - | | | (30.3 | ) | | (7.9 | ) | | (0.7 | ) | | (30.3 | ) | | (7.9 | ) | | (0.7 | ) |
| Risk management contracts gains | | - | | | - | | | - | | | (0.5 | ) | | (6.7 | ) | | (0.6 | ) | | (0.5 | ) | | (6.7 | ) | | (0.6 | ) |
| Impairment on PP&E | | 563.2 | | | - | | | - | | | 21.8 | | | - | | | 13.7 | | | 585.0 | | | - | | | 13.7 | |
| Operating income (loss) | $ | (706.8 | ) | $ | (140.6 | ) | $ | (94.7 | ) | $ | (12.7 | ) | $ | 111.2 | | $ | 45.6 | | $ | (719.5 | ) | $ | (29.4 | ) | $ | (49.1 | ) |
| Finance costs | | | | | | | | | | | | | | | | | | | | 111.0 | | | 109.1 | | | 100.8 | |
| Foreign exchange gains | | | | | | | | | | | | | | | | | | | | (1.3 | ) | | (4.0 | ) | | (3.4 | ) |
| Loss before income tax | | | | | | | | | | | | | | | | | | | $ | (829.2 | ) | $ | (134.5 | ) | $ | (146.5 | ) |
| Income tax recovery | | | | | | | | | | | | | | | | | | | | (109.1 | ) | | (29.8 | ) | | (65.3 | ) |
| Net loss | | | | | | | | | | | | | | | | | | | $ | (720.1 | ) | $ | (104.7 | ) | $ | (81.2 | ) |
| (1) | Of the total Downstream revenue, one customer represents sales of $4.0 billion for the year ended December 31, 2012 (2011 – two customers with sales of $1.6 billion and $586 million; 2010 – two customers with sales of $2.2 billion and $145 million). No other single customer within either segment represents greater than 10% of Harvest’s total revenue. |
| (2) | There is no intersegment activity. |
| (3) | The BlackGold segment is under development, as such, there are no operating activities to report. |
F - 38
| | | | Year Ended December 31, 2012 | |
| | Capital Expenditures | | Downstream | | | Upstream | | | BlackGold | | | Total | |
| | Additions to PP&E | $ | 54.2 | | $ | 404.1 | | $ | 164.1 | | $ | 622.4 | |
| | Additions to E&E | | - | | | 41.1 | | | - | | | 41.1 | |
| | Additions to other long term assets | | - | | | 2.4 | | | - | | | 2.4 | |
| | Property acquisitions (dispositions), net | | - | | | (87.2 | ) | | - | | | (87.2 | ) |
| | Total expenditures | $ | 54.2 | | $ | 360.4 | | $ | 164.1 | | $ | 578.7 | |
| | | | Year Ended December 31, 2011 | |
| | Capital Expenditures | | Downstream | | | Upstream | | | BlackGold | | | Total | |
| | Business acquisition | $ | - | | $ | 509.8 | | $ | - | | $ | 509.8 | |
| | Additions to PP&E | | 284.2 | | | 581.3 | | | 101.2 | | | 966.7 | |
| | Additions to E&E | | - | | | 50.9 | | | - | | | 50.9 | |
| | Additions to other long term assets | | - | | | 7.4 | | | - | | | 7.4 | |
| | Property acquisitions (dispositions), net | | - | | | (4.5 | ) | | - | | | (4.5 | ) |
| | Total expenditures | $ | 284.2 | | $ | 1,144.9 | | $ | 101.2 | | $ | 1,530.3 | |
| | | | Year Ended December 31, 2010 | |
| | Capital Expenditures | | Downstream | | | Upstream | | | BlackGold | | | Total | |
| | Business acquisition | $ | - | | $ | 145.1 | | $ | - | | $ | 145.1 | |
| | Additions to PP&E | | 71.2 | | | 336.1 | | | 20.8 | | | 428.1 | |
| | Additions to E&E | | - | | | 47.0 | | | - | | | 47.0 | |
| | Property acquisitions (dispositions), net | | - | | | 30.5 | | | - | | | 30.5 | |
| | Total expenditures | $ | 71.2 | | $ | 558.7 | | $ | 20.8 | | $ | 650.7 | |
| | | | | | | | | | | | | Other Long | | | | |
| | | | Total Assets | | | PP&E | | | E&E | | | Term Assets | | | Goodwill | |
| | December 31, 2012 | | | | | | | | | | | | | | | |
| | Downstream | $ | 780.3 | | $ | 604.5 | | $ | - | | $ | - | | $ | - | |
| | Upstream | | 4,189.4 | | | 3,499.0 | | | 73.4 | | | 8.6 | | | 391.8 | |
| | BlackGold | | 684.9 | | | 679.8 | | | - | | | - | | | - | |
| | Total | $ | 5,654.6 | | $ | 4,783.3 | | $ | 73.4 | | $ | 8.6 | | $ | 391.8 | |
| | | | | | | | | | | | | | | | | |
| | December 31, 2011 | | | | | | | | | | | | | | | |
| | Downstream | $ | 1,408.1 | | $ | 1,222.5 | | $ | - | | $ | - | | $ | - | |
| | Upstream | | 4,292.9 | | | 3,680.6 | | | 74.5 | | | 7.1 | | | 404.9 | |
| | BlackGold | | 583.4 | | | 497.3 | | | - | | | - | | | - | |
| | Total | $ | 6,284.4 | | $ | 5,400.4 | | $ | 74.5 | | $ | 7.1 | | $ | 404.9 | |
F - 39
| 24. | Commitments and Contingencies |
| | |
| From time to time, Harvest is involved in litigation or has claims brought against it in the normal course of business operations. Other than what has been accrued under “provisions” in the consolidated statements of financial position, management of Harvest is not currently aware of any claims or actions that would materially affect Harvest’s reported financial position or results from operations. In the normal course of operations, management may also enter into certain types of contracts that require Harvest to indemnify parties against possible third party claims, particularly when these contracts relate to purchase and sale agreements. The terms of such contracts vary and generally a maximum is not explicitly stated; as such the overall maximum amount of the obligations cannot be reasonably estimated. Management does not believe payments, if any, related to such contracts would have a material effect on Harvest’s reported financial position or results from operations. |
| | |
| The following are the significant commitments and contingencies at December 31, 2012: |
| | |
| As described under note 11, the BlackGold EPC contract now bears a cost reimbursable price. The expected cost outlays, including the $101 million of installment payments are included in the contractual obligation and commitment table below. |
| | |
| Under the SOA, as at December 31, 2012, Downstream had commitments totaling approximately $1.1 billion (2011 - $776.1 million) in respect of future crude oil feedstock purchases from Macquarie. |
| | |
| The following is a summary of Harvest’s contractual obligations and commitments as at December 31, 2012: |
| | | | Payments Due by Period | |
| | | | 1 year | | | 2-3 years | | | 4-5 years | | | After 5 years | | | Total | |
| | Debt repayments(1) | $ | 330.5 | | $ | 296.6 | | $ | 1,160.8 | | $ | – | | $ | 1,787.9 | |
| | Debt interest payments(1)(2) | | 88.2 | | | 122.2 | | | 101.7 | | | – | | | 312.1 | |
| | Purchase commitments(3) | | 252.0 | | | 48.1 | | | 20.0 | | | 60.0 | | | 380.1 | |
| | Operating leases | | 11.9 | | | 15.2 | | | 6.4 | | | 3.2 | | | 36.7 | |
| | Transportation agreements(4) | | 9.4 | | | 13.1 | | | 1.9 | | | 0.5 | | | 24.9 | |
| | Feedstock and other purchase commitments(5) | | 1,110.7 | | | – | | | – | | | – | | | 1,110.7 | |
| | Employee benefits(6) | | 11.8 | | | 20.7 | | | 4.3 | | | – | | | 36.8 | |
| | Decommissioning and environmental remediation liabilities(7) | | 24.6 | | | 57.6 | | | 48.2 | | | 1,659.7 | | | 1,790.1 | |
| | Total | $ | 1,839.1 | | $ | 573.5 | | $ | 1,343.3 | | $ | 1,723.4 | | $ | 5,479.3 | |
| | (1) | Assumes constant foreign exchange rate. |
| | (2) | Assumes interest rates as at December 31, 2012 will be applicable to future interest payments. |
| | (3) | Relates to drilling commitments, AFE commitments, BlackGold oil sands project commitment and Downstream capital commitments. |
| | (4) | Relates to firm transportation commitments. |
| | (5) | Includes commitments to purchase refinery crude stock and refined products for resale under the SOA. |
| | (6) | Relates to the expected contributions to employee benefit plans and long-term incentive plan payments. |
| | (7) | Represents the undiscounted obligation by period. |
| 25. | Related Party Transactions |
| | |
| On August 16, 2012, Harvest entered into a subordinated loan agreement with ANKOR to borrow US$170 million at a fixed interest rate of 4.62% per annum. The principal balance outstanding and accrued interest is revalued using the exchange rate at the end of each reporting period. At December 31, 2012, $169.1 million (2011 - $nil) of principal and $3.0 million (2011 - $nil) of accrued interest remained outstanding. Interest expense was $3.0 million for the year ended December 31, 2012 (2011 and 2010 - $nil). Harvest may, at its sole discretion, repay the principal in whole or in part without premium or penalty, together with all accrued interest at any time during the term of the agreement. There are no scheduled payments of principal or interest under the agreement prior to the maturity of the loan on October 2, 2017. The loan is unsecured and the loan agreement contains no restrictive covenants. For purposes of Harvest’s bank loan covenant requirements, the loan is excluded from the ‘total debt’ amount but included in the ‘total capitalization’ amount. |
| | |
| Harvest has a Global Technology and Research Centre (“GTRC”), which is used as a training and research facility for KNOC. For the year ended December 31, 2012, Harvest billed KNOC and certain subsidiaries for a total of $5.8 million (2011 – $1.6 million; 2010 - $0.2 million) primarily related to technical services provided by the GTRC. As at December 31, 2012, $1.6 million (2011 - $1.1 million) remained outstanding from KNOC in accounts receivable. KNOC billed Harvest $0.2 million (2011 – $0.6 million; 2010 - $nil) for reimbursement to KNOC for secondee salaries paid by KNOC on behalf of Harvest for the year ended December 31, 2012. As at December 31, 2012, $nil (2011 - $0.6 million) remains outstanding in accounts payable. |
F - 40
KNOC Trading Corporation (“KNOC Trading”) is a wholly owned subsidiary of North Atlantic. KNOC Trading bills KNOC, Ankor E&P Holdings Corp. (“ANKOR”) and Dana Petroleum plc (“Dana”) for oil marketing services, such as the sale of products, performed on behalf of KNOC, ANKOR and Dana. Both ANKOR and Dana are wholly owned subsidiaries of KNOC. For the year ended December 31, 2012, all of KNOC Trading’s revenue of $0.9 million (2011 and 2010 - $nil) was derived from KNOC, ANKOR and Dana. As at December 31, 2012, $0.1 million (2011 - $nil) remains outstanding in accounts receivable. As well, for the year ended December 31, 2012 ANKOR billed KNOC Trading Corporation a total of $0.4 million (2011 and 2010 - $nil) for office rent and salaries and benefits. As at December 31, 2012, $0.3 million (2011 - $nil) remains outstanding in accounts payable.
Directors and Key Management Personnel Remuneration
Key management personnel include the Company’s officers, other members of the executive management team and directors. The amounts disclosed in the table below are the amounts recognized as an expense during the reporting period related to key management personnel.
| | | Year Ended December 31 | |
| | | 2012 | | | 2011 | | | 2010 | |
| Short-term employee benefits | $ | 5.3 | | $ | 4.6 | | $ | 5.2 | |
| Other long-term benefits | | 0.4 | | | 1.0 | | | 1.0 | |
| Other | | 0.5 | | | − | | | − | |
| | $ | 6.2 | | $ | 5.6 | | $ | 6.2 | |
| 26. | Supplemental Guarantor Condensed Financial Information |
| | | |
| Harvest Breeze Trust No. 1, Harvest Breeze Trust No. 2, Breeze Resources Partnership, Hay River Partnership, 1496965 Alberta Ltd. and North Atlantic Refining Limited (collectively "guarantor subsidiaries") fully and unconditionally guarantees the 67/8% senior notes issued by Harvest Operations Corporation ("HOC"). Each of the guarantor subsidiaries is 100% owned by HOC. The full and unconditional guarantees may be automatically released under the following customary circumstances: |
| | | |
| • | the subsidiary is sold to a non-affiliate and ceases to be a restricted subsidiary; |
| • | the subsidiary is designated as an “unrestricted” subsidiary for covenant purposes; |
| • | the subsidiary’s guarantee of the indebtedness (such as indebtedness under the credit facility agreement) which resulted in the creation of the notes guarantee is terminated or (other than by payment) released; or |
| • | upon legal defeasance or covenant defeasance or satisfaction and discharge of the indenture. |
The following financial information for HOC, the guarantor subsidiaries and all other subsidiaries on a condensed consolidating basis is intended to provide investors with meaningful and comparable financial information about HOC and its subsidiaries and is provided pursuant to Rule 3-10 of Regulation S-X in lieu of the separate financial statements of each guarantor subsidiary. Investments include the investments in subsidiaries recorded under the equity method for the purposes of the condensed consolidating financial information. Equity income of subsidiaries is the group's share of profit related to such investments. The eliminations and reclassifications column includes the necessary amounts to eliminate the intercompany balances and transactions between subsidiaries. HOC's cost basis has not been pushed down to the subsidiaries as push-down accounting is not permitted in the separate financial statements of the subsidiaries.
F - 41
CONDENSED STATEMENT OF FINANCIAL POSITION
As at December 31, 2012
| | | | | | | | | Non | | | | | | | |
| | | | | | Guarantor | | | Guarantor | | | | | | Consolidated | |
| | | Issuer HOC | | | Subsidiaries | | | Subsidiaries | | | Eliminations | | | Totals | |
| Assets | | | | | | | | | | | | | | | |
| Current assets | | | | | | | | | | | | | | | |
| Cash and cash equivalents | $ | 0.7 | | $ | 2.5 | | $ | 4.4 | | $ | – | | $ | 7.6 | |
| Accounts receivable and other | | 102.4 | | | 69.2 | | | 4.0 | | | – | | | 175.6 | |
| Inventories | | 0.9 | | | 78.4 | | | 1.5 | | | – | | | 80.8 | |
| Prepaid expenses | | 13.5 | | | 6.7 | | | – | | | – | | | 20.2 | |
| Risk management contracts | | 1.8 | | | – | | | – | | | – | | | 1.8 | |
| Assets held for sale | | 16.9 | | | – | | | – | | | – | | | 16.9 | |
| Due from affiliates | | 748.5 | | | 66.0 | | | 0.4 | | | (814.9 | ) | | – | |
| | $ | 884.7 | | $ | 222.8 | | $ | 10.3 | | $ | (814.9 | ) | $ | 302.9 | |
| | | | | | | | | | | | | | | | |
| Non-current assets | | | | | | | | | | | | | | | |
| Long-term deposit | $ | 5.0 | | $ | – | | $ | – | | $ | – | | $ | 5.0 | |
| Investment tax credits and other | | – | | | 28.5 | | | – | | | – | | | 28.5 | |
| Deferred income tax asset | | 63.6 | | | (2.8 | ) | | 0.3 | | | | | | 61.1 | |
| Exploration & evaluation assets | | 67.3 | | | 6.1 | | | – | | | – | | | 73.4 | |
| Property, plant and equipment | | 3,530.1 | | | 1,251.6 | | | 1.6 | | | – | | | 4,783.3 | |
| Other long-term asset | | 8.6 | | | – | | | – | | | – | | | 8.6 | |
| Investment in subsidiaries | | 370.4 | | | – | | | – | | | (370.4 | ) | | – | |
| Goodwill | | 391.8 | | | – | | | – | | | – | | | 391.8 | |
| Total assets | $ | 5,321.5 | | $ | 1,506.2 | | $ | 12.2 | | $ | (1,185.3 | ) | $ | 5,654.6 | |
| | | | | | | | | | | | | | | | |
| Liabilities | | | | | | | | | | | | | | | |
| Current liabilities | | | | | | | | | | | | | | | |
| Accounts payable and accrued liabilities | $ | 228.5 | | $ | 141.4 | | $ | 6.1 | | $ | – | | $ | 376.0 | |
| Current portion of long-term debt | | 331.8 | | | – | | | – | | | – | | | 331.8 | |
| Current portion of long-term provisions | | 28.1 | | | – | | | – | | | – | | | 28.1 | |
| Liabilities associated with assets held for sale | | 11.9 | | | – | | | – | | | – | | | 11.9 | |
| Due to affiliates | | 58.3 | | | 747.2 | | | 9.4 | | | (814.9 | ) | | – | |
| | $ | 658.6 | | $ | 888.6 | | $ | 15.5 | | $ | (814.9 | ) | $ | 747.8 | |
| Non-current liabilities | | | | | | | | | | | | | | | |
| Long-term debt | | 1,277.9 | | | – | | | – | | | – | | | 1,277.9 | |
| Related party loan | | 172.1 | | | – | | | – | | | – | | | 172.1 | |
| Long-term liability and other | | 5.2 | | | – | | | – | | | – | | | 5.2 | |
| Long-term provisions | | 515.8 | | | 211.5 | | | – | | | – | | | 727.3 | |
| Post-employment benefit obligations | | – | | | 32.4 | | | – | | | – | | | 32.4 | |
| Intercompany loan | | – | | | 1,189.8 | | | 0.8 | | | (1,190.6 | ) | | – | |
| Total liabilities | $ | 2,629.6 | | $ | 2,322.3 | | $ | 16.3 | | $ | (2,005.5 | ) | $ | 2,962.7 | |
| Shareholder's equity | | 2,691.9 | | | (816.1 | ) | | (4.1 | ) | | 820.2 | | | 2,691.9 | |
| Total liabilities and shareholder'sequity | $ | 5,321.5 | | $ | 1,506.2 | | $ | 12.2 | | $ | (1,185.3 | ) | $ | 5,654.6 | |
F - 42
CONDENSED STATEMENTS OF COMPREHENSIVE INCOME (LOSS)
For the year ended December 31, 2012
| | | | | | | | | Non | | | | | | | |
| | | | | | Guarantor | | | Guarantor | | | | | | Consolidated | |
| | | Issuer HOC | | | Subsidiaries | | | Subsidiaries | | | Eliminations | | | Totals | |
| Petroleum, natural gas, and refined product sales | $ | 902.2 | | $ | 5,011.9 | | $ | 92.2 | | $ | (60.7 | ) | $ | 5,945.6 | |
| Royalty expense | | (114.7 | ) | | (49.9 | ) | | – | | | – | | | (164.6 | ) |
| Earnings from equity accounted subsidiaries | | (557.0 | ) | | (0.1 | ) | | – | | | 557.1 | | | – | |
| Revenues | | 230.5 | | | 4,961.9 | | | 92.2 | | | 496.4 | | | 5,781.0 | |
| | | | | | | | | | | | | | | | |
| Expenses | | | | | | | | | | | | | | | |
| Purchased products for processing and resale | | – | | | 4,494.4 | | | 85.1 | | | (59.2 | ) | | 4,520.3 | |
| Operating | | 288.6 | | | 327.4 | | | 6.0 | | | (1.5 | ) | | 620.5 | |
| Transportation and marketing | | 21.8 | | | 4.8 | | | – | | | – | | | 26.6 | |
| General and administrative | | 50.1 | | | 15.5 | | | – | | | – | | | 65.6 | |
| Depletion, depreciation and amortization | | 462.1 | | | 226.3 | | | – | | | – | | | 688.4 | |
| Exploration and evaluation | | 24.7 | | | 0.2 | | | – | | | – | | | 24.9 | |
| Gain on disposition of property, plant & equipment | | (6.8 | ) | | (23.5 | ) | | – | | | – | | | (30.3 | ) |
| Finance costs | | 107.2 | | | 3.8 | | | – | | | – | | | 111.0 | |
| Risk management contracts gains | | (0.5 | ) | | – | | | – | | | – | | | (0.5 | ) |
| Foreign exchange (gains) losses | | (10.7 | ) | | 9.4 | | | – | | | – | | | (1.3 | ) |
| Impairment on property, plant and equipment | | 11.3 | | | 573.7 | | | – | | | – | | | 585.0 | |
| Income (loss) before income tax | | (717.3 | ) | | (670.1 | ) | | 1.1 | | | 557.1 | | | (829.2 | ) |
| Income tax expense (recovery) | | 2.9 | | | (112.5 | ) | | 0.5 | | | – | | | (109.1 | ) |
| Net income (loss) | $ | (720.2 | ) | $ | (557.6 | ) | $ | 0.6 | | $ | 557.1 | | $ | (720.1 | ) |
| | | | | | | | | | | | | | | | |
| Other comprehensive income (loss) | | | | | | | | | | | | | | | |
| Losses on designated cash flow hedges, net of tax | | (13.2 | ) | | – | | | – | | | – | | | (13.2 | ) |
| Losses on foreign currency translation | | (17.7 | ) | | (17.7 | ) | | – | | | 17.7 | | | (17.7 | ) |
| Actuarial loss, net of tax | | (10.8 | ) | | (10.8 | ) | | – | | | 10.8 | | | (10.8 | ) |
| Comprehensive income (loss) | $ | (761.9 | ) | $ | (586.1 | ) | $ | 0.6 | | $ | 585.6 | | $ | (761.8 | ) |
CONDENSED STATEMENT OF CASH FLOWS
For the year ended December 31, 2012
| | | | | | | | | Non | | | | | | | |
| | | | | | Guarantor | | | Guarantor | | | | | | Consolidated | |
| | | Issuer HOC | | | Subsidiaries | | | Subsidiaries | | | Eliminations | | | Totals | |
| Cash provided by operating activities | $ | 122.8 | | $ | 318.7 | | $ | 1.3 | | $ | – | | $ | 442.8 | |
| Cash provided by (used in) financing activities | | 196.0 | | | (171.5 | ) | | – | | | 171.5 | | | 196.0 | |
| Cash used in investing activities | | (318.6 | ) | | (147.7 | ) | | – | | | (171.5 | ) | | (637.8 | ) |
| Change in cash and cash equivalents | | 0.2 | | | (0.5 | ) | | 1.3 | | | – | | | 1.0 | |
| Effect of exchange rate changes on cash | | – | | | – | | | – | | | – | | | – | |
| Cash and cash equivalents, beginning of year | | 0.5 | | | 3.0 | | | 3.1 | | | – | | | 6.6 | |
| Cash and cash equivalents, end of year | $ | 0.7 | | $ | 2.5 | | $ | 4.4 | | $ | – | | $ | 7.6 | |
F - 43
CONDENSED STATEMENT OF FINANCIAL POSITION
As at December 31, 2011
| | | | | | | | | Non | | | | | | | |
| | | | | | Guarantor | | | Guarantor | | | | | | Consolidated | |
| | | Issuer HOC | | | Subsidiaries | | | Subsidiaries | | | Eliminations | | | Totals | |
| Assets | | | | | | | | | | | | | | | |
| Current assets | | | | | | | | | | | | | | | |
| Cash and cash equivalents | $ | 0.5 | | $ | 3.0 | | $ | 3.1 | | $ | – | | $ | 6.6 | |
| Accounts receivable and other | | 121.3 | | | 89.8 | | | 1.2 | | | – | | | 212.3 | |
| Inventories | | 1.4 | | | 58.6 | | | 1.0 | | | – | | | 61.0 | |
| Prepaid expenses | | 11.8 | | | 6.7 | | | – | | | – | | | 18.5 | |
| Risk management contracts | | 20.2 | | | – | | | – | | | – | | | 20.2 | |
| Due from affiliates | | 517.1 | | | 44.8 | | | 0.2 | | | (562.1 | ) | | – | |
| | $ | 672.3 | | $ | 202.9 | | $ | 5.5 | | $ | (562.1 | ) | $ | 318.6 | |
| | | | | | | | | | | | | | | | |
| Non-current assets | | | | | | | | | | | | | | | |
| Long-term deposit | $ | 24.9 | | $ | – | | $ | – | | $ | – | | $ | 24.9 | |
| Investment tax credits and other | | – | | | 54.0 | | | – | | | – | | | 54.0 | |
| Exploration & evaluation assets | | 69.6 | | | 4.9 | | | – | | | – | | | 74.5 | |
| Property, plant and equipment | | 3,460.9 | | | 1,938.1 | | | 1.4 | | | – | | | 5,400.4 | |
| Other long-term asset | | 7.1 | | | – | | | – | | | – | | | 7.1 | |
| Investment in subsidiaries | | 1,127.4 | | | 0.1 | | | – | | | (1,127.5 | ) | | – | |
| Goodwill | | 404.9 | | | – | | | – | | | – | | | 404.9 | |
| Total assets | $ | 5,767.1 | | $ | 2,200.0 | | $ | 6.9 | | $ | (1,689.6 | ) | $ | 6,284.4 | |
| | | | | | | | | | | | | | | | |
| Liabilities | | | | | | | | | | | | | | | |
| Current liabilities | | | | | | | | | | | | | | | |
| Accounts payable and accrued liabilities | $ | 260.9 | | $ | 200.9 | | | 2.3 $ | | $ | – | | $ | 464.1 | |
| Current portion of long-term debt | | 107.1 | | | – | | | – | | | – | | | 107.1 | |
| Current portion of long-term provisions | | 17.1 | | | – | | | – | | | – | | | 17.1 | |
| Due to affiliates | | 39.3 | | | 513.3 | | | 9.5 | | | (562.1 | ) | | – | |
| | $ | 424.4 | | $ | 714.2 | | $ | 11.8 | | $ | (562.1 | ) | $ | 588.3 | |
| Non-current liabilities | | | | | | | | | | | | | | | |
| Long-term debt | | 1,486.2 | | | – | | | – | | | – | | | 1,486.2 | |
| Long-term liability and other | | 0.8 | | | – | | | – | | | – | | | 0.8 | |
| Long-term provisions | | 464.1 | | | 210.4 | | | – | | | – | | | 674.5 | |
| Post-employment benefit obligations | | – | | | 26.0 | | | – | | | – | | | 26.0 | |
| Deferred income tax liability | | (62.2 | ) | | 118.0 | | | (0.9 | ) | | – | | | 54.9 | |
| Intercompany loan | | – | | | 1,189.8 | | | – | | | (1,189.8 | ) | | – | |
| Total liabilities | $ | 2,313.3 | | $ | 2,258.4 | | $ | 10.9 | | $ | (1,751.9 | ) | $ | 2,830.7 | |
| Shareholder's equity | | 3,453.8 | | | (58.4 | ) | | (4.0 | ) | | 62.3 | | | 3,453.7 | |
| Total liabilities and shareholder'sequity | $ | 5,767.1 | | $ | 2,200.0 | | $ | 6.9 | | $ | (1,689.6 | ) | $ | 6,284.4 | |
F - 44
CONDENSED STATEMENTS OF COMPREHENSIVE LOSS
For the year ended December 31, 2011
| | | | | | | | | Non | | | | | | | |
| | | | | | Guarantor | | | Guarantor | | | | | | Consolidated | |
| | | Issuer HOC | | | Subsidiaries | | | Subsidiaries | | | Eliminations | | | Totals | |
| Petroleum, natural gas, and refined product sales | $ | 985.9 | | $ | 3,579.5 | | $ | 70.7 | | $ | (46.9 | ) | $ | 4,589.2 | |
| Royalty expense | | (146.3 | ) | | (49.2 | ) | | – | | | – | | | (195.5 | ) |
| Earnings from equity accounted subsidiaries | | (55.6 | ) | | (0.2 | ) | | – | | | 55.8 | | | – | |
| Revenues | | 784.0 | | | 3,530.1 | | | 70.7 | | | 8.9 | | | 4,393.7 | |
| | | | | | | | | | | | | | | | |
| Expenses | | | | | | | | | | | | | | | |
| Purchased products for processing and resale | | – | | | 3,098.5 | | | 65.4 | | | (45.8 | ) | | 3,118.1 | |
| Operating | | 280.7 | | | 290.1 | | | 6.4 | | | (1.1 | ) | | 576.1 | |
| Transportation and marketing | | 22.2 | | | 13.7 | | | – | | | – | | | 35.9 | |
| General and administrative | | 48.2 | | | 14.4 | | | – | | | – | | | 62.6 | |
| Depletion, depreciation and amortization | | 423.9 | | | 202.8 | | | – | | | – | | | 626.7 | |
| Exploration and evaluation | | 16.0 | | | 2.3 | | | – | | | – | | | 18.3 | |
| Gain on disposition of property, plant & equipment | | (7.9 | ) | | – | | | – | | | – | | | (7.9 | ) |
| Finance costs | | 102.5 | | | 6.6 | | | – | | | – | | | 109.1 | |
| Risk management contracts gains | | (6.7 | ) | | – | | | – | | | – | | | (6.7 | ) |
| Foreign exchange (gains) losses | | 11.7 | | | (15.8 | ) | | 0.1 | | | – | | | (4.0 | ) |
| Loss before income tax | | (106.6 | ) | | (82.5 | ) | | (1.2 | ) | | 55.8 | | | (134.5 | ) |
| Income tax recovery | | (1.8 | ) | | (27.4 | ) | | (0.6 | ) | | – | | | (29.8 | ) |
| Net loss | $ | (104.8 | ) | $ | (55.1 | ) | $ | (0.6 | ) | $ | 55.8 | | $ | (104.7 | ) |
| | | | | | | | | | | | | | | | |
| Other comprehensive loss | | | | | | | | | | | | | | | |
| Gains on designated cash flow hedges, net of tax | | 19.4 | | | – | | | – | | | – | | | 19.4 | |
| Gains on foreign currency translation | | 21.5 | | | 21.5 | | | – | | | (21.5 | ) | | 21.5 | |
| Actuarial loss, net of tax | | (4.9 | ) | | (4.9 | ) | | – | | | 4.9 | | | (4.9 | ) |
| Comprehensive loss | $ | (68.8 | ) | $ | (38.5 | ) | $ | (0.6 | ) | $ | 39.2 | | $ | (68.7 | ) |
CONDENSED STATEMENT OF CASH FLOWS
For the year ended December 31, 2011
| | | | | | | | | Non | | | | | | | |
| | | | | | Guarantor | | | Guarantor | | | | | | Consolidated | |
| | | Issuer HOC | | | Subsidiaries | | | Subsidiaries | | | Eliminations | | | Totals | |
| Cash provided by (used in) operating activities | $ | 62.1 | | $ | 498.7 | | $ | (0.3 | ) | $ | – | | $ | 560.5 | |
| Cash provided by (used in) financing activities | | 848.7 | | | (157.1 | ) | | – | | | 157.1 | | | 848.7 | |
| Cash used in investing activities | | (922.8 | ) | | (341.7 | ) | | – | | | (157.1 | ) | | (1,421.6 | ) |
| Change in cash and cash equivalents | | (12.0 | ) | | (0.1 | ) | | (0.3 | ) | | – | | | (12.4 | ) |
| Effect of exchange rate changes on cash | | – | | | 0.1 | | | – | | | – | | | 0.1 | |
| Cash and cash equivalents, beginning of year | | 12.5 | | | 3.0 | | | 3.4 | | | – | | | 18.9 | |
| Cash and cash equivalents, end of year | $ | 0.5 | | $ | 3.0 | | $ | 3.1 | | $ | – | | $ | 6.6 | |
F - 45
CONDENSED STATEMENT OF COMPREHENSIVE LOSS
For the year ended December 31, 2010
| | | | | | | | | Non | | | | | | | |
| | | | | | Guarantor | | | Guarantor | | | | | | Consolidated | |
| | | Issuer HOC | | | Subsidiaries | | | Subsidiaries | | | Eliminations | | | Totals | |
| Petroleum, natural gas, and refined product sales | $ | 719.5 | | $ | 3,468.8 | | $ | 34.4 | | $ | (22.4 | ) | $ | 4,200.3 | |
| Royalty expense | | (107.9 | ) | | (46.9 | ) | | – | | | – | | | (154.8 | ) |
| Earnings from equity accounted subsidiaries | | (65.0 | ) | | (0.3 | ) | | – | | | 65.3 | | | – | |
| Revenues | | 546.6 | | | 3,421.6 | | | 34.4 | | | 42.9 | | | 4,045.5 | |
| | | | | | | | | | | | | | | | |
| Expenses | | | | | | | | | | | | | | | |
| Purchased products for processing and resale | | – | | | 2,971.6 | | | 30.4 | | | (20.8 | ) | | 2,981.2 | |
| Operating | | 202.7 | | | 274.9 | | | 5.1 | | | (1.5 | ) | | 481.2 | |
| Transportation and marketing | | 8.0 | | | 7.7 | | | – | | | – | | | 15.7 | |
| General and administrative | | 31.4 | | | 15.7 | | | – | | | – | | | 47.1 | |
| Depletion, depreciation and amortization | | 340.3 | | | 213.4 | | | – | | | – | | | 553.7 | |
| Exploration and evaluation | | 3.3 | | | – | | | – | | | – | | | 3.3 | |
| Gain on disposition of property, plant & equipment | | (0.7 | ) | | – | | | – | | | – | | | (0.7 | ) |
| Finance costs | | 65.8 | | | 35.0 | | | – | | | – | | | 100.8 | |
| Risk management contracts gains | | (0.6 | ) | | – | | | – | | | – | | | (0.6 | ) |
| Foreign exchange (gains) losses | | (21.2 | ) | | 17.8 | | | – | | | – | | | (3.4 | ) |
| Impairment on property, plant and equipment | | 7.5 | | | 6.2 | | | – | | | – | | | 13.7 | |
| Loss before income tax | | (89.9 | ) | | (120.7 | ) | | (1.1 | ) | | 65.2 | | | (146.5 | ) |
| Income tax recovery | | (8.7 | ) | | (56.5 | ) | | (0.1 | ) | | – | | | (65.3 | ) |
| Net loss | $ | (81.2 | ) | $ | (64.2 | ) | $ | (1.0 | ) | $ | 65.2 | | $ | (81.2 | ) |
| | | | | | | | | | | | | | | | |
| Other comprehensive loss | | | | | | | | | | | | | | | |
| Losses on designated cash flow hedges, net of tax | | (5.0 | ) | | – | | | – | | | – | | | (5.0 | ) |
| Losses on foreign currency translation | | (45.9 | ) | | (45.9 | ) | | – | | | 45.9 | | | (45.9 | ) |
| Actuarial loss, net of tax | | (3.2 | ) | | (3.2 | ) | | – | | | 3.2 | | | (3.2 | ) |
| Comprehensive loss | $ | (135.3 | ) | $ | (113.3 | ) | $ | (1.0 | ) | $ | 114.3 | | $ | (135.3 | ) |
CONDENSED STATEMENT OF CASH FLOWS
For the year ended December 31, 2010
| | | | | | | | | Non | | | | | | | |
| | | | | | Guarantor | | | Guarantor | | | | | | Consolidated | |
| | | Issuer HOC | | | Subsidiaries | | | Subsidiaries | | | Eliminations | | | Totals | |
| Cash provided by operating activities | $ | 263.6 | | $ | 172.1 | | $ | 3.5 | | $ | – | | $ | 439.2 | |
| Cash provided by (used in) financing activities | | 204.9 | | | (60.5 | ) | | – | | | 58.1 | | | 202.5 | |
| Cash used in investing activities | | (456.0 | ) | | (114.0 | ) | | (0.1 | ) | | (58.1 | ) | | (628.2 | ) |
| Change in cash and cash equivalents | | 12.5 | | | (2.4 | ) | | 3.4 | | | – | | | 13.5 | |
| Effect of exchange rate changes on cash | | – | | | 5.4 | | | – | | | – | | | 5.4 | |
| Cash and cash equivalents, beginning of year | | – | | | – | | | – | | | – | | | – | |
| Cash and cash equivalents, end of year | $ | 12.5 | | $ | 3.0 | | $ | 3.4 | | $ | – | | $ | 18.9 | |
F - 46
SUPPLEMENTAL INFORMATION ON OIL AND GAS PRODUCING ACTIVITIES
(Unaudited)
The information below provides supplemental information on the oil and gas producing activities of the Corporation as of December 31, 2012 and 2011 and for the years ended December 31, 2012, 2011 and 2010 in accordance Financial Accounting Standards Board (“FASB”) Statement of Accounting Standards No. 69 -Disclosures about Oil and Gas Producing Activities (“FAS 69”). Activities not directly associated with oil and gas producing activities are excluded from all aspects of this supplemental information.
Tables I through III present information on Harvest’s estimated net proved reserve quantities; standardized measure of discounted future net cash flows, and changes in the standardized measure of discounted future net cash flows. Tables IV through VI provide historical cost information pertaining to result of operations related to oil and gas producing activities, capitalized costs related to oil and gas producing activities, and costs incurred in oil and gas exploration and development. Financial information included in tables IV through VI is derived from Harvest’s audited annual financial statements which are prepared in accordance with IFRS.
Table I: Net Proved Reserves (Harvest’s Share After Royalties)
Harvest’s net proved oil and gas reserves as of December 31, 2012 and 2011, and changes thereto for the years ended December 31, 2012, 2011 and 2010 are shown in the following table. Note that all Harvest’s proved reserves are located within Canada. Proved reserves as of December 31, 2012 and 2011 were calculated using the average first-day-of-the-month oil and gas prices for the prior twelve-month period.
Proved oil and gas reserves, as defined within the SEC’s Regulation S-X, are those quantities of oil and gas, which by analysis of geosciences and engineering data, can be estimated with reasonable certainty to be economically producible from a given date forward, from known reservoirs, and under existing economic conditions, operating methods, and government regulation before the time at which contracts providing the right to operate expire, unless evidence indicates that renewal is reasonably certain, regardless of whether the estimate is a deterministic estimate or probabilistic estimate.
Proved developed oil and gas reserves are proved reserves that can be expected to be recovered:
| | 1. | Through existing wells with existing equipment and operating methods or in which the cost of the required equipment is relatively minor compared with the cost of a new well; and |
| | 2. | Through installed extraction equipment and infrastructure operational at the time of the reserves estimate if the extraction is by means not involving a well. |
The process of estimating proved and proved developed reserves is very complex and requires significant judgment in the evaluation of all available geological, engineering and economic data for each reservoir. The data for a given reservoir may change significantly over time as a result of numerous factors, such as but not limited to, additional development activities, evolving production history, and continual reassessment of the viability of production under varying economic conditions. Although reasonable effort is made to ensure that reserve estimates reported represent the most accurate assessments possible, reserve estimates are subject to change as additional information becomes available, and as future economic and operating conditions change.
F - 47
| | | Crude | | | | | | | | | Natural | | | | |
| | | Oil | | | NGLs | | | Bitumen | | | Gas | | | Total | |
| | | (MMbbls) | | | (MMbbls) | | | (MMbbls) | | | (Bcf) | | | (MMBOE) | |
| January 1, 2010 | | 86.1 | | | 4.3 | | | - | | | 153.1 | | | 116.0 | |
Revisions of previous estimates (including infill drilling
& improved recovery) | | 8.4 | | | 1.3 | | | - | | | 18.9 | | | 12.8 | |
| Purchase of reserves in place | | 5.3 | | | - | | | 86.7 | | | 11.3 | | | 93.9 | |
| Sale of reserves in place | | - | | | - | | | - | | | - | | | - | |
| Discoveries and extensions | | 3.0 | | | - | | | - | | | 4.7 | | | 3.8 | |
| Production | | (10.2 | ) | | (0.8 | ) | | - | | | (24.3 | ) | | (15.1 | ) |
| December 31, 2010 | | 92.6 | | | 4.8 | | | 86.7 | | | 163.7 | | | 211.4 | |
Revisions of previous estimates (including infill drilling
& improved recovery) | | 2.7 | | | 2.5 | | | (4.5 | ) | | 21.1 | | | 4.2 | |
| Purchase of reserves in place | | 1.3 | | | 3.8 | | | - | | | 107.3 | | | 23.0 | |
| Sale of reserves in place | | - | | | - | | | - | | | - | | | - | |
| Discoveries and extensions | | 4.6 | | | 0.7 | | | - | | | 24.9 | | | 9.5 | |
| Production | | (10.6 | ) | | (1.6 | ) | | - | | | (36.6 | ) | | (18.3 | ) |
| December 31, 2011 | | 90.6 | | | 10.2 | | | 82.2 | | | 280.4 | | | 229.8 | |
Revisions of previous estimates (including infill
drilling & improved recovery) | | (0.9 | ) | | 1.1 | | | 2.7 | | | (42.7 | ) | | (4.3 | ) |
| Purchase of reserves in place | | - | | | - | | | - | | | - | | | - | |
| Sale of reserves in place | | (2.2 | ) | | (0.1 | ) | | - | | | (1.6 | ) | | (2.6 | ) |
| Discoveries and extensions | | 2.7 | | | - | | | - | | | 14.1 | | | 5.0 | |
| Production | | (11.1 | ) | | (1.7 | ) | | - | | | (37.5 | ) | | (19.1 | ) |
| December 31, 2012 | | 79.1 | | | 9.5 | | | 84.9 | | | 212.7 | | | 208.8 | |
| | | | | | | | | | | | | | | | |
| Proved Developed | | | | | | | | | | | | | | | |
| December 31, 2010 | | 79.9 | | | 4.4 | | | - | | | 143.7 | | | 108.3 | |
| December 31, 2011 | | 79.7 | | | 8.6 | | | - | | | 226.6 | | | 126.0 | |
| December 31, 2012 | | 71.0 | | | 7.3 | | | - | | | 168.9 | | | 106.3 | |
| Proved Undeveloped | | | | | | | | | | | | | | | |
| December 31, 2010 | | 12.7 | | | 0.4 | | | 86.7 | | | 20.0 | | | 103.1 | |
| December 31, 2011 | | 10.9 | | | 1.6 | | | 82.2 | | | 53.8 | | | 103.8 | |
| December 31, 2012 | | 8.1 | | | 2.2 | | | 84.9 | | | 43.8 | | | 102.5 | |
Table II: Standardized Measure of Discounted Future Net Cash Flows Relating to Proved Oil and Gas Reserves
The following table provides the standardized measure of discounted future cash flows relating to the proved reserves disclosed in Table I above. Future cash inflows are computed using Harvest’s after royalty share of estimated annual future production from proved oil and gas reserves and the average first-day-of-the-month oil and gas prices for the prior twelve-month period as prescribed by the SEC. Future development, production and abandonment costs to be incurred in producing and further developing the proved reserves are based on the costs at the balance sheet date and assuming continuation of existing economic conditions. Future income taxes are computed by applying year-end statutory tax rates to estimated future pre-tax net cash flows, less the tax basis of related assets. Discounted future net cash flows are calculated using 10% mid-period discount factors. This discounting requires a year-by-year estimate of when the future expenditure will be incurred and when the reserves will be produced.
The information provided in this table does not represent Harvest’s estimate of the Corporation’s expected future cash flows or the fair market value of the proved oil and gas reserves due to several factors including:
- Estimates of proved reserve quantities are subject to change as new information becomes available;
- Probable and possible reserves, which may become proved in the future, are excluded from the calculations;
- Future prices and costs rather than twelve-month average prices and costs at balance sheet date will apply;
F - 48
- Economic conditions such as interest rates and income tax rates and operating conditions may differ from what is used in the preparation of the estimates; and
- Future development and asset decommissioning costs will differ from those estimated.
| (millions of Canadian dollars) | | December 31, 2012 | | | December 31, 2011 | |
| Future cash inflows | $ | 13,235.9 | | $ | 15,741.6 | |
| Less future: | | | | | | |
| Production costs | | (6,709.0 | ) | | (7,467.8 | ) |
| Development costs | | (1,609.4 | ) | | (1,664.7 | ) |
| Decommissioning costs | | (1,020.0 | ) | | (885.8 | ) |
| Income taxes | | (78.8 | ) | | (598.2 | ) |
| Future net cash flows | | 3,818.7 | | | 5,125.1 | |
| Less 10% annual discount | | (1,733.0 | ) | | (2,285.9 | ) |
| Standardized measure of discounted future net cash flows | $ | 2,085.7 | | $ | 2,839.2 | |
Table III: Changes in Standardized Measure of Discounted Future Net Cash Flows Relating to Proved Oil and Gas Reserves
The following are the principal sources of change in the standardized measure of discounted future net cash flows:
| | | December 31, | | | December 31, | | | December 31, | |
| | | 2012 | | | 2011 | | | 2010 | |
| (millions of Canadian dollars) | | | | | (Restated)* | | | (Restated)* | |
| Future discounted net cash flow, beginning of year | $ | 2,839.2 | | $ | 1,863.9 | | $ | 1,242.9 | |
| Sales & transfers of oil and gas produced, net of production costs | | (669.8 | ) | | (711.3 | ) | | (577.3 | ) |
| Net change in sales & transfer prices and production costs related to future production | | (646.8 | ) | | 616.8 | | | 566.0 | |
| Development costs incurred during the period | | 566.7 | | | 680.3 | | | 354.9 | |
| Change in future development costs | | (524.0 | ) | | (658.4 | ) | | (429.1 | ) |
| Change due to extensions and discoveries | | 89.5 | | | 176.7 | | | 84.3 | |
| Accretion of discount | | 306.7 | | | 234.0 | | | 159.5 | |
| Sales of reserves in place | | (77.1 | ) | | - | | | - | |
| Purchase of reserves in place | | 0.3 | | | 293.3 | | | 200.2 | |
| Net change in income taxes | | 207.9 | | | (162.3 | ) | | (42.5 | ) |
| Changes due to revisions in timing of future net cash flow and other changes | | (6.9 | ) | | 506.2 | | | 305.0 | |
| Future discounted net cash flow, end of year | $ | 2,085.7 | | $ | 2,839.2 | | $ | 1,863.9 | |
| Net change for the year | $ | (753.5 | ) | $ | 975.3 | | $ | 621.0 | |
* The net change in income taxes and other changes for 2011 and 2010 have been restated to reflect the correct classification between the two items. As a result of the restatement, ($225.6) million and ($145) million were reclassified from net change in income taxes to other changes for 2011 and 2010, respectively.
F - 49
Table IV: Results of Operations
| | | Year Ended December 31 | |
| (millions of Canadian dollars) | | 2012 | | | 2011 | | | 2010 | |
| Petroleum and natural gas revenues, net of royalties | $ | 1,028.9 | | $ | 1,091.4 | | $ | 852.2 | |
| Less: | | | | | | | | | |
| Production costs | | 359.0 | | | 350.5 | | | 265.6 | |
| Exploration expense | | 24.9 | | | 18.3 | | | 3.3 | |
| Depletion, depreciation, and amortization(1) | | 577.5 | | | 533.4 | | | 470.7 | |
| Accretion of decommissioning liability | | 20.0 | | | 23.1 | | | 22.3 | |
| Impairment on oil and gas properties | | 21.8 | | | - | | | 13.7 | |
| Other (transportation and marketing costs) | | 22.2 | | | 29.6 | | | 9.4 | |
| Income tax expense(2) | | 7.3 | | | 29.7 | | | 9.0 | |
| Results of operations (excluding corporate overhead and interest costs) | | (3.8 | ) | $ | 106.8 | | $ | 58.2 | |
| (1) | Excludes depreciation on corporate assets. |
| (2) | Income tax expense has been calculated in accordance with FAS 69 using the statutory tax rate and reflecting tax deductions and credits and allowances relating to the oil and gas producing activities that are reflected in the consolidated income tax expense for the period. |
Table V: Capitalized Costs
| (millions of Canadian dollars) | | December 31, 2012 | | | December 31, 2011 | |
| Proved oil and gas properties(1)(2) | $ | 5,761.3 | | $ | 5,180.4 | |
| Unproved oil and gas properties | | | | | | |
| Unproven properties included in property, plant and equipment(3) | | 7.1 | | | 8.5 | |
| Exploration and evaluation assets(2) | | 73.8 | | | 74.5 | |
| Total unproved oil and gas properties | | 80.9 | | | 83.0 | |
| Total capital costs | | 5,842.2 | | | 5,263.4 | |
Accumulated depreciation, depletion and amortization (“DD&A”)(2) (3)
and impairment on oil and gas properties | | (1,579.9 | ) | | (1,015.5 | ) |
| Net capitalized costs | $ | 4,262.3 | | $ | 4,247.9 | |
| (1) | Proved oil and gas properties exclude $10.2 million of corporate assets as at December 31, 2012 (December 31, 2011 - $8.7 million). |
| (2) | As at December 31, 2012, Harvest had assets held for sale in proved oil and gas properties of $23.0 million with accumulated DD&A of $9.2 million and exploration and evaluation assets of $0.4 million (December 31, 2011 - $nil). |
| (3) | Costs related to incomplete wells as at year end. As at December 31, 2012, Harvest was in the process of drilling a total of 19 gross wells (December 31, 2011 – 10 gross wells). |
| (4) | Accumulated DD&A excludes accumulated depreciation on corporate assets of $6.1 million as at December 31, 2012 (December 31, 2011 - $4.1 million). |
Table VI: Costs Incurred
| | | Year Ended December 31 | |
| (millions of Canadian dollars) | | 2012 | | | 2011 | | | 2010 | |
| Property acquisitions(1) | | | | | | | | | |
| Proved property | $ | 1.3 | | $ | 495.5 | | $ | 550.9 | |
| Unproved property | | - | | | 18.6 | | | - | |
| Total property acquisition costs | | 1.3 | | | 514.1 | | | 550.9 | |
| Exploration costs | | 41.1 | | | 50.9 | | | 47.0 | |
| Development costs | | 667.8 | | | 662.0 | | | 423.6 | |
| Total costs incurred(2) | $ | 710.2 | | $ | 1,227.0 | | $ | 1,021.5 | |
| (1) | Property acquisition costs include business and property acquisitions and exclude proceeds received from dispositions of $88.5 million for the year ended December 31, 2012 (2011 - $8.7 million; 2010 - $1.0 million). |
F - 50
| (2) | Total costs incurred exclude costs related to corporate assets of $1.5 million for the year ended December 31, 2012 (2011 - $2.2 million; 2010 - $5.1 million). |
F - 51