Exhibit 99.4
 | MANAGEMENT’S DISCUSSION AND ANALYSIS |
MANAGEMENT’S DISCUSSION AND ANALYSIS
This Management’s Discussion and Analysis (“MD&A”) should be read in conjunction with the unaudited interim consolidated financial statements of Harvest Operations Corp. (“Harvest”, “we”, “us”, “our” or the “Company”) for the three and six months ended June 30, 2013 and the audited consolidated financial statements and MD&A for the year ended December 31, 2012. The information and opinions concerning the future outlook are based on information available at August 8, 2013.
Effective January 1, 2013, Harvest adopted new and amended accounting standards, described in the “Critical Accounting Estimates” section of this MD&A and in note 3 of the unaudited interim consolidated financial statements for the three and six months ended June 30, 2013. The retroactive application of these standards resulted in certain restatements in the 2012 comparative financial statements. The comparative financial information in this MD&A reflect such restated amounts and are consistent with the June 30, 2013 interim financial statements.
In this MD&A, all dollar amounts are expressed in Canadian dollars unless otherwise indicated. Tabular amounts are in millions of dollars, except where noted. All financial data has been prepared in accordance with International Financial Reporting Standards (“IFRS”) as issued by the International Accounting Standards Board except where otherwise noted.
Natural gas volumes are converted to barrels of oil equivalent (“boe”) using the ratio of six thousand cubic feet (“mcf”) of natural gas to one barrel of oil (“bbl”). Boes may be misleading, particularly if used in isolation. A boe conversion ratio of 6 mcf to 1 bbl is based on an energy equivalent conversion method primarily applicable at the burner tip and does not represent a value equivalent at the wellhead. In accordance with Canadian practice, petroleum and natural gas revenues are reported on a gross basis before deduction of Crown and other royalties.
Additional information concerning Harvest, including its audited annual consolidated financial statements and Annual Information Form (“AIF”) can be found on SEDAR atwww.sedar.com.
ADVISORY
This MD&A contains non-GAAP measures and forward-looking information about our current expectations, estimates and projections. Readers are cautioned that the MD&A should be read in conjunction with the “Non-GAAP Measures” and “Forward-Looking Information” sections at the end of this MD&A.
1
| MANAGEMENT’S DISCUSSION AND ANALYSIS |
FINANCIAL AND OPERATING HIGHLIGHTS
| | | Three Months Ended June 30 | | | | | | Six Months Ended June 30 | | | | |
| | | 2013 | | | 2012 | | | 2013 | | | 2012 | |
| UPSTREAM OPERATIONS | | | | | | | | | | | | |
| Daily sales volumes (boe/d) | | 53,461 | | | 60,874 | | | 54,510 | | | 60,712 | |
| Average realized price | | | | | | | | | | | | |
| Oil and NGLs ($/bbl)(2) | | 76.08 | | | 70.83 | | | 72.69 | | | 75.07 | |
| Gas ($/mcf) | | 3.83 | | | 2.11 | | | 3.64 | | | 2.20 | |
| Operating netback prior to hedging ($/boe)(1) | | 30.75 | | | 27.47 | | | 29.14 | | | 28.32 | |
| Operating loss | | (0.4 | ) | | (17.8 | ) | | (22.8 | ) | | (37.4 | ) |
| Cash contribution from operations(1) | | 136.1 | | | 140.9 | | | 259.0 | | | 288.1 | |
| Capital asset additions (excluding acquisitions) | | 29.6 | | | 72.8 | | | 152.6 | | | 279.9 | |
| Property and business acquisitions | | | | | | | | | | | | |
| (dispositions), net | | (125.4 | ) | | 1.6 | | | (122.1 | ) | | (0.3 | ) |
| Net wells drilled | | 0.2 | | | 6.9 | | | 45.1 | | | 62.3 | |
| Net undeveloped land additions (acres)(3) | | 5,730 | | | 10,156 | | | 21,943 | | | 55,087 | |
| | | | | | | | | | | | | |
| BLACKGOLD OIL SANDS | | | | | | | | | | | | |
| Capital asset additions | | 118.6 | | | 51.9 | | | 179.7 | | | 83.3 | |
| Net wells drilled | | - | | | 14.0 | | | - | | | 19.0 | |
| | | | | | | | | | | | | |
| DOWNSTREAM OPERATIONS | | | | | | | | | | | | |
| Average daily throughput (bbl/d) | | 106,245 | | | 114,552 | | | 103,176 | | | 107,276 | |
| Average refining gross margin (US$/bbl)(1) | | 0.74 | | | 2.71 | | | 1.59 | | | 3.58 | |
| Operating loss | | (51.6 | ) | | (42.7 | ) | | (106.6 | ) | | (92.0 | ) |
| Cash deficiency from operations(1) | | (28.1 | ) | | (14.9 | ) | | (61.2 | ) | | (38.9 | ) |
| Capital asset additions | | 10.1 | | | 6.5 | | | 22.6 | | | 19.8 | |
| | | | | | | | | | | | | |
| NET LOSS(4) | | (89.2 | ) | | (73.5 | ) | | (184.5 | ) | | (145.8 | ) |
| (1) | This is a non-GAAP measure; please refer to “Non-GAAP Measures” in this MD&A. |
| (2) | Excludes the effect of risk management contracts designated as hedges. |
| (3) | Includes lands acquired in business combinations. |
| (4) | Net loss includes the consolidated operating results of Harvest’s operating segments. |
REVIEW OF OVERALL PERFORMANCE
Upstream
Sales volumes for the second quarter and first six months of 2013 decreased by 7,413 boe/d and 6,202 bbl/d, respectively, as compared to the same periods in 2012. The decreases were primarily due to natural declines, smaller 2012 and 2013 capital drilling programs and dispositions of certain non-core producing properties in the most recent three quarters.
Operating netback prior to hedging for the second quarter of 2013 was $30.75/boe, an increase of $3.28/boe from 2012 mainly due to higher realized oil and natural gas prices, partially offset by higher royalties and operating expenses per boe. Operating netback prior to hedging for the first six months of 2013 was $29.14/boe, an increase of $0.82/boe from 2012 mainly due to higher realized natural gas prices and lower royalties, partially offset by lower realized heavy oil and NGL prices and higher operating expenses per boe.
2
| MANAGEMENT’S DISCUSSION AND ANALYSIS |
- Cash contribution from operations was $136.1 million for the second quarter of 2013, a $4.8 million decrease from the same period in 2012 driven by lower sales volumes, partially offset by higher operating netback per boe. For the first six months of 2013, cash contribution from operations was $259.0 million, a $29.1 million decrease from the same period in 2012 mainly driven by lower sales volumes.
- Operating loss was $0.4 million (2012 - $17.8 million) and $22.8 million (2012 - $37.4 million) for the second quarter and first six months of 2013, respectively. The improvements from the prior periods were mainly the result of positive variances in non-cash items including asset impairment and DD&A expense, partially offset by the decreased cash contribution described above.
- Capital asset additions of $29.6 million during the second quarter 2013 mainly relate to the tie-in of previously drilled wells. One gross well (0.2 net) was rig-released during the second quarter. Capital asset additions of $152.6 million for the first six months of 2013 mainly relate to the drilling and tie-in of 48.0 gross (45.1 net) wells which were rig-released in the first quarter of 2013.
- During the second quarter of 2013, Harvest sold certain non-core oil and gas assets with approximately 900 boe/d of production in west central Saskatchewan, for cash proceeds of $107.9 million which resulted in a gain of $1.9 million.
BlackGold
Capital asset additions of $118.6 million and $179.7 million for the second quarter and first six months of 2013, respectively, mainly relate to the development of the central processing facility (“CPF”).
The overall EPC contract was approximately 80% complete. Commissioning of the CPF, first steam and production are expected in 2014.
Downstream
Throughput volume averaged 106,245 bbl/d (2012 – 114,552 bbl/d) and 103,176 bbl/d (2012 – 107,276 bbl/d) for the second quarter and first six months of 2013, respectively. Downstream reduced the throughput in the second quarter of 2013 as a result of low refining gross margin. For the first six months of 2013, throughput volume was lower than the prior year because of a two-week unplanned outage in the first quarter as well as the reduced throughput in the second quarter.
Refining gross margin averaged US$0.74/bbl (2012 - US$2.71/bbl) and US$1.59/bbl (2012 - US$3.58/bbl) for the second quarter and first six months of 2013, respectively. The decrease in gross margin for the second quarter was mainly due to lower product crack spreads and the decrease for the first six months of 2013 was due to a decrease in the overall product yields combined with a change in yield mix and lower product crack spreads.
Cash deficiency from operations was $28.1 million (2012 - $14.9 million) and $61.2 million (2012 - $38.9 million) for the second quarter and first six months of 2013, respectively. The increases were mainly due to both lower throughput volumes and average refining gross margins per bbl, partially offset by lower purchased energy expenses.
3
| MANAGEMENT’S DISCUSSION AND ANALYSIS |
- Operating loss totaled $51.6 million (2012 – $42.7 million) and $106.6 million (2012 - $92.0 million) for the second quarter and first six months of 2013, respectively. The increases in operating losses were primarily due to decreases in the gross margin.
- Capital asset additions of $10.1 million (2012 - $6.5 million) and $22.6 million (2012 – $19.8 million) for the second quarter and first six months of 2013, respectively, relate to various capital improvement projects.
Corporate
Net loss was $89.2 million and $184.5 million for the second quarter and first six months of 2013, respectively. Net loss increased for both periods due to the changes in the operating losses of the Upstream and Downstream segments described above, as well as the increase in unrealized foreign exchange losses during 2013.
Harvest extended the credit facility agreement by one year to April 30, 2017.
Harvest early redeemed, at par, its 7.25% Debentures Due 2014 on April 2, 2013 and its 7.25% Debentures Due 2013 on April 15, 2013. The redemptions were funded using US$390 million of drawings on the US$400 million senior unsecured credit facility.
On May 14, 2013, Harvest issued US$630 million senior unsecured notes due May 14, 2018, that are unconditionally and irrevocably guaranteed by KNOC, with a coupon rate of 21/8% for net proceeds of US$626.1 million. The proceeds were used to repay the senior unsecured credit facility and early redeem, at par, the 7.50% Debentures Due 2015.
4
| MANAGEMENT’S DISCUSSION AND ANALYSIS |
UPSTREAM OPERATIONS
Summary of Financial and Operating Results
| | | Three Months Ended June 30 | | | Six Months Ended June 30 | |
| | | 2013 | | | 2012 | | | 2013 | | | 2012 | |
| FINANCIAL | | | | | | | | | | | | |
| Petroleum and natural gas sales(1) | | 284.8 | | | 292.4 | | | 553.7 | | | 616.5 | |
| Royalties | | (41.6 | ) | | (38.8 | ) | | (74.3 | ) | | (92.2 | ) |
| Revenues | | 243.2 | | | 253.6 | | | 479.4 | | | 524.3 | |
| Expenses | | | | | | | | | | | | |
| Operating | | 86.9 | | | 88.6 | | | 178.7 | | | 188.5 | |
| Transportation and marketing | | 5.2 | | | 5.4 | | | 10.2 | | | 11.0 | |
| Realized (gains) losses on risk management contracts(2) | | (2.1 | ) | | 0.2 | | | (3.9 | ) | | 0.2 | |
| Operating netback after hedging(3) | | 153.2 | | | 159.4 | | | 294.4 | | | 324.6 | |
| General and administrative | | 17.3 | | | 18.0 | | | 35.0 | | | 30.1 | |
| Depreciation, depletion and amortization | | 139.2 | | | 147.1 | | | 284.3 | | | 291.6 | |
| Exploration and evaluation | | 0.3 | | | 12.3 | | | 8.9 | | | 19.1 | |
| Impairment of property, plant and equipment | | - | | | - | | | - | | | 21.8 | |
| Unrealized (gains) losses on risk management contracts(4) | | (0.9 | ) | | 0.2 | | | (2.1 | ) | | (0.1 | ) |
| Gains on disposition of property, plant and equipment | | (2.3 | ) | | (0.4 | ) | | (8.9 | ) | | (0.5 | ) |
| Operating loss | | (0.4 | ) | | (17.8 | ) | | (22.8 | ) | | (37.4 | ) |
| Capital asset additions (excluding acquisitions) | | 29.6 | | | 72.8 | | | 152.6 | | | 279.9 | |
| Property and business acquisitions (dispositions), net | | (125.4 | ) | | 1.6 | | | (122.1 | ) | | (0.3 | ) |
| Decommissioning and environmental remediation expenditures | | 1.7 | | | 3.2 | | | 7.6 | | | 9.8 | |
| OPERATING | | | | | | | | | | | | |
| Light / medium oil (bbl/d) | | 11,837 | | | 13,758 | | | 12,523 | | | 14,069 | |
| Heavy oil (bbl/d) | | 17,455 | | | 20,700 | | | 17,341 | | | 20,264 | |
| Natural gas liquids (bbl/d) | | 5,510 | | | 5,468 | | | 5,730 | | | 5,568 | |
| Natural gas (mcf/d) | | 111,954 | | | 125,680 | | | 113,494 | | | 124,863 | |
| Total (boe/d) | | 53,461 | | | 60,874 | | | 54,510 | | | 60,712 | |
| (1) | Includes the effective portion of Harvest’s realized natural gas and crude oil hedges. |
| (2) | Realized (gains) losses on risk management contracts include the settlement amounts for power, crude oil and foreign exchange derivative contracts, excluding the effective portion of realized (gains) losses from Harvest’s designated accounting hedges. See “Risk Management, Financing and Other” section of this MD&A for details. |
| (3) | This is a non-GAAP measure; please refer to “Non-GAAP Measures” in this MD&A. |
| (4) | Unrealized (gains) losses on risk management contracts reflect the change in fair value of derivative contracts that are not designated as accounting hedges and the ineffective portion of changes in fair value of designated hedges. See “Risk Management, Financing and Other” section of this MD&A for details. |
5
| MANAGEMENT’S DISCUSSION AND ANALYSIS |
Commodity Price Environment
| | | Three Months Ended June 30 | | | Six Months Ended June 30 | |
| | | 2013 | | | 2012 | | | Change | | | 2013 | | | 2012 | | | Change | |
West Texas Intermediate (“WTI”) crude
oil (US$/bbl) | | 94.22 | | | 93.49 | | | 1% | | | 94.30 | | | 98.21 | | | (4% | ) |
| West Texas Intermediate crude oil ($/bbl) | | 96.45 | | | 94.32 | | | 2% | | | 95.81 | | | 98.67 | | | (3% | ) |
| Edmonton light sweet crude oil ($/bbl) | | 92.73 | | | 83.98 | | | 10% | | | 90.38 | | | 88.18 | | | 2% | |
Western Canadian Select (“WCS”)
crude oil ($/bbl) | | 76.78 | | | 71.29 | | | 8% | | | 69.87 | | | 76.45 | | | (9% | ) |
| AECO natural gas daily ($/mcf) | | 3.53 | | | 1.91 | | | 85% | | | 3.37 | | | 2.03 | | | 66% | |
| U.S. / Canadian dollar exchange rate | | 0.977 | | | 0.990 | | | (1% | ) | | 0.984 | | | 0.995 | | | (1% | ) |
| | | | | | | | | | | | | | | | | | | |
| Differential Benchmarks | | | | | | | | | | | | | | | | | | |
| WCS differential to WTI ($/bbl) | | 19.67 | | | 23.03 | | | (15% | ) | | 25.94 | | | 22.22 | | | 17% | |
| WCS differential as a % of WTI | | 20.4% | | | 24.4% | | | (16% | ) | | 27.1% | | | 22.5% | | | 20% | |
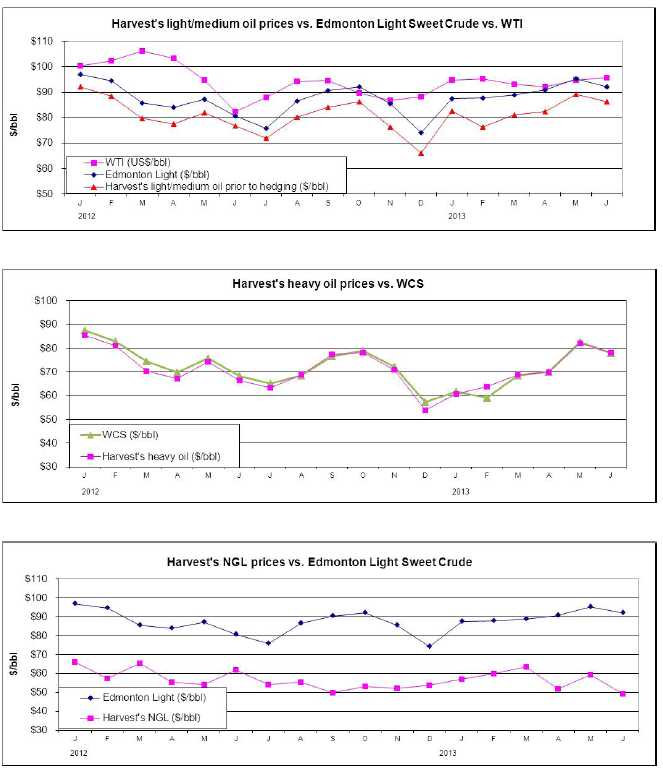
The average WTI benchmark price for 2013 increased 1% from the second quarter of 2012 but decreased 4% from the first six months of 2012. The average Edmonton light sweet crude oil price (“Edmonton Light”) increased 10% in the second quarter of 2013 mainly due to the narrowing of the light sweet differential. The Edmonton Light price increased 2% for the first six months of 2013 mainly due to the narrowing of the light sweet differential, partially offset by the decrease in the WTI price.
Heavy oil differentials fluctuate based on a combination of factors including the level of heavy oil production and inventories, pipeline and rail capacity to deliver heavy crude to U.S. markets and the seasonal demand for heavy oil. For the second quarter of 2013, the WCS price increased 8% as compared to the second quarter of 2012 mainly as a result of the narrowing of the WCS differential to WTI. For the first six months of 2013, the WCS price decreased 9% as a result of the decreased WTI price and widened WCS differential to WTI.
6
| MANAGEMENT’S DISCUSSION AND ANALYSIS |
Realized Commodity Prices
| | | Three Months Ended | | | Six Months Ended | |
| | | June 30 | | | June 30 | |
| | | | | | | | | | | | | | | | | | | |
| | | 2013 | | | 2012 | | | Change | | | 2013 | | | 2012 | | | Change | |
| Light to medium oil prior to hedging ($/bbl) | | 85.90 | | | 78.68 | | | 9% | | | 82.88 | | | 82.74 | | | - | |
| Heavy oil prior to hedging ($/bbl) | | 76.55 | | | 69.33 | | | 10% | | | 70.54 | | | 73.88 | | | (5% | ) |
| Natural gas liquids ($/bbl) | | 53.48 | | | 56.76 | | | (6% | ) | | 56.93 | | | 60.04 | | | (5% | ) |
| Natural gas prior to hedging ($/mcf) | | 3.83 | | | 2.11 | | | 82% | | | 3.64 | | | 2.20 | | | 65% | |
| Average realized price prior to hedging ($/boe)(1) | | 58.22 | | | 51.42 | | | 13% | | | 55.80 | | | 54.72 | | | 2% | |
| | | | | | | | | | | | | | | | | | | |
| Light to medium oil after hedging ($/bbl)(2) | | 85.90 | | | 84.68 | | | 1% | | | 82.88 | | | 87.31 | | | (5% | ) |
| Heavy oil after hedging ($/bbl)(2) | | 75.80 | | | 69.33 | | | 9% | | | 70.16 | | | 73.88 | | | (5% | ) |
| Natural gas after hedging ($/mcf)(2) | | 3.89 | | | 2.11 | | | 84% | | | 3.69 | | | 2.20 | | | 68% | |
| Average realized price after hedging ($boe)(1) (2) (3) | | 58.11 | | | 52.78 | | | 10% | | | 55.78 | | | 55.78 | | | - | |
| (1) | Inclusive of sulphur revenue. |
| (2) | Inclusive of the realized gains (losses) from contracts designated as hedges. Foreign exchange swaps and power contracts are excluded from the realized price. |
| (3) | Natural gas liquids prices are not hedged but are included in the average realized price after hedging. |
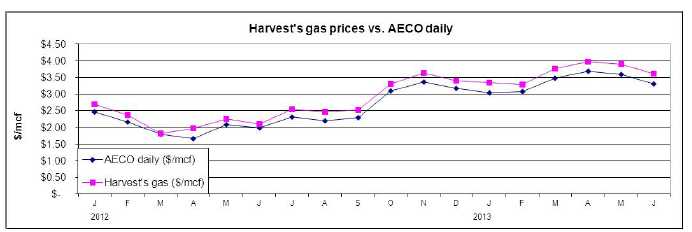
Harvest’s realized prices for light to medium oil, heavy oil and natural gas generally trend with the Edmonton Light, WCS and AECO benchmark prices, respectively. For the three months and six months ended June 30, 2013, the period-over-period variances and movements in these realized prices were consistent with the changes in the related benchmarks.
Natural gas liquids realized prices decreased by 6% for the second quarter of 2013 and 5% for the first six months of 2013 as compared to the same periods in 2012, reflecting the decrease in propane, ethane and butane commodity prices from 2012.
In order to mitigate the risk of fluctuating cash flows due to natural gas and crude oil price volatility, Harvest entered into AECO and WCS derivative contracts. Including the impact from the AECO hedges, Harvest’s realized gas prices increased by $0.06/mcf (2012 – $nil) in the second quarter of 2013 and $0.05/mcf (2012 - $nil) for the first six months of 2013. Harvest’s realized heavy oil prices decreased by $0.75/bbl (2012 - $nil) in the second quarter of 2013 and $0.38/bbl (2012 - $nil) for the first six months of 2013 as a result of the WCS hedges. There were no light to medium crude oil hedges for the second quarter or first six months of 2013, but in the prior year Harvest earned a $6.00/bbl and $4.57/bbl increase in realized light to medium oil price in the second quarter and first six months of 2012, respectively. Please see “Cash Flow Risk Management” section in this MD&A for further discussion with respect to the cash flow risk management program.
7
| MANAGEMENT’S DISCUSSION AND ANALYSIS |
8
| MANAGEMENT’S DISCUSSION AND ANALYSIS |
Sales Volumes
| | | Three Months Ended June 30 | |
| | | 2013 | | | 2012 | |
| | | | | | | | | | | | | | | % Volume | |
| | | Volume | | | Weighting | | | Volume | | | Weighting | | | Change | |
| Light to medium oil (bbl/d) | | 11,837 | | | 22% | | | 13,758 | | | 23% | | | (14% | ) |
| Heavy oil (bbl/d) | | 17,455 | | | 33% | | | 20,701 | | | 34% | | | (16% | ) |
| Natural gas liquids (bbl/d) | | 5,510 | | | 10% | | | 5,469 | | | 9% | | | 1% | |
| Total liquids (bbl/d) | | 34,802 | | | 65% | | | 39,928 | | | 66% | | | (13% | ) |
| Natural gas (mcf/d) | | 111,954 | | | 35% | | | 125,680 | | | 34% | | | (11% | ) |
| Total oil equivalent (boe/d) | | 53,461 | | | 100% | | | 60,874 | | | 100% | | | (12% | ) |
| | | Six Months Ended June 30 | |
| | | 2013 | | | 2012 | |
| | | | | | | | | | | | | | | % Volume | |
| | | Volume | | | Weighting | | | Volume | | | Weighting | | | Change | |
| Light to medium oil (bbl/d) | | 12,523 | | | 23% | | | 14,069 | | | 23% | | | (11% | ) |
| Heavy oil (bbl/d) | | 17,341 | | | 32% | | | 20,264 | | | 33% | | | (14% | ) |
| Natural gas liquids (bbl/d) | | 5,730 | | | 11% | | | 5,568 | | | 9% | | | 3% | |
| Total liquids (bbl/d) | | 35,594 | | | 66% | | | 39,901 | | | 65% | | | (11% | ) |
| Natural gas (mcf/d) | | 113,494 | | | 34% | | | 124,863 | | | 35% | | | (9% | ) |
| Total oil equivalent (boe/d) | | 54,510 | | | 100% | | | 60,712 | | | 100% | | | (10% | ) |
9
| MANAGEMENT’S DISCUSSION AND ANALYSIS |
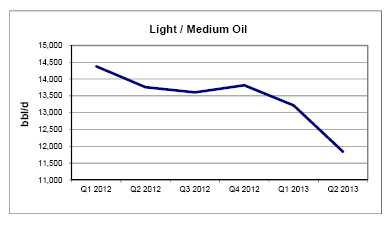 | Harvest’s average daily sales of light/medium oil decreased 14% and 11% for the second quarter and first six months of 2013 as compared to 2012. The decreases were due to natural declines, a lower level of drilling activity in 2012 and 2013 and the recent disposition of non-core properties. |
Heavy oil sales for the second quarter and first six months of 2013 decreased 16% and 14%, respectively, from the same periods in 2012 due to the same reasons as the light/medium oil, as well as an outage of a major oil battery in Alberta. |  |
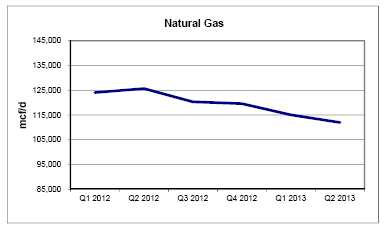 | Natural gas sales during the second quarter and first six months of 2013 decreased 11% and 9%, respectively, from the same periods in 2012. The decreases were due to natural declines, property dispositions and facility turnarounds, partially offset by the results of development drilling in the liquids-rich Deep Basin area. |
10
| MANAGEMENT’S DISCUSSION AND ANALYSIS |
Natural gas liquids sales for the second quarter and first six months of 2013 increased by 1% and 3%, respectively, mainly as a result of the liquids-rich drilling in the Deep Basin area, more than offsetting the impacts of natural declines and facility turnarounds. | 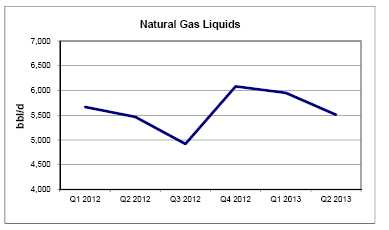 |
Revenues
| | | Three Months Ended June 30 | | | Six Months Ended June 30 | |
| | | 2013 | | | 2012 | | | Change | | | 2013 | | | 2012 | | | Change | |
| Light / medium oil sales after hedging(1) | | 92.5 | | | 106.0 | | | (13% | ) | | 187.9 | | | 223.6 | | | (16% | ) |
| Heavy oil sales sales after hedging(1) | | 120.4 | | | 130.6 | | | (8% | ) | | 220.2 | | | 272.5 | | | (19% | ) |
| Natural gas sales after hedging(1) | | 39.6 | | | 24.2 | | | 64% | | | 75.9 | | | 50.0 | | | 52% | |
| Natural gas liquids sales | | 26.8 | | | 28.2 | | | (5% | ) | | 59.0 | | | 60.8 | | | (3% | ) |
| Other(2) | | 5.5 | | | 3.4 | | | 62% | | | 10.7 | | | 9.6 | | | 11% | |
| Petroleum and natural gas sales | | 284.8 | | | 292.4 | | | (3% | ) | | 553.7 | | | 616.5 | | | (10% | ) |
| Royalties | | (41.6 | ) | | (38.8 | ) | | 7% | | | (74.3 | ) | | (92.2 | ) | | (19% | ) |
| Revenues | | 243.2 | | | 253.6 | | | (4% | ) | | 479.4 | | | 524.3 | | | (9% | ) |
| (1) | Inclusive of the effective portion of realized gains (losses) from natural gas and crude oil contracts designated as hedges. |
| (2) | Inclusive of sulphur revenue and miscellaneous income. |
Harvest’s revenue is subject to changes in sales volumes, commodity prices and currency exchange rates. In the second quarter of 2013, total petroleum and natural gas sales decreased by $7.6 million, mainly due to the 12% decrease in sales volumes, partially offset by the 10% increase in realized prices after hedging activities. For the first six months of 2013, total petroleum and natural gas sales decreased by $62.8 million, mainly due to the 10% decrease in sales volumes.
Sulphur revenue represented $3.4 million (2012 - $3.3 million) of the total in other revenues for the second quarter of 2013 and $7.4 million (2012 - $9.4 million) for the first six months of 2013.
Royalties
Harvest pays Crown, freehold and overriding royalties to the owners of mineral rights from which production is generated. These royalties vary for each property and product and Crown royalties are based on various sliding scales dependent on incentives, production volumes and commodity prices.
For the second quarter of 2013, royalties as a percentage of gross revenue averaged 14.6% (2012 – 13.3%) . The higher royalty rates in the second quarter of 2013 were mainly due to the annual Alberta Crown gas cost allowance adjustment, for which Harvest received a charge in the current year but a credit in the prior year.
11
| MANAGEMENT’S DISCUSSION AND ANALYSIS |
For the first six months of 2013, royalties as a percentage of gross revenue averaged 13.4% (2012 – 15.0%) . The lower royalty rates in the first six months of 2013 were mainly due to the lower heavy oil and natural gas liquids prices in 2013, combined with lower sales volumes and the resulting impact on sliding scale calcuations.
Operating and Transportation Expenses
| | | Three Months Ended June 30 | |
| | | | | | | | | | | | | | | $/boe | |
| | | 2013 | | | $/boe | | | 2012 | | | $/boe | | | Change | |
| Power and purchased energy | | 26.2 | | | 5.38 | | | 16.8 | | | 3.03 | | | 2.35 | |
| Well servicing | | 11.6 | | | 2.38 | | | 15.2 | | | 2.74 | | | (0.36 | ) |
| Repairs and maintenance | | 12.7 | | | 2.61 | | | 16.0 | | | 2.89 | | | (0.28 | ) |
| Lease rentals and property tax | | 9.1 | | | 1.86 | | | 9.0 | | | 1.63 | | | 0.23 | |
| Labor - internal | | 7.6 | | | 1.56 | | | 7.6 | | | 1.37 | | | 0.19 | |
| Labor - contract | | 4.0 | | | 0.82 | | | 4.6 | | | 0.83 | | | (0.01 | ) |
| Chemicals | | 4.4 | | | 0.90 | | | 4.6 | | | 0.82 | | | 0.08 | |
| Trucking | | 3.7 | | | 0.77 | | | 4.1 | | | 0.74 | | | 0.03 | |
| Processing and other fees | | 7.2 | | | 1.48 | | | 8.5 | | | 1.54 | | | (0.06 | ) |
| Other | | 0.4 | | | 0.09 | | | 2.2 | | | 0.39 | | | (0.30 | ) |
| Total operating expenses | | 86.9 | | | 17.85 | | | 88.6 | | | 15.98 | | | 1.87 | |
| Transportation and marketing | | 5.2 | | | 1.07 | | | 5.4 | | | 0.97 | | | 0.10 | |
| | | Six Months Ended June 30 | |
| | | | | | | | | | | | | | | $/boe | |
| | | 2013 | | | $/boe | | | 2012 | | | $/boe | | | Change | |
| Power and purchased energy | | 48.3 | | | 4.89 | | | 37.3 | | | 3.37 | | | 1.52 | |
| Well servicing | | 27.4 | | | 2.78 | | | 33.7 | | | 3.05 | | | (0.27 | ) |
| Repairs and maintenance | | 26.7 | | | 2.71 | | | 32.2 | | | 2.91 | | | (0.20 | ) |
| Lease rentals and property tax | | 18.5 | | | 1.88 | | | 18.5 | | | 1.68 | | | 0.20 | |
| Labor - internal | | 17.3 | | | 1.76 | | | 16.8 | | | 1.52 | | | 0.24 | |
| Labor - contract | | 8.2 | | | 0.83 | | | 9.9 | | | 0.90 | | | (0.07 | ) |
| Chemicals | | 10.5 | | | 1.07 | | | 9.1 | | | 0.83 | | | 0.24 | |
| Trucking | | 7.2 | | | 0.72 | | | 8.7 | | | 0.78 | | | (0.06 | ) |
| Processing and other fees | | 17.5 | | | 1.78 | | | 17.2 | | | 1.56 | | | 0.22 | |
| Other | | (2.9 | ) | | (0.32 | ) | | 5.1 | | | 0.46 | | | (0.78 | ) |
| Total operating expenses | | 178.7 | | | 18.10 | | | 188.5 | | | 17.06 | | | 1.04 | |
| Transportation and marketing | | 10.2 | | | 1.03 | | | 11.0 | | | 1.00 | | | 0.03 | |
Operating expenses for the second quarter and first six months of 2013 totaled $86.9 million and $178.7 million, respectively, a decrease of $1.7 million and $9.8 million compared to the same periods in 2012. The lower operating expenses were mainly attributable to the decrease in well servicing and repairs and maintenance activities and recent property dispositions, partially offset by the higher cost of Alberta power. Operating costs on a per barrel basis have increased by 12% to $17.85/boe for the second quarter of 2013 and 6% to $18.10/boe for the first half of 2013 mainly due to the higher cost of Alberta electricity.
12
| MANAGEMENT’S DISCUSSION AND ANALYSIS |
| | | Three Months Ended | | | Six Months Ended | |
| | | June 30 | | | June 30 | |
| ($/boe) | | 2013 | | | 2012 | | | Change | | | 2013 | | | 2012 | | | Change | |
| Power and purchased energy costs | | 5.38 | | | 3.03 | | | 2.35 | | | 4.89 | | | 3.37 | | | 1.52 | |
Realized gains on electricity risk
management contracts | | (0.45 | ) | | - | | | (0.45 | ) | | (0.25 | ) | | - | | | (0.25 | ) |
| Net power and purchased energy costs | | 4.93 | | | 3.03 | | | 1.90 | | | 4.64 | | | 3.37 | | | 1.27 | |
Alberta Power Pool electricity price
($/MWh) | | 123.36 | | | 40.15 | | | 83.21 | | | 93.74 | | | 49.96 | | | 43.78 | |
Power and purchased energy costs, comprised primarily of electric power costs, represented approximately 30% (2012 – 19%) of total operating expenses for the second quarter of 2013. The increase in power and purchased energy costs was mainly attributable to the higher average Alberta electricity price. Harvest did not have any risk management contracts relating to electricity during the first or second quarters of 2012.
Transportation and marketing expenses relate primarily to delivery of natural gas to Alberta’s natural gas sales hub, the AECO Storage Hub, and the cost of trucking crude oil to pipeline or rail receipt points. As a result, the total dollar amount of costs generally fluctuates in relation to sales volumes. For the second quarter and first six months of 2013, transportation and marketing expenses decreased by $0.2 million and $0.8 million, respectively, as compared to the same periods in 2012.
Operating Netback(1)
| | | Three Months Ended June 30 | | | Six Months Ended June 30 | |
| | | | | | | | | $/boe | | | | | | | | | $/boe | |
| ($/boe) | | 2013 | | | 2012 | | | Change | | | 2013 | | | 2012 | | | Change | |
Petroleum and natural gas sales
prior to hedging | | 58.22 | | | 51.42 | | | 6.80 | | | 55.80 | | | 54.72 | | | 1.08 | |
| Royalties | | (8.55 | ) | | (7.00 | ) | | (1.55 | ) | | (7.53 | ) | | (8.34 | ) | | 0.81 | |
| Operating expenses | | (17.85 | ) | | (15.98 | ) | | (1.87 | ) | | (18.10 | ) | | (17.06 | ) | | (1.04 | ) |
| Transportation and marketing | | (1.07 | ) | | (0.97 | ) | | (0.10 | ) | | (1.03 | ) | | (1.00 | ) | | (0.03 | ) |
| Operating netback prior to hedging(1) | | 30.75 | | | 27.47 | | | 3.28 | | | 29.14 | | | 28.32 | | | 0.82 | |
| Hedging gains(2) | | 0.32 | | | 1.33 | | | (1.01 | ) | | 0.38 | | | 1.05 | | | (0.67 | ) |
| Operating netback after hedging(1) | | 31.07 | | | 28.80 | | | 2.27 | | | 29.52 | | | 29.37 | | | 0.15 | |
| (1) | This is a non-GAAP measure; please refer to “Non-GAAP Measures” in this MD&A. |
| (2) | Hedging gains include the settlement amounts for natural gas, crude oil and power contracts. |
13
| MANAGEMENT’S DISCUSSION AND ANALYSIS |
General and Administrative (“G&A”) Expenses
| | | Three Months Ended June 30 | | | Six Months Ended June 30 | |
| | | 2013 | | | 2012 | | | 2013 | | | 2012 | |
| G&A | | 17.3 | | | 18.0 | | | 35.0 | | | 30.1 | |
| G&A ($/boe ) | | 3.55 | | | 3.24 | | | 3.55 | | | 2.73 | |
For the second quarter of 2013, G&A expenses were comparable to the same period in the prior year. For the first six months of 2013, G&A expenses increased by $4.9 million or 16% compared to the same period in the prior year, mainly due to the reversal in the prior year of a $4.3 million provision for potential renunciation shortfall on a series of flow through shares that was no longer required. Harvest does not have a stock option program, however there is a long-term incentive program which is a cash settled plan that has been included in the G&A expense.
Depletion, Depreciation and Amortization (“DD&A”) Expenses
| | | Three Months Ended | | | Six Months Ended | |
| | | June 30 | | | June 30 | |
| | | 2013 | | | 2012 | | | 2013 | | | 2012 | |
| DD&A | | 139.2 | | | 147.1 | | | 284.3 | | | 291.6 | |
| DD&A ($/boe) | | 28.59 | | | 26.55 | | | 28.82 | | | 26.38 | |
DD&A expenses for the second quarter and first six months of 2013 decreased by $7.9million and $7.3 million, respectively, as compared to the same periods in 2012 mainly due to lower sales volumes. DD&A per boe has increased for both current periods due to a lower depletable proved developed reserve base than in 2012.
Impairment
No impairment was recognized in the first six months of 2013. In the first quarter of 2012, Harvest recorded a pre-tax impairment charge of $21.8 million against the South Alberta Gas cash generating unit, as a result of the declining forecasted natural gas prices during the quarter. The recoverable value was determined based on the total proved plus probable reserves estimated by independent reserves evaluators using the April 1, 2012 commodity price forecast discounted at a pre-tax discount rate of 10%.
Property Dispositions
During the second quarter of 2013, Harvest sold certain non-core oil and gas assets with approximately 900 boe/d of production in west central Saskatchewan, for cash proceeds of $107.9 million. The transaction resulted in a gain of $1.9 million, which is recognized in the consolidated statements of comprehensive loss. Harvest also disposed of other non-core properties in Alberta and Saskatchewan for proceeds of $3.1 million and recorded a gain of $0.4 million. Total gain on dispositions of $2.3 million was recorded in the second quarter of 2013.
During the first quarter of 2013, Harvest disposed of certain non-core producing properties in Alberta and British Columbia for proceeds of $9.5 million. The transactions resulted in a gain of $6.6 million.
14
| MANAGEMENT’S DISCUSSION AND ANALYSIS |
Harvest continues with the process of marketing non-core properties for sale, to high-grade its asset portfolio and to monetize some of its assets. The impact to future production from the future dispositions is difficult to predict, given the occurrence and the timing of the transactions cannot be determined with a high level of certainty. The proceeds from any dispositions would be used to manage Harvest’s liquidity and to fund future development of core assets.
Capital Asset Additions
| | | Three Months Ended | | | Six Months Ended | |
| | | June 30 | | | June 30 | |
| | | 2013 | | | 2012 | | | 2013 | | | 2012 | |
| Drilling and completion | | 5.8 | | | 21.9 | | | 84.1 | | | 146.6 | |
| Well equipment, pipelines and facilities | | 17.0 | | | 42.0 | | | 49.2 | | | 104.4 | |
| Geological and geophysical | | 1.3 | | | 2.4 | | | 8.9 | | | 9.1 | |
| Land and undeveloped lease rentals | | 1.1 | | | 2.2 | | | 2.2 | | | 11.1 | |
| Corporate | | 0.7 | | | 0.3 | | | 2.0 | | | 0.5 | |
| Other | | 3.7 | | | 4.0 | | | 6.2 | | | 8.2 | |
| Total additions excluding acquisitions | | 29.6 | | | 72.8 | | | 152.6 | | | 279.9 | |
Total capital additions were lower for the three and six months ended June 30, 2013 compared to the same period in 2012 due to a lower capital budget for the current year. Most of Harvest’s capital costs incurred in the second quarter were to complete work from the previous quarter’s drilling program, including well completions, equipping and tie-ins.
The following table summarizes the wells drilled by Harvest and the related drilling and completion costs incurred in the period. A well is recorded in the table as having being drilled after it has been rig-released, however related drilling costs may be incurred in a period before a well has been spud (including survey, lease acquisition and construction costs) and related completion costs will be incurred in a period afterwards, as the completion work is done after a well is drilled.
| | | Three Months Ended | | | Six Months Ended | |
| | | June 30 | | | June 30 | |
| | | | | | | | | Drilling and | | | | | | | | | Drilling and | |
| Area | | Gross | | | Net | | | completion | | | Gross | | | Net | | | completion | |
| Hay River | | – | | | – | | $ | 2.0 | | | 26.0 | | | 26.0 | | $ | 32.4 | |
| Deep Basin | | – | | | – | | | 0.7 | | | 4.0 | | | 2.6 | | | 18.7 | |
| Western Alberta | | 1.0 | | | 0.2 | | | – | | | 5.0 | | | 3.5 | | | 11.5 | |
| Suffield | | – | | | – | | | 1.8 | | | 6.0 | | | 6.0 | | | 8.7 | |
| Red Earth | | – | | | – | | | 0.6 | | | 3.0 | | | 3.0 | | | 7.2 | |
| SE Saskatchewan | | – | | | – | | | – | | | 4.0 | | | 4.0 | | | 4.3 | |
| Other areas | | – | | | – | | | 0.7 | | | – | | | – | | | 1.3 | |
| Total | | 1.0 | | | 0.2 | | $ | 5.8 | | | 48.0 | | | 45.1 | | $ | 84.1 | |
For the six months ended June 30, 2013, Harvest drilled 26 gross (26.0 net) wells pursuing heavy gravity oil in the Bluesky formation in Hay River, including 16 producing, 9 injection and 1 Slave Point test wells. Harvest also drilled or participated in 4 gross (2.6 net) deep, multi-stage fractured, liquids-rich gas wells in the Falher
15
| MANAGEMENT’S DISCUSSION AND ANALYSIS |
and Montney formations in the Deep Basin area. At Red Earth, Harvest drilled 3 gross (3.0 net) oil wells into the Slave Point and Gilwood light oil formations. The Company’s remaining drilling program included oil and gas wells in the western Alberta areas as well as oil wells in Suffield and southeast Saskatchewan.
Decommissioning Liabilities
Harvest’s Upstream decommissioning liabilities at June 30, 2013 were $688.9 million (December 31, 2012 - $709.3 million) for future remediation, abandonment, and reclamation of Harvest’s oil and gas properties. The total of the decommissioning liabilities are based on management’s best estimate of costs to remediate, reclaim, and abandon wells and facilities. The costs will be incurred over the operating lives of the assets with the majority being at or after the end of reserve life. Please refer to the “Contractual Obligations and Commitments” section of this MD&A for the payments expected for each of the next five years and thereafter in respect of the decommissioning liabilities.
Goodwill
Goodwill is recorded when the purchase price of an acquired business exceeds the fair value of the net identifiable assets and liabilities of that acquired business. At June 30, 2013, Harvest had $382.5 million (December 31, 2012 - $391.8 million) of goodwill on the balance sheet related to the Upstream segment, a decrease of $9.3 million as a result of a disposition of the west central Saskatchewan properties (see the “Property Dispositions” section above). The goodwill balance is assessed annually for impairment or more frequently if events or changes in circumstances occur that would reasonably be expected to reduce the fair value of the acquired business to a level below its carrying amount.
BLACKGOLD OIL SANDS
Capital Asset Additions
| | | Three Months Ended June 30 | | | Six Months Ended June 30 | |
| | | 2013 | | | 2012 | | | 2013 | | | 2012 | |
| Drilling and completion | | 2.6 | | | 18.0 | | | 6.2 | | | 36.8 | |
| Well equipment, pipelines and facilities | | 110.7 | | | 30.2 | | | 162.7 | | | 39.1 | |
| Geological and geophysical | | – | | | 0.2 | | | – | | | 0.9 | |
| Other | | 5.3 | | | 3.5 | | | 10.8 | | | 6.5 | |
| Total BlackGold additions | | 118.6 | | | 51.9 | | | 179.7 | | | 83.3 | |
During the second quarter of 2013, Harvest invested $110.7 million on the CPF. As at June 30, 2013, the overall oil sands project was approximately 80% complete.
Oil Sands Project Development
Harvest is developing its BlackGold oil sands CPF under the engineering, procurement and construction (“EPC”) contract with expected total costs of approximately $520 million, after allowing for certain costs which are not reimbursable to the EPC contractor. Under the EPC contract, a maximum of approximately $101 million of the EPC costs will be paid in equal installments, without interest, over 10 years commencing on the completion of the EPC work in 2014. The liability is considered a financial liability and is initially recorded at fair value, which is estimated as the present value of all future cash payments discounted using the prevailing
16
| MANAGEMENT’S DISCUSSION AND ANALYSIS |
market rate of interest for similar instruments. As at June 30, 2013, Harvest recognized a liability of $58.8 million (December 31, 2012 - $4.7 million) using a discount rate of 4.5% (December 31, 2012 - 4.5%) .
Initially, Phase 1 of BlackGold will have with 30 steam assisted gravity drainage (“SAGD”) wells (15 well pairs) all of which were drilled by the end of the fourth quarter of 2012. More SAGD wells will be drilled over the Phase 1 project life. Detailed engineering of Phase 1 has been completed. For construction, the site has been cleared, graded and the piling completed, and now foundation, building erection, equipment placement and pipe rack module installation are ongoing. Commissioning of the central processing facility and first steam is anticipated in the second half of 2014, with first production occurring thereafter. The production capacity of the Phase 1 design is 10,000 bbl/d. Phase 2 of the project, which is targeted to increase production capacity to 30,000 bbl/d, is in the regulatory approval process and approval is anticipated in 2013.
As at June 30, 2013, Harvest has incurred costs of $327.4 million on the EPC contract. After the accounting impact of the deferred liability described above, Harvest has recorded $308.9 million of costs for the EPC contract and has recorded $466.1 million of costs on the entire project since acquiring the BlackGold assets in 2010.
The BlackGold project faces similar cost and schedule pressures as other oil sand projects, including shortage of skilled labor and rising costs.
Decommissioning Liabilities
Harvest’s BlackGold decommissioning liabilities at June 30, 2013 were $26.8 million (December 31, 2012 - $19.8 million) relating to the future remediation, abandonment, and reclamation of the SAGD wells and CPF. Please see the “Contractual Obligations and Commitments” section of this MD&A for the payments expected for each of the next five years and thereafter in respect of the decommissioning liabilities.
17
| MANAGEMENT’S DISCUSSION AND ANALYSIS |
DOWNSTREAM OPERATIONS
Summary of Financial and Operating Results
| | | Three Months Ended June 30 | | | Six Months Ended June 30 | |
| | | 2013 | | | 2012 | | | 2013 | | | 2012 | |
| FINANCIAL | | | | | | | | | | | | |
| Refined products sales(1) | | 1,156.1 | | | 1,280.2 | | | 2,278.1 | | | 2,435.6 | |
| Purchased products for processing and resale(1) | | 1,135.5 | | | 1,238.8 | | | 2,221.9 | | | 2,340.5 | |
| Gross margin(2) | | 20.6 | | | 41.4 | | | 56.2 | | | 95.1 | |
| | | | | | | | | | | | | |
| Operating expense(3) | | 31.3 | | | 30.8 | | | 65.3 | | | 58.2 | |
| Purchased energy expense | | 17.3 | | | 25.5 | | | 50.4 | | | 72.9 | |
| Marketing expense | | 1.3 | | | 1.0 | | | 2.8 | | | 2.4 | |
| General and administrative | | 0.1 | | | 0.1 | | | 0.3 | | | 0.3 | |
| Depreciation and amortization | | 22.2 | | | 26.7 | | | 44.0 | | | 53.3 | |
| Operating loss(2) | | (51.6 | ) | | (42.7 | ) | | (106.6 | ) | | (92.0 | ) |
| | | | | | | | | | | | | |
| Capital expenditures | | 10.1 | | | 6.5 | | | 22.6 | | | 19.8 | |
| | | | | | | | | | | | | |
| OPERATING | | | | | | | | | | | | |
| Feedstock volume (bbl/d)(4) | | 106,245 | | | 114,552 | | | 103,176 | | | 107,276 | |
| | | | | | | | | | | | | |
| Yield (% of throughput volume)(5) | | | | | | | | | | | | |
| Gasoline and related products | | 33% | | | 32% | | | 31% | | | 32% | |
| Ultra low sulphur diesel and jet fuel | | 43% | | | 41% | | | 39% | | | 42% | |
| High sulphur fuel oil | | 20% | | | 24% | | | 27% | | | 24% | |
| Total | | 96% | | | 97% | | | 97% | | | 98% | |
| | | | | | | | | | | | | |
| Average refining gross margin (US$/bbl)(6) | | 0.74 | | | 2.71 | | | 1.59 | | | 3.58 | |
| (1) | Refined product sales and purchased products for processing and resale are net of intra-segment sales of $131.9 million and $265.3 million for the three and six months ended June 30, 2013 (2012 - $164.5 million and $313.3 million), reflecting the refined products produced by the refinery and sold by the marketing division. |
| (2) | These are non-GAAP measures; please refer to “Non-GAAP Measures” in this MD&A. |
| (3) | Operating expense for the three and six months ended June 30, 2012 have been increased by $0.3 million and $0.6 million, respectively, as a result of the application of accounting standardIAS 19R Employee Benefits, which has increased prior period pension expense. |
| (4) | Barrels per day are calculated using total barrels of crude oil feedstock and vacuum gas oil. |
| (5) | Based on production volumes after adjusting for changes in inventory held for resale. |
| (6) | Average refining gross margin is calculated based on per barrel of feedstock throughput. |
18
| MANAGEMENT’S DISCUSSION AND ANALYSIS |
Refining Benchmark Prices
| | | Three Months Ended June 30 | | | Six Months Ended June 30 | |
| | | 2013 | | | 2012 | | | Change | | | 2013 | | | 2012 | | | Change | |
| WTI crude oil (US$/bbl) | | 94.22 | | | 93.49 | | | 1% | | | 94.30 | | | 98.21 | | | (4% | ) |
| Brent crude oil (US$/bbl) | | 103.31 | | | 109.01 | | | (5% | ) | | 107.97 | | | 113.64 | | | (5% | ) |
| Argus sour crude index (“ASCI”) (US$/bbl) | | 99.26 | | | 104.05 | | | (5% | ) | | 104.11 | | | 109.58 | | | (5% | ) |
| Brent – WTI differential (US$/bbl) | | 9.09 | | | 15.52 | | | (41% | ) | | 13.67 | | | 15.43 | | | (11% | ) |
| Brent – ASCI differential (US$/bbl) | | 4.05 | | | 4.96 | | | (18% | ) | | 3.86 | | | 4.06 | | | (5% | ) |
| Refined product prices | | | | | | | | | | | | | | | | | | |
| RBOB (US$/bbl) | | 118.87 | | | 123.97 | | | (4% | ) | | 122.31 | | | 126.02 | | | (3% | ) |
| Heating Oil (US$/bbl) | | 121.37 | | | 121.65 | | | - | | | 124.61 | | | 127.09 | | | (2% | ) |
| High Sulphur Fuel Oil (US$/bbl) | | 90.72 | | | 98.74 | | | (8% | ) | | 94.12 | | | 103.55 | | | (9% | ) |
| U.S. / Canadian dollar exchange rate | | 0.977 | | | 0.990 | | | (1% | ) | | 0.984 | | | 0.995 | | | (1% | ) |
Summary of Gross Margins
| | | Three Months Ended June 30 | |
| | | 2013 | | | 2012 | |
| | | | | | Volumes | | | | | | | | | Volumes | | | | |
| | | | | | (million | | | | | | | | | (million | | | | |
| | | $ | | | bbls) | | | (US$/bbl) | | | $ | | | bbls) | | | (US$/bbl) | |
| Refinery | | | | | | | | | | | | | | | | | | |
| Sales | | | | | | | | | | | | | | | | | | |
| Gasoline products | | 421.0 | | | 3.7 | | | 112.62 | | | 414.2 | | | 3.5 | | | 119.44 | |
| Distillates | | 533.8 | | | 4.5 | | | 116.40 | | | 572.2 | | | 4.6 | | | 122.19 | |
| High sulphur fuel oil | | 171.3 | | | 1.9 | | | 87.88 | | | 263.8 | | | 2.7 | | | 95.37 | |
| Total sales | | 1,126.1 | | | 10.1 | | | 109.61 | | | 1,250.2 | | | 10.8 | | | 114.52 | |
| Feedstock(1) | | | | | | | | | | | | | | | | | | |
| Crude oil | | 949.8 | | | 9.2 | | | 101.11 | | | 1,021.2 | | | 9.7 | | | 103.88 | |
| Vacuum Gas Oil (“VGO”) | | 54.0 | | | 0.5 | | | 107.53 | | | 81.8 | | | 0.7 | | | 116.97 | |
| Total feedstock | | 1,003.8 | | | 9.7 | | | 101.44 | | | 1,103.0 | | | 10.4 | | | 104.75 | |
| Other(2) | | 115.0 | | | | | | | | | 118.7 | | | | | | | |
| Total feedstock and other costs | | 1,118.8 | | | | | | | | | 1,221.7 | | | | | | | |
| Refinery gross margin(3) | | 7.3 | | | | | | 0.74 | | | 28.5 | | | | | | 2.71 | |
| | | | | | | | | | | | | | | | | | | |
| Marketing | | | | | | | | | | | | | | | | | | |
| Sales | | 161.9 | | | | | | | | | 194.5 | | | | | | | |
| Cost of products sold | | 148.6 | | | | | | | | | 181.6 | | | | | | | |
| Marketing gross margin(3) | | 13.3 | | | | | | | | | 12.9 | | | | | | | |
| | | | | | | | | | | | | | | | | | | |
| Total gross margin(3) | | 20.6 | | | | | | | | | 41.4 | | | | | | | |
| (1) | Cost of feedstock includes all costs of transporting the crude oil to the refinery in Newfoundland. |
| (2) | Includes inventory adjustments and additives and blendstocks |
| (3) | This is a non-GAAP measure; please refer to “Non-GAAP Measures” in this MD&A. |
19
| MANAGEMENT’S DISCUSSION AND ANALYSIS |
| | | Six Months Ended June 30 | |
| | | 2013 | | | 2012 | |
| | | | | | Volumes | | | | | | | | | Volumes | | | | |
| | | | | | (million | | | | | | | | | (million | | | | |
| | | $ | | | bbls) | | | (US$/bbl) | | | $ | | | bbls) | | | (US$/bbl) | |
| Refinery | | | | | | | | | | | | | | | | | | |
| Sales | | | | | | | | | | | | | | | | | | |
| Gasoline products | | 768.3 | | | 6.6 | | | 114.60 | | | 764.3 | | | 6.3 | | | 121.64 | |
| Distillates | | 961.5 | | | 7.8 | | | 121.41 | | | 1,109.9 | | | 8.6 | | | 127.93 | |
| High sulphur fuel oil | | 482.5 | | | 5.1 | | | 93.39 | | | 503.0 | | | 5.0 | | | 99.86 | |
| Total sales | | 2,212.3 | | | 19.5 | | | 111.79 | | | 2,377.2 | | | 19.9 | | | 118.88 | |
| Feedstock(1) | | | | | | | | | | | | | | | | | | |
| Crude oil | | 1,855.5 | | | 17.5 | | | 104.64 | | | 2,015.7 | | | 18.1 | | | 110.49 | |
| Vacuum Gas Oil (“VGO”) | | 137.9 | | | 1.2 | | | 110.72 | | | 164.4 | | | 1.4 | | | 119.11 | |
| Total feedstock | | 1,993.4 | | | 18.7 | | | 105.04 | | | 2,180.1 | | | 19.5 | | | 111.10 | |
| Other(2) | | 188.8 | | | | | | | | | 126.9 | | | | | | | |
| Total feedstock and other costs | | 2,182.2 | | | | | | | | | 2,307.0 | | | | | | | |
| Refinery gross margin(3) | | 30.1 | | | | | | 1.59 | | | 70.2 | | | | | | 3.58 | |
| | | | | | | | | | | | | | | | | | | |
| Marketing | | | | | | | | | | | | | | | | | | |
| Sales | | 331.1 | | | | | | | | | 371.7 | | | | | | | |
| Cost of products sold | | 305.0 | | | | | | | | | 346.8 | | | | | | | |
| Marketing gross margin(3) | | 26.1 | | | | | | | | | 24.9 | | | | | | | |
| | | | | | | | | | | | | | | | | | | |
| Total gross margin(3) | | 56.2 | | | | | | | | | 95.1 | | | | | | | |
| (1) | Cost of feedstock includes all costs of transporting the crude oil to the refinery in Newfoundland. |
| (2) | Includes inventory adjustments and additives and blendstocks |
| (3) | This is a non-GAAP measure; please refer to “Non-GAAP Measures” in this MD&A. |
Feedstock throughput averaged 106,245 bbl/d in the second quarter of 2013, 7% lower than the 114,552 bbl/d average feedstock in the second quarter of the prior year and 8% lower than the nameplate capacity of 115,000 bbl/d. The feedstock throughput for the six months ended June 30, 2013 was 103,176 bbl/d, a decrease of 4% from 107,276 bbl/d for the same period in 2012. The lower than nameplate capacity throughput rates in the current year were mainly due to a two-week refinery outage in early February caused by a power failure during a storm, reduced throughput rates following the outage as a result of additional repairs required to be completed to various refinery units and reduced throughput rates in the second quarter in response to economic conditions.
20
| MANAGEMENT’S DISCUSSION AND ANALYSIS |
The table below provides a comparison between the product crack spreads realized by Downstream and the benchmark crack spread for the three and six months ended June 30, with both crack spreads referring to the price of Brent crude oil.
| | | Three Months Ended June 30 | |
| | | 2013 | | | 2012 | |
| | | Refinery | | | Benchmark(1) | | | Difference | | | Refinery | | | Benchmark(1) | | | Difference | |
| Gasoline products (US$/bbl) | | 11.18 | | | 15.56 | (2) | | (4.38 | ) | | 14.69 | | | 14.96 | (2) | | (0.27 | ) |
| Distillates (US$/bbl) | | 14.96 | | | 18.06 | (3) | | (3.10 | ) | | 17.44 | | | 12.64 | (3) | | 4.80 | |
| High Sulphur Fuel Oil (US$/bbl) | | (13.56 | ) | | (12.59) | (4) | | (0.97 | ) | | (9.38 | ) | | (10.27) | (4) | | 0.89 | |
| (1) | Benchmark product crack is relative to Brent crude oil |
| (2) | RBOB benchmark market price sourced from NYMEX. |
| (3) | Heating Oil benchmark market price sourced from NYMEX. Distillate products are mainly comprised of ultra-low sulphur diesel which is a higher quality product and normally sells at a premium to the heating oil benchmark. |
| (4) | High Sulphur Fuel Oil benchmark market price sourced from Platts. High sulphur fuel oil normally contains higher sulphur content than the 3% content reflected in the benchmark price and sells at a discount to Brent crude oil. |
| | | Six Months Ended June 30 | |
| | | 2013 | | | 2012 | |
| | | Refinery | | | Benchmark(1) | | | Difference | | | Refinery | | | Benchmark(1) | | | Difference | |
| Gasoline products (US$/bbl) | | 9.56 | | | 14.34 | (2) | | (4.78 | ) | | 10.54 | | | 12.38 | (2) | | (1.84 | ) |
| Distillates (US$/bbl) | | 16.37 | | | 16.64 | (3) | | (0.27 | ) | | 16.83 | | | 13.45 | (3) | | 3.38 | |
| High Sulphur Fuel Oil (US$/bbl) | | (11.65 | ) | | (13.85) | (4) | | 2.20 | | | (11.24 | ) | | (10.09) | (4) | | (1.15 | ) |
| (1) | Benchmark product crack is relative to Brent crude oil |
| (2) | RBOB benchmark market price sourced from NYMEX. |
| (3) | Heating Oil benchmark market price sourced from NYMEX. Distillate products are mainly comprised of ultra-low sulphur diesel which is a higher quality product and normally sells at a premium to the heating oil benchmark. |
| (4) | High Sulphur Fuel Oil benchmark market price sourced from Platts. High sulphur fuel oil normally contains a higher sulphur content than the 3% content reflected in the benchmark price and sells at a discount to Brent crude oil. |
Downstream’s product crack spreads are different from the above noted benchmarks due to several factors, including timing of actual sales and feedstock purchases differing from the calendar month benchmarks, benchmark differentials, transportation costs, sour crude differentials, quality differentials and variability in the throughput volume over a given period of time. The refinery sales also include products for which market prices are not reflected in the benchmarks (such as hydrocracker bottoms that sell at spot market prices with a premium to the high sulphur fuel oil benchmark). An additional differing factor in 2013 is the cost of renewable identification numbers (“RINs”) that are necessary to meet blending requirements for gasoline and ultra-low sulphur diesel (“ULSD”) in the US market as mandated by the US government that have increased significantly over 2012. RINs costs are deducted from the realized product prices. As such, Downstream’s crack spreads for gasoline products and distillates for Downstream in the above tables include the actual cost of RINs whereas the benchmarks do not. For more details on RINs, see “Operational and Other Business Risks”.
The refinery sales decreased by $124.1 million in the second quarter of 2013 and decreased by $164.9 million for the first six months of 2013 as a consequence of reduced sales volumes combined with lower realized product prices. The lower sales volumes for both periods corresponded to the decrease in feedstock throughput volumes. The realized product prices were lower due to lower market prices and increased RINs costs in 2013 over 2012.
21
| MANAGEMENT’S DISCUSSION AND ANALYSIS |
The refinery gross margin for the three months ended June 30, 2013 decreased 73% as compared to the same period in the prior year due to lower throughput rates and lower product crack spreads. During the second quarter of 2013, the feedstock slate for the refinery included more light sweet crudes from the US as compared to the traditional heavy sour crudes processed in prior years. As a result, the cost of feedstock in the second quarter of 2013 was a US$2.20/bbl discount to the benchmark Brent crude oil as compared to a discount of US$5.13/bbl in the same period of the prior year. The improved yields normally associated with processing light sweet crudes (higher yield of the high value light end products and a lower yield of the low value heavy products) have been offset by the reduced rates on the isomax unit. The reduced rates were a consequence of economic conditions and the high cost of purchased VGO that was required to supplement the feedstock to the unit in order to maximize the operating rate.
The refinery gross margin for the six months ended June 30, 2013 decreased 56% as compared to the same period in the prior year. The lower gross margin was a consequence of the unplanned refinery unit outage in the first quarter of 2013 due to the power failure resulting in a slightly lower total yield, a shift in yield mix by producing a higher volume of heavy fuel oil, which sells at a discount to Brent crude oil, along with slightly lower product cracks.
The overall gross margin is also impacted by the purchasing of blendstocks to meet summer gasoline specifications, additives to meet product specifications, the build of unfinished saleable products some of which are recorded at a value lower than cost, and inventory write-downs and reversals. These costs are included in “other costs” in the Summary of Gross Margin Table above. The increase of $61.9 million for the six months ended June 30, 2013 as compared to the same period in 2012 was due to the sale and consumption of approximately $30 million of products in the first quarter of the current year that were previously held in inventory as compared to the build of inventory product in the first quarter of the prior year of approximately $38 million.
In addition, the higher consumption of produced fuels as energy in both the second quarter of 2013 and the six month period ended June 30, 2013, has negatively impacted the refinery gross margin with the offset reflected in the operating expense as decreased purchased volume of low-sulphur fuel oil (“LSFO”).
The gross margin from the marketing operations is comprised of the margin from both the retail and wholesale distribution of gasoline and home heating fuels as well as the revenues from marine services including tugboat revenues and reflects a moderate improvement for three and six months ended June 30, 2013 as compared to the same periods in 2012.
During the three and six months ended June 30, 2013, the Canadian dollar weakened as compared to the US dollar. The weakening of the Canadian dollar in 2013 has had a positive impact to the contribution from the refinery operations relative to the prior year as substantially all of its gross margin, cost of purchased energy and marketing expense are denominated in U.S. dollars.
22
| MANAGEMENT’S DISCUSSION AND ANALYSIS |
Operating Expenses
| | Three Months Ended June 30 |
| | 2013 | 2012 |
| | Refining | Marketing | Total | Refining | Marketing | Total |
| Operating cost | 25.7 | 5.6 | 31.3 | 26.2 | 4.6 | 30.8 |
| Purchased energy | 17.3 | - | 17.3 | 25.5 | - | 25.5 |
| | 43.0 | 5.6 | 48.6 | 51.7 | 4.6 | 56.3 |
| ($/bbl of feedstock throughput) | | | | | | |
| Operating cost | 2.66 | – | – | 2.51 | – | – |
| Purchased energy | 1.79 | – | – | 2.45 | – | – |
| | 4.45 | – | – | 4.97 | – | – |
| | Six Months Ended June 30 |
| | 2013 | 2012 |
| | Refining | Marketing | Total | Refining | Marketing | Total |
| Operating cost | 54.4 | 10.9 | 65.3 | 48.4 | 9.8 | 58.2 |
| Purchased energy | 50.4 | - | 50.4 | 72.9 | - | 72.9 |
| | 104.8 | 10.9 | 115.7 | 121.3 | 9.8 | 131.1 |
| ($/bbl of feedstock throughput) | | | | | | |
| Operating cost | 2.91 | – | – | 2.48 | – | – |
| Purchased energy | 2.70 | – | – | 3.73 | – | – |
| | 5.61 | – | – | 6.21 | – | – |
The refining operating cost per barrel of feedstock throughput increased by 6% and 17% respectively for the three and six months ended June 30, 2013 as compared to the prior year, mainly as a result of lower feedstock throughputs in 2013 and higher maintenance costs in the first quarter of 2013.
Purchased energy, consisting of LSFO and electricity, is required to provide heat and power to refinery operations. The purchased energy cost per barrel of feedstock throughput decreased by 27% and 28% respectively during the three and six months ended June 30, 2013 from the same periods of 2012 mainly due to a lower volume of purchased energy as a result of a higher consumption of produced fuel.
Capital Assets Additions
Capital asset additions for the three and six months ended June 30, 2013 totaled $10.1 million and $22.6 million respectively (2012 - $6.5 million and $19.8 million respectively), relating to various capital projects including the purchase of a compressor, crude tank recertification and turnaround planning and preparation costs.
23
| MANAGEMENT’S DISCUSSION AND ANALYSIS |
Depreciation and Amortization Expense
| | | Three Months Ended June 30 | | | Six Months Ended June 30 | |
| | | 2013 | | | 2012 | | | 2013 | | | 2012 | |
| Refining | | 21.3 | | | 25.8 | | | 42.1 | | | 51.4 | |
| Marketing | | 0.9 | | | 0.9 | | | 1.9 | | | 1.9 | |
| Total depreciation and amortization | | 22.2 | | | 26.7 | | | 44.0 | | | 53.3 | |
Depreciation and amortization expense decreased $4.5 million and $9.3 million respectively for the three and six months ended June 30, 2013 as compared to 2012 because of the $563.2 million impairment of refinery property, plant and equipment which occurred in the fourth quarter of 2012.The process units are amortized over an average useful life of 20 to 30 years and turnaround costs are amortized to the next scheduled turnaround.
Decommissioning Liabilities
Harvest’s Downstream decommissioning liabilities result from the ownership of the refinery and marketing assets. At June 30, 2013, Downstream’s decommissioning liabilities were $16.5 million (December 31, 2012 – $16.2 million) relating to the reclamation and abandonment of these assets with an expected abandonment date of 2069. Please see “Contractual Obligations and Commitments” section of this MD&A for the payments expected for each of the next five years and thereafter in respect of the decommissioning liabilities.
RISK MANAGEMENT, FINANCING AND OTHER
Cash Flow Risk Management
The Company at times enters into natural gas, crude oil, electricity and foreign exchange contracts to reduce the volatility of cash flows from some of its forecast sales and purchases, and when allowable, will designate these contracts as cash flow hedges. The following is a summary of Harvest’s risk management contracts outstanding at June 30, 2013:
| Contracts Designated as Hedges | | | | |
| Contract Quantity | Type of Contract | Term | Contract Price | Fair Value |
| 48,300 GJ/day | AECO swap | July – Dec 2013 | $3.52/GJ | 3.9 |
| 9,000 bbls/day | WCS swap | July – Dec 2013 | US$75.42/bbl | (0.9) |
| US$0.7 million/day | Foreign exchange swap | July – Dec 2013 | $1.0323 Cdn/US | (3.0) |
| | | | | – |
| | | | | |
| Contracts Not Designated as Hedges | | | | |
| Contract Quantity | Type of Contract | Term | Contract Price | Fair Value |
| 15 MWh | AESO power swap | July – Dec 2013 | $56.72/MWh | 1.3 |
24
| MANAGEMENT’S DISCUSSION AND ANALYSIS |
The following is a summary of Harvest’s realized and unrealized (gains) losses on risk management contracts:
| | Three Months Ended June 30 |
| | 2013 | 2012 |
Realized (gains) losses
recognized in: |
Power | Crude
Oil |
Currency | Natural
Gas |
Total | Crude
Oil |
Currency |
Total |
| Revenues | – | (1.2) | – | 0.6 | (0.6) | 7.5 | – | 7.5 |
| Risk management (gains) losses | (2.2) | – | 0.1 | – | (2.1) | – | 0.2 | 0.2 |
| | | | | | | | | |
Unrealized (gains) losses
recognized in: | | | | | | | | |
| OCI, before tax | – | (4.5) | – | 4.8 | 0.3 | 16.9 | – | 16.9 |
| Risk management (gains) losses | (0.9) | (0.9) | 0.9 | – | (0.9) | 0.1 | 0.1 | 0.2 |
| | Six Months Ended June 30 |
| | 2013 | 2012 |
Realized (gains) losses
recognized in: | Power | Crude
Oil | Currency | Natural
Gas | Total | Crude
Oil | Currency | Total |
| Revenues | – | (1.2) | – | 1.1 | (0.1) | 11.7 | – | 11.7 |
| Risk management (gains) losses | (2.5) | – | (1.4) | – | (3.9) | – | 0.2 | 0.2 |
| | | | | | | | | |
Unrealized (gains) losses
recognized in: | | | | | | | | |
| OCI, before tax | – | (6.0) | – | 3.2 | (2.8) | 11.3 | – | 11.3 |
| Risk management gains | (1.3) | (0.8) | – | – | (2.1) | (0.1) | – | (0.1) |
Financing Costs
| | | Three Months Ended | | | Six Months Ended | |
| | | June 30 | | | June 30 | |
| | | 2013 | | | 2012 | | | 2013 | | | 2012 | |
| Bank loan | | 4.7 | | | 4.1 | | | 8.9 | | | 7.5 | |
| Convertible debentures | | 4.3 | | | 12.3 | | | 14.9 | | | 24.7 | |
| 67/8% senior notes | | 9.3 | | | 9.1 | | | 18.3 | | | 18.1 | |
| 21/8% senior notes | | 2.8 | | | – | | | 2.8 | | | – | |
| Related party loan | | 2.0 | | | – | | | 4.0 | | | – | |
| Amortization of deferred finance charges and other | | 1.6 | | | 0.3 | | | 1.7 | | | 0.5 | |
| Interest and other financing charges | | 24.7 | | | 25.8 | | | 50.6 | | | 50.8 | |
| Accretion of decommissioning and environmental remediation liabilities | | 5.5 | | | 5.2 | | | 11.1 | | | 10.3 | |
| Gain on redemption of convertible debentures | | (3.6 | ) | | – | | | (3.6 | ) | | – | |
| Less: capitalized interest | | (4.1 | ) | | (3.4 | ) | | (8.2 | ) | | (6.2 | ) |
| | | 22.5 | | | 27.6 | | | 49.9 | | | 54.9 | |
Finance costs on Harvest’s bank loan increased by $0.6 million and $1.4 million for the second quarter and first six months of 2013 due to the higher average amount of loan principal outstanding during the periods as compared to the same periods in 2012. The effective interest rates for interest charges on the bank loan for the second quarter and first six months of 2013 were 2.63% and 2.79%, respectively (2012 – 2.84% for both periods).
25
| MANAGEMENT’S DISCUSSION AND ANALYSIS |
Interest expense on the convertible debentures for the second quarter and first six months of 2013 decreased by $8.0 million and $9.8 million, respectively, as compared to the same periods in 2012. Two series of convertible debentures were early redeemed in April and one series of convertible debentures were redeemed in June of 2013. There were no convertible debentures outstanding as at June 30, 2013. A $3.6 million gain was recognized on the early redemptions of the convertible debentures in the second quarter of 2013.
In May 2013, Harvest issued US$630 million 21/8% senior notes resulting in an interest expense and other financing costs of $2.8 million for the second quarter and first six months of 2013.
Interest expense on the related party loan was $2.0 million and $4.0 million for the second quarter and first six months of 2013, respectively (2012 – $nil for both periods). See the “Related Party Transactions” section of this MD&A for discussion of the related party loan.
During the second quarter and first six months of 2013, interest expense of $4.1 million and $8.2 million, respectively, was capitalized to BlackGold (2012 - $3.4 million and $6.2 million to BlackGold and Downstream’s debottlenecking project). The increase in capitalized interest for the current year was due to increased capital expenditures for the BlackGold project.
Currency Exchange
Currency exchange gains and losses are attributed to the changes in the value of the Canadian dollar relative to the U.S. dollar on the U.S. dollar denominated 67/8% and 21/8% senior notes, the related party loan and on any U.S. dollar denominated monetary assets or liabilities. Upon the issuance of the $US630 million 21/8% senior notes during the second quarter of 2013, Harvest has increased its sensitivity to fluctuations in the US/Canadian exchange rate. At June 30, 2013, the Canadian dollar had weakened compared to the US dollar as at March 31, 2013 and December 31, 2012, resulting in an unrealized foreign exchange loss of $31.7 million (2012 - $3.6 million loss) and $35.5 million (2012 - $0.8 million loss) for the three and six months ended June 30, 2013 respectively. Harvest recognized a realized foreign exchange gain of $0.9 million (2012 - $2.3 million gain) and a $1.1 million loss (2012 – $0.7 million gain) for the three and six months ended June 30, 2013, respectively, as a result of the settlement of U.S. dollar denominated transactions.
The cumulative translation adjustment recognized in other comprehensive income represents the translation of the Downstream operations’ U.S. dollar functional currency financial statements to Canadian dollars. During the second quarter of 2013, Downstream operations recognized a net cumulative translation gain of $4.9 million (2012 – gain of $16.0 million) and for the first six months of 2013 incurred a gain of $9.2 million (2012 – loss of $0.1) . The net cumulative translation gains recognized for both the three months and six months ended June 30, 2013 resulted from the weakening of the Canadian dollar relative to the U.S. dollar at June 30, 2013 compared to both March 31, 2013 and December 31, 2012. As Downstream operations’ functional currency is denominated in U.S. dollars, the strengthening (weakening) of the U.S. dollar would
26
| MANAGEMENT’S DISCUSSION AND ANALYSIS |
result in gains (losses) from decommissioning liabilities, pension obligations, accounts payable and other balances that are denominated in Canadian dollars, which partially offset the unrealized losses (gains) recognized on the senior notes and Upstream U.S. dollar denominated monetary items.
Deferred Income Taxes
For the three and six months ending June 30, 2013, Harvest recorded a deferred income tax recovery of $16.1 million (2012 – recovery of $15.9 million) and a recovery of $31.4 million (2012 – recovery of $38.6 million), respectively. Harvest’s deferred income tax asset (liability) will fluctuate during each accounting period to reflect changes in the temporary differences between the book value and tax basis of assets as well as legislative tax rate changes. Currently, the principal sources of temporary differences relate to the Company’s property, plant and equipment, decommissioning liabilities and the unclaimed tax pools.
Related Party Transactions
The following provides a summary of the related party transactions between Harvest and KNOC for the three and six months ended June 30, 2013:
Harvest has a Global Technology and Research Centre (“GTRC”), which is used as a training and research facility for KNOC. For the three and six months ended June 30, 2013, Harvest billed KNOC and certain subsidiaries for a total of $1.0 million and $2.1 million respectively (2012 – $0.3 million and $0.8 million) primarily related to technical services provided by the GTRC. The charges are recorded as a reduction in general and administrative expenses. As at June 30, 2013, $1.2 million (December 31, 2012 - $1.6 million) remained outstanding from KNOC in accounts receivable. In addition, GTRC was commissioned to perform a geological study on behalf of KNOC in 2013. For the three and six months ended June 30, 2013, Harvest received $3.1 million (2012 - $nil) from KNOC, of which $1.5 million (2012 - $nil) have been recorded as revenue.
KNOC billed Harvest $0.2 million and $0.8 million for reimbursement to KNOC for secondee salaries paid by KNOC on behalf of Harvest for the three and six months ended June 30, 2013 (2012 – $0.1 million for the three and six months ended). The charges are recorded in general and administrative expenses. As at June 30, 2013, $0.7 million (December 31, 2012 - $nil) remains outstanding in accounts payable.
KNOC Trading Corporation (“KNOC Trading”) is a wholly owned subsidiary of North Atlantic. KNOC Trading bills KNOC, Ankor E&P Holdings Corp. (“ANKOR”) and Dana Petroleum plc (“Dana”) for oil marketing services, such as the sale of products, performed on behalf of KNOC, ANKOR and Dana. Both ANKOR and Dana are wholly owned subsidiaries of KNOC. For the three and six month periods ended June 30, 2013, all of KNOC Trading’s revenue of $0.2 million and $0.4 million respectively (2012 - $0.2 million and $0.3 million respectively) was derived from KNOC, ANKOR, and Dana. As at June 30, 2013, there were no outstanding receivable amounts from KNOC, ANKOR, or Dana (December 31, 2012 - $0.1 million).
As well, for the three and six months ended June 30, 2013 ANKOR billed KNOC Trading Corporation a total of $0.1 million and $0.2 million respectively (2012 - $0.1 million and $0.2 million) for office rent and salaries and benefits. The charges are recorded in operating expenses. As at June 30, 2013, $0.2 million (December 31, 2012 - $0.3 million) remains outstanding in accounts payable.
27
| MANAGEMENT’S DISCUSSION AND ANALYSIS |
- At June 30, 2013, Harvest’s related party loan from ANKOR included $178.8 million (December 31, 2012 - $169.1 million) of principal and $2.9 million (December 31, 2012 - $3.0 million) of accrued interest. Interest expense was $2.0 million and $4.0 million for the three and six month periods ended June 30, 2013 (2012 - $nil).
- KNOC provided an irrevocable and unconditional guarantee on Harvest’s 21/8% senior notes and the senior unsecured credit facility. During the three and six months ended June 30, 2013, Harvest was charged $0.9 million (2012 - $nil) of guarantee fee from KNOC related to the senior notes and $0.4 million (2012 - $nil) related to the senior unsecured credit facility. The guarantee fees are recorded in finance costs. As at June 30, 2013, $0.9 million (December 31, 2012 - $nil) remains outstanding in accounts payable.
The Company identifies its related party transactions by: making inquiries of management and the Board of Directors; reviewing KNOC’s subsidiaries and associates; and performing a comprehensive search of transactions recorded in the accounting system. Material related party transactions require the Board of Directors’ approval.
CAPITAL RESOURCES
The following table summarizes Harvest’s capital structure and provides the key financial ratios defined in the credit facility agreement.
| | | June 30, 2013 | | | December 31, 2012 | |
| Debts | | | | | | |
| Bank loan(1) | | 562.1 | | | 494.2 | |
| 67/8% senior notes (US$500 million)(2) | | 525.9 | | | 497.5 | |
| 21/8% senior notes (US$630 million)(2) | | 662.6 | | | – | |
| Related party loan (US$170 million)(2) | | 178.8 | | | 169.1 | |
| Convertible debentures, at principal amount | | – | | | 627.2 | |
| | | 1,929.4 | | | 1,788.0 | |
| Shareholder’s Equity | | | | | | |
| 386,078,649 common shares issued(3) | | 2,524.5 | | | 2,691.9 | |
| | | 4,453.9 | | | 4,479.9 | |
| Financial Ratios(4) (5) | | | | | | |
| Senior debt to Annualized EBITDA(6) | | 1.38 | | | 1.10 | |
| Annualized EBITDA to Annualized Interest Expense(9) | | 4.44 | | | n/a | |
| Senior debt to Total Capitalization(6) (8) | | 16% | | | 14% | |
| Total debt to Total Capitalization(7)(8) | | 45% | | | 41% | |
| (1) | The bank loan net of deferred financing costs is $559.6 million (2012 - $491.3 million). |
| (2) | Face value converted at the period end exchange rate. |
| (3) | As at August 8, 2013, the number of common shares issued is 386,078,649. |
| (4) | Calculated based on Harvest’s credit facility covenant requirements (see note 13 of the June 30, 2013 financial statements). |
| (5) | The financial ratios and their components are non-GAAP measures; please refer to the “Non-GAAP Measures” section of this MD&A. |
28
| MANAGEMENT’S DISCUSSION AND ANALYSIS |
| (6) | Senior debt consists of letters of credit of $8.1 million (2012 – $8.2 million), bank loan of $559.6 million (2012 - $491.3 million) and guarantees of $62.6 million (2012 - $76.6 million) and risk management contracts liabilities of $4.5 million (December 31, 2012 - $nil) at June 30, 2013. |
| (7) | Total debt consists of senior debt, convertible debentures and senior notes. |
| (8) | Total capitalization includes total debt, related party loan and shareholder’s equity less equity attributed to BlackGold of $458.2 million at June 30, 2013 (2012 - $458.6 million). |
| (9) | Annualized interest expense is a reference to Consolidated Interest Expense as defined in Harvest’s credit facility agreement and includes all interest expenses and finance charges incurred during the last four quarters. |
Effective April 1, 2013, the financial covenants for the credit facility agreement were amended to remove the total debt to annualized EBITDA ratio and to add an interest coverage ratio (annualized EBITDA to annualized interest expense). The interest coverage ratio cannot be less than 2.50:1. In addition, Harvest extended the credit facility agreement by one year to April 30, 2017. Except for the above amendments, all other terms to the credit facility agreement remain unchanged.
LIQUIDITY
The Company’s liquidity needs are met through the following sources: cash generated from operations, proceeds from asset dispositions, borrowings under the long-term credit facility, long-term debt issuances and capital injections by KNOC. Harvest’s primary uses of funds are operating expenses, capital expenditures, and interest and principal repayments on debt instruments.
Cash flow from operating activities for the three and six months ended June 30, 2013 were $77.3 million and $143.9 million, respectively (2012 - $70.8 million and $155.9 million, respectively).
Cash contribution from Harvest’s Upstream operations was $136.1 million for the second quarter of 2013, a $4.8 million decrease from the same period in 2012 driven by lower sales volumes, partially offset by higher operating netback per boe. For the first six months of 2013, cash contribution from operations was $259.0 million, a $29.1 million decrease from the same period in 2012 mainly driven by lower sales volumes. Cash deficiency from Harvest’s Downstream operations was $28.1 million (2012 - $14.9 million) and $61.2 million (2012 - $38.8 million) for the second quarter and first six months of 2013, respectively. The increases were mainly due to both lower throughput volumes and average refining gross margins per barrel, partially offset by lower purchased energy expenses.
Harvest’s net repayment to the credit facility was $31.1 million during the second quarter of 2013 (2012 - $108.4 million net borrowings). For the six months ending June 30, 2013, Harvest had $67.8 million of net borrowings under the credit facility (2012 - $284.2 million net borrowings).
Harvest funded $114.7 million and $301.2 million of capital expenditures for the three and six months ending June 30, 2013, respectively, (2012 – $129.2 million and $381.0 million respectively) with cash generated from operating activities, property dispositions and borrowings under the credit facility.
Harvest had a working capital deficiency of $73.6 million as at June 30, 2013, as compared to a $441.9 million deficiency at December 31, 2012. The change in the negative working capital position in 2013 was primarily related to the redemption of the 7.25% Debentures Due 2013 which had been classified as $331.8 million current liabilities as at December 31, 2012. Harvest’s working capital is expected to fluctuate from time to time, and will be funded from cash flows from operations and borrowings from the credit facility, as required.
29
| MANAGEMENT’S DISCUSSION AND ANALYSIS |
Effective March 14, 2013, Harvest entered into a senior unsecured credit facility. Draws under the senior unsecured credit facility were made for an aggregate amount of US$390 million, to fund the early redemptions described above.
On May 14, 2013, Harvest issued US$630 million senior unsecured notes due May 14, 2018 for net proceeds of US$626.1 million. The notes bear a coupon rate of 21/8%, with interest paid semi-annually on May 14 and November 14 of each year. The notes are unconditionally and irrevocably guaranteed by Harvest’s parent company KNOC. Harvest used the proceeds from the senior unsecured notes towards the full repayment of the draws under the senior unsecured credit facility and on June 13, 2013 early redeemed, at par, the 7.50% Debentures Due 2015. With the issuance of the 21/8% senior notes and the extension of the credit facility, Harvest successfully improved its short-term liquidity and lowered future interest expenses.
Contractual Obligations and Commitments
Harvest has recurring and ongoing contractual obligations and estimated commitments entered into in the normal course of operations. As at the end of June 30, 2013, Harvest has the following significant contractual obligations and estimated commitments:
| | | Payments Due by Period | |
| | | 1 year | | | 2-3 years | | | 4-5 years | | | After 5 years | | | Total | |
| Debt repayments(1) | | 6.0 | | | 12.3 | | | 1,266.8 | | | 662.6 | | | 1,947.7 | |
| Debt interest payments(1)(2) | | 33.6 | | | 133.2 | | | 132.6 | | | 0.4 | | | 299.8 | |
| Purchase commitments(3) | | 147.3 | | | 48.6 | | | 20.0 | | | 60.0 | | | 275.9 | |
| Operating leases | | 8.7 | | | 14.0 | | | 6.4 | | | 2.4 | | | 31.5 | |
| Transportation agreements(4) | | 4.7 | | | 16.4 | | | 4.3 | | | 0.9 | | | 26.3 | |
| Feedstock and other purchase commitments(5) | | 855.7 | | | – | | | – | | | – | | | 855.7 | |
| Employee benefits(6) | | 9.2 | | | 15.1 | | | 1.0 | | | – | | | 25.3 | |
| Decommissioning and environmental liabilities(7) | | 28.7 | | | 52.2 | | | 34.5 | | | 1,594.0 | | | 1,709.4 | |
| Total | | 1,093.9 | | | 291.8 | | | 1,465.6 | | | 2,320.3 | | | 5,171.6 | |
| (1) | Assumes constant foreign exchange rate. |
| (2) | Assumes interest rates as at June 30, 2013 will be applicable to future interest payments. |
| (3) | Relates to drilling commitments, BlackGold oil sands project commitment and Downstream capital commitments. |
| (4) | Relates to firm transportation commitments. |
| (5) | Includes commitments to purchase refinery crude stock and refined products for resale under the SOA with Macquarie. |
| (6) | Relates to the expected contributions to employee benefit plans and long-term incentive plan payments. |
| (7) | Represents the undiscounted obligation by period. |
Off Balance Sheet Arrangements
As at June 30, 2013, Harvest has no off balance sheet arrangements in place.
30
| MANAGEMENT’S DISCUSSION AND ANALYSIS |
SUMMARY OF QUARTERLY RESULTS
The following table and discussion highlights the first quarter of 2013 results relative to the preceding 7 quarters:
| | | 2013 | | | 2012 | | | 2011 | |
| | | Q2 | | | Q1 | | | Q4 | | | Q3 | | | Q2 | | | Q1 | | | Q4 | | | Q3 | |
| FINANCIAL | | | | | | | | | | | | | | | | | | | | | | | | |
| Revenues | | 1,399.3 | | | 1,358.2 | | | 1,546.0 | | | 1,275.1 | | | 1,533.8 | | | 1,426.1 | | | 1,469.9 | | | 848.2 | |
| Net loss | | (89.2 | ) | | (95.4 | ) | | (536.6 | ) | | (38.5 | ) | | (73.5 | ) | | (72.3 | ) | | (74.0 | ) | | (49.3 | ) |
| Cash from operating activities | | 77.3 | | | 66.6 | | | 133.0 | | | 153.9 | | | 70.8 | | | 85.1 | | | 144.6 | | | 161.5 | |
| Total long-term financial debt | | 1,920.6 | | | 1,511.2 | | | 1,450.0 | | | 1,519.4 | | | 1,770.7 | | | 1,652.4 | | | 1,486.2 | | | 1,509.8 | |
| Total assets | | 5,606.6 | | | 5,672.1 | | | 5,654.6 | | | 6,162.9 | | | 6,277.5 | | | 6,322.3 | | | 6,284.4 | | | 6,483.6 | |
| | | | | | | | | | | | | | | | | | | | | | | | | |
| OPERATIONS | | | | | | | | | | | | | | | | | | | | | | | | |
| Upstream | | | | | | | | | | | | | | | | | | | | | | | | |
| Daily sales volumes (boe/d) | | 53,461 | | | 55,571 | | | 58,228 | | | 57,686 | | | 60,874 | | | 60,550 | | | 61,324 | | | 58,548 | |
Realized price prior to
hedges ($/boe) | | 58.22 | | | 53.43 | | | 52.82 | | | 52.02 | | | 51.42 | | | 58.07 | | | 64.61 | | | 57.85 | |
| Downstream | | | | | | | | | | | | | | | | | | | | | | | | |
Average daily throughput
(bbl/d) | | 106,245 | | | 100,074 | | | 114,065 | | | 84,889 | | | 114,552 | | | 100,000 | | | 89,468 | | | 43,357 | |
Average refining gross
margin (loss) (US$/bbl) | | 0.74 | | | 2.51 | | | 6.43 | | | 6.03 | | | 2.71 | | | 4.58 | | | (4.11 | ) | | 10.06 | |
The quarterly revenues and cash from operating activities are mainly impacted by the Upstream sales volumes, realized prices and operating expenses and Downstream throughput volumes, cost of feedstock and refined product prices. Significant items that impacted Harvest’s quarterly revenues include:
Revenues were highest in the fourth and second quarters of 2012, as a result of the refinery operating at near capacity during those periods.
The lower revenue in the third quarter of 2011 was due to lower Downstream sales as a result of a planned shutdown, partially offset by increased Upstream sales from the assets acquired from Hunt in the first quarter 2011 and higher commodity prices.
The higher Upstream sales volumes in the fourth quarter of 2011 was mainly attributable to the acquisition of oil and gas assets in the third quarter of 2010 and first quarter of 2011, combined with a very active drilling program in 2011. The decreases since 2011 were mainly due to natural declines, facility turnarounds and asset dispositions which more than offset the increases from the 2012 and 2013 drilling programs.
Downstream’s average daily throughput was lower in the third quarter of 2012 as compared to the other quarters of 2012 due to a two-week partial outage of some process units and a three-week unplanned shutdown of all process units while repairs were completed to the sulphur recovery unit. The average daily throughput was significantly lower than the 115,000 bbl/d nameplate capacity of the refinery for the third quarter of 2011 due to a planned turnaround.
31
| MANAGEMENT’S DISCUSSION AND ANALYSIS |
- Downstream’s refining gross margin/bbl was highest in the third quarter of 2011, reflecting the higher global refining crack spreads during these periods. However the weaker margins experienced in the seven following quarters reflect the decrease in the sour-crude differential from the Brent benchmark price for crude oil. In the second quarter of 2013, refining gross margins were significantly lower than the recent prior quarters due to the sharp increase in RINs costs.
Net loss reflects both cash and non-cash items. Changes in non-cash items including deferred income tax, DD&A expense, accretion of decommissioning and environmental remediation liabilities, impairment of long-lived assets, unrealized foreign exchange gains and losses, and unrealized gains and losses on risk management contracts impact net income (loss) from period to period. For these reasons, the net loss may not necessarily reflect the same trends as revenues or cash from operating activities, nor is it expected to. Net loss in the fourth quarter of 2012 was mainly due to the $563.2 million impairment of Downstream PP&E. Total assets also decreased significantly in the fourth quarter of 2012 as a result.
The increase in long-term financial debt in the second quarter of 2013 as compared to the first quarter of 2013 was a result of the early redemption of the convertible debentures, some of which were due in the current year, and replacing them with the US$630 million 21/8% senior notes due 2018.
OUTLOOK
The following guidance is provided as general information for stakeholders regarding management’s expectations for 2013 including operating performance, benchmark expenses and major cash outflows for the Upstream, BlackGold and Downstream business segments. The guidance information provided is consistent with Harvest’s most recent budget information. Readers are cautioned that the guidance information provided within this Outlook may not be appropriate for other purposes and the actual results may differ materially from those anticipated.
Upstream
The Upstream capital budget of $300 million is mainly allocated to production and reserve additions focused on crude oil opportunities in Western Canada, complemented with the liquids-rich natural gas wells in the Deep Basin area. As at June 30, 2013, Harvest spent $152.6 million of the 2013 Upstream capital budget.
Approximately $65 million will be allocated in the second half of 2013 to drilling 26 gross wells with 100% working interest and participation in 5 partner operated gross wells. In the Red Earth area we anticipate drilling 6 wells in the Slave Point oil formation, 3 wells within the Charlie Lake formation in northwestern Alberta and 18 heavy oil wells in eastern Alberta. Harvest also plans to participate in 4 oil wells and 1 gas well in the Deep Basin and west central Alberta. Through 2013, Harvest expects to drill or participate in a total of 79 gross wells. Additional capital is expected to be spent for the set up 2013/2014 winter drilling program.
Full year average production is targeted at 53,500 boe/d, which considers the effect of property dispositions in the first two quarters of 2013. Our base production coming into 2013 was supported by the acceleration of our 2013 winter drilling program in the fourth quarter of 2012 Actual operating expense was $18.10/boe for the first six months of 2013, approximately $1/boe higher than our target of $17/boe mainly due to significantly higher Alberta power prices that were not anticipated when we set our original guidance. This has created some pressure to our target operating expense/boe; as such, Harvest is currently reviewing our operating expense guidance to determine if any upward adjustment is necessary.
32
| MANAGEMENT’S DISCUSSION AND ANALYSIS |
BlackGold
The BlackGold 2013 capital budget is $315 million of which 73% is allocated to the construction of the 10,000 bbl/d Phase 1 CPF. At the end of 2012, approximately 61% of construction was complete and Harvest anticipates 95% completion at the end of 2013. Commissioning of the CPF, first steam and oil production from BlackGold is expected in 2014. Alberta Energy Regulator (“AER”) approval for an additional 20,000 bbl/d Phase 2 of the project is anticipated in 2013.
Downstream
The 2013 capital budget for the Downstream operations is $55 million focused on sustaining and reliability improvement projects. Throughput volume for the full year 2013 is anticipated to average 95,000 bbl/d, as lighter crudes being processed require lower throughput to stay within the capacity of the existing gasoline and distillate facilities. Operating costs and purchased energy costs are expected to aggregate to approximately $7/bbl for the full year 2013.
Corporate
From time-to-time Harvest will enter into risk management contracts with the objective of stabilizing cash flow from operating activities. Please refer to the Risk Management, Financing and Other section of the MD&A.
CRITICAL ACCOUNTING ESTIMATES
The preparation of financial statements in conformity with IFRS requires management to make judgments, estimates and assumptions that affect the application of accounting policies and the reported amounts of assets, liabilities, income and expenses. Actual results may differ from these estimates. Estimates and underlying assumptions are reviewed on an ongoing basis. Revisions to accounting estimates are recognized in the period in which the estimates are revised and in any future periods affected. Further information on the basis of preparation and significant accounting policies and estimates can be found in the notes to the audited consolidated financial statements for the year ended December 31, 2012. There have been no changes to the accounting policies and estimates in the second quarter or first six months of 2013, except for the following as a result of new and amended IFRS accounting standards:
- IFRS 10, “Consolidated Financial Statements”, replaces the consolidation requirements in SIC-12, “Consolidation – Special Purpose Entities” and a portion of IAS 27. IFRS 10 builds on existing principles by identifying the concept of control as the determining factor in whether an entity should be included within the consolidated financial statements of the parent company and provides additional guidance to assist in the determination of control where this is difficult to assess. The retrospective application of this standard does not have any impact on Harvest’s financial statements.
33
| MANAGEMENT’S DISCUSSION AND ANALYSIS |
IFRS 11, “Joint Arrangements”, focuses on the rights and obligations of the joint arrangement, rather than its legal form and requires joint arrangements to be classified either as joint operations or joint ventures. For joint operations, a company recognizes its share of assets, liabilities, revenues and expenses of the joint operation. To account for interests in joint ventures, the equity method is used. The retrospective application of this standard does not have any impact on Harvest’s financial statements.
IFRS 12, “Disclosure of Interest in Other Entities”, is a comprehensive standard on disclosure requirements for all forms of interests in other entities, including joint arrangements, associates, structure entities and other off balance sheet interests. The retrospective application of this standard does not have any impact on Harvest’s financial statements.
IFRS 13, “Fair Value Measurement”, provides a consistent definition of fair value, establishes a single framework for determining fair value and introduces requirements for disclosures related to fair value measurement. The measurement of the fair value is based on assumptions that market participants would use when pricing the asset or liability under current market conditions including assumptions about risks. The prospective adoption of this standard does not have any impact on Harvest’s financial statements, other than increasing the level of disclosures required.
IAS 19, “Employee Benefits”, changes the recognition and measurement of defined benefit pension expense and termination benefits and expands disclosure requirements for all employee benefit plans. The amendments to the standard include the requirement to recognize changes in the defined benefit obligation and in the fair value of the plan assets as they occur, thus eliminating the corridor approach that was previously permitted under the standard. All actuarial gains and losses must be recognized immediately through other comprehensive income and the net pension liability or asset must be recognized at the full amount of the plan deficit or surplus. An additional change to the standard is the elimination of the concept of expected return on plan assets that was previously recognized in net earnings and the introduction of the concept of net interest cost. The net interest cost is required to be recognized in net earnings and is calculated by applying the discount rate at the beginning of the reporting period to the net defined benefit liability or asset. As well under IAS 19R unvested past service costs are now recognized in profit or loss at the earlier of when the amendment occurs or when the related restructuring or termination costs are recognized. Other amendments include new disclosures, such as quantitative sensitivity disclosures.
The transition to IAS 19R impacted Harvest’s retained earnings and accumulated other comprehensive income as a result of the recognition of the net interest cost in profit or loss and the elimination of expected return on plan assets. The impacts as at December 31, 2012 and January 1, 2012, respectively, were an increase in the cumulative prior periods’ pre-tax pension expense of $2.7 million and $1.6 million ($2.2 million and $1.3 million after-tax, respectively) and a corresponding decrease in actuarial gains and losses recognized in accumulated other comprehensive income.
For the three and six month comparative periods ended June 30, 2012, operating expense increased by $0.3 million and $0.6 million respectively, as a result of increased pension expense and net actuarial losses on defined benefit plans recognized in other comprehensive income decreased by $0.3 million and $0.6 million, respectively ($0.2 million and $0.4 million after-tax).
34
| MANAGEMENT’S DISCUSSION AND ANALYSIS |
Harvest has also reviewed the classification of its accrual for the long term incentive program and reclassified the portion that will not be paid within the next 12 months to the line item “long-term liability and other” on the balance sheet. The balance of $3.0 million as at December 31, 2012 and $1.9 million as at January 1, 2012 were reclassified to long-term liabilities.
The rest of the amendments did not have any financial impact to Harvest.
- The Company has applied the amendments to IAS 1, "Presentation of Financial Statements" ("IAS 1"). The amendments require items within OCI to be grouped into two categories: (1) items that will not be subsequently reclassified to profit or loss or (2) items that may be subsequently reclassified to profit or loss when specific conditions are met. The amendment has been applied retrospectively and, as such, the presentation of items in OCI has been modified. The application of the amendment to IAS 1 did not result in any adjustments to other comprehensive income or comprehensive income.
- The amendments to IFRS 7 "Financial Instruments: Disclosures" develop common disclosure requirements for financial assets and financial liabilities that are offset in the financial statements, or that are subject to enforceable master netting arrangements or similar agreements. The adoption of these amendments does not have any impact to Harvest’s financial statements, other than increasing the level of annual disclosures.
RECENT PRONOUNCEMENTS
In May 2013, the IASB released an amendment to IAS 36, “Impairment of Assets”. This amendment requires an entity to disclose the recoverable amount of a cash generating unit for which the entity has recognized or reversed an impairment loss during the reporting period. If the recoverable amount was determined using fair value less costs of disposal, detailed disclosure of how it has been measured will be required. The amendment requires retrospective application and is effective for annual periods beginning on or after January 1, 2014. Harvest does not expect material impact to its consolidated financial statements from this amendment.
On June 27, 2013, the IASB issued amendments to IAS 39 “Financial Instruments: Recognition and Measurement” regarding hedge accounting and novation of derivatives. The amendment provides a relief from discontinuing hedge accounting when novation of a hedging instrument to a central counterparty meets specified criteria. The amendments are effective for annual periods beginning on or after January 1, 2014. Harvest does not expect material impact to its consolidated financial statements from this amendment.
A description of additional accounting pronouncements that will be adopted by Harvest in future periods can be found in note 2 of the Audited Consolidated Financial Statements for the year ended December 31, 2012.
35
| MANAGEMENT’S DISCUSSION AND ANALYSIS |
OPERATIONAL AND OTHER BUSINESS RISKS
Harvest’s operational and other business risks are substantially unchanged from those discussed in the annual MD&A and AIF for the year ended December 31, 2012 as filed on SEDAR atwww.sedar.comexcept for the new risk noted below.
Risk associated with Downstream Operations: Renewable Identification Numbers
The market prices for Renewable Identification Numbers (“RINs”) have increased significantly in 2013 in response to fears of a shortage of renewable fuels to meet future demand resulting in aggressive buying efforts by refiners. The Renewable Fuels Standard (“RFS”) was established in the US Energy Policy Act of 2005 (“EPA”) and significantly expanded in the Energy Independence and Security Act of 2007 (“EISA”). The EISA set mandated levels for various types of renewable fuels that are to be blended with US gasoline and diesel fuel with such levels scheduled to increase progressively each year from 2008 until 2022. The compliance obligation rests with the producers and importers of the fuels.
In order to ensure compliance with mandated levels of blending, the EPA established a tracking system called RINs. RINs are a complex mechanism and are issued at the point of biofuels production or import. When biofuels change ownership, the RINs are also transferred to the refiners, importers, and blenders of the fuel. These RINs are submitted to regulators to confirm blending requirements have been met. The EPA is responsible for overseeing and enforcing blending mandates and developing regulations for RINs.
The uncertainty surrounding the availability of sufficient renewable fuels to meet the increasing mandated levels during future years will continue to play havoc on the cost of RINs as supply and demand will dictate the price at any given time. The market has responded to these increased costs by reflecting higher New York Harbour market selling prices to the refiners and importers for gasoline and diesel fuel, however, the increase in market prices may not necessarily correspond to the same level of increase in the cost of RINs. The market response will normally trail the change in RINs cost, however, not always immediately. The RINs increase volatility to Downstream’s refining margins, which may negatively impact its operating results and cash flows.
CHANGES IN REGULATORY ENVIRONMENT
Harvest’s regulatory environment remains unchanged from that discussed in the annual MD&A and AIF for the year ended December 31, 2012 as filed on SEDAR atwww.sedar.com.
INTERNAL CONTROL OVER FINANCIAL REPORTING
There were no significant changes in the internal controls over financial reporting or disclosure controls and procedures described in the annual MD&A for the year ended December 31, 2012 as filed on SEDAR atwww.sedar.comthat have materially affected, or are reasonably likely to affect, internal controls over financial reporting.
ADDITIONAL GAAP MEASURE
Harvest uses “operating income (loss)”, an additional GAAP measure that is not defined under IFRS hereinafter also referred to as “GAAP”. The measure is commonly used for comparative purposes in the petroleum and natural gas and refining industries to reflect operating results before items not directly related to operations. Harvest uses this measure to assess and compare the performance of its operating segments.
36
| MANAGEMENT’S DISCUSSION AND ANALYSIS |
NON-GAAP MEASURES
Throughout this MD&A, the Company has referred to certain measures of financial performance that are not specifically defined under GAAP such as “operating netbacks”, “operating netback prior to/after hedging”, “gross margin (loss)”, “cash contribution (deficiency) from operations”, “total debt”, “total financial debt”, “total capitalization”, “Annualized EBITDA”, “senior debt to Annualized EBITDA”, “total debt to Annualized EBITDA”, “senior debt to total capitalization”, and “total debt to total capitalization”.
“Operating netbacks” are reported on a per boe basis and used extensively in the Canadian energy sector for comparative purposes. “Operating netbacks” include revenues, operating expenses, transportation and marketing expenses, and realized gains or losses on risk management contracts. “Gross margin (loss)” is commonly used in the refining industry to reflect the net funds received from the sale of refined products after considering the cost to purchase the feedstock and is calculated by deducting purchased products for resale and processing from total revenue. “Cash contribution (deficiency) from operations” is calculated as operating income (loss) adjusted for non-cash items. The measure demonstrates the ability of the each segment of Harvest to generate the cash from operations necessary to repay debt, make capital investments, and fund the settlement of decommissioning and environmental remediation liabilities. “Total debt”, “total financial debt”, “total capitalization”, and “Annualized EBITDA” are used to assist management in assessing liquidity and the Company’s ability to meet financial obligations. “Senior debt to Annualized EBITDA”, “total debt to Annualized EBITDA”, “senior debt to total capitalization” and “total debt to total capitalization” are terms defined in Harvest’s credit facility agreement for the purpose of calculation of financial covenants. The non-GAAP measures do not have any standardized meaning prescribed by GAAP and may not be comparable to similar measures used by other issuers. The determination of the non-GAAP measures have been illustrated throughout this MD&A, with reconciliations to IFRS measures and/or account balances, except for Annualized EBITDA and cash contribution (deficiency) which are shown below.
37
| MANAGEMENT’S DISCUSSION AND ANALYSIS |
Annualized EBITDA
The measure of Consolidated EBITDA (herein referred to as “Annualized EBITDA”) used in Harvest’s credit facility agreement is defined as earnings before finance costs, income tax expense or recovery, DD&A, exploration and evaluation costs, impairment of assets, unrealized gains or losses on risk management contracts, unrealized gains or losses on foreign exchange, gains or losses on disposition of assets and other non-cash items. The following is a reconciliation of Annualized EBITDA to the nearest GAAP measure net loss:
| | | June 30, 2013 | | | December 31, 2012 | |
| Net loss | | (759.7 | ) | | (720.1 | ) |
| DD&A | | 671.9 | | | 688.4 | |
| Finance costs | | 106.1 | | | 111.0 | |
| Income tax recovery | | (102.1 | ) | | (109.1 | ) |
| EBITDA | | (83.8 | ) | | (29.8 | ) |
| Unrealized losses on risk management contracts | | (1.0 | ) | | 1.1 | |
| Unrealized (gains) losses on foreign exchange | | 33.5 | | | (1.2 | ) |
| Unsuccessful exploration and evaluation costs | | 13.7 | | | 22.0 | |
| Impairment of PP&E | | 563.2 | | | 585.0 | |
| Gains on disposition of PP&E | | (38.7 | ) | | (30.3 | ) |
| Other non-cash items | | (1.3 | ) | | (6.7 | ) |
| Adjustments on acquisitions and dispositions(1) | | (24.3 | ) | | (13.4 | ) |
| Less earnings from non-restricted subsidiaries(1) | | (0.9 | ) | | (0.8 | ) |
| Annualized EBITDA(1) | | 460.4 | | | 525.9 | |
| (1) | Annualized EBITDA is on a consolidated basis for any period, the aggregate of the last four quarters of the earnings (calculated in accordance with GAAP) and accordingly is a twelve month rolling measure which, as well, is required to be adjusted to the net income impact from acquisitions or dispositions (with net proceeds over $20 million) as if the transaction had been effected at the beginning of the period and excludes earnings attributable to the BlackGold assets and non-restricted subsidiaries. |
38
| MANAGEMENT’S DISCUSSION AND ANALYSIS |
Cash Contribution (Deficiency) from Operations
Cash contribution (deficiency) from operations represents operating income (loss) adjusted for non-cash expense items within: general and administrative, exploration and evaluation, depletion, depreciation and amortization, gains on disposition of PP&E, risk management contracts gains or losses, impairment on PP&E, and the inclusion of cash interest, realized foreign exchange gains or losses and other cash items not included in operating income (loss). The measure demonstrates the ability of the Upstream and Downstream segments of Harvest to generate cash from their operations and is calculated before changes in non-cash working capital. There are no operating activities to report for the BlackGold segment as it is under development. The most directly comparable additional GAAP measure is operating income (loss). Operating income (loss) as presented in the notes to Harvest’s consolidated financial statements is reconciled to cash contribution (deficiency) from operations below:
| | | Three Months Ended June 30 | |
| | | Upstream | | | Downstream | | | Total | |
| | | 2013 | | | 2012 | | | 2013 | | | 2012 | | | 2013 | | | 2012 | |
| Operating loss | | (0.4 | ) | | (17.8 | ) | | (51.6 | ) | | (42.7 | ) | | (52.0 | ) | | (60.5 | ) |
| Adjustments: | | | | | | | | | | | | | | | | | | |
| Operating | | 0.4 | | | (0.4 | ) | | 1.3 | | | 1.1 | | | 1.7 | | | 0.7 | |
| General and administrative | | (0.1 | ) | | (0.1 | ) | | – | | | – | | | (0.1 | ) | | (0.1 | ) |
| Exploration and evaluation | | 0.2 | | | 12.3 | | | – | | | – | | | 0.2 | | | 12.3 | |
| Depletion, depreciation and amortization | | 139.2 | | | 147.1 | | | 22.2 | | | 26.7 | | | 161.4 | | | 173.8 | |
| Gains on disposition of PP&E | | (2.3 | ) | | (0.4 | ) | | – | | | �� | | | (2.3 | ) | | (0.4 | ) |
| Unrealized (gains) losses on risk management contracts | | (0.9 | ) | | 0.2 | | | – | | | – | | | (0.9 | ) | | 0.2 | |
| Cash contribution (deficiency) from operations | | 136.1 | | | 140.9 | | | (28.1 | ) | | (14.9 | ) | | 108.0 | | | 126.0 | |
| Inclusion of items not attributable to segments: | | | | | | | | | | | | | | | | | | |
| Net cash interest paid | | | | | | | | | | | | | | 18.0 | | | 22.5 | |
| Realized foreign exchange gains | | | | | | | | | | | | | | (0.9 | ) | | (2.3 | ) |
| Consolidated cash contribution from operations | | | | | | | | | | | | | | 90.9 | | | 105.8 | |
39
| MANAGEMENT’S DISCUSSION AND ANALYSIS |
| | | Six Months Ended June 30 | |
| | | Upstream | | | Downstream | | | Total | |
| | | 2013 | | | 2012 | | | 2013 | | | 2012 | | | 2013 | | | 2012 | |
| Operating loss | | (22.8 | ) | | (37.4 | ) | | (106.6 | ) | | (92.0 | ) | | (129.4 | ) | | (129.4 | ) |
| Adjustments: | | | | | | | | | | | | | | | | | | |
| Operating | | 0.5 | | | (3.6 | ) | | 1.4 | | | (0.2 | ) | | 1.9 | | | (3.8 | ) |
| General and administrative | | (0.2 | ) | | (0.2 | ) | | – | | | – | | | (0.2 | ) | | (0.2 | ) |
| Exploration and evaluation | | 8.2 | | | 16.5 | | | – | | | – | | | 8.2 | | | 16.5 | |
| Depletion, depreciation and amortization | | 284.3 | | | 291.6 | | | 44.0 | | | 53.3 | | | 328.3 | | | 344.9 | |
| Gains on disposition of PP&E | | (8.9 | ) | | (0.5 | ) | | – | | | – | | | (8.9 | ) | | (0.5 | ) |
| Unrealized gains on risk management contracts | | (2.1 | ) | | (0.1 | ) | | – | | | – | | | (2.1 | ) | | (0.1 | ) |
| Impairment on PP&E | | – | | | 21.8 | | | – | | | – | | | – | | | 21.8 | |
| Cash contribution (deficiency) from operations | | 259.0 | | | 288.1 | | | (61.2 | ) | | (38.9 | ) | | 197.8 | | | 249.2 | |
| Inclusion of items not attributable to segments: | | | | | | | | | | | | | | | | | | |
| Net cash interest paid | | | | | | | | | | | | | | 42.0 | | | 44.8 | |
| Realized foreign exchange (gains) losses | | | | | | | | | | | | | | 1.1 | | | (0.7 | ) |
| Consolidated cash contribution from operations | | | | | | | | | | | | | | 154.7 | | | 205.1 | |
FORWARD-LOOKING INFORMATION
This MD&A highlights significant business results and statistics from the consolidated financial statements for the three and six months ended June 30, 2013 and the accompanying notes thereto. In the interest of providing Harvest’s lenders and potential lenders with information regarding Harvest, including the Company’s assessment of future plans and operations, this MD&A contains forward-looking statements that involve risks and uncertainties.
Such risks and uncertainties include, but are not limited to: risks associated with conventional petroleum and natural gas operations; risks associated with refining and marketing operations; risks associated with the construction of the oil sands project; the volatility in commodity prices, interest rates and currency exchange rates; risks associated with realizing the value of acquisitions; general economic, market and business conditions; changes in environmental legislation and regulations; the availability of sufficient capital from internal and external sources; and, such other risks and uncertainties described from time to time in regulatory reports and filings made with securities regulators. The impact of any one risk, uncertainty or factor on a particular forward-looking statement is not determinable with certainty as these factors are interdependent, and management’s future course of action would depend on the assessment of all information at that time. Please also refer to “Operational and Other Business Risks” in this MD&A and “Risk Factors” in the Annual Information Form for detailed discussion on these risks.
Forward-looking statements in this MD&A include, but are not limited to, the forward looking statements made in the “Outlook” section as well as statements made throughout with reference to the following items to future periods: production volumes, refinery throughput volumes, royalty rates, operating costs, commodity prices, general and administrative costs, price risk management activities, acquisitions and dispositions, capital spending and allocation of such to various projects, reserve estimates and ultimate recovery of reserves, potential timing and commerciality of Harvest’s capital projects, the extent and success rate of Upstream and BlackGold drilling programs, the ability to achieve the maximum capacity from the BlackGold central processing facilities, refinery utilization and reliability rates, availability of the credit facility, access and ability to raise capital, ability to maintain debt covenants, debt levels, recovery of long-lived assets, the timing and amount of decommission and environmental related costs, income taxes, cash from operating activities, regulatory approval of development projects and regulatory changes. For this purpose, any statements that are contained herein that are not statements of historical fact may be deemed to be forward-looking statements. Forward-looking statements often contain terms such as “may”, “will”, “should”, “anticipate”, “expect”, “target”, “plan”, “potential”, “intend”, and similar expressions.
40
| MANAGEMENT’S DISCUSSION AND ANALYSIS |
All of the forward-looking statements in this MD&A are qualified by the assumptions that are stated or inherent in such forward-looking statements. Although Harvest believes that these assumptions are reasonable based on the information available to us on the date such assumptions were made, this list is not exhaustive of the factors that may affect any of the forward-looking statements and the reader should not place an undue reliance on these assumptions and such forward-looking statements. The key assumptions that have been made in connection with the forward-looking statements include the following: that the Company will conduct its operations and achieve results of operations as anticipated; that its development plans and sustaining maintenance programs will achieve the expected results; the general continuance of current or, where applicable, assumed industry conditions; the continuation of assumed tax, royalty and regulatory regimes; the accuracy of the estimates of the Company’s reserve volumes; commodity price, operation level, and cost assumptions; the continued availability of adequate cash flow and debt and/or equity financing to fund the Company’s capital and operating requirements as needed; and the extent of Harvest’s liabilities. Harvest believes the material factors, expectations and assumptions reflected in the forward-looking statements are reasonable, but no assurance can be given that these factors, expectations and assumptions will prove to be correct.
Although management believes that the forward-looking information is reasonable based on information available on the date such forward-looking statements were made, no assurances can be given as to future results, levels of activity and achievements. Therefore, readers are cautioned not to place undue reliance on forward-looking statements as the plans, intentions or expectations upon which the forward-looking information is based might not occur. Forward-looking statements contained in this MD&A are expressly qualified by this cautionary statement.
ADDITIONAL INFORMATION
Further information about us can be accessed under our public filings found on SEDAR atwww.sedar.comor atwww.harvestenergy.ca. Information can also be found by contacting our Investor Relations department at (403) 265-1178 or at 1-866-666-1178.
41