 | MANAGEMENT’S DISCUSSION AND ANALYSIS |
MANAGEMENT’S DISCUSSION AND ANALYSIS
This Management’s Discussion and Analysis (“MD&A”) should be read in conjunction with the unaudited interim consolidated financial statements of Harvest Operations Corp. (“Harvest”, “we”, “us”, “our” or the “Company”) for the three months ended March 31, 2014 and the audited annual consolidated financial statements for the year ended December 31, 2013 together with the accompanying notes. The information and opinions concerning the future outlook are based on information available at May 13, 2014.
In this MD&A, all dollar amounts are expressed in Canadian dollars unless otherwise indicated. Tabular amounts are in millions of dollars, except where noted. All financial data has been prepared in accordance with International Financial Reporting Standards (“IFRS”) as issued by the International Accounting Standards Board except where otherwise noted.
Natural gas volumes are converted to barrels of oil equivalent (“boe”) using the ratio of six thousand cubic feet (“mcf”) of natural gas to one barrel of oil (“bbl”). Boes may be misleading, particularly if used in isolation. A boe conversion ratio of 6 mcf to 1 bbl is based on an energy equivalent conversion method primarily applicable at the burner tip and does not represent a value equivalent at the wellhead. In accordance with Canadian practice, petroleum and natural gas revenues are reported on a gross basis before deduction of Crown and other royalties.
Additional information concerning Harvest, including its audited annual consolidated financial statements and Annual Information Form (“AIF”) can be found on SEDAR atwww.sedar.com.
ADVISORY
This MD&A contains non-GAAP measures and forward-looking information about our current expectations, estimates and projections. Readers are cautioned that the MD&A should be read in conjunction with the “Non-GAAP Measures” and “Forward-Looking Information” sections at the end of this MD&A.
1
| | MANAGEMENT’S DISCUSSION AND ANALYSIS |
FINANCIAL AND OPERATING HIGHLIGHTS
| | | Three Months Ended March 31 | |
| | | 2014 | | | 2013 | |
| UPSTREAM OPERATIONS | | | | | | |
| Daily sales volumes (boe/d) | | 48,487 | | | 55,571 | |
| Average realized price | | | | | | |
| Oil and NGLs ($/bbl)(2) | | 82.30 | | | 69.41 | |
| Gas ($/mcf)(2) | | 6.16 | | | 3.46 | |
| Operating netback prior to hedging ($/boe)(1) | | 37.27 | | | 27.55 | |
| Operating income (loss) | | 21.8 | | | (22.5 | ) |
| Cash contribution from operations(1) | | 139.8 | | | 122.9 | |
| Capital asset additions (excluding acquisitions) | | 134.3 | | | 123.2 | |
| Property and business acquisitions (dispositions), net | | (2.1 | ) | | 3.2 | |
| Net wells drilled | | 31.9 | | | 44.9 | |
| Net undeveloped land additions (acres) | | 6,444 | | | 16,213 | |
| | | | | | | |
| BLACKGOLD OIL SANDS | | | | | | |
| Capital asset additions | | 42.2 | | | 61.0 | |
| | | | | | | |
| DOWNSTREAM OPERATIONS | | | | | | |
| Average daily throughput (bbl/d) | | 95,767 | | | 100,074 | |
| Average refining gross margin (US$/bbl)(1) | | 9.58 | | | 2.51 | |
| Operating income (loss) | | 31.5 | | | (55.0 | ) |
| Cash contribution (deficiency) from operations(1) | | 33.7 | | | (33.0 | ) |
| Capital asset additions | | 3.1 | | | 12.5 | |
| | | | | | | |
| NET INCOME (LOSS)(3) | | 3.0 | | | (95.4 | ) |
| (1) | This is a non-GAAP measure; please refer to “Non-GAAP Measures” in this MD&A. |
| (2) | Excludes the effect of risk management contracts designated as hedges. |
| (3) | Net income (loss) includes the consolidated operating results of Harvest’s operating segments. |
REVIEW OF OVERALL PERFORMANCE
Upstream
| | • | Sales volumes for the first quarter ended March 31, 2014 decreased by 7,084 boe/d as compared to the same quarter in 2013. The decrease was primarily due to natural declines and dispositions of certain non-core producing properties during the year 2013. |
| | • | Operating netback prior to hedging for the first quarter of 2014 was $37.27/boe, an increase of $9.72/boe from the same quarter in 2013 mainly due to higher average realized prices, partially offset by higher operating expense and royalties per boe. |
| | • | Operating income was $21.8 million for the first quarter of 2014 (2013 – operating loss of $22.5 million), an increase of $44.3 million mainly due to the reduction in DD&A expense and the increase in average realized selling price. |
2
| | MANAGEMENT’S DISCUSSION AND ANALYSIS |
| | • | Cash contribution from Harvest’s Upstream operations for the first quarter of 2014 increased $16.9 million mainly driven by the increase in average realized prices, partially offset by lower sales volumes. |
| | • | Capital asset additions of $134.3 million during the first quarter of 2014 mainly related to the drilling, completion and tie-in of wells. Forty-one gross wells (31.9 net) were rig-released during the first quarter. |
| | • | On April 23, 2014, Harvest entered into two joint ventures with KERR Canada Co. Ltd. (“KERR”). See the “2014 Outlook” section for further discussion. |
BlackGold
| | • | Capital asset additions were $42.2 million for the first quarter of 2014 mainly related to the construction of the central processing facility (“CPF”). |
| | • | As at March 31, 2014 Phase 1 of the project was approximately 93% complete. Phase 1 completion, commissioning of the CPF and first steam are expected in 2014. |
Downstream
| | • | Throughput volume averaged 95,767 bbl/d for the first quarter of 2014 (2013 – 100,074 bbl/d). Reduced throughput was due to lower volumes of vacuum gas oil processed because of constrained market economics. |
| | • | Refining gross margin per bbl averaged US$9.58/bbl during the first quarter of 2014 (2013 - US$2.51/bbl). The increase in gross margin was mainly due to higher realized product margins as a consequence of improved sour crude differentials. |
| | • | Cash contribution from Harvest’s Downstream operations was $33.7 million for the first quarter of 2014 (2013 – deficiency of $33.0 million). The improvement in Downstream’s cash contribution was mainly due to higher average refining gross margin per bbl and improved yield mix as compared to the prior year quarter. |
| | • | Operating income totaled $31.5 million for the first quarter of 2014 (2013 – loss of $55.0 million). The improvement in operating income is mainly due to the increase in gross margin and reduction in depreciation and amortization. |
Corporate
| | • | Net income was $3.0 million for the first quarter of 2014 (2013 – net loss of $95.4 million). Net income increased in the first quarter of 2014 as compared to the same period in the prior year due to the improvements of the operating income in both the Upstream and Downstream segments in the current quarter as described above, partially offset by greater foreign exchange losses and a lower income tax recovery during the first quarter of 2014. |
| | • | On February 28, 2014, Harvest borrowed $80.0 million under the subordinated loan agreement with KNOC. |
3
| | MANAGEMENT’S DISCUSSION AND ANALYSIS |
UPSTREAM OPERATIONS
Summary of Financial and Operating Results
| | | Three Months Ended March 31 | |
| | | 2014 | | | 2013 | |
| FINANCIAL | | | | | | |
| Petroleum and natural gas sales(1) | | 287.7 | | | 268.9 | |
| Royalties | | (36.2 | ) | | (32.7 | ) |
| Revenues | | 251.5 | | | 236.2 | |
| Expenses | | | | | | |
| Operating | | 88.5 | | | 91.8 | |
| Transportation and marketing | | 6.3 | | | 5.1 | |
| Realized gains on risk management contracts(2) | | (0.5 | ) | | (1.8 | ) |
| Operating netback after hedging(3) | | 157.2 | | | 141.1 | |
| General and administrative | | 16.8 | | | 17.7 | |
| Depreciation, depletion and amortization | | 109.5 | | | 145.2 | |
| Exploration and evaluation | | 8.6 | | | 8.5 | |
| Unrealized gains on risk management contracts(4) | | (0.2 | ) | | (1.2 | ) |
| Losses (gains) on disposition of assets | | 0.7 | | | (6.6 | ) |
| Operating income (loss) | | 21.8 | | | (22.5 | ) |
| Capital asset additions (excluding acquisitions) | | 134.3 | | | 123.2 | |
| Property and business acquisitions (dispositions), net | | (2.1 | ) | | 3.2 | |
| Decommissioning and environmental remediation expenditures | | 2.9 | | | 5.8 | |
| OPERATING | | | | | | |
| Light to medium oil (bbl/d) | | 10,989 | | | 13,217 | |
| Heavy oil (bbl/d) | | 15,777 | | | 17,227 | |
| Natural gas liquids (bbl/d) | | 4,917 | | | 5,953 | |
| Natural gas (mcf/d) | | 100,823 | | | 115,050 | |
| Total (boe/d) | | 48,487 | | | 55,571 | |
| (1) | Includes the effective portion of Harvest’s realized natural gas and crude oil hedges. |
| (2) | Realized gains on risk management contracts include the settlement amounts for power, crude oil and foreign exchange derivative contracts, excluding the effective portion of realized gains from Harvest’s designated accounting hedges. See “Risk Management, Financing and Other” section of this MD&A for details. |
| (3) | This is a non-GAAP measure; please refer to “Non-GAAP Measures” in this MD&A. |
| (4) | Unrealized gains on risk management contracts reflect the change in fair value of derivative contracts that are not designated as accounting hedges and the ineffective portion of changes in fair value of designated hedges. See “Risk Management, Financing and Other” section of this MD&A for details. |
4
| | MANAGEMENT’S DISCUSSION AND ANALYSIS |
Commodity Price Environment
| | | Three Months Ended March 31 | |
| | | 2014 | | | 2013 | | | Change | |
| West Texas Intermediate (“WTI”) crude oil (US$/bbl) | | 98.68 | | | 94.37 | | | 5% | |
| West Texas Intermediate crude oil ($/bbl) | | 108.95 | | | 95.17 | | | 14% | |
| Edmonton light sweet crude oil ($/bbl) | | 99.83 | | | 88.03 | | | 13% | |
| Western Canadian Select (“WCS”) crude oil ($/bbl) | | 83.36 | | | 62.97 | | | 32% | |
| AECO natural gas daily ($/mcf) | | 5.66 | | | 3.20 | | | 77% | |
| U.S. / Canadian dollar exchange rate | | 0.906 | | | 0.992 | | | (9% | ) |
| | | | | | | | | | |
| Differential Benchmarks | | | | | | | | | |
| WCS differential to WTI ($/bbl) | | 25.59 | | | 32.20 | | | (21% | ) |
| WCS differential as a % of WTI | | 23.5% | | | 33.8% | | | (31% | ) |
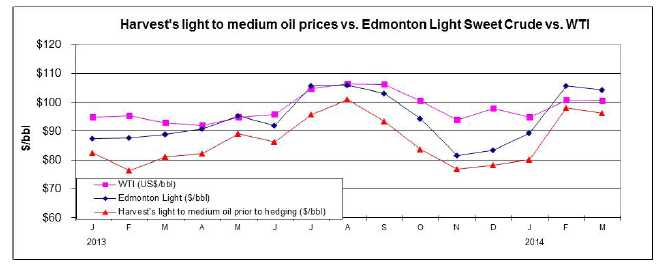
The average WTI benchmark price for the first quarter of 2014 increased 5% compared to 2013. The average Edmonton light sweet crude oil price (“Edmonton Light”) increased 13% in the first quarter of 2014 as compared to the first quarter of 2013 mainly due to the increase in the WTI price and the strengthening of the U.S. dollar against the Canadian dollar, partially offset by the widening of the Edmonton light differential.
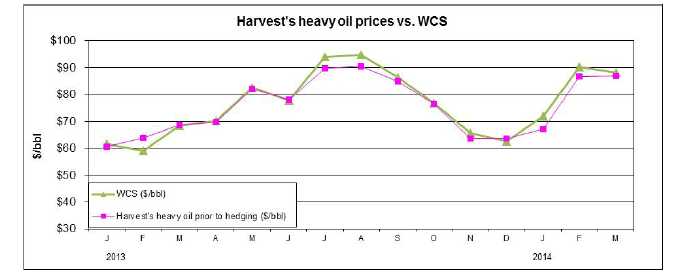
Heavy oil differentials fluctuate based on a combination of factors including the level of heavy oil production and inventories, pipeline and rail capacity to deliver heavy crude to U.S. markets and the seasonal demand for heavy oil. The increase in the WCS price for the first quarter 2014 as compared to the first quarter of 2013 was mainly the result of the narrowing of the WCS differential to WTI, the increase in the WTI price and the strengthening of the US dollar.
Realized Commodity Prices
| | | Three Months Ended March 31 | |
| | | 2014 | | | 2013 | | | Change | |
| Light to medium oil ($/bbl) | | 91.35 | | | 80.14 | | | 14% | |
| Heavy oil ($/bbl) | | 80.25 | | | 64.38 | | | 25% | |
| Natural gas liquids ($/bbl) | | 68.67 | | | 60.16 | | | 14% | |
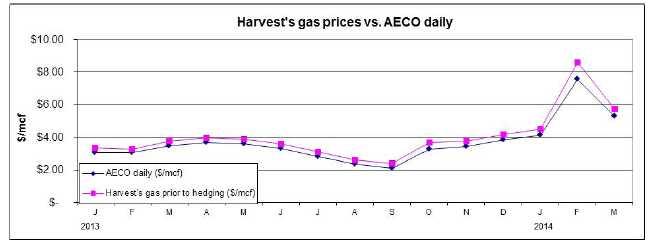
| Natural gas prior to hedging ($/mcf) | | 6.16 | | | 3.46 | | | 78% | |
| Average realized price prior to hedging ($/boe)(1) | | 67.29 | | | 53.43 | | | 26% | |
| | | | | | | | | | |
| Natural gas after hedging ($/mcf)(2) | | 5.48 | | | 3.50 | | | 57% | |
| Average realized price after hedging ($boe)(1)(2) | | 65.87 | | | 53.52 | | | 23% | |
| (1) | Inclusive of sulphur revenue. |
| (2) | Inclusive of the realized gains (losses) from contracts designated as hedges. Foreign exchange swaps and power contracts are excluded from the realized price. |
Harvest’s realized prices prior to hedging for light to medium oil, heavy oil and natural gas generally trend with the Edmonton Light, WCS and AECO benchmark prices, respectively. For the first quarter of 2014, the period-over-period variances and movements of light to medium oil and natural gas were consistent with the changes in their related benchmarks. Harvest’s heavy oil prices for the first quarter of 2014 increased 25% as compared to the prior year while the related WCS benchmark increased by 32%. The discrepancy between Harvest’s realized price on its heavy oil and the WCS benchmark is due to the fact a portion of our heavy oil volumes are actually sold based on a discounted light to medium price rather than the WCS benchmark. Because light to medium oil prices did not increase by the same percentage as heavy oil prices, a discrepancy between our realized heavy oil price and the WCS benchmark occurred.
5
| | MANAGEMENT’S DISCUSSION AND ANALYSIS |
Realized natural gas liquids prices increased by 14% for the first quarter 2014 as compared to the same period in the prior year. The increase mainly reflects the increase in the propane price from the first quarter of 2013.
In order to mitigate the risk of fluctuating cash flows due to natural gas volatility, Harvest was party to AECO derivative contracts during the first quarters of 2014 and 2013. Including the impact from the AECO hedges, Harvest’s realized natural gas price for the first quarter of 2014 decreased by $0.68/mcf (2013 – increased by $0.04/mcf) . Please see “Cash Flow Risk Management” section in this MD&A for further discussion with respect to the cash flow risk management program.
6
| | MANAGEMENT’S DISCUSSION AND ANALYSIS |

Sales Volumes
| | | Three Months Ended March 31 | |
| | | 2014 | | | 2013 | | | | |
| | | | | | | | | | | | | | | % Volume | |
| | | Volume | | | Weighting | | | Volume | | | Weighting | | | Change | |
| Light to medium oil (bbl/d) | | 10,989 | | | 23% | | | 13,217 | | | 24% | | | (17% | ) |
| Heavy oil (bbl/d) | | 15,777 | | | 33% | | | 17,227 | | | 31% | | | (8% | ) |
| Natural gas liquids (bbl/d) | | 4,917 | | | 10% | | | 5,953 | | | 11% | | | (17% | ) |
| Total liquids (bbl/d) | | 31,683 | | | 66% | | | 36,397 | | | 66% | | | (13% | ) |
| Natural gas (mcf/d) | | 100,823 | | | 34% | | | 115,050 | | | 34% | | | (12% | ) |
| Total oil equivalent (boe/d) | | 48,487 | | | 100% | | | 55,571 | | | 100% | | | (13% | ) |
| | MANAGEMENT’S DISCUSSION AND ANALYSIS |
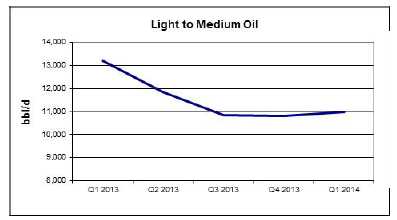 | Harvest’s average daily sales of light to medium oil decreased 17% for the first quarter of 2014 as compared to the first quarter of 2013. The decrease was due to natural declines and the disposition of non-core properties during 2013, partially offset by the results of Harvest’s drilling activity during the first quarter of 2014. |
Heavy oil sales for the first quarter of 2014 decreased 8% as compared to the prior year quarter, mainly due to natural declines and the disposition of non-core assets during 2013. | 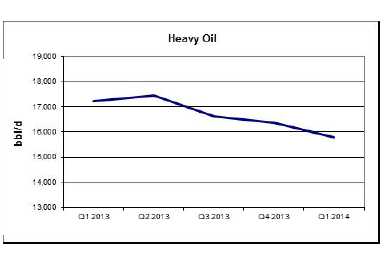 |
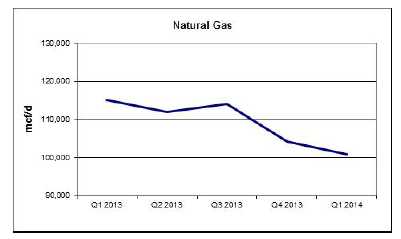 | Natural gas sales during the first quarter of 2014 decreased 12% from the first quarter of 2013. The decrease was mainly due to natural declines, third-party facility constraints and the disposition of non-core assets during 2013. |
8
| | MANAGEMENT’S DISCUSSION AND ANALYSIS |
Natural gas liquids sales for the first quarter of 2014 decreased by 17% from the same quarter in 2013. Consistent with natural gas sales volumes the decrease was mainly due to natural declines, third-party facility constraints and the disposition of non-core assets during 2013. | 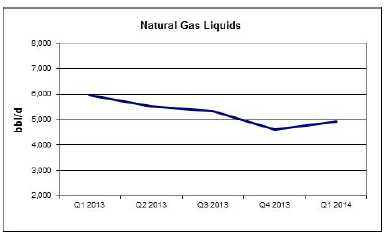 |
Revenues
| | | Three Months Ended March 31 | �� |
| | | 2014 | | | 2013 | | | Change | |
| Light to medium oil sales | | 90.4 | | | 95.3 | | | (5% | ) |
| Heavy oil sales | | 114.0 | | | 99.8 | | | 14% | |
| Natural gas sales after hedging(1) | | 49.7 | | | 36.3 | | | 37% | |
| Natural gas liquids sales | | 30.4 | | | 32.2 | | | (6% | ) |
| Other(2) | | 3.2 | | | 5.3 | | | (40% | ) |
| Petroleum and natural gas sales | | 287.7 | | | 268.9 | | | 7% | |
| Royalties | | (36.2 | ) | | (32.7 | ) | | 11% | |
| Revenues | | 251.5 | | | 236.2 | | | 6% | |
| (1) | Inclusive of the effective portion of realized gains (losses) from natural gas contracts designated as hedges. |
| (2) | Inclusive of sulphur revenue and miscellaneous income. |
Harvest’s revenue is subject to changes in sales volumes, commodity prices, currency exchange rates and hedging activities. In the first quarter of 2014, total petroleum and natural gas sales increased by 7%, mainly due to the 23% increase in realized prices after hedging activities and partially offset by the 13% decrease in sales volumes.
Sulphur revenue represented $3.0 million of the total in other revenues for the first quarter of 2014 (2013 - $4.0 million).
Royalties
Harvest pays Crown, freehold and overriding royalties to the owners of mineral rights from which production is generated. These royalties vary for each property and product and Crown royalties are based on various sliding scales dependent on incentives, production volumes and commodity prices.
For the first quarter of 2014, royalties as a percentage of gross revenue averaged 12.6% (2013 – 12.2%) and were consistent with the same quarter in the prior year.
9
| | MANAGEMENT’S DISCUSSION AND ANALYSIS |
Operating and Transportation Expenses
| | | Three Months Ended March 31 | |
| | | | | | | | | | | | | | | $/boe | |
| | | 2014 | | | $/boe | | | 2013 | | | $/boe | | | Change | |
| Power and purchased energy | | 21.0 | | | 4.82 | | | 22.1 | | | 4.42 | | | 0.40 | |
| Well servicing | | 12.3 | | | 2.81 | | | 15.9 | | | 3.17 | | | (0.36 | ) |
| Repairs and maintenance | | 13.3 | | | 3.05 | | | 14.0 | | | 2.80 | | | 0.25 | |
| Lease rentals and property tax | | 9.8 | | | 2.23 | | | 9.4 | | | 1.88 | | | 0.35 | |
| Labor - internal | | 9.3 | | | 2.13 | | | 9.7 | | | 1.94 | | | 0.19 | |
| Labor - contract | | 3.4 | | | 0.78 | | | 4.2 | | | 0.84 | | | (0.06 | ) |
| Chemicals | | 5.6 | | | 1.29 | | | 6.1 | | | 1.22 | | | 0.07 | |
| Trucking | | 3.4 | | | 0.78 | | | 3.5 | | | 0.69 | | | 0.09 | |
| Processing and other fees | | 8.8 | | | 2.02 | | | 10.4 | | | 2.07 | | | (0.05 | ) |
| Other | | 1.6 | | | 0.38 | | | (3.5 | ) | | (0.71 | ) | | 1.09 | |
| Total operating expenses | | 88.5 | | | 20.29 | | | 91.8 | | | 18.32 | | | 1.97 | |
| Transportation and marketing | | 6.3 | | | 1.43 | | | 5.1 | | | 1.02 | | | 0.41 | |
Operating expenses for the first quarter of 2014 decreased by $3.3 million compared to the same period in 2013. The lower operating expenses were mainly attributable to the decrease in well servicing expenses. Operating costs on a per barrel basis increased by 11% to $20.29/boe for the first quarter of 2014 mainly due to lower sales volumes.
| | | Three Months Ended March 31 | |
| ($/boe) | | 2014 | | | 2013 | | | Change | |
| Power and purchased energy costs | | 4.82 | | | 4.42 | | | 0.40 | |
| Realized gains on electricity risk management contracts | | (0.11 | ) | | (0.05 | ) | | (0.06 | ) |
| Net power and purchased energy costs | | 4.71 | | | 4.37 | | | 0.34 | |
| Alberta Power Pool electricity price ($/MWh) | | 61.75 | | | 64.12 | | | (2.37 | ) |
Power and purchased energy costs, comprised primarily of electric power costs, represented approximately 24% of total operating expenses for the first quarter of 2014 (2013 – 24%). Power and purchased energy costs per boe were relatively consistent between the first quarters of 2014 and 2013 due to the comparable levels of operating activity and only a $2.37/MWh change in the average Alberta electricity price.
Transportation and marketing expenses relate primarily to delivery of natural gas to the Nova Gas Transmission Limited System and the cost of trucking crude oil to pipeline or rail receipt points. As a result, the total dollar amount of costs generally fluctuates in relation to sales volumes. In the first quarter of 2014 higher transportation costs were incurred in the Deep Basin and Hayter areas due to facility restrictions as compared to the same period in the prior year. As such, despite the lower sales volumes for the first quarter of 2014, transportation and marketing expenses increased by $1.2 million as compared to the same period in 2013.
10
| | MANAGEMENT’S DISCUSSION AND ANALYSIS |
Operating Netback(1)
| | | Three Months Ended March 31 | |
| | | | | | | | | $/boe | |
| ($/boe) | | 2014 | | | 2013 | | | Change | |
| Petroleum and natural gas sales prior to hedging(2) | | 67.29 | | | 53.43 | | | 13.86 | |
| Royalties | | (8.30 | ) | | (6.54 | ) | | (1.76 | ) |
| Operating expenses | | (20.29 | ) | | (18.32 | ) | | (1.97 | ) |
| Transportation and marketing | | (1.43 | ) | | (1.02 | ) | | (0.41 | ) |
| Operating netback prior to hedging(1) | | 37.27 | | | 27.55 | | | 9.72 | |
| Hedging (loss) gain(3) | | (1.30 | ) | | 0.45 | | | (1.75 | ) |
| Operating netback after hedging(1) | | 35.97 | | | 28.00 | | | 7.97 | |
| (1) | This is a non-GAAP measure; please refer to “Non-GAAP Measures” in this MD&A. |
| (2) | Excludes miscellaneous income not related to oil and gas production |
| (3) | Hedging (loss) gain include the settlement amounts for natural gas, crude oil and power contracts. |
General and Administrative (“G&A”) Expenses
| | | Three Months Ended March 31 | |
| | | 2014 | | | 2013 | |
| G&A | | 16.8 | | | 17.7 | |
| G&A ($/boe ) | | 3.85 | | | 3.54 | |
For the first quarter of 2014, G&A expenses decreased $0.9 million from same period in the prior year. Harvest does not have a stock option program, however there is a long-term incentive program which is a cash settled plan that has been included in the G&A expense.
Depletion, Depreciation and Amortization (“DD&A”) Expenses
| | | Three Months Ended March 31 | |
| | | 2014 | | | 2013 | |
| DD&A | | 109.5 | | | 145.2 | |
| DD&A ($/boe) | | 25.09 | | | 29.03 | |
DD&A expenses for the first quarter of 2014 decreased by $35.7million as compared to the first quarter of 2013 mainly due to a change in Harvest’s DD&A accounting estimate in the fourth quarter of 2013, as well as lower sales volumes in the first quarter of 2014.
Capital Asset Additions
| | | Three Months Ended March 31 | |
| | | 2014 | | | 2013 | |
| Drilling and completion | | 81.8 | | | 78.3 | |
| Well equipment, pipelines and facilities | | 43.2 | | | 32.2 | |
| Geological and geophysical | | 4.6 | | | 7.5 | |
| Land and undeveloped lease rentals | | 0.6 | | | 1.1 | |
| Corporate | | 1.5 | | | 1.3 | |
| Other | | 2.6 | | | 2.8 | |
| Total additions excluding acquisitions | | 134.3 | | | 123.2 | |
11
| | MANAGEMENT’S DISCUSSION AND ANALYSIS |
Total capital additions were greater for the first quarter of 2014 as compared to the same period in the prior year mainly due to the drilling of deeper and more expensive wells, especially in the Red Earth and Deep Basin areas, in the current quarter.
The following table summarizes the wells drilled by Harvest and the related drilling and completion costs incurred in the period. A well is recorded in the table as having being drilled after it has been rig-released, however related drilling costs may be incurred in a period before a well has been spud (including survey, lease acquisition and construction costs) and related completion costs may be incurred in a period afterwards, depending on the timing of the completion work.
| | | Three Months Ended | |
| | | March 31, 2014 | |
| | | | | | | | | Drilling and | |
| Area | | Gross | | | Net | | | completion | |
| Red Earth | | 5.0 | | | 4.9 | | $ | 25.6 | |
| Hay River | | 16.0 | | | 16.0 | | | 20.4 | |
| Deep Basin | | 7.0 | | | 2.8 | | | 15.4 | |
| Western Alberta | | 5.0 | | | 1.8 | | | 6.8 | |
| Cecil | | 2.0 | | | 2.0 | | | 3.5 | |
| Suffield | | 2.0 | | | 2.0 | | | 2.9 | |
| Heavy Oil | | 1.0 | | | 1.0 | | | 2.2 | |
| Other areas | | 3.0 | | | 1.4 | | | 5.0 | |
| Total | | 41.0 | | | 31.9 | | $ | 81.8 | |
During the first quarter of 2014, Harvest continued to concentrate its drilling activities in certain of its core growth areas: Deep Basin, Hay River and Red Earth; supplemented with drilling in the strategic revenue generating areas in Western Alberta and the Heavy Oil area. The primary areas of focus for Harvest’s Upstream drilling program are as follows:
| • | Deep Basin – participating or drilling deep, horizontal multi-stage fractured wells to develop the liquids-rich Falher and Montney liquids-rich gas formations; |
| • | Hay River – pursuing heavy gravity oil in the Bluesky formation using multi-leg horizontal oil wells; |
| • | Red Earth – activities are spread across the Loon Lake, Gift, Evi and Golden areas targeting light oil formations primarily in the Slave Point and also the Gilwood; |
| • | Western Alberta – activities spread across several fields with recent efforts targeting mainly the Cardium, Glauconite, Ostracod, and Notikewin formations; |
| • | Heavy Oil area – horizontal heavy oil wells in the Lloydminster region of Alberta into the McLaren, Lloydminster, Grand Petroleum and Sparky formations. |
Decommissioning Liabilities
Harvest’s Upstream decommissioning liabilities at March 31, 2014 were $714.4 million (December 31, 2013 - $709.4 million) for future remediation, abandonment, and reclamation of Harvest’s oil and gas properties. The total of the decommissioning liabilities are based on management’s best estimate of costs to remediate, reclaim, and abandon wells and facilities. The costs will be incurred over the operating lives of the assets with the majority being at or after the end of reserve life. Please refer to the “Contractual Obligations and Commitments” section of this MD&A for the payments expected for each of the next five years and thereafter in respect of the decommissioning liabilities.
12
| | MANAGEMENT’S DISCUSSION AND ANALYSIS |
BLACKGOLD OIL SANDS
Capital Asset Additions
| | | Three Months Ended March 31 | |
| | | 2014 | | | 2013 | |
| Drilling and completion | | – | | | 3.6 | |
| Well equipment, pipelines and facilities | | 33.0 | | | 55.3 | |
| Pre-operating costs | | 0.1 | | | – | |
| Land and undeveloped lease rentals | | 0.4 | | | 0.1 | |
| Other | | 8.7 | | | 2.0 | |
| Total BlackGold additions | | 42.2 | | | 61.0 | |
During the first quarter of 2014, Harvest invested $33.0 million on the CPF. As at March 31, 2014, the overall oil sands project was approximately 93% complete.
Oil Sands Project Development
Harvest is developing its BlackGold oil sands CPF under the engineering, procurement and construction (“EPC”) contract. Expected total costs under the EPC contract are approximately $650 million. Under the EPC contract, a maximum of approximately $101 million of the EPC costs will be paid in equal installments, without interest, over 10 years commencing on the completion of the EPC work in 2014. The liability is considered a financial liability and is initially recorded at fair value, which is estimated as the present value of all future cash payments discounted using the prevailing market rate of interest for similar instruments. As at March 31, 2014, Harvest recognized a liability of $76.2 million (December 31, 2013 - $76.2 million) using a discount rate of 4.5% (December 31, 2013 - 4.5%) . Non-cash capital additions are recognized in well equipment, pipelines and facilities as the work is performed and the related deferred EPC liability is recognized. For the first quarter of 2014, no non-cash adjustments were recorded relating to the EPC contract (2013 – $10.3 million non-cash addition).
Initial drilling of 30 steam assisted gravity drainage (“SAGD”) wells (15 well pairs) was completed by the end of 2012. More SAGD wells will be drilled in the future to compensate for the natural decline in production of the initial well pairs and maintain the Phase 1 production capacity of 10,000 bbl/d. Preliminary construction has been substantially completed, including the building of the CPF plant site, the placement of site equipment and pipe rack module installation. Piping and cabling of the CPF are now ongoing. Commissioning of the CPF and first steam is anticipated in the fourth quarter of 2014. Phase 2 of the project, which is targeted to increase production capacity to 30,000 bbl/d, received all required regulatory approvals in 2013.
As at March 31, 2014, Harvest has incurred costs of $580.5 million on the EPC contract. After the accounting impact of the deferred liability described above, Harvest has recorded $561.6 million of costs for the EPC contract and has recorded $773.1 million of costs on the entire project since acquiring the BlackGold assets in 2010.
13
| | MANAGEMENT’S DISCUSSION AND ANALYSIS |
The BlackGold project faces similar cost and schedule pressures as other oil sand projects, including shortage of skilled labor and rising costs.
Decommissioning Liabilities
Harvest’s BlackGold decommissioning liabilities at March 31, 2014 were $34.7 million (December 31, 2013 - $34.3 million) relating to the future remediation, abandonment, and reclamation of the SAGD wells and CPF. Please see the “Contractual Obligations and Commitments” section of this MD&A for the payments expected for each of the next five years and thereafter in respect of the decommissioning liabilities.
DOWNSTREAM OPERATIONS
Summary of Financial and Operating Results
| | | Three Months Ended March 31 | |
| | | 2014 | | | 2013 | |
| FINANCIAL | | | | | | |
| Refined products sales(1) | | 1,113.4 | | | 1,122.0 | |
| Purchased products for processing and resale(1) | | 1,008.0 | | | 1,086.4 | |
| Gross margin(2) | | 105.4 | | | 35.6 | |
| | | | | | | |
| Operating expense | | 30.7 | | | 34.0 | |
| Purchased energy expense | | 37.9 | | | 33.1 | |
| Marketing expense | | 1.7 | | | 1.5 | |
| General and administrative | | 0.2 | | | 0.2 | |
| Depreciation and amortization | | 3.6 | | | 21.8 | |
| Gains on disposition of assets | | (0.2 | ) | | – | |
| Operating income (loss) | | 31.5 | | | (55.0 | ) |
| | | | | | | |
| Capital expenditures | | 3.1 | | | 12.5 | |
| | | | | | | |
| OPERATING | | | | | | |
| Feedstock volume (bbl/d)(3) | | 95,767 | | | 100,074 | |
| | | | | | | |
| Yield (% of throughput volume)(4) | | | | | | |
| Gasoline and related products | | 32% | | | 29% | |
| Ultra low sulphur diesel and jet fuel | | 37% | | | 35% | |
| High sulphur fuel oil and other | | 28% | | | 34% | |
| Total | | 97% | | | 98% | |
| | | | | | | |
| Average refining gross margin (US$/bbl)(5) | | 9.58 | | | 2.51 | |
| (1) Refined product sales and purchased products for processing and resale are net of intra-segment sales of $150.1 million for the three months ended March 31, 2014 (2013 - $133.4 million), reflecting the refined products produced by the refinery and sold by the marketing division. |
| (2) These are non-GAAP measures; please refer to “Non-GAAP Measures” in this MD&A. |
| (3) Barrels per day are calculated using total barrels of crude oil feedstock and purchased vacuum gas oil. |
| (4) Based on production volumes after adjusting for changes in inventory held for resale. |
| (5) Average refining gross margin is calculated based on per barrel of feedstock throughput. |
14
| | MANAGEMENT’S DISCUSSION AND ANALYSIS |
Refining Benchmark Prices
| | | Three Months Ended March 31 | |
| | | 2014 | | | 2013 | | | Change | |
| WTI crude oil (US$/bbl) | | 98.68 | | | 94.37 | | | 5% | |
| Brent crude oil (US$/bbl) | | 107.95 | | | 112.62 | | | (4% | ) |
| Argus sour crude index (“ASCI”) (US$/bbl) | | 100.51 | | | 108.97 | | | (8% | ) |
| Brent – WTI differential (US$/bbl) | | 9.27 | | | 18.25 | | | (49% | ) |
| Brent – ASCI differential (US$/bbl) | | 7.44 | | | 3.65 | | | 104% | |
| Refined product prices | | | | | | | | | |
| Platts RBOB (US$/bbl) | | 113.61 | | | 122.42 | | | (7% | ) |
| Platts Ultra Low Sulfur Diesel (US$/bbl) | | 128.02 | | | 130.63 | | | (2% | ) |
| Platts High Sulphur Fuel Oil (US$/bbl) | | 91.68 | | | 97.52 | | | (6% | ) |
| U.S. / Canadian dollar exchange rate | | 0.906 | | | 0.992 | | | (9% | ) |
Summary of Gross Margins
| | | Three Months Ended March 31 | |
| | | | | | 2014 | | | | | | | | | 2013 | | | | |
| | | | | | Volumes | | | | | | | | | Volumes | | | | |
| | | | | | (million | | | | | | | | | (million | | | | |
| | | | | | bbls) | | | (US$/bbl) | | | | | | bbls) | | | (US$/bbl) | |
| Refinery | | | | | | | | | | | | | | | | | | |
| Sales | | | | | | | | | | | | | | | | | | |
| Gasoline products | | 383.6 | | | 3.1 | | | 110.24 | | | 347.3 | | | 2.9 | | | 117.00 | |
| Distillates | | 458.4 | | | 3.3 | | | 125.78 | | | 427.7 | | | 3.3 | | | 128.10 | |
| High sulphur fuel oil | | 209.5 | | | 2.2 | | | 87.29 | | | 224.2 | | | 2.4 | | | 92.81 | |
| Other(1) | | 23.1 | | | 0.2 | | | 113.70 | | | 87.0 | | | 0.8 | | | 110.20 | |
| Total sales | | 1,074.6 | | | 8.8 | | | 110.47 | | | 1,086.2 | | | 9.4 | | | 114.19 | |
| Feedstock(2) | | | | | | | | | | | | | | | | | | |
| Crude oil | | 912.0 | | | 8.5 | | | 97.51 | | | 905.7 | | | 8.3 | | | 108.62 | |
| Vacuum Gas Oil (“VGO”) | | 17.3 | | | 0.1 | | | 108.26 | | | 83.9 | | | 0.7 | | | 113.26 | |
| Total feedstock | | 929.3 | | | 8.6 | | | 97.69 | | | 989.6 | | | 9.0 | | | 108.99 | |
| Other(3) | | 54.2 | | | | | | | | | 73.8 | | | | | | | |
| Total feedstock and other costs | | 983.5 | | | | | | | | | 1,063.4 | | | | | | | |
| Refinery gross margin(4) | | 91.1 | | | | | | 9.58 | | | 22.8 | | | | | | 2.51 | |
| | | | | | | | | | | | | | | | | | | |
| Marketing | | | | | | | | | | | | | | | | | | |
| Sales | | 188.9 | | | | | | | | | 169.2 | | | | | | | |
| Cost of products sold | | 174.6 | | | | | | | | | 156.4 | | | | | | | |
| Marketing gross margin(4) | | 14.3 | | | | | | | | | 12.8 | | | | | | | |
| | | | | | | | | | | | | | | | | | | |
| Total gross margin(4) | | 105.4 | | | | | | | | | 35.6 | | | | | | | |
| (1) | Includes sales of vacuum gas oil and hydrocracker bottoms. |
| (2) | Cost of feedstock includes all costs of transporting the crude oil to the refinery in Newfoundland. |
| (3) | Includes inventory adjustments, additives and blendstocks and purchased product for resale. |
| (4) | This is a non-GAAP measure; please refer to “Non-GAAP Measures” in this MD&A. |
15
| | MANAGEMENT’S DISCUSSION AND ANALYSIS |
Feedstock throughput averaged 95,767 bbl/d in the first quarter of 2014, 4% lower than the 100,074 bbl/d average feedstock in the first quarter of the prior year. The isomax throughput rate in the first quarter of 2014 was limited to process only the internally produced VGO as market economics did not dictate purchasing additional VGO to take advantage of the excess unit capacity. Crude feedstock throughput was higher this year, averaging 94,163 bbl/d compared to 91,904 bbl/d in 2013. The daily average throughput rate for 2013 was affected by an unplanned two-week outage in February due to a power failure during a storm, followed by a partial outage in March for additional repairs. Crude throughput rates in 2014 have been negatively impacted by a weather related power outage in January resulting in an unplanned one week unit outage.
The table below provides a comparison between the product crack spreads realized by Downstream and the benchmark crack spread for the three months ended March 31 2014 and 2013, with both crack spreads referring to the price of Brent crude oil.
| | | Three Months Ended March 31 | |
| | | | | | 2014 | | | | | | | | | 2013 | | | | |
| | | Refinery | | | Benchmark(1 | ) | | Difference | | | Refinery | | | Benchmark(1 | ) | | Difference | |
| Gasoline products (US$/bbl) | | 12.55 | | | 5.66 | (2) | | 6.89 | | | 8.01 | | | 9.80 | (2) | | (1.79 | ) |
| Distillates (US$/bbl) | | 28.09 | | | 20.07 | (2) | | 8.02 | | | 19.11 | | | 18.01 | (3) | | 1.10 | |
| High Sulphur Fuel Oil (US$/bbl) | | (10.40 | ) | | (16.27 | )(3) | | (5.87 | ) | | (16.18 | ) | | (15.10 | )(4) | | (1.08 | ) |
| (1) | Benchmark product crack is relative to Brent crude oil |
| (2) | RBOB and ultra low sulfur diesel benchmark market prices sourced from Platts. |
| (3) | High Sulphur Fuel Oil benchmark market price sourced from Platts. Our high sulphur fuel oil normally contains higher sulphur content than the 3% content reflected in the benchmark price. |
Downstream’s product crack spreads are different from the above noted benchmarks due to several factors, including the timing of actual sales and feedstock purchases differing from the calendar month benchmarks, transportation costs, sour crude differentials, quality differentials and variability in the throughput volume over a given period of time. The refinery sales also include products for which market prices are not reflected in the benchmarks. Downstream’s crack spreads for gasoline products and distillates in the above tables include the actual cost of renewable identification numbers (“RINS”) that are necessary to meet blending requirements for RBOB gasoline and ultra-low sulphur diesel (“ULSD”) in the US market as mandated by the US government. Our average RINs cost for the three months ended March 31, 2014 was approximately US$2.00/bbl each for RBOB gasoline and ULSD products compared to US$2.00/bbl and US$1.45/bbl, respectively, for the same period in the prior year. For more detail on RINs, see “Operational and Other Business Risks”.
Our refinery sales decreased by $11.6 million in the first quarter of 2014 from $1,086.2 million in the same period of 2013 mainly as a result of lower sales volume and lower realized product prices partially offset by a gain on the U.S. exchange rate. The lower realized product prices are consistent with changes in the benchmark market prices.
The refinery gross margin for the three months ended March 31, 2014 was nearly four times more than the $22.8 million as reported in the same period of the prior year mainly due to higher realized product margins as a consequence of wider sour crude differentials. The cost of our crude feedstock in the first quarter of 2014 was a US$10.44/bbl discount to the benchmark Brent crude oil as compared to a discount of US$4.00/bbl in the same period of the prior year.
16
| | MANAGEMENT’S DISCUSSION AND ANALYSIS |
The overall gross margin for our refinery is also impacted by the purchasing of blendstocks to meet summer gasoline specifications, additives to meet product specifications, the build of unfinished saleable products some of which are recorded at a value lower than cost, and inventory write-downs and reversals. These costs are included in “other costs” in the Summary of Gross Margin Table above. The decrease in other costs of $19.6 million for the three months ended March 31, 2014 is mainly due to the sale and consumption of products in the first quarter of the prior year that were previously held in inventory.
The gross margin from the marketing operations is comprised of the margin from both the retail and wholesale distribution of gasoline and home heating fuels as well as the revenues from marine services including tugboat revenues and reflects a 12% improvement for the three months ended March 31, 2014 as compared to the same period in 2013.
During the first quarter of this year, the Canadian dollar weakened as compared to the US dollar. As seen in the gross margin table, the weakening of the Canadian dollar has had a positive impact to the contribution from the refinery operations relative to the prior year as substantially all of its gross margin, cost of purchased energy and marketing expense are denominated in U.S. dollars.
Operating Expenses
| | | Three Months Ended March 31 | |
| | | 2014 | | | 2013 | |
| | | Refining | | | Marketing | | | Total | | | Refining | | | Marketing | | | Total | |
| Operating cost | | 25.7 | | | 5.0 | | | 30.7 | | | 28.7 | | | 5.3 | | | 34.0 | |
| Purchased energy | | 37.9 | | | - | | | 37.9 | | | 33.1 | | | - | | | 33.1 | |
| | | 63.6 | | | 5.0 | | | 68.6 | | | 61.8 | | | 5.3 | | | 67.1 | |
| ($/bbl of feedstock throughput) | | | | | | | | | | | | | | | | | | |
| Operating cost | | 2.98 | | | - | | | - | | | 3.19 | | | - | | | - | |
| Purchased energy | | 4.39 | | | - | | | - | | | 3.67 | | | - | | | - | |
| | | 7.37 | | | - | | | - | | | 6.86 | | | - | | | - | |
The refining operating cost per barrel of feedstock throughput decreased by 7% in the first quarter of 2014 as compared to the prior year mainly as a result of lower operating costs partially offset by lower throughput rates. Operating costs in 2013 include those associated with the February outage.
Purchased energy, consisting of LSFO and electricity, is required to provide heat and power to refinery operations. The purchased energy cost per barrel of feedstock throughput increased by 20% during the three months ended March 31, 2014 from the same period of 2013 mainly due to a lower consumption of produced fuel gas.
17
| | MANAGEMENT’S DISCUSSION AND ANALYSIS |
Capital Assets Additions
Capital asset additions for the three months ended March 31, 2014 totaled $3.1 million (2013 - $12.5 million), relating to various maintenance and sustaining projects.
Depreciation and Amortization Expense
| | | Three Months Ended March 31 | |
| | | 2014 | | | 2013 | |
| Refining | | 2.8 | | | 20.8 | |
| Marketing | | 0.8 | | | 1.0 | |
| Total depreciation and amortization | | 3.6 | | | 21.8 | |
Depreciation and amortization expense decreased $18.2 million for the three months ended March 31, 2014 as compared to 2013 because of the $458.9 million impairment of refinery property, plant and equipment which occurred in the fourth quarter of 2013.The process units are amortized over an average useful life of 20 to 35 years and turnaround costs are amortized to the next scheduled turnaround.
Decommissioning Liabilities
Harvest’s Downstream decommissioning liabilities result from the ownership of the refinery and marketing assets. At March 31, 2014, Downstream’s decommissioning liabilities were $16.8 million (December 31, 2013 – $16.7 million) relating to the reclamation and abandonment of these assets with an expected abandonment date of 2069. Please see “Contractual Obligations and Commitments” section of this MD&A for the payments expected for each of the next five years and thereafter in respect of the decommissioning liabilities.
RISK MANAGEMENT, FINANCING AND OTHER
Cash Flow Risk Management
The Company at times enters into natural gas, crude oil, electricity and foreign exchange contracts to reduce the volatility of cash flows from some of its forecast sales and purchases, and when allowable, will designate these contracts as cash flow hedges. The WCS price swap and foreign exchange swap were entered into concurrently and complement each other. The WCS swap mitigates crude oil price risk by fixing a certain U.S. dollar price per barrel on certain heavy oil volumes. The foreign exchange swap mitigates currency exchange risk by swapping the U.S. dollar notional value of the WCS price swap back to Harvest’s functional currency, the Canadian dollar. The following is a summary of Harvest’s risk management contracts outstanding at March 31, 2014:
Contracts Designated as Hedges
| Contract Quantity | | Type of Contract | | | Term | | | | | | Contract Price | | | Fair Value | |
| 44,600 GJ/day | | AECO swap | | | Apr - Dec | | | 2014 | | $ | 3.76/GJ | | | (8.2 | ) |
| 4,500 bbls/day | | WCS price swap | | | Apr - Dec | | | 2014 | | | US$76.81/bbl | | | (1.8 | ) |
| US$0.3 million/day | | Foreign exchange swap | | | Apr - Dec | | | 2014 | | $ | 1.1123 Cdn/US | | | – | |
| | | | | | | | | | | | | | | (10.0 | ) |
18
| | MANAGEMENT’S DISCUSSION AND ANALYSIS |
Contracts Not Designated as Hedges
| | | | | | | | | | |
| Contract Quantity | | Type of Contract | | | Term | | | Contract Price | | | Fair Value | |
| 35 MWh | | AESO power swap | | | Apr - Dec 2014 | | $ | 54.74/MWh | | | (0.2 | ) |
| 5 MWh | | AESO power swap | | | Jan - Dec 2015 | | $ | 49.50/MWh | | | 0.1 | |
| US$4.5 million | | Foreign exchange swap | | | Apr-14 | | $ | 1.1177 Cdn/US | | | (0.1 | ) |
| | | | | | | | | | | | (0.2 | ) |
The following is a summary of Harvest’s realized and unrealized (gains) losses on risk management contracts:
| | | Three Months Ended March 31, 2014 | |
| Realized (gains) losses | | Power | | | Crude | | | | | | Natural | | | | |
| recognized in: | | | | | Oil | | | Currency | | | Gas | | | Total | |
| Revenues | | – | | | – | | | – | | | 6.2 | | | 6.2 | |
| Risk management (gains) losses | | (0.5 | ) | | – | | | – | | | – | | | (0.5 | ) |
| | | | | | | | | | | | | | | | |
| Unrealized (gains) losses recognized in: | | | | | | | | | | | | | | | |
| OCI, before tax | | – | | | 1.7 | | | – | | | 14.5 | | | 16.2 | |
| Risk management (gains) losses | | (0.4 | ) | | 0.2 | | | – | | | – | | | (0.2 | ) |
| | | Three Months Ended March 31, 2013 | |
| Realized (gains) losses | | Power | | | Crude | | | | | | Natural | | | | |
| recognized in: | | | | | Oil | | | Currency | | | Gas | | | Total | |
| Revenues | | – | | | – | | | – | | | (0.4 | ) | | (0.4 | ) |
| Risk management (gains) losses | | (0.3 | ) | | – | | | (1.5 | ) | | – | | | (1.8 | ) |
| | | | | | | | | | | | | | | | |
| Unrealized (gains) losses recognized in: | | | | | | | | | | | | | | | |
| OCI, before tax | | – | | | 1.6 | | | – | | | 1.5 | | | 3.1 | |
| Risk management (gains) losses | | (0.3 | ) | | – | | | (0.9 | ) | | – | | | (1.2 | ) |
Financing Costs
| | | Three Months Ended March 31 | |
| | | 2014 | | | 2013 | |
| Credit facility | | 6.6 | | | 4.2 | |
| Convertible debentures | | – | | | 10.6 | |
| 6 7/8% senior notes | | 9.9 | | | 9.0 | |
| 2 1/8% senior notes(1) | | 4.8 | | | – | |
| Related party loans | | 4.0 | | | 2.0 | |
| Amortization of deferred finance charges and other | | 0.6 | | | 0.2 | |
| Interest and other financing charges | | 25.9 | | | 26.0 | |
| Accretion of decommissioning and environmental remediation liabilities | | 5.8 | | | 5.6 | |
| Less: capitalized interest | | (7.2 | ) | | (4.1 | ) |
| | | 24.5 | | | 27.5 | |
(1) Includes guarantee fee to KNOC.
19
| | MANAGEMENT’S DISCUSSION AND ANALYSIS |
No interest was paid on convertible debentures in the first quarter of 2014 as all remaining convertible debentures were redeemed in the second quarter 2013.
In May 2013, Harvest issued US$630 million 21/8% senior notes resulting in an interest expense and other financing costs of $4.8 million for the first quarter of 2014.
Currency Exchange
Currency exchange gains and losses are attributed to the changes in the value of the Canadian dollar relative to the U.S. dollar on the U.S. dollar denominated 6/% and 21/8% senior notes, the ANKOR related party loan and on any U.S. dollar denominated monetary assets or liabilities. As Downstream operations’ functional currency is denominated in U.S. dollars, the strengthening (weakening) of the U.S. dollar would result in unrealized currency exchange gains (losses) from its decommissioning liabilities, pension obligations, accounts payable and other balances that are denominated in Canadian dollars, which will partially offset Upstream’s unrealized losses (gains) recognized on the 6/% and 21/8% senior notes, ANKOR loan and any U.S. dollar denominated monetary items. At March 31, 2014, the Canadian dollar had weakened compared to the US dollar as at December 31, 2013 resulting in an unrealized foreign exchange loss of $30.2 million for the first quarter of 2014 (2013 - $3.8 million). Harvest recognized a realized foreign exchange loss of $2.0 million for the first quarter ended March 31, 2014 (2013 - $2.0 million) as a result of the settlement of U.S. dollar denominated transactions.
The cumulative translation adjustment recognized in other comprehensive loss represents the translation of the Downstream operations’ U.S. dollar functional currency financial statements to Canadian dollars. During the first quarter of 2014, Downstream operations incurred a net cumulative translation loss of $15.4 million (2013 – gain of $4.3 million) reflecting the changes in the Canadian dollar relative to the U.S. dollar on the negative value of Harvest’s net investment in the Downstream segment at March 31, 2014 compared to December 31, 2013.
Deferred Income Taxes
For the three months ending March 31, 2014 Harvest recorded a deferred income tax recovery of $6.4 million (2013 –$15.4 million). Harvest’s deferred income tax asset (liability) will fluctuate during each accounting period to reflect changes in the temporary differences between the book value and tax basis of assets as well as legislative tax rate changes. Currently, the principal sources of temporary differences relate to the Company’s property, plant and equipment, decommissioning liabilities and the unclaimed tax pools.
Related Party Transactions
The following provides a summary of the related party transactions between Harvest and KNOC for the three months ended March 31, 2014:
Related Party Loans
| • | On December 30, 2013, Harvest entered into a subordinated loan agreement with KNOC to borrow up to $200 million at a fixed interest rate of 5.3% per annum. The full principal and accrued interest is payable on December 30, 2018. At March 31, 2014, Harvest has drawn $160 million from the $200 million available under the loan agreement (December 31, 2013 - $80 million). The loan amount was recorded at fair value on initial recognition by discounting the future cash payments at the rate of 7% which is considered the market rate applicable to the liability. The difference between the fair value and the loan amount was recognized in contributed surplus. As at March 31, 2014, $8.4 million (December 31, 2013 - $4.3 million) have been recognized in contributed surplus related to the KNOC loan. For the three months ended March 31, 2014, interest expense of $1.8 million was recorded (2013 - $nil), of which $1.6 million remains outstanding as at March 31, 2014. The availability of any undrawn amounts under the facility will expire on December 31, 2014. |
20
| • | On August 16, 2012, Harvest entered into a subordinated loan agreement with ANKOR to borrow US$170 million at a fixed interest rate of 4.62% per annum. The principal balance and accrued interest is payable on October 2, 2017. At March 31, 2014, Harvest’s related party loan from ANKOR included $187.9 million (December 31, 2013 - $180.8 million) of principal and $0.8 million (December 31, 2013 - $3.0 million) of accrued interest. Interest expense was $2.2 million for the three months ended March 31, 2014 (2013 - $2.0 million). |
Other Related Party Transactions | | | | | | | | | | | | | | | | |
| | | Transactions | | | Balance Outstanding | |
| | | Three Months Ended | | | Accounts Receivable as at | | | Accounts Payable as at | |
| | | March 31 | | | | | | | | | | | | | |
| | | | | | | | | March 31, | | | December 31, | | | March 31, | | | December 31, | |
| | | 2014 | | | 2013 | | | 2014 | | | 2013 | | | 2013 | | | 2012 | |
| Revenues | | | | | | | | | | | | | | | | | | |
| Other KNOC Subsidiaries(1) | | 0.1 | | | 0.2 | | | - | | | - | | | - | | | - | |
| | | | | | | | | | | | | | | | | | | |
| Operating Expenses | | | | | | | | | | | | | | | | | | |
| Other KNOC Subsidiaries(2) | | - | | | 0.1 | | | - | | | - | | | - | | | - | |
| | | | | | | | | | | | | | | | | | | |
| G&A Expenses | | | | | | | | | | | | | | | | | | |
| KNOC(3) | | (1.1 | ) | | (0.4 | ) | | 0.6 | | | - | | | 2.0 | | | 0.5 | |
| | | | | | | | | | | | | | | | | | | |
| Finance Costs | | | | | | | | | | | | | | | | | | |
| KNOC(4) | | 1.0 | | | - | | | - | | | - | | | 1.5 | | | 0.5 | |
| (1) | On February 28, 2014 KNOC purchased 100% of the shares of KNOC Trading Corporation for US$0.4 million. Prior to the sale of KNOC Trading Corporation (“KNOC Trading”), KNOC Trading was a wholly owned subsidiary of North Atlantic. KNOC Trading bills Ankor E&P Holdings Corp. (“ANKOR”) and Dana Petroleum plc (“Dana”) for oil marketing services, such as the sale of products, performed on behalf of ANKOR and Dana. Both ANKOR and Dana are wholly owned subsidiaries of KNOC. |
| (2) | Billing from Ankor for office rent and salaries and benefits related to KNOC Trading. |
| (3) | Global Technology and Research Centre (“GTRC) is used as a training and research facility for KNOC. Amounts relate to the reimbursement from KNOC for general and administrative expenses incurred by the GTRC. Also included is Harvest’s reimbursement to KNOC for secondee salaries paid by KNOC on behalf of Harvest. |
| (4) | Charges from KNOC for the irrevocable and unconditional guarantee they provided on Harvest’s 21/8% senior notes and the senior unsecured credit facility. A guarantee fee of 52 basis points per annum is charged by KNOC. |
The Company identifies its related party transactions by: making inquiries of management and the Board of Directors, reviewing KNOC’s subsidiaries and associates, and performing a comprehensive search of transactions recorded in the accounting system. Material related party transactions require the Board of Directors’ approval.
21