 | MANAGEMENT’S DISCUSSION AND ANALYSIS |
MANAGEMENT’S DISCUSSION AND ANALYSIS
This Management’s Discussion and Analysis (“MD&A”) should be read in conjunction with the unaudited interim consolidated financial statements of Harvest Operations Corp. (“Harvest”, “we”, “us”, “our” or the “Company”) for the three and six months ended June 30, 2014 and the audited annual consolidated financial statements for the year ended December 31, 2013 together with the accompanying notes. The information and opinions concerning the future outlook are based on information available at August 12, 2014.
In this MD&A, all dollar amounts are expressed in Canadian dollars unless otherwise indicated. Tabular amounts are in millions of dollars, except where noted. All financial data has been prepared in accordance with International Financial Reporting Standards (“IFRS”) as issued by the International Accounting Standards Board except where otherwise noted.
Natural gas volumes are converted to barrels of oil equivalent (“boe”) using the ratio of six thousand cubic feet (“mcf”) of natural gas to one barrel of oil (“bbl”). Boes may be misleading, particularly if used in isolation. A boe conversion ratio of 6 mcf to 1 bbl is based on an energy equivalent conversion method primarily applicable at the burner tip and does not represent a value equivalent at the wellhead. In accordance with Canadian practice, petroleum and natural gas revenues are reported on a gross basis before deduction of Crown and other royalties.
Additional information concerning Harvest, including its audited annual consolidated financial statements and Annual Information Form (“AIF”) can be found on SEDAR atwww.sedar.com.
ADVISORY
This MD&A contains non-GAAP measures and forward-looking information about our current expectations, estimates and projections. Readers are cautioned that the MD&A should be read in conjunction with the “Non-GAAP Measures” and “Forward-Looking Information” sections at the end of this MD&A.
1
| | MANAGEMENT’S DISCUSSION AND ANALYSIS |
FINANCIAL AND OPERATING HIGHLIGHTS
| | | Three Months Ended June 30 | | | Six Months Ended June 30 | |
| | | 2014 | | | 2013 | | | 2014 | | | 2013 | |
| UPSTREAM OPERATIONS | | | | | | | | | | | | |
| Daily sales volumes (boe/d) | | 47,556 | | | 53,461 | | | 48,019 | | | 54,510 | |
| Average realized price | | | | | | | | | | | | |
| Oil and NGLs ($/bbl)(1) | | 87.49 | | | 76.08 | | | 84.89 | | | 72.69 | |
| Gas ($/mcf)(1) | | 5.32 | | | 3.83 | | | 5.75 | | | 3.64 | |
| Operating netback prior to hedging($/boe)(2) | | 37.02 | | | 30.75 | | | 37.15 | | | 29.14 | |
| Operating income (loss)(3) | | 32.2 | | | (0.4 | ) | | 53.8 | | | (22.8 | ) |
| Cash contribution from operations(2) | | 140.9 | | | 136.1 | | | 280.4 | | | 259.0 | |
| | | | | | | | | | | | | |
| Capital asset additions (excluding acquisitions) | | 61.6 | | | 29.7 | | | 195.9 | | | 153.0 | |
| Property and business (dispositions) acquisitions, net | | (90.4 | ) | | (125.4 | ) | | (92.5 | ) | | (122.1 | ) |
| | | | | | | | | | | | | |
| Net wells drilled | | 4.1 | | | 0.2 | | | 36.0 | | | 45.1 | |
| Net undeveloped land additions (acres) | | 11,534 | | | 5,730 | | | 17,977 | | | 21,943 | |
| | | | | | | | | | | | | |
| BLACKGOLD | | | | | | | | | | | | |
| Capital asset additions | | 49.2 | | | 118.6 | | | 91.4 | | | 179.7 | |
| | | | | | | | | | | | | |
| DOWNSTREAM OPERATIONS | | | | | | | | | | | | |
| Average daily throughput (bbl/d) | | 95,410 | | | 106,245 | | | 95,588 | | | 103,176 | |
| Average refining margin (US$/bbl)(2) | | 0.25 | | | 0.74 | | | 4.93 | | | 1.59 | |
| Operating loss(3) | | (46.9 | ) | | (51.6 | ) | | (15.3 | ) | | (106.6 | ) |
| Cash deficiency from operations(2) | | (43.6 | ) | | (28.1 | ) | | (9.8 | ) | | (61.2 | ) |
| Capital asset additions | | 7.4 | | | 10.1 | | | 10.6 | | | 22.6 | |
| | | | | | | | | | | | | |
| NET LOSS(3) | | (24.8 | ) | | (89.2 | ) | | (21.9 | ) | | (184.5 | ) |
| (1) | Excludes the effect of risk management contracts designated as hedges. |
| (2) | This is a non-GAAP measure; please refer to “Non-GAAP Measures” in this MD&A. |
| (3) | This is an additional GAAP measure; please refer to “Additional GAAP Measures” in this MD&A. |
| (4) | Net loss includes the consolidated operating results of Harvest’s operating segments. |
REVIEW OF OVERALL PERFORMANCE
Upstream
- Sales volumes for the second quarter and first six months of 2014 decreased by 5,905 boe/d and 6,491 boe/d, respectively, as compared to the same periods in 2013. The decreases were primarily due to natural declines exceeding the volume additions from our drilling program, the disposition of assets to the Deep Basin Partnership and dispositions of certain non-core producing properties during the year 2013.
- Operating netbacks prior to hedging for the second quarter and first six months of 2014 were $37.02/boe and $37.15/boe, respectively, increases of $6.27/boe and $8.01/boe from the same periods in 2013 mainly due to higher average realized prices, partially offset by higher royalties, operating expenses and transportation and marketing expenses per boe.
2
| | MANAGEMENT’S DISCUSSION AND ANALYSIS |
- Operating income was $32.2 million and $53.8 million for the second quarter and first six months of 2014, respectively (2013 – operating losses of $0.4 million and $22.8 million). The increase in operating income for both periods was mainly due to the decrease of DD&A expenses as a result of the change in accounting estimate made in the fourth quarter of 2013. Operating income for both periods also benefitted from increases in average realized prices and decreased operating expenses, partially offset by increased royalties expenses and lower sales volumes.
- Cash contributions from Harvest’s Upstream operations for the second quarter and first six months of 2014 were $140.9 million and $280.4 million, respectively (2013 – $136.1 million and $259.0 million). The increase in cash contributions as compared to the same periods in the prior year were mainly due to the higher operating netbacks per boe, partially offset by lower sales volumes.
- Capital asset additions of $61.6 million and $195.9 million during the second quarter and first six months of 2014 mainly related to the drilling, completion and tie-in of wells. Five gross wells (4.1 net) were rig-released during the second quarter and 46 gross wells (36.0 net) have been rig-released in the first six months of 2014.
- During the second quarter, Harvest entered into two joint ventures with KERR Canada Co. Ltd. (“KERR”). See the “Investments in Joint Ventures” section in this MD&A for further discussion.
BlackGold
- Capital asset additions were $49.2 million and $91.4 million for the second quarter and first six months of 2014, respectively, mainly related to the construction of the central processing facility (“CPF”) (2013 - $118.6 million and $179.7 million).
- As at June 30, 2014 Phase 1 of the project was approximately 95% complete. Phase 1 completion, commissioning of the CPF and first steam are expected in 2014.
Downstream
- Throughput volume averaged 95,410 bbl/d and 95,588 bbl/d for the second quarter and first six months of 2014, respectively (2013 – 106,245 bbl/d and 103,176 bbl/d). Reduced throughput for both periods was due to planned maintenance, unplanned outages and reduced throughput due to economic conditions.
- Refining gross margin per bbl averaged US$0.25/bbl during the second quarter of 2014 (2013 - US$0.74/bbl) and US$4.93/bbl for the first six months of 2014 (2013 - US$1.59/bbl). The decrease in gross margin per bbl for the second quarter was mainly due to a weaker yield mix with greater sales volumes of high sulphur fuel oil. The increase in gross margin per bbl for the first six months of the year was mainly due to higher realized product margins in the first quarter of 2014 as a consequence of improved sour crude differentials.
- Cash deficiency from Harvest’s Downstream operations for the second quarter of 2014 was $43.6 million (2013 – $28.1 million). The increase in Downstream’s cash deficiency was mainly due to lower refining gross margin and higher purchased energy expense as compared to the second quarter of 2013. Cash deficiency from Harvest’s Downstream operations for the first six months of 2014 was $9.8 million (2013 – $61.2 million). The improvement in Downstream’s cash deficiency was mainly due to a higher average refining gross margin for the year to date, most of which occurred in the first quarter of 2014.
- Operating loss totaled $46.9 million for the second quarter of 2014 (2013 –$51.6 million). The improvement in operating loss is mainly due to the decrease in depreciation and amortization, partially offset by higher purchased energy expense and a lower gross margin. Operating loss totaled $15.3 million for the first six months of 2014 (2013 – $106.6 million). The improvement in operating loss for the first six months of the year is mainly due to the increase in gross margin experienced in the first quarter of 2014 and the decrease in depreciation and amortization, partially offset by higher purchased energy expense.
3
| | MANAGEMENT’S DISCUSSION AND ANALYSIS |
Corporate
- Net loss was $24.8 million for the second quarter of 2014 (2013 – $89.2 million) and $21.9 million for the first six months of 2014 (2013 - $184.5 million). Net loss improved in both periods as compared to the prior year due to the improvements of operating income in both the Upstream and Downstream segments as described above and the positive changes to foreign exchange (gains) losses, partially offset by the recognition of income tax expense in the current year periods.
- On June 18, 2014, Harvest borrowed the final $40.0 million under the $200 million subordinated loan agreement with KNOC.
4
| | MANAGEMENT’S DISCUSSION AND ANALYSIS |
UPSTREAM OPERATIONS
Summary of Financial and Operating Results
| | | Three Months Ended June 30 | | | Six Months Ended June 30 | |
| | | 2014 | | | 2013 | | | 2014 | | | 2013 | |
| FINANCIAL | | | | | | | | | | | | |
| Petroleum and natural gas sales(1) | | 295.0 | | | 284.8 | | | 582.7 | | | 553.7 | |
| Royalties | | (50.9 | ) | | (41.6 | ) | | (87.2 | ) | | (74.3 | ) |
| Income from joint ventures | | 0.2 | | | — | | | 0.2 | | | — | |
| Revenues and other income(2) | | 244.3 | | | 243.2 | | | 495.7 | | | 479.4 | |
| | | | | | | | | | | | | |
| Expenses | | | | | | | | | | | | |
| Operating | | 81.4 | | | 86.9 | | | 169.9 | | | 178.7 | |
| Transportation and marketing | | 7.4 | | | 5.2 | | | 13.6 | | | 10.2 | |
| Realized losses (gains) on risk management contracts(3) | | 1.0 | | | (2.1 | ) | | 0.5 | | | (3.9 | ) |
| Operating netback after hedging(4) | | 154.5 | | | 153.2 | | | 311.7 | | | 294.4 | |
| | | | | | | | | | | | | |
| General and administrative | | 16.1 | | | 17.3 | | | 33.0 | | | 35.0 | |
| Depreciation, depletion and amortization | | 110.2 | | | 139.2 | | | 219.7 | | | 284.3 | |
| Exploration and evaluation | | 0.4 | | | 0.3 | | | 9.1 | | | 8.9 | |
| Unrealized gains on risk management contracts(5) | | (2.3 | ) | | (0.9 | ) | | (2.5 | ) | | (2.1 | ) |
| Gains on disposition of assets | | (2.1 | ) | | (2.3 | ) | | (1.4 | ) | | (8.9 | ) |
| Operating income (loss)(2) | | 32.2 | | | (0.4 | ) | | 53.8 | | | (22.8 | ) |
| | | | | | | | | | | | | |
| Capital asset additions (excluding acquisitions) | | 61.6 | | | 29.7 | | | 195.9 | | | 153.0 | |
| Property and business acquisitions (dispositions), net | | (90.4 | ) | | (125.4 | ) | | (92.5 | ) | | (122.1 | ) |
| Decommissioning and environmental remediation expenditures | | 0.7 | | | 1.7 | | | 3.6 | | | 7.6 | |
| | | | | | | | | | | | | |
| OPERATING | | | | | | | | | | | | |
| Light to medium oil (bbl/d) | | 10,573 | | | 11,837 | | | 10,780 | | | 12,523 | |
| Heavy oil (bbl/d) | | 16,245 | | | 17,455 | | | 16,012 | | | 17,341 | |
| Natural gas liquids (bbl/d) | | 4,356 | | | 5,510 | | | 4,635 | | | 5,730 | |
| Natural gas (mcf/d) | | 98,295 | | | 111,954 | | | 99,552 | | | 113,494 | |
| Total (boe/d) | | 47,556 | | | 53,461 | | | 48,019 | | | 54,510 | |
| (1) | Includes the effective portion of Harvest’s realized natural gas and crude oil hedges. |
| (2) | This is an additional GAAP measure; please refer to “Additional GAAP Measures” in this MD&A. |
| (3) | Realized gains on risk management contracts include the settlement amounts for power, crude oil and foreign exchange derivative contracts, excluding the effective portion of realized gains from Harvest’s designated accounting hedges. See “Risk Management, Financing and Other” section of this MD&A for details. |
| (4) | This is a non-GAAP measure; please refer to “Non-GAAP Measures” in this MD&A. |
| (5) | Unrealized gains on risk management contracts reflect the change in fair value of derivative contracts that are not designated as accounting hedges and the ineffective portion of changes in fair value of designated hedges. See “Risk Management, Financing and Other” section of this MD&A for details. |
5
| | MANAGEMENT’S DISCUSSION AND ANALYSIS |
Commodity Price Environment
| | | Three Months Ended June 30 | | | Six Months Ended June 30 | |
| | | 2014 | | | 2013 | | | Change | | | 2014 | | | 2013 | | | Change | |
| West Texas Intermediate ("WTI") crude oil (US$/bbl) | | 102.99 | | | 94.22 | | | 9% | | | 100.84 | | | 94.30 | | | 7% | |
| West Texas Intermediate crude oil ($/bbl) | | 112.27 | | | 96.45 | | | 16% | | | 110.61 | | | 95.81 | | | 15% | |
| Edmonton light sweet crude oil ($/bbl) | | 105.64 | | | 92.73 | | | 14% | | | 102.73 | | | 90.38 | | | 14% | |
| Western Canadian Select ("WCS") crude oil ($/bbl) | | 90.35 | | | 76.78 | | | 18% | | | 86.85 | | | 69.87 | | | 24% | |
| AECO natural gas daily ($/mcf) | | 4.69 | | | 3.53 | | | 33% | | | 5.18 | | | 3.37 | | | 54% | |
| | | | | | | | | | | | | | | | | | | |
| U.S. / Canadian dollar exchange rate | | 0.917 | | | 0.977 | | | (6% | ) | | 0.912 | | | 0.984 | | | (7% | ) |
| | | | | | | | | | | | | | | | | | | |
| Differential Benchmarks | | | | | | | | | | | | | | | | | | |
| WCS differential to WTI ($/bbl) | | 21.92 | | | 19.67 | | | 11% | | | 23.76 | | | 25.94 | | | (8% | ) |
| WCS differential as a % of WTI | | 19.5% | | | 20.4% | | | (4% | ) | | 21.5% | | | 27.1% | | | (21% | ) |
The average WTI benchmark price increased 9% and 7%, respectively, for the second quarter and first six months of 2014 as compared to the same periods in 2013. The average Edmonton light sweet crude oil price (“Edmonton Light”) increased 14% in in both the second quarter and first six months of 2014 mainly due to the increase in the WTI price and the strengthening of the U.S. dollar against the Canadian dollar, partially offset by the widening of the Edmonton light sweet differential.
Heavy oil differentials fluctuate based on a combination of factors including the level of heavy oil production and inventories, pipeline and rail capacity to deliver heavy crude to U.S. and offshore markets and the seasonal demand for heavy oil. The 18% increase in the WCS price for the second quarter of 2014 as compared to the second quarter of 2013 was mainly the result of the increase in the WTI price and the strengthening of the U.S. dollar, partially offset by of the widening of the WCS differential to WTI. The 24% increase in the WCS price for the first six months of 2014 as compared to the same period in 2013 was mainly the result of the increase in the WTI price, the strengthening of the U.S. dollar and the narrowing of the WCS differential to WTI.
Realized Commodity Prices
| | | Three Months Ended June 30 | | | Six Months Ended June 30 | |
| | | 2014 | | | 2013 | | | Change | | | 2014 | | | 2013 | | | Change | |
| Light to medium oil ($/bbl) | | 98.43 | | | 85.90 | | | 15% | | | 94.84 | | | 82.88 | | | 14% | |
| Heavy oil prior to hedging ($/bbl) | | 87.45 | | | 76.55 | | | 14% | | | 83.92 | | | 70.54 | | | 19% | |
| Natural gas liquids ($/bbl) | | 61.06 | | | 53.48 | | | 14% | | | 65.07 | | | 56.93 | | | 14% | |
| Natural gas prior to hedging($/mcf) | | 5.32 | | | 3.83 | | | 39% | | | 5.75 | | | 3.64 | | | 58% | |
| Average realized price prior to hedging ($/boe)(1) | | 69.30 | | | 58.22 | | | 19% | | | 68.29 | | | 55.80 | | | 22% | |
| | | | | | | | | | | | | | | | | | | |
| Heavy oil after hedging ($/bbl)(2) | | 85.76 | | | 75.80 | | | 13% | | | 83.06 | | | 70.16 | | | 18% | |
| Natural gas after hedging ($/mcf)(2) | | 5.02 | | | 3.89 | | | 29% | | | 5.25 | | | 3.69 | | | 42% | |
| Average realized price after hedging ($/boe)(1)(2) | | 68.09 | | | 58.11 | | | 17% | | | 66.97 | | | 55.78 | | | 20% | |
| (1) | Inclusive of sulphur revenue. |
| (2) | Inclusive of the realized gains (losses) from contracts designated as hedges. Foreign exchange swaps and power contracts are excluded from the realized price. |
6
| | MANAGEMENT’S DISCUSSION AND ANALYSIS |
Harvest’s realized prices prior to hedging for light to medium oil and natural gas generally trend with the Edmonton Light and AECO benchmark prices, respectively. Harvest’s realized prices prior to hedging for heavy oil are a function of both the WCS and Edmonton Light benchmarks due to a portion of our heavy oil volumes being sold based on a discount to the Edmonton Light benchmark. For the second quarter and first six months of 2014, the period-over-period variances and movements of light to medium oil, heavy oil and natural gas were consistent with the changes in their related benchmarks.
Realized natural gas liquids prices increased by 14% for both the second quarter and first six months of 2014 as compared to the same periods in the prior year, mainly due to the increase in the prices of propane, pentane and condensate.
In order to mitigate the risk of fluctuating cash flows due to oil and natural gas pricing volatility, Harvest had WCS and AECO derivative contracts in place during the second quarters and first six months of 2014 and 2013. Including the impact from the WCS hedges, Harvest’s realized heavy oil price for the second quarter of 2014 decreased by $1.69/bbl (2013 – $0.75/bbl) and decreased by $0.86/bbl for the first six months of 2014 (2013 – $0.38/bbl) . Including the impact from the AECO hedges, Harvest’s realized natural gas price for the second quarter of 2014 decreased by $0.30/mcf (2013 – increased by $0.06/mcf) and decreased by $0.50/mcf for the first six months of 2014 (2013 – increased by $0.05/mcf) . Please see “Cash Flow Risk Management” section in this MD&A for further discussion with respect to the cash flow risk management program.

7
| | MANAGEMENT’S DISCUSSION AND ANALYSIS |

8
| | MANAGEMENT’S DISCUSSION AND ANALYSIS |
Sales Volumes
| | | | | | Three Months Ended June 30 | | | | |
| | | 2014 | | | 2013 | |
| | | | | | | | | | | | | | | % Volume | |
| | | Volume | | | Weighting | | | Volume | | | Weighting | | | Change | |
| Light to medium oil (bbl/d) | | 10,573 | | | 22% | | | 11,837 | | | 22% | | | (11% | ) |
| Heavy oil (bbl/d) | | 16,245 | | | 34% | | | 17,455 | | | 33% | | | (7% | ) |
| Natural gas liquids (bbl/d) | | 4,356 | | | 9% | | | 5,510 | | | 10% | | | (21% | ) |
| Total liquids (bbl/d) | | 31,174 | | | 65% | | | 34,802 | | | 65% | | | (10% | ) |
| Natural gas (mcf/d) | | 98,295 | | | 35% | | | 111,954 | | | 35% | | | (12% | ) |
| Total oil equivalent (boe/d) | | 47,556 | | | 100% | | | 53,461 | | | 100% | | | (11% | ) |
| | | | | | Six Months Ended June 30 | | | | |
| | | 2014 | | | 2013 | |
| | | | | | | | | | | | | | | % Volume | |
| | | Volume | | | Weighting | | | Volume | | | Weighting | | | Change | |
| Light to medium oil (bbl/d) | | 10,780 | | | 22% | | | 12,523 | | | 23% | | | (14% | ) |
| Heavy oil (bbl/d) | | 16,012 | | | 33% | | | 17,341 | | | 32% | | | (8% | ) |
| Natural gas liquids (bbl/d) | | 4,635 | | | 10% | | | 5,730 | | | 11% | | | (19% | ) |
| Total liquids (bbl/d) | | 31,427 | | | 65% | | | 35,594 | | | 66% | | | (12% | ) |
| Natural gas (mcf/d) | | 99,552 | | | 35% | | | 113,494 | | | 34% | | | (12% | ) |
| Total oil equivalent (boe/d) | | 48,019 | | | 100% | | | 54,510 | | | 100% | | | (12% | ) |
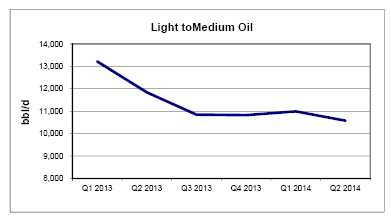 | Harvest’s average daily sales of light to medium oil decreased 11% and 14% for the second quarter and first six months of 2014, respectively, as compared to the same periods in 2013. The decreases were due to natural declines and the disposition of non-core properties, partially offset by the results of our 2013 and 2014 drilling activity. |
9
| | MANAGEMENT’S DISCUSSION AND ANALYSIS |

10
| | MANAGEMENT’S DISCUSSION AND ANALYSIS |
Revenues
| | | Three Months Ended June 30 | | | Six Months Ended June 30 | |
| | | 2014 | | | 2013 | | | Change | | | 2014 | | | 2013 | | | Change | |
| Light to medium oil sales | | 94.7 | | | 92.5 | | | 2% | | | 185.1 | | | 187.9 | | | (1% | ) |
| Heavy oil sales after hedging(1) | | 126.8 | | | 120.4 | | | 5% | | | 240.7 | | | 220.2 | | | 9% | |
| Natural gas sales after hedging(1) | | 44.9 | | | 39.6 | | | 13% | | | 94.6 | | | 75.9 | | | 25% | |
| Natural gas liquids sales | | 24.2 | | | 26.8 | | | (10% | ) | | 54.6 | | | 59.0 | | | (7% | ) |
| Other(2) | | 4.4 | | | 5.5 | | | (20% | ) | | 7.7 | | | 10.7 | | | (28% | ) |
| Petroleum and natural gas sales | | 295.0 | | | 284.8 | | | 4% | | | 582.7 | | | 553.7 | | | 5% | |
| Royalties | | (50.9 | ) | | (41.6 | ) | | 22% | | | (87.2 | ) | | (74.3 | ) | | 17% | |
| Revenues | | 244.1 | | | 243.2 | | | — | | | 495.5 | | | 479.4 | | | 3% | |
| (1) | Inclusive of the effective portion of realized gains (losses) from natural gas and crude oil contracts designated as hedges. |
| (2) | Inclusive of sulphur revenue and miscellaneous income. |
Harvest’s revenue is subject to changes in sales volumes, commodity prices, currency exchange rates and hedging activities. In the second quarter of 2014, total petroleum and natural gas sales increased by 4% as compared to the second quarter of 2013, mainly due to the 17% increase in realized prices after hedging activities and partially offset by the 11% decrease in sales volumes. Total petroleum and natural gas sales increased by 5% for the first six months of 2014 as compared to the same period in 2013, mainly due to the 20% increase in realized prices after hedging activities and partially offset by the 12% decrease in sales volumes.
Sulphur revenue represented $4.1 million of the total in other revenues for the second quarter of 2014 (2013 - $3.4 million) and $7.1 million for the first six months of 2014 (2013 - $7.4 million).
Royalties
Harvest pays Crown, freehold and overriding royalties to the owners of mineral rights from which production is generated. These royalties vary for each property and product and Crown royalties are based on various sliding scales dependent on incentives, production volumes and commodity prices.
For the second quarter and first six months of 2014, royalties as a percentage of gross revenue averaged 17.3% and 15.0%, respectively (2013 – 14.6% and 13.4%) . The increases in the royalties as a percentage of gross revenue were due to an unfavorable Alberta Crown gas cost allowance adjustment and the impacts of increased commodity prices.
11
| | MANAGEMENT’S DISCUSSION AND ANALYSIS |
Operating and Transportation Expenses
| | | | | | Three Months Ended June 30 | | | | |
| | | 2014 | | | $/boe | | | 2013 | | | $/boe | | | $/boe Change | |
| Power and purchased energy | | 16.8 | | | 3.88 | | | 26.2 | | | 5.38 | | | (1.50 | ) |
| Well servicing | | 8.9 | | | 2.06 | | | 11.6 | | | 2.38 | | | (0.32 | ) |
| Repairs and maintenance | | 13.3 | | | 3.07 | | | 12.7 | | | 2.61 | | | 0.46 | |
| Lease rentals and property tax | | 9.5 | | | 2.20 | | | 9.1 | | | 1.86 | | | 0.34 | |
| Labour - internal | | 7.3 | | | 1.69 | | | 7.6 | | | 1.56 | | | 0.13 | |
| Labour - contract | | 3.3 | | | 0.76 | | | 4.0 | | | 0.82 | | | (0.06 | ) |
| Chemicals | | 5.6 | | | 1.29 | | | 4.4 | | | 0.90 | | | 0.39 | |
| Trucking | | 4.8 | | | 1.11 | | | 3.7 | | | 0.77 | | | 0.34 | |
| Processing and other fees | | 7.8 | | | 1.80 | | | 7.2 | | | 1.48 | | | 0.32 | |
| Other | | 4.1 | | | 0.94 | | | 0.4 | | | 0.09 | | | 0.85 | |
| Total operating expenses | | 81.4 | | | 18.80 | | | 86.9 | | | 17.85 | | | 0.95 | |
| Transportation and marketing | | 7.4 | | | 1.71 | | | 5.2 | | | 1.07 | | | 0.64 | |
| | | | | | Six Months Ended June 30 | | | | |
| | | 2014 | | | $/boe | | | 2013 | | | $/boe | | | $/boe Change | |
| Power and purchased energy | | 37.8 | | | 4.35 | | | 48.3 | | | 4.89 | | | (0.54 | ) |
| Well servicing | | 21.1 | | | 2.43 | | | 27.4 | | | 2.78 | | | (0.35 | ) |
| Repairs and maintenance | | 26.6 | | | 3.06 | | | 26.7 | | | 2.71 | | | 0.35 | |
| Lease rentals and property tax | | 19.2 | | | 2.21 | | | 18.5 | | | 1.88 | | | 0.33 | |
| Labour - internal | | 16.6 | | | 1.91 | | | 17.3 | | | 1.76 | | | 0.15 | |
| Labour - contract | | 6.8 | | | 0.78 | | | 8.2 | | | 0.83 | | | (0.05 | ) |
| Chemicals | | 11.2 | | | 1.29 | | | 10.5 | | | 1.07 | | | 0.22 | |
| Trucking | | 8.2 | | | 0.94 | | | 7.2 | | | 0.72 | | | 0.22 | |
| Processing and other fees | | 16.6 | | | 1.91 | | | 17.5 | | | 1.78 | | | 0.13 | |
| Other | | 5.8 | | | 0.67 | | | (2.9 | ) | | (0.32 | ) | | 0.99 | |
| Total operating expenses | | 169.9 | | | 19.55 | | | 178.7 | | | 18.10 | | | 1.45 | |
| Transportation and marketing | | 13.6 | | | 1.56 | | | 10.2 | | | 1.03 | | | 0.53 | |
Operating expenses for the second quarter of 2014 decreased by $5.5 million compared to the same period in 2013, mainly attributable to the decrease in the cost of power during the quarter. Operating costs on a per barrel basis increased by 5% to $18.80/boe. Operating expenses for the first six months of 2014 decreased by $8.8 million compared to the same period in 2013, mainly attributable to the decrease in the cost of power, lower well servicing expenses and the impact of 2013 asset dispositions. Operating costs on a per barrel basis increased by 8% to $19.55/boe primarily due to the impact of lower sales volumes.
| | | Three Months Ended | | | Six Months Ended | |
| | | June 30 | | | June 30 | |
| ($/boe) | | 2014 | | | 2013 | | | Change | | | 2014 | | | 2013 | | | Change | |
| Power and purchased energy costs | | 3.88 | | | 5.38 | | | (1.50 | ) | | 4.35 | | | 4.89 | | | (0.54 | ) |
| Realized loss (gain) on electricity risk management contracts | | 0.22 | | | (0.45 | ) | | 0.67 | | | 0.05 | | | (0.25 | ) | | 0.30 | |
| Net power and purchased energy costs | | 4.10 | | | 4.93 | | | (0.83 | ) | | 4.40 | | | 4.64 | | | (0.24 | ) |
| Alberta Power Pool electricity price ($/MWh) | | 42.30 | | | 123.36 | | | (81.06 | ) | | 52.02 | | | 93.74 | | | (41.72 | ) |
12
| | MANAGEMENT’S DISCUSSION AND ANALYSIS |
Power and purchased energy costs, comprised primarily of electric power costs, represented approximately 21% of total operating expenses for the second quarter of 2014 (2013 – 30%). Power and purchased energy costs per boe were lower in the second quarter and first six months of 2014 as compared to 2013 due mainly to the lower average Alberta electricity price.
Transportation and marketing expenses relate primarily to delivery of natural gas to the Nova Gas Transmission Limited System and the cost of trucking crude oil to pipeline or rail receipt points. As a result, the total dollar amount of costs generally fluctuates in relation to sales volumes. In the second quarter and first six months of 2014 higher transportation costs were incurred in the Hay River and Deep Basin areas due to third-party turnarounds and facility restrictions. As such, despite the lower sales volumes for the second quarter and first six months of 2014, transportation and marketing expenses increased by $2.2 million and $3.4 million, respectively, as compared to the same periods in 2013.
Operating Netback(1)
| | | Three Months Ended June 30 | | | Six Months Ended June 30 | |
| ($/boe) | | 2014 | | | 2013 | | | Change | | | 2014 | | | 2013 | | | Change | |
| Petroleum and natural gas sales prior to hedging(2) | | 69.30 | | | 58.22 | | | 11.08 | | | 68.29 | | | 55.80 | | | 12.49 | |
| Royalties | | (11.77 | ) | | (8.55 | ) | | (3.22 | ) | | (10.03 | ) | | (7.53 | ) | | (2.50 | ) |
| Operating expenses | | (18.80 | ) | | (17.85 | ) | | (0.95 | ) | | (19.55 | ) | | (18.10 | ) | | (1.45 | ) |
| Transportation and marketing | | (1.71 | ) | | (1.07 | ) | | (0.64 | ) | | (1.56 | ) | | (1.03 | ) | | (0.53 | ) |
| Operating netback prior to hedging(1) | | 37.02 | | | 30.75 | | | 6.27 | | | 37.15 | | | 29.14 | | | 8.01 | |
| Hedging gain (loss)(3) | | (1.45 | ) | | 0.32 | | | (1.77 | ) | | (1.38 | ) | | 0.38 | | | (1.76 | ) |
| Operating netback after hedging(1) | | 35.57 | | | 31.07 | | | 4.50 | | | 35.77 | | | 29.52 | | | 6.25 | |
| (1) | This is a non-GAAP measure; please refer to “Non-GAAP Measures” in this MD&A. |
| (2) | Excludes miscellaneous income not related to oil and gas production |
| (3) | Hedging (loss) gain include the settlement amounts for natural gas, crude oil and power contracts. |
General and Administrative (“G&A”) Expenses
| | | Three Months Ended June 30 | | | Six Months Ended June 30 | |
| | | 2014 | | | 2013 | | | 2014 | | | 2013 | |
| G&A | | 16.1 | | | 17.3 | | | 33.0 | | | 35.0 | |
| G&A ($/boe ) | | 3.72 | | | 3.55 | | | 3.80 | | | 3.55 | |
For the second quarter and first six months of 2014, G&A expenses decreased $1.2 million and $2.0 million, respectively, from same periods in the prior year mainly due to lower salary and consulting costs. Harvest does not have a stock option program, however there is a long-term incentive program which is a cash settled plan that has been included in the G&A expense.
Depletion, Depreciation and Amortization (“DD&A”) Expenses
| | | Three Months Ended June 30 | | | Six Months Ended June 30 | |
| | | 2014 | | | 2013 | | | 2014 | | | 2013 | |
| DD&A | | 110.2 | | | 139.2 | | | 219.7 | | | 284.3 | |
| DD&A ($/boe) | | 25.46 | | | 28.59 | | | 25.28 | | | 28.82 | |
13
| | MANAGEMENT’S DISCUSSION AND ANALYSIS |
DD&A expenses for the second quarter and first six months of 2014 decreased by $29.0million and $64.6 million, respectively, as compared to the same periods in 2013 mainly due to a change in Harvest’s DD&A accounting estimate in the fourth quarter of 2013, as well as lower sales volumes.
Property Dispositions
Harvest disposed of $81.8 million of producing and non-producing assets to the Deep Basin Partnership and $8.4 million of construction assets-in-progress to the HK MS Partnership during the second quarter of 2014. No gain or loss was recorded relating to the dispositions as the proceeds received equaled the book value of these assets.
Subsequent to the second quarter of 2014, Harvest has entered into a purchase and sale agreement to sell certain non-core oil assets with approximately 2,000 barrels per day of production in Alberta for approximately $170 million in cash proceeds, net of any customary closing adjustments. The sale is expected to close during the third quarter of 2014.
Capital Asset Additions
| | | Three Months Ended June 30 | | | Six Months Ended June 30 | |
| | | 2014 | | | 2013 | | | 2014 | | | 2013 | |
| Drilling and completion | | 27.5 | | | 5.8 | | | 109.3 | | | 84.1 | |
| Well equipment, pipelines and facilities | | 23.7 | | | 17.0 | | | 66.9 | | | 49.2 | |
| Geological and geophysical | | — | | | 1.3 | | | 4.6 | | | 8.9 | |
| Land and undeveloped lease rentals | | 7.5 | | | 1.1 | | | 8.2 | | | 2.2 | |
| Corporate | | 0.5 | | | 0.7 | | | 2.0 | | | 2.0 | |
| Other | | 2.4 | | | 3.7 | | | 4.9 | | | 6.2 | |
| Total additions excluding acquisitions | | 61.6 | | | 29.6 | | | 195.9 | | | 152.6 | |
Total capital additions were greater in the second quarter and first six months of 2014 as compared to the same periods in the prior year mainly due to the drilling of deeper and more expensive wells, especially in the Red Earth and Deep Basin areas, in 2014.
The following table summarizes the wells drilled by Harvest and the related drilling and completion costs incurred in the period. A well is recorded in the table as having being drilled after it has been rig-released, however related drilling costs may be incurred in a period before a well has been spud (including survey, lease acquisition and construction costs) and related completion costs may be incurred in a period afterwards, depending on the timing of the completion work.
14
| | MANAGEMENT’S DISCUSSION AND ANALYSIS |
| | | Three Months Ended | | | Six Months Ended | |
| | | June 30 | | | June 30 | |
| | | | | | | | | Drilling and | | | | | | | | | Drilling and | |
| Area | | Gross | | | Net | | | completion | | | Gross | | | Net | | | completion | |
| Red Earth | | 2.0 | | | 2.0 | | $ | 11.8 | | | 7.0 | | | 6.9 | | $ | 37.3 | |
| Hay River | | — | | | — | | | 4.6 | | | 16.0 | | | 16.0 | | | 24.9 | |
| Deep Basin | | — | | | — | | | 2.8 | | | 7.0 | | | 2.8 | | | 18.2 | |
| Western Alberta | | 1.0 | | | 0.1 | | | 1.4 | | | 6.0 | | | 1.9 | | | 8.1 | |
| Cecil | | — | | | — | | | 1.1 | | | 2.0 | | | 2.0 | | | 4.6 | |
| Suffield | | — | | | — | | | 1.0 | | | 2.0 | | | 2.0 | | | 3.9 | |
| Heavy oil | | — | | | — | | | 0.2 | | | 1.0 | | | 1.0 | | | 2.4 | |
| Other areas | | 2.0 | | | 2.0 | | | 4.6 | | | 5.0 | | | 3.4 | | | 9.9 | |
| Total | | 5.0 | | | 4.1 | | $ | 27.5 | | | 46.0 | | | 36.0 | | $ | 109.3 | |
During the first six months of 2014, Harvest continued to concentrate its drilling activities in certain of its core growth areas: Deep Basin, Hay River and Red Earth; supplemented with drilling in the strategic revenue generating areas in Western Alberta and the Heavy Oil area. The primary areas of focus for Harvest’s Upstream drilling program are as follows:
- Deep Basin – participating or drilling deep, horizontal multi-stage fractured wells to develop the liquids-rich Falher and Montney gas formations;
- Hay River – pursuing heavy gravity oil in the Bluesky formation using multi-leg horizontal oil wells;
- Red Earth – activities are spread across the Loon Lake, Gift, Evi and Golden areas targeting light oil formations primarily in the Slave Point and also the Gilwood;
- Western Alberta – activities spread across several fields with recent efforts targeting mainly the Cardium, Glauconite, Ostracod, and Notikewin formations;
- Heavy Oil area – horizontal heavy oil wells in the Lloydminster region of Alberta into the McLaren, Lloydminster, Grand Petroleum and Sparky formations.
Decommissioning Liabilities
Harvest’s Upstream decommissioning liabilities at June 30, 2014 were $715.7 million (December 31, 2013 - $709.4 million) for future remediation, abandonment, and reclamation of Harvest’s oil and gas properties. The total of the decommissioning liabilities are based on management’s best estimate of costs to remediate, reclaim, and abandon wells and facilities. The costs will be incurred over the operating lives of the assets with the majority being at or after the end of reserve life. Please refer to the “Contractual Obligations and Commitments” section of this MD&A for the payments expected for each of the next five years and thereafter in respect of the decommissioning liabilities.
Investments in Joint Ventures
On April 23, 2014, Harvest entered into two joint ventures with KERR Canada Co. Ltd. (“KERR”): Deep Basin Partnership (“DPB”) and HK MS Partnership (“HKMS”). DBP was established for the purposes of exploring, developing and producing from certain oil and gas properties in the Deep Basin area in Northwest Alberta. Harvest contributed certain producing and non-producing properties to DBP in exchange for 467,386,000 of common partnership units (82.32% ownership interest), while KERR contributed $100.4 million for 100,368,000 preferred partnership units (17.68% ownership interest). Amounts contributed by KERR will be spent by the DBP to drill and develop partnership properties in the Deep Basin area. If funding from KERR is insufficient to fund the entire agreed initial multi-year development program, Harvest will fund the balance of the program from its share of partnership distributions.
15
| | MANAGEMENT’S DISCUSSION AND ANALYSIS |
The preferred partnership units provide KERR certain preference rights, including a put option right exercisable after 10.5 years, whereby KERR could cause DBP to redeem all its preferred partnership units for consideration equal to its initial contribution plus a minimum after-tax internal rate of return of two percent. If DBP does not have sufficient funds to complete the redemption obligation and after making efforts to secure funding, whether via issuing new equity, entering into a financing arrangement or selling assets, the partnership can cash-call Harvest to meet such obligation (the “top-up obligation”). This top-up obligation is accounted for by Harvest at fair value through profit and loss and is estimated using a probabilistic model of the estimated future cash flows of the DBP. The cash flow forecast is based on management’s internal assumptions of the volumes, commodity prices, royalties, operating costs and capital expenditures specific to the DBP. As at June 30, 2014, the fair value of the top-up obligation was estimated at $nil, therefore, no top-up obligation was recorded by Harvest. In addition, once KERR achieves the minimum after-tax internal rate of return on its investment, Harvest is entitled to increased return on its investment.
HKMS was formed for the purposes of constructing and operating a gas processing facility, which will be primarily used to process the gas produced from the properties owned by the Deep Basin Partnership. A gas processing agreement was entered by the two partnerships. For the HKMS Partnership, KERR contributed $22.6 million for 22,632,000 partnership units, which represent 34.82% of the outstanding partnership units. The remaining 65.18% (42,368,000 partnership units) will be contributed by Harvest as cash is required for the completion of construction of the gas processing facility. On the earlier of 10.5 years after the formation of HKMS or when KERR achieves certain internal rate of return, Harvest will have the right but not the obligation to purchase all of KERR’s interest for nominal consideration. As at June 30, 2014, no contribution had been made by Harvest to the HKMS partnership.
For the second quarter and first six months of 2014, Harvest recognized $0.2 million of income from its investment in these joint ventures.
See note 7 of the June 30, 2014 unaudited interim consolidated financial statements for discussion of the accounting implications of these joint ventures.
BLACKGOLD OIL SANDS
Capital Asset Additions
| | | Three Months Ended June 30 | | | Six Months Ended June 30 | |
| | | 2014 | | | 2013 | | | 2014 | | | 2013 | |
| Drilling and completion | | 0.4 | | | 2.6 | | | 0.4 | | | 6.2 | |
| Well equipment, pipelines and facilities | | 32.9 | | | 110.7 | | | 65.9 | | | 162.7 | |
| Pre-operating costs | | 5.1 | | | — | | | 5.3 | | | — | |
| Other | | 10.8 | | | 5.3 | | | 19.8 | | | 10.8 | |
| Total BlackGold additions | | 49.2 | | | 118.6 | | | 91.4 | | | 179.7 | |
16
| | MANAGEMENT’S DISCUSSION AND ANALYSIS |
During the second quarter and first six months of 2014, Harvest invested $32.9 million and $65.9 million, respectively, on the CPF. As at June 30, 2014, the overall oil sands project was approximately 95% complete.
Oil Sands Project Development
Harvest is developing its BlackGold oil sands CPF under the engineering, procurement and construction (“EPC”) contract. Expected total costs under the EPC contract are approximately $650 million.
Initial drilling of 30 steam assisted gravity drainage (“SAGD”) wells (15 well pairs) was completed by the end of 2012. More SAGD wells will be drilled in the future to compensate for the natural decline in production of the initial well pairs and maintain the Phase 1 production capacity of 10,000 bbl/d. Preliminary construction has been substantially completed, including the building of the CPF plant site, the placement of site equipment and pipe rack module installation. Piping and cabling of the CPF are now ongoing. Commissioning of the CPF and first steam is anticipated in the fourth quarter of 2014. Phase 2 of the project, which is targeted to increase production capacity to 30,000 bbl/d, received all required regulatory approvals in 2013.
As at June 30, 2014, Harvest has incurred costs of $611.3 million on the EPC contract. After the accounting impact of the deferred liability described below, Harvest has recorded $592.4 million of costs for the EPC contract and has recorded $822.3 million of costs on the entire project since acquiring the BlackGold assets in 2010. Under the EPC contract, a maximum of approximately $101 million of the EPC costs will be paid in equal installments, without interest, over 10 years commencing on the completion of the EPC work in 2014. The liability is considered a financial liability and is initially recorded at fair value, which is estimated as the present value of all future cash payments discounted using the prevailing market rate of interest for similar instruments. As at June 30, 2014, Harvest recognized a liability of $76.9 million (December 31, 2013 - $76.2 million) using a discount rate of 4.5% (December 31, 2013 - 4.5%) . Non-cash capital additions are recognized in well equipment, pipelines and facilities as the work is performed and the related deferred EPC liability is recognized.
The BlackGold project faces similar cost and schedule pressures as other oil sand projects, including shortage of skilled labor and rising costs.
Decommissioning Liabilities
Harvest’s BlackGold decommissioning liabilities at June 30, 2014 were $36.2 million (December 31, 2013 - $34.3 million) relating to the future remediation, abandonment, and reclamation of the SAGD wells and CPF. Please see the “Contractual Obligations and Commitments” section of this MD&A for the payments expected for each of the next five years and thereafter in respect of the decommissioning liabilities.
17
| | MANAGEMENT’S DISCUSSION AND ANALYSIS |
DOWNSTREAM OPERATIONS
Summary of Financial and Operating Results
| | | Three Months Ended | | | Six Months Ended | |
| | | June 30 | | | June 30 | |
| | | 2014 | | | 2013 | | | 2014 | | | 2013 | |
| FINANCIAL | | | | | | | | | | | | |
| Refined products sales(1) | | 1,120.4 | | | 1,156.1 | | | 2,233.8 | | | 2,278.1 | |
| Purchased products for processing and resale(1) | | 1,103.8 | | | 1,135.5 | | | 2,111.8 | | | 2,221.9 | |
| Gross margin(2) | | 16.6 | | | 20.6 | | | 122.0 | | | 56.2 | |
| | | | | | | | | | | | | |
| Operating expense | | 29.4 | | | 31.3 | | | 60.1 | | | 65.3 | |
| Purchased energy expense | | 28.3 | | | 17.3 | | | 66.2 | | | 50.4 | |
| Marketing expense | | 2.2 | | | 1.3 | | | 3.9 | | | 2.8 | |
| General and administrative | | 0.2 | | | 0.1 | | | 0.3 | | | 0.3 | |
| Depreciation and amortization | | 3.4 | | | 22.2 | | | 7.0 | | | 44.0 | |
| Gain on dispositions of PP&E | | — | | | — | | | (0.2 | ) | | — | |
| Operating loss(3) | | (46.9 | ) | | (51.6 | ) | | (15.3 | ) | | (106.6 | ) |
| Capital expenditures | | 7.4 | | | 10.1 | | | 10.6 | | | 22.6 | |
| OPERATING | | | | | | | | | | | | |
| Feedstock volume (bbl/d)(4) | | 95,410 | | | 106,245 | | | 95,588 | | | 103,176 | |
| Yield (% of throughput volume)(5) | | | | | | | | | | | | |
| Gasoline and related products | | 31% | | | 33% | | | 32% | | | 31% | |
| Ultra low sulphur diesel and jet fuel | | 36% | | | 43% | | | 36% | | | 39% | |
| High sulphur fuel oil | | 30% | | | 20% | | | 29% | | | 27% | |
| Total | | 97% | | | 96% | | | 97% | | | 97% | |
| Average refining gross margin (US$/bbl)(2)(6) | | 0.25 | | | 0.74 | | | 4.93 | | | 1.59 | |
(1) Refined product sales and purchased products for processing and resale are net of intra-segment sales of $138.9 million and $289.0 million for the three and six months ended June 30, 2014 (2013 - $131.9 million and $265.3 million), reflecting the refined products produced by the refinery and sold by the marketing division. |
| (2) These are non-GAAP measures; please refer to “Non-GAAP Measures” in this MD&A. |
| (3) This is an additional GAAP measure; please refer to “Additional GAAP Measures” in this MD&A. |
| (4) Barrels per day are calculated using total barrels of crude oil feedstock and purchased vacuum gas oil. |
| (5) Based on production volumes after adjusting for changes in inventory held for resale. |
| (6) Average refining gross margin is calculated based on per barrel of feedstock throughput. |
18
| | MANAGEMENT’S DISCUSSION AND ANALYSIS |
Refining Benchmark Prices
| | | Three Months Ended | | | Six Months Ended | |
| | | June 30 | | | June 30 | |
| | | 2014 | | | 2013 | | | Change | | | 2014 | | | 2013 | | | Change | |
| WTI crude oil (US$/bbl) | | 102.99 | | | 94.22 | | | 9% | | | 100.84 | | | 94.30 | | | 7% | |
| Brent crude oil (US$/bbl) | | 109.75 | | | 103.31 | | | 6% | | | 108.85 | | | 107.97 | | | 1% | |
| Argus sour crude index (“ASCI”) (US$/bbl) | | 100.11 | | | 99.26 | | | 1% | | | 100.31 | | | 104.11 | | | (4% | ) |
| Brent – WTI differential (US$/bbl) | | 6.76 | | | 9.09 | | | (26% | ) | | 8.01 | | | 13.67 | | | (41% | ) |
| Brent – ASCI differential (US$/bbl) | | 9.64 | | | 4.05 | | | 138% | | | 8.54 | | | 3.86 | | | 121% | |
| Refined product prices | | | | | | | | | | | | | | | | | | |
| Platts RBOB (US$/bbl) | | 126.25 | | | 118.60 | | | 6% | | | 119.93 | | | 120.51 | | | — | |
| Platts Ultra Low Sulfur Diesel (US$/bbl) | | 123.88 | | | 119.99 | | | 3% | | | 125.95 | | | 125.31 | | | 1% | |
| Platts High Sulphur Fuel Oil (US$/bbl) | | 92.79 | | | 90.72 | | | 2% | | | 92.24 | | | 94.12 | | | (2% | ) |
| U.S. / Canadian dollar exchange rate | | 0.917 | | | 0.977 | | | (6% | ) | | 0.911 | | | 0.984 | | | (7% | ) |
Summary of Gross Margins
| | | Three Months Ended June 30 | |
| | | 2014 | | | 2013 | |
| | | | | | Volumes(1 | ) | | (US$/bbl) | | | | | | Volumes(1 | ) | | (US$/bbl) | |
| Refinery | | | | | | | | | | | | | | | | | | |
| Sales | | | | | | | | | | | | | | | | | | |
| Gasoline products | | 357.1 | | | 2.8 | | | 119.33 | | | 421.0 | | | 3.7 | | | 112.62 | |
| Distillates | | 468.5 | | | 3.5 | | | 121.72 | | | 533.8 | | | 4.5 | | | 116.40 | |
| High sulphur fuel oil | | 211.8 | | | 2.2 | | | 89.47 | | | 159.0 | | | 1.8 | | | 86.73 | |
| Other(1) | | 50.2 | | | 0.4 | | | 112.91 | | | 12.3 | | | 0.1 | | | 105.84 | |
| Total sales | | 1,087.6 | | | 8.9 | | | 112.66 | | | 1,126.1 | | | 10.1 | | | 109.61 | |
| Feedstock(2) | | | | | | | | | | | | | | | | | | |
| Crude oil | | 987.5 | | | 8.5 | | | 105.91 | | | 949.8 | | | 9.2 | | | 101.11 | |
| Vacuum Gas Oil (“VGO”) | | 16.0 | | | 0.2 | | | 110.03 | | | 54.0 | | | 0.5 | | | 107.53 | |
| Total feedstock | | 1,003.5 | | | 8.7 | | | 105.98 | | | 1,003.8 | | | 9.7 | | | 101.44 | |
| Other(3) | | 81.7 | | | | | | | | | 115.0 | | | | | | | |
| Total feedstock and other costs | | 1,085.2 | | | | | | | | | 1,118.8 | | | | | | | |
| Refinery gross margin(4) | | 2.4 | | | | | | 0.25 | | | 7.3 | | | | | | 0.74 | |
| Marketing | | | | | | | | | | | | | | | | | | |
| Sales | | 171.7 | | | | | | | | | 161.9 | | | | | | | |
| Cost of products sold | | 157.5 | | | | | | | | | 148.6 | | | | | | | |
| Marketing gross margin(4) | | 14.2 | | | | | | | | | 13.3 | | | | | | | |
| Total gross margin(4) | | 16.6 | | | | | | | | | 20.6 | | | | | | | |
19
| | MANAGEMENT’S DISCUSSION AND ANALYSIS |
| | | Six Months Ended June 30 | |
| | | 2014 | | | 2013 | |
| | | | | | Volumes(1 | ) | | (US$/bbl) | | | | | | Volumes(1 | ) | | (US$/bbl) | |
| Refinery | | | | | | | | | | | | | | | | | | |
| Sales | | | | | | | | | | | | | | | | | | |
| Gasoline products | | 740.7 | | | 5.9 | | | 114.56 | | | 768.3 | | | 6.6 | | | 114.60 | |
| Distillates | | 926.9 | | | 6.8 | | | 123.74 | | | 961.5 | | | 7.8 | | | 121.41 | |
| High sulphur fuel oil | | 421.3 | | | 4.4 | | | 88.43 | | | 383.2 | | | 4.2 | | | 90.05 | |
| Other(1) | | 73.3 | | | 0.6 | | | 112.96 | | | 99.3 | | | 0.9 | | | 108.97 | |
| Total sales | | 2,162.2 | | | 17.7 | | | 111.63 | | | 2,212.3 | | | 19.5 | | | 111.79 | |
| Feedstock(2) | | | | | | | | | | | | | | | | | | |
| Crude oil | | 1,899.5 | | | 17.0 | | | 101.76 | | | 1,855.5 | | | 17.5 | | | 104.64 | |
| Vacuum Gas Oil (“VGO”) | | 33.3 | | | 0.3 | | | 109.19 | | | 137.9 | | | 1.2 | | | 110.72 | |
| Total feedstock | | 1,932.8 | | | 17.3 | | | 101.88 | | | 1,993.4 | | | 18.7 | | | 105.04 | |
| Other(3) | | 135.9 | | | | | | | | | 188.8 | | | | | | | |
| Total feedstock and other costs | | 2,068.7 | | | | | | | | | 2,182.2 | | | | | | | |
| Refinery gross margin(4) | | 93.5 | | | | | | 4.93 | | | 30.1 | | | | | | 1.59 | |
| Marketing | | | | | | | | | | | | | | | | | | |
| Sales | | 360.6 | | | | | | | | | 331.1 | | | | | | | |
| Cost of products sold | | 332.1 | | | | | | | | | 305.0 | | | | | | | |
| Marketing gross margin(4) | | 28.5 | | | | | | | | | 26.1 | | | | | | | |
| Total gross margin(4) | | 122.0 | | | | | | | | | 56.2 | | | | | | | |
| (1) | Volumes in million bbls. |
| (2) | Includes sales of vacuum gas oil and hydrocracker bottoms. |
| (3) | Cost of feedstock includes all costs of transporting the crude oil to the refinery in Newfoundland. |
| (4) | Includes inventory adjustments, additives and blendstocks and purchased product for resale. |
| (5) | This is a non-GAAP measure; please refer to “Non-GAAP Measures” in this MD&A. |
Feedstock throughput averaged 95,410 bbl/d in the second quarter of 2014, 10% lower than the 106,245 bbl/d average feedstock in the second quarter of the prior year. The feedstock throughput for the six months ended June 30, 2014 was 95,588 bbl/d, a decrease of 7% from 103,176 bbl/d for the same period in 2013. The lower daily average throughput rates for the current quarter and the current year is a consequence of a planned three-week outage on the platformer unit for regular maintenance at the end of May followed by an unplanned ten-day isomax outage. In addition, throughput was impacted by a power outage in January, an unplanned outage in the last week of March due to a leak on a pipe in the crude vacuum unit and reduced rates on the isomax unit due to market economics. The daily average throughput rate for 2013 has also been negatively impacted as a consequence of an unplanned two-week outage in February due to a power failure during a storm, a partial outage in March for additional repairs and reduced throughput rates in the second quarter of 2013 as a result of economic conditions.
20
| | MANAGEMENT’S DISCUSSION AND ANALYSIS |
The table below provides a comparison between the product crack spreads realized by Downstream and the benchmark crack spread for the three and six months ended June 30, with both crack spreads referring to the price of Brent crude oil.
| | | Three Months Ended June 30 | |
| | | 2014 | | | 2013 | |
| | | Refinery | | | Benchmark(1 | ) | | Difference | | | Refinery | | | Benchmark(1 | ) | | Difference | |
| Gasoline products (US$/bbl) | | 13.35 | | | 16.50 | (2) | | (3.15 | ) | | 11.18 | | | 15.29 | (2) | | (4.11 | ) |
| Distillates (US$/bbl) | | 15.74 | | | 14.13 | (2) | | 1.61 | | | 14.96 | | | 16.68 | (2) | | (1.72 | ) |
| High Sulphur Fuel Oil (US$/bbl) | | (16.51 | ) | | (16.96 | )(3) | | 0.45 | | | (14.71 | ) | | (12.59 | )(3) | | (2.12 | ) |
| | | Six Months Ended June 30 | |
| | | 2014 | | | 2013 | |
| | | Refinery | | | Benchmark(1 | ) | | Difference | | | Refinery | | | Benchmark(1 | ) | | Difference | |
| Gasoline products (US$/bbl) | | 12.68 | | | 11.08 | (2) | | 1.60 | | | 9.56 | | | 12.54 | (2) | | (2.98 | ) |
| Distillates (US$/bbl) | | 21.86 | | | 17.10 | (2) | | 4.76 | | | 16.37 | | | 17.34 | (2) | | (0.97 | ) |
| High Sulphur Fuel Oil (US$/bbl) | | (13.45 | ) | | (16.61 | )(3) | | 3.16 | | | (14.99 | ) | | (13.85 | )(3) | | (1.14 | ) |
| (1) | Benchmark product crack is relative to Brent crude oil |
| (2) | RBOB benchmark market price sourced from Platts. |
| (3) | High Sulphur Fuel Oil benchmark market price sourced from Platts. Our high sulphur fuel oil normally contains higher sulphur content than the 3% content reflected in the benchmark price. |
Downstream’s product crack spreads are different from the above noted benchmarks due to several factors, including the timing of actual sales and feedstock purchases differing from the calendar month benchmarks, transportation costs, sour crude differentials, quality differentials and variability in the throughput volume over a given period of time. The refinery sales also include products for which market prices are not reflected in the benchmarks. Downstream’s crack spreads for gasoline products and distillates in the above tables include the actual cost of renewable identification numbers (“RINs”) that are necessary to meet blending requirements for RBOB gasoline and ultra-low sulphur diesel (“ULSD”) in the US market as mandated by the US government. Our average RINs cost for the quarter was approximately US$1.85/bbl for RBOB gasoline and US$2.05/bbl for ULSD products compared to US$3.45/bbl and US$2.60/bbl, respectively, for the second quarter of 2013. Average RINs cost year to date was approximately US$1.90/bbl for RBOB gasoline and US$2.05/bbl for ULSD products compared to US$2.80/bbl and US$2.10/bbl, respectively, for the prior year. For more detail on RINs, see “Operational and Other Business Risks” section of our December 31, 2013 MD&A.
Our refinery sales for the three and six months ended June 30, 2014 have decreased by $38.5 million and $50.1 million from the same periods of 2013 respectively mainly as a result of lower sales volume partially offset by a stronger U.S. exchange rate and higher realized product prices. The higher realized product prices were consistent with changes in the benchmark market prices.
The refinery gross margin for the three months ended June 30, 2014 decreased 67% as compared to the same period in the prior year. The overall decrease can be attributed to lower sales volumes of gasoline products and distillates, increased sales volume of high sulphur fuel oil which sells at a discount to Brent crude oil, lower refinery throughput and a weakened yield mix due to the May and June 2014 outages. This is partly offset by higher realized product crack spreads on our gasoline and distillate products as a consequence of improved sour crude differentials and market conditions. The cost of our crude feedstock in the second quarter of 2014 was a US$3.84/bbl discount to the benchmark Brent crude oil as compared to a discount of US$2.20/bbl in the same period of the prior year.
21
| | MANAGEMENT’S DISCUSSION AND ANALYSIS |
The refinery gross margin for the six months ended June 30, 2014 was significantly higher than the $30.1 million as reported in the same period of the prior year due to higher realized product margins in the first quarter as a consequence of improved sour crude differentials.
The overall gross margin for our refinery is also impacted by the purchasing of blendstocks to meet summer gasoline specifications, additives to meet product specifications, the build of unfinished saleable products some of which are recorded at a value lower than cost, and inventory write-downs and reversals. These costs are included in “other costs” in the Summary of Gross Margin Table above. The lower costs for both the three and six months ended June 30, 2014 as compared to the prior year are a result of decreased purchases of blendstocks due to lower sales volume of gasoline. In addition, the refinery significantly reduced the amount of VGO purchased and processed in 2014 as compared to 2013 because of marginal economic returns.
The gross margin from the marketing operations is comprised of the margin from both the retail and wholesale distribution of gasoline and home heating fuels as well as the revenues from marine services including tugboat revenues and reflects a modest improvement for the three and six months ended June 30, 2014 as compared to the same period in 2013.
During the three and six months ended June 30, 2014, the Canadian dollar weakened as compared to the US dollar. As seen in the gross margin table, the weakening of the Canadian dollar has had a positive impact to the contribution from the refinery operations relative to the prior year as substantially all of its gross margin, cost of purchased energy and marketing expense are denominated in U.S. dollars.
Operating Expenses
| | | Three Months Ended June 30 | |
| | | 2014 | | | 2013 | |
| | | Refining | | | Marketing | | | Total | | | Refining | | | Marketing | | | Total | |
| Operating cost | | 23.6 | | | 5.8 | | | 29.4 | | | 25.7 | | | 5.6 | | | 31.3 | |
| Purchased energy | | 28.3 | | | — | | | 28.3 | | | 17.3 | | | — | | | 17.3 | |
| | | 51.9 | | | 5.8 | | | 57.7 | | | 43.0 | | | 5.6 | | | 48.6 | |
| ($/bbl of feedstock throughput) | | | | | | | | | | | | | | | | | | |
| Operating cost | | 2.7 | | | — | | | — | | | 2.7 | | | — | | | — | |
| Purchased energy | | 3.3 | | | — | | | — | | | 1.8 | | | — | | | — | |
| | | 6.0 | | | — | | | — | | | 4.5 | | | — | | | — | |
22
| | MANAGEMENT’S DISCUSSION AND ANALYSIS |
| | | Six Months Ended June 30 | |
| | | 2014 | | | 2013 | |
| | | Refining | | | Marketing | | | Total | | | Refining | | | Marketing | | | Total | |
| Operating cost | | 49.3 | | | 10.8 | | | 60.1 | | | 54.4 | | | 10.9 | | | 65.3 | |
| Purchased energy | | 66.2 | | | — | | | 66.2 | | | 50.4 | | | — | | | 50.4 | |
| | | 115.5 | | | 10.8 | | | 126.3 | | | 104.8 | | | 10.9 | | | 115.7 | |
| ($/bbl of feedstock throughput) | | | | | | | | | | | | | | | | | | |
| Operating cost | | 2.9 | | | — | | | — | | | 2.9 | | | — | | | — | |
| Purchased energy | | 3.8 | | | — | | | — | | | 2.7 | | | — | | | — | |
| | | 6.7 | | | — | | | — | | | 5.6 | | | — | | | — | |
The refining operating cost per barrel of feedstock throughput increased by 2% in the second quarter of 2014 as a result of decreased throughput however the operating cost per barrel of feedstock decreased by 2% for the six months ended mainly due to lower operating costs partially offset by lower throughput in 2014.
Purchased energy, consisting of LSFO and electricity, is required to provide heat and power to refinery operations. The purchased energy cost per barrel of feedstock throughput increased by 82% and 42% respectively during the three and six months ended June 30, 2014 as compared to the same periods of 2013 mainly due to a lower consumption of produced fuel gas in the current year.
Capital Assets Additions
Capital asset additions for the three and six months ended June 30, 2014 totaled $7.4 million and $10.6 million respectively (2013 - $10.1 million and $22.6 million respectively), relating to various capital projects including turnaround and preparation costs.
Depreciation and Amortization Expense
| | | Three Months Ended | | | Six Months Ended | |
| | | June 30 | | | June 30 | |
| | | 2014 | | | 2013 | | | 2014 | | | 2013 | |
| Refining | | 2.5 | | | 21.3 | | | 5.3 | | | 42.1 | |
| Marketing | | 0.9 | | | 0.9 | | | 1.7 | | | 1.9 | |
| Total depreciation and amortization | | 3.4 | | | 22.2 | | | 7.0 | | | 44.0 | |
Depreciation and amortization expense decreased $18.8 million and $37.0 million respectively for the three and six months ended June 30, 2014 as compared to 2013 because of the $458.9 million impairment of refinery property, plant and equipment which occurred in the fourth quarter of 2013.The process units are amortized over an average useful life of 20 to 35 years and turnaround costs are amortized to the next scheduled turnaround.
Decommissioning Liabilities
Harvest’s Downstream decommissioning liabilities result from the ownership of the refinery and marketing assets. At June 30, 2014, Downstream’s decommissioning liabilities were $17.0 million (December 31, 2013 – $16.7 million) relating to the reclamation and abandonment of these assets with an expected abandonment date of 2069. Please see “Contractual Obligations and Commitments” section of this MD&A for the payments expected for each of the next five years and thereafter in respect of the decommissioning liabilities.
23
| | MANAGEMENT’S DISCUSSION AND ANALYSIS |
RISK MANAGEMENT, FINANCING AND OTHER
Cash Flow Risk Management
The Company at times enters into natural gas, crude oil, electricity and foreign exchange contracts to reduce the volatility of cash flows from some of its forecast sales and purchases, and when allowable, will designate these contracts as cash flow hedges. The WCS price swap and foreign exchange swap were entered into concurrently and complement each other. The WCS swap mitigates crude oil price risk by fixing a certain U.S. dollar price per barrel on certain heavy oil volumes. The foreign exchange swap mitigates currency exchange risk by swapping the U.S. dollar notional value of the WCS price swap back to Harvest’s functional currency, the Canadian dollar. The following is a summary of Harvest’s risk management contracts outstanding at June 30, 2014:
| Contracts Designated as Hedges | | | | | | | | | | |
| Contract Quantity | | Type of Contract | | | Term | | | Contract Price | | | Fair value | |
| 44,600 GJ/day | | AECO swap | | | July - Dec 2014 | | $ | 3.76/GJ | | $ | (4.4 | ) |
| 6,500 bbls/day | | WCS price swap | | | July - Dec 2014 | | | US$77.78/bbl | | | (3.2 | ) |
| US$0.5 million/day | | Foreign exchange swap | | | July - Dec 2014 | | $ | 1.1088 Cdn/US | | | 3.4 | |
| | | | | | | | | | | $ | (4.2 | ) |
| Contracts Not Designated as Hedges | | | | | | | | | | |
| Contract Quantity | | Type of Contract | | | Term | | | Contract Price | | | Fair value | |
| 35 MWh | | AESO power swap | | | July - Dec 2014 | | $ | 54.74/MWh | | $ | 1.1 | |
| 15 MWh | | AESO power swap | | | Jan - Dec 2015 | | $ | 48.67/MWh | | | 0.9 | |
| | | | | | | | | | | $ | 2.0 | |
The following is a summary of Harvest’s realized and unrealized (gains) losses on risk management contracts:
| | | Three Months Ended June 30 | |
| | | 2014 | | | 2013 | |
| Realized (gains) losses recognized in: | | Power | | | CrudeOil | | | Currency | | | NaturalGas | | | Total | | | Power | | | Crude Oil | | | Currency | | | Natural Gas | | | Total | |
| Revenues | | — | | | 2.5 | | | — | | | 2.7 | | | 5.2 | | | — | | | 1.2 | | | — | | | (0.6 | ) | | 0.6 | |
Risk management
(gains) losses | | 0.9 | | | — | | | 0.1 | | | — | | | 1.0 | | | (2.2 | ) | | — | | | 0.1 | | | — | | | (2.1 | ) |
| Unrealized (gains) losses recognized in: | | | | | | | | | | | | | | | | | | | | | | | | | | | | | | |
| OCI, before tax | | — | | | 0.7 | | | — | | | (1.1 | ) | | (0.4 | ) | | — | | | 4.5 | | | — | | | (4.8 | ) | | (0.3 | ) |
Risk management
(gains) losses | | (2.1 | ) | | (0.2 | ) | | — | | | — | | | (2.3 | ) | | (0.9 | ) | | (0.9 | ) | | 0.9 | | | — | | | (0.9 | ) |
24
| | MANAGEMENT’S DISCUSSION AND ANALYSIS |
| | | Six Months Ended June 30 | |
| | | 2014 | | | 2013 | |
Realized (gains) losses
recognized in: | | Power | | | Crude
Oil | | | Currency | | | Natural
Gas | | | Total | | | Power | | | Crude
Oil | | | Currency | | | Natural
Gas | | | Total | |
| Revenues | | — | | | 2.5 | | | — | | | 9.0 | | | 11.5 | | | — | | | 1.2 | | | — | | | (1.1 | ) | | 0.1 | |
Risk management
(gains) losses | | 0.5 | | | — | | | — | | | — | | | 0.5 | | | (2.5 | ) | | — | | | (1.4 | ) | | — | | | (3.9 | ) |
Unrealized (gains) losses
recognized in: | | | | | | | | | | | | | | | | | | | | | | | | | | | | | | |
| OCI, before tax | | — | | | 2.3 | | | — | | | 13.5 | | | 15.8 | | | — | | | 6.0 | | | — | | | (3.2 | ) | | 2.8 | |
Risk management
gains | | (2.5 | ) | | — | | | — | | | — | | | (2.5 | ) | | (1.3 | ) | | (0.8 | ) | | — | | | — | | | (2.1 | ) |
Financing Costs
| | | Three Months Ended June 30 | | | Six Months Ended June 30 | |
| | | 2014 | | | 2013 | | | 2014 | | | 2013 | |
| Credit facility | | 6.9 | | | 4.7 | | | 13.6 | | | 8.9 | |
| Convertible debentures | | — | | | 4.3 | | | — | | | 14.9 | |
| 67/8% senior notes | | 10.0 | | | 9.3 | | | 19.9 | | | 18.3 | |
| 21/8% senior notes(1) | | 4.9 | | | 2.8 | | | 9.7 | | | 2.8 | |
| Related party loans | | 5.0 | | | 2.0 | | | 8.9 | | | 4.0 | |
| Amortization of deferred finance charges and other | | 0.7 | | | 1.6 | | | 1.3 | | | 1.7 | |
| Interest and other financing charges | | 27.5 | | | 24.7 | | | 53.4 | | | 50.6 | |
| Accretion of decommission and environmental remediation liabilities | | 5.8 | | | 5.5 | | | 11.6 | | | 11.1 | |
| Gain on redemption of convertible debentures | | — | | | (3.6 | ) | | — | | | (3.6 | ) |
| Less: capitalized interest | | (7.9 | ) | | (4.1 | ) | | (15.1 | ) | | (8.2 | ) |
| Total finance costs | | 25.4 | | | 22.5 | | | 49.9 | | | 49.9 | |
(1) Includes guarantee fee to KNOC.
The financing costs on the credit facility have increased in 2014, mainly due to the greater average amount of principal outstanding during the three months and six months ended June 30, 2014 and a higher effective interest rate, as compared to the same periods in the prior year. See note 8(a) of the June 30, 2014 interim consolidated financial statements.
No interest was paid on convertible debentures in the first quarter of 2014 as all remaining convertible debentures were redeemed in the second quarter 2013.
The financing costs on the 21/8% senior notes have increased in 2014 as the notes were issued in May of 2013 and now full-period interest has been accrued for the three months and six months ended June 30, 2014.
The financing costs on related party loans has increased in 2014 due to the borrowings under the KNOC subordinated agreement. See discussion in the “Related Party Transaction” section of this MD&A.
25
| | MANAGEMENT’S DISCUSSION AND ANALYSIS |
Capitalized interest relates to amounts borrowed to fund the capital expenditures of BlackGold. The increase in capitalized interest for the three months and six month periods ending June 30, 2014 is mainly due to the increase in our long-term borrowings attributable to BlackGold.
Currency Exchange
Currency exchange gains and losses are attributed to the changes in the value of the Canadian dollar relative to the U.S. dollar on the U.S. dollar denominated 67/8% and 21/8% senior notes, the ANKOR related party loan and on any U.S. dollar denominated monetary assets or liabilities. As Downstream operations’ functional currency is denominated in U.S. dollars, the strengthening (weakening) of the U.S. dollar would result in unrealized currency exchange gains (losses) from its decommissioning liabilities, pension obligations, accounts payable and other balances that are denominated in Canadian dollars, which will partially offset Upstream’s unrealized losses (gains) recognized on the 67/8% and 21/8% senior notes, ANKOR loan and any U.S. dollar denominated monetary items. At June 30, 2014, the Canadian dollar had strengthened compared to the US dollar as at March 31, 2014 resulting in an unrealized foreign exchange gain of $28.8 million for the second quarter of 2014 (2013 – loss of $31.7 million). Harvest recognized a realized foreign exchange gain of $1.0 million for the second quarter ended June 30, 2014 (2013 - $0.9 million) as a result of the settlement of U.S. dollar denominated transactions. Considering the six months ending June 30, 2014, the Canadian dollar marginally weakened compared to the US dollar as at December 31, 2013 resulting in an unrealized foreign exchange loss of $1.4 million (2013 – $35.5 million). Harvest recognized a realized foreign exchange loss of $1.0 million for the six months ended June 30, 2014 (2013 - $1.1 million) as a result of the settlement of U.S. dollar denominated transactions.
The cumulative translation adjustment recognized in other comprehensive loss represents the translation of the Downstream operations’ U.S. dollar functional currency financial statements to Canadian dollars. During the first six months of 2014, Downstream operations incurred a net cumulative translation loss of $1.5 million (2013 – gain of $9.2 million) reflecting the changes in the Canadian dollar relative to the U.S. dollar on the negative value of Harvest’s net investment in the Downstream segment at June 30, 2014 compared to December 31, 2013.
Deferred Income Taxes
For the three and six months ending June 30, 2014 Harvest recorded deferred income tax expense of $14.5 million and $8.1 million, respectively (2013 – recoveries of $16.1 million and $31.4 million). Harvest’s deferred income tax asset (liability) will fluctuate during each accounting period to reflect changes in the temporary differences between the book value and tax basis of assets as well as legislative tax rate changes. Currently, the principal sources of temporary differences relate to the Company’s property, plant and equipment, decommissioning liabilities and the unclaimed tax pools.
26
| | MANAGEMENT’S DISCUSSION AND ANALYSIS |
Related Party Transactions
The following provides a summary of the related party transactions between Harvest and KNOC for the three and six months ended June 30, 2014:
Related Party Loans
On December 30, 2013, Harvest entered into a subordinated loan agreement with KNOC to borrow up to $200 million at a fixed interest rate of 5.3% per annum. The full principal and accrued interest is payable on December 30, 2018. At June 30, 2014, Harvest has drawn the full $200 million allowable under the loan agreement (December 31, 2013 - $80 million). The loan amount was recorded at fair value on initial recognition by discounting the future cash payments at the rate of 7% which is considered the market rate applicable to the liability. The difference between the fair value and the loan amount was recognized in contributed surplus. As at June 30, 2014, $10.3 million (December 31, 2013 - $4.3 million) have been recognized in contributed surplus related to the KNOC loan. For the three and six months ended June 30, 2014, interest expenses of $2.4 million and $4.0 million were recorded (2013 - $nil), of which $4.0 million remains outstanding as at June 30, 2014 (December 31, 2013 - $nil).
On August 16, 2012, Harvest entered into a subordinated loan agreement with ANKOR to borrow US$170 million at a fixed interest rate of 4.62% per annum. The principal balance and accrued interest is payable on October 2, 2017. At June 30, 2014, Harvest’s related party loan from ANKOR included $181.4 million (December 31, 2013 - $180.8 million) of principal and $2.9 million (December 31, 2013 - $3.0 million) of accrued interest. Interest expenses were $2.1 million and $4.3 million for the three and six months ended June 30, 2014 (2013 - $2.0 million and $4.0 million, respectively).
The related party loans are unsecured and the loan agreements contain no restrictive covenants. For purposes of Harvest’s credit facility covenant requirements, the related party loans are excluded from the ‘total debt’ amount but included in the ‘total capitalization’ amount.
See note 20 of the June 30, 2014 unaudited interim consolidated financial statements for a table of other related party transactions.
The Company identifies its related party transactions by: making inquiries of management and the Board of Directors, reviewing KNOC’s subsidiaries and associates, and performing a comprehensive search of transactions recorded in the accounting system. Material related party transactions require the Board of Directors’ approval.
27
| | MANAGEMENT’S DISCUSSION AND ANALYSIS |
CAPITAL RESOURCES
The following table summarizes Harvest’s capital structure and provides the key financial ratios defined in the credit facility agreement.
| | | June 30, 2014 | | | December 31, 2013 | |
| Credit facility(1) | | 723.4 | | | 788.5 | |
| 67/8% senior notes (US$500 million)(1)(2) | | 533.5 | | | 531.8 | |
| 21/8%senior notes (US$630 million)(1)(2) | | 672.2 | | | 670.1 | |
| Related party loans (US$170 million and CAD$200 million)(2)(3) | | 381.4 | | | 260.8 | |
| | | 2,310.5 | | | 2,251.2 | |
| Shareholder's equity | | | | | | |
| 386,078,649 common shares issued | | 1,914.8 | | | 1,939.2 | |
| | | 4,225.3 | | | 4,190.4 | |
| Financial Ratios(4)(5) | | | | | | |
| Senior debt to annualized EBITDA | | 1.85 | | | 2.41 | |
| Annualized EBITDA to annualized interest expense | | 4.46 | | | 3.62 | |
| Senior debt to total capitalization | | 18% | | | 22% | |
| Total debt to total capitalization | | 45% | | | 54% | |
| (1) | Excludes capitalized financing fees |
| (2) | Face value converted at the period end exchange rate |
| (3) | As at December 31, 2013, related party loans comprised of US$170 million from ANKOR and CAD$80 million from KNOC. |
| (4) | Calculated based on Harvest’s credit facility covenant requirements. |
| (5) | The financial ratios and their components are non-GAAP measures; please refer to the “Non-GAAP Measures” section of this MD&A. |
On April 15, 2014, Harvest amended its credit facility to accommodate the progression of non-wholly owned partnership and joint venture arrangements for the development of Company lands. The amendments included provisions that allow the formation, operation and funding of partnerships that Harvest does not fully own, within specific parameters regarding the amount of assets and production contributed to such non-wholly owned partnership and joint venture arrangements. Limitation on distributions has been amended to allow distributions to Harvest or third parties by a joint venture partnership under specific provisions. The definitions for financial measures that are used in covenant ratios, including annualized EBITDA, total debt and senior debt have also been amended to accommodate the partnership and joint venture arrangements. In addition, the amendment removed Harvest’s option to cause the BlackGold assets to be removed from the security package of the credit facility, effectively enabling the Company to recognize equity related to BlackGold of $457.2 million as at June 30, 2014 for purposes of total capitalization, and specified an incremental amount of $229.5 million to be added to total capitalization for purposes of the total debt to total capitalization covenant, representing partial relief of the Downstream impairment charge incurred in 2013.
LIQUIDITY
The Company’s liquidity needs are met through the following sources: cash generated from operations, proceeds from asset dispositions, joint ventures, borrowings under the credit facility, related party loans, long-term debt issuances and capital injections by KNOC. Harvest’s primary uses of funds are operating expenses, capital expenditures, and interest and principal repayments on debt instruments.
28
| | MANAGEMENT’S DISCUSSION AND ANALYSIS |
Cash flow from operating activities for the three months and six months ended June 30, 2014 were $62.6 million and $258.2 million, respectively (2013 – $77.3 million and $143.9 million). The decrease for the second quarter of 2014 is mainly a result of the decrease in cash contribution from the Downstream segment. The increase for the first six months of 2014 is mainly a result of the increase in cash contribution of both the Downstream and Upstream segments.
Cash contribution from Harvest’s Upstream operations for the second quarter and first six months of 2014 were $140.9 million and $280.4 million, respectively (2013 – $136.1 million and $259.0 million). The increase in Upstream’s cash contribution as compared to the same periods in the prior year are mainly due to the increases in average realized prices, partially offset by lower sales volumes. Cash deficiency from Harvest’s Downstream operations for the second quarter of 2014 was $43.6 million (2013 – $28.1 million). The increase in Downstream’s cash deficiency was mainly due to lower refining gross margin and higher purchased energy expense as compared to the same quarter in the prior year. Cash deficiency from Harvest’s Downstream operations for the first six months of 2014 was $9.8 million (2013 – $61.2 million). The improvement in Downstream’s cash deficiency was mainly due to a higher average refining gross margin for the year to date, most of which occurred in the first quarter of 2014. See the “Cash Contribution (Deficiency) from Operations” section of this MD&A for further detail.
Harvest funded capital expenditures for the three and six months ended June 30, 2014 of $118.2 million and $297.9 million, respectively (2013 - $114.7 million and $301.2 million) with cash generated from operating activities, property dispositions and borrowings under both the credit facility and KNOC subordinated loan.
Harvest had a working capital deficiency of $67.1 million as at June 30, 2014, as compared to a $75.4 million deficiency at December 31, 2013. Harvest’s working capital is expected to fluctuate from time to time, and will be funded from cash flows from operations and borrowings from the credit facility, as required.
On February 28, 2014, Harvest borrowed $80.0 million under the subordinated loan agreement with KNOC and borrowed a further $40.0 million on June 18, 2014 (see the “Related Party Loans” section). These funds were partly used to repay a portion of the credit facility.
Harvest’s net repayment to the credit facility was $66.1 million during the first six months of 2014 (2013 - $67.8 million net borrowing).
Harvest ensures its liquidity through the management of its capital structure, seeking to balance the amount of debt and equity used to fund investment in each of our operating segments. Harvest evaluates its capital structure using the same financial covenant ratios as the ones externally imposed under the Company’s credit facility. The Company continually monitors its credit facility covenants and actively takes steps, such as reducing borrowings, increasing capitalization, amending or renegotiating covenants as and when required, to ensure compliance. Harvest was in compliance with all debt covenants at June 30, 2014. Harvest expects to meet its future cash requirements and financial obligations with cash from operations, proceeds from asset dispositions, joint ventures and the undrawn borrowing room under the credit facility.
29
| | MANAGEMENT’S DISCUSSION AND ANALYSIS |
Contractual Obligations and Commitments
Harvest has recurring and ongoing contractual obligations and estimated commitments entered into in the normal course of operations. As at the end of June 30, 2014, Harvest has the following significant contractual obligations and estimated commitments:
| | | | | | Payments Due by Period | | | | |
| | | 1 year | | | 2-3 years | | | 4-5 years | | | After 5 years | | | Total | |
| Debt repayments(1) | | 6.2 | | | 713.2 | | | 1,587.1 | | | — | | | 2,306.5 | |
| Debt interest payments(1)(2) | | 37.7 | | | 150.0 | | | 154.6 | | | — | | | 342.3 | |
| Purchase commitments(3) | | 62.5 | | | 20.6 | | | 20.0 | | | 40.0 | | | 143.1 | |
| Operating leases | | 10.9 | | | 20.1 | | | 22.9 | | | 44.8 | | | 98.7 | |
| Firm processing commitments | | 18.2 | | | 37.7 | | | 31.9 | | | 91.6 | | | 179.4 | |
| Firm transportation agreements | | 11.6 | | | 41.4 | | | 84.4 | | | 47.3 | | | 184.7 | |
| Employee benefits(4) | | 2.1 | | | 4.2 | | | 1.0 | | | 7.5 | | | 14.8 | |
| Decommissioning and environmental liabilities(5) | | 46.7 | | | 57.5 | | | 42.0 | | | 1,488.2 | | | 1,634.4 | |
| Total | | 195.9 | | | 1,044.7 | | | 1,943.9 | | | 1,719.4 | | | 4,903.9 | |
| (1) | Assumes constant foreign exchange rate. |
| (2) | Assumes interest rates as at June 30, 2014 will be applicable to future interest payments. |
| (3) | Relates to drilling commitments, BlackGold oil sands project commitment and Downstream capital commitments. |
| (4) | Relates to the expected contributions to employee benefit plans and long-term incentive plan payments. |
| (5) | Represents the undiscounted obligation by period. |
Harvest also has commitments to purchase refinery crude stock and sell refined products under a supply and offtake agreement with Macquarie Energy Canada Ltd. (“Macquarie”). These purchase commitments will be net settled against any refined product sales to Macquarie.
Off Balance Sheet Arrangements
See “Investments in Joint Ventures” section in this MD&A.
30
| | MANAGEMENT’S DISCUSSION AND ANALYSIS |
SUMMARY OF QUARTERLY RESULTS
The following table and discussion highlights the second quarter of 2014 results relative to the preceding 7 quarters:
| | | 2014 | | | | | | 2013 | | | | | | 2012 | |
| | | Q2 | | | Q1 | | | Q4 | | | Q3 | | | Q2 | | | Q1 | | | Q4 | | | Q3 | |
| FINANCIAL | | | | | | | | | | | | | | | | | | | | | | | | |
| Revenues and other income(1) | | 1,364.7 | | | 1,364.9 | | | 1,307.3 | | | 1,299.9 | | | 1,399.3 | | | 1,358.2 | | | 1,546.0 | | | 1,275.1 | |
| Net income (loss) | | (24.8 | ) | | 3.0 | | | (517.8 | ) | | (79.5 | ) | | (89.2 | ) | | (95.4 | ) | | (536.7 | ) | | (38.5 | ) |
| Cash from operating activities | | 62.6 | | | 195.6 | | | 6.1 | | | 50.6 | | | 77.3 | | | 66.6 | | | 133.0 | | | 153.9 | |
| Total financial debt(2), non-current | | 2,291.3 | | | 2,269.7 | | | 2,232.6 | | | 1,989.0 | | | 1,920.6 | | | 1,511.2 | | | 1,450.0 | | | 1,519.4 | |
| Total assets | | 5,388.1 | | | 5,378.3 | | | 5,289.9 | | | 5,626.1 | | | 5,606.6 | | | 5,672.1 | | | 5,654.6 | | | 6,162.9 | |
| | | | | | | | | | | | | | | | | | | | | | | | | |
| OPERATIONS | | | | | | | | | | | | | | | | | | | | | | | | |
| Upstream | | | | | | | | | | | | | | | | | | | | | | | | |
| Daily sales volumes (boe/d) | | 47,556 | | | 48,487 | | | 49,154 | | | 51,783 | | | 53,461 | | | 55,571 | | | 58,228 | | | 57,686 | |
| Realized price prior to hedging ($/boe) | | 69.30 | | | 67.29 | | | 54.01 | | | 60.62 | | | 58.22 | | | 53.43 | | | 52.82 | | | 51.86 | |
| Downstream | | | | | | | | | | | | | | | | | | | | | | | | |
| Average daily throughput (bbl/d) | | 95,410 | | | 95,767 | | | 92,339 | | | 93,798 | | | 106,245 | | | 100,074 | | | 114,065 | | | 84,889 | |
| Average refining gross margin (loss) ($US/bbl)(2) | | 0.25 | | | 9.58 | | | 2.50 | | | (1.43 | ) | | 0.74 | | | 2.51 | | | 6.43 | | | 6.03 | |
| (1) | This is an additional GAAP measure; please refer to “Additional GAAP Measures” in this MD&A. |
| (2) | This is a non-GAAP measure; please refer to “Non-GAAP Measures” in this MD&A. |
The quarterly revenues and cash from operating activities are mainly impacted by the Upstream sales volumes, realized prices and operating expenses and Downstream throughput volumes, cost of feedstock and refined product prices. Significant items that impacted Harvest’s quarterly revenues include:
- Revenues were highest in the fourth quarter of 2012, as a result of the refinery operating at near capacity during that period.
- The decline in Upstream’s sales volumes since 2012 were mainly due to natural declines, asset dispositions and a reduced capital program since 2012.
- Downstream’s average daily throughput was lower in the third quarter of 2012 as compared to the other reported quarters due to a two-week partial outage of some process units and a three-week unplanned shutdown of all process units while repairs were completed to the SRU. The average daily throughput was lower in the third quarter of 2013 due to repairs on the SRU reactor and lower in the fourth quarter of 2013 due to repairs and maintenance of the isomax and crude units.
- Downstream’s refining gross margin/bbl was highest in the first quarter of 2014 mainly due to improved sour crude differentials. The weaker margins during 2013 reflected poorer yield and the decrease in the sour-crude differential from the Brent benchmark price for crude oil. The refining gross margin was negatively impacted by increased RINs costs since the second quarter of 2013.
Net income (loss) reflects both cash and non-cash items. Changes in non-cash items including deferred income tax, DD&A expense, accretion of decommissioning and environmental remediation liabilities, impairment of long-lived assets, unrealized foreign exchange gains and losses, and unrealized gains and losses on risk management contracts impact net loss from period to period. For these reasons, the net loss may not necessarily reflect the same trends as revenues or cash from operating activities, nor is it expected to. Net losses in the fourth quarters of 2013 and 2012 were mainly due to the $458.9 million and $535.5 million impairments, respectively, of Downstream PP&E. Total assets also decreased significantly in the fourth quarters of 2013 and 2012 as a result.
31
| | MANAGEMENT’S DISCUSSION AND ANALYSIS |
Cash from operating activities was highest for the first quarter of 2014 mainly as a result of the significant improvement of cash contribution from Downstream as compared to previous quarters and a positive change in non-cash working capital. Cash from operating activities was lowest in the fourth quarter of 2013, mainly due to poor cash contribution from operations from the Upstream and Downstream segments and a negative $55 million change in non-cash working capital.
The increase in long-term financial debt in the second quarter of 2013 was a result of the issuance of the US$630 million 21/8% senior notes due 2018 which were used to early redeem Harvest’s convertible debentures, a portion of which had been classified as short-term debt. The $243.6 million increase in long-term financial debt in fourth quarter of 2013 as compared to the third quarter of 2013 was mainly a result of $125 million of further draws on our credit facility, receiving $80 million under the KNOC subordinated loan agreement and the $44 million impact of the weakening Canadian dollar on our U.S. dollar denominated debt.
2014 OUTLOOK
The following guidance is provided as general information for stakeholders regarding management’s expectations for 2014 for the Upstream, BlackGold and Downstream business segments. The guidance information provided is consistent with Harvest’s most recent budget information. Readers are cautioned that the guidance information provided within this Outlook may not be appropriate for other purposes and the actual results may differ materially from those anticipated.
Upstream
Production volume for the year 2014 is targeted at approximately 47,300 boe/d, a decrease from 48,800 as reported in the first quarter. This decrease is a result of Harvest selling assets to the Deep Basin Partnership in April of 2014 in addition to the disposition of certain oil and gas assets. Our 2014 operating costs are expected to average $19.50/boe an increase from $17.80/boe as reported in the first quarter. For the first six months of 2014 production averaged 48,019 boe/d and operating expense was $19.55/boe.
The 2014 annual capital budget for the Upstream business remained at $350 million. During the first six months of 2014 Harvest spent $195.9 million on capital expenditures.
BlackGold
The BlackGold capital spending budget has increased to $235 million from $131 million. The revision of the budget was a result of capital having been under budgeted earlier in the year and schedule delays due to the slowdown in the first quarter of 2014 combined with the shortage of skilled labor and rising costs of labor. During the first six months of 2014, Harvest added $91.4 million to BlackGold’s capital assets.
Harvest anticipates construction completion of the 10,000 bbl/d Phase 1 CPF in the second half of 2014 with first steam expected in the fourth quarter of 2014.
32
| | MANAGEMENT’S DISCUSSION AND ANALYSIS |
Downstream
The 2014 capital budget for the Downstream operations is $38 million. As at June 30, 2014 the Downstream had utilized $10.6 million of its capital budget.
For the full year 2014 throughput is anticipated to average approximately 87,100 bbl/d, with operating costs and purchased energy costs aggregating to approximately $8.00/bbl. For the first six months of 2014 throughput averaged 95,588 bbl/d with operating and purchased energy costs of $6.68/bbl.
Harvest’s revised capital expenditure budget for 2014 is $623 million, comprised of $350 million for Upstream oil & gas operations, $235 million for the BlackGold oil sands project and $38 million for the Downstream refining and marketing business.
CRITICAL ACCOUNTING ESTIMATES
The preparation of financial statements in conformity with IFRS requires management to make judgments, estimates and assumptions that affect the application of accounting policies and the reported amounts of assets, liabilities, income and expenses. Actual results may differ from these estimates. Estimates and underlying assumptions are reviewed on an ongoing basis. Revisions to accounting estimates are recognized in the period in which the estimates are revised and in any future periods affected. Further information on the basis of preparation and significant accounting policies and estimates can be found in the notes to the audited consolidated financial statements for the year ended December 31, 2013. There have been no changes to the accounting policies and estimates in the first quarter of 2014, except for the following as a result of the joint ventures Harvest entered into during 2014 and new and amended IFRS accounting standards:
Joint Arrangements
A joint arrangement is an arrangement in which two or more parties have joint control established by a contractual agreement. Joint control requires unanimous consent for decisions regarding the relevant activities of the arrangement. A joint arrangement is either a joint operation, whereby the parties have rights to the assets and obligations for the liabilities, or a joint venture, whereby the parties have rights to the net assets.
Interests in joint operations are recognized in the consolidated financial statements by including Harvest’s share of assets, liabilities, revenues and expenses of the arrangement. Interests in joint ventures are accounted for using the equity method of accounting.
Under the equity method of accounting, interests in joint ventures are initially recognized at cost, with the carrying value subsequently increased or decreased to reflect the Company’s proportionate share of the profit or loss of the investee after the date of acquisition. Distributions received from an investee reduce the carrying value of the Company’s investment. When necessary, adjustments are made to investee financial statements to align accounting policies of investees with those applied by the Company in its consolidated financial statements.
The carrying values of Harvest’s equity accounted investments are reviewed at each reporting date to determine whether any indicators of impairment are present. If an indicator of impairment is identified, the recoverable amount of the investment is estimated. If the carrying value of the investment exceeds the estimated recoverable amount, an impairment charge is recognized.
33
| | MANAGEMENT’S DISCUSSION AND ANALYSIS |
Unrealized gains resulting from transactions with joint ventures are eliminated, to the extent of the Company’s interest in the joint venture. For sales of products or services from the Company to its joint ventures, unrealized gains are eliminated against the carrying value of the investment.
Judgment is required in determining whether joint arrangement structured through a separate vehicle is a joint operation or joint venture and involves determining whether the legal form and contractual arrangements give the Company direct rights to the assets and obligations for the liabilities. Other facts and circumstances are also assessed by management, including but not limited to, the Company’s rights to the economic benefits of assets and its involvement and responsibility for settling liabilities associated with the arrangement.
On April 23, 2014, Harvest entered into two joint arrangements with KERR Canada Co. Ltd. (“KERR”): Deep Basin Partnership (“DBP”) and HK MS Partnership (“HKMS”) (also see note 7 of the June 30, 2014 unaudited interim consolidated financial statements). Unanimous consent must be obtained from the shareholders for decisions about relevant activities such as the approval of the overall capital program and budget. Based on management’s assessment, Harvest concluded that both joint arrangements are joint ventures. These joint ventures have been accounted for using the equity method of accounting. However, based on the terms of the agreement, which provide for differing proportions of earnings based on ownership percentages that are not representative of the economic substance, Harvest cannot simply apply its percentage ownership to pick up the net income from these joint ventures. Therefore, Harvest applied a hypothetical liquidation at book value (“HLBV”) method to calculate its equity share of net income for each reporting period. HLBV takes a balance sheet approach in calculating the earnings Harvest should recognize based on the change in Harvest’s share of the net assets in the partnerships under the provisions of the joint venture agreements in a liquidation scenario.
IAS 32 “Financial instruments: Presentation” has been amended to clarify that the right to offset financial assets and liabilities must be available on the current date and cannot be contingent on a future event. The adoption of this standard did not have any impact on the Company’s financial statements.
IFRS Interpretations Committee (“IFRIC”) 21 “Levies”, clarifies the recognition requirements concerning a liability to pay a levy imposed by a government other than income tax. IFRIC 21 clarifies that an entity recognizes a liability for a levy when the activity that triggers payment occurs. The adoption of this standard did not have any impact on Harvest’s financial statements.
34
| | MANAGEMENT’S DISCUSSION AND ANALYSIS |
RECENT ACCOUNTING PRONOUNCEMENTS
On May 28, 2014, the IASB issued IFRS 15 “Revenue”, which specifies how and when to recognize revenue as well as requiring entities to provide users of financial statements with more disclosure. The standard supersedes IAS 18 “Revenue”, IAS 11 “Construction Contracts”, and related interpretations. IFRS 15 will be effective for annual periods beginning on or after January 1, 2017. Application of the standard is mandatory and early adoption is permitted. Harvest is currently evaluating the impact of adopting IFRS 15 on its consolidated financial statements.
On July 24, 2014, the IASB issued IFRS 9 “Financial Instruments” to replace IAS 39 “Financial Instruments: Recognition and Measurement”. IFRS 9 is effective for years beginning on or after January 1, 2018. Harvest is currently evaluating the impact of adopting IFRS 9 on its consolidated financial statements.
A description of additional accounting pronouncements that will be adopted by Harvest in future periods can be found in note 3 of the audited consolidated financial statements for the year ended December 31, 2013.
OPERATIONAL AND OTHER BUSINESS RISKS
Harvest’s operational and other business risks remain unchanged from those discussed in the annual MD&A and AIF for the year ended December 31, 2013 as filed on SEDAR at www.sedar.com.
CHANGES IN REGULATORY ENVIRONMENT
Harvest’s regulatory environment remains unchanged from that discussed in the annual MD&A and AIF for the year ended December 31, 2013 as filed on SEDAR atwww.sedar.com.
INTERNAL CONTROL OVER FINANCIAL REPORTING
There were no significant changes in the internal controls over financial reporting or disclosure controls and procedures described in the annual MD&A for the year ended December 31, 2013 as filed on SEDAR atwww.sedar.com that have materially affected, or are reasonably likely to affect, internal controls over financial reporting.
ADDITIONAL GAAP MEASURES
Throughout this MD&A, Harvest uses additional GAAP measures that are not defined under IFRS (hereinafter also referred to as “GAAP”). “Operating income (loss)” is commonly used for comparative purposes in the petroleum and natural gas and refining industries to reflect operating results before items not directly related to operations. Harvest uses this measure to assess and compare the performance of its operating segments. “Revenues and other income” comprises sales of sales of petroleum, natural gas, and refined product sales, net of related royalties, and Harvest’s share of the net income from its joint ventures.
NON-GAAP MEASURES
Throughout this MD&A, the Company has referred to certain measures of financial performance that are not specifically defined under GAAP such as “operating netback”, “operating netback prior to/after hedging”, “gross margin (loss)”, “refining margin”, “average refining gross margin”, “cash contribution (deficiency) from operations”, “total debt”, “total financial debt”, “total capitalization”, “Annualized EBITDA”, “senior debt to Annualized EBITDA”, “total debt to Annualized EBITDA”, “senior debt to total capitalization”, and “total debt to total capitalization”.
35
| | MANAGEMENT’S DISCUSSION AND ANALYSIS |
“Operating netbacks” are reported on a per boe basis and used extensively in the Canadian energy sector for comparative purposes. “Operating netbacks” include revenues, operating expenses, transportation and marketing expenses, and realized gains or losses on risk management contracts. “Gross margin (loss)”, “refining margin” or “average refining gross margin” are commonly used in the refining industry to reflect the net funds received from the sale of refined products after considering the cost to purchase the feedstock and is calculated by deducting purchased products for resale and processing from total revenue. “Cash contribution (deficiency) from operations” is calculated as operating income (loss) adjusted for non-cash items. The measure demonstrates the ability of the each segment of Harvest to generate the cash from operations necessary to repay debt, make capital investments, and fund the settlement of decommissioning and environmental remediation liabilities. “Total debt”, “total financial debt”, “total capitalization”, and “Annualized EBITDA” are used to assist management in assessing liquidity and the Company’s ability to meet financial obligations. “Senior debt to Annualized EBITDA”, “total debt to Annualized EBITDA”, “senior debt to total capitalization” and “total debt to total capitalization” are terms defined in Harvest’s credit facility agreement for the purpose of calculation of financial covenants. The non-GAAP measures do not have any standardized meaning prescribed by GAAP and may not be comparable to similar measures used by other issuers. The determination of the non-GAAP measures have been illustrated throughout this MD&A, with reconciliations to IFRS measures and/or account balances, except for Annualized EBITDA and cash contribution (deficiency) which are shown below.
Annualized EBITDA
The measure of Consolidated EBITDA (herein referred to as “Annualized EBITDA”) used in Harvest’s credit facility agreement is defined as earnings before finance costs, income tax expense or recovery, DD&A, exploration and evaluation costs, impairment of assets, unrealized gains or losses on risk management contracts, unrealized gains or losses on foreign exchange, gains or losses on disposition of assets and other non-cash items. The following is a reconciliation of Annualized EBITDA to the nearest GAAP measure net loss:
| | | June 30, 2014 | | | December 31, 2013 | |
| Net loss | | (619.3 | ) | | (781.9 | ) |
| DD&A | | 511.1 | | | 612.8 | |
| Finance costs | | 94.1 | | | 94.2 | |
| Income tax recovery | | (24.7 | ) | | (64.2 | ) |
| EBITDA | | (38.7 | ) | | (139.1 | ) |
| Unrealized losses on risk management contracts | | 0.2 | | | 0.5 | |
| Unrealized losses on foreign exchange | | 6.7 | | | 40.8 | |
| Unsuccessful exploration and evaluation costs | | 12.0 | | | 11.5 | |
| Impairment of PP&E | | 483.0 | | | 483.0 | |
| Gains on disposition of assets | | (26.9 | ) | | (34.1 | ) |
| Other non-cash items | | 3.4 | | | (1.7 | ) |
| Adjustments on acquisitions and dispositions(1) | | (1.9 | ) | | (15.4 | ) |
| Annualized EBITDA | | 437.7 | | | 345.5 | |
| (1) | Annualized EBITDA is on a consolidated basis for any period, the aggregate of the last four quarters of the earnings (calculated in accordance with GAAP) and accordingly is a twelve month rolling measure which, as well, is required to be adjusted to the net income impact from acquisitions or dispositions (with net proceeds over $20 million) as if the transaction had been effected at the beginning of the period and excludes earnings attributable to the BlackGold assets and non-restricted subsidiaries. |
36
| | MANAGEMENT’S DISCUSSION AND ANALYSIS |
Cash Contribution (Deficiency) from Operations
Cash contribution (deficiency) from operations represents operating income (loss) adjusted for non-cash expense items within: general and administrative, exploration and evaluation, depletion, depreciation and amortization, gains on disposition of PP&E, risk management contracts gains or losses, impairment on PP&E, and the inclusion of cash interest, realized foreign exchange gains or losses and other cash items not included in operating income (loss). The measure demonstrates the ability of the Upstream and Downstream segments of Harvest to generate cash from their operations and is calculated before changes in non-cash working capital. There are no operating activities to report for the BlackGold segment as it is under development. The most directly comparable additional GAAP measure is operating income (loss). Operating income (loss) as presented in the notes to Harvest’s consolidated financial statements is reconciled to cash contribution (deficiency) from operations below:
| | | Three Months Ended June 30 | |
| | | Upstream | | | Downstream | | | Total | |
| | | 2014 | | | 2013 | | | 2014 | | | 2013 | | | 2014 | | | 2013 | |
| Operating income (loss) | | 32.2 | | | (0.4 | ) | | (46.9 | ) | | (51.6 | ) | | (14.7 | ) | | (52.0 | ) |
| Adjustments: | | | | | | | | | | | | | | | | | | |
| Operating | | — | | | 0.4 | | | (0.1 | ) | | 1.3 | | | (0.1 | ) | | 1.7 | |
| General and administrative | | 2.5 | | | (0.1 | ) | | — | | | — | | | 2.5 | | | (0.1 | ) |
| Exploration and evaluation | | 0.4 | | | 0.2 | | | — | | | — | | | 0.4 | | | 0.2 | |
| Depletion, depreciation and amortization | | 110.2 | | | 139.2 | | | 3.4 | | | 22.2 | | | 113.6 | | | 161.4 | |
| Gains on disposition of assets | | (2.1 | ) | | (2.3 | ) | | — | | | — | | | (2.1 | ) | | (2.3 | ) |
| Unrealized gains on risk management contracts | | (2.3 | ) | | (0.9 | ) | | — | | | — | | | (2.3 | ) | | (0.9 | ) |
| Cash contribution (deficiency) from operations | | 140.9 | | | 136.1 | | | (43.6 | ) | | (28.1 | ) | | 97.3 | | | 108.0 | |
| Inclusion of items not attributable to segments: | | | | | | | | | | | | | | | | | | |
| Net cash interest paid | | | | | | | | | | | | | | 13.5 | | | 18.0 | |
| Realized foreign exchange losses | | | | | | | | | | | | | | (1.0 | ) | | (0.9 | ) |
| Consolidated cash contribution from operations | | | | | | | | | | | | | | 84.8 | | | 90.9 | |
| | | Six Months Ended June 30 | |
| | | Upstream | | | Downstream | | | Total | |
| | | 2014 | | | 2013 | | | 2014 | | | 2013 | | | 2014 | | | 2013 | |
| Operating income (loss) | | 53.8 | | | (22.8 | ) | | (15.3 | ) | | (106.6 | ) | | 38.5 | | | (129.4 | ) |
| Adjustments: | | | | | | | | | | | | | | | | | | |
| Operating | | 1.5 | | | 0.5 | | | (1.3 | ) | | 1.4 | | | 0.2 | | | 1.9 | |
| General and administrative | | 0.7 | | | (0.2 | ) | | — | | | — | | | 0.7 | | | (0.2 | ) |
| Exploration and evaluation | | 8.6 | | | 8.2 | | | — | | | — | | | 8.6 | | | 8.2 | |
| Depletion, depreciation and amortization | | 219.7 | | | 284.3 | | | 7.0 | | | 44.0 | | | 226.7 | | | 328.3 | |
| Gains on disposition of assets | | (1.4 | ) | | (8.9 | ) | | (0.2 | ) | | — | | | (1.6 | ) | | (8.9 | ) |
| Unrealized gains on risk management contracts | | (2.5 | ) | | (2.1 | ) | | — | | | — | | | (2.5 | ) | | (2.1 | ) |
| Cash contribution (deficiency) from operations | | 280.4 | | | 259.0 | | | (9.8 | ) | | (61.2 | ) | | 270.6 | | | 197.8 | |
| Inclusion of items not attributable to segments: | | | | | | | | | | | | | | | | | | |
| Net cash interest paid | | | | | | | | | | | | | | 31.6 | | | 42.0 | |
| Realized foreign exchange gains | | | | | | | | | | | | | | 1.0 | | | 1.1 | |
| Consolidated cash contribution from operations | | | | | | | | | | | | | | 238.0 | | | 154.7 | |
37
| | MANAGEMENT’S DISCUSSION AND ANALYSIS |
FORWARD-LOOKING INFORMATION
This MD&A highlights significant business results and statistics from the consolidated financial statements for the three months and six month ended June 30, 2014 and the accompanying notes thereto. In the interest of providing Harvest’s lenders and potential lenders with information regarding Harvest, including the Company’s assessment of future plans and operations, this MD&A contains forward-looking statements that involve risks and uncertainties.
Such risks and uncertainties include, but are not limited to: risks associated with conventional petroleum and natural gas operations; risks associated with refining and marketing operations; risks associated with the construction of the oil sands project; the volatility in commodity prices, interest rates and currency exchange rates; risks associated with realizing the value of acquisitions; general economic, market and business conditions; changes in environmental legislation and regulations; the availability of sufficient capital from internal and external sources; and, such other risks and uncertainties described from time to time in regulatory reports and filings made with securities regulators. The impact of any one risk, uncertainty or factor on a particular forward-looking statement is not determinable with certainty as these factors are interdependent, and management’s future course of action would depend on the assessment of all information at that time. Please also refer to “Operational and Other Business Risks” in this MD&A and “Risk Factors” in the Annual Information Form for detailed discussion on these risks.
Forward-looking statements in this MD&A include, but are not limited to, the forward looking statements made in the “Outlook” section as well as statements made throughout with reference to the following items to future periods: production volumes, refinery throughput volumes, royalty rates, operating costs, commodity prices, general and administrative costs, price risk management activities, acquisitions and dispositions, capital spending and allocation of such to various projects, reserve estimates and ultimate recovery of reserves, potential timing and commerciality of Harvest’s capital projects, the extent and success rate of Upstream and BlackGold drilling programs, the ability to achieve the maximum capacity from the BlackGold central processing facilities, refinery utilization and reliability rates, availability of the credit facility, access and ability to raise capital, ability to maintain debt covenants, debt levels, recovery of long-lived assets, the timing and amount of decommission and environmental related costs, income taxes, cash from operating activities, regulatory approval of development projects and regulatory changes. For this purpose, any statements that are contained herein that are not statements of historical fact may be deemed to be forward-looking statements. Forward-looking statements often contain terms such as “may”, “will”, “should”, “anticipate”, “expect”, “target”, “plan”, “potential”, “intend”, and similar expressions.
All of the forward-looking statements in this MD&A are qualified by the assumptions that are stated or inherent in such forward-looking statements. Although Harvest believes that these assumptions are reasonable based on the information available to us on the date such assumptions were made, this list is not exhaustive of the factors that may affect any of the forward-looking statements and the reader should not place an undue reliance on these assumptions and such forward-looking statements. The key assumptions that have been made in connection with the forward-looking statements include the following: that the Company will conduct its operations and achieve results of operations as anticipated; that its development plans and sustaining maintenance programs will achieve the expected results; the general continuance of current or, where applicable, assumed industry conditions; the continuation of assumed tax, royalty and regulatory regimes; the accuracy of the estimates of the Company’s reserve volumes; commodity price, operation level, and cost assumptions; the continued availability of adequate cash flow and debt and/or equity financing to fund the Company’s capital and operating requirements as needed; and the extent of Harvest’s liabilities. Harvest believes the material factors, expectations and assumptions reflected in the forward-looking statements are reasonable, but no assurance can be given that these factors, expectations and assumptions will prove to be correct.
38
| | MANAGEMENT’S DISCUSSION AND ANALYSIS |
Although management believes that the forward-looking information is reasonable based on information available on the date such forward-looking statements were made, no assurances can be given as to future results, levels of activity and achievements. Therefore, readers are cautioned not to place undue reliance on forward-looking statements as the plans, intentions or expectations upon which the forward-looking information is based might not occur. Forward-looking statements contained in this MD&A are expressly qualified by this cautionary statement.
ADDITIONAL INFORMATION
Further information about us can be accessed under our public filings found on SEDAR atwww.sedar.com or atwww.harvestenergy.ca. Information can also be found by contacting our Investor Relations department at (403) 265-1178 or at 1-866-666-1178.
39