 | MANAGEMENT’S DISCUSSION AND ANALYSIS |
MANAGEMENT’S DISCUSSION AND ANALYSIS
This Management’s Discussion and Analysis (“MD&A”) should be read in conjunction with the audited annual consolidated financial statements of Harvest Operations Corp. (“Harvest”, “we”, “us”, “our” or the “Company”) for the year ended December 31, 2014 together with the accompanying notes. The information and opinions concerning the future outlook are based on information available at March 31, 2015.
In this MD&A, all dollar amounts are expressed in Canadian dollars unless otherwise indicated. Tabular amounts are in millions of dollars, except where noted. All financial data has been prepared in accordance with International Financial Reporting Standards (“IFRS”) as issued by the International Accounting Standards Board except where otherwise noted.
Natural gas volumes are converted to barrels of oil equivalent (“boe”) using the ratio of six thousand cubic feet (“mcf”) of natural gas to one barrel of oil (“bbl”). Boes may be misleading, particularly if used in isolation. A boe conversion ratio of 6 mcf to 1 bbl is based on an energy equivalent conversion method primarily applicable at the burner tip and does not represent a value equivalent at the wellhead. In accordance with Canadian practice, petroleum and natural gas revenues are reported on a gross basis before deduction of Crown and other royalties.
Additional information concerning Harvest, including its audited annual consolidated financial statements and Annual Information Form (“AIF”) can be found on SEDAR atwww.sedar.com.
ADVISORY
This MD&A contains non-GAAP measures and forward-looking information about our current expectations, estimates and projections. Readers are cautioned that the MD&A should be read in conjunction with the “Non-GAAP Measures” and “Forward-Looking Information” sections at the end of this MD&A.
1
| MANAGEMENT’S DISCUSSION AND ANALYSIS |
FINANCIAL AND OPERATING HIGHLIGHTS
| | | Three Months Ended December 31 | | | Year Ended December 31 | |
| | | 2014 | | | 2013 | | | 2014 | | | 2013 | |
| CONTINUING OPERATIONS | | | | | | | | | | | | |
| Upstream | | | | | | | | | | | | |
| Daily sales volumes (boe/d)(1) | | 42,539 | | | 49,154 | | | 45,825 | | | 52,473 | |
| Average realized price | | | | | | | | | | | | |
| Oil and NGLs ($/bbl)(2) | | 62.75 | | | 70.68 | | | 79.00 | | | 75.49 | |
| Gas ($/mcf)(2) | | 3.21 | | | 3.86 | | | 4.82 | | | 3.46 | |
| Operating netback prior to hedging($/boe)(3) | | 21.35 | | | 26.10 | | | 32.48 | | | 29.31 | |
| Operating income (loss)(4) | | (283.3 | ) | | 2.3 | | | (188.8 | ) | | (16.6 | ) |
| Cash contribution from operations(3) | | 82.8 | | | 119.5 | | | 485.4 | | | 518.2 | |
| | | | | | | | | | | | | |
| Capital asset additions (excluding acquisitions) | | 135.2 | | | 108.5 | | | 408.5 | | | 322.3 | |
| Property and business (dispositions) | | | | | | | | | | | | |
| acquisitions, net | | (30.1 | ) | | (27.5 | ) | | (301.1 | ) | | (155.6 | ) |
| | | | | | | | | | | | | |
| Net wells drilled | | 24.3 | | | 22.2 | | | 82.2 | | | 84.1 | |
| Net undeveloped land additions (acres) | | 76,436 | | | 18,595 | | | 105,818 | | | 50,651 | |
| Net undeveloped land dispositions (acres) | | (13,354 | ) | | (11,337 | ) | | (20,906 | ) | | (54,650 | ) |
| | | | | | | | | | | | | |
| BlackGold | | | | | | | | | | | | |
| Capital asset additions | | 98.9 | | | 128.1 | | | 283.5 | | | 444.5 | |
| | | | | | | | | | | | | |
| DISCONTINUED OPERATIONS | | | | | | | | | | | | |
| Downstream | | | | | | | | | | | | |
| Average daily throughput (bbl/d) | | 76,455 | | | 92,339 | | | 86,520 | | | 98,081 | |
| Average refining margin (US$/bbl)(3) | | 2.76 | | | 2.50 | | | 4.43 | | | 1.07 | |
| Operating loss(4) | | (6.6 | ) | | (506.4 | ) | | (226.1 | ) | | (691.1 | ) |
| Cash deficiency from operations(3) | | (14.6 | ) | | (32.3 | ) | | (36.2 | ) | | (152.4 | ) |
| | | | | | | | | | | | | |
| NET LOSS(5) | | (337.5 | ) | | (517.8 | ) | | (440.2 | ) | | (781.9 | ) |
| (1) | Excludes volumes from Harvest’s equity investment in the Deep Basin Partnership. |
| (2) | Excludes the effect of risk management contracts designated as hedges. |
| (3) | This is a non-GAAP measure; please refer to “Non-GAAP Measures” in this MD&A. |
| (4) | This is an additional GAAP measure; please refer to “Additional GAAP Measures” in this MD&A. |
| (5) | Net loss includes the consolidated operating results of Continuing and Discontinued operations. |
REVIEW OF OVERALL PERFORMANCE
Harvest is an energy company with a petroleum and natural gas business focused on the exploration, development and production of assets in western Canada (“Upstream”) and an oil sands project under construction and development in northern Alberta (“BlackGold”). During the year ended December 31, 2014, Harvest’s refining and marketing business, located in the Province of Newfoundland and Labrador (“Downstream”) was sold. The Downstream results have been segregated from continuing operations and separately disclosed as “Discontinued Operations”. Harvest is a wholly owned subsidiary of Korea National Oil Corporation (“KNOC”). Our earnings and cash flow from continuing operations are largely determined by the realized prices for our crude oil and natural gas production.
2
| MANAGEMENT’S DISCUSSION AND ANALYSIS |
CONTINUING OPERATIONS
Upstream
| • | Sales volumes for the fourth quarter and year ended December 31, 2014 decreased by 6,615 boe/d and 6,648 boe/d, respectively, as compared to the same periods in 2013. The decreases were primarily due to the disposition of assets to the Deep Basin Partnership (accounted for as an equity investment) and dispositions of certain non-core producing properties during 2013 and 2014, third party outages that restricted our gas and NGL production in the Deep Basin and West Central Alberta in 2014 and natural declines exceeding the volume additions from our drilling program. |
| • | During the second quarter of 2014, Harvest entered into two joint ventures with KERR Canada Co. Ltd. (“KERR”): Deep Basin Partnership (“DBP”) and HKMS Partnership (“HKMS”). The DBP was formed to explore, develop and produce from the Deep Basin area and HKMS was formed to construct and operate a gas processing facility, used primarily to process gas produced by DBP. Harvest’s share of DBP’s volumes for the quarter ended December 31, 2014 was 945 boe/d and 1,183 boe/d for the period from April 23, 2014 to December 31, 2014. The construction of the HKMS facility was completed in early 2015. Strategically, this facility provides the DBP an advantage of access to firm processing capability, the ability to extract maximum liquids from the natural gas produced by DBP and will allow DBP to pursue both acquisition and drilling opportunities in the region. |
| • | Operating netbacks prior to hedging for the fourth quarter and 2014 year were $21.35/boe and $32.48/boe respectively, a decrease of $4.75/boe and an increase of 3.17/boe from the same periods in 2013. The decrease in the fourth quarter was mainly due to lower realized prices and higher operating expenses per boe, partially offset by lower royalties and transportation and marketing expenses per boe. The increase for the year ended December 31, 2014 was mainly due to higher average realized prices partially offset by higher royalties and operating expense per boe. |
| • | Operating loss was $283.3 million (2013 – operating income of $2.3 million) for the fourth quarter, a decrease in income of $285.6 million mainly due to a $267.6 million asset impairment combined with lower realized prices and sales volumes. Operating loss was $188.8 million (2013 – $16.6 million), for the year ended December 31, 2014. The increase in operating loss for the year ended December 31, 2014 was mainly due to asset impairment and lower sales volumes, partially offset by higher realized prices, lower operating expense and the full year impact of the change in accounting estimate made in the fourth quarter of 2013 on DD&A expense. |
| • | Cash contributions from Harvest’s Upstream operations for the fourth quarter and year ended December 31, 2014 were $82.8 million and $485.4 million, respectively (2013 – $119.5 million and $518.2 million, respectively). The decrease in cash contribution for the fourth quarter of 2014 as compared to the same period in the prior year was mainly due to lower sales volumes and lower realized prices. The decrease in cash contribution for the year ended December 31, 2014 as compared to the prior year was mainly due to lower sales volumes, partially offset by higher realized prices and lower operating expense. |
| • | Capital asset additions of $135.2 million and $408.5 million during the fourth quarter and year ended December 31, 2014 mainly related to the drilling, completion and tie- in of wells. Twenty-nine gross wells (24.3 net) were rig-released during the fourth quarter and 100.0 gross wells (82.2 net) were rig-released year to date. |
| • | On February 27, 2015, Harvest closed the acquisition of Hunt Oil Company of Canada, Inc. (“Hunt”) by acquiring all of the issued and outstanding common shares of Hunt for cash consideration of approximately $36.5 million, subject to final purchase price adjustments. |
3
| MANAGEMENT’S DISCUSSION AND ANALYSIS |
BlackGold
| • | Capital asset additions were $98.9 million and $283.5 million for the fourth quarter and full year 2014, respectively, mainly related to the construction of the central processing facility (“CPF”) (2013 - $128.1 million and $444.5 million). |
| • | As at December 31, 2014, construction has been completed on well pads and connecting pipelines. The CPF was mechanically completed in early 2015. Minor pre-commissioning activities will continue at a measured pace throughout 2015 and first steam will occur once the heavy oil price environment becomes favourable. |
CORPORATE
| • | During the third quarter of 2014, Harvest completed a strategic tax planning transaction which resulted in an increase of deferred tax assets in the amount of $247.6 million, partially offset by a $92.1 million write- down of deferred tax assets related to the sale of the Downstream segment. |
| • | The strengthening of the U.S. dollar against the Canadian dollar during the fourth quarter and year ended December 31, 2014 resulted in unrealized foreign exchange losses of $51.7 million (2013 – $43.3 million loss) and $124.9 million (2013 – $75.2 million loss), respectively in Upstream operations. Downstream recognized unrealized foreign exchange gains of $0.5 million for the fourth quarter of 2014 (2013 – $19.3 million gain) and $21.6 million (2013 – $34.3 million) for the year ended December 31, 2014. |
| • | The net repayment to the credit facility was $169.4 million during the year ended December 31, 2014 (2013 - $293.8 million net borrowing). At December 31, 2014, Harvest had $620.7 million drawn from the $1.0 billion available under the credit facility (December 31, 2013 - $788.5 million). |
| • | On March 19, 2015, the KNOC Board approved a US$171 million loan to Harvest repayable within one year from the date of the first drawing. |
| • | Subsequent to the 2014 year end, Harvest reached an agreement in principle with its lenders to amend the terms of its existing credit facility and replace it with an up to $1.0 billion syndicated revolving credit facility maturing April 30, 2017. As at March 31, 2015, Harvest has received lending commitments from its syndicated lenders in the amount of $940 million. The amended credit facility will be guaranteed by KNOC. |
DISCONTINUED OPERATIONS
Downstream
| • | On November 13, 2014 the sale of the Downstream segment closed for net proceeds of $70.5 million. Harvest recorded a loss of $56.6 million on the disposal of this segment. |
| • | Throughput volume averaged 76,455 bbl/d and 86,520 bbl/d for the fourth quarter and year ended December 31, 2014, respectively (2013 – 92,339 bbl/d and 98,081 bbl/d). Reduced throughput for the fourth quarter of 2014 compared to 2013 is mainly due to the sale of the Refinery on November 13, 2014, while the decrease for the 2014 year was mainly due to the sale of the Refinery, planned maintenance and unplanned operational outages. |
| • | Refining gross margin per bbl averaged $2.76 during the fourth quarter of 2014 (2013 – $2.50) and $4.43 for the year ended December 31, 2014 (2013 – $1.07). The increase in gross margin per bbl for the fourth quarter was mainly due to lower sales volumes offset by higher realized crack spreads on all products. The increase in gross margin per bbl for the year ended December 31, 2014 was mainly due to higher realized product margins in the first and third quarters of 2014 as a consequence of improved sour crude differentials. |
4
| MANAGEMENT’S DISCUSSION AND ANALYSIS |
| • | Operating loss totaled $6.6 million for the fourth quarter of 2014 and $226.1 million for the year ended December 31, 2014 (2013 – $506.4 million and $691.1 million, respectively). The decrease in operating loss in the fourth quarter of 2014 is mainly due to a decrease in the impairment expense recorded in the fourth quarter of 2014, refinery operations for a period of October 1 to November 13, 2014 due to the sale, higher refining gross margin per bbl, partially offset by lower feedstock volume. The decrease in operating loss for the year ended December 31, 2014 is mainly due to a higher refining gross margin per bbl, lower impairment, depreciation and amortization and operating expense compared to 2013. |
| • | Cash deficiency from Harvest’s Downstream operations for the fourth quarter of 2014 was $14.6 million (2013 – $32.3 million) and $36.2 million (2013 – $152.4 million) for the year ended December 31, 2014. The decrease in Downstream’s cash deficiency for the fourth quarter of 2014 is primarily due to the sale of the Refinery on November 13, 2014 compared to a full quarter of operations in 2013. The decrease in cash deficiency for the year ended December 31, 2014 is mainly due to a higher average refining gross margin. |
GUIDANCE UPDATE
The following compares Harvest’s actual results for the year 2014 to the guidance previously disclosed in the interim MD&A for the three and nine months ended September 30, 2014:
Upstream
| • | Annual production was expected to average 45,500 boe/d and the actual was 45,825 boe/d. |
| • | The 2014 annual capital budget was $423 million and the actual amount spent was $408.5 million. The Upstream capital spent was under budget because Harvest scaled back its winter drilling program at Hay and Loon as a result of the decrease in commodity prices during the fourth quarter of 2014. |
| • | Harvest’s operating expense was $19.76/boe for the year ended December 31, 2014, which is within the targeted range of $19.70 and $20.00/boe. |
BlackGold
| • | BlackGold’s 2014 capital spent was $283.5 million compared to the budget of $235 million. The additional $48.5 million is mainly due to capitalized borrowing costs, combined with higher than anticipated costs to complete the facility. Management’s 2014 plan was to first steam the facility in the first quarter of 2015, resulting in a high level of activity during the year to complete construction at the site and to prepare for the operational phase. However, due to the decrease in heavy oil prices during the latter part of the fourth quarter of 2014, Management has now delayed first steam until the oil prices are more favourable. |
Downstream
| • | Downstream previously anticipated to incur $4.5 million on property, plant and equipment at September 30, 2014, before the sale of the segment and $8.0 million was spent and impaired by November 13, 2014 due to the delay of the closing date of the sale. |
5
| MANAGEMENT’S DISCUSSION AND ANALYSIS |
CONTINUING OPERATIONS (UPSTREAM)
Summary of Financial and Operating Results
| | | Three Months Ended December 31 | | | Year Ended December 31 | |
| | | 2014 | | | 2013 | | | 2014 | | | 2013 | |
| FINANCIAL | | | | | | | | | | | | |
| Petroleum and natural gas sales(1) | | 202.8 | | | 260.7 | | | 1,046.0 | | | 1,101.7 | |
| Royalties | | (27.4 | ) | | (37.5 | ) | | (149.7 | ) | | (153.9 | ) |
| Loss from joint ventures | | (2.7 | ) | | — | | | (4.7 | ) | | — | |
| Revenues and other income(2) | | 172.7 | | | 223.2 | | | 891.6 | | | 947.8 | |
| | | | | | | | | | | | | |
| Expenses | | | | | | | | | | | | |
| Operating | | 79.6 | | | 82.3 | | | 330.5 | | | 345.6 | |
| Transportation and marketing | | (2.7 | ) | | 6.4 | | | 17.5 | | | 22.6 | |
| Realized losses (gains) on risk management contracts(3) | | 1.9 | | | (0.6 | ) | | 1.4 | | | (4.9 | ) |
| Operating netback after hedging(4) | | 93.9 | | | 135.1 | | | 542.2 | | | 584.5 | |
| | | | | | | | | | | | | |
| General and administrative | | 15.4 | | | 16.5 | | | 64.8 | | | 68.1 | |
| Depreciation, depletion and amortization | | 110.3 | | | 113.4 | | | 435.2 | | | 530.0 | |
| Exploration and evaluation | | 0.6 | | | 0.7 | | | 10.2 | | | 12.3 | |
| Impairment of property, plant and equipment | | 267.6 | | | 24.1 | | | 267.6 | | | 24.1 | |
| Unrealized losses on risk management contracts(5) | | 1.6 | | | 1.6 | | | 0.7 | | | 0.5 | |
| Gains on disposition of assets | | (18.3 | ) | | (23.5 | ) | | (47.5 | ) | | (33.9 | ) |
| Operating income (loss)(2) | | (283.3 | ) | | 2.3 | | | (188.8 | ) | | (16.6 | ) |
| | | | | | | | | | | | | |
| Capital asset additions (excluding acquisitions) | | 135.2 | | | 108.5 | | | 408.5 | | | 322.3 | |
| Property and business acquisitions (dispositions), net | | (30.1 | ) | | (27.5 | ) | | (301.1 | ) | | (155.6 | ) |
| | | | | | | | | | | | | |
| OPERATING | | | | | | | | | | | | |
| Light to medium oil (bbl/d) | | 10,132 | | | 10,820 | | | 10,520 | | | 11,671 | |
| Heavy oil (bbl/d) | | 13,116 | | | 16,348 | | | 14,893 | | | 16,905 | |
| Natural gas liquids (bbl/d) | | 4,109 | | | 4,607 | | | 4,368 | | | 5,345 | |
| Natural gas (mcf/d) | | 91,092 | | | 104,269 | | | 96,265 | | | 111,313 | |
| Total (boe/d)(6) | | 42,539 | | | 49,154 | | | 45,825 | | | 52,473 | |
| (1) | Includes the effective portion of Harvest’s realized natural gas and crude oil hedges. |
| (2) | This is an additional GAAP measure; please refer to “Additional GAAP Measures” in this MD&A. |
| (3) | Realized gains on risk management contracts include the settlement amounts for power, crude oil, natural gas and foreign exchange derivative contracts, excluding the effective portion of realized gains from Harvest’s designated accounting hedges. See “Risk Management, Financing and Other” section of this MD&A for details. |
| (4) | This is a non-GAAP measure; please refer to “Non-GAAP Measures” in this MD&A. |
| (5) | Unrealized gains on risk management contracts reflect the change in fair value of derivative contracts that are not designated as accounting hedges and the ineffective portion of changes in fair value of designated hedges. See “Risk Management, Financing and Other” section of this MD&A for details. |
| (6) | Excludes volumes from Harvest’s equity investment in the Deep Basin Partnership. |
6
| MANAGEMENT’S DISCUSSION AND ANALYSIS |
Commodity Price Environment
| | | Three Months Ended December 31 | | | Year Ended December 31 | |
| | | 2014 | | | 2013 | | | Change | | | 2014 | | | 2013 | | | Change | |
| West Texas Intermediate ("WTI") crude oil (US$/bbl) | | 73.15 | | | 97.46 | | | (25% | ) | | 93.00 | | | 97.97 | | | (5% | ) |
| West Texas Intermediate crude oil ($/bbl) | | 82.97 | | | 102.30 | | | (19% | ) | | 102.49 | | | 100.95 | | | 2% | |
| Edmonton light sweet crude oil ("EDM") ($/bbl) | | 75.79 | | | 86.49 | | | (12% | ) | | 94.59 | | | 93.04 | | | 2% | |
| Western Canadian Select ("WCS") crude oil ($/bbl) | | 66.73 | | | 68.41 | | | (2% | ) | | 81.06 | | | 74.97 | | | 8% | |
| AECO natural gas daily ($/mcf) | | 3.60 | | | 3.53 | | | 2% | | | 4.49 | | | 3.17 | | | 42% | |
| U.S. / Canadian dollar exchange rate | | 0.880 | | | 0.953 | | | (8% | ) | | 0.905 | | | 0.971 | | | (7% | ) |
| Differential Benchmarks | | | | | | | | | | | | | | | | | | |
| EDM differential to WTI ($/bbl) | | 7.18 | | | 15.81 | | | (55% | ) | | 7.90 | | | 7.91 | | | — | |
| EDM differential as a % of WTI | | 8.7% | | | 15.5% | | | (44% | ) | | 7.7% | | | 7.8% | | | (1% | ) |
| WCS differential to WTI ($/bbl) | | 16.24 | | | 33.89 | | | (52% | ) | | 21.43 | | | 25.98 | | | (18% | ) |
| WCS differential as a % of WTI | | 19.6% | | | 33.1% | | | (41% | ) | | 20.9% | | | 25.7% | | | (19% | ) |
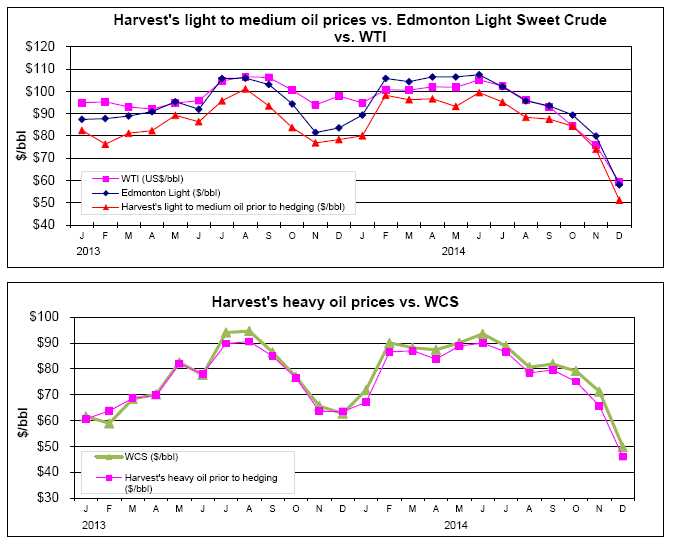
The average WTI benchmark price decreased 25% and 5%, respectively, for the fourth quarter and year ended December 31, 2014 as compared to the same periods in 2013. The average Edmonton light sweet crude oil price (“Edmonton Light”) decreased 12% in the fourth quarter compared to 2013, due to the decrease in the WTI price, partially offset by the strengthening of the U.S. dollar against the Canadian dollar and the narrowing of the Edmonton light sweet differential. The average Edmonton Light price increased 2% for the year ended December 31, 2014 compared to 2013, mainly due to the strengthening of the U.S. dollar against the Canadian dollar more than offsetting the decrease in the WTI price.
Heavy oil differentials fluctuate based on a combination of factors including the level of heavy oil production and inventories, pipeline and rail capacity to deliver heavy crude to U.S. and offshore markets and the seasonal demand for heavy oil. The changes in the WCS price for the fourth quarter and year ended December 31, 2014 as compared to the same periods in 2013 were mainly the result of the decrease in the WTI price, the narrowing of the WCS differential to WTI and the strengthening of the U.S. dollar.
7
| MANAGEMENT’S DISCUSSION AND ANALYSIS |
Realized Commodity Prices
| | | Three Months Ended December 31 | | | Year Ended December 31 | |
| | | 2014 | | | 2013 | | | Change | | | 2014 | | | 2013 | | | Change | |
| Light to medium oil prior to hedging ($/bbl) | | 69.69 | | | 79.67 | | | (13% | ) | | 87.65 | | | 85.38 | | | 3% | |
| Heavy oil prior to hedging ($/bbl) | | 62.33 | | | 68.03 | | | (8% | ) | | 78.59 | | | 74.37 | | | 6% | |
| Natural gas liquids ($/bbl) | | 46.96 | | | 58.97 | | | (20% | ) | | 59.53 | | | 57.44 | | | 4% | |
| Natural gas prior to hedging($/mcf) | | 3.21 | | | 3.86 | | | (17% | ) | | 4.82 | | | 3.46 | | | 39% | |
| Average realized price prior to hedging ($/boe)(1) | | 47.99 | | | 54.01 | | | (11% | ) | | 62.24 | | | 56.58 | | | 10% | |
| | | | | | | | | | | | | | | | | | | |
| Heavy oil after hedging ($/bbl)(2) | | 72.10 | | | 74.51 | | | (3% | ) | | 80.55 | | | 73.84 | | | 9% | |
| Natural gas after hedging ($/mcf)(2) | | 3.38 | | | 3.94 | | | (14% | ) | | 4.60 | | | 3.63 | | | 27% | |
| Average realized price after hedging ($/boe)(1)(2) | | 51.38 | | | 56.34 | | | (9% | ) | | 62.41 | | | 56.78 | | | 10% | |
| (1) | Inclusive of sulphur revenue. |
| (2) | Inclusive of the realized gains (losses) from contracts designated as hedges. Foreign exchange swaps and power contracts are excluded from the realized price. |
Harvest’s realized prices prior to hedging for light to medium oil generally trend with the Edmonton Light benchmark price. Harvest’s realized prices prior to hedging for heavy oil are a function of both the WCS and Edmonton Light benchmarks due to a portion of our heavy oil volumes being sold based on a discount to the Edmonton Light benchmark. For the fourth quarter and year ended December 31, 2014, the period-over-period variances and movements of light to medium oil and heavy oil were consistent with the changes in the Edmonton light and WCS benchmarks.
Harvest’s realized prices prior to hedging for natural gas generally trend with the AECO benchmark price, however, for the fourth quarter of 2014, the realized gas price prior to hedging decreased 17% while AECO increased 2% from the fourth quarter of 2013. This decrease in 2014 was primarily due to the reclassification of prior quarters’ transportation costs to gas revenues in the fourth quarter of 2014. The increase of 39% in the realized natural gas price before hedging for the year ended December 31, 2014 was consistent with the increase in the AECO benchmark from 2013.
Realized natural gas liquids prices decreased by 20% and increased by 4% for the fourth quarter and year ended December 31, 2014, respectively, as compared to the same periods in the prior year. The decrease in the fourth quarter was consistent with the decrease in oil prices late in the year. The increase in the full year price was mainly due to the higher average prices for propane and ethane more than offsetting the price declines in the fourth quarter of 2014.
In order to mitigate the risk of fluctuating cash flows due to oil and natural gas pricing volatility, Harvest had WCS and AECO derivative contracts in place during the fourth quarter and year ended December 31, 2014 and 2013. For the fourth quarter of 2014, the WCS hedge increased our heavy oil price by $9.77/bbl (2013 – $6.48/bbl) and for the year ended December 31, 2014, the WCS hedge increased our heavy oil price by $1.96/bbl (2013 – decreased by $0.53/bbl) .
For the fourth quarter of 2014, the AECO hedge increased our natural gas price by $0.17/mcf (2013 – $0.08/mcf) and for the year ended December 31, 2014, the AECO hedge decreased our natural gas price by $0.22/mcf (2013 – increased by $0.17/mcf) .
8
| MANAGEMENT’S DISCUSSION AND ANALYSIS |
Please see “Cash Flow Risk Management” section in this MD&A for further discussion with respect to the cash flow risk management program.
9
| MANAGEMENT’S DISCUSSION AND ANALYSIS |

10
| MANAGEMENT’S DISCUSSION AND ANALYSIS |
Sales Volumes
| | | Three Months Ended December 31 | |
| | | 2014 | | | 2013 | | | | |
| | | | | | | | | | | | | | | % Volume | |
| | | Volume | | | Weighting | | | Volume | | | Weighting | | | Change | |
| Light to medium oil (bbl/d) | | 10,132 | | | 24% | | | 10,820 | | | 22% | | | (6% | ) |
| Heavy oil (bbl/d) | | 13,116 | | | 31% | | | 16,348 | | | 33% | | | (20% | ) |
| Natural gas liquids (bbl/d) | | 4,109 | | | 10% | | | 4,607 | | | 9% | | | (11% | ) |
| Total liquids (bbl/d) | | 27,357 | | | 65% | | | 31,775 | | | 64% | | | (14% | ) |
| Natural gas (mcf/d) | | 91,092 | | | 35% | | | 104,269 | | | 36% | | | (13% | ) |
| Total oil equivalent (boe/d) | | 42,539 | | | 100% | | | 49,154 | | | 100% | | | (13% | ) |
| | | Year Ended December 31 | |
| | | 2014 | | | 2013 | | | | |
| | | | | | | | | | | | | | | % Volume | |
| | | Volume | | | Weighting | | | Volume | | | Weighting | | | Change | |
| Light to medium oil (bbl/d) | | 10,520 | | | 23% | | | 11,671 | | | 22% | | | (10% | ) |
| Heavy oil (bbl/d) | | 14,893 | | | 32% | | | 16,905 | | | 32% | | | (12% | ) |
| Natural gas liquids (bbl/d) | | 4,368 | | | 10% | | | 5,345 | | | 10% | | | (18% | ) |
| Total liquids (bbl/d) | | 29,781 | | | 65% | | | 33,921 | | | 64% | | | (12% | ) |
| Natural gas (mcf/d) | | 96,265 | | | 35% | | | 111,313 | | | 36% | | | (14% | ) |
| Total oil equivalent (boe/d) | | 45,825 | | | 100% | | | 52,473 | | | 100% | | | (13% | ) |
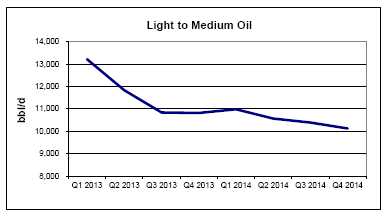 | Harvest’s average daily sales of light to medium oil decreased 6% and 10% for the fourth quarter and year ended December 31, 2014, respectively, as compared to the same periods in 2013. The decreases were due to natural declines and the disposition of non- core properties, partially offset by the results of our 2013 and 2014 drilling activity. |
11
| MANAGEMENT’S DISCUSSION AND ANALYSIS |
Heavy oil sales for the fourth quarter and year ended December 31, 2014 decreased 20% and 12%, respectively, as compared to the same periods in 2013 mainly due to non-core asset dispositions in the third quarter of 2014 (see the “Property Dispositions” section of this MD&A), previous dispositions and natural declines. 2013 sales were negatively impacted by an outage of a major oil battery in Alberta. | 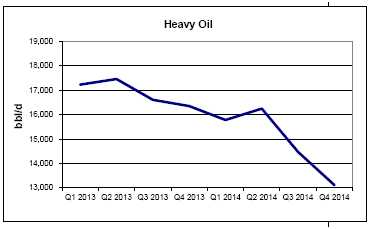 |
 | Natural gas sales during the fourth quarter and year ended December 31, 2014 decreased 13% and 14%, respectively, as compared to the same periods in 2013. The decreases were mainly due to natural declines, third-party processing facility constraints, disposition of assets to the Deep Basin Partnership during the second quarter of 2014 and disposition of non- core assets during 2013, partially offset by the results of our 2013 and 2014 drilling activity. |
Natural gas liquids sales for the fourth quarter and year ended December 31, 2014 decreased by 11% and 18%, respectively, from the same periods in 2013 for reasons consistent with natural gas sales. |  |
12
| MANAGEMENT’S DISCUSSION AND ANALYSIS |
Revenues
| | | Three Months Ended December 31 | | | Year Ended December 31 | |
| | | 2014 | | | 2013 | | | Change | | | 2014 | | | 2013 | | | Change | |
| Light to medium oil sales | | 65.0 | | | 79.3 | | | (18% | ) | | 336.6 | | | 363.7 | | | (7% | ) |
| Heavy oil sales after hedging(1) | | 87.0 | | | 112.1 | | | (22% | ) | | 437.9 | | | 455.6 | | | (4% | ) |
| Natural gas sales after hedging(1) | | 28.4 | | | 37.8 | | | (25% | ) | | 161.6 | | | 147.6 | | | 9% | |
| Natural gas liquids sales | | 17.8 | | | 25.0 | | | (29% | ) | | 94.9 | | | 112.1 | | | (15% | ) |
| Other(2) | | 4.6 | | | 6.5 | | | (29% | ) | | 15.0 | | | 22.7 | | | (34% | ) |
| Petroleum and natural gas sales | | 202.8 | | | 260.7 | | | (22% | ) | | 1,046.0 | | | 1,101.7 | | | (5% | ) |
| Royalties | | (27.4 | ) | | (37.5 | ) | | (27% | ) | | (149.7 | ) | | (153.9 | ) | | (3% | ) |
| Revenues | | 175.4 | | | 223.2 | | | (21% | ) | | 896.3 | | | 947.8 | | | (5% | ) |
| (1) | Inclusive of the effective portion of realized gains (losses) from natural gas and crude oil contracts designated as hedges. |
| (2) | Inclusive of sulphur revenue and miscellaneous income. |
Harvest’s revenue is subject to changes in sales volumes, commodity prices, currency exchange rates and hedging activities. In the fourth quarter of 2014, total petroleum and natural gas sales decreased by 22% as compared to the fourth quarter of 2013, mainly due to the 13% decrease in sales volumes and the 9% decrease in realized prices after hedging activities. Total petroleum and natural gas sales decreased by 5% for the year ended December 31, 2014 as compared to 2013, mainly due to the 13% decrease in sales volumes, partially offset by the 10% increase in realized prices after hedging activities.
Sulphur revenue represented $3.0 million of the total in other revenues for the fourth quarter of 2014 (2013 - $0.6 million) and $12.9 million for the 2014 year (2013 – $8.5 million).
Royalties
Harvest pays Crown, freehold and overriding royalties to the owners of mineral rights from which production is generated. These royalties vary for each property and product and Crown royalties are based on various sliding scales dependent on incentives, production volumes and commodity prices.
For the fourth quarter and year ended December 31, 2014, royalties as a percentage of gross revenue averaged 13.5% and 14.3%, respectively (2013 – 14.4% and 14.0%) . The decrease in royalties as a percentage of gross revenue for the fourth quarter of 2014 as compared to the same period in the prior year was mainly due to net positive royalty adjustments and lower commodity prices. The increase in royalties as a percentage of gross revenue for the 2014 year as compared to the prior year was mainly due to an unfavourable Alberta Crown gas cost allowance adjustment and the impacts of higher commodity prices.
13
| MANAGEMENT’S DISCUSSION AND ANALYSIS |
Operating and Transportation Expenses
| | | Three Months Ended December 31 | |
| | | 2014 | | | $/boe | | | 2013 | | | $/boe | | | $/boe Change | |
| Power and purchased energy | | 12.2 | | | 3.12 | | | 18.6 | | | 4.11 | | | (0.99 | ) |
| Repairs and maintenance | | 13.9 | | | 3.54 | | | 12.6 | | | 2.78 | | | 0.76 | |
| Well servicing | | 9.3 | | | 2.38 | | | 11.0 | | | 2.44 | | | (0.06 | ) |
| Processing and other fees | | 13.1 | | | 3.35 | | | 11.2 | | | 2.48 | | | 0.87 | |
| Lease rentals and property tax | | 10.6 | | | 2.71 | | | 10.1 | | | 2.23 | | | 0.48 | |
| Labour - internal | | 7.1 | | | 1.81 | | | 7.0 | | | 1.54 | | | 0.27 | |
| Chemicals | | 4.5 | | | 1.15 | | | 4.4 | | | 0.98 | | | 0.17 | |
| Labour - contract | | 3.9 | | | 1.00 | | | 3.7 | | | 0.81 | | | 0.19 | |
| Trucking | | 4.2 | | | 1.07 | | | 3.0 | | | 0.66 | | | 0.41 | |
| Other(1) | | 0.8 | | | 0.21 | | | 0.7 | | | 0.17 | | | 0.04 | |
| Total operating expenses | | 79.6 | | | 20.34 | | | 82.3 | | | 18.20 | | | 2.14 | |
| Transportation and marketing | | (2.7 | ) | | (0.68 | ) | | 6.4 | | | 1.42 | | | (2.10 | ) |
| (1) | Other operating expenses include Environmental, Health and Safety (2014 – $3.4 million, 2013 – $3.6 million), insurance and accruals. |
| | | Year Ended December 31 | |
| | | 2014 | | | $/boe | | | 2013 | | | $/boe | | | $/boe Change | |
| Power and purchased energy | | 67.6 | | | 4.04 | | | 89.1 | | | 4.65 | | | (0.61 | ) |
| Repairs and maintenance | | 53.2 | | | 3.18 | | | 51.6 | | | 2.70 | | | 0.48 | |
| Well servicing | | 39.6 | | | 2.37 | | | 49.9 | | | 2.60 | | | (0.23 | ) |
| Processing and other fees | | 38.2 | | | 2.28 | | | 36.8 | | | 1.92 | | | 0.36 | |
| Lease rentals and property tax | | 38.8 | | | 2.32 | | | 37.3 | | | 1.95 | | | 0.37 | |
| Labour - internal | | 30.9 | | | 1.85 | | | 31.8 | | | 1.66 | | | 0.19 | |
| Chemicals | | 19.9 | | | 1.19 | | | 18.7 | | | 0.98 | | | 0.21 | |
| Labour - contract | | 14.2 | | | 0.85 | | | 15.3 | | | 0.80 | | | 0.05 | |
| Trucking | | 13.8 | | | 0.82 | | | 13.9 | | | 0.72 | | | 0.10 | |
| Other(1) | | 14.3 | | | 0.86 | | | 1.2 | | | 0.07 | | | 0.79 | |
| Total operating expenses | | 330.5 | | | 19.76 | | | 345.6 | | | 18.05 | | | 1.71 | |
| Transportation and marketing | | 17.5 | | | 1.05 | | | 22.6 | | | 1.18 | | | (0.13 | ) |
| (1) | Other operating expenses include Environmental, Health and Safety (2014 – $12.2 million, 2013 – $9.5 million), insurance and accruals. |
Operating expenses for the fourth quarter of 2014 decreased by $2.7 million compared to the same period in 2013, mainly due to the decrease in the cost of power. Operating costs for the fourth quarter on a per barrel basis increased by 12% to $20.34 primarily due to the impact of lower sales volumes. Operating expenses for the year ended December 31, 2014 decreased by $15.1 million compared to the same period in 2013, mainly attributable to the decrease in the cost of power, lower well servicing expenses and the impact of asset dispositions in 2013 and 2014. Operating costs for the 2014 year on a per barrel basis increased by 9% to $19.76 primarily due to the impact of lower sales volumes.
14
| MANAGEMENT’S DISCUSSION AND ANALYSIS |
| | | Three Months Ended December 31 | | | Year Ended December 31 | |
| ($/boe) | | 2014 | | | 2013 | | | Change | | | 2014 | | | 2013 | | | Change | |
| Power and purchased energy costs | | 3.12 | | | 4.11 | | | (0.99 | ) | | 4.04 | | | 4.65 | | | (0.61 | ) |
| Realized losses (gain) on electricity risk | | | | | | | | | | | | | | | | | | |
| management contracts | | 0.48 | | | 0.06 | | | 0.42 | | | 0.10 | | | (0.16 | ) | | 0.26 | |
| Net power and purchased energy costs | | 3.60 | | | 4.17 | | | (0.57 | ) | | 4.14 | | | 4.49 | | | (0.35 | ) |
| Alberta Power Pool electricity price ($/MWh) | | 30.55 | | | 48.39 | | | (17.84 | ) | | 49.63 | | | 79.95 | | | (30.32 | ) |
Power and purchased energy costs, comprised primarily of electric power costs, represented approximately 15% of total operating expenses for the fourth quarter of 2014 (2013 – 23%). Power and purchased energy costs per boe were lower in the fourth quarter and year ended December 31, 2014 as compared to 2013 primarily due to the lower average Alberta electricity price.
Transportation and marketing expenses relate primarily to delivery of natural gas and the cost of trucking crude oil to pipeline or rail receipt points. The total dollar amount of costs generally fluctuates in relation to sales volumes. Transportation and marketing expenses in the fourth quarter and year ended December 31, 2014 decreased by $9.1 million and $5.1 million, respectively, as compared to the same periods in 2013. These decreases were primarily due to the reclassification of prior quarters’ gas transportation costs to revenue and favourable prior year trucking credits from the BC Crown during the fourth quarter of 2014, partially offset by higher transportation costs caused by third-party facility turnarounds, pipeline outages and facility restrictions in the Hay River and Deep Basin areas which required sales volumes to be trucked to different pipeline inlets.
Operating Netback(1)
| | | Three Months Ended December 31 | | | Year Ended December 31 | |
| ($/boe) | | 2014 | | | 2013 | | | Change | | | 2014 | | | 2013 | | | Change | |
| Petroleum and natural gas sales prior to hedging(2) | | 47.99 | | | 54.01 | | | (6.02 | ) | | 62.24 | | | 56.58 | | | 5.66 | |
| Royalties | | (6.98 | ) | | (8.29 | ) | | 1.31 | | | (8.95 | ) | | (8.04 | ) | | (0.91 | ) |
| Operating expenses | | (20.34 | ) | | (18.20 | ) | | (2.14 | ) | | (19.76 | ) | | (18.05 | ) | | (1.71 | ) |
| Transportation and marketing | | 0.68 | | | (1.42 | ) | | 2.10 | | | (1.05 | ) | | (1.18 | ) | | 0.13 | |
| Operating netback prior to hedging(1) | | 21.35 | | | 26.10 | | | (4.75 | ) | | 32.48 | | | 29.31 | | | 3.17 | |
| Hedging gain(3) | | 2.91 | | | 2.47 | | | 0.44 | | | 0.10 | | | 0.47 | | | (0.37 | ) |
| Operating netback after hedging(1) | | 24.26 | | | 28.57 | | | (4.31 | ) | | 32.58 | | | 29.78 | | | 2.80 | |
| (1) | This is a non-GAAP measure; please refer to “Non-GAAP Measures” in this MD&A. |
| (2) | Excludes miscellaneous income not related to oil and gas production |
| (3) | Hedging gain includes the settlement amounts for natural gas, crude oil, foreign exchange and power contracts. |
General and Administrative (“G&A”) Expenses
| | | Three Months Ended December 31 | | | Year Ended December 31 | |
| | | 2014 | | | 2013 | | | 2014 | | | 2013 | |
| G&A | | 15.4 | | | 16.5 | | | 64.8 | | | 68.1 | |
| G&A ($/boe ) | | 3.93 | | | 3.65 | | | 3.88 | | | 3.56 | |
15
| MANAGEMENT’S DISCUSSION AND ANALYSIS |
For the fourth quarter and year ended December 31, 2014, G&A expenses decreased $1.1 million and $3.3 million, respectively, from the same periods in the prior year mainly due to lower consulting costs. On a per boe basis, G&A expenses increased $0.28 and $0.32 in the fourth quarter and year to date 2014, respectively, from the same periods in the prior year mainly due to lower sales volumes in the current year periods. Harvest does not have a stock option program, however there is a long-term incentive program which is a cash settled plan that has been included in the G&A expense.
Depletion, Depreciation and Amortization (“DD&A”) Expenses
| | | Three Months Ended December 31 | | | Year Ended December 31 | |
| | | 2014 | | | 2013 | | | 2014 | | | 2013 | |
| DD&A | | 110.3 | | | 113.4 | | | 435.2 | | | 530.0 | |
| DD&A ($/boe) | | 28.18 | | | 25.08 | | | 26.02 | | | 27.67 | |
DD&A expense for the year ended December 31, 2014 decreased by $94.8 million as compared to the prior year, mainly due to a change in Harvest’s DD&A accounting estimate in the fourth quarter of 2013, combined with lower sales volumes in 2014, partially offset by the decrease in reserves at December 31, 2014.
Impairment of Property, Plant and Equipment
For the fourth quarter and year ended December 31, 2014, Harvest recognized an impairment loss of $267.6 million against PP&E relating to the North Alberta light oil (2014 – $131.8 million, 2013 – $nil), East Saskatchewan light oil (2014 – $100.8 million, 2013 – $nil) and South Alberta gas (2014 – $35.0 million, 2013 – $24.1 million) CGUs. Impairment in the oil CGUs was triggered by reserves write-downs as a result of a decline in the short-term oil prices and reduced estimates of recoverable oil from the CGUs. Impairment in the gas CGU was triggered by a reserves write-down as a result of lower forecast development activities and a decline in the long-term gas prices. The recoverable amount was based on the assets’ value-in-use (“VIU”), estimated using the net present value of proved plus probable reserves discounted at a pre-tax rate of 8% (2013 – 8%) for the gas CGU and 10% for oil CGUs. Please refer to note 8 of the December 31, 2014 consolidated financial statements for further discussion.
Property Dispositions & Acquisitions
At the end of the fourth quarter of 2014, Harvest sold certain non-core heavy oil assets with approximately 600 boe/d of production in Saskatchewan for net proceeds of $30.2 million before customary closing adjustments. The transaction resulted in a gain of $20.0 million which is recognized in the consolidated statement of comprehensive loss.
During the third quarter of 2014, Harvest sold certain non-core heavy oil assets with approximately 2,000 boe/d of production in southeastern Alberta for net proceeds of $167.0 million before customary closing adjustments. The transaction resulted in a gain of $27.0 million which is recognized in the consolidated statement of comprehensive loss for the year ended December 31, 2014.
In addition, Harvest also disposed of producing and non-producing assets with a net book value of $81.8 million to the Deep Basin Partnership and $8.4 million of construction assets-in-progress to the HKMS
16
| MANAGEMENT’S DISCUSSION AND ANALYSIS |
Partnership in the second quarter of 2014. Please see the “Investments in Joint Arrangements” section in this MD&A for further discussion with respect to the Deep Basin Partnership and HK MS Partnership.
During the year ended December 31, 2014, Harvest disposed 20,906 acres of net undeveloped land (2013 – 54,650 acres).
On February 27, 2015, Harvest closed the acquisition of Hunt by acquiring all of the issued and outstanding common shares for cash consideration of approximately $36.5 million, subject to final purchase price adjustments. Hunt is a private oil and gas company with operations immediately offsetting Harvest’s lands and production in the Deep Basin area of Alberta.
Capital Asset Additions
| | | Three Months Ended December 31 | | | Year Ended December 31 | |
| | | 2014 | | | 2013 | | | 2014 | | | 2013 | |
| Drilling and completion | | 75.6 | | | 62.1 | | | 235.7 | | | 180.9 | |
| Well equipment, pipelines and facilities | | 35.9 | | | 28.8 | | | 123.3 | | | 100.8 | |
| Land and undeveloped lease rentals | | 7.0 | | | 3.5 | | | 15.1 | | | 6.6 | |
| Geological and geophysical | | 5.0 | | | 5.9 | | | 10.6 | | | 14.4 | |
| Corporate | | 10.8 | | | 2.1 | | | 14.6 | | | 4.6 | |
| Other | | 0.9 | | | 6.1 | | | 9.2 | | | 15.0 | |
| Total additions excluding acquisitions | | 135.2 | | | 108.5 | | | 408.5 | | | 322.3 | |
Total capital additions were higher for year ended December 31, 2014 compared to 2013 mainly due to a higher capital budget for the current year to support drilling deeper and more expensive wells in the Red Earth and Deep Basin areas. Harvest’s capital expenditures in the fourth quarter related to the remainder of the 2014 drilling program as well as the commencement of the winter 2014/2015 drilling program in Hay River and Red Earth, and included drilling, well completions, equipping and tie-ins.
The following table summarizes the wells drilled in our six core growth areas, supplemented with drilling in strategic revenue generating areas in Heavy Oil, Suffield and other non-core areas, and the related drilling and completion costs incurred in the period. A well is recorded in the table as having being drilled after it has been rig-released, however related drilling costs may be incurred in a period before a well has been spud (including survey, lease acquisition and construction costs) and related completion costs may be incurred in a period afterwards, depending on the timing of the completion work.
17
| MANAGEMENT’S DISCUSSION AND ANALYSIS |
| | | Three Months Ended December 31 | | | Year Ended December 31 | |
| | | | | | | | | Drilling and | | | | | | | | | Drilling and | |
| Area | | Gross | | | Net | | | completion | | | Gross | | | Net | | | completion | |
| Deep Basin | | 5.0 | | | 3.7 | | $ | 31.8 | | | 15.0 | | | 8.3 | | $ | 67.8 | |
| Red Earth | | — | | | — | | | 8.0 | | | 8.0 | | | 7.9 | | | 48.8 | |
| Hay River | | 3.0 | | | 3.0 | | | 8.1 | | | 19.0 | | | 19.0 | | | 34.6 | |
| Western Alberta | | 5.0 | | | 1.6 | | | 6.9 | | | 12.0 | | | 3.5 | | | 15.7 | |
| Cecil | | — | | | — | | | 1.2 | | | 5.0 | | | 5.0 | | | 11.8 | |
| SE Saskatchewan | | 7.0 | | | 7.0 | | | 7.7 | | | 9.0 | | | 9.0 | | | 10.9 | |
| Heavy oil | | 6.0 | | | 6.0 | | | 6.0 | | | 19.0 | | | 18.4 | | | 17.5 | |
| Suffield | | 3.0 | | | 3.0 | | | 4.6 | | | 7.0 | | | 7.0 | | | 10.6 | |
| Other areas | | — | | | — | | | 1.3 | | | 6.0 | | | 4.1 | | | 18.0 | |
| Total | | 29.0 | | | 24.3 | | $ | 75.6 | | | 100.0 | | | 82.2 | | $ | 235.7 | |
In Red Earth, Harvest is pad drilling 6 wells from one surface location to reduce per well costs. All surface holes are drilled, followed by the main holes, and then the wells are completed and equipped for production. Several surface holes were drilled at Red Earth in the fourth quarter of 2014, but since these wells were not drilled and rig released before December 31, 2014, $8.0 million of capital was spent during the fourth quarter of 2014 with no related well additions in 2014. The drilling and completions in Cecil during the fourth quarter of 2014 related to the completion of wells drilled and rig released during the third quarter of 2014.
The primary areas of focus for Harvest’s Upstream drilling program were as follows:
- Deep Basin – participated or drilled horizontal multi-stage fractured wells to develop the liquids-rich Falher and Montney gas formations;
- Red Earth – drilled wells at Loon Lake, Girouxville and Evi targeting light oil in the Slave Point formation;
- Hay River – drilled producing and injection wells, pursuing slightly heavy (low 20 degree API) gravity oil in the Bluesky formation using multi-leg horizontal oil wells;
- West Central Alberta – drilled or participated in wells in several fields with recent efforts targeting the Bluesky, Cardium, Glauconite, and Notikewin formations;
- Cecil – drilled horizontal wells targeting light oil in the Charlie Lake formation.
- SE Saskatchewan – drilled horizontal wells targeting light oil in the Tilston formation.
- Heavy Oil area – drilled horizontal heavy oil wells in the Lloydminster region of Alberta into the Dina, General Petroleum, Lloydminster, McLaren and Sparky formations.
- Suffield and other areas – drilled light to heavy oil wells in southern Alberta, including Suffield, Enchant and Montgomery.
Harvest’s net undeveloped land additions of 105,818 acres during the year ended December 31, 2014 (2013 – 50,651 acres) were primarily in our core growth areas.
Decommissioning Liabilities
Harvest’s Upstream decommissioning liabilities at December 31, 2014 were $752.0 million (December 31, 2013 – $709.4 million) for future remediation, abandonment, and reclamation of Harvest’s oil and gas properties. The $42.6 million net increase in the liability is mainly a result of the change in discount rate from
18
| MANAGEMENT’S DISCUSSION AND ANALYSIS |
December 31, 2013 to 2014, partially offset by disposals of properties discussed in the “Property Dispositions” section above. The total of the decommissioning liabilities are based on management’s best estimate of costs to remediate, reclaim, and abandon wells and facilities. The costs will be incurred over the operating lives of the assets with the majority being at or after the end of reserve life. Please refer to the “Contractual Obligations and Commitments” section of this MD&A for the payments expected for each of the next five years and thereafter in respect of the decommissioning liabilities.
Goodwill
Goodwill is recorded when the purchase price of an acquired business exceeds the fair value of the net identifiable assets and liabilities of that acquired business. At December 31, 2014, Harvest had $353.1 million (December 31, 2013 – $379.8 million) of goodwill on the balance sheet related to the Upstream segment, a decrease of $26.7 million as a result of dispositions of certain oil and gas properties (see the “Property Dispositions” section above). The goodwill balance is assessed annually for impairment or more frequently if events or changes in circumstances occur that would reasonably be expected to reduce the fair value of the acquired business to a level below its carrying amount. No impairment was recorded in 2013 or 2014.
Investments in Joint Arrangements
On April 23, 2014, Harvest entered into the DBP and HKMS joint ventures with KERR, where Harvest contributed selected assets with upside development potential and KERR contributed cash for both infrastructure and development capital. These unique partnerships allow Harvest to grow its core business region while conserving capital. The principal place of operations for both DBP and HKMS is in Canada.
Deep Basin Partnership
DBP was established for the purposes of exploring, developing and producing from certain oil and gas properties in the Deep Basin area in Northwest Alberta. On April 23, 2014, Harvest contributed certain producing and non-producing properties to DBP in exchange for 467,386,000 of common partnership units (82.32% ownership interest), while KERR contributed $100.4 million for 100,368,000 preferred partnership units (17.68% ownership interest). On August 29, 2014, KERR contributed an additional $32.9 million to the DBP for an additional 32,913,506 preferred partnership units increasing KERR’s ownership interest to 22.19% and diluting Harvest’s ownership interest to 77.81% .
Amounts contributed by KERR are being spent by the DBP to purchase land, drill and develop partnership properties in the Deep Basin area. As the initial funding from KERR is consumed and additional funds are required to fund the entire agreed initial multi-year development program, Harvest will be obligated to fund the balance of the program from its share of partnership distributions. At December 31, 2014, Harvest received a total of $2.3 million in distributions from the DBP.
The preferred partnership units provide KERR certain preference rights, including a put option right exercisable after 10.5 years, whereby KERR could cause DBP to redeem all its preferred partnership units for consideration equal to its initial contribution plus a minimum after-tax internal rate of return of two percent. If DBP does not have sufficient funds to complete the redemption obligation and after making efforts to secure funding, whether via issuing new equity, entering into a financing arrangement or selling assets, the partnership can cash-call Harvest to meet such obligation (the “top-up obligation”). This obligation could also
19
| MANAGEMENT’S DISCUSSION AND ANALYSIS |
arise upon the termination of this arrangement. This top-up obligation is accounted for by Harvest at fair value through profit and loss and is estimated using a probabilistic model of the estimated future cash flows of the DBP. The cash flow forecast is based on management’s internal assumptions of the volumes, commodity prices, royalties, operating costs and capital expenditures specific to the DBP. As at December 31, 2014, the fair value of the top-up obligation was estimated as $nil, therefore, no top-up obligation was recorded by Harvest. Once KERR achieves the minimum after-tax internal rate of return on its investment, Harvest is entitled to increased return on its investment.
Harvest derives its income or loss from its investment in the DBP based upon Harvest’s share in the change of the net assets of the joint venture. Harvest’s share of the change in the net assets does not directly correspond to its ownership interest of 77.81% because of contractual preference rights to KERR. Considering that fact, Harvest’s share of the production of the DBP are as follows:
| | DBP volumes | Harvest's share |
| Three months ended December 31, 2014 (boe/d) | 1,214 | 945 |
| Period between April 23 - December 31, 2014 (boe/d) | 1,520 | 1183 |
During the second half of the 2014 year, DBP drilled 9 gross and net wells in the Deep Basin, targeting the Cadotte, Dunvegan, Falher and Montney locations. All wells were horizontal, multi-stage fracture stimulated wells targeting liquids rich gas. Production from these wells is processed through the new HKMS gas plant that was completed in early 2015.
HKMS Partnership
HKMS was formed for the purposes of constructing and operating a gas processing facility, which is primarily used to process the gas produced from the properties owned by the Deep Basin Partnership. A gas processing agreement was entered by the two partnerships. For the HKMS Partnership, KERR initially contributed $22.6 million on April 23, 2014 for 22,632,000 partnership units, which represented 34.82% of the outstanding partnership units. On August 29, 2014, KERR contributed an additional $7.4 million to HKMS for an additional 7,421,673 partnership units increasing KERR’s ownership interest to 46.24% . The remaining 53.76% (34,946,327 partnership units) will be contributed by Harvest as cash is required for the completion of construction of the gas processing facility. On the earlier of 10.5 years after the formation of HKMS or when KERR achieves specified internal rate of return, Harvest will have the right but not the obligation to purchase all of KERR’s interest in HKMS Partnership for nominal consideration. As at December 31, 2014, $26.7 million of contribution has been made by Harvest to the HKMS partnership. The remaining $8.2 million of committed cash contribution will be contributed to HKMS in 2015.
For the fourth quarter and year ended December 31, 2014, Harvest recognized losses of $2.7 million and $4.7 million, respectively, from its investment in these joint ventures.
See note 11 of the December 31, 2014 audited consolidated financial statements for discussion of the accounting implications of these joint arrangements.
20
| MANAGEMENT’S DISCUSSION AND ANALYSIS |
BLACKGOLD OIL SANDS
Capital Asset Additions
| | | Three Months Ended December 31 | | | Year Ended December 31 | |
| | | 2014 | | | 2013 | | | 2014 | | | 2013 | |
| Well equipment, pipelines and facilities | | 68.7 | | | 111.4 | | | 198.8 | | | 404.0 | |
| Pre-operating costs | | 11.8 | | | 0.6 | | | 32.2 | | | 0.6 | |
| Drilling and completion | | 4.1 | | | 5.3 | | | 6.3 | | | 13.7 | |
| Capitalized borrowing costs and other | | 14.3 | | | 10.8 | | | 46.2 | | | 26.2 | |
| Total BlackGold additions | | 98.9 | | | 128.1 | | | 283.5 | | | 444.5 | |
During the fourth quarter and year ended December 31, 2014, Harvest invested $68.7 million and $198.8 million, respectively, on the CPF.
Oil Sands Project Development
Harvest is developing its BlackGold oil sands CPF under the engineering, procurement and construction (“EPC”) contract. Initial drilling of 30 steam assisted gravity drainage (“SAGD”) wells (15 well pairs) was completed by the end of 2012 and the majority of the well completion activities were completed by the end of 2014. More SAGD wells will be drilled in the future to compensate for the natural decline in production of the initial well pairs and maintain the Phase 1 production capacity of 10,000 bbl/d. Subsequent to December 31, 2014, construction has been substantially completed, including the building of the CPF plant site, well pads, and connecting pipelines. The CPF was mechanically completed in early 2015. Minor pre-commissioning activities will continue at a measured pace throughout 2015 and first steam will occur once the heavy oil price environment becomes favourable. Phase 2 of the project, which is targeted to increase production capacity to 30,000 bbl/d, received all required regulatory approvals in 2013.
As at December 31, 2014, Harvest has incurred $659.5 million on the EPC contract from inception to date. After the accounting impact of the deferred liability described below, Harvest has recorded $642.2 million of costs for the EPC contract and has recorded $1,014.4 million of costs on the entire project since acquiring the BlackGold assets in 2010. This $1,014.4 million includes certain Phase 2 pre-investment which is expected to improve the capital efficiency over the project lifecycle. Under the EPC contract, a maximum of approximately $101 million of the EPC costs will be paid in equal installments, without interest, over 10 years commencing on the completion of the EPC work in 2015. The liability is considered a financial liability and is initially recorded at fair value, which is estimated as the present value of all future cash payments discounted using the prevailing market rate of interest for similar instruments. As at December 31, 2014, Harvest recognized a liability of $77.8 million (December 31, 2013 - $76.2 million) using a discount rate of 4.5% (December 31, 2013 - 4.5%) .
Decommissioning Liabilities
Harvest’s BlackGold decommissioning liabilities at December 31, 2014 were $47.5 million (December 31, 2013 - $34.3 million) relating to the future remediation, abandonment, and reclamation of the SAGD wells and CPF. Please see the “Contractual Obligations and Commitments” section of this MD&A for the payments expected for each of the next five years and thereafter in respect of the decommissioning liabilities.
21
| MANAGEMENT’S DISCUSSION AND ANALYSIS |
DISCONTINUED OPERATIONS (DOWNSTREAM)
The sale of the Downstream segment closed on November 13, 2014, which resulted in presentation of operations from October 1 to November 13, 2014 for the fourth quarter of 2014 and from January 1 to November 13, 2014 for the year ended December 31, 2014. Comparative results for 2013 are for the full quarter and year ended December 31, 2013.
Summary of Financial and Operating Results
| | | | | | Three Months | | | | | | | |
| | | October 1 - | | | Ended | | | | | | | |
| | | November 13 | | | December 31 | | | Year Ended December 31 | |
| | | 2014 | | | 2013 | | | 2014 | | | 2013 | |
| FINANCIAL | | | | | | | | | | | | |
| Refined products sales(1) | | 321.2 | | | 1,084.2 | | | 3,432.1 | | | 4,416.9 | |
| Purchased products for processing and resale(1) | | 305.1 | | | 1,049.2 | | | 3,250.0 | | | 4,327.4 | |
| Gross margin(2) | | 16.1 | | | 35.0 | | | 182.1 | | | 89.5 | |
| | | | | | | | | | | | | |
| Operating expense | | 16.0 | | | 31.3 | | | 107.4 | | | 126.4 | |
| Purchased energy expense | | 13.0 | | | 30.7 | | | 102.4 | | | 106.7 | |
| Marketing expense | | 0.7 | | | 1.8 | | | 6.0 | | | 5.4 | |
| General and administrative | | 0.1 | | | 0.1 | | | 0.5 | | | 0.6 | |
| Depreciation and amortization | | - | | | 18.6 | | | 12.8 | | | 82.8 | |
| Gain on dispositions of PP&E | | - | | | - | | | (0.2 | ) | | (0.2 | ) |
| Impairment on property, plant and equipment and other | | (7.1 | ) | | 458.9 | | | 179.3 | | | 458.9 | |
| Operating loss(3) | | (6.6 | ) | | (506.4 | ) | | (226.1 | ) | | (691.1 | ) |
| | | | | | | | | | | | | |
| Capital expenditures | | 8.0 | | | 18.1 | | | 27.8 | | | 53.2 | |
| | | | | | | | | | | | | |
| OPERATING | | | | | | | | | | | | |
| Feedstock volume (bbl/d)(4) | | 76,455 | | | 92,339 | | | 86,520 | | | 98,081 | |
| | | | | | | | | | | | | |
| Yield (% of throughput volume)(5) | | | | | | | | | | | | |
| Gasoline and related products | | 32% | | | 32% | | | 32% | | | 31% | |
| Ultra low sulphur diesel and jet fuel | | 35% | | | 37% | | | 37% | | | 37% | |
| High sulphur fuel oil | | 31% | | | 29% | | | 28% | | | 29% | |
| Total | | 98% | | | 98% | | | 97% | | | 97% | |
| | | | | | | | | | | | | |
| Average refining gross margin (US$/bbl)(6) | | 2.76 | | | 2.50 | | | 4.43 | | | 1.07 | |
(1) Refined product sales and purchased products for processing and resale are net of intra-segment sales of $56.4 million and $491.1 million for the three and twelve months ended December 31, 2014 (2013 - $146.1 million and $555.4 million), reflecting the refined products produced by the refinery and sold by the marketing division.
(2) These are non-GAAP measures; please refer to “Non-GAAP Measures” in this MD&A.
(3) These are additional GAAP measures; please refer to “Additional GAAP Measures” in this MD&A.
(4) Barrels per day are calculated using total barrels of crude oil feedstock and purchased vacuum gas oil.
(5) Based on production volumes after adjusting for changes in inventory held for resale.
(6) Average refining gross margin is calculated based on per barrel of feedstock throughput.
22
| MANAGEMENT’S DISCUSSION AND ANALYSIS |
Refining Benchmark Prices
| | | Three Months Ended | | | | | | | | | | |
| | | December 31(1) | | | Year Ended December 31 | |
| | | 2014 | | | 2013 | | | Change | | | 2014 | | | 2013 | | | Change | |
| WTI crude oil (US$/bbl) | | 73.15 | | | 97.46 | | | (25% | ) | | 93.00 | | | 97.97 | | | (5% | ) |
| Brent crude oil (US$/bbl) | | 77.03 | | | 109.36 | | | (30% | ) | | 99.48 | | | 108.75 | | | (9% | ) |
| Argus sour crude index (“ASCI”) (US$/bbl) | | 77.02 | | | 95.51 | | | (19% | ) | | 92.37 | | | 102.02 | | | (9% | ) |
| Brent – WTI differential (US$/bbl) | | 3.88 | | | 11.90 | | | (67% | ) | | 6.48 | | | 10.78 | | | (40% | ) |
| Brent – ASCI differential (US$/bbl) | | 0.01 | | | 13.85 | | | (100% | ) | | 7.11 | | | 6.73 | | | 6% | |
| Refined product prices | | | | | | | | | | | | | | | | | | |
| Platts RBOB (US$/bbl) | | 85.43 | | | 112.11 | | | (24% | ) | | 110.70 | | | 119.11 | | | (7% | ) |
| Platts Ultra Low Sulfur Diesel (US$/bbl) | | 98.19 | | | 125.49 | | | (22% | ) | | 117.15 | | | 125.76 | | | (7% | ) |
| Platts High Sulphur Fuel Oil (US$/bbl) | | 63.23 | | | 91.45 | | | (31% | ) | | 84.04 | | | 93.15 | | | (10% | ) |
| U.S. / Canadian dollar exchange rate | | 0.880 | | | 0.953 | | | (8% | ) | | 0.905 | | | 0.971 | | | (7% | ) |
| (1) | The 2014 quarterly benchmark prices and exchange rate are averages from October 1 to December 31, 2014. |
Summary of Gross Margins
| | | October 1 – November 13, 2014 | | | Three Months Ended December 31, 2013 | |
| | | | | | Volumes(1) | | | (US$/bbl) | | | | | | Volumes(1) | | | (US$/bbl) | |
| Refinery | | | | | | | | | | | | | | | | | | |
| Sales | | | | | | | | | | | | | | | | | | |
| Gasoline products | | 70.8 | | | 0.7 | | | 88.36 | | | 367.4 | | | 3.2 | | | 109.76 | |
| Distillates | | 143.9 | | | 1.2 | | | 104.37 | | | 444.0 | | | 3.4 | | | 125.15 | |
| High sulphur fuel oil | | 52.9 | | | 0.7 | | | 64.28 | | | 190.7 | | | 2.1 | | | 87.44 | |
| Other(2) | | 41.3 | | | 0.4 | | | 84.08 | | | 48.4 | | | 0.4 | | | 110.52 | |
| Total sales | | 308.9 | | | 3.0 | | | 88.41 | | | 1,050.5 | | | 9.1 | | | 110.43 | |
| Feedstock(3) | | | | | | | | | | | | | | | | | | |
| Crude oil | | 290.9 | | | 3.3 | | | 77.73 | | | 911.1 | | | 8.1 | | | 106.57 | |
| Vacuum Gas Oil (“VGO”) | | 4.4 | | | 0.1 | | | 88.16 | | | 38.5 | | | 0.4 | | | 105.20 | |
| Total feedstock | | 295.3 | | | 3.4 | | | 77.87 | | | 949.6 | | | 8.5 | | | 106.51 | |
| Other(4) | | 3.0 | | | | | | | | | 78.6 | | | | | | | |
| Total feedstock and other costs | | 298.3 | | | | | | | | | 1,028.2 | | | | | | | |
| Refinery gross margin(5) | | 10.6 | | | | | | 2.76 | | | 22.3 | | | | | | 2.50 | |
| | | | | | | | | | | | | | | | | | | |
| Marketing | | | | | | | | | | | | | | | | | | |
| Sales | | 68.7 | | | | | | | | | 179.8 | | | | | | | |
| Cost of products sold | | 63.2 | | | | | | | | | 167.1 | | | | | | | |
| Marketing gross margin(5) | | 5.5 | | | | | | | | | 12.7 | | | | | | | |
| | | | | | | | | | | | | | | | | | | |
| Total gross margin(5) | | 16.1 | | | | | | | | | 35.0 | | | | | | | |
23
| MANAGEMENT’S DISCUSSION AND ANALYSIS |
| | | Year Ended December 31 | |
| | | | | | 2014 | | | | | | | | | 2013 | | | | |
| | | | | | Volumes(1) | | | (US$/bbl) | | | | | | Volumes(1) | | | (US$/bbl) | |
| Refinery | | | | | | | | | | | | | | | | | | |
| Sales | | | | | | | | | | | | | | | | | | |
| Gasoline products | | 1,111.7 | | | 9.1 | | | 110.69 | | | 1,446.0 | | | 12.3 | | | 113.83 | |
| Distillates | | 1,442.8 | | | 11.0 | | | 119.08 | | | 1,833.2 | | | 14.5 | | | 122.76 | |
| High sulphur fuel oil | | 633.5 | | | 6.8 | | | 84.32 | | | 759.3 | | | 8.3 | | | 89.28 | |
| Other(2) | | 126.2 | | | 1.1 | | | 100.91 | | | 249.4 | | | 2.2 | | | 109.39 | |
| Total sales | | 3,314.2 | | | 28.0 | | | 107.18 | | | 4,287.9 | | | 37.3 | | | 111.60 | |
| Feedstock(3) | | | | | | | | | | | | | | | | | | |
| Crude oil | | 2,885.8 | | | 27.0 | | | 96.90 | | | 3,645.8 | | | 33.4 | | | 105.90 | |
| Vacuum Gas Oil (“VGO”) | | 55.1 | | | 0.5 | | | 105.05 | | | 270.5 | | | 2.4 | | | 110.81 | |
| Total feedstock | | 2,940.9 | | | 27.5 | | | 97.04 | | | 3,916.3 | | | 35.8 | | | 106.22 | |
| Other(4) | | 239.0 | | | | | | | | | 332.1 | | | | | | | |
| Total feedstock and other costs | | 3,179.9 | | | | | | | | | 4,248.4 | | | | | | | |
| Refinery gross margin(5) | | 134.3 | | | | | | 4.43 | | | 39.5 | | | | | | 1.07 | |
| | | | | | | | | | | | | | | | | | | |
| Marketing | | | | | | | | | | | | | | | | | | |
| Sales | | 609.0 | | | | | | | | | 684.4 | | | | | | | |
| Cost of products sold | | 561.2 | | | | | | | | | 634.4 | | | | | | | |
| Marketing gross margin(5) | | 47.8 | | | | | | | | | 50.0 | | | | | | | |
| | | | | | | | | | | | | | | | | | | |
| Total gross margin(5) | | 182.1 | | | | | | | | | 89.5 | | | | | | | |
| (1) | Volumes in million bbls. |
| (2) | Includes sales of vacuum gas oil and hydrocracker bottoms. |
| (3) | Cost of feedstock includes all costs of transporting the crude oil to the refinery in Newfoundland. |
| (4) | Includes inventory adjustments, additives and blendstocks and purchased product for resale. |
| (5) | This is a non-GAAP measure; please refer to “Non-GAAP Measures” in this MD&A. |
Feedstock throughput averaged 76,455 bbl/d in the fourth quarter of 2014, 17% lower than the 92,339 bbl/d average feedstock in the fourth quarter of the prior year, mainly due to the sale of the refinery on November 13, 2014. The average throughput rate for the year ended December 31, 2014 was 86,520 bbl/d, a 12% decrease from the 98,081 bbl/d in the prior year. The lower daily average throughput rate for 2014 is a consequence of a power outage in January, an unplanned outage in the last week of March, a planned three week outage on the platformer unit for regular maintenance followed by an unplanned ten day outage on the isomax unit. The daily average throughput rate for 2013 has been negatively impacted as a consequence of an unplanned two-week outage in February due to a power failure during a storm, a partial outage in March for additional repairs, reduced throughput rates in the second quarter of 2013 as a result of economic conditions and an unplanned isomax outage in July.
The table below provides a comparison between the product crack spreads realized by Downstream and the benchmark crack spread for the three months and year ended December 31, with both crack spreads referring to the price of Brent crude oil.
24
| MANAGEMENT’S DISCUSSION AND ANALYSIS |
| | | October 1 – November 13, 2014 | | | Three Months Ended December 31, 2013 | |
| | | Refinery | | | Benchmark(1) | | | Difference | | | Refinery | | | Benchmark(1) | | | Difference | |
| Gasoline products (US$/bbl) | | 10.49 | | | 8.40 | (2) | | 2.09 | | | 3.25 | | | 2.75 | (2) | | 0.50 | |
| Distillates (US$/bbl) | | 26.50 | | | 21.16 | (2) | | 5.34 | | | 18.64 | | | 16.13 | (2) | | 2.51 | |
| High Sulphur Fuel Oil (US$/bbl) | | (13.59 | ) | | (13.80 | )(3) | | 0.21 | | | (19.07 | ) | | (17.91 | )(3) | | (1.16 | ) |
| | | Year Ended December 31 | |
| | | 2014 | | | 2013 | |
| | | Refinery | | | Benchmark(1) | | | Difference | | | Refinery | | | Benchmark(1) | | | Difference | |
| Gasoline products (US$/bbl) | | 13.65 | | | 11.22 | (2) | | 2.43 | | | 7.61 | | | 10.36 | (2) | | (2.75 | ) |
| Distillates (US$/bbl) | | 22.04 | | | 17.67 | (2) | | 4.37 | | | 16.54 | | | 17.01 | (2) | | (0.47 | ) |
| High Sulphur Fuel Oil (US$/bbl) | | (12.72 | ) | | (15.44 | )(3) | | 2.72 | | | (17.76 | ) | | (15.60 | )(3) | | (2.16 | ) |
| (1) | Benchmark product crack is relative to Brent crude oil |
| (2) | RBOB benchmark market price sourced from Platts. |
| (3) | High Sulphur Fuel Oil benchmark market price sourced from Platts. Our high sulphur fuel oil normally contains higher sulphur content than the 3% content reflected in the benchmark price. |
Downstream’s product crack spreads are different from the above noted benchmarks due to several factors, including the timing of actual sales and feedstock purchases differing from the calendar month benchmarks, transportation costs, sour crude differentials, quality differentials and variability in the throughput volume over a given period of time. The refinery sales also include products for which market prices are not reflected in the benchmarks. Downstream’s crack spreads for gasoline products and distillates in the above tables include the actual cost of renewable identification numbers (“RIN”) that are necessary to meet blending requirements for RBOB gasoline and ultra-low sulphur diesel (“ULSD”) in the US market as mandated by the US government. Our average RINs cost for the quarter was approximately US$2.15/bbl for RBOB gasoline and US$2.20/bbl for ULSD products compared to US$1.20/bbl and US$1.50/bbl, respectively, for the fourth quarter of 2013. Average RINs cost year to date was approximately US$2.00/bbl for RBOB gasoline and US$2.10/bbl for ULSD products compared to US$2.50/bbl and US$3.00/bbl, respectively, for the prior year.
Our crude feedstock differential for the year ended December 31, 2014 is slightly lower than the differentials in 2013. Our realized sour crude differential of US$2.58/bbl for the year ended December 31, 2014 is US$0.27/bbl lower than our sour crude differential of US$2.85/bbl in the prior year. The narrowing realized differential is the result of processing more higher priced light sweet crudes which comprised 26% of our feedstock crude slate this year as compared to 21% in 2013. The improved yields normally associated with processing light sweet crudes (higher yield of the high value light end products and a lower yield of the low value heavy products) have been offset by outages on the refinery units in both years.
The refinery gross margin for the period from October 1 to November 13, 2014 decreased as compared to the gross margin in the fourth quarter of 2013. The overall decrease can be attributed to lower sales volumes as a result of the sale of the Refinery on November 13, 2014, partially offset by higher realized product crack spreads on all our products. The cost of our crude feedstock in the fourth quarter of 2014 was a premium of US$0.84/bbl to the benchmark Brent crude oil as compared to a discount of US$2.85/bbl in the same period
25
| MANAGEMENT’S DISCUSSION AND ANALYSIS |
of the prior year; the increased feedstock cost as compared to benchmark is mainly the result of processing more expensive light sweet crudes in 2014 as compared to processing more heavier sour crudes in 2013.
The refinery gross margin for the year ended December 31, 2014 was significantly higher than the $39.5 million as reported in the prior year due to higher realized product margins.
The overall gross margin for our refinery is also impacted by the purchasing of blendstocks to meet summer gasoline specifications, additives to meet product specifications, the build of unfinished saleable products, some of which are recorded at a value lower than cost, and inventory write-downs and reversals. These costs are included in “other costs” in the Summary of Gross Margin Table above.
The gross margin from the marketing operations is comprised of the margin from both the retail and wholesale distribution of gasoline and home heating fuels as well as the revenues from marine services including tugboat revenues.
Operating Expenses
| | | October 1 – November 13, 2014 | | | Three Months Ended December 31, 2013 | |
| | | Refining | | | Marketing | | | Total | | | Refining | | | Marketing | | | Total | |
| Operating cost | | 12.6 | | | 3.4 | | | 16.0 | | | 26.0 | | | 5.3 | | | 31.3 | |
| Purchased energy | | 13.0 | | | - | | | 13.0 | | | 30.7 | | | - | | | 30.7 | |
| | | 25.6 | | | 3.4 | | | 29.0 | | | 56.7 | | | 5.3 | | | 62.0 | |
| ($/bbl of feedstock throughput) | | | | | | | | | | | | | | | | | | |
| Operating cost | | 3.77 | | | - | | | - | | | 3.06 | | | - | | | - | |
| Purchased energy | | 3.85 | | | - | | | - | | | 3.62 | | | - | | | - | |
| | | 7.62 | | | - | | | - | | | 6.68 | | | - | | | - | |
| | | Year Ended December 31 | |
| | | 2014 | | | 2013 | |
| | | Refining | | | Marketing | | | Total | | | Refining | | | Marketing | | | Total | |
| Operating cost | | 88.5 | | | 18.9 | | | 107.4 | | | 104.8 | | | 21.6 | | | 126.4 | |
| Purchased energy | | 102.4 | | | - | | | 102.4 | | | 106.7 | | | - | | | 106.7 | |
| | | 190.9 | | | 18.9 | | | 209.8 | | | 211.5 | | | 21.6 | | | 233.1 | |
| ($/bbl of feedstock throughput) | | | | | | | | | | | | | | | | | | |
| Operating cost | | 3.23 | | | - | | | - | | | 2.92 | | | - | | | - | |
| Purchased energy | | 3.73 | | | - | | | - | | | 2.98 | | | - | | | - | |
| | | 6.96 | | | - | | | - | | | 5.90 | | | - | | | - | |
The refining operating cost per barrel of feedstock throughput increased by 23% in the fourth quarter of 2014 and 11% for the year ended as compared to the prior year mainly as a result of decreased throughput in 2014.
26
| MANAGEMENT’S DISCUSSION AND ANALYSIS |
Purchased energy, consisting of LSFO and electricity, is required to provide heat and power to refinery operations. The purchased energy cost per barrel of feedstock throughput increased by 6% and 25% respectively during the quarter and year ended December 31, 2014 from the same periods of 2013.
Capital Assets Additions
Capital asset additions for the quarter and year ended December 31, 2014 totaled $8.0 million and $27.8 million respectively (2013 - $18.1 million and $53.2 million respectively), relating to various capital projects.
Depreciation and Amortization Expense
| | | October 1 – November 13 | | | Year Ended December 31 | |
| | | 2014 | | | 2013 | | | 2014 | | | 2013 | |
| Refining | | - | | | 17.7 | | | 10.3 | | | 79.0 | |
| Marketing | | - | | | 0.9 | | | 2.5 | | | 3.8 | |
| Total depreciation and amortization | | - | | | 18.6 | | | 12.8 | | | 82.8 | |
There was no depreciation and amortization expense in the fourth quarter of 2014 as a result of the assets being fully impaired at the end of the third quarter. Likewise, the decrease in depreciation and amortization for the year ended December 31, 2014 as compared to 2013 is due to an impairment of assets of $458.9 million at the end of 2013 and depreciation recorded from January 1, 2014 to September 30, 2014 before the impairment of assets. The process units were amortized over an average useful life of 20 to 35 years and turnaround costs were amortized to the next scheduled turnaround.
Currency Exchange
As Downstream operations’ functional currency is denominated in U.S. dollars, the strengthening (weakening) of the U.S. dollar resulted in unrealized currency exchange gains (losses) from its decommissioning liabilities, pension obligations, accounts payable and other balances that are denominated in Canadian dollars. At December 31, 2014, the U.S. dollar had strengthened compared to the Canadian dollar as at September 30, 2014 resulting in an unrealized foreign exchange gain of $0.5 million for the fourth quarter of 2014 (2013 –$19.3 million). The U.S. dollar also strengthened at December 31, 2014 as compared to December 31, 2013 resulting in an unrealized foreign exchange gain of $21.6 million (2013 – $34.3 million).
The cumulative translation adjustment in other comprehensive income represents the translation of the Downstream operations’ U.S. dollar functional currency financial statements to Canadian dollars. During the fourth quarter and year ended December 31, 2014, Downstream incurred a net cumulative translation loss of $0.7 million (2013 – gain of $0.8 million) and $9.9 million (2013 – gain of $7.9 million), respectively, reflecting the changes in the Canadian dollar relative to the U.S. dollar on Harvest’s net investment in the Downstream segment at December 31, 2014 compared to December 31, 2013.
27
| MANAGEMENT’S DISCUSSION AND ANALYSIS |
Disposition of the Downstream Segment and Impairment on PP&E and other
Downstream operations included the purchase and refining of crude oil at a medium gravity sour crude oil hydrocracking refinery, and the sale of the refined products to commercial, wholesale and retail customers. Downstream was located in the Province of Newfoundland and Labrador. On November 13, 2014, Harvest closed the sale of the Downstream segment for net proceeds of approximately $70.5 million subject to post-closing adjustments. The Downstream segment has been classified as discontinued operations as at December 31, 2014.
The purchase and sale agreement to sell the Downstream segment triggered an impairment and onerous contract assessment during the third quarter of 2014. As a result of this assessment an onerous contract provision was recorded in the third quarter of 2014. Downstream recorded a recovery of $7.1 million during the fourth quarter of 2014 and a $179.3 million impairment loss for the year ended December 31, 2014 (2013 – $458.9 million) of the Downstream segment relating to the PP&E to reflect a recoverable amount of $nil at December 31, 2014. The recovery during the fourth quarter of 2014 resulted from the reversal of the onerous contract provision previously recorded. This amount has been included in the operating loss from discontinued operations. Also see note 7, Discontinued Operations of the December 31, 2014 audited consolidated financial statements.
Upon the disposal of the Downstream segment, a $44.1 million cumulative foreign translation adjustment loss was reclassified from accumulated other comprehensive income to the loss on disposal of the Downstream segment. Harvest recognized a loss on disposal of the Downstream segment of $56.6 million during the fourth quarter and year ended December 31, 2014.
As it was no longer probable for Downstream to utilize the deferred tax assets of $92.1 million, it was written down to $nil during the third quarter of 2014. Harvest also completed a strategic tax planning transaction during the third quarter of 2014, which resulted in an increase of deferred tax assets in the amount of $247.6 million. See note 18, Income Taxes of the December 31, 2014 audited consolidated financial statements.
28
| MANAGEMENT’S DISCUSSION AND ANALYSIS |
RISK MANAGEMENT, FINANCING AND OTHER
Cash Flow Risk Management
The Company at times enters into natural gas, crude oil, electricity and foreign exchange contracts to reduce the volatility of cash flows from some of its forecast sales and purchases, and when allowable, will designate these contracts as cash flow hedges. During 2014, Harvest entered into WCS price and foreign exchange swaps concurrently as they complement each other. The WCS swap mitigated crude oil price risk by fixing a certain U.S. dollar price per barrel on certain heavy oil volumes. The foreign exchange swap mitigated currency exchange risk by swapping the U.S. dollar notional value of the WCS price swap back to Harvest’s functional currency, the Canadian dollar. At December 31, 2014, these contracts matured. The following is a summary of Harvest’s risk management contracts outstanding at December 31, 2014:
| Contracts Designated as Hedges | | | | |
| Contract Quantity | Type of Contract | Term | Contract Price | Fair value |
| 5,400 GJ/day | AECO swap | Jan - Dec 2015 | $3.65/GJ | $ 1.9 |
| Contracts Not Designated as Hedges | | | | |
| Contract Quantity | Type of Contract | Term | Contract Price | Fair value |
| 30 MWh | AESO power swap | Jan - Dec 2015 | $47.75/MWh | $ (1.2) |
The following is a summary of Harvest’s realized and unrealized (gains) losses on risk management contracts:
| | | Three Months Ended December 31 | |
| | | | | | | | | 2014 | | | | | | | | | | | | | | | 2013 | | | | | | | |
| Realized (gains) losses | | | | | Crude | | | | | | Natural | | | | | | | | | Crude | | | | | | Natural | | | | |
| recognized in: | | Power | | | Oil | | | Currency | | | Gas | | | Total | | | Power | | | Oil | | | Currency | | | Gas | | | Total | |
| Revenues | | — | | | (11.8 | ) | | — | | | (1.5 | ) | | (13.3 | ) | | — | | | (9.7 | ) | | — | | | (0.8 | ) | | (10.5 | ) |
| Risk management (gains) losses | | 1.9 | | | — | | | — | | | — | | | 1.9 | | | 0.2 | | | (0.9 | ) | | 0.1 | | | — | | | (0.6 | ) |
| Unrealized (gains) lossesrecognized in: | | | | | | | | | | | | | | | | | | | | | | | | | | | | | | |
| OCI, before tax | | — | | | (10.3 | ) | | — | | | (4.6 | ) | | (14.9 | ) | | — | | | (5.8 | ) | | — | | | 0.8 | | | (5.0 | ) |
| Risk management (gains) losses | | 1.6 | | | — | | | — | | | — | | | 1.6 | | | 0.8 | | | 0.8 | | | — | | | — | | | 1.6 | |
| | | Year Ended December 31 | |
| | | | | | | | | 2014 | | | | | | | | | | | | | | | 2013 | | | | | | | |
| Realized (gains) losses | | | | | Crude | | | | | | Natural | | | | | | | | | Crude | | | | | | Natural | | | | |
| recognized in: | | Power | | | Oil | | | Currency | | | Gas | | | Total | | | Power | | | Oil | | | Currency | | | Gas | | | Total | |
| Revenues | | — | | | (10.7 | ) | | — | | | 7.7 | | | (3.0 | ) | | — | | | 3.3 | | | — | | | (7.2 | ) | | (3.9 | ) |
| Risk management (gains) losses | | 1.6 | | | — | | | (0.2 | ) | | — | | | 1.4 | | | (3.1 | ) | | (0.4 | ) | | (1.4 | ) | | — | | | (4.9 | ) |
| Unrealized (gains) lossesrecognized in: | | | | | | | | | | | | | | | | | | | | | | | | | | | | | | |
29
| MANAGEMENT’S DISCUSSION AND ANALYSIS |
| OCI, before tax | | — | | | (10.6 | ) | | — | | | 5.9 | | | (4.7 | ) | | — | | | 3.3 | | | — | | | (5.7 | ) | | (2.4 | ) |
| Risk management gains | | 0.7 | | | — | | | — | | | — | | | 0.7 | | | 0.5 | | | — | | | — | | | — | | | 0.5 | |
Finance Costs
| | | Three Months Ended December 31 | | | Year Ended December 31 | |
| | | 2014 | | | 2013 | | | 2014 | | | 2013 | |
| Credit facility | | 5.4 | | | 6.3 | | | 25.0 | | | 20.3 | |
| Convertible debentures | | — | | | — | | | — | | | 14.9 | |
| 667/8% senior notes | | 10.4 | | | 9.6 | | | 40.3 | | | 37.4 | |
| 221/8% senior notes(1) | | 5.0 | | | 4.8 | | | 19.6 | | | 11.7 | |
| Related party loans | | 5.7 | | | 2.1 | | | 20.2 | | | 8.1 | |
| Amortization of deferred finance charges and other | | 0.4 | | | 0.3 | | | 1.6 | | | 1.4 | |
| Interest and other financing charges(2) | | 26.9 | | | 23.1 | | | 106.7 | | | 93.8 | |
| Accretion of decommission and environmental remediation liabilities | | 5.1 | | | 5.5 | | | 22.0 | | | 21.8 | |
| Gain on redemption of convertible debentures | | — | | | — | | | — | | | (3.6 | ) |
| Less: capitalized interest | | (9.5 | ) | | (8.7 | ) | | (33.4 | ) | | (19.8 | ) |
| Total finance costs(2) | | 22.5 | | | 19.9 | | | 95.3 | | | 92.2 | |
| (1) | Includes guarantee fee to KNOC. |
| (2) | Excludes discontinued operations of the Downstream segment. |
The finance costs on the credit facility have increased from the year ended December 31, 2013 to 2014, mainly due to the greater average amount of principal outstanding during 2014 and a higher effective interest rate, as compared to the 2013. See note 12 of the December 31, 2014 audited consolidated financial statements.
No interest has been paid on convertible debentures in 2014 as all remaining convertible debentures were redeemed in the second quarter 2013.
The finance costs on the 221/8% senior notes have increased for the year ended December 31, 2014 as the notes were issued in May of 2013 and now full-period interest has been accrued for the 2014 year.
The finance costs on related party loans has increased in 2014 due to the additional borrowings in February and June 2014, under the KNOC subordinated agreement. See discussion in the “Related Party Transaction” section of this MD&A.
Capitalized interest relates to amounts borrowed to fund the capital expenditures of BlackGold. The increase in capitalized interest for the three months and year ended December 31, 2014 is mainly due to the increase in our long-term borrowings attributable to BlackGold.
30
| MANAGEMENT’S DISCUSSION AND ANALYSIS |
Currency Exchange
| | | Three Months Ended December 31 | | | Year Ended December 31 | |
| | | 2014 | | | 2013 | | | 2014 | | | 2013 | |
| Realized losses on foreign exchange(1) | | 0.6 | | | 1.1 | | | 1.5 | | | 3.5 | |
| Unrealized losses on foreign exchange(1) | | 51.7 | | | 43.3 | | | 124.9 | | | 75.2 | |
| | | 52.3 | | | 44.4 | | | 126.4 | | | 78.7 | |
| (1) | Excludes discontinued operations of the Downstream segment. |
Currency exchange gains and losses are attributed to the changes in the value of the Canadian dollar relative to the U.S. dollar on the U.S. dollar denominated 667/8% and 221/8% senior notes, the ANKOR related party loan and on any U.S. dollar denominated monetary assets or liabilities. At December 31, 2014, the Canadian dollar had weakened compared to the US dollar as at September 30, 2014 resulting in an unrealized foreign exchange loss of $51.7 million for the fourth quarter of 2014 (2013 – $43.3 million loss). Harvest recognized a realized foreign exchange loss of $0.6 million for the fourth quarter ended December 31, 2014 (2013 – $1.1 million loss) as a result of the settlement of U.S. dollar denominated transactions. The Canadian dollar also weakened for the year ended December 31, 2014 as compared to the US dollar as at December 31, 2013 resulting in an unrealized foreign exchange loss of $124.9 million (2013 – $75.2 million loss). Harvest recognized a realized foreign exchange loss of $1.5 million for the year ended December 31, 2014 (2013 – $3.5 million loss) as a result of the settlement of U.S. dollar denominated transactions.
Deferred Income Taxes
For the three months and year ended December 31, 2014 Harvest recorded deferred income tax recoveries from its Upstream operations of $82.5 million and $324.9 million, respectively (2013 – $12.2 million and $39.4 million, respectively). The large increase in Harvest’s deferred income tax recovery is mainly due to the net result of a strategic tax reorganization undertaken during the third quarter of 2014 in which $247.6 million of deferred tax assets were recognized in the Upstream segment. See the “Disposition of the Downstream Segment and Impairment Loss” section of this MD&A for further discussion.
Harvest’s deferred income tax asset (liability) will fluctuate during each accounting period to reflect changes in the temporary differences between the book value and tax basis of assets and liabilities. Currently, the principal sources of temporary differences relate to the Company’s property, plant and equipment, decommissioning liabilities and the unclaimed tax pools.
Related Party Transactions
The following provides a summary of the related party transactions between Harvest and KNOC for the quarter and year ended December 31, 2014:
Related Party Loans
On December 30, 2013, Harvest entered into a subordinated loan agreement with KNOC to borrow up to $200 million at a fixed interest rate of 5.3% per annum. The full principal and accrued interest is payable on December 30, 2018. As of December 31, 2014, Harvest has drawn $200.0 million from the loan agreement (December 31, 2013 - $80.0 million). The loan amount was recorded at fair value on initial recognition by discounting the future cash payments at the rate of 7% which is considered the market rate applicable to the liability. As at December 31, 2014, the carrying value of the KNOC loan was $191.2 million (December 31,
31
| MANAGEMENT’S DISCUSSION AND ANALYSIS |
2013 - $75.7 million). The difference between the fair value and the loan amount was recognized in contributed surplus. As at December 31, 2014, $10.3 million (December 31, 2013 – $4.3 million) has been recognized in contributed surplus related to the KNOC loan. For the year ended December 31, 2014, interest expense of $11.5 million was recorded (2013 and 2012 – $nil), of which $4.9 million remains outstanding as at December 31, 2014 (December 31, 2013 – $nil).
On August 16, 2012, Harvest entered into a subordinated loan agreement with ANKOR to borrow US$170 million at a fixed interest rate of 4.62% per annum. The principal balance and accrued interest is payable on October 2, 2017. At December 31, 2014, Harvest’s related party loan from ANKOR included $197.2 million (December 31, 2013 – $180.8 million) of principal and $3.1 million (December 31, 2013 – $3.0 million) of accrued interest. Interest expense was $8.7 million for the year ended December 31, 2014 (2013 – $8.1 million; 2012 – $3.0 million).
The related party loans are unsecured and the loan agreements contain no restrictive covenants. For purposes of Harvest’s credit facility covenant requirements, the related party loans are excluded from the ‘total debt’ amount but included in the ‘total capitalization’ amount.
| | | Transactions | | | Balance Outstanding | |
| | | Three Months Ended | | | Year Ended | | | Accounts Receivable as at | | | Accounts Payable as at | |
| | | December 31 | | | December 31 | | | December 31 | | | December 31 | |
| | | 2014 | | | 2013 | | | 2014 | | | 2013 | | | 2014 | | | 2013 | | | 2014 | | | 2013 | |
| Revenues | | | | | | | | | | | | | | | | | | | | | | | | |
| KNOC(1) | | 1.7 | | | − | | | 1.7 | | | 4.1 | | | − | | | − | | | − | | | − | |
| G&A Expenses | | | | | | | | | | | | | | | | | | | | | | | | |
| KNOC(2) | | (1.2 | ) | | (1.2 | ) | | (3.7 | ) | | (3.5 | ) | | 0.5 | | | − | | | 3.7 | | | 0.5 | |
| Finance costs | | | | | | | | | | | | | | | | | | | | | | | | |
| KNOC(3) | | 1.0 | | | 1.1 | | | 4.0 | | | 2.8 | | | − | | | − | | | 2.7 | | | 0.5 | |
| (1) | Global Technology and Research Centre (“GTRC) is used as a training and research facility for KNOC. In 2014 and 2013, the amounts are related to a geological study performed by the GTRC on behalf of KNOC. |
| (2) | Amounts relate to the reimbursement from KNOC for general and administrative expenses incurred by the GTRC. Also included is Harvest’s reimbursement to KNOC for secondee salaries paid by KNOC on behalf of Harvest. |
| (3) | Charges from KNOC for the irrevocable and unconditional guarantee they provided on Harvest’s 221/8% senior notes and the senior unsecured credit facility. A guarantee fee of 52 basis points per annum is charged by KNOC. |
The Company identifies its related party transactions by making inquiries of management and the Board of Directors, reviewing KNOC’s subsidiaries and associates, and performing a comprehensive search of transactions recorded in the accounting system. Material related party transactions require the Board of Directors’ approval. Also see note 11, “Investment in Joint Ventures” in the December 31, 2014 audited consolidated financial statements for details of related party transactions with DBP and HKMS.
On March 19, 2015, the KNOC Board approved a US$171 million loan to Harvest repayable within one year from the date of the first drawing.
32
| MANAGEMENT’S DISCUSSION AND ANALYSIS |
CAPITAL RESOURCES
The following table summarizes Harvest’s capital structure and provides the key financial ratios defined in the credit facility agreement.
| | | December 31, 2014 | | | December 31, 2013 | |
| Credit facility(1) | | 620.7 | | | 788.5 | |
| 667/8% senior notes (US$500 million) (1)(2) | | 580.1 | | | 531.8 | |
| 221/8% senior notes (US$630 million) (1)(2) | | 730.9 | | | 670.1 | |
| Related party loans (US$170 million and CAD$200 million)(2)(3) | | 397.2 | | | 260.8 | |
| | | 2,328.9 | | | 2,251.2 | |
| Shareholder's equity | | | | | | |
| 386,078,649 common shares issued | | 1,534.8 | | | 1,939.2 | |
| | | 3,863.7 | | | 4,190.4 | |
| Financial Ratios(4)(5) | | | | | | |
| Senior debt to annualized EBITDA | | 1.37 | | | 2.41 | |
| Annualized EBITDA to annualized interest expense | | 4.30 | | | 3.62 | |
| Senior debt to total capitalization | | 16% | | | 22% | |
| Total debt to total capitalization | | 49% | | | 54% | |
| (1) | Excludes capitalized financing fees |
| (2) | Face value converted at the period end exchange rate |
| (3) | As at December 31, 2013, related party loans comprised of US$170 million from ANKOR and CAD$80 million from KNOC. |
| (4) | Calculated based on Harvest’s credit facility covenant requirements (see note 12 of the December 31, 2014 annual consolidated financial statements). |
| (5) | The financial ratios and their components are non- GAAP measures; please refer to the “Non-GAAP Measures” section of this MD&A. |
On April 15, 2014, Harvest amended its credit facility to accommodate the progression of non-wholly owned partnership and joint arrangements for the development of Company lands. The amendments included provisions that allow the formation, operation and funding of partnerships that Harvest does not fully own, within specific parameters regarding the amount of assets and production contributed to such non-wholly owned partnership and joint venture arrangements. Limitation on distributions has been amended to allow distributions to Harvest or third parties by a joint venture partnership under specific provisions. The definitions for financial measures that are used in covenant ratios, including annualized EBITDA, total debt and senior debt have also been amended to accommodate the partnership and joint venture arrangements. In addition, the amendment removed Harvest’s option to cause the BlackGold assets to be removed from the security package of the credit facility, effectively enabling the Company to recognize equity related to BlackGold of $456.7 million as at December 31, 2014 for purposes of total capitalization, and specified an incremental amount of $229.5 million to be added to total capitalization for purposes of the total debt to total capitalization covenant, representing partial relief of the Downstream impairment charge incurred in 2013.
Subsequent to the 2014 year end, Harvest reached an agreement in principle with its lenders to amend the terms of its existing credit facility and replace it with an up to $1.0 billion syndicated revolving credit facility maturing April 30, 2017. As at March 31, 2015, Harvest has received lending commitments from its syndicated lenders in the amount of $940 million. The amended credit facility will be guaranteed by KNOC. Under the amended facility, applicable interest and fees will be based on a margin pricing grid based on the Moody’s and S&P credit ratings of KNOC. The financial covenants under the existing credit facility will be
33
| MANAGEMENT’S DISCUSSION AND ANALYSIS |
deleted and replaced with a new covenant: Total Debt to Capitalization ratio of 70% or less. The closing of the amended credit facility is expected to occur on or before April 16, 2015.
LIQUIDITY
The Company’s liquidity needs are met through the following sources: cash generated from operations, proceeds from asset dispositions, joint arrangements, borrowings under the credit facility, related party loans, long-term debt issuances and capital injections by KNOC. Harvest’s primary uses of funds are operating expenses, capital expenditures, and interest and principal repayments on debt instruments.
Cash flows for continuing and discontinued operations are presented on a combined basis in the consolidated financial statements. Cash flow from operating activities for the three months and year ended December, 2014 were $64.1 million and $482.9 million, respectively (2013 – $6.1 million and $200.6 million, respectively). The increase for the fourth quarter of 2014 is mainly a result of the increase in the change in non-cash working capital from the fourth quarter of 2013. The increase for the year ended December 31, 2014 is mainly a result of the decrease in cash deficiency in the Downstream segment and the increase in the change in non-cash working capital. Downstream cash used in operating activities was $22.2 million and $60.0 million for the three months and year ended December 31, 2014, respectively (2013 – $72.7 million and $177.4 million, respectively).
Cash contribution from Harvest’s Upstream operations for the fourth quarter and year ended December 31, 2014 were $82.8 million and $485.4 million, respectively (2013 – $119.5 million and $518.2 million). The decrease in Upstream’s cash contribution for the fourth quarter as compared to 2013 is mainly due to the decreases in average realized prices and lower sales volumes. The 2014 year to date Upstream cash contribution decreased from prior year mainly due to lower sales volumes, partially offset by higher realized prices than 2013.
Cash deficiency from Harvest’s Downstream operations for the fourth quarter of 2014 was $14.6 million (2013 – $32.3 million). The decrease in Downstream’s cash deficiency was mainly due to operations for 44 days in the fourth quarter of 2014 compared to a full quarter of operations in 2013. In addition, the decrease in cash deficiency was due to a higher refining gross margin as compared to the same quarter in the prior year, partially offset by the decrease in throughput volume. Cash deficiency from Harvest’s Downstream operations for year ended December 31, 2014 was $36.2 million (2013 – $152.4 million). The decrease in Downstream’s cash deficiency was mainly due to a higher average refining gross margin for the year to date, most of which occurred in the first and third quarters of 2014, partially offset by the decrease in throughput volume. See the “Cash Contribution (Deficiency) from Operations” section of this MD&A for further detail.
Harvest funded capital expenditures for the quarter and year ended December 31, 2014 of $241.1 million and $718.2 million, respectively (2013 – $249.7 million and $758.1 million) with cash generated from operating activities, property dispositions and borrowings under both the credit facility and KNOC subordinated loan.
34
| MANAGEMENT’S DISCUSSION AND ANALYSIS |
On February 28, 2014, Harvest borrowed $80.0 million under the subordinated loan agreement with KNOC and borrowed a further $40.0 million on June 18, 2014 (see the “Related Party Loans” section). These funds were partly used to repay a portion of the credit facility.
Harvest’s net repayment to the credit facility was $169.4 million during the year ended December 31, 2014 (2013 - $293.8 million net borrowing). The funds used to repay the credit facility in 2014 mainly came from the $167.0 million net proceeds of the property disposition in the third quarter of 2014 (see the “Property Dispositions” paragraphs in the Upstream section of this MD&A) and incremental drawings under the KNOC subordinated loan during the year.
Harvest had a working capital deficiency of $300.5 million as at December 31, 2014, as compared to a $75.4 million deficiency at December 31, 2013, mainly due to the disposal of the Downstream segment and the increase in accounts payable for amounts owing to DBP and HKMS, which were not present at December 31, 2013. Harvest’s working capital is expected to fluctuate from time to time, and will be funded from cash flows from operations and borrowings from the credit facility, as required.
Harvest ensures its liquidity through the management of its capital structure, seeking to balance the amount of debt and equity used to fund investment in each of our operating segments. Harvest evaluates its capital structure using the same financial covenant ratios as the ones externally imposed under the Company’s credit facility. The Company continually monitors its credit facility covenants and actively takes steps, such as reducing borrowings, increasing capitalization, amending or renegotiating covenants as and when required, to ensure compliance. Harvest was in compliance with all debt covenants at December 31, 2014.
In response to the low commodity price environment, Harvest is currently reviewing its 2015 capital program. Harvest plans to incur capital expenditures in 2015 based on project viability, growth opportunities in certain core development areas, as well as availability of funding. Harvest has also postponed first steam for the BlackGold project in response to the unfavourable heavy oil prices and will continually assess the commodity price environment to determine when the project will become viable. In addition, subsequent to December 31, 2014, Harvest reached an agreement in principle with its lenders to amend existing credit facility to provide for more financial flexibility. Harvest expects to meet its future cash requirements and financial obligations with cash from operations, the undrawn borrowing room under the new credit facility, the additional loan from KNOC, and proceeds from asset dispositions and joint arrangements.
35
| MANAGEMENT’S DISCUSSION AND ANALYSIS |
Contractual Obligations and Commitments
Harvest has recurring and ongoing contractual obligations and estimated commitments entered into in the normal course of operations. As at December 31, 2014, Harvest has the following significant contractual obligations and estimated commitments:
| | | Payments Due by Period | |
| | | 1 year | | | 2-3 years | | | 4-5 years | | | After 5 years | | | Total | |
| Debt repayments(1) | | — | | | 1,398.0 | | | 930.9 | | | — | | | 2,328.9 | |
| Debt interest payments(1)(2) | | 74.5 | | | 164.5 | | | 66.1 | | | — | | | 305.1 | |
| Purchase commitments(3) | | 23.4 | | | 20.0 | | | 20.0 | | | 40.0 | | | 103.4 | |
| Operating leases | | 5.2 | | | 16.0 | | | 14.6 | | | 42.1 | | | 77.9 | |
| Firm processing commitments | | 20.1 | | | 38.0 | | | 32.7 | | | 84.0 | | | 174.8 | |
| Firm transportation agreements | | 17.1 | | | 54.7 | | | 43.6 | | | 75.5 | | | 190.9 | |
| Employee benefits(4) | | 0.4 | | | 4.3 | | | — | | | — | | | 4.7 | |
| Decommissioning and environmental liabilities(5) | | 33.8 | | | 59.5 | | | 38.3 | | | 1,288.8 | | | 1,420.4 | |
| Total | | 174.5 | | | 1,755.0 | | | 1,146.2 | | | 1,530.4 | | | 4,606.1 | |
| (1) | Assumes constant foreign exchange rate. |
| (2) | Assumes interest rates as at December 31, 2014 will be applicable to future interest payments. |
| (3) | Relates to drilling and BlackGold oil sands project commitment. |
| (4) | Relates to the long-term incentive plan payments. |
| (5) | Represents the undiscounted obligation by period. |
Off Balance Sheet Arrangements
See “Investments in Joint Arrangements” section in this MD&A and note 11, “Investment in Joint Ventures” in the December 31, 2014 audited consolidated financial statements.
36
| MANAGEMENT’S DISCUSSION AND ANALYSIS |
SUMMARY OF QUARTERLY RESULTS
The following table and discussion highlights the fourth quarter of 2014 results relative to the preceding 7 quarters:
| | | | | | 2014 | | | | | | | | | 2013 | | | | |
| | | Q4 | | | Q3 | | | Q2 | | | Q1 | | | Q4 | | | Q3 | | | Q2 | | | Q1 | |
| FINANCIAL | | | | | | | | | | | | | | | | | | | | | | | | |
| Revenue, Upstream | | 172.7 | | | 223.1 | | | 244.3 | | | 251.5 | | | 223.1 | | | 245.3 | | | 243.2 | | | 236.2 | |
| Revenue, Downstream(1) | | 321.2 | | | 877.0 | | | 1,120.4 | | | 1,113.4 | | | 1,084.2 | | | 1,054.6 | | | 1,156.1 | | | 1,122.0 | |
| Total Revenues and other income(2) | | 493.9 | | | 1,100.1 | | | 1,364.7 | | | 1,364.9 | | | 1,307.3 | | | 1,299.9 | | | 1,399.3 | | | 1,358.2 | |
| | | | | | | | | | | | | | | | | | | | | | | | | |
| Net income (loss) from continuing operations | | (275.8 | ) | | 197.0 | | | 45.1 | | | (51.9 | ) | | (49.8 | ) | | 7.7 | | | (55.3 | ) | | (50.7 | ) |
| Net income (loss) from discontinued operations | | (61.7 | ) | | (277.9 | ) | | (69.9 | ) | | 54.9 | | | (468.0 | ) | | (87.2 | ) | | (33.9 | ) | | (44.7 | ) |
| Net income (loss) | | (337.5 | ) | | (80.9 | ) | | (24.8 | ) | | 3.0 | | | (517.8 | ) | | (79.5 | ) | | (89.2 | ) | | (95.4 | ) |
| | | | | | | | | | | | | | | | | | | | | | | | | |
| OPERATIONS | | | | | | | | | | | | | | | | | | | | | | | | |
| Upstream | | | | | | | | | | | | | | | | | | | | | | | | |
| Daily sales volumes (boe/d) | | 42,539 | | | 44,794 | | | 47,556 | | | 48,487 | | | 49,154 | | | 51,783 | | | 53,461 | | | 55,571 | |
| Realized price prior to hedging ($/boe) | | 47.99 | | | 62.99 | | | 69.30 | | | 67.29 | | | 54.01 | | | 60.62 | | | 58.22 | | | 53.43 | |
| Downstream | | | | | | | | | | | | | | | | | | | | | | | | |
| Average daily throughput (bbl/d) | | 76,455 | | | 73,495 | | | 95,410 | | | 95,767 | | | 92,339 | | | 93,798 | | | 106,245 | | | 100,074 | |
| Average refining gross margin (loss) ($US/bbl)(3) | | 2.76 | | | 4.09 | | | 0.25 | | | 9.58 | | | 2.50 | | | (1.43 | ) | | 0.74 | | | 2.51 | |
| (1) | Downstream operations for the fourth quarter of 2014 ended on November 13, 2014 and have been classified as “Discontinued Operations”. |
| (2) | This is an additional GAAP measure; please refer to “Additional GAAP Measures” in this MD&A. |
| (3) | This is a non-GAAP measure; please refer to “Non-GAAP Measures” in this MD&A. |
The quarterly revenues and cash from operating activities are mainly impacted by the Upstream sales volumes, realized prices and operating expenses and Downstream throughput volumes, cost of feedstock and refined product prices. Significant items that impacted Harvest’s quarterly revenues include:
| | • | Total revenues were highest in the second quarter of 2013, as a result of high daily throughput volumes from the refinery. |
| | • | Revenue from Upstream operations was the lowest in the fourth quarter of 2014 due to low realized prices combined with lower sales volumes. |
| | • | Revenues from Downstream operations were lowest in the fourth quarter of 2014 primarily due to the sale of the downstream segment on November 13, 2014. |
| | • | The declines in Upstream’s sales volumes since 2013 were mainly due to asset dispositions and a capital program that was insufficient to offset declines in production. |
| | • | Downstream’s average daily throughput was lowest in the third quarter of 2014 than comparative periods due to a scheduled month long refinery outage. |
| | • | Downstream’s refining gross margin/bbl was highest in the first quarter of 2014 mainly due to improved sour crude differentials. The weaker margins during 2013 reflected poorer yield and the |
37
| MANAGEMENT’S DISCUSSION AND ANALYSIS |
decrease in the sour-crude differential from the Brent benchmark price for crude oil. The refining gross margin was negatively impacted by increased RINs costs since the second quarter of 2013.
Net income (loss) reflects both cash and non-cash items. Changes in non-cash items including deferred income tax, DD&A expense, accretion of decommissioning and environmental remediation liabilities, impairment of long-lived assets, unrealized foreign exchange gains and losses, and unrealized gains and losses on risk management contracts impact net loss from period to period. For these reasons, the net loss may not necessarily reflect the same trends as revenues or cash from operating activities, nor is it expected to. Net losses in the fourth quarters of 2014 and 2013 and third quarter of 2014 were mainly due to the $267.6 million Upstream, $458.9 million and $186.4 million Downstream impairments, respectively.
SELECTED ANNUAL INFORMATION
| | | Year Ended December 31 | |
| | | 2014 | | | 2013 | | | 2012 | |
| Revenue, Upstream | | 891.6 | | | 947.8 | | | 1,028.9 | |
| Revenue, Downstream(1) | | 3,432.1 | | | 4,416.9 | | | 4,752.1 | |
| Total revenues and other income(2) | | 4,323.7 | | | 5,364.7 | | | 5,781.0 | |
| | | | | | | | | | |
| Net loss from continuing operations | | (85.6 | ) | | (148.1 | ) | | (91.1 | ) |
| Net loss from discontinued operations | | (354.6 | ) | | (633.8 | ) | | (629.9 | ) |
| Net loss | | (440.2 | ) | | (781.9 | ) | | (721.0 | ) |
| | | | | | | | | | |
| Total assets | | 5,091.6 | | | 5,289.9 | | | 5,654.6 | |
| Total financial liabilities, non-current(3)(4) | | 2,374.8 | | | 2,301.8 | | | 1,454.7 | |
| (1) | Downstream operations for 2014 ended on November 13, 2014 and have been classified as “Discontinued Operations”. |
| (2) | This is an additional GAAP measure; please refer to “Additional GAAP Measures” in this MD&A. |
| (3) | Total financial liabilities, non-current consists of the non- current portion of long-term debt, related party loans and long- term liability. |
| (4) | This is a non-GAAP measure; please refer to “Non-GAAP Measures” in this MD&A. |
Revenues and other income have decreased since 2012, mainly due to the decrease in Upstream sales volumes, decreased Downstream throughput volumes and declining average refining gross margins.
Total assets have decreased since 2012 mainly due to the impairment charges recorded in the Downstream segment of $179.3 million, $458.9 million and $535.5 million for the years ended December 31, 2014, 2013 and 2012, respectively. In addition, Harvest also recorded an impairment of $267.6 million during the year ended December 31, 2014 in its Upstream segment.
The increase in non-current financial liabilities in 2013 was a result of the issuance of the US$630 million
221/8% senior notes due 2018 which were used to early redeem Harvest’s convertible debentures, further draws of $494.2 million on our credit facility and an $80 million draw under the KNOC subordinated loan agreement.
38
| MANAGEMENT’S DISCUSSION AND ANALYSIS |
CRITICAL ACCOUNTING ESTIMATES
The preparation of financial statements in conformity with IFRS requires management to make judgments, estimates and assumptions that affect the application of accounting policies and the reported amounts of assets, liabilities, income and expenses. Actual results may differ from these estimates. Estimates and underlying assumptions are reviewed on an ongoing basis. Revisions to accounting estimates are recognized in the period in which the estimates are revised and in any future periods affected. Significant estimates and judgments made by management in the preparation of these consolidated financial statements are outlined below:
| (a) | Joint arrangements |
| Judgment is required to determine whether or not Harvest has joint control over an arrangement, which requires an assessment of the relevant activities and when the decisions in relation to those activities require unanimous consent. Harvest has determined that the relevant activities for its joint arrangements are those relating to the operating and capital decisions of the arrangement, such as approval of the capital expenditure program. The considerations made in determining joint control are similar to those necessary to determine control over subsidiaries. Refer to note 4 for more details. |
| | |
| In addition, judgment is required in determining whether joint arrangement structured through a separate vehicle is a joint operation or joint venture and involves determining whether the legal form and contractual arrangements give the Company direct rights to the assets and obligations for the liabilities. Other facts and circumstances are also assessed by management, including but not limited to, the Company’s rights to the economic benefits of assets and its involvement and responsibility for settling liabilities associated with the arrangement. |
| | |
| (b) | Reserves |
| The provision for depletion and depreciation of Upstream assets is calculated on the unit-of-production method based on proved developed reserves. As well, reserve estimates impact net income through the application of impairment tests. Provision for Upstream and BlackGold’s decommissioning liability may change as changes in reserve lives affect the timing of decommissioning activities. The recognition and carrying value of deferred income tax assets relating to Upstream and BlackGold may change as reserve estimates impact Harvest’s estimates of the likely recoverability of such assets. Revisions or changes in the reserve estimates can have either a positive or a negative impact on net income and PP&E. |
| | |
| The process of estimating reserves is complex and requires significant judgments based on available geological, geophysical, engineering and economic data. In the process of estimating the recoverable oil and natural gas reserves and related future net cash flows, Harvest incorporates many factors and assumptions, such as: |
| | • | expected reservoir characteristics based on geological, geophysical and engineering assessments; |
| | • | future production rates based on historical performance and expected future operating and investment activities; |
| | • | future commodity prices and quality differentials; |
| | • | discount rates; and |
| | • | future development costs. |
39
| MANAGEMENT’S DISCUSSION AND ANALYSIS |
| The recent downward trend in the commodity price environment could materially impact reserve estimates. As a result, accounting estimates based on reserves are expected to change from period to period. These changes could be material. |
| | |
| On an annual basis, the Company engages qualified, independent reserves evaluators to evaluate Harvest’s reserves data. |
| | |
| Significant judgment is required to determine the future economic benefits of the oil and gas assets and in turn, to derive the proper DD&A estimate. This includes the interpretation and application of reserves estimates, the selection of the reserves base for the unit of production calculation and the matching of capitalized costs with the benefit of production. |
| | |
| (c) | Impairment of long-lived assets |
| Long-lived assets (goodwill and PP&E) are aggregated into CGUs based on their ability to generate largely independent cash inflows and are used for impairment testing. The determination of the Company's CGUs is subject to significant judgment; product type, internal operational teams, geology and geography were key factors considered when grouping Harvest’s oil and gas assets into the CGUs. |
| | |
| PP&E is tested for impairment when indications of impairment exist. PP&E impairment indicators include declines in commodity prices, production, reserves and operating results, cost overruns and construction delays. E&E impairment indicators include expiration of the right to explore and cessation of exploration in specific areas, lack of potential for commercial viability and technical feasibility and when E&E costs are not expected to be recovered from successful development of an area. The determination of whether such indicators exist requires significant judgment. |
| | |
| The recoverable amounts of CGUs and individual assets are determined based on the higher of VIU calculations and estimated FVLCD. To determine the recoverable amounts under VIU, Harvest uses reserve estimates for both the Upstream and BlackGold operating segments. The estimates of reserves, future commodity prices, discount rates, operating expenses and future development costs require significant judgments. |
| | |
| During 2014, Harvest recognized an impairment loss of $131.8 million and $100.8 million against its Upstream PP&E in the North Alberta light oil and East Saskatchewan light oil CGUs, respectively (2013 and 2012 – $nil). A 200 bps increase in the discount rate would result in an additional impairment for the North Alberta light oil and East Saskatchewan light oil CGUs of approximately $15.9 million and $10.3 million, respectively. A 10% decrease in the forward oil price estimate would result in an additional impairment of approximately $50.1 million and $35.1 million for the North Alberta light oil and East Saskatchewan light oil CGUs, respectively. |
| | |
| During 2014, Harvest recognized an impairment loss of $35.0 million (2013 – $24.1 million; 2012 – $21.8 million) against its Upstream PP&E in the South Alberta gas. A 200 bps increase in the discount rate would result in an additional impairment for the South Alberta gas CGU of approximately $1.6 million while a 10% decrease in the forward gas price estimate would result in an additional impairment of approximately $9.1 million. |
40
| MANAGEMENT’S DISCUSSION AND ANALYSIS |
| (d) | Provisions |
| In the determination of provisions, management is required to make a significant number of estimates and assumptions with respect to activities that will occur in the future including the ultimate amounts and timing of settlements, inflation factors, risk-free discount rates, emergence of new restoration techniques and expected changes in legal, regulatory, environmental and political environments. A change in any one of the assumptions could impact the estimated future obligation and in return, net income and in the case of decommissioning liabilities, PP&E. |
| | |
| (e) | Income taxes |
| Tax interpretations, regulations and legislation in the various jurisdictions in which Harvest and its subsidiaries operate are subject to change. The Company is also subject to income tax audits and reassessments which may change its provision for income taxes. Therefore, the determination of income taxes is by nature complex, and requires making certain estimates and assumptions. |
| | |
| Harvest recognizes the net deferred tax benefit related to deferred tax assets to the extent that it is probable that the deductible temporary differences will reverse in the foreseeable future. Assessing the recoverability of deferred tax assets requires the Company to make significant estimates related to expectations of future taxable income. Estimates of future taxable income are based on forecast cash flows from operations and the application of existing tax laws in each jurisdiction. To the extent that future cash flows and taxable income differ significantly from estimates, the ability of the Company to realize the net deferred tax assets recorded at the reporting date could be impacted. |
| | |
| (f) | Fair value measurements |
| Significant judgment is required to determine what assumptions market participants would use to price an asset or a liability, such as forward prices, foreign exchange rates and discount rates. A fair value measurement of a non-financial asset takes into account a market participant's ability to generate economic benefits by using the asset in its highest and best use or by selling it to another market participant that would use the asset in its highest and best use. To determine “highest and best use” requires further judgment. Changes in estimates and assumptions about these inputs could affect the reported fair value. |
| | |
| (g) | Contingencies |
| Contingencies will only be resolved when one or more future events occur or fail to occur. The assessment of contingencies inherently involves the exercise of significant judgment and estimates of the outcome of future events. |
41
| MANAGEMENT’S DISCUSSION AND ANALYSIS |
CHANGES IN ACCOUNTING ESTIMATES AND POLICIES
Change in accounting estimate
Up to September 30, 2013, Harvest calculated depletion expense using a unit-of-production method where all unamortized PP&E costs were depleted based on proved developed oil and gas reserves.
As at October 1, 2013, a change in estimate was prospectively applied to the depletion calculation whereby costs related to developed oil and gas properties continue to be depleted based on proved developed reserves. Depletion of costs related to undeveloped oil and gas properties will start once such properties are developed. The costs relating to undeveloped oil and gas assets are transferred to the depletable pool as the underlying reserves are developed through drilling activities. The method of depleting oil and gas assets using the unit-of-production method over proved developed reserves remains unchanged.
Harvest’s reserves profile was trending towards a greater weighting of undeveloped reserves as a proportion of total reserves which triggered management to review the historical capital expenditures, reserves profile, and expected production profile of the Company. This change in estimate was made after the review and management concluded that the new estimation method would provide better matching of PP&E costs against the economic benefits from the periodic consumption of developed and undeveloped oil and gas assets of the Company.
If the new estimation method had been applied for the full year 2013, then the annual depreciation and depletion expense would have been $83.4 million lower than if the previous estimation method remained applicable for the full year of 2013. See the “Depletion, Depreciation and Amortization (“DDA”) Expenses” section of this MD&A for details.
Changes in accounting policies
Effective January 1, 2014, the Company has adopted the following new IFRS standards and amendments:
IAS 32 “Financial instruments: Presentation” has been amended to clarify that the right to offset financial assets and liabilities must be available on the current date and cannot be contingent on a future event. The adoption of this standard did not have a material impact on the Company’s financial statements.
IFRS Interpretations Committee (“IFRIC”) 21 “Levies”, clarifies the recognition requirements concerning a liability to pay a levy imposed by a government other than income tax. IFRIC 21 clarifies that an entity recognizes a liability for a levy when the activity that triggers payment occurs. The adoption of this standard did not have a material impact on Harvest’s financial statements.
RECENT ACCOUNTING PRONOUNCEMENTS
- On May 28, 2014, the IASB issued IFRS 15 “Revenue from Contracts with Customers”, which specifies how and when to recognize revenue as well as requiring entities to provide users of financial statements with more disclosure. The standard supersedes IAS 18 “Revenue”, IAS 11 “Construction Contracts”, and related interpretations. IFRS 15 will be effective for annual periods beginning on or after January 1, 2017. Application of the standard is mandatory and early adoption is permitted. Harvest is currently evaluating the impact of adopting IFRS 15 on its consolidated financial statements.
42
| MANAGEMENT’S DISCUSSION AND ANALYSIS |
- On July 24, 2014, the IASB issued IFRS 9 “Financial Instruments” to replace IAS 39 “Financial Instruments: Recognition and Measurement”. IFRS 9 includes revised guidance on the classification and measurement of financial instruments, including a new expected credit loss model for calculating impairment on financial assets, and the new general hedge accounting. No changes were introduced for the classification and measurement of financial liabilities, except for the recognition of changes in own credit risk in other comprehensive income for liabilities designated at fair value through profit or loss. IFRS 9 is effective for years beginning on or after January 1, 2018. Harvest is currently evaluating the impact of adopting IFRS 9 on its consolidated financial statements.
OPERATIONAL AND OTHER BUSINESS RISKS FOR CONTINUING OPERATIONS
Harvest’s Upstream and BlackGold operations are conducted in the same business environment as most other operators in the respective businesses and the business risks are very similar. Harvest has a risk management committee that meets on a regular basis to assess and manage operational and business risks and has a corporate Environment, Health and Safety (“EH&S”) policy. The following summarizes the significant risks:
Risks Associated with Commodity Prices
- Prices received for petroleum and natural gas have fluctuated widely in recent years. Natural gas prices have experienced significant declines since 2010 and crude oil prices have recently experienced a sharp decline. Crude oil differentials continue to be volatile. Decreases in commodity prices could reduce Harvest’s earnings and cash flow and have resulted in shut-in of certain natural gas properties. Low commodity prices and/or wide crude oil differentials may also result in asset impairment. Harvest manages commodity price risks by entering into various commodity price risk management contracts. Refer to the “Cash Flow Risk Management” section of this MD&A for further information.
Risks Associated with Operations
- The markets for petroleum and natural gas produced in western Canada are dependent upon available capacity to refine crude oil and process natural gas as well as pipeline or other methods to transport the products to consumers.
- Exploration and development activities may not yield anticipated production, and the associated cost outlay may not be recovered.
- Pipeline capacity and natural gas liquids fractionation capacity in Alberta has not kept pace with the drilling of liquid rich gas properties in some areas of the province which may limit production periodically.
- The production of petroleum and natural gas may involve a significant use of electrical power and since deregulation of the electric system in Alberta, electrical power prices in Alberta have been volatile. Increases in power prices reduce our cash flow and earnings. From time to time, Harvest may enter into electricity price swaps to manage our exposure to power price volatility.
43
| MANAGEMENT’S DISCUSSION AND ANALYSIS |
- Certain of Harvest’s properties are held in the form of licences and leases and working interests in licences and leases. If Harvest or the holder of the licence or lease fails to meet the specific requirements of a licence or lease, the licence or lease may terminate or expire.
- Aboriginal peoples have claimed aboriginal title and rights in portions of western Canada. Harvest is not aware that any claims have been made in respect of its properties and assets. However, if a claim arose and was successful, such claim may have a material adverse effect on Harvest's business, financial condition, results of operations and prospects.
Risks Associated with Reserve Estimates
- The reservoir and recovery information in reserve reports prepared by independent reserve evaluators are estimates and actual production and recovery rates may vary from the estimates and the variations may be significant.
- Prices paid for acquisitions are based in part on reserve report estimates and the assumptions made preparing the reserve reports are subject to change as well as geological and engineering uncertainty. The actual reserves acquired may be lower than expected, which could adversely impact our cash flow and earnings.
Risks Associated with the Oil Sands Project
- The BlackGold oil sands project is exposed to the risks associated with major construction projects. These risks include the possibility that the project will not be completed on budget and/or will not achieve the design objectives. This would have a significant impact on the financial results of the project.
- When operational, the BlackGold oil sands project will be subject to similar operating risks described above in “Risks associated with operations” such as: refinery and transportation constraints and the cost of Alberta Power.
Risks Associated with Acquisitions and Dispositions
- Harvest makes acquisitions and dispositions of businesses and assets in the ordinary course of business. Achieving the benefits of acquisitions depends in part on successfully consolidating functions and integrating operations and procedures in a timely and efficient manner as well as the Harvest's ability to realize the anticipated growth opportunities and synergies from combining the acquired businesses and operations with those of Harvest.
- Non- core assets are periodically disposed of, so that Harvest can focus its efforts and resources more efficiently. Depending on the state of the market for such non-core assets, certain non-core assets, if disposed of, could be expected to realize less than their carrying value on the financial statements.
Risks Associated with Environment, Health & Safety (“EH&S”)
- The operations of petroleum and natural gas properties involves a number of operating and natural hazards which may result in health and safety incidents, environmental damage and other unexpected and/or dangerous conditions.
44
| MANAGEMENT’S DISCUSSION AND ANALYSIS |
- Decommissioning liabilities are calculated using estimated costs and timelines based upon current operational plans, technology and reclamation practices, and environmental regulations. These factors are subject to change and such changes may impact the actual timing and amount of Harvest’s decommissioning costs.
- The operations of petroleum and natural gas properties are subject to environmental regulation pursuant to local, provincial and federal legislation. Changes in these regulations could have a material adverse effect as regards to operating costs and capital costs. A breach of such legislation may result in the imposition of fines as well as higher operating standards that may increase costs.
- Harvest’s corporate EH&S program has a number of specific policies and practices to minimize the risk of safety hazards and environmental incidents. It also includes an emergency response program should an incident occur. If areas of higher risk are identified, Harvest will undertake to analyze and recommend changes to reduce the risk including replacement of specific infrastructure. In addition, our business units conduct emergency response training on a regular basis in all of our operating fields to ensure a high level of response capability when placed in a challenging situation. Harvest also performs safety and environmental audits of our operating facilities. In addition to the above, Harvest maintains business interruption insurance, commercial general liability insurance as well as specific environmental liability insurance, in amounts consistent with industry standards.
- Harvest carries industry standard property and liability insurance on its Upstream operations. Losses associated with potential incidents described above could exceed insurance coverage limits.
Risks Associated with Liquidity
- Absent capital reinvestment or acquisition, Harvest’s reserves and production levels from petroleum and natural gas properties will decline over time as a result of natural declines. As a result, cash generated from operating these properties may decline.
- Fluctuations in interest rates and the U.S./Canada exchange rate on our current and/or future financing arrangements may result in significant increases in our borrowing costs.
- Harvest is required to comply with covenants under the credit facility and the senior notes. In the event that the Company does not comply with the covenants, its access to capital may be restricted or repayment may be required.
- Although the Company monitors the credit worthiness of third parties it contracts with through a formal risk management policy, there can be no assurance that the Company will not experience a loss for nonperformance by any counterparty with whom it has a commercial relationship. Such events may result in material adverse consequences on the business of the Company.
- Harvest’s ability to make scheduled repayments or refinance its debt obligations will depend upon its financial and operating performance, which in turn will partially depend upon prevailing industry and general economic conditions. There can be no assurance that our operating performance, cash flow and capital resources will be sufficient to service and/or repay the Company’s debt in the future, in which case the Company may sell assets, enter into joint ventures with 3rdparties to support current and future capital projects, defer capital expenditures, and/or raise additional debt, to the extent available.
Harvest monitors its cash flow projections and covenants on a routine basis and will adjust its development plans accordingly in response to changes in commodity prices and cash flows. Harvest is currently reviewing its 2015 capital program and plans to incur capital expenditures based on project viability, growth opportunities in certain core development areas, as well as availability of funding. Harvest has also postponed first steam for the BlackGold project in response to the unfavourable heavy oil prices and will continually assess the commodity price environment to determine when the commissioning of the CPF will begin.
45
| MANAGEMENT’S DISCUSSION AND ANALYSIS |
Risks Associated with Investment in Joint Arrangement
- As KERR has the ability to cause DBP to redeem all its preferred partnership units for consideration equal to its initial contribution plus a minimum after-tax internal rate of return of two percent, there is a risk that Harvest would have to meet this obligation if DBP does not have sufficient funds to complete the redemption obligation. This obligation could also arise upon the termination of this arrangement.
General Business Risks
- The operation of petroleum and natural gas properties requires physical access for people and equipment on a regular basis which could be affected by weather, accidents, government regulations or third party actions.
- Skilled labor is necessary to run operations (both those employed directly by Harvest and by our contractors) and there is a risk that we may have difficulty in sourcing skilled labor which could lead to increased operating and capital costs.
- The loss of a member of our senior management team and/or key technical operations employee could result in a disruption to our operations.
- In the future, Harvest may acquire or move into new industry related activities or new geographical areas or may acquire different energy related assets, and as a result may face unexpected risks or alternatively, significantly increase Harvest’s exposure to one or more existing risk factors, which may in turn result in the Harvest’s future operational and financial conditions being adversely affected.
- Upstream’s crude oil sales and a large portion of Harvest’s long-term debt are denominated in US dollars while the Company incurs operating and capital costs in Canadian dollars which results in a currency exchange exposure.
- The operations of Harvest operate under permits issued by the federal and provincial governments and these permits must be renewed periodically. The federal and provincial governments may make operating requirements more stringent which may require additional spending.
- Income tax laws, other laws or government incentive programs relating to the oil and gas industry, may in the future be changed or interpreted in a manner that affects Harvest or its stakeholders.
- In the normal course of operations, Harvest may become involved in, named as a party to, or be the subject of, various legal proceedings, including regulatory proceedings, tax proceedings and legal actions, related to personal injuries, property damage, property tax, land rights, the environment and contract disputes. The outcome of outstanding, pending or future proceedings cannot be predicted with certainty and it is possible that there could be material adverse developments in pending or future proceedings and as a result, could have a material adverse effect on Harvest’s assets, liabilities, business, financial condition and results of operations.
- Harvest may disclose confidential information relating to its business, operations or affairs while discussing potential business relationships or other transactions with third parties. Although confidentiality agreements are signed by third parties prior to the disclosure of any confidential information, a breach could put us at competitive risk and may cause significant damage to the business. The harm to the business from a breach of confidentiality cannot presently be quantified, but may be material and may not be compensable in damages.
46
| MANAGEMENT’S DISCUSSION AND ANALYSIS |
CHANGES IN REGULATORY ENVIRONMENT
The oil and gas industry is subject to extensive regulations imposed by many levels of government in Canada. Harvest currently operates in Alberta, British Columbia and Saskatchewan, all of which have different legislations and royalty programs which may be amended from time to time. A change in the royalty programs or legislations may have adverse impacts on Harvest’s future earnings and cash flows.
DISCLOSURE CONTROLS AND PROCEDURES
Under the supervision of the Chief Executive Officer and Chief Financial Officer, the Company has evaluated the effectiveness of its disclosure controls and procedures as of December 31, 2014 as defined under the rules adopted by the Canadian securities regulatory authorities and the U.S. Securities and Exchange Commission. Based on this evaluation, the Chief Executive Officer and Chief Financial Officer have concluded that as of December 31, 2014, the disclosure controls and procedures were effective to ensure that information required to be disclosed by Harvest in reports that it files or submits to Canadian and U.S. securities authorities was recorded, processed, summarized and reported within the time period specified in Canadian and U.S. securities laws and was accumulated and communicated to management, including its Chief Executive Officer and Chief Financial Officer, to allow timely decisions regarding required disclosures.
INTERNAL CONTROL OVER FINANCIAL REPORTING
The Company’s Chief Executive Officer (“CEO”) and Chief Financial Officer (“CFO”) are responsible for establishing and maintaining disclosure controls and procedures (“DC&P”) and internal control over financial reporting (“ICFR”) as defined under National Instrument 52-109 – Certification of Disclosure in Issuers’ Annual and Interim Filings. The Company’s DC&P are designed to provide reasonable assurance that (i) material information relating to the Company is made known to management by others, particularly during the period in which the annual filings are being prepared; and (ii) information required to be disclosed by the Company in its annual filings, interim filings or other reports filed or submitted by it under securities legislation is recorded, processed, summarized and reported within the time periods specified in securities legislation. The Company’s ICFR are designed to provide reasonable assurance regarding the reliability of financial reporting and preparation of financial statements for external purposes in accordance with IFRS as issued by IASB. The Company’s CEO and CFO have evaluated, or caused to be evaluated under their supervision, the design and operation of the Company’s DC&P and ICFR as of December 31, 2014. The evaluation was based on the Internal Control – Integrated Framework issued by the Committee of Sponsoring Organizations of the Treadway Commission (2013). Based on the evaluation, the CEO and CFO concluded that the Company’s internal control over financial reporting was effective as of December 31, 2014.
There were no significant changes in internal controls over financial reporting for the year ended December 31, 2014 that have materially affected, or are reasonably likely to materially affect, our internal controls over financial reporting.
47
| MANAGEMENT’S DISCUSSION AND ANALYSIS |
Because of its inherent limitations, disclosure controls and procedures and internal control over financial reporting may not prevent or detect misstatements, errors or fraud. Control systems, no matter how well conceived or operated, can provide only reasonable, but not absolute, assurance that the objectives of the control systems are met.
ADDITIONAL GAAP MEASURES
Throughout this MD&A, Harvest uses additional GAAP measures that are not defined under IFRS (hereinafter also referred to as “GAAP”). “Operating income (loss)” is commonly used for comparative purposes in the petroleum and natural gas and refining industries to reflect operating results before items not directly related to operations. Harvest uses this measure to assess and compare the performance of its operating segments. “Revenues and other income” comprises sales of sales of petroleum, natural gas, and refined product sales, net of related royalties, and Harvest’s share of the net income from its joint ventures.
NON-GAAP MEASURES
Throughout this MD&A, the Company has referred to certain measures of financial performance that are not specifically defined under GAAP such as “operating netback”, “operating netback prior to/after hedging”, “gross margin (loss)”, “refining margin”, “average refining gross margin”, “cash contribution (deficiency) from operations”, “total financial liabilities, non-current”, “Annualized EBITDA”, “senior debt to Annualized EBITDA”, “total debt to Annualized EBITDA”, “senior debt to total capitalization”, and “total debt to total capitalization”. “Operating netbacks” are reported on a per boe basis and used extensively in the Canadian energy sector for comparative purposes. “Operating netbacks” include revenues, operating expenses, transportation and marketing expenses, and realized gains or losses on risk management contracts. “Gross margin (loss)”, “refining margin” or “average refining gross margin” are commonly used in the refining industry to reflect the net funds received from the sale of refined products after considering the cost to purchase the feedstock and is calculated by deducting purchased products for resale and processing from total revenue. “Cash contribution (deficiency) from operations” is calculated as operating income (loss) adjusted for non-cash items. The measure demonstrates the ability of the each segment of Harvest to generate the cash from operations necessary to repay debt, make capital investments, and fund the settlement of decommissioning and environmental remediation liabilities. “total financial liabilities, non-current” and “Annualized EBITDA” are used to assist management in assessing liquidity and the Company’s ability to meet financial obligations. “Senior debt to Annualized EBITDA”, “total debt to Annualized EBITDA”, “senior debt to total capitalization” and “total debt to total capitalization” are terms defined in Harvest’s credit facility agreement for the purpose of calculation of financial covenants. The non-GAAP measures do not have any standardized meaning prescribed by GAAP and may not be comparable to similar measures used by other issuers. The determination of the non-GAAP measures have been illustrated throughout this MD&A, with reconciliations to IFRS measures and/or account balances, except for Annualized EBITDA and cash contribution (deficiency) which are shown below.
48
| MANAGEMENT’S DISCUSSION AND ANALYSIS |
Annualized EBITDA
The measure of Consolidated EBITDA (herein referred to as “Annualized EBITDA”) used in Harvest’s credit facility agreement is defined as earnings before finance costs, income tax expense or recovery, DD&A, exploration and evaluation costs, impairment of assets, unrealized gains or losses on risk management contracts, unrealized gains or losses on foreign exchange, gains or losses on disposition of assets and other non-cash items. The following is a reconciliation of Annualized EBITDA to the nearest GAAP measure net loss:
| | | December 31, 2014 | | | December 31, 2013 | |
| Net loss | | (440.2 | ) | | (781.9 | ) |
| DD&A | | 448.0 | | | 612.8 | |
| Finance costs | | 96.8 | | | 94.2 | |
| Income tax recovery | | (232.8 | ) | | (64.2 | ) |
| EBITDA | | (128.2 | ) | | (139.1 | ) |
| Unrealized losses on risk management contracts | | 0.7 | | | 0.5 | |
| Unrealized losses on foreign exchange | | 103.3 | | | 40.8 | |
| Unsuccessful exploration and evaluation costs | | 9.4 | | | 11.5 | |
| Impairment of PP&E | | 446.9 | | | 483.0 | |
| Gains on disposition of assets | | 8.9 | | | (34.1 | ) |
| Loss from joint ventures | | 4.7 | | | - | |
| Other non-cash items | | 8.7 | | | (1.7 | ) |
| Adjustments on acquisitions and dispositions(1) | | 4.6 | | | (15.4 | ) |
| Annualized EBITDA | | 459.0 | | | 345.5 | |
| (1) | Annualized EBITDA is on a consolidated basis for any period, the aggregate of the last four quarters of the earnings (calculated in accordance with GAAP) and accordingly is a twelve month rolling measure which, as well, is required to be adjusted to the net income impact from acquisitions or dispositions (with net proceeds over $20 million) as if the transaction had been effected at the beginning of the period. The year ended December 31, 2014 includes the sale of the Downstream segment on November 13, 2014. |
Cash Contribution (Deficiency) from Operations
Cash contribution (deficiency) from operations represents operating income (loss) adjusted for non-cash expense items within: operating, general and administrative, exploration and evaluation, depletion, depreciation and amortization, gains on disposition of assets, risk management contracts gains or losses, impairment and other charges, and the inclusion of cash interest, realized foreign exchange gains or losses and other cash items not included in operating income (loss). The measure demonstrates the ability of the Upstream and Downstream segments of Harvest to generate cash from their operations and is calculated before changes in non-cash working capital. Effective November 13, 2014, the Downstream segment was discontinued and therefore there will no longer be cash deficiencies going forward from the Downstream segment. There are no operating activities to report for the BlackGold segment as it is under development. The most directly comparable additional GAAP measure is operating income (loss). Operating income (loss) as presented in the notes to Harvest’s consolidated financial statements is reconciled to cash contribution (deficiency) from operations below:
49
| MANAGEMENT’S DISCUSSION AND ANALYSIS |
| | | Three Months Ended December 31 | |
| | | Upstream | | | Downstream(1) | | | Total | |
| | | 2014 | | | 2013 | | | 2014 | | | 2013 | | | 2014 | | | 2013 | |
| Operating income (loss) | | (283.3 | ) | | 2.3 | | | (6.6 | ) | | (506.4 | ) | | (289.9 | ) | | (504.1 | ) |
| Adjustments: | | | | | | | | | | | | | | | | | | |
| Loss from joint ventures | | 2.7 | | | — | | | — | | | — | | | 2.7 | | | — | |
| Operating, non-cash | | 1.2 | | | 0.3 | | | (0.9 | ) | | (3.4 | ) | | 0.3 | | | (3.1 | ) |
| General and administrative, non-cash | | 0.6 | | | 0.6 | | | — | | | — | | | 0.6 | | | 0.6 | |
| Exploration and evaluation, non-cash | | 0.4 | | | 0.7 | | | — | | | — | | | 0.4 | | | 0.7 | |
| Depletion, depreciation and amortization | | 110.3 | | | 113.4 | | | — | | | 18.6 | | | 110.3 | | | 132.0 | |
| Gains on disposition of assets | | (18.3 | ) | | (23.5 | ) | | — | | | — | | | (18.3 | ) | | (23.5 | ) |
| Unrealized losses on risk management contracts | | 1.6 | | | 1.6 | | | — | | | — | | | 1.6 | | | 1.6 | |
| Impairment and other charges, non-cash | | 267.6 | | | 24.1 | | | (7.1 | ) | | 458.9 | | | 260.5 | | | 483.0 | |
| Cash contribution (deficiency) from operations | | 82.8 | | | 119.5 | | | (14.6 | ) | | (32.3 | ) | | 68.2 | | | 87.2 | |
| Inclusion of items not attributable to segments: | | | | | | | | | | | | | | | | | | |
| Net cash interest | | | | | | | | | | | | | | 10.4 | | | 11.7 | |
| Realized foreign exchange (gains) losses | | | | | | | | | | | | | | (0.5 | ) | | 1.1 | |
| Consolidated cash contribution from operations | | | | | | | | | | | | | | 58.3 | | | 74.4 | |
| (1) | Downstream fourth quarter 2014 results are from October 1 – November 13, 2014. The Downstream segment was sold on November 13, 2014 and results have been classified as “Discontinued Operations”. |
| | | Year Ended December 31 | |
| | | Upstream | | | Downstream(1) | | | Total | |
| | | 2014 | | | 2013 | | | 2014 | | | 2013 | | | 2014 | | | 2013 | |
| Operating income (loss) | | (188.8 | ) | | (16.6 | ) | | (226.1 | ) | | (691.1 | ) | | (414.9 | ) | | (707.7 | ) |
| Adjustments: | | | | | | | | | | | | | | | | | | |
| Loss from joint ventures | | 4.7 | | | — | | | — | | | — | | | 4.7 | | | — | |
| Operating, non-cash | | 2.3 | | | 0.9 | | | (2.0 | ) | | (2.8 | ) | | 0.3 | | | (1.9 | ) |
| General and administrative, non-cash | | 1.8 | | | 1.7 | | | — | | | — | | | 1.8 | | | 1.7 | |
| Exploration and evaluation, non-cash | | 9.4 | | | 11.5 | | | — | | | — | | | 9.4 | | | 11.5 | |
| Depletion, depreciation and amortization | | 435.2 | | | 530.0 | | | 12.8 | | | 82.8 | | | 448.0 | | | 612.8 | |
| Gains on disposition of assets | | (47.5 | ) | | (33.9 | ) | | (0.2 | ) | | (0.2 | ) | | (47.7 | ) | | (34.1 | ) |
| Unrealized gains on risk management contracts | | 0.7 | | | 0.5 | | | — | | | — | | | 0.7 | | | 0.5 | |
| Impairment and other charges, non-cash | | 267.6 | | | 24.1 | | | 179.3 | | | 458.9 | | | 446.9 | | | 483.0 | |
| Cash contribution (deficiency) from operations | | 485.4 | | | 518.2 | | | (36.2 | ) | | (152.4 | ) | | 449.2 | | | 365.8 | |
| Inclusion of items not attributable to segments: | | | | | | | | | | | | | | | | | | |
| Net cash interest | | | | | | | | | | | | | | 63.0 | | | 72.9 | |
| Realized foreign exchange losses | | | | | | | | | | | | | | 1.4 | | | 3.4 | |
| Consolidated cash contribution from operations | | | | | | | | | | | | | | 384.8 | | | 289.5 | |
| (1) | Downstream results are from January 1 – November 13, 2014. The Downstream segment was sold on November 13, 2014 and results have been classified as “Discontinued Operations”. |
FORWARD-LOOKING INFORMATION
This MD&A highlights significant business results and statistics from the consolidated financial statements for the three months and year ended December 31, 2014 and the accompanying notes thereto. In the interest of providing Harvest’s lenders and potential lenders with information regarding Harvest, including the Company’s assessment of future plans and operations, this MD&A contains forward-looking statements that involve risks and uncertainties.
50
| MANAGEMENT’S DISCUSSION AND ANALYSIS |
Such risks and uncertainties include, but are not limited to: risks associated with conventional petroleum and natural gas operations; risks associated with the construction of the oil sands project; the volatility in commodity prices, interest rates and currency exchange rates; risks associated with realizing the value of acquisitions; general economic, market and business conditions; changes in environmental legislation and regulations; the availability of sufficient capital from internal and external sources; and, such other risks and uncertainties described from time to time in regulatory reports and filings made with securities regulators. The impact of any one risk, uncertainty or factor on a particular forward-looking statement is not determinable with certainty as these factors are interdependent, and management’s future course of action would depend on the assessment of all information at that time. Please also refer to “Operational and Other Business Risks” in this MD&A and “Risk Factors” in the Annual Information Form for detailed discussion on these risks.
Forward-looking statements in this MD&A include, but are not limited to: commodity prices, price risk management activities, acquisitions and dispositions, capital spending and allocation of such to various projects, reserve estimates and ultimate recovery of reserves, potential timing and commerciality of Harvest’s capital projects, the extent and success rate of Upstream and BlackGold drilling programs, the ability to achieve the maximum capacity from the BlackGold central processing facilities, availability of the credit facility, access and ability to raise capital, ability to maintain debt covenants, debt levels, recovery of long-lived assets, the timing and amount of decommission and environmental related costs, income taxes, cash from operating activities, regulatory approval of development projects and regulatory changes. For this purpose, any statements that are contained herein that are not statements of historical fact may be deemed to be forward-looking statements. Forward-looking statements often contain terms such as “may”, “will”, “should”, “anticipate”, “expect”, “target”, “plan”, “potential”, “intend”, and similar expressions.
All of the forward-looking statements in this MD&A are qualified by the assumptions that are stated or inherent in such forward-looking statements. Although Harvest believes that these assumptions are reasonable based on the information available to us on the date such assumptions were made, this list is not exhaustive of the factors that may affect any of the forward-looking statements and the reader should not place an undue reliance on these assumptions and such forward-looking statements. The key assumptions that have been made in connection with the forward-looking statements include the following: that the Company will conduct its operations and achieve results of operations as anticipated; that its development plans and sustaining maintenance programs will achieve the expected results; the general continuance of current or, where applicable, assumed industry conditions; the continuation of assumed tax, royalty and regulatory regimes; the accuracy of the estimates of the Company’s reserve volumes; commodity price, operation level, and cost assumptions; the continued availability of adequate cash flow and debt and/or equity financing to fund the Company’s capital and operating requirements as needed; and the extent of Harvest’s liabilities. Harvest believes the material factors, expectations and assumptions reflected in the forward-looking statements are reasonable, but no assurance can be given that these factors, expectations and assumptions will prove to be correct.
51
| MANAGEMENT’S DISCUSSION AND ANALYSIS |
Although management believes that the forward-looking information is reasonable based on information available on the date such forward-looking statements were made, no assurances can be given as to future results, levels of activity and achievements. Therefore, readers are cautioned not to place undue reliance on forward-looking statements as the plans, intentions or expectations upon which the forward-looking information is based might not occur. Forward-looking statements contained in this MD&A are expressly qualified by this cautionary statement.
ADDITIONAL INFORMATION
Further information about us can be accessed under our public filings found on SEDAR atwww.sedar.comor atwww.harvestenergy.ca. Information can also be found by contacting our Investor Relations department at (403) 265-1178 or at 1-866-666-1178.
52