 | MANAGEMENT’S DISCUSSION AND ANALYSIS |
MANAGEMENT’S DISCUSSION AND ANALYSIS
This Management’s Discussion and Analysis (“MD&A”) should be read in conjunction with the unaudited condensed interim consolidated financial statements of Harvest Operations Corp. (“Harvest”, “we”, “us”, “our” or the “Company”) for the three and nine months ended September 30, 2016 and the MD&A and audited annual consolidated financial statements for the year ended December 31, 2015 together with the accompanying notes. The information and opinions concerning the future outlook are based on information available at November 9, 2016.
In this MD&A, all dollar amounts are expressed in Canadian dollars unless otherwise indicated. Tabular amounts are in millions of dollars, except where noted.
Natural gas volumes are converted to barrels of oil equivalent (“boe”) using the ratio of six thousand cubic feet (“mcf”) of natural gas to one barrel of oil (“bbl”). Boes may be misleading, particularly if used in isolation. A boe conversion ratio of 6 mcf to 1 bbl is based on an energy equivalent conversion method primarily applicable at the burner tip and does not represent a value equivalent at the wellhead. In accordance with Canadian practice, petroleum and natural gas revenues are reported on a gross basis before deduction of Crown and other royalties.
Additional information concerning Harvest, including its audited annual consolidated financial statements and Annual Information Form (“AIF”) can be found on SEDAR atwww.sedar.com.
ADVISORY
This MD&A contains non-GAAP measures and forward-looking information about our current expectations, estimates and projections. Readers are cautioned that the MD&A should be read in conjunction with the “Non-GAAP Measures” and “Forward-Looking Information” sections at the end of this MD&A.
1
| MANAGEMENT’S DISCUSSION AND ANALYSIS |
FINANCIAL AND OPERATING HIGHLIGHTS
| | | Three Months Ended September 30 | | | Nine Months Ended September 30 | |
| | | 2016 | | | 2015 | | | 2016 | | | 2015 | |
| Upstream | | | | | | | | | | | | |
| Daily sales volumes (boe/d)(1) | | 30,051 | | | 43,356 | | | 33,812 | | | 42,946 | |
| Deep Basin Partnership | | | | | | | | | | | | |
| Daily sales volumes (boe/d) | | 5,735 | | | 4,569 | | | 5,885 | | | 3,691 | |
| Harvest's share of daily sales volumes (boe/d)(3) | | 4,704 | | | 3,626 | | | 4,826 | | | 2,920 | |
| Average realized price | | | | | | | | | | | | |
| Oil and NGLs ($/bbl)(2) | | 39.31 | | | 41.50 | | | 35.10 | | | 44.61 | |
| Gas ($/mcf)(2) | | 2.11 | | | 2.80 | | | 1.66 | | | 2.72 | |
| Operating netback prior to hedging($/boe)(3) | | 13.16 | | | 12.97 | | | 8.69 | | | 13.18 | |
| Operating loss(3) | | (37.9 | ) | | (354.0 | ) | | (184.4 | ) | | (598.3 | ) |
| Cash contribution from operations(3) | | 25.2 | | | 53.1 | | | 41.4 | | | 124.6 | |
| | | | | | | | | | | | | |
| Capital asset additions (excluding acquisitions) | | 2.5 | | | 19.0 | | | 5.3 | | | 124.1 | |
| Corporate acquisition(4) | | — | | | 0.4 | | | — | | | 37.1 | |
| Property dispositions, net | | (31.5 | ) | | (1.5 | ) | | (170.2 | ) | | (60.0 | ) |
| | | | | | | | | | | | | |
| Net wells drilled | | — | | | — | | | 0.3 | | | 19.2 | |
| Net undeveloped land additions (acres) | | 316 | | | 3,648 | | | 11,184 | | | 42,192 | |
| Net undeveloped land dispositions (acres) | | — | | | (281 | ) | | (33,867 | ) | | (5,799 | ) |
| | | | | | | | | | | | | |
| BlackGold | | | | | | | | | | | | |
| Capital asset additions | | (0.1 | ) | | 0.9 | | | — | | | 65.5 | |
| Pre-operating loss(3)(5) | | (2.8 | ) | | (266.7 | ) | | (10.0 | ) | | (273.6 | ) |
| | | | | | | | | | | | | |
| NET LOSS | | (106.9 | ) | | (588.7 | ) | | (185.7 | ) | | (899.2 | ) |
(1) Excludes volumes from Harvest’s equity investment in the Deep Basin Partnership.
(2) Excludes the effect of derivative contracts designated as hedges.
(3) This is a non-GAAP measure; please refer to “Non-GAAP Measures” in this MD&A.
(4) Corporate acquisition represents the total consideration for the transaction including working capital assumed.
(5) BlackGold was substantially completed in Q1 2015, all pre-operating expenses prior to Q1 2015 were capitalized.
REVIEW OF OVERALL PERFORMANCE
Harvest is an energy company with a petroleum and natural gas business focused on the exploration, development and production of assets in western Canada (“Upstream”) and an in-situ oil sands project in the pre-commissioning phase in northern Alberta (“BlackGold”). Harvest is a wholly owned subsidiary of Korea National Oil Corporation (“KNOC”). Our earnings and cash flow from continuing operations are largely determined by the realized prices for our crude oil and natural gas production.
2
| MANAGEMENT’S DISCUSSION AND ANALYSIS |
The latter part of 2014, 2015 and the first nine months of 2016 have been challenging for the oil and gas industry. The 57% and 58% percent declines in crude oil and natural gas prices respectively since June 2014 have resulted in widespread reductions in capital spending programs and extensive efforts to reduce costs across the industry. We believe that commodity prices will eventually improve; however, the timing of that improvement is uncertain and we expect continued commodity price and cash flow volatility in the near term. In the meantime, we are focused on executing on cost reductions as well as keeping our capital program focused on necessary spending to meet our commitments and maintain assets.
Upstream
| • | Sales volumes for the third quarter and nine months ended September 30, 2016 decreased by 13,305 boe/d and 9,134 boe/d, respectively, as compared to the same periods in 2015. The decreases were primarily due to dispositions of certain producing properties during 2015 and 2016 and natural declines which exceeded the volume added from our drilling program. |
| • | Harvest’s share of Deep Basin Partnership (“DBP”) volumes for the third quarter and nine months ended September 30, 2016 increased 1,078 boe/d and 1,906 boe/d, respectively, as compared to the same periods in 2015. The increases are due primarily to the contribution of certain gas assets by Harvest in the fourth quarter of 2015 and volume additions from DBP’s drilling program. The construction of the HK MS Partnership (“HKMS”) natural gas processing plant was completed and operational in early 2015. Strategically, this facility provides the DBP an advantage of access to firm processing capability, the ability to extract maximum liquids from the natural gas produced by DBP wells and will allow DBP to pursue drilling opportunities in the region. |
| • | Operating netback per boe prior to hedging for the third quarter and nine months ended September 30, 2016 was $13.16 and $8.69, respectively, an increase of $0.19 and $4.49 from the same periods in 2015 respectively. The year to date decrease from 2015 was mainly due to lower realized prices per boe as a result of commodity benchmarks price declines, partially offset by lower operating expenses per boe. The third quarter increase from 2015 was mainly due to lower operating expenses and transportation and marketing per boe, partially offset by lower commodity benchmarks prices and increased royalties per boe. |
| • | Operating losses for the third quarter and nine months ended September 30, 2016 were $37.9 million and $184.4 million, respectively (2015 –$354.0 million and $598.3 million). The decreases in operating loss from 2015 were due to gains on dispositions of assets, lower impairment expenses, depreciation, depletion and amortization expenses, royalties, operating expenses, general and administrative expenses, partially offset by lower realized prices and sales volumes. |
| • | Cash contributions from Harvest’s Upstream operations for the third quarter and first nine months of 2016 was $25.2 million and $41.4 million, respectively (2015 –$53.1 million and $124.6 million). The decreases in cash contribution were mainly due to lower sales volumes and lower realized prices, partially offset by lower operating expenses, and general and administrative expenses. |
| • | Capital asset additions of $2.5 million and $5.3 million in the third quarter and first nine months of 2016, respectively, were mainly related to well equipment, pipelines and facilities. One gross well (0.3 net) was rig-released during the first nine months of 2016. |
| • | On August 16, 2016 Harvest closed the disposition of some of its oil and gas assets in Southern Alberta for net proceeds of $6.7 million. On June 30, 2016, Harvest closed the disposition of all of its oil and gas assets in Saskatchewan for net proceeds of $61.6 million. Together with other less significant dispositions of Upstream assets, Harvest recognized a gain of $17.6 million and $34.9 million for the three and nine months ended September 30, 2016, respectively (2015 – losses of $0.9 million and $6.2 million), relating to the de-recognition of PP&E, E&E, goodwill and decommissioning and environmental liabilities. |
3
| MANAGEMENT’S DISCUSSION AND ANALYSIS |
BlackGold
| • | Pre-operating losses for the third quarter and first nine months of 2016 were $2.8 million and $10.0 million, respectively (2015 –$266.7 million and $273.6 million, respectively). The 2016 pre-operating losses were mainly due to pre-operating and general and administrative expenses, whereas the 2015 pre-operating losses also included an asset impairment expense of $262.0 million. |
| • | The central processing facility (“CPF”) was substantially completed in early 2015. The decision to complete commissioning of the CPF and commence steam injection depends on a number of factors including the bitumen price environment. |
Corporate
| • | The credit facility net movement during the third quarter and nine months ended September 30, 2016 was $3.7 million net borrowing and $35.2 million net repayment, respectively (2015 - $6.0 million net repayment and $260.4 million net borrowings). At September 30, 2016, Harvest had $888.6 million drawn under the credit facility (December 31, 2015 - $926.6 million). |
| • | The weakening of the Canadian dollar against the U.S. dollar during the latter part of the third quarter of 2016 resulted in net unrealized foreign exchange loss of $36.4 million for the three months ended September 30, 2016 (2015 - $122.7 million loss). The weakening of the U.S. dollar against the Canadian dollar during the first nine months of 2016 resulted in net unrealized foreign exchange gain of $69.3 million (2015 - $238.8 million loss). Unrealized foreign exchange gains and losses resulted primarily due to the translation of U.S. dollar denominated debt (including related party loans) into Canadian dollars. |
| • | During 2015, Harvest amended the terms of its $1.0 billion syndicated revolving credit facility and replaced it with a KNOC guaranteed $1.0 billion syndicated revolving credit facility maturing April 30, 2017. Under the amended credit facility, applicable interest and fees are based on a margin pricing grid based on the Moody’s and S&P credit ratings of KNOC. The financial covenants under the previous credit facility were deleted and replaced with a new covenant: Total Debt to Capitalization ratio of 70% or less. At December 31, 2015, Harvest was in violation of the debt covenant and the carrying value of the credit facility, $923.8 million, was reclassified from long-term debt to a current liability. On February 5, 2016 Harvest’s syndicate banks consented to a waiver of this covenant for the duration of the term of the credit facility and the maturity date remains at April 30, 2017. |
| • | Subsequent to September 30, 2016, KNOC and Harvest Board of Directors approved the conversion of all KNOC’s outstanding related party loans plus accrued interest to common equity. The transaction is subject to certain registration requirements involving the government of South Korea and is expected to close in the fourth quarter of 2016. After the transaction closes there will be no related party loans outstanding. The total related party loan balance as at September 30, 2016 was $702.6 million (December 31, 2015 $629.9 million). The transaction provides significant saving to Harvest by reducing interest expense by approximately $40.0 million annually, which improves the company’s balance sheet and is further evidence of KNOC’s continuing financial support of Harvest. |
4
| MANAGEMENT’S DISCUSSION AND ANALYSIS |
UPSTREAM
Summary of Financial and Operating Results
| | | Three Months Ended September 30 | | | Nine Months Ended September 30 | |
| | | 2016 | | | 2015 | | | 2016 | | | 2015 | |
| FINANCIAL | | | | | | | | | | | | |
| Petroleum and natural gas sales(1) | | 78.5 | | | 131.9 | | | 231.5 | | | 401.3 | |
| Royalties | | (12.7 | ) | | (11.5 | ) | | (28.6 | ) | | (36.8 | ) |
| Revenues and other income | | 65.8 | | | 120.4 | | | 202.9 | | | 364.5 | |
| | | | | | | | | | | | | |
| Expenses | | | | | | | | | | | | |
| Operating | | 28.8 | | | 61.0 | | | 119.7 | | | 199.0 | |
| Transportation and marketing | | (0.4 | ) | | 1.3 | | | 1.9 | | | 4.3 | |
| Realized losses on derivative contracts(3) | | 0.4 | | | 1.6 | | | 1.3 | | | 2.4 | |
| Operating netback after hedging(4) | | 37.0 | | | 56.5 | | | 80.0 | | | 158.8 | |
| | | | | | | | | | | | | |
| General and administrative | | 11.8 | | | 14.3 | | | 39.9 | | | 46.2 | |
| Depreciation, depletion and amortization | | 61.4 | | | 102.8 | | | 202.7 | | | 300.0 | |
| Loss from joint ventures | | 6.6 | | | 9.8 | | | 35.7 | | | 25.9 | |
| Exploration and evaluation | | 0.5 | | | 0.6 | | | 2.5 | | | 5.2 | |
| Impairment | | 2.7 | | | 280.0 | | | 2.7 | | | 374.2 | |
| Unrealized losses (gains) on derivative contracts(5) | | 9.5 | | | 2.1 | | | 15.8 | | | (0.6 | ) |
| Losses (gains) on disposition of assets | | (17.6 | ) | | 0.9 | | | (34.9 | ) | | 6.2 | |
| Operating loss(2) | | (37.9 | ) | | (354.0 | ) | | (184.4 | ) | | (598.3 | ) |
| | | | | | | | | | | | | |
| Capital asset additions (excluding acquisitions) | | 2.5 | | | 19.0 | | | 5.3 | | | 124.1 | |
| Corporate acquisition(6) | | — | | | 0.4 | | | — | | | 37.1 | |
| Property dispositions, net | | (31.5 | ) | | (1.5 | ) | | (170.2 | ) | | (60.0 | ) |
| | | | | | | | | | | | | |
| OPERATING | | | | | | | | | | | | |
| Light to medium oil (bbl/d) | | 4,377 | | | 8,633 | | | 6,128 | | | 9,049 | |
| Heavy oil (bbl/d) | | 8,987 | | | 11,155 | | | 9,627 | | | 11,724 | |
| Natural gas liquids (bbl/d) | | 3,380 | | | 3,998 | | | 3,640 | | | 4,002 | |
| Natural gas (mcf/d) | | 79,846 | | | 117,419 | | | 86,498 | | | 109,024 | |
| Total (boe/d)(7) | | 30,051 | | | 43,356 | | | 33,812 | | | 42,946 | |
| (1) | Includes the effective portion of Harvest’s realized natural gas and oil hedges. |
| (2) | This is a non-GAAP measure; please refer to “Non-GAAP Measures” in this MD&A. |
| (3) | Realized gains on derivative contracts include the settlement amounts for power, crude oil, natural gas and foreign exchange derivative contracts, excluding the effective portion of realized gains from Harvest’s designated accounting hedges. See “Risk Management, Financing and Other” section of this MD&A for details. |
| (4) | Unrealized gains on derivative contracts reflect the change in fair value of derivative contracts that are not designated as accounting hedges and the ineffective portion of changes in fair value of designated hedges. See “Risk Management, Financing and Other” section of this MD&A for details. |
| (5) | Corporate acquisition represents the total consideration for the transaction, including working capital assumed. |
| (6) | Excludes volumes from Harvest’s equity investment in the Deep Basin Partnership. |
5
| MANAGEMENT’S DISCUSSION AND ANALYSIS |
Benchmark Prices
| | | Three Months Ended September 30 | | | Nine Months Ended September 30 | |
| | | 2016 | | | 2015 | | | Change | | | 2016 | | | 2015 | | | Change | |
| West Texas Intermediate ("WTI") crude oil (US$/bbl) | | 44.94 | | | 46.43 | | | (3% | ) | | 41.33 | | | 51.00 | | | (19% | ) |
| West Texas Intermediate crude oil ($/bbl) | | 58.59 | | | 60.73 | | | (4% | ) | | 54.60 | | | 64.11 | | | (15% | ) |
| Edmonton Light Sweet crude oil ("EDM") ($/bbl) | | 54.80 | | | 56.23 | | | (3% | ) | | 50.09 | | | 58.64 | | | (15% | ) |
| Western Canadian Select ("WCS") crude oil ($/bbl) | | 41.03 | | | 43.38 | | | (5% | ) | | 36.41 | | | 47.51 | | | (23% | ) |
| AECO natural gas daily ($/mcf) | | 2.32 | | | 2.90 | | | (20% | ) | | 1.85 | | | 2.77 | | | (33% | ) |
| U.S. / Canadian dollar exchange rate | | 0.767 | | | 0.764 | | | 0% | | | 0.757 | | | 0.795 | | | (5% | ) |
| | | | | | | | | | | | | | | | | | | |
| Differential Benchmarks | | | | | | | | | | | | | | | | | | |
| EDM differential to WTI ($/bbl) | | 3.79 | | | 4.50 | | | (16% | ) | | 4.51 | | | 5.47 | | | (18% | ) |
| EDM differential as a % of WTI | | 6.5% | | | 7.4% | | | (12% | ) | | 8.3% | | | 8.5% | | | (2% | ) |
| WCS differential to WTI ($/bbl) | | 17.56 | | | 17.35 | | | 1% | | | 18.19 | | | 16.60 | | | 10% | |
| WCS differential as a % of WTI | | 30.0% | | | 28.6% | | | 5% | | | 33.3% | | | 25.9% | | | 29% | |
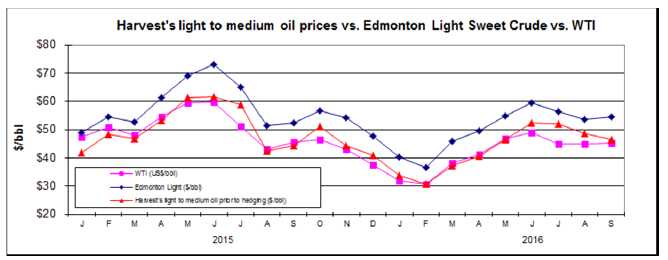
The average WTI benchmark price decreased 3% and 19%, respectively for the third quarter and nine months ended September 30, 2016 as compared to the same periods in 2015. The average Edmonton Light Sweet crude oil price (“Edmonton Light”) decreased 3% and 15%, respectively, in the third quarter and nine months ended September 30, 2016 compared to the same periods 2015. The decrease in Edmonton Light for the third quarter is due to the decrease in the WTI price. The decrease in Edmonton Light for the first nine months is due to the decrease in the WTI price, partially offset by the narrowing of the Edmonton Light differential while the U.S. dollar strengthened against the Canadian dollar.
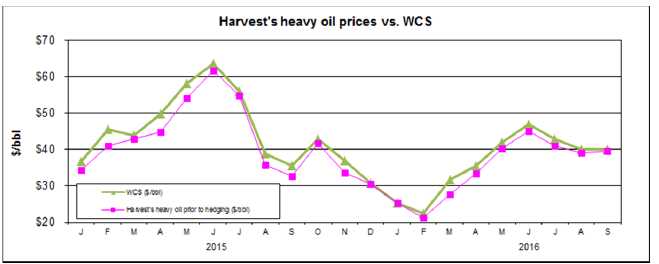
Heavy oil differentials fluctuate based on a combination of factors including the level of heavy oil production and inventories, pipeline and rail capacity to deliver heavy crude to U.S. and offshore markets and the seasonal demand for heavy oil. The 5% and 23% decreases in the WCS price for the third quarter and nine months ended September 30, 2016, respectively, as compared to the same period in 2015 was mainly the result of the decrease in the WTI price, the widening of the WCS differential to WTI partially offset by the strengthening of the U.S. dollar against the Canadian dollar.
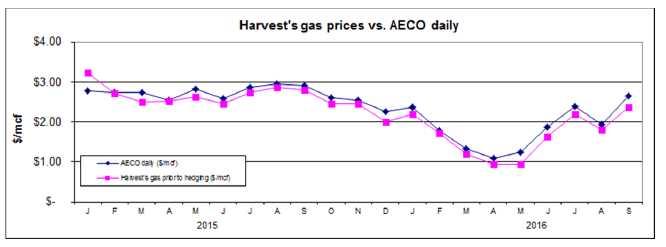
North American natural gas prices strengthened compared to the second quarter but overall continued to be weak during the third quarter and first nine months of 2016 compared to the same period in 2015. Harvest’s realized natural gas price is referenced to the AECO hub, which decreased 20% and 33%, respectively, in the third quarter and first nine months of 2016 when compared to the same period in 2015.
6
| MANAGEMENT’S DISCUSSION AND ANALYSIS |
Realized Commodity Prices
| | | Three Months Ended September 30 | | | Nine Months Ended September 30 | |
| | | 2016 | | | 2015 | | | Change | | | 2016 | | | 2015 | | | Change | |
| Light to medium oil ($/bbl) | | 49.28 | | | 48.78 | | | 1% | | | 42.07 | | | 50.80 | | | (17% | ) |
| Heavy oil prior to hedging($/bbl) | | 39.94 | | | 41.23 | | | (3% | ) | | 34.55 | | | 44.73 | | | (23% | ) |
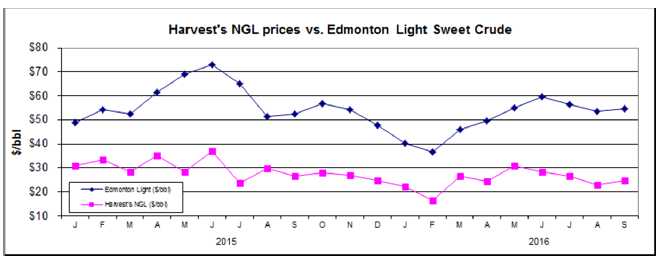
| Natural gas liquids ($/bbl) | | 24.74 | | | 26.56 | | | (7% | ) | | 24.84 | | | 30.25 | | | (18% | ) |
| Natural gas prior to hedging($/mcf) | | 2.11 | | | 2.80 | | | (25% | ) | | 1.66 | | | 2.72 | | | (39% | ) |
| Average realized price prior to hedging ($/boe)(1) | | 28.03 | | | 31.47 | | | (11% | ) | | 24.91 | | | 33.66 | | | (26% | ) |
| | | | | | | | | | | | | | | | | | | |
| Heavy oil after hedging ($/bbl)(2) | | 40.78 | | | 46.64 | | | (13% | ) | | 34.69 | | | 46.01 | | | (25% | ) |
| Natural gas after hedging ($/mcf)(2) | | 2.11 | | | 2.85 | | | (26% | ) | | 1.66 | | | 2.78 | | | (40% | ) |
| Average realized price after hedging ($/boe)(1)(2) | | 28.28 | | | 32.99 | | | (14% | ) | | 24.95 | | | 34.16 | | | (27% | ) |
| (1) | Inclusive of sulphur revenue. |
| (2) | Inclusive of the realized gains (losses) from contracts designated as hedges. Foreign exchange swaps and power contracts are excluded from the realized price. |
Harvest’s realized prices prior to any hedging activity for light to medium oil generally trends with the Edmonton Light benchmark price. Harvest’s realized prices prior to any hedging activity for heavy oil are a function of both the WCS and Edmonton Light benchmarks due to a portion of our heavy oil volumes being sold based on a discount to the Edmonton Light benchmark. For the third quarter and first nine months of 2016, the period-over-period variances and movements of light to medium oil and heavy oil were relatively consistent with the changes in their related benchmarks.
7
| MANAGEMENT’S DISCUSSION AND ANALYSIS |
Harvest’s realized prices prior to any hedging activity for natural gas generally trend with the AECO benchmark prices. For the third quarter and first nine months of 2016, the period-over-period variances and movements of natural gas price prior to hedging were relatively consistent with the changes in its benchmark.
8
| MANAGEMENT’S DISCUSSION AND ANALYSIS |
Realized natural gas liquids prices decreased by 7% and 18% for the third quarter and nine months ended September 30, 2016 as compared to the same periods in 2015. The decreases are relatively consistent with the decrease in oil prices.
In order to partially mitigate the risk of fluctuating cash flows due to natural gas and heavy oil pricing volatility, Harvest will periodically enter into WCS and AECO derivative contracts. During the first nine months of 2015 Harvest had AECO derivative contracts in place for a portion of its production, however none were in place in the first nine months of 2016. During the third quarter of 2015 and 2016 Harvest had WCS derivative contracts in place for a portion of its production.
Please see “Cash Flow Risk Management” section in this MD&A for further discussion with respect to the cash flow risk management program.
9
| MANAGEMENT’S DISCUSSION AND ANALYSIS |
Sales Volumes
| | | Three Months Ended September 30 | |
| | | 2016 | | | 2015 | | | | |
| | | | | | | | | | | | | | | % Volume | |
| | | Volume | | | Weighting | | | Volume | | | Weighting | | | Change | |
| Light to medium oil (bbl/d) | | 4,377 | | | 15% | | | 8,633 | | | 20% | | | (49% | ) |
| Heavy oil (bbl/d) | | 8,987 | | | 30% | | | 11,155 | | | 26% | | | (19% | ) |
| Natural gas liquids (bbl/d) | | 3,380 | | | 11% | | | 3,998 | | | 9% | | | (15% | ) |
| Total liquids (bbl/d) | | 16,744 | | | 56% | | | 23,786 | | | 55% | | | (30% | ) |
| Natural gas (mcf/d) | | 79,846 | | | 44% | | | 117,419 | | | 45% | | | (32% | ) |
| Total oil equivalent (boe/d) | | 30,051 | | | 100% | | | 43,356 | | | 100% | | | (31% | ) |
| | | Nine Months Ended September 30 | |
| | | 2016 | | | 2015 | | | | |
| | | | | | | | | | | | | | | % Volume | |
| | | Volume | | | Weighting | | | Volume | | | Weighting | | | Change | |
| Light to medium oil (bbl/d) | | 6,128 | | | 18% | | | 9,049 | | | 21% | | | (32% | ) |
| Heavy oil (bbl/d) | | 9,627 | | | 28% | | | 11,724 | | | 27% | | | (18% | ) |
| Natural gas liquids (bbl/d) | | 3,640 | | | 11% | | | 4,002 | | | 9% | | | (9% | ) |
| Total liquids (bbl/d) | | 19,395 | | | 57% | | | 24,775 | | | 57% | | | (22% | ) |
| Natural gas (mcf/d) | | 86,498 | | | 43% | | | 109,024 | | | 43% | | | (21% | ) |
| Total oil equivalent (boe/d) | | 33,812 | | | 100% | | | 42,946 | | | 100% | | | (21% | ) |
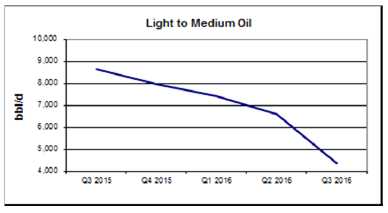 | Harvest’s average daily sales of light to medium oil decreased 49% in the third quarter of 2016, as compared to the same period in 2015. The decrease was mainly due to the disposition of properties, natural declines, and reflects a greatly reduced drilling program in 2016. |
Heavy oil sales for the third quarter of 2016 decreased 19% as compared to the same period in 2015 mainly due to dispositions of properties, natural declines, and reflect a greatly reduced drilling program in 2016. | 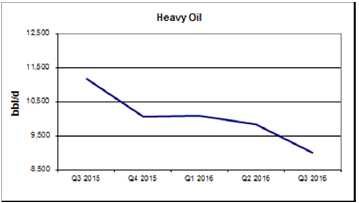 |
10
| MANAGEMENT’S DISCUSSION AND ANALYSIS |
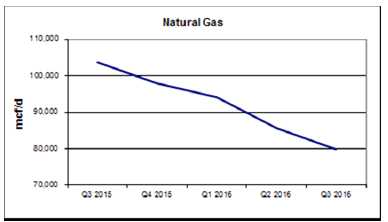 | Natural gas sales during the third quarter of 2016 decreased 32%, as compared to the same period in 2015. The decrease was mainly a result of disposition of assets to the Deep Basin Partnership during the fourth quarter of 2015, disposition of properties to third parties, natural declines and reflects a greatly reduced drilling program in 2016. |
Natural gas liquids sales for the third quarter of 2016 decreased by 15% from the same period in 2015 due to natural declines and third party constraints. |  |
Revenues
Sales Revenue by Product
| | | Three Months Ended September 30 | | | Nine Months Ended September 30 | |
| | | 2016 | | | 2015 | | | Change | | | 2016 | | | 2015 | | | Change | |
| Light to medium oil sales | | 19.8 | | | 38.7 | | | (49% | ) | | 70.6 | | | 125.5 | | | (44% | ) |
| Heavy oil sales after hedging(1) | | 33.7 | | | 47.9 | | | (30% | ) | | 91.5 | | | 147.3 | | | (38% | ) |
| Natural gas sales after hedging(1) | | 15.5 | | | 30.8 | | | (50% | ) | | 39.3 | | | 82.7 | | | (52% | ) |
| Natural gas liquids sales | | 7.7 | | | 9.8 | | | (21% | ) | | 24.8 | | | 33.0 | | | (25% | ) |
| Other(2) | | 1.8 | | | 4.7 | | | (62% | ) | | 5.3 | | | 12.8 | | | (59% | ) |
| Petroleum and natural gas sales | | 78.5 | | | 131.9 | | | (40% | ) | | 231.5 | | | 401.3 | | | (42% | ) |
| Royalties | | (12.7 | ) | | (11.5 | ) | | 10% | | | (28.6 | ) | | (36.8 | ) | | (22% | ) |
| Revenues | | 65.8 | | | 120.4 | | | (45% | ) | | 202.9 | | | 364.5 | | | (44% | ) |
| (1) | Inclusive of the effective portion of realized gains (losses) from natural gas and crude oil contracts designated as hedges. |
| (2) | Inclusive of sulphur revenue and miscellaneous income. |
Harvest’s revenue is subject to changes in sales volumes, commodity prices, currency exchange rates and hedging activities. Total petroleum and natural gas sales decreased in the third quarter and first nine months of 2016 as compared to 2015, mainly due to the decrease in sales volumes and the decrease in the realized prices.
11
| MANAGEMENT’S DISCUSSION AND ANALYSIS |
Sulphur revenue represented $1.4 million of the total in other revenues for the third quarter of 2016 (2015 - $4.4 million) and $4.9 million for the first nine months of 2016 (2015 - $12.0 million).
Revenue by Product Type as % of Total Revenue
| | | Three Months Ended September 30 | | | Nine Months Ended September 30 | |
| | | 2016 | | | 2015 | | | 2016 | | | 2015 | |
| Light to medium oil sales | | 25% | | | 29% | | | 30% | | | 31% | |
| Heavy oil sales after hedging | | 43% | | | 36% | | | 40% | | | 37% | |
| Natural gas sales after hedging | | 20% | | | 23% | | | 17% | | | 21% | |
| Natural gas liquids sales | | 10% | | | 7% | | | 11% | | | 8% | |
| Other | | 2% | | | 5% | | | 2% | | | 3% | |
| Total Sales Revenue | | 100% | | | 100% | | | 100% | | | 100% | |
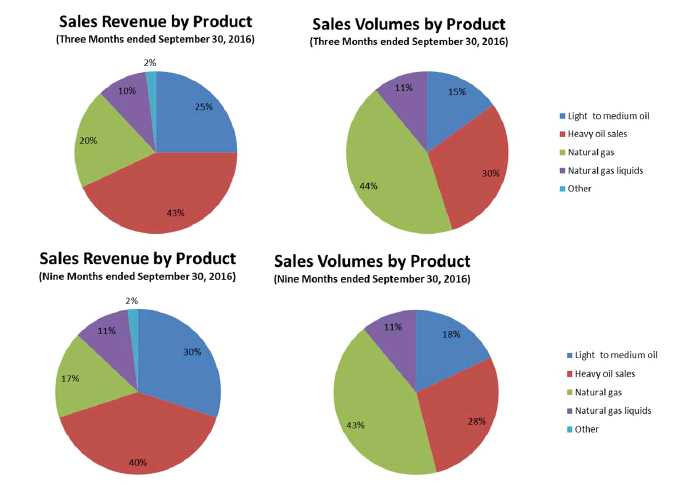
Although Harvest’s product mix on a volumetric basis is slightly weighted heavier towards crude oil and natural gas liquids than natural gas, revenue contribution is more heavily weighted to crude oil and liquids as shown by the graphs above. Compared to the prior year quarter, revenue contributions by light to medium oil has decreased related primarily to the sale of light to medium oil properties during the year which has resulted in an increased of revenue contributions from Heavy oil, natural gas, and natural gas liquids.
12
| MANAGEMENT’S DISCUSSION AND ANALYSIS |
Royalties
Harvest pays Crown, freehold and overriding royalties to the owners of mineral rights from which production is generated. These royalties vary for each property and product and Crown royalties are based on various sliding scales dependent on incentives, production volumes and commodity prices.
For the third quarter ended and nine months ended September 30, 2016, royalties as a percentage of gross revenue averaged 16.2% and 12.4% respectively (2015 –8.7% and 9.2%) . The increase in royalties as a percentage of gross revenue was mainly due to a $4.3 million current quarter and $9.3 million year to date prior period adjustment related to a Crown royalty audit.
Operating Expenses
| | Three Months Ended September 30 | | | Nine Months Ended September 30 | |
| | | 2016 | | | 2015 | | | 2016 | | | 2015 | |
| Operating expense | | 28.8 | | | 61.0 | | | 119.7 | | | 199.0 | |
| Operating expense ($/boe) | | 10.41 | | | 15.28 | | | 12.92 | | | 16.97 | |
Operating expenses for the third quarter and first nine months of 2016 decreased by $32.2 million and $79.3 million, respectively, compared to the same periods in 2015. The decreases were mainly due to overall lower activity levels, reduced levels of well servicing and repairs and maintenance activity, reductions in labour and the impact of asset dispositions. Additionally, electricity costs were lower in the third quarter and first nine months of 2016 due to lower Power Pool Rates of $17.93 and $17.00 per megawatt hour respectively (2015 - $26.04 and $37.48, respectively), further reducing operating costs.
Operating expenses on a per barrel basis decreased by 32% to $10.41 per barrel and 24% to $12.92 per barrel for third quarter and first nine months of 2016, respectively when compared to the same periods in 2015, mainly due to lower activity levels and spending, partially offset by the lower sales volumes.
Transportation and Marketing Expense
| | | Three Months Ended September 30 | | | Nine Months Ended September 30 | |
| | | 2016 | | | 2015 | | | 2016 | | | 2015 | |
| Transportation and marketing | | (0.4 | ) | | 1.3 | | | 1.9 | | | 4.3 | |
| Transportation and marketing ($/boe) | | (0.14 | ) | | 0.33 | | | 0.21 | | | 0.37 | |
Transportation and marketing expenses relate primarily to the cost of trucking crude oil to pipeline or rail receipt points. Transportation and marketing expenses in the third quarter and first nine months of 2016 were lower due to reversal of a $1.1 million accrual in the current period when compared to the same periods in 2015. The reversal of the accrual is primarily related to lower activity and costs than previously estimated.
13
| MANAGEMENT’S DISCUSSION AND ANALYSIS |
Operating Netback(1)
| | | Three Months Ended September 30 | | | Nine Months Ended September 30 | |
| ($/boe) | | 2016 | | | 2015 | | | Change | | | 2016 | | | 2015 | | | Change | |
| Petroleum and natural gas sales prior to hedging(2) | | 28.03 | | | 31.47 | | | (3.44 | ) | | 24.91 | | | 33.66 | | | (8.75 | ) |
| Royalties | | (4.60 | ) | | (2.89 | ) | | (1.71 | ) | | (3.09 | ) | | (3.14 | ) | | 0.05 | |
| Operating expenses | | (10.41 | ) | | (15.28 | ) | | 4.87 | | | (12.92 | ) | | (16.97 | ) | | 4.05 | |
| Transportation and marketing | | 0.14 | | | (0.33 | ) | | 0.47 | | | (0.21 | ) | | (0.37 | ) | | 0.16 | |
| Operating netback prior to hedging(1) | | 13.16 | | | 12.97 | | | 0.19 | | | 8.69 | | | 13.18 | | | (4.49 | ) |
| Hedging (loss) gain(3) | | 0.09 | | | 1.11 | | | (1.02 | ) | | (0.10 | ) | | 0.30 | | | (0.40 | ) |
| Operating netback after hedging(1) | | 13.25 | | | 14.08 | | | (0.83 | ) | | 8.59 | | | 13.48 | | | (4.89 | ) |
| (1) | This is a non-GAAP measure; please refer to “Non-GAAP Measures” in this MD&A. |
| (2) | Excludes miscellaneous income not related to oil and gas production |
| (3) | Includes the settlement amounts for natural gas, crude oil and power contracts. |
For the third quarter and nine months ended September 30, 2016 netback prior to hedging were $13.16 per boe and $8.69 per boe, respectively, representing a 1 percent increase and 34 percent decrease compared to the same periods in 2015.
For the third quarter and nine months ended September 30, 2016 netback after hedging were $13.25 per boe and $8.59 per boe, respectively, representing decreases of 6 percent and 36 percent compared to the same periods in 2015.
The decrease in the period was mainly due to lower realized sale prices, partially offset by reduced operating expenses.
General and Administrative (“G&A”) Expenses
| | | Three Months Ended September 30 | | | Nine Months Ended September 30 | |
| | | 2016 | | | 2015 | | | Change | | | 2016 | | | 2015 | | | Change | |
| Gross G&A expenses | | 12.4 | | | 16.6 | | | (25% | ) | | 41.8 | | | 54.1 | | | (23% | ) |
| Capitalized G&A and recoveries | | (0.6 | ) | | (2.3 | ) | | 74% | | | (1.9 | ) | | (7.9 | ) | | 76% | |
| Net G&A expenses | | 11.8 | | | 14.3 | | | (17% | ) | | 39.9 | | | 46.2 | | | (14% | ) |
| Net G&A expenses ($/boe) | | 4.27 | | | 3.59 | | | 19% | | | 4.31 | | | 3.94 | | | 9% | |
For the third quarter and first nine months ended September 30, 2016 G&A expenses net of capitalized G&A decreased $2.5 million and $6.3 million respectively, while gross G&A expenses decreased $4.2 million and $12.3 million respectively, when compared to the same period in the prior year. The decrease in the gross G&A expenses from the same periods in the prior year were mainly due to comparative lower staffing levels, lower bonus and long-term incentive (“LTI”) accruals, decreases in employee benefits expenses, partially offset by higher severance charges related to staff layoff completed during the first nine months of 2016. The reduction in capitalized G&A is mainly related to reduced capital spending in 2016. Harvest does not have a stock option program, however there is a LTI program which is a cash settled plan that has been included in the G&A expense.
14
| MANAGEMENT’S DISCUSSION AND ANALYSIS |
On a per boe basis, G&A expenses increased $0.68 and $0.37 in the third quarter and first nine months of 2016, from the same period in the prior year mainly due to lower sales volumes in the current year.
Depletion, Depreciation and Amortization (“DD&A”) Expenses
| | | Three Months Ended September 30 | | | Nine Months Ended September 30 | |
| | | 2016 | | | 2015 | | | 2016 | | | 2015 | |
| DD&A | | 61.4 | | | 102.8 | | | 202.7 | | | 300.0 | |
| DD&A ($/boe) | | 22.22 | | | 25.77 | | | 21.88 | | | 25.59 | |
DD&A expense for the third quarter and first nine months of 2016 decreased by $41.4 million and $97.3 million, respectively as compared to the same period in 2015, mainly due to lower sales volumes and the impact of a lower DD&A rate due to impairment charges recorded during fiscal 2015.
Onerous Contract
As the result the recent staff reduction Harvest vacated some floors of its head office lease, when combined with the poor sublease market in Calgary resulted in an onerous contract. During the third quarter of 2016 Harvest recognized a provision of $9.4 million. The provision represents the present value of the difference between future lease obligations and the estimated sublease recoveries. The onerous contract provision is estimated to be settled in periods up to August 2025.
Impairment Expense
As a result of the onerous contract noted above, for the third quarter and first nine months of 2016, Harvest recognized an impairment loss of $2.7 million related to leasehold improvement and furniture and fixtures.
Harvest recognized no impairment loss for the third quarter and first nine months of 2016 (2015 – $280.0 million and $374.2 million, respectively) against PP&E relating to the cash generating units (“CGU” ). At June 30, 2016, Harvest reviewed and adjusted its CGUs as a result of the Company’s ongoing divestiture activity and corporate re-organization. CGU’s were aggregated due to similarities in operations, product composition, cash flows and management and monitoring.
Acquisitions & Dispositions
On August 16, 2016 Harvest closed the disposition of some of its oil and gas assets in Southern Alberta for net proceeds of $6.7 million. On June 30, 2016, Harvest closed the disposition of all of its oil and gas assets in Saskatchewan for net proceeds of $61.6 million. Together with other insignificant dispositions of Upstream assets, Harvest recognized a gain of $17.6 million and $34.9 million for the three and nine months ended September 30, 2016, respectively (2015 – losses of $0.9 million and $6.2 million), relating to the de-recognition of PP&E, E&E, goodwill and decommissioning and environmental liabilities.
15
| MANAGEMENT’S DISCUSSION AND ANALYSIS |
Capital Asset Additions
| | | Three Months Ended September 30 | | | Nine Months Ended September 30 | |
| | | 2016 | | | 2015 | | | 2016 | | | 2015 | |
| Drilling and completion | | (1.2 | ) | | 7.2 | | | (2.1 | ) | | 77.4 | |
| Well equipment, pipelines and facilities | | 2.8 | | | 7.6 | | | 5.6 | | | 32.9 | |
| Land and seismic | | 0.2 | | | 1.5 | | | 0.5 | | | 3.6 | |
| Corporate | | 0.1 | | | 0.4 | | | (0.3 | ) | | 3.4 | |
| Other | | 0.6 | | | 2.3 | | | 1.6 | | | 6.8 | |
| Total additions excluding acquisitions | | 2.5 | | | 19.0 | | | 5.3 | | | 124.1 | |
Total capital additions were lower for the third quarter and first nine months of 2016 compared to 2015 mainly due to reduced capital activity for the current year in response to a low commodity price environment and the impact of accrual reversals. The reversal of the accrual is primarily related to lower actual costs than previously estimated. Harvest’s capital expenditures in the third quarter and first nine months of 2016 related to well equipment, pipelines and facilities.
During the third quarter of 2016 Harvest did not drill any wells. During the first nine months of 2016 Harvest participated in one partner-operated horizontal multi-stage fractured well (0.3 net) to develop the liquids-rich Falher gas formation.
During the third quarter and nine months ended September 30, 2016, Harvest’s net undeveloped land additions were 316 acres and 11,184 acres respectively (2015 –3,648 acres and 42,192 acres).
Decommissioning Liabilities
Harvest’s Upstream decommissioning liabilities at September 30, 2016 was $732.8 million (December 31, 2015 – $796.6 million) for future remediation, abandonment, and reclamation of Harvest’s oil and gas properties. The total of the decommissioning liabilities are based on management’s best estimate of costs to remediate, reclaim, and abandon wells and facilities. The decrease in balance as at September 30, 2016 is mainly due disposition of properties, partially offset by revisions to the estimate as a result of changes in the Bank of Canada long term interest rates. The costs will be incurred over the operating lives of the assets with the majority being at or after the end of reserve life. Please refer to the “Contractual Obligations and Commitments” section of this MD&A for the payments expected for each of the next five years and thereafter in respect of the decommissioning liabilities.
Investments in Joint Ventures
Harvest has equity investments in Deep Basin Partnership (“DBP”) and HK MS Partnership (“HKMS”) joint ventures with KERR Canada Co. Ltd. (“KERR”) which are accounted for as equity investments. Harvest derives its income or loss from its investments based upon Harvest’s share in the change of the net assets of the joint venture. Harvest’s share of the change in the net assets does not directly correspond to its ownership interest because of contractual preference rights to KERR and changes based on contributions made by either party during the year. For the third quarter and nine months ended September 30, 2016, Harvest recognized a loss of $6.6 million and $35.7 million (2015 –$9.8 million and $25.9 million) from its investment in the DBP and HKMS joint ventures.
16
| MANAGEMENT’S DISCUSSION AND ANALYSIS |
Below is an overview of operational and financial highlights of the DBP and HKMS joint ventures for the third quarter and nine months ended September 30, 2016. Unless otherwise noted the following discussion relates to 100% of the joint venture results and not based on Harvest ownership share.
Deep Basin Partnership
DBP was established for the purposes of exploring, developing and producing from certain oil and gas properties in the Deep Basin area in Northwest Alberta. During 2015 and in the first nine month ended September 30, 2016 Harvest made various contributions to the DBP that resulted in increase in its ownership percentage as reflected in the table below.
| | | September | | | | | | | | | December | | | September | | | | | | | | | December | |
| | | 30, | | | June 30, | | | March 31, | | | 31, | | | 30, | | | June 30, | | | March 31, | | | 31, | |
| | | 2016 | | | 2016 | | | 2016 | | | 2015 | | | 2015 | | | 2015 | | | 2015 | | | 2014 | |
| Harvest's ownership interest | | 82.03% | | | 82.00% | | | 81.98% | | | 81.71% | | | 81.05% | | | 79.30% | | | 77.81% | | | 77.81% | |
| KERR's ownership interest | | 17.97% | | | 18.00% | | | 18.02% | | | 18.29% | | | 18.95% | | | 20.70% | | | 22.19% | | | 22.19% | |
| Total | | 100.00% | | | 100.00% | | | 100.00% | | | 100.00% | | | 100.00% | | | 100.00% | | | 100.00% | | | 100.00% | |
As at September 30, 2016, the fair value of Harvest’s top-up obligation to KERR, related to a minimum rate of return commitment was estimated as $14.5 million (December 31, 2015 - $2.0 million).
At September 30, 2016, Harvest received a total of $6.0 million (December 31, 2015 - $4.3 million) in distributions from the DBP from inception of the joint venture.
| | | Three Months Ended September 30 | | | Nine Months Ended September 30 | |
| | | 2016 | | | 2015 | | | Change | | | 2016 | | | 2015 | | | Change | |
| Natural gas (mcf/d) | | 27,525 | | | 20,886 | | | 32% | | | 27,892 | | | 16,813 | | | 66% | |
| Natural gas liquids (bbl/d) | | 1,145 | | | 1,088 | | | 5% | | | 1,235 | | | 887 | | | 39% | |
| Light to medium oil (bbl/d) | | 2 | | | - | | | 200% | | | 2 | | | 1 | | | 100% | |
| Total (boe/d) | | 5,735 | | | 4,569 | | | 26% | | | 5,885 | | | 3,691 | | | 59% | |
| Harvest's share(1) | | 4,704 | | | 3,626 | | | 30% | | | 4,826 | | | 2,920 | | | 65% | |
| (1) | This is a non-GAAP measure; please refer to “Non-GAAP Measures” in this MD&A. |
Sales volumes for the third quarter and nine months ended September 30, 2016 increased by 1,166 boe/d and 2,194 boe/d respectively, as compared to the same periods in 2015. The increases were primarily due to new wells being brought online and additional assets contributed on October 1, 2015 by Harvest, partially offset by production curtailments due to third party transportation restrictions.
| | | Three Months Ended September 30 | | | Nine Months Ended September 30 | |
| | | 2016 | | | 2015 | | | Change | | | 2016 | | | 2015 | | | Change | |
| Revenues(2) | | 8.2 | | | 9.5 | | | (14% | ) | | 22.5 | | | 21.6 | | | 4% | |
| Operating expenses and Other | | (6.6 | ) | | (8.1 | ) | | 19% | | | (22.1 | ) | | (19.2 | ) | | (15% | ) |
| Depletion, depreciation and amortization | | (9.7 | ) | | (13.0 | ) | | 25% | | | (29.4 | ) | | (30.9 | ) | | 5% | |
| Finance costs | | (0.7 | ) | | (0.8 | ) | | 13% | | | (2.1 | ) | | (2.0 | ) | | (5% | ) |
| Impairment | | - | | | - | | | - | | | (1.4 | ) | | - | | | - | |
| Losses on disposition of assets | | - | | | - | | | - | | | (9.8 | ) | | - | | | - | |
| Net loss(1) | | (8.8 | ) | | (12.4 | ) | | 29% | | | (42.3 | ) | | (30.5 | ) | | (39% | ) |
| (1) | Balances represent 100% share of the DBP. |
| (2) | Revenue is presented net of royalties |
17
| MANAGEMENT’S DISCUSSION AND ANALYSIS |
The lower sales revenues in the third quarter ended September 30, 2016 reflect the lower commodity prices, partially offset by higher volumes, and higher royalties compared to the same period in the prior year. The higher sales revenues in the first nine months of 2016 reflect the higher sales volumes and lower royalties, partially offset by lower commodity prices compared to the same period in 2015.
Operating expenses and other expenses for the third quarter and first nine months of 2016 were $12.59 per boe and $13.73, respectively, decreases of $6.57 and $5.29 from the same periods in 2015. The decreases from 2015 was mainly due to the higher sales volume being processed through the HKMS natural gas processing plant resulting in lower operating expense on a boe basis.
Depletion for the third quarter and nine months ended September 30, 2016 were $18.43 per boe and $18.25 per boe, respectively (2015 –$30.89 per boe and $30.67 per boe). The decreases from 2015 was mainly due to the impact of an impairment charge recorded during the fourth quarter of 2015 and additional proved reserves recognized in the fourth quarter of 2015 partially offset by higher volumes.
For the nine months of 2016, the DBP recognized an impairment loss of $1.4 million relating to a final statement of adjustments for a corporate acquisition completed in the fourth quarter of 2015. As the partnerships property, plant and equipment (PP&E) assets were impaired as at December 31, 2015 the additions to PP&E as a result of the statement of adjustment were flowed through as an expense in the first quarter of 2016.
On January 15, 2016 the DBP closed an asset exchange whereby the carrying value of assets given up exceeded the fair value of assets received based on the booked reserves associated with the properties exchanged. This transaction resulted in a loss on disposition of PP&E of $9.8 million.
| | Three Months Ended September 30 | | | Nine Months Ended | |
| | 2016 | | | 2015 | | | 2016 | | | 2015 | |
| Drilling and completion | | 0.8 | | | 0.4 | | | 7.8 | | | 41.5 | |
| Well equipment, pipelines and facilities | | 0.3 | | | 1.7 | | | 3.6 | | | 16.6 | |
| Land and seismic | | - | | | - | | | - | | | - | |
| Total(1) | | 1.1 | | | 2.1 | | | 11.4 | | | 58.1 | |
| (1) | Balances represent 100% share of the DBP. |
Capital asset additions were $1.1 million and $11.4 million in the third quarter and nine months ended September 30, 2016, mainly related to drilling, completion and tie-in of wells. During the first nine months of 2016, DBP drilled 3 gross (2.5 net) wells.
18
| MANAGEMENT’S DISCUSSION AND ANALYSIS |
HKMS Partnership
During 2015 and in the first nine months ended September 30, 2016 Harvest made various contributions to the HKMS that resulted in increase in its ownership percentage as reflected in the table below.
| | | September | | | | | | | | | December | | | September | | | | | | | | | December | |
| | | 30, | | | June 30, | | | March 31, | | | 31, | | | 30, | | | June 30, | | | March 31, | | | 31, | |
| | | 2016 | | | 2016 | | | 2016 | | | 2015 | | | 2015 | | | 2015 | | | 2015 | | | 2014 | |
| Harvest's ownership | | 70.21% | | | 70.19% | | | 70.15% | | | 69.93% | | | 69.16% | | | 68.69% | | | 49.49% | | | 47.01% | |
| KERR's ownership | | 29.79% | | | 29.81% | | | 29.85% | | | 30.07% | | | 30.84% | | | 31.31% | | | 50.51% | | | 52.99% | |
| Total | | 100.00% | | | 100.00% | | | 100.00% | | | 100.00% | | | 100.00% | | | 100.00% | | | 100.00% | | | 100.00% | |
At September 30, 2016, Harvest received a total of $19.4 million (December 31, 2015 - $7.7 million) in distributions from the HKMS from inception of the joint venture
| | | Three Months Ended September 30 | | | Nine Months Ended September 30 | |
| | | 2016 | | | 2015 | | | Change | | | 2016 | | | 2015 | | | Change | |
| Revenues | | 5.6 | | | 6.1 | | | (8% | ) | | 17.8 | | | 13.9 | | | 28% | |
| Operating expenses and other | | 0.1 | | | (0.2 | ) | | 150% | | | (0.8 | ) | | (1.2 | ) | | 33% | |
| Depreciation and amortization | | (0.9 | ) | | (0.8 | ) | | (13% | ) | | (2.6 | ) | | (2.3 | ) | | (13% | ) |
| Finance costs | | (4.9 | ) | | (4.9 | ) | | 0% | | | (14.7 | ) | | (10.0 | ) | | (47% | ) |
| Net (loss) income(1) | | (0.1 | ) | | 0.2 | | | (150% | ) | | (0.3 | ) | | 0.4 | | | (175% | ) |
| (1) | Balances represent 100% share of the HKMS. |
The Gas Processing Agreement between the HKMS and DBP ensures that HKMS receives an 18% internal rate of return on capital deployed over the term of the contract. In order to guarantee this return, DBP is required to provide HKMS with a minimum monthly capital fee that is currently $1.9 million a month. This capital fee is accounted for as revenue for HKMS and an operating expense for the DBP. In addition HKMS also generates revenue from charging an operating fee to recover operating expenses incurred. For the third quarter and nine months ended September 30, 2016 the partnership generated revenues of $5.6 million and $17.8 million, respectively (2015 –$6.1 million and $13.9 million).
Operating expenses of the facility are recovered through charging an operating fee to the producers. For the third quarter and nine months ended September 30, 2016 the partnership operating expense and other were a recovery of $0.1 million and an expense of $0.8 million, respectively (2015 – expense of $0.2 million and $1.2 million).
Depreciation has been calculated on a straight-line basis over a 30 year useful life. Based on the capital expenditures incurred to date, the depreciation on a monthly basis is approximately $0.3 million per month. For the third quarter and nine months ended September 30, 2016 the partnership depreciation expense were $0.9 million and $2.6 million, respectively (2015 – $0.8 million and $2.3 million).
Finance costs mainly represent an accounting charge resulting from the Partner’s contributions being classified as liabilities, as a result of the Gas Processing Agreement guaranteed returns. The finance costs represent the 18% rate of return on the partner’s contributions. For the third quarter and nine months ended September 30, 2016 the partnership finance costs was $4.9 million and $14.7 million, respectively (2015 –$4.9 million and $10.0 million).
19
| MANAGEMENT’S DISCUSSION AND ANALYSIS |
See note 8 of the September 30, 2016 condensed interim consolidated financial statements for discussion of the accounting implications of these joint ventures.
BLACKGOLD OIL SANDS
Pre-operating Results
| | | Three Months Ended September 30 | | | Nine Months Ended September 30 | |
| | | 2016 | | | 2015 | | | 2016 | | | 2015 | |
| Expenses | | | | | | | | | | | | |
| Pre-operating | | 2.0 | | | 3.7 | | | 7.8 | | | 9.1 | |
| General and administrative | | 0.6 | | | 0.8 | | | 1.7 | | | 2.2 | |
| Depreciation and amortization | | 0.2 | | | 0.2 | | | 0.5 | | | 0.3 | |
| Impairment of property, plant and equipment | | — | | | 262.0 | | | — | | | 262.0 | |
| (Gains) losses on disposition of assets | | — | | | — | | | — | | | - | |
| Pre-Operating loss(1) | | (2.8 | ) | | (266.7 | ) | | (10.0 | ) | | (273.6 | ) |
| (1) | This is an non GAAP measure; please refer to “non-GAAP Measures” in this MD&A. |
As the CPF was substantially completed during the first quarter of 2015, the operating expenses that were previously capitalized to property plant and equipment are now expensed on the income statement. For the third quarter and nine months ended September 30, 2016, Harvest recognized an operating loss of $2.8 million and $10.0 million (2015 –$266.7 million and $273.6 million) respectively, mainly relating to labour, power, maintenance and general and administrative expenses.
Capital Asset Additions
| | | Three Months Ended September 30 | | | Nine Months Ended September 30 | |
| | | 2016 | | | 2015 | | | 2016 | | | 2015 | |
| Well equipment, pipelines and facilities | | 0.1 | | | 0.8 | | | 0.2 | | | 44.1 | |
| Pre-operating costs | | — | | | — | | | — | | | 7.0 | |
| Drilling and completion | | — | | | — | | | — | | | 0.4 | |
| Capitalized borrowing costs and other | | (0.2 | ) | | 0.1 | | | (0.2 | ) | | 14.0 | |
| Total BlackGold additions | | (0.1 | ) | | 0.9 | | | - | | | 65.5 | |
The minimal capital spending during the third quarter and first nine months of 2016 reflects a halt in BlackGold activity since the first quarter of 2015.
Decommissioning Liabilities
Harvest’s BlackGold decommissioning liabilities at September 30, 2016 was $64.0 million (December 31, 2015 - $50.1 million) relating to the future remediation, abandonment, and reclamation of the steam assisted gravity drainage (“SAGD”) wells and CPF. The increase in balance as at September 30, 2016 is mainly due to revisions to the estimate as a result of changes in the Bank of Canada long term interest rates. Please see the “Contractual Obligations and Commitments” section of this MD&A for the payments expected for each of the next five years and thereafter in respect of the decommissioning liabilities.
20
| MANAGEMENT’S DISCUSSION AND ANALYSIS |
Project Development
Harvest has been developing its BlackGold oil sands CPF under the engineering, procurement and construction (“EPC”) contract. Initial drilling of 30 SAGD wells (15 well pairs) was completed by the end of 2012 and the majority of the well completion activities were completed by the end of 2014. More SAGD wells will be drilled in the future to compensate for the natural decline in production of the initial well pairs and maintain the Phase 1 production capacity of 10,000 bbl/d. During the first quarter of 2015 construction had been substantially completed, including the building of the CPF plant site, well pads, and connecting pipelines. Several systems have since been commissioned and others will be progressed slowly within a limited budget. The decision to complete commissioning of the CPF and commence steam injection depends on a number of factors including the bitumen price environment.
Harvest has recorded net $1,080.6 million of costs on the entire project since acquiring the BlackGold assets in 2010. This $1,080.6 million includes certain Phase 2 pre-investment which is expected to improve the capital efficiency over the project lifecycle. Under the EPC contract, $94.9 million of the EPC costs will be paid in equal installments, without interest, over 10 years. Payments commenced during the second quarter of 2015 with two payments made on April 30, 2015. Harvest withheld the third deferred payment due April 30, 2016 as it is in process of conducting a comprehensive audit of costs and expenses incurred by the Contractor in connection with the work. The liability is considered a financial liability and is initially recorded at fair value, which is estimated as the present value of all future cash payments discounted using the prevailing market rate of interest for similar instruments. As at September 30, 2016, Harvest recognized a liability of $64.4 million (December 31, 2015 - $62.0 million) using a discount rate of 5.5% (December 31, 2015 - 5.5%) .
As Harvest uses the unit of production method for depletion and the BlackGold assets currently have no production, no depletion on the BlackGold property, plant and equipment has been recorded. Minor depreciation has been recorded during the third quarter and first nine months of 2016 on administrative assets.
RISK MANAGEMENT, FINANCING AND OTHER
Cash Flow Risk Management
The Company at times enters into natural gas, crude oil, electricity and foreign exchange contracts to reduce the volatility of cash flows from some of its forecast sales and purchases, and when allowable, will designate these contracts as cash flow hedges. The following is a summary of Harvest’s derivative contracts outstanding at September 30, 2016:
21
| MANAGEMENT’S DISCUSSION AND ANALYSIS |
| Contracts Designated as Hedges | | | | |
| | | | | Fair value of |
| Contract Quantity | Type of Contract | Term | | Liability |
| 2,800 bbl/day | WCS price swap | Oct - Dec 2016 | US$33.50/bbl | $ (0.4) |
| Contracts Not Designated as Hedges | | | | |
| | | | | Fair Value of |
| Contract Quantity | Type of Contract | Term/Expiry | Contract Price | Liability |
| 12 MW | AESO power swap | Oct - Dec 2016 | $34.63/MWh | $ (0.1) |
| US$380 million | Foreign exchange swap | October 2016 | $1.32 Cdn/US | (3.2) |
| | | | | $ (3.3) |
Harvest has entered into U.S. dollar currency swap transactions related to a LIBOR borrowings, which results in a reduction of interest expense paid on Harvest’s borrowings related to its credit facility. As a result of these transactions, Harvest’s effective interest rate for borrowings under the credit facility for the three and nine months ended September 30, 2016 was 1.5% and 1.6%, respectively (2015 – 1.7% and 2.2%, respectively).
| | | Three Months Ended September 30 | |
| | | 2016 | | | 2015 Crude Natural | |
| Realized (gains) losses | | | | | Crude | | | | | | Natural | | | Top-Up | | | | | | | | | | | | | | | | | | | |
| recognized in: | | Power | | | Oil | | | Currency | | | Gas | | | Obligation | | | Total | | | Power | | | Oil | | | Currency | | | Gas | | | Total | |
| Revenues | | — | | | (0.7 | ) | | — | | | — | | | — | | | (0.7 | ) | | — | | | (5.6 | ) | | — | | | (0.5 | ) | | (6.1 | ) |
| Derivative contract (gains) | | 0.5 | | | — | | | — | | | — | | | — | | | 0.5 | | | 1.6 | | | — | | | — | | | — | | | 1.6 | |
| Unrealized (gains) lossesrecognized in: | | | | | | | | | | | | | | | | | | | | | | | | | | | | | | | | | |
| OCI, before tax | | — | | | (1.6 | ) | | — | | | — | | | — | | | (1.6 | ) | | — | | | (14.1 | ) | | — | | | (0.3 | ) | | (14.4 | ) |
| Derivative contract (gains) | | 0.2 | | | — | | | 6.7 | | | — | | | 2.5 | | | 9.4 | | | 2.1 | | | — | | | — | | | — | | | 2.1 | |
| | | Nine Months Ended September 30 | |
| | | 2016 | | | 2015 | |
| Realized (gains) losses | | | | | Crude | | | | | | Natural | | | Top-Up | | | | | | | | | Crude | | | | | | Natural | | | | |
| recognized in: | | Power | | | Oil | | | Currency | | | Gas | | | Obligation | | | Total | | | Power | | | Oil | | | Currency | | | Gas | | | Total | |
| Revenues | | — | | | (0.4 | ) | | — | | | — | | | — | | | (0.4 | ) | | — | | | (4.1 | ) | | | | | (1.8 | ) | | (5.9 | ) |
| Derivative contract (gains) | | 1.3 | | | — | | | — | | | — | | | — | | | 1.3 | | | 2.2 | | | — | | | 0.2 | | | — | | | 2.4 | |
| Unrealized (gains) losses | | | | | | | | | | | | | | | | | | | | | | | | | | | | | | | | | |
| recognized in: | | | | | | | | | | | | | | | | | | | | | | | | | | | | | | | | | |
| OCI, before tax | | — | | | — | | | — | | | — | | | — | | | — | | | — | | | (10.8 | ) | | — | | | (1.0 | ) | | (11.8 | ) |
| Derivative contract (gains) | | 0.1 | | | — | | | 3.2 | | | — | | | 12.5 | | | 15.8 | | | (0.6 | ) | | — | | | — | | | — | | | (0.6 | ) |
22
| MANAGEMENT’S DISCUSSION AND ANALYSIS |
Finance Costs
| | | Three Months Ended September 30 | | | Nine Months Ended September 30 | |
| | | 2016 | | | 2015 | | | 2016 | | | 2015 | |
| Credit facility(1) | | 4.4 | | | 3.8 | | | 13.8 | | | 17.5 | |
| 6⅞% senior notes | | 6.8 | | | 12.1 | | | 30.3 | | | 34.6 | |
| 2⅛% senior notes(1) | | 5.9 | | | 5.9 | | | 17.7 | | | 16.8 | |
| 2⅓% senior notes(1) | | 1.8 | | | - | | | 2.0 | | | - | |
| Related party loans | | 10.2 | | | 7.0 | | | 28.1 | | | 20.1 | |
| Amortization of deferred finance charges and other | | 0.6 | | | 0.6 | | | 2.0 | | | 1.5 | |
| Interest and other financing charges | | 29.7 | | | 29.4 | | | 93.9 | | | 90.5 | |
| Accretion of decommission and environmental remediation liabilities | | 3.5 | | | 4.6 | | | 13.3 | | | 14.0 | |
| Accretion of long-term liability | | 0.7 | | | 0.8 | | | 2.4 | | | 1.7 | |
| Less: capitalized interest | | — | | | — | | | — | | | (9.7 | ) |
| Total finance costs | | 33.9 | | | 34.8 | | | 109.6 | | | 96.5 | |
| (1) | Includes guarantee fee to KNOC. |
Currency Exchange
| | | Three Months Ended September 30 | | | Nine Months Ended September 30 | |
| | | 2016 | | | 2015 | | | 2016 | | | 2015 | |
| Realized (gains) losses on foreign exchange | | (13.6 | ) | | (0.1 | ) | | (38.7 | ) | | 0.8 | |
| Unrealized (gains) losses on foreign exchange | | 36.4 | | | 122.7 | | | (69.3 | ) | | 238.8 | |
| Total (gains) losses on foreign exchange | | 22.8 | | | 122.6 | | | (108.0 | ) | | 239.6 | |
Currency exchange gains and losses are attributed to the changes in the value of the Canadian dollar relative to the U.S. dollar on the U.S. dollar denominated 6⅞%, 2⅛% and 2⅓% senior notes, the ANKOR and KNOC related party loan and on any U.S. dollar denominated monetary assets or liabilities. At September 30, 2016, the Canadian dollar had weakened compared to the US dollar as at June 30, 2016 resulting in an unrealized foreign exchange loss of $36.4 million for the third quarter of 2016 (2015 –$122.7 million). Harvest recognized a realized foreign exchange gain of $13.6 million for the third quarter of 2016 (2015 –$0.1 million gain) as a result of the settlement of U.S. dollar denominated transactions and $15.7 million of which relates to the settlement of the ANKOR loan. During the nine months ending September 30, 2016, the Canadian dollar had strengthened compared to the US dollar as at December 31, 2015 resulting in an unrealized foreign exchange gain of $69.3 million (2015 –$238.8 million loss). Harvest recognized a realized foreign exchange gain of $38.7 million for the first nine months of 2016 (2015 –$0.8 million loss) as a result of the settlement of U.S. dollar denominated transactions, $15.7 million of which relates to the settlement of the ANKOR loan and $16.3 million of which relates to the 6⅞% senior notes debt exchange transaction. For a discussion on the ANKOR loan transaction, please refer to the related party transactions section below.
Deferred Income Taxes
For the third quarter and nine months ended September 30, 2016 Harvest did not record a deferred income tax recovery (2015 – $189.4 million and $313.9 million, respectively). Harvest’s deferred income tax asset will fluctuate during each accounting period to reflect changes in the temporary differences between the book value and tax basis of assets and liabilities. Currently, the principal sources of temporary differences relate to the Company’s property, plant and equipment, decommissioning liabilities and the unclaimed tax pools.
23
| MANAGEMENT’S DISCUSSION AND ANALYSIS |
Related Party Transactions
The following provides a summary of the related party transactions between Harvest and KNOC for the quarter ended September 30, 2016:
Related Party Loans
| Related | | | | | Interest | | | | | | Carrying Value(1) | | | Interest Payable | |
| Party | | Principal | | | Rate | | | Maturity Date | | | Sept 30, 2016 | | | Dec 31, 2015 | | | Sept 30, 2016 | | | Dec 31, 2015 | |
| KNOC | | US$171 | | | 5.91% | | | Dec 31, 2017 | | $ | 224.3 | | $ | 166.1 | | $ | 12.9 | | $ | 4.1 | |
| KNOC | | $200 | | | 5.30% | | | Dec 30, 2018 | | | 194.8 | | | 193.2 | | | 25.5 | | | 16.7 | |
| KNOC | | US$184.8 | | | 4.66% | | | Oct 2, 2017 | | | 242.4 | | | - | | | 2.7 | | | - | |
| ANKOR | | US$170 | | | 4.62% | | | Oct 2, 2017 | | | - | | | 235. | | | - | | | 14.6 | |
| | | | | | | | | | | | Interest expense | |
| | | | | | | | | | | | Three Months ended | | | Nine Months Ended | |
| Related | | | | | Interest | | | | | | September 30 | | | September 30 | |
| Party | | Principal | | | Rate | | | Maturity Date | | | 2016 | | | 2015 | | | 2016 | | | 2015 | |
| KNOC | | US$171 | | | 5.91% | | | Dec 31, 2017 | | $ | 3.3 | | $ | 0.9 | | $ | 9.0 | | $ | 2.5 | |
| KNOC | | $200 | | | 5.30% | | | Dec 30, 2018 | | | 3.5 | | | 3.5 | | | 10.4 | | | 10.3 | |
| KNOC | | US$184.8 | | | 4.66% | | | Oct 2, 2017 | | | 2.7 | | | - | | | 2.7 | | | — | |
| ANKOR | | US$170 | | | 4.62% | | | Oct 2, 2017 | | | 0.7 | | | 2.6 | | | 5.9 | | | 7.4 | |
On June 30, 2016 Harvest entered into an US$184.8 million loan agreement with KNOC, due on October 2, 2017. During the third quarter of 2016, Harvest drew down the US$184.8 million and used the proceeds to repay the US$170 million ANKOR loan, including accrued interest. ANKOR is a fully-owned subsidiary of KNOC. As a result of this transaction, all related party loans are with KNOC. The related party loans are unsecured and the loan agreements contain no restrictive covenants.
Subsequent to September 30, 2016, KNOC and Harvest Board of Directors approved the conversion of all KNOC’s outstanding related party loans plus accrued interest to common equity. The transaction is subject to certain registration requirements involving the government of South Korea and is expected to close in the fourth quarter of 2016. After the transaction closes there will be no related party loans outstandingThe transaction provides significant saving to Harvest by reducing interest expense by approximately $40.0 million annually, improves the company’s balance sheet metrics and is further evidence of KNOC’s continuing financial support of Harvest.
24
| MANAGEMENT’S DISCUSSION AND ANALYSIS |
| | | Transactions | | | | | | | | | Balance Outstanding | |
| | | Three Months Ended | | | Nine Months Ended | | | Accounts Payable as at | |
| | | September 30 | | | September 30 | | | September 30 | | | December 31 | |
| | | 2016 | | | 2015 | | | 2016 | | | 2015 | | | 2016 | | | 2015 | |
| G&A Expenses | | | | | | | | | | | | | | | | | | |
| KNOC(1) | | 0.1 | | | (2.0 | ) | | 0.3 | | | (4.6 | ) | | 0.9 | | | 0.8 | |
| Finance costs | | | | | | | | | | | | | | | | | | |
| KNOC(2) | | 2.5 | | | 1.2 | | | 6.7 | | | 3.4 | | | 4.0 | | | 3.5 | |
| (1) | Amounts relate to the payments to (reimbursement from) KNOC for secondee salaries. |
| (2) | Charges from KNOC for the irrevocable and unconditional guarantee they provided on Harvest’s 2⅛%, 2⅓% senior notes and the senior unsecured credit facility. A guarantee fee of 52 and 37 basis points per annum is charged by KNOC on the 2⅛% and 2⅓% senior notes, respectively and 37 basis points per annum on the credit facility. |
The Company identifies its related party transactions by making inquiries of management and the Board of Directors, reviewing KNOC’s subsidiaries and associates, and performing a comprehensive search of transactions recorded in the accounting system. Material related party transactions require the Board of Directors’ approval. Also see note 8, “Investment in Joint Ventures” in the September 30, 2016 condensed interim consolidated financial statements for details of related party transactions with DBP and HKMS.
CAPITAL RESOURCES
The following table summarizes Harvest’s capital structure and provides the key financial ratios defined in the credit facility agreement.
| | | September 30, 2016 | | | December 31, 2015 | |
| Credit facility(1) | | 888.6 | | | 926.6 | |
| 6⅞% senior notes (US$282.5 million)(1)(2) | | 370.5 | | | 692.0 | |
| 2⅛% senior notes (US$630 million)(1)(2) | | 826.4 | | | 871.9 | |
| 2⅓% senior notes (US$195.8 million)(2) | | 256.8 | | | — | |
| Related party loans (US$355.8 million and CAD$200 million)(2)(3) | | 666.7 | | | 601.4 | |
| | | 3,009.0 | | | 3,091.9 | |
| Shareholder's deficiency | | | | | | |
| 386,078,649 common shares issued | | (461.3 | ) | | (275.3 | ) |
| | | 2,547.7 | | | 2,816.6 | |
| (1) | Excludes capitalized financing fees |
| (2) | Face value converted at the period end exchange rate |
| (3) | As at December 31, 2015, related party loans comprised of US$170 million from ANKOR, US$120 million from KNOC and $200 million from KNOC. |
On June 16, 2016 Harvest completed an exchange of a significant portion of its 6⅞% senior notes due 2017 for new 2⅓% senior notes due 2021, at an exchange ratio of US$900 principal amount of the new 2⅓% senior notes for each US$1,000 principal amount of the old 6⅞% senior notes. US$217.5 million of the old 6⅞% senior notes was exchanged for US$195.8 million new 2⅓% senior notes. The extinguishment of the old 6⅞% senior notes resulted in a gain of $19.7 million and a realized foreign exchange gain of $16.3 million. The transaction provides significant saving to Harvest by reducing interest expense by US$9.9 million annually, as well as reduction in principal of US $21.7 million.
25
| MANAGEMENT’S DISCUSSION AND ANALYSIS |
During 2015, Harvest amended its $1 billion syndicated revolving credit facility and replaced it with a KNOC guaranteed $1.0 billion revolving credit facility that matures on April 30, 2017, with a syndicate of nine financial institutions. A guarantee fee of 0.37% per annum of the principal balance is payable to KNOC semi-annually.
Under the amended credit facility, applicable interest and fees are based on a margin pricing grid based on the Moody’s and S&P credit ratings of KNOC. The financial covenants under the previous credit facility were deleted and replaced with a new covenant: Total Debt to Capitalization ratio of 70% or less. At December 31, 2015, Harvest was in violation of the debt covenant and the carrying value of the credit facility, $923.8 million, was reclassified from long-term debt to a current liability. On February 5, 2016 Harvest’s syndicate banks consented to a waiver of this covenant for the duration of the term of the credit facility and the maturity date remains at April 30, 2017, and the credit facility was classified as current as at September 30, 2016.
LIQUIDITY
The Company’s liquidity needs are met through the following sources: cash generated from operations,proceeds from asset dispositions, joint arrangements, borrowings under the credit facility, related party loans, long-term debt issuances and capital injections by KNOC. Harvest’s primary uses of funds are operating expenses, capital expenditures, and interest and principal repayments on debt instruments.
Cash used in operating activities for the three months ended September 30, 2016 was $8.5 million (2015 –$40.7 million cash generated from operations). The decrease in the third quarter of 2016 is mainly a result of reduced expenses and changes in working capital requirement partially offset by lower revenues. Cash used in operating activities for the nine months ended September 30, 2016 was $48.4 million (2015 – $14.4 million). The increase in the first nine months of 2016 is mainly a result lower revenues partially offset by reduced expenses and changes in working capital requirement.
Cash contributions from Harvest’s Upstream operations for the third quarter and September 30, 2016 was $25.2 million and $41.3 million, respectively (2015 –$53.1 million and $124.6 million). The decrease in Upstream’s cash contribution for the third quarter and nine months as compared to 2015 is mainly due to the decreases in average realized prices and lower sales volumes, partially offset by lower expenses.
Harvest funded capital expenditures for the third quarter and nine months ended September 30, 2016 of $2.4 million and $5.3 million, respectively (2015 –$19.9 million and $225.1 million) with the proceeds from property dispositions and borrowings under both the credit facility and KNOC subordinated loan.
Harvest net drawings from the credit facility was $3.7 million (2015 – $6.0 million) during the third quarter ended September 30, 2016. Harvest made a net repayment $35.2 million during nine month period ended September 30, 2016 (2015 – $260.4 million net drawings).
Harvest had a working capital deficiency of $989.8 million as at September 30, 2016, as compared to a $1,070.5 million deficiency at December 31, 2015, mainly due to the inclusion of the credit facility as current. Harvest is in consultation with KNOC, who provides a guarantee on the credit facility, about the credit facility and 2017 senior note refinancing plans and anticipates engaging discussion with its syndicate banks to extend the maturity of the credit facility later in 2016. Harvest’s working capital is expected to fluctuate from time to time, and will be funded from cash flows from operations and borrowings from the credit facility managing the collection and payment of accounts receivables and accounts payables respectively and using the proceeds from possible sale of assets, as required.
26
| MANAGEMENT’S DISCUSSION AND ANALYSIS |
Harvest ensures its liquidity through the management of its capital structure, seeking to balance the amount of debt and equity used to fund investment in each of our operating segments. Harvest evaluates its capital structure using the same financial covenant ratios as the ones that were externally imposed under the Company’s credit facility and the senior notes. The Company continually monitors its credit facility covenants and actively takes steps, such as reducing borrowings, increasing capitalization, amending or renegotiating covenants as and when required.
In response to the low commodity price environment, Harvest plans to constrain its capital expenditures in 2016, focusing on capital maintenance and regulatory activities. Harvest also continues to postpone first steam for the BlackGold project in response to the unfavourable heavy oil prices and will continually assess the commodity price environment to determine when to complete commissioning of the CPF and first steam injection.
Harvest is a significant subsidiary for KNOC in terms of production and reserves. KNOC has directly or indirectly invested and provided financial support to Harvest since 2009 and, as at the date of preparation of this MD&A, it is the Company’s expectation that such support will continue for at least next twelve months so that Harvest is able to continue as a going concern.
Contractual Obligations and Commitments
Harvest has recurring and ongoing contractual obligations and estimated commitments entered into in the normal course of operations. As at September 30, 2016, Harvest has the following significant contractual obligations and estimated commitments:
| | | Payments Due by Period | |
| | | 1 year | | | 2-3 years | | | 4-5 years | | | After 5 years | | | Total | |
| Debt repayments(1) | | 888.6 | | | 1,863.5 | | | 256.8 | | | — | | | 3,008.9 | |
| Debt interest payments(1)(2) | | 61.4 | | | 144.0 | | | 13.9 | | | — | | | 219.3 | |
| Purchase commitments(3) | | 22.1 | | | 19.5 | | | 19.0 | | | 61.0 | | | 121.6 | |
| Operating leases | | 6.8 | | | 15.3 | | | 17.2 | | | 30.8 | | | 70.1 | |
| Firm processing commitments | | 15.5 | | | 25.4 | | | 18.2 | | | 36.7 | | | 95.8 | |
| Firm transportation agreements | | 31.7 | | | 60.0 | | | 31.6 | | | 50.1 | | | 173.4 | |
| Employee benefits(4) | | 1.7 | | | 0.6 | | | — | | | — | | | 2.3 | |
| Decommissioning and environmental liabilities(5) | | 25.6 | | | 68.8 | | | 37.2 | | | 1,099.2 | | | 1,230.8 | |
| Total | | 1,053.4 | | | 2,197.1 | | | 393.9 | | | 1,277.8 | | | 4,922.2 | |
(1) Assumes constant foreign exchange rate.
(2) Assumes interest rates as at September 30, 2016 will be applicable to future interest payments.
(3) Relates to the BlackGold deferred payment under the EPC contract (see “BlackGold Oil Sands” section of this MD&A for details), and revised estimated capital costs for the Bellshill area (see “Impairment of Property, Plant & Equipment” section of this MD&A for details).
(4) Relates to the long-term incentive plan payments.
(5) Represents the undiscounted obligation by period.
27
| MANAGEMENT’S DISCUSSION AND ANALYSIS |
Off Balance Sheet Arrangements
See “Investments in Joint Ventures” section in this MD&A and note 8, “Investment in Joint Ventures” in the September 30, 2016 condensed interim consolidated financial statements.
SUMMARY OF QUARTERLY RESULTS
The following table and discussion highlights the third quarter of 2016 results relative to the preceding 7 quarters:
| | | 2016 | 2015 | | 2014 | |
| | | Q3 | | | Q2 | | | Q1 | | | Q4 | | | Q3 | | | Q2 | | | Q1 | | | Q4 | |
| FINANCIAL | | | | | | | | | | | | | | | | | | | | | | | | |
| Revenue, Upstream | | 59.2 | | | 62.2 | | | 45.9 | | | 25.6 | | | 110.6 | | | 120.7 | | | 107.4 | | | 172.7 | |
| Revenue, Downstream(1) | | — | | | — | | | — | | | — | | | — | | | — | | | — | | | 321.2 | |
| Total Revenues and other income | | 59.2 | | | 62.2 | | | 45.9 | | | 25.6 | | | 110.6 | | | 120.7 | | | 107.4 | | | 493.9 | |
| | | | | | | | | | | | | | | | | | | | | | | | | |
| Net income (loss) from continuing operations | | (106.9 | ) | | (65.7 | ) | | (13.1 | ) | | (894.2 | ) | | (588.7 | ) | | (87.0 | ) | | (223.5 | ) | | (275.8 | ) |
| Net loss from discontinued operations | | — | | | — | | | — | | | (15.5 | ) | | — | | | — | | | — | | | (61.7 | ) |
| Net loss | | (106.9 | ) | | (65.7 | ) | | (13.1 | ) | | (909.7 | ) | | (588.7 | ) | | (87.0 | ) | | (223.5 | ) | | (337.5 | ) |
| | | | | | | | | | | | | | | | | | | | | | | | | |
| OPERATIONS | | | | | | | | | | | | | | | | | | | | | | | | |
| Continuing Operations | | | | | | | | | | | | | | | | | | | | | | | | |
| Daily sales volumes (boe/d)(3) | | 30,051 | | | 34,440 | | | 36,986 | | | 38,141 | | | 43,356 | | | 41,716 | | | 43,770 | | | 42,539 | |
| Realized price prior to hedging ($/boe) | | 28.03 | | | 26.50 | | | 20.86 | | | 27.89 | | | 31.47 | | | 37.85 | | | 31.85 | | | 47.99 | |
| Discontinued Operations(1) | | | | | | | | | | | | | | | | | | | | | | | | |
| Average daily throughput (bbl/d) | | — | | | — | | | — | | | — | | | — | | | — | | | — | | | 76,455 | |
| Average refining gross margin (US$/bbl)(3) | | — | | | — | | | — | | | — | | | — | | | — | | | — | | | 2.76 | |
| (1) | Downstream operations have been classified as “Discontinued Operations” as a result of disposition on November 13, 2014. |
| (2) | This is a non-GAAP measure; please refer to “Non-GAAP Measures” in this MD&A. |
| (3) | Excludes volumes from the DBP |
The quarterly revenues and cash from operating activities are mainly impacted by the Upstream sales volumes, realized prices and operating expenses and previously, Downstream throughput volumes, cost of feedstock and refined product prices. Significant items that impacted Harvest’s quarterly revenues include:
- Total revenues were highest in the fourth quarter of 2014, as a result of high daily sales volumes and throughput volumes from discontinued operations and lowest in the fourth quarter of 2015 due to low realized prices combined with low sales volumes from continuing operations and the absence of revenues from discontinued operations.
- The declines in Upstream’s sales volumes since 2014 were mainly due to asset dispositions and a capital program that was insufficient to offset declines in production.
28
| MANAGEMENT’S DISCUSSION AND ANALYSIS |
Net income (loss) reflects both cash and non-cash items. Changes in non-cash items including deferred income tax, DD&A expense, accretion of decommissioning and environmental remediation liabilities, impairment of long-lived assets, unrealized foreign exchange gains and losses, and unrealized gains and losses on derivative contracts impact net loss from period to period. For these reasons, the net loss may not necessarily reflect the same trends as revenues or cash from operating activities, nor is it expected to. The net loss from continuing operations in the third quarter of 2016 is mainly a result of lower realized prices and sales volumes. The net loss from continuing operations in the second quarter of 2016 is mainly a result of lower realized prices and sales volumes, and a $10.6 million loss from joint ventures. The net loss from continuing operations in the first quarter of 2016 is mainly a result of lower realized prices and sales volumes, and a $18.5 million loss from joint ventures. The net loss from continuing operations in the fourth quarter of 2015 is mainly a result of lower realized prices and sales volumes, a $620.1 million impairment expense, and a $71.5 million loss from joint ventures. The net loss from continuing operations in the third quarter of 2015 is mainly a result of lower realized prices and sales volumes and a $542.0 million impairment expense. The net loss from continuing operations in the second quarter of 2015 is mainly a result of a result of lower realized prices and sales volumes and a $70.7 million impairment expense. The net loss from continuing operations in the first quarter of 2015 was mainly a result of lower realized prices and sales volumes, a $140.5 million foreign exchange loss and a $23.5 million impairment expense. The net loss from continuing operations in the fourth quarter of 2014 was mainly due to the $267.6 million impairment expense.
CRITICAL ACCOUNTING ESTIMATES
The preparation of financial statements in conformity with IFRS requires management to make judgments, estimates and assumptions that affect the application of accounting policies and the reported amounts of assets, liabilities, income and expenses. Actual results may differ from these estimates. Estimates and underlying assumptions are reviewed on an ongoing basis. Revisions to accounting estimates are recognized in the period in which the estimates are revised and in any future periods affected. Further information on the basis of preparation and significant accounting policies and estimates can be found in the notes to the audited consolidated financial statements for the year ended December 31, 2015. There have been no changes to the accounting policies and critical accounting estimates in the third quarter of 2016.
RECENT ACCOUNTING PRONOUNCEMENTS
There were no new or amended standards issued during the nine months ended September 30, 2016 that are applicable to Harvest in future periods. A description of additional accounting pronouncements that will be adopted by Harvest in future periods can be found in note 3 of the audited consolidated financial statements for the year ended December 31, 2015.
OPERATIONAL AND OTHER BUSINESS RISKS FOR CONTINUING OPERATIONS
Harvest’s operational and other business risks remain unchanged from those discussed in the annual MD&A and AIF for the year ended December 31, 2015 as filed on SEDAR atwww.sedar.com.
29
| MANAGEMENT’S DISCUSSION AND ANALYSIS |
CHANGES IN REGULATORY ENVIRONMENT
Harvest’s regulatory environment remains unchanged from that discussed in the annual MD&A and AIF for the year ended December 31, 2015 as filed on SEDAR atwww.sedar.com.
INTERNAL CONTROL OVER FINANCIAL REPORTING
Harvest is required to comply with National Instrument 52-109 “Certification of Disclosure in Issuers’ Annual and Interim Filings”. The certificate requires that Harvest disclosure in the interim MD&A any significant changes or material weaknesses in Harvest’s internal control over financial reporting that occurred during the period that have materially affected, or are reasonably likely to materially affect Harvest’s internal controls over financial reporting. Harvest confirms that no such significant changes or weaknesses were identified in Harvest’s internal controls over financial reporting during the third quarter and first nine months of 2016 described in the annual MD&A for the year ended December 31, 2015 as filed on SEDAR atwww.sedar.com.
NON-GAAP MEASURES
Throughout this MD&A, Harvest uses certain terms or performance measure commonly used in the oil and natural gas industry that are not defined under IFRS (hereinafter also referred to as “GAAP”). These non-GAAP measures do not have any standardized meaning prescribed by IFRS and therefore may not be comparable with the calculation of similar measures of other companies. The data presented is intended to provide additional information and should not be considered in isolation or as a substitute for measures of performance prepared in accordance with IFRS. These non-IFRS measures should be read in conjunction with the Company’s audited consolidated financial statements and the accompanying notes. The determination of the non-GAAP measures have been illustrated throughout this MD&A, with reconciliations to IFRS measures and/or account balances, except for cash contribution (deficiency) which is shown below.
BOE presentation
Boe means barrel of oil equivalent. All boe conversions in this MD&A are derived by converting gas to oil at the ratio of six thousand cubic feet (“Mcf”) of natural gas to one barrel (“Bbl”) of oil. Boe may be misleading, particularly if used in isolation. A Boe conversion rate of 1 Bbl : 6 Mcf is based on an energy equivalency conversion method primarily applicable at the burner tip and does not represent a value equivalency at the wellhead. Given that the value ratio of oil compared to natural gas based on currently prevailing prices is significantly different than the energy equivalency ratio of 1 Bbl : 6 Mcf, utilizing a conversion ratio of 1 Bbl : 6 Mcf may be misleading as an indication of value.
“Operating income (loss)” and “pre-operating loss”is a non-GAAP measure which Harvest uses as a performance measure to provide comparability of financial performance between periods excluding non-operating items. Harvest also uses this measure to assess and compare the performance of its operating segments. The amounts disclosed in the MD&A reconcile to segmented information in the financial statements.
30
| MANAGEMENT’S DISCUSSION AND ANALYSIS |
“Operating netbacks” is calculated on a per boe basis and include revenues, operating expenses, transportation and marketing expenses, and realized gains or losses on derivative contracts. Operating netback is utilized by Harvest and other to analyze the operating performance of its oil and natural gas assets.
“Total debt to total capitalization” is a term defined in Harvest’s amended credit facility agreement for the purpose of calculation of the financial covenant. The non-GAAP measures do not have any standardized meaning prescribed by GAAP and may not be comparable to similar measures used by other issuers.
“Average refining gross margin” is commonly used in the refining industry to reflect the net funds received from the sale of refined products after considering the cost to purchase the feedstock and is calculated by deducting purchased products for resale and processing from total revenue.
“Cash contribution (deficiency) from operations”is calculated as operating income (loss) adjusted for non-cash items. The measure demonstrates the ability of the each segment of Harvest to generate the cash from operations necessary to repay debt, make capital investments, and fund the settlement of decommissioning and environmental remediation liabilities. Cash contribution (deficiency) from operations represents operating income (loss) adjusted for non-cash expense items within: operating, general and administrative, exploration and evaluation, depletion, depreciation and amortization, gains on disposition of assets, derivative contracts gains or losses, impairment and other charges, and the inclusion of cash interest, realized foreign exchange gains or losses and other cash items not included in operating income (loss). The measure demonstrates the ability of Harvest’s upstream segment to generate cash from operations and is calculated before changes in non-cash working capital. The most directly comparable additional GAAP measure is operating income (loss). Operating income (loss) as presented in the notes to Harvest’s consolidated financial statements is reconciled to cash contribution (deficiency) from operations below.
| | | Three Months Ended September 30 | |
| | | Upstream | | | BlackGold | | | Total | |
| | | 2016 | | | 2015 | | | 2016 | | | 2015 | | | 2016 | | | 2015 | |
| Operating loss | | (37.9 | ) | | (354.0 | ) | | (2.8 | ) | | (266.7 | ) | | (40.7 | ) | | (620.7 | ) |
| Adjustments: | | | | | | | | | | | | | | | | | | |
| Loss from joint ventures | | 6.6 | | | 9.8 | | | — | | | — | | | 6.6 | | | 9.8 | |
| Operating, non-cash | | — | | | — | | | — | | | — | | | — | | | — | |
| General and administrative, non-cash | | — | | | 10.9 | | | — | | | — | | | — | | | 10.9 | |
| Exploration and evaluation, non-cash | | 0.5 | | | 0.6 | | | — | | | — | | | 0.5 | | | 0.6 | |
| Depletion, depreciation and amortization | | 61.4 | | | 102.8 | | | 0.2 | | | 0.2 | | | 61.6 | | | 103.0 | |
| (Gains) losses on disposition of assets | | (17.6 | ) | | 0.9 | | | — | | | — | | | (17.6 | ) | | 0.9 | |
| Unrealized losses on derivative contracts | | 9.5 | | | 2.1 | | | — | | | — | | | 9.5 | | | 2.1 | |
| Impairment and other charges, non-cash | | 2.7 | | | 280.0 | | | — | | | 262.0 | | | 2.7 | | | 542.0 | |
| Cash contribution (deficiency) from operations | | 25.2 | | | 53.1 | | | (2.6 | ) | | (4.5 | ) | | 22.6 | | | 48.6 | |
| Inclusion of items not attributable to segments: | | | | | | | | | | | | | | | | | | |
| Net cash interest | | | | | | | | | | | | | | 22.5 | | | 20.2 | |
| Realized foreign exchange gains | | | | | | | | | | | | | | (13.6 | ) | | (0.1 | ) |
| Consolidated cash contribution from operations | | | | | | | | | | | | | | 13.7 | | | 28.5 | |
31
| MANAGEMENT’S DISCUSSION AND ANALYSIS |
| | | Nine Months Ended September 30 | |
| | | Upstream | | | BlackGold | | | Total | |
| | | 2016 | | | 2015 | | | 2016 | | | 2015 | | | 2016 | | | 2015 | |
| Operating loss | | (184.4 | ) | | (598.3 | ) | | (10.0 | ) | | (273.6 | ) | | (194.4 | ) | | (871.9 | ) |
| Adjustments: | | | | | | | | | | | | | | | | | | |
| Loss from joint ventures | | 35.7 | | | 25.9 | | | — | | | — | | | 35.7 | | | 25.9 | |
| Operating, non-cash | | 0.3 | | | (0.9 | ) | | — | | | — | | | 0.3 | | | (0.9 | ) |
| General and administrative, non-cash | | 0.9 | | | 12.9 | | | — | | | — | | | 0.9 | | | 12.9 | |
| Exploration and evaluation, non-cash | | 2.5 | | | 5.2 | | | — | | | — | | | 2.5 | | | 5.2 | |
| Depletion, depreciation and amortization | | 202.7 | | | 300.0 | | | 0.5 | | | 0.3 | | | 203.2 | | | 300.3 | |
| (Gains) losses on disposition of assets | | (34.9 | ) | | 6.2 | | | — | | | — | | | (34.9 | ) | | 6.2 | |
| Unrealized (gains) losses on derivative contracts | | 15.8 | | | (0.6 | ) | | — | | | — | | | 15.8 | | | (0.6 | ) |
| Impairment and other charges, non-cash | | 2.7 | | | 374.2 | | | — | | | 262.0 | | | 2.7 | | | 636.2 | |
| Cash contribution (deficiency) from operations | | 41.3 | | | 124.6 | | | (9.5 | ) | | (11.3 | ) | | 31.8 | | | 113.3 | |
| Inclusion of items not attributable to segments: | | | | | | | | | | | | | | | | | | |
| Net cash interest | | | | | | | | | | | | | | 67.0 | | | 55.2 | |
| Realized foreign exchange losses (gains) | | | | | | | | | | | | | | (38.7 | ) | | 0.8 | |
| Consolidated cash contribution from operations | | | | | | | | | | | | | | 3.5 | | | 57.3 | |
FORWARD-LOOKING INFORMATION
This MD&A highlights significant business results and statistics from the consolidated financial statements for the three months and nine months ended September 30, 2016 and the accompanying notes thereto. In the interest of providing Harvest’s lenders and potential lenders with information regarding Harvest, including the Company’s assessment of future plans and operations, this MD&A contains forward-looking statements that involve risks and uncertainties.
Such risks and uncertainties include, but are not limited to: risks associated with conventional petroleum and natural gas operations; risks associated with the construction of the oil sands project; the volatility in commodity prices, interest rates and currency exchange rates; risks associated with realizing the value of acquisitions; general economic, market and business conditions; changes in environmental legislation and regulations; the availability of sufficient capital from internal and external sources; and, such other risks and uncertainties described from time to time in regulatory reports and filings made with securities regulators. The impact of any one risk, uncertainty or factor on a particular forward-looking statement is not determinable with certainty as these factors are interdependent, and management’s future course of action would depend on the assessment of all information at that time. Please also refer to “Operational and Other Business Risks” in this MD&A and “Risk Factors” in the Annual Information Form for detailed discussion on these risks.
Forward-looking statements in this MD&A include, but are not limited to: commodity prices, price risk management activities, acquisitions and dispositions, capital spending and allocation of such to various projects, reserve estimates and ultimate recovery of reserves, potential timing and commerciality of Harvest’s capital projects, the extent and success rate of Upstream and BlackGold drilling programs, the ability to achieve the maximum capacity from the BlackGold central processing facilities, availability of the credit facility, access and ability to raise capital, ability to maintain debt covenants, debt levels, recovery of long-lived assets, the timing and amount of decommission and environmental related costs, income taxes, cash from operating activities, regulatory approval of development projects and regulatory changes. For this purpose, any statements that are contained herein that are not statements of historical fact may be deemed to be forward-looking statements. Forward-looking statements often contain terms such as “may”, “will”, “should”, “anticipate”, “expect”, “target”, “plan”, “potential”, “intend”, and similar expressions.
32
| MANAGEMENT’S DISCUSSION AND ANALYSIS |
All of the forward-looking statements in this MD&A are qualified by the assumptions that are stated or inherent in such forward-looking statements. Although Harvest believes that these assumptions are reasonable based on the information available to us on the date such assumptions were made, this list is not exhaustive of the factors that may affect any of the forward-looking statements and the reader should not place an undue reliance on these assumptions and such forward-looking statements. The key assumptions that have been made in connection with the forward-looking statements include the following: that the Company will conduct its operations and achieve results of operations as anticipated; that its development plans and sustaining maintenance programs will achieve the expected results; the general continuance of current or, where applicable, assumed industry conditions; the continuation of assumed tax, royalty and regulatory regimes; the accuracy of the estimates of the Company’s reserve volumes; commodity price, operation level, and cost assumptions; the continued availability of adequate cash flow and debt and/or equity financing to fund the Company’s capital and operating requirements as needed; and the extent of Harvest’s liabilities. Harvest believes the material factors, expectations and assumptions reflected in the forward-looking statements are reasonable, but no assurance can be given that these factors, expectations and assumptions will prove to be correct.
Although management believes that the forward-looking information is reasonable based on information available on the date such forward-looking statements were made, no assurances can be given as to future results, levels of activity and achievements. Therefore, readers are cautioned not to place undue reliance on forward-looking statements as the plans, intentions or expectations upon which the forward-looking information is based might not occur. Forward-looking statements contained in this MD&A are expressly qualified by this cautionary statement.
ADDITIONAL INFORMATION
Further information about us can be accessed under our public filings found on SEDAR atwww.sedar.comor atwww.harvestenergy.ca.Information can also be found by contacting our Investor Relations department at (403) 265-1178 or at 1-866-666-1178.
33