 | MANAGEMENT’S DISCUSSION AND ANALYSIS |
MANAGEMENT’S DISCUSSION AND ANALYSIS
This Management’s Discussion and Analysis (“MD&A”) should be read in conjunction with the audited annual consolidated financial statements of Harvest Operations Corp. (“Harvest”, “we”, “us”, “our” or the “Company”) for the year ended December 31, 2016 together with the accompanying notes. The information and opinions concerning the future outlook are based on information available at February 23, 2016.
In this MD&A, all dollar amounts are expressed in Canadian dollars unless otherwise indicated. Tabular amounts are in millions of dollars, except where noted.
Natural gas volumes are converted to barrels of oil equivalent (“boe”) using the ratio of six thousand cubic feet (“mcf”) of natural gas to one barrel of oil (“bbl”). Boes may be misleading, particularly if used in isolation. A boe conversion ratio of 6 mcf to 1 bbl is based on an energy equivalent conversion method primarily applicable at the burner tip and does not represent a value equivalent at the wellhead. In accordance with Canadian practice, petroleum and natural gas revenues are reported on a gross basis before deduction of Crown and other royalties.
Additional information concerning Harvest, including its audited annual consolidated financial statements and Annual Information Form (“AIF”) can be found on SEDAR atwww.sedar.com.
ADVISORY
This MD&A contains non-GAAP measures and forward-looking information about our current expectations, estimates and projections. Readers are cautioned that the MD&A should be read in conjunction with the “Non-GAAP Measures” and “Forward-Looking Information” sections at the end of this MD&A.
1
| MANAGEMENT’S DISCUSSION AND ANALYSIS |
FINANCIAL AND OPERATING HIGHLIGHTS
| | | Three Months Ended December 31 | | | Twelve Months Ended December 31 | |
| | | 2016 | | | 2015 | | | 2016 | | | 2015 | |
| Conventional | | | | | | | | | | | | |
| Petroleum and natural gas sales(1) | | 90.8 | | | 109.0 | | | 322.3 | | | 510.3 | |
| Daily sales volumes (boe/d)(2) | | 26,589 | | | 38,141 | | | 31,996 | | | 41,735 | |
| Deep Basin Partnership | | | | | | | | | | | | |
| Daily sales volumes (boe/d) | | 5,553 | | | 5,418 | | | 5,802 | | | 4,126 | |
| Harvest's share of daily sales volumes (boe/d)(4) | | 4,571 | | | 4,427 | | | 4,762 | | | 3,300 | |
| Average realized price | | | | | | | | | | | | |
| Oil and NGLs ($/bbl)(3) | | 45.12 | | | 37.65 | | | 37.14 | | | 43.02 | |
| Gas ($/mcf)(3) | | 4.27 | | | 2.30 | | | 2.22 | | | 2.62 | |
| Operating netback prior to hedging($/boe)(4) | | 15.97 | | | 9.29 | | | 10.22 | | | 12.30 | |
| Operating loss(4) | | (71.4 | ) | | (569.7 | ) | | (265.2 | ) | | (1,167.9 | ) |
| Cash contribution from operations(4) | | 33.3 | | | 29.8 | | | 74.6 | | | 154.3 | |
| | | | | | | | | | | | | |
| Capital asset additions (excluding acquisitions) | | 13.7 | | | 22.4 | | | 19.0 | | | 146.5 | |
| Corporate acquisition(5) | | — | | | — | | | — | | | 37.1 | |
| Property dispositions, net | | — | | | (9.4 | ) | | (170.2 | ) | | (130.5 | ) |
| | | | | | | | | | | | | |
| Net wells drilled | | 2.1 | | | — | | | 2.4 | | | 19.2 | |
| Net undeveloped land additions (acres) | | 3,608 | | | 795 | | | 15,513 | | | 42,988 | |
| Net undeveloped land dispositions (acres) | | (3,794 | ) | | (14,902 | ) | | (43,842 | ) | | (20,702 | ) |
| | | | | | | | | | | | | |
| Oil Sands | | | | | | | | | | | | |
| Capital asset additions | | 1.9 | | | 0.5 | | | 1.9 | | | 66.0 | |
| Pre-operating loss(4)(6) | | (3.5 | ) | | (235.1 | ) | | (13.5 | ) | | (508.7 | ) |
| | | | | | | | | | | | | |
| NET LOSS | | (162.5 | ) | | (909.7 | ) | | (348.2 | ) | | (1,808.9 | ) |
| (1) | Includes the effective portion of Harvest’s realized natural gas and crude oil hedges. |
| (2) | Excludes volumes from Harvest’s equity investment in the Deep Basin Partnership. |
| (3) | Excludes the effect of derivative contracts designated as hedges. |
| (4) | This is a non-GAAP measure; please refer to “Non-GAAP Measures” in this MD&A. |
| (5) | Corporate acquisition represents the total consideration for the transaction including working capital assumed. |
| (6) | Oil Sands was substantially completed in Q1 2015, all pre-operating expenses prior to Q1 2015 were capitalized. |
REVIEW OF OVERALL PERFORMANCE
Harvest is an energy company with a petroleum and natural gas business focused on the exploration, development and production of assets in western Canada (“Conventional”) and an in-situ oil sands project (“Oil Sands”) in the pre-commissioning phase in northern Alberta. Harvest is a wholly owned subsidiary of Korea National Oil Corporation (“KNOC”). Our earnings and cash flow from continuing operations are largely determined by the realized prices for our crude oil and natural gas production.
2
| MANAGEMENT’S DISCUSSION AND ANALYSIS |
The global commodity market for crude oil and natural gas has remained depressed since the latter part of 2014. We believe that commodity prices will eventually improve; however, the timing of that improvement is uncertain and we expect continued commodity price and cash flow volatility in the near term. In the meantime, we are focused on directing our capital spending on high impact programs, operational optimizations, and executing on cost reductions.
Conventional
| • | Petroleum and natural gas sales for the fourth quarter and twelve months ended December 31, 2016 decreased by $18.2 million and $188.0 million, respectively when compared to the same periods in 2015. The decrease on a fourth quarter basis was due primarily to a reduction in sales volumes which was partially offset by increased commodity prices. The decrease on a twelve month basis was due to a reduction in sales volumes and decreased commodity prices. |
| • | Sales volumes for the fourth quarter and twelve months ended December 31, 2016 decreased by 11,552 boe/d and 9,739 boe/d, respectively, as compared to the same periods in 2015. The decreases were primarily due to dispositions of certain producing properties during 2015 and 2016 and natural declines which exceeded the volume added from our curtailed drilling program in 2016. |
| • | Harvest’s share of Deep Basin Partnership (“DBP”) volumes for the fourth quarter and twelve months ended December 31, 2016 increased 144 boe/d and 1,462 boe/d, respectively, when compared to the same periods in 2015. The fourth quarter increase was due to DBP’s successful 2016 drilling program. The twelve month increase was primarily due to new wells being brought online and additional assets contributed on October 1, 2015 by Harvest. These were partially offset by production curtailments due to third party transportation restrictions. |
| • | Operating losses for the fourth quarter and twelve months ended December 31, 2016 were $71.4 million and $265.2 million, respectively (2015 – $569.7 million and $1,167.9 million). The decrease in operating loss from the fourth quarter and twelve months of 2015 was primarily due to lower impairment expenses, depreciation, depletion and amortization expenses, loss from joint ventures, royalties, operating expenses and higher gains on disposition of assets, which was partially offset by lower revenue. |
| • | Capital asset additions of $13.7 million and $19.0 million in the fourth quarter and twelve months of 2016, respectively, were mainly related to drilling and completion, well equipment, pipelines and facilities. Four gross wells (2.1 net) and five gross wells (2.4 net) were rig-released during the fourth quarter and twelve months of 2016, respectively. |
| • | On August 16, 2016 Harvest closed the disposition of some of its oil and gas assets in Southern Alberta for net proceeds of $6.7 million. On June 30, 2016, Harvest closed the disposition of all of its oil and gas assets in Saskatchewan for net proceeds of $61.6 million. Together with other less significant dispositions of Conventional assets, Harvest recognized gains of $0.3 million and $35.2 million for the three and twelve months ended December 31, 2016, respectively (2015 – gains of $4.5 million and losses of $1.7 million), relating to the derecognition of PP&E, E&E, goodwill, and decommissioning and environmental liabilities. |
| • | Operating netback prior to hedging per boe for the fourth quarter and twelve months ended December 31, 2016 were $15.97 and $10.22 respectively; an increase of $6.68 and a decrease of $2.08 from the same periods in 2015. The year to date decrease was mainly due to lower realized prices, which was partially offset by lower operating expenses per boe. The fourth quarter increase was mainly due to higher realized prices which were partially offset by increased transportation and marketing expenses per boe. |
3
| MANAGEMENT’S DISCUSSION AND ANALYSIS |
| • | Cash contributions from Harvest’s Conventional operations for the fourth quarter and twelve months of 2016 were $33.3 million and $74.6 million, respectively (2015 – $29.8 million and $154.3 million). The fourth quarter increase in cash contributions is primarily due to higher commodity prices, decreased operating costs and royalties. These increases were partially offset by lower revenue and increased transportation costs. The twelve month decrease in cash contributions was mainly due to lower revenue, partially offset by lower operating expenses, and general and administrative expenses. |
Oil Sands
| • | Pre-operating losses for the fourth quarter and twelve months of 2016 were $3.5 million and $13.5 million, respectively (2015 – $235.1 million and $508.7 million, respectively). The 2016 pre-operating losses were mainly due to pre-operating and general and administrative expenses. Prior year pre-operating losses also included asset impairment expenses of $229.0 million and $491.0 million, respectively. |
| • | The central processing facility (“CPF”) was substantially completed in early 2015. The decision to complete commissioning of the CPF and commence steam injection depends on the bitumen price environment, and a number of operational factors. |
Corporate
| • | The credit facility net movements during the fourth quarter and twelve months ended December 31, 2016 were $6.8 million net borrowing and $42.1 million net repayment, respectively (2015 – $44.1 million net repayment and $304.4 million net borrowings). At December 31, 2016, Harvest had $893.5 million drawn under the credit facility (December 31, 2015 - $926.6 million). |
| • | The weakening of the Canadian dollar against the U.S. dollar during the fourth quarter of 2016 resulted in a net unrealized foreign exchange loss of $45.5 million (2015 - $69.6 million). The strengthening of the Canadian dollar against the U.S. dollar during the twelve months of 2016 resulted in net unrealized foreign exchange gain of $23.8 million (2015 - $308.4 million loss). Unrealized foreign exchange gains and losses resulted primarily due to the translation of U.S. dollar denominated debt (including related party loans) into Canadian dollars. For the fourth quarter and twelve months ended 2016, the total effect of currency fluctuations on unrealized foreign exchange was reduced by lower levels of U.S. dollar denominated debt as a result of the conversion of all related party debt into equity on December 22, 2016, and the reduction in principal balance of senior notes resulting from a 6⅞% senior notes debt exchange transaction. |
| • | During 2015, Harvest amended the terms of its $1.0 billion syndicated revolving credit facility and replaced it with a KNOC guaranteed $1.0 billion syndicated revolving credit facility, maturing April 30, 2017. Under the amended credit facility, applicable interest and fees are based on a margin pricing grid based on the Moody’s and S&P credit ratings of KNOC. The financial covenants under the previous credit facility were deleted and replaced with a new covenant: Total Debt to Capitalization ratio of 70% or less. At December 31, 2015, Harvest was in violation of the debt covenant, and as a result, the carrying value of the credit facility of $923.8 million was reclassified from long-term debt to a current liability. On February 5, 2016 Harvest’s syndicate banks consented to a waiver of this covenant for the duration of the term of the credit facility and the maturity date remains at April 30, 2017. |
| • | On February 17, 2017, Harvest entered into an agreement with a Korean based bank that allows Harvest to borrow $500 million through a three year fixed rate term loan. Once drawn, proceeds from the term loan will be used to repay credit facility borrowings. In addition, as at February 23, 2017, Harvest has received formal commitments for a new three year $500 million revolving credit facility with a syndicate of banks that will replace the Company’s $1 billion revolving credit facility. Both the term loan and new syndicated revolving credit facility are guaranteed by KNOC and are both expected to close on February 24, 2017. The new syndicated revolving credit facility is secured by a first floating charge over all of the assets of Harvest and its material subsidiaries and contains no financial covenants. |
4
| MANAGEMENT’S DISCUSSION AND ANALYSIS |
| • | On December 22, 2016, KNOC converted all its outstanding loans to common shares of Harvest. The carrying value of the loans, plus accrued interest at December 22, 2016 of $722.2 million was converted to equity and $10.3 million previously recognized in contributed surplus relating to these loans were transferred to shareholder’s capital. As a result, 72.7 million common shares were issued to KNOC. As at December 31, 2016 there were no related party loans outstanding. This transaction provides significant savings to Harvest through reducing interest expense by approximately $40.0 million annually, improving the Company’s balance sheet, and is further evidence of KNOC’s continuing financial support of Harvest. |
| • | On June 16, 2016 Harvest completed an exchange of a significant portion of its 6⅞% senior notes due 2017, for new 2⅓% senior notes due 2021, at an exchange ratio of US$900 principal amount of the new 2⅓% senior notes for each US$1,000 principal amount of the old 6⅞% senior notes. US$217.5 million of the old 6⅞% senior notes was exchanged for US$195.8 million new 2⅓% senior notes. The extinguishment of the old 6⅞% senior notes resulted in a gain of $36.0 million. The transaction provides significant saving to Harvest by reducing interest expense by US$9.9 million annually, as well as a reduction in principal of US $21.7 million. |
5
| MANAGEMENT’S DISCUSSION AND ANALYSIS |
CONVENTIONAL
Summary of Financial and Operating Results
| | | Three Months Ended December 31 | | | Twelve Months Ended December 31 | |
| | | 2016 | | | 2015 | | | 2016 | | | 2015 | |
| FINANCIAL | | | | | | | | | | | | |
| Petroleum and natural gas sales(1) | | 90.8 | | | 109.0 | | | 322.3 | | | 510.3 | |
| Royalties | | (6.4 | ) | | (11.9 | ) | | (35.0 | ) | | (48.7 | ) |
| Revenues and other income | | 84.4 | | | 97.1 | | | 287.3 | | | 461.6 | |
| | | | | | | | | | | | | |
| Expenses | | | | | | | | | | | | |
| Operating | | 36.2 | | | 52.5 | | | 155.9 | | | 251.5 | |
| Transportation and marketing | | 9.1 | | | 0.9 | | | 11.0 | | | 5.2 | |
| Realized losses on derivative contracts(3) | | 0.3 | | | 2.0 | | | 1.6 | | | 4.4 | |
| Operating netback after hedging(2) | | 38.8 | | | 41.7 | | | 118.8 | | | 200.5 | |
| | | | | | | | | | | | | |
| General and administrative | | 11.2 | | | 11.5 | | | 51.1 | | | 57.7 | |
| Depreciation, depletion and amortization | | 86.4 | | | 118.1 | | | 289.1 | | | 418.1 | |
| Loss from joint ventures | | 8.1 | | | 71.5 | | | 43.8 | | | 97.3 | |
| Exploration and evaluation | | 17.4 | | | 22.3 | | | 19.9 | | | 27.5 | |
| Impairment | | (1.7 | ) | | 391.1 | | | 1.0 | | | 765.3 | |
| Unrealized losses (gains) on derivative contracts(4) | | (12.2 | ) | | 1.4 | | | 3.6 | | | 0.8 | |
| Loss on onerous contract | | 1.3 | | | - | | | 10.7 | | | - | |
| Losses (gains) on disposition of assets | | (0.3 | ) | | (4.5 | ) | | (35.2 | ) | | 1.7 | |
| Operating loss(2) | | (71.4 | ) | | (569.7 | ) | | (265.2 | ) | | (1,167.9 | ) |
| | | | | | | | | | | | | |
| Capital asset additions (excluding acquisitions) | | 13.7 | | | 22.4 | | | 19.0 | | | 146.5 | |
| Corporate acquisition(5) | | — | | | — | | | — | | | 37.1 | |
| Property dispositions, net | | — | | | (9.4 | ) | | (170.2 | ) | | (130.5 | ) |
| | | | | | | | | | | | | |
| OPERATING | | | | | | | | | | | | |
| Light to medium oil (bbl/d) | | 3,821 | | | 7,934 | | | 5,548 | | | 8,768 | |
| Heavy oil (bbl/d) | | 7,760 | | | 10,044 | | | 9,158 | | | 11,301 | |
| Natural gas liquids (bbl/d) | | 3,188 | | | 3,820 | | | 3,527 | | | 3,956 | |
| Natural gas (mcf/d) | | 70,923 | | | 98,055 | | | 82,583 | | | 106,259 | |
| Total (boe/d)(6) | | 26,589 | | | 38,141 | | | 31,996 | | | 41,735 | |
| (1) | Includes the effective portion of Harvest’s realized natural gas and oil hedges. |
| (2) | This is a non-GAAP measure; please refer to “Non-GAAP Measures” in this MD&A. |
| (3) | Realized losses on derivative contracts include the settlement amounts for power, crude oil, natural gas and foreign exchange derivative contracts, excluding the effective portion of realized gains from Harvest’s designated accounting hedges. See “Risk Management, Financing and Other” section of this MD&A for details. |
| (4) | Unrealized gains or losses on derivative contracts reflect the change in fair value of derivative contracts that are not designated as accounting hedges and the ineffective portion of changes in fair value of designated hedges. See “Risk Management, Financing and Other” section of this MD&A for details. |
| (5) | Corporate acquisition represents the total consideration for the transaction, including working capital assumed. |
| (6) | Excludes volumes from Harvest’s equity investment in the Deep Basin Partnership. |
6
| MANAGEMENT’S DISCUSSION AND ANALYSIS |
Benchmark Prices
| | | Twelve Months Ended December 31 | | | Three Months Ended December 31 | |
| | | 2016 | | | 2015 | | | Change | | | 2016 | | | 2015 | | | Change | |
| West Texas Intermediate ("WTI") crude oil (US$/bbl) | | 49.29 | | | 42.18 | | | 17% | | | 43.32 | | | 48.80 | | | (11% | ) |
| West Texas Intermediate crude oil ($/bbl) | | 65.81 | | | 56.22 | | | 17% | | | 57.38 | | | 62.13 | | | (8% | ) |
| Edmonton Light Sweet crude oil ("EDM") ($/bbl) | | 61.58 | | | 52.89 | | | 16% | | | 52.96 | | | 57.20 | | | (7% | ) |
| Western Canadian Select ("WCS") crude oil ($/bbl) | | 46.63 | | | 36.88 | | | 26% | | | 38.96 | | | 44.85 | | | (13% | ) |
| AECO natural gas daily ($/mcf) | | 3.09 | | | 2.47 | | | 25% | | | 2.16 | | | 2.69 | | | (20% | ) |
| U.S. / Canadian dollar exchange rate | | 0.749 | | | 0.749 | | | 0% | | | 0.755 | | | 0.783 | | | (4% | ) |
| | | | | | | | | | | | | | | | | | | |
| Differential Benchmarks | | | | | | | | | | | | | | | | | | |
| EDM differential to WTI ($/bbl) | | 4.23 | | | 3.33 | | | 27% | | | 4.42 | | | 4.93 | | | (10% | ) |
| EDM differential as a % of WTI | | 6.4% | | | 5.9% | | | 8% | | | 7.7% | | | 7.9% | | | (3% | ) |
| WCS differential to WTI ($/bbl) | | 19.18 | | | 19.34 | | | (1% | ) | | 18.42 | | | 17.28 | | | 7% | |
| WCS differential as a % of WTI | | 29.1% | | | 34.4% | | | (15% | ) | | 32.1% | | | 27.8% | | | 15% | |
For the fourth quarter and twelve months of 2016, the average WTI benchmark price increased 17% and decreased 11% compared to the same periods in 2015. The average Edmonton Light Sweet crude oil price (“Edmonton Light”) increased 16% and decreased 7% compared to the same periods 2015. The increase in Edmonton Light for the fourth quarter of 2016 is due to the increase in the WTI price, which was partially offset by an increase in the Edmonton Light differential to WTI. The decrease in Edmonton Light for the twelve months is due to the decrease in the WTI price offset by a depreciation of the Canadian dollar against the U.S. dollar, and the narrowing of the Edmonton Light differential to WTI.
Heavy oil differentials fluctuate based on a combination of factors including production and inventory levels of heavy oil, pipeline and rail capacity to deliver heavy crude to market, and the seasonal demand for heavy oil. The 26% increase in the WCS price for the fourth quarter of 2016 compared to the same period in 2015 was due to the increase in the WTI price and a decrease in the WCS differential to WTI. The 13% decrease in the WCS price for the twelve months ended December 31, 2016, as compared to the same period in 2015 was mainly the result of the decrease in the WTI price and a widening of WCS differential to WTI, partially offset by a depreciation of the Canadian dollar against the U.S. dollar.
In the fourth quarter of 2016, North American natural gas prices strengthened compared to the fourth quarter of 2015, but overall average price for the twelve months of 2016 weakened in comparison to the same period in 2015. Harvest’s realized natural gas price is referenced to the AECO hub, which increased 25% and decreased 20%, respectively, in the fourth quarter and twelve months of 2016 when compared to the same period in 2015.
7
| MANAGEMENT’S DISCUSSION AND ANALYSIS |
Realized Commodity Prices
| | | Twelve Months Ended December 31 | | | Three Months Ended December 31 | |
| | | 2016 | | | 2015 | | | Change | | | 2016 | | | 2015 | | | Change | |
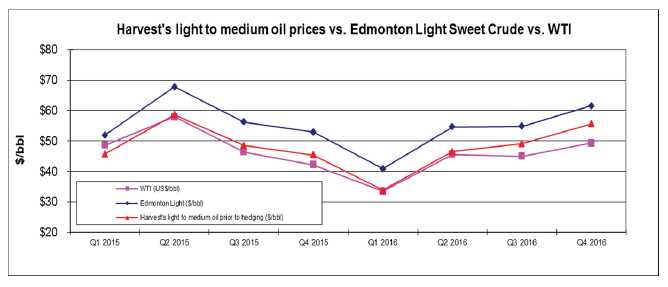
| Light to medium oil ($/bbl) | | 55.63 | | | 45.52 | | | 22% | | | 44.41 | | | 49.59 | | | (10% | ) |
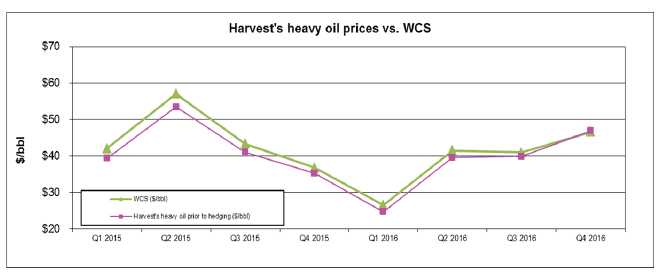
| Heavy oil prior to hedging($/bbl) | | 46.94 | | | 35.63 | | | 32% | | | 37.19 | | | 42.69 | | | (13% | ) |
| Natural gas liquids ($/bbl) | | 28.08 | | | 26.61 | | | 6% | | | 25.58 | | | 29.36 | | | (13% | ) |
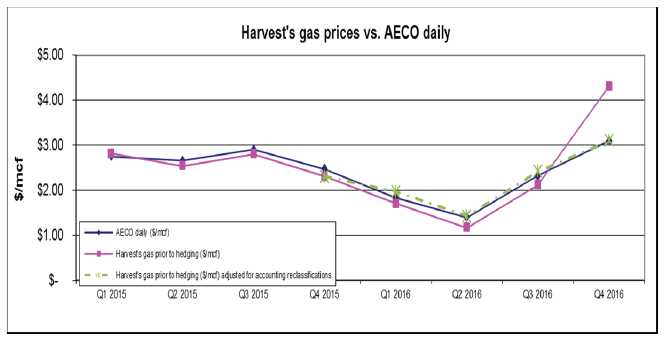
| Natural gas prior to hedging($/mcf) | | 4.27 | | | 2.30 | | | 86% | | | 2.22 | | | 2.62 | | | (15% | ) |
| Average realized price prior to hedging ($/boe)(1) | | 37.06 | | | 27.89 | | | 33% | | | 27.45 | | | 32.33 | | | (15% | ) |
| | | | | | | | | | | | | | | | | | | |
| Heavy oil after hedging ($/bbl)(2) | | 46.23 | | | 44.69 | | | 3% | | | 37.15 | | | 45.71 | | | (19% | ) |
| Natural gas after hedging ($/mcf)(2) | | 4.27 | | | 2.61 | | | 64% | | | 2.22 | | | 2.74 | | | (19% | ) |
| Average realized price after hedging ($/boe)(1)(2) | | 36.85 | | | 31.06 | | | 19% | | | 27.43 | | | 33.45 | | | (18% | ) |
| (1) | Inclusive of sulphur revenue. |
| (2) | Inclusive of the realized gains (losses) from contracts designated as hedges. Foreign exchange swaps and power contracts are excluded from the realized price. |
Harvest’s realized prices prior to any hedging activity for light to medium oil generally trends with the Edmonton Light benchmark price. Harvest’s realized prices prior to any hedging activity for heavy oil are a function of both the WCS and Edmonton Light benchmarks due to a portion of our heavy oil volumes being sold based on a discount to the Edmonton Light benchmark. For the fourth quarter and twelve months of 2016, the period-over-period variances and movements of light to medium oil and heavy oil were relatively consistent with the changes in their related benchmarks.
8
| MANAGEMENT’S DISCUSSION AND ANALYSIS |
Realized natural gas prices prior to hedging increased by 86% and decreased by 15% for the fourth quarter and twelve months ended December 31, 2016 as compared to the same periods in 2015. The increase in the fourth quarter 2016 realized price is primarily due to a reclassification of prior quarters’ transportation charges previously netted against revenue that are now being presented on a gross basis. When the realized price for the fourth quarter of 2016 is adjusted for reclassified amounts for the year, it fluctuates in a relatively consistent manner with its benchmark.
9
| MANAGEMENT’S DISCUSSION AND ANALYSIS |
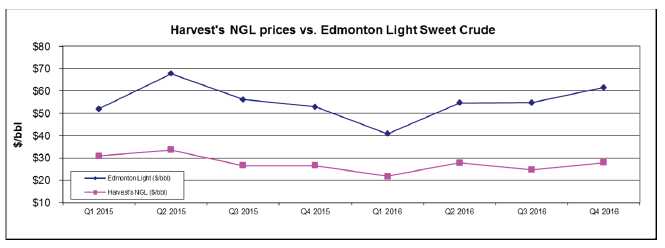
Realized natural gas liquids prices increased by 6% and decreased by 13% for the fourth quarter and year ended December 31, 2016, respectively, as compared to the same periods in the prior year. The changes are consistent with the changes in its benchmark oil prices.
In order to partially mitigate the risk of fluctuating cash flows due to natural gas and heavy oil pricing volatility, Harvest will periodically enter into WCS and AECO derivative contracts. During the twelve months of 2015 Harvest had AECO derivative contracts in place for a portion of its production; however none were in place in the twelve months of 2016. During the fourth quarter of 2015 and 2016, and for portions of the twelve months ended 2015 and 2016, Harvest had WCS derivative contracts in place for a portion of its production.
Please see “Cash Flow Risk Management” section in this MD&A for further discussion with respect to the cash flow risk management program.
10
| MANAGEMENT’S DISCUSSION AND ANALYSIS |
Sales Volumes
| | | Three Months Ended December 31 | |
| | | 2016 | | | 2015 | | | | |
| | | | | | | | | | | | | | | % Volume | |
| | | Volume | | | Weighting | | | Volume | | | Weighting | | | Change | |
| Light to medium oil (bbl/d) | | 3,821 | | | 14% | | | 7,934 | | | 21% | | | (52% | ) |
| Heavy oil (bbl/d) | | 7,760 | | | 29% | | | 10,044 | | | 26% | | | (23% | ) |
| Natural gas liquids (bbl/d) | | 3,188 | | | 12% | | | 3,820 | | | 10% | | | (17% | ) |
| Total liquids (bbl/d) | | 14,769 | | | 55% | | | 21,798 | | | 57% | | | (32% | ) |
| Natural gas (mcf/d) | | 70,923 | | | 45% | | | 98,055 | | | 43% | | | (28% | ) |
| Total oil equivalent (boe/d) | | 26,589 | | | 100% | | | 38,141 | | | 100% | | | (30% | ) |
| | | Twelve Months Ended December 31 | |
| | | 2016 | | | 2015 | | | | |
| | | | | | | | | | | | | | | % Volume | |
| | | Volume | | | Weighting | | | Volume | | | Weighting | | | Change | |
| Light to medium oil (bbl/d) | | 5,548 | | | 17% | | | 8,768 | | | 21% | | | (37% | ) |
| Heavy oil (bbl/d) | | 9,158 | | | 29% | | | 11,301 | | | 27% | | | (19% | ) |
| Natural gas liquids (bbl/d) | | 3,527 | | | 11% | | | 3,956 | | | 9% | | | (11% | ) |
| Total liquids (bbl/d) | | 18,233 | | | 57% | | | 24,025 | | | 57% | | | (24% | ) |
| Natural gas (mcf/d) | | 82,583 | | | 43% | | | 106,259 | | | 43% | | | (22% | ) |
| Total oil equivalent (boe/d) | | 31,996 | | | 100% | | | 41,735 | | | 100% | | | (23% | ) |
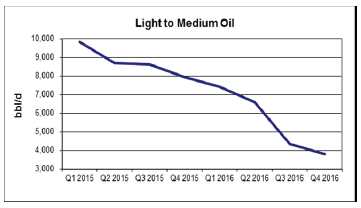 | Harvest’s average daily sales of light to medium oil decreased 52% in the fourth quarter of 2016, as compared to the same period in 2015. The decrease was mainly due to the disposition of Harvest’s Saskatchewan properties, natural declines, and reflects a greatly reduced drilling program in 2016. |
Heavy oil sales for the fourth quarter of 2016 decreased 23% as compared to the same period in 2015 mainly due to dispositions of properties, natural declines, and reflect a greatly reduced drilling program in 2016. | 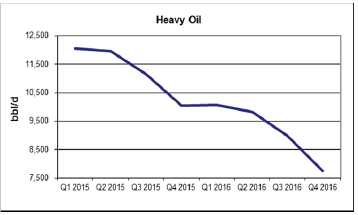 |
11
| MANAGEMENT’S DISCUSSION AND ANALYSIS |
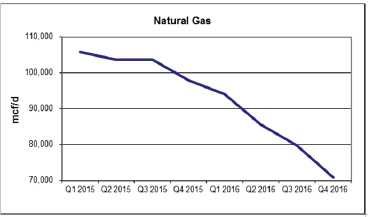 | Natural gas sales during the fourth quarter of 2016 decreased 28%, as compared to the same period in 2015. The decrease was mainly a result of disposition of assets to the Deep Basin Partnership during the fourth quarter of 2015, disposition of properties to third parties, natural declines and a curtailed drilling program in 2016. |
Natural gas liquids sales for the fourth quarter of 2016 decreased by 17% from the same period in 2015 due to natural declines and third party constraints. |  |
Revenues
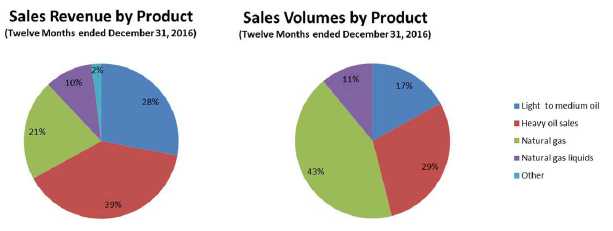
Sales Revenue by Product
| | | Three Months Ended December 31 | | | Twelve Months Ended December 31 | |
| | | 2016 | | | 2015 | | | Change | | | 2016 | | | 2015 | | | Change | |
| Light to medium oil sales | | 19.6 | | | 33.2 | | | (41% | ) | | 90.2 | | | 158.7 | | | (43% | ) |
| Heavy oil sales after hedging(1) | | 33.0 | | | 41.3 | | | (20% | ) | | 124.5 | | | 188.6 | | | (34% | ) |
| Natural gas sales after hedging(1) | | 27.8 | | | 23.5 | | | 18% | | | 67.1 | | | 106.3 | | | (37% | ) |
| Natural gas liquids sales | | 8.2 | | | 9.4 | | | (13% | ) | | 33.0 | | | 42.4 | | | (22% | ) |
| Other(2) | | 2.2 | | | 1.6 | | | 38% | | | 7.5 | | | 14.3 | | | (48% | ) |
| Petroleum and natural gas sales | | 90.8 | | | 109.0 | | | (17% | ) | | 322.3 | | | 510.3 | | | (37% | ) |
| Royalties | | (6.4 | ) | | (11.9 | ) | | (46% | ) | | (35.0 | ) | | (48.7 | ) | | (28% | ) |
| Revenues | | 84.4 | | | 97.1 | | | (13% | ) | | 287.3 | | | 461.6 | | | (38% | ) |
| (1) | Inclusive of the effective portion of realized gains (losses) from natural gas and crude oil contracts designated as hedges. |
| (2) | Inclusive of sulphur revenue and miscellaneous income. |
Harvest’s revenue is subject to changes in sales volumes, commodity prices, currency exchange rates and hedging activities. Total petroleum and natural gas sales decreased in the twelve months of 2016 as compared to 2015, mainly due to the decrease in sales volumes and the decrease in the realized prices. Total petroleum and natural gas sales decreased in the fourth quarter of 2016 as compared to 2015, primarily due to the decrease in sales volumes which was partially offset by an increase realized prices.
12
| MANAGEMENT’S DISCUSSION AND ANALYSIS |
Sulphur revenue represented $1.5 million of the total in other revenues for the fourth quarter of 2016 (2015 - $1.5 million) and $6.4 million for the twelve months of 2016 (2015 - $13.6 million).
Revenue by Product Type as % of Total Revenue
| | | Three Months Ended December 31 | | | Twelve Months Ended December 31 | |
| | | 2016 | | | 2015 | | | 2016 | | | 2015 | |
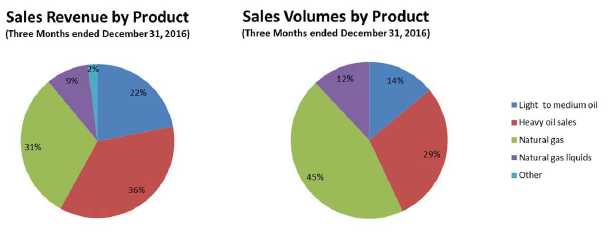
| Light to medium oil sales | | 22% | | | 30% | | | 28% | | | 31% | |
| Heavy oil sales after hedging | | 36% | | | 38% | | | 39% | | | 37% | |
| Natural gas sales after hedging | | 31% | | | 22% | | | 21% | | | 21% | |
| Natural gas liquids sales | | 9% | | | 9% | | | 10% | | | 8% | |
| Other | | 2% | | | 1% | | | 2% | | | 3% | |
| Total Sales Revenue | | 100% | | | 100% | | | 100% | | | 100% | |
13
| MANAGEMENT’S DISCUSSION AND ANALYSIS |
Harvest’s product mix on a volumetric basis is slightly weighted heavier towards crude oil and natural gas liquids than natural gas. Revenue contribution is more heavily weighted to crude oil and liquids as shown by the pie charts above.
Royalties
Harvest pays Crown, freehold and overriding royalties to the owners of mineral rights from which production is generated. These royalties vary for each property and product and Crown royalties are based on various sliding scales dependent on incentives, production volumes and commodity prices.
For the fourth quarter and twelve months ended December 31, 2016, royalties as a percentage of gross revenue averaged 7.0% and 10.9% respectively (2015 – 10.9% and 9.5%) . The decrease in royalties as a percentage of gross revenue for the fourth quarter of 2016 as compared to the same period of 2015 was due to lower production and the 2016 disposition of assets with high royalty rates, partially offset by increased realized prices. The increase in royalties as a percentage of gross revenue for the twelve months of 2016 was mainly due to a $10.0 million year to date prior period adjustment related to a Crown royalty audit which was partially offset by lower royalty rates due to lower prices, production volumes, and the disposition of assets with high royalty rates.
Operating Expenses
| | | Three Months Ended December 31 | | | Twelve Months Ended December 31 | |
| | | 2016 | | | 2015 | | | 2016 | | | 2015 | |
| Operating expense | | 36.2 | | | 52.5 | | | 155.9 | | | 251.5 | |
| Operating expense ($/boe) | | 14.81 | | | 14.96 | | | 13.31 | | | 16.50 | |
Operating expenses for the fourth quarter and twelve months of 2016 decreased by $16.3 million and $95.6 million, respectively, compared to the same periods in 2015. The decreases were mainly due to overall lower activity levels, reduced levels of well servicing and repairs and maintenance activity, reductions in labour and the impact of asset dispositions. Additionally, electricity costs were lower in the twelve months of 2016 due to lower Power Pool Rates of $18.24 per megawatt hour (2015 - $33.41 per megawatt hour), which resulted in decreased power and energy costs.
Operating expenses on a per boe basis decreased by 1% to $14.81 per boe and 19% to $13.31 per boe for fourth quarter and twelve months of 2016, respectively, when compared to the same periods in 2015, mainly due to lower activity levels and spending, partially offset by the lower sales volumes in comparison to fixed operating costs.
Transportation and Marketing Expense
| | | Three Months Ended December 31 | | | Twelve Months Ended December 31 | |
| | | 2016 | | | 2015 | | | 2016 | | | 2015 | |
| Transportation and marketing | | 9.1 | | | 0.9 | | | 11.0 | | | 5.2 | |
| Transportation and marketing ($/boe) | | 3.69 | | | 0.26 | | | 0.94 | | | 0.34 | |
14
| MANAGEMENT’S DISCUSSION AND ANALYSIS |
Transportation and marketing expenses relate primarily to the cost of delivery of natural gas and natural gas liquids, and trucking crude oil to pipeline or rail receipt points. Transportation and marketing expenses in the fourth quarter and twelve months of 2016 were $8.2 million and $5.8 million higher in comparison to the same periods in 2015. The increases were primarily due to the reclassification of prior quarters’ gas transportation costs to being presented on a gross basis.
Operating Netback(1)
| | | Three Months Ended December 31 | | | Twelve Months Ended December 31 | |
| ($/boe) | | 2016 | | | 2015 | | | Change | | | 2016 | | | 2015 | | | Change | |
| Petroleum and natural gas sales prior to hedging(2) | | 37.06 | | | 27.89 | | | 9.17 | | | 27.45 | | | 32.33 | | | (4.88 | ) |
| Royalties | | (2.59 | ) | | (3.38 | ) | | 0.79 | | | (2.98 | ) | | (3.19 | ) | | 0.21 | |
| Operating expenses | | (14.81 | ) | | (14.96 | ) | | 0.15 | | | (13.31 | ) | | (16.50 | ) | | 3.19 | |
| Transportation and marketing | | (3.69 | ) | | (0.26 | ) | | (3.43 | ) | | (0.94 | ) | | (0.34 | ) | | (0.60 | ) |
| Operating netback prior to hedging(1) | | 15.97 | | | 9.29 | | | 6.68 | | | 10.22 | | | 12.30 | | | (2.08 | ) |
| Hedging (loss) gain(3) | | (0.35 | ) | | 2.59 | | | (2.94 | ) | | (0.15 | ) | | 0.82 | | | (0.97 | ) |
| Operating netback after hedging(1) | | 15.62 | | | 11.88 | | | 3.74 | | | 10.07 | | | 13.12 | | | (3.05 | ) |
| (1) | This is a non-GAAP measure; please refer to “Non-GAAP Measures” in this MD&A. |
| (2) | Excludes miscellaneous income not related to oil and gas production |
| (3) | Includes the settlement amounts for natural gas, crude oil and power contracts. |
For the fourth quarter and twelve months ended December 31, 2016 netback prior to hedging were $15.97 per boe and $10.22 per boe, respectively, representing a 72 percent increase and a 17 percent decrease compared to the same periods in 2015.
For the fourth quarter and twelve months ended December 31, 2016 netback after hedging were $15.62 per boe and $10.07 per boe, respectively, representing an increase of 31 percent and a decrease of 23 percent compared to the same periods in 2015.
The increase in operating netback for the fourth quarter of 2016 in comparison to the same period in 2015 was mainly due to increased realized sale prices, partially offset by increased transportation and marketing expenses. The decrease in operating netback for the 12 month period of 2016 in comparison to the same period in 2015 was mainly due to lower realized sale prices, partially offset by reduced operating expenses.
General and Administrative (“G&A”) Expenses
| | | Three Months Ended December 31 | | | Twelve Months Ended December 31 | |
| | | 2016 | | | 2015 | | | Change | | | 2016 | | | 2015 | | | Change | |
| Gross G&A expenses | | 11.7 | | | 13.2 | | | (11% | ) | | 53.5 | | | 67.2 | | | (20% | ) |
| Capitalized G&A and recoveries | | (0.5 | ) | | (1.7 | ) | | 71% | | | (2.4 | ) | | (9.5 | ) | | 75% | |
| Net G&A expenses | | 11.2 | | | 11.5 | | | (3% | ) | | 51.1 | | | 57.7 | | | (11% | ) |
| Net G&A expenses ($/boe) | | 4.58 | | | 3.28 | | | 40% | | | 4.36 | | | 3.79 | | | 15% | |
For the fourth quarter and twelve months ended December 31, 2016 G&A expenses net of capitalized G&A decreased $0.3 million and $6.6 million respectively, while gross G&A expenses decreased $1.5 million and $13.7 million respectively, when compared to the same period in the prior year. The decrease in the gross G&A expenses from the same periods in the prior year were mainly due to comparative lower staffing levels, lower bonus and long-term incentive (“LTI”) accruals, and decreases in employee benefit expenses, partially offset by higher severance charges related to staff layoffs completed during the twelve months of 2016. The reduction in capitalized G&A is mainly related to reduced capital spending in 2016. Harvest does not have a stock option program, however there is a LTI program which is a cash settled plan that has been included in the G&A expense.
15
| MANAGEMENT’S DISCUSSION AND ANALYSIS |
On a per boe basis, G&A expenses increased $1.30 and $0.57 in the fourth quarter and twelve months of 2016, from the same period in the prior year mainly due to lower sales volumes in the current year.
Depletion, Depreciation and Amortization (“DD&A”) Expenses
| | | Three Months Ended December 31 | | | Twelve Months Ended December 31 | |
| | | 2016 | | | 2015 | | | 2016 | | | 2015 | |
| DD&A | | 86.4 | | | 118.1 | | | 289.1 | | | 418.1 | |
| DD&A ($/boe) | | 35.33 | | | 33.66 | | | 24.69 | | | 27.45 | |
DD&A expense for the fourth quarter and twelve months of 2016 decreased by $31.7 million and $129.0 million, respectively as compared to the same period in 2015, mainly due to lower sales volumes and the impact of a lower DD&A rate due to impairment charges recorded during fiscal 2015. These decreases were partially offset by a fourth quarter write down of reserves on non-core assets due to the current pricing environment. This write down led to an acceleration of DD&A of $32.2 million in the fourth quarter of 2016.
Onerous Contract
As the result of recent staff reductions, Harvest vacated some floors of its head office lease. This occurrence, in conjunction with the poor sublease market in Calgary resulted in an onerous contract. During the twelve months ended 2016, Harvest recognized a provision of $10.7 million. The provision represents the present value of the difference between future lease obligations and the estimated sublease recoveries. The onerous contract provision will be settled in periods up to August 2025. The recording of the provision for onerous contract resulted in a $10.7 million loss on onerous contract, and an impairment of leasehold improvements and furniture and fixtures of $2.8 million.
Impairment Expense/Reversal
As a result of the onerous contract noted above, for the twelve months of 2016, Harvest recognized an impairment loss of $2.8 million related to leasehold improvement and furniture and fixtures.
As a result of changes in future development plans and lease expirations, exploration and evaluation assets were impaired in the amount of $17.4 million and $19.9 million, respectively, for the fourth quarter and twelve months of 2016 (2015 - $22.3 million and $27.5 million).
Subsequent to December 31, 2016 an indicative bid was received from an arm’s length party to purchase certain oil and gas assets in Southern Alberta. The assets included in the bid are in the South Oil and South Gas CGUs. The estimated proceeds, which is the recoverable amount based on the FVLCD (level 2 fair value input) of the assets included in the proposed transaction was estimated at $1.3 million. This triggered an impairment reversal for the three and twelve months ended December 31, 2016, of $38.8 million to PP&E in Harvest’s Conventional segment (2015 – $196.1 million and $570.3 million, respectively), which has been included in Impairment, net of reversal line in the statement of comprehensive loss.
16
| MANAGEMENT’S DISCUSSION AND ANALYSIS |
During the 12 months ended December 31, 2016, Harvest reviewed and adjusted its Conventional CGUs as a result of the Company’s ongoing divestiture activity and corporate re-organization. CGU’s were aggregated due to similarities in operations, product composition, cash flows and management and monitoring.
For the year ended December 31, 2015, the Conventional segment recorded an impairment expense of $570.3 million. Of this total, $560.2 million related to all Conventional CGUs except for two out of sixteen. Impairment in the South Oil CGU at March 31, 2015 was triggered by reserves write-downs as a result of a decline in oil prices combined with underperforming assets. Impairments in West Alberta Gas and South Alberta Gas CGUs at June 30, 2015 were triggered by a decline in gas prices while the East Central Oil CGU impairment was triggered by revised estimated capital costs in the Bellshill area. The recoverable amounts for respective CGUs were estimated at their FVLCD, which is classified as a level 3 fair value measurement, based on the net present value of pre-tax cash flows from proved plus probable oil and gas reserves estimated by an independent reserve evaluator and the estimated fair value of undeveloped land. A discount rate in the range of 11% - 16.5% was used to determine the recoverable amount of $965.8 million for the CGUs impaired during the year ended December 31, 2015.
The remainder of the Conventional impairment of $10.1 million during the year ended December 31, 2015 related to assets held for sale in 2015. The sale of certain Conventional oil and gas assets in the Willesden Green area closed on February 1, 2016. As such, these assets were classified as assets held for sale at December 31, 2015. As a result of this classification, the assets were tested for impairment and written down to its recoverable amount of $nil.
The results of the impairment assessments conducted during the year ended December 31, 2016 are sensitive to changes in any of the key management judgments and estimates inherent to the assessments made. These judgments and estimates include revisions in reserves or resources, a change in forecast commodity prices, expected royalty rates, required future development expenditures, and expected future production costs all of which could increase or decrease the recoverable amount of the assets.
Goodwill
Goodwill is recorded when the purchase price of an acquired business exceeds the fair value of the net identifiable assets and liabilities of that acquired business. At December 31, 2016, Harvest had $100.3 million (2015 – $149.0 million) of goodwill on the balance sheet related to the Conventional segment. The decrease of $48.7 million resulted from dispositions of certain oil and gas properties totaling (see the “Property Dispositions” section below), and impairment charges.
Goodwill has been allocated to the Conventional operating segment. In assessing whether goodwill has been impaired, the carrying amount of the operating segment (including goodwill) is compared with the recoverable amount of the operating segment. The estimated recoverable amount of the segment is determined based on its FVLCD.
17
| MANAGEMENT’S DISCUSSION AND ANALYSIS |
Market participants generally apply the market multiple enterprise value per barrel of proved and probable reserves (“EV/2P”) when estimating the fair value of an oil and gas company. As such, Harvest determined the fair value of its Upstream segment by applying the observed EV/2P multiple of comparable public companies to its proved and probable reserves (Level 2 fair value input). Harvest’s proved and probable reserves were estimated by an independent qualified reserves evaluator and are subject to significant judgment.
At December 31, 2016, the EV/2P multiples ranged from $5.60 to $17.61 per barrel of proved and probable reserves for a group of comparable companies of similar size, operating metrics and production profile. Harvest used an average EV/2P multiple of $6.00 per barrel of proved and probable reserves when determining the implied fair value of Harvest’s Upstream segment. As at December 31, 2016, the carrying value exceeded the recoverable amount by $37.0 million (2015 - $195.0 million), as such, goodwill impairment was recorded.
Acquisitions & Dispositions
On August 16, 2016 Harvest closed the disposition of some of its oil and gas assets in Southern Alberta for net proceeds of $6.7 million. On June 30, 2016, Harvest closed the disposition of all of its oil and gas assets in Saskatchewan for net proceeds of $61.6 million. Together with other insignificant dispositions of Conventional assets, Harvest recognized a gain of $0.3 million and $35.2 million for the three months and year ended December 31, 2016, respectively (2015 – gain of $4.5 million and loss $1.7 million), relating to the de-recognition of PP&E, E&E, goodwill and decommissioning and environmental liabilities.
Capital Asset Additions
| | | Three Months Ended December 31 | | | Twelve Months Ended December 31 | |
| | | 2016 | | | 2015 | | | 2016 | | | 2015 | |
| Drilling and completion | | 7.0 | | | 0.6 | | | 4.9 | | | 78.0 | |
| Well equipment, pipelines and facilities | | 5.3 | | | 17.1 | | | 10.9 | | | 50.0 | |
| Land and seismic | | 0.7 | | | 0.1 | | | 1.2 | | | 1.9 | |
| Geological and geophysical | | — | | | 1.0 | | | — | | | 2.9 | |
| Corporate | | 0.3 | | | 2.2 | | | — | | | 5.6 | |
| Other | | 0.4 | | | 1.4 | | | 2.0 | | | 8.1 | |
| Total additions excluding acquisitions | | 13.7 | | | 22.4 | | | 19.0 | | | 146.5 | |
Total capital additions were lower for the fourth quarter and twelve months of 2016 compared to 2015 mainly due to reduced capital activity for the current year in response to a low commodity price environment and the impact of accrual reversals. The reversal of the accrual is primarily related to lower actual costs than previously estimated. Harvest’s capital expenditures in the fourth quarter and twelve months of 2016 related to the drilling and completion of new wells, and the addition of capital expenditures related to well equipment, pipelines and facilities.
During the fourth quarter of 2016 Harvest drilled a horizontal well targeting light oil in the Charlie Lake formation, and participated in three partner operated horizontal multi-stage fractured wells (1.1 net). During the twelve months of 2016 Harvest drilled a horizontal well targeting light oil in the Charlie Lake formation, and participated in four partner-operated horizontal multi-stage fractured well (1.4 net) to develop the liquids-rich Falher gas formation.
18
| MANAGEMENT’S DISCUSSION AND ANALYSIS |
During the fourth quarter and twelve months ended December 31, 2016, Harvest’s net undeveloped land additions were 3,608 acres and 15,513 acres respectively (2015 – 795 acres and 42,988 acres).
Decommissioning Liabilities
Harvest’s Conventional decommissioning liabilities at December 31, 2016 was $615.4 million (December 31, 2015 – $796.6 million) for future remediation, abandonment, and reclamation of Harvest’s oil and gas properties. The total of the decommissioning liabilities are based on management’s best estimate of costs to remediate, reclaim, and abandon wells and facilities. The decrease in balance as at December 31, 2016 is mainly due disposition of properties and revisions to the estimate as a result of changes in the Bank of Canada long term interest rates, and cost estimates. The costs will be incurred over the operating lives of the assets with the majority being at or after the end of reserve life. Please refer to the “Contractual Obligations and Commitments” section of this MD&A for the payments expected for each of the next five years and thereafter in respect of the decommissioning liabilities.
Investments in Joint Ventures
Harvest has equity investments in Deep Basin Partnership (“DBP”) and HK MS Partnership (“HKMS”) joint ventures with KERR Canada Co. Ltd. (“KERR”) which are accounted for as equity investments. Harvest derives its income or loss from its investments based upon Harvest’s share in the change of the net assets of the joint venture. Harvest’s share of the change in the net assets does not directly correspond to its ownership interest because of contractual preference rights to KERR and changes based on contributions made by either party during the year. For the fourth quarter and twelve months ended December 31, 2016, Harvest recognized a loss of $8.1 million and $43.8 million (2015 – $71.5 million and $97.3 million) from its investment in the DBP and HKMS joint ventures.
Below is an overview of operational and financial highlights of the DBP and HKMS joint ventures for the fourth quarter and twelve months ended December 31, 2016. Unless otherwise noted the following discussion relates to 100% of the joint venture results and not based on Harvest ownership share.
Deep Basin Partnership
DBP was established for the purposes of exploring, developing and producing from certain oil and gas properties in the Deep Basin area in Northwest Alberta. During 2015 and in the twelve month ended December 31, 2016 Harvest made various contributions to the DBP that resulted in increase in its ownership percentage as reflected in the table below.
| | | December 31, | | | September 30, | | | June 30, | | | March 31, | | | December 31, | |
| | | 2016 | | | 2016 | | | 2016 | | | 2016 | | | 2015 | |
| Harvest's ownership interest | | 82.32% | | | 82.03% | | | 82.00% | | | 81.98% | | | 81.71% | |
| KERR's ownership interest | | 17.68% | | | 17.97% | | | 18.00% | | | 18.02% | | | 18.29% | |
| Total | | 100.00% | | | 100.00% | | | 100.00% | | | 100.00% | | | 100.00% | |
19
| MANAGEMENT’S DISCUSSION AND ANALYSIS |
As at December 31, 2016, the fair value of Harvest’s top-up obligation to KERR, related to a minimum rate of return commitment was estimated as $6.7 million (December 31, 2015 - $2.0 million).
At December 31, 2016, Harvest received a total of $6.0 million (December 31, 2015 - $4.3 million) in distributions from the DBP from inception of the joint venture.
| | | Three Months Ended December 31 | | | Twelve Months Ended December 31 | |
| | | 2016 | | | 2015 | | | Change | | | 2016 | | | 2015 | | | Change | |
| Natural gas (mcf/d) | | 25,835 | | | 26,026 | | | (1% | ) | | 27,375 | | | 19,135 | | | 43% | |
| Natural gas liquids (bbl/d) | | 1,246 | | | 1,080 | | | 15% | | | 1,238 | | | 936 | | | 32% | |
| Light to medium oil (bbl/d) | | 2 | | | — | | | — | | | 2 | | | 1 | | | 100% | |
| Total (boe/d) | | 5,553 | | | 5,418 | | | 2% | | | 5,802 | | | 4,126 | | | 41% | |
| Harvest's share(1) | | 4,571 | | | 4,427 | | | 3% | | | 4,762 | | | 3,300 | | | 44% | |
| (1) | This is a non-GAAP measure; please refer to “Non-GAAP Measures” in this MD&A. |
Sales volumes for the fourth quarter and twelve months ended December 31, 2016 increased by 135 boe/d and 1,676 boe/d respectively, as compared to the same periods in 2015. The fourth quarter increase was due to DBP’s 2016 drilling program. The twelve month increase was due to new wells being brought online and additional assets contributed on October 1, 2015 by Harvest, partially offset by production curtailments due to third party transportation restrictions.
| | | Three Months Ended December 31 | | | Twelve Months Ended December 31 | |
| | | 2016 | | | 2015 | | | Change | | | 2016 | | | 2015 | | | Change | |
| Revenues(2) | | 14.7 | | | 8.6 | | | 71% | | | 37.2 | | | 30.2 | | | 23% | |
| Operating expenses and Other | | (12.8 | ) | | (8.8 | ) | | (45% | ) | | (34.8 | ) | | (27.9 | ) | | (25% | ) |
| Depletion, depreciation and amortization | | (11.3 | ) | | (13.0 | ) | | 13% | | | (40.7 | ) | | (43.9 | ) | | 7% | |
| Finance costs | | (0.7 | ) | | (0.7 | ) | | — | | | (2.8 | ) | | (2.7 | ) | | (4% | ) |
| Impairment | | — | | | (59.8 | ) | | — | | | (1.4 | ) | | (59.8 | ) | | - | |
| Loss on disposition of assets | | — | | | — | | | — | | | (9.8 | ) | | - | | | - | |
| Net loss(1) | | (10.1 | ) | | (73.7 | ) | | 86% | | | (52.3 | ) | | (104.1 | ) | | 50% | |
| (1) | Balances represent 100% share of the DBP. |
| (2) | Revenue is presented net of royalties |
The higher sales revenues in the fourth quarter ended December 31, 2016 reflects the higher commodity prices and higher volumes compared to the same period in the prior year, as well as a reclassification of previous quarters’ transportation and marketing costs netted against revenues. The higher sales revenues in the twelve months of 2016 reflect a reclassification of transportation and marketing costs previously netted against revenue, as well as higher sales volumes, which was partially offset by lower commodity prices compared to the same period in 2015.
Operating expenses and other expenses for the fourth quarter and twelve months of 2016 were $24.83 per boe and $16.40 per boe, respectively, an increase of $7.31 per boe and a decrease of $2.12 per boe from the same periods in 2015. The increase in fourth quarter operating expenses was due to a reclassification of prior quarters’ transportation and marketing costs previously netted against revenue. The decrease on a twelve month basis from 2015 was mainly due to the higher sales volume being processed through the HKMS natural gas processing plant resulting in lower operating expense on a boe basis.
20
| MANAGEMENT’S DISCUSSION AND ANALYSIS |
Depletion for the fourth quarter and twelve months ended December 31, 2016 were $22.12 per boe and $19.18 per boe, respectively (2015 – $26.13 per boe and $29.17 per boe). The decreases from 2015 were mainly due to the impact of an impairment charge recorded during the fourth quarter of 2015 and additional proved reserves recognized in the fourth quarter of 2015.
For the twelve months of 2016, the DBP recognized an impairment loss of $1.4 million relating to a final statement of adjustments for a corporate acquisition completed in the fourth quarter of 2015. As the partnerships property, plant and equipment (PP&E) assets were impaired as at December 31, 2015 the additions to PP&E as a result of the statement of adjustment were flowed through as an expense in the first quarter of 2016.
On January 15, 2016 the DBP closed an asset exchange whereby the carrying value of assets given up exceeded the fair value of assets received based on the booked reserves associated with the properties exchanged. This transaction resulted in a loss on disposition of PP&E of $9.8 million.
| | | Three Months Ended December 31 | | | Twelve Months Ended December 31 | |
| | | 2016 | | | 2015 | | | 2016 | | | 2015 | |
| Drilling and completion | | 9.6 | | | 22.7 | | | 17.4 | | | 64.6 | |
| Well equipment, pipelines and facilities | | 2.8 | | | 7.4 | | | 6.4 | | | 23.4 | |
| Total(1) | | 12.4 | | | 30.1 | | | 23.8 | | | 88.0 | |
| (1) | Balances represent 100% share of the DBP. |
Capital asset additions were $12.4 million and $23.8 million in the fourth quarter and twelve months ended December 31, 2016, mainly related to drilling, completion and tie-in of wells. During the fourth quarter and twelve months of 2016, DBP drilled 1 gross (1 net) and 4 gross (3.5 net) wells, respectively.
HKMS Partnership
The HKMS Partnership was formed for the purposes of constructing and operating a gas processing facility, which is primarily used to process the gas produced from the properties owned by the Deep Basin Partnership. A gas processing agreement was entered into by the two partnerships.
During 2015 and in the twelve months ended December 31, 2016 Harvest made various contributions to the HKMS Partnership that resulted in increase in its ownership percentage as reflected in the table below.
| | | December 31, | | | September 30, | | | June 30, | | | March 31, | | | December 31, | |
| | | 2016 | | | 2016 | | | 2016 | | | 2016 | | | 2015 | |
| Harvest's ownership interest | | 70.23% | | | 70.21% | | | 70.19% | | | 70.15% | | | 69.93% | |
| KERR's ownership interest | | 29.77% | | | 29.79% | | | 29.81% | | | 29.85% | | | 30.07% | |
| Total | | 100.00% | | | 100.00% | | | 100.00% | | | 100.00% | | | 100.00% | |
21
| MANAGEMENT’S DISCUSSION AND ANALYSIS |
At December 31, 2016, Harvest received a total of $23.4 million (December 31, 2015 - $7.7 million) in distributions from HKMS from inception of the joint venture.
| | | Three Months Ended December 31 | | | Twelve Months Ended December 31 | |
| | | 2016 | | | 2015 | | | Change | | | 2016 | | | 2015 | | | Change | |
| Revenues | | 6.7 | | | 5.8 | | | 16% | | | 24.6 | | | 19.8 | | | 24% | |
| Operating expenses and other | | (0.7 | ) | | (0.2 | ) | | (250% | ) | | (1.5 | ) | | (1.5 | ) | | 0% | |
| Depreciation and amortization | | (0.9 | ) | | (0.8 | ) | | (13% | ) | | (3.5 | ) | | (3.1 | ) | | (13% | ) |
| Finance costs | | (4.9 | ) | | (4.9 | ) | | 0% | | | (19.6 | ) | | (15.0 | ) | | (31% | ) |
| Net (loss) income(1) | | 0.2 | | | (0.1 | ) | | 300% | | | — | | | 0.2 | | | (100% | ) |
| (1) | Balances represent 100% share of HKMS. |
The Gas Processing Agreement between HKMS and DBP ensures that HKMS receives an 18% internal rate of return on capital deployed over the term of the contract. In order to guarantee this return, DBP is required to provide HKMS with a minimum monthly capital fee that is currently $1.9 million a month. This capital fee is accounted for as revenue for HKMS and an operating expense for the DBP. In addition HKMS also generates revenue from charging an operating fee to recover operating expenses incurred. For the fourth quarter and twelve months ended December 31, 2016 the partnership generated revenues of $6.7 million and $24.6 million, respectively (2015 – $5.8 million and $19.8 million).
Operating expenses of the facility are recovered through charging an operating fee to the producers. For the fourth quarter and twelve months ended December 31, 2016 the partnership operating expense and other were $0.7 million and $1.5 million, respectively (2015 – $0.2 million and $1.5 million).
Depreciation has been calculated on a straight-line basis over a 30 year useful life. Based on the capital expenditures incurred to date, the depreciation on a monthly basis is approximately $0.3 million per month. For the fourth quarter and twelve months ended December 31, 2016 the partnership depreciation expense were $0.9 million and $3.5 million, respectively (2015 – $0.8 million and $3.1 million).
Finance costs mainly represent an accounting charge resulting from the Partner’s contributions being classified as liabilities, as a result of the Gas Processing Agreement guaranteed returns. The finance costs represent the 18% rate of return on the partner’s contributions. For the fourth quarter and twelve months ended December 31, 2016 the partnership financing costs were $4.9 million and $19.6 million, respectively (2015 – $4.9 million and $15.0 million).
See note 12 of the December 31, 2016 audited consolidated financial statements for discussion of the accounting implications of these joint ventures.
22
| MANAGEMENT’S DISCUSSION AND ANALYSIS |
OIL SANDS
Pre-operating Results
| | | Three Months Ended December 31 | | | Twelve Months Ended December 31 | |
| | | 2016 | | | 2015 | | | 2016 | | | 2015 | |
| Expenses | | | | | | | | | | | | |
| Pre-operating | | 2.9 | | | 5.0 | | | 10.7 | | | 14.1 | |
| General and administrative | | 0.5 | | | 0.9 | | | 2.2 | | | 3.1 | |
| Depreciation and amortization | | 0.1 | | | 0.2 | | | 0.6 | | | 0.5 | |
| Impairment of property, plant and equipment | | — | | | 229.0 | | | — | | | 491.0 | |
| Pre-Operating loss(1) | | (3.5 | ) | | (235.1 | ) | | (13.5 | ) | | (508.7 | ) |
| (1) | This is an non GAAP measure; please refer to “non-GAAP Measures” in this MD&A. |
As the CPF was substantially completed during the first quarter of 2015, the operating expenses that were previously capitalized to property plant and equipment are now expensed on the income statement. For the fourth quarter and twelve months ended December 31, 2016, Harvest recognized an operating loss of $3.5 million and $13.5 million (2015 – $235.1 million and $508.7 million) respectively, mainly relating to labour, power, maintenance and general and administrative expenses.
For the fourth quarter and twelve months of 2016, no impairments were charged to the Oil Sands segment (after-tax discount rate of 9.5% for proved plus probable reserves and 12% for possible reserves). Impairment charges of $229.0 million and $491.0 million were recognized for the fourth quarter and twelve months ended December 31, 2015, respectively (2015 - $491.0 million at a pre-tax discount rate of 12% resulting in a recoverable amount of $959.1 million).
Capital Asset Additions
| | | Three Months Ended December 31 | | | Twelve Months Ended December 31 | |
| | | 2016 | | | 2015 | | | 2016 | | | 2015 | |
| Well equipment, pipelines and facilities | | (0.1 | ) | | 0.3 | | | 0.1 | | | 44.4 | |
| Pre-operating costs | | — | | | (0.2 | ) | | — | | | 6.8 | |
| Drilling and completion | | — | | | — | | | — | | | 0.4 | |
| Capitalized borrowing costs and other | | 2.0 | | | 0.4 | | | 1.8 | | | 14.4 | |
| Total Oil Sands additions | | 1.9 | | | 0.5 | | | 1.9 | | | 66.0 | |
The minimal capital spending during the fourth quarter and twelve months of 2016 reflects a halt in Oil Sands activity since the first quarter of 2015.
Decommissioning Liabilities
Harvest’s Oil Sands decommissioning liabilities at December 31, 2016 was $48.6 million (December 31, 2015 - $50.1 million) relating to the future remediation, abandonment, and reclamation of the steam assisted gravity drainage (“SAGD”) wells and CPF. The decrease in this balance as at December 31, 2016 is mainly due to revisions to the estimate as a result of changes in the Bank of Canada long term interest rates. Please see the “Contractual Obligations and Commitments” section of this MD&A for the payments expected for each of the next five years and thereafter in respect of the decommissioning liabilities.
23
| MANAGEMENT’S DISCUSSION AND ANALYSIS |
Project Development
Harvest has been developing its Oil Sands CPF under the engineering, procurement and construction (“EPC”) contract. Initial drilling of 30 SAGD wells (15 well pairs) was completed by the end of 2012 and the majority of the well completion activities were completed by the end of 2014. More SAGD wells will be drilled in the future to compensate for the natural decline in production of the initial well pairs and maintain the Phase 1 production capacity of 10,000 bbl/d. During the first quarter of 2015 construction had been substantially completed, including the building of the CPF plant site, well pads, and connecting pipelines. Several systems have since been commissioned and others will be progressed slowly within a limited budget. The decision to complete commissioning of the CPF and commence steam injection depends on a number of factors including the bitumen price environment.
Harvest has recorded net $1,082.5 million of costs on the entire project since acquiring the Oil Sands assets in 2010. This $1,082.5 million includes certain Phase 2 pre-investment which is expected to improve the capital efficiency over the project lifecycle. Under the EPC contract, $94.9 million of the EPC costs will be paid in equal installments, without interest, over 10 years. Payments commenced during the second quarter of 2015 with two payments made on April 30, 2015. Harvest withheld the third deferred payment due April 30, 2016 as it is in process of conducting a comprehensive audit of costs and expenses incurred by the Contractor in connection with the work. The liability is considered a financial liability and is initially recorded at fair value, which is estimated as the present value of all future cash payments discounted using the prevailing market rate of interest for similar instruments. As at December 31, 2016, Harvest recognized a liability of $67.2 million (December 31, 2015 - $62.0 million) using a discount rate of 4.5% (December 31, 2015 - 5.5%) .
As Harvest uses the unit of production method for depletion and the Oil Sands assets currently have no production, no depletion on the Oil Sands property, plant and equipment has been recorded. Minor depreciation has been recorded during the fourth quarter and twelve months of 2016 on administrative assets.
RISK MANAGEMENT, FINANCING AND OTHER
Cash Flow Risk Management
The Company at times enters into natural gas, crude oil, electricity and foreign exchange contracts to reduce the volatility of cash flows from some of its forecast sales and purchases, and when allowable, will designate these contracts as cash flow hedges. The following is a summary of Harvest’s derivative contracts outstanding at December 31, 2016:
| Contracts Not Designated as Hedges | |
| | | | | | | | | | | | Fair Value of | |
| Contract Quantity | | Type of Contract | | | Term/Expiry | | | Contract Price | | | asset | |
| US$373 million | | Foreign exchange swap | | | January 2017 | | $ | 1.34 Cdn/US | | | 1.1 | |
| | | | | | | | | | | $ | 1.1 | |
Harvest has entered into U.S. dollar currency swap transactions related to a LIBOR borrowings, which results in a reduction of interest expense paid on Harvest’s borrowings related to its credit facility. As a result of these transactions, Harvest’s effective interest rate for borrowings under the credit facility for the three and twelve months ended December 31, 2016 was 1.5% and 1.6%, respectively (2015 – 1.7% and 2.0%, respectively).
24
| MANAGEMENT’S DISCUSSION AND ANALYSIS |
| | | Three Months Ended December 31 | |
| | | 2016 | | | 2015 | |
| Realized (gains) losses | | Crude | | | Top-Up | | | Crude | | | Natural | | | Top-Up | |
| recognized in: | | Power | | | Oil | | | Currency | | | Obligation | | | Total | | | Power | | | Oil | | | Currency | | | Gas | | | Obligation | | | Total | |
| Revenues | | — | | | 0.5 | | | — | | | — | | | 0.5 | | | — | | | (8.4 | ) | | — | | | (2.7 | ) | | — | | | (11.1 | ) |
| Derivative contract (gains) | | | | | | | | | | | | | | | | | | | | | | | | | | | | | | | | | |
| losses | | 0.3 | | | — | | | — | | | — | | | 0.3 | | | 2.0 | | | — | | | — | | | — | | | — | | | 2.0 | |
| Unrealized (gains) lossesrecognized in: | | | | | | | | | | | | | | | | | | | | | | | | | | | | | | | | | |
| OCI, before tax | | — | | | 0.1 | | | — | | | — | | | 0.1 | | | — | | | (1.7 | ) | | — | | | (1.6 | ) | | — | | | (3.3 | ) |
| Derivative contract (gains) | | | | | | | | | | | | | | | | | | | | | | | | | | | | | | | | | |
| losses | | (0.1 | ) | | — | | | (4.3 | ) | | (7.8 | ) | | (12.2 | ) | | (0.6 | ) | | — | | | — | | | — | | | 2.0 | | | 1.4 | |
| | | Twelve Months Ended December 31 | |
| | | 2016 | | | 2015 | |
| Realized (gains) losses | | Crude | | | Top-Up | | | Crude | | | Natural | | | Top-Up | |
| recognized in: | | Power | | | Oil | | | Currency | | | Obligation | | | Total | | | Power | | | Oil | | | Currency | | | Gas | | | Obligation | | | Total | |
| Revenues | | — | | | 0.1 | | | — | | | — | | | 0.1 | | | — | | | (12.5 | ) | | — | | | (4.5 | ) | | — | | | (17.0 | ) |
| Derivative contract (gains) | | | | | | | | | | | | | | | | | | | | | | | | | | | | | | | | | |
| losses | | 1.6 | | | — | | | — | | | — | | | 1.6 | | | 4.2 | | | — | | | 0.2 | | | — | | | — | | | 4.4 | |
| Unrealized (gains) lossesrecognized in: | | | | | | | | | | | | | | | | | | | | | | | | | | | | | | | | | |
| OCI, before tax | | — | | | 0.1 | | | — | | | — | | | 0.1 | | | — | | | (12.5 | ) | | — | | | (2.6 | ) | | — | | | (15.1 | ) |
| Derivative contract (gains) | | | | | | | | | | | | | | | | | | | | | | | | | | | | | | | | | |
| losses | | — | | | — | | | (1.1 | ) | | 4.7 | | | 3.6 | | | (1.2 | ) | | — | | | — | | | — | | | 2.0 | | | 0.8 | |
Finance Costs
| | | Three Months Ended December 31 | | | Twelve Months Ended December | |
| | | 2016 | | | 2015 | | | 201631 | | | 2015 | |
| Credit facility(1) | | 3.9 | | | 10.0 | | | 17.7 | | | 27.4 | |
| 6⅞% senior notes | | 7.1 | | | 12.3 | | | 37.4 | | | 46.9 | |
| 2⅛% senior notes(1) | | 6.0 | | | 5.9 | | | 23.7 | | | 22.8 | |
| 2⅓% senior notes(1) | | 1.8 | | | — | | | 3.8 | | | — | |
| Related party loans | | 11.9 | | | 7.4 | | | 39.9 | | | 27.6 | |
| Amortization of deferred finance charges and other | | 1.0 | | | 0.6 | | | 3.1 | | | 2.0 | |
| Interest and other financing charges | | 31.7 | | | 36.2 | | | 125.6 | | | 126.7 | |
| Accretion of decommission and | | | | | | | | | | | | |
| environmental remediation liabilities | | 3.4 | | | 4.6 | | | 16.7 | | | 18.5 | |
| Accretion of long-term liability | | 0.7 | | | 0.8 | | | 3.1 | | | 2.6 | |
| Less: capitalized interest | | — | | | — | | | — | | | (9.7 | ) |
| Total finance costs | | 35.8 | | | 41.6 | | | 145.4 | | | 138.1 | |
| (1) | Includes guarantee fee to KNOC. |
25
| MANAGEMENT’S DISCUSSION AND ANALYSIS |
Currency Exchange
| | | Three Months Ended December 31 | | | Twelve Months Ended December | |
| | | 2016 | | | 2015 | | | 2016 | | | 2015 | |
| Realized (gains) losses on foreign exchange | | 6.3 | | | 1.3 | | | (16.1 | ) | | 2.1 | |
| Unrealized (gains) losses on foreign exchange | | 45.5 | | | 69.6 | | | (23.8 | ) | | 308.4 | |
| Total (gains) losses on foreign exchange | | 51.8 | | | 70.9 | | | (39.9 | ) | | 310.5 | |
Currency exchange gains and losses are attributed to the changes in the value of the Canadian dollar relative to the U.S. dollar on the U.S. dollar denominated 6⅞%, 2⅛% and 2⅓% senior notes, the ANKOR and KNOC related party loans and on any U.S. dollar denominated monetary assets or liabilities. At December 31, 2016, the Canadian dollar had weakened compared to the US dollar, resulting in an unrealized foreign exchange loss of $45.5 million for the fourth quarter of 2016 (2015 – $69.6 million). Harvest recognized a realized foreign exchange loss of $6.3 million for the fourth quarter of 2016 (2015 – $1.3 million) as a result of a weaker Canadian dollar, primarily relating to a $6.0 million loss on the settlement of related party debt. During the twelve months ending December 31, 2016, the Canadian dollar had strengthened compared to the US dollar as at December 31, 2015 resulting in an unrealized foreign exchange gain of $23.8 million (2015 – $308.4 million loss). Harvest recognized a realized foreign exchange gain of $16.1 million for the twelve months of 2016 (2015 – $2.1 million loss), which was primarily the result of a $15.7 million realized foreign exchange gain related to the settlement of the ANKOR loan, which was partially offset by a realized loss of $6.0 million relating to the settlement of related party debt. The remainder of the realized foreign exchange for 2016 relates to the settlement of U.S. dollar denominated working capital, interest payments on U.S. dollar denominated debt, and gains and losses on foreign exchange hedging instruments. For a discussion on the ANKOR loan transaction, and settlement of related party debt, please refer to the related party transactions section below.
Income Taxes
For the fourth quarter and twelve months ended December 31, 2016 Harvest recorded a deferred income tax recovery of $nil and $0.1 million, respectively (2015 – $189.4 million and $313.9 million). Harvest’s deferred income tax asset will fluctuate during each accounting period to reflect changes in the temporary differences between the book value and tax basis of assets and liabilities. Currently, the principal sources of temporary differences relate to the Company’s property, plant and equipment, decommissioning liabilities and the unclaimed tax pools.
Related Party Transactions
The following provides a summary of the related party transactions between Harvest and KNOC for the quarter ended December 31, 2016:
Related Party Loans
| Related | | | | | Interest | | | | | | Carrying Value | | | Interest Payable | |
| Party | | Principal | | | Rate | | | Maturity Date | | | Dec 31, 2016 | | | Dec 31, 2015 | | | Dec 31, 2016 | | | Dec 31, 2015 | |
| KNOC | | US$171 | | | 5.91% | | | Dec 31, 2017 | | | — | | | 166.1 | | | — | | | 4.1 | |
| KNOC | $ | 200 | | | 5.30% | | | Dec 30, 2018 | | | — | | | 193.2 | | | — | | | 16.7 | |
| KNOC | | US$184.8 | | | 4.66% | | | Oct 2, 2017 | | | — | | | — | | | — | | | — | |
| ANKOR | | US$170 | | | 4.62% | | | Oct 2, 2017 | | | — | | | 235.2 | | | — | | | 14.6 | |
26
| MANAGEMENT’S DISCUSSION AND ANALYSIS |
| | | | | | | | | | | | Interest expense | |
| | | | | | | | | | | | Three months ended | | | Twelve Months Ended | |
| Related | | | | | Interest | | | | | | December 31 | | | December 31 | |
| Party | | Principal | | | Rate | | | Maturity Date | | | 2016 | | | 2015 | | | 2016 | | | 2015 | |
| KNOC | | US$171 | | | 5.91% | | | Dec 31, 2017 | | | 5.1 | | | 1.3 | | | 14.1 | | | 3.8 | |
| KNOC | $ | 200 | | | 5.30% | | | Dec 30, 2018 | | | 3.6 | | | 3.4 | | | 14.0 | | | 13.7 | |
| KNOC | | US$184.8 | | | 4.66% | | | Oct 2, 2017 | | | 3.2 | | | — | | | 5.9 | | | — | |
| ANKOR | | US$170 | | | 4.62% | | | Oct 2, 2017 | | | — | | | 2.6 | | | 5.9 | | | 10.0 | |
On June 30, 2016 Harvest entered into an US$184.8 million loan agreement with KNOC, due on October 2, 2017. During the third quarter of 2016, Harvest drew down the US$184.8 million and used the proceeds to repay the US$170 million ANKOR loan, including accrued interest. ANKOR is a fully-owned subsidiary of KNOC. The related party loans are unsecured and the loan agreements contain no restrictive covenants.
On December 22, 2016, KNOC converted all its outstanding loans to common shares of Harvest. The carrying value of the loans plus accrued interest at December 22, 2016 of $722.2 million was converted to equity and $10.3 million previously recognized in contributed surplus relating to these loans were transferred to shareholder’s capital. As a result, 72.7 million common shares were issued to KNOC. As at December 31, 2016 there were no related party loans outstanding. This transaction provides significant savings to Harvest by reducing interest expense by approximately $40.0 million annually, improves the company’s balance sheet, and is further evidence of KNOC’s continuing financial support of Harvest.
| Transactions | | | Balance Outstanding | |
| | | Three Months Ended | | | Twelve Months Ended | | | Accounts Receivable as at | | | Accounts Payable as at | |
| | | December 31 | | | December 31 | | | December 31 | | | December 31 | | | December 31 | | | December 31 | |
| | | 2016 | | | 2015 | | | 2016 | | | 2015 | | | 2016 | | | 2015 | | | 2016 | | | 2015 | |
| G&A Expenses | | | | | | | | | | | | | | | | | | | | | | | | |
| KNOC(1) | | 0.1 | | | (1.0 | ) | | 0.4 | | | (5.6 | ) | | 0.1 | | | — | | | 0.4 | | | 0.8 | |
| Finance costs | | | | | | | | | | | | | | | | | | | | | | | | |
| KNOC(2) | | 2.3 | | | 4.1 | | | 9.0 | | | 7.5 | | | — | | | — | | | 1.7 | | | 3.5 | |
| (1) | The Global Technology and Research Centre (“GTRC”) was used as a training and research facility for KNOC. The GTRC was closed at the end of 2015. Amounts relate to the reimbursement from KNOC for general and administrative expenses incurred by the GTRC. Also included is Harvest’s reimbursement to KNOC for secondee salaries paid by KNOC on behalf of Harvest. |
| (2) | Charges from KNOC for the irrevocable and unconditional guarantee they provided on Harvest’s 2⅛% and 2⅓% senior notes and the senior unsecured credit facility. A guarantee fee of 52 basis points per annum is charged by KNOC on the 2⅛% senior notes and 37 basis points per annum on the credit facility. |
During the year ended December 31, 2016, Harvest entered into an agreement with KNOC to drill a well and provide technical data to KNOC. KNOC initially provided Harvest with $5.3 million in cash, and any additional amounts incurred relating to the well will be billed to KNOC for reimbursement up to a maximum of 9.4 billion Korean won equivalent. The initial funds of $5.3 million provided by KNOC was recorded in contributed surplus.
The Company identifies its related party transactions by making inquiries of management and the Board of Directors, reviewing KNOC’s subsidiaries and associates, and performing a comprehensive search of transactions recorded in the accounting system. Material related party transactions require the Board of Directors’ approval. Also see note 12, “Investment in Joint Ventures” in the December 31, 2016 audited consolidated financial statements for details of related party transactions with DBP and HKMS.
27
| MANAGEMENT’S DISCUSSION AND ANALYSIS |
CAPITAL RESOURCES
The following table summarizes Harvest’s capital structure and provides the key financial ratios defined in the credit facility agreement.
| | | December 31, 2016 | | | December 31, 2015 | |
| Credit facility(1) | | 893.5 | | | 926.6 | |
| 6⅞% senior notes (US$282.5 million)(1)(2)(4) | | 379.3 | | | 692.0 | |
| 2⅛% senior notes (US$630 million)(1)(2) | | 845.9 | | | 871.9 | |
| 2⅓% senior notes (US$195.8 million)(2) | | 262.9 | | | — | |
| Related party loans (US$355.8 million and CAD$200 million)(2)(3) | | — | | | 601.4 | |
| | | 2,381.6 | | | 3,091.9 | |
| Shareholder's equity (deficiency) | | | | | | |
| 458,766,467 (2015 - 386,078,649) common shares issued | | 104.0 | | | (275.3 | ) |
| | | 2,485.6 | | | 2,816.6 | |
| (1) | Excludes capitalized financing fees |
| (2) | Face value converted at the period end exchange rate |
| (3) | As at December 31, 2015, related party loans comprised of US$170 million from ANKOR, US$120 million from KNOC and $200 million from KNOC. |
| (4) | As at December 31, 2015, there were US$500 million of 6⅞% senior notes outstanding |
On June 16, 2016 Harvest completed an exchange of a significant portion of its 6⅞% senior notes due 2017 for new 2⅓% senior notes due 2021, at an exchange ratio of US$900 principal amount of the new 2⅓% senior notes for each US$1,000 principal amount of the old 6⅞% senior notes. US$217.5 million of the old 6⅞% senior notes was exchanged for US$195.8 million new 2⅓% senior notes. The extinguishment of the old 6⅞% senior notes resulted in a gain of $36.0 million. The transaction provides significant saving to Harvest by reducing interest expense by US$9.9 million annually, as well as reduction in principal of US $21.7 million.
During 2015, Harvest amended its $1 billion syndicated revolving credit facility and replaced it with a KNOC guaranteed $1.0 billion revolving credit facility that matures on April 30, 2017, with a syndicate of nine financial institutions. A guarantee fee of 0.37% per annum of the principal balance is payable to KNOC semi-annually.
Under the amended credit facility, applicable interest and fees are based on a margin pricing grid based on the Moody’s and S&P credit ratings of KNOC. The financial covenants under the previous credit facility were deleted and replaced with a new covenant: Total Debt to Capitalization ratio of 70% or less. At December 31, 2015, Harvest was in violation of the debt covenant and the carrying value of the credit facility, $923.8 million, was reclassified from long-term debt to a current liability. On February 5, 2016 Harvest’s syndicate banks consented to a waiver of this covenant for the duration of the term of the credit facility and the maturity date remains at April 30, 2017, and the credit facility was classified as current as at December 31, 2016.
On February 17, 2017, Harvest entered into an agreement with a Korean based bank that allows Harvest to borrow $500 million through a three year fixed rate term loan. Once drawn, proceeds from the term loan will be used to repay credit facility borrowings. In addition, as at February 23, 2017, Harvest has received formal commitments for a new three year $500 million revolving credit facility with a syndicate of banks that will replace the Company’s $1 billion revolving credit facility. Both the term loan and new syndicated revolving credit facility are guaranteed by KNOC and are both expected to close on February 24, 2017. The new syndicated revolving credit facility is secured by a first floating charge over all of the assets of Harvest and its material subsidiaries and contains no financial covenants.
28
| MANAGEMENT’S DISCUSSION AND ANALYSIS |
LIQUIDITY
The Company’s liquidity needs are met through the following sources: cash generated from operations, proceeds from asset dispositions, joint arrangements, borrowings under the credit facility, related party loans, long-term debt issuances and capital injections by KNOC. Harvest’s primary uses of funds are operating expenses, capital expenditures, and interest and principal repayments on debt instruments.
Cash generated from operating activities for the three months ended December 31, 2016 was $15.1 million (2015 – $21.0 million cash used in operations). The increase in the fourth quarter of 2016 is mainly a result of reduced expenses and changes in working capital requirement partially offset by increased interest expense. Cash used in operating activities for the twelve months ended December 31, 2016 was $33.3 million (2015 – $35.4 million). The increase in the twelve months of 2016 is mainly a result of lower revenues partially offset by reduced expenses, foreign exchange gains, and changes in working capital requirement.
Cash contributions from Harvest’s Conventional operations for the fourth quarter and December 31, 2016 was $33.3 million and $74.6 million, respectively (2015 – $29.8 million and $154.3 million). The fourth quarter increase in cash contributions is primarily due to decreased operating costs and royalties, which was partially offset by lower sales volumes and increased transportation costs. The twelve month decrease in cash contribution was mainly due to lower sales volumes and lower realized prices, partially offset by lower operating expenses, and general and administrative expenses.
Harvest funded capital expenditures for the fourth quarter and twelve months ended December 31, 2016 of $15.6 million and $20.9 million, respectively (2015 – $22.9 million and $249.6 million) with the proceeds from property dispositions and borrowings under both the credit facility and KNOC subordinated loan.
Harvest’s net drawings from the credit facility was $6.8 million (2015 – $44.1 million) during the fourth quarter ended December 31, 2016. Harvest made a net repayment of $42.1 million during the twelve month period ended December 31, 2016 (2015 – $304.4 million net drawings).
Harvest had a working capital deficiency of $1,370.9 million as at December 31, 2016, as compared to a $1,070.5 million deficiency at December 31, 2015, mainly due to long term debt with a 2017 maturity date becoming a current obligation in the year, which was partially offset by repayments to the credit facility. Harvest is in consultation with KNOC about the 6⅞% senior note refinancing plans in October 2017. Harvest’s working capital is expected to fluctuate from time to time, and will be funded from cash flows from operations and borrowings from the credit facility managing the collection and payment of accounts receivables and accounts payables respectively and using the proceeds from possible sale of assets, as required.
29
| MANAGEMENT’S DISCUSSION AND ANALYSIS |
Harvest ensures its liquidity through the management of its capital structure, seeking to balance the amount of debt and equity used to fund investment in each of our operating segments. Harvest evaluates its capital structure using the same financial covenant ratios as the ones that were externally imposed under the Company’s credit facility and the senior notes. The Company continually monitors its credit facility covenants and actively takes steps, such as reducing borrowings, increasing capitalization, amending or renegotiating covenants as and when required.
In response to the low commodity price environment, Harvest constrained its capital expenditures in 2016, focusing on capital maintenance and regulatory activities. Harvest also continues to postpone first steam for the Oil Sands project in response to the unfavourable heavy oil prices and will continually assess the commodity price environment to determine when to complete commissioning of the CPF and first steam injection.
On February 17, 2017, Harvest entered into an agreement with a Korean based bank that allows Harvest to borrow $500 million through a three year fixed rate term loan. Once drawn, proceeds from the term loan will be used to repay credit facility borrowings. In addition, as at February 23, 2017, Harvest has received formal commitments for a new three year $500 million revolving credit facility with a syndicate of banks that will replace the Company’s $1 billion revolving credit facility. Both the term loan and new syndicated revolving credit facility are guaranteed by KNOC and are both expected to close on February 24, 2017. The new syndicated revolving credit facility is secured by a first floating charge over all of the assets of Harvest and its material subsidiaries and contains no financial covenants.
Harvest is a significant subsidiary for KNOC in terms of production and reserves. KNOC has directly or indirectly invested and provided financial support to Harvest since 2009 and, as at the date of preparation of this MD&A, it is the Company’s expectation that such support will continue.
Contractual Obligations and Commitments
Harvest has recurring and ongoing contractual obligations and estimated commitments entered into in the normal course of operations. As at December 31, 2016, Harvest has the following significant contractual obligations and estimated commitments:
| | | Payments Due by Period | |
| | | 1 year | | | 2-3 years | | | 4-5 years | | | After 5 years | | | Total | |
| Debt repayments(1) | | 1,273.2 | | | 845.9 | | | 262.9 | | | — | | | 2,382.0 | |
| Debt interest payments(1)(2) | | 60.6 | | | 25.4 | | | 10.6 | | | — | | | 96.6 | |
| Purchase commitments(3) | | 20.5 | | | 19.0 | | | 19.0 | | | 33.1 | | | 91.6 | |
| Operating leases | | 6.8 | | | 15.7 | | | 17.0 | | | 28.8 | | | 68.3 | |
| Firm processing commitments | | 14.8 | | | 24.4 | | | 17.9 | | | 34.4 | | | 91.5 | |
| Firm transportation agreements | | 25.0 | | | 53.2 | | | 32.2 | | | 47.0 | | | 157.4 | |
| Employee benefits(4) | | 1.5 | | | 0.3 | | | — | | | — | | | 1.8 | |
| Decommissioning and environmental liabilities(5) | | 9.7 | | | 56.1 | | | 73.4 | | | 1,094.1 | | | 1,233.3 | |
| Total | | 1,412.1 | | | 1,040.0 | | | 433.0 | | | 1,237.4 | | | 4,122.5 | |
| (1) | Assumes constant foreign exchange rate. |
| (2) | Assumes interest rates as at December 31, 2016 will be applicable to future interest payments. |
30
| MANAGEMENT’S DISCUSSION AND ANALYSIS |
| (3) | Relates to the Oil Sands deferred payment under the EPC contract (see “Oil Sands” section of this MD&A for details), and revised estimated capital costs for the Bellshill area (see “Impairment of Property, Plant & Equipment” section of this MD&A for details). |
| (4) | Relates to the long-term incentive plan payments. |
| (5) | Represents the undiscounted obligation by period. |
Environmental Initiatives Impacting Harvest
Subsequent to year end, on January 1, 2017, the provincial government of Alberta implemented an economy wide carbon emissions tax. The tax was set at $20 per tonne and is expected to increase to $30 per tonne on January 1, 2018. In addition, as part of their Climate Leadership Plan, they implemented an oil sands emission production cap of 100 megatonnes a year, have a plan to phase out of coal-fired power production by 2030, and initiated a program to reduce methane gas emissions by 45% from Alberta’s oil and gas operations by the year 2025. Harvest anticipates these initiatives will result in an increase in the cost of operating its properties located in Alberta.
Off Balance Sheet Arrangements
See “Investments in Joint Ventures” section in this MD&A and note 12, “Investment in Joint Ventures” in the December 31, 2016 audited consolidated financial statements.
SUMMARY OF QUARTERLY RESULTS
The following table and discussion highlights the fourth quarter of 2016 results relative to the preceding 8 quarters:
| | | 2016 | | | 2015 | | | 2014 | |
| | | Q4 | | | Q3 | | | Q2 | | | Q1 | | | Q4 | | | Q3 | | | Q2 | | | Q1 | | | Q4 | |
| FINANCIAL | | | | | | | | | | | | | | | | | | | | | | | | | | | |
| Revenue, Conventional | | 84.4 | | | 65.8 | | | 72.7 | | | 64.4 | | | 97.1 | | | 120.4 | | | 130.8 | | | 113.3 | | | 175.5 | |
| Revenue, Downstream(1) | | — | | | — | | | — | | | — | | | — | | | — | | | — | | | — | | | 321.2 | |
| Total Revenues and other income(2) | | 84.4 | | | 65.8 | | | 72.7 | | | 64.4 | | | 97.1 | | | 120.4 | | | 130.8 | | | 113.3 | | | 496.7 | |
| | | | | | | | | | | | | | | | | | | | | | | | | | | | |
| Net loss from continuing operations | | (162.5 | ) | | (106.9 | ) | | (65.7 | ) | | (13.1 | ) | | (894.2 | ) | | (588.7 | ) | | (87.0 | ) | | (223.5 | ) | | (275.8 | ) |
| Net loss from discontinued operations | | — | | | — | | | — | | | — | | | (15.5 | ) | | — | | | — | | | — | | | (61.7 | ) |
| Net loss | | (162.5 | ) | | (106.9 | ) | | (65.7 | ) | | (13.1 | ) | | (909.7 | ) | | (588.7 | ) | | (87.0 | ) | | (223.5 | ) | | (337.5 | ) |
| | | | | | | | | | | | | | | | | | | | | | | | | | | | |
| OPERATIONS | | | | | | | | | | | | | | | | | | | | | | | | | | | |
| Continuing Operations | | | | | | | | | | | | | | | | | | | | | | | | | | | |
| Daily sales volumes (boe/d) | | 26,589 | | | 30,051 | | | 34,440 | | | 36,986 | | | 38,141 | | | 43,356 | | | 41,716 | | | 43,770 | | | 42,539 | |
| Realized price prior to hedging ($/boe) | | 37.06 | | | 28.03 | | | 26.50 | | | 20.86 | | | 27.89 | | | 31.47 | | | 37.85 | | | 31.85 | | | 47.99 | |
| Discontinued Operations(1) | | | | | | | | | | | | | | | | | | | | | | | | | | | |
| Average daily throughput (bbl/d) | | — | | | — | | | — | | | — | | | — | | | — | | | — | | | — | | | 76,455 | |
| Average refining gross margin (US$/bbl)(3) | | — | | | — | | | — | | | — | | | — | | | — | | | — | | | — | | | 2.76 | |
| (1) | Downstream operations have been classified as “Discontinued Operations” as a result of disposition on |
| (2) | This is a non-GAAP measure; please refer to “Non-GAAP Measures” in this MD&A. |
| (3) | Excludes volumes from the DBP |
31
| MANAGEMENT’S DISCUSSION AND ANALYSIS |
The quarterly revenues and cash from operating activities are mainly impacted by the Conventional sales volumes, realized prices and operating expenses and previously, Downstream throughput volumes, cost of feedstock and refined product prices. Significant items that impacted Harvest’s quarterly revenues include:
| | • | Total revenues were highest in the fourth quarter of 2014, as a result of high daily sales volumes and revenue from Downstream refinery, and lowest in the first quarter of 2016 due to reduced commodity prices. |
| | • | The declines in Conventional’s sales volumes since 2014 were mainly due to asset dispositions and a capital program that was insufficient to offset declines in production. |
Net loss reflects both cash and non-cash items. Changes in non-cash items including deferred income tax, DD&A expense, accretion of decommissioning and environmental remediation liabilities, accretion of onerous contracts, impairment of long-lived assets, unrealized foreign exchange gains and losses, and unrealized gains and losses on derivative contracts impact net loss from period to period. For these reasons, the net loss may not necessarily reflect the same trends as revenues or cash from operating activities, nor is it expected to. The net loss from continuing operations in the fourth quarter of 2016 is mainly a result of a $17.4 million write off of exploration and evaluation assets, and $51.8 million of foreign exchange losses on the company’s U.S. denominated debt. The net loss from continuing operations in the third quarter of 2016 is mainly a result of lower realized prices and sales volumes. The net loss from continuing operations in the second quarter of 2016 is mainly a result of lower realized prices and sales volumes, and a $10.6 million loss from joint ventures. The net loss from continuing operations in the first quarter of 2016 is mainly a result of lower realized prices and sales volumes, and an $18.5 million loss from joint ventures. The net loss from continuing operations in the fourth quarter of 2015 is mainly a result of lower realized prices and sales volumes, a $620.1 million impairment expense, and a $71.5 million loss from joint ventures. The net loss from continuing operations in the third quarter of 2015 is mainly a result of lower realized prices and sales volumes and a $542.0 million impairment expense. The net loss from continuing operations in the second quarter of 2015 is mainly a result of a result of lower realized prices and sales volumes and a $70.7 million impairment expense. The net loss from continuing operations in the first quarter of 2015 was mainly a result of lower realized prices and sales volumes, a $140.5 million foreign exchange loss and a $23.5 million impairment expense. The net loss from continuing operations in the fourth quarter of 2014 was mainly due to the $267.6 million impairment expense.
32
| MANAGEMENT’S DISCUSSION AND ANALYSIS |
SELECTED ANNUAL INFORMATION
| | | Year Ended December 31 | |
| | | 2016 | | | 2015 | | | 2014 | |
| Revenue, Conventional | | 287.3 | | | 461.6 | | | 896.3 | |
| Revenue, Downstream(1) | | — | | | — | | | 3,432.1 | |
| Total revenues and other income(2) | | 287.3 | | | 461.6 | | | 4,328.4 | |
| | | | | | | | | | |
| Net loss from continuing operations | | (348.2 | ) | | (1,793.4 | ) | | (85.6 | ) |
| Net loss from discontinued operations | | — | | | (15.5 | ) | | (354.6 | ) |
| Net loss | | (348.2 | ) | | (1,808.9 | ) | | (440.2 | ) |
| | | | | | | | | | |
| | | | | | | | | | |
| | | | | | | | | | |
| Total assets | | 3,374.9 | | | 3,928.1 | | | 5,091.6 | |
| Total financial liabilities, non-current(3)(4) | | 1,172.8 | | | 2,252.2 | | | 2,374.8 | |
| (1) | Downstream operations for 2014 ended on November 13, 2014 and have been classified as “Discontinued Operations”. |
| (2) | This is an additional GAAP measure; please refer to “Additional GAAP Measures” in this MD&A. |
| (3) | Total financial liabilities, non-current consists of the non-current portion of long-term debt, related party loans and long-term liability. |
| (4) | This is a non-GAAP measure; please refer to “Non-GAAP Measures” in this MD&A. |
Revenues and other income have decreased since 2014, mainly due to the decrease in Conventional sales volumes and realized prices, as well as discontinued Downstream operations.
Total assets have decreased since 2014 due to the impairment charges recorded of $1,523.9 million and $179.3 million for the years ended December 31, 2015 and 2014, respectively, the sale of Conventional assets in 2014, 2015 and 2016, and the sale of the Downstream segment in 2014, which was partially offset by a 2016 impairment reversal of $38.8 million.
The decrease in non-current financial liabilities in 2016 is due primarily to the conversion of $722.2 million of related party debt to equity, and the reclassification of $379.7 million in long term senior notes as current which was partially offset by changes in the liabilities denominated in US dollars due to movement in the foreign currency exchange rates.
CRITICAL ACCOUNTING ESTIMATES
The preparation of financial statements in conformity with IFRS requires management to make judgments, estimates and assumptions that affect the application of accounting policies and the reported amounts of assets, liabilities, income and expenses. Actual results may differ from these estimates. Estimates and underlying assumptions are reviewed on an ongoing basis. Revisions to accounting estimates are recognized in the period in which the estimates are revised and in any future periods affected. Harvest has identified the following areas where significant estimates and judgments are required. Further information on each of these areas and how they impact various accounting policies are described below and also in relevant notes to the audited consolidated financial statements. Changes in estimates are accounted for prospectively.
33
| MANAGEMENT’S DISCUSSION AND ANALYSIS |
Judgment is required to determine whether or not Harvest has joint control over an arrangement, which requires an assessment of the relevant activities and when the decisions in relation to those activities require unanimous consent. Harvest has determined that the relevant activities for its joint arrangements are those relating to the operating and capital decisions of the arrangement, such as approval of the capital expenditure program. The considerations made in determining joint control are similar to those necessary to determine control over subsidiaries. Refer to note 5 of the audited consolidated financial statements for more details.
In addition, judgment is required in determining whether joint arrangement structured through a separate vehicle is a joint operation or joint venture and involves determining whether the legal form and contractual arrangements give the Company direct rights to the assets and obligations for the liabilities. Other facts and circumstances are also assessed by management, including but not limited to, the Company’s rights to the economic benefits of assets and its involvement and responsibility for settling liabilities associated with the arrangement. This often requires significant judgment. A different conclusion about both joint control and whether the arrangement is a joint venture or joint operation may materially impact the accounting.
On April 23, 2014, Harvest entered into two joint arrangements with KERR Canada Co. Ltd. (“KERR”): Deep Basin Partnership (“DBP”) and HK MS Partnership (“HKMS”) (also see note 12 of the audited consolidated financial statements). Unanimous consent must be obtained from the shareholders for decisions about relevant activities that impact the returns on investment. Such activities include but are not limited to the approval of the overall capital program and budget. Based on management’s assessment, Harvest concluded that both joint arrangements are joint ventures as neither KERR nor Harvest has a direct interest in the underlying assets or liabilities. These joint ventures have been recognized using the equity method of accounting. However, based on the terms of the agreement, which provide for differing proportions of earnings based on ownership percentages that are not representative of the economic substance, Harvest cannot simply apply its percentage ownership to pick up the net income from these joint ventures. Therefore, Harvest applies a hypothetical liquidation at book value (“HLBV”) method to calculate its equity share of net income for each reporting period. HLBV takes a balance sheet approach in calculating the earnings Harvest should recognize based on the change in Harvest’s economic interest in the net assets in the partnerships under the provisions of the joint venture agreements in a liquidation scenario.
The provision for depletion and depreciation of Conventional assets is calculated on the unit-of-production method based on proved developed reserves. As well, reserve estimates impact net income through the application of impairment tests. Provision for Conventional and Oil Sands’ decommissioning liability may change as changes in reserve lives affect the timing of decommissioning activities. The recognition and carrying value of deferred income tax assets relating to Conventional and Oil Sands may change as reserve estimates impact Harvest’s estimates of the likely recoverability of such assets.
34
| MANAGEMENT’S DISCUSSION AND ANALYSIS |
The process of estimating reserves is complex and requires significant judgments based on available geological, geophysical, engineering and economic data. In the process of estimating the recoverable oil and natural gas reserves and related future net cash flows, Harvest incorporates many factors and assumptions, such as:
| • | expected reservoir characteristics based on geological, geophysical and engineering assessments; |
| • | future production rates based on historical performance and expected future operating and investment activities; |
| | • | future commodity prices and quality differentials; |
| | • | discount rates; and |
| | • | future development costs. |
As the economic assumptions used may change, such changes may impact the reported financial position and results, which include E&E, PP&E, goodwill, DD&A, provisions for decommissioning liabilities and deferred tax assets.
On an annual basis, the Company engages qualified, independent reserves evaluators to evaluate Harvest’s reserves data.
Significant judgment is required to determine the future economic benefits of the oil and gas assets and in turn, to derive the proper DD&A estimate. This includes the interpretation and application of reserves estimates, the selection of the reserves base for the unit of production (“UOP”) calculation and the matching of capitalized costs with the benefit of production. The calculation of the UOP rate of DD&A will be impacted to the extent that actual production in the future is different from current forecasted production based on total proved reserves or future development cost estimate changes.
| (c) | Impairment of long-lived assets |
Long-lived assets (goodwill and PP&E) are aggregated into CGUs based on their ability to generate largely independent cash inflows and are used for impairment testing. The determination of the Company's CGUs is subject to significant judgment; product type, internal operational teams, geology and geography were key factors considered when grouping Harvest’s oil and gas assets into the CGUs.
PP&E is tested for impairment when indications of impairment exist. PP&E impairment indicators include declines in commodity prices, production, reserves and operating results, cost overruns and construction delays. The determination of whether such indicators exist requires significant judgment.
E&E impairment indicators include expiration of the right to explore and cessation of exploration in specific areas, lack of potential for commercial viability and technical feasibility and when E&E costs are not expected to be recovered from successful development of an area. The determination of whether such indicators exist requires significant judgment and directly impact the timing and amount of impairment. These assumptions may change as new information become available. If, after E&E expenditure is capitalized, information becomes available suggesting that the recovery of the expenditure is unlikely, the relevant capitalized amount is written off in the statement of comprehensive loss in the period when the new information becomes available.
35
| MANAGEMENT’S DISCUSSION AND ANALYSIS |
The recoverable amounts of CGUs and individual assets are determined based on the higher of VIU calculations and estimated FVLCD. To determine the recoverable amounts under VIU, Harvest uses reserve estimates for both the Conventional and Oil Sands operating segments. The estimates of reserves, future commodity prices, discount rates, operating expenses and future development costs require significant judgments. FVLCD is determined using judgments, see note 5(c) of the audited consolidated financial statements for further discussion.
In the determination of the decommissioning liability provision and provision for onerous contract, management is required to make a significant number of estimates and assumptions with respect to activities that will occur in the future including the ultimate amounts and timing of settlements, inflation factors, discount rates, emergence of new restoration techniques and expected changes in legal, regulatory, environmental and political environments. A change in any one of the assumptions could impact the estimated future obligation and in return, net income and in the case of decommissioning liabilities, PP&E. The provisions at the reporting date represents management’s best estimate of the present value of the future decommissioning costs required.
Tax interpretations, regulations and legislation in the various jurisdictions in which Harvest and its subsidiaries operate are subject to change. The Company is also subject to income tax audits and reassessments which may change its provision for income taxes. Therefore, the determination of income taxes is by nature complex, and requires making certain estimates and assumptions.
Harvest recognizes the net deferred tax benefit related to deferred tax assets to the extent that it is probable that the deductible temporary differences will reverse in the foreseeable future. Assessing the recoverability of deferred tax assets requires the Company to make significant estimates related to expectations of future taxable income. Estimates of future taxable income are based on forecast cash flows from operations (which are impacted by production and sales volumes, oil and natural gas prices, reserves, operating costs, capital expenditures, general and administrative expenses and finance costs) and the judgment about the application of existing tax laws in each jurisdiction. To the extent that future cash flows and taxable income differ significantly from estimates, the ability of the Company to realize the net deferred tax assets recorded at the reporting date could be impacted.
| (f) | Fair value measurements |
Significant judgment is required to determine what assumptions market participants would use to price an asset or a liability, such as forward prices, foreign exchange rates and discount rates. A fair value measurement of a non-financial asset takes into account a market participant's ability to generate economic benefits by using the asset in its highest and best use or by selling it to another market participant that would use the asset in its highest and best use. To determine “highest and best use” requires further judgment. Changes in estimates and assumptions about these inputs could affect the reported fair value.
36
| MANAGEMENT’S DISCUSSION AND ANALYSIS |
RECENT ACCOUNTING PRONOUNCEMENTS
On May 28, 2014, the IASB issued IFRS 15 “Revenue from Contracts with Customers”, which specifies how and when to recognize revenue as well as requiring entities to provide users of financial statements with more disclosure. In April 2016, the IASB issued its final amendments that provide new examples and clarification on how the principles should be applied. The standard supersedes IAS 18 “Revenue”, IAS 11 “Construction Contracts”, and related interpretations. IFRS 15 will be effective for annual periods beginning January 1, 2018. Application of the standard is mandatory and early adoption is permitted. Harvest is currently evaluating the impact of adopting IFRS 15 on its consolidated financial statements.
On July 24, 2014, the IASB issued IFRS 9 “Financial Instruments” to replace IAS 39 “Financial Instruments: Recognition and Measurement”. IFRS 9 includes revised guidance on the classification and measurement of financial instruments, including a new expected credit loss model for calculating impairment on financial assets, and the new general hedge accounting. No changes were introduced for the classification and measurement of financial liabilities, except for the recognition of changes in own credit risk in other comprehensive income for liabilities designated at fair value through profit or loss. IFRS 9 is effective for years beginning on or after January 1, 2018. Harvest is currently evaluating the impact of adopting IFRS 9 on its consolidated financial statements.
In January 2016, the IASB issued IFRS 16 “Leases” to replace IAS 17 “Leases”. IFRS 16 requires lessees to recognize most leases on the statement of financial position using a single recognition and measurement model. IFRS 16 will be effective for annual periods beginning on or after January 1, 2019, with earlier adoption permitted if the entity is also applying IFRS 15. IFRS 16 will be applied by Harvest on January 1, 2019. Harvest is currently evaluating the impact on its consolidated financial statements.
OPERATIONAL AND OTHER BUSINESS RISKS FOR CONTINUING OPERATIONS
Harvest’s Conventional and Oil Sands operations are conducted in the same business environment as most other operators in the respective businesses and the business risks are very similar. Harvest has a risk management committee that meets on a regular basis to assess and manage operational and business risks and has a corporate Environment, Health and Safety (“EH&S”) policy. For further risk discussion, refer to Harvest’s AIF, which can be found on SEDAR atwww.sedar.com. The Harvest management team is focused on long-term strategic planning and has identified the key risks and uncertainties associated with the business that could impact the financial results. The following summarizes the significant risks:
Risks Associated with Commodity Prices
| | • | Prices received for petroleum and natural gas have fluctuated widely in recent years. Natural gas prices have experienced significant declines since 2010 and crude oil prices have experienced a sharp decline since 2014. Crude oil differentials continue to be volatile due to pipeline and infrastructure constraints. Decreases in commodity prices could reduce Harvest’s earnings and cash flow and could resulted in shut-in of certain producing properties. Low commodity prices and/or wide crude oil differentials may also result in asset impairment. Commodity prices are determined by economic, political and supply and demand factors. Harvest manages commodity price risks by entering into various commodity price risk management contracts. Refer to the “Cash Flow Risk Management” section of this MD&A for further information. To the extent that Harvest engages in risk management activities related to commodity prices, it will be subject to credit risks associated with the counterparties of the contracts. |
37
| MANAGEMENT’S DISCUSSION AND ANALYSIS |
Risk Associated with Refinancing
| | • | Harvest currently has a $1 billion financial covenant based syndicated revolving credit facility with nine financial institutions that matures on April 30, 2017. On February 17, 2017, Harvest entered into an agreement with a Korean based bank that allows Harvest to borrow $500 million through a three year fixed rate term loan. Once drawn, proceeds from the term loan will be used to repay credit facility borrowings. In addition, as at February 23, 2017, Harvest has received formal commitments for a new three year $500 million revolving credit facility with a syndicate of banks that will replace the Company’s $1 billion revolving credit facility. Both the term loan and new syndicated revolving credit facility are guaranteed by KNOC and are both expected to close on February 24, 2017. The new syndicated revolving credit facility is secured by a first floating charge over all of the assets of Harvest and its material subsidiaries and contains no financial covenants. In the event that Harvest is unable to fund future principal repayments on its term loan, it could impact Harvest’s ability to fund its ongoing operations. |
| | • | Harvest currently has $1,488.1 million of long-term fixed interest rate debt outstanding with require repayments in 2017 through to 2021. Harvest intends to fund these principal repayments with issuance of new long-term debt. In the event that Harvest is unable to fund future principal repayments, it could impact Harvest’s ability to fund its ongoing operations. |
Risks Associated with Operations
| • | The markets for petroleum and natural gas produced in western Canada are dependent upon available capacity to refine crude oil and process natural gas as well as pipeline or other methods to transport the products to consumers. |
| • | Exploration and development activities may not yield anticipated production, and the associated cost outlay may not be recovered. |
| • | Pipeline capacity and natural gas liquids fractionation capacity in Alberta has not kept pace with the drilling of liquid rich gas properties in some areas of the province which may limit production periodically. |
| • | The production of petroleum and natural gas may involve a significant use of electrical power which has been volatile in price since deregulation of the electric system in Alberta. Increases in power prices reduce our cash flow and earnings. From time to time, Harvest may enter into electricity price swaps to manage our exposure to power price volatility. |
| • | Certain of Harvest’s properties are held in the form of licences and leases and working interests in licences and leases. If Harvest or the holder of the licence or lease fails to meet the specific requirements of a licence or lease, the licence or lease may terminate or expire. |
| • | Aboriginal peoples have claimed aboriginal title and rights in portions of western Canada. Harvest is not aware that any claims have been made in respect of its properties and assets. However, if a claim arose and was successful, such claim may have a material adverse effect on Harvest's business, financial condition, results of operations and prospects. |
38
| MANAGEMENT’S DISCUSSION AND ANALYSIS |
| • | Decommissioning liabilities are calculated using estimated costs and timelines based upon current operational plans, technology and reclamation practices, and environmental regulations. These factors are subject to change and such changes may impact the actual timing and amount of Harvest’s decommissioning costs. |
Risks Associated with Reserve Estimates
| • | The reservoir and recovery information in reserve reports prepared by independent reserve evaluators are estimates and actual production and recovery rates may vary from the estimates and the variations may be significant. The actual production and ultimate reserves and resources from Harvest’s properties maybe greater or less than the estimates prepared. |
| • | Reserve and resource reports are prepared using certain commodity price assumptions for crude oil, natural gas, and natural gas liquids. If Harvest’s realized price for the commodity are lower than the estimated amount, then the amount of reserves and resources and cash flows generated would be reduced and the decrease could be significant. |
| • | Prices paid for acquisitions are based in part on reserve report estimates and the assumptions made preparing the reserve reports are subject to change as well as geological and engineering uncertainty. The actual reserves acquired may be lower than expected, which could adversely impact our cash flow and earnings. |
Risks Associated with the Oil Sands Project
| • | The BlackGold Oil Sands project is exposed to the risks associated with major construction projects. These risks include the possibility that the project will not achieve the design objectives. This would have a significant impact on the financial results of the project. |
| • | When operational, the BlackGold Oil Sands project will be subject to similar operating risks described above in “Risks associated with operations” such as: refinery and transportation constraints and the cost of Alberta Power. |
Risks Associated with Acquisitions and Dispositions
| • | Harvest makes acquisitions and dispositions of businesses and assets in the ordinary course of business. Achieving the benefits of acquisitions depends in part on successfully consolidating functions and integrating operations and procedures in a timely and efficient manner as well as the Harvest's ability to realize the anticipated growth opportunities and synergies from combining the acquired businesses and operations with those of Harvest. |
| • | Non-core assets are periodically disposed of, so that Harvest can focus its efforts and resources more efficiently. Depending on the state of the market for such non-core assets, certain non-core assets, if disposed of, could be expected to realize less than their carrying value on the financial statements. |
39
| MANAGEMENT’S DISCUSSION AND ANALYSIS |
Risks Associated with Environment, Health & Safety (“EH&S”)
| • | The operations of petroleum and natural gas properties involves a number of operating and natural hazards which may result in health and safety incidents, environmental damage and other unexpected and/or dangerous conditions. |
| • | The operations of petroleum and natural gas properties are subject to environmental regulation pursuant to local, provincial and federal legislation. Changes in these regulations could have a material adverse effect as regards to operating costs and capital costs. A breach of such legislation may result in the imposition of fines as well as higher operating standards that may increase costs. |
| • | Harvest’s corporate EH&S program has a number of specific policies and practices to minimize the risk of safety hazards and environmental incidents. It also includes an emergency response program should an incident occur. If areas of higher risk are identified, Harvest will undertake to analyze and recommend changes to reduce the risk including replacement of specific infrastructure. In addition, our business units conduct emergency response training on a regular basis in all of our operating fields to ensure a high level of response capability when placed in a challenging situation. Harvest also performs safety and environmental audits of our operating facilities. In addition to the above, Harvest maintains business interruption insurance, commercial general liability insurance as well as specific environmental liability insurance, in amounts consistent with industry standards. |
| • | Harvest carries industry standard property and liability insurance on its Conventional operations. Losses associated with potential incidents described above could exceed insurance coverage limits. |
Risks Associated with Liquidity
| • | Absent capital reinvestment or acquisition, Harvest’s reserves and production levels from petroleum and natural gas properties will decline over time as a result of natural declines. As a result, cash generated from operating these properties may decline. |
| • | Fluctuations in interest rates and the U.S./Canada exchange rate on our current and/or future financing arrangements may result in significant increases in our borrowing costs. |
| • | Harvest is required to comply with covenants under the credit facility and the senior notes. In 2016, the syndicate of financial institutions consented to waive the credit facility financial covenant. In the event that the Company does not comply with the covenants, its access to capital may be restricted or repayment may be required. |
| • | Although the Company monitors the credit worthiness of third parties it contracts with through a formal risk management policy, there can be no assurance that the Company will not experience a loss for nonperformance by any counterparty with whom it has a commercial relationship. Such events may result in material adverse consequences on the business of the Company. |
| • | Harvest’s ability to make scheduled repayments or refinance its debt obligations will depend upon its financial and operating performance, which in turn will partially depend upon prevailing industry and general economic conditions. There can be no assurance that our operating performance, cash flow and capital resources will be sufficient to service and/or repay the Company’s debt in the future, in which case the Company may sell assets, enter into joint ventures with 3rd parties to support current and future capital projects, defer capital expenditures, and/or raise additional debt, to the extent available. |
40
| MANAGEMENT’S DISCUSSION AND ANALYSIS |
Harvest monitors its cash flow projections and covenants on a routine basis and will adjust its development plans accordingly in response to changes in commodity prices and cash flows. Harvest has sought financial support from KNOC as and when required, while KNOC has demonstrated its commitment to support Harvest through liquidity injections and guarantees, in the event KNOC withdraws or curtails its future financial support, this could result in material adverse consequences to Harvest. Harvest has also postponed first steam for the BlackGold Oil Sands project in response to the unfavourable heavy oil prices and will continually assess the commodity price environment to determine when to complete commissioning of the CPF and first steam injection.
Risks Associated with Investment in Joint Arrangement
| • | As KERR has the ability to cause DBP and HKMS to redeem all its preferred partnership units for consideration equal to its initial contribution plus a minimum after-tax internal rate of return of two percent, there is a risk that Harvest would have to meet this obligation if DBP does not have sufficient funds to complete the redemption obligation. This obligation could also arise upon the termination of this arrangement. |
General Business Risks
| • | The operation of petroleum and natural gas properties requires physical access for people and equipment on a regular basis which could be affected by weather, accidents, government regulations or third party actions. |
| • | Skilled labor is necessary to run operations (both those employed directly by Harvest and by our contractors) and there is a risk that we may have difficulty in sourcing skilled labor which could lead to increased operating and capital costs. |
| • | The loss of a member of our senior management team and/or key technical operations employee could result in a disruption to our operations. |
| • | In the future, Harvest may acquire or move into new industry related activities or new geographical areas or may acquire different energy related assets, and as a result may face unexpected risks or alternatively, significantly increase Harvest’s exposure to one or more existing risk factors, which may in turn result in the Harvest’s future operational and financial conditions being adversely affected. |
| • | Conventional’s crude oil sales and a large portion of Harvest’s long-term debt are denominated in US dollars while the Company incurs operating and capital costs in Canadian dollars which results in a currency exchange exposure. |
| • | The operations of Harvest operate under permits issued by the federal and provincial governments and these permits must be renewed periodically. The federal and provincial governments may make operating requirements more stringent which may require additional spending. |
| • | Income tax laws, other laws or government incentive programs relating to the oil and gas industry, may in the future be changed or interpreted in a manner that affects Harvest or its stakeholders. |
| • | In the normal course of operations, Harvest may become involved in, named as a party to, or be the subject of, various legal proceedings, including regulatory proceedings, tax proceedings and legal actions, related to personal injuries, property damage, property tax, land rights, the environment and contract disputes. The outcome of outstanding, pending or future proceedings cannot be predicted with certainty and it is possible that there could be material adverse developments in pending or future proceedings and as a result, could have a material adverse effect on Harvest’s assets, liabilities, business, financial condition and results of operations. |
41
| MANAGEMENT’S DISCUSSION AND ANALYSIS |
| • | Harvest may disclose confidential information relating to its business, operations or affairs while discussing potential business relationships or other transactions with third parties. Although confidentiality agreements are signed by third parties prior to the disclosure of any confidential information, a breach could put us at competitive risk and may cause significant damage to the business. The harm to the business from a breach of confidentiality cannot presently be quantified, but may be material and may not be compensable in damages. |
CHANGES IN REGULATORY ENVIRONMENT
The oil and gas industry is subject to extensive regulations imposed by many levels of government in Canada. Harvest currently operates in Alberta and British Columbia, both of which have different legislations and royalty programs which may be amended from time to time. A change in the royalty programs or legislations may have adverse impacts on Harvest’s future earnings and cash flows.
DISCLOSURE CONTROLS AND PROCEDURES
Under the supervision of the Chief Executive Officer and Chief Financial Officer, the Company has evaluated the effectiveness of its disclosure controls and procedures as of December 31, 2016 as defined under the rules adopted by the Canadian securities regulatory authorities and the U.S. Securities and Exchange Commission. Based on this evaluation, the Chief Executive Officer and Chief Financial Officer have concluded that as of December 31, 2016, the disclosure controls and procedures were effective to ensure that information required to be disclosed by Harvest in reports that it files or submits to Canadian and U.S. securities authorities was recorded, processed, summarized and reported within the time period specified in Canadian and U.S. securities laws and was accumulated and communicated to management, including its Chief Executive Officer and Chief Financial Officer, to allow timely decisions regarding required disclosures.
INTERNAL CONTROL OVER FINANCIAL REPORTING
The Company’s Chief Executive Officer (“CEO”) and Chief Financial Officer (“CFO”) are responsible for establishing and maintaining disclosure controls and procedures (“DC&P”) and internal control over financial reporting (“ICFR”) as defined under National Instrument 52-109 – Certification of Disclosure in Issuers’ Annual and Interim Filings. The Company’s DC&P are designed to provide reasonable assurance that (i) material information relating to the Company is made known to management by others, particularly during the period in which the annual filings are being prepared; and (ii) information required to be disclosed by the Company in its annual filings, interim filings or other reports filed or submitted by it under securities legislation is recorded, processed, summarized and reported within the time periods specified in securities legislation. The Company’s ICFR are designed to provide reasonable assurance regarding the reliability of financial reporting and preparation of financial statements for external purposes in accordance with IFRS as issued by IASB. The Company’s CEO and CFO have evaluated, or caused to be evaluated under their supervision, the design and operation of the Company’s DC&P and ICFR as of December 31, 2016. The evaluation was based on the Internal Control – Integrated Framework issued by the Committee of Sponsoring Organizations of the Treadway Commission (2013). Based on the evaluation, the CEO and CFO concluded that the Company’s internal control over financial reporting was effective as of December 31, 2016.
42
| MANAGEMENT’S DISCUSSION AND ANALYSIS |
There were no significant changes in internal controls over financial reporting for the year ended December 31, 2016 that have materially affected, or are reasonably likely to materially affect, our internal controls over financial reporting.
Because of its inherent limitations, disclosure controls and procedures and internal control over financial reporting may not prevent or detect misstatements, errors or fraud. Control systems, no matter how well conceived or operated, can provide only reasonable, but not absolute, assurance that the objectives of the control systems are met.
NON-GAAP MEASURES
Throughout this MD&A, Harvest uses certain terms or performance measure commonly used in the oil and natural gas industry that are not defined under IFRS (hereinafter also referred to as “GAAP”). These non-GAAP measures do not have any standardized meaning prescribed by IFRS and therefore may not be comparable with the calculation of similar measures of other companies. The data presented is intended to provide additional information and should not be considered in isolation or as a substitute for measures of performance prepared in accordance with IFRS. These non-IFRS measures should be read in conjunction with the Company’s audited consolidated financial statements and the accompanying notes. The determination of the non-GAAP measures have been illustrated throughout this MD&A, with reconciliations to IFRS measures and/or account balances, except for cash contribution (deficiency) which is shown below.
BOE presentation
Boe means barrel of oil equivalent. All boe conversions in this MD&A are derived by converting gas to oil at the ratio of six thousand cubic feet (“Mcf”) of natural gas to one barrel (“Bbl”) of oil. Boe may be misleading, particularly if used in isolation. A Boe conversion rate of 1 Bbl : 6 Mcf is based on an energy equivalency conversion method primarily applicable at the burner tip and does not represent a value equivalency at the wellhead. Given that the value ratio of oil compared to natural gas based on currently prevailing prices is significantly different than the energy equivalency ratio of 1 Bbl : 6 Mcf, utilizing a conversion ratio of 1 Bbl : 6 Mcf may be misleading as an indication of value.
“Operating income (loss)” and “pre-operating loss” is a non-GAAP measure which Harvest uses as a performance measure to provide comparability of financial performance between periods excluding non-operating items. Harvest also uses this measure to assess and compare the performance of its operating segments. The amounts disclosed in the MD&A reconcile to segmented information in the financial statements.
“Operating netbacks” is calculated on a per boe basis and include revenues, operating expenses, transportation and marketing expenses, and realized gains or losses on derivative contracts. Operating netback is utilized by Harvest and other to analyze the operating performance of its oil and natural gas assets.
43
| MANAGEMENT’S DISCUSSION AND ANALYSIS |
“Total debt to total capitalization” is a term defined in Harvest’s amended credit facility agreement for the purpose of calculation of the financial covenant. The non-GAAP measures do not have any standardized meaning prescribed by GAAP and may not be comparable to similar measures used by other issuers.
“Cash contribution (deficiency) from operations”is calculated as operating income (loss) adjusted for non-cash items. The measure demonstrates the ability of the each segment of Harvest to generate the cash from operations necessary to repay debt, make capital investments, and fund the settlement of decommissioning and environmental remediation liabilities. Cash contribution (deficiency) from operations represents operating income (loss) adjusted for non-cash expense items within: operating, general and administrative, exploration and evaluation, depletion, depreciation and amortization, gains on disposition of assets, derivative contracts gains or losses, impairment and other charges, and the inclusion of cash interest, realized foreign exchange gains or losses and other cash items not included in operating income (loss). The measure demonstrates the ability of Harvest’s Conventional segment to generate cash from operations and is calculated before changes in non-cash working capital. The most directly comparable additional GAAP measure is operating income (loss). Operating income (loss) as presented in the notes to Harvest’s consolidated financial statements is reconciled to cash contribution (deficiency) from operations below.
44
| MANAGEMENT’S DISCUSSION AND ANALYSIS |
| | | Three Months Ended December 31 | |
| | | Conventional | | | Oilsands | | | Total | |
| | | 2016 | | | 2015 | | | 2016 | | | 2015 | | | 2016 | | | 2015 | |
| Operating loss Adjustments: | | (71.4 | ) | | (569.7 | ) | | (3.5 | ) | | (235.1 | ) | | (74.9 | ) | | (804.8 | ) |
| Loss from joint ventures | | 8.1 | | | 71.5 | | | — | | | — | | | 8.1 | | | 71.5 | |
| Operating, non-cash | | 5.8 | | | — | | | — | | | — | | | 5.8 | | | — | |
| General and administrative, non-cash | | (0.1 | ) | | (0.5 | ) | | — | | | — | | | (0.1 | ) | | (0.5 | ) |
| Exploration and evaluation, non-cash | | 17.4 | | | 22.3 | | | — | | | — | | | 17.4 | | | 22.3 | |
| Depletion, depreciation and amortization | | 86.4 | | | 118.2 | | | 0.1 | | | 0.2 | | | 86.5 | | | 118.4 | |
| (Gains) losses on disposition of assets | | (0.3 | ) | | (4.5 | ) | | — | | | — | | | (0.3 | ) | | (4.5 | ) |
| Unrealized losses on derivative contracts | | (12.2 | ) | | 1.4 | | | — | | | — | | | (12.2 | ) | | 1.4 | |
| Loss on onerous contract | | 1.3 | | | — | | | — | | | — | | | 1.3 | | | — | |
| Impairment and other charges, non-cash | | (1.7 | ) | | 391.1 | | | — | | | 229.0 | | | (1.7 | ) | | 620.1 | |
| Cash contribution (deficiency) from operations | | 33.3 | | | 29.8 | | | (3.4 | ) | | (5.9 | ) | | 29.9 | | | 23.9 | |
| Inclusion of items not attributable to segments: | | | | | | | | | | | | | | | | | | |
| Net cash interest | | | | | | | | | | | | | | (25.4 | ) | | (26.7 | ) |
| Realized foreign exchange gains | | | | | | | | | | | | | | (6.3 | ) | | (1.3 | ) |
| Consolidated cash contribution from operations | | | | | | | | | | | | | | (1.8 | ) | | (4.1 | ) |
| Loss on disposition of Downstream subsidiary | | | | | | | | | | | | | | — | | | (15.5 | ) |
| Other non-cash items | | | | | | | | | | | | | | (2.2 | ) | | (6.5 | ) |
| Change in non-cash working capital | | | | | | | | | | | | | | 19.2 | | | 5.2 | |
| Cash from (used in) operating activities | | | | | | | | | | | | | | 15.2 | | | (20.9 | ) |
| | | Twelve Months Ended December 31 | |
| | | Conventional | | | Oilsands | | | Total | |
| | | 2016 | | | 2015 | | | 2016 | | | 2015 | | | 2016 | | | 2015 | |
| Operating loss Adjustments: | | (265.2 | ) | | (1,167.9 | ) | | (13.5 | ) | | (508.7 | ) | | (278.7 | ) | | (1,676.6 | ) |
| Loss from joint ventures | | 43.8 | | | 97.3 | | | — | | | — | | | 43.8 | | | 97.3 | |
| Operating, non-cash | | 6.1 | | | (0.9 | ) | | — | | | — | | | 6.1 | | | (0.9 | ) |
| General and administrative, non-cash | | 0.8 | | | 12.4 | | | — | | | — | | | 0.8 | | | 12.4 | |
| Exploration and evaluation, non-cash | | 19.9 | | | 27.5 | | | — | | | — | | | 19.9 | | | 27.5 | |
| Depletion, depreciation and amortization | | 289.1 | | | 418.1 | | | 0.6 | | | 0.5 | | | 289.7 | | | 418.6 | |
| (Gains) losses on disposition of assets | | (35.2 | ) | | 1.7 | | | — | | | — | | | (35.2 | ) | | 1.7 | |
| Unrealized (gains) losses on derivative contracts | | 3.6 | | | 0.8 | | | — | | | — | | | 3.6 | | | 0.8 | |
| Loss on onerous contract | | 10.7 | | | — | | | — | | | — | | | 10.7 | | | — | |
| Impairment and other charges, non-cash | | 1.0 | | | 765.3 | | | — | | | 491.0 | | | 1.0 | | | 1,256.3 | |
| Cash contribution (deficiency) from operations | | 74.6 | | | 154.3 | | | (12.9 | ) | | (17.2 | ) | | 61.7 | | | 137.1 | |
| Inclusion of items not attributable to segments: | | | | | | | | | | | | | | | | | | |
| Net cash interest | | | | | | | | | | | | | | (92.4 | ) | | (81.7 | ) |
| Realized foreign exchange losses (gains) | | | | | | | | | | | | | | 16.1 | | | (2.1 | ) |
| Consolidated cash contribution from operations | | | | | | | | | | | | | | (14.6 | ) | | 53.3 | |
| Loss on disposition of Downstream subsidiary | | | | | | | | | | | | | | — | | | (15.5 | ) |
| Other non-cash items | | | | | | | | | | | | | | (6.5 | ) | | (7.0 | ) |
| Change in non-cash working capital | | | | | | | | | | | | | | (12.2 | ) | | (66.2 | ) |
| Cash from (used in) operating activities | | | | | | | | | | | | | | (33.3 | ) | | (35.4 | ) |
45
| MANAGEMENT’S DISCUSSION AND ANALYSIS |
FORWARD-LOOKING INFORMATION
This MD&A highlights significant business results and statistics from the consolidated financial statements for the three months and twelve months ended December 31, 2016 and the accompanying notes thereto. In the interest of providing Harvest’s lenders and potential lenders with information regarding Harvest, including the Company’s assessment of future plans and operations, this MD&A contains forward-looking statements that involve risks and uncertainties.
Such risks and uncertainties include, but are not limited to: risks associated with conventional petroleum and natural gas operations; risks associated with the construction of the oil sands project; the volatility in commodity prices, interest rates and currency exchange rates; risks associated with realizing the value of acquisitions; general economic, market and business conditions; changes in environmental legislation and regulations; the availability of sufficient capital from internal and external sources; and, such other risks and uncertainties described from time to time in regulatory reports and filings made with securities regulators. The impact of any one risk, uncertainty or factor on a particular forward-looking statement is not determinable with certainty as these factors are interdependent, and management’s future course of action would depend on the assessment of all information at that time. Please also refer to “Operational and Other Business Risks” in this MD&A and “Risk Factors” in the Annual Information Form for detailed discussion on these risks.
Forward-looking statements in this MD&A include, but are not limited to: commodity prices, price risk management activities, acquisitions and dispositions, capital spending and allocation of such to various projects, reserve estimates and ultimate recovery of reserves, potential timing and commerciality of Harvest’s capital projects, the extent and success rate of Conventional and Oil Sands drilling programs, the ability to achieve the maximum capacity from the Oil Sands central processing facilities, availability of the credit facility, access and ability to raise capital, ability to maintain debt covenants, debt levels, recovery of long-lived assets, the timing and amount of decommission and environmental related costs, income taxes, cash from operating activities, regulatory approval of development projects and regulatory changes. For this purpose, any statements that are contained herein that are not statements of historical fact may be deemed to be forward-looking statements. Forward-looking statements often contain terms such as “may”, “will”, “should”, “anticipate”, “expect”, “target”, “plan”, “potential”, “intend”, and similar expressions.
All of the forward-looking statements in this MD&A are qualified by the assumptions that are stated or inherent in such forward-looking statements. Although Harvest believes that these assumptions are reasonable based on the information available to us on the date such assumptions were made, this list is not exhaustive of the factors that may affect any of the forward-looking statements and the reader should not place an undue reliance on these assumptions and such forward-looking statements. The key assumptions that have been made in connection with the forward-looking statements include the following: that the Company will conduct its operations and achieve results of operations as anticipated; that its development plans and sustaining maintenance programs will achieve the expected results; the general continuance of current or, where applicable, assumed industry conditions; the continuation of assumed tax, royalty and regulatory regimes; the accuracy of the estimates of the Company’s reserve volumes; commodity price, operation level, and cost assumptions; the continued availability of adequate cash flow and debt and/or equity financing to fund the Company’s capital and operating requirements as needed; and the extent of Harvest’s liabilities. Harvest believes the material factors, expectations and assumptions reflected in the forward-looking statements are reasonable, but no assurance can be given that these factors, expectations and assumptions will prove to be correct.
46
| MANAGEMENT’S DISCUSSION AND ANALYSIS |
Although management believes that the forward-looking information is reasonable based on information available on the date such forward-looking statements were made, no assurances can be given as to future results, levels of activity and achievements. Therefore, readers are cautioned not to place undue reliance on forward-looking statements as the plans, intentions or expectations upon which the forward-looking information is based might not occur. Forward-looking statements contained in this MD&A are expressly qualified by this cautionary statement.
ADDITIONAL INFORMATION
Further information about us can be accessed under our public filings found on SEDAR atwww.sedar.com or atwww.harvestenergy.ca. Information can also be found by contacting our Investor Relations department at (403) 265-1178 or at 1-866-666-1178.
47