Exhibit 99.3
 | MANAGEMENT’S DISCUSSION AND ANALYSIS |
REVIEW OF OVERALL PERFORMANCE
Upstream
Sales volumes increased by 10,771 boe/d to 58,548 boe/d from the third quarter of 2010 primarily due to additional production from recently acquired properties, partially offset by production reductions due to the Plains Rainbow Pipeline outage for two months during the quarter. Plains Midstream Canada received final approval from the ERCB to resume operations of the Rainbow Pipeline on August 26, 2011.
Harvest’s operating netback was $30.96/boe prior to hedging for the third quarter of 2011, an increase of 3% from the same quarter in 2010, reflecting higher realized commodity prices in oil and natural gas liquids partially offset by an increase in operating expense. Operating netback after hedging totaled $175.6 million ($32.60/boe) as compared to $130.9 million ($29.76/boe) in the same quarter of 2010. The increase in operating netback after hedging is primarily due to higher commodity prices and sales volumes and gains from hedging activities, partially offset by an increase in operating costs.
Capital spending of $190.6 million includes the drilling of 69.0 gross (55.6 net) wells with a success rate of 100%. In the third quarter of 2010, capital expenditures of $90.1 million included drilling of 27.0 gross (23.0 net) wells.
Downstream
Throughput volume averaged 41,756 bbl/d as compared to 96,514 bbl/d in the same quarter of 2010 due to a planned shutdown of the refinery units that started in May and was substantially completed in mid- August. Refining gross margin averaged $10.44/bbl in the third quarter of 2011, an increase of $7.42/bbl from the same quarter in 2010.
Operating loss totaled $20.3 million in the third quarter of 2011 as compared to an operating loss of $30.8 million in the same quarter of 2010. The decrease in operating losses is primarily due to higher refinery margins in 2011.
Capital spending was $100.1 million, an increase of $78.6 million from the same quarter in 2010. During the third quarter of 2011 and 2010, $15.9 million and $12.3 million, respectively, were spent on the debottlenecking project. The remaining increase in capital spending is mainly due to the capitalization of plant turnaround costs of $44.6 million and catalyst replacements of $6.0 million.
A new Supply and Offtake Agreement (“SOA”) was signed on October 11, 2011 with Macquarie Energy Canada Ltd. to supply feedstocks and purchase certain finished products from the Company effective November 1, 2011. The prior contract with Vitol Refining S.A. (“Vitol”) terminated at the end of October 2011.
1
| MANAGEMENT’S DISCUSSION AND ANALYSIS |
UPSTREAM OPERATIONS
Summary of Financial and Operating Results
| | | Three Months Ended September 30 | | | Nine Months Ended September 30 | |
| | | 2011 | | | 2010 | | | Change | | | 2011 | | | 2010 | | | Change | |
FINANCIAL | | | | | | | | | | | | | | | | | | |
Petroleum and natural gas sales(1) | $ | 318,731 | | $ | 231,694 | | | 38% | | $ | 923,238 | | $ | 748,992 | | | 23% | |
Royalties | | (46,996 | ) | | (33,698 | ) | | 39% | | | (139,415 | ) | | (116,655 | ) | | 20% | |
Revenues | | 271,735 | | | 197,996 | | | 37% | | | 783,823 | | | 632,337 | | | 24% | |
| | | | | | | | | | | | | | | | | | |
Operating expenses | | 88,121 | | | 63,362 | | | 39% | | | 254,031 | | | 195,944 | | | 30% | |
Transportation and marketing | | 9,758 | | | 2,485 | | | 293% | | | 23,886 | | | 6,760 | | | 253% | |
Realized loss (gain) on risk management contracts(2) | | (1,707 | ) | | 1,277 | | | (234% | ) | | (3,915 | ) | | 1,090 | | | (459% | ) |
Operating netback after hedging(2)(3) | | 175,563 | | | 130,872 | | | 34% | | | 509,821 | | | 428,543 | | | 19% | |
| | | | | | | | | | | | | | | | | | |
General and administrative expenses | | 14,621 | | | 9,720 | | | 50% | | | 42,960 | | | 33,863 | | | 27% | |
Depreciation, depletion and amortization | | 137,070 | | | 118,320 | | | 16% | | | 386,348 | | | 352,459 | | | 10% | |
Exploration and evaluation | | 831 | | | 759 | | | 9% | | | 11,286 | | | 3,288 | | | 243% | |
Loss (gain) on disposition of property, plant and equipment | | (65 | ) | | 407 | | | (116% | ) | | (745 | ) | | (612 | ) | | 22% | |
| $ | 23,106 | | $ | 1,666 | | | 1,287% | | $ | 69,972 | | $ | 39,545 | | | 77% | |
| | | | | | | | | | | | | | | | | | |
Capital asset additions (excluding acquisitions) | $ | 190,597 | | $ | 90,138 | | | 111% | | $ | 553,747 | | $ | 255,959 | | | 116% | |
Property and business acquisitions (dispositions) | $ | (2,582 | ) | $ | 146,481 | | | (102% | ) | $ | 513,327 | | $ | 176,453 | | | 191% | |
Abandonment and reclamation expenditures | $ | 5,923 | | $ | 5,796 | | | 2% | | $ | 12,172 | | $ | 13,813 | | | (12% | ) |
| | | | | | | | | | | | | | | | | | |
OPERATING | | | | | | | | | | | | | | | | | | |
Light / medium oil (bbl/d) | | 23,621 | | | 22,886 | | | 3% | | | 23,805 | | | 24,076 | | | (1% | ) |
Heavy oil (bbl/d) | | 8,825 | | | 9,235 | | | (4% | ) | | 8,807 | | | 9,192 | | | (4% | ) |
Natural gas liquids (bbl/d) | | 5,392 | | | 2,465 | | | 119% | | | 4,935 | | | 2,537 | | | 95% | |
Natural gas (mcf/d) | | 124,259 | | | 79,147 | | | 57% | | | 109,265 | | | 80,222 | | | 36% | |
Total (boe/d) | | 58,548 | | | 47,777 | | | 23% | | | 55,758 | | | 49,175 | | | 13% | |
| (1) | Inclusive of the effective portion of Harvest’s realized crude oil hedges. |
| (2) | Realized loss (gain) on risk management contracts includes the settlement amounts for power derivative contracts and the ineffective portion of realized crude oil hedges. |
| (3) | This is a non-GAAP measure; please refer to “Non-GAAP Measures” in this MD&A. |
2
| MANAGEMENT’S DISCUSSION AND ANALYSIS |
Commodity Price Environment
| | Three Months Ended | | | Nine Months Ended | |
| | September 30 | | | September 30 | |
| | 2011 | | | 2010 | | | Change | | | 2011 | | | 2010 | | | Change | |
West Texas Intermediate crude oil (US$ per barrel) | | 89.76 | | | 76.20 | | | 18% | | | 95.48 | | | 77.65 | | | 23% | |
Edmonton light crude oil ($ per barrel) | | 91.90 | | | 74.52 | | | 23% | | | 94.40 | | | 76.64 | | | 23% | |
Bow River blend crude oil ($ per barrel) | | 72.01 | | | 63.97 | | | 13% | | | 75.53 | | | 68.03 | | | 11% | |
AECO natural gas daily ($ per mcf) | | 3.66 | | | 3.55 | | | 3% | | | 3.76 | | | 4.13 | | | (9% | ) |
Canadian / U.S. dollar exchange rate | | 1.020 | | | 0.962 | | | 6% | | | 1.023 | | | 0.965 | | | 6% | |
| | | | | | | | | | | | | | | | | | |
Differential Benchmarks | | | | | | | | | | | | | | | | | | |
Bow River blend differential to Edmonton Par ($/bbl) | $ | 19.89 | | $ | 10.55 | | | 89% | | $ | 18.87 | | $ | 8.62 | | | 119% | |
Bow River blend differential as a % of Edmonton Par | | 21.6% | | | 14.2% | | | 52% | | | 20.0% | | | 11.2% | | | 79% | |
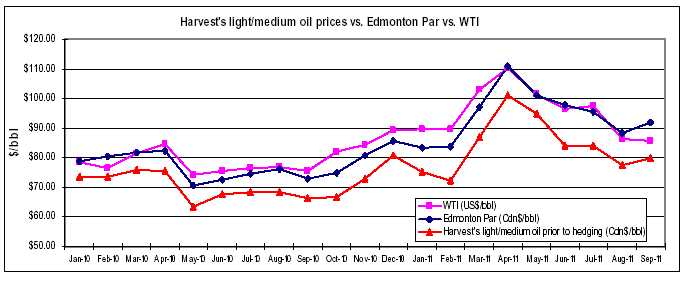
The average WTI benchmark price for the three and nine months ended September 30, 2011 was 18% and 23% higher than the same periods in 2010, respectively. The average Edmonton light crude oil price (“Edmonton Par”) increased in the third quarter as well as for the nine months ended September 30, 2011 due to the higher WTI prices and improvement of the light sweet differential in the third quarter of 2011, partially offset by the strong Canadian dollar.
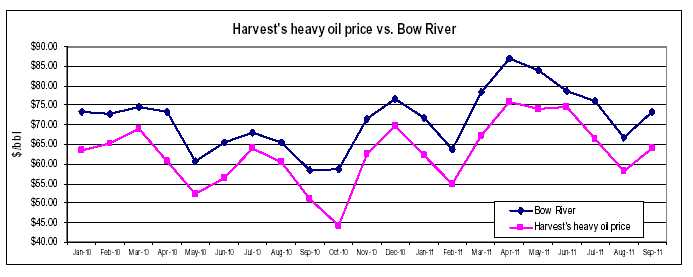
During the three and nine months ended September 30, 2011, the Bow River heavy oil differential relative to Edmonton Par widened, as compared to the same periods in 2010. Heavy oil differentials fluctuate based on a combination of factors including the level of heavy oil inventories, pipeline capacity to deliver heavy crude to U.S. markets and the seasonal demand for heavy oil. The Bow River blend crude oil price (“Bow River”) increased in 2011 with the higher WTI price, and was partially offset by the stronger Canadian dollar and wider Bow River differential.
Realized Commodity Prices
| | Three Months Ended | | | Nine Months Ended | |
| | September 30 | | | September 30 | |
| | 2011 | | | 2010 | | | Change | | | 2011 | | | 2010 | | | Change | |
Light to medium oil prior to hedging ($/bbl) | | 80.43 | | | 67.71 | | | 19% | | | 84.08 | | | 70.30 | | | 20% | |
Heavy oil ($/bbl) | | 62.84 | | | 58.52 | | | 7% | | | 66.28 | | | 60.33 | | | 10% | |
Natural gas liquids ($/bbl) | | 67.51 | | | 53.85 | | | 25% | | | 67.10 | | | 58.15 | | | 15% | |
Natural gas ($/mcf) | | 3.97 | | | 3.74 | | | 6% | | | 3.98 | | | 4.35 | | | (9% | ) |
Average realized price prior to hedging ($/boe)(2) | | 57.85 | | | 52.71 | | | 10% | | | 61.21 | | | 55.79 | | | 10% | |
| | | | | | | | | | | | | | | | | | |
Light to medium oil after hedging ($/bbl)(1) | | 83.71 | | | 67.71 | | | 24% | | | 82.77 | | | 70.30 | | | 18% | |
Average realized price after hedging ($boe)(1) | | 59.17 | | | 52.71 | | | 12% | | | 60.65 | | | 55.79 | | | 9% | |
| (1) | Inclusive of the effective portion of the realized gain (loss) from crude oil contracts designated as hedges. Foreign exchange swaps and power contracts are excluded from the realized price. |
| (2) | Inclusive of sulphur revenue. |
Prior to hedging activities, our realized prices for light to medium oil for the three and nine months ended September 30, 2011 increased by 19% and 20%, respectively, compared to the same periods in 2010. This is consistent with the upward movement in Edmonton Par prices for the three and nine months ended September 30, 2011.
3
| MANAGEMENT’S DISCUSSION AND ANALYSIS |
In order to manage commodity price volatility effects on cash flow, Harvest has entered into various crude oil fixed-for-floating swaps. The impact of this hedging activity resulted in an increase of $3.28/bbl (2010 – $nil) in Harvest’s realized light to medium oil price to $83.71/bbl in the third quarter of 2011, and a decrease of $1.31/bbl (2010 - $nil) for the nine months ended September 30, 2011. Please see “Cash Flow Risk Management” section in this MD&A for further discussion with respect to our cash flow risk management program.
Harvest’s realized heavy oil prices for the three and nine months ended September 30, 2011 increased by 7% and 10% respectively, mainly due to the increase in the Bow River prices.
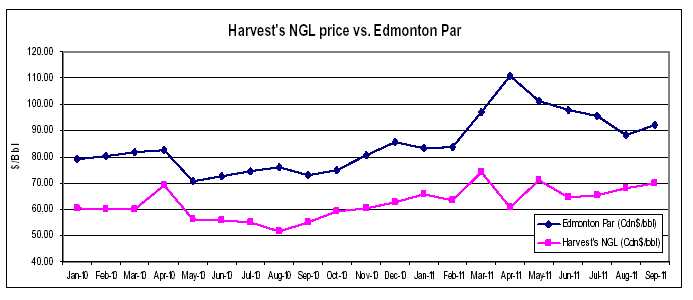
For the three and nine months ended September 30, 2011, our realized prices for natural gas liquids increased by 25% and 15%, respectively, reflecting the increase in natural gas liquids commodity prices.
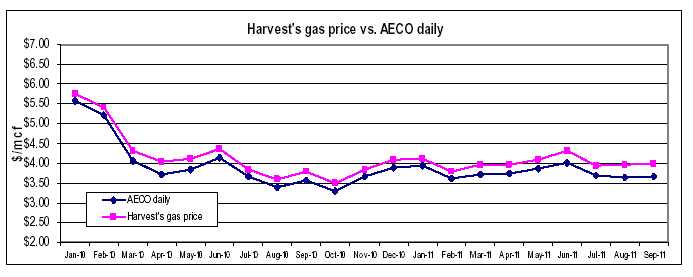
The realized prices for Harvest’s natural gas production increased by 6% in the third quarter of 2011 and decreased by 9% for the first nine months of 2011 compared to the same periods in 2010, reflecting the movement in AECO benchmark prices.
4
| MANAGEMENT’S DISCUSSION AND ANALYSIS |
5
| MANAGEMENT’S DISCUSSION AND ANALYSIS |
Sales Volumes
| | Three Months Ended September 30 | |
| | 2011 | | | 2010 | | | | |
| | Volume | | | Weighting | | | Volume | | | Weighting | | | % Volume | |
| | | | | | | | | | | | | | Change | |
Light to medium oil (bbl/d)(1) | | 23,621 | | | 40% | | | 22,886 | | | 48% | | | 3% | |
Heavy oil (bbl/d) | | 8,825 | | | 15% | | | 9,235 | | | 19% | | | (4% | ) |
Natural gas liquids (bbl/d) | | 5,392 | | | 9% | | | 2,465 | | | 5% | | | 119% | |
Total liquids (bbl/d) | | 37,838 | | | 64% | | | 34,586 | | | 72% | | | 9% | |
Natural gas (mcf/d) | | 124,259 | | | 36% | | | 79,147 | | | 28% | | | 57% | |
Total oil equivalent (boe/d) | | 58,548 | | | 100% | | | 47,777 | | | 100% | | | 23% | |
| | | | | | | | | | | | | | | |
| | Nine Months Ended September 30 | |
| | 2011 | | | 2010 | | | | |
| | Volume | | | Weighting | | | Volume | | | Weighting | | | % Volume | |
| | | | | | | | | | | | | | Change | |
Light to medium oil (bbl/d)(1) | | 23,805 | | | 43% | | | 24,076 | | | 49% | | | (1% | ) |
Heavy oil (bbl/d) | | 8,807 | | | 16% | | | 9,192 | | | 19% | | | (4% | ) |
Natural gas liquids (bbl/d) | | 4,935 | | | 9% | | | 2,537 | | | 5% | | | 95% | |
Total liquids (bbl/d) | | 37,547 | | | 68% | | | 35,805 | | | 73% | | | 5% | |
Natural gas (mcf/d) | | 109,265 | | | 32% | | | 80,222 | | | 27% | | | 36% | |
Total oil equivalent (boe/d) | | 55,758 | | | 100% | | | 49,175 | | | 100% | | | 13% | |
| (1) | Harvest classifies our oil production, except that produced from Hay River, as light to medium and heavy according to NI 51-101 guidance. The oil produced from Hay River has an average API of 24o(medium grade) and is classified as a light to medium oil; notwithstanding that, it benefits from a heavy oil royalty regime and therefore would be classified as heavy oil according to NI 51-101. |
Total sales volumes were 58,548 boe/d for the third quarter of 2011 and 55,758 boe/d for the first nine months of 2011, an increase of 23% and 13% respectively, compared to the same periods in 2010. These increases are primarily attributable to the acquisition of assets at the end of the third quarter of 2010 and the acquisition of the Hunt assets at the end of February 2011.
 | Harvest’s light/medium oil sales for the third quarter of 2011 were 23,621 bbl/d, a 735 bbl/d (3%) increase from the same quarter in 2010. Sales volumes increased due to the third quarter 2010 acquisition and the Hunt acquisition in the first quarter of 2011, partially offset by the Plains Rainbow Pipeline outage for two months in the third quarter. Approval to resume operations of the pipeline was received by Plains on August 26, 2011. Harvest’s year-to-date 2011 light/medium oil sales volumes were consistent with 2010. |
6
| MANAGEMENT’S DISCUSSION AND ANALYSIS |
Heavy oil sales decreased by 4% for the three and nine months ended September 30, 2011 compared to the same periods in 2010. The decreases are primarily due to natural declines. | 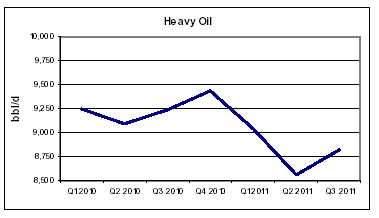 |
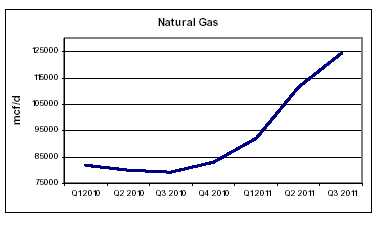 | Natural gas sales averaged 124,259 mcf/d during the third quarter of 2011 reflecting a 45,112 mcf/d (57%) increase from the third quarter of 2010. For the nine months ended September 30, 2011 natural gas sales increased by 29,043 mcf/d (36%), compared to 2010. These increases are mainly due to the acquisition of Hunt assets at the end of February 2011. |
Natural gas liquids sales for the three and nine months ended September 30, 2011 increased by 119% and 95% respectively, compared to the same periods in 2010. Similar to the increases in natural gas sales volumes, these increases are mainly due to the acquisition of Hunt assets at the end of February 2011. | 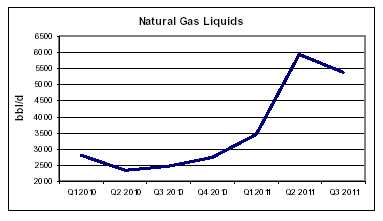 |
7
| MANAGEMENT’S DISCUSSION AND ANALYSIS |
Revenues
| | | Three Months Ended September 30 | | | Nine Months Ended September 30 | |
| | | 2011 | | | 2010 | | | Change | | | 2011 | | | 2010 | | | Change | |
Light / medium oil sales after hedging(1) | $ | 181,913 | | $ | 142,557 | | | 28% | | $ | 537,903 | | $ | 462,093 | | | 16% | |
Heavy oil sales | | 51,025 | | | 49,719 | | | 3% | | | 159,350 | | | 151,397 | | | 5% | |
Natural gas sales | | 45,333 | | | 27,205 | | | 67% | | | 118,716 | | | 95,223 | | | 25% | |
Natural gas liquids sales | | 33,492 | | | 12,195 | | | 175% | | | 90,404 | | | 40,148 | | | 125% | |
Other(2) | | 6,968 | | | 18 | | | 38,611% | | | 16,865 | | | 131 | | | 12,774% | |
Petroleum and natural gas sales | | 318,731 | | | 231,694 | | | 38% | | | 923,238 | | | 748,992 | | | 23% | |
Royalties | | (46,996 | ) | | (33,698 | ) | | 39% | | | (139,415 | ) | | (116,655 | ) | | 20% | |
Revenues | $ | 271,735 | | $ | 197,996 | | | 37% | | $ | 783,823 | | $ | 632,337 | | | 24% | |
| (1) | Inclusive of realized gain (loss) from crude oil contracts designated as hedges. Foreign exchange swaps and power contracts are excluded from the sales revenue. |
| (2) | Inclusive of sulphur revenue and miscellaneous income. |
Harvest’s revenue is subject to changes in sales volumes, commodity prices and currency exchange rates. In the third quarter of 2011, total petroleum and natural gas sales increased by $87.0 million, compared to the third quarter of 2010. The 38% increase is attributable to the increase of 12% in realized prices after hedging activities and 23% in sales volumes combined with the increase in sulphur revenue from the acquisition of Hunt assets at the end of February 2011.
For the first nine months of 2011, total petroleum and natural gas sales increased by $174.2 million (23%), also reflecting the increase in realized prices after hedging activities, sales volumes and sulphur revenue.
Royalties
Harvest pays Crown, freehold and overriding royalties to the owners of mineral rights from which production is generated. These royalties vary for each property and product and our Crown royalties are based on a sliding scale dependent on production volumes and commodity prices.
Royalties as a percentage of gross revenue for the three and nine months ended September 30, 2011 were relatively consistent with the same periods in 2010 at 14.7% (2010 – 14.5%) and 15.1% (2010 – 15.6%), respectively.
8
| MANAGEMENT’S DISCUSSION AND ANALYSIS |
Operating Expenses
| | | Three Months Ended September 30 | |
| | | | | | | | | | | | | | | Per BOE | |
| | | 2011 | | | Per BOE | | | 2010 | | | Per BOE | | | Change | |
| Operating expense | | | | | | | | | | | | | | | |
| Power and fuel | $ | 22,854 | | $ | 4.24 | | $ | 11,977 | | $ | 2.72 | | $ | 1.52 | |
| Well servicing | | 10,797 | | | 2.00 | | | 12,815 | | | 2.92 | | | (0.92 | ) |
| Repairs and maintenance | | 16,113 | | | 2.99 | | | 11,950 | | | 2.72 | | | 0.27 | |
| Lease rentals and property tax | | 9,280 | | | 1.72 | | | 7,575 | | | 1.72 | | | - | |
| Labor - internal | | 7,551 | | | 1.40 | | | 5,484 | | | 1.25 | | | 0.15 | |
| Labor - contract | | 5,085 | | | 0.95 | | | 3,903 | | | 0.89 | | | 0.06 | |
| Chemicals | | 3,446 | | | 0.65 | | | 2,489 | | | 0.57 | | | 0.08 | |
| Trucking | | 3,512 | | | 0.65 | | | 2,428 | | | 0.55 | | | 0.10 | |
| Processing and other fees | | 6,692 | | | 1.24 | | | 3,657 | | | 0.83 | | | 0.41 | |
| Other | | 2,791 | | | 0.52 | | | 1,084 | | | 0.25 | | | 0.27 | |
| Total operating expenses | $ | 88,121 | | $ | 16.36 | | $ | 63,362 | | $ | 14.42 | | $ | 1.94 | |
| | | | | | | | | | | | | | | | |
| Transportation and marketing | $ | 9,758 | | $ | 1.81 | | $ | 2,485 | | $ | 0.57 | | $ | 1.24 | |
| | | Nine Months Ended September 30 | |
| | | | | | | | | | | | | | | Per BOE | |
| | | 2011 | | | Per BOE | | | 2010 | | | Per BOE | | | Change | |
| Operating expense | | | | | | | | | | | | | | | |
| Power and fuel | $ | 61,005 | | $ | 4.01 | | $ | 43,694 | | $ | 3.27 | | $ | 0.74 | |
| Well servicing | | 43,986 | | | 2.89 | | | 37,060 | | | 2.76 | | | 0.13 | |
| Repairs and maintenance | | 42,562 | | | 2.80 | | | 32,787 | | | 2.44 | | | 0.36 | |
| Lease rentals and property tax | | 25,025 | | | 1.65 | | | 23,404 | | | 1.74 | | | (0.09 | ) |
| Labor - internal | | 21,294 | | | 1.40 | | | 17,222 | | | 1.28 | | | 0.12 | |
| Labor - contract | | 14,205 | | | 0.93 | | | 11,820 | | | 0.88 | | | 0.05 | |
| Chemicals | | 11,419 | | | 0.75 | | | 10,346 | | | 0.77 | | | (0.02 | ) |
| Trucking | | 9,467 | | | 0.62 | | | 7,111 | | | 0.53 | | | 0.09 | |
| Processing and other fees | | 12,819 | | | 0.84 | | | 10,636 | | | 0.79 | | | 0.05 | |
| Other | | 12,249 | | | 0.80 | | | 1,864 | | | 0.14 | | | 0.66 | |
| Total operating expenses | $ | 254,031 | | $ | 16.69 | | $ | 195,944 | | $ | 14.60 | | $ | 2.09 | |
| | | | | | | | | | | | | | | | |
| Transportation and marketing | $ | 23,886 | | $ | 1.57 | | $ | 6,760 | | $ | 0.50 | | $ | 1.07 | |
Operating costs for the third quarter of 2011 totaled $88.1 million, an increase of $24.8 million compared to the same period in 2010. The increase in operating costs is attributable to the acquisition of assets at the end of September 2010 and February 2011 combined with increased power and fuel costs. Operating costs on a per barrel basis have increased to $16.36/boe as compared to $14.42/boe in the third quarter of 2010. The 13% increase on a per barrel basis is substantially attributed to higher power and fuel costs.
On a year-to-date basis, operating costs for 2011 totaled $254.0 million, an increase of $58.1 million when compared to the same period in 2010. On a per barrel basis, year-to-date operating costs increased by $2.09/boe (14%) which is mainly attributable to higher power and fuel, well servicing, and repairs and maintenance costs.
9
| MANAGEMENT’S DISCUSSION AND ANALYSIS |
| | | Three Months Ended | | | Nine Months Ended | |
| | September 30 | | | September 30 | |
($ per boe) | | 2011 | | | 2010 | | | Change | | | 2011 | | | 2010 | | | Change | |
Electric power and fuel costs | $ | 4.24 | | $ | 2.72 | | $ | 1.52 | | $ | 4.01 | | $ | 3.27 | | $ | 0.74 | |
Realized (gain) loss on electricity risk management contracts | | (0.59 | ) | | 0.29 | | | (0.88 | ) | | (0.38 | ) | | 0.08 | | | (0.46 | ) |
Net electric power and fuel costs | $ | 3.65 | | $ | 3.01 | | $ | 0.64 | | $ | 3.63 | | $ | 3.35 | | $ | 0.28 | |
| | | | | | | | | | | | | | | | | | |
Alberta Power Pool electricity price ($ per MWh) | $ | 94.71 | | $ | 35.69 | | $ | 59.02 | | $ | 76.72 | | $ | 52.38 | | $ | 24.34 | |
Power and fuel costs, comprised primarily of electric power costs, represented approximately 26% of our total operating costs during the third quarter of 2011 (2010 – 19%). The 7% increase from the third quarter of 2010 is primarily attributable to the $59.02/MWh increase in the average Alberta electric power price to $94.71/MWh in the third quarter of 2011. The power and fuel costs for the first nine months of 2011 totaled $61.0 million, an increase of 40% compared to 2010, mainly attributable to the higher average power prices.
Transportation and marketing costs relate primarily to delivery of natural gas to Alberta’s natural gas sales hub, the AECO Storage Hub, and the cost of trucking clean crude oil to pipeline receipt points. As a result, the total dollar amount of costs generally fluctuates in relation to our sales volumes. The transportation and marketing expense increased by $1.24/boe or $7.3 million in the third quarter of 2011 compared to the third quarter of 2010, and year-to-date 2011 increased by $1.07/boe or $17.1 million compared to the same period in 2010. The primary reason for the increases is due Harvest incurring higher oil trucking costs at Hay and Red Earth in response to the outage of the Plains Rainbow Pipeline from the end of April to the end of August 2011.
Operating Netback
| | | Three Months Ended | | | Nine Months Ended | |
| | | September 30 | | | September 30 | |
| ($ per BOE) | | 2011 | | | 2010 | | | Change | | | 2011 | | | 2010 | | | Change | |
Petroleum and natural gas sales prior to hedging | $ | 57.85 | | $ | 52.71 | | | 10% | | $ | 61.21 | | $ | 55.79 | | | 10% | |
Royalties | | (8.72 | ) | | (7.67 | ) | | 14% | | | (9.16 | ) | | (8.69 | ) | | 5% | |
Operating expense | | (16.36 | ) | | (14.42 | ) | | 13% | | | (16.69 | ) | | (14.60 | ) | | 14% | |
Transportation expense | | (1.81 | ) | | (0.57 | ) | | 218% | | | (1.57 | ) | | (0.50 | ) | | 214% | |
Operating netback prior to hedging(1) | | 30.96 | | | 30.05 | | | 3% | | | 33.79 | | | 32.00 | | | 6% | |
Hedging gain (loss)(2) | | 1.64 | | | (0.29 | ) | | 666% | | | (0.30 | ) | | (0.08 | ) | | (275% | ) |
Operating netback after hedging(1) | $ | 32.60 | | $ | 29.76 | | | 10% | | $ | 33.49 | | $ | 31.92 | | | 5% | |
| (1) | This is a non-GAAP measure; please refer to “Non-GAAP Measures” in this MD&A. |
| (2) | Hedging gain (loss) includes the settlement amounts for crude oil and power contracts. |
Harvest’s operating netback represents the net amount realized on a per boe basis after deducting directly related costs. In the third quarter of 2011, operating netback prior to hedging increased by $0.91/boe or 3% compared to the third quarter of 2010. For year-to-date 2011, operating netback prior to hedging increased by $1.79/boe, an increase of 6% when compared to the same period in 2010. The increase is primarily attributable to increases in realized commodity prices and sales volumes, partially offset by increases in royalties, operating costs and transportation costs.
10
| MANAGEMENT’S DISCUSSION AND ANALYSIS |
General and Administrative (“G&A”) Expense
| | | Three Months Ended September 30 | | | Nine Months Ended September 30 | |
| | | 2011 | | | 2010 | | | Change | | | 2011 | | | 2010 | | | Change | |
| G&A expense | $ | 14,621 | | $ | 9,720 | | | 50% | | $ | 42,960 | | $ | 33,863 | | | 27% | |
| G&A per boe ($/boe ) | $ | 2.71 | | $ | 2.21 | | | 23% | | $ | 2.82 | | $ | 2.52 | | | 12% | |
For the third quarter of 2011, G&A expense increased by $4.9 million (50%) compared to the same quarter in 2010. For the first nine months of 2011, G&A expense increased 27% compared to the same period in 2010. The increase in G&A is primarily due to increased salary expense, partially resulting from the acquisition of assets at the end of September 2010 and February 2011. Approximately 93% of the G&A expenses are related to salaries and other employee related costs. Harvest does not have a stock option program, however there is a long-term cash incentive program.
Depletion, Depreciation and Amortization (“DDA”)
| | | Three Months Ended | | | Nine Months Ended | |
| | September 30 | | | September 30 | |
| | 2011 | | | 2010 | | | Change | | | 2011 | | | 2010 | | | Change | |
Depletion, depreciation and amortization | $ | 137,070 | | $ | 118,320 | | | 16% | | $ | 386,348 | | $ | 352,459 | | | 10% | |
DDA per boe ($/boe) | $ | 25.45 | | $ | 26.92 | | | (5% | ) | $ | 25.38 | | $ | 26.25 | | | (3% | ) |
DDA expense for the three and nine months ended September 30, 2011 increased by $18.8million and $33.9 million, respectively, compared to the same periods in 2010, mainly due to higher sales volumes.
Capital Expenditures
| | | Three Months Ended | | | Nine Months Ended | |
| | | September 30 | | | September 30 | |
| | 2011 | | | 2010 | | | Change | | | 2011 | | | 2010 | | | Change | |
Drilling and completion | $ | 98,566 | | $ | 49,998 | | | 97% | | $ | 291,774 | | $ | 144,754 | | | 102% | |
Well equipment, pipelines and facilities | | 50,998 | | | 26,448 | | | 93% | | | 149,059 | | | 72,178 | | | 107% | |
Geological and geophysical | | 1,282 | | | 417 | | | 207% | | | 15,214 | | | 11,846 | | | 28% | |
Land and undeveloped lease rentals | | 7,107 | | | 6,027 | | | 18% | | | 17,208 | | | 16,434 | | | 5% | |
Capitalized G&A expenses | | 3,070 | | | 3,528 | | | (13% | ) | | 7,993 | | | 6,706 | | | 19% | |
Furniture, leaseholds and office equipment | | 1,010 | | | 104 | | | 871% | | | 2,059 | | | 425 | | | 384% | |
| | 162,033 | | | 86,522 | | | 87% | | | 483,307 | | | 252,343 | | | 92% | |
BlackGold oil sands | | 28,564 | | | 3,616 | | | 690% | | | 70,440 | | | 3,616 | | | 1,848% | |
Total development capital expenditures excluding acquisitions | $ | 190,597 | | $ | 90,138 | | | 111% | | $ | 553,747 | | $ | 255,959 | | | 116% | |
The third quarter of 2011 was more active for Harvest when compared to the same quarter in 2010. Total capital spending excluding BlackGold oil sands for the three months ended September 30, 2011 was $162.0 million, an increase of $75.5 million from the same period in 2010. In particular, capital spending on well equipment, pipelines and facilities increased by 93% as compared to the same quarter in 2010 due to an increase in activities related to the tie-in of wells drilled in the previous quarters, particularly in the Hay, Red Earth, and Heavy Oil areas. In addition, approximately $2.0 million was invested in building a new trucking terminal in the Hay area. During the third quarter of 2011, Harvest drilled 69 gross (55.6 net) horizontal, vertical, and service wells. Harvest was most active drilling high netback light oil stage frac’d horizontal wells in the Red Earth, Ante Creek, and Kindersley areas and conventional horizontal wells in the SE Saskatchewan, Cecil and Markerville areas. A combined total of 35 gross (26.6 net) wells were drilled in the noted areas for a total expenditure of approximately $53.8 million. In the heavy oil areas, Harvest drilled 27 gross (25.2 net) wells in the Lloydminster, Murray Lake, and Suffield areas for a total expenditure of approximately $18.7 million. The majority of these wells were horizontal wells. In addition, a total of 7 gross (3.8 net) liquids rich natural gas wells were drilled with the most active areas being in the Willesden Green Glauc Hoadley trend. Together with the completion of wells drilled in the previous quarter, a total expenditure of approximately $26.1 million was incurred. Included in the total of the natural gas wells was a Notikewin stage frac’d horizontal well, which was the first well of this type in Harvest’s drilling program. Harvest also drilled the first operated horizontal well in the Falher formation in the Deep Basin area. These wells are expected to be on production in December 2011 and January 2012 respectively. With the new land base acquired in Q1 2011, drilling in the Deep Basin area will increase over the next year as geological prospects are identified and drilling rigs are mobilized.
11
| MANAGEMENT’S DISCUSSION AND ANALYSIS |
Capital spending excluding BlackGold oil sands for the nine months ended September 30, 2011 totaled $483.3 million (2010 - $252.3 million). For the first nine months in 2011, Harvest drilled a total of 203 gross (174.9 net) wells (2010 – 120 gross and 99.7 net wells). The increase in capital spending compared to 2010 is mainly due to a more active drilling program in the Company’s large resource oil pools.
Below is a summary of the wells drilled by Harvest during the three and nine months ended September 30, 2011. For the third quarter of 2011, Harvest’s overall success rate was 100% (year-to-date 2011 success rate was 98%).
| | | September 30, 2011 | |
| | | Three Months Ended | | | Nine Months Ended | |
| Area | | Gross | | | Net | | | Gross | | | Net | |
| Hay River | | - | | | - | | | 38.0 | | | 38.0 | |
| Red Earth | | 6.0 | | | 5.5 | | | 29.0 | | | 26.5 | |
| Rimbey/Markerville | | 6.0 | | | 4.3 | | | 16.0 | | | 9.2 | |
| Lloydminster Heavy Oil | | 18.0 | | | 16.2 | | | 30.0 | | | 27.5 | |
| Kindersley | | 8.0 | | | 6.5 | | | 21.0 | | | 19.3 | |
| SE Saskatchewan | | 8.0 | | | 8.0 | | | 12.0 | | | 12.0 | |
| Crossfield | | - | | | - | | | 3.0 | | | 2.4 | |
| Suffield | | 6.0 | | | 6.0 | | | 9.0 | | | 9.0 | |
| Other Areas | | 17.0 | | | 9.1 | | | 33.0 | | | 19.0 | |
| Oil sands | | - | | | - | | | 12.0 | | | 12.0 | |
| Total | | 69.0 | | | 55.6 | | | 203.0 | | | 174.9 | |
BlackGold oil sands
The BlackGold oil sands project continued to progress in the third quarter of 2011. For the three months ended September 30, 2011, Harvest invested a total of $28.6 million (2010 - $3.6 million) in the BlackGold oil sands project for the construction of the central processing facility and well pads. For the nine months ended September 30, 2011, Harvest incurred $70.4 million (2010 - $3.6 million) for the construction of the facility and the drilling of 12.0 wells.
12
| MANAGEMENT’S DISCUSSION AND ANALYSIS |
Decommissioning Liabilities
Harvest’s decommissioning liabilities increased by $107.7 million during the first nine months of 2011 as a result of $38.0 million of liabilities acquired from Hunt, accretion of $17.4 million, new liabilities of $9.7 million incurred on new drills, and a revision of estimates of $54.7 million, partially offset by $12.2 million of reclamation and abandonment expenditures.
13
| MANAGEMENT’S DISCUSSION AND ANALYSIS |
DOWNSTREAM OPERATIONS
| | Three Months Ended | | | Nine Months Ended | |
| | September 30 | | | September 30 | |
| | 2011 | | | 2010 | | | Change | | | 2011 | | | 2010 | | | Change | |
FINANCIAL | | | | | | | | | | | | | | | | | | |
Refined products sales(1) | | 528,210 | | | 753,389 | | | (30% | ) | | 1,980,891 | | | 1,913,093 | | | 4% | |
Purchased products for processing and resale(1) | | 479,428 | | | 712,687 | | | (33% | ) | | 1,782,256 | | | 1,776,726 | | | - | |
Gross margin(2) | | 48,782 | | | 40,702 | | | 20% | | | 198,635 | | | 136,367 | | | 46% | |
| | | | | | | | | | | | | | | | | | |
Operating expense | | 24,077 | | | 24,465 | | | (2% | ) | | 75,883 | | | 82,202 | | | (8% | ) |
Purchased energy expense | | 19,768 | | | 23,152 | | | (15% | ) | | 67,760 | | | 65,622 | | | 3% | |
Marketing expense | | 2,295 | | | 1,507 | | | 52% | | | 5,229 | | | 4,822 | | | 8% | |
General and administrative | | 441 | | | 441 | | | - | | | 1,323 | | | 1,323 | | | - | |
Depreciation and amortization | | 22,532 | | | 21,914 | | | 3% | | | 64,208 | | | 62,538 | | | 3% | |
Operating loss(2) | | (20,331 | ) | | (30,777 | ) | | 34% | | | (15,768 | ) | | (80,140 | ) | | 80% | |
| | | | | | | | | | | | | | | | | | |
Capital expenditures | | 100,132 | | | 21,501 | | | 366% | | | 244,752 | | | 38,643 | | | 533% | |
| | | | | | | | | | | | | | | | | | |
OPERATING | | | | | | | | | | | | | | | | | | |
Feedstock volume (bbl/d)(3) | | 41,756 | | | 96,514 | | | (57% | ) | | 58,866 | | | 77,658 | | | (24% | ) |
| | | | | | | | | | | | | | | | | | |
Yield (% of throughput volume)(4) | | | | | | | | | | | | | | | | | | |
Gasoline and related products | | 31% | | | 28% | | | 11% | | | 32% | | | 30% | | | 7% | |
Ultra low sulphur diesel and jet fuel | | 47% | | | 31% | | | 52% | | | 39% | | | 34% | | | 15% | |
High sulphur fuel oil | | 21% | | | 38% | | | (45% | ) | | 26% | | | 33% | | | (21% | ) |
Total | | 99% | | | 97% | | | 2% | | | 97% | | | 97% | | | - | |
| | | | | | | | | | | | | | | | | | |
Average refining gross margin (US$/bbl)(5) | | 10.44 | | | 3.02 | | | 246% | | | 10.26 | | | 4.67 | | | 120% | |
| (1) | Refined product sales and purchased products for processing and resale are net of intra-segment sales of $122.2 million and $363.0 million for the three and nine months ended September 30, 2011 respectively (2010 - $116.5 million and $324.9 million), reflecting the refined products produced by the refinery and sold by the marketing division. |
| (2) | These are non-GAAP measures; please refer to “Non-GAAP Measures” in this MD&A. |
| (3) | Barrels per day are calculated using total barrels of crude oil feedstock and vacuum gas oil. |
| (4) | Based on production volumes after adjusting for changes in inventory held for resale. |
| (5) | Average refining gross margin is calculated based on per barrel of feedstock throughput. |
Refining Benchmark Prices
| | | Three Months Ended | | | Nine Months Ended | |
| | | September 30 | | | September 30 | |
| | | 2011 | | | 2010 | | | Change | | | 2011 | | | 2010 | | | Change | |
WTI crude oil (US$/bbl) | | 89.76 | | | 76.20 | | | 18% | | | 95.48 | | | 77.65 | | | 23% | |
Brent crude oil (US$/bbl) | | 112.29 | | | 77.04 | | | 46% | | | 111.49 | | | 78.10 | | | 43% | |
Mars premium (discount) (US$/bbl) | | 19.93 | | | (1.36 | ) | | 1,565% | | | 12.26 | | | (1.55 | ) | | 891% | |
2-1-1 crack spread (US$/bbl) | | 33.83 | | | 9.02 | | | 275% | | | 27.12 | | | 9.72 | | | 179% | |
RBOB crack spread (US$/bbl) | | 31.96 | | | 7.81 | | | 309% | | | 25.86 | | | 10.10 | | | 156% | |
Heating Oil crack spread (US$/bbl) | | 35.70 | | | 10.23 | | | 249% | | | 28.38 | | | 9.34 | | | 204% | |
High Sulphur Fuel Oil premium (discount) (US$/bbl) | | 9.58 | | | (7.81 | ) | | 223% | | | 0.82 | | | (8.19 | ) | | 110% | |
Canadian / U.S. dollar exchange rate | | 1.020 | | | 0.962 | | | 6% | | | 1.023 | | | 0.965 | | | 6% | |
14
| MANAGEMENT’S DISCUSSION AND ANALYSIS |
Summary of Gross Margins
| | | Three Months Ended September 30 | |
| | | 2011 | | | 2010 | |
| | | | | | Volumes | | | | | | | | | Volumes | | | | |
| | | | | | (000’s bbls) | | | (US$/bbl)(4) | | | | | | (000’s bbls) | | | (US$/bbl)(4) | |
| Refinery | | | | | | | | | | | | | | | | | | |
| Sales | | | | | | | | | | | | | | | | | | |
| Gasoline products | $ | 195,153 | | | 1,709 | | $ | 116.48 | | $ | 241,082 | | | 2,829 | | $ | 81.98 | |
| Distillates | | 242,889 | | | 1,967 | | | 125.95 | | | 253,518 | | | 2,744 | | | 88.88 | |
| | | | | | | | | | | | | | | | | | | |
| High sulphur fuel oil | | 49,433 | | | 488 | | | 103.32 | | | 225,279 | | | 3,047 | | | 71.13 | |
| | | | | | | | | | | | | | | | | | | |
| Total sales | | 487,475 | | | 4,164 | | | 119.41 | | | 719,879 | | | 8,620 | | | 80.34 | |
| Feedstock(1) | | | | | | | | | | | | | | | | | | |
| | | | | | | | | | | | | | | | | | | |
| Middle Eastern | | 324,134 | | | 3,370 | | | 98.11 | | | 436,467 | | | 5,649 | | | 74.33 | |
| | | | | | | | | | | | | | | | | | | |
| Russian | | - | | | - | | | - | | | 145,624 | | | 1,879 | | | 74.56 | |
| | | | | | | | | | | | | | | | | | | |
| South American | | - | | | - | | | - | | | 79,996 | | | 1,125 | | | 68.41 | |
| | | 324,134 | | | 3,370 | | | 98.11 | | | 662,087 | | | 8,653 | | | 73.61 | |
| | | | | | | | | | | | | | | | | | | |
| Vacuum Gas Oil (“VGO”) | | 50,864 | | | 472 | | | 109.92 | | | 19,082 | | | 226 | | | 81.23 | |
| Total feedstock | | 374,998 | | | 3,842 | | | 99.56 | | | 681,169 | | | 8,879 | | | 73.80 | |
| Other(2) | | 73,141 | | | | | | | | | 10,817 | | | | | | | |
| Total feedstock and other costs | | 448,139 | | | | | | | | | 691,986 | | | | | | | |
| Refinery gross margin(3) | $ | 39,336 | | | | | $ | 10.44 | | $ | 27,893 | | | | | $ | 3.02 | |
| | | | | | | | | | | | | | | | | | | |
| Marketing | | | | | | | | | | | | | | | | | | |
| Sales | $ | 162,968 | | | | | | | | $ | 149,982 | | | | | | | |
| Cost of products sold | | 153,522 | | | | | | | | | 137,173 | | | | | | | |
| Marketing grossmargin(3) | $ | 9,446 | | | | | | | | $ | 12,809 | | | | | | | |
| | | | | | | | | | | | | | | | | | | |
| Total gross margin(3) | $ | 48,782 | | | | | | | | $ | 40,702 | | | | | | | |
| (1) | Cost of feedstock includes all costs of transporting the crude oil to the refinery in Newfoundland. |
| (2) | Includes inventory adjustments and additives and blendstocks |
| (3) | This is a non-GAAP measure; please refer to “Non-GAAP Measures” in this MD&A. |
| (4) | Converted using average Canadian/ U.S. dollar exchange rates. |
15
| MANAGEMENT’S DISCUSSION AND ANALYSIS |
| | | Nine Months Ended September 30 | |
| | | 2011 | | | 2010 | |
| | | | | | Volumes | | | | | | | | | Volumes | | | | |
| | | | | | (000’s bbls) | | | (US$/bbl)(4) | | | | | | (000’s bbls) | | | (US$/bbl)(4) | |
| Refinery | | | | | | | | | | | | | | | | | | |
| Sales | | | | | | | | | | | | | | | | | | |
| Gasoline products | $ | 692,761 | | | 6,096 | | $ | 116.26 | | $ | 601,469 | | | 6,801 | | $ | 85.34 | |
| Distillates | | 807,465 | | | 6,573 | | | 125.67 | | | 717,516 | | | 7,797 | | | 88.80 | |
| High sulphur fuel oil | | 358,271 | | | 3,969 | | | 92.34 | | | 503,221 | | | 6,908 | | | 70.30 | |
| | | | | | | | | | | | | | | | | | | |
| Total sales | | 1,858,497 | | | 16,638 | | | 114.27 | | | 1,822,206 | | | 21,506 | | | 81.76 | |
| Feedstock(1) | | | | | | | | | | | | | | | | | | |
| | | | | | | | | | | | | | | | | | | |
| Middle Eastern | | 1,471,532 | | | 15,161 | | | 99.29 | | | 1,106,059 | | | 14,437 | | | 73.93 | |
| | | | | | | | | | | | | | | | | | | |
| Russian | | 1,311 | | | 14 | | | 95.80 | | | 274,104 | | | 3,431 | | | 77.09 | |
| | | | | | | | | | | | | | | | | | | |
| South American | | - | | | - | | | - | | | 177,451 | | | 2,555 | | | 67.02 | |
| | | | | | | | | | | | | | | | | | | |
| | | 1,472,843 | | | 15,175 | | | 99.29 | | | 1,557,614 | | | 20,423 | | | 73.60 | |
| | | | | | | | | | | | | | | | | | | |
| Vacuum Gas Oil (“VGO”) | | 95,547 | | | 895 | | | 109.21 | | | 64,152 | | | 777 | | | 79.67 | |
| Total feedstock | | 1,568,390 | | | 16,070 | | | 99.84 | | | 1,621,766 | | | 21,200 | | | 73.82 | |
| Other(2) | | 128,884 | | | | | | | | | 97,928 | | | | | | | |
| Total feedstock and other costs | | 1,697,274 | | | | | | | | | 1,719,694 | | | | | | | |
| Refinery gross margin(3) | $ | 161,223 | | | | | $ | 10.26 | | $ | 102,512 | | | | | $ | 4.67 | |
| | | | | | | | | | | | | | | | | | | |
| Marketing | | | | | | | | | | | | | | | | | | |
| Sales | $ | 485,370 | | | | | | | | $ | 415,805 | | | | | | | |
| Cost of products sold | | 447,958 | | | | | | | | | 381,950 | | | | | | | |
| Marketing(3)gross margin | $ | 37,412 | | | | | | | | $ | 33,855 | | | | | | | |
| | | | | | | | | | | | | | | | | | | |
| Total gross margin(3) | $ | 198,635 | | | | | | | | $ | 136,367 | | | | | | | |
| (1) | Cost of feedstock includes all costs of transporting the crude oil to the refinery in Newfoundland. |
| (2) | Includes inventory adjustments and additives and blendstocks |
| (3) | This is a non-GAAP measure; please refer to “Non-GAAP Measures” in this MD&A. |
| (4) | Converted using average Canadian/ U.S. dollar exchange rates. |
Feedstock throughput averaged 41,756 bbl/d in the third quarter of 2011, a decrease of 57% from 96,514 bbl/d in the third quarter of the prior year, due to the planned shutdown of the refinery units for turnaround work that started in May and was substantially completed mid-August. The daily average throughput rate for the nine months ended September 30, 2011 is 24% lower than the same period in the prior year as a consequence of an extended planned maintenance shutdown in 2011 as compared to the ten-week unplanned shutdown for fire repairs in 2010. As well, following the completion of the turnaround in mid-August, average daily throughput was at a reduced rate as a consequence of the staged unit start-up and the pre-start-up and commissioning of the new heat exchanger.
16
| MANAGEMENT’S DISCUSSION AND ANALYSIS |
The increase in the refinery gross margin for the three months ended September 30, 2011, as compared to the third quarter of the prior year, reflects the improved market prices and product crack spreads, partially offset by the negative volume impact from the planned shutdown. For the nine months ended September 30, 2011 refinery gross margins increased 57%, as compared to the prior year, reflecting significantly stronger global refinery margin, partially offset by the increase in sour crude premium on our feedstock costs. The Downstream operations’ refining gross margin is impacted by several factors including the configuration of the refinery product yields, timing of sales under the SOA, transportation costs, location differentials, quality differentials and variability in our throughput volume over a given period of time.
Refinery sales decreased by $232.4 million in the third quarter of 2011 from $719.9 million in the same quarter of 2010 due to the planned maintenance shutdown of the refinery units. The increase of $36.3 million for refinery sales for the nine months ended September 30, 2011, as compared to the nine months ended September 30, 2010, is mainly the result of higher market prices on refined products, partially offset by lower sales volumes.
The cost of our crude oil feedstock in the third quarter of 2011 was at a US$9.80/bbl premium to the benchmark WTI as compared to a discount of US$2.40/bbl in the same period of the prior year. Similarly, the cost of crude oil feedstock for the nine months ended September 30, 2011 was at a US$4.36/bbl premium to the benchmark WTI as compared to a discount of US$3.83/bbl in 2010. The change from a discount to a premium is a result of the continuing wide spread between WTI and Brent.
Although the Canadian dollar weakened as compared to the US dollar at the end of the third quarter of 2011, it was consistently strong throughout most of the quarter. The strong Canadian dollar in 2011 has negatively impacted the contribution from our refinery operations relative to the prior year as substantially all of its gross margin, cost of purchased energy and marketing expense are denominated in U.S. dollars.
Operating Expenses
| | | Three Months Ended September 30 | |
| | | 2011 | | | 2010 | |
| | | Refining | | | Marketing | | | Total | | | Refining | | | Marketing | | | Total | |
| | | | | | | | | | | | | | | | | | | |
| Operating cost | $ | 19,292 | | $ | 4,785 | | $ | 24,077 | | $ | 20,037 | | $ | 4,428 | | $ | 24,465 | |
| Purchased energy | | 19,768 | | | - | | | 19,768 | | | 23,152 | | | - | | | 23,152 | |
| | $ | 39,060 | | $ | 4,785 | | $ | 43,845 | | $ | 43,189 | | $ | 4,428 | | $ | 47,617 | |
| ($/bbl of feedstock throughput) | | | | | | | | | | | | | | | | | | |
| Operating cost | | 5.02 | | | - | | | - | | | 2.25 | | | - | | | - | |
| Purchased energy | | 5.15 | | | - | | | - | | | 2.61 | | | - | | | - | |
| | | 10.17 | | | - | | | - | | | 4.86 | | | - | | | - | |
17
| MANAGEMENT’S DISCUSSION AND ANALYSIS |
| | | Nine Months Ended September 30 | |
| | | 2011 | | | 2010 | |
| | | Refining | | | Marketing | | | Total | | | Refining | | | Marketing | | | Total | |
| | | | | | | | | | | | | | | | | | | |
| Operating cost | $ | 61,790 | | $ | 14,093 | | $ | 75,883 | | $ | 69,690 | | $ | 12,512 | | $ | 82,202 | |
| Purchased energy | | 67,760 | | | - | | | 67,760 | | | 65,622 | | | - | | | 65,622 | |
| | $ | 129,550 | | $ | 14,093 | | $ | 143,643 | | $ | 135,312 | | $ | 12,512 | | $ | 147,824 | |
| ($/bbl of feedstock throughput) | | | | | | | | | | | | | | | | | | |
| Operating cost | | 3.84 | | | - | | | - | | | 3.29 | | | - | | | - | |
| Purchased energy | | 4.22 | | | - | | | - | | | 3.09 | | | - | | | - | |
| | | 8.06 | | | - | | | - | | | 6.38 | | | - | | | - | |
During the third quarter of 2011, refining operating costs per barrel of feedstock throughput increased 123% as compared to the same period in the prior year, reflecting the lower throughput volume from the continuation of the planned shutdown of the units for major maintenance work. Likewise, refining operating costs per barrel increased 17% for the nine months ended September 30, 2011 also as a consequence of lower throughput volumes.
Purchased energy, consisting of low sulphur fuel oil (“LSFO”) and electricity, is required to provide heat and power to refinery operations. Purchased energy costs in the third quarter of 2011 decreased 15% from the third quarter of 2010 and increased 3% during the nine months ended September 30, 2011. The lower consumption in the third quarter of 2011 is a result of the lower feedstock throughput in 2011. The increase in the per barrel cost of energy is also attributable to the decreased throughput rates in 2011 combined with increased prices.
Capital Expenditures
Capital spending for the three and nine months ended September 30, 2011 totaled $100.1 million and $244.8 million, respectively, (2010 - $21.5 million and $38.6 million) relating to various capital improvement projects, including $15.9 million and $56.2 million, respectively, (2010 - $12.3 million and $21.9 million) for the debottlenecking project. The remaining increase in capital spending for the three and nine months ended September 30, 2011 is mainly due to the capitalization of turnaround costs of $44.6 million and $98.5 million, respectively, as well as the replacement of catalysts for $6.0 million and $35.7 million, respectively.
Depreciation and Amortization Expense
| | | Three Months Ended September 30 | | | Nine Months Ended September 30 | |
| | | 2011 | | | 2010 | | | 2011 | | | 2010 | |
| | | | | | | | | | | | | |
| Refining | $ | 21,566 | | $ | 21,028 | | $ | 61,394 | | $ | 59,941 | |
| Marketing | | 966 | | | 886 | | | 2,814 | | | 2,597 | |
| Total depreciation and amortization | $ | 22,532 | | $ | 21,914 | | $ | 64,208 | | $ | 62,538 | |
The process units are amortized over an average useful life of 20 to 30 years.
18
| MANAGEMENT’S DISCUSSION AND ANALYSIS |
RISK MANAGEMENT, FINANCING AND OTHER
Cash Flow Risk Management
The following is a summary of Harvest’s risk management contracts outstanding at September 30, 2011:
| Contracts Not Designated as Hedges | |
| Contract Quantity | | Type of Contract | | | Term | | | Contract Price | | | Fair value | |
| 30 MWh | | Electricity price swap | | | 2011 | | | Cdn $46.87 | | $ | 2,461 | |
| US $6,300 | | Foreign exchange swap | | | Oct 2011 | | | $1.0225 Cdn/US | | | 163 | |
| | | | | | | | | Total | | $ | 2,624 | |
| Contracts Designated as Hedges | |
| Contract quantity | | Type of Contract | | | Term | | | Contract Price | | | Fair value | |
| 8,200 bbls/d | | Crude oil price swap | | | Jan - Dec 2011 | | | US $91.23/bbl | | $ | 9,376 | |
| 5,000 bbls/d | | Crude oil price swap | | | Feb - Dec 2011 | | | US $95.82/bbl | | | 7,931 | |
| 3,200 bbls/d | | Crude oil price swap | | | Mar - Dec 2011 | | | US $95.87/bbl | | | 5,091 | |
| 4,200 bbls/d | | Crude oil price swap | | | 2012 | | | US $111.37/bbl | | | 48,995 | |
| 20,600 bbls/d | | | | | | | | | | $ | 71,393 | |
| US $468/day | | Foreign exchange forward | | | 2012 | | | $1.0236 Cdn/US | | | (4,812 | ) |
| | | | | | | | | Total | | $ | 66,581 | |
The following is a summary of Harvest’s realized and unrealized gains (losses) from derivative contracts entered into to manage each category of risk:
| | Three Months Ended September 30 | |
| | 2011 | | | 2010 | |
| | | | | Crude | | | | | | | | | | | | Crude | | | | | | | |
| | Power | | | oil | | | Currency | | | Total | | | Power | | | oil | | | Currency | | | Total | |
Realized (gains) losses risk management contracts | $ | (3,178 | ) | $ | 1,471 | | $ | - | | $ | (1,707 | ) | $ | 1,277 | | $ | - | | $ | - | | $ | 1,277 | |
Unrealized (gains) losses on risk management contracts | | 1,507 | | | (2,470 | ) | | (163 | ) | | (1,126 | ) | | 1,230 | | | - | | | (192 | ) | | 1,038 | |
Risk management contracts (gains) losses | $ | (1,671 | ) | $ | (999 | ) | $ | (163 | ) | $ | (2,833 | ) | $ | 2,507 | | $ | - | | $ | (192 | ) | $ | 2,315 | |
| | | Nine Months Ended September 30 | |
| | 2011 | | | 2010 | |
| | | | | Crude | | | | | | | | | | | | Crude | | | | | | | |
| | Power | | | oil | | | Currency | | | Total | | | Power | | | oil | | | Currency | | | Total | |
Realized (gains) losses risk management contracts | $ | (5,794 | ) | $ | 1,879 | | $ | - | | $ | (3,915 | ) | $ | 1,073 | | $ | - | | $ | 17 | | $ | 1,090 | |
Unrealized (gains) losses on risk management contracts | | (1,453 | ) | | (2,596 | ) | | (163 | ) | | (4,212 | ) | | (1,079 | ) | $ | - | | | (192 | ) | | (1,271 | ) |
Risk management contracts (gains) losses | $ | (7,247 | ) | $ | (717 | ) | $ | (163 | ) | $ | (8,127 | ) | $ | (6 | ) | $ | - | | $ | (175 | ) | $ | (181 | ) |
19
| MANAGEMENT’S DISCUSSION AND ANALYSIS |
The Company enters into crude oil and foreign exchange contracts to reduce the volatility of cash flows from some of its forecast sales. Harvest designates all of its crude oil derivative contracts and certain foreign exchange contracts as cash flow hedges, which are entered into for periods consistent with the forecast petroleum sales. The effective portion of the unrealized gain for the three months and nine months ended September 30, 2011 of $48.3 million, net of tax of $16.3 million (2010 – $nil) and $47.2 million, net of tax of $15.9 million (2010 – $nil) was included in other comprehensive income. The ineffective portion of the unrealized gains for the three and nine months ended September 30, 2011 recognized in net income was $2.5 million and $2.6 million respectively. The amount removed from accumulated other comprehensive income during the period and included in petroleum, natural gas, and refined product sales was a gain of $5.3 million (2010 – $nil) and a loss of $6.4 million (2010 – $nil) (net of tax of 1.8 million and a recovery of $2.1 million) for the three and nine months ended September 30, 2011 respectively. The Company expects that the $48.5 million of gains reported in accumulated other comprehensive income will be released to net income within the next fifteen months. The ineffective portion of the realized cash flow hedges recognized in net income for the three and nine months ended September 30, 2011 was $1.5 million (2010 – $nil) and $1.9 million (2010 – $nil) of losses respectively.
Financing Costs
| | | Three Months Ended September 30 | | | Nine months ended September 30 | |
| | 2011 | | | 2010 | | | Change | | | 2011 | | | 2010 | | | Change | |
Bank loan | $ | 1,979 | | $ | 1,537 | | | 29% | | $ | 5,026 | | $ | 4,244 | | | 18% | |
Convertible Debentures | | 12,471 | | | 12,819 | | | (3% | ) | | 37,250 | | | 39,126 | | | (5% | ) |
Senior notes | | 8,913 | | | 4,021 | | | 122% | | | 26,391 | | | 12,376 | | | 113% | |
Amortization of deferred finance charges | | 130 | | | 281 | | | (54% | ) | | 667 | | | 469 | | | 42% | |
Interest and other financing charges | $ | 23,493 | | $ | 18,658 | | | 26% | | $ | 69,334 | | $ | 56,215 | | | 23% | |
Capitalized interest | | (2,611 | ) | | - | | | 100% | | | (5,894 | ) | | - | | | 100% | |
| | 20,882 | | | 18,658 | | | 12% | | | 63,440 | | | 56,215 | | | 13% | |
Accretion of decommissioning liabilities | | 5,819 | | | 5,620 | | | 4% | | | 17,662 | | | 17,076 | | | 3% | |
Total finance costs | $ | 26,701 | | $ | 24,278 | | | 10% | | $ | 81,102 | | $ | 73,291 | | | 11% | |
Interest and other financing charges for the three and nine months ended September 30, 2011, including the amortization of related financing costs, increased by $4.8 million (26%) and $13.1 million (23%), respectively, compared to the same periods in 2010. The increase from prior year is primarily due to the increased amount of senior notes principal outstanding.
Interest expense on Harvest’s bank loan for the three and nine months ended September 30, 2011 increased by 29% and 18%, respectively, due to the increase in the amount of loan principal outstanding. The effective interest rate for interest charges on our bank loan for both the three and nine months ended September 30, 2011 was 2.98%, compared to 2.90% and 1.85% for the same periods in 2010.
Interest expense on our senior notes increased 122% and 113% for the three and nine months ended September 30, 2011, respectively, when compared to the same periods in 2010. The increase is due to the higher principal balance of the 67/8% senior notes issued in the fourth quarter of 2010, as compared to the 77/8% senior notes outstanding during the first nine months of 2010, which were fully redeemed by the end of 2010.
20
| MANAGEMENT’S DISCUSSION AND ANALYSIS |
During the three and nine months ended September 30, 2011, a total of $2.6 million and $5.9 million of interest expense, respectively, was capitalized to the BlackGold oil sands project and the Downstream debottlenecking project. No interest expense was capitalized for the same periods in 2010.
Currency Exchange
Currency exchange gains and losses are attributed to the changes in the value of the Canadian dollar relative to the U.S. dollar on our U.S. dollar denominated 67/8% Senior Notes and on any U.S. dollar cash balances. At September 30, 2011, the Canadian dollar had weakened compared to December 31, 2010, resulting in an unrealized foreign exchange loss of $21.2 million (2010 - $1.8 million gain) for the third quarter of 2011 and a loss of $10.1 million (2010 - $1.5 million loss) for the first nine months of 2011. Harvest recognized a realized foreign exchange gain of $9.0 million (2010 - $0.1 million loss) and $9.2 million (2010 - $5.3 million loss) for the three and nine months ended September 30, 2011, respectively, as a result of the settlement of U.S. dollar denominated transactions.
The cumulative translation adjustment recognized in other comprehensive income represents the translation of the Downstream operations’ U.S. dollar functional currency financial statements to Canadian dollars using the current rate method. During the three and nine months ended September 30 2011, the weakening of the Canadian dollar relative to the U.S. dollar resulted in a $79.3 million and $50.3 million net cumulative translation gain respectively (2010 – $33.6 million loss and $13.8 million loss), as the stronger U.S. dollar results in an increase in the relative value of the net assets in our Downstream operations.
Deferred Income Taxes
For the three and nine months ended September 30, 2011, Harvest recorded a deferred income tax expense of $14.2 million and $7.1 million respectively. Our deferred income tax liability will fluctuate during each accounting period to reflect changes in the temporary differences between the book value and tax basis of assets as well as legislative tax rate changes. Currently, the principal source of our temporary differences is the net book value of the Company’s property, plant and equipment versus the unclaimed tax pools.
21
| MANAGEMENT’S DISCUSSION AND ANALYSIS |
Contractual Obligations and Commitments
Harvest has contractual obligations and commitments entered into in the normal course of operations including the purchase of assets and services, operating agreements, transportation commitments, sales commitments, royalty obligations, and land lease obligations. These obligations are of a recurring and consistent nature and impact cash flow in an ongoing manner. As at September 30, 2011, Harvest has the following significant contractual commitments:
| | | Maturity | |
| | | 1 year | | | 2-3 years | | | 4-5 years | | | After 5 years | | | Total | |
| Debt Repayments(1) | $ | - | | $ | 497,394 | | $ | 495,746 | | $ | 524,100 | | $ | 1,517,240 | |
| Debt interest payments(1) | | 94,516 | | | 151,809 | | | 108,070 | | | 15,764 | | | 370,159 | |
| Purchase Commitments(2) | | 207,011 | | | 64,603 | | | 250 | | | - | | | 271,864 | |
| Operating Leases | | 9,116 | | | 15,300 | | | 3,706 | | | 141 | | | 28,263 | |
| Transportation Agreements(3) | | 9,649 | | | 15,033 | | | 7,520 | | | 294 | | | 32,496 | |
| Feedstock & other purchase commitments(4) | | 996,767 | | | - | | | - | | | - | | | 996,767 | |
| Employee benefits(5) | | 6,700 | | | 9,638 | | | 7,950 | | | 1,006 | | | 25,294 | |
| Decommissioning liabilities(6) | | 20,104 | | | 33,975 | | | 41,037 | | | 1,299,039 | | | 1,394,155 | |
| Total | $ | 1,343,863 | | $ | 787,752 | | $ | 664,279 | | $ | 1,840,344 | | $ | 4,636,238 | |
| (1) | Assumes constant foreign exchange rate. |
| (2) | Relates to drilling commitments, AFE commitments, BlackGold oil sands project commitment and Downstream purchase commitments. |
| (3) | Relates to firm transportation commitments. |
| (4) | Includes commitments to purchase refinery crude stock and refined products for resale, including a commitment to purchase $322.5 million of sour crude from KNOC, a related party, at arm’s length terms. |
| (5) | Relates to the expected contributions to employee benefit plans and long-term incentive plan payments. |
| (6) | Represents the undiscounted obligation by period. |
Related Party Transactions
Harvest is a wholly owned subsidiary of the Korea National Oil Corporation (“KNOC”). As at September 30, 2011, North Atlantic committed to the purchase of $322.5 million of crude feedstock under the SOA that was sourced from KNOC. The cost of these purchases is based on the pricing terms set forth in the SOA and these commitments have been reflected in the “Contractual Obligations and Commitments” section of this MD&A.
Off Balance Sheet Arrangements
As of September 30, 2011, there were no off balance sheet arrangements in place.
LIQUIDITY
Cash flow from operating activities for the three and nine months ended September 30, 2011 was $161.5 million and $415.9 million, respectively, compared to $97.4 million and $297.0 million for the same periods in 2010. For the third quarter of 2011, the change in non-cash working capital was a surplus of $16.2 million (2010 – surplus of $11.1 million), and $5.9 million (2010 - $5.8 million) was incurred in the settlement of decommissioning liabilities. For the nine months ended September 30, 2011, the change in non-cash working capital from operating activities was a deficit of $32.8 million (2010 – surplus of $1.4 million), and $12.2 million (2010 - $13.8 million) was incurred in the settlement of decommissioning liabilities.
For the third quarter of 2011, Harvest’s financing activities provided $83.9 million of cash from net borrowings from the credit facility. For the nine months ended September 30, 2011 Harvest’s financing activities provided $749.6 million of cash, including $505.4 million of capital injection from KNOC to fund the acquisition of the Hunt assets and $244.2 million of net borrowings from the credit facility. Harvest funded $802.2 million of capital expenditures and net asset acquisition activities for the first nine months of 2011 with cash generated from operating activities and financing activities.
22
| MANAGEMENT’S DISCUSSION AND ANALYSIS |
Harvest had a working capital deficiency of $61.2 million at September 30, 2011, as compared to a $2.1 million deficiency at December 31, 2010. The negative working capital at September 30, 2011 is primarily related to the use of the $40 million deposit paid in 2010 for the Hunt acquisition, capital expenditures during the period, partially offset by increased assets arising from the risk management contracts. The Company’s working capital is expected to fluctuate from time to time, and will be funded from cash flows from operations and borrowings from the credit facility, as required.
Through a combination of cash available at September 30, 2011, cash from operating activities and available undrawn credit facility, it is anticipated that Harvest will have adequate liquidity to fund future operations, debt repayments and forecasted capital expenditures (excluding any major acquisitions). Refer to the “Contractual Obligations and Commitments”section above for Harvest’s future commitments and the discussion below on certain significant items.
BlackGold Oil Sands Project
Harvest signed a lump-sum engineering, procurement and construction contract in 2010 for phase 1 of our oil sands project, of which $77.0 million (including a $31.1 million deposit), has been paid up to September 30, 2011. Together with capital expenditures relating to drilling and completion of 12 observation wells, Harvest has invested $91.6 million since acquiring the assets in 2010.
The Company is gearing up for an active drilling program during which 30 wells (15 well pairs) are expected to be drilled starting in October 2011 through to the end of 2012. Other near-term activities include completion of the detail engineering work, site preparation and the commencement of major equipment fabrication. While work continues on phase 1, phase 2 of the project, which is targeted to increase production capacity to 30,000 bbl/d, is now pending for ERCB approval. With this opportunity, the Company has deferred first production to 2014 and is expecting phase 1 costs, which include $70 million of pre-invested facilities such as pipelines, access road, and tank farms, to increase by approximately 10-20%. Harvest plans to fund the future capital expenditures with future cash flow from operating activities and the undrawn credit facility.
Supply and Offtake Agreement (“SOA”)
Among other services, the SOA provides working capital financing for Harvest’s refinery inventories of crude oil and substantially all refined products held for sale. Pursuant to the SOA, Harvest estimates that Vitol held inventories of VGO and crude oil feedstock (both delivered and in-transit) valued at approximately $639.4million at September 30, 2011 and $774.7 million at December 31, 2010, which would have otherwise been assets of Harvest. In April 2011, Vitol provided Harvest a six-month notice to terminate the SOA at the end of October 2011. On October 11, 2011, the Company entered into a new SOA with Macquarie Energy Canada Ltd. (“Macquarie”). The new SOA establishes that, effective November 1, 2011, Macquarie will supply the Company with feedstocks and purchase certain finished products from the Company on favorable terms. The Company will provide storage tanks for the feedstock and finished products and is accountable for services related to the storage and handling of the feedstock and finished products at the refinery, including vessel loading and offloading. The new SOA is an evergreen arrangement with an initial one year term.
23
| MANAGEMENT’S DISCUSSION AND ANALYSIS |
CAPITAL RESOURCES
The following table summarizes our capital structure as at September 30, 2011 and December 31, 2010 and provides the key financial ratios defined in Harvest’s revolving credit facility.
| | | September 30, 2011 | | | December 31, 2010 | |
| Debts | | | | | | |
| Bank loan(1) | $ | 259,167 | | $ | 14,000 | |
| Senior notes, at principal amount (US$500 million)(2) | | 524,100 | | | 497,300 | |
| Convertible debentures, at principal amount | | 733,973 | | | 733,973 | |
| Total Debt | $ | 1,517,240 | | $ | 1,245,273 | |
| | | | | | | |
| Shareholder’s Equity | | | | | | |
| 386,078,649 issued at September 30, 2011 | $ | 3,587,718 | | $ | - | |
| 335,535,047 issued at December 31, 2010 | | - | | $ | 3,016,855 | |
| | | | | | | |
| Total Capitalization | $ | 5,104,958 | | $ | 4,262,128 | |
| | | | | | | |
| Financial Ratios(3) | | | | | | |
| Secured Debt to Annualized EBITDA(4)(5) | | 0.42 | | | 0.06 | |
| Total Debt to Annualized EBITDA(4)(6) | | 2.29 | | | 2.38 | |
| Secured Debt to Total Capitalization(5)(7) | | 6% | | | 1% | |
| Total Debt to Total Capitalization(6)(7) | | 33% | | | 33% | |
| (1) | The bank loan net of deferred financing costs is $256.5 million (2010 - $11.4 million). |
| (2) | Principal amount converted at the period end exchange rate. |
| (3) | Calculated based on Harvest’s credit facility covenant requirements (see note 11 of the September 30, 2011 financial statements). |
| (4) | Annualized Earnings Before Interest, Taxes, Depreciation and Amortization based on twelve month rolling average. |
| (5) | “Secured Debt” includes letter of credit, bank debt and guarantees. |
| (6) | “Total Debt” includes the secured debt, convertible debentures and notes. |
| (7) | “Total Capitalization” includes total debt and shareholder’s equity less equity attributed to BlackGold. |
Credit Facility
On April 29, 2011, Harvest’s revolving credit facility (“the Facility”) was extended by two years to April 30, 2015. The minimum rate charged on the Facility was also amended from 200 bps to 175 bps over bankers’ acceptance rates as long as Harvest’s secured debt to EBITDA ratio remains below or equal to one. The borrowing capacity of the Facility remains at $500 million and the financial covenants calculation as disclosed above remain unchanged.
24
| MANAGEMENT’S DISCUSSION AND ANALYSIS |
SUMMARY OF QUARTERLY RESULTS
The following table and discussion highlights our third quarter of 2011 relative to the preceding 6 quarters:
| | | 2011 | | | 2010 | |
| | Q3 | | | Q2 | | | Q1 | | | Q4 | | | Q3 | | | Q2 | | | Q1 | |
| | | | | | | | | | | | | | | | | | | | | |
Revenues(1) | $ | 799,945 | | $ | 746,066 | | $ | 1,218,702 | | $ | 1,255,403 | | $ | 951,385 | | $ | 1,024,565 | | $ | 569,480 | |
Net income (loss) | | (49,204 | ) | | (19,529 | ) | | 37,961 | | | (12,332 | ) | | (26,082 | ) | | (22,796 | ) | | (19,952 | ) |
Cash from operating activities | | 161,499 | | | 107,588 | | | 146,777 | | | 132,121 | | | 97,412 | | | 121,830 | | | 77,808 | |
Total long-term financial debt | | 1,509,773 | | | 1,384,862 | | | 1,244,825 | | | 1,239,024 | | | 1,251,658 | | | 1,153,972 | | | 1,150,321 | |
| | | | | | | | | | | | | | | | | | | | | |
Total assets | | 6,483,568 | | | 6,121,547 | | | 6,041,118 | | | 5,388,740 | | | 5,303,486 | | | 4,764,141 | | | 4,757,865 | |
| | | | | | | | | | | | | | | | | | | | | |
| | | | | | | | | | | | | | | | | | | | | |
| | | | | | | | | | | | | | | | | | | | | |
Upstream total daily sales volumes (boe/d) | | 58,548 | | | 55,338 | | | 53,331 | | | 50,054 | | | 47,777 | | | 49,597 | | | 50,178 | |
Upstream realized price prior to hedges ($/boe) | $ | 57.85 | | $ | 66.73 | | $ | 59.19 | | $ | 56.03 | | $ | 52.71 | | $ | 54.41 | | $ | 60.17 | |
Downstream average daily throughput (bbl/d) | | 41,756 | | | 38,016 | | | 97,438 | | | 111,317 | | | 96,514 | | | 94,833 | | | 41,016 | |
Downstream average refining margin ($US/bbl) | $ | 10.44 | | $ | 8.09 | | $ | 10.96 | | $ | 6.13 | | $ | 3.02 | | $ | 8.56 | | $ | - | |
| (1) | Revenues are comprised of revenues net of royalties from Upstream operations as well as sales of refined products from Downstream operations. |
The quarterly revenues and cash from operating activities are mainly impacted by the Upstream sales volumes, realized prices and operating expenses and Downstream throughput volumes, cost of feedstock and realized prices. Significant items that impacted Harvest’s quarterly revenues include:
- Revenues were the highest in the fourth quarter of 2010, followed by the first quarter of 2011, reflecting higher commodity prices, stronger sales volumes in the Upstream operations and improved throughput volumes from the Downstream operations. Revenues were the lowest in the first quarter of 2010, primarily due to the shutdown of the refinery units for repairs in the Downstream operations.
- The lower revenue in the second and third quarters of 2011 was due to lower Downstream sales as a result of lower throughput due to a planned shutdown, partially offset by increased Upstream sales from the Hunt assets and higher commodity prices.
- The increasing Upstream sales volumes since the third quarter of 2010 were mainly attributable to the acquisition of oil and gas assets in the third quarter of 2010 and first quarter of 2011.
- Downstream’s refining margin/bbl increased in the first and third quarter of 2011, reflecting the improving global refining crack spreads. The decrease in Downstream’s refining margin/bbl in the second quarter of 2011 is due to a planned shutdown of the refinery units.
Net income (loss) reflects both cash and non-cash items. Changes in non-cash items including deferred income tax, DDA expense, accretion of decommissioning liabilities, impairment of long-lived assets, unrealized foreign exchange gains and losses, and unrealized gains on risk management contracts impact net income (loss) from period to period. For these reasons, the net income (loss) may not necessarily reflect the same trends as revenues or cash from operating activities, nor is it expected to.
25
| MANAGEMENT’S DISCUSSION AND ANALYSIS |
Total assets increased from the second quarter of 2010 to the third quarter of 2010 due to the acquisition of the BlackGold assets in August and certain oil and gas assets in September 2010. The increase in the first quarter of 2011 was due to the Hunt acquisition and Harvest’s active winter drilling programs. The third quarter of 2011 increase is reflecting active capital programs, the Downstream exchange adjustment and the current value of risk management contracts.
OUTLOOK
While crude oil prices weakened through the third quarter of 2011, the average realized prices received remained strong. Concerns surrounding the global economic outlook continue to create crude oil price volatility. Although weak natural gas prices continued through the quarter we maintained strong Upstream cash flow due to our oil weighted assets. Refining margins for North Atlantic have remained at healthy levels and look to be improving in the years ahead as less attractive refining capacity that services our markets is being shut-down.
Third quarter average production for our Upstream business was 58,548 boe/d. We are now expecting production in the fourth quarter of about 60,000 boe/d bringing average yearly production to close to our previous guidance. Our 2011 guidance remains unchanged for general and administrative costs and operating costs (inclusive of the impact of our fixed price power hedges) at $2.75/boe and $16.00/boe respectively.
The turnaround and maintenance work at our Downstream business was completed in the third quarter and positions the business well for the months and years ahead. However, with the project taking longer than expected, we now expect full year throughput to average about 70,000 bpd. Full year operating and purchased energy costs continue to be expected to aggregate to approximately $7.00/bbl.
Harvest’s revenue is impacted by changes in sales volumes, commodity prices and currency exchange rates. From time-to-time Harvest enters into risk management contracts with various counterparties, principally financial institutions with investment grade credit ratings. During the third quarter Harvest entered into foreign exchange hedges for the calendar year 2012. The average rate forwards are for an average of $0.5 million dollars per day at an average price of $1.0236 CAD per $1USD or $0.9769 USD per $1CAD. For the remainder of 2011 we hold 16,400 bbl/d WTI hedges under contract with an average price of US$93.45/bbl.
Previous capital spending guidance for 2011 was just over $1.5 billion inclusive of the $505 million acquisition completed early in 2011 that was financed with an equity injection from KNOC. We now expect to spend slightly less than that amount with reduction in our Upstream business at the Blackgold project exceeding the increase in the Downstream business. We continue to be highly focused on maximizing project returns.
ACCOUNTING POLICIES AND CRITICAL ACCOUNTING ESTIMATES
On January 1, 2011, Harvest adopted IFRS, with January 1, 2010 as the “transition date”. A full description of the new accounting policies is outlined in Note 3 to the unaudited interim consolidated financial statements for the three months ended March 31, 2011. Additionally, transition date information and reconciliations between IFRS and Canadian GAAP for comparative periods in 2010 are described in Note 20 of our September 30, 2011 unaudited interim consolidated financial statements. The adoption of IFRS has not led to any changes in the business operations, capital strategies or funds flow of the Company. Harvest’s nature and type of critical accounting estimates remain unchanged upon transition to IFRS; however some accounting differences exist relating to the recognition and measurement of these estimates. A description of these estimates is outlined in Note 2 to the unaudited interim consolidated financial statements for the three months ended March 31, 2011.
26
| MANAGEMENT’S DISCUSSION AND ANALYSIS |
RECENT PRONOUNCEMENTS
The Company has reviewed new and revised accounting pronouncements that have been issued but are not yet effective and determined that the following may have an impact on the Company.
Harvest will be required to adopt IFRS 9, “Financial Instruments”, which is the result of the first phase of the IASB’s project to replace IAS 39, “Financial Instruments: Recognition and Measurement”. The new standard replaces the current multiple classification and measurement models for financial assets and liabilities with a single model that has only two classification categories: amortized cost and fair value. At the November 7, 2011 IASB meeting, the IASB tentatively decided that IFRS 9 should be amended to require application for annual periods beginning on or after January 1, 2015, rather than January 1, 2013. Early adoption of the new standard would continue to be permitted. Harvest is in the process of determining the potential impact of the adoption of this new standard.
In May 2011, the IASB issued IFRS 13, “Fair Value Measurement” (“IFRS 13”) which provides a consistent and less complex definition of fair value, establishes a single source for determining fair value and introduces consistent requirements for disclosures related to fair value measurement. IFRS 13 is effective for annual periods beginning on or after January 1, 2013 and applies prospectively from the beginning of the annual period in which the standard is adopted. Early adoption is permitted. The Company is currently evaluating the impact of adopting IFRS 13 on its Consolidated Financial Statements.
On May 12, 2011 the IASB issued three new standards: IFRS 10, “Consolidated Financial Statements”, IFRS 11, “Joint Arrangements” and IFRS 12, “Disclosure of Interest in Other Entities”.These new standards are effective for annual periods beginning on or after January 1, 2013. IFRS 10 replaces the consolidation requirements in SIC-12, “Consolidation – Special Purpose Entities” and a portion of IAS 27, “Consolidated and Separate Financial Statements”. IFRS 10 builds on existing principles by identifying the concept of control as the determining factor in whether an entity should be included within the consolidated financial statements of the parent company and provides additional guidance to assist in the determination of control where this is difficult to assess. IFRS 11 focuses on the rights and obligations of the joint arrangement, rather than its legal form (as is currently the case) and requires a single method to account for interests in jointly controlled entities (equity method). IFRS 12 is a new and comprehensive standard on disclosure requirements for all forms of interests in other entities, including joint arrangements, associates, special purpose vehicles and other off balance sheet. Harvest is assessing for the potential impact of the adoption of these new standards.
On June 16, 2011, the IASB issued an amendment to IAS 19, “Employee Benefits”, which changes the recognition and measurement of defined benefit pension expense and termination benefits and expands disclosure requirements for all employee benefit plans. The new standard is required to be adopted for periods beginning on or after January 1, 2013. Harvest is currently assessing the impact of the new standard.
The IASB issued an amendment to IAS 1, “Presentation of Financial Statements” on June 16, 2011, which requires separating items presented in other comprehensive income between those that are recycled to income and those that are not. The standard is required to be adopted for periods beginning on or after July 1, 2012. The adoption of this standard should not have a material impact on the Company’s consolidated financial statements.
27
| MANAGEMENT’S DISCUSSION AND ANALYSIS |
OPERATIONAL AND OTHER BUSINESS RISKS
Harvest’s operational and other business risks remain unchanged from those discussed in our MD&A for the year ended December 31, 2010 as filed on SEDAR atwww.sedar.com, except for the following new development and the addition of certain risks.
Upstream Operations
- The operation of petroleum and natural gas properties requires physical access for people and equipment on a regular basis which could be affected by weather, accidents, government regulations or third party actions.
Downstream Operations
- The refinery utilizes a SOA to facilitate the supply of crude feedstock to the refinery and the offtake of refined products. This agreement has termination rights and replacement arrangements may not be as favorable and may result in an increase in costs.
- The operation of the refinery requires physical access for people and equipment on a regular basis which could be affected by weather, accidents, government regulations or third party actions.
- The demand for skilled labor remains high in Newfoundland and the supply of skilled labor remains limited. There is a risk that we may have difficulty in sourcing skilled labor and the cost of replacement labor would result in increased operating and capital costs.
- Fluctuations in demand and supply for refined products could impact the Company’s margins.
- Maintenance activities may not improve operational performance or the output of related facilities; risks and uncertainties affecting construction or planned maintenance schedules, including the availability of labour and other impacts of competing projects drawing on the same resources during the same time period; and the potential for disruptions to operations and construction projects.
CHANGES IN REGULATORY ENVIRONMENT
Harvest’s regulatory environment remains unchanged from those discussed in our MD&A for the year ended December 31, 2010 as filed on SEDAR atwww.sedar.com, except for the addition of the following changes:
Saskatchewan
On June 22, 2011, the government announced its new Upstream Petroleum Industry Associated Gas Conservation Standards, which are designed to reduce emissions from the flaring and venting of associated gas. They establish a specified limit for the amount of natural gas that can be flared and vented from an oil well or associated facility. If that limit is exceeded, the producer is required to conserve and store the associated gas, and then either use or sell it. The standards will come into effect July 1, 2012 for new wells and facilities licensed on or after that date, and July 1, 2015 for existing wells and facilities.
Newfoundland
The Federal Renewable Fuel Regulations were published in the Canada Gazette, April 10, 2010. At that time an exemption was provided for the addition of ethanol to gasoline sold in Newfoundland and Labrador and on June 20, 2011 a further exemption was provided for the requirements for renewable content in diesel fuel and heating distillate oil sold in Newfoundland and Labrador.
28
| MANAGEMENT’S DISCUSSION AND ANALYSIS |
INTERNAL CONTROL OVER FINANCIAL REPORTING
In connection with the adoption of IFRS, Harvest established additional internal controls over financial reporting, as necessary, to review and validate the conversion to IFRS and relevant transitional activities including restatement of comparative financial information for 2010 and related disclosures. There were no other significant changes in internal controls over financial reporting for the period ended September 30, 2011 that have materially affected, or are reasonably likely to materially affect, our internal controls over financial reporting.
NON-GAAP MEASURES
Throughout this MD&A, the Company has referred to certain measures of financial performance that are not specifically defined under IFRS, herein after referred to as GAAP, such as “operating netbacks”, “operating income”, “gross margin”, “total debt”, “total capitalization” and “EBITDA”. “Operating netbacks” are always reported on a per boe basis and used extensively in the Canadian energy sector for comparative purposes. “Operating netbacks” include revenues, operating expenses, transportation and marketing expenses, and realized gains or losses on risk management contracts. “Gross margin” is commonly used in the refining industry to reflect the net funds received from the sale of refined products after considering the cost to purchase the feedstock and is calculated by deducting purchased products for resale and processing from total revenue. “Operating income” is commonly used for comparative purposes in the petroleum and natural gas and refining industries to reflect operating results before items not directly related to operations. “Total debt”, “total capitalization” and “EBITDA” are used to assist management in assessing liquidity and the Company’s ability to meet financial obligations. The non-GAAP measures may not be comparable to similar measures by other issuers.
FORWARD-LOOKING INFORMATION
This MD&A highlights significant business results and statistics from our unaudited interim consolidated financial statements for the three and nine months ended September 30, 2011 and the accompanying notes thereto. In the interest of providing our lenders and potential lenders with information regarding Harvest, including our assessment of our future plans and operations, this MD&A contains forward-looking statements that involve risks and uncertainties.
Such risks and uncertainties include, but are not limited to: risks associated with conventional petroleum and natural gas operations; risks associated with refining and marketing operations; the volatility in commodity prices and currency exchange rates; risks associated with realizing the value of acquisitions; general economic, market and business conditions; changes in environmental legislation and regulations; the availability of sufficient capital from internal and external sources; and, such other risks and uncertainties described from time to time in our regulatory reports and filings made with securities regulators.
Forward-looking statements in this MD&A include, but are not limited to, the forward looking statements made in the “Outlook” section as well as statements made throughout with reference to production volumes, refinery throughput volumes, royalty rates, operating costs, commodity prices, administrative costs, price risk management activities, acquisitions and dispositions, capital spending, reserve estimates, access to credit facilities, income taxes, cash from operating activities, and regulatory changes. For this purpose, any statements that are contained herein that are not statements of historical fact may be deemed to be forward-looking statements. Forward-looking statements often contain terms such as “may”, “will”, “should”, “anticipate”, “expect”, “target”, “plan”, “potential”, “intend”, and similar expressions.
29
| MANAGEMENT’S DISCUSSION AND ANALYSIS |
Readers are cautioned not to place undue reliance on forward-looking statements as there can be no assurance that the plans, intentions or expectations upon which they are based will occur. Although we consider such information reasonable at the time of preparation, it may prove to be incorrect and actual results may differ materially from those anticipated. Harvest assumes no obligation to update forward-looking statements should circumstances, estimates or opinions change, except as required by law. Forward-looking statements contained in this MD&A are expressly qualified by this cautionary statement.
ADDITIONAL INFORMATION
Further information about us can be accessed under our public filings found on SEDAR atwww.sedar.com or atwww.harvestenergy.ca. Information can also be found by contacting our Investor Relations department at (403) 265-1178 or at 1-866-666-1178.
30