 | MANAGEMENT’S DISCUSSION AND ANALYSIS |
MANAGEMENT’S DISCUSSION AND ANALYSIS
This Management’s Discussion and Analysis (“MD&A”) should be read in conjunction with the unaudited interim consolidated financial statements of Harvest Operations Corp. (“Harvest”, “we”, “us”, “our” or the “Company”) for the three months ended March 31, 2012 and the audited consolidated financial statements and MD&A for the year ended December 31, 2011. The information and opinions concerning our future outlook are based on information available at May 11, 2012.
In this MD&A, all dollar amounts are expressed in Canadian dollars unless otherwise indicated. Tabular amounts are in thousands of dollars, except where noted. Natural gas volumes are converted to barrels of oil equivalent (“boe”) using the ratio of six thousand cubic feet (“mcf”) of natural gas to one barrel of oil (“bbl”). Boes may be misleading, particularly if used in isolation. A boe conversion ratio of 6 mcf to 1 bbl is based on an energy equivalent conversion method primarily applicable at the burner tip and does not represent a value equivalent at the wellhead. In accordance with Canadian practice, petroleum and natural gas revenues are reported on a gross basis before deduction of Crown and other royalties. In addition to disclosing reserves under the requirements of National Instrument (“NI”) 51-101, Harvest also discloses our reserves on a company interest basis which is not a term defined under NI 51-101. This information may not be comparable to similar measures by other issuers.
Additional information concerning Harvest, including its Annual Information Form (“AIF”) can be found on SEDAR atwww.sedar.com.
ADVISORY
This MD&A contains non-GAAP measures and forward-looking information about our current expectations, estimates and projections. Readers are cautioned that the MD&A should be read in conjunction with the “Non-GAAP Measures” and “Forward-Looking Information” sections at the end of this MD&A.
1
| MANAGEMENT’S DISCUSSION AND ANALYSIS |
SELECTED INFORMATION
The table below provides a summary of Harvest’s financial and operating results for the three months ended March 31, 2012 and 2011.
| | Three Months Ended March 31 | |
| | 2012 | | | 2011 | |
FINANCIAL | | | | | | |
Revenues(1) | | 1,426,140 | | | 1,248,924 | |
Cash from operating activities | | 85,110 | | | 146,828 | |
Net income (loss) | | (72,081 | ) | | 37,961 | |
| | | | | | |
Bank loan | | 531,619 | | | 29,660 | |
Convertible debentures | | 741,237 | | | 744,490 | |
Senior notes | | 486,611 | | | 470,676 | |
Total financial debt(2) | | 1,759,467 | | | 1,244,826 | |
| | | | | | |
Total assets | | 6,322,250 | | | 6,041,118 | |
| | | | | | |
UPSTREAM OPERATIONS | | | | | | |
Daily sales volumes (boe/d) | | 60,550 | | | 53,331 | |
Average realized price | | | | | | |
Oil and NGLs ($/bbl)(3) | | 79.32 | | | 73.75 | |
Gas ($/mcf) | | 2.29 | | | 3.83 | |
Operating netback prior to hedging ($/boe)(2) | | 29.21 | | | 33.67 | |
| | | | | | |
Capital asset additions (excluding acquisitions) | | 238,592 | | | 237,649 | |
Property and business acquisitions (dispositions), net | | (1,988 | ) | | 515,496 | |
Abandonment and reclamation expenditures | | 6,587 | | | 1,967 | |
Net wells drilled | | 60.4 | | | 104.9 | |
Net undeveloped land acquired in business combinations (acres)(4) | | – | | | 223,405 | |
Net undeveloped land additions (acres) | | 44,931 | | | 53,480 | |
| | | | | | |
DOWNSTREAM OPERATIONS | | | | | | |
Average daily throughput (bbl/d) | | 100,000 | | | 97,438 | |
Average refining margin (US$/bbl) | | 4.58 | | | 10.96 | |
| | | | | | |
Capital asset additions | | 13,263 | | | 35,879 | |
| (1) | Revenues are net of royalties and the effective portion of Harvest’s realized crude oil hedges. |
| (2) | This is a non-GAAP measure; please refer to “Non-GAAP Measures” in this MD&A. |
| (3) | Excludes the effect of risk management contracts designated as hedges. |
| (4) | Excludes carried interest lands acquired in business combinations. |
2
| MANAGEMENT’S DISCUSSION AND ANALYSIS |
REVIEW OF OVERALL PERFORMANCE
Upstream
Sales volumes for the three months ended March 31, 2012 increased by 7,219 boe/d compared to the same period in 2011. The increase reflects a full quarter of production from the assets acquired from Hunt Oil Company of Canada, Inc. and Hunt Oil Alberta, Inc. (collectively “Hunt”) at the end of February 2011 as well as production increases from Harvest’s capital program during the second half of 2011.
Operating loss was $19.8 million for the first quarter of 2012 as compared to an operating income of $23.2 million for the same quarter in 2011. The decrease in operating income is mainly attributable to the higher depreciation, depletion and amortization expense and the impairment taken on certain gas properties due to declining future natural gas prices, partially offset by the higher operating netback after hedging received during the quarter.
Harvest’s operating netback was $29.21/boe prior to hedging for the first quarter of 2012, a decrease of 13% from the same quarter in 2011, reflecting lower realized prices from natural gas and natural gas liquids (“NGLs”) sales and increased royalties, operating and transportation expenses, partially offset by higher oil prices.
Capital spending of $238.6 million includes the drilling of 51 gross oil wells, 6 gross gas wells, and 12 gross service wells.
Downstream
Throughput volume averaged 100,000 bbl/d, an increase of 3% as compared to the first quarter of 2011. The current quarter’s throughput rate was slightly below the nameplate capacity of 115,000 bbl/d in response to the declining refining margins during the latter part of the quarter. Refining gross margin averaged $4.58/bbl in the first quarter of 2012, a decrease of $6.38/bbl from the same quarter in 2011 reflecting the widening differential between WTI and Brent.
Operating loss totaled $48.9 million for the three months ended March 31, 2012 as compared to an operating income of $36.2 million in the same period in 2011. The decrease in operating income reflects the higher feedstock costs and purchased energy expenses, partially offset by higher refined product sales.
Capital spending was $13.3 million for the quarter, of which $3.3 million was spent on the debottlenecking project.
3
| MANAGEMENT’S DISCUSSION AND ANALYSIS |
UPSTREAM OPERATIONS
Summary of Financial and Operating Results
| | | Three Months Ended March 31 | |
| | | 2012 | | | 2011 | |
FINANCIAL | | | | | | |
Petroleum and natural gas sales(1) | | 324,151 | | | 281,051 | |
Royalties | | (53,417 | ) | | (35,858 | ) |
Revenues | | 270,734 | | | 245,193 | |
| | | | | | |
Expenses | | | | | | |
Operating | | 99,975 | | | 83,595 | |
Transportation and marketing | | 5,686 | | | 3,003 | |
Realized gains on risk management contracts(2) | | – | | | (2,223 | ) |
Operating netback after hedging(3) | | 165,073 | | | 160,818 | |
| | | | | | |
General and administrative | | 12,153 | | | 13,522 | |
Depreciation, depletion and amortization | | 144,482 | | | 121,344 | |
Exploration and evaluation | | 6,736 | | | 6,215 | |
Impairment of property, plant and equipment | | 21,843 | | | – | |
Unrealized gains on risk management contracts(4) | | (271 | ) | | (3,240 | ) |
Gains on disposition of property, plant and equipment | | (106 | ) | | (240 | ) |
Operating income (loss)(3) | | (19,764 | ) | | 23,217 | |
| | | | | | |
Capital asset additions (excluding acquisitions) | | 238,592 | | | 237,649 | |
Property and business acquisitions (dispositions), net | | (1,988 | ) | | 515,496 | |
Abandonment and reclamation expenditures | | 6,587 | | | 1,967 | |
| | | | | | |
OPERATING | | | | | | |
Light / medium oil (bbl/d) | | 24,936 | | | 25,523 | |
Heavy oil (bbl/d) | | 9,272 | | | 9,038 | |
Natural gas liquids (bbl/d) | | 5,668 | | | 3,455 | |
Natural gas (mcf/d) | | 124,045 | | | 91,888 | |
Total (boe/d) | | 60,550 | | | 53,331 | |
| (1) | Inclusive of the effective portion of Harvest’s realized crude oil hedges. |
| (2) | Realized (gains) losses on risk management contracts include the settlement amounts for power derivative contracts and the ineffective portion of realized crude oil hedges. |
| (3) | This is a non-GAAP measure; please refer to “Non-GAAP Measures” in this MD&A. |
| (4) | Unrealized (gains) losses on risk management contracts reflect the change in fair value of the power derivative contracts and the ineffective portion of crude oil hedges. |
4
| MANAGEMENT’S DISCUSSION AND ANALYSIS |
Commodity Price Environment
| | | Three Months Ended March 31 | |
| | 2012 | | | 2011 | | | Change | |
West Texas Intermediate (“WTI”) crude oil (US$/bbl) | | 102.93 | | | 94.10 | | | 9% | |
West Texas Intermediate (“WTI”) crude oil ($/bbl) | | 103.02 | | | 92.74 | | | 11% | |
Edmonton light crude oil ($/bbl) | | 92.37 | | | 88.04 | | | 5% | |
Bow River blend crude oil ($/bbl) | | 82.93 | | | 71.33 | | | 16% | |
Western Canadian Select (“WCS”) crude oil ($/bbl) | | 81.61 | | | 70.19 | | | 16% | |
AECO natural gas daily ($/mcf) | | 2.15 | | | 3.76 | | | (43% | ) |
U.S. / Canadian dollar exchange rate | | 0.999 | | | 1.014 | | | (1% | ) |
| | | | | | | | | |
Differential Benchmarks | | | | | | | | | |
Bow River blend differential to WTI ($/bbl) | | 20.09 | | | 21.41 | | | (6% | ) |
Bow River blend differential as a % of WTI | | 19.5% | | | 23.1% | | | (16% | ) |
WCS differential to WTI ($/bbl) | | 21.41 | | | 22.55 | | | (5% | ) |
WCS differential as a % of WTI | | 20.8% | | | 24.3% | | | (14% | ) |
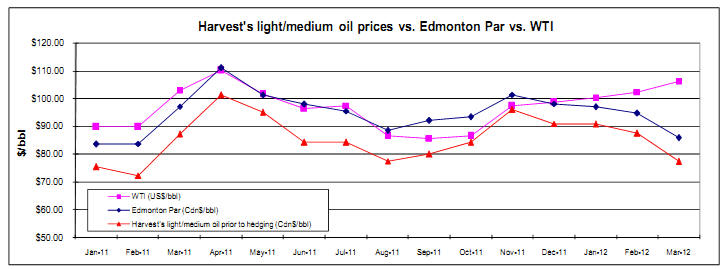
The average WTI benchmark price in the first quarter of 2012 was 9% higher than the first quarter of 2011. The average Edmonton light crude oil price (“Edmonton Par”) also experienced an increase over the first quarter of the prior year, due to the higher WTI prices but partially offset by the widening of the light sweet differential.
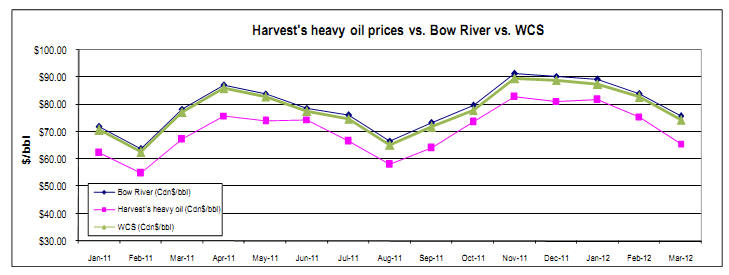
Heavy oil differentials fluctuate based on a combination of factors including the level of heavy oil inventories, pipeline capacity to deliver heavy crude to U.S. markets and the seasonal demand for heavy oil. The Bow River blend crude oil price (“Bow River”) increased 16% from the first quarter of 2011, which is consistent with the higher WTI price and the narrowing of the Bow River and WCS differential relative to WTI.
Realized Commodity Prices
| | | Three Months Ended March 31 | |
| | | 2012 | | | 2011 | | | Change | |
Light to medium oil prior to hedging ($/bbl) | | 84.88 | | | 78.69 | | | 8% | |
Heavy oil ($/bbl) | | 74.24 | | | 61.51 | | | 21% | |
Natural gas liquids ($/bbl) | | 63.20 | | | 69.32 | | | (9% | ) |
Natural gas ($/mcf) | | 2.29 | | | 3.83 | | | (40% | ) |
Average realized price prior to hedging ($/boe)(1) | | 58.07 | | | 59.19 | | | (2% | ) |
| | | | | | | | | |
Light to medium oil after hedging ($/bbl)(2) | | 86.72 | | | 77.37 | | | 12% | |
Average realized price after hedging ($boe)(1)(2) | | 58.83 | | | 58.55 | | | – | |
| (1) | Inclusive of sulphur revenue. |
| (2) | Inclusive of the realized gains (losses) from contracts designated as hedges. Contracts that are not designated as hedges are excluded from the realized price. |
Prior to hedging activities, our realized price for light to medium oil increased by 8% in the first quarter of 2012 as compared to the same period in the prior year. This increase is consistent with the upward movement in Edmonton Par prices during the first three months of 2012.
5
| MANAGEMENT’S DISCUSSION AND ANALYSIS |
In order to mitigate the risk of fluctuating cash flows due to crude oil price volatility, Harvest has entered into fixed-for-floating swaps. The impact of this hedging activity resulted in an increase of $1.84/bbl (2011 – decrease of $1.32/bbl) in Harvest’s realized light to medium oil price in the first quarter of 2012. With respect to our cash flow risk management program, see “Cash Flow Risk Management” in this MD&A.
Harvest’s realized heavy oil prices for the first quarter of 2012 increased by 21%, mainly due to the increase in the Bow River prices.
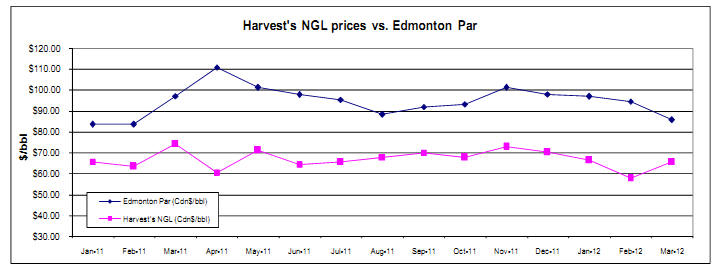
Although NGL benchmark prices have increased from the first quarter of 2011, the realized prices for NGLs decreased by 9% due to a higher percentage of ethane in the NGL product mix. This change is a result of the assets acquired from Hunt.
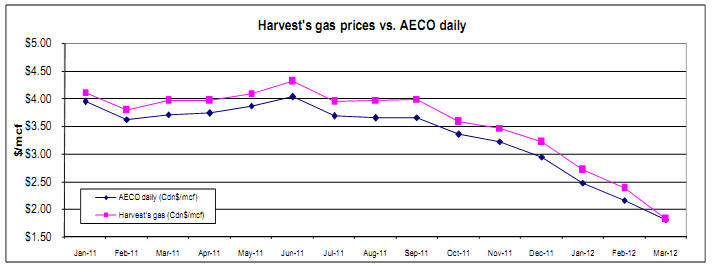
The average realized price for Harvest’s natural gas sales decreased by 40% compared to the first quarter of 2011, reflecting the 43% decrease in the AECO benchmark price.
6
| MANAGEMENT’S DISCUSSION AND ANALYSIS |
Sales Volumes
| | | Three Months Ended March 31 | |
| | | 2012 | | | 2011 | | | | |
| | | | | | | | | | | | | | | % Volume | |
| | | Volume | | | Weighting | | | Volume | | | Weighting | | | Change | |
| Light to medium oil (bbl/d)(1) | | 24,936 | | | 41% | | | 25,523 | | | 48% | | | (2% | ) |
| Heavy oil (bbl/d) | | 9,272 | | | 15% | | | 9,038 | | | 17% | | | 3% | |
| Natural gas liquids (bbl/d) | | 5,668 | | | 9% | | | 3,455 | | | 6% | | | 64% | |
| Total liquids (bbl/d) | | 39,876 | | | 65% | | | 38,016 | | | 71% | | | 5% | |
| Natural gas (mcf/d) | | 124,045 | | | 35% | | | 91,888 | | | 29% | | | 35% | |
| Total oil equivalent (boe/d) | | 60,550 | | | 100% | | | 53,331 | | | 100% | | | 14% | |
| (1) | Harvest classifies all oil production, except that produced from Hay River, as light to medium and heavy according to NI 51-101 guidance. The oil produced from Hay River has an average API of 24o(medium grade) and is classified as a light to medium oil; notwithstanding that, it benefits from a heavy oil royalty regime and therefore would be classified as heavy oil according to NI 51-101. |
7
| MANAGEMENT’S DISCUSSION AND ANALYSIS |
Harvest’s sales volumes increased to 60,550 boe/d in the first quarter of 2012, a 14% increase over the first quarter of 2011. The increase reflects a full quarter of production from the assets acquired from Hunt at the end of February 2011 as well as production increases resulting from Harvest’s capital program during the second half of 2011.
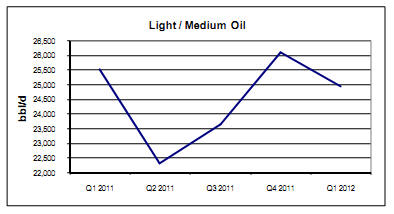
| Harvest’s average light/medium oil sales were 24,936 bbl/d for the first quarter of 2012, a 2% decrease from the same quarter in 2011. The slight decrease from Q1 2011 reflects natural declines and minor production interruptions during the quarter. |
Heavy oil sales for the first quarter of 2012 increased by 3% to an average of 9,272 bbl/d, reflecting production increases from Harvest’s 2011 drilling and reactivation programs. | 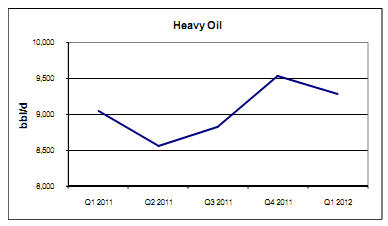
|
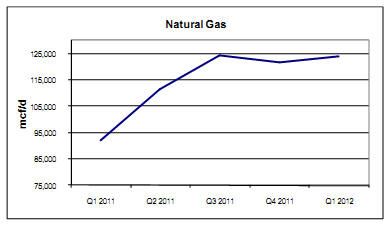
| Natural gas sales averaged 124,045 mcf/d in the first quarter of 2012 compared to 91,888 mcf/d in 2011. The increase reflects a full quarter of production from assets acquired from Hunt. |
8
| MANAGEMENT’S DISCUSSION AND ANALYSIS |
Natural gas liquids sales for the three months ended March 31, 2012 increased by 64%, compared to the same period in 2011. Similar to the increase in natural gas sales, the increase was mainly due to the sales volumes reflecting a full quarter of production from assets acquired from Hunt. | 
|
Revenues
| | | Three Months Ended March 31 | |
| | | 2012 | | | 2011 | | | Change | |
| Light / medium oil sales after hedging(1) | | 196,774 | | | 177,725 | | | 11% | |
| Heavy oil sales | | 62,642 | | | 50,032 | | | 25% | |
| Natural gas sales | | 25,877 | | | 31,679 | | | (18% | ) |
| Natural gas liquids sales | | 32,596 | | | 21,473 | | | 52% | |
| Other(2) | | 6,262 | | | 142 | | | 100% | |
| Petroleum and natural gas sales | | 324,151 | | | 281,051 | | | 15% | |
| Royalties | | (53,417 | ) | | (35,858 | ) | | 49% | |
| Revenues | | 270,734 | | | 245,193 | | | 10% | |
| (1) | Inclusive of the effective portion of realized gains (losses) from contracts designated as hedges. |
| (2) | Inclusive of sulphur revenue and miscellaneous income. |
Harvest’s revenue is subject to changes in sales volumes, commodity prices and currency exchange rates. In the first quarter of 2012, total petroleum and natural gas sales increased by $43.1 million, mainly due to the 14% increase in sales volumes and the increase in sulphur revenue from the acquired Hunt assets. Sulphur revenue represented $6.0 million (2011 - $0.1 million) of the total in other revenues for the three months ended March 31, 2012.
Royalties
Harvest pays Crown, freehold and overriding royalties to the owners of mineral rights from which production is generated. These royalties vary for each property and product and our Crown royalties are based on a sliding scale dependent on production volumes and commodity prices.
Royalties as a percentage of gross revenue averaged 16.5% as compared to 12.8% in the same quarter of 2011. The increase is mainly due to the higher oil prices in the first quarter of 2012 combined with adjustments made to Freehold Mineral Tax estimates in the first quarter of 2011.
9
| MANAGEMENT’S DISCUSSION AND ANALYSIS |
Operating and Transportation Expenses
| | | Three Months Ended March 31 | |
| | | | | | | | | | | | | | | $/boe | |
| | | 2012 | | | $/boe | | | 2011 | | | $/boe | | | Change | |
| Power and purchased energy | | 20,501 | | | 3.72 | | | 21,551 | | | 4.49 | | | (0.77 | ) |
| Well servicing | | 18,520 | | | 3.36 | | | 16,912 | | | 3.52 | | | (0.16 | ) |
| Repairs and maintenance | | 16,164 | | | 2.93 | | | 12,871 | | | 2.68 | | | 0.25 | |
| Lease rentals and property tax | | 9,520 | | | 1.73 | | | 7,768 | | | 1.62 | | | 0.11 | |
| Labor - internal | | 9,190 | | | 1.67 | | | 7,048 | | | 1.47 | | | 0.20 | |
| Labor - contract | | 5,319 | | | 0.97 | | | 4,073 | | | 0.85 | | | 0.12 | |
| Chemicals | | 4,584 | | | 0.83 | | | 3,826 | | | 0.80 | | | 0.03 | |
| Trucking | | 4,555 | | | 0.83 | | | 2,554 | | | 0.53 | | | 0.30 | |
| Processing and other fees | | 8,693 | | | 1.58 | | | 1,307 | | | 0.27 | | | 1.31 | |
| Other | | 2,929 | | | 0.52 | | | 5,685 | | | 1.19 | | | (0.67 | ) |
| Total operating expenses | | 99,975 | | | 18.14 | | | 83,595 | | | 17.42 | | | 0.72 | |
| Transportation and marketing | | 5,686 | | | 1.03 | | | 3,003 | | | 0.63 | | | 0.40 | |
Operating expenses for the first quarter of 2012 totaled $100.0 million, an increase of $16.4 million as compared to the same quarter in the prior year. The increase in operating costs is attributable to the acquisition of Hunt assets combined with higher activity levels on well servicing and repairs and maintenance.
Operating expenses on a per barrel basis increased to $18.14/boe as compared to $17.42/boe in the first quarter of 2011. The 4% increase on a per barrel basis is substantially attributed to higher activity levels on gas processing and repairs and maintenance.
| | Three Months Ended March 31 | |
($/boe) | | 2012 | | | 2011 | | | Change | |
Power and purchased energy costs | | 3.72 | | | 4.49 | | | (0.77 | ) |
Realized gains on electricity risk management contracts | | – | | | (0.47 | ) | | 0.47 | |
Net power and purchased energy costs | | 3.72 | | | 4.02 | | | (0.30 | ) |
Alberta Power Pool electricity price ($/MWh) | | 59.76 | | | 83.34 | | | (23.58 | ) |
Power and purchased energy costs, comprised primarily of electric power costs, represented approximately 21% of our total operating costs during the first quarter of 2012 (2011 – 26%). The 5% decrease in power and purchased energy costs is primarily attributable to the lower average Alberta electricity price of $59.76/MWh for the quarter (2011 - $83.34/MWh) .
Transportation and marketing expenses relate primarily to delivery of natural gas to Alberta’s natural gas sales hub, the AECO Storage Hub, and the cost of trucking clean crude oil to pipeline receipt points. As a result, the total dollar amount of costs generally fluctuates in relation to our sales volumes. Transportation and marketing expenses increased by $0.40/boe or $2.7 million in the first quarter of 2012 compared to the same quarter in 2011, primarily due to the acquisition of Hunt assets at the end of February 2011.
10
| MANAGEMENT’S DISCUSSION AND ANALYSIS |
Operating Netback(1)
| | | Three Months Ended March 31 | |
($/boe) | | 2012 | | | 2011 | | | $/boe Change | |
Petroleum and natural gas sales prior to hedging | | 58.07 | | | 59.19 | | | (1.12 | ) |
Royalties | | (9.69 | ) | | (7.47 | ) | | (2.22 | ) |
Operating expenses | | (18.14 | ) | | (17.42 | ) | | (0.72 | ) |
Transportation expenses | | (1.03 | ) | | (0.63 | ) | | (0.40 | ) |
Operating netback prior to hedging(1) | | 29.21 | | | 33.67 | | | (4.46 | ) |
Hedging gains (losses)(2) | | 0.76 | | | (0.17 | ) | | 0.93 | |
Operating netback after hedging(1) | | 29.97 | | | 33.50 | | | (3.53 | ) |
| (1) | This is a non-GAAP measure; please refer to “Non-GAAP Measures” in this MD&A. |
| (2) | Hedging gains (losses) include the settlement amounts for crude oil and power contracts. |
Harvest’s operating netback represents the net amount realized on a per boe basis after deducting directly related costs. In the first quarter of 2012, our operating netback prior to hedging decreased by $4.46/boe or 13% compared to the same quarter in the prior year. The decrease in our operating netback is primarily attributed to lower realized commodity prices prior to hedging and increases in royalties and operating expenses.
General and Administrative (“G&A”) Expenses
| | | Three Months Ended March 31 | |
| | | 2012 | | | 2011 | |
| G&A | | 12,153 | | | 13,522 | |
| G&A per boe ($/boe ) | | 2.21 | | | 2.82 | |
For the three months ended March 31, 2012, G&A expenses decreased by $1.4 million compared to the same period in 2011. The decrease was mainly due to the reversal of a $4.3 million provision for potential renunciation shortfall on a series of flow-through shares that was no longer required, partially offset by the increase in salary expense. G&A expenses are mainly comprised of salaries and other employee related costs. Harvest does not have a stock option program, however there is a long-term cash incentive program.
Depletion, Depreciation and Amortization (“DDA”) Expenses
| | | Three Months Ended March 31 | |
| | | 2012 | | | 2011 | |
| DD&A | | 144,482 | | | 121,344 | |
| DD&A per boe ($/boe) | | 26.22 | | | 25.28 | |
DD&A expenses for the three months ended March 31, 2012 were $23.1 million (19%) higher compared to the same period in the prior year, mainly due to higher sales volumes.
Impairment
In the first quarter of 2012, Harvest recorded a pre-tax impairment charge of $21.8 million against the South Alberta Gas cash generating unit, as a result of the declining forecasted natural gas prices during the quarter. The fair value was determined based on the total proved plus probable reserves estimated by our independent reserves evaluators using the April 1, 2012 commodity price forecast discounted at a pre-tax discount rate of 10%.
11
| MANAGEMENT’S DISCUSSION AND ANALYSIS |
Capital Asset Additions
| | | Three Months Ended March 31 | |
| | | 2012 | | | 2011 | |
Drilling and completion | | 124,679 | | | 137,599 | |
Well equipment, pipelines and facilities | | 62,429 | | | 57,689 | |
Geological and geophysical | | 6,723 | | | 10,800 | |
Land and undeveloped lease rentals | | 8,923 | | | 5,690 | |
Corporate | | 248 | | | 646 | |
Other | | 4,225 | | | 2,450 | |
Total additions before BlackGold | | 207,227 | | | 214,874 | |
| | | | | | |
BlackGold oil sands (“BlackGold”) | | | | | | |
Drilling and completion | | 18,904 | | | 4,910 | |
Well equipment, pipelines and facilities | | 8,904 | | | 17,130 | |
Geological and geophysical | | 714 | | | 107 | |
Land and undeveloped lease rentals | | 72 | | | – | |
Other | | 2,771 | | | 628 | |
Total BlackGold additions | | 31,365 | | | 22,775 | |
Total additions excluding acquisitions | | 238,592 | | | 237,649 | |
Below is a summary of the wells drilled by Harvest and the related drilling and completion expenditures in the first quarter of 2012. Harvest’s overall success rate was 98%.
| | | Three Months Ended March 31, 2012 | |
| Area | | Gross | | | Net | | | | |
| Hay River | | 27.0 | | | 27.0 | | $ | 37,162 | |
| Red Earth | | 10.0 | | | 9.3 | | | 38,065 | |
| Rimbey/Markerville/West Central | | 4.0 | | | 2.5 | | | 11,072 | |
| SE Saskatchewan | | 7.0 | | | 7.0 | | | 7,896 | |
| Deep Basin | | 3.0 | | | 2.3 | | | 16,909 | |
| Other areas | | 13.0 | | | 7.3 | | | 13,575 | |
| Total before BlackGold | | 64.0 | | | 55.4 | | $ | 124,679 | |
| BlackGold oil sands | | 5.0 | | | 5.0 | | | 18,904 | |
| Total | | 69.0 | | | 60.4 | | $ | 143,583 | |
During the first quarter of 2012, Harvest drilled 69 gross (60.4 net) wells (2011 – 115 gross; 104.9 net). Capital asset additions, excluding BlackGold for the quarter totaled $207.2 million (2011 – $214.9 million), of which $124.7 million was spent on drilling and completion and $39.5 million was spent on equipping and tie-in of wells. The higher drilling and completion costs per well in the first quarter of 2012 compared to 2011 is mainly due to Harvest drilling more horizontal wells into deeper zones during 2012. In addition, Harvest spent $22.8 million during the first quarter of 2012 to complete wells that were drilled in the fourth quarter of 2011.
For the quarter, Harvest mainly focused on oil drilling opportunities with only 6 gross gas wells being drilled. In Hay River, Harvest continued with the drilling program that began in November 2011 where 17 producer and 10 injector wells were drilled in the Bluesky formation. Harvest began bringing this new production on from Hay River in March 2012 and will be ramping up production through April 2012. In Red Earth, Harvest drilled 10 gross stage stimulated horizontal oil wells in the Slave Point formation. These wells were tied into existing infrastructure or were set-up as single well batteries from which Harvest began trucking production into Harvest operated facilities. In Southeast Saskatchewan, Harvest continued with drilling its 100% working interest horizontal wells, where 7 wells were drilled into the Souris Valley and Tilston formations. Harvest also drilled 3 gross stage stimulated horizontal liquids rich gas wells in the Deep Basin area. These wells were completed and tied into third party infrastructure during the quarter. The remainder of Harvest’s capital program during the quarter was focused on developing our existing oil pools.
12
| MANAGEMENT’S DISCUSSION AND ANALYSIS |
BlackGold oil sands
Harvest began drilling the first pad of horizontal steam assisted gravity drainage (“SAGD”) producer wells. During the first quarter of 2012, Harvest drilled 5 gross wells and invested a total of $8.9 million on infrastructure and construction of the central processing facility.
Decommissioning and Environmental Remediation Liabilities
Harvest’s Upstream decommissioning and environmental remediation liabilities at March 31, 2012 were $676.0 million (2011 - $672.7 million) for future remediation, abandonment, and reclamation of Harvest’s oil and gas properties. The increase of $3.2 million during the first three months of 2012 was a result of new liabilities of $4.8 million incurred on new drills and environmental remediation plus accretion of $5.0 million, partially offset by $6.6 million of remediation, abandonment and reclamation expenditures. The total of our decommissioning and environmental remediation liabilities are based on management’s best estimate of costs to remediate, abandon and reclaim our wells, pipelines and facilities. The costs will be incurred over the operating lives of the assets with the majority being at or after the end of reserve life. Please refer to the “Contractual Obligations and Commitments” section of this MD&A for the payments due for each of the next five years and thereafter in respect of our decommissioning and environmental remediation liabilities.
13
| MANAGEMENT’S DISCUSSION AND ANALYSIS |
DOWNSTREAM OPERATIONS
| | | Three Months Ended March 31 | |
| | | 2012 | | | 2011 | |
FINANCIAL | | | | | | |
Refined products sales(1) | | 1,155,406 | | | 1,003,731 | |
Purchased feedstock for processing and resale(1) | | 1,101,716 | | | 892,013 | |
Gross margin(2) | | 53,690 | | | 111,718 | |
| | | | | | |
Expenses | | | | | | |
Operating | | 27,133 | | | 26,083 | |
Power and purchased energy | | 47,348 | | | 27,856 | |
Marketing | | 1,365 | | | 1,694 | |
General and administrative | | 150 | | | 441 | |
Depreciation and amortization | | 26,570 | | | 19,400 | |
Operating income (loss)(2) | | (48,876 | ) | | 36,244 | |
| | | | | | |
Capital expenditures | | 13,263 | | | 35,879 | |
| | | | | | |
OPERATING | | | | | | |
Feedstock volume (bbl/d)(3) | | 100,000 | | | 97,438 | |
| | | | | | |
Yield (% of throughput volume)(4) | | | | | | |
Gasoline and related products | | 31% | | | 32% | |
Ultra low sulphur diesel and jet fuel | | 43% | | | 35% | |
High sulphur fuel oil | | 24% | | | 29% | |
Total | | 98% | | | 96% | |
| | | | | | |
Average refining gross margin (US$/bbl)(5) | | 4.58 | | | 10.96 | |
| (1) | Refined product sales and purchased products for processing and resale are net of intra-division sales of $148.8 million for the three months ended March 31, 2012 (2011 - $116.4 million), reflecting the refined products produced by the refinery and sold by the marketing division. |
| (2) | These are non-GAAP measures; please refer to “Non-GAAP Measures” in this MD&A. |
| (3) | Barrels per day are calculated using total barrels of crude oil feedstock and vacuum gas oil. |
| (4) | Based on production volumes after adjusting for changes in inventory held for resale. |
| (5) | Average refining gross margin is calculated based on per barrel of feedstock throughput. |
14
| MANAGEMENT’S DISCUSSION AND ANALYSIS |
Refining Benchmark Prices
| | | Three Months Ended March 31 | |
| | 2012 | | | 2011 | | | Change | |
WTI crude oil (US$/bbl) | | 102.93 | | | 94.10 | | | 9% | |
Brent crude oil (US$/bbl) | | 118.28 | | | 105.01 | | | 13% | |
Harvest’s feedstock costs (US$/bbl) | | 118.24 | | | 94.95 | | | 25% | |
Brent – WTI differential (US$/bbl) | | 15.35 | | | 10.91 | | | 41% | |
Crack spread to Brent crude oil | | | | | | | | | |
RBOB (US$/bbl) | | 9.80 | | | 6.87 | | | 43% | |
Heating Oil (US$/bbl) | | 14.27 | | | 13.04 | | | 9% | |
High Sulphur Fuel Oil discount (US$/bbl) | | (9.92 | ) | | (16.42 | ) | | (40% | ) |
U.S. / Canadian dollar exchange rate | | 0.999 | | | 1.014 | | | (1% | ) |
Summary of Gross Margins
| | | Three Months Ended March 31 | |
| | | 2012 | | | 2011 | |
| | | | | | Volumes | | | | | | | | | Volumes | | | | |
| | | | | | (000’s bbls) | | | (US$/bbl) | | | | | | (000’s bbls) | | | (US$/ bbl) | |
| Refinery | | | | | | | | | | | | | | | | | | |
| Sales | | | | | | | | | | | | | | | | | | |
| Gasoline products | | 350,101 | | | 2,819 | | | 124.07 | | | 345,883 | | | 3,194 | | | 109.81 | |
| Distillates | | 537,661 | | | 3,996 | | | 134.42 | | | 395,340 | | | 3,261 | | | 122.93 | |
| High sulphur fuel oil | | 239,244 | | | 2,274 | | | 105.10 | | | 221,310 | | | 2,577 | | | 87.08 | |
| Total sales | | 1,127,006 | | | 9,089 | | | 123.87 | | | 962,533 | | | 9,032 | | | 108.06 | |
| Feedstock(1) | | | | | | | | | | | | | | | | | | |
| Middle Eastern | | 935,854 | | | 7,946 | | | 117.66 | | | 809,752 | | | 8,648 | | | 94.95 | |
| Russian | | – | | | – | | | – | | | 1,311 | | | 14 | | | 94.95 | |
| South America | | 58,621 | | | 473 | | | 123.81 | | | – | | | – | | | – | |
| | | 994,475 | | | 8,419 | | | 118.00 | | | 811,063 | | | 8,662 | | | 94.95 | |
| Vacuum Gas Oil (“VGO”) | | 82,601 | | | 681 | | | 121.17 | | | 10,050 | | | 107 | | | 95.24 | |
| Total feedstock | | 1,077,076 | | | 9,100 | | | 118.24 | | | 821,113 | | | 8,769 | | | 94.95 | |
| Other(2) | | 8,215 | | | | | | | | | 46,617 | | | | | | | |
| Total feedstock and other | | 1,085,291 | | | | | | | | | 867,730 | | | | | | | |
| Refinery gross margin(3) | | 41,715 | | | | | | 4.58 | | | 94,803 | | | | | | 10.96 | |
| | | | | | | | | | | | | | | | | | | |
| Marketing | | | | | | | | | | | | | | | | | | |
| Sales | | 177,152 | | | | | | | | | 157,583 | | | | | | | |
| Cost of products sold | | 165,177 | | | | | | | | | 140,668 | | | | | | | |
| Marketing gross margin(3) | | 11,975 | | | | | | | | | 16,915 | | | | | | | |
| | | | | | | | | | | | | | | | | | | |
| Total gross margin(3) | | 53,690 | | | | | | | | | 111,718 | | | | | | | |
| (1) | Cost of feedstock includes all costs of transporting the crude oil to the refinery in Newfoundland. |
| (2) | Includes inventory adjustments and additives and blendstocks. |
| (3) | This is a non-GAAP measure; please refer to “Non-GAAP Measures” in this MD&A. |
15
| MANAGEMENT’S DISCUSSION AND ANALYSIS |
Feedstock throughput averaged 100,000 bbl/d in the first quarter of 2012, a moderate increase of 3% from 97,438 bbl/d average feedstock throughput in the first quarter of the prior year. The lower crude oil throughput in 2012 as compared to 2011 has been offset by the higher consumption of purchased VGO. The lower consumption of purchased VGO in 2011 resulted from the temporary outage of the isomax and hydrogen units due to a steam leak in the hydrogen plant. Current year throughput rates are less than the nameplate capacity of 115,000 bbl/d reflecting the strategic decision to reduce rates in the latter part of the quarter in response to declining refining margins.
The Downstream operations’ refining gross margin is impacted by several factors including the configuration of the refinery product yields, timing of sales under the SOA, transportation costs, location differentials, quality differentials and variability in throughput volume over a given period of time. Product pricing under the SOA is based primarily on New York Harbour reference prices whereas feedstock costs are determined by crude oil reference prices and feedstock crude quality.
Our refinery sales increased by $164.5 million in the first quarter of 2012 from $962.5 million in the same quarter of 2011, mainly due to increased product prices. The cost of our crude oil feedstock in the first quarter of 2012 was US$0.04/bbl discount to the Brent crude oil benchmark as compared to a discount of US$10.06/bbl in the same period of the prior year. Our feedstock costs in 2012 continue to reflect the high cost of crude oil commitments from the fourth quarter of 2011 with such crude oil feedstocks processed early in the first quarter of 2012. The increased feedstock costs have resulted in the 56% decrease in gross margin for the three months ended March 31, 2012 as compared to 2011.
The gross margin from the marketing operations is comprised of the margin from both the retail and wholesale distribution of gasoline and home heating fuels as well as the revenues from marine services including tugboat revenues, and for 2011, the inclusion of the US$5.0 million settlement from the business interruption claim relating to the fire in the first quarter of 2010.
During the three months ended March 31, 2012, the Canadian dollar weakened as compared to the U.S. dollar. The weakening of the Canadian dollar in 2012 has had a positive impact to the contribution from our refinery operations relative to the prior year as substantially all of its gross margin, cost of purchased energy and marketing expense are denominated in U.S. dollars.
Operating Expenses
| | | Three Months Ended March 31 | |
| | | 2012 | | | 2011 | |
| | Refining | | | Marketing | | | Total | | | Refining | | | Marketing | | | Total | |
Operating cost | | 21,858 | | | 5,275 | | | 27,133 | | | 21,577 | | | 4,506 | | | 26,083 | |
Power and purchased energy | | 47,348 | | | – | | | 47,348 | | | 27,856 | | | – | | | 27,856 | |
| | 69,206 | | | 5,275 | | | 74,481 | | | 49,433 | | | 4,506 | | | 53,939 | |
($/bbl of feedstock throughput) | | | | | | | | | | | | | | | | | | |
Operating cost | | 2.40 | | | – | | | – | | | 2.46 | | | – | | | – | |
Power and purchased energy | | 5.21 | | | – | | | – | | | 3.18 | | | – | | | – | |
| | 7.61 | | | – | | | – | | | 5.64 | | | – | | | – | |
16
| MANAGEMENT’S DISCUSSION AND ANALYSIS |
During the three months ended March 31, 2012, refining operating costs were comparable to the same period in the prior year with a modest increase of 1%.
Power and purchased energy, consisting of low sulphur fuel oil (“LSFO”) and electricity, is required to provide heat and power to refinery operations. Power and purchased energy expenses in the first quarter of 2012 increased 70% over the first quarter of 2011 due to a volume variance of $9.2 million combined with a price variance of $10.2 million. The additional LSFO was purchased to supplement internally produced butane that normally would have been used to heat the refinery units but instead was blended with winter RBOB gasoline for sale under the SOA.
Capital Asset Additions
Capital spending for the three months ended March 31, 2012 totaled $13.3 million (2011 - $35.9 million) relating to various capital improvement projects including $3.3 million (2011 - $14.6 million) for the debottlenecking project.
Depreciation and Amortization Expense
| | | Three Months Ended March 31 | |
| | | 2012 | | | 2011 | |
| Refining | | 25,609 | | | 18,479 | |
| Marketing | | 961 | | | 921 | |
| Total depreciation and amortization | | 26,570 | | | 19,400 | |
The process units are amortized over an average useful life of 20 to 30 years and turnaround costs are amortized over 2 to 4 years.
17
| MANAGEMENT’S DISCUSSION AND ANALYSIS |
RISK MANAGEMENT, FINANCING AND OTHER
Cash Flow Risk Management
The Company enters into crude oil and foreign exchange contracts to reduce the volatility of cash flows from some of its forecast sales. Harvest designates all of its crude oil derivative contracts and certain foreign exchange contracts as cash flow hedges, which are entered into for periods consistent with the forecast petroleum sales. The following is a summary of Harvest’s risk management contracts outstanding at March 31, 2012:
| Contracts Designated as Hedges | |
| Contract Quantity | | Type of Contract | | | Term | | | Contract Price | | | Fair Value | |
| 4,200 bbls/day | | Crude oil price swap | | | Apr – Dec 2012 | | | US $111.37/bbl | | $ | 10,578 | |
| US $468/day | | Foreign exchange swap | | | Apr – Dec 2012 | | | $1.0236 Cdn/US | | | 67 | |
| | | | | | | | | | | $ | 10,645 | |
The following is a summary of Harvest’s realized and unrealized (gains) losses on risk management contracts:
| | Three Months Ended March 31 | |
| | 2012 | | | 2011 | |
Contracts not designated as hedges | | Power | | | Currency | | | Total | | | Power | | | Currency | | | Total | |
Realized gains | | – | | | – | | | – | | | (2,282 | ) | | – | | | (2,282 | ) |
Unrealized (gains) losses | | – | | | (66 | ) | | (66 | ) | | (3,554 | ) | | 29 | | | (3,525 | ) |
(Gains) losses recognized in net income | | – | | | (66 | ) | | (66 | ) | | (5,836 | ) | | 29 | | | (5,807 | ) |
| | | | | | | | | | | | | | | | | | |
Contracts designated as hedges | | | | | | | | Crude Oil | | | | | | | | | Crude Oil | |
Realized (gains) losses | | | | | | | | | | | | | | | | | | |
Reclassified from other comprehensive income (“OCI”) to revenues, net of tax | | | | | | | | (3,126 | ) | | | | | | | | 2,224 | |
Ineffective portion recognized in net income | | | | | | | | – | | | | | | | | | 59 | |
| | | | | | | | (3,126 | ) | | | | | | | | 2,283 | |
Unrealized (gains) losses | | | | | | | | | | | | | | | | | | |
Recognized in OCI, net of tax | | | | | | | | 4,195 | | | | | | | | | 42,631 | |
Ineffective portion recognized in net income | | | | | | | | (205 | ) | | | | | | | | 285 | |
| | | | | | | | 3,990 | | | | | | | | | 42,916 | |
| | | | | | | | | | | | | | | | | | |
Net losses recognized in OCI | | | | | | | | 7,321 | | | | | | | | | 40,407 | |
Net (gains) losses recognized in revenues | | | | | | | | (3,126 | ) | | | | | | | | 2,224 | |
Net gains recognized in net income outside of revenues | | | | | | | | (271 | ) | | | | | | | | (5,463 | ) |
18
| MANAGEMENT’S DISCUSSION AND ANALYSIS |
Financing Costs
| | | Three Months Ended March 31 | |
| | | 2012 | | | 2011 | |
Bank loan | | 3,463 | | | 1,633 | |
Convertible debentures | | 12,332 | | | 12,327 | |
Senior notes | | 9,025 | | | 8,776 | |
Amortization of deferred finance charges | | 255 | | | 281 | |
Interest and other financing charges | | 25,075 | | | 23,017 | |
Capitalized interest | | (2,892 | ) | | (1,296 | ) |
| | 22,183 | | | 21,721 | |
Accretion of decommissioning liabilities | | 5,153 | | | 5,796 | |
Total finance costs | | 27,336 | | | 27,517 | |
Interest and other financing charges, including the amortization of related financing costs, increased by $2.1 million (9%) compared to the three months ended March 31, 2011, mainly due to the increased interest expense on Harvest’s bank loan as a result of the increased amount of loan principal outstanding. During the quarter, interest charges on our bank loan reflected an effective interest rate of 2.84% (2011 – 3.06%) .
Currency Exchange
Currency exchange gains and losses are attributed to the changes in the value of the Canadian dollar relative to the U.S. dollar on our U.S. dollar denominated 67/8% Senior Notes and on any U.S. dollar denominated monetary assets or liabilities. At March 31, 2012, the Canadian dollar relative to the U.S. dollar strengthened compared to December 31, 2011, resulting in an unrealized foreign exchange gain of $2.8 million (2011 - $9.6 million gain) for the three months ended March 31, 2012. Harvest recognized a realized foreign exchange loss of $1.6 million for the three months ended March 31, 2012 (2011 - $0.2 million gain) as a result of the settlement of U.S. dollar denominated transactions.
The cumulative translation adjustment recognized in other comprehensive income results from the translation of the Downstream operation’s U.S. dollar functional currency financial statements to Canadian dollars. During the first quarter of 2012, Downstream recognized a net cumulative translation loss of $16.1 million (2011 - $23.9 million loss), which resulted from the strengthening of the Canadian dollar relative to the U.S. dollar at March 31, 2012 compared to December 31, 2011. As Downstream’s functional currency is U.S. dollars, the weakening of the U.S. dollar would result in losses from decommissioning liabilities, pension obligations, accounts payable and other balances that are denominated in Canadian dollars, which partially offset the unrealized gains recognized on the senior notes and Upstream U.S. dollar denominated monetary items.
Deferred Income Taxes
For the three months ended March 31, 2012, Harvest recorded a deferred income tax recovery of $22.7 million (2011 – expense of $3.8 million). Our deferred income tax liability will fluctuate during each accounting period to reflect changes in the temporary differences between the book value and tax basis of assets as well as legislative tax rate changes. Currently, the principal source of our temporary differences is the net book value of the Company’s property, plant and equipment and the unclaimed tax pools.
19
| MANAGEMENT’S DISCUSSION AND ANALYSIS |
LIQUIDITY
For the three months ended March 31, 2012, cash flow from operating activities was $85.1 million (2011 - $146.8 million) including $7.7 million (2011 - $32.8 million) used in reducing non-cash working capital and $6.6 million (2011 - $2.0 million) used in the settlement of decommissioning and environmental remediation liabilities. At March 31, 2012, Harvest’s financing activities provided $175.8 million (2011 - $524.1 million) of cash from net borrowings from the credit facility. Harvest funded $249.9 million (2011 - $275.6 million) of capital expenditures and net asset acquisition activity during the first quarter of 2012 with cash generated from operating activities and financing activities.
Harvest had a working capital deficiency of $258.7 million at March 31, 2012, as compared to a $265.6 million deficiency at December 31, 2011. The slight improvement in our working capital deficiency at March 31, 2012 compared to December 31, 2011 was primarily due to the decrease in accrued liabilities relating to capital expenditures during the period. The Company’s working capital is expected to fluctuate from time to time, and will be funded from cash flows from operations and borrowings from Harvest’s credit facility, as required.
Through a combination of cash available at March 31, 2012, cash from operating activities and the available undrawn amount from the credit facility, it is anticipated that Harvest will have adequate liquidity to fund future operations, debt repayments and forecasted capital expenditures (excluding major acquisitions). Refer to the “Contractual Obligations and Commitments”section above for Harvest’s future commitments and the discussion below on certain significant items.
BlackGold Oil Sands Project
Harvest signed an engineering, procurement and construction (“EPC”) contract in 2010 for phase 1 of the BlackGold project, of which $98.2 million (including a $31.1 million deposit) has been paid to the end of March 31, 2012. Together with capital expenditures relating to drilling and completion of 17 wells, Harvest has invested $153.7 million since acquiring the assets in 2010. For 2012, $215 million of the capital expenditure program is allocated to the continued development of BlackGold. Harvest plans to fund the capital expenditures with cash flows from operating activities and the undrawn amount from the credit facility.
The Company is engaging in an active drilling program under which the drilling of 30 wells (15 well pairs) is expected to be completed by the end of 2012. Five wells were drilled during the first quarter of 2012. Engineering of the project is now 70% complete and the site has been cleared and graded. Other near-term activities include completion of the detailed engineering work, site preparation and the commencement of major equipment fabrication. Phase 2 of the project, which is targeted to increase production capacity to 30,000 bbl/d, is in the regulatory approval process and approval is anticipated in 2012.
The BlackGold project faces similar cost and schedule pressures as other oil sand projects, including shortage of skilled labor, rising costs, and logistics issues surrounding module transportation; phase 1 production is now expected to start in 2014. As a result of these pressures, Harvest is actively reviewing changes to the EPC contract terms with the contractor and revising methods to execute the project; these changes are expected to result in material increases to the project cost.
20
| MANAGEMENT’S DISCUSSION AND ANALYSIS |
Contractual Obligations and Commitments
Harvest has contractual obligations and commitments entered into in the normal course of operations including the purchase of assets and services, operating agreements, transportation commitments, sales commitments, royalty obligations, and land lease obligations. These obligations are of a recurring and consistent nature and impact cash flow in an ongoing manner. As at March 31, 2012, Harvest has the following significant contractual commitments:
| | | Maturity | |
| | 1 year | | | 2-3 years | | | 4-5 years | | | After 5 years | | | Total | |
Debt repayments(1) | $ | 106,796 | | $ | 390,598 | | $ | 771,254 | | $ | 498,750 | | $ | 1,767,398 | |
Debt interest payments(1) | | 106,158 | | | 145,976 | | | 75,646 | | | 19,288 | | | 347,068 | |
Purchase commitments(2) | | 222,988 | | | 42,144 | | | – | | | – | | | 265,132 | |
Operating leases | | 12,100 | | | 19,713 | | | 7,224 | | | 2,358 | | | 41,395 | |
Transportation agreements(3) | | 8,803 | | | 12,808 | | | 4,186 | | | 237 | | | 26,034 | |
Feedstock & other purchase commitments(4) | | 940,304 | | | – | | | – | | | – | | | 940,304 | |
Employee benefits(5) | | 4,102 | | | 7,433 | | | 5,178 | | | 2,877 | | | 19,590 | |
Decommissioning liabilities(6) | | 16,687 | | | 53,884 | | | 34,343 | | | 1,349,810 | | | 1,454,724 | |
Total | $ | 1,417,938 | | $ | 672,556 | | $ | 897,831 | | $ | 1,873,320 | | $ | 4,861,645 | |
| (1) | Assumes constant period end foreign exchange rate. |
| (2) | Relates to drilling commitments, AFE commitments, BlackGold oil sands project commitment and Downstream capital commitments. |
| (3) | Relates to firm transportation commitments. |
| (4) | Includes commitments to purchase refinery crude stock and refined products for resale under the supply and offtake agreement. |
| (5) | Relates to the expected contributions to employee benefit plans and long-term incentive plan payments. |
| (6) | Represents the undiscounted obligation by period. |
Off Balance Sheet Arrangements
As of March 31, 2012, there were no off balance sheet arrangements in place.
21
| MANAGEMENT’S DISCUSSION AND ANALYSIS |
CAPITAL RESOURCES
The following table summarizes our capital structure as at March 31, 2012 and December 31, 2011 and provides the key financial ratios defined in Harvest’s credit facility agreement.
| | | March 31, 2012 | | | December 31, 2011 | |
| Debts | | | | | | |
| Bank loan(1) | $ | 534,675 | | $ | 358,885 | |
| Convertible debentures, at principal amount | | 733,973 | | | 733,973 | |
| Senior notes, at principal amount (US$500 million)(2) | | 498,750 | | | 508,500 | |
| | | 1,767,398 | | | 1,601,358 | |
| | | | | | | |
| Shareholder’s Equity | | | | | | |
| 386,078,649 common shares issued(3) | | 3,355,333 | | | 3,453,644 | |
| | $ | 5,122,731 | | $ | 5,055,002 | |
| | | | | | | |
| Financial Ratios(4)(5) | | | | | | |
| Secured Debt to Annualized EBITDA(6) | | 1.18 | | | 0.73 | |
| Total Debt to Annualized EBITDA(7) | | 3.48 | | | 2.72 | |
| Secured Debt to Total Capitalization(6)(8) | | 13% | | | 10% | |
| Total Debt to Total Capitalization(7)(8) | | 39% | | | 36% | |
| (1) | The bank loan net of deferred financing costs is $531.6 million (2011 - $355.6 million). |
| (2) | Principal amount converted at the period end exchange rate. |
| (3) | As at May 11, 2012, the number of common shares issued is 386,078,649. |
| (4) | Calculated based on Harvest’s credit facility covenant requirements (see note 11 of the March 31, 2012 financial statements). |
| (5) | The financial ratios and their components are non-GAAP measures; please refer to the “Non-GAAP Measures” section of this MD&A. |
| (6) | Secured debt includes bank loan of $531.6 million (2011 - $355.6 million), letters of credit of $8.7 million (2011 - $8.7 million), and guarantees of $90.3 million (2011- $92.1 million) at March 31, 2012. |
| (7) | Total debt includes the secured debt, convertible debentures of $741.2 million (2011 - $742.1 million) and senior notes of $486.6 million (2011 - $495.7 million) at March 31, 2012. |
| (8) | Total capitalization includes total debt and shareholder’s equity less equity attributed to BlackGold of $458.9 million at March 31, 2012 (2011 - $459.9 million). |
22
| MANAGEMENT’S DISCUSSION AND ANALYSIS |
SUMMARY OF QUARTERLY RESULTS
The following table and discussion highlights our first quarter of 2012 results relative to the preceding 7 quarters:
| | | 2012 | | | 2011 | | | 2010 | |
| | | Q1 | | | Q4 | | | Q3 | | | Q2 | | | Q1 | | | Q4 | | | Q3 | | | Q2 | |
FINANCIAL | | | | | | | | | | | | | | | | | | | | | | | | |
Revenues | | 1,426,140 | | | 1,462,535 | | | 837,381 | | | 782,030 | | | 1,248,924 | | | 1,301,348 | | | 1,001,203 | | | 1,067,341 | |
Net income (loss) | | (72,081 | ) | | (73,885 | ) | | (49,204 | ) | | (19,529 | ) | | 37,961 | | | (12,333 | ) | | (26,082 | ) | | (22,796 | ) |
Cash from operating activities | | 85,110 | | | 144,625 | | | 161,499 | | | 107,588 | | | 146,828 | | | 142,134 | | | 97,412 | | | 121,830 | |
Total long-term financial debt | | 1,652,424 | | | 1,486,170 | | | 1,509,773 | | | 1,384,862 | | | 1,244,825 | | | 1,239,024 | | | 1,251,658 | | | 1,153,972 | |
Total assets | | 6,322,250 | | | 6,284,370 | | | 6,483,568 | | | 6,121,547 | | | 6,041,118 | | | 5,388,740 | | | 5,303,486 | | | 4,764,141 | |
| | | | | | | | | | | | | | | | | | | | | | | | |
OPERATIONS | | | | | | | | | | | | | | | | | | | | | | | | |
Upstream | | | | | | | | | | | | | | | | | | | | | | | | |
Daily sales volumes (boe/d) | | 60,550 | | | 61,324 | | | 58,548 | | | 55,338 | | | 53,331 | | | 50,054 | | | 47,777 | | | 49,597 | |
Realized price prior to hedges ($/boe) | | 58.07 | | | 64.61 | | | 57.85 | | | 66.73 | | | 59.19 | | | 56.03 | | | 52.71 | | | 54.41 | |
Downstream | | | | | | | | | | | | | | | | | | | | | | | | |
Average daily throughput (bbl/d) | | 100,000 | | | 88,824 | | | 41,756 | | | 38,016 | | | 97,438 | | | 111,317 | | | 96,514 | | | 94,833 | |
Average refining margin (loss) ($US/bbl) | | 4.58 | | | (4.14 | ) | | 10.44 | | | 8.09 | | | 10.96 | | | 6.13 | | | 3.02 | | | 8.56 | |
The quarterly revenues and cash from operating activities are mainly impacted by the Upstream sales volumes, realized prices and operating expenses and Downstream throughput volumes, cost of feedstock and realized prices. Significant items that impacted Harvest’s quarterly revenues include:
Revenues were the highest in the fourth quarter of 2011, followed by the first quarter of 2012, reflecting higher commodity prices and stronger sales volumes in the Upstream operations.
The lower revenue in the second and third quarters of 2011 was due to lower Downstream sales as a result of lower throughput due to a planned shutdown, partially offset by increased Upstream sales from the assets acquired in the first quarter 2011 and higher commodity prices.
The increasing Upstream sales volumes since the third quarter of 2010 were mainly attributable to the acquisition of oil and gas assets in the third quarter of 2010 and first quarter of 2011. Daily sales volumes decreased in the first quarter of 2012 compared to the fourth quarter of 2011 mainly due to natural declines and minor production interruptions.
Downstream’s refining margin/bbl increased in the first and third quarter of 2011, reflecting the improving global refining crack spreads during these periods. The decrease in the second quarter of 2011 is due to a planned shutdown of the refinery units. In the fourth quarter of 2011, Downstream realized a loss reflecting the high cost of crude oil feedstock and decreasing gasoline prices.
Net income (loss) reflects both cash and non-cash items. Changes in non-cash items including deferred income tax, DD&A expense, accretion of decommissioning and environmental remediation liabilities, impairment of long-lived assets, unrealized foreign exchange gains and losses, and unrealized gains and losses on risk management contracts impact net income (loss) from period to period. For these reasons, the net income (loss) may not necessarily reflect the same trends as revenues or cash from operating activities, nor is it expected to.
23
| MANAGEMENT’S DISCUSSION AND ANALYSIS |
The increasing total assets since the second quarter of 2010 up to the third quarter of 2011 was due to the acquisition of the BlackGold assets in August 2010 and certain oil and gas assets in September 2010 and February 2011 in addition to capital additions from Harvest’s capital program.
OUTLOOK
The diversity and integration provided by being active in both the Upstream and Downstream parts of the business provides the long-term sustainability that optimizes our ability to create value.
Upstream
During the first quarter of 2012, Harvest’s Upstream operations (excluding BlackGlold) spent $207 million of the $435 million 2012 capital budget. Harvest drilled 69 (60.4 net) wells and intends to drill an additional 86 wells during the remainder of 2012. The majority of the capital spending and drilling activity takes place within the first few months of the year as we have a very active winter drilling program.
Harvest will continue to concentrate activity on our oil weighted assets which include large pools of light/medium and heavy crude oils that have significant opportunity for development through drilling or optimization. These are complemented by our liquids-rich natural gas opportunities with attractive economics, despite low natural gas prices. Production during the first quarter of 60,550 boe/d exceeded expectations. We maintain production guidance of 60,000 boe/d for 2012, weighted approximately 30-35% percent natural gas and 65-70% percent crude oil and NGLs.
There have been no changes to the previously reported royalty and general and administrative costs guidance. We anticipate royalties to be approximately 16% of revenue and general and administrative costs to average $2.80/boe in 2012. Based on the actual operating costs incurred in the first quarter of 2012, guidance to operating costs has been revised to average approximately $16.50/boe in 2012.
Harvest has allocated 2012 capital spending of $215 million for the Blackgold oil sands project, of which $31.4 million has been spent in the first quarter of 2012. The 2012 activities for the BlackGold team will be module assembly, facility construction and an active drilling program of 30 wells (15 SAGD well pairs). First oil production from phase 1 is expected in 2014 and we anticipate ERCB approval in 2012 for an additional 20,000 bbl/d for phase 2 expansion of the project.
Downstream
Harvest’s Downstream operations has revised the 2012 capital budget from $120 million to $84 million as a result of deferring certain discretionary projects from 2012 to later years. Of the revised budget, approximately 25% is earmarked for a crude tank and engineering on projects involving low cost and simple debottlenecking of existing process units. Approximately 50% of the budget will be used for mandatory maintenance projects with the remainder on smaller value-add projects.
Throughput in the first quarter of 2012 was 100,000 bbl/d. Throughput volume is expected to average 100,000 to 106,000 bbl/d in 2012, with operating costs and purchased energy costs aggregating to approximately $8.00/bbl.
24
| MANAGEMENT’S DISCUSSION AND ANALYSIS |
Corporate
In October of this year, the 6.40% convertible unsecured subordinated debentures (TSX: HTE.DB.D) will mature. The principal amount outstanding at the end of the first quarter is $106.8 million. The debentures may be redeemed at the Company’s option in whole or in part prior to maturity at 100% of the face value. On redemption, Harvest will repay the indebtedness through a combination of cash on hand, draws on the credit facility, debt issuance and capital injection.
Harvest mitigates commodity price risk through closely monitoring the various commodity markets and establishing commodity price risk management programs, as deemed necessary, to provide stability to its cash flows. Harvest’s cash flow risk management strategies are financially integrated, reflecting that the commodity price risk of its Upstream cash flows from producing crude oil is partially financially offset partially by its requirement to purchase crude oil feedstock for the Downstream even though the crude oil produced by the Upstream does not physically flow to the Refinery in Newfoundland.
ACCOUNTING POLICIES AND CRITICAL ACCOUNTING ESTIMATES
The preparation of Harvest’s financial and operating results requires management to make judgments, estimates and assumptions in the application of accounting policies that could have a significant impact on our results. Actual results may differ from those estimates. Estimates and underlying assumptions are reviewed on an ongoing basis. Further information on the basis of presentation and our significant accounting policies and estimates can be found in the notes to the audited consolidated financial statements for the year ended December 31, 2011. There have been no changes to our critical accounting policies and estimates in the first quarter of 2012.
RECENT PRONOUNCEMENTS
There have been no updates during the first quarter of 2012 to the future accounting policies that were described in the annual MD&A for the year ended December 31, 2011. Harvest is currently assessing the potential impact from the adoption of those new standards.
OPERATIONAL AND OTHER BUSINESS RISKS
Harvest’s operational and other business risks remain unchanged from those discussed in our annual MD&A for the year ended December 31, 2011 as filed on SEDAR atwww.sedar.com.
CHANGES IN REGULATORY ENVIRONMENT
Harvest’s regulatory environment remains unchanged from those discussed in our annual MD&A for the year ended December 31, 2011 as filed on SEDAR atwww.sedar.com.
INTERNAL CONTROL OVER FINANCIAL REPORTING
During the interim period ended March 31, 2012, there were no significant changes in internal controls over financial reporting that have materially affected, or are reasonably likely to materially affect our internal controls over financial reporting.
NON-GAAP MEASURES
Throughout this MD&A, the Company has referred to certain measures of financial performance that are not specifically defined under IFRS, hereinafter referred to as “GAAP”, such as “operating netbacks”, “operating netback prior to/after hedging”, “operating income (loss)”, “gross margin (loss)”, “total debt”, “total financial debt”, “total capitalization”, “EBITDA”, “secured debt to annualized EBITDA”, “total debt to annualized EBITDA”, “secured debt to total capitalization”, and “total debt to total capitalization”.
25
| MANAGEMENT’S DISCUSSION AND ANALYSIS |
“Operating netbacks” are reported on a per boe basis and used extensively in the Canadian energy sector for comparative purposes. “Operating netbacks” include revenues, operating expenses, transportation and marketing expenses, and realized gains or losses on risk management contracts. “Gross margin (loss)” is commonly used in the refining industry to reflect the net funds received from the sale of refined products after considering the cost to purchase the feedstock and is calculated by deducting purchased products for resale and processing from total revenue. “Operating income (loss)” is commonly used for comparative purposes in the petroleum and natural gas and refining industries to reflect operating results before items not directly related to operations. “Total debt”, “total financial debt”, “total capitalization”, and “EBITDA” are used to assist management in assessing liquidity and the Company’s ability to meet financial obligations. “Secured debt to annualized EBITDA”, “total debt to annualized EBITDA”, “secured debt to total capitalization” and “total debt to total capitalization” are terms defined in Harvest’s credit facility agreement for the purpose of calculation of our financial covenants. The non-GAAP measures do not have any standardized meaning prescribed by GAAP and may not be comparable to similar measures used by other issuers. The determination of the non-GAAP measures have been illustrated throughout this MD&A, with reconciliations to IFRS measures and/or account balances, except for EBITDA which is shown below.
Reconciliation of EBITDA
EBITDA is defined in Harvest’s credit facility agreement as earnings before finance costs, income tax expense or recovery, DD&A, exploration and evaluation costs, impairment of assets, unrealized gains or losses on risk management contracts, unrealized gains or losses on foreign exchange, gains or losses on disposition of assets and other non-cash items. The following is a reconciliation of EBITDA to the nearest GAAP measure net income (loss):
Twelve months rolling: | | March 31, 2012 | | | December 31, 2011 | |
Net loss | | (214,699 | ) | | (104,657 | ) |
DD&A | | 657,007 | | | 626,698 | |
Unrealized gains on risk management contracts | | 2,222 | | | (746 | ) |
Unrealized gains on foreign exchange | | 9,408 | | | 2,555 | |
Unsuccessful exploration and evaluation costs | | 15,824 | | | 17,757 | |
Impairment of PP&E | | 21,843 | | | – | |
Gains on disposition of PP&E | | (7,749 | ) | | (7,883 | ) |
Income tax recovery | | (56,320 | ) | | (29,827 | ) |
Other non-cash items | | (328 | ) | | 4,795 | |
Finance costs | | 108,946 | | | 109,127 | |
EBITDA(1) | | 536,154 | | | 617,819 | |
(1) | As stipulated by the credit facility agreement, annualized EBITDA is a twelve month rolling EBITDA which also includes net income impact from acquisition or disposition as if the transaction had been effected at the beginning of the period and excludes earnings attributable to the BlackGold assets and non-restricted subsidiaries. As such, the March 31, 2012 annualized EBITDA is $1.4 million (2011 – $5.0 million higher) lower than the EBITDA. |
FORWARD-LOOKING INFORMATION
This MD&A highlights significant business results and statistics from our unaudited consolidated financial statements for the three months ended March 31, 2012 and the accompanying notes thereto. In the interest of providing our lenders and potential lenders with information regarding Harvest, including our assessment of our future plans and operations, this MD&A contains forward-looking statements that involve risks and uncertainties.
26
| MANAGEMENT’S DISCUSSION AND ANALYSIS |
Such risks and uncertainties include, but are not limited to: risks associated with conventional petroleum and natural gas operations; risks associated with refining and marketing operations; risks associated with the construction of the oil sands project; the volatility in commodity prices, interest rates and currency exchange rates; risks associated with realizing the value of acquisitions; general economic, market and business conditions; changes in environmental legislation and regulations; the availability of sufficient capital from internal and external sources; and, such other risks and uncertainties described from time to time in our regulatory reports and filings made with securities regulators.
Forward-looking statements in this MD&A include, but are not limited to, the forward looking statements made in the “Outlook” section as well as statements made throughout with reference to production volumes, refinery throughput volumes, royalty rates, operating costs, commodity prices, administrative costs, price risk management activities, acquisitions and dispositions, capital spending, reserve estimates, access to credit facilities, income taxes, cash from operating activities, and regulatory changes. For this purpose, any statements that are contained herein that are not statements of historical fact may be deemed to be forward-looking statements. Forward-looking statements often contain terms such as “may”, “will”, “should”, “anticipate”, “expect”, “target”, “plan”, “potential”, “intend”, and similar expressions.
Readers are cautioned not to place undue reliance on forward-looking statements as there can be no assurance that the plans, intentions or expectations upon which they are based will occur. Although we consider such information reasonable at the time of preparation, it may prove to be incorrect and actual results may differ materially from those anticipated. Harvest assumes no obligation to update forward-looking statements should circumstances, estimates or opinions change, except as required by law. Forward-looking statements contained in this MD&A are expressly qualified by this cautionary statement.
ADDITIONAL INFORMATION
Further information about us can be accessed under our public filings found on SEDAR atwww.sedar.com or atwww.harvestenergy.ca. Information can also be found by contacting our Investor Relations department at (403) 265-1178 or at 1-866-666-1178.
27