FORM 6-K
SECURITIES AND EXCHANGE COMMISSION
Washington, D.C. 20549
REPORT OF FOREIGN PRIVATE ISSUER
PURSUANT TO RULE 13a-16 OR 15d-16
UNDER THE SECURITIES EXCHANGE ACT OF 1934
August 12, 2008
Commission File Number: 333-121627
HARVEST ENERGY TRUST
(Exact name of registrant as specified in its charter)
Suite 2100, 330 - 5th Avenue S.W.
Calgary, Alberta, Canada T2P 0L4
(403) 265-1178
(Address of principal executive offices)
Indicate by check mark whether the registrant files or will file annual reports under cover Form 20-F or Form 40-F.
Form 20-F o Form 40-F x
Indicate by check mark if the registrant is submitting the Form 6-K in paper as permitted by Regulation S-T Rule 101(b)(1). o
Note: Regulation S-T Rule 101(b)(1) only permits the submission in paper of a Form 6-K if submitted solely to provide an attached annual report to security holders.
Indicate by check mark if the registrant is submitting the Form 6-K in paper as permitted by Regulation S-T Rule 101(b)(7):
Note: Regulation S-T Rule 101(b)(7) only permits the submission in paper of a Form 6-K if submitted to furnish a report or other document that the registrant foreign private issuer must furnish and make public under the laws of the jurisdiction in which the registrant is incorporated, domiciled or legally organized (the registrant’s "home country"), or under the rules of the home country exchange on which the registrant’s securities are traded, as long as the report or other document is not a press release, is not required to be and has not been distributed to the registrant’s security holders, and, if discussing a material event, has already been the subject of a Form 6-K submission or other Commission filing on EDGAR.
Indicate by check mark whether the registrant by furnishing the information contained in this Form is also thereby furnishing the information to the Commission pursuant to Rule 12g3-2(b) under the Securities Exchange Act of 1934.
Yes o No x
If "Yes" is marked, indicate below the file number assigned to the registrant in connection with Rule 12g3-2(b):
| EXHIBIT | | TITLE |
| | | |
| 1. | | News release issued August 11, 2008 announcing second quarter 2008 results and continued C$0.30 monthly distribution. |
| | | |
| 2. | | CFO Certification form pertaining to Harvest’s second quarter 2008 financial & operating results. |
| | | |
| 3. | | CEO Certification form pertaining to Harvest’s second quarter 2008 financial & operating results. |
| | | |
| 4. | | Interim Unaudited Financial Statements for three month period ending June 30, 2008. |
| | | |
| 5. | | Interim Management’s Discussion & Analysis for the three month period ending June 30, 2008. |
SIGNATURE
Pursuant to the requirements of the Securities Exchange Act of 1934, the registrant has duly caused this report to be signed on its behalf by the undersigned, thereunto duly authorized.
| | HARVEST ENERGY TRUST |
| | (Registrant) |
| | | |
| Date: August 12, 2008 | By: | <<signed>> |
| | | John Zahary |
| | | President & Chief Executive Officer |
INDEX TO EXHIBITS
| EXHIBIT | | TITLE |
| | | |
| 1. | | News release issued August 11, 2008 announcing second quarter 2008 results and continued C$0.30 monthly distribution. |
| | | |
| 2. | | CFO Certification form pertaining to Harvest’s second quarter 2008 financial & operating results. |
| | | |
| 3. | | CEO Certification form pertaining to Harvest’s second quarter 2008 financial & operating results. |
| | | |
| 4. | | Interim Unaudited Financial Statements for three month period ending June 30, 2008. |
| | | |
| 5. | | Interim Management’s Discussion & Analysis for the three month period ending June 30, 2008. |
HARVEST ENERGY ANNOUNCES SECOND QUARTER 2008 RESULTS AND CONTINUES C$0.30 MONTHLY DISTRIBUTION
Calgary, Alberta – August 11, 2008 (TSX: HTE.UN; NYSE: HTE) – Harvest Energy (“Harvest”) today announces the release of its second quarter 2008 financial and operating results. The unaudited financial statements, notes and MD&A pertaining to the period ended June 30, 2008 are filed on SEDAR at www.sedar.com and are available on Harvest’s website at www.harvestenergy.ca. All figures reported herein are Canadian dollars unless otherwise stated.
Corporate Highlights:
| · | Cash from Operating Activities before changes in non-cash working capital and asset retirement obligations was $183.5 million ($1.21 per Trust Unit), and $210.5 million ($1.39 per Trust Unit) after these items. This resulted in distributions declared as a percentage of Cash from Operating Activities of 75% and 65%, respectively; |
| · | Subsequent to the end of the quarter, declared the C$0.30 per unit monthly distribution for each of August, September and October; |
| · | Subsequent to the end of the quarter, appointed William D. Robertson, FCA to Harvest’s Board of Directors. |
Upstream Highlights:
| · | Upstream production of 55,574 barrels of oil equivalent per day (boe/d) indicates good operational performance slightly offset by spring break-up and extended turnarounds at third party facilities; |
| · | Upstream operating cash flow of $309.8 million reflects strong crude oil and natural gas prices, stable production volumes and operating netbacks that were 122% higher than the same quarter the previous year; |
| · | Capital investments of $39.7 million in our western Canadian upstream business contributed to our stable production volumes and resulted in the drilling of 12 gross wells with a 100% success rate; |
| · | We achieved excellent results from our enhanced waterflood project at Hay River completed during the first quarter, commenced the waterflood project at Suffield early in the third quarter and continued to make good progress on our enhanced oil recovery projects at Bellshill and Wainwright. |
Downstream Highlights:
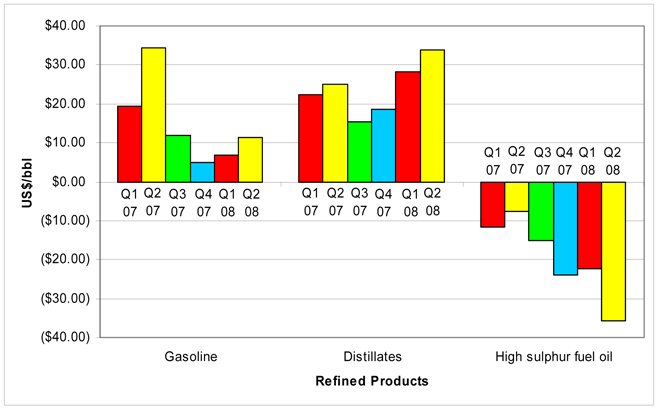
| · | Good performance from the operating units at the refinery, but the weaker high sulphur fuel oil (HSFO) market prompted a reduction in throughput to 100,422 bbl/d as well as operational and feedstock changes to reduce HSFO production through the quarter; |
| · | Downstream operating cash flow was slightly above break-even, contributing $1.3 million. Distillate margins remained strong through the quarter, gasoline margins were higher than the previous quarter, but were offset by significantly weaker margins on HSFO as well as higher costs for feedstock and purchased energy needed to run the refinery; |
| · | Invested $8.6 million in capital improvement projects, including $4.1 million for continued work on the visbreaker enhancement project, with the balance invested in discretionary projects designed to improve reliability and performance; and |
| · | An analysis of the potential refinery enhancement opportunities was completed by a global engineering firm during the quarter, which validates the previous work done on the attractive investment options, including exploiting existing opportunities for de-bottlenecking, further reducing feedstock costs, and upgrading HSFO into higher valued products. Next steps will include review of the extensive data contained in the report as well as options for project structure, financing and identifying potential partnering candidates. |
HARVEST ENERGY | | |
PRESS RELEASE | Page 2 of 6 | August 11, 2008 |
Financial & Operating Highlights
The table below provides a summary of our financial and operating results for the three and six month periods ended June 30, 2008 and 2007.
| | | Three Months Ended June 30 | | Six Months Ended June 30 | |
($000s except where noted) | | 2008 | | 2007 | | Change | | 2008 | | 2007 | | Change | |
| | | | | | | | | | | | | | |
Revenue, net(1) | | | 1,622,079 | | | 1,133,450 | | | 43 | % | | 2,999,431 | | | 2,158,962 | | | 39 | % |
| | | | | | | | | | | | | | | | | | | | |
| Cash From Operating Activities before changes in non-cash working capital and asset retirement obligations | | | 183,455 | | | 244,461 | | | (25 | )% | | 368,841 | | | 458,402 | | | (20 | )% |
Per trust unit, basic | | $ | 1.21 | | $ | 1.83 | | | (34 | )% | $ | 2.44 | | $ | 3.51 | | | (30 | )% |
| | | | | | | | | | | | | | | | | | | | |
| Cash From Operating Activities | | | 210,534 | | | 251,218 | | | (16 | )% | | 338,653 | | | 362,266 | | | (7 | )% |
| Per trust unit, basic | | $ | 1.39 | | $ | 1.88 | | | (26 | )% | $ | 2.24 | | $ | 2.78 | | | (19 | )% |
| Per trust unit, diluted | | $ | 0.83 | | $ | 1.67 | | | (50 | )% | $ | 1.35 | | $ | 2.52 | | | (46 | )% |
| | | | | | | | | | | | | | | | | | | | |
Net Income (Loss)(2) | | | (162,063 | ) | | 6,248 | | | (2,694 | )% | | (162,409 | ) | | 76,098 | | | (313 | )% |
| Per trust unit, basic | | $ | (1.07 | ) | $ | 0.05 | | | (2,240 | )% | $ | (1.08 | ) | $ | 0.58 | | | (286 | )% |
| Per trust unit, diluted | | $ | (1.07 | ) | $ | 0.05 | | | (2,240 | )% | $ | (1.08 | ) | $ | 0.58 | | | (286 | )% |
| | | | | | | | | | | | | | | | | | | | |
| Distributions declared | | | 137,001 | | | 154,057 | | | (11 | )% | | 272,168 | | | 299,327 | | | (9 | )% |
| Distributions declared, per trust unit | | $ | 0.90 | | $ | 1.14 | | | (21 | )% | $ | 1.80 | | $ | 2.28 | | | (21 | )% |
| Distributions declared as a percentage of Cash From Operating Activities before changes in non-cash working capital and asset retirement obligations | | | 75 | % | | 63 | % | | 12 | % | | 74 | % | | 65 | % | | 9 | % |
| Distributions declared as a percentage of Cash From Operating Activities | | | 65 | % | | 61 | % | | 4 | % | | 80 | % | | 83 | % | | (3 | )% |
| | | | | | | | | | | | | | | | | | | | |
| Bank debt | | | | | | | | | | | | 1,035,285 | | | 1,047,965 | | | (1 | )% |
77/8% Senior Notes | | | | | | | | | | | | 248,836 | | | 258,387 | | | (4 | )% |
Convertible debentures(3) | | | | | | | | | | | | 821,877 | | | 681,000 | | | 21 | % |
Total long-term debt(3) | | | | | | | | | | | | 2,105,998 | | | 1,987,352 | | | 6 | % |
| | | | | | | | | | | | | | | | | | | | |
| Total assets | | | | | | | | | | | | 5,637,879 | | | 5,613,333 | | | - | % |
| | | | | | | | | | | | | | | | | | | | |
UPSTREAM OPERATIONS | | | | | | | | | | | | | | | | | | | |
| Daily Production | | | | | | | | | | | | | | | | | | | |
| Light to medium oil (bbl/d) | | | 25,365 | | | 27,586 | | | (8 | )% | | 25,439 | | | 27,311 | | | (7 | )% |
| Heavy oil (bbl/d) | | | 12,092 | | | 14,719 | | | (18 | )% | | 12,534 | | | 15,164 | | | (17 | )% |
| Natural gas liquids (bbl/d) | | | 2,614 | | | 2,338 | | | 12 | % | | 2,549 | | | 2,417 | | | 5 | % |
| Natural gas (mcf/d) | | | 93,014 | | | 98,078 | | | (5 | )% | | 97,792 | | | 99,671 | | | (2 | )% |
Total daily sales volumes (boe/d) | | | 55,574 | | | 60,989 | | | (9 | )% | | 56,820 | | | 61,504 | | | (8 | )% |
| | | | | | | | | | | | | | | | | | | | |
| Operating Netback ($/boe) | | $ | 62.98 | | $ | 28.35 | | | 122 | % | $ | 53.97 | | $ | 29.08 | | | 86 | % |
| | | | | | | | | | | | | | | | | | | | |
| Cash capital expenditures | | | 39,669 | | | 48,221 | | | (18 | )% | | 119,240 | | | 196,708 | | | (39 | )% |
| | | | | | | | | | | | | | | | | | | | |
DOWNSTREAM OPERATIONS | | | | | | | | | | | | | | | | | | | |
| Average daily throughput (bbl/d) | | | 100,422 | | | 115,570 | | | (13 | )% | | 106,211 | | | 114,646 | | | (7 | )% |
| Aggregate throughput (mbbl) | | | 9,138 | | | 10,517 | | | (13 | )% | | 19,330 | | | 20,751 | | | (7 | )% |
| | | | | | | | | | | | | | | | | | | | |
| Average Refining Margin (US$/bbl) | | $ | 5.66 | | $ | 15.64 | | | (64 | )% | $ | 7.36 | | $ | 13.69 | | | (46 | )% |
| | | | | | | | | | | | | | | | | | | | |
| Cash capital expenditures | | | 8,619 | | | 9,871 | | | (13 | )% | | 14,646 | | | 14,754 | | | (1 | )% |
| (1) | Revenues are net of royalties. |
| (2) | Net Income (Loss) includes a future income tax recovery of $95.2 million and $117.0 million for the three and six months ended June 30, 2008 respectively (expense of $177.7 million and $177.7 million for the three and six months ended June 30, 2007) and an unrealized net loss from risk management activities of $305.1 million and $366.0 million for the three and six months ended June 30, 2008 respectively (gain of $11.0 million and loss of $3.1 million for the three and six months ended June 30, 2007). |
| (3) | Includes current portion of Convertible Debentures. |
HARVEST ENERGY | | |
PRESS RELEASE | Page 3 of 6 | August 11, 2008 |
Message to Unitholders
Through the second quarter and first half of 2008, we have experienced strong performance from our upstream business segment and continue to make progress in our analyses and planning for major capital investment opportunities in the downstream business. During this period of high crude oil prices and narrow heavy oil differentials, our oil weighted upstream asset base has contributed significantly to our overall operating cash flow, and our full exposure to natural gas prices has been beneficial as gas prices have strengthened. Our corporate cash flow before changes in non-cash working capital and asset retirement obligations totaled $183.5 million, ($1.21 per trust unit) for the quarter, resulting in distributions as a percentage of cash flow of 75%. This financial performance, coupled with our expectations for the second half of 2008 resulted in Harvest maintaining our current $0.30 per unit monthly distribution level for August, September and October.
Upstream
Our operating cash flow from the upstream business segment was $309.8 million during the second quarter, driven largely by a very strong commodity price environment. We realized operating netbacks that were 39% higher than the previous quarter, and 122% higher than the same quarter last year. Excluding the impact of an extended turnaround at a 3rd party operated gas plant in our Bashaw area, our average upstream volumes of 55,574 boe/d were right on budget for the period.
We continued to execute our capital program in the second quarter, investing $39.7 million into drilling 12 new wells which realized a 100% success rate. Our drilling activities were primarily focused in Southeast Saskatchewan where we drilled 4 wells including one horizontal well that confirmed a geological extension to our Kenosee pool, resulting in initial production rates of approximately 300 bopd of light oil from that one well, and Ferrier where we drilled 2 wells including a successful third delineation well into our Ostracod gas discovery from late 2007.
In addition to the near term impacts realized by drilling & optimization, our teams are also very focused on longer term opportunities with Enhanced Oil Recovery (EOR) projects, and continued to work on our active EOR projects during the second quarter. We realized a benefit from the Hay River waterflooding enhancement and optimization project, which involved the injection of incremental source water back into the reservoir to support and enhance our reservoir performance. The cost of this project was less than expected and yet resulted in an average boost of 600 boe/d to our production in the second quarter over the first quarter 2008. We expect that Hay River will be a very active region for our winter 2008/2009 drilling season in light of the improved reservoir response. We made good progress on our enhanced waterflood projects during the quarter, with our Suffield project now on injection, and our Bellshill enhanced waterflood expected to be on injection early in the fourth quarter. Based on the progress of these two projects, we would anticipate a production response by early 2009. For our Wainwright polymer flood, we began construction of the mixing skid in the second quarter and anticipate that we will be injecting the first slug of polymer into the reservoir in the fourth quarter of 2008, with a production response expected by mid-2009.
Over the medium to longer-term, we have identified follow-on EOR projects which include acid gas / solvent injection at Hayter, enhanced brine injection in Kindersley and further chemical flood (Polymer/Alkaline Surfactant Polymer) opportunities in Hardisty, Suffield and Hay River. In addition to these EOR opportunities, we are also looking at other long-term projects such as the delineation and optimal development strategy for our 47,000 net acres of oilsands leases, and the potential for CO2 flooding across a large portion of our asset base. The Alberta government announced recently that there is $2 billion available of funding for carbon capture and storage which will facilitate development of CO2 floods in the province. Other long-term development options for Harvest include our large resource base of assets in Coal Bed Methane (CBM), which we are continuing to investigate for future development. We are currently working to further quantify this resource, which would underlay approximately 155,000 net acres of Harvest rights in the main CBM fairway through Alberta.
In addition to our drilling, optimization and other value-added activities in the upstream, we continue to seek opportunities to make acquisitions that supplement our existing portfolio with assets we can acquire at good metrics. Through the quarter, we screened a number of potential acquisition opportunities, with two such opportunities that we were successful in acquiring. The first of these transactions closed in late July, and resulted in Harvest successfully adding approximately 750 boe/d through the acquisition of a small, private oil and gas company. The acquired production is split equally between light gravity (38° API) crude oil from the Slave Point / Granite Wash formations that complements our existing operations in the Red Earth area of Alberta, and shallow, sweet natural gas from the Mannville formation. We also entered into an agreement to acquire a 100% working interest in an operated property at Cecil in northern Alberta plus an average working interest of approximately 40% in non-operated properties in the same area with a portion of the non-operated properties subject to a right of first refusal. The Cecil properties averaged approximately 1,900 boe/d of production in the first quarter of 2008, comprised of 1,225 bbl of medium gravity crude oil and natural gas liquids, and 3,920 thousand cubic feet (mcf) of natural gas. This transaction is expected to close in late August. We will continue to look for opportunities to optimize, consolidate and rationalize assets in this environment, with the view to realizing maximum value for our unitholders.
HARVEST ENERGY | | |
PRESS RELEASE | Page 4 of 6 | August 11, 2008 |
Downstream
Despite good operational performance from the refinery and marketing operations, the financial performance of the downstream business has been challenged by the rapid rise of crude oil prices and the lagging finished product markets. Consistent with the strategy for all of our assets, we strive to continuously improve the performance of these operations. This includes not only operational improvements that can be undertaken to improve gross margins, but also a focus on cost reduction and efficiency projects. We are unwavering in our commitment to control operating costs and taking a prudent approach to all capital investment opportunities to ensure the maximum return on our invested dollars.
We have taken steps to mitigate the impact lagging product prices have had on our refining margins, including shifting our feedstock mix in an effort to minimize production of high sulfur fuel oil (HSFO), which has realized particularly weak market prices so far this year. Since the beginning of 2008, distillate prices have been higher than gasoline prices, which is uncommon this time of year. To capitalize on the inherent capability of our hydrocracking refinery to produce a distillate weighted product mix, we have also varied our feedstocks and altered our operations to maximize distillate yields. In addition to impacting feedstock costs, strong crude prices also negatively impact our refinery operating costs because we must purchase low sulfur fuel oil (LSFO) to fuel our process heaters.
Despite the financial challenges faced by the refining industry today, it is a cyclical business that we firmly believe will make a more significant contribution to our cash flow in better markets. The forward markets for refining margins in the second half of 2008 and 2009 show an improving business, and in fact we have already seen some strengthening in heavy fuel oil margins. We recognize that the downstream business segment represents a very long-life asset which enables us to consider some discretionary but highly attractive capital investment projects. Through late 2007 and to date in 2008, we have been working on an expansion to our visbreaker unit, which is progressing very well and is on time and on budget. Construction of the vessel is complete and has been delivered to North Atlantic, with implementation of the vessel expected to continue through October with full resumption of the expanded visbreaker expected by the beginning of November. As a result, we anticipate fourth quarter throughput at the refinery to average 93,000 bpd, but upon completion expect to experience significantly improved margins on approximately 1,500 bpd of HSFO.
Longer term, we have identified a major growth opportunity at the refinery, an investment estimated at approximately $2 billion. A global engineering firm has completed an analysis of previous studies completed by refinery engineers and has generally validated the earlier conclusions regarding technical feasibility and preliminary design of major reconfiguration opportunities. The expansion recommended in the report is a capital investment estimated at about $2 billion. This would incorporate three major elements: 1) an expansion of the crude unit up to 190,000 bpd of a mix of heavy sour and medium sour oil; 2) the installation of a delayed coking unit to upgrade all of the negative margin, high sulphur fuel oil we produce into valuable distillate and gasoline products; and 3) expansion / reconfiguration of existing units and installation of new units in the refinery to enable processing of heavier, more sour grades of crude oil which sell at even greater discounts than our current crude slate. Economic analyses indicate the projected return on investment and other financial metrics are compelling. Our next steps will include a thorough review of the extensive data and information provided by the engineering firm, selection of general project design for more extensive study and engineering, expansion of our evaluation beyond the technical and operational issues into options for project structure and financing, and then identifying potential partnering candidates who may be interested in participating in such an investment opportunity.
Corporate
Early in the quarter, we successfully closed a $250 million convertible debenture issue which enabled Harvest to increase the undrawn, committed bank line to $500 million while also further extending the maturity on our debt. A goal for us going forward is to continue to improve our flexibility by repaying our bank debt and freeing up room on our credit facility that we can use to pursue value-added acquisitions or other accretive projects.
HARVEST ENERGY | | |
PRESS RELEASE | Page 5 of 6 | August 11, 2008 |
Part of our strategy includes managing risk, which we have strived to do by engaging in price risk management activities to protect our cash flow and distributions from volatility. Although our existing risk management contracts do limit our full participation in the current oil price environment, the existing contracts are reduced for the second half of 2008, reduced again for the first half of 2009, and we currently have no contracts in place beyond June of 2009. We also mitigate risk by focusing efforts on maintaining high standards of environmental, health & safety (EH&S) performance. As a result of our commitment to good EH&S practices in both the upstream and downstream business segments, we continue to be an industry leader in this area.
A higher price environment not only contributes to additional cash flow generation, but it also impacts the underlying value of our reserves. We had our third party engineers do a calculation of the value of our year end reserves based on current pricing rather than the pricing in place at the end of 2007, and estimate that the present value of our Proved + Probable reserves discounted at 10% has increased by almost 45%. In this type of pricing environment, it would appear that the value of the assets is not fully recognized by the market. We continue to work with current and potential investors to increase the understanding of our very long life asset base and significant opportunity for value creation within our existing portfolio.
With respect to the pending 2011 trust tax, Harvest’s tax and legal advisors are reviewing the draft legislation that, if passed, will allow us to convert to a corporate structure on a tax-free basis. While we continue to evaluate other potential alternatives, including a US Master Limited Partnership (MLP) or some other structure, we consider conversion to a dividend-paying Canadian corporate entity to be our base case scenario. Since we can still benefit from two more years in the trust structure, we would likely look to convert sometime in 2010.
Today, we are very pleased to announce the appointment of William (Bill) D. Robertson, FCA to Harvest’s Board of Directors. Mr. Robertson has a distinguished 36 year career with Price Waterhouse and PriceWaterhouseCoopers, focused almost exclusively on auditing larger public companies in the oil and gas sector. Mr. Robertson retired as an active partner in 2002 and serves on the board for several public companies in the energy sector. He is also a past member of the CIM Petroleum Society Standing Committee on Reserve Definitions, the Alberta Securities Commission Financial Advisory Committee, the working sub-committee of the Alberta Securities Commission Taskforce of Oil and Gas Reporting and the Council of the Institute of Chartered Accounts of Alberta. I would also like to recognize Jacob Roorda, who left the company in the second quarter, for his many years of valued contributions to Harvest’s growth. We wish him all the best in his future endeavours.
In closing, I would like to thank all of our Unitholders for your support as we weather the challenging times in the downstream business and enjoy the attractive times in the upstream business. As always, I would encourage you to contact us with your feedback and questions about Harvest Energy.
Distribution Declaration
The distributions declared are based on forecast commodity price levels and operating performance that are consistent with the current environment.
Record Date | | Ex-Distribution Date | | Payment Date | | $Cdn Distribution Amount | |
| August 22, 2008 | | | August 20, 2008 | | | Sept. 15, 2008 | | $ | 0.30 | |
| Sept. 22, 2008 | | | Sept. 18, 2008 | | | Oct. 15, 2008 | | $ | 0.30 | |
| Oct. 22, 2008 | | | Oct. 20, 2008 | | | Nov. 17, 2008 | | $ | 0.30 | |
The Cdn$0.30 per unit is equivalent to approximately US$0.28 per unit if converted using a Canadian/U.S. dollar exchange rate of 0.9367. For U.S. beneficial holders, the U.S. dollar equivalent distribution will be based upon the actual Canadian/U.S. exchange rate applied on the payment date and will be net of any Canadian withholding taxes that may apply.
Conference Call & Webcast
Harvest will be hosting a conference call and Webcast to discuss our second quarter 2008 results at 9:00 a.m. Mountain time (11:00 a.m. Eastern time) on August 12th, 2008. Callers may dial 888-575-8232 (international callers or Toronto local dial 416-406-6419) a few minutes prior to start and request the Harvest conference call. The call will also be available for replay by dialing 800-408-3053 (international callers or Toronto local dial 416-695-5800) and entering passcode 3265692.
Webcast listeners are invited to go to the Investor Relations - Presentations & Events page of the Harvest Energy website at www.harvestenergy.ca for the live Webcast and/or a replay of the Webcast.
HARVEST ENERGY | | |
PRESS RELEASE | Page 6 of 6 | August 11, 2008 |
Harvest is a significant operator in Canada’s energy industry offering Unitholders exposure to an integrated structure with upstream and downstream segments. We focus on identifying opportunities to create and deliver value to Unitholders through monthly distributions and unit price appreciation. Given our size, liquidity and integrated structure, Harvest is well positioned to complement our internal portfolio with value-added acquisitions that help drive our Sustainable Growth strategy. Our upstream oil and gas production is weighted approximately 72% to crude oil and liquids and 28% to natural gas, and is complemented by our long-life refining and marketing business. Harvest trust units are traded on the Toronto Stock Exchange ("TSX") under the symbol "HTE.UN" and on the New York Stock Exchange ("NYSE") under the symbol "HTE".
ADVISORY
Certain information in this press release, including management’s assessment of future plans and operations, contains forward-looking information that involves risk and uncertainty. Such risks and uncertainties include, but are not limited to, risks associated with: imprecision of reserve estimates; conventional oil and natural gas operations; the volatility in commodity prices and currency exchange rates; risks associated with realizing the value of acquisitions; general economic, market and business conditions; changes in environmental legislation and regulations; the availability of sufficient capital from internal and external sources; and, such other risks and uncertainties described from time to time in Harvest’s regulatory reports and filings made with securities regulators.
Forward-looking statements in this press release may include, but are not limited to, production volumes, operating costs, commodity prices, capital spending, access to credit facilities, and regulatory changes. For this purpose, any statements that are contained in this press release that are not statements of historical fact may be deemed to be forward-looking statements. Forward-looking statements often contain terms such as “may”, “will”, “should”, “anticipate”, “expects” and similar expressions.
Readers are cautioned not to place undue reliance on forward-looking statements as there can be no assurance that the plans, intentions or expectations upon which they are based will occur. Such information, although considered reasonable by management at the time of preparation, may prove to be incorrect and actual results may differ materially from those anticipated. Harvest assumes no obligation to update forward-looking statements should circumstances or management’s estimates or opinions change. Forward-looking statements contained in this press release are expressly qualified by this cautionary statement.
Investor & Media Contacts:
John Zahary, President & CEO
Robert Fotheringham, Chief Financial Officer
Cindy Gray, Manager, Investor Relations
Corporate Head Office:
Harvest Energy
2100, 330 - 5th Avenue S.W.
Calgary, AB Canada T2P 0L4
Phone: (403) 265-1178
Toll Free Investor Mailbox: (866) 666-1178
Email: information@harvestenergy.ca
Website: www.harvestenergy.ca
FORM 52-109F2
CERTIFICATION OF INTERIM FILINGS
I, Robert Fotheringham, Chief Financial Officer of Harvest Operations Corp., certify that:
| 1. | I have reviewed the interim filings (as this term is defined in Multilateral Instrument 52- 109 Certification of Disclosure in Issuers’ Annual and Interim Filings) of Harvest Energy Trust, (the issuer) for the interim period ending June 30, 2008; |
| 2. | Based on my knowledge, the interim filings do not contain any untrue statement of a material fact or omit to state a material fact required to be stated or that is necessary to make a statement not misleading in light of the circumstances under which it was made, with respect to the period covered by the interim filings; |
| 3. | Based on my knowledge, the interim financial statements together with the other financial information included in the interim filings fairly present in all material respects the financial condition, results of operations and cash flows of the issuer, as of the date and for the periods presented in the interim filings; |
| 4. | The issuer's other certifying officers and I are responsible for establishing and maintaining disclosure controls and procedures and internal control over financial reporting for the issuer, and we have: |
| | (a) | designed such disclosure controls and procedures, or caused them to be designed under our supervision, to provide reasonable assurance that material information relating to the issuer, including its consolidated subsidiaries, is made known to us by others within those entities, particularly during the period in which the interim filings are being prepared and |
| | (b) | designed such internal control over financial reporting, or caused it to be designed under our supervision, to provide reasonable assurance regarding the reliability of financial reporting and the preparation of financial statements for external purposes in accordance with the issuer's GAAP; and |
| 5. | I have caused the issuer to disclose in the interim MD&A any change in the issuer's internal control over financial reporting that occurred during the issuer's most recent interim period that has materially affected, or is reasonably likely to materially affect, the issuer's internal control over financial reporting. |
Date: August 11th, 2008
Robert Fotheringham
Chief Financial Officer
FORM 52-109F2
CERTIFICATION OF INTERIM FILINGS
I, John Zahary, President and Chief Executive Officer of Harvest Operations Corp., certify that:
| 1. | I have reviewed the interim filings (as this term is defined in Multilateral Instrument 52- 109 Certification of Disclosure in Issuers’ Annual and Interim Filings) of Harvest Energy Trust, (the issuer) for the interim period ending June 30, 2008; |
| 2. | Based on my knowledge, the interim filings do not contain any untrue statement of a material fact or omit to state a material fact required to be stated or that is necessary to make a statement not misleading in light of the circumstances under which it was made, with respect to the period covered by the interim filings; |
| 3. | Based on my knowledge, the interim financial statements together with the other financial information included in the interim filings fairly present in all material respects the financial condition, results of operations and cash flows of the issuer, as of the date and for the periods presented in the interim filings; |
| 4. | The issuer's other certifying officers and I are responsible for establishing and maintaining disclosure controls and procedures and internal control over financial reporting for the issuer, and we have: |
| | (a) | designed such disclosure controls and procedures, or caused them to be designed under our supervision, to provide reasonable assurance that material information relating to the issuer, including its consolidated subsidiaries, is made known to us by others within those entities, particularly during the period in which the interim filings are being prepared and |
| | (b) | designed such internal control over financial reporting, or caused it to be designed under our supervision, to provide reasonable assurance regarding the reliability of financial reporting and the preparation of financial statements for external purposes in accordance with the issuer's GAAP; and |
| 5. | I have caused the issuer to disclose in the interim MD&A any change in the issuer's internal control over financial reporting that occurred during the issuer's most recent interim period that has materially affected, or is reasonably likely to materially affect, the issuer's internal control over financial reporting. |
Date: August 11th, 2008
John Zahary
President & Chief Executive Officer
CONSOLIDATED BALANCE SHEETS (UNAUDITED)
(thousands of Canadian dollars) | | June 30, 2008 | | December 31, 2007 | |
Assets | | | | | | | |
| Current assets | | | | | | | |
| Cash | | $ | - | | $ | - | |
| Accounts receivable and other | | | 414,819 | | | 215,803 | |
Fair value of risk management contracts [Note 13] | | | 19,532 | | | 16,442 | |
| Prepaid expenses and deposits | | | 12,172 | | | 15,144 | |
Inventories [Note 3] | | | 94,118 | | | 58,934 | |
| | | | 540,641 | | | 306,323 | |
| | | | | | | | |
Property, plant and equipment [Note 4] | | | 4,115,740 | | | 4,197,507 | |
Intangible assets [Note 5] | | | 93,293 | | | 95,075 | |
| Future income tax | | | 30,385 | | | - | |
| Goodwill | | | 857,820 | | | 852,778 | |
| | | $ | 5,637,879 | | $ | 5,451,683 | |
| | | | | | | | |
Liabilities and Unitholders’ Equity | | | | | | | |
| Current liabilities | | | | | | | |
| Accounts payable and accrued liabilities | | $ | 476,951 | | $ | 270,243 | |
| Cash distribution payable | | | 45,819 | | | 44,487 | |
Current portion of convertible debentures [Note 7] | | | - | | | 24,273 | |
Fair value deficiency of risk management contracts [Note 13] | | | 535,190 | | | 131,020 | |
| | | | 1,057,960 | | | 470,023 | |
| | | | | | | | |
| Bank loan | | | 1,035,285 | | | 1,279,501 | |
77/8% Senior notes | | | 248,836 | | | 241,148 | |
Convertible debentures [Note 7] | | | 821,877 | | | 627,495 | |
Fair value deficiency of risk management contracts [Note 13] | | | - | | | 35,095 | |
Asset retirement obligation [Note 6] | | | 218,254 | | | 213,529 | |
Employee future benefits [Note 12] | | | 12,506 | | | 12,168 | |
| Deferred credit | | | 604 | | | 710 | |
| Future income tax | | | - | | | 86,640 | |
| | | | | | | | |
| Unitholders’ equity | | | | | | | |
Unitholders’ capital [Note 8] | | | 3,830,865 | | | 3,736,080 | |
| Equity component of convertible debentures | | | 84,100 | | | 39,537 | |
Contributed surplus [Note 9] | | | 6,433 | | | - | |
| Accumulated income | | | 84,456 | | | 246,865 | |
| Accumulated distributions | | | (1,612,517 | ) | | (1,340,349 | ) |
| Accumulated other comprehensive loss | | | (150,780 | ) | | (196,759 | ) |
| | | | 2,242,557 | | | 2,485,374 | |
| | | $ | 5,637,879 | | $ | 5,451,683 | |
Commitments, contingencies and guarantees [Note 15]
Subsequent events [Note 16]
See accompanying notes to these consolidated financial statements.
Approved by the Board of Directors:
((signed))
Hector J. McFadyen
Director
((signed))
Verne G. Johnson
Director
CONSOLIDATED STATEMENTS OF INCOME (LOSS) AND COMPREHENSIVE INCOME (UNAUDITED)
(thousands of Canadian dollars, except per Trust Unit amounts) | | | | | |
| | | Three Months Ended June 30, 2008 | | Three Months Ended June 30, 2007 | | Six Months Ended June 30, 2008 | | Six Months Ended June 30, 2007 | |
Revenue | | | | | | | | | | | | | |
| Petroleum, natural gas, and refined product sales | | $ | 1,698,892 | | $ | 1,186,998 | | $ | 3,138,644 | | $ | 2,262,159 | |
| Royalty expense | | | (76,813 | ) | | (53,548 | ) | | (139,213 | ) | | (103,197 | ) |
| | | | 1,622,079 | | | 1,133,450 | | | 2,999,431 | | | 2,158,962 | |
| | | | | | | | | | | | | | |
Expenses | | | | | | | | | | | | | |
| Purchased products for processing and resale | | | 1,160,558 | | | 708,642 | | | 2,120,550 | | | 1,340,938 | |
| Operating | | | 128,608 | | | 117,254 | | | 269,953 | | | 238,911 | |
| Transportation and marketing | | | 12,753 | | | 12,434 | | | 24,375 | | | 22,589 | |
General and administrative [Note 11] | | | 13,310 | | | 16,463 | | | 25,787 | | | 26,867 | |
| Realized net losses on risk management contracts | | | 94,424 | | | 6,826 | | | 130,718 | | | 7,123 | |
| Unrealized net losses (gains) on risk management contracts | | | 305,127 | | | (11,014 | ) | | 365,985 | | | 3,107 | |
| Interest and other financing charges on short term debt | | | - | | | 577 | | | 201 | | | 4,204 | |
| Interest and other financing charges on long term debt | | | 35,948 | | | 39,803 | | | 71,051 | | | 80,252 | |
| Depletion, depreciation, amortization and accretion | | | 124,114 | | | 129,631 | | | 255,039 | | | 263,423 | |
| Foreign exchange loss (gain) | | | 4,045 | | | (71,098 | ) | | 14,710 | | | (82,358 | ) |
| Large corporations tax and other tax | | | 446 | | | - | | | 496 | | | 124 | |
| Future income tax (recovery) expense | | | (95,191 | ) | | 177,684 | | | (117,025 | ) | | 177,684 | |
| | | | 1,784,142 | | | 1,127,202 | | | 3,161,840 | | | 2,082,864 | |
Net income (loss) for the period | | | (162,063 | ) | | 6,248 | | | (162,409 | ) | | 76,098 | |
| | | | | | | | | | | | | | |
| Cumulative Translation Adjustment | | | (4,534 | ) | | (128,491 | ) | | 45,979 | | | (144,631 | ) |
Comprehensive income (loss) for the period | | | (166,597 | ) | | (122,243 | ) | | (116,430 | ) | | (68,533 | ) |
| | | | | | | | | | | | | | |
Net income (loss) per Trust Unit, basic [Note 8] | | $ | (1.07 | ) | $ | 0.05 | | $ | (1.08 | ) | $ | 0.58 | |
Net income (loss) per Trust Unit, diluted [Note 8] | | $ | (1.07 | ) | $ | 0.05 | | $ | (1.08 | ) | $ | 0.58 | |
See accompanying notes to these consolidated financial statements.
CONSOLIDATED STATEMENTS OF UNITHOLDERS’ EQUITY (UNAUDITED)
(thousands of Canadian dollars) | | Unitholders’ Capital | | Equity Component of Convertible Debentures | | Contributed Surplus | | Accumulated Income | | Accumulated Distributions | | Accumulated Other Comprehensive (Loss) Income | |
At December 31, 2006 | | $ | 3,046,876 | | $ | 36,070 | | $ | - | | $ | 271,155 | | $ | (730,069 | ) | $ | 46,873 | |
| Adjustment arising from change in accounting policies | | | (49 | ) | | - | | | - | | | 1,386 | | | - | | | - | |
| Issued for cash | | | | | | | | | | | | | | | | | | | |
| February 1, 2007 | | | 143,834 | | | - | | | - | | | - | | | - | | | - | |
| June 1, 2007 | | | 230,029 | | | | | | | | | | | | | | | | |
| Equity component of convertible debenture issuances | | | | | | | | | | | | | | | | | | | |
| 7.25% Debentures Due 2014 | | | - | | | 13,100 | | | - | | | - | | | - | | | - | |
| Convertible debenture conversions | | | | | | | | | | | | | | | | | | | |
| 9% Debentures Due 2009 | | | 168 | | | - | | | - | | | - | | | - | | | - | |
| 8% Debentures Due 2009 | | | 416 | | | (3 | ) | | - | | | - | | | - | | | - | |
| 10.5% Debentures Due 2008 | | | 1,426 | | | (298 | ) | | | | | | | | | | | | |
| 6.40% Debentures Due 2012 | | | 122 | | | (10 | ) | | - | | | - | | | - | | | - | |
| 7.25% Debentures Due 2013 | | | 93 | | | (3 | ) | | | | | | | | | | | | |
| 7.25% Debentures Due 2014 | | | 124,302 | | | (7,064 | ) | | | | | | | | | | | | |
| Exercise of unit appreciation rights and other | | | 278 | | | - | | | - | | | - | | | - | | | - | |
| Issue costs | | | (24,409 | ) | | - | | | - | | | - | | | - | | | - | |
| Foreign currency translation adjustment | | | - | | | - | | | - | | | - | | | - | | | (144,631 | ) |
| Net income | | | - | | | - | | | - | | | 76,098 | | | - | | | - | |
| Distributions and distribution reinvestment plan | | | 87,744 | | | - | | | - | | | - | | | (299,327 | ) | | - | |
At June 30, 2007 | | $ | 3,610,830 | | $ | 41,792 | | $ | - | | $ | 348,639 | | $ | (1,029,396 | ) | $ | (97,758 | ) |
| | | | | | | | | | | | | | | | | | | | |
At December 31, 2007 | | $ | 3,736,080 | | $ | 39,537 | | $ | - | | $ | 246,865 | | $ | (1,340,349 | ) | $ | (196,759 | ) |
| Equity component of convertible debenture issuances | | | | | | | | | | | | | | | | | | | |
| 7.5% Debentures Due 2015 | | | - | | | 51,000 | | | - | | | - | | | - | | | - | |
| Convertible debenture conversions | | | | | | | | | | | | | | | | | | | |
| 9% Debentures Due 2009 | | | 17 | | | - | | | - | | | - | | | - | | | - | |
| 8% Debentures Due 2009 | | | 141 | | | (1 | ) | | - | | | - | | | - | | | - | |
| 10.5% Debentures Due 2008 | | | 13 | | | (3 | ) | | - | | | - | | | - | | | - | |
| Redemption of convertible debentures | | | | | | | | | | | | | | | | | | | |
10.5% Debentures Due 2008 [Note 9] | | | 24,249 | | | (6,433 | ) | | 6,433 | | | - | | | - | | | - | |
| Exercise of unit appreciation rights and other | | | 1,182 | | | - | | | - | | | - | | | - | | | - | |
| Issue costs | | | (2,179 | ) | | - | | | - | | | - | | | - | | | - | |
| Foreign currency translation adjustment | | | - | | | - | | | - | | | - | | | - | | | 45,979 | |
| Net loss | | | - | | | - | | | - | | | (162,409 | ) | | - | | | - | |
| Distributions and distribution reinvestment plan | | | 71,362 | | | - | | | - | | | - | | | (272,168 | ) | | - | |
At June 30, 2008 | | $ | 3,830,865 | | $ | 84,100 | | $ | 6,433 | | $ | 84,456 | | $ | (1,612,517 | ) | $ | (150,780 | ) |
See accompanying notes to these consolidated financial statements.
CONSOLIDATED STATEMENTS OF CASH FLOWS (UNAUDITED)
(thousands of Canadian dollars) | | | | | |
| | | Three Months Ended June 30, 2008 | | Three Months Ended June 30, 2007 | | Six Months Ended June 30, 2008 | | Six Months Ended June 30, 2007 | |
Cash provided by (used in) | | | | | | | | | | | | | |
Operating Activities | | | | | | | | | | | | | |
| Net income (loss) for the period | | $ | (162,063 | ) | $ | 6,248 | | $ | (162,409 | ) | $ | 76,098 | |
| Items not requiring cash | | | | | | | | | | | | | |
| Depletion, depreciation, amortization and accretion | | | 124,114 | | | 129,631 | | | 255,039 | | | 263,423 | |
| Unrealized foreign exchange loss (gain) | | | 3,678 | | | (68,286 | ) | | 13,544 | | | (79,022 | ) |
| Non-cash interest expense and amortization of finance charges | | | 3,529 | | | 2,760 | | | 6,040 | | | 7,133 | |
Unrealized loss on risk management contracts [Note 13] | | | 305,127 | | | (11,014 | ) | | 365,985 | | | 3,107 | |
| Future income tax expense (recovery) | | | (95,191 | ) | | 177,684 | | | (117,025 | ) | | 177,684 | |
| Unit based compensation expense | | | 4,133 | | | 6,447 | | | 7,367 | | | 8,877 | |
| Employee benefit obligation | | | 168 | | | 988 | | | 337 | | | 1,096 | |
| Other non-cash items | | | (40 | ) | | 3 | | | (37 | ) | | 6 | |
Settlement of asset retirement obligations [Note 6] | | | (1,502 | ) | | (2,268 | ) | | (3,755 | ) | | (4,388 | ) |
| Change in non-cash working capital | | | 28,581 | | | 9,025 | | | (26,433 | ) | | (91,748 | ) |
| | | | 210,534 | | | 251,218 | | | 338,653 | | | 362,266 | |
| | | | | | | | | | | | | | |
Financing Activities | | | | | | | | | | | | | |
| Issue of Trust Units, net of issue costs | | | (2,165 | ) | | 218,541 | | | (2,179 | ) | | 354,557 | |
| Issue of convertible debentures, net of issue costs | | | 241,600 | | | - | | | 241,600 | | | 220,489 | |
| Bank borrowings (repayments), net | | | (295,138 | ) | | (266,999 | ) | | (244,216 | ) | | (492,370 | ) |
| Financing costs | | | - | | | - | | | - | | | (273 | ) |
| Cash distributions | | | (101,051 | ) | | (105,006 | ) | | (199,474 | ) | | (203,448 | ) |
| Change in non-cash working capital | | | 3,604 | | | 5,261 | | | 3,671 | | | 11,463 | |
| | | | (153,150 | ) | | (148,203 | ) | | (200,598 | ) | | (109,582 | ) |
| | | | | | | | | | | | | | |
Investing Activities | | | | | | | | | | | | | |
| Additions to property, plant and equipment | | | (48,288 | ) | | (58,092 | ) | | (133,886 | ) | | (211,462 | ) |
| Business acquisitions | | | - | | | - | | | - | | | (30,264 | ) |
| Property acquisitions (dispositions), net | | | 4,734 | | | 21,801 | | | 4,549 | | | 21,112 | |
| Change in non-cash working capital | | | (13,630 | ) | | (53,481 | ) | | (7,984 | ) | | (29,478 | ) |
| | | | (57,184 | ) | | (89,772 | ) | | (137,321 | ) | | (250,092 | ) |
| | | | | | | | | | | | | | |
| Change in cash and cash equivalents | | $ | 200 | | $ | 13,243 | | $ | 734 | | $ | 2,592 | |
| | | | | | | | | | | | | | |
| Effect of exchange rate changes on cash | | | (200 | ) | | 204 | | | (734 | ) | | 849 | |
| | | | | | | | | | | | | | |
| Cash and cash equivalents, beginning of period | | | - | | | - | | | - | | | 10,006 | |
| | | | | | | | | | | | | | |
| Cash and cash equivalents, end of period | | $ | - | | $ | 13,447 | | $ | - | | $ | 13,447 | |
| | | | | | | | | | | | | | |
| Interest paid | | $ | 19,457 | | $ | 35,017 | | $ | 43,498 | | $ | 50,860 | |
| Large corporation tax and other tax paid | | $ | 521 | | $ | - | | $ | 571 | | $ | 124 | |
See accompanying notes to these consolidated financial statements.
NOTES TO CONSOLIDATED FINANCIAL STATEMENTS
Period ended June 30, 2008
(tabular amounts in thousands of Canadian dollars, except Trust Unit, and per Trust Unit amounts)
| 1. | Significant Accounting Policies |
These interim consolidated financial statements of Harvest Energy Trust (the “Trust” or “Harvest”) have been prepared by management in accordance with Canadian generally accepted accounting principles (“Canadian GAAP”). The preparation of financial statements requires management to make estimates and assumptions that affect the reported amounts of assets and liabilities and disclosures of contingencies, if any, as at the date of the financial statements and the reported amounts of revenues and expenses during the period. In the opinion of management, these financial statements have been prepared within reasonable limits of materiality. These interim consolidated financial statements follow the same significant accounting policies as described and used in the consolidated financial statements of Harvest for the year ended December 31, 2007 which should be read in conjunction with that report.
These consolidated financial statements include the accounts of the Trust, its wholly owned subsidiaries and its proportionate interest in a partnership with a third party.
| 2. | Change in Accounting Policy |
Effective January 1, 2008, Harvest adopted the following new Canadian Institute of Chartered Accountants (“CICA”) accounting standards:
“Financial Instruments – Disclosure”, section 3862 and “Financial Instruments - Presentation”, section 3863. These new standards require increased disclosure on financial instruments, particularly with regard to the nature and extent of risks arising from financial instruments and how the entity manages those risks.
“Capital Disclosures”, section 1535 requires the disclosure of information about an entity’s objectives, policies and processes for managing capital; quantitative data about what the entity regards as capital; whether the entity has complied with any externally imposed capital requirements; and if it has not complied, the consequences of such non-compliance.
“Inventories”, section 3031, which replaces the existing inventories standard. This new standard provides additional guidance with respect to the measurement and disclosure requirements for inventories, requiring inventories to be valued at the lower of cost and net realizable value. The adoption of this section did not have a material impact on our financial statements.
| | | June 30, 2008 | | December 31, 2007 | |
| Petroleum products | | $ | 89,864 | | $ | 55,036 | |
| Parts and supplies | | | 4,254 | | | 3,898 | |
| Total inventories | | $ | 94,118 | | $ | 58,934 | |
| 4. | Property, Plant and Equipment |
| | | June 30, 2008 | | December 31, 2007 | |
| | | Upstream | | Downstream | | Total | | Upstream | | Downstream | | Total | |
| Cost | | $ | 4,363,151 | | $ | 1,212,591 | | $ | 5,575,742 | | $ | 4,247,819 | | $ | 1,164,310 | | $ | 5,412,129 | |
| Accumulated depletion and depreciation | | | (1,354,948 | ) | | (105,054 | ) | | (1,460,002 | ) | | (1,142,345 | ) | | (72,277 | ) | | (1,214,622 | ) |
| Net book value | | $ | 3,008,203 | | $ | 1,107,537 | | $ | 4,115,740 | | $ | 3,105,474 | | $ | 1,092,033 | | $ | 4,197,507 | |
General and administrative costs of $3.3 million have been capitalized during the three month period ended June 30, 2008 (three months ended June 30, 2007 – $3.9 million), of which $0.9 million (three months ended June 30, 2007 – $1.7 million) relate to the Trust Unit Rights Incentive Plan and the Unit Award Incentive Plan. For the six month period ended June 30, 2008 $6.5 million (six months ended June 30, 2007 - $6.5 million) of general and administrative costs have been capitalized, of which $1.6 million (six months ended June 30, 2007 – $2.2 million) relate to the Trust Unit Rights Incentive Plan and the Unit Award Incentive Plan.
| | | June 30, 2008 | | December 31, 2007 | |
| | | Cost | | Accumulated Amortization | | Net book value | | Cost | | Accumulated Amortization | | Net book value | |
| Engineering drawings | | $ | 90,753 | | $ | (7,752 | ) | $ | 83,001 | | $ | 88,227 | | $ | (5,330 | ) | $ | 82,897 | |
| Marketing contracts | | | 6,312 | | | (1,603 | ) | | 4,709 | | | 6,136 | | | (1,099 | ) | | 5,037 | |
| Customer lists | | | 3,821 | | | (653 | ) | | 3,168 | | | 3,714 | | | (449 | ) | | 3,265 | |
| Fair value of office lease | | | 931 | | | (540 | ) | | 391 | | | 931 | | | (428 | ) | | 503 | |
| Financing costs | | | 7,300 | | | (5,276 | ) | | 2,024 | | | 12,113 | | | (8,740 | ) | | 3,373 | |
| Total | | $ | 109,117 | | $ | (15,824 | ) | $ | 93,293 | | $ | 111,121 | | $ | (16,046 | ) | $ | 95,075 | |
| 6. | Asset Retirement Obligation |
Harvest’s asset retirement obligations result from its net ownership interest in petroleum and natural gas assets including well sites, gathering systems and processing facilities and the estimated costs and timing to reclaim and abandon them. Harvest estimates the total undiscounted amount of cash flows required to settle its asset retirement obligations to be approximately $1,009 million which will be incurred between 2008 and 2057. The majority of the costs will be incurred between 2015 and 2040. A credit-adjusted risk-free discount rate of 8% - 10% and inflation rate of approximately 2% were used to calculate the fair value of the asset retirement obligations.
A reconciliation of the asset retirement obligations is provided below:
| | | June 30, 2008 | | December 31, 2007 | |
| Balance, beginning of period | | $ | 213,529 | | $ | 202,480 | |
| Incurred on acquisition of a private corporation | | | - | | | 1,629 | |
| Incurred on acquisition of Grand | | | - | | | 4,416 | |
| Liabilities incurred | | | 517 | | | 9,553 | |
| Revision of estimates | | | (1,230 | ) | | (6,088 | ) |
| Liabilities settled through disposition | | | - | | | (3,708 | ) |
| Liabilities settled | | | (3,755 | ) | | (13,090 | ) |
| Accretion expense | | | 9,193 | | | 18,337 | |
| Balance, end of period | | $ | 218,254 | | $ | 213,529 | |
Harvest has undiscounted asset retirement obligations of approximately $14.7 million relating to the refining and marketing assets. The fair value of this obligation cannot be reasonably determined because the assets currently have an indeterminate life.
At June 30, 2008, Harvest had seven series of Convertible Unsecured Subordinated Debentures outstanding the details of which have been outlined in Harvest’s Consolidated Financial Statements for the year ended December 31, 2007.
The following table summarizes the face value, carrying amount and fair value of the Convertible Debentures:
| | | June 30, 2008 | | December 31, 2007 | |
| | | Face Value | | Carrying Amount(1) | | Fair Value | | Face Value | | Carrying Amount(1) | | Fair Value | |
| 9% Debentures Due 2009 | | $ | 959 | | $ | 950 | | $ | 1,649 | | $ | 976 | | $ | 962 | | $ | 1,806 | |
| 8% Debentures Due 2009 | | | 1,588 | | | 1,564 | | | 2,461 | | | 1,728 | | | 1,692 | | | 2,022 | |
| 6.5% Debentures Due 2010 | | | 37,062 | | | 35,010 | | | 37,155 | | | 37,062 | | | 34,653 | | | 35,950 | |
| 10.5% Debentures Due 2008 | | | - | | | - | | | - | | | 24,258 | | | 24,273 | | | 24,258 | |
| 6.40% Debentures Due 2012 | | | 174,626 | | | 168,876 | | | 164,148 | | | 174,626 | | | 168,325 | | | 148,432 | |
| 7.25% Debentures Due 2013 | | | 379,256 | | | 356,793 | | | 350,812 | | | 379,256 | | | 355,145 | | | 344,895 | |
| 7.25% Debentures Due 2014 | | | 73,222 | | | 67,122 | | | 72,673 | | | 73,222 | | | 66,718 | | | 65,892 | |
| 7.5% Debentures Due 2015 | | | 250,000 | | | 191,562 | | | 243,500 | | | - | | | - | | | - | |
| | | $ | 916,713 | | $ | 821,877 | | $ | 872,398 | | $ | 691,128 | | $ | 651,768 | | $ | 623,255 | |
(1)Excluding the equity component.
On January 31, 2008, the 10.5% Debenture Due 2008 matured and Harvest elected to settle the obligation with the issuance of 1,166,593 Trust Units rather than settling the obligation in cash.
On April 25, 2008, Harvest issued $250 million principle amount of 7.5% Convertible Debentures for total net proceeds from the issue of $239.5 million. These debentures mature on May 31, 2015 and have a conversion price of $27.40.
The authorized capital consists of an unlimited number of Trust Units.
| | (b) | Number of Units Issued |
| | | Six months ended June 30, | |
| | | 2008 | | 2007 | |
| Outstanding, beginning of period | | | 148,291,170 | | | 122,096,172 | |
| Issued for cash | | | | | | | |
| February 1, 2007 | | | - | | | 6,146,750 | |
| June 1, 2007 | | | - | | | 7,302,500 | |
| Convertible debenture conversions | | | | | | | |
| 9% Debentures Due 2009 | | | 1,227 | | | 12,128 | |
| 8% Debentures Due 2009 | | | 8,710 | | | 25,819 | |
| 10.5% Debentures Due 2008 | | | 344 | | | 38,721 | |
| 6.40% Debentures Due 2012 | | | - | | | 2,542 | |
| 7.25% Debentures Due 2013 | | | - | | | 2,885 | |
| 7.25% Debentures Due 2014 | | | - | | | 4,551,551 | |
| Redemption of convertible debentures | | | | | | | |
| 10.5% Debentures Due 2008 | | | 1,166,593 | | | - | |
| Distribution reinvestment plan issuance | | | 3,209,929 | | | 3,316,725 | |
| Exercise of unit appreciation rights and other | | | 53,525 | | | 10,065 | |
| Outstanding, end of period | | | 152,731,498 | | | 143,505,858 | |
| | (c) | Per Trust Unit Information |
The following tables summarize the net income and Trust Units used in calculating income per Trust Unit:
Net income | | Three months ended June 30, 2008 | | Three months ended June 30, 2007 | | Six months ended June 30, 2008 | | Six months ended June 30, 2007 | |
Net income (loss), basic and diluted(1) | | $ | (162,063 | ) | $ | 6,248 | | $ | (162,409 | ) | $ | 76,098 | |
Weighted average Trust Units | | | | | | | | | | | | | |
| Weighted average Trust Units outstanding, basic | | | 151,955,252 | | | 133,815,690 | | | 150,927,368 | | | 130,420,556 | |
| Effect of convertible debentures | | | - | | | - | | | - | | | - | |
| Effect of Employee Unit Incentive Plans | | | - | | | 1,128,828 | | | - | | | 690,930 | |
Weighted average Trust Units outstanding, diluted(2) | | | 151,955,252 | | | 134,944,518 | | | 150,927,368 | | | 131,111,486 | |
| (1) | Net income, diluted excludes the impact of the conversions of certain of the convertible debentures for the three and six month periods ended June 30, 2008 of $17,546,000 and $30,810,000 respectively (three and six months ended June 30, 2007 - $16,594,000 and $31,688,000), as the impact would be anti-dilutive. |
| (2) | Weighted average Trust Units outstanding, diluted for the three and six month periods ended June 30, 2008 does not include the unit impact of 120,747,828 and 121,717,018 respectively for certain of the convertible debentures (three and six months ended June 30, 2007 - 25,743,388 and 25,333,076) and 681,864 and 401,5779 respectively for the Unit Appreciation Rights, as the impact would be anti-dilutive. |
Contributed surplus of $6.4 million has been recorded during the six month period ended June 30, 2008 due to the maturity of the 10.5% Debentures Due 2008 and the resulting expiration of the conversion option which was previously recorded in equity component of convertible debentures.
Harvest’s primary objective in its management of capital resources is to ensure sufficient financial flexibility to access capital to fund its financial obligations as well as to fund future growth. Harvest considers its capital structure to comprise its credit facilities, 77/8% Senior Notes, convertible debentures and unitholders’ equity.
Harvest monitors its capital structure using the following non-GAAP financial ratios: bank debt to Twelve Month Trailing Earnings Before Interest, Taxes, Depreciation and Amortization and non-cash amounts (“EBITDA”), secured debt to net present value of our proved petroleum and natural gas reverses discounted at 10% and total debt to total debt plus unitholders’ equity. Total debt includes borrowings under credit facilities plus our 77/8% Senior Notes and principal amount of convertible debentures and Unitholders’ equity is adjusted to remove the equity component of convertible debentures.
Harvest’s capital management strategy with regards to our bank debt is to maintain a bank debt to EBITDA ratio between 1.0 and 2.5 times. This ratio is calculated as follows:
| | | June 30, 2008 | | December 31, 2007 | |
| Cash provided by operating activities | | $ | 617,700 | | $ | 641,313 | |
| Settlement of asset retirement obligations | | | 12,458 | | | 13,090 | |
| Change in non-cash working capital | | | (47,930 | ) | | 17,384 | |
| Interest paid | | | 133,628 | | | 145,740 | |
| Large Corporations Tax and other taxes paid | | | (602 | ) | | (974 | ) |
| Total EBITDA | | $ | 715,254 | | $ | 816,553 | |
| Bank debt | | $ | 1,035,285 | | $ | 1,279,501 | |
| Bank debt to EBITDA | | | 1.45 | | | 1.57 | |
With respect to its senior debt, Harvest’s strategy is to target a ratio of secured debt to 65% of the net present value of its proved petroleum and natural gas reserves discounted at 10% (as determined on an annual basis) of less than 0.9 times. This is calculated as follows:
| | | June 30, 2008 | | December 31, 2007 | |
| Secured debt (borrowings under Credit Facilities) | | $ | 1,035,285 | | $ | 1,279,501 | |
| | | | | | | | |
| Proved petroleum and natural gas reserves (January 1, 2008 Net Present Value discounted at 10%) | | $ | 2,865,200 | | $ | 2,865,200 | |
| 65% of Proved petroleum and natural gas reserves | | $ | 1,862,380 | | $ | 1,862,380 | |
| Secured debt to 65% of proved petroleum and natural gas reserves | | | 0.56 | | | 0.69 | |
Harvest targets its total debt to total debt plus unitholders’ equity to be a ratio between 0.25 and 0.55 times calculated as follows:
| | | June 30, 2008 | | December 31, 2007 | |
| Bank debt | | $ | 1,035,285 | | $ | 1,279,501 | |
77/8% Senior Notes | | | 248,836 | | | 241,148 | |
| Principal amount of convertible debentures | | | 916,713 | | | 691,128 | |
| Total Debt | | | 2,200,834 | | | 2,211,777 | |
| Unitholders’ equity (less equity component of convertible debentures ) | | | 2,158,457 | | | 2,445,837 | |
| Total debt plus unitholders’ equity | | $ | 4,359,291 | | $ | 4,657,614 | |
| Total debt to total debt plus unitholders’ equity | | | 0.50 | | | 0.47 | |
Harvest’s capital structure is limited by a covenant in its Convertible Debenture Indenture which currently restricts the issuance of additional convertible debentures to approximately $270 million. In addition, although Harvest’s Trust Unit Indenture provides for the issuance of an unlimited number of Trust Units, the “normal growth guidelines” contained in Bill C-52 issued by the Government of Canada limits the future issuance of convertible debentures and Trust Units at June 30, 2008 to approximately $550 million in each of 2008, 2009 and 2010 with any unused normal growth available for use prior to 2011. Harvest is also entitled to issue approximately $590 million to replace debt held by the Trust on October 31, 2006.
Harvest monitors its capital structure and makes adjustments according to market conditions to remain flexible while meeting its objectives as outlined above. Accordingly, Harvest may adjust its capital spending programs, adjust the amount of distributions paid to Unitholders, issue new Trust Units, convertible debentures or senior notes or repay existing debt. Harvest’s capital management targets have remained unchanged during the six month period ended June 30, 2008.
| 11. | Employee Unit Incentive Plans |
Trust Unit Rights Incentive Plan
As at June 30, 2008, a total of 5,163,805 (3,823,683 - December 31, 2007) Unit Appreciation Rights were outstanding under the Trust Unit Rights Incentive Plan at an average exercise price of $23.73 ($25.74 - December 31, 2007).
The following summarizes the Trust Units reserved for issuance under the Trust Unit Rights Incentive Plan:
| | | Six months ended June 30, 2008 | | Year ended December 31, 2007 | |
| | | Unit Appreciation Rights | | Weighted Average Exercise Price | | Unit Appreciation Rights | | Weighted Average Exercise Price | |
| Outstanding beginning of period | | | 3,823,683 | | $ | 30.74 | | | 3,788,125 | | $ | 30.81 | |
| Granted | | | 1,889,622 | | | 23.69 | | | 576,383 | | | 29.03 | |
| Exercised | | | (54,650 | ) | | 25.56 | | | (92,775 | ) | | 21.88 | |
| Forfeited | | | (494,850 | ) | | 29.78 | | | (448,050 | ) | | 31.10 | |
| Outstanding before exercise price reductions | | | 5,163,805 | | | 28.31 | | | 3,823,683 | | | 30.74 | |
| Exercise price reductions | | | - | | | (4.58 | ) | | - | | | (5.00 | ) |
| Outstanding, end of period | | | 5,163,805 | | | 23.73 | | | 3,823,683 | | $ | 25.74 | |
| Exercisable before exercise price reductions | | | 538,000 | | $ | 25.65 | | | 138,350 | | $ | 22.72 | |
| Exercise price reductions | | | - | | | (6.95 | ) | | - | | | (9.38 | ) |
| Exercisable, end of period | | | 538,000 | | $ | 18.70 | | | 138,350 | | $ | 13.34 | |
The following table summarizes information about Unit appreciation rights outstanding at June 30, 2008.
| | | | | Outstanding | | Exercisable | |
Exercise Price before price reductions | | Exercise Price net of price reductions | | At June 30, 2008 | | Weighted Average Exercise Price net of price reductions(1) | | Remaining Contractual Life (1) | | At June 30, 2008 | | Weighted Average Exercise Price net of price reductions(1) | |
| $13.15-$14.99 | | $ | 0.78-$3.71 | | | 21,250 | | $ | 3.02 | | | 0.9 | | | 21,250 | | $ | 3.02 | |
| $18.90-$25.37 | | $ | 7.70-$25.28 | | | 1,935,072 | | | 22.06 | | | 4.5 | | | 115,575 | | | 14.12 | |
| $26.09-$28.41 | | $ | 20.50-$25.93 | | | 1,468,250 | | | 20.81 | | | 3.5 | | | 364,150 | | | 20.62 | |
| $28.59-$37.56 | | $ | 19.58-$31.27 | | | 1,739,233 | | | 28.31 | | | 2.9 | | | 37,025 | | | 23.18 | |
| $13.15-$37.56 | | $ | 0.78-$31.27 | | | 5,163,805 | | $ | 23.73 | | | 3.7 | | | 538,000 | | $ | 18.70 | |
(1) Based on weighted average Unit appreciation rights outstanding.
Unit Award Incentive Plan(“Unit Award Plan”)
At June 30, 2008, 380,898 Units were outstanding under the Unit Award Incentive Plan.
The following table summarizes the Trust Units reserved for issuance under the Unit Award Incentive Plan.
Number | | June 30, 2008 | | December 31, 2007 | |
| Outstanding, beginning of period | | | 348,248 | | | 306,699 | |
| Granted | | | 107,682 | | | 56,132 | |
| Adjusted for distributions | | | 25,955 | | | 48,280 | |
| Exercised | | | (86,212 | ) | | (37,072 | ) |
| Forfeitures | | | (14,775 | ) | | (25,791 | ) |
| Outstanding, end of period | | | 380,898 | | | 348,248 | |
| Exercisable, end of period | | | 180,828 | | | 168,401 | |
Harvest has recognized compensation expense of $4.5 million and $8.1 million for the three and six months ended June 30, 2008 respectively ($7.6 million and $10.5 million - three and six months ended June 30, 2007), including non cash compensation expense of $4.1 million and $7.2 million for the three and six months ended June 30, 2008 respectively ($6.3 million and $8.7 million - three and six months ended June 30, 2007), related to the Trust Unit Rights Incentive Plan and the Unit Award Incentive Plan. This is reflected in general and administrative expense in the consolidated statements of income.
| 12. | Employee Future Benefit Plans |
Defined Contribution Pension Plan
Total expense for the defined contribution plan is equal to Harvest’s required contributions and was $0.2 million and $0.4 million for the three and six month periods ended June 30, 2008, respectively ($0.2 million and $0.4 million - three and six months ended June 30, 2007)
Defined Benefit Plans
Estimated pension and other benefit payments to plan participants, which reflect expected future service, expected to be paid from 2008 to 2017 are summarized in the commitment table [see Note 15].
The table below shows the components of the net benefit plan expense:
| | | Three Months ended June 30, 2008 | | Three Months ended June 30, 2007 | |
| | | Pension Plans | | Other Benefit Plans | | Pension Plans | | Other Benefit Plans | |
| Current service cost | | $ | 838 | | $ | 92 | | $ | 760 | | $ | 92 | |
| Interest costs | | | 668 | | | 87 | | | 594 | | | 79 | |
| Expected return on assets | | | (698 | ) | | - | | | (668 | ) | | - | |
| Net benefit plan expense | | $ | 808 | | $ | 179 | | $ | 686 | | $ | 171 | |
| | | Six Months ended June 30, 2008 | | Six Months ended June 30, 2007 | |
| | | Pension Plans | | Other Benefit Plans | | Pension Plans | | Other Benefit Plans | |
| Current service cost | | $ | 1,677 | | $ | 184 | | $ | 1,521 | | $ | 184 | |
| Interest costs | | | 1,335 | | | 174 | | | 1,187 | | | 158 | |
| Expected return on assets | | | (1,396 | ) | | - | | | (1,334 | ) | | - | |
| Net benefit plan expense | | $ | 1,616 | | $ | 358 | | $ | 1,374 | | $ | 342 | |
| 13. | Financial Instruments and risk management contracts |
Financial instruments of Harvest consist of cash, accounts receivable, long-term receivables, accounts payable and accrued liabilities, cash distribution payable, bank loan, risk management contracts, convertible debentures and the 77/8% Senior Notes. The carrying value and fair value of these financial instruments at June 30, 2008 is disclosed below by financial instrument category, as well as any related gains or losses and interest income or expense for the six month period ended June 30, 2008:
| | | Carrying Value | | Fair Value | | Gains/ (Losses) | | Interest Income/ (Expense) | | Other Income/ (Expense) | |
Loans and Receivables | | | | | | | | | | | | | | | | |
| Accounts receivable | | $ | 414,819 | | $ | 414,819 | | $ | - | | $ | 86 | (2) | $ | - | |
Liabilities Held for Trading | | | | | | | | | | | | |
| Net fair value of risk management contracts | | | 515,658 | | | 515,658 | | | (496,703 | )(3) | | - | | | - | |
Other Liabilities | | | | | | | | | | | | | | | | |
| Accounts payable | | | 476,951 | | | 476,951 | | | - | | | - | | | - | |
| Cash distribution payable | | | 45,819 | | | 45,819 | | | - | | | - | | | - | |
| Bank loan | | | 1,035,285 | | | 1,035,285 | | | - | | | (28,446 | )(4) | | (1,349 | )(4) |
77/8% Senior Notes | | | 248,836 | (1) | | 234,531 | | | - | | | (10,647 | )(5) | | - | |
| Convertible debentures | | $ | 821,877 | | $ | 872,398 | | $ | - | | $ | (30,810 | )(5) | $ | - | |
(1) The face value of the 77/8% Senior Notes at June 30, 2008 is $254.9 million (U.S. $250 million).
(2) Included in petroleum, natural gas, and refined product sales in the statement of income and comprehensive income.
(3) Included in risk management contracts - realized and unrealized gains/(losses) in the statement of income and comprehensive income.
(4) Included in interest and other financing charges on short term/long term debt in the statement of income and comprehensive income. The amortization of financing fees related to this liability is included in Amortization of deferred finance charges in the statement of cash flows.
(5) Included in Interest and other financing charges on short term/long term debt in the statement of income and comprehensive income. The non-cash interest expense relating to the accretion of premiums, discounts or transaction costs that are netted against these liabilities are included in non-cash interest in the statement of cash flows.
The fair values of the convertible debentures and the 77/8% Senior Notes are based on quoted market prices as at June 30, 2008. The risk management contracts are recorded on the balance sheet at their fair value, accordingly, there is no difference between fair value and carrying value. The bank loan is recorded at amortized cost, but as there are no transaction costs associated with our bank debt and the financing costs are included in intangible assets, there is no difference between the carrying value and the fair value. Due to the short term nature of accounts receivable, accounts payable and cash distribution payable, their carrying values approximate their fair values.
(a) Risk Exposure
Harvest is exposed to market risks resulting from fluctuations in commodity prices, foreign exchange rates and interest rates in the normal course of operations. Harvest is also exposed, to a lesser extent, to credit risk on accounts receivable and counterparties to price risk management contracts and to liquidity risk relating to our debt.
(i.) Credit Risk
Upstream Accounts Receivable
Accounts receivable in our upstream operations are due from crude oil and natural gas purchasers as well as joint venture partners in the petroleum and natural gas industry and are subject to normal industry credit risks. Concentration of credit risk is mitigated by having a broad customer base, which includes a significant number of companies engaged in joint operations with Harvest. Harvest periodically assesses the financial strength of its crude oil and natural gas purchasers and will adjust its marketing plan to mitigate credit risks. This assessment involves a review of external credit ratings; however, if external ratings are not available, Harvest requests a guarantee from the parent company that does have a credit rating. If this is not possible, Harvest performs an internal credit review based on the purchaser’s past financial performance. The credit risk associated with joint venture partners is mitigated by reviewing the credit history of partners and requiring some partners to provide cash prior to incurring significant capital costs on their behalf. As well, most agreements have a provision that enables us to use the proceeds from the sale of production that would otherwise be taken in kind by the partner to offset against amounts owing from the partner that are in default. Generally, the only instances of impairment are when a purchaser or partner is facing bankruptcy or extreme financial distress.
Risk Management Contract Counterparties
Harvest is also exposed to credit risk from the counterparties to our risk management contracts. This risk is managed by diversifying Harvest’s risk management portfolio among a number of counterparties and limiting those counterparties to lenders in our syndicated credit facilities; we have no history of impairment with these counterparties.
Downstream Accounts Receivable
The Supply and Offtake Agreement entered into in conjunction with the purchase of the refinery exposed Harvest to the credit risk of Vitol Refining S.A. (“Vitol”) as all feedstock purchases and the majority of product sales are made with Vitol under this agreement. Harvest mitigates this risk by requiring that Vitol maintain a minimum B+ credit rating as assessed by Standard and Poors. If the credit rating falls below this line, additional security is required to be supplied to Harvest. This credit risk is also mitigated by the amounts owing to Vitol for feedstock purchases that are offset against amounts receivable from Vitol for product sales with the balance being net settled. Harvest is in a net payable position with Vitol at June 30, 2008 and accordingly the outstanding balance is included in current trade accounts payable in the liability liquidity table below.
Harvest’s policy is to manage its credit risk by dealing with only financially sound customers, based on an evaluation of the customer’s financial condition. At June 30, 2008, Harvest had an accounts receivable balance with one customer of $27.0 million resulting from the sale of refined product, representing approximately 13% of total downstream accounts receivable. This customer is an integrated multinational oil and gas company with an AA public credit rating.
Our maximum exposure to credit risk relating to the above classes of financial assets at June 30, 2008 is the carrying value of accounts receivable. The table below provides an analysis of our current financial assets and the age of our past due but not impaired financial assets by type of credit risk.
| | | Current AR | | Overdue AR | |
| | | | | < 30 days | | > 30 days, < 60 days | | > 60 days, < 90 days | | > 90 days | |
| Upstream Accounts Receivable | | $ | 182,495 | | $ | 310 | | $ | 2,523 | | $ | 482 | | $ | 21,153 | |
| Risk Management Contract Counterparties | | | 1,483 | | | - | | | - | | | - | | | - | |
| Downstream Accounts Receivable | | | 196,188 | | | 4,763 | | | 1,029 | | | 638 | | | 3,755 | |
Total | | $ | 380,166 | | $ | 5,073 | | $ | 3,552 | | $ | 1,120 | | $ | 24,908 | |
(ii.) Liquidity Risk
Harvest is exposed to liquidity risk due to our borrowings under our credit facilities and 77/8% Senior Notes with repayment requirements. This risk is mitigated by managing the maturity dates on our obligations, complying with covenants and managing our cash flow by entering into price risk management contracts. Additionally, when we enter into price risk management contracts we select counterparties that are also lenders in our syndicated credit facility, using the security provided in our credit agreement to extend to our risk management contracts eliminating the requirement for margin calls and the pledging of collateral.
The following table provides an analysis of our financial liability maturities based on the remaining terms of our liabilities as at June 30, 2008 and includes the related interest charges:
| | | <1 year | | >1 year <3 years | | >4 years <5 years | | >5 years | | Total | |
| Trade accounts payable | | $ | 476,951 | | $ | - | | $ | - | | $ | - | | $ | 476,951 | |
| Distributions payable | | | 45,819 | | | - | | | - | | | - | | | 45,819 | |
Settlements of risk management contracts(1) | | | 539,731 | | | - | | | - | | | - | | | 539,731 | |
| Bank loan and interest | | | 19,830 | | | 1,087,697 | | | - | | | - | | | 1,107,527 | |
Convertible debentures interest(2) | | | 32,855 | | | 130,403 | | | 123,563 | | | 71,900 | | | 358,721 | |
77/8% Senior Notes and interest | | | 10,093 | | | 40,151 | | | 270,710 | | | - | | | 320,954 | |
| Pension contributions | | | 572 | | | 3,631 | | | 5,301 | | | 21,285 | | | 30,789 | |
| Asset retirement obligations | | | 20,861 | | | 17,350 | | | 27,437 | | | 943,784 | | | 1,009,432 | |
Total | | $ | 1,146,712 | | $ | 1,279,232 | | $ | 427,011 | | $ | 1,036,969 | | $ | 3,889,924 | |
(1) This value is determined using the relevant forward prices as of June 30, 2008. Additionally, only those contracts that are currently in a deficiency position are presented herein and the offsetting effect of contracts that are in an asset position is not reflected.
(2) Convertible debentures are typically converted into Trust Units prior to maturity or are redeemed for Trust Units at maturity by Harvest; therefore, only the interest portion is represented in the table above.
(iii.) Market Risks and Sensitivity Analysis
Harvest is exposed to three types of market risks: interest rate risk, foreign currency exchange rate risk and commodity price risk. How these risks arise, how they are managed and how Harvest’s net income and other comprehensive income could be affected by changes in the underlying risk variables are presented below.
We have performed sensitivity analysis on the three types of risks identified, assuming that the volatility of the risks over the next quarter will be similar to that experienced in the past year. Harvest has determined that a reasonably possible price or rate variance over the next reporting period for a given risk variable can be estimated by calculating two standard deviations for each three month period in the last year for the relevant daily price/rate settings and using an average of the standard deviation as a reasonable estimate of the expected variance. This variance is then applied to the relevant period end rate or price to determine a reasonable percentage increase and decrease in the risk variable which can then be applied to the outstanding risk exposure at period end. Using 12 months of data, we factor in the seasonality of our business and the price volatility therein. At this time, we have not adjusted the data for any unusual or extreme situations but should one arise, the data would be adjusted accordingly.
Interest rate risk
Harvest is exposed to interest rate risk on its bank borrowings as interest rates are determined in relation to floating market rates plus an incremental charge based on secured debt to EBITDA. Harvest’s convertible debentures and 77/8% Senior Notes have fixed interest rates and therefore do not have any additional interest rate risk. Harvest manages its interest rate risk by targeting appropriate levels of debt relative to its expected cash flow from operations.
At June 30, 2008, if interest rates had decreased by 10% with all other variables held constant, after-tax net income for the period would have been $2.7 million higher, as a result of lower interest expense on variable rate borrowings. If interest rates had increased by 10%, with all other variables held constant, the after-tax net income would have been $1.1 million higher. This unexpected increase in net income despite an increase in the period end interest rate results from the decrease in the Prime lending rate that occurred towards the end of the quarter, resulting in a forward interest rate that is less than Harvest’s effective interest rate throughout the period. As well, we reduced our outstanding borrowings by approximately $240 million at the end of April with the net proceeds of our 7.5% convertible debenture offering.
Foreign currency exchange rate risk
Harvest is exposed to the risk of changes in the U.S. dollar exchange rate on its U.S. dollar denominated revenues as well as Canadian dollar revenues that are based on a U.S. dollar commodity price. In addition, Harvest’s 77/8% Senior Notes are denominated in U.S. dollars (U.S.$250 million) and interest on these notes is payable semi-annually in U.S. dollars and accordingly the principal and any interest payable at the balance sheet date are also subject to currency exchange rate risk. Harvest is also exposed to currency exchange rate risk on its net investment in a self sustaining subsidiary that uses a U.S. dollar functional currency. Harvest manages these exchange rate risks by occasionally entering into fixed rate currency exchange contracts on future U.S. dollar payments and U.S. dollar sales.
At June 30, 2008, if the U.S. dollar strengthened or weakened by 5% relative to the Canadian dollar, the impact on net income and other comprehensive income due to the translation of monetary financial instruments would be as follows:
| | | Impact on | |
| | | Net Income | | Other Comprehensive Income | |
| U.S. Dollar Exchange Rate - 5% increase | | $ | (12,650 | ) | $ | (13,104 | ) |
| U.S. Dollar Exchange Rate - 5% decrease | | $ | 12,650 | | $ | 13,104 | |
As mentioned above, Harvest’s wholly owned subsidiary North Atlantic Refining LP operates with a U.S. dollar functional currency which gives rise to currency exchange rate risk on North Atlantic’s Canadian dollar denominated monetary assets and liabilities, such as Canadian dollar bank accounts and accounts receivable and payable, as follows:
| | | Impact on | |
| | | Net Income | | Other Comprehensive Income | |
| Canadian Dollar Exchange Rate - 5% increase | | $ | (4,629 | ) | $ | - | |
| Canadian Dollar Exchange Rate - 5% decrease | | $ | 4,629 | | $ | - | |
Commodity Price Risk
Harvest uses price risk management contracts to manage a portion of its crude oil, natural gas and refined product sales price exposure and power costs. As many of these contracts are denominated in U.S. dollars, we also enter into fixed rate currency exchange contracts. These contracts are recorded on the balance sheet at their fair value as of the balance sheet date, with changes from the prior period’s fair value recorded in net income for the period. These fair values are generally determined as the difference between the stated fixed price of the contract and an expected future price of the underlying asset. Variances in expected future prices expose us to commodity price risk as changes will result in a gain or loss that we will realize on settlement of these contracts. This risk is mitigated by continuously monitoring the effectiveness of these contracts.
If the following changes in expected forward prices were applied to the fair value of risk management contracts in place at June 30, 2008, net income would be impacted as follows:
| | | | | Impact on NI | |
Contract | | % Change | | Due to % increase | | Due to % decrease | |
| Heating Oil NYMEX | | | 10 | % | $ | (75,032 | ) | $ | 75,032 | |
| Heating Oil NYMEX - Crack | | | 15 | % | | (4,480 | ) | | 4,480 | |
| RBOB Gasoline NYMEX – Crack | | | 100 | % | | (3,400 | ) | | 3,400 | |
| #6 (1%) HFO Platts | | | 10 | % | | (33,420 | ) | | 33,420 | |
| #6 (1%) HFO Platts – Crack | | | 20 | % | | 2,244 | | | (2,244 | ) |
| West Texas Intermediate | | | 10 | % | | (15,873 | ) | | 15,873 | |
| Alberta Power Pool | | | 40 | % | | 6,006 | | | (6,006 | ) |
| Currency Forwards | | | 5 | % | | (996 | ) | | 996 | |
Total | | | | | $ | (124,951 | ) | $ | 124,951 | |
(b) Fair Values
At June 30, 2008, the net fair value deficiency reflected on the balance sheet for all the risk management contracts outstanding at that date was approximately $515.7 million ($149.7 million - December 31, 2007), which was included in the balance sheet as follows: fair value of risk management contracts (current assets) $19.5 million, fair value deficiency of risk management contracts (current liabilities) $314.1 million and fair value deficiency of risk management contracts $221.1 million.
The following is a summary of Harvest’s risk management contracts outstanding, along with their fair value at June 30, 2008:
Quantity | | Type of Contract | | Term | | Average Price | | Fair value | |
| | | | | | | | | | |
Crude Oil Price Risk Management | | | | | | | | | | | | | |
| 6,000 bbl/d | | | WTI 3-way contract | | | Jul. 08 – Dec. 08 | | | US$62.00 - $87.53 ($72.00 | )(a) | | (60,009 | ) |
| | | | | | | | | | | | | | |
Refined Product Price Risk Management | | | | | | | | | | | | | |
| 10,000 bbl/d | | | NYMEX heating oil 3-way contract | | | Jul. 08 – Dec. 08 | | | US$60.90 - $93.31 ($81.06 | )(b)(h) | $ | (138,774 | ) |
| 6,000 bbl/d | | | Platt’s fuel oil 3-way contract | | | Jul. 08 – Dec. 08 | | | US$43.00 - $63.21 ($51.67 | )(c) | | (53,431 | ) |
| 2,000 bbl/d | | | NYMEX heating oil collar | | | Jul. 08 – Dec. 08 | | | US$79.80 - $91.35 | (d) (h) | | (28,442 | ) |
| 2,000 bbl/d | | | Platt’s fuel oil collar | | | Jul. 08 – Dec. 08 | | | US$51.00 - $58.68 | (e) | | (19,448 | ) |
| 12,000 bbl/d | | | NYMEX heating oil 3-way contract | | | Jan. 09 – Jun. 09 | | | US$72.59 - $98.73 ($86.52 | )(f) (h) | | (152,411 | ) |
| 8,000 bbl/d | | | Platt’s fuel oil 3-way contract | | | Jan. 09 – Jun. 09 | | | US$49.75 - $65.89 ($57.38 | )(g) | | (68,681 | ) |
| | | | | | | | | | | | $ | (461,187 | ) |
| | | | | | | | | | | | | | |
Natural Gas Price Risk Management | | | | | | | | | | | | | |
| 276 GJ/d | | | Fixed price – natural gas contract | | | Jul. 08 – Dec. 08 | | | Cdn$4.16 | (i) | $ | (444 | ) |
| | | | | | | | | | | | | | |
Electricity Price Risk Management | | | | | | | | | | | | | |
| 35 MWh | | | Electricity price swap contracts | | | Jul. 08 – Dec. 08 | | | Cdn $56.69 | | $ | 6,254 | |
| | | | | | | | | | | | | | |
Refined Product Crack Spread Risk Management | | | | | | | | | | | | | |
| 2,000 bbl/d | | | Platt’s fuel oil crack swap | | | Jul. 08 – Dec. 08 | | | US($16.50 | ) | $ | 4,984 | |
| 6,000 bbl/d | | | NYMEX heating oil crack swap | | | Jul. 08 – Dec. 08 | | | US$14.63 | | | (13,550 | ) |
| 6,000 bbl/d | | | NYMEX RBOB crack swap | | | Jul. 08 – Dec. 08 | | | US$10.00 | | | 7,836 | |
| | | | | | | | | | | | $ | (730 | ) |
| | | | | | | | | | | | | | |
Foreign Currency Exchange Rate Risk Management | | | | | | | | | | | | | |
| $10,000,000/month | | | U.S./Cdn dollar collar | | | Jul. 08 – Dec. 08 | | | 1.000 Cdn/US- 1.055 Cdn/US | (j) | | 458 | |
Total net fair value deficiency of risk management contracts | | $ | (515,658 | ) |
| | (a) | If the market price is below $62.00, price received is market price plus $10.00; if the market price is between $62.00 and $72.00, the price received is $72.00; if the market price is between $72.00 and the ceiling of $87.53, the price received is market price; if the market price is over the ceiling of $87.53, price received is $87.53. |
| | (b) | If the market price is below $60.90, price received is market price plus $20.16; if the market price is between $60.90 and $81.06, the price received is $81.06; if the market price is between $81.06 and the ceiling of $93.31, the price received is market price; if the market price is over the ceiling of $93.31, price received is $93.31. |
| | (c) | If the market price is below $43.00, price received is market price plus $8.67; if the market price is between $43.00 and $51.67, the price received is $51.67; if the market price is between $51.67 and the ceiling of $63.21, the price received is market price; if the market price is over the ceiling of $63.21, price received is $63.21. |
| | (d) | If the market price is below $79.80, price received is $79.80; if the market price is between $79.80 and $91.35, the price received is market price; if the market price is over the ceiling of $91.35, price received is $91.35. |
| | (e) | If the market price is below $51.00, price received is $51.00; if the market price is between $51.00 and the ceiling of $58.68, the price received is market price; if the market price is over the ceiling of $58.68, price received is $58.68. |
| | (f) | If the market price is below the floor price of $72.59, price received is market price plus $13.93; if the market price is between the floor price of $72.59 and $86.52, the price received is $86.52; if the market price is between $86.52 and the ceiling of $98.73, the price received is market price; if the market price is over the ceiling of $98.73, price received is $98.73. |
| | (g) | If the market price is below the floor of $49.75, price received is market price plus $7.63; if the market price is between the floor price of $49.75 and $57.38, the price received is $57.38; if the market price is between $57.38 and the ceiling of $65.89, the price received is market price; if the market price is over the ceiling of $65.89, price received is $65.89. |
| | (h) | Heating oil contracts are contracted in U.S. dollars per U.S. gallon and are presented in this table in U.S. dollars per barrel for comparative purposes (1 barrel equals 42 U.S. gallons). |
| | (i) | This contract contains an annual escalation factor such that the fixed price is adjusted each year. |
| | (j) | If the market price is below $1.000, price received is $1.000; if the market price is between $1.000 and the ceiling of $1.055, the price received is market price; if the market price is over the ceiling of $1.055, price received is the stated ceiling price. |
For the three and six months ended June 30, 2008, the total unrealized gain/loss recognized in the consolidated statement of income and comprehensive income was a loss of $305.1 million and a loss of $366.0 million respectively (a gain of $11.0 million and a loss of $3.1 million - three and six months ended June 30, 2007), which represents the change in fair value of financial assets and liabilities classified as held for trading. The realized gains and losses on all risk management contracts are included in the period in which they are incurred.
Harvest operates in Canada and has two reportable operating segments, Upstream and Downstream. Harvest’s upstream operations consist of development, production and subsequent sale of petroleum, natural gas and natural gas liquids, while its downstream operations include the purchase of crude oil, the refining of crude oil, the sale of the refined products including a network of retail operations and the supply of refined products to commercial and wholesale customers.
| | | Downstream(1) | | Upstream(1) | | Total | |
| | | Three months ended June 30, | | Three months ended June 30, | | Three months ended June 30, | |
| | | 2008 | | 2007 | | 2008 | | 2007 | | 2008 | | 2007 | |
Results of Continuing Operations | | | | | | | | | | | | | | | | | | | |
Revenue(2) | | $ | 1,227,126 | | $ | 900,387 | | $ | 471,766 | | $ | 286,611 | | $ | 1,698,892 | | $ | 1,186,998 | |
| Royalties | | | - | | | - | | | (76,813 | ) | | (53,548 | ) | | (76,813 | ) | | (53,548 | ) |
| Less: | | | | | | | | | | | | | | | | | | | |
| Purchased products for resale and processing | | | 1,160,558 | | | 708,642 | | | - | | | - | | | 1,160,558 | | | 708,642 | |
| Operating | | | 55,516 | | | 44,921 | | | 73,092 | | | 72,333 | | | 128,608 | | | 117,254 | |
| Transportation and marketing | | | 9,401 | | | 9,059 | | | 3,352 | | | 3,375 | | | 12,753 | | | 12,434 | |
| General and administrative | | | 600 | | | 402 | | | 12,710 | | | 16,061 | | | 13,310 | | | 16,463 | |
| Depletion, depreciation, amortization and accretion | | | 16,743 | | | 18,185 | | | 107,371 | | | 111,446 | | | 124,114 | | | 129,631 | |
| | | $ | (15,692 | ) | $ | 119,178 | | $ | 198,428 | | $ | 29,848 | | | 182,736 | | | 149,026 | |
| | | | | | | | | | | | | | | | | | | | |
| Realized net losses on risk management contracts | | | | | | | | | | | | | | | (94,424 | ) | | (6,826 | ) |
Unrealized net (losses) gains on risk management contracts | | | | | | | | | | | | | | | (305,127 | ) | | 11,014 | |
| Interest and other financing charges on short term debt, net | | | | | | | | | | | | | | | - | | | (577 | ) |
| Interest and other financing charges on long term debt | | | | | | | | | | | | | | | (35,948 | ) | | (39,803 | ) |
| Foreign exchange gain (loss) | | | | | | | | | | | | | | | (4,045 | ) | | 71,098 | |
| Large corporations tax and other tax | | | | | | | | | | | | | | | (446 | ) | | - | |
| Future income tax recovery (expense) | | | | | | | | | | | | | | | 95,191 | | | (177,684 | ) |
| Net (loss) income | | | | | | | | | | | | | | $ | (162,063 | ) | $ | 6,248 | |
| | | | | | | | | | | | | | | | | | | | |
Total Assets(3) | | $ | 1,684,003 | | $ | 1,660,754 | | $ | 3,903,959 | | $ | 3,926,731 | | $ | 5,637,879 | | $ | 5,613,333 | |
| | | | | | | | | | | | | | | | | | | | |
Capital Expenditures | | | | | | | | | | | | | | | | | | | |
| Development and other activity | | $ | 8,619 | | $ | 9,871 | | $ | 39,669 | | $ | 48,221 | | $ | 48,288 | | $ | 58,092 | |
| Property acquisitions (dispositions), net | | | - | | | - | | | (4,734 | ) | | (21,801 | ) | | (4,734 | ) | | (21,801 | ) |
| Total expenditures | | $ | 8,619 | | $ | 9,871 | | $ | 34,935 | | $ | 26,420 | | $ | 43,554 | | $ | 36,291 | |
| | | | | | | | | | | | | | | | | | | | |
Property, plant and equipment | | | | | | | | | | | | | | | | | | | |
| Cost | | $ | 1,212,591 | | $ | 1,215,329 | | $ | 4,363,151 | | $ | 4,010,056 | | $ | 5,575,742 | | $ | 5,225,385 | |
| Less: Accumulated depletion and depreciation | | | (105,054 | ) | | (45,556 | ) | | (1,354,948 | ) | | (923,470 | ) | | (1,460,002 | ) | | (969,026 | ) |
| Net book value | | $ | 1,107,537 | | $ | 1,169,773 | | $ | 3,008,203 | | $ | 3,086,586 | | $ | 4,115,740 | | $ | 4,256,359 | |
| | | | | | | | | | | | | | | | | | | | |
Goodwill | | | | | | | | | | | | | | | | | | | |
| Beginning of period | | $ | 182,232 | | $ | 207,984 | | $ | 676,795 | | $ | 656,248 | | $ | 859,027 | | $ | 864,232 | |
| Addition (reduction) to goodwill | | | (1,207 | ) | | (16,068 | ) | | - | | | - | | | (1,207 | ) | | (16,068 | ) |
| End of period | | $ | 181,025 | | $ | 191,916 | | $ | 676,795 | | $ | 656,248 | | $ | 857,820 | | $ | 848,164 | |
(1) Accounting policies for segments are the same as those described in the Significant Accounting Policies
(2) Of the total downstream revenue for the three months ended June 30, 2008, $826.1 million is from one customer (three months ended June 30, 2007 - $784.8 million). No other single customer within either division represents greater than 10% of Harvest’s total revenue.
(3) Total Assets on a consolidated basis as at June 30, 2008 includes $19.5 million (June 30, 2007 - $25.8 million) relating to the fair value of risk management contracts and $30.4 million relating to future income tax (June 30, 2007- nil).
(4) There is no intersegment activity.
| | | Downstream(1) | | Upstream(1) | | Total | |
| | | Six months ended June 30, | | Six months ended June 30, | | Six months ended June 30, | |
| | | 2008 | | 2007 | | 2008 | | 2007 | | 2008 | | 2007 | |
Results of Continuing Operations | | | | | | | | | | | | | | | | | | | |
Revenue(2) | | $ | 2,289,545 | | $ | 1,684,432 | | $ | 849,099 | | $ | 577,727 | | $ | 3,138,644 | | $ | 2,262,159 | |
Royalties | | | - | | | - | | | (139,213 | ) | | (103,197 | ) | | (139,213 | ) | | (103,197 | ) |
Less: | | | | | | | | | | | | | | | | | | | |
Purchased products for resale and processing | | | 2,120,550 | | | 1,340,938 | | | - | | | - | | | 2,120,550 | | | 1,340,938 | |
Operating | | | 124,538 | | | 94,282 | | | 145,415 | | | 144,629 | | | 269,953 | | | 238,911 | |
Transportation and marketing | | | 17,998 | | | 16,402 | | | 6,377 | | | 6,187 | | | 24,375 | | | 22,589 | |
General and administrative | | | 1,168 | | | 702 | | | 24,619 | | | 26,165 | | | 25,787 | | | 26,867 | |
Depletion, depreciation, amortization and accretion | | | 33,243 | | | 37,574 | | | 221,796 | | | 225,849 | | | 255,039 | | | 263,423 | |
| | | $ | (7,952 | ) | $ | 194,534 | | $ | 311,679 | | $ | 71,700 | | $ | 303,727 | | | 266,234 | |
| | | | | | | | | | | | | | | | | | | | |
Realized net losses on risk management contracts | | | | | | | | | | | | | | | (130,718 | ) | | (7,123 | ) |
| Unrealized net (losses) gains on risk management contracts | | | | | | | | | | | | | | | (365,985 | ) | | (3,107 | ) |
Interest and other financing charges on short term debt, net | | | | | | | | | | | | | | | (201 | ) | | (4,204 | ) |
Interest and other financing charges on long term debt | | | | | | | | | | | | | | | (71,051 | ) | | (80,252 | ) |
Foreign exchange gain (loss) | | | | | | | | | | | | | | | (14,710 | ) | | 82,358 | |
Large corporations tax and other tax | | | | | | | | | | | | | | | (496 | ) | | (124 | ) |
Future income tax recovery (expense) | | | | | | | | | | | | | | | 117,025 | | | (177,684 | ) |
Net (loss) income | | | | | | | | | | | | | | $ | (162,409 | ) | $ | 76,098 | |
| | | | | | | | | | | | | | | | | | | | |
Total Assets(3) | | $ | 1,684,003 | | $ | 1,660,754 | | $ | 3,903,959 | | $ | 3,926,731 | | $ | 5,637,879 | | $ | 5,613,333 | |
| | | | | | | | | | | | | | | | | | | | |
Capital Expenditures | | | | | | | | | | | | | | | | | | | |
| Development and other activity | | $ | 14,646 | | $ | 14,754 | | $ | 119,240 | | $ | 196,708 | | $ | 133,886 | | $ | 211,462 | |
| Business acquisitions | | | - | | | - | | | - | | | 30,264 | | | - | | | 30,264 | |
| Property acquisitions (dispositions), net | | | - | | | - | | | (4,549 | ) | | (21,112 | ) | | (4,549 | ) | | (21,112 | ) |
| Total expenditures | | $ | 14,646 | | $ | 14,754 | | $ | 114,691 | | $ | 205,860 | | $ | 129,337 | | $ | 220,614 | |
| | | | | | | | | | | | | | | | | | | | |
Property, plant and equipment | | | | | | | | | | | | | | | | | | | |
| Cost | | $ | 1,212,591 | | $ | 1,215,329 | | $ | 4,363,151 | | $ | 4,010,056 | | $ | 5,575,742 | | $ | 5,225,385 | |
| Less: Accumulated depletion and depreciation | | | (105,054 | ) | | (45,556 | ) | | (1,354,948 | ) | | (923,470 | ) | | (1,460,002 | ) | | (969,026 | ) |
| Net book value | | $ | 1,107,537 | | $ | 1,169,773 | | $ | 3,008,203 | | $ | 3,086,586 | | $ | 4,115,740 | | $ | 4,256,359 | |
| | | | | | | | | | | | | | | | | | | | |
Goodwill | | | | | | | | | | | | | | | | | | | |
| Beginning of period | | $ | 175,983 | | $ | 209,930 | | $ | 676,795 | | $ | 656,248 | | $ | 852,778 | | $ | 866,178 | |
| Addition (reduction) to goodwill | | | 5,042 | | | (18,014 | ) | | - | | | - | | | 5,042 | | | (18,014 | ) |
| End of period | | $ | 181,025 | | $ | 191,916 | | $ | 676,795 | | $ | 656,248 | | $ | 857,820 | | $ | 848,164 | |
(1) Accounting policies for segments are the same as those described in the Significant Accounting Policies
(2) Of the total downstream revenue for the six months ended June 30, 2008, $1,627.0 million is from one customer (six months ended June 30, 2007 - $1,474.5 million). No other single customer within either division represents greater than 10% of Harvest’s total revenue.
(3) Total Assets on a consolidated basis as at June 30, 2008 includes $19.5 million (June 30, 2007 - $25.8 million) relating to the fair value of risk management contracts and $30.4 million relating to future income tax (June 30, 2007- nil).
(4) There is no intersegment activity.
| 15. | Commitments, Contingencies and Guarantees |
From time to time, Harvest is involved in litigation or has claims brought against it in the normal course of business operations. Management of Harvest is not currently aware of any claims or actions that would materially affect Harvest’s reported financial position or results from operations. In the normal course of operations, management may also enter into certain types of contracts that require Harvest to indemnify parties against possible third party claims, particularly when these contracts relate to purchase and sale agreements. The terms of such contracts vary and generally a maximum is not explicitly stated; as such the overall maximum amount of the obligations cannot be reasonably estimated. Management does not believe payments, if any, related to such contracts would have a material effect on Harvest’s reported financial position or results from operations.
The following are the significant commitments and contingencies at June 30, 2008:
| | (a) | North Atlantic has a Supply and Offtake Agreement with Vitol Refining S.A. This agreement provides that the ownership of substantially all crude oil feedstock and refined product inventory at the refinery be retained by Vitol Refining S.A. and that for a minimum period of up to two years commencing October 19, 2006, Vitol Refining S.A. will be granted the right and obligation to provide crude oil feedstock for delivery to the refinery, as well as the right and obligation to purchase substantially all refined products produced by the refinery. As such, at June 30, 2008, North Atlantic had commitments totaling approximately $1,063.4 million ($671.6 million - June 30, 2007) in respect of future crude oil feedstock purchases and related transportation from Vitol Refining S.A. |
| | (b) | In January 2008 Vitol entered into a six month term contract with Iraq's State Oil Marketing Organization (“SOMO”) for 33,000 bbl/day of Basrah crude oil at market prices on behalf of Harvest per the Supply and Offtake Agreement. The remaining commitment (742,000 barrels) is included in the total feedstock commitment disclosed below. |
The following is a summary of Harvest’s contractual obligations and commitments as at June 30, 2008:
| | | Payments Due by Period | |
| | | 2008 | | 2009 | | 2010 | | 2011 | | 2012 | | Thereafter | | Total | |
Debt repayments (1) | | $ | - | | $ | - | | $ | 1,035,285 | | $ | 254,925 | | $ | - | | $ | - | | $ | 1,290,210 | |
Capital commitments(2) | | | 18,823 | | | 5,590 | | | - | | | - | | | - | | | - | | | 24,413 | |
Operating leases(3) | | | 3,663 | | | 6,676 | | | 5,921 | | | 5,419 | | | 1,876 | | | 248 | | | 23,803 | |
Pension contributions(4) | | | 572 | | | 1,583 | | | 2,048 | | | 2,454 | | | 2,847 | | | 21,285 | | | 30,789 | |
Transportation agreements(5) | | | 2,130 | | | 1,892 | | | 1,503 | | | 785 | | | 506 | | | 47 | | | 6,863 | |
Feedstock commitments(6) | | | 1,063,446 | | | - | | | - | | | - | | | - | | | - | | | 1,063,446 | |
| Contractual obligations | | $ | 1,088,634 | | $ | 15,741 | | $ | 1,044,757 | | $ | 263,583 | | $ | 5,229 | | $ | 21,580 | | $ | 2,439,524 | |
(1) Assumes that the outstanding convertible debentures either convert at the holders’ option for Units or are redeemed for Units at Harvest’s option.
(2) Relating to drilling contracts, AFE commitments, equipment rental contracts and environmental capital projects.
(3) Relating to building and automobile leases.
(4) Relating to expected contributions for employee benefit plans [see Note 12].
(5) Relating to oil and natural gas pipeline transportation agreements.
(6) Relating to crude oil feedstock purchases and related transportation costs [see Note 15 (a) above].
Subsequent to June 30, 2008, Harvest declared a distribution of $0.30 per unit for Unitholders of record on August 22, 2008, September 22, 2008, and October 22, 2008.
Between July 1, 2008 and August 11, 2008, an additional $360.0 million was committed to the purchase of feedstock inventory under the Supply and Offtake Agreement held with Vitol Refining S.A. [see table in Note 15].
On June 6, 2008, Harvest entered into an acquisition agreement with Greenfield Resources Ltd. (“Greenfield”) to purchase all of the issued and outstanding common shares of Greenfield for $3.51 per share. On July 24th 95% of the shares were acquired, enabling Harvest to acquire the remaining shares pursuant to the compulsory acquisition provisions of the Business Corporations Act. As a result, Harvest acquired Greenfield for a total purchase price of $36.5 million, including the assumption of $5.3 million of bank debt. Commencing on the purchase date, Greenfield’s operating results will be included in Harvest’s revenues, expenses and capital spending.
On July 25th Harvest signed a purchase and sale agreement to purchase certain petroleum and natural gas assets in exchange for $136.0 million in cash plus our interest in two non-operated properties. The purchase of these properties is subject to a 30 days right of first refusal and as a result, the acquisition is not expected to close until the end of August. Upon completion of this purchase, the production from these properties will be included in Harvest’s results.
| 17. | Related Party Transactions |
During the three and six month periods ended June 30, 2008, Vitol Refining S.A. purchased $4.6 million and $72.4 million respectively ($131.2 million and $131.2 million - three and six month periods ended June 30, 2007) of Russian crude oil at fair market value for processing by Harvest, which had been sourced from a private corporation of which a director of Harvest is also a director and holds a minority ownership interest. As at June 30, 2008, no amounts related to these transactions are included in accounts payable and accrued liabilities.
At June 30, 2008, there is $266.9 million included in our feedstock purchase commitments with Vitol Refining S.A. in respect of Iraqi crude oil to be purchased from this same private corporation of which a director of Harvest is also a director and holds a minority ownership interest [See Note 15].
Certain comparative figures have been reclassified to conform to the current period’s presentation.
MANAGEMENT’S DISCUSSION AND ANALYSIS
Management’s discussion and analysis (“MD&A”) of the financial condition and results of operations of Harvest Energy Trust should be read in conjunction with our audited consolidated financial statements and accompanying notes for the years ended December 31, 2007 and 2006, our MD&A for the year ended December 31, 2007 as well as our interim consolidated financial statements and notes for the three and six month periods ended June 30, 2008 and 2007. The information and opinions concerning our future outlook are based on information available at August 11, 2008.
In this MD&A, reference to "Harvest", "we", "us" or "our" refers to Harvest Energy Trust and all of its controlled entities on a consolidated basis. All references are to Canadian dollars unless otherwise indicated. Tabular amounts are in thousands of dollars unless otherwise stated. Natural gas volumes are converted to barrels of oil equivalent (“boe”) using the ratio of six thousand cubic feet (“mcf”) of natural gas to one barrel of oil (“bbl”). Boes may be misleading, particularly if used in isolation. A boe conversion ratio of 6 mcf to 1 bbl is based on an energy equivalent conversion method primarily applicable at the burner tip and does not represent a value equivalent at the wellhead. In accordance with Canadian practice, petroleum and natural gas revenues are reported on a gross basis, before deduction of Crown and other royalties. In addition to disclosing reserves under the requirements of National Instrument 51-101, we also disclose our reserves on a company interest basis which is not a term defined under National Instrument 51-101. This information may not be comparable to similar measures by other issuers.
In this MD&A, we use certain financial reporting measures that are commonly used as benchmarks within the petroleum and natural gas industry such as Earnings From Operations, Cash General and Administrative Expenses and Operating Netbacks and with respect to the refining industry, Earnings from Operations and Gross Margin which are each defined in this MD&A. These measures are not defined under Canadian generally accepted accounting principles (“GAAP”) and should not be considered in isolation or as an alternative to conventional GAAP measures. Certain of these measures are not necessarily comparable to a similarly titled measure of another issuer. When these measures are used, they are defined as “Non-GAAP measures” and should be given careful consideration by the reader. Please refer to the discussion under the heading “Non-GAAP Measures” at the end of this MD&A for a detailed discussion of these measures.
FORWARD-LOOKING INFORMATION
This MD&A highlights significant business results and statistics from our consolidated financial statements for the three and six month periods ended June 30, 2008 and the accompanying notes thereto. In the interest of providing our Unitholders and potential investors with information regarding Harvest, including our assessment of our future plans and operations, this MD&A contains forward-looking statements that involve risks and uncertainties. Such risks and uncertainties include, but are not limited to, risks associated with conventional petroleum and natural gas operations; risks associated with refining and marketing operations, the volatility in commodity prices and currency exchange rates; risks associated with realizing the value of acquisitions; general economic, market and business conditions; changes in environmental legislation and regulations; the availability of sufficient capital from internal and external sources and such other risks and uncertainties described from time to time in our regulatory reports and filings made with securities regulators.
Forward-looking statements in this MD&A include, but are not limited to the forward looking statements made in the “Outlook” section as well as statements made throughout with reference to, production volumes, refinery throughput volumes, royalty rates, operating costs, commodity prices, administrative costs, price risk management activity, acquisitions and dispositions, capital spending, reserve estimates, distributions, access to credit facilities, capital taxes, income taxes, cash from operating activities and regulatory changes. For this purpose, any statements that are contained herein that are not statements of historical fact may be deemed to be forward-looking statements. Forward-looking statements often contain terms such as “may”, “will”, “should”, “anticipate”, “expects”, and similar expressions.
Readers are cautioned not to place undue reliance on forward-looking statements as there can be no assurance that the plans, intentions or expectations upon which they are based will occur. Although we consider such information reasonable, at the time of preparation, it may prove to be incorrect and actual results may differ materially from those anticipated. We assume no obligation to update forward-looking statements should circumstances, estimates or opinions change, except as required by law. Forward-looking statements contained in this MD&A are expressly qualified by this cautionary statement.
Consolidated Financial and Operating Highlights – Second Quarter 2008
| · | Cash flow from operating activities of $210.5 million as compared to $251.2 million in the prior year, while $0.30 monthly distributions aggregated to $137.0 million and distributions declared as a percentage of cash flow from operating activities of 65% as compared to $154.1 million with distributions declared as a percentage of cash flow from operating activities of 61% in the prior year. |
| · | Upstream operating cash flow of $309.8 million as compared to $140.9 million in the prior year reflected the strength of commodity prices in 2008 with average daily production of 55,574 boe/d as compared to 60,989 boe/d in the prior year. |
| · | Upstream capital spending of $39.7 million includes the drilling of 12 wells with a success ratio of 100% and a successful stratigraphic well confirming a significant extension of our Kenosee pool discovered in 2006. |
| · | Downstream operating cash flow of $1.3 million reflects the impact of weak pricing for gasoline and fuel oil products and higher costs for purchased energy offseting the benefits of reliable refinery operations - throughput averaged 100,422 as compared to 111,999 in the First Quarter of 2008 in an effort to enhance profitability by minimizing the volume of fuel oil produced. |
| · | Balance sheet liquidity bolstered with the issuance of $250 million of principal amount of 7.5% Convertible Unsecured Subordinated Debentures for net proceeds of $239.5 million. |
| · | Subsequent to the end of the quarter, we entered into an agreement to purchase a private oil and natural gas company in exchange for aggregate cash consideration of $36.5 million as well as agreed to purchase certain oil and natural gas properties for cash consideration $136.0 million plus our interest in two non-operated properties with this purchase commitment subject to Rights of First Refusal and closing expected in late August. |
SELECTED INFORMATION
The table below provides a summary of our financial and operating results for three and six month periods ended June 30, 2008 and 2007.
| | | Three Month Period Ended June 31 | | Six Month Period Ended June 31 | |
($000s except where noted) | | 2008 | | 2007 | | Change | | 2008 | | 2007 | | Change | |
| | | | | | | | | | | | | | |
Revenue, net(1) | | | 1,622,079 | | | 1,133,450 | | | 43 | % | | 2,999,431 | | | 2,158,962 | | | 39 | % |
| | | | | | | | | | | | | | | | | | | | |
| Cash From Operating Activities | | | 210,534 | | | 251,218 | | | (16 | )% | | 338,653 | | | 362,266 | | | (7 | )% |
| Per Trust Unit, basic | | $ | 1.39 | | $ | 1.88 | | | (26 | )% | $ | 2.24 | | $ | 2.78 | | | (19 | )% |
| Per Trust Unit, diluted | | $ | 0.83 | | $ | 1.67 | | | (50 | )% | $ | 1.35 | | $ | 2.52 | | | (46 | )% |
| | | | | | | | | | | | | | | | | | | | |
Net Income (Loss)(2) | | | (162,063 | ) | | 6,248 | | | (2,694 | )% | | (162,409 | ) | | 76,098 | | | (313 | )% |
| Per Trust Unit, basic | | $ | (1.07 | ) | $ | 0.05 | | | (2,240 | )% | $ | (1.08 | ) | $ | 0.58 | | | (286 | )% |
| Per Trust Unit, diluted | | $ | (1.07 | ) | $ | 0.05 | | | (2,240 | )% | $ | (1.08 | ) | $ | 0.58 | | | (286 | )% |
| | | | | | | | | | | | | | | | | | | | |
| Distributions declared | | | 137,001 | | | 154,057 | | | (11 | )% | | 272,168 | | | 299,327 | | | (9 | )% |
| Distributions declared, per Trust Unit | | $ | 0.90 | | $ | 1.14 | | | (21 | )% | $ | 1.80 | | $ | 2.28 | | | (21 | )% |
Distributions declared as a percentage of Cash From Operating Activities | | | 65 | % | | 61 | % | | 4 | % | | 80 | % | | 83 | % | | (3 | )% |
| | | | | | | | | | | | | | | | | | | | |
| Bank debt | | | | | | | | | | | | 1,035,285 | | | 1,047,965 | | | (1 | )% |
77/8% Senior Notes | | | | | | | | | | | | 248,836 | | | 258,387 | | | (4 | )% |
Convertible Debentures(3) | | | | | | | | | | | | 821,877 | | | 681,000 | | | 21 | % |
Total long-term debt(3) | | | | | | | | | | | | 2,105,998 | | | 1,987,352 | | | 6 | % |
| | | | | | | | | | | | | | | | | | | | |
| Total assets | | | | | | | | | | | | 5,637,879 | | | 5,613,333 | | | - | % |
| | | | | | | | | | | | | | | | | | | | |
UPSTREAM OPERATIONS | | | | | | | | | | |
| Daily Production | | | | | | | | | | | | | | | | | | | |
| Light to medium oil (bbl/d) | | | 25,365 | | | 27,586 | | | (8 | )% | | 25,439 | | | 27,311 | | | (7 | )% |
| Heavy oil (bbl/d) | | | 12,092 | | | 14,719 | | | (18 | )% | | 12,534 | | | 15,164 | | | (17 | )% |
| Natural gas liquids (bbl/d) | | | 2,614 | | | 2,338 | | | 12 | % | | 2,549 | | | 2,417 | | | 5 | % |
| Natural gas (mcf/d) | | | 93,014 | | | 98,078 | | | (5 | )% | | 97,792 | | | 99,671 | | | (2 | )% |
Total daily sales volumes (boe/d) | | | 55,574 | | | 60,989 | | | (9 | )% | | 56,820 | | | 61,504 | | | (8 | )% |
| | | | | | | | | | | | | | | | | | | | |
| Operating Netback ($/boe) | | | 62.98 | | | 28.35 | | | 122 | % | | 53.97 | | | 29.08 | | | 86 | % |
| | | | | | | | | | | | | | | | | | | | |
| Cash capital expenditures | | | 39,669 | | | 48,221 | | | (18 | )% | | 119,240 | | | 196,708 | | | (39 | )% |
| | | | | | | | | | | | | | | | | | | | |
DOWNSTREAM OPERATIONS | | | | | | | | | | |
| Average daily throughput (bbl/d) | | | 100,422 | | | 115,570 | | | (13 | )% | | 106,211 | | | 114,646 | | | (7 | )% |
| Aggregate throughput (mbbl) | | | 9,138 | | | 10,517 | | | (13 | )% | | 19,330 | | | 20,751 | | | (7 | )% |
| | | | | | | | | | | | | | | | | | | | |
| Average Refining Margin (US$/bbl) | | | 5.66 | | | 15.64 | | | (64 | )% | | 7.36 | | | 13.69 | | | (46 | )% |
| | | | | | | | | | | | | | | | | | | | |
| Cash capital expenditures | | | 8,619 | | | 9,871 | | | (13 | )% | | 14,646 | | | 14,754 | | | (1 | )% |
| (1) | Revenues are net of royalties. |
| (2) | Net Income (Loss) includes a future income tax recovery of $95.2 million and $117.0 million for the three and six months ended June 30, 2008 respectively (expense of $177.7 million and $177.7 million for the three and six months ended June 30, 2007) and an unrealized net loss from risk management activities of $305.1 million and $366.0 million for the three and six months ended June 30, 2008 respectively (gain of $11.0 million and loss of $3.1 million for the three and six months ended June 30, 2007). |
| (3) | Includes current portion of Convertible Debentures. |
REVIEW OF OVERALL PERFORMANCE
Harvest is an integrated energy trust with our petroleum and natural gas operations focused on operations and further development of assets in western Canada (“upstream operations”) and our refining and marketing business focused on the safe operation of a medium gravity sour crude hydrocracking refinery and a retail and wholesale petroleum marketing business both located in the Province of Newfoundland and Labrador (“downstream operations”).
During the Second Quarter of 2008, cash flow from operating activities of $210.5 million is substantially comprised of cash flow contributions of $309.8 million and $1.3 million from the upstream and downstream operations, respectively, plus a $28.6 million reduction in working capital requirements offset by $94.4 million of cash settlements from our risk management activities and $34.8 million of financing and other costs. The year-over-year reduction in cash flow from operating activities of $40.7 million is primarily attributed to a $137.1 million reduction in the contribution from our downstream operations and an $87.6 million increase in cash settlement on price risk management contracts partially offset by $162.1 million increase in the contribution from upstream operations. Our monthly distributions of $0.30 per Trust Unit during the Second Quarter represent 65% of our cash provided by operating activities and we have declared monthly distributions of $0.30 per Trust Unit for July, August and September of 2008. Unitholder participation in our distribution reinvestment programs has generated $35.5 million of equity capital reflecting a 26% average level of participation.
Cash flow provided from our upstream operations totaled $309.8 million during the Second Quarter of 2008 as compared to $147.7 million in the prior year. The strength in Canadian crude oil prices during 2008 reflected a 91% increase in the WTI benchmark price, a 9% strengthening of the Canadian dollar relative to the US dollar and tighter heavy oil differentials. During the quarter, our realized price averaged $93.29 per boe as compared to $71.41 in the prior quarter and $51.64 in the prior year while our average daily production of 55,574 boe/d during the quarter compares to 58,067 in the First Quarter of 2008 and 60,989 in the Second Quarter of the prior year. During the Second Quarter of 2008, our production was impacted by an extended spring break-up with wet conditions limiting our well servicing activity. Our operating costs averaged $14.45 per boe during the quarter as compared to $13.69 in the First Quarter of the year with the increase the result of a stable level of spending spread over a reduced volume. Our netback price averaged $62.99 per boe during the quarter as compared to $45.34 in the First Quarter of 2008 and $28.35 in the Second Quarter of the prior year.
Cash flow from our downstream operations totaled $1.3 million as compared to $24.5 million in the First Quarter of 2008 and $138.4 million in the Second Quarter of the prior year. As compared with the prior year, this reduced level of profitability is primarily the result of a $128.4 million drop in our refining gross margin, as lower margins for our gasoline and fuel oil products more than offset improved distillate margins, coupled with lower differentials for our medium sour crude oil feedstocks and a $11.6 million increase in the cost of purchased energy to operate the refinery. During the quarter, our average refining margin was US$5.66 per barrel of throughput, a drop of US$9.98 as compared to the Second Quarter of the prior year and a drop of US$3.24 as compared to US$8.90 in the First Quarter of 2008. While we achieved very reliable refinery operations with no unplanned disruptions, our throughput averaged 100,422 bbls/d during the quarter as crude oil feed was reduced to minimize the production of high sulphur fuel oil (“HSFO”) as compared to throughput of 111,999 bbls/d in the First Quarter of 2008 and 115,570 bbls/d in the Second Quarter of the prior year.
On April 25, 2008, Harvest improved its financial liquidity with the issuance of $250 million principal amount of 7.50% Convertible Unsecured Subordinated Convertible Debentures for net proceeds of $239.5 million which were used to reduce bank indebtedness. At the end of June 2008, we had $564.7 million of available credit under our $1.6 billion Extendible Revolving Credit Facility. At the end of the quarter, our bank debt to annualized earnings before interest, taxes depreciation and amortization (“EBITDA”) was 1.5 times.
Subsequent to the end of the Second Quarter, we entered into an agreement to purchase a private oil and natural gas company for aggregate cash consideration of $36.5 million. With daily production currently averaging 750 boe/d, this acquisition represents a cost of approximately $48,700 per boe/d. The production is comprised of approximately 390 bbls/d of light oil and 2,300 mcf/d of natural gas. We have also entered into an agreement to purchase oil and natural gas properties currently producing approximately 1,900 boe/d in exchange for cash consideration of $136.0 million plus our interest in two non-operated properties currently producing approximately 85 boe/d. This purchase commitment is subject to a Right of First Refusal on approximately half the value of the transaction and is expected to close in late August 2008. Assuming no Rights of First Refusal are exercised, this acquisition represents a cost of approximately $75,000 per flowing boe/d and is comprised of approximately 1,225 bbls/d of light to medium gravity oil and approximately 3,900 mcf/d of natural gas.
Business Segments
The following table presents selected financial information for our two business segments:
| | | Three Month Period Ended June 30 | |
| | | 2008 | | 2007 | |
(in $000s) | | Upstream | | Downstream | | Total | | Upstream | | Downstream | | Total | |
Revenue(1) | | | 394,952 | | | 1,227,126 | | | 1,622,078 | | | 233,063 | | | 900,387 | | | 1,133,450 | |
Earnings From Operations(2) | | | 198,428 | | | (15,692 | ) | | 182,736 | | | 29,848 | | | 119,178 | | | 149,026 | |
| Capital expenditures | | | 39,669 | | | 8,619 | | | 48,288 | | | 48,221 | | | 9,871 | | | 58,092 | |
Total assets(3) | | | 3,903,959 | | | 1,684,003 | | | 5,637,879 | | | 3,926,731 | | | 1,660,754 | | | 5,613,333 | |
| | | Six Month Period Ended June 30 | |
| | | 2008 | | 2007 | |
(in $000s) | | Upstream | | Downstream | | Total | | Upstream | | Downstream | | Total | |
Revenue(1) | | | 709,886 | | | 2,289,545 | | | 2,999,431 | | | 474,530 | | | 1,684,432 | | | 2,158,962 | |
Earnings From Operations(2) | | | 311,679 | | | (7,952 | ) | | 303,727 | | | 71,700 | | | 194,534 | | | 266,234 | |
| Capital expenditures | | | 119,240 | | | 14,646 | | | 133,886 | | | 196,708 | | | 14,754 | | | 211,462 | |
Total assets(3) | | | 3,903,959 | | | 1,684,003 | | | 5,637,879 | | | 3,926,731 | | | 1,660,754 | | | 5,613,333 | |
| (1) | Revenues are net of royalties. |
| (2) | These are non-GAAP measures; please refer to “Non-GAAP Measures” in this MD&A. |
| (3) | Total Assets on a consolidated basis as at June 30, 2008 includes $19.5 million (2007 - $25.8 million) relating to the fair value of risk management contracts and $30.4 million related to future income tax (2007 – nil). |
Our upstream and downstream operations are each discussed separately in the sections that follow. Additionally, we have included a section entitled ‘Risk Management, Financing and Other’ that discusses, among other things, our cash flow risk management program.
UPSTREAM OPERATIONS
Second Quarter Highlights
| | · | Operating cash flow of $309.8 million for the quarter reflects a $162.1 million improvement over the prior year as it reflects the strength of commodity prices. |
| | · | Our operating netback of $62.99 per boe represents an increase of $34.64 from the $28.35 realized in the prior year, an increase of 122% attributed primarily to substantially higher commodity prices. |
| | · | Operating costs were essentially unchanged from the First Quarter of this year and the Second Quarter of the prior year with the operating costs per boe of $14.45 as compared to $13.69 and $13.03 in the prior quarter and prior year, respectively, reflecting the lower production volume in the Second Quarter of 2008. |
| | · | Capital spending of $39.7 million resulted in 12 wells drilled including the confirmation of a significant extension to an oil pool in southeast Saskatchewan. |
Summary of Financial and Operating Results
| | | Three Month Period Ended June 30 | | Six Month Period Ended June 30 | |
(in $000s) | | 2008 | | 2007 | | Change | | 2008 | | 2007 | | Change | |
| | | | | | | | | | | | | | |
| Revenues | | $ | 471,766 | | $ | 286,611 | | | 65 | % | $ | 849,099 | | $ | 577,727 | | | 47 | % |
| Royalties | | | (76,814 | ) | | (53,548 | ) | | 43 | % | | (139,213 | ) | | (103,197 | ) | | 35 | % |
| Net revenues | | | 394,952 | | | 233,063 | | | 69 | % | | 709,886 | | | 474,530 | | | 50 | % |
| | | | | | | | | | | | | | | | | | | | |
| Operating expenses | | | 73,092 | | | 72,333 | | | 1 | % | | 145,415 | | | 144,629 | | | 1 | % |
| General and administrative | | | 12,710 | | | 16,061 | | | (21 | )% | | 24,619 | | | 26,165 | | | (6 | )% |
| Transportation and marketing | | | 3,352 | | | 3,375 | | | (1 | )% | | 6,377 | | | 6,187 | | | 3 | % |
| Depreciation, depletion, amortization and accretion | | | 107,371 | | | 111,446 | | | (4 | )% | | 221,796 | | | 225,849 | | | (2 | )% |
| | | | | | | | | | | | | | | | | | | | |
Earnings From Operations(1) | | | 198,427 | | | 29,848 | | | 565 | % | | 311,679 | | | 71,700 | | | 335 | % |
| | | | | | | | | | | | | | | | | | | | |
| Cash capital expenditures (excluding acquisitions) | | | 39,669 | | | 48,221 | | | (18 | )% | | 119,240 | | | 196,708 | | | (39 | )% |
| Property and business acquisitions, net of dispositions | | | (4,734 | ) | | (21,801 | ) | | (78 | )% | | (4,549 | ) | | 9,152 | | | (150 | )% |
| | | | | | | | | | | | | | | | | | | | |
| Daily sales volumes | | | | | | | | | | | | | | | | | | | |
| Light to medium oil (bbl/d) | | | 25,365 | | | 27,586 | | | (8 | )% | | 25,439 | | | 27,311 | | | (7 | )% |
| Heavy oil (bbl/d) | | | 12,092 | | | 14,719 | | | (18 | )% | | 12,534 | | | 15,164 | | | (17 | )% |
| Natural gas liquids (bbl/d) | | | 2,614 | | | 2,338 | | | 12 | % | | 2,549 | | | 2,417 | | | 5 | % |
| Natural gas (mcf/d) | | | 93,014 | | | 98,078 | | | (5 | )% | | 97,792 | | | 99,671 | | | (2 | )% |
| Total (boe/d) | | | 55,574 | | | 60,989 | | | (9 | )% | | 56,820 | | | 61,504 | | | (8 | )% |
(1) These are non-GAAP measures; please refer to “Non-GAAP Measures” in this MD&A.
Commodity Price Environment
| | | Three Month Period Ended June 30 | | Six Month Period Ended June 30 | |
| Benchmarks | | 2008 | | 2007 | | Change | | 2008 | | 2007 | | Change | |
| | | | | | | | | | | | | | |
| West Texas Intermediate crude oil (US$ per barrel) | | | 123.98 | | | 65.03 | | | 91 | % | | 110.94 | | | 61.60 | | | 80 | % |
| Edmonton light crude oil ($ per barrel) | | | 125.88 | | | 71.89 | | | 75 | % | | 111.62 | | | 69.50 | | | 61 | % |
| Bow River blend crude oil ($ per barrel) | | | 104.38 | | | 50.78 | | | 106 | % | | 91.05 | | | 50.41 | | | 81 | % |
| AECO natural gas daily ($ per mcf) | | | 10.22 | | | 7.07 | | | 44 | % | | 9.06 | | | 7.23 | | | 25 | % |
| | | | | | | | | | | | | | | | | | | | |
| Canadian / U.S. dollar exchange rate | | | 0.990 | | | 0.911 | | | 9 | % | | 0.993 | | | 0.882 | | | 13 | % |
The average Second Quarter 2008 West Texas Intermediate (“WTI”) benchmark price increased 91% over the Second Quarter 2007 and the average price for the six months ended June 30, 2008 was 80% higher than in the prior year. The average Edmonton light crude oil price (“Edmonton Par”) has also increased steadily over the past twelve months, resulting in a Second Quarter 2008 average price of $125.88, an increase of 75% over the prior year and an average price of $111.62/bbl for the six months ended June 30, 2008, an increase of 61% over the prior year. This increase has been less than that of the WTI benchmark price due to the strength of the Canadian dollar relative to the US dollar, which has increased 9% in value compared to the Second Quarter of 2007 and 13% for the six months ended June 30 relative to the prior year.
Heavy oil differentials fluctuate based on a combination of factors including the level of heavy oil inventories, pipeline capacity to deliver heavy crude to U.S. markets and the seasonal demand for heavy oil. In the first two months of the Second Quarter of 2008 production shortfalls reduced supply while the start of the North American asphalt season increased demand for heavy oil, which contributed to shrinking the differential relative to Edmonton Par to 17.1% as compared to 29.4% in the Second Quarter of the prior year. During the six months ended June 30, 2008, heavy oil differentials have been on average 9% lower than the first six months of 2007 reflecting reduced supply due to production disruptions attributed to poor weather conditions during the first four months of 2008.
| | | 2008 | | 2007 | | 2006 | |
| Differential Benchmarks | | | Q2 | | | Q1 | | | Q4 | | | Q3 | | | Q2 | | | Q1 | | | Q4 | | | Q3 | |
| Bow River Blend differential to Edmonton Par | | | 17.1 | % | | 20.2 | % | | 34.2 | % | | 30.0 | % | | 29.4 | % | | 25.4 | % | | 30.3 | % | | 25.8 | % |
Compared to the prior year, the average AECO natural gas price was 44% and 25% higher during the three and six months ended June 30, 2008, respectively. Natural gas prices have strengthened in 2008 relative to 2007 due to the cold winter weather in Canada and the northern United States contributing to increased demand for natural gas resulting in lower inventories.
Realized Commodity Prices(1)
The following table summarizes our average realized price by product for the three and six month periods ended June 30, 2008 and 2007.
| | | Three Month Period Ended June 30 | | Six Month Period Ended June 30 | |
| | | 2008 | | 2007 | | Change | | 2008 | | 2007 | | Change | |
| Light to medium oil ($/bbl) | | | 109.26 | | | 59.20 | | | 85 | % | | 97.86 | | | 58.93 | | | 66 | % |
| Heavy oil ($/bbl) | | | 96.79 | | | 43.27 | | | 124 | % | | 82.44 | | | 44.15 | | | 87 | % |
| Natural gas liquids ($/bbl) | | | 88.87 | | | 58.67 | | | 51 | % | | 83.59 | | | 55.64 | | | 50 | % |
| Natural gas ($/mcf) | | | 10.86 | | | 7.57 | | | 43 | % | | 9.51 | | | 7.81 | | | 22 | % |
| Average realized price ($/boe) | | | 93.29 | | | 51.64 | | | 81 | % | | 82.11 | | | 51.90 | | | 58 | % |
(1) Realized commodity prices exclude the impact of price risk management activities.
During the three and six months ended June 30, 2008, our average realized price was 81% and 58% higher, respectively, than the comparable periods in 2007 with every product realizing a higher average price than in the prior year.
Our realized price for light to medium oil sales increased 85% in the Second Quarter of 2008 compared to the Second Quarter of 2007, reflecting the 75% increase in Edmonton Par pricing coupled with improved quality differentials realized on our light to medium oil production relative to the Edmonton Par price. During the six months ended June 30, 2008, our realized price for light to medium oil sales was 66% higher than the same period in 2007 which also reflects the 61% increase in Edmonton Par pricing over the prior year.
Harvest’s heavy oil price increased 124% in the Second Quarter of 2008 relative to the Second Quarter of 2007, reflecting the 106% increase in the average posted Bow River price for the same periods. Similarly, our average heavy oil price for the year-to-date is 87% higher than the prior year, reflecting the increase of 81% in the Bow River posted price for the first six months of 2008 relative to the first six months of 2007.
The average realized price for our natural gas production was 43% higher in the Second Quarter of 2008 as compared with 2007 reflecting the increase of 44% in the AECO daily pricing over the same period, while during the first six months of 2008, we realized a natural gas sales price that was 22% higher than in the prior year while AECO daily pricing increased 25%. Throughout 2007, we marketed approximately 60% of our natural gas production at the AECO daily price, 30% at the AECO monthly price and the remaining production was sold to aggregators. Commencing in January 2008, substantially all of our natural gas production was sold at the AECO daily price, which has realized a premium relative to the AECO monthly price in 2008. We continue to manage the amount sold at the AECO daily and AECO monthly price on an ongoing basis. Additionally, our larger natural gas producing properties generally have a higher than average heat content, which realizes a premium in its pricing.
Sales Volumes
The average daily sales volumes by product were as follows:
| | | Three Month Period Ended June 30 | | | |
| | | 2008 | | 2007 | | | |
| | | Volume | | Weighting | | Volume | | Weighting | | % Volume Change | |
Light to medium oil (bbl/d)(1) | | | 25,365 | | | 45 | % | | 27,586 | | | 45 | % | | (8 | )% |
| Heavy oil (bbl/d) | | | 12,092 | | | 22 | % | | 14,719 | | | 24 | % | | (18 | )% |
| Natural gas liquids (bbl/d) | | | 2,614 | | | 5 | % | | 2,338 | | | 4 | % | | 12 | % |
| Total liquids (bbl/d) | | | 40,071 | | | 72 | % | | 44,643 | | | 73 | % | | (10 | )% |
| Natural gas (mcf/d) | | | 93,014 | | | 28 | % | | 98,078 | | | 27 | % | | (5 | )% |
| Total oil equivalent (boe/d) | | | 55,574 | | | 100 | % | | 60,989 | | | 100 | % | | (9 | )% |
| | | Six Month Period Ended June 30 | | | |
| | | 2008 | | 2007 | | | |
| | | Volume | | Weighting | | Volume | | Weighting | | % Volume Change | |
Light to medium oil (bbl/d)(1) | | | 25,439 | | | 45 | % | | 27,311 | | | 44 | % | | (7 | )% |
| Heavy oil (bbl/d) | | | 12,534 | | | 22 | % | | 15,164 | | | 25 | % | | (17 | )% |
| Natural gas liquids (bbl/d) | | | 2,549 | | | 4 | % | | 2,417 | | | 4 | % | | 5 | % |
| Total liquids (bbl/d) | | | 40,522 | | | 71 | % | | 44,892 | | | 73 | % | | (10 | )% |
| Natural gas (mcf/d) | | | 97,792 | | | 29 | % | | 99,671 | | | 27 | % | | (2 | )% |
| Total oil equivalent (boe/d) | | | 56,820 | | | 100 | % | | 61,504 | | | 100 | % | | (8 | )% |
(1) Harvest classifies our oil production, except that produced from Hay River, as light to medium and heavy according to NI 51-101 guidance. The oil produced from Hay River has an average API of 24o (medium grade) and is classified as a light to medium oil, however, it benefits from a heavy oil royalty regime and therefore would be classified as heavy oil according to NI 51-101.

Harvest’s Second Quarter 2008 light/medium oil production was 25,365 bbl/d, which is a 2,221 bbl/d or 8% reduction from the same period in the prior year, and a reduction of 144 bbl/d or 1% from the First Quarter of 2008. During the Second Quarter of 2007, production volumes included incremental production following our 2007 winter drilling program, particularly in the Hay River area. During the remainder of 2007, we experienced steeper than expected declines in Hay River, lower levels of drilling activity and the disposition of approximately 280 bbl/d of assets in the southeast Saskatchewan area in the Fourth Quarter of 2007. During the First Quarter of 2008, we experienced various production disruptions associated with the cold weather in January coupled with downtime associated with service work. During the Second Quarter of 2008, volumes remained relatively constant with the prior quarter despite downtime due to access problems related to wet weather and spring break-up as various optimization projects have added incremental production in certain areas. Relative to the first six months of 2007, Harvest’s year-to-date light/medium oil production has decreased by 7% due to steeper than anticipated declines throughout 2007, a lower level of capital drilling activity in 2008 and dispositions of certain assets in late 2007.
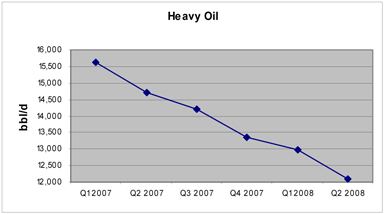
Our heavy oil production has decreased steadily over the past twelve months resulting in Second Quarter 2008 production of 12,092 bbl/d compared to 14,719 bbl/d in the Second Quarter of 2007, a reduction of 18% year-over-year. This reduction is a result of increased water cuts experienced on large producing wells in west central Saskatchewan and Lloydminster coupled with well servicing activities and normal declines during the Third and Fourth Quarters of 2007. Throughout the First Quarter of 2008 this trend continued, despite bringing on additional production through the acquisition of some heavy oil properties late in December 2007 and service work completed in the Fourth Quarter of 2007, as production was lost due to operational problems resulting from cold weather and shut-in wells to accommodate nearby drilling activity. During the Second Quarter of 2008, heavy oil production experienced further decline with operational problems related to poor weather conditions, increased water cuts experienced on some wells and production issues related to spring break-up. On a year-to-date basis, these same factors contributed to the decrease in volumes from 15,164 bbl/d during the first six months of 2007 to 12,534 bbl/d during the first six months of 2008.
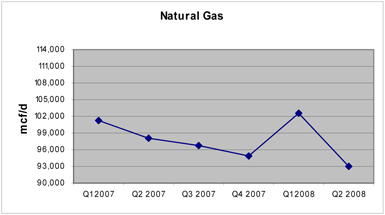
Our Second Quarter of 2008 natural gas production decreased by 5% relative to the Second Quarter of 2007, averaging 93,014 mcf/d. Relative to the First Quarter of 2008, our Second Quarter natural gas production has decreased by 9%, primarily due to incremental production experienced during the First Quarter on new wells drilled in 2007 coupled with downtime at certain third-party processing facilities throughout the Second Quarter, operational problems and a small divestment of approximately 200 mcf/d. Throughout 2007, our natural gas production had been steadily declining as we faced higher than anticipated decline rates on properties acquired in 2006 as well as encountered disruptions from various third party processing facility turnarounds, one of which lasted for an extended period, reducing quarterly volumes by 1,600 mcf/d. Harvest’s 2008 year-to-date production is 2% lower that the first six months of 2007 due to continued production declines throughout the Third and Fourth Quarters of 2007, offset by an increase in production during the First Quarter of 2008 primarily attributed to incremental production from new wells drilled late in 2007 and early 2008 offset somewhat by Second Quarter 2008 production disruptions resulting from operational problems and turnarounds at third-party processing facilities.
Revenues
| | | Three Month Period Ended June 30 | | Six Month Period Ended June 30 | |
(000s) | | 2008 | | 2007 | | Change | | 2008 | | 2007 | | Change | |
| Light to medium oil sales | | $ | 252,206 | | $ | 148,619 | | | 70 | % | $ | 453,081 | | $ | 291,290 | | | 56 | % |
| Heavy oil sales | | | 106,506 | | | 57,952 | | | 84 | % | | 188,057 | | | 121,170 | | | 55 | % |
| Natural gas sales | | | 91,912 | | | 67,563 | | | 36 | % | | 169,183 | | | 140,933 | | | 20 | % |
| Natural gas liquids sales and other | | | 21,142 | | | 12,477 | | | 69 | % | | 38,778 | | | 24,334 | | | 59 | % |
| Total sales revenue | | | 471,766 | | | 286,611 | | | 65 | % | | 849,099 | | | 577,727 | | | 47 | % |
| Royalties | | | (76,814 | ) | | (53,548 | ) | | 43 | % | | (139,213 | ) | | (103,197 | ) | | 35 | % |
Net Revenues | | $ | 394,952 | | $ | 233,063 | | | 69 | % | $ | 709,886 | | $ | 474,530 | | | 50 | % |
Our revenue is impacted by changes to production volumes, commodity prices, and currency exchange rates. Second Quarter of 2008 total sales revenue of $471.8 million is $185.2 million higher than in the prior year, of which $209.5 million is attributed to higher realized prices offset by $24.3 million in respect of lower production volumes. The price increase reflects the 75% increase in Edmonton Par pricing and 44% in AECO natural gas pricing in the Second Quarter of 2008 as compared to 2007, while our decreased production volume is attributed to the higher than anticipated decline rates experienced throughout 2007 coupled with various operational difficulties. On a year-to-date basis, our total sales revenue of $849.1 million is $271.3 million higher than for the comparable period in 2007, comprised of $310.7 million of additional revenue attributed to higher prices offset by a reduction in revenue of $39.4 million resulting from decreased production volumes, also attributed to various operational challenges experienced over the past twelve months.
Light to medium oil sales revenue for the Second Quarter of 2008 was $103.6 million higher than in the comparative period, due to a $115.6 million favourable price variance offset by a $12.0 million unfavourable volume variance. The price variance reflects a 75% increase in Edmonton par pricing relative to the Second Quarter of the prior year plus improved differentials with a negative volume variance reflecting normal declines coupled with lower drilling activity in the winter of 2008 as compared to the prior year. For the six months ended June 30, 2008, light to medium oil sales revenue was $161.8 million higher than the prior year-to-date, attributed to $180.3 million increased revenues resulting from increased commodity pricing offset by $18.5 million reduction due to declines on production.
Second Quarter of 2008 heavy oil sales revenue of $106.5 million was $48.6 million higher than in the prior year due to a $58.9 million favourable price variance resulting from a 12% improvement in heavy oil differentials relative to the prior year coupled with the impact of the 91% increase in WTI, offset by a $10.3 million unfavourable volume variance reflecting a natural decline rate. The same factors apply to the variances in the first six months of 2008 relative to 2007, where heavy oil sales revenue has increased by $66.9 million resulting from a favourable price variance of $87.3 million offset by an unfavorable volume variance of $20.4 million.
Natural gas sales revenue increased by $24.4 million in the Second Quarter of 2008 compared to the same period in 2007 due to a $27.8 million favourable price variance offset by a $3.4 million unfavourable volume variance. The favourable price variance reflects the $3.29/mcf increase in our realized natural gas prices resulting from a 44% increase in the AECO daily price relative to the prior year. The unfavourable volume variance is primarily attributed to production declines throughout the last half of 2007 coupled with operational difficulties experienced in 2008 and shut-in production due to downtime at third-party processing facilities. During the first six months of 2008, natural gas sales revenue was $28.3 million higher than the first six months of the prior year, resulting from increased revenue of $30.1 million attributed to the increase in AECO pricing of 25% offset by a reduction in revenue of $1.8 million resulting from lower volumes.
In the Second Quarter of 2008, natural gas liquids and other sales revenue increased by $8.7 million compared to the Second Quarter of the prior year resulting from a $7.2 million favourable price variance and a $1.5 million favourable volume variance. Similarly, year-to-date natural gas liquids and other sales revenues increased by $14.4 million compared to the first six months of 2007 resulting from a $13.0 million favourable price variance coupled with a $1.4 million favourable volume variance. Generally, the natural gas liquids volume variance will be aligned with our production of natural gas while the price variances will be aligned with the prices realized for our oil production.
Royalties
We pay Crown, freehold and overriding royalties to the owners of mineral rights from which production is generated. These royalties vary for each property and product and our Crown royalties are based on a sliding scale dependent on production volumes and commodity prices.
For the Second Quarter of 2008 net royalties as a percentage of gross revenue were 16.3% (18.7% in the Second Quarter of 2007) and aggregated to $76.8 million (2007 - $53.5 million). Our royalty rate for the Second Quarter of 2008 was slightly lower than the expected rate of 17% due to receipt of Gas Cost Allowance credits as well as other minor adjustments. Our royalties for the first six months of 2008 were $139.2 million, resulting in a rate of 16.4% compared to $103.2 million and a rate of 17.9%, respectively, for the first six months of 2007 due to the credits received in the Second Quarter of 2008 as well as over-delivery and low production credits received in the First Quarter of 2008, while a one-time adjustment of additional crown royalties were assessed on our Hay River property in the Second Quarter of 2007, increasing the prior year royalty rate.
Operating Expenses
| | | Three Month Period Ended June 30 | |
| | | 2008 | | 2007 | | | |
(000s except per boe amounts) | | Total | | Per BOE | | Total | | Per BOE | | Per BOE Change | |
| Operating expense | | | | | | | | | | | | | | | | |
| Power and fuel | | $ | 22,633 | | $ | 4.47 | | $ | 14,002 | | $ | 2.52 | | | 77 | % |
| Well Servicing | | | 13,204 | | | 2.61 | | | 14,809 | | | 2.67 | | | (2 | )% |
| Repairs and maintenance | | | 12,193 | | | 2.41 | | | 12,548 | | | 2.26 | | | 7 | % |
| Lease rentals and property taxes | | | 7,107 | | | 1.40 | | | 6,074 | | | 1.09 | | | 28 | % |
| Processing and other fees | | | 3,391 | | | 0.67 | | | 3,553 | | | 0.64 | | | 5 | % |
| Labour – internal | | | 5,769 | | | 1.14 | | | 5,471 | | | 0.99 | | | 15 | % |
| Labour – contract | | | 4,131 | | | 0.82 | | | 3,796 | | | 0.68 | | | 21 | % |
| Chemicals | | | 5,743 | | | 1.14 | | | 4,973 | | | 0.90 | | | 27 | % |
| Trucking | | | 2,910 | | | 0.58 | | | 3,077 | | | 0.55 | | | 5 | % |
| Other | | | (3,989 | ) | | (0.79 | ) | | 4,030 | | | 0.73 | | | (208 | )% |
| Total operating expense | | | 73,092 | | | 14.45 | | | 72,333 | | | 13.03 | | | 11 | % |
| | | | | | | | | | | | | | | | | |
| Transportation and marketing expense | | $ | 3,352 | | $ | 0.66 | | $ | 3,375 | | $ | 0.61 | | | 8 | % |
| | | Six Month Period Ended June 30 | |
| | | 2008 | | 2007 | | | |
(000s except per boe amounts) | | Total | | Per BOE | | Total | | Per BOE | | Per BOE Change | |
| Operating expense | | | | | | | | | | | | | | | | |
| Power and fuel | | $ | 41,133 | | $ | 3.98 | | $ | 29,780 | | $ | 2.68 | | | 49 | % |
| Well Servicing | | | 24,402 | | | 2.36 | | | 32,018 | | | 2.88 | | | (18 | )% |
| Repairs and maintenance | | | 23,879 | | | 2.31 | | | 24,339 | | | 2.19 | | | 5 | % |
| Lease rentals and property taxes | | | 14,613 | | | 1.41 | | | 9,814 | | | 0.88 | | | 60 | % |
| Processing and other fees | | | 5,597 | | | 0.54 | | | 8,412 | | | 0.76 | | | (29 | )% |
| Labour – internal | | | 12,091 | | | 1.17 | | | 12,125 | | | 1.09 | | | 7 | % |
| Labour – contract | | | 8,032 | | | 0.78 | | | 7,795 | | | 0.70 | | | 11 | % |
| Chemicals | | | 9,832 | | | 0.95 | | | 8,530 | | | 0.77 | | | 23 | % |
| Trucking | | | 5,707 | | | 0.55 | | | 6,124 | | | 0.55 | | | - | % |
| Other | | | 129 | | | 0.01 | | | 5,692 | | | 0.49 | | | (98 | )% |
| Total operating expense | | | 145,415 | | | 14.06 | | | 144,629 | | | 12.99 | | | 8 | % |
| | | | | | | | | | | | | | | | | |
| Transportation and marketing expense | | $ | 6,377 | | $ | 0.62 | | $ | 6,187 | | $ | 0.56 | | | 11 | % |
Second Quarter 2008 operating costs totaled $73.1 million, an increase of $0.8 million from the operating costs incurred in the Second Quarter of 2007. On a per barrel basis, operating costs have increased to $14.45 in the Second Quarter of 2008 compared to $13.03 in the prior year, an 11% increase substantially attributed to reduced production volumes. The largest components of operating expense are power and fuel costs, well servicing and repairs and maintenance costs. Well servicing and repairs and maintenance costs reflect the continued high demand for oilfield services, although with reduced activity compared to the same period in the prior year, we have seen reductions in well servicing costs while repairs and maintenance costs have remained relatively stable. On a year-to-date basis, operating costs totaled $145.4 million ($14.06/boe) for the first six months of 2008, compared to $144.6 million ($12.99/boe) for the first six months of 2007. This 8% per boe increase is attributed to reduced production volumes.
Power and fuel costs, comprised primarily of electric power costs, represented approximately 31% of our total operating costs during the Second Quarter of 2008. Electric power prices of $107.56/MWh in the Second Quarter of 2008 were 115% higher than the Second Quarter 2007 average of $49.97/MWh and this is reflected in Harvest’s 77% per boe increase in power and fuel costs over the prior year. Similarly, the average power price for the first six months of 2008 was $92.13/MWh as compared to $56.80/MWh during the first six months of 2007. To manage our exposure to electric power price fluctuations we have electric power price risk management contracts in place which resulted in a gain of $3.6 million and $5.2 million for the three and six months ended June 30, 2008, respectively, compared to a loss of $0.6 million and $0.1 million in the same periods of the prior year. The following table details the electric power costs per boe before and after the impact of our price risk management program.
| | | Three Month Period Ended June 30 | | Six Month Period Ended June 30 | |
(per boe) | | 2008 | | 2007 | | Change | | 2008 | | 2007 | | Change | |
| Electric power and fuel costs | | $ | 4.47 | | $ | 2.52 | | | 77 | % | $ | 3.98 | | $ | 2.68 | | | 49 | % |
| Realized gains on electricity risk management contracts | | | (0.71 | ) | | 0.10 | | | (810 | )% | | (0.50 | ) | | 0.01 | | | (5,100 | )% |
| Net electric power costs | | $ | 3.76 | | $ | 2.62 | | | 44 | % | $ | 3.48 | | $ | 2.69 | | | 29 | % |
| Alberta Power Pool electricity price (per MWh) | | $ | 107.56 | | $ | 49.97 | | | 115 | % | $ | 92.13 | | $ | 56.80 | | | 62 | % |
Approximately 52% of our estimated Alberta electricity usage is protected by fixed price purchase contracts at an average price of $56.69 per MWh through December 2008. These contracts moderate the impact of future price swings in electric power as will capital projects undertaken that contribute to improving our efficient use of electric power.
Second Quarter 2008 transportation and marketing expense was $3.4 million or $0.66 per boe, an increase of 8% per boe from $3.4 million or $0.61 per boe in the Second Quarter of 2007. On a year-to-date basis, transportation and marketing expense has increased 11% per boe as compared to the first six months of the prior year, from $6.2 million or $0.56/boe in 2007 to $6.4 million or $0.62/boe in 2008. These costs relate primarily to delivery of natural gas to Alberta’s natural gas sales hub, the AECO Storage Hub, and to a lesser extent, our costs of trucking clean crude oil to pipeline receipt points. As a result, the total dollar amount of costs fluctuate in relation with our natural gas production volumes while the cost per boe typically remains relatively constant.
Operating Netback
| | | Three Month Period Ended June 30 | | Six Month Period Ended June 30 | |
(per boe) | | 2008 | | 2007 | | 2008 | | 2007 | |
| Revenues | | $ | 93.29 | | $ | 51.64 | | $ | 82.11 | | $ | 51.90 | |
| Royalties | | | (15.19 | ) | | (9.65 | ) | | (13.46 | ) | | (9.27 | ) |
| Operating expense | | | (14.45 | ) | | (13.03 | ) | | (14.06 | ) | | (12.99 | ) |
| Transportation and marketing expense | | | (0.66 | ) | | (0.61 | ) | | (0.62 | ) | | (0.56 | ) |
Operating netback(1) | | $ | 62.99 | | $ | 28.35 | | $ | 53.97 | | $ | 29.08 | |
(1) These are non-GAAP measures; please refer to “Non-GAAP Measures” in this MD&A.
Harvest’s operating netback represents the net amount realized on a per boe basis after deducting directly related costs. In the Second Quarter of 2008, our operating netback increased by $34.64/boe or 122% over the Second Quarter of 2007. The increase in our operating netback is primarily attributed to a $41.65/boe increase in realized commodity prices, reflecting the increase in Edmonton Par, Bow River and AECO pricing over the prior year, offset by an increase in royalties of $5.54/boe resulting from higher realized prices and a $1.42/boe increase in operating expenses due primarily to increased power costs and decreased production volumes. For the six months ended June 30, 2008, Harvest’s operating netback was $53.97/boe, an increase of $24.89/boe or 86% compared to the first half of the prior year, attributed to significantly increased commodity prices, offset by increased royalties and operating expenses.
General and Administrative (“G&A”) Expense
| | | Three Month Period Ended June 30 | | Six Month Period Ended June 30 | |
(000s except per boe) | | 2008 | | 2007 | | Change | | 2008 | | 2007 | | Change | |
| Cash G&A | | $ | 8,318 | | $ | 8,512 | | | (2 | )% | $ | 16,787 | | $ | 15,717 | | | 7 | % |
| Unit based compensation expense | | | 4,392 | | | 7,549 | | | (42 | )% | | 7,832 | | | 10,448 | | | (25 | )% |
| Total G&A | | $ | 12,710 | | $ | 16,061 | | | (21 | )% | $ | 24,619 | | $ | 26,165 | | | (6 | )% |
| | | | | | | | | | | | | | | | | | | | |
| Cash G&A per boe ($/boe) | | $ | 1.64 | | $ | 1.53 | | | 7 | % | $ | 1.62 | | $ | 1.41 | | | 15 | % |
For the three months ended June 30, 2008, Cash G&A costs decreased by $0.2 million (or 2%) compared to the same period in 2007, reflecting consistent employee costs in a continued tight market for technically qualified staff in the western Canadian petroleum and natural gas industry and other minor administrative cost reductions in the quarter. Generally, approximately 75% of our Cash G&A expenses are related to salaries and other employee related costs. For the six months ended June 30, 2008, Harvest’s cash G&A was $16.8 million, an increase of 7% over the first six months of the prior year due primarily to increased employee and consulting costs during the First Quarter of 2008.
Our unit based compensation plans provide the employee with the option of settling outstanding awards with cash. As a result, unit based compensation expense is determined using the intrinsic method, being the difference between the Trust Unit trading price and the strike price of the unit awards adjusted for the proportion that is vested. The market price of our Trust Units was $23.00 at March 31, 2008 and on June 30, 2008, the price was $24.75. This increase in unit value coupled with an increasing number of outstanding awards becoming vested resulted in a Second Quarter of 2008 unit based compensation expense of $4.4 million. Total unit based compensation expense decreased $3.2 million in the Second Quarter of 2008 compared to the same period in 2007 due to a reduction in the market price of Harvest Trust Units from $32.95 at June 30, 2007 to $24.75 at June 30, 2008. For the year-to-date, total unit-based compensation expense of $7.8 million has been recorded, a 25% reduction compared to the same period in the prior year due to a reduced market price of Harvest Trust Units.
Depletion, Depreciation, Amortization and Accretion Expense
| | | Three Month Period Ended June 30 | | Six Month Period Ended June 30 | |
(000s except per boe) | | 2008 | | 2007 | | Change | | 2008 | | 2007 | | Change | |
| Depletion, depreciation and amortization | | $ | 99,421 | | $ | 103,034 | | | (4 | )% | $ | 205,625 | | $ | 208,930 | | | (2 | )% |
| Depletion of capitalized asset retirement costs | | | 3,354 | | | 3,939 | | | (15 | )% | | 6,978 | | | 8,000 | | | (13 | )% |
Accretion on asset retirement obligation | | | 4,596 | | | 4,473 | | | 3 | % | | 9,193 | | | 8,919 | | | 3 | % |
| Total depletion, depreciation, amortization and accretion | | $ | 107,371 | | $ | 111,446 | | | (4 | )% | $ | 221,796 | | $ | 225,849 | | | (2 | )% |
| Per boe | | | 21.23 | | | 20.08 | | | 6 | % | | 21.45 | | | 20.29 | | | 6 | % |
Our overall depletion, depreciation, amortization and accretion (“DDA&A”) expense for the three and six months ended June 30, 2008 were both $4.1 million lower compared to the same period in the prior year. The decrease is attributed to lower production volumes partially offset by slightly higher finding and development costs that have increased our depletion rate compared to the same periods of the prior year.
Capital Expenditures
| | | Three Month Period Ended June 30 | | Six Month Period Ended June 30 | |
(000s) | | 2008 | | 2007 | | 2008 | | 2007 | |
| Land and undeveloped lease rentals | | $ | 1,164 | | $ | 261 | | $ | 2,149 | | $ | 421 | |
| Geological and geophysical | | | 811 | | | 1,710 | | | 3,947 | | | 5,724 | |
| Drilling and completion | | | 16,910 | | | 16,396 | | | 73,286 | | | 94,990 | |
| Well equipment, pipelines and facilities | | | 18,259 | | | 27,806 | | | 34,667 | | | 91,151 | |
| Capitalized G&A expenses | | | 2,467 | | | 2,208 | | | 5,133 | | | 4,451 | |
| Furniture, leaseholds and office equipment | | | 58 | | | (160 | ) | | 58 | | | (29 | ) |
| Development capital expenditures excluding acquisitions and non-cash items | | | 39,669 | | | 48,221 | | | 119,240 | | | 196,708 | |
| Non-cash capital additions (recoveries) | | | 812 | | | 1,680 | | | 1,355 | | | 2,095 | |
| Total development capital expenditures excluding acquisitions | | $ | 40,481 | | $ | 49,901 | | $ | 120,595 | | $ | 198,803 | |
Capital activity for the Second Quarter was approximately $40.5 million and was impacted by a typical spring break-up. Drilling capital was approximately $16.9 million with 12 gross (9.6 net) wells drilled. At southeast Saskatchewan, Harvest drilled 4 wells including a successful stratigraphic pilot hole that confirmed an extension to our 2006 Kenosee pool discovery. The subsequent horizontal well drilled from the pilot hole has achieved initial production rates of approximately 300 boe/d. At Ferrier, Harvest drilled 2 wells, including a 3rd delineation well into the Ostracod reservoir discovered in 2007, and encountered Ostracod gas pay consistent with our expectations. Testing is underway and we are evaluating additional tie-in options given the limited gas processing capacity in the immediate area. At Bassano, we drilled two wells into an interpreted Glaucontic channel extension from our main Bassano oilfield and cased two oil wells. In addition to drilling, we proceeded to install the injection pipeline at Suffield allowing water from our Batus field to be transferred and injected into our Lark field to improve reservoir pressure support and overall oil recovery.
The following summarizes Harvest’s participation in gross and net wells drilled during the three months ended June 30, 2008:
| | | Total Wells | | Successful Wells | | Abandoned Wells | |
Area | | Gross | | Net | | Gross | | Net | | Gross | | Net | |
| | | | | | | | | | | | | | |
| Hay River | | | - | | | - | | | - | | | - | | | - | | | - | |
| Southeast Saskatchewan | | | 4.0 | | | 3.5 | | | 4.0 | | | 3.5 | | | - | | | - | |
| Markerville | | | 1.0 | | | 0.5 | | | 1.0 | | | 0.5 | | | - | | | - | |
| Lloydminster | | | - | | | - | | | - | | | - | | | - | | | - | |
| Red Earth | | | - | | | - | | | - | | | - | | | - | | | - | |
| Suffield | | | - | | | - | | | - | | | - | | | - | | | - | |
| Hayter | | | - | | | - | | | - | | | - | | | - | | | - | |
| Other Areas | | | 7.0 | | | 5.6 | | | 7.0 | | | 5.6 | | | - | | | - | |
| Total | | | 12.0 | | | 9.6 | | | 12.0 | | | 9.6 | | | - | | | - | |
The following summarizes Harvest’s participation in gross and net wells drilled during the six months ended June 30, 2008:
| | | Total Wells | | Successful Wells | | Abandoned Wells | |
Area | | Gross1 | | Net | | Gross | | Net | | Gross | | Net | |
| | | | | | | | | | | | | | |
| Hay River | | | - | | | - | | | - | | | - | | | - | | | - | |
| Southeast Saskatchewan | | | 20.0 | | | 18.0 | | | 20.0 | | | 18.0 | | | - | | | - | |
| Markerville | | | 23.0 | | | 7.1 | | | 23.0 | | | 7.1 | | | - | | | - | |
| Lloydminster | | | 6.0 | | | 6.0 | | | 6.0 | | | 6.0 | | | - | | | - | |
| Red Earth | | | 12.0 | | | 11.3 | | | 12.0 | | | 11.3 | | | - | | | - | |
| Suffield | | | 8.0 | | | 8.0 | | | 8.0 | | | 8.0 | | | - | | | - | |
| Hayter | | | - | | | - | | | - | | | - | | | - | | | - | |
| Other Areas | | | 29.0 | | | 17.0 | | | 29.0 | | | 17.0 | | | - | | | - | |
| Total | | | 98.0 | | | 67.4 | | | 98.0 | | | 67.4 | | | - | | | - | |
| | (1) | Excludes 9 additional wells that we have an overriding royalty interest in. |
Acquisitions and Divestitures
During the Second Quarter of 2008, Harvest sold approximately $6.2 million and purchased approximately $1.5 million in oil and natural gas properties. Subsequent to the end of the quarter, Harvest entered into an agreement to purchase a private oil and natural gas company in exchange for aggregate cash consideration of $36.5 million as well as agreed to purchase certain oil and natural gas properties for cash consideration $136.0 million plus our interest in two non-operated properties with this purchase commitment subject to a Rights of First Refusal and closing expected in late August.
Asset Retirement Obligation (“ARO”)
In connection with property acquisitions and development expenditures, we record the fair value of the ARO as a liability in the same year as the expenditure occurs. The associated asset retirement costs are capitalized as part of the carrying amount of the assets and are depleted and depreciated over our estimated net proved reserves. Once the initial ARO is measured, it is adjusted at the end of each period to reflect the passage of time as well as changes in the estimated future cash flows of the underlying obligation. Our asset retirement obligation increased by $3.0 million during the Second Quarter of 2008 as a result of accretion expense of $4.6 million offset by $1.5 million of actual asset retirement expenditures incurred.
DOWNSTREAM OPERATIONS
Second Quarter Highlights
| | · | Reliable refinery operations experienced limited unplanned downtime as levels of throughput are reduced in an effort to improve our refining margins by minimizing production of high sulphur fuel oil (HSFO) which continue to reflect weak prices. |
| | · | Year-over-year, refining margin of US$5.66 per barrel reflects a 64% decrease from the US$15.64 realized in the Second Quarter of the prior year as price increases for refined products are insufficient to offset the increases in the cost of feedstock. |
| | · | Operating costs are consistent at $2.21 per barrel of throughput compared to $2.10 in the First Quarter of the year and $2.10 in the Second Quarter of the prior year reflecting the impact of reduced throughput. |
| | · | Costs of purchased energy at $3.27 per barrel of throughput are trending lower compared to $4.23 in the First Quarter of the year but significantly higher than $1.74 in the Second Quarter of the prior year, reflecting a significantly higher commodity price environment. |
| | · | Report by independent engineering advisors confirms the technical and economic feasibility of a $300 million de-bottlenecking project and a $2 billion expansion opportunity which would significantly alter the capacity, feedstock and mix of refined products. |
Summary of Financial and Operational Results
| | Three Month Period Ended June 30 | | Six Month Period Ended June 30 | |
(in $000’s except where noted below) | | 2008 | | 2007 | | 2008 | | 2007 | |
| | | | | | | | | | |
| Revenues | | | 1,227,126 | | | 900,387 | | | 2,289,545 | | | 1,684,432 | |
| Purchased feedstock for processing and products purchased for resale | | | 1,160,558 | | | 708,642 | | | 2,120,550 | | | 1,340,938 | |
Gross Margin(1) | | | 66,568 | | | 191,745 | | | 168,995 | | | 343,494 | |
| | | | | | | | | | | | | | |
| Costs and expenses | | | | | | | | | | | | | |
| Operating expense | | | 25,617 | | | 26,584 | | | 51,512 | | | 51,945 | |
| Purchased energy expense | | | 29,899 | | | 18,337 | | | 73,026 | | | 42,337 | |
| Marketing expense | | | 9,402 | | | 9,059 | | | 17,999 | | | 16,402 | |
| General and Administrative | | | 600 | | | 402 | | | 1,168 | | | 702 | |
| Depreciation and amortization expense | | | 16,742 | | | 18,185 | | | 33,243 | | | 37,574 | |
Earnings (loss) from operations(1) | | | (15,692 | ) | | 119,168 | | | (7,952 | ) | | 194,534 | |
| | | | | | | | | | | | | | |
| Cash capital expenditures | | | 8,619 | | | 9,871 | | | 14,646 | | | 14,754 | |
| | | | | | | | | | | | | | |
Feedstock volume (bbl/day)(2) | | | 100,422 | | | 115,570 | | | 106,211 | | | 114,646 | |
| | | | | | | | | | | | | | |
| Yield (000’s barrels) | | | | | | | | | | | | | |
| Gasoline and related products | | | 2,627 | | | 3,379 | | | 6,044 | | | 6,689 | |
| Ultra low sulphur diesel and jet fuel | | | 3,755 | | | 4,020 | | | 8,016 | | | 8,233 | |
| High sulphur fuel oil | | | 2,534 | | | 2,950 | | | 5,100 | | | 5,695 | |
| Total | | | 8,916 | | | 10,349 | | | 19,160 | | | 20,617 | |
| | | | | | | | | | | | | | |
Average Refining Margin (US$/bbl)(3) | | | 5.66 | | | 15.64 | | | 7.36 | | | 13.69 | |
(1) These are non-GAAP measures; please refer to “Non-GAAP Measures” in this MD&A
(2) Barrels per day are calculated using total barrels of crude oil feedstock and Vacuum Gas Oil.
(3) Average refining margin is calculated based on per barrel of feedstock throughput
Refining Benchmark Prices
The North American refining industry has numerous pricing indicators against which to compare refinery gross margin performance. Typically, these gross margin indicators include prices for refined products such as Reformulated Blendstock for Oxygenate Blending gasoline (“RBOB gasoline”) and heating oil. The New York Mercantile Exchange (“NYMEX”) “2-1-1 Crack Spread” is such an indicator and is calculated assuming that the processing of two barrels of light sweet crude oil (defined as a WTI quality) yields one barrel of RBOB gasoline and one barrel of heating oil both of which are delivered to the New York market where product prices are set in relation to NYMEX RBOB gasoline and NYMEX heating oil prices. The following average prices, gross margin indicators and currency exchange rates are provided as reference points with which to index our refinery’s performance:
| | | Three Months Ended June 30 | | Six Months Ended June 30 | |
| | | 2008 | | 2007 | | Change | | 2008 | | 2007 | | Change | |
| WTI crude oil (US$/bbl) | | | 123.98 | | | 65.03 | | | 91 | % | | 110.94 | | | 61.60 | | | 80 | % |
| Brent crude oil (US$/bbl) | | | 122.94 | | | 68.76 | | | 79 | % | | 108.17 | | | 63.65 | | | 70 | % |
| Basrah Official Sales Price (US$/bbl) | | | (8.07 | ) | | (5.02 | ) | | 61 | % | | (7.93 | ) | | (6.32 | ) | | 25 | % |
| RBOB gasoline (US$/bbl/gallon) | | | 133.44/3.18 | | | 93.79/2.23 | | | 42 | % | | 118.90/2.83 | | | 82.62/1.97 | | | 44 | % |
| Heating Oil (US$/bbl/gallon) | | | 148.62/3.54 | | | 80.27/1.91 | | | 85 | % | | 131.86/3.14 | | | 75.15/1.79 | | | 75 | % |
| High Sulphur Fuel Oil (US$/bbl) | | | 85.23 | | | 50.38 | | | 69 | % | | 77.60 | | | 45.11 | | | 72 | % |
| 2-1-1 Crack Spread (US$/bbl) | | | 17.05 | | | 22.00 | | | (23 | )% | | 14.44 | | | 17.29 | | | (16 | )% |
| Canadian / US dollar exchange rate | | | 0.990 | | | 0.911 | | | 9 | % | | 0.993 | | | 0.881 | | | 13 | % |
During the Second Quarter of 2008, the 2-1-1 Crack Spread decreased US$4.95/bbl as compared to the prior year as a result of a US$19.30/bbl drop in the RBOB Crack Spread to US$9.46/bbl, which was offset to a large degree by a US$9.40/bbl increase in the Heating Oil Crack Spread to US$24.64/bbl. Similarly, for the six month period ended June 30, 2008, the 2-1-1 Crack Spread benchmark decreased by US$2.85/bbl as compared to the prior year, due to a US$13.06/bbl decrease in the RBOB Crack Spread to US$7.96/bbl offset by a US$7.37/bbl increase in the Heating Oil Crack Spread to US$20.92/bbl.
Harvest’s refinery production differs from that in the 2-1-1 Crack Spread indicator in that it also produces approximately 25% to 30% High Sulphur Fuel Oil (“HSFO”) not represented in the 2-1-1 Crack Spread. HSFO typically sells at a discount to WTI resulting in a negative contribution to our gross margin relative to the 2-1-1 Crack Spread. On the other hand, our refinery also processes a medium gravity sour crude oil rather than a WTI quality of light sweet crude oil which is purchased at a discount to WTI. Lastly, to optimize the throughput of our Isomax hydrocracker unit, we typically purchase approximately 5,000 to 10,000 bbl/d of vacuum gas oil (“VGO”) which can sell at either a premium or discounted price to the WTI benchmark price which further differentiates the Harvest’s refining margin from the 2-1-1 Crack Spread.
Downstream Gross Margin
The following summarizes the downstream operations’ gross margin contributions for each of the three and six months ended June 30, 2008 and 2007 segregated between refining activities and marketing and other related businesses.
| | | Three Months Ended June 30 | |
| | | 2008 | | 2007 | |
| (000’s of Canadian dollars) | | Refining | | Marketing | | Total | | Refining | | Marketing | | Total | |
| | | | | | | | | | | | | | |
Sales revenue(1) | | | 1,200,950 | | | 180,217 | | | 1,227,126 | | | 879,110 | | | 115,404 | | | 900,387 | |
Cost of feedstock for processing and products for resale(1) | | | 1,148,750 | | | 165,849 | | | 1,160,558 | | | 698,500 | | | 104,269 | | | 708,642 | |
Gross margin(2) | | | 52,200 | | | 14,368 | | | 66,568 | | | 180,610 | | | 11,135 | | | 191,745 | |
| | | | | | | | | | | | | | | | | | | | |
| Average Refining Margin (US$/bbl) | | | 5.66 | | | | | | | | | 15.64 | | | | | | | |
| | | Six Months Ended June 30 | |
| | | 2008 | | 2007 | |
| (000’s of Canadian dollars) | | Refining | | Marketing | | Total | | Refining | | Marketing | | Total | |
| | | | | | | | | | | | | | |
Sales revenue(1) | | | 2,237,581 | | | 324,223 | | | 2,289,545 | | | 1,640,447 | | | 206,694 | | | 1,684,432 | |
Cost of feedstock for processing and products for resale(1) | | | 2,094,349 | | | 298,460 | | | 2,120,550 | | | 1,317,886 | | | 185,761 | | | 1,340,938 | |
Gross margin(2) | | | 143,232 | | | 25,763 | | | 168,995 | | | 322,561 | | | 20,933 | | | 343,494 | |
| | | | | | | | | | | | | | | | | | | | |
| Average Refining Margin (US$/bbl) | | | 7.36 | | | | | | | | | 13.69 | | | | | | | |
| (1) | Downstream operations sales revenue and cost of products for processing and resale are net of inter-segment sales of $154,041,000 and $272,259,000 for the three and six months ended June 30, 2008 respectively ($94,127,000 and $162,709,000 – three and six months ended June 30, 2007) reflecting the refined products produced by the refinery and sold by Marketing Division. |
| (2) | These are non-GAAP measures; please refer to “Non-GAAP Measures” in this MD&A. |
Harvest’s refining margin comprises sales of refined petroleum products that realize a premium price relative to WTI while it purchases crude oil and VGO as feedstock which is typically purchased for a discount relative to WTI. During the Second Quarter of 2008, our refining operations margin totaled $52.2 million, or US$5.66/bbl which is a 64% decrease compared to the margin of $180.6 million or US$15.64/bbl realized during the Second Quarter of 2007. This decrease is attributed to a 57% reduction in the premium realized on refined product sales relative to the WTI benchmark price between the Second Quarter of 2008 and 2007 coupled with a 67% reduction in the discount on refinery feedstock costs for the same periods.
For the six months ended June 30, 2008, Harvest’s refining margin totaled $143.2 million, a reduction of $179.3 million compared to the first six months of the prior year, reflecting an average refining margin of US$7.36/bbl in 2008 as compared to US$13.69/bbl in 2007. The US$6.33/bbl or 46% year-over-year decrease in our average refining margin is due to lower gasoline and HSFO crack spreads as well as an increase in feedstock costs relative to WTI, only partially offset by improved crack spreads on distillate products.
The following summarizes our refining margin per barrel relative to our cost of feedstock and the WTI benchmark from the period January 2007 to June 2008:
Relative to the average Second Quarter 2008 2-1-1 Crack Spread of US$17.05, our average refining margin of US$5.66/bbl is US$11.39/bbl lower as compared to being US$6.36/bbl lower than the 2-1-1 Crack Spread in the prior year. The relative drop in our refining margin is primarily attributed to the increased discount on HSFO relative to WTI in 2008 coupled with a tightening of the relative discount to purchase medium gravity sour crude oil feedstock. In the Second Quarter of 2008, the average selling price of our HSFO was US$86.64/bbl, a discount of US$37.34/bbl relative to WTI as compared to an average selling price of US$52.85 and a discount of US$12.18 in the prior year.
On a year-to-date basis, our average refining margin of US$7.36/bbl was US$7.08/bbl lower than the average 2-1-1 Crack Spread of US$14.44 for the first six months of 2008. This compares to an average refining margin of US$13.69/bbl which was US$3.60/bbl lower than the 2-1-1 Crack Spread for the six months ended June 30, 2007. The US$3.48/bbl increase in differential from the 2-1-1 Crack Spread is also primarily attributed to increased discounts in the selling price of HSFO coupled with increased feedstock costs relative to WTI in the current year.
Harvest’s marketing and related businesses is comprised of the retail and wholesale distribution of gasoline, diesel, jet and other transportation fuels as well as home heating fuels and related appliances and the revenues from our marine services including tugboat revenues. During the three and six months ended June 30, 2008, the gross margin contributed by our marketing division increased by 29% and 23%, respectively, as compared to the prior year primarily due to a significant increase in the price of sulphur, which is sold through a profit sharing agreement with a third party processor.
Refined Product Sales Revenue
All of our gasoline and distillate products are sold to Vitol pursuant to the Supply and Offtake Agreement with the exception of products sold in Newfoundland through our marketing division and effective January 20, 2008, our HSFO is sold to a wholly-owned affiliate of one of the world’s largest integrated oil and natural gas producers. Prior to January 20, 2008, our HSFO had also been sold to Vitol. The Supply and Offtake Agreement has pricing terms that reflect market prices based on an average delay of ten days which results in our sales to Vitol and our cost of refinery feedstock purchased from Vitol being priced on a slightly different time period than the prices at the time of delivery. With the exception of the sales to Vitol, our refined products are sold at prices that reflect market prices at the time that the product is delivered to the purchaser. For more information on the Supply and Offtake Agreement with Vitol, see the description of the Supply and Offtake Agreement in our Annual Information Form for the year ended December 31, 2007 as filed on SEDAR at www.sedar.com.
A comparison of our refinery yield, product pricing and revenue for each of the three and six months ended June 30, 2008 and 2007 is presented below.
| | | Three Months Ended June 30 | |
| | | 2008 | | 2007 | |
| | | Refinery Revenues | | Volume | | Sales Price(1) | | Refinery Revenues | | Volume | | Sales Price(1) | |
| | | (000’s of Cdn $) | | (000s of bbls) | | (US$ per bbl/ US$ per US gal) | | (000’s of Cdn $) | | (000s of bbls) | | (US$ per bbl/ US$ per US gal) | |
| Gasoline products | | | 366,304 | | | 2,710 | | | 133.82/3.19 | | | 334,391 | | | 3,210 | | | 94.90/2.26 | |
| Distillates | | | 606,578 | | | 3,844 | | | 156.22/3.72 | | | 366,846 | | | 3,912 | | | 85.43/2.03 | |
| High sulphur fuel oil | | | 228,068 | | | 2,606 | | | 86.64 | | | 177,873 | | | 3,066 | | | 52.85 | |
| | | | 1,200,950 | | | 9,160 | | | 129.80 | | | 879,110 | | | 10,188 | | | 78.61 | |
| Inventory adjustment | | | | | | (244 | ) | | | | | | | | 161 | | | | |
| Total production | | | | | | 8,916 | | | | | | | | | 10,349 | | | | |
Yield (as a % of Feedstock) (2) | | 98 | % | | | | | | | | 98 | % | | | |
| | | Six Months Ended June 30 | |
| | | 2008 | | 2007 | |
| | | Refinery Revenues | | Volume | | Sales Price(1) | | Refinery Revenues | | Volume | | Sales Price(1) | |
| | | (000’s of Cdn $) | | (000s of bbls) | | (US$ per bbl/ US$ per US gal) | | (000’s of Cdn $) | | (000s of bbls) | | (US$ per bbl/ US per US gal) | |
| Gasoline products | | | 721,868 | | | 6,238 | | | 114.91/2.74 | | | 611,618 | | | 6,543 | | | 82.35/1.96 | |
| Distillates | | | 1,119,164 | | | 8,060 | | | 137.88/3.28 | | | 727,656 | | | 8,066 | | | 79.48/1.89 | |
| High sulphur fuel oil | | | 396,549 | | | 4,968 | | | 79.26 | | | 301,173 | | | 5,693 | | | 46.61 | |
| | | | 2,237,581 | | | 19,266 | | | 115.33 | | | 1,640,447 | | | 20,302 | | | 71.19 | |
| Inventory adjustment | | | | | | (106 | ) | | | | | | | | 315 | | | | |
| Total production | | | | | | 19,160 | | | | | | | | | 20,617 | | | | |
Yield (as a % of Feedstock) (2) | | 99 | % | | | | | | | | 99 | % | | | |
| (1) | Average product sales prices are based on the deliveries at our refinery loading facilities |
| (2) | After adjusting for changes in inventory held for resale |
Our refinery sales revenue is dependent on the sales value of the refined products produced as well as the yield of refined products produced from the various crude oil feedstocks. We analyze our sales revenue from refined product sales relative to the premium (or discount) compared to industry benchmark prices for specific refined products as well as relative to the WTI benchmark price. Although our yield can be altered slightly by adjusting refinery operations to react to market conditions and seasonal demand, product yields are primarily impacted by the type of crude oil feedstock processed and refinery performance. For the three months ended June 30, 2008, our refinery yield was comprised of 30% gasoline products, 42% distillates and 28% HSFO as compared to 32%, 39% and 29%, respectively, in the prior year. For the six months ended June 30, 2008, our refinery yield was comprised of 32% gasoline products, 42% distillates and 26% HSFO compared to 32%, 40% and 28% for the same products, respectively during 2007.
The aggregate average sales price for our refined products was US$129.80/bbl during the Second Quarter of 2008, representing premium to WTI of US$5.82/bbl as compared to an average selling price of US$78.61/bbl realized in the Second Quarter of the prior year with a premium to WTI of US$13.58/bbl. The reduction of US$7.76/bbl in our sales price relative to WTI aggregates to a $71.8 million reduction in sales revenue and gross margin. During the Second Quarter of 2008, the US$133.82/bbl average sales price for our gasoline products reflects a US$9.84/bbl premium over WTI, a decrease of 67% compared to the US$29.87/bbl premium over WTI realized in 2007. For distillates, our average sales price was US$156.22/bbl during the Second Quarter of 2008, a US$32.24/bbl premium over WTI, an increase of 58% compared to a US$20.40/bbl premium realized in the Second Quarter of 2007. Included in our distillate sales are approximately 2,576,000 barrels of distillate product that were shipped to Europe during the Second Quarter of 2008 for which we received $4.3 million of incremental revenue (US$1.65 per barrel) pursuant to our profit sharing arrangement with Vitol. The average sales price of our HSFO of US$86.64/bbl reflects a US$37.34/bbl discount to WTI as compared to a US$12.18/bbl discount in 2007. The US$11.84 improvement in our distillate pricing relative to WTI and the shift in product yield from gasoline and HSFO to distillates was insufficient to offset the impact of the US$20.03 and US$25.16 price reductions relative to WTI for our gasoline products and HSFO, respectively.
During the six months ended June 30, 2008, our average aggregate selling price for refined products was US$115.33/bbl, representing a premium to the average WTI price of US$4.39/bbl compared to an average selling price of US$71.19/bbl and a premium to WTI of US$9.59/bbl during 2007, representing a US$5.20 drop and a 54% reduction. Similar to what was experienced in the Second Quarter, this reduction is also attributed to an 81% reduction in the gasoline premium relative to WTI and a 111% increase in the discount on HSFO relative to WTI, partially offset by improved premiums relative to WTI on distillate products of 51% and a 2% shift in product yield from HSFO to distillates.
The following chart summarizes Harvest’s refining margin by product per barrel over the past six quarters:
Refinery Feedstock
We purchase our refinery feedstock from Vitol pursuant to the terms of the Supply and Offtake Agreement whereby the price of feedstock floats with WTI for the period from pricing through to the date it is charged to the refinery subject to an average ten day delay in pricing similar to the product sales pricing formulas. This pricing accelerates the impact of pricing trends on the cost of our feedstock and results in our costs being based on a slightly different time period than the monthly average WTI benchmark price.
A comparison of crude oil and VGO feedstock processed for the three and six months ended June 30, 2008 and 2007 is presented below.
| | | Three Months Ended June 30 | |
| | | 2008 | | 2007 | |
| | | Cost of Feedstock | | Volume | | Cost per Barrel(1) | | Cost of Feedstock | | Volume | | Cost per Barrel(1) | |
| | | (000’s of Cdn $) | | (000s of bbls) | | (US$/bbl) | | (000’s of Cdn $) | | (000s of bbls) | | (US$/bbl) | |
| | | | | | | | | | | | | | |
| Iraqi | | | 684,241 | | | 5,625 | | | 120.43 | | | 436,452 | | | 6,793 | | | 58.53 | |
| Russian | | | 84,816 | | | 695 | | | 120.82 | | | 109,631 | | | 1,516 | | | 65.88 | |
| Venezuelan | | | 215,427 | | | 1,752 | | | 121.73 | | | 75,524 | | | 1,215 | | | 56.63 | |
| Crude Oil Feedstock | | | 984,484 | | | 8,072 | | | 120.74 | | | 621,607 | | | 9,524 | | | 59.46 | |
| Vacuum Gas Oil | | | 145,888 | | | 1,066 | | | 135.49 | | | 76,351 | | | 993 | | | 70.04 | |
| | | | 1,130,372 | | | 9,138 | | | 122.46 | | | 697,958 | | | 10,517 | | | 60.46 | |
| Other costs | | | 18,378 | | | | | | | | | 542 | | | | | | | |
| | | | 1,148,750 | | | | | | | | | 698,500 | | | | | | | |
| | | Six Months Ended June 30 | |
| | | 2008 | | 2007 | |
| | | Cost of Feedstock | | Volume | | Cost per Barrel(1) | | Cost of Feedstock | | Volume | | Cost per Barrel(1) | |
| | | (000’s of Cdn $) | | (000s of bbls) | | (US$/bbl) | | (000’s of Cdn $) | | (000s of bbls) | | (US$/bbl) | |
| | | | | | | | | | | | | | |
| Iraqi | | | 1,224,126 | | | 11,528 | | | 105.44 | | | 859,308 | | | 13,795 | | | 54.88 | |
| Russian | | | 279,984 | | | 2,705 | | | 102.78 | | | 152,007 | | | 2,246 | | | 59.63 | |
| Venezuelan | | | 356,371 | | | 3,259 | | | 108.58 | | | 172,501 | | | 2,879 | | | 52.79 | |
| Crude Oil Feedstock | | | 1,860,481 | | | 17,492 | | | 105.62 | | | 1,183,816 | | | 18,920 | | | 55.12 | |
| Vacuum Gas Oil | | | 225,965 | | | 1,837 | | | 122.15 | | | 134,347 | | | 1,831 | | | 64.64 | |
| | | | 2,086,446 | | | 19,329 | | | 107.19 | | | 1,318,163 | | | 20,751 | | | 55.96 | |
| Other costs | | | 7,903 | | | | | | | | | (277 | ) | | | | | | |
| | | | 2,094,349 | | | | | | | | | 1,317,886 | | | | | | | |
(1) Cost of feedstock includes all costs of transporting the crude oil to refinery in Newfoundland
During the Second Quarter of 2008, our feedstock was comprised of 88,708 bbl/d of medium sour crude oil and 11,714 bbl/d of VGO as compared to 104,659 bbl/d of crude oil and 10,911 bbl/d of VGO in the prior year. While the refinery experienced limited unplanned downtime during the period, our daily volume of crude oil throughput decreased by 15,148 bbl/d due to a decision to reduce crude oil feedstock volumes to the level sufficient to eliminate the production of vacuum tower bottoms (“VTB’s”) in excess of our visbreaker unit capacity, eliminating the need to downgrade middle distillate valued streams to blend the excess VTB’s into HSFO thereby improving overall gross margin. To offset the reduced crude oil throughput, VGO purchases were increased to maintain ISOMAX rates at the highest possible levels and maximize the gross margin contribution from this process unit.
The cost of our crude oil feedstock averaged US$120.74/bbl during the Second Quarter of 2008 representing a US$3.24/bbl discount from WTI as compared to a cost of US$59.46/bbl and a discount of US$5.57/bbl, respectively, in the prior year. While the US$2.33/bbl reduction in discount to WTI aggregates to a $19.0 million incremental increase in crude oil feedstock costs, the year-over-year US$58.95 increase in WTI represents a 91% increase and added a further $480.7 million to our crude oil feedstock cost during the Second Quarter of 2008. In aggregate, the US$122.46/bbl average cost of feedstock during the Second Quarter of 2008 represents a 103% increase over the average cost in the prior year, which impacts our working capital and increases our “Time Value of Money” charges paid to Vitol as part of the Supply and Offtake agreement. The cost of feedstock reflects numerous factors beyond changes in WTI such as the crude oil slate processed during the period, the Official Selling Price (“OSP”) as set by the Oil Marketing Company of the Republic of Iraq, the costs of transporting the crude feedstock to our refinery and the ten day delay in pricing as a result of the Supply and Offtake pricing formula.
The WTI benchmark price averaged US$112.46 for the month of April 2008, US$125.46 for May 2008 and US$134.02 for June 2008 as compared to the average for the three months ended June 2008 of US$123.98. This volatility in WTI results in it being difficult to compare the economics of individual crude costs on a quarterly basis when our consumptions of crude types varies from month to month and the aggregation of feedstock costs, including their discount relative to WTI, is priced based on benchmark pricing ten days after consumption.
The average cost of purchased VGO during the Second Quarter of 2008 was US$135.49/bbl representing a premium of US$11.51/bbl relative to the average WTI benchmark price as compared to US$70.04 and a US$5.01 premium, respectively, in the prior year. The increased premium in 2008 is attributed to supply and demand disruptions in the very tightly balanced VGO market. We processed 1.1 million barrels of VGO during the Second Quarter of 2008, as such the US$6.50/bbl increase in price over WTI aggregates to a $7.0 million increase in feedstock costs and similarly, a $7.0 million reduction in gross margin compared to the Second Quarter of 2007.
During the first six months of 2008, the total cost of feedstock was US$107.19/bbl, an increase of 92% over the first six months of 2007 during which period the total cost of feedstock averaged US$55.96/bbl. This increase is primarily attributed to the 80% increase in WTI during the first six months of 2008 relative to the first six months of 2007, coupled with a reduction in the average discount realized to WTI on crude oil purchases and a US$8.17/bbl increase in the premium paid for VGO relative to WTI. The total increase in feedstock costs was $776.5 million during the first six months of 2008 as compared to the same period in the prior year.
Operating Expenses
The following summarizes the operating costs from the refinery and marketing division for the three and six months ended June 30, 2008 and 2007:
| | | Three Months Ended June 30 | |
| | | 2008 | | 2007 | |
| (000’s of Canadian dollars) | | Refining | | Marketing | | Total | | Refining | | Marketing | | Total | |
| | | | | | | | | | | | | | |
| Operating expense | | | 20,158 | | | 5,459 | | | 25,617 | | | 22,122 | | | 4,462 | | | 26,584 | |
| Purchased energy | | | 29,899 | | | - | | | 29,899 | | | 18,337 | | | - | | | 18,337 | |
| | | | 50,057 | | | 5,459 | | | 55,516 | | | 40,459 | | | 4,462 | | | 44,921 | |
| | | Six Months Ended June 30 | |
| | | 2008 | | 2007 | |
| (000’s of Canadian dollars) | | Refining | | Marketing | | Total | | Refining | | Marketing | | Total | |
| | | | | | | | | | | | | | |
| Operating expense | | | 41,533 | | | 9,979 | | | 51,512 | | | 43,153 | | | 8,792 | | | 51,945 | |
| Purchased energy | | | 73,026 | | | - | | | 73,026 | | | 42,337 | | | - | | | 42,337 | |
| | | | 114,559 | | | 9,979 | | | 124,538 | | | 85,490 | | | 8,792 | | | 94,282 | |
The largest component of refining operating expense is wages, salaries and benefits which totaled $11.9 million during the Second Quarter of 2008 (2007 - $13.7 million) while the other significant components were maintenance and repairs costs of $3.5 million (2007 - $3.0 million), insurance of $1.5 million (2007 - $1.7 million) and professional services of $0.9 million (2007 - $1.6 million). Refining operating expenses were $2.21/bbl during the Second Quarter of 2008 as compared to $2.10/bbl in the Second Quarter of 2007 due primarily to reduced throughput. During the three months ended June 30, 2008, the Marketing Division’s operating costs increased by approximately $1.0 million over the prior period to $5.5 million, primarily due to scheduled repair and maintenance on one of our tug boats in June.
On a year-to-date basis, downstream operating costs were $51.5 million in 2008, relatively unchanged from the first six months of 2007. Refining operating expenses were $2.15/bbl as compared to $2.08/bbl in the prior year due primarily to reduced throughput. Marketing operating expenses have increased by $1.2 million due to tug boat repair and maintenance costs.
Purchased energy, consisting of low sulphur fuel oil and electric power, is required to provide heat and power to refinery operations. Our purchased energy for the three and six months ended June 30, 2008 was $3.27 and $3.78 per barrel of throughput, respectively, as compared to $1.74/bbl and $2.04/bbl for the three and six month periods ended June 30, 2007. In the Second Quarter of 2008, we purchased approximately 268,000 barrels of fuel oil at an average price of US$101.65/bbl as compared to approximately 293,000 barrels purchased in the Second Quarter of 2007 at an average price of US$48.65/bbl. The increase in the per barrel cost of fuel oil is the primary reason for the $11.6 million increase in the cost of purchased energy. Our electricity costs remained substantially unchanged during the Second Quarter of 2008 at $2.4 million as compared to $2.7 million in the prior year.
Marketing Expense
During the three and six months ended June 30, 2008, marketing expense was comprised of $0.7 million and $1.6 million, respectively, of marketing fees (based on US $0.08/bbl) to acquire feedstock (three and six months ended June 30, 2007 - $1.0 million and $2.0 million) and $8.7 million and $16.4 million, respectively, of “Time Value of Money” charges (three and six months ended June 30, 2007 - $8.1 million and $14.4 million) both pursuant to the terms of the Supply and Offtake Agreement. The increased “Time Value of Money” charge is the result a larger crude oil inventory investment due to the higher WTI benchmark price during 2008. As at June 30, 2008, Harvest has commitments totaling approximately $1,063.4 million in respect of future crude oil feedstock purchases and related transportation from Vitol.
Capital Expenditures
Capital spending for the three and six month periods ended June 30, 2008 totaled $8.6 million and $14.7 million respectively. The largest component of our 2008 downstream capital program relates to the enhancement of our visbreaker capacity, estimated at $25 million, of which approximately $4.1 million was incurred in the Second Quarter ($5.9 million year-to-date).
Depreciation and Amortization Expense
The following summarizes the depreciation and amortization expense for the three and six months ended June 30, 2008 and 2007:
| | | Three Months Ended June 30 | |
| | | 2008 | | 2007 | |
| (000’s of Canadian dollars) | | Refining | | Marketing | | Total | | Refining | | Marketing | | Total | |
| | | | | | | | | | | | | | |
| Tangible assets | | | 14,701 | | | 612 | | | 15,313 | | | 16,111 | | | 470 | | | 16,581 | |
| Intangible assets | | | 1,123 | | | 306 | | | 1,429 | | | 1,221 | | | 383 | | | 1,604 | |
| | | | 15,824 | | | 918 | | | 16,742 | | | 17,332 | | | 853 | | | 18,185 | |
| | | Six Months Ended June 30 | |
| | | 2008 | | 2007 | |
| (000’s of Canadian dollars) | | Refining | | Marketing | | Total | | Refining | | Marketing | | Total | |
| | | | | | | | | | | | | | |
| Tangible assets | | | 29,180 | | | 1,165 | | | 30,345 | | | 33,294 | | | 965 | | | 34,259 | |
| Intangible assets | | | 2,241 | | | 656 | | | 2,897 | | | 2,525 | | | 790 | | | 3,315 | |
| | | | 31,421 | | | 1,821 | | | 33,242 | | | 35,819 | | | 1,755 | | | 37,574 | |
The process units are amortized over an average useful life of 20-30 years. The intangible assets, consisting of engineering drawings, customer lists and fuel supply contracts, are amortized over a period of 20 years, 10 years and the term of the expected cash flows, respectively.
Goodwill
As the downstream assets are held in a self-sustaining subsidiary with a US dollar functional currency, the value of the goodwill is adjusted at the end of each accounting period to reflect the current US dollar exchange rate. We assess goodwill for impairment annually, or more frequently if events or changes in circumstances warrant. There has been no charge for impairment to goodwill since the date of acquisition.
RISK MANAGEMENT, FINANCING AND OTHER
Cash Flow Risk Management
With respect to our cash flow risk management program, our MD&A for the year ended December 31, 2007 included a wholesome discussion of our approach to analyzing our cash flow at risk relative to changes in crude oil prices, natural gas prices, the US/Canadian dollar exchange rate and certain refined product prices. See the “Cash Flow Risk Management” in our MD&A for the year ended December 31, 2007 filed on SEDAR at www.sedar.com. The details of our commodity price contracts outstanding at June 30, 2008 are included in Notes of our consolidated financial statements which are also filed on SEDAR at www.sedar.com.
While high commodity prices have resulted in record operating cash flow from our upstream activities, these strong commodity prices have also resulted in significant realized and unrealized losses on our price risk management contracts. The table below provides a summary of the net gains and losses realized on our price risk management contracts for each of the three month and six month periods ended June 30, 2008 and 2007:
(in 000s) | | Crude Oil | | Refined Products | | Natural Gas | | Currency Exchange Rates | | Electric Power | | Total | |
| | | | | | | | | | | | | | |
Three Months ended June 30, 2008 | | $ | (15,110 | ) | $ | (85,273 | ) | $ | (156 | ) | $ | 2,504 | | $ | 3,611 | | $ | (94,424 | ) |
| | | | | | | | | | | | | | | | | | | | |
Three Months ended June 30, 2007 | | $ | (7,043 | ) | $ | - | | $ | 130 | | $ | 647 | | $ | (560 | ) | $ | (6,826 | ) |
| | | | | | | | | | | | | | | | | | | | |
Six Months ended June 30, 2008 | | $ | (23,688 | ) | $ | (117,089 | ) | $ | (258 | ) | $ | 5,158 | | $ | 5,159 | | $ | (130,718 | ) |
| | | | | | | | | | | | | | | | | | | | |
Six Months ended June 30, 2007 | | $ | (6,753 | ) | $ | - | | $ | 291 | | $ | (601 | ) | $ | (60 | ) | $ | (7,123 | ) |
During the first six months of 2008, the net realized loss on price risk management contracts aggregated to $130.7 million as compared to $7.1 million in the prior year. This increase is primarily due to the increased losses related to our crude oil and refined product pricing contracts offset somewhat by increased gains on currency exchange rate and electric power contracts. During this period, the WTI benchmark price averaged US$110.94 in 2008 as compared to US$61.60 in 2007, while the contracted prices capped our WTI price exposure at an average of US$78.39 on 30,000 bbls/d in 2008 while in 2007 our crude oil price contracts had price caps of US$57.18 per bbl plus 70% participation on prices above US$57.18 on 30,000 bbls/d. For the balance of 2008, we have capped our WTI price exposure on 26,000 bbls/d at an average of US$80.82 while our exposure in 2009 is capped on 20,000 bbls/d at an average of US$85.09. As discussed in our 2007 year end MD&A, our WTI price risk management is comprised of both WTI price contracts as well as the refined product price contracts for heating oil and fuel oil, as refined product prices are essentially comprised of a WTI benchmark price plus the related crack spread, in our case, either a NYMEX heating oil or Platt’s fuel oil crack spread. Relative to our average 32,735 bbls/d of daily production of crude oil and natural gas liquids, net of royalties, during the first six months of 2008, our price risk management contracts left 2,735 bbls/d of net production exposed to WTI prices above US$78.39 while during the second half of 2008, we expect to be exposed to 6,735 bbls/d of WTI prices above US$85.09 in addition to a US$6.70/bbl increased cap on 26,000 bbls/d.
For the Second Quarter of 2008, we had contracts in place for 10,000 bbl/d of WTI prices with an average floor price of US$60.00 and participation in 73% of the upside above US$60.00 with the cash settlements of this obligation totaling $15.1 million. These contracts terminated at the end of June 2008.
In respect of refined products, we also had pricing contracts in place for 12,000 bbl/d of NYMEX heating oil and 8,000 bbl/d of Platts heavy fuel oil for the Second Quarter of 2008 and the cash settlements of these contracts aggregated to $82.8 million during the quarter. In addition, we had contracts in place on 6,000 bbl/d of NYMEX heating oil crack spread and 2,000 bbl/d of Platts heavy fuel oil crack spread which were settled with cash payments of $2.5 million during the Second Quarter of 2008. As of June 30, 2008, we had the following refined product price contracts in place:
For the period from July 2008 through December 2008
| | · | 12,000 bbl/d of NYMEX heating oil, |
| | · | 8,000 bbl/d of Platts heavy fuel oil, |
| | · | 6,000 bbl/d of NYMEX heating oil crack spread, and |
| | · | 2,000 bbl/d of Platts heavy fuel oil crack spread. |
| | · | 6,000 bbl/d of NYMEX RBOB gasoline comprised of an RBOB crack contract and a WTI price contract. |
For the period from January 2009 through June 2009
| | · | 12,000 bbl/d of NYMEX heating oil, and |
| | · | 8,000 bbl/d of Platts heavy fuel oil. |
At the end of June 2008, we had a modest 276 GJ/d of natural gas price contracts in place through December 2008.
With respect to currency exchange rates, we had contracted to fix the exchange rate during the Second Quarter of 2008 on US$8.3 million per month averaging Cdn$1.11 per US $1.00 and collared an exchange rate of Cdn$1.00 to Cdn$1.055 per US$1.00 on a further US$10 million per month. The settlements on the fixed rate contract resulted in $2.5 million received by Harvest during the Second Quarter of 2008 while the exchange rate collar settled with a nominal payment to Harvest. The exchange rate collar extends through December 2008 while the fixed rate contract terminated at the end of June 2008.
During the Second Quarter of 2008, the settlement of our fixed price power contracts for 35 MWh at $56.69 per MWh resulted in $3.6 million received by Harvest as the Alberta electric power prices averaged $107.56 per MWh during the period. This fixed price contract continues for 35 MWh through December 2008.
The following is a summary of net unrealized gains and losses recorded for our price risk management contracts for each of the three and six month periods ended June 30, 2008 and 2007:
(in 000s) | | Crude Oil | | Refined Products | | Natural Gas | | Currency Exchange Rates | | Electric Power | | Total | |
| | | | | | | | | | | | | | |
Three Months ended June 30, 2008 | | $ | (30,518 | ) | $ | (271,766 | ) | $ | (114 | ) | $ | (2,188 | ) | $ | (541 | ) | $ | (305,126 | ) |
| | | | | | | | | | | | | | | | | | | | |
Three Months ended June 30, 2007 | | $ | 872 | | $ | (8,651 | ) | $ | 7,355 | | $ | 9,703 | | $ | 1,735 | | $ | 11,014 | |
| | | | | | | | | | | | | | | | | | | | |
Six Months ended June 30, 2008 | | $ | (35,121 | ) | $ | (323,117 | ) | $ | (234 | ) | $ | (8,137 | ) | $ | 624 | | $ | (365,985 | ) |
| | | | | | | | | | | | | | | | | | | | |
Six Months ended June 30, 2007 | | $ | (11,368 | ) | $ | (8,651 | ) | $ | 4,539 | | $ | 11,065 | | $ | 1,308 | | $ | (3,107 | ) |
At the end of 2007, the mark-to-market deficiency on our refined product and WTI price contracts was $138.8 million and $24.9 million, respectively, while the mark-to-market value of our natural gas, currency exchange rate and electrical power price contracts aggregated to $14.0 million. At of June 30, 2008, the mark-to-market deficiency on our refined product and WTI price contracts was $521.9 million while the mark-to-market value of our natural gas, currency exchange rate and electrical power price contracts aggregated to $6.2 million.
In July 2008, the settlement of our price risk management contracts resulted in cash payments of $46.0 million in respect of our refined product and WTI price contracts and cash receipts of $0.3 million in respect of our Alberta power price contracts. On July 31, 2008, the WTI forward price curve was US$15.92 lower than on June 30, 2008 which combined with other fluctuations in the forward curve for refined product prices has resulted in our mark-to-market deficiency at the end of July being approximately $150 million lower than at the end of June.
Interest Expense
| | | Three Month Period Ended June 30 | | Six Month Period Ended June 30 | |
(000s) | | 2008 | | 2007 | | Change | | 2008 | | 2007 | | Change | |
| Interest on short term debt | | | | | | | | | | | | | | | | | | | |
| Bank loan | | $ | - | | $ | (71 | ) | | 100 | % | $ | - | | $ | 1,099 | | | (100 | )% |
| Convertible Debentures | | | - | | | 648 | | | (100 | )% | | 201 | | | 1,294 | | | (84 | )% |
| Amortization of deferred finance charges – short term debt | | | - | | | - | | | - | % | | - | | | 1,811 | | | (100 | )% |
| | | | - | | | 577 | | | (100 | )% | | 201 | | | 4,204 | | | (95 | )% |
| | | | | | | | | | | | | | | | | | | | |
| Interest on long-term debt | | | | | | | | | | | | | | | | | | | |
| Bank loan | | | 12,386 | | | 17,530 | | | (29 | )% | | 28,446 | | | 36,706 | | | (23 | )% |
| Convertible Debentures | | | 17,547 | | | 15,946 | | | 10 | % | | 30,609 | | | 30,394 | | | 1 | % |
77/8% Senior Notes | | | 5,341 | | | 5,659 | | | (6 | )% | | 10,647 | | | 11,805 | | | (10 | )% |
| Amortization of deferred finance charges – long term debt | | | 674 | | | 668 | | | 1 | % | | 1,349 | | | 1,347 | | | - | % |
| | | | 35,948 | | | 39,803 | | | (10 | )% | | 71,051 | | | 80,252 | | | (11 | )% |
| Total interest expense | | $ | 35,948 | | $ | 40,380 | | | (11 | )% | $ | 71,252 | | $ | 84,456 | | | (16 | )% |
Interest expense, which includes the amortization of related financing costs, was $4.4 million and $13.2 million lower respectively for the three and six month periods ended June 30, 2008 than in the same periods in the prior year. The primary cause of this decrease is a reduction in our average bank borrowings outstanding in the Second Quarter, which resulted in a $5.1 million and $9.4 million decrease in bank loan interest for the three month and six month periods ended June 30, 2008 respectively.
At June 30, 2008, we had drawn approximately $1,035.3 million of bank borrowings as compared to $1,279.5 million at December 31, 2007 and $1,330.4 million at March 31, 2008. The decrease in our outstanding bank borrowings is the result of applying the net proceeds of $239.5 million from the 7.5% Convertible Debenture offering against our outstanding debt at the end of April. The interest on our $1.6 billion Extendible Revolving Credit Facility is at a floating rate based on 75 basis points over bankers’ acceptances for Canadian dollar borrowings. During the three and six month periods ended June 30, 2008, interest charges on bank loans aggregated to $12.4 million and $28.4 million, reflecting an effective interest rates of 3.89% and 4.38% respectively. Further details on our credit facilities are included under “Liquidity and Capital Resources”.
The interest on our Convertible Debentures totaled $17.5 million and $30.8 million during the three and six month periods ended June 30, 2008, representing a $1.0 million increase and $0.9 million decrease over the same periods in the prior year. The increase in the three month period ended June 30, 2008 is due to the April 25 issuance of $250 million face value of 7.5% Convertible Debentures due 2015. The decrease in the six month period ended June 30, 2008 is due to the five months of reduced interest expense from the settlement of the 10.5% Convertible Debentures on January 31, 2008 having a greater impact than the two months of additional interest on the newly issued 7.5% Convertible Debentures. Details on the Convertible Debentures outstanding are fully described in Note 12 to the audited consolidated financial statements for the year ended December 31, 2007 filed on SEDAR at www.sedar.com. During the three and six month periods ended June 30, 2008, there were $0.1 million and $24.4 million of principal amount of Convertible Debentures converted to 7,504 and 1,176,874 Trust Units respectively, including the settlement of $24.2 million principal amount of 10.5% Convertible Debentures that matured on January 31, 2008 with 1,166,593 Trust Units. Interest on the Convertible Debentures is based on the effective yield of the debt component of the Convertible Debentures, and as a result, the interest expense recorded is greater than the cash interest paid.
The interest on our 77/8% Senior Notes totaled $5.3 million and $10.6 million for the three and six month periods ended June 30, 2008, representing a $0.3 million and $1.2 million decrease over the same periods in the prior year. This decrease is due to the strength of the Canadian dollar during these periods as compared to the relative periods in the prior year, as the interest on these notes is denominated in U.S. dollars. Similar to our Convertible Debentures, interest expense is based on the effective yield, and as a result, the interest expense recorded is greater than the cash interest paid.
Included in short and long term interest expense is the amortization of the discount on the 77/8% Senior Notes, the accretion on the debt component balance of the Convertible Debentures to face value at maturity, as well as the amortization of commitment fees and legal costs incurred for our credit facility, all totaling $0.7 million and $1.3 million for the three and six month periods ended June 30, 2008.
Currency Exchange
Currency exchange gains and losses are attributed to the changes in the value of the Canadian dollar relative to the U.S. dollar on our U.S. dollar denominated 77/8% Senior Notes as well as any other U.S. dollar cash balances. Since December 31, 2007, the Canadian dollar has modestly weakened compared to the U.S dollar, resulting in an unrealized foreign exchange loss of $13.5 million. Of this unrealized loss, $6.9 million relates to the 77/8% Senior Notes, while the remaining $6.6 million is primarily attributed to downstream transactions. Realized foreign exchange losses of $0.4 million and $1.2 million for the three and six months ended June 30, 2008, respectively, have resulted from the settlement of US dollar denominated transactions.
Our downstream operations are considered a self-sustaining operation with a U.S. dollar functional currency. The foreign exchange gains and losses incurred by our downstream operations relate to Canadian dollar transactions converted to U.S. dollars as their functional currency is U.S. dollars. The cumulative translation adjustment recognized in other comprehensive income represents the translation of our downstream operation’s U.S. dollar functional currency financial statements to Canadian dollars using the current rate method. During the Second Quarter of 2008, the strengthening of the Canadian dollar relative to the U.S. dollar resulted in a $4.5 million cumulative translation loss (six months ended June 30, 2008 – gain of $46.0 million) as the stronger Canadian dollar results in a decrease in the relative value of the net assets in our downstream operations.
Future Income Tax
At the end of 2007, we had a net future income tax provision on our balance sheet totaling $86.6 million comprised of a $270.5 million provision for our mutual fund trust and other “flow through” entities and a net asset of $183.9 million for our corporate entities. For the three and six months ended June 30, 2008, we have recorded a future income tax recovery of $95.2 million and $117.0 million, respectively, to reflect the changes in both the temporary differences held in our corporate entities and for changes in our forecasted temporary differences for our “flow through entities” as well as legislative tax rate changes both as of January 1, 2011. At June 30, 2008 we have a net future tax asset on our balance sheet totaling $30.4 million comprised of a $316.4 million net asset for our corporate entities offset by a $286.0 million provision for our mutual fund trust and other “flow through” entities. The future income tax asset recorded by our corporate entities will fluctuate during each accounting period to reflect changes in the respective temporary differences between the book value and tax basis of their assets as well as further legislative tax rate changes.
Currently, the principal source of our corporate entities’ temporary differences is the difference between our net book value of our property, plant and equipment versus our unclaimed tax pools and the recognition for accounting purposes of a mark-to-market deficiency on our risk management contracts.
Contractual Obligations and Commitments
We have contractual obligations and commitments entered into in the normal course of operations including purchase of assets and services, operating agreements, transportation commitments, sales commitments, royalty obligations, and land lease obligations. These obligations are of a recurring and consistent nature and impact cash flow in an ongoing manner. We also have contractual obligations and commitments that are of a less routine nature as disclosed in the following table:
| | | Maturity | |
Annual Contractual Obligations (000s) | | Total | | Less than 1 year | | 1-3 years | | 4-5 years | | After 5 years | |
Long-term debt(2) | | $ | 1,290,210 | | $ | - | | $ | 1,035,285 | | $ | 254,925 | | $ | - | |
Interest on long-term debt(4) | | | 138,270 | | | 29,922 | | | 92,563 | | | 15,785 | | | - | |
Interest on Convertible Debentures(3) | | | 358,720 | | | 32,855 | | | 130,403 | | | 123,563 | | | 71,899 | |
| Operating and premise leases | | | 23,803 | | | 3,663 | | | 12,597 | | | 7,295 | | | 248 | |
Purchase commitments(5) | | | 24,413 | | | 18,823 | | | 5,590 | | | - | | | - | |
Asset retirement obligations(6) | | | 1,009,432 | | | 20,861 | | | 17,350 | | | 27,437 | | | 943,784 | |
Transportation (7) | | | 6,863 | | | 2,130 | | | 3,395 | | | 1,291 | | | 47 | |
| Pension contributions | | | 30,789 | | | 572 | | | 3,631 | | | 5,301 | | | 21,285 | |
| Feedstock commitments | | | 1,063,446 | | | 1,063,446 | | | - | | | - | | | - | |
| Total | | $ | 3,945,946 | | $ | 1,172,272 | | $ | 1,300,814 | | $ | 435,597 | | $ | 1,037,263 | |
| (1) | As at June 30, 2008, we had entered into physical and financial contracts for upstream production with average deliveries of approximately 6,000 bbl/d for the remainder of 2008. We have also entered into financial contracts for downstream production of refined products with average deliveries of approximately 34,000 bbl/d for the remainder of 2008 and 20,000 bbl/d for the first half of 2009. We have also entered into financial contracts to minimize our exposure to fluctuating electricity prices. Please see Note 13 to the consolidated financial statements for further details. |
| (2) | Assumes that the outstanding Convertible Debentures either convert at the holders’ option or are redeemed for Trust Units at our option. |
| (3) | Assumes no conversions and redemption by Harvest for Trust Units at the end of the second redemption period. Only cash commitments are presented. |
| (4) | Assumes constant foreign exchange rate. |
| (5) | Relates to drilling commitments, AFE commitments and downstream purchase commitments. |
| (6) | Represents the undiscounted obligation by period |
| (7) | Relates to firm transportation commitment on the Nova pipeline. |
We have a number of operating leases for moveable field equipment, vehicles and office space and our commitments under those leases are noted in our annual contractual obligations table above. The leases require periodic lease payments and are recorded as either operating costs or G&A. We also finance our annual insurance premiums, whereby a portion of the annual premium is deferred and paid monthly over the balance of the term.
Related Party Transactions
During the three and six month periods ended June 30, 2008, Vitol purchased $4.6 million and $72.4 million respectively of Russian crude oil pursuant to the terms and conditions of the Supply and Offtake Agreement from a company in which a director of Harvest holds a minority equity interest. As at June 30, 2008, no amount related to these purchases is included in Harvest’s accounts payable and accrued liabilities. However, $266.9 million is included in the total feedstock commitments disclosed at the end of June 2008 for the purchase of Iraqi crude oil. Subsequent to June 30, 2008, no further commitments have been incurred relating to crude oil purchases by Vitol from this private company.
CHANGE IN ACCOUNTING POLICIES
Effective January 1, 2008, we have adopted the requirements of the Canadian Institute of Chartered Accountants (“CICA”) Section 3862 Financial Instruments – Disclosures, Section 3863 Financial Instruments – Presentation, and Section 1535 Capital Disclosures. The additional disclosures required as a result of adopting these new standards can be found in the notes to our consolidated financial statements for the three and six months ended June 30, 2008.
In June 2007, the CICA issued Section 3031 – Inventories, which replaces the existing standard for inventories. This new standard provides additional disclosure requirements for inventories, and requires that inventories be valued at the lower of cost and net realizable value. The standard is effective for Harvest beginning January 1, 2008. Application of this new standard did not have a material impact on our financial statements.
LIQUIDITY AND CAPITAL RESOURCES
During the first half of 2008, cash flow from operating activities was $338.7 million, including a $26.4 million reduction in respect of changes in non-cash working capital. The non-cash working capital requirement is primarily due to a $199.0 million increase in accounts receivable and a $35.2 million increase in inventories offset by a $206.7 million increase in accounts payable. Cash flow from operating activities before changes in non-cash working capital and asset retirement expenditures totaled $368.8 million for the first half of 2008. We declared distributions of $272.2 million, required $133.9 million for capital expenditures and raised $71.4 million with our distribution re-investment plans resulting in our cash flows excluding working capital adjustments being balanced. Our bank borrowings totaled $1035.3 million at the end of the Second Quarter of 2008, a reduction of $244.2 million which approximately equals the net proceeds from our issuance of $250 million of principal amount 7.5% Convertible Debentures on April 25, 2008.
At the end of June 2008, we had $564.7 million of available borrowing capacity under our $1.6 billion Extendible Revolving Credit Facility as compared to $269.6 million at the beginning of the quarter. To date, we have deferred our request to extend the maturity date of our Extendible Revolving Credit Facility for an additional year resulting in the facility currently maturing in April 2010. Subsequent to June 30, 2008, we closed our acquisition of a private oil and natural gas company currently producing 750 boe/d for aggregate consideration of approximately $36.5 million and entered into an agreement to acquire conventional oil and natural gas producing properties with approximately 1,900 boe/d of production for cash consideration of $136.0 million plus our interest in two non-operated properties currently producing approximately 85 boe/d. Approximately half of our $136.0 million commitment is subject to Rights of First Refusal which we anticipate will be resolved by the end of August 2008. After considering these acquisitions and assuming there are no Rights of First Refusal exercised, our available borrowing capacity would be approximately $392.2 million with an April 2010 maturity date on the credit facility.
Our cash flow risk management program includes our entering into numerous pricing contracts. We have limited the counterparties to such contracts to the lenders in our syndicated credit facilities as the security provided in our credit agreement extends to these pricing contracts and this eliminates the potential requirement for margin calls and/or the pledging of collateral as well as limits the negotiation of events of default, all of which contribute to ensuring that these contracts improve our liquidity rather than exacerbate credit concerns. In July 2008, a US-based energy trader declared bankruptcy after reporting US$3.2 billion of oil trading losses. Harvest’s exposure to this situation is limited to approximately $1 million in respect of oil sold to the Canadian subsidiary for which we are an unsecured creditor.
Since December 31, 2007, the significant changes to our capital structure were:
| | · | Issuance of $250 million principal amount of 7.50% Debentures due 2015 for aggregate cash consideration of $239.5 million, |
| | · | Issuance of 3,209,929 Trust Units pursuant to Harvest’s Premium DistributionTM, Distribution Reinvestment and Optional trust unit Purchase Plan (the “DRIP Plans”) raising $71.4 million, and |
| | · | Issuance of 1,176,874 Trust Units on the conversion of $24.4 million of principal amount of Convertible Debentures including 1,166,593 in respect of the maturing of $24.3 million of principal amount of 10.5% Convertible Debentures due January 31, 2008. |
The following table summarizes our capital structure as at June 30, 2008 as well as at ended December 31, 2007:
(in millions) | | June 30 2008 | | December 31 2007 | |
DEBT | | | | | | | |
| Three Year Extendible Revolving Credit Facility | | $ | 1,035.3 | | $ | 1,279.5 | |
| | | | | | | | |
| 7 7/8 % Senior Notes Due 2011 (US$250 million) | | | 254.9 | (1) | | 247.8 | (1) |
| | | | | | | | |
| Convertible Debentures, at principal amount | | | | | | | |
10.5% Debentures Due 2008 | | | - | | | 24.3 | |
9% Debentures Due 2009 | | | 0.9 | | | 1.0 | |
8% Debentures Due 2009 | | | 1.6 | | | 1.7 | |
6.5% Debentures Due 2010 | | | 37.1 | | | 37.1 | |
6.4% Debentures Due 2012 | | | 174.6 | | | 174.6 | |
| 7.25% Debentures Due 2013 | | | 379.3 | | | 379.3 | |
7.25% Debentures Due 2014 | | | 73.2 | | | 73.2 | |
7.50% Debentures Due 2015 | | | 250.0 | | | - | |
| Total Convertible Debentures | | | 916.7 | | | 691.2 | |
| | | | | | | | |
Total Debt | | | 2,206.9 | | | 2,218.5 | |
| | | | | | | | |
TRUST UNITS | | | | | | | |
| 152,731,498 issued at June 30, 2008 | | | 3,830.9 | | | | |
148,291,170 issued at December 31, 2007 | | | | | | 3,736.1 | |
| | | | | | | | |
TOTAL OF DEBT AND TRUST UNITS | | $ | 6,037.8 | | $ | 5,954.6 | |
(1) Face value converted at the period end exchange rate.
A full description of terms and covenants of our $1.6 billion Extendible Revolving Credit Agreement, 77/8% Senior Notes as well as our Convertible Debentures are contained in the notes to our audited consolidated financial statements for the year ended December 31, 2007 and the Liquidity and Capital Resources section of our MD&A for the year ended December 31, 2007 filed on SEDAR at www.sedar.com.
The credit facility contains floating interest rates that are expected to range between 65 and 115 basis points over bankers’ acceptance rates (currently 75 bps) depending on the ratio of our secured senior debt (excluding 77/8% Senior Notes and convertible debentures) to earnings before interest, taxes, depletion, amortization and other non-cash amounts (“EBITDA”) with availability under this facility subject to:
| Secured senior debt to EBITDA | 3.0 to 1.0 or less |
| Total Debt to EBITDA | 3.5 to 1.0 or less |
| 50% or less |
| Total Debt to capitalization | 55% or less |
At June 30, 2008, our Bank Debt to annualized EBITDA was 1.5 to 1.0, Total Debt (excluding convertible debentures) to annualized EBITDA was 1.8 to 1.0, while the Bank Debt to Total Capitalization was 24% and Total Debt to Total Capitalization was 30%.
The 77/8% Senior Notes contain certain covenants which among other things restrict our secured indebtedness to an amount less than 65% of the present value of future net revenues from our proved petroleum and natural gas reserves discounted at an annual rate of 10%. At the end of 2007, 65% of the present value of the future net revenues from our proved petroleum and natural gas reserves discounted at an annual rate of 10% was approximately $1.85 billion. At the end of July 2008, our independent reservoir engineering firm had raised their WTI price forecast to US$122.40 from US$86.70 at the end of December 2007 and in respect of AECO natural gas prices, had raised their forecast to $10.15 from $7.00. These increased price forecasts will raise the value of our petroleum and natural gas reserves and thereby increase the amount of secured indebtedness permitted under this covenant.
The most restrictive term of the Convertible Debentures limits the issuance of additional Convertible Debentures if the principal amount of all issued and outstanding Convertible Debentures immediately after the issuance exceed 25% of the total market capitalization, being an aggregate of the principal amount of all issued and outstanding Convertible Debentures plus an amount equal to the current market price of all of the issued and outstanding Trust Units. At June 30, 2008, the covenants of our Convertible Debentures will limit our issuance of additional convertible debentures to approximately $270 million based on our market capitalization at this date.
Concurrent with the closing of the North Atlantic acquisition, we entered into a Supply and Offtake Agreement with Vitol Refining S.A. (“Vitol”), a third party related to the vendor of North Atlantic. The agreement provides for ownership of substantially all of the crude oil feedstock and refined product inventory at the refinery be retained by Vitol and that Vitol be granted the right and obligation to provide and deliver crude oil feedstock to the refinery as well as the right and obligation to purchase all refined products produced by the refinery. For a more complete description of this Supply and Offtake Agreement, see the description of the Supply and Offtake Agreement in our Annual Information Form for the year ended December 31, 2007 filed on SEDAR at www.sedar.com. At the end of June 2008, we estimate that Vitol held inventories of VGO, crude oil feedstock (both delivered and in-transit) and refined products for resale valued at approximately $1.1 billion which would have otherwise have been assets of Harvest. Effective April 19, 2008, both Harvest and Vitol Refining S.A. may terminate the Supply and Offtake Agreement by providing six months written notice. As of August 8, 2008, neither party has provided notice of its intent to terminate the agreement.
Year-to-date in 2008, the trading value of our Trust Units ranged from a high of $26.00 in February to a low of $18.90 in August. This volatility in our trading value is generally attributed to the seasonal decline in refining margins. At the end June 2008 approximately 67% of our Unitholders were non-residents of Canada which is up slightly from 66% at the end of 2007. The following summarizes the trading value of our Trust Units during 2008:
| | | Trading Price | | | |
Month | | High | | Low | | Volume | |
TSX Trading | | | | | | | | | | |
| January 2008 | | $ | 23.56 | | $ | 20.48 | | | 10,474,631 | |
| February 2008 | | $ | 26.00 | | $ | 22.49 | | | 8,552,342 | |
| March 2008 | | $ | 24.13 | | $ | 22.00 | | | 9,638,750 | |
| April 2008 | | $ | 24.94 | | $ | 22.23 | | | 11,965,637 | |
| May 2008 | | $ | 25.67 | | $ | 22.15 | | | 14,019,461 | |
| June 2008 | | $ | 25.77 | | $ | 23.32 | | | 9,263,955 | |
| July 2008 | | $ | 24.60 | | $ | 19.32 | | | 10,210,064 | |
| August 1 – 8, 2008 | | $ | 20.41 | | $ | 18.90 | | | 2,483,575 | |
| | | | | | | | | | | |
NYSE Trading (in US$) | | | | | | | | | | |
| January 2008 | | $ | 23.24 | | $ | 20.00 | | | 18,167,009 | |
| February 2008 | | $ | 25.70 | | $ | 22.51 | | | 15,108,961 | |
| March 2008 | | $ | 24.49 | | $ | 21.44 | | | 17,099,323 | |
| April 2008 | | $ | 24.82 | | $ | 22.06 | | | 20,845,245 | |
| May 2008 | | $ | 26.08 | | $ | 21.75 | | | 24,871,749 | |
| June 2008 | | $ | 25.28 | | $ | 23.05 | | | 16,892,369 | |
| July 2008 | | $ | 24.30 | | $ | 18.80 | | | 23,625,243 | |
| August 1 – 8, 2008 | | $ | 19.99 | | $ | 17.73 | | | 6,018,621 | |
Through a combination of cash from operating activities, unused credit capacity and the working capital provided by the Supply and Offtake Agreement, it is anticipated that we will have enough liquidity to fund future operations and forecasted capital expenditures although cash from operating activities used to fund ongoing operations may reduce the amount of future distributions paid to Unitholders.
Harvest is an integrated energy trust with a declining asset base in our upstream operations and a “near perpetual” asset in our downstream operations. The future of our upstream operations relies on the successful exploitation of our existing reserves, future development activities and strategic acquisitions to replace existing production and add additional reserves, as well as future petroleum and natural gas prices. With a prudent maintenance program, our downstream assets are expected to have a long life with growth in profitability available by upgrading HSFO, enhancing our refining processes to handle a heavier more-sour feedstock and/or expanding our refining capacity which is expected to benefit from the incremental economics available with our existing infrastructure. Future development activities and modest acquisitions in our upstream business as well as the maintenance program in our downstream business will likely be funded by our cash generated from operating activities while we will generally rely on funding more significant acquisitions and growth initiatives from some combination of cash from operating activities, issuances of Trust Units and incremental debt. To the extent that we finance acquisitions and growth initiatives from cash from operating activities, the amount of our distributions to Unitholders may be reduced. Should capital markets or incremental debt not be available to us, our ability to make the necessary expenditures to maintain or expand our assets may be impaired and result in reductions to future distributions paid to Unitholders. In our upstream business, it is not possible to distinguish between expenditures to maintain productive capacity and spending to increase productive capacity due to the numerous factors impacting reserve reporting and the natural decline in reservoirs. Accordingly, maintenance capital is not disclosed separately.
Our distributions will generally exceed the net income reported in our financial statements as a result of significant non-cash charges recorded in our income statement. In the first six months of 2008, we recorded a $366.0 million charge in respect of unrealized losses on price risk management contracts. In addition we recorded a further $255.0 million provision in respect of depreciation and depletion based primarily on our historic costs of property, plant and equipment that does not accurately represent the fair value or replacement cost of the assets, nor does it affect cash generated in the current period. These charges result in significant changes to net income with no impact on cash from operating activities. Accordingly, we anticipate that over time our net income may fluctuate significantly from our cash flow from operating activities as well as distributions to Unitholders. During the first six months of 2008, our distributions to Unitholders exceeded our net loss of $162.4 million by $434.6 million as compared to the prior year where our distributions to Unitholders exceeded our net income of $76.1 million by $223.2 million. In instances where our distributions exceed our net earnings, a portion of the distribution may represent a return of capital rather than a distribution of earnings. For the first six months of 2008, our distributions declared totaled $272.2 million, representing 80% of cash from operating activities.
Management, together with the Board of Directors of Harvest, continually assess the level of our monthly distributions in light of commodity price expectations, currency exchange rates, production and throughput projections, operating cost forecasts, debt leverage and spending plans. Since November 2007, we have declared a monthly distribution of $0.30 per Trust Unit through October 2008, a level of distributions that reflects our expectations of future commodity prices and currency exchange rates as well as our future production and throughput volumes and operating costs.
Prior to January 1, 2011, the Trust is subject to tax on its taxable income less the portion that is paid or payable to the Unitholders at the end of each taxation year. For 2008, we anticipate that distributions to Unitholders will be 100% taxable and that the Trust will have no taxable income. The following table summarizes the distributions declared, the proceeds from our distribution reinvestment programs as well as distributions as a percentage of cash from operating activities for the three and six months ended June 30, 2008 and 2007:
| | | Three Month Period Ended June 30 | | Six Month Period Ended June 30 | |
(000s except per Trust Unit amounts) | | 2008 | | 2007 | | Change | | 2008 | | 2007 | | Change | |
| Distributions declared | | $ | 137,001 | | $ | 154,057 | | | (11 | )% | $ | 272,168 | | $ | 299,327 | | | (9 | )% |
| Per Trust Unit | | $ | 0.90 | | $ | 1.14 | | | (21 | )% | $ | 1.80 | | $ | 2.28 | | | (21 | )% |
| Distribution reinvestment proceeds | | $ | 35,472 | | $ | 43,947 | | | (19 | )% | $ | 71,362 | | $ | 87,744 | | | (19 | )% |
| Distributions as a percentage of cash from operating activities | | | 65 | % | | 61 | % | | 4 | % | | 80 | % | | 83 | % | | (3 | )% |
Throughout the first six months of 2008, we declared monthly distributions of $0.30 per Trust Unit to Unitholders, compared to a $0.38 per Trust Unit distribution for the same period in 2007. For the three and six months ended June 30, 2008, the total amount of distributions declared was $137.0 million and $272.2 million, respectively, which is 65% and 80%, respectively, of our cash from operating activities. The decrease in distributions declared of $17.1 million for the three months ended June 30, 2008 and $27.2 million for the six months ended June 30, 2008 is primarily due to the decrease of $0.08 in the monthly distribution declared per Trust Unit, offset by an increase of approximately 9.2 million Trust Units outstanding.
OUTLOOK
For the balance of 2008, we have increased the forecasted production volumes from our upstream operations in the 55,500 to 56,500 boe/d range with our annual capital spending expectation unchanged at $245 million. For our downstream operations, we expect that the refinery throughput will average approximately 95,000 bbls/d for the last six month of 2008 reflecting a planned reduction in feed until HSFO margins improve which along with the completion of the visbreaker expansion project in early October 2008 which will result in an improved yield of higher valued gasoline and distillate products.
On July 24, 2008, we completed our acquisition of a private oil and gas company for cash consideration of $36.5 million and added approximately 390 boe/d of light oil production in the Red Earth area and approximately 2,300 mcf/d of natural gas production in the Masten Lake area. On July 25, 2008, we entered into an agreement to acquire, subject to Rights of First Refusal on certain properties, oil and natural gas properties in the Peace River Arch area of northern Alberta which are currently producing approximately 1,900 boe/d in exchange for $136.0 million in cash plus our interest in two non-operated properties producing approximately 85 boe/d; this acquisition is expected to close in late August. Additional drilling locations have been identified with both acquisitions and while maintaining our $245 million annual capital spending estimate, we are reassessing our options in light of these new opportunities.
We will continue our focus on drilling in southeast Saskatchewan, Lloydminister, Red Earth and Hayter with our planned investment in enhanced oil recovery projects and infrastructure accounting for approximately 25% of our capital spending. Our operating costs are expected to average $14.40 per boe for the last half of 2008 with electric power and well servicing comprising approximately 50% of our costs. Power costs are significant for us and we have fixed price electric power contracts in place for approximately 65% of our expected 2008 Alberta power consumption at a price of $56.69 per MWh.
In our downstream operations, we expect refinery throughput will be reduced to limit our production of vacuum tower bottoms to the capacity of our visbreaker which will substantially reduce the use of higher valued middle distillate material to blend excess vacuum tower bottoms to a HSFO product as current prices for HSFO are weak as compared to distillate prices. To offset a portion of this reduction in throughput, additional vacuum gas oil will be purchased to maintain hydrocracking throughput and optimize our gross margin contribution. In October 2008, we anticipate that the visbreaker expansion project will be completed which based on the current differential between HSFO and distillate prices should generate an incremental monthly gross margin contribution of approximately $2 million. There are no planned shutdowns anticipated for the balance of 2008 except to enable the commissioning of the visbreaker expansion. For the balance of 2008, we expect that our refinery operating costs will continue to average $2.10 to $2.20 per bbl of throughput and that our costs of purchased energy, primarily the cost to purchase a lower sulphur fuel oil than we produce, should average approximately $3.50 per barrel of throughput reflecting a significantly higher commodity price environment. Our 2008 capital spending expectations for our downstream operations are now $56 million, a reduction of $7 million for the year as compared to our earlier estimates. In conjuction with the SNC Lavalin review, we have identified $300 million of incremental growth projects which include a 5,000 bbl/d expansion of our isomax hydrocracking capacity, an improvement to our process heater efficiency, and the introduction of a “deeper cut” in our crude unit to increase our VGO cut with lower but harder vacuum tower bottoms. Based on a wide range of economic assumptions, these incremental growth projects are expected to provide very attractive economics for our Unitholders and could be funded from cash flow and likely spread over a three year period.
In July 2008, SNC Lavalin completed their preliminary evaluation of a broad range of refinery reconfigurations. The most economic case is a refinery configuration which would process approximately 190,000 bbls/d of feedstock comprised of a blend of heavy and medium gravity sour crudes. As currently proposed, this expansion is a five year commitment which includes further engineering and design as well as the construction and commissioning with estimated spending of approximately $2 billion in nominal 2008 dollars. This expansion opportunity will require further engineering to improve the certainty of cost estimates as well as pursue a financial plan to optimize the economic benefits available for our Unitholders.
As referred to in the Cash Flow Risk Management section of this MD&A, we have not entered into any refined product and WTI pricing contracts since the end of 2007 and have approximately 83% of our WTI sensitive cash flow exposure in the second half of 2008 under contract as well as 60% for the first half of 2009 with our WTI price exposure capped at approximately US$80.82 and US$85.09, respectively. With respect to our cash flow exposure related to refined product crack spreads, we have contracts in place for approximately 30% of our exposure for the second half of 2008. As our upstream operations continue to enjoy the unprecedented crude oil prices as compared to 2007, our upside participation in WTI prices will be limited to an average US$80.82 on 26,000 bbls/d during the last six months of 2008 and to US$85.09 on 20,000 bbls/d for the first half of 2009. We have currency exchange contracts on US$10.0 million per month through to December 2008 representing approximately 10% of our exposure to fluctuations in the US dollar to Canadian dollar exchange rate, prior to considering the offsetting exposure of our US dollar denominated 77/8% Senior Notes. We have also entered into power contracts to fix the price of 35 MWh through to the end of December 2008 at a price of $56.69 with the objective of reducing the volatility of our operating costs to fluctuating electricity costs which represent approximately 25% of our upstream operating costs.
We manage our exposure to fluctuations in interest rates by maintaining a mix of short and longer term financing with the short term financing typically carrying floating interest rates and longer term financing (our 77/8% Senior Notes and convertible debentures) carrying fixed rates of interest. Our short term financing consists of borrowings under our credit facilities totaling $1,035.3 million at June 30, 2008 which represents approximately 47% of our total debt. As a result, approximately 47% of our interest rate exposure is floating and 53% is fixed. Currently, our most significant exposure to increasing interest rates is through the re-pricing of credit if we extend (or renew) our credit facilities or enter into additional longer term financings. We have decided to defer extending the April 2010 maturity date on our $1.6 billion Extendible Revolving Credit Facility pending a general strengthening to the credit markets. With respect to further reducing our borrowings under our credit facility, we continue to monitor the high yield market as well as opportunities to issue additional Trust Units and Convertible Debentures.
Upon the maturing of our Convertible Debentures, we may elect to satisfy these obligations by issuing Trust Units rather than settling the obligations in cash. The maturity date spread on the $916.7 million of principal amount of Convertible Debentures outstanding is as follows: 2009 - $2.5 million; 2010 - $37.1 million; 2012 - $174.6 million; 2013 - $379.3 million; 2014 - $73.2 million and 2015 – $250 million. While not necessarily impacting 2008, we anticipate that as these convertible debentures mature, or are converted into Trust Units before their maturity date, we will be able to retire $916.7 million of principal amount of unsecured debt with equity issuances.
Overall, we expect that based on current commodity price expectations, our 2008 cash from operating activities will be sufficient to fund our planned capital expenditures as well as maintain our present level of distributions. We expect that the participation level in our distribution re-investment programs will continue at approximately 25% with non-Canadian ownership of our Trust Units maintained at approximately 65% to 70%.
While we do not forecast commodity prices nor refining margins, we have entered into price risk management contracts to mitigate a substantial portion of our price volatility with the objective of stabilizing our 2008 cash flow from operating activities through a wide variety of pricing environments. The following table reflects the sensitivity of our 2008 operations to changes in the following key factors to our business over the remaining six months of the year:
| | | Assumption | | Change | | Impact on Cash Flow | |
| WTI oil price (US$/bbl) | | $ | 120.00 | | $ | 5.00 | | $ | 0.03 / Unit | |
| CAD/USD exchange rate | | $ | 1.00 | | $ | 0.05 | | $ | 0.15 / Unit | |
| AECO daily natural gas price | | $ | 8.00 | | $ | 1.00 | | $ | 0.10 / Unit | |
| Refinery crack spread (US$/bbl) | | $ | 8.63 | | $ | 1.00 | | $ | 0.12 / Unit | |
| Upstream Operating Expenses (per boe) | | $ | 14.45 | | $ | 1.00 | | $ | 0.07 / Unit | |
In our upstream business, we will continue to evaluate opportunities to acquire producing oil and/or natural gas properties as well as offer selected properties for divestment while striving to maintain or enhance our productive capability and improve our unit operating costs. In addition, we intend to be an active participant in the consolidation of the Canadian energy industry, including other royalty trusts.
On July 14, 2008, the Department of Finance for the Government of Canada released the proposed draft legislation to permit income funds to “convert” into taxable Canadian corporations and wind-up their existing structures without triggering adverse Canadian income tax consequences to the income fund or its Unitholders. This proposed legislation follows the announcement on October 31, 2006 to apply a 31.5% tax on distributions from publicly traded mutual fund trusts, such as Harvest, which has now been enacted with an effective date of January 1, 2011. This legislation essentially provides two alternatives to convert to a taxable Canadian corporation provided the conversion occurs after July 14, 2008 and before January 1, 2013 and includes proposals to substantially reduce the administration and compliance associated with conversion as well as enable the tax deferred wind-up of lower tier trusts and partnerships. We are evaluating the impact of this proposed legislation should Harvest choose to convert to a taxable Canadian corporation. We will also continue to search and validate other capital structures, balancing the benefits of the remaining years of tax efficient distributions against the longer term benefits of continuing with a growth strategy beyond the announced “normal growth” limitations.
SUMMARY OF QUARTERLY RESULTS
The following table and discussion highlights our Second Quarter of 2008 relative to the preceding seven quarters:
| | | 2008 | | 2007 | | 2006 | |
(000s except where noted) | | Q2 | | Q1 | | Q4 | | Q3 | | Q2 | | Q1 | | Q4 | | Q3 | |
| Revenue, net of royalties | | $ | 1,622,079 | | $ | 1,377,352 | | $ | 879,124 | | $ | 1,007,786 | | $ | 1,133,450 | | $ | 1,025,512 | | $ | 682,744 | | $ | 259,818 | |
| | | | | | | | | | | | | | | | | | | | | | | | | | |
| Net income (loss) | | $ | (162,063 | ) | $ | (346 | ) | $ | (113,585 | ) | $ | 11,811 | | $ | 6,248 | | $ | 69,850 | | $ | 1,533 | | $ | 107,768 | |
Per Trust Unit, basic1 | | $ | (1.07 | ) | $ | - | | $ | (0.77 | ) | $ | 0.08 | | $ | 0.05 | | $ | 0.55 | | $ | 0.01 | | $ | 1.01 | |
Per Trust Unit, diluted1 | | $ | (1.07 | ) | $ | - | | $ | (0.77 | ) | $ | 0.08 | | $ | 0.05 | | $ | 0.55 | | $ | 0.01 | | $ | 0.99 | |
| | | | | | | | | | | | | | | | | | | | | | | | | | |
| Cash from operating activities | | $ | 210,534 | | $ | 128,119 | | $ | 87,998 | | $ | 191,049 | | $ | 251,218 | | $ | 111,048 | | $ | 140,543 | | $ | 143,597 | |
| Per Trust Unit, basic | | $ | 1.39 | | $ | 0.85 | | $ | 0.60 | | $ | 1.31 | | $ | 1.88 | | $ | 0.87 | | $ | 1.21 | | $ | 1.35 | |
| Per Trust Unit, diluted | | $ | 0.83 | | $ | 0.83 | | $ | 0.60 | | $ | 1.22 | | $ | 1.67 | | $ | 0.84 | | $ | 1.16 | | $ | 1.31 | |
| | | | | | | | | | | | | | | | | | | | | | | | | | |
| Distributions per Unit, declared | | $ | 0.90 | | $ | 0.90 | | $ | 0.98 | | $ | 1.14 | | $ | 1.14 | | $ | 1.14 | | $ | 1.14 | | $ | 1.14 | |
| | | | | | | | | | | | | | | | | | | | | | | | | | |
| Total long term debt | | $ | 2,105,998 | | $ | 2,209,451 | | $ | 2,172,417 | | $ | 2,097,187 | | $ | 1,987,352 | | $ | 2,436,018 | | $ | 2,488,524 | | $ | 1,105,728 | |
| Total assets | | $ | 5,637,879 | | $ | 5,574,528 | | $ | 5,451,683 | | $ | 5,585,651 | | $ | 5,613,333 | | $ | 5,800,346 | | $ | 5,745,558 | | $ | 4,076,771 | |
| | (1) | The sum of the interim periods does not equal the total per year amount as there were large fluctuations in the weighted average number of Trust Units outstanding in each individual quarter. |
Net revenues are comprised of revenues net of royalties from our upstream operations as well as sales of refined products from our downstream operations. Accordingly, since the acquisition of the downstream operations in the Fourth Quarter of 2006, our revenues have increased substantially and then throughout 2007 have remained relatively stable until the Fourth Quarter of 2007 when the refinery throughput decreased due to a planned shutdown for more than half of the quarter. Throughout 2008, net revenues have been the highest in Harvest’s history due to strong commodity prices (for both the upstream and downstream operations).
The growth in cash from operating activities is closely aligned with the trend in net revenues and is attributed to the same factors as the growth in net revenues, reflecting the cyclical nature of the downstream segment in 2007. In the Second Quarter of 2008, cash from operating activities has increased from the previous quarter reflecting strong commodity prices from our upstream production offset by reduced refining margins in our downstream operations and increased losses settled on our price risk management contracts.
Net income reflects both cash and non-cash items. Changes in non-cash items, including future income tax, DDA&A expense, unrealized foreign exchange gains and losses, unrealized gains and losses on risk management contracts and Trust Unit right compensation expense cause net income to vary significantly from period to period. In the Second Quarter of 2007 Bill C-52 was substantively enacted, which imposed a new tax on distributions from publicly traded income trusts resulting in a large future income tax expense in the quarter. In the Fourth Quarter of 2007 Bill C-28 implemented reductions in the federal corporate income tax rates which will also apply to the tax on distributions from publicly traded mutual fund trusts, resulting in a significant future income tax recovery in the quarter. In the First Quarter of 2008, future income tax recovery of $21.8 million was recorded as a result of the excess depreciation expense recorded over the amount of tax pool claims to be made; an additional recovery of $95.2 million was recorded in the Second Quarter of 2008. Changes in the fair value of our risk management contracts have also contributed to the volatility in net income (loss) over the preceding eight quarters. For these reasons, our net income (loss) does not reflect the same trends as net revenues or cash from operating activities, nor is it expected to.
Growth in total assets over the last eight quarters is directly attributed to our acquisition of Birchill in the Third Quarter of 2006 and North Atlantic in the Fourth Quarter of 2006. The changes in total long term financial liabilities is primarily due to the impact of our acquisitions, offset by the issuance of Trust Units and the net cash surplus of cash from operating activities over distributions to Unitholders.
CRITICAL ACCOUNTING ESTIMATES
There are a number of critical estimates underlying the accounting policies applied when preparing the consolidated financial statements due to timing differences between when certain activities are settled and when these activities are recognized for accounting purposes. Changes in these estimates could have a material impact on our reported results. These estimates are described in detail in our MD&A for the year ended December 31, 2007 as filed on SEDAR at www.sedar.com. There have been no significant changes to any of our critical accounting estimates in our consolidated financial statements for the three and six month periods ended June 30, 2008 from those described in our annual MD&A.
RECENT CANADIAN ACCOUNTING AND RELATED PRONOUNCEMENTS
Convergence of Canadian GAAP with International Financial Reporting Standards
In early 2008, Canada’s Accounting Standards Board (“AcSB”) announced that Canadian public reporting issuers will be required to report under International Financial Reporting Standards (“IFRS”) beginning January 1, 2011. The adoption of IFRS is intended to bring more transparency and a higher degree of global comparability as IFRS has been adopted in more than 100 countries. In preparation of this move to IFRS, Harvest has retained a professional advisor who has completed a diagnostic review identifying the areas of Harvest’s financial reporting likely to be most significantly affected by the transition. Harvest has also appointed internal staff to lead the conversion project with project sponsorship from the senior executive team and has also assembled an IFRS steering committee consisting of senior personnel from various functional areas within the organization.
In February 2008, the CICA issued Section 3064, Goodwill and Intangible Assets, replacing Section 3062 Goodwill and Other Intangible Assets and Section 3450, Research and Development Costs. The new Section will be effective on January 1, 2009. Section 3062 establishes standards for the recognition, measurement, presentation and disclosure of goodwill and intangible assets subsequent to its initial recognition. Standards concerning goodwill are unchanged from the standards included in the previous Section 3062. We are currently evaluating the impact of the adoption of this new section, however do not expect a material impact on our Consolidated Financial Statements.
OPERATIONAL AND OTHER BUSINESS RISKS
Our financial and operating performance is subject to risks and uncertainties which include, but are not limited to: upstream operations, downstream operations, reserve estimates, commodity prices, ability to obtain financing, environmental, health and safety risk, regulatory risk, disruptions in the supply of crude oil and delivery of refined products, employee relations, and other risks specifically discussed previously in this MD&A. We intend to continue executing our business plan to create value for Unitholders by paying stable monthly distributions and increasing the net asset value per Trust Unit. All of our risk management activities are carried out under policies approved by the Board of Directors of Harvest Operations, and are intended to mitigate the risks noted above as follows:
The following summarizes the more significant risks of our upstream and downstream operations. See our Annual Information Form for a full description of these risks as well as risks associated with our royalty trust structure.
Operation of oil and natural gas properties:
| | · | Applying a proactive management approach to our properties; |
| | · | Selectively adding skilled and experienced employees and providing encouragement and opportunities to maintain and improve technical competence; and |
Operation of a refining and petroleum marketing business
| | · | Maintaining a proactive approach to managing the supply of feedstock and sale of refined products to ensure the continuity of supply of crude oil to the refinery and the delivery of refined products from the refinery; |
| | · | Allocating sufficient resources to ensure good relations are maintained with our non-unionized and unionized work force; and |
| | · | Selectively adding experienced refining management to further strengthen our “in-house” management team. |
Estimates of the quantity of recoverable reserves:
| | · | Acquiring oil and natural gas properties that have high-quality reservoirs combined with mature, predictable and reliable production and thus reduce technical uncertainty; |
| | · | Subjecting all property acquisitions to rigorous operational, geological, financial and environmental review; and |
| | · | Pursuing a capital expenditure program to reduce production decline rates, improve operating efficiency and increase ultimate recovery of the resource-in-place. |
Commodity price exposures:
| | · | Maintaining a risk-management policy and committee to continuously review effectiveness of existing actions, identify new or developing issues and devise and recommend to the Board of Directors of Harvest Operations action to be taken; |
| | · | Executing risk management contracts with a portfolio of credit-worthy counterparties; |
| | · | Maintaining an efficient cost structure to maximize product netbacks; and |
| | · | Limiting the period of exposure to price fluctuations between crude oil prices and product prices by entering into contracts such that crude oil feedstock will be priced based on the price at or near the time of delivery to the refinery, which may be as much as 24 days subsequent to the time the feedstock is initially loaded onto the shipping vessel. Thereby, minimizing the time between the pricing of the feedstock and the refined products with the objective of maintaining margins. |
Financial risk:
| | · | Monitoring financial markets to ensure the cost of debt and equity capital is kept as low as reasonably possible; |
| | · | Retaining a portion of cash flows to finance capital expenditures and future property acquisitions; and |
| | · | Carrying adequate insurance to cover property and business interruption losses. |
Environmental, health and safety risks:
| | · | Adhering to our safety programs and keeping abreast of current industry practices for both the oil and natural gas industry as well as the refining industry; and |
| | · | Committing funds on an ongoing basis toward the remediation of potential environmental issues. |
Changing government policy, including revisions to royalty legislation, income tax laws, and incentive programs related to the oil and natural gas industry:
| | · | Retaining an experienced, diverse and actively involved Board of Directors to ensure good corporate governance; and |
| | · | Engaging technical specialists when necessary to advise and assist with the implementation of policies and procedures to assist in dealing with the changing regulatory environment. |
CHANGES IN REGULATORY ENVIRONMENT
For a detailed discussion of the most recent changes to our regulatory environment, please refer to our MD&A for the year ended December 31, 2007 as filed on SEDAR at www.sedar.com.
NON-GAAP MEASURES
Throughout this MD&A we have referred to certain measures of financial performance that are not specifically defined under Canadian GAAP. Cash G&A and Operating Netbacks are non-GAAP measures used extensively in the Canadian energy trust sector for comparative purposes. Cash G&A are G&A expenses excluding the effect of our unit based compensation plans, while Operating Netbacks are always reported on a per boe basis, and include gross revenue, royalties, operating expenses, and transportation and marketing expenses. Gross Margin is commonly used in the refining industry to reflect the net funds received from the sale of refined products after considering the cost to purchase the feedstock and is calculated by deducting purchased products for resale and processing from total revenue. Earnings From Operations is also commonly used in the petroleum and natural gas and refining industries to reflect operating results before items not directly related to operations.
ADDITIONAL INFORMATION
Further information about us, including our Annual Information Form, can be accessed under our public filings found on SEDAR at www.sedar.com or at www.harvestenergy.ca. Information can also be found by contacting our Investor Relations department at (403) 265-1178 or at 1-866-666-1178.