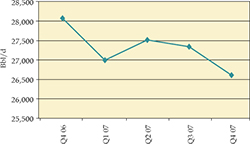
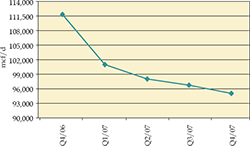
The table and discussion below highlight our fourth quarter 2007 performance over the preceding seven quarters on select measures:
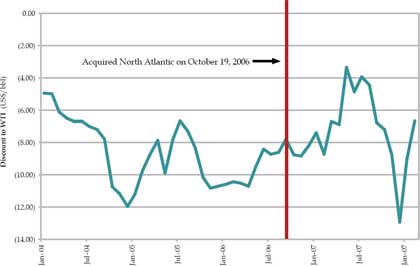
Net revenues have generally increased steadily over the eight quarters with significantly higher revenue in the Second and Third Quarters of 2006 over the preceding quarters due to the incremental revenue from the Viking acquisition in February 2006 along with stronger commodity prices including narrowing crude oil differentials. In the Fourth Quarter of 2006, the significant increase in revenue over the prior quarter is attributed to the North Atlantic acquisition which is a margin business with significant revenues coupled with significant costs for crude oil feedstock. In the second half of 2007 net revenues decreased from the first half of 2007 due to the Refinery’s lower realized prices and decreased throughput due to two planned shutdowns. The growth in cash from operating activities is closely aligned with the growth in net revenues and is attributed to the same factors as the growth in net revenues, reflecting the cyclical nature of the downstream segment in 2007.
Net income reflects both cash and non-cash items. Changes in non-cash items, including future income tax, DDA&A expense, unrealized foreign exchange gains and losses, unrealized gains and losses on risk management contracts and Trust Unit right compensation expense cause net income to vary significantly from period to period. In the Second Quarter of 2007 Bill C-52 was substantively enacted, which imposed a new tax on distributions from publicly traded income trusts resulting in a large future income tax expense in the quarter. In the Fourth Quarter of 2007 Bill C-28 implemented reductions in the federal corporate income tax rates which will also apply to the tax on distributions from publicly traded mutual fund trusts, resulting in a significant future income tax recovery in the quarter. Additionally, the volatility in net income (loss) between quarters in 2006 and 2007 is due to the changes in the fair value of our risk management contracts and this is the primary reason why our net income (loss) does not reflect the same trends as net revenues or cash from operating activities.
Growth in total assets over the last eight quarters is directly attributed to our acquisition of Viking in the first quarter of 2006, Birchill in the Third Quarter of 2006 and North Atlantic in the Fourth Quarter of 2006. The changes in our total long term financial liabilities is primarily due to the impact of our acquisitions, offset by our issuance of Trust Units and the net cash surplus of cash from operating activities over our distributions to Unitholders.
| |
| |
Management’s Discussion and Analysis | |
| |
CRITICAL ACCOUNTING ESTIMATES
There are a number of critical estimates underlying the accounting policies applied when preparing the consolidated financial statements due to timing differences between when certain activities take place and when these activities are reported. Changes in these estimates could have a material impact on our reported results.
Reserves
The process of estimating reserves is complex. It requires significant judgments and decisions based on available geological, geophysical, engineering and economic data. In the process of estimating the economically recoverable oil and natural gas reserves and related future net cash flows, we incorporate many factors and assumptions, such as:
| |
• | Expected reservoir characteristics based on geological, geophysical and engineering assessments; |
| |
• | Future production rates based on historical performance and expected future operating and investment activities; |
| |
• | Future oil and gas prices and quality differentials; and |
| |
• | Future development costs. |
We follow the full cost method of accounting for our oil and natural gas activities. All costs of acquiring oil and natural gas properties and related exploration and development costs, including overhead charges directly related to these activities, are capitalized and accumulated in one cost centre. Maintenance and repairs are charged against income, and renewals and enhancements that extend the economic life of the capital assets are capitalized. The provision for depletion and depreciation of petroleum and natural gas assets is calculated on the unit-of-production method, based on proved reserves as estimated by independent petroleum engineers.
Reserve estimates impact net income through depletion, the determination of asset retirement obligations and the application of an impairment test. Revisions or changes in the reserve estimates can have either a positive or a negative impact on net income, capital assets and asset retirement obligations.
Asset Retirement Obligations
In the determination of our asset retirement obligations, management is required to make a significant number of estimates with respect to activities that will occur in many years to come. In arriving at the recorded amount of the asset retirement obligation numerous assumptions are made with respect to ultimate settlement amounts, inflation factors, credit adjusted risk free discount rates, timing of settlement and expected changes in legal, regulatory, environmental and political environments. The asset retirement obligation also results in an increase to the carrying cost of capital assets. The obligation accretes to a higher amount with the passage of time as it is determined using discounted present values. A change in any one of the assumptions could impact the estimated future obligation and in return, net income. It is difficult to determine the impact of a change in any one of our assumptions. As a result, a reasonable sensitivity analysis cannot be performed.
Impairment of Capital Assets
Numerous estimates and judgments are involved in determining any potential impairment of capital assets. The most significant assumptions in determining future cash flows are future prices and reserves for our upstream operations and expected future refining margins for our downstream operations.
The estimates of future prices and refining margins require significant judgments about highly uncertain future events. Historically, oil, natural gas and refined product prices have exhibited significant volatility. The prices used in carrying out our impairment tests for each operating segment are based on prices derived from a consensus of future price forecasts among industry analysts. Given the number of significant assumptions required and the possibility that actual conditions will differ, we consider the assessment of impairment to be a critical accounting estimate.
If forecast WTI crude oil prices were to fall by 20%, the initial assessment of impairment of our upstream assets would not change; however, below that level, we would likely experience an impairment. Although oil and natural gas prices fluctuate a great deal in the short-term, they are typically stable over a longer time horizon. This mitigates potential for impairment. Similarly, for our downstream operations, if forecast refining margins were to fall by more than 25%, it is likely that our downstream assets would experience an impairment despite the expected seasonal volatility in earnings.
Reductions in estimated future prices may also have an impact on estimates of economically recoverable proved reserves.
Any impairment charges would reduce our net income.
| |
| |
| Management’s Discussion and Analysis |
| |
It is difficult to determine and assess the impact of a decrease in our proved reserves on our impairment tests. The relationship between the reserve estimate and the estimated undiscounted cash flows is complex. As a result, we are unable to provide a reasonable sensitivity analysis of the impact that a reserve estimate decrease would have on our assessment of impairment.
Goodwill
Goodwill is recorded on a business combination when the total purchase consideration exceeds the fair value of the net identifiable assets and liabilities of the acquired entity. The goodwill balance is not amortized, however, must be assessed for impairment at least annually. Impairment is initially determined based on the fair value of a reporting unit compared to its book value. Any impairment must be charged to earnings in the period the impairment occurs. Harvest has a goodwill balance for each of our upstream and downstream operations. As at December 31, 2007, we have determined there was no goodwill impairment in either of our reporting units.
Employee Future Benefits
We maintain a defined benefit pension plan for the employees of North Atlantic. Obligations under employee future benefit plans are recorded net of plan assets where applicable. An independent actuary determines the costs of our employee future benefit programs using the projected benefit method. The determination of these costs requires management to estimate or make assumptions regarding the expected plan investment performance, salary escalation, retirement ages of employees, expected health care costs, employee turnover, discount rates and return on plan assets. The obligation and expense recorded related to our employee future benefit plans could increase or decrease if there were to be a change in these estimates. Pension expense represented less than 0.5% of our total expenses for 2007 (0.5% in 2006).
Purchase Price Allocations
Business acquisitions are accounted for by the purchase method of accounting. Under this method, the purchase price is allocated to the assets acquired and the liabilities assumed based on the fair values at the time of the acquisitions. The excess of the purchase price over the assigned fair values of the identifiable assets and liabilities is allocated to goodwill. In determining the fair value of the assets and liabilities we are often required to make assumptions and estimates about future events, such as future oil and gas prices, refining margins and discount rates. Changes in any of these assumptions would impact amounts assigned to assets and liabilities and goodwill in the purchase price allocation and as a result, future net earnings.
RECENT CANADIAN ACCOUNTING AND RELATED PRONOUNCEMENTS
Convergence of Canadian GAAP with International Financial Reporting Standards
In early 2007, Canada’s Accounting Standards Board (“AcSB”) issued a decision summary with respect to a previously issued strategic plan that will result in Canadian GAAP, as used by public companies, being converged with International Financial Reporting Standards (“IFRS”). In early 2008, it was confirmed by the AcSB that the transitions date from Canadian GAAP to IFRS will be January 1, 2011. We are currently evaluating our options with respect to this change and accordingly it is premature to assess the impact of the initiative, if any, on our financial statements at this time.
Financial Instruments – Disclosures and Presentation
On December 1, 2006, the AcSB issued the following two new standards regarding the disclosure and presentation of financial instruments with an implementation date for annual and interim financial statements beginning on or after October 1, 2007.
| |
• | Section 3862 –Financial Instruments – Disclosures |
| |
| This standard requires entities to provide disclosures in their financial statements that enable users to evaluate the significance of financial instruments to the entity’s financial position and performance. It also requires that entities disclose the nature and extent of risks arising from financial instruments and how the entity manages those risks. |
| |
• | Section 3863 –Financial Instruments – Presentation |
| |
| This standard establishes standards for presentation of financial instruments and non-financial derivatives and deals with the classification of financial instruments, from the perspective of the issuer, between liabilities and equity, the classification of related interest, dividends, losses and gains, and the circumstances in which financial assets and financial liabilities are offset. |
Also on December 1, 2006, the AcSB issued a new standard regardingCapital Disclosurerequiring the disclosure of information about an entity’s objectives, policies and processes for managing capital; quantitative data about what the entity regards as capital; whether the entity has complied with any externally imposed capital requirements; and if it has not complied, the consequences of such non-compliance. This standard also has an implementation date for annual and interim financial statements beginning on or after October 1, 2007.
| |
| |
Management’s Discussion and Analysis | |
| |
In June 2007, the AcSB issued section 3031, Inventories, which replaces the existing inventories standard. This new standard provides additional guidance with respect to the measurement and disclosure requirements for inventories, requiring inventories to be valued at the lower of cost and net realizable value. This standard is to be adopted for fiscal years beginning on or after January 1, 2008. We do not expect the adoption of this section to have a material impact on our net income or financial position.
In February 2008, the CICA issued Section 3064, Goodwill and Intangible Assets, replacing Section 3062 Goodwill and Other Intangible Assets and Section 3450, Research and Development Costs. The new Section will be effective on January 1, 2009. Section 3062 establishes standards for the recognition, measurement, presentation and disclosure of goodwill and intangible assets subsequent to its initial recognition. Standards concerning goodwill are unchanged from the standards included in the previous Section 3062. We are currently evaluating the impact of the adoption of this new Section, however do not expect a material impact on our Consolidated Financial Statements.
OPERATIONAL AND OTHER BUSINESS RISKS
Our financial and operating performance is subject to risks and uncertainties which include, but are not limited to: upstream operations, downstream operations, reserve estimates, commodity prices, ability to obtain financing, environmental, health and safety risk, regulatory risk, disruptions in the supply of crude oil and delivery of refined products, employee relations, and other risks specifically discussed previously in this MD&A. We intend to continue executing our business plan to create value for Unitholders by paying stable monthly distributions and increasing the net asset value per Trust Unit. All of our risk management activities are carried out under policies approved by the Board of Directors of Harvest Operations, and are intended to mitigate the risks noted above as follows:
The following summarizes the more significant risks of our upstream and downstream operations. See our Annual Information Form for a full description of these risks as well as risks associated with our royalty trust structure.
Operation of oil and natural gas properties:
| |
• | Applying a proactive management approach to our properties; |
| |
• | Selectively adding skilled and experienced employees and providing encouragement and opportunities to maintain and improve technical competence; and |
Operation of a refining and petroleum marketing business:
| |
• | Maintaining a proactive approach to managing the supply of feedstock and sale of refined products (including the Supply and Offtake Agreement with Vitol Refining S.A.) to ensure the continuity of supply of crude oil to the refinery and the delivery of refined products from the refinery; |
| |
• | Allocating sufficient resources to ensure good relations are maintained with our non-unionized and unionized work force; and |
| |
• | Selectively adding experienced refining management to further strengthen our “in-house” management team. |
Estimates of the quantity of recoverable reserves:
| |
• | Acquiring oil and natural gas properties that have high-quality reservoirs combined with mature, predictable and reliable production and thus reduce technical uncertainty; |
| |
• | Subjecting all property acquisitions to rigorous operational, geological, financial and environmental review; and |
| |
• | Pursuing a capital expenditure program to reduce production decline rates, improve operating efficiency and increase ultimate recovery of the resource-in-place. |
Commodity price exposures:
| |
• | Maintaining a risk-management policy and committee to continuously review effectiveness of existing actions, identify new or developing issues and devise and recommend to the Board of Directors of Harvest Operations action to be taken; |
| |
• | Executing risk management contracts with a portfolio of credit-worthy counterparties; |
| |
• | Maintaining an efficient cost structure to maximize product netbacks; and |
| |
• | Limiting the period of exposure to price fluctuations between crude oil prices and product prices by entering into contracts such that crude oil feedstock will be priced based on the price at or near the time of delivery to the refinery, which may be as much as 24 days subsequent to the time the feedstock is initially loaded onto the shipping vessel. Thereby, minimizing the time between the pricing of the feedstock and the refined products with the objective of maintaining margins. |
| |
| |
| Management’s Discussion and Analysis |
| |
Financial risk:
| |
• | Monitoring financial markets to ensure the cost of debt and equity capital is kept as low as reasonably possible; |
| |
• | Retaining a portion of cash flows to finance capital expenditures and future property acquisitions; and |
| |
• | Carrying adequate insurance to cover property and business interruption losses. |
Environmental, health and safety risks:
| |
• | Adhering to our safety programs and keeping abreast of current industry practices for both the oil and natural gas industry as well as the refining industry; and |
| |
• | Committing funds on an ongoing basis toward the remediation of potential environmental issues. |
Changing government policy, including revisions to royalty legislation, income tax laws, and incentive programs related to theoil and natural gas industry:
| |
• | Retaining an experienced, diverse and actively involved Board of Directors to ensure good corporate governance; and |
| |
• | Engaging technical specialists when necessary to advise and assist with the implementation of policies and procedures to assist in dealing with the changing regulatory environment. |
CHANGES IN REGULATORY ENVIRONMENT
On October 25, 2007, the Government of Alberta released its New Royalty Framework outlining changes that effective January 1, 2009 will increase the royalty rates on conventional oil and gas, oil sands and coalbed methane using a price-sensitive and volume-sensitive sliding rate formula for both conventional oil and natural gas. While there are considerable details to be provided, our preliminary assessment is that the impact of the changes on Harvest will be modest, as many of our oil and natural gas wells will be considered low productivity wells that continue to attract favourable royalty treatment. Based on the information available and assuming royalties will continue to be based on field gate prices realized by producers, our analysis indicates that if our field gate prices are less than $53.00, our oil royalties will be lower and if prices are higher, our royalties will increase and similarly for natural gas, if our gas plant prices are less than $7.00, our royalties will be lower and if prices are higher, our royalties will increase. Of particular concern is the royalty rates on natural gas where production from recently drilled wells may qualify as high productivity for a period of time and attract a royalty that is 15% to 20% higher than under the current royalty regime and this could significantly penalize the economics of our drilling natural gas wells. Generally, we will pay higher royalties if commodity prices are high and lower royalties on most of our wells as they will be considered to be low productivity wells.
In 2007, the Government of Alberta introduced the Climate Change and Emissions Management Amendment Act which intends to reduce greenhouse gas emissions intensity from large emitting facilities. On January 24, 2008, the Government of Alberta announced their plan to reduce projected emissions in the province by 50% under the new climate change plan by 2050. This will result in real reductions of 14% below 2005 levels. The Government of Alberta stated they will form a government-industry council to determine a go-forward plan for implementing technologies, which will significantly reduce greenhouse gas emissions by capturing air emissions from industrial sources and locking them permanently underground in deep rock formations.
In 2002, the Government of Canada ratified the Kyoto Protocol which calls for Canada to reduce its greenhouse gas emissions to specified levels. On April 26, 2007, the Government of Canada released its Action Plan to Reduce Greenhouse Gases and Air Pollution (the “Action Plan”) which includes a regulatory framework for air emissions. This Action Plan is to regulate the fuel efficiency of vehicles and the strengthening of energy standards for a number of energy-using products. On March 10, 2008, the Government of Canada released “Turning the Corner” outlining additional details to implement their April 2007 commitment to cut greenhouse gas emissions by an absolute 20% by 2020. “Turning the Corner” sets out a framework to establish a market price for carbon emissions and sets up a carbon emission trading market to provide incentives for Canadians to reduce their greenhouse gas emissions. In addition, the regulations include new measures for oil sands developers that require an 18% reduction from 2006 levels by 2010 for existing operations and for oil sands operations commencing in 2012, a carbon capture and storage capability. There is no mention of targeting reductions for unintentional fugitive emissions for conventional producers. Companies will be able to choose the most cost effective way to meet their emissions reduction targets from in-house reductions, contributions to time-limited technology funds, domestic emissions trading and the United Nations’ Clean Development Mechanism. Companies that have already reduced their greenhouse gas emissions prior to 2006 will have access to a limited one-time credit for early adoption. Giving the evolving nature of the debate related to climate change and the control of greenhouse gases and resulting requirements, and the lack of detail in the Government of Canada’s announcement, it is not possible to assess the impact of the requirements on our operations and financial performance.
| |
| |
Management’s Discussion and Analysis | |
| |
NON-GAAP MEASURES
Throughout this MD&A we have referred to certain measures of financial performance that are not specifically defined under Canadian GAAP. Cash G&A and Operating Netbacks are non-GAAP measures used extensively in the Canadian energy trust sector for comparative purposes. Cash G&A are G&A expenses excluding the effect of our unit based compensation plans, while Operating Netbacks are always reported on a per boe basis, and include gross revenue, royalties, operating expenses, and transportation and marketing expenses. Gross Margin is commonly used in the refining industry to reflect the net funds received from the sale of refined products after considering the cost to purchase the feedstock and is calculated by deducting purchased products for resale and processing from total revenue. Earnings From Operations is also commonly used in the petroleum and natural gas and refining industries to reflect operating results before items not directly related to operations.
Disclosure Controls and Procedures and Internal Control over Financial Reporting
Under the supervision of our Chief Executive Officer and Chief Financial Officer, we have evaluated the effectiveness of our disclosure controls and procedures as of December 31, 2007 as defined under the rules adopted by the Canadian securities regulatory authorities and the US Securities and Exchange Commission. Based on this evaluation, our Chief Executive Officer and Chief Financial Officer have concluded that as of December 31, 2007, our disclosure controls and procedures were effective to ensure that information required to be disclosed by Harvest in reports it files or submits to Canadian and US securities authorities was recorded, processed, summarized and reported within the time period specified in Canadian and US securities laws and was accumulated and communicated to Harvest’s management, including its Chief Executive Officer and Chief Financial Officer, to allow timely decisions regarding required disclosures.
Management is responsible for establishing and maintaining internal control over our financial reporting. Our internal control is designed to provide reasonable assurance regarding the reliability of financial reporting and preparation of financial statements for external purposes in accordance with Canadian Generally Accepted Accounting Principles. Management, with the participation of our Chief Executive Officer and Chief Financial Officer, has evaluated in the effectiveness of our internal control over financial reporting as of December 31, 2007. The evaluation was based on the Internal Control - Integrated Framework issued by the Committee of Sponsoring Organizations of the Treadway Commission. Based on that evaluation, management has concluded that as of December 31, 2007, we had effective internal control over financial reporting.
The effectiveness of our internal control over financial reporting as of December 31, 2007 was audited by KPMG, an independent registered public accounting firm, as stated in their report, which is included in our audited consolidated financial statements for the year ended December 31, 2007.
During the year ended December 31, 2007, there were no changes in our internal control over financial reporting that have materially affected, or are reasonably likely to materially affect, our internal control over financial reporting except for the appointment of a Chief Operating Officer - Downstream. The appointment enhanced our oversight of these operations.
Based on their inherent limitations, disclosure controls and procedures and internal controls over financial reporting may not prevent or detect misstatements, errors or fraud. Control systems, no matter now well conceived or operated, can provide only reasonable, but not absolute, assurance that the objectives of the control systems are met.
ADDITIONAL INFORMATION
Further information about us, including our Annual Information Form, can be accessed under our public filings found on SEDAR at www.sedar.com or at www.harvestenergy.ca. Information can also be found by contacting our Investor Relations department at (403) 265-1178 or at 1-866-666-1178.
| |
| |
| Consolidated Financial Statements |
| |
MANAGEMENT’S REPORT
In management’s opinion, the accompanying consolidated financial statements of Harvest Energy Trust (the “Trust”) have been prepared within reasonable limits of materiality and in accordance with Canadian generally accepted accounting principles. Since a precise determination of many assets and liabilities is dependent on future events, the preparation of financial statements necessarily involves the use of estimates and approximations. These have been made using careful judgment and with all information available up to March 12, 2008. Management is responsible for all information in the annual report and for the consistency, therewith, of all other financial and operating data presented in this report.
To meet its responsibility for reliable and accurate financial statements, management has established and monitors systems of internal control which are designed to provide reasonable assurance that financial information is relevant, reliable and accurate, and that assets are safeguarded and transactions are executed in accordance with management’s authorization.
Under the supervision of our Chief Executive Officer and our Chief Financial Officer we have conducted an evaluation of the effectiveness of our internal control over financial reporting based on theInternal Control-Integrated Frameworkissued by the Committee of Sponsoring Organizations of the Treadway Commission (COSO). We have concluded that as of December 31, 2007, our internal controls over financial reporting were effective.
Because of inherent limitations, internal control over financial reporting may not prevent or detect misstatements and even those systems determined to be effective can provide only reasonable assurance with respect to the financial statement preparation and presentation.
The consolidated financial statements and the Trusts’ internal control over financial reporting have been examined by KPMG LLP, Independent Registered Public Accountants. Their responsibility is to express a professional opinion on the fair presentation of the consolidated financial statements in accordance with Canadian generally accepted accounting principles. The Independent Registered Public Accountants Report outlines the scope of their examination and sets forth their opinion.
The Audit Committee, consisting exclusively of independent directors, has reviewed these statements with management and the Independent Registered Public Accountants and has recommended their approval to the Board of Directors. The Board of Directors has approved the consolidated financial statements of the Trust.
| |

| 
|
|
John E. Zahary | Robert W. Fotheringham |
President and Chief Executive Officer | Chief Financial Officer |
Calgary, Alberta
March 12, 2008
| |
| |
Consolidated Financial Statements | |
| |
REPORT OF INDEPENDENT REGISTERED PUBLIC ACCOUNTING FIRM
To the Board of Directors of Harvest Operations Corp. on behalf of Harvest Energy Trust and
the Unitholders of Harvest Energy Trust
We have audited Harvest Energy Trust’s (“the Trust”) internal control over financial reporting as of December 31, 2007, based on the criteria established inInternal Control — Integrated Frameworkissued by the Committee of Sponsoring Organizations of the Treadway Commission (COSO). The Trust’s management is responsible for maintaining effective internal control over financial reporting and for its assessment of the effectiveness of internal control over financial reporting included in the accompanying Management’s Report. Our responsibility is to express an opinion on the Trust’s internal control over financial reporting based on our audit.
We conducted our audit in accordance with the standards of the Public Company Accounting Oversight Board (United States). Those standards require that we plan and perform the audit to obtain reasonable assurance about whether effective internal control over financial reporting was maintained in all material respects. Our audit included obtaining an understanding of internal control over financial reporting, assessing the risk that a material weakness exists and testing and evaluating the design and operating effectiveness of internal control based on the assessed risk. Our audit also included such other procedures as we considered necessary in the circumstances. We believe that our audit provides a reasonable basis for our opinion.
An entity’s internal control over financial reporting is a process designed to provide reasonable assurance regarding the reliability of financial reporting and the preparation of financial statements for external purposes in accordance with generally accepted accounting principles. An entity’s internal control over financial reporting includes those policies and procedures that (1) pertain to the maintenance of records that, in reasonable detail, accurately and fairly reflect the transactions and dispositions of the assets of the entity; (2) provide reasonable assurance that transactions are recorded as necessary to permit preparation of financial statements in accordance with generally accepted accounting principles, and that receipts and expenditures of the entity are being made only in accordance with authorizations of management and directors of the entity; and (3) provide reasonable assurance regarding prevention or timely detection of unauthorized acquisition, use, or disposition of the entity’s assets that could have a material effect on the financial statements.
Because of its inherent limitations, internal control over financial reporting may not prevent or detect misstatements. Also, projections of any evaluation of effectiveness to future periods are subject to the risk that controls may become inadequate because of changes in conditions, or that the degree of compliance with the policies or procedures may deteriorate.
In our opinion, the Trust maintained, in all material respects, effective internal control over financial reporting as of December 31, 2007, based on the criteria established inInternal Control — Integrated Frameworkissued by the Committee of Sponsoring Organizations of the Treadway Commission (COSO).
We also have conducted our audits on the consolidated financial statements in accordance with Canadian generally accepted auditing standards. With respect to the years ended December 31, 2007 and 2006, we also have conducted our audit in accordance with the standards of the Public Company Accounting Oversight Board (United States). Our report dated March 12, 2008, expressed an unqualified opinion on those consolidated financial statements.

KPMG LLP
Chartered Accountants
Calgary, Canada
March 12, 2008
| |
| |
| Consolidated Financial Statements |
| |
AUDITORS’ REPORT
To the Unitholders of Harvest Energy Trust
We have audited the consolidated balance sheets of Harvest Energy Trust (the “Trust”) as at December 31, 2007 and 2006 and the consolidated statements of income and comprehensive (loss) income, unitholders’ equity and cash flows for the years then ended. These financial statements are the responsibility of the Trust’s management. Our responsibility is to express an opinion on these financial statements based on our audits.
We conducted our audits in accordance with Canadian generally accepted auditing standards. With respect to the consolidated financial statements for the years ended December 31, 2007 and 2006, we also conducted our audit in accordance with the standards of the Public Company Accounting Oversight Board (United States). Those standards require that we plan and perform an audit to obtain reasonable assurance whether the financial statements are free of material misstatement. An audit includes examining, on a test basis, evidence supporting the amounts and disclosures in the financial statements. An audit also includes assessing the accounting principles used and significant estimates made by management, as well as evaluating the overall financial statement presentation.
In our opinion, these consolidated financial statements present fairly, in all material respects, the financial position of the Trust as at December 31, 2007 and 2006 and the results of its operations and its cash flows for the years then ended in accordance with Canadian generally accepted accounting principles.
We also have audited, in accordance with the standards of the Public Company Accounting Oversight Board (United States), the Trust’s internal control over financial reporting as of December 31, 2007, based on the criteria established inInternalControl — Integrated Frameworkissued by the Committee of Sponsoring Organizations of the Treadway Commission (COSO), and our report dated March 12, 2008 expressed an unqualified opinion on the effectiveness of the internal control over financial reporting.
KPMG LLP
Chartered Accountants
Calgary, Canada
March 12, 2008
COMMENTS BY AUDITORS FOR UNITED STATES READERS ON CANADA –
UNITED STATES REPORTING DIFFERENCES
In the United States, reporting standards for auditors require the addition of an explanatory paragraph (following the opinion paragraph) when there is a change in accounting principles that has a material effect on the comparability of the Trust’s financial statements, such as the change described in note 3 to the consolidated financial statements as at December 31, 2007 and 2006 and for the years then ended. Our report to the unitholders dated March 12, 2008, is expressed in accordance with Canadian reporting standards, which do not require a reference to such a change in accounting principles in the auditors’ report when the change is properly accounted for and adequately disclosed in the financial statements.
KPMG LLP
Chartered Accountants
Calgary, Canada
March 12, 2008
| |
| |
Consolidated Financial Statements | |
| |
CONSOLIDATED BALANCE SHEETS
As at December 31
| | | | | | | | |
| | | | | | | | | |
|
(thousands of Canadian dollars) | | | 2007 | | | | 2006 | |
| | | | | | | | | |
ASSETS | | | | | | | | |
Current assets | | | | | | | | |
Cash | | $ | - | | | $ | 10,006 | |
Accounts receivable and other | | | 215,803 | | | | 257,131 | |
Fair value of risk management contracts[Note 18] | | | 16,442 | | | | 17,914 | |
Prepaid expenses and deposits | | | 15,144 | | | | 12,713 | |
Inventories[Note 5] | | | 58,934 | | | | 23,792 | |
| | | | | | | | | |
| | | 306,323 | | | | 321,556 | |
| | | | | | | | |
Deferred charges and other non-current assets[Note 8] | | | - | | | | 25,067 | |
Fair value of risk management contracts[Note 18] | | | - | | | | 9,843 | |
Property, plant and equipment[Note 6] | | | 4,197,507 | | | | 4,400,552 | |
Intangible assets[Note 7] | | | 95,075 | | | | 122,362 | |
Goodwill[Note 4] | | | 852,778 | | | | 866,178 | |
| | | | | | | | | |
| | $ | 5,451,683 | | | $ | 5,745,558 | |
| | | | | | | | | |
| | | | | | | | |
LIABILITIES AND UNITHOLDERS’ EQUITY | | | | | | | | |
Current liabilities | | | | | | | | |
Accounts payable and accrued liabilities[Note 9] | | $ | 270,243 | | | $ | 294,582 | |
Cash distribution payable | | | 44,487 | | | | 46,397 | |
Current portion of convertible debentures[Note 12] | | | 24,273 | | | | - | |
Fair value deficiency of risk management contracts[Note 18] | | | 131,020 | | | | 26,764 | |
| | | | | | | | | |
| | | 470,023 | | | | 367,743 | |
| | | | | | | | | |
| | | | | | | | |
Bank loan[Note 11] | | | 1,279,501 | | | | 1,595,663 | |
77/8% Senior notes[Note 13] | | | 241,148 | | | | 291,350 | |
Convertible debentures[Note 12] | | | 627,495 | | | | 601,511 | |
Fair value deficiency of risk management contracts[Note 18] | | | 35,095 | | | | 2,885 | |
Asset retirement obligation[Note 10] | | | 213,529 | | | | 202,480 | |
Employee future benefits[Note 17] | | | 12,168 | | | | 12,227 | |
Deferred credit | | | 710 | | | | 794 | |
Future income tax[Note 16] | | | 86,640 | | | | - | |
| | | | | | | | |
Unitholders’ equity | | | | | | | | |
Unitholders’ capital[Note 14] | | | 3,736,080 | | | | 3,046,876 | |
Equity component of convertible debentures | | | 39,537 | | | | 36,070 | |
Accumulated income | | | 246,865 | | | | 271,155 | |
Accumulated distributions | | | (1,340,349 | ) | | | (730,069 | ) |
Accumulated other comprehensive (loss) income[Note 3] | | | (196,759 | ) | | | 46,873 | |
| | | | | | | | | |
| | | 2,485,374 | | | | 2,670,905 | |
| | | | | | | | | |
| | $ | 5,451,683 | | | $ | 5,745,558 | |
| | | | | | | | | |
Commitments, contingencies and guarantees [Note 20].
Subsequent events [Note 22].
See accompanying notes to these consolidated financial statements.
Approved by the Board of Directors:
| |

| 
|
Hector J. McFadyen | Verne G. Johnson |
Director | Director |
| |
| |
| Consolidated Financial Statements |
| |
CONSOLIDATED STATEMENTS OF INCOME (LOSS) AND
COMPREHENSIVE INCOME (LOSS)
For the Years Ended December 31
| | | | | | | | |
| | | | | | | |
|
(thousands of Canadian dollars, except per Trust Unit amounts) | | 2007 | | | 2006 | |
| | | | | | | | | |
REVENUE | | | | | | | | |
Petroleum, natural gas, and refined product sales | | $ | 4,283,013 | | | $ | 1,580,934 | |
Royalty expense | | | (213,413 | ) | | | (200,109 | ) |
| | | | | | | | | |
| | | 4,069,600 | | | | 1,380,825 | |
| | | | | | | | |
EXPENSES | | | | | | | | |
Purchased products for processing and resale | | | 2,667,714 | | | | 386,014 | |
Operating | | | 530,208 | | | | 276,537 | |
Transportation and marketing | | | 46,916 | | | | 17,202 | |
General and administrative[Note 15] | | | 36,328 | | | | 28,372 | |
Transaction costs | | | - | | | | 12,072 | |
Realized net losses on risk management contracts | | | 26,291 | | | | 44,808 | |
Unrealized net losses (gains) on risk management contracts | | | 147,781 | | | | (52,179 | ) |
Interest and other financing charges on short term debt, net | | | 5,584 | | | | 4,864 | |
Interest and other financing charges on long term debt | | | 152,201 | | | | 78,828 | |
Depletion, depreciation, amortization and accretion | | | 526,741 | | | | 429,470 | |
Foreign exchange loss (gain) | | | (109,316 | ) | | | 21,100 | |
Large corporations tax and other tax | | | (974 | ) | | | (9 | ) |
Future income tax expense (recovery)[Note 16] | | | 65,802 | | | | (2,300 | ) |
| | | | | | | | | |
| | | 4,095,276 | | | | 1,244,779 | |
| | | | | | | | | |
NET INCOME (LOSS) FOR THE YEAR | | | (25,676 | ) | | | 136,046 | |
| | | | | | | | |
Cumulative Translation Adjustment | | | (243,632 | ) | | | - | |
| | | | | | | | | |
COMPREHENSIVE INCOME (LOSS) FOR THE PERIOD[Note 3] | | $ | (269,308 | ) | | $ | 136,046 | |
| | | | | | | | | |
| | | | | | | | |
Net income per Trust Unit, basic[Note 14] | | $ | (0.19 | ) | | $ | 1.34 | |
Net income per Trust Unit, diluted[Note 14] | | $ | (0.19 | ) | | $ | 1.33 | |
| | | | | | | | | |
See accompanying notes to these consolidated financial statements.
| |
| |
Consolidated Financial Statements | |
| |
|
CONSOLIDATED STATEMENTS OF UNITHOLDERS’ EQUITY |
|
For the Years Ended December 31 |
| | | | | | | | | | | | | | | | | | | |
| | | | | | | | | | | | | | | | | | | | |
(thousands of Canadian dollars) | | Unitholders’
Capital | | Equity
Component
of Convertible
Debentures | | Accumulated
Income | | Accumulated
Distributions | | Accumulated
Other
Comprehensive
(Loss) Income
[Note 3] | | Total | |
| | | | | | | | | | | | | | |
At December 31, 2005 | | $ | 747,312 | | $ | 2,639 | | $ | 135,665 | | $ | (261,282 | ) | $ | - | | $ | 624,334 | |
Issued in exchange for assets of Viking | | | | | | | | | | | | | | | | | | | |
[Note 4(e)] | | | 1,638,131 | | | - | | | - | | | - | | | - | | | 1,638,131 | |
Issued for cash | | | | | | | | | | | | | | | | | | | |
August 17, 2006 | | | 230,118 | | | - | | | - | | | - | | | - | | | 230,118 | |
November 22, 2006 | | | 258,848 | | | - | | | - | | | - | | | - | | | 258,848 | |
Equity component of convertible debenture issuances | | | | | | | | | | | | | | | | | | | |
10.5% Debentures Due 2008 | | | - | | | 9,301 | | | - | | | - | | | - | | | 9,301 | |
6.40% Debentures Due 2012 | | | - | | | 14,822 | | | - | | | - | | | - | | | 14,822 | |
7.25% Debentures Due 2013 | | | - | | | 11,800 | | | - | | | - | | | - | | | 11,800 | |
Convertible debenture conversions | | | | | | | | | | | | | | | | | | | |
9% Debentures Due 2009 | | | 551 | | | - | | | - | | | - | | | - | | | 551 | |
8% Debentures Due 2009 | | | 1,550 | | | (12 | ) | | - | | | - | | | - | | | 1,538 | |
6.5% Debentures Due 2010 | | | 3,563 | | | (223 | ) | | - | | | - | | | - | | | 3,340 | |
10.5% Debentures Due 2008 | | | 10,761 | | | (2,238 | ) | | - | | | - | | | - | | | 8,523 | |
6.40% Debentures Due 2012 | | | 231 | | | (19 | ) | | - | | | - | | | - | | | 212 | |
Exchangeable share retraction | | | 2,648 | | | - | | | (556 | ) | | - | | | - | | | 2,092 | |
Exercise of unit appreciation rights and other | | | 12,034 | | | - | | | - | | | - | | | - | | | 12,034 | |
Issue costs | | | (26,414 | ) | | - | | | - | | | - | | | - | | | (26,414 | ) |
Foreign currency translation adjustment | | | - | | | - | | | - | | | - | | | 46,873 | | | 46,873 | |
Net income | | | - | | | - | | | 136,046 | | | - | | | - | | | 136,046 | |
Distributions and distribution reinvestment plan | | | 167,543 | | | - | | | - | | | (468,787 | ) | | - | | | (301,244 | ) |
| | | | | | | | | | | | | | | | | | | | |
At December 31, 2006 [Note 3] | | | 3,046,876 | | | 36,070 | | | 271,155 | | | (730,069 | ) | | 46,873 | | | 2,670,905 | |
Adjustment arising from change in accounting policies [Note 3] | | | (49 | ) | | - | | | 1,386 | | | - | | | - | | | 1,337 | |
Issued for cash | | | | | | | | | | | | | | | | | | | |
February 1, 2007 | | | 143,834 | | | - | | | - | | | - | | | - | | | 143,834 | |
June 1, 2007 | | | 230,029 | | | - | | | - | | | - | | | - | | | 230,029 | |
Equity component of convertible debenture issuances | | | | | | | | | | | | | | | | | | | |
7.25% Debentures Due 2014 | | | - | | | 13,100 | | | - | | | - | | | - | | | 13,100 | |
Convertible debenture conversions | | | | | | | | | | | | | | | | | | | |
9% Debentures Due 2009 | | | 250 | | | - | | | - | | | - | | | - | | | 250 | |
8% Debentures Due 2009 | | | 513 | | | (4 | ) | | - | | | - | | | - | | | 509 | |
6.5% Debentures Due 2010 | | | 882 | | | (55 | ) | | - | | | - | | | - | | | 827 | |
10.5% Debentures Due 2008 | | | 2,999 | | | (627 | ) | | - | | | - | | | - | | | 2,372 | |
6.40% Debentures Due 2012 | | | 122 | | | (10 | ) | | - | | | - | | | - | | | 112 | |
7.25% Debentures Due 2013 | | | 244 | | | (8 | ) | | - | | | - | | | - | | | 236 | |
7.25% Debentures Due 2014 | | | 157,139 | | | (8,929 | ) | | - | | | - | | | - | | | 148,210 | |
Exercise of unit appreciation rights and other | | | 658 | | | - | | | - | | | - | | | - | | | 658 | |
Issue costs | | | (25,906 | ) | | - | | | - | | | - | | | - | | | (25,906 | ) |
Foreign currency translation adjustment | | | - | | | - | | | - | | | - | | | (243,632 | ) | | (243,632 | ) |
Net income | | | - | | | - | | | (25,676 | ) | | - | | | - | | | (25,676 | ) |
Distributions and distribution reinvestment plan | | | 178,489 | | | - | | | - | | | (610,280 | ) | | - | | | (431,791 | ) |
| | | | | | | | | | | | | | | | | | | | |
At December 31, 2007 | | $ | 3,736,080 | | $ | 39,537 | | $ | 246,865 | | $ | (1,340,349 | ) | $ | (196,759 | ) | $ | 2,485,374 | |
| | | | | | | | | | | | | | | | | | | | |
See accompanying notes to these consolidated financial statements.
| |
| |
| Consolidated Financial Statements |
| |
|
CONSOLIDATED STATEMENTS OF CASH FLOWS |
|
For the Years Ended December 31 |
| | | | | | | | |
| | | | | | | | | |
| | | | | | | | |
(thousands of Canadian dollars) | | 2007 | | | 2006 | |
| | | | | | | |
Cash provided by (used in) | | | | | | | | |
OPERATING ACTIVITIES | | | | | | | | |
Net (loss) income for the year | | $ | (25,676 | ) | | $ | 136,046 | |
Items not requiring cash | | | | | | | | |
Depletion, depreciation, amortization and accretion | | | 526,741 | | | | 429,470 | |
Unrealized foreign exchange loss (gain) | | | (55,725 | ) | | | 23,956 | |
Non-cash interest expense | | | 7,534 | | | | 1,577 | |
Amortization of deferred finance charges | | | 4,509 | | | | 8,432 | |
Unrealized loss (gain) on risk management contracts[Note 18] | | | 147,781 | | | | (52,179 | ) |
Future income tax expense (recovery) | | | 65,802 | | | | (2,300 | ) |
Non-controlling interest | | | - | | | | (65 | ) |
Unit based compensation expense | | | 743 | | | | 775 | |
Amortization of office lease premiums and deferred rent expense | | | 139 | | | | (161 | ) |
Employee benefit obligation | | | (61 | ) | | | (328 | ) |
Settlement of asset retirement obligations[Note 10] | | | (13,090 | ) | | | (9,186 | ) |
Change in non-cash working capital | | | (17,384 | ) | | | (28,152 | ) |
| | | | | | | | | |
| | | 641,313 | | | | 507,885 | |
| | | | | | | | | |
| | | | | | | | |
FINANCING ACTIVITIES | | | | | | | | |
Issue of Trust Units, net of issue costs | | | 354,549 | | | | 463,160 | |
Issue of convertible debentures, net of issue costs[Note 12] | | | 220,488 | | | | 363,742 | |
Redemption of exchangeable shares | | | - | | | | (1,022 | ) |
Bank borrowings (repayments), net [Note 11] | | | (291,947 | ) | | | 1,452,138 | |
Financing costs | | | (273 | ) | | | (13,071 | ) |
Cash distributions | | | (433,699 | ) | | | (273,391 | ) |
Change in non-cash working capital | | | (1,223 | ) | | | (12,604 | ) |
| | | | | | | | | |
| | | (152,105 | ) | | | 1,978,952 | |
| | | | | | | | | |
| | | | | | | | |
INVESTING ACTIVITIES | | | | | | | | |
Additions to property, plant and equipment | | | (344,785 | ) | | | (398,292 | ) |
Business acquisitions | | | (170,782 | ) | | | (2,044,640 | ) |
Property acquisitions | | | (27,943 | ) | | | (65,773 | ) |
Property dispositions | | | 60,569 | | | | 20,856 | |
Increase in other non-current assets | | | - | | | | (165 | ) |
Change in non-cash working capital | | | (14,710 | ) | | | 10,886 | |
| | | | | | | | | |
| | | (497,651 | ) | | | (2,477,128 | ) |
| | | | | | | | | |
| | | | | | | | |
Change in cash and cash equivalents | | | (8,443 | ) | | | 9,709 | |
| | | | | | | | |
Effect of exchange rate changes on cash | | | (1,563 | ) | | | 297 | |
| | | | | | | | |
Cash and cash equivalents, beginning of year | | | 10,006 | | | | - | |
| | | | | | | | |
| | | | | | | | | |
Cash and cash equivalents, end of year | | $ | - | | | $ | 10,006 | |
| | | | | | | | | |
| | | | | | | | |
Interest paid | | $ | 130,990 | | | $ | 53,434 | |
Large corporation tax and other tax paid | | $ | 442 | | | $ | 862 | |
| | | | | | | | | |
See accompanying notes to these consolidated financial statements.
| |
| |
Consolidated Financial Statements | |
| |
Notes To Consolidated Financial Statements
|
December 31, 2007 and 2006 |
(tabular amounts in thousands of Canadian dollars, except Trust Unit, and per Trust Unit amounts) |
Harvest Energy Trust (the “Trust”) is an open-ended, unincorporated investment trust established under the laws of the Province of Alberta on July 10, 2002 and is governed pursuant to the Amended and Restated Trust Indenture dated February 3, 2006 between Harvest Operations Corp. (“Harvest Operations”), a wholly owned subsidiary and manager of the Trust, and Valiant Trust Company as Trustee (the “Trust Indenture”). The purpose of the Trust is to indirectly exploit, develop and hold interests in petroleum and natural gas properties and refining and marketing assets through investments in the securities of its subsidiaries and net profits interests in petroleum and natural gas properties. The beneficiaries of the Trust are the holders of its Trust Units (the “Unitholders”) who receive monthly distributions from the Trust’s net cash flow from its various investments after the provision for interest due to the holders of convertible debentures. Pursuant to the Trust Indenture, the Trust is required to distribute 100% of its taxable income to its Unitholders each year and to comply with the mutual fund trust requirements of the Income Tax Act (Canada). The Trusts’ activities are limited to holding and administering permitted investments and making distributions to its Unitholders.
The business of the Trust is carried on by Harvest Operations and other operating subsidiaries of the Trust, including North Atlantic Refining Limited Partnership. The activities of Harvest Operations and the Trust’s subsidiaries are financed through interest bearing notes from the Trust, net profit interests issued to the Trust, and third party debt such as the bank debt and the 77/8% senior notes.
The net profit interests are determined pursuant to the terms of each respective net profit interest agreement. The Trust is entitled to net profit interests equal to the amount by which 99% of the gross proceeds from the sale of production from petroleum and natural gas properties exceed 99% of certain deductible expenditures. Under the terms of the net profits interests agreements, deductible expenditures may include discretionary amounts to fund capital expenditures, to repay third party debt and to provide for working capital required to carry out the operations of the operating subsidiaries.
References to “Harvest” refers to the Trust on a consolidated basis. References to “North Atlantic” refers to North Atlantic Refining Limited Partnership and it subsidiaries, all of which are 100% owned by Harvest.
| |
2. | SIGNIFICANT ACCOUNTING POLICIES |
These financial statements have been prepared by management in accordance with Canadian generally accepted accounting principles (“Canadian GAAP”). These principles differ in certain respects from accounting principles generally accepted in the United States of America (“US GAAP”) and to the extent that the differences materially affect Harvest, they are described in Note 21.
| |
(a) | Consolidation |
| |
| These consolidated financial statements include the accounts of Harvest and its subsidiaries. All inter-entity transactions and balances have been eliminated upon consolidation. |
| |
(b) | Use of Estimates |
| |
| The preparation of financial statements requires management to make estimates and assumptions that affect the reported amounts of assets and liabilities and disclosures of contingencies, if any, as at the date of the financial statements and the reported amounts of revenues and expenses during the period. Specifically, amounts recorded for depletion, depreciation, amortization and accretion expense, asset retirement obligations, fair value of risk management contracts, employee future benefits and amounts used in the impairment tests for intangible assets, goodwill, inventory and property, plant and equipment are based on estimates. These estimates include petroleum and natural gas reserves, future petroleum and natural gas prices, future interest rates and future costs required to develop those reserves as well as other fair value assumptions. By their nature, these estimates are subject to measurement uncertainty and the effect on the financial statements of changes in such estimates in future years could be material. |
| |
| |
| Consolidated Financial Statements |
| |
| |
(c) | Revenue Recognition |
| |
| Revenues associated with the sale of crude petroleum, natural gas, natural gas liquids and refined products are recognized when title passes to customers and payment has either been received or collection is reasonably certain. Concurrent with the recognition of revenue from the sale of refined products and included in purchased products for resale and processing are associated transportation charges. Revenues for retail services are recorded when the services are provided. |
| |
| The sales price of residential home heating fuels and automotive gasoline and diesel within the Province of Newfoundland and Labrador is subject to regulation under the Petroleum Products Act. The Petroleum Products Pricing Commissioner sets the maximum wholesale and retail prices that a wholesaler and a retailer may charge and sets the maximum mark-up between the wholesale price to the retailer and the retail price to the consumer. Prices are set biweekly using a price adjustment formula based on an allowable premium above Platt’s with an interruption formula. The full effect of rate regulation is reflected in the product sales revenue as recorded by Harvest. |
| |
(d) | Inventories |
| |
| Inventories are carried at the lower of cost or net realizable value. The costs of in process inventory are determined using the weighted average cost method. The costs of purchased goods and petroleum products held for resale are determined under the first in, first out method. The costs of parts and supplies inventories are determined under the average cost method. |
| |
(e) | Joint Venture and Partnership Accounting |
| |
| The subsidiaries of Harvest conduct substantially all of their petroleum and natural gas production activities through joint ventures and through partnerships. The consolidated financial statements reflect only Harvest’s proportionate interest in such activities. |
| |
(f) | Property, Plant, and Equipment |
| |
| Petroleum and Natural Gas |
| |
| Harvest follows the full cost method of accounting for its petroleum and natural gas activities. All costs of acquiring petroleum and natural gas properties, whether productive or unproductive, related development costs, and overhead charges directly related to these activities, are capitalized and accumulated in one cost centre. Maintenance and repair costs that do not extend or enhance the recoverable reserves are charged against income. |
| |
| Proceeds from the sale of petroleum and natural gas properties are applied against capital costs. Gains and losses are not recognized on the disposition of petroleum and natural gas properties unless that disposition would alter the rate of depletion and depreciation by 20% or more. |
| |
| Provision for depletion and depreciation of petroleum and natural gas assets is calculated using the unit-of-production method, based on proved reserves net of royalties as evaluated by independent petroleum engineers. The cost basis used for the depletion and depreciation provision is the capitalized costs of petroleum and natural gas assets plus the estimated future development costs of proved undeveloped reserves. Reserves are converted to equivalent units on the basis of six thousand cubic feet of natural gas to one barrel of petroleum, reflecting the approximate relative energy content. |
| |
| Harvest places a limit on the aggregate carrying amount of property, plant and equipment associated with petroleum and natural gas activities which may be amortized to depletion and depreciation in future periods. Impairment is recognized when the carrying amount of the petroleum and natural gas assets exceeds the sum of the undiscounted future cash flows expected from the proved reserves. |
| |
| To recognize impairment, Harvest would then measure the amount of impairment by comparing the carrying amounts of the petroleum and natural gas assets to an amount equal to the estimated net present value of future cash flows from proved plus probable reserves using Harvest’s risk-free discount rate. Any excess carrying amount above the net present value of Harvest’s future cash flows would be a permanent impairment and reflected as a charge to net income for the period. |
| |
| Cash flows are calculated based on future price estimates, adjusted for Harvest’s contractual arrangements related to pricing and quality differentials. |
| |
| The cost of unproved properties is excluded from the impairment test calculation described above and subject to a separate impairment test. An impairment of unproved properties is recognized when the cost base exceeds the fair value determined by a reference to market prices, historical experience or a third party independent evaluator. There were no impairment write downs for petroleum and natural gas assets for the years ended December 31, 2007 and 2006. |
| |
| |
Consolidated Financial Statements | |
| |
| |
| Refining and Marketing |
| |
| Property, plant and equipment related to the refining assets are recorded at cost. Depreciation of recorded cost less salvage value is provided on a straight-line basis over the estimated useful life of the assets as set out below. Any gains or losses on disposal of individual assets are recognized in the year of disposal. |
| |
| | |
Asset | Period |
| | |
Refining and production plant: | |
| | |
Processing equipment | 5 – 25 years |
| | |
Structures | 15 – 20 years |
| | |
Catalysts | 2 – 5 years |
| | |
Tugs | 25 years |
| | |
Vehicles | 2-5 years |
| | |
| |
| Maintenance and repair costs including major maintenance activities, are expensed as incurred. Improvements that increase or prolong the service life or capacity of an asset are capitalized. |
| |
| Property, plant and equipment related to refining assets are tested for recovery whenever events or changes in circumstances indicate that their carrying amount may not be recoverable. Property, plant and equipment related to refining assets are not recoverable if their carrying amounts exceed the sum of the undiscounted cash flows expected to result from their use and eventual disposition. If property, plant and equipment related to refining assets are not recoverable, an impairment loss is recognized in an amount by which their carrying amount exceed their fair value, with fair value determined based on discounted estimated net cash flows. There was no impairment write-down for refining assets for the years ended December 31, 2007 and 2006. |
| |
(g) | Goodwill and Other Intangible Assets |
| |
| Goodwill is recognized when the purchase price of an acquired business exceeds the fair value of the net identifiable assets and liabilities of the acquired business. Goodwill is carried at cost less impairment and is not amortized. The carrying amount of goodwill is assessed for impairment annually at year-end, or more frequently if events occur that could result in an impairment. The goodwill impairment test is a two step test. In the first step, the carrying amount of the assets and liabilities, including goodwill, is compared to the fair value of the reporting unit. The fair value of a reporting unit is determined by calculating the present value of the expected future cash flows from the reporting unit. If the fair value is less than the carrying amount of the reporting unit, a potential impairment of goodwill may exist requiring the second test to be performed. Impairment is measured by allocating the fair value of the reporting unit, as determined in the first test, over the identifiable assets and liabilities. The excess of the fair value of the reporting unit over the fair value of the identifiable assets and liabilities represents the fair value of goodwill. The excess of the book value of goodwill over this implied fair value is then recognized as an impairment and charged to income in the period in which it occurs. There were no impairment write-downs for each of the years ended December 31, 2007 and 2006. |
| |
| Intangible assets with determinable useful lives are amortized using the straight line method over the estimated lives of the assets, which range from 5–20 years. The amortization methods and estimated service lives are reviewed annually. The carrying amounts of intangible assets are tested for recoverability whenever events or changes in circumstances indicate that their carrying amounts may not be recoverable. Intangibles are not recoverable if their carrying amounts exceed the sum of the undiscounted cash flows expected to result from their use and eventual disposition. If intangibles are not recoverable, an impairment loss is recognized in an amount by which their carrying amount exceeds their fair value, with fair value determined based on discounted estimated net cash flows. There was no impairment write-down for the years ended December 31, 2007 and 2006. |
| |
(h) | Asset Retirement Obligations |
| |
| Harvest recognizes the fair value of any asset retirement obligations as a liability in the period in which it incurs a legal obligation associated with the retirement of tangible long-lived assets that result from the acquisition, construction, development, and normal use of the assets. Harvest uses a credit-adjusted risk free discount rate to estimate this fair value. The associated asset retirement costs are capitalized as part of the carrying amount of the long-lived asset and depleted and depreciated using the method described under “Property, Plant and Equipment”. Subsequent to the initial measurement of the asset retirement obligation, the obligation is adjusted at the end of each subsequent period to reflect the passage of time and changes in the timing and amount of estimated future cash flows underlying the obligation. Actual costs incurred upon settlement of the retirement obligation are charged against the obligation to the extent of the liability recorded. |
| |
(i) | Income Taxes |
| |
| Under the Income Tax Act (Canada) the Trust and its trust subsidiary entities are taxable only on income that is not distributed or distributable to their Unitholders. As both the Trust and its Trust subsidiaries distribute all of their taxable income to their respective Unitholders pursuant to the requirements of their trust indentures, neither the Trust nor its trust |
|
|
Consolidated Financial Statements |
|
| |
| subsidiaries are currently subject to income tax. However, pursuant to newly enacted legislation in 2007, the Trust and its flow-through subsidiaries will become subject to a distribution tax beginning in 2011, provided that Harvest maintains its current structure. Harvest now makes provisions for future income taxes to reflect this new legislation. |
| |
| Harvest follows the liability method of accounting for income taxes. Under this method, income tax liabilities and assets are recognized for the estimated tax consequences attributable to differences between the amounts reported in the financial statements of the corporate subsidiaries and their respective tax bases, using enacted or substantively enacted income tax rates. The effect of a change in income tax rates on future tax liabilities and assets is recognized in income in the period in which the change occurs. A valuation allowance is recorded against any future income tax asset if it is more likely than not that the asset will not be realized. |
| |
(j) | Unit-based Compensation |
| |
| Harvest determines compensation expense for the Trust Unit Rights Incentive Plan (“Trust Unit Incentive Plan”) and the Unit Award Incentive Plan (“Unit Award Incentive Plan”) by estimating the intrinsic value of the rights at each period end and recognizing the amount in income over the vesting period. After the rights have vested, further changes in the intrinsic value are recognized in income in the period of change. |
| |
| The intrinsic value is the difference between the market value of the Units and the exercise price of the right in the case of the Trust Unit Incentive Plan, and in the case of the Unit Award Incentive Plan the market value of the Units represents the intrinsic value of the Award. Under the Trust Unit Incentive Plan, the intrinsic value method is used as participants in the plan have the option to either purchase the Units at the exercise price or to receive a cash payment or Trust Unit equivalent, equal to the excess of the market value of the Units over the exercise price. Under the Unit Award Incentive Plan participants have the option upon exercise to receive a cash payment or Trust Unit equivalent, equal to the value of awards outstanding, which is equivalent to the market value of the Units. |
| |
(k) | Employee Future Benefits |
| |
| North Atlantic maintains defined benefit and defined contribution plans and provides certain post-retirement health care benefits, which cover the majority of its employees and their surviving spouses. |
| |
| (i) Defined Contribution Plan |
| |
| Under the defined contribution plan, the annual contribution of each participating employee’s pensionable earnings is as follows: |
| | | | | | | | |
| | Employee category | | | | | | |
| | Permanent | | | 5.0 | % | | |
| | | | | | | | |
| | Part-time | | | 2.5 | % | | |
| | | | | | | | |
| |
| The contributions associated with the defined contribution plan is expensed as incurred. |
| |
| (ii) Defined Benefit Plans |
| |
| The cost of providing the defined benefits and other post-retirement benefits is actuarially determined based upon an independent actuarial valuation using management’s best estimates of discount rates, rate of return on plan assets, rate of compensation increase, retirement ages of employees, and expected health care costs. The cost of pensions earned by employees is actuarially determined using the projected benefit method prorated on credited service. Funding of the defined benefit pension plans complies with Canadian federal and provincial regulations, and requires contributions to the plans be made based on independent actuarial valuation. Pension plan assets are measured at fair values with the difference between the fair value of the plan assets and the total employee benefit obligation recorded on the balance sheet. For the purpose of calculating the expected return on assets, the fair value of the plan assets is used. |
| |
| The defined benefit plans provide benefits based on length of service and the best five years of the last ten years’ average earnings. There is no recognition or amortization of actuarial gains or losses less than 10% of the greater of the accrued benefit obligations and the fair value of plan assets for the defined benefit pension plans. Actuarial gains and losses over 10% are amortized on a straight-line basis over the average remaining service period of the plan participants. Actuarial gains or losses related to the other post-retirements benefits are recognized in income immediately. Past service costs are amortized on a straight-line basis over the expected average remaining service life of plan participants. |
| |
(l) | Currency Translation |
| |
| Monetary assets and liabilities denominated in a currency other than Canadian dollars are translated at the rate of exchange in effect at the balance sheet date. Revenues and expenses denominated in a foreign currency are translated at the monthly average rate of exchange. Translation gains and losses are included in income in the period in which they arise. |
| |
| |
Consolidated Financial Statements | |
| |
| |
| Harvest’s investment in a subsidiary with a functional currency denominated in a currency other than the Canadian dollars is translated using the current rate method as the subsidiary is considered a self-sustaining operation. Gains and losses resulting from this translation are recorded in the cumulative translation adjustment in unitholders’ equity. |
| |
(m) | Rate Regulation |
| |
| The sales price of residential home heating fuels and automotive gasoline and diesel within the Province of Newfoundland and Labrador is subject to regulation under the Petroleum Products Act. The Petroleum Products Pricing Commissioner sets the maximum mark-up between the wholesale price to the retailer and the retail price to the consumer. The full effect of rate regulation is reflected in the product sales revenue as recorded. |
| |
3. | CHANGE IN ACCOUNTING POLICY |
Financial Instruments and Comprehensive Income
Effective January 1, 2007, Harvest adopted three new and revised Canadian accounting standards as issued by the Canadian Institute of Chartered Accountants respecting “Financial Instruments – Recognition and Measurement”, “Financial Instruments – Presentation and Disclosure” and “Comprehensive Income”.
Financial Instruments
The revised standard on financial instruments provides new guidance on how to recognize and measure financial instruments. It requires all financial instruments to be recorded at fair value when initially recognized. Subsequent measurement is either at fair value or amortized cost, depending on the classification of the financial instrument. Financial assets and liabilities that are held-for-trading are measured at fair value with changes in those fair values recognized in net income. Available-for-sale financial assets are measured at fair value with unrealized gains or losses recognized in other comprehensive income. Held-to-maturity assets, loans and receivables and other liabilities are all measured at amortized cost with any related expenses or income recognized in net income. Price risk management contracts are classified as held-for-trading and are measured at fair value at initial recognition and at subsequent measurement dates. Any derivatives embedded in other financial or non-financial contracts that were entered into on or after January 1, 2001 must also be measured at fair value and recorded in the financial statements if the embedded derivative is not closely related to the host contract. Fair value of financial instruments is based on market prices where available, otherwise it is calculated as the net present value of expected future cash flows. For those items measured at amortized cost, interest expense is calculated using an effective interest rate that accretes any discount or premium over the life of the instrument so that the carrying value equals the face value at maturity.
Harvest does not have any financial assets classified as available-for-sale or held-to-maturity. The only items on Harvest’s balance sheet that are classified as held-for-trading and subsequently measured at fair value are cash and our price risk management contracts. The remainder of the financial instruments are measured at amortized cost. As well, there are no significant embedded derivatives that need to be recorded in the financial statements.
Transaction costs relating to financial instruments classified as held-for-trading are expensed in net income in the period that they are incurred. Harvest has elected to add all other transaction costs that are directly attributable to the acquisition or issue of a financial asset or liability to the amount of the financial asset or liability that is recorded on initial recognition.
The transitional provisions of the financial instruments standard require retrospective adoption without restatement of prior period financial statements. The provisions also require all financial instruments to be remeasured using the criteria of the new standard and any change in the previous carrying amount to be recognized as an adjustment to retained earnings on January 1, 2007. As our price risk management contracts were already measured at fair value, the most significant change for Harvest was reclassifying the deferred charges relating to our senior notes and convertible debentures and netting these amounts against the respective liability. These charges are then amortized to income using an effective interest rate. The effect of applying this new standard on January 1, 2007 was to reduce the carrying value of the following accounts as indicated with an offsetting reduction to deferred charges:
| | | | |
| | | | |
Deferred charges | | $ | (25,067 | ) |
77/8% Senior notes | | | (9,522 | ) |
Convertible debentures | | | (16,882 | ) |
Unitholders’ capital | | | (49 | ) |
Accumulated income | | | 1,386 | |
| | | | | |
See Note 18 for the additional presentation and disclosure requirements for Financial Instruments.
|
|
Consolidated Financial Statements |
|
Other Comprehensive Income
The new standards introduce the concept of comprehensive income, which consists of net income and other comprehensive income. Other comprehensive income represents changes in Unitholders’ equity during a period arising from transactions and other events with non-owner sources. The transitional provisions of this section require that the comparative statements are restated to reflect the application of this standard only on certain items.
For Harvest, the only such item is the unrealized foreign currency translation gains or losses arising from our downstream operations, which is considered a self-sustaining operation with a US dollar functional currency. As the cumulative translation adjustment was presented as a separate component of Unitholders’ equity already, this restatement simply required the cumulative translation adjustment to be reclassified to accumulated other comprehensive income on the balance sheet and statement of Unitholders’ equity.
Future Accounting Changes
The AcSB issued new accounting standards on December 1, 2006 that require increased disclosure on financial instruments, particularly with regard to the nature and extent of risks arising from financial instruments and how the entity manages those risks. This standard has an implementation date for annual and interim financial statements beginning on or after October 1, 2007.
Also on December 1, 2006, the AcSB issued a new standard regarding Capital Disclosure requiring the disclosure of information about an entity’s objectives, policies and processes for managing capital; quantitative data about what the entity regards as capital; whether the entity has complied with any externally imposed capital requirements; and if it has not complied, the consequences of such non-compliance. This standard also has an implementation date for annual and interim financial statements beginning on or after October 1, 2007.
In June 2007, the AcSB issued section 3031, Inventories, which replaces the existing inventories standard. This new standard provides additional guidance with respect to the measurement and disclosure requirements for inventories, requiring inventories to be valued at the lower of cost and net realizable value. This standard is to be adopted for fiscal years beginning on or after January 1, 2008. We do not expect the adoption of this section to have a material impact on our net income or financial position.
In February 2008, the CICA issued Section 3064, Goodwill and Intangible Assets, replacing Section 3062 Goodwill and Other Intangible Assets and Section 3450, Research and Development Costs. The new Section will be effective on January 1, 2009. Section 3062 establishes standards for the recognition, measurement, presentation and disclosure of goodwill and intangible assets subsequent to its initial recognition. Standards concerning goodwill are unchanged from the standards included in the previous Section 3062. We are currently evaluating the impact of the adoption of this new Section, however do not expect a material impact on our Consolidated Financial Statements.
| |
4. | BUSINESS ACQUISITIONS |
| |
(a) | Grand Petroleum Inc. (“Grand”) |
| |
| Pursuant to its cash offer of $3.84 for each issued and outstanding common share of Grand, Harvest acquired control of Grand with its acquisition of 21,310,419 Grand common shares for cash consideration of $81.8 million on July 26, 2007. Subsequent to this acquisition of 74.6% of the issued and outstanding common shares of Grand, Harvest acquired the remaining 7,251,604 common shares of Grand for an additional $27.8 million by extending its offer to purchase to August 9, 2007 and thereafter pursuant to the compulsory acquisition provisions of the Business Corporations Act (Alberta). The aggregate consideration for the Grand acquisition consists of the following: |
| | | | |
| | Amount | |
Cash paid | | $ | 109,678 | |
Assumption of bank debt | | | 28,798 | |
Acquisition costs | | | 785 | |
| | | | | |
| | $ | 139,261 | |
| | | | | |
| |
| |
Consolidated Financial Statements | |
| |
| |
| This acquisition has been accounted for using the purchase method, whereby the assets acquired and the liabilities assumed are recorded at their fair values with the excess of the aggregate consideration over the fair value of the identifiable net assets allocated to goodwill. As of the acquisition date, Grand’s operating results have been included in Harvest’s revenues, expenses and capital spending. The following summarizes the allocation of the aggregate consideration for the Grand acquisition. |
| | | | |
| | Amount | |
Net working capital | | $ | (3,451 | ) |
Property, plant and equipment | | | 147,420 | |
Goodwill | | | 20,546 | |
Asset retirement obligation | | | (4,416 | ) |
Future income tax | | | (20,838 | ) |
| | | | | |
| | $ | 139,261 | |
| | | | | |
| |
| Amendments may be made to the purchase equation as the cost estimates and balances are finalized. |
| |
(b) | Private petroleum and natural gas corporation |
| |
| On March 1, 2007, Harvest acquired all of the issued and outstanding shares of a private petroleum and natural gas corporation for $30.6 million net of working capital adjustments and transaction costs. The results of operations of this acquisition have been included in the consolidated financial statements since its acquisition date. An officer of Harvest was a director of this private corporation and received proceeds that are considered to be insignificant to both the officer and Harvest. |
| |
(c) | North Atlantic Refining Limited |
| |
| On October 19, 2006, Harvest acquired all of the issued and outstanding shares of North Atlantic Refining Limited for $1.6 billion plus certain working capital and other adjustments. The principal asset of North Atlantic Refining Limited is a medium gravity, sour-crude hydrocracking refinery. North Atlantic Refining Limited also operates a marketing division which includes gas stations, a retail heating fuels business and other ancillary services. The results of operations of North Atlantic have been included in the consolidated financial statements since its acquisition on October 19, 2006. |
| |
| The aggregate consideration for the acquisition of North Atlantic consists of the following: |
| | | | |
| | Amount | |
Cash paid | | $ | 1,592,793 | |
Acquisition costs | | | 4,331 | |
| | | | | |
| | $ | 1,597,124 | |
| | | | | |
| |
| This transaction has been accounted for using the purchase method whereby the assets acquired and the liabilities assumed are recorded at their fair values with the excess of the aggregated consideration over the fair value of the identifiable net assets allocated to goodwill. These amounts are estimates made by management based on currently available information. The following summarizes the aggregate consideration for the North Atlantic acquisition: |
| | | | |
| | Amount | |
Net working capital (including cash of $22,464) | | $ | 2,863 | |
Inventory | | | 36,137 | |
Property, plant and equipment | | | 1,254,696 | |
Intangible assets (Note 7) | | | 111,977 | |
Long-term receivables | | | 2,729 | |
Goodwill | | | 200,925 | |
Funding deficiency of pension and other benefit plans | | | (12,203 | ) |
| | | | | |
| | $ | 1,597,124 | |
| | | | | |
| |
| During 2007 the acquisition costs were reduced by $0.7 million and net working capital was increased by $2.9 million, with a corresponding decrease in goodwill, as certain accrued liabilities that were estimated at the time of purchase did not materialize subsequent to the acquisition. |
| |
(d) | Birchill Energy Limited (“Birchill”) |
| |
| On July 26, 2006, Harvest signed a binding agreement to purchase all of the issued and outstanding shares of Birchill on August 15, 2006 for $446.8 million net of working capital adjustments and transaction costs. The results of operations of Birchill have been included in the consolidated financial statements since the time of effective control, July 26, 2006. |
| |
| |
| Consolidated Financial Statements |
| |
| |
| The aggregate consideration for the acquisition of Birchill consists of the following: |
| | | | | |
| | | | | |
| | | Amount | |
| | | | | |
| Cash paid, net of expected working capital recoveries | | $ | 447,511 | |
| Acquisition costs | | | 267 | |
| | | | | |
| | | $ | 447,778 | |
| | | | | |
| |
| This transaction has been accounted for using the purchase method whereby the assets acquired and the liabilities assumed are recorded at their fair values with the excess of the aggregate consideration over the fair value of the identifiable net assets allocated to goodwill. The following summarizes the allocation of the aggregate consideration for the Birchill acquisition. |
| | | | | |
| | | | | |
| | | Amount | |
| | | | | |
| Net working capital deficiency (including nil cash) | | $ | (14,755 | ) |
| Property, plant and equipment | | | 463,752 | |
| Asset retirement obligation | | | (1,219 | ) |
| | | | | |
| | | $ | 447,778 | |
| | | | | |
| |
| During 2007 the cash paid for Birchill was increased by $1.9 million while the acquisition costs were decreased by $1.0 million with the corresponding net increase of $0.9 million reflected in property, plant and equipment. The increase in cash paid is due to additional assets that could not be valued at the time of acquisition and were therefore subsequently valued and settled, while the reduction in acquisition costs relates to certain accrued liabilities that were estimated at the time of purchase and did not materialize subsequent to the acquisition. |
| |
(e) | Viking Energy Royalty Trust (“Viking”) |
| |
| On February 3, 2006, the unitholders of Harvest and Viking voted to approve a resolution to effect the Plan of Arrangement (the “Plan of Arrangement”) by which unitholders of Viking received 0.25 Harvest Trust Units for every Viking Trust Unit held, and Harvest acquired all of the assets and assumed all of the liabilities of Viking for total consideration of approximately $1,638.1 million plus assumption of debt. This amount consisted of the issuance of 46,040,788 Trust Units [Note 14(b)] at an ascribed value of $35.58 per Trust Unit, based on the weighted average trading price of the Harvest Trust Units before and after the announcement date of November 28, 2005. Pursuant to the terms and conditions of Vikings’ convertible debenture indenture, Harvest’s acquisition of Viking’s net assets resulted in Harvest assuming the obligations of Viking’s convertible debentures, including the adjustment of the conversion ratio to reflect the 0.25 Harvest Trust Unit for each Viking Trust Unit exchange ratio. |
| |
| The aggregate consideration for the acquisition of Viking consists of the following: |
| | | | | |
| | | | | |
| | | Amount | |
| | | | | |
| Ascribed value of Trust Units issued | | $ | 1,638,131 | |
| Bank debt assumed | | | 106,247 | |
| Convertible debentures assumed | | | - | |
| Debt component | | | 202,232 | |
| Equity component | | | 24,123 | |
| Acquisition costs | | | 4,600 | |
| | | | | |
| | | $ | 1,975,333 | |
| | | | | |
| |
| This transaction has been accounted for using the purchase method whereby the assets acquired and the liabilities assumed are recorded at their fair values with the excess of the aggregate consideration over the fair value of the identifiable net assets allocated to goodwill. The following summarizes the allocation of the aggregate consideration for the Viking acquisition. |
| | | | | |
| | | | | |
| | | Amount | |
| | | | | |
| Net working capital deficiency (including nil cash) | | $ | (31,297 | ) |
| Property, plant and equipment | | | 1,455,000 | |
| Fair value deficiency of risk management contracts | | | (1,224 | ) |
| Fair value of office lease (Note 6) | | | 931 | |
| Goodwill | | | 612,416 | |
| Asset retirement obligation | | | (60,493 | ) |
| | | | | |
| | | $ | 1,975,333 | |
| | | | | |
| |
| Effective February 3, 2006, the results of Viking have been included in the consolidated financial statements. |
| |
| |
Consolidated Financial Statements | |
| |
| | | | | | | | |
| | | | | | | | | |
| | December 31, 2007 | | | December 31, 2006 | |
| | | | | | | | | |
Petroleum products | | $ | 55,036 | | | $ | 19,513 | |
Parts and supplies | | | 3,898 | | | | 4,279 | |
| | | | | | | | | |
Total inventories, net | | $ | 58,934 | | | $ | 23,792 | |
| | | | | | | | | |
| |
6. | PROPERTY, PLANT AND EQUIPMENT |
| | | | | | | | | | | | | | | | | | | | |
| | | | | | | |
| | December 31, 2007 | | | December 31, 2006 | |
| | | | | | | |
| | Upstream | | Downstream | | Total | | | Upstream | | Downstream | | Total | |
| | | | | | | | | | | | | | | | | | | | | |
Cost | | $ | 4,247,819 | | $ | 1,164,310 | | $ | 5,412,129 | | | $ | 3,801,054 | | $ | 1,320,698 | | $ | 5,121,752 | |
Accumulated depletion and
depreciation | | | (1,142,345 | ) | | (72,277 | ) | | (1,214,622 | ) | | | (706,540 | ) | | (14,660 | ) | | (721,200 | ) |
| | | | | | | | | | | | | | | | | | | | | |
Net book value | | $ | 3,105,474 | | $ | 1,092,033 | | $ | 4,197,507 | | | $ | 3,094,514 | | $ | 1,306,038 | | $ | 4,400,552 | |
| | | | | | | | | | | | | | | | | | | | | |
General and administrative costs of $9.2 million (2006 – $12.1 million) have been capitalized during the year ended December 31, 2007, of which $0.6 million (2006 - $3.0 million) relate to the Trust Unit Incentive Plan and the Unit Award Incentive Plan.
All costs, except those associated with undeveloped properties, major spare parts inventory and assets under construction, are subject to depletion and depreciation at December 31, 2007 including future development costs of $325.4 million (2006 – $289.2 million). No amounts for undeveloped properties were excluded from the asset base subject to depletion for the years ended December 31, 2007 and 2006. Downstream major parts inventory of $6.1 million were excluded from the asset base subject to depreciation at December 31, 2007 (2006 - $6.7 million). Downstream assets under construction of $7.4 million were excluded from the asset base subject to depreciation at December 31, 2007 (2006 - $5.5 million).
The petroleum and natural gas future prices used in the impairment test for petroleum and natural gas assets were obtained from third party engineers and were adjusted for contractual arrangements relating to pricing and quality differentials specific to Harvest. Based on these assumptions, the undiscounted future net revenue from Harvest’s proved reserves exceed the carrying amount of its petroleum and natural gas assets as at December 31, 2007 and 2006, and therefore no impairment was recorded in either of the periods ended on these dates.
Benchmark prices and US$/Cdn.$ exchange rate assumptions reflected in the impairment test as at December 31, 2007 were as follows:
| | | | | | | | | | | | | | | | |
| | | | | | | | | | | | | | | | | |
Year | | | WTI Oil(1)
(US$/barrel) | | | | Foreign
Exchange Rate | | | | Edmonton Light Crude Oil(1)
(CDN$ barrel) | | | | AECO Gas(1)
(CDN$/Gigajoule) | |
| | | | | | | | | | | | | | | | | |
2008 | | | 90.00 | | | | 1.00 | | | | 89.00 | | | | 6.45 | |
| | | | | | | | | | | | | | | | | |
2009 | | | 86.70 | | | | 1.00 | | | | 85.70 | | | | 7.00 | |
| | | | | | | | | | | | | | | | | |
2010 | | | 83.20 | | | | 1.00 | | | | 82.20 | | | | 7.00 | |
| | | | | | | | | | | | | | | | | |
2011 | | | 79.60 | | | | 1.00 | | | | 78.50 | | | | 7.00 | |
| | | | | | | | | | | | | | | | | |
2012 | | | 78.50 | | | | 1.00 | | | | 77.40 | | | | 7.10 | |
| | | | | | | | | | | | | | | | | |
Thereafter (escalation) | | | 2 | % | | | 0 | % | | | 2 | % | | | 2 | % |
| | | | | | | | | | | | | | | | | |
| |
(1) | Actual prices used in the impairment test were adjusted for commodity price differentials specific to Harvest. |
| |
7. | INTANGIBLE ASSETS |
| | | | | | | | | | | | | | | | | | | | |
| | | | | | | | | | | | | | | | | | | | | |
| | December 31, 2007 | | | December 31, 2006 | |
| | | | | | | | | | | | | | | | | | | | | |
| | Cost | | Accumulated
Amortization | | Net book
value | | | Cost | | Accumulated
Amortization | | Net book
value | |
| | | | | | | | | | | | | | | | | | | | | |
Engineering drawings | | $ | 88,227 | | $ | 5,330 | | $ | 82,897 | | | $ | 103,721 | | $ | 1,080 | | $ | 102,641 | |
Marketing contracts | | | 6,136 | | | 1,099 | | | 5,037 | | | | 7,214 | | | 105 | | | 7,109 | |
Customer lists | | | 3,714 | | | 449 | | | 3,265 | | | | 4,368 | | | 92 | | | 4,276 | |
Fair value of office lease | | | 931 | | | 428 | | | 503 | | | | 931 | | | 205 | | | 726 | |
Financing costs | | | 12,113 | | | 8,740 | | | 3,373 | | | | 11,840 | | | 4,230 | | | 7,610 | |
| | | | | | | | | | | | | | | | | | | | | |
Total | | $ | 111,121 | | $ | 16,046 | | $ | 95,075 | | | $ | 128,074 | | $ | 5,712 | | $ | 122,362 | |
| | | | | | | | | | | | | | | | | | | | | |
| |
8. | OTHER NON-CURRENT ASSETS |
| | | | | | | | | | |
| | | | | | | | | | | |
| | December 31, 2007 | | | December 31, 2006 | |
| | | | | | | | | | | |
Deferred charges, net of amortization [Note 3] | | $ | - | | | | $ | 23,659 | |
Discount on senior notes, net of amortization[Note 3] | | | - | | | | | 1,408 | |
| | | | | | | | | | | |
Total | | $ | - | | | | $ | 25,067 | |
| | | | | | | | | | | |
| |
| |
| Consolidated Financial Statements |
| |
| |
9. | ACCOUNTS PAYABLE AND ACCRUED LIABILITIES |
| | | | | | | | |
| | | | | | | | | |
| | December 31, 2007 | | | December 31, 2006 | |
| | | | | | | | | |
Trade accounts payable | | $ | 100,265 | | | $ | 111,837 | |
Accrued interest | | | 15,779 | | | | 14,367 | |
Trust Unit Incentive Plan and Unit Award Incentive Plan[Note 15] | | | 7,218 | | | | 6,442 | |
Other accrued liabilities | | | 146,981 | | | | 161,936 | |
| | | | | | | | | |
Total | | $ | 270,243 | | | $ | 294,582 | |
| | | | | | | | | |
| |
10. | ASSET RETIREMENT OBLIGATION |
Harvest’s asset retirement obligations result from its net ownership interest in petroleum and natural gas assets including well sites, gathering systems and processing facilities and the estimated costs and timing to reclaim and abandon them. Harvest estimates the total undiscounted amount of cash flows required to settle its asset retirement obligations to be approximately $1,003 million which will be incurred between 2008 and 2057. The majority of the costs will be incurred between 2015 and 2040. A credit-adjusted risk-free discount rate of 8% - 10% and inflation rate of approximately 2% were used to calculate the fair value of the asset retirement obligations.
A reconciliation of the asset retirement obligations is provided below:
| | | | | | | | |
| | | | | | | | | |
| | December 31, 2007 | | | December 31, 2006 | |
| | | | | | | | | |
| | | | | | | | |
Balance, beginning of year | | $ | 202,480 | | | $ | 110,693 | |
Incurred on acquisition of a private corporation | | | 1,629 | | | | - | |
Incurred on acquisition of Grand | | | 4,416 | | | | - | |
Incurred on acquisition of Viking | | | - | | | | 60,493 | |
Incurred on acquisition of Birchill | | | - | | | | 1,219 | |
Liabilities incurred | | | 9,553 | | | | 2,763 | |
Revision of estimates | | | (6,088 | ) | | | 20,544 | |
Liabilities settled through disposition | | | (3,708 | ) | | | - | |
Liabilities settled | | | (13,090 | ) | | | (9,186 | ) |
Accretion expense | | | 18,337 | | | | 15,954 | |
| | | | | | | | | |
Balance, end of year | | $ | 213,529 | | | $ | 202,480 | |
| | | | | | | | | |
Harvest has gross asset retirement obligations of approximately $14.7 million relating to the refining and marketing assets. The fair value of this obligation cannot be reasonably determined because the assets currently have an indeterminate life.
At December 31, 2007, Harvest had $1,279.5 million drawn under its $1.6 billion Three Year Extendible Revolving Credit Facility (“Credit Facility”). At December 31, 2006, Harvest had $1,306.0 million drawn under the Credit Facility, of which $763.0 million was payable in US dollars, and $289.7 million drawn under its $350 million Senior Secured Bridge Facility.
The Credit Facility was established on February 3, 2006 and subsequently amended on October 19, 2006 to accommodate the purchase of North Atlantic. This amendment increased the borrowing capacity to $1.4 billion and established a $350 million Senior Secured Bridge Facility. The maturity date of this facility was March 31, 2009, but could be extended on an annual basis for an additional 364 days with the consent of the lenders. The credit facility is secured by a $2.5 billion first floating charge over all of the assets of Harvest’s operating subsidiaries plus a first mortgage security interest on the refinery assets of North Atlantic. Amounts borrowed under this facility bear interest at a floating rate based on bankers’ acceptances plus a range of 65 to 115 basis points depending on Harvest’s ratio of senior debt (excluding convertible debentures) to its earnings before interest, taxes, depletion, amortization and other non-cash amounts (“EBITDA”). An additional fee of 15 basis points was applicable so long as the Senior Unsecured Bridge Facility was outstanding. Availability under this facility is subject to the following quarterly financial covenants:
| | | | | |
| | | | | |
| | Senior debt to EBITDA | | | 3.0 to 1.0 or less |
| | | | | |
| | Total debt to EBITDA | | | 3.5 to 1.0 or less |
| | | | | |
| | Senior debt to Capitalization | | | 50% or less |
| | | | | |
| | Total debt to Capitalization | | | 55% or less |
| | | | | |
The $350 million Senior Secured Bridge Facility provided Harvest with a single draw on this facility within five days of the closing of its acquisition of North Atlantic and required repayments equivalent to the net proceeds from an issuance of equity or equity like securities including convertible debentures and, in all events, repayment in full within 18 months of the initial draw.
| |
| |
Consolidated Financial Statements | |
| |
On February 1, 2007, Harvest issued 6,146,750 Trust Units and 200,000 convertible debentures for total net proceeds of $328.6 million which was used to fully repay the remaining $289.7 million outstanding on the Senior Secured Bridge Facility with the remainder applied to the Credit Facility.
On May 7, 2007, Harvest and its lenders amended the Credit Facility to increase the aggregate commitment amount from $1.4 billion to $1.6 billion and extend the maturity date of the facility from March 31, 2009 to April 30, 2010 with respect to $1,535 million of the aggregate commitment amount. Effective May 7, 2007, the Credit Facility consisted of $1,535 million of commitments with a maturity date of April 30, 2010 and $65 million of commitments with a maturity date of March 31, 2009.
On October 1, 2007, two of Harvest’s existing lenders agreed to assume $50 million of the $65 million commitment to mature on March 31, 2009 and concurrently extended the maturity to April 30, 2010. On November 1, 2007, another of Harvest’s existing lenders agreed to assume the remaining $15 million of credit commitments to mature on March 31, 2009 and similarly extended the maturity to April 30, 2010. Subsequent to these reassignments, the entire $1.6 billion of the Credit Facility matures on April 30, 2010.
On October 19, 2006, North Atlantic entered into an amended and restated credit agreement that provided for a $10 million demand operating line of credit to finance its receivables and inventory in the Province of Newfoundland and Labrador as well as support periodic cash management market transactions. This facility is secured by a guarantee from Harvest Operations Corp. with amounts borrowed bearing interest at the bank’s prime lending rate.
For the year ended December 31, 2007 Harvest paid interest at an average rate of 5.28% (2005 – 4.86%) and 6.08% (2005 – 6.07%) for the Canadian and U.S amounts drawn, respectively.
| |
12. | CONVERTIBLE DEBENTURES |
Harvest has seven series of convertible unsecured subordinated debentures outstanding. Interest on the debentures is payable semi-annually in arrears in equal installments on dates prescribed by each series. The debentures are convertible into fully paid and non-assessable Trust Units, at the option of the holder, at any time prior to the close of business on the earlier of the maturity date and the business day immediately preceding the date specified by Harvest for redemption. The conversion price per Trust Unit is specified for each series and may be supplemented with a cash payment for accrued interest and in lieu of any fractional Trust Units resulting from the conversion.
The debentures may be redeemed by Harvest at its option in whole or in part prior to their respective maturity dates. The redemption price for the first redemption period is at a price equal to $1,050 per debenture and at $1,025 per debenture during the second redemption period. Any redemption will include accrued and unpaid interest at such time. Harvest may elect to settle the principal due at maturity or on redemption and periodic interest payments in the form of Trust Units at a price equal to 95% of the weighted average trading price for the preceding 20 consecutive trading days, 5 days prior to settlement date.
The following is a summary of the seven series of convertible debentures:
| | | | | | | | | | | | | |
| | | | | | | | | | |
Series | | Conversion
price / Trust
Unit | | Maturity | | First redemption period | | Second redemption
period | |
| | | | | | | | | | |
9% Debenture Due 2009 | | $ | 13.85 | | | May 31, 2009 | | | Jun. 1/07-May 31/08 | | | Jun. 1/08-May. 30/09 | |
8% Debenture Due 2009 | | $ | 16.07 | | | Sept. 30, 2009 | | | Oct. 1/07-Sept. 30/08 | | | Oct. 1/08-Sept. 29/09 | |
6.5% Debenture Due 2010 | | $ | 31.00 | | | Dec. 31, 2010 | | | Jan. 1/09-Dec. 31/09 | | | Jan. 1/10-Dec. 30/10 | |
10.5% Debenture Due 2008 | | $ | 29.00 | | | Jan. 31, 2008 | | | Feb. 1/06-Jan. 31/07 | | | Feb. 1/07-Jan. 30/08 | |
6.40% Debenture Due 2012(1) | | $ | 46.00 | | | Oct. 31, 2012 | | | Nov. 1/08-Oct. 31/09 | | | Nov. 1/09-Oct. 31/10 | |
7.25% Debenture Due 2013(1) | | $ | 32.20 | | | Sept. 30, 2013 | | | Oct. 1/09-Sept. 30/10 | | | Oct. 1/10-Sept. 30/11 | |
7.25% Debenture Due 2014(1) | | $ | 27.25 | | | Feb. 28, 2014 | | | Mar. 1/10-Feb. 28/11 | | | Mar. 1/11-Feb. 29/12 | |
| | | | | | | | | | | | | | |
| |
(1) | These series of convertible debentures may also be redeemed by Harvest at a price of $1,000 per debenture after the second redemption period until maturity. |
| |
| |
| Consolidated Financial Statements |
| |
The following table summarizes the face value, carrying amount and fair value of the convertible debentures:
| | | | | | | | | | | | | | | | |
| | | | | | | | |
| | December 31, 2007 | | | | December 31, 2006 | |
| | | | | | | | |
| | Face Value | | Carrying
Amount(1) | | Fair Value | | Face Value | | Carrying
Amount(1) | |
| | | | | | | | | | | | |
9% Debentures Due 2009 | | $ | 976 | | $ | 962 | | $ | 1,806 | | $ | 1,226 | | $ | 1,226 | |
8% Debentures Due 2009 | | | 1,728 | | | 1,692 | | | 2,022 | | | 2,239 | | | 2,229 | |
6.5% Debentures Due 2010 | | | 37,062 | | | 34,653 | | | 35,950 | | | 37,929 | | | 35,988 | |
10.5% Debentures Due 2008 | | | 24,258 | | | 24,273 | | | 24,258 | | | 26,621 | | | 26,824 | |
6.40% Debentures Due 2012 | | | 174,626 | | | 168,325 | | | 148,432 | | | 174,743 | | | 167,401 | |
7.25% Debentures Due 2013 | | | 379,256 | | | 355,145 | | | 344,895 | | | 379,500 | | | 367,843 | |
7.25% Debentures Due 2014 | | | 73,222 | | | 66,718 | | | 65,892 | | | - | | | - | |
| | | | | | | | | | | | | | | | | |
| | $ | 691,128 | | $ | 651,768 | | $ | 623,255 | | $ | 622,258 | | $ | 601,511 | |
| | | | | | | | | | | | | | | | | |
| |
(1) | Excluding the equity component. |
On January 31, 2008, the 10.5% Debentures due 2008 matured and Harvest elected to settle the obligation by issuing 1,116,593 Trust Units rather than settling the obligation in cash.
On October 14, 2004, Harvest Operations Corp., a wholly owned subsidiary of Harvest, issued US$250 million of 77/8% Senior Notes for cash proceeds of $311,951,000. The 77/8% Senior Notes are unsecured, require interest payments semi-annually on April 15 and October 15 each year and mature on October 15, 2011. Prior to maturity, redemptions are permitted as follows:
| |
• | Beginning on October 15, 2007 at 103.938% of the principal amount(1) |
| |
• | After October 15, 2008 at 103.938% of the principal amount |
| |
• | After October 15, 2009 at 101.969% of the principal amount |
| |
• | After October 15, 2010 at 100% of the principal amount |
| |
(1) | Only permitted if necessary to prevent the Trust from being disqualified as a trust for the purpose of the Income Tax Act. Limited to 35% of the notes issued or less; otherwise 100% of the notes issued. |
The 77/8% Senior Notes contain certain covenants restricting, among other things, the sale of assets and the incurrence of additional indebtedness if such issuance would result in an interest coverage ratio, as defined, of less than 2.5 to 1. The covenants of the 77/8% Senior Notes also restrict Harvest’s secured indebtedness to an amount less than 65% of the present value of the future net revenues from its proven petroleum and natural gas reserves discounted at an annual rate of 10%. In addition, the 77/8% Senior Notes restrict Harvest’s ability to pay distributions to an amount equal to 80% of the cumulative net proceeds from the issuance of Trust Units plus the cash flows from operations, before settlement of asset retirement obligations and changes in non-cash working capital, both calculated from the date of issuance of the 77/8% Senior Notes. An excess carryforward balance of approximately Cdn$1.5 billion exists as at December 31, 2007.
The 77/8% Senior Notes are unconditionally guaranteed by Harvest and all of its wholly-owned subsidiaries. The fair value of the 77/8% Senior Notes at December 31, 2007 was US$232.6 million (2006 - $236.3 million).
| |
| |
Consolidated Financial Statements | |
| |
| |
(a) | Authorized |
|
| The authorized capital consists of an unlimited number of Trust Units. |
| |
(b) | Number of Units Issued |
| | | | | | | | |
| | | | |
| | Year ended December 31, | |
| | | | |
| | 2007 | | | 2006 | |
| | | | | | | |
Outstanding, beginning of year | | | 122,096,172 | | | | 52,982,567 | |
Issued in exchange for assets of Viking [Note 4(e)] | | | - | | | | 46,040,788 | |
Issued for cash | | | | | | | | |
August 17, 2006 | | | - | | | | 7,026,500 | |
November 22, 2006 | | | - | | | | 9,499,000 | |
February 1, 2007 | | | 6,146,750 | | | | - | |
June 1, 2007 | | | 7,302,500 | | | | - | |
Convertible debenture conversions | | | | | | | | |
9% Debentures Due 2009 | | | 18,047 | | | | 39,777 | |
8% Debentures Due 2009 | | | 31,790 | | | | 96,252 | |
6.5% Debentures Due 2010 | | | 27,967 | | | | 114,313 | |
10.5% Debentures Due 2008 | | | 81,478 | | | | 290,919 | |
6.40% Debentures Due 2012 | | | 2,542 | | | | 4,825 | |
7.25% Debentures Due 2013 | | | 7,574 | | | | - | |
7.25% Debentures Due 2014 | | | 5,753,310 | | | | - | |
Exchangeable share retraction | | | - | | | | 184,809 | |
Distribution reinvestment plan issuance | | | 6,809,987 | | | | 5,464,450 | |
Exercise of unit appreciation rights and other | | | 13,053 | | | | 351,972 | |
| | | | | | | | | |
Outstanding, end of year | | | 148,291,170 | | | | 122,096,172 | |
| | | | | | | | | |
| | | | |
| |
| On August 17, 2005, Harvest implemented a premium distribution reinvestment plan. The premium distribution program enables investors to receive a cash payment equal to 102% of the regular distribution amount. The impact to Harvest is the same as the regular distribution reinvestment plan whereby it settles distributions with units rather than cash, at a discount to the current market price of the Units. |
| |
(c) | Per Trust Unit Information |
| |
| The following tables summarize the net income and Trust Units used in calculating income per Trust Unit: |
| | | | | | | | |
| | | | | | | |
Net income adjustments | | December 31, 2007 | | | December 31, 2006 | |
| | | | | | | |
Net (loss) income, basic | | $ | (25,676 | ) | | $ | 136,046 | |
Interest on convertible debentures and other | | | - | | | | 310 | |
| | | | | | | | | |
Net income, diluted(1) | | $ | (25,676 | ) | | $ | 136,356 | |
| | | | | | | | |
| | | | | | | |
Weighted average Trust Units adjustments | | December 31, 2007 | | | December 31, 2006 | |
| | | | | | | |
Number of Units | | | | | | | | |
Weighted average Trust Units outstanding, basic | | | 138,440,869 | | | | 101,590,850 | |
Effect of convertible debentures and other | | | - | | | | 322,793 | |
Effect of Employee Unit Incentive Plans | | | - | | | | 268,518 | |
| | | | | | | | | |
Weighted average Trust Units outstanding, diluted(2) | | | 138,440,869 | | | | 102,182,161 | |
| | | | | | | | | |
| |
(1) | Net income, diluted excludes the impact of the conversions of certain of the convertible debentures of $59,238,000 for the year ended December 31, 2007 (2006 - $19,855,000), as the impact would be anti-dilutive. |
|
(2) | Weighted average Trust Units outstanding, diluted for the year ended December 31, 2007 does not include the unit impact of 23,636,000 for certain of the convertible debentures (2006 – 6,980,000) and 682,000 (2006 – nil) for the Employee Unit Incentive Plans, as the impact would be anti-dilutive. |
| |
15. | EMPLOYEE UNIT INCENTIVE PLANS |
Trust Unit Rights Incentive Plan
Harvest is authorized to grant non-transferable Unit appreciation rights to directors, officers, consultants, employees and other service providers to an aggregate of a rolling maximum of 7% of the outstanding Trust Units and the number of Trust Units issuable upon the exchange of any outstanding exchangeable shares. The initial exercise price of rights granted under the plan is equal to the market price of the Trust Units at the time of grant and the maximum term of each right is five years. The rights vest equally over four years commencing on the first anniversary of the grant date. The exercise price of the rights may be reduced by an amount up to the amount of cash distributions made on the Trust Units subsequent to the date of grant of the respective right, provided that Harvest’s net operating cash flow (on an annualized basis) exceeds 10% of Harvest’s recorded cost of
| |
| |
| Consolidated Financial Statements |
| |
property, plant and equipment less all debt, working capital deficiency (surplus) or debt equivalent instruments, accumulated depletion, depreciation and amortization charges, asset retirement obligations, and any future income tax liability associated with such property, plant and equipment. Any portion of a distribution that does not reduce the exercise price on exercised rights is paid to the holder in a lump sum cash payment after the rights have been exercised.
Upon the exercise of unit appreciation rights the holder has the sole discretion to elect to receive cash or units. As a result, Harvest recognizes a liability on its consolidated balance sheet associated with the rights reserved under the plan. This obligation represents the difference between the market value of the Trust Units and the exercise price of the vested Unit rights outstanding under the plan. As such, an obligation of $1.4 million (2006 - $2.8 million) has been recorded in accounts payable and accrued liabilities for the graded vested portion of the 3,823,683 (2006 – 3,788,125) Trust Units outstanding under the plan at December 31, 2007. For accounting purposes, vesting is deemed to occur on a pro rata basis throughout the year, rather than at a vesting date which only occurs on the anniversary date of the grant.
The following summarizes the Trust Units reserved for issuance under the Trust Unit Incentive Plan:
| | | | | | | | | | | | | |
| | | | | | | | | | |
| | Year ended December 31, 2007 | | Year ended December 31, 2006 | |
| | | | | | | | | | |
| | Unit
Appreciation
Rights | | Weighted
Average Exercise
Price | | Unit
Appreciation
Rights | | Weighted
Average Exercise
Price | |
| | | | | | | | | | |
Outstanding beginning of year | | | 3,788,125 | | $ | 30.81 | | | 1,305,143 | | $ | 19.72 | |
Granted | | | 576,383 | | | 29.03 | | | 3,924,300 | | | 31.92 | |
Exercised | | | (92,775 | ) | | 21.88 | | | (1,039,018 | ) | | 18.58 | |
Forfeited | | | (448,050 | ) | | 31.10 | | | (402,300 | ) | | 37.25 | |
| | | | | | | | | | | | | | |
Outstanding before exercise price reductions | | | 3,823,683 | | | 30.74 | | | 3,788,125 | | | 30.81 | |
Exercise price reductions | | | - | | | (5.00 | ) | | - | | | (1.67 | ) |
| | | | | | | | | | | | | | |
Outstanding, end of year | | | 3,823,683 | | $ | 25.74 | | | 3,788,125 | | $ | 29.14 | |
| | | | | | | | | | | | | | |
Exercisable before exercise price reductions | | | 138,350 | | $ | 22.72 | | | 266,125 | | $ | 24.18 | |
Exercise price reductions | | | - | | | (9.38 | ) | | - | | | (5.37 | ) |
| | | | | | | | | | | | | | |
Exercisable, end of year | | | 138,350 | | $ | 13.34 | | | 266,125 | | $ | 18.81 | |
| | | | | | | | | | | | | | |
The following table summarizes information about Unit appreciation rights outstanding at December 31, 2007.
| | | | | | | | | | | | | | | | | | | |
| | | | | | | | | | | | | | | | | | | | |
| | | | | | | | Outstanding | | | | | Exercisable | |
| | | | | | | | | | | | | | | | | | | |
Exercise Price
before price
reductions | | Exercise Price
net of price
reductions | | At December
31, 2007 | |
Weighted
Average
Exercise Price
net of price
reductions(1)
| | Remaining
Contractual
Life(1) | | At December
31, 2007 | | Weighted
Average
Exercise Price
net of price
reductions(1) | |
| | | | | | | | | | | | | | |
$12.19-$13.15 | | $ | 0.87-$2.20 | | | 6,250 | | $ | 1.93 | | | 0.9 | | | 6.250 | | $ | 1.93 | |
$13.75-$14.99 | | $ | 2.99-$5.13 | | | 18,250 | | | 4.95 | | | 1.5 | | | 18,250 | | | 4.95 | |
$18.90-$25.05 | | $ | 9.12-$22.58 | | | 183,650 | | | 17.51 | | | 3.2 | | | 113,850 | | | 15.31 | |
$26.09-$28.41 | | $ | 21.92-$27.35 | | | 1,669,300 | | | 22.21 | | | 4.0 | | | - | | | - | |
$28.59-$37.56 | | $ | 21.00-$32.69 | | | 1,946,233 | | | 29.81 | | | 3.4 | | | - | | | - | |
| | | | | | | | | | | | | | | | | | | | |
$12.19-$37.56 | | $ | 0.87-$32.69 | | | 3,823,683 | | $ | 25.74 | | | 3.6 | | | 138,350 | | $ | 13.34 | |
| | | | | | | | | | | | | | | | | | | | |
| |
(1) | Based on weighted average Unit appreciation rights outstanding. |
| |
| |
Consolidated Financial Statements | |
| |
Unit Award Incentive Plan (“Unit Award Plan”)
The Unit Award Plan authorizes Harvest to grant awards of Trust Units to directors, officers, employees and consultants of Harvest and its affiliates (to an aggregate of a rolling maximum of 0.5% of the outstanding Trust Units and the number of Trust Units issuable upon the exercise of any outstanding exchangeable shares). Subject to the Board of Directors’ discretion, awards vest annually over a two to four year period and, upon vesting, entitle the holder to elect to receive the number of Trust Units subject to the award or the equivalent cash amount. The number of Units to be issued is adjusted at each distribution date for an amount approximately equal to the foregone distributions. Harvest recognizes a liability on its consolidated balance sheet associated with the awards granted under the plan. This obligation represents the fair value of the vested Trust Units granted under the Unit Award Plan. As such, an obligation of $5.8 million (2006 - $3.6 million) has been recorded in accounts payable and accrued liabilities for the graded vested portion of the 348,248 (2006 – 306,699) Unit Awards outstanding under the plan at December 31, 2007. For accounting purposes, vesting is deemed to occur on a pro rata basis throughout the year, rather than at a vesting date.
| | | | |
| | | | | |
Number | December 31, 2007 | | December 31, 2006 | |
| | | | | |
Outstanding, beginning of year | 306,699 | | 35,365 | |
Granted | 56,132 | | 320,905 | |
Adjusted for distributions | 48,280 | | 27,879 | |
Exercised | (37,072 | ) | (41,530 | ) |
Forfeitures | (25,791 | ) | (35,920 | ) |
| | | | | |
Outstanding, end of year | 348,248 | | 306,699 | |
| | | | | |
Exercisable, end of year | 168,401 | | 67,428 | |
| | | | | |
Upon closing of the Viking Plan of Arrangement all awards and rights issued under Harvest’s employee unit incentive plans vested and additional rights and awards were issued under both plans.
Harvest has recognized compensation expense of $2.7 million (2006 – $9.9 million), including non cash compensation expense of $0.6 million (2006 - $0.8 million), for the year ended December 31, 2007, related to the Trust Unit Incentive Plan and the Unit Award Plan and this is reflected in general and administrative expense in the consolidated statements of income.
The future income tax provision reflects the net tax effects of temporary differences between the carrying amounts of assets and liabilities of the Trust and their corresponding income tax bases as at that date. Changes in the temporary differences are reflected in future income tax expense or recovery.
In the second quarter of 2007, the Canadian government enacted legislation to apply a 31.5% tax to distributions from Canadian publicly traded income trusts. In the fourth quarter of 2007, the tax rate for trust distributions was reduced to 29.5% for 2011 and to 28% for 2012 and subsequent years. The new tax is not expected to apply to Harvest until 2011, as a transition period has been established for publicly traded trusts that existed prior to November 1, 2006. This portion of the Trust’s future income tax liability represents its tax-effected temporary differences that it estimates will exist on January 1, 2011, pursuant to the current legislation and Harvest’s current structure.
Concurrent with the tax rate reductions referred to above, further reductions in Federal corporate income tax rates were enacted. Under the legislation, Federal corporate rates will decline until 2012, resulting in an effective tax rate for the Trust’s corporate entities of approximately 26%, which is the rate applied to the temporary differences in the future income tax calculation based on when these differences are expected to reverse.
| |
| |
| Consolidated Financial Statements |
| |
The provision for future income taxes varies from the amount that would be computed by applying the relevant Canadian income tax rates to reported income before taxes as follows:
| | | | | | | |
| | | | |
| | Year ended December 31 | |
| | | | |
| | | 2007 | | | 2006 | |
| | | | |
Income before taxes | | $ | 39,152 | | $ | 133,737 | |
Combined Canadian Federal and Provincial statutory income tax rate | | | 32.7 | % | | 35.3 | % |
| | | | | | | | |
Computed income tax expense at statutory rates | | | 12,803 | | | 47,209 | |
Income earned by flow through entities | | | (179,750 | ) | | (136,452 | ) |
| | | | | | | | |
Loss in corporate entities | | | (166,947 | ) | | (89,243 | ) |
Increased expense (recovery) resulting from the following: | | | | | | | |
Initial recognition of trust temporary differences | | | 271,705 | | | | |
Benefit of future tax deductions (recognized) not recognized | | | (72,073 | ) | | 62,384 | |
Difference between current and expected tax rates | | | 44,547 | | | 10,465 | |
Non-taxable portion of capital (gain) loss | | | (20,515 | ) | | 1,789 | |
Change in estimates | | | 8,860 | | | - | |
Non-deductible expenses | | | 225 | | | 3,228 | |
Non-deductible crown charges in excess of resource allowance | | | - | | | 9,077 | |
| | | | | | | | |
Future income tax expense (recovery) | | | 65,802 | | | (2,300 | ) |
| | | | | | | | |
The components of the future income tax liability (asset) are as follows:
| | | | | | | |
| | | | | | | | |
| | December 31, 2007 | | December 31, 2006 | |
| | | | | | | | |
Net book value of petroleum and natural gas assets in excess of tax pools | | $ | 333,466 | | $ | 29,896 | |
Net book value of intangible assets in excess of tax pools | | | 13,998 | | | - | |
Asset retirement obligation | | | (56,066 | ) | | (17,641 | ) |
Net unrealized losses related to risk management contracts and foreign exchange positions – current | | | (38,642 | ) | | (3,818 | ) |
Net unrealized losses related to risk management contracts and foreign exchange positions – long-term | | | 304 | | | (1,266 | ) |
Non-capital loss carry forwards for tax purposes | | | (161,706 | ) | | (40,412 | ) |
Deferral of taxable income in partnership | | | 1,492 | | | 1,483 | |
Future employee retirement costs | | | (3,607 | ) | | - | |
Working capital and other items | | | (2,599 | ) | | (2,787 | ) |
Valuation allowance | | | - | | | 34,545 | |
| | | | | | | | |
Future income tax liability (asset), net | | $ | 86,640 | | $ | - | |
| | | | | | | | |
Canada Revenue Agency (“CRA”) Assessment
In 2002, the CRA assessed, as a $30 million forgiveness of debt, a 1994 share issue in connection with the acquisition of North Atlantic in 1994 by a Vitol Refining S.A. affiliate. North Atlantic disagrees with the CRA’s position and believes that the value of the common shares issued in 1994 was equal to the value of the debt exchanged and has filed a Notice of Objection to the CRA’s Notice of Reassessment. There are no contingent amounts accrued related to this matter in these financial statements. Harvest is indemnified by the vendor of North Atlantic in respect of this contingent liability.
| |
17. | EMPLOYEE FUTURE BENEFIT PLANS |
Defined Contribution Pension Plan
Total expense for the defined contribution plan is equal to Harvest’s required contributions and was $0.7 million for the year ended December 31, 2007 (2006 – $0.1 million).
Defined Benefit Plans
The measurement of the accrued benefit obligation and annual expense for the defined benefit plans requires actuarial calculations and several assumptions. These assumptions, set annually on December 31, are as follows;
| | | | | | | | | | | | | |
| |
| | December 31, 2007 | | December 31, 2006 | |
| |
| | Pension Plans | | Other Benefit
Plans | | Pension Plans | | Other Benefit
Plans | |
| |
Discount rate | | | 5.0 | % | | 5.0 | % | | 5.0 | % | | 5.0 | % |
Expected long-term rate of return on plan assets | | | 7.0 | % | | - | | | 7.0 | % | | - | |
Rate of compensation increase | | | 3.5 | % | | - | | | 3.5 | % | | - | |
Employee contribution of pensionable income | | | 6.0 | % | | - | | | 6.0 | % | | - | |
Annual rate of increase in covered health care benefits | | | - | | | 11.0 | % | | - | | | 12.0 | % |
Expected average remaining service lifetime (years) | | | 11.7 | | | 10.8 | | | 11.7 | | | 11.1 | |
| | | | | | | | | | | | | | |
| |
| |
Consolidated Financial Statements | |
| |
The assets of the defined benefit plan are invested and maintain the following asset mix:
| | |
| |
| December 31, 2007 | December 31, 2006 |
| |
Bonds/fixed income securities | 32% | 32% |
Equity securities | 68% | 68% |
| | | |
The expected long-term rates of return are estimated based on many factors, including the expected forecast for inflation, risk premiums for each class of asset, and current and future financial market conditions.
The defined benefit pension plans were subject to an actuarial valuation on December 31, 2005 and the next valuation report is due no later than December 31, 2008. The post-retirement health care benefits plan was last subject to an actuarial valuation on December 31, 2006.
| | | | | | | | | | | | | |
| |
| | December 31, 2007 | | December 31, 2006 | |
| | | | | | |
| | Pension Plans | | Other Benefit
Plans | | Pension
Plans | | Other Benefit
Plans | |
| |
| | | | | | | | | | | | | |
Employee benefit obligation, beginning of year | | $ | 43,101 | | $ | 6,027 | | $ | 38,754 | | $ | 5,315 | |
Current service costs | | | 3,043 | | | 369 | | | 648 | | | 88 | |
Interest | | | 2,357 | | | 316 | | | 546 | | | 74 | |
Actuarial losses | | | 1,409 | | | 162 | | | 3,422 | | | 601 | |
Plan amendment | | | - | | | - | | | - | | | - | |
Benefits paid | | | (828 | ) | | (221 | ) | | (269 | ) | | (51 | ) |
Impact of foreign exchange on translation | | | - | | | - | | | - | | | - | |
| | | | | | | | | | | | | | |
Employee benefit obligation, end of year | | | 49,082 | | | 6,653 | | | 43,101 | | | 6,027 | |
| | | | | | | | | | | | | | |
| | | | | | | | | | | | | |
Fair value of plan assets, beginning of year | | | 36,576 | | | - | | | 31,878 | | | - | |
Actual return on plan assets | | | (1,682 | ) | | - | | | 3,181 | | | - | |
Employer contributions | | | 3,428 | | | 221 | | | 1,306 | | | 51 | |
Employee contributions | | | 1,409 | | | - | | | 480 | | | - | |
Benefits paid | | | (828 | ) | | (221 | ) | | (269 | ) | | (51 | ) |
Impact of foreign exchange on translation | | | - | | | - | | | - | | | - | |
| | | | | | | | | | | | | | |
Fair value of plan assets, end of year | | | 38,903 | | | - | | | 36,576 | | | - | |
| | | | | | | | | | | | | | |
Funded status | | | (10,179 | ) | | (6,653 | ) | | (6,525 | ) | | (6,027 | ) |
Unamortized balances: | | | | | | | | | | | | | |
Net actuarial losses | | | 4,664 | | | - | | | 325 | | | - | |
Past services | | | - | | | - | | | - | | | - | |
| | | | | | | | | | | | | | |
Carrying amount | | $ | (5,515 | ) | $ | (6,653 | ) | $ | (6,200 | ) | $ | (6,027 | ) |
| | | | | | | | | | | | | | |
| | | | | | | |
| |
| | December, 31, 2007 | | December 31, 2006 | |
| |
Summary: | | | | | | | |
Pension plans | | $ | 5,515 | | $ | 6,200 | |
Other benefit plans | | | 6,653 | | | 6,027 | |
| | | | | | | | |
Carrying amount | | $ | 12,168 | | $ | 12,227 | |
| | | | | | | | |
Estimated pension and other benefit payments to plan participants, which reflect expected future service, expected to be paid from 2008 to 2017 are summarized in the commitment table [see Note 20].
The table below shows the components of the net benefit plan expense:
| | | | | | | | | | | | | |
| |
| | Year ended December 31, 2007 | | Year ended December 31, 2006 | |
| |
| | Pension Plans | | Other Benefit
Plans | | Pension Plans | | Other Benefit
Plans | |
| |
Current service cost | | $ | 3,043 | | $ | 369 | | $ | 648 | | $ | 88 | |
Interest costs | | | 2,357 | | | 316 | | | 546 | | | 74 | |
Expected return on assets | | | (2,657 | ) | | - | | | (563 | ) | | - | |
Amortization of net actuarial losses | | | - | | | 101 | | | - | | | 588 | |
| | | | | | | | | | | | | | |
Net benefit plan expense | | $ | 2,743 | | $ | 786 | | $ | 631 | | $ | 750 | |
| | | | | | | | | | | | | | |
| |
| |
| Consolidated Financial Statements |
| |
A1% change in the expected health care cost trend rate would have the following annual impacts as at December 31, 2007:
| | | | | | | |
| | | | | | |
| | 1% Increase | | 1% Decrease | |
| | | | | | |
Impact on post-retirement benefit expense | | $ | 1 | | $ | (2 | ) |
Impact on projected benefit obligation | | | 9 | | | (11 | ) |
| | | | | | | | |
| |
18. | FINANCIAL INSTRUMENTS AND RISK MANAGEMENT CONTRACTS |
Financial instruments of Harvest consist of cash, accounts receivable, long-term receivables, accounts payable and accrued liabilities, cash distribution payable, bank loan, risk management contracts, convertible debentures and senior notes. The carrying value and fair value of these financial instruments at December 31, 2007 is disclosed below by financial instrument category, as well as any related gains or losses and interest income or expense for the year ended December 31, 2007:
| | | | | | | | | | | | | | | | |
| | | | | | | | | | | | |
Financial Instrument | | Carrying
Value | | Fair Value | | Gains/
(Losses) | | Interest
Income/
(Expense) | | Other Income/
(Expense) | |
| | | | | | | | | | | | |
Loans and Receivables | | | | | | | | | | | | | | | | |
Accounts receivable | | | 212,271 | | | 212,271 | | | - | | | - | | | - | |
Lease payments receivable | | | 3,532 | (1) | | 3,532 | | | - | | | 201 | (2) | | - | |
| | | | | | | | | | | | | | | | | |
Liabilites Held For Trading | | | | | | | | | | | | | | | | |
Net fair value of risk management contracts | | | 149,673 | | | 149,673 | | | (174,072 | )(3) | | - | | | - | |
| | | | | | | | | | | | | | | | | |
Other Liabilities | | | | | | | | | | | | | | | | |
Accounts payable | | | 270,243 | | | 270,243 | | | - | | | - | | | - | |
Cash distribution payable | | | 44,487 | | | 44,487 | | | - | | | - | | | - | |
Bank loan | | | 1,279,501 | | | 1,279,501 | | | - | | | (71,477 | )(4) | | (4,509 | )(4) |
77/8% Senior Notes | | | 241,148 | (6) | | 232,646 | | | - | | | (22,561 | )(5) | | - | |
Convertible debentures | | | 651,768 | | | 623,255 | | | - | | | (59,238 | )(5) | | - | |
| | | | | | | | | | | | | | | | | |
| |
(1) | Included in accounts receivable on the balance sheet. |
|
(2) | Included in petroleum, natural gas, and refined product sales in the statement of income and comprehensive income. |
|
(3) | Included in risk management contracts - realized and unrealized gains/(losses) in the statement of income and comprehensive income. |
|
(4) | Included in interest and other financing charges on short term/long term debt in the statement of income and comprehensive income. The amortization of financing fees related to this liability is included in Amortization of deferred finance charges in the statement of cash flows. |
|
(5) | Included in Interest and other financing charges on short term/long term debt in the statement of income and comprehensive income. The non-cash interest expense relating to the accretion of premiums, discounts or transaction costs that are netted against these liabilities are included in non-cash interest in the statement of cash flows. |
|
(6) | The face value of the 77/8% Senior Notes at December 31, 2007 is $247.8 million (US $250 million). |
The fair value of the lease payments receivable is the present value of expected future cash flows. The fair values of the convertible debentures and the 77/8% Senior Notes are based on quoted market prices as at December 31, 2007. The risk management contracts are recorded on the balance sheet at their fair value, accordingly, there is no difference between fair value and carrying value. The bank loan is recorded at amortized cost, but there are no transaction costs associated with this and the financing costs are included in intangible assets; therefore, there is no difference between the carrying value and the fair value. Due to the short term nature of cash, accounts receivable, accounts payable and cash distribution payable, their carrying values approximate their fair values.
| |
(a) | Risk Exposure |
| |
| Harvest is exposed to market risks resulting from fluctuations in commodity prices, foreign exchange rates and interest rates in the normal course of operations. Harvest is also exposed, to a lesser extent, to credit risk on accounts receivable and counterparties to price risk management contracts and to liquidity risk relating to our debt. |
| |
| (i.) Credit Risk |
| |
| Upstream Accounts Receivable |
| |
| Accounts receivable in our upstream operations are due from crude oil and natural gas purchasers as well as joint venture partners. These balances are due from companies in the petroleum and natural gas industry and are subject to normal industry credit risks. Concentration of credit risk is mitigated by having a broad customer base, which includes a significant number of companies engaged in joint operations with Harvest. Harvest periodically assesses the financial strength of its crude oil and natural gas purchasers and will adjust its marketing plan to mitigate credit risks. This assessment involves a review of external credit ratings; however, if external ratings are not available, we try to obtain a guarantee from the parent company. If this is not possible, we perform our own internal credit review based on the purchaser’s past financial performance. The credit risk associated with our joint venture partners is mitigated by reviewing the credit history of partners and requiring some partners to provide cash upfront in the form of cash calls for significant capital projects. As well, most agreements have a net off provision that enables us to use the proceeds from the sale of production that would otherwise be taken in kind by the partner to net off amounts owing from the partner that are in default. Historically, the only instances of impairment have been when a purchaser or partner has gone bankrupt. |
| |
| |
Consolidated Financial Statements | |
| |
Risk Management Contract Counterparties
Harvest is also exposed to credit risk from the counterparties to our risk management contracts. This risk is managed by diversifying Harvest’s risk management portfolio among a number of counterparties and by dealing with investment grade financial institutions. We have no history of impairment with these counterparties and therefore no impairment is recorded at December 31, 2007 or 2006.
Supply and Offtake Agreement Accounts Receivable (Vitol)
The Supply and Offtake Agreement entered into in conjunction with the purchase of the refinery exposed Harvest to the credit risk of Vitol Refining S.A. (“Vitol”) as all feedstock purchases and substantially all product sales are made with Vitol. Harvest mitigates this risk by requiring that Vitol maintain a minimum B+ credit rating as assessed by Standard and Poors. If the credit rating falls below this line, additional security is required to be supplied to Harvest.
Other Accounts Receivable
Harvest does not have any significant exposure to any individual customer in its downstream operations and its policy is to manage its credit risk by dealing with only financially sound customers. Credit is extended based on an evaluation of the customer’s financial condition. The carrying amount of accounts receivable reflects management’s assessment of the associated credit risks.
Harvest is also exposed to credit risk from customers due to the lease payments receivable relating to our net investment in vehicle and equipment leases. As some of the counterparties to these leases are employees or distributors, any over due amounts can be deducted from wages or commissions and therefore, the credit risk is low.
(ii.) Liquidity Risk
Harvest is exposed to liquidity risk mainly due to our outstanding bank balances and 77/8% Senior Notes with repayment requirements. This risk is mitigated by managing the maturity dates on our obligations and complying with the covenants.
(iii.) Market Risk
Harvest is exposed to three types of market risks: interest rate risk, foreign currency exchange rate risk and commodity price risk.
Interest Rate Risk
Harvest is exposed to interest rate risk on its bank loans as interest rates are determined in relation to floating market rates. Harvest’s convertible debentures and 77/8% Senior Notes have fixed interest rates and therefore do not create an interest rate risk. Harvest manages its exposure to interest rate risk by maintaining its debt in a combination of floating rate debt denominated in Canadian dollars and bearing interest relative to the Canadian interest rate benchmark, and fixed rate debt denominated in US dollars.
In addition, Harvest manages its interest rate risk by targeting appropriate levels of debt relative to its expected cash flow from operations.
Foreign Currency Exchange Rate Risk
Harvest is exposed to the risk of changes in the Canadian/US dollar exchange rate on its US dollar denominated revenues and in respect of its refinery crude oil purchases and sales of refined products. In addition, Harvest’s 77/8% Senior Notes are denominated in US dollars (US$250 million). Interest is payable semi-annually in US dollars on the notes; therefore, any interest payable at the balance sheet date is also subject to currency exchange rate risk. Harvest manages these exchange rate risks by occasionally entering into fixed rate currency exchange contracts on future US dollar payments and US dollar sales.
Commodity Price Risk
Harvest uses price risk management contracts for a portion of its crude oil, natural gas and refined product sales to manage its commodity price exposure and power costs. These contracts are recorded on the balance sheet at their fair value as of the balance sheet date, with changes from the prior period’s fair value recorded in net income for the period. These fair values are generally determined as the difference between the stated fixed price of the contract and some expected future price of the underlying asset. Variances in expected future prices expose us to commodity price risk as they will change the gain or loss that we ultimately realize on these contracts. This risk is mitigated by continuously monitoring the effectiveness of these contracts and other risk management actions.
| |
(b) | Fair Values |
|
| At December 31, 2007, the net fair value deficiency reflected on the balance sheet for all the risk management contracts outstanding at that date was approximately $149.7 million ($1.9 million – December 31, 2006), which was included in the balance sheet as follows: Fair value of risk management contracts (current assets) $16.4 million, fair value deficiency of risk management contracts (current liabilities) $131.0 million and fair value deficiency of risk management contracts $35.1 million. |
| |
| |
| Consolidated Financial Statements |
| |
The following is a summary of Harvest’s risk management contracts outstanding, along with their fair value at December 31, 2007:
| | | | | | | | | |
| | | | | | | | | | |
Quantity | | Type of Contract | | Term | | Average Price | | | Fair value |
| | | | | | | | | | |
Crude Oil Price Risk Management | | | | | | | |
| | | | | | | | |
10,000 bbl/d | | WTI Participating swap | | Jan. 08 – Jun. 08 | | US$60.00(b) | | | (15,873) |
6,000 bbl/d | | WTI 3-way contract | | Jul. 08 – Dec. 08 | | US$62.00 - $87.53 | | | (9,015) |
| | | | | | ($72.00)(c) | | | |
| | | | | | | | | | |
| | | | | | | | $ | (24,888) |
| | | | | | | | | | |
|
| | | | | | | | | | |
Refined Product Price Risk Management | | | | | | | |
| | | | | | | | |
10,000 bbl/d | | NYMEX heating oil 3-way contract | | Jan. 08 – Dec. 08 | | US$60.90 - $93.31 | | $ | (56,929) |
| | | | | | ($81.06)(e)(k) | | | |
6,000 bbl/d | | Platt’s fuel oil 3-way contract | | Jan. 08 – Dec. 08 | | US$43.00 - $63.21 | | | (25,196) |
| | | | | | ($51.67)(f) | | | |
2,000 bbl/d | | NYMEX heating oil collar | | Jan. 08 – Dec. 08 | | US$79.80 - $91.35(g)(k) | | | (12,513) |
2,000 bbl/d | | Platt’s fuel oil collar | | Jan. 08 – Dec. 08 | | US$51.00 - $58.68(h) | | | (11,203) |
12,000 bbl/d | | NYMEX heating oil 3-way contract | | Jan. 09 – Jun. 09 | | US$72.59 - $98.73 | | | (21,840) |
| | | | | | ($86.52)(i)(k) | | | |
8,000 bbl/d | | Platt’s fuel oil 3-way contract | | Jan. 09 – Jun. 09 | | US$49.75 - $65.89 ($57.38)(j) | | | (13,255) |
| | | | | | | | | | |
| | | | | | | | $ | (140,936) |
| | | | | | | | | | |
|
| | | | | | | | | | |
Natural Gas Price Risk Management | | | | | | | |
| | | | | | | | |
276 GJ/d | | Fixed price – natural gas contract | | Jan. 08 – Dec. 08 | | Cdn$4.16(d) | | $ | (210) |
| | | | | | | | | | |
| | | | | | | | | |
| | | | | | | | | | |
Electricity Price Risk Management | | | | | | | |
| | | | | | | | |
35 MWH | | Electricity price swap contracts | | Jan. 08 – Dec. 08 | | Cdn $56.69 | | $ | 5,631 |
| | | | | | | | | | |
| | | | | | | | | |
| | | | | | | | | | |
Refined Product Crack Spread Risk Management | | | | | | | |
| | | | | | | | |
2,000 bbl/d | | Platt’s fuel oil crack swap | | Jan. 08 – Dec. 08 | | US($16.50) | | $ | 1,815 |
6,000 bbl/d | | NYMEX heating oil crack swap | | Jan. 08 – Dec. 08 | | US$14.63 | | | 30 |
6,000 bbl/d | | NYMEX RBOB crack swap | | Jul. 08 – Dec. 08 | | US$10.00 | | | 290 |
| | | | | | | | | | |
| | | | | | | | $ | 2,135 |
| | | | | | | | | | |
| | | | | | | | | |
| | | | | | | | | | |
Foreign Currency Exchange Rate Risk Management | | | | | |
| | | | | | |
$8,333,333/ | | US/Cdn dollar exchange rate swap | | Jan. 08 – Jun. 08 | | 1.1099 Cdn/US | | | 5,865 |
month | | | | | | | | | |
$10,000,000/ | | US/Cdn dollar collar | | Jan. 08 – Dec. 08 | | 1.000 Cdn/US- 1.055 | | | 2,730 |
month | | | | | | Cdn/US(a) | | | |
| | | | | | | | | | |
| | | | | | | | $ | 8,595 |
| | | | | | | | | | |
Total net fair value deficiency of risk management contracts | | | | $ | (149,673) |
| | | | | | |
| |
(a) | If the market price is below $1.000, price received is $1.000; if the market price is between $1.000 and the ceiling of $1.055, the price received is market price; if the market price is over the ceiling of $1.055, price received is the stated ceiling price. |
|
(b) | This is the average price of the price floors. Harvest realizes this price plus 67-79%, or an average of 73%, of the difference between spot price and the given floor price. |
|
(c) | If the market price is below $62.00, price received is market price plus $10.00; if the market price is between $62.00 and $72.00, the price received is $72.00; if the market price is between $72.00 and the ceiling of $87.53, the price received is market price; if the market price is over the ceiling of $87.53, price received is the stated ceiling price. |
|
(d) | This contract contains an annual escalation factor such that the fixed price is adjusted each year. |
|
(e) | If the market price is below $60.90, price received is market price plus $20.16; if the market price is between $60.90 and $81.06, the price received is $81.06; if the market price is between $81.06 and the ceiling of $93.31, the price received is market price; if the market price is over the ceiling of $93.31, price received is $93.31. |
|
(f) | If the market price is below $43.00, price received is market price plus $8.67; if the market price is between $43.00 and $51.67, the price received is $81.06; if the market price is between $51.67 and the average ceiling of $63.21, the price received is market price; if the market price is over the average ceiling of $63.21, price received is the stated ceiling price. |
|
(g) | If the market price is below $79.80, price received is $79.80; if the market price is between $79.80 and $91.35, the price received is market price; if the market price is over the ceiling of $91.35, price received is $91.35. |
|
(h) | If the market price is below $51.00, price received is $51.00; if the market price is between $51.00 and the average ceiling of $58.68, the price received is market price; if the market price is over the average ceiling of $58.68, price received is the stated ceiling price. |
|
(i) | If the market price is below the floor price of $72.59, price received is market price plus $13.93; if the market price is between the floor price of $72.59 and $86.52, the price received is $86.52; if the market price is between $86.52 and the ceiling of $98.73, the price received is market price; if the market price is over the average ceiling of $98.73, price received is the stated ceiling price. |
|
(j) | If the market price is below the average floor of $49.75, price received is market price plus $7.63; if the market price is between the average floor price of $49.75 and $57.38, the price received is $57.38; if the market price is between $57.38 and the average ceiling of $65.89, the price received is market price; if the market price is over the average ceiling of $65.89, price received is the stated ceiling price. |
|
(k) | Heating oil contracts are contracted in US dollars per US gallon adn are presented in this table in US dollars per barrel for comparative purposes (1 barrel equals 42 US gallons). |
| |
| |
Consolidated Financial Statements | |
| |
| |
| For the year ended December 31, 2007, the total unrealized gain/loss on risk management contracts recognized in the consolidated statement of income and comprehensive income was a loss of $147.8 million (2006 - a gain of $55.2 million), which represents the change in fair value of financial assets and liabilities classified as held for trading. The realized gains and losses on all risk management contracts are included in the period in which they are incurred. |
| |
19. | SEGMENT INFORMATION |
| |
| Harvest operates in Canada and has two reportable operating segments, Upstream and Downstream. Harvest’s upstream operations consist of development, production and subsequent sale of petroleum, natural gas and natural gas liquids, while its downstream operations include the purchase of crude oil, the refining of crude oil, the sale of the refined products including a network of retail operations and the supply of refined products to commercial and wholesale customers. |
| | | | | | | | | | | | | | | | | | | | |
| | | | | | | | |
| Results of Continuing Operations | | | | | | |
| | | | | | | | |
| | | Downstream(1) | | Upstream(1) | | Total | |
| | | | | | | | |
| | | 2007 | | 2006 | | 2007 | | 2006 | | 2007 | | 2006 | |
| | | | | | | | |
| Revenue(2)(3) | | $ | 3,098,556 | | $ | 460,359 | | $ | 1,184,457 | | $ | 1,120,575 | | $ | 4,283,013 | | $ | 1,580,934 | |
| Royalties | | | - | | | - | | | (213,413 | ) | | (200,109 | ) | | (213,413 | ) | | (200,109 | ) |
| Less: | | | | | | | | | | | | | | | | | | | |
| Purchased products for resale and processing | | | 2,667,714 | | | 386,014 | | | - | | | - | | | 2,667,714 | | | 386,014 | |
| Operating(4) | | | 229,290 | | | 34,063 | | | 300,918 | | | 242,474 | | | 530,208 | | | 276,537 | |
| Transportation and marketing | | | 34,970 | | | 5,060 | | | 11,946 | | | 12,142 | | | 46,916 | | | 17,202 | |
| General and administrative | | | 1,713 | | | - | | | 34,615 | | | 28,372 | | | 36,328 | | | 28,372 | |
| Transaction costs | | | - | | | - | | | - | | | 12,072 | | | - | | | 12,072 | |
| Depletion, depreciation, amortization and accretion | | | 72,599 | | | 15,482 | | | 454,142 | | | 413,988 | | | 526,741 | | | 429,470 | |
| | | | | | | | | | | | | | | | | | | | |
| | | $ | 92,270 | | $ | 19,740 | | $ | 169,423 | | $ | 211,418 | | | 261,693 | | | 231,158 | |
| Realized net losses on risk management contracts | | | | | | | | | | | | | | | (26,291 | ) | | (44,808 | ) |
| Unrealized net (losses) gains on risk management contracts | | | | | | | | | | | | | | | (147,781 | ) | | 52,179 | |
| Interest and other financing charges on short term debt | | | | | | | | | | | | | | | (5,584 | ) | | (4,864 | ) |
| Interest and other financing charges on long term debt | | | | | | | | | | | | | | | (152,201 | ) | | (78,828 | ) |
| Foreign exchange gain (loss) | | | | | | | | | | | | | | | 109,316 | | | (21,100 | ) |
| Large corporations tax and other tax | | | | | | | | | | | | | | | 974 | | | 9 | |
| Future income tax | | | | | | | | | | | | | | | (65,802 | ) | | 2,300 | |
| | | | | | | | | | | | | | | | | | | | |
| Net (loss) income | | | | | | | | | | | | | | $ | (25,676 | ) | $ | 136,046 | |
| | | | | | | | | | | | | | | | | | | | |
| | | | | | | | | | | | | | | | | | | | |
| | | | | | | | | | | | | | | | | | | | |
| Total Assets(5) | | $ | 1,482,904 | | $ | 1,727,797 | | $ | 3,952,337 | | $ | 3,990,004 | | $ | 5,451,683 | | $ | 5,745,558 | |
| | | | | | | | | | | | | | | | | | | | |
| | | | | | | | | | | | | | | | | | | | |
| Capital Expenditures | | | | | | | | | | | | | | | | | | | |
| Development and other activity | | $ | 44,111 | | $ | 21,411 | | $ | 300,674 | | $ | 376,881 | | $ | 344,785 | | $ | 398,292 | |
| Business acquisitions | | | - | | | 1,597,793 | | | 170,782 | | | 2,422,180 | (6) | | 170,782 | | | 4,019,973 | |
| Property acquisitions | | | - | | | - | | | 27,943 | | | 65,773 | | | 27,943 | | | 65,773 | |
| Property dispositions | | | - | | | - | | | (60,569 | ) | | (20,856 | ) | | (60,569 | ) | | (20,856 | ) |
| Increase in other non-current assets | | | - | | | 165 | | | - | | | - | | | - | | | 165 | |
| | | | | | | | | | | | | | | | | | | | |
| Total expenditures | | $ | 44,111 | | $ | 1,619,369 | | $ | 438,830 | | $ | 2,843,978 | | $ | 482,941 | | $ | 4,463,347 | |
| | | | | | | | | | | | | | | | | | | | |
| Property, plant and equipment | | | | | | | | | | | | | | | | | | | |
| Cost | | $ | 1,164,310 | | $ | 1,320,698 | | $ | 4,247,819 | | $ | 3,801,054 | | $ | 5,412,129 | | $ | 5,121,752 | |
| Less: Accumulated depletion, depreciation, amortization and accretion | | | (72,277 | ) | | (14,660 | ) | | (1,142,345 | ) | | (706,540 | ) | | (1,214,622 | ) | | (721,200 | ) |
| | | | | | | | | | | | | | | | | | | | |
| Net book value | | $ | 1,092,033 | | $ | 1,306,038 | | $ | 3,105,474 | | $ | 3,094,514 | | $ | 4,197,507 | | $ | 4,400,552 | |
| | | | | | | | | | | | | | | | | | | | |
| Goodwill | | | | | | | | | | | | | | | | | | | |
| Beginning of year | | $ | 209,930 | | $ | - | | $ | 656,248 | | $ | 43,832 | | $ | 866,178 | | $ | 43,832 | |
| Addition (reduction) to goodwill | | | (33,946 | ) | | 209,930 | | | 20,546 | | | 612,416 | | | (13,400 | ) | | 822,346 | |
| | | | | | | | | | | | | | | | | | | | |
| End of year | | $ | 175,984 | | $ | 290,930 | | $ | 676,794 | | $ | 656,248 | | $ | 852,778 | | $ | 866,178 | |
| | | | | | | | | | | | | | | | | | | | |
| | |
| (1) | Accounting policies for segments are the same as those described in the Significant Accounting Policies |
|
| (2) | Of the total downstream revenue for the year ended December 31, 2007, $2,651.5 million is from one customer (2006 - $427.1 million). No other single customer within either division represents greater than 10% of Harvest’s total revenue. |
|
| (3) | Of the total consolidated revenue for the year ended December 31, 2007, $1,626.3 million is attributable to sales in Canada (2006 - $1,150.5 million), while $2,656.7 million is attributable to sales in the United States (2006 - $430.4 million). |
|
| (4) | Downstream operating expenses for the period ended December 31, 2007 include $34.5 million of turnaround and catalyst costs related to the planned shutdown of the Isomax and Platformer commencing on September 21, 2007. |
|
| (5) | Total Assets on a consolidated basis includes $16.4 million (2006 - $27.8 million) relating to the fair value of risk management contracts |
|
| (6) | Included in this amount is $1,975.3 million relating to the acquisition of Viking, which was acquired through the issuance of Trust Units and is therefore not reflected in the cash flow statement. |
|
| (7) | There is no intersegment activity. |
| |
| |
| Consolidated Financial Statements |
| |
| |
20. | COMMITMENTS, CONTINGENCIES AND GUARANTEES |
From time to time, Harvest is involved in litigation or has claims brought against it in the normal course of business operations. Management of Harvest is not currently aware of any claims or actions that would materially affect Harvest’s reported financial position or results from operations. In the normal course of operations, management may also enter into certain types of contracts that require Harvest to indemnify parties against possible third party claims, particularly when these contracts relate to purchase and sale agreements. The terms of such contracts vary and generally a maximum is not explicitly stated; as such the overall maximum amount of the obligations cannot be reasonably estimated. Management does not believe payments, if any, related to such contracts would have a material effect on Harvest’s reported financial position or results from operations.
The following are the significant commitments and contingencies at December 31, 2007:
| | |
(a) | North Atlantic has a Supply and Offtake Agreement with Vitol Refining S.A. This agreement provides that the ownership of substantially all crude oil feedstock and refined product inventory at the refinery be retained by Vitol Refining S.A. and that for a minimum period of up to two years Vitol Refining S.A. will be granted the right and obligation to provide crude oil feedstock for delivery to the refinery, as well as the right and obligation to purchase substantially all refined products produced by the refinery. As such, at December 31, 2007, North Atlantic had commitments totaling approximately $843.6 million (2006 - $550.2 million) in respect of future crude oil feedstock purchases and related transportation from Vitol Refining S.A. |
| | |
(b) | North Atlantic has an agreement with Newsul Enterprises Inc. (“Newsul”) whereby North Atlantic committed to provide Newsul with its inventory and production of sulphur to February 12, 2008. The agreement has been renewed for a further period of ten years. |
| |
| Newsul has named North Atlantic in a claim in the amount of US$2.7 million and has requested the services of an arbitration board to make a determination on the claim. The claim is for additional costs and lost revenues related to alleged contaminated sulphur delivered by North Atlantic. An accrual of $0.5 million has been established based on North Atlantic’s estimate of their liability, but since the eventual outcome of the arbitration hearing is undeterminable, there exists an exposure to loss in excess of the amount accrued. |
| |
(c) | North Atlantic has an environmental agreement with the Province of Newfoundland and Labrador, Canada, committing to programs that reduce the environmental impact of the refinery over time. Initiatives include a schedule of activities to be undertaken with regard to improvements in areas such as emissions, waste water treatment, terrestrial effects, and other matters. In accordance with the agreement, certain projects have been completed and others have been scheduled. Costs relating to certain activities scheduled to be undertaken over the next two years are estimated to be approximately $3.5 million and are included in the table below; costs cannot yet be estimated for the remaining projects. |
| |
(d) | North Atlantic has been named a defendant in The State of New Hampshire versus Amerada Hess Corp. et al, one of more than 100 methyl tertiary butyl ether (“MTBE”) US product liability litigation cases that have been consolidated for pre-trial purposes in this matter. The plaintiffs seek relief for alleged contamination of ground water from the various defendants’ use of the gasoline additive MTBE. Although the plaintiffs have not made a particular monetary demand, they are asserting collective and joint liability against all defendants. All consolidated lawsuits are at a preliminary stage and, accordingly, it is too early in the legal process to reach any conclusion regarding the ability of the State of New Hampshire to properly assert jurisdiction over North Atlantic in the lawsuit or to reach any conclusions regarding the substance of the plaintiffs’ claims. Accordingly, the evaluation of the risk of liability to North Atlantic is not determinable at this time and no amounts are accrued in the consolidated financial statements in respect of this matter. Harvest is indemnified by Vitol Group B.V. in respect of this contingent liability. |
| |
(e) | Petro-Canada, a former owner of the North Atlantic refinery, holds certain contractual rights in relation to production at the refinery, namely: |
| |
| i. | a right to share, subject to a maximum limit, in the profits of the sale of any refined product, refined at the refinery, sold in Canada, exclusive of the province of Newfoundland and Labrador; |
| | |
| ii. | a right of first refusal to any refinery and/or terminaling capacity in excess of North Atlantic’s requirements; |
| | |
| iii. | a right to participate in any venture to produce petrochemicals at the refinery; and |
| | |
| iv. | the rights in paragraphs (i) and (ii) above continue for a period of 25 years from December 1, 1986, while the rights in paragraph (iii) continue until amended by the parties. |
| |
| |
Consolidated Financial Statements | |
| |
The following is a summary of Harvest’s contractual obligations and commitments as at December 31, 2007:
| | | | | | | | | | | | | | | | | | | | | | |
| | | | |
| | Payments Due by Period | |
| | | | |
| | 2008 | | 2009 | | 2010 | | 2011 | | 2012 | | Thereafter | | Total | |
| | | | | | | | | | | | | | | | |
Debt repayments(1) | | | - | | | - | | | 1,279,501 | | | 247,825 | | | - | | | - | | | 1,527,326 | |
Capital commitments(2) | | | 15,924 | | | 1,300 | | | - | | | - | | | - | | | - | | | 17,224 | |
Operating leases(3) | | | 7,572 | | | 6,655 | | | 5,742 | | | 5,292 | | | 1,853 | | | 248 | | | 27,362 | |
Pension contributions(4) | | | 1,143 | | | 1,583 | | | 2,048 | | | 2,454 | | | 2,847 | | | 21,285 | | | 31,360 | |
Transportation agreements(5) | | | 2,249 | | | 1,684 | | | 1,269 | | | 565 | | | 296 | | | 47 | | | 6,110 | |
Feedstock commitments(6) | | | 843,583 | | | - | | | - | | | - | | | - | | | - | | | 843,583 | |
| | | | | | | | | | | | | | | | | | | | | | | |
Contractual obligations | | | 870,471 | | | 11,222 | | | 1,288,560 | | | 256,136 | | | 4,996 | | | 21,580 | | | 2,452,965 | |
| | | | | | | | | | | | | | | | | | | | | | | |
| |
(1) | Assumes that the outstanding convertible debentures either convert at the holders’ option for Units or are redeemed for Units at Harvest’s option. |
|
(2) | Relating to drilling contracts, AFE commitments and equipment rental contracts. |
|
(3) | Relating to building and automobile leases. |
|
(4) | Relating to expected contributions for employee benefit plans [see Note 17]. |
|
(5) | Relating to oil and natural gas pipeline transportation agreements. |
|
(6) | Relating to crude oil feedstock purchases and related transportation costs [see Note 20(a) above]. |
| |
21. | RECONCILIATION OF THE CONSOLIDATED FINANCIAL STATEMENTS TO
UNITED STATES GENERALLY ACCEPTED ACCOUNTING PRINCIPLES |
These consolidated financial statements have been prepared in accordance with Canadian GAAP which, in most respects, conforms to US GAAP. Any differences in accounting principles as they have been applied to the accompanying consolidated financial statements are not material except as described below. Items required for financial disclosure under US GAAP may be different from disclosure standards under Canadian GAAP; any such differences are not reflected here.
The application of US GAAP would have the following effects on net income as reported:
| | | | | | | |
| | | | |
| | Year Ended December 31 | |
| | | | |
| | 2007 | | 2006 | |
| | | | | | |
Net income (loss) under Canadian GAAP | | $ | (25,676 | ) | $ | 136,046 | |
| | | | | | | |
Adjustments | | | | | | | |
Write-down of property, plant and equipment(a) | | | - | | | (615,000 | ) |
Unrealized loss on risk management contracts(f) | | | - | | | (398 | ) |
Depletion, depreciation, amortization and accretion(b) | | | 78,180 | | | 8,825 | |
Non-cash interest expense on debentures(d) | | | 6,371 | | | 454 | |
Non-cash interest expense on Senior Notes(h) | | | 842 | | | - | |
Amortization of deferred financing charges(d) | | | (3,471 | ) | | 65 | |
Foreign exchange gain on Senior Notes(h) | | | 1,720 | | | - | |
Foreign exchange gain (loss) on unit distribution(i) | | | 10,045 | | | (1,038 | ) |
Non-controlling interest (e) | | | - | | | (65 | ) |
Non-cash general and administrative expenses (c) | | | (443 | ) | | (3,291 | ) |
Future income tax recovery(g) | | | 91,626 | | | 670 | |
| | | | | | | | |
Net income (loss) under US GAAP before cumulative effect of change in accounting policy | | | 159,194 | | | (473,732 | ) |
| | | | | | | |
Cumulative effect of change in accounting policy(c) | | | - | | | 4,891 | |
| | | | | | | | |
Net income (loss) under US GAAP after cumulative effect of change in accounting policy | | | 159,194 | | | (468,841 | ) |
| | | | | | | |
Net change in cumulative translation adjustment(i) | | | (253,677 | ) | | 47,911 | |
Employee future benefits - actuarial loss | | | (4,339 | ) | | - | |
| | | | | | | | |
Comprehensive income (loss) | | $ | (98,822 | ) | $ | (420,930 | ) |
| | | | | | | | |
| | | | | | | |
BASIC | | | | | | | |
Net income (loss) per Trust Unit under US GAAP before cumulative effect of change in accounting policy | | $ | 1.15 | | $ | (4.66 | ) |
Cumulative effect of change in accounting policy | | | - | | | 0.05 | |
Net income (loss) per Trust Unit under US GAAP after cumulative effect of change in accounting policy | | $ | 1.15 | | $ | (4.61 | ) |
| | | | | | | | |
| | | | | | | |
| |
| |
| Consolidated Financial Statements |
| |
| | | | | | | | |
DILUTED | | | | | | | | |
Net income (loss) per Trust Unit under US GAAP before cumulative effect of change in
accounting policy | | $ | 1.14 | | | $ | (4.66 | ) |
Cumulative effect of change in accounting policy | | | - | | | | 0.05 | |
Net income (loss) per Trust Unit under US GAAP after cumulative effect of change in accounting policy | | $ | 1.14 | | | $ | (4.61 | ) |
| | | | | | | | | |
| | | | | | | | |
STATEMENT OF ACCUMULATED INCOME (LOSS) | | | | | | | | |
Balance, beginning of year – US GAAP | | | 33,880 | | | | (895,736 | ) |
Net income (loss) – US GAAP | | | 159,194 | | | | (473,732 | ) |
Cumulative effect of change in accounting policy | | | - | | | | 4,891 | |
Change in redemption value of Trust Units | | | 371,316 | | | | 1,398,457 | |
| | | | | | | | | |
Balance, end of year – US GAAP | | | 564,390 | | | | 33,880 | |
| | | | | | | | | |
| | | | | | | | |
ACCUMULATED OTHER COMPREHENSIVE INCOME (LOSS) | | | | | | | | |
| | | 47,586 | | | | - | |
Balance, beginning of year – US GAAP | | | | | | | | |
Other comprehensive income | | | (258,016 | ) | | | 47,911 | |
Employee future benefits – Adoption of FAS 158(j) | | | - | | | | (325 | ) |
| | | | | | | | | |
Balance, end of year – US GAAP | | | (210,430 | ) | | | 47,586 | |
| | | | | | | | | |
The application of US GAAP would have the following effect on the consolidated balance sheets as reported:
| | | | | | | | | | | | | | |
| | | | | | | | | | | | | | | |
| | December 31, 2007 | | December 31, 2006 | |
| | Canadian GAAP | | US GAAP | | Canadian GAAP | | US GAAP | |
| | | | | | | | | | |
| | | | | | | | | | | | | | |
Assets | | | | | | | | | | | | | | |
Property, plant and equipment(a) (b) | | $ | 4,197,506 | | $ | 3,670,688 | | | $ | 4,393,832 | | $ | 3,788,606 | |
Deferred charges(d) (f) (h) | | $ | - | | $ | 23,390 | | | $ | 35,657 | | $ | 34,199 | |
Non current benefit plan assets(j) | | $ | - | | $ | 393 | | | $ | - | | $ | 373 | |
Future income tax(f) (g) | | $ | - | | $ | 4,986 | | | $ | - | | $ | - | |
| | | | | | | | | | | | | | |
Liabilities | | | | | | | | | | | | | | |
Accounts payable and accrued liabilities(c) | | $ | 270,240 | | $ | 268,669 | | | $ | 294,582 | | $ | 292,338 | |
Current portion of convertible debentures(d) | | $ | 24,273 | | $ | 24,210 | | | $ | - | | $ | - | |
Current other benefit plan liability(j) | | $ | - | | $ | 170 | | | $ | - | | $ | 162 | |
Deferred credit(f) | | $ | - | | $ | - | | | $ | 794 | | $ | 794 | |
77/8% Senior notes(h) | | $ | 241,148 | | $ | 246,710 | | | $ | 291,350 | | $ | 289,952 | |
Convertible debentures – liability(d) | | $ | 627,495 | | $ | 671,818 | | | $ | 601,511 | | $ | 627,722 | |
Non current benefit plan liability(j) | | $ | 12,168 | | $ | 17,054 | | | $ | 12,227 | | $ | 12,762 | |
Future income tax(f)(g) | | $ | 86,640 | | $ | - | | | $ | - | | $ | - | |
| | | | | | | | | | | | | | |
Temporary equity(e) | | $ | - | | $ | 2,997,136 | | | $ | - | | $ | 2,680,017 | |
| | | | | | | | | | | | | | |
Unitholders’ Equity | | | | | | | | | | | | | | |
Unitholders’ capital(e) | | $ | 3,736,080 | | $ | - | | | $ | 3,046,876 | | $ | - | |
Equity component of convertible debentures(d) | | $ | 39,537 | | $ | - | | | $ | 36,070 | | $ | - | |
Additional paid-in capital | | $ | - | | $ | 9,913 | | | $ | - | | $ | 9,913 | |
Accumulated income(i) | | $ | 246,865 | | $ | 564,390 | | | $ | 271,155 | | $ | 33,880 | |
Cumulative foreign currency translation adjustment(i) | | $ | - | | $ | - | | | $ | 46,873 | | $ | - | |
Accumulated other comprehensive income(j) (i) | | $ | (196,759 | ) | $ | (210,430 | ) | | $ | - | | $ | 47,586 | |
| | | | | | | | | | | | | | | |
| |
(a) | Under Canadian GAAP, Harvest performs an impairment test that limits the capitalized costs of its petroleum and natural gas assets to the discounted estimated future net revenue from proved and probable petroleum and natural gas reserves plus the cost of unproved properties less impairment, estimated future prices and costs. The discount rate used is equal to Harvest’s risk free interest rate. Under US GAAP, entities using the full cost method of accounting for petroleum and natural gas activities perform an impairment test on each cost centre using discounted future net revenue from proved petroleum and natural gas reserves discounted at 10%. The prices used under the US GAAP impairment test are those in effect at year end. There was no impairment under US GAAP at December 31, 2007. As at December 31, 2006, the application of the ceiling test under US GAAP resulted in a write down of $615.0 million of capitalized costs. |
| |
104 | Harvest Energy |
| |
| |
Consolidated Financial Statements | |
| |
| |
(b) | Under Canadian GAAP, proved reserves are estimated using estimated future prices and costs. These proved reserves form the basis for the depletion calculation. |
| |
| Under US GAAP, proved reserves used for the depletion calculation are estimated using constant prices and costs as of the date the estimate of reserves is made. In both the current and comparative year there were differences in proved reserves under US GAAP and Canadian GAAP and as a result the difference is realized in the depletion expense. Additionally, the ceiling test write down required under US GAAP in 2006 reduced the US GAAP depletable asset base which results in a lower depletion expense in 2007 and future years. |
| |
(c) | Under Canadian GAAP, the Trust determines compensation expense and the resulting obligation related to its Trust Unit Incentive Plan and Unit Award Plan using the intrinsic value method described in Note 2 (j). Under US GAAP, for the year ended December 31, 2006 Harvest adopted SFAS 123(R) “Share Based Payments” using the modified prospective approach. Under FAS 123(R), expenses and obligations for liability-based stock compensation plans are recorded using the fair-value method of accounting and are revalued at each period end. As a result, general and administrative expense is higher under US GAAP by $0.4 million for the year ended December 31, 2007 (2006 - $3.3 million) and accounts payable and accrued liabilities is higher under US GAAP by $0.7 million as at December 31, 2007 (December 31, 2006 - lower by $2.2 million). |
| |
| To the extent compensation costs relates to employees directly involved in natural gas and crude oil exploration and development activities, such amounts are capitalized to property, plant and equipment. Amounts not capitalized are recognized as administrative expenses. |
| |
| The Trust adopted SFAS 123(R) under the modified prospective approach, which requires the cumulative impact of a change in an accounting policy to be presented in the current year consolidated statement of income. The cumulative effect of initially adopting SFAS 123(R) on January 1, 2006 was a gain of $4.9 million. |
| |
(d) | Under Canadian GAAP, Harvest’s convertible debentures are classified as debt with a portion, representing the value associated with the conversion feature, being allocated to equity under Canadian GAAP. Issue costs related to the debentures are netted against each respective debt and equity component. In addition, under Canadian GAAP a non-cash interest expense representing the effective yield of the debt component and the amortization of the issue costs is recorded in the consolidated statements of income with a corresponding credit to the convertible debenture liability balance to accrete that balance to the full principal due on maturity. |
| |
| Under US GAAP, the convertible debentures are classified as debt in their entirety, and issue costs are recorded as deferred charges. To the extent that a portion of the issue costs are netted against the respective debt and equity components of the convertible debentures under Canadian GAAP there is a difference in the capitalization and amortization of the related deferred charges under US GAAP. The non-cash interest expense recorded under Canadian GAAP would not be recorded under US GAAP. |
| |
| In addition, convertible debentures that are assumed in a business combination are recorded at their fair value at the date of the acquisition as part of the cost of the acquired enterprise. Under US GAAP, if the conversion feature is in-the-money at the acquisition date (a beneficial conversion feature), the feature should be recognized and measured by allocating a portion of the proceeds equal to the intrinsic value of that feature to additional paid-in capital. Where the debenture has a stated redemption date, the corresponding value is recognized as a discount on the convertible debenture balance and accreted from the date of acquisition to the redemption date. |
| |
(e) | Under Harvest’s Trust Indenture, Trust Units are redeemable at any time on demand by the Unitholder for cash. Under US GAAP, the amount included on the consolidated balance sheet for Unitholders’ Equity would be reduced by an amount equal to the redemption value of the Trust Units as at the balance sheet date. The redemption value of the Trust Units is determined with respect to the trading value of the Trust Units as at each balance sheet date, and the amount of the redemption value is classified as temporary equity. Changes, if any, in the redemption value during a period results in a charge to permanent equity. |
| |
(f) | Under US GAAP, SFAS 133 “Accounting for Derivative Instruments and Hedging Activities” requires that all derivative instruments be recorded on the consolidated balance sheet as either an asset or liability measured at fair value, and requires that changes in fair value be recognized currently in income unless specific hedge accounting criteria are met. US GAAP requires that a company formally document, designate, and assess the effectiveness of derivative instruments before hedge accounting may be applied. Harvest had not formally documented and designated any hedging relationships as at December 31, 2007 or December 31, 2006 and as such, its risk management contracts were not eligible for hedge accounting treatment under US GAAP. |
| |
| |
| Consolidated Financial Statements |
| |
| |
| Harvest implemented fair value accounting effective January 1, 2004 under Canadian GAAP and had designated a portion of its risk management contracts as hedges. During the year ended December 31, 2004, the Trust discontinued hedge accounting for all risk management contracts under Canadian GAAP. Upon discontinuing hedge accounting, a deferred charge or gain is recorded representing the fair value of the contract at that time. This difference is amortized over the term of the contract. Under US GAAP there were no contracts designated as hedges. To the extent deferred charges and credits were recorded and amortized when hedge accounting was discontinued, there is a difference between Canadian and US GAAP. The deferred charges and gains were to be amortized under Canadian GAAP for the year ended December 31, 2006, and created a difference from US GAAP. There was no such impact for the year ended December 31, 2007. |
| |
(g) | The Canadian GAAP liability method of accounting for income taxes is similar to the US GAAP SFAS 109, “Accounting for Income Taxes”, which requires the recognition of tax assets and liabilities for the expected future tax consequences of events that have been recognized in Harvest’s consolidated financial statements. Pursuant to US GAAP, enacted tax rates are used to calculate future income tax, whereas Canadian GAAP uses substantively enacted rates. There are no differences for the years ended December 31, 2007 and December 31, 2006 relating to tax rate differences. |
| |
| Under Canadian GAAP as at December 31, 2007, Harvest’s carrying value of its net assets exceed its tax basis and accordingly results in recording a future income tax liability. Adjustments under US GAAP result in a large future income tax recovery and corresponding future income tax asset balance being booked, as the ceiling test write down from 2006 significantly lowered Harvest’s property, plant, and equipment carrying value under US GAAP and thus increased the corresponding temporary differences for future tax purposes. |
| |
(h) | With the adoption of Financial Instruments under Canadian GAAP effective January 1, 2007, issue costs are applied against the 77/8% Senior Notes balance and accreted into income using the effective interest method. Under US GAAP, these amounts are capitalized as a deferred charge and expensed into income using the effective interest method. |
| |
(i) | With the adoption of the new accounting standards for financial instruments under Canadian GAAP effective January 1, 2007, the cumulative translation adjustment generated upon translating the financial statements of Harvest’s downstream operations denominated in a foreign currency previously recognized as a separate component of equity is now recognized in comprehensive income consistent with the treatment under US GAAP. Additionally, under US GAAP, partnership distributions are required to be translated at the historic foreign exchange rate in place at the time of initial paid-in capital and any translation gains or losses are recorded in other comprehensive income. Under Canadian GAAP, it is permissible to translate foreign currency denominated partnership distributions at the historic exchange rate that has been proportionately adjusted for the subsequent periods when income has been earned. The effects of the translation is reflected in net income. |
| |
(j) | At December 31, 2006 the Trust adopted US GAAP SFAS 158, “Employers’ Accounting for Defined Benefit Pension and Other Postretirement Plans, an amendment of FASB Statements No. 87, 88, 106, and 132(R). Under SFAS 158, the over-funded or under-funded status of our defined benefit postretirement plan are recognized on the balance sheet as an asset or liability and changes in the funded status are recognized through comprehensive income. As a result, for the year ended December 31, 2007 employee future benefits are higher by $4.3 million (2006 - $0.3 million) and $4.3 million was included in other comprehensive income (2006 - $0.3 million included in accumulated other comprehensive income on adoption of SFAS 158). Canadian GAAP currently does not require the Trust to recognize the funding status of the plan on its balance sheet. |
| |
(k) | In its December 31, 2007 financial statements, Harvest adopted the FASB Interpretation No. 48 “Accounting for Uncertainty for Income Taxes” (FIN 48). FIN 48 is an interpretation of FASB Statement 109 “Accounting for Income Taxes” and outlines the recognition and related disclosure requirements of uncertain tax positions determined to be more likely than not, defined as greater than 50%, to be sustained on audit. This adoption did not result in a US GAAP difference. |
| |
| The following are standards and interpretations that have been issued by the Financial Accounting Standards Board (“FASB”) which are not yet in effect for the periods presented but would become US GAAP when implemented: |
| |
| In September 2006, FASB issued Statement 157, “Fair Value Measurements”. SFAS 157 defines fair value, establishes a framework for measuring fair value under US GAAP and expands disclosures about fair value measurements. This statement is effective for fiscal years beginning after November 15, 2007. We do not expect the adoption of this statement will have a material impact on our results of operations or financial position. |
| |
106 | Harvest Energy |
| |
| |
Consolidated Financial Statements | |
| |
| |
| In February 2007, the FASB issued SFAS No. 159, “The Fair Value Option for Financial Assets and Financial Liabilities - Including an Amendment of FASB Statement No. 115.” This pronouncement permits entities to use the fair value method to measure certain financial assets and liabilities by electing an irrevocable option to use the fair value method at specified election dates. After election of the option, subsequent changes in fair value would result in the recognition of unrealized gains or losses as period costs during the period the change occurred. SFAS No. 159 becomes effective as of the beginning of the first fiscal year that begins after November 15, 2007, with early adoption permitted. However, entities may not retroactively apply the provisions of SFAS No. 159 to fiscal years preceding the date of adoption. We are currently evaluating the impact that SFAS No. 159 may have on our financial position, results of operations and cash flows. |
| |
| Additional disclosures required under US GAAP: |
| | | | | | | | |
| | | | | | |
(thousands of Canadian dollars) | | December 31, 2007 | | | December 31, 2006 | |
| | | | | | |
| | | | | | | | |
Components of accounts receivable | | | | | | | | |
Trade | | $ | 115,112 | | | $ | 135,578 | |
Accruals | | | 100,691 | | | | 118,573 | |
| | | | | | | | | |
| | $ | 215,803 | | | $ | 254,151 | |
| | | | | | | | | |
| | | | | | | | |
Components of prepaid expenses and deposits | | | | | | | | |
Prepaid expenses | | $ | 14,004 | | | $ | 11,877 | |
Funds on deposit | | | 1,140 | | | | 836 | |
| | | | | | | | | |
| | $ | 15,144 | | | $ | 12,713 | |
| | | | | | | | | |
Subsequent to December 31, 2007, Harvest declared a distribution of $0.30 per unit for Unitholders of record on January 24, 2008, February 22, 2008, March 25, 2008 and April 22, 2008.
Between January 1, 2008 and March 12, 2008, an additional $577.0 million was committed to the purchase of feedstock inventory under the Supply and Offtake Agreement held with Vitol Refining S.A. [see table in Note 20].
On January 31, 2008 the 10.5% debentures matured and the obligation was settled through the issuance of 1,116,593 Trust Units. See Note 12 for further details.
| |
23. | RELATED PARTY TRANSACTIONS |
During the year ended December 31, 2007, in the normal course of operations, Vitol Refining S.A. purchased $354.8 million of Iraqi crude oil through the Supply and Offtake Agreement at fair market value for processing, which has been sourced from a private corporation of which a director of Harvest is also a director and holds a minority ownership interest. As at December 31, 2007, no amount related to these transactions is included in accounts payable and accrued liabilities and $68.0 million is included in feedstock commitments for the purchase of Iraqi crude oil [See Note 20]. None of the US $577.0 million committed to the purchase of feedstock inventory under the Supply and Offtake Agreement held with Vitol Refining S.A. between January 1, 2008 and March 12, 2008 [see Note 22] was purchased from this private corporation. During the year ended December 31, 2006, there were no related party transactions.
Certain comparative figures have been reclassified to conform to the current year’s presentation.
| |
| |
| |
| FORWARD-LOOKING INFORMATION |
| |
| In the interest of providing our unitholders and potential investors with information regarding Harvest, including our assessment of our future plans and operations, this annual report contains forward-looking statements that involve risks and uncertainties. Such risks and uncertainties include, but are not limited to, risks associated with conventional petroleum and natural gas operations; risks associated with refinery operations; the volatility in commodity prices and currency exchange rates; risks associated with realizing the value of acquisitions; general economic, market and business conditions; changes in tax, royalty and environment laws and regulation; the availability of sufficient capital from internal and external sources and such other risks and uncertainties described from time to time in our regulatory reports and filings made with securities regulators. |
| |
| Forward-looking statements in this annual report include, but are not limited to, production volumes, refinery throughput volumes, royalty rates, operating costs, commodity prices, administrative costs, commodity price risk management activity, acquisitions and dispositions, capital spending, reserve estimates, distributions, access to credit facilities, capital taxes, income taxes, Cash Flow From Operating Activities and regulatory changes. For this purpose, any statements that are contained herein that are not statements of historical fact may be deemed to be forward-looking statements. Forward-looking statements often contain terms such as “may”, “will”, “should”, “anticipate”, “expects”, and similar expressions. |
| |
| Readers are cautioned not to place undue reliance on forward-looking statements as there can be no assurance that the plans, intentions or expectations upon which they are based will occur. Although we consider such information reasonable, at the time of preparation, it may prove to be incorrect and actual results may differ materially from those anticipated. We assume no obligation to update forward-looking statements should circumstances or estimates or opinions change except as required by law. Forward-looking statements contained in this annual report are expressly qualified by this cautionary statement. |
| |
| All estimates of original oil in place (OOIP) in this Annual Report are classified as Discovered Petroleum Initially-In-Place which is defined as that quantity of Petroleum that is estimated as at September 30, 2007, to be contained in known accumulations prior to production. There is no certainty that it will be commercially viable to produce any portion of these resources. |
| |
| |
Corporate
INFORMATION
|
|
DIRECTORS |
|
M. Bruce Chernoff, Chairman(3) |
Kevin Bennett(2) |
Dale Blue(1) |
David Boone(2) |
John Brussa(3) |
William Friley(3) |
Verne Johnson(1)(2) |
Hector McFadyen(1) |
|
(1) Member of the Audit Committee. |
(2) Member of the Reserves, Safety and Environment Committee. |
(3) Member of the Corporate Governance/ Compensation Committee. |
|
OFFICERS & SENIOR MANAGEMENT |
|
John Zahary, P.Eng. |
President & Chief Executive Officer |
|
Robert Fotheringham, C.A. |
Chief Financial Officer |
|
Rob Morgan, P.Eng. |
Chief Operating Officer, Upstream |
|
Brad Aldrich |
Chief Operating Officer, Downstream |
|
Jacob Roorda, P.Eng. |
Vice President, Corporate |
|
Gary Boukall, P. Geol |
Vice President, Geosciences |
|
Les Hogan |
Vice President, Land |
|
Phil Reist, C.A. |
Vice President, Controller |
|
Jim Sheasby, P.Eng |
Vice President, Engineering |
|
Neil Sinclair |
Vice President, Operations |
|
Dean Beacon |
Treasurer |
|
David Rain, C.A. |
Corporate Secretary |
|
F. Steven Saunders, C.A. |
Director of Taxation and Assistant Corporate Secretary |
|
Designed by Bryan mills Iradesso |
|
TRUST UNIT LISTING |
|
Toronto Stock Exchange: HTE.UN | |
New York Stock Exchange: HTE |
|
Convertible Debenture Listings: | |
| | | | |
| | |
TSX Ticker | Coupon | Conversion
Price | Maturity | |
| | |
HTE.DB | 9% | $13.85 | May 31, 2009 | |
| | |
HTE.DB.A | 8% | $16.07 | September 30, 2009 | |
| | |
HTE.DB.B | 6.5% | $31.00 | December 31, 2010 | |
| | |
HTE.DB.D | 6.40% | $46.00 | October 31, 2012 | |
| | |
HTE.DB.E | 7.25% | $32.20 | September 30, 2013 | |
| | |
HTE.DB.F | 7.25% | $27.25 | February 28, 2014 | |
| | |
|
REGISTRAR AND TRANSFER AGENT |
|
Valiant Trust Company
310, 606-4th Street S.W.
Calgary, Alberta, Canada T2P 1T1
Telephone: (403) 233-2801 |
|
AUDITOR |
|
KPMG LLP
|
LEGAL COUNSEL |
|
Canada: Burnet, Duckworth & Palmer |
U.S: Paul, Weiss, Rifkind, Wharton & Garrison |
|
RESERVES EVALUATORS |
|
McDaniel & Associates Ltd. |
GLJ Petroleum Consultants Ltd. |
|
INVESTOR RELATIONS |
|
Toll Free: 866-666-1178 |
Email: Information@harvestenergy.ca |
|
Please contact us if you would like to receive an investor package or be added to Harvest’s mailing lists. |
|