MANAGEMENT’S DISCUSSION AND ANALYSIS
Management’s discussion and analysis (“MD&A”) of the financial condition and results of operations of Harvest Energy Trust should be read in conjunction with our audited consolidated financial statements and accompanying notes for the years ended December 31, 2008 and 2007. The information and opinions concerning our future outlook are based on information available at March 2, 2009.
In this MD&A, reference to "Harvest", "we", "us" or "our" refers to Harvest Energy Trust and all of its controlled entities on a consolidated basis. All references are to Canadian dollars unless otherwise indicated. Tabular amounts are in thousands of dollars unless otherwise stated. Natural gas volumes are converted to barrels of oil equivalent (“boe”) using the ratio of six thousand cubic feet (“mcf”) of natural gas to one barrel of oil (“bbl”). Boes may be misleading, particularly if used in isolation. A boe conversion ratio of 6 mcf to 1 bbl is based on an energy equivalent conversion method primarily applicable at the burner tip and does not represent a value equivalent at the wellhead. In accordance with Canadian practice, petroleum and natural gas revenues are reported on a gross basis before deduction of Crown and other royalties. In addition to disclosing reserves under the requirements of National Instrument 51-101, we also disclose our reserves on a company interest basis which is not a term defined under National Instrument 51-101. This information may not be comparable to similar measures by other issuers.
NON-GAAP MEASURES
Throughout this MD&A we have referred to certain measures of financial performance that are not specifically defined under Canadian GAAP. Cash G&A and Operating Netbacks are non-GAAP measures used extensively in the Canadian energy trust sector for comparative purposes. Cash G&A are G&A expenses excluding the effect of our unit based compensation plans, while Operating Netbacks are always reported on a per boe basis, and include gross revenue, royalties, operating expenses, and transportation and marketing expenses. Gross Margin is also a non-GAAP measure and is commonly used in the refining industry to reflect the net funds received from the sale of refined products after considering the cost to purchase the feedstock and is calculated by deducting purchased products for resale and processing from total revenue. Earnings From Operations is also a non-GAAP measure and is commonly used in the petroleum and natural gas and refining industries to reflect operating results before items not directly related to operations.
FORWARD-LOOKING INFORMATION
This MD&A highlights significant business results and statistics from our consolidated financial statements for the year ended December 31, 2008 and the accompanying notes thereto. In the interest of providing our Unitholders and potential investors with information regarding Harvest, including our assessment of our future plans and operations, this MD&A contains forward-looking statements that involve risks and uncertainties. Such risks and uncertainties include, but are not limited to, risks associated with conventional petroleum and natural gas operations; risks associated with refining and marketing operations; the volatility in commodity prices and currency exchange rates; risks associated with realizing the value of acquisitions; general economic, market and business conditions; changes in environmental legislation and regulations; the availability of sufficient capital from internal and external sources and such other risks and uncertainties described from time to time in our regulatory reports and filings made with securities regulators.
Forward-looking statements in this MD&A include, but are not limited to, the forward looking statements made in the “Outlook” section as well as statements made throughout with reference to production volumes, refinery throughput volumes, royalty rates, operating costs, commodity prices, administrative costs, price risk management activity, acquisitions and dispositions, capital spending, reserve estimates, distributions, access to credit facilities, capital taxes, income taxes, cash from operating activities, and regulatory changes. For this purpose, any statements that are contained herein that are not statements of historical fact may be deemed to be forward-looking statements. Forward-looking statements often contain terms such as “may”, “will”, “should”, “anticipate”, “expects”, and similar expressions.
Readers are cautioned not to place undue reliance on forward-looking statements as there can be no assurance that the plans, intentions or expectations upon which they are based will occur. Although we consider such information reasonable at the time of preparation, it may prove to be incorrect and actual results may differ materially from those anticipated. We assume no obligation to update forward-looking statements should circumstances, estimates or opinions change, except as required by law. Forward-looking statements contained in this MD&A are expressly qualified by this cautionary statement.
1
Consolidated Financial and Operating Highlights – 2008
- Cash from operating activities of $655.9 million, relatively unchanged from $641.3 million in the prior year, as a $321.6 million improvement in the contribution from upstream operations was substantially offset by a $174.5 million increase in the cash settlements on price risk management contracts, an $81.4 million drop in contribution from downstream operations and a $19.1 million realized loss on currency exchange transactions as compared to a gain of $53.6 million in the prior year.
- Upstream operations contributed $945.9 million of cash reflecting average daily production of 55,932 boe with strong commodity prices more than offsetting a strengthening Canadian dollar, lower production and higher operating costs.
- Upstream production was bolstered with the acquisition of 2,650 boe/d of producing assets in the Third Quarter for cash consideration of $167.6 million, representing a cost per flowing barrel of approximately $63,000.
- Capital spending of $271.3 million in our upstream business, plus $128.8 million of net acquisitions, replaced our 2008 production with finding and development costs, including changes in future development costs, of $25.97 per boe of proved reserves and $29.87 per boe for proved plus probable reserves.
- Downstream operations contributed $83.6 million of cash reflecting sound operating performance more than offset by generally lower refining margins as high commodity prices during the first three quarters increased our cost of purchased energy and lower commodity prices in the Fourth Quarter resulted in an inventory write-down.
- Capital expenditures in our downstream operations totaled $56.2 million, including the commissioning of our $30.1 million visbreaker expansion project in November, which is expected to upgrade approximately 1,500 bbls/d of high sulphur fuel oil (“HSFO”) to distillate yield.
- Record high commodity prices resulted in $200.8 million of cash settlements on our price risk management contracts with $225.2 million of net cash settlements during the first three quarters offset by $24.4 million of settlements in our favour during the Fourth Quarter.
- Balance sheet liquidity was improved with the issuance of $250 million principal amount of 7.5% Convertible Unsecured Subordinated Debentures for net proceeds of $239.5 million in April 2008.
- Declared distributions totaling $551.3 million ($3.60 per Trust Unit) reflecting an 84% payout ratio based on cash from operating activities and 81% payout ratio if asset retirement expenditures and non-capital working capital are excluded from the cash flow.
2
SELECTED INFORMATION
The table below provides a summary of our financial and operating results for the years ended December 31, 2008, 2007 and 2006.
| | | Year Ended December 31 | |
| | | | | | | | | | |
| ($000s except where noted) | | 2008 | | | 2007 | | | 2006 | |
| | | | | | | | | | |
| Revenue, net(1) | | 5,489,364 | | | 4,069,600 | | | 1,380,825 | |
Cash From Operating Activities |
|
655,887 |
|
|
641,313 |
|
|
507,885 |
|
| Per Trust Unit, basic | $ | 4.29 | | $ | 4.63 | | $ | 5.00 | |
| Per Trust Unit, diluted | $ | 4.05 | | $ | 4.30 | | $ | 4.84 | |
Net Income (Loss)(2) |
|
212,019 |
|
|
(25,676 |
) |
|
136,046 |
|
| Per Trust Unit, basic | $ | 1.39 | | $ | (0.19 | ) | $ | 1.34 | |
| Per Trust Unit, diluted | $ | 1.39 | | $ | (0.19 | ) | $ | 1.33 | |
Distributions declared |
|
551,325 |
|
|
610,280 |
|
|
468,787 |
|
| Distributions declared, per Trust Unit | $ | 3.60 | | $ | 4.40 | | $ | 4.53 | |
| Distributions declared as a percentage of Cash From Operating Activities | | 84% | | | 95% | | | 92% | |
Bank debt |
|
1,226,228 |
|
|
1,279,501 |
|
|
1,595,663 |
|
| 77/8% Senior Notes | | 298,210 | | | 241,148 | | | 291,350 | |
| Convertible Debentures(3) | | 827,759 | | | 651,768 | | | 601,511 | |
| Total long-term financial debt(3) | | 2,352,197 | | | 2,172,417 | | | 2,488,524 | |
Total assets |
|
5,745,407 |
|
|
5,451,683 |
|
|
5,745,558 |
|
UPSTREAM OPERATIONS |
|
|
|
|
|
|
|
|
|
| Daily Production | | | | | | | | | |
| Light to medium oil (bbl/d) | | 25,093 | | | 27,165 | | | 27,482 | |
| Heavy oil (bbl/d) | | 12,162 | | | 14,469 | | | 13,904 | |
| Natural gas liquids (bbl/d) | | 2,624 | | | 2,412 | | | 2,247 | |
| Natural gas (mcf/d) | | 96,315 | | | 97,744 | | | 96,578 | |
| Total daily sales volumes (boe/d) | | 55,932 | | | 60,336 | | | 59,729 | |
Operating Netback ($/boe) |
|
47.89 |
|
|
29.89 |
|
|
30.54 |
|
Cash capital expenditures |
|
271,312 |
|
|
300,674 |
|
|
376,881 |
|
| Business and property acquisitions, net | | 128,773 | | | 138,156 | | | 2,467,097 | |
DOWNSTREAM OPERATIONS |
|
|
|
|
|
|
|
|
|
| Average daily throughput (bbl/d) | | 103,497 | | | 98,617 | | | 86,890 | |
| Average Refining Margin (US$/bbl) | | 7.16 | | | 10.05 | | | 9.32 | |
Cash capital expenditures |
|
56,162 |
|
|
44,111 |
|
|
21,411 |
|
| (1) | Revenues are net of royalties. |
| (2) | Net Income (Loss) includes a future income tax expense of $108.6 million (2007 – an expense of $65.8 million; 2006 – a recovery of $2.3 million) and an unrealized net gain from risk management activities of $185.9 million (2007 - net losses of $147.8 million; 2006 – net gains of $52.2 million) for the year ended December 31, 2008. Please see Notes 18 and 20 to the Consolidated Financial Statements for further information. |
| (3) | Includes current portion of Convertible Debentures. |
| (4) | Downstream operations acquired on October 19, 2006. |
3
REVIEW OF OVERALL PERFORMANCE
Harvest is an integrated energy trust with our petroleum and natural gas business focused on the operation and further development of assets in western Canada (our “upstream operations”) and our refining and marketing business focused on the safe operation of a medium gravity sour crude oil hydrocracking refinery and a retail and wholesale petroleum marketing business both located in the Province of Newfoundland and Labrador (our “downstream operations”). Our earnings and cash flow from operating activities are largely determined by the realized prices for our crude oil and natural gas production as well as refined product crack spreads, including the effects of changes in the U.S. dollar to Canadian dollar exchange rate. Recently, changes in crude oil and natural gas prices and the exchange rate between U.S. dollars and Canadian dollars have moved together with changes in the currency exchange rate partially offsetting changes in crude oil and natural gas prices.
During 2008, cash from operating activities totaled $655.9 million, a $14.6 million increase as compared to $641.3 million in the prior year. While cash generated from our upstream operations of $945.9 million in 2008 was a significant improvement from the $624.3 million in the prior year, the cash generated in our downstream operations of $83.6 million was approximately half the $165.0 million generated in the prior year. The $321.6 million improvement in our upstream operations reflects the year-over-year strength in commodity prices as well as a tightening of heavy crude oil differentials in western Canada. The reduced contribution from our downstream operations should be considered in light of the generally weaker refined product crack spreads in 2008 as well as the impact of significantly lower commodity prices in the Fourth Quarter resulting in inventory write-downs of $35.3 million. The average exchange rate between the Canadian dollar and U.S. dollar was relatively unchanged year-over-year with the 2008 year-end exchange rate of Cdn$1.00 to US$0.80 reflecting a significant strengthening of the U.S. dollar in the last half of 2008 which bolstered our realized crude oil prices and refined product crack spreads, both of which are denominated in U.S. dollars.
Our upstream operations averaged production of 55,932 boe/d in 2008 as compared to 60,336 boe/d in the prior year, reflecting a 7% reduction. Our production in 2008 reflects a modest 4% decline as compared to the 58,416 boe/d averaged in the Fourth Quarter of 2007 as our reduced capital program in 2008 and net acquisitions substantially stabilized our production. In 2007, we benefited from a $148.5 million drilling effort in the First Quarter boosting production to an average of 62,024 boe/d for the quarter as compared to capital expenditures of $79.6 million in the First Quarter of 2008. In 2008, we shifted our efforts to the re-pressurization of a few of our larger oil reservoirs rather than further development drilling and are expecting longer term more stable benefits, as compared to the flush production and accelerated declines associated with some drilling programs. Our operating costs of $300.9 million in 2008 are unchanged from the prior year as the overheated Alberta oilfield services industry did not weaken until late in the year with continued weakening expected in 2009. Our operating netback of $47.89 per boe represents a 60% increase over the prior year and is primarily attributed to higher commodity prices and tightening heavy crude oil differentials in western Canada.
During the Third Quarter of 2008, we completed two acquisitions for an aggregate cash consideration of $167.6 million to acquire approximately 1,645 bbls/d of light oil and 6,200 mcf/d of natural gas which represents an acquisition cost of approximately $63,000 per flowing boe. The principal asset acquired was a large pool of medium gravity oil of which approximately 7% of the original oil in place has been recovered and it is anticipated that with a combination of additional drilling and reservoir management, the recoveries from this pool can be substantially improved. In addition to numerous minor acquisitions/dispositions, we disposed of 481 boe/d of natural gas and natural gas liquids production for $36.8 million, representing proceeds of approximately $76,000 per flowing boe.
Reserve additions in our upstream operations replaced our production during 2008 with our proved plus probable reserves at December 31, 2008 totaling 219.9 million boe substantially unchanged from 220.9 million boe at the end of 2007. Including changes in future development costs, our 2008 finding and development costs averaged $25.97 per boe of proved reserves as compared to $28.44 per boe in the prior year and a three year average of $27.27 per boe while our finding and development costs averaged $29.87 per boe for proved plus probable reserves as compared to $28.10 per boe in the prior year and a three year average of $28.00 per boe. Including changes in future development costs, our 2008 finding, development and acquisition costs averaged $27.90 per boe of proved reserves as compared to $26.98 per boe in the prior year and a three year average of $28.78 per boe while on a proved plus probable basis, our costs were $28.84 per boe in 2008 as compared to $22.97 per boe in the prior year and a three year average of $25.47 per boe, respectively. Proved plus probable reserve additions are 13.7 million boe attributed to our 2008 capital program, enhanced oil recovery plans and new undeveloped reserves which, when coupled with the 5.8 million boe acquired during the year, substantially offsets our 2008 production. Relative to our 2008 netback price of $47.89, our finding and development costs represent a recycle ratio of 1.6 while our finding, development and acquisition costs represent a recycle ratio of 1.7.
4
During 2008, our downstream operations generated $83.6 million of cash as compared to $165.0 million in the prior year with the reduced contribution primarily the result of an $86.8 million drop in gross margin. The drop in North American demand for gasoline that began in mid-2007 continued through 2008 with the slowing US economy and record high prices curtailing consumer driving. As a result, the gasoline crack spread weakened significantly from the US$28.76 averaged during the Second Quarter of 2007 culminating in a negative spread during the Fourth Quarter of 2008. Similarly, the prices for high sulphur fuel oil (“HSFO”) during the first half of 2008 did not proportionately reflect increases in crude oil prices resulting in a significant deterioration of the HSFO crack spread which averaged US$38.75 less than the West Texas Intermediate (“WTI”) benchmark price of US$123.98/bbl during the Second Quarter of 2008 as compared to an average of US$26.52/bbl less than the WTI benchmark for the entire year. In contrast, the strong global demand for distillate products improved the refining margins for heating oil, diesel and jet fuel. Overall, our refining margin in 2008 was US$7.16 per barrel of throughput, a drop of $2.89 per barrel from the prior year.
Our refinery throughput averaged 103,497 bbls/d during 2008 with First Quarter throughput of approximately 112,000 bbls/d somewhat tempered by a four day unplanned outage. Throughput in May through August was reduced to approximately 95,500 bbls/d to optimize margins by minimizing the production of HSFO and reduced to approximately 102,800 bbls/d from September through December due to fouling of heat exchangers. Average daily throughput in 2008 represents a utilization factor of 90% as compared to the refinery’s 115,000 bbls/d nameplate capacity. As compared to the prior year with $34.5 million of turnaround and catalyst costs incurred during an extensive shutdown in the Fourth Quarter, our refinery operations incurred $5.6 million of turnaround and catalyst costs during a partial turnaround of the visbreaker unit in 2008. Our refinery operating costs totaled $78.9 million ($2.08 per bbl of throughput) in 2008 as compared to $83.9 million ($2.33 per bbl of throughput) in the prior year while our cost of purchased energy was $131.9 million ($3.48 per bbl) in the current year as compared to $92.3 million ($2.57 per bbl) in 2007 which when aggregated totals $5.56 per barrel of throughput for 2008 as compared to $4.90 in the prior year, a net increase of $0.66 per barrel.
In 2008, the strength in commodity prices resulted in cash settlements paid of $225.2 million on our price risk management contracts during the first nine months of 2008, offset somewhat by $24.4 million received during the Fourth Quarter of the year as commodity prices weakened significantly.
In April 2008, we raised $239.5 million of net proceeds with the issuance of $250 million principal amount of 7.5% Convertible Unsecured Subordinated Debentures and applied the net proceeds to reduce borrowings under our Extendible Revolving Credit Facility. As the disruptions in the capital markets continued in 2008, we have deferred our request to extend the maturity date of our credit facility beyond April 2010 in an effort to maintain the cost of our bank borrowing as well as retain our $1.6 billion of credit capacity.
In 2008, we declared distributions to Unitholders totaling $551.3 million ($3.60 per Trust Unit) as compared to $610.3 million ($4.40 per Trust Unit) in 2007. We have maintained a monthly distribution of $0.30 per Trust Unit since November 2007 and in light of the significant reduction in commodity prices, we have declared a distribution of $0.05 per Trust Unit for Unitholders of record on March 23, 2009 and payable on April 15, 2009. In the near term, substantially all of our cash flow from operating activities will be directed to enhancing Unitholder value through capital expenditures focused on maintaining our productive capacity as well as low risk profit/growth initiatives with the remaining cash directed towards improving our balance sheet liquidity by repaying bank borrowings.
5
Business Segments
The following table presents selected financial information for our two business segments:
| | Year Ended December 31 |
| | 2008 | 2007 |
| | | | | | | |
| (in $000s) | Upstream | Downstream | Total | Upstream | Downstream | Total |
| Revenue(1) | 1,294,769 | 4,194,595 | 5,489,364 | 971,044 | 3,098,556 | 4,069,600 |
| Earnings From Operations(2) | 498,786 | 14,125 | 512,911 | 169,423 | 92,270 | 261,693 |
| Capital expenditures | 271,312 | 56,162 | 327,474 | 300,674 | 44,111 | 344,785 |
| Total assets(3) | 3,933,632 | 1,775,688 | 5,745,407 | 3,952,337 | 1,482,904 | 5,451,683 |
| (1) | Revenues are net of royalties. |
| (2) | This is a non-GAAP measure; please refer to “Non-GAAP Measures” in this MD&A. |
| (3) | Total assets on a consolidated basis as at December 31, 2008 include $36.1 million (2007 - $16.4 million) relating to the fair value of risk management contracts. |
Our upstream and downstream operations are each discussed separately in the sections that follow. Additionally, we have included a section entitled “Risk Management, Financing and Other” that discusses, among other things, our cash flow risk management program.
UPSTREAM OPERATIONS
2008 Highlights
- Operating cash flow of $945.9 million, an improvement of $321.6 million over the prior year, reflecting the year- over-year strength of crude oil prices as well as a tightening of quality differentials.
- Average production of 55,932 boe/d as compared to production of 60,336 boe/d in the prior year reflects higher decline rates in 2007 and a reduction in 2008 capital spending.
- Operating costs of $300.9 million were unchanged from the prior year, representing $14.70/boe in the current year as compared to $13.66/boe in the prior year.
- Operating netback of $47.89/boe, representing an $18.00/boe (60%) increase over the prior year, attributed to substantially higher commodity prices.
- Completion of two acquisitions for aggregate cash consideration of $167.6 million, to acquire 2,650 boe/d of production representing an average cost per flowing barrel of approximately $63,000 comprised of 1,645 bbls/d of light oil and 6,200 mcf/d of natural gas, offset by divestments of $46.5 million and 640 boe/d.
- Capital spending of $271.3 million included the drilling of 247 wells (150.3 on a net basis) with a 100% success rate plus $128.8 million in net acquisitions, replaced 2008 production with finding and development costs, including changes in future development costs, of $25.97 per boe of proved reserves and $29.87 per boe for proved plus probable reserves.
6
Summary of Financial and Operating Results
| | Year Ended December 31 |
| (in $000s except where noted) | | 2008 | | | 2007 | | | Change | |
| | | | | | | | | | |
| Revenues | | 1,543,214 | | | 1,184,457 | | | 30% | |
| Royalties | | (248,445 | ) | | (213,413 | ) | | 16% | |
| Net revenues | | 1,294,769 | | | 971,044 | | | 33% | |
Operating expenses |
|
300,890 |
|
|
300,918 |
|
|
0% |
|
| General and administrative | | 32,868 | | | 34,615 | | | (5% | ) |
| Transportation and marketing | | 13,490 | | | 11,946 | | | 13% | |
| Depreciation, depletion, amortization and accretion | | 448,735 | | | 454,142 | | | (1% | ) |
Earnings From Operations(1) |
|
498,786 |
|
|
169,423 |
|
|
194% |
|
Cash capital expenditures (excluding acquisitions) |
|
271,312 |
|
|
300,674 |
|
|
(10% |
) |
| Property and business acquisitions, net of dispositions | | 128,773 | | | 138,158 | | | (7% | ) |
Daily sales volumes |
|
|
|
|
|
|
|
|
|
| Light to medium oil (bbl/d) | | 25,093 | | | 27,165 | | | (8% | ) |
| Heavy oil (bbl/d) | | 12,162 | | | 14,469 | | | (16% | ) |
| Natural gas liquids (bbl/d) | | 2,624 | | | 2,412 | | | 9% | |
| Natural gas (mcf/d) | | 96,315 | | | 97,744 | | | (1% | ) |
| Total (boe/d) | | 55,932 | | | 60,336 | | | (7% | ) |
| (1)This is a non-GAAP measure; please refer to “Non-GAAP Measures” in this MD&A. | | | | | | | | | |
Commodity Price Environment
| | Year Ended December 31 |
| Benchmarks | | 2008 | | | 2007 | | | Change | |
| | | | | | | | | | |
| West Texas Intermediate crude oil (US$ per barrel) | | 99.65 | | | 72.31 | | | 38% | |
| Edmonton light crude oil ($ per barrel) | | 102.02 | | | 76.25 | | | 34% | |
| Bow River blend crude oil ($ per barrel) | | 84.10 | | | 53.36 | | | 58% | |
| AECO natural gas daily ($ per mcf) | | 8.14 | | | 6.45 | | | 26% | |
Canadian / U.S. dollar exchange rate |
|
0.943 |
|
|
0.935 |
|
|
1% |
|
7
The following graph summarizes benchmark commodity prices for our upstream production for the period of January 2007 to December 2008:
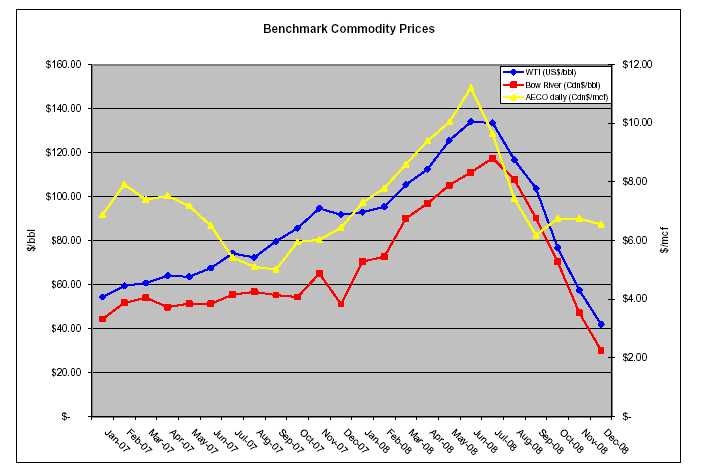
During 2008, the average WTI benchmark price was 38% higher than the prior year. The average Edmonton light crude oil price (“Edmonton Par”) also increased from the prior year to average $102.02 in 2008, an increase of 34%. The increase in Edmonton Par has been less than the increase in WTI due to weaker demand for light crude oil in western Canada as a result of refineries converting to heavier crude blends coupled with the modest strengthening of the Canadian dollar relative to the U.S. dollar in 2008.
Heavy oil differentials fluctuate based on a combination of factors including the level of heavy oil inventories, pipeline capacity to deliver heavy crude to U.S. markets and the seasonal demand for heavy oil. During 2008, the Bow River heavy oil differential relative to Edmonton Par tightened to an average of $17.92/bbl (or 17.6%) compared to $22.89/bbl (or 30.0%) in 2007. On a per barrel basis, heavy oil differentials tightened throughout the year as production shortfalls and increased refinery demand for heavier grades of oil put upward pressure on pricing.
| | 2008 | 2007 |
| Differential Benchmarks | Q4 | Q3 | Q2 | Q1 | Q4 | Q3 | Q2 | Q1 |
| Bow River Blend differential to Edmonton Par ($/bbl) | 14.07 | 16.48 | 21.50 | 19.63 | 29.51 | 23.87 | 21.12 | 17.06 |
| Bow River Blend differential as a % of Edmonton Par | 22.2% | 13.5% | 17.1% | 20.2% | 34.2% | 30.0% | 29.4% | 25.4% |
Compared to the prior year, the average AECO daily natural gas price was 26% higher during the year ended December 31, 2008. Natural gas prices have strengthened in 2008 relative to 2007 due to a general strengthening of commodity prices.
8
Realized Commodity Prices(1)
The following table summarizes our average realized price by product for 2008 and 2007.
| | Year Ended December 31 |
| | 2008 | 2007 | Change |
| Light to medium oil ($/bbl) | 89.72 | 64.09 | 40% |
| Heavy oil ($/bbl) | 77.22 | 46.71 | 65% |
| Natural gas liquids ($/bbl) | 75.16 | 62.26 | 21% |
| Natural gas ($/mcf) | 8.60 | 6.94 | 24% |
| Average realized price ($/boe) | 75.39 | 53.78 | 40% |
| (1)Realized commodity prices exclude the impact of price risk management activities. | | | |
Our realized price for light to medium oil sales increased by $25.63/bbl (or 40%) compared to the prior year, reflecting the $25.77/bbl (or 34%) increase in Edmonton Par pricing. Harvest’s heavy oil price increased by $30.51/bbl (or 65%) compared to the prior year, reflecting the $30.74/bbl (or 58%) increase in the Bow River price. Our average realized price for our natural gas production increased by $1.66/mcf (or 24%) compared to the prior year, reflecting the $1.69/mcf (or 26%) increase in AECO daily pricing over the year.
Sales Volumes
The average daily sales volumes by product were as follows:
| | Year Ended December 31 | | | | |
| | 2008 | 2007 | | | | |
| | | Volume | | | Weighting | | | Volume | | | Weighting | | | % Volume Change | |
| Light to medium oil (bbl/d)(1) | | 25,093 | | | 45% | | | 27,165 | | | 45% | | | (8% | ) |
| Heavy oil (bbl/d) | | 12,162 | | | 22% | | | 14,469 | | | 24% | | | (16% | ) |
| Natural gas liquids (bbl/d) | | 2,624 | | | 5% | | | 2,412 | | | 4% | | | 9% | |
| Total liquids (bbl/d) | | 39,879 | | | 72% | | | 44,046 | | | 73% | | | (9% | ) |
| Natural gas (mcf/d) | | 96,315 | | | 28% | | | 97,744 | | | 27% | | | (1% | ) |
| Total oil equivalent (boe/d) | | 55,932 | | | 100% | | | 60,336 | | | 100% | | | (7% | ) |
| (1) | Harvest classifies our oil production, except that produced from Hay River, as light to medium and heavy according to NI 51-101 guidance. The oil produced from Hay River has an average API of 24o (medium grade) and is classified as a light to medium oil, notwithstanding that, it benefits from a heavy oil royalty regime and therefore would be classified as heavy oil according to NI 51-101. |
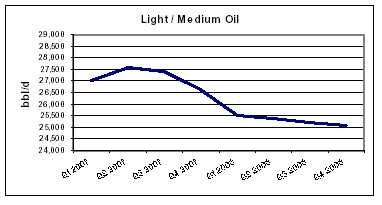
Harvest’s average daily production of light/medium oil in 2008 was 25,093 bbl/d, a 2,072 bbl/d or 8% reduction from the prior year. The 8% reduction is mainly attributed to a lower lever of drilling activity in 2008 and the initial flush production from wells completed in early 2007 stabilized at lower rates by the end of 2007. Light/medium production in 2008 has continued to remain relatively consistent as compared to the 2007 exit rate of production as increased water cuts and production lost to downtime have been substantially offset by new wells drilled in 2008 and the production from acquisitions completed during the Third Quarter. Production at our largest area, Hay River, has remained constant over the past year reflecting our increased water injection in early 2008 which improved recovery.
9
Our heavy oil production has decreased steadily over the past twelve months resulting in a 16% reduction with year-to-date production of 12,162 bbl/d as compared to 14,469 bbl/d in 2007. This reduction is largely the result of cold and wet weather related operational problems in the first half of 2008. Additionally, increased water cuts on our larger producing wells in the west central Saskatchewan and Lloydminster areas were only partially offset by new wells drilled in the year.

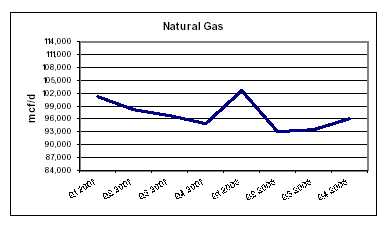
Our 2008 natural gas production decreased by 1% relative to 2007, averaging 96,315 mcf/d. Harvest’s 2008 average daily production is lower than in 2007 due to continued declines and production disruptions throughout the Fourth Quarter of 2007 and Second Quarter 2008 offset by incremental production resulting from our 2008 winter drilling program, acquisitions completed in the Third Quarter of 2008, and improved run time on our largest producing wells in the Fourth Quarter of 2008.
Revenues
| | | Year Ended December 31 |
| | | | | | | | | | |
| (000s) | | 2008 | | | 2007 | | | Change | |
| Light to medium oil sales | $ | 824,014 | | $ | 635,470 | | | 30% | |
| Heavy oil sales | | 343,717 | | | 246,674 | | | 39% | |
| Natural gas sales | | 303,303 | | | 247,499 | | | 23% | |
| Natural gas liquids sales and other | | 72,180 | | | 54,808 | | | 32% | |
| Total sales revenue | | 1,543,214 | | | 1,184,451 | | | 30% | |
| Royalties | | (248,445 | ) | | (213,413 | ) | | 16% | |
| Net Revenues | $ | 1,294,769 | | $ | 971,038 | | | 33% | |
Our revenue is impacted by changes to production volumes, commodity prices and currency exchange rates. Our 2008 total sales revenue of $1,543.2 million is $358.8 million higher than the prior year, of which $442.4 million is attributed to higher realized prices offset by a $83.6 million negative variance in respect of lower production volumes. The price increase reflects the 34% increase in Edmonton Par pricing and the 26% increase in AECO daily natural gas pricing in 2008 as compared to 2007, while our decreased production volume is attributed to decline rates, particularly in 2007, and a reduction in 2008 capital spending.
As discussed earlier, light to medium oil sales revenue for 2008 was $188.5 million higher than the prior year due to a $235.4 million favourable price variance offset by a $46.9 million unfavourable volume variance. Heavy oil sales revenue of $343.7 million in 2008 was $97.0 million higher than in the prior year due to a $135.8 million favourable price variance offset by a $38.8 million unfavourable volume variance. Natural gas sales revenue increased by $55.8 million in 2008 compared to 2007 due to a $58.8 million favourable price variance offset by a $3.0 million unfavourable volume variance.
10
During 2008, natural gas liquids and other sales revenue increased by $17.4 million compared to the prior year resulting from a $12.4 million favourable price variance and a $5.0 million favourable volume variance. Generally, the natural gas liquids volume variance will be aligned with our production of natural gas while the price variances will be aligned with the prices realized for our oil production. The positive volume variance is attributed to a few natural gas wells drilled near the end of 2007 and throughout 2008, which yielded significant natural gas liquids.
Royalties
We pay Crown, freehold and overriding royalties to the owners of mineral rights from which production is generated. These royalties vary for each property and product and our Crown royalties are based on a sliding scale dependent on production volumes and commodity prices.
Throughout 2008, net royalties as a percentage of gross revenue were 16.1% (2007 - 18.0%) and aggregated to $248.4 million (2007 - $213.4 million). Our royalty rate for the year was slightly lower than the expected rate of 17% due to various credits received throughout the year.
Operating Expenses
| | Year Ended December 31 |
| | | | | | | | | | | | | | | | |
| | 2008 | 2007 | | | Per BOE | |
| (000s except per boe amounts) | | Total | | | Per BOE | | | Total | | | Per BOE | | | Change | |
| Operating expense | | | | | | | | | | | | | | | |
| Power and fuel | $ | 80,162 | | $ | 3.92 | | $ | 64,053 | | $ | 2.91 | | | 35% | |
| Well Servicing | | 52,561 | | | 2.57 | | | 59,500 | | | 2.70 | | | (5% | ) |
| Repairs and maintenance | | 51,462 | | | 2.51 | | | 50,244 | | | 2.28 | | | 10% | |
| Lease rentals and property taxes | | 27,953 | | | 1.37 | | | 23,803 | | | 1.08 | | | 27% | |
| Processing and other fees | | 15,073 | | | 0.74 | | | 17,556 | | | 0.80 | | | (8% | ) |
| Labour – internal | | 23,785 | | | 1.16 | | | 22,757 | | | 1.03 | | | 13% | |
| Labour – contract | | 17,128 | | | 0.84 | | | 15,511 | | | 0.70 | | | 20% | |
| Chemicals | | 15,968 | | | 0.78 | | | 14,910 | | | 0.68 | | | 15% | |
| Trucking | | 11,297 | | | 0.55 | | | 11,833 | | | 0.54 | | | 2% | |
| Other | | 5,501 | | | 0.26 | | | 20,751 | | | 0.94 | | | (72% | ) |
| Total operating expense | $ | 300,890 | | $ | 14.70 | | $ | 300,918 | | $ | 13.66 | | | 8% | |
| | | | | | | | | | | | | | | | |
| Transportation and marketing expense | $ | 13,490 | | $ | 0.66 | | $ | 11,946 | | $ | 0.54 | | | 22% | |
Our 2008 operating costs totaled $300.9 million, unchanged from 2007. On a per barrel basis, operating costs have increased to $14.70/boe as compared to $13.66/boe in the prior year, an 8% increase substantially attributed to reduced production volumes. The largest components of operating expense are power and fuel costs, well servicing, and repairs and maintenance costs. Well servicing and repairs and maintenance costs continue to reflect the high demand for oilfield services, although with reduced activity compared to the prior year, these costs have remained relatively stable.
Power and fuel costs, comprised primarily of electric power costs, represented approximately 27% of our total operating costs during 2008. The average Alberta electric power price of $89.95/MWh in the year was 35% higher than the average 2007 price of $66.84/MWh and this increase is reflected in our 35% per boe increase in power and fuel costs compared to the prior year. To mitigate our exposure to electric power price fluctuations we had electric power price risk management contracts in place which resulted in a gain of $10.0 million compared to a gain of $3.1 million in the prior year. The risk management contracts for electric power costs ended in December 2008 and accordingly our electricity usage in Alberta will be exposed to market prices beginning January 1, 2009. The following table details the electric power costs per boe before and after the impact of our price risk management program.
11
| | | Year Ended December 31 |
| (per boe) | | 2008 | | | 2007 | | | Change | |
| Electric power and fuel costs | $ | 3.92 | | $ | 2.91 | | | 35% | |
| Realized gains on electricity risk management contracts | | (0.49 | ) | | (0.14 | ) | | 250% | |
| Net electric power and fuel costs | $ | 3.43 | | $ | 2.77 | | | 24% | |
| Alberta Power Pool electricity price (per MWh) | $ | 89.95 | | $ | 66.84 | | | 35% | |
Transportation and marketing expense for 2008 was $13.5 million or $0.66/boe, an increase of 22% per boe from $11.9 million or $0.54 per boe in 2007. These costs relate primarily to delivery of natural gas to Alberta’s natural gas sales hub, the AECO Storage Hub, and to a lesser extent, our costs of trucking clean crude oil to pipeline receipt points. As a result, the total dollar amount of costs fluctuates in relation with our natural gas production volumes while the cost per boe typically remains relatively constant. The increased transportation and marketing expense in 2008 is primarily due to increased clean oil trucking costs associated with the two acquisitions completed in the Third Quarter.
Operating Netback
| | Year Ended December 31 |
| (per boe) | | 2008 | | | 2007 | |
| Revenues | $ | 75.39 | | $ | 53.78 | |
| Royalties | | (12.14 | ) | | (9.69 | ) |
| Operating expense | | (14.70 | ) | | (13.66 | ) |
| Transportation and marketing expense | | (0.66 | ) | | (0.54 | ) |
| Operating netback(1) | $ | 47.89 | | $ | 29.89 | |
| (1)This is a non-GAAP measure; please refer to “Non-GAAP Measures” in this MD&A. | | | | | | |
Harvest’s operating netback represents the net amount realized on a per boe basis after deducting directly related costs. In 2008, our operating netback increased by $18.00/boe or 60% over the prior year. The increase in our operating netback is primarily attributed to a $21.61/boe increase in realized commodity prices, reflecting the increase in Edmonton Par, Bow River and AECO pricing over the prior year, offset by an increase in royalties of $2.45/boe resulting from higher realized prices.
General and Administrative (“G&A”) Expense
| | Year Ended December 31 | |
| (000s except per boe) | | 2008 | | | 2007 | | | Change | |
| Cash G&A | $ | 33,643 | | $ | 31,892 | | | 5% | |
| Unit based compensation expense (recovery) | | (775 | ) | | 2,723 | | | (128% | ) |
| Total G&A | $ | 32,868 | | $ | 34,615 | | | (5% | ) |
Cash G&A per boe ($/boe) |
$ |
1.64 |
|
$ |
1.45 |
|
|
13% |
|
For the year ended December 31, 2008, Cash G&A costs increased by $1.8 million (or 5%) compared to the prior year, reflecting higher employee costs in a continued tight market for technically qualified staff in the western Canadian petroleum and natural gas industry. Generally, approximately 75% of our Cash G&A expenses are related to salaries and other employee related costs.
Our unit based compensation plans provide employees with the option of settling outstanding awards with cash. As a result, unit based compensation expense is determined using the intrinsic method, being the difference between the Trust Unit trading price and the strike price of the unit awards adjusted for the proportion that is vested. The market price of our Trust Units was $20.63 at December 31, 2007 and on December 31, 2008, the price was $10.50. Total unit based compensation expense decreased $3.5 million in 2008 compared to 2007 as the market price of Harvest Trust Units decreased by $10.13 per Trust Unit in 2008 which was greater than the $5.60 per Trust Unit decrease in 2007.
12
Depletion, Depreciation, Amortization and Accretion Expense
| | Year Ended December 31 |
| (000s except per boe) | | 2008 | | | 2007 | | | Change | |
| Depletion, depreciation and amortization | $ | 414,969 | | $ | 420,184 | | | (1% | ) |
| Depletion of capitalized asset retirement costs | | 15,135 | | | 15,621 | | | (3% | ) |
| Accretion on asset retirement obligation | | 18,631 | | | 18,337 | | | 2% | |
| Total depletion, depreciation, amortization and accretion | $ | 448,735 | | $ | 454,142 | | | (1% | ) |
| Per boe | $ | 21.92 | | $ | 20.62 | | | 6% | |
Our overall depletion, depreciation, amortization and accretion (“DDA&A”) expense for the year ended December 31, 2008 was $5.4 million lower compared to the prior year. The decrease is attributed to lower production volumes partially offset by slightly higher finding, development and acquisition costs that have increased our depletion rate compared to the same periods of the prior year.
Capital Expenditures
| | | Year Ended December 31 | |
| (000s) | | 2008 | | | 2007 | |
| Land and undeveloped lease rentals | $ | 7,762 | | $ | 2,785 | |
| Geological and geophysical | | 6,782 | | | 6,058 | |
| Drilling and completion | | 164,628 | | | 146,941 | |
| Well equipment, pipelines and facilities | | 81,680 | | | 134,423 | |
| Capitalized G&A expenses | | 10,235 | | | 8,353 | |
| Furniture, leaseholds and office equipment | | 225 | | | 2,114 | |
| Development capital expenditures excluding acquisitions and non-cash items | | 271,312 | | | 300,674 | |
| Non-cash capital additions (recoveries) | | (251 | ) | | 371 | |
| Total development capital expenditures excluding acquisitions | $ | 271,061 | | $ | 301,045 | |
In 2008, approximately 61% of our development capital expenditures were incurred to drill 247 gross wells with a success rate of 100%, compared to 182 gross wells with a success rate of 98% in 2007. While we continued to focus our drilling activity on oil opportunities (68% of net wells drilled) given the strong oil price environment through most of the year, our natural gas drilling in central Alberta resulted in some particularly successful wells. At Chedderville, we benefited from our 2006 exploration discovery with the drilling of 3 additional wells into this prolific Mannville channel. Additional pipeline infrastructure was completed by the end of the year and the wells were brought on stream bringing our production from this once undeveloped area to approximately 1,800 boe/d.
Over 80% of our 2008 drilling activity focused on our Markerville, Lloydminster/Hayter, southeast Saskatchewan, southeast Alberta and Rimbey properties. In Markerville we drilled 63 gross wells focusing on infill opportunities in our Edmonton sands shallow gas play as well as deeper targets in the Ostracod and Ellerslie channel systems. At Lloydminster/Hayter, we drilled 34 gross wells, primarily horizontal wells targeting infill locations in both the Lloydminster and Dina sandstone formations. In southeast Saskatchewan, we drilled 45 gross horizontal wells pursuing light oil accumulations in both the Souris Valley and Tilston formations with a 100% success rate. A horizontal test well into the Bakken formation provided us with information to further assess the Bakken potential on Harvest’s Bakken rights of approximately 12,000 net acres. In southeast Alberta, we drilled 40 gross wells including the transferring of our horizontal well experience in Lloydminster to the development of a new heavy oil play in the Sunburst sandstone formation at Murray Lake where we drilled 4 horizontal wells. At Rimbey, we continued to pursue primarily gas opportunities by drilling 21 gross wells to continue our successful exploration activities pursuing Ostracod channel sands as well as shallow Edmonton sands opportunities.
Our enhanced oil recovery (“EOR”) efforts continue. At Hay River, rather than executing a large drilling program, we focused on enhancing our infrastructure and water injection to better manage the performance of our Bluesky reservoir. By increasing injection in early 2008, we were able to maintain our production levels throughout 2008 without drilling any new wells, our December 2008 production was 1,600 boe/d ahead of our original expectations.
13
At Bellshill Lake, an independent engineering study, as well as field trials, confirmed that increased water injection would reduce our production decline rate and result in an overall improved recovery from this large Ellerslie medium gravity oil pool. In 2008, we completed the installation of a water transfer line from our south Bellshill pool to bring incremental produced water to our main Bellshill Lake pool which has allowed us to further increase the volume of water injection in the Fourth Quarter of 2008.
At Suffield, we launched an enhanced water flood pilot with the installation of a water transfer line from our main Batus facility to our Lark oil pool. Suffield produces heavy gravity oil from Basal Quartz sandstone reservoirs and produced water collected from a number of separate oil pools (including Lark) was not re-distributed to the pools resulting in reduced reservoir pressure as fluids were produced over time. By redistributing water from Batus to the other pools, we will be able to access incremental oil reserves as we “re-charge” the reservoirs. Our main Batus reservoir will also benefit as we will be reducing the amount of “over-injection” which can result in this heavier oil being bypassed in favor of the more mobile water. Injection was initiated in the Third Quarter of 2008.
At Wainwright, we completed the majority of our laboratory testing and completed the acquisition of our polymer injection skid with injection scheduled to begin late in the First Quarter of 2009. The polymer injection represents the first phase of our pilot testing the enhanced recovery impact on this medium gravity Sparky oil pool. We will be initially testing the benefit of polymer injection alone, to be followed up with an Alkaline Surfactant Polymer pilot should the test results be favorable.
The $81.7 million of well equipment, pipelines and facilities expenditures during 2008 includes the equipping of wells drilled during the year, and also a number of infrastructure initiatives to optimize the production performance of our asset base. Approximately $9 million was invested at various properties to ensure the integrity of our transportation and processing infrastructure. At Chedderville, we completed an expansion to our gathering infrastructure for approximately $1 million to allow new wells to be brought on stream, and to fully optimize the production from our original discovery well. At southeast Saskatchewan, we installed a free water knockout vessel at our Kenossee pool for total capital of approximately $1 million to allow production to be optimized from our infill and step out drilling program. Approximately $8 million was part of our EOR implementation at Bellshill Lake, Suffield, Hay River and Wainwright as noted above.
The following summarizes Harvest’s participation in gross and net wells drilled during 2008:
| | Total Wells | Successful Wells | Abandoned Wells |
| Area | Gross(1) | Net | Gross | Net | Gross | Net |
| | | | | | | |
| Southeast Saskatchewan | 45.0 | 35.5 | 45.0 | 35.5 | - | - |
| Southeast Alberta | 40.0 | 15.5 | 40.0 | 15.5 | - | - |
| Red Earth | 12.0 | 11.3 | 12.0 | 11.3 | - | - |
| Suffield | 12.0 | 12.0 | 12.0 | 12.0 | - | - |
| Lloydminster/Hayter | 34.0 | 31.8 | 34.0 | 31.8 | - | - |
| Rimbey | 21.0 | 7.3 | 21.0 | 7.3 | - | - |
| Markerville | 63.0 | 26.9 | 63.0 | 26.9 | - | - |
| Northwest Alberta | 10.0 | 3.8 | 10.0 | 3.8 | - | - |
| Other Areas | 10.0 | 6.2 | 10.0 | 6.2 | - | - |
| Total | 247.0 | 150.3 | 247.0 | 150.3 | - | - |
| (1)Excludes 18 additional wells that we have an overriding royalty interest in. | | | | |
Our 2008 capital program, along with our acquisitions and divestitures, replaced our production on a proved plus probable basis with 2008 year end reserves of 219.9 million boe, substantially unchanged from 220.9 million boe at the end of 2007. Including changes in future development costs, our 2008 finding and development costs averaged $25.97 per boe of proved reserves while our finding, development and acquisition costs averaged $27.90 per boe of proved reserves as compared to $28.44/boe and $26.98/boe, respectively, in the prior year and a three year average of $27.27/boe and $28.78/boe, respectively. Based on the forecast prices and costs of our independent reservoir engineers as at December 31, 2008, the net present value of our future net revenues from proved reserves using a 10% discount rate is $2,941.8 million and $3,893.8 million from proved plus probable reserves. With 2008 netback price of $47.89/boe in 2008, our finding and development costs result in a recycle ratio of 1.6 while our finding, development and acquisition costs result in a recycle ratio of 1.7. Based on our 2008 production of 20.5 million boe, our 2008 year end proved reserves represent a reserve life index of 7.5 years while our proved plus probable reserves represent a reserve life index of 10.8 years.
14
Acquisitions and Divestitures
In late July 2008, we acquired a private oil and natural gas company for cash consideration of $36.8 million. The associated production was approximately 390 bbl/d of light oil in an area immediately adjacent to our existing operations in Red Earth plus 2,300 mcf/d of natural gas from a shallow gas play in north central Alberta. An independent engineering report prepared effective April 1, 2008 estimated proved and probable reserves of 1,800 mboe.
In early September 2008, we acquired conventional oil and gas properties in the Peace River Arch area of northern Alberta with approximately 1,900 boe of daily production (66% oil and 24% natural gas) in exchange for cash consideration of $130.8 million plus some minor natural gas interests which produced approximately 85 boe/d during the first half of 2008. During the first half of 2008, the acquired properties averaged production of approximately 1,255 bbl/d of light gravity oil and natural gas liquids plus 3,900 mcf/d of natural gas. An independent engineering report prepared effective December 31, 2007 estimated proved reserves at 7,260 mboe and proved plus probable reserves at 9,899 mboe.
During the Third Quarter, we disposed of various non-operated properties in the Pouce Coupe area in exchange for cash consideration of $36.8 million plus some freehold mineral interests in southeast Saskatchewan. These properties had average daily production of approximately 2,800 mcf/d of natural gas and 14 boe/d of natural gas liquids.
Goodwill
Goodwill is recorded when the purchase price of an acquired business exceeds the fair value of the net identifiable assets and liabilities of that acquired business. At December 31, 2008, we had $677.6 million of goodwill on our balance sheet related to our upstream segment, of which $0.8 million was added during 2008 with our purchase of a private oil and natural gas company. The goodwill balance is assessed annually for impairment or more frequently if events or changes in circumstances occur that would reasonably be expected to reduce the fair value of the acquired business to a level below its carrying amount. Although commodity prices decreased significantly in the second half of 2008 no goodwill impairment charges have been made due to the historical cost of the oil assets, which were acquired based on oil prices consistent or lower compared to prices prevalent in the market today.
Asset Retirement Obligation (“ARO”)
In connection with property acquisitions and development expenditures, we record the fair value of the ARO as a liability in the same year the expenditures occur. The associated asset retirement costs are capitalized as part of the carrying amount of the assets and are depleted and depreciated over our estimated net proved reserves. Once the initial ARO is measured, it is adjusted at the end of each period to reflect the passage of time as well as changes in the estimated future cash flows of the underlying obligation. Our asset retirement obligation increased by $63.8 million during 2008 as a result of accretion expense of $18.6 million, new liabilities recorded of $7.2 million, and upward revisions in estimates of $49.4 million, offset by $11.4 million of actual asset retirement expenditures incurred.
15
DOWNSTREAM OPERATIONS
2008 Highlights
- Cash from downstream operations totaled $83.6 million (2007 - $165.0 million) with sound operating performance more than offset by generally lower refining margins, higher costs for purchased energy and, in the Fourth Quarter, an inventory write-down due to significantly lower commodity prices.
- An average refining margin of US$7.16/bbl reflects a US$2.89 decrease over the prior year primarily attributed to lower margins on gasoline and high sulphur fuel oil (“HSFO”) products partially offset by improved margins on distillate products and higher discounts on feedstock, all relative to the WTI benchmark price.
- Refinery throughput averaged 103,497 bbls/d, representing a 90% utilization rate, with throughput limited from May through August in an effort to optimize refining margins by minimizing the production of HSFO and from September through December due to fouling of heat exchangers.
- Refining operating costs of $2.08/bbl of throughput as compared to $2.33/bbl in the prior year reflects increased throughput and cost containment efforts resulting in a relatively stable level of spending at $78.9 million.
- Cost of purchased energy increased to $3.48/bbl of throughput as compared to $2.57/bbl in the prior year reflecting a significantly higher commodity price environment during the first three quarters of 2008, while turnaround and catalyst costs reflect a modest visbreaker turnaround in 2008 as compared to an extensive shutdown in 2007.
- Capital spending totaled $56.2 million as compared to $44.1 million in the prior year with $30.1 million incurred for the visbreaker expansion project commissioned in November 2008.
Summary of Financial and Operational Results
| | Year Ended December 31 |
| (in $000’s except where noted below) | | 2008 | | | 2007 | | | Change | |
| | | | | | | | | | |
| Revenues | | 4,194,595 | | | 3,098,556 | | | 35% | |
| Purchased feedstock for processing and products purchased for resale(4) | | 3,850,507 | | | 2,667,714 | | | 44% | |
| Gross margin(1) | | 344,088 | | | 430,842 | | | (20% | ) |
Costs and expenses |
|
|
|
|
|
|
|
|
|
| Operating expense | | 98,736 | | | 102,476 | | | (4% | ) |
| Purchased energy expense | | 131,878 | | | 92,328 | | | 43% | |
| Turnaround and catalyst expense | | 5,645 | | | 34,486 | | | (84% | ) |
| Marketing expense and other | | 20,753 | | | 34,970 | | | (41% | ) |
| General and administrative expense | | 1,875 | | | 1,713 | | | 9% | |
| Depreciation and amortization expense | | 71,076 | | | 72,600 | | | (2% | ) |
| Earnings From Operations(1) | | 14,125 | | | 92,269 | | | (85% | ) |
Cash capital expenditures |
|
56,162 |
|
|
44,111 |
|
|
27% |
|
Feedstock volume (bbl/day)(2) |
|
103,497 |
|
|
98,617 |
|
|
5% |
|
Yield (000’s barrels) |
|
|
|
|
|
|
|
|
|
| Gasoline and related products | | 12,068 | | | 11,515 | | | 5% | |
| Ultra low sulphur diesel and jet fuel | | 15,668 | | | 14,406 | | | 9% | |
| High sulphur fuel oil | | 9,952 | | | 9,843 | | | 1% | |
| Total | | 37,688 | | | 35,764 | | | 5% | |
Average refining margin (US$/bbl)(3) |
|
7.16 |
|
|
10.05 |
|
|
(29% |
) |
| (1) | These are non-GAAP measures; please refer to “Non-GAAP Measures” in this MD&A. |
| (2) | Barrels per day are calculated using total barrels of crude oil feedstock and vacuum gas oil. |
| (3) | Average refining margin is calculated based on per barrel of feedstock throughput. |
| (4) | Purchased feedstock for processing and products purchased for resale includes inventory write-downs of $35.3 million in the Fourth Quarter of 2008. |
16
Overview of Downstream Operations
Our downstream operations are comprised of an 115,000 bbls/d medium gravity sour crude oil hydrocracking refinery and a retail and wholesale petroleum marketing business both located in the Province of Newfoundland and Labrador. Our petroleum marketing business is comprised of the retail and wholesale distribution of gasoline, diesel, jet and other transportation fuels as well as home heating fuels and related appliances and the revenues from our marine services including tugboat revenues.
The financial performance of our refinery reflects its throughput, feedstock selection, operating effectiveness, refining margins and operating costs. Our refining margin is dependent on the sales value of the refined products produced and the cost of crude oil feedstock purchased as well as the yield of refined products from various crude oil feedstocks. We continuously evaluate the market and relative refinery values of several different crude oils and vacuum gas oils to determine the optimal feedstock mix. We analyze our refining margin on each refined product and our sales revenue relative to benchmark prices for the refined product and the WTI benchmark price. With respect to feedstock costs, we analyze our price discounts relative to the WTI benchmark price and segregate crude oil sources by country of origin.
We purchase substantially all of our refinery feedstock and sell our distillate and gasoline products, with the exception of products sold in Newfoundland through our petroleum marketing division, to Vitol Refining S.A. (“Vitol”) pursuant to the Supply and Offtake Agreement. Effective January 20, 2008, our HSFO is sold to a wholly-owned affiliate of one of the world’s largest integrated energy companies; prior to this, our HSFO had been sold to Vitol. During the year ended December 31, 2008, approximately 67% of our refined product sales were to Vitol.
The Supply and Offtake Agreement with Vitol contains pricing terms that reflect market prices based on an average ten day delay which results in our purchases from and sales to Vitol being priced on future prices as compared to pricing at the time of delivery. With the exception of the sales to Vitol, our refined products are sold at prices that reflect market prices at the time that the product is delivered to the purchaser. For more information on the Supply and Offtake Agreement with Vitol, see the description in our Annual Information Form for the year ended December 31, 2007 as filed on SEDAR atwww.sedar.com.
For the year ended December 31, 2008, our refining gross margin was $287.6 million as compared to $386.7 million in the prior year, a decrease of $99.1 million. The decrease in refining gross margin is primarily due to weaker gasoline and HSFO margins which resulted in negative price variances of $224.9 million and $66.5 million, respectively, partially offset by improved distillate margins and improved discounts to WTI on our feedstock which resulted in positive price variances of $92.3 million and $121.7 million, respectively.
For the year ended December 31, 2008, our marketing division earned a gross margin of $56.5 million as compared to $44.1 million in the prior year, an increase of 28% primarily due to a significant increase in the price of sulphur, which is sold through a profit sharing agreement with a third party processor and contributed $8.5 million in 2008 as compared to $0.3 in 2007.
17
Refining Benchmark Prices
The following average benchmark prices and currency exchange rates are the reference points from which we discuss our refinery’s financial performance:
| | Year Ended December 31 |
| | 2008 | 2007 | Change |
| WTI crude oil (US$/bbl) | 99.65 | 72.31 | 38% |
| Brent crude oil (US$/bbl) | 98.38 | 72.67 | 35% |
| Basrah Official Sales Price Discount (US$/bbl) | (7.40) | (6.84) | 8% |
| RBOB gasoline (US$/bbl/gallon) | 104.40/2.49 | 86.86/2.07 | 20% |
| Heating Oil (US$/bbl/gallon) | 119.89/2.85 | 85.65/2.04 | 40% |
| High Sulphur Fuel Oil (US$/bbl) | 73.13 | 54.02 | 35% |
| Canadian / U.S. dollar exchange rate | 0.943 | 0.935 | 1% |
The following graph summarizes the crack spreads between the respective benchmark prices for refined products and WTI for the period of January 2007 to December 2008:

During 2008, the Heating Oil Crack Spread averaged US$20.24/bbl, an increase of US$6.90/bbl over the US$13.34/bbl averaged in the prior year, as strong demand for distillate products in North America, Europe and Asia improved margins. The RBOB Gasoline Crack Spread averaged US$4.75/bbl in 2008, a drop of US$9.80/bbl from the US$14.55/bbl averaged in the prior year, as North American demand for gasoline continued to weaken subsequent to June 2007 due to slowing economic activity and consumer response to the record setting prices for gasoline in the summer of 2008. Similarly, the HSFO Crack Spread differential averaged US$26.52/bbl less than WTI in 2008, an increase of US$8.23/bbl from the average differential of US$18.29/bbl less than WTI in the prior year, as margins in the Second Quarter of 2008 were particularly weak.
18
During 2008, the Canadian/U.S. dollar exchange rate averaged 0.943, an increase of 0.008 from the prior year. The relative strength of the Canadian dollar resulted in a nominal decrease in our cash flows from downstream operations in 2008, as refined product and crude oil prices are denominated in U.S. dollars.
Summary of Gross Margin
The following table summarizes our downstream gross margin for the years ended December 31, 2008 and 2007 segregated between refining activities and petroleum marketing and other related businesses.
| | | Year Ended December 31 |
| | | 2008 | | | 2007 | |
| (000’s of Canadian dollars) | | Refining | | | Marketing | | | Total | | | Refining | | | Marketing | | | Total | |
| | | | | | | | | | | | | | | | | | | |
| Sales revenue(1) | | 4,092,555 | | | 670,686 | | | 4,194,595 | | | 2,982,655 | | | 504,375 | | | 3,098,556 | |
| Cost of feedstock for processing and products | | | | | | | | | | | | | | | | | | |
| for resale(1) | | 3,804,952 | | | 614,201 | | | 3,850,507 | | | 2,595,907 | | | 460,281 | | | 2,667,714 | |
| Gross margin(2) | | 287,603 | | | 56,485 | | | 344,088 | | | 386,748 | | | 44,094 | | | 430,842 | |
Average refining margin (US$/bbl) |
|
7.16 |
|
|
|
|
|
|
|
|
10.05 |
|
|
|
|
|
|
|
| (1) | Downstream sales revenue and cost of products for processing and resale are net of intra-segment sales of $568.6 million for the year ended December 31, 2008 (2007 - $388.5 million) reflecting the refined products produced by the refinery and sold by the Marketing Division. |
| (2) | This is a non-GAAP measure; please refer to “Non-GAAP Measures” in this MD&A. |
Refining Gross Margin
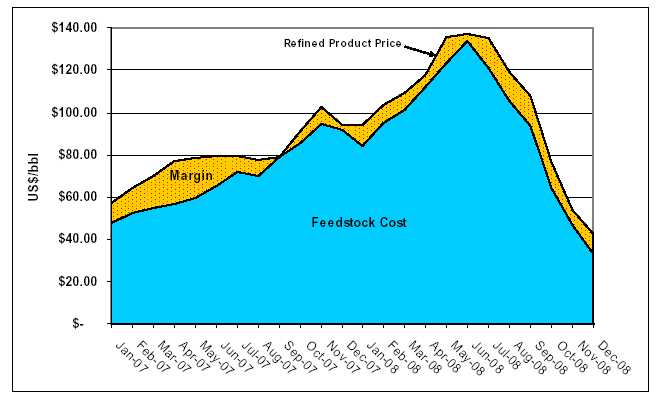
The following graph summarizes our average refining margin relative to the cost of feedstock for the period of January 2007 to December 2008:
19
The following chart summarizes our refining margin by refined product over the same time period by quarter:
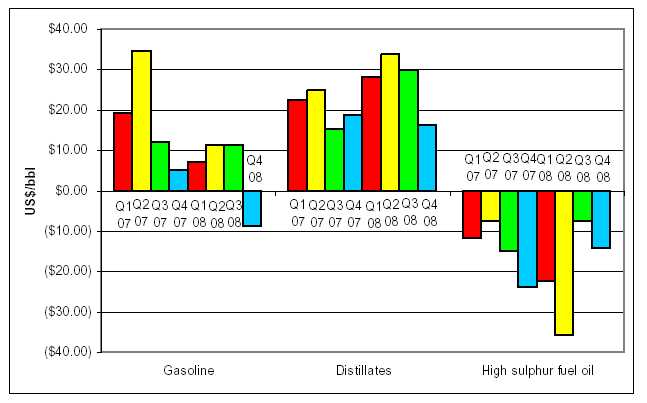
Crack spreads on gasoline and HSFO peaked during the first half of 2007, resulting in an average refining margin of US$13.69 per bbl with the distillate refining margin averaging US$23.52 per bbl. However, during the second half of 2007 and the first half of 2008 as feedstock costs continued to rise, crack spreads on gasoline and HSFO declined considerably from their peak, and were only partially offset by improved crack spreads on distillate products, which resulted in our average refining margin dropping to US$4.16 per bbl and US$7.36 per bbl for the six month periods ended December 31, 2007 and June 30, 2008, respectively. During the second half of 2008, although feedstock costs decreased significantly, crack spreads on gasoline continued to deteriorate, particularly in the Fourth Quarter when gasoline crack spreads were negative, resulting in an average refining margin of US$6.95 per bbl.
20
Refinery Throughput
The throughput of our refinery for the period of January 2007 to December 2008 is illustrated below in thousands of barrels of feedstock per day:
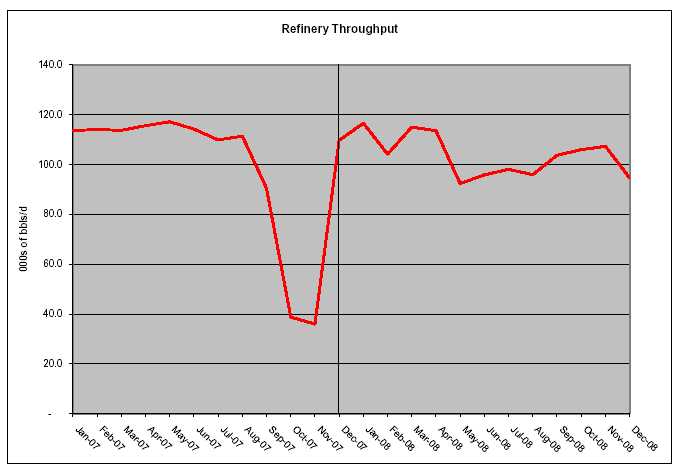
During 2008, our feedstock was comprised of 93,697 bbl/d of medium sour crude oil and 9,800 bbl/d of vacuum gas oil (“VGO”) as compared to 87,060 bbl/d of crude oil and 11,557 bbl/d of VGO in the prior year. Our aggregate total throughput in 2008 was 103,497 bbls/d, a 4,880 bbls/d increase over the prior year reflecting a utilization rate of 90% relative to an 115,000 bbls/d nameplate capacity. While the refinery experienced limited planned or unplanned downtime in 2008, our throughput was intentionally reduced from May through August in an effort to improve overall gross margin by reducing feedstock to eliminate the production of vacuum tower bottoms (“VTB’s”) in excess of our visbreaker unit capacity, thereby eliminating the need to downgrade middle distillate valued streams to blend the excess VTB’s into lower valued HSFO. Throughput during September through December was reduced due to fouling in heat exchangers, including an online partial exchanger cleaning in December. The remaining exchangers will be cleaned during the ISOMAX catalysts replacement planned for April 2009. During the Fourth Quarter of 2007, we completed a turnaround of the crude unit and vacuum tower and positioned the refinery for uninterrupted operations in 2008 except for the visbreaker turnaround in the Fourth Quarter of 2008.
21
Refinery Sales Revenue
A comparison of our refinery yield, product pricing and revenue for the years ended December 31, 2008 and 2007 is presented below:
| | Year Ended December 31 |
| | | 2008 | | | 2007 | |
| | Refinery | Volume | Sales | Refinery | Volume | Sales |
| | Revenues | | Price(1) | Revenues | | Price(1) |
| | (000’s of Cdn $) | (000s of bbls) | (US$ per bbl/ | (000’s of Cdn $) | (000s of bbls) | (US$ per bbl/ |
| | | | US$ per US gal) | | | US$ per US gal) |
| | | | | | | |
| Gasoline products | 1,327,599 | 12,830 | 97.58/2.32 | 1,088,215 | 11,726 | 86.77/2.07 |
| Distillates | 2,006,406 | 15,661 | 120.81/2.88 | 1,339,388 | 14,245 | 87.91/2.09 |
| High sulphur fuel oil | 758,550 | 9,651 | 74.12 | 555,052 | 9,740 | 53.28 |
| | 4,092,555 | 38,142 | 101.18 | 2,982,655 | 35,711 | 78.09 |
| Inventory adjustment | | (454) | | | 53 | |
| Total production | | 37,688 | | | 35,764 | |
| Yield (as a % of Feedstock)(2) | 100% | | | 99% | |
| (1) | Average product sales prices are based on the deliveries at our refinery loading facilities. |
| (2) | After adjusting for changes in inventory held for resale. |
Our refinery sales revenue is dependent on the selling price of the refined products produced as well as the yield of refined products produced from the crude oil and other feedstocks. Although our yield can be altered slightly by adjusting refinery operations to react to market conditions and seasonal demand, product yields are primarily impacted by the type of crude oil feedstock processed and refinery performance. For the year ended December 31, 2008, our refinery yield was comprised of 32% gasoline products, 42% distillates and 26% HSFO compared to 32%, 40% and 28% for the same products respectively during 2007. The shift in product yield in 2008 from HSFO to distillates is primarily attributed to feedstock selection, process unit optimization and reduced throughput.
Our average sales price for our refined products relative to the average WTI price in the current year was US$4.25/bbl lower than in the prior year. In 2008, our average sales price was US$101.18/bbl (a premium of US$1.53/bbl over WTI) as compared to an average selling price of US$78.09/bbl in the prior year (a premium of US$5.78bbl over WTI). This reduction in premium represents a $171.9 million price variance in 2008.
During 2008, the average sales price of our gasoline products of US$97.58/bbl was a US$2.07/bbl discount to the average WTI price as compared to a US$14.46/bbl premium over WTI realized in 2007 representing a $224.9 million decrease in gross margin as compared to the prior year. This US$16.53 drop in our gasoline refining margin relative to WTI reflects generally weaker demand for gasoline in North America.
During 2008, the average sales price for our distillate products of US$120.81/bbl was a US$21.16/bbl premium over the average WTI price as compared to a US$15.60/bbl premium over WTI realized in 2007 representing a $92.3 million increase in gross margin as compared to the prior year. During 2008, the international demand for distillate products was strong supporting improved distillate margins. During 2008, we received US$7.9 million of incremental revenue from delivering approximately 7.5 million barrels of distillate products to Europe pursuant to our profit sharing arrangement with Vitol.
During 2008, the average sales price of our HSFO of US$74.12/bbl was a US$25.53/bbl discount to average WTI price as compared to a US$19.03/bbl discount in 2007 representing a $66.5 million reduction in gross margin as compared to the prior year. The US$5.56/bbl improvement in our distillate pricing relative to WTI and the shift in product yield from HSFO to distillates was insufficient to fully offset the US$16.53/bbl and US$6.50/bbl margin reductions for gasoline products and HSFO, respectively.
22
Refinery Feedstock
The volatility of WTI prices throughout 2008 makes it difficult to compare the economics of crude types when our consumption of crude type varies from month to month and costs are aggregated over the year. Further, our refinery competes for international waterborne crude oils and VGOs and the WTI benchmark price generally reflects a land-locked North American price with limited access to the international markets. A comparison of crude oil and VGO feedstock processed for the years ended December 31, 2008 and 2007 is presented below:
| | Year Ended December 31 |
| | 2008 | | 2007 | |
| | | Cost of | | | Volume | | | Cost per | | | Cost of | | | Volume | | | Cost per | |
| | | Feedstock | | | | | | Barrel(1 | ) | | Feedstock | | | | | | Barrel(1 | ) |
| | | (000’s of Cdn $ | ) | | (000s of bbls | ) | | (US$/bbl) | | | (000’s of Cdn $ | ) | | (000s of bbls | ) | | (US$/bbl) | |
| | | | | | | | | | | | | | | | | | | |
| Iraqi | | 1,963,882 | | | 21,218 | | | 87.28 | | | 1,608,356 | | | 23,230 | | | 64.74 | |
| Russian | | 614,187 | | | 5,973 | | | 96.97 | | | 237,449 | | | 3,367 | | | 65.94 | |
| Venezuelan | | 676,777 | | | 7,102 | | | 89.86 | | | 362,868 | | | 5,180 | | | 65.50 | |
| Crude Oil Feedstock | | 3,254,846 | | | 34,293 | | | 89.50 | | | 2,208,673 | | | 31,777 | | | 64.99 | |
| Vacuum Gas Oil | | 396,676 | | | 3,586 | | | 104.31 | | | 354,858 | | | 4,218 | | | 78.66 | |
| | | 3,651,522 | | | 37,879 | | | 90.90 | | | 2,563,531 | | | 35,995 | | | 66.59 | |
Net inventory adjustment(2) |
|
(8,990 |
) |
|
|
|
|
|
|
|
(36,378 |
) |
|
|
|
|
|
|
| Additives and blendstocks | | 127,136 | | | | | | | | | 68,754 | | | | | | | |
| Inventory write-down(3) | | 35,284 | | | | | | | | | - | | | | | | | |
| | | 3,804,952 | | | | | | | | | 2,595,907 | | | | | | | |
| (1) | Cost of feedstock includes all costs of transporting the crude oil to refinery in Newfoundland. |
| (2) | Inventories are determined using the weighted average cost method. |
| (3) | Inventory write-downs are calculated on a product by product basis using the lower of cost or net realizable value. |
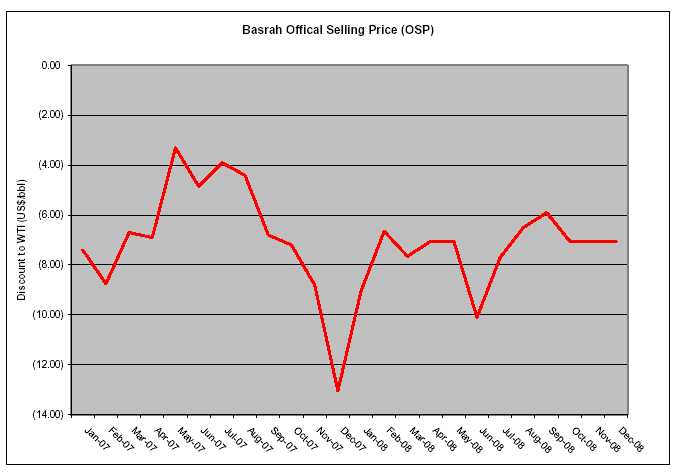
Changes to the cost of our feedstock reflect numerous factors beyond changes in WTI price, including the quality of the crude oil processed, the mix of crude oil types, the costs of transporting the crude oil to our refinery, the ten day delay in pricing pursuant to the Supply and Offtake Agreement and for Iraqi crude oil purchased, the Official Selling Price (“OSP”) as set by the Oil Marketing Company of the Republic of Iraq. The discount of Iraqi crude oil relative to the WTI benchmark price is influenced by the quality of the crude oil as well as by the demand from other purchasers who may not be North American based. On a monthly basis, the OSP discount is announced as a discount to the WTI benchmark price for North American deliveries. Since our acquisition of North Atlantic in October 2006, the OSP has fluctuated from a low of US$3.30 in May 2007 to a high of US$13.05 in December 2007. The following graph illustrates the volatility of the OSP for Basrah Light since January 2007 which, relative to our US$7.16 average refining margin for 2008, is a significant factor to our downstream financial performance:
23
Although the OSP discount may change between the date of loading in Iraq and its consumption a few months later at our refinery, the OSP discount applicable at the time of loading does not change for our purchase. For example, the OSP discount of US$7.05 in April 2008 was a component of the cost of our feedstock processed in June and July recognizing the 30 to 45 days required to load in Iraq, in transit time and unloading at our refinery. While we are able to “operationally hedge” the WTI component of our feedstock costs between the date we purchase crude oil and our processing of the crude oil we are not able to hedge or otherwise manage the basis risk associated with the medium sour crude oils we typically process.
The cost of our crude oil feedstock averaged US$89.50/bbl during 2008 representing a US$10.15/bbl discount from WTI as compared to a cost of US$64.99/bbl and a discount of US$7.32/bbl in the prior year. While the increased discount to WTI aggregates to a $102.9 million improved gross margin, the year-over-year US$27.34 increase in the average WTI price added $994.2 million to our crude oil feedstock cost during 2008. The US$89.50/bbl average cost of crude oil feedstock during the year represents a 38% increase over the average cost in the prior year, which impacts Vitol’s working capital required and increases our “Time Value of Money” charges paid to Vitol as part of the Supply and Offtake Agreement.
The average cost of purchased VGO during 2008 was US$104.31/bbl representing a premium of US$4.66/bbl relative to the WTI benchmark price as compared to US$78.66/bbl and a US$6.35/bbl premium in the prior year. The higher premium in 2007 is attributed to supply and demand disruptions in that year in the very tightly balanced VGO market. We processed 3.6 million barrels of VGO during the year, as such the US$1.69/bbl lower premium aggregates to a $6.4 million decrease in feedstock costs and a corresponding increase in gross margin compared to 2007.
The benchmark refining crack spreads closely track refining margins if the accounting for feedstock is on a last-in-first-out (“LIFO”) basis. Our financial statements account for feedstock on a weighted average cost basis which is in accordance with Canadian generally accepted accounting principles. In a stable commodity price environment, weighted average cost and LIFO accounting results should not be significantly different from market benchmarks and individual refinery results. In a rapidly declining commodity price environment, such as the Fourth Quarter of 2008, the result is that the cost of crude oil feedstock consumed under weighted average cost is higher than on a LIFO basis due to the time lag between crude feedstock
24
purchase and processing. For Harvest, the Supply and Offtake Agreement requires Vitol to hold all crude oil feedstock inventory and substantially all gasoline and distillate inventories and requires Vitol to provide the crude oil feedstock to us at current market prices, resulting in our exposure to falling commodity prices being limited to the inventory we hold, which is primarily work in process material and HSFO inventory. Accordingly, during the Fourth Quarter our refining margins were negatively impacted by write-downs of $35.3 million on our work in progress and HSFO inventories. This write-down is relatively modest compared to the $319.7 million in inventory and in transit commitment held by Vitol to operate our refinery at December 31, 2008, which was a decrease of $540.2 million from the $859.9 million held by Vitol on September 30, 2008.
Operating Expenses
The following summarizes the operating costs from the refinery and marketing division for the years ended December 31, 2008 and 2007:
| | | Year Ended December 31 | |
| | | 2008 | | | 2007 | |
| (000’s of Canadian dollars) | | Refining | | | Marketing | | | Total | | | Refining | | | Marketing | | | Total | |
| | | | | | | | | | | | | | | | | | | |
| Operating expense | | 78,907 | | | 19,829 | | | 98,736 | | | 83,935 | | | 18,541 | | | 102,476 | |
| Turnaround and catalyst | | 5,645 | | | - | | | 5,645 | | | 34,486 | | | - | | | 34,486 | |
| Purchased energy | | 131,878 | | | - | | | 131,878 | | | 92,328 | | | - | | | 92,328 | |
| | | 216,430 | | | 19,829 | | | 236,259 | | | 210,749 | | | 18,541 | | | 229,290 | |
The largest component of refining operating expense is wages, salaries and benefits which totaled $49.6 million during 2008 (2007 - $51.3 million) while the other significant components were maintenance and repair costs of $13.2 million (2007 - $11.9 million), insurance of $5.7 million (2007 - $6.6 million) and professional services of $5.1 million (2007 - $5.7 million). Refining operating expenses were $2.08/bbl during the year as compared to $2.33/bbl in 2007 reflecting increased throughput and a reduction in total refining operating expenses. The marketing division’s operating expenses have increased by $1.3 million primarily due to scheduled tug boat maintenance in June 2008.
Turnaround and catalyst expenditures of $5.6 million (2007 - $34.5 million) relate to planned equipment certifications scheduled during the shutdown to implement the visbreaker unit project modifications.
Purchased energy, consisting of low sulphur fuel oil and electricity, is required to provide heat and power to refinery operations. Our purchased energy for the year ended December 31, 2008 was $3.48/bbl of throughput as compared to $2.57/bbl for 2007. In 2008, we purchased approximately 1,599,000 barrels of fuel oil at an average price of US$72.79/bbl as compared to approximately 1,398,000 barrels purchased in 2007 at an average price of US$55.68/bbl. The $39.6 million increase in the cost of purchased fuel oil is due to a $27.3 million increased price variance and an $11.9 million increase in volume consumed. Our electricity costs remained substantially unchanged during the year at $9.9 million as compared to $9.6 million in the prior year.
Marketing Expense and Other
During the year ended December 31, 2008, marketing expense was comprised of $3.4 million (2007 - $3.4 million) of marketing fees (based on US$0.08/bbl) to acquire feedstock and $26.0 million (2007 - $31.6 million) of “Time Value of Money” charges both pursuant to the terms of the Supply and Offtake Agreement. The decreased “Time Value of Money” charge is mainly the result of a lower LIBOR rate in 2008 which was partially offset by a larger crude oil inventory investment due to the higher commodity prices. In the Fourth Quarter of 2008, marketing expense and other includes $8.7 million in one time accrual reversals related to prior periods. As at December 31, 2008, Harvest had commitments totaling approximately $319.7 million in respect of future crude oil feedstock purchases and related transportation from Vitol.
Capital Expenditures
Capital spending for the year ended December 31, 2008 totaled $56.2 million (2007 - $44.1 million). The largest component of our 2008 downstream capital program relates to the expansion and improvement of our visbreaker. The total costs associated with this project were $32.2 million of which approximately $30.1 million was incurred in 2008; the project was completed in mid-November. The increased capacity will upgrade approximately 1,500 bbls/d of HSFO into middle distillate valued streams.
25
Depreciation and Amortization Expense
The following summarizes the depreciation and amortization expense for the years ended December 31, 2008 and 2007:
| | | Year Ended December 31 | |
| | | 2008 | | | 2007 | |
| (000’s of Canadian dollars) | | Refining | | | Marketing | | | Total | | | Refining | | | Marketing | | | Total | |
| | | | | | | | | | | | | | | | | | | |
| Tangible assets | | 62,383 | | | 2,555 | | | 64,938 | | | 64,251 | | | 2,071 | | | 66,322 | |
| Intangible assets | | 4,749 | | | 1,389 | | | 6,138 | | | 4,781 | | | 1,497 | | | 6,278 | |
| | | 67,132 | | | 3,944 | | | 71,076 | | | 69,032 | | | 3,568 | | | 72,600 | |
The process units are amortized over an average useful life of 20 to 30 years. The intangible assets, consisting of engineering drawings, customer lists and fuel supply contracts, are amortized over a period of 20 years, 10 years and the term of the expected cash flows respectively.
Goodwill
At December 31, 2008, we had $216.2 million of goodwill on our balance sheet related to the October 2006 acquisition of our downstream business segment. As our downstream assets are held in a self-sustaining subsidiary with a U.S. dollar functional currency, our goodwill is adjusted at each balance sheet date to reflect the period end foreign exchange rate. We assess our goodwill for impairment on an annual basis unless events or changes in circumstances warrant more frequent testing. To assess goodwill for potential impairment we compare the estimated fair value of the business segment at the balance sheet date to the recorded net book value. If the estimated fair value exceeds the net book value, no further evaluation is required. Management uses judgment in determining the estimated fair value using internal assumptions and external information to compute the present value of expected future cash flows using discount rates commensurate with the risks involved.
Our fair value estimate at December 31, 2008 assumes the completion of $300 million of planned debottlenecking projects and the related throughput, yield, and energy efficiency improvements. Estimated future refining margins were based on forward curve pricing at December 31, 2008 for the first two years of our projection and were assumed to be constant for subsequent years. Our selected discount rate is based on the long-term risk-free interest rate at December 31, 2008 and adjusted for an appropriate credit spread based on estimated current capital market expectations. We calculated the expected future cash flows for each of the next five years in our fair value model and have computed a terminal value to reflect cash flows to be earned in the years thereafter. At December 31, 2008, the estimated fair value of our downstream business segment exceeded its carrying value, and accordingly, no goodwill impairment was identified.
Related Party Transactions
During the year ended December 31, 2008, Vitol purchased $320.9 million (2007 - $354.8 million) of crude oil pursuant to the terms and conditions of the Supply and Offtake Agreement from a company in which a director of Harvest holds a minority equity interest. On December 21, 2008, the director disposed the interest in the company and as such, subsequent to this date, this company no longer represents a related party.
26
RISK MANAGEMENT, FINANCING AND OTHER
Cash Flow Risk Management
Harvest employs an integrated approach to cash flow risk management strategies whereby the our cash flow from producing crude oil in western Canada is financially integrated with our requirement to purchase crude oil feedstock for our Downstream operations even though the crude oil produced in western Canada does not physically flow to our refinery in Newfoundland. As a result, our 2009 cash flow at risk is comprised of approximately 33,000 bbls/d of refined product price exposure, 82,000 bbls/d of refined product crack spread exposure and 84,000 mcf/d of western Canadian natural gas price exposure.
Our cash flow risk management program includes a detailed analysis of the impact of changes in crude oil prices, natural gas prices, the U.S./Canadian dollar exchange rate and certain refined product prices. While the strong commodity prices experienced throughout the first three quarters of 2008 resulted in record operating cash flow from our upstream operations, they also resulted in $225.2 million of realized losses on our price risk management contracts. As commodity prices declined in the Fourth Quarter of 2008, we realized $24.4 million of gains on our risk management contracts. The table below provides a summary of the gains and losses realized on our price risk management contracts for the years ended December 31, 2008 and 2007:
| | | Year Ended December 31 | |
| | | | | | | | | | |
| (000s) | | 2008 | | | 2007 | | | Change | |
| Crude oil | $ | (36,625 | ) | $ | (41,462 | ) | | (12% | ) |
| Refined product | | (174,129 | ) | | - | | | n/a | |
| Natural gas | | (381 | ) | | 6,299 | | | (106% | ) |
| Currency exchange rates | | 401 | | | 5,725 | | | (93% | ) |
| Electric Power | | 9,952 | | | 3,147 | | | 216% | |
| Total | $ | (200,782 | ) | $ | (26,291 | ) | | 664% | |
During 2008, our net realized loss on price risk management contracts increased to $200.8 million, primarily due to the losses on our refined product pricing contracts of $174.1 million, as lower settlements on crude oil and increased gains on electric power contracts were substantially offset by lower gains on our currency exchange and natural gas contracts
With respect to our crude oil production, we had pricing contracts in place for 10,000 bbl/d during the first half of 2008 at an average price of US$60.00/bbl with 73% participation on prices above US$60.00. We had a further 6,000 bbl/d contracted during the second half of 2008, which capped the WTI price at US$87.53 and provided a floor of US$62.00. As WTI averaged US$99.65 in 2008, cash settlements on these crude oil contracts aggregated to $36.6 million, with losses of $41.2 million during the first three quarters, offset by gains of $4.6 million in the Fourth Quarter.
In respect of refined products, we had pricing contracts in place for 12,000 bbl/d of NYMEX heating oil and 8,000 bbl/d of Platts heavy fuel oil throughout 2008. The cash settlements of these contracts aggregated to $128.0 million and $49.3 million, respectively, during the year. In addition, we had contracts in place on 6,000 bbl/d of NYMEX heating oil crack spread, which were settled with cash payments of $12.9 million; 2,000 bbl/d of Platts heavy fuel oil crack spread, which settled with cash received by Harvest of $5.1 million; and 6,000 bbl/d of NYMEX RBOB gasoline crack spread, which were settled with cash received by Harvest of $10.9 million during the year. In total, during the first three quarters of 2008, we realized losses on our refined product contracts totaling $195.7 million, offset by gains of $21.6 million in the Fourth Quarter.
With respect to currency exchange rates, we had contracted to fix the exchange rate during the first six months of 2008 on US$8.3 million per month averaging Cdn$1.11 per US $1.00 and throughout 2008 we had an exchange rate collar in place that collared an exchange rate of Cdn$1.00 to Cdn$1.055 per US$1.00 on a further US$10 million per month. The settlements on the fixed rate contract resulted in $5.2 million received by Harvest during the first six months of 2008 while the exchange rate collar settled with payments of $4.8 million by Harvest.
27
During 2008, the settlement of our fixed price power contracts for 35 MWh at $56.69 per MWh resulted in $10.0 million received by Harvest as the Alberta electric power prices averaged $89.95 per MWh during the period. The fixed price contract ended in December 2008.
As of December 31, 2008, the mark-to-market value on our refined product contracts was $36.1 million, while the mark-to-market deficiency on our natural gas contracts was $0.2 million. We had no contracts for WTI, currency exchange rate and electrical power at the end of December 2008. Further details on our financial instruments and risk management contracts are included in Note 20 to the audited consolidated financial statements for the year ended December 31, 2008 filed on SEDAR at www.sedar.com.
As of December 31, 2008, we had risk management contracts in place for 12,000 bbl/d of NYMEX heating oil and 8,000 bbl/d of Platts heavy fuel oil from January 2009 through June 2009 and a negligible amount of natural gas contracts through to the end of 2009. These contracts are more fully described in the “Outlook” section of this MD&A.
Interest Expense
| | | Year Ended December 31 | |
| | | | | | | | | | |
| (000s) | | 2008 | | | 2007 | | | Change | |
| Interest on short term debt | | | | | | | | | |
| Bank loan | $ | - | | $ | 1,275 | | | (100% | ) |
| Convertible Debentures | | 295 | | | 2,498 | | | (88% | ) |
| Amortization of deferred finance charges – short term debt | | - | | | 1,811 | | | (100% | ) |
| | | 295 | | | 5,584 | | | (95% | ) |
Interest on long-term debt |
|
|
|
|
|
|
|
|
|
| Bank loan | | 51,855 | | | 70,204 | | | (26% | ) |
| Convertible Debentures | | 69,159 | | | 56,740 | | | 22% | |
| 77/8% Senior Notes | | 22,662 | | | 22,561 | | | 0% | |
| Amortization of deferred finance charges – long term debt | | 2,699 | | | 2,696 | | | 0% | |
| | | 146,375 | | | 152,201 | | | (4% | ) |
| Total interest expense | $ | 146,670 | | $ | 157,785 | | | (7% | ) |
Interest expense, including the amortization of related financing costs, decreased $11.1 million (7%) compared to the prior year as interest on our bank borrowings has decreased by $19.6 million due to lower borrowing costs, while total interest expense on Convertible Debentures has increased as a result of our 2008 Convertible Debenture offering.
The interest on our $1.6 billion Extendible Revolving Credit Facility is at a floating rate based on 70 basis points over bankers’ acceptances for Canadian dollar borrowings. During the year, interest charges on bank loans reflected an effective interest rate of 4.12% . Further details on our credit facilities are included under “Liquidity and Capital Resources” and Note 10 to the audited consolidated financial statements for the year ended December 31, 2008 filed on SEDAR at www.sedar.com.
The interest on our Convertible Debentures totaled $69.5 million during 2008, representing a $10.2 million increase over the prior year. The increase is due to the April 25th issuance of $250 million face value of 7.5% Convertible Debentures due 2015. Details on the Convertible Debentures outstanding are fully described in Note 12 to the audited consolidated financial statements for the year ended December 31, 2008 filed on SEDAR at www.sedar.com. Interest on the Convertible Debentures is based on the effective yield of the debt component of the Convertible Debentures, and as a result, the interest expense recorded is greater than the cash interest paid.
The interest on our 77/8% Senior Notes totaled $22.7 million for the year ended December 31, 2008. Similar to our Convertible Debentures, interest expense is based on the effective yield, and as a result, the interest expense recorded is greater than the cash interest paid.
28
Included in short and long term interest expense is the amortization of the discount on the 77/8% Senior Notes, the accretion on the debt component balance of the Convertible Debentures to face value at maturity, as well as the amortization of commitment fees and legal costs incurred for our credit facility, all totaling $2.7 million for the year ended December 31, 2008.
Currency Exchange
Currency exchange gains and losses are attributed to the changes in the value of the Canadian dollar relative to the U.S. dollar on our U.S. dollar denominated 77/8% Senior Notes as well as any other U.S. dollar cash balances. Realized foreign exchange losses of $19.1 million for 2008, have resulted from the settlement of U.S. dollar denominated transactions. In 2007 we refinanced our U.S. dollar denominated bank loans with Canadian bank borrowings, realizing a foreign exchange gain of $47.1 million in respect of this loan. Since December 31, 2007, the Canadian dollar has weakened compared to the U.S dollar from near parity to a rate of 1.218 at December 31, 2008, resulting in a year-to-date unrealized foreign exchange loss of $11.7 million. Of this unrealized loss, $55.4 million relates to the 77/8% Senior Notes, offset by $43.9 million of unrealized foreign exchange gains attributed to downstream transactions.
Our downstream operations are considered a self-sustaining operation with a U.S. dollar functional currency. The foreign exchange gains and losses incurred by our downstream operations relate to Canadian dollar transactions converted to U.S. dollars as their functional currency is U.S. dollars. The cumulative translation adjustment recognized in other comprehensive income represents the translation of our downstream operation’s U.S. dollar functional currency financial statements to Canadian dollars using the current rate method. During 2008, the weakening of the Canadian dollar relative to the U.S. dollar resulted in a $284.7 million net cumulative translation gain (2007 – net loss of $243.6 million) as the stronger U.S. dollar results in an increase in the relative value of the net assets in our downstream operations.
Future Income Tax
Following the enactment of Bill C-52 in June 2007, we recorded a $177.7 million future income tax charge in our Second Quarter 2007 results reflecting the taxing of the temporary differences between the book value and tax basis of assets held by our Mutual Fund Trust and our other “flow through” entities. The principal source of temporary differences for our corporate entities is in respect of our property, plant and equipment and the recognition for accounting purposes of the mark-to-market value of our price risk management contracts while for our Mutual Fund Trust and other “flow through” entities, the temporary differences arise due to our net profits royalty interests. With respect to the future income tax provision for our Mutual Fund Trust and other “flow through” entities, the provision is based on the expected temporary differences and applicable income tax rates as at January 1, 2011 when the impact of Bill C-52 becomes effective and this provision will change to reflect changes in estimates of the temporary differences and legislated changes to income tax rates to be in effect on January 1, 2011.
During 2008, we recorded a $108.6 million future income tax charge reflecting the net impact of the exempt income earned by our “flow through” entities and a significant change to our estimate of the expected temporary differences of our “flow through” entities on January 1, 2011. Currently, income earned by our “flow through” entities in respect of net profits royalty interests and interest on inter-entity debt between our operating entities and our Mutual Fund Trust is exempt from income taxes as income tax liability is transferred to our Unitholders with the payment of distributions.
At the end of 2008, we had a net future income tax provision on our balance sheet of $204.0 million comprised of a $372.6 million future liability provision for our Mutual Fund Trust and other “flow through” entities and an offsetting future income tax asset of $168.6 million for our corporate entities as compared to a net future income tax provision of $86.6 million comprised of a $270.5 million provision and a $183.9 million net asset at the end of the prior year.
29
At the end of 2008, we estimated our unclaimed capital expenditures to be:
| Tax Classification (in millions) | | Trust | | | Upstream | | | Downstream | | | Total | |
| | | | | | Operations | | | Operations | | | | |
| Canadian Oil & Gas Property Expenditures | $ | 514.9 | | $ | 377.9 | | $ | - | | $ | 892.8 | |
| Canadian Development & Exploration Expenditures | | - | | | 309.8 | | | - | | | 309.8 | |
| Unclaimed Capital Costs | | - | | | 465.0 | | | 380.0 | | | 845.0 | |
| Non-capital losses and other | | 28.9 | | | 778.4 | | | 272.4 | | | 1,079.7 | |
| Total | $ | 543.8 | | $ | 1,931.1 | | $ | 652.4 | | $ | 3,127.3 | |
Income Tax Reassessment
In January 2009, the Canada Revenue Agency (“CRA”) issued a Notice of Reassessment to Harvest Energy Trust in respect of its 2002 through 2004 taxation years claiming past taxes, interest and penalties totaling $6.2 million. The CRA has adjusted taxable income to include the net profits interest revenue to an accrual basis whereas our income tax filings have been prepared on a cash basis. Management and our legal advisors believe the reassessment by the CRA has not properly applied a provision of the Income Tax Act (Canada) that entitles income from a property to be included in taxable income in the year in which the payment is received. In addition to presenting the merit of our position to the CRA, we have filed a Notice of Objection with the CRA and expect that the matter will be referred to a judicial proceeding.
In 2005, the Harvest Energy Trust tax return was prepared on a cash basis with no taxes payable and if prepared on an accrual basis of reporting consistent with the 2002 through 2004 taxation years as reassessed by the CRA, there would be taxes owing of approximately $40 million. In 2006, the Harvest Energy Trust tax return was prepared using an accrual basis of reporting for the Net Profits Interest payments and included the incremental payments required to align the prior years’ cash basis of reporting with no taxes payable.
As both management and our legal advisors believe the Income Tax Act (Canada) entitles income from a property to be reported on a cash basis prior to 2007, we expect the outcome of the CRA reassessments will be resolved with no taxes paid for taxation years 2002 through 2006. Accordingly, the amount of this contingent liability has not been accrued for the year ended December 31, 2008.
Update on the Taxation of Royalty Trusts
Following the October 31, 2006 announcement to apply a tax to the distributions from certain publicly traded mutual fund trusts, the Government of Canada introduced Bill C-52 and Bill C-28 to implement the changes. On June 22, 2007, Bill C-52 was enacted which implemented the proposals to tax publicly traded mutual fund trusts and as a result, we recorded a $177.7 million future income tax net charge in our Second Quarter 2007 results reflecting the taxing of the temporary differences between the book value and the tax basis of our assets held by our Mutual Fund Trust and our other “flow through” entities. On December 14, 2007, Bill C-28 was enacted to implement reductions in the federal corporate income tax rates from 20.5% to 19.5% in 2008 with further reductions scheduled resulting in a 15% rate as of January 1, 2012 and we adjusted our future income tax provisions accordingly.
During 2008, the Government of Canada introduced legislation to adjust the deemed provincial tax rate component for the tax on distributions from publicly traded mutual fund trusts to reflect the provincial allocation of business activity as well as legislation to enable income trusts and royalty trusts to convert to publicly traded corporations without adverse Canadian income tax consequences and also accelerated the normal growth guideline contained in Bill C-52. However, neither of these proposed legislative changes became law due to federal elections and the proroguing of Parliament deferring the process.
We continue to review and evaluate the impact of the enacted changes as well as the proposed changes and while there has been no decision at this time, we are more likely to convert to a corporation while retaining the income tax advantages until 2011.
30
Contractual Obligations and Commitments
We have contractual obligations and commitments entered into in the normal course of operations including the purchase of assets and services, operating agreements, transportation commitments, sales commitments, royalty obligations, and land lease obligations. These obligations are of a recurring and consistent nature and impact cash flow in an ongoing manner. We also have contractual obligations and commitments that are of a less routine nature as disclosed in the following table:
| | | Maturity | |
| Annual Contractual Obligations(000s) | | Total | | | Less than 1 year | | | 1-3 years | | | 4-5 years | | | After 5 years | |
| Long-term debt(2) | $ | 1,530,728 | | $ | - | | $ | 1,530,728 | | $ | - | | $ | - | |
| Interest on long-term debt(4) | | 104,781 | | | 52,612 | | | 52,169 | | | - | | | - | |
| Interest on Convertible Debentures(3) | | 325,818 | | | 65,269 | | | 127,864 | | | 105,386 | | | 27,299 | |
| Operating and premise leases | | 24,348 | | | 7,868 | | | 13,074 | | | 2,840 | | | 566 | |
| Purchase commitments(5) | | 36,537 | | | 36,537 | | | - | | | - | | | - | |
| Asset retirement obligations(6) | | 1,203,785 | | | 14,214 | | | 30,790 | | | 26,958 | | | 1,131,823 | |
| Transportation(7) | | 6,679 | | | 2,744 | | | 3,202 | | | 733 | | | - | |
| Pension contributions(8) | | 43,526 | | | 6,900 | | | 14,217 | | | 14,791 | | | 7,618 | |
| Feedstock commitments | | 319,746 | | | 319,746 | | | - | | | - | | | - | |
| Total | $ | 3,595,948 | | $ | 505,890 | | $ | 1,772,044 | | $ | 150,708 | | $ | 1,167,306 | |
| (1) | As at December 31, 2008, we have entered into financial contracts for downstream production of refined products with average deliveries of approximately 20,000 bbl/d for the first half of 2009. |
| (2) | Assumes that the outstanding Convertible Debentures either convert at the holders’ option or are redeemed for Trust Units at our option. |
| (3) | Assumes no conversions and redemption by Harvest for Trust Units at the end of the second redemption period. At the Trust’s option the interest on Convertible Debentures can be settled in Trust Units. |
| (4) | Assumes constant foreign exchange rate. |
| (5) | Relates to drilling commitments, AFE commitments and downstream purchase commitments. |
| (6) | Represents the undiscounted obligation by period. |
| (7) | Relates to firm transportation commitment on the Nova pipeline. |
| (8) | Relates to the expected contributions for employee benefit plans. |
We have a number of operating leases for moveable field equipment, vehicles and office space and our commitments under those leases are noted in our annual contractual obligations table above. The leases require periodic lease payments and are recorded as either operating costs or G&A. We also finance our annual insurance premiums, whereby a portion of the annual premium is deferred and paid monthly over the balance of the term.
Off Balance Sheet Arrangements
As at December 31, 2008 and December 31, 2007, we have no off balance sheet arrangements in place.
Change In Accounting Policies
Effective January 1, 2008, we have adopted the requirements of the Canadian Institute of Chartered Accountants (“CICA”) Section 3862 Financial Instruments – Disclosures, Section 3863 Financial Instruments – Presentation, and Section 1535 Capital Disclosures. The additional disclosures required as a result of adopting these new standards can be found in the notes to our consolidated financial statements for the year ended December 31, 2008 filed on SEDAR atwww.sedar.com.
In June 2007, the CICA issued Section 3031 – Inventories, which replaces the existing standard for inventories. This standard provides additional disclosure requirements for inventories, and requires that inventories be valued at the lower of cost and net realizable value. The standard was effective for Harvest on January 1, 2008. Application of this standard did not have a material impact on our financial statements.
DISTRIBUTIONS TO UNITHOLDERS
We declare monthly distributions to Unitholders in light of our expectations of cash from operating activities and capital expenditure plans as well as debt repayment requirements. We typically declare monthly distributions for the quarter and with a longer term view of the commodity price environment, use our balance sheet to provide a stable stream of distributions from a business operating in a commodity price environment that may be volatile from time to time. Our distributions will generally exceed the net income reported in our financial statements as a result of significant non-cash charges recorded in our income statement which have no impact on cash from operating activities. Our net income will fluctuate significantly from our cash flow from operating activities.
31
The following table summarizes our cash from operating activities, net income (loss), distributions declared and proceeds from our distribution reinvestment programs as well as distributions as percentage of cash from operating activities for the past two years:
| | | Year Ended December 31 | |
| (000s except per trust unit amounts) | | 2008 | | | 2007 | | | Change | |
| Cash from Operating Activities | $ | 655,877 | | $ | 641,313 | | | 2% | |
| Net Income (Loss) | $ | 212,019 | | $ | (25,676 | ) | | 926% | |
| Distributions declared | $ | 551,325 | | $ | 610,280 | | | (10% | ) |
| Per trust unit | $ | 3.60 | | $ | 4.40 | | | (18% | ) |
| Distribution reinvestment proceeds | $ | 137,974 | | $ | 178,489 | | | (23% | ) |
| Distributions as a percentage of cash from operating activities | | 84% | | | 95% | | | (11% | ) |
In 2008, our distributions exceeded our net income by $339.3 million with non-cash charges of $519.8 million for depletion, depreciation, amortization and accretion (“DDA&A”), a $108.6 million charge in respect of future income tax expense and an $11.7 of unrealized currency exchange losses offset by $185.9 million of unrealized gains on price risk management contracts. Our provision of $519.8 million in respect of DDA&A is based primarily on a unit-of-production amortization of our historic costs of property, plant and equipment and does not accurately represent the fair value or replacement cost of the assets. During 2007, our distributions to Unitholders exceeded our loss by $636.0 million with non-cash charges of $526.7 million for depletion and depreciation, $147.8 million in respect of unrealized price risk management contracts and a $65.8 million of future income provision somewhat offset by $55.7 million of unrealized currency exchange gains. During 2008, distributions declared represented 84% of cash from operating activities as compared to 95% in the prior year, both of which are in excess of our 55% to 80% annual target.
As we declare distributions, management, together with the Board of Directors, assess the level of our monthly distributions in light of commodity price expectations, currency exchange rates, upstream production and downstream throughput projections, operating cost forecasts, debt leverage and spending plans. On November 12, 2008 with the WTI benchmark price trading at approximately US$60.00, we declared a $0.30 distribution for the next four months to be paid on December 15, 2008, January 15, 2009, February 17, 2009 and March 16, 2009. Subsequent to this declaration, the severity of the global economic slowdown and drop in commodity prices exceeded expectations and as a result, the distributions declared in the Fourth Quarter of 2008 represent approximately 141% of our cash from operating activities before adjustment for non-cash working capital and asset retirement expenditures. With capital spending of $107.3 million in the Fourth Quarter of 2008, we have relied on other sources to fund distributions and with expectations of approximately $120 million of capital spending in the First Quarter of 2009, we will likely be relying on other sources to fund a significant portion of our distributions in the First Quarter of 2009.
After having maintained a monthly distribution of at least $0.30 from February 2006 through March 2009, we have declared a $0.05 per Trust Unit distribution for Unitholders of record on March 23, 2009 and payable on April 15, 2009 due to the challenging economic conditions; low commodity prices, capital expenditures in the First Quarter of 2009 and balance sheet liquidity. This measure is part of a business strategy to direct substantially all of our future cash flow to a combination of capital expenditures to maintain our productive capacity and improve our liquidity by reducing bank borrowings. As a result of the ongoing turmoil in global credit markets, there is also a heightened need to focus on renewing/extending our Extendible Revolving Credit Facility maturing in April 2010 under which we are currently borrowing approximately $1,250 million. We expect that with a lower level of bank borrowing, the renewal/extension of our credit facility should be less strained. Currently, debt covenants in our credit facility agreement and 77/8Senior Note indenture that could limit our distributions are not expected to restrict distributions in the foreseeable future.
32
Premium Distribution, Distribution Reinvestment and Optional Trust Unit Purchase Plan
We have a Premium Distribution, Distribution Reinvestment and Optional Trust Unit Purchase Plan (the “DRIP”) that entitles eligible Unitholders to direct their distributions to the purchase of additional Trust Units at 95% of the average market price, as defined in the DRIP. Alternatively, eligible Unitholders may elect under the premium distribution plan to have their distributions invested in new Trust Units and exchanged through the DRIP broker for a premium distribution equal to 102% of the amount that the Unitholder would otherwise have received, subject to proration and withholding tax reductions in certain circumstances. Only Canadian resident Unitholders are eligible to participate in the premium distribution plan at this time.
During 2008, Unitholders elected to direct $138.0 million of distributions to either the distribution reinvestment plan or the premium distribution plan resulting in the issuance of 7,655,414 Trust Units as compared to $178.5 million and 6,809,987 Trust Units in the prior year. The optional trust unit purchase plan was not used in either 2008 or 2007.
LIQUIDITY AND CAPITAL RESOURCES
Harvest is an integrated energy trust with a declining asset base in our upstream operations and a “near perpetual” asset in our downstream operations. As well as future petroleum and natural gas prices, our upstream operations rely on the successful exploitation of our existing reserves, future development activities and strategic acquisitions to replace existing production and add additional reserves. With a prudent maintenance program, our downstream assets are expected to have a long life with additional growth in profitability available by upgrading the HSFO currently produced, enhancing our refining capability to handle a lower cost feedstock and/or expanding our refining throughput capacity. Future development activities and modest acquisitions in our upstream business as well as the maintenance program in our downstream business will likely be funded by our cash flow from operating activities while we will generally rely on funding more significant acquisitions and growth initiatives from some combination of cash flow from operating activities, issuances of Trust Units and incremental debt. To the extent that we finance acquisitions and growth initiatives from cash flow from operating activities, the amount of our distributions to Unitholders may be reduced. Should equity capital markets or incremental debt not be available to us, our ability to make the necessary expenditures to maintain or expand our assets may be impaired and result in reductions to future distributions paid to Unitholders. In our upstream business, it is not possible to distinguish between expenditures to maintain productive capacity and spending to increase productive capacity due to the numerous factors impacting reserve reporting and the natural decline in reservoirs and accordingly, maintenance capital is not disclosed separately.
During 2008, global economic conditions changed significantly from an expectation of strong economic growth in the first half of the year to a more broadly based credit crunch with a tightening of capital availability and higher borrowing costs during the second half of the year. As global economic conditions changed so did commodity prices with the NYMEX futures for WTI priced at US$100 per barrel in January, climbing to an all-time record of US$147 in July and then falling to approximately US$40 by the end of the year as significant economies fell into recession and the growth in developing economies slowed sharply. This has resulted in a significant reduction in the trading value of our Trust Units and has resulted in our access to capital markets becoming more difficult. These conditions have also significantly impacted our cash flow from operating activities as well as opportunities to improve our balance sheet leverage.
During 2008, cash flow from operating activities was $655.9 million including the $9.9 million increase in non-cash working capital. We declared distributions of $551.3 million ($413.3 million net of our distribution re-investment plans), required $327.5 million for capital expenditures and a further $128.8 million for our acquisition and disposition activity resulting in a net cash requirement of $213.7 million. At the end of 2008, our bank borrowings totaled $1,226.2 million, a reduction of $53.3 million over the prior year as the $239.5 million of net proceeds from the issuance of $250 million principal amount of 7.5% Convertible Unsecured Subordinated Debentures in April more than offset the net cash requirement from capital investing and distributions to Unitholders in excess of cash provided by operating activities.
33
For the year ended December 31, 2007, cash flow from operating activities was $641.3 million after providing $17.4 million for an increased investment in non-cash working capital with distributions to Unitholders of $610.3 million declared ($431.8 million net of Unitholder participation in our distribution re-investment plans) and $482.9 million of capital expenditures and acquisitions (net of divestitures) resulting in a net cash requirement of $273.4 million. With net proceeds of $576.0 million from the issuance of $230 million of principal amount of 7.25% Convertible Unsecured Subordinated Debentures and 13,449,250 Trust Units, drawing under our credit facilities were reduced by $302.6 million during 2007.
During the Fourth Quarter of 2008, cash flow from operating activities was $183.7 million, including an additional $89.0 million provided by a reduction in non-cash working capital. Cash flow from operating activities before changes in non-cash working capital totaled $94.8 million as compared to $71.4 million in the Fourth Quarter of 2007. After declaring distributions of $140.6 million (a $109.2 million cash requirement after Unitholder participation in our distribution reinvestment plans) and $107.3 million for capital expenditures, the net cash requirement of $32.8 million was funded by an increase in bank borrowings.
During 2008, the principal change in our capital structure was our issuance in April of $250 million principal amount of 7.5% Convertible Debentures Due 2015 with the net proceeds of $239.5 million. With lesser impact, we elected to settle the maturity of $24.3 million principal amount of 10.5% Convertible Debentures on January 31, 2008 with the issuance of 1,116,593 Trust Units rather than settling the obligation with cash and during 2008, we issued 7,655,414 Trust Units pursuant to Harvest’s Premium DistributionTM, Distribution Reinvestment and Optional Trust Unit Purchase Plan (the “DRIP Plans”) raising $138.0 million.
The following table summarizes our capital structure as at December 31, 2008 and 2007:
| | | As At December 31 | |
| (in millions) | | 2008 | | | 2007 | |
| DEBT | | | | | | |
| | | | | | | |
| Extendible Revolving Credit Facility | $ | 1,226.2 | | $ | 1,279.5 | |
| 7 7/8 % Senior Notes Due 2011 (US$250 million)(1) | | 304.5 | | | 247.8 | |
| Convertible Debentures, at principal amount(2) | | 916.7 | | | 691.2 | |
Total Debt |
|
2,447.4 |
|
|
2,218.5 |
|
Unitholders’ Equity,at book value less equity component of convertible debentures |
|
|
|
|
|
|
| 157,200,701 issued at December 31, 2008 | | 2,559.2 | | | | |
| 148,291,170 issued at December 31, 2007 | | | | | 2,445.8 | |
TOTAL CAPITALIZATION |
$ |
5,006.6 |
|
$ |
4,664.3 |
|
| (1) | Face value converted at the period end exchange rate. |
| (2) | See Note 12 of the Consolidated Financial Statements for the years ended December 31, 2008 and 2007 filed on SEDAR atwww.sedar.com. |
At the end of 2008, we had $373.8 million of unutilized borrowing capacity under our $1.6 billion Extendible Revolving Credit Facility. This syndicated covenant-based secured facility matures in April 2010 unless extended, which would require each lender to consent with respect to their individual commitments. In light of the credit crunch, we deferred requesting an extension in 2008 as some lenders may have chosen to not extend and extending lenders would have likely required increased fees and credit spreads, as well as a reduced level of commitment. At December 31, 2008, our secured debt to annualized EBITDA was 1.5 to 1.0, total debt (excluding convertible debentures) to annualized EBITDA was 1.8 to 1.0, while the secured debt to total capitalization was 25% and total debt (excluding convertible debentures) to total capitalization was 31%. For a complete description of our covenant-based credit agreement, see Note 10 to our audited consolidated financial statements for the year ended December 31, 2008 and our credit agreement filed on SEDAR atwww.sedar.com.
34
Our cash flow risk management program includes our entering into numerous pricing contracts. We have limited our counterparties to the lenders in our Extendible Revolving Credit Facility as the security provided in our credit agreement extends to our pricing contracts and this eliminates the requirement for margin calls and the pledging of collateral as well as limits the negotiation of events of default, all of which contribute to ensuring that these contracts improve our liquidity rather than exacerbate credit concerns.
In October 2004, Harvest Operations Corp., a wholly-owned subsidiary of Harvest, issued US$250 million of principal amount 77/8% Senior Notes and they remain outstanding at December 31, 2008. These 77/8% Senior Notes are unsecured, require semi-annual payments of interest and mature on October 15, 2011. The most restrictive covenant of the 77/8% Senior Notes limits the incurrence of additional indebtedness if such issuance would result in an interest coverage ratio, as defined, of less than 2.5 to 1.0 and in respect of the incurrence of secured indebtedness, limits the amount to less than 65% of the present value of future net revenues from our proved petroleum and natural gas reserves discounted at an annual rate of 10%. At the end 2008, 65% of the present value of the future net revenues from our proved petroleum and natural gas reserves discounted at an annual rate of 10% is approximately $1.9 billion.
Our 77/8% Senior Notes are rated by both Standard and Poor’s Ratings Services (“S&P”) and Moody’s Investors Service (‘Moody’s”) who have assigned a corporate rating of “B” and “B3”, respectively, and have rated the 77/8% Senior Notes as “CCC+” and “Caa1”, respectively. These ratings reflect Harvest’s relatively high financial leverage and inability to fund meaningful growth (or debt reduction) from internal cash flows while maintaining a significant level of distributions to Unitholders. Recently, S&P have revised its ratings outlook from stable to negative reflecting an expectation of lower upstream production and weakened financial metrics as a result of low hydrocarbon prices. In 2007, Moody’s had also cautioned that their stable outlook assumes that commodity prices and refining margins remain supportive and that the leverage is reduced before market conditions soften.
At the end of 2008, we had $916.7 million of principal amount of Convertible Debentures issued in seven series with $39.6 million of principal amount due prior to the end of 2011 and $877.1 million of principal amount due beyond 2011. As the conversion price of the outstanding Convertible Debentures ranges from $13.85 to $46.00, we do not expect a significant amount of conversion activity until the trading value of our Trust Units appreciates from its current trading range. The most restrictive term of the Convertible Debentures limits the issuance of additional Convertible Debentures if the principal amount of all issued and outstanding Convertible Debentures immediately after the issuance exceed 25% of the total market capitalization, being an aggregate of the principal amount of all issued and outstanding Convertible Debentures plus an amount equal to the current market price of all of the issued and outstanding Trust Units. At December 31, 2008, our total market capitalization was approximately $2.6 billion which would limit the issuance of any further Convertible Debentures.
35
During 2008, the trading value of our Trust Units ranged from a high of $26.00 in February to a low of $8.33 in October. During October, the volume of units traded and drop in trading price is generally attributed to the precipitous drop in crude oil and natural gas prices to a level that will likely result in abnormally low cash flows and the deterioration of business fundamentals beyond the normal cyclical fluctuations. The following summarizes the trading value of our Trust Units during 2008 and the first two months of 2009:
| | | Trading Price | | | | |
| Month | | High | | | Low | | | Volume | |
| Canadian Trading | | | | | | | | | |
| January 2008 | $ | 23.56 | | $ | 20.48 | | | 10,474,631 | |
| February 2008 | $ | 26.00 | | $ | 22.49 | | | 8,552,342 | |
| March 2008 | $ | 24.13 | | $ | 22.00 | | | 9,638,750 | |
| April 2008 | $ | 24.94 | | $ | 22.23 | | | 11,965,637 | |
| May 2008 | $ | 25.67 | | $ | 22.15 | | | 14,019,461 | |
| June 2008 | $ | 25.77 | | $ | 23.32 | | | 9,263,955 | |
| July 2008 | $ | 24.60 | | $ | 19.32 | | | 10,210,064 | |
| August 2008 | $ | 21.75 | | $ | 18.90 | | | 12,078,183 | |
| September 2008 | $ | 21.12 | | $ | 15.89 | | | 9,834,707 | |
| October 2008 | $ | 17.69 | | $ | 8.33 | | | 26,521,040 | |
| November 2008 | $ | 14.09 | | $ | 10.65 | | | 14,381,812 | |
| December 2008 | $ | 12.68 | | $ | 9.42 | | | 11,179,958 | |
| January 2009 | $ | 11.91 | | $ | 10.36 | | | 10,266,136 | |
| February 2009 | $ | 10.57 | | $ | 5.87 | | | 13,739,710 | |
| U.S. Trading (in US$) | | | | | | | | | |
| January 2008 | $ | 23.24 | | $ | 20.00 | | | 18,167,009 | |
| February 2008 | $ | 25.70 | | $ | 22.51 | | | 15,108,961 | |
| March 2008 | $ | 24.49 | | $ | 21.44 | | | 17,099,323 | |
| April 2008 | $ | 24.82 | | $ | 22.06 | | | 20,845,245 | |
| May 2008 | $ | 26.08 | | $ | 21.75 | | | 24,871,749 | |
| June 2008 | $ | 25.28 | | $ | 23.05 | | | 16,892,369 | |
| July 2008 | $ | 24.30 | | $ | 18.80 | | | 23,625,243 | |
| August 2008 | $ | 20.55 | | $ | 17.73 | | | 17,597,112 | |
| September 2008 | $ | 20.01 | | $ | 15.17 | | | 24,126,064 | |
| October 2008 | $ | 16.69 | | $ | 7.00 | | | 65,647,621 | |
| November 2008 | $ | 11.55 | | $ | 8.60 | | | 37,694,288 | |
| December 2008 | $ | 10.17 | | $ | 7.26 | | | 31,705,600 | |
| January 2009 | $ | 10.10 | | $ | 8.25 | | | 25,461,464 | |
| February 2009 | $ | 8.55 | | $ | 4.69 | | | 36,881,966 | |
We are authorized to issue an unlimited number of Trust Units and at the end of 2008, approximately 71% of our Unitholders were non-residents of Canada which is relatively unchanged from 66% at the end of 2007. As of February 28, 2009, we had 159,240,909 Trust Units outstanding, 7,995,016 of Unit Appreciation Rights granted (of which 2,032,922 were vested) and 649,357 awards issued under the Unit Awards Incentive Plan (of which 273,771 were vested).
On October 20, 2008, we announced that the Toronto Stock Exchange had accepted our intention to commence a Normal Course Issuer Bid to purchase for cancellation at prevailing market prices up to 14,826,261 Trust Units as well as up to $91.4 million principal amount of Convertible Debentures. To date, we have not purchased any securities pursuant to this Normal Course Issuer Bid.
We have entered into a Supply and Offtake Agreement with Vitol, an international crude oil trader, that initially required the ownership of the crude oil feedstock and substantially all of the refined product inventory at the refinery be retained by Vitol and granted Vitol the right and obligation to provide and deliver crude oil feedstock to the refinery as well as the right and obligation to purchase substantially all refined products produced by the refinery. This arrangement provides Harvest with financial support for its crude oil purchase commitments as well as working capital financing for its inventories of crude oil and substantially all refined products held for sale. For a more complete description of this Supply and Offtake Agreement, see the description of the Supply and Offtake Agreement in our Annual Information Form for the year ended December 31, 2007 filed on SEDAR atwww.sedar.com. Currently, the Supply and Offtake Agreement may be terminated by either Vitol or Harvest with six months prior notice. Pursuant to the Supply and Offtake Agreement, we estimate that Vitol held inventories of VGO, crude oil feedstock (both delivered and in-transit) valued at approximately $319.7 million at the end of 2008 which would have otherwise have been assets of Harvest as compared to $843.6 million at the end of 2007.
36
As provided for in the Supply and Offtake Agreement and effective January 20, 2008, we entered into an independent fuel oil offtake arrangement with a wholly-owned affiliate of one of the world’s largest integrated energy companies for the sale of all of our HSFO production for a period of one year with a one year renewal option requiring mutual consent. This arrangement required that we provide financing for our inventories of HSFO which at December 31, 2008 totaled $6.7 million.
Through a combination of cash from operating activities, available undrawn credit capacity and the working capital provided by the Supply and Offtake Agreement with Vitol, it is anticipated that we will have enough liquidity to fund future operations and forecasted capital expenditures although cash from operating activities used to fund ongoing operations may reduce the amount of future distributions paid to Unitholders.
37
SUMMARY OF FOURTH QUARTER RESULTS
| | | | | | Three months ended December 31 | |
| | | | | | 2008 | | | 2007 | | | | |
| | | | | | Upstream | | | Downstream | | | Total | | | Upstream | | | Downstream | | | Total | | | Change | |
| | | | | | | | | | | | | | | | | | | | | | | | | |
| Revenues | | | 238,550 | | | 690,152 | | | 928,702 | | | 308,022 | | | 624,512 | | | 932,534 | | | 0% | |
| Royalties | | | (35,963 | ) | | - | | | (35,963 | ) | | (53,410 | ) | | - | | | (53,410 | ) | | (33% | ) |
| Net revenues | | | 202,587 | | | 690,152 | | | 892,739 | | | 254,612 | | | 624,512 | | | 879,124 | | | 2% | |
Less: |
|
|
|
|
|
|
|
|
|
|
|
|
|
|
|
|
|
|
|
|
|
|
| Purchased product for resale and processing | | | - | | | 629,994 | | | 629,994 | | | - | | | 579,766 | | | 579,766 | | | 9% | |
| Operating expenses | | | 82,161 | | | 53,395 | | | 135,556 | | | 76,100 | | | 81,271 | | | 157,371 | | | (14% | ) |
| Transportation and marketing | | | 3,258 | | | (5,805 | ) | | (2,547 | ) | | 2,347 | | | 7,895 | | | 10,242 | | | (125% | ) |
| Cash G&A | | | 8,299 | | | 440 | | | 8,739 | | | 7,844 | | | 441 | | | 8,285 | | | 5% | |
| Unit based compensation expense | | | (2,197 | ) | | (79 | ) | | (2,276 | ) | | (3,553 | ) | | 48 | | | (3,505 | ) | | (35% | ) |
| Total G&A | | | 6,102 | | | 361 | | | 6,463 | | | 4,291 | | | 489 | | | 4,780 | | | 35% | |
| Depreciation, depletion and accretion | | | 119,339 | | | 20,638 | | | 139,977 | | | 115,176 | | | 17,746 | | | 132,922 | | | 5% | |
| Net income per segment | | | (8,273 | ) | | (8,431 | ) | | (16,704 | ) | | 56,698 | | | (62,654 | ) | | (5,957 | ) | | 180% | |
Realized gains (losses) on risk management |
|
|
|
|
|
|
|
|
24,434 |
|
|
|
|
|
|
|
|
(17,375 |
) |
|
(241% |
) |
| contracts | | | | | | | | | | | | | | | | | | | | | | |
| Unrealized gains (losses) on risk management | | | | | | | | | 192,252 | | | | | | | | | (122,739 | ) | | (257% | ) |
| contracts | | | | | | | | | | | | | | | | | | | | | | |
| Interest and other financing charges | | | | | | | | | (37,324 | ) | | | | | | | | (36,959 | ) | | 1% | |
| Currency exchange (loss) gain | | | | | | | | | (8,510 | ) | | | | | | | | 10,856 | | | (178% | ) |
| Large corporation tax and other tax | | | | | | | | | 552 | | | | | | | | | 1,059 | | | (48% | ) |
| Future income tax (expense) recovery | | | | | | | | | (76,060 | ) | | | | | | | | 57,530 | | | (232% | ) |
| Net income (loss) | | | | | | | | | 78,640 | | | | | | | | | (113,585 | ) | | (169% | ) |
| Per Trust Unit, basic | | | | | | | | | 0.50 | | | | | | | | | (0.77 | ) | | (165% | ) |
| Per Trust Unit, diluted | | | | | | | | | 0.50 | | | | | | | | | (0.77 | ) | | (165% | ) |
Cash From Operating Activities |
|
|
|
|
|
|
|
|
183,740 |
|
|
|
|
|
|
|
|
87,998 |
|
|
109% |
|
| Per Trust Unit, basic | | | | | | | | | 1.18 | | | | | | | | | 0.60 | | | 97% | |
| Per Trust Unit, diluted | | | | | | | | | 1.10 | | | | | | | | | 0.60 | | | 83% | |
Distributions declared |
|
|
|
|
|
|
|
|
140,646 |
|
|
|
|
|
|
|
|
144,681 |
|
|
(3% |
) |
| Distributions declared, per Trust Unit | | | | | | | | | 0.90 | | | | | | | | | 0.98 | | | (8% | ) |
| Distributions declared as a percentage of Cash From | | | | | | 77% | | | | | | | | | 164% | | | (87% | ) |
| Operations | | | | | | | | | | | | | | | | | | | | | | |
UPSTREAM OPERATIONS |
|
|
|
|
|
|
|
|
|
|
|
|
|
|
|
|
|
|
|
|
|
|
| Daily Production | | | | | | | | | | | | | | | | | | | | | | |
| Light / medium oil (bbl/d) | | | | | | | | | 25,088 | | | | | | | | | 26,640 | | | (6% | ) |
| Heavy oil (bbl/d) | | | | | | | | | 11,306 | | | | | | | | | 13,354 | | | (15% | ) |
| Natural gas liquids (bbl/d) | | | | | | | | | 2,770 | | | | | | | | | 2,595 | | | 7% | |
| Natural gas (mcf/d) | | | | | | | | | 96,079 | | | | | | | | | 94,961 | | | 1% | |
| Total daily sales volume (boe/d) | | | | | | | | | 55,177 | | | | | | | | | 58,416 | | | (6% | ) |
Operating Netback(1)($/BOE) |
|
|
|
|
|
|
|
|
|
|
|
|
|
|
|
|
|
|
|
|
|
|
| Revenue | | | | | | | | | 46.99 | | | | | | | | | 57.32 | | | (18% | ) |
| Royalties | | | | | | | | | (7.08 | ) | | | | | | | | (9.94 | ) | | (29% | ) |
| Operating expense | | | | | | | | | (16.19 | ) | | | | | | | | (14.16 | ) | | 14% | |
| Transportation expense | | | | | | | | | (0.64 | ) | | | | | | | | (0.44 | ) | | 45% | |
| Operating Netback(1) | | | | | | | | | 23.08 | | | | | | | | | 32.78 | | | (30% | ) |
Cash capital expenditures |
|
|
|
|
|
|
|
|
82,975 |
|
|
|
|
|
|
|
|
30,643 |
|
|
171% |
|
DOWNSTREAM OPERATIONS |
|
|
|
|
|
|
|
|
|
|
|
|
|
|
|
|
|
|
|
|
|
|
| Average daily throughput (bbl/d) | | | | | | | | | 102,500 | | | | | | | | | 61,717 | | | 66% | |
| Aggregate throughput (mbbl) | | | | | | | | | 9,430 | | | | | | | | | 5,678 | | | 66% | |
| Average Refining Margin (US$/bbl) | | | | | | | | | 3.93 | | | | | | | | | 6.00 | | | (35% | ) |
| Cash capital expenditures | | | | | | | | | 24,317 | | | | | | | | | 16,889 | | | 44% | |
| (1)This is a non-GAAP measure, please refer to “Non-GAAP Measure” in this MD&A. | | | | | | | | | | | | | |
During the Fourth Quarter of 2008, cash from operating activities totaled $183.7 million, a $95.7 million increase as compared to $88.0 million in the prior year. The increase is primarily due to an $89.0 million reduction in working capital as compared to a $16.6 million reduction in the prior year and $24.4 million in realized gains on risk management contracts as compared to realized losses of $17.4 million in the prior year. Cash generated from our upstream operations of $108.9 million, reflects a decrease of $59.3 million as compared to $168.2 million in the prior year, primarily due to a 30% decrease in operating netbacks and a 6% decrease in production volumes. Cash generated from our downstream operations increased to $10.6 million during the Fourth Quarter of 2008, as compared to a $44.9 million cash deficiency in the prior year, reflecting the impact of the planned turnarounds in 2007, partially offset by lower refining margins in the current period.
38
Upstream Operations
Our 2008 Fourth Quarter revenues decreased $69.5 million compared to the prior year as a result of our realized commodity prices decreasing by $10.33/boe (18%) due to lower crude oil prices and a decrease in production volumes of 3,239 boe/d as compared to the prior period due to normal decline and a reduction in 2008 capital spending. Light/medium oil sales revenue for the three month period ended December 31, 2008 was $53.3 million (31%) lower than in same period in the prior year due to an unfavourable price variance of $43.2 million and an unfavourable volume variance of $10.1 million. Heavy oil revenues for the three months ended December 31, 2008 decreased by $15.9 million (26%) due to an unfavourable price variance of $6.7 million and an unfavourable volume variance of $9.2 million. Natural gas sales revenue increased by $5.3 million (9%) for the three months ended December 31, 2008 over the same period in 2007, which reflects a favourable price variance of $4.6 million and a favourable volume variance of $0.7 million.
For the three months ended December 31, 2008, our net royalties as a percentage of revenue were 15.1% ($36.0 million) as compared to 17.3% ($53.4 million) in the same period in 2007. Our royalty rate for the Fourth Quarter of 2008 was lower than in the same period in 2007, due to favourable one-time credits received during the period.
Operating expenses increased by $6.1 million (8%) for the three months ended December 31, 2008 as compared to the same period in the prior year, which reflects a $5.7 million increase in power and fuel costs, comprised primarily of electric power costs. The average Alberta electric power price of $95.17/MWh in the Fourth Quarter of 2008 was 54% higher than the average price of $61.76/MWh in the same period in 2007.
Transportation and marketing expense increased by $0.9 million to $3.3 million for the three months ended December 31, 2008, due to increased clean oil trucking costs associated with the two acquisitions completed in the Third Quarter of 2008.
For the three months ended December 31, 2008, cash G&A increased by $0.5 million (6%) compared to the same period in the prior year reflecting increased costs to retain technically qualified staff in the western Canadian petroleum and natural gas industry.
Capital spending in the Fourth Quarter of 2008 increased by $52.3 million to $83.0 million as compared to the prior year. The increase in spending is primarily due to increased drilling activity as we drilled 82 wells (48.0 net) in the Fourth Quarter of 2008 as compared to drilling 21 wells (10.0 net) in the Fourth Quarter of 2007.
Downstream Operations
Our 2008 Fourth Quarter gross margin increased by $15.4 million to $60.2 million as compared to $44.8 million in the same period in the prior year, reflecting increased throughput offset by lower refining margins. In the Fourth Quarter of 2008, refinery throughput averaged 102,500 bbl/d compared to 61,717 bbl/d in the prior year reflecting the impact of planned turnarounds in 2007. However, throughput was below the refinery’s nameplate capacity of 115,000 bbls/d in the Fourth Quarter of 2008 due to our managing the fouling in heat exchangers, including an online partial exchanger cleaning in December. While throughput increased, our 2008 Fourth Quarter average refining margin decreased by US$2.07/bbl to US$3.93/bbl from US$6.00/bbl in the Fourth Quarter of 2007 reflecting negative gasoline crack spreads in the Fourth Quarter of 2008 and a $35.3 million write-down on inventories, which were partially offset by increased discounts relative to the WTI benchmark on our feedstock costs.
39
The cost of feedstock was US$48.34/bbl in the Fourth Quarter, a decrease of US$43.76/bbl compared to the prior year due to the significant quarter over quarter decrease in WTI.
Operating costs averaged $2.00/bbl of throughput for the Fourth Quarter of 2008 as compared to $3.61/bbl in the same period in the prior year. The decrease is due to turnaround activity in the prior year reducing throughput.
Capital spending increased by $7.4 million to $24.3 million in the Fourth Quarter of 2008 as compared the prior year due to spending $13.7 million to complete of our visbreaker project in November 2008.
Corporate
Interest expense increased by $0.4 million for the three months ended December 31, 2008 relative to the same period in the prior year. The increase is attributed to a $5.6 million increase in interest expense on our Convertible Debentures, with the issuance of $250 million of principle amount of 7.5% Convertible Debentures in April; a $1.2 million increase in interest expense on our U.S. dollar Senior notes, due to the strengthening of the U.S. dollar; offset by a $6.4 million decrease in interest expense on our bank borrowings, due to lower interest rates.
In the Fourth Quarter of 2008, we realized a $24.4 million gain and a $192.3 million unrealized gain on our risk management contracts as compared to a realized loss of $17.4 million and a $122.7 million unrealized loss in the same period in 2007. The realized and unrealized gains in the Fourth Quarter of 2008 is due the significant decrease in commodity prices in the period.
In the Fourth Quarter of 2008, we realized an $11.8 million loss on currency exchange transactions and an unrealized $3.3 million gain on currency translation, as compared to a $4.7 million realized gain and a $6.2 million unrealized gain in the same period in 2007. The realized losses in the Fourth Quarter of 2008 are primarily the result of our downstream operations settling trade payables as the Canadian dollar weakened, which accounted for $8.1 million of the total $11.8 million realized loss. The unrealized gain in the Fourth Quarter of 2008 relates to an increase in the net assets of our downstream operation on translation to Canadian dollars, offset by an increase in the value of our U.S. dollar denominated Senior Notes.
SUMMARY OF QUARTERLY RESULTS
The following table and discussion highlights our Fourth Quarter of 2008 relative to the preceding seven quarters:
| | | 2008 | | | 2007 | |
| (000s except where noted) | | Q4 | | | Q3 | | | Q2 | | | Q1 | | | Q4 | | | Q3 | | | Q2 | | | Q1 | |
| Revenue, net of royalties | $ | 892,739 | | $ | 1,597,195 | | $ | 1,622,079 | | $ | 1,377,352 | | $ | 879,124 | | $ | 1,031,514 | | $ | 1,133,450 | | $ | 1,025,512 | |
Net income (loss) |
$ |
78,640 |
|
$ |
295,788 |
|
$ |
(162,063 |
) |
$ |
(346 |
) |
$ |
(113,585 |
) |
$ |
11,811 |
|
$ |
6,248 |
|
$ |
69,850 |
|
| Per Trust Unit, basic(1) | $ | 0.50 | | $ | 1.93 | | $ | (1.07 | ) | $ | - | | $ | (0.77 | ) | $ | 0.08 | | $ | 0.05 | | $ | 0.55 | |
| Per Trust Unit, diluted(1) | $ | 0.50 | | $ | 1.73 | | $ | (1.07 | ) | $ | - | | $ | (0.77 | ) | $ | 0.08 | | $ | 0.05 | | $ | 0.55 | |
Cash from operating |
|
|
|
|
|
|
|
|
|
|
|
|
|
|
|
|
|
|
|
|
|
|
|
|
| activities | $ | 183,740 | | $ | 133,493 | | $ | 210,534 | | $ | 128,119 | | $ | 87,998 | | $ | 191,049 | | $ | 251,218 | | $ | 111,048 | |
| Per Trust Unit, basic | $ | 1.18 | | $ | 0.87 | | $ | 1.39 | | $ | 0.85 | | $ | 0.60 | | $ | 1.31 | | $ | 1.88 | | $ | 0.87 | |
| Per Trust Unit, diluted | $ | 1.10 | | $ | 0.84 | | $ | 0.83 | | $ | 0.83 | | $ | 0.60 | | $ | 1.22 | | $ | 1.67 | | $ | 0.84 | |
Distributions per Unit, declared |
$ |
0.90 |
|
$ |
0.90 |
|
$ |
0.90 |
|
$ |
0.90 |
|
$ |
0.98 |
|
$ |
1.14 |
|
$ |
1.14 |
|
$ |
1.14 |
|
Total long-term financial debt |
$ |
2,352,196 |
|
$ |
2,284,664 |
|
$ |
2,105,998 |
|
$ |
2,209,451 |
|
$ |
2,172,417 |
|
$ |
2,097,187 |
|
$ |
1,987,352 |
|
$ |
2,436,018 |
|
| Total assets | $ | 5,745,407 | | $ | 5,659,227 | | $ | 5,637,879 | | $ | 5,574,528 | | $ | 5,451,683 | | $ | 5,585,651 | | $ | 5,613,333 | | $ | 5,800,346 | |
| (1) | The sum of the interim periods does not equal the total per year amount as there were large fluctuations in the weighted average number of Trust Units outstanding in each individual quarter. |
Net revenues are comprised of revenues net of royalties from our upstream operations as well as sales of refined products from our downstream operations. Revenues throughout 2007 remained relatively stable until the Fourth Quarter of 2007 when the refinery throughput decreased due to a planned shutdown for more than half the quarter. Throughout the first three quarters of 2008, net revenues have been the highest in Harvest’s history due to strong commodity prices; however the significant decrease in commodity prices in the Fourth Quarter of 2008 resulted in a significant decrease in net revenues.
40
The growth in cash from operating activities is closely aligned with the trend in commodity prices for our upstream operations, reflects the cyclical nature of the downstream segment, and is significantly impacted by changes in working capital. In the Fourth Quarter of 2008, cash from operating activities has increased from the previous quarter reflecting decreased working capital requirements in our downstream business, partially offset by a $37.30/boe decrease in our upstream operating netback and a $6.54/bbl decrease in refining margins, both due to the decrease in the demand for commodities as the economy slowed.
Net income reflects both cash and non-cash items. Changes in non-cash items, including future income tax, DDA&A expense, unrealized foreign exchange gains and losses, unrealized gains on risk management contracts and Trust Unit right compensation expense cause net income to vary significantly from period to period. In the Second Quarter of 2007 Bill C-52 was enacted, which imposed a new tax on distributions from publicly traded income trusts resulting in a $177.7 million future income tax expense in the quarter. In the Fourth Quarter of 2007 Bill C-28 implemented reductions in the federal corporate income tax rates which will also apply to the tax on distributions from publicly traded mutual fund trusts, resulting in a $57.5 million future income tax recovery in the quarter. In the First Quarter of 2008, future income tax recovery of $21.8 million was recorded as a result of the reversal of temporary timing differences between depreciation recorded over the amount of tax pool claims; an additional recovery of $95.2 million was recorded in the Second Quarter of 2008; an expense of $149.5 million was recorded in the Third Quarter of 2008; and an expense of $76.1 million was recorded in the Fourth Quarter. Changes in the fair value of our risk management contracts have also contributed to the volatility in net income (loss) over the preceding eight quarters. For these reasons, our net income (loss) does not reflect the same trends as net revenues or cash from operating activities, nor is it expected to.
Total assets over the last eight quarters have remained relatively stable. The stability reflects moderate acquisition activity offset by a reduction in net book value associated with depletion and depreciation charges. Total long term financial liabilities have also remained relatively stable over the last eight quarters, reflecting moderate acquisition activity, offset by the issuance of Trust Units in the First and Second Quarters of 2007, and a net cash surplus of cash from operating activities over distributions to Unitholders.
OUTLOOK
We anticipate that 2009 will be a challenging year with the global economic slowdown and financial crisis continuing to limit liquidity in the financial markets and causing reduction in demand for commodities including gasoline and distillate products in North America and Europe. These factors will impact our performance and we have taken action to minimize the impact with sizable reductions to our capital spending plans and a “belt tightening” of expenses. In light of reduced availability of liquidity/credit and significantly reduced cash flow with lower commodity prices, we intend to be responsible and disciplined in our approach to capital expenditures to maintain our productive capacity and reduce debt.
For our upstream operations, our original capital spending plan approved spending of $250 million including the Enhanced Oil Recovery (���EOR”) projects identified in late 2007 focusing on reservoir management. In early 2009, we revised our upstream spending plan to $170 million including $110 million in the First Quarter of the year. We are continuing most of the drilling program scheduled for the First Quarter as a large percentage of the program is at Hay River where the projects remain attractive at current prices and the area is only accessible in the winter months. There are a few wells planned for southeast Saskatchewan and Cheddarville for the First Quarter of 2009 that will proceed while substantially all other drilling activity planned has been curtailed. As commodity prices continued to weaken in late 2008 and early 2009, we have re-focused our spending on projects that remain economically viable with a shift to light to medium oil prospects.
During the last three quarters of 2009, our drilling commitments will continue to be subjected to a rigorous evaluation reflecting the current commodity price outlook as well as considering the impact of costs which are expected to soften following spring break-up. However, spending on our EOR projects will continue in our larger oil reservoirs at Hay River, Bellshill Lake, Wainwright and Suffield with planned spending of $20 million. We expect our EOR projects to reduce decline rates for an extended period with improved recoveries due to maintaining reservoir pressures and the bolstering of traditional water flood projects with the introduction of chemical enhancements, such as alkaline surfactant polymers. Our continued focus on reservoir management and reduced drilling activity will likely result in a relatively stable production profile throughout 2009 with the front-end loaded Hay River production providing a “step change” to our Second Quarter production as compared to the Fourth Quarter of 2008.
41
We anticipate that our upstream production will average approximately 35,000 bbls/d of liquids and 90,000 mcf/d of natural gas (approximately 50,000 boe/d), with a strong Second Quarter reflecting the drilling results from Hay River. Light and medium gravity oil, including natural gas liquids, is expected to represent approximately 53% of our total production in 2009 with heavy oil and natural gas accounting for 19% and 28%, respectively. We will continue to focus on operating costs and G&A costs and pursue opportunities to reduce costs given the less active investment environment. For 2009, we are projecting our operating costs to be approximately $15.50 per boe as compared to $14.70 per boe in 2008, an increase of $0.80 per boe primarily due to reduced production volumes. We anticipate general and administrative costs to be approximately $1.50 per boe.
In our downstream operations, our capital spending will be directed to maintenance activities and incremental discretionary investments to improve reliability, increase throughput, enhance margins and reduce operating costs. While initial spending plans totaled $62 million, our revised plan of $50 million for 2009 includes predominately turnaround and reliability projects. We are now anticipating a 35-day shutdown of the hydrocracker unit for refurbishing and catalyst replacement during April, including a 21-day shutdown of the entire refinery, at a planned cost of $45 million with the expected benefit of improved distillate yields and a 1,000 bbls/d increase to the hydrocracker unit capacity. As a result of reduced cash flow, we will continue to evaluate discretionary investments at a measured pace such that we will be positioned to advance these enhancement projects quickly when the commodity price environment and credit/capital markets improve. The $2 billion refinery expansion project discussed in 2008, while still an attractive growth initiative in the appropriate economic climate, has been deferred with no further capital committed.
For 2009, we anticipate that the refinery’s daily throughput will average approximately 106,000 bbl/d of feedstock with a refined product yield of 45% distillates, 29% gasoline and 26% HSFO reflecting an increased yield of distillates of approximately 1,500 bbl/d with the completion of the visbreaker expansion project in the Fourth Quarter of 2008. Similar to the Fourth Quarter of 2008, during the First Quarter of 2009 our crude oil and hydrocracker rates will continue to be limited by fouled exchangers and end of life catalyst, and both of these issues will be addressed during the planned April shutdowns. We expect that operating costs and purchased energy costs will aggregate to $5.75 per bbl of throughput with a currency exchange rate of US$0.80 per Canadian dollar. The cash flow contribution from our marketing activities in the Province of Newfoundland and Labrador is expected to add approximately $24 million of incremental cash flow to the downstream operations.
As discussed in the Cash Flow Risk Management section of this MD&A, we have entered into refined product pricing contracts that represent approximately 68% of our WTI price exposure and 18% of our refined product crack spread exposure during the first half of 2008. The heating oil price contracts provides downside protection on the price of 12,000 bbl/d to market prices plus US$13.93 per bbl when prices are lower than US$72.59 and provides a price of US$86.52 when the market price is between US$72.59 and US$86.52 with our upside participation limited to US$98.73 per bbl. Similarly, on the price of 8,000 bbl/d of fuel oil, we have price protection equivalent to market prices plus US$7.63 per bbl when prices are lower than US$49.75 and provide a price of US$57.38 when the market price is between US$49.75 and US$57.38 with our upside participation limited to US$65.89 per bbl. Beyond June 30, 2009, we have no price risk management contracts in place.
We manage our exposure to fluctuations in interest rates by maintaining a mix of short and longer term financing with the short term financing typically carrying floating interest rates and longer term financing (our 77/8% Senior Notes and Convertible Debentures) carrying fixed rates of interest. Our Extendible Revolving Credit Facility, which had a balance of $1,226.2 million at December 31, 2008, requires interest payments based on floating rates and accordingly, approximately 50% of our interest rate exposure is floating. Currently, our most significant exposure to increasing interest rates is through the renewal/extension of our credit facilities or the issuance of additional longer term financings as the credit spreads have increased substantially since our most recent renewal or issuance.
42
Our most pressing financial issues are the renewal of our credit facility with a syndicate of fourteen banks, including Canada’s six largest chartered banks, followed by the maturity of the 77/8% Senior Notes on October 15, 2011. Currently, we have $373.8 million of undrawn capacity and in the First Quarter of 2009, the drawn portion is likely to increase by approximately $150 million. We anticipate that in light of the tightened credit markets, the significant slowdown in the global economy and current commodity prices, the renewal of our credit facility may result in more onerous terms. Although lenders are currently committed to our existing credit facility until its maturity, we will likely renew credit commitments with many of our lenders in advance of the maturity date to extend the term of our available credit beyond April 2010 which may result in an increase in the credit spreads on our borrowings as well as a commitment fee. With respect to the maturity of the 77/8% Senior Notes in 2011, we intend to create capacity in our credit facilities to enable the repayment of this obligation should alternative sources of debt and/or equity be unavailable.
At the beginning of 2009, we have $916.7 million principle amount of Convertible Debentures issued in seven series with a weighted average interest rate of approximately 7.1% . The terms of our Convertible Debentures require semi-annual payments of interest which may be settled with the issuance of Trust Units at a price equal to 95% of the weighted average trading price for the preceding 20 consecutive trading days 5 days prior to the settlement date. In addition, we may elect to satisfy the maturity of these obligations by issuing Trust Units rather than settling the obligations in cash based on the same equivalent price as the settlement of interest obligations. We anticipate that as these Convertible Debentures mature, or are converted into Trust Units before their maturity date, we will be able to retire the entire principal obligation with equity issuances. Due to an incurrence covenant based on total market capitalization, we are currently restricted from issuing an additional Convertible Debenture. See Note 12 to our audited consolidated financial statements for the year ended December 31, 2008 filed on SEDAR atwww.sedar.comas well as the Liquidity and Capital Resources section of this MD&A for a full description of the incurrence covenant.
Overall, we expect that based on current commodity price expectations, our 2009 cash from operating activities will be significantly lower than in 2008 and that our capital expenditures and distributions to Unitholders will be constrained with the objective of reducing borrowings under our credit facilities and improving our credit profile. Distributions are approved by our Board of Directors after considering the current and expected economic conditions and in light of the significant reduction in commodity prices, we have declared a distribution of $0.05 per Trust Unit for Unitholders of record on March 23, 2009 and payable on April 15, 2009. In prior years, we have balanced our cash from operating activities and the funding of capital expenditures and distributions with reliance on proceeds from our distribution re-investment programs for shortfalls.
While we do not forecast commodity prices nor refining margins, we have entered into price risk management contracts to mitigate a substantial portion of our price volatility in the first half of 2009, with the objective of stabilizing our 2009 cash flow from operating activities. The following table reflects the sensitivity of our 2009 operations to changes in the following key factors to our business:
| | | Assumption | | | Change | | | Impact on Cash Flow | |
| WTI oil price (US$/bbl) | $ | 50.00 | | $ | 5.00 | | $ | 0.27 / Unit | |
| CAD/USD exchange rate | $ | 0.80 | | $ | 0.05 | | $ | 0.28 / Unit | |
| AECO daily natural gas price | $ | 5.00 | | $ | 1.00 | | $ | 0.17 / Unit | |
| Refinery crack spread (US$/bbl) | $ | 9.00 | | $ | 1.00 | | $ | 0.24 / Unit | |
| Upstream Operating Expenses (per boe) | $ | 15.00 | | $ | 1.00 | | $ | 0.11 / Unit | |
In our upstream business, we will continue to evaluate opportunities to acquire producing oil and/or natural gas properties in exchange for Trust Units as well as offer selected properties for divestment to maintain and enhance our productive capability and improve our unit operating costs.
43
CRITICAL ACCOUNTING ESTIMATES
There are a number of critical estimates underlying the accounting policies applied when preparing the consolidated financial statements due to timing differences between when certain activities take place and when they are reported. Changes in these estimates could have a material impact on our reported results.
Reserves
The process of estimating reserves is complex. It requires significant judgments and decisions based on available geological, geophysical, engineering and economic data. In the process of estimating the economically recoverable oil and natural gas reserves and related future net cash flows, we incorporate many factors and assumptions, such as:
- Expected reservoir characteristics based on geological, geophysical and engineering assessments;
- Future production rates based on historical performance and expected future operating and investment activities;
- Future oil and gas prices and quality differentials; and
- Future development costs.
We follow the full cost method of accounting for our oil and natural gas activities. All costs of acquiring oil and natural gas properties and related exploration and development costs, including overhead charges directly related to these activities, are capitalized and accumulated in one cost centre. Maintenance and repairs are charged against income, and renewals and enhancements that extend the economic life of the capital assets are capitalized. The provision for depletion and depreciation of petroleum and natural gas assets is calculated on the unit-of-production method based on proved reserves as estimated by independent petroleum engineers.
Reserve estimates impact net income through depletion, the determination of asset retirement obligations and the application of an impairment test. Revisions or changes in the reserve estimates can have either a positive or a negative impact on net income, capital assets and asset retirement obligations.
Asset Retirement Obligations
In the determination of our asset retirement obligations, management is required to make a significant number of estimates with respect to activities that will occur in many years to come. In arriving at the recorded amount of the asset retirement obligation numerous assumptions are made with respect to ultimate settlement amounts, inflation factors, credit adjusted risk free discount rates, timing of settlement and expected changes in legal, regulatory, environmental and political environments. The asset retirement obligation also results in an increase to the carrying cost of capital assets. The obligation accretes to a higher amount with the passage of time as it is determined using discounted present values. A change in any one of the assumptions could impact the estimated future obligation and in return, net income. It is difficult to determine the impact of a change in any one of our assumptions. As a result, a reasonable sensitivity analysis cannot be performed.
Impairment of Capital Assets
Numerous estimates and judgments are involved in determining any potential impairment of capital assets. The most significant assumptions in determining future cash flows are future prices and reserves for our upstream operations and expected future refining margins and capital spending plans for our downstream operations.
The estimates of future prices and refining margins require significant judgments about highly uncertain future events. Historically, oil, natural gas and refined product prices have exhibited significant volatility from time to time. The prices used in carrying out our impairment tests for each operating segment are based on prices derived from a consensus of future price forecasts among industry analysts. Given the number of significant assumptions required and the possibility that actual conditions will differ, we consider the assessment of impairment to be a critical accounting estimate.
If forecast WTI crude oil prices were to fall by 40%, the initial assessment of impairment of our upstream assets would not change; however, below that level, we would likely experience an impairment. Although oil and natural gas prices fluctuate a great deal in the short-term, they are typically stable over a longer time horizon. This mitigates potential for impairment.
44
Similarly, for our downstream operations, if forecast refining margins were to fall by more than 15%, it is likely that our downstream assets would experience an impairment despite the expected seasonal volatility in earnings.
Reductions in estimated future prices may also have an impact on estimates of economically recoverable proved reserves. It is difficult to determine and assess the impact of a decrease in our proved reserves on our impairment tests. The relationship between the reserve estimate and the estimated undiscounted cash flows is complex. As a result, we are unable to provide a reasonable sensitivity analysis of the impact that a reserve estimate decrease would have on our assessment of impairment.
Goodwill
Goodwill is recorded on a business combination when the total purchase consideration exceeds the fair value of the net identifiable assets and liabilities of the acquired entity. The goodwill balance is not amortized, however, and must be assessed for impairment at least annually. Impairment is initially determined based on the fair value of a reporting unit compared to its book value. Any impairment must be charged to earnings in the period the impairment occurs. Harvest has a goodwill balance for each of our upstream and downstream operations. As at December 31, 2008, we have determined there was no goodwill impairment in either of our reporting units.
Employee Future Benefits
We maintain a defined benefit pension plan for the employees of North Atlantic. Obligations under employee future benefit plans are recorded net of plan assets where applicable. An independent actuary determines the costs of our employee future benefit programs using the projected benefit method. The determination of these costs requires management to estimate or make assumptions regarding the expected plan investment performance, salary escalation, retirement ages of employees, expected health care costs, employee turnover, discount rates and return on plan assets. The obligation and expense recorded related to our employee future benefit plans could increase or decrease if there were to be a change in these estimates. Pension expense represented less than 0.5% of our total expenses for 2008 (2007 - 0.5%) .
Purchase Price Allocations
Business acquisitions are accounted for by the purchase method of accounting. Under this method, the purchase price is allocated to the assets acquired and the liabilities assumed based on the fair values at the time of the acquisition. The excess of the purchase price over the assigned fair values of the identifiable assets and liabilities is allocated to goodwill. In determining the fair value of the assets and liabilities we are often required to make assumptions and estimates about future events, such as future oil and gas prices, refining margins and discount rates. Changes in any of these assumptions would impact amounts assigned to assets and liabilities and goodwill in the purchase price allocation and as a result, future net earnings.
RECENT CANADIAN ACCOUNTING AND RELATED PRONOUNCEMENTS
In February 2008, the CICA issued Section 3064, Goodwill and Intangible Assets, replacing Section 3062 Goodwill and Other Intangible Assets and Section 3450, Research and Development Costs. The new Section will be effective on January 1, 2009. Section 3062 establishes standards for the recognition, measurement, presentation and disclosure of goodwill and intangible assets subsequent to its initial recognition. Standards concerning goodwill are unchanged from the standards included in the previous Section 3062. We are currently evaluating the impact of the adoption of this new section, however do not expect a material impact on our consolidated financial statements.
In December 2008, the CICA issued section 1582, Business Combinations, replacing Section 1581 of the same name. The new Section will be effective on January 1, 2011 with prospective application. Under the new guidance, the purchase price used in a business combination is based on the fair value of shares exchanged at their market price at the date of the exchange. Currently the purchase price used is based on the market price of the shares for a reasonable period before and after the date the acquisition is agreed upon and announced. This new guidance generally requires all acquisition costs to be expensed, while the current standard requires capitalization as part of the purchase price. Contingent liabilities are to be recognized at fair value at the acquisition date and remeasured at fair value through earnings each period until settled. While under the current standard only contingent liabilities that are resolved and payable are included in the cost to acquire the business. In addition, negative goodwill is required to be recognized immediately in earnings, unlike the current requirement to eliminate it by deducting it from non-current assets in the purchase price allocation.
45
International Financial Reporting Standards
In February 2008, the CICA Accounting Standards Board (“ASB”) announced that Canadian public reporting issuers will be required to report under International Financial Reporting Standard (“IFRS”) commencing January 1, 2011 which will require comparative IFRS information for the 2010 year end. In mid-2008, the ASB issued an exposure draft to incorporate IFRS into the Canadian accounting standards. In September 2008, the International Accounting Standards Board (“IASB”) issued an exposure draft proposing amendments for first time adopters of IFRS to enable an entity to measure exploration and evaluation assets at the amount determined under the entity’s previous accounting principles and it also provides for the measurement of oil and gas assets in the development or production phase, among other things, by allocating the amount determined by the entity’s previous accounting principles to the underlying assets on a pro rata basis using reserve volumes or reserve values at the date of transition. If formally approved by the IASB, these amendments will substantially ease the adoption of IFRS for Harvest. We have determined that our accounting for property, plant and equipment will be impacted as we currently use the full cost method of accounting in accordance with the CICA Accounting Guideline 16: “Oil and Gas Accounting – Full Cost.” At this time, the full impact of conversion to IFRS on Harvest’s consolidated financial statements is not reasonably determinable.
We have established an IFRS Conversion Plan and have staffed a project team with regular reporting to our senior management team and to the Audit Committee of the Board of Directors. We have completed an initial assessment of the differences between Canadian accounting standards and IFRS and are currently completing a comprehensive assessment of the impact of adopting IFRS on our accounting policies, information technology and data systems, internal control over financial reporting, disclosure controls and procedures, financial reporting expertise as well as business activities that may be influenced such as debt covenants, capital requirements and compensation arrangements.
OPERATIONAL AND OTHER BUSINESS RISKS
Both Harvest’s upstream operations and its downstream operations are conducted in the same business environment as most other operators in the respective businesses and the business risks are very similar. However, our structure as a publicly traded mutual fund trust is significantly different than that of a traditional corporation with share capital and there are some unique business risks of our structure. In addition, Harvest’s monthly cash distributions limits its accumulation of capital resources from internal sources. We intend to continue executing our business plan to create value for Unitholders by increasing the net asset value per Trust Unit with our risk management activities carried out under policies approved by our Board of Directors.
We have segregated the identification of business risks into those generally applicable to upstream operations as well as downstream operations and those applicable to our royalty trust structure and should be read in conjunction with the full description of these risks in our Annual Information Form for the year ended December 31, 2008 to be filed onwww.sedar.com. The following summarizes the more significant risks:
Upstream Operations
- Prices received for petroleum and natural gas have fluctuated widely in recent years and are also impacted by the volatility in the Canadian/US currency exchange rate.
- The differential between light oil and heavy oil compounds the fluctuations in the benchmark oil prices.
- The operation of petroleum and natural gas properties involves a number of operating and natural hazards which may result in blowouts, environmental damage and other unexpected and/or dangerous conditions.
- The production of petroleum and natural gas may involve a significant use of electrical power and since de- regulation of the electric system in Alberta, electrical power prices in Alberta have been volatile.
- The markets for petroleum and natural gas produced in western Canada depend upon available capacity to refine crude oil and process natural gas as well as pipeline capacity to transport the products to consumers.
46
- The reservoir and recovery information in reserve reports are estimates and actual production and recovery rates may vary from the estimates and the variations may be significant.
- Absent capital reinvestment, production levels from petroleum and natural gas properties will decline over time and absent commodity price increases, cash generated from operating these assets will also decline.
- Prices paid for acquisitions are based in part on reserve report estimates and the assumptions made preparing the reserve reports are subject to change as well as geological and engineering uncertainty.
- The operation of petroleum and natural gas properties is subject to environmental regulation pursuant to local, provincial and federal legislation and a breach of such legislation may result in the imposition of fines as well as higher operating standards that may increase costs.
Downstream Operations
- The market prices for crude oil and refined products have fluctuated significantly, the direction of the fluctuations may be inversely related and the relative magnitude may be different resulting volatile refining margins.
- The prices for crude oil and refined products are generally based in US dollars while our operating costs are denominated in Canadian dollars which introduces currency exchange rate exposure.
- Crude oil feedstock is delivered to our refinery via waterborne vessels which could experience delays in transporting supplies due to weather, accidents, government regulations or third party actions.
- Over 60% of our feedstock in 2008 was supplied from sources in Iraq and if Iraq curtails supply, we may not be able to find another source with an adequate amount of similar type of crude oil.
- We are relying on the creditworthiness of Vitol for our purchase of feedstock and should their creditworthiness deteriorate, crude oil suppliers may restrict the sale of crude oil to Vitol.
- Our refinery is a single train integrated interdependent facility which could experience a major accident, be damaged by sever weather or otherwise be forced to shutdown which may reduce or eliminate our cash flow.
- Our refining operations which include the transportation and storage of a significant amount of crude oil and refined products are adjacent to environmentally sensitive coastal waters, and are subject to hazards and similar risks such as fires, explosions, spills and mechanical failures, any of which may result in personal injury, damage to our property and/or the property of others along with significant other liabilities in connection with a discharge of materials.
- The production of aviation fuels subjects us to liability should contaminants in the fuel result in aircraft engines being damaged and/or aircraft crashes.
- Collective agreements with our employees and the United Steel Workers of America may not prevent a strike or work stoppage and future agreements may result in an increase in operating costs.
- Refinery operations are subject to environmental regulation pursuant to local, provincial and federal legislation and a breach of such legislation may result in the imposition of fines as well as higher operating standards that may increase costs.
47
General Business Risks
- The loss of a member to our senior management team and/or key technical operations employee could result in a disruption to either our upstream or downstream operations.
- Our credit facility and other financing agreements contain financial covenants and maturity dates that may limit our ability to sell assets, enter into certain financing arrangements and/or pay distributions to Unitholders.
- Variations in interest rates on our current and/or future financing arrangements may result in significant increases in our borrowing costs and result in less cash available for distributions to Unitholders.
- Our crude oil sales and refining margins are denominated in US dollars while we pay distributions to our Unitholders in Canadian dollars which results in a currency exchange exposure.
Royalty Trust Structural Risks
- Trust Units are hybrid securities in that they share certain attributes common to both equity securities and debt instruments and represent a fractional interest in the Trust.
- Recent changes to income tax legislation related to the royalty trust structure will result in a tax, at the trust level of our structure, on distributions from Harvest at rates of tax comparable to the combined federal and provincial corporate income tax rates in Canada and to treat such distributions as dividends to the Unitholders for income tax purposes.
CHANGES IN REGULATORY ENVIRONMENT
On October 25, 2007, the Government of Alberta released its New Royalty Framework (the “NRF”) outlining changes that increase the royalty rates on conventional oil and gas, oil sands and coal bed methane using a price-sensitive and volume-sensitive sliding rate formula for both conventional oil and natural gas. These proposals were given Royal Assent on December 2, 2008 and became effective January 1, 2009. Prior to the NRF, the amount of royalties payable was influenced by the oil price, oil production, density of oil and the vintage of the oil with the rate ranging from 10% to 35% and with respect to natural gas production, the royalty reserved was between 15% to 35% depending on the a prescribed or corporate average reference price and subject to various incentive programs.
The NRF sets royalty rates for conventional oil by a single sliding rate formula which is applied monthly and increases the range of royalty rates to up to 50% and with rate caps once the price of conventional oil reaches $120 per barrel. With respect to natural gas production, the royalties outlined in the NRF are set by a single sliding rate formula ranging from 5% to 50% with a rate cap once the price of natural gas reaches $16.59 per GJ.
The NRF also includes a policy of “shallow rights reversion.” The shallow rights reversion policy affects all petroleum and natural gas agreements, however, the timing of the reversion will differ depending on whether the leases and licences were acquired prior to or subsequent to January 1, 2009. Leases granted after January 1, 2009 will be subject to shallow rights reversion at the expiry of the primary term, and in the event of a licence, the policy will apply after the expiry of the intermediate term. Holders of leases and licences that have been continued indefinitely prior to January 1, 2009 will receive a notice regarding the reversion of the shallow rights which will be implemented three years from the date of the notice. The lease or licence holder can make a request to extend this period. The Government intends this policy to maximize the development of currently undeveloped resources by having the mineral rights to shallow gas geological formations that are not being developed revert back to the Government and be made available for resale.
On April 10, 2008, the Government of Alberta introduced two new royalty programs for the development of deep oil and natural gas reserves. A five-year oil program for exploratory wells over 2,000 meters will provide royalty adjustments up to $1 million or 12 months of royalty offsets whichever comes first while a natural gas deep drilling program for wells deeper than 2,500 meters will create a sliding scale of royalty credit according to depth of up to $3,750/meter.
On November 19, 2008, the Government of Alberta announced the introduction of a five year program of Transitional Royalty Plan (the “TRP”) which effective January 1, 2009, offers companies drilling new natural gas or conventional deep oil wells (between 1,000 and 3,500 meters) a one-time option, on a well-by-well basis, to reduced royalty rates for new wells for a maximum period of five years to December 31, 2013 after which all wells convert to the NRF. To qualify for this program, wells must be drilled between November 19, 2008 and December 31, 2013.
48
Based on the information available and assuming royalties will continue to be based on field gate prices realized by producers, our analysis indicates that if our field gate prices for conventional oil are less than $53.00, our oil royalties will be lower under the NRF and if prices are higher, our royalties will increase and similarly for natural gas, if our gas plant prices are less than $7.00, our royalties will be lower and if prices are higher, our royalties will increase. Of particular concern is the royalty rates on natural gas where production from recently drilled wells may qualify as high productivity for a period of time and attract a royalty that is 15% to 20% higher than under the current royalty regime and this could significantly penalize the economics of our drilling of natural gas wells. Generally, we will pay higher royalties if commodity prices are high and lower royalties on most of our wells as they will be considered to be low productivity wells.
For a detailed discussion of our regulatory environment, please refer to the discussion of Industry Conditions in the General Business Description of our Annual Information Form for the year ended December 31, 2008 which will be filed on SEDAR atwww.sedar.com
In 2007, the Government of Alberta introduced the Climate Change and Emissions Management Amendment Act which intends to reduce greenhouse gas emissions intensity from large emitting facilities. On January 24, 2008, the Government of Alberta announced their plan to reduce projected emissions in the province by 50% under the new climate change plan by 2050. This will result in real reductions of 14% below 2005 levels. The Government of Alberta stated they will form a government-industry council to determine a go-forward plan for implementing technologies, which will significantly reduce greenhouse gas emissions by capturing air emissions from industrial sources and locking them permanently underground in deep rock formations.
In 2002, the Government of Canada ratified the Kyoto Protocol which calls for Canada to reduce its greenhouse gas emissions to specified levels. On April 26, 2007, the Government of Canada released its Action Plan to Reduce Greenhouse Gases and Air Pollution (the “Action Plan”) which includes a regulatory framework for air emissions. This Action Plan is to regulate the fuel efficiency of vehicles and the strengthening of energy standards for a number of energy-using products. On March 10, 2008, the Government of Canada released “Turning the Corner” outlining additional details to implement their April 2007 commitment to cut greenhouse gas emissions by an absolute 20% by 2020. “Turning the Corner” sets out a framework to establish a market price for carbon emissions and sets up a carbon emission trading market to provide incentives for Canadians to reduce their greenhouse gas emissions. In addition, the regulations include new measures for oil sands developers that require an 18% reduction from 2006 levels by 2010 for existing operations and for oil sands operations commencing in 2012, a carbon capture and storage capability. There is no mention of targeting reductions for unintentional fugitive emissions for conventional producers. Companies will be able to choose the most cost effective way to meet their emissions reduction targets from in-house reductions, contributions to time-limited technology funds, domestic emissions trading and the United Nations’ Clean Development Mechanism. Companies that have already reduced their greenhouse gas emissions prior to 2006 will have access to a limited one-time credit for early adoption. Giving the evolving nature of the debate related to climate change and the control of greenhouse gases and resulting requirements, and the lack of detail in the Government of Canada’s announcement, it is not possible to assess the impact of the requirements on our operations and financial performance.
DISCLOSURE CONTROLS AND PROCEDURES
Under the supervision of our Chief Executive Officer and Chief Financial Officer, we have evaluated the effectiveness of our disclosure controls and procedures as of December 31, 2008 as defined under the rules adopted by the Canadian securities regulatory authorities and the U.S. Securities and Exchange Commission. Based on this evaluation, our Chief Executive Officer and Chief Financial Officer have concluded that as of December 31, 2008, our disclosure controls and procedures were effective to ensure that information required to be disclosed by Harvest in reports it files or submits to Canadian and U.S. securities authorities was recorded, processed, summarized and reported within the time period specified in Canadian and U.S. securities laws and was accumulated and communicated to Harvest’s management, including its Chief Executive Officer and Chief Financial Officer, to allow timely decisions regarding required disclosures.
49
INTERNAL CONTROL OVER FINANCIAL REPORTING
Management is responsible for establishing and maintaining internal control over our financial reporting. Our internal control is designed to provide reasonable assurance regarding the reliability of financial reporting and preparation of financial statements for external purposes in accordance with Canadian Generally Accepted Accounting Principles. Management, with the participation of our Chief Executive Officer and Chief Financial Officer, has evaluated the effectiveness of our internal control over financial reporting as of December 31, 2008. The evaluation was based on the Internal Control – Integrated Framework issued by the Committee of Sponsoring Organizations of the Treadway Commission. Based on that evaluation, management has concluded that as of December 31, 2008, the design and operation of internal controls were effective..
The effectiveness of our internal control over financial reporting as of December 31, 2008 was audited by KPMG, an independent registered public accounting firm, as stated in their report, which is included in our audited consolidated financial statements for the year ended December 31, 2008 filed on SEDAR atwww.sedar.com.
During the year ended December 31, 2008, there were no changes in our internal control over financial reporting that have materially affected, or are reasonably likely to materially affect, our internal control over financial reporting.
Based on their inherent limitations, disclosure controls and procedures and internal control over financial reporting may not prevent or detect misstatements, errors or fraud. Control systems, no matter how well conceived or operated, can provide only reasonable, but not absolute, assurance that the objectives of the control systems are met.
ADDITIONAL INFORMATION
Further information about us, including our Annual Information Form, can be accessed under our public filings found on SEDAR atwww.sedar.com or atwww.harvestenergy.ca. Information can also be found by contacting our Investor Relations department at (403) 265-1178 or at 1-866-666-1178.
50