Exhibit 99.3
MANAGEMENT’S DISCUSSION AND ANALYSIS
Management’s discussion and analysis (“MD&A”) of the financial condition and results of operations of Harvest Energy Trust should be read in conjunction with our audited consolidated financial statements and accompanying notes for the years ended December 31, 2008 and 2007, our MD&A for the year ended December 31, 2008 as well as our interim consolidated financial statements and notes for the three and six month periods ended June 30, 2009 and 2008. The information and opinions concerning our future outlook are based on information available at August 10, 2009.
In this MD&A, reference to "Harvest", "we", "us" or "our" refers to Harvest Energy Trust and all of its controlled entities on a consolidated basis. All references are to Canadian dollars unless otherwise indicated. Tabular amounts are in thousands of dollars unless otherwise stated. Natural gas volumes are converted to barrels of oil equivalent (“boe”) using the ratio of six thousand cubic feet (“mcf”) of natural gas to one barrel of oil (“bbl”). Boes may be misleading, particularly if used in isolation. A boe conversion ratio of 6 mcf to 1 bbl is based on an energy equivalent conversion method primarily applicable at the burner tip and does not represent a value equivalent at the wellhead. In accordance with Canadian practice, petroleum and natural gas revenues are reported on a gross basis before deduction of Crown and other royalties. In addition to disclosing reserves under the requirements of National Instrument 51-101, we also disclose our reserves on a company interest basis which is not a term defined under National Instrument 51-101. This information may not be comparable to similar measures by other issuers.
NON-GAAP MEASURES
Throughout this MD&A we have referred to certain measures of financial performance that are not specifically defined under Canadian GAAP. Cash G&A and Operating Netbacks are non-GAAP measures used extensively in the Canadian energy trust sector for comparative purposes. Cash G&A are G&A expenses excluding the effect of our unit based compensation plans, while Operating Netbacks are always reported on a per boe basis, and include gross revenue, royalties, operating expenses, and transportation and marketing expenses. Gross Margin is also a non-GAAP measure and is commonly used in the refining industry to reflect the net funds received from the sale of refined products after considering the cost to purchase the feedstock and is calculated by deducting purchased products for resale and processing from total revenue. Earnings From Operations and Cash From Operations are also non-GAAP measures and are commonly used for comparative purposes in the petroleum and natural gas and refining industries to reflect operating results before items not directly related to operations. This information may not be comparable to similar measures by other issuers.
FORWARD-LOOKING INFORMATION
This MD&A highlights significant business results and statistics from our consolidated financial statements for the three and six months ended June 30, 2009 and the accompanying notes thereto. In the interest of providing our Unitholders and potential investors with information regarding Harvest, including our assessment of our future plans and operations, this MD&A contains forward-looking statements that involve risks and uncertainties. Such risks and uncertainties include, but are not limited to, risks associated with conventional petroleum and natural gas operations; risks associated with refining and marketing operations; the volatility in commodity prices and currency exchange rates; risks associated with realizing the value of acquisitions; general economic, market and business conditions; changes in environmental legislation and regulations; the availability of sufficient capital from internal and external sources and such other risks and uncertainties described from time to time in our regulatory reports and filings made with securities regulators.
Forward-looking statements in this MD&A include, but are not limited to, the forward looking statements made in the “Outlook” section as well as statements made throughout with reference to production volumes, refinery throughput volumes, royalty rates, operating costs, commodity prices, administrative costs, price risk management activity, acquisitions and dispositions, capital spending, reserve estimates, distributions, access to credit facilities, income taxes, cash from operating activities, and regulatory changes. For this purpose, any statements that are contained herein that are not statements of historical fact may be deemed to be forward-looking statements. Forward-looking statements often contain terms such as “may”, “will”, “should”, “anticipate”, “expects”, and similar expressions.
1
Readers are cautioned not to place undue reliance on forward-looking statements as there can be no assurance that the plans, intentions or expectations upon which they are based will occur. Although we consider such information reasonable at the time of preparation, it may prove to be incorrect and actual results may differ materially from those anticipated. We assume no obligation to update forward-looking statements should circumstances, estimates or opinions change, except as required by law. Forward-looking statements contained in this MD&A are expressly qualified by this cautionary statement.
Consolidated Financial and Operating Highlights – Second Quarter 2009
Quarterly cash flow from operating activities of $75.9 million as compared to $210.5 million in the prior year reflects a $188.7 million decrease in the contribution from our Upstream operations as well as a $40.2 million decrease in the contribution from our Downstream operations partially offset by a $113.9 million favourable change in the settlements of our corporate price risk management contracts.
Upstream operating cash flow of $121.1 million reflects substantially weaker commodity prices as compared to the prior year along with a decline in our average daily production to 52,745 boe/d from 55,574 boe/d in the prior year primarily due to a reduced level of investment in heavy oil prospects due to weak commodity prices.
Upstream capital spending of $33.4 million including the drilling of three wells and the tie-in and completion of our First Quarter drilling program at Hay River and central Alberta. In addition, the sale of two non-core properties generated net proceeds of approximately $63 million which were applied to reduce bank borrowings.
In our Downstream operations, we successfully completed a 42-day turnaround of the hydrocracking and hydrogen units, including the replacement of catalyst, resulting in a significant curtailment of throughput and a cash flow deficiency of $38.8 million compared to $1.3 million generated in the prior year.
Cash receipts totaled $20.1 million on the settlement of 20,000 bbl/d of refined products price risk management contracts during the quarter as compared to payments of $85.3 million in the prior year.
Raised $120.2 million of net proceeds with the issuance of 17,330,000 Trust Units and applied the net proceeds to reduce our bank borrowings which at the end of the quarter totaled $1,097.8 million.
On June 23, 2009, we offered to purchase all of the outstanding shares of Pegasus Oil & Gas Inc, a junior oil and natural gas producer, in exchange for the issuance of approximately 670,000 Trust Units and the assumption of approximately $14 million of bank debt. With slightly less than 90% of the outstanding shares tendered by July 30, 2009, this offer has been extended to August 11, 2009.
Maintained monthly distributions of $0.05 per Trust Unit during the quarter aggregating to $25.2 million, representing 33% of cash from operating activities.
2
SELECTED INFORMATION
The table below provides a summary of our financial and operating results for the three and six months ended June 30, 2009 and 2008.
| | | Three Months Ended June 30 | | | Six Months Ended June 30 | |
| | | | | | | | | | | | | | | | | | | |
| ($000s except where noted) | | 2009 | | | 2008 | | | Change | | | 2009 | | | 2008 | | | Change | |
| | | | | | | | | | | | | | | | | | | |
| Revenue, net(1) | | 562,997 | | | 1,622,079 | | | (65% | ) | | 1,294,092 | | | 2,999,431 | | | (57% | ) |
| | | | | | | | | | | | | | | | | | | |
| Cash From Operating Activities | | 75,879 | | | 210,534 | | | (64% | ) | | 297,624 | | | 338,653 | | | (12% | ) |
| Per Trust Unit, basic | $ | 0.45 | | $ | 1.39 | | | (68% | ) | $ | 1.83 | | $ | 2.24 | | | (18% | ) |
| Per Trust Unit, diluted | $ | 0.45 | | $ | 1.26 | | | (64% | ) | $ | 1.75 | | $ | 2.05 | | | (15% | ) |
| | | | | | | | | | | | | | | | | | | |
| Net Loss(2) | | (265,779 | ) | | (162,063 | ) | | 64% | | | (208,915 | ) | | (162,409 | ) | | 29% | |
| Per Trust Unit, basic | $ | (1.59 | ) | $ | (1.07 | ) | | 49% | | $ | (1.28 | ) | $ | (1.08 | ) | | 19% | |
| Per Trust Unit, diluted | $ | (1.59 | ) | $ | (1.07 | ) | | 49% | | $ | (1.28 | ) | $ | (1.08 | ) | | 19% | |
| | | | | | | | | | | | | | | | | | | |
| Distributions declared | | 25,193 | | | 137,001 | | | (82% | ) | | 128,495 | | | 272,168 | | | (53% | ) |
| Distributions declared, per Trust Unit | $ | 0.15 | | $ | 0.90 | | | (83% | ) | $ | 0.80 | | $ | 1.80 | | | (56% | ) |
| Distributions declared as a percentage | | | | | | | | | | | | | | | | | | |
| of Cash From Operating Activities | | 33% | | | 65% | | | (32% | ) | | 43% | | | 80% | | | (37% | ) |
| | | | | | | | | | | | | | | | | | | |
| Bank debt | | | | | | | | | | | 1,097,820 | | | 1,035,285 | | | 6% | |
| 77/8% Senior Notes | | | | | | | | | | | 285,708 | | | 248,836 | | | 15% | |
| Convertible Debentures(3) | | | | | | | | | | | 832,924 | | | 821,877 | | | 1% | |
| Total debt(3) | | | | | | | | | | | 2,216,452 | | | 2,105,998 | | | 5% | |
| | | | | | | | | | | | | | | | | | | |
| Total assets | | | | | | | | | | | 5,296,596 | | | 5,637,879 | | | (6% | ) |
| | | | | | | | | | | | | | | | | | | |
| UPSTREAM OPERATIONS | | | | | | | | | | | | | | | | | | |
| Daily Production | | | | | | | | | | | | | | | | | | |
| Light to medium oil (bbl/d) | | 24,316 | | | 25,365 | | | (4% | ) | | 24,275 | | | 25,439 | | | (5% | ) |
| Heavy oil (bbl/d) | | 10,365 | | | 12,092 | | | (14% | ) | | 10,751 | | | 12,534 | | | (14% | ) |
| Natural gas liquids (bbl/d) | | 2,675 | | | 2,614 | | | 2% | | | 2,756 | | | 2,549 | | | 8% | |
| Natural gas (mcf/d) | | 92,335 | | | 93,014 | | | (1% | ) | | 93,870 | | | 97,792 | | | (4% | ) |
| Total daily sales volumes (boe/d) | | 52,745 | | | 55,574 | | | (5% | ) | | 53,427 | | | 56,820 | | | (6% | ) |
| | | | | | | | | | | | | | | | | | | |
| Operating Netback ($/boe) | | 26.88 | | | 62.98 | | | (57% | ) | | 21.64 | | | 53.97 | | | (60% | ) |
| | | | | | | | | | | | | | | | | | | |
| Cash capital expenditures | | 33,391 | | | 39,669 | | | (16% | ) | | 142,101 | | | 119,240 | | | 19% | |
| Business and property dispositions, net | | (61,403 | ) | | (4,734 | ) | | 1,197% | | | (60,728 | ) | | (4,549 | ) | | 1,235% | |
| | | | | | | | | | | | | | | | | | | |
| DOWNSTREAM OPERATIONS | | | | | | | | | | | | | | | | | | |
| Average daily throughput (bbl/d) | | 52,808 | | | 100,422 | | | (47% | ) | | 78,410 | | | 106,211 | | | (26% | ) |
| Average Refining Gross Margin (US$/bbl) | | 6.50 | | | 5.66 | | | 15% | | | 12.51 | | | 7.36 | | | 70% | |
| | | | | | | | | | | | | | | | | | | |
| Cash capital expenditures | | 19,929 | | | 8,619 | | | 131% | | | 26,833 | | | 14,646 | | | 83% | |
| (1) | Revenues are net of royalties. |
| (2) | Net Loss includes a goodwill impairment of $206.5 million for the three and six months ended June 30, 2009 (nil for the three and six months ended June 30, 2008), a future income tax recovery of $12.1 million and $10.1 million for the three and six months ended June 30, 2009, respectively ($95.2 million and $117.0 million for the three and six months ended June 30, 2008) and an unrealized net loss from risk management activities of $15.0 million and $25.2 million for the three and six months ended June 30, 2009, respectively ($305.1 million and $366.0 million for the three and six months ended June 30, 2008). |
| (3) | Includes current portion of Convertible Debentures and excludes the equity component of Convertible Debentures. |
3
REVIEW OF OVERALL PERFORMANCE
Harvest is an integrated energy trust with our petroleum and natural gas business focused on the operation and further development of assets in western Canada (our “upstream operations”) and our refining and marketing business focused on the safe operation of a medium gravity sour crude oil hydrocracking refinery and a retail and wholesale petroleum marketing business both located in the Province of Newfoundland and Labrador (our “downstream operations”). Our earnings and cash flow from operating activities are largely determined by the realized prices for our crude oil and natural gas production as well as refined product crack spreads, including the effects of changes in the U.S. dollar to Canadian dollar exchange rate. Recently, changes in crude oil and natural gas prices and the exchange rate between U.S. dollars and Canadian dollars have moved together with changes in the currency exchange rate partially offsetting changes in crude oil and natural gas prices.
Cash flow from operating activities of $75.9 million in the Second Quarter of 2009 is comprised of $121.1 million cash flow contributions from our Upstream operations plus $19.4 million of net cash receipts from our corporate price risk management activities and a $2.9 million net increase in non-cash working capital offset by a $38.8 cash flow deficiency from our Downstream operations and $25.9 million of financing and other costs. As compared to $210.5 million reported in the Second Quarter of 2008, the year-over-year $134.6 million decrease in cash flow from operating activities is comprised of a $188.7 million and $40.2 million decrease in contribution from our Upstream operations and Downstream operations, respectively, along with a $25.7 million reduced non-cash working capital adjustment offset by a $113.9 million improvement in price risk management settlements and a $6.6 million reduction in financing costs. The $25.7 million reduction in the non-cash working capital adjustment is primarily the result of the impact of commodity price fluctuations on our Downstream inventories and a significantly lower Upstream capital spending program during the Second Quarter.
Cash flow provided from our Upstream operations totaled $121.1 million during the Second Quarter of 2009, an increase of $49.7 million from the First Quarter of the year and a drop of $188.7 million compared to the $309.8 million reported in the prior year. The principal factor impacting our Second Quarter financial performance is an average West Texas Intermediate benchmark price of US$59.62 as compared to US$123.98 in the prior year offset somewhat by a relative weakening in Canadian/U.S. dollar exchange rate. Our Second Quarter production of 52,745 boe/d is 5% lower than in the prior year primarily due to a 14% decline in heavy oil production, the result of a lower level of investment since mid-2008. Operating costs of $12.77 per boe reflect a 50% reduction in power costs driven by significantly lower electric power prices in Alberta and represent a 12% improvement over the $14.45 per boe incurred in the prior year. Our netback price for the Second Quarter of 2009 was $26.88 per boe as compared to $62.99 per boe in the prior year and $16.45 per boe in the First Quarter of this year. Capital spending of $33.4 million primarily focused on the tie-in and completion of the 82 wells drilled in the First Quarter of the year as well as the drilling of 3 wells in the quarter.
During the Second Quarter, we closed the sale of two non-operated properties with net proceeds of approximately $63 million. The sale of our natural gas interests in Channel Lake for $43 million resulted in a disposition metric of approximately $53,000 per boe based on its current production of 4,860 mcf/d and approximately $2.30 per mcf based on proved plus probable reserves of approximately 19 bcf. Our sale of certain non-operated interests in the Pembina area for $20 million resulted in a disposition metric of approximately $94,800 per boe based on its current production of 211 boe/d (weighted 70% light oil and natural gas liquids and 30% natural gas) and approximately $13.00 per boe based on proved plus probable reserves of 1,520 mboe. The net proceeds were applied to reduce our bank borrowings.
During the Second Quarter, the successful execution of a planned 42-day turnaround enabled our refinery to exit the quarter with throughput established at 117,000 bbl/d as compared to the 104,296 bbl/d averaged in the First Quarter as throughput was curtailed to accommodate the reduced activity level of hydrocracker catalyst. The turnaround included the refurbishment of our hydrocracker and hydrogen units including the replacement of hydrocracking and distillate hydrotreating catalysts at an aggregate cost of $47.5 million of which $43.3 million was incurred in the Second Quarter. In addition to the turnaround, capital expenditures totaled $19.9 million during the quarter including $7.0 million to upgrade heaters and $2.5 million related to debottlenecking projects. Late in the First Quarter and continuing through the Second Quarter, our refining gross margins were significantly impacted by a deterioration in heating oil crack spreads and a tightening of the quality discounts of our feedstock as well as strengthening of the Canadian dollar. While gasoline margins remained steady, the improvement in fuel oil margins and a lower cost for purchased energy to operate the refinery were not sufficient to offset the aggregate impact of the reduced heating oil crack spreads and tightening of feedstock discounts. During the Second Quarter, our Downstream operations incurred a $38.8 million operating cash flow deficiency primarily attributed to the 42-day turnaround. Year-to-date, our Downstream operations have generated operating cash flow of $103.2 million as compared to $25.9 million in the prior year, with the 2009 performance heavily influenced by the $142.0 million reported in the First Quarter. Included in the 2009 year-to-date gross margin and cash flows are US$57.2 million (US$45.0 million in the First Quarter of 2009) of operational hedging gains generated by the month-to-month hedging of the WTI price component of our crude oil feedstock purchase commitments.
4
On June 4, 2009, we issued 17,330,000 Trust Units at an issue price of $7.30 per Trust Unit with net proceeds of $120.2 million after issue costs. The net proceeds were applied to reduce our bank borrowings which at the end of the Second Quarter totaled $1,097.8 million with our bank debt to cash flow before interest being 1.5 times and our senior debt to cash flow before interest being 2.0 times. This reduction in bank borrowings is another meaningful step in the de-leveraging of our balance sheet in advance of the maturity of our credit facilities in April 2010.
On June 23, 2009, we offered to purchase all of the outstanding shares of Pegasus Oil and Gas Inc., a natural gas weighted producer with approximately 650 boe/d of production, in exchange for Trust Units. On July 30, 2009, the offer expired with slightly less than 90% of the outstanding shares tendered at which time, we extended the offer to August 11, 2009 in an effort to increase the number of tendered shares to the 90% minimum condition of our offer. Including the obligation to assume approximately $14 million of bank debt, the acquisition metrics are approximately $30,000 per boe/d of production and approximately $4.25 per boe of reserves on a proved plus probable basis. The principal asset in this acquisition is a 7% working interest in liquids rich natural gas production from a property in the Crossfield area which is operated by Harvest. This potential acquisition includes access to over 150,000 acres of land and over $50 million of income tax pools.
Our monthly distributions of $0.05 per Trust Unit during the quarter represent 33% of our cash from operating activities as compared to a monthly distribution of $0.30 per Trust Unit and 65% for cash from operating activities in the prior year. Year-to-date, our cash from operating activities, before adjustment for non-cash working capital and asset retirement expenditures, aggregated to $284.4 million while capital expenditures totaled $168.9 million and distributions declared were $128.5 million ($93.4 million net of Unitholder participation in our distribution reinvestment programs).
5
Business Segments
| | | | | | | | | | | | | | | | | | |
| The following table presents selected financial information for our two business segments: | | | | | | | |
| | | | | | | | | | | | | | | | | | | |
| | | | | | | | | Three Months Ended June 30 | | | | | | | |
| | | | | | 2009 | | | | | | | | | 2008 | | | | |
| | | | | | | | | | | | | | | | | | | |
| (in $000s) | | Upstream | | | Downstream | | | Total | | | Upstream | | | Downstream | | | Total | |
| Revenue(1) | | 193,916 | | | 369,081 | | | 562,997 | | | 394,953 | | | 1,227,126 | | | 1,622,079 | |
| Earnings From Operations(2) | | 2,522 | | | (264,377 | ) | | (261,855 | ) | | 198,428 | | | (15,692 | ) | | 182,736 | |
| Cash From Operations(2) | | 121,052 | | | (38,843 | ) | | 82,209 | | | 309,796 | | | 1,314 | | | 311,110 | |
| Capital expenditures | | 33,391 | | | 19,929 | | | 53,320 | | | 39,669 | | | 8,619 | | | 48,288 | |
| Total assets(3) | | 3,798,159 | | | 1,487,628 | | | 5,296,596 | | | 3,903,959 | | | 1,684,003 | | | 5,637,879 | |
| | | | | | | | | | | | | | | | | | | |
| | | | | | | | | Six Months Ended June 30 | | | | | | | |
| | | | | | 2009 | | | | | | | | | 2008 | | | | |
| | | | | | | | | | | | | | | | | | | |
| (in $000s) | | Upstream | | | Downstream | | | Total | | | Upstream | | | Downstream | | | Total | |
| Revenue(1) | | 352,307 | | | 941,785 | | | 1,294,092 | | | 709,886 | | | 2,289,545 | | | 2,999,431 | |
| Earnings From Operations(2) | | (41,760 | ) | | (143,803 | ) | | (185,563 | ) | | 311,679 | | | (7,952 | ) | | 303,727 | |
| Cash From Operations(2) | | 192,394 | | | 103,173 | | | 295,567 | | | 540,569 | | | 25,851 | | | 566,420 | |
| Capital expenditures | | 142,101 | | | 26,833 | | | 168,934 | | | 119,240 | | | 14,646 | | | 133,886 | |
| Total assets(3) | | 3,798,159 | | | 1,487,628 | | | 5,296,596 | | | 3,903,959 | | | 1,684,003 | | | 5,637,879 | |
| (1) | Revenues are net of royalties. |
| (2) | This is a non-GAAP measure; please refer to “Non-GAAP Measures” in this MD&A. |
| (3) | Total assets on a consolidated basis as June 30, 2009 include $10.8 million (2008 - $19.5 million) relating to the fair value of risk management contracts and nil related to future income tax (2008 - $30.4 million). |
Our Upstream and Downstream operations are each discussed separately in the sections that follow. Additionally, we have included a section entitled “Risk Management, Financing and Other” that discusses, among other things, our cash flow risk management program.
UPSTREAM OPERATIONS
Second Quarter Highlights
- Second Quarter 2009 operating cash flow of $121.1 million, as compared to $309.8 in the prior year, reflecting a year-over-year drop in commodity prices as well as lower heavy oil production.
- Average production of 52,745 boe/d during the Second Quarter of 2009 as compared to production of 55,574 boe/d in the Second Quarter of 2008 and 54,115 boe/d during the First Quarter of 2009 reflects normal decline rates and in heavy oil, the impact of reduced capital spending.
- Second Quarter 2009 operating netback of $26.88/boe, representing a $36.11/boe (57%) drop over the same period in the prior year, attributed to substantially lower commodity prices.
- Capital spending of $33.4 million including the drilling of three wells and the tie-in and completion of our First Quarter drilling program at Hay River and central Alberta. In addition, the sale of two non-core properties generated net proceeds of approximately $63 million which were applied to reduce bank borrowings.
6
| Summary of Financial and Operating Results | | | | | | | | | | | | | | | | | | |
| | | | | | | | | | | | | | | | | | | |
| | | Three Months Ended June 30 | | | Six Months Ended June 30 | |
| (in $000s except where noted) | | 2009 | | | 2008 | | | Change | | | 2009 | | | 2008 | | | Change | |
| | | | | | | | | | | | | | | | | | | |
| Revenues | | 222,115 | | | 471,766 | | | (53% | ) | | 405,035 | | | 849,099 | | | (52% | ) |
| Royalties | | (28,199 | ) | | (76,813 | ) | | (63% | ) | | (52,728 | ) | | (139,213 | ) | | (62% | ) |
| Net revenues | | 193,916 | | | 394,953 | | | (51% | ) | | 352,307 | | | 709,886 | | | (50% | ) |
| | | | | | | | | | | | | | | | | | | |
| Operating expenses | | 61,317 | | | 73,092 | | | (16% | ) | | 136,652 | | | 145,415 | | | (6% | ) |
| General and administrative | | 8,874 | | | 12,710 | | | (30% | ) | | 16,268 | | | 24,619 | | | (34% | ) |
| Transportation and marketing | | 3,584 | | | 3,352 | | | 7% | | | 6,516 | | | 6,377 | | | 2% | |
| Depreciation, depletion, amortization and accretion | | 117,619 | | | 107,371 | | | 10% | | | 234,631 | | | 221,796 | | | 6% | |
| | | | | | | | | | | | | | | | | | | |
| Earnings (Loss) From Operations(1) | | 2,522 | | | 198,428 | | | (99% | ) | | (41,760 | ) | | 311,679 | | | (113% | ) |
| | | | | | | | | | | | | | | | | | | |
| Cash capital expenditures (excluding acquisitions) | | 33,391 | | | 39,669 | | | (16% | ) | | 142,101 | | | 119,240 | | | 19% | |
| Property and business acquisitions, net of | | | | | | | | | | | | | | | | | | |
| dispositions | | (61,403 | ) | | (4,734 | ) | | 1,197% | | | (60,728 | ) | | (4,549 | ) | | 1,235% | |
| | | | | | | | | | | | | | | | | | | |
| Daily sales volumes | | | | | | | | | | | | | | | | | | |
| Light to medium oil (bbl/d) | | 24,316 | | | 25,365 | | | (4% | ) | | 24,275 | | | 25,439 | | | (5% | ) |
| Heavy oil (bbl/d) | | 10,365 | | | 12,092 | | | (14% | ) | | 10,751 | | | 12,534 | | | (14% | ) |
| Natural gas liquids (bbl/d) | | 2,675 | | | 2,614 | | | 2% | | | 2,756 | | | 2,549 | | | 8% | |
| Natural gas (mcf/d) | | 92,335 | | | 93,014 | | | (1% | ) | | 93,870 | | | 97,792 | | | (4% | ) |
| Total (boe/d) | | 52,745 | | | 55,574 | | | (5% | ) | | 53,427 | | | 56,820 | | | (6% | ) |
| (1)This is a non-GAAP measure; please refer to “Non-GAAP Measures” in this MD&A. | | | | | | | | | | | | | |
| | | | | | | | | | | | | | | | | | | |
| Commodity Price Environment | | | | | | | | | | | | | | | | | | |
| | | Three Months Ended June 30 | | | Six Months Ended June 30 | |
| Benchmarks | | 2009 | | | 2008 | | | Change | | | 2009 | | | 2008 | | | Change | |
| | | | | | | | | | | | | | | | | | | |
| West Texas Intermediate crude oil (US$ per barrel) | | 59.62 | | | 123.98 | | | (52% | ) | | 51.35 | | | 110.94 | | | (54% | ) |
| Edmonton light crude oil ($ per barrel) | | 65.88 | | | 125.88 | | | (48% | ) | | 57.74 | | | 111.62 | | | (48% | ) |
| Bow River blend crude oil ($ per barrel) | | 61.97 | | | 104.38 | | | (41% | ) | | 53.03 | | | 91.05 | | | (42% | ) |
| AECO natural gas daily ($ per mcf) | | 3.45 | | | 10.22 | | | (66% | ) | | 4.18 | | | 9.06 | | | (54% | ) |
| | | | | | | | | | | | | | | | | | | |
| Canadian / U.S. dollar exchange rate | | 0.858 | | | 0.990 | | | (13% | ) | | 0.831 | | | 0.993 | | | (16% | ) |
The average WTI benchmark price in the Second Quarter 2009 of US$59.62 was 38% higher than in the First Quarter of 2009, which was greater than the increase in the average Edmonton light crude oil price (“Edmonton Par”) of 33% due to the 7% appreciation in the Canadian dollar. For the three and six months ended June 30, 2009, the average WTI benchmark price was 52% and 54% lower, respectively, as compared to the prior year as the declining global economy continued to precipitate a significant decrease in commodity prices. Edmonton Par also decreased significantly, resulting in a Second Quarter 2009 price of $65.88, a decrease of 48% compared to the prior year and an average price of $57.74 for the six months ended June 30, 2009, a decrease of 48% compared to the prior year. The decrease in the Edmonton Par benchmark price has been less than that of the WTI benchmark price due to the weakening of the Canadian dollar relative to the U.S. dollar as compared to the prior year.
Heavy oil differentials fluctuate based on a combination of factors including the level of heavy oil inventories, pipeline capacity to deliver heavy crude to U.S. markets and the seasonal demand for heavy oil. During the three and six months ended June 30, 2009, the Bow River heavy oil differential relative to Edmonton Par averaged $3.91/bbl and $4.71/bbl, respectively, as compared $21.50/bbl and $20.57/bbl, respectively, in the prior year. On a per barrel basis, heavy oil differentials have tightened since the Second Quarter of 2008 as production shortfalls and increased refinery demand for heavier grades of oil put upward pressure on pricing.
7
| | | | | | | | |
| | 2009 | | 2008 | | | 2007 | |
| Differential Benchmarks | Q2 | Q1 | Q4 | Q3 | Q2 | Q1 | Q4 | Q3 |
| Bow River Blend differential to Edmonton Par ($/bbl) | 3.91 | 5.50 | 14.07 | 16.48 | 21.50 | 19.63 | 29.51 | 23.87 |
| Bow River Blend differential as a % of Edmonton Par | 5.9% | 11.1% | 22.2% | 13.5% | 17.1% | 20.2% | 34.2% | 30.0% |
Compared to the prior year, the average AECO daily natural gas price was 66% and 54% lower during the three and six months ended June 30, 2009, respectively, due to increased storage levels and decreased economic activity which has led to a decline in industrial consumption.
Realized Commodity Prices(1)
The following table summarizes our average realized price by product for the three and six months ended June 30, 2009 and 2008.
| | | Three Months Ended June 30 | | | Six Months Ended June 30 | |
| | | 2009 | | | 2008 | | | Change | | | 2009 | | | 2008 | | | Change | |
| Light to medium oil ($/bbl) | | 57.54 | | | 109.26 | | | (47% | ) | | 49.33 | | | 97.86 | | | (50% | ) |
| Heavy oil ($/bbl) | | 55.12 | | | 96.79 | | | (43% | ) | | 45.86 | | | 82.44 | | | (44% | ) |
| Natural gas liquids ($/bbl) | | 42.26 | | | 88.87 | | | (52% | ) | | 41.73 | | | 83.59 | | | (50% | ) |
| Natural gas ($/mcf) | | 3.87 | | | 10.86 | | | (64% | ) | | 4.61 | | | 9.51 | | | (52% | ) |
| Average realized price ($/boe) | | 46.28 | | | 93.29 | | | (50% | ) | | 41.89 | | | 82.11 | | | (49% | ) |
| (1)Realized commodity prices exclude the impact of price risk management activities. | | | | | | | | | | | | | |
Our realized price for light to medium oil sales decreased by $51.72/bbl (47%) in the Second Quarter of 2009 as compared to the prior year, reflecting the $60.00/bbl (48%) decrease in Edmonton Par pricing. During the six months ended June 30, 2009, our realized price for light to medium oil sales decreased by $48.53/bbl (50%) as compared to the prior year reflecting the $53.88/bbl (48%) decrease in Edmonton Par Pricing.
Harvest’s heavy oil price decreased by $41.67/bbl (43%) in the Second Quarter of 2009 as compared to the prior year, reflecting the $42.41/bbl (41%) decrease in the Bow River price. During the six months ended June 30, 2009, our realized price for heavy oil decreased by $36.58/bbl (44%) as compared to the prior year reflecting the $38.02/bbl (42%) decrease in the Bow River price.
Our average realized price for our natural gas production decreased by $6.99/mcf (64%) in the Second Quarter of 2009 as compared to the prior year, reflecting the $6.77/mcf (66%) decrease in the AECO daily price. During the six months ended June 30, 2009, our realized price for natural gas decreased by $4.90/mcf (52%), reflecting the $4.88/mcf (54%) decrease in the AECO daily price.
8
| Sales Volumes | | | | | | | | | | | | | | | |
| The average daily sales volumes by product were as follows: | | | | | | | | | | |
| | | | | | | | | | | | | | | | |
| | | | | | Three Months Ended June 30 | | | | | | | |
| | | | | | 2009 | | | 2008 | | | | | | | |
| | | Volume | | | Weighting | | | Volume | | | Weighting % Volume Change | |
| Light to medium oil (bbl/d)(1) | | 24,316 | | | 46% | | | 25,365 | | | 45% | | | (4% | ) |
| Heavy oil (bbl/d) | | 10,365 | | | 20% | | | 12,092 | | | 22% | | | (14% | ) |
| Natural gas liquids (bbl/d) | | 2,675 | | | 5% | | | 2,614 | | | 5% | | | 2% | |
| Total liquids (bbl/d) | | 37,356 | | | 71% | | | 40,071 | | | 72% | | | (7% | ) |
| Natural gas (mcf/d) | | 92,335 | | | 29% | | | 93,014 | | | 28% | | | (1% | ) |
| Total oil equivalent (boe/d) | | 52,745 | | | 100% | | | 55,574 | | | 100% | | | (5% | ) |
| | | | | | | | | | | | | | | | |
| | | | | | Six Months Ended June 30 | | | | | | | |
| | | | | | 2009 | | | 2008 | | | | | | | |
| | | Volume | | | Weighting | | | Volume | | | Weighting % Volume Change | |
| Light to medium oil (bbl/d)(1) | | 24,275 | | | 45% | | | 25,439 | | | 45% | | | (5% | ) |
| Heavy oil (bbl/d) | | 10,751 | | | 20% | | | 12,534 | | | 22% | | | (14% | ) |
| Natural gas liquids (bbl/d) | | 2,756 | | | 5% | | | 2,549 | | | 4% | | | 8% | |
| Total liquids (bbl/d) | | 37,782 | | | 70% | | | 40,522 | | | 71% | | | (7% | ) |
| Natural gas (mcf/d) | | 93,870 | | | 30% | | | 97,792 | | | 29% | | | (4% | ) |
| Total oil equivalent (boe/d) | | 53,427 | | | 100% | | | 56,820 | | | 100% | | | (6% | ) |
| (1) | Harvest classifies our oil production, except that produced from Hay River, as light to medium and heavy according to NI 51-101 guidance. The oil produced from Hay River has an average API of 24o(medium grade) and is classified as a light to medium oil, notwithstanding that, it benefits from a heavy oil royalty regime and therefore would be classified as heavy oil according to NI 51-101. |
 | Harvest’s Second Quarter 2009 light/medium oil production was 24,316 bbl/d, a 1,049 bbl/d or 4% reduction from the prior year and substantially unchanged from the First Quarter of 2009. Production in the Second Quarter of 2009 was impacted by downtime at Hay River, our largest production area, due to a scheduled turnaround at a third party facility. The reduction in light/medium oil production for the three and six months ended June 30, 2009 of 4% and 5%, respectively, as compared to the prior year is largely the result of normal decline. |
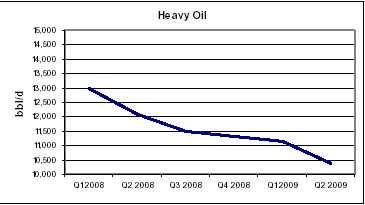 | During the Second Quarter of 2009, our heavy oil production averaged 10,365 bbls/d, a 1,727 bbl/d or 14% decrease from the prior year. Relative to the First Quarter of 2009, our Second Quarter heavy oil production decreased by 776 bbl/d or 7%, mainly due to downtime for servicing work at Lloydminster and Hayter and a reduced level of investment due to weak commodity prices. The reduction in heavy oil production for the three and six months ended June 30, 2009 of 1,727 bbl/d and 1,783 bbl/d, respectively, as compared to the prior year is largely the result of, increased water cuts on our larger producing wells in the west central Saskatchewan and Lloydminster areas, and reduced spending on our heavy oil properties due to weak commodity prices. |
9
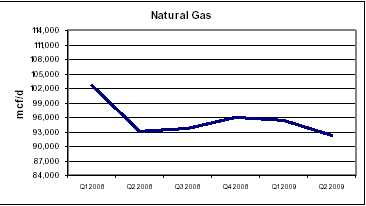 | Natural gas production averaged 92,335 mcf/d in the Second Quarter of 2009, a 679 mcf/d or 1% reduction from the Second Quarter of 2008. Relative to the First Quarter of 2009, our Second Quarter natural gas production decreased by 3,086 mcf/d or 3%, primarily due to downtime at certain third-party processing facilities, including in the Chedderville, Sylvan Lake, Innisfail and Crossfield areas, coupled with the divestment of approximately 5,000 mcf/d at the end of May 2009 of our Channel Lake properties. The reduction in natural gas production for the three and six months ended June 30, 2009 of 1% and 4%, respectively, as compared to the same period in the prior year is mainly due to natural declines offset by the acquisitions completed in the Third Quarter of 2008 and the incremental production from the 2009 winter drilling program. |
| Revenues | | | | | | | | | | | | | | | | | | |
| | | Three Months Ended June 30 | | | Six Months Ended June 30 | |
| | | | | | | | | | | | | | | | | | | |
| (000s) | | 2009 | | | 2008 | | | Change | | | 2009 | | | 2008 | | | Change | |
| Light to medium oil sales | $ | 127,320 | | $ | 252,206 | | | (50% | ) | $ | 216,725 | | $ | 453,081 | | | (52% | ) |
| Heavy oil sales | | 51,992 | | | 106,506 | | | (51% | ) | | 89,247 | | | 188,057 | | | (53% | ) |
| Natural gas sales | | 32,514 | | | 91,912 | | | (65% | ) | | 78,249 | | | 169,183 | | | (54% | ) |
| Natural gas liquids sales and other | | 10,289 | | | 21,142 | | | (51% | ) | | 20,814 | | | 38,778 | | | (46% | ) |
| Total sales revenue | | 222,115 | | | 471,766 | | | (53% | ) | | 405,035 | | | 849,099 | | | (52% | ) |
| Royalties | | (28,199 | ) | | (76,813 | ) | | (63% | ) | | (52,728 | ) | | (139,213 | ) | | (62% | ) |
| Net Revenues | $ | 193,916 | | $ | 394,953 | | | (51% | ) | $ | 352,307 | | $ | 709,886 | | | (50% | ) |
Our revenue is impacted by changes to production volumes, commodity prices and currency exchange rates. Our total sales revenue for the three months ended June 30, 2009 of $222.1 million is $249.7 million lower than the same period of the prior year, of which $223.9 million is attributed to lower realized prices and $25.8 million is attributed to lower production volumes. The price decrease reflects the 48% decrease in Edmonton Par pricing and the 66% decrease in AECO daily natural gas pricing in the Second Quarter of 2009 as compared to 2008, while our decreased production volumes are attributed to natural decline rates and reduced spending. Our revenues were also impacted by the weakening in the Canadian/US dollar exchange rate, which resulted in a favourable variance of approximately $29.6 million. For the six months ended June 30, 2009, our total sales revenue of $405.0 million is $444.1 million lower than the same period of the prior year, of which $388.6 million is attributed to lower realized prices, as the Edmonton Par Price decrease by 48% and the AECO daily natural gas price decrease by 54%, and $55.5 million is attributed to lower production.
As discussed earlier, light to medium oil sales revenue for the Second Quarter of 2009 was $124.9 million lower than the comparative period due to a $114.5 million unfavourable price variance and a $10.4 million unfavourable volume variance. For the six months ended June 30, 2009, light to medium oil sales revenue was $236.4 million lower than the comparative period due to a $213.3 million unfavourable price variance and a $23.1 million unfavourable volume variance. Heavy oil sales revenue in the Second Quarter of 2009 was $54.5 million lower than in the prior year due to a $39.3 million unfavourable price variance and a $15.2 million unfavourable volume variance. For the six months ended June 30, 2009, heavy oil revenue was $98.8 million lower than the comparative period due to a $71.2 million unfavourable price variance and a $27.6 million unfavourable volume variance. Natural gas sales revenue in the Second Quarter of 2009 was $59.4 million lower than in the prior year due to a $58.7 million unfavourable price variance and a $0.7 million unfavourable volume variance. For the six months ended June 30, 2009, natural gas sales revenue was $90.9 million lower than the comparative period due to an $83.2 million unfavourable price variance and a $7.7 million unfavourable volume variance.
10
During the Second Quarter of 2009, natural gas liquids and other sales revenue decreased by $10.9 million compared to the prior year resulting from an $11.3 million unfavourable price variance offset by a $0.4 million favourable volume variance. For the six months ended June 30, 2009, natural gas liquids and other sales revenue decreased by $18.0 million as compared to the prior year resulting from a $20.9 million unfavourable price variance offset by a $2.9 million favourable volume variance. Generally, the natural gas liquids volume variance will be aligned with our production of natural gas while the price variances will be aligned with the prices realized for our oil production. The positive volume variances for the three and six months ended June 30, 2009, is attributed to a few natural gas wells drilled in 2008 and the First Quarter of 2009 which yielded significant natural gas liquids.
Royalties
We pay Crown, freehold and overriding royalties to the owners of mineral rights from which production is generated. These royalties vary for each property and product and our Crown royalties are based on a sliding scale dependent on production volumes and commodity prices.
For the Second Quarter of 2009, net royalties as a percentage of gross revenue were 12.7% (2008 – 16.3%) and aggregated to $28.2 million (2008 - - $76.8 million). For the six months ended June 30, 2009, net royalties as a percentage of gross revenue were 13.0% (2008 – 16.4%) and aggregated to $52.7 million (2008 – $139.2 million). The decrease in our royalty rate for the three and six months ended June 30, 2009 is due to reduced royalty rates in a lower commodity price environment as mandated by the Government of Alberta’s New Royalty Framework.
| Operating Expenses | | | | | | | | | | | | | | | |
| | | | | | Three Months Ended June 30 | | | | |
| | | | | | | | | | | | | | | | |
| | | 2009 | | | | | | 2008 | | | | | | Per BOE | |
| (000s except per boe amounts) | | Total | | | Per BOE | | | Total | | | Per BOE | | | Change | |
| Operating expense | | | | | | | | | | | | | | | |
| Power and fuel | $ | 11,376 | | $ | 2.37 | | $ | 22,633 | | $ | 4.47 | | | (47% | ) |
| Well servicing | | 12,403 | | | 2.58 | | | 11,121 | | | 2.20 | | | 17% | |
| Repairs and maintenance | | 10,079 | | | 2.10 | | | 10,269 | | | 2.03 | | | 3% | |
| Lease rentals and property taxes | | 6,750 | | | 1.41 | | | 7,107 | | | 1.40 | | | 1% | |
| Processing and other fees | | 3,275 | | | 0.68 | | | 2,856 | | | 0.56 | | | 21% | |
| Labour – internal | | 5,332 | | | 1.11 | | | 5,769 | | | 1.14 | | | (3% | ) |
| Labour – contract | | 4,452 | | | 0.93 | | | 4,131 | | | 0.82 | | | 13% | |
| Chemicals | | 3,818 | | | 0.80 | | | 4,837 | | | 0.96 | | | (17% | ) |
| Trucking | | 2,860 | | | 0.60 | | | 2,910 | | | 0.58 | | | 3% | |
| Other | | 972 | | | 0.19 | | | 1,459 | | | 0.29 | | | (34% | ) |
| Total operating expense | $ | 61,317 | | $ | 12.77 | | $ | 73,092 | | $ | 14.45 | | | (12% | ) |
| Transportation and marketing expense | $ | 3,584 | | $ | 0.75 | | $ | 3,352 | | $ | 0.66 | | | 14% | |
| | | | | | | | | | |
| | | | | | Six Months Ended June 30 | | | | |
| | | | | | | | | | | | | | | | |
| | | 2009 | | | | | | 2008 | | | | | | Per BOE | |
| (000s except per boe amounts) | | Total | | | Per BOE | | | Total | | | Per BOE | | | Change | |
| Operating expense | | | | | | | | | | | | | | | |
| Power and fuel | $ | 29,404 | | $ | 3.04 | | $ | 41,133 | | $ | 3.98 | | | (24% | ) |
| Well servicing | | 25,452 | | | 2.63 | | | 23,159 | | | 2.24 | | | 17% | |
| Repairs and maintenance | | 22,292 | | | 2.31 | | | 22,832 | | | 2.21 | | | 5% | |
| Lease rentals and property taxes | | 14,348 | | | 1.48 | | | 14,612 | | | 1.41 | | | 5% | |
| Processing and other fees | | 8,473 | | | 0.88 | | | 5,229 | | | 0.51 | | | 73% | |
| Labour – internal | | 11,594 | | | 1.20 | | | 12,091 | | | 1.17 | | | 3% | |
| Labour – contract | | 8,238 | | | 0.85 | | | 8,032 | | | 0.78 | | | 9% | |
| Chemicals | | 7,822 | | | 0.81 | | | 9,233 | | | 0.89 | | | (9% | ) |
| Trucking | | 5,990 | | | 0.62 | | | 5,707 | | | 0.55 | | | 13% | |
| Other | | 3,039 | | | 0.31 | | | 3,387 | | | 0.32 | | | (3% | ) |
| Total operating expense | $ | 136,652 | | $ | 14.13 | | $ | 145,415 | | $ | 14.06 | | | -% | |
| Transportation and marketing expense | $ | 6,516 | | $ | 0.67 | | $ | 6,377 | | $ | 0.62 | | | 8% | |
11
Second Quarter 2009 operating costs totaled $61.3 million, a decrease of $11.8 million as compared to the same period in the prior year primarily due to lower power and fuel costs. On a per barrel basis, operating costs have decreased to $12.77/boe in the Second Quarter 2009 as compared to $14.45/boe during the same period in the prior year, a 12% decrease substantially attributed to reduced power and fuel costs partially offset by lower production volumes. On a year-to-date basis, operating costs totaled $136.7 million, a decrease of $8.8 million as compared to the same period in the prior year. On a per barrel basis, year-to-date operating costs have remained relatively consistent as lower power and fuel costs have been substantially offset by higher well servicing and processing fees coupled with lower production volumes.
Power and fuel costs, comprised primarily of electric power costs, represented approximately 19% of our total operating costs during the Second Quarter of 2009. The average Alberta electric power price of $32.31/MWh in the Second Quarter of 2009 was 70% lower than the average price of $107.56/MWh in the Second Quarter of 2008. Similarly, the average Alberta electric power price for the first six months of 2009 of $47.66/MWh was 48% lower than the same period in the prior year. However, the decrease is not fully reflected in our three and six month period ending June 30, 2009 power and fuel costs due to increased power consumption at Hay River as we began purchasing power from BC Hydro late in the First Quarter of 2008. During the First Quarter of 2009, Harvest electricity usage in Alberta was exposed to market prices. Beginning in April 2009, we have electric power price risk management contracts on 10 MWh at an average price of $61.90 per MWh through December 2009, which resulted in a loss of $0.6 million for the three and six months ended June 30, 2009 as compared to gains of $3.6 million and $5.2 million, respectively, in the prior year. The following table details the electric power costs per boe before and after the impact of our price risk management program.
| | | Three Months Ended June 30 | | | Six Months Ended June 30 | |
| (per boe) | | 2009 | | | 2008 | | | Change | | | 2009 | | | 2008 | | | Change | |
| Electric power and fuel costs | $ | 2.37 | | $ | 4.47 | | | (47% | ) | $ | 3.04 | | $ | 3.98 | | | (24% | ) |
| Realized losses (gains) on electricity risk managementcontracts | | 0.13 | | | (0.71 | ) | | (118% | ) | | 0.07 | | | (0.50 | ) | | (114% | ) |
| Net electric power and fuel costs | $ | 2.50 | | $ | 3.76 | | | (34% | ) | $ | 3.11 | | $ | 3.48 | | | (11% | ) |
| Alberta Power Pool electricity price (per MWh) | $ | 32.31 | | $ | 107.56 | | | (70% | ) | $ | 47.66 | | $ | 92.13 | | | (48% | ) |
For the three and six months ended June 30, 2009, transportation and marketing expense remained relatively unchanged at $3.6 million and $6.5 million, respectively, as compared to the prior year when transportation and marketing expense totaled $3.4 million and $6.4 million, respectively. These costs relate primarily to delivery of natural gas to Alberta’s natural gas sales hub, the AECO Storage Hub, and to a lesser extent, our costs of trucking clean crude oil to pipeline receipt points. As a result, the total dollar amount of costs fluctuates in relation with our natural gas production volumes while the cost per boe typically remains relatively constant.
| Operating Netback | | | | | | | | | | | | |
| | | Three Months Ended June 30 | | | Six Months Ended June 30 | |
| (per boe) | | 2009 | | | 2008 | | | 2009 | | | 2008 | |
| Revenues | $ | 46.28 | | $ | 93.29 | | $ | 41.89 | | $ | 82.11 | |
| Royalties | | (5.88 | ) | | (15.19 | ) | | (5.45 | ) | | (13.46 | ) |
| Operating expense | | (12.77 | ) | | (14.45 | ) | | (14.13 | ) | | (14.06 | ) |
| Transportation and marketing expense | | (0.75 | ) | | (0.66 | ) | | (0.67 | ) | | (0.62 | ) |
| Operating netback(1) | $ | 26.88 | | $ | 62.99 | | $ | 21.64 | | $ | 53.97 | |
| (1)This is a non-GAAP measure; please refer to “Non-GAAP Measures” in this MD&A. | | | | | | | | | | |
Harvest’s operating netback represents the net amount realized on a per boe basis after deducting directly related costs. For the three and six months ended June 30, 2009, our operating netback decreased by $36.11/boe and $32.33/boe, respectively, as compared to the prior year. The decreases are primarily attributed to lower realized commodity prices, reflecting the decrease in Edmonton Par, Bow River and AECO pricing, partially offset by a decrease in royalties.
12
| General and Administrative (“G&A”) Expense | | | | | | | | | | | | | | | | |
| | | Three Months Ended June 30 | | | Six Months Ended June 30 | |
| | | | | | | | | | | | | | | | | | | |
| (000s except per boe) | | 2009 | | | 2008 | | | Change | | | 2009 | | | 2008 | | | Change | |
| Cash G&A | $ | 7,945 | | $ | 8,318 | | | (4% | ) | $ | 16,598 | | $ | 16,787 | | | (1% | ) |
| Unit based compensation (recovery) expense | | 929 | | | 4,392 | | | (79% | ) | | (330 | ) | | 7,832 | | | (104% | ) |
| Total G&A | $ | 8,874 | | $ | 12,710 | | | (30% | ) | $ | 16,268 | | $ | 24,619 | | | (34% | ) |
| | | | | | | | | | | | | | | | | | | |
| Cash G&A per boe | $ | 1.66 | | $ | 1.64 | | | 1% | | $ | 1.72 | | $ | 1.62 | | | 6% | |
For the three months ended June 30, 2009, cash G&A costs decreased by $0.4 million (4%) as compared to the same period in the prior year, primarily due to cost reduction efforts made in the first half of 2009. For the six months ended June 30, 2009, cash G&A costs decreased by $0.2 million (1%), as the majority of the cost saving benefits were not realized until the Second Quarter of 2009. Generally, approximately 75% of our cash G&A expenses are related to salaries and other employee related costs.
Our unit based compensation plans provide employees with the option of settling outstanding awards with cash. As a result, unit based compensation expense is determined using the intrinsic method, being the difference between the Trust Unit trading price and the strike price of the unit awards adjusted for the proportion that is vested. For the three and six months ended June 30, 2009, total unit based compensation expense decreased $3.5 million and $8.2 million, respectively, as compared to the same periods in the prior year as the market price of our Trust Units dropped in 2009, while appreciating in 2008.
| Depletion, Depreciation, Amortization and Accretion Expense | | | | | | | | | | | | | |
| | | Three Months Ended June 30 | | | Six Months Ended June 30 | |
| (000s except per boe) | | 2009 | | | 2008 | | | Change | | | 2009 | | | 2008 | | | Change | |
| Depletion, depreciation and amortization | $ | 106,841 | | $ | 99,421 | | | 7% | | $ | 213,050 | | $ | 205,625 | | | 4% | |
| Depletion of capitalized asset retirement costs | | 4,741 | | | 3,354 | | | 41% | | | 9,489 | | | 6,978 | | | 36% | |
| Accretion on asset retirement obligation | | 6,037 | | | 4,596 | | | 31% | | | 12,092 | | | 9,193 | | | 32% | |
| Total depletion, depreciation, amortization and accretion | $ | 117,619 | | $ | 107,371 | | | 10% | | $ | 234,631 | | $ | 221,796 | | | 6% | |
| Per boe | $ | 24.50 | | $ | 21.23 | | | 15% | | $ | 24.26 | | $ | 21.45 | | | 13% | |
Our overall depletion, depreciation, amortization and accretion (“DDA&A”) expense for the three and six months ended June 30, 2009 was $10.2 million and $12.8 million higher, respectively, compared to the prior year. The increase is attributed to higher accretion expense due to an increase in the asset retirement obligation balance quarter over quarter and slightly higher finding, development and acquisition costs that have increased our depletion rate, which was offset by lower production volumes.
| Capital Expenditures | | | | | | | | | | | | |
| | | Three Months Ended June 30 | | | Six Months Ended June 30 | |
| (000s) | | 2009 | | | 2008 | | | 2009 | | | 2008 | |
| Land and undeveloped lease rentals | $ | 354 | | $ | 1,164 | | $ | 1,188 | | $ | 2,149 | |
| Geological and geophysical | | 237 | | | 811 | | | 1,252 | | | 3,947 | |
| Drilling and completion | | 11,829 | | | 16,910 | | | 71,851 | | | 73,286 | |
| Well equipment, pipelines and facilities | | 18,616 | | | 18,259 | | | 62,426 | | | 34,667 | |
| Capitalized G&A expenses | | 2,532 | | | 2,467 | | | 5,294 | | | 5,133 | |
| Furniture, leaseholds and office equipment | | (177 | ) | | 58 | | | 90 | | | 58 | |
| Development capital expenditures excluding | | | | | | | | | | | | |
| acquisitions and non-cash items | | 33,391 | | | 39,669 | | | 142,101 | | | 119,240 | |
| Non-cash capital (recoveries) additions | | 194 | | | 812 | | | (108 | ) | | 1,355 | |
| Total development capital expenditures excluding acquisitions | $ | 33,585 | | $ | 40,481 | | $ | 141,993 | | $ | 120,595 | |
13
Our activity in the Second Quarter of 2009 was focused on the completion of our Hay River project in northeast British Columbia. Hay River is a winter access only property requiring that all heavy equipment, such as drilling rigs, only operate from December to March. Early in the Second Quarter we started the completion and tie-in of the 39 wells we drilled at Hay River over the winter season, resulting in expenditures of approximately $19 million. The new wells were brought on stream during the quarter with production for our Hay River property reaching 7,000 boe/d. In our Rimbey area, we completed the tie-in of 3 wells at Chedderville drilled during the First Quarter, and drilled a new Ostracod discovery well at Wilson Creek for total capital expenditures of approximately $5 million. Drilling activity was significantly reduced in the Second Quarter, as we drilled 3 wells (2.5 net) as compared to 82 wells (62.1 net) in the First Quarter of 2009 due to spring breakup.
Polymer injection at our Wainwright project commenced in June and we will be monitoring the performance over the Third and Fourth Quarters of 2009.
The following summarizes Harvest’s participation in gross and net wells drilled during the three months ended June 30, 2009:
| | Total Wells | Successful Wells | Abandoned Wells |
| Area | Gross | Net | Gross | Net | Gross | Net |
| | | | | | | |
| Hay River | - | - | - | - | - | - |
| Southeast Saskatchewan | 2.0 | 1.5 | 2.0 | 1.5 | - | - |
| Southeast Alberta | - | - | - | - | - | - |
| Red Earth | - | - | - | - | - | - |
| Suffield | - | - | - | - | - | - |
| Lloydminster/Hayter | - | - | - | - | - | - |
| Rimbey | 1.0 | 1.0 | 1.0 | 1.0 | - | - |
| Markerville | - | - | - | - | - | - |
| Northwest Alberta | - | - | - | - | - | - |
| Other Areas | - | - | - | - | - | - |
| Total | 3.0 | 2.5 | 3.0 | 2.5 | - | - |
The following summarizes Harvest’s participation in gross and net wells drilled during the six months ended June 30, 2009:
| | Total Wells | Successful Wells | Abandoned Wells |
| Area | Gross(1) | Net | Gross | Net | Gross | Net |
| | | | | | | |
| Hay River | 43.0 | 43.0 | 43.0 | 43.0 | - | - |
| Southeast Saskatchewan | 4.0 | 3.5 | 4.0 | 3.5 | - | - |
| Southeast Alberta | 25.0 | 11.5 | 25.0 | 11.5 | - | - |
| Red Earth | 1.0 | 1.0 | 1.0 | 1.0 | - | - |
| Suffield | 1.0 | 1.0 | 1.0 | 1.0 | - | - |
| Lloydminster/Hayter | - | - | - | - | - | - |
| Rimbey | 10.0 | 3.6 | 10.0 | 3.6 | - | - |
| Markerville | - | - | - | - | - | - |
| Northwest Alberta | - | - | - | - | - | - |
| Other Areas | 1.0 | 1.0 | 1.0 | 1.0 | - | - |
| Total | 85.0 | 64.6 | 85.0 | 64.6 | - | - |
| (1)Excludes 1 additional well that we have an overriding royalty interest in. | | | | |
Asset Retirement Obligation (“ARO”)
In connection with property acquisitions and development expenditures, we record the fair value of the ARO as a liability in the same year the expenditures occur. The associated asset retirement costs are capitalized as part of the carrying amount of the assets and are depleted and depreciated over our estimated net proved reserves. Once the initial ARO is measured, it is adjusted at the end of each period to reflect the passage of time as well as changes in the estimated future cash flows of the underlying obligation. Our asset retirement obligation increased by $4.9 million during the first six months of 2009 as a result of accretion expense of $12.1 million and new liabilities recorded of $0.4 million, offset by $5.0 million of asset retirement expenditures and net dispositions of $2.5 million.
14
Acquisitions and Divestitures
During the Second Quarter, we closed the sale of two non-operated properties with net proceeds of approximately $63 million. The sale of our natural gas interests in Channel Lake for $43 million resulted in a disposition metric of approximately $53,000 per boe based on its current production of 4,860 mcf/d and approximately $2.30 per mcf based on proved plus probable reserves of approximately 19 bcf. Our sale of certain non-operated interests in the Pembina area for $20 million resulted in a disposition metric of approximately $94,800 per boe based on its current production of 211 boe/d (weighted 70% light oil and natural gas liquids and 30% natural gas) and approximately $13.00 per boe based on proved plus probable reserves of 1,520 mboe. The net proceeds were applied to reduce our bank borrowings.
On June 23, 2009, we offered to purchase all of the outstanding shares of Pegasus Oil and Gas Inc., a natural gas weighted producer with approximately 650 boe/d of production, in exchange for Trust Units. On July 30, 2009, the offer expired with slightly less than 90% of the outstanding shares tendered at which time, we extended the offer to August 11, 2009 in an effort to increase the number of tendered shares to the 90% minimum condition of our offer. Including the obligation to assume approximately $14 million of bank debt, the acquisition metrics are approximately $30,000 per boe/d of production and approximately $4.25 per boe of reserves on a proved plus probable basis. The principal asset in this acquisition is a 7% working interest in liquids rich natural gas production from a property in the Crossfield area which is operated by Harvest. This potential acquisition includes access to over 150,000 acres of land and over $50 million of income tax pools. The President and Chief Executive Officer of Harvest as well as two Directors of Harvest each hold a nominal number of shares in Pegasus Oil and Gas Inc.
DOWNSTREAM OPERATIONS
Second Quarter Highlights
Successfully completed a 42-day planned turnaround of the hydrocracking and hydrogen units, replacement of distillate hydrotreating and hydrocracking catalyst, and regeneration of the naphtha reforming unit catalyst for a total cost of approximately $47.5 million, with the refinery exiting the quarter with throughput averaging approximately 117,000 bbls/d comprised of 110,000 bbls/d of crude oil feedstock and 7,000 bbls/d of Vacuum Gas Oil.
In addition to the turnaround, capital expenditures totaled $19.9 million during the quarter including $7.0 million to upgrade heaters and $2.5 million related to debottlenecking projects.
During the Second Quarter of 2009, the operational hedging of the WTI component of our feedstock costs through the Supply and Offtake Agreement resulted in a US$12.2 million reduction in our feedstock costs (US$2.54/bbl of throughput). Further, the weakening of the Canadian dollar relative to the U.S. dollar in the Second Quarter of 2009 as compared to the Second Quarter of 2008, added $4.2 million to our gross margin in 2009 as our U.S. dollar denominated margins are translated to Canadian dollars.
During the Second Quarter of 2009, downstream refining gross margins averaged US$6.50/bbl reflecting a US$0.84/bbl increase over the prior year mainly due to improved margins on high sulphur fuel oil (“HSFO”) and gasoline products, partially offset by lower margins on distillate products and lower discounts on our feedstock purchases, all relative to the WTI benchmark price.
15
| Summary of Financial and Operational Results | | | | | | | | | | | | | | | | |
| | | Three Months Ended June 30 | | | Six Months Ended June 30 | |
| (in $000’s except where noted below) | | 2009 | | | 2008 | | | Change | | | 2009 | | | 2008 | | | Change | |
| | | | | | | | | | | | | | | | | | | |
| Revenues | | 369,081 | | | 1,227,126 | | | (70% | ) | | 941,785 | | | 2,289,545 | | | (59% | ) |
| Purchased feedstock for processing and | | | | | | | | | | | | | | | | | | |
| products purchased for resale | | 322,855 | | | 1,160,558 | | | (72% | ) | | 704,692 | | | 2,120,550 | | | (67% | ) |
| Gross margin(1) | | 46,226 | | | 66,568 | | | (31% | ) | | 237,093 | | | 168,995 | | | 40% | |
| | | | | | | | | | | | | | | | | | | |
| Costs and expenses | | | | | | | | | | | | | | | | | | |
| Operating expense | | 26,974 | | | 25,617 | | | 5% | | | 50,940 | | | 51,512 | | | (1% | ) |
| Purchased energy expense | | 11,161 | | | 29,899 | | | (63% | ) | | 27,768 | | | 73,026 | | | (62% | ) |
| Turnaround and catalyst expense | | 43,285 | | | - | | | 100% | | | 47,487 | | | - | | | 100% | |
| Marketing expense | | 3,122 | | | 9,401 | | | (67% | ) | | 6,101 | | | 17,998 | | | (66% | ) |
| General and administrative expense | | 520 | | | 600 | | | (13% | ) | | 875 | | | 1,168 | | | (25% | ) |
| Depreciation and amortization expense | | 19,076 | | | 16,743 | | | 14% | | | 41,260 | | | 33,243 | | | 24% | |
| Goodwill impairment | | 206,465 | | | - | | | 100% | | | 206,465 | | | - | | | 100% | |
| Loss From Operations(1) | | (264,377 | ) | | (15,692 | ) | | 1,585% | | | (143,803 | ) | | (7,952 | ) | | 1,708% | |
| | | | | | | | | | | | | | | | | | | |
| Cash capital expenditures | | 19,929 | | | 8,619 | | | 131% | | | 26,833 | | | 14,646 | | | 83% | |
| | | | | | | | | | | | | | | | | | | |
| Feedstock volume (bbl/day)(2) | | 52,808 | | | 100,422 | | | (47% | ) | | 78,410 | | | 106,211 | | | (26% | ) |
| | | | | | | | | | | | | | | | | | | |
| Yield (000’s barrels) | | | | | | | | | | | | | | | | | | |
| Gasoline and related products | | 1,372 | | | 2,627 | | | (48% | ) | | 4,693 | | | 6,044 | | | (22% | ) |
| Ultra low sulphur diesel and jet fuel | | 1,830 | | | 3,755 | | | (51% | ) | | 5,324 | | | 8,016 | | | (34% | ) |
| High sulphur fuel oil | | 1,183 | | | 2,534 | | | (53% | ) | | 3,553 | | | 5,100 | | | (30% | ) |
| Total | | 4,385 | | | 8,916 | | | (51% | ) | | 13,570 | | | 19,160 | | | (29% | ) |
| | | | | | | | | | | | | | | | | | | |
| Average refining gross margin (US$/bbl)(3) | | 6.50 | | | 5.66 | | | 15% | | | 12.51 | | | 7.36 | | | 70% | |
| (1) | These are non-GAAP measures; please refer to “Non-GAAP Measures” in this MD&A. |
| (2) | Barrels per day are calculated using total barrels of crude oil feedstock and vacuum gas oil. |
| (3) | Average refining gross margin is calculated based on per barrel of feedstock throughput. |
Refining Benchmark Prices
The following average benchmark prices and currency exchange rates are the reference points from which we discuss our refinery’s financial performance:
| | Three Months Ended June 30 | Six Months Ended June 30 |
| | 2009 | 2008 | Change | 2009 | 2008 | Change |
| WTI crude oil (US$/bbl) | 59.62 | 123.98 | (52%) | 51.35 | 110.94 | (54%) |
| Brent crude oil (US$/bbl) | 59.76 | 122.94 | (51%) | 52.72 | 108.17 | (51%) |
| Basrah Official Sales Price Discount (US$/bbl) | (1.88) | (8.07) | (77%) | (2.82) | (7.93) | (64%) |
| RBOB gasoline (US$/bbl/gallon) | 71.87/1.71 | 133.44/3.18 | (46%) | 62.00/1.48 | 118.90/2.83 | (48%) |
| Heating Oil (US$/bbl/gallon) | 65.33/1.56 | 148.62/3.54 | (56%) | 60.90/1.45 | 131.86/3.14 | (54%) |
| High Sulphur Fuel Oil (US$/bbl) | 50.93 | 85.23 | (40%) | 43.96 | 77.60 | (43%) |
| Canadian / U.S. dollar exchange rate | 0.858 | 0.990 | (13%) | 0.831 | 0.993 | (16%) |
During the Second Quarter of 2009, the Heating Oil Crack Spread averaged US$5.71/bbl, a decrease of US$7.67/bbl over the First Quarter of 2009 and a decrease of US$18.93/bbl over the US$24.64/bbl averaged in the prior year, due to soft demand resulting from the global economic slowdown. The RBOB Gasoline Crack Spread averaged US$12.25/bbl in the Second Quarter of 2009, an increase of US$3.20/bbl from the First Quarter of 2009 and an increase of US$2.79/bbl from the US$9.46/bbl in the prior year, as North American refinery output was curtailed to balance weak demand resulting in the improvement in gasoline margins. The HSFO price averaged US$8.69/bbl less than WTI in the Second Quarter of 2009, a decrease of US$2.60/bbl over the First Quarter of 2009 and an improvement of US$30.06/bbl over the prior year, all relative to the WTI benchmark price. Similarly, for the six month period ended June 30, 2009, as compared to the same period in the prior year, the Heating Oil Crack Spread decreased by US$11.37/bbl to US$9.55/bbl, the RBOB Gasoline Crack Spread increased by US$2.69/bbl to US$10.65/bbl, and the HSFO price relative to WTI improved by US$25.95/bbl to US$7.39/bbl less WTI.
16
During the three and six months ended June 30, 2009, the Canadian/U.S. dollar exchange rate averaged 0.858 and 0.831, respectively, as compared to 0.990 and 0.993, respectively, in the prior year. The weakening of the Canadian dollar in 2009 has improved the contribution from our Downstream operations as substantially all of its gross margin, cost of purchased energy and marketing expense are denominated in U.S. dollars. The net impact of a weakening Canadian dollar increased our refining gross margin by $4.2 million in the Second Quarter as compared to the prior year.
Summary of Gross Margin
The following table summarizes our downstream gross margin for the three and six months ended June 30, 2009 and 2008 segregated between refining activities and petroleum marketing and other related businesses.
| | | | | | | | | Three Months Ended June 30 | | | | | | | |
| | | | | | 2009 | | | | | | | | | 2008 | | | | |
| (000’s of Canadian dollars) | | Refining | | | Marketing | | | Total | | | Refining | | | Marketing | | | Total | |
| Sales revenue(1) | | 350,845 | | | 102,833 | | | 369,081 | | | 1,200,950 | | | 180,217 | | | 1,227,126 | |
| Cost of feedstock for processing and products | | | | | | | | | | | | | | | | | | |
| for resale(1) | | 314,455 | | | 92,997 | | | 322,855 | | | 1,148,750 | | | 165,849 | | | 1,160,558 | |
| Gross margin(2) | | 36,390 | | | 9,836 | | | 46,226 | | | 52,200 | | | 14,368 | | | 66,568 | |
| | | | | | | | | | | | | | | | | | | |
| Average refining gross margin (US$/bbl) | | 6.50 | | | | | | | | | 5.66 | | | | | | | |
| | | | | | | | | | | | | | | | | | | |
| | | | | | | | | Six Months Ended June 30 | | | | | | | |
| | | | | | 2009 | | | | | | | | | 2008 | | | | |
| (000’s of Canadian dollars) | | Refining | | | Marketing | | | Total | | | Refining | | | Marketing | | | Total | |
| Sales revenue(1) | | 901,059 | | | 203,508 | | | 941,785 | | | 2,237,581 | | | 324,223 | | | 2,289,545 | |
| Cost of feedstock for processing and products | | | | | | | | | | | | | | | | | | |
| for resale(1) | | 687,438 | | | 180,036 | | | 704,692 | | | 2,094,349 | | | 298,460 | | | 2,120,550 | |
| Gross margin(2) | | 213,621 | | | 23,472 | | | 237,093 | | | 143,232 | | | 25,763 | | | 168,995 | |
| | | | | | | | | | | | | | | | | | | |
| Average refining gross margin (US$/bbl) | | 12.51 | | | | | | | | | 7.36 | | | | | | | |
(1)
Downstream sales revenue and cost of products for processing and resale are net of intra-segment sales of $84.6 million and $162.8 million for the three and six months ended June 30, 2009 ($154.0 million and $272.3 million – three and six months ended June 30, 2008) reflecting the refined products produced by the refinery and sold by the Marketing Division.
(2)
This is a non-GAAP measure; please refer to “Non-GAAP Measures” in this MD&A.
For the three months ended June 30, 2009, our refining gross margin was $36.4 million, a decrease of $140.8 million as compared to the First Quarter of 2009 and a decrease of $15.8 million as compared to the prior year. The decrease in refining gross margin is primarily due to the reduction in throughput due to the planned turnaround completed in the Second Quarter of 2009 resulting in average throughput of 52,808 bbl/d as compared to 100,422 bbl/d in the same period of the prior year, as well as an US$18.93/bbl decrease in the Heating Oil benchmark crack spread, and a US$3.28/bbl reduction in our feedstock discount. These factors were partially offset by a US$30.06/bbl improvement in the HSFO benchmark crack spread, a US$2.79/bbl improvement in the RBOB gasoline benchmark crack spread, a US$12.2 million operational hedging gain on our feedstock purchases, and the translation of our U.S. dollar denominated gross margin to Canadian dollars resulted in an increase to gross margin of $4.2 million. The reduction in throughput resulted in an unfavourable volume variance of $24.7 million while the net impact of the changes in refined product and feedstock prices resulted in a favourable price variance of $8.9 million, of which $4.2 million relates to the change in the Canadian/U.S. dollar exchange rate.
For the six months ended June 30, 2009, our refining gross margin was $213.6 million as compared to $143.2 million in the prior year, an increase of $70.4 million. The increase in refining gross margin is primarily due to US$25.95/bbl improvement in the HSFO benchmark crack spread, a US$2.69/bbl improvement in the RBOB gasoline benchmark crack spread, a US$57.2 million operational hedging gain on our feedstock purchases, and the translation of our U.S. dollar denominated gross margin to Canadian dollars in light of the weakening Canadian dollar. These factors were partially offset by an US$11.37/bbl decrease in the Heating Oil benchmark crack spread. The reduction in throughput resulted in an unfavourable volume variance of $38.1 million while the net impact of the changes in refined product and feedstock prices resulted in a favourable price variance of $108.5 million, of which $20.5 million relates to the change in the Canadian/U.S. dollar exchange rate.
17
For the three and six months ended June 30, 2009, our marketing division earned a gross margin of $9.8 million and $23.5 million, respectively, as compared to $14.4 million and $25.8 million, respectively, in the prior year. The decrease for the three and six months ended June 30, 2009 of 32% and 9% respectively, compared to the prior year is primarily due to reduced margins on sulphur sales.
Refining Gross Margin
We analyze our refining gross margin on each refined product and our sales revenue relative to benchmark prices for the refined product and the WTI benchmark price. With respect to feedstock costs, we analyze our price discounts relative to the WTI benchmark price and segregate crude oil sources by country of origin. The following graph summarizes our average refining gross margin relative to the cost of feedstock for the period of January 2008 to June 2009:
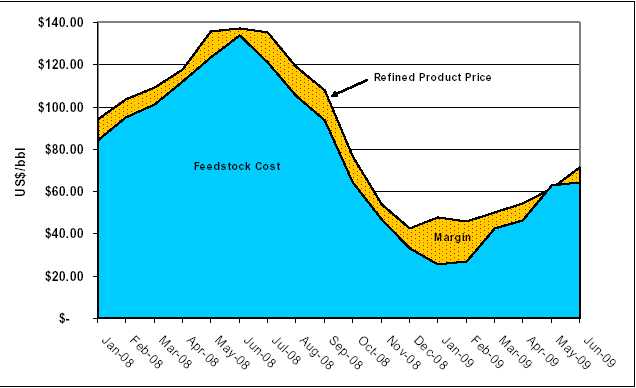
18
The following chart summarizes our refining gross margin by refined product over the same time period by quarter:
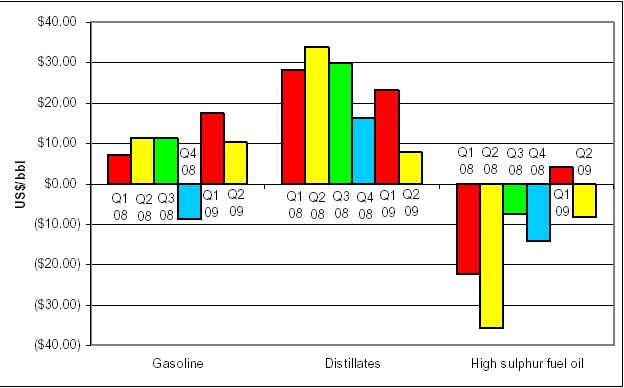
Our gasoline margins in the Second Quarter of 2009 decreased from the First Quarter of 2009, however they remained relatively unchanged from the Second Quarter of 2008. Margins on distillate products have decreased significantly in the Second Quarter as compared to the First Quarter of 2009 and the Second Quarter of 2008. Refining gross margins on HSFO decreased in the Second Quarter of 2009 relative to the First Quarter of 2009, however they have improved significantly relative to the Second Quarter of 2008.
Refinery Sales Revenue
Our refinery sales revenue is dependent on the selling price as well as the yield of refined products produced from the crude oil and other feedstocks. Although our yield can be altered slightly by adjusting refinery operations to react to market conditions and seasonal demand, product yields are primarily impacted by the type of crude oil feedstock processed and refinery performance. A comparison of our refinery yield, product pricing and revenue for the three and six months ended June 30, 2009 and 2008 is presented below:
| | | | | | | | | Three Months Ended June 30 | | | | | | | |
| | | | | | 2009 | | | | | | | | | 2008 | | | | |
| | | Refinery | | | Volume | | | Sales | | | Refinery | | | Volume | | | Sales | |
| | | Revenues | | | | | | Price(1) | | | Revenues | | | | | | Price(1) | |
| | | (000’s of Cdn $) | | | (000s of bbls) | | | (US$ per bbl/ | | | (000’s of Cdn $) | | | (000s of bbls) | | | (US$ per bbl/ | |
| | | | | | | | | US$ per US gal) | | | | | | | | | US$ per US gal) | |
| | | | | | | | | | | | | | | | | | | |
| Gasoline products | | 120,889 | | | 1,449 | | | 71.58/1.70 | | | 366,304 | | | 2,710 | | | 133.82/3.19 | |
| Distillates | | 164,499 | | | 2,042 | | | 69.12/1.65 | | | 606,578 | | | 3,844 | | | 156.22/3.72 | |
| High sulphur fuel oil | | 65,457 | | | 1,058 | | | 53.08 | | | 228,068 | | | 2,606 | | | 86.64 | |
| | | 350,845 | | | 4,549 | | | 66.17 | | | 1,200,950 | | | 9,160 | | | 129.80 | |
| Inventory adjustment | | | | | (164 | ) | | | | | | | | (244 | ) | | | |
| Total production | | | | | 4,385 | | | | | | | | | 8,916 | | | | |
| Yield (as a % of Feedstock)(2) | | | 91% | | | | | | | | | 98% | | | | |
19
| | | | | | | | | Six Months Ended June 30 | | | | | | | |
| | | | | | 2009 | | | | | | | | | 2008 | | | | |
| | | Refinery | | | Volume | | | Sales | | | Refinery | | | Volume | | | Sales | |
| | | Revenues | | | | | | Price(1) | | | Revenues | | | | | | Price(1) | |
| | | (000’s of Cdn $) | | | (000s of bbls) | | | (US$ per bbl/ | | | (000’s of Cdn $) | | | (000s of bbls) | | | (US$ per bbl/ | |
| | | | | | | | | US$ per US gal) | | | | | | | | | US$ per US gal) | |
| | | | | | | | | | | | | | | | | | | |
| Gasoline products | | 335,360 | | | 4,941 | | | 56.40/1.34 | | | 721,868 | | | 6,238 | | | 114.91/2.74 | |
| Distillates | | 388,953 | | | 5,315 | | | 60.81/1.45 | | | 1,119,164 | | | 8,060 | | | 137.88/3.28 | |
| High sulphur fuel oil | | 176,746 | | | 3,531 | | | 41.60 | | | 396,549 | | | 4,968 | | | 79.26 | |
| | | 901,059 | | | 13,787 | | | 54.31 | | | 2,237,581 | | | 19,266 | | | 115.33 | |
| Inventory adjustment | | | | | (217 | ) | | | | | | | | (106 | ) | | | |
| Total production | | | | | 13,570 | | | | | | | | | 19,160 | | | | |
| Yield (as a % of Feedstock)(2) | | | 96% | | | | | | | | | 99% | | | | |
| (1) | Average product sales prices are based on the deliveries at our refinery loading facilities. |
| (2) | After adjusting for changes in inventory held for resale. |
For the three months ended June 30, 2009, our refinery yield was comprised of 31% gasoline products, 42% distillates and 27% HSFO which is relatively consistent with the prior year when refinery yield averaged 30%, 42% and 28% for the same products respectively. For the six months ended June 30, 2009, our refinery yield was comprised of 35% gasoline products, 39% distillates and 26% HSFO as compared to 32%, 42%, and 26%, respectively, in the prior year. The shift in product yield in 2009 from distillates to gasoline is attributed to end of run activity of the hydrocracker catalyst as well as other end of run conditions in the First Quarter of 2009 prior to the scheduled turnaround completed in the Second Quarter of 2009 and operational changes to capitalize on the higher gasoline margins.
In the Second Quarter of 2009, our average sales price was US$66.17/bbl (a premium of US$6.55/bbl over WTI) as compared to an average selling price of US$129.80/bbl in the prior year (a premium of US$5.82/bbl over WTI). This increase in premium relative to WTI represents a $3.9 million favourable price variance. For the six months ended June 30, 2009, our average sales price was US$54.31/bbl (a premium of US$2.96/bbl over WTI) as compared to an average selling price of US$115.33/bbl in the prior year (a premium of US$4.39/bbl over WTI). This decrease in premium relative to WTI represents a $23.7 unfavourable price variance.
During the Second Quarter of 2009, the average sales price of our gasoline products of US$71.58/bbl was an US$11.96/bbl premium to the average WTI price as compared to a US$9.84/bbl premium over WTI realized in the prior year, representing a $3.6 million increase in gross margin. This US$2.12/bbl increase in our gasoline refining gross margin relative to WTI is reflective of the US$2.79/bbl increase in the NYMEX benchmark RBOB gasoline crack spread. For the six months ended June 30, 2009, the average sales price of our gasoline products of $56.40/bbl was a US$5.05/bbl premium to the average WTI price as compared to a US$3.97/bbl premium over WTI realized in the prior year, representing a $6.4 million increase in gross margin. This US$1.08/bbl increase in our gasoline refining gross margin relative to WTI is attributed to the US$2.69/bbl increase in the NYMEX benchmark RBOB gasoline crack spread, offset by increased freight costs and timing under the Supply and Offtake Agreement with Vitol.
During the Second Quarter of 2009, the average sales price for our distillate products of US$69.12/bbl was a US$9.50/bbl premium over the average WTI price as compared to a US$32.24/bbl premium over WTI realized in the prior year representing a $54.1 million drop in gross margin. The US$22.74/bbl decrease in our distillate refining gross margin relative to WTI reflects the US$18.93/bbl decrease in the NYMEX benchmark Heating Oil crack spread. For the six months ended June 30, 2009, the average sales price for our distillate products of US$60.81/bbl was a US$9.46/bbl premium over the average WTI price as compared to a US$26.94/bbl premium over WTI realized in the prior year representing a $111.8 million reduction in gross margin.
During the Second Quarter of 2009, the average sales price of our HSFO of US$53.08/bbl was a US$6.54/bbl discount to the average WTI price as compared to a US$37.34/bbl discount in the prior year, representing a $38.0 million increase in gross margin. The US$30.80/bbl improvement in our HSFO refining gross margin relative to WTI reflects the US$30.06/bbl increase in the benchmark HSFO crack spread. For the six months ended June 30, 2009, the average sales price of our HSFO of US$41.60/bbl was a US$9.75/bbl discount to the average WTI price as compared to a US$31.68/bbl discount in the prior year, representing a $93.2 million increase in gross margin. The US$21.93/bbl improvement in our HSFO refining gross margin relative to WTI reflects the US$25.95/bbl increase in the HSFO benchmark crack spread.
20
Refinery Feedstock
The volatility of WTI prices from month to month makes it difficult to compare the financial impact of specific crude types when our consumption of crude types varies from month to month and costs are aggregated over the quarter. Further, our refinery competes for international waterborne crude oil and VGO and the WTI benchmark price reflects a land-locked North American price with limited access to the international markets.
The cost of our feedstock reflects numerous factors beyond WTI prices, including the quality of the crude oil processed, the mix of crude oil types, the costs of transporting the crude oil to our refinery, the operational hedging of the WTI component of our feedstock costs through the Supply and Offtake Agreement, the ten day delay in pricing pursuant to the Supply and Offtake Agreement and for Iraqi crude oil purchased, the Official Selling Price (“OSP”) as set by the Oil Marketing Company of the Republic of Iraq. On a monthly basis, the OSP discount relative to the WTI benchmark price is announced for North American deliveries and is influenced by the quality of the crude oil as well as by the demand from other purchasers.
A comparison of crude oil and VGO feedstock processed for the three and six months ended June 30, 2009 and 2008 is presented below:
| | | | | | Three Months Ended June 30 | | | | | | | |
| | | | | | 2009 | | | | | | | | | 2008 | | | | |
| | | Cost of | | | Volume | | | Cost per | | | Cost of | | | Volume | | | Cost per | |
| | | Feedstock | | | | | | Barrel(1) | | | Feedstock | | | | | | Barrel(1) | |
| | | (000’s of Cdn $) | | | (000s of bbls) | | | (US$/bbl) | | | (000’s of Cdn $) | | | (000s of bbls) | | | (US$/bbl) | |
| | | | | | | | | | | | | | | | | | | |
| Iraqi | | 208,942 | | | 2,901 | | | 61.80 | | | 684,241 | | | 5,625 | | | 120.43 | |
| Russian | | 66,374 | | | 884 | | | 64.42 | | | 84,816 | | | 695 | | | 120.82 | |
| Venezuelan | | 62,381 | | | 916 | | | 58.43 | | | 215,427 | | | 1,752 | | | 121.73 | |
| Crude Oil Feedstock | | 337,697 | | | 4,701 | | | 61.63 | | | 984,484 | | | 8,072 | | | 120.74 | |
| Vacuum Gas Oil | | 6,093 | | | 105 | | | 49.79 | | | 145,888 | | | 1,066 | | | 135.49 | |
| | | 343,790 | | | 4,806 | | | 61.38 | | | 1,130,372 | | | 9,138 | | | 122.46 | |
| | | | | | | | | | | | | | | | | | | |
| Net inventory adjustment(2) | | (13,017 | ) | | | | | | | | (17,269 | ) | | | | | | |
| Additives and blendstocks | | (12,767 | ) | | | | | | | | 35,647 | | | | | | | |
| Inventory write-down (recovery)(3) | | (3,551 | ) | | | | | | | | - | | | | | | | |
| | | 314,455 | | | | | | | | | 1,148,750 | | | | | | | |
| | | | | | | | | | | | | | | | | | | |
| | | | | | | | | Six Months Ended June 30 | | | | | | | |
| | | | | | 2009 | | | | | | | | | 2008 | | | | |
| | | Cost of | | | Volume | | | Cost per | | | Cost of | | | Volume | | | Cost per | |
| | | Feedstock | | | | | | Barrel(1) | | | Feedstock | | | | | | Barrel(1) | |
| | | (000’s of Cdn $) | | | (000s of bbls) | | | (US$/bbl) | | | (000’s of Cdn $) | | | (000s of bbls) | | | (US$/bbl) | |
| | | | | | | | | | | | | | | | | | | |
| Iraqi | | 501,283 | | | 9,924 | | | 41.98 | | | 1,224,126 | | | 11,528 | | | 105.44 | |
| Russian | | 81,513 | | | 1,109 | | | 61.08 | | | 279,984 | | | 2,705 | | | 102.78 | |
| Venezuelan | | 113,902 | | | 2,651 | | | 35.70 | | | 356,371 | | | 3,259 | | | 108.58 | |
| Crude Oil Feedstock | | 696,698 | | | 13,684 | | | 42.31 | | | 1,860,481 | | | 17,492 | | | 105.62 | |
| Vacuum Gas Oil | | 20,407 | | | 508 | | | 33.38 | | | 225,965 | | | 1,837 | | | 122.15 | |
| | | 717,105 | | | 14,192 | | | 41.99 | | | 2,086,446 | | | 19,329 | | | 107.19 | |
| | | | | | | | | | | | | | | | | | | |
| Net inventory adjustment(2) | | (17,834 | ) | | | | | | | | (32,126 | ) | | | | | | |
| Additives and blendstocks | | (5,350 | ) | | | | | | | | 40,029 | | | | | | | |
| Inventory write-down (recovery)(3) | | (6,483 | ) | | | | | | | | - | | | | | | | |
| | | 687,438 | | | | | | | | | 2,094,349 | | | | | | | |
| (1) | Cost of feedstock includes all costs of transporting the crude oil to the refinery in Newfoundland. |
| (2) | Inventories are determined using the weighted average cost method. |
| (3) | Inventory write-downs are calculated on a product by product basis using the lower of cost or net realizable value. |
21
For the three and six months ended June 30, 2009, throughput was limited by a planned 42-day turnaround in the Second Quarter, which reduced feedstock volume to an average of 52,808 bbl/d and 78,410 bbl/d, respectively, as compared to 100,422 bbl/d and 106,211 bbl/d, respectively, in the prior year.
As is normal business practice, the WTI component of our feedstock cost is operationally hedged under the Supply and Offtake Agreement. When we commit to crude oil purchases, Vitol sells a forward WTI price contract for the next contract month, which results in price fluctuations subsequent to our purchase commitment being offset by the price volatility of the forward price curve. If the timing between processing the crude oil and the expiration of the forward contract are not aligned, the volume of the forward contract relating to unprocessed crude oil is rolled to the next contract month. This practice results in better matching of our refined product sales prices with our cost of feedstock. The persistent contango shape of the NYMEX WTI futures price curve since October 2008 has resulted in accumulated gains from the rolling forward of these operational hedges, which under the terms of the Supply and Offtake Agreement reduce our feedstock costs in the month the feedstock is processed. During the three and six months ended June 30, 2009, this operational hedging resulted in reductions to the cost of our feedstock of US$12.2 million and US$57.2 million, respectively, as compared to the prior year when this operational hedging resulted in increases to the cost of our feedstock of US$5.3 million and US$12.8 million, respectively. The Supply and Offtake Agreement is more fully described in our Annual Information Form for the year ended December 31, 2008 filed on SEDAR atwww.sedar.com.
The cost of our crude oil feedstock averaged US$61.63/bbl during the Second Quarter of 2009 representing a US$2.01/bbl premium over WTI as compared to a cost of US$120.74/bbl and a discount of US$3.24/bbl in the Second Quarter of the prior year. The US$2.01/bbl premium is primarily due to the majority of our throughput being processed in June, when the average WTI price was US$69.70 as compared to the quarterly average WTI price of US$59.62, as the refinery was in turnaround during the first half of the quarter. Removing the effect of the timing difference, our crude oil feedstock was comprised of a US$1.46/bbl quality discount (2008 – US$6.87/bbl), plus a US$2.29/bbl operational hedging gain (2008 –charge of US$0.61/bbl) . For the six months ended June 30, 2009, the cost of our crude oil feedstock averaged US$42.31/bbl representing a US$9.04/bbl discount to WTI as compared to a discount of US$5.32/bbl in the prior year. The US$9.04/bbl discount is comprised of a US$5.29/bbl quality discount (2008 – US$6.93/bbl), plus a US$3.87/bbl operational hedging gain (2008 – charge of US$0.67/bbl), offset by a US$0.12/bbl charge relating to timing under the Supply and Offtake Agreement with Vitol (2008 – US$0.94/bbl) The average cost of purchased VGO during the Second Quarter of 2009 was US$49.79/bbl representing a discount of US$9.83/bbl relative to the WTI price as compared to US$135.49/bbl and an US$11.51/bbl premium in the prior year. The US$9.83/bbl discount in 2009 is comprised of a US$3.72/bbl pricing discount relative to WTI (2008 – a premium of US$5.03/bbl), a US$13.65/bbl operational hedging gain (2008 – charge of US$0.41/bbl) offset by a US$7.54/bbl charge relating to timing under the Supply and Offtake Agreement with Vitol (2008 – US$6.06/bbl) . For the six months ended June 30, 2009, the average cost of purchased VGO was US$33.38/bbl representing a discount of US$17.97/bbl relative to WTI as compared to a US$11.21/bbl premium in the prior year. The US$17.97 discount is comprised of a US$6.04/bbl pricing discount relative to WTI (2008 – premium of US$4.48/bbl), an US$8.31/bbl operational hedging gain (2008 – charge of US$0.56/bbl) and a US$3.62 reduction related to timing under the Supply and Offtake Agreement with Vitol (2008 – charge of US$6.16/bbl) . The pricing discount for the three and six months ended June 30, 2009 is attributed to supply and demand disruptions in the very tightly balanced VGO market coupled with the benefit of our operational hedging.
Operating Expenses
The following summarizes the operating costs from the refinery and marketing division for the three and six months ended June 30, 2009 and 2008:
| | | | | | | | | Three Months Ended June 30 | | | | | | | |
| | | | | | 2009 | | | | | | | | | 2008 | | | | |
| (000’s of Canadian dollars) | | Refining | | | Marketing | | | Total | | | Refining | | | Marketing | | | Total | |
| | | | | | | | | | | | | | | | | | | |
| Operating expense | | 22,300 | | | 4,674 | | | 26,974 | | | 20,158 | | | 5,459 | | | 25,617 | |
| Turnaround and catalyst | | 43,285 | | | - | | | 43,285 | | | - | | | - | | | - | |
| Purchased energy | | 11,161 | | | - | | | 11,161 | | | 29,899 | | | - | | | 29,899 | |
| | | 76,746 | | | 4,674 | | | 81,420 | | | 50,057 | | | 5,459 | | | 55,516 | |
22
| | | | | | | | | Six Months Ended June 30 | | | | | | | |
| | | | | | 2009 | | | | | | | | | 2008 | | | | |
| (000’s of Canadian dollars) | | Refining | | | Marketing | | | Total | | | Refining | | | Marketing | | | Total | |
| | | | | | | | | | | | | | | | | | | |
| Operating expense | | 41,514 | | | 9,426 | | | 50,940 | | | 41,533 | | | 9,979 | | | 51,512 | |
| Turnaround and catalyst | | 47,487 | | | - | | | 47,487 | | | - | | | - | | | - | |
| Purchased energy | | 27,768 | | | - | | | 27,768 | | | 73,026 | | | - | | | 73,026 | |
| | | 116,769 | | | 9,426 | | | 126,195 | | | 114,559 | | | 9,979 | | | 124,538 | |
The largest component of refining operating expense is wages, salaries and benefits which totaled $13.1 million during the Second Quarter of 2009 (2008 - $11.9 million) while the other significant components were maintenance and repair costs of $4.2 million (2008 - $3.5 million), insurance of $1.7 million (2008 - $1.5 million) and professional services of $0.6 million (2008 - $0.9 million). During the three months ended June 30, 2009, refining operating expenses were $4.64/bbl as compared to $2.21/bbl in the prior year reflecting the reduction in throughput due to the 42-day turnaround completed in the Second Quarter of 2009. During the Second Quarter of 2009, the marketing division’s operating expenses of $4.7 million remained relatively unchanged from the $4.8 million incurred in the First Quarter of 2009, the $0.8 million decrease from the Second Quarter of 2008 is due to approximately $1.0 million being incurred in the prior year for tug boat maintenance.Turnaround and catalyst expenditures for the three and six months ended June 30, 2009 of $43.3 million and $47.5 million, respectively, relate to costs incurred in preparation for and completion of the scheduled turnaround of the hydrocracking and hydrogen units, replacement of distillate hydrotreating and hydrocracker catalyst, and the regeneration of the naphtha reforming unit catalyst. Of the total costs incurred related to the turnaround, $21.5 million relates to catalyst replacement, while the balance relates to other turnaround activities. Harvest’s accounting policy is to expense all turnaround and catalyst replacement and regeneration expenditures, while capitalizing projects that provide future economic benefit.
Purchased energy, consisting of low sulphur fuel oil and electricity, is required to provide heat and power to refinery operations. Our purchased energy for the three and six months ended June 30, 2009 was $2.32/bbl and $1.96/bbl of throughput, respectively, as compared to $3.27/bbl and $3.78/bbl, respectively, in the same periods of the prior year. In the Second Quarter of 2009, we purchased approximately 157,000 barrels of fuel oil at an average price of US$54.87/bbl as compared to approximately 268,000 barrels purchased in the Second Quarter of 2008 at an average price of US$101.65/bbl. The $17.7 million decrease in the cost of purchased fuel oil is due to a $6.3 million decrease in price and an $11.4 million decrease in purchased volumes as we required less fuel oil due to the 42-day turnaround completed in the Second Quarter. Our electricity costs were similarly reduced by the turnaround in the Second Quarter of 2009 at $1.4 million as compared to $2.4 million in the prior year.
Marketing Expense and Other
During the three and six months ended June 30, 2009, marketing expense was comprised of $0.4 million and $1.4 million respectively (three and six months ended June 30, 2008 - $0.7 million and $1.6 million) of marketing fees (based on US$0.08/bbl) to acquire feedstock and $2.7 million and $4.7 million, respectively (three and six months ended June 30, 2008 - $8.7 million and $16.4 million) of “Time Value of Money” charges both pursuant to the terms of the Supply and Offtake Agreement. The decreased “Time Value of Money” charge is mainly the result of a lower LIBOR rate in the first half of 2009 coupled with a lower crude oil inventory investment due to the lower commodity prices. As at June 30, 2009, Harvest had commitments totaling approximately $610.3 million in respect of future crude oil feedstock purchases and related transportation from Vitol.
Capital Expenditures
Capital spending for the three and six months ended June 30, 2009 totaled $19.9 million and $26.8 million, respectively, (three and six months ended June 30, 2008 - $8.6 million and $14.7 million) relating to various capital improvement projects including $7.0 million to upgrade heaters and $2.5 million related to debottlenecking projects in the Second Quarter.
Depreciation and Amortization Expense
The following summarizes the depreciation and amortization expense for the three and six months ended June 30, 2009 and 2008:
23
| | | | | | | | | Three Months Ended June 30 | | | | | | | |
| | | | | | 2009 | | | | | | | | | 2008 | | | | |
| (000’s of Canadian dollars) | | Refining | | | Marketing | | | Total | | | Refining | | | Marketing | | | Total | |
| Tangible assets | | 16,623 | | | 816 | | | 17,439 | | | 14,701 | | | 612 | | | 15,313 | |
| Intangible assets | | 1,298 | | | 339 | | | 1,637 | | | 1,123 | | | 307 | | | 1,430 | |
| | | 17,921 | | | 1,155 | | | 19,076 | | | 15,824 | | | 919 | | | 16,743 | |
| | | | | | | | | | | | | | | | | | | |
| | | | | | | | | Six Months Ended June 30 | | | | | | | |
| | | | | | 2009 | | | | | | | | | 2008 | | | | |
| (000’s of Canadian dollars) | | Refining | | | Marketing | | | Total | | | Refining | | | Marketing | | | Total | |
| Tangible assets | | 36,169 | | | 1,708 | | | 37,877 | | | 29,180 | | | 1,165 | | | 30,345 | |
| Intangible assets | | 2,682 | | | 701 | | | 3,383 | | | 2,241 | | | 657 | | | 2,898 | |
| | | 38,851 | | | 2,409 | | | 41,260 | | | 31,421 | | | 1,822 | | | 33,243 | |
The process units are amortized over an average useful life of 20 to 30 years. The intangible assets, consisting of engineering drawings, customer lists and fuel supply contracts, are amortized over a period of 20 years, 10 years and the term of the expected cash flows respectively.
Goodwill
As the Downstream assets are held in a self-sustaining subsidiary with a U.S. dollar functional currency, the goodwill balance is adjusted at the end of each accounting period to reflect the current U.S. dollar exchange rate. We assess goodwill for impairment annually, or more frequently if events or changes in circumstances warrant. At June 30, 2009, it was determined that an impairment test was required due to expectations of lower refining gross margins and the probable deferral of certain future capital expenditures. The fair value of the Downstream reporting unit was determined using a discounted cash flow approach which incorporated management’s expectations of future throughput and expenses and the forward curve for refined product crack spreads. At June 30, 2009, the fair value of the Downstream reporting unit was below its carrying value, indicating a potential impairment. Subsequently, the fair value of the Downstream goodwill was determined by valuing the reporting unit’s net assets in the same manner as allocating a purchase price in a business combination. As the carrying value of the reporting unit’s goodwill exceeded its fair value, it was determined that the goodwill associated with the Downstream reporting unit was fully impaired. Accordingly, a charge of $206.5 million was recorded in the financial results at June 30, 2009.
RISK MANAGEMENT, FINANCING AND OTHER
Cash Flow Risk Management
With respect to our cash flow risk management program, see “Cash Flow Risk Management” in our MD&A for the year ended December 31, 2008 filed on SEDAR atwww.sedar.com. The details of our commodity price contracts outstanding at June 30, 2009 are included in the notes to our consolidated financial statements which are also filed on SEDAR atwww.sedar.com.
During the three and six months ended June 30, 2009, the lower commodity price environment resulted in Harvest realizing gains of $19.4 million and $45.0 million respectively, on our risk management contracts, while the higher commodity prices experienced in the first half of 2008 resulted in realized losses of $94.4 million and $130.7 million in the same periods of the prior year. The table below provides a summary of the gains and losses realized on our price risk management contracts for the three and six months ended June 30, 2009 and 2008:
24
| | | Three Months Ended June 30 | | | Six Months Ended June 30 | |
| | | | | | | | | | | | | | | | | | | |
| (000s) | | 2009 | | | 2008 | | | Change | | | 2009 | | | 2008 | | | Change | |
| Crude oil | $ | - | | $ | (15,110 | ) | | (100% | ) | $ | - | | $ | (23,688 | ) | | (100% | ) |
| Refined product | | 20,133 | | | (85,273 | ) | | (124% | ) | | 45,705 | | | (117,089 | ) | | (139% | ) |
| Natural gas | | (57 | ) | | (156 | ) | | (63% | ) | | (87 | ) | | (258 | ) | | (66% | ) |
| Currency exchange rates | | - | | | 2,504 | | | (100% | ) | | - | | | 5,158 | | | (100% | ) |
| Electric power | | (646 | ) | | 3,611 | | | (118% | ) | | (646 | ) | | 5,159 | | | (113% | ) |
| Total | $ | 19,430 | | $ | (94,424 | ) | | (121% | ) | $ | 44,972 | | $ | (130,718 | ) | | (134% | ) |
Our refined product contracts during the first half of 2009 consisted of 12,000 bbl/d of NYMEX heating oil and 8,000 bbl/d of Platts heavy fuel oil, and realized gains of $20.1 million and $45.7 million during the three and six months ended June 30, 2009 respectively, due to the lower commodity price environment compared to losses of $85.3 million and $117.1 million respectively, in the same periods of the prior year when commodity prices were higher. Subsequent to June 30, 2009, we have no refined product price contracts in place.
For the three and six months ended June 30, 2009, our electricity price contracts realized losses of $0.6 million compared to gains of $3.6 million and $5.2 million in the same periods of the prior year. In the Second Quarter we entered into electricity price swap contracts for 10 MWh at $63.55/MWh from January to December 2010. Subsequent to June 30, 2009 we entered into another electricity price swap contract for 5 MWh at $60.75/MWh from January to December 2010.
During the first half of 2009, Harvest did not have any crude oil or currency exchange rate contracts in place, while in the three and six months ended June 30, 2008, losses on our crude oil contracts totaled $15.1 million and $23.7 million respectively, and gains on our currency exchange rates totaled $2.5 million and $5.2 million respectively.
As at June 30, 2009, the mark-to-market value on our currency contracts, natural gas contracts and electric power contracts aggregated to $10.7 million.
| Interest Expense | | | | | | | | | | | | | | | | | | |
| | | Three Months Ended June 30 | | | Six Months Ended June 30 | |
| | | | | | | | | | | | | | | | | | | |
| (000s) | | 2009 | | | 2008 | | | Change | | | 2009 | | | 2008 | | | Change | |
| Interest on short term debt | | | | | | | | | | | | | | | | | | |
| Bank loan | $ | 2,423 | | $ | - | | | 100% | | $ | 2,423 | | $ | - | | | 100% | |
| Convertible Debentures | | 52 | | | - | | | 100% | | | 112 | | | 201 | | | (44% | ) |
| | | 2,475 | | | - | | | 100% | | | 2,535 | | | 201 | | | 1,161% | |
| | | | | | | | | | | | | | | | | | | |
| Interest on long-term debt | | | | | | | | | | | | | | | | | | |
| Bank loan | | 1,306 | | | 12,386 | | | (89% | ) | | 7,557 | | | 28,446 | | | (73% | ) |
| Convertible Debentures | | 19,426 | | | 17,547 | | | 11% | | | 38,539 | | | 30,609 | | | 26% | |
| 77/8% Senior Notes | | 6,252 | | | 5,341 | | | 17% | | | 12,805 | | | 10,647 | | | 20% | |
| Amortization of deferred finance charges – long term debt | | - | | | 674 | | | (100% | ) | | 675 | | | 1,349 | | | (50% | ) |
| | | 26,984 | | | 35,948 | | | (25% | ) | | 59,576 | | | 71,051 | | | (16% | ) |
| Total interest expense | $ | 29,459 | | $ | 35,948 | | | (18% | ) | $ | 62,111 | | $ | 71,252 | | | (13% | ) |
Interest expense for the three and six months ended June 30, 2009, including the amortization of related financing costs, decreased $6.5 million (18%) and $9.1 million (13%) respectively, compared to the prior year as interest on our bank borrowings decreased by $8.7 million and $18.5 million respectively, due to lower interest rates and lower borrowings. Total interest expense on Convertible Debentures has increased as a result of our Second Quarter 2008 Convertible Debenture offering.
25
The interest on our Revolving Credit Facility is at a floating rate of 70 basis points over bankers’ acceptances for Canadian dollar borrowings. During the three and six months ended June 30, 2009, interest charges on bank loans reflected an average interest rate of 1.32% and 1.66% respectively, compared to 4.11% and 4.47% in the prior year.
The interest on our Convertible Debentures totaled $19.5 million and $38.7 million during the three and six months ended June 30, 2009 respectively, representing a $1.9 million and $7.8 million increase compared to the prior year. The increase is due to the April 25, 2008 issuance of $250 million face value of 7.5% Convertible Debentures due 2015. Details on the Convertible Debentures outstanding are fully described in Note 12 to the audited consolidated financial statements for the year ended December 31, 2008 filed on SEDAR atwww.sedar.com. Interest on the Convertible Debentures is based on the effective yield of the debt component of the Convertible Debentures, and as a result, the interest expense recorded is greater than the cash interest paid.
The interest on our 77/8% Senior Notes totaled $6.3 million and $12.8 million for the three and six months ended June 30, 2009 respectively, which is an increase of $0.9 million and $2.2 million over the prior year. The increase is due to the weakening of the Canadian dollar compared to the prior year, as the interest on these notes is denominated in U.S. dollars. Similar to our Convertible Debentures, interest expense is based on the effective yield, and as a result, the interest expense recorded is greater than the cash interest paid.
Included in short and long term interest expense is the amortization of the discount on the 77/8% Senior Notes and the accretion on the debt component balance of the Convertible Debentures to face value at maturity. The amortization of commitment fees and legal costs incurred for our credit facility, all totaling $0.7 million for the six months ended June 30, 2009, were fully amortized as of March 31, 2009.
Currency Exchange
Currency exchange gains and losses are attributed to the changes in the value of the Canadian dollar relative to the U.S. dollar on our U.S. dollar denominated 77/8% Senior Notes as well as any other U.S. dollar cash balances. Realized foreign exchange losses of $1.3 million and $1.8 million for the three and six months ended June 30, 2009 respectively, have resulted from the settlement of U.S. dollar denominated transactions. Since March 31, 2009, the Canadian dollar has strengthened resulting in an unrealized foreign exchange gain of $10.3 million for the Second Quarter of 2009 and $10.7 million for the six months ended June 30, 2009.
Our downstream operations are considered a self-sustaining operation with a U.S. dollar functional currency. The foreign exchange gains and losses incurred by our downstream operations relate to Canadian dollar transactions converted to U.S. dollars as their functional currency is U.S. dollars. The cumulative translation adjustment recognized in other comprehensive income represents the translation of our Downstream operation’s U.S. dollar functional currency financial statements to Canadian dollars using the current rate method. During the Second Quarter of 2009, the strengthening of the Canadian dollar relative to the U.S. dollar resulted in a $120.9 million net cumulative translation loss (2008 – $4.5 million) as the weaker U.S. dollar results in a decrease in the relative value of the net assets in our Downstream operations.
Future Income Tax
At the end of 2008, we had a net future income tax provision on our balance sheet totaling $204.0 million comprised of a $372.6 million provision for our mutual fund trust and other “flow through” entities and a net asset of $168.6 million for our corporate entities. For the three and six months ended June 30, 2009, we have recorded a future income tax reduction of $12.1 million and $10.1 million, respectively, to reflect the changes in both the temporary differences held in our corporate entities and for changes in our forecasted temporary differences for our “flow through” entities as well as legislative tax rate changes both as of January 1, 2011. At June 30, 2009 we have a net future tax liability on our balance sheet totaling $192.9 million comprised of a $177.9 million net asset for our corporate entities offset by a $370.8 million provision for our mutual fund trust and other “flow through” entities. The future income tax asset recorded by our corporate entities will fluctuate during each accounting period to reflect changes in the respective temporary differences between the book value and tax basis of their assets as well as further legislative tax rate changes.
26
Currently, the principal source of our corporate entities’ temporary differences is the difference between our net book value of our property, plant and equipment versus our unclaimed tax pools and the recognition for accounting purposes of a mark-to-market position on our risk management contracts.
Income Tax Reassessment
In January 2009, the Canada Revenue Agency (“CRA”) issued a Notice of Reassessment to Harvest Energy Trust in respect of its 2002 through 2004 taxation years claiming past taxes, interest and penalties totaling $6.2 million. The CRA has adjusted taxable income to include the net profits interest revenue to an accrual basis whereas our income tax filings have been prepared on a cash basis. Management and our legal advisors believe the reassessment by the CRA has not properly applied a provision of the Income Tax Act (Canada) and accordingly, the amount of this contingent liability has not been accrued at June 30, 2009. In addition to presenting the merit of our position to the CRA, we have filed a Notice of Objection with the CRA and filed a Notice of Appeal with the Tax Court. The CRA has advised that they will file their Reply/Statement of Defense shortly and we have scheduled examinations for discovery in mid-November 2009.
Contractual Obligations and Commitments
We have contractual obligations and commitments entered into in the normal course of operations including the purchase of assets and services, operating agreements, transportation commitments, sales commitments, royalty obligations, and land lease obligations. These obligations are of a recurring and consistent nature and impact cash flow in an ongoing manner. As at June 30, 2009, we also have contractual obligations and commitments that are of a less routine nature as disclosed in the following table:
| | Maturity |
| Annual Contractual Obligations(000s) | | Total | | | Less than 1 year | | | 1-3 years | | | 4-5 years | | | After 5 years | |
| Long-term debt(1) | $ | 1,388,570 | | $ | 1,097,820 | | $ | 290,750 | | $ | - | | $ | - | |
| Interest on long-term debt(3) | | 62,741 | | | 17,796 | | | 44,945 | | | - | | | - | |
| Interest on Convertible Debentures(2) | | 293,418 | | | 32,869 | | | 127,864 | | | 105,386 | | | 27,299 | |
| Operating and premise leases | | 20,693 | | | 3,884 | | | 13,348 | | | 2,895 | | | 566 | |
| Purchase commitments(4) | | 5,834 | | | 5,834 | | | - | | | - | | | - | |
| Asset retirement obligations(5) | | 1,178,244 | | | 9,200 | | | 30,592 | | | 26,942 | | | 1,111,510 | |
| Transportation(6) | | 6,132 | | | 2,171 | | | 3,369 | | | 592 | | | - | |
| Pension contributions(7) | | 39,026 | | | 2,400 | | | 14,217 | | | 14,791 | | | 7,618 | |
| Feedstock commitments | | 610,293 | | | 610,293 | | | - | | | - | | | - | |
| Total | $ | 3,604,951 | | $ | 1,782,267 | | $ | 525,085 | | $ | 150,606 | | $ | 1,146,993 | |
| (1) | Assumes that the outstanding Convertible Debentures either convert at the holders’ option or are redeemed for Trust Units at our option. |
| (2) | Assumes no conversions and redemption by Harvest for Trust Units at the end of the second redemption period. |
| (3) | Assumes a constant foreign exchange rate. |
| (4) | Relates to drilling commitments, AFE commitments and downstream purchase commitments. |
| (5) | Represents the undiscounted obligation by period. |
| (6) | Relates to firm transportation commitment on the Nova pipeline. |
| (7) | Relates to the expected contributions for employee benefit plans. |
We have a number of operating leases for moveable field equipment, vehicles and office space and our commitments under those leases are noted in our annual contractual obligations table above. The leases require periodic lease payments and are recorded as either operating costs or G&A. We also finance our annual insurance premiums, whereby a portion of the annual premium is deferred and paid monthly over the balance of the term.
Change In Accounting Policies
Effective January 1, 2009, Harvest adopted the new Canadian Institute of Chartered Accountants (“CICA”) accounting standard “Goodwill and Intangible Assets”, section 3064 which replaced section 3062 “Goodwill and Other Intangible Assets” and section 3450, “Research and Development Costs”. Section 3064 establishes standards for the recognition, measurement, presentation and disclosure of intangible assets and goodwill subsequent to its initial recognition. The new standard contains additional guidance with respect to the recognition of intangible assets.
27
DISTRIBUTIONS TO UNITHOLDERS
Harvest is an integrated energy trust with a declining asset base in our Upstream operations and a “near perpetual” asset in our Downstream operations. The contribution from our Upstream operations relies on the successful exploitation of our existing reserves, future development activities and strategic acquisitions to replace existing production and add additional reserves as well as future petroleum and natural gas prices. With a prudent maintenance program, our Downstream assets are expected to have a long life with additional growth in profitability available by upgrading the heavy fuel oil currently produced and/or expanding our refining capacity. Future development activities and modest acquisitions in our Upstream business as well as the maintenance program in our Downstream business will likely be funded by our cash generated from operating activities while we will generally rely on funding more significant acquisitions and growth initiatives from some combination of cash from operating activities, issuances of Trust Units and incremental debt. To the extent that we finance acquisitions and growth initiatives from cash from operating activities, distributions to Unitholders may be reduced. Should equity capital markets or incremental debt not be available to us, our ability to make the necessary expenditures to maintain or expand our assets may be impaired and result in reductions to future distributions paid to Unitholders.
The following table summarizes our cash from operating activities, net loss, distributions declared and proceeds from our distribution reinvestment programs as well as distributions as a percentage of cash from operating activities for the three and six months ended June 30, 2009 and 2008:
| | | Three Months Ended June 30 | | | Six Months Ended June 30 | |
| (000s except per trust unit amounts) | | 2009 | | | 2008 | | | Change | | | 2009 | | | 2008 | | | Change | |
| Cash from Operating Activities | $ | 75,879 | | $ | 210,534 | | | (64% | ) | $ | 297,624 | | $ | 338,653 | | | (12% | ) |
| Net Loss | $ | (265,779 | ) | $ | (162,063 | ) | | 64% | | $ | (208,915 | ) | $ | (162,409 | ) | | 29% | |
| Distributions declared | $ | 25,193 | | $ | 137,001 | | | (82% | ) | $ | 128,495 | | $ | 272,168 | | | (53% | ) |
| Per trust unit | $ | 0.15 | | $ | 0.90 | | | (83% | ) | $ | 0.80 | | $ | 1.80 | | | (56% | ) |
| Distribution reinvestment proceeds | $ | 5,062 | | $ | 35,472 | | | (86% | ) | $ | 35,100 | | $ | 71,362 | | | (51% | ) |
| Distributions as a percentage of cash from | | | | | | | | | | | | | | | | | | |
| operating activities | | 33% | | | 65% | | | (32% | ) | | 43% | | | 80% | | | (37% | ) |
LIQUIDITY AND CAPITAL RESOURCES
During the first six months of 2009, cash flow from operating activities was $297.6 million as compared to $338.7 million in the prior year while cash flow for the Second Quarter totaled $75.9 million in 2009 as compared to $210.5 million in 2008. Cash flow from operating activities before changes in non-cash working capital and asset retirement expenditures totaled $284.4 million during the first half of 2009 as compared to $368.8 million during the prior year. During the first six months of 2009, we declared distributions of $128.5 million ($93.4 million net of our distribution re-investment programs) and required $168.9 million for capital expenditures resulting in $22.1 million in available cash. In addition to the $63 million raised with the sale of two non-core properties, on June 4, 2009, our bank borrowings were reduced by the $120.2 million of net proceeds from the issuance of 17,330,000 Trust Units in a “bought-deal” financing. At the end of June 30, 2009, our bank borrowings totaled $1,097.8 million with $502.2 million of undrawn credit commitments.
The following table summarizes our capital structure as at June 30, 2009 and December 31, 2008 as well as provides the key financial ratios contained in our Revolving Credit Facility. For a complete description of our Revolving Credit Facility, 77/8%Senior Notes and Convertible Debentures, see Notes 10, 11 and 12 to our audited consolidated financial statements for the year ended December 31, 2008, respectively, filed on SEDAR atwww.sedar.com.
28
| | | June 30, 2009 | | | December 31, 2008 | |
| SUMMARY OF CAPITALIZATION(in millions) | | | | | | |
| | | | | | | |
| Revolving Credit Facility | $ | 1,097.8 | | $ | 1,226.2 | |
| 77/8% Senior Notes Due 2011 (US$250 million)(1) | | 290.8 | | | 304.5 | |
| Convertible Debentures, at principal amount | | 915.8 | | | 916.7 | |
| Total Debt | | 2,304.4 | | | 2,447.4 | |
| | | | | | | |
| Unitholders’ Equity,at book value less equity component of Convertible Debentures | | | | | | |
| 179,859,593 issued at June 30, 2009 | | 2,307.7 | | | | |
| 157,200,701 issued at December 31, 2008 | | | | | 2,559.2 | |
| TOTAL CAPITALIZATION | $ | 4,612.1 | | $ | 5,006.6 | |
| | | | | | | |
| FINANCIAL RATIOS | | | | | | |
| | | | | | | |
| Secured Debt to Annualized EBITDA(2) | | 1.5 | | | 1.5 | |
| Senior Debt to Annualized EBITDA(2) | | 2.0 | | | 1.8 | |
| Secured Debt to Total Capitalization | | 24% | | | 25% | |
| Senior Debt to Total Capitalization | | 30% | | | 31% | |
| (1) | Face value converted at the period end exchange rate. |
| (2) | Annualized Earnings Before Interest, Taxes, Depreciation and Amortization based on twelve month rolling average. |
During the first six months of 2009, the global economic and financial crisis continued to reduce liquidity in financial markets with a universal reduction in the appetite for risk, a tightening of capital availability and higher costs for new credit commitments. It has also caused a significant decline in economic activity resulting in deteriorating demand for commodities and lower commodity prices. Subsequent to the end of the Second Quarter, there is a sense that the global economic slowdown and financial crisis may have bottomed-out and that a slow recovery is underway. However, the current state of the credit markets remains challenging with new financing being completed at higher prices.
Our Revolving Credit Facility matures in April 2010, and accordingly, we have classified the entire amount of the borrowings under our existing Revolving Credit Facility as a current liability as at June 30, 2009. To date, we have received the revised terms and pricing for a new credit facility from the two leads of our current banking syndicate, which proposes that a new credit facility will transition to a revolving facility supported by the borrowing base of our Upstream reserves plus an amount based on the Earnings Before Interest, Taxes, Depreciation and Amortization for our Downstream business. The proposed terms include scheduled principal repayments on a portion of the debt over the proposed two year term. The proposed financial covenants would be substantially unchanged from our current credit agreement. We anticipate that during the Fourth Quarter the syndication of the proposed credit facility will be completed.
The most restrictive covenant of the 77/8% Senior Notes limits the incurrence of additional indebtedness if such issuance would result in an interest coverage ratio, as defined, of less than 2.5 to 1.0 and in respect of the incurrence of secured indebtedness, limits the amount to less than 65% of the present value of future net revenues from our proved petroleum and natural gas reserves discounted at an annual rate of 10%. At the end 2008, 65% of the present value of the future net revenues from our proved petroleum and natural gas reserves discounted at an annual rate of 10% is approximately $1.91 billion. Our 77/8% Senior Notes are rated by both Standard and Poor’s Ratings Services (“S&P”) and Moody’s Investors Service who currently have assigned a corporate rating of “B-” and “B3”, respectively, and have rated the 77/8% Senior Notes as “CCC” and “Caa1”, respectively.
At June 30, 2009, we have $915.8 million of principal amount of Convertible Debentures issued in six series with conversion privileges to Trust Units at prices that range from $16.07 to $46.00 and maturity dates over the next six years. With our Trust Units currently trading in the $5 to $7 range, we do not anticipate many conversions in the near term. During the Second Quarter, we settled the maturing of $0.9 million of 9% Debentures with the issuance of 136,906 Trust Units. The most restrictive term of the Convertible Debentures limits the issuance of additional Convertible Debentures if the principal amount of all issued and outstanding Convertible Debentures immediately after the issuance exceed 25% of the total market capitalization, being an aggregate of the principal amount of all issued and outstanding Convertible Debentures plus an amount equal to the current market price of all of the issued and outstanding Trust Units. At June 30, 2009, our total market capitalization was approximately $2.1 billion which would prohibit the issuance of further Convertible Debentures.
29
During 2009, the trading value of our trust units ranged from a high of $11.91 in January to a low of $3.87 in March. The following summarizes the trading value of our Trust Units year-to-date for 2009:
| | Trading Price | | | |
| Month | | High | | | Low | | | Volume | |
| TSX Trading | | | | | | | | | |
| January 2009 | $ | 11.91 | | $ | 10.36 | | | 10,266,136 | |
| February 2009 | $ | 10.57 | | $ | 5.87 | | | 13,739,710 | |
| March 2009 | $ | 6.20 | | $ | 3.87 | | | 16,343,646 | |
| April 2009 | $ | 6.18 | | $ | 4.44 | | | 8,769,868 | |
| May 2009 | $ | 8.72 | | $ | 5.71 | | | 21,261,237 | |
| June 2009 | $ | 7.24 | | $ | 5.91 | | | 14,518,231 | |
| July 2009 | $ | 6.22 | | $ | 5.12 | | | 8,381,376 | |
| August 1 to 7, 2009 | $ | 6.45 | | $ | 6.10 | | | 1,724,506 | |
| | | | | | | | | | |
| NYSE Trading (in US$) | | | | | | | | | |
| January 2009 | $ | 10.10 | | $ | 8.25 | | | 25,461,464 | |
| February 2009 | $ | 8.55 | | $ | 4.69 | | | 36,881,966 | |
| March 2009 | $ | 4.83 | | $ | 3.00 | | | 36,763,788 | |
| April 2009 | $ | 5.08 | | $ | 3.50 | | | 21,501,439 | |
| May 2009 | $ | 7.47 | | $ | 4.80 | | | 36,288,909 | |
| June 2009 | $ | 6.67 | | $ | 5.12 | | | 24,119,534 | |
| July 2009 | $ | 5.59 | | $ | 4.41 | | | 25,765,389 | |
| August 1to 7, 2009 | $ | 5.99 | | $ | 5.50 | | | 5,572,358 | |
On August 4, 2009, we provided notice to the holders of the 8% Debentures due September 30, 2009 that the principle amount of $1.6 million will be settled with the issuance of Trust Units at 95% of the market value of the Trust Units.
We are authorized to issue an unlimited number of trust units and at the end of the Second Quarter of 2009, approximately 62% of the 179,859,593 Trust Units issued were held by non-residents of Canada.
During the first six months of 2009, we did not purchase any securities pursuant to our Normal Course Issuer Bid and continue to have approval to purchase for cancellation at prevailing market prices up to 14,826,261 trust units as well as up to $91.4 million principal amount of Convertible Debentures.
Concurrent with our purchase of our Downstream assets in 2006, we entered into a Supply and Offtake Agreement that required the ownership of all crude oil feedstock and substantially all of the refined product inventory at the refinery be retained by Vitol Refining S.A. (an international oil trader) and granted Vitol the right and obligation to provide and deliver crude oil feedstock to the refinery as well as the right and obligation to purchase all refined products produced by the refinery. This arrangement provides Harvest with financial support for its crude oil purchase commitments as well as working capital financing for its inventories of crude oil and refined products held for sale. For a more complete description of this Supply and Offtake Agreement, see the description of the Supply and Offtake Agreement in our Annual Information Form for the year ended December 31, 2008 filed on SEDAR atwww.sedar.com. Currently, the Supply and Offtake Agreement may be terminated by either Vitol or Harvest with six months prior notice. Pursuant to the Supply and Offtake Agreement, we estimate that Vitol held inventories of VGO, crude oil feedstock (both delivered and in-transit) and refined products held for resale valued at approximately $610.3 million at June 30, 2009 ($319.7 million at December 31, 2008) which may otherwise have been assets of Harvest.
30
Effective January 20, 2008, we entered into an offtake arrangement with a wholly-owned affiliate of one of the world’s largest integrated oil and natural gas producers for all of our HSFO production for a period of one year and in the fourth quarter of 2008, we extended the agreement for a further one year term.
In light of the current global economic outlook with particular attention to commodity prices, we will continue with our reduced level of capital spending and our $0.05 monthly distributions in an effort to manage our balance sheet flexibility. Accordingly, through a combination of cash from operating activities and the working capital provided by the Supply and Offtake Agreement with Vitol, it is anticipated that we will be able to fund future operations and forecasted capital expenditures although debt repayment obligations may reduce future distributions paid to Unitholders.
SUMMARY OF QUARTERLY RESULTS
The following table and discussion highlights our Second Quarter of 2009 relative to the preceding seven quarters:
| | | 2009 | | | | | | 2008 | | | | | | | | | 2007 | |
| (000s except where noted) | | Q2 | | | Q1 | | | Q4 | | | Q3 | | | Q2 | | | Q1 | | | Q4 | | | Q3 | |
| Revenue, net of royalties | $ | 562,997 | | $ | 731,095 | | $ | 892,739 | | $ | 1,597,195 | | $ | 1,622,079 | | $ | 1,377,352 | | $ | 879,124 | | $ | 1,031,514 | |
| | | | | | | | | | | | | | | | | | | | | | | | | |
| Net income (loss) | $ | (265,779 | ) | $ | 56,864 | | $ | 78,640 | | $ | 295,788 | | $ | (162,063 | ) | $ | (346 | ) | $ | (113,585 | ) | $ | 11,811 | |
| Per Trust Unit, basic(1) | $ | (1.59 | ) | $ | 0.36 | | $ | 0.50 | | $ | 1.93 | | $ | (1.07 | ) | $ | - | | $ | (0.77 | ) | $ | 0.08 | |
| Per Trust Unit, diluted(1) | $ | (1.59 | ) | $ | 0.36 | | $ | 0.50 | | $ | 1.73 | | $ | (1.07 | ) | $ | - | | $ | (0.77 | ) | $ | 0.08 | |
| | | | | | | | | | | | | | | | | | | | | | | | | |
| Cash from operating | | | | | | | | | | | | | | | | | | | | | | | | |
| activities | $ | 75,879 | | $ | 221,745 | | $ | 183,740 | | $ | 133,493 | | $ | 210,534 | | $ | 128,119 | | $ | 87,998 | | $ | 191,049 | |
| Per Trust Unit, basic | $ | 0.45 | | $ | 1.40 | | $ | 1.18 | | $ | 0.87 | | $ | 1.39 | | $ | 0.85 | | $ | 0.60 | | $ | 1.31 | |
| Per Trust Unit, diluted | $ | 0.45 | | $ | 1.28 | | $ | 1.10 | | $ | 0.84 | | $ | 1.26 | | $ | 0.83 | | $ | 0.60 | | $ | 1.22 | |
| | | | | | | | | | | | | | | | | | | | | | | | | |
| Distributions per Unit, | | | | | | | | | | | | | | | | | | | | | | | | |
| declared | $ | 0.15 | | $ | 0.65 | | $ | 0.90 | | $ | 0.90 | | $ | 0.90 | | $ | 0.90 | | $ | 0.98 | | $ | 1.14 | |
| | | | | | | | | | | | | | | | | | | | | | | | | |
| Total debt | $ | 2,216,452 | | $ | 2,373,925 | | $ | 2,352,196 | | $ | 2,284,664 | | $ | 2,105,998 | | $ | 2,209,451 | | $ | 2,172,417 | | $ | 2,097,187 | |
| Total assets | $ | 5,296,596 | | $ | 5,785,269 | | $ | 5,745,407 | | $ | 5,659,227 | | $ | 5,637,879 | | $ | 5,574,528 | | $ | 5,451,683 | | $ | 5,585,651 | |
| (1) | The sum of the interim periods does not equal the total per year amount as there were large fluctuations in the weighted average number of Trust Units outstanding in each individual quarter. |
Net revenues are comprised of revenues net of royalties from our Upstream operations as well as sales of refined products from our Downstream operations. Revenues in the Fourth Quarter of 2007 decreased when the refinery throughput decreased due to a planned shutdown for more than half the quarter. Throughout the first three quarters of 2008, net revenues were the highest in Harvest’s history due to strong commodity prices; however the significant decrease in commodity prices in the Fourth Quarter of 2008 through to the Second Quarter 2009 coupled with the refinery turnaround in the Second Quarter of 2009, resulted in a significant decrease in net revenues.
The growth in cash from operating activities is closely aligned with the trend in commodity prices for our Upstream operations, reflects the cyclical nature of the Downstream segment, and is significantly impacted by changes in working capital. In the Second Quarter of 2009, cash from operating activities has decreased from the previous quarter mainly reflecting the reduction in product sales from the Downstream due to the completion of a planned turnaround.
Net income reflects both cash and non-cash items. Changes in non-cash items, including future income tax, DDA&A expense, unrealized foreign exchange gains and losses, unrealized gains on risk management contracts, goodwill impairment and Trust Unit right compensation expense cause net income to vary significantly from period to period. In the Second Quarter of 2009, a goodwill impairment charge of $206.5 million relating to the Downstream reporting unit was recognized. In the Fourth Quarter of 2007 Bill C-28 implemented reductions in the federal corporate income tax rates which will also apply to the tax on distributions from publicly traded mutual fund trusts, resulting in a significant future income tax recovery in the quarter. Changes in the fair value of our risk management contracts have also contributed to the volatility in net income (loss) over the preceding eight quarters. For these reasons, our net income (loss) does not reflect the same trends as net revenues or cash from operating activities, nor is it expected to.
31
Total assets over the last eight quarters have remained relatively stable until the Second Quarter of 2009. The stability reflects moderate acquisition activity offset by a reduction in net book value associated with depletion and depreciation charges. The decrease in assets at June 30, 2009 resulted from the impairment charge associated with the Downstream reporting unit’s goodwill. Total long term financial liabilities have also remained relatively stable over the last eight quarters, reflecting moderate acquisition activity, offset by the issuance of Trust Units in the Second Quarter of 2009, and a net cash surplus of cash from operating activities over distributions to Unitholders.
OUTLOOK
After the first six months of 2009, there is a sense that the global economic slowdown and financial crisis may have bottomed-out and that a slow recovery is underway. The debt capital markets are opening to quality offerings with appropriate pricing and the equity markets have recovered somewhat. Concurrent with this change in sentiment, the WTI crude oil price has appreciated from US$44.60 at the end of 2008 to US$69.45 at the end of July 2009 in spite of the reduction in the global demand for crude oil and the North American demand for refined products remaining weak, particularly for distillate products. As our revenue is primarily based on U.S. dollars, the recent strengthening of the Canadian dollar versus the US dollar (US$0.82 per Canadian dollar at the end of 2008 to US$0.93 at the end of July 2009) will negatively impact our cash flow although offset somewhat by the settlement of our currency exchange rate contracts.
In light of these anticipated conditions, we are continuing with a reduced capital spending budget and some non-core asset sales. We continue to target bank borrowings of approximately $1 billion by April 2010. We are expecting that our financial results for the second half of 2009 will be stronger than the Second Quarter as the significant Downstream turnaround completed in the Second Quarter should result in improved downstream throughput performance and the recent strengthening in crude oil prices should be more than sufficient to offset the tightening in refining gross margins. With our future monthly distribution unlikely to exceed $0.05 per Trust Unit in the near future and our capital spending for 2009 targeted to be less than $220 million, we anticipate that with the current forward curve commodity price and exchange rate expectations, our cash flow from operating activities during the second half of 2009 will be sufficient to fund our capital spending and distributions.
In our upstream operations, we estimate capital spending for the remainder of 2009 will be approximately $30 million and continue to expect 2009 production to be between 50,000 boe/d to 51,000 boe/d after the impact of our recent asset dispositions. For the balance of 2009, our capital spending will focus on the drilling of approximately 10 wells, enhanced oil recovery projects and production optimization initiatives. We will also continue to reduce costs including general and administrative and operating costs with our 2009 costs expected to approximate $1.50 per boe and $14.50 per boe, respectively.
During the second half of 2009, we expect that our refinery throughput will average approximately 117,000 bbl/d of feedstock as our turnaround completed in the Second Quarter should result in improved operating performance. We expect our operating costs will average approximately $1.90 per bbl of throughput and our cost of purchased energy will average approximately $3.35 per bbl of throughput reflecting an exchange rate expectation of approximately US$0.92 per Canadian dollar and a reduction in the consumption of internally produced HSFO and butane. Capital spending in our downstream operations is expected to total $19 million with approximately $6 million incurred to advance the refinery debottlenecking projects.
During the First Quarter of 2009, we entered into currency exchange rate contracts that fixed the exchange rate on US$15 million per month for the period from July through December 2009 at approximately US$0.78/Cdn$ 1.00 representing approximately 25% of our currency exchange rate exposure, prior to considering the offsetting exposure of our U.S. dollar denominated 77/8% Senior Notes. In addition, we have entered into contracts to fix the price of 10 MWh of Alberta power prices for the period from April through December 2009 at a price of $61.90 with the objective of reducing the volatility of our operating costs to fluctuating electricity costs which represent approximately 25% of our Upstream operating costs. Beyond June 30, 2009, we have no crude oil, refined product or natural gas price risk management contracts in place.
32
We manage our exposure to fluctuations in interest rates by maintaining a mix of short and longer term financing with the short term financing typically carrying floating interest rates and longer term financing (our 77/8% Senior Notes and Convertible Debentures) carrying fixed rates of interest. Our short term financing consists of bank borrowings under our credit facilities which totaled $1,097.8 million at June 30, 2009, representing approximately 48% of our total debt. As a result, approximately 48% of our interest rate exposure is floating and 52% is fixed. Currently, our most significant exposure to increasing interest rates is through the re-pricing of bank borrowings as we renew our credit facilities or enter into additional longer term financings. In October 2011, our US$250 million of 77/8% Senior Notes mature and the re-financing of this maturity also presents an exposure to increased borrowing costs while the maturing of the $915.8 million of principal amount of Convertible Debentures (2009 - $1.6 million; 2010 - $37.1 million; 2012 - $174.6 million; 2013 - $379.3 million; 2014 - $73.2 million and 2015 - $250 million) will not necessarily result in an exposure to increased borrowing costs as we anticipate that as these Convertible Debentures mature, or are converted into Trust Units before their maturity date, the principal amount will be settled with the issuance of Trust Units.
While we do not forecast commodity prices nor refining gross margins, we may enter into commodity price risk management contracts from time-to-time to mitigate some portion of our price volatility with the objective of stabilizing our cash flow from operating activities. The following table reflects the sensitivity of our 2009 cash flow from operating activities over the
| last six months of 2009 to changes in the following benchmark prices: | | | | | | | |
| | | Assumption | | | Change | | | Impact on Cash Flow | |
| WTI oil price (US$/bbl) | $ | 70.00 | | $ | 5.00 | | $ | 0.10 / Unit | |
| CAD/USD exchange rate | $ | 0.92 | | $ | 0.05 | | $ | 0.07 / Unit | |
| AECO daily natural gas price | $ | 3.80 | | $ | 1.00 | | $ | 0.08 / Unit | |
| Refinery crack spread (US$/bbl) | $ | 4.00 | | $ | 1.00 | | $ | 0.13 / Unit | |
| Upstream operating expenses (per boe) | $ | 14.50 | | $ | 1.00 | | $ | 0.05 / Unit | |
Overall, we expect that based on current commodity price expectations, our 2009 cash from operating activities will be sufficient to fund our capital expenditures and distributions paid to Unitholders. In prior years, we have balanced our cash from operating activities and the funding of capital expenditures and distributions paid to Unitholders with reliance on the proceeds from our distribution reinvestment programs for any shortfalls.
In light of the current state of the credit markets and the proposed pricing received from the lead banks to amend and extend our credit facility, we continue to pursue opportunities to reduce our bank borrowings to less than $1 billion prior to the April 2010 maturity date of our current credit facility. We expect to use net cash flow after capital spending plus some combination of asset sales, distribution reductions or additional equity to achieve this objective. A target of approximately $1 billion in bank borrowings is based on a prudent evaluation of our debt capacity and available credit.
CRITICAL ACCOUNTING ESTIMATES
There are a number of critical estimates underlying the accounting policies applied when preparing the consolidated financial statements due to timing differences between when certain activities are settled and when these activities are recognized for accounting purposes. Changes in these estimates could have a material impact on our reported results. These estimates are described in detail in our MD&A for the year ended December 31, 2008 as filed on SEDAR atwww.sedar.com. There have been no significant changes to any of our critical accounting estimates in our consolidated financial statements for the three and six months ended June 30, 2009 from those described in our annual MD&A.
RECENT CANADIAN ACCOUNTING AND RELATED PRONOUNCEMENTS
In June 2009, the CICA amended Section 3862, “Financial Instruments – Disclosures,” to include additional disclosure requirements about fair value measurement for financial instruments and liquidity risk disclosures. These amendments require a three level hierarchy that reflects the significance of the inputs used in making the fair value measurements. Fair values of assets and liabilities included in Level 1 are determined by reference to quoted prices in active markets for identical assets and liabilities. Assets and liabilities in Level 2 include valuations using inputs other than quoted prices for which all significant outputs are observable, either directly or indirectly. Level 3 valuations are based on inputs that are unobservable and significant to the overall fair value measurement. These amendments are effective for Harvest on December 31, 2009.
33
International Financial Reporting Standards
In February 2008, the CICA Accounting Standards Board (“ASB”) announced that Canadian public reporting issuers will be required to report under International Financial Reporting Standards (“IFRS”) commencing January 1, 2011 which will require comparative IFRS information for the 2010 year end. In mid-2008, the ASB issued an exposure draft to incorporate IFRS as of the end of 2007 into the Canadian accounting standards. For changes to IFRS subsequent to 2007, the ASB expects to issue further exposure drafts and to incorporate these into the CICA Handbook by the end of 2009.
In July 2009, the International Accounting Standards Board (“IASB”) issued an amendment with additional exemptions for first time adopters of IFRS to enable an entity to measure exploration and evaluation assets at the amount determined under the entity’s previous accounting principles and it also provides for the measurement of oil and gas assets in the development or production phase, among other things, by allocating the amount determined by the entity’s previous accounting principles to the underlying assets on a pro rata basis using reserve volumes or reserve values at the date of transition. These amendments will substantially ease the adoption of IFRS for Harvest.
We have established an IFRS Conversion Plan and have staffed a project team with regular reporting to our senior management team and to the Audit Committee of the Board of Directors. We have completed an initial assessment of the differences between Canadian accounting standards and IFRS and are currently completing a comprehensive assessment of the impact of adopting IFRS on our accounting policies, information technology and data systems, internal control over financial reporting, disclosure controls and procedures, financial reporting expertise as well as business activities that may be influenced such as debt covenants, capital requirements and compensation arrangements. At this stage in the project we are unable to determine the full impact of adopting IFRS on Harvest’s financial position and future results.
OPERATIONAL AND OTHER BUSINESS RISKS
Both Harvest’s Upstream operations and its Downstream operations are conducted in the same business environment as most other operators in the respective businesses and the business risks are very similar. However, our structure as a publicly traded mutual fund trust is significantly different than that of a traditional corporation with share capital and there are some unique business risks of our structure. In addition, Harvest’s monthly cash distributions limits its accumulation of capital resources from internal sources. We intend to continue executing our business plan to create value for Unitholders by increasing the net asset value per Trust Unit with our risk management activities carried out under policies approved by our Board of Directors.
We have segregated the identification of business risks into those generally applicable to Upstream operations as well as Downstream operations and those applicable to our royalty trust structure and these should be read in conjunction with the full description of these risks in our Annual Information Form for the year ended December 31, 2008 filed onwww.sedar.com. The following summarizes the more significant risks:
Upstream Operations
Prices received for petroleum and natural gas have fluctuated widely in recent years and are also impacted by the volatility in the Canadian/U.S. currency exchange rate.
The differential between light oil and heavy oil compounds the fluctuations in the benchmark oil prices.
The operation of petroleum and natural gas properties involves a number of operating and natural hazards which may result in blowouts, environmental damage and other unexpected and/or dangerous conditions.
The production of petroleum and natural gas may involve a significant use of electrical power and since de- regulation of the electric system in Alberta, electrical power prices in Alberta have been volatile.
34
The markets for petroleum and natural gas produced in western Canada depend upon available capacity to refine crude oil and process natural gas as well as pipeline capacity to transport the products to consumers.
The reservoir and recovery information in reserve reports are estimates and actual production and recovery rates may vary from the estimates and the variations may be significant.
Absent capital reinvestment, production levels from petroleum and natural gas properties will decline over time and absent commodity price increases, cash generated from operating these assets will also decline.
Prices paid for acquisitions are based in part on reserve report estimates and the assumptions made preparing the reserve reports are subject to change as well as geological and engineering uncertainty.
The operation of petroleum and natural gas properties is subject to environmental regulation pursuant to local, provincial and federal legislation and a breach of such legislation may result in the imposition of fines as well as higher operating standards that may increase costs.
Downstream Operations
The market prices for crude oil and refined products have fluctuated significantly, the direction of the fluctuations may be inversely related and the relative magnitude may be different resulting in volatile refining gross margins.
The prices for crude oil and refined products are generally based in U.S. dollars while our operating costs are denominated in Canadian dollars which introduces currency exchange rate exposure.
Crude oil feedstock is delivered to our refinery via waterborne vessels which could experience delays in transporting supplies due to weather, accidents, government regulations or third party actions.
Over 60% of our feedstock in 2008 was supplied from sources in Iraq and if Iraq curtails supply, we may not be able to find another source with an adequate amount of a similar type of crude oil.
We are relying on the marketing ability and creditworthiness of Vitol for our purchase of feedstock and should their creditworthiness deteriorate, crude oil suppliers may restrict the sale of crude oil to Vitol and we would be required to find another counterparty to our Supply and Offtake Agreement.
Our refinery is a single train integrated interdependent facility which could experience a major accident, be damaged by sever weather or otherwise be forced to shutdown which may reduce or eliminate our cash flow.
Our refining operations which include the transportation and storage of a significant amount of crude oil and refined products are adjacent to environmentally sensitive coastal waters, and are subject to hazards and similar risks such as fires, explosions, spills and mechanical failures, any of which may result in personal injury, damage to our property and/or the property of others along with significant other liabilities in connection with a discharge of materials.
The production of aviation fuels subjects us to liability should contaminants in the fuel result in aircraft engines being damaged and/or aircraft crashes.
Collective agreements with our employees and the United Steel Workers of America may not prevent a strike or work stoppage and future agreements may result in an increase in operating costs.
Refinery operations are subject to environmental regulation pursuant to local, provincial and federal legislation and a breach of such legislation may result in the imposition of fines as well as higher operating standards that may increase costs.
General Business Risks
The loss of a member to our senior management team and/or key technical operations employee could result in a disruption to either our Upstream or Downstream operations.
Our credit facility and other financing agreements contain financial covenants and maturity dates that may limit our ability to sell assets, enter into certain financing arrangements and/or pay distributions to Unitholders.
Variations in interest rates on our current and/or future financing arrangements may result in significant increases in our borrowing costs and result in less cash available for distributions to Unitholders.
Our crude oil sales and refining gross margins are denominated in U.S. dollars while we pay distributions to our Unitholders in Canadian dollars which results in currency exchange rate exposure.
35
Royalty Trust Structural Risks
Trust Units are hybrid securities in that they share certain attributes common to both equity securities and debt instruments and represent a fractional interest in the Trust.
Recent changes to income tax legislation related to the royalty trust structure will result in a tax, at the trust level of our structure, on distributions from Harvest at rates of tax comparable to the combined federal and provincial corporate income tax rates in Canada and to treat such distributions as dividends to the Unitholders for income tax purposes.
CHANGES IN REGULATORY ENVIRONMENT
For a detailed discussion of the most recent changes to our regulatory environment, please refer to our MD&A for the year ended December 31, 2008 as filed on SEDAR atwww.sedar.com.
INTERNAL CONTROL OVER FINANCIAL REPORTING
For a detailed discussion of our internal control over financial reporting, please refer to our MD&A for the year ended December 31, 2008 as filed on SEDAR atwww.sedar.com. During the three and six months ended June 30, 2009, there were no changes in our internal control over financial reporting that have materially affected, or are reasonably likely to materially affect, our internal control over financial reporting except for the upgrading of the Downstream accounting software to versions that are supported by their vendors. This change, while strengthening our controls, required that a significant amount of historical data be converted to be compatible with the upgraded software.
ADDITIONAL INFORMATION
Further information about us, including our Annual Information Form, can be accessed under our public filings found on SEDAR atwww.sedar.com or atwww.harvestenergy.ca. Information can also be found by contacting our Investor Relations department at (403) 265-1178 or at 1-866-666-1178.
36