UNITED STATES
SECURITIES AND EXCHANGE COMMISSION
Washington, D.C. 20549
FORM N-CSR
CERTIFIED SHAREHOLDER REPORT OF REGISTERED
MANAGEMENT INVESTMENT COMPANIES
Investment Company Act file number 811-21681
Old Mutual/Claymore Long-Short Fund
(Exact name of registrant as specified in charter)
| 2455 Corporate West Drive, Lisle, IL | 60532 | |
| (Address of principal executive offices) | (Zip code) |
Nicholas Dalmaso, Chief Legal and Executive Officer
Old Mutual/Claymore Long-Short Fund
2455 Corporate West Drive, Lisle, IL 60532
(Name and address of agent for service)
Registrant’s telephone number, including area code: (630) 505-3700
Date of fiscal year end: December 31
Date of reporting period: December 31, 2005
Form N-CSR is to be used by management investment companies to file reports with the Commission not later than 10 days after the transmission to stockholders of any report that is required to be transmitted to stockholders under Rule 30e-1 under the Investment Company Act of 1940 (17 CFR 270.30e-1). The Commission may use the information provided on Form N-CSR in its regulatory, disclosure review, inspection, and policymaking roles.
A registrant is required to disclose the information specified by Form N-CSR, and the Commission will make this information public. A registrant is not required to respond to the collection of information contained in Form N-CSR unless the Form displays a currently valid Office of Management and Budget (“OMB”) control number. Please direct comments concerning the accuracy of the information collection burden estimate and any suggestions for reducing the burden to Secretary, Securities and Exchange Commission, 450 Fifth Street, NW, Washington, DC 20549-0609. The OMB has reviewed this collection of information under the clearance requirements of 44 U.S.C. Section 3507.
| Item 1. | Reports to Stockholders. |
The registrant’s annual report transmitted to shareholders pursuant to Rule 30e-1 under the Investment Company Act of 1940 is as follows:
www.oldmutualclaymore.com
| ...your course to the LATEST, | ||
| most up-to-date INFORMATION about the | ||
| Old Mutual/Claymore Long-Short Fund | ||
The shareholder report you are reading right now is just the beginning of the story. Online at oldmutualclaymore.com, you will find:
| • | Daily, weekly and monthly data on share prices, distributions and more |
| • | Monthly portfolio overviews and performance analyses |
| • | Announcements, press releases, special notices and tax characteristics |
Analytic Investors, Inc. and Claymore are continually updating and expanding shareholder information services on the Fund’s website, in an ongoing effort to provide you with the most current information about how your Fund’s assets are managed, and the results of our efforts. It is just one more way we are working to keep you better informed about your investment in the Fund.
2 | Annual Report | December 31, 2005 |
OLA | Old Mutual/Claymore Long-Short Fund
Dear Shareholder |
We are delighted to submit the first annual shareholder report for the Old Mutual/Claymore Long-Short Fund (“OLA”). This report covers performance from the Fund’s inception on August 25, 2005, through December 31, 2005. As you may know, the Fund’s investment objective is to seek a high level of current income and gains with a secondary objective of long-term capital appreciation. The Fund seeks to achieve that objective by investing in a diversified portfolio of common stocks and other equity securities utilizing a 120% long / 20% short strategy and opportunistically employing a strategy of writing (selling) calls on equity indexes.
Analytic Investors, Inc. (“Analytic”) is the Fund’s Sub-Adviser. The firm was founded in 1970 and is a wholly-owned subsidiary of Old Mutual (US) Holdings Inc., more commonly known as Old Mutual Asset Management. With approximately $10 billion in assets under management as of December 31, 2005, Analytic specializes in the creation and continuous management of optioned-equity and optioned-debt portfolios for mutual funds, foundations, insurance companies, endowments, profit-sharing plans, funds-of-hedge-funds and individual investors.
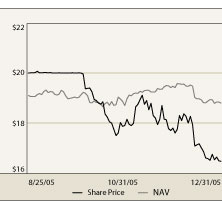
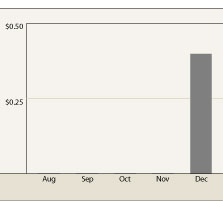
Since its inception on August 25, 2005, the Fund generated a total return of 0.52% at net asset value (“NAV”). This represents a change in NAV from $19.10 at inception to $18.80 on December 31, 2005, plus the reinvestment of the Fund’s quarterly distribution. During this same period, the Fund’s total return based on market price was -15.76%. This reflects a change in market price from $20.00 at inception to $16.47 on December 31, 2005, plus the reinvestment of dividends. The Fund paid its initial quarterly dividend of $0.40 per share on December 31, 2005. This dividend represents an annualized distribution yield of 8% based on the Fund’s initial offering price of $20.
The Fund’s market price is trading at a discount to its NAV. This discount from NAV highlights the fact that most closed-end funds have fallen out of favor with investors recently. However, we feel that this discount represents an opportunity as common shares of the Fund are now available in the market at prices below the value of the securities in the underlying portfolio.
Shareholders have the opportunity to reinvest their dividends from the Fund through the Dividend Reinvestment Plan (DRIP) that is described in detail on page 26 of this report. If shares trade at a discount to NAV, the DRIP takes advantage of the discount by reinvesting the quarterly dividend distribution in common shares of the Fund purchased in the market at a price less than NAV. Conversely, when the market price of the Fund’s common shares is at a premium above NAV, the DRIP reinvests participants’ dividends in newly-issued common shares at NAV, subject to an IRS limitation that the purchase price cannot be more than 5% below the market price per share. The DRIP provides a cost effective means to accumulate additional shares and enjoy the benefits of compounding returns over time.
To learn more about the Fund’s performance over this fiscal period, we encourage you to read the Questions & Answers section of the report on page 4. You will find information on Analytic’s investment philosophy and discipline and their views on the overall market environment and how they structured the portfolio based on their views.
We appreciate your investment and look forward to serving your investment needs in the future. For the most up-to-date information on your investment, please visit the Fund’s website at www.oldmutualclaymore.com.
Sincerely,
 |
Nicholas Dalmaso |
| Old Mutual/Claymore Long-Short Fund |
February 3, 2006
| Annual Report | December 31, 2005 | 3 |
OLA | Old Mutual/Claymore Long-Short Fund
Questions & Answers |
Dennis M. Bein, CFA
Chief Investment Officer, Portfolio Manager
Analytic Investors, Inc.
As Chief Investment Officer, Dennis Bein oversees the implementation of Analytic’s investment strategies. He is a major contributor to the firm’s ongoing research efforts as well as to the new product development efforts and strategy applications. As Portfolio Manager, Bein directs the Fund’s management team on day-to-day portfolio management and research related to the Fund’s equity-based investment strategies. Bein joined Analytic in 1995, and has more than 15 years of investment experience. He is a CFA charterholder and earned an M.B.A. from the Anderson Graduate School of Management, University of California, Riverside.
The Old Mutual/Claymore Long-Short Fund is managed by Analytic Investors, Inc. In the following interview, Chief Investment Officer and Portfolio Manager Dennis Bein, CFA, explains how he and his team of investment professionals structured the portfolio. He also discusses the Fund’s performance from its inception on August 25, 2005 through December 31, 2005, the end of its annual fiscal period.
Before we discuss performance, will you first remind us of the Fund’s investment objectives and explain how your investment process seeks to achieve those objectives?
The Fund’s investment objective is to seek a high level of current income and gains with a secondary objective of long-term capital appreciation. The Fund seeks to achieve that objective by investing in a diversified portfolio of common stocks and other equity securities utilizing a 120% long/20% short strategy (“120/20”) and opportunistically employing a strategy of writing (selling) calls on equity indexes. This 120/20 strategy provides the Fund with full market exposure and participation relative to the S&P 500 Index. The S&P 500 Index is generally considered representative of the U.S. stock market. The Fund’s short position allows us to take advantage of securities that we believe are likely to experience declines.
Our investment process begins by utilizing quantitative models to develop an equity portfolio that offers the potential for capital appreciation. The portfolio is constructed with a level of diversification and risk similar to that of the S&P 500 Index, but is designed to outperform the index over a full market cycle by having its long positions invested in what we believe are the stocks that will outperform, while selling short the stocks that we believe will be the underperformers. To generate income and help reduce volatility, we then apply a call options overlay.
We believe our investment strategy is unique in the following ways.
Our Stock Selection Process Our process begins by analyzing stock characteristics, rather than focusing on individual stocks like many investment managers do. Our quantitative review is based on sophisticated mathematical models focused on variables that cover multiple dimensions of a stock’s true value, such as its valuation, growth potential, historical return patterns, liquidity and risk. The system identifies characteristics that are currently being rewarded or punished by investors through examining a universe of approximately 3,000
4 | Annual Report | December 31, 2005 |
OLA | Old Mutual/Claymore Long-Short Fund | Questions & Answers continued
stocks to determine which financial characteristics are shared by the market’s largest gaining or losing stocks. Stocks possessing favorable characteristics are ranked highly and become good candidates for the long portfolio. Stocks that possess unfavorable characteristics rank poorly and are good candidates for the short portfolio. Ultimately a portfolio of at least 75 highly-ranked stocks is combined with short positions in 20 to 30 low-ranked stocks. We monitor the portfolio on a real-time basis using our proprietary management system that identifies media events or changes in fundamental factors that are potentially significant for the portfolio holdings. However, we only trade securities when we believe the incremental return potential will exceed the associated transaction costs.
What is a short sale?
A short sale is a three-step trading strategy that seeks to capitalize on an anticipated decline in the price of a security. First, arrangements are made to borrow shares of the security, typically from a broker. Next, the investor will sell the shares immediately in the open market with the intention of buying them back at some point in the future. Finally, to complete the cycle, at a later date he/she will repurchase the shares (hopefully at a lower price) and will return them to the lender. In the end, the investor will pocket the difference if the share price falls, but will of course incur a loss if it rises.
Options Overlay This Fund is unique because we typically won’t write (sell) call options on individual securities like a traditional covered call fund might. We prefer to sell options on index options, since we have strong convictions about the stocks we own. This strategy helps preserve the upside potential on our individual equity holdings, which is more important to us than giving away the upside potential of the market sectors on which we’ve written the calls. We believe giving away market or sector upside potential in exchange for lower overall volatility and a higher yield provided by the call options premiums benefits the Fund.
What is an index option?
An index option is a contract which gives the buyer the right to participate in market gains over and above (in the case of a call) or below (in the case of a put) at a specified price (the strike price) on or before a pre-determined date (the expiration date). After this pre-determined date, the option and its corresponding rights expire. For example, the seller of an index call option is obligated, until the expiration date, to pay the holder of the option the difference between the index price and the option’s strike price, upon the holder’s request. The price of the option is determined from trading activity in the options market, and generally reflects the relationship between the current price for the index and the strike price, as well as the time remaining until the expiration date.
Will you provide a market overview for the fiscal period and discuss the Fund’s performance?
There was considerable volatility within the market from the Fund’s inception on August 25, 2005 through December 31, 2005. Days after the Fund’s inception, Hurricanes Katrina and Rita waged destruction on the Gulf Coast and crude oil prices reached historically high levels. Ongoing geopolitical events supported the
| Annual Report | December 31, 2005 | 5 |
OLA | Old Mutual/Claymore Long-Short Fund | Questions & Answers continued
volatility as did conjecture about whether the Federal Reserve Board was nearing an end to its interest rate tightening cycle. In the end, however, stocks posted strong gains, and the Standard & Poor’s 500 Index returned 3.65% during the fiscal period. Index returns include the reinvestment of all distributions. It is not possible to invest directly in an index.
The Fund generated a total return of 0.52% at net asset value (“NAV”). This represents a change in NAV from $19.10 at inception to $18.80 on December 31, 2005, plus the reinvestment of the Fund’s quarterly distribution. While the Fund underperformed the S&P 500 during this period, it outperformed the negative - -0.04% return of the CBOE BuyWrite Index (“BXM”). The BXM is an index that simulates an ongoing covered call strategy on the S&P 500 and consists of an unmanaged portfolio of stocks upon which a one-month call option on the S&P 500 is continuously written.
The Fund’s NAV underperformance relative to the S&P 500 was due in part to our stock selection, but to a greater degree it was due to the Fund’s options overlay. The Fund’s covered call program is designed to limit the Fund’s downside risk when the market declines. Conversely, it impedes performance when the market rises, as it did in this period. We believe, however, that the BXM is an index more reflective of the Fund’s structure than the S&P 500. With that said, we’re pleased with the Fund’s performance relative to the BXM.
During this same period, the Fund’s total return based on market price was a negative return of -15.76%. This reflects a change in market price from $20.00 at inception to $16.47 on December 31, 2005, plus the reinvestment of the Fund’s quarterly distributions. The decline in the Fund’s market price and its deep discount to the Fund’s NAV was disappointing. As the Fund’s investment manager we have a clear objective of providing a high level of current income and gains for shareholders. We are pleased that the Fund earned and paid its initial quarterly dividend of $0.40 per share on December 31, 2005. This dividend represents an annualized distribution yield of 8% based on the Fund’s initial offering price of $20. We believe that if we can continue to deliver a favorable distribution rate and improve the Fund’s net asset value, its discount to market price will improve. Market price may also be helped by positive analyst ratings and media coverage – both of which the Fund received during this period.
Will you provide examples of characteristics favored by your quantitative model during the period and explain how this information impacted Fund performance?
The model pointed us to companies with positive earnings estimate revisions, strong projected earnings growth rates, above average sales and revenues relative to price, and those with above average return on assets.
The model deemphasized companies with above-average dividend yield, above-average trading volume, and those with strong asset utilization/turnover.
6 | Annual Report | December 31, 2005 |
OLA | Old Mutual/Claymore Long-Short Fund | Questions & Answers continued
We structured the long equity portfolio and sold short positions based on the model’s assumptions and our fundamental review. In some cases, these assumptions translated into gains for the Fund. In other cases, they directed us to investments that detracted from performance.
Examples of stocks that helped performance Based on the model’s assumptions, we established an overweight position in Darden Restaurants (1.8% of long-term investments and securities sold short) because of the company’s strong estimate revisions scores. Darden Restaurants is the parent company of the Olive Garden and Red Lobster restaurant chains. Darden rallied strongly in the period after it posted a better-than-expected rise in quarterly earnings and boosted its profit outlook for the year. We established an equity position in Yahoo! Inc. (0.2% of long-term investments and securities sold short) because of its strong projected earnings growth rate. Yahoo! provides Internet services and a range of tools and marketing solutions for businesses. The stock rallied strongly after a surge in third quarter revenue was announced. The Fund also benefited from its short position in OfficeMax, Inc. (0.4% of long-term investments and securities sold short) We shorted the office supply retailer because of its above-average trading volume and below-average earnings estimate revisions. The stock moved lower in the period after the company reported a deeper-than-expected loss for the third quarter as a result of sluggish retail sales. The Fund profited from the stock’s decline as a result of using the short sale strategy.
Examples of stocks that hurt performance Strong sales relative to stock price led us to invest in CenterPoint Energy, Inc. (1.0% of long-term investments and securities sold short) The company, which distributes natural gas and electric energy, declined with the energy sector in the fourth quarter and on news that it would restate its finances to correct accounting errors that overstated the company’s revenue and natural gas expenses. The Fund’s overweight position in Johnson & Johnson (“J&J”) (3.1% of long-term investments and securities sold short) relative to the S&P 500 was also disappointing. J&J is a pharmaceutical, medical device and consumer products company. We liked J&J because of the strong return on assets it had been providing. Pharmaceutical companies struggled in the period and so did J&J. The company’s stock also declined when a company it had been pursuing to acquire announced failures in some of its medical device products. Janus Capital Group, Inc. (0.5% of long-term investments and securities sold short) is an example of a short position we took on a stock that gained ground in the period. We shorted this issuer, an investment products firm, because of its poor sales relative to its price per share, which suggested to us that its stock price was overvalued.
| Annual Report | December 31, 2005 | 7 |
OLA | Old Mutual/Claymore Long-Short Fund | Questions & Answers continued
The stock rallied, however, after Janus named a new chief executive officer and reported better-than- expected earnings and strong investor cash flows.
The Fund’s stock holdings provided mixed performance during this short period. While we were disappointed, we are not surprised at the results. The fiscal period was one of transition within the market and one in which investor attitudes vacillated rapidly. During such scenarios, it is likely that the Fund’s quantitative model will be less effective in its selection process and the stock portfolio may not provide its best returns. We would expect better equity performance within the portfolio during periods in which there are more consistent trends in place.
How quickly do you adjust portfolio holdings based on changing opinions toward characteristics?
We closely monitor the Fund’s portfolio and the dynamics of characteristics within the market. As soon as we see a characteristic begin to fall out of investors’ favor we react immediately, but not dramatically, by lessening the Fund’s exposure to stocks with that characteristic. We move the portfolio gradually to guard against being “whipsawed” based on what could simply be a temporary change in investor preferences. If investor preferences continue to shift, we continue to shift the portfolio away from the characteristic that is falling out of favor. We liken our approach to navigating a sailboat. We follow the direction of the wind slowly and steadily, not dramatically. If things reverse course, we adjust our direction.
Are you able to preserve potential upside in a strong equity market given the Fund’s options overlay strategy?
As with our equity portfolio, we actively manage the Fund’s options strategy. If market shifts cause our options to move “into the money,” meaning we’re sacrificing premiums and giving away upside potential, we’ll actively move (or roll) the options to higher strike prices in order to capture some of the appreciation in price as the underlying basket of securities moves higher. Conversely, if the market is declining and the options are not providing enough protection, we’ll trade out of those positions and establish other more favorable and defensive options positions. We work hard to add value at both and equity and options level at all times.
What is your outlook for the market and the Fund in 2006?
The valuation of the U.S. equity market remains attractive versus relatively low bond yields as the forecasted earnings for the S&P 500 improved in the fourth quarter of 2005. On a global basis, however, U.S. valuations still appear slightly more expensive than average. In this type of environment, we expect slightly higher-than-average returns for the U.S. equity market, which should produce strong positive returns for the Fund, though likely limited value added relative to the S&P 500.
8 | Annual Report | December 31, 2005 |
OLA | Old Mutual/Claymore Long-Short Fund | Questions & Answers continued
OLA Risks and Other Considerations
The Fund is a newly organized, diversified, closed-end management investment company with no history of operations. As with any stock, the price of the Fund’s Common Shares will fluctuate with market conditions and other factors. Shares of closed-end management investment companies frequently trade at a discount from their net asset value. If you sell your common shares, you may receive more or less than your original investment. Net asset value will be reduced immediately following the initial offering by the sales load and by offering expenses paid or reimbursed by the Fund. The Fund’s Common Shares may trade at a price that is less than their initial offering price. This risk may be greater for investors who sell their shares relatively shortly after completion of the initial public offering. The common shares are designed for long-term investors and should not be treated as a vehicle for trading.
The Fund will ordinarily have substantial exposure (both long and short) to common stocks and other equity securities in pursuing its investment objectives and policies. The market price of common stocks and other equity securities in which the Fund invests may go up or down, sometimes rapidly or unpredictably. Equity securities may decline in value due to factors affecting equity securities markets generally, particular industries represented in those markets or the issuer itself.
The Fund is expected to make substantial use of short sales for investment and risk management purposes, including when Analytic anticipates that the market price of securities will decline or will underperform relative to other securities held in the Fund’s portfolio. The Fund initially intends to take short equity positions in an amount equal to approximately 20% of the Fund’s net assets at the time of sale, but reserves the flexibility to hold short positions of up 70% of net assets. Short sales are transactions in which the Fund sells a security or other instrument (such as an option, forward, futures or other derivative contract) that it does not own. When the Fund engages in a short sale on a security, it must borrow the security sold short and deliver it to the counterparty. The Fund will ordinarily have to pay a fee or premium to borrow particular securities and be obligated to repay the lender of the security any dividends or interest that accrue on the security during the period of the loan. The amount of any gain from a short sale will be decreased, and the amount of any loss increased, by the amount of the premium, dividends, interest or expenses the Fund pays in connection with the short sale. Short sales expose the Fund to the risk that it will be required to cover its short position at a time when the securities have appreciated in value, thus resulting in a potentially unlimited loss to the Fund.
The distributions shareholders receive from the Fund are based primarily on the dividends it earns from its equity investments as well as the gains the Fund receives from writing options and using other derivative instruments, closing out short sales and selling portfolio securities, each of which can vary widely over the short and long term. The dividend income from the Fund’s investments in equity securities will be influenced by both general economic activity and issuer-specific factors. In the event of a recession or adverse events affecting a specific industry or issuer, an issuer of equity securities held by the Fund may reduce the dividends paid on such securities. If prevailing market interest rates decline, interest rates on any debt instruments held by the Fund, and shareholders’ income from the Fund, would likely decline as well. Please see “Distributions” for a description of other risks associated with the level, timing and character of the Fund’s distributions.
There are various risks associated with the Option Strategy. The purchaser of an index option written by the Fund has the right to any appreciation in the cash value of the index over the strike price on the expiration date. Therefore, as the writer of an index call option, the Fund forgoes the opportunity to profit from increases in the index over the strike price of the option. However, the Fund has retained the risk of loss (net of premiums received) should the price of the Fund’s portfolio securities decline. Similarly, as the writer of a call option on an individual security held in the Fund’s portfolio, the Fund forgoes, during the option’s life, the opportunity to profit from increases in the market value of the security covering the call option above the sum of the premium and the strike price of the call but has retained the risk of loss (net of premiums received) should the price of the underlying security decline. The value of options written by the Fund, which will be priced daily, will be affected by, among other factors, changes in the value of underlying securities (including those comprising an index), changes in the dividend rates of underlying securities, changes in interest rates, changes in the actual or perceived volatility of the stock market and underlying securities and the remaining time to an option’s expiration. The value of an option also may be adversely affected if the market for the option is reduced or becomes less liquid.
An investment in the Fund is subject to certain risks and other considerations, including, but not limited to: Equity Risk; Short Sale Risk; Options Risk, Management Risk; Tax Treatment of Distributions; Derivatives Risk; Counterparty Risk; Credit Risk; Income Risk; Medium- and Smaller-Company Risk; Focused Investment Risk; Interest Rate Risk; Liquidity Risk; Market Disruption and Geopolitical Risk; Leverage Risk; Foreign Investment Risk; Other Investment Companies Risk; and Inflation/Deflation Risk.
Investors should consider the investment objectives and policies, risk considerations, charges and expenses of the Fund carefully before investing.
| Annual Report | December 31, 2005 | 9 |
OLA | Old Mutual/Claymore Long-Short Fund
Fund Summary | As of December 31, 2005 (unaudited)
Fund Statistics | ||||
Share Price | $ | 16.47 | ||
Common Share Net Asset Value | $ | 18.80 | ||
Premium/(Discount) to NAV | -12.39 | % | ||
Net Assets ($000) | $ | 357,292 | ||
Total Returns | Market | NAV | ||||
Since Inception – cumulative | - 15.76 | % | 0.52 | % |
Sector Breakdown | % of Long-Term Investments and Securities Sold Short | ||
Financials | 23.8 | % | |
Energy | 14.5 | % | |
Technology | 14.1 | % | |
Consumer Discretionary | 13.2 | % | |
Health Care | 9.5 | % | |
Industrials | 6.9 | % | |
Consumer Staples | 6.9 | % | |
Telecommunications | 5.5 | % | |
Materials | 4.8 | % | |
Utilities | 0.8 | % |
Securities are classified by sectors that represent broad groupings of related industries.
Top Ten Long-Term Holdings | % of Net Assets | ||
Exxon Mobil Corp. | 4.3 | % | |
Johnson & Johnson | 4.1 | % | |
Allstate Corp. | 3.1 | % | |
International Business Machines Corp. | 3.1 | % | |
Intel Corp. | 3.0 | % | |
Chevron Corp. | 2.9 | % | |
St. Paul Travelers Cos., Inc. | 2.9 | % | |
MetLife, Inc. | 2.8 | % | |
Fortune Brands, Inc. | 2.7 | % | |
Home Depot, Inc. | 2.7 | % |
Sectors and holdings are subject to change daily. For more current information, please visit www.claymore.com The above summaries are provided for informational purposes only and should not be viewed as recommendations. Past performance does not guarantee future results.
Share Price & NAV Performance
Distributions to Shareholders
Top Five Securities Sold Short | % of Net Assets | ||
XL Capital, Ltd. | 2.3 | % | |
Kinder Morgan, Inc. | 2.2 | % | |
CenturyTel, Inc. | 1.8 | % | |
Vulcan Materials Co. | 1.0 | % | |
Temple-Inland, Inc. | 0.9 | % |
10 | Annual Report | December 31, 2005 |
OLA | Old Mutual/Claymore Long-Short Fund
Portfolio of Investments | December 31, 2005
| Number of Shares | Value | ||||
| Long-Term Investments - 113.8% | |||||
| Common Stocks - 113.8% | |||||
| Consumer Discretionary - 14.8% | |||||
| 15,925 | AutoNation, Inc. (a)(b) | $ | 346,050 | ||
| 24,741 | Black & Decker Corp. (b) | 2,151,477 | |||
| 217,726 | Brunswick Corp. (b) | 8,852,739 | |||
| 11,917 | Carnival Corp. (b) | 637,202 | |||
| 170,129 | Cendant Corp. (b) | 2,934,725 | |||
| 223,986 | Darden Restaurants, Inc. (b) | 8,708,576 | |||
| 238,726 | Home Depot, Inc. (b) | 9,663,628 | |||
| 6,315 | J.C. Penny Co., Inc. (b) | 351,114 | |||
| 21,000 | Lennar Corp.- Class A | 1,281,420 | |||
| 28,140 | News Corp.- Class A (b) | 437,577 | |||
| 139,898 | VF Corp. | 7,741,955 | |||
| 43,965 | Wal-Mart Stores, Inc. | 2,057,562 | |||
| 319,114 | Walt Disney Co. (b) | 7,649,163 | |||
| 52,813,188 | |||||
| Consumer Staples - 8.6% | |||||
| 24,521 | Altria Group, Inc. | 1,832,209 | |||
| 106,197 | Archer-Daniels - Midland Co. (b) | 2,618,818 | |||
| 14,394 | Clorox Co. (b) | 818,875 | |||
| 285,589 | Coca-Cola Enterprises, Inc. (b) | 5,474,741 | |||
| 47,246 | Constellation Brands, Inc.- Class A (a)(b) | 1,239,263 | |||
| 125,420 | Fortune Brands, Inc. (b) | 9,785,268 | |||
| 8,057 | Reynolds American, Inc. | 768,074 | |||
| 11,842 | SUPERVALU, Inc. (b) | 384,628 | |||
| 455,347 | Tyson Foods, Inc.- Class A (b) | 7,786,434 | |||
| 30,708,310 | |||||
| Energy - 16.1% | |||||
| 15,137 | Amerada Hess Corp. (b) | 1,919,674 | |||
| 10,776 | Burlington Resources, Inc. (b) | 928,891 | |||
| 356,955 | CenterPoint Energy, Inc. (b) | 4,586,872 | |||
| 184,266 | Chevron Corp. (b) | 10,460,781 | |||
| 42,346 | ConocoPhillips (b) | 2,463,690 | |||
| 123,432 | Devon Energy Corp. (b) | 7,719,437 | |||
| 70,350 | Edison International (b) | 3,067,963 | |||
| 274,311 | Exxon Mobil Corp. | 15,408,049 | |||
| 29,139 | Marathon Oil Corp. | 1,776,605 | |||
| 6,204 | Murphy Oil Corp. | 334,954 | |||
| 4,385 | Nabors Industries, Ltd. (Bermuda) (a)(b) | 332,164 | |||
| 10,041 | Occidental Petroleum Corp. (b) | 802,075 | |||
| 149,816 | TXU Corp. (b) | 7,519,265 | |||
| 57,320,420 | |||||
| Financials - 27.8% | |||||
| 204,186 | Allstate Corp. (b) | 11,040,337 | |||
| 55,692 | American Express Co. (b) | 2,865,910 | |||
| 45,089 | American International Group, Inc. (b) | 3,076,422 | |||
| 121,835 | Bank of America Corp. (b) | 5,622,685 | |||
| 3,041 | Bear Stearns Cos., Inc. (b) | 351,327 | |||
| 10,074 | Capital One Financial Corp. (b) | 870,394 | |||
| 13,771 | CIGNA Corp. (b) | 1,538,221 | |||
| 6,681 | CIT Group, Inc. (b) | 345,942 | |||
| 14,405 | Citigroup, Inc. (b) | 699,075 | |||
| 93,465 | Countrywide Financial Corp. (b) | 3,195,568 | |||
| 11,154 | Goldman Sachs Group, Inc. (b) | 1,424,477 | |||
| 341,072 | H&R Block, Inc. (b) | 8,373,318 | |||
| 31,104 | Hartford Financial Services Group, Inc. (b) | 2,671,523 | |||
| 111,432 | JPMorgan Chase & Co. (b) | 4,422,736 | |||
| 29,377 | Lehman Brothers Holdings, Inc. | 3,765,250 | |||
| 62,737 | Loews Corp. (b) | 5,950,604 | |||
| 35,171 | MBNA Corp. (b) | 954,893 | |||
| 203,448 | MetLife, Inc. (b) | 9,968,952 | |||
| 59,697 | PNC Financial Services Group, Inc. | 3,691,066 | |||
| 90,850 | Simon Property Group, Inc. (b) | 6,961,836 | |||
| 231,518 | St. Paul Travelers Cos., Inc. (b) | 10,341,909 | |||
| 63,182 | Wachovia Corp. | 3,339,801 | |||
| 42,302 | Washington Mutual, Inc. (b) | 1,840,137 | |||
| 96,179 | Wells Fargo & Co. | 6,042,927 | |||
| 99,355,310 | |||||
| Health Care - 12.4% | |||||
| 86,457 | Abbott Laboratories (b) | 3,409,000 | |||
| 220,662 | AmerisourceBergen Corp. (b) | 9,135,407 | |||
| 14,466 | Amgen, Inc. (a)(b) | 1,140,789 | |||
| 20,986 | Becton, Dickinson & Co. (b) | 1,260,839 | |||
| 18,708 | Boston Scientific Corp. (a)(b) | 458,159 | |||
| 8,719 | C.R. Bard, Inc. (b) | 574,756 | |||
| 5,098 | Cardinal Health, Inc. (b) | 350,488 | |||
| 32,767 | Fisher Scientific International, Inc. (a)(b) | 2,026,967 | |||
| 55,728 | Forest Laboratories, Inc. (a)(b) | 2,267,015 | |||
| 8,792 | Guidant Corp. (b) | 569,282 | |||
| 23,549 | Humana, Inc. (a)(b) | 1,279,417 | |||
| 243,648 | Johnson & Johnson (b) | 14,643,245 | |||
| 63,394 | McKesson Corp. (b) | 3,270,496 | |||
| 104,527 | Pfizer, Inc. (b) | 2,437,570 | |||
| 29,870 | Quest Diagnostics, Inc. (b) | 1,537,708 | |||
| 44,361,138 | |||||
See notes to financial statements.
| Annual Report | December 31, 2005 | 11 |
OLA | Old Mutual/Claymore Long-Short Fund | Portfolio of Investments continued
| Number of Shares | Value | ||||||
| Industrials - 7.8% | |||||||
| 6,975 | CSX Corp. (b) | $ | 354,121 | ||||
| 21,254 | Cummins, Inc. (b) | 1,907,121 | |||||
| 25,923 | D.R. Horton, Inc. (b) | 926,229 | |||||
| 35,188 | Eaton Corp. (b) | 2,360,763 | |||||
| 8,244 | General Dynamics Corp. (b) | 940,228 | |||||
| 32,425 | General Electric Co. (b) | 1,136,496 | |||||
| 13,324 | Goodrich Corp. (b) | 547,616 | |||||
| 77,319 | KB HOME (b) | 5,617,999 | |||||
| 8,085 | L-3 Communications Holdings, Inc. (b) | 601,120 | |||||
| 34,026 | Lockheed Martin Corp. (b) | 2,165,074 | |||||
| 27,347 | Navistar International Corp. (a)(b) | 782,671 | |||||
| 30,701 | Pulte Homes, Inc. (b) | 1,208,391 | |||||
| 8,221 | Ryder System, Inc. (b) | 337,225 | |||||
| 87,897 | Union Pacific Corp. | 7,076,587 | |||||
| 26,926 | United Parcel Service, Inc.- Class B | 2,023,489 | |||||
| 27,985,130 | |||||||
| Materials - 4.1% | |||||||
| 120,090 | Ball Corp. (b) | 4,769,975 | |||||
| 130,353 | Dow Chemical Co. (b) | 5,712,068 | |||||
| 200,311 | Hercules Inc. (a)(b) | 2,263,514 | |||||
| 19,959 | Newmont Mining Corp. (b) | 1,065,811 | |||||
| 16,701 | Sherwin-Williams Co. (b) | 758,559 | |||||
| 14,569,927 | |||||||
| Technology - 17.0% | |||||||
| 106,180 | Affiliated Computer Services, Inc.- Class A (a)(b) | 6,283,732 | |||||
| 101,818 | Amazon.com, Inc. (a)(b) | 4,800,719 | |||||
| 26,245 | Autodesk, Inc. (a)(b) | 1,127,223 | |||||
| 294,515 | Cisco Systems, Inc. (a)(b) | 5,042,097 | |||||
| 46,739 | Dell, Inc. (a)(b) | 1,401,703 | |||||
| 135,792 | Freescale Semiconductor, Inc.- Class B (a)(b) | 3,417,885 | |||||
| 228,585 | Hewlett-Packard Co. (b) | 6,544,389 | |||||
| 436,263 | Intel Corp. (b) | 10,889,124 | |||||
| 133,022 | International Business Machines Corp. (b) | 10,934,408 | |||||
| 18,216 | Intuit, Inc. (a) | 970,913 | |||||
| 17,402 | Microsoft Corp. (b) | 455,062 | |||||
| 29,431 | NCR Corp. (a)(b) | 998,888 | |||||
| 9,400 | NVIDIA Corp. (a)(b) | 343,664 | |||||
| 27,878 | Oracle Corp. (a)(b) | 340,390 | |||||
| 21,951 | Symantec Corp. (a)(b) | 384,143 | |||||
| 190,684 | Texas Instruments, Inc. (b) | 6,115,236 | |||||
| 19,041 | Yahoo!, Inc. (a) | 746,026 | |||||
| 60,795,602 | |||||||
| Telecommunications - 5.0% | |||||||
| 16,986 | AT&T, Inc. (b) | 415,987 | |||||
| 19,870 | Comcast Corp.- Class A (a)(b) | 515,825 | |||||
| 106,351 | Motorola, Inc. (b) | 2,402,469 | |||||
| 60,084 | Qwest Communications International, Inc. (a)(b) | 339,475 | |||||
| 218,033 | Sprint Nextel Corp. (b) | 5,093,251 | |||||
| 302,225 | Verizon Communications, Inc. | 9,103,017 | |||||
| 17,870,024 | |||||||
| Utilities - 0.2% | |||||||
| 21,461 | AES Corp. (a)(b) | 339,728 | |||||
| 6,420 | Public Service Enterprise Group, Inc. (b) | 417,107 | |||||
| 756,835 | |||||||
Total Long-Term Investments (Cost $413,094,976) | $ | 406,535,884 | |||||
| Principal Amount | Value | ||||||
| Short-Term Investments - 4.6% | |||||||
| U.S Government and Agency Securities - 4.6% | |||||||
| $ | 3,000,000 | Federal Home Loan Discount Notes, yielding | |||||
| 3.50%, 1/6/06 (c) | $ | 2,998,968 | |||||
| 13,600,000 | U.S. Treasury Bills, yielding | ||||||
| 3.60% - 3.86%, 2/23/06 (b)(c) | 13,526,560 | ||||||
Total Short-Term Investments (Cost $16,525,467) | 16,525,528 | ||||||
Total Investments - 118.4% (Cost $429,620,443) | 423,061,412 | ||||||
Securities Sold Short - (18.9%) (Proceeds $66,419,335) | (67,443,291 | ) | |||||
| Other Assets less Liabilities - 0.8% | 2,933,297 | ||||||
| Total Value of Options Written - (0.3%) | (1,259,800 | ) | |||||
| Net Assets - 100.0% | $ | 357,291,618 | |||||
See notes to financial statements.
12 | Annual Report | December 31, 2005 |
OLA | Old Mutual/Claymore Long-Short Fund | Portfolio of Investments continued
| Number of Shares | Value | ||||
| Securities Sold Short - 18.9% | |||||
| Common Stocks - 18.9% | |||||
| Consumer Discretionary - 2.7% | |||||
| 168,164 | Cooper Tire & Rubber Co. | $ | 2,576,272 | ||
| 12,514 | Dow Jones & Co., Inc. | 444,122 | |||
| 27,952 | New York Times Co.- Class A | 739,330 | |||
| 56,117 | Tiffany & Co. | 2,148,720 | |||
| 13,965 | Univision Communications, Inc.- Class A (a) | 410,431 | |||
| 117,115 | Visteon Corp. (a) | 733,140 | |||
| 48,614 | Wendy’s International, Inc. | 2,686,410 | |||
| 9,738,425 | |||||
| Consumer Staples - 0.5% | |||||
| 48,310 | Avon Products, Inc. | 1,379,251 | |||
| 6,317 | BrownForman Corp.- Class B | 437,894 | |||
| 1,817,145 | |||||
| Energy - 3.1% | |||||
| 27,498 | EOG Resources, Inc. | 2,017,528 | |||
| 85,091 | Kinder Morgan, Inc. | 7,824,117 | |||
| 59,765 | Williams Cos., Inc. | 1,384,755 | |||
| 11,226,400 | |||||
| Financials - 3.8% | |||||
| 23,325 | Ambac Financial Group, Inc. | 1,797,425 | |||
| 131,339 | Janus Capital Group, Inc. | 2,446,846 | |||
| 9,525 | MBIA, Inc. | 573,024 | |||
| 7,416 | Northern Trust Corp. | 384,297 | |||
| 121,421 | XL Capital, Ltd.- Class A (Cayman Islands) | 8,181,347 | |||
| 13,382,939 | |||||
| Health Care - 0.2% | |||||
| 22,272 | MedImmune, Inc. (a) | 779,965 | |||
Industrials - 1.4% | |||||
| 57,293 | Avery Dennison Corp. | 3,166,584 | |||
| 68,597 | OfficeMax, Inc. | 1,739,620 | |||
| 4,906,204 | |||||
| Materials - 2.3% | |||||
| 14,691 | Ashland, Inc. | 850,609 | |||
| 74,136 | Temple-Inland, Inc. | 3,325,000 | |||
| 54,817 | Vulcan Materials Co. | 3,713,852 | |||
| 5,768 | Weyerhaeuser Co. | 382,649 | |||
| 8,272,110 | |||||
| Technology - 1.7% | |||||
| 103,424 | International Game Technology | 3,183,391 | |||
| 46,550 | KLA-Tencor Corp. | 2,296,311 | |||
| 63,858 | PMC-Sierra, Inc. (a) | 492,345 | |||
| 5,972,047 | |||||
| Telcommunications - 2.4% | |||||
| 188,779 | CenturyTel, Inc. | 6,259,912 | |||
| 199,685 | Tellabs, Inc. (a) | 2,176,566 | |||
| 8,436,478 | |||||
| Utilities - 0.8% | |||||
| 70,413 | Pinnacle West Capital Corp. | 2,911,578 | |||
Total Securities Sold Short (Proceeds $66,419,335) | $ | 67,443,291 | |||
Contracts (100 shares per contract) | Call Options Written(a) | Expiration Date | Exercise Price | Value | ||||||
| 103 | Dow Jones Utilities | January 2006 | $ | 420.00 | $ | 10,300 | ||||
| 200 | Morgan Stanley Cyclical IX | January 2006 | 810.00 | 35,000 | ||||||
| 1,450 | Philadelphia KBW Bank Index | January 2006 | 102.50 | 304,500 | ||||||
| 350 | Philadelphia Utility Index | January 2006 | 452.50 | 17,500 | ||||||
| 500 | S&P 500 Index | January 2006 | 1,250.00 | 565,000 | ||||||
| 500 | S&P 500 Index | January 2006 | 1,265.00 | 280,000 | ||||||
| 950 | S&P 500 Index | January 2006 | 1,300.00 | 47,500 | ||||||
Total Call Options Written (Premiums received $2,306,421) | $ | 1,259,800 | ||||||||
| (a) | Non-income producing security. |
| (b) | All or a portion of these securities are held as collateral for Securities Sold Short, options, forwards and futures. |
| (c) | Interest rate shown represents discount rate at time of purchase. |
See notes to financial statements.
| Annual Report | December 31, 2005 | 13 |
OLA | Old Mutual/Claymore Long-Short Fund
Statement of Assets and Liabilities | December 31, 2005
Assets | ||||
Investments, at value (cost $429,620,443) | $ | 423,061,412 | ||
Cash | 1,773,442 | |||
Receivable for securities sold | 33,697,425 | |||
Unrealized appreciation on forward currency contracts | 658,351 | |||
Dividends and interest receivable | 377,058 | |||
Variation margin on futures | 371,251 | |||
Other assets | 4,495 | |||
Total assets | 459,943,434 | |||
Liabilities | ||||
Securities sold short, at value (proceeds $66,419,335) | 67,443,291 | |||
Options written, at value (premiums received of $2,306,421) | 1,259,800 | |||
Payable for securities purchased | 33,094,192 | |||
Offering costs payable | 333,648 | |||
Advisory fee payable | 309,318 | |||
Accrued expenses | 211,567 | |||
Total liabilities | 102,651,816 | |||
Net Assets | $ | 357,291,618 | ||
Composition of Net Assets | ||||
Common stock, $.01 par value per share; | $ | 190,052 | ||
Additional paid-in capital | 362,050,032 | |||
Net realized gain on investments, futures, options, securities sold short, forwards and currency transactions | 3,675,387 | |||
Net unrealized depreciation on investments, futures, options, securities sold short, forwards and currency translation | (5,747,753 | ) | ||
Distributions in excess of net investment income | (2,876,100 | ) | ||
Net Assets | $ | 357,291,618 | ||
Net Asset Value (based on 19,005,240 common shares outstanding) | $ | 18.80 | ||
See notes to financial statements.
14 | Annual Report | December 31, 2005 |
OLA | Old Mutual/Claymore Long-Short Fund
Statement of Operations | For the Period August 25, 2005* through December 31, 2005
Investment Income | |||||||
Dividends | $ | 2,356,140 | |||||
Interest | 493,445 | ||||||
Total income | $ | 2,849,585 | |||||
Expenses | |||||||
Advisory fee | 1,226,289 | ||||||
Dividends on securities sold short | 383,861 | ||||||
Custodian fee | 168,273 | ||||||
Professional fees | 71,010 | ||||||
Trustees’ fees and expenses | 63,815 | ||||||
Administration fee | 34,718 | ||||||
Fund accounting | 31,256 | ||||||
Printing expense | 22,903 | ||||||
Transfer agent fee | 17,027 | ||||||
NYSE listing fee | 11,801 | ||||||
Insurance | 5,600 | ||||||
Miscellaneous | 7,455 | ||||||
Total expenses | 2,044,008 | ||||||
Net investment income | 805,577 | ||||||
Realized and Unrealized Gain (Loss): | |||||||
Net realized gain (loss) on: | |||||||
Investments | 12,953,722 | ||||||
Futures | (647,783 | ) | |||||
Options | (4,579,570 | ) | |||||
Securities sold short | 1,149,267 | ||||||
Foreign currency forwards and currency transactions | (1,279,830 | ) | |||||
Net unrealized appreciation (depreciation) on: | |||||||
Investments | (6,559,031 | ) | |||||
Futures | 133,618 | ||||||
Options | 1,046,621 | ||||||
Securities sold short | (1,023,956 | ) | |||||
Foreign currency forwards and currency translation | 654,995 | ||||||
Net realized and unrealized gain | 1,848,053 | ||||||
Net Increase in Net Assets Resulting from Operations | $ | 2,653,630 | |||||
| * | Commencement of investment operations. |
See notes to financial statements.
| Annual Report | December 31, 2005 | 15 |
OLA | Old Mutual/Claymore Long-Short Fund
Statement of Changes in Net Assets |
For the Period August 25, 2005* through December 31, 2005 | ||||
Increase (Decrease) in Net Assets from Operations | ||||
Net investment income | $ | 805,577 | ||
Net realized gain on investments, futures, options, securities sold short, forwards and currency transactions | 7,595,806 | |||
Net unrealized depreciation on investments, futures, options, securities sold short, forwards and currency translation | (5,747,753 | ) | ||
Net increase in net assets resulting from operations | 2,653,630 | |||
Distributions to Common Shareholders | ||||
From and in excess of net investment income | (7,602,096 | ) | ||
Capital Share Transactions | ||||
Proceeds from the issuance of common shares | 362,900,000 | |||
Common share offering costs charged to paid-in capital | (760,000 | ) | ||
Net increase from capital share transactions | 362,140,000 | |||
Total increase in net assets | 357,191,534 | |||
Net Assets | ||||
Beginning of period | 100,084 | |||
End of period (including distributions in excess of net investment income of $2,876,100) | $ | 357,291,618 | ||
| * | Commencement of investment operations. |
See notes to financial statements.
16 | Annual Report | December 31, 2005 |
OLA | Old Mutual/Claymore Long-Short Fund
Financial Highlights |
Per share operating performance for a common share outstanding throughout the period | For the Period August 25, 2005* through December 31, 2005 | |||
Net asset value, beginning of period | $ | 19.10 | (a) | |
Income from investment operations | ||||
Net investment income (b) | 0.04 | |||
Net realized and unrealized gain on investments, futures, options, securities sold short, forwards and currency transactions and translation | 0.10 | |||
Total from investment operations | 0.14 | |||
Common shares’ offering expenses charged to paid-in capital | (0.04 | ) | ||
Distributions to Common Shareholders | ||||
From and in excess of net investment income | (0.40 | ) | ||
Net asset value, end of period | $ | 18.80 | ||
Market value, end of period | $ | 16.47 | ||
Total investment return (c) | ||||
Net asset value | 0.52 | % | ||
Market value | -15.76 | % | ||
Ratios and supplemental data | ||||
Net assets, end of period (thousands) | $ | 357,292 | ||
Ratios to average net assets, including dividend expense on securities sold short: | ||||
Expense ratio | 1.58 | %(d)(e) | ||
Net investment income ratio | 0.75 | %(d)(e) | ||
Portfolio turnover | 60 | % | ||
| * | Commencement of investment operations. |
| (a) | Before deduction of offering expenses charged to capital. |
| (b) | Based on average shares outstanding during the period. |
| (c) | Total investment return is calculated assuming a purchase of a common share at the beginning of the period and a sale on the last day of the period reported either at net asset value (“NAV”) or market price per share. Dividends and distributions are assumed to be reinvested at NAV for NAV returns or the prices obtained under the Fund’s Dividend Reinvestment Plan for market value returns. Total investment return does not reflect brokerage commissions. A return calculated for a period of less than one year is not annualized. |
| (d) | Annualized. |
| (e) | The expense ratio includes dividend payments made on securities sold short. During the approximate four month period from August 25, 2005 through December 31, 2005, nine securities sold short made two quarterly distribution payments. The annualized ratios noted above have been adjusted such that these securities would only reflect the equivalent of four quarterly dividends per security. Had this adjustment not been made, the expense ratio would have been 1.65% and the net investment income ratio would have been 0.68%. |
See notes to financial statements.
| Annual Report | December 31, 2005 | 17 |
OLA | Old Mutual/Claymore Long-Short Fund
Notes to Financial Statements |
Note 1 – Organization:
Old Mutual/Claymore Long-Short Fund (the “Fund”) was organized as a Massachusetts business trust on December 3, 2004. The Fund is registered as a diversified, closed-end management investment company under the Investment Company Act of 1940, as amended.
The Fund’s primary investment objective is to provide a high level of current income and current gains. The Fund’s secondary investment objective is to provide long-term capital appreciation. The Fund seeks to achieve its investment objective by investing in a diversified portfolio of equity securities and by selling securities short in the S&P 500 Index that it believes will underperform relative to the average stock in the S&P 500. The Fund will also write (sell) call options on equity indexes and, to a lesser extent on individual securities held in the Fund’s portfolio. The Fund may also employ a variety of other strategies involving futures and forward contracts and other derivative instruments in an attempt to enhance the Fund’s investment returns. There can be no assurance that the Fund’s investment objective will be achieved.
Note 2 – Accounting Policies:
The preparation of the financial statements in accordance with U.S. generally accepted accounting principles requires management to make estimates and assumptions that affect the reported amounts and disclosures in the financial statements. Actual results could differ from these estimates.
The following is a summary of significant accounting policies followed by the Fund.
(a) Valuation of Investments
Equity securities listed on an exchange are valued at the last reported sale price on the primary exchange on which they are traded. Equity securities for which there are no transactions on a given day are valued at the mean of the closing bid and asked prices. Securities traded on NASDAQ are valued at the NASDAQ Official Closing Price. Equity securities not listed on a securities exchange or NASDAQ are valued at the mean of the closing bid and asked prices. Debt securities are valued by independent pricing services or dealers using the mean of the closing bid and asked prices for such securities or, if such prices are not available, at prices for securities of comparable maturity, quality and type. Exchange-traded options are valued at the mean between the bid and asked price on the primary exchange on which they are traded. Futures and options on futures contracts are valued at the settlement price determined by the exchange on which they are traded. All other types of securities, including restricted securities, and securities for which market quotations are not readily available, are valued as determined in accordance with procedures established in good faith by the Board of Trustees. Short-term securities having a remaining maturity of sixty days or less at the time of purchase are valued at amortized cost, which approximates market value.
(b) Investment Transactions and Investment Income
Investment transactions are accounted for on the trade date. Realized gains and losses on investments are determined on the identified cost basis. Dividend income is recorded net of applicable withholding taxes on the ex-dividend date and interest income is recorded on an accrual basis. Discounts or premiums on debt securities purchased are accreted or amortized to interest income over the lives of the respective securities using the effective interest method.
(c) Futures
The Fund may engage in asset allocation strategies by purchasing or selling futures contracts on U.S. and foreign securities indexes and other assets. A futures contract provides for the future sale by one party and purchase by another party of a specified quantity of the security or other financial instrument at a specified price and time. A futures contract on an index is an agreement in which two parties agree to take or make delivery of an amount of cash equal to the difference between the value of the index at the close of the last trading day of the contract and the price at which the index contract was originally written. The Fund may use futures contracts in an attempt to enhance the Fund’s investment returns, as an efficient way to gain broad market exposure with reduced transaction costs and/or to to hedge against market and other risks in the Fund’s portfolio. There are a number of risks associated with the use of futures contracts. A purchase or sale of a futures contract may result in losses in excess of the amount invested in the futures contract. If futures are used for hedging, there can be no guarantee that there will be a correlation between price movements in the hedging vehicle and in the Fund’s portfolio securities being hedged.
(d) Options
The Fund will opportunistically employ an option strategy in an attempt to generate gains from option premiums, enhance distributions payable to the Fund’s shareholders and reduce overall portfolio risk. The Fund intends to pursue its options strategy primarily by writing call options on equity indexes. As the writer (seller) of an equity index call option, the Fund would receive cash (the premium) from the purchaser of the option, and the purchaser would have the right to receive from the Fund any appreciation in the cash value of the index over the strike price upon exercise. If the purchaser exercises the index option sold by the Fund, the Fund would pay the purchaser the difference between the cash value of the index and the strike price. In effect, the Fund sells the potential appreciation in the value of the index above the strike price in exchange for the premium.
(e) Securities Sold Short
The Fund may sell securities short. A short sale is a transaction in which the Fund sells securities it does not own, but rather has borrowed, in anticipation of a decline in the market price of the securities. The Fund is obligated to replace the borrowed securities at their market price at the time of replacement. The Fund’s obligation to replace the securities borrowed in connection with a short sale will be fully secured by collateral held in a segregated account at the custodian.
18 | Annual Report | December 31, 2005 |
OLA | Old Mutual/Claymore Long-Short Fund | Notes to Financial Statements continued
Short sales by the Fund involve certain risks and special considerations. Possible losses from short sales differ from losses that could be incurred from a purchase of a security because losses from a short sale may be unlimited, whereas losses from purchases cannot exceed the total amount invested.
(f) Currency Translation
Assets and liabilities denominated in foreign currencies are translated into U.S. dollars at the mean of the bid and asked price of respective exchange rates on the last day of the period. Purchases and sales of investments denominated in foreign currencies are translated at the exchange rate on the date of the transaction.
Foreign exchange gain or loss resulting from holding of a foreign currency, expiration of a currency exchange contract, difference in exchange rates between the trade date and settlement date of an investment purchased or sold, and the difference between dividends actually received compared to the amount shown in the Fund’s accounting records on the date of receipt are shown as net realized gains or losses on foreign currency forwards and currency transactions in the Fund’s Statement of Operations.
Foreign exchange gain or loss on assets and liabilities, other than investments, are shown as unrealized appreciation (depreciation) on foreign currency translations.
(g) Forward Exchange Currency Contracts
The Fund may enter into forward exchange currency contracts in order to hedge its exposure to changes in foreign currency exchange rates on its foreign portfolio holdings, to hedge certain firm purchases and sales commitments denominated in foreign currencies and for investment purposes. A forward exchange currency contract is a commitment to purchase or sell a foreign currency on a future date at a negotiated forward rate. The gain or loss arising from the difference between the original contracts and the closing of such contracts are included in net realized gain or loss on foreign currency transactions.
Fluctuations in the value of open forward exchange currency contracts are recorded for financial reporting purposes as unrealized appreciation and depreciation by the Fund.
The Fund’s custodian will place and maintain cash not available for investment or other liquid assets in a separate account of the Fund having a value at least equal to the aggregate amount of the Fund’s commitments under forward exchange currency contracts entered into with respect to position hedges.
Risks may arise from the potential inability of a counterparty to meet the terms of a contract and from unanticipated movements in the value of a foreign currency relative to the U.S. dollar. The face or contract amount, in U.S. dollars, reflects the total exposure the Fund has in that particular currency contract.
(h) Distributions to Shareholders
The Fund declares and pays quarterly dividends to common shareholders. These dividends consist of investment company taxable income, which generally includes qualified dividend income, ordinary income, short-term capital gains and premiums received on certain written options. Realized short-term capital gains and premiums received on certain options are considered ordinary income for tax purposes and will be reclassified at the Fund’s fiscal year end on the Fund’s Statement of Assets and Liabilities from accumulated net realized gains to distributions in excess of net investment income. Any net realized long-term capital gains are distributed annually to common shareholders.
Distributions to shareholders are recorded on the ex-dividend date. The amount and timing of distributions are determined in accordance with federal income tax regulations, which may differ from U.S. generally accepted accounting principles.
Note 3 – Investment Advisory Agreement, Sub-Advisory Agreement and Other Agreements:
Pursuant to an Investment Advisory Agreement (the “Agreement”) between the Fund and Claymore Advisors, LLC (the “Adviser”), the Adviser will furnish offices, necessary facilities and equipment, provide administrative services, oversee the activities of Analytic Investors, Inc. (“Analytic” or the “Sub-Adviser”), provide personnel including certain officers required for its administrative management and pay the compensation of all officers and trustees of the Fund who are its affiliates. As compensation for these services, the Fund will pay the Adviser an annual fee, payable monthly, in an amount equal to 1.00% of the Fund’s average daily total net assets.
Pursuant to a Sub-Advisory Agreement (the “Sub-Advisory Agreement”) between the Fund, the Adviser and the Sub-Adviser, the Sub-Adviser under the supervision of the Fund’s Board of Trustees and the Adviser, provides a continuous investment program for the Fund’s portfolio; provides investment research, makes and executes recommendations for the purchase and sale of securities; and provides certain facilities and personnel, including certain officers required for its administrative management and pays the compensation of all officers and trustees of the Fund who are its affiliates. As compensation for its services, the Adviser pays the Sub-Adviser a fee, payable monthly, in an annual amount equal to 0.50% of the Fund’s average daily total net assets. Analytic is wholly owned by Old Mutual (US) Holdings, Inc.
The Bank of New York (“BNY”) acts as the Fund’s custodian, accounting agent, administrator and transfer agent. As custodian, BNY is responsible for the custody of the Fund’s assets. As accounting agent and administrator, BNY is responsible for maintaining the books and records of the Fund’s securities and cash. As transfer agent, BNY is responsible for performing transfer agency services for the Fund.
| Annual Report | December 31, 2005 | 19 |
OLA | Old Mutual/Claymore Long-Short Fund | Notes to Financial Statements continued
Certain officers and trustees of the Fund are also officers and directors of the Adviser or the Sub-Adviser. The Fund does not compensate its officers or trustees who are officers of the aforementioned firms.
Note 4 – Federal Income Taxes:
The Fund intends to comply with the requirements of Subchapter M of the Internal Revenue Code of 1986, as amended, applicable to regulated investment companies. Accordingly, no provision for U.S. federal income taxes is required. In addition, by distributing substantially all of its ordinary income and long-term capital gains, if any, during each calendar year, the Fund intends not to be subject to U.S. federal excise tax.
Due to inherent differences in the recognition of income, expenses, and realized gains/losses under U.S. generally accepted accounting principles and federal income tax purposes, permanent differences between book and tax basis reporting have been identified and appropriately reclassified on the Statement of Assets and Liabilities. A permanent book and tax difference relating to a distribution reclass in the amount of $6,148,635 was reclassified from net investment income to net realized gain. Also permanent book and tax differences relating to losses on foreign currency transactions in the amount of $2,228,216 were reclassified from net realized gain to net investment income.
Capital losses and foreign currency transactions incurred after October 31 (“post-October” losses) within the taxable year are deemed to arise on the first business day of the Fund’s next taxable year. The Fund incurred and will elect to defer net capital losses during 2005 in the amount of $4,829,695 and foreign currency related loss of $2,217,749.
Information on the tax components of investments, excluding short sales transactions and excluding written options as of December 31, 2005 is as follows:
Cost of Investments for Tax Purposes | Gross Tax Unrealized Appreciation | Gross Tax Unrealized Depreciation | Net Tax Unrealized Depreciation on Investments | Net Tax Unrealized Appreciation on Derivatives and Foreign Currency | ||||||||||
$429,620,443 | $ | 5,766,460 | $ | (12,325,491 | ) | $ | (6,559,031 | ) | $ | 502,950 | ||||
Information on the tax components of securities sold short as of December 31, 2005 is as follows:
Cost of Securities Sold Short for Tax Purposes | Gross Tax Unrealized Appreciation | Gross Tax Unrealized Depreciation | Net Tax Unrealized Depreciation on Securities Sold Short | ||||||||
$(66,419,335) | $ | 1,973,065 | $ | (2,997,021 | ) | $ | (1,023,956 | ) | |||
Tax components of the following balances as of December 31, 2005 are as follows:
Undistributed ordinary income | $ | 9,179,015 | ||
Accumulated capital and other losses | $ | (7,047,444 | ) |
For the period ended December 31, 2005, the tax character of distributions paid, as reflected in the Statement of Changes in Net Assets, was $4,935,421 of ordinary income and $2,666,675 of long-term capital gains.
Note 5 – Investment Transactions and Options Written:
For the period ended December 31, 2005, purchases and sales of investments, excluding written options and short-term securities, were $563,176,821 and $247,428,327, respectively.
The Fund entered into written option contracts during the period ended December 31, 2005. Details of the transactions were as follows:
| Number of Contracts | Premiums Received | ||||||
Options written, during the period | 21,603 | $ | 16,631,029 | ||||
Options expired, during the period | (2,500 | ) | (2,084,562 | ) | |||
Options closed, during the period | (15,050 | ) | (12,240,046 | ) | |||
Options assigned, during the period | — | — | |||||
Options outstanding, end of period | 4,053 | $ | 2,306,421 | ||||
Note 6 – Derivatives:
At December 31, 2005, the following futures contracts were outstanding:
Long Contracts | Number of Contracts | Unrealized Appreciation (Depreciation) | |||
Amsterdam Exchanges Index - January 2006 (Current notional value of 87,410 Euro per contract) | 157 | $ | 113,524 | ||
CAC 40 10 Year Euro Index - January 2006 (Current notional value of 47,185 Euro per contract) | 276 | 55,805 | |||
Canada 10 Year Bond - March 2006 (Current notional value of 114,380 Canadian dollars per contract) | 400 | 78,575 | |||
Dow Jones Euro STOXX 50 - March 2006 (Current notional value of 35,880 Euro per contract) | 59 | 42,511 | |||
FTSE 100 Index - March 2006 (Current notional value of 56,160 Pound Sterling per contract) | 159 | 208,953 | |||
IBEX 35 Index - January 2006 (Current notional value of 106,970 Euro per contract) | 112 | 235,958 | |||
Japan 10 Year Bond (TSE) - March 2006 (Current notional value of 137,350,000 Japanese Yen per contract) | 25 | 140,123 | |||
OMXS 30 Index - January 2006 (Current notional value of 96,200 Swedish Krona per contract) | 108 | 28,866 | |||
RUIX Index - Euro Bond - March 2006 (Current notional value of 121,840 Euro per contract) | 180 | 218,322 | |||
TOPIX Index - March 2006 (Current notional value of 16,435,000 Japanese Yen per contract) | 98 | 435,179 | |||
| 1,574 | $ | 1,557,816 | |||
20 | Annual Report | December 31, 2005 |
OLA | Old Mutual/Claymore Long-Short Fund | Notes to Financial Statements continued
Short Contracts | Number of Contracts | Unrealized Appreciation | ||||
Australia 10 Year Bond - March 2006 (Current notional value of 106,097 Australian dollars per contract) | 115 | $ | (164,678 | ) | ||
DAX Index - March 2006 (Current notional value of 135,950 Euro per contract) | 96 | (330,496 | ) | |||
Hang Seng Stock Index - January 2006 (Current notional value of 741,900 Hong Kong dollar per contract) 105 | 314,820 | |||||
Long Gilt - March 2006 (Current notional value of 114,450 Pound Sterling per contract) | 215 | (401,059 | ) | |||
S&P 500 E-Mini - March 2006 (Current notional value of $62,740 per contract) | 150 | 141,750 | ||||
S&P/MIB Index - March 2006 (Current notional value of 179,100 Euro per contract) | 22 | (106,166 | ) | |||
S&P/TSE 60 Index - March 2006 (Current notional value of 127,420 Canadian dollars per contract) | 76 | (64,556 | ) | |||
SPI 200 Index - March 2006 (Current notional value of 118,175 Australian dollars per contract) | 167 | (441,125 | ) | |||
U.S. 10 Year Treasury Notes - March 2006 (Current notional value of $109,406 per contract) | 459 | (372,688 | ) | |||
| 1,405 | (1,424,198 | ) | ||||
| 2,979 | $ | 133,618 | ||||
All notional values are denominated in local currencies.
At December 31, 2005, the following forward exchange currency contracts were outstanding:
Long Contracts | Local Currency Value | Unrealized Appreciation (Depreciation) | ||||
Australian Dollar, 40,000,000 expiring 3/15/06 | 29,280,138 | $ | (375,983 | ) | ||
New Zealand Dollar, 13,000,000 expiring 3/15/06 | 8,801,436 | (91,084 | ) | |||
Norwegian Krone, 200,000,000 expiring 3/15/06 | 29,651,922 | (572,001 | ) | |||
Swedish Krona, 240,000,000 expiring 3/15/06 | 30,258,592 | 65,382 | ||||
| $ | (973,686 | ) | ||||
Short Contracts | ||||||
Canadian Dollar, 33,000,000 expiring 3/15/06 | 28,306,990 | 264,009 | ||||
Euro, 26,000,000 expiring 3/15/06 | 30,787,931 | 572,319 | ||||
Japanese Yen, 2,700,000,000 expiring 3/15/06 | 23,074,073 | 364,567 | ||||
Pound Sterling, 6,000,000 expiring 3/15/06 | 10,299,734 | 132,106 | ||||
Swiss Franc, 39,000,000 expiring 3/15/06 | 29,794,547 | 299,036 | ||||
| 1,632,037 | ||||||
| $ | 658,351 | |||||
Note 7 – Capital:
Common Shares
In connection with its organization process, the Fund sold 5,240 shares of beneficial interest to Claymore Securities, Inc., an affiliate of the Adviser, for consideration of $100,084 at a price of $19.10 per share. The Fund has an unlimited amount of common shares, $0.01 par value, authorized and 19,005,240 issued and outstanding. Of this amount, the Fund issued 18,000,000 shares of common stock in its initial public offering and issued pursuant to an over allotment option to the underwriters, an additional 1,000,000 shares on September 13, 2005. These shares were issued at $19.10 per share after deducting the sales load but before underwriters’ expense reimbursement. In addition, the Fund’s Adviser and Sub-Adviser have agreed to pay all of the Fund’s organizational costs, estimated at $25,000.
Offering costs, estimated at $760,000 or $0.04 per share, in connection with the issuance of common shares have been borne by the Fund and were charged to paid-in capital. The Adviser and Sub-Adviser have agreed to pay offering expenses (other than sales load, but including reimbursement of expenses to the underwriters) in excess of $0.04 per common share.
Note 8 – Indemnifications:
In the normal course of business, the Fund enters into contracts that contain a variety of representations, which provide general indemnifications. The Fund’s maximum exposure under these arrangements is unknown, as this would require future claims that may be made against the Fund that have not yet occurred. However, the Fund expects the risk of loss to be remote.
Note 9 – Subsequent event:
In November 2005, the Board of Trustees approved Claymore Advisors, LLC to replace BNY as the Fund Administration Agent, effective March 1, 2006.
| Annual Report | December 31, 2005 | 21 |
OLA | Old Mutual/Claymore Long-Short Fund
Report of Independent Registered Public Accounting Firm |
To the Shareholders and Board of Trustees of Old Mutual/Claymore Long-Short Fund
We have audited the accompanying statement of assets and liabilities of Old Mutual/Claymore Long-Short Fund (the “Fund”), including the portfolio of investments, as of December 31, 2005, and the related statement of operations, statement of changes in net assets, and financial highlights for the period from August 25, 2005 (commencement of investment operations) through December 31, 2005. These financial statements and financial highlights are the responsibility of the Fund’s management. Our responsibility is to express an opinion on these financial statements and financial highlights based on our audit.
We conducted our audit in accordance with the standards of the Public Company Accounting Oversight Board (United States). Those standards require that we plan and perform the audit to obtain reasonable assurance about whether the financial statements and financial highlights are free of material misstatement. We were not engaged to perform an audit of the Fund’s internal control over financial reporting. Our audit included consideration of internal control over financial reporting as a basis for designing audit procedures that are appropriate in the circumstances, but not for the purpose of expressing an opinion on the effectiveness of the Fund’s internal control over financial reporting. Accordingly, we express no such opinion. An audit also includes examining, on a test basis, evidence supporting the amounts and disclosures in the financial statements and financial highlights, assessing the accounting principles used and significant estimates made by management, and evaluating the overall financial statement presentation. Our procedures included confirmation of securities owned as of December 31, 2005, by correspondence with the custodian and brokers or by other appropriate auditing procedures where replies from brokers were not received. We believe that our audit provides a reasonable basis for our opinion.
In our opinion, the financial statements and financial highlights referred to above present fairly, in all material respects, the financial position of Old Mutual/Claymore Long-Short Fund at December 31, 2005, and the results of its operations, changes in its net assets and its financial highlights for the period from August 25, 2005 (commencement of investment operations) through December 31, 2005, in conformity with U.S. generally accepted accounting principles.

Chicago, Illinois
February 17, 2006
22 | Annual Report | December 31, 2005 |
OLA | Old Mutual/Claymore Long-Short Fund
Supplemental Information | (unaudited)
Federal Income Tax Information
Qualified dividend income of as much as $1,908,590 was taxable to the Fund through December 31, 2005. The Fund intends to designate the maximum amount of dividends that qualify for the reduced tax rate pursuant to the Jobs and Growth Tax Relief Reconciliation Act of 2003.
For corporate shareholders, $1,902,795 of investment income (dividend income plus short-term gains, if any) qualifies for the dividends-received deduction.
In January 2006, you were advised on IRS Form 1099 DIV or substitute 1099 DIV as to the federal tax status of the distributions received by you in the calendar year 2005.
Trustees
The Trustees of the Old Mutual/Claymore Long-Short Fund and their principal occupations during the past five years:
Name, Address*, Age and Position(s) held with Registrant | Term of Office** and Length of Time Served | Principal Occupation During the Past Five Years and Other Affiliations | Number of Portfolios in the | Other Directorships Held by Trustee | ||||
| Independent Trustees: | ||||||||
Randall C. Barnes Year of Birth: 1951 Trustee | Since 2005 | Formerly, Senior Vice President & Treasurer (1993-1997), President, Pizza Hut International (1991-1993) and Senior Vice President, Strategic Planning and New Business Development (1987-1990) of PepsiCo, Inc. (1987-1997). | 12 | None. | ||||
Steven D. Cosler Year of Birth: 1955 Trustee | Since 2005 | Formerly, President, Chief Executive Officer and Director of Priority Healthcare Corp. (2002-2005). Formerly, President and Chief Operating Officer of Priority Healthcare Corp. (2001-2002). Formerly, Executive Vice President and Chief Operating Officer of Priority Healthcare Corp. (2000-2001). | 2 | None. | ||||
Robert M. Hamje Year of Birth: 1942 Trustee | Since 2005 | Advisor to the Cleveland Foundation Investment Committee. Formerly, President and Chief Investment Officer of TRW Investment Management Co. (1990-2003). | 2 | Trustee, Old Mutual Advisor Mutual Funds. | ||||
L. Kent Moore Year of Birth: 1955 Trustee | Since 2005 | Partner at WilSource Enterprise (October 2005-present). Previously, Managing Director High Sierra Energy L.P., (2004-2005). Formerly, Portfolio Manager and Vice President of Janus Capital Corp. (2000-2002) and Senior Analyst/Portfolio Manager of Marsico Capital Management (1997-1999). | 2 | Trustee, Old Mutual Advisor Mutual Funds. | ||||
Ronald A. Nyberg Year of Birth: 1953 Trustee | Since 2005 | Principal of Ronald A. Nyberg, Ltd., a law firm specializing in corporate law, estate planning and business transactions (2000-present). Formerly, Executive Vice President, General Counsel and Corporate Secretary of Van Kampen Investments (1982-1999). | 16 | Director, Edward Hospital Foundation, Naperville, IL; Trustee, North Park University, Chicago. | ||||
| Ronald E. Toupin, Jr. Year of Birth: 1958 Trustee | Since 2005 | Formerly, Vice President, Manager and Portfolio Manager of Nuveen Asset Management (1998- 1999), Vice President of Nuveen Investment Advisory Corp. (1992-1999), Vice President and Manager of Nuveen Unit Investment Trusts (1991-1999), and Assistant Vice President and Portfolio Manager of Nuveen Unit Investment Trusts (1988-1999), each of John Nuveen & Co., Inc. (1982-1999). | 14 | None. | ||||
| Matthew J. Appelstein† Year of Birth: 1961 Trustee | Since 2005 | Director of Investment Services, Old Mutual Asset Management (2003-present). Formerly, Senior Vice President of Consulting Relationships, Fidelity Management Trust Co. (1998-2003). | 2 | None. | ||||
Nicholas Dalmaso Year of Birth: 1965 Trustee; Chief Legal and Executive Officer | Since 2005 | Senior Managing Director and General Counsel of Claymore Advisors, LLC and Claymore Securities, Inc. (2001-present). Formerly, Assistant General Counsel, John Nuveen and Co., Inc. (1999-2000). Former Vice President and Associate General Counsel of Van Kampen Investments, Inc. (1992-1999). | 16 | None. | ||||
| * | Address for all Trustees unless otherwise noted: 2455 Corporate West Drive, Lisle, IL 60532 |
| ** | After a Trustee’s initial term, each Trustee is expected to serve a three-year term concurrent with the class of Trustees for which he serves: |
| • | Messrs. Appelstein and Barnes, as Class I Trustees, are expected to stand for re-election at the Fund’s 2006 annual meeting of shareholders. |
| • | Messrs. Cosler, Dalmaso and Hamje, as Class II Trustees, are expected to stand for re-election at the Fund’s 2007 annual meeting of shareholders. |
| • | Messrs. Moore, Nyberg and Toupin, as Class III Trustees, are expected to stand for re-election at the Fund’s 2008 annual meeting of shareholders. |
| *** | The Claymore Fund Complex consists of U.S. registered investment companies advised or serviced by Claymore Advisors, LLC or Claymore Securities, Inc. The Claymore Fund Complex is overseen by multiple Boards of Trustees. |
| † | Mr. Appelstein is an “interested person” (as defined in Section 2(a)(19) of the 1940 Act) of the Fund because of his position as an officer of Old Mutual Asset Management, the parent company of the Fund’s Sub-Adviser. |
| †† | Mr. Dalmaso is an “interested person” (as defined in Section 2(a)(19) of the 1940 Act) of the Fund because of his position as an officer of Claymore Advisors, LLC, the Fund’s Investment Adviser. |
| Annual Report | December 31, 2005 | 23 |
OLA | Old Mutual/Claymore Long-Short Fund | Supplemental Information (unaudited) continued
Officers
The Officers of the Old Mutual/Claymore Long-Short Fund and their principal occupations during the past five years:
Name, Address*, Age and Position(s) held with | Term of Office** and Length of Time Served | Principal Occupation During the Past Five Years and Other Affiliations | ||
Officers: | ||||
Steven M. Hill Year of Birth: 1964 | Since 2004 | Senior Managing Director and Chief Financial Officer of Claymore Advisors, LLC and Claymore Securities, Inc. (2005-present). Managing Director of Claymore Advisors, LLC and Claymore Securities, Inc. (2003-2005). Previously, Treasurer of Henderson Global Funds and Operations Manager for Henderson Global Investors (North America) Inc. (2002-2003); Managing Director, FrontPoint Partners LLC (2001- 2002); Vice President, Nuveen Investments (1999-2001); Chief Financial Officer, Skyline Asset Management LP,( 1999); Vice President, Van Kampen Investments and Assistant Treasurer, Van Kampen mutual funds (1989-1999). | ||
Jim Howley Year of Birth: 1972 Assistant Treasurer | Since 2005 | Vice President, Fund Administration of Claymore Securities, Inc. (2004-present). Previously, Manager, Mutual Fund Administration of Van Kampen Investments, Inc. | ||
Richard Sarhaddi Year of Birth: 1973 Assistant Secretary | Since 2005 | Assistant Vice President of Claymore Advisors, LLC and Claymore Securities, Inc.; Previously, Editor, CCH Inc. | ||
| * | Address for all Officers: 2455 Corporate West Drive, Lisle, IL 60532 |
| ** | Officers serve at the pleasure of the Board of Trustees and until his or her successor is appointed and qualified or until his or her earlier resignation or removal. |
24 | Annual Report | December 31, 2005 |
OLA | Old Mutual/Claymore Long-Short Fund
Investment Advisory and Sub-Advisory Agreement Contracts | (unaudited)
Section 15(c) of the Investment Company Act of 1940, as amended (the “1940 Act”) contemplates that the Board of Trustees (the “Board”) of the Fund, including a majority of the Trustees who have no direct or indirect interest in the investment advisory or investment sub-advisory agreements and are not “interested persons ”of the Fund, as defined in the 1940 Act (the “Independent Trustees”), are required to approve the terms of the Fund’s investment advisory and sub-advisory agreements prior to the commencement of Fund operations. In this regard, the Board reviewed and approved the Advisory Agreement and the Sub-Advisory Agreement with the Adviser and the Sub-Adviser for the Fund.
At a meeting held on July 18, 2005, the Board, including the Independent Trustees, who were advised by their independent legal counsel, considered the factors and reached the conclusions described below relating to the selection of the Adviser and the Sub-Adviser and approval of the Advisory Agreement and of the Sub-Advisory Agreement. Going forward, the Board will review the Advisory Agreement and the Sub-Advisory Agreement on an annual basis (after the initial two year term) and approval from the Board will be required for the agreements to remain in effect.
The Board of Trustees of the Fund, in approving the selection of the Investment Adviser and the Investment Sub-Adviser and in approving the Investment Advisory Agreement between the Fund and the Investment Adviser and the Investment Sub-Advisory Agreement among the Fund, the Investment Adviser and the Investment Sub-Adviser (collectively, the “Agreements”), considered and concluded the following:
Factors Considered
In considering the Agreements, the Board of Trustees, including the non-interested Trustees, did not identify any factor as all-important or all-controlling and instead considered many factors collectively in light of all of the Fund’s surrounding circumstances, including the following: (i) the investment objectives and policies of the Fund, (ii) the team of investment advisory personnel at the Investment Sub-Adviser who will be primarily responsible for the day-to-day management of the Fund, one of whom was present at the meeting at which the Agreements were considered, (iii) the nature and quality of the services to be provided to the Fund by the Investment Adviser and the Investment Sub-Adviser, (iv) the Fund’s proposed fee and estimated expense data as compared to peer groups of open-end and closed-end funds with similar or related investment strategies as the Fund, as well as similar institutional accounts managed by the Investment Sub-Adviser, (v) the investment performance of the Investment Sub-Adviser with respect to a similar open-end fund and other accounts, (vi) a pro forma profitability analysis of the Investment Sub-Adviser with respect to the Fund based on certain assumed levels of total managed assets and (vi) the direct and indirect benefits to the Investment Adviser and the Investment Sub-Adviser from their relationships with the Fund.
During its deliberations, the Board of Trustees focused, in part, on the experience, resources and strengths of (i) the Investment Sub-Adviser in managing investment companies and other accounts with investment strategies similar to those of the Fund and (ii) the Investment Adviser in supervising the investment activities of certain other closed-end funds and providing or overseeing various administrative and shareholder support services to closed-end funds. The Board of Trustees discussed with representatives of the Investment Sub-Adviser the investment policies of the Fund and the means by which they intend to pursue those policies, how those means may differ from the means employed with respect to other funds and accounts managed by the Investment Sub-Adviser, and the Investment Sub-Adviser’s policies and procedures in respect of execution of portfolio transactions. The Board of Trustees also discussed the compliance and administrative staff at the Investment Adviser and assured themselves that the services provided by such staff would be made available to the Fund. They also considered the compliance policies and procedures of the Investment Adviser and the Investment Sub-Adviser.
The Board of Trustees also reviewed the Fund’s investment advisory fee rate, investment sub-advisory fee rate, and estimated total expense ratio as compared to those of open-end and closed-end funds, as well as separate accounts of the Investment Sub-Adviser, with similar or related investment objectives and strategies (such information was provided by the Investment Adviser or the Investment Sub-Adviser). The Board of Trustees also considered whether the Fund’s proposed advisory fee structure presented opportunities for economies of scale.
The non-interested Trustees were represented by independent counsel who assisted them in their deliberations. Although the Board of Trustees was made aware of certain arrangements to be entered into between the Investment Adviser and/or the Investment Sub-Adviser and certain third parties in connection with the on-going operation of the Fund (including anticipated fees to be paid to such third parties), the Board of Trustees was informed by independent counsel to the non-interested Trustees that it was not to consider any such fees being paid by the Investment Adviser and/or the Investment Sub-Adviser to third parties when considering the reasonableness of each of the investment advisory fee and sub- advisory fee proposed to be paid to the Investment Adviser and the Investment Sub-Adviser, respectively, by the Fund and the Investment Adviser in connection with the services the Investment Adviser and the Investment Sub-Adviser will provide to the Fund.
Conclusions
Based on the information reviewed and discussions held with respect to each of the foregoing items, the Board of Trustees, including a majority of the non-interested Trustees, concluded that:
| • | it was satisfied with the nature, extent and quality of the services to be provided by each of the Investment Adviser and the Investment Sub-Adviser to the Fund; |
| • | there did not appear at this time to be any significant economies of scale to be shared between the Fund and the Investment Sub-Adviser or the Investment Adviser; |
| • | in light of the anticipated costs of providing investment sub-advisory and investment advisory services to the Fund, the ancillary benefits that the Investment Sub-Adviser and the Investment Adviser were projected to receive with regard to providing investment sub-advisory, investment advisory and other services to the Fund were reasonable; and |
| • | each of the investment advisory fee rate and investment sub-advisory fee rate was reasonable in relation to such services, giving due regard to the sophisticated and multi- dimensional nature of the investment strategies to be employed on behalf of the Fund. |
| Annual Report | December 31, 2005 | 25 |
OLA | Old Mutual/Claymore Long-Short Fund
Dividend Reinvestment Plan | (unaudited)
Unless the registered owner of common shares elects to receive cash by contacting the Bank of New York (the “Plan Administrator”), all dividends declared on common shares of the Fund will be automatically reinvested by the Plan Administrator for shareholders in the Fund’s Dividend Reinvestment Plan (the “Plan”), in additional common shares of the Fund. Participation in the Plan is completely voluntary and may be terminated or resumed at any time without penalty by notice if received and processed by the Plan Administrator prior to the dividend record date; otherwise such termination or resumption will be effective with respect to any subsequently declared dividend or other distribution. Some brokers may automatically elect to receive cash on your behalf and may re-invest that cash in additional common shares of the Fund for you. If you wish for all dividends declared on your common shares of the Fund to be automatically reinvested pursuant to the Plan, please contact your broker.
The Plan Administrator will open an account for each common shareholder under the Plan in the same name in which such common shareholder’s common shares are registered. Whenever the Fund declares a dividend or other distribution (together, a “Dividend”) payable in cash, non-participants in the Plan will receive cash and participants in the Plan will receive the equivalent in common shares. The common shares will be acquired by the Plan Administrator for the participants’ accounts, depending upon the circumstances described below, either (i) through receipt of additional unissued but authorized common shares from the Fund (“Newly Issued Common Shares”) or (ii) by purchase of outstanding common shares on the open market (“Open-Market Purchases”) on the New York Stock Exchange or elsewhere. If, on the payment date for any Dividend, the closing market price plus estimated brokerage commission per common share is equal to or greater than the net asset value per common share, the Plan Administrator will invest the Dividend amount in Newly Issued Common Shares on behalf of the participants. The number of Newly Issued Common Shares to be credited to each participant’s account will be determined by dividing the dollar amount of the Dividend by the net asset value per common share on the payment date; provided that, if the net asset value is less than or equal to 95% of the closing market value on the payment date, the dollar amount of the Dividend will be divided by 95% of the closing market price per common share on the payment date. If, on the payment date for any Dividend, the net asset value per common share is greater than the closing market value plus estimated brokerage commission, the Plan Administrator will invest the Dividend amount in common shares acquired on behalf of the participants in Open-Market Purchases.
If, before the Plan Administrator has completed its Open-Market Purchases, the market price per common share exceeds the net asset value per common share, the average per common share purchase price paid by the Plan Administrator may exceed the net asset value of the common shares, resulting in the acquisition of fewer common shares than if the Dividend had been paid in Newly Issued Common Shares on the Dividend payment date. Because of the foregoing difficulty with respect to Open-Market Purchases, the Plan provides that if the Plan Administrator is unable to invest the full Dividend amount in Open-Market Purchases during the purchase period or if the market discount shifts to a market premium during the purchase period, the Plan Administrator may cease making Open-Market Purchases and may invest the uninvested portion of the Dividend amount in Newly Issued Common Shares at net asset value per common share at the close of business on the Last Purchase Date provided that, if the net asset value is less than or equal to 95% of the then current market price per common share; the dollar amount of the Dividend will be divided by 95% of the market price on the payment date.
The Plan Administrator maintains all shareholders’ accounts in the Plan and furnishes written confirmation of all transactions in the accounts, including information needed by shareholders for tax records. Common shares in the account of each Plan participant will be held by the Plan Administrator on behalf of the Plan participant, and each shareholder proxy will include those shares purchased or received pursuant to the Plan. The Plan Administrator will forward all proxy solicitation materials to participants and vote proxies for shares held under the Plan in accordance with the instruction of the participants.
There will be no brokerage charges with respect to common shares issued directly by the Fund. However, each participant will pay a pro rata share of brokerage commission incurred in connection with Open-Market Purchases. The automatic reinvestment of Dividends will not relieve participants of any Federal, state or local income tax that may be payable (or required to be withheld) on such Dividends.
The Fund reserves the right to amend or terminate the Plan. There is no direct service charge to participants with regard to purchases in the Plan; however, the Fund reserves the right to amend the Plan to include a service charge payable by the participants.
All correspondence or questions concerning the Plan should be directed to the Plan Administrator, The Bank of New York, P.O. Box 463, East Syracuse, New York 13057-0463, Attention: Shareholder Services Department, Phone Number: (800) 701-8178.
26 | Annual Report | December 31, 2005 |
OLA | Old Mutual/Claymore Long-Short Fund
Fund Information |
Board of Trustees |
Matthew J. Appelstein*
Randall C. Barnes
Steven D. Cosler
Nicholas Dalmaso*
Robert M. Hamje
L. Kent Moore
Ronald A. Nyberg
Ronald E. Toupin, Jr. |
| * | Trustee is an “interested person” of the Fund as defined in the Investment Company Act of 1940, as amended. |
| Officers |
| Nicholas Dalmaso |
| Chief Executive Officer and |
| Chief Legal Officer |
| Steven M. Hill |
| Chief Accounting Officer, |
| Chief Financial Officer and Treasurer |
| Jim Howley |
| Assistant Treasurer |
| Richard Sarhaddi |
| Assistant Secretary |
| Investment Adviser |
| Claymore Advisors, LLC |
| Lisle, Illinois |
| Investment Sub-Adviser |
| Analytic Investors, Inc. |
| Los Angeles, California |
| Administrator, Custodian and Transfer Agent |
| The Bank of New York |
| New York, New York |
| Legal Counsel |
| Skadden, Arps, Slate, Meagher & Flom LLP |
| Chicago, Illinois |
| Independent Registered Public Accounting Firm |
| Ernst & Young LLP |
| Chicago, Illinois |
Privacy Principles of Old Mutual/Claymore Long-Short Fund for Shareholders
The Fund is committed to maintaining the privacy of its shareholders and to safeguarding its non-public personal information. The following information is provided to help you understand what personal information the Fund collects, how we protect that information and why, in certain cases, we may share information with select other parties.
Generally, the Fund does not receive any non-public personal information relating to its shareholders, although certain non-public personal information of its shareholders may become available to the Fund. The Fund does not disclose any non-public personal information about its shareholders or former shareholders to anyone, except as permitted by law or as is necessary in order to service shareholder accounts (for example, to a transfer agent or third party administrator).
The Fund restricts access to non-public personal information about the shareholders to Claymore Advisors, LLC employees with a legitimate business need for the information. The Fund maintains physical, electronic and procedural safeguards designed to protect the non-public personal information of its shareholders.
Questions concerning your shares of Old Mutual/Claymore Long-Short Fund?
| • | If your shares are held in a Brokerage Account, contact your Broker. |
| • | If you have physical possession of your shares in certificate form, contact the Fund’s Administrator, Custodian and Transfer Agent: |
The Bank of New York, 111 Sanders Creek Parkway, East Syracuse, New York 13057 (800) 701-8178
This report is sent to shareholders of Old Mutual/Claymore Long-Short Fund for their information. It is not a Prospectus, circular or representation intended for use in the purchase or sale of shares of the Fund or of any securities mentioned in this report.
A description of the Fund’s proxy voting policies and procedures related to portfolio securities is available without charge, upon request, by calling the Fund at (800) 345-7999 or on the U.S. Securities and Exchange Commission’s (“SEC”) website at http://www.sec.gov.
The Fund files its complete schedule of portfolio holdings with the SEC for the first and third quarters of each fiscal year on Form N-Q. The Fund’s Form N-Q is available on the SEC website at http://www. sec. gov. The Fund’s Form N-Q may also be viewed and copied at the SEC’s Public Reference Room in Washington, DC; information on the operation of the Public Reference Room may be obtained by calling (800) SEC-0330 or at www.claymore.com.
In August 2005, the Fund submitted a CEO annual certification to the NYSE in which the Fund’s principal executive officer certified that he was not aware, as of the date of the certification, of any violation by the Fund of the NYSE’s Corporate Governance listing standards. In addition, as required by Section 302 of the Sarbanes-Oxley Act of 2002 and related SEC rules, the Fund’s principal executive and principal financial officers have made quarterly certifications, included in filings with the SEC on Forms N-CSR and N-Q, relating to, among other things, the Fund’s disclosure controls and procedures and internal control over financial reporting.
| Annual Report | December 31, 2005 | 27 |
OLA | Old Mutual/Claymore Long-Short Fund
About the Fund Manager |
Analytic Investors, Inc.
Analytic Investors specializes in the application of systematic investment processes to evaluate and exploit opportunities in the global equity, fixed income and derivative securities markets. Based in Los Angeles and wholly owned by Old Mutual plc, Analytic employs 35 professionals and manages more than $10 billion. The firm manages a range of traditional, long-only equity products as well as a number of absolute return strategies. The firm was founded in 1970 and, since that time, has focused on delivering valued-added, risk-controlled investment strategies to its range of institutional, fund-of-fund, and high net worth clients.
Investment Philosophy
Analytic’s philosophy is anchored in the conviction that the systematic application of quantitative techniques to assess opportunity has the potential to deliver quality, risk-adjusted performance, regardless of market cycle. Analytic’s quantitative methods bring together the best attributes of individual security selection and unbiased portfolio modeling, yielding a management style that is both disciplined and responsive.
Investment Process
Analytic’s innovative research seeks to uncover the factors that are driving performance and are likely to be important going forward. Two core beliefs underlie the firm’s investment process:
| • | The attractiveness of every security is determined by a multitude of factors that can be measured. |
| • | The desirability of a security’s characteristics change with economic conditions. |
Sophisticated quantitative techniques enable Analytic to simultaneously analyze a variety of unique characteristics – such as relative valuation, growth potential, historical returns, liquidity and risk – in an effort to identify and exploit opportunities. Analtic uses through statistical analysis in an attempt to identify the merits of each security as well as the relationships between each security’s measurable characteristics that may be driving its performance.
Analytic’s proprietary multi-factor return models are applied in a risk-controlled environment. The firm’s highly evolved and successful approach, supported by the research efforts of its investment team, capitalizes on opportunity while neutralizing systematic market exposure and overall risk.
Claymore Securities, Inc. 2455 Corporate West Drive Lisle, IL 60532 Member NASD/SIPC |
OLA-AR-1205 |

| Item 2. | Code of Ethics. |
(a) The registrant has adopted a code of ethics (the “Code of Ethics”) that applies to its principal executive officer, principal financial officer, principal accounting officer or controller, or persons performing similar functions.
(b) No information need be disclosed pursuant to this paragraph.
(c) There have been no revisions to the Code of Ethics during the period covered by the shareholder report presented in Item 1.
(d) The registrant has not granted a waiver or an implicit waiver to its principal executive officer, principal financial officer, principal accounting officer or controller, or persons performing similar functions from a provision of its Code of Ethics during the period covered by this report.
(e) Not applicable.
| (f) | (1) The registrant’s Code of Ethics is attached hereto as an exhibit. |
(2) Not applicable.
(3) Not applicable.
| Item 3. | Audit Committee Financial Expert. |
The registrant’s Board of Trustees has determined that it has at least one audit committee financial expert serving on its audit committee, Ronald E. Toupin, Jr. Mr. Toupin is an “independent” Trustee for purposes of this Item 3 of Form N-CSR. Mr. Toupin qualifies as an audit committee financial expert by virtue of his experience obtained as a portfolio manager and research analyst, which included review and analysis of offering documents and audited and unaudited financial statements using GAAP to show accounting estimates, accruals and reserves.
(Under applicable securities laws, a person who is determined to be an audit committee financial expert will not be deemed an “expert” for any purpose, including without limitation for the purposes of Section 11 of the Securities Act of 1933, as amended, as a result of being designated or identified as an audit committee financial expert. The designation or identification of a person as an audit committee financial expert does not impose on such person any duties, obligations, or liabilities that are greater than the duties, obligations, and liabilities imposed on such person as a member of the audit committee and Board of Trustees in the absence of such designation or identification. The designation of identification of a person as an audit committee financial expert does not affect the duties, obligations or liability of any other member of the audit committee or board of directors.)
| Item 4. | Principal Accountant Fees and Services. |
a). Audit Fees: the aggregate fees billed for the period from August 25, 2005 (inception of the trust) through December 31, 2005, for professional services rendered by the principal accountant for the audit were $46,000. The aggregate fees billed for fiscal year 2004 for professional services rendered by the principal accountant is $0 as this fund had not commenced operations in 2004.
b). Audit-Related Fees: the aggregate fees billed for the period from August 25, 2005 (inception of the trust) through December 31, 2005, for assurance and related services by the principal accountant that are reasonably related to the performance of the audit of the registrant’s financial statements and are not reported under paragraph (a) of this item were $0. The Audit-Related fees for 2004 is $0 as this fund had not commenced operations in 2004.
c). Tax Fees: the aggregate fees billed for the period from August 25, 2005 (inception of the trust) through December 31, 2005, for professional services rendered by the principal accountant for tax compliance, tax advice, and tax planning were $6,000. The Tax fees for 2004 is $0 as this fund had not commenced operations in 2004.
d). All Other Fees: the aggregate fees billed for the period from August 25, 2005 (inception of the trust) through December 31, 2005, for products and services provided by the principal accountant, other than the services reported in paragraphs (a) and (c) of this Item were $0. The Other Audit fees for 2004 is $0 as this fund had not commenced operations in 2004.
(e) Audit Committee Pre-Approval Policies and Procedures.
(i) The Registrant’s audit committee reviews, and in its sole discretion, pre-approves, pursuant to written pre-approval procedures (A) all engagements for audit and non-audit services to be provided by the principal accountant to the registrant and (B) all engagements for non-audit services to be provided by the principal accountant (1) to the registrant’s investment adviser (not including a sub-adviser whose role is primarily portfolio management and is sub-contracted or overseen by another investment adviser) and (2) to any entity controlling, controlled by or under common control with the registrant’s investment adviser that provides ongoing services to the registrant; but in the case of the services described in subsection (B)(1) or (2), only if the engagement relates directly to the operations and financial reporting of the registrant; provided that such pre-approval need not be obtained in circumstances in which the pre-approval requirement is waived under rules promulgated by the Securities and Exchange Commission or New York Stock Exchange listing standards. Sections IV.C.2 and IV.C.3 of the Audit Committee’s revised Audit Committee Charter contain the Audit Committee’s Pre-Approval Policies and Procedures and such sections are included below.
| IV.C.2 | Pre-approve any engagement of the independent auditors to provide any non-prohibited services to the Trust, including the fees and other compensation to be paid to the independent auditors (unless an exception is available under Rule 2-01 of Regulation S-X). |
(a) The Chairman or any member of the Audit Committee may grant the pre-approval of services to the Fund for non-prohibited services up to $10,000. All such delegated pre-approvals shall be presented to the Audit Committee no later than the next Audit Committee meeting.
| IV.C.3 | Pre-approve any engagement of the independent auditors, including the fees and other compensation to be paid to the independent auditors, to provide any non-audit services to the Adviser (or any “control affiliate” of the Adviser providing ongoing services to the Trust), if the engagement relates directly to the operations and financial reporting of the Trust (unless an exception is available under Rule 2-01 of Regulation S-X). |
(a) The Chairman or any member of the Audit Committee may grant the pre-approval for non-prohibited services to the Adviser up to $10,000. All such delegated pre-approvals shall be presented to the Audit Committee no later than the next Audit Committee meeting.
(ii) None of the services described in each of Items 4(b) through (d) were approved by the audit committee pursuant to paragraph (c)(7)(i) (c) or (c) (7) (ii) of Rule 2-01 of Regulation S-X.
(f) The percentage of hours expended on the principal accountant’s engagement to audit the Fund’s financial statements for the most recent fiscal year attributable to work performed by persons other than the principal accountant’s full-time, permanent employees was 0%.
(g) The aggregate non-audit fees billed by the registrant’s accountant for services rendered to the registrant, the registrant’s investment adviser and any entity controlling, controlled by, or under common control with the adviser that provides ongoing services to the registrant (not including a sub-adviser whose role is primarily portfolio management and is sub-contracted with or overseen by another investment adviser) that directly related to the operations and financial reporting of the registrant for the period from August 25, 2005 (inception of trust) through December 31, 2005, was $0. The aggregate non-audit fees billed for 2004 is $0 as this fund had not commenced operations in 2004.
(h) Not Applicable.
| Item 5. | Audit Committee of Listed Registrants. |
(a)The registrant has a separately designated standing audit committee established in accordance with Section 3(a)(58)(A) of the Securities Exchange Act of 1934. The audit committee of the registrant is comprised of: Randall Barnes, Steven Cosler, Robert Hamje, L. Kent Moore, Ronald A. Nyberg and Ronald E. Toupin, Jr.
(b) Not Applicable.
| Item 6. | Schedule of Investments. |
The Schedule of Investments is included as part of Item 1.
| Item 7. | Disclosure of Proxy Voting Policies and Procedures for Closed-End Management Investment Companies. |
The registrant has delegated the voting of proxies relating to its voting securities to its investment sub-adviser, Analytic Investors, Inc. (the “Sub-Adviser”). The Sub-Adviser’s Proxy Voting Policies and Procedures are included as an exhibit hereto.
| Item 8. | Portfolio Managers of Closed-End Management Investment Companies. |
A team of investment professionals at Analytic share primary responsibility for the day-to-day portfolio management of the Fund. Mr. McMurran and Mr. Bein oversee the team regarding the management of the Fund. The following provides information regarding the members of the team.
Name | Since | Professional Experience | ||
| Gregory M. McMurran | 2005 (Inception) | Mr. McMurran (Chief Investment Officer and Portfolio Manager) is responsible for the management of implementation of Analytic’s investment strategies, including those used for the Fund. He joined Analytic in 1976. He is a major contributor to the firm’s ongoing research efforts as well as new product development and strategy applications. Mr. McMurran has an extensive background in the implementation of the firm’s quantitative investment strategies. He received a B.S. in Economics from the University of California, Irvine. He also received an M.A. in Economics at California State University, Fullerton. He has 28 years of industry experience. | ||
Harindra de Silva, Ph.D., CFA | 2005 (Inception) | Dr. de Silva (President and Portfolio Manager) is responsible for Analytic’s strategic direction and the ongoing development of its investment processes. He focuses on the ongoing research and portfolio management efforts for the firm’s U.S. equity strategies and Tactical Asset Allocation strategies. Before joining Analytic in 1995, he was a Principal at Analysis Group, Inc., where he was responsible for providing economic research services to institutional investors including investment managers, large pension funds and endowments. He received a Ph.D. in Finance from the University of California, Irvine. He holds a B.S. in Mechanical Engineering from the University of Manchester Institute of Science and Technology and an M.B.A. in Finance and an M.S. in Economic Forecasting from the University of Rochester. Dr. de Silva is a member of Association for Investment Management and Research, the American Finance Association and the International Association of Financial Analysts. He has 19 years of industry experience. | ||
| Dennis Bein, CFA | 2005 (Inception) | Mr. Bein (Chief Investment Officer and a Portfolio Manager) is responsible for the ongoing research for Analytic’s U.S. equity strategies as well as the day-to-day portfolio management and trading of those accounts. Before joining Analytic in 1995, Mr. Bein was a Senior Consultant for AG Risk Management, Analysis Group, Inc.’s investment consulting subsidiary. He received an M.B.A. from the Anderson Graduate School of Management at the University of California, Riverside. Mr. Bein completed his undergraduate studies in Business Administration at the University of California, Riverside. He is a Chartered Financial Analyst and a member of the Association for Investment Management and Research, the Institute of Chartered Financial Analysts and the Los Angeles Society of Financial Analysts. He has 14 years of industry experience. | ||
| Scott Barker, CFA | 2005 (Inception) | Mr. Barker (Portfolio Manager) is responsible for the ongoing research for Analytic’s options and fixed income based strategies as well as day-to-day portfolio management and trading of those accounts. Before joining Analytic in 1995, Mr. Barker was a Research Analyst for Analysis Group, Inc. He received a B.A. in Physics from Pomona College. He is a Chartered Financial Analyst and a member of the Association for Investment Management and Research and the Los Angeles Society of Financial Analysts. He has 11 years of industry experience. | ||
Robert Murdock, Ph.D., CFA | 2005 (Inception) | Dr. Murdock (Portfolio Manager) is responsible for research and development of quantitative models specializing in global asset allocation research, as well as the day-to-day portfolio management and trading of those accounts. Before joining Analytic in 1997, he was employed by The Anderson Graduate School of Management, UCLA as a researcher specializing in international trade policy. Previously, he was a project manager at the Institute for Policy Reform in Washington, DC. He also worked at State Street Bank & Trust Company in Boston as an investment analyst and a research economist for Bonneville Power Administration. Dr. Murdock received a Ph.D. in International Finance and Economics from UCLA’s Anderson Graduate School of Management; an M.B.A. in Finance from The Tuck School at Dartmouth College; an M.A. in Economics from University of Pennsylvania; and a B.S. in Economics and Mathematics from the University of Wyoming. He is a Chartered Financial Analyst. He has nine years of industry experience. | ||
| Steven Sapra, CFA | 2005 (Inception) | Mr. Sapra (Portfolio Manager) is responsible for the ongoing research for Analytic’s U.S. equity strategies as well as day-to-day portfolio management and trading. Before joining Analytic in 1999, Mr. Sapra was a Senior Consultant for BARRA, Inc. He received an M.A. in Economics from the University of Southern California and a B.S. in Economics from California State Polytechnic University, Pomona. He is a Chartered Financial Analyst and a member of the CFA Institute and the Los Angeles Society of Financial Analysts. He has seven years of industry experience. | ||
Gregory McMurran and Dennis Bein, as Analytic Chief Investment Officers, generally oversee all aspects of the day-to-day management of the Fund. Mr. McMurran has primary responsibility for the oversight of the firm’s derivatives based investment strategies and Mr. Bein has primary responsibility for the oversight of the firm’s equity based investment strategies. Under Mr. McMurran’s direction, Robert Murdock serves as lead portfolio manager for futures based strategies and Scott Barker serves as lead portfolio manager for options based strategies. Under Mr. Bein’s direction, Steven Sapra serves as lead portfolio manager for U.S. equity based strategies, and Harindra de Silva heads the firm’s research efforts on behalf of the Fund.
The following summarizes the structure of and methods used to determine the compensation of each individual, each of whom is employed by the Investment Sub-Adviser, that shares primary responsibility for the day-to-day portfolio management of the Fund (the “Analytic Portfolio Managers”):
Compensation. Analytic’s compensation structure for professional employees consists of an industry median base salary (based on independent industry information) and an annual discretionary bonus. Bonus amounts are determined using the following factors: the overall success of the firm; the overall success of the department or team; and an individual’s contribution to the team. Members of Analytic’s senior management team and investment management professionals may also have a deferred component to their total compensation (with a three-year vesting period) that is invested in the firm’s investment products to tie the interests of the individual to the interests of the firm and its clients.
The base salaries of the Analytic Portfolio Managers are typically reviewed on an annual basis, determined by each portfolio manager’s date of employment. Discretionary bonuses are determined annually, based upon an analysis of information from the prior calendar year.
Conflicts of Interest. Analytic and its officers, employees and beneficial owners shall be free from time to time to acquire, possess, manage, and dispose of securities or other investment assets for their own accounts, for the accounts of their families, for the account of any entity in which they have a beneficial interest or for the accounts of others for whom they may provide investment advisory, brokerage or other services (collectively, “Managed Accounts”), in transactions which may or may not correspond with transactions effected or positions held in the Fund. It is understood that when Analytic determines that it would be appropriate for the Fund and one or more Managed Accounts to participate in an investment opportunity, Analytic will seek to execute orders for the Fund and for such Managed Accounts on a basis which it considers equitable, but that equality of treatment of the Fund and other Managed Accounts is not assured. In such situations, Analytic may (but is not be required to) place orders for the Fund and each other Managed Account simultaneously and if all such orders are not filled at the same price, Analytic may cause the Fund and each Managed Account to pay or receive the average of the prices at which the orders were filled. If all such orders cannot be fully executed under prevailing market conditions, Analytic may allocate the securities traded among the Fund and other Managed Accounts in a manner which it considers equitable, taking into account the size of the order placed for the Fund and each other Managed Account as well as any other factors which it deems relevant.
Certain of the Managed Accounts Analytic advises may sell securities short, including securities with respect to which other Managed Accounts hold long positions. The portfolio managers and traders for these Managed Accounts are not separated from the rest of Analytic’s investment personnel and therefore have access to full information about Analytic’s investment research and the investment decisions and strategies being employed for the Managed Accounts. These Managed Accounts pay Analytic management fees at rates comparable to and in some cases lower than those paid by the Fund and other Managed Accounts. Analytic also receives a significant share of any profits earned by certain of the Managed Accounts as incentive compensation. As a result, Analytic may have a conflict between its own interests and the interests of other Analytic investment advisory clients in managing the portfolios of certain of these Managed Accounts.
In order to minimize these potential conflicts of interest, Analytic has adopted various procedures and safeguards. For example, except for short sales done to take advantage of short-term volatility, Analytic will not sell a security short that another Managed Account owns until (1) it discloses to the relevant portfolio managers its intention to short and the reasons for selling short and (2) allows the portfolio managers a reasonable time to make an investment decision to hold or sell that security.
Other accounts managed. The following summarizes information regarding each of the other accounts managed by the Analytic Portfolio Managers as of January 31, 2006:
Registered Investment Companies | Other Pooled Investment Vehicles | Other Accounts | |||||||||||||||
Name | # of Accounts | Total Assets | # of Accounts | Total Assets | # of Accounts | Total Assets | |||||||||||
Scott Barker | 3 | $ | 619.4 million | 0 | 0 | 2 | * | $ | 5,272.1 million | ||||||||
Dennis Bein | 12 | $ | 2,011.8 million | 21 | ** | $ | 1,368.1 million | 20 | *** | $ | 817.1 million | ||||||
Harindra de Silva | 12 | $ | 2,059.3 million | 23 | **** | $ | 1,709.1 million | 22 | *** | $ | 987.9 million | ||||||
Greg McMurran | 3 | $ | 619.4 million | 3 | ***** | $ | 383.9 million | 9 | * | $ | 5,541.5 million | ||||||
Robert Murdock | 1 | $ | 487.7 million | 3 | ***** | $ | 383.9 million | 7 | $ | 269.4 million | |||||||
Steven Sapra | 10 | $ | 1,925.3 million | 14 | ****** | $ | 942.8 million | 20 | *** | $ | 817.1 million | ||||||
| * | Includes one account with assets under management of $5,258.0 million that is subject to a performance-based advisory fee. |
| ** | Includes 16 accounts with aggregated assets under management of $778.8 million that are subject to a performance-based advisory fee. |
| *** | Includes six accounts with aggregated assets under management of $303.4 million that are subject a performance-based advisory fee. |
| **** | Includes 18 accounts with aggregated assets under management of $963.8 million that are subject to a performance-based advisory fee. |
| ***** | Includes two accounts with assets under management of $286.6 million that is subject to a performance-based advisory fee. |
| ****** | Includes 10 accounts with aggregated assets under management of $396.4 million that are subject to a performance-based advisory fee. |
Securities ownership. The following table discloses the dollar range of equity securities of the Fund beneficially owned by the each of the Analytic Portfolio Managers as of January 31, 2006:
Name of Portfolio Manager | Dollar Range of Equity Securities in Fund | |
Scott Barker | None | |
Dennis Bein | None | |
Harindra de Silva | None | |
Greg McMurran | None | |
Robert Murdock | None | |
Steven Sapra | None | |
| Item 9. | Purchases of Equity Securities by Closed-End Management Investment Company and Affiliated Purchasers. |
None.
| Item 10. | Submission of Matters to a Vote of Security Holders. |
The registrant has not made any material changes to the procedures by which shareholders may recommend nominees to the registrant’s Board of Trustees.
| Item 11. | Controls and Procedures. |
(a) The registrant’s principal executive officer and principal financial officer have evaluated the registrant’s disclosure controls and procedures within 90 days of this filing and have concluded based on such evaluation, that the registrant’s disclosure controls and procedures were effective as of that date in ensuring that information required to be disclosed by the registrant in this Form N-CSR was recorded, processed, summarized, and reported within the time periods specified in the Securities and Exchange Commission’s rules and forms.
(b) There were no changes in the registrant’s internal control over financial reporting (as defined in Rule 30a-3(d) under the Investment Company Act of 1940) that occurred during the registrant’s second fiscal quarter of the period covered by this report that have materially affected, or are reasonably likely to materially affect, the registrant’s internal control over financial reporting.
| Item 12. | Exhibits. |
| (a)(1) | Code of Ethics for Chief Executive and Senior Financial Officer. | |
| (a)(2) | Certifications of principal executive officer and principal financial officer pursuant to Rule 30a-2 of the Investment Company Act of 1940. | |
| (b) | Certifications of principal executive officer and principal financial officer pursuant to Section 906 of the Sarbanes-Oxley Act of 2002. | |
| (c) | Proxy Voting Policies and Procedures. | |
SIGNATURES
Pursuant to the requirements of the Securities Exchange Act of 1934 and the Investment Company Act of 1940, the registrant has duly caused this report to be signed on its behalf by the undersigned, thereunto duly authorized.
(Registrant) Old Mutual/Claymore Long-Short Fund | ||
By: | /s/ Nicholas Dalmaso | |
Name: | Nicholas Dalmaso | |
Title: | Chief Legal and Executive Officer | |
Date: | March 2, 2006 | |
Pursuant to the requirements of the Securities Exchange Act of 1934 and the Investment Company Act of 1940, this report has been signed by the following persons on behalf of the registrant and in the capacities and on the dates indicated.
By: | /s/ Nicholas Dalmaso | |
Name: | Nicholas Dalmaso | |
Title: | Chief Legal and Executive Officer | |
Date: | March 2, 2006 | |
By: | /s/ Steven M. Hill | |
Name: | Steven M. Hill | |
Title: | Treasurer and Chief Financial Officer | |
Date: | March 2, 2006 | |