UNITED STATES
SECURITIES AND EXCHANGE COMMISSION
Washington, D.C. 20549
FORM N-CSR
CERTIFIED SHAREHOLDER REPORT OF REGISTERED MANAGEMENT
INVESTMENT COMPANIES
Investment Company Act file number 811-21681
Old Mutual/Claymore Long-Short Fund
(Exact name of registrant as specified in charter)
| | |
| 2455 Corporate West Drive, Lisle, IL | | 60532 |
| (Address of principal executive offices) | | (Zip code) |
Nicholas Dalmaso
Old Mutual/Claymore Long-Short Fund
2455 Corporate West Drive, Lisle, IL 60532
(Name and address of agent for service)
Registrant’s telephone number, including area code: (630) 505-3700
Date of fiscal year end: December 31
Date of reporting period: June 30, 2007
Form N-CSR is to be used by management investment companies to file reports with the Commission not later than 10 days after the transmission to stockholders of any report that is required to be transmitted to stockholders under Rule 30e-1 under the Investment Company Act of 1940 (17 CFR 270.30e-1). The Commission may use the information provided on Form N-CSR in its regulatory, disclosure review, inspection, and policymaking roles.
A registrant is required to disclose the information specified by Form N-CSR, and the Commission will make this information public. A registrant is not required to respond to the collection of information contained in Form N-CSR unless the Form displays a currently valid Office of Management and Budget (“OMB”) control number. Please direct comments concerning the accuracy of the information collection burden estimate and any suggestions for reducing the burden to Secretary, Securities and Exchange Commission, 450 Fifth Street, NW, Washington, DC 20549-0609. The OMB has reviewed this collection of information under the clearance requirements of 44 U.S.C. Section 3507.
| Item 1. | Reports to Stockholders. |
The registrant’s semi-annual report transmitted to shareholders pursuant to Rule 30e-1 under the Investment Company Act of 1940, as amended (the “Investment Company Act”), is as follows:
| | | | | | |
SemiAnnual Report June 30, 2007 (Unaudited) | | Old Mutual/Claymore Long-Short Fund | | OLA | | |

|
| www.oldmutualclaymore.com |
|
| ... your course to the LATEST, |
|
| most up-to-date INFORMATION about the |
|
| Old Mutual/Claymore Long-Short Fund |
The shareholder report you are reading right now is just the beginning of the story. Online at www.oldmutualclaymore.com, you will find:
| | • | | Daily, weekly and monthly data on share prices, distributions and more |
| | • | | Portfolio overviews and performance analyses |
| | • | | Announcements, press releases and special notices |
| | • | | Fund and adviser contact information |
Analytic Investors, Inc. and Claymore are continually updating and expanding shareholder information services on the Fund’s website, in an ongoing effort to provide you with the most current information about how your Fund’s assets are managed, and the results of our efforts. It is just one more way we are working to keep you better informed about your investment in the Fund.
2 | SemiAnnual Report | June 30, 2007
OLA | Old Mutual/Claymore Long-Short Fund
Dear Shareholder |
We are pleased to submit the semi-annual shareholder report for the Old Mutual/Claymore Long-Short Fund (the “Fund”) for the six months ended June 30, 2007. As you may know, the Fund’s investment objective is to provide a high level of current income and gains with a secondary objective of long-term capital appreciation. The Fund seeks to achieve these objectives by investing in a diversified portfolio of common stocks and other equity securities utilizing a long/short strategy and opportunistically employing a strategy of writing (selling) calls on equity indices and, to a lesser extent, on individual securities. The Fund also seeks to enhance returns through an asset allocation strategy that involves purchasing or selling futures contracts on U.S. or foreign securities indices, foreign currencies and other assets.
Analytic Investors, Inc. (“Analytic”) is the Fund’s Sub-Adviser. The firm, established in 1970, is a wholly-owned subsidiary of Old Mutual (US) Holdings Inc., more commonly known as Old Mutual Asset Management. Analytic specializes in the creation and continuous management of optioned-equity and optioned-debt portfolios for mutual funds, foundations, insurance companies, endowments, profit-sharing plans, funds of hedge funds, and individual investors.
We believe that the Fund provides shareholders with the potential to outperform the S&P 500 Index over full market cycles through its unique multi-strategy approach to investing. Analytic has employed the Fund’s strategy for nearly three decades in other investment products for institutional and retail investors. While the Fund’s options overlay has similarities to a covered call fund, the Fund’s long/short equity security selection and its asset allocation makes it different. This multi-strategy approach provides opportunities unavailable in a traditional covered call fund and provides the potential for high returns over time.
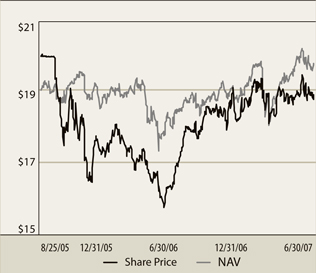
All Fund returns cited – whether based on net asset value (“NAV”) or market price – assume the reinvestment of all distributions. For this six-month period, the Fund provided a total return based on market value of 7.62%. This represents a closing market price of $18.93 on June 30, 2007, versus $18.33 on December 31, 2006. On an NAV basis, the Fund generated a total return of 9.25%. This represents a NAV of $19.81 on June 30, 2007, versus $18.89 on December 31, 2006. The Fund’s market price at June 30, 2007, represented a discount to NAV of 4.44%; as of December 31, 2006, the share price was at a 2.96% discount to NAV. We believe that the Fund’s market price discount to NAV represents an opportunity, as common shares of the Fund are now available in the market at prices below the value of the securities in the underlying portfolio.
SemiAnnual Report | June 30, 2007 | 3
OLA | Old Mutual/Claymore Long-Short Fund | Dear Shareholder continued
Shareholders have the opportunity to reinvest their dividends from the Fund through the Dividend Reinvestment Plan (“DRIP”), which is described in detail on page 24 of this report. If shares trade at a discount to NAV, the DRIP takes advantage of the discount by reinvesting the quarterly dividend distributions in common shares of the Fund purchased in the market at a price less than NAV. Conversely, when the market price of the Fund’s common shares is at a premium above NAV, the DRIP reinvests participants’ dividends in newly-issued common shares at NAV, subject to an IRS limitation that the purchase price cannot be more than 5% below the market price per share. The DRIP provides a cost effective means to accumulate additional shares and enjoy the benefits of compounding returns over time.
To learn more about the Fund’s performance and investment strategy, we encourage you to read the Questions & Answers section of the report, which begins on page 5. You will find information about Analytic’s investment philosophy and discipline, its views on the market environment and how it structured the Fund’s portfolio based on its views.
We appreciate your investment and look forward to serving your investment needs in the future. For the most up-to-date information on your investment, please visit the Fund’s website at www.oldmutualclaymore.com.
Sincerely,

Nicholas Dalmaso
Old Mutual/Claymore Long-Short Fund
4 | SemiAnnual Report | June 30, 2007
OLA | Old Mutual/Claymore Long-Short Fund |
Questions & Answers |
Dennis M. Bein, CFA
Chief Investment Officer, Portfolio Manager
Analytic Investors, Inc.
As Chief Investment Officer, Dennis Bein oversees the implementation of Analytic’s investment strategies. He is a major contributor to the firm’s ongoing research efforts as well as to the new product development efforts and strategy applications. As Portfolio Manager, Bein directs the Fund’s management team on day-to-day portfolio management and research related to the Fund’s equity-based investment strategies. Bein joined Analytic in 1995, and has more than 15 years of investment experience. He is a CFA charterholder and earned an M.B.A. from the Anderson Graduate School of Management at the University of California, Riverside.
The Old Mutual/Claymore Long-Short Fund (the “Fund”) is managed by Analytic Investors, Inc. In the following interview, Chief Investment Officer and Portfolio Manager Dennis Bein, CFA, explains the factors that impacted the Fund’s performance for the semi-annual period ended June 30, 2007.
Before we discuss performance, will you remind us of the Fund’s investment objectives and explain how your investment strategy seeks to achieve those objectives?
The Fund’s primary investment objective is to provide a high level of current income and gains, with a secondary objective of long-term capital appreciation. The Fund seeks to achieve these objectives by investing in a diversified portfolio of common stocks and other equity securities, utilizing a long and short strategy and opportunistically employing a strategy of writing (selling) calls on equity indices, sectors and, to a lesser extent, on individual securities.
We utilize quantitative models to develop an equity portfolio that offers the potential for capital appreciation. The portfolio is constructed with a level of diversification and risk similar to that of the S&P 500, but is designed with the objective of outperforming the index over a full market cycle by having its long positions invested in what we believe are the stocks that will outperform, while selling short the stocks that we believe will underperform. To generate income and help reduce volatility, we then apply a call options overlay. Finally, to potentially enhance returns, we also engage in asset allocation strategies by purchasing or selling futures contracts on U.S. or foreign securities indices as well as foreign currency forward contracts and other assets.
Will you tell us more about the specifics of your process?
There are three components of the strategy that we believe make the Fund unique among covered call funds.
Stock Selection. We begin by analyzing stock characteristics rather than focusing on individual stocks as many investment managers do. Our quantitative review is based on sophisticated mathematical models focused on variables that cover multiple dimensions of a stock’s value, such as its valuation, growth potential, historical return patterns, liquidity and risk. The models identify characteristics that investors are currently rewarding or punishing by examining a universe of approximately 3,000 stocks to determine which financial characteristics are shared by the market’s largest gaining or losing stocks. Stocks possessing favorable characteristics are ranked and become candidates for the long portfolio. Stocks that possess unfavorable characteristics are candidates for the short portfolio. Ultimately a portfolio of at least 75 highly-ranked stocks is combined with short positions of at least 20 low-ranked stocks. We monitor the portfolio on a real-time basis using our proprietary management system, which identifies media events or changes in fundamental factors that are potentially significant for the portfolio holdings. However, we trade securities only when we believe the incremental return potential will exceed the associated transaction costs.
Options Overlay. Our process is unique because we typically do not write (sell) call options on individual securities as a traditional covered call fund might. We prefer to sell options on indices because we have strong convictions about the stocks held in the Fund’s portfolio. This strategy helps preserve the upside potential of the Fund’s individual equity holdings, which is more important
SemiAnnual Report | June 30, 2007 | 5
OLA | Old Mutual/Claymore Long-Short Fund | Questions & Answers continued
to us than giving away the upside potential of the market sectors on which we have written the calls. We believe giving away market or sector upside potential in exchange for lower overall volatility and a higher yield provided by the call options premiums benefits the Fund.
Asset Allocation. We also engage in asset allocation strategies for the Fund by purchasing or selling futures contracts on U.S. or foreign securities indices, foreign currencies and other assets. This enables us to attempt to enhance Fund returns, to hedge against market and other risks in the portfolio and to obtain market exposure with reduced transaction costs. Essentially we take long and short equity, fixed-income and currency futures positions based on our global research models.
What is a short sale?
A short sale is three-step trading strategy that seeks to capitalize on an anticipated decline in the price of a security. First, arrangements are made to borrow shares of the security, typically from a broker. Next, the investor will sell the borrowed shares immediately in the open market with the intention of buying them back at some point in the future. Finally, to complete the cycle, at a later date the investor will repurchase the shares (hopefully at a lower price) and will return them to the lender. In the end, the investor will receive the difference if the share price falls, but will of course incur a loss if it rises.
What is an index option?
An index option is a contract which gives the buyer the right to participate in market gains over and above (in the case of a call) or below (in the case of a put) a specified price (the strike price) on or before a pre-determined date (the expiration date). After this pre-determined date, the option and its corresponding rights expire. For example, the seller of an index call option is obligated, until the expiration date, to pay the holder of the option the difference between the index price and the option’s strike price, upon the holder’s request. The price of the option is determined from trading activity in the options market and generally reflects the relationship between the current price for the index and the strike price, as well as the time remaining until the expiration date.
Will you provide an overview of equity markets during the first half of 2007?
Except for a period of weakness in late February and early March, equity markets were generally strong during the first six months of 2007, despite moderation in economic growth. By the end of May, most indices were at or near their all-time highs; markets were volatile with no pronounced trend in June.
During the first half of 2007, investors favored certain valuation characteristics, such as sales-to-price, cash-flow-to-price and earnings-to-price ratios, while avoiding companies with above-average dividend yields. Lower quality companies outperformed higher quality companies during the period, and companies with above average price momentum underperformed. Also, companies with strong earnings growth slightly underperformed during the period.
How did the Fund perform in this environment?
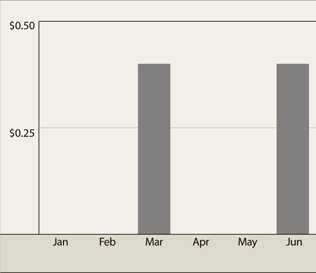
The Fund successfully met its primary investment objective of generating a high level of current income. The Fund generated net dividend income from its long equity positions and realized gains from its portfolio and through its options writing (selling) program. Additionally, the Fund experienced net appreciation on its portfolio during the period. However, there is no guarantee that this level of income or gains will be maintained. The Fund provided investors with consistent quarterly distributions of $0.40 per share during the first half of 2007. This represents an annualized distribution rate of 8.45% based upon the closing market price of $18.93 on June 30, 2007. Each of the distributions was accompanied by a letter detailing the source of the distribution. (These letters are also posted on the Fund’s web site.) However, a final determination of the components of the Fund’s distributions for tax purposes will be made in January 2008 after the end of the Fund’s fiscal year.
6 | SemiAnnual Report | June 30, 2007
OLA | Old Mutual/Claymore Long-Short Fund | Questions & Answers continued
The Fund met its secondary objective of capital appreciation as well. All Fund returns cited – whether based on net asset value (“NAV”) or market price – assume the reinvestment of all distributions. For the six months ended June 30, 2007, the Fund provided a total return based on market price of 7.62% The Fund’s performance was even stronger on an NAV basis, with a total return of 9.25% for the six months ended June 30, 2007.
On June 30, 2007, the Fund’s closing market price was $18.93, which represented a discount of 4.44% to NAV of $19.81. On December 31, 2006, the Fund’s market price closed at $18.33 and its NAV was $18.89, reflecting a discount of 2.96%.
The Fund’s return exceeded returns of the S&P 500 Index, which returned 6.96%, and the CBOE S&P 500 BuyWrite Index (“BXM”), which returned 3.77%. The BXM is an index that simulates an ongoing covered call strategy on the S&P 500 and consists of an unmanaged portfolio of stocks upon which a one-month at-the-money call option on the S&P 500 is continuously written.
When comparing the Fund’s performance to the S&P 500 and BXM indices, it is important to remember that while the Fund invests primarily in domestic equities, it also employs an options overlay and asset allocation strategies. The effect of the Fund’s options program was essentially neutral for performance during this six-month period, while the asset allocation strategies added value.
Will you tell us about the characteristics favored by your quantitative model during the first half of 2007?
Analytic Investors’ process is based on the fundamental belief that there is persistency in the types of stock characteristics investors prefer, and we believe that portfolios that reflect these biases will add value in the long run. Investor behavior observed during the first six months of 2007 was very consistent with that seen over recent years. As a result, Analytic’s investment process was effective, benefiting particularly from an emphasis on companies with above-average sales-to-price ratios. These companies generally performed well, as investors rewarded companies with favorable valuations that were generating strong revenues. In addition, positioning the portfolio toward lower quality companies also helped as these stocks continued to outperform higher quality issues. (Our definition of quality is based on a number of factors such as financial strength and profitability; it is intended to reflect the market’s overall view of quality.)
Which decisions regarding the common equity portfolio had the greatest positive impact on performance?
Stock selection was positive within the majority of economic sectors, with health care, financials, and consumer staples being the strongest.
Among the best performing stocks was a long position in The Goodyear Tire & Rubber Company (0.1% of total common stocks and securities sold short), which rallied after the company took steps to improve its standing with credit agencies. Goodyear was deemed attractive by our model because it had strong sales-to-price ratios, below average dividend yield and was below average quality, all factors which worked during the period.
A long position in Medco Health Solutions Inc. (0.5% of total common stocks and securities sold short), contributed to performance, as the pharmacy benefits manager reported a 29% rise in fourth quarter profits, due primarily to increased rates for generic drugs and improvement in its specialty pharmacy business. Medco had strong sales-to-price numbers, a factor that was strongly rewarded by investors during the period. In addition, it had below average quality scores at a time investors favored lower quality stocks.
A long position in General Motors Corporation (0.9% of total common stocks and securities sold short) also helped, as the stock climbed steadily during the month after the first quarter earnings release revealed a net profit of $63 million. GM’s sales-to-price ratio was extremely attractive.
SemiAnnual Report | June 30, 2007 | 7
OLA | Old Mutual/Claymore Long-Short Fund | Questions & Answers continued
Several short positions also helped the Fund’s relative results during the period. For example, a short position in Whole Foods Market, Inc. (0.8% of total common stocks and securities sold short) helped as shares fell sharply after the natural and organic foods supermarket chain reported a disappointing fiscal second quarter, with profit falling far short of analysts’ expectations. Whole Foods was an attractive short because of its poor sales-to-price and earnings-to-price ratios. Financial guarantee insurer MBIA Inc. (0.4% of total common stocks and securities sold short) and payroll processor Paychex, Inc. (1.7% of total common stocks and securities sold short), both companies having high quality scores, were other short positions that added value to the Fund during the period.
Which areas of the equity portfolio hurt performance?
Detracting from performance was a long position in Electronic Data Systems Corp. (1.0% of total common stocks and securities sold short), an information technology services company, which moved lower over analyst concerns regarding lower booking and free cash flow. EDS had above average earnings growth, which was not rewarded during the period.
A long position is Office Depot, Inc. (0.6% of total common stocks and securities sold short) hurt performance as the stock moved lower even though the office-supplies retailer reported a 20% jump in first-quarter profit, as the earnings report was below analysts’ expectations. A short position in First Data Corporation (not held in the portfolio as of 6/30/07) also negatively impacted performance as the financial services company soared on news of a $26 billion takeover bid from a private equity firm. First Data was a strong short candidate because of weak earnings growth. During the period, companies with below average earnings growth outperformed.
Finally, a short position in Weyerhaeuser Company (not held in the portfolio as of 6/30/07) hurt performance, as the company rallied after the U.S. Supreme Court set aside an antitrust ruling and the subsequent announcement of a reversal of a $95 million in pre-tax charges related to the antitrust suits. Weyerhauser had poor momentum relative to other companies in its industry group.
What was the impact on performance of the options and asset allocation programs?
The net effect of the options program was minimal during the period, as it was a strong period for equity markets. Asset allocation added value during the period. Currency gains, primarily a long position in the Australian dollar and a short position in the Japanese yen, were the main contributors to performance. The equity component of asset allocation offset some of the gains, as a general flight from risk at the end of February and into March led to losses. Specifically, a long position in Hong Kong underperformed a short position in Japan. Short positions in both Sweden and Australia also negatively impacted performance as these markets performed well.
What is your outlook for the market and the Fund in the months ahead?
After the strong market experienced in the first half of 2007, we believe that more modest returns are likely for the remainder of the year. In the equity portion of the Fund’s portfolio, we intend to continue to emphasize stocks with above-average sales-to-price ratios and to focus on select companies with attractive cash-flow-to-price ratios, while de-emphasizing companies with above-average dividend yields and profit margins.
We believe that the Fund’s structure, with a long and short equity portfolio, an index options program to preserve upside potential of individual securities and an asset allocation strategy for exposure to world markets has the potential to provide attractive returns in a wide variety of market conditions.
8 | SemiAnnual Report | June 30, 2007
OLA | Old Mutual/Claymore Long-Short Fund | Questions & Answers continued
OLA Risks and Other Considerations
As with any stock, the price of the Fund’s Common Shares will fluctuate with market conditions and other factors. Shares of closed-end management investment companies frequently trade at a discount from their net asset value. If you sell your common shares, you may receive more or less than your original investment. The Fund’s Common Shares may trade at a price that is less than their initial offering price. This risk may be greater for investors who sell their shares relatively shortly after completion of the initial public offering. The common shares are designed for long-term investors and should not be treated as a vehicle for trading.
The Fund will ordinarily have substantial exposure (both long and short) to common stocks and other equity securities in pursuing its investment objectives and policies. The market price of common stocks and other equity securities in which the Fund invests may go up or down, sometimes rapidly or unpredictably. Equity securities may decline in value due to factors affecting equity securities markets generally, particular industries represented in those markets or the issuer itself.
The Fund makes substantial use of short sales for investment and risk management purposes, including when Analytic anticipates that the market price of securities will decline or will underperform relative to other securities held in the Fund’s portfolio. The Fund intends to take short equity positions in an amount equal to approximately 30% of the Fund’s net assets at the time of sale, but reserves the flexibility to hold short positions of up 70% of net assets. Short sales are transactions in which the Fund sells a security or other instrument (such as an option, forward, futures or other derivative contract) that it does not own. When the Fund engages in a short sale on a security, it must borrow the security sold short and deliver it to the counterparty. The Fund will ordinarily have to pay a fee or premium to borrow particular securities and be obligated to repay the lender of the security any dividends or interest that accrue on the security during the period of the loan. The amount of any gain from a short sale will be decreased, and the amount of any loss increased, by the amount of the premium, dividends, interest or expenses the Fund pays in connection with the short sale. Short sales expose the Fund to the risk that it will be required to cover its short position at a time when the securities have appreciated in value, thus resulting in a potentially unlimited loss to the Fund.
The distributions shareholders receive from the Fund are based primarily on the dividends it earns from its equity investments as well as the gains the Fund receives from writing options and using other derivative instruments, closing out short sales and selling portfolio securities, each of which can vary widely over the short and long term. The dividend income from the Fund’s investments in equity securities will be influenced by both general economic activity and issuer-specific factors. In the event of a recession or adverse events affecting a specific industry or issuer, an issuer of equity securities held by the Fund may reduce the dividends paid on such securities. If prevailing market interest rates decline, interest rates on any debt instruments held by the Fund, and shareholders’ income from the Fund, would likely decline as well. Please see the “Distributions” section of the Prospectus for a description of other risks associated with the level, timing and character of the Fund’s distributions.
There are various risks associated with the Option Strategy. The purchaser of an index option written by the Fund has the right to any appreciation in the cash value of the index over the strike price on the expiration date. Therefore, as the writer of an index call option; the Fund forgoes the opportunity to profit from increases in the index over the strike price of the option. However, the Fund has retained the risk of loss (net of premiums received) should the price of the Fund’s portfolio securities decline. Similarly, as the writer of a call option on an individual security held in the Fund’s portfolio, the Fund forgoes, during the option’s life, the opportunity to profit from increases in the market value of the security covering the call option above the sum of the premium and the strike price of the call but has retained the risk of loss (net of premiums received) should the price of the underlying security decline. The value of options written by the Fund, which will be priced daily, will be affected by, among other factors, changes in the value of underlying securities (including those comprising an index), changes in the dividend rates of underlying securities, changes in interest rates, changes in the actual or perceived volatility of the stock market and underlying securities and the remaining time to an option’s expiration. The value of an option also may be adversely affected if the market for the option is reduced or becomes less liquid.
An investment in the Fund is subject to certain risks and other considerations, including, but not limited to: Equity Risk; Short Sale Risk; Options Risk, Management Risk; Tax Treatment of Distributions; Derivatives Risk; Counterparty Risk; Credit Risk; Income Risk; Medium- and Smaller-Company Risk; Focused Investment Risk; Interest Rate Risk; Liquidity Risk; Market Disruption and Geopolitical Risk; Leverage Risk; Foreign Investment Risk; Other Investment Companies Risk; and Inflation/Deflation Risk.
SemiAnnual Report | June 30, 2007 | 9
OLA | Old Mutual/Claymore Long-Short Fund
Fund Summary | As of June 30, 2007 (unaudited)
| | | | |
Fund Statistics | | | |
Share Price | | $ | 18.93 | |
Common Share Net Asset Value | | $ | 19.81 | |
Premium/(Discount) to NAV | | | -4.44 | % |
Net Assets ($000) | | $ | 376,538 | |
| | | | | | |
Total Returns | | | | | | |
(Inception 8/25/05) | | Market | | | NAV | |
Six Months | | 7.62 | % | | 9.25 | % |
One Year | | 27.10 | % | | 18.26 | % |
Since Inception - average annual | | 5.47 | % | | 10.44 | % |
| | | |
Sector Breakdown | | % of Common
Stocks and
Securities Sold Short | |
Information Technology | | 20.6 | % |
Financials | | 19.6 | % |
Consumer Discretionary | | 12.6 | % |
Industrials | | 10.8 | % |
Energy | | 8.8 | % |
Health Care | | 8.7 | % |
Consumer Staples | | 7.9 | % |
Telecommunications | | 5.6 | % |
Utilities | | 3.1 | % |
Materials | | 2.3 | % |
Securities are classified by sectors that represent broad groupings of related industries.
| | | |
Top Ten Long-Term Common Stocks | | % of Net
Assets | |
JPMorgan Chase & Co. | | 3.8 | % |
International Business Machines Corp. | | 3.7 | % |
Exxon Mobil Corp. | | 3.6 | % |
Hewlett-Packard Co. | | 3.1 | % |
Chevron Corp. | | 3.0 | % |
Cardinal Health, Inc. | | 2.8 | % |
Tyco International Ltd. | | 2.7 | % |
Loews Corp. | | 2.6 | % |
Boeing Co. | | 2.5 | % |
McKesson Corp. | | 2.3 | % |
| | | |
Top Five Securities Sold Short | | % of Net
Assets | |
Paychex, Inc. | | 2.6 | % |
Automatic Data Processing, Inc. | | 2.3 | % |
Hudson City Bancorp, Inc. | | 2.2 | % |
PACCAR, Inc. | | 1.9 | % |
Spectra Energy Corp. | | 1.5 | % |
Past performance does not guarantee future results. All portfolio data is subject to change daily. For more current information, please visit www.claymore.com. The above summaries are provided for informational purposes only and should not be viewed as recommendations.
Share Price & NAV Performance
Distributions to Shareholders
| | | |
Fund Breakdown | | % of Net Assets | |
Long-Term Investments | | 119.7 | % |
Short-Term Investments | | 7.3 | % |
| | | |
Total Investments | | 127.0 | % |
Securities Sold Short | | -27.7 | % |
Other Assets less Liabilities | | 1.2 | % |
Total Value of Options Written | | -0.5 | % |
| | | |
Total Net Assets | | 100.0 | % |
| | | |
10 | SemiAnnual Report | June 30, 2007
OLA | Old Mutual/Claymore Long-Short Fund
Portfolio of Investments | June 30, 2007 (unaudited)
| | | | | |
Number of Shares | | | | Value |
| | Long-Term Investments - 119.7% | | | |
| | |
| | Common Stocks - 119.7% | | | |
| | |
| | Consumer Discretionary - 14.3% | | | |
| 16,058 | | Amazon.com, Inc. (a)(b) | | $ | 1,098,528 |
| 5,647 | | AutoNation, Inc. (a)(b) | | | 126,719 |
| 52,149 | | Best Buy Co., Inc. (b) | | | 2,433,794 |
| 2,863 | | Citadel Broadcasting Corp. (b) | | | 18,466 |
| 3,736 | | Clear Channel Communications, Inc. (b) | | | 141,296 |
| 116,971 | | Comcast Corp. - Class A (a)(b) | | | 3,289,224 |
| 11,599 | | Darden Restaurants, Inc. (b) | | | 510,240 |
| 37,849 | | Dillard’s, Inc. - Class A (b) | | | 1,359,915 |
| 144,449 | | DIRECTV Group, Inc. (The) (a)(b) | | | 3,338,216 |
| 124,419 | | Eastman Kodak Co. (b) | | | 3,462,581 |
| 492,695 | | Ford Motor Co. (a)(b) | | | 4,641,187 |
| 135,914 | | General Motors Corp. (b) | | | 5,137,549 |
| 6,700 | | Goodyear Tire & Rubber Co. (a)(b) | | | 232,892 |
| 752 | | Harrah’s Entertainment, Inc. (b) | | | 64,116 |
| 276,882 | | Interpublic Group of Companies, Inc. (a)(b) | | | 3,156,455 |
| 51,406 | | JC Penney Co., Inc. (b) | | | 3,720,766 |
| 9,492 | | Marriott International, Inc. - Class A (b) | | | 410,434 |
| 23,133 | | Nike, Inc. - Class B (b) | | | 1,348,423 |
| 11,662 | | Nordstrom, Inc. (b) | | | 596,161 |
| 103,656 | | Office Depot, Inc. (a)(b) | | | 3,140,777 |
| 17,769 | | OfficeMax, Inc. (b) | | | 698,322 |
| 18,422 | | Omnicom Group, Inc. (b) | | | 974,892 |
| 2,436 | | Sears Holding Corp. (a)(b) | | | 412,902 |
| 10,230 | | Sherwin-Williams Co. (b) | | | 679,988 |
| 55,098 | | TJX Co., Inc. | | | 1,515,195 |
| 35,410 | | Target Corp. | | | 2,252,076 |
| 188,173 | | Walt Disney Co. (The) (b) | | | 6,424,226 |
| 23,936 | | Whirlpool Corp. | | | 2,661,683 |
| | | | | |
| | | | | 53,847,023 |
| | | | | |
| | Consumer Staples - 9.9% | | | |
| 124,338 | | Altria Group, Inc. (b) | | | 8,721,067 |
| 132,595 | | Archer-Daniels-Midland Co. (b) | | | 4,387,569 |
| 63,046 | | Clorox Co. (b) | | | 3,915,157 |
| 20,909 | | Coca-Cola Enterprises, Inc. (b) | | | 501,816 |
| 8,444 | | Costco Wholesale Corp. (b) | | | 494,143 |
| 14,975 | | CVS Caremark Corp. (b) | | | 545,839 |
| 24,727 | | Kraft Foods, Inc. - Class A (b) | | | 871,627 |
| 128,101 | | Kroger Co. (b) | | | 3,603,481 |
| 33,972 | | Pepsi Bottling Group, Inc. (b) | | | 1,144,177 |
| 50,197 | | Safeway, Inc. (b) | | | 1,708,204 |
| 22,107 | | SUPERVALU, Inc. (b) | | | 1,023,996 |
| 298,137 | | Tyson Foods, Inc. - Class A | | | 6,869,076 |
| 74,450 | | Wal-Mart Stores, Inc. | | | 3,581,789 |
| | | | | |
| | | | | 37,367,941 |
| | | | | |
| | Energy - 11.4% | | | |
| 133,813 | | Chevron Corp. (b) | | | 11,272,407 |
| 932 | | ConocoPhillips (b) | | | 73,162 |
| 159,930 | | Exxon Mobil Corp. | | | 13,414,928 |
| 65,305 | | Hess Corp. (b) | | | 3,850,383 |
| 124,856 | | Marathon Oil Corp. (b) | | | 7,486,366 |
| 26,727 | | Murphy Oil Corp. (b) | | | 1,588,653 |
| 56,235 | | Nabors Industries Ltd. (Bermuda) (a)(b) | | | 1,877,124 |
| 12,372 | | Sunoco, Inc. (b) | | | 985,801 |
| 32,304 | | Valero Energy Corp. | | | 2,385,974 |
| | | | | |
| | | | | 42,934,798 |
| | | | | |
| | Financials - 24.6% | | | |
| 59,650 | | ACE Ltd. (Bermuda) (b) | | | 3,729,318 |
| 39,706 | | Aon Corp. (b) | | | 1,691,873 |
| 44,112 | | Assurant, Inc. (b) | | | 2,599,079 |
| 17,568 | | AvalonBay Communities, Inc. - REIT (b) | | | 2,088,484 |
| 136,496 | | Bank of America Corp. (b) | | | 6,673,289 |
| 19,956 | | Boston Properties, Inc. - REIT (b) | | | 2,038,106 |
| 17,762 | | Capital One Financial Corp. (b) | | | 1,393,251 |
| 107,219 | | Citigroup, Inc. (b) | | | 5,499,263 |
| 34,629 | | Fannie Mae (b) | | | 2,262,313 |
| 106,724 | | Freddie Mac (b) | | | 6,478,147 |
| 4,846 | | Goldman Sachs Group, Inc. (b) | | | 1,050,370 |
| 9,498 | | Hartford Financial Services Group, Inc. (b) | | | 935,648 |
| 106,148 | | Host Hotels & Resorts, Inc. - REIT (b) | | | 2,454,142 |
| 294,007 | | JPMorgan Chase & Co. (b) | | | 14,244,639 |
| 21,886 | | Lehman Brothers Holdings, Inc. (b) | | | 1,630,945 |
| 192,725 | | Loews Corp. (b) | | | 9,825,120 |
| 14,435 | | Mellon Financial Corp. (b) | | | 635,140 |
| 19,225 | | Merrill Lynch & Co., Inc. (b) | | | 1,606,825 |
| 134,239 | | MetLife, Inc. (b) | | | 8,655,731 |
| 47,434 | | Morgan Stanley (b) | | | 3,978,764 |
| 76,780 | | PNC Financial Services Group, Inc. (b) | | | 5,495,912 |
| 2,200 | | Prudential Financial, Inc. (b) | | | 213,906 |
| 4,603 | | SLM Corp. (b) | | | 265,041 |
| 22,339 | | Safeco Corp. (b) | | | 1,390,826 |
| 49,466 | | Travelers Co., Inc. | | | 2,646,431 |
| 9,256 | | Wachovia Corp. | | | 474,370 |
| 30,998 | | Wells Fargo & Co. | | | 1,090,200 |
| 18,700 | | Zions Bancorporation | | | 1,438,217 |
| | | | | |
| | | | | 92,485,350 |
| | | | | |
See notes to financial statements.
SemiAnnual Report | June 30, 2007 | 11
OLA | Old Mutual/Claymore Long-Short Fund | Portfolio of Investments (unaudited) continued
| | | | | |
Number of Shares | | | | Value |
| | Health Care - 11.8% | | | |
| 102,266 | | AmerisourceBergen Corp. (b) | | $ | 5,059,099 |
| 8,819 | | Amgen, Inc. (a)(b) | | | 487,602 |
| 49,712 | | Baxter International, Inc. (b) | | | 2,800,774 |
| 34,319 | | Bristol-Myers Squibb Co. (b) | | | 1,083,108 |
| 148,127 | | Cardinal Health, Inc. (b) | | | 10,463,691 |
| 41,598 | | Cigna Corp. (b) | | | 2,172,248 |
| 14,704 | | Hospira, Inc. (a)(b) | | | 574,044 |
| 44,224 | | Humana, Inc. (a)(b) | | | 2,693,684 |
| 78,485 | | Johnson & Johnson (b) | | | 4,836,246 |
| 146,924 | | McKesson Corp. (b) | | | 8,762,547 |
| 32,878 | | Medco Health Solutions, Inc. (a)(b) | | | 2,564,155 |
| 32,518 | | WellPoint, Inc. (a) | | | 2,595,912 |
| 7,397 | | Wyeth | | | 424,144 |
| | | | | |
| | | | | 44,517,254 |
| | | | | |
| | Industrials - 14.0% | | | |
| 96,567 | | Boeing Co. (b) | | | 9,285,883 |
| 30,323 | | Cooper Industries, Inc. - Class A (b) | | | 1,731,140 |
| 815 | | Cummins, Inc. (b) | | | 82,486 |
| 107,489 | | Donnelley (R.R.) & Sons Co. (b) | | | 4,676,846 |
| 36,055 | | FedEx Corp. (b) | | | 4,001,023 |
| 17,699 | | Fluor Corp. (b) | | | 1,971,138 |
| 3,674 | | General Electric Co. (b) | | | 140,641 |
| 28,395 | | Goodrich Corp. (b) | | | 1,691,206 |
| 13,926 | | Lockheed Martin Corp. (b) | | | 1,310,854 |
| 19,118 | | Northrop Grumman Corp. (b) | | | 1,488,719 |
| 34,205 | | Parker Hannifin Corp. (b) | | | 3,349,012 |
| 50,075 | | Raytheon Co. (b) | | | 2,698,542 |
| 19,669 | | Rockwell Automation, Inc. (b) | | | 1,365,815 |
| 161,000 | | Ryder System, Inc. (b) | | | 8,661,800 |
| 303,027 | | Tyco International Ltd. (Bermuda) | | | 10,239,282 |
| 1,060 | | WW Grainger, Inc. (b) | | | 98,633 |
| | | | | |
| | | | | 52,793,020 |
| | | | | |
| | Information Technology - 20.8% | | | |
| 30,504 | | Agilent Technologies, Inc. (a)(b) | | | 1,172,574 |
| 141,812 | | Applied Materials, Inc. (b) | | | 2,817,804 |
| 44,912 | | Cisco Systems, Inc. (a)(b) | | | 1,250,799 |
| 112,473 | | Computer Sciences Corp. (a)(b) | | | 6,652,778 |
| 2,687 | | Convergys Corp. (a)(b) | | | 65,133 |
| 88,250 | | Dell, Inc. (a)(b) | | | 2,519,537 |
| 204,672 | | Electronic Data Systems Corp. (b) | | | 5,675,554 |
| 8,832 | | First Data Corp. (b) | | | 288,541 |
| 12,097 | | Google, Inc. - Class A (a)(b) | | | 6,331,328 |
| 260,343 | | Hewlett-Packard Co. (b) | | | 11,616,505 |
| 187,456 | | Intel Corp. (b) | | | 4,453,954 |
| 131,728 | | International Business Machines Corp. (b) | | | 13,864,372 |
| 57,210 | | Jabil Circuit, Inc. (b) | | | 1,262,625 |
| 7,999 | | LSI Logic Corp. (a)(b) | | | 60,072 |
| 18,386 | | Lexmark International, Inc. - Class A (a)(b) | | | 906,614 |
| 15,623 | | MEMC Electronic Materials, Inc. (a) | | | 954,878 |
| 101,340 | | NCR Corp. (a)(b) | | | 5,324,404 |
| 31,867 | | NVIDIA Corp. (a)(b) | | | 1,316,426 |
| 3,500 | | Teradyne, Inc. (a) | | | 61,530 |
| 152,029 | | Texas Instruments, Inc. | | | 5,720,851 |
| 135,054 | | Unisys Corp. (a) | | | 1,234,394 |
| 31,678 | | VeriSign, Inc. (a) | | | 1,005,143 |
| 26,753 | | Western Union Co. | | | 557,265 |
| 172,266 | | Xerox Corp. (a) | | | 3,183,476 |
| | | | | |
| | | | | 78,296,557 |
| | | | | |
| | Materials - 3.2% | | | |
| 4,016 | | Allegheny Technologies, Inc. (b) | | | 421,198 |
| 82,049 | | Du Pont (E.I.) de Nemours and Co. (b) | | | 4,171,371 |
| 260,956 | | Hercules, Inc. (a)(b) | | | 5,127,785 |
| 55,194 | | International Paper Co. (b) | | | 2,155,326 |
| 2,427 | | Vulcan Materials Co. | | | 277,989 |
| | | | | |
| | | | | 12,153,669 |
| | | | | |
| | Telecommunications - 6.4% | | | |
| 177,650 | | AT&T, Inc. | | | 7,372,475 |
| 23,436 | | Alltel Corp. (b) | | | 1,583,102 |
| 76,770 | | Embarq Corp. (b) | | | 4,864,915 |
| 371,489 | | Qwest Communications International, Inc. (a)(b) | | | 3,603,443 |
| 112,628 | | Sprint Nextel Corp. (b) | | | 2,332,526 |
| 102,533 | | Verizon Communications, Inc. | | | 4,221,284 |
| | | | | |
| | | | | 23,977,745 |
| | | | | |
| | Utilities - 3.3% | | | |
| 120,341 | | AES Corp. (a)(b) | | | 2,633,061 |
| 24,774 | | Allegheny Energy, Inc. (a)(b) | | | 1,281,807 |
| 61,609 | | CMS Energy Corp. (b) | | | 1,059,675 |
| 42,325 | | Edison International (b) | | | 2,375,279 |
| 96,770 | | PG&E Corp. (b) | | | 4,383,681 |
| 3,525 | | Public Service Enterprise Group, Inc. (b) | | | 309,424 |
| 6,684 | | TXU Corp. (b) | | | 449,833 |
| | | | | |
| | | | | 12,492,760 |
| | | | | |
| | Total Long-Term Investments - 119.7% (Cost $426,311,971) | | | 450,866,117 |
| | | | | |
See notes to financial statements.
12 | SemiAnnual Report | June 30, 2007
OLA | Old Mutual/Claymore Long-Short Fund | Portfolio of Investments (unaudited) continued
| | | | | | |
Principal Amount | | | | Value | |
| | Short-Term Investments - 7.3% | | | | |
| | |
| | | U.S. Government and Agency Securities - 7.3% | | | |
| $2,500,000 | | Federal Home Loan Bank Discount Notes, yielding 4.70%, 07/02/07 maturity | | $ | 2,500,000 | |
| 24,850,000 | | U.S. Treasury Bill yielding 5.06%, 07/05/07 maturity (b) | | | 24,843,340 | |
| | | | | | |
| | Total Short-Term Investments (Cost $ 27,336,025) | | | 27,343,340 | |
| | | | | | |
| | Total Investments - 127.0% (Cost $ 453,647,996) | | | 478,209,457 | |
| | Securities Sold Short - (27.7%) | | | | |
| | (Proceeds $ 100,994,001) | | | (104,131,664 | ) |
| | Other Assets less Liabilities - 1.2% | | | 4,503,364 | |
| | Total Value of Options Written - (0.5%) | | | (2,043,250 | ) |
| | | | | | |
| | Net Assets - 100.0% | | $ | 376,537,907 | |
| | | | | | |
| | |
Number of Shares | | | | Value | |
| | Securities Sold Short - 27.7% | | | | |
| | |
| | Common Stocks - 27.7% | | | | |
| | |
| | Consumer Discretionary - 4.3% | | | | |
| 29,639 | | Apollo Group, Inc. - Class A | | $ | 1,731,807 | |
| 31,756 | | CBS Corp. - Class B | | | 1,058,110 | |
| 33,371 | | Centex Corp. | | | 1,338,177 | |
| 3,356 | | EW Scripps Co. - Class A | | | 153,335 | |
| 10,741 | | H&R Block, Inc. | | | 251,017 | |
| 142,760 | | International Game Technology | | | 5,667,572 | |
| 57,953 | | Limited Brands, Inc. | | | 1,590,810 | |
| 79,200 | | Tiffany & Co. | | | 4,202,352 | |
| | | | | | |
| | | | | 15,993,180 | |
| | | | | | |
| | Consumer Staples - 1.7% | | | | |
| 110,480 | | Whole Foods Market, Inc. | | | 4,231,384 | |
| 37,335 | | Wrigley (Wm) Jr. Co. | | | 2,064,999 | |
| | | | | | |
| | | | | 6,296,383 | |
| | | | | | |
| | Energy - 1.5% | | | | |
| 220,401 | | Spectra Energy Corp. | | | 5,721,610 | |
| | | | | | |
| | Financials - 4.3% | | | | |
| 23,728 | | Cincinnati Financial Corp. | | | 1,029,795 | |
| 82,636 | | Commerce Bancorp, Inc. | | | 3,056,706 | |
| 15,362 | | Fifth Third Bancorp | | | 610,947 | |
| 670,521 | | Hudson City Bancorp, Inc. | | | 8,193,767 | |
| 31,384 | | MBIA, Inc. | | | 1,952,712 | |
| 57,780 | | Sovereign Bancorp, Inc. | | | 1,221,469 | |
| | | | | | |
| | | | | 16,065,396 | |
| | | | | | |
| | Health Care - 1.0% | | | | |
| 237,486 | | Boston Scientific Corp. | | | 3,643,035 | |
| | | | | | |
| | Industrials - 1.9% | | | | |
| 82,890 | | PACCAR, Inc | | | 7,214,746 | |
| | | | | | |
| | Information Technology - 9.6% | | | | |
| 55,450 | | Advanced Micro Devices, Inc. | | | 792,935 | |
| 176,259 | | Automatic Data Processing, Inc. | | | 8,543,274 | |
| 15,762 | | Cognizant Technology Solutions Corp. - Class A | | | 1,183,569 | |
| 82,979 | | JDS Uniphase Corp. | | | 1,114,408 | |
| 142,421 | | Juniper Networks, Inc. | | | 3,584,737 | |
| 81,911 | | Linear Technology Corp. | | | 2,963,540 | |
| 103,440 | | Micron Technology, Inc. | | | 1,296,103 | |
| 106,061 | | PMC-Sierra, Inc. | | | 819,851 | |
| 245,577 | | Paychex, Inc. | | | 9,606,972 | |
| 138,917 | | QLogic Corp. | | | 2,312,968 | |
| 30,341 | | SanDisk Corp. | | | 1,484,889 | |
| 94,717 | | Symantec Corp. | | | 1,913,283 | |
| 59,154 | | Tellabs, Inc. | | | 636,497 | |
| | | | | | |
| | | | | 36,253,026 | |
| | | | | | |
| | Materials - 0.2% | | | | |
| 21,086 | | Sigma-Aldrich Corp. | | | 899,740 | |
| | | | | | |
| | Telecommunications - 1.9% | | | | |
| 49,666 | | CenturyTel, Inc. | | | 2,436,117 | |
| 106,203 | | Citizens Communications Co. | | | 1,621,720 | |
| 213,128 | | Windstream Corp. | | | 3,145,769 | |
| | | | | | |
| | | | | 7,203,606 | |
| | | | | | |
| | Utilities - 1.3% | | | | |
| 78,412 | | Duke Energy Corp. | | | 1,434,940 | |
| 79,357 | | Nicor, Inc. | | | 3,406,002 | |
| | | | | | |
| | | | | 4,840,942 | |
| | | | | | |
| | Total Securities Sold Short - 27.7 % (Proceeds $100,994,001) | | $ | 104,131,664 | |
| | | | | | |
| | | | | | | | | | |
Contracts (100 shares
per contract) | | Call Options Written(a) | | Expiration Date | | Exercise Price | | Value |
| 175 | | AMEX Biotechnology Index | | July 2007 | | $ | 780.00 | | $ | 213,500 |
| 150 | | PHLX Utility Index | | July 2007 | | | 540.00 | | | 75,000 |
| 300 | | PHLX Semiconductor Index | | July 2007 | | | 505.00 | | | 238,500 |
| 200 | | S&P 100 Index | | July 2007 | | | 710.00 | | | 48,500 |
| 1,275 | | S&P 500 Index | | July 2007 | | | 1,535.00 | | | 981,750 |
| 300 | | S&P 500 Index | | July 2007 | | | 1,515.00 | | | 486,000 |
| | | | | | | | | | |
| | Total Call Options Written (Premiums received $ 4,601,338) | | | | | | | $ | 2,043,250 |
| | | | | | | | | | |
REIT – Real Estate Investment Trust
| (a) | Non-income producing security. |
| (b) | All or a portion of these securities are held as collateral for Securities Sold Short, options, forwards and futures. |
Securities are classified by sectors that represent broad groupings of related industries.
See notes to financial statements.
SemiAnnual Report | June 30, 2007 | 13
OLA | Old Mutual/Claymore Long-Short Fund
Statement of Assets and Liabilities | June 30, 2007 (unaudited)
| | | | |
Assets | | | | |
Investments, at value (cost $453,647,996) | | $ | 478,209,457 | |
Variation margin on futures | | | 4,528,594 | |
Unrealized appreciation on forward currency exchange contracts | | | 1,730,741 | |
Dividends and interest receivable | | | 233,144 | |
Other assets | | | 29,433 | |
| | | | |
Total assets | | | 484,731,369 | |
| | | | |
| |
Liabilities | | | | |
Securities sold short, at value (proceeds $100,994,001) | | | 104,131,664 | |
Options written, at value (premiums received of $4,601,338) | | | 2,043,250 | |
Unrealized depreciation on forward currency exchange contracts | | | 961,311 | |
Custodian bank | | | 595,746 | |
Advisory fee payable | | | 310,344 | |
Administration fee payable | | | 15,820 | |
Accrued expenses | | | 135,327 | |
| | | | |
Total liabilities | | | 108,193,462 | |
| | | | |
Net Assets | | $ | 376,537,907 | |
| | | | |
| |
Composition of Net Assets | | | | |
Common stock, $.01 par value per share; unlimited number of shares authorized, 19,005,240 shares issued and outstanding | | $ | 190,052 | |
Additional paid-in capital | | | 362,050,032 | |
Net unrealized appreciation on investments, futures, options, securities sold short, forwards and currency translation | | | 29,289,353 | |
Accumulated net realized gain on investments, futures, options, securities sold short, forwards and currency transactions | | | 7,048,488 | |
Accumulated net investment loss | | | (22,040,018 | ) |
| | | | |
Net Assets | | $ | 376,537,907 | |
| | | | |
Net Asset Value (based on 19,005,240 common shares outstanding) | | $ | 19.81 | |
| | | | |
See notes to financial statements.
14 | SemiAnnual Report | June 30, 2007
OLA | Old Mutual/Claymore Long-Short Fund
Statement of Operations | For the six months ended June 30, 2007 (unaudited)
| | | | | | | |
Investment Income | | | | | | | |
Dividends | | $ | 3,293,666 | | | | |
Interest | | | 793,075 | | | | |
| | | | | | | |
Total income | | | | | $ | 4,086,741 | |
| | | | | | | |
| Expenses | | | | | | | |
Dividends on securities sold short | | | 3,597,657 | | | | |
Advisory fee | | | 1,826,383 | | | | |
Custodian fee | | | 631,085 | | | | |
Trustees’ fees and expenses | | | 66,318 | | | | |
Professional fees | | | 62,638 | | | | |
Fund accounting | | | 51,214 | | | | |
Administration fee | | | 43,966 | | | | |
Printing expense | | | 43,538 | | | | |
Transfer agent fee | | | 25,309 | | | | |
NYSE listing fee | | | 10,498 | | | | |
Insurance | | | 10,140 | | | | |
Miscellaneous | | | 5,710 | | | | |
| | | | | | | |
Total expenses | | | | | | 6,374,456 | |
| | | | | | | |
Net investment loss | | | | | | (2,287,715 | ) |
| | | | | | | |
Realized and Unrealized Gain (Loss): | | | | | | | |
Net realized gain (loss) on: | | | | | | | |
Investments | | | | | | 23,694,857 | |
Futures | | | | | | (4,758,302 | ) |
Options | | | | | | (7,858,951 | ) |
Securities sold short | | | | | | (6,682,453 | ) |
Foreign currency forwards and currency transactions | | | | | | 5,606,708 | |
Net change in unrealized appreciation (depreciation) on: | | | | | | | |
Investments | | | | | | 19,188,400 | |
Futures | | | | | | 2,647,935 | |
Options | | | | | | 747,226 | |
Securities sold short | | | | | | 2,246,095 | |
Foreign currency forwards and currency translation | | | | | | 162,380 | |
| | | | | | | |
Net realized and unrealized gain | | | | | | 34,993,895 | |
| | | | | | | |
Net Increase in Net Assets Resulting from Operations | | | | | $ | 32,706,180 | |
| | | | | | | |
See notes to financial statements.
SemiAnnual Report | June 30, 2007 | 15
OLA | Old Mutual/Claymore Long-Short Fund
Statement of Changes in Net Assets |
| | | | | | | | |
| | | For the Six Months Ended June 30, 2007 (unaudited) | | | For the Year Ended
December 31, 2006 | |
Increase (Decrease) in Net Assets from Operations | | | | | | | | |
Net investment income (loss) | | $ | (2,287,715 | ) | | $ | 1,388,009 | |
Net realized gain (loss) on investments, futures, options, securities sold short, forwards and currency transactions | | | 10,001,859 | | | | 20,719,606 | |
Net unrealized appreciation (depreciation) on investments, futures, options, securities sold short, forwards and currency translation | | | 24,992,036 | | | | 10,045,070 | |
| | | | | | | | |
Net increase in net assets resulting from operations | | | 32,706,180 | | | | 32,152,685 | |
| | | | | | | | |
| | |
Distributions to Common Shareholders | | | | | | | | |
From and in excess of net investment income | | | (15,204,192 | ) | | | (30,408,384 | ) |
| | | | | | | | |
Total increase in net assets | | | 17,501,988 | | | | 1,744,301 | |
| | |
Net Assets | | | | | | | | |
Beginning of period | | | 359,035,919 | | | | 357,291,618 | |
| | | | | | | | |
End of period (including accumulated net investment loss of ($22,040,018) and ($4,548,111), respectively) | | $ | 376,537,907 | | | $ | 359,035,919 | |
| | | | | | | | |
See notes to financial statements.
16 | SemiAnnual Report | June 30, 2007
OLA | Old Mutual/Claymore Long-Short Fund
Financial Highlights |
| | | | | | | | | | | | |
Per share operating performance for a common share outstanding throughout the period | | For the Six Months Ended
June 30, 2007 (unaudited) | | | For the Year Ended December 31, 2006 | | | For the Period
August 25, 2005*
through December 31, 2005 | |
| | | |
Net asset value, beginning of period | | $ | 18.89 | | | $ | 18.80 | | | $ | 19.10 | (a) |
| | | | | | | | | | | | |
Income from investment operations | | | | | | | | | | | | |
Net investment income (loss)(b) | | | (0.12 | ) | | | 0.07 | | | | 0.04 | |
Net realized and unrealized gain on investments, futures, options, securities sold short, forwards and foreign currency | | | 1.84 | | | | 1.62 | | | | 0.10 | |
| | | | | | | | | | | | |
Total from investment operations | | | 1.72 | | | | 1.69 | | | | 0.14 | |
| | | | | | | | | | | | |
Common shares’ offering expenses charged to paid-in capital | | | — | | | | — | | | | (0.04 | ) |
| | | | | | | | | | | | |
Distributions to Common Shareholders | | | | | | | | | | | | |
From and in excess of net investment income | | | (0.80 | ) | | | (1.60 | ) | | | (0.40 | ) |
| | | | | | | | | | | | |
Net asset value, end of period | | $ | 19.81 | | | $ | 18.89 | | | $ | 18.80 | |
| | | | | | | | | | | | |
Market value, end of period | | $ | 18.93 | | | $ | 18.33 | | | $ | 16.47 | |
| | | | | | | | | | | | |
Total investment return(c) | | | | | | | | | | | | |
Net asset value | | | 9.25 | % | | | 9.36 | % | | | 0.52 | % |
Market value | | | 7.62 | % | | | 21.70 | % | | | -15.76 | % |
| | | |
Ratios and supplemental data | | | | | | | | | | | | |
Net assets, end of period (thousands) | | $ | 376,538 | | | $ | 359,036 | | | $ | 357,292 | |
| | | |
Ratios to average net assets, including dividend expense on securities sold short: | | | | | | | | | | | | |
Total expense ratio | | | 2.74 | %(d) | | | 2.00 | % | | | 1.58 | %(d)(e) |
Operating expense ratio | | | 1.52 | %(d) | | | 1.52 | % | | | 1.34 | %(d) |
Dividends paid on securities sold short | | | 1.22 | %(d) | | | 0.48 | % | | | 0.24 | %(d)(e) |
Net investment income (loss) ratio | | | -0.50 | %(d) | | | 0.39 | % | | | 0.75 | %(d)(e) |
Portfolio turnover | | | 124 | % | | | 248 | % | | | 60 | % |
| * | Commencement of investment operations. |
| (a) | Before deduction of offering expenses charged to capital. |
| (b) | Based on average shares outstanding during the period. |
| (c) | Total investment return is calculated assuming a purchase of a common share at the beginning of the period and a sale on the last day of the period reported either at net asset value (“NAV”) or market price per share. Dividends and distributions are assumed to be reinvested at NAV for NAV returns or the prices obtained under the Fund’s Dividend Reinvestment Plan for market value returns. Total investment return does not reflect brokerage commissions. A return calculated for a period of less than one year is not annualized. |
| (e) | The expense ratio includes dividend payments made on securities sold short. During the approximate four month period from August 25, 2005 through December 31, 2005, nine securities sold short made two quarterly payments. The annualized ratios noted above have been adjusted such that these securities would only reflect the equivalent of four quarterly dividends per security. Had this adjustment not been made, the expense ratio would have been 1.65% and the net investment ratio would have been 0.68%. |
See notes to financial statements.
SemiAnnual Report | June 30, 2007 | 17
OLA | Old Mutual/Claymore Long-Short Fund
Notes to Financial Statements | June 30, 2007 (unaudited)
Note 1 – Organization:
Old Mutual/Claymore Long-Short Fund (the “Fund”) was organized as a Massachusetts business trust on December 3, 2004. The Fund is registered as a diversified, closed-end management investment company under the Investment Company Act of 1940, as amended.
The Fund’s primary investment objective is to provide a high level of current income and current gains. The Fund’s secondary investment objective is to provide long-term capital appreciation. The Fund seeks to achieve its investment objective by investing in a diversified portfolio of equity securities and by selling securities short in the S&P 500 Index that it believes will underperform relative to the average stock in the S&P 500. The Fund will also write (sell) call options on equity indices and, to a lesser extent, on individual securities held in the Fund’s portfolio. The Fund may also employ a variety of other strategies involving futures and forward contracts and other derivative instruments in an attempt to enhance the Fund’s investment returns. There can be no assurance that the Fund’s investment objective will be achieved.
Note 2 – Accounting Policies:
The preparation of the financial statements in accordance with U.S. generally accepted accounting principles requires management to make estimates and assumptions that affect the reported amounts and disclosures in the financial statements. Actual results could differ from these estimates.
The following is a summary of significant accounting policies followed by the Fund.
(a) Valuation of Investments and Derivatives
Equity securities listed on an exchange are valued at the last reported sale price on the primary exchange on which they are traded. Equity securities for which there are no transactions on a given day are valued at the mean of the closing bid and asked prices. Securities traded on NASDAQ are valued at the NASDAQ Official Closing Price. Readily marketable securities listed on an exchange are valued at the last reported sale price on the primary exchange or in the principal over the counter (“OTC”) market on which they are traded. Debt securities are valued by independent pricing services or dealers using the mean of the closing bid and asked prices for such securities or, if such prices are not available, at prices for securities of comparable maturity, quality and type. Equity index options are valued at the closing price on the primary exchange on which they are traded. Futures and options on future contracts are valued at the settlement price determined by the exchange on which they are traded. Forward exchange currency contracts are valued daily at current exchange rates. All other types of securities, including restricted securities, and securities for which market quotations are not readily available, are valued as determined in accordance with procedures established in good faith by the Board of Trustees. Short-term securities having a remaining maturity of sixty days or less at the time of purchase are valued at amortized cost, which approximates market value.
(b) Investment Transactions and Investment Income
Investment transactions are accounted for on the trade date. Realized gains and losses on investments are determined on the identified cost basis. Dividend income is recorded net of applicable withholding taxes on the ex-dividend date and interest income is recorded on an accrual basis. Discounts or premiums on debt securities purchased are accreted or amortized to interest income over the lives of the respective securities using the effective interest method.
(c) Futures
The Fund may engage in asset allocation strategies by purchasing or selling futures contracts on U.S. and foreign securities indices and other assets. A futures contract provides for the future sale by one party and purchase by another party of a specified quantity of the security or other financial instrument at a specified price and time. A futures contract on an index is an agreement in which two parties agree to take or make delivery of an amount of cash equal to the difference between the value of the index at the close of the last trading day of the contract and the price at which the index contract was originally written. The Fund may use futures contracts in an attempt to enhance the Fund’s investment returns, as an efficient way to gain broad market exposure with reduced transaction costs and/or to hedge against market and other risks in the Fund’s portfolio. There are a number of risks associated with the use of futures contracts. A purchase or sale of a futures contract may result in losses in excess of the amount invested in the futures contract. If futures are used for hedging, there can be no guarantee that there will be a correlation between price movements in the hedging vehicle and in the Fund’s portfolio securities being hedged.
(d) Options
The Fund will opportunistically employ an option strategy in an attempt to generate gains from option premiums, enhance distributions payable to the Fund’s shareholders and reduce overall portfolio risk. The Fund intends to pursue its options strategy primarily by writing call options on equity indices. As the writer (seller) of an equity index call option, the Fund would receive cash (the premium) from the purchaser of the option, and the purchaser would have the right to receive from the Fund any appreciation in the cash value of the index over the strike price upon exercise. If the purchaser exercises the index option sold by the Fund, the Fund would pay the purchaser the difference between the cash value of the index and the strike price. In effect, the Fund sells the potential appreciation in the value of the index above the strike price in exchange for the premium.
(e) Securities Sold Short
The Fund may sell securities short. A short sale is a transaction in which the Fund sells securities it does not own, but rather has borrowed, in anticipation of a decline in the market price of the securities. The Fund is obligated to replace the borrowed securities at their market price at the time of replacement. The Fund’s obligation to replace the securities borrowed in connection with a short sale will be fully secured by collateral held in a segregated account at the custodian. Short sales by the Fund involve certain risks and special considerations. Possible losses from short sales differ from losses that could be incurred from a purchase of a security because losses from a short sale may be unlimited, whereas losses from purchases cannot exceed the total amount invested.
18 | SemiAnnual Report | June 30, 2007
OLA | Old Mutual/Claymore Long-Short Fund | Notes to Financial Statements (unaudited) continued
(f) Currency Translation
Assets and liabilities denominated in foreign currencies are translated into U.S. dollars at the mean of the bid and asked price of respective exchange rates on the last day of the period. Purchases and sales of investments denominated in foreign currencies are translated at the exchange rate on the date of the transaction.
Foreign exchange gain or loss resulting from holding of a foreign currency, expiration of a currency exchange contract, difference in exchange rates between the trade date and settlement date of an investment purchased or sold, and the difference between dividends actually received compared to the amount shown in a Fund’s accounting records on the date of receipt are included as net realized gains or losses on foreign currency forwards and currency transactions in the Fund’s Statement of Operations.
Foreign exchange gain or loss on assets and liabilities, other than investments, are included in unrealized appreciation (depreciation) on foreign currency translations.
(g) Forward Exchange Currency Contracts
The Fund may enter into forward exchange currency contracts in order to hedge its exposure to changes in foreign currency exchange rates on its foreign portfolio holdings, to hedge certain firm purchases and sales commitments denominated in foreign currencies and for investment purposes. A forward exchange currency contract is a commitment to purchase or sell a foreign currency on a future date at a negotiated forward rate. The gain or loss arising from the difference between the original contracts and the closing of such contracts are included in net realized gain or loss on foreign currency forwards and currency transactions on the Statement of Operations.
Fluctuations in the value of open forward exchange currency contracts are recorded for financial reporting purposes as unrealized appreciation and depreciation on foreign currency forwards and currency translation on the Statement of Operations.
The Fund’s custodian will place and maintain cash not available for investment or other liquid assets in a separate account of the Fund having a value at least equal to the aggregate amount of the Fund’s commitments under forward exchange currency contracts entered into with respect to position hedges.
Risks may arise from the potential inability of a counterparty to meet the terms of a contract and from unanticipated movements in the value of a foreign currency relative to the U.S. dollar. The face or contract amount, in U.S. dollars, reflects the total exposure the Fund has in that particular currency contract.
(h) Distributions to Shareholders
The Fund declares and pays quarterly dividends to common shareholders. Distributions to shareholders are recorded on the ex-dividend date. The amount and timing of distributions are determined in accordance with federal income tax regulations, which may differ from U.S. generally accepted accounting principles. These dividends consist of investment company taxable income, which generally includes qualified dividend income, ordinary income, short-term capital gains and premiums received on certain written options. Realized short-term capital gains and premiums received on certain options are considered ordinary income for tax purposes and will be reclassified at the Fund’s fiscal year end on the Fund’s Statement of Assets and Liabilities from accumulated net realized gains to accumulated net investment loss. Any net realized long-term capital gains will be distributed annually to common shareholders.
Note 3 – Investment Advisory Agreement, Sub-Advisory Agreement and Other Agreements:
Pursuant to an Investment Advisory Agreement (the “Agreement”) between the Fund and Claymore Advisors, LLC (the “Adviser”), the Adviser will furnish offices, necessary facilities and equipment, oversee the activities of Analytic Investors, Inc. (“Analytic” or the “Sub-Adviser”), provide personnel including certain officers required for its administrative management and pay the compensation of all officers and trustees of the Fund who are its affiliates. As compensation for these services, the Fund will pay the Adviser an annual fee, payable monthly, in an amount equal to 1.00% of the Fund’s average daily total net assets.
Pursuant to a Sub-Advisory Agreement (the “Sub-Advisory Agreement”) between the Fund, the Adviser and the Sub-Adviser, the Sub-Adviser under the supervision of the Fund’s Board of Trustees and the Adviser, provides a continuous investment program for the Fund’s portfolio; provides investment research, makes and executes recommendations for the purchase and sale of securities; and provides certain facilities and personnel, including certain officers required for its administrative management and pays the compensation of all officers and trustees of the Fund who are its affiliates. As compensation for its services, the Adviser pays the Sub-Adviser a fee, payable monthly, in an annual amount equal to 0.50% of the Fund’s average daily total net assets. Analytic is wholly owned by Old Mutual (US) Holdings, Inc.
The Adviser provides Fund Administration services to the Fund. For its services, the Adviser receives a fund administration fee payable monthly at the annual rate set forth below as a percentage of the average daily total net assets of the Fund:
| | | |
Net Assets | | Rate | |
First $ 200,000,000 | | 0.0275 | % |
Next $ 300,000,000 | | 0.0200 | % |
Next $ 500,000,000 | | 0.0150 | % |
Over $ 1,000,000,000 | | 0.0100 | % |
The Bank of New York (“BNY”) acts as the Fund’s custodian, accounting agent, and transfer agent. As custodian, BNY is responsible for the custody of the Fund’s assets. As accounting agent, BNY is responsible for maintaining the books and records of the Fund’s securities and cash. As transfer agent, BNY is responsible for performing transfer agency services for the Fund.
Certain officers and trustees of the Fund are also officers and directors of the Adviser or the Sub-Adviser. The Fund does not compensate its officers or trustees who are officers of the aforementioned firms.
Note 4 – Federal Income Taxes:
The Fund intends to comply with the requirements of Subchapter M of the Internal Revenue Code of 1986, as amended, applicable to regulated investment companies. Accordingly, no provision for U.S. federal income taxes is required. In addition, by distributing substantially all of its ordinary income and long-term capital gains, if any, during each calendar year, the Fund intends not to be subject to U.S. federal excise tax.
Capital losses and foreign currency transactions incurred after October 31 (“post-October” losses) within the taxable year are deemed to arise on the first business day of the Fund’s next taxable year. The Fund incurred and elected to defer foreign currency related losses from 2006 in the amount of $3,949,433 and capital losses of $606,989.
SemiAnnual Report | June 30, 2007 | 19
OLA | Old Mutual/Claymore Long-Short Fund | Notes to Financial Statements (unaudited) continued
Information on the tax components of investments, excluding short sales transactions and excluding written options, and net assets as of June 30, 2007 is as follows:
| | | | | | | | | | | | | | |
Cost of Investments for Tax Purposes | | Gross Tax Unrealized Appreciation | | Gross Tax Unrealized Depreciation | | | Net Tax Unrealized Appreciation on Investments | | Net Tax Unrealized Appreciation on Derivatives and Foreign Currency |
| $ | 454,070,002 | | $ | 31,748,211 | | $ | (7,608,756 | ) | | $ | 24,139,455 | | $ | 4,365,364 |
Information on the tax components of securities sold short as of June 30, 2007 is as follows:
| | | | | | | | | | | | |
Cost of Securities Sold Short for Tax Purposes | | Gross Tax Unrealized Appreciation | | Gross Tax Unrealized Depreciation | | | Net Tax Unrealized Depreciation On Securities Sold Short | |
| $ | 100,501,697 | | $ | 3,742,026 | | $ | (7,371,993 | ) | | $ | (3,629,967 | ) |
Tax components of the following balances as of December 31, 2006 are as follows:
| | | | |
| | | December 31, 2006 | |
Undistributed ordinary income | | $ | (3,599,922 | ) |
Accumulated capital and other losses | | $ | (606,989 | ) |
For the year ended December 31, 2006, the tax character of distributions paid to common share holders as reflected in the Statement of Changes in Net Assets, was as follows:
| | | |
Distributions paid from: | | 2006 |
Ordinary income | | $ | 25,380,687 |
Capital Gain | | | 5,027,697 |
| | | |
| | $ | 30,408,384 |
| | | |
The final determination of the source of the 2007 distributions for tax purposes will be made after the end of the Fund’s fiscal year and will be reported to shareholders in January 2008 on IRS Form 1099 DIV.
Note 5 – Investment Transactions and Options Written:
For the period ended June 30, 2007, purchases and sales of investments, excluding written options and short-term securities, were $544,302,864 and $572,667,913, respectively.
The Fund entered into written option contracts during the period ended June 30, 2007. Details of the transactions were as follows:
| | | | | | | |
| | | Number of Contracts | | | Premiums Received | |
Options outstanding, beginning of period | | 2,650 | | | $ | 3,595,800 | |
Options written, during the period | | 24,425 | | | | 34,915,081 | |
Options expired, during the period | | (5,300 | ) | | | (5,951,850 | ) |
Options closed, during the period | | (19,375 | ) | | | (27,957,693 | ) |
| | | | | | | |
Options outstanding, end of period | | 2,400 | | | $ | 4,601,338 | |
| | | | | | | |
Note 6 – Derivatives:
At June 30, 2007, the following futures contracts were outstanding:
| | | | | | |
Long Contracts | | Number of
Contracts | | Unrealized Appreciation (Depreciation) | |
Amsterdam Exchanges Index—July 2007 | | | | | | |
(Current notional value of 109,860 Euro per contract) | | 424 | | $ | 1,040,451 | |
CAC 40 10 Year Euro Index—July 2007 | | | | | | |
(Current notional value of 60,710 Euro per contract) | | 420 | | | 721,594 | |
DAX Index—September 2007 | | | | | | |
(Current notional value of 201,963 Euro per contract) | | 62 | | | 569,593 | |
Dow Jones Euro STOXX 50—September 2007 | | | | | | |
(Current notional value of 45,150 Euro per contract) | | 114 | | | 110,395 | |
FTSE 100 Index—September 2007 | | | | | | |
(Current notional value of 66,380 Pound Sterling per contract) | | 305 | | | 112,145 | |
IBEX 35 Index—July 2007 | | | | | | |
(Current notional value of 148,240 Euro per contract) | | 204 | | | (35,458 | ) |
S&P/MIB Index—September 2007 | | | | | | |
(Current notional value of 211,825 Euro per contract) | | 192 | | | 572,920 | |
| | | | | | |
| | 1,721 | | $ | 3,091,640 | |
| | | | | | |
20 | SemiAnnual Report | June 30, 2007
OLA | Old Mutual/Claymore Long-Short Fund | Notes to Financial Statements (unaudited) continued
| | | | | | |
Short Contracts | | Number of
Contracts | | Unrealized Appreciation
(Depreciation) | |
Hang Seng Stock Index—July 2007 | | | | | | |
(Current notional value of 1,093,750 Hong Kong dollars per contract) | | 170 | | $ | 40,259 | |
OMXS 30 Index—July 2007 | | | | | | |
(Current notional value of 125,525 Swedish Krona per contract) | | 2,394 | | | 1,363,062 | |
S&P/TSE 60 Index—September 2007 | | | | | | |
(Current notional value of 160,980 Canadian dollars per contract) | | 348 | | | (673,579 | ) |
S&P 500 E-Mini—September 2007 | | | | | | |
(Current notional value of $75,770 per contract) | | 483 | | | 172,672 | |
SPI 200 Index—September 2007 | | | | | | |
(Current notional value of 156,925 Australian dollars per contract) | | 423 | | | 559,421 | |
TOPIX Index—September 2007 | | | | | | |
(Current notional value of 17,750,000 Japanese Yen per contract) | | 32 | | | (2,229 | ) |
| | | | | | |
| | 3,850 | | | 1,459,606 | |
| | | | | | |
| | 5,571 | | $ | 4,551,246 | |
| | | | | | |
All notional values are denominated in local currencies.
At June 30, 2007, the following forward exchange currency contracts were outstanding:
| | | | | |
Long Contracts | | Local Currency Value | | Unrealized Appreciation (Depreciation) |
Australian Dollar, 91,000,000 expiring 09/19/07 | | 77,033,542 | | $ | 562,041 |
New Zealand Dollar, 3,000,000 expiring 09/19/07 | | 2,302,946 | | | 58,919 |
Norwegian Krone, 300,000,000 expiring 09/19/07 | | 50,860,542 | | | 984,977 |
| | | | | |
| | | | $ | 1,605,937 |
| | | | | |
| | | | | | |
Short Contracts | | Local Currency Value | | Unrealized Appreciation Depreciation) | |
Canadian Dollar, 81,000,000 expiring 09/19/07 | | 76,283,547 | | $ | (228,939 | ) |
Euro, 60,000,000 expiring 09/19/07 | | 81,246,994 | | | (578,195 | ) |
Japanese Yen, 6,600,000,000 expiring 09/19/07 | | 53,994,943 | | | (29,373 | ) |
| | | | | | |
| | | | | (836,507 | ) |
| | | | | | |
| | | | $ | 769,430 | |
| | | | | | |
Note 7 – Capital:
Common Shares
The Fund has an unlimited amount of common shares, $0.01 par value, authorized and 19,005,240 issued and outstanding.
There were no transactions in common shares during the six months ended June 30, 2007 or the year ended December 31, 2006.
Note 8 – Indemnifications:
In the normal course of business, the Fund enters into contracts that contain a variety of representations, which provide general indemnifications. The Fund’s maximum exposure under these arrangements is unknown, as this would require future claims that may be made against the Fund that have not yet occurred. However, the Fund expects the risk of loss to be remote.
Note 9 – Accounting Pronouncements:
On July 13, 2006, the Financial Accounting Standards Board (“FASB”) released FASB Interpretation No. 48, “Accounting for Uncertainty in Income Taxes” (“FIN 48”). FIN 48 provides guidance for how uncertain tax positions should be recognized, measured, presented and disclosed in the financial statements. FIN 48 requires the evaluation of tax positions taken or expected to be taken in the course of preparing the Fund’s tax returns to determine whether the tax positions are “more-likely-than-not” of being sustained by the applicable tax authority. Tax positions not deemed to meet the more-likely-than-not threshold would be recorded as a tax benefit or expense in the current year. Adoption of FIN 48 is required for fiscal years beginning after December 15, 2006, but not before its last NAV calculation in the first required financial statement reporting period for its fiscal year beginning after December 15, 2006, and is to be applied to all open tax years as of the effective date. Management has evaluated the implications of FIN 48 and has determined it does not have any impact on the financial statements as of June 30, 2007.
On September 15, 2006, the FASB released Statement of Financial Accounting Standards No. 157, “Fair Valuation Measurements” (“FAS 157”) which provides enhanced guidance for measuring fair value. The standard requires companies to provide expanded information about the assets and liabilities measured at fair value and the potential effect of these fair valuations on an entity’s financial performance. The standard does not expand the use of fair value in any new circumstances, but provides clarification on acceptable fair valuation methods and applications. Adoption of FAS 157 is required for fiscal years beginning after November 15, 2007. At this time, management is evaluating the implications of FAS 157 and its impact in the financial statements has not yet been determined.
SemiAnnual Report | June 30, 2007 | 21
OLA | Old Mutual/Claymore Long-Short Fund
Supplemental Information | (unaudited)
Results of Shareholder Votes
The Annual Meeting of Shareholders of the Fund was held on May 21, 2007. Holders of the Fund’s common shares of beneficial interest voted on the election of Trustees.
Voting results with respect to the election of trustees:
| | | | |
| | | # of Shares In Favor | | # of Shares Withheld |
Steven D. Cosler | | 17,432,580 | | 227,507 |
Nicholas Dalmaso | | 17,430,917 | | 229,170 |
Robert M. Hamje | | 17,425,617 | | 234,470 |
The terms of the following Trustees of the Fund did not expire in 2007: Matthew J. Appelstein, Randall C. Barnes, L. Kent Moore, Ronald A. Nyberg and Ronald E.Toupin, Jr.
Trustees
The Trustees of the Old Mutual/Claymore Long-Short Fund and their principal occupations during the past five years:
| | | | | | | | |
Name, Address,* Year of Birth and Position(s) held with Registrant | | Term of Office**
and Length of
Time Served | | Principal Occupation During the Past Five Years
and Other Affiliations | | Number of
Portfolios in the Fund Complex***
Overseen by Trustee | | Other Directorships Held by Trustee |
Independent Trustees: | | | | | | | | |
| | | | |
Randall C. Barnes Year of Birth: 1951 Trustee | | Since 2005 | | Formerly, Senior Vice President & Treasurer (1993-1997), President, Pizza Hut International (1991-1993) and Senior Vice President, Strategic Planning and New Business Development (1987-1990) of PepsiCo, Inc. (1987-1997). | | 37 | | None. |
| | | | |
Steven D. Cosler Year of Birth: 1955 Trustee | | Since 2005 | | Formerly, President, Chief Executive Officer and Director of Priority Healthcare Corp. (2002-2005). Formerly, President and Chief Operating Officer of Priority Healthcare Corp. (2001-2002). Formerly, Executive Vice President and Chief Operating Officer of Priority Healthcare Corp. (2000-2001). | | 2 | | None. |
| | | | |
Robert M. Hamje Year of Birth: 1942 Trustee | | Since 2005 | | Advisor to the Cleveland Foundation Investment Committee. Formerly, President and Chief Investment Officer of TRW Investment Management Co. (1990-2003). | | 2 | | Trustee, Old Mutual Advisor Mutual Funds. |
| | | | |
L. Kent Moore Year of Birth: 1955 Trustee | | Since 2005 | | Partner at WilSource Enterprise (December 2005-present). Previously, Managing Director High Sierra Energy L.P., (2004-2005). Formerly, Portfolio Manager and Vice President of Janus Capital Corp. (2000-2002) and Senior Analyst/Portfolio Manager of Marsico Capital Management (1997-1999). | | 2 | | Trustee, Old Mutual Advisor Mutual Funds. |
| | | | |
Ronald A. Nyberg Year of Birth: 1953 Trustee | | Since 2005 | | Partner of Nyberg & Cassioppi, LLC, a law firm specializing in corporate law, estate planning and business transactions (2000-present). Formerly, Executive Vice President, General Counsel and Corporate Secretary of Van Kampen Investments (1982-1999). | | 40 | | None. |
| | | | |
Ronald E. Toupin, Jr. Year of Birth: 1958 Trustee | | Since 2005 | | Formerly, Vice President, Manager and Portfolio Manager of Nuveen Asset Management (1998-1999), Vice President of Nuveen Investment Advisory Corp. (1992-1999), Vice President and Manager of Nuveen Unit Investment Trusts (1991-1999), and Assistant Vice President and Portfolio Manager of Nuveen Unit Investment Trusts (1988-1999), each of John Nuveen & Co., Inc. (1982-1999). | | 37 | | None. |
Interested Trustees: | | | | | | | | |
| | | | |
Matthew J. Appelstein† Year of Birth: 1961 Trustee | | Since 2005 | | Senior Vice President of Product Strategy and Retirement Solutions Planning, Director of Investment Services, Old Mutual Asset Management (2003-present). Formerly, Senior Vice President of Consulting Relationships, Fidelity Management Trust Co. (1998-2003). | | 2 | | None. |
| | | | |
Nicholas Dalmaso†† Year of Birth: 1965 Trustee; Chief Legal and Executive Officer | | Since 2005 | | Senior Managing Director and General Counsel of Claymore Advisors, LLC and Claymore Securities, Inc. (2001-present). Formerly, Assistant General Counsel, John Nuveen and Co., Inc. (1999-2000). Former Vice President and Associate General Counsel of Van Kampen Investments, Inc. (1992-1999). | | 40 | | None. |
| * | Address for all Trustees unless otherwise noted: 2455 Corporate West Drive, Lisle, IL 60532 |
| ** | After a Trustee’s initial term, each Trustee is expected to serve a three-year term concurrent with the class of Trustees for which he serves: |
–Messrs. Moore, Nyberg and Toupin, as Class III Trustees, are expected to stand for re-election at the Fund’s 2008 annual meeting of shareholders.
–Messrs. Appelstein and Barnes, as Class I Trustees, are expected to stand for re-election at the Fund’s 2009 annual meeting of shareholders.
–Messrs. Cosler, Dalmaso and Hamje, as Class II Trustees, are expected to stand for re-election at the Fund’s 2010 annual meeting of shareholders.
| *** | The Claymore Fund Complex consists of U.S. registered investment companies advised or serviced by Claymore Advisors, LLC or Claymore Securities, Inc. The Claymore Fund Complex is overseen by multiple Boards of Trustees. |
| † | Mr. Appelstein is an “interested person” (as defined in Section 2(a)(19) of the 1940 Act) of the Fund because of his position as an officer of Old Mutual Asset Management, the parent company of the Fund’s Sub-Adviser. |
| †† | Mr. Dalmaso is an “interested person” (as defined in Section 2(a)(19) of the 1940 Act) of the Fund because of his position as an officer of Claymore Advisors, LLC, the Fund’s Investment Adviser. |
22 | SemiAnnual Report | June 30, 2007
OLA | Old Mutual/Claymore Long-Short Fund | Supplemental Information (unaudited) continued
Officers
The Officers of the Old Mutual/Claymore Long-Short Fund and their principal occupations during the past five years:
| | | | |
Name, Address*, Year of
Birth and Position(s) held with
Registrant Officers: | | Term of Office** and Length of Time Served | | Principal Occupation During the Past Five Years and Other Affiliations |
Steven M. Hill Year of Birth: 1964 Chief Accounting Officer, Chief Financial Officer and Treasurer | | Since 2005 | | Senior Managing Director of Claymore Advisors, LLC and Claymore Securities, Inc. (2005- present). Chief Financial Officer of Claymore Group, Inc. (2005-2006). Managing Director of Claymore Advisors, LLC and Claymore Securities, Inc. (2003-2005). Previously, Treasurer of Henderson Global Funds and Operations Manager for Henderson Global Investors (North America) Inc. (2002-2003); Managing Director, FrontPoint Partners LLC (2001-2002); Vice President, Nuveen Investments (1999-2001); Chief Financial Officer, Skyline Asset Management LP (1999); Vice President, Van Kampen Investments and Assistant Treasurer, Van Kampen mutual funds (1989-1999). |
| | |
Matthew J. Patterson Year of Birth: 1971 Secretary | | Since 2006 | | Vice President; Assistant General Counsel of Claymore Group Inc. (2006-present). Secretary of certain funds in the Fund Complex. Previously, Chief Compliance Officer and Clerk, The Preferred Group of Mutual Funds (2005-2006); Chief Compliance Officer and Secretary, Caterpillar Investment Management Ltd (2005-2006); Securities Counsel, Caterpillar Inc. (2004-2006); Associate, Skadden, Arps, Slate, Meagher & Flom LLP (2002-2004). |
| | |
Bruce Saxon Year of Birth: 1957 Chief Compliance Officer | | Since 2006 | | Vice President-Fund Compliance Officer of Claymore Advisors, LLC (Feb 2006-present). Chief Compliance Officer/Assistant Secretary of Harris Investment Management, Inc. (2003-2006). Director-Compliance of Harrisdirect LLC (1999-2003). |
| * | Address for all Officers: 2455 Corporate West Drive, Lisle, IL 60532 |
| ** | Officers serve at the pleasure of the Board of Trustees and until his or her successor is appointed and qualified or until his or her earlier resignation or removal. |
SemiAnnual Report | June 30, 2007 | 23
OLA | Old Mutual/Claymore Long-Short Fund
Dividend Reinvestment Plan | (unaudited)
Unless the registered owner of common shares elects to receive cash by contacting the Bank of New York (the “Plan Administrator”), all dividends declared on common shares of the Fund will be automatically reinvested by the Plan Administrator for shareholders in the Fund’s Dividend Reinvestment Plan (the “Plan”), in additional common shares of the Fund. Participation in the Plan is completely voluntary and may be terminated or resumed at any time without penalty by notice if received and processed by the Plan Administrator prior to the dividend record date; otherwise such termination or resumption will be effective with respect to any subsequently declared dividend or other distribution. Some brokers may automatically elect to receive cash on your behalf and may re-invest that cash in additional common shares of the Fund for you. If you wish for all dividends declared on your common shares of the Fund to be automatically reinvested pursuant to the Plan, please contact your broker.
The Plan Administrator will open an account for each common shareholder under the Plan in the same name in which such common shareholder’s common shares are registered. Whenever the Fund declares a dividend or other distribution (together, a “Dividend”) payable in cash, non-participants in the Plan will receive cash and participants in the Plan will receive the equivalent in common shares. The common shares will be acquired by the Plan Administrator for the participants’ accounts, depending upon the circumstances described below, either (i) through receipt of additional unissued but authorized common shares from the Fund (“Newly Issued Common Shares”) or (ii) by purchase of outstanding common shares on the open market (“Open-Market Purchases”) on the New York Stock Exchange or elsewhere. If, on the payment date for any Dividend, the closing market price plus estimated brokerage commission per common share is equal to or greater than the net asset value per common share, the Plan Administrator will invest the Dividend amount in Newly Issued Common Shares on behalf of the participants. The number of Newly Issued Common Shares to be credited to each participant’s account will be determined by dividing the dollar amount of the Dividend by the net asset value per common share on the payment date; provided that, if the net asset value is less than or equal to 95% of the closing market value on the payment date, the dollar amount of the Dividend will be divided by 95% of the closing market price per common share on the payment date. If, on the payment date for any Dividend, the net asset value per common share is greater than the closing market value plus estimated brokerage commission, the Plan Administrator will invest the Dividend amount in common shares acquired on behalf of the participants in Open-Market Purchases.
If, before the Plan Administrator has completed its Open-Market Purchases, the market price per common share exceeds the net asset value per common share, the average per common share purchase price paid by the Plan Administrator may exceed the net asset value of the common shares, resulting in the acquisition of fewer common shares than if the Dividend had been paid in Newly Issued Common Shares on the Dividend payment date. Because of the foregoing difficulty with respect to Open-Market Purchases, the Plan provides that if the Plan Administrator is unable to invest the full Dividend amount in Open-Market Purchases during the purchase period or if the market discount shifts to a market premium during the purchase period, the Plan Administrator may cease making Open-Market Purchases and may invest the uninvested portion of the Dividend amount in Newly Issued Common Shares at net asset value per common share at the close of business on the Last Purchase Date provided that, if the net asset value is less than or equal to 95% of the then current market price per common share; the dollar amount of the Dividend will be divided by 95% of the market price on the payment date.
The Plan Administrator maintains all shareholders’ accounts in the Plan and furnishes written confirmation of all transactions in the accounts, including information needed by shareholders for tax records. Common shares in the account of each Plan participant will be held by the Plan Administrator on behalf of the Plan participant, and each shareholder proxy will include those shares purchased or received pursuant to the Plan. The Plan Administrator will forward all proxy solicitation materials to participants and vote proxies for shares held under the Plan in accordance with the instruction of the participants.
There will be no brokerage charges with respect to common shares issued directly by the Fund. However, each participant will pay a pro rata share of brokerage commission incurred in connection with Open-Market Purchases. The automatic reinvestment of Dividends will not relieve participants of any Federal, state or local income tax that may be payable (or required to be withheld) on such Dividends.
The Fund reserves the right to amend or terminate the Plan. There is no direct service charge to participants with regard to purchases in the Plan; however, the Fund reserves the right to amend the Plan to include a service charge payable by the participants.
All correspondence or questions concerning the Plan should be directed to the Plan Administrator, The Bank of New York, Attention: Stock Transfer Department, 101 Barclay 11W, New York, New York 10286, Phone Number: (866) 488-3559.
24 | SemiAnnual Report | June 30, 2007
OLA | Old Mutual/Claymore Long-Short Fund
Investment Advisory and Management Agreement Contract Re-approvals | (unaudited)
On February 14, 2007, the Board of Trustees (the “Board”), including those trustees who are not interested persons as defined by the Investment Company Act of 1940 (the “Independent Trustees”), of Old Mutual/Claymore Long-Short Fund (the “Fund”) met to consider the renewal of: (1) the investment advisory agreement (“Investment Advisory Agreement”) between the Fund and Claymore Advisors, LLC (“Adviser”) and (2) the subadvisory agreement (the “Subadvisory Agreement”) among the Adviser, the Fund and Analytic Investors, Inc. (the “Subadviser”). (The Investment Advisory Agreement and the Subadvisory Agreement are together referred to as the “Advisory Agreements.”) As part of its review process, the Nominating and Governance Committee of the Board (referred to as the “Committee” and consisting solely of Independent Trustees) was represented by independent legal counsel. The Board reviewed materials received from the Adviser, the Subadviser, and independent legal counsel.
In preparation for its review, the Committee communicated with independent legal counsel regarding the nature of information to be provided, and independent legal counsel, on behalf of the Committee, sent a formal request for information. The Adviser and the Subadviser provided extensive information in response to the request. Among other information, the Adviser and the Subadviser provided general information to assist the Committee in assessing the nature and quality of services provided by the Adviser and the Subadviser and information comparing the investment performance, advisory fees and total expenses of the Fund to other funds, information about the profitability from the Advisory Agreements to the Adviser and the Subadviser and the compliance policies and procedures adopted by each of the Adviser and the Subadviser.
Based upon its review, the Committee and the Board concluded that it was in the best interests of the Fund to renew each of the Advisory Agreements. In reaching this conclusion for the Fund, no single factor was determinative in the Board’s analysis, but rather the Board considered a variety of factors.
Investment Advisory Agreement
With respect to the nature, extent and quality of services currently provided by the Adviser, the Board noted that the Adviser had delegated responsibility for the investment and reinvestment of the Fund’s assets to the Subadviser. The Board considered the Adviser’s responsibility to oversee the Subadviser and that the Adviser has similar oversight responsibilities for other registered funds for which it serves as investment adviser. The Board reviewed financial information regarding the Adviser and its parent company and considered the parent company’s guaranty of the Adviser’s obligations under the Investment Advisory Agreement. The Board considered the experience and qualifications of the Adviser’s personnel relating to compliance oversight, its open communications with the Board and its capabilities concerning its monitoring of a subadviser’s portfolio management team. Considering these factors, the Board concluded that the Adviser and its personnel were qualified to serve the Fund in such capacity.
The Board reviewed the Fund’s investment performance by reviewing the Fund’s total return on a net asset value and market price basis for the twelve months ended December 31, 2006 and since inception (August 25, 2005 through December 31, 2006) and compared it to the total return performance of a peer group of closed-end funds, which also invest primarily in domestic equity securities and some of which employ an options writing (selling) program (“peer group of funds”), and the Fund’s benchmark indices (the S&P 500 Index and the CBOE Buy-Write (BXM) Index) for the same time periods. The Board noted that the Fund’s investment results were consistent with the Fund’s investment objective and met expectations. The Board also considered that the Adviser does not directly control investment performance but had delegated such duties to the Subadviser. The Board concluded that the Adviser had appropriately reviewed and monitored the Subadviser’s investment performance and efforts to seek the Fund’s investment objective, and that the Adviser’s performance was satisfactory.
The Board compared the Fund’s advisory fee (which includes the subadvisory fee paid to the Subadviser) and expense ratio to the peer group of funds and to the advisory fee that the Adviser charges to other closed-end funds for which it serves as adviser. The Board also reviewed the mean and median advisory fees and expense ratios of the peer group of funds. The Board concluded that the Fund’s advisory fee was reasonable.
With respect to the costs of services to be provided and profits realized by the Adviser from its relationship to the Fund, the Board reviewed information regarding the revenues the Adviser received under the Investment Advisory Agreement as well as the estimated direct and indirect costs the Adviser incurs in providing the services described in the Investment Advisory Agreement, including paying the subadvisory fees to the Subadviser. The Board concluded that the Adviser’s profitability was not unreasonable.
The Board considered the extent to which economies of scale could be realized with respect to the management of the Fund as the Fund grows and whether fee levels reflect a reasonable sharing of such economies of scale for the benefit of Fund investors and also considered the current assets of the Fund. Because of the nature of closed-end funds, the Board does not expect the Fund to grow significantly in the next twelve months. The Board also considered the Adviser’s statement that it believes expenses relating to providing investment advisory services to the Fund will remain approximately the same over the next year. Therefore, the Board concluded that the Fund is unlikely to realize any significant economies of scale with respect to the advisory services at the time the Investment Advisory Agreement was being reviewed.
The Board considered other benefits available to the Adviser because of its relationship to the Fund and noted that the administrative services fees received by the Adviser from serving as administrator to the Fund provide it with additional revenue and concluded that the management fee was reasonable, taking into account this benefit.
SemiAnnual Report | June 30, 2007 | 25
OLA | Old Mutual/Claymore Long-Short Fund | Investment Advisory and Management Agreement Contract Re-approvals (unaudited) continued
Subadvisory Agreement
With respect to the nature, extent and quality of services provided by the Subadviser, the Board considered the qualifications, experience, good reputation and skills of the Subadviser’s portfolio management and other key personnel. The Board reviewed information regarding the Subadviser’s financial statements. The Board considered the Subadviser’s ability to achieve the Fund’s investment objective of seeking a high level of current income and gains with a secondary objective of long-term capital appreciation, and noted the Fund’s performance relative to its benchmark indices and the peer group of funds. The Board concluded that the Subadviser was qualified to provide the services under the Subadvisory Agreement.
In evaluating investment performance, the Board reviewed the level of the Fund’s distributions and the Fund’s investment performance on a total return net asset value basis relative to the S & P 500 and BXM indices over relevant time periods. The Board considered that the Subadviser’s management of the Fund’s portfolio had produced consistent quarterly distributions of $0.40 per share, consistent with the Fund’s primary investment objective of seeking a high level of current income and gains. The Board also considered that although the Fund’s total return was lower than the returns of the indices, the Fund’s underperformance relative to the indices was not unexpected in a rising equity environment due to the Subadviser’s use of an options overlay strategy. With respect to the Fund’s market price performance, the Board considered that the Fund’s shares were trading at a discount and at a larger discount than the average of the peer group of funds, but the Board noted that the size of the discount had diminished over the last year. The Board also noted that, over the relevant time periods, performance based upon a market price total return basis had been positive. The Board concluded that the Fund has demonstrated positive absolute performance over the relevant time periods.
The Board reviewed the subadvisory fee paid by the Adviser to the Subadviser and compared it to the fees charged by the Subadviser to other accounts with investment strategies comparable to the Fund’s for which the Subadviser serves as adviser or subadviser, including to a registered open-end investment company. The Board noted that the sub-advisory fee charged to the Fund was at the low end of the range of advisory fees charged by the Subadviser to these comparable accounts. Accordingly, the Board concluded that the subadvisory fee was reasonable.
With respect to the costs of services to be provided and profits realized by the Subadviser from its relationship to the Fund, the Board reviewed information regarding the revenues the Subadviser received under the Subadvisory Agreement and estimated direct and indirect allocated expenses of the Subadviser in providing services under the Subadvisory Agreement and concluded that the profitability was not unreasonable.
The Board reviewed the extent to which economies of scale with respect to the subadvisory services provided to the Fund would be realized as the Fund grows and whether fee levels reflect a reasonable sharing of such economies of scale for the benefit of Fund investors. The Board considered that the realization of economies of scale with regard to a closed-end fund is not likely due to the fixed nature of the assets, and that the Subadviser anticipates its expenses relating to providing services to the Fund will remain the same over the next year. Given these factors, the Board concluded that the Fund is unlikely to realize any significant economies of scale with respect to the subadvisory services at the time the Subadvisory Agreement was being reviewed.
The Board considered other benefits derived by the Subadviser from its relationship with the Fund. The Board noted the Subadviser’s statement that it does not enter into soft dollar arrangements and that it is not aware of any other benefits from its relationship with the Fund. The Board concluded that the subadvisory fee was reasonable, taking into account these factors.
Overall Conclusions
Based upon all of the information considered and the conclusions reached, the Board determined that the terms of each Advisory Agreement continue to be fair and reasonable and that the continuation of each Advisory Agreement is in the best interests of the Fund.
26 | SemiAnnual Report | June 30, 2007
OLA | Old Mutual/Claymore Long-Short Fund
Fund Information |
| | | | |
Board of Trustees | | Officers | | Investment Adviser |
Matthew J. Appelstein* | | Nicholas Dalmaso | | Claymore Advisors, LLC |
| | Chief Executive Officer and | | Lisle, Illinois |
Randall C. Barnes | | Chief Legal Officer | | |
| | | | Investment Sub-Adviser |
Steven D. Cosler | | Steven M. Hill | | Analytic Investors, Inc. |
| | Chief Accounting Officer, Chief | | Los Angeles, California |
Nicholas Dalmaso* | | Financial Officer and Treasurer | | |
| | | | Administrator |
Robert M. Hamje | | Matthew J. Patterson | | Claymore Advisors, LLC |
| | Secretary | | Lisle, Illinois |
| | | | |
L. Kent Moore | | Bruce Saxon | | Accounting Agent, Custodian |
| | Chief Compliance Officer | | and Transfer Agent |
Ronald A. Nyberg | | | | The Bank of New York |
| | | | NewYork, NewYork |
Ronald E. Toupin, Jr. | | | | |
| | | | Legal Counsel |
* Trustee is an “interested person” of the | | | | Skadden, Arps, Slate, |
Fund as defined in the Investment | | | | Meagher & Flom LLP |
Company Act of 1940, as amended. | | | | Chicago, Illinois |
| | |
| | | | Independent Registered Public |
| | | | Accounting Firm |
| | | | Ernst & Young LLP |
| | | | Chicago, Illinois |
Privacy Principles of Old Mutual/Claymore Long-Short Fund for Shareholders
The Fund is committed to maintaining the privacy of its shareholders and to safeguarding its non-public personal information. The following information is provided to help you understand what personal information the Fund collects, how we protect that information and why, in certain cases, we may share information with select other parties.
Generally, the Fund does not receive any non-public personal information relating to its shareholders, although certain non-public personal information of its shareholders may become available to the Fund. The Fund does not disclose any non-public personal information about its shareholders or former shareholders to anyone, except as permitted by law or as is necessary in order to service shareholder accounts (for example, to a transfer agent or third party administrator).
The Fund restricts access to non-public personal information about the shareholders to Claymore Advisors, LLC employees with a legitimate business need for the information. The Fund maintains physical, electronic and procedural safeguards designed to protect the non-public personal information of its shareholders.
Questions concerning your shares of Old Mutual/Claymore Long-Short Fund?
| • | | If your shares are held in a Brokerage Account, contact your Broker. |
| • | | If you have physical possession of your shares in certificate form, contact the Fund’s Administrator, Custodian and Transfer Agent The Bank of New York, 101 Barclay 11W, New York, New York 12086 (866) 488-3559 |
This report is sent to shareholders of Old Mutual/Claymore Long-Short Fund for their information. It is not a Prospectus, circular or representation intended for use in the purchase or sale of shares of the Fund or of any securities mentioned in this report.
A description of the Fund’s proxy voting policies and procedures related to portfolio securities is available without charge, upon request, by calling the Fund at (800) 345-7999 or by accessing the Fund’s Form N-PX on the U.S. Securities and Exchange Commission’s (“SEC”) website at http://www.sec.gov.
The Fund files its complete schedule of portfolio holdings with the SEC for the first and third quarters of each fiscal year on Form N-Q. The Fund’s Form N-Q is available on the SEC website at http://www.sec.gov. The Fund’s Form N-Q may also be viewed and copied at the SEC’s Public Reference Room in Washington, DC; information on the operation of the Public Reference Room may be obtained by calling (800) SEC-0330 or at www.claymore.com.
In June 2007, the Fund submitted a CEO annual certification to the NYSE in which the Fund’s principal executive officer certified that he was not aware, as of the date of the certification, of any violation by the Fund of the NYSE’s Corporate Governance listing standards. In addition, as required by Section 302 of the Sarbanes-Oxley Act of 2002 and related SEC rules, the Fund’s principal executive and principal financial officers have made quarterly certifications, included in filings with the SEC on Forms N-CSR and N-Q, relating to, among other things, the Fund’s disclosure controls and procedures and internal control over financial reporting.
SemiAnnual Report | June 30, 2007 | 27
OLA | Old Mutual/Claymore Long-Short Fund
About the Fund Manager |
Analytic Investors, Inc.
Analytic Investors specializes in the application of systematic investment processes to evaluate and exploit opportunities in the global equity, fixed income and derivative securities markets. Based in Los Angeles and wholly owned by Old Mutual plc, Analytic employs 35 professionals and manages more than $12 billion. The firm manages a range of traditional, long-only equity products as well as a number of absolute return strategies. The firm was founded in 1970 and, since that time, has focused on delivering valued-added, risk-controlled investment strategies to its range of institutional, fund-of-fund, and high net worth clients.
Investment Philosophy
Analytic’s philosophy is anchored in the conviction that the systematic application of quantitative techniques to assess opportunity has the potential to deliver quality, risk-adjusted performance, regardless of market cycle. Analytic’s quantitative methods bring together the best attributes of individual security selection and unbiased portfolio modeling, yielding a management style that is both disciplined and responsive.
Investment Process
Analytic’s innovative research seeks to uncover the factors that are driving performance and are likely to be important going forward. Two core beliefs underlie the firm’s investment process:
| | • | | The attractiveness of every security is determined by a multitude of factors that can be measured. |
| | • | | The desirability of a security’s characteristics change with economic conditions. |
Sophisticated quantitative techniques enable Analytic to simultaneously analyze a variety of unique characteristics – such as relative valuation, growth potential, historical returns, liquidity and risk – in an effort to identify and exploit opportunities. Analtic uses thorough statistical analysis in an attempt to identify the merits of each security as well as the relationships between each security’s measurable characteristics that may be driving its performance.
Analytic’s proprietary multi-factor return models are applied in a risk-controlled environment. The firm’s highly evolved and successful approach, supported by the research efforts of its investment team, capitalizes on opportunity while neutralizing systematic market exposure and overall risk.
| | |
Claymore Securities, Inc. 2455 Corporate West Drive Lisle, IL 60532 Member NASD/SIPC | |  |
Not applicable for a semi-annual reporting period.
| Item 3. | Audit Committee Financial Expert. |
Not applicable for a semi-annual reporting period.
| Item 4. | Principal Accountant Fees and Services. |
Not applicable for a semi-annual reporting period.
| Item 5. | Audit Committee of Listed Registrants. |
Not applicable for a semi-annual reporting period.
| Item 6. | Schedule of Investments. |
The Schedule of Investments is included as part of Item 1.
| Item 7. | Disclosure of Proxy Voting Policies and Procedures for Closed-End Management Investment Companies. |
Not applicable for a semi-annual reporting period.
| Item 8. | Portfolio Managers of Closed-End Management Investment Companies. |
Not applicable for a semi-annual reporting period.
| Item 9. | Purchases of Equity Securities by Closed-End Management Investment Company and Affiliated Purchasers. |
None.
| Item 10. | Submission of Matters to a Vote of Security Holders. |
The registrant has not made any material changes to the procedures by which shareholders may recommend nominees to the registrant’s Board of Trustees.
| Item 11. | Controls and Procedures. |
(a) The registrant’s principal executive officer and principal financial officer have evaluated the registrant’s disclosure controls and procedures (as defined in Rule 30a3(c) under the Investment Company Act) within 90 days of this filing and have concluded based on such evaluation, that the registrant’s disclosure controls and procedures were effective as of that date in ensuring that information required to be disclosed by the registrant in this Form N-CSR was recorded, processed, summarized, and reported within the time periods specified in the Securities and Exchange Commission’s rules and forms.
(b) There were no changes in the registrant’s internal control over financial reporting (as defined in Rule 30a-3(d) under the Investment Company Act) that occurred during the registrant’s last fiscal quarter of the period covered by this report that have materially affected, or are reasonably likely to materially affect, the registrant’s internal control over financial reporting.
| | |
| (a)(1) | | Not applicable. |
| |
| (a)(2) | | Certifications of principal executive officer and principal financial officer pursuant to Rule 30a-2(a) of the Investment Company Act. |
| |
| (a)(3) | | Not Applicable. |
| |
| (b) | | Certifications of principal executive officer and principal financial officer pursuant to Rule 30a-2(b) of the Investment Company Act. |
SIGNATURES
Pursuant to the requirements of the Securities Exchange Act of 1934 and the Investment Company Act of 1940, the registrant has duly caused this report to be signed on its behalf by the undersigned, thereunto duly authorized.
| | |
| (Registrant) Old Mutual/Claymore Long-Short Fund |
| |
| By: | | /s/ Nicholas Dalmaso |
| Name: | | Nicholas Dalmaso |
| Title: | | Chief Legal and Executive Officer |
| |
| Date: | | August 31, 2007 |
Pursuant to the requirements of the Securities Exchange Act of 1934 and the Investment Company Act of 1940, this report has been signed by the following persons on behalf of the registrant and in the capacities and on the dates indicated.
| | |
| |
| By: | | /s/ Nicholas Dalmaso |
| Name: | | Nicholas Dalmaso |
| Title: | | Chief Legal and Executive Officer |
| |
| Date: | | August 31, 2007 |
| |
| By: | | /s/ Steven M. Hill |
| Name: | | Steven M. Hill |
| Title: | | Treasurer and Chief Financial Officer |
| |
| Date: | | August 31, 2007 |